Exhibit 99.2
Exhibit 99.2
Management’s Discussion and Analysis
February 25, 2015
This discussion and analysis of Stantec Inc.’s operations, financial position, and cash flows for the year ended December 31, 2014, dated
February 25, 2015, should be read in conjunction with the Company’s 2014 audited consolidated financial statements and related notes for the year ended December 31, 2014. Our 2014 audited consolidated financial statements and related
notes are prepared in accordance with International Financial Reporting Standards (IFRS) as issued by the International Accounting Standards Board (IASB). All comparative share capital, earnings per share, dividends per share, and share-based
payment transaction information have been adjusted for amounts previously reported for the two-for-one share split that occurred on November 14, 2014. Unless otherwise indicated, all amounts shown in this report are in Canadian dollars.
Additional information regarding the Company, including our Annual Information Form, is available on SEDAR at www.sedar.com and on EDGAR at www.sec.gov. Such
additional information is not incorporated by reference unless otherwise specified and should not be deemed to be made part of this Management’s Discussion and Analysis.
Executive Summary
Core Business and
Strategy
| |
• |
|
We collaborate across disciplines and industries to bring buildings, energy and resource, and infrastructure projects to life. We provide professional consulting services in planning, engineering, architecture, interior
design, landscape architecture, surveying, environmental sciences, project management, and project economics. Our promise is to “design with community in mind.” |
| |
• |
|
Our business objective is to be a top 10 global design firm. We plan to achieve a compound average growth rate of 15% through a combination of organic and acquisition growth. |
| |
• |
|
To achieve our business objective, we focus on the following: using the strength of our local positioning to bring our world-class expertise to the communities in which we live and work; driving a client-focused culture
through cross-selling efforts, account management strategies, and strong local relationships; focusing on quality and creativity; positioning ourselves among the top-tier service providers in the sectors and geographic locations in which we operate;
and expanding our capabilities and geographic reach through strategic hires and the acquisition and integration of firms that share our vision and culture. |
|
|
|
|
|
| Management’s Discussion and Analysis
December 31, 2014 |
|
M-1 |
|
Stantec Inc. |
Key Performance Drivers and Capabilities
| |
• |
|
Our performance is driven by external factors in the infrastructure and facilities industry and by internal strategic drivers and capabilities that are articulated through our value statements: we put people first, we
are better together, we do what is right, and we are driven to achieve. |
Results
| |
• |
|
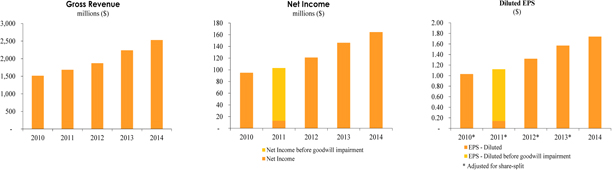
Continued profitability and organic growth. Our gross revenue grew 13.1% in 2014 compared to 2013. Of this gross revenue growth, 6.5% resulted from acquisitions and 3.9% from organic growth, particularly in our
Power, Water, and Community Development sectors. We achieved a 12.8% increase in our EBITDA and our diluted earnings per share increased 10.8% to $1.74 in 2014 compared to $1.57 in 2013. |
| |
• |
|
Growth through acquisition. Acquisitions completed in 2013 and 2014 contributed $144.6 million to the increase in our gross revenue in 2014 compared to 2013. We completed eight acquisitions in 2014 and five in
2013.These acquisitions strengthened our presence in the North America. |
| |
• |
|
Strong balance sheet and liquidity. Our balance sheet remains strong. Cash flows from operations in the year supported acquisition growth and continued dividends. During the year, we extended the maturity date of
our existing $350 million revolving credit facility to August 31, 2018. As at December 31, 2014, $281.9 million of additional borrowing was available under our revolving credit facility for future acquisitions, working capital needs,
and general corporate purposes. |
| |
• |
|
Evolution to business operating units. In 2014, we realigned our organizational structure from five practice area units to three business operating units: Buildings, Energy & Resources, and
Infrastructure. |
Outlook
| |
• |
|
We believe that we will achieve a moderate increase of approximately 3% organic gross revenue growth in 2015 compared to 2014. For both our Canadian operations and our Energy & Resources business operating
unit, we anticipate a decline in organic growth in the first half of 2015 compared to 2014, followed by stable organic revenues in the second half of the year. We expect to achieve moderate full-year organic revenue growth in both our US and
International operations. Our Buildings and Infrastructure business operating units are also expected to achieve moderate organic revenue growth in 2015 over 2014. |
Risks
| |
• |
|
Various risk factors could cause our actual results to differ materially from those projected in the Outlook section and forward-looking statements of this report. The material, known risks are described in the
Risk Factors section of this report. We believe there will be increased activity in sectors and geographical regions that are linked to non-energy export markets led by the improving US economy. Economic pressures and uncertainties, volatility
in the Canadian/US exchange rate, volatility in energy and commodity prices, and public infrastructure funding may adversely impact our current outlook for 2015. |
|
|
|
|
|
| Management’s Discussion and Analysis
December 31, 2014 |
|
M-2 |
|
Stantec Inc. |
Core Business and Strategy
Core Business
The following discussion includes forward-looking
statements. For an outline of the material risks and assumptions associated with these statements, refer to the Cautionary Note Regarding Forward-Looking Statements at the end of this report.
We collaborate across disciplines and industries to bring buildings, energy and resource, and infrastructure projects to life. Our work—professional
consulting in planning, engineering, architecture, interior design, landscape architecture, surveying, environmental sciences, project management, and project economics— begins at the intersection of community, creativity, and client
relationships.
Our Company celebrated its 60th year of operations in 2014. Since 1954, our local
strength, knowledge, and relationships, coupled with our world-class expertise, have allowed us to go anywhere to meet our clients’ needs in more creative and personalized ways. With a long-term commitment to the people and places we serve,
Stantec has the unique ability to connect to projects on a personal level and advance the quality of life in communities across the globe.
Business Objective
Our business objective is to be a top 10 global design firm. Currently, we are a top 10 design firm in North America and a top 20 firm globally. We
continue to work diligently to improve this top-tier position. We believe that our continued growth will increase shareholder value and give our employees the opportunity to bring their talent and expertise to top clients with complex projects that
span multiple disciplines around the world. We plan to achieve a compound average growth rate of 15% through a combination of organic and acquisition growth.
Strategy
To establish a clear plan for achieving our business
objective—to be a top 10 global design firm—we have a strategic planning process that consists of three-year cycles between comprehensive strategic review years and interim execution years. In a comprehensive strategic review year we
develop our long-range (five-year) strategy. In the three interim execution years, we focus on implementing and executing that long-range strategy. Following the 2012 comprehensive strategic review year, 2013, 2014, and 2015 are execution years. In
2015, we will complete a comprehensive strategic review.
In 2014, we focused on executing our strategy. Our purpose, promise, and values form the
foundation for our strategy. Our purpose is to create communities, and our promise is to design with community in mind. Our values are
| |
• |
|
We are driven to achieve |
For each action-oriented value statement, we identify annual initiatives relating to
human capital, learning and growth, clients, business processes, and operational and financial performance. (Our four value statements and initiatives are further described in the Key Performance Drivers and Capabilities section of this report.) We
seek to achieve our business objective by executing the following strategies:
| |
• |
|
Design. Focusing on professional consulting, we take on little or no construction risk |
|
|
|
|
|
| Management’s Discussion and Analysis
December 31, 2014 |
|
M-3 |
|
Stantec Inc. |
| |
• |
|
Community presence. Using the strength of our local position to bring our world-class expertise to the communities in which we live and work |
| |
• |
|
Local and global client focus. Driving a client-focused culture through cross-selling efforts, account management strategies, and strong local relationships |
| |
• |
|
Culture of excellence. Focusing on quality and creativity to provide value-added services through integrated quality management systems |
| |
• |
|
Top-tier positioning. Positioning ourselves among the top-tier service providers in the sectors and geographic locations in which we operate |
| |
• |
|
Expansion of capabilities and geographic reach. Expanding our capabilities and geographic reach through strategic hires and the acquisition and integration of firms that share our vision and culture
|
| |
• |
|
Diversification. Pursuing project and client diversification through a three-dimensional business model, thereby mitigating risk |
Business Model
Our business model is
a key element of our strategy. It is based on providing services across diverse geographic locations, business operating units, and all phases of the infrastructure and facilities project life cycle—planning, design, construction, maintenance,
and decommissioning.
Because of the diversity of our model, we can generally adapt to changes in market conditions by offsetting decreased demand for
services in one business operating unit or geographic location with increased demand for services in another. We believe this strategy allows us to mitigate risk while continuing to increase our revenue and earnings. Also, it allows us to provide
services to many clients and for many projects, ensuring that we do not rely on a few large projects for our revenue and that no single client or project accounts for more than 5% of our gross revenue.
Under the rules of IFRS, we have one reportable segment—Consulting Services—that is an aggregate of our operating segments. Our chief operating
decision maker (chief executive officer) assesses our Company’s performance based on financial information available from our operating segments, which are based on our regional geographic areas. In addition, we have business operating unit
leaders who provide strategic direction, mentoring, and technical support to operations across our geographic regions.
The following information outlines
the three main components of our business model: geographic diversification, business operating units, and life cycle solutions.
Geographic
Diversification
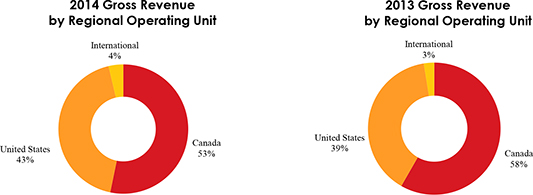
The first element of our business model is geographic diversification. We operate in three geographic regional operating
units—Canada, the United States, and International. Our International offices are in the Middle East, the United Kingdom, India, and the Caribbean. In 2014, we earned 53% of our gross revenue in Canada, 43% in the United States, and 4% in
International locations. Our aim is to leverage global expertise while focusing on our strong local presence.
Over the next three to five years, we
expect that the majority of our revenue growth will come from within North America and that this will occur through both organic growth and acquisitions. During this time, we will gradually increase our geographic reach in other markets suited for
and receptive to our services.
|
|
|
|
|
| Management’s Discussion and Analysis
December 31, 2014 |
|
M-4 |
|
Stantec Inc. |
Canada. At December 31, 2014, we had approximately 7,500 employees in Canada. We benefit from a
mature market position within each of our regions. Strategically, we view our opportunities as follows:
| |
• |
|
In western Canada, our primary growth areas include developing our significant multisector opportunities and continuing to develop our presence in oil and gas, power, mining, and commercial areas. To pursue clients, our
Environmental Services, Power, Mining, and Oil & Gas teams will continue to work collaboratively on business development. |
| |
• |
|
In Ontario, we continue to focus on augmenting our existing capabilities by emphasizing growth in our Transportation, Healthcare, Community Development, Water, and Power sectors, as well as in other areas.
|
| |
• |
|
The Dessau Inc. acquisition on January 16, 2015, added over 1,300 employees to our Company. Because of this, we believe we can now leverage opportunities in Quebec, particularly in resource and commercial
development, as a result of the significant investment planned and underway by the public sector in infrastructure and social facilities. |
| |
• |
|
In Atlantic Canada, we anticipate taking advantage of industrial and commercial opportunities for our Buildings business operating unit in two ways: by accessing our relationships in our Energy & Resources
business operating unit and by capitalizing on our significant local market presence. |
We believe that sustainable resource development is
important for the future of our Canadian operations. Our joint ventures and partnerships with Aboriginal groups, communities, and governments have given us a substantial local presence and a commanding presence in the North; we believe our presence
positions us well to capitalize on opportunities, particularly with oil and gas and mining clients. We will continue to pursue wins in public-private partnerships (P3) and emerging integrated project delivery (IPD) markets, particularly in our
Transportation and Healthcare sectors.
United States. We have approximately 6,400 employees in the United States, where economic growth is
improving. Due to acquisitions over the past five years, we are achieving critical mass and diversity across many sectors in many geographies. Strategically, we view our opportunities as follows:
| |
• |
|
We anticipate taking advantage of improved economic conditions in the transportation and community development sectors and the relative stability in the environmental services, buildings, and industrial buildings
sectors. |
| |
• |
|
We expect to build on our energy-related business because of the significant activity in shale, the strength of the power industry, and the need for infrastructure to support development. |
| |
• |
|
We expect to capitalize on infrastructure opportunities supported by certain state regulations promoting alternative project delivery (APD). |
| |
• |
|
We believe we can leverage our new acquisitions in the United States to diversify beyond our infrastructure roots and better position ourselves in the energy and resources and buildings markets. |
| |
• |
|
We believe we are well positioned in our Community Development sector to capture increased housing activities in Florida and California. |
| |
• |
|
We anticipate that trends like resiliency planning and storm preparation will continue. We also anticipate progress in areas such as healthcare and education, which are driven by population growth, supportive state
initiatives, and increased clarity in federal programs. |
|
|
|
|
|
| Management’s Discussion and Analysis
December 31, 2014 |
|
M-5 |
|
Stantec Inc. |
International. We have approximately 300 employees in our International operations. The majority of
revenue comes from our Buildings business operating unit and our Mining sector. During 2014, growth was positively impacted by hospital and institutional projects. However, the mining sector business is cyclical, so we expect that organic growth
will level off over the medium term.
To offset this trend, we will focus on growing organically in other sectors where we will concentrate activities in
areas where we currently have a presence. Like we do in our other locations, we expect to leverage our local position to drive cross-selling opportunities to clients in the United Kingdom and the Middle East.
Business Operating Units
Business operating unit
specialization is the second element of our business model. During 2014, we completed the realignment of our organizational structure from five practice area units to three specialized business operating units: Buildings, Energy &
Resources, and Infrastructure. We believe that this realignment ensures better support for our clients, stronger accountability for our leadership team, and more opportunities for cross selling, which, in turn, creates future growth and success. We
will accomplish these while maintaining the core elements of our strategy. In 2014, we earned 21% of our gross revenue in Buildings, 44% in Energy & Resources, and 35% in Infrastructure.
Within our three business operating units, we focus on the top 12 sectors that our clients operate in. By better understanding our clients’ goals, market
influences, and business drivers, we can offer multidisciplinary solutions to meet their needs.
Buildings. Most revenue in the Buildings business
operating unit consists of services in architecture, buildings engineering, project management, interior design, and functional planning for vertical infrastructure. The majority of our revenue is earned from private sector and institutional
clients, the remaining from public sector clients. We provide services in the following sectors:
| |
• |
|
Education & Institutional |
Energy & Resources. Most revenue in our Energy &
Resources business operating unit is composed of environmental services (these services are also provided to other business operating units), industrial engineering services, project management, and construction management services, primarily for
private sector clients. Services are provided in the following sectors:
Infrastructure. The majority of revenue in our Infrastructure business operating unit is from
design and engineering services, with a small portion from project and construction management. We provide services in the following sectors:
| |
• |
|
Transportation (Bridges, Roadways, and Transit & Rail) |
|
|
|
|
|
| Management’s Discussion and Analysis
December 31, 2014 |
|
M-6 |
|
Stantec Inc. |
For the most part, the Community Development sector serves private sector clients. Our Transportation and Water
sectors primarily serve public sector clients.
Life Cycle Solutions
The third element of our business model is providing professional services in all phases of the project life cycle: planning, design, construction,
maintenance, and decommissioning. This inclusive approach enables us to deliver services during periods of strong new capital project activity (design and construction), plus deliver services during periods of redevelopment or operational spending
activity (maintenance, integrity management, and remediation). We believe this strategy enables us to maintain long-term client relationships throughout the life of a project or an infrastructure asset.
Beginning with the planning and design stages, we provide conceptual and detailed design services, conduct feasibility studies, and prepare plans and
specifications. During the construction phase, we generally act as the owner’s representative and provide project management, construction management, surveying, and resident engineering services. We focus principally on fee-for-service work
and rarely act as the contractor or take on construction risk. During the maintenance phase that follows project completion, we provide ongoing professional services for integrity management, as well as maintenance and rehabilitation projects in
areas such as facilities and infrastructure management, facilities operations, and performance engineering. Finally, in the decommissioning phase, we provide solutions, recommendations, and remediation strategies for taking facilities out of active
service.
Key Performance Drivers and Capabilities
Our key performance drivers are defined by external forces and by internal factors that are articulated through our value statements: we put people first, we
are better together, we do what is right, and we are driven to achieve. The following discussion includes forward-looking statements. For an outline of the material risks and assumptions associated with these statements, refer to the Cautionary Note
Regarding Forward-Looking Statements at the end of this report.
Key External Drivers
Our core business is driven by a number of external industry factors that affect the demand for our services.
Buildings. In our Buildings business operating unit, economic outlook, unemployment rates, population growth, changing demographics in North America,
security, and aging infrastructure are the overarching drivers that impact the need for new facilities and renovations and expansions to existing buildings.
Our Buildings sectors and additional drivers that impact them follow:
| |
• |
|
Airports & Aviation – level of passenger traffic and security requirements (these influence the building and renovation of airport facilities) |
| |
• |
|
Commercial – consumer demand and market penetration relating to retail consumption and commercial workspace |
| |
• |
|
Education – population growth, public funding, technology, scientific advancement, and confidence in the economic turnaround |
|
|
|
|
|
| Management’s Discussion and Analysis
December 31, 2014 |
|
M-7 |
|
Stantec Inc. |
| |
• |
|
Healthcare – aging and growing population and government funding of capital projects (in particular, health reform supports capital spending in the United States) |
| |
• |
|
Industrial Buildings – strong manufacturing industry in North America and process improvements (these affect the need for industrial buildings and facilities) |
Energy & Resources. Our Energy & Resources business operating unit is driven primarily by the supply and demand for commodities in
the global economy and is affected by commodity prices. In recent years, strong demand for commodities from countries such as China, India, and Brazil has generally caused a rise in the prices of oil, gas, and mineral resources. However, the market
is cyclical and can cause dramatic fluctuations in supply and demand conditions, thereby affecting commodity prices. In periods of declining oil prices, upstream and downstream segments of the energy sector may delay or cancel investments in capital
projects. However, in the midstream sector, where we have significant expertise, clients may move forward with new, rehabilitated, or repurposed large capital infrastructure in periods of declining oil prices as these are significant multiyear
projects that are not as affected by short-term commodity fluctuations. Environmental regulations and stakeholder engagements also influence the development of energy and resources, especially in North America where assessment, compliance, and
monitoring are subject to increasingly stringent requirements.
Our Power sector is more of an infrastructure business, but economic activity also affects
power demand and therefore impacts this market to a degree. In addition, activity in our Power sector is influenced by regulations, the age of infrastructure, the location of supply and demand for transmission and distribution, and the level of
subsidization related to renewables.
Infrastructure. Our Infrastructure business operating unit is driven by population growth, urbanization, and
the continuous need to rehabilitate aging infrastructure. Government funding and environmental regulations impact this market as do changes in the housing market and special community initiatives. Also, government funding—whether at the
federal, state/provincial, or municipal level—generally determines capital spending and infrastructure project priorities. Increasingly, the private sector is influencing this market by engaging in project delivery approaches, such as P3s, and
projects with direct user fees, such as toll roads. Overall, this business operating unit relies heavily on local and regional clients and benefits from Stantec’s strong community presence.
Key Internal Drivers
We believe our actionable value statements
best reflect what unites Stantec and compels our people to come to work and do their best every day. Our performance depends on our ability to achieve excellence by putting people first, developing strong, long-lasting relationships with each other
and our clients, doing what is right, and being driven to achieve at every level. Our value system provides a framework for the strategic initiatives we implement to drive our performance and obtain our overall business objective to be a top 10
global design firm.
We Put People First
We continue to evolve by attracting talent and developing our people. This entails assessing and guiding current employees, engaging and developing leadership,
and ensuring we create an experience and work environment that retains talent. The total number of employees at our Company increased from close to 13,200 in 2013 to approximately 14,200 at the end of 2014. At December 31, 2014, our workforce
included approximately 8,500 professionals, 4,000 technical staff, and 1,700 support personnel. With the addition of Dessau Inc. on January 16, 2015, we have grown to over 15,500 employees.
|
|
|
|
|
| Management’s Discussion and Analysis
December 31, 2014 |
|
M-8 |
|
Stantec Inc. |
Employees
We strive to attract and retain the best employees in the field. To do this, we design our programs to be competitive and flexible, and to reward top
performance. This begins with providing comprehensive benefits programs, including a wellness culture where we provide tools and support to help employees and their families improve their health and well-being.
We have three career streams—business, technical, and project management—to provide employees with career development direction and growth
opportunities based on their primary area of interest. We have a comprehensive, blended learning environment for our employees that combines experiential on-the-job training, coaching and mentorship, improved tools and practices, and external
networks. Career stream and learning initiatives in 2014 included continuing to formalize our succession planning and launching an Emerging Leadership program that is consistent across all geographic regions.
In 2015, we plan to continue to enhance our leadership and training programs. In addition, we will focus on our Alternative Work Schedule and Global Mobility
programs to establish policies and practices to support our current and future business needs for a flexible and mobile workforce.
Our
Diversity & Inclusion Committee fosters a workplace that is supportive of the unique differences among our clients and employees. In 2014, we hired an external consultant to help develop a three- and five-year Diversity and Inclusion
(D&I) Plan. We will implement this plan in 2015, starting by formalizing a D&I Council.
In 2014, we continued with our Human Resources
realignment (initiated in 2013) to create a new service delivery model that will accommodate our current and future size based on forecasted growth. Our Human Resource structure will focus on three distinct service streams—shared services,
business partnerships, and centers of expertise.
We measure the success of our various initiatives through employee surveys, 360-degree feedback, and
exit interviews. The results help us develop future programs and initiatives.
Realignment of Senior Leadership Team
During 2014, in addition to realigning our organizational structure, we also realigned our senior leadership team into the following two levels:
| |
• |
|
Executive Vice President Team (EVPT) – consists of the chief executive officer (CEO), chief financial officer (CFO), chief operating officer (COO), and executive vice presidents (EVPs) The EVPT oversees the overall
performance of the Company, including developing and monitoring the Company’s business plan, monitoring financial performance and risks, approving policies and procedures, and overseeing acquisitions and divestitures. EVPs are specifically
responsible for the performance of our regional operating units and our business operating units. |
| |
• |
|
Executive Leadership Team (ELT) – consists of senior vice presidents and certain vice presidents. The ELT has numerous responsibilities, including the execution of our business plan and the management of the
Company’s operating performance. |
|
|
|
|
|
| Management’s Discussion and Analysis
December 31, 2014 |
|
M-9 |
|
Stantec Inc. |
Leadership Compensation
Our ability to align the activities of our senior managers with our short- and long-term financial and strategic goals is a key driver for our success. In
addition to fixed salaries, we provide short- and long-term compensation, on a discretionary basis, that is designed to reward our senior managers (including our CFO and COO, regional operating unit leaders, and business operating unit leaders) for
their individual and corporate contributions to meeting our objectives.
For our senior managers and other key employees, short-term compensation includes
an annual cash bonus. The total amount available in the annual bonus pool is calculated as a percentage of our annual pre-tax, pre-bonus net income, which encourages our senior managers to achieve profitable business results. To determine the awards
for the year, we evaluate each eligible employee’s personal contributions to our Company-wide profitability and performance. In our view, this creates a sense of shared responsibility for achieving outstanding business results and meeting our
clients’ needs.
In 2014, we revised our compensation program for the senior leadership team to provide a mix of base salary, short-term incentive
cash bonuses, and long-term incentives using both share options and performance share units (PSUs). We believe this plan further invests our senior leadership team in our long-term share performance.
As part of long-term compensation for key employees, we grant options through our long-term incentive plan, further aligning their interests with our
shareholders’ interests, as well as encouraging those employees to remain with us over the long term. In 2014, the number of options available for issuance was tied to the achievement of two key performance metrics contained in our strategic
plan: earnings per share and pre-tax, pre-bonus net income as a percentage of net revenue (“net revenue” is defined in Definition of Additional IFRS Measures in the Critical Accounting Estimates, Developments, and Measures section of this
report).
In 2015, we will continue to issue share options and will continue to supplement our long-term incentive plan for our senior leadership team
with PSUs.
Effective January 1, 2014, our CEO entered into a new employment contract with the Company, which provides for greater alignment between
the CEO’s compensation program and the rest of our senior leadership team’s compensation and our long-term shareholders’ interests. The CEO’s bonus is evaluated by the board annually based on the achievement of corporate and
individual performance metrics, and he is awarded annual long-term incentive grants of share options and PSUs.
We require our CEO, COO, CFO, and EVPs to
own a minimum number of shares in the Company. These executives must own a multiple of their base salary in shares. We believe our long-term incentive programs and the minimum ownership requirement provide the appropriate incentives for our EVPT to
achieve growth in our share price, thereby aligning their compensation with the interests of shareholders.
We Are Better Together
Strong, long-lasting relationships are at the center of everything we do, and they directly impact our employees and clients, as well as
project success. Each employee brings individual strengths to the Company, whether that is technical expertise, particular sector experience, or exceptional client relationships. When we combine those strengths, we believe we reach our full
potential as an organization and that we are a trusted advisor to our clients.
Our ability to attract and retain top clients drives the success of our
business. Currently, a majority of our business comes through repeat clients, and our 10 largest clients account for approximately 20.0% of our revenue. In 2014, we focused on the continued evolution of the organization and the enhancement of two
key strategies: client development and community engagement.
|
|
|
|
|
| Management’s Discussion and Analysis
December 31, 2014 |
|
M-10 |
|
Stantec Inc. |
Organizational Evolution
In 2014, we continued the process of realigning our internal structure to better serve our clients by formalizing our three business operating
units—Buildings, Energy & Resources, and Infrastructure. In 2015, we will continue to focus on collaborating and sharing responsibilities for operational performance in our organizational structure, and we will continue to refine and
clarify various roles.
Client Development and Account Management
We continue to pursue a client strategy that focuses on growing global accounts while augmenting the strength of our local client base and differentiating us
from our peers in the marketplace. The purpose of our account management system is to position Stantec for sustainable organic growth. To find and retain top clients, we develop targeted marketing and business development plans—by geographic
area for regional and local clients and by sector for global and national clients. By better understanding our top clients, we can increase our ability to provide services that enhance their success and, in turn, create organic growth for our
Company.
In 2014, we created an Account Management focus group, consisting of account managers across regions and sectors, to assist with implementing
our business development framework. In 2015, we will continue to enhance our client development strategies through this framework.
We Do
What Is Right
Doing what is right means paying attention to the impact that every decision has on how we do business. It means holding
ourselves to a high standard of ethics and integrity in everything we do and committing to professional excellence in a manner that fosters a culture of safety and sustainability that is both innovative and forward looking.
Ethics and Integrity
Our reputation remains a
significant asset; therefore, the focus continues to be on aligning our actions and decisions with our integrity and ethics policies. One way we ensure this is by conducting annual ethics, integrity, and anti-corruption compliance training for all
employees. We are—and should be—held to a high standard of business practices. At Stantec, we articulate our high standard through our Project Management Framework, code of ethics, and policies and practices. In 2014, we engaged an outside
agency to monitor, review, and report any issues identified through our Integrity Hotline.
Professional Excellence
We use a number of methods to ensure high-quality project execution, including the following:
Project Management Framework. We are committed to efficient and high-quality project execution within a framework that incorporates ethics, safety,
sustainability, innovation, and profitability. Our Project Management Framework helps us improve project planning, remain committed to quality assurance, and fulfill peer review requirements.
We always strive to enhance our project execution and forecasting ability and to facilitate more efficient resource management. Currently, we use a diverse
range of tools, including our Enterprise Management System, to execute projects effectively, and we will continue to invest in these tools in 2015.
Internal Practice Audits. We conduct internal practice audits to identify opportunities for quality enhancement across regions, disciplines, and
sectors.
|
|
|
|
|
| Management’s Discussion and Analysis
December 31, 2014 |
|
M-11 |
|
Stantec Inc. |
Integrated Management Systems. Our Integrated Management Systems clarify expectations for project delivery
and client service excellence and convey the steps employees must take to achieve more consistent and successful project outcomes. These systems are certified to the International Organization for Standardization (ISO) 9001:2008 (Quality
Management), ISO 14001:2004 (Environmental Management), and ISO 20000-1:2011 (IT Service Management System) standards. We believe that benchmarking against internationally recognized management standards
such as ISO provides transparent accountability that aligns with industry best practices—and we believe this ultimately improves client service delivery and satisfaction.
Project Management Career Streams and Training. Effective project management depends not only on tools but on people as well. Project management is a
career stream at Stantec. We have a Project Delivery Office that houses a peer group of senior project managers and project management specialists who can be deployed when required on any project throughout Stantec.
Regulatory Compliance. We operate in a diverse regulatory environment and are committed to compliance with regulatory requirements. For instance, we
comply with financial reporting standards and controls and with employment practices. We also demonstrate our commitment to excellence through our documented policies and procedures.
Social Responsibility
We commit to doing what is right
by demonstrating the values of social, economic, and environmental responsibility and a culture of health and safety through the implementation of various programs.
Sustainability. In our operations, we are committed to reducing our negative impact on the environment by progressing toward least-impact approaches to
energy consumption, paper consumption, and waste disposal. We track and report our progress in our annual Sustainability Report, in the Carbon Disclosure Project (CDP), and through certification to ISO 14001:2004 (Environmental Management). In 2015,
we will remain focused on meeting established targets to reduce the environmental impacts that result from our operations.
Stantec is at the forefront in
the rapidly emerging field of Integrated Infrastructure and is implementing a new planning framework and evaluation system called Envision™, developed by the Institute for Sustainable Infrastructure and the Harvard Graduate School of Design.
Envision provides a holistic framework for planning, designing, evaluating, and rating the community, environmental, and economic benefits of infrastructure projects and systems. In total, over 100 of our professional staff achieved their Envision
Sustainability Professional (ENV SP) credentials.
Health and Safety. We are committed to ensuring the health and safety of all employees and
stakeholders involved in our professional work. We continue to promote a culture of safety across our organization by implementing numerous formal and informal initiatives. In 2014, we implemented a safe return-to-work program and received OHSAS
18001:2007 certification for the Occupational Health & Safety (OHS) Management System. We continue to work on reducing our Total Recordable Incident Rate and Total Injury Rate.
Community Engagement. Our purpose is to create communities. At Stantec, we aim to be active members in our communities, making lasting connections with
the people where we live and work. We regularly partner with a number of charitable and community organizations to help support their growth and development by working on social projects, environmental projects, charitable initiatives, and more. In
addition to the many community outreach activities we participate in throughout the year, in 2014, we held our second Company-wide Stantec in the Community Day—more than 5,500 employees spent the day volunteering in their communities.
|
|
|
|
|
| Management’s Discussion and Analysis
December 31, 2014 |
|
M-12 |
|
Stantec Inc. |
In every region, we make decisions locally with local input and focus. We recognize that local staff best
understand how to match our resources and unique capabilities with the priorities of their communities and how to provide support to the organizations that make a difference. Corporately, we provide the framework that guides decision making,
ensuring our community investments align with our organizational objectives and resonate with our employees and business leaders in the communities we serve. We target donating 1% of our annual pre-tax profits, through direct cash contributions or
services in kind, to charitable or not-for-profit endeavors in the arts, education, environment, and health and wellness.
We Are Driven
to Achieve
Achievement at every level begins and ends with a firm commitment to being the best that we can be. To capitalize on market
opportunities and core strengths, we identify and adapt to changing market conditions in our various sectors. We identify growth opportunities—both organically and by acquisition—where we are well positioned and able to effectively manage
risk. We remain committed to growing our top and bottom line through a continued focus on design services and by maintaining a low to moderate risk profile.
Growth Opportunities
Our aim is to achieve consistent
growth and profitability. We will do this by sustaining a culture of excellence that remains committed to our clients, our people, our communities, and our shareholders. We commit to maintaining our diversification strategy, ensuring an appropriate
balance within our sector mix.
Achieving a high level of market presence in the communities we serve is a key driver to our success. Our approach to
regional growth is to effectively service our existing regional and local clients, develop new relationships, and grow our reputation and business where opportunities exist. Our target is to be among the
top-tier service providers in each region and sector. With this level of market presence, we will less likely be affected by downturns in regional economies.
Our strong presence in Canadian markets gives us the ability to capitalize on opportunities within each region. We continue to pursue areas in Canada where we
believe we can further increase our market presence in specific sectors. In the United States, our market position is growing, and we have taken strong steps to better position ourselves as a national firm. We have an emerging international
presence, mainly in our Buildings business operating unit and our Mining sector, and we aim to grow organically by introducing more services to current and new clients.
Organic growth has been and continues to be a key driver to our success. To achieve growth, we leverage client relationships through our sector approach, by
cross-selling, and through our account management programs, and we refine internal strategies that foster a culture of revenue generation in all areas of the Company.
Acquisitions are key to our strategy, and increasing the depth of our capabilities and broadening our geographic coverage enables us to better service our
clients and achieve growth. Therefore, we maintain a consistent and disciplined approach to sourcing firms that align with our Company’s culture and strategy. We continue to target these “right fit” firms based on sector and regional
priorities, while we remain open to new opportunities.
|
|
|
|
|
| Management’s Discussion and Analysis
December 31, 2014 |
|
M-13 |
|
Stantec Inc. |
Because we operate in a highly fragmented industry, we are confident that we can continue to take advantage of
acquisition opportunities. According to internal analyses and Engineering News-Record’s 2014 report on the top 500 design firms, the largest engineering and architecture companies (our principal competitors) operating in North America
generate about US$100 billion in annual design fees. Currently, our share is approximately 3%.
When we acquire a firm, integration starts immediately
following the acquisition closing date. Full integration usually takes between six months and two years to complete and involves implementing our Company-wide information technology and financial management systems and providing support services
from our corporate and regional offices. This approach allows new staff to focus, with minimal interruption, on their primary responsibility: continuing to serve clients while allowing staff to take advantage of our systems and expertise.
We measure our success integrating acquired employees by using a post-integration survey and assessing the results to improve future integration activities.
We also monitor leadership retention from acquisitions, key project submissions, and key client pursuits. In addition, we measure our growth success by monitoring our year-over-year increase in gross revenue
attributable to organic and acquisition growth.
Financing
Our continued ability to finance our growth plan supports our success. Adequate financing gives us the flexibility to acquire firms that are appropriate for
our vision and complement our business model.
Since our shares began being publicly traded on the Toronto Stock Exchange (TSX) in 1994, we have increased
our gross revenue at a compound annual rate of 18.3%. To fund acquisition growth, we require cash generated from both internal and external sources. Historically, we have completed acquisitions using (almost entirely) cash generated from operations
and vendor notes.
In 2014, we extended the maturity date of our existing $350 million revolving credit facility to August 31, 2018. This facility
also gives us access to $150 million in additional funds, subject to approval from our lenders. At December 31, 2014, we had $281.9 million of additional borrowing available under the facility. In 2011, we issued $70 million of 4.332% secured
notes due May 10, 2016, and $55 million of 4.757% senior secured notes due May 10, 2018, which were used to repay existing debt.
|
|
|
|
|
| Management’s Discussion and Analysis
December 31, 2014 |
|
M-14 |
|
Stantec Inc. |
Results
Overall Annual Performance
In 2014, we achieved solid growth. We completed eight acquisitions in the year and had organic growth in all geographic
regions and business operating units. Our 2014 organic growth demonstrates the effectiveness of our diversified business model: even though during the second half of the year we had a retraction in our Energy & Resources business operating
unit, we experienced growth in our Buildings and Infrastructure business operating units.
The following highlights other major financial achievements and
strategic activities in 2014 that contributed to our financial performance and overall financial condition:
| |
• |
|
Continuous profitability. Since the inception of our Company, we have achieved uninterrupted profitability. We ended 2014 with 13.1% growth in gross revenue, a 12.8% increase in EBITDA, a 12.5% increase in
net income, and a 10.8% increase in diluted earnings per share compared to 2013. (The terms “gross revenue” and “EBITDA” are defined in Definition of Additional IFRS Measures and Definition of Non-IFRS Measures in the Critical
Accounting Estimates, Developments, and Measures section (together, the “Definitions section”) of this report.) |
| |
• |
|
Growth through acquisitions. Acquisitions completed in 2013 and 2014 contributed $144.6 million or 6.5% to the increase in our gross revenue in 2014 compared to 2013. In particular, we strengthened our presence
in the United States as we continued to build a top-tier position in our sectors. |
| |
• |
|
Organic growth. In 2014, we achieved organic gross revenue growth of 3.9% and net revenue growth of 4.1%. By consistently executing our business strategy, we were able to capitalize on opportunities to increase
project activity in all business operating units. In particular, we experienced strong growth in our Power, Water, and Community Development sectors. |
| |
• |
|
Growth in backlog. Our contract backlog grew 28.6% from $1.4 billion at December 31, 2013, to $1.8 billion at December 31, 2014. (“Backlog” is a non-IFRS measure and is further discussed in
the Definitions section of this report.) |
| |
• |
|
Strong balance sheet and liquidity. Our balance sheet remains strong with a net debt to EBITDA ratio of 0.53. (“Net debt to EBITDA” is a non-IFRS measure and is defined in the Definitions section of
this report.) Cash flows from operations in the year supported acquisition growth and continued dividends. During the year, we extended the maturity date of our existing $350 million revolving credit facility to August 31, 2018. As at
December 31, 2014, $281.9 million of additional borrowing was available under our revolving credit facility for future acquisitions, working capital needs, and general corporate purposes. |
|
|
|
|
|
| Management’s Discussion and Analysis
December 31, 2014 |
|
M-15 |
|
Stantec Inc. |
| |
• |
|
Two-for-one share split. Our board of directors declared a two-for-one share split that was effected by way of a share dividend. Shareholders of record on October 31, 2014, received a share dividend on
November 14, 2014. |
| |
• |
|
Evolution to business operating units. In 2014, we realigned our organizational structure from five practice area units to three business operating units: Buildings, Energy & Resources, and
Infrastructure. Our matrix-based business model and leadership structure are organized around geographic diversification and business operating units, and we continue to provide services throughout the project life cycle. This realignment allows us
to better support our clients and better align us with their business drivers. |
Selected Annual Information
The following table highlights trending of certain annual information:
|
|
|
|
|
|
|
|
|
|
|
|
|
|
|
|
|
|
|
|
|
| (In millions of Canadian dollars,
except per share and share amounts) |
|
2014 |
|
|
2014 vs.
2013
(%) |
|
|
2013 |
|
|
2013 vs.
2012
(%) |
|
|
2012* |
|
|
|
|
|
|
|
| Gross revenue (note 1) |
|
|
2,529.9 |
|
|
|
13.1% |
|
|
|
2,236.4 |
|
|
|
19.6% |
|
|
|
1,870.3 |
|
| Net revenue (note 1) |
|
|
2,075.3 |
|
|
|
13.3% |
|
|
|
1,832.4 |
|
|
|
17.9% |
|
|
|
1,553.8 |
|
| EBITDA (note 2) |
|
|
294.7 |
|
|
|
12.8% |
|
|
|
261.2 |
|
|
|
18.1% |
|
|
|
221.0 |
|
| Net income |
|
|
164.5 |
|
|
|
12.5% |
|
|
|
146.2 |
|
|
|
20.8% |
|
|
|
121.0 |
|
| Earnings per share – basic (note 3) |
|
|
1.76 |
|
|
|
11.4% |
|
|
|
1.58 |
|
|
|
19.7% |
|
|
|
1.32 |
|
| Earnings per share – diluted (note 3) |
|
|
1.74 |
|
|
|
10.8% |
|
|
|
1.57 |
|
|
|
18.9% |
|
|
|
1.32 |
|
| Cash dividends declared per common share (note 3) |
|
|
0.37 |
|
|
|
12.1% |
|
|
|
0.33 |
|
|
|
10.0% |
|
|
|
0.30 |
|
|
|
|
|
|
|
| Total assets |
|
|
2,010.5 |
|
|
|
20.5% |
|
|
|
1,668.2 |
|
|
|
13.9% |
|
|
|
1,464.2 |
|
| Total long-term debt |
|
|
309.3 |
|
|
|
29.9% |
|
|
|
238.1 |
|
|
|
(20.4%) |
|
|
|
299.3 |
|
|
|
|
|
|
|
| Cash flows |
|
|
|
|
|
|
|
|
|
|
|
|
|
|
|
|
|
|
|
|
| From operating activities |
|
|
207.2 |
|
|
|
|
|
|
|
272.1 |
|
|
|
|
|
|
|
180.6 |
|
| Used in investing activities |
|
|
(174.3) |
|
|
|
|
|
|
|
(117.4) |
|
|
|
|
|
|
|
(143.2) |
|
| Used in financing activities |
|
|
(24.7) |
|
|
|
|
|
|
|
(54.2) |
|
|
|
|
|
|
|
(31.3) |
|
|
|
|
|
|
|
| Outstanding common shares as at |
|
|
|
|
|
|
|
|
|
|
|
|
|
|
|
|
|
|
|
|
| December 31 (note 3) |
|
|
93,836,258 |
|
|
|
|
|
|
|
93,152,264 |
|
|
|
|
|
|
|
91,967,788 |
|
| February 25, 2015 |
|
|
93,839,015 |
|
|
|
|
|
|
|
|
|
|
|
|
|
|
|
|
|
| Outstanding share options as at |
|
|
|
|
|
|
|
|
|
|
|
|
|
|
|
|
|
|
|
|
| December 31 (note 3) |
|
|
2,676,568 |
|
|
|
|
|
|
|
2,610,830 |
|
|
|
|
|
|
|
2,951,646 |
|
| February 25, 2015 |
|
|
2,673,811 |
|
|
|
|
|
|
|
|
|
|
|
|
|
|
|
|
|
note 1: Gross revenue and net revenue are defined in Definition of Additional IFRS Measures in the
Definitions section of this report.
note 2: EBITDA is calculated as net income before income taxes plus net interest expense,
amortization of intangible assets, and depreciation of property and equipment (further discussed in the Definitions section of this report).
note 3: All comparative earnings per share, dividends per share, common share, and share option amounts have been adjusted from previously
reported amounts for the two-for-one share split that occurred on November 14, 2014.
* Certain figures for 2012 have been
restated due to the adoption of IFRS 10 and 11.
|
|
|
|
|
| Management’s Discussion and Analysis
December 31, 2014 |
|
M-16 |
|
Stantec Inc. |
2014 vs. 2013. Eight acquisitions completed in 2014 and five completed in 2013 contributed to our
year-over-year growth in gross revenue, EBITDA, and net income, as well as growth in our basic and diluted earnings per share. As a result of acquisitions, gross revenue increased 6.5%. Also, gross revenue increased 3.9% and net revenue increased
4.1% because of organic growth. Organic growth occurred in all geographic regions and all business operating units. In Canada, the 3.8% organic gross revenue growth was primarily caused by increased activity in our Oil & Gas, Water, and
Community Development sectors. In the United States, organic gross revenue grew 2.7%, primarily in our Power, Transportation, and Water sectors. Internationally, we had organic growth that mainly occurred in our Buildings business operating unit.
Our EBITDA as a percentage of net revenue for 2014 was 14.2%—remaining consistent with 2013. Gross margin increased from 54.7% in 2013 to 54.9% in
2014, partly due to our revenue base growing in higher margin business operating units (Buildings and Infrastructure). In addition, gross margin increased as a result of improvements in project management in our Buildings business operating unit and
Transportation sector. (“Gross margin” is defined in the Definitions section of this report.) Administrative and marketing expenses increased mainly due to lower utilization, which was partly caused by increased integration activities from
acquisitions. The growth in net income and basic and diluted earnings per share over 2013 was a result of the above-noted factors.
2013 vs. 2012.
Five acquisitions completed in 2013 and seven completed in 2012 contributed to our year-over-year growth in gross revenue, EBITDA, and net income, as well as our growth in basic and diluted earnings per share.
This acquisition growth was supplemented by stronger organic growth in 2013 than in 2012. As a result of strong organic growth, gross revenue increased 8.8% and net revenue increased 7.6%. Organic growth occurred in all geographic regions and in all
practice area units except Buildings, mainly due to intensified competition and the softening of the buildings market, particularly in healthcare. Organic growth in other practice area units was mainly a result of a robust oil and gas market and
increased project activity in our Transportation sector.
Our 2013 EBITDA was impacted by a decrease in our gross margin—from 55.0% in 2012 to 54.7%
in 2013—while our administrative and marketing expenses as a percentage of net revenue remained the same as 2012 at 40.7%. Our gross margin declined slightly in 2013 because our revenue base grew in lower margin operations (Industrial and
Transportation in the United States), resulting in an overall lower 2013 consolidated gross margin. The growth in net income and basic and diluted earnings per share over 2012 was a result of the above-noted
factors.
|
|
|
|
|
| Management’s Discussion and Analysis
December 31, 2014 |
|
M-17 |
|
Stantec Inc. |
Results Compared to 2014 Targets
In our 2013 Management’s Discussion and Analysis, we established various ranges of expected performance for 2014. In 2014, we met or performed better than
all of our targets. The following table presents those results:
|
|
|
|
|
|
|
|
|
|
|
|
|
| Measure |
|
2014
Target Range |
|
Results
Achieved |
|
|
| Gross margin as % of net revenue |
|
Between 54% and 56% |
|
|
|
54.9 |
% |
|
|
ü |
|
|
| Administrative and marketing expenses as % of net revenue |
|
Between 40% and 42% |
|
|
|
40.8 |
% |
|
|
ü |
|
|
| EBITDA as % of net revenue (notes 1 and 4) |
|
Between 13% and 15% |
|
|
|
14.2 |
% |
|
|
ü |
|
|
| Net income as % of net revenue |
|
At or above 6% |
|
|
|
7.9 |
% |
|
|
ü |
|
|
| Effective income tax rate |
|
At or below 28.5% |
|
|
|
26.3 |
% |
|
|
ü |
|
|
| Return on equity (notes 2 and 4) |
|
At or above 14% |
|
|
|
16.8 |
% |
|
|
ü |
|
|
| Net debt to EBITDA (notes 1, 3, and 4) |
|
Below 2.5 |
|
|
|
0.5 |
|
|
|
ü |
|
|
note 1: EBITDA as a percentage of net revenue is calculated as EBITDA divided by net revenue. EBITDA is
calculated as income before income taxes, plus net interest expense, amortization of intangible assets, and depreciation of property and equipment.
note 2: Return on equity is calculated as net income for the last four quarters, divided by the average shareholders’ equity over each
of the last four quarters.
note 3: Net debt to EBITDA is calculated as the sum of (1) long-term debt, including current
portion, plus bank indebtedness, less cash and cash equivalents, divided by (2) EBITDA for the last four quarters.
note 4:
Return on equity, EBITDA as a percentage of net revenue, and net debt to EBITDA are non-IFRS measures (discussed in the Definitions section of this report).
ü Met or performed better than target.
Acquisitions
Consideration for acquisitions completed was $186.9 million in 2014 and $11.4 million in 2013. We completed the following acquisitions in 2014:
| |
• |
|
On January 24, 2014, we acquired Williamsburg Environmental Group, Inc. and Cultural Resources, Inc. (WEG), adding approximately 115 staff to our Company. This addition expands our environmental services in the US
Mid Atlantic. |
| |
• |
|
On March 7, 2014, we acquired Processes Unlimited International, Inc. (ProU), which added approximately 450 staff to our Company. This addition expands our oil and gas expertise in the United States.
|
| |
• |
|
On May 9, 2014, we acquired JBR Environmental Consultants, Inc. (JBR), adding approximately 140 staff to our Company. The addition of JBR increases the depth of our services in various market sectors, including
manufacturing, oil and gas, mining, and power generation and transmission in the United States. |
| |
• |
|
On May 23, 2014, we acquired Group Affiliates Inc. (SHW), increasing the number of staff in our Company by approximately 300. Adding SHW enhances our US architectural, interior design, planning, and engineering
services to higher education and K–12 clients. |
| |
• |
|
On June 6, 2014, we acquired Wiley Engineering, Inc. (Wiley); this added 14 staff to our Company. Based in Georgia, this firm provides automation, electrical, and instrumentation engineering services to oil and
gas, mining, power, and other industries. |
| |
• |
|
On June 27, 2014, we acquired USKH Inc. (USKH), increasing our staff count by approximately 130. The addition of USKH enables us to provide locally based infrastructure, building, and geospatial services in Alaska
and expands our presence in the Pacific Northwest. |
| |
• |
|
On September 19, 2014, we acquired ADD, Inc., adding close to 210 staff to our Company. This addition enhances our architecture, interior design, planning, and branding services in the Boston market and widens our
presence in southern Florida. |
|
|
|
|
|
| Management’s Discussion and Analysis
December 31, 2014 |
|
M-18 |
|
Stantec Inc. |
| |
• |
|
On October 24, 2014, we acquired Penfield & Smith Engineers, Inc. (Penfield & Smith), adding approximately 90 staff to our Company. Penfield & Smith is based in Santa Barbara, California,
with additional offices in Camarillo, Santa Maria, and Lancaster, California. This addition strengthens our civil engineering and land planning expertise and enhances our presence along the California Central Coast. |
Discussion of Operations
Our Company operates in one reportable
segment: Consulting Services. We provide knowledge-based solutions for infrastructure and facilities projects through value-added professional services, principally under fee-for-service agreements with clients.
The following table summarizes key operating results on a percentage of net revenue basis and the percentage increase in the dollar amount for each key
operating result:
|
|
|
|
|
|
|
|
|
|
|
|
|
| |
|
Year Ended Dec 31 |
|
| |
|
Percentage of
Net Revenue |
|
|
Percentage
Increase
(Decrease) * |
|
| |
|
2014 |
|
|
2013 |
|
|
2014 vs. 2013 |
|
|
|
|
|
| Gross revenue ** |
|
|
121.9% |
|
|
|
122.0% |
|
|
|
13.1% |
|
| Net revenue ** |
|
|
100.0% |
|
|
|
100.0% |
|
|
|
13.3% |
|
| Direct payroll costs |
|
|
45.1% |
|
|
|
45.3% |
|
|
|
12.9% |
|
| Gross margin ** |
|
|
54.9% |
|
|
|
54.7% |
|
|
|
13.6% |
|
| Administrative and marketing expenses |
|
|
40.8% |
|
|
|
40.7% |
|
|
|
13.4% |
|
| Depreciation of property and equipment |
|
|
1.9% |
|
|
|
1.8% |
|
|
|
19.4% |
|
| Amortization of intangible assets |
|
|
1.2% |
|
|
|
1.2% |
|
|
|
14.6% |
|
| Net interest expense |
|
|
0.4% |
|
|
|
0.5% |
|
|
|
(1.2%) |
|
| Other net finance expense (income) |
|
|
0.1% |
|
|
|
(0.2%) |
|
|
|
n/m |
|
| Share of income from joint ventures and associates |
|
|
(0.1%) |
|
|
|
(0.1%) |
|
|
|
4.3% |
|
| Foreign exchange gain |
|
|
0.0% |
|
|
|
0.0% |
|
|
|
n/m |
|
| Other (income) expense |
|
|
(0.2%) |
|
|
|
(0.1%) |
|
|
|
n/m |
|
| Income before income taxes |
|
|
10.8% |
|
|
|
10.9% |
|
|
|
12.2% |
|
| Income taxes |
|
|
2.9% |
|
|
|
2.9% |
|
|
|
11.4% |
|
| Net income |
|
|
7.9% |
|
|
|
8.0% |
|
|
|
12.5% |
|
n/m = not meaningful
* Percentage increase (decrease) calculated based on the dollar change from the comparable period.
** The terms gross and net revenue and gross margin are discussed in the Definitions section of this report.
The percentage increase in gross and net revenue in 2014 compared to 2013 was due to acquisition growth and organic growth in all geographic regions and
business operating units (further explained in the Gross and Net Revenue section that follows). We were positively impacted by an increase in our gross margin as a percentage of net revenue. This was partly offset by our administrative and marketing
expenses and depreciation of property and equipment since both as a percentage of net revenue increased compared to 2013 (further explained in the respective sections of this report). Our net income for 2014 increased by 12.5%.
|
|
|
|
|
| Management’s Discussion and Analysis
December 31, 2014 |
|
M-19 |
|
Stantec Inc. |
Gross and Net Revenue
The following discussion includes forward-looking statements. For an outline of the material risks and assumptions associated with these statements, refer to
the Cautionary Note Regarding Forward-Looking Statements at the end of this report. For definitions of “gross revenue” and “net revenue,” refer to Definition of Additional IFRS Measures in the Definitions section of this
report.
Revenue earned by acquired companies in the first 12 months following acquisition is reported as revenue from acquisitions and, thereafter, as
organic growth.
Each business operating unit generates a portion of gross revenue in the United States. The value of the Canadian dollar averaged US$0.91
in 2014 compared to US$0.97 in 2013—a 6.2% decrease. The weakening of the Canadian dollar for the year had a positive effect on revenue reported in 2014 compared to 2013.
Our contract backlog grew 28.6%—from $1.4 billion at December 31, 2013, to $1.8 billion at December 31, 2014. A significant majority of this
increase resulted from recent project wins and acquisitions completed in the year. We define “backlog” as the total value of secured work that has not yet been completed where we have an executed contract or a letter of intent that
management is reasonably assured will be finalized in a formal contract (further described in the Definitions section of this report). Only approximately the first 12 to 18 months of the total value of secured work for a project is included in
contract backlog.
The following tables summarize the impact of acquisition growth, organic growth, and foreign exchange on our gross and net revenue for
2014 compared to 2013:
|
|
|
|
|
| Management’s Discussion and Analysis
December 31, 2014 |
|
M-20 |
|
Stantec Inc. |
|
|
|
|
|
| Gross Revenue
(In millions of Canadian dollars) |
|
2014 vs. 2013 |
|
|
|
| Increase due to |
|
|
|
|
| Acquisition growth |
|
|
144.6 |
|
| Organic growth |
|
|
86.4 |
|
| Impact of foreign exchange rates on revenue earned by foreign subsidiaries |
|
|
62.5 |
|
|
|
| Total net increase in gross revenue |
|
|
293.5 |
|
|
|
| Net Revenue
(In millions of Canadian dollars) |
|
2014 vs. 2013 |
|
| Increase due to |
|
|
|
|
| Acquisition growth |
|
|
119.6 |
|
| Organic growth |
|
|
74.8 |
|
| Impact of foreign exchange rates on revenue earned by foreign subsidiaries |
|
|
48.5 |
|
|
|
| Total net increase in net revenue |
|
|
242.9 |
|
The increase in acquisition gross and net revenue in 2014 compared to 2013 was due to the revenue earned in 2013 that was
attributed to the acquisitions listed in the Gross Revenue by Region and Gross Revenue by Business Operating Unit sections below. We experienced increases in organic gross revenue in 2014 compared to 2013 in all regions and all business operating
units.
Gross Revenue by Region
The following charts and
tables summarize gross revenue and gross revenue growth in our three regional operating units—Canada, United States, and International:
|
|
|
|
|
| Management’s Discussion and Analysis
December 31, 2014 |
|
M-21 |
|
Stantec Inc. |
The following table summarizes the growth in gross revenue by region for 2014 compared to 2013:
|
|
|
|
|
|
|
|
|
|
|
|
|
|
|
|
|
|
|
|
|
|
|
|
|
| (In millions of Canadian dollars) |
|
Year Ended
Dec 31,
2014 |
|
|
Year Ended
Dec 31,
2013 |
|
|
Total
Change |
|
|
Change Due
to
Acquisitions |
|
|
Change Due
to Organic
Growth |
|
|
Change Due
to Foreign
Exchange |
|
|
|
|
|
|
|
|
| Canada |
|
|
1,346.6 |
|
|
|
1,290.2 |
|
|
|
56.4 |
|
|
|
7.8 |
|
|
|
48.6 |
|
|
|
n/a |
|
| United States |
|
|
1,090.6 |
|
|
|
867.5 |
|
|
|
223.1 |
|
|
|
136.8 |
|
|
|
23.8 |
|
|
|
62.5 |
|
| International |
|
|
92.7 |
|
|
|
78.7 |
|
|
|
14.0 |
|
|
|
- |
|
|
|
14.0 |
|
|
|
- |
|
|
|
|
|
|
|
|
| Total |
|
|
2,529.9 |
|
|
|
2,236.4 |
|
|
|
293.5 |
|
|
|
144.6 |
|
|
|
86.4 |
|
|
|
62.5 |
|
Total gross revenue was positively impacted by acquisitions completed in 2013 and 2014, by organic growth, and by the
weakening of the Canadian dollar in 2014 compared to 2013.
Following is a list of acquisitions completed in 2013 and 2014 that impacted specific regions
during 2014:
| |
• |
|
Canada: Ashley-Pryce Interior Designers Inc. (AP/ID) (May 2013); JDA Architects Limited (JDA) (November 2013); and Cambria Gordon Ltd. (CGL) (November 2013) |
| |
• |
|
United States: IBE Consulting Engineers, Inc. (IBE) (May 2013); Roth Hill, LLC (Roth Hill) (June 2013); Williamsburg Environmental Group, Inc. and Cultural Resources, Inc. (WEG) (January 2014); Processes
Unlimited International, Inc. (ProU) (March 2014); JBR Environmental Consultants, Inc. (JBR) (May 2014); Group Affiliates Inc. (SHW) (May 2014); Wiley Engineering, Inc. (Wiley) (June 2014); USKH Inc. (USKH) (June 2014); ADD, Inc. (September 2014);
and Penfield & Smith Engineers, Inc. (Penfield & Smith) (October 2014) |
Canada. Gross revenue in our Canadian
operations increased by 4.4% in 2014 compared to 2013. The increase resulted from acquisition and organic growth. The 3.8% in organic gross revenue growth was primarily due to a strong first half of 2014 in our Oil & Gas sector. All other
sectors achieved organic revenue growth throughout the year, except for Transportation, which had a slight retraction in gross revenue in 2014 compared to 2013. Oil & Gas organic revenue retracted in Q4 14 because many projects were
substantially completed or were waiting on regulatory approvals and clients’ decisions to proceed to the next phase of these projects.
In 2014, we
continued to provide a significant amount of services to the energy and resources markets, particularly in western Canada. Private investment continued in energy midstream infrastructure projects, including pipeline and related facilities, to
increase the transport capacity for oil and gas for export. We did experience reduced activity in the last two quarters of 2014 compared to the same period in 2013, mainly due to the completion of certain pipeline terminal projects. The decline in
oil prices in the latter half of 2014 did not materially impact our midstream work; however, we are cautious on how the recent commodity price fluctuations may impact our clients’ decisions and timing to advance their projects going forward.
(The expected impact for 2015 is discussed in the Outlook section of this report.)
The activity in the energy market also generated organic revenue
growth for both private and public clients in other sectors including Water and Community Development in Alberta. Our Water sector was particularly active with increased work in water and wastewater infrastructure facilities. Our Power sector,
particularly in transmission and distribution, showed strength in the second half of 2014.
|
|
|
|
|
| Management’s Discussion and Analysis
December 31, 2014 |
|
M-22 |
|
Stantec Inc. |
In the public sector, federal and provincial budgets maintained stable levels for infrastructure funding, and
municipal funding increased. Federal conditional regulatory approvals continued to support pipeline enhancement and expansion. However, increasingly, these projects were delayed because of the increased time required to obtain regulatory approvals
in certain provinces and to clear the identified regulatory conditions attached, and because of the time spent surmounting opposition in communities. The public-private partnership (P3) model continued to be supported in Canada as new P3 projects
were released, particularly in Ontario and the western provinces. Increasingly, P3s are being considered at the municipal level.
United States.
Gross revenue in our US operations increased by 25.7% in 2014 compared to 2013. This increase resulted mainly from acquisition growth—especially in our Buildings business operating unit and Oil & Gas sector—and from foreign
exchange because of the weakening of the Canadian dollar in 2014 compared to 2013. Also, organic gross revenue grew by 2.7% in 2014 compared to 2013. Organic growth occurred primarily in our Power, Transportation, and Water sectors, though it was
partly offset by a retraction in our Buildings business operating unit and Mining sector.
Organic gross revenue demonstrated a strong recovery since the
beginning of 2014 when the harsh winter conditions, particularly in the Midwest and Northeast, resulted in project delays and additional time to complete work in progress. By building on strong, established client relationships, our Transportation
sector experienced increased organic revenue in almost all geographies. During 2014, the public sector was characterized as uncertain in the political and regulatory environment, notably at the federal level. Although public sector budgets were
tight, we did benefit from greater stability in public sector funding for roadways and transportation in 2014 compared to 2013.
The private sector
experienced increased activity as improvement in the US economy gained momentum in 2014. The US housing market gradually continued to recover. Even though we completed certain mining projects in the latter half of 2013, replenishing our backlog in
2014 was slow because of global softening in the mining sector.
International. Gross revenue in our International operations increased by 17.8% in
2014 compared to 2013. This increase resulted from organic growth, particularly in the Middle East, and from mining projects in Indonesia. The volume of projects in 2014 compared to 2013 increased in both our Buildings and Energy &
Resources business operating units, predominately for private sector clients. In our Mining sector, our top-tier expertise in underground engineering enabled us to continue working for major global clients—in spite of a general slowdown in the
mining industry. Organic growth was positively impacted by hospital and institutional projects that were secured early in the year in both the Middle East and United Kingdom.
|
|
|
|
|
| Management’s Discussion and Analysis
December 31, 2014 |
|
M-23 |
|
Stantec Inc. |
Gross Revenue by Business Operating Unit
The following charts and tables summarize gross revenue and gross revenue growth in our three business operating units—Buildings, Energy &
Resources, and Infrastructure:
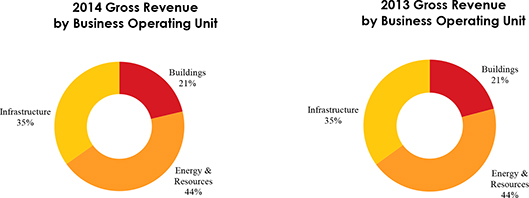
|
|
|
|
|
|
|
|
|
|
|
|
|
|
|
|
|
|
|
|
|
| (In millions of Canadian dollars, except %) |
|
2014 |
|
|
% of
Consulting
Services
Gross Revenue |
|
|
2013 |
|
|
% of
Consulting
Services
Gross Revenue |
|
|
% Change in
Gross Revenue
2014 vs. 2013 |
|
|
|
|
|
|
|
| Buildings |
|
|
538.5 |
|
|
|
21.3% |
|
|
|
466.6 |
|
|
|
20.9% |
|
|
|
15.4% |
|
| Energy & Resources |
|
|
1,109.2 |
|
|
|
43.8% |
|
|
|
986.8 |
|
|
|
44.1% |
|
|
|
12.4% |
|
| Infrastructure |
|
|
882.2 |
|
|
|
34.9% |
|
|
|
783.0 |
|
|
|
35.0% |
|
|
|
12.7% |
|
| Total |
|
|
2,529.9 |
|
|
|
100.0% |
|
|
|
2,236.4 |
|
|
|
100.0% |
|
|
|
13.1% |
|
Note: Comparative figures have been reclassified due to a realignment of several business lines between our
Buildings, Energy & Resources, and Infrastructure
business operating units.
As indicated above, our gross revenue was positively impacted by acquisitions and organic growth, as well as the effect of foreign exchange rates on revenue
earned by our foreign subsidiaries. The impact of these factors on gross revenue earned by business operating unit is summarized in the following table:
|
|
|
|
|
|
|
|
|
|
|
|
|
|
|
|
|
| |
|
2014 Compared to 2013 |
|
| (In millions of Canadian dollars) |
|
Total Change |
|
|
Change Due to
Acquisitions |
|
|
Change Due to
Organic Growth |
|
|
Change Due to
Foreign Exchange |
|
|
|
|
|
|
| Buildings |
|
|
71.9 |
|
|
|
54.4 |
|
|
|
5.7 |
|
|
|
11.8 |
|
| Energy & Resources |
|
|
122.4 |
|
|
|
77.2 |
|
|
|
28.9 |
|
|
|
16.3 |
|
| Infrastructure |
|
|
99.2 |
|
|
|
13.0 |
|
|
|
51.8 |
|
|
|
34.4 |
|
| Total |
|
|
293.5 |
|
|
|
144.6 |
|
|
|
86.4 |
|
|
|
62.5 |
|
Note: Comparative figures have been reclassified due to a realignment of several business lines between our
Buildings, Energy & Resources, and Infrastructure
business operating units.
|
|
|
|
|
| Management’s Discussion and Analysis
December 31, 2014 |
|
M-24 |
|
Stantec Inc. |
The following summarizes the acquisitions completed in 2013 and 2014 that impacted specific business operating
units during 2014:
| |
• |
|
Buildings: AP/ID (May 2013); IBE (May 2013); JDA (November 2013); SHW (May 2014); USKH (June 2014); and ADD, Inc. (September 2014) |
| |
• |
|
Energy & Resources: CGL (November 2013); WEG (January 2014); ProU (March 2014); JBR (May 2014); and Wiley (June 2014) |
| |
• |
|
Infrastructure: Roth Hill (June 2013); USKH (June 2014); and Penfield & Smith (October 2014) |
Buildings. The Buildings business operating unit achieved 1.2% organic gross revenue growth in 2014 compared to 2013. Growth in the second half of 2014
exceeded the retraction in the first half. Organic gross revenue growth occurred in our Canadian and International regional operating units, and the United States retracted in 2014 compared to 2013. During 2014, Canada and the United States
experienced a soft buildings market, intense competition, and reduced availability of funding for public sector projects. Since mid-2014, activity increased in our Healthcare and US Education sectors.
The majority of revenue for our Buildings business operating unit is generated from our key sectors: Education, Healthcare, and Commercial. We see increased
opportunities in the education sector, especially for science, technology, engineering, and mathematics facilities. For example, during the fourth quarter of 2014, we secured architectural and engineering work for the Lake Forest College Johnson
Science Center in Lake Forest, Illinois. Renovations and a 51,000-square-foot (4,700-square-metre) addition will transform the existing center into a contemporary state-of-the-art science facility.
In Canada, an increase in organic gross revenue in our Healthcare sector offset a retraction in the early part of the year. This retraction occurred because
we substantially completed the rollout of certain cross-country retail programs for national retail and commercial clients. However, commercial opportunities continued to exist in 2014. To illustrate, in the latter part of 2014, we were chosen to
design a new mixed-use high-rise office and residential tower in Edmonton, Alberta; this part of the development will become the new headquarters for Stantec Inc. Our multidiscipline project team spans North America. Their talent and expertise will
contribute to building this signature building, which will redefine the Edmonton skyline. Opportunities for P3 projects continued, despite public funding constraints and increased international competition.
In the United States, the retraction in organic gross revenue resulted chiefly from increased competition and fewer healthcare projects. Nevertheless, in the
latter part of 2014, the healthcare market showed signs of improvement as clients moved forward with their capital plans. Revenue from our US biopharmaceutical clients has declined because of industry consolidation and increased competition.
Recent projects secured in the Middle East increased our International healthcare and institutional portfolios.
Energy & Resources. The Energy & Resources business operating unit achieved 2.9% organic gross revenue growth in 2014 compared to
2013. Our Power sector achieved moderate organic revenue growth, while mining organic revenue was stable in 2014 compared to 2013. In our Oil & Gas sector, strong organic growth occurred in the first half of 2014, with retraction occurring
in the second half of the year. Growth in our Oil & Gas sector occurred primarily related to our engineering and environmental services work on Canadian midstream pipelines and facilities. Activity in this sector decreased in the last
two quarters of 2014, primarily due to the winding down of certain terminal projects. Outside of Oil & Gas, environmental services had a slow start in the first half of 2014 due to the harsher-than-usual winter and a longer ramp-up for the
seasonally strong spring and summer months, although revenue grew in the second half of the year.
|
|
|
|
|
| Management’s Discussion and Analysis
December 31, 2014 |
|
M-25 |
|
Stantec Inc. |
In our Energy & Resources business operating unit, the engineering and environmental services in our
Oil & Gas sector accounted for over three-quarters of our gross revenue in 2014. Global energy demand and production are driving the need for supporting infrastructure, including storage, processing facilities, and pipelines. Because of our
diverse project expertise and depth of experience, we are recognized as a top integrated provider of midstream services, which helped us to continue securing engineering and environmental services projects for large national clients for major oil
and gas export pipelines in Canada. High commodity prices during the first half of 2014 and continued activity to increase and improve infrastructure in the Canadian midstream market also resulted in growth in our engineering and environmental
services. However, the decline in oil prices at the end of 2014 and the possibility of sustained depressed prices in 2015 bring uncertainty to the oil and gas sector (further discussed in the Outlook section of this report). In the United States,
where our oil and gas presence is emerging, we experienced slight organic revenue growth in 2014 compared to 2013. On both sides of the border, environmental services grew in 2014 because of our expertise in providing diverse services, including
work on large pipelines and LNG projects as well as on non-energy related activities (these environmental services are also provided to other business operating units).
Our Power sector had organic gross revenue growth in 2014 compared to 2013, despite the continued slowdown in the power industry affecting public and private
sector clients. Growth in the United States was principally due to an increase in gas generation projects, but an increase in maintenance-related work with utilities was also a factor because aging infrastructure, such as substations and
switchyards, needs to be replaced. Our organic revenue also grew in Canada, where we are seen as a top provider of strategic regulatory and environmental scoping for power projects and where we continue to perform engineering, procurement, and
construction management (EPCM) work. We continue to work on renewables, generation, and transmission and distribution projects across Canada.
On both
sides of the border, we see a push for higher efficiency thermal and combined-cycle power plants to replace aging plants that are being shut down. In one case during the year, we were selected by Quanta Power Generation to provide engineering and
design services as part of their engineering, procurement, and construction (EPC) team for the new 120-megawatt combined-cycle thermal power plant being built in Anchorage, Alaska. The new plant is expected to use less natural gas and release fewer
emissions than traditional thermal plants. We also secured the engineering and design services for a combined 14-megawatt heat and power facility in Brooks, Alberta.
We are recognized for our top-tier expertise in wind design, and as a result, we secured the preliminary engineering work on the Roosevelt Wind Project during
2014. This project, about 18 miles (29 kilometres) southwest of Portales, New Mexico, will have up to 300-megawatts of capacity and is expected to begin operating by December 2015. Stantec will provide the detailed electrical design for the
transmission line, collector substations, joint-use switching station, and collector and communication systems.
Our Mining sector had moderate organic
revenue growth in 2014 compared to 2013. We experienced this growth in Canada and internationally due to continued work with major global clients; this growth was offset by a decline in our US Mining sector. Weakening commodity prices and, in some
cases, excess supply, have resulted in global softening in mining. Companies tightened capital investment, scaling back expansion plans and exploration, and ceasing development. Nonetheless, we maintained our revenue levels in the Mining sector in
2014 because of our reputation, strong relationships with repeat clients, diversified commodities exposure, and diversified range of services, including our ability to provide services at the front end and provide detailed design and construction
management.
|
|
|
|
|
| Management’s Discussion and Analysis
December 31, 2014 |
|
M-26 |
|
Stantec Inc. |
Infrastructure. The Infrastructure business operating unit achieved 6.6% organic gross revenue growth in
2014 compared to 2013. We experienced this growth in all our Infrastructure sectors.
Our Water sector had strong organic gross revenue growth in 2014
compared to 2013, as well as an increase in backlog. Our business is benefiting from ongoing demand for our services as a result of the rehabilitation required on aging infrastructure, the energy sector, and regulatory requirements, including the
consent decrees in the United States that mandate municipalities to upgrade their water and wastewater facilities. Growth in Canada and the United States was partly due to the work we added in mid-2013 on the major PCCP Constructors joint
venture project in New Orleans for the US Army Corps of Engineers. During 2014, we continued to secure significant water projects such as a five-year renewal of our Risk Mapping Assessment and Planning (Risk MAP) contract with the Federal Emergency
Management Agency (FEMA) and several other ongoing projects for the Tennessee Valley Authority. The nationwide contract with FEMA will provide services for the agency’s flood risk mapping and hazard mitigation programs—a multipronged
effort that will help communities identify and understand the risks that natural and manmade disasters pose to infrastructure and buildings. In addition, because of our expertise in flood protection, we secured the Springbank Off-stream Storage (SR1) Protection project west of Calgary, Alberta—one of the largest flood mitigation projects in Alberta’s history.
Our Transportation sector experienced organic gross revenue growth in 2014 compared to 2013. Approximately 75% of our Transportation revenue is generated in
the United States. Organic revenue growth that took place in the United States was due to our strong client relationships and stable infrastructure spending, which led to new projects. As an example, during 2014, we secured work on the Golden Glades
Interchange design-bid-build project, one of the largest conventional projects to come out of the Florida Department of Transportation in recent years. We will develop improvements to enhance safety, mobility, and multimodal use to support the
establishment of an Ultimate Master Plan that incorporates express-lane connections between SR 826, I-95, and the Turnpike. In Canada, retraction occurred because the design phase for a number of projects was completed and new work was slow to
start.
Our Community Development sector had strong organic gross revenue growth in 2014 compared to 2013. In this sector, we do half our work in Canada
and half in the United States. Both countries experienced organic revenue growth, especially Canada because of a strong demand for housing and urban land development projects in western Canada. This demand increased as a result of the energy and
natural resource market. Growth was also strong in California and the southeastern United States. The southern United States continued to show signs of improved housing markets; in particular, multipurpose and senior housing are gaining greater
prominence, consistent with demographic trends. The single-family market demand is coming around to equal that of the other markets, and the return of large-scale single-family development is predominant in parts of Canada and in southern states
such as Florida and California.
|
|
|
|
|
| Management’s Discussion and Analysis
December 31, 2014 |
|
M-27 |
|
Stantec Inc. |
Gross Margin
For a
definition of “gross margin,” refer to Definition of Additional IFRS Measures in the Definitions section of this report.
In general,
gross margin fluctuations depend on the particular mix of projects in progress during any year and on our project execution. These fluctuations reflect the basis of our business model: diversifying our operations across geographic locations,
business operating units, and all phases of the infrastructure and facilities project life cycle.
Gross margin as a percentage of net revenue increased
to 54.9% in 2014 from 54.7% in 2013 and is within our targeted range of 54% to 56% (set out in our 2013 Annual Report). This increase in our 2014 consolidated gross margin was due in part to the growth in the revenue base of our Buildings and
Infrastructure business operating units; these business operating units have higher margins than our Energy & Resources business operating unit (further explained below). In addition, the increase resulted from improvements in project
management in our Buildings business operating unit and Transportation sector.
The following table summarizes our gross margin percentages by region:
Gross Margin by Regional Operating Unit
|
|
|
|
|
|
|
|
|
| |
|
2014 |
|
|
2013 |
|
|
|
|
| Canada |
|
|
55.9% |
|
|
|
55.1% |
|
| United States |
|
|
54.0% |
|
|
|
54.4% |
|
| International |
|
|
47.4% |
|
|
|
50.6% |
|
In our Canadian operations, the increase in gross margin in 2014 compared to 2013 was primarily due to improvements in project
management as well as the mix of projects because of growth in the higher margin environmental services and the Water and Community Development sectors. In our US operations, the reduction in gross margin is mainly due to lower margins in our
Oil & Gas sector, which is a growing component of our US revenue. The reduction in gross margin in our International operations was due to the mix of project activity.
The following table summarizes our gross margin percentages by business operating unit:
Gross Margin by Business Operating Unit
|
|
|
|
|
|
|
|
|
| |
|
2014 |
|
|
2013 |
|
|
|
|
| Buildings |
|
|
55.1% |
|
|
|
54.8% |
|
| Energy & Resources |
|
|
53.2% |
|
|
|
53.3% |
|
| Infrastructure |
|
|
56.8% |
|
|
|
56.4% |
|
Note: Comparative figures have been reclassified due to a realignment of several
business lines between our Buildings, Energy & Resources, and Infrastructure business
operating units.
|
|
|
|
|
| Management’s Discussion and Analysis
December 31, 2014 |
|
M-28 |
|
Stantec Inc. |
Our Buildings business operating unit experienced a higher gross margin in 2014 compared to 2013, mostly as a
result of improved project management and the mix of projects in progress during the year.
Our Infrastructure business operating unit had a higher gross
margin in 2014 compared to 2013, mainly due to improved project management in our Transportation sector. In addition, gross margin improved due to project mix, in particular, because of an increase in the number of projects in the water and
community development residential markets, which typically have higher margins.
Administrative and Marketing Expenses
Administrative and marketing expenses increased by $100.0 million from 2013 to 2014. As a percentage of net revenue, our administrative and marketing expenses
increased from 40.7% in 2013 to 40.8% in 2014 while still falling within the expected range of 40% to 42% set out in our 2013 Annual Report.
Administrative and marketing expenses fluctuate from year to year because of the amount of staff time charged to marketing and administrative labor, which is
influenced by the mix of projects in progress during the period, as well as by business development and acquisition integration activities.
In 2014,
administrative and marketing expenses were impacted by lower utilization, which is partly caused by an increase in integration activities. In the months after completing an acquisition, staff time charged to administration and marketing is usually
higher because of integration activities, including orienting newly acquired staff. Eight acquisitions were completed in 2014 compared to five in 2013. The impact of lower utilization on administrative and marketing expenses was partly offset by a
decrease in our provisions for claims in 2014 compared to 2013.
Depreciation of Property and Equipment
Depreciation increased by $6.3 million year over year. As a percentage of net revenue, depreciation of property and equipment increased from 1.8% in 2013 to
1.9% in 2014. This increase was primarily due to an increase in depreciation on leasehold improvements. During 2014, additions to property and equipment were $44.9 million compared to $53.5 million in 2013. Contributing to the higher spending in
2013 was an increase in leasehold and furniture improvements made to various office locations.
As a professional services organization, we are not
capital intensive. In the past, we made capital expenditures primarily for items such as leasehold improvements, computer equipment and software, furniture, and other office and field equipment. During 2014, the $44.9 million in additions to
property and equipment were consistent with our budget of approximately $45.0 million established at the beginning of 2014. We expect our total capital additions in 2015 to be approximately $50.0 million, excluding capital assets acquired from
acquisitions. Our capital expenditures during 2014 were financed by cash flows from operations.
Intangible Assets
The timing of completed acquisitions, the size of acquisitions, and the type of intangible assets acquired impact the amount of amortization of intangible
assets in a period. Client relationships are amortized over estimated useful lives ranging from 10 to 15 years. Contract backlog is amortized over an estimated useful life of generally 1 to 2 years. Consequently, the impact of the amortization of
contract backlog can be significant in the 4 to 8 quarters following an acquisition. As at December 31, 2014, $5.8 million of the $97.2 million in intangible assets related to backlog.
|
|
|
|
|
| Management’s Discussion and Analysis
December 31, 2014 |
|
M-29 |
|
Stantec Inc. |
Also included in intangible assets is purchased and internally generated computer software that is replaceable
and not an integral part of related hardware. This computer software is amortized over an estimated useful life ranging from 3 to 7 years.
The following
table summarizes the amortization of identifiable intangible assets:
Amortization of Intangibles
|
|
|
|
|
|
|
|
|
| (In thousands of Canadian dollars) |
|
2014 |
|
|
2013 |
|
|
|
|
| Client relationships |
|
|
8,432 |
|
|
|
7,294 |
|
| Backlog (Note) |
|
|
4,819 |
|
|
|
5,342 |
|
| Software |
|
|
11,270 |
|
|
|
9,675 |
|
| Other |
|
|
962 |
|
|
|
982 |
|
| Lease disadvantage |
|
|
(1,231) |
|
|
|
(2,058) |
|
|
|
|
| Total amortization of intangible assets |
|
|
24,252 |
|
|
|
21,235 |
|
Note: Backlog is a non-IFRS measure and is further discussed in the Definitions section of this report.
The $3.0 million increase in intangible asset amortization from 2013 to 2014 was mainly due to an increase in the amortization of software from the renewal of
our Autodesk, Bentley, and Adobe software in 2013. Also, amortization increased due to intangible assets added from acquisitions in the year. During 2014, we added $40.1 million to intangible assets: $9.6 million was mainly the result of the
renewal of our Microsoft agreement and incremental software licenses on our Enterprise Management System and $29.8 million was the result of acquisitions, primarily from the ProU, SHW, ADD, Inc., and Penfield & Smith acquisitions. The $9.6
million addition to intangible software was below our expectation of approximately $15.0 million at the beginning of 2014, mainly because of the timing of software finance lease contract renewals. We expect our total software additions in 2015 to be
approximately $25.0 million. We plan to continue to invest in enhancements to our business information systems to optimize and streamline our business processes and prepare for continued growth.
In accordance with our accounting policies, we review intangible assets at each reporting period to determine whether there is an indication of impairment. An
asset may be impaired if there is objective evidence of impairment as a result of one or more events that have occurred after the initial recognition of the asset and if that event has an impact on the estimated future cash flows of the asset.
To determine indicators of impairment of intangible assets, we consider external sources of information such as prevailing economic and market conditions. We
also consider internal sources of information such as the historical and expected financial performance of the intangible assets. If indicators of impairment are present, the asset’s recoverable amount is estimated. If the carrying amount
exceeds the recoverable amount (on a discounted basis), the asset value is written down to the recoverable amount. (For further discussion on the methodology used in testing long-lived assets and intangibles for impairment, refer to the Critical
Accounting Estimates in the Critical Accounting Estimates, Developments, and Measures section of this report.)
Based on our review of intangible assets
at each reporting period in 2014 and 2013, there have been no material indications of impairment.
|
|
|
|
|
| Management’s Discussion and Analysis
December 31, 2014 |
|
M-30 |
|
Stantec Inc. |
Net Interest Expense
Our net interest expense decreased by $0.1 million in 2014 compared to 2013, mainly due to an increase in bank interest income and interest income earned on
available-for-sale investment debt securities, partially offset by an increase in the interest expense on other notes payable. In particular, the balance for other notes payable was $111.2 million at December 31, 2014, compared to $53.0 million
at December 31, 2013. The weighted average interest rate on our other notes payable was 3.65% in 2014 as compared to 3.10% in 2013. As well, interest expensed on our revolving credit facility for the year slightly increased compared to 2013.
The balance of our revolving credit facility was higher at $65.0 million at December 31, 2014, compared to $51.1 million at December 31, 2013. The average interest rate of our revolving credit facility was 1.37% at both
December 31, 2014, and 2013. (The revolving credit facility and senior secured notes are further described in the Liquidity and Capital Resources section of this report.)
Based on our credit balance at December 31, 2014, we estimate that a 0.5% increase or decrease in interest rates, with all other variables held constant,
would have had an immaterial impact on our net income and basic earnings per share for the year. We have the flexibility to partly mitigate our exposure to interest rate changes by maintaining a mix of both fixed and floating rate debt. Our senior
secured notes have fixed interest rates; therefore, interest rate fluctuations would have no impact on the senior secured notes interest payments.
Foreign
Exchange Gains
We reported a foreign exchange gain of $0.4 million in 2014 compared to $0.2 million in 2013. The foreign exchange gains arose from the
translation of the foreign-denominated assets and liabilities held in our Canadian companies and in our non-US-based foreign subsidiaries. We minimize our exposure to foreign exchange fluctuations by matching foreign currency assets with foreign
currency liabilities and, when appropriate, by entering into forward contracts to buy or sell US dollars or British pounds in exchange for Canadian dollars. The foreign exchange gains in 2014 and 2013 were caused by the volatility of daily foreign
exchange rates and the timing of the recognition and relief of foreign-denominated assets and liabilities. As at December 31, 2014, we had no material foreign-currency forward-contract agreements.
We estimate that because of a slight net exposure at December 31, 2014, a $0.01 increase or decrease in the
US-dollar to Canadian-dollar exchange rate, with all other variables held constant, would have had an immaterial impact on our net income for the year.
Income Taxes
Our 2014 effective income tax rate was 26.3% compared
to 26.5% in 2013. Our 2014 effective income tax rate was impacted by additional income earned in lower tax jurisdictions and less income earned in higher jurisdictions in 2014 compared to 2013. The effective tax rate of 26.3% meets the target of at
or below 28.5% set out in our 2013 Annual Report.
Fourth Quarter Results
Gross revenue increased 12.5% to $647.5 million in Q4 14 compared to $575.3 million in Q4 13; 9.2% of this increase is due to acquisitions completed in 2013
and 2014. EBITDA increased 10.9% to $69.1 million from $62.3 million, net income increased 6.7% to $38.1 million from $35.7 million, and our diluted earnings per share increased 5.3% to $0.40 from $0.38 when comparing Q4 14 to Q4 13. Diluted
earnings per share was positively impacted by a decrease in administrative and marketing expense as a percentage of net revenue and a decrease in income tax expense. This was partly offset by an increase in our depreciation, amortization, net
interest expense and other net finance expense as further discussed below.
|
|
|
|
|
| Management’s Discussion and Analysis
December 31, 2014 |
|
M-31 |
|
Stantec Inc. |
The following table summarizes our key operating results for Q4 14 on a percentage of net revenue basis and the
percentage increase in the dollar amount of these results compared to the same period last year:
|
|
|
|
|
|
|
|
|
|
|
|
|
|
|
|
|
|
|
|
|
|
|
|
|
| |
|
Quarter Ended
December 31 |
|
|
|
|
% of Net Revenue |
|
|
|
|
% Increase
(Decrease)* |
|
| (In millions of Canadian dollars, except %) |
|
2014 |
|
|
2013 |
|
|
|
|
2014 |
|
|
2013 |
|
|
|
|
2014 vs. 2013 |
|
|
|
|
|
|
|
|
|
| Gross revenue |
|
|
647.5 |
|
|
|
575.3 |
|
|
|
|
|
124.6% |
|
|
|
127.5% |
|
|
|
|
|
12.5% |
|
| Net revenue |
|
|
519.6 |
|
|
|
451.3 |
|
|
|
|
|
100.0% |
|
|
|
100.0% |
|
|
|
|
|
15.1% |
|
| Direct payroll costs |
|
|
230.6 |
|
|
|
196.6 |
|
|
|
|
|
44.4% |
|
|
|
43.6% |
|
|
|
|
|
17.3% |
|
| Gross margin |
|
|
289.0 |
|
|
|
254.7 |
|
|
|
|
|
55.6% |
|
|
|
56.4% |
|
|
|
|
|
13.5% |
|
| Administrative and marketing expenses |
|
|
220.6 |
|
|
|
197.3 |
|
|
|
|
|
42.5% |
|
|
|
43.7% |
|
|
|
|
|
11.8% |
|
| Depreciation of property and equipment |
|
|
10.9 |
|
|
|
8.7 |
|
|
|
|
|
2.1% |
|
|
|
1.9% |
|
|
|
|
|
25.3% |
|
| Amortization of intangible assets |
|
|
7.0 |
|
|
|
4.6 |
|
|
|
|
|
1.3% |
|
|
|
1.0% |
|
|
|
|
|
52.2% |
|
| Net interest expense |
|
|
2.4 |
|
|
|
1.9 |
|
|
|
|
|
0.5% |
|
|
|
0.4% |
|
|
|
|
|
26.3% |
|
| Other net finance expense (income) |
|
|
0.9 |
|
|
|
(3.3) |
|
|
|
|
|
0.2% |
|
|
|
(0.7%) |
|
|
|
|
|
n/m |
|
| Share of income from joint ventures and associates |
|
|
(0.6) |
|
|
|
(0.9) |
|
|
|
|
|
(0.1% |
) |
|
|
(0.1%) |
|
|
|
|
|
(33.3%) |
|
| Foreign exchange gain |
|
|
(0.3) |
|
|
|
0.0 |
|
|
|
|
|
(0.1% |
) |
|
|
0.0% |
|
|
|
|
|
n/m |
|
| Other income |
|
|
(0.7) |
|
|
|
(0.7) |
|
|
|
|
|
(0.2% |
) |
|
|
(0.2%) |
|
|
|
|
|
n/m |
|
| Income before income taxes |
|
|
48.8 |
|
|
|
47.1 |
|
|
|
|
|
9.4% |
|
|
|
10.4% |
|
|
|
|
|
3.6% |
|
| Income taxes |
|
|
10.7 |
|
|
|
11.4 |
|
|
|
|
|
2.1% |
|
|
|
2.5% |
|
|
|
|
|
(6.1%) |
|
| Net income |
|
|
38.1 |
|
|
|
35.7 |
|
|
|
|
|
7.3% |
|
|
|
7.9% |
|
|
|
|
|
6.7% |
|
n/m = not meaningful
* % increase (decrease) calculated based on the dollar change from the comparable period.
Gross Revenue
|
|
|
|
|
| (In millions of Canadian dollars) |
|
Q4 14 vs. Q4 13 |
|
|
|
| Increase in gross revenue due to |
|
|
|
|
| Acquisition growth |
|
|
53.1 |
|
| Organic growth |
|
|
1.4 |
|
| Impact of foreign exchange rates on revenue earned by foreign subsidiaries |
|
|
17.7 |
|
|
|
| Total net increase in gross revenue |
|
|
72.2 |
|
During Q4 14, our gross revenue increased by $72.2 million, or 12.5%, compared to the same period in 2013. This change
occurred because of the impact of acquisitions completed in 2013 and 2014, as well as the weakening of the Canadian dollar. The average exchange rate for the Canadian dollar was US$0.88 during Q4 14 compared to US$0.95 during Q4 13.
|
|
|
|
|
| Management’s Discussion and Analysis
December 31, 2014 |
|
M-32 |
|
Stantec Inc. |
The following tables summarize the change in gross revenue by region and by business operating unit in the fourth
quarter of 2014 compared to the same period in 2013:
Gross Revenue by
Regional Operating Unit
|
|
|
|
|
|
|
|
|
|
|
|
|
|
|
|
|
|
|
|
|
|
|
|
|
| (In millions of Canadian dollars) |
|
Quarter
Ended Dec 31,
2014 |
|
|
Quarter
Ended Dec 31,
2013 |
|
|
Total
Change |
|
|
Change Due
to Acquisitions |
|
|
Change Due
to Organic
Growth |
|
|
Change Due
to Foreign
Exchange |
|
|
|
|
|
|
|
|
| Canada |
|
|
325.9 |
|
|
|
338.4 |
|
|
|
(12.5) |
|
|
|
1.2 |
|
|
|
(13.7) |
|
|
|
n/a |
|
| United States |
|
|
299.7 |
|
|
|
217.2 |
|
|
|
82.5 |
|
|
|
51.9 |
|
|
|
12.9 |
|
|
|
17.7 |
|
| International |
|
|
21.9 |
|
|
|
19.7 |
|
|
|
2.2 |
|
|
|
- |
|
|
|
2.2 |
|
|
|
- |
|
| Total |
|
|
647.5 |
|
|
|
575.3 |
|
|
|
72.2 |
|
|
|
53.1 |
|
|
|
1.4 |
|
|
|
17.7 |
|
| n/a = not applicable |
|
|
|
|
|
|
|
|
|
|
|
|
|
|
|
|
|
|
|
|
|
|
|
|
|
|
|
|
|
|
|
| Gross Revenue by |
|
|
|
|
|
|
|
|
|
|
|
|
|
|
|
|
|
|
|
|
|
|
|
|
| Business Operating Unit |
|
|
|
|
|
|
|
|
|
|
|
|
|
|
|
|
|
|
|
|
|
|
|
|
| (In millions of Canadian dollars) |
|
Quarter
Ended
Dec 31,
2014 |
|
|
Quarter
Ended
Dec 31,
2013 |
|
|
Total
Change |
|
|
Change Due
to Acquisitions |
|
|
Change Due
to Organic
Growth |
|
|
Change Due
to Foreign
Exchange |
|
|
|
|
|
|
|
|
| Buildings |
|
|
146.6 |
|
|
|
110.0 |
|
|
|
36.6 |
|
|
|
24.2 |
|
|
|
9.2 |
|
|
|
3.2 |
|
| Energy & Resources |
|
|
273.1 |
|
|
|
263.3 |
|
|
|
9.8 |
|
|
|
22.2 |
|
|
|
(17.3) |
|
|
|
4.9 |
|
| Infrastructure |
|
|
227.8 |
|
|
|
202.0 |
|
|
|
25.8 |
|
|
|
6.7 |
|
|
|
9.5 |
|
|
|
9.6 |
|
| |
|
|
|
|
|
|
| Total |
|
|
647.5 |
|
|
|
575.3 |
|
|
|
72.2 |
|
|
|
53.1 |
|
|
|
1.4 |
|
|
|
17.7 |
|
Comparative figures have been reclassified due to a realignment of several business lines between our
Buildings, Energy & Resources, and Infrastructure business operating units.
Organic growth in Q4 14 was positive in all business operating
units except Energy & Resources. The Energy & Resources business operating unit decline occurred primarily because of certain terminal projects winding down in our Oil & Gas sector in Canada. Buildings continued its
momentum of organic growth with an increase of 8.4% in Q4 14 compared to Q4 13. This occurred mainly from improved project management and growth in our Canadian and International Healthcare sectors. The 4.7% organic gross revenue growth in our
Infrastructure business operating unit resulted from growth in all its three sectors—Community Development, Transportation, and Water—in particular, our US Transportation sector where we benefit from strong client relationships.
In Q4 14 our gross margin decreased to 55.6% from 56.4% in Q4 13. Our gross margin decreased quarter over quarter in our regional operating units and our
business operating units as summarized in the tables below:
|
|
|
|
|
| Management’s Discussion and Analysis
December 31, 2014 |
|
M-33 |
|
Stantec Inc. |
|
|
|
|
|
|
|
| Gross Margin by Regional Operating Unit |
|
Quarter Ended
Dec 31 |
| |
|
2014 |
|
|
2013 |
|
|
|
| Canada |
|
|
57.6% |
|
|
56.9% |
| United States |
|
|
54.4% |
|
|
56.2% |
| International |
|
|
38.1% |
|
|
50.5% |
|
|
| Gross Margin by Business Operating Unit |
|
Quarter Ended
Dec 31 |
| |
|
2014 |
|
|
2013 |
|
|
|
| Buildings |
|
|
53.8% |
|
|
55.8% |
| Energy & Resources |
|
|
54.2% |
|
|
54.8% |
| Infrastructure |
|
|
58.3% |
|
|
58.7% |
| Note: Comparative figures have been reclassified due to a realignment of several business lines between our Buildings, Energy &
Resources, and Infrastructure business operating units. |
The nature of our business model—based on diversifying operations across geographic regions, business operating units,
and all phases of the infrastructure and facilities project life cycle—will continue to cause fluctuations in our gross margin percentage from period to period, depending on the mix of projects during any given quarter. In our US operations,
the reduction in gross margin is primarily due to lower margins in our Oil & Gas sector which is a growing component of our US revenue. In our Buildings business operating unit and International operations, gross margins were
negatively impacted by project adjustments to estimated costs to complete.
Administrative and marketing expense as a percentage of net revenue decreased
to 42.5% in Q4 14 from 43.7% in Q4 13. The expense in Q4 13 was historically high due to additional charges for seasonal holidays and an increase in the fair value of restricted share units and deferred share units. Administrative and marketing
expense increase sequentially from Q3 14 to Q4 14 partly due to decreased utilization from seasonality and increased integration activities from acquisitions.
Depreciation and amortization as a percentage of net revenue increased due to an increase in property and equipment and intangible assets resulting from
organic growth and acquisitions. Interest expense was higher in Q4 14 compared to Q4 13 due to an increase in notes payable from acquisitions. Other net finance expense (income) was in a $3.3 million income position in Q4 13 compared to an expense
of $0.9 million in Q4 14 because we derecognized a $4.2 million note payable from an acquisition.
Our effective tax rate is based on statutory rates in
jurisdictions where we operate. Our effective income tax rate decreased sequentially from 27.5% in Q3 14 to 26.3% in Q4 14 due to more-than-expected income earned in lower tax rate jurisdictions and less income earned in higher tax rate
jurisdictions. In addition, the rate declined because of an increase in deductions for US share options exercised and because we used previously unrecognized tax losses.
|
|
|
|
|
| Management’s Discussion and Analysis
December 31, 2014 |
|
M-34 |
|
Stantec Inc. |
Quarterly Trends
The
following is a summary of our quarterly operating results for the last two fiscal years, all prepared in accordance with IFRS:
|
|
|
|
|
|
|
|
|
|
|
|
|
|
|
|
|
| Quarterly Unaudited Financial Information |
|
|
|
|
|
|
| (In millions of Canadian dollars,
except per share amounts) |
|
Dec 31, 2014 |
|
|
Sept 30, 2014* |
|
|
Jun 30, 2014* |
|
|
Mar 31, 2014* |
|
|
|
|
|
|
| Gross revenue |
|
|
647.5 |
|
|
|
674.7 |
|
|
|
633.8 |
|
|
|
573.9 |
|
| Net revenue |
|
|
519.6 |
|
|
|
544.2 |
|
|
|
530.2 |
|
|
|
481.3 |
|
| Net income |
|
|
38.1 |
|
|
|
48.6 |
|
|
|
44.3 |
|
|
|
33.5 |
|
| EPS – basic |
|
|
0.41 |
|
|
|
0.52 |
|
|
|
0.47 |
|
|
|
0.36 |
|
| EPS – diluted |
|
|
0.40 |
|
|
|
0.51 |
|
|
|
0.47 |
|
|
|
0.36 |
|
|
|
|
|
|
| |
|
|
Dec 31, 2013 |
* |
|
|
Sept 30, 2013 |
* |
|
|
Jun 30, 2013 |
* |
|
|
Mar 31, 2013 |
* |
|
|
|
|
|
| Gross revenue |
|
|
575.3 |
|
|
|
581.2 |
|
|
|
566.7 |
|
|
|
513.2 |
|
| Net revenue |
|
|
451.3 |
|
|
|
484.8 |
|
|
|
469.4 |
|
|
|
426.9 |
|
| Net income |
|
|
35.7 |
|
|
|
45.9 |
|
|
|
36.2 |
|
|
|
28.4 |
|
| EPS – basic |
|
|
0.38 |
|
|
|
0.50 |
|
|
|
0.39 |
|
|
|
0.31 |
|
| EPS – diluted |
|
|
0.38 |
|
|
|
0.49 |
|
|
|
0.39 |
|
|
|
0.31 |
|
Quarterly earnings per share on a basic and diluted basis are not additive and may not equal the annual
earnings per share reported. This is a result of the effect of shares issued or repurchased during the year on the weighted average number of shares. Diluted earnings per share on a quarterly basis and an annual basis are also affected by the change
in the market price of our shares, since we do not include in dilution options when the exercise price of the option is not in the money.
*Earnings per share have been adjusted from previously reported amounts for the two-for-one share split that occurred on November 14, 2014.
The following items impact the comparability of our quarterly results:
|
|
|
|
|
|
|
|
|
|
|
|
|
|
|
|
|
| Gross Revenue
(In millions of Canadian dollars) |
|
Q4 14 vs.
Q4 13 |
|
|
Q3 14 vs.
Q3 13 |
|
|
Q2 14 vs.
Q2 13 |
|
|
Q1 14 vs.
Q1 13 |
|
|
|
|
|
|
| Increase in gross revenue due to |
|
|
|
|
|
|
|
|
|
|
|
|
|
|
|
|
| Acquisition growth |
|
|
53.1 |
|
|
|
48.6 |
|
|
|
31.8 |
|
|
|
11.1 |
|
| Organic growth |
|
|
1.4 |
|
|
|
34.1 |
|
|
|
21.0 |
|
|
|
29.9 |
|
| Impact of foreign exchange rates on revenue earned by foreign subsidiaries |
|
|
17.7 |
|
|
|
10.8 |
|
|
|
14.3 |
|
|
|
19.7 |
|
|
|
|
|
|
| Total net increase in gross revenue |
|
|
72.2 |
|
|
|
93.5 |
|
|
|
67.1 |
|
|
|
60.7 |
|
|
|
|
|
|
| Management’s Discussion and Analysis
December 31, 2014 |
|
M-35 |
|
Stantec Inc. |
Q1 14 vs. Q1 13. During Q1 14, net income increased by $5.1 million, or 18.0%, from the same period in
2013, and diluted earnings per share for Q1 14 increased by $0.05, or 16.1%, compared to Q1 13. Net income for Q1 14 was positively impacted by an increase in revenue resulting from acquisitions completed in 2013 and 2014, and by strong organic
growth in our Energy & Resources and Infrastructure business operating units. Growth was driven mainly by our Oil & Gas sector, particularly by work in the midstream industry, and by increased activity in our Water sector. We
reported organic growth in our Canadian and International operations. Our results were also positively impacted by an increase in gross margin—from 54.0% in Q1 13 to 54.4% in Q1 14. This increase was offset by an increase in our
administrative and marketing expenses as a percentage of net revenue—from 41.1% in Q1 13 to 41.5% in Q1 14. Our bottom line was also positively impacted by a reduction in net interest expense and an increase in income from joint ventures and
associates.
Q2 14 vs. Q2 13. During Q2 14, net income increased by $8.1 million, or 22.4%, from the same period in 2013, and diluted earnings per
share for Q2 14 increased by $0.08, or 20.5%, compared to Q2 13. Net income for Q2 14 was positively impacted by an increase in revenue because of acquisitions completed in 2013 and 2014, and organic revenue growth in our Energy &
Resources and Infrastructure business operating units. Strong growth occurred in our Water and Community Development sectors. Overall activity in our Oil & Gas sector, particularly in the midstream industry, remained strong, although at a
reduced pace of growth compared to Q1 14 due to the winding down of certain terminal projects. Organic growth continued to occur in Canada and internationally. The slight retraction in the United States was mostly due to a softened buildings sector,
and harsh weather conditions in Q1 14 caused a slower-than-expected ramp-up on projects. Our results were also positively impacted by an increase in gross margin—from 54.2% in Q2 13 to 54.7% in Q2 14—and a reduction in our administrative
and marketing expenses as a percentage of net revenue—from 40.0% in Q2 13 to 39.9% in Q2 14. Our bottom line was also positively impacted by a decrease in net interest expense and amortization of intangible assets.
Q3 14 vs. Q3 13. During Q3 14, net income increased by $2.7 million, or 5.9%, from the same period in 2013, and diluted earnings per share for Q3 14
increased by $0.02, or 4.1%, compared to Q3 13. Net income for Q3 14 was positively impacted by an increase in revenue because of acquisitions completed in 2013 and 2014, and organic revenue growth in Buildings and Infrastructure while our
Energy & Resources business operating unit had a reduced pace of growth due to retraction in our Mining sector. Our United States operations had strong organic growth of 10.4% in Q3 14 compared to Q3 13, resulting mainly from growth in our
Power and Transportation sectors and in our Buildings business operating unit. Our results were also positively impacted by an increase in gross margin—from 54.3% in Q3 13 to 54.7% in Q3 14. This was offset by an increase in our administrative
and marketing expenses as a percentage of net revenue—from 38.3% in Q3 13 to 39.3% in Q3 14—mainly from lower utilization due in part to increased integration activities from acquisitions.
|
|
|
|
|
| Management’s Discussion and Analysis
December 31, 2014 |
|
M-36 |
|
Stantec Inc. |
Balance Sheet
The
following highlights the major changes to our assets, liabilities, and equity from December 31, 2013, to December 31, 2014:
|
|
|
|
|
|
|
|
|
|
|
|
|
|
|
|
|
| (In millions of Canadian dollars) |
|
Dec 31, 2014 |
|
|
Dec 31, 2013 |
|
|
$ Change |
|
|
% Change |
|
|
|
|
|
|
| Total current assets |
|
|
844.4 |
|
|
|
726.2 |
|
|
|
118.2 |
|
|
|
16.3% |
|
|
|
|
|
|
| Property and equipment |
|
|
152.7 |
|
|
|
133.5 |
|
|
|
19.2 |
|
|
|
14.4% |
|
| Goodwill |
|
|
760.6 |
|
|
|
594.8 |
|
|
|
165.8 |
|
|
|
27.9% |
|
| Intangible assets |
|
|
97.2 |
|
|
|
78.9 |
|
|
|
18.3 |
|
|
|
23.2% |
|
| Other financial assets |
|
|
90.7 |
|
|
|
83.2 |
|
|
|
7.5 |
|
|
|
9.0% |
|
| All other assets |
|
|
64.9 |
|
|
|
51.6 |
|
|
|
13.3 |
|
|
|
25.8% |
|
|
|
|
|
|
| Total assets |
|
|
2,010.5 |
|
|
|
1,668.2 |
|
|
|
342.3 |
|
|
|
20.5% |
|
|
|
|
|
|
| Current portion of long-term debt |
|
|
53.2 |
|
|
|
37.1 |
|
|
|
16.1 |
|
|
|
43.4% |
|
| Other liabilities |
|
|
12.0 |
|
|
|
9.8 |
|
|
|
2.2 |
|
|
|
22.4% |
|
| All other current liabilities |
|
|
409.9 |
|
|
|
360.1 |
|
|
|
49.8 |
|
|
|
13.8% |
|
| Total current liabilities |
|
|
475.1 |
|
|
|
407.0 |
|
|
|
68.1 |
|
|
|
16.7% |
|
|
|
|
|
|
| Long-term debt |
|
|
256.1 |
|
|
|
200.9 |
|
|
|
55.2 |
|
|
|
27.5% |
|
| Other liabilities |
|
|
64.3 |
|
|
|
58.0 |
|
|
|
6.3 |
|
|
|
10.9% |
|
| All other liabilities |
|
|
128.8 |
|
|
|
109.7 |
|
|
|
19.1 |
|
|
|
17.4% |
|
| Equity |
|
|
1,086.2 |
|
|
|
892.6 |
|
|
|
193.6 |
|
|
|
21.7% |
|
|
|
|
|
|
| Total liabilities and equity |
|
|
2,010.5 |
|
|
|
1,668.2 |
|
|
|
342.3 |
|
|
|
20.5% |
|
Refer to the Liquidity and Capital Resources section of this report for an explanation of the change in current assets and
current liabilities.
Property and equipment increased mainly because of the number of leasehold and furniture improvements made to various offices and as
a result of the acquisitions of WEG, ProU, JBR, SHW, USKH, ADD, Inc., and Penfield & Smith. Because of these acquisitions and changes in foreign exchange, goodwill increased (explained below). Intangible assets increased mostly because of
customer relationships and backlog acquired from these acquisitions and the renewal of our Autodesk and Bentley agreements in Q1 14 and incremental software licenses on our enterprise management system. Total current and long-term other financial
assets increased mainly due to an increase in investments held for self-insured liabilities. Total current and long-term debt increased mainly as a result of an increase in notes payable from acquisitions, as well as an increase in our revolving
credit facility and finance lease obligations. The increase in other liabilities was primarily caused by an increase in lease inducement benefits from leasehold improvements.
Overall, the carrying amounts of the assets and liabilities of our US subsidiaries on our consolidated balance sheets increased because of the weakening of
the Canadian dollar—from US$0.94 at December 31, 2013, to US$0.86 at December 31, 2014.
Goodwill
In accordance with our accounting policies, described in note 4 of our audited consolidated financial statements, we conduct a goodwill impairment test
annually as at October 1 or more frequently if circumstances indicate that an impairment may occur or if a significant acquisition occurs between the annual impairment test date and December 31.
|
|
|
|
|
| Management’s Discussion and Analysis
December 31, 2014 |
|
M-37 |
|
Stantec Inc. |
We allocate goodwill to our cash generating units (CGUs), which are also our operating segments. CGUs are defined
based on the smallest identifiable group of assets that generates cash inflows that are largely independent of cash inflows from other assets or groups of assets. Other factors are considered, including how management monitors the entity’s
operations. We defined our CGUs as Canada, the United States, and International. No goodwill is allocated to our International CGU. As a Company, we are constantly evolving and continuing to expand into different geographic locations. As we evolve,
we regularly review our corporate and management structure to ensure our operations are organized into logical units, particularly for making operating decisions and assessing performance. If we determine that our corporate and management structure
should change, we review our definitions of CGUs and reportable segments. We do not allocate goodwill to or monitor it by our business operating units.
On October 1, 2014, and October 1, 2013, we performed our annual goodwill impairment test. Based on the results of these tests, we concluded that
the recoverable amount of each CGU exceeded its carrying amount and, therefore, goodwill was not impaired.
Valuation techniques
When performing our goodwill impairment test, we compare the recoverable amount of our CGUs to their respective carrying amounts. If the carrying amount of a
CGU is higher than its recoverable amount, an impairment charge is recorded as a reduction in the carrying amount of the goodwill on the consolidated statement of financial position and recognized as a non-cash impairment charge in income. We
estimate the recoverable amount by using the fair value less costs of disposal approach. It estimates fair value using market information and discounted after-tax cash flow projections, which is known as the income approach. The income approach uses
a CGU’s projection of estimated operating results and discounted cash flows based on a discounted rate that reflects current market conditions.
We
use cash flow projections from financial forecasts approved by senior management covering a five-year period. For our last two impairment tests on October 1, 2014, and October 1, 2013, we discounted our CGU cash flows using after-tax
discount rates ranging from 8.7% to 11.5%. To arrive at cash flow projections, we use estimates of economic and market information including growth rates in revenues, estimates of future expected changes in operating margins, and cash expenditures.
Other significant estimates and assumptions include future estimates of capital expenditures and changes in future working capital requirements.
We
believe that our methodology provides us with a reasonable basis for determining whether an impairment charge should be taken. Note 11 in our 2014 audited consolidated financial statements provides more detail about our goodwill impairment test and
is incorporated by reference.
If market and economic conditions deteriorate or if volatility in the financial markets causes declines in our share price,
increases our weighted-average cost of capital, or changes valuation multiples or other inputs to our goodwill assessment, our goodwill may require testing for impairment between our annual test dates. In addition, changes in the numerous variables
associated with the judgments, assumptions, and estimates we made in assessing the fair value of our goodwill could cause our CGUs to be impaired. These impairments are non-cash charges that could have a material adverse effect on our consolidated
financial statements but would not have any adverse effect on our liquidity, cash flows from operating activities, or debt covenants, and would not have an impact on future operations.
|
|
|
|
|
| Management’s Discussion and Analysis
December 31, 2014 |
|
M-38 |
|
Stantec Inc. |
Sensitivity
The calculation of fair value less costs of disposal for all of our CGUs is most sensitive to the following assumptions:
| |
• |
|
Operating margins based on actual experience and management’s long-term projections. |
| |
• |
|
Discount rates—reflecting investors’ expectations when discounting future cash flows to a present value—that take into consideration market rates of return, capital structure, company size, and industry
risk. This rate is further adjusted to reflect risks specific to the CGU for which future estimates of cash flows have not been adjusted. |
| |
• |
|
Growth rate estimates based on actual experience and market analysis. Projections are extrapolated beyond five years using a growth rate that typically does not exceed 3.0%. |
At October 1, 2014, the recoverable amounts of our Canadian and US CGUs exceeded their carrying amounts. For assessing fair value less costs of disposal,
we believe that no reasonably possible change in any key assumption listed above would have caused the carrying amount of the Canadian or US CGU to materially exceed its recoverable amount.
Liquidity and Capital Resources
The following discussion includes
forward-looking statements. For an outline of the material risks and assumptions associated with these statements, refer to the Cautionary Note Regarding Forward-Looking Statements at the end of this report. We are able to meet our liquidity needs
through a variety of sources, including cash generated from operations, long- and short-term borrowings from our $350 million credit facility, senior secured notes, and the issuance of common shares. Our primary use of funds is for paying
operational expenses, completing acquisitions, sustaining capital spending on property and equipment and software, repaying long-term debt, and paying dividend distributions to shareholders.
We believe that internally generated cash flows, supplemented by borrowings, if necessary, will be sufficient to cover our normal operating and capital
expenditures. We also believe that the design of our business model (explained in the Core Business and Strategy section of this report) reduces the impact of changing market conditions on our operating cash flows. Consequently, we do not anticipate
any immediate need to access additional capital through the issuance of common shares. However, under certain favorable market conditions, we would consider issuing common shares to facilitate acquisition growth or to reduce borrowings under our
credit facility.
We continue to limit our exposure to credit risk by placing our cash and short-term deposits in—and, when appropriate, by entering
into derivative agreements with—high-quality credit institutions. Our investments held for self-insured liabilities include bonds, equities, and term deposits. We mitigate risk associated with these bonds, equities, and term deposits through
the overall quality and mix of our investment portfolio.
|
|
|
|
|
| Management’s Discussion and Analysis
December 31, 2014 |
|
M-39 |
|
Stantec Inc. |
Working Capital
The following table shows summarized working capital information as at December 31, 2014, compared to December 31, 2013:
|
|
|
|
|
|
|
|
|
|
|
|
|
| (In millions of Canadian dollars, except ratio) |
|
2014 |
|
|
2013 |
|
|
$ Change |
|
|
|
|
|
| Current assets |
|
|
844.4 |
|
|
|
726.2 |
|
|
|
118.2 |
|
| Current liabilities |
|
|
(475.1) |
|
|
|
(407.0) |
|
|
|
(68.1) |
|
| Working capital (Note) |
|
|
369.3 |
|
|
|
319.2 |
|
|
|
50.1 |
|
| Current ratio (Note) |
|
|
1.78 |
|
|
|
1.78 |
|
|
|
n/a |
|
Note: Working capital is calculated by subtracting current liabilities from current assets. Current ratio is calculated by
dividing current assets by current liabilities. Both non-IFRS measures are further described in the Definitions section of this report.
Current
assets increased primarily because of a $95.3 million increase in trade and other receivables and unbilled revenue as a result of acquisitions and organic growth in the year. Investment in trade and other receivables and unbilled revenue was 86 days
at both December 31, 2014, and 2013. Year over year, cash and cash equivalents increased by $10.7 million, income tax recoverable increased by $2.4 million, and prepaid expenses increased by $4.5 million. Current other financial assets
increased $10.1 million from December 31, 2013, because of an increase in our investments held for self-insured liabilities.
An increase in current
liabilities was largely due to a $41.2 million increase in trade and other payables resulting from increased activity, higher payroll accruals because of an increase in employee numbers, and an increase in bonuses payable. In addition, billings in
excess of costs increased $18.3 million primarily from increased project activity in the United States and project mix. The current portion of long-term debt increased $16.0 million, which was mainly a result of additional notes payable from current
acquisitions and an increase in finance lease obligations. These increases were partly offset by a $9.1 million decrease in income taxes payable since December 31, 2013, due to the timing of our tax instalments.
Cash Flows
Our cash flows from (used
in) operating, investing, and financing activities, as reflected in our consolidated statements of cash flows, are summarized in the following table:
|
|
|
|
|
|
|
|
|
|
|
|
|
| (In millions of Canadian dollars) |
|
2014 |
|
|
2013 |
|
|
$ Change |
|
|
|
|
|
| Cash flows from operating activities |
|
|
207.2 |
|
|
|
272.1 |
|
|
|
(64.9) |
|
| Cash flows used in investing activities |
|
|
(174.3) |
|
|
|
(117.4) |
|
|
|
(56.9) |
|
| Cash flows used in financing activities |
|
|
(24.7) |
|
|
|
(54.2) |
|
|
|
29.5 |
|
|
|
|
|
|
| Management’s Discussion and Analysis
December 31, 2014 |
|
M-40 |
|
Stantec Inc. |
Cash Flows from Operating Activities
Cash flows from operating activities are impacted by the timing of payroll and acquisitions, particularly the timing of payments of acquired trade and other
payables, including employee annual bonuses. The $64.9 million decrease in cash flows from operating activities resulted from an increase in cash paid to employees, which was caused by an increase in the number of employees and the bonuses and
restricted share units paid in the year. Cash paid to suppliers increased because of our acquisitions and organic growth and the timing of various payments. As a consequence of higher 2014 tax installment requirements, income taxes paid increased by
$14.5 million. Also, we recovered $9.7 million less in income taxes due to a higher income tax refund in 2013. These increases in cash outflows were partly offset by an increase in cash receipts from clients due to our acquisitions and organic
growth.
Cash Flows Used in Investing Activities
Cash flows used in investing activities increased in 2014 compared to 2013 due to an increase in cash used for business acquisitions. We used $123.7 million
for the payment of cash consideration and notes payable from acquisitions in 2014 compared to $43.5 million in 2013. This increase in cash outflows was partly offset by a reduction in cash outflows for investments held for self-insured liabilities
and for property and equipment. In 2014, property and equipment purchases totaled $42.7 million compared to $52.6 million in 2013. Contributing to the higher spending in 2013 was the purchase of furniture and leasehold improvements made to various
office locations.
Cash Flows Used in Financing Activities
Cash outflows used in financing activities decreased mainly due to a net inflow in 2014 of $3.5 million from our revolving credit facility—compared
to a net outflow in 2013 of $34.6 million to repay our revolving credit facility. The reductions in outflows were partly offset by a decrease in cash received from the issuance of shares from employees exercising their share options and a
$3.9 million increase in cash outflows for the payment of dividends in 2014 compared to 2013.
Capital Structure
We manage our capital structure according to our internal guideline of maintaining a net debt to EBITDA ratio of less than 2.5. At December 31, 2014, our
net debt to EBITDA ratio was 0.53. Going forward, there may be occasions when we exceed our target by completing opportune acquisitions that increase our debt level for a period of time.
During 2014, we extended the maturity of our existing $350 million revolving credit facility to August 31, 2018. This credit facility allows us access to
an additional $150 million under the same terms and conditions on approval from our lenders. Our credit facility is available for acquisitions, working capital needs, and general corporate purposes. Depending on the form under which the credit
facility is accessed and on certain financial covenant calculations, rates of interest may vary between Canadian prime, US base rate, LIBOR, or bankers’ acceptance rates, plus specified basis points. The specified basis points may vary,
depending on our level of consolidated debt to EBITDA—from 20 to 125 for Canadian prime and US base rate loans and from 120 to 225 for bankers’ acceptances, LIBOR loans, and letters of credit. Before the extension, the basis points varied,
depending on our level of consolidated debt to EBITDA—from 20 to 145 for Canadian prime and US base rate loans, and from 120 to 245 for bankers’ acceptances, LIBOR loans, and letters of credit. At December 31, 2014, $281.9 million was
available in the revolving credit facility for future activities.
On May 13, 2011, we issued $70 million of 4.332% senior secured notes due
May 10, 2016, and $55 million of 4.757% senior secured notes due May 10, 2018. These amounts were recorded net of transaction costs of $1.1 million. The senior secured notes were issued pursuant to an indenture dated May 13,
2011, between Stantec Inc., as issuer, and BNY Trust Company of Canada, as trustee and collateral agent. These notes are
|
|
|
|
|
| Management’s Discussion and Analysis
December 31, 2014 |
|
M-41 |
|
Stantec Inc. |
ranked equally with our existing revolving credit facility. Interest on the senior secured notes is payable semi-annually in arrears on May 10 and
November 10 each year until maturity or the earlier payment, redemption, or purchase in full of the notes. We may redeem them, in whole at any time or in part from time to time, at specified redemption prices and subject to certain conditions
required by the indenture. The senior secured notes contain restrictive covenants. All of our assets are held as collateral under a general security agreement for the revolving credit facility and the senior secured notes.
We are subject to financial and operating covenants related to our credit facility and senior secured notes. Failure to meet the terms of one or more of these
covenants may constitute a default, potentially resulting in accelerated repayment of our debt obligation. In particular, at each quarter-end, we must satisfy the following at any time: (1) our consolidated EBITDAR (earnings before interest,
taxes, depreciation, amortization, and restructuring or rent costs) to debt service ratio must not be less than 1.25 to 1.0 for the revolving credit facility and senior secured notes and (2) our consolidated debt to EBITDA ratio must not exceed
2.5 to 1.0 for the revolving credit facility and 2.75 to 1.0 for the senior secured notes, except in the case of a material acquisition when our consolidated debt to EBITDA ratio must not exceed 3.0 to 1.0 for the revolving credit facility and 3.25
to 1.0 for the senior secured notes for a period of two complete quarters following the acquisition. EBITDA and EBITDAR to debt service ratios are defined in Definition of Non-IFRS Measures in the Definitions section of this report. We were in
compliance with all these covenants as at and throughout the period ended December 31, 2014.
During 2014, we extended the maturity of our bid bond
facility to August 31, 2018, from August 31, 2017, and increased the limit from $10 million to $15 million. This facility allows us to access an additional $5 million under the same terms and conditions upon approval from our lenders. This
facility may be used for the issuance of bid bonds, performance guarantees, letters of credit, and documentary credits in international currencies. At December 31, 2014, $8.5 million had been issued under this bid bond facility, expiring at
various dates before January 2016.
|
|
|
|
|
| Management’s Discussion and Analysis
December 31, 2014 |
|
M-42 |
|
Stantec Inc. |
Shareholders’ Equity
Our shareholders’ equity increased by $193.6 million in 2014 and by $165.6 million in 2013. The following table summarizes the reasons for these
increases:
|
|
|
|
|
|
|
|
|
| (In millions of Canadian dollars) |
|
2014 |
|
|
2013 |
|
|
|
|
| Beginning shareholders’ equity |
|
|
892.6 |
|
|
|
727.0 |
|
|
|
|
| Net income for the year |
|
|
164.5 |
|
|
|
146.2 |
|
| Currency translation adjustments |
|
|
46.3 |
|
|
|
26.1 |
|
| Net unrealized gain on financial assets |
|
|
2.9 |
|
|
|
5.0 |
|
| Net realized gain on financial assets transferred to income |
|
|
(0.7) |
|
|
|
(0.6) |
|
| Recognition of fair value of share-based compensation |
|
|
4.6 |
|
|
|
3.8 |
|
| Share options exercised for cash |
|
|
10.6 |
|
|
|
16.5 |
|
| Dividends declared |
|
|
(34.6) |
|
|
|
(30.6) |
|
| Purchase of non-controlling interests |
|
|
0.0 |
|
|
|
(0.8) |
|
|
|
|
| Total change |
|
|
193.6 |
|
|
|
165.6 |
|
|
|
|
| Ending shareholders’ equity |
|
|
1,086.2 |
|
|
|
892.6 |
|
During 2014, we recorded a $46.3 million foreign exchange gain in our currency translation adjustments in other comprehensive
income compared to a $26.1 million gain in 2013. These unrealized gains arose when translating our foreign operations into Canadian dollars. We do not hedge for this foreign exchange translation risk. The gain recorded during 2014 was caused by the
weakening of the Canadian dollar—from US$0.94 at December 31, 2013, to US$0.86 at December 31, 2014.
We hold investments for self-insured
liabilities consisting of government and corporate bonds, equity securities, and term deposits. These investments are classified as available for sale and are stated at fair value with the unrecognized gain or loss recorded in other comprehensive
income. We gained $2.9 million in 2014 and $5.0 million in 2013 in the fair value of these investments.
Our board of directors grants share options
as part of our incentive programs. In 2014, our board granted 803,926 (in 2013, 910,000) share options to various officers and employees of the Company. These options vest equally over a three-year period and have a contractual life of seven years
from the grant date. Share options exercised in 2014 generated $10.6 million in cash compared to $16.5 million in 2013.
Our board of directors has
declared dividends to common shareholders: $34.6 million in dividends were declared in 2014 and $30.6 million were declared in 2013.
|
|
|
|
|
| Management’s Discussion and Analysis
December 31, 2014 |
|
M-43 |
|
Stantec Inc. |
Other
Outstanding Share Data
At
December 31, 2014, there were 93,836,258 common shares and 2,676,568 share options outstanding. From December 31, 2014, to February 25, 2015, no share options were granted, 2,757 share options were exercised, and no share options were
forfeited. At February 25, 2015, there were 93,839,015 common shares and 2,673,811 share options outstanding.
Contractual
Obligations
As part of our continuing operations, we enter into long-term contractual arrangements from time to time. The following table
summarizes the contractual obligations due on our long-term debt, operating and finance lease commitments, purchase and service obligations, and other liabilities as at December 31, 2014:
|
|
|
|
|
|
|
|
|
|
|
|
|
|
|
|
|
|
|
|
|
| |
|
Payment Due by Period |
|
|
|
|
|
|
|
| (In millions of Canadian dollars) |
|
Total |
|
|
Less than
1 Year |
|
|
1–3 Years |
|
|
4–5 Years |
|
|
After
5 Years |
|
|
|
|
|
|
|
| Debt |
|
|
301.5 |
|
|
|
47.7 |
|
|
|
129.0 |
|
|
|
124.3 |
|
|
|
0.5 |
|
| Interest on debt |
|
|
22.0 |
|
|
|
9.9 |
|
|
|
10.5 |
|
|
|
1.6 |
|
|
|
- |
|
| Operating leases |
|
|
846.5 |
|
|
|
119.3 |
|
|
|
205.4 |
|
|
|
142.5 |
|
|
|
379.3 |
|
| Finance lease obligation |
|
|
8.2 |
|
|
|
5.6 |
|
|
|
2.6 |
|
|
|
- |
|
|
|
- |
|
| Purchase and service obligations |
|
|
35.7 |
|
|
|
14.7 |
|
|
|
19.4 |
|
|
|
1.6 |
|
|
|
- |
|
| Other obligations |
|
|
26.6 |
|
|
|
1.9 |
|
|
|
9.2 |
|
|
|
0.2 |
|
|
|
15.3 |
|
|
|
|
|
|
|
| Total contractual obligations |
|
|
1,240.5 |
|
|
|
199.1 |
|
|
|
376.1 |
|
|
|
270.2 |
|
|
|
395.1 |
|
For further information regarding the nature and repayment terms of our long-term debt, operating leases, and finance lease
obligations, refer to the Cash Flows Used in Financing Activities section of this report and notes 16 and 19 in our audited consolidated financial statements for the year ended December 31, 2014, incorporated by reference herein.
Our operating lease commitments include future minimum rentals payments under non-cancellable agreements for office space. Our purchase and service
obligations include agreements to purchase future goods and services that are enforceable and legally binding. Our other obligations include amounts payable under our deferred share unit and restricted share unit plans and amounts payable for
performance share units issued under our long-term incentive program. Failure to meet the terms of our operating lease commitments may constitute a default, potentially resulting in a lease termination payment, accelerated payments, or a penalty as
detailed in each lease agreement.
|
|
|
|
|
| Management’s Discussion and Analysis
December 31, 2014 |
|
M-44 |
|
Stantec Inc. |
Off-Balance Sheet Arrangements
As at December 31, 2014, we had off-balance sheet financial arrangements relating to letters of credit in the amount of $3.2 million that expire at
various dates before January 2016. These letters of credit were issued in the normal course of operations, including the guarantee of certain office rental obligations. As part of the normal course of operations, we also have a surety facility to
enable the issuance of bonds for certain types of project work. As at December 31, 2014, $3.3 million in bonds were issued under this agreement and expire at various dates before April 2020. In addition, we have a bid bond facility that allows
us to issue bid bonds, performance guarantees, letters of credit, and documentary credits in international currencies. At December 31, 2014, $8.5 million, expiring at various dates before January 2016, was issued under this bid bond
facility.
During 2009, we issued a guarantee up to a maximum of US$60.0 million for project work with the US federal government. During 2014, this
agreement expired due to the completion of project work. We did not make any payments under this guarantee, and no amounts were accrued in our consolidated financial statements with respect to the guarantee.
In the normal course of business, we also provide indemnifications and, in very limited circumstances, surety bonds. These indemnifications are granted on
commercially reasonable contractual terms and are provided to counterparties in transactions such as purchase and sale contracts for assets or shares, service agreements, and leasing transactions. In addition, we indemnify our directors and officers
against any and all claims or losses reasonably incurred in the performance of their service to the Company to the extent permitted by law. These indemnifications may require us to compensate the counterparty for costs incurred through various
events. The terms of these indemnification agreements will vary based on the contract, the nature of which prevents us from making a reasonable estimate of the maximum potential amount that could be required to pay counterparties. Historically, we
have not made any significant payments under such indemnifications, and no amounts have been accrued in our consolidated financial statements with respect to these guarantees.
Financial Instruments and Market Risk
Fair value. As at December 31, 2014, we value and record our financial instruments as follows:
| |
• |
|
Cash and cash equivalents are classified as financial assets at fair value through profit and loss (FVPL) and are recorded at fair value, with realized and unrealized gains and losses reported in income.
|
| |
• |
|
Trade and other receivables are classified as receivables and are initially accounted for at fair value and subsequently adjusted for any allowance for doubtful accounts, with allowances reported in administrative and
marketing expenses. |
| |
• |
|
Investments held for self-insured liabilities, consisting of bonds, equity securities, and term deposits, are classified as financial assets available for sale and are recorded at fair value, with accumulated unrealized
gains and losses reported in other comprehensive income until disposed of; at that time, the realized gains and losses are recognized in other income for equity securities and in net finance income for bonds and term deposits. Interest income is
recorded in finance income; dividends are recorded in other income. |
| |
• |
|
Trade and other payables are classified as other financial liabilities and recorded at fair value; subsequently, they are recorded at amortized cost using the effective interest rate (EIR) method, with realized gains
and losses reported in income. The EIR method discounts estimated future cash payments or receipts through the expected life of a financial instrument, thereby calculating the amortized cost and subsequently allocating the interest income or expense
over the life of the instrument. |
| |
• |
|
Long-term debts, including non-interest-bearing debts, are classified as loans and borrowings and are initially recorded at fair value and subsequently recorded at amortized cost using the EIR method, with the EIR
amortization and realized gains and losses reported in finance costs. |
|
|
|
|
|
| Management’s Discussion and Analysis
December 31, 2014 |
|
M-45 |
|
Stantec Inc. |
All financial assets are recognized initially at fair value plus directly attributable transaction costs, except
for financial assets at FVPL, for which transaction costs are expensed. Purchases or sales of financial assets are accounted for at trade dates. All financial liabilities are recognized initially at fair value and, in the case of loans and
borrowings, net of directly attributable transaction costs.
After initial recognition, the fair values of financial instruments are based on the bid
prices in quoted active markets for financial assets and on the ask prices for financial liabilities. For financial instruments not traded in an active market, the fair value is determined using appropriate valuation techniques, which may include
recent arm’s-length market transactions, reference to the current fair value of another instrument that is substantially the same, and discounted cash flow analysis; however, other valuation models may be used. The fair values of cash and cash
equivalents, trade and other receivables, and trade and other payables approximate their carrying amounts because of the short-term maturity of these instruments. The carrying amounts of bank loans approximates their fair values because the
applicable interest rate is based on variable reference rates. The carrying amounts of other financial assets and financial liabilities approximate their fair values.
Market risk. We are exposed to various market factors that can affect our performance, primarily our currency and interest rates.
Currency
Our currency exchange rate risk results
primarily from the following three factors:
| 1. |
A significant portion of our revenue and expenses is generated or incurred in US dollars; therefore, we are exposed to fluctuations in exchange rates. To the
extent that |
| |
• |
|
US-dollar revenues are greater than US-dollar expenses in a strengthening US-dollar environment, we expect to see a positive impact on our income from operations |
| |
• |
|
US-dollar revenues are greater than US-dollar expenses in a weakening US-dollar environment, we expect to see a negative impact on our income from operations |
This exchange rate risk primarily reflects, on an annual basis, the impact of fluctuating exchange rates on the net difference between total
US-dollar revenue and US-dollar expenses. Other exchange rate risk arises from the revenue and expenses generated or incurred by subsidiaries located outside Canada and the United States. Our income from operations will be impacted by exchange rate
fluctuations used in translating these revenues and expenses, and they are recorded in other comprehensive income. We do not hedge for this foreign exchange translation risk.
| 2. |
Foreign exchange fluctuations may also arise on the translation of the balance sheet of (net investment in) our US-based subsidiaries or other foreign
subsidiaries where the functional currency is different from the Canadian dollar, and they are recorded in other comprehensive income. We do not hedge for this foreign exchange translation risk. |
| 3. |
Foreign exchange gains or losses arise on the translation of foreign-denominated assets and liabilities (such as accounts receivable, accounts payable and
accrued liabilities, and long-term debt) held in our Canadian operations and non-US-based foreign subsidiaries. We minimize our exposure to foreign exchange fluctuations on these items by matching US-dollar foreign currency assets with US-dollar
foreign currency liabilities and, when appropriate, by entering into forward contracts to buy or sell US dollars and British pounds in exchange for Canadian dollars. |
|
|
|
|
|
| Management’s Discussion and Analysis
December 31, 2014 |
|
M-46 |
|
Stantec Inc. |
Although we may buy or sell foreign currencies in exchange for Canadian dollars in accordance with our foreign
exchange risk mitigation strategy, on occasion we may have a net exposure to foreign exchange fluctuations because of the timing of the recognition and relief of foreign-denominated assets and liabilities. We estimate that based on a slight net
exposure at December 31, 2014, a $0.01 increase or decrease in the exchange rates (with all other variables held constant) would have had an immaterial impact on our net income for the year.
Interest rates
Changes in interest rates also present a
risk to our performance. Our revolving credit facility carries a floating rate of interest. In addition, we are subject to interest rate pricing risk to the extent that our investments held for self-insured liabilities contain fixed-rate government
and corporate bonds and term deposits. We estimate that, based on our loan balance at December 31, 2014, a 0.5% increase in interest rates (with all other variables held constant) would have had an immaterial impact on our basic earnings per
share for the year.
We have the flexibility to partly mitigate our exposure to interest rate changes by maintaining a mix of both fixed- and
floating-rate debt. Our $125 million in senior secured notes have fixed interest rates until they are due—$70 million at 4.332% due May 10, 2016, and $55 million at 4.757% due May 10, 2018. Since these have fixed rates, interest rate
fluctuations would have no impact on the senior secured notes interest payments.
Price risk
We are subject to market price risk to the extent that our investments held for self-insured liabilities contain equity funds. This risk is mitigated to the
extent that the portfolio of equity funds is monitored regularly and is relatively diversified. The effects of a 1.0% decline or increase in equity prices (with all other variables held constant) would have had an insignificant impact on our
comprehensive income for the year.
Related-Party Transactions
We have subsidiaries that are 100% owned and are consolidated in our financial statements. We also have management agreements in place with several structured
entities to provide various services, including architecture, engineering, planning, and project management. Based on these management agreements, we have assessed that we have control over the relevant activities, we are exposed to variable
returns, and we can use our power to influence the variable returns; therefore, we control these entities and have consolidated them in our consolidated financial statements. We receive a management fee generally equal to the net income of the
entities and have an obligation regarding their liabilities and losses. Transactions among subsidiaries and structured entities are entered into in the normal course of business and on an arm’s-length basis. Using the consolidated method of
accounting, all intercompany balances are eliminated.
From time to time, we enter into transactions with associated companies and other entities pursuant
to a joint arrangement. These transactions involve providing or receiving services and are entered into in the normal course of business and on an arm’s-length basis. Associated companies are entities over which we are able to exercise
significant influence but not control. A joint arrangement is classified as either a joint venture or joint operation, based on the rights and obligations arising from the contractual obligations between the parties to the arrangement. A joint
venture provides us with rights to the net assets of the arrangement. A joint operation provides us with rights to the individual assets and obligations.
|
|
|
|
|
| Management’s Discussion and Analysis
December 31, 2014 |
|
M-47 |
|
Stantec Inc. |
We account for a joint operation by recognizing our share of assets, liabilities, revenues, and expenses of the
joint operation and by combining them line by line with similar items in our consolidated financial statements. We use the equity method of accounting for our associated companies and joint ventures. In 2014, the total sales to our associates were
$19.7 million and distributions paid by our associates were $0.2 million. At December 31, 2014, receivables from our associates were $4.5 million. Total sales to our joint ventures were $18.6 million and distributions paid by our joint ventures
were $2.3 million in 2014. At December 31, 2014, receivables from our joint ventures were $6.1 million.
Key management personnel have authority and
responsibility for planning, directing, and controlling the activities of our Company and include our CEO, COO, CFO, and executive senior vice presidents. Total compensation to key management personnel and directors recognized as an expense was
$12.9 million in 2014 compared to $19.1 million in 2013. The decrease year over year is mainly due to the decrease in the fair value of restrictive share units and deferred share units.
From time to time, we guarantee the obligations of subsidiaries or structured entities regarding lease agreements. We also, from time to time, guarantee
subsidiaries’ or structured entities’ obligations to a third party pursuant to an acquisition agreement. (Transactions with subsidiaries, structured entities, associated companies, and joint ventures are further described in notes 13 and
30 of our 2014 audited consolidated financial statements and are incorporated by reference herein.)
Outlook
The following discussion includes forward-looking statements. For an outline of the material risks and assumptions associated with these statements, refer to
the Cautionary Note Regarding Forward-Looking Statements section. The following table summarizes our expectations for the coming year:
|
|
|
| Measure |
|
2015 Target Range |
| Gross margin as % of net revenue |
|
Between 54% and 56% |
| Administrative and marketing expenses as % of net revenue |
|
Between 40% and 42% |
| EBITDA as % of net revenue |
|
Between 13% and 15% |
| Net income as % of net revenue |
|
At or above 6% |
| Return on equity |
|
At or above 14% |
| Net debt to EBITDA |
|
Below 2.5 |
We removed the target for an effective income tax rate of at or below 28.5% set in 2013. We removed this target since our
effective income tax rate is based on statutory rates in jurisdictions where we operate. All other targets remain the same.
Actual performance will
fluctuate depending on the mix of clients and projects, as well as the number of acquisitions completed in a year. Some targets, such as net debt to EBITDA, could be impacted and potentially exceeded by completing an opportune larger acquisition
that increases our debt level above our target for a period of time.
|
|
|
|
|
| Management’s Discussion and Analysis
December 31, 2014 |
|
M-48 |
|
Stantec Inc. |
The diverse infrastructure and facilities market consists of many sectors and industries in both the public and
private sectors. Clients within this market require services from multiple disciplines and areas of expertise for projects of varying complexities across the project life cycle. In North America, revenue for our principal area of
operation—design-related services for the infrastructure and facilities market—is approximately US$100 billion, and our market share is approximately 3%. Market size is affected by many factors, including capital spending plans of private
sector clients, government allocations to infrastructure, and the range of alternative project delivery methods in certain sectors. Our footprint in the Middle East, United Kingdom, India, and the Caribbean provides an additional, although small,
presence in international markets.
In 2015, we have an overall moderate growth outlook for professional services in our key sectors in North America.
When determining our overall outlook, we considered the following expectations:
| |
• |
|
Continued improvement in the United States as we build a top-tier position. |
| |
• |
|
Greater strength in private sector markets than in public sector markets. |
| |
• |
|
Energy and resource development moderation to potential retraction in Canada—compared to the robustness experienced in the past few years—due to the decline in commodity prices and delay in regulatory
approvals which may delay projects moving forward. |
| |
• |
|
Continued efforts to be made by all levels of government to address the ongoing infrastructure spending deficit. |
| |
• |
|
Support for alternative project delivery approaches, including P3s, to continue in Canada and to present new opportunities in the United States. |
| |
• |
|
The regulatory and political environment will continue to support infrastructure development in North America. |
| |
• |
|
Continuing public awareness and regulatory focus on environmental issues. Increased awareness can have numerous effects: moving towards responsible industrial development, pursuing sustainable design, improving water
distribution and treatment, and reducing the ecological footprint. |
The overall outlook for our International operations is moderate growth
as we continue to organically build our experience and presence. We base our overall outlook on a variety of factors, including the material factors described below.
Geographic Outlook
Canada
We believe that organic gross revenue growth for our Canadian operations will be stable for 2015 but may retract in the first half of 2015, primarily due to a
retraction in our Oil & Gas sector. However, we expect organic revenue growth will stabilize in the second half of 2015. Organic revenue growth in 2015 is expected to be positively impacted by increased activity in sectors and geographical
regions that are linked to non-energy-related sectors.
Private sector: Business sentiment remains positive overall, but the recent decline in oil
prices has significantly dampened the outlook in this cyclical energy sector, largely in the upstream segment. A significant portion of our work is in the midstream segment and in front-end planning and permitting on large multiyear projects. We
believe these projects will continue to be advanced in 2015; however, the timing may be significantly impacted by regulatory approval processes and our clients’ decisions to proceed with the next phase of these projects.
|
|
|
|
|
| Management’s Discussion and Analysis
December 31, 2014 |
|
M-49 |
|
Stantec Inc. |
The power sector is expected to remain stable as infrastructure is built out to maintain and replace aging
generation, transmission, and distribution assets and, in particular, to meet federal government regulations. Global mining markets have been cautious throughout 2014; this will likely continue in the short term as a result of the continuing
weakness in the global economy and low non-energy commodity prices. This will cause a decrease in the pace of capital expenditures, delays in some projects, or cancellation altogether if non-energy commodity prices remain subdued.
Although we are in a low-interest-rate environment, we expect stability in housing activity in 2015. Recently, supply has exceeded demographic requirements,
and this supply is expected to come onto the market in the near term. In addition, the recent decline in oil prices is likely to cause a slowdown in residential construction in commodity-driven markets, specifically in western Canada.
The competitive landscape is expected to remain relatively stable because the flow of international competitors into the Canadian marketplace has stabilized.
Labor constraints may ease due to declining commodity prices in the energy sector over the short- and mid-term.
Public sector: Despite moderate
fiscal restraint, the budget situation of the federal government and most provincial governments is improving and projects are being released. Even so, declining energy prices may put renewed strain on the budgets of energy-reliant provinces and on
the federal government. The New Building Canada Plan and provincial infrastructure initiatives recently announced establish long-term stability for funding in infrastructure.
Provincially and federally, support for the P3 model remains strong. Because of this and the trend towards larger, more complex projects to meet
infrastructure demands, we anticipate P3 activity levels to remain consistent with levels of the past few years. In addition, more and more projects are expected to emerge at the municipal level, especially in the transportation sector, and in
nontraditional sectors like water and airports. Overall, we expect that public spending will improve slightly; yet if a significant decline in public spending occurs, it could create challenges for meeting our outlook.
Other factors: Overall, the following factors support our outlook of stable organic gross revenue growth:
| |
• |
|
GDP is projected to remain steady at 2.1% in 2015 according to the Bank of Canada. |
| |
• |
|
The Bank of Canada overnight rate target is currently at 0.75% and is expected to remain low in 2015. |
| |
• |
|
The unemployment rate at the end of 2014 was 6.6%. We expect this rate will not change significantly in 2015. |
| |
• |
|
The World Bank expects that the overall weakness in metal prices will likely persist in 2015. |
| |
• |
|
The Energy Information Administration (EIA) projects a lower-than-average demand for oil. With this revised lower demand and falling prices, the EIA expects non-OPEC producers to slow production growth to move toward
balancing the market going forward. |
| |
• |
|
The Canadian dollar has recently depreciated to nearly $0.80. The Bank of Canada estimates that the Canada/US exchange rate average will remain near current levels throughout the year. |
| |
• |
|
The Canadian Mortgage and Housing Corporation suggests that total housing starts will remain stable—from 189,300 in 2014 to 187,400 in 2015—with single family housing starts increasing slightly over 2014.
|
|
|
|
|
|
| Management’s Discussion and Analysis
December 31, 2014 |
|
M-50 |
|
Stantec Inc. |
United States
We believe that our US operations will achieve moderate organic gross revenue growth in 2015. The US economy, driven by steady domestic economic fundamentals,
continued to gain momentum in 2014; this is expected to carry on into 2015. Even though growth did slowly improve in the public sector during 2014, we believe the outlook for the private sector is more favorable than for the public sector.
Private sector: Business investment, supported by improving domestic demand and an improving credit market, is showing positive signs; nonetheless, the
recent decline in oil prices is expected to negatively impact the outlook in the energy sector, largely in the upstream segment.
We expect increased
residential and nonresidential construction spending, including investment in commercial buildings and manufacturing. Lower energy costs are improving competitiveness in manufacturing and driving investment in chemical and metals processing
facilities. Notwithstanding the decline in oil prices, we anticipate that investment in infrastructure to support the production, transportation, and processing of oil and gas will continue in the near term. This would create growth across multiple
sectors, including resource management and environmental protection. However, a sustained drop in oil prices could eventually result in lower production and create uncertainty around the timing of new projects.
The power sector remains optimistic because it is geared to retrofit or replace aging coal generation infrastructure with natural gas facilities and to comply
with new federal government environmental regulations. Housing construction remains below long-run demographic fundamentals and is expected to continue experiencing significant growth.
Public sector: Federal government spending has been relatively flat, but higher state and municipal tax receipts are contributing to a more positive
fiscal situation. In 2014, the majority of states enacted higher spending levels relative to 2013 and many recommended a moderate increase in general fund spending in fiscal 2015. There is still some caution around state spending since some of the
recent increases in state revenues are considered nonrecurring and structural issues persist.
We expect transportation funding to be stable in the short
term; the recent extension to the federal transportation legislation will enable some program planning and a consistent investment in maintenance. We believe that opportunities for our Water sector will increase because of new and increasing
regulations for water treatment, as well as state and municipal attention to flood protection and natural disaster risk mitigation.
Long-term funding
constraints and budget tightness are influencing the movement toward alternative project delivery as a solution to US infrastructure build-out. In both the transportation and water sectors, these funding constraints will continue to drive innovative
project delivery approaches, including an increase in design-build water projects and P3 transportation projects. With our expanding local presence and relationships, as well as a portfolio of relevant experience, we believe we are well positioned
for this market.
In general, because of funding restraints, the public sector market is expected to remain competitive in the near term until the volume
of projects increases to sustainable levels.
Other factors: The United States remains a very large market, and our presence continues to gain
critical mass and diversity across sectors. We expect our market share and performance to gradually improve throughout 2015. The following factors support our outlook of moderate organic gross revenue growth:
| |
• |
|
The US Congressional Budget Office projects real GDP growth to increase to 2.8% in 2015. |
|
|
|
|
|
| Management’s Discussion and Analysis
December 31, 2014 |
|
M-51 |
|
Stantec Inc. |
| |
• |
|
The Federal Reserve is expected to moderately raise its targeted overnight federal funds rate from 0.00% to 0.25% in the second half of 2015. |
| |
• |
|
The unemployment rate was 5.6% at the end of 2014. We expect this rate will improve in 2015. |
| |
• |
|
In recent months, the Architecture Billings Index from the American Institute of Architects has remained consistently positive, reporting above 50.0, which suggests improved demand for design services.
|
| |
• |
|
The EIA projects oil production in the United States will increase in 2015 and 2016, albeit at a slower rate due to declining oil prices. This is expected to continue driving momentum in the midstream oil and gas
sector, where we anticipate leveraging the expertise of our recent acquisitions. |
| |
• |
|
Housing activity is expected to increase in 2015, with the seasonally adjusted annual rate increasing to 1,169,000 from 1,004,000 housing starts in 2014. |
International
We believe that our
International operations will achieve moderate organic gross revenue growth in 2015. Currently, these operations—mainly within our Buildings business operating unit and Mining sector—make up a small percentage of our business. Economic
conditions and business operations in our International regions are mixed. Similar to other locations, we expect to leverage our local position to drive cross-selling opportunities with clients in the United Kingdom and the Middle East.
In 2015, we expect stable performance in our Mining sector because we are continuing projects despite the global market remaining cautious. Over the medium
term, we expect recovery, although the timing is difficult to predict due to the cyclical nature of this business. We expect to grow organically in other sectors in the international locations where we currently have a presence.
The following factors support our outlook of moderate organic gross revenue growth:
| |
• |
|
The World Bank forecasted global real GDP growth of 3.0% for 2015. Forecasted real GDP growth is 2.5% for the Middle East, 6.4% for India, and 2.9% for the United Kingdom. |
| |
• |
|
The Middle East continued to win projects in infrastructure in 2014, and we expect a continued effort to introduce more of our services to existing clients. |
Business Operating Unit Outlook
Buildings
We believe that our Buildings business operating unit will experience moderate organic gross revenue growth for 2015. Overall, we anticipate
that the buildings industry will recover from the levels of previous years, and because of our top-tier positioning and global expertise—especially in healthcare, education, and airports—we believe we are well positioned to capitalize
on this growth.
We established our outlook based on our expectations, which are listed below:
| |
• |
|
We expect that the pipeline of P3 projects in the healthcare sector will continue to be released in Canada, and that we will be able to secure our share of projects in a highly competitive environment. In the United
States, the trend for P3 and integrated project delivery is still emerging in the healthcare sector. We anticipate increasing international opportunities in the Middle East and the United Kingdom. |
|
|
|
|
|
| Management’s Discussion and Analysis
December 31, 2014 |
|
M-52 |
|
Stantec Inc. |
| |
• |
|
In the commercial sector, we expect to continue winning national projects, although we expect activity to be slower than in 2014 due in part to elevated vacancy rates in Canada. These projects will involve revitalizing
current properties and retail rollout projects, particularly in Canada. In the United States, we anticipate that trends like investing in corporate real estate and workplaces, and multiuse buildings will continue. We believe the addition of ADD,
Inc. will enhance our position in the commercial sector. |
| |
• |
|
We expect that the education sector will continue to improve since colleges and universities in the United States have more capital for infrastructure investments. The increased use of technology, distance
learning, and online delivery may impact the demand for new facilities and design services. In Canada, we anticipate the education market will remain steady because of continuing economic growth and stable enrollment and provincial funding. We
believe the addition of SHW will further strengthen our position in the education sector. |
| |
• |
|
We anticipate that the highly competitive landscape for our Industrial Buildings sector will remain stable and the trend for P3 procurement of maintenance, operations, and storage facilities will continue with municipal
clients across Canada. Recent acquisitions give us the ability to introduce this sector expertise into the United States. |
| |
• |
|
We expect the airport sector to remain moderately active, and we will continue to win projects in this sector due to our strong positioning as well as our expertise across our geographic platform. We believe the United
States is well poised and we are well positioned to begin using P3 and alternative procurement strategies. |
Energy & Resources
We
believe that organic gross revenue growth for our Energy & Resources business operating unit will be stable for 2015, but it may retract in the first half of 2015 and may stabilize in the second half of the year. We expect the mining sector
to remain stable and the power sector to grow moderately. The overall growth in the oil and gas sector is expected to moderate in Canada from the comparative robust growth experienced during the past few years.
We established our outlook based on our expectations, which are listed below:
| |
• |
|
Volatility in commodity and resource prices is depressing the markets and will create uncertainty for client capital expenditure plans in 2015. We believe clients in midstream may slow down their release of new,
rehabilitated, or repurposed large capital infrastructure; however, we are confident they will proceed in 2015 as these are significant multiyear projects. We are cautious on how our clients will be impacted by commodity price fluctuations. In the
United States, we anticipate that activity in shale oil and gas may be impacted by cyclical low commodity prices, but we believe we are well positioned to capture an increasing share of both upstream and midstream activities. We expect our
environmental services will experience continued moderate activity in all three of our business operating units. |
| |
• |
|
We anticipate that commodity prices relating to our Mining sector will remain relatively low. Pricing fluctuations in more volatile commodities as well as a focus on operational efficiencies in 2015 may limit new
project spending or delay current projects. The focus will be on less risky projects and smaller outlays, such as repairing and replacing existing facilities. We expect limited opportunities in US mining due to the global mining slowdown, although
we may obtain an additional share of the market due to the recent JBR acquisition. Canadian and international projects may experience some delays. |
| |
• |
|
We expect that transmission and distribution in infrastructure will continue to be built out in the power sector in Canada. In the United States, we anticipate a recovering power sector, including environmental services
and engineering. Driven by changes in regulatory requirements, the US generation market could experience growth in permitting, evaluation, retrofitting, and decommissioning work. |
|
|
|
|
|
| Management’s Discussion and Analysis
December 31, 2014 |
|
M-53 |
|
Stantec Inc. |
Infrastructure
In 2015, we expect moderate organic gross revenue growth in the Infrastructure business operating unit. We expect that a gradual continuation of long-term
trends—in particular, population growth, urbanization, and the need to rehabilitate aging infrastructure—will further drive the requirement for our water, community development, and transportation services.
We established our outlook based on our expectations, which are listed below:
| |
• |
|
We expect public infrastructure funding to remain relatively stable across North America. We anticipate that geographies impacted by population growth or benefiting from significant energy and private sector development
will experience greater infrastructure demands in the transportation, community development, and water sectors. |
| |
• |
|
We believe that the community development sector, primarily dependent on residential housing activity, will continue to improve in the United States and remain stable in Canada, but it could see some downward pressure
in western Canada. Continued diversification of the community development sector and expansion into higher density regions such as Quebec will better position us to respond to re-urbanization trends and provide opportunities to leverage
cross-company expertise to support retail and municipal clients. |
| |
• |
|
In transportation, we expect state, provincial, and municipal budgets to provide a stable level of funding, and P3 opportunities will remain moderate in 2015 in a competitive environment. In the United States, stable
short-term funding enabled by the Transportation Bill will support our transportation business. |
| |
• |
|
We anticipate that capital spending will remain stable for our municipal water business because of increased regulation, aging infrastructure, and population growth. Growth—driven by increasing demand for flood
management, water resource management, and industrial treatment services in the areas of mining, oil and gas, and power—is likely. |
Overall
Outlook
We believe that we will achieve a moderate increase of approximately 3% organic revenue growth in 2015 compared to 2014. This revenue will be
generated mainly in regions and sectors where we have a strong community presence as a top-tier service provider.
Compared to 2014, the 2015 organic
gross revenue outlook for our Energy & Resources business operating unit will be stable, but it may decline in the first half of the year and may stabilize in the second half of 2015. We believe that our Buildings and Infrastructure
business operating units will achieve moderate organic revenue growth.
Because of our diversity of operations, mix of clients, flexibility of our
business model, and positioning to work effectively in local communities and on national opportunities, we believe that we will continue to operate our business efficiently, to adapt our business to changing economic conditions, and to position
ourselves for growth in a very large infrastructure and facilities market.
Going forward, we expect to achieve a long-term average annual compound growth
rate for gross revenue of 15%. We have met or exceeded 15% each year since our initial public offering in 1994. This continued growth results from successfully executing our strategy, allowing us to enhance the depth of our expertise, broaden our
service offerings, increase our geographic presence in communities across North America, provide expanded opportunities for our employees, and leverage our Integrated Management Systems. Further maximizing the critical mass and maturity we have
achieved in certain business lines and geographic locations also enables us to increase our business with key clients and sell our services across local markets.
|
|
|
|
|
| Management’s Discussion and Analysis
December 31, 2014 |
|
M-54 |
|
Stantec Inc. |
Our ability to expand 15% annually depends on our strategic efforts to grow organically and the availability of
acquisition opportunities. We do not expect to encounter constraints when looking for available acquisition candidates, given our past success and the trend in our industry—smaller firms wanting to join larger and more stable organizations. At
any particular time, we discuss consolidation opportunities with many firms. Since we want an appropriate cultural fit and complementary services that can provide an accretive transaction, the acquisition process can extend over months, even years.
To establish our budgets for 2015, we
| |
• |
|
Assumed that compared to the US dollar, the Canadian dollar would remain relatively stable during 2015 |
| |
• |
|
Assumed that the average interest rate would remain relatively stable in 2015 compared to 2014 |
| |
• |
|
Considered the tax rates substantially enacted at December 31, 2014, for the countries in which we operate (primarily Canada and the United States) to establish our effective income tax rate |
| |
• |
|
Expect to support our targeted level of growth using a combination of cash flows from operations and borrowings |
Critical Accounting Estimates, Developments, and Measures
Critical Accounting Estimates
Our consolidated financial statements are prepared in accordance with IFRS, which requires us to make various judgments, estimates, and assumptions. Note 5 of
our December 31, 2014, consolidated financial statements outlines our significant accounting estimates and is incorporated by reference in this report.
The accounting estimates discussed in our consolidated financial statements are considered particularly important because they require the most difficult,
subjective, and complex management judgments. Accounting estimates are done for the following:
| |
• |
|
Revenue and cost recognition on contracts |
| |
• |
|
Allowance for doubtful accounts |
| |
• |
|
Provision for self-insured liabilities |
| |
• |
|
Share-based transactions |
| |
• |
|
Fair values on business combinations |
| |
• |
|
Assessment of impairment of non-financial assets |
| |
• |
|
Fair value of financial instruments |
| |
• |
|
Categorizing interests in other entities |
Because of the uncertainties inherent in making assumptions and
estimates regarding unknown future outcomes, future events may result in significant differences between estimates and actual results. We believe that each of our assumptions and estimates is appropriate to the circumstances and represents the most
likely future outcome.
Unless otherwise specified in our discussion of specific critical accounting estimates, we expect no material changes in overall
financial performance and financial statement line items to arise, either from reasonably likely changes in material assumptions underlying an estimate or within a valid range of estimates from which the recorded estimate was selected. In addition,
we are not aware of trends, commitments, events, or uncertainties that can reasonably be expected to materially affect the methodology or assumptions associated with our critical accounting estimates, subject to items identified in the Risk Factors
and Cautionary Note Regarding Forward-Looking Statements sections of this report.
|
|
|
|
|
| Management’s Discussion and Analysis
December 31, 2014 |
|
M-55 |
|
Stantec Inc. |
Accounting Developments
Recently adopted
Effective January 1, 2014, we adopted the following amendments:
| |
• |
|
International Accounting Standard (IAS) 32 Financial Instruments: Presentation (amended) |
| |
• |
|
IAS 36 Impairment of Assets – Recoverable Amount Disclosures for Non-Financial Assets (amended) |
| |
• |
|
International Financial Reporting Interpretations Committee (IFRIC) Interpretation 21 Levies (IFRIC 21) |
The adoption of these new standards and amendments did not have an impact on the financial position or performance of our Company. Note 6 to our
December 31, 2014, consolidated financial statements describes these amendments and is incorporated by reference in this report.
Future adoptions
The listing below
includes issued standards, amendments, and interpretations that we reasonably expect to be applicable at a future date and intend to adopt when they become effective. We are currently assessing the impact of adopting these standards, amendments, and
interpretations on our consolidated financial statements and cannot reasonably estimate the effect at this time.
| |
• |
|
Annual Improvements (2010-2012 Cycle) |
| |
• |
|
Annual Improvements (2011-2013 Cycle) |
| |
• |
|
IFRS 15 Revenue from Contracts with Customers |
| |
• |
|
Accounting for Acquisitions of Interests in Joint Operations (Amendments to IFRS 11) |
| |
• |
|
IFRS 9 Financial Instruments |
| |
• |
|
Sale or Contributions of Assets between an Investor and its Associate or Joint Venture (Amendments to IFRS 10 Consolidated Financial Statements and IAS 28 Investments in Associates and Joint Ventures)
|
| |
• |
|
Annual Improvements (2012-2014 Cycle) |
These standards, amendments, and interpretations are described in note
6 of our December 31, 2014, consolidated financial statements and are incorporated by reference in this report.
Materiality
We determine whether information is “material” based on whether we believe that a reasonable investor’s decision to buy, sell, or hold
securities in our Company would likely be influenced or changed if the information was omitted or misstated.
Definition of Additional IFRS Measures
IFRS mandates certain minimum line items for financial statements and requires presentation of additional line items, headings, and subtotals when such
presentation is relevant to an understanding of a company’s financial position and performance. Because IFRS requires such additional GAAP measures, the measures are considered additional IFRS measures, rather than non-IFRS financial measures.
This Management’s Discussion and Analysis includes reference to and uses terms that are considered additional IFRS measures. We believe that the measures defined here are useful for providing investors with additional information to assist them
in understanding components of our financial results.
|
|
|
|
|
| Management’s Discussion and Analysis
December 31, 2014 |
|
M-56 |
|
Stantec Inc. |
Gross Revenue and Net Revenue. Our Company provides knowledge-based solutions for infrastructure and
facilities projects through value-added professional services, principally under fee-for-service agreements with clients. While providing services, we incur certain direct costs for subconsultants, equipment, and other expenditures that are
recoverable directly from our clients. Revenue associated with these direct costs is included in our gross revenue. Because these direct costs and associated revenue can vary significantly from contract to contract, changes in our gross revenue may
not be indicative of our revenue trends. Accordingly, we also report net revenue (which is gross revenue less subconsultant and other direct expenses) and analyze our results in relation to net revenue rather than to gross revenue.
Gross Margin. We monitor our gross margin percentage levels to ensure that they are within an established acceptable range for the profitability of our
operations. Gross margin is calculated as net revenue minus direct payroll costs. Direct payroll costs include the cost of salaries and related fringe benefits for labor hours that are directly associated with the completion of projects. Labor costs
and related fringe benefits for labor hours that are not directly associated with the completion of projects are included in administrative and marketing expenses.
Definition of Non-IFRS Measures
This Management’s Discussion
and Analysis includes references to and uses terms that are not specifically defined in IFRS and do not have any standardized meaning prescribed by IFRS. These non-IFRS measures may not be comparable to similar measures presented by other companies.
We believe that the measures defined here are useful for providing investors with additional information to assist them in understanding components of our financial results.
Working Capital. We use working capital as a measure for assessing overall liquidity. Working capital is calculated by subtracting current liabilities
from current assets. There is no directly comparable IFRS measure for working capital.
Current Ratio. We use current ratio as a measure for
assessing overall liquidity. Current ratio is calculated by dividing current assets by current liabilities. There is no directly comparable IFRS measure for current ratio.
Return on Equity. As part of our overall assessment of value added for shareholders, we monitor our return on equity. Return on equity is calculated as
net income for the last four quarters, divided by the average shareholders’ equity over each of the last four quarters. There is no directly comparable IFRS measure for return on equity.
EBITDA. EBITDA represents net income before interest expense, income taxes, depreciation of property and equipment, and amortization of intangible
assets. This measure is referenced in our credit facility agreement as part of our debt covenants, and we use it as part of our overall assessment of our operating performance. There is no directly comparable IFRS measure for EBITDA.
EBITDAR. This measure is referenced in our credit facility agreement as part of our debt covenants. It is defined as an amount equal to EBITDA, plus
building rental obligations net of common area costs, taxes, charges, and levies. There is no directly comparable IFRS measure for EBITDAR.
Debt to
EBITDA Ratio. This ratio is referenced in our credit facility agreement as part of our debt covenants. It is defined as the sum of permanent principal and interest payments in respect of the debt, plus building rental obligations net of common
area costs, taxes, charges, and levies, divided by EBITDA. There is no directly comparable IFRS measure for debt to EBITDA ratio.
|
|
|
|
|
| Management’s Discussion and Analysis
December 31, 2014 |
|
M-57 |
|
Stantec Inc. |
Net Debt to EBITDA. As part of our assessment of our capital structure, we monitor net debt to EBITDA.
This measure is referenced in our credit facility agreement as part of our debt covenants. It is defined as the sum of (1) long-term debt, including current portion, plus bank indebtedness, less cash and cash equivalents, divided by
(2) EBITDA (as defined above). There is no directly comparable IFRS measure for net debt to EBITDA.
EBITDAR to Debt Service Ratio. This ratio
is referenced in our credit facility agreement as part of our debt covenants. It is defined as EBITDAR, divided by permanent principal and interest payments in respect of the debt, plus building rental obligations net of common area costs, taxes,
charges, and levies. There is no directly comparable IFRS measure for EBITDAR to debt service ratio.
Backlog. As part of our assessment of our
financial condition, we monitor our backlog. We define backlog as the total value of secured work that has not yet been completed that
| |
• |
|
Is assessed by management as having a high certainty of being performed by either the existence of an executed contract or work order specifying the job scope, value, and timing, or |
| |
• |
|
Has been awarded to us through an executed binding or non-binding letter of intent or agreement describing the general job scope, value, and timing. Management must be reasonably assured that the letter of intent or
agreement will be finalized in the form of a formal contract. |
Only the first 12 to 18 months of the total value of secured work of a project
are included in work backlog.
Backlog is not a recognized performance measure under IFRS and does not have any standardized meaning prescribed by IFRS.
We believe that backlog is a useful means of projecting activity in future periods. There is no directly comparable IFRS measure for backlog.
Risk Factors
Enterprise Risk Management Program
To preserve and enhance stakeholder value, we approach risk management strategically through our Enterprise Risk Management (ERM) program. We have
adopted the integrated framework designed by the Committee of Sponsoring Organizations of the Treadway Commission (COSO) (2004 framework). It consists of eight stages of risk management, and we have consolidated those stages into four categories,
described below.
1. Internal Environment and Objective Setting
Our internal environment includes the tone set by our board and management, and it establishes the basis for how risk is viewed and addressed by all employees.
It includes our risk management philosophy and risk appetite, our integrity and ethical values, and the environment in which we operate.
2. Event Identification and Risk Assessment
We analyze the likelihood that risks will occur and the impact of risks. Events are identified and assessed for inherent risk (before giving consideration to
risk mitigation) and then for residual risk (after giving consideration to risk mitigation). Management can then assess whether current risk management techniques are sufficient or whether additional risk mitigation is required. We have aligned the
identification of principal risks with our strategic planning process. In this way, key Company initiatives are identified while considering our risk appetite and appropriately managed to ensure we deliver value to our stakeholders.
|
|
|
|
|
| Management’s Discussion and Analysis
December 31, 2014 |
|
M-58 |
|
Stantec Inc. |
3. Risk Response and Control Activities
Policies and procedures are established to help ensure that the risk-specific response (avoiding, accepting, reducing, or sharing) aligns with our risk
tolerances and risk appetite.
4. Information and Communication and Monitoring
We identify, process, and communicate relevant information within necessary time frames. Effective communication flows down, up, and across the Company to
enable people to carry out their responsibilities. We monitor control activities—through ongoing management activities, separate evaluations, or both—and make changes as required.
The Team
The team involved with risk management includes our board
of directors, the Audit and Risk Committee, the CEO, and, of course, the Risk Management Team. Our Risk Management Team includes representatives from legal, insurance and claims management. Our Executive Leadership, Functional Services, Integrity
Management, and Practice and Quality Management teams also play key roles.
Stantec’s board of directors provides oversight and carries out its risk
management mandate primarily through the Audit and Risk Committee. The committee is not involved in day-to-day risk management activities; rather, it ensures that the Company has an appropriate risk management system, one that allows management to
bring the Company’s principal risks to the board’s attention.
The committee’s oversight responsibilities follow:
| |
• |
|
Ensure that management has developed appropriate methods to identify, evaluate, mitigate, and report on the principal risks inherent to our business and strategic direction |
| |
• |
|
Ensure that our systems, policies, and practices are appropriate and address our principal risks |
| |
• |
|
Review the Company’s risk appetite, risk tolerance, and risk retention philosophy |
Within the Company,
our CEO is directly accountable to the board of directors for all risk-taking activities and risk management practices. The Risk Management Team supports the CEO and mandates the ERM process.
Our Executive Leadership and Functional Services teams are responsible for identifying and mitigating principal risks. The Company’s Integrity Management
Team conducts fraud risk assessments for the Company’s operations and is a key control function for Stantec.
Internal Audit also supports the
Company’s overall risk management program by assisting the Audit and Risk Committee in the discharge of its responsibilities relating to financial controls and control deviations. Internal Audit also conducts internal audits in various areas of
the Company and works within the ERM framework, ensuring that the Company’s principal risks have been appropriately identified. One goal of the ERM program is to continue leveraging the expertise of Internal Audit to design better control and
monitoring activities.
|
|
|
|
|
| Management’s Discussion and Analysis
December 31, 2014 |
|
M-59 |
|
Stantec Inc. |
Finally, our Practice and Quality Management Team plays a vital role by
| |
• |
|
Conducting internal practice audits of one-third of our offices each year to assess compliance with the ISO 90001:2008 registered Quality Management System |
| |
• |
|
Conducting comprehensive audits of a sampling of our major projects where our exposure to risk is more significant (in collaboration with our major projects group) |
| |
• |
|
Monitoring our operations to ensure compliance to our risk mitigation strategies |
| |
• |
|
Identifying emerging risks and areas for further improvement |
Although management remains optimistic about our
ability to successfully carry out long-term objectives, we are exposed to a number of risks and uncertainties, just like other professional infrastructure and facilities services firms. When appropriate, we realign our risk disclosures as part of
the continuous monitoring and annual assessment of our risks. In 2014, there were no material changes in our Company’s principal risks from what is described in our 2013 Annual Report.
The most significant risks are listed below (from most to least serious) based on an assessment of the impact on our Company and the probability that they
will occur. Readers of this report should consider carefully the risks and uncertainties described below, together with all other information in this report.
The risks and uncertainties described in this report are not the only ones we face. Additional risks and uncertainties—that we are unaware of or that we
currently believe are not material—may also become important factors that adversely affect our business. If any of the following risks actually occur, the effects described below in respect of each risk are not the only ones we face, and our
business, financial condition, results of operations, and future prospects could be materially and adversely affected in ways we do not currently anticipate.
Strategic Risks
Strategic Positioning
Stantec focuses on achieving a certain level of market presence in the geographic locations we serve, which, at this time, is principally North America.
Therefore, we are exposed primarily to the economic conditions of the marketplaces within North America. During economic downturns in North America, the ability of both private and government entities to fund expenditures may decline significantly,
which could have a material adverse effect on revenue and profitability.
If we are unable to adjust our workforce or service mix for a downturn in a
particular region, industry, or sector in a timely manner, the downturn could have a material adverse effect on our overall business, including the results of operations and liquidity. We cannot be certain that the North American economic or
political conditions will generally be favorable or that there will not be significant fluctuations that adversely affect our industry as a whole or the key markets we serve.
Sourcing, Executing, and Integrating Acquisitions
We may
not be able to locate suitable acquisitions or complete acquisition transactions under terms and conditions that are acceptable to us. As the professional services industry consolidates, suitable acquisition candidates are expected to become more
difficult to find and may only be available at prices or under terms that are less favorable than they once were.
|
|
|
|
|
| Management’s Discussion and Analysis
December 31, 2014 |
|
M-60 |
|
Stantec Inc. |
When we do acquire a company, we face a complex task: integrating that company’s operations into our own.
Integrations can be time consuming or challenging and can divert management’s attention to the integration effort. Difficulties encountered while combining operations could adversely affect the combined company’s business. This might
prevent us from achieving the anticipated improvement in professional service offerings, market penetration, profitability, and geographic presence that were the main reasons for acquiring the company in the first place. Employees of the acquired
firm could depart because of the uncertainty and difficulties in completing the acquisition and integration or because they don’t want to remain with the combined company. Accordingly, we may be unable to retain key acquired employees to the
extent projected at the time of acquisition.
Organic Growth
We may not be able to increase the size of our operations organically. Organic growth is achieved when we meet client expectations through effective quality
project delivery and expand services provided to existing and new clients. If we are unable to effectively compete for projects, expand services to existing and new clients, or attract qualified staff, we will have difficulty increasing market share
and achieving growth plans.
Organic growth is also affected by factors beyond our control, such as economic conditions. During economic downturns, the
ability of both private and government entities to fund expenditures may decline significantly, which could in turn have a material adverse effect on our organic growth.
Operational Risks
Operational Effectiveness
Our clients depend on us to deliver projects on time, on budget, and at acceptable quality levels. For Stantec to succeed, our internal processes must support
effective professional practice standards, including strong project managers and project management tools, an appropriate insurance program, and a simple and effective way to bill and collect from clients. If we fail to manage projects effectively,
we may incur additional costs, which may in turn result in a project not being as profitable as we expect. In addition, projects that are not completed on schedule further reduces profitability because our staff must continue to work on them longer
than anticipated, which may prevent staff from pursuing and working on new projects. Projects that are over budget or not on schedule may also lead to client dissatisfaction.
Further, because of the nature of our contracts, we commit resources to projects before we receive payments in amounts sufficient to cover our expenditures.
Delays in billings and customer payments may require us to make a working capital investment. In our experience, clients who withhold payment are more likely to be dissatisfied with our services and are more likely to bring claims against us.
Human Capital Management (Attracting, Retaining, Succession Planning, Resource Management)
We derive revenue almost exclusively from services performed by our employees. Consequently, one crucial driver of our business is our ability to attract and
retain qualified people. There is significant competition for people—from major and boutique consulting, engineering, public agency, research, and other professional services firms—with the necessary skills. If we cannot attract and retain
qualified staff, we will be less able to secure and complete projects and maintain client relationships. If key personnel are unable or unwilling to continue employment with Stantec and we do not have a well-developed succession plan in place, our
business, operations, and prospects may be adversely affected.
|
|
|
|
|
| Management’s Discussion and Analysis
December 31, 2014 |
|
M-61 |
|
Stantec Inc. |
Major Project Delivery
As our Company grows, we are presented with the opportunity to work on larger and more complex projects. Historically, our business has been fee-for-service.
Now, some clients are demanding alternative project delivery methods, such as bundled services for engineering, procurement, and construction (EPC), design-builds, and public-private partnerships (P3s). If we fail to respond to these market demands,
clients may award these projects to our competitors. For us, this could mean lost revenue. Poor project management on these more complex projects may result in a higher probability of cost overruns and liabilities.
Business Continuity Planning
We rely heavily on our core
and regional networks, complex server infrastructure and operating systems, communications and collaboration technology, design software and business applications to sustain business operations. Our service delivery and revenues could be interrupted
or delayed if we are unable to
| |
• |
|
Scale core infrastructure and upgrade our applications |
| |
• |
|
Effectively upgrade our systems and network infrastructure |
| |
• |
|
Attract and retain our key information technology personnel |
| |
• |
|
Enhance our cybersecurity posture to prevent or contain network/data breaches or unauthorized access to our corporate data |
Any of these risks could cause system interruptions, loss of critical data, or a delay in operations, or could prevent operations entirely. Our operating
results, liquidity, or financial position might also be affected, and adverse financial impacts could include remediation costs, costs associated with increased protection, lost revenues, litigation costs, and reputational damage leading to lost
clients.
As a corollary to IT disasters, if we fail to maintain clear crisis communication plans, effective emergency response plans and effective
pandemic response plans, we put our employees and clients at risk. Failure to quickly respond to a crisis could impair our ability to start or complete work for clients, leading to client dissatisfaction and claims.
Workplace Health, Safety & Environment
Our
Health, Safety & Environment program is aimed at reducing risks to people, the environment, and our business; however, our employees are subject to environmental, health, and safety risks during their employment. These risks could result in
personal injury, loss of life, or environmental or other damage to our property or the property of others. If we have inadequate health and safety policies and practices, we could be exposed to civil or statutory liability arising from injuries or
deaths. If we cannot insure or elect not to insure because of high premium costs or other reasons, we could become liable for damages arising from these events. If we require additional time to complete projects or lose employee time because of
injury, we risk incurring additional costs on projects that have sustained environmental, health, and safety incidents. Further, we risk losing existing projects if our health, safety and environment program and metrics fail to meet the expectations
of our clients.
Reputational Harm
Reputational harm
is not a stand-alone risk exposure, but is often the outcome of or interdependent with numerous other risk events. To manage our reputation, we must understand the extent to which stakeholders believe the Company is meeting their expectations. Our
stakeholders—such as investors, employees, and clients—respond quickly to negative news about the Company, especially when we have failed to meet our commitments.
|
|
|
|
|
| Management’s Discussion and Analysis
December 31, 2014 |
|
M-62 |
|
Stantec Inc. |
Investors: We make commitments to our investors to deliver on our set operating and financial targets and
revenue growth (listed in the Results and Outlook sections in this report). Investors measure the Company’s ability to do this and to achieve other strategic objectives, such as acquiring strong organizations with strong operations to avoid the
need to write down the value of our goodwill and intangible assets.
Employees: We make commitments to our employees to provide stimulating,
challenging work and assist them to become leaders in their fields and communities. If we fail to do this, we risk employee dissatisfaction, disengagement, and turnover.
Clients: We make commitments to our clients to do what is right within a framework committed to excellence. Failing to do this means we run the risk of
eroding the client relationship. This could result in less repeat business and a poor reputation in the marketplace.
Reporting and Compliance Risk
Controls and Disclosure
Inadequate internal or disclosure
controls over financial reporting could result in material misstatements in our financial statements and related public disclosures. This, in turn, could lead to a loss of market confidence and a decrease in market value.
Inadequate controls could also result in other risks: fraud, system downtime, delayed processing, inappropriate decisions based on non-current internal
financial information, or the inability to continue our business operations.
Regulatory and Legal Risk
We are subject to a variety of regulations and standards. Our business model includes a range of business operating units and jurisdictions, each with its own
set of rules and regulations. Our primary regulatory and legal risks include the following:
| |
• |
|
Compliance with additional regulations and standards could materially increase our costs |
| |
• |
|
Noncompliance with laws and regulations could have a significant impact on our results |
| |
• |
|
Litigation and legal matters that we may be involved in during the normal course of business are subject to many uncertainties, and the outcome of an individual matter may be unpredictable |
Availability of Capital
To deliver on our strategic
plan, we need access to substantial capital. However, obtaining capital for a successful acquisition program may be difficult when we must meet other cash needs. If we are unable to obtain additional capital on acceptable terms, we may have to
reduce the scope of our anticipated expansion, which may negatively affect our future competitiveness and results of operations. Using internally generated cash or taking on debt to complete acquisitions could substantially limit our operational and
financial flexibility. Also, we have no assurance that existing debt will continue to be available from our current lenders or other financial institutions on similar favorable terms.
Market Risk
Several capital market risks affect our
business. For us, two key drivers are currency risk and interest rate risk.
Currency risk: Although we report financial results in Canadian
dollars, a substantial portion of revenue and expenses is generated or incurred in non-Canadian dollars. If the Canadian dollar strengthened relative to the
|
|
|
|
|
| Management’s Discussion and Analysis
December 31, 2014 |
|
M-63 |
|
Stantec Inc. |
US dollar and other currencies, the net income from our non-Canadian dollar business could decrease. This could have a material adverse effect on our business, financial condition, and
results of operations. During 2014, the value of the Canadian dollar averaged US$0.91 compared to US$0.97 in 2013. This 6.2% weakening of the Canadian dollar had a positive effect on revenue reported in 2014 compared to 2013.
Interest rate risk: Changes in interest rates present a risk to our performance. Our revolving credit facility carries a floating rate of interest, and
we are also subject to interest rate pricing risk to the extent that our investments held for self-insured liabilities contain fixed-rate government, corporate bonds, and term deposits.
Tax Risk
Uncertainties exist when interpreting complex
tax regulations and assessing the amount and timing of deferred taxable income. Stantec is also exposed to transfer pricing risk in the following three areas: provision of management services, insurance and financing of operations, and cross-border
labor sharing and charging for services provided to external clients. Stantec has the largest exposure while providing these services between Canada and the United States.
Managing our Risks
Business Model
As a professional services firm, we focus on design. We typically do not take on construction risk or contribute equity in projects. We mitigate our operating,
market, growth, and acquisition and integration risks through our business strategy and other measures. We focus our business on two client types: regional/local and global/national.
Our matrix-based model—based on geographic, business operating unit, and life cycle diversification—reduces our dependency on any particular
industry or economic driver. We intend to continue diversifying our geographic presence and service offerings and focusing our organization around key client sectors. We believe this reduces our susceptibility to industry-specific and regional
economic cycles and will help us take advantage of economies of scale in the highly fragmented professional services industry.
We also differentiate our
Company from competitors by entering into both large and small contracts with a variety of fee amounts. A broad project mix strengthens our brand identity and ensures that we do not rely on only a few large projects for our revenue. No one client or
project accounts for more than 5% of our overall business. We expect to continue to pursue selective acquisitions, enabling us to enhance our market penetration and increase and diversify our revenue base.
Effective Processes and Systems
To ensure the most
effective project management and execution, our Integrated Management Systems (IMS) is certified to the ISO9001:2008 (Quality Management), ISO14001:2004 (Environmental Management), and ISO 20000-1:2011 (IT Service Management System) standards. IMS
provides clarity about project delivery expectations and client service excellence.
At the heart of the IMS is our 10-point project management (PM)
framework that—along with the more detailed practice frameworks that exist in our business operating units—clearly conveys the steps employees must take to achieve more consistent and successful project outcomes. The PM framework helps
create consistent principles relating to project execution and ensure that employees from every office are aligned with those principles. To improve PM framework compliance in specific offices and regions, we adopt regional operating unit
improvement plans. These address specific corrective action, responsibilities, and deadlines for completion.
|
|
|
|
|
| Management’s Discussion and Analysis
December 31, 2014 |
|
M-64 |
|
Stantec Inc. |
We maintain insurance coverage for our operations, including policies covering general liability, automobile
liability, environmental liability, workers’ compensation and employers’ liability, directors’ and officers’ liability, and professional liability. We have a regulated captive insurance company to insure and fund the payment of
any professional liability self-insured retentions related to claims arising after August 1, 2003. We or our clients also obtain project-specific insurance for certain projects when required.
In addition, we invest resources in a Risk Management Team that is dedicated to providing Company-wide support and guidance on risk avoidance practices and
procedures. One of our practices is to carry out select client evaluations, including credit risk appraisals, before entering into contract agreements. This reduces the risk of nonpayment for our services.
Growth Management
We have an acquisition and integration
program managed by a dedicated acquisition team to address the risk of being unsuccessful when integrating acquired companies. A senior regional or practice leader is appointed for each acquisition. The team supports and is responsible for
| |
• |
|
Identifying and valuing acquisition candidates |
| |
• |
|
Undertaking and coordinating due diligence |
| |
• |
|
Negotiating and closing transactions |
| |
• |
|
Integrating employees and systems immediately following an acquisition |
As Stantec continues to expand
internationally, we are developing a disciplined approach for operating outside of North America. We consider differences in accounting systems, legal structures, languages, and cultures. We also have an integration plan that involves implementing
our Company-wide information technology and financial management systems and providing support services from our corporate and regional offices.
We are
able to meet our liquidity needs and expansion strategy through a variety of sources that include cash generated from operations, short- and long-term borrowings from our $350 million credit facility, senior secured notes, and the issuance of common
shares.
Executive Compensation
In 2014, we rolled
out a new executive compensation program which is tied to the changes we made to our leadership and organizational structure. The highlights of the changes to the executive compensation program are
| |
• |
|
Aligning the compensation program of our CEO with that of the executive leadership team |
| |
• |
|
Enhancing the alignment between our executives’ and long-term shareholders’ interests through increased focus on long-term pay-for-performance compensation vehicles |
| |
• |
|
Adopting a median target pay positioning as compared with our industry peers |
| |
• |
|
Providing additional transparency by disclosing Company-wide performance metrics (which follow our strategic plan); these are used to assess both short- and long-term variable pay |
Our executive compensation philosophy remains the same: we seek to align our compensation practices with our risk mitigation strategies. We continue to
compensate our executives with a mix of fixed and at-risk compensation. Our annual bonus pool rewards near-term performance contributions to encourage executives to achieve profitable business results. The amount of the bonus pool is determined as a
percentage of our pre-tax, pre-bonus net income. Our employee share option plan rewards long-term performance by aligning the interests of key employees with increased shareholder returns. Our share options vest over a three-year period to encourage
long-term alignment with the interests of our shareholders.
|
|
|
|
|
| Management’s Discussion and Analysis
December 31, 2014 |
|
M-65 |
|
Stantec Inc. |
In addition to our compensation programs, we have adopted share ownership requirements for our executives to
further demonstrate their commitment to creating shareholder value. Also, our executives are prohibited from speculating in the securities of the Company or purchasing financial instruments that are designed to hedge or offset a decrease in value of
equity securities of the Company.
We are also committed to the principle that compensation paid to our executives—based on financial information
that has since been restated—should be returned. To that end, in 2012, our board of directors adopted an executive compensation claw-back policy.
Controls and Procedures
Disclosure controls and procedures are designed to ensure that information we are required to disclose in
reports filed with securities regulatory agencies is recorded, processed, summarized, and reported on a timely basis and is accumulated and communicated to management, including our CEO and CFO, as appropriate, to allow timely decisions regarding
required disclosure.
Under the supervision and with the participation of management, including our CEO and CFO, we carried out an evaluation of the
effectiveness of our disclosure controls and procedures as of December 31, 2014 (as defined in rules adopted by the SEC in the United States and as defined in Canada by National Instrument 52-109, Certification of Disclosure in Issuer’s
Annual and Interim Filings). Based on this evaluation, our CEO and CFO concluded that the design and operation of our disclosure controls and procedures were effective.
Internal control over financial reporting is a process designed to provide reasonable assurance regarding the reliability of financial reporting and
preparation of financial statements for external purposes in accordance with IFRS. A control system, no matter how well designed and operated, can provide only reasonable, not absolute, assurance with respect to the reliability of our financial
reporting and preparation of our financial statements. Accordingly, management, including our CEO and CFO, does not expect that our internal control over financial reporting will prevent or detect all errors and all fraud. Management’s Annual
Report on Internal Control over Financial Reporting and the Independent Auditors’ Report on Internal Controls are included in our 2014 consolidated financial statements.
There has been no change in our internal control over financial reporting during the year ended December 31, 2014, that materially affected or is
reasonably likely to materially affect our internal control over financial reporting.
We will continue to periodically review our disclosure controls and
procedures and internal control over financial reporting and may make modifications from time to time as considered necessary or desirable.
|
|
|
|
|
| Management’s Discussion and Analysis
December 31, 2014 |
|
M-66 |
|
Stantec Inc. |
Corporate Governance
Disclosure Committee
Stantec has a Disclosure Committee, consisting
of a cross-section of management. The committee’s mandate is to provide ongoing review of Stantec’s continuous disclosure policy and to facilitate compliance with applicable legislative and regulatory reporting requirements.
Board of Directors
Stantec’s board of directors currently
includes nine members—eight are independent under Canadian securities laws and under the rules of the SEC and the NYSE and free from any interest or relationship that could materially interfere with their ability to act in the best interest of
our Company and shareholders.
The board’s mandate is to supervise Stantec’s management with a view to the Company’s best interests. The
board fulfills its mandate by
| |
• |
|
Overseeing the Company’s strategic planning process |
| |
• |
|
Satisfying itself as to the integrity of the CEO and other executive officers |
| |
• |
|
Ensuring that the Company has a policy in place for communicating effectively with shareholders, other stakeholders, and the public |
| |
• |
|
Reviewing and monitoring the Company’s principal business risks as identified by management, along with the systems for managing such risks |
| |
• |
|
Overseeing senior management succession planning, including the appointment, development, and monitoring of senior management |
| |
• |
|
Ensuring that management maintains the integrity of the Company’s internal controls and management information systems |
In 2014, Stantec’s board included two committees: the Audit and Risk Committee and the Corporate Governance and Compensation Committee. Both committees
are composed entirely of independent directors.
Audit and Risk Committee
The Audit and Risk Committee monitors, evaluates, approves, and makes recommendations on matters affecting Stantec’s external audit, financial reporting,
accounting control policies, and risk management matters. The chair of the committee provides regular reports at the Company’s board meetings. The board has determined that each of the Audit and Risk Committee’s members is financially
literate and independent and three of the four members are “financial experts” as such term is defined under the rules of the SEC and NYSE.
Corporate
Governance and Compensation Committee
The Corporate Governance and Compensation Committee monitors, evaluates, approves, and makes recommendations on
matters affecting governance and compensation. Governance matters include, but are not limited to, board size, nominations, orientation, education, and self-evaluation. Compensation matters include, but are not limited to, executive management
compensation, performance review, and succession plans. The committee reviews and approves the CEO’s objectives and monitors these objectives on a quarterly basis. The chair of the committee provides regular reports at the Company’s board
meetings.
|
|
|
|
|
| Management’s Discussion and Analysis
December 31, 2014 |
|
M-67 |
|
Stantec Inc. |
More information about Stantec’s corporate governance can be found on our website (www.stantec.com) and in
the Management Information Circular for our May 14, 2015, Annual General Meeting of Shareholders. In addition, the following documents are posted on our website:
| |
• |
|
Corporate Governance Guidelines |
| |
• |
|
Audit and Risk Committee Terms of Reference |
| |
• |
|
Corporate Governance and Compensation Committee Terms of Reference |
The above information is not and should not be deemed to be incorporated by reference
herein. Copies of these documents will be made available in print form to any shareholder who requests them.
Subsequent Events
On January 16, 2015, we acquired certain assets and liabilities of Dessau Inc., which added approximately 1,300 staff to our Company. We acquired the
Canadian engineering operations of this Montreal-based firm, Dessau Inc., and its operations in Plania, Gestrans, and Azimuth. Dessau Inc. has offices throughout Quebec as well as in Mississauga and Ottawa, Ontario. This acquisition adds to our
expertise in healthcare, water, power and energy, transportation, and community development, as well as introduces telecommunications and security services to our broader platform.
On January 30, 2015, we entered into an agreement to acquire the shares of Sparling, Inc. (Sparling), which will add approximately 130 staff to our
Company. The acquisition is expected to be completed on February 28, 2015, subject to certain conditions. Sparling is based in Seattle, Washington, and has additional offices in San Diego, California; and Portland, Oregon. Sparling provides
expertise in electrical engineering and architectural lighting design. This addition will further enhance our West Coast presence in the United States.
On February 25, 2015, the Company declared a cash dividend of $0.105 per share, payable on April 16, 2015, to shareholders of record on
March 31, 2015, an increase of 13.5% from last year.
Cautionary Note Regarding Forward-Looking Statements
Our public communications often include written or verbal “forward-looking statements” within the meaning of the US Private Securities Litigation
Reform Act of 1995 and “forward-looking information” within the meaning of applicable Canadian securities laws (collectively, “forward-looking statements”). Forward-looking statements are disclosures regarding possible events,
conditions, or results of operations that are based on assumptions about future economic conditions or courses of action and include future-oriented financial information.
Statements of this type are contained in this report, including the discussion of our goals in the Core Business and Strategy section and of our targets
and expectations for our regions, and business operating units, and overall business outlook in the Outlook section, and may be contained in filings with securities regulators or in other communications. Forward-looking statements may involve, but
are not limited to, comments with respect to our objectives for 2015 and beyond, our strategies or future actions, our targets, our expectations for our financial condition, or the results of or outlook for our operations.
|
|
|
|
|
| Management’s Discussion and Analysis
December 31, 2014 |
|
M-68 |
|
Stantec Inc. |
We provide forward-looking information for our business in the Executive Summary (under Core Business and
Strategy and under Outlook), the Core Business and Strategy section, the Key Performance Drivers and Capabilities section, and the Results (under Liquidity and Capital Resources subsection) and Outlook sections of this report to describe the
management expectations and targets by which we measure our success and to assist our shareholders in understanding our financial position as at and for the periods ended on the dates presented in this report. Readers are cautioned that this
information may not be appropriate for other purposes.
By their nature, forward-looking statements require us to make assumptions and are subject
to inherent risks and uncertainties. There is a significant risk that predictions, forecasts, conclusions, projections, and other forward-looking statements will not prove to be accurate. We caution readers of this report not to place undue reliance
on our forward-looking statements since a number of factors could cause actual future results, conditions, actions, or events to differ materially from the targets, expectations, estimates, or intentions expressed in these forward-looking
statements.
The following factors, among others listed under the Key Performance Drivers and Capabilities section, could cause our actual results
to differ materially from those projected in our forward-looking statements:
| |
• |
Global capital market activities |
| |
• |
Fluctuations in interest rates or currency values |
| |
• |
Fluctuations in commodity prices |
| |
• |
Effects of war or terrorist activities |
| |
• |
Effects of disease or illness on local, national, or international economies |
| |
• |
Effects of disruptions to public infrastructure such as transportation, communications, power, or water |
| |
• |
Global economic or political conditions |
| |
• |
Regulatory or statutory developments |
| |
• |
Effects of competition in the geographic or business areas in which we operate |
Many of these factors are beyond our control and have effects which are
difficult to predict. Future outcomes relating to forward-looking statements may be influenced by these and other factors, including, but not limited to, material and known risks, which are further described in the Risk Factors section of this
report.
Assumptions
In determining
our forward-looking statements, we consider material factors including assumptions about the performance of the Canadian and US economies in 2015 and their effect on our business. The assumptions we made in determining the outlook for each of our
business operating units, our geographic areas, our annual targets, and our outlook for 2015 are listed in the Outlook section of this report.
The
preceding list of factors is not exhaustive. Investors and the public should carefully consider these factors, other uncertainties and potential events, and the inherent uncertainty of forward-looking statements when relying on these statements to
make decisions with respect to our Company. The forward-looking statements contained herein represent our expectations as of February 25, 2015, and, accordingly, are subject to change after such date. Except as may be required by law, we do not
undertake to update any forward-looking statement, whether written or verbal, that may be made from time to time. In the case of the ranges of expected performance for fiscal year 2015, it is our current practice to evaluate and, where we deem
appropriate, provide updates. However, subject to legal requirements, we may change this practice at any time at our sole discretion.
|
|
|
|
|
| Management’s Discussion and Analysis
December 31, 2014 |
|
M-69 |
|
Stantec Inc. |