ATHNQ22015PreparedRemarks
Second Quarter Fiscal Year 2015 
Prepared Remarks July 23, 2015
Jonathan Bush, Chairman & Chief Executive Officer
Kristi Matus, Executive Vice President, Chief Financial & Administrative Officer
About These Remarks
The following commentary is provided by management in conjunction with the second quarter fiscal year 2015 earnings press release issued by athenahealth, Inc. (“athenahealth” or “we”). These remarks represent management’s current views on our financial and operational performance and are provided to give investors and analysts more time to analyze and understand our performance in advance of the earnings conference call. These prepared remarks will not be read on the conference call. A complete reconciliation between generally accepted accounting principles (“GAAP”) and non-GAAP results, as well as a summary of supplemental metrics and definitions, is provided in the tables following these prepared remarks.
Earnings Conference Call Information
To participate in our live conference call and webcast, please dial 877-853-5645 (or 408-940-3868 for international calls) using conference code No. 68777413, or visit the Investors section of our website at www.athenahealth.com. A replay will be available for one week following the conference call at 855-859-2056 (and 404-537-3406 for international calls) using conference code No. 68777413. A webcast replay will also be archived on our website.
Safe Harbor and Forward-Looking Statements
These remarks contain forward-looking statements, which are made pursuant to the safe harbor provisions of the Private Securities Litigation Reform Act of 1995, including statements reflecting management’s expectations for future financial and operational performance and operational expenditures, expected growth and penetration in major health care and technology markets, and business outlook, including the reaffirmed fiscal year 2015 guidance; statements regarding our research and development efforts and product offerings and enhancements; the benefits of and anticipated operational results from our service offerings and demands for and adoption of our service offerings; the further integration of our services and the resulting benefits; changes in the types of providers and health care entities we serve and the range of tasks we perform for clients; our sales, marketing and partnering activities and plans; introduction of new programs as part of our “More Disruption Please” (MDP) effort and anticipated operational results from partners’ service offerings; the development of the athenaClinicals® Enterprise, athenaCoordinator® Enterprise, and athenaText® service offerings; client behavior and preferences, and implementation of services for new clients and deals; our market position and awareness among physicians; the potential for cross-sales among service offerings and sales involving multiple services; our implementation pipeline and expectations on new deals and network growth; the expansion of the number of users of our services; the interoperability of athenaNet®; changes in the industry, our positioning to lead such changes, and the extent of our experience to manage such changes for our clients; the creation of a sustainable market for health information exchange, an ecosystem of developers and third-party service providers, and a national health IT network; and statements found under our “Reconciliation of Non-GAAP Financial Measures to Comparable GAAP Measures” section of these remarks. Forward-looking statements may often be identified with words such as “we expect,” “we anticipate,” “upcoming,” “plan,” “aim,” or similar indications of future expectations. These statements are neither promises nor guarantees, and are subject to a variety of risks and uncertainties, many of which are beyond our control, which could cause actual results to differ materially from those contemplated in these forward-looking statements. In particular, the risks and uncertainties include, among other things: our fluctuating operating results; our variable sales and implementation cycles, which may result in fluctuations in our quarterly results; risks associated with the acquisition and integration of companies and new technologies, including those related to our ability to integrate the services, offerings, and technologies of Epocrates, Razor Insights, LLC, and webOMR and realize the expected benefits such as increased awareness among physicians and acceleration into new market segments; risks associated with our expectations regarding our ability to maintain profitability; the impact of increased sales and marketing and research and development expenditures, including whether increased expansion in revenues is attained, and impact on margins and profitability; changes in tax rates or exposure to additional tax
liabilities; the highly competitive industry in which we operate and the relative immaturity of the market for our service offerings; and the evolving and complex governmental and regulatory compliance environment in which we and our clients operate. Existing and prospective investors are cautioned not to place undue reliance on these forward-looking statements, which speak only as of the date hereof. We undertake no obligation to update or revise the information contained in these remarks, whether as a result of new information, future events or circumstances, or otherwise. For additional disclosure regarding these and other risks faced by us, see the disclosures contained in our public filings with the Securities and Exchange Commission (“SEC”), available on the Investors section of our website at www.athenahealth.com and on the SEC’s website at www.sec.gov.
Use of Non-GAAP Financial Measures
These remarks contain non-GAAP financial measures, as defined by SEC Regulation G. The GAAP financial measure most directly comparable to each non-GAAP financial measure used or discussed, and a reconciliation of the differences between each non-GAAP financial measure and the comparable GAAP financial measure, are included following these prepared remarks or can be found within our second quarter fiscal year 2015 earnings press release in the Investors section of our website at www.athenahealth.com.
Opening Remarks
athenahealth’s vision is to build the health care internet and connect care across care continuum. Today, we connect providers to financial results and clinical outcomes, we connect providers to their patients, we connect providers to new innovations and finally, we connect providers to each other. During Q2 2015, we added 2,882 providers and 522 receiver nodes onto the network, connected our clients and their trading partners across 178 thousand interfaces, and grew our health system client network with the signing of The Kirkland Clinic of UAB Hospital (athenaCoordinator Enterprise) and NewYork-Presbyterian (athenaOne®). Additionally, we are further connecting providers to disruptive innovation with the expansion of our MDP Accelerator program into San Francisco, California and Austin, Texas. Finally, we are connecting providers to each other and helping them collaborate and coordinate care with the launch of our athenaText service in June 2015.
Highlights from Q2 2015 include the following:
| |
• | Grew consolidated revenue by 21% and athenahealth-branded revenue by 23% over Q2 2014 |
| |
• | Delivered Non-GAAP Adjusted Gross Margin rate of 63.3%, up from 63.0% in Q2 2014 |
| |
• | Grew net new active physicians on athenaCollector® (2,114 physicians added), athenaClinicals (1,127 physicians added), and athenaCommunicator® (1,670 physicians added) in Q2 2015, compared to athenaCollector (2,023 physicians added), athenaClinicals (1,151 physicians added), and athenaCommunicator (1,807 physicians added) in Q2 2014 |
| |
• | Grew athenaCollector physicians by 24%, athenaClinicals physicians by 43%, and athenaCommunicator physicians by 36% over Q2 2014, representing continued strong network growth in 2015 |
| |
• | Completed implementations at Women’s Health USA (athenaOne), Marquette Physician Practices (athenaCollector and athenaCommunicator), and brought seven additional waves live at Ascension Health (athenaCollector and athenaCommunicator) |
| |
• | Launched athenaText, our secure text messaging service, for athenaClinicals, athenaCoordinator, and Epocrates users in June 2015 |
| |
• | Welcomed three portfolio companies to our new San Francisco-based MDP Accelerator program and expanded our MDP Accelerator program into Austin, Texas |
| |
• | Named as the best ambulatory portal (athenaCommunicator) in the 2015 KLAS Patient Portal Report - “Patient Portals 2015 Adoption Beyond Meaningful Use” (released in March 2015) |
| |
• | Recognized as leading the market in electronic health record usability (athenaClinicals) in the 2015 KLAS Usability Report - “Is Ambulatory EMR Usability Improving?” (released in June 2015) |
| |
• | Ranked as the top medical app (Epocrates) among U.S. physicians according to Manhattan Research’s 2015 Taking the Pulse® U.S. study |
Results Overview
athenahealth’s top line results for the second quarter of fiscal year (“FY”) 2015 reflect solid revenue growth:
| |
◦ | $224.7 million in Q2 2015, representing 21% growth over $185.9 million in Q2 2014 |
| |
▪ | athenahealth-branded revenue was $209.1 million in Q2 2015, representing 23% growth over $170.3 million for Q2 2014 |
| |
◦ | $431.1 million for the six months ending June 30, 2015, representing 24% growth over $349.0 million in the same period last year |
| |
▪ | athenahealth-branded revenue was $401.2 million for the six months ending June 30, 2015, representing 24% growth over $318.5 million in the same period last year |
Our bottom line results for Q2 2015, consistent with our growth strategy, demonstrate strong sales, marketing, and research and development investments, and a focus on operating efficiencies:
| |
• | Non-GAAP Adjusted Gross Profit and Margin: |
| |
◦ | $142.1 million, or 63.3% of total revenue, in Q2 2015, an increase of 21% over $117.1 million, or 63.0% of total revenue, in Q2 2014 |
| |
• | GAAP selling and marketing expense: |
| |
◦ | $54.4 million, or 24.2% of total revenue, in Q2 2015, an increase of 7% over $50.7 million, or 27.3% of total revenue, in Q2 2014 |
| |
• | GAAP research and development expense: |
| |
◦ | $24.4 million, or 10.9% of total revenue, in Q2 2015, an increase of 49% over $16.4 million, or 8.8% of total revenue, in Q2 2014 |
| |
• | GAAP general and administrative expense: |
| |
◦ | $36.1 million, or 16.1% of total revenue, in Q2 2015, an increase of 19% from $30.4 million, or 16.4% of total revenue, in Q2 2014 |
| |
• | Non-GAAP Adjusted EBITDA: |
| |
◦ | $43.4 million, or 19.3% of total revenue, in Q2 2015, an increase of 20% from $36.3 million, or 19.5% of total revenue, in Q2 2014 |
| |
• | Non-GAAP Adjusted Operating Income: |
| |
◦ | $22.2 million, or 9.9% of total revenue, in Q2 2015, an increase of 3% from $21.6 million, or 11.6% of total revenue, in Q2 2014 |
| |
• | Non-GAAP Adjusted Net Income: |
| |
◦ | $12.4 million, or $0.32 per diluted share, in Q2 2015, an increase of 2% from $12.2 million, or $0.32 per diluted share, in Q2 2014 |
We measure our performance based on a balanced scorecard model. We believe that this framework is an excellent report card for our performance for the current year and that it measures the key performance indicators required for long-term success. For 2015, we have developed a more streamlined and more heavily weighted scorecard focused on 8 key stability, performance, satisfaction and financial metrics. The table below shows the scorecard results for Q1 2015, Q2 2015 and year-to-date Q2 2015. For certain metrics (i.e., Client Days in Accounts Receivable), our goal is to improve our performance by effectively reducing the scorecard metrics results throughout the year. Please reference the last page of this document for definitions of our corporate scorecard metrics.
|
| | | | | | | | | |
| Q1 2015
Results | Q2 2015
Results | YTD 2015 Results |
|
| | | |
Stability (10% weight) | | | |
Voluntary Turnover | 2.2 | % | 2.8 | % | 5.0 | % |
Employee Engagement | (a) | 4.3 |
| 4.3 |
|
Stability Results | 115 | % | 95 | % | 105 | % |
| | | |
Performance (25% weight) | | | |
Client Days in Accounts Receivable (“DAR”) | 41.1 |
| 40.8 |
| 41.0 |
|
Closed-Loop Order Rate | 42.5 | % | 43.5 | % | 43.0 | % |
Performance Results | 97 | % | 95 | % | 96 | % |
| | | |
Satisfaction (20% weight) | | | |
Net Promoter Score | 42.3 |
| 40.5 |
| 41.4 |
|
Satisfaction Results | 96 | % | 92 | % | 94 | % |
| | | |
Financial (45% weight) | | | |
Bookings (b) | (b) | (b) | (b) |
Total Revenue ($M) | $ | 206.4 |
| $ | 224.7 |
| $ | 431.1 |
|
Non-GAAP Adjusted Operating Income ($M) | $ | 16.3 |
| $ | 22.2 |
| $ | 38.4 |
|
Financial Results | 130 | % | 115 | % | 126 | % |
| | | |
Total Results | 113 | % | 103 | % | 110 | % |
| |
(a) | Employee Engagement survey result reported in Q2 and Q4 only. |
| |
(b) | Since the bookings metric contains highly sensitive data, we do not disclose all of the specific performance measures and targets, because we believe that such disclosure would result in serious competitive harm. |
We believe that our underlying drivers of long-term success remain relatively strong as supported by the following metric results:
| |
• | Voluntary Turnover of 2.8% in Q2 2015, slightly above our goal of 2.6%. |
| |
• | Employee Engagement of 4.3 in Q2 2015, in line with our goal of 4.3. |
| |
• | Client Days in Accounts Receivable of 40.8 days in Q2 2015, above our goal of 37.6 days, and above 39.0 days in Q2 2014. Client Days in Accounts Receivable continues to be impacted by credentialing-related activity resulting from strong provider growth within the base as well as new provider growth. Client Days in Accounts Receivable was also temporarily impacted by an increase in Medicare DAR due to the legislative fix or permanent repeal of the Medicare Sustainable Growth Rate (“SGR”). SGR was a method used by the Centers for Medicare and Medicaid services to control spending by Medicare on physician services. President Barack |
Obama signed a bill into law on April 16, 2015, the Medicare Access and CHIP Reauthorization Act of 2015, which ended the use of SGR.
| |
• | Closed-Loop Order Rate of 43.5% in Q2 2015, mostly in line with our goal of 44.0%. |
| |
• | Net Promoter Score of 40.5 in Q2 2015, versus goal of 44.0 and 42.3 in Q1 2015. We continue to focus on improving our service around change management, the client on-boarding experience, and issue resolution. |
athenahealth’s client base continues to expand while client adoption of other services in the athenahealth service suite grows. As our client base expands outside the traditional ambulatory market, we believe that total active providers, or nodes, on our network will become a more appropriate metric to use in measuring our market share. During Q2 2015:
| |
• | 81% of all new athenaCollector deals included athenaClinicals, compared to 80% in Q2 2014 |
| |
• | 78% of all new athenaCollector deals included athenaClinicals, athenaCommunicator and athenaCoordinator, compared to 73% in Q2 2014. |
| |
• | 43% of total athenaCollector physicians have adopted athenaClinicals, up from 37% in Q2 2014 |
| |
• | 72% of total athenaCollector physicians have adopted athenaCommunicator, up from 65% in Q2 2014 |
| |
• | Net new physicians and providers added sequentially to the network were as follows: |
|
| | | | | | | | | | | | | | |
| athenaCollector | | athenaClinicals | | athenaCommunicator |
Active physicians and providers: | Physicians | Providers | | Physicians | Providers | | Physicians | Providers |
Beginning balance as of 3/31/15 | 47,062 |
| 64,648 |
| | 19,796 |
| 26,166 |
| | 33,578 |
| 43,770 |
|
Net new additions | 2,114 |
| 2,882 |
| | 1,127 |
| 1,475 |
| | 1,670 |
| 2,132 |
|
Ending balance as of 6/30/15 | 49,176 |
| 67,530 |
| | 20,923 |
| 27,641 |
| | 35,248 |
| 45,902 |
|
Sequential growth % | 4 | % | 4 | % | | 6 | % | 6 | % | | 5 | % | 5 | % |
| |
• | Net new physicians and providers added to the network since Q2 2014 were as follows: |
|
| | | | | | | | | | | | | | |
| athenaCollector | | athenaClinicals | | athenaCommunicator |
Active physicians and providers: | Physicians | Providers | | Physicians | Providers | | Physicians | Providers |
Beginning balance as of 6/30/14 | 39,686 |
| 55,425 |
| | 14,672 |
| 19,733 |
| | 25,837 |
| 33,976 |
|
Net new additions | 9,490 |
| 12,105 |
| | 6,251 |
| 7,908 |
| | 9,411 |
| 11,926 |
|
Ending balance as of 6/30/15 | 49,176 |
| 67,530 |
| | 20,923 |
| 27,641 |
| | 35,248 |
| 45,902 |
|
Y/Y growth % | 24 | % | 22 | % | | 43 | % | 40 | % | | 36 | % | 35 | % |
| |
• | 522 athenaCoordinator receivers were added to the network, bringing our athenaCoordinator receiver base to 6,706 receivers |
Revenue Discussion
Q2 2015 revenue was $224.7 million and grew by 21% (or $38.8 million) over Q2 2014. athenahealth-branded revenue for Q2 2015 was $209.1 million and grew by 23% (or $38.8 million) over Q2 2014. Revenue for the six months ended June 30, 2015 was $431.1 million and grew by 24% (over $82.1 million) over the same period last year. athenahealth-branded revenue for the six months ended June 30, 2015 was $401.2 and grew by 26% ($82.7 million) over the same period last year.
|
| | | | |
| Q2 2015 | Q2 2014 | Y/Y Growth% |
athenahealth-branded | $209.1 | $170.3 | 23 | % |
Epocrates-branded | $11.6 | $11.3 | 3 | % |
Third-party tenant and other non-core | $4.0 | $4.3 | (7 | )% |
Consolidated Revenue | $224.7 | $185.9 | 21 | % |
|
| | | | |
| YTD Q2 2015 | YTD Q2 2014 | Y/Y Growth% |
athenahealth-branded | $401.2 | $318.5 | 26 | % |
Epocrates-branded | $22.4 | $21.9 | 2 | % |
Third-party tenant and other non-core | $7.5 | $8.6 | (13 | )% |
Consolidated Revenue | $431.1 | $349.0 | 24 | % |
In terms of trends in our recurring revenue base, same-store analysis of claims created—a proxy for physician office utilization—indicates that physician office activity in Q2 2015 increased slightly over physician office activity during Q2 2014 but was relatively flat to physician office activity in Q1 2015. This is not unexpected as we typically see a seasonal drop in claims from Q1 to Q2.
Non-GAAP Adjusted Gross Margin Discussion
Our Non-GAAP Adjusted Gross Margin was 63.3% for Q2 2015, up approximately 30 basis points from 63.0% in Q2 2014. One of our goals is to improve gross margin on a service-line basis each year. As previously discussed, the expansion of our newer service offerings, such as athenaCoordinator Enterprise and athenaClinicals Enterprise, is expected to serve as a headwind to total company margin expansion until these new services become more automated and scalable.
Balance Sheet and Cash Flow Highlights
As of June 30, 2015, we had cash and cash equivalents of $104.9 million and outstanding indebtedness of $300.0 million. Operating cash flow increased by $10.8 million from net cash provided by operating activities of $63.8 million for the six months ended June 30, 2014, to net cash provided by operating activities of $74.6 million for the six months ended June 30, 2015.
Fiscal Year 2015 Outlook
Our fiscal year 2015 guidance we released in conjunction with our fourth quarter and full year 2014 earnings call on February 6, 2015 is summarized in the following table:
|
| |
For the Fiscal Year Ending December 31, 2015 |
Forward-Looking Guidance |
GAAP Total Revenue | $905 - $925 million |
Non-GAAP Adjusted Gross Margin | 62.5% - 63.5% |
Non-GAAP Adjusted Operating Income | $75 - $85 million |
Non-GAAP Adjusted Net Income per Diluted Share | $1.10 - $1.20 |
Non-GAAP Tax Rate | 40% |
We are not making any changes to the fiscal year 2015 guidance we released in conjunction with our fourth quarter and full year 2014 earnings call on February 6, 2015. However, based on our year-to-date performance and our current expectations for the second half of 2015, we are providing additional insight into our fiscal year 2015 guidance as follows:
| |
• | We expect GAAP Total Revenue to be at or above the mid-point of the $905 million to $925 million guidance range. |
| |
• | We expect Non-GAAP Adjusted Gross Margin to be at or above the mid-point of the 62.5% to 63.5% guidance range. |
| |
• | We expect Non-GAAP Adjusted Operating Income to be at or above the mid-point of the $75 million to $85 million guidance range. |
| |
• | Finally, we expect Non-GAAP Adjusted Net Income per Diluted share to be at or above the mid-point of the $1.10 to $1.20 guidance range. |
Please refer to our press release dated February 5, 2015 for a reconciliation of these non-GAAP financial measures to comparable GAAP measures for fiscal year 2015 guidance.
Product Development Discussion
Product development at athenahealth is organized around our mission to be health care providers’ most trusted service, helping them do well doing the right thing. In order to fulfill this goal, we deliver services backed by cloud-based software, networked knowledge, and back-office work. We deliver cloud-based services for revenue cycle management and medical billing, electronic health records, patient engagement, care coordination, population health management, and clinical intelligence and decision support.
athenahealth-branded service offerings
The following suite of cloud-based services connects our clients to financial results, clinical outcomes, patients and the care continuum:
athenaCollector is our cloud-based medical billing and practice management service. It is the foundation of our service portfolio and entered general availability in 2000.
athenaClinicals is our cloud-based electronic health record (“EHR”) service. It entered general availability in 2006 and was made available as a stand-alone service in 2010.
athenaCommunicator is our cloud-based patient engagement and communication service. It entered general availability in 2010 and, at this time, requires adoption of athenaCollector or athenaOne.
athenaCommunicator Enterprise (formerly included in our athenaCoordinator Enterprise service) is our cloud-based population health management service. It entered general availability in 2012 upon the acquisition of Healthcare Data Services LLC in October 2012.
athenaCoordinator (formerly known as athenaCoordinator Core) is our cloud-based order transmission and care collaboration service for providers and facilities that receive and fulfill health care orders. It entered general availability in 2012.
athenaCoordinator Enterprise is our cloud-based care coordination and patient access service. It assures smooth transitions in care, with network-wide scheduling and secure text messaging for provider collaboration. athenahealth teams take on the referral management work so providers and staff get all relevant information and patients receive a “red carpet” experience upon arrival. It was launched in early 2014 and it entered general availability for specific markets in 2015.
Connecting to financial results:
We empower our clients to achieve and sustain financial health while staying focused on quality patient care by combining cloud-based software, networked knowledge, and back-office work. The athenaNet platform, a single instance of cloud-based software, enables every client to benefit from the collective knowledge of all other clients. Key to our networked knowledge is the industry’s largest database of payer-specific reimbursement requirements. This proprietary rules engine delivers in-depth insight and knowledge that helps clients get paid by payers. Our rules engine contains information amassed over years, is updated daily based on our research and the collective experience of thousands of clients, and tracks the evolving requirements of hundreds of payers and thousands of benefit plans. We are constantly focused on staying up-to-date on payer-specific reimbursement requirements and using our patented rules
engine to avoid denials and reimbursement delays, thus improving practice performance. For example, we processed over 35.0 million claims during Q2 2015, representing an increase of 24.2% over the same period last year. While processing this large claim volume, our athenaNet rules engine fired 20.7 million times in the quarter, greatly reducing claim denials and delivering an impressive first pass resolve rate of 94.0% for the benefit of our clients. The fact that 35% of our athenaNet rules fired in the quarter were created or modified in the past 12 months is clear proof that our regularly updated network gets “smarter” and more powerful all the time.
The power of our cloud-based services model is also demonstrated by our readiness for the ICD-10 transition. We have been ready for the ICD-10 transition since February 2014, with all the necessary changes and improvements already implemented on our cloud-based network. Today, we are 100% ready to submit ICD-10 compatible claims and we are focusing our testing efforts on the areas of greatest risk. Our Payer Outreach team is utilizing the network to reach out to payers representing over 90% of our claim volume to determine their ICD-10 readiness and to establish collaborative testing plans. As of June 2015, 62.7% of payers by claim volume have completed testing or are in active testing, with an additional 20.2% planned for testing as we work through scoping with those payers. We are also actively testing interfaces across our cloud-based network to ensure our clients and their vendors are ready to send ICD-10 codes. It is our goal to test 100% of charge interfaces by the October 1 transition date to prevent payment disruption. As of June 2015, 86.2% of inbound charge interfaces by claim dollars have been tested or are in the process of being tested. Finally, we will continue to monitor and manage ICD-10 readiness leading up to the October 1 transition date and expect to provide detailed performance monitoring after the October 1 transition date.
Connecting to clinical outcomes:
Three years ago, we set out on an ambitious program to disrupt ourselves and deliver a radically improved physician experience of the patient encounter. The Streamlined experience of athenaClinicals was born of this disruption. Through the Streamlined experience of athenaClinicals, we aim to deliver an EHR that preserves the humanity of the patient encounter, reinforces effective delegation, encourages lightweight documentation, and illuminates the patient’s clinical history. During Q1 2015, we sold, onboarded, and trained our first set of new providers onto the Streamlined experience. Although it is still early in the process and the sample size is relatively small, the initial performance is very encouraging. For example, the Streamlined providers have performed significantly better on key metrics such as same day encounter close rate and post-visit documentation rate as compared to their counterparts on the Classic experience of athenaClinicals. Moreover, the Streamlined providers rate the experience highly with a net promoter score of over 50. We are currently focused on rolling out Streamlined to our small group practices and expect to continue to roll out Streamlined on a specialty by specialty basis. Stay tuned for more highlights as we introduce our Streamlined experience to the broader athenaClinicals client base.
We are well on our way to making athenaClinicals the most usable and intuitive EHR in the market with the Streamlined experience of athenaClinicals. Our Classic experience of athenaClinicals already leads the market in electronic health record usability per the latest KLAS report. This industry ranking is part of the 2015 KLAS Usability Report released in June 2015, which ranks the usability levels of nine different ambulatory electronic medical record (EMR) solutions based on feedback from physician leaders across 145 organizations. In addition to being recognized as leading the market in EHR usability, athenahealth was also praised in the same KLAS report for the following: showing high involvement in helping to drive usability for clients; demonstrating leadership in enabling provider productivity; having the most visually pleasing user interface; ranking #1 in three out of the five examined EMR module categories (ePrescribing, problem lists, clinical decision support); and leading its peers in mobile EHR app adoption and mobile EHR app usability.
Connecting to patients:
We remain committed to helping our clients drive patient engagement, improve patient access, and close care gaps. Patient engagement is the active collaboration between patients and providers. Studies show that unengaged patients are three-times more likely to have unmet medical needs and two-times more likely to defer care. As Leonard Kish, Principal and Co-Founder of VivaPhi, states, “if patient engagement were a drug, it would be the blockbuster drug of the century and malpractice not to use it.” Engaged patients will follow through on orders and schedule necessary follow up appointments, thereby driving positive outcomes. We believe portal adoption is the gateway to patient engagement and should be a critical focus of any patient engagement strategy. Digitally connecting patients and providers improves the patient experience, boosts retention, and improves health outcomes. In our efforts to improve patient engagement for our clients, we have mined athenaNet data and analyzed client performance to share insights and best practices. The outcome of this research and network insight is our new Patient Engagement Resource Center and our new Portal Adoption Resource Center. These resource centers include webinars, whitepapers, videos, patient facing materials, and step by step best practices that will help clients improve patient engagement and portal adoption. As a result of these efforts, portal adoption has increased to 28.6% this quarter, up from 18.3% in Q2 2014 and from 26.3% in Q1 2015.
In addition, we are helping our clients drive increased patient engagement and improved health outcomes through our population health campaigns. Today, we offer 18 pre-packaged population health campaigns that focus on adult preventive care (i.e., Medicare Annual Wellness visits), pediatric preventive care (i.e., Adolescent Well Care visits), disease-specific chronic care management (i.e., Diabetes), vaccinations (i.e., Human Papilloma Virus), and at-risk populations (i.e., patients with high BMI). Our data indicates that clients running these population health campaigns have a better success rate at closing care gaps across these population health measures. For example, clients who ran an adult or pediatric influenza campaign had a 30% higher vaccination rate than those clients not utilizing these campaigns and clients who ran cancer screening campaigns for breast cancer, colon cancer, or cervical cancer also had a 30% higher screening rate than those clients not utilizing these campaigns. Similar to our rules engine for claims processing, we have begun to crowdsource the network in order to build a knowledge base (or rules engine) on how to best reach out and engage our clients and their patients to drive a better patient experience and improve clinical outcomes.
Also of note, our athenaCommunicator patient portal was named the best ambulatory portal in the 2015 KLAS Patient Portal Report and was also rated highest for overall customer experience, patient adoption, and vendor guidance. This high ranking by KLAS further validates the power of our differentiated service approach and our efforts to drive portal adoption across our growing athenaCommunicator client base.
Connecting to the care continuum:
Every day, the athenahealth team shows up for work to build the nation’s health information backbone. Our health care transactions team is dedicated to making athenahealth’s network the most connected, single national platform in health care. We connect with labs, pharmacies, hospitals, radiology centers, and imaging centers as well as nearly every insurance company in the country. We are exchanging health information and connecting care across the health care continuum in an operational and usable way. This important work benefits both athenahealth and our clients in equal measure. In the past quarter alone, there were 825 million electronic exchanges of patient information between athenaNet users and the rest of the health care supply chain using 178 thousand active interfaces. This is up from 470 million electronic exchanges of patient information across 127 thousand active interfaces in Q2 2014. Each connection we build helps us eliminate paper and further tap into the power of our cloud-based network. For example, there were approximately 478 thousand faxes mitigated by new interface projects, new client implementations, and department adds from existing clients during Q2 2015, up from 331 thousand
faxes mitigated during Q1 2015. Our efforts to foster the electronic exchange of health information produce results for clients, reduce inefficiencies, and increase automation rates across athenaNet.
Committed to advancing the seamless transfer of patient information across care settings, we will continue to leverage our cloud-based software platform, network knowledge, and set of services to deliver better care coordination for patients served across our growing base of providers. Part of this commitment is to connect physicians to each other in a more meaningful way. For example, we recently launched athenaText, our secure text service that enables health care providers to collaborate and coordinate care via the web inside athenaClinicals and athenaCoordinator, via a mobile phone as well as an Apple Watch. The athenaText application is also connected to Epocrates via our drug monographs and provider directory. With athenaText, health care providers can communicate wherever and whenever they need on a unified, easy-to-use platform. athenaText was launched on June 13, 2015 and as of July 23, 2015, we have rolled out this service to nearly 45,000 athenaClinicals, athenaCoordinator, and Epocrates users. athenaText is currently available to all Epocrates users and we expect it to be available to all new athenaClinicals and athenaCoordinator clients as they go live onto our network. We expect to also continue to roll out athenaText to all existing athenaClinicals clients and athenaCoordinator clients through the end of the year. In addition, we expect athenaClinicals users with athenaText to be able to send a link to a patient’s clinical briefing to any other verified athenaText user by the end of the year. This functionality is a major differentiator from other texting services. The ultimate goal of our athenaText service is to encourage and enable our clients to collaborate with other providers both within their practices and outside the walls of their practices.
Epocrates-branded service offerings
Our Epocrates services center around a variety of clinical information and clinical decision support offerings and are available through health care professionals’ mobile devices. These services include: drug and disease information, medical calculator and tools, clinical guidelines, clinical messaging, virtual representative services, market research, and formulary hosting. The Epocrates network consists of over one million health care professionals, including approximately 50% of active U.S. physicians. athenahealth acquired Epocrates on March 12, 2013.
The Epocrates team delivered another strong quarter for the third quarter in a row. After successfully stabilizing the business in 2014, the team has now shifted focus to setting the groundwork to introduce new types of physician engagement services and to broaden the understanding of what the Epocrates platform can offer to both providers and sponsors. In addition, the team is further engaging pharma clients and demonstrating our thought leadership by hosting our first ever pharma-focused athenahealth Leadership Institute in Q2 2015. The event was successful in bringing together today’s pharma leaders to share ideas, to develop strategies for modeling inventive leadership, and to explore strategies to drive innovation in today’s challenging health care environment. By continuously disrupting the status quo and identifying the needs of both providers and sponsors, we believe we can shape the future of mobile decision support, evolve clinical support solutions, and create positive change in health care by making the necessary connections across the care continuum. Our ability to drive increased awareness and to promote the Epocrates channel was further assisted by the latest Manhattan Research study. Once again, Epocrates has been recognized as the #1 medical app in terms of reach on smartphones or tablets according to Manhattan Research’s 2015 Taking the Pulse® U.S. study. One of the key findings from this study was that nearly one-third of physicians who employed Epocrates on a smartphone launched the app three or more times a day last year. Today, usage has increased to over one-third (39%) with nearly one-quarter of the physicians launching the app five or more times a day. We continue to leverage the brand awareness, familiarity, and trust that Epocrates has garnered among U.S. health care providers to help expand adoption of our athenahealth-branded services. The Epocrates channel, one of our top 5 athenahealth lead sources, contributed approximately 13% of our total lead volume in Q2 2015 and
approximately 14% year-to-date. We will continue to strengthen the Epocrates brand by focusing our energies and investments on what we do best: helping heath care providers make more confident and efficient clinical decisions in the moments of care.
Business Development Update
More Disruption Please (“MDP”)
Opening athenaNet and building an ecosystem of partners remains a key element of our strategic priorities. Through our MDP program, we will continue to ensure that all of athenaNet is open with application programming interfaces for new generations of innovators and entrepreneurs looking to disrupt the health care industry. Our MDP program consists of three major pillars: network, marketplace, and accelerator. The MDP Network is comprised of innovative thinkers, entrepreneurs, and startups with a shared mission to improve the state of health care. The MDP Marketplace features technology partners with capabilities that integrate with athenaNet, adding value to our overall service offerings and client experience. We are currently contracted and live with 37 partners to sell their technology and services to our client base. An additional 27 partners are in beta testing as we look to rapidly expand the number of partners and capabilities offered on our MDP Marketplace. As of June 30, 2015, 865 clients are live on at least one solution offered by these MDP Marketplace partners, up from 730 clients as of March 31, 2015. Perhaps, the most exciting component of the MDP program is the Accelerator. The MDP Accelerator program provides seed funding, free office space, and ongoing mentorship from our experts, advisors, and partners to early-stage companies. This past quarter, we welcomed three portfolio companies to our new San Francisco-based Accelerator program and we also opened the doors to our accelerator program into Austin, Texas. Hale Health, Lifesquare, and PatientPop have joined the accelerator program roster, increasing our portfolio to six participating companies since the launch of the program in 2014. Hale Health, representing our first investment in telehealth, is a remote care platform that connects providers and their patients between visits. Lifesquare is a health data solution that provides qualified health care professionals instant, seamless access to health information pre-approved by the patient. Finally, PatientPop is a comprehensive marketing platform designed specifically to help providers grow their practices, manage and boost their reputations, and retain patients. We also added a co-working component to our accelerator program in order to build an entrepreneurial health care technology community independent of our portfolio companies. We launched the co-working program in 2015 and we are already housing co-working companies in our Watertown and San Francisco offices. To learn more about our MDP program and partnership opportunities and to explore the athenahealth Marketplace, please visit www.athenahealth.com/disruption.
Recent acquisitions
On January 13, 2015, athenahealth acquired Razor Insights, LLC (“RazorInsights”), a leader in cloud-based electronic health record and financial solutions for rural, critical access, and community hospitals. On January 23, 2015, athenahealth signed an agreement to purchase webOMR, the web-based clinical applications and electronic health record platform developed by Beth Israel Deaconess Medical Center in Boston, Massachusetts. Both acquisitions are expected to accelerate athenahealth’s ability to support the full spectrum of the hospital and health system market. We acquired RazorInsights for $40.0 million and we purchased webOMR from Beth Israel Deaconess Medical Center for $22.0 million. Our purchase price of the webOMR technology asset is included in capitalized software development costs.
Client Base Discussion
The total number of physicians who have gone live on athenaCollector, our core service offering, is the metric we currently use to define our client base and market share. However, as our client base expands outside the traditional ambulatory market, total active providers—or nodes on our network—will become a more appropriate metric used to define our client base and market share.
During Q2 2015, 81% of all new athenaCollector deals included athenaClinicals, above 80% in Q2 2014. 78% of all new athenaCollector deals included athenaClinicals, athenaCommunicator, and athenaCoordinator. The athenaOne rate of 78% in Q2 2015 compares to 73% in Q2 2014. Among “live” (i.e., implemented and active) athenaCollector clients, adoption of athenaClinicals and athenaCommunicator continues to grow and resulted in continued growth to our installed base across all of our service offerings.
athenahealth Service Offering Adoption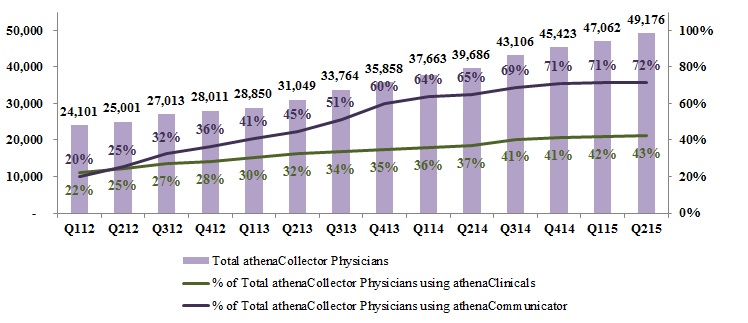
athenaCollector Clients
During Q2 2015, total active physicians on athenaCollector grew by 24% year-over-year, to 49,176. On a sequential basis, we added 2,114 net new active physicians on athenaCollector, versus 2,023 in Q2 2014. Our quarterly net new physician additions may vary widely due to the number and size of clients that go live in a particular quarter. Furthermore, our larger clients can be more complex and take longer to go live, particularly if our clients request a more phased implementation approach. Total active providers on athenaCollector grew by 22% year-over-year, to 67,530. On a sequential basis, we added 2,882 net new active providers on athenaCollector, versus 2,539 in Q2 2014.
athenaClinicals Clients
During Q2 2015, total active physicians live on athenaClinicals grew by 43% year-over-year, to 20,923. On a sequential basis, we added 1,127 net new active physicians on athenaClinicals, versus 1,151 in Q2 2014. This equates to an overall adoption rate of 43% of total athenaCollector physicians, up from 37% in Q2 2014. Total active providers on athenaClinicals grew by 40% year-over-year, to 27,641. On a sequential basis, we added 1,475 net new active providers on athenaClinicals, versus 1,390 in Q2 2014. We expect the athenaClinicals client base to increase over time due to cross-selling within our existing base and growth in the volume of athenaOne deals.
athenaCommunicator Clients
During Q2 2015, total active physicians live on athenaCommunicator grew by 36% year-over-year, to 35,248. On a sequential basis, we added 1,670 net new active physicians on athenaCommunicator, versus 1,807 in Q2 2014. This equates to an overall adoption rate of 72% of total athenaCollector physicians, up from 65% in Q2 2014. Total active providers on athenaCommunicator grew by 35% year-over-year, to 45,902. On a sequential basis, we added 2,132 net new providers on athenaCommunicator, versus 2,269 in Q2 2014. We expect the athenaCommunicator client base to increase over time due to cross-selling within our existing base and growth in the volume of athenaOne deals.
New Deals
On June 29, 2015, we announced that The University of Alabama at Birmingham Medical Center (“UAB Medicine”) has selected our athenaCoordinator Enterprise patient access services to advance care coordination at The Kirklin Clinic of UAB Hospital, a multi-specialty ambulatory care site that serves more than 2,000 patients a day across 35 specialties. UAB Medicine is expected to implement our patient access services at The Kirklin Clinic in July 2015.
On July 23, 2015, we announced that NewYork-Presbyterian has selected our suite of cloud-based services, athenaOne, to streamline expansion and establish a clinically-integrated, cloud-based technology infrastructure for its multi-specialty physician practices in New York state. NewYork-Presbyterian, through its Physician Services Organization, will manage the NewYork-Presbyterian Medical Groups’ physician practices through implementation of our suite of cloud-based services for more than 800 physicians and an additional 300 licensed professionals. Initial deployment of our services expects to begin at NewYork-Presbyterian Medical Group/Hudson Valley, NewYork-Presbyterian Medical Group/Queens, and NewYork-Presbyterian Medical Group/Westchester with future implementation to follow in Brooklyn and other areas in the region.
Client Implementations
Below are the publicly disclosed clients that went live or partially live during Q2 2015:
| |
• | Marquette Physician Practices (~200 physicians, ~250 providers) went live on athenaCollector, athenaCommunicator, and athenaCoordinator Analytics in April 2015. |
| |
• | Women’s Health USA (~220 physicians, ~260 providers) went live on our full suite of services, athenaOne, in waves during Q2 2015 while its In Vitro Sciences business went live on athenaCollector and athenaCommunicator in Q2 2015. |
| |
• | Ascension Health (over 4,000 providers) continued the phased rollout of athenaCollector, athenaCommunicator, and athenaCoordinator Analytics and brought seven waves live in Q2 2015. |
| |
• | CareWell Urgent Care (~50 providers) went live on our full suite of services, athenaOne, in July 2015. |
Growth Discussion
The athenahealth marketing organization encompasses our growth and sales operations, event and partner marketing, inside sales agents (“ISAs”), advertising, corporate communications, and product marketing teams. This organization executes in-market investments in an effort to generate new business opportunities for athenahealth. The athenahealth sales organization includes all quota-carrying sales representatives, as well as our sales team leaders, channel sales team, and sales training and development organization.
The athenahealth team continues to track well against our annual growth goals. Second quarter 2015 bookings performance was highlighted by the following: 1) delivered record bookings in our group and small group segments; 2) closed additional inpatient deals, including the first cross sale of RazorInsights into an existing athenahealth client; 3) signed another athenaCoordinator Enterprise client with The Kirkland Clinic at UAB Hospital; and 4) expanded our athenaOne services into the health system market with the signing of NewYork-Presbyterian.
As of June 30, 2015, we have a total of 151 quota-carrying sales representatives, up 8% from June 30, 2014. Our athenahealth-branded services sales force is currently divided into three groups: enterprise, which is dedicated to serving the largest managed care organizations, as well as those with high growth potential; group, which is dedicated to medical practices with seven to 150 physicians; and small group, which is dedicated to medical practices with one to six physicians.
Stock-Based Compensation Expense, Amortization of Purchased Intangible Assets, and Reconciliation of Non-GAAP Financial Measures
athenahealth, Inc.
STOCK-BASED COMPENSATION
(Unaudited, in thousands)
Set forth below is a breakout of stock-based compensation impacting the Condensed Consolidated Statements of Income for the three and six months ended June 30, 2015, and 2014:
|
| | | | | | | | | | | | | | | |
| Three Months Ended
June 30, | | Six Months Ended
June 30, |
| 2015 | | 2014 | | 2015 | | 2014 |
Stock-based compensation charged to Condensed Consolidated Statements of Income: | | | | | | | |
Direct operating | $ | 3,603 |
| | $ | 3,222 |
| | $ | 7,299 |
| | $ | 5,818 |
|
Selling and marketing | 4,631 |
| | 4,202 |
| | 9,583 |
| | 7,226 |
|
Research and development | 2,296 |
| | 2,135 |
| | 4,543 |
| | 3,800 |
|
General and administrative | 6,559 |
| | 4,655 |
| | 11,538 |
| | 9,721 |
|
Total stock-based compensation expense | 17,089 |
| | 14,214 |
| | 32,963 |
| | 26,565 |
|
Amortization of capitalized stock-based compensation related to software development (1) | 835 |
| | 481 |
| | 1,768 |
| | 880 |
|
Total | $ | 17,924 |
| | $ | 14,695 |
| | $ | 34,731 |
| | $ | 27,445 |
|
| | | | | | | |
| |
(1) | In addition, for the three months ended June 30, 2015, and 2014, $1.7 million and $1.0 million, respectively, of stock-based compensation was capitalized in the line item Capitalized software costs, net in the Condensed Consolidated Balance Sheets for which $0.8 million and $0.5 million, respectively, of amortization was included in the line item Depreciation and amortization in the Condensed Consolidated Statements of Income. For the six months ended June 30, 2015, and 2014, $3.6 million and $1.8 million, respectively, of stock-based compensation was capitalized in the line item Capitalized software costs, net in the Condensed Consolidated Balance Sheets for which $1.8 million and $0.9 million, respectively, of amortization was included in the line item Depreciation and amortization in the Condensed Consolidated Statements of Income. |
athenahealth, Inc.
AMORTIZATION OF PURCHASED INTANGIBLE ASSETS
(Unaudited, in thousands)
Set forth below is a breakout of amortization of purchased intangible assets impacting the Condensed Consolidated Statements of Income for the three and six months ended June 30, 2015, and 2014:
|
| | | | | | | | | | | | | | | |
| Three Months Ended
June 30, | | Six Months Ended
June 30, |
Amortization of purchased intangible assets allocated to: | 2015 | | 2014 | | 2015 | | 2014 |
Direct operating | $ | 3,726 |
| | $ | 2,716 |
| | $ | 7,515 |
| | $ | 6,655 |
|
Selling and marketing | 2,462 |
| | 5,820 |
| | 4,746 |
| | 8,971 |
|
Total amortization of purchased intangible assets | $ | 6,188 |
| | $ | 8,536 |
| | $ | 12,261 |
| | $ | 15,626 |
|
| | | | | | | |
athenahealth, Inc.
RECONCILIATION OF NON-GAAP FINANCIAL MEASURES
TO COMPARABLE GAAP MEASURES
(Unaudited, in thousands, except per share amounts)
The following is a reconciliation of the non-GAAP financial measures used by us to describe our financial results determined in accordance with accounting principles generally accepted in the United States of America (“GAAP”). An explanation of these measures is also included below under the heading “Explanation of Non-GAAP Financial Measures.”
While management believes that these non-GAAP financial measures provide useful supplemental information to investors regarding the underlying performance of our business operations, investors are reminded to consider these non-GAAP measures in addition to, and not as a substitute for, financial performance measures prepared in accordance with GAAP. In addition, it should be noted that these non-GAAP financial measures may be different from non-GAAP measures used by other companies, and management may utilize other measures to illustrate performance in the future. Non-GAAP measures have limitations in that they do not reflect all of the amounts associated with our results of operations as determined in accordance with GAAP.
Please note that these figures may not sum exactly due to rounding.
Non-GAAP Adjusted Gross Margin
Set forth below is a presentation of our “Non-GAAP Adjusted Gross Profit” and “Non-GAAP Adjusted Gross Margin,” which represents Non-GAAP Adjusted Gross Profit as a percentage of total revenue.
|
| | | | | | | | | | | | | | | |
(unaudited, in thousands) | Three Months Ended | | Six Months Ended |
| June 30, | | June 30, |
| 2015 | | 2014 | | 2015 | | 2014 |
| | | | | | | |
Total revenue | $ | 224,694 |
| | $ | 185,922 |
| | $ | 431,128 |
| | $ | 348,957 |
|
Direct operating expense | 89,899 |
| | 74,774 |
| | 174,456 |
| | 146,922 |
|
| | | | | | | |
Total revenue less direct operating expense | 134,795 |
| | 111,148 |
| | 256,672 |
| | 202,035 |
|
Add: Stock-based compensation
allocated to direct operating expense | 3,603 |
| | 3,222 |
| | 7,299 |
| | 5,818 |
|
Add: Amortization of purchased intangible assets
allocated to direct operating expense | 3,726 |
| | 2,716 |
| | 7,515 |
| | 6,655 |
|
| | | | | | | |
Non-GAAP Adjusted Gross Profit | $ | 142,124 |
| | $ | 117,086 |
| | $ | 271,486 |
| | $ | 214,508 |
|
| | | | | | | |
Non-GAAP Adjusted Gross Margin | 63.3 | % | | 63.0 | % | | 63.0 | % | | 61.5 | % |
Non-GAAP Adjusted EBITDA
Set forth below is a reconciliation of our “Non-GAAP Adjusted EBITDA” and “Non-GAAP Adjusted EBITDA Margin,” which represents Non-GAAP Adjusted EBITDA as a percentage of total revenue.
|
| | | | | | | | | | | | | | | |
(unaudited, in thousands) | Three Months Ended | | Six Months Ended |
| June 30, | | June 30, |
| 2015 | | 2014 | | 2015 | | 2014 |
| | | | | | | |
Total revenue | $ | 224,694 |
| | $ | 185,922 |
| | $ | 431,128 |
| | $ | 348,957 |
|
| | | | | | | |
GAAP net income (loss) | 9,349 |
| | (2,162 | ) | | 517 |
| | (10,217 | ) |
Add: Provision for (benefit) from income taxes | 8,010 |
| | (739 | ) | | 4,047 |
| | (5,221 | ) |
Add: Total other (income) expense | (19,568 | ) | | 1,281 |
| | (18,553 | ) | | 2,717 |
|
Add: Stock-based compensation expense | 17,089 |
| | 14,214 |
| | 32,963 |
| | 26,565 |
|
Add: Depreciation and amortization | 22,101 |
| | 15,186 |
| | 42,453 |
| | 29,435 |
|
Add: Amortization of purchased intangible assets | 6,188 |
| | 8,536 |
| | 12,261 |
| | 15,626 |
|
Add: Integration and transaction costs | — |
| | — |
| | 964 |
| | — |
|
Add: Lease termination costs | 261 |
| | — |
| | 4,446 |
| | — |
|
| | | | | | | |
Non-GAAP Adjusted EBITDA | $ | 43,430 |
| | $ | 36,316 |
| | $ | 79,098 |
| | $ | 58,905 |
|
| | | | | | | |
Non-GAAP Adjusted EBITDA Margin | 19.3 | % | | 19.5 | % | | 18.3 | % | | 16.9 | % |
Non-GAAP Adjusted Operating Income
Set forth below is a reconciliation of our “Non-GAAP Adjusted Operating Income” and “Non-GAAP Adjusted Operating Income Margin,” which represents Non-GAAP Adjusted Operating Income as a percentage of total revenue.
|
| | | | | | | | | | | | | | | |
(unaudited, in thousands) | Three Months Ended | | Six Months Ended |
| June 30, | | June 30, |
| 2015 | | 2014 | | 2015 | | 2014 |
| | | | | | | |
Total revenue | $ | 224,694 |
| | $ | 185,922 |
| | $ | 431,128 |
| | $ | 348,957 |
|
| | | | | | | |
GAAP net income (loss) | 9,349 |
| | (2,162 | ) | | 517 |
| | (10,217 | ) |
Add: Provision for (benefit) from income taxes | 8,010 |
| | (739 | ) | | 4,047 |
| | (5,221 | ) |
Add: Total other (income) expense | (19,568 | ) | | 1,281 |
| | (18,553 | ) | | 2,717 |
|
Add: Stock-based compensation expense | 17,089 |
| | 14,214 |
| | 32,963 |
| | 26,565 |
|
Add: Amortization of capitalized stock-based compensation related to software development | 835 |
| | 481 |
| | 1,768 |
| | 880 |
|
Add: Amortization of purchased intangible assets | 6,188 |
| | 8,536 |
| | 12,261 |
| | 15,626 |
|
Add: Integration and transaction costs | — |
| | — |
| | 964 |
| | — |
|
Add: Lease termination costs | 261 |
| | — |
| | 4,446 |
| | — |
|
| | | | | | | |
Non-GAAP Adjusted Operating Income | $ | 22,164 |
| | $ | 21,611 |
| | $ | 38,413 |
| | $ | 30,350 |
|
| | | | | | | |
Non-GAAP Adjusted Operating Income Margin | 9.9 | % | | 11.6 | % | | 8.9 | % | | 8.7 | % |
Non-GAAP Adjusted Net Income
Set forth below is a reconciliation of our “Non-GAAP Adjusted Net Income” and “Non-GAAP Adjusted Net Income per Diluted Share.”
|
| | | | | | | | | | | | | | | |
(unaudited, in thousands) | Three Months Ended | | Six Months Ended |
| June 30, | | June 30, |
| 2015 | | 2014 | | 2015 | | 2014 |
| | | | | | | |
GAAP net income (loss) | $ | 9,349 |
| | $ | (2,162 | ) | | $ | 517 |
| | $ | (10,217 | ) |
Add: Stock-based compensation expense | 17,089 |
| | 14,214 |
| | 32,963 |
| | 26,565 |
|
Add: Amortization of capitalized stock-based compensation related to software development | 835 |
| | 481 |
| | 1,768 |
| | 880 |
|
Add: Amortization of purchased intangible assets | 6,188 |
| | 8,536 |
| | 12,261 |
| | 15,626 |
|
Add: Integration and transaction costs | — |
| | — |
| | 964 |
| | — |
|
Add: Lease termination costs | 261 |
| | — |
| | 4,446 |
| | — |
|
Less: Gain on sale of marketable securities | (21,071 | ) | | — |
| | (21,071 | ) | | — |
|
| | | | | | | |
Sub-total of tax deductible items | 3,302 |
| | 23,231 |
| | 31,331 |
| | 43,071 |
|
| | | | | | | |
Less: Tax impact of tax deductible items (1) | (1,321 | ) | | (9,292 | ) | | (12,532 | ) | | (17,228 | ) |
Add: Tax impact resulting from applying non-GAAP tax rate (2) | 1,067 |
| | 421 |
| | 2,221 |
| | 954 |
|
| | | | | | | |
Non-GAAP Adjusted Net Income | $ | 12,397 |
| | $ | 12,198 |
| | $ | 21,537 |
| | $ | 16,580 |
|
| | | | | | | |
Weighted average shares - diluted | 39,340 |
| | 37,860 |
| | 39,338 |
| | 37,673 |
|
| | | | | | | |
Non-GAAP Adjusted Net Income per Diluted Share | $ | 0.32 |
| | $ | 0.32 |
| | $ | 0.55 |
| | $ | 0.44 |
|
| |
(1) | Tax impact calculated using a statutory tax rate of 40%. |
| |
(2) | Represents adjusting the GAAP net loss at a non-GAAP tax rate of 40%. We used a non-GAAP tax rate of 40% to normalize the tax impact to our Non-GAAP Adjusted Net Income per Diluted Share based on the fact that a relatively small change in pre-tax GAAP income (loss) in any one period could result in a volatile GAAP effective tax rate. |
|
| | | | | | | | | | | | | | | |
(unaudited, in thousands) | Three Months Ended | | Six Months Ended |
| June 30, | | June 30, |
| 2015 | | 2014 | | 2015 | | 2014 |
| | | | | | | |
GAAP net income (loss) per share - diluted | $ | 0.24 |
| | $ | (0.06 | ) | | $ | 0.01 |
| | $ | (0.27 | ) |
Add: Stock-based compensation expense | 0.43 |
| | 0.38 |
| | 0.84 |
| | 0.71 |
|
Add: Amortization of capitalized stock-based compensation related to software development | 0.02 |
| | 0.01 |
| | 0.04 |
| | 0.02 |
|
Add: Amortization of purchased intangible assets | 0.16 |
| | 0.23 |
| | 0.31 |
| | 0.41 |
|
Add: Integration and transaction costs | — |
| | — |
| | 0.02 |
| | — |
|
Add: Lease termination costs | 0.01 |
| | — |
| | 0.11 |
| | — |
|
Less: Gain on sale of marketable securities | (0.54 | ) | | — |
| | (0.54 | ) | | — |
|
| | | | | | | |
Sub-total of tax deductible items | 0.08 |
| | 0.61 |
| | 0.80 |
| | 1.14 |
|
| | | | | | | |
Less: Tax impact of tax deductible items (1) | (0.03 | ) | | (0.25 | ) | | (0.32 | ) | | (0.46 | ) |
Add: Tax impact resulting from applying non-GAAP tax rate (2) | 0.03 |
| | 0.01 |
| | 0.06 |
| | 0.03 |
|
| | | | | | | |
Non-GAAP Adjusted Net Income per Diluted Share | $ | 0.32 |
| | $ | 0.32 |
| | $ | 0.55 |
| | $ | 0.44 |
|
| | | | | | | |
Weighted average shares - diluted | 39,340 |
| | 37,860 |
| | 39,338 |
| | 37,673 |
|
| |
(1) | Tax impact calculated using a statutory tax rate of 40%. |
| |
(2) | Represents adjusting the GAAP net loss at a non-GAAP tax rate of 40%. We used a non-GAAP tax rate of 40% to normalize the tax impact to our Non-GAAP Adjusted Net Income per Diluted Share based on the fact that a relatively small change in pre-tax GAAP income (loss) in any one period could result in a volatile GAAP effective tax rate. |
Explanation of Non-GAAP Financial Measures
We report our financial results in accordance with accounting principles generally accepted in the United States of America, or GAAP. However, management believes that, in order to properly understand our short-term and long-term financial and operational trends, investors may wish to consider the impact of certain non-cash or non-recurring items, when used as a supplement to financial performance measures in accordance with GAAP. These items result from facts and circumstances that vary in frequency and impact on continuing operations. Management also uses results of operations before such items to evaluate the operating performance of athenahealth and compare it against past periods, make operating decisions, and serve as a basis for strategic planning. These non-GAAP financial measures provide management with additional means to understand and evaluate the operating results and trends in our ongoing business by eliminating certain non-cash expenses and other items that management believes might otherwise make comparisons of our ongoing business with prior periods more difficult, obscure trends in ongoing operations, or reduce management’s ability to make useful forecasts. Management believes that these non-GAAP financial measures provide additional means of evaluating period-over-period operating performance. In addition, management understands that some investors and financial analysts find this information helpful in analyzing our financial and operational performance and comparing this performance to our peers and competitors.
Management defines “Non-GAAP Adjusted Gross Profit” as total revenue, less direct operating expense, plus (1) stock-based compensation expense allocated to direct operating expense and (2) amortization of purchased intangible assets allocated to direct operating expense, and “Non-GAAP Adjusted Gross Margin” as Non-GAAP Adjusted Gross Profit as a percentage of total revenue. Management considers these non-GAAP financial measures to be important indicators of our operational strength and performance of our business and a good measure of our historical operating trends. Moreover, management believes that these measures enable investors and financial analysts to closely monitor and understand changes in our ability to generate income from ongoing business operations.
Management defines “Non-GAAP Adjusted EBITDA” as the sum of GAAP net income (loss) before provision for (benefit) from income taxes, total other (income) expense, stock-based compensation expense, depreciation and amortization, amortization of purchased intangible assets, integration and transaction costs, and lease termination costs and “Non-GAAP Adjusted EBITDA Margin” as Non-GAAP Adjusted EBITDA as a percentage of total revenue. Management defines “Non-GAAP Adjusted Operating Income” as the sum of GAAP net income (loss) before provision for (benefit) from income taxes, total other (income) expense, stock-based compensation expense, amortization of capitalized stock-based compensation related to software development, amortization of purchased intangible assets, integration and transaction costs, and lease termination costs and “Non-GAAP Adjusted Operating Income Margin” as Non-GAAP Adjusted Operating Income as a percentage of total revenue. Management defines “Non-GAAP Adjusted Net Income” as the sum of GAAP net income (loss) before stock-based compensation expense, amortization of capitalized stock-based compensation related to software development, amortization of purchased intangible assets, integration and transaction costs, lease termination costs, and gain on sale of marketable securities and any tax impact related to these preceding items, and an adjustment to the tax provision for the non-GAAP tax rate and “Non-GAAP Adjusted Net Income per Diluted Share” as Non-GAAP Adjusted Net Income divided by weighted average diluted shares outstanding. Management considers all of these non-GAAP financial measures to be important indicators of our operational strength and performance of our business and a good measure of our historical operating trends, in particular the extent to which ongoing operations impact our overall financial performance.
Management excludes or adjusts each of the items identified below from the applicable non-GAAP financial measure referenced above for the reasons set forth with respect to that excluded item:
| |
• | Stock-based compensation expense and amortization of capitalized stock-based compensation related to software development — excluded because these are non-cash expenditures that management does not consider part of ongoing operating results when assessing the performance of our business, and also because the total amount of the expenditure is partially outside of our control because it is based on factors such as stock price, volatility, and interest rates, which may be unrelated to our performance during the period in which the expenses are incurred. |
| |
• | Amortization of purchased intangible assets — purchased intangible assets are amortized over their estimated useful lives and generally cannot be changed or influenced by management after the acquisition. Accordingly, this item is not considered by management in making operating decisions. Management does not believe such charges accurately reflect the performance of our ongoing operations for the period in which such charges are incurred. |
| |
• | Integration and transaction costs — Integration costs are the severance payments and retention bonuses for certain employees relating to the RazorInsights acquisition. Transaction costs are non-recurring costs related to specific transactions. Accordingly, management believes that such expenses do not have a direct correlation to future business operations, and therefore, these costs are not considered by management in making operating decisions. Management does not believe such charges accurately reflect the performance of our ongoing operations for the period in which such charges are incurred. |
| |
• | Lease termination costs — represents costs to terminate certain lease agreements. Management does not believe such costs accurately reflect the performance of our ongoing operations for the period in which such costs are incurred. |
| |
• | Gain on sale of marketable securities — represents gain on sale of marketable securities. Management does not believe such gains accurately reflect the performance of our ongoing operations for the period in which such gains are reported. |
| |
• | Non-GAAP tax rate — We use a non-GAAP tax rate of 40% to normalize the tax impact to our Non-GAAP Adjusted Net Income per Diluted Share based on the fact that a relatively small change in pre-tax GAAP income (loss) in any one period could result in a volatile GAAP effective tax rate. |
Supplemental Metrics and Definitions
|
| | | | | | | | | | | | | | | |
| | | Fiscal Year 2014 | | Fiscal Year 2015 |
| | | |
| | | Q1 |
| Q2 |
| Q3 |
| Q4 |
| | Q1 |
| Q2 |
|
Client Base | | | | | | | | | |
Total Physicians on athenaCollector | | 37,663 |
| 39,686 |
| 43,106 |
| 45,423 |
| | 47,062 |
| 49,176 |
|
Total Providers on athenaCollector | | 52,886 |
| 55,425 |
| 59,415 |
| 62,349 |
| | 64,648 |
| 67,530 |
|
Total Physicians on athenaClinicals | | 13,521 |
| 14,672 |
| 17,458 |
| 18,811 |
| | 19,796 |
| 20,923 |
|
Total Providers on athenaClinicals | | 18,343 |
| 19,733 |
| 23,053 |
| 24,804 |
| | 26,166 |
| 27,641 |
|
Total Physicians on athenaCommunicator | | 24,030 |
| 25,837 |
| 29,683 |
| 32,163 |
| | 33,578 |
| 35,248 |
|
Total Providers on athenaCommunicator | | 31,707 |
| 33,976 |
| 38,699 |
| 41,777 |
| | 43,770 |
| 45,902 |
|
| | | | | | | | | |
Client Performance | | | | | | | | | |
Net Promoter Score | | | 44.7 |
| 41.2 |
| 47.5 |
| 42.0 |
| | 42.3 |
| 40.5 |
|
Client Days in Accounts Receivable (“DAR”) | | 41.1 |
| 39.0 |
| 39.2 |
| 38.8 |
| | 41.1 |
| 40.8 |
|
First Pass Resolution (“FPR”) Rate | | 93.5 | % | 93.7 | % | 93.7 | % | 94.3 | % | | 93.7 | % | 94.0 | % |
Electronic Remittance Advice (“ERA”) Rate | | 82.3 | % | 82.6 | % | 82.8 | % | 84.6 | % | | 83.2 | % | 82.9 | % |
Total Claims Submitted | | 25,785,710 |
| 28,177,665 |
| 29,169,062 |
| 32,864,269 |
| | 32,809,734 |
| 35,002,061 |
|
Total Client Collections ($) | | 3,172,115,234 |
| 3,679,375,661 |
| 3,843,394,756 |
| 4,263,271,914 |
| | 4,110,989,781 |
| 4,633,427,941 |
|
Total Working Days | | | 61 |
| 64 |
| 64 |
| 62 |
| | 61 |
| 64 |
|
| | | | | | | | | |
Employees | | | | | | | | | |
Direct | | | 1,573 |
| 1,633 |
| 1,698 |
| 1,797 |
| | 1,914 |
| 2,123 |
|
Selling & Marketing | | | 509 |
| 556 |
| 569 |
| 582 |
| | 602 |
| 649 |
|
Research & Development | | 717 |
| 812 |
| 918 |
| 952 |
| | 1,010 |
| 1,172 |
|
General & Administrative | | 289 |
| 311 |
| 340 |
| 345 |
| | 351 |
| 380 |
|
Total Employees | | | 3,088 |
| 3,312 |
| 3,525 |
| 3,677 |
| | 3,877 |
| 4,324 |
|
| | | | | | | | | |
Quota Carrying Sales Force | | | | | | | | |
Total Quota Carrying Sales Representatives | | 133 |
| 140 |
| 142 |
| 153 |
| | 150 |
| 151 |
|
|
| |
Supplemental Metrics Definitions | |
| |
Client Base | |
Total Physicians on athenaCollector | The number of physicians that have rendered a service which generated a medical claim that was billed during the last 91 days on the athenaCollector platform. Examples of physicians include Medical Doctors (“MDs”) and Doctors of Osteopathic Medicine (“DOs”). |
Total Providers on athenaCollector | The number of providers, including physicians, that have rendered a service which generated a medical claim that was billed during the last 91 days on the athenaCollector platform. Examples of non-physician providers are Nurse Practitioners (“NPs”) and Registered Nurses (“RNs”). |
Total Physicians on athenaClinicals | The number of physicians that have rendered a service through the athenaClinicals platform which generated a medical claim that was billed during the last 91 days on the athenaCollector platform. |
Total Providers on athenaClinicals | The number of providers, including physicians, that have rendered a service through the athenaClinicals platform which generated a medical claim that was billed during the last 91 days on the athenaCollector platform. |
Total Physicians on athenaCommunicator | The number of physicians that have rendered a service which generated a medical claim that was billed during the last 91 days on the athenaCollector platform and whose practice is actively using athenaCommunicator. |
Total Providers on athenaCommunicator | The number of providers, including physicians, that have rendered a service which generated a medical claim that was billed during the last 91 days on the athenaCollector platform and whose practice is actively using athenaCommunicator. |
| |
Client Performance | |
Net Promoter Score | The percentage of clients who chose 9 or 10 (defined as promoters) less the percentage of clients who chose 0 through 6 ( defined as detractors) on a scale of 1 to 10 when asked if they would recommend athenahealth to a trusted friend or colleague. These responses are generated from a "client listening" survey that the Company conducts for its client base twice per year. |
Client Days in Accounts Receivable (“DAR”) | The average number of days that it takes outstanding balances on claims to be resolved, e.g. paid, for clients on athenaCollector. Clients that have been live less than 90 days are excluded, as well as clients who are terminating services. |
First Pass Resolution (“FPR”) Rate | Approximates the percentage of primary claims that are favorably adjudicated and closed after a single submission during the period. Currently, the FPR rate is calculated on a monthly basis, and certain practices are excluded (e.g. those that have been live for less than 90 days). |
Electronic Remittance Advice (“ERA”) Rate | Remittance refers to the information about payments (a/k/a explanations of benefits) received from insurance companies during the period. The ERA rate reflects the percentage of total charges that were posted using electronic remittance. |
Total Claims Submitted | The number of claims billed through athenaNet during the period. |
Total Client Collections | The dollar value of collections posted on behalf of clients during the period. |
Total Working Days | The total number of days during the quarter minus weekends and U.S. Post Office holidays. |
| |
Employees | |
Direct | The total number of full time equivalent individuals (“FTEs”) employed by athenahealth to support its service operations as of quarter end. This team includes production systems, enrollment services, paper claim submission, claim resolution, clinical operations, professional services, account management, and client services. |
Selling & Marketing | The total number of FTEs employed by athenahealth to support its sales and marketing efforts as of quarter end. This team includes sales representatives, business development staff and the marketing team. |
Research & Development | The total number of FTEs employed by athenahealth to support its research and development efforts as of quarter end. This team includes product development and product management. |
General & Administrative | The total number of FTEs employed by athenahealth to support its general and administrative functions as of quarter end. This team includes finance, human resources, compliance, learning and development, internal audit, corporate technology, recruiting, facilities, and legal. |
Total Employees | The total number of FTEs employed by athenahealth as of quarter end. This number excludes interns and seasonal employees. |
Total Quota Carrying Sales Representatives | The total number of athenahealth-branded services sales representatives who carry quota for net new annual recurring revenue as of quarter end. |
|
| |
Corporate Scorecard Metrics Definitions |
| |
Stability | |
Voluntary Turnover | A quarterly average of the number of voluntary terminations divided by starting headcount. Voluntary turnover excludes employees on action plans or employees on counseling out plans. |
Employee Engagement | Quarterly engagement survey results for employees.. Employee engagement results are reported in Q2 and Q4 only. |
| |
Performance | |
Client Days in Accounts Receivable (“DAR”) | The average number of days that it takes outstanding balances on claims to be resolved, e.g. paid, for clients on athenaCollector. Clients that have been live less than 90 days are excluded, as well as clients who are terminating services. |
Closed-Loop Order Rate | The percent of orders that are tied within 90 days of order submission (Non-Rx) and the percent of Rx orders with notification that the prescription was received by the patient based on claim history or refill requests (Rx). |
| |
Satisfaction | |
Net Promoter Score | Survey respondents from athenaOne survey (sample includes all clients live, surveyed on a bi-annual basis) are categorized as detractors (0-6 score for "likelihood to recommend"), passives (7-8), and promoters (9-10). The Net Promoter Score is calculated by subtracting the % of detractors from the % of promoters. |
| |
Financial | |
Bookings | The annualized value of deals sold. |
Total Revenue | Total consolidated revenue. |
Non-GAAP Adjusted Operating Income | Total non-GAAP adjusted operating income. |