Third Quarter Fiscal Year 2014 
Prepared Remarks October 16, 2014
Jonathan Bush, Chairman & Chief Executive Officer
Kristi Matus, Executive Vice President, Chief Financial & Administrative Officer
About These Remarks
The following commentary is provided by management in conjunction with the third quarter fiscal year 2014 earnings press release issued by athenahealth, Inc. (“athenahealth” or “we”). These remarks represent management’s current views on our financial and operational performance and are provided to give investors and analysts more time to analyze and understand our performance in advance of the earnings conference call. These prepared remarks will not be read on the conference call. A complete reconciliation between generally accepted accounting principles (“GAAP”) and non-GAAP results, as well as a summary of supplemental metrics and definitions, is provided in the tables following these prepared remarks.
Earnings Conference Call Information
To participate in our live conference call and webcast, please dial 877-853-5645 (or 408-940-3868 for international calls) using conference code No. 5761982, or visit the Investors section of our web site at www.athenahealth.com. A replay will be available for one week following the conference call at 855-859-2056 (and 404-537-3406 for international calls) using conference code No. 5761982. A webcast replay will also be archived on our website.
Safe Harbor and Forward-Looking Statements
These remarks contain forward-looking statements, which are made pursuant to the safe harbor provisions of the Private Securities Litigation Reform Act of 1995, including statements reflecting management’s expectations for future financial and operational performance and operational expenditures, expected growth and penetration in major health care and technology markets, and business outlook; statements regarding our research and development efforts, product offerings and enhancements, and upgrade plans and timelines; the benefits of and anticipated operational results from our service offerings and demands for and adoption of our service offerings; the further integration of our services and the resulting benefits; changes in the types of providers and health care entities we serve and the range of tasks we perform for clients; our sales, marketing and partnering activities and plans; the benefits of integrating with partners and collaborators like Henry Schein, introduction of new programs as part of our “More Disruption Please” effort, and anticipated operational results from partners’ service offerings; the integration of Epocrates, including the development of new product offerings, enhancement of existing functionalities such as Monograph Messaging and DocAlerts®, and integration with our EHR; client behavior and preferences, and implementation of services for new clients and deals, including our expansion into the enterprise segment; our market position and awareness among physicians; the potential for cross-sales among service offerings and sales involving multiple services; our implementation pipeline and expectations on new deals and network growth; the expansion of the number of users of our services; our plans and readiness in regard to ICD-10 and Stage 2 of Meaningful Use and our ability to help providers get Medicare payments; the interoperability of athenaNet®; changes in the industry, our positioning to lead such changes, and the extent of our experience to manage such changes for our clients; the creation of a sustainable market for health information exchange, an ecosystem of developers and third-party service providers, and a national health IT network; our progress and plans on the new athenaNet user experience project, athenaCoordinator® Enterprise offering, and population health services; and statements found under our “Reconciliation of Non-GAAP Financial Measures to Comparable GAAP Measures” section of these remarks. Forward-looking statements may often be identified with words such as “we expect,” “we anticipate,” “upcoming,” “plan,” “aim,” or similar indications of future expectations. These statements are neither promises nor guarantees, and are subject to a variety of risks and uncertainties, many of which are beyond our control, which could cause actual results to differ materially from those contemplated in these forward-looking statements. In particular, the risks and uncertainties include, among other things: our fluctuating operating results; our variable sales and implementation cycles, which may result in fluctuations in our quarterly results; risks associated with the acquisition and integration of companies and new technologies, those related to our ability to
1
integrate the services and offerings of Epocrates and realize the expected benefits such as increased awareness among physicians of our overall services and offerings; risks associated with our ability to realize the expected benefits from the purchase of the Arsenal on the Charles campus in Watertown, Massachusetts; risks associated with our expectations regarding our ability to maintain profitability; the impact of increased sales and marketing expenditures, including whether increased expansion in revenues is attained and impact on margins and profitability; changes in tax rates or exposure to additional tax liabilities; the highly competitive industry in which we operate and the relative immaturity of the market for our service offerings; and the evolving and complex governmental and regulatory compliance environment in which we and our clients operate. Existing and prospective investors are cautioned not to place undue reliance on these forward-looking statements, which speak only as of the date hereof. We undertake no obligation to update or revise the information contained in these remarks, whether as a result of new information, future events or circumstances, or otherwise. For additional disclosure regarding these and other risks faced by us, see the disclosures contained in our public filings with the Securities and Exchange Commission (“SEC”), available on the Investors section of our website at www.athenahealth.com and on the SEC’s website at www.sec.gov.
Use of Non-GAAP Financial Measures
These remarks contain non-GAAP financial measures, as defined by SEC Regulation G. The GAAP financial measure most directly comparable to each non-GAAP financial measure used or discussed, and a reconciliation of the differences between each non-GAAP financial measure and the comparable GAAP financial measure, are included following these prepared remarks or can be found within our third quarter fiscal year 2014 earnings press release in the Investors section of our web site at www.athenahealth.com.
Opening Remarks
The athenahealth team continued to make progress in building the nation’s health information backbone. We added a record 3,990 providers onto the network in Q3 2014, grew our academic medical center client network with the signing of the University of Toledo Physicians, and launched our MDP Accelerator program. Additionally, we expanded our geographic footprint with the grand openings of our Atlanta and San Francisco offices in the quarter.
Highlights from Q3 2014 include the following:
• | Grew consolidated revenue by 26% and athenahealth-branded revenue by 31% over Q3 2013 |
• | Grew net new active physicians on athenaCollector® (3,420 physicians added), athenaClinicals® (2,786 physicians added), and athenaCommunicator® (3,846 physicians added) in Q3 2014, compared to athenaCollector (2,715 physicians added), athenaClinicals (1,343 physicians added), and athenaCommunicator (3,499 physicians added) in Q3 2013 |
• | Grew athenaCollector physicians by 28% over Q3 2013, representing continued strong network growth in 2014 |
• | Improved net promoter score from 41.2 in Q2 2014 to 47.5 in Q3 2014 |
• | Completed implementations at CaroMont Health (athenaCoordinator - Population Health Management), Hallmark Health (athenaCoordinator - Population Health Management), and Summit Medical Group (athenaClinicals and athenaCommunicator) |
• | Expanded our strategic relationship with Henry Schein, whereby our athenaNet® platform and Henry Schein’s Dentrix® Enterprise are expected to integrate to streamline reporting and reduce costs for Community Health Centers (“CHCs”) and Federally Qualified Health Centers (“FQHCs”) |
• | Opened offices in Atlanta, Georgia and San Francisco, California as part of our national growth strategy, increasing our foothold in major health care and technology markets |
2
• | Launched the MDP Accelerator, the third pillar of our MDP program, to further drive disruption in health care by fostering the growth of high-potential, early-stage start-ups |
• | Launched a reimagined developer portal via the MDP program, designed to streamline global connectivity with athenaNet |
• | Recognized for excellence in KLAS EMR Interoperability 2014 Report1; rated the top EMR vendor for overall contribution to interoperability success |
• | Updated our Meaningful Use Performance dashboard to reflect our 2014 Stage 2 performance: 36.6 percent of our eligible providers have either attested or are ready to attest for Stage 2 Meaningful Use as of Q2 2014, up from 18.6 percent as of Q1 2014 |
• | Continued to lead the industry in Meaningful Use Stage 2 attestations, making up 37.4 percent of attestations year-to-date based on Centers for Medicare & Medicaid Services data published through August 2014 |
Results Overview
athenahealth’s top line results for the third quarter of fiscal year (“FY”) 2014 reflect solid revenue growth:
• | Total revenue: |
◦ | $190.4 million in Q3 2014, representing 26% growth over $151.5 million in Q3 2013 |
▪ | athenahealth-branded revenue was $175.6 million in Q3 2014, representing 31% growth over $134.3 million for Q3 2013 |
▪ | Epocrates-branded revenue was $9.8 million, representing a 27% decline from $13.4 million for Q3 2013 |
▪ | Third-party tenant and other non-core revenue was $5.0 million, representing 32% growth over $3.8 million for Q3 2013 |
Our bottom line results for Q3 2014, consistent with our growth strategy, demonstrate strong sales, marketing, and research and development investments, and a focus on operating efficiencies:
• | Non-GAAP Adjusted Gross Profit and Margin: |
◦ | $116.6 million, or 61.2% of total revenue, in Q3 2014, an increase of 24% over $93.8 million, or 61.9% of total revenue, in Q3 2013 |
◦ | Q3 2014 Non-GAAP Adjusted Gross Margin was impacted by higher implementation costs relating to the record physician additions onto athenaCollector and athenaClinicals in the quarter |
• | GAAP selling and marketing expense: |
◦ | $45.2 million, or 23.7% of total revenue, in Q3 2014, an increase of 20% over $37.6 million, or 24.8% of total revenue, in Q3 2013 |
• | GAAP research and development expense: |
◦ | $18.1 million, or 9.5% of total revenue, in Q3 2014, an increase of 20% over $15.1 million, or 10.0% of total revenue, in Q3 2013 |
_____________________________________________________________________________________
1“EMR Interoperability 2014: Where Are We on the Yellow Brick Road?,” October 2014. © 2014 KLAS Enterprises, LLC. All rights reserved.
3
• | GAAP general and administrative expense: |
◦ | $31.8 million, or 16.7% of total revenue, in Q3 2014, an increase of 47% from $21.7 million, or 14.3% of total revenue, in Q3 2013 |
• | Non-GAAP Adjusted EBITDA: |
◦ | $35.2 million, or 18.5% of total revenue, in Q3 2014, an increase of 16% from $30.2 million, or 20.0% of total revenue, in Q3 2013 |
• | Non-GAAP Adjusted Operating Income: |
◦ | $18.5 million, or 9.7% of total revenue, in Q3 2014, a decrease of 4% from $19.3 million, or 12.7% of total revenue, in Q3 2013 |
• | Non-GAAP Adjusted Net Income: |
◦ | $10.4 million, or $0.27 per diluted share, in Q3 2014, a decrease of 7% from $11.2 million, or $0.29 per diluted share, in Q3 2013 |
◦ | For 2014, we are using a non-GAAP tax rate of 40% to normalize the tax impact to our Non-GAAP Adjusted Net Income per Diluted Share based on the fact that a relatively small change in pre-tax GAAP income (loss) could result in a volatile GAAP effective tax rate. If this approach had been used for the three months ended September 30, 2013, our Non-GAAP Adjusted Net Income per Diluted Share would have been $0.28 instead of $0.29. |
We measure our performance based on a balanced scorecard model. We believe that this framework is an excellent report card for our performance for the current year and that it measures the key performance indicators required for long-term success. The table below shows the scorecard results for Q1 2014, Q2 2014, Q3 2014, and year-to-date Q3 2014. For certain metrics (i.e., Days of Client Work and Provider Documentation Time), our goal is to improve our performance by effectively reducing the scorecard metrics results throughout the year. Please reference the last page of this document for definitions of our corporate scorecard metrics.
4
Q1 2014 Results | Q2 2014 Results | Q3 2014 Results | YTD Q3 2014 Results | |||||||||
Stability (10% weight) | ||||||||||||
Voluntary Turnover | 2.3 | % | 3.2 | % | 2.5 | % | 8.0 | % | ||||
Corporate Citizenship | 92.5 | % | 90.8 | % | 95.4 | % | 92.9 | % | ||||
Employee Engagement | 4.1 | 4.1 | (a) | 4.1 | ||||||||
Stability Results | 101 | % | 80 | % | 98 | % | 93 | % | ||||
Performance (35% weight) | ||||||||||||
Total Automation Rate | 48.2 | % | 49.0 | % | 49.7 | % | 49.0 | % | ||||
Net On-boarding Success | 67.1 | % | 65.0 | % | 66.5 | % | 66.2 | % | ||||
Patient Full Registration | 49.5 | % | 50.8 | % | 52.4 | % | 50.9 | % | ||||
Performance Results | 103 | % | 101 | % | 99 | % | 101 | % | ||||
Satisfaction (25% weight) | ||||||||||||
Net Promoter Score | 44.7 | 41.2 | 47.5 | 44.5 | ||||||||
Days of Client Work | 8.8 | 8.8 | 9.4 | 9.0 | ||||||||
Provider Documentation Time | 5.4 | 5.3 | 5.3 | 5.3 | ||||||||
Minutes per RVU | 11.7 | 12.0 | 10.8 | 11.5 | ||||||||
Satisfaction Results | 92 | % | 86 | % | 85 | % | 88 | % | ||||
Financial (30% weight) | ||||||||||||
Bookings (b) | (b) | (b) | (b) | (b) | ||||||||
Total Revenue ($M) | $ | 163.0 | $ | 185.9 | $ | 190.4 | $ | 539.4 | ||||
Non-GAAP Adjusted Operating Income ($M) | $ | 8.7 | $ | 21.6 | $ | 18.5 | $ | 48.9 | ||||
# of Physicians on the Network | 296,477 | 297,652 | 303,895 | 299,341 | ||||||||
Financial Results | 99 | % | 100 | % | 82 | % | 92 | % | ||||
Total Results | 99 | % | 95 | % | 90 | % | 94 | % | ||||
(a) | Employee Engagement survey result reported in Q1, Q2, and Q4 only. |
(b) | Since the bookings metric contains highly sensitive data, we do not disclose all of the specific performance measures and targets, because we believe that such disclosure would result in serious competitive harm. |
We believe that our underlying drivers of long-term success remain relatively strong as supported by the following metric results:
• | Total Automation Rate of 49.7% in Q3 2014, just shy of our goal of 51.0% but up from 46.9% in Q3 2013 |
• | Net On-boarding Success of 66.5% in Q3 2014, shy of our goal of 74.0% |
• | Patient Full Registration of 52.4% in Q3 2014, ahead of our goal of 48.0% |
• | Net Promoter Score of 47.5 in Q3 2014, versus goal of 52.5 but up sequentially from 41.2 in Q2 2014 |
• | Days of Client Work of 9.4 days in Q3 2014, versus goal of 7.5 days and up sequentially from 8.8 days in Q2 2014. Days of Client Work has been impacted by growth in athenaCollector physicians and providers and payer driven revalidation efforts during initial on-boarding. |
5
• | Provider Documentation Time per Appointment of 5.3 minutes in Q3 2014, versus goal of 5.0 minutes and Q3 2013 actual result of 5.1 minutes. Provider documentation time has been adversely impacted by Meaningful Use Stage 2 measures. |
• | Minutes per RVU of 10.8 minutes in Q3 2014, versus goal of 11.5 minutes |
athenahealth’s client base continues to expand while client adoption of other services in the athenahealth service suite grows. As our client base expands outside the traditional ambulatory market, we believe that total active providers, or nodes, on our network will become a more appropriate metric to use in measuring our market share. During Q3 2014:
• | 79% of all new athenaCollector deals included athenaClinicals, compared to 83% in Q3 2013 |
• | 74% of all new athenaCollector deals included athenaClinicals and athenaCommunicator, compared to 78% in Q3 2013. Additionally, 74% of all new athenaOne deals sold during Q3 2014 also included athenaCoordinator Core, compared to 78% in Q3 2013 |
• | 41% of total athenaCollector physicians have adopted athenaClinicals, up from 34% in Q3 2013 |
• | 69% of total athenaCollector physicians have adopted athenaCommunicator, up from 51% in Q3 2013 |
• | Net new physicians and providers added sequentially to the network were as follows: |
athenaCollector | athenaClinicals | athenaCommunicator | ||||||||||||
Active physicians and providers: | Physicians | Providers | Physicians | Providers | Physicians | Providers | ||||||||
Beginning balance as of 6/30/14 | 39,686 | 55,425 | 14,672 | 19,733 | 25,837 | 33,976 | ||||||||
Net new additions | 3,420 | 3,990 | 2,786 | 3,320 | 3,846 | 4,723 | ||||||||
Ending balance as of 9/30/14 | 43,106 | 59,415 | 17,458 | 23,053 | 29,683 | 38,699 | ||||||||
Sequential growth % | 9 | % | 7 | % | 19 | % | 17 | % | 15 | % | 14 | % | ||
• | Net new physicians and providers added to the network since Q3 2013 were as follows: |
athenaCollector | athenaClinicals | athenaCommunicator | ||||||||||||
Active physicians and providers: | Physicians | Providers | Physicians | Providers | Physicians | Providers | ||||||||
Beginning balance as of 9/30/13 | 33,764 | 47,195 | 11,401 | 15,483 | 17,330 | 23,024 | ||||||||
Net new additions | 9,342 | 12,220 | 6,057 | 7,570 | 12,353 | 15,675 | ||||||||
Ending balance as of 9/30/14 | 43,106 | 59,415 | 17,458 | 23,053 | 29,683 | 38,699 | ||||||||
Y/Y growth % | 28 | % | 26 | % | 53 | % | 49 | % | 71 | % | 68 | % | ||
Revenue Discussion
Q3 2014 revenue was $190.4 million and grew by 26% (or $38.9 million) over Q3 2013. athenahealth-branded revenue for Q3 2014 was $175.6 million and grew by 31% over prior year.
Q3 2014 | Q3 2013 | Y/Y Growth% | ||
athenahealth-branded | $175.6 | $134.3 | 31 | % |
Epocrates-branded | $9.8 | $13.4 | (27 | )% |
Third-party tenant and other non-core | $5.0 | $3.8 | 32 | % |
Consolidated Revenue | $190.4 | $151.5 | 26 | % |
6
In terms of trends in our recurring revenue base, same-store analysis of claims created—a proxy for physician office utilization—indicates that physician office activity in Q3 2014 increased slightly over physician office activity during Q3 2013. As seen in prior years, our analysis also showed a slight increase in physician office activity in Q3 2014 compared to Q2 2014.
Non-GAAP Adjusted Gross Margin Discussion
Our Non-GAAP Adjusted Gross Margin was 61.2% for Q3 2014, down approximately 70 basis points from 61.9% in Q3 2013. While we continued to make very good progress in scaling and automating our service offerings, we brought a record number of physicians live onto our network. Notably, in Q3 2014, we on-boarded a record 2,786 physicians onto athenaClinicals and the cost to bring physicians live onto athenaClinicals is greater than athenaCollector. We still, however, expect our full year Non-GAAP Adjusted Gross Margin to be close to the mid-point of our 62.5% to 63.5% guidance range.
Balance Sheet and Cash Flow Highlights
As of September 30, 2014, we had cash and cash equivalents of $59.5 million and outstanding indebtedness of $212.5 million. Operating cash flow increased by $47.9 million from net cash provided by operating activities of $56.2 million for the nine months ended September 30, 2013, to net cash provided by operating activities of $104.1 million for the nine months ended September 30, 2014.
Fiscal Year 2014 Outlook
Our fiscal year 2014 guidance we presented at our 6th Annual Investor Summit on December 12, 2013, is summarized in the following table:
For the Fiscal Year Ending December 31, 2014 | |
Forward-Looking Guidance | |
GAAP Total Revenue | $725 - $755 million |
Non-GAAP Adjusted Gross Margin | 62.5% - 63.5% |
Non-GAAP Adjusted Operating Income | $70 - $80 million |
Non-GAAP Adjusted Net Income per Diluted Share | $0.98 - $1.10 |
Non-GAAP Tax Rate | 40% |
We are not making any changes to the fiscal year 2014 guidance we presented at our 6th Annual Investor Summit on December 12, 2013. However, based on our year-to-date performance and current expectations for Q4 2014, we are providing additional insight into our fiscal year 2014 guidance as follows:
• | We expect GAAP Total Revenue to be at or above the mid-point of the $725 million to $755 million guidance range. |
• | We expect Non-GAAP Adjusted Gross Margin to be close to the mid-point of the 62.5% to 63.5% guidance range. |
• | We expect Non-GAAP Adjusted Operating Income to be at or above the mid-point of the $70 million to $80 million guidance range. |
• | Finally, we expect Non-GAAP Adjusted Net Income per Diluted share to be close to the high end of the $0.98 to $1.10 guidance range. |
Our 7th Annual Investor Summit will be held at our Watertown, Massachusetts headquarters on December 11, 2014.
7
Product Development Discussion
Product development at athenahealth is organized around our mission to be health care providers’ most trusted service, helping them do well doing the right thing. In order to fulfill this goal, we deliver services backed by cloud-based software, proprietary knowledge, and robust back-office services.
athenaCollector service offering
athenaCollector is our cloud-based medical billing and practice management solution. It is the foundation of our service portfolio and entered general availability in 2000.
The athenahealth team remains focused on helping health care providers get paid more, faster, and with less work. Our cloud-based services remove administrative burdens allowing our clients to stay focused on patient care. Our commitment to health care providers and our extensive experience managing industry change on behalf of our clients differentiates us from traditional software vendors. The transition date for the next big change in health care compliance, the International Statistical Classification of Diseases and Related Health Problems, 10th Revision (“ICD-10”), has been reset to October 1, 2015. ICD-10 remains a significant area of focus for the athenahealth team. Our cloud-based service approach has allowed us to react rapidly to the new ICD-10 compliance date. Our products and services are designed to be flexible, enabling us to adjust to the new compliance date and payer readiness with minimal software development effort. The new date has shifted our ICD-10 client support and operations priorities from 2014 into 2015, including our client advisory and collaborative payer testing engagements. The new ICD-10 compliance date has not affected our readiness as our ICD-10 ready version was released in early 2014. Over the coming year, we will continue to focus our efforts on ensuring a smooth transition for our clients.
athenaCollector network performance metrics were as follows for Q3 2014:
• | $3,843,394,756 posted in total client collections, up 29.2% from Q3 2013 |
• | 29,169,062 total claims submitted, up 27.4% from Q3 2013 |
• | 82.8% electronic remittance advice (“ERA”) rate, up 0.8 points from 82.0% at Q3 2013 |
• | 93.7% first pass resolution (“FPR”) rate, down 0.4 points from 94.1% at Q3 2013 |
• | 39.2 average client days in accounts receivable (“DAR”), up 0.8 days from 38.4 days at Q3 2013 due to self-pay DAR and client mix |
athenaClinicals service offering
athenaClinicals is our cloud-based electronic health record (“EHR”) management service. It entered general availability in 2006 and was made available as a stand-alone service in 2010.
The complex business of health care is becoming increasingly more reliant on interoperability - the easy, open flow of clinical and financial information. Our platform integration team is dedicated to making athenahealth’s network the most connected, single national platform in health care. In the past quarter alone, there were approximately 560 million electronic exchanges of patient information between athenaNet users and the rest of the health care supply chain using 145 thousand active interfaces. This is up from 470 million electronic exchanges of patient information across 127 thousand active interfaces in Q2 2014. We will continue to leverage our cloud-based software platform, network knowledge, and set of services to deliver better care coordination for patients served across our growing base of providers. Our commitment to interoperability has been validated by the KLAS EMR Interoperability 2014 Report1 which ranked athenahealth as the top EMR vendor for overall contribution to client interoperability
_____________________________________________________________________________________
1“EMR Interoperability 2014: Where Are We on the Yellow Brick Road?,” October 2014. © 2014 KLAS Enterprises, LLC. All rights reserved.
8
success, inter-vendor cooperation, and incorporation of outside data into workflow. For more information on athenahealth’s interoperability initiatives, please visit www.athenahealth.com/interoperability.
The Meaningful Use section of athenahealth.com focuses on how our providers are meeting the requirements of the Medicare Meaningful Use program. By publishing this data, we hope to illustrate the uniqueness of the cloud and our service-based approach to EHRs, while simultaneously challenging other EHR vendors to provide the same level of transparency into their Meaningful Use performance. We have updated the Meaningful Use Performance dashboard on athenahealth.com to reflect our 2014 Stage 2 performance. As of the end of Q2 2014, 36.6 percent of our eligible providers have either attested or are ready to attest for Meaningful Use Stage 2, which is up from 18.6 percent after Q1 2014. Our eligible providers are also performing at 90 percent or above in 13 out of the 15 core Stage 2 measures. In addition, Centers for Medicare & Medicaid Services recently updated their publicly available Stage 2 attestation data which shows that athenahealth is still leading the industry in Meaningful Use Stage 2 attestations as of August 2014. In Q4 2014, we will be making product enhancements that will help ease the burden of some of the more difficult measures. As a result, our Meaningful Use Stage 2 attestation success is expected to continue to increase as the year progresses and we expect the rate to be at 90+ percent after Q4 2014.
Finally, on September 13, 2014, athenaNet turned from green to purple for all clients. These enhancements include a refined look, more intuitive navigation, and redesigned home pages for all users. Over the past few months, our beta testing for these updates confirmed that our user base was ready for the release. As a cloud-based service provider, we were able to release these updates across the entire user base with minimal disruption. We also decided that one component of the new athenaNet experience, the streamlined view of the clinical chart and encounter, will remain in beta testing for a little longer. The streamlined view strives to reinforce effective delegation, encourage lightweight documentation, and illuminate the patient’s clinical story. We have a large group of beta providers currently using streamlined features for the majority of their patient visits. We are, however, adding more features to the streamlined workflow in order to support a larger beta group before making it generally available to all athenaClinicals users. We will continually monitor this growing beta group and make improvements to the streamlined view informed by network insights and client performance.
athenaCommunicator service offering
athenaCommunicator is our cloud-based patient communication management service. It entered general availability in 2010 and, at this time, requires adoption of athenaCollector or athenaOne.
The athenaCommunicator team continues to make progress on important initiatives aimed at driving patient engagement, improving patient access, and boosting schedule density. During Q1 2014, we introduced our new population health campaigns which leverage athenaClinicals’ robust, evidence-based quality measures with athenaCommunicator’s GroupCall functionality for seamless patient outreach. Our clients gain from the efficiency of tapping into our quality management engine, making these “pre-packaged” population health campaigns in athenaCommunicator fast, effective, and easy-to-use. These solutions pinpoint gaps in patient care, help with patient outreach for valuable preventive services, and enable the client to easily manage these services at the practice level.
We recently launched a pediatrics influenza campaign to coincide with the start of the 2014/2015 influenza season. Today, we have ten population health campaigns with pre-packaged messaging covering a range of preventive care needs. While we are still in the early stages of this program, initial results from these campaigns show increased patient engagement and improved outcomes for our clients. For example, athenahealth clients contacted approximately 62,000 adult patients and approximately 15,000 pediatric patients who have not received their influenza shots, prompting them to schedule appointments. Approximately 11% of adult patients and 15% of pediatric patients contacted have scheduled
9
appointments to receive their influenza shots. In addition, we expanded the scope of our service offerings, launching three pre-packaged campaigns this quarter focused on general health awareness. These campaigns help both specialty and primary care clients conduct patient outreach to their broader patient populations, covering topics such as general fitness, influenza prevention awareness, and heart health and stroke awareness. The campaigns are expected to be an effective tool to help practices meet the Meaningful Use Patient Engagement measure for sending Preventive Reminders. For example, athenahealth clients have contacted approximately 127,000 patients with these new health awareness campaigns, assisting them in meeting important Meaningful Use measures. We plan to launch additional population health campaigns this year and look forward to providing further performance metrics as we expand these programs.
athenaCommunicator network performance metrics were as follows for Q3 2014:
• | Provider adoption rate has increased to 65%, as compared to 61% in Q2 2014 and 49% in Q3 2013. |
• | athenaCommunicator delivered over 54.9 million automated messages during Q3 2014 across our active patient base of over 21.2 million patients. |
• | Patient portal adoption has increased by 8% since Q2 2014 from approximately 3.3 million to approximately 3.6 million patients registered as of Q3 2014. |
• | athenaCommunicator has collected $23.8 million in self-pay collections during Q3 2014 via the patient portal and our live operator service, an increase of 125% over the Q3 2013 self-pay collections of $10.6 million. |
athenaCoordinator service offerings
Our athenaCoordinator service offerings include athenaCoordinator Core, athenaCoordinator Analytics, and athenaCoordinator Enterprise. athenaCoordinator Core is a cloud-based order transmission service for all entities that receive and fulfill health care orders. athenaCoordinator Core entered general availability in 2012. athenaCoordinator Analytics is a cloud-based business intelligence service for health care professionals. athenaCoordinator Analytics has been generally available since 2004 through Anodyne Health Partners, Inc., which athenahealth acquired in October of 2009. athenaCoordinator Enterprise is our cloud-based population health service designed to enhance physician and patient satisfaction by delivering seamless transitions in care.
Whether health systems are moving rapidly or slowly toward value-based reimbursement, the success of health systems hinge more and more on their ability to activate and engage patient populations and coordinate their care across a multitude of settings, while optimizing their revenue and efficiency along the way. These challenges are driving a market for population health management solutions that can position health systems for success in a changing reimbursement landscape. However, the majority of the population health management solutions focus only on data management with little ability to realize value and extract results. athenaCoordinator Enterprise delivers a differentiated approach for mastering population health and delivering results. athenaCoordinator Enterprise offers an end-to-end population health management service that is designed to connect care across the entire continuum. This enterprise service combines the power of cloud-based software, knowledge, and services to identify and engage patients in need of care, coordinate their care, and analyze the results of that care across a health system with disparate EHRs and practice management systems. The implementations at Steward Medical Group, Griffin Hospital and Arise Austin Medical Center continue to progress well. The major implementation threads include: 1) secure text messaging services; 2) population health management services; 3) centralized patient access services; 4) network-wide direct scheduling; and 5) network facesheet. We
10
expect both Steward Medical Group and Griffin Hospital to be live by year-end and we expect Arise Austin Medical Center to be live in 2015. While we remain focused on selling additional athenaCoordinator Enterprise deals, the team continues to close stand-alone population health management deals, which are a subset of the full athenaCoordinator Enterprise offering. As of September 30, 2014, our stand-alone population health management service supports 29 risk-bearing entities across eleven states, up over 60 percent from 18 risk-bearing entities across three states one year ago.
Epocrates service offerings
Epocrates has been recognized for developing the #1 medical application among U.S. physicians for clinical content, practice tools, and health industry engagement at the point of care. Epocrates has established a loyal network of more than one million health care professionals, including approximately 50 percent of U.S. physicians, who routinely use its intuitive solutions to help streamline workflow and improve patient care. Epocrates was acquired by athenahealth on March 12, 2013.
It has been over a year and a half since athenahealth acquired Epocrates. Since then, we have focused our energy and investments on what we do best: helping heath care providers make more confident and efficient decisions in the moments of care. We have updated our core Epocrates infrastructure and user experience, improved drug-to-drug interaction tools, and improved our commercial offerings. For example, we offer our commercial media sponsors improved physician-level reporting and data sharing, and a more flexible and competitive pricing model. We have also introduced several new products that showcase our customer engagement model like expanded Monograph Messaging, enhanced DocAlerts, and Patient Adherence campaigns. By combining Epocrates and athenahealth EHR-based services, we offer powerful ways to engage providers inside their personal and health information technology platforms. For example, our Patient Adherence campaigns enable our sponsor clients to embed their brand message, post-prescription, directly inside athenaClinicals and the athenaCommunicator patient portal. This program will not only improve patient medication adherence but will also deliver medication savings via coupons, vouchers, and co-pay offers to qualified patients. Our uniqueness continues to be validated by our ever-growing customer base, their high engagement, and industry recognition. We have made some great strides in helping health care providers make more confident and efficient decisions in the moments of care and will continue to work on maximizing this very important and strategic asset.
Business Development Update
More Disruption Please (“MDP”)
The MDP team remains steadfastly focused on accelerating high value innovation in health care via the cloud. The MDP program consists of three major pillars: Network, Marketplace, and Accelerator. The network, started in 2010, is comprised of innovative thinkers, entrepreneurs, and startups with a shared mission to improve the state of health care. We gather this network through conferences, hackathons, and other events to encourage thought leadership and collaboration across the continuum of care. The MDP program grew in 2013 with the addition of the athenahealth Marketplace. As of Q3 2014, the athenahealth Marketplace features 26 technology partners covering 15 capabilities that integrate with athenaNet, adding critical value to the overall athenahealth service offerings and client experience. This past quarter, the MDP team raised the program to the next level with the official launch of the MDP Accelerator program. By fostering the growth of high-potential, early-stage health care start-ups, the MDP team hopes to drive disruption by bringing entrepreneurialism back to an industry desperate for change. Although the entrepreneurs who fill the Accelerator space are independent from athenahealth, we believe they are central to our vision of becoming the cloud-based information backbone for health care. athenahealth will provide these entrepreneurs with the tools to test, grow, and optimize their solutions with the end goal of offering their services to our clients through the MDP Marketplace or building them directly into our core service offerings. Smart Scheduling is the first of many portfolio companies expected to inhabit the MDP program’s Accelerator space on our Watertown campus. The participating portfolio companies will
11
receive seed funding, free office space at our Watertown headquarters, and ongoing mentorship from athenahealth experts, advisors, and partners. In addition, the MDP Accelerator provides exposure to our network of providers via integration with our athenaNet platform. To learn more about our MDP program and partnership opportunities and to explore the athenahealth Marketplace, please visit www.athenahealth.com/disruption.
Client Base Discussion
The total number of physicians who have gone live on athenaCollector, our core service offering, is the metric we currently use to define our client base and market share. However, as our client base expands outside the traditional ambulatory market, total active providers—or nodes on our network—will become a more appropriate metric used to define our client base and market share.
During Q3 2014, 79% of all new athenaCollector deals included athenaClinicals, slightly below 83% in Q3 2013. 74% of all new athenaCollector deals included athenaCommunicator and athenaClinicals. Additionally, 74% of all new athenaOne deals also included athenaCoordinator Core. The athenaOne rate of 74% in Q3 2014 compares to 78% in Q3 2013. Among “live” (i.e., implemented and active) athenaCollector clients, adoption of athenaClinicals and athenaCommunicator continues to grow rapidly and resulted in continued growth to our installed base across all of our service offerings.
athenahealth Service Offering Adoption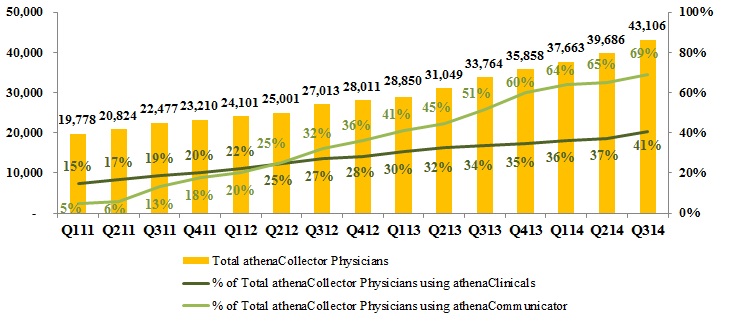
athenaCollector Clients
During Q3 2014, total active physicians on athenaCollector grew by 28% year-over-year, to 43,106. On a sequential basis, we added a record 3,420 net new active physicians on athenaCollector, versus 2,715 in Q3 2013. Our quarterly net new physician additions may vary widely due to the number and size of clients that go live in a particular quarter. Furthermore, our larger clients can be more complex and take longer to go live, particularly if our clients request a more phased implementation approach. Total active providers on athenaCollector grew by 26% year-over-year, to 59,415. On a sequential basis, we added a record 3,990 net new active providers on athenaCollector, versus 3,337 in Q3 2013.
athenaClinicals Clients
We continue to experience rapid growth in client adoption of athenaClinicals. Total active physicians live on athenaClinicals grew by 53% year-over-year, to 17,458. On a sequential basis, we added a record 2,786 net new active physicians on athenaClinicals, versus 1,343 in Q3 2013. This equates to an overall adoption rate of 41% of total athenaCollector physicians, up from 34% in Q3 2013. Total active providers
12
on athenaClinicals grew by 49% year-over-year, to 23,053. On a sequential basis, we added a record 3,320 net new active providers on athenaClinicals, versus 1,665 in Q3 2013. We expect the athenaClinicals client base to increase over time due to cross-selling within our existing base and growth in the volume of athenaOne deals.
athenaCommunicator Clients
Our athenaCommunicator client base is also growing rapidly. Total active physicians live on athenaCommunicator grew by an impressive 71% year-over-year, to 29,683. On a sequential basis, we added 3,846 net new active physicians on athenaCommunicator, versus 3,499 in Q3 2013. This equates to an overall adoption rate of 69% of total athenaCollector physicians, up from 51% in Q3 2013. Total active providers on athenaCommunicator grew by 68% year-over-year, to 38,699. On a sequential basis, we added 4,723 net new providers on athenaCommunicator, versus 4,262 in Q3 2013. We expect the athenaCommunicator client base to increase over time due to cross-selling within our existing base and growth in the volume of athenaOne deals.
New Deals
On July 23, 2014, we announced that New Haven Community Medical Group has endorsed our suite of services, athenaOne, for its approximately 600-member provider network.
On September 2, 2014, we announced that University of Toledo Physicians (“UTP”) has selected our suite of cloud-based services, athenaOne, to advance connectivity, drive efficiency, and support its population health initiatives. The UTP network of 260 providers, including 214 specialty and primary care physicians, is part of University of Toledo Medical Center and serves over 500,000 patients in the greater Toledo area. UTP is expected to go live on athenaCollector, athenaClinicals, and athenaCommunicator in Q1 2015.
Client Implementations
Our publicly disclosed implementation pipeline includes the following status updates as of October 16, 2014:
• | Hallmark Health went live on athenaCoordinator - Population Health Management in Q3 2014. |
• | CaroMont Health went live on athenaCoordinator - Population Health Management in Q3 2014. |
• | Summit Medical Group (~300 physicians, ~400 providers) went live on athenaClinicals and athenaCommunicator in Q3 2014 and is expected to go live on athenaCoordinator - Population Health Management in late 2014 or in early 2015. |
• | Saint Peter’s Healthcare System (~170 physicians, ~180 providers) is expected to go live on our full suite of services, athenaOne, in Q4 2014. |
• | Health Management Associates (~900 physicians, ~1,200 providers), now part of Community Health Systems, is expected to bring the majority of the remaining providers and physicians live on our suite of cloud-based services by means of a phased implementation by the end of 2014. |
• | Ascension Health (over 4,000 providers) continued the phased rollout of athenaCollector, athenaCommunicator, and athenaCoordinator Analytics and brought six waves live in Q3 2014. Five of these six implementation waves included athenaClinicals. |
• | Steward Medical Group is expected to go live on athenaCoordinator Enterprise in Q4 2014. |
• | Griffin Hospital is expected to go live on athenaCoordinator Enterprise in Q4 2014. |
• | Arise Austin Medical Center is expected to go live on athenaCoordinator Enterprise in early 2015. |
• | Marquette Physician Practices (~200 physicians, ~250 providers) is expected to go live on athenaCollector, athenaCommunicator, and athenaCoordinator Analytics in Q1 2015. |
• | Hospital Physician Partners (~2,000 providers) is expected to go live on athenaCollector, athenaCommunicator, and athenaCoordinator Analytics by means of a phased implementation. |
13
Growth Discussion
The athenahealth marketing organization encompasses our growth and sales operations, event and partner marketing, inside sales agents (“ISAs”), advertising, corporate communications, and product marketing teams. This organization executes in-market investments in an effort to generate new business opportunities for athenahealth. The athenahealth sales organization includes all quota-carrying sales representatives, as well as our sales team leaders, channel sales team, and sales training and development organization.
As of September 30, 2014, we have a total of 142 quota-carrying sales representatives, up 18% from September 2013. Our athenahealth-branded services sales force is currently divided into three groups: enterprise, which is dedicated to serving the largest managed care organizations, as well as those with high growth potential; group, which is dedicated to medical practices with seven to 150 physicians; and small group, which is dedicated to medical practices with one to six physicians. Year-to-date, bookings for athenahealth-branded services are modestly behind plan, driven by timing of deals in the enterprise space. However, we continue to believe we are well positioned to deliver strong results this year as our pipeline across the business is strong and the active pipeline in enterprise continues to mature nicely.
athenahealth continues to supplement our direct sales force with a growing list of diverse channel partners including medical societies, consultants, health systems, clients, and medical supply distributors. On July 28, 2014, we announced an expansion of our strategic agreement with Henry Schein. Through this strategic relationship, athenahealth’s athenaNet platform and Henry Schein’s Dentrix Enterprise is expected to integrate to facilitate integrated Uniform Data System (“UDS”) reporting, which is a requirement for CHCs, including FQHCs. The anticipated integration of the athenaNet and Dentrix Enterprise platforms is expected automate the UDS reporting process, ensuring accurate, complete UDS reports, without the need for manual and time-consuming reconciliation between disparate systems. This collaboration is expected to strengthen athenahealth and Henry Schein’s efforts to serve CHCs and FQHCs.
14
Stock-Based Compensation Expense, Amortization of Purchased Intangible Assets, and Reconciliation of Non-GAAP Financial Measures
athenahealth, Inc.
STOCK-BASED COMPENSATION
(Unaudited, in thousands)
Set forth below is a breakout of stock-based compensation impacting the Condensed Consolidated Statements of Income for the three and nine months ended September 30, 2014, and 2013:
Three Months Ended September 30, | Nine Months Ended September 30, | ||||||||||||||
2014 | 2013 | 2014 | 2013 | ||||||||||||
Stock-based compensation charged to Condensed Consolidated Statements of Income: | |||||||||||||||
Direct operating | $ | 2,987 | $ | 1,854 | $ | 8,806 | $ | 5,618 | |||||||
Selling and marketing | 3,652 | 3,058 | 10,878 | 9,209 | |||||||||||
Research and development | 1,499 | 959 | 5,298 | 3,247 | |||||||||||
General and administrative | 4,283 | 3,891 | 14,004 | 15,650 | |||||||||||
Total stock-based compensation expense | 12,421 | 9,762 | 38,986 | 33,724 | |||||||||||
Amortization of capitalized stock-based compensation related to software development (1) | 635 | 302 | 1,515 | 680 | |||||||||||
Total | $ | 13,056 | $ | 10,064 | $ | 40,501 | $ | 34,404 | |||||||
(1) | In addition, for the three months ended September 30, 2014, and 2013, $1.7 million and $0.8 million, respectively, of stock-based compensation was capitalized in the line item Capitalized Software Costs, net in the Condensed Consolidated Balance Sheets for which $0.6 million and $0.3 million, respectively, of amortization was included in the line item Depreciation and Amortization in the Condensed Consolidated Statements of Income. For the nine months ended September 30, 2014 and 2013, $3.5 million and $1.7 million, respectively, of stock-based compensation was capitalized in the line item Capitalized Software Costs, net in the Condensed Consolidated Balance Sheets for which $1.5 million and $0.7 million, respectively, of amortization was included in the line item Depreciation and Amortization in the Condensed Consolidated Statements of Income. |
athenahealth, Inc.
AMORTIZATION OF PURCHASED INTANGIBLE ASSETS
(Unaudited, in thousands)
Set forth below is a breakout of amortization of purchased intangible assets impacting the Condensed Consolidated Statements of Income for the three and nine months ended September 30, 2014, and 2013:
Three Months Ended September 30, | Nine Months Ended September 30, | ||||||||||||||
Amortization of purchased intangible assets allocated to: | 2014 | 2013 | 2014 | 2013 | |||||||||||
Direct operating | $ | 2,534 | $ | 3,695 | $ | 9,189 | $ | 7,840 | |||||||
Selling and marketing | 4,206 | 2,421 | 13,178 | 4,842 | |||||||||||
Total amortization of purchased intangible assets | $ | 6,740 | $ | 6,116 | $ | 22,367 | $ | 12,682 | |||||||
15
athenahealth, Inc.
RECONCILIATION OF NON-GAAP FINANCIAL MEASURES
TO COMPARABLE GAAP MEASURES
(Unaudited, in thousands, except per share amounts)
The following is a reconciliation of the non-GAAP financial measures used by us to describe our financial results determined in accordance with accounting principles generally accepted in the United States of America (“GAAP”). An explanation of these measures is also included below under the heading “Explanation of Non-GAAP Financial Measures.”
While management believes that these non-GAAP financial measures provide useful supplemental information to investors regarding the underlying performance of our business operations, investors are reminded to consider these non-GAAP measures in addition to, and not as a substitute for, financial performance measures prepared in accordance with GAAP. In addition, it should be noted that these non-GAAP financial measures may be different from non-GAAP measures used by other companies, and management may utilize other measures to illustrate performance in the future. Non-GAAP measures have limitations in that they do not reflect all of the amounts associated with our results of operations as determined in accordance with GAAP.
Please note that these figures may not sum exactly due to rounding.
Non-GAAP Adjusted Gross Margin
Set forth below is a presentation of our “Non-GAAP Adjusted Gross Profit” and “Non-GAAP Adjusted Gross Margin,” which represents Non-GAAP Adjusted Gross Profit as a percentage of total revenue.
(unaudited, in thousands) | Three Months Ended | Nine Months Ended | |||||||||||||
September 30, | September 30, | ||||||||||||||
2014 | 2013 | 2014 | 2013 | ||||||||||||
Total revenue | $ | 190,428 | $ | 151,527 | $ | 539,385 | $ | 423,424 | |||||||
Direct operating expense | 79,343 | 63,245 | 226,265 | 175,820 | |||||||||||
Total revenue less direct operating expense | 111,085 | 88,282 | 313,120 | 247,604 | |||||||||||
Add: Stock-based compensation allocated to direct operating expense | 2,987 | 1,854 | 8,806 | 5,618 | |||||||||||
Add: Amortization of purchased intangible assets allocated to direct operating expense | 2,534 | 3,695 | 9,189 | 7,840 | |||||||||||
Non-GAAP Adjusted Gross Profit | $ | 116,606 | $ | 93,831 | $ | 331,115 | $ | 261,062 | |||||||
Non-GAAP Adjusted Gross Margin | 61.2 | % | 61.9 | % | 61.4 | % | 61.7 | % | |||||||
16
Non-GAAP Adjusted EBITDA
Set forth below is a reconciliation of our “Non-GAAP Adjusted EBITDA” and “Non-GAAP Adjusted EBITDA Margin,” which represents Non-GAAP Adjusted EBITDA as a percentage of total revenue.
(unaudited, in thousands) | Three Months Ended | Nine Months Ended | |||||||||||||
September 30, | September 30, | ||||||||||||||
2014 | 2013 | 2014 | 2013 | ||||||||||||
Total Revenue | $ | 190,428 | $ | 151,527 | $ | 539,385 | $ | 423,424 | |||||||
GAAP net (loss) income | (1,631 | ) | 1,170 | (11,848 | ) | (10,551 | ) | ||||||||
Add: (Benefit from) provision for income taxes | (853 | ) | 80 | (6,074 | ) | (5,290 | ) | ||||||||
Add: Total other expense | 1,218 | 1,391 | 3,935 | 2,439 | |||||||||||
Add: Stock-based compensation expense | 12,421 | 9,762 | 38,986 | 33,724 | |||||||||||
Add: Depreciation and amortization | 17,258 | 11,263 | 46,693 | 30,711 | |||||||||||
Add: Amortization of purchased intangible assets | 6,740 | 6,116 | 22,367 | 12,682 | |||||||||||
Add: Integration and transaction costs | — | 454 | — | 6,468 | |||||||||||
Add: Non-tax deductible transaction costs | — | — | — | 2,159 | |||||||||||
Less: Gain on early termination of lease | — | — | — | (2,468 | ) | ||||||||||
Non-GAAP Adjusted EBITDA | $ | 35,153 | $ | 30,236 | $ | 94,059 | $ | 69,874 | |||||||
Non-GAAP Adjusted EBITDA Margin | 18.5 | % | 20.0 | % | 17.4 | % | 16.5 | % | |||||||
Non-GAAP Adjusted Operating Income
Set forth below is a reconciliation of our “Non-GAAP Adjusted Operating Income” and “Non-GAAP Adjusted Operating Income Margin,” which represents Non-GAAP Adjusted Operating Income as a percentage of total revenue.
(unaudited, in thousands) | Three Months Ended | Nine Months Ended | |||||||||||||
September 30, | September 30, | ||||||||||||||
2014 | 2013 | 2014 | 2013 | ||||||||||||
Total revenue | $ | 190,428 | $ | 151,527 | $ | 539,385 | $ | 423,424 | |||||||
GAAP net (loss) income | (1,631 | ) | 1,170 | (11,848 | ) | (10,551 | ) | ||||||||
Add: (Benefit from) provision for income taxes | (853 | ) | 80 | (6,074 | ) | (5,290 | ) | ||||||||
Add: Total other expense | 1,218 | 1,391 | 3,935 | 2,439 | |||||||||||
Add: Stock-based compensation expense | 12,421 | 9,762 | 38,986 | 33,724 | |||||||||||
Add: Amortization of capitalized stock-based compensation related to software development | 635 | 302 | 1,515 | 680 | |||||||||||
Add: Amortization of purchased intangible assets | 6,740 | 6,116 | 22,367 | 12,682 | |||||||||||
Add: Integration and transaction costs | — | 454 | — | 6,468 | |||||||||||
Add: Non-tax deductible transaction costs | — | — | — | 2,159 | |||||||||||
Less: Gain on early termination of lease | — | — | — | (2,468 | ) | ||||||||||
Non-GAAP Adjusted Operating Income | $ | 18,530 | $ | 19,275 | $ | 48,881 | $ | 39,843 | |||||||
Non-GAAP Adjusted Operating Income Margin | 9.7 | % | 12.7 | % | 9.1 | % | 9.4 | % | |||||||
17
Non-GAAP Adjusted Net Income
Set forth below is a reconciliation of our “Non-GAAP Adjusted Net Income” and “Non-GAAP Adjusted Net Income per Diluted Share.”
(unaudited, in thousands) | Three Months Ended | Nine Months Ended | |||||||||||||
September 30, | September 30, | ||||||||||||||
2014 | 2013 | 2014 | 2013 | ||||||||||||
GAAP net (loss) income | $ | (1,631 | ) | $ | 1,170 | $ | (11,848 | ) | $ | (10,551 | ) | ||||
Add: Stock-based compensation expense | 12,421 | 9,762 | 38,986 | 33,724 | |||||||||||
Add: Amortization of capitalized stock-based compensation related to software development | 635 | 302 | 1,515 | 680 | |||||||||||
Add: Amortization of purchased intangible assets | 6,740 | 6,116 | 22,367 | 12,682 | |||||||||||
Add: Integration and transaction costs | — | 454 | — | 6,468 | |||||||||||
Less: Gain on early termination of lease | — | — | — | (2,468 | ) | ||||||||||
Sub-total of tax deductible items | 19,796 | 16,634 | 62,868 | 51,086 | |||||||||||
Less: Tax impact of tax deductible items (1) | (7,918 | ) | (6,654 | ) | (25,147 | ) | (20,434 | ) | |||||||
Add: Non-tax deductible transaction costs | — | — | — | 2,159 | |||||||||||
Add: Tax impact resulting from applying non-GAAP tax rate (2) | 140 | — | 1,095 | — | |||||||||||
Non-GAAP Adjusted Net Income | $ | 10,387 | $ | 11,150 | $ | 26,968 | $ | 22,260 | |||||||
Weighted average shares - diluted | 37,999 | 38,343 | 37,783 | 36,722 | |||||||||||
Non-GAAP Adjusted Net Income per Diluted Share | $ | 0.27 | $ | 0.29 | $ | 0.71 | $ | 0.61 | |||||||
(1) | Tax impact calculated using a statutory tax rate of 40%. |
(2) | Represents adjusting the GAAP net loss at a non-GAAP tax rate of 40%. For 2014, we are using a non-GAAP tax rate of 40% to normalize the tax impact to our Non-GAAP Adjusted Net Income per Diluted Share based on the fact that a relatively small change in pre-tax GAAP income (loss) could result in a volatile GAAP effective tax rate. If this approach had been used for the three months ended September 30, 2013, the tax impact from applying a non-GAAP tax rate would have been $(420) and our Non-GAAP Adjusted Net Income per Diluted Share would have been $0.28, or a decrease of $0.01. For the nine months ended September 30, 2013, the tax impact from applying a non-GAAP tax rate would have been $183 and our Non-GAAP Adjusted Net Income per Diluted Share would have been unchanged at $0.61. |
18
(unaudited, in thousands) | Three Months Ended | Nine Months Ended | |||||||||||||
September 30, | September 30, | ||||||||||||||
2014 | 2013 | 2014 | 2013 | ||||||||||||
GAAP net (loss) income per share - diluted | $ | (0.04 | ) | $ | 0.03 | $ | (0.31 | ) | $ | (0.29 | ) | ||||
Add: Stock-based compensation expense | 0.33 | 0.25 | 1.03 | 0.92 | |||||||||||
Add: Amortization of capitalized stock-based compensation related to software development | 0.02 | 0.01 | 0.04 | 0.02 | |||||||||||
Add: Amortization of purchased intangible assets | 0.18 | 0.16 | 0.59 | 0.35 | |||||||||||
Add: Integration and transaction costs | — | 0.01 | — | 0.18 | |||||||||||
Less: Gain on early termination of lease | — | — | — | (0.07 | ) | ||||||||||
Sub-total of tax deductible items | 0.52 | 0.43 | 1.66 | 1.39 | |||||||||||
Less: Tax impact of tax deductible items (1) | (0.21 | ) | (0.17 | ) | (0.67 | ) | (0.56 | ) | |||||||
Add: Non-tax deductible transaction costs | — | — | — | 0.06 | |||||||||||
Add: Tax impact resulting from applying non-GAAP tax rate (2) | — | — | 0.03 | — | |||||||||||
Non-GAAP Adjusted Net Income per Diluted Share | $ | 0.27 | $ | 0.29 | $ | 0.71 | $ | 0.61 | |||||||
Weighted average shares - diluted | 37,999 | 38,343 | 37,783 | 36,722 | |||||||||||
(1) | Tax impact calculated using a statutory tax rate of 40%. |
(2) | Represents adjusting the GAAP net loss at a non-GAAP tax rate of 40%. For 2014, we are using a non-GAAP tax rate of 40% to normalize the tax impact to our Non-GAAP Adjusted Net Income per Diluted Share based on the fact that a relatively small change in pre-tax GAAP income (loss) could result in a volatile GAAP effective tax rate. If this approach had been used for the three months ended September 30, 2013, the tax impact from applying a non-GAAP tax rate would have been $(420) and our Non-GAAP Adjusted Net Income per Diluted Share would have been $0.28, or a decrease of $0.01. For the nine months ended September 30, 2013, the tax impact from applying a non-GAAP tax rate would have been $183 and our Non-GAAP Adjusted Net Income per Diluted Share would have been unchanged at $0.61. |
19
Explanation of Non-GAAP Financial Measures
We report our financial results in accordance with accounting principles generally accepted in the United States of America, or GAAP. However, management believes that, in order to properly understand our short-term and long-term financial and operational trends, investors may wish to consider the impact of certain non-cash or non-recurring items, when used as a supplement to financial performance measures in accordance with GAAP. These items result from facts and circumstances that vary in frequency and impact on continuing operations. Management also uses results of operations before such items to evaluate the operating performance of athenahealth and compare it against past periods, make operating decisions, and serve as a basis for strategic planning. These non-GAAP financial measures provide management with additional means to understand and evaluate the operating results and trends in our ongoing business by eliminating certain non-cash expenses and other items that management believes might otherwise make comparisons of our ongoing business with prior periods more difficult, obscure trends in ongoing operations, or reduce management’s ability to make useful forecasts. Management believes that these non-GAAP financial measures provide additional means of evaluating period-over-period operating performance. In addition, management understands that some investors and financial analysts find this information helpful in analyzing our financial and operational performance and comparing this performance to our peers and competitors.
Management defines “Non-GAAP Adjusted Gross Profit” as total revenue, less direct operating expense, plus (1) stock-based compensation expense allocated to direct operating expense and (2) amortization of purchased intangible assets allocated to direct operating expense, and “Non-GAAP Adjusted Gross Margin” as Non-GAAP Adjusted Gross Profit as a percentage of total revenue. Management considers these non-GAAP financial measures to be important indicators of our operational strength and performance of our business and a good measure of our historical operating trends. Moreover, management believes that these measures enable investors and financial analysts to closely monitor and understand changes in our ability to generate income from ongoing business operations.
Management defines “Non-GAAP Adjusted EBITDA” as the sum of GAAP net income (loss) before provision for (benefit from) income taxes, total other (income) expense, stock-based compensation expense, depreciation and amortization, amortization of purchased intangible assets, integration costs, transaction costs, and gain on early termination of lease and “Non-GAAP Adjusted EBITDA Margin” as Non-GAAP Adjusted EBITDA as a percentage of total revenue. Management defines “Non-GAAP Adjusted Operating Income” as the sum of GAAP net income (loss) before provision for (benefit from income taxes, total other (income) expense, stock-based compensation expense, amortization of capitalized stock-based compensation related to software development, amortization of purchased intangible assets, integration costs, transaction costs, and gain on early termination of lease and “Non-GAAP Adjusted Operating Income Margin” as Non-GAAP Adjusted Operating Income as a percentage of total revenue. Management defines “Non-GAAP Adjusted Net Income” as the sum of GAAP net income (loss) before stock-based compensation expense, amortization of capitalized stock-based compensation related to software development, amortization of purchased intangible assets, integration costs, transaction costs, and gain on early termination of lease and any tax impact related to these preceding items, and an adjustment to the tax provision for the non-GAAP tax rate and “Non-GAAP Adjusted Net Income per Diluted Share” as Non-GAAP Adjusted Net Income divided by weighted average diluted shares outstanding. Management considers all of these non-GAAP financial measures to be important indicators of our operational strength and performance of our business and a good measure of our historical operating trends, in particular the extent to which ongoing operations impact our overall financial performance.
20
Management excludes or adjusts each of the items identified below from the applicable non-GAAP financial measure referenced above for the reasons set forth with respect to that excluded item:
• | Stock-based compensation expense and amortization of capitalized stock-based compensation related to software development — excluded because these are non-cash expenditures that management does not consider part of ongoing operating results when assessing the performance of our business, and also because the total amount of the expenditure is partially outside of our control because it is based on factors such as stock price, volatility, and interest rates, which may be unrelated to our performance during the period in which the expenses are incurred. |
• | Amortization of purchased intangible assets — purchased intangible assets are amortized over their estimated useful lives and generally cannot be changed or influenced by management after the acquisition. Accordingly, this item is not considered by management in making operating decisions. Management does not believe such charges accurately reflect the performance of our ongoing operations for the period in which such charges are incurred. |
• | Integration costs — integration costs are the severance payments and retention bonuses for certain employees relating to the Epocrates acquisition. Accordingly, management believes that such expenses do not have a direct correlation to future business operations, and therefore, these costs are not considered by management in making operating decisions. Management does not believe such charges accurately reflect the performance of our ongoing operations for the period in which such charges are incurred. |
• | Transaction costs — transaction costs are non-recurring costs related to specific transactions. Accordingly, management believes that such expenses do not have a direct correlation to future business operations, and therefore, these costs are not considered by management in making operating decisions. Management does not believe such charges accurately reflect the performance of our ongoing operations for the period in which such charges are incurred. |
• | Gain on early termination of lease — Gain on early termination of lease was a non-recurring gain related to the early termination of the Arsenal on the Charles lease. Accordingly, this gain was not considered by management in making operating decisions, and management believes that this gain does not have a direct correlation to future business operations. Management does not believe such gain accurately reflects the performance of our ongoing operations for the period in which such gain was recorded. |
• | Non-GAAP tax rate — For 2014, we are using a non-GAAP tax rate of 40% to normalize the tax impact to our Non-GAAP Adjusted Net Income (Loss) per Diluted Share based on the fact that a relatively small change in pre-tax GAAP income (loss) could result in a volatile GAAP effective tax rate. |
21
Supplemental Metrics and Definitions
Fiscal Year 2013 | Fiscal Year 2014 | ||||||||||||||||
Q1 | Q2 | Q3 | Q4 | Q1 | Q2 | Q3 | |||||||||||
Client Base | |||||||||||||||||
Total Physicians on athenaCollector | 28,850 | 31,049 | 33,764 | 35,858 | 37,663 | 39,686 | 43,106 | ||||||||||
Total Providers on athenaCollector | 40,937 | 43,858 | 47,195 | 50,212 | 52,886 | 55,425 | 59,415 | ||||||||||
Total Physicians on athenaClinicals | 8,776 | 10,058 | 11,401 | 12,388 | 13,521 | 14,672 | 17,458 | ||||||||||
Total Providers on athenaClinicals | 12,139 | 13,818 | 15,483 | 16,805 | 18,343 | 19,733 | 23,053 | ||||||||||
Total Physicians on athenaCommunicator | 11,840 | 13,831 | 17,330 | 21,516 | 24,030 | 25,837 | 29,683 | ||||||||||
Total Providers on athenaCommunicator | 16,296 | 18,762 | 23,024 | 28,360 | 31,707 | 33,976 | 38,699 | ||||||||||
Client Performance | |||||||||||||||||
Net Promoter Score (1) | n/a | n/a | n/a | n/a | 44.7 | 41.2 | 47.5 | ||||||||||
Client Days in Accounts Receivable (“DAR”) | 37.6 | 37.0 | 38.4 | 38.0 | 41.1 | 39.0 | 39.2 | ||||||||||
First Pass Resolution (“FPR”) Rate | 93.9 | % | 94.2 | % | 94.1 | % | 93.9 | % | 93.5 | % | 93.7 | % | 93.7 | % | |||
Electronic Remittance Advice (“ERA”) Rate | 81.8 | % | 82.8 | % | 82.0 | % | 83.3 | % | 82.3 | % | 82.6 | % | 82.8 | % | |||
Total Claims Submitted | 20,732,485 | 21,691,357 | 22,903,118 | 25,435,690 | 25,785,710 | 28,177,665 | 29,169,062 | ||||||||||
Total Client Collections ($) | 2,566,960,419 | 2,836,765,406 | 2,974,736,918 | 3,285,027,602 | 3,172,115,234 | 3,679,375,661 | 3,843,394,756 | ||||||||||
Total Working Days | 61 | 64 | 64 | 62 | 61 | 64 | 64 | ||||||||||
Employees | |||||||||||||||||
Direct | 1,426 | 1,438 | 1,460 | 1,533 | 1,573 | 1,633 | 1,698 | ||||||||||
Selling & Marketing | 426 | 455 | 464 | 473 | 509 | 556 | 569 | ||||||||||
Research & Development | 526 | 587 | 651 | 677 | 717 | 812 | 918 | ||||||||||
General & Administrative | 275 | 278 | 290 | 284 | 289 | 311 | 340 | ||||||||||
Total Employees | 2,652 | 2,758 | 2,865 | 2,966 | 3,088 | 3,312 | 3,525 | ||||||||||
Quota Carrying Sales Force | |||||||||||||||||
Total Quota Carrying Sales Representatives | 114 | 119 | 120 | 126 | 133 | 140 | 142 | ||||||||||
(1) Net Promoter Score is a new metric for 2014
Supplemental Metrics Definitions | |
Client Base | |
Total Physicians on athenaCollector | The number of physicians that have rendered a service which generated a medical claim that was billed during the last 91 days on the athenaCollector platform. Examples of physicians include Medical Doctors (“MDs”) and Doctors of Osteopathic Medicine (“DOs”). |
Total Providers on athenaCollector | The number of providers, including physicians, that have rendered a service which generated a medical claim that was billed during the last 91 days on the athenaCollector platform. Examples of non-physician providers are Nurse Practitioners (“NPs”) and Registered Nurses (“RNs”). |
Total Physicians on athenaClinicals | The number of physicians that have rendered a service through the athenaClinicals platform which generated a medical claim that was billed during the last 91 days on the athenaCollector platform. |
Total Providers on athenaClinicals | The number of providers, including physicians, that have rendered a service through the athenaClinicals platform which generated a medical claim that was billed during the last 91 days on the athenaCollector platform. |
Total Physicians on athenaCommunicator | The number of physicians that have rendered a service which generated a medical claim that was billed during the last 91 days on the athenaCollector platform and whose practice is actively using athenaCommunicator. |
Total Providers on athenaCommunicator | The number of providers, including physicians, that have rendered a service which generated a medical claim that was billed during the last 91 days on the athenaCollector platform and whose practice is actively using athenaCommunicator. |
Client Performance | |
Net Promoter Score | The percentage of clients who chose 9 or 10 ( defined as promoters) less the percentage of clients who chose 0 through 6 ( defined as detractors) on a scale of 1 to 10 when asked if they would recommend athenahealth to a trusted friend or colleague. These responses are generated from a "client listening" survey that the Company conducts for its client base twice per year. |
Client Days in Accounts Receivable (“DAR”) | The average number of days that it takes outstanding balances on claims to be resolved, e.g. paid, for clients on athenaCollector. Clients that have been live less than 90 days are excluded, as well as clients who are terminating services. |
First Pass Resolution (“FPR”) Rate | Approximates the percentage of primary claims that are favorably adjudicated and closed after a single submission during the period. Currently, the FPR rate is calculated on a monthly basis, and certain practices are excluded (e.g. those that have been live for less than 90 days). |
Electronic Remittance Advice (“ERA”) Rate | Remittance refers to the information about payments (a/k/a explanations of benefits) received from insurance companies during the period. The ERA rate reflects the percentage of total charges that were posted using electronic remittance. |
Total Claims Submitted | The number of claims billed through athenaNet during the period. |
Total Client Collections | The dollar value of collections posted on behalf of clients during the period. |
Total Working Days | The total number of days during the quarter minus weekends and U.S. Post Office holidays. |
Employees | |
Direct | The total number of full time equivalent individuals (“FTEs”) employed by athenahealth to support its service operations as of quarter end. This team includes production systems, enrollment services, paper claim submission, claim resolution, clinical operations, professional services, account management, and client services. |
Selling & Marketing | The total number of FTEs employed by athenahealth to support its sales and marketing efforts as of quarter end. This team includes sales representatives, business development staff and the marketing team. |
Research & Development | The total number of FTEs employed by athenahealth to support its research and development efforts as of quarter end. This team includes product development and product management. |
General & Administrative | The total number of FTEs employed by athenahealth to support its general and administrative functions as of quarter end. This team includes finance, human resources, compliance, learning and development, internal audit, corporate technology, recruiting, facilities, and legal. |
Total Employees | The total number of FTEs employed by athenahealth as of quarter end. This number excludes interns and seasonal employees. |
Total Quota Carrying Sales Representatives | The total number of athenahealth-branded services sales representatives who carry quota for net new annual recurring revenue as of quarter end. |
Corporate Scorecard Metrics Definitions | |
Stability | |
Voluntary Turnover | A quarterly average of the number of voluntary terminations divided by starting headcount. Voluntary turnover excludes employees on action plans or employees on counseling out plans. |
Corporate Citizenship | Percentage of compliance tasks that are met within the deadline. |
Employee Engagement | Quarterly engagement survey results for employees. |
Performance | |
Total Automation Rate | Percentage of major revenue cycle management, clinicals and patient statement transactions that were sent or received in a structured electronic format. The Total Automation Rate definition changed from 2013 and the metric results may not be comparable. |
Net On-boarding Success | This metric calculates net on-boarding success which represents the number of providers added to athenaClinicals that are not considered stragglers in their fourth week post go-live. Providers are categorized as either champions, neutrals, or stragglers based on several key performance metrics including same day encounter close rate, provider documentation time, and the percentage of encounters documented during the patient visit. |
Patient Full Registration | The percentage of patients in the current panel (claims created in the last 18 months) with complete patient registration information including driver's license, insurance card and confirmed eligibility. |
Satisfaction | |
Net Promoter Score | The percentage of clients who chose 9 or 10 ( defined as promoters) less the percentage of clients who chose 0 through 6 ( defined as detractors) on a scale of 1 to 10 when asked if they would recommend athenahealth to a trusted friend or colleague. These responses are generated from a “client listening” survey that the Company conducts for its client base twice per year. |
Days of Client Work | The outstanding work that clients have in our clinicals and revenue cycle offerings. For clinicals, the total stock of work on the clinicals dashboard divided by average daily inflow of tasks. For revenue cycle, the days in accounts receivable relating to work that needs to be resolved by the client. Both clinicals and revenue cycle are weighted at 50%. |
Provider Documentation Time per Appointment | The average number of minutes athenaClinicals providers spend on the computer documenting the exam and orders for each appointment. Providers that have been live less than 90 days are excluded. |
Minutes per RVU | Total minutes spent within athenaCollector webpages based on weblogs divided by RVU’s posted. |
Financial | |
Bookings | The annualized value of deals sold. |
Total Revenue | Total consolidated revenue. |
Non-GAAP Adjusted Operating Income | Total non-GAAP adjusted operating income. |
# of Physicians on the Network | Active physicians in the last 90 days on Epocrates and rendering physicians live on athenaNet. Physicians live on athenaNet is defined as the number of physicians that have rendered a service which generated a medical claim that was billed during the last 91 days on the athenaCollector platform. Examples of physicians include Medical Doctors (“MDs”) and Doctors of Osteopathic Medicine (“DOs”). |