Second Quarter Fiscal Year 2014 
Prepared Remarks July 17, 2014
Jonathan Bush, Chairman & Chief Executive Officer
Karl Stubelis, Vice President, Corporate Controller & Acting Chief Financial Officer
About These Remarks
The following commentary is provided by management in conjunction with the second quarter fiscal year 2014 earnings press release issued by athenahealth, Inc. (“athenahealth” or “we”). These remarks represent management’s current views on our financial and operational performance and are provided to give investors and analysts more time to analyze and understand our performance in advance of the earnings conference call. These prepared remarks will not be read on the conference call. A complete reconciliation between generally accepted accounting principles “GAAP” and non-GAAP results, as well as a summary of supplemental metrics and definitions, is provided in the tables following these prepared remarks.
Earnings Conference Call Information
To participate in our live conference call and webcast, please dial 877-853-5645 (or 408-940-3868 for international calls) using conference code No. 59551365, or visit the Investors section of our web site at www.athenahealth.com. A replay will be available for one week following the conference call at 855-859-2056 (and 404-537-3406 for international calls) using conference code No. 59551365. A webcast replay will also be archived on our website.
Safe Harbor and Forward-Looking Statements
These remarks contain forward-looking statements, which are made pursuant to the safe harbor provisions of the Private Securities Litigation Reform Act of 1995, including statements reflecting management’s expectations for future financial and operational performance and operational expenditures, expected growth, and business outlook; statements regarding our research and development efforts and product offering and upgrade plans and timelines; the benefits of and anticipated operational results from our service offerings and demands for our service offerings; the further integration of our services and the resulting benefits; changes in the types of providers and health care entities we serve and the range of tasks we perform for clients; our sales, marketing and partnering activities and plans; the benefits of integrating with partners, introduction of new capabilities to the athenahealth Marketplace, and anticipated operational results from partners’ service offerings; the integration of Epocrates and building of new functionalities such as Secure Text Messaging and integration of existing functionality with our EHR; client behavior and preferences, and implementation of services for new clients and deals, including our expansion into the enterprise segment; our market position and awareness among physicians; the potential for cross-sales among service offerings and sales involving multiple services; our implementation pipeline and expectations on new deals and network growth; the expansion of the number of users of our services; our plans and readiness in regard to Stage 2 of Meaningful Use and our ability to help providers get Medicare payments; changes in the industry, including an increased emphasis on coordinated care; the creation of a sustainable market for health information exchange, an ecosystem of developers and third-party service providers, and a national health IT network; our progress and plans on the new athenaNet® experience project, athenaCoordinator® Enterprise offering, and population health services; and statements found under our “Reconciliation of Non-GAAP Financial Measures to Comparable GAAP Measures” section of these remarks. Forward-looking statements may often be identified with words such as “we expect”, “we anticipate”, “upcoming”, “plan”, “aim” or similar indications of future expectations. These statements are neither promises nor guarantees, and are subject to a variety of risks and uncertainties, many of which are beyond our control, which could cause actual results to differ materially from those contemplated in these forward-looking statements. In particular, the risks and uncertainties include, among other things: our fluctuating operating results; our variable sales and implementation cycles, which may result in fluctuations in our quarterly results; risks associated with the acquisition and integration of companies and new technologies, including those related to our ability to successfully scale the athenaCoordinator services, those related to our ability to integrate the services and offerings of Epocrates and realize the expected benefits such as increased awareness among physicians of our overall services and offerings; risks associated with our ability to realize the expected benefits from the purchase of
1
the Arsenal on the Charles campus in Watertown, Massachusetts; risks associated with our expectations regarding our ability to maintain profitability; the impact of increased sales and marketing expenditures, including whether increased expansion in revenues is attained and impact on margins and profitability; changes in tax rates or exposure to additional tax liabilities; the highly competitive industry in which we operate and the relative immaturity of the market for our service offerings; and the evolving and complex governmental and regulatory compliance environment in which we and our clients operate. Existing and prospective investors are cautioned not to place undue reliance on these forward-looking statements, which speak only as of the date hereof. We undertake no obligation to update or revise the information contained in these remarks, whether as a result of new information, future events or circumstances, or otherwise. For additional disclosure regarding these and other risks faced by us, see the disclosures contained in our public filings with the Securities and Exchange Commission (“SEC”), available on the Investors section of our website at www.athenahealth.com and on the SEC’s website at www.sec.gov.
Use of Non-GAAP Financial Measures
These remarks contain non-GAAP financial measures, as defined by SEC Regulation G. The GAAP financial measure most directly comparable to each non-GAAP financial measure used or discussed, and a reconciliation of the differences between each non-GAAP financial measure and the comparable GAAP financial measure, are included following these prepared remarks or can be found within our second quarter fiscal year 2014 earnings press release in the Investors section of our web site at www.athenahealth.com.
Opening Remarks
The athenahealth team continued to build on our strong momentum during Q2 2014. We added 2,539 providers onto the network, expanded our channel partnership program with the addition of Henry Schein, and began implementing our first athenaCoordinator Enterprise clients. Additionally, our most important assets, our employees and our culture, were further strengthened with the addition of Kristi Matus to our senior management team. Ms. Matus, our Executive Vice President and Chief Financial and Administrative Officer, brings to athenahealth both the financial and operational experience to help take this company to the next level.
Highlights from Q2 2014 include the following:
• | Grew consolidated revenue by 27% and athenahealth-branded revenue by 32% over Q2 2013 |
• | Grew net new active physicians on athenaCollector® (2,023 physicians added), athenaClinicals® (1,151 physicians added), and athenaCommunicator® (1,807 physicians added) in Q2 2014 |
• | Grew athenaCollector physicians by 28% over Q2 2013, representing continued strong network growth in 2014 |
• | Completed implementations at Privia Medical Group (athenaOne®), Phoebe Physician Group (athenaOne), and Children’s Integrated Health Organization (athenaCoordinator - Population Health Management) |
• | Signed our third athenaCoordinator Enterprise deal with Arise Austin Medical Center in June 2014 |
• | Entered into a strategic relationship with Henry Schein, expanding athenahealth’s channel partnership program and marketing efforts to physicians across the U.S. |
• | Released our 2013 Medicare Meaningful Use Stage 1 attestation results of 95.4% |
• | Extended the athenahealth Meaningful Use guarantee to 2015 |
• | Launched four additional population health campaigns in Q2 2014 and plan to launch six more campaigns in the second half of 2014 |
• | Introduced ACAView, a joint initiative between athenahealth and the Robert Wood Johnson Foundation, focusing on the impact of health care reform on physician practices |
2
• | Ranked #1 smartphone and tablet medical reference app (Epocrates) among U.S. physicians by Manhattan Research’s 2014 Taking the Pulse® U.S. study |
Results Overview
athenahealth’s top line results for the second quarter of fiscal year (“FY”) 2014 reflect solid revenue growth:
• | Total revenue: |
◦ | $185.9 million in Q2 2014, representing 27% growth over $146.3 million in Q2 2013 |
▪ | athenahealth-branded revenue was $170.3 million in Q2 2014, representing 32% growth |
▪ | Epocrates-branded revenue was $11.3 million, representing a 23% decline |
▪ | Other revenue was $4.3 million, representing 95% growth |
Our bottom line results for Q2 2014, consistent with our growth strategy, demonstrate strong sales, marketing, and research and development investments, and a focus on operating efficiencies:
• | Non-GAAP Adjusted Gross Profit and Margin: |
◦ | $117.1 million, or 63.0% of total revenue, in Q2 2014, an increase of 28% over $91.4 million, or 62.4% of total revenue, in Q2 2013 |
• | GAAP selling and marketing expense: |
◦ | $50.7 million, or 27.3% of total revenue, in Q2 2014, an increase of 24% over $41.0 million, or 28.0% of total revenue, in Q2 2013 |
• | GAAP research and development expense: |
◦ | $16.4 million, or 8.8% of total revenue, in Q2 2014, an increase of 15% over $14.3 million, or 9.8% of total revenue, in Q2 2013 |
• | GAAP general and administrative expense: |
◦ | $30.4 million, or 16.4% of total revenue, in Q2 2014, an increase of 23% from $24.7 million, or 16.9% of total revenue, in Q2 2013 |
• | Non-GAAP Adjusted EBITDA: |
◦ | $36.3 million, or 19.5% of total revenue, in Q2 2014, an increase of 65% from $22.1 million, or 15.1% of total revenue, in Q2 2013 |
• | Non-GAAP Adjusted Operating Income: |
◦ | $21.6 million, or 11.6% of total revenue, in Q2 2014, an increase of 93% from $11.2 million, or 7.6% of total revenue, in Q2 2013 |
• | Non-GAAP Adjusted Net Income: |
◦ | $12.2 million, or $0.32 per diluted share, in Q2 2014, an increase of 492% from Non-GAAP Adjusted Net Loss of $3.1 million, or $0.08 per diluted share, in Q2 2013 |
◦ | For 2014, we are using a non-GAAP tax rate of 40% to normalize the tax impact to our Non-GAAP Adjusted Net Income per Diluted Share based on the fact that a relatively small change in pre-tax GAAP income (loss) could result in a volatile GAAP effective tax rate. If this approach had been used for the three months ended June 30, 2013, our Non-GAAP Adjusted Net Income per Diluted Share would have been $0.17 instead of Non-GAAP Adjusted Net Loss per Diluted Share of $0.08. |
3
We measure our performance based on a balanced scorecard model. We believe that this framework is an excellent report card for our performance for the current year and that it measures the key performance indicators required for long-term success. The table below shows the scorecard results for Q1 2014, Q2 2014, and year-to-date Q2 2014. For certain metrics (i.e., Days of Client Work and Provider Documentation Time), our goal is to improve our performance by effectively reducing the scorecard metrics results throughout the year. Please reference the last page of this document for definitions of our corporate scorecard metrics.
Q1 2014 Results | Q2 2014 Results | YTD Q2 2014 Results | ||||
Stability (10% weight) | ||||||
Voluntary Turnover | 2.3 | % | 3.2 | % | 5.5 | % |
Corporate Citizenship | 92.5 | % | 90.8 | % | 91.6 | % |
Employee Engagement | 4.1 | 4.1 | 4.1 | |||
Stability Results | 101 | % | 80 | % | 91 | % |
Performance (35% weight) | ||||||
Total Automation Rate | 48.2 | % | 49.0 | % | 48.6 | % |
Net On-boarding Success | 67.1 | % | 65.0 | % | 66.1 | % |
Patient Full Registration | 49.5 | % | 50.8 | % | 50.1 | % |
Performance Results | 103 | % | 101 | % | 102 | % |
Satisfaction (25% weight) | ||||||
Net Promoter Score | 44.7 | 41.2 | 43 | |||
Days of Client Work | 8.8 | 8.8 | 8.8 | |||
Provider Documentation Time | 5.4 | 5.3 | 5.4 | |||
Minutes per RVU | 11.7 | 12.0 | 11.9 | |||
Satisfaction Results | 92 | % | 86 | % | 89 | % |
Financial (30% weight) | ||||||
Bookings (a) | (a) | (a) | (a) | |||
Total Revenue ($M) | $163.0 | $185.9M | $348.9M | |||
Non-GAAP Adjusted Operating Income ($M) | $8.7 | $21.6M | $30.3M | |||
# of Physicians on the Network | 296,477 | 297,652 | 297,065 | |||
Financial Results | 99 | % | 100 | % | 100 | % |
Total Results | 99 | % | 95 | % | 97 | % |
(a) | Since the bookings metric contains highly sensitive data, we do not disclose all of the specific performance measures and targets, because we believe that such disclosure would result in serious competitive harm. |
We believe that our underlying drivers of long-term success remain relatively strong as supported by the following metric results:
• | Employee Engagement at 4.1 out of 5.0 in Q2 2014, versus goal of 4.1 and Q2 2013 actual result of 4.1 |
4
• | Total Automation Rate of 49.0% in Q2 2014, in line with our goal of 49.0% and Q2 2013 actual result of 46.9% |
• | Net On-boarding Success of 65.0% in Q2 2014, shy of our goal of 70.0% |
• | Patient Full Registration of 50.8% in Q2 2014, ahead of our goal of 46.0% |
• | Net Promoter Score of 41.2 in Q2 2014, versus goal of 51.0 |
• | Days of Client Work of 8.8 days in Q2 2014, versus goal of 7.8 days |
• | Provider Documentation Time per Appointment of 5.3 minutes in Q2 2014, versus goal of 5.0 minutes and Q2 2013 actual result of 5.2 minutes |
• | Minutes per RVU of 12.0 minutes in Q2 2014, versus goal of 11.5 minutes |
athenahealth’s client base continues to expand while client adoption of other services in the athenahealth service suite grows. As our client base expands outside the traditional ambulatory market, we believe that total active providers, or nodes, on our network will become a more appropriate metric to use in measuring our market share. During Q2 2014:
• | 80% of all new athenaCollector deals included athenaClinicals, in line with the 80% in Q2 2013 |
• | 73% of all new athenaCollector deals included athenaClinicals and athenaCommunicator, compared to 68% in Q2 2013. Additionally, 73% of all new athenaOne deals sold during Q2 2014 also included athenaCoordinator Core, compared to 68% in Q2 2013 |
• | 37% of total athenaCollector physicians have adopted athenaClinicals, up from 32% in Q2 2013 |
• | 65% of total athenaCollector physicians have adopted athenaCommunicator, up from 45% in Q2 2013 |
• | Net new physicians and providers added sequentially to the network were as follows: |
athenaCollector | athenaClinicals | athenaCommunicator | ||||||||||||
Active physicians and providers: | Physicians | Providers | Physicians | Providers | Physicians | Providers | ||||||||
Beginning balance as of 3/31/14 | 37,663 | 52,886 | 13,521 | 18,343 | 24,030 | 31,707 | ||||||||
Net new additions | 2,023 | 2,539 | 1,151 | 1,390 | 1,807 | 2,269 | ||||||||
Ending balance as of 6/30/14 | 39,686 | 55,425 | 14,672 | 19,733 | 25,837 | 33,976 | ||||||||
Sequential growth % | 5 | % | 5 | % | 9 | % | 8 | % | 8 | % | 7 | % | ||
• | Net new physicians and providers added to the network since Q2 2013 were as follows: |
athenaCollector | athenaClinicals | athenaCommunicator | ||||||||||||
Active physicians and providers: | Physicians | Providers | Physicians | Providers | Physicians | Providers | ||||||||
Beginning balance as of 6/30/13 | 31,049 | 43,858 | 10,058 | 13,818 | 13,831 | 18,762 | ||||||||
Net new additions | 8,637 | 11,567 | 4,614 | 5,915 | 12,006 | 15,214 | ||||||||
Ending balance as of 6/30/14 | 39,686 | 55,425 | 14,672 | 19,733 | 25,837 | 33,976 | ||||||||
Y/Y growth % | 28 | % | 26 | % | 46 | % | 43 | % | 87 | % | 81 | % | ||
5
Revenue Discussion
Q2 2014 revenue was $185.9 million and grew by 27% (or $39.6 million) over Q2 2013. athenahealth-branded revenue for Q2 2014 was $170.3 million and grew by 32% over prior year.
Q2 2014 | Q2 2013 | Y/Y Growth% | ||
athenahealth-branded | $170.3 | $129.5 | 32 | % |
Epocrates-branded | $11.3 | $14.6 | (23 | )% |
Other | $4.3 | $2.2 | 95 | % |
Consolidated | $185.9 | $146.3 | 27 | % |
In terms of trends in our recurring revenue base, same-store analysis of claims created—a proxy for physician office utilization—indicates that physician office activity in Q2 2014 increased slightly over physician office activity during Q2 2013. In addition, our analysis showed an increase in physician office activity in Q2 2014 compared to Q1 2014. This sequential improvement was expected as claim activity in Q1 2014 was most likely impacted by the sustained inclement weather experienced across much of the country during the first quarter.
Non-GAAP Adjusted Gross Margin Discussion
Our Non-GAAP Adjusted Gross Margin was 63.0% for Q2 2014, up approximately 60 basis points from 62.4% in Q2 2013. One of our goals is to improve gross margin on a service-line basis each year. As previously discussed, the expansion of our newer service offerings, such as athenaCoordinator Enterprise, will serve as a headwind to total company margin expansion until these new services become more automated and scalable.
Balance Sheet and Cash Flow Highlights
As of June 30, 2014, we had cash and cash equivalents of $56.2 million and outstanding indebtedness of $216.3 million. Operating cash flow increased by $44.0 million from net cash provided by operating activities of $19.8 million for the six months ended June 30, 2013, to net cash provided by operating activities of $63.8 million for the six months ended June 30, 2014.
Fiscal Year 2014 Outlook
athenahealth is not making any changes to the fiscal year 2014 guidance we presented at our 6th Annual Investor Summit on December 12, 2013.
For the Fiscal Year Ending December 31, 2014 | |
Forward Looking Guidance | |
GAAP Total Revenue | $725 - $755 million |
Non-GAAP Adjusted Gross Margin | 62.5% - 63.5% |
Non-GAAP Adjusted Operating Income | $70 - $80 million |
Non-GAAP Adjusted Net Income per Diluted Share | $0.98 - $1.10 |
Non-GAAP Tax Rate | 40% |
Product Development Discussion
Product development at athenahealth is organized around our mission to be caregivers’ most trusted service, helping them do well doing the right thing. In order to fulfill this goal, we deliver services backed by cloud-based software, proprietary knowledge, and robust back-office services.
6
athenaCollector service offering
athenaCollector is our cloud-based medical billing and practice management solution. It is the foundation of our service portfolio and entered general availability in 2000.
The athenahealth team remains focused on helping caregivers get paid more, faster, and with less work. We released our digital check-in capabilities on the athenahealth Marketplace in Q2 2014. Our digital check-in partners, Epion Health, PatientPoint, Phreesia, and Seamless Medical Systems, aim to reduce administrative burdens while improving revenue capture and delivering an enhanced patient experience. These new capabilities are helping us extend the modern, automated experience we deliver to our providers to their patients as well. We also introduced the athenaCollector QuickPay Portal, our new billing only website, designed specifically for patients to pay balances on-line quickly and easily. This portal for athenaCollector only clients demonstrates our ability and on-going desire to help our clients improve their self-pay collections and get paid faster. Finally, we generally released our athenaCollector credentialing service to both new and existing athenaCollector clients. Our athenaCollector credentialing service was created to take on the work of initial provider setup and configuration, as well as ongoing credentialing and maintenance. This comprehensive service also gives our clients a new level of transparency into the credentialing lifecycle with robust dashboards and reports providing continuous visibility and analysis throughout the payer credentialing process. These additional services and capabilities demonstrate our ongoing commitment to improve our clients’ financial and operational performance.
athenaCollector network performance metrics were as follows for Q2 2014:
• | $3,679,375,661 posted in total client collections, up 29.7% from Q2 2013 |
• | 28,117,665 total claims submitted, up 29.6% from Q2 2013 |
• | 82.6% electronic remittance advice (“ERA”) rate, down 0.2 points from 82.8% at Q2 2013 |
• | 93.7% first pass resolution (“FPR”) rate, down 0.5 points from 94.2% at Q2 2013 |
• | 39.0 average client days in accounts receivable (“DAR”), up 2 days from 37.0 days at Q2 2013 |
athenaClinicals service offering
athenaClinicals is our cloud-based electronic health record (“EHR”) management service. It entered general availability in 2006 and was made available as a stand-alone service in 2010.
The Meaningful Use (“MU”) section of athenahealth.com reports on the progress our providers are making in meeting the requirements of the Medicare MU program. By publishing this data, we are able to illustrate the uniqueness of the cloud and our service-approach to EHRs, while simultaneously challenging other EHR vendors to provide the same level of transparency into their MU performance. On April 22, 2014, we released our 2013 Stage 1 MU attestation rate as well as our initial 2014 Stage 2 MU performance data. We are proud to report that 95.4 percent of our participating providers have successfully attested for MU Stage 1 in 2013. Furthermore, athenaClinicals currently leads the industry in 2014 Stage 2 MU attestations as reported by the Centers of Medicare and Medicaid Services (“CMS”) on June 18, 2014. Per the CMS report of attestations by vendor, athenahealth clients represent 59.2 percent of providers across the U.S. who have successfully attested to Stage 2 of the MU incentive program as of May 31, 2014. We remain confident in our ability to help providers get Medicare payments for “meaningful use of an EHR” through the HITECH Act incentive program and are extending our MU attestation guarantee to clients who are live by December 31, 2014.
athenahealth’s platform integration team is dedicated and focused on building bi-directional clinical data exchange channels with peer EHR systems. In the past quarter alone, there were over 470 million electronic exchanges of patient information between athenaNet users and the rest of the health care supply
7
chain using 127 thousand active interfaces. Committed to advancing the seamless transfer of patient information across care settings, we will continue to leverage our cloud-based software platform, network knowledge, and set of services to deliver better care coordination for patients served across our growing base of providers. For more information on athenahealth’s interoperability initiatives, please visit www.athenahealth.com/interoperability.
Lastly, the new athenaNet experience initiative is on track to be released to the entire client base in early fall. We have been continuously expanding the beta cohort this year and will be using this large beta group to stress test the experience, representing our final step before the launch. As a cloud-based service provider, we continually make improvements informed by network insights and performance to benefit our clients. The new athenaNet experience will provide our clients with a refined look, more intuitive navigation, and a redesigned home page for all users. In addition, a component of the new athenaNet experience is the reimagined provider experience, which makes available both a classic view and a streamlined view of the clinical chart and encounter. The streamlined view strives to reinforce effective delegation, encourage lightweight documentation, and illuminate the patient’s clinical story.
athenaCommunicator service offering
athenaCommunicator is our cloud-based patient communication management service. It entered general availability in 2010 and, at this time, requires adoption of athenaCollector or athenaClinicals.
The athenaCommunicator team continues to make progress on important initiatives aimed at driving patient engagement, improving patient access, and boosting schedule density. Last quarter, we introduced our new population health campaigns which leverage athenaClinicals’ robust, evidence-based quality measures with athenaCommunicator’s GroupCall functionality for seamless patient outreach. Our clients gain from the efficiency of tapping into our quality management engine, making these “pre-packaged” population health campaigns in athenaCommunicator fast, effective, and easy-to-use. These solutions pinpoint gaps in patient care, help with patient outreach for valuable preventive services, and enable the client to easily manage these services at the practice level. Building off the success of the population health campaigns launched last quarter, we introduced the next wave of campaigns in May 2014 consisting of Medicare pelvic examinations, adult annual preventive visits, breast cancer screenings, and diabetes screenings. We presently have nine available population health campaigns with pre-packaged messaging and we remain on track to launch additional population health campaigns in the second half of 2014. While we are still in the early stages of this program, initial results from the campaigns launched last quarter indicate promising outcomes for our clients. For example, athenahealth clients contacted approximately 31,000 patients over the age of 50 who have not had colorectal screenings, prompting them to schedule time with their providers to discuss the cancer screenings. Approximately 15 percent of those patients contacted made appointments for their colorectal cancer screening exams. In another example, our clients contacted approximately 54,000 Medicare patients who have not had their Annual Wellness Visit, prompting them to schedule time with their providers for this annual visit. Approximately 19 percent of those patients contacted made appointments for their annual visits. We look forward to providing further performance metrics as we expand these population health campaigns.
athenaCommunicator network performance metrics were as follows for Q2 2014:
• | Provider adoption rate has increased to 61%, as compared to 60% in Q1 2014 and 43% in Q2 2013. |
• | athenaCommunicator delivered over 55.5 million automated messages during Q2 2014 across our active patient base of over 19.4 million patients. |
8
• | Patient portal adoption has increased by 12% since Q1 2014 to 3.3 million patients registered as of Q2 2014. |
• | athenaCommunicator has collected $19.0 million in self-pay collections during Q2 2014 via the patient portal and our live operator service, an increase of 111% over the Q2 2013 self-pay collections of $9.0 million. |
athenaCoordinator service offerings
Our athenaCoordinator service offerings include athenaCoordinator Core, athenaCoordinator Analytics, and athenaCoordinator Enterprise. athenaCoordinator Core is a cloud-based order transmission service for all receiver types and physicians using athenaClinicals. athenaCoordinator Core entered general availability in 2012. athenaCoordinator Analytics is a cloud-based business intelligence service for health care professionals. athenaCoordinator Analytics has been generally available since 2004 through Anodyne Health Partners, Inc., which athenahealth acquired in October of 2009. athenaCoordinator Enterprise is our cloud-based population health management service designed to enhance physician and patient loyalty by ensuring successful care transitions.
athenaCoordinator Enterprise is what we believe to be the first cloud-based clinical integration and patient access service. This enterprise service combines the power of cloud-based software, knowledge, and services to identify and engage patients in need of care, coordinate their care, and analyze the results of that care across a health system with disparate EHRs and practice management systems. After signing our first two clients, Steward Medical Group and Griffin Hospital in March 2014 and April 2014, respectively, the athenaCoordinator Enterprise team got right to work with these partners to start building out the complete service offering. While implementation and co-development efforts will be rolled out in phases, we have already kicked off the implementations at both Steward Medical Group and Griffin Hospital. The major implementation threads include: 1) secure text messaging services; 2) population health management services; 3) centralized patient access services; 4) network-wide direct scheduling; and 5) network facesheet. We expect both Steward Medical Group and Griffin Hospital to be live by year end. We signed our third athenaCoordinator Enterprise deal with Arise Austin Medical Group in June 2014.
Epocrates service offerings
Epocrates has been recognized for developing the #1 medical application among U.S. physicians for clinical content, practice tools, and health industry engagement at the point of care. Epocrates has established a loyal network of more than one million health care professionals, including approximately 50 percent of U.S. physicians, who routinely use its intuitive solutions to help streamline workflow and improve patient care. For more information, please visit www.epocrates.com. Epocrates was acquired by athenahealth on March 12, 2013.
We remain singularly focused on keeping Epocrates the #1 source of content for helping caregivers make efficient and confident decisions. We bought Epocrates because it is a great service that physicians know and trust, it adds value to the physicians’ work and enables them to make confident and efficient decisions in the moments of care. The proven brand awareness, familiarity, and trust that Epocrates engenders among U.S. physicians was made apparent once again with Epocrates’ ranking as the top medical reference app among U.S. physicians for the fifth consecutive year. Epocrates was once again rated the digital health care leader in terms of medical reference app reach and frequency of use on smartphones, according to Manhattan Research’s 2014 Taking the Pulse® U.S. study. In addition, Epocrates has earned a Net Promoter Score of 68, reflecting a customer satisfaction level equivalent to that at companies like Apple. This net promoter score is a reflection of customer loyalty as well as our hard work and consistent delivery of product stability and functionality. While we are thrilled with this score, we are continuing to invest in product enhancements and the improvement of the overall user experience. In April 2014, we
9
launched a refreshed Epocrates core app on the iPhone with a crisp, simplified iOS7-optimized design. Users now experience a cleaner and more modern Epocrates app. This new aesthetic will also be more cohesive with the new athenaNet experience and secure text messaging experience, both of which will be launched later this year.
We are pleased with the underlying performance and usage metrics for the Epocrates-branded services. As a result of this strong physician engagement, our lite service on-ramp strategy is starting to show signs of success. While we are still early in the process of leveraging the Epocrates user base as a sales channel, our research and development roadmap is on schedule for deploying deeper athenahealth engagement, via the core Epocrates app, to aim to drive more lead generation this year. We are also continuing to explore ways to optimize our performance with our sponsor clients including several new initiatives aimed to make the product more impactful. These initiatives include refreshing the product packaging and pricing to highlight Epocrates’ unique point of care messaging benefits as well as adding new offerings like monograph messaging which we launched in Q1 2014.
Business Development Update
More Disruption Please (“MDP”)
Building on the momentum from last quarter, our MDP team made more progress towards accelerating high value innovation in health care via the cloud. As of Q2 2014, we have 28 technology partners, 51 clinical exchange partners and six ICD-10 partners featured on the athenahealth Marketplace. In addition to adding new partners and capabilities, like medical image exchange and digital check-in, our MDP team recently launched our revenue share program. We introduced the revenue share pricing model to support the operational resources required to grow and scale this program. We believe our MDP program is unique in the industry. First, we run beta programs with each partner to ensure a successful launch to all clients. Second, we guarantee free connectivity to clients using an approved partner solution. And finally, we commit to having interfaces up and running within five business days of the initial request. We are currently in the process of transitioning certain MDP partners offering particular capabilities to a revenue share arrangement and expect to transition these partners by the end of the year. The MDP team will continue to introduce new capabilities and partner solutions throughout 2014. For example, throughput optimization, an upcoming capability on the athenahealth Marketplace, will allow clients to text patients when they are ready to be seen. This allows patients to step away from the waiting room between check-in and intake. We are also expanding the MDP program with the introduction of our accelerator program, an incubator for early stage start-ups to be hosted on the Arsenal campus. Smart Scheduling, the first to participate in the accelerator program, recently moved onto the Arsenal campus and has begun to work with the athenahealth team to help grow and scale its company. Our commitment to innovation remains unchanged, and the athenahealth Marketplace will continue to offer what we believe to be the best-in-breed health care IT solutions to the athenahealth network. To learn more about our MDP program and partnership opportunities and to explore the athenahealth Marketplace, please visit www.athenahealth.com/disruption.
Client Base Discussion
The total number of physicians who have gone live on athenaCollector, our core service offering, is the metric we currently use to define our client base and market share. However, as our client base expands outside the traditional ambulatory market, total active providers—or nodes on our network—will become a more appropriate metric used to define our client base and market share.
During Q2 2014, 80% of all new athenaCollector deals included athenaClinicals, in line with 80% in Q2 2013. 73% of all new athenaCollector deals included athenaCommunicator and athenaClinicals. Additionally, 73% of all new athenaOne deals also included athenaCoordinator Core. The athenaOne rate of 73% in Q2 2014 compares to 68% in Q2 2013. Among “live” (i.e., implemented and active)
10
athenaCollector clients, adoption of athenaClinicals and athenaCommunicator continues to grow rapidly and resulted in continued growth to our installed base across all of our service offerings.
athenahealth Service Offering Adoption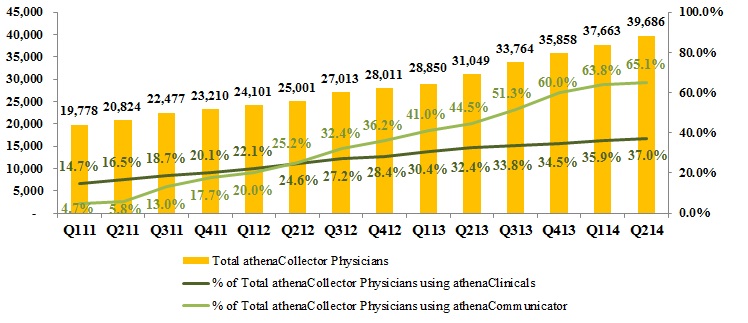
athenaCollector Clients
During Q2 2014, total active physicians on athenaCollector grew by 28% year-over-year, to 39,686. On a sequential basis, we added 2,023 net new active physicians on athenaCollector, versus 2,199 in Q2 2013. Our quarterly net new physician additions may vary widely due to the number and size of clients that go live in a particular quarter. Furthermore, our larger clients can be more complex and take longer to go live, particularly if our clients request a more phased implementation approach. Total active providers on athenaCollector grew by 26% year-over-year, to 55,425. On a sequential basis, we added 2,539 net new active providers on athenaCollector, versus 2,921 in Q2 2013.
athenaClinicals Clients
We continue to experience rapid growth in client adoption of athenaClinicals. Total active physicians live on athenaClinicals grew by 46% year-over-year, to 14,672. On a sequential basis, we added 1,151 net new active physicians on athenaClinicals, versus 1,282 in Q2 2013. This equates to an overall adoption rate of 37% of total athenaCollector physicians, up from 32% in Q2 2013. Total active providers on athenaClinicals grew by 43% year-over-year, to 19,733. On a sequential basis, we added 1,390 net new active providers on athenaClinicals, versus 1,679 in Q2 2013. We expect the athenaClinicals client base to increase over time due to cross-selling within our existing base and growth in the volume of athenaOne deals.
athenaCommunicator Clients
Our athenaCommunicator client base is also growing rapidly. Total active physicians live on athenaCommunicator grew by an impressive 87% year-over-year, to 25,837. On a sequential basis, we added 1,807 net new active physicians on athenaCommunicator, versus 1,991 in Q2 2013. This equates to an overall adoption rate of 65% of total athenaCollector physicians, up from 45% in Q2 2013. Total active providers on athenaCommunicator grew by 81%, to 33,976. On a sequential basis, we added 2,269 net new providers on athenaCommunicator, versus 2,466 in Q2 2013. We expect the athenaCommunicator client base to increase over time due to cross-selling within our existing base and growth in the volume of athenaOne deals.
11
New Deals
On April 17, 2014, we announced that Steward Medical Group (“Steward”) selected athenaCoordinator Enterprise to enable care coordination for its employed providers and their patients. athenahealth and Steward will work together to co-develop and launch our athenaCoordinator Enterprise service. Steward is expected to go live on athenaCoordinator Enterprise by Q4 2014.
On April 17, 2014, we announced that Griffin Hospital (“Griffin”) selected athenaCoordinator Enterprise to advance patient-centered care and coordination initiatives across its community health care network. athenahealth and Griffin will work together to co-develop and launch our athenaCoordinator Enterprise service. Griffin is expected to go live on athenaCoordinator Enterprise by Q4 2014.
On July 15, 2014, we announced that Arise Austin Medical Center (“AAMC”) selected athenaCoordinator Enterprise to advance care coordination for its more than 100-physician network. AAMC is a physician-owned, licensed general acute care hospital that provides a full spectrum of general, surgical, and specialized care in the greater Austin area.
Client Implementations
Our publicly disclosed implementation pipeline includes the following status updates as of July 17, 2014:
• | Children’s Integrated Care Organization went live on athenaCoordinator - Population Health Management in Q2 2014. |
• | Privia Medical Group (~140 physicians, ~154 providers) went live on our full suite of services, athenaOne, in Q2 2014. |
• | Phoebe Physician Group (~192 physicians, ~260 providers) went live on our full suite of services, athenaOne, in Q2 2014. |
• | Hallmark Health is expected to go live on athenaCoordinator - Population Health Management in Q3 2014. |
• | CaroMont Health is expected to go live on athenaCoordinator - Population Health Management in Q3 2014. |
• | Marquette Physician Practices (~200 physicians, ~250 providers) is expected to go live on athenaCollector, athenaCommunicator, and athenaCoordinator Analytics in Q3 2014. |
• | Saint Peter’s Healthcare System (~176 physicians, ~182 providers) is expected to go live on our full suite of services, athenaOne, in Q3 2014. |
• | Summit Medical Group (~300 physicians, ~400 providers) is expected to go live on athenaClinicals and athenaCommunicator in Q3 2014 and on athenaCoordinator - Population Health Management in Q4 2014. |
• | Health Management Associates (~900 physicians, ~1,200 providers), now part of Community Health Systems, is expected to bring the majority of the remaining providers and physicians live on our suite of cloud-based services by means of a phased implementation over the next twelve months. |
• | Ascension Health (over 4,000 providers) continued the phased rollout of athenaCollector, athenaCommunicator, and athenaCoordinator Analytics and brought two waves live in Q2 2014 and another wave live in early July. Two of these three implementation waves also included athenaClinicals. |
• | Hospital Physician Partners (~2,000 providers) is expected to go live on athenaCollector, athenaCommunicator, and athenaCoordinator Analytics by means of a phased implementation. |
Marketing and Selling Discussion
Marketing Update
The athenahealth marketing organization encompasses our growth and sales operations, event and partner marketing, inside sales agents (“ISAs”), advertising, corporate communications, and product
12
marketing teams. This organization executes in-market investments in an effort to generate new business opportunities for athenahealth.
We hosted our biggest and best User Conference in April 2014. Building off of our HIMSS theme of “We Connect Care,” this year’s User Conference theme was “Get Connected.” Our clients who attended the User Conference connected with athenahealth employees, their peers, and the strategies and expert knowledge required to tackle current and future challenges. This event helped us equip our clients with the actionable strategies and skills they need to enhance their patient interactions, optimize their performance and ensure readiness for change. Highlights from our 2014 User Conference are as follows:
• | Almost 1,300 clients attended over 55 sessions at the User Conference |
• | Almost 300 clients participated in our pre-conference athenaClassroom with our athenaCare team |
• | 48 exhibitors, including 22 MDP partners, participated in the User Conference |
• | Christy Turlington Burns was presented the athenaVision award for her work as founder of Every Mother Counts, a campaign to end preventable deaths caused by pregnancy and childbirth around the world |
• | Dr. Allen Gee was presented the client athenaVision award for his work using innovative telemedicine technology to create a virtual practice eliminating geographical barriers to bring high-quality care to patients across the state of Wyoming |
On May 15, 2014, athenahealth announced the release of Jonathan Bush’s book entitled “Where Does It Hurt?: An Entrepreneur’s Guide to Fixing Health Care,” published by The Penguin Group. This book explains how government, doctors, entrepreneurs, and patients can work together to transform the health care experience into what we all want, deserve, and can afford. For more information on “Where Does It Hurt?: An Entrepreneur’s Guide to Fixing Health Care,” please visit http://www.athenahealth.com/jonathan-bush/where-does-it-hurt.php.
Selling Update
The athenahealth sales organization includes all quota-carrying sales representatives, as well as our sales team leaders, channel sales team, and sales training and development organization.
As of June 30, 2014, we have a total of 140 quota-carrying sales representatives, up 18% from last year. Our athenahealth-branded services sales force is currently divided into three groups: the enterprise team, which is dedicated to serving the largest managed care organizations, as well as those with high growth potential; the group team, which is dedicated to medical practices with seven to 150 physicians; and the small group team, which is dedicated to medical practices with one to six physicians. Halfway through the year, bookings for athenahealth-branded services are slightly below plan mostly driven by timing of deals in the enterprise segment. However, the enterprise team has continued to build out its pipeline of deals and remains focused on delivering approximately 50% of our total bookings in 2014.
athenahealth continues to supplement our direct sales force with a growing list of diverse channel partners including medical societies, consultants, health systems, our clients, and medical supply distributors. On May 21, 2014, we announced the expansion of our channel partnership program with our newest partner, Henry Schein. Through this strategic relationship, athenahealth and Henry Schein will jointly market athenahealth’s suite of cloud-based services, athenaOne, to physicians across the U.S. Beyond channels activities, our organizations are also engaged in exploring a variety of connectivity initiatives, including integrating data from our technology platforms and creating enhanced reporting for mutual customers. The athenahealth team will continue to look for additional partnerships that align with our strategic objectives and with our vision to become the leading connectivity platform in health care.
13
Stock-Based Compensation Expense, Amortization of Purchased Intangible Assets, and Reconciliation of Non-GAAP Financial Measures
athenahealth, Inc.
STOCK-BASED COMPENSATION
(Unaudited, in thousands)
Set forth below is a breakout of stock-based compensation impacting the Condensed Consolidated Statements of Income for the three and six months ended June 30, 2014, and 2013:
Three Months Ended June 30, | Six Months Ended June 30, | ||||||||||||||
2014 | 2013 | 2014 | 2013 | ||||||||||||
Stock-based compensation charged to Condensed Consolidated Statements of Income: | |||||||||||||||
Direct operating | $ | 3,222 | $ | 2,047 | $ | 5,818 | $ | 3,764 | |||||||
Selling and marketing | 4,202 | 3,275 | 7,226 | 6,151 | |||||||||||
Research and development | 2,135 | 965 | 3,800 | 2,288 | |||||||||||
General and administrative | 4,655 | 4,017 | 9,721 | 11,759 | |||||||||||
Total stock-based compensation expense | 14,214 | 10,304 | 26,565 | 23,962 | |||||||||||
Amortization of capitalized stock-based compensation related to software development (1) | 481 | 222 | 880 | 378 | |||||||||||
Total | $ | 14,695 | $ | 10,526 | $ | 27,445 | $ | 24,340 | |||||||
(1) | In addition, for the three months ended June 30, 2014, and 2013, $1.0 million and $0.5 million, respectively, of stock-based compensation was capitalized in the line item Capitalized Software Costs, net in the Condensed Consolidated Balance Sheets for which $0.5 million and $0.2 million, respectively, of amortization was included in the line item Depreciation and Amortization in the Condensed Consolidated Statements of Income. For the six months ended June 30, 2014 and 2013, $1.8 million and $0.9 million, respectively, of stock-based compensation was capitalized in the line item Capitalized Software Costs, net in the Condensed Consolidated Balance Sheets for which $0.9 million and $0.4 million, respectively, of amortization was included in the line item Depreciation and Amortization in the Condensed Consolidated Statements of Income. |
athenahealth, Inc.
AMORTIZATION OF PURCHASED INTANGIBLE ASSETS
(Unaudited, in thousands)
Set forth below is a breakout of amortization of purchased intangible assets impacting the Condensed Consolidated Statements of Income for the three and six months ended June 30, 2014, and 2013:
Three Months Ended June 30, | Six Months Ended June 30, | ||||||||||||||
Amortization of purchased intangible assets allocated to: | 2014 | 2013 | 2014 | 2013 | |||||||||||
Direct operating | $ | 2,716 | $ | 2,405 | $ | 6,655 | $ | 4,145 | |||||||
Selling and marketing | 5,820 | 2,421 | 8,971 | 2,421 | |||||||||||
Total amortization of purchased intangible assets | $ | 8,536 | $ | 4,826 | $ | 15,626 | $ | 6,566 | |||||||
14
athenahealth, Inc.
RECONCILIATION OF NON-GAAP FINANCIAL MEASURES
TO COMPARABLE GAAP MEASURES
(Unaudited, in thousands, except per share amounts)
The following is a reconciliation of the non-GAAP financial measures used by us to describe our financial results determined in accordance with accounting principles generally accepted in the United States of America (“GAAP”). An explanation of these measures is also included below under the heading “Explanation of Non-GAAP Financial Measures.”
While management believes that these non-GAAP financial measures provide useful supplemental information to investors regarding the underlying performance of our business operations, investors are reminded to consider these non-GAAP measures in addition to, and not as a substitute for, financial performance measures prepared in accordance with GAAP. In addition, it should be noted that these non-GAAP financial measures may be different from non-GAAP measures used by other companies, and management may utilize other measures to illustrate performance in the future. Non-GAAP measures have limitations in that they do not reflect all of the amounts associated with our results of operations as determined in accordance with GAAP.
Please note that these figures may not sum exactly due to rounding.
Non-GAAP Adjusted Gross Margin
Set forth below is a presentation of our “Non-GAAP Adjusted Gross Profit” and “Non-GAAP Adjusted Gross Margin,” which represents Non-GAAP Adjusted Gross Profit as a percentage of total revenue.
(unaudited, in thousands) | Three Months Ended | Six Months Ended | |||||||||||||
June 30, | June 30, | ||||||||||||||
2014 | 2013 | 2014 | 2013 | ||||||||||||
Total revenue | $ | 185,922 | $ | 146,301 | $ | 348,957 | $ | 271,897 | |||||||
Direct operating expense | 74,774 | 59,390 | 146,922 | 112,575 | |||||||||||
Total revenue less direct operating expense | 111,148 | 86,911 | 202,035 | 159,322 | |||||||||||
Add: Stock-based compensation allocated to direct operating expense | 3,222 | 2,047 | 5,818 | 3,764 | |||||||||||
Add: Amortization of purchased intangible assets allocated to direct operating expense | 2,716 | 2,405 | 6,655 | 4,145 | |||||||||||
Non-GAAP Adjusted Gross Profit | $ | 117,086 | $ | 91,363 | $ | 214,508 | $ | 167,231 | |||||||
Non-GAAP Adjusted Gross Margin | 63.0 | % | 62.4 | % | 61.5 | % | 61.5 | % | |||||||
15
Non-GAAP Adjusted EBITDA
Set forth below is a reconciliation of our “Non-GAAP Adjusted EBITDA” and “Non-GAAP Adjusted EBITDA Margin,” which represents Non-GAAP Adjusted EBITDA as a percentage of total revenue.
(unaudited, in thousands) | Three Months Ended | Six Months Ended | |||||||||||||
June 30, | June 30, | ||||||||||||||
2014 | 2013 | 2014 | 2013 | ||||||||||||
Total Revenue | $ | 185,922 | $ | 146,301 | $ | 348,957 | $ | 271,897 | |||||||
GAAP net loss | (2,162 | ) | (12,421 | ) | (10,217 | ) | (11,721 | ) | |||||||
Add: (Benefit) from provision for income taxes | (739 | ) | 7,313 | (5,221 | ) | (5,370 | ) | ||||||||
Add: Total other expense | 1,281 | 938 | 2,717 | 1,048 | |||||||||||
Add: Stock-based compensation expense | 14,214 | 10,304 | 26,565 | 23,962 | |||||||||||
Add: Depreciation and amortization | 15,186 | 11,107 | 29,435 | 19,448 | |||||||||||
Add: Amortization of purchased intangible assets | 8,536 | 4,826 | 15,626 | 6,566 | |||||||||||
Add: Integration and transaction costs | — | 2,220 | — | 6,014 | |||||||||||
Add: Non-tax deductible transaction costs | — | 244 | — | 2,159 | |||||||||||
Less: Gain on early termination of lease | — | (2,468 | ) | — | (2,468 | ) | |||||||||
Non-GAAP Adjusted EBITDA | $ | 36,316 | $ | 22,063 | $ | 58,905 | $ | 39,638 | |||||||
Non-GAAP Adjusted EBITDA Margin | 19.5 | % | 15.1 | % | 16.9 | % | 14.6 | % | |||||||
Non-GAAP Adjusted Operating Income
Set forth below is a reconciliation of our “Non-GAAP Adjusted Operating Income” and “Non-GAAP Adjusted Operating Income Margin,” which represents Non-GAAP Adjusted Operating Income as a percentage of total revenue.
(unaudited, in thousands) | Three Months Ended | Six Months Ended | |||||||||||||
June 30, | June 30, | ||||||||||||||
2014 | 2013 | 2014 | 2013 | ||||||||||||
Total revenue | $ | 185,922 | $ | 146,301 | $ | 348,957 | $ | 271,897 | |||||||
GAAP net loss | (2,162 | ) | (12,421 | ) | (10,217 | ) | (11,721 | ) | |||||||
Add: (Benefit) from provision for income taxes | (739 | ) | 7,313 | (5,221 | ) | (5,370 | ) | ||||||||
Add: Total other expense | 1,281 | 938 | 2,717 | 1,048 | |||||||||||
Add: Stock-based compensation expense | 14,214 | 10,304 | 26,565 | 23,962 | |||||||||||
Add: Amortization of capitalized stock-based compensation related to software development | 481 | 222 | 880 | 378 | |||||||||||
Add: Amortization of purchased intangible assets | 8,536 | 4,826 | 15,626 | 6,566 | |||||||||||
Add: Integration and transaction costs | — | 2,220 | — | 6,014 | |||||||||||
Add: Non-tax deductible transaction costs | — | 244 | — | 2,159 | |||||||||||
Less: Gain on early termination of lease | — | (2,468 | ) | — | (2,468 | ) | |||||||||
Non-GAAP Adjusted Operating Income | $ | 21,611 | $ | 11,178 | $ | 30,350 | $ | 20,568 | |||||||
Non-GAAP Adjusted Operating Income Margin | 11.6 | % | 7.6 | % | 8.7 | % | 7.6 | % | |||||||
16
Non-GAAP Adjusted Net Income (Loss)
Set forth below is a reconciliation of our “Non-GAAP Adjusted Net Income (Loss)” and “Non-GAAP Adjusted Net Income (Loss) per Diluted Share.”
(unaudited, in thousands) | Three Months Ended | Six Months Ended | |||||||||||||
June 30, | June 30, | ||||||||||||||
2014 | 2013 | 2014 | 2013 | ||||||||||||
GAAP net loss | $ | (2,162 | ) | $ | (12,421 | ) | $ | (10,217 | ) | $ | (11,721 | ) | |||
Add: Stock-based compensation expense | 14,214 | 10,304 | 26,565 | 23,962 | |||||||||||
Add: Amortization of capitalized stock-based compensation related to software development | 481 | 222 | 880 | 378 | |||||||||||
Add: Amortization of purchased intangible assets | 8,536 | 4,826 | 15,626 | 6,566 | |||||||||||
Add: Integration and transaction costs | — | 2,220 | — | 6,014 | |||||||||||
Less: Gain on early termination of lease | — | (2,468 | ) | — | (2,468 | ) | |||||||||
Sub-total of tax deductible items | 23,231 | 15,104 | 43,071 | 34,452 | |||||||||||
Less: Tax impact of tax deductible items (1) | (9,292 | ) | (6,042 | ) | (17,228 | ) | (13,781 | ) | |||||||
Add: Non-tax deductible transaction costs | — | 244 | — | 2,159 | |||||||||||
Add: Tax impact resulting from applying non-GAAP tax rate (2) | 421 | — | 954 | — | |||||||||||
Non-GAAP Adjusted Net Income (Loss) | $ | 12,198 | $ | (3,115 | ) | $ | 16,580 | $ | 11,109 | ||||||
Weighted average shares - diluted | 37,860 | 36,760 | 37,673 | 36,598 | |||||||||||
Non-GAAP Adjusted Net Income (Loss) per Diluted Share | $ | 0.32 | $ | (0.08 | ) | $ | 0.44 | $ | 0.30 | ||||||
(1) | Tax impact calculated using a statutory tax rate of 40%. |
(2) | Represents adjusting the GAAP net loss at a non-GAAP tax rate of 40%. For 2014, we are using a non-GAAP tax rate of 40% to normalize the tax impact to our Non-GAAP Adjusted Net Income (Loss) per Diluted Share based on the fact that a relatively small change in pre-tax GAAP income (loss) could result in a volatile GAAP effective tax rate. If this approach had been used for the three months ended June 30, 2013, the tax impact from applying a non-GAAP tax rate would have been $9,259 and our Non-GAAP Adjusted Net Income per Diluted Share would have been $0.17, or an increase of $0.25. For the six months ended June 30, 2013, the tax impact from applying a non-GAAP tax rate would have been $603 and our Non-GAAP Adjusted Net Income per Diluted Share would have been $0.32, or an increase of $0.02. |
17
(unaudited, in thousands) | Three Months Ended | Six Months Ended | |||||||||||||
June 30, | June 30, | ||||||||||||||
2014 | 2013 | 2014 | 2013 | ||||||||||||
GAAP net loss per share - diluted | $ | (0.06 | ) | $ | (0.34 | ) | $ | (0.27 | ) | $ | (0.32 | ) | |||
Add: Stock-based compensation expense | 0.38 | 0.28 | 0.71 | 0.65 | |||||||||||
Add: Amortization of capitalized stock-based compensation related to software development | 0.01 | 0.01 | 0.02 | 0.01 | |||||||||||
Add: Amortization of purchased intangible assets | 0.23 | 0.13 | 0.41 | 0.18 | |||||||||||
Add: Integration and transaction costs | — | 0.06 | — | 0.16 | |||||||||||
Less: Gain on early termination of lease | — | (0.07 | ) | — | (0.07 | ) | |||||||||
Sub-total of tax deductible items | 0.62 | 0.41 | 1.14 | 0.94 | |||||||||||
Less: Tax impact of tax deductible items (1) | (0.25 | ) | (0.16 | ) | (0.46 | ) | (0.38 | ) | |||||||
Add: Non-tax deductible transaction costs | — | 0.01 | — | 0.06 | |||||||||||
Add: Tax impact resulting from applying non-GAAP tax rate (2) | 0.01 | — | 0.03 | — | |||||||||||
Non-GAAP Adjusted Net Income (Loss) per Diluted Share | $ | 0.32 | $ | (0.08 | ) | $ | 0.44 | $ | 0.30 | ||||||
Weighted average shares - diluted | 37,860 | 36,760 | 37,673 | 36,598 | |||||||||||
(1) | Tax impact calculated using a statutory tax rate of 40%. |
(2) | Represents adjusting the GAAP net loss at a non-GAAP tax rate of 40%. For 2014, we are using a non-GAAP tax rate of 40% to normalize the tax impact to our Non-GAAP Adjusted Net Income (Loss) per Diluted Share based on the fact that a relatively small change in pre-tax GAAP income (loss) could result in a volatile GAAP effective tax rate. If this approach had been used for the three months ended June 30, 2013, the tax impact from applying a non-GAAP tax rate would have been $9,259 and our Non-GAAP Adjusted Net Income per Diluted Share would have been $0.17, or an increase of $0.25. For the six months ended June 30, 2013, the tax impact from applying a non-GAAP tax rate would have been $603 and our Non-GAAP Adjusted Net Income per Diluted Share would have been $0.32, or an increase of $0.02. |
18
Explanation of Non-GAAP Financial Measures
We report our financial results in accordance with accounting principles generally accepted in the United States of America, or GAAP. However, management believes that, in order to properly understand our short-term and long-term financial and operational trends, investors may wish to consider the impact of certain non-cash or non-recurring items, when used as a supplement to financial performance measures in accordance with GAAP. These items result from facts and circumstances that vary in frequency and impact on continuing operations. Management also uses results of operations before such items to evaluate the operating performance of athenahealth and compare it against past periods, make operating decisions, and serve as a basis for strategic planning. These non-GAAP financial measures provide management with additional means to understand and evaluate the operating results and trends in our ongoing business by eliminating certain non-cash expenses and other items that management believes might otherwise make comparisons of our ongoing business with prior periods more difficult, obscure trends in ongoing operations, or reduce management’s ability to make useful forecasts. Management believes that these non-GAAP financial measures provide additional means of evaluating period-over-period operating performance. In addition, management understands that some investors and financial analysts find this information helpful in analyzing our financial and operational performance and comparing this performance to our peers and competitors.
Management defines “Non-GAAP Adjusted Gross Profit” as total revenue, less direct operating expense, plus (1) stock-based compensation expense allocated to direct operating expense and (2) amortization of purchased intangible assets allocated to direct operating expense, and “Non-GAAP Adjusted Gross Margin” as Non-GAAP Adjusted Gross Profit as a percentage of total revenue. Management considers these non-GAAP financial measures to be important indicators of our operational strength and performance of our business and a good measure of our historical operating trends. Moreover, management believes that these measures enable investors and financial analysts to closely monitor and understand changes in our ability to generate income from ongoing business operations.
Management defines “Non-GAAP Adjusted EBITDA” as the sum of GAAP net income (loss) before provision for (benefit) from income taxes, total other (income) expense, stock-based compensation expense, depreciation and amortization, amortization of purchased intangible assets, integration costs, transaction costs, and gain on early termination of lease and “Non-GAAP Adjusted EBITDA Margin” as Non-GAAP Adjusted EBITDA as a percentage of total revenue. Management defines “Non-GAAP Adjusted Operating Income” as the sum of GAAP net income (loss) before provision for (benefit) from income taxes, total other (income) expense, stock-based compensation expense, amortization of capitalized stock-based compensation related to software development, amortization of purchased intangible assets, integration costs, transaction costs, and gain on early termination of lease and “Non-GAAP Adjusted Operating Income Margin” as Non-GAAP Adjusted Operating Income as a percentage of total revenue. Management defines “Non-GAAP Adjusted Net Income (Loss)” as the sum of GAAP net income (loss) before stock-based compensation expense, amortization of capitalized stock-based compensation related to software development, amortization of purchased intangible assets, integration costs, transaction costs, and gain on early termination of lease and any tax impact related to these preceding items, and an adjustment to the tax provision for the non-GAAP tax rate and “Non-GAAP Adjusted Net Income (Loss) per Diluted Share” as Non-GAAP Adjusted Net Income (Loss) divided by weighted average diluted shares outstanding. Management considers all of these non-GAAP financial measures to be important indicators of our operational strength and performance of our business and a good measure of our historical operating trends, in particular the extent to which ongoing operations impact our overall financial performance.
19
Management excludes or adjusts each of the items identified below from the applicable non-GAAP financial measure referenced above for the reasons set forth with respect to that excluded item:
• | Stock-based compensation expense and amortization of capitalized stock-based compensation related to software development — excluded because these are non-cash expenditures that management does not consider part of ongoing operating results when assessing the performance of our business, and also because the total amount of the expenditure is partially outside of our control because it is based on factors such as stock price, volatility, and interest rates, which may be unrelated to our performance during the period in which the expenses are incurred. |
• | Amortization of purchased intangible assets — purchased intangible assets are amortized over their estimated useful lives and generally cannot be changed or influenced by management after the acquisition. Accordingly, this item is not considered by management in making operating decisions. Management does not believe such charges accurately reflect the performance of our ongoing operations for the period in which such charges are incurred. |
• | Integration costs — integration costs are the severance payments and retention bonuses for certain employees relating to the Epocrates acquisition. Accordingly, management believes that such expenses do not have a direct correlation to future business operations, and therefore, these costs are not considered by management in making operating decisions. Management does not believe such charges accurately reflect the performance of our ongoing operations for the period in which such charges are incurred. |
• | Transaction costs — transaction costs are non-recurring costs related to specific transactions. Accordingly, management believes that such expenses do not have a direct correlation to future business operations, and therefore, these costs are not considered by management in making operating decisions. Management does not believe such charges accurately reflect the performance of our ongoing operations for the period in which such charges are incurred. |
• | Gain on early termination of lease — Gain on early termination of lease was a non-recurring gain related to the early termination of the Arsenal on the Charles lease. Accordingly, this gain was not considered by management in making operating decisions, and management believes that this gain does not have a direct correlation to future business operations. Management does not believe such gain accurately reflects the performance of our ongoing operations for the period in which such gain was recorded. |
• | Non-GAAP tax rate — For 2014, we are using a non-GAAP tax rate of 40% to normalize the tax impact to our Non-GAAP Adjusted Net Income (Loss) per Diluted Share based on the fact that a relatively small change in pre-tax GAAP income (loss) could result in a volatile GAAP effective tax rate. |
20
Supplemental Metrics and Definitions
Fiscal Year 2013 | Fiscal Year 2014 | ||||||||||||||
Q1 | Q2 | Q3 | Q4 | Q1 | Q2 | ||||||||||
Client Base | |||||||||||||||
Total Physicians on athenaCollector | 28,850 | 31,049 | 33,764 | 35,858 | 37,663 | 39,686 | |||||||||
Total Providers on athenaCollector | 40,937 | 43,858 | 47,195 | 50,212 | 52,886 | 55,425 | |||||||||
Total Physicians on athenaClinicals | 8,776 | 10,058 | 11,401 | 12,388 | 13,521 | 14,672 | |||||||||
Total Providers on athenaClinicals | 12,139 | 13,818 | 15,483 | 16,805 | 18,343 | 19,733 | |||||||||
Total Physicians on athenaCommunicator | 11,840 | 13,831 | 17,330 | 21,516 | 24,030 | 25,837 | |||||||||
Total Providers on athenaCommunicator | 16,296 | 18,762 | 23,024 | 28,360 | 31,707 | 33,976 | |||||||||
Client Performance | |||||||||||||||
Net Promoter Score (1) | n/a | n/a | n/a | n/a | 44.7 | 41.2 | |||||||||
Client Days in Accounts Receivable (“DAR”) | 37.6 | 37.0 | 38.4 | 38.0 | 41.1 | 39.0 | |||||||||
First Pass Resolution (“FPR”) Rate | 93.9 | % | 94.2 | % | 94.1 | % | 93.9 | % | 93.5 | % | 93.7 | % | |||
Electronic Remittance Advice (“ERA”) Rate | 81.8 | % | 82.8 | % | 82.0 | % | 83.3 | % | 82.3 | % | 82.6 | % | |||
Total Claims Submitted | 20,732,485 | 21,691,357 | 22,903,118 | 25,435,690 | 25,785,710 | 28,177,665 | |||||||||
Total Client Collections ($) | 2,566,960,419 | 2,836,765,406 | 2,974,736,918 | 3,285,027,602 | 3,172,115,234 | 3,679,375,661 | |||||||||
Total Working Days | 61 | 64 | 64 | 62 | 61 | 64 | |||||||||
Employees | |||||||||||||||
Direct | 1,426 | 1,438 | 1,460 | 1,533 | 1,573 | 1,633 | |||||||||
Selling & Marketing | 426 | 455 | 464 | 473 | 509 | 556 | |||||||||
Research & Development | 526 | 587 | 651 | 677 | 717 | 812 | |||||||||
General & Administrative | 275 | 278 | 290 | 284 | 289 | 311 | |||||||||
Total Employees | 2,652 | 2,758 | 2,865 | 2,966 | 3,088 | 3,312 | |||||||||
Quota Carrying Sales Force | |||||||||||||||
Total Quota Carrying Sales Representatives | 114 | 119 | 120 | 126 | 133 | 140 | |||||||||
(1) Net Promoter Score is a new metric for 2014
Supplemental Metrics Definitions | |
Client Base | |
Total Physicians on athenaCollector | The number of physicians that have rendered a service which generated a medical claim that was billed during the last 91 days on the athenaCollector platform. Examples of physicians include Medical Doctors (“MDs”) and Doctors of Osteopathic Medicine (“DOs”). |
Total Providers on athenaCollector | The number of providers, including physicians, that have rendered a service which generated a medical claim that was billed during the last 91 days on the athenaCollector platform. Examples of non-physician providers are Nurse Practitioners (“NPs”) and Registered Nurses (“RNs”). |
Total Physicians on athenaClinicals | The number of physicians that have rendered a service through the athenaClinicals platform which generated a medical claim that was billed during the last 91 days on the athenaCollector platform. |
Total Providers on athenaClinicals | The number of providers, including physicians, that have rendered a service through the athenaClinicals platform which generated a medical claim that was billed during the last 91 days on the athenaCollector platform. |
Total Physicians on athenaCommunicator | The number of physicians that have rendered a service which generated a medical claim that was billed during the last 91 days on the athenaCollector platform and whose practice is actively using athenaCommunicator. |
Total Providers on athenaCommunicator | The number of providers, including physicians, that have rendered a service which generated a medical claim that was billed during the last 91 days on the athenaCollector platform and whose practice is actively using athenaCommunicator. |
Client Performance | |
Net Promoter Score | The percentage of clients who chose 9 or 10 ( defined as promoters) less the percentage of clients who chose 0 through 6 ( defined as detractors) on a scale of 1 to 10 when asked if they would recommend athenahealth to a trusted friend or colleague. These responses are generated from a "client listening" survey that the Company conducts for its client base twice per year. |
Client Days in Accounts Receivable (“DAR”) | The average number of days that it takes outstanding balances on claims to be resolved, e.g. paid, for clients on athenaCollector. Clients that have been live less than 90 days are excluded, as well as clients who are terminating services. |
First Pass Resolution (“FPR”) Rate | Approximates the percentage of primary claims that are favorably adjudicated and closed after a single submission during the period. Currently, the FPR rate is calculated on a monthly basis, and certain practices are excluded (e.g. those that have been live for less than 90 days). |
Electronic Remittance Advice (“ERA”) Rate | Remittance refers to the information about payments (a/k/a explanations of benefits) received from insurance companies during the period. The ERA rate reflects the percentage of total charges that were posted using electronic remittance. |
Total Claims Submitted | The number of claims billed through athenaNet during the period. |
Total Client Collections | The dollar value of collections posted on behalf of clients during the period. |
Total Working Days | The total number of days during the quarter minus weekends and U.S. Post Office holidays. |
Employees | |
Direct | The total number of full time equivalent individuals (“FTEs”) employed by the Company to support its service operations as of quarter end. This team includes production systems, enrollment services, paper claim submission, claim resolution, clinical operations, professional services, account management, and client services. |
Selling & Marketing | The total number of FTEs employed by the Company to support its sales and marketing efforts as of quarter end. This team includes sales representatives, business development staff and the marketing team. |
Research & Development | The total number of FTEs employed by the Company to support its research and development efforts as of quarter end. This team includes product development and product management. |
General & Administrative | The total number of FTEs employed by the Company to support its general and administrative functions as of quarter end. This team includes finance, human resources, compliance, learning and development, internal audit, corporate technology, recruiting, facilities, and legal. |
Total Employees | The total number of FTEs employed by the Company as of quarter end. This number excludes interns and seasonal employees. |
Corporate Scorecard Metrics Definitions | |
Stability | |
Voluntary Turnover | A quarterly average of the number of voluntary terminations divided by starting headcount. Voluntary turnover excludes employees on action plans or employees on counseling out plans. |
Corporate Citizenship | Percentage of compliance tasks that are met within the deadline. |
Employee Engagement | Quarterly engagement survey results for employees. |
Performance | |
Total Automation Rate | Percentage of major revenue cycle management, clinicals and patient statement transactions that were sent or received in a structured electronic format. The Total Automation Rate definition changed from 2013 and the metric results may not be comparable. |
Net On-boarding Success | This metric calculates net on-boarding success which represents the number of providers added to athenaClinicals that are not considered stragglers in their fourth week post go-live. Providers are categorized as either champions, neutrals, or stragglers based on several key performance metrics including same day encounter close rate, provider documentation time, and the percentage of encounters documented during the patient visit. |
Patient Full Registration | The percentage of patients in the current panel (claims created in the last 18 months) with complete patient registration information including driver's license, insurance card and confirmed eligibility. |
Satisfaction | |
Net Promoter Score | The percentage of clients who chose 9 or 10 ( defined as promoters) less the percentage of clients who chose 0 through 6 ( defined as detractors) on a scale of 1 to 10 when asked if they would recommend athenahealth to a trusted friend or colleague. These responses are generated from a “client listening” survey that the Company conducts for its client base twice per year. |
Days of Client Work | The outstanding work that clients have in our clinicals and revenue cycle offerings. For clinicals, the total stock of work on the clinicals dashboard divided by average daily inflow of tasks. For revenue cycle, the days in accounts receivable relating to work that needs to be resolved by the client. Both clinicals and revenue cycle are weighted at 50%. |
Provider Documentation Time per Appointment | The average number of minutes athenaClinicals providers spend on the computer documenting the exam and orders for each appointment. Providers that have been live less than 90 days are excluded. |
Minutes per RVU | Total minutes spent within athenaCollector webpages based on weblogs divided by RVU’s posted. |
Financial | |
Bookings | The annualized value of deals sold. |
Total Revenue | Total consolidated revenue. |
Non-GAAP Adjusted Operating Income | Total non-GAAP adjusted operating income. |
# of Physicians on the Network | Active physicians in the last 90 days on Epocrates and rendering physicians live on athenaNet. Physicians live on athenaNet is defined as the number of physicians that have rendered a service which generated a medical claim that was billed during the last 91 days on the athenaCollector platform. Examples of physicians include Medical Doctors (“MDs”) and Doctors of Osteopathic Medicine (“DOs”). |