As filed with the Securities and Exchange Commission on June 4, 2013
|
|
|
|
|
|
|
UNITED STATES |
||||
|
SECURITIES AND EXCHANGE COMMISSION |
||||
|
Washington, D.C. 20549 |
||||
|
|
||||
|
FORM N-CSR |
||||
|
|
|
|
|
|
|
CERTIFIED SHAREHOLDER REPORT OF
REGISTERED |
||||
|
|
|
|
|
|
|
Investment Company Act file number 811-10267 |
||||
|
|
|
|
|
|
|
|
|
GPS Funds I |
|
|
|
|
|
|
||
|
(Exact name of registrant as specified in charter) |
||||
|
|
|
|
|
|
|
2300 Contra Costa Boulevard, Suite 600 |
||||
|
|
Pleasant Hill, CA 94523-3967 |
|
||
|
|
|
|
||
|
(Address of principal executive offices) (Zip code) |
||||
|
|
|
|
|
|
|
Starr E. Frohlich |
||||
|
Genworth Financial Wealth Management, Inc. |
||||
|
2300 Contra Costa Boulevard, Suite 600 |
||||
|
|
Pleasant Hill, CA 94523-3967 |
|
||
|
|
|
|
||
|
(Name and address of agent for service) |
||||
|
|
|
|
|
|
|
|
|
800-664-5345 |
|
|
|
|
|
|||
|
Registrant’s telephone number, including area code |
||||
Date of fiscal year end: March 31, 2013
Date of reporting period: April 1, 2012 through March 31, 2013
Item 1. Reports to Stockholders.
|
|
|
|
|
|
|
|
|
GuideMarkSM Funds |
|
|
|
|
|
GuidePathSM Funds |
|
|
|
|
|
|
|
|
|
|
|
Investment Advisor |
|
|
|
|
|
Genworth Financial Wealth Management, Inc. |
|
|
|
|
|
|
|
|
|
|
|
|
|
|
|
|
ANNUAL REPORT |
|
|
|
|
|
|
|
|
|
|
|
|
|
|
|
|
|
March 31, 2013 |
|
|
|
|
|
|
|
|
|
|
|
|
|
||
|
|
|
|
|
|
|
|
GUIDEMARKSM LARGE CAP GROWTH FUND |
|
|
|
|
|
|
|
|
|
|
|
GUIDEMARKSM LARGE CAP VALUE FUND |
|
|
|
|
|
|
|
|
|
|
|
GUIDEMARKSM SMALL/MID CAP CORE FUND |
|
|
|
|
|
|
|
|
|
|
|
GUIDEMARKSM WORLD EX-US FUND |
|
|
|
|
|
|
|
|
|
|
|
GUIDEMARKSM OPPORTUNISTIC EQUITY FUND |
|
|
|
|
|
|
|
|
|
|
|
GUIDEMARKSM GLOBAL REAL RETURN FUND |
|
|
|
|
|
|
|
|
|
|
|
GUIDEMARKSM CORE FIXED INCOME FUND |
|
|
|
|
|
|
|
|
|
|
|
GUIDEMARKSM TAX-EXEMPT FIXED INCOME FUND |
|
|
|
|
|
|
|
|
|
|
|
GUIDEMARKSM OPPORTUNISTIC FIXED INCOME FUND |
|
|
|
|
|
|
|
|
|
|
|
GUIDEPATHSM STRATEGIC ASSET ALLOCATION FUND |
|
|
|
|
|
|
|
|
|
|
|
GUIDEPATHSM TACTICAL CONSTRAINEDSM ASSET ALLOCATION FUND |
|
|
|
|
|
|
|
|
|
|
|
GUIDEPATHSM TACTICAL UNCONSTRAINEDSM ASSET ALLOCATION FUND |
|
|
|
|
|
|
|
|
|
|
|
GUIDEPATHSM ABSOLUTE RETURN ASSET ALLOCATION FUND |
|
|
|
|
|
|
|
|
|
|
|
GUIDEPATHSM MULTI-ASSET INCOME ASSET ALLOCATION FUND |
|
|
|
|
|
|
|
|
|
|
|
GUIDEPATHSM FIXED INCOME ALLOCATION FUND |
|
|
|
|
|
|
|
|
|
|
|
GUIDEPATHSM ALTEGRIS® MULTI-STRATEGY ALTERNATIVE ALLOCATION FUND |
|
|
|
|
|
|
|
|
|
|
|
|
|
||
May 30, 2013
Dear Shareholder:
Enclosed is the Annual Report for the GuideMarkSM and GuidePathSM Funds covering the period April 1, 2012 through March 31, 2013 (the “period”).
Market Review
Despite a weak start to the period, the past 12 months saw equity markets rally, with the US markets achieving the strongest returns. Concerns over European debt issues, a slowdown in China, and weaker than expected US economic data reported at the start of the period were quickly overshadowed by central bank action. The market drove ahead based on the pledge by Mario Draghi from the European Central Bank to do “whatever it takes” to support the Eurozone, and the continuation of quantitative easing by the Federal Reserve, including the announcement of an open-ended policy of Fed support. Even the potential fiscal cliff in the United States at the end of 2012 did not deter the US equity market from its upward climb to a new record high by the end of March.
Within the US equity market, the more stable and defensively oriented sectors of Telecommunications, Healthcare and Consumer Staples all provided returns exceeding 20%1 for the reporting year ended March 31, lifting the value indices. Technology was the only sector that saw a negative return for the 12-month period, largely impacted by the performance of Apple, which fell by more than 45% from its high of over $700 a share in September 2012 to below $445 a share at the end of March 2013.
Small capitalization companies outperformed their larger capitalization counterparts for the 12-month period, with the Russell 2000 Index returning 16.3%, while the Russell 1000 Index rose 14.4%. Smaller capitalization equities were aided by investor risk-taking in view of the market’s resiliency and improving economic data within the United States.
The international markets, while providing positive returns, trailed the domestic markets once currency effects were considered.2 The MSCI All Country World Index (ACWI) ex-US returned 13.5% in local currency terms, which was in line with the return of the S&P 500® at 14%. However, when taking into account the strength of the US dollar, which rallied more than 5% for the 12-month period, the MSCI ACWI ex-US returned 8.9% in dollar terms. While the headlines out of Europe brought new concerns that weighed on the developed market indices, the emerging markets were surprisingly weak, given the risk-taking appetite of investors, as the MSCI Emerging Markets Index returned just 2.3% for the 12-month period. A general slowing of economic growth across the emerging market countries, alongside central bank action to curb inflation, gave investors cause for concern. Globally, dividend paying securities performed well, with the MSCI World High Dividend Index up 16.9% for the 12-month period, benefitting from the strength seen from the more defensive sectors that typically provide a stable dividend.
The key components of real asset exposure saw mixed results over the period. Commodities and global natural resources3 were both in negative territory for the full period, despite a strong third quarter in 2012. Both sectors were tempered by increased supply and a general global economic slowdown giving rise to uncertain global growth prospects. Gold, as measured by gold perpetual futures contracts4, saw its biggest six-month decline in 15 years during the period, when it lost 10.1%. REITs saw strong returns and, unlike the equity markets, international REITs saw stronger returns than domestic REITs over the 12-month period. The Dow Jones Global ex-US Select REIT index was up 26.7%, while the FTSE NAREIT All Equity Index was up 17.1% over the 12 months, reversing the trend seen in prior periods. The Barclays US TIPS Index also produced a positive return for the 12 months, up 5.7%, with most of the strength coming in the first two months of the period as the sector benefited from the flight-to-safety.
The broad fixed income markets trailed equities and, similar to the trend seen in equities, the domestic markets fared better than international and emerging markets. The Barclays US Aggregate Bond Index returned 3.8% for the period, lifted by corporate credit, with investors’ risk appetites returning as concerns about the global economic slowdown eased. Spread compression in the credit markets boosted the returns of corporate bonds, with the lower credit quality securities seeing the greatest benefit based on strong momentum. The demand for income pushed yields on high yield bonds down to around 6% during the first quarter of 2013, below the long-term average of 8.4%.5 The municipal market outperformed the taxable fixed income market over the period, with the Barclays Municipal Bond Index returning 5.3% for the 12 months. Strong demand for municipal securities, given concerns about higher tax rates and lower supply due to limited issuance in the municipal market, drove municipal bond prices higher.
Currency impacts, with the significant rally in the US dollar, took their toll on the international fixed income markets, although emerging markets fared better than developed markets over the full 12-month period. In local currency terms, Asian and European fixed income markets, as defined by the Barclays Euro Aggregate and Barclays Asia Pacific Aggregate Bond Indices, provided stronger returns than the US fixed income markets. However, once converted into US-dollar terms, international bonds underperformed US fixed income for the 12-month period. Emerging market bonds fared better as policymakers were in better stead, with less debt and more levers to pull to combat the global slowdown and growing inflation concerns. The Barclays Emerging Market USD Aggregate Bond Index was up 10.2% for the 12-month period, outpacing the US domestic fixed income market by over 6%.
GuideMark and GuidePath Fund Review
While the markets continued to react to central bank announcements and actions, some degree of normalcy returned, with fundamentals starting to matter again. Fundamentally driven markets provide an environment where active security selection typically is rewarded, and this is the key driver of performance for the GuideMark Funds. Most of the GuideMark Funds provided returns that were generally in line with, or better than their benchmarks. The two exceptions were the large cap equity funds, where active security selection within the industry was challenged, and over 60% of large cap equity managers trailed their benchmarks in 20126. The more opportunistic funds within the fund family had the best relative returns, as their flexible approaches allowed them to take advantage of non-benchmark exposures.
Due to their global approach and therefore lack of US concentration, the GuidePath Funds were challenged given the strength of the domestic markets over the 12-month period. The strengthening dollar saw the S&P 500® outperform the MSCI ACWI ex-US by over 5%. Similar to the GuideMark Funds, the GuidePath Funds that had greater flexibility in their asset allocations or took greater exposure to opportunistically managed mutual funds tended to reap rewards. However, use of the GuideMark Funds for large cap equity exposures within the GuidePath Funds tempered returns.
Looking Ahead
With the S&P 500 reaching a record high on the last trading day of March 2013, investors may question the path forward. Is the expectation for more of the same in terms of up-trending markets, or will we see heightened levels of volatility and a market correction? Lower long-term growth projections and elevated valuations as measured by the cyclically-adjusted Shiller P/E ratio7 suggest to us more muted returns ahead for equities. However, these data points have less predictive ability for shorter-term market moves. And, to date, the equity market has responded favorably to Federal Reserve actions, although at diminishing levels with each new action, while inflation pressures have remained contained. Moreover, we believe continued strength in company earnings reports could drive stocks even higher.
Many have pointed to a so-called “Great Rotation,” with investors reducing allocations to bonds in favor of stocks. However, while flows into equity mutual funds and ETFs have increased, investors continue to seek fixed income investments as well.8 Given the still uncertain economic climate, confidence among consumers and investors remains fragile. This suggests to us that incorporating a diversified investment approach with exposure across multiple asset classes and strategies remains important.
Please contact your financial advisor to discuss any questions about your investment strategy or changes in your financial goals. We thank you for including the Funds in your portfolio and appreciate the trust you have placed in us.
Sincerely,

Carrie E. Hansen
President of the Funds
2
The Genworth Financial Wealth Management platform provides fee-based investment advisory programs. Investors are advised to refer to the appropriate Disclosure Brochure, which can be obtained from your financial advisor, for a full description of services provided, including all applicable fees.
Genworth Financial Wealth Management, Inc. is an investment advisor registered with the Securities and Exchange Commission. Genworth Financial Wealth Management and Capital Brokerage Corporation are wholly owned subsidiaries of Genworth Financial, Inc.
Index Definitions
The Barclays Asian Pacific Aggregate Bond Index contains fixed rate investment grade securities denominated in the Japanese yen, Australian dollar, Hong Kong dollar, Malaysian ringgit, New Zealand dollar, Singapore dollar and South Korean won. Inclusion is based on the currency of the issue and not the country of domicile of the issuer. The index is composed primarily of local currency sovereign debt but also includes government-related, corporate, and securitized bonds.
The Barclays Emerging Markets USD Aggregate Bond Index is a flagship hard currency emerging markets debt benchmark that includes fixed and floating-rate U.S.-dollar-denominated debt issued from sovereign, quasi-sovereign, and corporate emerging markets issuers.
The Barclays Euro Aggregate Bond Index tracks fixed rate, investment grade euro-denominated securities. Inclusion is based on the currency of the issue, not the domicile of the issuer. The principal sectors in the index are Treasury, corporate, government-related and securitized.
The Barclays US Aggregate Bond Index is a broad-based index that measures the investment grade, US dollar-denominated, fixed rate taxable bond market, including Treasuries, government-related and corporate securities, mortgage- and asset-backed securities. All securities contained in the Barclays US Aggregate Bond Index have a minimum term to maturity of one year.
The Barclays US TIPS Index includes all publicly issued, US Treasury inflation-protected securities that have at least one year remaining to maturity, are rated investment grade, and have $250 million or more of outstanding face value.
The Barclays Municipal Bond Index measures the performance of investment-grade, fixed-rate, tax-exempt bonds.
The Dow Jones Global ex-US Select REITSM Index measures the performance of publicly traded REITs and REIT-like securities globally with the exception of the US It is designed to serve as a proxy for direct real estate investment, in part by excluding companies whose performance may be driven by factors other than the value of real estate.
The DJ UBS Commodity Index is a broadly diversified index that allows investors to track futures contracts of physical commodities traded on US exchanges, with the exception of aluminum, nickel and zinc, which trade on the London Metal Exchange (LME). The component weightings are also determined by several rules designed to insure diversified commodity exposure.
The FTSE NAREIT All Equity REITs Index includes US publicly traded REITs. Equity REITs include those firms that own, manage and lease investment-grade commercial real estate. Specifically, a company is classified as an equity REIT if 75% or more of its gross invested book assets are invested in real property.
The MSCI All Country World Index (ACWI) ex-US measures the equity market performance of developed and emerging markets excluding the United States.
The MSCI Emerging Markets Index is a free float-adjusted market-capitalization-weighted index that is designed to measure the equity market performance of countries considered to represent emerging markets.
The MSCI World High Dividend Yield Index includes large and mid cap developed market stocks covered by the MSCI World Index and is designed to reflect the performance of equities selected from the parent index, excluding REITs, with higher than average dividend yields that are both sustainable and persistent.
The Russell 1000® Index measures the performance of the large cap segment of the US equity universe.
3
The Russell 2000® Index is an unmanaged index consisting of those Russell 3000® Index companies considered to represent the small cap segment of the US equity market.
The S&P Global Natural Resources Index is a diversified index that allows investors track equity exposure of commodities-related companies across three primary sectors: agriculture; energy; and metals and mining. The index is made up of 90 of the largest companies with natural resources and commodities businesses that meet specific investability requirements and are traded publicly.
The S&P 500® Index focuses on the large cap segment of the US equity market. It includes 500 leading companies in leading industries of the US economy, capturing approximately 75% coverage of US equities.
The S&P 500 Sector Indices are designed to measure the performance of the nine Global Industry Classification Standard (GICS®) sectors.
|
|
|
|
|
|
||
|
|
|
|
|
1 |
S&P 500 Sector/Telecom Services Total Return, S&P 500 Sector/Health Care Total Return, S&P 500 Sector/Consumer Staples Total Return, and S&P 500 Sector/Information Technology Total Return. All index returns sourced from Morningstar. |
|
|
2 |
The US dollar appreciated relative to other major foreign currencies so the international markets, as measured in dollar terms, trailed the US markets. |
|
|
3 |
S&P Global Natural Resources Total Return USD, S&P GSCI Commodity Total Return USD, and DJ UBS Commodity Total Return USD. All index returns sourced from Morningstar. |
|
|
4 |
The Commodity Systems, Inc. Perpetual Contract® is an indicator of market volume and liquidity. |
|
|
5 |
J.P. Morgan first quarter 2013 Quarterly Call. |
|
|
6 |
S&P Indices Versus Active (SPIVA®) US Year-End 2012 Report |
|
|
7 |
The Schiller P/E ratio is calculated using the market price of a stock divided by the company’s average earnings over the past 10 years to adjust for earning cycles. |
|
|
8 |
Source: Investment Company institute; IndexUniverse, March 2013 |
|
|
|
||
|
FX2013-0528-0251 |
||
4
|
|
|
GuideMarkSM Large Cap Growth Fund |
|
MANAGER’S DISCUSSION OF FUND PERFORMANCE (Unaudited) |
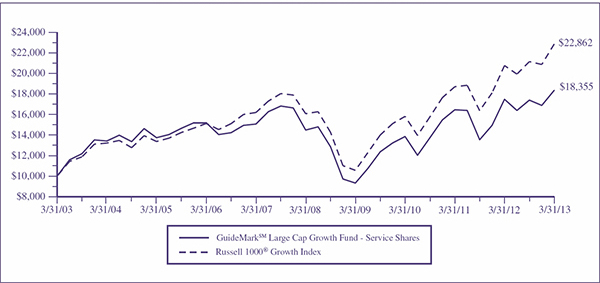
This chart assumes an initial gross investment of $10,000 made on March 31, 2003. Returns shown include the reinvestment of all dividends. Returns shown do not reflect the deduction of taxes that a shareholder would pay on Fund distributions or the redemption of Fund shares. In the absence of fee waivers and reimbursements, when they are necessary to keep expenses at the expense cap, total return would be reduced. Past performance is not predictive of future performance. Investment return and principal value will fluctuate so that your shares, when redeemed, may be worth more or less than the original cost. Index returns do not reflect the effects of fees or expenses. It is not possible to invest directly in an index.
RUSSELL 1000® GROWTH INDEX – An unmanaged index which measures the performance of those Russell 1000® companies with higher price-to-book ratios and higher forecasted growth values. The Russell 1000® Index is an unmanaged index which measures the performance of the 1,000 largest companies in the Russell 3000® Index. The Russell 3000® Index is an unmanaged index which measures the performance of the 3,000 largest US Companies, based on total market capitalization, which represents approximately 98% of the investable US equity market.
|
|
|
|
|
|
|
|
|
|
|
|
|
|
|
|
AVERAGE ANNUAL TOTAL RETURN (for periods ended March 31) |
|||||||||||||
|
|
|
One Year |
|
Five Year |
|
Ten Year |
|
Since Inception(1) |
|
||||
|
|
|
|
|
|
|
||||||||
|
GuideMarkSM Large Cap Growth Fund |
|
|
|
|
|
|
|
|
|
|
|
|
|
|
Service Shares |
|
5.00 |
% |
|
4.85 |
% |
|
6.26 |
% |
|
1.58 |
% |
|
|
Institutional Shares |
|
5.54 |
% |
|
N/A |
|
|
N/A |
|
|
4.71 |
% |
|
|
Russell 1000® Growth Index |
|
10.09 |
% |
|
7.30 |
% |
|
8.62 |
% |
|
3.59 |
%(2) |
|
|
|
|
|
(1) |
Inception date is 6/29/01 for Service Shares and 4/29/11 for Institutional Shares. |
|
|
|
|
(2) |
The return shown for the Russell 1000® Growth Index is from the inception date of the Service Shares. The Russell 1000® Growth Index return from the inception date of the Institutional Shares is 9.11%. |
5
|
|
|
GuideMarkSM Large Cap Growth Fund |
|
MANAGER’S DISCUSSION OF FUND PERFORMANCE (Continued) (Unaudited) |
|
|
|
|
• |
For the 12 months ended March 2013, the Fund returned 5.00%, underperforming the Russell 1000 Growth Index at 10.09%. |
|
|
|
|
• |
The relative underperformance resulted from both sector positioning and security selection, especially within the technology sector. |
|
|
|
|
• |
Performance was harmed by overweight exposure to technology, which suffered as concerns over future information technology spending budgets increased. Apple, a widely held security in the technology sector, was a large detractor to returns due to concerns over the company’s future growth prospects and valuation risk. |
|
|
|
|
• |
Underweight exposure to early cycle retailers and consumer stocks more levered to the improving housing market negatively impacted performance as consumer demand proved more resilient than expected. In addition to being underweight to industrials, a preference for traditional large industrial companies like Cummins and Caterpillar detracted from performance. |
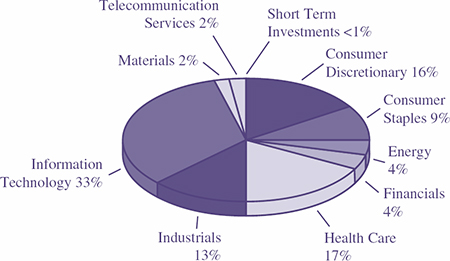
Components of Portfolio Holdings*
*Pie chart represents percentages of total portfolio, less securities lending collateral.
Top Ten Holdings
|
|
|
|
|
|
|
|
|
Rank |
|
Security/Holding |
|
% of Net |
||
|
1 |
|
|
Cisco Systems, Inc. |
|
5.15 |
|
|
2 |
|
|
Microsoft Corp. |
|
3.10 |
|
|
3 |
|
|
Google, Inc. |
|
2.98 |
|
|
4 |
|
|
Apple, Inc. |
|
2.64 |
|
|
5 |
|
|
Amgen, Inc. |
|
2.51 |
|
|
6 |
|
|
Verizon Communications, Inc. |
|
2.20 |
|
|
7 |
|
|
Oracle Corp. |
|
2.20 |
|
|
8 |
|
|
Wal-Mart Stores, Inc. |
|
2.14 |
|
|
9 |
|
|
Boeing Co. |
|
1.79 |
|
|
10 |
|
|
Honeywell International, Inc. |
|
1.72 |
|
The Global Industry Classification Standard (“GICS®”) was developed by and/or is the exclusive property of MSCI, Inc. (“MSCI”) and Standard & Poor’s Financial Services LLC (“S&P”). GICS is a service mark of MSCI and S&P, and has been licensed for use by U.S. Bancorp Fund Services, LLC.
6
|
|
|
GuideMarkSM Large Cap Value Fund |
|
MANAGER’S DISCUSSION OF FUND PERFORMANCE (Unaudited) |
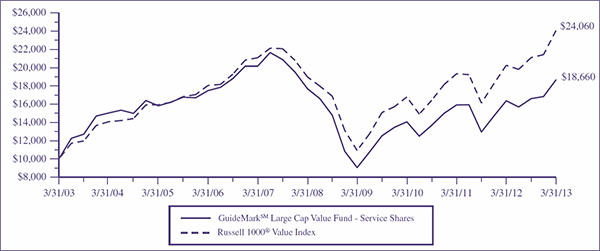
This chart assumes an initial gross investment of $10,000 made on March 31, 2003. Returns shown include the reinvestment of all dividends. Returns shown do not reflect the deduction of taxes that a shareholder would pay on Fund distributions or the redemption of Fund shares. In the absence of fee waivers and reimbursements, when they are necessary to keep expenses at the expense cap, total return would be reduced. Past performance is not predictive of future performance. Investment return and principal value will fluctuate so that your shares, when redeemed, may be worth more or less than the original cost. Index returns do not reflect the effects of fees or expenses. It is not possible to invest directly in an index.
RUSSELL 1000® VALUE INDEX – An unmanaged index which measures the performance of those Russell 1000® companies with lower price-to-book ratios and lower forecasted growth values. The Russell 1000® Index is an unmanaged index which measures the performance of the 1,000 largest companies in the Russell 3000® Index. The Russell 3000® Index is an unmanaged index which measures the performance of the 3,000 largest US Companies, based on total market capitalization, which represents approximately 98% of the investable US equity market.
|
|
|
|
|
|
|
|
|
|
|
|
|
|
|
|
AVERAGE ANNUAL TOTAL RETURN (for periods ended March 31) |
|||||||||||||
|
|
|
One Year |
|
Five Year |
|
Ten Year |
|
Since Inception(1) |
|
||||
|
|
|
|
|
|
|
||||||||
|
GuideMarkSM Large Cap Value Fund |
|
|
|
|
|
|
|
|
|
|
|
|
|
|
Service Shares |
|
13.96 |
% |
|
1.06 |
% |
|
6.44 |
% |
|
2.58 |
% |
|
|
Institutional Shares |
|
14.70 |
% |
|
N/A |
|
|
N/A |
|
|
7.81 |
% |
|
|
Russell 1000® Value Index |
|
18.77 |
% |
|
4.85 |
% |
|
9.18 |
% |
|
5.37 |
%(2) |
|
|
|
|
|
(1) |
Inception date is 6/29/01 for Service Shares and 4/29/11 for Institutional Shares. |
|
|
|
|
(2) |
The return shown for the Russell 1000® Value Index is from the inception date of the Service Shares. The Russell 1000® Value Index return from the inception date of the Institutional Shares is 10.53%. |
7
|
|
|
GuideMarkSM Large Cap Value Fund |
|
MANAGER’S DISCUSSION OF FUND PERFORMANCE (Continued) (Unaudited) |
|
• |
For the 12 months ended March 2013, the Fund returned 13.96%, underperforming the Russell 1000 Value Index at 18.77%. |
|
|
|
|
• |
Security selection was the key detractor from performance over the period and offset the positive contribution from sector positioning. Exposure to securities with lower relative volatility and higher valuations had a negative impact on performance. A lower average market capitalization relative to the benchmark proved beneficial. |
|
|
|
|
• |
Overweight exposure to health care contributed to absolute returns as defensive sectors performed well over the period. Within the health care sector, a bias towards managed care versus large cap pharmaceuticals detracted from performance, as managed care stocks traded lower due to company-specific reasons and regulatory concerns. |
|
|
|
|
• |
Security selection within the consumer discretionary sector dragged on returns. Specifically, underweight exposure to early cycle retailers and retailers levered to the housing market dampened performance as domestic consumers continued to spend despite the weak job market outlook. |
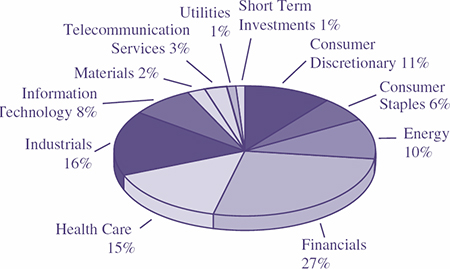
*Pie chart represents percentages of total portfolio, less securities lending collateral.
Top Ten Holdings
|
|
|
|
|
|
|
|
|
Rank |
|
Security/Holding |
|
% of Net |
||
|
1 |
|
|
Capital One Financial Corp. |
|
2.53 |
|
|
2 |
|
|
SLM Corp. |
|
2.42 |
|
|
3 |
|
|
Citigroup, Inc. |
|
2.16 |
|
|
4 |
|
|
JPMorgan Chase & Co. |
|
2.13 |
|
|
5 |
|
|
Johnson & Johnson |
|
2.11 |
|
|
6 |
|
|
AT&T, Inc. |
|
2.06 |
|
|
7 |
|
|
Stanley Black & Decker, Inc. |
|
2.05 |
|
|
8 |
|
|
Wells Fargo & Co. |
|
1.95 |
|
|
9 |
|
|
Rockwood Holdings, Inc. |
|
1.80 |
|
|
10 |
|
|
Pentair Ltd. |
|
1.80 |
|
8
|
|
|
GuideMarkSM Small/Mid Cap Core Fund |
|
MANAGER’S DISCUSSION OF FUND PERFORMANCE (Unaudited) |
TOTAL RETURN BASED ON
A $10,000 INVESTMENT
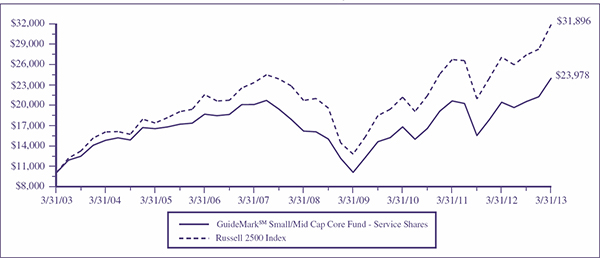
This chart assumes an initial gross investment of $10,000 made on March 31, 2003. Returns shown include the reinvestment of all dividends. Returns shown do not reflect the deduction of taxes that a shareholder would pay on Fund distributions or the redemption of Fund shares. In the absence of fee waivers and reimbursements, when they are necessary to keep expenses at the expense cap, total return would be reduced. Past performance is not predictive of future performance. Investment return and principal value will fluctuate so that your shares, when redeemed, may be worth more or less than the original cost. Index returns do not reflect the effects of fees or expenses. It is not possible to invest directly in an index.
RUSSELL 2500TM INDEX – Measures the performance of the small- to mid-cap segment of the US equity universe, commonly referred to as “smid” cap. The Russell 2500TM Index is a subset of the Russell 3000® Index. The Russell 2500TM Index includes approximately 2,500 of the smallest securities based on a combination of their market cap and current index membership.
|
|
|
|
|
|
|
|
|
|
|
|
|
|
|
|
AVERAGE ANNUAL TOTAL RETURN (for periods ended March 31) |
|||||||||||||
|
|
|
One Year |
|
Five Year |
|
Ten Year |
|
Since Inception(1) |
|
||||
|
|
|
|
|
|
|
||||||||
|
GuideMarkSM Small/Mid Cap Core Fund |
|
|
|
|
|
|
|
|
|
|
|
|
|
|
Service Shares |
|
17.32 |
% |
|
8.17 |
% |
|
9.14 |
% |
|
6.25 |
% |
|
|
Institutional Shares |
|
17.95 |
% |
|
N/A |
|
|
N/A |
|
|
6.93 |
% |
|
|
Russell 2500TM Index |
|
17.73 |
% |
|
9.02 |
% |
|
12.30 |
% |
|
7.93 |
%(2) |
|
|
|
|
|
(1) |
Inception date is 6/29/01 for Service Shares and 4/29/11 for Institutional Shares. |
|
|
|
|
(2) |
The return shown for the Russell 2500TM Index is from the inception date of the Service Shares. The Russell 2500TM Index return from the inception date of the Institutional Shares is 8.00%. |
9
|
|
|
GuideMarkSM Small/Mid Cap
Core Fund |
|
|
|
|
|
|
• |
For the 12 months ended March 2013, the Fund returned 17.32%, underperforming the Russell 2500 Index at 17.73%. |
|
|
|
|
• |
The Fund’s modestly higher average market capitalization relative to the benchmark and exposure to securities with higher price-to-book ratios were the primary drivers of the relative underperformance for the period. |
|
|
|
|
• |
A more defensive posture, favoring companies towards the higher end of the market capitalization spectrum detracted from performance. Investor risk taking behavior created a favorable backdrop for the smaller market capitalization companies. |
|
|
|
|
• |
Security selection within the consumer discretionary sector contributed to returns. Consumer stocks including Hanes brands and Urban Outfitters benefited from higher consumer spending, while auto parts providers including Cooper Tire and Rubber experienced strong sales growth due to consumers’ focus on maintaining their cars rather than investing in new ones. |
Components of Portfolio Holdings*
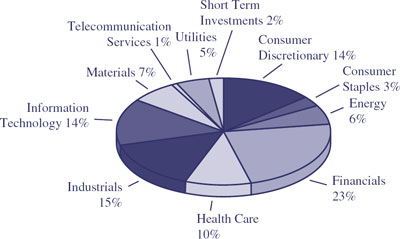
*Pie chart represents percentages of total portfolio, less securities lending collateral.
Top Ten Holdings
|
|
|
|
|
|
|
|
|
Rank |
|
Security/Holding |
|
% of Net |
||
|
1 |
|
|
Douglas Emmett, Inc. |
|
1.77 |
|
|
2 |
|
|
Axis Capital Holdings Ltd. |
|
1.65 |
|
|
3 |
|
|
NASDAQ OMX Group, Inc. |
|
1.56 |
|
|
4 |
|
|
American Campus Communities, Inc. |
|
1.41 |
|
|
5 |
|
|
Huntington Bancshares, Inc. |
|
1.33 |
|
|
6 |
|
|
Onyx Pharmaceuticals, Inc. |
|
1.32 |
|
|
7 |
|
|
Nordson Corp. |
|
1.31 |
|
|
8 |
|
|
DFC Global Corp. |
|
1.29 |
|
|
9 |
|
|
FirstMerit Corp. |
|
1.25 |
|
|
10 |
|
|
Triumph Group, Inc. |
|
1.23 |
|
10
|
|
|
GuideMarkSM
World ex-US Fund |

This chart assumes an initial gross investment of $10,000 made on March 31, 2003. Returns shown include the reinvestment of all dividends. Returns shown do not reflect the deduction of taxes that a shareholder would pay on Fund distributions or the redemption of Fund shares. In the absence of fee waivers and reimbursements, when they are necessary to keep expenses at the expense cap, total return would be reduced. Past performance is not predictive of future performance. Investment return and principal value will fluctuate so that your shares, when redeemed, may be worth more or less than the original cost. Index returns do not reflect the effects of fees or expenses. It is not possible to invest directly in an index.
MSCI ALL COUNTRY WORLD EX-US INDEX – A free float-adjusted market capitalization weighted index that is designed to measure the equity market performance of developed and emerging markets. It consists of country indices comprised of developed and emerging market country indices. The developed market country indices included are: Australia, Austria, Belgium, Canada, Denmark, Finland, France, Germany, Greece, Hong Kong, Ireland, Israel, Italy, Japan, Netherlands, New Zealand, Norway, Portugal, Singapore, Spain, Sweden, Switzerland, and the United Kingdom. The emerging market country indices included are: Brazil, Chile, China, Colombia, Czech Republic, Egypt, Hungary, India, Indonesia, Korea, Malaysia, Mexico, Morocco, Peru, Philippines, Poland, Russia, South Africa, Taiwan, Thailand, and Turkey.
|
|
|
|
|
|
|
|
|
|
|
|
|
|
|
|
|
AVERAGE ANNUAL TOTAL RETURN (for periods ended March 31) |
||||||||||||||
|
|
|
One Year |
|
Five Year |
|
Ten Year |
|
Since Inception(1) |
|
|||||
|
|
|
|
|
|
|
|||||||||
|
GuideMarkSM World ex-US Fund |
||||||||||||||
|
Service Shares |
|
7.53 |
% |
|
-6.03 |
% |
|
6.38 |
% |
|
2.21 |
% |
|
|
|
Institutional Shares |
|
8.09 |
% |
|
N/A |
|
|
N/A |
|
|
-2.77 |
% |
|
|
|
MSCI All Country World ex-US Index |
|
8.87 |
% |
|
0.07 |
% |
|
11.41 |
% |
|
6.79 |
%(2) |
|
|
|
|
|
|
(1) |
Inception date is 6/29/01 for Service Shares and 4/29/11 for Institutional Shares. |
|
|
|
|
(2) |
The return shown for the MSCI All Country World ex-US Index is from the inception date of the Service Shares. The MSCI All Country World ex-US Index return from the inception date of the Institutional Shares is -1.71%. |
11
|
|
|
GuideMarkSM World ex-US Fund |
|
MANAGER’S DISCUSSION OF FUND PERFORMANCE (Continued) (Unaudited) |
|
|
|
|
• |
For the 12 months ended March 2013, the Fund returned 7.53%, underperforming the MSCI All Country World ex-US Index at 8.87%. |
|
|
|
|
• |
Security selection was the primary driver of the relative underperformance for the period and offset the positive contributions from country and sector positioning. |
|
|
|
|
• |
Security selection within emerging markets detracted from performance with exposure to India harming performance as the Indian market retreated. Fears of a slowdown in China created a challenge for emerging market equities in general. |
|
|
|
|
• |
Exposure to two energy stocks focused on oil and gas exploration in Latin America dampened performance. Petrominerales, a Canadian listed energy company and Petroleo Brasileiro trailed during the period due to production and profit margin concerns. |
Components of Portfolio Holdings*
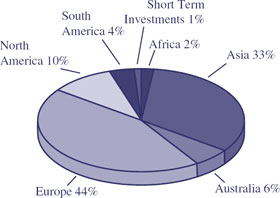
*Pie chart represents percentages of total portfolio, less securities lending collateral.
Top Ten Holdings
|
|
|
|
|
|
|
|
|
Rank |
|
Security/Holding |
|
%
of Net |
||
|
1 |
|
|
Nestle SA |
|
1.93 |
|
|
2 |
|
|
Sanofi-Aventis SA |
|
1.39 |
|
|
3 |
|
|
PowerShares India Portfolio |
|
1.33 |
|
|
4 |
|
|
Samsung Electronics Co. Ltd. |
|
1.21 |
|
|
5 |
|
|
Royal Dutch Shell Plc |
|
1.20 |
|
|
6 |
|
|
Westpac Banking Corp. |
|
1.08 |
|
|
7 |
|
|
HSBC Holdings Plc |
|
1.06 |
|
|
8 |
|
|
Australia & New Zealand Banking Group Ltd. |
|
1.05 |
|
|
9 |
|
|
Novo Nordisk A/S |
|
0.94 |
|
|
10 |
|
|
British American Tobacco Plc |
|
0.92 |
|
12
|
|
|
GuideMarkSM Opportunistic Equity Fund |
|
MANAGER’S DISCUSSION OF FUND PERFORMANCE (Unaudited) |
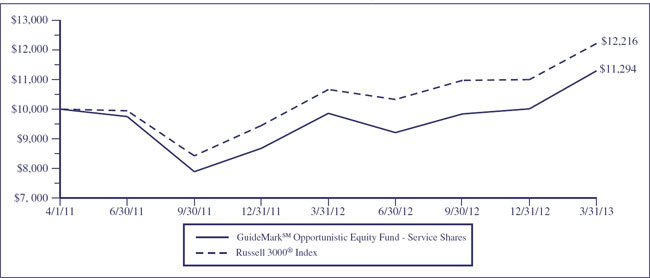
This chart assumes an initial gross investment of $10,000 made on April 1, 2011 (commencement of the Fund’s Service Shares operations). Returns shown include the reinvestment of all dividends. Returns shown do not reflect the deduction of taxes that a shareholder would pay on Fund distributions or the redemption of Fund shares. In the absence of fee waivers and reimbursements, when they are necessary to keep expenses at the expense cap, total return would be reduced. Past performance is not predictive of future performance. Investment return and principal value will fluctuate so that your shares, when redeemed, may be worth more or less than the original cost. Index returns do not reflect the effects of fees or expenses. It is not possible to invest directly in an index.
RUSSELL 3000® INDEX – Measures the performance of the largest 3,000 US companies representing approximately 98% of the investable US equity market.
|
|
|
AVERAGE ANNUAL TOTAL RETURN (for the period ended March 31) |
|
|
|
|
|
|
|
|
|
|
|
|
One Year |
|
Since Inception(1) |
|
||
|
|
|
|
|
||||
|
GuideMarkSM Opportunistic Equity Fund |
|
|
|
|
|
|
|
|
Service Shares |
|
14.56 |
% |
|
6.29 |
% |
|
|
Institutional Shares |
|
15.22 |
% |
|
6.00 |
% |
|
|
Russell 3000® Index |
|
14.56 |
% |
|
10.53 |
%(2) |
|
|
|
|
|
(1) |
Inception date is 4/1/11 for Service Shares and 4/29/11 for Institutional Shares. |
|
|
|
|
(2) |
The return shown for the Russell 3000® Index is from the inception date of the Service Shares. The Russell 3000® Index return from the inception date of the Institutional Shares is 9.58%. |
13
|
|
|
GuideMarkSM Opportunistic Equity Fund |
|
MANAGER’S DISCUSSION OF FUND PERFORMANCE (Continued) (Unaudited) |
|
|
|
|
• |
For the 12 months ended March 2013, the Fund returned 14.56%, performing in line with the Russell 3000 Index at 14.56%. |
|
|
|
|
• |
Security selection was the primary driver of returns. The Fund’s modestly lower average market capitalization relative to the benchmark and exposure to securities with lower price-to-book ratios contributed to performance. |
|
|
|
|
• |
Positive security selection within the consumer discretionary sector was a large driver of returns. H&R Block and Marriott Vacations were among the best performers for the period. Exposure to Bank of America also benefited performance as large money center banks were buoyed by improving fundamentals. |
|
|
|
|
• |
Exposure to securities with commodities exposure negatively impacted performance. Owning Apache and Devon dampened returns as energy stocks traded lower on production and pricing concerns. Newmont Mining and AngloGold Ashanti continued to lag due to concerns of rising production costs and fears regarding nationalization of mines in some African countries. |
Components of Portfolio Holdings*
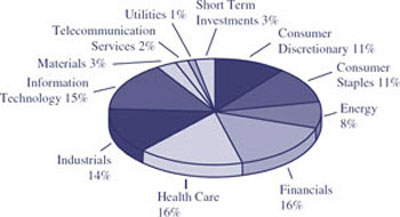
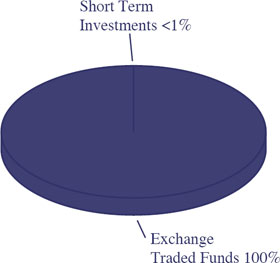
*Pie chart represents percentages of total portfolio, less securities lending collateral.
Top Ten Holdings
|
|
|
|
|
|
|
|
|
Rank |
|
Security/Holding |
|
%
of Net |
||
|
1 |
|
|
Apple, Inc. |
|
2.43 |
|
|
2 |
|
|
Medtronic, Inc. |
|
2.39 |
|
|
3 |
|
|
United Technologies Corp. |
|
2.28 |
|
|
4 |
|
|
Prudential Financial, Inc. |
|
1.84 |
|
|
5 |
|
|
ConAgra Foods, Inc. |
|
1.81 |
|
|
6 |
|
|
Baxter International, Inc. |
|
1.75 |
|
|
7 |
|
|
Microsoft Corp. |
|
1.66 |
|
|
8 |
|
|
Pfizer, Inc. |
|
1.63 |
|
|
9 |
|
|
Apache Corp. |
|
1.61 |
|
|
10 |
|
|
Southwest Airlines Co. |
|
1.58 |
|
14
|
|
|
GuideMarkSM Global Real Return Fund |
|
MANAGER’S DISCUSSION OF FUND PERFORMANCE (Unaudited) |
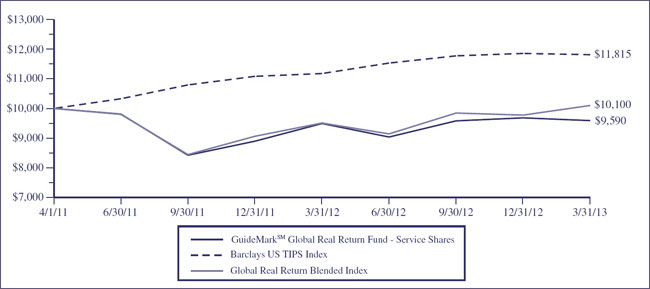
This chart assumes an initial gross investment of $10,000 made on April 1, 2011 (commencement of the Fund’s Service Shares operations). Returns shown include the reinvestment of all dividends. Returns shown do not reflect the deduction of taxes that a shareholder would pay on Fund distributions or the redemption of Fund shares. In the absence of fee waivers and reimbursements, when they are necessary to keep expenses at the expense cap, total return would be reduced. Past performance is not predictive of future performance. Investment return and principal value will fluctuate so that your shares, when redeemed, may be worth more or less than the original cost. Index returns do not reflect the effects of fees or expenses. It is not possible to invest directly in an index.
BARCLAYS US TIPS INDEX – Includes all publicly-issued, US Treasury inflation-protected securities that have at least one year remaining to maturity, are rated investment grade, and have $250 million or more of outstanding face value.
GLOBAL REAL RETURN BLENDED INDEX – A weighted combination of 20% of the total return from the Dow Jones-UBS Commodities Index, 35% of the total return from the S&P Natural Resources North American Index, 20% of the total return from the Dow Jones Global Select RESI Index and 25% of the total return from the Barclays Global Inflation Linked Bond Index. Returns are weighted on a 20/35/20/25 basis for each historical month and then the longer-term Blended Index returns are geometrically combined from these historical monthly returns to create aggregate returns (1-year, 3-years, 5-years, etc.) for the Blended Index.
|
|
|
AVERAGE ANNUAL TOTAL RETURN (for the period ended March 31) |
|
|
|
|
|
|
|
|
|
|
|
|
One Year |
|
Since Inception(1) |
|
||
|
|
|
|
|
||||
|
GuideMarkSM Global Real Return Fund |
|
|
|
|
|
|
|
|
Service Shares |
|
1.05 |
% |
|
-2.07 |
% |
|
|
Institutional Shares |
|
1.73 |
% |
|
-3.10 |
% |
|
|
Barclays US TIPS Index |
|
5.68 |
% |
|
8.70 |
%(2) |
|
|
Global Real Return Blended Index |
|
6.20 |
% |
|
0.50 |
%(3) |
|
|
|
|
|
(1) |
Inception date is 4/1/11 for Service Shares and 4/29/11 for Institutional Shares. |
|
|
|
|
(2) |
The return shown for the Barclays US TIPS Index is from the inception date of the Service Shares. The Barclays US TIPS Index return from the inception date of the Institutional Shares is 7.86%. |
|
|
|
|
(3) |
The return shown for the Global Real Return Blended Index is from the inception date of the Service Shares. The Global Real Return Blended Index return from the inception date of the Institutional Shares is -1.02%. |
15
|
|
|
GuideMarkSM Global Real Return Fund |
|
MANAGER’S DISCUSSION OF FUND PERFORMANCE (Continued) (Unaudited) |
|
|
|
|
• |
For the 12 months ended March 2013, the Fund returned 1.05%, underperforming the Barclays U.S. TIPS Index at 5.68% and its blended benchmark of 20% Dow Jones-UBS Commodities Index, 35% S&P North American Natural Resources Sector Index, 20% Dow Jones Global Select RESI Index, and 25% Barclays Global Inflation Linked Bonds Index, which returned 6.20%. |
|
|
|
|
• |
Underweight exposure to U.S. TIPS and exposure to gold miners was the primary detractor from returns relative to both the primary and blended benchmarks. Exposure to gold miners harmed returns due to the spread between gold metal and gold miners remaining significantly above the historic average as a result of rising production costs and geopolitical risk in Africa. |
|
|
|
|
• |
Commodities exposure dampened results relative to the primary benchmark. The asset class fell under pressure as investors feared a slowdown in China could negatively impact the demand for commodities including steel. |
|
|
|
|
• |
Relative to the blended benchmark, a reduced exposure to REITs due to valuation concerns detracted from performance as global REITs posted strong returns for the period. |
Components of Portfolio Holdings*
*Pie chart represents percentages of total portfolio, less securities lending collateral.
Top Ten Holdings
|
|
|
|
|
|
|
|
|
Rank |
|
Security/Holding |
|
%
of Net |
||
|
1 |
|
|
SPDR S&P Global Natural Resources ETF |
|
30.09 |
|
|
2 |
|
|
SPDR Barclays Capital TIPS ETF |
|
14.28 |
|
|
3 |
|
|
PowerShares DB Commodity Index Tracking Fund |
|
14.11 |
|
|
4 |
|
|
SPDR Dow Jones International Real Estate ETF |
|
11.09 |
|
|
5 |
|
|
SPDR Dow Jones REIT ETF |
|
9.68 |
|
|
6 |
|
|
SPDR DB
International Government Inflation-Protected |
|
9.13 |
|
|
7 |
|
|
PowerShares Global Agriculture ETF |
|
3.01 |
|
|
8 |
|
|
SPDR Metals and Mining ETF |
|
2.93 |
|
|
9 |
|
|
Energy Select Sector SPDR Fund |
|
2.05 |
|
|
10 |
|
|
SPDR S&P International Equity Sector ETF |
|
2.01 |
|
16
|
|
|
GuideMarkSM Core Fixed Income Fund |
|
MANAGER’S DISCUSSION OF FUND PERFORMANCE (Unaudited) |
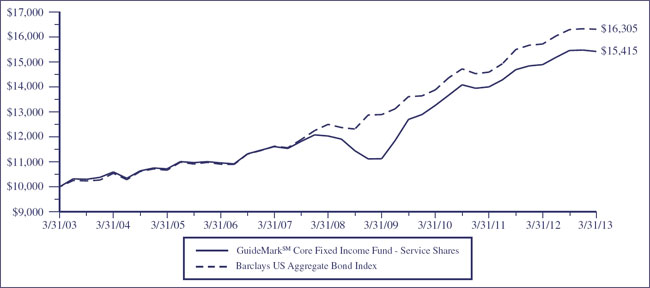
This chart assumes an initial gross investment of $10,000 made on March 31, 2003. Returns shown include the reinvestment of all dividends. Returns shown do not reflect the deduction of taxes that a shareholder would pay on Fund distributions or the redemption of Fund shares. In the absence of fee waivers and reimbursements, when they are necessary to keep expenses at the expense cap, total return would be reduced. Past performance is not predictive of future performance. Investment return and principal value will fluctuate so that your shares, when redeemed, may be worth more or less than the original cost. Index returns do not reflect the effects of fees or expenses. It is not possible to invest directly in an index.
BARCLAYS US AGGREGATE BOND INDEX – A broad-based benchmark that measures the investment-grade, US dollar-denominated fixed-rate taxable bond market, including US Treasuries, government-related and corporate debt securities, and mortgage- and asset-backed securities. All securities contained in the Barclays US Aggregate Bond Index have a minimum term to maturity of one year.
|
|
|
AVERAGE ANNUAL TOTAL RETURN (for periods ended March 31) |
|
|
|
|
|
|
|
|
|
|
|
|
|
|
|
|
|
|
One Year |
|
Five Year |
|
Ten Year |
|
Since Inception(1) |
|
||||
|
|
|
|
|
|
|
||||||||
|
GuideMarkSM Core Fixed Income Fund |
|
|
|
|
|
|
|
|
|
|
|
|
|
|
Service Shares |
|
3.55 |
% |
|
5.08 |
% |
|
4.43 |
% |
|
4.88 |
% |
|
|
Institutional Shares |
|
4.12 |
% |
|
N/A |
|
|
N/A |
|
|
5.05 |
% |
|
|
Barclays US Aggregate Bond Index |
|
3.77 |
% |
|
5.47 |
% |
|
5.02 |
% |
|
5.66 |
%(2) |
|
|
|
|
|
(1) |
Inception date is 6/29/01 for Service Shares and 4/29/11 for Institutional Shares. |
|
|
|
|
(2) |
The return shown for the Barclays US Aggregate Bond Index is from the inception date of the Service Shares. The Barclays US Aggregate Bond Index return from the inception date of the Institutional Shares is 5.27%. |
17
|
|
|
GuideMarkSM Core Fixed Income Fund |
|
MANAGER’S DISCUSSION OF FUND PERFORMANCE (Continued) (Unaudited) |
|
|
|
|
• |
For the 12 months ended March 2013, the Fund returned 3.55%, underperforming the Barclays US Aggregate Bond Index at 3.77%. |
|
|
|
|
• |
Overweight exposure to corporate credit, particularly within the financials sector, contributed positively to performance. |
|
|
|
|
• |
An emphasis towards higher rated securities dampened relative performance. Investors’ search for yield and risk taking behavior helped support lower credit quality bonds. |
|
|
|
|
• |
A slightly shorter duration position given concerns about rising rates slightly dampened returns. Longer dated securities traded higher as the Federal Reserve announced its open-ended asset buying program. |
Components of Portfolio Holdings*
*Pie chart represents percentages of total portfolio, less securities lending collateral.
Top Ten Holdings
|
|
|
|
|
|
|
|
|
Rank |
|
Security/Holding |
|
%
of Net |
||
|
1 |
|
|
U.S. Treasury Note, 2.000%, 02/15/2022 |
|
2.99 |
|
|
2 |
|
|
U.S. Treasury Note,0.250%, 07/15/2015 |
|
2.54 |
|
|
3 |
|
|
U.S. Treasury Note, 0.875%, 01/31/2017 |
|
2.27 |
|
|
4 |
|
|
U.S. Treasury Bond, 3.125%, 11/15/2041 |
|
1.78 |
|
|
5 |
|
|
U.S. Treasury Note, 1.875%, 09/30/2017 |
|
1.58 |
|
|
6 |
|
|
Federal
National Mortgage Association, |
|
1.51 |
|
|
7 |
|
|
U.S. Treasury Note, 0.875%, 04/30/2017 |
|
1.43 |
|
|
8 |
|
|
U.S. Treasury Note, 0.625%, 07/15/2014 |
|
1.38 |
|
|
9 |
|
|
Federal
National Mortgage Association, |
|
1.28 |
|
|
10 |
|
|
Federal
National Mortgage Association, |
|
1.15 |
|
18
|
|
|
GuideMarkSM Tax-Exempt Fixed Income Fund |
|
MANAGER’S DISCUSSION OF FUND PERFORMANCE (Unaudited) |
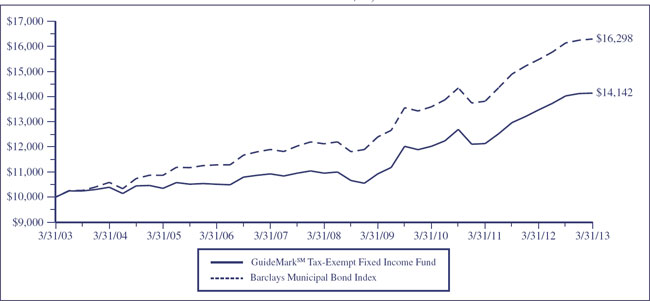
This chart assumes an initial gross investment of $10,000 made on March 31, 2003. Returns shown include the reinvestment of all dividends. Returns shown do not reflect the deduction of taxes that a shareholder would pay on Fund distributions or the redemption of Fund shares. In the absence of fee waivers and reimbursements, when they are necessary to keep expenses at the expense cap, total return would be reduced. Past performance is not predictive of future performance. Investment return and principal value will fluctuate so that your shares, when redeemed, may be worth more or less than the original cost. Index returns do not reflect the effects of fees or expenses. It is not possible to invest directly in an index.
BARCLAYS MUNICIPAL BOND INDEX – The Barclays Municipal Bond Index is a market-value-weighted index for the long-term tax-exempt bond market. The index has four main sectors: state and local general obligation bonds, revenue bonds, insured bonds, and pre-refunded bonds.
|
|
|
AVERAGE ANNUAL TOTAL RETURN (for periods ended March 31) |
|
|
|
|
|
|
|
|
|
|
|
|
|
|
|
|
|
|
One Year |
|
Five Year |
|
Ten Year |
|
Since Inception(1) |
|
||||
|
|
|
|
|
|
|
||||||||
|
GuideMarkSM Tax-Exempt Fixed Income Fund |
|
4.93 |
% |
|
5.24 |
% |
|
3.53 |
% |
|
3.99 |
% |
|
|
|
|
|
|
|
|
|
|
|
|
|
|
|
|
|
Barclays Municipal Bond Index |
|
5.25 |
% |
|
6.10 |
% |
|
5.01 |
% |
|
5.36 |
% |
|
|
|
|
|
(1) |
Inception date is 6/29/01. |
19
|
|
|
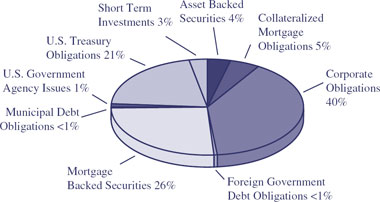
GuideMarkSM Tax-Exempt Fixed Income Fund |
|
MANAGER’S DISCUSSION OF FUND PERFORMANCE (Continued) (Unaudited) |
|
|
|
|
• |
For the 12 months ended March 2013, the Fund returned 4.93%, underperforming the Barclays Municipal Bond Index at 5.25%. |
|
|
|
|
• |
Credit positioning had mixed results for the period. Exposure to ‘BBB’ rated securities proved beneficial, while an overweight exposure to ‘AAA’ rated securities dampened returns. |
|
|
|
|
• |
The ongoing search for yield from both traditional tax-exempt investors given concerns about increased tax rates and cross over sector investors led to strength in returns from below investment grade securities. |
|
|
|
|
• |
A modest exposure to Puerto Rico obligation bonds negatively impacted returns. Puerto Rico bonds sold off after Puerto Rico was downgraded by the rating agencies based on a weak economic and revenue outlook. |
|
|
|
Components of Portfolio Holdings* |
|
|
|
|
|
*Pie chart represents percentages of total portfolio. |
Top Ten Holdings
|
|
|
|
|
|
|
|
|
Rank |
|
Security/Holding |
|
%
of Net |
||
|
1 |
|
|
California, GO, 6.500%, 04/01/2033 |
|
1.63 |
|
|
2 |
|
|
Wisconsin, Series A, Refunding, Revenue Bond, |
|
|
|
|
|
|
|
6.000%, 05/01/2033 |
|
1.61 |
|
|
3 |
|
|
Utah Associated Municipal Power Systems San Juan Project, |
|
|
|
|
|
|
|
Refunding, Revenue Bond, 5.500%, 06/01/2022 |
|
1.59 |
|
|
4 |
|
|
Henry County Public Service Authority Water & Sewer, |
|
|
|
|
|
|
|
Refunding, Revenue Bond, FSA Insured, 5.500%, 11/15/2019 |
|
1.58 |
|
|
5 |
|
|
Los Angeles Department of Airports, Series A, Refunding, |
|
|
|
|
|
|
|
Revenue Bond, 5.250%, 05/15/2029 |
|
1.56 |
|
|
6 |
|
|
Boise-Kuna District, Revenue Bond, 7.375%, 06/01/2034 |
|
1.52 |
|
|
7 |
|
|
Metropolitan Transportation Authority, Series F, |
|
|
|
|
|
|
|
Revenue Bond, 5.000%, 11/15/2014 |
|
1.42 |
|
|
8 |
|
|
Allegheny County Hospital Development Authority, |
|
|
|
|
|
|
|
Series A, Revenue Bond, 5.000%, 09/01/2014 |
|
1.41 |
|
|
9 |
|
|
New York, GO, 5.375%, 04/01/2036 |
|
1.38 |
|
|
10 |
|
|
Louisiana Citizens Property, Revenue Bond, 6.750%, 06/01/2026 |
|
1.31 |
|
20
|
|
|
GuideMarkSM Opportunistic Fixed Income Fund |
|
MANAGER’S DISCUSSION OF FUND PERFORMANCE (Unaudited) |
|
|
|
TOTAL RETURN BASED ON
A $10,000 INVESTMENT |
|
|
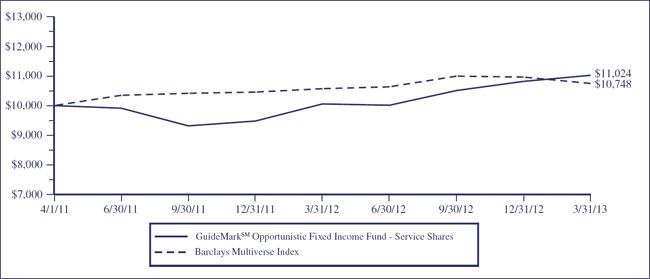
This chart assumes an initial gross investment of $10,000 made on April 1, 2011 (commencement of the Fund’s Service Shares operations). Returns shown include the reinvestment of all dividends. Returns shown do not reflect the deduction of taxes that a shareholder would pay on Fund distributions or the redemption of Fund shares. In the absence of fee waivers and reimbursements, when they are necessary to keep expenses at the expense cap, total return would be reduced. Past performance is not predictive of future performance. Investment return and principal value will fluctuate so that your shares, when redeemed, may be worth more or less than the original cost. Index returns do not reflect the effects of fees or expenses. It is not possible to invest directly in an index.
BARCLAYS MULTIVERSE INDEX – The Barclays Multiverse Index is a broad-based index that provides a measure of the global fixed income market.
|
|
|
|
|
|
|
|
|
|
AVERAGE ANNUAL TOTAL RETURN (for the period ended March 31) |
|||||||
|
|
|
One Year |
|
Since Inception(1) |
|
||
|
|
|
|
|
||||
|
GuideMarkSM Opportunistic Fixed Income Fund |
|
|
|
|
|
|
|
|
Service Shares |
|
9.64 |
% |
|
5.01 |
% |
|
|
Institutional Shares |
|
10.33 |
% |
|
5.41 |
% |
|
|
Barclays Multiverse Index |
|
1.68 |
% |
|
3.68 |
%(2) |
|
|
|
|
|
(1) |
Inception date is 4/1/11 for Service Shares and 4/29/11 for Institutional Shares. |
|
|
|
|
(2) |
The return shown for the Barclays Multiverse Index is from the inception date of the Service Shares. The Barclays Multiverse Index return from the inception date of the Institutional Shares is 1.99%. |
21
|
|
|
GuideMarkSM Opportunistic Fixed Income Fund |
|
MANAGER’S DISCUSSION OF FUND PERFORMANCE (Continued) (Unaudited) |
|
|
|
|
• |
For the 12 months ended March 2013, the Fund returned 9.64%, outperforming the Barclays Multiverse Index at 1.68%. |
|
|
|
|
• |
Overweight exposure to non-US currencies and a bias to corporate debt securities were the primary drivers of the relative outperformance. Risk assets rallied over the period as coordinated monetary easing on a global scale provided a tailwind for the global fixed income markets. |
|
|
|
|
• |
A relative bias to emerging market and currencies like the Polish Zloty positively contributed to performance and Asia Pacific ex-Japanese currencies outperformed the Japanese Yen. |
|
|
|
|
• |
Exposure to corporate credit across the rating spectrum benefited performance. Corporate credit securities continued to experience spread tightening as investors moved away from defensive investment vehicles like US Treasuries in search of yield. |
|
|
|
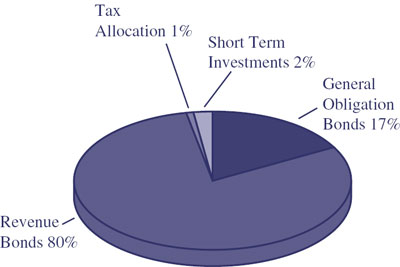
Components of Portfolio Holdings* |
|
|
|
|
|
*Pie chart represents percentages of total portfolio. |
|
|
|
|
|
|
|
|
|
Rank |
|
Security/Holding |
|
%
of Net |
||
|
1 |
|
|
Republic of Korea, 3.000%, 12/10/2013 |
|
3.50 |
|
|
2 |
|
|
Federal National Mortgage Association, |
|
|
|
|
|
|
|
Series #1209, 3.500%, 10/01/2042 |
|
2.55 |
|
|
3 |
|
|
Federal Home Loan Mortgage Corp., |
|
|
|
|
|
|
|
Series #280, 3.000%, 09/15/2042 |
|
2.03 |
|
|
4 |
|
|
Petroleos de Venezuela SA, 4.900%, 10/28/2014 |
|
1.77 |
|
|
5 |
|
|
Republic of Ireland, 5.000%, 10/18/2020 |
|
1.22 |
|
|
6 |
|
|
Federal National Mortgage Association, |
|
|
|
|
|
|
|
Series #1237, 3.000%, 11/01/2032 |
|
1.21 |
|
|
7 |
|
|
Federal Home Loan Mortgage Corp., |
|
|
|
|
|
|
|
Series #267, 3.000%, 08/15/2042 |
|
1.20 |
|
|
8 |
|
|
Federal National Mortgage Association, |
|
|
|
|
|
|
|
Series #1200, 3.000%, 10/01/2032 |
|
1.20 |
|
|
9 |
|
|
Federal Home Loan Mortgage Corp., |
|
|
|
|
|
|
|
Series #60853, 3.500%, 09/01/2042 |
|
1.14 |
|
|
10 |
|
|
Republic of Hungary, 6.750%, 02/24/2017 |
|
1.10 |
|
22
|
|
|
GuidePathSM Strategic Asset Allocation Fund |
|
MANAGER’S DISCUSSION OF FUND PERFORMANCE (Unaudited) |
|
|
|
TOTAL RETURN BASED ON
A $10,000 INVESTMENT |
|
|
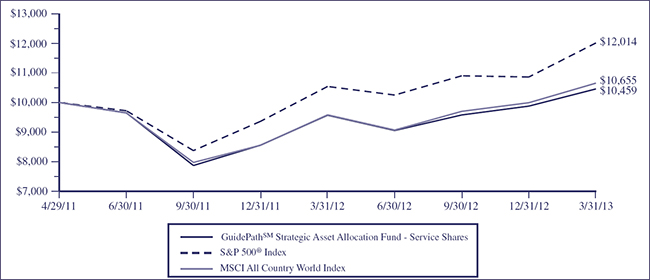
This chart assumes an initial gross investment of $10,000 made on April 29, 2011 (commencement of the Fund’s Service Shares operations). Returns shown include the reinvestment of all dividends. Returns shown do not reflect the deduction of taxes that a shareholder would pay on Fund distributions or the redemption of Fund shares. In the absence of fee waivers and reimbursements, when they are necessary to keep expenses at the expense cap, total return would be reduced. Past performance is not predictive of future performance. Investment return and principal value will fluctuate so that your shares, when redeemed, may be worth more or less than the original cost. Index returns do not reflect the effects of fees or expenses. It is not possible to invest directly in an index.
S&P 500® INDEX – An index of 500 stocks chosen for market size, liquidity and industry grouping, among other factors. It is designed to be a leading indicator of U.S. equities and is meant to reflect the risk/return characteristics of the large cap universe. MSCI ALL COUNTRY WORLD INDEX – A free float-adjusted market capitalization weighted index that is designed to measure the equity market performance of developed and emerging markets. It consists of 45 country indices comprising 24 developed and 21 emerging market country indices. The developed market country indices included are: Australia, Austria, Belgium, Canada, Denmark, Finland, France, Germany, Greece, Hong Kong, Ireland, Israel, Italy, Japan, Netherlands, New Zealand, Norway, Portugal, Singapore, Spain, Sweden, Switzerland, the United Kingdom and the United States. The emerging market country indices included are: Brazil, Chile, China, Colombia, Czech Republic, Egypt, Hungary, India, Indonesia, Korea, Malaysia, Mexico, Morocco, Peru, Philippines, Poland, Russia, South Africa, Taiwan, Thailand, and Turkey.
|
|
|
|
|
|
|
|
|
|
AVERAGE ANNUAL TOTAL RETURN (for the period ended March 31) |
|||||||
|
|
|
One Year |
|
Since Inception(1) |
|
||
|
|
|
|
|
||||
|
GuidePathSM Strategic Asset Allocation Fund |
|
|
|
|
|
|
|
|
Service Shares |
|
9.30 |
% |
|
2.37 |
% |
|
|
Institutional Shares |
|
N/A |
|
7.68 |
%(2) |
|
|
|
S&P 500® Index |
|
13.96 |
% |
|
10.01 |
%(3) |
|
|
MSCI All Country World Index |
|
11.19 |
% |
|
3.35 |
%(4) |
|
|
|
|
|
(1) |
Inception date is 4/29/11 for Service Shares and 9/13/12 for Institutional Shares. |
|
|
|
|
(2) |
The return shown is cumulative from the inception date. |
|
|
|
|
(3) |
The return shown for the S&P 500® Index is annualized from the inception date of the Service Shares. The S&P 500® Index cumulative return from the inception date of the Institutional Shares is 8.80%. |
|
|
|
|
(4) |
The return shown for the MSCI All Country World Index is annualized from the inception date of the Service Shares. The MSCI All Country World Index cumulative return from the inception date of the Institutional Shares is 8.98%. |
23
|
|
|
GuidePathSM Strategic Asset Allocation Fund |
|
MANAGER’S DISCUSSION OF FUND PERFORMANCE (Continued) (Unaudited) |
|
|
|
|
• |
For the 12 months ended March 2013, the Fund returned 9.30% underperforming the S&P 500 Index at 13.96%. The Fund trailed the MSCI All Country World Index at 11.19%. |
|
|
|
|
• |
Exposure to international and emerging markets equities was the largest driver of underperformance to the S&P 500 Index as international market returns were tempered due to volatility from resurgent Eurozone debt concerns. |
|
|
|
|
• |
Small- and mid-cap stocks benefited performance, with exposure to securities with higher price-to-book ratios and investor behavior favoring risk assets. |
|
|
|
|
• |
Exposure to global real return assets detracted from performance as exposure to global commodities and natural resources fell as investors feared a slowdown in China could negatively impact demand. |
|
|
|
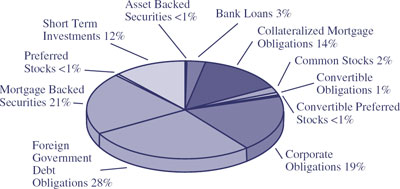
Components of Portfolio Holdings* |
|
|
|
|
|
|
|
*Pie chart represents percentages of total portfolio, less securities lending collateral. |
Top Ten Holdings
|
|
|
|
|
|
|
|
|
Rank |
|
Security/Holding |
|
%
of Net |
||
|
1 |
|
|
SPDR S&P 500 ETF Trust |
|
15.84 |
|
|
2 |
|
|
GuideMarkSM World ex-US Fund – Institutional Shares |
|
15.06 |
|
|
3 |
|
|
Vanguard FTSE All-World ex-US Index Fund |
|
14.99 |
|
|
4 |
|
|
GuideMarkSM Small/Mid Cap Core Fund – Institutional Shares |
|
9.01 |
|
|
5 |
|
|
GuideMarkSM Large Cap Value Fund – Institutional Shares |
|
8.39 |
|
|
6 |
|
|
GuideMarkSM Opportunistic Equity Fund – Institutional Shares |
|
7.81 |
|
|
7 |
|
|
GuideMarkSM Large Cap Growth Fund – Institutional Shares |
|
7.46 |
|
|
8 |
|
|
GuideMarkSM Global Real Return Fund – Institutional Shares |
|
4.69 |
|
|
9 |
|
|
SPDR S&P 600 Small Cap Growth |
|
2.76 |
|
|
10 |
|
|
Altegris Macro Strategy Fund – Institutional Shares |
|
2.41 |
|
24
|
|
|
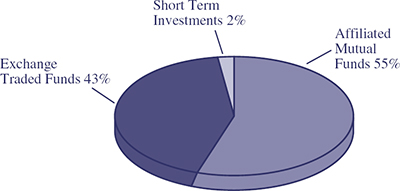
GuidePathSM Tactical ConstrainedSM Asset Allocation Fund |
|
MANAGER’S DISCUSSION OF FUND PERFORMANCE (Unaudited) |
|
|
|
TOTAL RETURN BASED ON A $10,000 INVESTMENT |
|
|
|
|
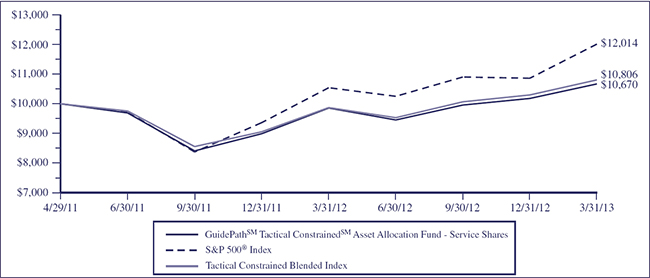
S&P 500® INDEX – Focuses on the large-cap segment of the US equities market. It includes 500 leading companies in leading industries of the US economy, capturing approximately 75% coverage of US equities.
TACTICAL CONSTRAINED BLENDED INDEX – A weighted combination of 75% of the total return from the MSCI All Country World Index with 25% of the total return from the Barclays US Aggregate Bond Index. Returns are weighted on a 75/25 basis for each historical month and then the longer-term Blended Index returns are geometrically combined from these historical monthly returns to create aggregate returns (1-year, 3-years, 5-years, etc.) for the Blended Index.
|
|
|
|
|
|
|
|
|
|
AVERAGE ANNUAL TOTAL RETURN (for the period ended March 31) |
|||||||
|
|
|
One Year |
|
Since Inception(1) |
|
||
|
|
|
|
|
||||
|
GuidePathSM Tactical ConstrainedSM Asset Allocation Fund |
|
|
|
|
|
|
|
|
Service Shares |
|
8.25 |
% |
|
3.44 |
% |
|
|
Institutional Shares |
|
N/A |
|
6.29 |
%(2) |
|
|
|
S&P 500® Index |
|
13.96 |
% |
|
10.01 |
%(3) |
|
|
Tactical Constrained Blended Index |
|
9.48 |
% |
|
4.11 |
%(4) |
|
|
|
|
|
(1) |
Inception date is 4/29/11 for Service Shares and 9/13/12 for Institutional Shares. |
|
|
|
|
(2) |
The return shown is cumulative from the inception date. |
|
|
|
|
(3) |
The return shown for the S&P 500® Index is annualized from the inception date of the Service Shares. The S&P 500® Index cumulative return from the inception date of the Institutional Shares is 8.80%. |
|
|
|
|
(4) |
The return shown for the Tactical Constrained Blended Index is annualized from the inception date of the Service Shares. The Tactical Constrained Blended Index cumulative return from the inception date of the Institutional Shares is 6.87%. |
25
|
|
|
GuidePathSM Tactical ConstrainedSM Asset Allocation Fund |
|
MANAGER’S DISCUSSION OF FUND PERFORMANCE (Continued) (Unaudited) |
|
|
|
|
• |
For the 12 months ended March 2013, the Fund returned 8.25% underperforming the S&P 500 Index at 13.96%. The Fund trailed the blended benchmark of 75% MSCI All Country World Index and 25% Barclays US Aggregate Index at 9.48%. |
|
|
|
|
• |
Exposure to core fixed income, and international and emerging markets equities were the largest drivers of underperformance relative to the S&P 500 Index. A bias toward higher quality credit within core fixed income harmed returns. International and emerging markets equities were tempered due to volatility from resurgent Eurozone debt concerns. |
|
|
|
|
• |
Security selection within the consumer discretionary sector of the opportunistic equity strategy contributed positively to returns. Opportunistic fixed income exposure contributed to performance with an overweight to non-US currencies and a bias to corporate debt securities. |
|
|
|
|
• |
Large cap equity exposure contributed to performance on improving US economic data. However weakness from security selection, specifically large cap securities within the consumer discretionary sector, harmed returns. |
|
|
|
Components of Portfolio Holdings* |
|
|
|
|
|
|
|
*Pie chart represents percentages of total portfolio, less securities lending collateral. |
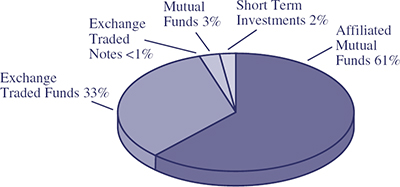
Top Ten Holdings
|
|
|
|
|
|
|
|
|
Rank |
|
Security/Holding |
|
%
of Net |
||
|
1 |
|
|
GuideMarkSM World ex-US Fund – Institutional Shares |
|
16.72 |
|
|
2 |
|
|
SPDR S&P 500 ETF Trust |
|
13.42 |
|
|
3 |
|
|
GuideMarkSM Core Fixed Income Fund – Institutional Shares |
|
10.84 |
|
|
4 |
|
|
GuideMarkSM Opportunistic Equity Fund – Institutional Shares |
|
10.56 |
|
|
5 |
|
|
GuideMarkSM Large Cap Growth Fund – Institutional Shares |
|
6.73 |
|
|
6 |
|
|
GuideMarkSM Large Cap Value Fund – Institutional Shares |
|
6.68 |
|
|
7 |
|
|
GuideMarkSM Opportunistic Fixed Income Fund – |
|
|
|
|
|
|
|
Institutional Shares |
|
5.98 |
|
|
8 |
|
|
iShares Core MSCI Emerging Markets ETF |
|
4.23 |
|
|
9 |
|
|
GuideMarkSM Small/Mid Cap Core Fund – Institutional Shares |
|
3.68 |
|
|
10 |
|
|
Vanguard REIT ETF |
|
1.99 |
|
26
|
|
|
GuidePathSM Tactical UnconstrainedSM Asset Allocation Fund |
|
MANAGER’S DISCUSSION OF FUND PERFORMANCE (Unaudited) |
|
|
|
TOTAL RETURN BASED ON A $10,000 INVESTMENT |
|
|
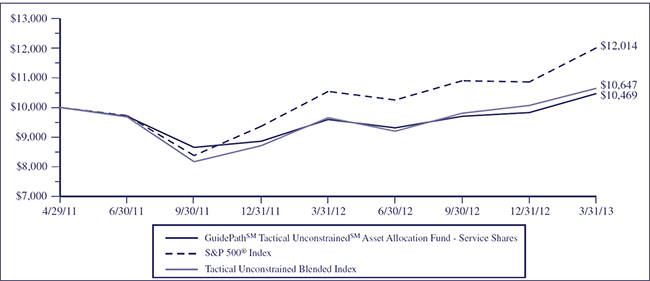
This chart assumes an initial gross investment of $10,000 made on April 29, 2011 (commencement of the Fund’s Service Shares operations). Returns shown include the reinvestment of all dividends. Returns shown do not reflect the deduction of taxes that a shareholder would pay on Fund distributions or the redemption of Fund shares. In the absence of fee waivers and reimbursements, when they are necessary to keep expenses at the expense cap, total return would be reduced. Past performance is not predictive of future performance. Investment return and principal value will fluctuate so that your shares, when redeemed, may be worth more or less than the original cost. Index returns do not reflect the effects of fees or expenses. It is not possible to invest directly in an index.
S&P 500® INDEX – Focuses on the large-cap segment of the US equities market. It includes 500 leading companies in leading industries of the US economy, capturing approximately 75% coverage of US equities.
TACTICAL UNCONSTRAINED BLENDED INDEX – A weighted combination of 90% of the total return from the MSCI All Country World Index with 10% of the total return from the Barclays Multiverse Index. Returns are weighted on a 90/10 basis for each historical month and then the longer-term Blended Index returns are geometrically combined from these historical monthly returns to create aggregate returns (1-year, 3-years, 5-years, etc.) for the Blended Index.
|
|
|
|
|
|
|
|
|
|
AVERAGE ANNUAL TOTAL RETURN (for the period ended March 31) |
|||||||
|
|
|
One Year |
|
Since Inception(1) |
|
||
|
|
|
|
|
||||
|
GuidePathSM Tactical UnconstrainedSM Asset Allocation Fund |
|
|
|
|
|
|
|
|
Service Shares |
|
9.15 |
% |
|
2.41 |
% |
|
|
Institutional Shares |
|
N/A |
|
7.11 |
%(2) |
|
|
|
S&P 500® Index |
|
13.96 |
% |
|
10.01 |
%(3) |
|
|
Tactical Unconstrained Blended Index |
|
10.27 |
% |
|
3.31 |
%(4) |
|
|
|
|
|
(1) |
Inception date is 4/29/11 for Service Shares and 9/13/12 for Institutional Shares. |
|
|
|
|
(2) |
The return shown is cumulative from the inception date. |
|
|
|
|
(3) |
The return shown for the S&P 500® Index is annualized from the inception date of the Service Shares. The S&P 500® Index cumulative return from the inception date of the Institutional Shares is 8.80%. |
|
|
|
|
(4) |
The return shown for the Tactical Unconstrained Blended Index is annualized from the inception date of the Service Shares. The Tactical Unconstrained Blended Index cumulative return from the inception date of the Institutional Shares is 7.86%. |
27
|
|
|
GuidePathSM Tactical UnconstrainedSM Asset Allocation Fund |
|
MANAGER’S DISCUSSION OF FUND PERFORMANCE (Continued) (Unaudited) |
|
|
|
|
• |
For the 12 months ended March 2013, the Fund returned 9.15% underperforming the S&P 500 Index at 13.96%. The Fund trailed the blended benchmark of 90% MSCI All Country World Index and 10% Barclays Multiverse Index at 10.27%. |
|
|
|
|
• |
Defensive positioning and higher cash allocations within the fund hindered returns, especially during the market rallies beginning in June 2012 and January 2013. Exposure to floating rate notes and core fixed income also detracted from performance. |
|
|
|
|
• |
Exposure to high yield bonds and small- and mid-cap equities proved beneficial based on investors’ risk taking behavior. Opportunistic exposures in both equities and fixed income were additive to returns. |
|
|
|
|
• |
US equity exposure contributed to performance on improving US economic data. However the actively managed large cap funds detracted from returns due to security selection. |
|
|
|
Components of Portfolio Holdings* |
|
|
|
|
|
|
|
*Pie chart represents percentages of total portfolio, less securities lending collateral. |
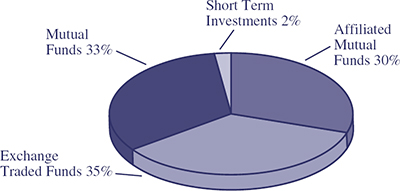
Top Ten Holdings
|
|
|
|
|
|
|
|
|
Rank |
|
Security/Holding |
|
%
of Net |
||
|
1 |
|
|
Virtus Premium AlphaSector Fund - Institutional Shares |
|
12.39 |
|
|
2 |
|
|
SPDR S&P 500 ETF Trust |
|
10.23 |
|
|
3 |
|
|
GuideMarkSM Opportunistic Equity Fund – Institutional Shares |
|
7.68 |
|
|
4 |
|
|
iShares MSCI ACWI ex US Index Fund |
|
6.78 |
|
|
5 |
|
|
GuideMarkSM Large Cap Value Fund – Institutional Shares |
|
6.73 |
|
|
6 |
|
|
Eaton Vance Floating-Rate Fund – Institutional Shares |
|
5.60 |
|
|
7 |
|
|
Stadion Managed Portfolio Trust – Institutional Shares |
|
5.23 |
|
|
8 |
|
|
GuideMarkSM Opportunistic Fixed Income Fund – |
|
|
|
|
|
|
|
Institutional Shares |
|
4.47 |
|
|
9 |
|
|
GuideMarkSM Small/Mid Cap Core Fund – Institutional Shares |
|
4.33 |
|
|
10 |
|
|
Guggenheim S&P 500 Equal Weight ETF |
|
3.95 |
|
28
|
|
|
GuidePathSM Absolute Return Asset Allocation Fund |
|
MANAGER’S DISCUSSION OF FUND PERFORMANCE (Unaudited) |
|
|
|
TOTAL RETURN BASED ON A $10,000 INVESTMENT |
|
|
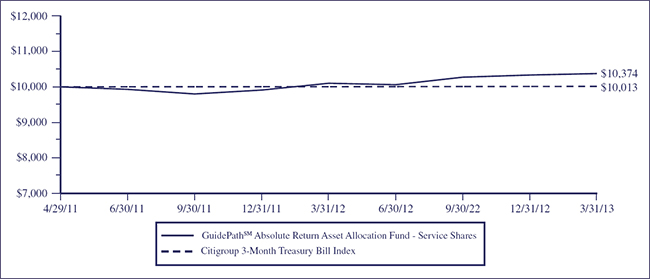
This chart assumes an initial gross investment of $10,000 made on April 29, 2011 (commencement of the Fund’s Service Shares operations). Returns shown include the reinvestment of all dividends. Returns shown do not reflect the deduction of taxes that a shareholder would pay on Fund distributions or the redemption of Fund shares. In the absence of fee waivers and reimbursements, when they are necessary to keep expenses at the expense cap, total return would be reduced. Past performance is not predictive of future performance. Investment return and principal value will fluctuate so that your shares, when redeemed, may be worth more or less than the original cost. Index returns do not reflect the effects of fees or expenses. It is not possible to invest directly in an index.
CITIGROUP 3-MONTH TREASURY BILL INDEX – Tracks the performance of US Treasury Bills with a remaining maturity of three months.
|
|
|
|
|
|
|
|
|
|
AVERAGE ANNUAL TOTAL RETURN (for the period ended March 31) |
|||||||
|
|
|
One Year |
|
Since Inception(1) |
|
||
|
|
|
|
|
||||
|
GuidePathSM Absolute Return Asset Allocation Fund |
|
|
|
|
|
|
|
|
Service Shares |
|
2.71 |
% |
|
1.93 |
% |
|
|
Institutional Shares |
|
N/A |
|
1.53 |
%(2) |
|
|
|
Citigroup 3-Month Treasury Bill Index |
|
0.08 |
% |
|
0.06 |
%(3) |
|
|
|
|
|
(1) |
Inception date is 4/29/11 for Service Shares and 9/13/12 for Institutional Shares. |
|
|
|
|
(2) |
The return shown is cumulative from the inception date. |
|
|
|
|
(3) |
The return shown for the Citigroup 3-Month Treasury Bill Index is annualized from the inception date of the Service Shares. The Citigroup 3-Month Treasury Bill Index cumulative return from the inception date of the Institutional Shares is 0.04%. |
29
|
|
|
GuidePathSM Absolute Return Asset Allocation Fund |
|
MANAGER’S DISCUSSION OF FUND PERFORMANCE (Continued) (Unaudited) |
|
|
|
|
• |
For the 12 months ended March 2013, the Fund returned 2.71% outperforming the Citigroup 3-month Treasury Bill Index at 0.08%. |
|
|
|
|
• |
Exposure to opportunistic fixed income strategies that favored corporate credit, global high yield bonds, and currencies was the primary driver of performance. |
|
|
|
|
• |
Security selection within mortgage-backed securities strategies, specifically non-agency bonds, proved beneficial to performance along with a small exposure to equities. |
Components of Portfolio Holdings*
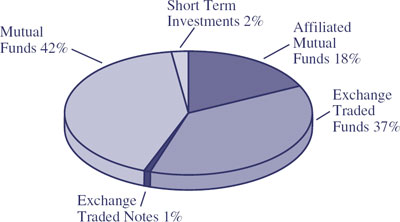
*Pie chart represents percentages of total portfolio, less securities lending collateral.
Top Ten Holdings
|
|
|
|
|
|
|
|
|
Rank |
|
Security/Holding |
|
% of Net |
||
|
1 |
|
|
GuideMarkSM Core Fixed Income Fund – Institutional Shares |
|
9.78 |
|
|
2 |
|
|
Pioneer Strategic Income Fund – Class Y |
|
9.28 |
|
|
3 |
|
|
iShares Barclays Credit Bond Fund |
|
7.84 |
|
|
4 |
|
|
GuideMarkSM
Opportunistic Fixed Income Fund – |
|
7.77 |
|
|
5 |
|
|
DoubleLine Total Return Bond Fund – Institutional Shares |
|
6.71 |
|
|
6 |
|
|
iShares JPMorgan USD Emerging Markets Bond Fund |
|
4.93 |
|
|
7 |
|
|
iShares Barclays MBS Bond Fund |
|
4.79 |
|
|
8 |
|
|
BlackRock Low Duration Bond Portfolio – Institutional Shares |
|
3.62 |
|
|
9 |
|
|
SPDR Barclays Capital 1-3 Month T-Bill ETF |
|
3.24 |
|
|
10 |
|
|
iShares Floating Rate Note Fund |
|
2.74 |
|
30
|
|
|
GuidePathSM Multi-Asset Income Asset Allocation Fund |
|
MANAGER’S DISCUSSION OF FUND PERFORMANCE (Unaudited) |
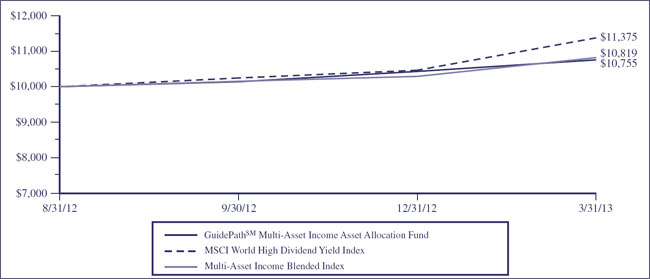
This chart assumes an initial gross investment of $10,000 made on August 31, 2012 (commencement of the Fund’s operations). Returns shown include the reinvestment of all dividends. Returns shown do not reflect the deduction of taxes that a shareholder would pay on Fund distributions or the redemption of Fund shares. In the absence of fee waivers and reimbursements, when they are necessary to keep expenses at the expense cap, total return would be reduced. Past performance is not predictive of future performance. Investment return and principal value will fluctuate so that your shares, when redeemed, may be worth more or less than the original cost. Index returns do not reflect the effects of fees or expenses. It is not possible to invest directly in an index.
MSCI WORLD HIGH DIVIDEND YIELD INDEX – An index that is based on the MSCI World Index, its parent index, and includes large and mid cap stocks across 24 developed market countries. The Index is designed to reflect the performance of equities (excluding REITs) with higher than average dividend yields that are both sustainable and persistent.
MULTI-ASSET INCOME BLENDED INDEX – A weighted combination of 60% of the total return from the MSCI World High Dividend Yield Index with 40% of the total return from the Barclays US Aggregate Bond Index. Returns are weighted on a 60/40 basis for each historical month and then the longer-term Blended Index returns are geometrically combined from these historical monthly returns to create aggregate returns (1-year, 3-years, 5-years, etc.) for the Blended Index.
|
|
|
|
|
|
|
CUMULATIVE TOTAL RETURN (for the period ended March 31) |
||||
|
|
|
Since Inception(1) |
|
|
|
|
|
|
||
|
GuidePathSM Multi-Asset Income Asset Allocation Fund |
|
7.55 |
% |
|
|
MSCI World High Dividend Yield Index |
|
13.75 |
% |
|
|
Multi-Asset Income Blended Index |
|
8.20 |
% |
|
|
|
|
|
(1) |
Inception date is 8/31/12. |
31
|
|
|
GuidePathSM Multi-Asset Income Asset Allocation Fund |
|
MANAGER’S DISCUSSION OF FUND PERFORMANCE (Continued) (Unaudited) |
|
|
|
|
• |
Since inception to the period ended March 2013, the Fund returned 7.55% underperforming the MSCI World High Dividend Yield Index at 13.75%. The Fund trailed the blended benchmark of 60% MSCI World High Dividend Yield Index and 40% Barclays US Aggregate Index at 8.20%. |
|
|
|
|
• |
Exposure and positioning within fixed income was the largest driver of underperformance. Allocations to US Treasury securities within core fixed income experienced negative returns during the period as yields rose modestly. |
|
|
|
|
• |
An emphasis towards internationally diversified dividend securities benefited returns, lifted higher by financials within Europe and the more defensive sectors of the market. A dedicated exposure to Australian dividend securities proved beneficial. |
|
|
|
|
• |
Small cap equity exposure boosted returns within US equities based on risk taking behavior by investors. |
Components of Portfolio Holdings*
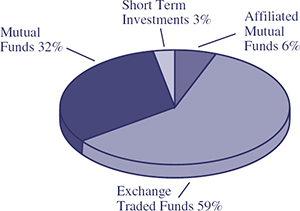
*Pie chart represents percentages of total portfolio, less securities lending collateral.
Top Ten Holdings
|
|
|
|
|
|
|
|
|
Rank |
|
Security/Holding |
|
% of Net |
||
|
1 |
|
|
SPDR S&P International Dividend ETF |
|
11.23 |
|
|
2 |
|
|
Wisdom Tree Equity Income Fund |
|
9.73 |
|
|
3 |
|
|
Forward Select Income Fund – Institutional Shares |
|
8.02 |
|
|
4 |
|
|
iShares S&P Global Infrastructure Index Fund |
|
7.86 |
|
|
5 |
|
|
iShares iBoxx $ High Yield Corporate Bond Fund |
|
7.40 |
|
|
6 |
|
|
iShares JPMorgan USD Emerging Markets Bond Fund |
|
7.05 |
|
|
7 |
|
|
JPMorgan High Yield Fund – Select Shares |
|
5.80 |
|
|
8 |
|
|
JPMorgan Income Builder Fund – Select Shares |
|
4.97 |
|
|
9 |
|
|
Forward International Dividend Fund – Institutional Shares |
|
4.05 |
|
|
10 |
|
|
Forward EM Corporate Debt Fund |
|
4.00 |
|
32
|
|
|
GuidePathSM Fixed Income Allocation Fund |
|
MANAGER’S DISCUSSION OF FUND PERFORMANCE (Unaudited) |
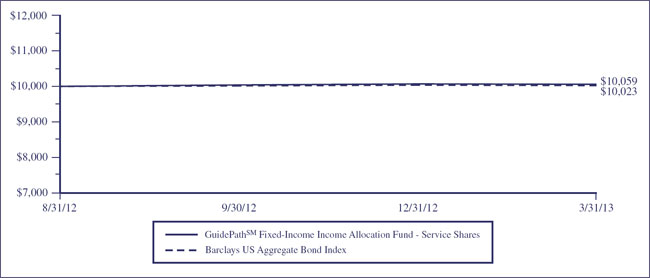
This chart assumes an initial gross investment of $10,000 made on August 31, 2012 (commencement of the Fund’s Service Shares operations). Returns shown include the reinvestment of all dividends. Returns shown do not reflect the deduction of taxes that a shareholder would pay on Fund distributions or the redemption of Fund shares. In the absence of fee waivers and reimbursements, when they are necessary to keep expenses at the expense cap, total return would be reduced. Past performance is not predictive of future performance. Investment return and principal value will fluctuate so that your shares, when redeemed, may be worth more or less than the original cost. Index returns do not reflect the effects of fees or expenses. It is not possible to invest directly in an index.
BARCLAYS US AGGREGATE BOND INDEX – A broad-based benchmark that measures the investment-grade, US dollar-denominated fixed-rate taxable bond market, including US Treasuries, government-related and corporate debt securities, and mortgage- and asset-backed securities. All securities contained in the Barclays US Aggregate Bond Index have a minimum term to maturity of one year.
|
|
|
|
|
|
|
CUMULATIVE TOTAL RETURN (for the period ended March 31) |
||||
|
|
|
Since Inception(1) |
|
|
|
|
|
|
||
|
GuidePathSM Fixed Income Allocation Fund |
|
|
|
|
|
Service Shares |
|
0.59 |
% |
|
|
Institutional Shares |
|
0.88 |
% |
|
|
Barclays US Aggregate Bond Index |
|
0.23 |
%(2) |
|
|
|
|
|
(1) |
Inception date is 8/31/12 for Service Shares and 9/13/12 for Institutional Shares. |
|
|
|
|
(2) |
The return shown for the Barclays US Aggregate Bond Index is from the inception date of the Service Shares. The Barclays US Aggregate Bond Index return from the inception date of the Institutional Shares is 0.62%. |
33
|
|
|
GuidePathSM Fixed Income Allocation Fund |
|
MANAGER’S DISCUSSION OF FUND PERFORMANCE (Continued) (Unaudited) |
|
|
|
|
• |
Since inception to the period ended March 2013, the Fund returned 0.59% outperforming the Barclays US Aggregate Index at 0.23%. |
|
|
|
|
• |
Exposure to opportunistic fixed income strategies that favored corporate credit, global high yield bonds, and currencies was the primary driver of performance. The ongoing demand for yield and risk taking investor behavior helped lift the returns of these asset classes. |
|
|
|
|
• |
Security selection within mortgage-backed securities strategies, specifically non-agency bonds, proved beneficial to performance. |
Components of Portfolio Holdings*
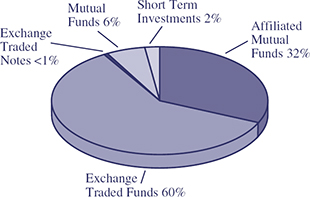
*Pie chart represents percentages of total portfolio, less securities lending collateral.
Top Ten Holdings
|
|
|
|
|
|
|
|
|
Rank |
|
Security/Holding |
|
% of Net |
||
|
1 |
|
|
GuideMarkSM Core Fixed Income Fund – Institutional Shares |
|
24.32 |
|
|
2 |
|
|
Vanguard Total Bond Market ETF |
|
22.08 |
|
|
3 |
|
|
GuideMarkSM
Opportunistic Fixed Income Fund – |
|
7.19 |
|
|
4 |
|
|
iShares Barclays Credit Bond Fund |
|
6.61 |
|
|
5 |
|
|
Vanguard Mortgage-Backed Securities ETF |
|
5.83 |
|
|
6 |
|
|
iShares Barclays 1-3 Year Treasury Bond Fund |
|
4.67 |
|
|
7 |
|
|
iShares Barclays 7-10 Year Treasury Bond Fund |
|
4.41 |
|
|
8 |
|
|
SPDR Barclays TIPS ETF |
|
3.18 |
|
|
9 |
|
|
SPDR Barclays High Yield Bond ETF |
|
3.08 |
|
|
10 |
|
|
PIMCO Unconstrained Bond Fund – Institutional Shares |
|
2.41 |
|
34
|
|
|
GuidePathSM Altegris® Multi-Strategy Alternative Allocation Fund |
|
MANAGER’S DISCUSSION OF FUND PERFORMANCE (Unaudited) |
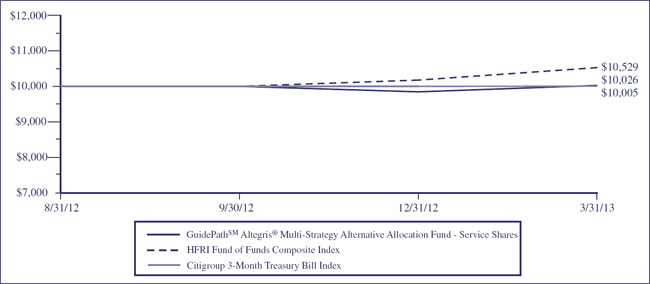
This chart assumes an initial gross investment of $10,000 made on August 31, 2012 (commencement of the Fund’s Service Shares operations). Returns shown include the reinvestment of all dividends. Returns shown do not reflect the deduction of taxes that a shareholder would pay on Fund distributions or the redemption of Fund shares. In the absence of fee waivers and reimbursements, when they are necessary to keep expenses at the expense cap, total return would be reduced. Past performance is not predictive of future performance. Investment return and principal value will fluctuate so that your shares, when redeemed, may be worth more or less than the original cost. Index returns do not reflect the effects of fees or expenses. It is not possible to invest directly in an index.
HFRI FUND OF FUNDS COMPOSITE INDEX – The HFRI Fund of Funds Composite Index is an equally weighted hedge fund index including over 650 domestic and off-shore funds of funds.
CITIGROUP 3-MONTH TREASURY BILL INDEX – Tracks the performance of US Treasury Bills with a remaining maturity of three months.
|
|
|
|
|
|
|
CUMULATIVE TOTAL RETURN (for the period ended March 31) |
||||
|
|
|
Since Inception(1) |
|
|
|
|
|
|
||
|
GuidePathSM Altegris® Multi-Strategy Alternative Allocation Fund |
|
|
|
|
|
Service Shares |
|
0.26 |
% |
|
|
Institutional Shares |
|
-0.19 |
% |
|
|
HFRI Fund of Funds Composite Index |
|
5.74 |
%(2) |
|
|
Citigroup 3-Month Treasury Bill Index |
|
0.05 |
%(3) |
|
|
|
|
|
(1) |
Inception date is 8/31/12 for Service Shares and 9/13/12 for Institutional Shares. |
|
|
|
|
(2) |
Reflects index performance since the date closest to the Institutional Shares’ inception for which data is available. The HFRI Fund of Funds Composite Index is calculated from August 31, 2012, the inception date of the Service Shares. |
|
|
|
|
(3) |
The return shown for the Citigroup 3-Month Treasury Bill Index is from the inception date of the Service Shares. The Citigroup 3-Month Treasury Bill Index return from the inception of the Institutional Shares is 0.04%. |
35
|
|
|
GuidePathSM Altegris® Multi-Strategy Alternative Allocation Fund |
|
MANAGER’S DISCUSSION OF FUND PERFORMANCE (Continued) (Unaudited) |
|
|
|
|
• |
For the period ended March 2013, the Fund returned 0.26% underperforming the HFRI Fund of Funds Composite Index at 5.74%. The Fund outperformed the Citigroup 3-Month Treasury Bill Index at 0.05%. |
|
|
|
|
• |
Currency positioning was the main factor that adversely impacted returns. A net long position in the Japanese yen detracted from performance as the Bank of Japan moved towards more aggressive economic policy actions. |
|
|
|
|
• |
The commodities markets as a whole have moved in a sideways pattern defying the broader market rally. The Fund’s commodities exposures were broad based, without a bias towards any specific sector that might have been advantageous. |
|
|
|
|
• |
Equity exposure favoring financials and small caps, contributed positively towards performance. Exposure to opportunistic fixed income strategies that favored corporate credit, global high yield bonds, and currencies also benefitted returns. |
Components of Portfolio Holdings*
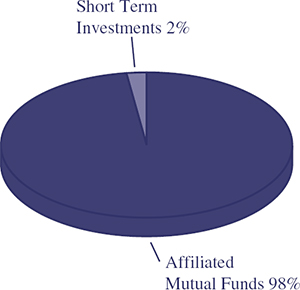
*Pie chart represents percentages of total portfolio, less securities lending collateral.
Top Ten Holdings
|
|
|
|
|
|
|
|
|
Rank |
|
Security/Holding |
|
% of Net |
||
|
1 |
|
|
Altegris® Equity Long Short Fund – Institutional Shares |
|
41.90 |
|
|
2 |
|
|
Altegris® Macro Strategy Fund – Institutional Shares |
|
19.23 |
|
|
3 |
|
|
GuideMarkSM
Opportunistic Fixed Income Fund – |
|
12.63 |
|
|
4 |
|
|
Altegris® Futures Evolution Strategy Fund – Institutional Shares |
|
8.63 |
|
|
5 |
|
|
Altegris® Managed Futures Strategy Fund – Institutional Shares |
|
8.55 |
|
|
6 |
|
|
Altegris® Fixed Income Long Short Fund – Institutional Shares |
|
6.80 |
|
36
|
|
|
GuideMarkSM
Funds & GuidePathSM Funds |
|
March 31, 2013 |
As a shareholder of the GuideMarkSM & GuidePathSM Funds (the “Funds”), you incur ongoing costs, including management fees, distribution and/or service fees, and other Fund expenses. The Expense Example shown in this section is intended to help you understand your ongoing costs (in dollars) of investing in the Funds and to compare these costs with the ongoing costs of investing in other mutual funds.
The Expense Examples are based on an investment of $1,000 invested at the beginning of a six-month period and held for the entire period, which for all Funds is from October 1, 2012 to March 31, 2013.
Actual Expenses
The first
line of the Expense Example table provides information about actual account
values and actual expenses. You may use the information in this line, together
with the amount you invested, to estimate the expenses that you paid over the
period. Simply divide your account value by $1,000 (for example, an $8,600
account value divided by $1,000 = 8.6), then multiply the result by the number
in the first line under the heading entitled “Expenses Paid During Period” to
estimate the expenses you paid on your account during this period.
The example includes, but is not limited to, management fees, shareholder servicing fees, distribution fees, fund accounting fees, custody fees and transfer agent fees. However, the example below does not include portfolio trading commissions and related expenses, interest expense or dividends on short positions taken by a Fund and other extraordinary expenses as determined under U.S. generally accepted accounting principles. To the extent that a Fund invests in shares of other investment companies as part of its investment strategy, you will indirectly bear your proportionate share of any fees and expenses charged by the underlying funds in which a Fund invests in addition to the expenses of the Fund. Actual expenses of the underlying funds are expected to vary among the various underlying funds. These expenses are not included in the example below.
Hypothetical Example
for Comparison Purposes
The second
line of the table below provides information about hypothetical account values
and hypothetical expenses based on each Fund’s actual expenses ratios and an
assumed rate of return of 5% per year before expenses, which is not the Fund’s
actual return. The hypothetical account values and expenses may not be used to
estimate the actual ending account balance or expenses you paid for the period.
You may use this information to compare the ongoing costs of investing in the
Funds and other funds. To do so, compare this 5% hypothetical example with the
5% hypothetical examples that appear in the shareholder reports of the other
funds.
37
|
|
|
GuideMarkSM Funds & GuidePathSM Funds |
|
EXPENSE EXAMPLE (Continued) (Unaudited) |
|
March 31, 2013 |
|
|
|
|
|
|
|
|
|
|
|
|
|
|
|
|
|
|
|
|
|
|
|
|
Fund |
|
|
|
Beginning |
|
Ending |
|
Annualized |
|
Expenses Paid |
|
||||||||||
|
INSTITUTIONAL SHARES |
|
|
|
|
|
|
|
|
|
|
|
|
|
|
|
|
|
|
|
|
|
|
GuideMarkSM Large Cap |
|
Actual |
|
|
$ |
1,000.00 |
|
|
|
$ |
1,058.40 |
|
|
0.91 |
% |
|
|
$ |
4.67 |
|
|
|
Growth Fund |
|
Hypothetical3 |
|
|
$ |
1,000.00 |
|
|
|
$ |
1,020.39 |
|
|
0.91 |
% |
|
|
$ |
4.58 |
|
|
|
GuideMarkSM Large Cap |
|
Actual |
|
|
$ |
1,000.00 |
|
|
|
$ |
1,128.20 |
|
|
0.92 |
% |
|
|
$ |
4.88 |
|
|
|
Value Fund |
|
Hypothetical3 |
|
|
$ |
1,000.00 |
|
|
|
$ |
1,020.34 |
|
|
0.92 |
% |
|
|
$ |
4.63 |
|
|
|
GuideMarkSM Small/Mid Cap |
|
Actual |
|
|
$ |
1,000.00 |
|
|
|
$ |
1,170.40 |
|
|
1.09 |
% |
|
|
$ |
5.90 |
|
|
|
Core Fund |
|
Hypothetical3 |
|
|
$ |
1,000.00 |
|
|
|
$ |
1,019.50 |
|
|
1.09 |
% |
|
|
$ |
5.49 |
|
|
|
GuideMarkSM World |
|
Actual |
|
|
$ |
1,000.00 |
|
|
|
$ |
1,089.60 |
|
|
1.09 |
% |
|
|
$ |
5.68 |
|
|
|
ex-US Fund |
|
Hypothetical3 |
|
|
$ |
1,000.00 |
|
|
|
$ |
1,019.50 |
|
|
1.09 |
% |
|
|
$ |
5.49 |
|
|
|
GuideMarkSM Opportunistic |
|
Actual |
|
|
$ |
1,000.00 |
|
|
|
$ |
1,152.20 |
|
|
1.05 |
% |
|
|
$ |
5.63 |
|
|
|
Equity Fund |
|
Hypothetical3 |
|
|
$ |
1,000.00 |
|
|
|
$ |
1,019.70 |
|
|
1.05 |
% |
|
|
$ |
5.29 |
|
|
|
GuideMarkSM Global |
|
Actual |
|
|
$ |
1,000.00 |
|
|
|
$ |
1,004.40 |
|
|
0.83 |
% |
|
|
$ |
4.15 |
|
|
|
Real Return Fund |
|
Hypothetical3 |
|
|
$ |
1,000.00 |
|
|
|
$ |
1,020.79 |
|
|
0.83 |
% |
|
|
$ |
4.18 |
|
|
|
GuideMarkSM Core |
|
Actual |
|
|
$ |
1,000.00 |
|
|
|
$ |
1,000.50 |
|
|
0.73 |
% |
|
|
$ |
3.64 |
|
|
|
Fixed Income Fund |
|
Hypothetical3 |
|
|
$ |
1,000.00 |
|
|
|
$ |
1,021.29 |
|
|
0.73 |
% |
|
|
$ |
3.68 |
|
|
|
GuideMarkSM Opportunistic |
|
Actual |
|
|
$ |
1,000.00 |
|
|
|
$ |
1,052.20 |
|
|
1.05 |
% |
|
|
$ |
5.37 |
|
|
|
Fixed Income Fund |
|
Hypothetical3 |
|
|
$ |
1,000.00 |
|
|
|
$ |
1,019.70 |
|
|
1.05 |
% |
|
|
$ |
5.29 |
|
|
|
GuidePathSM Strategic |
|
Actual |
|
|
$ |
1,000.00 |
|
|
|
$ |
1,095.00 |
|
|
0.42 |
% |
|
|
$ |
2.19 |
|
|
|
Asset Allocation Fund |
|
Hypothetical3 |
|
|
$ |
1,000.00 |
|
|
|
$ |
1,022.84 |
|
|
0.42 |
% |
|
|
$ |
2.12 |
|
|
|
GuidePathSM Tactical ConstrainedSM |
|
Actual |
|
|
$ |
1,000.00 |
|
|
|
$ |
1,075.80 |
|
|
0.44 |
% |
|
|
$ |
2.28 |
|
|
|
Asset Allocation Fund |
|
Hypothetical3 |
|
|
$ |
1,000.00 |
|
|
|
$ |
1,022.74 |
|
|
0.44 |
% |
|
|
$ |
2.22 |
|
|
|
GuidePathSM Tactical UnconstrainedSM |
|
Actual |
|
|
$ |
1,000.00 |
|
|
|
$ |
1,081.00 |
|
|
0.52 |
% |
|
|
$ |
2.70 |
|
|
|
Asset Allocation Fund |
|
Hypothetical3 |
|
|
$ |
1,000.00 |
|
|
|
$ |
1,022.34 |
|
|
0.52 |
% |
|
|
$ |
2.62 |
|
|
|
GuidePathSM Absolute Return |
|
Actual |
|
|
$ |
1,000.00 |
|
|
|
$ |
1,013.30 |
|
|
0.51 |
% |
|
|
$ |
2.56 |
|
|
|
Asset Allocation Fund |
|
Hypothetical3 |
|
|
$ |
1,000.00 |
|
|
|
$ |
1,022.39 |
|
|
0.51 |
% |
|
|
$ |
2.57 |
|
|
|
GuidePathSM Fixed Income |
|
Actual |
|
|
$ |
1,000.00 |
|
|
|
$ |
1,004.80 |
|
|
0.50 |
% |
|
|
$ |
2.50 |
|
|
|
Allocation Fund |
|
Hypothetical3 |
|
|
$ |
1,000.00 |
|
|
|
$ |
1,022.44 |
|
|
0.50 |
% |
|
|
$ |
2.52 |
|
|
|
GuidePathSM Altegris® Multi-Strategy |
|
Actual |
|
|
$ |
1,000.00 |
|
|
|
$ |
1,005.10 |
|
|
0.30 |
% |
|
|
$ |
1.50 |
|
|
|
Alternative Allocation Fund |
|
Hypothetical3 |
|
|
$ |
1,000.00 |
|
|
|
$ |
1,023.44 |
|
|
0.30 |
% |
|
|
$ |
1.51 |
|
|
|
|
|
|
1 |
The expense ratio excludes the securities lending credit. |
|
2 |
Expenses are equal to the Fund’s annualized expense ratio, multiplied by the average account value over the period, multiplied by 182/365 to reflect the one-half year period. |
|
3 |
5% return before expenses. |
38
|
|
|
GuideMarkSM Funds & GuidePathSM Funds |
|
EXPENSE EXAMPLE (Continued) (Unaudited) |
|
March 31, 2013 |
|
|
|
|
|
|
|
|
|
|
|
|
|
|
|
|
|
|
|
|
|
|
|
|
Fund |
|
|
|
Beginning |
|
Ending |
|
Annualized |
|
Expenses Paid |
|
||||||||||
|
SERVICE SHARES |
|
|
|
|
|
|
|
|
|
|
|
|
|
|
|
|
|
|
|
|
|
|
GuideMarkSM Large Cap |
|
Actual |
|
|
$ |
1,000.00 |
|
|
|
$ |
1,054.90 |
|
|
1.53 |
% |
|
|
$ |
7.84 |
|
|
|
Growth Fund |
|
Hypothetical3 |
|
|
$ |
1,000.00 |
|
|
|
$ |
1,017.30 |
|
|
1.53 |
% |
|
|
$ |
7.70 |
|
|
|
GuideMarkSM Large Cap |
|
Actual |
|
|
$ |
1,000.00 |
|
|
|
$ |
1,123.70 |
|
|
1.49 |
% |
|
|
$ |
7.89 |
|
|
|
Value Fund |
|
Hypothetical3 |
|
|
$ |
1,000.00 |
|
|
|
$ |
1,017.50 |
|
|
1.49 |
% |
|
|
$ |
7.49 |
|
|
|
GuideMarkSM Small/Mid Cap |
|
Actual |
|
|
$ |
1,000.00 |
|
|
|
$ |
1,167.10 |
|
|
1.63 |
% |
|
|
$ |
8.81 |
|
|
|
Core Fund |
|
Hypothetical3 |
|
|
$ |
1,000.00 |
|
|
|
$ |
1,016.80 |
|
|
1.63 |
% |
|
|
$ |
8.20 |
|
|
|
GuideMarkSM World |
|
Actual |
|
|
$ |
1,000.00 |
|
|
|
$ |
1,086.80 |
|
|
1.59 |
% |
|
|
$ |
8.27 |
|
|
|
ex-US Fund |
|
Hypothetical3 |
|
|
$ |
1,000.00 |
|
|
|
$ |
1,017.00 |
|
|
1.59 |
% |
|
|
$ |
8.00 |
|
|
|
GuideMarkSM Opportunistic |
|
Actual |
|
|
$ |
1,000.00 |
|
|
|
$ |
1,147.90 |
|
|
1.61 |
% |
|
|
$ |
8.62 |
|
|
|
Equity Fund |
|
Hypothetical3 |
|
|
$ |
1,000.00 |
|
|
|
$ |
1,016.90 |
|
|
1.61 |
% |
|
|
$ |
8.10 |
|
|
|
GuideMarkSM Global |
|
Actual |
|
|
$ |
1,000.00 |
|
|
|
$ |
1,000.90 |
|
|
1.40 |
% |
|
|
$ |
6.98 |
|
|
|
Real Return Fund |
|
Hypothetical3 |
|
|
$ |
1,000.00 |
|
|
|
$ |
1,017.95 |
|
|
1.40 |
% |
|
|
$ |
7.04 |
|
|
|
GuideMarkSM Core |
|
Actual |
|
|
$ |
1,000.00 |
|
|
|
$ |
997.50 |
|
|
1.30 |
% |
|
|
$ |
6.47 |
|
|
|
Fixed Income Fund |
|
Hypothetical3 |
|
|
$ |
1,000.00 |
|
|
|
$ |
1,018.45 |
|
|
1.30 |
% |
|
|
$ |
6.54 |
|
|
|
GuideMarkSM Tax-Exempt |
|
Actual |
|
|
$ |
1,000.00 |
|
|
|
$ |
1,007.80 |
|
|
1.29 |
% |
|
|
$ |
6.46 |
|
|
|
Fixed Income Fund |
|
Hypothetical3 |
|
|
$ |
1,000.00 |
|
|
|
$ |
1,018.50 |
|
|
1.29 |
% |
|
|
$ |
6.49 |
|
|
|
GuideMarkSM Opportunistic |
|
Actual |
|
|
$ |
1,000.00 |
|
|
|
$ |
1,049.10 |
|
|
1.55 |
% |
|
|
$ |
7.92 |
|
|
|
Fixed Income Fund |
|
Hypothetical3 |
|
|
$ |
1,000.00 |
|
|
|
$ |
1,017.20 |
|
|
1.55 |
% |
|
|
$ |
7.80 |
|
|
|
GuidePathSM Strategic |
|
Actual |
|
|
$ |
1,000.00 |
|
|
|
$ |
1,091.90 |
|
|
1.03 |
% |
|
|
$ |
5.37 |
|
|
|
Asset Allocation Fund |
|
Hypothetical3 |
|
|
$ |
1,000.00 |
|
|
|
$ |
1,019.80 |
|
|
1.03 |
% |
|
|
$ |
5.19 |
|
|
|
GuidePathSM Tactical ConstrainedSM |
|
Actual |
|
|
$ |
1,000.00 |
|
|
|
$ |
1,071.60 |
|
|
1.04 |
% |
|
|
$ |
5.37 |
|
|
|
Asset Allocation Fund |
|
Hypothetical3 |
|
|
$ |
1,000.00 |
|
|
|
$ |
1,019.75 |
|
|
1.04 |
% |
|
|
$ |
5.24 |
|
|
|
GuidePathSM Tactical UnconstrainedSM |
|
Actual |
|
|
$ |
1,000.00 |
|
|
|
$ |
1,079.00 |
|
|
1.16 |
% |
|
|
$ |
6.01 |
|
|
|
Asset Allocation Fund |
|
Hypothetical3 |
|
|
$ |
1,000.00 |
|
|
|
$ |
1,019.15 |
|
|
1.16 |
% |
|
|
$ |
5.84 |
|
|
|
GuidePathSM Absolute Return |
|
Actual |
|
|
$ |
1,000.00 |
|
|
|
$ |
1,010.00 |
|
|
1.13 |
% |
|
|
$ |
5.66 |
|
|
|
Asset Allocation Fund |
|
Hypothetical3 |
|
|
$ |
1,000.00 |
|
|
|
$ |
1,019.30 |
|
|
1.13 |
% |
|
|
$ |
5.69 |
|
|
39
|
|
|
GuideMarkSM Funds & GuidePathSM Funds |
|
EXPENSE EXAMPLE (Continued) (Unaudited) |
|
March 31, 2013 |
|
|
|
|
|
|
|
|
|
|
|
|
|
|
|
|
|
|
|
|
|
|
|
|
Fund |
|
|
|
Beginning |
|
Ending |
|
Annualized |
|
Expenses Paid |
|
||||||||||
|
SERVICE SHARES (Continued) |
|
|
|
|
|
|
|
|
|
|
|
|
|
|
|
|
|
|
|
|
|
|
GuidePathSM Multi-Asset Income |
|
Actual |
|
|
$ |
1,000.00 |
|
|
|
$ |
1,060.70 |
|
|
1.29 |
% |
|
|
$ |
6.63 |
|
|
|
Asset Allocation Fund |
|
Hypothetical3 |
|
|
$ |
1,000.00 |
|
|
|
$ |
1,018.50 |
|
|
1.29 |
% |
|
|
$ |
6.49 |
|
|
|
GuidePathSM Fixed Income |
|
Actual |
|
|
$ |
1,000.00 |
|
|
|
$ |
1,001.90 |
|
|
1.10 |
% |
|
|
$ |
5.49 |
|
|
|
Allocation Fund |
|
Hypothetical3 |
|
|
$ |
1,000.00 |
|
|
|
$ |
1,019.45 |
|
|
1.10 |
% |
|
|
$ |
5.54 |
|
|
|
GuidePathSM Altegris® Multi-Strategy |
|
Actual |
|
|
$ |
1,000.00 |
|
|
|
$ |
1,002.60 |
|
|
0.68 |
% |
|
|
$ |
3.40 |
|
|
|
Alternative Allocation Fund |
|
Hypothetical3 |
|
|
$ |
1,000.00 |
|
|
|
$ |
1,021.54 |
|
|
0.68 |
% |
|
|
$ |
3.43 |
|
|
|
|
|
|
1 |
The expense ratio excludes the securities lending credit. |
|
2 |
Expenses are equal to the Fund’s annualized expense ratio, multiplied by the average account value over the period, multiplied by 182/365 to reflect the one-half year period. |
|
3 |
5% return before expenses. |
40
|
|
|
GuideMarkSM Large Cap Growth Fund |
|
SCHEDULE OF INVESTMENTS |
|
March 31, 2013 |
|
|
|
|
|
|
|
|
|
|
Number of |
|
|
|
Value |
|
||
|
|
|
|
|
||||
|
|
|
|
COMMON STOCKS - 99.72% |
|
|
|
|
|
|
|
|
Aerospace & Defense - 5.01% |
|
|
|
|
|
|
37,692 |
|
Boeing Co. |
|
$ |
3,235,858 |
|
|
|
41,480 |
|
Honeywell International, Inc. |
|
|
3,125,518 |
|
|
|
29,015 |
|
United Technologies Corp. |
|
|
2,710,872 |
|
|
|
|
|
|
|
|
||
|
|
|
|
|
|
|
9,072,248 |
|
|
|
|
|
|
|
|
||
|
|
|
|
Automobiles - 0.56% |
|
|
|
|
|
|
77,068 |
|
Ford Motor Co. |
|
|
1,013,444 |
|
|
|
|
|
|
|
|
||
|
|
|
|
Beverages - 1.93% |
|
|
|
|
|
|
11,709 |
|
Anheuser-Busch InBev NV - ADR |
|
|
1,165,631 |
|
|
|
57,440 |
|
The Coca-Cola Company |
|
|
2,322,873 |
|
|
|
|
|
|
|
|
||
|
|
|
|
|
|
|
3,488,504 |
|
|
|
|
|
|
|
|
||
|
|
|
|
Biotechnology - 6.62% |
|
|
|
|
|
|
44,418 |
|
Amgen, Inc. |
|
|
4,553,289 |
|
|
|
10,761 |
|
Biogen Idec, Inc. (b) |
|
|
2,075,905 |
|
|
|
23,196 |
|
Celgene Corp. (b) |
|
|
2,688,648 |
|
|
|
54,676 |
|
Gilead Sciences, Inc. (b) |
|
|
2,675,297 |
|
|
|
|
|
|
|
|
||
|
|
|
|
|
|
|
11,993,139 |
|
|
|
|
|
|
|
|
||
|
|
|
|
Chemicals - 1.69% |
|
|
|
|
|
|
28,939 |
|
Monsanto Co. |
|
|
3,056,827 |
|
|
|
|
|
|
|
|
||
|
|
|
|
Commercial Services & Supplies - 0.48% |
|
|
|
|
|
|
17,675 |
|
The ADT Corp. |
|
|
865,014 |
|
|
|
|
|
|
|
|
||
|
|
|
|
Communications Equipment - 6.46% |
|
|
|
|
|
|
446,142 |
|
Cisco Systems, Inc. |
|
|
9,328,829 |
|
|
|
4,151 |
|
F5 Networks, Inc. (b) |
|
|
369,771 |
|
|
|
30,085 |
|
Qualcomm, Inc. |
|
|
2,014,191 |
|
|
|
|
|
|
|
|
||
|
|
|
|
|
|
|
11,712,791 |
|
|
|
|
|
|
|
|
||
|
|
|
|
Computers & Peripherals - 6.95% |
|
|
|
|
|
|
10,800 |
|
Apple, Inc. |
|
|
4,780,404 |
|
|
|
13,722 |
|
International Business Machines |
|
|
2,926,903 |
|
|
|
76,112 |
|
NetApp, Inc. (b) |
|
|
2,599,986 |
|
|
|
19,793 |
|
QLogic Corp. (b) |
|
|
229,599 |
|
|
|
24,833 |
|
SanDisk Corp. (b) |
|
|
1,365,815 |
|
|
|
13,623 |
|
Western Digital Corp. |
|
|
684,964 |
|
|
|
|
|
|
|
|
||
|
|
|
|
|
|
|
12,587,671 |
|
|
|
|
|
|
|
|
||
|
|
|
|
Consumer Finance - 1.24% |
|
|
|
|
|
|
33,271 |
|
American Express Co. |
|
|
2,244,462 |
|
|
|
|
|
|
|
|
||
|
|
|
|
Diversified Financial Services - 2.49% |
|
|
|
|
|
|
240,912 |
|
Bank of America Corp. |
|
|
2,934,308 |
|
|
|
33,391 |
|
JPMorgan Chase & Co. |
|
|
1,584,737 |
|
|
|
|
|
|
|
|
||
|
|
|
|
|
|
|
4,519,045 |
|
|
|
|
|
|
|
|
||
|
|
|
|
|
|
|
||
|
Number of |
|
|
|
Value |
|
||
|
|
|
|
|
||||
|
|
|
|
Diversified Telecommunication Services - 2.20% |
|
|
|
|
|
|
81,247 |
|
Verizon Communications, Inc. |
|
$ |
3,993,290 |
|
|
|
|
|
|
|
|
||
|
|
|
|
Energy Equipment & Services - 2.77% |
|
|
|
|
|
|
2,107 |
|
Core Laboratories NV |
|
|
290,597 |
|
|
|
18,055 |
|
Diamond Offshore Drilling, Inc. (a) |
|
|
1,255,906 |
|
|
|
12,042 |
|
National-Oilwell Varco, Inc. |
|
|
851,972 |
|
|
|
20,252 |
|
Oceaneering International, Inc. |
|
|
1,344,935 |
|
|
|
24,575 |
|
Transocean Ltd. - ADR (b) |
|
|
1,276,917 |
|
|
|
|
|
|
|
|
||
|
|
|
|
|
|
|
5,020,327 |
|
|
|
|
|
|
|
|
||
|
|
|
|
Food & Staples Retailing - 4.78% |
|
|
|
|
|
|
20,625 |
|
Costco Wholesale Corp. |
|
|
2,188,519 |
|
|
|
47,127 |
|
CVS Caremark Corp. |
|
|
2,591,513 |
|
|
|
51,859 |
|
Wal-Mart Stores, Inc. |
|
|
3,880,609 |
|
|
|
|
|
|
|
|
||
|
|
|
|
|
|
|
8,660,641 |
|
|
|
|
|
|
|
|
||
|
|
|
|
Food Products - 0.92% |
|
|
|
|
|
|
29,304 |
|
Green Mountain Coffee Roasters, |
|
|
1,663,295 |
|
|
|
|
|
|
|
|
||
|
|
|
|
Health Care Equipment & Supplies - 2.33% |
|
|
|
|
|
|
9,801 |
|
Edwards Lifesciences Corp. (b) |
|
|
805,250 |
|
|
|
44,031 |
|
Hologic, Inc. (b) |
|
|
995,101 |
|
|
|
16,019 |
|
Medtronic, Inc. |
|
|
752,252 |
|
|
|
22,213 |
|
Zimmer Holdings, Inc. |
|
|
1,670,862 |
|
|
|
|
|
|
|
|
||
|
|
|
|
|
|
|
4,223,465 |
|
|
|
|
|
|
|
|
||
|
|
|
|
Health Care Providers & Services - 1.61% |
|
|
|
|
|
|
22,427 |
|
Aetna, Inc. |
|
|
1,146,468 |
|
|
|
16,432 |
|
McKesson Corp. |
|
|
1,773,999 |
|
|
|
|
|
|
|
|
||
|
|
|
|
|
|
|
2,920,467 |
|
|
|
|
|
|
|
|
||
|
|
|
|
Hotels, Restaurants & Leisure - 1.54% |
|
|
|
|
|
|
21,983 |
|
Starwood Hotels & Resorts |
|
|
1,400,977 |
|
|
|
10,324 |
|
Wyndham Worldwide Corp. |
|
|
665,691 |
|
|
|
5,855 |
|
Wynn Resorts Ltd. |
|
|
732,812 |
|
|
|
|
|
|
|
|
||
|
|
|
|
|
|
|
2,799,480 |
|
|
|
|
|
|
|
|
||
|
|
|
|
Industrial Conglomerates - 2.92% |
|
|
|
|
|
|
25,144 |
|
3M Co. |
|
|
2,673,059 |
|
|
|
79,229 |
|
General Electric Co. |
|
|
1,831,774 |
|
|
|
24,620 |
|
Tyco International Ltd. - ADR |
|
|
787,840 |
|
|
|
|
|
|
|
|
||
|
|
|
|
|
|
|
5,292,673 |
|
|
|
|
|
|
|
|
||
|
|
|
|
Internet & Catalog Retail - 2.15% |
|
|
|
|
|
|
10,128 |
|
Amazon.com, Inc. (b) |
|
|
2,699,011 |
|
|
|
1,728 |
|
Priceline.com, Inc. (b) |
|
|
1,188,743 |
|
|
|
|
|
|
|
|
||
|
|
|
|
|
|
|
3,887,754 |
|
|
|
|
|
|
|
|
||
See notes to financial statements.
41
|
|
|
GuideMarkSM Large Cap Growth Fund |
|
SCHEDULE OF INVESTMENTS (Continued) |
|
March 31, 2013 |
|
|
|
|
|
|
|
|
|
|
Number of |
|
|
|
Value |
|
||
|
|
|
|
|
||||
|
|
|
|
COMMON STOCKS (Continued) |
|
|
|
|
|
|
|
|
Internet Software & Services - 6.30% |
|
|
|
|
|
|
41,687 |
|
eBay, Inc. (b) |
|
$ |
2,260,269 |
|
|
|
6,792 |
|
Google, Inc. (b) |
|
|
5,393,052 |
|
|
|
45,577 |
|
IAC/InterActiveCorp |
|
|
2,036,380 |
|
|
|
73,094 |
|
Yahoo, Inc. (b) |
|
|
1,719,902 |
|
|
|
|
|
|
|
|
||
|
|
|
|
|
|
|
11,409,603 |
|
|
|
|
|
|
|
|
||
|
|
|
|
|
|
|
|
|
|
|
|
|
IT Services - 1.65% |
|
|
|
|
|
|
5,668 |
|
Paychex, Inc. |
|
|
198,777 |
|
|
|
16,446 |
|
Visa, Inc. |
|
|
2,793,188 |
|
|
|
|
|
|
|
|
||
|
|
|
|
|
|
|
2,991,965 |
|
|
|
|
|
|
|
|
||
|
|
|
|
Life Sciences Tools & Services - 0.47% |
|
|
|
|
|
|
44,817 |
|
Bruker Corp. (b) |
|
|
856,005 |
|
|
|
|
|
|
|
|
||
|
|
|
|
Machinery - 3.63% |
|
|
|
|
|
|
30,111 |
|
Danaher Corp. |
|
|
1,871,398 |
|
|
|
15,076 |
|
Dover Corp. |
|
|
1,098,739 |
|
|
|
23,838 |
|
Illinois Tool Works, Inc. |
|
|
1,452,688 |
|
|
|
23,479 |
|
Parker Hannifin Corp. |
|
|
2,150,207 |
|
|
|
|
|
|
|
|
||
|
|
|
|
|
|
|
6,573,032 |
|
|
|
|
|
|
|
|
||
|
|
|
|
|
|
|
|
|
|
|
|
|
Media - 4.63% |
|
|
|
|
|
|
69,217 |
|
Comcast Corp. |
|
|
2,907,806 |
|
|
|
63,422 |
|
News Corp. |
|
|
1,935,639 |
|
|
|
36,442 |
|
Omnicom Group, Inc. |
|
|
2,146,434 |
|
|
|
455,636 |
|
Sirius XM Radio, Inc. (a) |
|
|
1,403,359 |
|
|
|
|
|
|
|
|
||
|
|
|
|
|
|
|
8,393,238 |
|
|
|
|
|
|
|
|
||
|
|
|
|
|
|
|
|
|
|
|
|
|
Metals & Mining - 0.18% |
|
|
|
|
|
|
19,736 |
|
Allied Nevada Gold Corp. (b) |
|
|
324,855 |
|
|
|
|
|
|
|
|
||
|
|
|
|
Multiline Retail - 0.73% |
|
|
|
|
|
|
27,423 |
|
Dollar Tree, Inc. (b) |
|
|
1,328,096 |
|
|
|
|
|
|
|
|
||
|
|
|
|
Oil & Gas - 0.89% |
|
|
|
|
|
|
35,624 |
|
Valero Energy Corp. |
|
|
1,620,536 |
|
|
|
|
|
|
|
|
||
|
|
|
|
Pharmaceuticals - 5.88% |
|
|
|
|
|
|
68,892 |
|
Abbott Laboratories |
|
|
2,433,265 |
|
|
|
41,237 |
|
AbbVie, Inc. |
|
|
1,681,645 |
|
|
|
47,380 |
|
Eli Lilly & Co. |
|
|
2,690,710 |
|
|
|
25,890 |
|
Johnson & Johnson |
|
|
2,110,812 |
|
|
|
39,170 |
|
Merck & Co., Inc. |
|
|
1,732,489 |
|
|
|
|
|
|
|
|
||
|
|
|
|
|
|
|
10,648,921 |
|
|
|
|
|
|
|
|
||
|
|
|
|
|
|
|
|
|
|
Number of |
|
|
|
Value |
|
||
|
|
|
|
|
||||
|
|
|
|
Road & Rail - 0.71% |
|
|
|
|
|
|
57,534 |
|
Hertz Global Holdings, Inc. (b) |
|
$ |
1,280,707 |
|
|
|
|
|
|
|
|
||
|
|
|
|
Semiconductor & Semiconductor |
|
|
|
|
|
|
63,541 |
|
Altera Corp. |
|
|
2,253,799 |
|
|
|
38,424 |
|
Broadcom Corp. |
|
|
1,332,160 |
|
|
|
32,758 |
|
Microchip Technology, Inc. |
|
|
1,204,184 |
|
|
|
37,071 |
|
Xilinx, Inc. |
|
|
1,415,000 |
|
|
|
|
|
|
|
|
||
|
|
|
|
|
|
|
6,205,143 |
|
|
|
|
|
|
|
|
||
|
|
|
|
Software - 8.18% |
|
|
|
|
|
|
19,096 |
|
BMC Software, Inc. (b) |
|
|
884,718 |
|
|
|
31,979 |
|
Check Point Software Technologies |
|
|
1,502,693 |
|
|
|
14,107 |
|
Intuit, Inc. |
|
|
926,125 |
|
|
|
196,573 |
|
Microsoft Corp. |
|
|
5,623,953 |
|
|
|
9,370 |
|
NetSuite, Inc. (a)(b) |
|
|
750,162 |
|
|
|
122,983 |
|
Oracle Corp. |
|
|
3,977,270 |
|
|
|
22,801 |
|
Red Hat, Inc. (b) |
|
|
1,152,819 |
|
|
|
|
|
|
|
|
||
|
|
|
|
|
|
|
14,817,740 |
|
|
|
|
|
|
|
|
||
|
|
|
|
Specialty Retail - 6.70% |
|
|
|
|
|
|
39,787 |
|
Home Depot, Inc. |
|
|
2,776,337 |
|
|
|
80,244 |
|
Lowe’s Companies, Inc. |
|
|
3,042,852 |
|
|
|
21,629 |
|
O’Reilly Automotive, Inc. (b) |
|
|
2,218,054 |
|
|
|
13,169 |
|
PetSmart, Inc. |
|
|
817,795 |
|
|
|
6,682 |
|
Sherwin Williams Co. |
|
|
1,128,523 |
|
|
|
24,127 |
|
The Buckle, Inc. (a) |
|
|
1,125,525 |
|
|
|
22,040 |
|
The TJX Companies, Inc. |
|
|
1,030,370 |
|
|
|
|
|
|
|
|
||
|
|
|
|
|
|
|
12,139,456 |
|
|
|
|
|
|
|
|
||
|
|
|
|
Tobacco - 1.70% |
|
|
|
|
|
|
33,225 |
|
Philip Morris International, Inc. |
|
|
3,080,290 |
|
|
|
|
|
|
|
|
||
|
|
|
|
Total Common Stocks |
|
|
180,684,124 |
|
|
|
|
|
|
|
|
||
|
|
|
|
SHORT TERM INVESTMENTS - 0.13% |
|
|
|
|
|
|
|
|
Money Market Funds - 0.13% |
|
|
|
|
|
|
243,645 |
|
Federated Prime Obligations Fund |
|
|
243,645 |
|
|
|
|
|
|
|
|
||
|
|
|
|
Total Short Term Investments |
|
|
243,645 |
|
|
|
|
|
|
|
|
||
See notes to financial statements.
42
|
|
|
GuideMarkSM Large Cap Growth Fund |
|
SCHEDULE OF INVESTMENTS (Continued) |
|
March 31, 2013 |
|
|
|
|
|
|
|
|
|
|
Number of |
|
|
|
Value |
|
||
|
|
|
|
|
||||
|
|
|
|
INVESTMENTS PURCHASED |
|
|
|
|
|
|
|
|
Money Market Funds - 3.27% |
|
|
|
|
|
|
5,923,707 |
|
First American Government |
|
$ |
5,923,707 |
|
|
|
20,508 |
|
Reserve Primary Fund (c) |
|
|
792 |
|
|
|
|
|
|
|
|
||
|
|
|
|
Total Money Market Funds |
|
|
5,924,499 |
|
|
|
|
|
|
|
|
||
|
|
|
|
|
|
|
|
|
|
Principal |
|
|
|
Value |
|
||
|
|
|
|
|
||||
|
|
|
|
Cash - 0.03% |
|
|
|
|
|
$ |
61,497 |
|
Cash |
|
$ |
61,497 |
|
|
|
|
|
|
|
|
||
|
|
|
|
Total Cash (Cost $61,497) |
|
|
61,497 |
|
|
|
|
|
|
|
|
||
|
|
|
|
Total Investments Purchased as |
|
|
5,985,996 |
|
|
|
|
|
|
|
|
||
|
|
|
|
Total Investments |
|
|
186,913,765 |
|
|
|
|
|
Liabilities in Excess of |
|
|
(5,723,172 |
) |
|
|
|
|
|
|
|
||
|
|
|
|
TOTAL NET |
|
$ |
181,190,593 |
|
|
|
|
|
|
|
|
||
|
|
|
|
Percentages are stated as a percent of
net assets. |
|
|
(a) |
All or portion of this security is on loan. |
|
(b) |
Non-income producing security. |
|
(c) |
As of March 31, 2013, the Fund has fair valued this security and deemed it illiquid. The value of this security was $792, which represents 0.00% of total net assets. |
See notes to financial statements.
43
|
|
|
GuideMarkSM Large Cap Value Fund |
|
SCHEDULE OF INVESTMENTS |
|
March 31, 2013 |
|
|
|
|
|
|
|
|
|
|
Number of |
|
|
|
Value |
|
||
|
|
|
|
|
||||
|
|
|
|
COMMON STOCKS - 98.67% |
|
|
|
|
|
|
|
|
Aerospace & Defense - 2.01% |
|
|
|
|
|
|
40,800 |
|
Honeywell International, Inc. |
|
$ |
3,074,280 |
|
|
|
15,800 |
|
Raytheon Co. |
|
|
928,882 |
|
|
|
|
|
|
|
|
||
|
|
|
|
|
|
|
4,003,162 |
|
|
|
|
|
|
|
|
||
|
|
|
|
Auto Components - 1.08% |
|
|
|
|
|
|
48,700 |
|
Delphi Automotive Plc (b) |
|
|
2,162,280 |
|
|
|
|
|
|
|
|
||
|
|
|
|
Automobiles - 1.35% |
|
|
|
|
|
|
49,500 |
|
Daimler AG - ADR (a) |
|
|
2,696,760 |
|
|
|
|
|
|
|
|
||
|
|
|
|
Building Products - 1.05% |
|
|
|
|
|
|
103,200 |
|
Masco Corp. |
|
|
2,089,800 |
|
|
|
|
|
|
|
|
||
|
|
|
|
Capital Markets - 2.13% |
|
|
|
|
|
|
29,000 |
|
Ameriprise Financial, Inc. |
|
|
2,135,850 |
|
|
|
35,700 |
|
State Street Corp. |
|
|
2,109,513 |
|
|
|
|
|
|
|
|
||
|
|
|
|
|
|
|
4,245,363 |
|
|
|
|
|
|
|
|
||
|
|
|
|
|
|
|
|
|
|
|
|
|
Chemicals - 2.29% |
|
|
|
|
|
|
19,700 |
|
E.I. du Pont de Nemours & Co. |
|
|
968,452 |
|
|
|
55,000 |
|
Rockwood Holdings, Inc. |
|
|
3,599,200 |
|
|
|
|
|
|
|
|
||
|
|
|
|
|
|
|
4,567,652 |
|
|
|
|
|
|
|
|
||
|
|
|
|
Commercial Banks - 4.84% |
|
|
|
|
|
|
168,600 |
|
Fifth Third Bancorp |
|
|
2,749,866 |
|
|
|
45,300 |
|
PNC Financial Services Group, Inc. |
|
|
3,012,450 |
|
|
|
105,100 |
|
Wells Fargo & Co. |
|
|
3,887,649 |
|
|
|
|
|
|
|
|
||
|
|
|
|
|
|
|
9,649,965 |
|
|
|
|
|
|
|
|
||
|
|
|
|
Computers & Peripherals - 1.53% |
|
|
|
|
|
|
14,300 |
|
International Business Machines |
|
|
3,050,190 |
|
|
|
|
|
|
|
|
||
|
|
|
|
Consumer Finance - 7.70% |
|
|
|
|
|
|
45,100 |
|
American Express Co. |
|
|
3,042,446 |
|
|
|
91,800 |
|
Capital One Financial Corp. |
|
|
5,044,410 |
|
|
|
54,700 |
|
Discover Financial Services |
|
|
2,452,748 |
|
|
|
235,700 |
|
SLM Corp. |
|
|
4,827,136 |
|
|
|
|
|
|
|
|
||
|
|
|
|
|
|
|
15,366,740 |
|
|
|
|
|
|
|
|
||
|
|
|
|
Diversified Financial Services - 6.01% |
|
|
|
|
|
|
283,100 |
|
Bank of America Corp. |
|
|
3,448,158 |
|
|
|
97,380 |
|
Citigroup, Inc. |
|
|
4,308,091 |
|
|
|
89,400 |
|
JPMorgan Chase & Co. |
|
|
4,242,924 |
|
|
|
|
|
|
|
|
||
|
|
|
|
|
|
|
11,999,173 |
|
|
|
|
|
|
|
|
||
|
|
|
|
|
|
|
|
|
|
Number of |
|
|
|
Value |
|
||
|
|
|
|
|
||||
|
|
|
|
Diversified Telecommunication Services - 2.60% |
|
|
|
|
|
|
112,100 |
|
AT&T, Inc. |
|
$ |
4,112,949 |
|
|
|
21,900 |
|
Verizon Communications, Inc. |
|
|
1,076,385 |
|
|
|
|
|
|
|
|
||
|
|
|
|
|
|
|
5,189,334 |
|
|
|
|
|
|
|
|
||
|
|
|
|
Electrical Equipment - 2.89% |
|
|
|
|
|
|
49,400 |
|
Eaton Corp. Plc |
|
|
3,025,750 |
|
|
|
49,200 |
|
Emerson Electric Co. |
|
|
2,748,804 |
|
|
|
|
|
|
|
|
||
|
|
|
|
|
|
|
5,774,554 |
|
|
|
|
|
|
|
|
||
|
|
|
|
Electronic Equipment & Instruments - 1.27% |
|
|
|
|
|
|
86,800 |
|
Molex, Inc. (a) |
|
|
2,541,504 |
|
|
|
|
|
|
|
|
||
|
|
|
|
Energy Equipment & Services - 1.20% |
|
|
|
|
|
|
64,100 |
|
SeaDrill Ltd. (a) |
|
|
2,385,161 |
|
|
|
|
|
|
|
|
||
|
|
|
|
Food & Staples Retailing - 2.48% |
|
|
|
|
|
|
27,400 |
|
CVS Caremark Corp. |
|
|
1,506,726 |
|
|
|
72,200 |
|
Walgreen Co. |
|
|
3,442,496 |
|
|
|
|
|
|
|
|
||
|
|
|
|
|
|
|
4,949,222 |
|
|
|
|
|
|
|
|
||
|
|
|
|
Gas Utilities - 0.65% |
|
|
|
|
|
|
27,400 |
|
ONEOK, Inc. |
|
|
1,306,158 |
|
|
|
|
|
|
|
|
||
|
|
|
|
Health Care Equipment & Supplies - 3.02% |
|
|
|
|
|
|
34,800 |
|
Baxter International, Inc. |
|
|
2,527,872 |
|
|
|
74,600 |
|
Medtronic, Inc. |
|
|
3,503,216 |
|
|
|
|
|
|
|
|
||
|
|
|
|
|
|
|
6,031,088 |
|
|
|
|
|
|
|
|
||
|
|
|
|
Health Care Providers & Services - 5.79% |
|
|
|
|
|
|
47,800 |
|
Cardinal Health, Inc. |
|
|
1,989,436 |
|
|
|
39,100 |
|
CIGNA Corp. |
|
|
2,438,667 |
|
|
|
68,700 |
|
Omnicare, Inc. |
|
|
2,797,464 |
|
|
|
47,700 |
|
UnitedHealth Group, Inc. |
|
|
2,728,917 |
|
|
|
24,200 |
|
WellPoint, Inc. |
|
|
1,602,766 |
|
|
|
|
|
|
|
|
||
|
|
|
|
|
|
|
11,557,250 |
|
|
|
|
|
|
|
|
||
|
|
|
|
Hotels, Restaurants & Leisure - 4.19% |
|
|
|
|
|
|
86,800 |
|
Carnival Corp. - ADR |
|
|
2,977,240 |
|
|
|
166,400 |
|
International Game Technology |
|
|
2,745,600 |
|
|
|
79,100 |
|
Royal Caribbean Cruises Ltd. (a) |
|
|
2,627,702 |
|
|
|
|
|
|
|
|
||
|
|
|
|
|
|
|
8,350,542 |
|
|
|
|
|
|
|
|
||
|
|
|
|
Household Durables - 2.05% |
|
|
|
|
|
|
50,400 |
|
Stanley Black & Decker, Inc. |
|
|
4,080,888 |
|
|
|
|
|
|
|
|
||
|
|
|
|
Industrial Conglomerates - 2.83% |
|
|
|
|
|
|
109,200 |
|
General Electric Co. |
|
|
2,524,704 |
|
|
|
97,500 |
|
Tyco International Ltd. - ADR |
|
|
3,120,000 |
|
|
|
|
|
|
|
|
||
|
|
|
|
|
|
|
5,644,704 |
|
|
|
|
|
|
|
|
||
See notes to financial statements.
44
|
|
|
GuideMarkSM Large Cap Value Fund |
|
SCHEDULE OF INVESTMENTS (Continued) |
|
March 31, 2013 |
|
|
|
|
|
|
|
|
|
|
Number of |
|
|
|
Value |
|
||
|
|
|
|
|
||||
|
|
|
|
COMMON STOCKS (Continued) |
|
|
|
|
|
|
|
|
Insurance - 3.06% |
|
|
|
|
|
|
17,700 |
|
Chubb Corp. |
|
$ |
1,549,281 |
|
|
|
24,500 |
|
Travelers Companies, Inc. |
|
|
2,062,655 |
|
|
|
82,000 |
|
XL Group Plc |
|
|
2,484,600 |
|
|
|
|
|
|
|
|
||
|
|
|
|
|
|
|
6,096,536 |
|
|
|
|
|
|
|
|
||
|
|
|
|
Leisure Equipment & Products - 0.99% |
|
|
|
|
|
|
45,100 |
|
Hasbro, Inc. (a) |
|
|
1,981,694 |
|
|
|
|
|
|
|
|
||
|
|
|
|
|
|
|
|
|
|
|
|
|
Machinery - 5.23% |
|
|
|
|
|
|
47,100 |
|
Illinois Tool Works, Inc. |
|
|
2,870,274 |
|
|
|
30,650 |
|
ITT Corp. |
|
|
871,379 |
|
|
|
68,089 |
|
Pentair Ltd. |
|
|
3,591,695 |
|
|
|
39,200 |
|
SPX Corp. |
|
|
3,095,232 |
|
|
|
|
|
|
|
|
||
|
|
|
|
|
|
|
10,428,580 |
|
|
|
|
|
|
|
|
||
|
|
|
|
|
|
|
|
|
|
|
|
|
Multiline Retail - 1.56% |
|
|
|
|
|
|
45,500 |
|
Target Corp. |
|
|
3,114,475 |
|
|
|
|
|
|
|
|
||
|
|
|
|
Oil & Gas - 8.52% |
|
|
|
|
|
|
69,800 |
|
BP Plc - ADR |
|
|
2,956,030 |
|
|
|
24,400 |
|
Chevron Corp. |
|
|
2,899,208 |
|
|
|
45,500 |
|
ConocoPhillips |
|
|
2,734,550 |
|
|
|
97,900 |
|
Marathon Oil Corp. |
|
|
3,301,188 |
|
|
|
35,000 |
|
Occidental Petroleum Corp. |
|
|
2,742,950 |
|
|
|
33,850 |
|
Phillips 66 |
|
|
2,368,485 |
|
|
|
|
|
|
|
|
||
|
|
|
|
|
|
|
17,002,411 |
|
|
|
|
|
|
|
|
||
|
|
|
|
Pharmaceuticals - 6.19% |
|
|
|
|
|
|
51,700 |
|
Johnson & Johnson |
|
|
4,215,101 |
|
|
|
123,600 |
|
Pfizer, Inc. |
|
|
3,567,096 |
|
|
|
51,400 |
|
Sanofi Aventis - ADR |
|
|
2,625,512 |
|
|
|
49,200 |
|
Teva Pharmaceutical Industries |
|
|
1,952,256 |
|
|
|
|
|
|
|
|
||
|
|
|
|
|
|
|
12,359,965 |
|
|
|
|
|
|
|
|
||
|
|
|
|
Semiconductor & Semiconductor |
|
|
|
|
|
|
79,200 |
|
Microchip Technology, Inc. |
|
|
2,911,392 |
|
|
|
84,400 |
|
Texas Instruments, Inc. |
|
|
2,994,512 |
|
|
|
|
|
|
|
|
||
|
|
|
|
|
|
|
5,905,904 |
|
|
|
|
|
|
|
|
||
|
|
|
|
Software - 2.27% |
|
|
|
|
|
|
89,200 |
|
CA, Inc. |
|
|
2,245,164 |
|
|
|
79,800 |
|
Microsoft Corp. |
|
|
2,283,078 |
|
|
|
|
|
|
|
|
||
|
|
|
|
|
|
|
4,528,242 |
|
|
|
|
|
|
|
|
||
|
|
|
|
|
|
|
|
|
|
Number of |
|
|
|
Value |
|
||
|
|
|
|
|
||||
|
|
|
|
Specialty Retail - 0.83% |
|
|
|
|
|
|
44,900 |
|
Rent-A-Center, Inc. (a) |
|
$ |
1,658,606 |
|
|
|
|
|
|
|
|
||
|
|
|
|
Textiles, Apparel & Luxury Goods - 1.38% |
|
|
|
|
|
|
60,500 |
|
Hanesbrands, Inc. (b) |
|
|
2,756,380 |
|
|
|
|
|
|
|
|
||
|
|
|
|
Thrifts & Mortgage Finance - 3.06% |
|
|
|
|
|
|
214,600 |
|
New York Community Bancorp, |
|
|
3,079,510 |
|
|
|
225,600 |
|
People’s United Financial, Inc. |
|
|
3,032,064 |
|
|
|
|
|
|
|
|
||
|
|
|
|
|
|
|
6,111,574 |
|
|
|
|
|
|
|
|
||
|
|
|
|
Tobacco - 3.66% |
|
|
|
|
|
|
84,800 |
|
Altria Group, Inc. |
|
|
2,916,272 |
|
|
|
22,800 |
|
Imperial Tobacco Group Plc - ADR |
|
|
1,596,000 |
|
|
|
30,000 |
|
Philip Morris International, Inc. |
|
|
2,781,300 |
|
|
|
|
|
|
|
|
||
|
|
|
|
|
|
|
7,293,572 |
|
|
|
|
|
|
|
|
||
|
|
|
|
Total Common Stocks |
|
|
196,879,429 |
|
|
|
|
|
|
|
|
||
|
|
|
|
SHORT TERM INVESTMENTS - 1.11% |
|
|
|
|
|
|
|
|
Money Market Funds - 1.11% |
|
|
|
|
|
|
2,211,047 |
|
Federated Prime Obligations Fund |
|
|
2,211,047 |
|
|
|
|
|
|
|
|
||
|
|
|
|
Total Short Term Investments |
|
|
2,211,047 |
|
|
|
|
|
|
|
|
||
|
|
|
|
INVESTMENTS PURCHASED |
|
|
|
|
|
|
|
|
Money Market Funds - 3.67% |
|
|
|
|
|
|
7,326,426 |
|
First American Government |
|
|
7,326,426 |
|
|
|
23,460 |
|
Reserve Primary Fund (c) |
|
|
906 |
|
|
|
|
|
|
|
|
||
|
|
|
|
Total Money Market Funds |
|
|
7,327,332 |
|
|
|
|
|
|
|
|
||
See notes to financial statements.
45
|
|
|
GuideMarkSM Large Cap Value Fund |
|
SCHEDULE OF INVESTMENTS (Continued) |
|
March 31, 2013 |
|
|
|
|
|
|
|
|
|
|
Principal |
|
|
|
Value |
|
||
|
|
|
|
|
||||
|
|
|
|
Cash - 0.04% |
|
|
|
|
|
$ |
76,060 |
|
Cash |
|
$ |
76,060 |
|
|
|
|
|
|
|
|
||
|
|
|
|
Total Cash (Cost $76,060) |
|
|
76,060 |
|
|
|
|
|
|
|
|
||
|
|
|
|
Total Investments Purchased as |
|
|
7,403,392 |
|
|
|
|
|
|
|
|
||
|
|
|
|
Total Investments |
|
|
206,493,868 |
|
|
|
|
|
Liabilities in Excess of |
|
|
(6,969,152 |
) |
|
|
|
|
|
|
|
||
|
|
|
|
TOTAL NET |
|
$ |
199,524,716 |
|
|
|
|
|
|
|
|
||
|
|
|
|
Percentages are stated as a percent of
net assets. |
|
|
(a) |
All or portion of this security is on loan. |
|
(b) |
Non-income producing security. |
|
(c) |
As of March 31, 2013, the Fund has fair valued this security and deemed it illiquid. The value of this security was $906, which represents 0.00% of total net assets. |
See notes to financial statements.
46
|
|
|
GuideMarkSM Small/Mid Cap Core Fund |
|
SCHEDULE OF INVESTMENTS |
|
March 31, 2013 |
|
|
|
|
|
|
|
|
|
|
Number of |
|
|
|
Value |
|
||
|
|
|
|
|
||||
|
|
|
|
COMMON STOCKS - 92.37% |
|
|
|
|
|
|
|
|
Aerospace & Defense - 2.40% |
|
|
|
|
|
|
16,410 |
|
BE Aerospace, Inc. (b) |
|
$ |
989,359 |
|
|
|
13,340 |
|
Triumph Group, Inc. (a) |
|
|
1,047,190 |
|
|
|
|
|
|
|
|
||
|
|
|
|
|
|
|
2,036,549 |
|
|
|
|
|
|
|
|
||
|
|
|
|
Airlines - 1.21% |
|
|
|
|
|
|
8,600 |
|
Copa Holdings SA |
|
|
1,028,646 |
|
|
|
|
|
|
|
|
||
|
|
|
|
Beverages - 0.73% |
|
|
|
|
|
|
13,020 |
|
Constellation Brands, Inc. (b) |
|
|
620,273 |
|
|
|
|
|
|
|
|
||
|
|
|
|
Biotechnology - 4.63% |
|
|
|
|
|
|
23,900 |
|
Amarin Corp. - ADR (a)(b) |
|
|
177,099 |
|
|
|
10,820 |
|
BioMarin Pharmaceutical, Inc. (b) |
|
|
673,653 |
|
|
|
41,690 |
|
Coronado Biosciences, Inc. (a)(b) |
|
|
405,227 |
|
|
|
8,590 |
|
Genomic Health, Inc. (a)(b) |
|
|
242,925 |
|
|
|
9,560 |
|
Medivation, Inc. (b) |
|
|
447,121 |
|
|
|
12,600 |
|
Onyx Pharmaceuticals, Inc. (b) |
|
|
1,119,636 |
|
|
|
1,480 |
|
Repligen Corp. (b) |
|
|
10,227 |
|
|
|
41,210 |
|
Sunesis Pharmaceuticals, Inc. (a)(b) |
|
|
225,419 |
|
|
|
43,790 |
|
Synta Pharmaceuticals Corp. (a)(b) |
|
|
376,594 |
|
|
|
64,230 |
|
Vical, Inc. (b) |
|
|
255,635 |
|
|
|
|
|
|
|
|
||
|
|
|
|
|
|
|
3,933,536 |
|
|
|
|
|
|
|
|
||
|
|
|
|
Building Products - 0.84% |
|
|
|
|
|
|
19,050 |
|
Fortune Brands Home & Security, |
|
|
713,041 |
|
|
|
|
|
|
|
|
||
|
|
|
|
Capital Markets - 3.94% |
|
|
|
|
|
|
57,780 |
|
FXCM, Inc. |
|
|
790,430 |
|
|
|
20,500 |
|
Invesco Ltd. |
|
|
593,680 |
|
|
|
19,210 |
|
Investment Technology Group (b) |
|
|
212,079 |
|
|
|
22,150 |
|
Raymond James Financial, Inc. |
|
|
1,021,115 |
|
|
|
19,640 |
|
Walter Investment Management |
|
|
731,590 |
|
|
|
|
|
|
|
|
||
|
|
|
|
|
|
|
3,348,894 |
|
|
|
|
|
|
|
|
||
|
|
|
|
Chemicals - 2.90% |
|
|
|
|
|
|
8,620 |
|
Ashland, Inc. |
|
|
640,466 |
|
|
|
10,570 |
|
Innophos Holdings, Inc. |
|
|
576,699 |
|
|
|
13,000 |
|
Innospec, Inc. |
|
|
575,640 |
|
|
|
10,280 |
|
Rockwood Holdings, Inc. |
|
|
672,723 |
|
|
|
|
|
|
|
|
||
|
|
|
|
|
|
|
2,465,528 |
|
|
|
|
|
|
|
|
||
|
|
|
|
|
|
|
|
|
|
Number of |
|
|
|
Value |
|
||
|
|
|
|
|
||||
|
|
|
|
Commercial Banks - 4.02% |
|
|
|
|
|
|
11,250 |
|
BBCN Bancorp, Inc. |
|
$ |
146,925 |
|
|
|
64,290 |
|
FirstMerit Corp. (a) |
|
|
1,062,714 |
|
|
|
7,930 |
|
Hancock Holding Co. |
|
|
245,195 |
|
|
|
153,330 |
|
Huntington Bancshares, Inc. |
|
|
1,133,109 |
|
|
|
800 |
|
SCBT Financial Corp. |
|
|
40,320 |
|
|
|
11,100 |
|
SVB Financial Group (b) |
|
|
787,434 |
|
|
|
|
|
|
|
|
||
|
|
|
|
|
|
|
3,415,697 |
|
|
|
|
|
|
|
|
||
|
|
|
|
Commercial Services & Supplies - 0.77% |
|
|
|
|
|
|
7,850 |
|
Multi-Color Corp. |
|
|
202,452 |
|
|
|
12,600 |
|
Waste Connections, Inc. |
|
|
453,348 |
|
|
|
|
|
|
|
|
||
|
|
|
|
|
|
|
655,800 |
|
|
|
|
|
|
|
|
||
|
|
|
|
Communications Equipment - 3.26% |
|
|
|
|
|
|
30,020 |
|
ADTRAN, Inc. (a) |
|
|
589,893 |
|
|
|
47,210 |
|
Juniper Networks, Inc. (b) |
|
|
875,274 |
|
|
|
21,610 |
|
NetGear, Inc. (b) |
|
|
724,151 |
|
|
|
10,270 |
|
Palo Alto Networks, Inc. (a)(b) |
|
|
581,282 |
|
|
|
|
|
|
|
|
||
|
|
|
|
|
|
|
2,770,600 |
|
|
|
|
|
|
|
|
||
|
|
|
|
Computers & Peripherals - 1.08% |
|
|
|
|
|
|
33,340 |
|
NCR Corp. (b) |
|
|
918,850 |
|
|
|
|
|
|
|
|
||
|
|
|
|
Construction & Engineering - 0.65% |
|
|
|
|
|
|
17,220 |
|
KBR, Inc. |
|
|
552,418 |
|
|
|
|
|
|
|
|
||
|
|
|
|
Construction Materials - 1.63% |
|
|
|
|
|
|
10,460 |
|
Eagle Materials, Inc. |
|
|
696,950 |
|
|
|
6,780 |
|
Martin Marietta Materials, Inc. (a) |
|
|
691,695 |
|
|
|
|
|
|
|
|
||
|
|
|
|
|
|
|
1,388,645 |
|
|
|
|
|
|
|
|
||
|
|
|
|
Consumer Finance - 1.29% |
|
|
|
|
|
|
65,740 |
|
DFC Global Corp. (b) |
|
|
1,093,914 |
|
|
|
|
|
|
|
|
||
|
|
|
|
Containers & Packaging - 1.55% |
|
|
|
|
|
|
13,960 |
|
AptarGroup, Inc. |
|
|
800,606 |
|
|
|
5,580 |
|
Rock-Tenn Co. |
|
|
517,768 |
|
|
|
|
|
|
|
|
||
|
|
|
|
|
|
|
1,318,374 |
|
|
|
|
|
|
|
|
||
|
|
|
|
Diversified Financial Services - 2.45% |
|
|
|
|
|
|
50,750 |
|
Interactive Brokers Group, Inc. |
|
|
756,682 |
|
|
|
40,930 |
|
NASDAQ OMX Group, Inc. |
|
|
1,322,039 |
|
|
|
|
|
|
|
|
||
|
|
|
|
|
|
|
2,078,721 |
|
|
|
|
|
|
|
|
||
|
|
|
|
Diversified Telecommunication Services - 0.33% |
|
|
|
|
|
|
3,850 |
|
Cogent Communications |
|
|
101,640 |
|
|
|
44,190 |
|
Frontier Communications Corp. (a) |
|
|
175,876 |
|
|
|
|
|
|
|
|
||
|
|
|
|
|
|
|
277,516 |
|
|
|
|
|
|
|
|
||
See notes to financial statements.
47
|
|
|
GuideMarkSM Small/Mid Cap Core Fund |
|
SCHEDULE OF INVESTMENTS (Continued) |
|
March 31, 2013 |
|
|
|
|
|
|
|
|
|
|
Number of |
|
|
|
Value |
|
||
|
|
|
|
|
||||
|
|
|
|
COMMON STOCKS (Continued) |
|
|
|
|
|
|
|
|
Electric Utilities - 2.33% |
|
|
|
|
|
|
6,550 |
|
ITC Holdings Corp. |
|
$ |
584,653 |
|
|
|
25,990 |
|
Portland General Electric Co. |
|
|
788,277 |
|
|
|
12,380 |
|
UNS Energy Corp. |
|
|
605,877 |
|
|
|
|
|
|
|
|
||
|
|
|
|
|
|
|
1,978,807 |
|
|
|
|
|
|
|
|
||
|
|
|
|
Electrical Equipment - 1.71% |
|
|
|
|
|
|
17,740 |
|
AMETEK, Inc. |
|
|
769,207 |
|
|
|
8,370 |
|
Regal Beloit Corp. |
|
|
682,657 |
|
|
|
|
|
|
|
|
||
|
|
|
|
|
|
|
1,451,864 |
|
|
|
|
|
|
|
|
||
|
|
|
|
Energy Equipment & Services - 3.25% |
|
|
|
|
|
|
26,430 |
|
Forum Energy Technologies, |
|
|
760,127 |
|
|
|
3,840 |
|
Geospace Technologies Corp. (b) |
|
|
414,413 |
|
|
|
8,140 |
|
Oil States International, Inc. (b) |
|
|
663,979 |
|
|
|
37,000 |
|
Pacific Drilling SA (b) |
|
|
373,700 |
|
|
|
10,870 |
|
Tidewater, Inc. (a) |
|
|
548,935 |
|
|
|
|
|
|
|
|
||
|
|
|
|
|
|
|
2,761,154 |
|
|
|
|
|
|
|
|
||
|
|
|
|
Food & Staples Retailing - 0.87% |
|
|
|
|
|
|
14,950 |
|
United Natural Foods, Inc. (b) |
|
|
735,540 |
|
|
|
|
|
|
|
|
||
|
|
|
|
Food Products - 0.64% |
|
|
|
|
|
|
15,480 |
|
Hillshire Brands Co. |
|
|
544,122 |
|
|
|
|
|
|
|
|
||
|
|
|
|
Gas Utilities - 1.22% |
|
|
|
|
|
|
24,290 |
|
Atmos Energy Corp. |
|
|
1,036,940 |
|
|
|
|
|
|
|
|
||
|
|
|
|
Health Care Equipment & Supplies - 1.93% |
|
|
|
|
|
|
29,130 |
|
NuVasive, Inc. (b) |
|
|
620,760 |
|
|
|
4,810 |
|
Teleflex, Inc. |
|
|
406,493 |
|
|
|
16,380 |
|
Thoratec Corp. (b) |
|
|
614,250 |
|
|
|
|
|
|
|
|
||
|
|
|
|
|
|
|
1,641,503 |
|
|
|
|
|
|
|
|
||
|
|
|
|
Health Care Providers & Services - 0.71% |
|
|
|
|
|
|
9,430 |
|
Universal Health Services, Inc. |
|
|
602,294 |
|
|
|
|
|
|
|
|
||
|
|
|
|
Hotels, Restaurants & Leisure - 0.56% |
|
|
|
|
|
|
7,750 |
|
Papa Johns International, Inc. (b) |
|
|
479,105 |
|
|
|
|
|
|
|
|
||
|
|
|
|
Household Durables - 3.20% |
|
|
|
|
|
|
40,100 |
|
D.R. Horton, Inc. |
|
|
974,430 |
|
|
|
18,465 |
|
Jarden Corp. (b) |
|
|
791,225 |
|
|
|
27,930 |
|
Toll Brothers, Inc. (b) |
|
|
956,323 |
|
|
|
|
|
|
|
|
||
|
|
|
|
|
|
|
2,721,978 |
|
|
|
|
|
|
|
|
||
|
|
|
|
Industrial Conglomerates - 1.20% |
|
|
|
|
|
|
14,980 |
|
Carlisle Companies, Inc. |
|
|
1,015,494 |
|
|
|
|
|
|
|
|
||
|
|
|
|
|
|
|
|
|
|
Number of |
|
|
|
Value |
|
||
|
|
|
|
|
||||
|
|
|
|
Insurance - 3.86% |
|
|
|
|
|
|
33,700 |
|
Axis Capital Holdings Ltd. (a) |
|
$ |
1,402,594 |
|
|
|
11,900 |
|
Platinum Underwriters Holdings Ltd. |
|
|
664,139 |
|
|
|
9,870 |
|
Reinsurance Group of America |
|
|
588,943 |
|
|
|
14,510 |
|
StanCorp Financial Group, Inc. |
|
|
620,448 |
|
|
|
|
|
|
|
|
||
|
|
|
|
|
|
|
3,276,124 |
|
|
|
|
|
|
|
|
||
|
|
|
|
Internet Software & Services - 0.67% |
|
|
|
|
|
|
24,630 |
|
ExactTarget, Inc. (b) |
|
|
573,140 |
|
|
|
|
|
|
|
|
||
|
|
|
|
IT Services - 3.46% |
|
|
|
|
|
|
22,250 |
|
ExlService Holdings, Inc. (b) |
|
|
731,580 |
|
|
|
7,280 |
|
Fleetcor Technologies, Inc. (b) |
|
|
558,158 |
|
|
|
18,630 |
|
Global Payments, Inc. |
|
|
925,166 |
|
|
|
29,190 |
|
Total System Services, Inc. |
|
|
723,328 |
|
|
|
|
|
|
|
|
||
|
|
|
|
|
|
|
2,938,232 |
|
|
|
|
|
|
|
|
||
|
|
|
|
Life Sciences Tools & Services - 1.65% |
|
|
|
|
|
|
38,700 |
|
Bruker Corp. (b) |
|
|
739,170 |
|
|
|
4,140 |
|
Charles River Laboratories (b) |
|
|
183,278 |
|
|
|
7,060 |
|
Techne Corp. |
|
|
479,021 |
|
|
|
|
|
|
|
|
||
|
|
|
|
|
|
|
1,401,469 |
|
|
|
|
|
|
|
|
||
|
|
|
|
Machinery - 4.94% |
|
|
|
|
|
|
15,790 |
|
Colfax Corp. (b) |
|
|
734,867 |
|
|
|
4,460 |
|
Flowserve Corp. |
|
|
747,986 |
|
|
|
12,050 |
|
IDEX Corp. |
|
|
643,711 |
|
|
|
16,840 |
|
Nordson Corp. |
|
|
1,110,598 |
|
|
|
12,150 |
|
SPX Corp. |
|
|
959,364 |
|
|
|
|
|
|
|
|
||
|
|
|
|
|
|
|
4,196,526 |
|
|
|
|
|
|
|
|
||
|
|
|
|
Media - 0.95% |
|
|
|
|
|
|
48,540 |
|
Regal Entertainment Group (a) |
|
|
809,162 |
|
|
|
|
|
|
|
|
||
|
|
|
|
Metals & Mining - 0.62% |
|
|
|
|
|
|
6,680 |
|
Compass Minerals International, Inc. |
|
|
527,052 |
|
|
|
|
|
|
|
|
||
|
|
|
|
Multi-Utilities - 1.52% |
|
|
|
|
|
|
16,920 |
|
NRG Energy, Inc. |
|
|
448,211 |
|
|
|
12,100 |
|
OGE Energy Corp. |
|
|
846,758 |
|
|
|
|
|
|
|
|
||
|
|
|
|
|
|
|
1,294,969 |
|
|
|
|
|
|
|
|
||
|
|
|
|
Oil & Gas - 2.91% |
|
|
|
|
|
|
10,940 |
|
Berry Petroleum Co. (a) |
|
|
506,413 |
|
|
|
5,500 |
|
Concho Resources, Inc. (b) |
|
|
535,865 |
|
|
|
21,060 |
|
Diamondback Energy, Inc. (b) |
|
|
565,250 |
|
|
|
24,380 |
|
Western Refining, Inc. |
|
|
863,296 |
|
|
|
|
|
|
|
|
||
|
|
|
|
|
|
|
2,470,824 |
|
|
|
|
|
|
|
|
||
See notes to financial statements.
48
|
|
|
GuideMarkSM Small/Mid Cap Core Fund |
|
SCHEDULE OF INVESTMENTS (Continued) |
|
March 31, 2013 |
|
|
|
|
|
|
|
|
|
|
Number of |
|
|
|
Value |
|
||
|
|
|
|
|
||||
|
|
|
|
COMMON STOCKS (Continued) |
|
|
|
|
|
|
|
|
Personal Products - 0.46% |
|
|
|
|
|
|
8,760 |
|
Nu Skin Enterprises, Inc. (a) |
|
$ |
387,192 |
|
|
|
|
|
|
|
|
||
|
|
|
|
Pharmaceuticals - 1.16% |
|
|
|
|
|
|
5,850 |
|
Theravance, Inc. (b) |
|
|
138,177 |
|
|
|
62,600 |
|
Warner Chilcott Plc |
|
|
848,230 |
|
|
|
|
|
|
|
|
||
|
|
|
|
|
|
|
986,407 |
|
|
|
|
|
|
|
|
||
|
|
|
|
Road & Rail - 0.75% |
|
|
|
|
|
|
6,830 |
|
Genesee & Wyoming, Inc. (b) |
|
|
635,941 |
|
|
|
|
|
|
|
|
||
|
|
|
|
Semiconductor &
Semiconductor |
|
|
|
|
|
|
88,510 |
|
Atmel Corp. (b) |
|
|
616,030 |
|
|
|
12,140 |
|
Cavium, Inc. (b) |
|
|
471,153 |
|
|
|
14,980 |
|
M/A-Com Technology Solutions |
|
|
240,729 |
|
|
|
25,880 |
|
Monolithic Power Systems, Inc. |
|
|
630,695 |
|
|
|
|
|
|
|
|
||
|
|
|
|
|
|
|
1,958,607 |
|
|
|
|
|
|
|
|
||
|
|
|
|
Software - 3.40% |
|
|
|
|
|
|
18,380 |
|
Aspen Technology, Inc. (b) |
|
|
593,490 |
|
|
|
22,810 |
|
Bottomline Technologies, Inc. (b) |
|
|
650,313 |
|
|
|
18,870 |
|
Guidewire Software, Inc. (b) |
|
|
725,363 |
|
|
|
15,580 |
|
Sourcefire, Inc. (b) |
|
|
922,804 |
|
|
|
|
|
|
|
|
||
|
|
|
|
|
|
|
2,891,970 |
|
|
|
|
|
|
|
|
||
|
|
|
|
Specialty Retail - 8.22% |
|
|
|
|
|
|
9,770 |
|
Advance Auto Parts, Inc. |
|
|
807,491 |
|
|
|
14,900 |
|
Dicks Sporting Goods, Inc. |
|
|
704,770 |
|
|
|
23,440 |
|
Foot Locker, Inc. |
|
|
802,586 |
|
|
|
15,340 |
|
PetSmart, Inc. |
|
|
952,614 |
|
|
|
22,440 |
|
Sally Beauty Holdings, Inc. (b) |
|
|
659,287 |
|
|
|
55,250 |
|
Staples, Inc. |
|
|
742,007 |
|
|
|
8,200 |
|
Tractor Supply Co. |
|
|
853,866 |
|
|
|
11,230 |
|
Ulta Salon, Cosmetics & |
|
|
911,539 |
|
|
|
11,330 |
|
Vitamin Shoppe, Inc. (b) |
|
|
553,470 |
|
|
|
|
|
|
|
|
||
|
|
|
|
|
|
|
6,987,630 |
|
|
|
|
|
|
|
|
||
|
|
|
|
Textiles, Apparel & Luxury Goods - 1.15% |
|
|
|
|
|
|
19,140 |
|
Under Armour, Inc. (b) |
|
|
979,968 |
|
|
|
|
|
|
|
|
||
|
|
|
|
Thrifts & Mortgage Finance - 1.22% |
|
|
|
|
|
|
28,080 |
|
Nationstar Mortgage Holdings, |
|
|
1,036,152 |
|
|
|
|
|
|
|
|
||
|
|
|
|
|
|
|
|
|
|
Number of |
|
|
|
Value |
|
||
|
|
|
|
|
||||
|
|
|
|
Trading Companies & Distributors - 1.06% |
|
|
|
|
|
|
12,450 |
|
Wesco International, Inc. (a)(b) |
|
$ |
903,995 |
|
|
|
|
|
|
|
|
||
|
|
|
|
Wireless Telecommunication Services - 0.77% |
|
|
|
|
|
|
10,630 |
|
Clearwire Corp. (b) |
|
|
34,441 |
|
|
|
10,950 |
|
NII Holdings, Inc. (a)(b) |
|
|
47,414 |
|
|
|
7,960 |
|
SBA Communications Corp. (a)(b) |
|
|
573,279 |
|
|
|
|
|
|
|
|
||
|
|
|
|
|
|
|
655,134 |
|
|
|
|
|
|
|
|
||
|
|
|
|
Total Common Stocks |
|
|
78,496,297 |
|
|
|
|
|
|
|
|
||
|
|
|
|
REAL ESTATE INVESTMENT |
|
|
|
|
|
|
|
|
Real Estate Investment Trusts - 5.94% |
|
|
|
|
|
|
26,520 |
|
American Campus Communities, |
|
|
1,202,417 |
|
|
|
60,490 |
|
Douglas Emmett, Inc. (a) |
|
|
1,508,016 |
|
|
|
20,720 |
|
Extra Space Storage, Inc. |
|
|
813,674 |
|
|
|
12,710 |
|
Post Properties, Inc. |
|
|
598,641 |
|
|
|
39,950 |
|
Redwood Trust, Inc. (a) |
|
|
926,041 |
|
|
|
|
|
|
|
|
||
|
|
|
|
Total Real Estate
Investment Trusts |
|
|
5,048,789 |
|
|
|
|
|
|
|
|
||
|
|
|
|
SHORT TERM INVESTMENTS - 1.56% |
|
|
|
|
|
|
|
|
Money Market Funds - 1.56% |
|
|
|
|
|
|
1,324,970 |
|
Federated Prime Obligations Fund |
|
|
1,324,970 |
|
|
|
|
|
|
|
|
||
|
|
|
|
Total Short Term
Investments |
|
|
1,324,970 |
|
|
|
|
|
|
|
|
||
|
|
|
|
INVESTMENTS PURCHASED |
|
|
|
|
|
|
|
|
Money Market Funds - 9.57% |
|
|
|
|
|
|
8,136,015 |
|
First American Government |
|
|
8,136,015 |
|
|
|
6,386 |
|
Reserve Primary Fund (c) |
|
|
247 |
|
|
|
|
|
|
|
|
||
|
|
|
|
Total Money Market
Funds |
|
|
8,136,262 |
|
|
|
|
|
|
|
|
||
See notes to financial statements.
49
|
|
|
GuideMarkSM Small/Mid Cap Core Fund |
|
SCHEDULE OF INVESTMENTS (Continued) |
|
March 31, 2013 |
|
|
|
|
|
|
|
|
|
|
Principal |
|
|
|
Value |
|
||
|
|
|
|
|
||||
|
|
|
|
Cash - 0.10% |
|
|
|
|
|
$ |
84,465 |
|
Cash |
|
$ |
84,465 |
|
|
|
|
|
|
|
|
||
|
|
|
|
Total Cash (Cost $84,465) |
|
|
84,465 |
|
|
|
|
|
|
|
|
||
|
|
|
|
Total Investments
Purchased as |
|
|
8,220,727 |
|
|
|
|
|
|
|
|
||
|
|
|
|
Total Investments |
|
|
93,090,783 |
|
|
|
|
|
Liabilities in Excess
of |
|
|
(8,107,715 |
) |
|
|
|
|
|
|
|
||
|
|
|
|
TOTAL NET |
|
$ |
84,983,068 |
|
|
|
|
|
|
|
|
||
|
|
|
|
Percentages are stated as a percent of net assets. |
|
|
ADR - American Depositary Receipt |
|
|
(a) |
All or portion of this security is on loan. |
|
(b) |
Non-income producing security. |
|
(c) |
As of March 31, 2013, the Fund has fair valued this security and deemed it illiquid. The value of this security was $247, which represents 0.00% of total net assets. |
See notes to financial statements.
50
|
|
|
GuideMarkSM World ex-US Fund |
|
SCHEDULE OF INVESTMENTS |
|
March 31, 2013 |
|
|
|
|
|
|
|
|
|
|
Number of |
|
|
|
Value |
|
||
|
|
|
|
|
||||
|
|
|
|
COMMON STOCKS - 94.53% |
|
|
|
|
|
|
|
|
Australia - 6.10% |
|
|
|
|
|
|
99,295 |
|
Australia and New Zealand |
|
$ |
2,961,397 |
|
|
|
24,104 |
|
BHP Billiton Ltd. |
|
|
823,995 |
|
|
|
58,712 |
|
Boral Ltd. |
|
|
301,363 |
|
|
|
31,721 |
|
CSL Ltd. |
|
|
1,960,718 |
|
|
|
122,721 |
|
Fortescue Metals Group Ltd. |
|
|
508,068 |
|
|
|
69,246 |
|
Goodman Group |
|
|
346,129 |
|
|
|
29,855 |
|
Iluka Resources Ltd. |
|
|
293,433 |
|
|
|
96,161 |
|
Incitec Pivot Ltd. |
|
|
310,807 |
|
|
|
19,888 |
|
Medusa Mining Ltd. |
|
|
89,382 |
|
|
|
183,856 |
|
Mirvac Group |
|
|
311,093 |
|
|
|
31,078 |
|
Newcrest Mining Ltd. |
|
|
650,590 |
|
|
|
72,477 |
|
Origin Energy Ltd. |
|
|
1,008,696 |
|
|
|
7,388 |
|
Rio Tinto Ltd. |
|
|
443,147 |
|
|
|
1 |
|
SCA Property Group (b) |
|
|
2 |
|
|
|
150,161 |
|
SP AusNet |
|
|
187,381 |
|
|
|
188,369 |
|
Spark Infrastructure Group |
|
|
326,184 |
|
|
|
83,303 |
|
Tatts Group Ltd. |
|
|
275,485 |
|
|
|
54,502 |
|
Transurban Group |
|
|
362,394 |
|
|
|
99,855 |
|
Westfield Group |
|
|
1,131,361 |
|
|
|
95,105 |
|
Westpac Banking Corp. |
|
|
3,060,623 |
|
|
|
11,278 |
|
Woodside Petroleum Ltd. |
|
|
422,710 |
|
|
|
41,145 |
|
Woolworths Ltd. |
|
|
1,452,565 |
|
|
|
|
|
|
|
|
||
|
|
|
|
|
|
|
17,227,523 |
|
|
|
|
|
|
|
|
||
|
|
|
|
Belgium - 1.56% |
|
|
|
|
|
|
18,877 |
|
Anheuser-Busch InBev NV |
|
|
1,876,709 |
|
|
|
24,351 |
|
KBC Groep NV |
|
|
844,352 |
|
|
|
6,300 |
|
ThromboGenics NV (b) |
|
|
303,565 |
|
|
|
9,200 |
|
UCB SA |
|
|
588,523 |
|
|
|
17,037 |
|
Umicore SA |
|
|
801,352 |
|
|
|
|
|
|
|
|
||
|
|
|
|
|
|
|
4,414,501 |
|
|
|
|
|
|
|
|
||
|
|
|
|
Bermuda - 0.33% |
|
|
|
|
|
|
135,000 |
|
COSCO Pacific Ltd. |
|
|
195,471 |
|
|
|
51,000 |
|
Hongkong Land Holdings Ltd. |
|
|
378,922 |
|
|
|
366,000 |
|
Noble Group Ltd. |
|
|
360,602 |
|
|
|
|
|
|
|
|
||
|
|
|
|
|
|
|
934,995 |
|
|
|
|
|
|
|
|
||
|
|
|
|
Brazil - 1.65% |
|
|
|
|
|
|
45,000 |
|
Banco do Brasil SA |
|
|
609,724 |
|
|
|
31,000 |
|
BM&FBovespa SA |
|
|
208,482 |
|
|
|
|
|
|
|
|
|
|
|
Number of |
|
|
|
Value |
|
||
|
|
|
|
|
||||
|
|
|
|
Brazil (Continued) |
|
|
|
|
|
|
18,600 |
|
Cia de Saneamento Basico do |
|
$ |
886,210 |
|
|
|
23,100 |
|
Cosan SA Industria e Comercio |
|
|
516,242 |
|
|
|
26,500 |
|
EcoRodovias Infraestructura e |
|
|
227,527 |
|
|
|
23,700 |
|
Ez Tec Empreendimentos e |
|
|
316,899 |
|
|
|
14,700 |
|
M Dias Branco SA |
|
|
585,600 |
|
|
|
80,900 |
|
Petroleo Brasileiro SA |
|
|
671,781 |
|
|
|
35,900 |
|
Qualicorp SA (b) |
|
|
360,466 |
|
|
|
65,700 |
|
Tim Participacoes SA |
|
|
288,062 |
|
|
|
|
|
|
|
|
||
|
|
|
|
|
|
|
4,670,993 |
|
|
|
|
|
|
|
|
||
|
|
|
|
Canada - 7.47% |
|
|
|
|
|
|
30,100 |
|
Alamos Gold, Inc. (b) |
|
|
413,344 |
|
|
|
19,400 |
|
Alimentation Couche Tard, Inc. (b) |
|
|
1,051,498 |
|
|
|
13,000 |
|
Baytex Energy Corp. (b) |
|
|
544,775 |
|
|
|
36,100 |
|
Canadian Natural Resources Ltd. (b) |
|
|
1,157,432 |
|
|
|
9,900 |
|
Canadian Pacific Railway Ltd. (b) |
|
|
1,291,673 |
|
|
|
8,000 |
|
Catamaran Corp. (b) |
|
|
423,921 |
|
|
|
35,100 |
|
Cenovus Energy, Inc. (b) |
|
|
1,087,017 |
|
|
|
15,000 |
|
Dollarama, Inc. (b) |
|
|
963,184 |
|
|
|
65,920 |
|
Eldorado Gold Corp. (b) |
|
|
630,096 |
|
|
|
37,800 |
|
First Quantum Minerals Ltd. |
|
|
718,901 |
|
|
|
4,400 |
|
Franco Nevada Corp. |
|
|
200,845 |
|
|
|
14,400 |
|
Goldcorp, Inc. (b) |
|
|
484,512 |
|
|
|
12,100 |
|
Intact Financial Corp. (b) |
|
|
741,473 |
|
|
|
66,600 |
|
Manulife Financial Corp. (b) |
|
|
980,790 |
|
|
|
10,300 |
|
National Bank Of Canada (b) |
|
|
756,493 |
|
|
|
9,800 |
|
Open Text Corp. (b) |
|
|
579,211 |
|
|
|
20,500 |
|
Research In Motion Ltd. (b) |
|
|
304,518 |
|
|
|
35,000 |
|
Royal Bank Of Canada (b) |
|
|
2,108,579 |
|
|
|
13,100 |
|
Silver Wheaton Corp. (b) |
|
|
410,080 |
|
|
|
19,400 |
|
Sun Life Financial, Inc. (b) |
|
|
529,377 |
|
|
|
35,900 |
|
Suncor Energy, Inc. (b) |
|
|
1,075,745 |
|
|
|
23,300 |
|
Toronto-Dominion Bank (b) |
|
|
1,939,966 |
|
|
|
25,100 |
|
TransCanada Corp. (b) |
|
|
1,198,356 |
|
|
|
20,500 |
|
Valeant Pharmaceuticals |
|
|
1,538,938 |
|
|
|
|
|
|
|
|
||
|
|
|
|
|
|
|
21,130,724 |
|
|
|
|
|
|
|
|
||
See notes to financial statements.
51
|
|
|
GuideMarkSM World ex-US Fund |
|
SCHEDULE OF INVESTMENTS (Continued) |
|
March 31, 2013 |
|
|
|
|
|
|
|
|
|
|
Number of |
|
|
|
Value |
|
||
|
|
|
|
|
||||
|
|
|
|
COMMON STOCKS (Continued) |
|
|
|
|
|
|
|
|
Cayman Islands - 1.22% |
|
|
|
|
|
|
158,500 |
|
Lifestyle International |
|
$ |
352,439 |
|
|
|
194,200 |
|
Sands China Ltd. |
|
|
1,010,509 |
|
|
|
560,000 |
|
Sino Biophamaceutical |
|
|
391,745 |
|
|
|
26,800 |
|
Tencent Holdings Ltd. |
|
|
857,188 |
|
|
|
42,000 |
|
TPK Holding Co. Ltd. |
|
|
840,847 |
|
|
|
|
|
|
|
|
||
|
|
|
|
|
|
|
3,452,728 |
|
|
|
|
|
|
|
|
||
|
|
|
|
Chile - 0.43% |
|
|
|
|
|
|
460,900 |
|
Aguas Andinas SA |
|
|
371,545 |
|
|
|
5,147,500 |
|
Banco Santander Chile |
|
|
364,746 |
|
|
|
10,226 |
|
Cia Cervecerias Unidas SA |
|
|
170,008 |
|
|
|
14,700 |
|
ENTEL Chile SA |
|
|
311,041 |
|
|
|
|
|
|
|
|
||
|
|
|
|
|
|
|
1,217,340 |
|
|
|
|
|
|
|
|
||
|
|
|
|
China - 2.06% |
|
|
|
|
|
|
1,312,000 |
|
Bank of China Ltd. |
|
|
610,424 |
|
|
|
1,822,000 |
|
China Construction Bank Corp. |
|
|
1,493,528 |
|
|
|
887,000 |
|
China Eastern Airlines Corp. |
|
|
387,210 |
|
|
|
458,000 |
|
China National Building |
|
|
579,145 |
|
|
|
298,000 |
|
China Oilfield Services, Ltd. |
|
|
626,328 |
|
|
|
59,400 |
|
China Pacific Insurance Group |
|
|
196,185 |
|
|
|
702,000 |
|
China Petroleum & Chemical Corp. |
|
|
823,239 |
|
|
|
196,500 |
|
Great Wall Motor Co. Ltd. |
|
|
668,761 |
|
|
|
256,000 |
|
Guangshen Railway Co. Ltd. |
|
|
125,602 |
|
|
|
244,000 |
|
Petrochina Co. |
|
|
321,315 |
|
|
|
|
|
|
|
|
||
|
|
|
|
|
|
|
5,831,737 |
|
|
|
|
|
|
|
|
||
|
|
|
|
Colombia - 0.13% |
|
|
|
|
|
|
9,060 |
|
Almacenes Exito SA |
|
|
163,780 |
|
|
|
12,610 |
|
Bancolombia SA |
|
|
198,941 |
|
|
|
|
|
|
|
|
||
|
|
|
|
|
|
|
362,721 |
|
|
|
|
|
|
|
|
||
|
|
|
|
Czech Republic - 0.24% |
|
|
|
|
|
|
3,550 |
|
Komercni Banka AS |
|
|
677,287 |
|
|
|
|
|
|
|
|
||
|
|
|
|
Denmark - 1.65% |
|
|
|
|
|
|
83 |
|
A.P. Moller - Maersk Group |
|
|
651,430 |
|
|
|
33,243 |
|
Danske Bank A/S (b) |
|
|
596,024 |
|
|
|
16,452 |
|
Novo Nordisk A/S |
|
|
2,651,768 |
|
|
|
97,500 |
|
TDC A/S |
|
|
750,447 |
|
|
|
|
|
|
|
|
||
|
|
|
|
|
|
|
4,649,669 |
|
|
|
|
|
|
|
|
||
|
|
|
|
|
|
|
|
|
|
Number of |
|
|
|
Value |
|
||
|
|
|
|
|
||||
|
|
|
|
Finland - 0.23% |
|
|
|
|
|
|
16,700 |
|
Sampo OYJ |
|
$ |
644,105 |
|
|
|
|
|
|
|
|
||
|
|
|
|
France - 6.32% |
|
|
|
|
|
|
10,961 |
|
Alstom SA |
|
|
447,080 |
|
|
|
7,400 |
|
Arkema SA |
|
|
674,362 |
|
|
|
3,779 |
|
AtoS |
|
|
260,404 |
|
|
|
26,603 |
|
BNP Paribas SA |
|
|
1,367,866 |
|
|
|
19,056 |
|
Carrefour SA |
|
|
522,007 |
|
|
|
2,925 |
|
Christian Dior SA |
|
|
485,518 |
|
|
|
2,515 |
|
Iliad SA |
|
|
535,000 |
|
|
|
12,800 |
|
Lagardere SCA |
|
|
471,779 |
|
|
|
13,000 |
|
Legrand SA |
|
|
567,160 |
|
|
|
6,496 |
|
LVMH Moet Hennessy Louis |
|
|
1,116,081 |
|
|
|
2,900 |
|
Pernod-Ricard SA |
|
|
361,451 |
|
|
|
4,550 |
|
PPR SA |
|
|
1,000,675 |
|
|
|
11,400 |
|
Renault SA |
|
|
715,211 |
|
|
|
16,830 |
|
Safran SA |
|
|
751,145 |
|
|
|
19,522 |
|
Saint-Gobain SA |
|
|
724,923 |
|
|
|
38,554 |
|
Sanofi-Aventis SA |
|
|
3,931,956 |
|
|
|
17,245 |
|
Schneider Electric SA |
|
|
1,261,096 |
|
|
|
5,600 |
|
Technip SA |
|
|
574,393 |
|
|
|
17,065 |
|
Total SA |
|
|
817,312 |
|
|
|
12,980 |
|
Vinci SA |
|
|
585,890 |
|
|
|
32,206 |
|
Vivendi SA |
|
|
666,281 |
|
|
|
|
|
|
|
|
||
|
|
|
|
|
|
|
17,837,590 |
|
|
|
|
|
|
|
|
||
|
|
|
|
Germany - 5.63% |
|
|
|
|
|
|
5,800 |
|
Adidas AG |
|
|
602,908 |
|
|
|
14,223 |
|
Allianz SE |
|
|
1,938,917 |
|
|
|
6,788 |
|
BASF SE |
|
|
596,006 |
|
|
|
21,717 |
|
Bayer AG |
|
|
2,244,371 |
|
|
|
7,871 |
|
Beiersdorf AG |
|
|
727,474 |
|
|
|
3,200 |
|
Brenntag AG |
|
|
500,376 |
|
|
|
16,374 |
|
E.ON AG |
|
|
286,509 |
|
|
|
4,800 |
|
Fresenius SE & Co. KGaA |
|
|
593,076 |
|
|
|
17,229 |
|
GEA Group AG |
|
|
569,059 |
|
|
|
8,732 |
|
HeidelbergCement AG |
|
|
629,640 |
|
|
|
5,777 |
|
Henkel AG & Co. KGaA |
|
|
456,619 |
|
|
|
13,121 |
|
Lanxess AG |
|
|
932,734 |
|
|
|
6,607 |
|
Linde AG |
|
|
1,230,740 |
|
|
|
20,300 |
|
ProSiebenSat.1 Media AG |
|
|
726,630 |
|
|
|
24,291 |
|
SAP AG |
|
|
1,953,663 |
|
|
|
10,000 |
|
ThyssenKrupp AG |
|
|
203,874 |
|
|
|
8,629 |
|
Volkswagen AG |
|
|
1,718,662 |
|
|
|
|
|
|
|
|
||
|
|
|
|
|
|
|
15,911,258 |
|
|
|
|
|
|
|
|
||
See notes to financial statements.
52
|
|
|
GuideMarkSM World ex-US Fund |
|
SCHEDULE OF INVESTMENTS (Continued) |
|
March 31, 2013 |
|
|
|
|
|
|
|
|
|
|
Number of |
|
|
|
Value |
|
||
|
|
|
|
|
||||
|
|
|
|
COMMON STOCKS (Continued) |
|
|
|
|
|
|
|
|
Hong Kong - 3.38% |
|
|
|
|
|
|
324,200 |
|
AIA Group Ltd. |
|
$ |
1,425,419 |
|
|
|
139,000 |
|
BOC Hong Kong Holdings Ltd. |
|
|
464,903 |
|
|
|
76,000 |
|
China Mobile Ltd. |
|
|
806,086 |
|
|
|
84,000 |
|
China Resources Land Ltd. |
|
|
235,529 |
|
|
|
218,000 |
|
China Resources Power Holdings |
|
|
653,002 |
|
|
|
373,000 |
|
CNOOC Ltd. |
|
|
717,244 |
|
|
|
142,000 |
|
Galaxy Entertainment Group |
|
|
595,463 |
|
|
|
42,000 |
|
Hengan International Group Co. Ltd. |
|
|
412,037 |
|
|
|
68,000 |
|
Hysan Development Co. Ltd. |
|
|
344,248 |
|
|
|
1,039,000 |
|
Industrial & Commercial Bank |
|
|
730,726 |
|
|
|
170,000 |
|
Kunlun Energy Co. Ltd. |
|
|
362,187 |
|
|
|
678,000 |
|
KWG Property Holding Ltd. |
|
|
425,999 |
|
|
|
50,500 |
|
Orient Overseas International Ltd. |
|
|
342,038 |
|
|
|
196,000 |
|
Skyworth Digital Holdings Ltd. |
|
|
132,063 |
|
|
|
80,000 |
|
Sun Hung Kai Properties Ltd. |
|
|
1,079,559 |
|
|
|
139,600 |
|
Swire Properties Ltd. |
|
|
496,493 |
|
|
|
30,686 |
|
Wing Hang Bank Ltd. |
|
|
326,675 |
|
|
|
|
|
|
|
|
||
|
|
|
|
|
|
|
9,549,671 |
|
|
|
|
|
|
|
|
||
|
|
|
|
Indonesia - 0.87% |
|
|
|
|
|
|
1,130,000 |
|
Bank Rakyat Indonesia Persero |
|
|
1,021,351 |
|
|
|
1,837,000 |
|
Media Nusantara Citra Tbk PT |
|
|
535,560 |
|
|
|
88,500 |
|
Semen Indonesia Persero Tbk PT |
|
|
161,660 |
|
|
|
304,500 |
|
Telekomunikasi Indonesia Persero |
|
|
345,595 |
|
|
|
620,500 |
|
Tower Bersama Infrastructure |
|
|
386,798 |
|
|
|
|
|
|
|
|
||
|
|
|
|
|
|
|
2,450,964 |
|
|
|
|
|
|
|
|
||
|
|
|
|
Ireland - 0.11% |
|
|
|
|
|
|
28,560 |
|
James Hardie Industries Plc |
|
|
299,600 |
|
|
|
|
|
|
|
|
||
|
|
|
|
Israel - 0.12% |
|
|
|
|
|
|
25,100 |
|
Israel Chemicals Ltd. |
|
|
325,249 |
|
|
|
|
|
|
|
|
||
|
|
|
|
Italy - 0.94% |
|
|
|
|
|
|
318,824 |
|
Enel S.p.A. |
|
|
1,045,405 |
|
|
|
25,496 |
|
Eni S.p.A. |
|
|
570,816 |
|
|
|
170,600 |
|
Intesa Sanpaolo S.p.A. |
|
|
251,364 |
|
|
|
78,270 |
|
Mediobanca S.p.A. |
|
|
400,095 |
|
|
|
12,566 |
|
Saipem S.p.A. |
|
|
386,221 |
|
|
|
|
|
|
|
|
||
|
|
|
|
|
|
|
2,653,901 |
|
|
|
|
|
|
|
|
||
|
|
|
|
|
|
|
|
|
|
Number of |
|
|
|
Value |
|
||
|
|
|
|
|
||||
|
|
|
|
Japan - 14.47% |
|
|
|
|
|
|
7,600 |
|
AEON Financial Service Co. Ltd. |
|
$ |
215,586 |
|
|
|
12,500 |
|
Aeon Mall Co. Ltd. |
|
|
381,692 |
|
|
|
29,000 |
|
Ajinomoto Co, Inc. |
|
|
426,409 |
|
|
|
54,000 |
|
Asahi Kasei Corp. |
|
|
364,944 |
|
|
|
16,100 |
|
Astellas Pharma, Inc. |
|
|
868,867 |
|
|
|
24,000 |
|
Bridgestone Corp. |
|
|
807,553 |
|
|
|
22,100 |
|
Canon, Inc. |
|
|
812,175 |
|
|
|
6,700 |
|
Credit Saison Co. |
|
|
167,625 |
|
|
|
144 |
|
Dai-ichi Life Insurance |
|
|
193,237 |
|
|
|
12,000 |
|
Daiichi Sankyo Company, Ltd. |
|
|
231,633 |
|
|
|
4,700 |
|
Daito Trust Construction Co. Ltd. |
|
|
403,330 |
|
|
|
17,500 |
|
Dena Co. Ltd. |
|
|
477,163 |
|
|
|
11,600 |
|
Denso Corp. |
|
|
492,866 |
|
|
|
13,300 |
|
East Japan Railway Co. |
|
|
1,094,813 |
|
|
|
32,000 |
|
Fuji Heavy Industries Ltd. |
|
|
507,582 |
|
|
|
9,300 |
|
Hitachi High-Technologies Corp. |
|
|
194,492 |
|
|
|
137,000 |
|
Hitachi Ltd. |
|
|
799,808 |
|
|
|
33,900 |
|
Honda Motor Co. Ltd. |
|
|
1,305,505 |
|
|
|
98 |
|
Inpex Corp. |
|
|
527,807 |
|
|
|
45,800 |
|
ITOCHU Corp. |
|
|
562,760 |
|
|
|
3,800 |
|
Japan Airlines Co. Ltd. |
|
|
177,259 |
|
|
|
45,600 |
|
Japan Tobacco, Inc. |
|
|
1,458,631 |
|
|
|
15,300 |
|
JFE Holdings, Inc. |
|
|
296,132 |
|
|
|
26,200 |
|
JS Group Corp. |
|
|
522,735 |
|
|
|
12,000 |
|
JSR Corp. |
|
|
245,965 |
|
|
|
38,600 |
|
JX Holdings, Inc. |
|
|
217,645 |
|
|
|
11,000 |
|
Kakaku.com, Inc. |
|
|
276,936 |
|
|
|
34,000 |
|
Kubota Corp. |
|
|
493,370 |
|
|
|
2,600 |
|
Kyocera Corp. |
|
|
238,557 |
|
|
|
6,700 |
|
Makita Corp. |
|
|
298,697 |
|
|
|
32,200 |
|
Mitsubishi Corp. |
|
|
606,450 |
|
|
|
64,000 |
|
Mitsubishi Electric Corp. |
|
|
520,637 |
|
|
|
35,000 |
|
Mitsubishi Gas Chemical Co., Inc. |
|
|
231,806 |
|
|
|
143,000 |
|
Mitsubishi Heavy Industries Ltd. |
|
|
827,322 |
|
|
|
98,300 |
|
Mitsubishi UFJ Financial Group, Inc. |
|
|
593,067 |
|
|
|
45,800 |
|
Mitsubishi UFJ Lease & Finance |
|
|
240,000 |
|
|
|
69,400 |
|
Mitsui & Co. Ltd. |
|
|
978,407 |
|
|
|
7,000 |
|
Mitsui Fudosan Co., Ltd. |
|
|
199,901 |
|
|
|
35,700 |
|
MS&AD Insurance Group Holdings |
|
|
795,162 |
|
|
|
8,000 |
|
Murata Manufacturing Co. Ltd. |
|
|
604,878 |
|
|
|
98,000 |
|
Nippon Steel & Sumitomo |
|
|
249,615 |
|
|
|
74,400 |
|
Nissan Motor Co. |
|
|
721,712 |
|
See notes to financial statements.
53
|
|
|
GuideMarkSM World ex-US Fund |
|
SCHEDULE OF INVESTMENTS (Continued) |
|
March 31, 2013 |
|
|
|
|
|
|
|
|
|
|
Number of |
|
|
|
Value |
|
||
|
|
|
|
|
||||
|
|
|
|
COMMON STOCKS (Continued) |
|
|
|
|
|
|
|
|
Japan (Continued) |
|
|
|
|
|
|
14,100 |
|
Nitto Denko Corp. |
|
$ |
848,993 |
|
|
|
11,800 |
|
Nomura Research Institute Ltd. |
|
|
304,737 |
|
|
|
39,000 |
|
NSK Ltd. |
|
|
297,699 |
|
|
|
263 |
|
NTT DoCoMo, Inc. |
|
|
390,967 |
|
|
|
17,300 |
|
Olympus Corp. |
|
|
410,512 |
|
|
|
88,500 |
|
ORIX Corp. |
|
|
1,129,965 |
|
|
|
52,500 |
|
Rakuten, Inc. |
|
|
536,926 |
|
|
|
23,000 |
|
Rohto Pharmaceutical Co. Ltd. |
|
|
319,817 |
|
|
|
19,100 |
|
Seven & I Holdings Co. Ltd. |
|
|
633,730 |
|
|
|
8,800 |
|
Shin-Etsu Chemical Co. Ltd. |
|
|
583,640 |
|
|
|
30,800 |
|
Shinko Electric Industries Co. Ltd. |
|
|
257,095 |
|
|
|
343,000 |
|
Shinsei Bank |
|
|
788,176 |
|
|
|
12,700 |
|
Shionogi & Co. Ltd. |
|
|
257,380 |
|
|
|
3,000 |
|
SMC Corp. |
|
|
582,563 |
|
|
|
38,100 |
|
Softbank Corp. |
|
|
1,755,335 |
|
|
|
25,700 |
|
Sony Financial Holdings, Inc. |
|
|
384,387 |
|
|
|
33,200 |
|
Sumitomo Electric Industries Ltd. |
|
|
408,495 |
|
|
|
42,700 |
|
Sumitomo Mitsui Financial |
|
|
1,751,762 |
|
|
|
118,000 |
|
Sumitomo Mitsui Trust |
|
|
561,896 |
|
|
|
13,100 |
|
Suzuki Motor Corp. |
|
|
293,588 |
|
|
|
2,200 |
|
Sysmex Corp. |
|
|
134,040 |
|
|
|
17,000 |
|
Takeda Pharmaceutical Co., Ltd. |
|
|
931,307 |
|
|
|
65,200 |
|
The Kansai Electric Power Co. Inc. |
|
|
618,279 |
|
|
|
11,700 |
|
Tokio Marine Holdings, Inc. |
|
|
338,485 |
|
|
|
61,000 |
|
Tokyo Tatemono Co. |
|
|
436,073 |
|
|
|
54,000 |
|
Toray Industries, Inc. |
|
|
366,782 |
|
|
|
122,000 |
|
Toshiba Corp. |
|
|
622,137 |
|
|
|
49,700 |
|
Toyota Motor Corp. |
|
|
2,562,819 |
|
|
|
2,800 |
|
West Japan Railway Co. |
|
|
134,709 |
|
|
|
1,286 |
|
Yahoo Japan Corp. |
|
|
593,260 |
|
|
|
|
|
|
|
|
||
|
|
|
|
|
|
|
40,866,285 |
|
|
|
|
|
|
|
|
||
|
|
|
|
Jersey - 0.86% |
|
|
|
|
|
|
95,200 |
|
Glencore Intl Plc |
|
|
516,555 |
|
|
|
69,000 |
|
Resolution Ltd. |
|
|
286,641 |
|
|
|
23,640 |
|
United Business Media Ltd. |
|
|
253,623 |
|
|
|
11,002 |
|
Wolseley Plc |
|
|
548,685 |
|
|
|
50,964 |
|
WPP Plc |
|
|
814,462 |
|
|
|
|
|
|
|
|
||
|
|
|
|
|
|
|
2,419,966 |
|
|
|
|
|
|
|
|
||
|
|
|
|
|
|
|
|
|
|
Number of |
|
|
|
Value |
|
||
|
|
|
|
|
||||
|
|
|
|
Malaysia - 0.29% |
|
|
|
|
|
|
214,800 |
|
CIMB Group Holdings Bhd |
|
$ |
531,282 |
|
|
|
167,000 |
|
IJM Corp. Bhd |
|
|
297,492 |
|
|
|
|
|
|
|
|
||
|
|
|
|
|
|
|
828,774 |
|
|
|
|
|
|
|
|
||
|
|
|
|
Mexico - 1.03% |
|
|
|
|
|
|
196,700 |
|
Alfa SAB de CV |
|
|
479,987 |
|
|
|
20,400 |
|
Alsea SAB de CV (b) |
|
|
58,616 |
|
|
|
443,100 |
|
America Movil SAB de CV |
|
|
470,312 |
|
|
|
49,900 |
|
Fomento Economico Mexicano |
|
|
560,956 |
|
|
|
124,900 |
|
Grupo Mexico SAB de CV |
|
|
502,980 |
|
|
|
157,900 |
|
Mexichem SAB de CV |
|
|
845,657 |
|
|
|
|
|
|
|
|
||
|
|
|
|
|
|
|
2,918,508 |
|
|
|
|
|
|
|
|
||
|
|
|
|
Netherlands - 1.91% |
|
|
|
|
|
|
144,000 |
|
AEGON NV |
|
|
869,484 |
|
|
|
10,432 |
|
ASML Holding NV |
|
|
702,659 |
|
|
|
4,323 |
|
Gemalto NV |
|
|
377,386 |
|
|
|
4,000 |
|
Koninklijke DSM NV |
|
|
233,092 |
|
|
|
28,900 |
|
Koninklijke Philips Electronics NV |
|
|
855,067 |
|
|
|
14,000 |
|
Randstad Holding NV |
|
|
574,666 |
|
|
|
38,357 |
|
Reed Elsevier NV |
|
|
657,582 |
|
|
|
27,649 |
|
Unilever NV |
|
|
1,132,881 |
|
|
|
|
|
|
|
|
||
|
|
|
|
|
|
|
5,402,817 |
|
|
|
|
|
|
|
|
||
|
|
|
|
Nigeria - 0.10% |
|
|
|
|
|
|
33,695 |
|
Guaranty Trust Bank Plc - ADR (b) |
|
|
274,614 |
|
|
|
|
|
|
|
|
||
|
|
|
|
Norway - 0.93% |
|
|
|
|
|
|
24,580 |
|
Aker Solutions ASA |
|
|
461,375 |
|
|
|
72,400 |
|
DNB ASA |
|
|
1,065,523 |
|
|
|
35,700 |
|
Orkla ASA |
|
|
286,973 |
|
|
|
36,720 |
|
Telenor ASA |
|
|
808,504 |
|
|
|
|
|
|
|
|
||
|
|
|
|
|
|
|
2,622,375 |
|
|
|
|
|
|
|
|
||
|
|
|
|
Philippines - 0.30% |
|
|
|
|
|
|
739,200 |
|
Alliance Global Group, Inc. |
|
|
383,254 |
|
|
|
104,260 |
|
Security Bank Corp. |
|
|
465,176 |
|
|
|
|
|
|
|
|
||
|
|
|
|
|
|
|
848,430 |
|
|
|
|
|
|
|
|
||
|
|
|
|
Republic of Korea - 3.85% |
|
|
|
|
|
|
5,600 |
|
Daelim Industrial |
|
|
463,044 |
|
|
|
18,130 |
|
DGB Financial Group, Inc. |
|
|
274,864 |
|
|
|
12,200 |
|
Hana Financial Group, Inc. |
|
|
432,536 |
|
|
|
16,560 |
|
Hynix Semiconductor, Inc. (b) |
|
|
438,440 |
|
|
|
9,251 |
|
Hyundai Motor Co. |
|
|
1,870,043 |
|
|
|
4,910 |
|
KB Financial Group, Inc. |
|
|
164,025 |
|
See notes to financial statements.
54
|
|
|
GuideMarkSM World ex-US Fund |
|
SCHEDULE OF INVESTMENTS (Continued) |
|
March 31, 2013 |
|
|
|
|
|
|
|
|
|
|
Number of |
|
|
|
Value |
|
||
|
|
|
|
|
||||
|
|
|
|
COMMON STOCKS (Continued) |
|
|
|
|
|
|
|
|
Republic of Korea (Continued) |
|
|
|
|
|
|
15,980 |
|
Korea Electric Power Corp. (b) |
|
$ |
436,256 |
|
|
|
42,313 |
|
Korean Reinsurance Co. |
|
|
436,058 |
|
|
|
2,376 |
|
LG Chemical Ltd. |
|
|
570,029 |
|
|
|
820 |
|
LG Household & Health Care Ltd. |
|
|
450,764 |
|
|
|
475 |
|
Orion Corp. |
|
|
464,928 |
|
|
|
2,444 |
|
POSCO |
|
|
719,200 |
|
|
|
4,900 |
|
Samsung C&T Corp. |
|
|
303,305 |
|
|
|
2,509 |
|
Samsung Electronics Co. Ltd. |
|
|
3,419,843 |
|
|
|
13,390 |
|
Samsung Heavy Industries Co. Ltd. |
|
|
425,664 |
|
|
|
|
|
|
|
|
||
|
|
|
|
|
|
|
10,868,999 |
|
|
|
|
|
|
|
|
||
|
|
|
|
Russian Federation - 1.74% |
|
|
|
|
|
|
7,990 |
|
Eurasia Drilling Co. Ltd. |
|
|
284,731 |
|
|
|
80,905 |
|
Gazprom OAO - ADR (b) |
|
|
659,184 |
|
|
|
18,330 |
|
Lukoil OAO |
|
|
1,131,878 |
|
|
|
3,090 |
|
Magnit OJSC |
|
|
500,580 |
|
|
|
23,360 |
|
Mobile TeleSystems OJSC - ADR |
|
|
484,486 |
|
|
|
410,370 |
|
Sberbank of Russia (b) |
|
|
1,299,755 |
|
|
|
571,840 |
|
Surgutneftegas OAO - ADR (b) |
|
|
548,966 |
|
|
|
|
|
|
|
|
||
|
|
|
|
|
|
|
4,909,580 |
|
|
|
|
|
|
|
|
||
|
|
|
|
Singapore - 1.13% |
|
|
|
|
|
|
200,000 |
|
Global Logistic Properties Ltd. |
|
|
424,734 |
|
|
|
392,000 |
|
Singapore Telecommunications Ltd. |
|
|
1,136,560 |
|
|
|
76,581 |
|
United Overseas Bank Ltd. |
|
|
1,262,511 |
|
|
|
63,000 |
|
UOL Group Ltd. |
|
|
355,758 |
|
|
|
|
|
|
|
|
||
|
|
|
|
|
|
|
3,179,563 |
|
|
|
|
|
|
|
|
||
|
|
|
|
South Africa - 1.65% |
|
|
|
|
|
|
16,460 |
|
AngloGold Ashanti Ltd. |
|
|
387,310 |
|
|
|
71,900 |
|
AVI Ltd. |
|
|
419,867 |
|
|
|
25,900 |
|
Bidvest Group Ltd. |
|
|
682,724 |
|
|
|
71,700 |
|
Discovery Ltd. |
|
|
610,715 |
|
|
|
27,500 |
|
Harmony Gold Mining Co. Ltd. |
|
|
177,243 |
|
|
|
28,700 |
|
MTN Group Ltd. |
|
|
504,324 |
|
|
|
216,900 |
|
Nampak Ltd. |
|
|
756,916 |
|
|
|
10,790 |
|
Naspers Ltd. |
|
|
672,283 |
|
|
|
57,600 |
|
Woolworths Holdings Ltd. |
|
|
442,251 |
|
|
|
|
|
|
|
|
||
|
|
|
|
|
|
|
4,653,633 |
|
|
|
|
|
|
|
|
||
|
|
|
|
Spain - 1.62% |
|
|
|
|
|
|
20,400 |
|
Amadeus IT Holding SA |
|
|
553,006 |
|
|
|
202,135 |
|
Banco Bilbao Vizcaya |
|
|
1,765,013 |
|
|
|
21,377 |
|
Grifols SA - ADR (b) |
|
|
620,147 |
|
|
|
|
|
|
|
|
|
|
|
Number of |
|
|
|
Value |
|
||
|
|
|
|
|
||||
|
|
|
|
Spain (Continued) |
|
|
|
|
|
|
53,385 |
|
Iberdrola SA |
|
$ |
249,569 |
|
|
|
21,743 |
|
Repsol YPF SA |
|
|
441,732 |
|
|
|
69,320 |
|
Telefonica SA |
|
|
939,189 |
|
|
|
|
|
|
|
|
||
|
|
|
|
|
|
|
4,568,656 |
|
|
|
|
|
|
|
|
||
|
|
|
|
Sweden - 2.01% |
|
|
|
|
|
|
18,200 |
|
Assa Abloy AB |
|
|
744,029 |
|
|
|
11,200 |
|
Atlas Copco AB |
|
|
318,680 |
|
|
|
39,400 |
|
H & M Hennes & Mauritz AB |
|
|
1,411,076 |
|
|
|
86,600 |
|
Nordea Bank AB |
|
|
982,452 |
|
|
|
47,600 |
|
Sandvik AB |
|
|
734,265 |
|
|
|
9,900 |
|
SKF AB - B Shares |
|
|
241,908 |
|
|
|
28,400 |
|
Svenska Cellulosa AB |
|
|
733,229 |
|
|
|
35,100 |
|
Volvo AB |
|
|
512,454 |
|
|
|
|
|
|
|
|
||
|
|
|
|
|
|
|
5,678,093 |
|
|
|
|
|
|
|
|
||
|
|
|
|
Switzerland - 5.56% |
|
|
|
|
|
|
3,655 |
|
Cie Financiere Richemont SA |
|
|
287,764 |
|
|
|
35,408 |
|
Credit Suisse Group AG |
|
|
931,256 |
|
|
|
75,152 |
|
Nestle SA |
|
|
5,439,097 |
|
|
|
1,379 |
|
Partners Group Holding AG |
|
|
340,556 |
|
|
|
2,897 |
|
Roche Holding AG |
|
|
675,358 |
|
|
|
3,266 |
|
Schindler Holding AG |
|
|
479,041 |
|
|
|
214 |
|
SGS SA |
|
|
525,239 |
|
|
|
1,882 |
|
Swisscom AG |
|
|
871,607 |
|
|
|
2,140 |
|
Syngenta AG |
|
|
895,500 |
|
|
|
1,474 |
|
The Swatch Group AG |
|
|
859,339 |
|
|
|
13,545 |
|
Transocean Ltd. (b) |
|
|
699,790 |
|
|
|
148,418 |
|
UBS AG |
|
|
2,282,256 |
|
|
|
5,108 |
|
Zurich Financial Services AG |
|
|
1,425,897 |
|
|
|
|
|
|
|
|
||
|
|
|
|
|
|
|
15,712,700 |
|
|
|
|
|
|
|
|
||
|
|
|
|
Taiwan - 1.66% |
|
|
|
|
|
|
369,000 |
|
Cathay Financial Holding Co. Ltd. |
|
|
509,071 |
|
|
|
363,000 |
|
Chipbond Technology Corp. |
|
|
824,315 |
|
|
|
232,000 |
|
Far EasTone Telecommunications |
|
|
526,151 |
|
|
|
233,500 |
|
Hon Hai Precision Industry |
|
|
649,834 |
|
|
|
20,000 |
|
Mediatek, Inc. |
|
|
228,575 |
|
|
|
582,000 |
|
Taiwan Semiconductor |
|
|
1,949,267 |
|
|
|
|
|
|
|
|
||
|
|
|
|
|
|
|
4,687,213 |
|
|
|
|
|
|
|
|
||
See notes to financial statements.
55
|
|
|
GuideMarkSM World ex-US Fund |
|
SCHEDULE OF INVESTMENTS (Continued) |
|
March 31, 2013 |
|
|
|
|
|
|
|
|
|
|
Number of |
|
|
|
Value |
|
||
|
|
|
|
|
||||
|
|
|
|
COMMON STOCKS (Continued) |
|
|
|
|
|
|
|
|
Thailand - 0.85% |
|
|
|
|
|
|
68,700 |
|
Bangkok Bank PCL |
|
$ |
531,921 |
|
|
|
354,400 |
|
CP ALL PCL |
|
|
554,531 |
|
|
|
115,000 |
|
Kasikornbank PCL |
|
|
823,372 |
|
|
|
37,600 |
|
PTT Exploration & Production PCL |
|
|
191,383 |
|
|
|
94,300 |
|
Total Access Communication PCL |
|
|
306,028 |
|
|
|
|
|
|
|
|
||
|
|
|
|
|
|
|
2,407,235 |
|
|
|
|
|
|
|
|
||
|
|
|
|
Turkey - 0.57% |
|
|
|
|
|
|
56,811 |
|
Aygaz AS |
|
|
339,183 |
|
|
|
8,500 |
|
Coca-Cola Icecek AS |
|
|
240,797 |
|
|
|
14,400 |
|
Tupras Turkiye Petroleum |
|
|
433,116 |
|
|
|
54,900 |
|
Turkiye Halk Bankasi AS |
|
|
587,165 |
|
|
|
|
|
|
|
|
||
|
|
|
|
|
|
|
1,600,261 |
|
|
|
|
|
|
|
|
||
|
|
|
|
United Kingdom - 13.56% |
|
|
|
|
|
|
60,100 |
|
African Minerals Ltd. (b) |
|
|
211,925 |
|
|
|
37,600 |
|
Amarin Corp. - ADR (a)(b) |
|
|
278,616 |
|
|
|
507,237 |
|
Barclays Plc |
|
|
2,256,841 |
|
|
|
69,433 |
|
BG Group Plc |
|
|
1,194,812 |
|
|
|
82,724 |
|
BHP Billiton Plc |
|
|
2,409,076 |
|
|
|
198,046 |
|
BP Plc |
|
|
1,392,667 |
|
|
|
48,190 |
|
British American Tobacco Plc |
|
|
2,584,081 |
|
|
|
328,000 |
|
BT Group Plc |
|
|
1,385,341 |
|
|
|
12,700 |
|
Bunzl Plc |
|
|
250,680 |
|
|
|
26,500 |
|
Capita Plc |
|
|
362,240 |
|
|
|
250,001 |
|
Centrica Plc |
|
|
1,399,431 |
|
|
|
32,800 |
|
Experian Plc |
|
|
568,492 |
|
|
|
71,833 |
|
GlaxoSmithKline Plc |
|
|
1,682,124 |
|
|
|
16,177 |
|
Hikma Pharmaceuticals Plc |
|
|
254,562 |
|
|
|
280,122 |
|
HSBC Holdings Plc |
|
|
2,988,797 |
|
|
|
28,400 |
|
IMI Plc |
|
|
560,636 |
|
|
|
38,239 |
|
Imperial Tobacco Group Plc |
|
|
1,337,426 |
|
|
|
224,000 |
|
ITV Plc |
|
|
441,668 |
|
|
|
18,816 |
|
Johnson Matthey Plc |
|
|
660,077 |
|
|
|
99,600 |
|
Kingfisher Plc |
|
|
436,582 |
|
|
|
294,894 |
|
Legal & General Group Plc |
|
|
776,027 |
|
|
|
1,483,000 |
|
Lloyds Banking Group Plc (b) |
|
|
1,105,016 |
|
|
|
41,900 |
|
Meggitt Plc |
|
|
313,506 |
|
|
|
4,800 |
|
Next Plc |
|
|
318,896 |
|
|
|
4,100 |
|
Randgold Resources Ltd. |
|
|
353,579 |
|
|
|
11,000 |
|
Reckitt Benckiser Group Plc |
|
|
789,777 |
|
|
|
48,200 |
|
Rolls-Royce Holdings Plc (b) |
|
|
829,388 |
|
|
|
104,426 |
|
Royal Dutch Shell Plc, Class A |
|
|
3,385,860 |
|
|
|
|
|
|
|
|
|
|
|
Number of |
|
|
|
Value |
|
||
|
|
|
|
|
||||
|
|
|
|
United Kingdom (Continued) |
|
|
|
|
|
|
20,735 |
|
Royal Dutch Shell Plc, Class B |
|
$ |
689,547 |
|
|
|
32,789 |
|
SABMiller Plc |
|
|
1,729,489 |
|
|
|
62,100 |
|
Sage Group Plc |
|
|
323,840 |
|
|
|
30,141 |
|
Serco Group |
|
|
288,129 |
|
|
|
49,500 |
|
SSE Plc |
|
|
1,119,019 |
|
|
|
35,793 |
|
Standard Chartered Plc |
|
|
929,409 |
|
|
|
21,640 |
|
Unilever Plc |
|
|
915,314 |
|
|
|
418,978 |
|
Vodafone Group Plc |
|
|
1,188,932 |
|
|
|
9,416 |
|
Whitbread Plc |
|
|
368,291 |
|
|
|
40,425 |
|
William Hill Plc |
|
|
227,494 |
|
|
|
|
|
|
|
|
||
|
|
|
|
|
|
|
38,307,587 |
|
|
|
|
|
|
|
|
||
|
|
|
|
Total Common Stocks |
|
|
266,997,845 |
|
|
|
|
|
|
|
|
||
|
|
|
|
INVESTMENT COMPANIES - 1.33% |
|
|
|
|
|
|
|
|
India - 1.33% |
|
|
|
|
|
|
207,800 |
|
PowerShares India Portfolio |
|
|
3,754,946 |
|
|
|
|
|
|
|
|
||
|
|
|
|
Total Investment
Companies |
|
|
3,754,946 |
|
|
|
|
|
|
|
|
||
|
|
|
|
PREFERRED STOCKS - 1.68% |
|
|
|
|
|
|
|
|
Brazil - 1.62% |
|
|
|
|
|
|
38,170 |
|
Banco Bradesco SA |
|
|
643,927 |
|
|
|
20,700 |
|
Cia de Bebidas das Americas |
|
|
872,560 |
|
|
|
60,900 |
|
Itau Unibanco Holding SA |
|
|
1,082,533 |
|
|
|
86,700 |
|
Klabin SA |
|
|
592,945 |
|
|
|
50,900 |
|
Petroleo Brasileiro SA |
|
|
462,716 |
|
|
|
56,100 |
|
Vale SA |
|
|
928,360 |
|
|
|
|
|
|
|
|
||
|
|
|
|
|
|
|
4,583,041 |
|
|
|
|
|
|
|
|
||
|
|
|
|
Colombia - 0.06% |
|
|
|
|
|
|
2,378 |
|
Bancolombia SA |
|
|
150,409 |
|
|
|
|
|
|
|
|
||
|
|
|
|
Total Preferred Stocks |
|
|
4,733,450 |
|
|
|
|
|
|
|
|
||
|
|
|
|
REAL ESTATE INVESTMENT |
|
|
|
|
|
|
|
|
United Kingdom - 0.11% |
|
|
|
|
|
|
38,703 |
|
British Land Co. Plc |
|
|
320,396 |
|
|
|
|
|
|
|
|
||
|
|
|
|
Total Real Estate
Investment Trusts |
|
|
320,396 |
|
|
|
|
|
|
|
|
||
|
|
|
|
RIGHTS - 0.01% |
|
|
|
|
|
|
|
|
United Kingdom - 0.01% |
|
|
|
|
|
|
8,983 |
|
William Hill Plc |
|
|
16,925 |
|
|
|
|
|
|
|
|
||
|
|
|
|
Total Rights (Cost $10,502) |
|
|
16,925 |
|
|
|
|
|
|
|
|
||
See notes to financial statements.
56
|
|
|
GuideMarkSM World ex-US Fund |
|
SCHEDULE OF INVESTMENTS (Continued) |
|
March 31, 2013 |
|
|
|
|
|
|
|
|
|
|
Number of |
|
|
|
Value |
|
||
|
|
|
|
|
||||
|
|
|
|
SHORT TERM INVESTMENTS - 1.23% |
|
|
|
|
|
|
|
|
Money Market Funds - 1.23% |
|
|
|
|
|
|
3,465,923 |
|
Federated Prime Obligations Fund |
|
$ |
3,465,923 |
|
|
|
|
|
|
|
|
||
|
|
|
|
Total Short Term
Investments |
|
|
3,465,923 |
|
|
|
|
|
|
|
|
||
|
|
|
|
INVESTMENTS PURCHASED |
|
|
|
|
|
|
|
|
Money Market Funds - 0.11% |
|
|
|
|
|
|
297,792 |
|
First American Government |
|
|
297,792 |
|
|
|
5,588 |
|
Reserve Primary Fund (c) |
|
|
216 |
|
|
|
|
|
|
|
|
||
|
|
|
|
Total Investments
Purchased as |
|
|
298,008 |
|
|
|
|
|
|
|
|
||
|
|
|
|
Total Investments |
|
|
279,587,493 |
|
|
|
|
|
Other Assets in Excess
of |
|
|
2,822,868 |
|
|
|
|
|
|
|
|
||
|
|
|
|
TOTAL NET |
|
$ |
282,410,361 |
|
|
|
|
|
|
|
|
||
|
|
|
|
Percentages are stated as a percent of net assets. |
|
|
ADR - American Depositary Receipt |
|
|
(a) |
All or portion of this security is on loan. |
|
(b) |
Non-income producing security. |
|
(c) |
As of March 31, 2013, the Fund has fair valued this security and deemed it illiquid. The value of this security was $216, which represents 0.00% of total net assets. |
See notes to financial statements.
57
|
|
|
GuideMarkSM Opportunistic Equity Fund |
|
SCHEDULE OF INVESTMENTS |
|
March 31, 2013 |
|
|
|
|
|
|
|
|
|
|
Number of |
|
|
|
Value |
|
||
|
|
|
|
|
||||
|
|
|
|
COMMON STOCKS - 95.36% |
|
|
|
|
|
|
|
|
Aerospace & Defense - 4.06% |
|
|
|
|
|
|
10,090 |
|
BE Aerospace, Inc. (b) |
|
$ |
608,326 |
|
|
|
7,700 |
|
General Dynamics Corp. |
|
|
542,927 |
|
|
|
20,690 |
|
Hexcel Corp. (b) |
|
|
600,217 |
|
|
|
4,850 |
|
Lockheed Martin Corp. |
|
|
468,122 |
|
|
|
9,300 |
|
Raytheon Co. |
|
|
546,747 |
|
|
|
37,685 |
|
United Technologies Corp. |
|
|
3,520,910 |
|
|
|
|
|
|
|
|
||
|
|
|
|
|
|
|
6,287,249 |
|
|
|
|
|
|
|
|
||
|
|
|
|
Air Freight & Logistics - 0.57% |
|
|
|
|
|
|
10,300 |
|
United Parcel Service, Inc. |
|
|
884,770 |
|
|
|
|
|
|
|
|
||
|
|
|
|
Airlines - 1.58% |
|
|
|
|
|
|
181,080 |
|
Southwest Airlines Co. |
|
|
2,440,958 |
|
|
|
|
|
|
|
|
||
|
|
|
|
Beverages - 2.36% |
|
|
|
|
|
|
16,975 |
|
Dr. Pepper Snapple Group, Inc. |
|
|
796,976 |
|
|
|
11,800 |
|
Molson Coors Brewing Co. |
|
|
577,374 |
|
|
|
28,720 |
|
PepsiCo., Inc. |
|
|
2,272,039 |
|
|
|
|
|
|
|
|
||
|
|
|
|
|
|
|
3,646,389 |
|
|
|
|
|
|
|
|
||
|
|
|
|
Biotechnology - 1.46% |
|
|
|
|
|
|
16,970 |
|
Celgene Corp. (b) |
|
|
1,966,993 |
|
|
|
6,270 |
|
Medivation, Inc. (a)(b) |
|
|
293,248 |
|
|
|
|
|
|
|
|
||
|
|
|
|
|
|
|
2,260,241 |
|
|
|
|
|
|
|
|
||
|
|
|
|
Capital Markets - 3.45% |
|
|
|
|
|
|
9,760 |
|
Ameriprise Financial, Inc. |
|
|
718,824 |
|
|
|
2,565 |
|
Blackrock, Inc. |
|
|
658,897 |
|
|
|
94,005 |
|
Morgan Stanley |
|
|
2,066,230 |
|
|
|
107,320 |
|
The Charles Schwab Corp. |
|
|
1,898,491 |
|
|
|
|
|
|
|
|
||
|
|
|
|
|
|
|
5,342,442 |
|
|
|
|
|
|
|
|
||
|
|
|
|
Chemicals - 1.69% |
|
|
|
|
|
|
10,370 |
|
Eastman Chemical Co. |
|
|
724,552 |
|
|
|
2,280 |
|
Innophos Holdings, Inc. |
|
|
124,397 |
|
|
|
9,150 |
|
Monsanto Co. |
|
|
966,514 |
|
|
|
5,940 |
|
PPG Industries, Inc. |
|
|
795,604 |
|
|
|
|
|
|
|
|
||
|
|
|
|
|
|
|
2,611,067 |
|
|
|
|
|
|
|
|
||
|
|
|
|
Commercial Banks - 2.29% |
|
|
|
|
|
|
9,600 |
|
Commerce Bancshares, Inc. |
|
|
391,968 |
|
|
|
12,500 |
|
PNC Financial Services Group, Inc. |
|
|
831,250 |
|
|
|
57,930 |
|
Popular, Inc. (b) |
|
|
1,599,447 |
|
|
|
21,350 |
|
U.S. Bancorp |
|
|
724,406 |
|
|
|
|
|
|
|
|
||
|
|
|
|
|
|
|
3,547,071 |
|
|
|
|
|
|
|
|
||
|
|
|
|
|
|
|
|
|
|
Number of |
|
|
|
Value |
|
||
|
|
|
|
|
||||
|
|
|
|
Commercial Services & Supplies - 1.17% |
|
|
|
|
|
|
11,400 |
|
ABM Industries, Inc. |
|
$ |
253,536 |
|
|
|
19,300 |
|
Iron Mountain, Inc. |
|
|
700,783 |
|
|
|
17,700 |
|
Republic Services, Inc. |
|
|
584,100 |
|
|
|
7,400 |
|
The Geo Group, Inc. |
|
|
278,388 |
|
|
|
|
|
|
|
|
||
|
|
|
|
|
|
|
1,816,807 |
|
|
|
|
|
|
|
|
||
|
|
|
|
Communications Equipment - 1.56% |
|
|
|
|
|
|
82,095 |
|
Cisco Systems, Inc. |
|
|
1,716,606 |
|
|
|
10,390 |
|
Qualcomm, Inc. |
|
|
695,611 |
|
|
|
|
|
|
|
|
||
|
|
|
|
|
|
|
2,412,217 |
|
|
|
|
|
|
|
|
||
|
|
|
|
Computers & Peripherals - 3.76% |
|
|
|
|
|
|
8,484 |
|
Apple, Inc. |
|
|
3,755,273 |
|
|
|
9,640 |
|
International Business Machines |
|
|
2,056,212 |
|
|
|
|
|
|
|
|
||
|
|
|
|
|
|
|
5,811,485 |
|
|
|
|
|
|
|
|
||
|
|
|
|
Containers & Packaging - 0.36% |
|
|
|
|
|
|
13,700 |
|
Bemis, Inc. |
|
|
552,932 |
|
|
|
|
|
|
|
|
||
|
|
|
|
Distributors - 0.29% |
|
|
|
|
|
|
5,800 |
|
Genuine Parts Co. |
|
|
452,400 |
|
|
|
|
|
|
|
|
||
|
|
|
|
Diversified Consumer Services - 0.19% |
|
|
|
|
|
|
11,400 |
|
Hillenbrand, Inc. |
|
|
288,192 |
|
|
|
|
|
|
|
|
||
|
|
|
|
Diversified Financial Services - 2.86% |
|
|
|
|
|
|
46,995 |
|
Citigroup, Inc. |
|
|
2,079,059 |
|
|
|
10,925 |
|
CME Group, Inc. |
|
|
670,686 |
|
|
|
35,305 |
|
JPMorgan Chase & Co. |
|
|
1,675,575 |
|
|
|
|
|
|
|
|
||
|
|
|
|
|
|
|
4,425,320 |
|
|
|
|
|
|
|
|
||
|
|
|
|
Diversified Telecommunication Services - 1.02% |
|
|
|
|
|
|
31,980 |
|
Verizon Communications, Inc. |
|
|
1,571,817 |
|
|
|
|
|
|
|
|
||
|
|
|
|
Electric Utilities - 0.24% |
|
|
|
|
|
|
7,695 |
|
UNS Energy Corp. |
|
|
376,593 |
|
|
|
|
|
|
|
|
||
|
|
|
|
Electrical Equipment - 0.35% |
|
|
|
|
|
|
9,700 |
|
Emerson Electric Co. |
|
|
541,939 |
|
|
|
|
|
|
|
|
||
|
|
|
|
Electronic Equipment & Instruments - 0.33% |
|
|
|
|
|
|
38,225 |
|
Corning, Inc. |
|
|
509,539 |
|
|
|
|
|
|
|
|
||
|
|
|
|
Energy Equipment & Services - 0.78% |
|
|
|
|
|
|
18,480 |
|
Halliburton Co. |
|
|
746,777 |
|
|
|
6,450 |
|
National-Oilwell Varco, Inc. |
|
|
456,337 |
|
|
|
|
|
|
|
|
||
|
|
|
|
|
|
|
1,203,114 |
|
|
|
|
|
|
|
|
||
See notes to financial statements.
58
|
|
|
GuideMarkSM Opportunistic Equity Fund |
|
SCHEDULE OF INVESTMENTS (Continued) |
|
March 31, 2013 |
|
|
|
|
|
|
|
|
|
|
Number of |
|
|
|
Value |
|
||
|
|
|
|
|
||||
|
|
|
|
COMMON STOCKS (Continued) |
|
|
|
|
|
|
|
|
Food & Staples Retailing - 2.10% |
|
|
|
|
|
|
4,100 |
|
Costco Wholesale Corp. |
|
$ |
435,051 |
|
|
|
25,200 |
|
SYSCO Corp. |
|
|
886,284 |
|
|
|
18,700 |
|
Walgreen Co. |
|
|
891,616 |
|
|
|
7,600 |
|
Wal-Mart Stores, Inc. |
|
|
568,708 |
|
|
|
5,330 |
|
Whole Foods Market, Inc. |
|
|
462,378 |
|
|
|
|
|
|
|
|
||
|
|
|
|
|
|
|
3,244,037 |
|
|
|
|
|
|
|
|
||
|
|
|
|
Food Products - 5.69% |
|
|
|
|
|
|
23,000 |
|
B&G Foods, Inc. |
|
|
701,270 |
|
|
|
78,205 |
|
ConAgra Foods, Inc. |
|
|
2,800,521 |
|
|
|
48,930 |
|
General Mills, Inc. |
|
|
2,412,738 |
|
|
|
10,890 |
|
Hershey Co. |
|
|
953,202 |
|
|
|
14,093 |
|
Kraft Foods Group, Inc. |
|
|
726,212 |
|
|
|
31,350 |
|
Mondelez International, Inc. - Class A |
|
|
959,624 |
|
|
|
14,330 |
|
WhiteWave Foods Co. (a)(b) |
|
|
244,613 |
|
|
|
|
|
|
|
|
||
|
|
|
|
|
|
|
8,798,180 |
|
|
|
|
|
|
|
|
||
|
|
|
|
Gas Utilities - 0.65% |
|
|
|
|
|
|
4,500 |
|
AmeriGas Partners, L.P. (a) |
|
|
202,185 |
|
|
|
13,200 |
|
National Fuel Gas Co. |
|
|
809,820 |
|
|
|
|
|
|
|
|
||
|
|
|
|
|
|
|
1,012,005 |
|
|
|
|
|
|
|
|
||
|
|
|
|
Health Care Equipment & Supplies - 6.71% |
|
|
|
|
|
|
26,820 |
|
Arthrocare Corp. (b) |
|
|
932,263 |
|
|
|
37,250 |
|
Baxter International, Inc. |
|
|
2,705,840 |
|
|
|
6,000 |
|
Becton Dickinson & Co. |
|
|
573,660 |
|
|
|
216,890 |
|
Boston Scientific Corp. (b) |
|
|
1,693,911 |
|
|
|
78,705 |
|
Medtronic, Inc. |
|
|
3,695,987 |
|
|
|
7,210 |
|
The Cooper Companies, Inc. |
|
|
777,815 |
|
|
|
|
|
|
|
|
||
|
|
|
|
|
|
|
10,379,476 |
|
|
|
|
|
|
|
|
||
|
|
|
|
Health Care Providers & Services - 1.29% |
|
|
|
|
|
|
21,100 |
|
Owens & Minor, Inc. (a) |
|
|
687,016 |
|
|
|
22,985 |
|
UnitedHealth Group, Inc. |
|
|
1,314,972 |
|
|
|
|
|
|
|
|
||
|
|
|
|
|
|
|
2,001,988 |
|
|
|
|
|
|
|
|
||
|
|
|
|
Hotels, Restaurants & Leisure - 1.99% |
|
|
|
|
|
|
6,660 |
|
Bob Evans Farms, Inc. |
|
|
283,849 |
|
|
|
13,010 |
|
Darden Restaurants, Inc. |
|
|
672,357 |
|
|
|
13,975 |
|
McDonald’s Corp. |
|
|
1,393,168 |
|
|
|
12,870 |
|
Starbucks Corp. |
|
|
733,075 |
|
|
|
|
|
|
|
|
||
|
|
|
|
|
|
|
3,082,449 |
|
|
|
|
|
|
|
|
||
|
|
|
|
Household Durables - 0.92% |
|
|
|
|
|
|
669 |
|
NVR, Inc. (b) |
|
|
722,593 |
|
|
|
8,670 |
|
Stanley Black & Decker, Inc. |
|
|
702,010 |
|
|
|
|
|
|
|
|
||
|
|
|
|
|
|
|
1,424,603 |
|
|
|
|
|
|
|
|
||
|
|
|
|
|
|
|
|
|
|
Number of |
|
|
|
Value |
|
||
|
|
|
|
|
||||
|
|
|
|
Household Products - 0.95% |
|
|
|
|
|
|
8,950 |
|
Kimberly-Clark Corp. |
|
$ |
876,921 |
|
|
|
7,700 |
|
Procter & Gamble Co. |
|
|
593,362 |
|
|
|
|
|
|
|
|
||
|
|
|
|
|
|
|
1,470,283 |
|
|
|
|
|
|
|
|
||
|
|
|
|
Industrial Conglomerates - 1.17% |
|
|
|
|
|
|
17,095 |
|
3M Co. |
|
|
1,817,369 |
|
|
|
|
|
|
|
|
||
|
|
|
|
Insurance - 5.26% |
|
|
|
|
|
|
24,140 |
|
American International Group, |
|
|
937,115 |
|
|
|
68,315 |
|
Assured Guaranty Ltd. |
|
|
1,407,972 |
|
|
|
85,350 |
|
Hartford Financial Services |
|
|
2,202,030 |
|
|
|
8,000 |
|
PartnerRe Ltd. |
|
|
744,880 |
|
|
|
48,190 |
|
Prudential Financial, Inc. |
|
|
2,842,728 |
|
|
|
|
|
|
|
|
||
|
|
|
|
|
|
|
8,134,725 |
|
|
|
|
|
|
|
|
||
|
|
|
|
Internet & Catalog Retail - 0.69% |
|
|
|
|
|
|
2,310 |
|
Amazon.com, Inc. (b) |
|
|
615,592 |
|
|
|
648 |
|
Priceline.com, Inc. (b) |
|
|
445,779 |
|
|
|
|
|
|
|
|
||
|
|
|
|
|
|
|
1,061,371 |
|
|
|
|
|
|
|
|
||
|
|
|
|
Internet Software & Services - 1.23% |
|
|
|
|
|
|
1,690 |
|
Google, Inc. (b) |
|
|
1,341,911 |
|
|
|
11,100 |
|
J2 Global, Inc. |
|
|
435,231 |
|
|
|
700 |
|
LinkedIn Corp. (b) |
|
|
123,242 |
|
|
|
|
|
|
|
|
||
|
|
|
|
|
|
|
1,900,384 |
|
|
|
|
|
|
|
|
||
|
|
|
|
IT Services - 2.69% |
|
|
|
|
|
|
6,790 |
|
Alliance Data Systems Corp. (b) |
|
|
1,099,233 |
|
|
|
10,905 |
|
Automatic Data Processing, Inc. |
|
|
709,043 |
|
|
|
5,750 |
|
Cognizant Technology Solutions |
|
|
440,508 |
|
|
|
12,100 |
|
Paychex, Inc. |
|
|
424,347 |
|
|
|
26,330 |
|
The Western Union Co. |
|
|
396,003 |
|
|
|
6,410 |
|
Visa, Inc. |
|
|
1,088,674 |
|
|
|
|
|
|
|
|
||
|
|
|
|
|
|
|
4,157,808 |
|
|
|
|
|
|
|
|
||
|
|
|
|
Leisure Equipment & Products - 0.49% |
|
|
|
|
|
|
17,100 |
|
Hasbro, Inc. (a) |
|
|
751,374 |
|
|
|
|
|
|
|
|
||
|
|
|
|
Life Sciences Tools & Services - 0.60% |
|
|
|
|
|
|
12,080 |
|
Thermo Fisher Scientific, Inc. |
|
|
923,999 |
|
|
|
|
|
|
|
|
||
|
|
|
|
Machinery - 2.88% |
|
|
|
|
|
|
13,950 |
|
Danaher Corp. |
|
|
866,992 |
|
|
|
18,725 |
|
Dover Corp. |
|
|
1,364,678 |
|
|
|
20,240 |
|
Illinois Tool Works, Inc. |
|
|
1,233,426 |
|
|
|
10,845 |
|
Parker Hannifin Corp. |
|
|
993,185 |
|
|
|
|
|
|
|
|
||
|
|
|
|
|
|
|
4,458,281 |
|
|
|
|
|
|
|
|
||
See notes to financial statements.
59
|
|
|
GuideMarkSM Opportunistic Equity Fund |
|
SCHEDULE OF INVESTMENTS (Continued) |
|
March 31, 2013 |
|
|
|
|
|
|
|
|
|
|
Number of |
|
|
|
Value |
|
||
|
|
|
|
|
||||
|
|
|
|
COMMON STOCKS (Continued) |
|
|
|
|
|
|
|
|
Media - 1.90% |
|
|
|
|
|
|
22,340 |
|
Gannett Co., Inc. |
|
$ |
488,576 |
|
|
|
6,880 |
|
Liberty Global, Inc. (a)(b) |
|
|
504,992 |
|
|
|
29,300 |
|
Regal Entertainment Group (a) |
|
|
488,431 |
|
|
|
12,300 |
|
The Walt Disney Co. |
|
|
698,640 |
|
|
|
23,300 |
|
Thomson Reuters Corp. |
|
|
756,784 |
|
|
|
|
|
|
|
|
||
|
|
|
|
|
|
|
2,937,423 |
|
|
|
|
|
|
|
|
||
|
|
|
|
Metals & Mining - 0.38% |
|
|
|
|
|
|
12,700 |
|
Nucor Corp. (a) |
|
|
586,105 |
|
|
|
|
|
|
|
|
||
|
|
|
|
Multiline Retail - 0.88% |
|
|
|
|
|
|
12,500 |
|
Kohl’s Corp. |
|
|
576,625 |
|
|
|
11,500 |
|
Target Corp. |
|
|
787,175 |
|
|
|
|
|
|
|
|
||
|
|
|
|
|
|
|
1,363,800 |
|
|
|
|
|
|
|
|
||
|
|
|
|
Multi-Utilities - 0.19% |
|
|
|
|
|
|
11,000 |
|
Avista Corp. |
|
|
301,400 |
|
|
|
|
|
|
|
|
||
|
|
|
|
Oil & Gas - 7.71% |
|
|
|
|
|
|
32,230 |
|
Apache Corp. |
|
|
2,486,867 |
|
|
|
28,800 |
|
BreitBurn Energy Partners L.P. |
|
|
577,152 |
|
|
|
6,900 |
|
Chevron Corp. |
|
|
819,858 |
|
|
|
16,420 |
|
Cimarex Energy Co. |
|
|
1,238,725 |
|
|
|
13,010 |
|
Denbury Resources, Inc. (b) |
|
|
242,637 |
|
|
|
30,070 |
|
Devon Energy Corp. |
|
|
1,696,549 |
|
|
|
30,350 |
|
Occidental Petroleum Corp. |
|
|
2,378,529 |
|
|
|
15,540 |
|
Tesoro Corp. |
|
|
909,867 |
|
|
|
21,310 |
|
Valero Energy Corp. |
|
|
969,392 |
|
|
|
11,825 |
|
Williams Partners L.P. (a) |
|
|
612,535 |
|
|
|
|
|
|
|
|
||
|
|
|
|
|
|
|
11,932,111 |
|
|
|
|
|
|
|
|
||
|
|
|
|
Paper & Forest Products - 0.44% |
|
|
|
|
|
|
14,710 |
|
International Paper Co. |
|
|
685,192 |
|
|
|
|
|
|
|
|
||
|
|
|
|
Pharmaceuticals - 5.43% |
|
|
|
|
|
|
23,265 |
|
Abbott Laboratories |
|
|
821,720 |
|
|
|
7,450 |
|
Actavis, Inc. (b) |
|
|
686,220 |
|
|
|
21,070 |
|
Bristol Myers Squibb Co. |
|
|
867,873 |
|
|
|
38,260 |
|
Forest Labs, Inc. (b) |
|
|
1,455,411 |
|
|
|
8,600 |
|
Johnson & Johnson |
|
|
701,158 |
|
|
|
30,340 |
|
Merck & Co., Inc. |
|
|
1,341,938 |
|
|
|
87,515 |
|
Pfizer, Inc. |
|
|
2,525,683 |
|
|
|
|
|
|
|
|
||
|
|
|
|
|
|
|
8,400,003 |
|
|
|
|
|
|
|
|
||
|
|
|
|
Real Estate - 0.58% |
|
|
|
|
|
|
35,260 |
|
CBRE Group, Inc. (b) |
|
|
890,315 |
|
|
|
|
|
|
|
|
||
|
|
|
|
|
|
|
|
|
|
Number of |
|
|
|
Value |
|
||
|
|
|
|
|
||||
|
|
|
|
Road & Rail - 1.20% |
|
|
|
|
|
|
6,600 |
|
J.B. Hunt Transport Services, Inc. |
|
$ |
491,568 |
|
|
|
8,060 |
|
Landstar Systems, Inc. |
|
|
460,145 |
|
|
|
11,800 |
|
Norfolk Southern Corp. |
|
|
909,544 |
|
|
|
|
|
|
|
|
||
|
|
|
|
|
|
|
1,861,257 |
|
|
|
|
|
|
|
|
||
|
|
|
|
Semiconductor & Semiconductor |
|
|
|
|
|
|
39,900 |
|
Intel Corp. |
|
|
871,815 |
|
|
|
9,990 |
|
Maxim Integrated Products, Inc. |
|
|
326,173 |
|
|
|
24,230 |
|
Skyworks Solutions, Inc. (b) |
|
|
533,787 |
|
|
|
|
|
|
|
|
||
|
|
|
|
|
|
|
1,731,775 |
|
|
|
|
|
|
|
|
||
|
|
|
|
Software - 4.33% |
|
|
|
|
|
|
22,925 |
|
CA, Inc. |
|
|
577,022 |
|
|
|
9,100 |
|
Citrix Systems, Inc. (b) |
|
|
656,656 |
|
|
|
89,995 |
|
Microsoft Corp. |
|
|
2,574,757 |
|
|
|
7,350 |
|
NICE Systems Ltd. - ADR (b) |
|
|
270,701 |
|
|
|
26,590 |
|
Nuance Communications, Inc. (b) |
|
|
536,586 |
|
|
|
24,420 |
|
Oracle Corp. |
|
|
789,743 |
|
|
|
12,820 |
|
Red Hat, Inc. (b) |
|
|
648,179 |
|
|
|
3,580 |
|
Salesforce.com, Inc. (a)(b) |
|
|
640,211 |
|
|
|
|
|
|
|
|
||
|
|
|
|
|
|
|
6,693,855 |
|
|
|
|
|
|
|
|
||
|
|
|
|
Specialty Retail - 3.29% |
|
|
|
|
|
|
48,770 |
|
Aarons, Inc. |
|
|
1,398,724 |
|
|
|
9,990 |
|
Home Depot, Inc. |
|
|
697,102 |
|
|
|
8,390 |
|
Signet Jewelers Ltd. |
|
|
562,130 |
|
|
|
31,405 |
|
The TJX Companies, Inc. |
|
|
1,468,184 |
|
|
|
18,860 |
|
Williams Sonoma, Inc. |
|
|
971,667 |
|
|
|
|
|
|
|
|
||
|
|
|
|
|
|
|
5,097,807 |
|
|
|
|
|
|
|
|
||
|
|
|
|
Textiles, Apparel & Luxury Goods - 1.26% |
|
|
|
|
|
|
8,535 |
|
Coach, Inc. |
|
|
426,665 |
|
|
|
9,070 |
|
VF Corp. |
|
|
1,521,492 |
|
|
|
|
|
|
|
|
||
|
|
|
|
|
|
|
1,948,157 |
|
|
|
|
|
|
|
|
||
|
|
|
|
Trading Companies & Distributors - 0.55% |
|
|
|
|
|
|
11,690 |
|
Wesco International, Inc. (a)(b) |
|
|
848,811 |
|
|
|
|
|
|
|
|
||
|
|
|
|
Wireless Telecommunication Services - 0.42% |
|
|
|
|
|
|
23,100 |
|
Vodafone Group Plc - ADR |
|
|
656,271 |
|
|
|
|
|
|
|
|
||
|
|
|
|
Total Common Stocks |
|
|
147,535,156 |
|
|
|
|
|
|
|
|
||
See notes to financial statements.
60
|
|
|
GuideMarkSM Opportunistic Equity Fund |
|
SCHEDULE OF INVESTMENTS (Continued) |
|
March 31, 2013 |
|
|
|
|
|
|
|
|
|
|
Number of |
|
|
|
Value |
|
||
|
|
|
|
|
||||
|
|
|
|
PREFERRED STOCKS - 0.35% |
|
|
|
|
|
|
|
|
Diversified Telecommunicaiton |
|
|
|
|
|
|
20,600 |
|
Telefonica Brasil SA |
|
$ |
549,608 |
|
|
|
|
|
|
|
|
||
|
|
|
|
Total Preferred Stocks |
|
|
549,608 |
|
|
|
|
|
|
|
|
||
|
|
|
|
REAL ESTATE INVESTMENT |
|
|
|
|
|
|
|
|
Real Estate Investment Trusts - 1.03% |
|
|
|
|
|
|
147,045 |
|
iStar Financial, Inc. (a)(b) |
|
|
1,601,320 |
|
|
|
|
|
|
|
|
||
|
|
|
|
Total Real Estate Investment Trusts |
|
|
1,601,320 |
|
|
|
|
|
|
|
|
||
|
|
|
|
SHORT TERM INVESTMENTS - 2.90% |
|
|
|
|
|
|
|
|
Money Market Funds - 2.90% |
|
|
|
|
|
|
4,481,280 |
|
Federated Prime Obligations Fund |
|
|
4,481,280 |
|
|
|
|
|
|
|
|
||
|
|
|
|
Total Short Term Investments |
|
|
4,481,280 |
|
|
|
|
|
|
|
|
||
|
|
|
|
INVESTMENTS PURCHASED |
|
|
|
|
|
|
|
|
Money Market Funds - 3.38% |
|
|
|
|
|
|
5,228,051 |
|
First American Government |
|
|
5,228,051 |
|
|
|
|
|
|
|
|
||
|
|
|
|
Total Investments Purchased as |
|
|
5,228,051 |
|
|
|
|
|
|
|
|
||
|
|
|
|
Total Investments |
|
|
159,395,415 |
|
|
|
|
|
Liabilities in Excess of |
|
|
(4,678,032 |
) |
|
|
|
|
|
|
|
||
|
|
|
|
|
|
|
|
|
|
|
|
|
TOTAL NET |
|
$ |
154,717,383 |
|
|
|
|
|
|
|
|
||
Percentages are
stated as a percent of net assets.
ADR - American Depositary Receipt
(a) All or portion of this security is on loan.
(b) Non-income producing security.
See notes to financial statements.
61
|
|
|
GuideMarkSM Global Real Return Fund |
|
SCHEDULE OF INVESTMENTS |
|
March 31, 2013 |
|
|
|
|
|
|
|
|
|
|
Number of |
|
|
|
Value |
|
||
|
|
|
|
|
||||
|
|
|
|
INVESTMENT COMPANIES - 99.88% |
|
|
|
|
|
|
|
|
Exchange Traded Funds - 99.88% |
|
|
|
|
|
|
21,291 |
|
Energy Select Sector SPDR Fund |
|
$ |
1,688,802 |
|
|
|
11,411 |
|
Market Vectors Gold Miners ETF |
|
|
431,906 |
|
|
|
11 |
|
PowerShares DB Agriculture |
|
|
285 |
|
|
|
425,906 |
|
PowerShares DB Commodity Index |
|
|
11,631,493 |
|
|
|
15,666 |
|
PowerShares DB Gold Fund (a) |
|
|
853,484 |
|
|
|
78,817 |
|
PowerShares Global Agriculture |
|
|
2,478,006 |
|
|
|
194,904 |
|
SPDR Barclays TIPS ETF |
|
|
11,772,202 |
|
|
|
121,237 |
|
SPDR DB International Government |
|
|
7,527,605 |
|
|
|
212,568 |
|
SPDR Dow Jones International |
|
|
9,142,550 |
|
|
|
102,311 |
|
SPDR Dow Jones REIT ETF (b) |
|
|
7,942,403 |
|
|
|
59,911 |
|
SPDR Metals & Mining ETF (b) |
|
|
2,419,206 |
|
|
|
493,598 |
|
SPDR S&P Global Natural |
|
|
24,813,171 |
|
|
|
68,210 |
|
SPDR S&P International Energy |
|
|
1,654,775 |
|
|
|
|
|
|
|
|
||
|
|
|
|
|
|
|
82,355,888 |
|
|
|
|
|
|
|
|
||
|
|
|
|
Total Investment Companies |
|
|
82,355,888 |
|
|
|
|
|
|
|
|
||
|
|
|
|
|
|
|
|
|
|
Number of |
|
|
|
Value |
|
||
|
|
|
|
|
||||
|
|
|
|
SHORT TERM INVESTMENTS - 0.40% |
|
|
|
|
|
|
|
|
Money Market Funds - 0.40% |
|
|
|
|
|
|
333,219 |
|
Federated Prime Obligations Fund |
|
$ |
333,219 |
|
|
|
|
|
|
|
|
||
|
|
|
|
Total Short Term Investments |
|
|
333,219 |
|
|
|
|
|
|
|
|
||
|
|
|
|
INVESTMENTS PURCHASED |
|
|
|
|
|
|
|
|
Money Market Funds - 38.57% |
|
|
|
|
|
|
31,804,600 |
|
First American Government |
|
|
31,804,600 |
|
|
|
|
|
|
|
|
||
|
|
|
|
Total Investment Purchased as |
|
|
31,804,600 |
|
|
|
|
|
|
|
|
||
|
|
|
|
Total Investments |
|
|
114,493,707 |
|
|
|
|
|
Liabilities in Excess of |
|
|
(32,032,537 |
) |
|
|
|
|
|
|
|
||
|
|
|
|
TOTAL NET |
|
$ |
82,461,170 |
|
|
|
|
|
|
|
|
||
Percentages are
stated as a percent of net assets.
(a) Non-income producing security.
(b) All or portion of this security is on loan.
See notes to financial statements.
62
|
|
|
GuideMarkSM Core Fixed Income Fund |
|
SCHEDULE OF INVESTMENTS |
|
March 31, 2013 |
|
|
|
|
|
|
|
|
|
|
Principal |
|
|
|
Value |
|
||
|
|
|
|
|
||||
|
|
|
|
ASSET BACKED SECURITIES - 3.42% |
|
|
|
|
|
|
186,807 |
|
Accredited Mortgage Loan Trust |
|
$ |
183,574 |
|
|
|
|
|
Ally Master Owner Trust |
|
|
|
|
|
|
255,000 |
|
Series 2013-1, 1.000%, |
|
|
255,602 |
|
|
|
535,000 |
|
Series 2012-5, 1.540%, |
|
|
537,689 |
|
|
|
|
|
American Credit Acceptance |
|
|
|
|
|
|
420,818 |
|
Series 2012-3, 1.640%, 11/15/2016 |
|
|
420,909 |
|
|
|
370,000 |
|
Series A, 1.450%, 04/16/2018 |
|
|
370,093 |
|
|
|
315,000 |
|
AmeriCredit Automobile |
|
|
314,816 |
|
|
|
500,000 |
|
Apidos CDO |
|
|
500,000 |
|
|
|
245,254 |
|
ARI Fleet Lease Trust |
|
|
244,730 |
|
|
|
500,000 |
|
Atrium IX |
|
|
500,494 |
|
|
|
365,000 |
|
CIFC Funding Ltd. |
|
|
365,365 |
|
|
|
|
|
CNH Equipment Trust |
|
|
|
|
|
|
192,025 |
|
Series 2010-C, 1.170%, |
|
|
192,449 |
|
|
|
740,000 |
|
Series 2011-A, 2.040%, |
|
|
757,227 |
|
|
|
1,185,000 |
|
Series 2012-A, 0.940%, |
|
|
1,191,475 |
|
|
|
|
|
|
|
|
|
|
|
Principal |
|
|
|
Value |
|
||
|
|
|
|
|
||||
|
|
|
|
ASSET BACKED SECURITIES (Continued) |
|
|
|
|
|
|
69,899 |
|
Conseco Finance Securitizations Corp. |
|
$ |
53,012 |
|
|
|
61,335 |
|
Countrywide Asset-Backed |
|
|
61,612 |
|
|
|
265,000 |
|
CPS Auto Receivables Trust |
|
|
264,394 |
|
|
|
|
|
CPS Auto Trust |
|
|
|
|
|
|
135,841 |
|
Series 2012-C, 1.820%, 12/16/2019 |
|
|
136,531 |
|
|
|
222,638 |
|
Series 2012-D, 1.480%, 03/16/2020 |
|
|
223,419 |
|
|
|
|
|
Credit Acceptance Auto Loan Trust |
|
|
|
|
|
|
265,000 |
|
Series B, 3.960%, 09/15/2019 |
|
|
274,340 |
|
|
|
356,000 |
|
Series 2012-2, 1.520%, 03/16/2020 |
|
|
358,422 |
|
|
|
425,000 |
|
Dryden XXVI Senior Loan Fund |
|
|
425,165 |
|
|
|
193,635 |
|
Education Funding Capital Trust I |
|
|
192,998 |
|
|
|
215,000 |
|
Enterprise Fleet Financing LLC |
|
|
216,821 |
|
|
|
650,000 |
|
Ford Credit Auto Lease Trust |
|
|
650,269 |
|
|
|
100,000 |
|
GCO Education Loan Funding Trust |
|
|
92,196 |
|
See notes to financial statements.
63
|
|
|
GuideMarkSM Core Fixed Income Fund |
|
SCHEDULE OF INVESTMENTS (Continued) |
|
March 31, 2013 |
|
|
|
|
|
|
|
|
|
|
Principal |
|
|
|
Value |
|
||
|
|
|
|
|
||||
|
|
|
|
ASSET BACKED SECURITIES (Continued) |
|
|
|
|
|
|
|
|
HLSS Servicer Advance Receivables |
|
|
|
|
|
|
165,000 |
|
Series 2013-T1, 1.495%, |
|
$ |
166,314 |
|
|
|
175,000 |
|
Series 2013-T1, 2.289%, |
|
|
178,718 |
|
|
|
542,598 |
|
Morgan Stanley |
|
|
504,695 |
|
|
|
1,440,000 |
|
Nissan Auto Lease Trust |
|
|
1,442,064 |
|
|
|
83,894 |
|
Northstar Education Finance, Inc. |
|
|
83,875 |
|
|
|
27,520 |
|
Panhandle-Plains Higher Education |
|
|
27,897 |
|
|
|
695,000 |
|
Race Point VIII CLO Ltd. |
|
|
696,608 |
|
|
|
142,862 |
|
Residential Asset Mortgage |
|
|
125,323 |
|
|
|
295,000 |
|
Santander Consumer Acquired |
|
|
295,945 |
|
|
|
290,000 |
|
Santander Drive Auto |
|
|
292,982 |
|
|
|
145,113 |
|
U.S. Education Loan Trust, LLC |
|
|
144,214 |
|
|
|
1,310,000 |
|
Volkswagen Auto Lease Trust |
|
|
1,315,991 |
|
|
|
|
|
|
|
|
|
|
|
Principal |
|
|
|
Value |
|
||
|
|
|
|
|
||||
|
|
|
|
ASSET BACKED SECURITIES (Continued) |
|
|
|
|
|
|
155,000 |
|
Westlake Automobile |
|
$ |
155,313 |
|
|
|
|
|
|
|
|
||
|
|
|
|
Total Asset Backed Securities |
|
|
14,213,541 |
|
|
|
|
|
|
|
|
||
|
|
|
|
COLLATERALIZED MORTGAGE |
|
|
|
|
|
|
|
|
Bank of America Commercial |
|
|
|
|
|
|
610,000 |
|
Series 2007-4, 5.739%, |
|
|
710,767 |
|
|
|
110,000 |
|
Series 2007-5, 5.620%, |
|
|
113,704 |
|
|
|
490,000 |
|
BB-UBS Trust |
|
|
496,268 |
|
|
|
|
|
Bear Stearns Commercial Mortgage |
|
|
|
|
|
|
3,250,000 |
|
Series 2006-PW13, 5.540%, |
|
|
3,676,468 |
|
|
|
1,364,925 |
|
Series 2004-PWR5, 4.831%, |
|
|
1,380,119 |
|
|
|
225,000 |
|
Bear Stearns Trust |
|
|
248,174 |
|
|
|
265,000 |
|
CD Commercial Mortgage Trust |
|
|
302,238 |
|
|
|
165,678 |
|
Chase Mortgage Financial Trust |
|
|
165,204 |
|
|
|
295,000 |
|
COBALT CMBS Commercial |
|
|
330,575 |
|
|
|
485,000 |
|
COMM Mortgage Trust |
|
|
493,511 |
|
See notes to financial statements.
64
|
|
|
GuideMarkSM Core Fixed Income Fund |
|
SCHEDULE OF INVESTMENTS (Continued) |
|
March 31, 2013 |
|
|
|
|
|
|
|
|
|
|
Principal |
|
|
|
Value |
|
||
|
|
|
|
|
||||
|
|
|
|
COLLATERALIZED MORTGAGE |
|
|
|
|
|
|
245,000 |
|
Commercial Mortgage Pass-Through |
|
$ |
248,429 |
|
|
|
|
|
Countrywide Home Loans, Inc. |
|
|
|
|
|
|
32,331 |
|
Series 2004-HYB6, 2.920%, |
|
|
30,603 |
|
|
|
215,051 |
|
Series 2005-11, 0.504%, |
|
|
176,148 |
|
|
|
460,000 |
|
Credit Suisse First Boston Mortgage |
|
|
488,353 |
|
|
|
135,000 |
|
DBUBS Mortgage Trust |
|
|
159,882 |
|
|
|
|
|
Federal Home Loan Mortgage Corp. |
|
|
|
|
|
|
800,000 |
|
Series K-703, 2.699%, |
|
|
857,207 |
|
|
|
600,000 |
|
Series K-705, 2.303%, |
|
|
630,927 |
|
|
|
900,000 |
|
Series K-706, 2.323%, |
|
|
946,999 |
|
|
|
600,000 |
|
Series K-709, 2.086%, |
|
|
622,996 |
|
|
|
400,000 |
|
Four Times Square Trust |
|
|
475,199 |
|
|
|
|
|
GS Mortgage Securities Corp. |
|
|
|
|
|
|
295,000 |
|
Series 2012-SHOP, 2.933%, |
|
|
310,065 |
|
|
|
430,000 |
|
Series 2012-ALOH, 3.551%, |
|
|
455,165 |
|
|
|
322,902 |
|
Series 2005-GG4, 4.680%, |
|
|
326,031 |
|
|
|
685,000 |
|
Series 2012-GCJ7, 3.377%, |
|
|
731,825 |
|
|
|
|
|
|
|
|
|
|
|
Principal |
|
|
|
Value |
|
||
|
|
|
|
|
||||
|
|
|
|
COLLATERALIZED MORTGAGE |
|
|
|
|
|
|
|
|
GS Mortgage Securities Corp. II |
|
|
|
|
|
|
145,000 |
|
Series 2012-BWTR, 2.954%, |
|
$ |
145,382 |
|
|
|
445,000 |
|
Series 2005-GG4, 4.751%, |
|
|
474,416 |
|
|
|
320,000 |
|
Series 2013-GC10, 2.943%, |
|
|
325,687 |
|
|
|
415,000 |
|
JPMorgan Commercial Mortgage |
|
|
444,060 |
|
|
|
130,000 |
|
JPMorgan Commercial Mortgage |
|
|
134,230 |
|
|
|
|
|
Lehman Brothers-UBS Commercial |
|
|
|
|
|
|
245,479 |
|
Series 2005-C3, 4.664%, |
|
|
249,637 |
|
|
|
625,000 |
|
Series 2007-C1, 5.424%, |
|
|
715,158 |
|
|
|
490,000 |
|
Series 2007-C2, 5.430%, |
|
|
554,696 |
|
|
|
550,000 |
|
Series 2008-C1, 6.153%, |
|
|
663,022 |
|
|
|
285,000 |
|
Merrill Lynch Mortgage Trust |
|
|
333,712 |
|
|
|
600,000 |
|
Morgan Stanley Capital I Trust |
|
|
726,837 |
|
|
|
320,000 |
|
OBP Depositor LLC Trust |
|
|
370,502 |
|
|
|
482,394 |
|
TIAA Seasoned Commercial |
|
|
506,425 |
|
See notes to financial statements.
65
|
|
|
GuideMarkSM Core Fixed Income Fund |
|
SCHEDULE OF INVESTMENTS (Continued) |
|
March 31, 2013 |
|
|
|
|
|
|
|
|
|
|
Principal |
|
|
|
Value |
|
||
|
|
|
|
|
||||
|
|
|
|
COLLATERALIZED MORTGAGE |
|
|
|
|
|
|
440,000 |
|
UBS-Barclays Commercial |
|
$ |
454,075 |
|
|
|
280,000 |
|
Wachovia Bank Commercial |
|
|
299,721 |
|
|
|
|
|
Wells Fargo-RBS Commercial |
|
|
|
|
|
|
375,000 |
|
Series 2011-C3, 4.375%, |
|
|
425,767 |
|
|
|
60,000 |
|
Series 2012-C10, 2.875%, |
|
|
60,807 |
|
|
|
165,000 |
|
Series 2013-C11, 3.071%, |
|
|
170,118 |
|
|
|
|
|
|
|
|
||
|
|
|
|
Total Collateralized Mortgage |
|
|
21,431,109 |
|
|
|
|
|
|
|
|
||
|
|
|
|
CORPORATE OBLIGATIONS - 39.63% |
|
|
|
|
|
|
|
|
Precision Castparts Corp. |
|
|
|
|
|
|
540,000 |
|
0.700%, 12/20/2015 |
|
|
541,437 |
|
|
|
150,000 |
|
2.500%, 01/15/2023 |
|
|
148,527 |
|
|
|
1,675,000 |
|
United Technologies Corp. |
|
|
1,729,472 |
|
|
|
|
|
|
|
|
||
|
|
|
|
|
|
|
2,419,436 |
|
|
|
|
|
|
|
|
||
|
|
|
|
Agricultural Products - 0.20% |
|
|
|
|
|
|
250,000 |
|
Cargill, Inc. |
|
|
241,060 |
|
|
|
475,000 |
|
Imperial Tobacco Finance Plc |
|
|
480,193 |
|
|
|
65,000 |
|
Lorillard Tobacco Co. |
|
|
82,800 |
|
|
|
|
|
|
|
|
||
|
|
|
|
|
|
|
804,053 |
|
|
|
|
|
|
|
|
||
|
|
|
|
Air Freight & Logistics - 0.08% |
|
|
|
|
|
|
345,000 |
|
United Parcel Service, Inc. |
|
|
347,650 |
|
|
|
|
|
|
|
|
||
|
|
|
|
|
|
|
|
|
|
Principal |
|
|
|
Value |
|
||
|
|
|
|
|
||||
|
|
|
|
Auto Components - 0.18% |
|
|
|
|
|
|
740,000 |
|
Johnson Controls, Inc. |
|
$ |
748,594 |
|
|
|
|
|
|
|
|
||
|
|
|
|
Auto Manufacturers - 0.14% |
|
|
|
|
|
|
570,000 |
|
Daimler Finance North America LLC |
|
|
572,342 |
|
|
|
|
|
|
|
|
||
|
|
|
|
Banks - 2.86% |
|
|
|
|
|
|
1,115,000 |
|
Bank Of Nova Scotia |
|
|
1,115,250 |
|
|
|
400,000 |
|
Barclays Bank Plc |
|
|
429,824 |
|
|
|
500,000 |
|
BNP Paribas SA |
|
|
507,938 |
|
|
|
955,000 |
|
Canadian Imperial Bank of Commerce |
|
|
995,829 |
|
|
|
745,000 |
|
Cooperatieve Centrale |
|
|
767,738 |
|
|
|
760,000 |
|
Glitnir Bank |
|
|
|
|
|
|
|
|
6.693%, 06/15/2016 |
|
|
13,300 |
|
|
|
250,000 |
|
HSBC Holdings Plc |
|
|
320,608 |
|
|
|
250,000 |
|
Kaupthing Bank Hf |
|
|
4,375 |
|
|
|
325,000 |
|
KeyCorp |
|
|
379,002 |
|
|
|
|
|
PNC Funding Corp. |
|
|
|
|
|
|
810,000 |
|
4.250%, 09/21/2015 |
|
|
878,513 |
|
|
|
735,000 |
|
3.300%, 03/08/2022 |
|
|
759,293 |
|
|
|
|
|
Royal Bank of Canada |
|
|
|
|
|
|
615,000 |
|
1.150%, 03/13/2015 |
|
|
622,114 |
|
|
|
1,990,000 |
|
0.625%, 12/05/2016 |
|
|
1,990,122 |
|
|
|
|
|
Royal Bank of Scotland Group Plc |
|
|
|
|
|
|
115,000 |
|
5.000%, 11/12/2013 |
|
|
117,588 |
|
|
|
230,000 |
|
2.550%, 09/18/2015 |
|
|
236,532 |
|
|
|
1,040,000 |
|
SunTrust Banks, Inc. |
|
|
1,114,574 |
|
See notes to financial statements.
66
|
|
|
GuideMarkSM Core Fixed Income Fund |
|
SCHEDULE OF INVESTMENTS (Continued) |
|
March 31, 2013 |
|
|
|
|
|
|
|
|
|
|
Principal |
|
|
|
Value |
|
||
|
|
|
|
|
||||
|
|
|
|
CORPORATE OBLIGATIONS (Continued) |
|
|
|
|
|
|
|
|
Banks (Continued) |
|
|
|
|
|
|
|
|
U.S. Bancorp |
|
|
|
|
|
|
990,000 |
|
1.650%, 05/15/2017 |
|
$ |
1,009,847 |
|
|
|
200,000 |
|
4.125%, 05/24/2021 |
|
|
224,366 |
|
|
|
300,000 |
|
Wachovia Bank NA |
|
|
398,689 |
|
|
|
|
|
|
|
|
||
|
|
|
|
|
|
|
11,885,502 |
|
|
|
|
|
|
|
|
||
|
|
|
|
Beverages - 1.00% |
|
|
|
|
|
|
1,005,000 |
|
Diageo Capital Plc |
|
|
1,019,873 |
|
|
|
90,000 |
|
Heineken NV |
|
|
88,575 |
|
|
|
215,000 |
|
Molson Coors Brewing Co. |
|
|
224,110 |
|
|
|
|
|
Pepsico, Inc. |
|
|
|
|
|
|
930,000 |
|
2.500%, 05/10/2016 |
|
|
978,967 |
|
|
|
1,105,000 |
|
2.750%, 03/01/2023 |
|
|
1,108,419 |
|
|
|
740,000 |
|
The Coca-Cola Co. |
|
|
742,182 |
|
|
|
|
|
|
|
|
||
|
|
|
|
|
|
|
4,162,126 |
|
|
|
|
|
|
|
|
||
|
|
|
|
Biotechnology - 0.42% |
|
|
|
|
|
|
450,000 |
|
Amgen, Inc. |
|
|
470,831 |
|
|
|
415,000 |
|
Genzyme Corp. |
|
|
491,546 |
|
|
|
780,000 |
|
Gilead Sciences, Inc. |
|
|
801,844 |
|
|
|
|
|
|
|
|
||
|
|
|
|
|
|
|
1,764,221 |
|
|
|
|
|
|
|
|
||
|
|
|
|
Capital Markets - 4.46% |
|
|
|
|
|
|
2,885,000 |
|
Bear Stearns Companies, Inc. |
|
|
3,589,153 |
|
|
|
|
|
Goldman Sachs Group, Inc. |
|
|
|
|
|
|
300,000 |
|
5.625%, 01/15/2017 |
|
|
336,166 |
|
|
|
1,125,000 |
|
5.950%, 01/18/2018 |
|
|
1,313,032 |
|
|
|
85,000 |
|
6.150%, 04/01/2018 |
|
|
100,271 |
|
|
|
95,000 |
|
7.500%, 02/15/2019 |
|
|
118,997 |
|
|
|
50,000 |
|
5.375%, 03/15/2020 |
|
|
57,049 |
|
|
|
125,000 |
|
5.750%, 01/24/2022 |
|
|
145,597 |
|
|
|
725,000 |
|
6.750%, 10/01/2037 |
|
|
814,990 |
|
|
|
|
|
Merrill Lynch & Co., Inc. |
|
|
|
|
|
|
2,145,000 |
|
6.400%, 08/28/2017 |
|
|
2,520,032 |
|
|
|
|
|
|
|
|
|
|
|
Principal |
|
|
|
Value |
|
||
|
|
|
|
|
||||
|
|
|
|
Capital Markets (Continued) |
|
|
|
|
|
|
650,000 |
|
6.500%, 07/15/2018 |
|
$ |
773,294 |
|
|
|
625,000 |
|
6.110%, 01/29/2037 |
|
|
706,289 |
|
|
|
|
|
Morgan Stanley |
|
|
|
|
|
|
745,000 |
|
1.750%, 02/25/2016 |
|
|
751,330 |
|
|
|
600,000 |
|
5.950%, 12/28/2017 |
|
|
695,377 |
|
|
|
300,000 |
|
5.625%, 09/23/2019 |
|
|
345,439 |
|
|
|
200,000 |
|
5.500%, 07/24/2020 |
|
|
230,685 |
|
|
|
295,000 |
|
4.875%, 11/01/2022 (a) |
|
|
313,334 |
|
|
|
860,000 |
|
3.750%, 02/25/2023 |
|
|
871,064 |
|
|
|
100,000 |
|
6.375%, 07/24/2042 |
|
|
120,583 |
|
|
|
1,505,000 |
|
State Street Corp. |
|
|
1,603,356 |
|
|
|
1,310,000 |
|
The Bank of New York Mellon Corp. |
|
|
1,373,399 |
|
|
|
1,435,000 |
|
Wachovia Corp. |
|
|
1,709,850 |
|
|
|
|
|
|
|
|
||
|
|
|
|
|
|
|
18,489,287 |
|
|
|
|
|
|
|
|
||
|
|
|
|
Chemicals - 0.36% |
|
|
|
|
|
|
670,000 |
|
Dow Chemical Co. |
|
|
738,186 |
|
|
|
740,000 |
|
El du Pont de Nemours & Co. |
|
|
753,182 |
|
|
|
|
|
|
|
|
||
|
|
|
|
|
|
|
1,491,368 |
|
|
|
|
|
|
|
|
||
|
|
|
|
Commercial Banks - 0.04% |
|
|
|
|
|
|
155,000 |
|
Wells Fargo & Co. |
|
|
156,366 |
|
|
|
|
|
|
|
|
||
|
|
|
|
Commercial Services & Supplies - 0.17% |
|
|
|
|
|
|
650,000 |
|
International Lease Finance Corp. |
|
|
705,250 |
|
|
|
|
|
|
|
|
||
|
|
|
|
Communications - 0.15% |
|
|
|
|
|
|
595,000 |
|
Rogers Cable, Inc. |
|
|
622,184 |
|
|
|
|
|
|
|
|
||
|
|
|
|
Computers & Peripherals - 0.06% |
|
|
|
|
|
|
250,000 |
|
Hewlett Packard Co. |
|
|
258,979 |
|
|
|
|
|
|
|
|
||
|
|
|
|
Consumer Finance - 2.00% |
|
|
|
|
|
|
877,000 |
|
American Express Co. |
|
|
845,390 |
|
|
|
2,430,000 |
|
American Express Credit Corp. |
|
|
2,484,264 |
|
|
|
670,000 |
|
Capital One Financial Corp. |
|
|
680,695 |
|
See notes to financial statements.
67
|
|
|
GuideMarkSM Core Fixed Income Fund |
|
SCHEDULE OF INVESTMENTS (Continued) |
|
March 31, 2013 |
|
|
|
|
|
|
|
|
|
|
Principal |
|
|
|
Value |
|
||
|
|
|
|
|
||||
|
|
|
|
CORPORATE OBLIGATIONS (Continued) |
|
|
|
|
|
|
|
|
Consumer Finance (Continued) |
|
|
|
|
|
|
|
|
Caterpillar Financial Services Corp. |
|
|
|
|
|
|
705,000 |
|
1.100%, 05/29/2015 |
|
$ |
713,433 |
|
|
|
960,000 |
|
1.625%, 06/01/2017 (a) |
|
|
978,078 |
|
|
|
|
|
John Deere Capital Corp. |
|
|
|
|
|
|
350,000 |
|
0.950%, 06/29/2015 |
|
|
353,416 |
|
|
|
890,000 |
|
1.300%, 03/12/2018 (a) |
|
|
894,256 |
|
|
|
200,000 |
|
Total Capital International SA |
|
|
206,253 |
|
|
|
1,100,000 |
|
Toyota Motor Credit Corp. |
|
|
1,138,943 |
|
|
|
|
|
|
|
|
||
|
|
|
|
|
|
|
8,294,728 |
|
|
|
|
|
|
|
|
||
|
|
|
|
Diversified Financial Services - 3.53% |
|
|
|
|
|
|
225,000 |
|
American Honda Finance Corp. |
|
|
227,961 |
|
|
|
|
|
Bank of America Corp. |
|
|
|
|
|
|
200,000 |
|
3.875%, 03/22/2017 |
|
|
215,351 |
|
|
|
700,000 |
|
7.625%, 06/01/2019 |
|
|
890,331 |
|
|
|
175,000 |
|
5.875%, 01/05/2021 |
|
|
206,996 |
|
|
|
75,000 |
|
5.000%, 05/13/2021 |
|
|
84,210 |
|
|
|
430,000 |
|
5.700%, 01/24/2022 |
|
|
504,569 |
|
|
|
145,000 |
|
3.300%, 01/11/2023 |
|
|
143,275 |
|
|
|
|
|
Citigroup, Inc. |
|
|
|
|
|
|
450,000 |
|
5.000%, 09/15/2014 |
|
|
472,680 |
|
|
|
560,000 |
|
6.010%, 01/15/2015 |
|
|
606,642 |
|
|
|
165,000 |
|
1.250%, 01/15/2016 |
|
|
164,914 |
|
|
|
550,000 |
|
4.450%, 01/10/2017 |
|
|
606,045 |
|
|
|
1,060,000 |
|
8.500%, 05/22/2019 |
|
|
1,413,960 |
|
|
|
345,000 |
|
4.050%, 07/30/2022 |
|
|
357,084 |
|
|
|
150,000 |
|
6.875%, 03/05/2038 |
|
|
197,465 |
|
|
|
|
|
Ford Motor Credit Co. LLC |
|
|
|
|
|
|
325,000 |
|
2.750%, 05/15/2015 |
|
|
331,918 |
|
|
|
200,000 |
|
3.984%, 06/15/2016 |
|
|
212,051 |
|
|
|
|
|
General Electric Capital Corp. |
|
|
|
|
|
|
1,245,000 |
|
5.500%, 01/08/2020 |
|
|
1,477,413 |
|
|
|
350,000 |
|
4.375%, 09/16/2020 |
|
|
391,488 |
|
|
|
370,000 |
|
5.300%, 02/11/2021 |
|
|
424,852 |
|
|
|
485,000 |
|
4.650%, 10/17/2021 |
|
|
543,951 |
|
|
|
250,000 |
|
6.750%, 03/15/2032 |
|
|
319,151 |
|
|
|
1,065,000 |
|
5.875%, 01/14/2038 |
|
|
1,246,092 |
|
|
|
|
|
|
|
|
|
|
|
Principal |
|
|
|
Value |
|
||
|
|
|
|
|
||||
|
|
|
|
Diversified Financial Services (Continued) |
|
|
|
|
|
|
450,000 |
|
Hutchison Whampoa |
|
$ |
480,208 |
|
|
|
|
|
JPMorgan Chase & Co. |
|
|
|
|
|
|
125,000 |
|
6.300%, 04/23/2019 |
|
|
152,874 |
|
|
|
415,000 |
|
4.250%, 10/15/2020 |
|
|
456,084 |
|
|
|
600,000 |
|
4.500%, 01/24/2022 |
|
|
658,759 |
|
|
|
135,000 |
|
3.250%, 09/23/2022 |
|
|
135,065 |
|
|
|
|
|
National Rural Utilities Cooperative |
|
|
|
|
|
|
735,000 |
|
1.125%, 11/01/2013 |
|
|
738,203 |
|
|
|
600,000 |
|
5.450%, 04/10/2017 |
|
|
700,284 |
|
|
|
300,000 |
|
NCUA Guaranteed Notes |
|
|
329,175 |
|
|
|
|
|
|
|
|
||
|
|
|
|
|
|
|
14,689,051 |
|
|
|
|
|
|
|
|
||
|
|
|
|
Diversified Manufacturing - 0.60% |
|
|
|
|
|
|
|
|
Cooper U.S., Inc. |
|
|
|
|
|
|
720,000 |
|
6.100%, 07/01/2017 |
|
|
851,771 |
|
|
|
675,000 |
|
3.875%, 12/15/2020 |
|
|
728,130 |
|
|
|
|
|
Tyco Electronics Group SA |
|
|
|
|
|
|
440,000 |
|
1.600%, 02/03/2015 |
|
|
445,417 |
|
|
|
405,000 |
|
6.550%, 10/01/2017 |
|
|
484,795 |
|
|
|
|
|
|
|
|
||
|
|
|
|
|
|
|
2,510,113 |
|
|
|
|
|
|
|
|
||
|
|
|
|
Diversified Telecommunication Services - 1.40% |
|
|
|
|
|
|
|
|
AT&T, Inc. |
|
|
|
|
|
|
1,090,000 |
|
0.800%, 12/01/2015 |
|
|
1,088,538 |
|
|
|
695,000 |
|
5.350%, 09/01/2040 |
|
|
746,802 |
|
|
|
470,000 |
|
France Telecom SA |
|
|
490,650 |
|
|
|
|
|
Verizon Communications, Inc. |
|
|
|
|
|
|
800,000 |
|
1.950%, 03/28/2014 |
|
|
811,595 |
|
|
|
295,000 |
|
3.500%, 11/01/2021 |
|
|
307,121 |
|
|
|
420,000 |
|
2.450%, 11/01/2022 |
|
|
398,059 |
|
|
|
150,000 |
|
6.400%, 02/15/2038 |
|
|
181,025 |
|
|
|
1,355,000 |
|
Verizon Wireless Capital LLC |
|
|
1,805,349 |
|
|
|
|
|
|
|
|
||
|
|
|
|
|
|
|
5,829,139 |
|
|
|
|
|
|
|
|
||
|
|
|
|
Electric Utilities - 0.74% |
|
|
|
|
|
|
100,000 |
|
American Electric Power Co., Inc. |
|
|
100,451 |
|
See notes to financial statements.
68
|
|
|
GuideMarkSM Core Fixed Income Fund |
|
SCHEDULE OF INVESTMENTS (Continued) |
|
March 31, 2013 |
|
|
|
|
|
|
|
|
|
|
Principal |
|
|
|
Value |
|
||
|
|
|
|
|
||||
|
|
|
|
CORPORATE OBLIGATIONS (Continued) |
|
|
|
|
|
|
|
|
Electric Utilities (Continued) |
|
|
|
|
|
|
375,000 |
|
Nevada Power Co. |
|
$ |
408,829 |
|
|
|
875,000 |
|
PSI Energy, Inc. |
|
|
1,003,977 |
|
|
|
|
|
Union Electric Co. |
|
|
|
|
|
|
570,000 |
|
6.700%, 02/01/2019 |
|
|
715,588 |
|
|
|
350,000 |
|
3.900%, 09/15/2042 |
|
|
346,663 |
|
|
|
470,000 |
|
Westar Energy, Inc. |
|
|
500,372 |
|
|
|
|
|
|
|
|
||
|
|
|
|
|
|
|
3,075,880 |
|
|
|
|
|
|
|
|
||
|
|
|
|
Energy Equipment & Services - 0.38% |
|
|
|
|
|
|
275,000 |
|
Cameron International Corp. |
|
|
330,743 |
|
|
|
605,000 |
|
Halliburton Co. |
|
|
643,111 |
|
|
|
480,000 |
|
Pride International, Inc. |
|
|
602,673 |
|
|
|
|
|
|
|
|
||
|
|
|
|
|
|
|
1,576,527 |
|
|
|
|
|
|
|
|
||
|
|
|
|
Engineering Construction - 0.12% |
|
|
|
|
|
|
495,000 |
|
ABB Finance USA, Inc. |
|
|
503,381 |
|
|
|
|
|
|
|
|
||
|
|
|
|
Food & Staples Retailing - 0.38% |
|
|
|
|
|
|
|
|
CVS Caremark Corp. |
|
|
|
|
|
|
200,000 |
|
4.750%, 05/18/2020 |
|
|
231,828 |
|
|
|
300,000 |
|
6.250%, 06/01/2027 |
|
|
384,715 |
|
|
|
355,000 |
|
Walgreen Co. |
|
|
352,006 |
|
|
|
450,000 |
|
Wal-Mart Stores, Inc. |
|
|
609,854 |
|
|
|
|
|
|
|
|
||
|
|
|
|
|
|
|
1,578,403 |
|
|
|
|
|
|
|
|
||
|
|
|
|
Food Products - 0.49% |
|
|
|
|
|
|
|
|
ConAgra Foods, Inc. |
|
|
|
|
|
|
110,000 |
|
1.350%, 09/10/2015 |
|
|
110,869 |
|
|
|
50,000 |
|
1.900%, 01/25/2018 |
|
|
50,552 |
|
|
|
505,000 |
|
3.200%, 01/25/2023 |
|
|
504,394 |
|
|
|
|
|
Kraft Foods Group, Inc. |
|
|
|
|
|
|
380,000 |
|
1.625%, 06/04/2015 |
|
|
386,061 |
|
|
|
75,000 |
|
2.250%, 06/05/2017 |
|
|
77,884 |
|
|
|
400,000 |
|
3.500%, 06/06/2022 |
|
|
419,069 |
|
|
|
375,000 |
|
Mondelez International, Inc. |
|
|
488,715 |
|
|
|
|
|
|
|
|
||
|
|
|
|
|
|
|
2,037,544 |
|
|
|
|
|
|
|
|
||
|
|
|
|
|
|
|
|
|
|
Principal |
|
|
|
Value |
|
||
|
|
|
|
|
||||
|
|
|
|
Health Care Equipment & Supplies - 1.08% |
|
|
|
|
|
|
495,000 |
|
Baxter International, Inc. |
|
$ |
507,789 |
|
|
|
725,000 |
|
Becton Dickinson & Co. |
|
|
771,038 |
|
|
|
630,000 |
|
Covidien International Finance SA |
|
|
659,239 |
|
|
|
1,575,000 |
|
Medtronic, Inc. |
|
|
1,650,651 |
|
|
|
865,000 |
|
St. Jude Medical, Inc. |
|
|
897,881 |
|
|
|
|
|
|
|
|
||
|
|
|
|
|
|
|
4,486,598 |
|
|
|
|
|
|
|
|
||
|
|
|
|
Health Care Providers & Services - 1.33% |
|
|
|
|
|
|
105,000 |
|
Aetna, Inc. |
|
|
102,957 |
|
|
|
745,000 |
|
Cardinal Health, Inc. |
|
|
742,829 |
|
|
|
|
|
Express Scripts Holding Co. |
|
|
|
|
|
|
325,000 |
|
3.125%, 05/15/2016 |
|
|
343,578 |
|
|
|
125,000 |
|
3.500%, 11/15/2016 |
|
|
134,780 |
|
|
|
1,000,000 |
|
Humana, Inc. |
|
|
989,777 |
|
|
|
|
|
UnitedHealth Group, Inc. |
|
|
|
|
|
|
735,000 |
|
5.375%, 03/15/2016 |
|
|
828,723 |
|
|
|
360,000 |
|
3.950%, 10/15/2042 |
|
|
340,474 |
|
|
|
|
|
Wellpoint, Inc. |
|
|
|
|
|
|
125,000 |
|
1.250%, 09/10/2015 |
|
|
126,109 |
|
|
|
1,175,000 |
|
4.350%, 08/15/2020 |
|
|
1,309,180 |
|
|
|
425,000 |
|
3.125%, 05/15/2022 |
|
|
428,728 |
|
|
|
150,000 |
|
5.850%, 01/15/2036 |
|
|
177,587 |
|
|
|
|
|
|
|
|
||
|
|
|
|
|
|
|
5,524,722 |
|
|
|
|
|
|
|
|
||
|
|
|
|
Independent Power Producers & |
|
|
|
|
|
|
|
|
Exelon Generation Co., LLC |
|
|
|
|
|
|
540,000 |
|
5.200%, 10/01/2019 |
|
|
612,014 |
|
|
|
605,000 |
|
6.250%, 10/01/2039 |
|
|
705,004 |
|
|
|
|
|
|
|
|
||
|
|
|
|
|
|
|
1,317,018 |
|
|
|
|
|
|
|
|
||
|
|
|
|
Industrial Conglomerates - 0.27% |
|
|
|
|
|
|
930,000 |
|
Koninklijke Philips Electronics NV |
|
|
1,110,127 |
|
|
|
|
|
|
|
|
||
|
|
|
|
Insurance - 0.84% |
|
|
|
|
|
|
|
|
American International Group, Inc. |
|
|
|
|
|
|
100,000 |
|
8.250%, 08/15/2018 |
|
|
129,845 |
|
|
|
30,000 |
|
4.875%, 06/01/2022 |
|
|
34,002 |
|
See notes to financial statements.
69
|
|
|
GuideMarkSM Core Fixed Income Fund |
|
SCHEDULE OF INVESTMENTS (Continued) |
|
March 31, 2013 |
|
|
|
|
|
|
|
|
|
|
Principal |
|
|
|
Value |
|
||
|
|
|
|
|
||||
|
|
|
|
CORPORATE OBLIGATIONS (Continued) |
|
|
|
|
|
|
|
|
Insurance (Continued) |
|
|
|
|
|
|
810,000 |
|
CNA Financial Corp. |
|
$ |
1,026,676 |
|
|
|
615,000 |
|
Liberty Mutual Group, Inc. |
|
|
676,120 |
|
|
|
500,000 |
|
New York Life Global Funding |
|
|
525,789 |
|
|
|
375,000 |
|
Prudential Financial, Inc. |
|
|
422,170 |
|
|
|
605,000 |
|
Willis North America, Inc. |
|
|
689,917 |
|
|
|
|
|
|
|
|
||
|
|
|
|
|
|
|
3,504,519 |
|
|
|
|
|
|
|
|
||
|
|
|
|
Internet Software & Services - 0.17% |
|
|
|
|
|
|
700,000 |
|
eBay, Inc. |
|
|
708,476 |
|
|
|
|
|
|
|
|
||
|
|
|
|
Life Sciences Tools & Services - 0.04% |
|
|
|
|
|
|
150,000 |
|
Life Technologies Corp. |
|
|
168,532 |
|
|
|
|
|
|
|
|
||
|
|
|
|
Machinery - 0.15% |
|
|
|
|
|
|
530,000 |
|
Eaton Corp. |
|
|
625,456 |
|
|
|
|
|
|
|
|
||
|
|
|
|
Media - 2.32% |
|
|
|
|
|
|
|
|
CBS Corp. |
|
|
|
|
|
|
525,000 |
|
3.375%, 03/01/2022 |
|
|
535,736 |
|
|
|
100,000 |
|
4.850%, 07/01/2042 |
|
|
97,625 |
|
|
|
|
|
Comcast Corp. |
|
|
|
|
|
|
1,345,000 |
|
5.875%, 02/15/2018 |
|
|
1,624,365 |
|
|
|
250,000 |
|
6.400%, 05/15/2038 |
|
|
315,501 |
|
|
|
150,000 |
|
COX Communications, Inc. |
|
|
152,699 |
|
|
|
|
|
DIRECTV Holdings, LLC |
|
|
|
|
|
|
1,095,000 |
|
1.750%, 01/15/2018 |
|
|
1,083,549 |
|
|
|
475,000 |
|
3.800%, 03/15/2022 |
|
|
486,449 |
|
|
|
375,000 |
|
6.350%, 03/15/2040 |
|
|
419,226 |
|
|
|
65,000 |
|
Discovery Communications LLC |
|
|
66,089 |
|
|
|
|
|
|
|
|
|
|
|
Principal |
|
|
|
Value |
|
||
|
|
|
|
|
||||
|
|
|
|
Media (Continued) |
|
|
|
|
|
|
145,000 |
|
NBCUniversal Enterprise, Inc. |
|
$ |
146,000 |
|
|
|
400,000 |
|
NBCUniversal Media LLC |
|
|
474,783 |
|
|
|
|
|
News America, Inc. |
|
|
|
|
|
|
275,000 |
|
4.500%, 02/15/2021 |
|
|
310,612 |
|
|
|
250,000 |
|
6.150%, 02/15/2041 |
|
|
300,453 |
|
|
|
|
|
Time Warner, Inc. |
|
|
|
|
|
|
1,105,000 |
|
6.750%, 07/01/2018 |
|
|
1,361,328 |
|
|
|
400,000 |
|
4.700%, 01/15/2021 |
|
|
451,791 |
|
|
|
750,000 |
|
4.125%, 02/15/2021 |
|
|
806,316 |
|
|
|
225,000 |
|
3.400%, 06/15/2022 |
|
|
232,475 |
|
|
|
225,000 |
|
7.625%, 04/15/2031 |
|
|
305,270 |
|
|
|
200,000 |
|
4.500%, 09/15/2042 |
|
|
182,514 |
|
|
|
250,000 |
|
Viacom, Inc. |
|
|
297,744 |
|
|
|
|
|
|
|
|
||
|
|
|
|
|
|
|
9,650,525 |
|
|
|
|
|
|
|
|
||
|
|
|
|
Metals & Mining - 0.61% |
|
|
|
|
|
|
495,000 |
|
BHP Billiton Finance USA Ltd. |
|
|
504,302 |
|
|
|
|
|
Freeport-McMoRan Copper & Gold, Inc. |
|
|
|
|
|
|
80,000 |
|
2.375%, 03/15/2018 |
|
|
80,428 |
|
|
|
75,000 |
|
3.100%, 03/15/2020 |
|
|
75,367 |
|
|
|
335,000 |
|
3.875%, 03/15/2023 |
|
|
336,644 |
|
|
|
735,000 |
|
Rio Tinto Finance USA Ltd. |
|
|
767,919 |
|
|
|
435,000 |
|
Teck Resources Ltd. |
|
|
452,633 |
|
|
|
|
|
Xstrata Finance Canada Ltd. |
|
|
|
|
|
|
165,000 |
|
2.450%, 10/25/2017 |
|
|
167,426 |
|
|
|
135,000 |
|
4.000%, 10/25/2022 |
|
|
136,238 |
|
|
|
|
|
|
|
|
||
|
|
|
|
|
|
|
2,520,957 |
|
|
|
|
|
|
|
|
||
See notes to financial statements.
70
|
|
|
GuideMarkSM Core Fixed Income Fund |
|
SCHEDULE OF INVESTMENTS (Continued) |
|
March 31, 2013 |
|
|
|
|
|
|
|
|
|
|
Principal |
|
|
|
Value |
|
||
|
|
|
|
|
||||
|
|
|
|
CORPORATE OBLIGATIONS (Continued) |
|
|
|
|
|
|
|
|
Multi-Utilities - 0.71% |
|
|
|
|
|
|
650,000 |
|
Dominion Resources, Inc. |
|
$ |
651,959 |
|
|
|
580,000 |
|
Sempra Energy |
|
|
676,459 |
|
|
|
1,380,000 |
|
Xcel Energy, Inc. |
|
|
1,594,621 |
|
|
|
|
|
|
|
|
||
|
|
|
|
|
|
|
2,923,039 |
|
|
|
|
|
|
|
|
||
|
|
|
|
Oil & Gas - 4.45% |
|
|
|
|
|
|
150,000 |
|
Anadarko Petroleum Corp. |
|
|
202,203 |
|
|
|
375,000 |
|
Apache Corp. |
|
|
405,259 |
|
|
|
|
|
BP Capital Markets Plc |
|
|
|
|
|
|
350,000 |
|
3.200%, 03/11/2016 |
|
|
373,095 |
|
|
|
1,235,000 |
|
4.500%, 10/01/2020 |
|
|
1,413,379 |
|
|
|
1,120,000 |
|
2.500%, 11/06/2022 |
|
|
1,092,447 |
|
|
|
945,000 |
|
Canadian Natural Resources Ltd. |
|
|
1,005,580 |
|
|
|
1,105,000 |
|
ConocoPhillips |
|
|
1,389,785 |
|
|
|
|
|
Energy Transfer Partners LP |
|
|
|
|
|
|
943,000 |
|
8.500%, 04/15/2014 |
|
|
1,015,305 |
|
|
|
570,000 |
|
9.000%, 04/15/2019 |
|
|
751,910 |
|
|
|
225,000 |
|
5.200%, 02/01/2022 |
|
|
253,059 |
|
|
|
|
|
Husky Energy, Inc. |
|
|
|
|
|
|
465,000 |
|
5.900%, 06/15/2014 |
|
|
493,022 |
|
|
|
810,000 |
|
3.950%, 04/15/2022 |
|
|
868,233 |
|
|
|
475,000 |
|
Kinder Morgan Energy Partners LP |
|
|
481,064 |
|
|
|
800,000 |
|
Marathon Oil Corp. |
|
|
950,915 |
|
|
|
|
|
Nexen, Inc. |
|
|
|
|
|
|
150,000 |
|
5.875%, 03/10/2035 |
|
|
181,761 |
|
|
|
150,000 |
|
7.500%, 07/30/2039 |
|
|
218,843 |
|
|
|
780,000 |
|
ONEOK Partners LP |
|
|
910,375 |
|
|
|
|
|
Petrobras International Finance Co. |
|
|
|
|
|
|
305,000 |
|
3.500%, 02/06/2017 |
|
|
315,673 |
|
|
|
550,000 |
|
5.375%, 01/27/2021 |
|
|
596,196 |
|
|
|
250,000 |
|
6.875%, 01/20/2040 |
|
|
288,421 |
|
|
|
375,000 |
|
Petroleos Mexicanos |
|
|
481,875 |
|
|
|
|
|
|
|
|
|
|
|
Principal |
|
|
|
Value |
|
||
|
|
|
|
|
||||
|
|
|
|
Oil & Gas (Continued) |
|
|
|
|
|
|
|
|
Phillips 66 |
|
|
|
|
|
|
425,000 |
|
1.950%, 03/05/2015 |
|
$ |
434,541 |
|
|
|
845,000 |
|
4.300%, 04/01/2022 |
|
|
929,355 |
|
|
|
300,000 |
|
Schlumberger Investment SA |
|
|
320,910 |
|
|
|
1,915,000 |
|
Shell International Finance BV |
|
|
1,923,321 |
|
|
|
405,000 |
|
Spectra Energy Partners LP |
|
|
433,695 |
|
|
|
295,000 |
|
Valero Energy Corp. |
|
|
402,949 |
|
|
|
370,000 |
|
Williams Cos., Inc. |
|
|
368,050 |
|
|
|
|
|
|
|
|
||
|
|
|
|
|
|
|
18,501,221 |
|
|
|
|
|
|
|
|
||
|
|
|
|
Pharmaceuticals - 1.87% |
|
|
|
|
|
|
|
|
AbbVie, Inc. |
|
|
|
|
|
|
705,000 |
|
1.200%, 11/06/2015 |
|
|
710,930 |
|
|
|
280,000 |
|
1.750%, 11/06/2017 |
|
|
283,717 |
|
|
|
335,000 |
|
2.000%, 11/06/2018 |
|
|
339,440 |
|
|
|
550,000 |
|
2.900%, 11/06/2022 |
|
|
551,642 |
|
|
|
2,105,000 |
|
GlaxoSmithKline Capital Plc |
|
|
2,142,884 |
|
|
|
1,210,000 |
|
Novartis Capital Corp. |
|
|
1,269,622 |
|
|
|
|
|
Sanofi-Aventis SA |
|
|
|
|
|
|
560,000 |
|
1.625%, 03/28/2014 |
|
|
567,262 |
|
|
|
780,000 |
|
4.000%, 03/29/2021 |
|
|
869,393 |
|
|
|
920,000 |
|
Teva Pharmaceutical Finance |
|
|
965,675 |
|
|
|
85,000 |
|
Zoetis, Inc. |
|
|
85,646 |
|
|
|
|
|
|
|
|
||
|
|
|
|
|
|
|
7,786,211 |
|
|
|
|
|
|
|
|
||
See notes to financial statements.
71
|
|
|
GuideMarkSM Core Fixed Income Fund |
|
SCHEDULE OF INVESTMENTS (Continued) |
|
March 31, 2013 |
|
|
|
|
|
|
|
|
|
|
Principal |
|
|
|
Value |
|
||
|
|
|
|
|
||||
|
|
|
|
CORPORATE OBLIGATIONS (Continued) |
|
|
|
|
|
|
|
|
Pipelines - 1.31% |
|
|
|
|
|
|
490,000 |
|
Duke Energy, Inc. |
|
$ |
521,581 |
|
|
|
|
|
Enterprise Products Operating LLC |
|
|
|
|
|
|
815,000 |
|
5.650%, 04/01/2013 |
|
|
815,000 |
|
|
|
330,000 |
|
3.350%, 03/15/2023 |
|
|
336,760 |
|
|
|
680,000 |
|
6.125%, 10/15/2039 |
|
|
802,362 |
|
|
|
86,000 |
|
4.450%, 02/15/2043 |
|
|
83,032 |
|
|
|
760,000 |
|
Spectra Energy Capital LLC |
|
|
895,430 |
|
|
|
|
|
TransCanada Pipelines Ltd. |
|
|
|
|
|
|
660,000 |
|
7.625%, 01/15/2039 |
|
|
949,890 |
|
|
|
300,000 |
|
6.350%, 05/15/2067 (d) |
|
|
320,308 |
|
|
|
|
|
Transocean, Inc. |
|
|
|
|
|
|
155,000 |
|
2.500%, 10/15/2017 (a) |
|
|
157,129 |
|
|
|
500,000 |
|
6.500%, 11/15/2020 |
|
|
578,719 |
|
|
|
|
|
|
|
|
||
|
|
|
|
|
|
|
5,460,211 |
|
|
|
|
|
|
|
|
||
|
|
|
|
Real Estate - 1.60% |
|
|
|
|
|
|
250,000 |
|
Duke Realty LP |
|
|
266,404 |
|
|
|
250,000 |
|
ERP Operating LP |
|
|
280,837 |
|
|
|
|
|
HCP, Inc. |
|
|
|
|
|
|
250,000 |
|
2.625%, 02/01/2020 |
|
|
251,975 |
|
|
|
955,000 |
|
5.375%, 02/01/2021 |
|
|
1,111,138 |
|
|
|
|
|
Health Care Property Investments, Inc. |
|
|
|
|
|
|
125,000 |
|
6.300%, 09/15/2016 |
|
|
144,875 |
|
|
|
200,000 |
|
6.000%, 01/30/2017 |
|
|
231,712 |
|
|
|
|
|
Health Care REIT, Inc. |
|
|
|
|
|
|
385,000 |
|
3.625%, 03/15/2016 |
|
|
408,188 |
|
|
|
245,000 |
|
2.250%, 03/15/2018 |
|
|
247,511 |
|
|
|
90,000 |
|
4.125%, 04/01/2019 |
|
|
97,694 |
|
|
|
675,000 |
|
5.250%, 01/15/2022 |
|
|
762,860 |
|
|
|
|
|
Liberty Property LP |
|
|
|
|
|
|
325,000 |
|
5.500%, 12/15/2016 |
|
|
367,735 |
|
|
|
25,000 |
|
4.125%, 06/15/2022 |
|
|
26,480 |
|
|
|
25,000 |
|
3.375%, 06/15/2023 |
|
|
24,873 |
|
|
|
161,000 |
|
Realty Income Corp. |
|
|
157,965 |
|
|
|
|
|
Simon Property Group LP |
|
|
|
|
|
|
1,105,000 |
|
6.125%, 05/30/2018 |
|
|
1,351,592 |
|
|
|
400,000 |
|
4.125%, 12/01/2021 |
|
|
443,140 |
|
|
|
|
|
|
|
|
|
|
|
Principal |
|
|
|
Value |
|
||
|
|
|
|
|
||||
|
|
|
|
Real Estate (Continued) |
|
|
|
|
|
|
|
|
Ventas Realty LP |
|
|
|
|
|
|
335,000 |
|
2.000%, 02/15/2018 |
|
$ |
337,281 |
|
|
|
150,000 |
|
2.700%, 04/01/2020 |
|
|
151,396 |
|
|
|
|
|
|
|
|
||
|
|
|
|
|
|
|
6,663,656 |
|
|
|
|
|
|
|
|
||
|
|
|
|
Road & Rail - 0.27% |
|
|
|
|
|
|
565,000 |
|
Burlington Northern Santa Fe LLC |
|
|
785,027 |
|
|
|
309,000 |
|
Canadian Pacific Railway Ltd. |
|
|
343,434 |
|
|
|
|
|
|
|
|
||
|
|
|
|
|
|
|
1,128,461 |
|
|
|
|
|
|
|
|
||
|
|
|
|
Semiconductor & Semiconductor |
|
|
|
|
|
|
340,000 |
|
Altera Corp. |
|
|
347,764 |
|
|
|
725,000 |
|
Analog Devices, Inc. |
|
|
767,567 |
|
|
|
780,000 |
|
Applied Materials, Inc. |
|
|
821,210 |
|
|
|
|
|
Intel Corp. |
|
|
|
|
|
|
725,000 |
|
1.350%, 12/15/2017 |
|
|
728,295 |
|
|
|
470,000 |
|
3.300%, 10/01/2021 |
|
|
494,051 |
|
|
|
425,000 |
|
TSMC Global Ltd. |
|
|
424,715 |
|
|
|
|
|
|
|
|
||
|
|
|
|
|
|
|
3,583,602 |
|
|
|
|
|
|
|
|
||
|
|
|
|
Software - 0.22% |
|
|
|
|
|
|
925,000 |
|
Oracle Corp. |
|
|
927,036 |
|
|
|
|
|
|
|
|
||
|
|
|
|
Specialty Retail - 0.16% |
|
|
|
|
|
|
310,000 |
|
Autozone, Inc. |
|
|
332,182 |
|
|
|
250,000 |
|
Home Depot, Inc. |
|
|
311,807 |
|
|
|
|
|
|
|
|
||
|
|
|
|
|
|
|
643,989 |
|
|
|
|
|
|
|
|
||
|
|
|
|
Thrifts & Mortgage Finance - 0.02% |
|
|
|
|
|
|
60,000 |
|
Santander Holdings USA, Inc. |
|
|
64,208 |
|
|
|
|
|
|
|
|
||
See notes to financial statements.
72
|
|
|
GuideMarkSM Core Fixed Income Fund |
|
SCHEDULE OF INVESTMENTS (Continued) |
|
March 31, 2013 |
|
|
|
|
|
|
|
|
|
|
Principal |
|
|
|
Value |
|
||
|
|
|
|
|
||||
|
|
|
|
CORPORATE OBLIGATIONS (Continued) |
|
|
|
|
|
|
|
|
Tobacco - 0.30% |
|
|
|
|
|
|
|
|
Altria Group, Inc. |
|
|
|
|
|
|
306,000 |
|
9.700%, 11/10/2018 |
|
$ |
426,341 |
|
|
|
665,000 |
|
2.850%, 08/09/2022 |
|
|
655,089 |
|
|
|
155,000 |
|
Reynolds American, Inc. |
|
|
155,153 |
|
|
|
|
|
|
|
|
||
|
|
|
|
|
|
|
1,236,583 |
|
|
|
|
|
|
|
|
||
|
|
|
|
Trucking - 0.11% |
|
|
|
|
|
|
|
|
Penske Truck Leasing Co., L.P. |
|
|
|
|
|
|
400,000 |
|
3.125%, 05/11/2015 |
|
|
414,086 |
|
|
|
35,000 |
|
2.875%, 07/17/2018 |
|
|
35,733 |
|
|
|
|
|
|
|
|
||
|
|
|
|
|
|
|
449,819 |
|
|
|
|
|
|
|
|
||
|
|
|
|
Wireless Telecommunication Services - 0.28% |
|
|
|
|
|
|
1,165,000 |
|
Vodafone Group Plc |
|
|
1,177,774 |
|
|
|
|
|
|
|
|
||
|
|
|
|
Total Corporate Obligations |
|
|
164,684,864 |
|
|
|
|
|
|
|
|
||
|
|
|
|
FOREIGN GOVERNMENT DEBT |
|
|
|
|
|
|
196,000 |
|
Federal Government of Mexico |
|
|
203,840 |
|
|
|
250,000 |
|
Republic of Colombia |
|
|
280,250 |
|
|
|
|
|
|
|
|
||
|
|
|
|
Total Foreign Government Debt |
|
|
484,090 |
|
|
|
|
|
|
|
|
||
|
|
|
|
MORTGAGE BACKED SECURITIES - 25.83% |
|
|
|
|
|
|
|
|
Federal Home Loan Mortgage Corp. |
|
|
|
|
|
|
711,515 |
|
Series 2590, Pool #2590NV |
|
|
761,266 |
|
|
|
9,580 |
|
Pool #E9-9763 |
|
|
10,198 |
|
|
|
9,572 |
|
Pool #E9-9764 |
|
|
10,443 |
|
|
|
169,021 |
|
Pool #D9-6291 |
|
|
184,410 |
|
|
|
519,022 |
|
Pool #G1-3624 |
|
|
555,835 |
|
|
|
|
|
|
|
|
|
|
|
Principal |
|
|
|
Value |
|
||
|
|
|
|
|
||||
|
|
|
|
MORTGAGE BACKED |
|
|
|
|
|
|
524,853 |
|
Series 2329, Pool #2329ZA |
|
$ |
602,060 |
|
|
|
275,982 |
|
Series 2338, Pool #2338ZC |
|
|
318,114 |
|
|
|
480,178 |
|
Pool #78-0447 |
|
|
512,923 |
|
|
|
473 |
|
Pool #A4-3129 |
|
|
522 |
|
|
|
2,961,686 |
|
Pool #A8-9148 |
|
|
3,148,982 |
|
|
|
1,319,222 |
|
Pool #C0-3815 |
|
|
1,397,018 |
|
|
|
1,754,015 |
|
Pool #C0-3830 |
|
|
1,864,939 |
|
|
|
975,103 |
|
Pool #U9-0688 |
|
|
1,069,830 |
|
|
|
344,082 |
|
Pool #Q0-9530 |
|
|
363,244 |
|
|
|
2,207,844 |
|
Pool #Q0-9949 |
|
|
2,269,641 |
|
|
|
|
|
Federal National Mortgage Association |
|
|
|
|
|
|
487,551 |
|
Pool #467626 |
|
|
541,781 |
|
|
|
3,140 |
|
Pool #685505 |
|
|
3,373 |
|
|
|
3,057 |
|
Pool #705709 |
|
|
3,283 |
|
|
|
2,139,088 |
|
Pool #AH6301 |
|
|
2,290,716 |
|
|
|
1,106,716 |
|
Pool #AL2877 |
|
|
1,178,809 |
|
|
|
325,226 |
|
Pool #544859 |
|
|
341,875 |
|
|
|
360,266 |
|
Pool #786848 |
|
|
429,769 |
|
|
|
15,854 |
|
Pool #727181 |
|
|
17,597 |
|
|
|
7,488 |
|
Pool #730727 |
|
|
8,333 |
|
|
|
2,014 |
|
Pool #741862 |
|
|
2,236 |
|
|
|
2,781 |
|
Pool #766197 |
|
|
3,088 |
|
See notes to financial statements.
73
|
|
|
GuideMarkSM Core Fixed Income Fund |
|
SCHEDULE OF INVESTMENTS (Continued) |
|
March 31, 2013 |
|
|
|
|
|
|
|
|
|
|
Principal |
|
|
|
Value |
|
||
|
|
|
|
|
||||
|
|
|
|
MORTGAGE BACKED |
|
|
|
|
|
|
461 |
|
Pool #776974 |
|
$ |
519 |
|
|
|
322,960 |
|
Pool #888504 |
|
|
345,116 |
|
|
|
15,106 |
|
Pool #775776 |
|
|
16,777 |
|
|
|
366,160 |
|
Pool #802783 |
|
|
389,487 |
|
|
|
20,964 |
|
Pool #781629 |
|
|
23,241 |
|
|
|
715 |
|
Pool #806098 |
|
|
797 |
|
|
|
287,239 |
|
Pool #735504 |
|
|
323,328 |
|
|
|
17,391 |
|
Pool #822815 |
|
|
19,314 |
|
|
|
18,034 |
|
Pool #357850 |
|
|
20,028 |
|
|
|
18,223 |
|
Pool #820242 |
|
|
20,281 |
|
|
|
3,918 |
|
Pool #838452 |
|
|
4,402 |
|
|
|
19,045 |
|
Pool #865854 |
|
|
21,283 |
|
|
|
34,367 |
|
Pool #891474 |
|
|
38,490 |
|
|
|
35,622 |
|
Pool #906000 |
|
|
39,116 |
|
|
|
286 |
|
Pool #928062 |
|
|
317 |
|
|
|
404 |
|
Pool #899119 |
|
|
445 |
|
|
|
522 |
|
Pool #938488 |
|
|
575 |
|
|
|
642 |
|
Pool #970131 |
|
|
712 |
|
|
|
656 |
|
Pool #981313 |
|
|
728 |
|
|
|
852 |
|
Pool #985108 |
|
|
945 |
|
|
|
297 |
|
Pool #964930 |
|
|
329 |
|
|
|
334 |
|
Pool #987032 |
|
|
368 |
|
|
|
|
|
|
|
|
|
|
|
Number |
|
|
|
Value |
|
||
|
|
|
|
|
||||
|
|
|
|
MORTGAGE BACKED |
|
|
|
|
|
|
459 |
|
Pool #968371 |
|
$ |
509 |
|
|
|
206,412 |
|
Pool #AD0095 |
|
|
226,400 |
|
|
|
298 |
|
Pool #993050 |
|
|
328 |
|
|
|
273 |
|
Pool #MC0018 |
|
|
276 |
|
|
|
76,733 |
|
Pool #993579 |
|
|
81,867 |
|
|
|
17,810 |
|
Pool #AA5840 |
|
|
19,001 |
|
|
|
214,046 |
|
Pool #AA7670 |
|
|
234,463 |
|
|
|
133,014 |
|
Pool #AA8715 |
|
|
146,465 |
|
|
|
16,099 |
|
Pool #AA9133 |
|
|
17,933 |
|
|
|
34,604 |
|
Pool #AC2861 |
|
|
38,684 |
|
|
|
76,743 |
|
Pool #AC6121 |
|
|
85,790 |
|
|
|
13,204 |
|
Pool #AC8372 |
|
|
14,497 |
|
|
|
607,252 |
|
Pool #AD0586 |
|
|
678,838 |
|
|
|
614,684 |
|
Pool #AD5574 |
|
|
675,263 |
|
|
|
2,454,210 |
|
Pool #AD5661 |
|
|
2,706,815 |
|
|
|
3,088,865 |
|
Pool #AB1231 |
|
|
3,406,792 |
|
|
|
122,394 |
|
Pool #AD7793 |
|
|
132,080 |
|
|
|
37,950 |
|
Pool #AD9896 |
|
|
40,489 |
|
|
|
1,336,250 |
|
Pool #AE0217 |
|
|
1,439,905 |
|
|
|
45,105 |
|
Pool #AB1500 |
|
|
48,123 |
|
|
|
33,885 |
|
Pool #AD9856 |
|
|
36,152 |
|
|
|
45,520 |
|
Pool #AE2559 |
|
|
48,566 |
|
See notes to financial statements.
74
|
|
|
GuideMarkSM Core Fixed Income Fund |
|
SCHEDULE OF INVESTMENTS (Continued) |
|
March 31, 2013 |
|
|
|
|
|
|
|
|
|
|
Principal |
|
|
|
Value |
|
||
|
|
|
|
|
||||
|
|
|
|
MORTGAGE BACKED |
|
|
|
|
|
|
14,883 |
|
Pool #AE2562 |
|
$ |
15,879 |
|
|
|
18,045 |
|
Pool #AE2566 |
|
|
19,252 |
|
|
|
101,988 |
|
Pool #AE4124 |
|
|
108,812 |
|
|
|
59,144 |
|
Pool #AE4888 |
|
|
63,102 |
|
|
|
66,987 |
|
Pool #AE3916 |
|
|
71,469 |
|
|
|
10,869 |
|
Pool #AE5147 |
|
|
11,597 |
|
|
|
135,907 |
|
Pool #AE8715 |
|
|
145,000 |
|
|
|
1,312,466 |
|
Pool #AH1089 |
|
|
1,407,164 |
|
|
|
1,268,301 |
|
Pool #AE0698 |
|
|
1,368,668 |
|
|
|
237,733 |
|
Pool #AE8893 |
|
|
253,639 |
|
|
|
14,206 |
|
Pool #AH0006 |
|
|
15,156 |
|
|
|
39,400 |
|
Pool #AH0020 |
|
|
42,036 |
|
|
|
76,881 |
|
Pool #AH0599 |
|
|
82,025 |
|
|
|
28,984 |
|
Pool #AH0601 |
|
|
30,923 |
|
|
|
113,374 |
|
Pool #AE7893 |
|
|
120,960 |
|
|
|
51,255 |
|
Pool #AH1263 |
|
|
54,684 |
|
|
|
256,329 |
|
Pool #AH2999 |
|
|
273,479 |
|
|
|
1,921,825 |
|
Pool #AH3373 |
|
|
2,119,633 |
|
|
|
449,225 |
|
Pool #AB2265 |
|
|
493,249 |
|
|
|
14,314 |
|
Pool #AH4659 |
|
|
15,276 |
|
|
|
2,463,482 |
|
Pool #AH5574 |
|
|
2,670,261 |
|
|
|
|
|
|
|
|
|
|
|
Principal |
|
|
|
Value |
|
||
|
|
|
|
|
||||
|
|
|
|
MORTGAGE BACKED |
|
|
|
|
|
|
213,717 |
|
Pool #AH5653 |
|
$ |
231,455 |
|
|
|
97,802 |
|
Pool #AH5783 |
|
|
105,443 |
|
|
|
413,421 |
|
Pool #AL0934 |
|
|
455,706 |
|
|
|
444,069 |
|
Pool #AD1889 |
|
|
479,210 |
|
|
|
27,344 |
|
Pool #AH6150 |
|
|
29,182 |
|
|
|
95,577 |
|
Pool #AH6583 |
|
|
102,002 |
|
|
|
843,363 |
|
Pool #AH4246 |
|
|
910,630 |
|
|
|
3,603,245 |
|
Pool #AH8854 |
|
|
3,946,942 |
|
|
|
278,768 |
|
Pool #AL0215 |
|
|
305,358 |
|
|
|
3,133,728 |
|
Pool #AL0247 |
|
|
3,440,834 |
|
|
|
1,181,113 |
|
Pool #AI1856 |
|
|
1,306,692 |
|
|
|
322,712 |
|
Pool #AL0187 |
|
|
350,281 |
|
|
|
2,886,076 |
|
Pool #AL0208 |
|
|
3,161,365 |
|
|
|
48,079 |
|
Pool #AL0456 |
|
|
52,186 |
|
|
|
663,535 |
|
Pool #AI7368 |
|
|
716,459 |
|
|
|
2,591,176 |
|
Pool #AB3395 |
|
|
2,838,337 |
|
|
|
827,031 |
|
Pool #AI7913 |
|
|
892,995 |
|
|
|
232,610 |
|
Pool #AI8154 |
|
|
248,245 |
|
|
|
185,970 |
|
Pool #AI8842 |
|
|
200,803 |
|
|
|
38,372 |
|
Pool #AJ1080 |
|
|
41,432 |
|
|
|
70,249 |
|
Pool #AL0815 |
|
|
77,353 |
|
See notes to financial statements.
75
|
|
|
GuideMarkSM Core Fixed Income Fund |
|
SCHEDULE OF INVESTMENTS (Continued) |
|
March 31, 2013 |
|
|
|
|
|
|
|
|
|
|
Principal |
|
|
|
Value |
|
||
|
|
|
|
|
||||
|
|
|
|
MORTGAGE BACKED |
|
|
|
|
|
|
191,683 |
|
Pool #AB3691 |
|
$ |
206,635 |
|
|
|
24,063 |
|
Pool #AJ1562 |
|
|
26,496 |
|
|
|
27,220 |
|
Pool #AJ1972 |
|
|
29,973 |
|
|
|
3,739,457 |
|
Pool #AJ2212 |
|
|
4,106,665 |
|
|
|
51,146 |
|
Pool #AJ3146 |
|
|
55,225 |
|
|
|
257,734 |
|
Pool #AJ4044 |
|
|
283,797 |
|
|
|
37,620 |
|
Pool #AJ4756 |
|
|
41,424 |
|
|
|
2,319,842 |
|
Pool #AL0933 |
|
|
2,567,291 |
|
|
|
1,490,922 |
|
Pool #AB3876 |
|
|
1,607,214 |
|
|
|
28,786 |
|
Pool #AJ3330 |
|
|
31,697 |
|
|
|
32,528 |
|
Pool #AJ4549 |
|
|
35,817 |
|
|
|
23,860 |
|
Pool #AJ4698 |
|
|
26,273 |
|
|
|
49,251 |
|
Pool #AJ5424 |
|
|
54,232 |
|
|
|
27,599 |
|
Pool #AJ7840 |
|
|
30,390 |
|
|
|
30,537 |
|
Pool #AB3995 |
|
|
33,625 |
|
|
|
254,088 |
|
Pool #AB4054 |
|
|
279,783 |
|
|
|
32,188 |
|
Pool #AI0848 |
|
|
35,443 |
|
|
|
29,221 |
|
Pool #AJ4187 |
|
|
32,176 |
|
|
|
38,044 |
|
Pool #AJ5736 |
|
|
41,892 |
|
|
|
31,068 |
|
Pool #AJ5968 |
|
|
33,156 |
|
|
|
36,580 |
|
Pool #AJ6061 |
|
|
40,279 |
|
|
|
|
|
|
|
|
|
|
|
Principal |
|
|
|
Value |
|
||
|
|
|
|
|
||||
|
|
|
|
MORTGAGE BACKED |
|
|
|
|
|
|
490,601 |
|
Pool #AJ7684 |
|
$ |
540,213 |
|
|
|
25,329 |
|
Pool #AJ7868 |
|
|
27,890 |
|
|
|
53,797 |
|
Pool #AJ8104 |
|
|
59,237 |
|
|
|
31,947 |
|
Pool #AJ8109 |
|
|
35,178 |
|
|
|
23,796 |
|
Pool #AJ8171 |
|
|
26,203 |
|
|
|
40,728 |
|
Pool #AJ8341 |
|
|
44,846 |
|
|
|
61,010 |
|
Pool #AJ8436 |
|
|
67,180 |
|
|
|
25,232 |
|
Pool #AJ8912 |
|
|
27,784 |
|
|
|
29,939 |
|
Pool #AJ9248 |
|
|
32,966 |
|
|
|
44,159 |
|
Pool #AJ2446 |
|
|
47,127 |
|
|
|
37,967 |
|
Pool #AJ7538 |
|
|
41,807 |
|
|
|
17,578 |
|
Pool #AJ8001 |
|
|
18,828 |
|
|
|
39,586 |
|
Pool #AJ8369 |
|
|
43,589 |
|
|
|
34,307 |
|
Pool #AJ9162 |
|
|
37,776 |
|
|
|
187,392 |
|
Pool #AJ9330 |
|
|
206,342 |
|
|
|
23,824 |
|
Pool #AJ9779 |
|
|
26,233 |
|
|
|
30,736 |
|
Pool #AK0170 |
|
|
33,844 |
|
|
|
63,753 |
|
Pool #AK0543 |
|
|
70,200 |
|
|
|
26,329 |
|
Pool #AK0563 |
|
|
28,992 |
|
|
|
57,047 |
|
Pool #AK1827 |
|
|
62,816 |
|
|
|
3,703,977 |
|
Pool #AB4438 |
|
|
3,945,546 |
|
See notes to financial statements.
76
|
|
|
GuideMarkSM Core Fixed Income Fund |
|
SCHEDULE OF INVESTMENTS (Continued) |
|
March 31, 2013 |
|
|
|
|
|
|
|
|
|
|
Principal |
|
|
|
Value |
|
||
|
|
|
|
|
||||
|
|
|
|
MORTGAGE BACKED |
|
|
|
|
|
|
4,379,087 |
|
Pool #AK9382 |
|
$ |
4,776,763 |
|
|
|
5,943,314 |
|
Pool #AJ0130 |
|
|
6,281,712 |
|
|
|
390,705 |
|
Pool #AO4164 |
|
|
426,430 |
|
|
|
195,059 |
|
Pool #AB5529 |
|
|
212,894 |
|
|
|
346,897 |
|
Pool #AB6228 |
|
|
366,648 |
|
|
|
3,145,981 |
|
Pool #AP4786 |
|
|
3,248,413 |
|
|
|
5,135,001 |
|
Pool #AR8929 |
|
|
5,302,196 |
|
|
|
|
|
Government National Mortgage Association |
|
|
|
|
|
|
250,947 |
|
Pool #752842X |
|
|
270,775 |
|
|
|
32,668 |
|
Pool #614436X |
|
|
35,573 |
|
|
|
590,628 |
|
Pool #618907X |
|
|
648,418 |
|
|
|
76,025 |
|
Pool #605098X |
|
|
83,321 |
|
|
|
71,655 |
|
Pool #520279X |
|
|
78,307 |
|
|
|
1,256,806 |
|
Pool #644812X |
|
|
1,426,239 |
|
|
|
1,290,186 |
|
Pool #688021X |
|
|
1,452,831 |
|
|
|
127,507 |
|
Pool #736686X |
|
|
139,186 |
|
|
|
1,602,989 |
|
Pool #723248 |
|
|
1,785,379 |
|
|
|
624,126 |
|
Pool #726382 |
|
|
695,140 |
|
|
|
421,575 |
|
Pool #782916X |
|
|
461,572 |
|
|
|
1,291,828 |
|
Pool #752599C |
|
|
1,433,777 |
|
|
|
1,929,518 |
|
Pool #752631C |
|
|
2,148,217 |
|
|
|
|
|
|
|
|
|
|
|
Principal |
|
|
|
Value |
|
||
|
|
|
|
|
||||
|
|
|
|
MORTGAGE BACKED |
|
|
|
|
|
|
1,509,641 |
|
Pool #005176M |
|
$ |
1,663,954 |
|
|
|
799,429 |
|
Pool #783511M |
|
|
865,488 |
|
|
|
|
|
|
|
|
||
|
|
|
|
Total Mortgage Backed Securities |
|
|
107,338,606 |
|
|
|
|
|
|
|
|
||
|
|
|
|
MUNICIPAL DEBT OBLIGATIONS - 0.37% |
|
|
|
|
|
|
|
|
California, GO, |
|
|
|
|
|
|
230,000 |
|
7.500%, 04/01/2034 |
|
|
320,353 |
|
|
|
175,000 |
|
7.950%, 03/01/2036 |
|
|
219,133 |
|
|
|
425,000 |
|
7.550%, 04/01/2039 |
|
|
613,985 |
|
|
|
315,000 |
|
Illinois, GO, |
|
|
378,054 |
|
|
|
|
|
|
|
|
||
|
|
|
|
Total Municipal Debt Obligations |
|
|
1,531,525 |
|
|
|
|
|
|
|
|
||
|
|
|
|
U.S. GOVERNMENT AGENCY ISSUES - 1.24% |
|
|
|
|
|
|
|
|
Federal Home Loan Mortgage Corp. |
|
|
|
|
|
|
300,000 |
|
0.500%, 10/15/2013 |
|
|
300,609 |
|
|
|
1,300,000 |
|
1.000%, 03/08/2017 |
|
|
1,317,130 |
|
|
|
400,000 |
|
1.250%, 05/12/2017 |
|
|
409,171 |
|
|
|
1,200,000 |
|
1.000%, 06/29/2017 |
|
|
1,215,242 |
|
|
|
|
|
Federal National Mortgage Association |
|
|
|
|
|
|
200,000 |
|
4.125%, 04/15/2014 |
|
|
208,247 |
|
|
|
1,700,000 |
|
0.625%, 10/30/2014 |
|
|
1,710,196 |
|
|
|
|
|
|
|
|
||
|
|
|
|
Total U.S. Government Agency Issues |
|
|
5,160,595 |
|
|
|
|
|
|
|
|
||
|
|
|
|
U.S. TREASURY OBLIGATIONS - 20.84% |
|
|
|
|
|
|
|
|
U.S. Treasury Bonds - 4.69% |
|
|
|
|
|
|
2,900,000 |
|
4.250%, 11/15/2014 |
|
|
3,089,181 |
|
|
|
2,555,000 |
|
5.375%, 02/15/2031 |
|
|
3,554,644 |
|
|
|
1,200,000 |
|
4.250%, 11/15/2040 |
|
|
1,475,626 |
|
|
|
500,000 |
|
4.375%, 05/15/2041 |
|
|
627,344 |
|
|
|
7,360,000 |
|
3.125%, 11/15/2041 |
|
|
7,404,852 |
|
|
|
365,000 |
|
3.000%, 05/15/2042 |
|
|
357,415 |
|
|
|
2,125,000 |
|
2.750%, 08/15/2042 |
|
|
1,971,934 |
|
|
|
1,100,000 |
|
2.750%, 11/15/2042 |
|
|
1,019,734 |
|
|
|
|
|
U.S. Treasury Notes - 16.15% |
|
|
|
|
|
|
1,385,000 |
|
0.250%, 11/30/2013 |
|
|
1,386,137 |
|
|
|
3,600,000 |
|
0.250%, 05/31/2014 |
|
|
3,603,096 |
|
|
|
5,700,000 |
|
0.625%, 07/15/2014 |
|
|
5,731,840 |
|
|
|
10,550,000 |
|
0.250%, 07/15/2015 |
|
|
10,543,406 |
|
|
|
3,125,000 |
|
1.750%, 07/31/2015 |
|
|
3,231,691 |
|
See notes to financial statements.
77
|
|
|
GuideMarkSM Core Fixed Income Fund |
|
SCHEDULE OF INVESTMENTS (Continued) |
|
March 31, 2013 |
|
|
|
|
|
|
|
|
|
|
Principal |
|
|
|
Value |
|
||
|
|
|
|
|
||||
|
|
|
|
U.S. TREASURY OBLIGATIONS (Continued) |
|
|
|
|
|
|
|
|
U.S. Treasury Notes (Continued) |
|
|
|
|
|
|
4,365,000 |
|
2.000%, 04/30/2016 |
|
$ |
4,581,548 |
|
|
|
9,295,000 |
|
0.875%, 01/31/2017 |
|
|
9,418,447 |
|
|
|
5,875,000 |
|
0.875%, 04/30/2017 |
|
|
5,946,146 |
|
|
|
6,240,000 |
|
1.875%, 09/30/2017 |
|
|
6,575,887 |
|
|
|
3,555,000 |
|
2.000%, 11/15/2021 |
|
|
3,666,648 |
|
|
|
12,080,000 |
|
2.000%, 02/15/2022 |
|
|
12,420,692 |
|
|
|
|
|
|
|
|
||
|
|
|
|
Total U.S. Treasury Obligations |
|
|
86,606,268 |
|
|
|
|
|
|
|
|
||
|
|
|
|
|
|
|
|
|
|
Number |
|
|
|
|
|
|
|
|
|
|
|
|
|
|
||
|
|
|
|
SHORT TERM INVESTMENTS - 2.77% |
|
|
|
|
|
|
|
|
Money Market Funds - 2.77% |
|
|
|
|
|
|
11,520,091 |
|
Federated Prime Obligations Fund |
|
|
11,520,091 |
|
|
|
|
|
|
|
|
||
|
|
|
|
Total Short Term Investments |
|
|
11,520,091 |
|
|
|
|
|
|
|
|
||
|
|
|
|
INVESTMENTS PURCHASED |
|
|
|
|
|
|
|
|
Money Market Funds - 0.37% |
|
|
|
|
|
|
1,549,788 |
|
First American Government |
|
|
1,549,788 |
|
|
|
4,931 |
|
Reserve Primary Fund (f) |
|
|
191 |
|
|
|
|
|
|
|
|
||
|
|
|
|
Total Money Market Funds |
|
|
1,549,979 |
|
|
|
|
|
|
|
|
||
|
|
|
|
|
|
|
|
|
|
Principal |
|
|
|
Value |
|
||
|
|
|
|
|
||||
|
|
|
|
Cash - 0.01% |
|
|
|
|
|
|
16,089 |
|
Cash |
|
$ |
16,089 |
|
|
|
|
|
|
|
|
||
|
|
|
|
Total Cash (Cost $16,089) |
|
|
16,089 |
|
|
|
|
|
|
|
|
||
|
|
|
|
Total Investments Purchased as |
|
|
1,566,068 |
|
|
|
|
|
|
|
|
||
|
|
|
|
Total Investments |
|
|
414,536,757 |
|
|
|
|
|
Other Assets in Excess |
|
|
1,006,232 |
|
|
|
|
|
|
|
|
||
|
|
|
|
TOTAL NET |
|
$ |
415,542,989 |
|
|
|
|
|
|
|
|
||
|
|
|
|
(a) |
All or portion of this security is on loan. |
|
(b) |
Restricted securities as defined in Rule 144(a) under the Securities Act of 1933. Such securities are treated as liquid securities according to the Fund’s liquidity guidelines. The value of these securities total $16,464,124, which represents 3.96% of total net assets. |
|
(c) |
Restricted securities as defined in Rule 144(a) under the Securities Act of 1933. Such securities are treated as illiquid securities according to the Fund’s liquidity guidelines. The value of these securities total $17,675, which represents 0.00% of total net assets. |
|
(d) |
Variable Rate Security. The rate shown is the rate in effect on March 31, 2013. |
|
(e) |
Non-income producing. Item identified as in default as to payment of interest. |
|
(f) |
As of March 31, 2013, the Fund has fair valued this security and deemed it illiquid. The value of this security was $191, which represents 0.00% of total net assets. |
See notes to financial statements.
78
|
|
|
GuideMarkSM Tax-Exempt Fixed Income Fund |
|
SCHEDULE OF INVESTMENTS |
|
March 31, 2013 |
|
|
|
|
|
|
|
|
|
|
Principal |
|
|
|
Value |
|
||
|
|
|
|
|
||||
|
|
|
|
MUNICIPAL DEBT OBLIGATIONS - 97.53% |
|
|
|
|
|
|
|
|
Alaska - 1.03% |
|
|
|
|
|
$ |
195,000 |
|
Northern Tobacco Securitization |
|
$ |
174,223 |
|
|
|
500,000 |
|
Valdez Marine Terminal - BP |
|
|
607,505 |
|
|
|
|
|
|
|
|
||
|
|
|
|
|
|
|
781,728 |
|
|
|
|
|
|
|
|
||
|
|
|
|
Arizona - 2.72% |
|
|
|
|
|
|
250,000 |
|
Arizona State Health Facilities |
|
|
266,162 |
|
|
|
590,000 |
|
Arizona University System Board |
|
|
691,380 |
|
|
|
450,000 |
|
Phoenix Civic Improvement |
|
|
518,931 |
|
|
|
500,000 |
|
Salt River Project, Series A, |
|
|
582,085 |
|
|
|
|
|
|
|
|
||
|
|
|
|
|
|
|
2,058,558 |
|
|
|
|
|
|
|
|
||
|
|
|
|
Arkansas - 0.99% |
|
|
|
|
|
|
210,000 |
|
Springdale School District, |
|
|
210,321 |
|
|
|
500,000 |
|
University of Arkansas, Series A, |
|
|
538,330 |
|
|
|
|
|
|
|
|
||
|
|
|
|
|
|
|
748,651 |
|
|
|
|
|
|
|
|
||
|
|
|
|
California - 9.23% |
|
|
|
|
|
|
445,000 |
|
California Economic Recovery, |
|
|
541,739 |
|
|
|
400,000 |
|
California Municipal Finance |
|
|
442,424 |
|
|
|
|
|
|
|
|
|
|
|
Principal |
|
|
|
Value |
|
||
|
|
|
|
|
||||
|
|
|
|
California (Continued) |
|
|
|
|
|
$ |
500,000 |
|
California Statewide Communities |
|
$ |
534,165 |
|
|
|
500,000 |
|
California Statewide Community |
|
|
548,945 |
|
|
|
|
|
California, GO, |
|
|
|
|
|
|
250,000 |
|
5.500%, 04/01/2018 |
|
|
304,402 |
|
|
|
1,000,000 |
|
6.500%, 04/01/2033 |
|
|
1,231,410 |
|
|
|
100,000 |
|
California, Refunding, GO, |
|
|
122,634 |
|
|
|
|
|
Golden State Tobacco Securitization, |
|
|
|
|
|
|
555,000 |
|
5.125%, 06/01/2047 |
|
|
490,581 |
|
|
|
325,000 |
|
5.750%, 06/01/2047 |
|
|
312,315 |
|
|
|
700,000 |
|
Golden State Tobacco Securitization, |
|
|
705,425 |
|
|
|
1,000,000 |
|
Los Angeles Department of Airports, |
|
|
1,178,650 |
|
|
|
500,000 |
|
San Mateo Joint Powers Financing |
|
|
576,185 |
|
|
|
|
|
|
|
|
||
|
|
|
|
|
|
|
6,988,875 |
|
|
|
|
|
|
|
|
||
|
|
|
|
Colorado - 2.30% |
|
|
|
|
|
|
280,000 |
|
Colorado Health Facilities Authority, |
|
|
312,460 |
|
|
|
500,000 |
|
Colorado Regional Transportation |
|
|
597,405 |
|
|
|
700,000 |
|
Regional Transportation District, |
|
|
834,421 |
|
|
|
|
|
|
|
|
||
|
|
|
|
|
|
|
1,744,286 |
|
|
|
|
|
|
|
|
||
|
|
|
|
Connecticut - 0.78% |
|
|
|
|
|
|
500,000 |
|
Connecticut Health & Educational |
|
|
588,760 |
|
|
|
|
|
|
|
|
||
See notes to financial statements.
79
|
|
|
GuideMarkSM Tax-Exempt Fixed Income Fund |
|
SCHEDULE OF INVESTMENTS (Continued) |
|
March 31, 2013 |
|
|
|
|
|
|
|
|
|
|
Principal |
|
|
|
Value |
|
||
|
|
|
|
|
||||
|
|
|
|
MUNICIPAL DEBT OBLIGATIONS (Continued) |
|
|
|
|
|
|
|
|
Delaware - 0.68% |
|
|
|
|
|
$ |
500,000 |
|
New Castle County, Revenue Bond, |
|
$ |
516,275 |
|
|
|
|
|
|
|
|
||
|
|
|
|
District of Columbia - 0.57% |
|
|
|
|
|
|
380,000 |
|
District of Columbia, Series A, |
|
|
429,704 |
|
|
|
|
|
|
|
|
||
|
|
|
|
Florida - 2.72% |
|
|
|
|
|
|
300,000 |
|
Brevard County Health Facilities |
|
|
368,529 |
|
|
|
500,000 |
|
Florida Board of Education, |
|
|
558,450 |
|
|
|
500,000 |
|
Miami-Dade County Health Facilities, |
|
|
557,810 |
|
|
|
500,000 |
|
Miami-Dade County Transit Sales |
|
|
572,370 |
|
|
|
|
|
|
|
|
||
|
|
|
|
|
|
|
2,057,159 |
|
|
|
|
|
|
|
|
||
|
|
|
|
Georgia - 1.27% |
|
|
|
|
|
|
500,000 |
|
Atlanta Water & Wastewater, |
|
|
610,350 |
|
|
|
325,000 |
|
Marietta Development Authority, |
|
|
349,333 |
|
|
|
|
|
|
|
|
||
|
|
|
|
|
|
|
959,683 |
|
|
|
|
|
|
|
|
||
|
|
|
|
Hawaii - 0.77% |
|
|
|
|
|
|
85,000 |
|
Hawaii, Series CW, Refunding, GO |
|
|
97,310 |
|
|
|
415,000 |
|
Hawaii, Series DJ, GO, |
|
|
486,069 |
|
|
|
|
|
|
|
|
||
|
|
|
|
|
|
|
583,379 |
|
|
|
|
|
|
|
|
||
|
|
|
|
Idaho - 1.72% |
|
|
|
|
|
|
1,000,000 |
|
Boise-Kuna District, Revenue Bond, |
|
|
1,154,390 |
|
|
|
140,000 |
|
Nampa Development Corp., |
|
|
146,542 |
|
|
|
|
|
|
|
|
||
|
|
|
|
|
|
|
1,300,932 |
|
|
|
|
|
|
|
|
||
|
|
|
|
|
|
|
|
|
|
Principal |
|
|
|
Value |
|
||
|
|
|
|
|
||||
|
|
|
|
Illinois - 3.12% |
|
|
|
|
|
$ |
225,000 |
|
Illinois Financial Authority, |
|
$ |
268,592 |
|
|
|
100,000 |
|
Illinois Financing Authority, |
|
|
102,012 |
|
|
|
|
|
Railsplitter Tobacco Settlement |
|
|
|
|
|
|
750,000 |
|
5.000%, 06/01/2018 |
|
|
867,360 |
|
|
|
500,000 |
|
6.250%, 06/01/2024 |
|
|
559,055 |
|
|
|
500,000 |
|
University of Illinois, Series C, |
|
|
570,070 |
|
|
|
|
|
|
|
|
||
|
|
|
|
|
|
|
2,367,089 |
|
|
|
|
|
|
|
|
||
|
|
|
|
Indiana - 3.50% |
|
|
|
|
|
|
500,000 |
|
Fishers Industry Redevelopment |
|
|
552,400 |
|
|
|
|
|
Indiana Financing Authority, |
|
|
|
|
|
|
145,000 |
|
5.000%, 07/01/2035 |
|
|
152,347 |
|
|
|
295,000 |
|
5.000%, 07/01/2040 |
|
|
305,021 |
|
|
|
500,000 |
|
Indiana State Finance Authority, |
|
|
608,450 |
|
|
|
400,000 |
|
Sheridan Community School’s |
|
|
463,536 |
|
|
|
500,000 |
|
Tri-Creek Middle School Building |
|
|
568,700 |
|
|
|
|
|
|
|
|
||
|
|
|
|
|
|
|
2,650,454 |
|
|
|
|
|
|
|
|
||
|
|
|
|
Iowa - 1.37% |
|
|
|
|
|
|
400,000 |
|
Iowa Board of Regents, |
|
|
406,588 |
|
|
|
600,000 |
|
Iowa Finance Authority Pollution |
|
|
632,832 |
|
|
|
|
|
|
|
|
||
|
|
|
|
|
|
|
1,039,420 |
|
|
|
|
|
|
|
|
||
See notes to financial statements.
80
|
|
|
GuideMarkSM Tax-Exempt Fixed Income Fund |
|
SCHEDULE OF INVESTMENTS (Continued) |
|
March 31, 2013 |
|
|
|
|
|
|
|
|
|
|
Principal |
|
|
|
Value |
|
||
|
|
|
|
|
||||
|
|
|
|
MUNICIPAL DEBT OBLIGATIONS (Continued) |
|
|
|
|
|
|
|
|
Kansas - 0.46% |
|
|
|
|
|
$ |
530,000 |
|
Wyandotte County/Kansas City |
|
$ |
350,547 |
|
|
|
|
|
|
|
|
||
|
|
|
|
Kentucky - 0.67% |
|
|
|
|
|
|
500,000 |
|
Pikeville Hospital, Revenue Bond, |
|
|
504,380 |
|
|
|
|
|
|
|
|
||
|
|
|
|
Louisiana - 2.61% |
|
|
|
|
|
|
800,000 |
|
Louisiana Citizens Property, |
|
|
988,528 |
|
|
|
500,000 |
|
Louisiana Public Facilities Authority, |
|
|
655,055 |
|
|
|
300,000 |
|
St. Charles Parish Louisana Gulf, |
|
|
329,667 |
|
|
|
|
|
|
|
|
||
|
|
|
|
|
|
|
1,973,250 |
|
|
|
|
|
|
|
|
||
|
|
|
|
Maryland - 2.64% |
|
|
|
|
|
|
325,000 |
|
Anne Arundel County, |
|
|
353,854 |
|
|
|
600,000 |
|
Maryland Department of |
|
|
711,588 |
|
|
|
400,000 |
|
Maryland Student Housing Economic |
|
|
430,588 |
|
|
|
250,000 |
|
Montgomery County Public |
|
|
251,008 |
|
|
|
250,000 |
|
Prince George’s County, Series B, |
|
|
254,297 |
|
|
|
|
|
|
|
|
||
|
|
|
|
|
|
|
2,001,335 |
|
|
|
|
|
|
|
|
||
|
|
|
|
Massachusetts - 4.08% |
|
|
|
|
|
|
430,000 |
|
Massachusetts Development Finance |
|
|
440,569 |
|
|
|
|
|
|
|
|
|
|
|
Principal |
|
|
|
Value |
|
||
|
|
|
|
|
||||
|
|
|
|
Massachusetts (Continued) |
|
|
|
|
|
|
|
|
Massachusetts Health & Educational |
|
|
|
|
|
$ |
500,000 |
|
5.000%, 12/15/2029 |
|
$ |
587,775 |
|
|
|
785,000 |
|
5.500%, 11/15/2036 |
|
|
937,165 |
|
|
|
500,000 |
|
Massachusetts Health & Educational |
|
|
568,085 |
|
|
|
500,000 |
|
Massachusetts, Series D, |
|
|
558,880 |
|
|
|
|
|
|
|
|
||
|
|
|
|
|
|
|
3,092,474 |
|
|
|
|
|
|
|
|
||
|
|
|
|
Minnesota - 2.29% |
|
|
|
|
|
|
700,000 |
|
Minneapolis & St. Paul Housing |
|
|
746,270 |
|
|
|
250,000 |
|
Minnesota Trunk Highway, |
|
|
315,575 |
|
|
|
560,000 |
|
Rochester Health Care Facilities |
|
|
671,815 |
|
|
|
|
|
|
|
|
||
|
|
|
|
|
|
|
1,733,660 |
|
|
|
|
|
|
|
|
||
|
|
|
|
Missouri - 4.09% |
|
|
|
|
|
|
810,000 |
|
Hannibal Industrial Development |
|
|
834,721 |
|
|
|
250,000 |
|
Missouri Board of Public Buildings, |
|
|
250,333 |
|
|
|
500,000 |
|
Missouri Health & Educational |
|
|
576,855 |
|
|
|
500,000 |
|
Missouri Highway & Transportation |
|
|
562,900 |
|
See notes to financial statements.
81
|
|
|
GuideMarkSM Tax-Exempt Fixed Income Fund |
|
SCHEDULE OF INVESTMENTS (Continued) |
|
March 31, 2013 |
|
|
|
|
|
|
|
|
|
|
Principal |
|
|
|
Value |
|
||
|
|
|
|
|
||||
|
|
|
|
MUNICIPAL DEBT OBLIGATIONS (Continued) |
|
|
|
|
|
|
|
|
Missouri (Continued) |
|
|
|
|
|
$ |
250,000 |
|
Sikeston Electric, Refunding, |
|
$ |
284,885 |
|
|
|
500,000 |
|
St. Louis Airport, Revenue Bond, |
|
|
588,155 |
|
|
|
|
|
|
|
|
||
|
|
|
|
|
|
|
3,097,849 |
|
|
|
|
|
|
|
|
||
|
|
|
|
Nebraska - 0.77% |
|
|
|
|
|
|
500,000 |
|
Omaha Public Power Distributors, |
|
|
587,185 |
|
|
|
|
|
|
|
|
||
|
|
|
|
New Hampshire - 0.18% |
|
|
|
|
|
|
120,000 |
|
New Hampshire Health & |
|
|
133,404 |
|
|
|
|
|
|
|
|
||
|
|
|
|
New Jersey - 3.02% |
|
|
|
|
|
|
500,000 |
|
New Jersey State Transportation |
|
|
630,885 |
|
|
|
500,000 |
|
New Jersey State Transportation |
|
|
541,540 |
|
|
|
340,000 |
|
New Jersey Transportation Trust |
|
|
405,970 |
|
|
|
315,000 |
|
New Jersey Turnpike Authority, |
|
|
344,475 |
|
|
|
300,000 |
|
New Jersey Turnpike Authority, |
|
|
363,027 |
|
|
|
|
|
|
|
|
||
|
|
|
|
|
|
|
2,285,897 |
|
|
|
|
|
|
|
|
||
|
|
|
|
New York - 9.27% |
|
|
|
|
|
|
325,000 |
|
Brooklyn Arena Local Development |
|
|
397,231 |
|
|
|
|
|
|
|
|
|
|
|
Principal |
|
|
|
Value |
|
||
|
|
|
|
|
||||
|
|
|
|
New York (Continued) |
|
|
|
|
|
$ |
500,000 |
|
Build NYC Resource Corp., |
|
$ |
593,880 |
|
|
|
480,000 |
|
Hudson Yards Infrastructure Corp., |
|
|
559,426 |
|
|
|
1,000,000 |
|
Metropolitan Transportation Authority, |
|
|
1,075,740 |
|
|
|
95,000 |
|
Nassau County Local Economic |
|
|
110,437 |
|
|
|
40,000 |
|
New York City Industrial |
|
|
43,874 |
|
|
|
500,000 |
|
New York City Transitional Financing |
|
|
497,650 |
|
|
|
325,000 |
|
New York Dormitory Authority, |
|
|
362,443 |
|
|
|
300,000 |
|
New York Dormitory Authority, |
|
|
316,848 |
|
|
|
250,000 |
|
New York Dormitory Authority, |
|
|
290,313 |
|
|
|
500,000 |
|
New York Environmental Facilities, |
|
|
671,670 |
|
|
|
900,000 |
|
New York, GO, |
|
|
1,043,757 |
|
|
|
500,000 |
|
New York, Series E, GO, |
|
|
550,490 |
|
|
|
500,000 |
|
Tobacco Settlement Financing, |
|
|
503,925 |
|
|
|
|
|
|
|
|
||
|
|
|
|
|
|
|
7,017,684 |
|
|
|
|
|
|
|
|
||
See notes to financial statements.
82
|
|
|
GuideMarkSM Tax-Exempt Fixed Income Fund |
|
SCHEDULE OF INVESTMENTS (Continued) |
|
March 31, 2013 |
|
|
|
|
|
|
|
|
|
|
Principal |
|
|
|
Value |
|
||
|
|
|
|
|
||||
|
|
|
|
MUNICIPAL DEBT OBLIGATIONS (Continued) |
|
|
|
|
|
|
|
|
North Carolina - 2.23% |
|
|
|
|
|
$ |
500,000 |
|
North Carolina Capital Facilities |
|
$ |
580,660 |
|
|
|
500,000 |
|
North Carolina, Series C, |
|
|
614,665 |
|
|
|
400,000 |
|
Wake County, Series C, |
|
|
496,620 |
|
|
|
|
|
|
|
|
||
|
|
|
|
|
|
|
1,691,945 |
|
|
|
|
|
|
|
|
||
|
|
|
|
North Dakota - 0.75% |
|
|
|
|
|
|
500,000 |
|
University of North Dakota, |
|
|
570,280 |
|
|
|
|
|
|
|
|
||
|
|
|
|
Ohio - 2.15% |
|
|
|
|
|
|
500,000 |
|
Buckeye Tobacco Settlement |
|
|
450,380 |
|
|
|
500,000 |
|
Ohio Air Quality Development |
|
|
597,635 |
|
|
|
500,000 |
|
Ohio Higher Education Facilities |
|
|
583,505 |
|
|
|
|
|
|
|
|
||
|
|
|
|
|
|
|
1,631,520 |
|
|
|
|
|
|
|
|
||
|
|
|
|
Oregon - 0.61% |
|
|
|
|
|
|
400,000 |
|
Clackamas County School |
|
|
461,004 |
|
|
|
|
|
|
|
|
||
|
|
|
|
Pennsylvania - 6.73% |
|
|
|
|
|
|
1,000,000 |
|
Allegheny County Hospital |
|
|
1,066,130 |
|
|
|
180,000 |
|
Allegheny County Industrial |
|
|
194,521 |
|
|
|
|
|
|
|
|
|
|
|
Principal |
|
|
|
Value |
|
||
|
|
|
|
|
||||
|
|
|
|
Pennsylvania (Continued) |
|
|
|
|
|
$ |
500,000 |
|
Butler County Hospital Authority, |
|
$ |
628,290 |
|
|
|
200,000 |
|
Montgomery County Industrial |
|
|
203,750 |
|
|
|
400,000 |
|
Pennsylvania Economic |
|
|
466,280 |
|
|
|
325,000 |
|
Pennsylvania Economic Development |
|
|
387,829 |
|
|
|
|
|
Pennsylvania Higher Educational |
|
|
|
|
|
|
500,000 |
|
5.250%, 07/01/2019 |
|
|
569,100 |
|
|
|
400,000 |
|
5.800%, 07/01/2030 |
|
|
455,652 |
|
|
|
250,000 |
|
Pennsylvania Higher Educational |
|
|
298,692 |
|
|
|
500,000 |
|
Philadelphia Gas Works, Refunding, |
|
|
572,170 |
|
|
|
250,000 |
|
Tioga County Industrial Development |
|
|
252,970 |
|
|
|
|
|
|
|
|
||
|
|
|
|
|
|
|
5,095,384 |
|
|
|
|
|
|
|
|
||
|
|
|
|
Puerto Rico - 1.48% |
|
|
|
|
|
|
375,000 |
|
Puerto Rico Commonwealth, |
|
|
406,223 |
|
|
|
620,000 |
|
Puerto Rico Commonwealth, |
|
|
714,221 |
|
|
|
|
|
|
|
|
||
|
|
|
|
|
|
|
1,120,444 |
|
|
|
|
|
|
|
|
||
See notes to financial statements.
83
|
|
|
GuideMarkSM Tax-Exempt Fixed Income Fund |
|
SCHEDULE OF INVESTMENTS (Continued) |
|
March 31, 2013 |
|
|
|
|
|
|
|
|
|
|
Principal |
|
|
|
Value |
|
||
|
|
|
|
|
||||
|
|
|
|
MUNICIPAL DEBT OBLIGATIONS (Continued) |
|
|
|
|
|
|
|
|
South Carolina - 0.63% |
|
|
|
|
|
$ |
450,000 |
|
South Carolina Transportation |
|
$ |
478,895 |
|
|
|
|
|
|
|
|
||
|
|
|
|
South Dakota - 0.68% |
|
|
|
|
|
|
500,000 |
|
South Dakota Housing Development |
|
|
518,495 |
|
|
|
|
|
|
|
|
||
|
|
|
|
Texas - 10.62% |
|
|
|
|
|
|
430,000 |
|
Central Texas Regional Mobility |
|
|
499,811 |
|
|
|
635,000 |
|
Clifton Texas Higher Education |
|
|
670,109 |
|
|
|
625,000 |
|
Dallas Recreational Facility |
|
|
771,344 |
|
|
|
515,000 |
|
Frisco Texas Independent School |
|
|
621,358 |
|
|
|
425,000 |
|
Harris County Industrial Development, |
|
|
466,272 |
|
|
|
500,000 |
|
Houston, GO, |
|
|
579,450 |
|
|
|
580,000 |
|
La Porte Independent School |
|
|
668,960 |
|
|
|
250,000 |
|
North Texas Tollway Authority, |
|
|
300,845 |
|
|
|
770,000 |
|
North Texas Tollway Authority, |
|
|
872,125 |
|
|
|
400,000 |
|
Texas Private Activity Surface |
|
|
498,924 |
|
|
|
|
|
|
|
|
|
|
|
Principal |
|
|
|
Value |
|
||
|
|
|
|
|
||||
|
|
|
|
Texas (Continued) |
|
|
|
|
|
$ |
445,000 |
|
Texas Private Activity Surface |
|
$ |
550,776 |
|
|
|
500,000 |
|
Texas Transportation Commission, |
|
|
583,900 |
|
|
|
|
|
Texas Transportation Commission, |
|
|
|
|
|
|
245,000 |
|
5.000%, 04/01/2020 |
|
|
303,205 |
|
|
|
155,000 |
|
5.000%, 04/01/2021 |
|
|
193,345 |
|
|
|
400,000 |
|
Texas, Series A, GO, |
|
|
463,520 |
|
|
|
|
|
|
|
|
||
|
|
|
|
|
|
|
8,043,944 |
|
|
|
|
|
|
|
|
||
|
|
|
|
Utah - 1.82% |
|
|
|
|
|
|
1,000,000 |
|
Utah Associated Municipal Power |
|
|
1,202,200 |
|
|
|
200,000 |
|
Utah Charter School Finance |
|
|
178,224 |
|
|
|
|
|
|
|
|
||
|
|
|
|
|
|
|
1,380,424 |
|
|
|
|
|
|
|
|
||
|
|
|
|
Virginia - 2.33% |
|
|
|
|
|
|
1,000,000 |
|
Henry County Public Service |
|
|
|
|
|
|
|
|
5.500%, 11/15/2019 |
|
|
1,199,420 |
|
|
|
400,000 |
|
Virginia College Building Authority |
|
|
562,040 |
|
|
|
|
|
|
|
|
||
|
|
|
|
|
|
|
1,761,460 |
|
|
|
|
|
|
|
|
||
|
|
|
|
Washington - 1.50% |
|
|
|
|
|
|
500,000 |
|
Energy Northwest Washington |
|
|
574,530 |
|
|
|
500,000 |
|
King County Hospital, Refunding, |
|
|
560,965 |
|
|
|
|
|
|
|
|
||
|
|
|
|
|
|
|
1,135,495 |
|
|
|
|
|
|
|
|
||
See notes to financial statements.
84
|
|
|
GuideMarkSM Tax-Exempt Fixed Income Fund |
|
SCHEDULE OF INVESTMENTS (Continued) |
|
March 31, 2013 |
|
|
|
|
|
|
|
|
|
|
Principal |
|
|
|
Value |
|
||
|
|
|
|
|
||||
|
|
|
|
MUNICIPAL DEBT OBLIGATIONS (Continued) |
|
|
|
|
|
|
|
|
Wisconsin - 3.15% |
|
|
|
|
|
$ |
500,000 |
|
Southeast Wisconsin Professional |
|
$ |
623,080 |
|
|
|
150,000 |
|
Wisconsin Health & Educational |
|
|
149,259 |
|
|
|
220,000 |
|
Wisconsin Public Finance Authority, |
|
|
242,207 |
|
|
|
150,000 |
|
Wisconsin Public Financing Authority, |
|
|
150,420 |
|
|
|
1,000,000 |
|
Wisconsin, Series A, Refunding, |
|
|
1,218,870 |
|
|
|
|
|
|
|
|
||
|
|
|
|
|
|
|
2,383,836 |
|
|
|
|
|
|
|
|
||
|
|
|
|
Total Municipal Debt Obligations |
|
|
73,865,744 |
|
|
|
|
|
|
|
|
||
|
|
|
|
|
|
|
|
|
|
Number |
|
|
|
Value |
|
||
|
|
|
|
|
||||
|
|
|
|
SHORT TERM INVESTMENTS - 1.62% |
|
|
|
|
|
|
|
|
Money Market Funds - 1.62% |
|
|
|
|
|
|
1,226,791 |
|
Fidelity Tax Exempt Portfolio |
|
$ |
1,226,791 |
|
|
|
|
|
|
|
|
||
|
|
|
|
Total Short Term Investments |
|
|
1,226,791 |
|
|
|
|
|
|
|
|
||
|
|
|
|
Total Investments |
|
|
75,092,535 |
|
|
|
|
|
Other Assets in Excess |
|
|
647,338 |
|
|
|
|
|
|
|
|
||
|
|
|
|
TOTAL NET |
|
$ |
75,739,873 |
|
|
|
|
|
|
|
|
||
|
|
|
|
Percentages are stated as a percent of net assets. |
|
|
(a) |
Variable Rate Security. The rate shown is the rate in effect on March 31, 2013. |
|
(b) |
Zero coupon bond. |
|
|
|
|
Glossary of Terms |
|
|
FGIC |
- Financial Guaranty Insurance Corp. |
|
FSA |
- Financial Security Assurance, Inc. |
|
GO |
- General Obligation |
|
MBIA |
- Municipal Bond Investors Assurance Corp. |
See notes to financial statements.
85
|
|
|
GuideMarkSM Opportunistic Fixed Income Fund |
|
SCHEDULE OF INVESTMENTS |
|
March 31, 2013 |
|
|
|
|
|
|
|
|
|
|
Principal |
|
|
|
Value |
|
||
|
|
|
|
|
||||
|
|
|
|
ASSET BACKED SECURITIES - 0.33% |
|
|
|
|
|
|
619,357 |
|
Diamond Resorts Owner Trust |
|
$ |
635,747 |
|
|
|
208,851 |
|
Sierra Receivables Funding Co., LLC |
|
|
214,570 |
|
|
|
|
|
|
|
|
||
|
|
|
|
Total Asset Backed Securities |
|
|
850,317 |
|
|
|
|
|
|
|
|
||
|
|
|
|
BANK LOANS - 2.39% |
|
|
|
|
|
|
85,000 |
|
Acosta, Inc. |
|
|
86,169 |
|
|
|
|
|
Alcatel-Lucent USA, Inc. |
|
|
|
|
|
|
264,025 |
|
7.250%, 01/09/2019 |
|
|
268,618 |
|
|
|
384,038 |
|
7.500%, 01/09/2019 |
|
|
497,588 |
|
|
|
74,813 |
|
AmeriForge Group, Inc. |
|
|
75,888 |
|
|
|
130,000 |
|
AmWINS Group, Inc. |
|
|
131,679 |
|
|
|
125,000 |
|
AOT Bedding Super Holdings, LLC |
|
|
126,901 |
|
|
|
140,000 |
|
Apex Tool Group, LLC |
|
|
142,187 |
|
|
|
95,519 |
|
Arch Coal, Inc. |
|
|
97,238 |
|
|
|
237,600 |
|
Ascend Performance Materials LLC |
|
|
242,946 |
|
|
|
69,825 |
|
Asurion Corporation |
|
|
70,472 |
|
|
|
168,485 |
|
Blackboard, Inc. |
|
|
170,801 |
|
|
|
174,125 |
|
Brand Energy and Infrastructure |
|
|
174,850 |
|
|
|
44,775 |
|
CPG International, Inc. |
|
|
45,195 |
|
|
|
74,813 |
|
Dematic Corp. |
|
|
75,576 |
|
|
|
79,200 |
|
DS Waters of America, Inc. |
|
|
81,576 |
|
|
|
249,236 |
|
Essar Steel Algoma, Inc. |
|
|
255,467 |
|
|
|
|
|
|
|
|
|
|
|
Principal |
|
|
|
Value |
|
||
|
|
|
|
|
||||
|
|
|
|
BANK LOANS (Continued) |
|
|
|
|
|
|
105,000 |
|
First Data Corporation |
|
$ |
105,973 |
|
|
|
69,825 |
|
FleetPride Corp. |
|
|
70,829 |
|
|
|
90,000 |
|
Fogo de Chão Churrascaria |
|
|
90,900 |
|
|
|
154,613 |
|
Getty Images, Inc. |
|
|
157,139 |
|
|
|
105,679 |
|
HarbourVest Partners |
|
|
106,471 |
|
|
|
50,000 |
|
Integra Telecom, Inc. |
|
|
50,769 |
|
|
|
327,857 |
|
NGPL PipeCo, LLC |
|
|
333,048 |
|
|
|
25,000 |
|
Nuveen Investments, Inc. |
|
|
25,484 |
|
|
|
139,650 |
|
NXP Semiconductors USA, Inc. |
|
|
143,025 |
|
|
|
90,000 |
|
Paradigm |
|
|
91,744 |
|
|
|
240,000 |
|
Patriot Coal Corporation (DIP) |
|
|
242,100 |
|
|
|
184,538 |
|
Phoenix Services, LLC |
|
|
187,306 |
|
|
|
119,400 |
|
Pinnacle Agriculture Holdings |
|
|
120,892 |
|
|
|
105,000 |
|
Rocket Software, Inc. |
|
|
104,737 |
|
|
|
105,000 |
|
Sensus Metering Systems |
|
|
106,050 |
|
|
|
89,775 |
|
Sequa Corp. |
|
|
91,309 |
|
|
|
78,803 |
|
Six3 Systems, Inc. |
|
|
79,295 |
|
|
|
175,000 |
|
SUPERVALU, Inc. |
|
|
178,297 |
|
|
|
154,613 |
|
Taminco Group Holdings |
|
|
156,449 |
|
|
|
|
|
The TriZetto Group, Inc. |
|
|
|
|
|
|
138,565 |
|
4.750%, 05/02/2018 |
|
|
139,735 |
|
|
|
35,000 |
|
8.500%, 03/27/2019 |
|
|
35,350 |
|
|
|
225,000 |
|
TI Automotive Limited |
|
|
222,750 |
|
See notes to financial statements.
86
|
|
|
GuideMarkSM Opportunistic Fixed Income Fund |
|
SCHEDULE OF INVESTMENTS (Continued) |
|
March 31, 2013 |
|
|
|
|
|
|
|
|
|
|
Principal |
|
|
|
Value |
|
||
|
|
|
|
|
||||
|
|
|
|
BANK LOANS (Continued) |
|
|
|
|
|
|
29,850 |
|
Transtar, Inc. |
|
$ |
30,447 |
|
|
|
75,587 |
|
Tronox Ltd. |
|
|
76,708 |
|
|
|
129,199 |
|
Truven Health Analytics |
|
|
131,460 |
|
|
|
64,838 |
|
Tube City IMS LLC |
|
|
65,648 |
|
|
|
49,750 |
|
United Surgical Partners |
|
|
50,279 |
|
|
|
174,789 |
|
Visant Holding Corp. |
|
|
169,946 |
|
|
|
49,875 |
|
WESCO International, Inc. |
|
|
50,430 |
|
|
|
119,700 |
|
Wilsonart International, Inc. |
|
|
121,608 |
|
|
|
|
|
|
|
|
||
|
|
|
|
Total Bank Loans |
|
|
6,079,329 |
|
|
|
|
|
|
|
|
||
|
|
|
|
COLLATERALIZED MORTGAGE |
|
|
|
|
|
|
199,689 |
|
American Home Mortgage |
|
|
160,322 |
|
|
|
|
|
Banc of America Funding Corp. |
|
|
|
|
|
|
166,796 |
|
2004-B, 2.975%, 11/20/2034 (e) |
|
|
151,972 |
|
|
|
2,251,654 |
|
2006-3, 5.750%, 03/25/2036 |
|
|
2,178,780 |
|
|
|
129,595 |
|
2008-R4, 0.654%, 07/25/2037 |
|
|
80,668 |
|
|
|
1,183,091 |
|
2007-8, 6.000%, 08/25/2037 |
|
|
1,081,327 |
|
|
|
158,128 |
|
Bank of America Mortgage |
|
|
156,110 |
|
|
|
257,134 |
|
Bear Stearns Adjustable Rate |
|
|
253,649 |
|
|
|
240,000 |
|
Bear Stearns Commercial |
|
|
244,183 |
|
|
|
122,099 |
|
Bella Vista Mortgage Trust |
|
|
94,453 |
|
|
|
|
|
|
|
|
|
|
|
Principal |
|
|
|
Value |
|
||
|
|
|
|
|
||||
|
|
|
|
COLLATERALIZED MORTGAGE |
|
|
|
|
|
|
835,000 |
|
CFCRE Commercial Mortgage Trust |
|
$ |
889,214 |
|
|
|
1,636,186 |
|
Chase Mortgage Finance Corp. |
|
|
1,452,315 |
|
|
|
|
|
CHL Mortgage Pass-Through Trust |
|
|
|
|
|
|
79,220 |
|
2004-HYB4,
2.718%, |
|
|
75,818 |
|
|
|
372,916 |
|
2004-HYB8,
3.566%, |
|
|
355,087 |
|
|
|
105,855 |
|
2005-11, 0.474%, 04/25/2035 (e) |
|
|
78,830 |
|
|
|
301,900 |
|
2005-13, 5.500%, 06/25/2035 |
|
|
303,044 |
|
|
|
863,350 |
|
Citigroup Mortgage Loan Trust |
|
|
897,330 |
|
|
|
|
|
Citimortgage Alternative Loan Trust |
|
|
|
|
|
|
189,150 |
|
2006-A3, 6.000%, 07/25/2036 |
|
|
163,500 |
|
|
|
358,476 |
|
2007-A6, 6.000%, 06/25/2037 |
|
|
311,044 |
|
|
|
|
|
Countrywide Alternative Loan Trust |
|
|
|
|
|
|
264,460 |
|
2006-J4, 6.250%, 07/25/2036 |
|
|
183,160 |
|
|
|
254,155 |
|
2007-4CB, 5.750%, 04/25/2037 |
|
|
217,044 |
|
|
|
|
|
Credit Suisse First Boston Mortgage |
|
|
|
|
|
|
69,884 |
|
2005-1, 5.250%, 05/25/2028 |
|
|
72,413 |
|
|
|
224,859 |
|
2004-AR5, 2.764%, 06/25/2034 (e) |
|
|
222,839 |
|
|
|
190,765 |
|
2005-10, 5.500%, 11/25/2035 |
|
|
167,241 |
|
|
|
237,353 |
|
Credit Suisse Mortgage Capital |
|
|
199,065 |
|
|
|
|
|
Credit Suisse Mortgage Capital |
|
|
|
|
|
|
962,338 |
|
2006-9, 6.000%, 11/25/2036 |
|
|
917,162 |
|
|
|
1,014,453 |
|
2007-1, 6.000%, 02/25/2037 |
|
|
933,604 |
|
|
|
1,255,000 |
|
Deutsche Bank - UBS Mortgage Trust |
|
|
1,337,977 |
|
|
|
381,000 |
|
Extended Stay America Trust |
|
|
397,469 |
|
See notes to financial statements.
87
|
|
|
GuideMarkSM Opportunistic Fixed Income Fund |
|
SCHEDULE OF INVESTMENTS (Continued) |
|
March 31, 2013 |
|
|
|
|
|
|
|
|
|
|
Principal |
|
|
|
Value |
|
||
|
|
|
|
|
||||
|
|
|
|
COLLATERALIZED MORTGAGE |
|
|
|
|
|
|
749,324 |
|
First Horizon Alternative Mortgage |
|
$ |
655,451 |
|
|
|
993,714 |
|
First Horizon Mortgage Pass- |
|
|
954,547 |
|
|
|
313,615 |
|
GMAC Mortgage Corp. Loan Trust |
|
|
291,147 |
|
|
|
|
|
GSR Mortgage Loan Trust |
|
|
|
|
|
|
62,197 |
|
2004-14, 3.127%, 12/25/2034 (e) |
|
|
54,587 |
|
|
|
225,492 |
|
2005-AR4, 3.045%, 07/25/2035 (e) |
|
|
208,378 |
|
|
|
280,169 |
|
2006-8F, 6.000%, 09/25/2036 |
|
|
245,230 |
|
|
|
1,606,195 |
|
2006-9F, 6.500%, 10/25/2036 |
|
|
1,460,706 |
|
|
|
845,360 |
|
2007-4F, 6.000%, 07/25/2037 |
|
|
799,842 |
|
|
|
670,304 |
|
Impac Secured Assets Trust |
|
|
433,606 |
|
|
|
1,089,658 |
|
IndyMac IMJA Mortgage Loan Trust |
|
|
966,121 |
|
|
|
|
|
IndyMac Index Mortgage Loan Trust |
|
|
|
|
|
|
1,005,724 |
|
2005-AR1, 2.659%, 03/25/2035 (e) |
|
|
977,005 |
|
|
|
59,377 |
|
2005-AR16IP,
0.524%, |
|
|
50,281 |
|
|
|
8,948,327 |
|
JPMorgan Chase Commercial |
|
|
1,187,456 |
|
|
|
|
|
Master Adjustable Rate Mortgages Trust |
|
|
|
|
|
|
1,122,284 |
|
2006-2, 2.994%, 01/25/2036 (e) |
|
|
1,075,991 |
|
|
|
514,427 |
|
2006-2, 2.990%, 04/25/2036 (e) |
|
|
478,785 |
|
|
|
147,807 |
|
MLCC Mortgage Investors, Inc. |
|
|
148,447 |
|
|
|
400,000 |
|
Morgan Stanley Capital I |
|
|
420,161 |
|
|
|
|
|
Morgan Stanley Mortgage Loan Trust |
|
|
|
|
|
|
1,593,706 |
|
2005-10, 6.000%, 12/25/2035 |
|
|
1,356,999 |
|
|
|
390,710 |
|
2006-11, 6.000%, 08/25/2036 |
|
|
355,097 |
|
|
|
200,000 |
|
Motel 6 Trust |
|
|
200,324 |
|
|
|
130,536 |
|
New York Mortgage Trust |
|
|
113,843 |
|
|
|
|
|
|
|
|
|
|
|
Principal |
|
|
|
Value |
|
||
|
|
|
|
|
||||
|
|
|
|
COLLATERALIZED MORTGAGE |
|
|
|
|
|
|
|
|
Residential Asset Securitization Trust |
|
|
|
|
|
|
418,973 |
|
2005-A8CB, 5.375%, 07/25/2035 |
|
$ |
358,400 |
|
|
|
1,488,484 |
|
2007-A2, 6.000%, 04/25/2037 |
|
|
1,341,041 |
|
|
|
1,158,682 |
|
2007-A6, 6.000%, 06/25/2037 |
|
|
1,043,562 |
|
|
|
1,451,732 |
|
2007-A7, 6.000%, 07/25/2037 |
|
|
1,192,510 |
|
|
|
203,865 |
|
Residential Funding Mortgage |
|
|
211,375 |
|
|
|
98,871 |
|
Structured Adjustable Rate |
|
|
74,253 |
|
|
|
|
|
WaMu Mortgage Pass-Through |
|
|
|
|
|
|
54,836 |
|
2006-AR17,
0.987%, |
|
|
48,834 |
|
|
|
103,708 |
|
2007-OA3,
0.937%, |
|
|
89,647 |
|
|
|
1,350,000 |
|
Wells Fargo - RBS Commercial |
|
|
1,416,394 |
|
|
|
599,161 |
|
Wells Fargo Alternative Loan Trust |
|
|
523,179 |
|
|
|
|
|
Wells Fargo Mortgage Backed |
|
|
|
|
|
|
68,696 |
|
2003-J, 4.560%, 10/25/2033 (e) |
|
|
68,866 |
|
|
|
196,779 |
|
2005-11, 5.500%, 11/25/2035 |
|
|
204,263 |
|
|
|
137,198 |
|
2005-17, 5.500%, 01/25/2036 |
|
|
142,949 |
|
|
|
1,502,382 |
|
2006-4, 5.500%, 04/25/2036 |
|
|
1,498,598 |
|
|
|
|
|
|
|
|
||
|
|
|
|
Total Collateralized Mortgage |
|
|
34,223,495 |
|
|
|
|
|
|
|
|
||
|
|
|
|
|
|
|
|
|
|
Number of |
|
|
|
|
|
|
|
|
|
|
|
|
|
|
||
|
|
|
|
COMMON STOCKS - 1.56% |
|
|
|
|
|
|
1,450 |
|
Rockwood Holdings, Inc. |
|
|
94,888 |
|
|
|
5,767 |
|
The Dow Chemical Co. |
|
|
183,621 |
|
|
|
10,808 |
|
Tronox Ltd. |
|
|
214,107 |
|
|
|
|
|
|
|
|
492,616 |
|
See notes to financial statements.
88
|
|
|
GuideMarkSM Opportunistic Fixed Income Fund |
|
SCHEDULE OF INVESTMENTS (Continued) |
|
March 31, 2013 |
|
|
|
|
|
|
|
|
|
|
Number of |
|
|
|
Value |
|
||
|
|
|
|
|
||||
|
|
|
|
COMMON STOCKS (Continued) |
|
|
|
|
|
|
|
|
Diversified Financial Services - 0.07% |
|
|
|
|
|
|
3,797 |
|
JPMorgan Chase & Co. |
|
$ |
180,205 |
|
|
|
|
|
|
|
|
||
|
|
|
|
Diversified Telecommunication Services - 0.33% |
|
|
|
|
|
|
5,886 |
|
AT&T, Inc. |
|
|
215,957 |
|
|
|
11,942 |
|
Deutsche Telekom AG - ADR |
|
|
126,347 |
|
|
|
5,482 |
|
France Telecom SA - ADR |
|
|
55,697 |
|
|
|
11,285 |
|
Telefonica SA - ADR |
|
|
152,460 |
|
|
|
5,918 |
|
Verizon Communications, Inc. |
|
|
290,870 |
|
|
|
|
|
|
|
|
||
|
|
|
|
|
|
|
841,331 |
|
|
|
|
|
|
|
|
||
|
|
|
|
Industrial Conglomerates - 0.03% |
|
|
|
|
|
|
762 |
|
Siemens AG - ADR |
|
|
82,143 |
|
|
|
|
|
|
|
|
||
|
|
|
|
Metals & Mining - 0.07% |
|
|
|
|
|
|
1,884 |
|
Barrick Gold Corp. |
|
|
55,390 |
|
|
|
1,743 |
|
Goldcorp, Inc. |
|
|
58,617 |
|
|
|
1,443 |
|
Newmont Mining Corp. |
|
|
60,447 |
|
|
|
|
|
|
|
|
||
|
|
|
|
|
|
|
174,454 |
|
|
|
|
|
|
|
|
||
|
|
|
|
Office Electronics - 0.02% |
|
|
|
|
|
|
1,139 |
|
Canon, Inc. - ADR |
|
|
41,790 |
|
|
|
|
|
|
|
|
||
|
|
|
|
Oil & Gas - 0.35% |
|
|
|
|
|
|
1,625 |
|
Chevron Corp. |
|
|
193,082 |
|
|
|
2,477 |
|
Exxon Mobil Corp. |
|
|
223,202 |
|
|
|
3,106 |
|
Royal Dutch Shell Plc - ADR |
|
|
202,387 |
|
|
|
2,856 |
|
Statoil ASA - ADR |
|
|
70,315 |
|
|
|
4,315 |
|
Total SA - ADR |
|
|
207,034 |
|
|
|
|
|
|
|
|
||
|
|
|
|
|
|
|
896,020 |
|
|
|
|
|
|
|
|
||
|
|
|
|
Pharmaceuticals - 0.14% |
|
|
|
|
|
|
2,193 |
|
Bristol Myers Squibb Co. |
|
|
90,330 |
|
|
|
2,838 |
|
GlaxoSmithKline Plc - ADR |
|
|
133,130 |
|
|
|
4,410 |
|
Pfizer, Inc. |
|
|
127,273 |
|
|
|
|
|
|
|
|
||
|
|
|
|
|
|
|
350,733 |
|
|
|
|
|
|
|
|
||
|
|
|
|
Semiconductor & Semiconductor |
|
|
|
|
|
|
1,800 |
|
KLA-Tencor Corp. |
|
|
94,932 |
|
|
|
|
|
|
|
|
||
|
|
|
|
Software - 0.05% |
|
|
|
|
|
|
4,283 |
|
Microsoft Corp. |
|
|
122,537 |
|
|
|
|
|
|
|
|
||
|
|
|
|
Textiles, Apparel & Luxury Goods - 0.03% |
|
|
|
|
|
|
1,478 |
|
NIKE, Inc. |
|
|
87,217 |
|
|
|
|
|
|
|
|
||
|
|
|
|
Tobacco - 0.11% |
|
|
|
|
|
|
4,248 |
|
Altria Group, Inc. |
|
|
146,089 |
|
|
|
1,483 |
|
Philip Morris International, Inc. |
|
|
137,489 |
|
|
|
|
|
|
|
|
||
|
|
|
|
|
|
|
283,578 |
|
|
|
|
|
|
|
|
||
|
|
|
|
|
|
|
|
|
|
Number of |
|
|
|
Value |
|
||
|
|
|
|
|
||||
|
|
|
|
Trading Companies & Distributors - 0.02% |
|
|
|
|
|
|
140 |
|
Mitsui & Co. Ltd. - ADR (a) |
|
$ |
39,060 |
|
|
|
|
|
|
|
|
||
|
|
|
|
Wireless Telecommunication Services - 0.11% |
|
|
|
|
|
|
9,708 |
|
Vodafone Group Plc - ADR |
|
|
275,804 |
|
|
|
|
|
|
|
|
||
|
|
|
|
Total Common Stocks |
|
|
3,962,420 |
|
|
|
|
|
|
|
|
||
|
|
|
|
|
|
|
|
|
|
Principal |
|
|
|
|
|
|
|
|
|
|
|
|
|
|
||
|
|
|
|
CONVERTIBLE OBLIGATIONS - 1.38% |
|
|
|
|
|
|
|
|
Auto Components - 0.11% |
|
|
|
|
|
|
140,000 |
|
TRW Automotive, Inc. |
|
|
|
|
|
|
|
|
3.500%, 12/01/2015 |
|
|
272,650 |
|
|
|
|
|
|
|
|
||
|
|
|
|
Automobiles - 0.13% |
|
|
|
|
|
|
205,000 |
|
Ford Motor Co. |
|
|
329,537 |
|
|
|
|
|
|
|
|
||
|
|
|
|
Biotechnology - 0.11% |
|
|
|
|
|
|
125,000 |
|
Gilead Sciences, Inc. |
|
|
271,563 |
|
|
|
|
|
|
|
|
||
|
|
|
|
Communications Equipment - 0.12% |
|
|
|
|
|
|
280,000 |
|
Ciena Corp. |
|
|
318,850 |
|
|
|
|
|
|
|
|
||
|
|
|
|
Computers & Peripherals - 0.26% |
|
|
|
|
|
|
185,000 |
|
EMC Corp. |
|
|
276,229 |
|
|
|
295,000 |
|
SanDisk Corp. |
|
|
381,656 |
|
|
|
|
|
|
|
|
||
|
|
|
|
|
|
|
657,885 |
|
|
|
|
|
|
|
|
||
|
|
|
|
Metals & Mining - 0.04% |
|
|
|
|
|
|
114,000 |
|
United States Steel Corp. |
|
|
115,853 |
|
|
|
|
|
|
|
|
||
|
|
|
|
Oil & Gas - 0.15% |
|
|
|
|
|
|
105,000 |
|
Chesapeake Energy Corp. |
|
|
105,656 |
|
|
|
335,000 |
|
Peabody Energy Corp. |
|
|
274,700 |
|
|
|
|
|
|
|
|
||
|
|
|
|
|
|
|
380,356 |
|
|
|
|
|
|
|
|
||
|
|
|
|
Pharmaceuticals - 0.09% |
|
|
|
|
|
|
100,000 |
|
Mylan, Inc. |
|
|
222,063 |
|
|
|
|
|
|
|
|
||
See notes to financial statements.
89
|
|
|
GuideMarkSM Opportunistic Fixed Income Fund |
|
SCHEDULE OF INVESTMENTS (Continued) |
|
March 31, 2013 |
|
|
|
|
|
|
|
|
|
|
Principal |
|
|
|
Value |
|
||
|
|
|
|
|
||||
|
|
|
|
CONVERTIBLE OBLIGATIONS (Continued) |
|
|
|
|
|
|
|
|
Semiconductor & Semiconductor |
|
|
|
|
|
|
285,000 |
|
Intel Corp. |
|
$ |
343,605 |
|
|
|
75,000 |
|
Xilinx, Inc. |
|
|
106,734 |
|
|
|
|
|
|
|
|
||
|
|
|
|
|
|
|
450,339 |
|
|
|
|
|
|
|
|
||
|
|
|
|
Software - 0.06% |
|
|
|
|
|
|
160,000 |
|
Nuance Communications, Inc. |
|
|
166,100 |
|
|
|
|
|
|
|
|
||
|
|
|
|
Textiles, Apparel & Luxury Goods - 0.13% |
|
|
|
|
|
|
300,000 |
|
Iconix Brand Group, Inc. |
|
|
334,688 |
|
|
|
|
|
|
|
|
||
|
|
|
|
Total Convertible Obligations |
|
|
3,519,884 |
|
|
|
|
|
|
|
|
||
|
|
|
|
|
|
|
|
|
|
Number of |
|
|
|
|
|
|
|
|
|
|
|
|
|
|
||
|
|
|
|
CONVERTIBLE PREFERRED STOCKS - 0.39% |
|
|
|
|
|
|
|
|
Automobiles - 0.16% |
|
|
|
|
|
|
9,570 |
|
General Motors Co. |
|
|
410,936 |
|
|
|
|
|
|
|
|
||
|
|
|
|
Metals & Mining - 0.04% |
|
|
|
|
|
|
4,750 |
|
ArcelorMittal SA (a) |
|
|
99,512 |
|
|
|
|
|
|
|
|
||
|
|
|
|
Oil & Gas - 0.08% |
|
|
|
|
|
|
200 |
|
Chesapeake Energy Corp. |
|
|
204,875 |
|
|
|
|
|
|
|
|
||
|
|
|
|
Real Estate Investment Trust - 0.11% |
|
|
|
|
|
|
5,451 |
|
iStar Financial, Inc. (a) |
|
|
282,580 |
|
|
|
|
|
|
|
|
||
|
|
|
|
Total Convertible Preferred Stocks |
|
|
997,903 |
|
|
|
|
|
|
|
|
||
|
|
|
|
|
|
|
|
|
|
Principal |
|
|
|
|
|
|
|
|
|
|
|
|
|
|
||
|
|
|
|
CORPORATE OBLIGATIONS - 17.97% |
|
|
|
|
|
|
|
|
Aerospace & Defense - 0.21% |
|
|
|
|
|
|
|
|
Meccanica Holdings USA, Inc. |
|
|
|
|
|
|
275,000 |
|
7.375%, 07/15/2039 (Acquired |
|
|
259,911 |
|
|
|
|
|
|
|
|
|
|
|
|
|
|
|
|
|
|
|
|
Principal |
|
|
|
Value |
|
||
|
|
|
|
|
||||
|
|
|
|
Aerospace & Defense (Continued) |
|
|
|
|
|
|
305,000 |
|
6.250%, 01/15/2040 (Acquired |
|
$ |
268,973 |
|
|
|
|
|
|
|
|
||
|
|
|
|
|
|
|
528,884 |
|
|
|
|
|
|
|
|
||
|
|
|
|
Airlines - 0.62% |
|
|
|
|
|
|
261,467 |
|
Delta Air Lines, Inc. |
|
|
296,112 |
|
|
|
|
|
Continental Airlines, Inc. |
|
|
|
|
|
|
135,000 |
|
6.125%, 04/29/2018 (d) |
|
|
135,675 |
|
|
|
306,483 |
|
6.545%, 08/02/2020 |
|
|
338,663 |
|
|
|
70,000 |
|
5.500%, 04/29/2022 |
|
|
73,150 |
|
|
|
85,000 |
|
4.000%, 04/29/2026 |
|
|
88,400 |
|
|
|
|
|
US Airways Group, Inc. |
|
|
|
|
|
|
415,000 |
|
5.900%, 04/01/2026 |
|
|
463,763 |
|
|
|
180,000 |
|
4.625%, 12/03/2026 |
|
|
187,650 |
|
|
|
|
|
|
|
|
||
|
|
|
|
|
|
|
1,583,413 |
|
|
|
|
|
|
|
|
||
|
|
|
|
Auto Components - 0.04% |
|
|
|
|
|
|
100,000 |
|
Goodyear Tire & Rubber Co. |
|
|
103,625 |
|
|
|
|
|
|
|
|
||
|
|
|
|
Banks - 2.07% |
|
|
|
|
|
|
200,000,000 |
|
Banco Santander Chile |
|
|
419,936 |
|
|
|
770,000 |
|
Intesa Sanpaolo SpA |
|
|
794,635 |
|
|
|
1,000,000 |
|
Halyk Savings Bank of |
|
|
1,065,000 |
|
|
|
|
|
Royal Bank of Scotland Plc |
|
|
|
|
|
|
425,000 |
|
6.125%, 12/15/2022 |
|
|
441,183 |
|
|
|
200,000 |
|
6.934%, 04/09/2018 |
|
|
277,802 |
|
|
|
500,000 |
|
Barclays Bank Plc |
|
|
704,006 |
|
|
|
430,000 |
|
Lloyds TSB Bank Plc |
|
|
610,489 |
|
|
|
335,000 |
|
Eksportfinans ASA |
|
|
315,309 |
|
See notes to financial statements.
90
|
|
|
GuideMarkSM Opportunistic Fixed Income Fund |
|
SCHEDULE OF INVESTMENTS (Continued) |
|
March 31, 2013 |
|
|
|
|
|
|
|
|
|
|
Principal |
|
|
|
Value |
|
||
|
|
|
|
|
||||
|
|
|
|
CORPORATE OBLIGATIONS (Continued) |
|
|
|
|
|
|
|
|
Banks (Continued) |
|
|
|
|
|
|
300,000 |
|
Societe Generale SA |
|
$ |
438,394 |
|
|
|
|
|
CIT Group, Inc. |
|
|
|
|
|
|
100,000 |
|
5.375%, 05/15/2020 |
|
|
110,250 |
|
|
|
100,000 |
|
5.000%, 08/15/2022 |
|
|
107,275 |
|
|
|
|
|
|
|
|
||
|
|
|
|
|
|
|
5,284,279 |
|
|
|
|
|
|
|
|
||
|
|
|
|
Business Services - 0.49% |
|
|
|
|
|
|
1,120,000 |
|
Alfa Bond Issuance Plc |
|
|
1,257,200 |
|
|
|
|
|
|
|
|
||
|
|
|
|
Capital Markets - 0.13% |
|
|
|
|
|
|
320,000 |
|
Jefferies Group LLC |
|
|
339,463 |
|
|
|
|
|
|
|
|
||
|
|
|
|
Chemicals - 0.58% |
|
|
|
|
|
|
100,000 |
|
Ashland, Inc. |
|
|
102,000 |
|
|
|
660,000 |
|
Hercules, Inc. |
|
|
613,800 |
|
|
|
520,000 |
|
Orion Engineered Carbons Finance |
|
|
527,800 |
|
|
|
|
|
Ineos Group Holdings Ltd. |
|
|
|
|
|
|
100,000 |
|
8.500%,
02/15/2016 |
|
|
102,000 |
|
|
|
100,000 |
|
7.875%, 02/15/2016 |
|
|
129,467 |
|
|
|
|
|
|
|
|
||
|
|
|
|
|
|
|
1,475,067 |
|
|
|
|
|
|
|
|
||
|
|
|
|
Commercial Services & Supplies - 0.35% |
|
|
|
|
|
|
200,000 |
|
Emergency Medical Services Corp. |
|
|
220,500 |
|
|
|
100,000 |
|
Jaguar Holding Co. I |
|
|
107,875 |
|
|
|
515,000 |
|
Steelcase, Inc. |
|
|
570,249 |
|
|
|
|
|
|
|
|
||
|
|
|
|
|
|
|
898,624 |
|
|
|
|
|
|
|
|
||
|
|
|
|
|
|
|
|
|
|
Principal |
|
|
|
Value |
|
||
|
|
|
|
|
||||
|
|
|
|
Communications - 0.09% |
|
|
|
|
|
|
200,000 |
|
Univision Communications, Inc. |
|
|
|
|
|
|
|
|
(Acquired 04/20/2011, |
|
$ |
221,000 |
|
|
|
|
|
|
|
|
||
|
|
|
|
Computers & Peripherals - 0.16% |
|
|
|
|
|
|
380,000 |
|
Hewlett Packard Co. |
|
|
394,725 |
|
|
|
|
|
|
|
|
||
|
|
|
|
Construction Materials - 0.09% |
|
|
|
|
|
|
200,000 |
|
Cemex S.A.B. de C.V. |
|
|
222,500 |
|
|
|
|
|
|
|
|
||
|
|
|
|
Consumer Finance - 0.10% |
|
|
|
|
|
|
200,000 |
|
Ally Financial, Inc. |
|
|
244,750 |
|
|
|
|
|
|
|
|
||
|
|
|
|
Diversified Financial Services - 1.09% |
|
|
|
|
|
|
230,000 |
|
Doric Nimrod Air Finance Alpha Ltd. |
|
|
247,250 |
|
|
|
600,000 |
|
General Electric Capital Corp. |
|
|
699,049 |
|
|
|
100,000 |
|
Nuveen Investments, Inc. |
|
|
105,000 |
|
|
|
675,000 |
|
Sasol Financing International PLC |
|
|
669,937 |
|
|
|
392,533 |
|
Schahin II Finance Co. SPV Ltd. |
|
|
407,253 |
|
|
|
715,000 |
|
Textron Financial Corp. |
|
|
654,225 |
|
|
|
|
|
|
|
|
||
|
|
|
|
|
|
|
2,782,714 |
|
|
|
|
|
|
|
|
||
|
|
|
|
Diversified Telecommunication Services - 0.48% |
|
|
|
|
|
|
250,000 |
|
Cricket Communications, Inc. |
|
|
250,625 |
|
See notes to financial statements.
91
|
|
|
GuideMarkSM Opportunistic Fixed Income Fund |
|
SCHEDULE OF INVESTMENTS (Continued) |
|
March 31, 2013 |
|
|
|
|
|
|
|
|
|
|
Principal |
|
|
|
Value |
|
||
|
|
|
|
|
||||
|
|
|
|
CORPORATE OBLIGATIONS (Continued) |
|
|
|
|
|
|
|
|
Diversified Telecommunication |
|
|
|
|
|
|
240,000,000 |
|
Empresa de Telecomunicaciones |
|
$ |
140,016 |
|
|
|
100,000 |
|
Frontier Communications Corp. |
|
|
102,875 |
|
|
|
710,000 |
|
Qwest Corp. |
|
|
717,450 |
|
|
|
|
|
|
|
|
||
|
|
|
|
|
|
|
1,210,966 |
|
|
|
|
|
|
|
|
||
|
|
|
|
Electrical Equipment, Instruments & |
|
|
|
|
|
|
325,000 |
|
Ingram Micro, Inc. |
|
|
341,488 |
|
|
|
|
|
|
|
|
||
|
|
|
|
Energy Equipment & Services - 0.28% |
|
|
|
|
|
|
200,000 |
|
Basic Energy Services, Inc. |
|
|
205,500 |
|
|
|
200,000 |
|
Cie Generale de Geophysique - Veritas |
|
|
207,000 |
|
|
|
580,000 |
|
Cia de Eletricidade do Estado da Bahia |
|
|
304,674 |
|
|
|
|
|
|
|
|
||
|
|
|
|
|
|
|
717,174 |
|
|
|
|
|
|
|
|
||
|
|
|
|
Food & Staples Retailing - 0.18% |
|
|
|
|
|
|
440,000 |
|
SUPERVALU, Inc. |
|
|
459,800 |
|
|
|
|
|
|
|
|
||
|
|
|
|
Food Products - 0.55% |
|
|
|
|
|
|
500,000 |
|
BRF-Brasil Foods SA |
|
|
557,500 |
|
|
|
200,000 |
|
Del Monte Corp. |
|
|
208,500 |
|
|
|
410,000 |
|
Hawk Acquisition Sub, Inc. |
|
|
411,025 |
|
|
|
|
|
|
|
|
|
|
|
Principal |
|
|
|
Value |
|
||
|
|
|
|
|
||||
|
|
|
|
Food Products (Continued) |
|
|
|
|
|
|
200,000 |
|
JBS USA, LLC/JBS USA |
|
$ |
219,500 |
|
|
|
|
|
|
|
|
||
|
|
|
|
|
|
|
1,396,525 |
|
|
|
|
|
|
|
|
||
|
|
|
|
Health Care Providers & Services - 0.17% |
|
|
|
|
|
|
200,000 |
|
Community Health Systems, Inc. |
|
|
222,500 |
|
|
|
200,000 |
|
HCA Holdings, Inc. |
|
|
221,500 |
|
|
|
|
|
|
|
|
||
|
|
|
|
|
|
|
444,000 |
|
|
|
|
|
|
|
|
||
|
|
|
|
Hotels, Restaurants & Leisure - 0.24% |
|
|
|
|
|
|
100,000 |
|
ClubCorp Club Operations, Inc. |
|
|
113,500 |
|
|
|
250,000 |
|
Caesars Entertainment Operating |
|
|
267,188 |
|
|
|
200,000 |
|
MGM Resorts International |
|
|
222,500 |
|
|
|
|
|
|
|
|
||
|
|
|
|
|
|
|
603,188 |
|
|
|
|
|
|
|
|
||
|
|
|
|
Household Products - 0.10% |
|
|
|
|
|
|
250,000 |
|
Reynolds Group Issuer LLC |
|
|
258,437 |
|
|
|
|
|
|
|
|
||
|
|
|
|
Independent Power Producers & |
|
|
|
|
|
|
|
|
Energy Future Intermediate |
|
|
|
|
|
|
360,000 |
|
10.000%, 12/01/2020 (Acquired |
|
|
406,800 |
|
|
|
630,000 |
|
11.750%, 03/01/2022 (Acquired |
|
|
727,650 |
|
|
|
|
|
Enel Finance International NV |
|
|
|
|
|
|
200,000 |
|
6.800%,
09/15/2037 |
|
|
207,164 |
|
|
|
500,000 |
|
6.000%, 10/07/2039 (Acquired |
|
|
477,383 |
|
|
|
|
|
|
|
|
||
|
|
|
|
|
|
|
1,818,997 |
|
|
|
|
|
|
|
|
||
See notes to financial statements.
92
|
|
|
GuideMarkSM Opportunistic Fixed Income Fund |
|
SCHEDULE OF INVESTMENTS (Continued) |
|
March 31, 2013 |
|
|
|
|
|
|
|
|
|
|
Principal |
|
|
|
Value |
|
||
|
|
|
|
|
||||
|
|
|
|
CORPORATE OBLIGATIONS (Continued) |
|
|
|
|
|
|
|
|
Insurance - 0.47% |
|
|
|
|
|
|
500,000 |
|
AXA SA |
|
$ |
498,750 |
|
|
|
550,000 |
|
Metlife Capital Trust IV |
|
|
694,375 |
|
|
|
|
|
|
|
|
||
|
|
|
|
|
|
|
1,193,125 |
|
|
|
|
|
|
|
|
||
|
|
|
|
Internet Software & Services - 0.04% |
|
|
|
|
|
|
100,000 |
|
Equinix, Inc. |
|
|
101,750 |
|
|
|
|
|
|
|
|
||
|
|
|
|
Investment Companies - 0.04% |
|
|
|
|
|
|
100,000 |
|
PBF Holding Co. LLC / PBF |
|
|
|
|
|
|
|
|
8.250%, 02/15/2020 |
|
|
110,500 |
|
|
|
|
|
|
|
|
||
|
|
|
|
Machinery - 0.08% |
|
|
|
|
|
|
200,000 |
|
Navistar International Corp. |
|
|
204,750 |
|
|
|
|
|
|
|
|
||
|
|
|
|
Media - 0.44% |
|
|
|
|
|
|
150,000 |
|
DISH DBS Corp. |
|
|
167,437 |
|
|
|
100,000 |
|
Nara Cable Funding Ltd. |
|
|
105,250 |
|
|
|
|
|
Clear Channel Communications, Inc. |
|
|
|
|
|
|
510,000 |
|
5.500%, 09/15/2014 |
|
|
502,350 |
|
|
|
200,000 |
|
9.000%, 03/01/2021 |
|
|
187,750 |
|
|
|
|
|
Clear Channel Worldwide Holdings, Inc. |
|
|
|
|
|
|
50,000 |
|
7.625%, 03/15/2020 |
|
|
52,438 |
|
|
|
100,000 |
|
6.500%,
11/15/2022 |
|
|
106,000 |
|
|
|
|
|
|
|
|
||
|
|
|
|
|
|
|
1,121,225 |
|
|
|
|
|
|
|
|
||
|
|
|
|
Metals & Mining - 1.30% |
|
|
|
|
|
|
405,000 |
|
AngloGold Ashanti Holdings PLC |
|
|
411,305 |
|
|
|
|
|
|
|
|
|
|
|
Principal |
|
|
|
Value |
|
||
|
|
|
|
|
||||
|
|
|
|
Metals & Mining (Continued) |
|
|
|
|
|
|
335,000 |
|
ArcelorMittal SA |
|
$ |
334,317 |
|
|
|
250,000 |
|
FMG Resources Ltd. |
|
|
263,750 |
|
|
|
520,000 |
|
IAMGOLD Corp. |
|
|
503,100 |
|
|
|
200,000 |
|
Inmet Mining Corp. |
|
|
223,000 |
|
|
|
315,000 |
|
New Gold, Inc. |
|
|
331,538 |
|
|
|
380,000 |
|
Newcrest Finance Ltd. |
|
|
395,589 |
|
|
|
435,000 |
|
Samarco Mineracao SA |
|
|
424,342 |
|
|
|
430,000 |
|
Xstrata Finance Canada Ltd. |
|
|
418,409 |
|
|
|
|
|
|
|
|
||
|
|
|
|
|
|
|
3,305,350 |
|
|
|
|
|
|
|
|
||
|
|
|
|
Multi-Utilities - 0.15% |
|
|
|
|
|
|
200,000 |
|
Intergen NV |
|
|
197,500 |
|
|
|
250,000 |
|
Texas Competitive Electric |
|
|
188,125 |
|
|
|
|
|
|
|
|
||
|
|
|
|
|
|
|
385,625 |
|
|
|
|
|
|
|
|
||
See notes to financial statements.
93
|
|
|
GuideMarkSM Opportunistic Fixed Income Fund |
|
SCHEDULE OF INVESTMENTS (Continued) |
|
March 31, 2013 |
|
|
|
|
|
|
|
|
|
|
Principal |
|
|
|
Value |
|
||
|
|
|
|
|
||||
|
|
|
|
CORPORATE OBLIGATIONS (Continued) |
|
|
|
|
|
|
|
|
Office Equipment - 0.09% |
|
|
|
|
|
|
200,000 |
|
CDW LLC / CDW Finance Corp. |
|
$ |
224,250 |
|
|
|
|
|
|
|
|
||
|
|
|
|
Oil & Gas - 3.42% |
|
|
|
|
|
|
200,000 |
|
Chesapeake Energy Corp. |
|
|
213,750 |
|
|
|
305,000 |
|
Connacher Oil & Gas Ltd. |
|
|
203,588 |
|
|
|
375,000 |
|
Halcon Resources Corp. |
|
|
416,250 |
|
|
|
250,000 |
|
Linn Energy LLC |
|
|
269,375 |
|
|
|
345,000 |
|
Newfield Exploration Co. |
|
|
357,075 |
|
|
|
800,000 |
|
OGX Petroleo & Gas Participacoes SA |
|
|
606,000 |
|
|
|
200,000 |
|
Offshore Group Investment Ltd. |
|
|
213,000 |
|
|
|
88,000 |
|
Petroleos Mexicanos |
|
|
810,787 |
|
|
|
250,000 |
|
Plains Exploration & Production Co. |
|
|
276,250 |
|
|
|
200,000 |
|
Quicksilver Resources, Inc. |
|
|
185,000 |
|
|
|
450,000 |
|
Rosneft Oil Co. via Rosneft |
|
|
447,187 |
|
|
|
|
|
|
|
|
|
|
|
Principal |
|
|
|
Value |
|
||
|
|
|
|
|
||||
|
|
|
|
Oil & Gas (Continued) |
|
|
|
|
|
|
200,000 |
|
Samson Investment Co. |
|
$ |
213,500 |
|
|
|
4,650,000 |
|
Petroleos de Venezuela SA |
|
|
4,487,250 |
|
|
|
|
|
|
|
|
||
|
|
|
|
|
|
|
8,699,012 |
|
|
|
|
|
|
|
|
||
|
|
|
|
Pipelines - 0.22% |
|
|
|
|
|
|
400,000 |
|
IFM US Colonial Pipeline 2 LLC |
|
|
449,899 |
|
|
|
100,000 |
|
Sabine Pass Liquefaction LLC |
|
|
103,875 |
|
|
|
|
|
|
|
|
||
|
|
|
|
|
|
|
553,774 |
|
|
|
|
|
|
|
|
||
|
|
|
|
Publishing - 0.07% |
|
|
|
|
|
|
200,000 |
|
Visant Corp. |
|
|
183,500 |
|
|
|
|
|
|
|
|
||
|
|
|
|
Real Estate - 0.09% |
|
|
|
|
|
|
215,000 |
|
CBRE Services, Inc. |
|
|
218,494 |
|
|
|
|
|
|
|
|
||
|
|
|
|
Semiconductor & Semiconductor |
|
|
|
|
|
|
250,000 |
|
Abengoa Finance SAU |
|
|
245,000 |
|
|
|
200,000 |
|
Freescale Semiconductor, Inc. |
|
|
212,500 |
|
|
|
|
|
Micron Technology, Inc. |
|
|
|
|
|
|
210,000 |
|
3.125%,
05/01/2032 (Acquired |
|
|
263,025 |
|
|
|
205,000 |
|
1.875%, 08/01/2031 |
|
|
240,363 |
|
|
|
|
|
|
|
|
||
|
|
|
|
|
|
|
960,888 |
|
|
|
|
|
|
|
|
||
|
|
|
|
Software - 0.10% |
|
|
|
|
|
|
|
|
First Data Corp. |
|
|
|
|
|
|
150,000 |
|
8.250%,
01/15/2021 (Acquired |
|
|
156,750 |
|
|
|
100,000 |
|
12.625%, 01/15/2021 |
|
|
108,875 |
|
|
|
|
|
|
|
|
||
|
|
|
|
|
|
|
265,625 |
|
|
|
|
|
|
|
|
||
See notes to financial statements.
94
|
|
|
GuideMarkSM Opportunistic Fixed Income Fund |
|
SCHEDULE OF INVESTMENTS (Continued) |
|
March 31, 2013 |
|
|
|
|
|
|
|
|
|
|
Principal |
|
|
|
Value |
|
||
|
|
|
|
|
||||
|
|
|
|
CORPORATE OBLIGATIONS (Continued) |
|
|
|
|
|
|
|
|
Telecommunication Services - 1.12% |
|
|
|
|
|
|
300,000 |
|
Colombia Telecomunicaciones SA ESP |
|
$ |
301,500 |
|
|
|
200,000 |
|
Digicel Group Ltd. |
|
|
213,000 |
|
|
|
250,000 |
|
Intelsat Jackson Holdings SA |
|
|
279,375 |
|
|
|
585,000 |
|
Alcatel-Lucent USA, Inc. |
|
|
453,375 |
|
|
|
200,000 |
|
Lynx II Corp. |
|
|
210,500 |
|
|
|
375,000 |
|
Telecom Italia Capital SA |
|
|
350,010 |
|
|
|
100,000 |
|
West Corp. |
|
|
107,000 |
|
|
|
250,000 |
|
Wind Acquisition Finance SA |
|
|
266,250 |
|
|
|
100,000 |
|
Nokia Siemens Networks Finance BV |
|
|
130,509 |
|
|
|
100,000 |
|
UPC Holding B.V. |
|
|
128,345 |
|
|
|
|
|
Telefonica Emisiones SAU |
|
|
|
|
|
|
75,000 |
|
7.045%, 06/20/2036 |
|
|
80,888 |
|
|
|
200,000 |
|
5.597%, 03/12/2020 |
|
|
327,073 |
|
|
|
|
|
|
|
|
||
|
|
|
|
|
|
|
2,847,825 |
|
|
|
|
|
|
|
|
||
|
|
|
|
Textiles, Apparel & Luxury Goods - 0.66% |
|
|
|
|
|
|
|
|
Edcon Holdings (Proprietary) Limited |
|
|
|
|
|
|
150,000 |
|
5.683%,
06/15/2015 (Acquired |
|
|
176,896 |
|
|
|
|
|
|
|
|
|
|
|
Principal |
|
|
|
Value |
|
||
|
|
|
|
|
||||
|
|
|
|
Textiles, Apparel & Luxury Goods (Continued) |
|
|
|
|
|
|
1,120,000 |
|
9.500%,
03/01/2018 (Acquired |
|
$ |
1,120,000 |
|
|
|
300,000 |
|
9.500%,
03/01/2018 (Acquired |
|
|
384,556 |
|
|
|
|
|
|
|
|
||
|
|
|
|
|
|
|
1,681,452 |
|
|
|
|
|
|
|
|
||
|
|
|
|
Trading Companies & Distributors - 0.05% |
|
|
|
|
|
|
100,000 |
|
International Lease Finance Corp. |
|
|
122,750 |
|
|
|
|
|
|
|
|
||
|
|
|
|
Transportation - 0.16% |
|
|
|
|
|
|
200,000 |
|
CHC Helicopter SA |
|
|
213,625 |
|
|
|
|
|
CEVA Group PLC |
|
|
|
|
|
|
100,000 |
|
8.375%,
12/01/2017 |
|
|
103,500 |
|
|
|
100,000 |
|
11.500%,
04/01/2018 |
|
|
92,250 |
|
|
|
|
|
|
|
|
||
|
|
|
|
|
|
|
409,375 |
|
|
|
|
|
|
|
|
||
|
|
|
|
Trucking & Leasing - 0.10% |
|
|
|
|
|
|
|
|
Aviation Capital Group Corp. |
|
|
|
|
|
|
210,000 |
|
4.625%,
01/31/2018 |
|
|
216,886 |
|
|
|
45,000 |
|
6.750%,
04/06/2021 |
|
|
50,121 |
|
|
|
|
|
|
|
|
||
|
|
|
|
|
|
|
267,007 |
|
|
|
|
|
|
|
|
||
|
|
|
|
Wireless Telecommunication Services - 0.12% |
|
|
|
|
|
|
|
|
Sprint Nextel Corp. |
|
|
|
|
|
|
150,000 |
|
9.000%,
11/15/2018 |
|
|
185,813 |
|
|
|
100,000 |
|
7.000%,
03/01/2020 |
|
|
116,750 |
|
|
|
|
|
|
|
|
||
|
|
|
|
|
|
|
302,563 |
|
|
|
|
|
|
|
|
||
|
|
|
|
Total Corporate Obligations |
|
|
45,745,659 |
|
|
|
|
|
|
|
|
||
See notes to financial statements.
95
|
|
|
GuideMarkSM Opportunistic Fixed Income Fund |
|
SCHEDULE OF INVESTMENTS (Continued) |
|
March 31, 2013 |
|
|
|
|
|
|
|
|
|
|
Principal |
|
|
|
Value |
|
||
|
|
|
|
|
||||
|
|
|
|
FOREIGN GOVERNMENT DEBT |
|
|
|
|
|
|
810,000 |
|
Autonomous Community of |
|
$ |
819,825 |
|
|
|
|
|
Bank Negara Malaysia Monetary Notes |
|
|
|
|
|
|
690,000 |
|
0.000%, 06/11/2013 (f) |
|
|
221,492 |
|
|
|
7,170,000 |
|
0.000%, 06/20/2013 (f) |
|
|
2,299,913 |
|
|
|
380,000 |
|
0.000%, 09/05/2013 (f) |
|
|
121,141 |
|
|
|
950,000 |
|
0.000%, 11/19/2013 (f) |
|
|
301,066 |
|
|
|
810,000 |
|
0.000%, 01/09/2014 (f) |
|
|
255,514 |
|
|
|
1,050,000 |
|
Brazil Government International Bond |
|
|
555,982 |
|
|
|
|
|
Canada Government Bond |
|
|
|
|
|
|
754,000 |
|
2.250%, 08/01/2014 |
|
|
754,423 |
|
|
|
1,147,000 |
|
1.000%, 11/01/2014 |
|
|
1,129,217 |
|
|
|
1,975,000 |
|
2.750%, 09/01/2016 |
|
|
2,046,565 |
|
|
|
400,000,000 |
|
Chile Government International Bond |
|
|
919,406 |
|
|
|
|
|
Financing of Infrastructural Projects |
|
|
|
|
|
|
100,000 |
|
8.375%,
11/03/2017 |
|
|
102,375 |
|
|
|
1,180,000 |
|
7.400%,
04/20/2018 |
|
|
1,142,856 |
|
|
|
|
|
Ghana Government Bond |
|
|
|
|
|
|
2,530,000 |
|
12.390%, 04/28/2014 |
|
|
1,251,093 |
|
|
|
860,000 |
|
13.000%, 06/02/2014 |
|
|
427,958 |
|
|
|
1,470,000 |
|
14.990%, 02/23/2015 |
|
|
730,106 |
|
|
|
1,630,000 |
|
24.000%, 05/25/2015 |
|
|
940,395 |
|
|
|
325,000 |
|
Italy Buoni Poliennali Del Tesoro |
|
|
443,119 |
|
|
|
736,000,000 |
|
Korea Treasury Bond |
|
|
670,359 |
|
|
|
|
|
Malaysia Government Bond |
|
|
|
|
|
|
470,000 |
|
3.210%, 05/31/2013 |
|
|
151,821 |
|
|
|
3,610,000 |
|
5.094%, 04/30/2014 |
|
|
1,191,290 |
|
|
|
|
|
Mexican Bonos |
|
|
|
|
|
|
15,090 |
|
9.000%, 06/20/2013 |
|
|
123,599 |
|
|
|
214,500 |
|
8.000%, 12/19/2013 |
|
|
1,786,560 |
|
|
|
|
|
|
|
|
|
|
|
Principal |
|
|
|
Value |
|
||
|
|
|
|
|
||||
|
|
|
|
FOREIGN GOVERNMENT DEBT |
|
|
|
|
|
|
185,600 |
|
6.000%, 06/18/2015 |
|
$ |
1,561,174 |
|
|
|
11,460 |
|
8.000%, 12/17/2015 |
|
|
101,303 |
|
|
|
2,990 |
|
6.250%, 06/16/2016 |
|
|
25,546 |
|
|
|
20,000 |
|
7.750%, 12/14/2017 |
|
|
183,421 |
|
|
|
40,000 |
|
8.500%, 12/13/2018 |
|
|
384,940 |
|
|
|
|
|
Mexican Udibonos |
|
|
|
|
|
|
9,985 |
|
4.500%, 12/18/2014 |
|
|
86,022 |
|
|
|
25,506 |
|
5.000%, 06/16/2016 |
|
|
232,713 |
|
|
|
21,799 |
|
3.500%, 12/14/2017 |
|
|
196,558 |
|
|
|
13,099 |
|
4.000%, 06/13/2019 |
|
|
125,034 |
|
|
|
10,825 |
|
2.500%, 12/10/2020 |
|
|
96,414 |
|
|
|
|
|
Poland Government Bond |
|
|
|
|
|
|
5,658,000 |
|
3.980%, 01/25/2017 (e) |
|
|
1,741,698 |
|
|
|
8,783,000 |
|
5.150%, 01/25/2021 (e) |
|
|
2,676,698 |
|
|
|
1,580,000 |
|
Queensland Treasury Corp. |
|
|
|
|
|
|
|
|
5.750%, 11/21/2014 |
|
|
1,712,909 |
|
|
|
60,000 |
|
Republic of Ghana |
|
|
30,813 |
|
|
|
|
|
Republic of Hungary |
|
|
|
|
|
|
314,600,000 |
|
5.500%, 02/12/2014 |
|
|
1,336,254 |
|
|
|
373,600,000 |
|
6.750%, 08/22/2014 |
|
|
1,620,548 |
|
|
|
1,800,000 |
|
8.000%, 02/12/2015 |
|
|
8,046 |
|
|
|
8,800,000 |
|
5.500%, 02/12/2016 |
|
|
37,616 |
|
|
|
632,400,000 |
|
6.750%, 02/24/2017 |
|
|
2,798,577 |
|
|
|
440,000 |
|
4.375%, 07/04/2017 |
|
|
548,167 |
|
|
|
59,580,000 |
|
6.750%, 11/24/2017 |
|
|
264,623 |
|
|
|
150,000 |
|
5.750%, 06/11/2018 |
|
|
194,905 |
|
|
|
2,700,000 |
|
6.500%, 06/24/2019 |
|
|
11,791 |
|
|
|
2,650,000 |
|
6.375%, 03/29/2021 |
|
|
2,742,750 |
|
|
|
|
|
Republic of Iceland |
|
|
|
|
|
|
790,000 |
|
4.875%,
06/16/2016 |
|
|
843,590 |
|
|
|
200,000 |
|
5.875%,
05/11/2022 |
|
|
229,715 |
|
|
|
|
|
Republic of Ireland |
|
|
|
|
|
|
1,019,000 |
|
4.400%, 06/18/2019 |
|
|
1,377,803 |
|
|
|
220,000 |
|
5.900%, 10/18/2019 |
|
|
320,791 |
|
|
|
750,000 |
|
4.500%, 04/18/2020 |
|
|
1,008,377 |
|
|
|
2,224,000 |
|
5.000%, 10/18/2020 |
|
|
3,080,690 |
|
|
|
1,563,000 |
|
5.400%, 03/13/2025 |
|
|
2,171,735 |
|
See notes to financial statements.
96
|
|
|
GuideMarkSM Opportunistic Fixed Income Fund |
|
SCHEDULE OF INVESTMENTS (Continued) |
|
March 31, 2013 |
|
|
|
|
|
|
|
|
|
|
Principal |
|
|
|
Value |
|
||
|
|
|
|
|
||||
|
|
|
|
FOREIGN GOVERNMENT
DEBT |
|
|
|
|
|
|
|
|
Republic of Korea |
|
|
|
|
|
|
1,310,000,000 |
|
3.750%, 06/10/2013 |
|
$ |
1,180,202 |
|
|
|
9,845,000,000 |
|
3.000%, 12/10/2013 |
|
|
8,880,321 |
|
|
|
570,000 |
|
Republic of Portugal |
|
|
|
|
|
|
|
|
3.850%, 04/15/2021 |
|
|
626,421 |
|
|
|
1,060,000 |
|
Republic of Serbia |
|
|
1,177,925 |
|
|
|
|
|
Serbia Treasury Bonds |
|
|
|
|
|
|
55,000,000 |
|
10.000%, 03/01/2015 |
|
|
619,362 |
|
|
|
20,200,000 |
|
10.000%, 04/27/2015 |
|
|
227,004 |
|
|
|
18,170,000 |
|
10.000%, 11/08/2017 |
|
|
195,875 |
|
|
|
6,900,000 |
|
South Africa Government Bond |
|
|
799,669 |
|
|
|
|
|
Spain Government Bond |
|
|
|
|
|
|
350,000 |
|
4.300%, 10/31/2019 |
|
|
452,014 |
|
|
|
170,000 |
|
4.650%, 07/30/2025 |
|
|
206,527 |
|
|
|
|
|
Sri Lanka Government Bond |
|
|
|
|
|
|
37,900,000 |
|
11.000%, 09/01/2015 |
|
|
299,131 |
|
|
|
132,300,000 |
|
8.000%, 06/01/2016 |
|
|
960,266 |
|
|
|
16,500,000 |
|
5.800%, 07/15/2017 |
|
|
106,761 |
|
|
|
5,580,000 |
|
8.500%, 04/01/2018 |
|
|
39,334 |
|
|
|
140,000 |
|
8.500%, 06/01/2018 |
|
|
982 |
|
|
|
340,000 |
|
9.000%, 05/01/2021 |
|
|
2,301 |
|
|
|
|
|
Ukraine Government International Bond |
|
|
|
|
|
|
620,000 |
|
9.250%,
07/24/2017 |
|
|
674,312 |
|
|
|
2,300,000 |
|
7.950%,
02/23/2021 |
|
|
2,405,800 |
|
|
|
|
|
Uruguay Government International Bond |
|
|
|
|
|
|
8,877,254 |
|
4.250%, 04/05/2027 |
|
|
582,467 |
|
|
|
1,918,700 |
|
4.375%, 12/15/2028 |
|
|
128,134 |
|
|
|
27,776,448 |
|
4.375%, 12/15/2028 |
|
|
1,854,959 |
|
|
|
|
|
Uruguay Notas del Tesoro |
|
|
|
|
|
|
227,000 |
|
9.000%, 01/27/2014 |
|
|
12,036 |
|
|
|
96,000 |
|
9.750%, 06/14/2014 |
|
|
5,079 |
|
|
|
16,480,000 |
|
10.500%, 03/15/2015 |
|
|
893,299 |
|
|
|
2,105,000 |
|
10.250%, 08/22/2015 |
|
|
112,349 |
|
|
|
5,158,400 |
|
4.000%, 06/10/2020 |
|
|
308,874 |
|
|
|
|
|
|
|
|
|
|
|
Principal |
|
|
|
Value |
|
||
|
|
|
|
|
||||
|
|
|
|
FOREIGN GOVERNMENT DEBT |
|
|
|
|
|
|
278,554 |
|
2.500%, 09/27/2022 |
|
$ |
15,110 |
|
|
|
257,920 |
|
4.000%, 05/25/2025 |
|
|
16,163 |
|
|
|
|
|
|
|
|
||
|
|
|
|
Total Foreign Government Debt |
|
|
68,919,973 |
|
|
|
|
|
|
|
|
||
|
|
|
|
MORTGAGE BACKED SECURITIES - 20.03% |
|
|
|
|
|
|
|
|
Federal Home Loan Mortgage Corp. |
|
|
|
|
|
|
2,000,000 |
|
Series 3800, |
|
|
2,224,323 |
|
|
|
697,000 |
|
Series 4050, |
|
|
725,239 |
|
|
|
882,840 |
|
Series 4062, |
|
|
880,554 |
|
|
|
2,926,426 |
|
Series 267, |
|
|
3,048,293 |
|
|
|
1,968,772 |
|
Series 274, |
|
|
2,063,549 |
|
|
|
2,041,192 |
|
Series 4097, |
|
|
2,153,678 |
|
|
|
2,807,430 |
|
Series T60853, |
|
|
2,894,468 |
|
|
|
2,649,612 |
|
Series T60854, |
|
|
2,731,757 |
|
|
|
4,926,744 |
|
Series 280, |
|
|
5,135,416 |
|
|
|
2,521,199 |
|
Series 284, |
|
|
2,627,920 |
|
|
|
|
|
Federal National Mortgage Association |
|
|
|
|
|
|
2,898,007 |
|
Series 1200, |
|
|
3,032,100 |
|
|
|
1,435,961 |
|
Series 1201, |
|
|
1,533,876 |
|
|
|
2,931,700 |
|
Series 1237, |
|
|
3,067,353 |
|
|
|
1,081,345 |
|
Series 2005-56, |
|
|
1,052,452 |
|
|
|
1,121,049 |
|
Series 2011-113, |
|
|
1,140,611 |
|
|
|
1,878,574 |
|
Series 2012-63, |
|
|
1,889,113 |
|
|
|
2,000,000 |
|
Series 2011-131, |
|
|
2,363,733 |
|
|
|
1,210,726 |
|
Series 4787, |
|
|
1,253,933 |
|
See notes to financial statements.
97
|
|
|
GuideMarkSM Opportunistic Fixed Income Fund |
|
SCHEDULE OF INVESTMENTS (Continued) |
|
March 31, 2013 |
|
|
|
|
|
|
|
|
|
|
Principal |
|
|
|
Value |
|
||
|
|
|
|
|
||||
|
|
|
|
MORTGAGE BACKED |
|
|
|
|
|
|
6,213,677 |
|
Series 1209, |
|
$ |
6,459,288 |
|
|
|
1,976,478 |
|
Series 2012-125, |
|
|
2,081,907 |
|
|
|
1,133,345 |
|
Series 2013-6, |
|
|
1,132,077 |
|
|
|
|
|
Government National Mortgage |
|
|
|
|
|
|
2,482,819 |
|
Series 2010-62, |
|
|
390,843 |
|
|
|
2,582,803 |
|
Series 2011-72, |
|
|
377,120 |
|
|
|
700,000 |
|
Series 2012-40, |
|
|
751,297 |
|
|
|
|
|
|
|
|
||
|
|
|
|
Total Mortgage Backed Securities |
|
|
51,010,900 |
|
|
|
|
|
|
|
|
||
|
|
|
|
|
|
|
|
|
|
Number of |
|
|
|
|
|
|
|
|
|
|
|
|
|
|
||
|
|
|
|
PREFERRED STOCKS - 0.31% |
|
|
|
|
|
|
|
|
Consumer Finance - 0.29% |
|
|
|
|
|
|
753 |
|
Ally Financial, Inc. (Acquired |
|
|
744,717 |
|
|
|
|
|
|
|
|
||
|
|
|
|
Metal Ore Mining - 0.02% |
|
|
|
|
|
|
3,189 |
|
Cliffs Natural Resources, Inc. (a) |
|
|
59,539 |
|
|
|
|
|
|
|
|
||
|
|
|
|
Total Preferred Stocks |
|
|
804,256 |
|
|
|
|
|
|
|
|
||
|
|
|
|
|
|
|
|
|
|
Principal |
|
|
|
Value |
|
||
|
|
|
|
|
||||
|
|
|
|
SHORT TERM INVESTMENTS - 11.53% |
|
|
|
|
|
|
|
|
Foreign Treasury Bill - 1.12% |
|
|
|
|
|
|
1,320,000 |
|
Hungary Treasury Bills |
|
$ |
5,385 |
|
|
|
52,510 |
|
Mexico Cetes |
|
|
41,221 |
|
|
|
11,400,000 |
|
Serbia Treasury Bill |
|
|
118,823 |
|
|
|
|
|
Uruguay Treasury Bill |
|
|
|
|
|
|
23,827,000 |
|
0.140%, 04/26/2013 |
|
|
1,257,257 |
|
|
|
770,000 |
|
0.094%, 05/09/2013 |
|
|
40,480 |
|
|
|
6,625,000 |
|
0.060%, 05/31/2013 |
|
|
346,427 |
|
|
|
1,160,000 |
|
0.041%, 06/27/2013 |
|
|
60,266 |
|
|
|
6,809,000 |
|
0.038%, 07/05/2013 |
|
|
352,404 |
|
|
|
8,171,000 |
|
0.028%, 08/09/2013 |
|
|
420,510 |
|
|
|
4,161,000 |
|
0.023%, 09/09/2013 |
|
|
212,285 |
|
|
|
|
|
|
|
|
||
|
|
|
|
|
|
|
2,855,058 |
|
|
|
|
|
|
|
|
||
|
|
|
|
|
|
|
|
|
|
Number of |
|
|
|
|
|
|
|
|
|
|
|
|
|
|
||
|
|
|
|
Money Market Funds - 9.45% |
|
|
|
|
|
|
24,045,212 |
|
Federated Prime Obligations Fund |
|
|
24,045,212 |
|
|
|
|
|
|
|
|
||
See notes to financial statements.
98
|
|
|
GuideMarkSM Opportunistic Fixed Income Fund |
|
SCHEDULE OF INVESTMENTS (Continued) |
|
March 31, 2013 |
|
|
|
|
|
|
|
|
|
|
Principal |
|
|
|
Value |
|
||
|
|
|
|
|
||||
|
|
|
|
U.S. Government Agency Issue - 0.45% |
|
|
|
|
|
|
1,150,000 |
|
Federal Farm Credit Discount Note |
|
$ |
1,150,000 |
|
|
|
|
|
|
|
|
||
|
|
|
|
U.S. Treasury Bill - 0.51% |
|
|
|
|
|
|
1,300,000 |
|
United States Treasury Bill |
|
|
1,299,382 |
|
|
|
|
|
|
|
|
||
|
|
|
|
Total Short Term
Investments |
|
|
29,349,652 |
|
|
|
|
|
|
|
|
||
|
|
|
|
Total Investments |
|
|
245,463,788 |
|
|
|
|
|
Other Assets in
Excess |
|
|
9,171,340 |
|
|
|
|
|
|
|
|
||
|
|
|
|
TOTAL NET |
|
$ |
254,635,128 |
|
|
|
|
|
|
|
|
||
|
|
|
Percentages are stated as a percent of net assets. |
|
Principal amounts are denominated in the currency in which the security was purchased. |
|
ADR - American Depositary Receipt |
|
|
|
|
(a) |
Non-income producing. |
|
(b) |
Restricted securities as defined in Rule 144(a) under the Securities Act of 1933. Such securities are treated as liquid securities according to the Fund’s liquidity guidelines. The value of these securities total $38,271,017, which represents 15.03% of total net assets. |
|
|
|
|
(c) |
Restricted security as defined in Rule 144(a) under the Securities Act of 1933. This security is treated as an illiquid security according to the Fund’s liquidity guidelines. The value of this security is $92,250, which represents 0.04% of total net assets. |
|
(d) |
Restricted security as defined as a private placement. This security is treated as a liquid security according to the Fund’s liquidity quidelines. The value of this security is $135,675, which represents 0.05% of total net assets. |
|
(e) |
Variable rate security. The rate shown is the rate in effect on March 31, 2013. |
|
(f) |
Zero coupon bond. |
|
(g) |
Partially assigned as collateral for certain futures contracts. |
|
(h) |
Represents an interest-only security that entitles holders to receive only interest payments on the underlying mortgages. The yield-to-maturity of an interest-only security is extremely sensitive to the rate of principal payments on the underlying mortgage assets. A rapid (slow) rate of principal repayments may have an adverse (positive) effect on yield to maturity. The principal amount shown is the notional amount of the underlying mortgages. Interest rate disclosed represents yield upon the estimated timing and amount of future cash flows at March 31, 2013. The securities are liquid and the value of these securities total $1,955,419, which represents 0.77% of total net assets. |
See notes to financial statements.
99
|
|
|
GuideMarkSM Opportunistic Fixed Income Fund |
|
SCHEDULE OF OPEN FORWARD CURRENCY CONTRACTS |
|
March 31, 2013 |
|
|
|
|
|
|
|
|
|
|
|
|
|
|
|
|
|
|
|
|
Forward |
|
Currency to be received |
|
Amount
of |
|
|
Currency
to |
|
Amount
of |
|
Unrealized |
|
|||||
|
|
|
|
|
|
|
|
|||||||||||
|
4/30/2013 |
|
Australian Dollar |
|
|
3,589,562 |
|
|
U.S. Dollars |
|
|
3,721,633 |
|
|
$ |
6,438 |
|
|
|
11/5/2013 |
|
Australian Dollar |
|
|
1,379,430 |
|
|
U.S. Dollars |
|
|
1,395,983 |
|
|
|
16,215 |
|
|
|
4/4/2013 |
|
British Pound |
|
|
597,071 |
|
|
Euro |
|
|
700,000 |
|
|
|
9,843 |
|
|
|
6/4/2013 |
|
British Pound |
|
|
180,000 |
|
|
U.S. Dollars |
|
|
268,808 |
|
|
|
4,594 |
|
|
|
4/12/2013 |
|
Chilean Peso |
|
|
1,342,012,500 |
|
|
U.S. Dollars |
|
|
2,675,997 |
|
|
|
163,695 |
|
|
|
4/17/2013 |
|
Chilean Peso |
|
|
1,884,575,000 |
|
|
U.S. Dollars |
|
|
3,713,448 |
|
|
|
271,495 |
|
|
|
4/3/2013 |
|
Euro |
|
|
390,000 |
|
|
U.S. Dollars |
|
|
499,941 |
|
|
|
2 |
|
|
|
4/4/2013 |
|
Euro |
|
|
700,000 |
|
|
British Pound |
|
|
606,080 |
|
|
|
(23,533 |
) |
|
|
4/9/2013 |
|
Euro |
|
|
397,000 |
|
|
U.S. Dollars |
|
|
515,272 |
|
|
|
(6,337 |
) |
|
|
4/10/2013 |
|
Euro |
|
|
4,283,445 |
|
|
Swedish Krone |
|
|
35,980,000 |
|
|
|
(28,521 |
) |
|
|
4/11/2013 |
|
Euro |
|
|
2,430,500 |
|
|
U.S. Dollars |
|
|
3,066,732 |
|
|
|
49,094 |
|
|
|
4/15/2013 |
|
Euro |
|
|
2,420,000 |
|
|
U.S. Dollars |
|
|
3,237,234 |
|
|
|
(134,789 |
) |
|
|
4/16/2013 |
|
Euro |
|
|
238,000 |
|
|
U.S. Dollars |
|
|
308,457 |
|
|
|
(3,339 |
) |
|
|
5/6/2013 |
|
Euro |
|
|
690,000 |
|
|
U.S. Dollars |
|
|
919,588 |
|
|
|
(34,879 |
) |
|
|
5/17/2013 |
|
Euro |
|
|
1,511,000 |
|
|
U.S. Dollars |
|
|
1,982,508 |
|
|
|
(44,964 |
) |
|
|
6/5/2013 |
|
Euro |
|
|
3,021,000 |
|
|
U.S. Dollars |
|
|
3,815,130 |
|
|
|
59,248 |
|
|
|
11/5/2013 |
|
Euro |
|
|
351,926 |
|
|
Norwegian Krone |
|
|
2,650,000 |
|
|
|
1,996 |
|
|
|
4/15/2013 |
|
Ghanaian Cedi |
|
|
120,000 |
|
|
U.S. Dollars |
|
|
61,515 |
|
|
|
(113 |
) |
|
|
4/19/2013 |
|
Ghanaian Cedi |
|
|
120,000 |
|
|
U.S. Dollars |
|
|
61,178 |
|
|
|
107 |
|
|
|
4/29/2013 |
|
Ghanaian Cedi |
|
|
100,000 |
|
|
U.S. Dollars |
|
|
50,826 |
|
|
|
(2 |
) |
|
|
4/30/2013 |
|
Ghanaian Cedi |
|
|
60,000 |
|
|
U.S. Dollars |
|
|
30,496 |
|
|
|
(17 |
) |
|
|
4/2/2013 |
|
Hungarian Forint |
|
|
35,900,000 |
|
|
U.S. Dollars |
|
|
158,779 |
|
|
|
(7,683 |
) |
|
|
4/3/2013 |
|
Hungarian Forint |
|
|
35,900,000 |
|
|
U.S. Dollars |
|
|
146,872 |
|
|
|
4,206 |
|
|
|
4/12/2013 |
|
Indian Rupee |
|
|
117,200,000 |
|
|
U.S. Dollars |
|
|
2,159,314 |
|
|
|
(9,781 |
) |
|
|
4/16/2013 |
|
Indian Rupee |
|
|
117,575,000 |
|
|
U.S. Dollars |
|
|
2,156,865 |
|
|
|
(2,301 |
) |
|
|
4/1/2013 |
|
Japanese Yen |
|
|
195,000,000 |
|
|
U.S. Dollars |
|
|
2,059,615 |
|
|
|
11,925 |
|
|
|
4/10/2013 |
|
Japanese Yen |
|
|
201,000,000 |
|
|
U.S. Dollars |
|
|
2,567,706 |
|
|
|
(432,304 |
) |
|
|
5/2/2013 |
|
Japanese Yen |
|
|
81,440,438 |
|
|
Euro |
|
|
675,000 |
|
|
|
(103 |
) |
|
|
4/22/2013 |
|
Mexican Peso |
|
|
10,200,000 |
|
|
U.S. Dollars |
|
|
820,444 |
|
|
|
3,411 |
|
|
|
8/6/2013 |
|
Mexican Peso |
|
|
1,597,390 |
|
|
U.S. Dollars |
|
|
115,456 |
|
|
|
12,306 |
|
|
|
8/8/2013 |
|
Mexican Peso |
|
|
1,605,500 |
|
|
U.S. Dollars |
|
|
118,877 |
|
|
|
9,509 |
|
|
|
10/3/2013 |
|
Mexican Peso |
|
|
22,740,000 |
|
|
U.S. Dollars |
|
|
1,707,207 |
|
|
|
101,981 |
|
|
|
10/11/2013 |
|
Mexican Peso |
|
|
18,798,000 |
|
|
U.S. Dollars |
|
|
1,414,075 |
|
|
|
80,408 |
|
|
|
12/5/2013 |
|
Mexican Peso |
|
|
15,200,710 |
|
|
U.S. Dollars |
|
|
1,134,153 |
|
|
|
68,364 |
|
|
|
3/10/2014 |
|
Mexican Peso |
|
|
11,784,520 |
|
|
U.S. Dollars |
|
|
897,048 |
|
|
|
27,324 |
|
|
|
6/18/2013 |
|
Malaysian Ringgit |
|
|
2,500,000 |
|
|
U.S. Dollars |
|
|
773,898 |
|
|
|
28,937 |
|
|
|
6/21/2013 |
|
Malaysian Ringgit |
|
|
2,167,800 |
|
|
U.S. Dollars |
|
|
676,888 |
|
|
|
19,138 |
|
|
|
9/17/2013 |
|
Malaysian Ringgit |
|
|
1,024,011 |
|
|
U.S. Dollars |
|
|
326,461 |
|
|
|
480 |
|
|
|
9/18/2013 |
|
Malaysian Ringgit |
|
|
799,497 |
|
|
U.S. Dollars |
|
|
254,479 |
|
|
|
764 |
|
|
|
9/26/2013 |
|
Malaysian Ringgit |
|
|
741,000 |
|
|
U.S. Dollars |
|
|
236,895 |
|
|
|
(442 |
) |
|
|
10/3/2013 |
|
Malaysian Ringgit |
|
|
5,330,000 |
|
|
U.S. Dollars |
|
|
1,707,567 |
|
|
|
(7,380 |
) |
|
|
12/4/2013 |
|
Malaysian Ringgit |
|
|
2,827,440 |
|
|
U.S. Dollars |
|
|
913,728 |
|
|
|
(14,683 |
) |
|
|
3/11/2014 |
|
Malaysian Ringgit |
|
|
2,414,589 |
|
|
U.S. Dollars |
|
|
761,989 |
|
|
|
1,985 |
|
|
|
3/12/2014 |
|
Malaysian Ringgit |
|
|
612,600 |
|
|
U.S. Dollars |
|
|
193,438 |
|
|
|
375 |
|
|
See notes to financial statements.
100
|
|
|
GuideMarkSM Opportunistic Fixed Income Fund |
|
SCHEDULE OF OPEN FORWARD CURRENCY CONTRACTS (Continued) |
|
March 31, 2013 |
|
|
|
|
|
|
|
|
|
|
|
|
|
|
|
|
|
|
|
|
Forward |
|
Currency to be received |
|
Amount
of |
|
|
Currency
to |
|
Amount
of |
|
Unrealized |
|
|||||
|
|
|
|
|
|
|
|
|||||||||||
|
3/26/2014 |
|
Malaysian Ringgit |
|
|
514,000 |
|
|
U.S. Dollars |
|
|
161,911 |
|
|
$ |
1,506 |
|
|
|
11/5/2013 |
|
Norwegian Krone |
|
|
11,570,000 |
|
|
Euro |
|
|
1,544,726 |
|
|
|
(19,255 |
) |
|
|
4/10/2013 |
|
Philippine Peso |
|
|
144,452,000 |
|
|
U.S. Dollars |
|
|
3,337,076 |
|
|
|
204,830 |
|
|
|
4/15/2013 |
|
Philippine Peso |
|
|
144,887,500 |
|
|
U.S. Dollars |
|
|
3,356,441 |
|
|
|
196,237 |
|
|
|
4/10/2013 |
|
Polish Zloty |
|
|
4,746,256 |
|
|
Euro |
|
|
1,104,012 |
|
|
|
40,376 |
|
|
|
4/15/2013 |
|
Polish Zloty |
|
|
4,578,308 |
|
|
Euro |
|
|
1,052,146 |
|
|
|
54,736 |
|
|
|
8/6/2013 |
|
Polish Zloty |
|
|
963,300 |
|
|
Euro |
|
|
224,792 |
|
|
|
4,494 |
|
|
|
8/8/2013 |
|
Polish Zloty |
|
|
497,150 |
|
|
Euro |
|
|
117,939 |
|
|
|
(175 |
) |
|
|
8/9/2013 |
|
Polish Zloty |
|
|
350,574 |
|
|
Euro |
|
|
82,996 |
|
|
|
88 |
|
|
|
2/24/2014 |
|
Polish Zloty |
|
|
2,950,000 |
|
|
Euro |
|
|
688,770 |
|
|
|
621 |
|
|
|
3/10/2014 |
|
Polish Zloty |
|
|
4,450,638 |
|
|
Euro |
|
|
1,040,598 |
|
|
|
(2,232 |
) |
|
|
4/10/2013 |
|
Swedish Krona |
|
|
44,055,858 |
|
|
Euro |
|
|
4,916,290 |
|
|
|
456,164 |
|
|
|
4/15/2013 |
|
Swedish Krona |
|
|
43,466,148 |
|
|
Euro |
|
|
4,812,727 |
|
|
|
497,532 |
|
|
|
10/3/2013 |
|
Swedish Krona |
|
|
7,620,000 |
|
|
Euro |
|
|
887,150 |
|
|
|
25,659 |
|
|
|
3/10/2014 |
|
Swedish Krona |
|
|
1,010,000 |
|
|
Euro |
|
|
119,913 |
|
|
|
(384 |
) |
|
|
3/28/2014 |
|
Serbian Dinar |
|
|
31,310,564 |
|
|
Euro |
|
|
259,086 |
|
|
|
(1,406 |
) |
|
|
6/5/2013 |
|
Singapore Dollar |
|
|
405,248 |
|
|
U.S. Dollars |
|
|
332,088 |
|
|
|
(5,311 |
) |
|
|
7/31/2013 |
|
Singapore Dollar |
|
|
1,428,700 |
|
|
U.S. Dollars |
|
|
1,145,251 |
|
|
|
7,010 |
|
|
|
8/1/2013 |
|
Singapore Dollar |
|
|
1,145,260 |
|
|
U.S. Dollars |
|
|
920,627 |
|
|
|
3,040 |
|
|
|
8/6/2013 |
|
Singapore Dollar |
|
|
917,603 |
|
|
U.S. Dollars |
|
|
736,912 |
|
|
|
3,160 |
|
|
|
8/13/2013 |
|
Singapore Dollar |
|
|
917,160 |
|
|
U.S. Dollars |
|
|
740,720 |
|
|
|
(987 |
) |
|
|
9/18/2013 |
|
Singapore Dollar |
|
|
1,411,379 |
|
|
U.S. Dollars |
|
|
1,128,201 |
|
|
|
10,295 |
|
|
|
10/11/2013 |
|
Singapore Dollar |
|
|
2,419,882 |
|
|
U.S. Dollars |
|
|
1,971,873 |
|
|
|
(19,706 |
) |
|
|
3/11/2014 |
|
Singapore Dollar |
|
|
1,387,980 |
|
|
U.S. Dollars |
|
|
1,115,139 |
|
|
|
5,148 |
|
|
|
4/8/2013 |
|
South Korean Won |
|
|
921,000,000 |
|
|
U.S. Dollars |
|
|
828,983 |
|
|
|
(1,702 |
) |
|
|
4/11/2013 |
|
South Korean Won |
|
|
1,286,797,500 |
|
|
U.S. Dollars |
|
|
1,182,555 |
|
|
|
(26,899 |
) |
|
|
4/15/2013 |
|
South Korean Won |
|
|
636,801,620 |
|
|
U.S. Dollars |
|
|
579,437 |
|
|
|
(7,665 |
) |
|
|
6/27/2013 |
|
South Korean Won |
|
|
606,000,000 |
|
|
U.S. Dollars |
|
|
514,890 |
|
|
|
27,177 |
|
|
|
8/27/2013 |
|
South Korean Won |
|
|
1,900,000,000 |
|
|
U.S. Dollars |
|
|
1,655,918 |
|
|
|
39,623 |
|
|
|
9/26/2013 |
|
South Korean Won |
|
|
608,000,000 |
|
|
U.S. Dollars |
|
|
535,306 |
|
|
|
6,640 |
|
|
|
3/12/2014 |
|
South Korean Won |
|
|
636,720,000 |
|
|
U.S. Dollars |
|
|
574,501 |
|
|
|
(10,501 |
) |
|
|
4/30/2013 |
|
U.S. Dollars |
|
|
3,363,466 |
|
|
Australian Dollar |
|
|
3,275,930 |
|
|
|
(38,871 |
) |
|
|
5/2/2013 |
|
U.S. Dollars |
|
|
1,743,390 |
|
|
Australian Dollar |
|
|
1,675,000 |
|
|
|
4,031 |
|
|
|
4/11/2013 |
|
U.S. Dollars |
|
|
826,430 |
|
|
British Pound |
|
|
550,000 |
|
|
|
(9,202 |
) |
|
|
6/4/2013 |
|
U.S. Dollars |
|
|
607,439 |
|
|
British Pound |
|
|
400,000 |
|
|
|
(122 |
) |
|
|
4/12/2013 |
|
U.S. Dollars |
|
|
1,348,089 |
|
|
Chilean Peso |
|
|
670,000,000 |
|
|
|
(69,628 |
) |
|
|
4/3/2013 |
|
U.S. Dollars |
|
|
511,992 |
|
|
Euro |
|
|
390,000 |
|
|
|
12,050 |
|
|
|
4/4/2013 |
|
U.S. Dollars |
|
|
459,571 |
|
|
Euro |
|
|
350,000 |
|
|
|
10,902 |
|
|
|
4/8/2013 |
|
U.S. Dollars |
|
|
746,460 |
|
|
Euro |
|
|
573,000 |
|
|
|
11,906 |
|
|
|
4/9/2013 |
|
U.S. Dollars |
|
|
1,193,702 |
|
|
Euro |
|
|
918,000 |
|
|
|
16,869 |
|
|
|
4/11/2013 |
|
U.S. Dollars |
|
|
3,882,699 |
|
|
Euro |
|
|
2,962,500 |
|
|
|
84,865 |
|
|
|
4/15/2013 |
|
U.S. Dollars |
|
|
4,260,047 |
|
|
Euro |
|
|
3,230,000 |
|
|
|
119,181 |
|
|
|
4/16/2013 |
|
U.S. Dollars |
|
|
974,193 |
|
|
Euro |
|
|
752,000 |
|
|
|
10,122 |
|
|
|
4/24/2013 |
|
U.S. Dollars |
|
|
455,002 |
|
|
Euro |
|
|
351,000 |
|
|
|
4,993 |
|
|
See notes to financial statements.
101
|
|
|
GuideMarkSM Opportunistic Fixed Income Fund |
|
SCHEDULE OF OPEN FORWARD CURRENCY CONTRACTS (Continued) |
|
March 31, 2013 |
|
|
|
|
|
|
|
|
|
|
|
|
|
|
|
|
|
|
|
|
Forward |
|
Currency to be received |
|
Amount
of |
|
|
Currency
to |
|
Amount
of |
|
Unrealized |
|
|||||
|
|
|
|
|
|
|
|
|||||||||||
|
4/26/2013 |
|
U.S. Dollars |
|
|
872,759 |
|
|
Euro |
|
|
672,000 |
|
|
$ |
11,193 |
|
|
|
5/2/2013 |
|
U.S. Dollars |
|
|
862,495 |
|
|
Euro |
|
|
675,000 |
|
|
|
(2,956 |
) |
|
|
5/3/2013 |
|
U.S. Dollars |
|
|
500,035 |
|
|
Euro |
|
|
390,000 |
|
|
|
1,754 |
|
|
|
5/6/2013 |
|
U.S. Dollars |
|
|
937,507 |
|
|
Euro |
|
|
690,000 |
|
|
|
52,798 |
|
|
|
5/17/2013 |
|
U.S. Dollars |
|
|
5,003,048 |
|
|
Euro |
|
|
3,891,000 |
|
|
|
13,648 |
|
|
|
6/5/2013 |
|
U.S. Dollars |
|
|
3,761,547 |
|
|
Euro |
|
|
3,021,000 |
|
|
|
(112,832 |
) |
|
|
6/11/2013 |
|
U.S. Dollars |
|
|
550,973 |
|
|
Euro |
|
|
434,350 |
|
|
|
(6,100 |
) |
|
|
6/13/2013 |
|
U.S. Dollars |
|
|
591,606 |
|
|
Euro |
|
|
469,000 |
|
|
|
(9,917 |
) |
|
|
7/16/2013 |
|
U.S. Dollars |
|
|
794,025 |
|
|
Euro |
|
|
648,000 |
|
|
|
(37,316 |
) |
|
|
7/18/2013 |
|
U.S. Dollars |
|
|
503,368 |
|
|
Euro |
|
|
409,000 |
|
|
|
(21,362 |
) |
|
|
7/19/2013 |
|
U.S. Dollars |
|
|
154,375 |
|
|
Euro |
|
|
125,000 |
|
|
|
(5,996 |
) |
|
|
7/22/2013 |
|
U.S. Dollars |
|
|
271,143 |
|
|
Euro |
|
|
220,000 |
|
|
|
(11,118 |
) |
|
|
7/23/2013 |
|
U.S. Dollars |
|
|
220,270 |
|
|
Euro |
|
|
178,745 |
|
|
|
(9,062 |
) |
|
|
7/30/2013 |
|
U.S. Dollars |
|
|
855,323 |
|
|
Euro |
|
|
691,917 |
|
|
|
(32,472 |
) |
|
|
7/31/2013 |
|
U.S. Dollars |
|
|
1,013,798 |
|
|
Euro |
|
|
816,000 |
|
|
|
(33,217 |
) |
|
|
8/1/2013 |
|
U.S. Dollars |
|
|
3,049,429 |
|
|
Euro |
|
|
2,478,287 |
|
|
|
(130,508 |
) |
|
|
8/2/2013 |
|
U.S. Dollars |
|
|
506,076 |
|
|
Euro |
|
|
409,000 |
|
|
|
(18,724 |
) |
|
|
8/5/2013 |
|
U.S. Dollars |
|
|
1,439,236 |
|
|
Euro |
|
|
1,123,318 |
|
|
|
(2,167 |
) |
|
|
8/6/2013 |
|
U.S. Dollars |
|
|
683,197 |
|
|
Euro |
|
|
559,081 |
|
|
|
(34,203 |
) |
|
|
8/9/2013 |
|
U.S. Dollars |
|
|
99,760 |
|
|
Euro |
|
|
80,000 |
|
|
|
(2,897 |
) |
|
|
8/15/2013 |
|
U.S. Dollars |
|
|
112,773 |
|
|
Euro |
|
|
88,500 |
|
|
|
(797 |
) |
|
|
8/16/2013 |
|
U.S. Dollars |
|
|
351,278 |
|
|
Euro |
|
|
283,000 |
|
|
|
(11,894 |
) |
|
|
8/19/2013 |
|
U.S. Dollars |
|
|
393,415 |
|
|
Euro |
|
|
319,000 |
|
|
|
(15,967 |
) |
|
|
8/20/2013 |
|
U.S. Dollars |
|
|
1,012,006 |
|
|
Euro |
|
|
816,000 |
|
|
|
(35,199 |
) |
|
|
8/23/2013 |
|
U.S. Dollars |
|
|
290,617 |
|
|
Euro |
|
|
232,085 |
|
|
|
(7,235 |
) |
|
|
9/4/2013 |
|
U.S. Dollars |
|
|
126,768 |
|
|
Euro |
|
|
100,331 |
|
|
|
(2,008 |
) |
|
|
9/11/2013 |
|
U.S. Dollars |
|
|
557,879 |
|
|
Euro |
|
|
434,350 |
|
|
|
350 |
|
|
|
9/24/2013 |
|
U.S. Dollars |
|
|
248,084 |
|
|
Euro |
|
|
191,000 |
|
|
|
2,889 |
|
|
|
9/26/2013 |
|
U.S. Dollars |
|
|
115,300 |
|
|
Euro |
|
|
89,000 |
|
|
|
1,044 |
|
|
|
10/31/2013 |
|
U.S. Dollars |
|
|
99,134 |
|
|
Euro |
|
|
76,597 |
|
|
|
762 |
|
|
|
11/8/2013 |
|
U.S. Dollars |
|
|
171,118 |
|
|
Euro |
|
|
133,000 |
|
|
|
294 |
|
|
|
11/14/2013 |
|
U.S. Dollars |
|
|
131,320 |
|
|
Euro |
|
|
100,000 |
|
|
|
2,872 |
|
|
|
11/15/2013 |
|
U.S. Dollars |
|
|
112,911 |
|
|
Euro |
|
|
88,500 |
|
|
|
(767 |
) |
|
|
11/20/2013 |
|
U.S. Dollars |
|
|
224,070 |
|
|
Euro |
|
|
175,000 |
|
|
|
(729 |
) |
|
|
12/6/2013 |
|
U.S. Dollars |
|
|
1,084,621 |
|
|
Euro |
|
|
826,000 |
|
|
|
23,381 |
|
|
|
1/7/2014 |
|
U.S. Dollars |
|
|
637,792 |
|
|
Euro |
|
|
485,308 |
|
|
|
14,048 |
|
|
|
3/3/2014 |
|
U.S. Dollars |
|
|
86,663 |
|
|
Euro |
|
|
65,866 |
|
|
|
1,957 |
|
|
|
3/7/2014 |
|
U.S. Dollars |
|
|
316,357 |
|
|
Euro |
|
|
241,782 |
|
|
|
5,401 |
|
|
|
3/10/2014 |
|
U.S. Dollars |
|
|
507,210 |
|
|
Euro |
|
|
389,341 |
|
|
|
6,461 |
|
|
|
3/17/2014 |
|
U.S. Dollars |
|
|
159,900 |
|
|
Euro |
|
|
122,880 |
|
|
|
1,846 |
|
|
|
3/18/2014 |
|
U.S. Dollars |
|
|
105,924 |
|
|
Euro |
|
|
81,594 |
|
|
|
973 |
|
|
|
3/20/2014 |
|
U.S. Dollars |
|
|
259,255 |
|
|
Euro |
|
|
200,000 |
|
|
|
1,997 |
|
|
|
3/21/2014 |
|
U.S. Dollars |
|
|
94,285 |
|
|
Euro |
|
|
72,605 |
|
|
|
893 |
|
|
|
4/2/2013 |
|
U.S. Dollars |
|
|
151,012 |
|
|
Hungarian Forint |
|
|
35,900,000 |
|
|
|
(85 |
) |
|
See notes to financial statements.
102
|
|
|
GuideMarkSM Opportunistic Fixed Income Fund |
|
SCHEDULE OF OPEN FORWARD CURRENCY CONTRACTS (Continued) |
|
March 31, 2013 |
|
|
|
|
|
|
|
|
|
|
|
|
|
|
|
|
|
|
|
|
Forward |
|
Currency to be received |
|
Amount
of |
|
|
Currency
to |
|
Amount
of |
|
Unrealized |
|
|||||
|
|
|
|
|
|
|
|
|||||||||||
|
4/1/2013 |
|
U.S. Dollars |
|
|
2,102,540 |
|
|
Japanese Yen |
|
|
195,000,000 |
|
|
$ |
31,000 |
|
|
|
4/10/2013 |
|
U.S. Dollars |
|
|
8,474,973 |
|
|
Japanese Yen |
|
|
694,608,750 |
|
|
|
1,095,526 |
|
|
|
4/15/2013 |
|
U.S. Dollars |
|
|
8,759,430 |
|
|
Japanese Yen |
|
|
706,185,270 |
|
|
|
1,256,741 |
|
|
|
2/12/2014 |
|
U.S. Dollars |
|
|
383,202 |
|
|
Japanese Yen |
|
|
35,633,000 |
|
|
|
3,305 |
|
|
|
2/13/2014 |
|
U.S. Dollars |
|
|
383,218 |
|
|
Japanese Yen |
|
|
35,430,000 |
|
|
|
5,479 |
|
|
|
2/18/2014 |
|
U.S. Dollars |
|
|
127,765 |
|
|
Japanese Yen |
|
|
11,830,000 |
|
|
|
1,629 |
|
|
|
2/19/2014 |
|
U.S. Dollars |
|
|
255,466 |
|
|
Japanese Yen |
|
|
23,630,000 |
|
|
|
3,512 |
|
|
|
2/25/2014 |
|
U.S. Dollars |
|
|
63,841 |
|
|
Japanese Yen |
|
|
5,910,000 |
|
|
|
820 |
|
|
|
2/27/2014 |
|
U.S. Dollars |
|
|
170,697 |
|
|
Japanese Yen |
|
|
15,746,000 |
|
|
|
2,786 |
|
|
|
3/19/2014 |
|
U.S. Dollars |
|
|
375,691 |
|
|
Japanese Yen |
|
|
35,670,000 |
|
|
|
(4,798 |
) |
|
|
3/24/2014 |
|
U.S. Dollars |
|
|
379,267 |
|
|
Japanese Yen |
|
|
35,843,000 |
|
|
|
(3,098 |
) |
|
|
4/22/2013 |
|
U.S. Dollars |
|
|
2,115,265 |
|
|
Mexican Peso |
|
|
26,300,000 |
|
|
|
(8,987 |
) |
|
|
8/1/2013 |
|
U.S. Dollars |
|
|
925,986 |
|
|
Singapore Dollar |
|
|
1,145,260 |
|
|
|
2,320 |
|
|
|
4/8/2013 |
|
U.S. Dollars |
|
|
845,614 |
|
|
South Korean Won |
|
|
921,000,000 |
|
|
|
18,333 |
|
|
|
4/11/2013 |
|
U.S. Dollars |
|
|
249,201 |
|
|
Swiss Franc |
|
|
235,000 |
|
|
|
1,608 |
|
|
|
|
|
|
|
|
|
|
|
|
|
|
|
|
|
|
|
||
|
|
|
|
|
|
|
|
|
|
|
|
|
|
|
$ |
3,853,087 |
|
|
|
|
|
|
|
|
|
|
|
|
|
|
|
|
|
|
|
||
|
GuideMarkSM Opportunistic Fixed Income Fund |
|
SCHEDULE OF OPEN FUTURES CONTRACTS |
|
March 31, 2013 |
|
|
|
|
|
|
|
|
|
|
|
|
|
|
|
|
|
|
|
Description |
|
|
Number
of |
|
Notional |
|
Settlement |
|
Unrealized |
|
||||||
|
|
|
|
|
|
|
|||||||||||
|
Euro-Bund Futures |
|
(19 |
) |
|
$ |
(3,543,442 |
) |
|
Jun-13 |
|
|
$ |
(53,858 |
) |
|
|
|
Euro-OATS Futures |
|
(15 |
) |
|
|
(2,615,367 |
) |
|
Jun-13 |
|
|
|
(24,253 |
) |
|
|
|
Euro Stoxx Futures |
|
(8 |
) |
|
|
(261,909 |
) |
|
Jun-13 |
|
|
|
7,494 |
|
|
|
|
S&P 500 Index Mini Futures |
|
(37 |
) |
|
|
(2,890,995 |
) |
|
Jun-13 |
|
|
|
(41,354 |
) |
|
|
|
U.S. Treasury 10-Year Note Futures |
|
(32 |
) |
|
|
(4,223,500 |
) |
|
Jun-13 |
|
|
|
(14,559 |
) |
|
|
|
U.S. Treasury Long Bond Futures |
|
(11 |
) |
|
|
(1,589,156 |
) |
|
Jun-13 |
|
|
|
(3,973 |
) |
|
|
|
|
|
|
|
|
|
|
|
|
|
|
|
|
|
|||
|
|
|
|
|
|
|
|
|
|
|
|
|
$ |
(130,503 |
) |
|
|
|
|
|
|
|
|
|
|
|
|
|
|
|
|
|
|||
See notes to financial statements.
103
|
|
|
GuideMarkSM Opportunistic Fixed Income Fund |
|
CREDIT DEFAULT SWAPS ON CORPORATE, INDICES, SOVEREIGN, AND U.S. MUNICIPAL ISSUES — BUY PROTECTION(1) |
|
March 31, 2013 |
|
|
|
|
|
|
|
|
|
|
|
|
|
|
|
|
|
|
|
|
|
|
|
|
|
|
|
Reference |
|
|
Implied |
|
Fixed |
|
Maturity |
|
Counterparty |
|
Notional |
|
Fair |
|
Upfront |
|
Unrealized |
|
||||||
|
|
|
|
|
|
|
|
|
|
|
|||||||||||||||
|
ARAMARK Corp. |
|
2.69% |
|
5.000% |
|
3/20/2018 |
|
Deutsche Bank |
|
|
$225,000 |
|
$ |
(24,136 |
) |
$ |
(21,800 |
) |
|
$ |
(2,336 |
) |
|
|
|
ARAMARK Corp. |
|
2.69% |
|
5.000% |
|
3/20/2018 |
|
Deutsche Bank |
|
|
425,000 |
|
|
(45,590 |
) |
|
(42,838 |
) |
|
|
(2,752 |
) |
|
|
|
ARAMARK Corp. |
|
2.69% |
|
5.000% |
|
3/20/2018 |
|
Deutsche Bank |
|
|
250,000 |
|
|
(26,818 |
) |
|
(24,596 |
) |
|
|
(2,222 |
) |
|
|
|
Bank of Scotland |
|
0.62% |
|
1.000% |
|
6/20/2017 |
|
Merrill Lynch |
|
|
600,000 |
|
|
(12,121 |
) |
|
25,158 |
|
|
|
(37,279 |
) |
|
|
|
Boston Scientific Corp. |
|
0.93% |
|
1.000% |
|
9/20/2017 |
|
Credit Suisse / |
|
|
725,000 |
|
|
(2,102 |
) |
|
9,787 |
|
|
|
(11,889 |
) |
|
|
|
CDX.NA.HY.19 Index |
|
4.01% |
|
5.000% |
|
12/20/2017 |
|
Deutsche Bank |
|
|
2,225,000 |
|
|
(91,140 |
) |
|
(54,491 |
) |
|
|
(36,649 |
) |
|
|
|
CDX.NA.HY.20 Index |
|
4.31% |
|
5.000% |
|
6/20/2018 |
|
Credit Suisse / |
|
|
700,000 |
|
|
(21,390 |
) |
|
(19,569 |
) |
|
|
(1,821 |
) |
|
|
|
CDX.NA.IG.19 Index |
|
0.82% |
|
1.000% |
|
12/20/2017 |
|
Citigroup / |
|
|
550,000 |
|
|
(4,607 |
) |
|
(5,106 |
) |
|
|
499 |
|
|
|
|
CDX.NA.IG.20 Index |
|
0.91% |
|
1.000% |
|
6/20/2018 |
|
Credit Suisse / |
|
|
425,000 |
|
|
(1,954 |
) |
|
(1,910 |
) |
|
|
(44 |
) |
|
|
|
Dell, Inc. |
|
3.32% |
|
1.000% |
|
3/20/2018 |
|
Merrill Lynch |
|
|
325,000 |
|
|
34,536 |
|
|
33,472 |
|
|
|
1,064 |
|
|
|
|
Dell, Inc. |
|
3.32% |
|
1.000% |
|
3/20/2018 |
|
Merrill Lynch |
|
|
525,000 |
|
|
55,788 |
|
|
55,083 |
|
|
|
705 |
|
|
|
|
Dell, Inc. |
|
3.32% |
|
5.000% |
|
3/20/2018 |
|
Deutsche Bank |
|
|
850,000 |
|
|
90,324 |
|
|
116,705 |
|
|
|
(26,381 |
) |
|
|
|
Freescale |
|
5.71% |
|
5.000% |
|
3/20/2018 |
|
Credit Suisse |
|
|
525,000 |
|
|
16,228 |
|
|
26,157 |
|
|
|
(9,929 |
) |
|
|
|
Freescale |
|
5.71% |
|
5.000% |
|
3/20/2018 |
|
Credit Suisse |
|
|
375,000 |
|
|
11,592 |
|
|
19,190 |
|
|
|
(7,598 |
) |
|
|
|
General Mills, Inc. |
|
0.45% |
|
1.000% |
|
6/20/2018 |
|
Credit Suisse |
|
|
800,000 |
|
|
(22,769 |
) |
|
(21,577 |
) |
|
|
(1,192 |
) |
|
|
|
H.J. Heinz Co. |
|
1.52% |
|
1.000% |
|
3/20/2018 |
|
Credit Suisse |
|
|
900,000 |
|
|
22,492 |
|
|
29,001 |
|
|
|
(6,509 |
) |
|
|
|
iTraxx Europe
Crossover |
|
4.20% |
|
5.000% |
|
12/20/2017 |
|
Merrill Lynch |
|
|
400,000 |
|
|
(16,457 |
) |
|
(15,661 |
) |
|
|
(796 |
) |
|
|
|
iTraxx Europe Sub |
|
2.93% |
|
5.000% |
|
12/20/2017 |
|
Credit Suisse / |
|
|
860,000 |
|
|
(99,087 |
) |
|
(143,492 |
) |
|
|
44,405 |
|
|
|
|
MeadWestvaco Corp. |
|
1.11% |
|
1.000% |
|
9/20/2017 |
|
Merrill Lynch |
|
|
300,000 |
|
|
1,471 |
|
|
3,425 |
|
|
|
(1,954 |
) |
|
|
|
Republic of South Africa |
|
1.75% |
|
1.000% |
|
3/20/2018 |
|
Citigroup |
|
|
300,000 |
|
|
10,623 |
|
|
7,341 |
|
|
|
3,282 |
|
|
|
|
Republic of South Africa |
|
1.80% |
|
1.000% |
|
6/20/2018 |
|
Merrill Lynch |
|
|
225,000 |
|
|
8,936 |
|
|
8,786 |
|
|
|
150 |
|
|
|
|
Russia Foreign Bond |
|
1.60% |
|
1.000% |
|
6/20/2018 |
|
Morgan Stanley |
|
|
1,700,000 |
|
|
51,043 |
|
|
49,313 |
|
|
|
1,730 |
|
|
|
|
SLM Corp. |
|
2.97% |
|
5.000% |
|
6/20/2018 |
|
Citigroup |
|
|
350,000 |
|
|
(33,568 |
) |
|
(34,587 |
) |
|
|
1,019 |
|
|
|
|
Textron, Inc. |
|
0.25% |
|
1.000% |
|
3/20/2017 |
|
Merrill Lynch |
|
|
250,000 |
|
|
(7,448 |
) |
|
(6,109 |
) |
|
|
(1,339 |
) |
|
|
|
Textron, Inc. |
|
0.25% |
|
1.000% |
|
3/20/2017 |
|
Morgan Stanley |
|
|
400,000 |
|
|
(11,917 |
) |
|
(9,305 |
) |
|
|
(2,612 |
) |
|
|
|
Textron, Inc. |
|
0.27% |
|
1.000% |
|
6/20/2017 |
|
Merrill Lynch |
|
|
300,000 |
|
|
(9,216 |
) |
|
(7,494 |
) |
|
|
(1,722 |
) |
|
|
|
|
|
|
|
|
|
|
|
|
|
|
|
|
|
|
|
|
||||||||
|
|
|
|
|
|
|
|
|
|
|
|
|
|
$ |
(127,287 |
) |
$ |
(25,117 |
) |
|
$ |
(102,170 |
) |
|
|
|
|
|
|
|
|
|
|
|
|
|
|
|
|
|
|
|
|
||||||||
See notes to financial statements.
104
|
|
|
GuideMarkSM Opportunistic Fixed Income Fund |
|
CREDIT DEFAULT SWAPS ON CORPORATE, SOVEREIGN, AND U.S. MUNICIPAL ISSUES — SELL PROTECTION(2) |
|
March 31, 2013 |
|
|
|
|
|
|
|
|
|
|
|
|
|
|
|
|
|
|
|
|
|
|
|
|
|
|
|
Reference |
|
|
Implied |
|
Fixed |
|
Maturity |
|
Counterparty |
|
Notional |
|
Fair |
|
Upfront |
|
Unrealized |
|
||||||
|
|
|
|
|
|
|
|
|
|
|
|||||||||||||||
|
Boyd Gaming Corp. |
|
7.02% |
|
5.000% |
|
3/20/2018 |
|
Credit Suisse |
|
|
$450,000 |
|
$ |
(38,008 |
) |
$ |
(58,668 |
) |
|
$ |
20,660 |
|
|
|
|
Boyd Gaming Corp. |
|
7.02% |
|
5.000% |
|
3/20/2018 |
|
Credit Suisse |
|
|
325,000 |
|
|
(27,450 |
) |
|
(42,020 |
) |
|
|
14,570 |
|
|
|
|
|
|
|
|
|
|
|
|
|
|
|
|
|
|
|
|
|
|
|||||||
|
|
|
|
|
|
|
|
|
|
|
|
|
|
$ |
(65,458 |
) |
$ |
(100,688 |
) |
|
$ |
35,230 |
|
|
|
|
|
|
|
|
|
|
|
|
|
|
|
|
|
|
|
|
|
|
|||||||
|
|
|
|
1) |
If the Fund is a buyer of protection and a credit event occurs, as defined under the terms of that particular swap agreement, the Fund will either (i) receive from the seller of protection an amount equal to the notional amount of the swap and take delivery of the referenced obligation or underlying securities comprising the referenced index or (ii) pay a net settlement amount in the form of cash or securities equal to the notional amount of the swap less the recovery value of the referenced obligation or underlying securities comprising the referenced index. |
|
2) |
If the Fund is a seller of protection and a credit event occurs, as defined under the terms of that particular swap agreement, the Fund will either (i) pay to the buyer of protection an amount equal to the notional amount of the swap and take delivery of the referenced obligation or underlying securities comprising the referenced index or (ii) pay a net settlement amount in the form of cash or securities equal to the notional amount of the swap less the recovery value of the referenced obligation or underlying securities comprising the referenced index. |
|
3) |
Implied credit spreads, represented in absolute terms, utilized in determining the market value of credit default swap agreements on U.S. municipal issues, corporate issues or sovereign issues of an emerging country as of period end serve as an indicator of the current status of the payment/performance risk and represent the likelihood or risk of default for the credit derivative. The implied credit spread of a particular referenced entity reflects the cost of buying/selling protection and may include upfront payments required to be made to enter into the agreement. Wider credit spreads represent a deterioration of the referenced entity’s credit soundness and a greater likelihood or risk of default or other credit event occurring as defined under the terms of the agreement. A credit spread identified as “Defaulted” indicates a credit event has occurred for the referenced entity or obligation. |
|
4) |
The maximum potential amount the Fund could be required to pay as seller of credit protection or receive as a buyer of credit protection if a credit event occurs as defined under the terms of that particular swap agreement. Notional amounts are denominated in the currency in which the security was purchased. |
See notes to financial statements.
105
|
|
|
GuidePathSM Strategic Asset Allocation Fund |
|
SCHEDULE OF INVESTMENTS |
|
March 31, 2013 |
|
|
|
|
|
|
|
|
|
|
Number of |
|
|
|
Value |
|
||
|
|
|
|
|
||||
|
|
|
|
INVESTMENT COMPANIES - 97.32% |
|
|
|
|
|
|
|
|
Affiliated Mutual Funds - 54.73% |
|
|
|
|
|
|
658,931 |
|
Altegris Macro Strategy Fund - |
|
$ |
5,759,061 |
|
|
|
1,244,155 |
|
GuideMarkSM Global Real |
|
|
11,682,616 |
|
|
|
1,657,702 |
|
GuideMarkSM Large Cap Growth |
|
|
18,566,266 |
|
|
|
2,215,495 |
|
GuideMarkSM Large Cap Value |
|
|
20,892,117 |
|
|
|
1,715,833 |
|
GuideMarkSM Opportunistic
Equity |
|
|
19,457,551 |
|
|
|
1,660,595 |
|
GuideMarkSM Small/Mid Cap
Core |
|
|
22,434,638 |
|
|
|
4,651,171 |
|
GuideMarkSM World ex-US Fund
- |
|
|
37,488,436 |
|
|
|
|
|
|
|
|
||
|
|
|
|
|
|
|
136,280,685 |
|
|
|
|
|
|
|
|
||
|
|
|
|
Exchange Traded Funds - 42.59% |
|
|
|
|
|
|
84,913 |
|
iShares Core MSCI Emerging |
|
|
4,310,184 |
|
|
|
190,482 |
|
iShares MSCI Canada Index |
|
|
5,430,642 |
|
|
|
124,543 |
|
iShares MSCI Switzerland Capped |
|
|
3,656,582 |
|
|
|
251,952 |
|
SPDR S&P 500 ETF Trust |
|
|
39,443,085 |
|
|
|
48,621 |
|
SPDR S&P 600 Small Cap |
|
|
6,864,313 |
|
|
|
53,546 |
|
SPDR S&P China ETF |
|
|
3,745,543 |
|
|
|
804,889 |
|
Vanguard FTSE All-World |
|
|
37,314,654 |
|
|
|
27,360 |
|
Vanguard Global ex-US |
|
|
1,569,917 |
|
|
|
52,736 |
|
Vanguard REIT ETF |
|
|
3,719,470 |
|
|
|
|
|
|
|
|
||
|
|
|
|
|
|
|
106,054,390 |
|
|
|
|
|
|
|
|
||
|
|
|
|
Total Investment
Companies |
|
|
242,335,075 |
|
|
|
|
|
|
|
|
||
|
|
|
|
|
|
|
|
|
|
Number of |
|
|
|
Value |
|
||
|
|
|
|
|
||||
|
|
|
|
SHORT TERM INVESTMENTS - 2.41% |
|
|
|
|
|
|
|
|
Money Market Funds - 2.41% |
|
|
|
|
|
|
5,991,979 |
|
Federated Prime Obligations Fund |
|
$ |
5,991,979 |
|
|
|
|
|
|
|
|
||
|
|
|
|
Total Short Term Investments |
|
|
5,991,979 |
|
|
|
|
|
|
|
|
||
|
|
|
|
INVESTMENTS PURCHASED |
|
|
|
|
|
|
|
|
Money Market Funds - 8.56% |
|
|
|
|
|
|
21,329,599 |
|
First American Government |
|
|
21,329,599 |
|
|
|
|
|
|
|
|
||
|
|
|
|
Total Investments
Purchased as |
|
|
21,329,599 |
|
|
|
|
|
|
|
|
||
|
|
|
|
Total Investments |
|
|
269,656,653 |
|
|
|
|
|
Liabilities in Excess
of Other |
|
|
(20,649,600 |
) |
|
|
|
|
|
|
|
||
|
|
|
|
TOTAL NET ASSETS - 100.00% |
|
$ |
249,007,053 |
|
|
|
|
|
|
|
|
||
|
|
|
|
Percentages are stated as a percent of net assets. |
|
|
(a) |
Non-income producing security. |
|
(b) |
All or portion of this security is on loan. |
See notes to financial statements.
106
|
|
|
GuidePathSM Tactical ConstrainedSM Asset Allocation Fund |
|
SCHEDULE OF INVESTMENTS |
|
March 31, 2013 |
|
|
|
|
|
|
|
|
|
|
Number of |
|
|
|
Value |
|
||
|
|
|
|
|
||||
|
|
|
|
INVESTMENT COMPANIES - 97.32% |
|
|
|
|
|
|
|
|
Affiliated Mutual Funds - 61.19% |
|
|
|
|
|
|
2,527,212 |
|
GuideMarkSM Core Fixed
Income |
|
$ |
24,918,314 |
|
|
|
1,380,568 |
|
GuideMarkSM Large Cap Growth |
|
|
15,462,360 |
|
|
|
1,627,466 |
|
GuideMarkSM Large Cap Value |
|
|
15,347,000 |
|
|
|
2,139,399 |
|
GuideMarkSM Opportunistic
Equity |
|
|
24,260,787 |
|
|
|
1,337,971 |
|
GuideMarkSM Opportunistic
Fixed |
|
|
13,740,964 |
|
|
|
625,965 |
|
GuideMarkSM Small/Mid Cap
Core |
|
|
8,456,785 |
|
|
|
4,766,673 |
|
GuideMarkSM World ex-US Fund
- |
|
|
38,419,385 |
|
|
|
|
|
|
|
|
||
|
|
|
|
|
|
|
140,605,595 |
|
|
|
|
|
|
|
|
||
|
|
|
|
Exchange Traded Funds - 32.68% |
|
|
|
|
|
|
16,832 |
|
Energy Select Sector SPDR Fund |
|
|
1,335,114 |
|
|
|
30,340 |
|
Industrial Select Sector SPDR |
|
|
1,266,088 |
|
|
|
191,626 |
|
iShares Core MSCI Emerging |
|
|
9,726,936 |
|
|
|
27,831 |
|
iShares JPMorgan USD Emerging |
|
|
3,269,308 |
|
|
|
77,786 |
|
iShares MSCI Canada Index Fund |
|
|
2,217,679 |
|
|
|
23,551 |
|
iShares MSCI Chile Capped |
|
|
1,528,695 |
|
|
|
61,765 |
|
iShares S&P India Nifty 50 |
|
|
1,482,360 |
|
|
|
18,759 |
|
iShares 10+ Year Credit Bond Fund |
|
|
1,134,169 |
|
|
|
36,207 |
|
Market Vectors Steel Index Fund |
|
|
1,576,453 |
|
|
|
55,484 |
|
PowerShares FTSE RAFI Asia |
|
|
3,228,608 |
|
|
|
20,491 |
|
PowerShares DB Gold Fund (a)(b) |
|
|
1,116,350 |
|
|
|
21,119 |
|
Materials Select Sector SPDR |
|
|
827,442 |
|
|
|
61,861 |
|
SPDR Barclays High Yield Bond |
|
|
2,543,106 |
|
|
|
36,629 |
|
SPDR Barclays Short Term High |
|
|
1,131,104 |
|
|
|
196,915 |
|
SPDR S&P 500 ETF Trust |
|
|
30,827,043 |
|
|
|
26,107 |
|
SPDR S&P Dividend ETF (a) |
|
|
1,722,801 |
|
|
|
23,340 |
|
SPDR S&P International |
|
|
1,134,557 |
|
|
|
53,198 |
|
SPDR DB International Government |
|
|
|
|
|
|
|
|
Inflation-Portected Bond ETF |
|
|
3,303,064 |
|
|
|
|
|
|
|
|
|
|
|
Number of |
|
|
|
Value |
|
||
|
|
|
|
|
||||
|
|
|
|
Exchange Traded Funds (Continued) |
|
|
|
|
|
|
20,202 |
|
Vanguard Global ex-U.S. |
|
$ |
1,159,191 |
|
|
|
64,766 |
|
Vanguard REIT ETF (a) |
|
|
4,567,946 |
|
|
|
|
|
|
|
|
||
|
|
|
|
|
|
|
75,098,014 |
|
|
|
|
|
|
|
|
||
|
|
|
|
Exchange Traded Notes - 0.24% |
|
|
|
|
|
|
21,317 |
|
iPath U.S. Treasury 10-year |
|
|
551,258 |
|
|
|
|
|
|
|
|
||
|
|
|
|
Mutual Funds - 3.21% |
|
|
|
|
|
|
253,343 |
|
AQR Diversified Arbitrage Fund - |
|
|
2,822,241 |
|
|
|
149,641 |
|
DoubleLine Total Return Bond |
|
|
1,696,929 |
|
|
|
262,118 |
|
PIMCO Emerging Local Bond |
|
|
2,841,362 |
|
|
|
|
|
|
|
|
||
|
|
|
|
|
|
|
7,360,532 |
|
|
|
|
|
|
|
|
||
|
|
|
|
Total Investment
Companies |
|
|
223,615,399 |
|
|
|
|
|
|
|
|
||
|
|
|
|
SHORT TERM INVESTMENTS - 2.41% |
|
|
|
|
|
|
|
|
Money Market Funds - 2.41% |
|
|
|
|
|
|
5,548,455 |
|
Federated Prime Obligations Fund |
|
|
5,548,455 |
|
|
|
|
|
|
|
|
||
|
|
|
|
Total Short Term
Investments |
|
|
5,548,455 |
|
|
|
|
|
|
|
|
||
|
|
|
|
INVESTMENTS PURCHASED |
|
|
|
|
|
|
|
|
Money Market Funds - 6.66% |
|
|
|
|
|
|
15,311,873 |
|
First American Government |
|
|
15,311,873 |
|
|
|
|
|
|
|
|
||
|
|
|
|
Total Investments
Purchased as |
|
|
15,311,873 |
|
|
|
|
|
|
|
|
||
|
|
|
|
Total Investments |
|
|
244,475,727 |
|
|
|
|
|
Liabilities in Excess
of Other |
|
|
(14,690,956 |
) |
|
|
|
|
|
|
|
||
|
|
|
|
TOTAL NET ASSETS - 100.00% |
|
$ |
229,784,771 |
|
|
|
|
|
|
|
|
||
|
|
|
|
Percentages are stated as a percent of net assets. |
|
|
(a) |
All or portion of this security is on loan. |
|
(b) |
Non-income producing security. |
|
(c) |
The value of an exchange-traded note can be impacted by the credit quality of the issuer. The issuer for this exchange-traded note is Barclay’s PLC. |
See notes to financial statements.
107
|
|
|
GuidePathSM Tactical UnconstrainedSM Asset Allocation Fund |
|
SCHEDULE OF INVESTMENTS |
|
March 31, 2013 |
|
|
|
|
|
|
|
|
|
|
Number of |
|
|
|
Value |
|
||
|
|
|
|
|
||||
|
|
|
|
INVESTMENT COMPANIES - 97.65% |
|
|
|
|
|
|
|
|
Affiliated Mutual Funds - 29.52% |
|
|
|
|
|
|
156,438 |
|
GuideMarkSM Core Fixed
Income |
|
$ |
1,542,475 |
|
|
|
977,647 |
|
GuideMarkSM Large Cap Growth |
|
|
10,949,650 |
|
|
|
2,219,422 |
|
GuideMarkSM Large Cap Value |
|
|
20,929,147 |
|
|
|
2,106,155 |
|
GuideMarkSM Opportunistic
Equity |
|
|
23,883,793 |
|
|
|
1,353,926 |
|
GuideMarkSM Opportunistic
Fixed |
|
|
13,904,822 |
|
|
|
997,005 |
|
GuideMarkSM Small/Mid Cap
Core |
|
|
13,469,543 |
|
|
|
888,234 |
|
GuideMarkSM World ex-US Fund
- |
|
|
7,159,164 |
|
|
|
|
|
|
|
|
||
|
|
|
|
|
|
|
91,838,594 |
|
|
|
|
|
|
|
|
||
|
|
|
|
Exchange Traded Funds - 35.43% |
|
|
|
|
|
|
206,184 |
|
Guggenheim S&P 500 Equal |
|
|
12,296,814 |
|
|
|
11,015 |
|
iShares Barclays CMBS Bond |
|
|
569,696 |
|
|
|
21,435 |
|
iShares Barclays MBS Bond |
|
|
2,313,694 |
|
|
|
18,810 |
|
iShares Core MSCI Emerging |
|
|
954,796 |
|
|
|
56,034 |
|
iShares Core S&P Small-Cap ETF (a) |
|
|
4,878,320 |
|
|
|
491,954 |
|
iShares MSCI ACWI ex US Index |
|
|
21,085,148 |
|
|
|
6,040 |
|
PowerShares DB Gold Fund (a)(b) |
|
|
329,059 |
|
|
|
43,391 |
|
SPDR Barclays 1-3 Month T-Bill (b) |
|
|
1,987,742 |
|
|
|
54,211 |
|
SPDR Barclays Short Term |
|
|
1,917,443 |
|
|
|
103,252 |
|
SPDR Barclays High Yield Bond |
|
|
4,244,690 |
|
|
|
203,336 |
|
SPDR S&P 500 ETF Trust |
|
|
31,832,251 |
|
|
|
48,171 |
|
SPDR S&P Emerging Asia Pacific |
|
|
3,674,965 |
|
|
|
22,031 |
|
SPDR S&P MidCap 400 ETF Trust |
|
|
4,620,341 |
|
|
|
65,644 |
|
Vanguard FTSE All-World |
|
|
3,043,256 |
|
|
|
197,627 |
|
Vanguard High Dividend Yield |
|
|
10,831,936 |
|
|
|
67,405 |
|
Vanguard Total Bond Market ETF |
|
|
5,637,754 |
|
|
|
|
|
|
|
|
||
|
|
|
|
|
|
|
110,217,905 |
|
|
|
|
|
|
|
|
||
|
|
|
|
|
|
|
|
|
|
Number of |
|
|
|
Value |
|
||
|
|
|
|
|
||||
|
|
|
|
Mutual Funds - 32.70% |
|
|
|
|
|
|
1,892,627 |
|
Eaton Vance Floating-Rate Fund - |
|
$ |
17,431,097 |
|
|
|
809,012 |
|
Eaton Vance Global Macro Absolute |
|
|
8,122,479 |
|
|
|
294,670 |
|
Eaton Vance Global Macro Absolute |
|
|
2,911,339 |
|
|
|
129,827 |
|
Eaton Vance Government Obligations |
|
|
941,242 |
|
|
|
568,635 |
|
Eaton Vance Income Fund of Boston - |
|
|
3,451,612 |
|
|
|
94,628 |
|
Eaton Vance Multi-Strategy Absolute |
|
|
857,326 |
|
|
|
77,426 |
|
Eaton Vance Worldwide Health |
|
|
789,749 |
|
|
|
31,557 |
|
Parametric Option Absolute Return |
|
|
315,889 |
|
|
|
302,749 |
|
Pioneer Strategic Income Fund - |
|
|
3,439,230 |
|
|
|
1,529,235 |
|
Stadion Managed Portfolio Trust - |
|
|
16,271,065 |
|
|
|
624,683 |
|
Virtus Allocator Premium AlphaSector |
|
|
6,965,215 |
|
|
|
151,070 |
|
Virtus Global Premium AlphaSector |
|
|
1,704,075 |
|
|
|
2,630,420 |
|
Virtus Premium AlphaSector Fund - |
|
|
38,535,657 |
|
|
|
|
|
|
|
|
||
|
|
|
|
|
|
|
101,735,975 |
|
|
|
|
|
|
|
|
||
|
|
|
|
Total Investment
Companies |
|
|
303,792,474 |
|
|
|
|
|
|
|
|
||
See notes to financial statements.
108
|
|
|
GuidePathSM Tactical UnconstrainedSM Asset Allocation Fund |
|
SCHEDULE OF INVESTMENTS (Continued) |
|
March 31, 2013 |
|
|
|
|
|
|
|
|
|
|
Number of |
|
|
|
Value |
|
||
|
|
|
|
|
||||
|
|
|
|
SHORT TERM INVESTMENTS - 2.40% |
|
|
|
|
|
|
|
|
Money Market Funds - 2.40% |
|
|
|
|
|
|
7,476,129 |
|
Federated Prime Obligations Fund |
|
$ |
7,476,129 |
|
|
|
|
|
|
|
|
||
|
|
|
|
Total Short Term
Investments |
|
|
7,476,129 |
|
|
|
|
|
|
|
|
||
|
|
|
|
INVESTMENTS PURCHASED |
|
|
|
|
|
|
|
|
Money Market Funds - 7.95% |
|
|
|
|
|
|
24,743,125 |
|
First American Government |
|
|
24,743,125 |
|
|
|
|
|
|
|
|
||
|
|
|
|
Total Investments Purchased
as |
|
|
24,743,125 |
|
|
|
|
|
|
|
|
||
|
|
|
|
Total Investments |
|
|
336,011,728 |
|
|
|
|
|
Liabilities in Excess
of Other |
|
|
(24,885,152 |
) |
|
|
|
|
|
|
|
||
|
|
|
|
TOTAL NET ASSETS - 100.00% |
|
$ |
311,126,576 |
|
|
|
|
|
|
|
|
||
|
|
|
|
Percentages are stated as a percent of net assets. |
|
|
(a) |
All or portion of this security is on loan. |
|
(b) |
Non-income producing security. |
See notes to financial statements.
109
|
|
|
GuidePathSM Absolute Return Asset Allocation Fund |
|
SCHEDULE OF INVESTMENTS |
|
March 31, 2013 |
|
|
|
|
|
|
|
|
|
|
Number of |
|
|
|
Value |
|
||
|
|
|
|
|
||||
|
|
|
|
INVESTMENT COMPANIES - 97.82% |
|
|
|
|
|
|
|
|
Affiliated Mutual Funds - 18.20% |
|
|
|
|
|
|
5,060,797 |
|
GuideMarkSM Core Fixed
Income |
|
$ |
49,899,463 |
|
|
|
347,581 |
|
GuideMarkSM Large Cap Value |
|
|
3,277,692 |
|
|
|
3,862,066 |
|
GuideMarkSM Opportunistic
Fixed |
|
|
39,663,422 |
|
|
|
|
|
|
|
|
||
|
|
|
|
|
|
|
92,840,577 |
|
|
|
|
|
|
|
|
||
|
|
|
|
Exchange Traded Funds - 36.67% |
|
|
|
|
|
|
43,783 |
|
iShares Barclays Agency Bond |
|
|
4,965,097 |
|
|
|
355,466 |
|
iShares Barclays Credit Bond Fund |
|
|
40,014,808 |
|
|
|
226,443 |
|
iShares Barclays MBS Bond |
|
|
24,442,257 |
|
|
|
41,742 |
|
iShares Core MSCI Emerging |
|
|
2,118,824 |
|
|
|
276,329 |
|
iShares Floating Rate Note Fund |
|
|
14,004,354 |
|
|
|
214,014 |
|
iShares JPMorgan USD Emerging |
|
|
25,140,225 |
|
|
|
99,680 |
|
iShares MSCI ACWI Index Fund |
|
|
5,058,760 |
|
|
|
97,081 |
|
PowerShares DB Agriculture |
|
|
2,513,427 |
|
|
|
10,830 |
|
PowerShares DB Base Metals |
|
|
189,958 |
|
|
|
34,655 |
|
PowerShares DB Energy Fund (a)(b) |
|
|
1,008,807 |
|
|
|
46,555 |
|
PowerShares DB Precious Metals |
|
|
2,511,642 |
|
|
|
116,440 |
|
PowerShares International Corporate |
|
|
3,325,526 |
|
|
|
360,455 |
|
SPDR Barclays 1-3 Month T-Bill |
|
|
16,512,444 |
|
|
|
40,117 |
|
SPDR Barclays Convertible |
|
|
1,700,560 |
|
|
|
101,336 |
|
SPDR DB International Government |
|
|
6,291,952 |
|
|
|
11,764 |
|
SPDR S&P 500 ETF Trust |
|
|
1,841,654 |
|
|
|
85,726 |
|
Vanguard FTSE All-World |
|
|
3,974,257 |
|
|
|
22,313 |
|
Vanguard Mid-Cap Value ETF |
|
|
1,499,211 |
|
|
|
4,524 |
|
Vanguard Small-Cap Value ETF |
|
|
371,647 |
|
|
|
153,880 |
|
Vanguard Short-Term Bond ETF |
|
|
12,462,741 |
|
|
|
146,061 |
|
Vanguard Total Bond Market ETF |
|
|
12,216,542 |
|
|
|
95,006 |
|
WisdomTree Asia Local Debt Fund |
|
|
4,974,514 |
|
|
|
|
|
|
|
|
||
|
|
|
|
|
|
|
187,139,207 |
|
|
|
|
|
|
|
|
||
|
|
|
|
|
|
|
|
|
|
Number of |
|
|
|
Value |
|
||
|
|
|
|
|
||||
|
|
|
|
Exchange Traded Notes - 0.61% |
|
|
|
|
|
|
120,670 |
|
iPath U.S. Treasury 10-year Bear |
|
$ |
3,120,526 |
|
|
|
|
|
|
|
|
||
|
|
|
|
Mutual Funds - 42.34% |
|
|
|
|
|
|
841,839 |
|
Aberdeen Equity Long Short Fund - |
|
|
10,093,651 |
|
|
|
1,875,802 |
|
BlackRock Low Duration Bond |
|
|
18,457,892 |
|
|
|
1,062,814 |
|
DoubleLine Core Fixed Income |
|
|
11,999,176 |
|
|
|
685,465 |
|
DoubleLine Low Duration Bond |
|
|
6,998,598 |
|
|
|
413,823 |
|
DoubleLine Multi-Asset Growth |
|
|
4,121,672 |
|
|
|
3,020,623 |
|
DoubleLine Total Return Bond |
|
|
34,253,865 |
|
|
|
475,646 |
|
DWS Disciplined Market Neutural |
|
|
4,637,544 |
|
|
|
416,548 |
|
Eaton Vance Floating-Rate Fund - |
|
|
3,836,407 |
|
|
|
1,256,746 |
|
Eaton Vance Global Macro Absolute |
|
|
12,416,652 |
|
|
|
1,311,657 |
|
Eaton Vance Multi-Strategy Absolute |
|
|
11,883,615 |
|
|
|
64,602 |
|
Parametric Absolute Return Fund - |
|
|
646,670 |
|
|
|
193,918 |
|
Gateway Fund - Class Y |
|
|
5,431,639 |
|
|
|
714,211 |
|
Highbridge Statistical Market |
|
|
10,498,900 |
|
|
|
1,135,579 |
|
JPMorgan Floating Rate Income Fund |
|
|
11,480,707 |
|
|
|
1,266,741 |
|
JPMorgan Income Builder Fund - |
|
|
12,794,086 |
|
|
|
67,980 |
|
JPMorgan Research Equity Long/Short |
|
|
1,099,232 |
|
|
|
586,749 |
|
JPMorgan Strategic Income |
|
|
6,999,916 |
|
|
|
70,955 |
|
JPMorgan Strategic Preservation |
|
|
1,021,042 |
|
|
|
4,170,515 |
|
Pioneer Strategic Income Fund - |
|
|
47,377,053 |
|
|
|
|
|
|
|
|
||
|
|
|
|
|
|
|
216,048,317 |
|
|
|
|
|
|
|
|
||
|
|
|
|
Total Investment
Companies |
|
|
499,148,627 |
|
|
|
|
|
|
|
|
||
See notes to financial statements.
110
|
|
|
GuidePathSM Absolute Return Asset Allocation Fund |
|
SCHEDULE OF INVESTMENTS (Continued) |
|
March 31, 2013 |
|
|
|
|
|
|
|
|
|
|
Number of |
|
|
|
Value |
|
||
|
|
|
|
|
||||
|
|
|
|
SHORT TERM INVESTMENTS - 2.28% |
|
|
|
|
|
|
|
|
Money Market Funds - 2.28% |
|
|
|
|
|
|
11,658,838 |
|
Federated Prime Obligations Fund |
|
$ |
11,658,838 |
|
|
|
|
|
|
|
|
||
|
|
|
|
Total Short Term
Investments |
|
|
11,658,838 |
|
|
|
|
|
|
|
|
||
|
|
|
|
INVESTMENT PURCHASED |
|
|
|
|
|
|
|
|
Money Market Funds - 4.15% |
|
|
|
|
|
|
21,172,507 |
|
First American Government |
|
|
21,172,507 |
|
|
|
|
|
|
|
|
||
|
|
|
|
Total Investment
Purchased as |
|
|
21,172,507 |
|
|
|
|
|
|
|
|
||
|
|
|
|
Total Investments |
|
|
531,979,972 |
|
|
|
|
|
Liabilities in Excess
of Other |
|
|
(21,705,315 |
) |
|
|
|
|
|
|
|
||
|
|
|
|
TOTAL NET ASSETS - 100.00% |
|
$ |
510,274,657 |
|
|
|
|
|
|
|
|
||
|
|
|
|
Percentages are stated as a percent of net assets. |
|
|
(a) |
All or portion of this security is on loan. |
|
(b) |
Non-income producing security. |
|
(c) |
The value of an exchange-traded note can be impacted by the credit quality of the issuer. The issuer for this exchange-traded note is Barclay’s PLC. |
See notes to financial statements.
111
|
|
|
GuidePathSM Multi-Asset Income Asset Allocation Fund |
|
SCHEDULE OF INVESTMENTS |
|
March 31, 2013 |
|
|
|
|
|
|
|
|
|
|
Number of |
|
|
|
Value |
|
||
|
|
|
|
|
||||
|
|
|
|
INVESTMENT COMPANIES - 97.16% |
|
|
|
|
|
|
|
|
Affiliated Mutual Funds - 6.25% |
|
|
|
|
|
|
252,360 |
|
GuideMarkSM Core Fixed
Income |
|
$ |
2,488,267 |
|
|
|
259,325 |
|
GuideMarkSM World ex-US Fund
- |
|
|
2,090,157 |
|
|
|
|
|
|
|
|
||
|
|
|
|
|
|
|
4,578,424 |
|
|
|
|
|
|
|
|
||
|
|
|
|
Exchange Traded Funds - 59.18% |
|
|
|
|
|
|
16,747 |
|
iShares Barclays 20+ Year Treasury |
|
|
1,972,127 |
|
|
|
10,014 |
|
iShares Barclays 7-10 Year Treasury |
|
|
1,074,903 |
|
|
|
797 |
|
iShares Barclays Agency Bond Fund |
|
|
90,382 |
|
|
|
5,357 |
|
iShares Barclays TIPS Bond Fund |
|
|
649,536 |
|
|
|
57,459 |
|
iShares iBoxx $ High Yield |
|
|
5,421,257 |
|
|
|
181 |
|
iShares iBoxx Investment Grade |
|
|
21,702 |
|
|
|
43,946 |
|
iShares JPMorgan USD Emerging |
|
|
5,162,337 |
|
|
|
154,949 |
|
iShares S&P Global Infrastructure |
|
|
5,759,454 |
|
|
|
25,890 |
|
iShares S&P US Preferred Stock |
|
|
1,049,063 |
|
|
|
39,391 |
|
SPDR Barclays High Yield |
|
|
1,619,364 |
|
|
|
4,098 |
|
SPDR Barclays International |
|
|
239,733 |
|
|
|
169,212 |
|
SPDR S&P International |
|
|
8,225,394 |
|
|
|
12,762 |
|
Vanguard Global ex-US |
|
|
732,284 |
|
|
|
14,160 |
|
Vanguard REIT ETF (a) |
|
|
998,705 |
|
|
|
9,799 |
|
WisdomTree Australia Dividend |
|
|
633,407 |
|
|
|
13,141 |
|
WisdomTree Emerging Markets |
|
|
723,543 |
|
|
|
139,319 |
|
WisdomTree Equity Income Fund (a) |
|
|
7,131,740 |
|
|
|
13,950 |
|
WisdomTree Europe SmallCap |
|
|
582,552 |
|
|
|
22,327 |
|
WisdomTree SmallCap |
|
|
1,273,979 |
|
|
|
|
|
|
|
|
||
|
|
|
|
|
|
|
43,361,462 |
|
|
|
|
|
|
|
|
||
|
|
|
|
|
|
|
|
|
|
Number of |
|
|
|
Value |
|
||
|
|
|
|
|
||||
|
|
|
|
Mutual Funds - 31.73% |
|
|
|
|
|
|
297,936 |
|
Forward EM Corporate Debt |
|
$ |
2,928,710 |
|
|
|
363,437 |
|
Forward International Dividend |
|
|
2,969,284 |
|
|
|
227,423 |
|
Forward Select Income Fund - |
|
|
5,876,606 |
|
|
|
338,943 |
|
Henderson Global Equity Income |
|
|
2,599,693 |
|
|
|
64,391 |
|
JPMorgan Global Equity Income |
|
|
981,315 |
|
|
|
515,166 |
|
JPMorgan High Yield Fund - |
|
|
4,250,118 |
|
|
|
360,799 |
|
JPMorgan Income Builder Fund - |
|
|
3,644,073 |
|
|
|
|
|
|
|
|
||
|
|
|
|
|
|
|
23,249,799 |
|
|
|
|
|
|
|
|
||
|
|
|
|
Total Investment
Companies |
|
|
71,189,685 |
|
|
|
|
|
|
|
|
||
|
|
|
|
SHORT TERM INVESTMENTS - 3.45% |
|
|
|
|
|
|
|
|
Money Market Funds - 3.45% |
|
|
|
|
|
|
2,531,910 |
|
Federated Prime Obligations Fund |
|
|
2,531,910 |
|
|
|
|
|
|
|
|
||
|
|
|
|
Total Short Term
Investments |
|
|
2,531,910 |
|
|
|
|
|
|
|
|
||
|
|
|
|
INVESTMENT PURCHASED |
|
|
|
|
|
|
|
|
Money Market Funds - 18.06% |
|
|
|
|
|
|
13,230,715 |
|
First American Government |
|
|
13,230,715 |
|
|
|
|
|
|
|
|
||
|
|
|
|
Total Investment
Purchased as |
|
|
13,230,715 |
|
|
|
|
|
|
|
|
||
|
|
|
|
Total Investments |
|
|
86,952,310 |
|
|
|
|
|
Liabilities in Excess
of Other |
|
|
(13,682,688 |
) |
|
|
|
|
|
|
|
||
|
|
|
|
TOTAL NET ASSETS - 100.00% |
|
$ |
73,269,622 |
|
|
|
|
|
|
|
|
||
|
|
|
|
Percentages are stated as a percent of net assets. |
|
|
(a) |
All or portion of this security is on loan. |
See notes to financial statements.
112
|
|
|
GuidePathSM Fixed Income Allocation Fund |
|
SCHEDULE OF INVESTMENTS |
|
March 31, 2013 |
|
|
|
|
|
|
|
|
|
|
Number of |
|
|
|
Value |
|
||
|
|
|
|
|
||||
|
|
|
|
INVESTMENT COMPANIES - 97.94% |
|
|
|
|
|
|
|
|
Affiliated Mutual Funds - 31.51% |
|
|
|
|
|
|
5,630,992 |
|
GuideMarkSM Core Fixed
Income |
|
$ |
55,521,580 |
|
|
|
1,599,071 |
|
GuideMarkSM Opportunistic
Fixed |
|
|
16,422,458 |
|
|
|
|
|
|
|
|
||
|
|
|
|
|
|
|
71,944,038 |
|
|
|
|
|
|
|
|
||
|
|
|
|
Exchange Traded Funds - 59.63% |
|
|
|
|
|
|
126,294 |
|
iShares Barclays 1-3 Year Treasury |
|
|
10,668,054 |
|
|
|
14,553 |
|
iShares Barclays 20+ Year Treasury |
|
|
1,713,761 |
|
|
|
93,876 |
|
iShares Barclays 7-10 Year Treasury |
|
|
10,076,650 |
|
|
|
38,187 |
|
iShares Barclays Agency Bond |
|
|
4,330,497 |
|
|
|
134,112 |
|
iShares Barclays Credit Bond Fund |
|
|
15,096,988 |
|
|
|
44,793 |
|
iShares JPMorgan USD Emerging |
|
|
5,261,834 |
|
|
|
24,303 |
|
iShares 10+ Year Core Bond Fund |
|
|
1,469,359 |
|
|
|
103,673 |
|
PowerShares Senior Loan |
|
|
2,603,229 |
|
|
|
40,636 |
|
SPDR Barclays 1-3 Month |
|
|
1,861,535 |
|
|
|
171,306 |
|
SPDR Barclays High Yield Bond |
|
|
7,042,390 |
|
|
|
120,396 |
|
SPDR Barclays TIPS ETF |
|
|
7,271,918 |
|
|
|
31,785 |
|
SPDR Barclays Short Term |
|
|
981,521 |
|
|
|
30,264 |
|
SPDR DB International Government |
|
|
1,879,092 |
|
|
|
255,452 |
|
Vanguard Mortgage-Backed |
|
|
13,319,267 |
|
|
|
602,626 |
|
Vanguard Total Bond Market ETF |
|
|
50,403,639 |
|
|
|
28,664 |
|
WisdomTree Asia Local |
|
|
1,500,847 |
|
|
|
12,591 |
|
WisdomTree Emerging Markets |
|
|
661,909 |
|
|
|
|
|
|
|
|
||
|
|
|
|
|
|
|
136,142,490 |
|
|
|
|
|
|
|
|
||
|
|
|
|
Exchange Traded Notes - 0.39% |
|
|
|
|
|
|
34,596 |
|
iPath U.S. Treasury 10-year Bear |
|
|
894,653 |
|
|
|
|
|
|
|
|
||
|
|
|
|
|
|
|
|
|
|
Number of |
|
|
|
Value |
|
||
|
|
|
|
|
||||
|
|
|
|
Mutual Funds - 6.41% |
|
|
|
|
|
|
410,823 |
|
DoubleLine
Total Return Bond |
|
$ |
4,658,730 |
|
|
|
206,738 |
|
Loomis
Sayles Bond Fund - |
|
|
3,161,022 |
|
|
|
119,727 |
|
PIMCO
Emerging Local Bond |
|
|
1,297,843 |
|
|
|
476,847 |
|
PIMCO
Unconstrained Bond Fund - |
|
|
5,507,588 |
|
|
|
|
|
|
|
|
||
|
|
|
|
|
|
|
14,625,183 |
|
|
|
|
|
|
|
|
||
|
|
|
|
Total Investment Companies |
|
|
223,606,364 |
|
|
|
|
|
|
|
|
||
|
|
|
|
SHORT TERM INVESTMENTS - 1.73% |
|
|
|
|
|
|
|
|
Money Market Funds - 1.73% |
|
|
|
|
|
|
3,940,201 |
|
Federated
Prime Obligations Fund |
|
|
3,940,201 |
|
|
|
|
|
|
|
|
||
|
|
|
|
Total Short Term Investments |
|
|
3,940,201 |
|
|
|
|
|
|
|
|
||
|
|
|
|
INVESTMENTS PURCHASED |
|
|
|
|
|
|
|
|
Money Market Funds - 9.46% |
|
|
|
|
|
|
21,608,881 |
|
First
American Government |
|
|
21,608,881 |
|
|
|
|
|
|
|
|
||
|
|
|
|
Total Investments Purchased as |
|
|
21,608,881 |
|
|
|
|
|
|
|
|
||
|
|
|
|
Total Investments |
|
|
249,155,446 |
|
|
|
|
|
Liabilities in Excess of Other |
|
|
(20,835,663 |
) |
|
|
|
|
|
|
|
||
|
|
|
|
TOTAL NET ASSETS - 100.00% |
|
$ |
228,319,783 |
|
|
|
|
|
|
|
|
||
|
|
|
|
Percentages are stated as a percent of net assets. |
|
|
(a) |
All or portion of this security is on loan. |
|
(b) |
Non-income producing security. |
|
(c) |
The value of an exchange-traded note can be impacted by the credit quality of the issuer. The issuer for this exchange-traded note is Barclay’s PLC. |
See notes to financial statements.
113
|
|
|
GuidePathSM Altegris® Multi-Strategy Alternative Allocation Fund |
|
SCHEDULE OF INVESTMENTS |
|
March 31, 2013 |
|
|
|
|
|
|
|
|
|
|
Number of |
|
|
|
Value |
|
||
|
|
|
|
|
||||
|
|
|
|
INVESTMENT COMPANIES - 97.73% |
|
|
|
|
|
|
|
|
Affiliated Mutual Funds - 97.73% |
|
|
|
|
|
|
6,441,197 |
|
Altegris® Equity Long Short |
|
$ |
67,761,391 |
|
|
|
1,097,163 |
|
Altegris® Fixed Income Long
Short |
|
|
10,993,569 |
|
|
|
1,391,288 |
|
Altegris® Futures Evolution |
|
|
13,954,623 |
|
|
|
3,557,734 |
|
Altegris® Macro Strategy
Fund - |
|
|
31,094,593 |
|
|
|
1,449,997 |
|
Altegris® Managed Futures |
|
|
13,832,972 |
|
|
|
1,988,818 |
|
GuideMarkSM Opportunistic
Fixed |
|
|
20,425,156 |
|
|
|
|
|
|
|
|
||
|
|
|
|
|
|
|
158,062,304 |
|
|
|
|
|
|
|
|
||
|
|
|
|
Total Investment
Companies |
|
|
158,062,304 |
|
|
|
|
|
|
|
|
||
|
|
|
|
SHORT TERM INVESTMENTS - 2.20% |
|
|
|
|
|
|
|
|
Money Market Funds - 2.20% |
|
|
|
|
|
|
3,561,497 |
|
Federated Prime Obligations Fund |
|
|
3,561,497 |
|
|
|
|
|
|
|
|
||
|
|
|
|
Total Short Term
Investments |
|
|
3,561,497 |
|
|
|
|
|
|
|
|
||
|
|
|
|
Total Investments |
|
|
161,623,801 |
|
|
|
|
|
Other Assets in Excess
of |
|
|
113,753 |
|
|
|
|
|
|
|
|
||
|
|
|
|
TOTAL NET ASSETS - 100.00% |
|
$ |
161,737,554 |
|
|
|
|
|
|
|
|
||
|
|
|
|
Percentages are stated as a percent of net assets. |
|
|
(a) |
Non-income producing security. |
See notes to financial statements.
114
|
|
|
GuideMarkSM Funds & GuidePathSM Funds |
|
STATEMENTS OF ASSETS & LIABILITIES |
|
March 31, 2013 |
|
|
|
|
|
|
|
|
|
|
|
|
|
|
|
Large
Cap |
|
Large
Cap |
|
Small/Mid
Cap |
|
|||
|
|
|
|
|
|
||||||
|
ASSETS: |
|
|
|
|
|
|
|
|
|
|
|
Investments,
at value (cost 146,447,673, $161,466,260, |
|
$ |
186,913,765 |
|
$ |
206,493,868 |
|
$ |
93,090,783 |
|
|
Cash |
|
|
3,463 |
|
|
48,962 |
|
|
26,908 |
|
|
Income receivable |
|
|
141,562 |
|
|
246,759 |
|
|
63,881 |
|
|
Receivable for dividend reclaims |
|
|
— |
|
|
13,392 |
|
|
— |
|
|
Receivable for investment securities sold |
|
|
802,040 |
|
|
— |
|
|
599,878 |
|
|
Receivable for fund shares sold |
|
|
587,822 |
|
|
630,295 |
|
|
193,762 |
|
|
Receivable from securities lending agent (See Note 6) |
|
|
— |
|
|
— |
|
|
15,207 |
|
|
Other assets |
|
|
18,057 |
|
|
17,559 |
|
|
18,513 |
|
|
|
|
|
|
|
||||||
|
Total Assets |
|
|
188,466,799 |
|
|
207,450,835 |
|
|
94,008,932 |
|
|
|
|
|
|
|
||||||
|
LIABILITIES: |
|
|
|
|
|
|
|
|
|
|
|
Payable for collateral on securities loaned |
|
|
6,000,926 |
|
|
7,421,930 |
|
|
8,242,073 |
|
|
Payable to securities lending agent (See Note 6) |
|
|
4,786 |
|
|
4,016 |
|
|
— |
|
|
Payable for investment securities purchased |
|
|
787,461 |
|
|
— |
|
|
560,600 |
|
|
Payable for fund shares redeemed |
|
|
209,430 |
|
|
223,734 |
|
|
78,399 |
|
|
Payable to Investment Advisor |
|
|
112,507 |
|
|
116,947 |
|
|
55,472 |
|
|
Other accrued expenses |
|
|
161,096 |
|
|
159,492 |
|
|
89,320 |
|
|
|
|
|
|
|
||||||
|
Total Liabilities |
|
|
7,276,206 |
|
|
7,926,119 |
|
|
9,025,864 |
|
|
|
|
|
|
|
||||||
|
NET ASSETS |
|
$ |
181,190,593 |
|
$ |
199,524,716 |
|
$ |
84,983,068 |
|
|
|
|
|
|
|
||||||
|
NET ASSETS CONSIST OF: |
|
|
|
|
|
|
|
|
|
|
|
Capital stock |
|
|
202,515,767 |
|
|
326,720,994 |
|
|
94,289,652 |
|
|
Unrealized appreciation on investments |
|
|
40,466,092 |
|
|
45,027,608 |
|
|
15,687,742 |
|
|
Accumulated undistributed net investment income (loss) |
|
|
62,114 |
|
|
525,829 |
|
|
(62,048 |
) |
|
Accumulated undistributed net realized loss |
|
|
(61,853,380 |
) |
|
(172,749,715 |
) |
|
(24,932,278 |
) |
|
|
|
|
|
|
||||||
|
Total Net Assets |
|
$ |
181,190,593 |
|
$ |
199,524,716 |
|
$ |
84,983,068 |
|
|
|
|
|
|
|
||||||
|
Institutional Shares |
|
|
|
|
|
|
|
|
|
|
|
Shares outstanding (unlimited shares of no par value authorized) |
|
|
4,015,917 |
|
|
6,409,964 |
|
|
3,283,565 |
|
|
Net assets |
|
|
44,994,114 |
|
|
60,452,681 |
|
|
44,361,656 |
|
|
Net asset value, offering and redemption price per share |
|
$ |
11.20 |
|
$ |
9.43 |
|
$ |
13.51 |
|
|
|
|
|
|
|
||||||
|
Service Shares |
|
|
|
|
|
|
|
|
|
|
|
Shares outstanding (unlimited shares of no par value authorized) |
|
|
12,246,008 |
|
|
14,604,541 |
|
|
3,020,363 |
|
|
Net assets |
|
|
136,196,479 |
|
|
139,072,035 |
|
|
40,621,412 |
|
|
Net asset value, offering and redemption price per share |
|
$ |
11.12 |
|
$ |
9.52 |
|
$ |
13.45 |
|
|
|
|
|
|
|
||||||
|
1Includes loaned securities with a market value of: |
|
$ |
5,513,907 |
|
$ |
7,234,414 |
|
$ |
7,965,827 |
|
|
|
|
|
|
|
||||||
See notes to financial statements.
115
|
|
|
GuideMarkSM Funds & GuidePathSM Funds |
|
STATEMENTS OF ASSETS & LIABILITIES (Continued) |
|
March 31, 2013 |
|
|
|
|
|
|
|
|
|
|
|
|
|
|
|
World
|
|
Opportunistic |
|
Global
Real |
|
|||
|
|
|
|
|
|
||||||
|
ASSETS: |
|
|
|
|
|
|
|
|
|
|
|
Investments, at value (cost $250,665,046, $135,546,316, |
|
$ |
279,587,493 |
|
$ |
159,395,415 |
|
$ |
114,493,707 |
|
|
Foreign currencies (cost $1,137,719, $0, and $0, respectively) |
|
|
1,158,403 |
|
|
— |
|
|
— |
|
|
Cash |
|
|
199,580 |
|
|
38,404 |
|
|
— |
|
|
Income receivable |
|
|
912,129 |
|
|
145,199 |
|
|
11 |
|
|
Receivable for dividend reclaims |
|
|
169,774 |
|
|
— |
|
|
— |
|
|
Receivable for investment securities and foreign currencies sold |
|
|
1,863,750 |
|
|
1,241,250 |
|
|
— |
|
|
Receivable for fund shares sold |
|
|
887,946 |
|
|
304,474 |
|
|
105,114 |
|
|
Other assets |
|
|
20,538 |
|
|
25,138 |
|
|
27,259 |
|
|
|
|
|
|
|
||||||
|
Total Assets |
|
|
284,799,613 |
|
|
161,149,880 |
|
|
114,626,091 |
|
|
|
|
|
|
|
||||||
|
LIABILITIES: |
|
|
|
|
|
|
|
|
|
|
|
Payable for collateral on securities loaned |
|
|
297,792 |
|
|
5,228,051 |
|
|
31,804,600 |
|
|
Payable to securities lending agent (See Note 6) |
|
|
5,588 |
|
|
— |
|
|
— |
|
|
Payable for investment securities purchased |
|
|
1,302,627 |
|
|
769,549 |
|
|
— |
|
|
Payable for fund shares redeemed |
|
|
338,024 |
|
|
205,300 |
|
|
178,419 |
|
|
Payable to Investment Advisor |
|
|
156,620 |
|
|
108,041 |
|
|
45,848 |
|
|
Other accrued expenses |
|
|
288,601 |
|
|
121,556 |
|
|
136,054 |
|
|
|
|
|
|
|
||||||
|
Total Liabilities |
|
|
2,389,252 |
|
|
6,432,497 |
|
|
32,164,921 |
|
|
|
|
|
|
|
||||||
|
NET ASSETS |
|
$ |
282,410,361 |
|
$ |
154,717,383 |
|
$ |
82,461,170 |
|
|
|
|
|
|
|
||||||
|
NET ASSETS CONSIST OF: |
|
|
|
|
|
|
|
|
|
|
|
Capital stock |
|
|
471,022,314 |
|
|
138,381,303 |
|
|
91,508,481 |
|
|
Unrealized appreciation (depreciation) on: |
|
|
|
|
|
|
|
|
|
|
|
Investments |
|
|
28,922,447 |
|
|
23,849,099 |
|
|
(140,119 |
) |
|
Foreign currencies |
|
|
(11,613 |
) |
|
— |
|
|
— |
|
|
Accumulated undistributed net investment income (loss) |
|
|
2,777,603 |
|
|
159,773 |
|
|
14,888 |
|
|
Accumulated undistributed net realized loss |
|
|
(220,300,390 |
) |
|
(7,672,792 |
) |
|
(8,922,080 |
) |
|
|
|
|
|
|
||||||
|
Total Net Assets |
|
$ |
282,410,361 |
|
$ |
154,717,383 |
|
$ |
82,461,170 |
|
|
|
|
|
|
|
||||||
|
Institutional Shares |
|
|
|
|
|
|
|
|
|
|
|
Shares outstanding (unlimited shares of no par value authorized) |
|
|
10,565,402 |
|
|
5,961,387 |
|
|
1,244,155 |
|
|
Net assets |
|
|
85,157,441 |
|
|
67,574,510 |
|
|
11,681,383 |
|
|
Net asset value, offering and redemption price per share |
|
$ |
8.06 |
|
$ |
11.34 |
|
$ |
9.39 |
|
|
|
|
|
|
|
||||||
|
Service Shares |
|
|
|
|
|
|
|
|
|
|
|
Shares outstanding (unlimited shares of no par value authorized) |
|
|
24,504,047 |
|
|
7,732,872 |
|
|
7,510,001 |
|
|
Net assets |
|
|
197,252,920 |
|
|
87,142,873 |
|
|
70,779,787 |
|
|
Net asset value, offering and redemption price per share |
|
$ |
8.05 |
|
$ |
11.27 |
|
$ |
9.42 |
|
|
|
|
|
|
|
||||||
|
1Includes loaned securities with a market value of: |
|
$ |
275,830 |
|
$ |
5,101,789 |
|
$ |
30,817,207 |
|
|
|
|
|
|
|
||||||
See notes to financial statements.
116
|
|
|
GuideMarkSM Funds & GuidePathSM Funds |
|
STATEMENTS OF ASSETS & LIABILITIES (Continued) |
|
March 31, 2013 |
|
|
|
|
|
|
|
|
|
|
|
|
|
|
|
Core |
|
Tax-Exempt |
|
Opportunistic |
|
|||
|
|
|
|
|
|
||||||
|
ASSETS: |
|
|
|
|
|
|
|
|
|
|
|
Investments, at value (cost $403,299,231, $68,889,301, |
|
$ |
414,536,757 |
|
$ |
75,092,535 |
|
$ |
245,463,788 |
|
|
Appreciation of swap agreements |
|
|
— |
|
|
— |
|
|
88,084 |
|
|
Foreign currencies (cost $0, $0, and $3,820,112, respectively) |
|
|
— |
|
|
— |
|
|
3,803,507 |
|
|
Cash |
|
|
899,039 |
|
|
— |
|
|
24,907 |
|
|
Income receivable |
|
|
2,431,491 |
|
|
968,093 |
|
|
2,256,117 |
|
|
Receivable for dividend reclaims |
|
|
— |
|
|
— |
|
|
3,325 |
|
|
Receivable for investment securities and foreign currencies sold |
|
|
2,127,637 |
|
|
— |
|
|
2,378,562 |
|
|
Receivable for fund shares sold |
|
|
1,785,786 |
|
|
297,993 |
|
|
1,462,858 |
|
|
Swap premiums paid |
|
|
— |
|
|
— |
|
|
383,418 |
|
|
Deposits with brokers for forwards, options and swaps |
|
|
— |
|
|
— |
|
|
330,000 |
|
|
Appreciation of forward foreign currency contracts |
|
|
— |
|
|
— |
|
|
5,380,715 |
|
|
Other assets |
|
|
90,444 |
|
|
40,210 |
|
|
29,822 |
|
|
|
|
|
|
|
||||||
|
Total Assets |
|
|
421,871,154 |
|
|
76,398,831 |
|
|
261,605,103 |
|
|
|
|
|
|
|
||||||
|
LIABILITIES: |
|
|
|
|
|
|
|
|
|
|
|
Depreciation of forward foreign currency contracts |
|
|
— |
|
|
— |
|
|
1,527,628 |
|
|
Depreciation on swap agreements |
|
|
— |
|
|
— |
|
|
155,024 |
|
|
Payable for collateral on securities loaned |
|
|
1,569,991 |
|
|
— |
|
|
— |
|
|
Payable to securities lending agent (See Note 6) |
|
|
817 |
|
|
— |
|
|
— |
|
|
Payable for investment securities and foreign currencies purchased |
|
|
2,752,458 |
|
|
488,511 |
|
|
1,246,504 |
|
|
Payable for fund shares redeemed |
|
|
1,497,136 |
|
|
41,859 |
|
|
3,055,738 |
|
|
Payable to Investment Advisor |
|
|
169,667 |
|
|
28,261 |
|
|
135,495 |
|
|
Swap premiums received |
|
|
— |
|
|
— |
|
|
509,223 |
|
|
Variation margin on futures contracts |
|
|
— |
|
|
— |
|
|
5,384 |
|
|
Other accrued expenses |
|
|
338,096 |
|
|
100,327 |
|
|
334,979 |
|
|
|
|
|
|
|
||||||
|
Total Liabilities |
|
|
6,328,165 |
|
|
658,958 |
|
|
6,969,975 |
|
|
|
|
|
|
|
||||||
|
NET ASSETS |
|
$ |
415,542,989 |
|
$ |
75,739,873 |
|
$ |
254,635,128 |
|
|
|
|
|
|
|
||||||
|
NET ASSETS CONSIST OF: |
|
|
|
|
|
|
|
|
|
|
|
Capital stock |
|
|
403,033,896 |
|
|
73,796,721 |
|
|
246,491,161 |
|
|
Unrealized appreciation (depreciation) on: |
|
|
|
|
|
|
|
|
|
|
|
Investments |
|
|
11,237,534 |
|
|
6,203,234 |
|
|
5,389,460 |
|
|
Foreign currencies |
|
|
— |
|
|
— |
|
|
(31,037 |
) |
|
Swaps |
|
|
— |
|
|
— |
|
|
(66,940 |
) |
|
Forward currency exchange contracts |
|
|
— |
|
|
— |
|
|
3,853,087 |
|
|
Futures contracts |
|
|
— |
|
|
— |
|
|
(130,503 |
) |
|
Accumulated undistributed net investment income (loss) |
|
|
176,482 |
|
|
68,147 |
|
|
(1,481,815 |
) |
|
Accumulated undistributed net realized gain (loss) |
|
|
1,095,077 |
|
|
(4,328,229 |
) |
|
611,715 |
|
|
|
|
|
|
|
||||||
|
Total Net Assets |
|
$ |
415,542,989 |
|
$ |
75,739,873 |
|
$ |
254,635,128 |
|
|
|
|
|
|
|
||||||
|
Institutional Shares |
|
|
|
|
|
|
|
|
|
|
|
Shares outstanding (unlimited shares of no par value authorized) |
|
|
13,627,799 |
|
|
— |
|
|
10,141,852 |
|
|
Net assets |
|
|
134,362,492 |
|
|
— |
|
|
104,141,739 |
|
|
Net asset value, offering and redemption price per share |
|
$ |
9.86 |
|
|
— |
|
$ |
10.27 |
|
|
|
|
|
|
|
||||||
|
Service Shares |
|
|
|
|
|
|
|
|
|
|
|
Shares outstanding (unlimited shares of no par value authorized) |
|
|
28,451,675 |
|
|
6,474,779 |
|
|
14,638,386 |
|
|
Net assets |
|
|
281,180,497 |
|
|
75,739,873 |
|
|
150,493,389 |
|
|
Net asset value, offering and redemption price per share |
|
$ |
9.88 |
|
$ |
11.70 |
|
$ |
10.28 |
|
|
|
|
|
|
|
||||||
|
1Includes loaned securities with a market value of: |
|
$ |
1,530,699 |
|
$ |
— |
|
$ |
— |
|
|
|
|
|
|
|
||||||
|
|
|
|
|
|
|
|
|
|
|
|
See notes to financial statements.
117
|
|
|
GuideMarkSM Funds & GuidePathSM Funds |
|
STATEMENTS OF ASSETS & LIABILITIES (Continued) |
|
March 31, 2013 |
|
|
|
|
|
|
|
|
|
|
|
|
|
|
|
|
|
|
Strategic |
|
Tactical |
|
Tactical |
|
Absolute |
|
||||
|
|
|
|
|
|
|
||||||||
|
ASSETS: |
|
|
|
|
|
|
|
|
|
|
|
|
|
|
Investments, at value (cost $121,739,215, $96,888,236,
$229,567,316, |
|
$ |
133,375,968 |
|
$ |
103,870,132 |
|
$ |
244,173,134 |
|
$ |
439,139,395 |
|
|
Investments in affiliates, at value (cost $118,024,211, $124,278,013, $76,183,744 and $89,901,330, respectively) |
|
|
136,280,685 |
|
|
140,605,595 |
|
|
91,838,594 |
|
|
92,840,577 |
|
|
Cash |
|
|
137,274 |
|
|
51,683 |
|
|
91,971 |
|
|
3,907 |
|
|
Income receivable |
|
|
172,643 |
|
|
152,483 |
|
|
280,438 |
|
|
617,970 |
|
|
Receivable for fund shares sold |
|
|
1,799,107 |
|
|
1,740,635 |
|
|
1,280,801 |
|
|
1,845,238 |
|
|
Other assets |
|
|
28,568 |
|
|
35,266 |
|
|
39,635 |
|
|
48,146 |
|
|
|
|
|
|
|
|
||||||||
|
Total Assets |
|
|
271,794,245 |
|
|
246,455,794 |
|
|
337,704,573 |
|
|
534,495,233 |
|
|
|
|
|
|
|
|
||||||||
|
LIABILITIES: |
|
|
|
|
|
|
|
|
|
|
|
|
|
|
Payable for collateral on securities loaned |
|
|
21,329,599 |
|
|
15,311,873 |
|
|
24,743,125 |
|
|
21,172,507 |
|
|
Payable for investment securities purchased |
|
|
1,065,192 |
|
|
1,005,482 |
|
|
1,300,637 |
|
|
1,883,933 |
|
|
Payable for fund shares redeemed |
|
|
90,719 |
|
|
64,878 |
|
|
105,321 |
|
|
459,599 |
|
|
Payable to Investment Advisor |
|
|
15,632 |
|
|
25,193 |
|
|
86,127 |
|
|
172,601 |
|
|
Other accrued expenses |
|
|
286,050 |
|
|
263,597 |
|
|
342,787 |
|
|
531,936 |
|
|
|
|
|
|
|
|
||||||||
|
Total Liabilities |
|
|
22,787,192 |
|
|
16,671,023 |
|
|
26,577,997 |
|
|
24,220,576 |
|
|
|
|
|
|
|
|
||||||||
|
NET ASSETS |
|
$ |
249,007,053 |
|
$ |
229,784,771 |
|
$ |
311,126,576 |
|
$ |
510,274,657 |
|
|
|
|
|
|
|
|
||||||||
|
NET ASSETS CONSIST OF: |
|
|
|
|
|
|
|
|
|
|
|
|
|
|
Capital stock |
|
|
220,634,800 |
|
|
207,057,962 |
|
|
281,852,037 |
|
|
502,419,212 |
|
|
Unrealized appreciation on: |
|
|
|
|
|
|
|
|
|
|
|
|
|
|
Investments |
|
|
11,636,753 |
|
|
6,981,896 |
|
|
14,605,818 |
|
|
5,843,157 |
|
|
Investments in affiliates |
|
|
18,256,474 |
|
|
16,327,582 |
|
|
15,654,850 |
|
|
2,939,247 |
|
|
Accumulated undistributed net investment income (loss) |
|
|
(292,420 |
) |
|
65,093 |
|
|
(30,953 |
) |
|
1,979,089 |
|
|
Accumulated undistributed net realized loss |
|
|
(1,228,554 |
) |
|
(647,762 |
) |
|
(955,176 |
) |
|
(2,906,048 |
) |
|
|
|
|
|
|
|
||||||||
|
Total Net Assets |
|
$ |
249,007,053 |
|
$ |
229,784,771 |
|
$ |
311,126,576 |
|
$ |
510,274,657 |
|
|
|
|
|
|
|
|
||||||||
|
Institutional Shares |
|
|
|
|
|
|
|
|
|
|
|
|
|
|
Shares outstanding (unlimited shares of no par value authorized) |
|
|
86,282 |
|
|
84,336 |
|
|
79,088 |
|
|
56,068 |
|
|
Net assets |
|
|
884,658 |
|
|
879,348 |
|
|
810,333 |
|
|
569,773 |
|
|
Net asset value, offering and redemption price per share |
|
$ |
10.25 |
|
$ |
10.43 |
|
$ |
10.25 |
|
$ |
10.16 |
|
|
|
|
|
|
|
|
||||||||
|
Service Shares |
|
|
|
|
|
|
|
|
|
|
|
|
|
|
Shares outstanding (unlimited shares of no par value authorized) |
|
|
24,181,650 |
|
|
21,923,550 |
|
|
30,226,593 |
|
|
50,126,371 |
|
|
Net assets |
|
|
248,122,395 |
|
|
228,905,423 |
|
|
310,316,243 |
|
|
509,704,884 |
|
|
Net asset value, offering and redemption price per share |
|
$ |
10.26 |
|
$ |
10.44 |
|
$ |
10.27 |
|
$ |
10.17 |
|
|
|
|
|
|
|
|
||||||||
|
1Includes loaned securities with a market value of: |
|
$ |
20,668,407 |
|
$ |
14,936,110 |
|
$ |
24,185,761 |
|
$ |
20,691,438 |
|
|
|
|
|
|
|
|
||||||||
See notes to financial statements.
118
|
|
|
GuideMarkSM Funds & GuidePathSM Funds |
|
STATEMENTS OF ASSETS & LIABILITIES (Continued) |
|
March 31, 2013 |
|
|
|
|
|
|
|
|
|
|
|
|
|
|
|
Multi-Asset |
|
Fixed
Income |
|
Altegris® |
|
|||
|
|
|
|
|
|
||||||
|
ASSETS: |
|
|
|
|
|
|
|
|
|
|
|
Investments,
at value (cost $79,668,985, $178,208,644, |
|
$ |
82,373,886 |
|
$ |
177,211,408 |
|
$ |
3,561,497 |
|
|
Investments in affiliates, at value (cost $4,439,705,
|
|
|
4,578,424 |
|
|
71,944,038 |
|
|
158,062,304 |
|
|
Cash |
|
|
34,735 |
|
|
14,558 |
|
|
— |
|
|
Income receivable |
|
|
54,780 |
|
|
33,748 |
|
|
231 |
|
|
Receivable for investment securities sold |
|
|
— |
|
|
693,949 |
|
|
— |
|
|
Receivable for fund shares sold |
|
|
695,280 |
|
|
1,007,021 |
|
|
654,443 |
|
|
Other assets |
|
|
31,190 |
|
|
31,230 |
|
|
20,654 |
|
|
|
|
|
|
|
||||||
|
Total Assets |
|
|
87,768,295 |
|
|
250,935,952 |
|
|
162,299,129 |
|
|
|
|
|
|
|
||||||
|
LIABILITIES: |
|
|
|
|
|
|
|
|
|
|
|
Payable for collateral on securities loaned |
|
|
13,230,715 |
|
|
21,608,881 |
|
|
— |
|
|
Payable for investment securities purchased |
|
|
1,136,733 |
|
|
88,511 |
|
|
335,305 |
|
|
Payable for fund shares redeemed |
|
|
22,505 |
|
|
604,402 |
|
|
67,807 |
|
|
Payable to Investment Advisor |
|
|
16,141 |
|
|
48,298 |
|
|
— |
|
|
Other accrued expenses |
|
|
92,579 |
|
|
266,077 |
|
|
158,463 |
|
|
|
|
|
|
|
||||||
|
Total Liabilities |
|
|
14,498,673 |
|
|
22,616,169 |
|
|
561,575 |
|
|
|
|
|
|
|
||||||
|
NET ASSETS |
|
$ |
73,269,622 |
|
$ |
228,319,783 |
|
$ |
161,737,554 |
|
|
|
|
|
|
|
||||||
|
NET ASSETS CONSIST OF: |
|
|
|
|
|
|
|
|
|
|
|
Capital stock |
|
|
69,969,385 |
|
|
228,801,457 |
|
|
161,591,969 |
|
|
Unrealized appreciation (depreciation) on: |
|
|
|
|
|
|
|
|
|
|
|
Investments |
|
|
2,704,901 |
|
|
(997,236 |
) |
|
— |
|
|
Investments in affiliates |
|
|
138,719 |
|
|
(431,920 |
) |
|
266,232 |
|
|
Accumulated undistributed net investment income |
|
|
377,469 |
|
|
596,489 |
|
|
18,359 |
|
|
Accumulated undistributed net realized gain (loss) |
|
|
79,148 |
|
|
350,993 |
|
|
(139,006 |
) |
|
|
|
|
|
|
||||||
|
Total Net Assets |
|
$ |
73,269,622 |
|
$ |
228,319,783 |
|
$ |
161,737,554 |
|
|
|
|
|
|
|
||||||
|
Institutional Shares |
|
|
|
|
|
|
|
|
|
|
|
Shares outstanding (unlimited shares of no par value authorized) |
|
|
— |
|
|
50,391 |
|
|
51,382 |
|
|
Net assets |
|
|
— |
|
|
503,918 |
|
|
514,104 |
|
|
Net asset value, offering and redemption price per share |
|
|
— |
|
$ |
10.00 |
|
$ |
10.01 |
|
|
|
|
|
|
|
||||||
|
Service Shares |
|
|
|
|
|
|
|
|
|
|
|
Shares outstanding (unlimited shares of no par value authorized) |
|
|
6,922,220 |
|
|
22,820,774 |
|
|
16,122,685 |
|
|
Net assets |
|
|
73,269,622 |
|
|
227,815,865 |
|
|
161,223,450 |
|
|
Net asset value, offering and redemption price per share |
|
$ |
10.58 |
|
$ |
9.98 |
|
$ |
10.00 |
|
|
|
|
|
|
|
||||||
|
1Includes loaned securities with a market value of: |
|
$ |
12,924,266 |
|
$ |
21,080,267 |
|
$ |
— |
|
|
|
|
|
|
|
||||||
See notes to financial statements.
119
|
|
|
GuideMarkSM Funds & GuidePathSM Funds |
|
STATEMENTS OF OPERATIONS |
|
For the Year Ended March 31, 2013 |
|
|
|
|
|
|
|
|
|
|
|
|
|
|
|
Large Cap |
|
Large Cap |
|
Small/Mid Cap |
|
|||
|
|
|
|
|
|
||||||
|
INVESTMENT INCOME: |
|
|
|
|
|
|
|
|
|
|
|
Dividend income (net of withholding tax of $130, $16,414, |
||||||||||
|
and $0, respectively) |
|
$ |
3,045,018 |
|
$ |
5,302,833 |
|
$ |
1,327,190 |
|
|
Interest income |
|
|
4,303 |
|
|
1,853 |
|
|
1,956 |
|
|
|
|
|
|
|
||||||
|
Total investment income |
|
|
3,049,321 |
|
|
5,304,686 |
|
|
1,329,146 |
|
|
|
|
|
|
|
||||||
|
EXPENSES: |
|
|
|
|
|
|
|
|
|
|
|
Investment advisory fees |
|
|
1,249,893 |
|
|
1,318,651 |
|
|
592,024 |
|
|
Distribution (12b-1) fees – Service Shares |
|
|
352,268 |
|
|
351,396 |
|
|
105,744 |
|
|
Administrative service fees – Service Shares |
|
|
352,268 |
|
|
351,396 |
|
|
105,744 |
|
|
Shareholder servicing fees – Service Shares |
|
|
103,165 |
|
|
102,957 |
|
|
29,608 |
|
|
Custody fees |
|
|
81,918 |
|
|
26,531 |
|
|
54,459 |
|
|
Administration fees |
|
|
65,859 |
|
|
70,379 |
|
|
30,061 |
|
|
Legal fees |
|
|
64,724 |
|
|
98,347 |
|
|
38,695 |
|
|
Federal and state registration fees |
|
|
50,453 |
|
|
48,835 |
|
|
46,511 |
|
|
Fund accounting fees |
|
|
38,511 |
|
|
39,528 |
|
|
20,451 |
|
|
Audit and tax fees |
|
|
32,948 |
|
|
32,934 |
|
|
29,973 |
|
|
Directors’ fees and expenses |
|
|
31,414 |
|
|
32,940 |
|
|
15,876 |
|
|
Reports to shareholders |
|
|
27,123 |
|
|
29,259 |
|
|
12,099 |
|
|
Transfer agent fees and expenses |
|
|
13,774 |
|
|
14,030 |
|
|
9,399 |
|
|
Insurance fees |
|
|
9,240 |
|
|
9,544 |
|
|
3,684 |
|
|
Compliance fees |
|
|
7,018 |
|
|
7,356 |
|
|
3,178 |
|
|
|
|
|
|
|
||||||
|
Total expenses |
|
|
2,480,576 |
|
|
2,534,083 |
|
|
1,097,506 |
|
|
|
|
|
|
|
||||||
|
Expense recapture (reimbursement) by Advisor (See Note 3) |
|
|
2,135 |
|
|
— |
|
|
(9,272 |
) |
|
Less securities lending credit (See Note 6) |
|
|
(49,380 |
) |
|
(8,160 |
) |
|
(32,525 |
) |
|
|
|
|
|
|
||||||
|
Net expenses |
|
|
2,433,331 |
|
|
2,525,923 |
|
|
1,055,709 |
|
|
|
|
|
|
|
||||||
|
Net investment income |
|
|
615,990 |
|
|
2,778,763 |
|
|
273,437 |
|
|
|
|
|
|
|
||||||
|
NET REALIZED AND UNREALIZED GAIN |
||||||||||
|
ON INVESTMENTS: |
|
|
|
|
|
|
|
|
|
|
|
Net realized gain on investments |
|
|
12,907,901 |
|
|
1,243,514 |
|
|
5,068,942 |
|
|
Net change in unrealized appreciation (depreciation) on |
||||||||||
|
investments |
|
|
(6,127,721 |
) |
|
19,933,765 |
|
|
7,546,233 |
|
|
|
|
|
|
|
||||||
|
Net realized and unrealized gain |
|
|
6,780,180 |
|
|
21,177,279 |
|
|
12,615,175 |
|
|
|
|
|
|
|
||||||
|
NET INCREASE IN NET ASSETS |
||||||||||
|
RESULTING FROM OPERATIONS |
|
$ |
7,396,170 |
|
$ |
23,956,042 |
|
$ |
12,888,612 |
|
|
|
|
|
|
|
||||||
See notes to financial statements.
120
|
|
|
GuideMarkSM Funds & GuidePathSM Funds |
|
STATEMENTS OF OPERATIONS (Continued) |
|
For the Year Ended March 31, 2013 |
|
|
|
|
|
|
|
|
|
|
|
|
|
|
|
World |
|
Opportunistic |
|
Global |
|
|||
|
|
|
|
|
|
||||||
|
INVESTMENT INCOME: |
|
|
|
|
|
|
|
|
|
|
|
Dividend income (net of withholding tax of $792,227, $1,791, |
||||||||||
|
and $0, respectively) |
|
$ |
6,717,867 |
|
$ |
2,772,021 |
|
$ |
2,205,608 |
|
|
Interest income |
|
|
3,381 |
|
|
10,264 |
|
|
3,996 |
|
|
|
|
|
|
|
||||||
|
Total investment income |
|
|
6,721,248 |
|
|
2,782,285 |
|
|
2,209,604 |
|
|
|
|
|
|
|
||||||
|
EXPENSES: |
|
|
|
|
|
|
|
|
|
|
|
Investment advisory fees |
|
|
1,827,904 |
|
|
1,171,961 |
|
|
653,256 |
|
|
Distribution (12b-1) fees – Service Shares |
|
|
486,113 |
|
|
227,107 |
|
|
221,730 |
|
|
Administrative service fees – Service Shares |
|
|
486,113 |
|
|
227,107 |
|
|
221,730 |
|
|
Shareholder servicing fees – Service Shares |
|
|
136,112 |
|
|
63,590 |
|
|
62,084 |
|
|
Custody fees |
|
|
466,275 |
|
|
28,445 |
|
|
19,573 |
|
|
Administration fees |
|
|
96,405 |
|
|
53,894 |
|
|
40,647 |
|
|
Legal fees |
|
|
106,846 |
|
|
92,051 |
|
|
37,988 |
|
|
Federal and state registration fees |
|
|
54,840 |
|
|
57,391 |
|
|
46,525 |
|
|
Fund accounting fees |
|
|
147,317 |
|
|
33,384 |
|
|
18,090 |
|
|
Audit and tax fees |
|
|
31,868 |
|
|
29,991 |
|
|
17,002 |
|
|
Directors’ fees and expenses |
|
|
46,275 |
|
|
29,480 |
|
|
20,906 |
|
|
Reports to shareholders |
|
|
34,937 |
|
|
25,749 |
|
|
8,804 |
|
|
Transfer agent fees and expenses |
|
|
17,437 |
|
|
10,464 |
|
|
12,902 |
|
|
Insurance fees |
|
|
12,136 |
|
|
7,059 |
|
|
4,587 |
|
|
Compliance fees |
|
|
10,615 |
|
|
5,575 |
|
|
3,692 |
|
|
|
|
|
|
|
||||||
|
Total expenses |
|
|
3,961,193 |
|
|
2,063,248 |
|
|
1,389,516 |
|
|
|
|
|
|
|
||||||
|
Expense reimbursement by Advisor (See Note 3) |
|
|
(142,200 |
) |
|
(18,376 |
) |
|
— |
|
|
Less securities lending credit (See Note 6) |
|
|
(886 |
) |
|
(8,645 |
) |
|
(77,165 |
) |
|
|
|
|
|
|
||||||
|
Net expenses |
|
|
3,818,107 |
|
|
2,036,227 |
|
|
1,312,351 |
|
|
|
|
|
|
|
||||||
|
Net investment income |
|
|
2,903,141 |
|
|
746,058 |
|
|
897,253 |
|
|
|
|
|
|
|
||||||
|
NET REALIZED AND UNREALIZED GAIN |
||||||||||
|
ON INVESTMENTS: |
|
|
|
|
|
|
|
|
|
|
|
Net realized gain (loss) on: |
|
|
|
|
|
|
|
|
|
|
|
Investments |
|
|
(4,073,079 |
) |
|
4,854,198 |
|
|
(4,756,580 |
) |
|
Foreign currencies |
|
|
(106,587 |
) |
|
— |
|
|
— |
|
|
|
|
|
|
|
||||||
|
Total |
|
|
(4,179,666 |
) |
|
4,854,198 |
|
|
(4,756,580 |
) |
|
|
|
|
|
|
||||||
|
Net change in unrealized appreciation (depreciation) on: |
|
|
|
|
|
|
|
|
|
|
|
Investments |
|
|
25,826,429 |
|
|
13,201,143 |
|
|
4,879,279 |
|
|
Foreign currencies |
|
|
(8,390 |
) |
|
— |
|
|
— |
|
|
|
|
|
|
|
||||||
|
Total |
|
|
25,818,039 |
|
|
13,201,143 |
|
|
4,879,279 |
|
|
|
|
|
|
|
||||||
|
Net realized and unrealized gain |
|
|
21,638,373 |
|
|
18,055,341 |
|
|
122,699 |
|
|
|
|
|
|
|
||||||
|
NET INCREASE IN NET ASSETS |
||||||||||
|
RESULTING FROM OPERATIONS |
|
$ |
24,541,514 |
|
$ |
18,801,399 |
|
$ |
1,019,952 |
|
|
|
|
|
|
|
||||||
See notes to financial statements.
121
|
|
|
GuideMarkSM Funds & GuidePathSM Funds |
|
STATEMENTS OF OPERATIONS (Continued) |
|
For the Year Ended March 31, 2013 |
|
|
|
|
|
|
|
|
|
|
|
|
|
|
|
Core |
|
Tax-Exempt |
|
Opportunistic |
|
|||
|
|
|
|
|
|
||||||
|
INVESTMENT INCOME: |
|
|
|
|
|
|
|
|
|
|
|
Dividend income (net of withholding tax of $0, $0, $14,911) |
|
$ |
9,053 |
|
$ |
— |
|
$ |
339,018 |
|
|
Interest income (net of withholding tax of $0, $0, $201,172) |
|
|
10,343,267 |
|
|
3,301,520 |
|
|
13,043,580 |
|
|
|
|
|
|
|
||||||
|
Total investment income |
|
|
10,352,320 |
|
|
3,301,520 |
|
|
13,382,598 |
|
|
|
|
|
|
|
||||||
|
EXPENSES: |
|
|
|
|
|
|
|
|
|
|
|
Investment advisory fees |
|
|
2,245,480 |
|
|
404,636 |
|
|
1,820,884 |
|
|
Distribution (12b-1) fees – Service Shares |
|
|
919,158 |
|
|
202,318 |
|
|
444,610 |
|
|
Administrative service fees – Service Shares |
|
|
919,158 |
|
|
202,318 |
|
|
444,610 |
|
|
Shareholder servicing fees – Service Shares |
|
|
308,100 |
|
|
64,743 |
|
|
144,282 |
|
|
Custody fees |
|
|
69,955 |
|
|
11,344 |
|
|
199,038 |
|
|
Administration fees |
|
|
166,780 |
|
|
31,056 |
|
|
108,071 |
|
|
Legal fees |
|
|
230,686 |
|
|
26,863 |
|
|
126,905 |
|
|
Federal and state registration fees |
|
|
44,238 |
|
|
49,408 |
|
|
60,373 |
|
|
Fund accounting fees |
|
|
200,588 |
|
|
39,869 |
|
|
194,645 |
|
|
Audit and tax fees |
|
|
37,993 |
|
|
27,503 |
|
|
44,242 |
|
|
Directors’ fees and expenses |
|
|
82,733 |
|
|
14,251 |
|
|
46,216 |
|
|
Reports to shareholders |
|
|
61,027 |
|
|
8,206 |
|
|
32,319 |
|
|
Transfer agent fees and expenses |
|
|
26,306 |
|
|
6,973 |
|
|
15,876 |
|
|
Insurance fees |
|
|
24,874 |
|
|
4,712 |
|
|
9,412 |
|
|
Compliance fees |
|
|
17,282 |
|
|
3,479 |
|
|
9,568 |
|
|
|
|
|
|
|
||||||
|
Total expenses |
|
|
5,354,358 |
|
|
1,097,679 |
|
|
3,701,051 |
|
|
|
|
|
|
|
||||||
|
Expense reimbursement by Advisor (See Note 3) |
|
|
(24,268 |
) |
|
(53,717 |
) |
|
(82,362 |
) |
|
Less securities lending credit (See Note 6) |
|
|
(1,255 |
) |
|
— |
|
|
— |
|
|
|
|
|
|
|
||||||
|
Net expenses |
|
|
5,328,835 |
|
|
1,043,962 |
|
|
3,618,689 |
|
|
|
|
|
|
|
||||||
|
Net investment income |
|
|
5,023,485 |
|
|
2,257,558 |
|
|
9,763,909 |
|
|
|
|
|
|
|
||||||
|
NET REALIZED AND UNREALIZED GAIN |
||||||||||
|
ON INVESTMENTS: |
|
|
|
|
|
|
|
|
|
|
|
Net realized gain (loss) on: |
|
|
|
|
|
|
|
|
|
|
|
Investments |
|
|
8,864,753 |
|
|
1,992,488 |
|
|
1,821,569 |
|
|
Foreign currencies |
|
|
— |
|
|
— |
|
|
(147,803 |
) |
|
Forward currency exchange contracts |
|
|
— |
|
|
— |
|
|
4,235,304 |
|
|
Forward sale commitments |
|
|
(371,406 |
) |
|
— |
|
|
— |
|
|
Swaps |
|
|
— |
|
|
— |
|
|
(1,712,489 |
) |
|
Futures contracts |
|
|
460,104 |
|
|
— |
|
|
(442,195 |
) |
|
Written Options |
|
|
— |
|
|
— |
|
|
183,971 |
|
|
|
|
|
|
|
||||||
|
Total |
|
|
8,953,451 |
|
|
1,992,488 |
|
|
3,938,357 |
|
|
|
|
|
|
|
||||||
|
Net change in unrealized appreciation (depreciation) on: |
|
|
|
|
|
|
|
|
|
|
|
Investments |
|
|
3,588,507 |
|
|
(279,838 |
) |
|
9,105,830 |
|
|
Foreign currencies |
|
|
— |
|
|
— |
|
|
(29,295 |
) |
|
Forward currency contracts |
|
|
— |
|
|
— |
|
|
2,397,330 |
|
|
Forward sale commitments |
|
|
3,125 |
|
|
— |
|
|
— |
|
|
Swaps |
|
|
— |
|
|
— |
|
|
(16,597 |
) |
|
Futures contracts |
|
|
198,569 |
|
|
— |
|
|
(103,448 |
) |
|
Written Options |
|
|
— |
|
|
— |
|
|
(141,239 |
) |
|
|
|
|
|
|
||||||
|
Total |
|
|
3,790,201 |
|
|
(279,838 |
) |
|
11,212,581 |
|
|
|
|
|
|
|
||||||
|
Net realized and unrealized gain |
|
|
12,743,652 |
|
|
1,712,650 |
|
|
15,150,938 |
|
|
|
|
|
|
|
||||||
|
NET INCREASE IN NET ASSETS |
||||||||||
|
RESULTING FROM OPERATIONS |
|
$ |
17,767,137 |
|
$ |
3,970,208 |
|
$ |
24,914,847 |
|
|
|
|
|
|
|
||||||
See notes to financial statements.
122
|
|
|
GuideMarkSM Funds & GuidePathSM Funds |
|
STATEMENTS OF OPERATIONS (Continued) |
|
For the Year Ended March 31, 2013 |
|
|
|
|
|
|
|
|
|
|
|
|
|
|
|
|
|
|
Strategic |
|
Tactical |
|
Tactical |
|
Absolute |
|
||||
|
|
|
|
|
|
|
||||||||
|
INVESTMENT INCOME: |
|
|
|
|
|
|
|
|
|
|
|
|
|
|
Dividend income |
|
$ |
2,317,830 |
|
$ |
2,023,992 |
|
$ |
3,914,253 |
|
$ |
9,821,901 |
|
|
Dividends from affiliate investments |
|
|
1,174,406 |
|
|
1,671,924 |
|
|
1,159,229 |
|
|
1,849,307 |
|
|
Interest income |
|
|
5,997 |
|
|
5,662 |
|
|
7,484 |
|
|
12,800 |
|
|
|
|
|
|
|
|
||||||||
|
Total investment income |
|
|
3,498,233 |
|
|
3,701,578 |
|
|
5,080,966 |
|
|
11,684,008 |
|
|
|
|
|
|
|
|
||||||||
|
EXPENSES: |
|
|
|
|
|
|
|
|
|
|
|
|
|
|
Investment advisory fees |
|
|
486,217 |
|
|
464,995 |
|
|
866,360 |
|
|
1,396,688 |
|
|
Distribution (12b-1) fees – Service Shares |
|
|
485,478 |
|
|
464,260 |
|
|
618,155 |
|
|
997,171 |
|
|
Administrative service fees – Service Shares |
|
|
485,478 |
|
|
464,260 |
|
|
618,155 |
|
|
997,171 |
|
|
Shareholder servicing fees – Service Shares |
|
|
194,191 |
|
|
185,704 |
|
|
247,261 |
|
|
398,869 |
|
|
Custody fees |
|
|
58,604 |
|
|
81,569 |
|
|
114,283 |
|
|
141,569 |
|
|
Administration fees |
|
|
78,097 |
|
|
75,063 |
|
|
99,048 |
|
|
160,324 |
|
|
Legal fees |
|
|
60,312 |
|
|
57,890 |
|
|
76,789 |
|
|
120,514 |
|
|
Federal and state registration fees |
|
|
51,144 |
|
|
48,970 |
|
|
58,197 |
|
|
79,952 |
|
|
Fund accounting fees |
|
|
28,350 |
|
|
27,684 |
|
|
36,733 |
|
|
58,384 |
|
|
Audit and tax fees |
|
|
16,149 |
|
|
16,449 |
|
|
16,449 |
|
|
16,449 |
|
|
Directors’ fees and expenses |
|
|
28,566 |
|
|
27,485 |
|
|
36,772 |
|
|
56,676 |
|
|
Reports to shareholders |
|
|
21,747 |
|
|
21,194 |
|
|
26,071 |
|
|
32,322 |
|
|
Transfer agent fees and expenses |
|
|
9,283 |
|
|
9,106 |
|
|
10,340 |
|
|
14,160 |
|
|
Insurance fees |
|
|
4,609 |
|
|
4,550 |
|
|
6,051 |
|
|
8,317 |
|
|
Compliance fees |
|
|
7,497 |
|
|
7,212 |
|
|
9,402 |
|
|
15,648 |
|
|
|
|
|
|
|
|
||||||||
|
Total expenses |
|
|
2,015,722 |
|
|
1,956,391 |
|
|
2,840,066 |
|
|
4,494,214 |
|
|
|
|
|
|
|
|
||||||||
|
Expense recapture (reimbursement) by Advisor |
|||||||||||||
|
(See Note 3) |
|
|
(14,630 |
) |
|
(13,560 |
) |
|
(12,695 |
) |
|
31,499 |
|
|
Less securities lending credit (See Note 6) |
|
|
(58,110 |
) |
|
(84,675 |
) |
|
(106,275 |
) |
|
(137,285 |
) |
|
|
|
|
|
|
|
||||||||
|
Net expenses |
|
|
1,942,982 |
|
|
1,858,156 |
|
|
2,721,096 |
|
|
4,388,428 |
|
|
|
|
|
|
|
|
||||||||
|
Net investment income |
|
|
1,555,251 |
|
|
1,843,422 |
|
|
2,359,870 |
|
|
7,295,580 |
|
|
|
|
|
|
|
|
||||||||
|
NET REALIZED AND UNREALIZED GAIN |
|||||||||||||
|
ON INVESTMENTS: |
|
|
|
|
|
|
|
|
|
|
|
|
|
|
Net realized gain (loss) on: |
|
|
|
|
|
|
|
|
|
|
|
|
|
|
Investments |
|
|
464,646 |
|
|
1,383,914 |
|
|
5,039,177 |
|
|
(2,176,876 |
) |
|
Investments in affiliates |
|
|
(571,277 |
) |
|
(71,183 |
) |
|
(949,867 |
) |
|
148,319 |
|
|
|
|
|
|
|
|
||||||||
|
Total |
|
|
(106,631 |
) |
|
1,312,731 |
|
|
4,089,310 |
|
|
(2,028,557 |
) |
|
|
|
|
|
|
|
||||||||
|
Net change in unrealized appreciation on: |
|
|
|
|
|
|
|
|
|
|
|
|
|
|
Investments |
|
|
7,836,218 |
|
|
3,577,065 |
|
|
9,624,470 |
|
|
4,119,824 |
|
|
Investments in affiliates |
|
|
12,628,536 |
|
|
10,807,207 |
|
|
9,626,562 |
|
|
2,101,797 |
|
|
|
|
|
|
|
|
||||||||
|
Total |
|
|
20,464,754 |
|
|
14,384,272 |
|
|
19,251,032 |
|
|
6,221,621 |
|
|
|
|
|
|
|
|
||||||||
|
Net realized and unrealized gain |
|
|
20,358,123 |
|
|
15,697,003 |
|
|
23,340,342 |
|
|
4,193,064 |
|
|
|
|
|
|
|
|
||||||||
|
NET INCREASE IN NET ASSETS |
|||||||||||||
|
RESULTING FROM OPERATIONS |
|
$ |
21,913,374 |
|
$ |
17,540,425 |
|
$ |
25,700,212 |
|
$ |
11,488,644 |
|
|
|
|
|
|
|
|
||||||||
See notes to financial statements.
123
|
|
|
GuideMarkSM Funds & GuidePathSM Funds |
|
STATEMENTS OF OPERATIONS (Continued) |
|
For the Period August 31, 20121 through March 31, 2013 |
|
|
|
|
|
|
|
|
|
|
|
|
|
|
|
Multi-Asset |
|
Fixed Income |
|
Altegris® |
|
|||
|
|
|
|
|
|
||||||
|
INVESTMENT INCOME: |
|
|
|
|
|
|
|
|
|
|
|
Dividend income |
|
$ |
1,601,014 |
|
$ |
2,012,717 |
|
$ |
— |
|
|
Dividends from affiliate investments |
|
|
63,267 |
|
|
1,612,901 |
|
|
1,038,662 |
|
|
Interest income |
|
|
1,101 |
|
|
3,976 |
|
|
1,990 |
|
|
|
|
|
|
|
||||||
|
Total investment income |
|
|
1,665,382 |
|
|
3,629,594 |
|
|
1,040,652 |
|
|
|
|
|
|
|
||||||
|
EXPENSES: |
|
|
|
|
|
|
|
|
|
|
|
Investment advisory fees |
|
|
116,937 |
|
|
315,680 |
|
|
32,195 |
|
|
Distribution (12b-1) fees – Service Shares |
|
|
83,526 |
|
|
315,289 |
|
|
218,292 |
|
|
Administrative service fees – Service Shares |
|
|
83,526 |
|
|
315,289 |
|
|
53,616 |
|
|
Shareholder servicing fees – Service Shares |
|
|
33,411 |
|
|
126,116 |
|
|
87,317 |
|
|
Custody fees |
|
|
26,382 |
|
|
38,668 |
|
|
21,215 |
|
|
Administration fees |
|
|
12,163 |
|
|
47,149 |
|
|
34,021 |
|
|
Legal fees |
|
|
26,779 |
|
|
101,055 |
|
|
86,565 |
|
|
Federal and state registration fees |
|
|
32,385 |
|
|
55,557 |
|
|
45,925 |
|
|
Fund accounting fees |
|
|
1,445 |
|
|
4,119 |
|
|
2,492 |
|
|
Audit and tax fees |
|
|
16,443 |
|
|
16,443 |
|
|
16,443 |
|
|
Directors’ fees and expenses |
|
|
3,807 |
|
|
14,888 |
|
|
10,312 |
|
|
Reports to shareholders |
|
|
3,844 |
|
|
15,320 |
|
|
11,754 |
|
|
Transfer agent fees and expenses |
|
|
1,021 |
|
|
5,996 |
|
|
2,249 |
|
|
Insurance fees |
|
|
560 |
|
|
1,060 |
|
|
1,060 |
|
|
Compliance fees |
|
|
987 |
|
|
3,911 |
|
|
2,685 |
|
|
|
|
|
|
|
||||||
|
Total expenses |
|
|
443,216 |
|
|
1,376,540 |
|
|
626,141 |
|
|
|
|
|
|
|
||||||
|
Expense reimbursement by Advisor (See Note 3) |
|
|
(20,380 |
) |
|
— |
|
|
— |
|
|
Less securities lending credit (See Note 6) |
|
|
(55,320 |
) |
|
(77,710 |
) |
|
— |
|
|
|
|
|
|
|
||||||
|
Net expenses |
|
|
367,516 |
|
|
1,298,830 |
|
|
626,141 |
|
|
|
|
|
|
|
||||||
|
Net investment income |
|
|
1,297,866 |
|
|
2,330,764 |
|
|
414,511 |
|
|
|
|
|
|
|
||||||
|
NET REALIZED AND UNREALIZED GAIN (LOSS) |
||||||||||
|
ON INVESTMENTS: |
|
|
|
|
|
|
|
|
|
|
|
Net realized gain (loss) on: |
|
|
|
|
|
|
|
|
|
|
|
Investments |
|
|
73,320 |
|
|
123,584 |
|
|
— |
|
|
Investments in affiliates |
|
|
5,828 |
|
|
258,054 |
|
|
(139,006 |
) |
|
|
|
|
|
|
||||||
|
Total |
|
|
79,148 |
|
|
381,638 |
|
|
(139,006 |
) |
|
|
|
|
|
|
||||||
|
Net change in unrealized appreciation (depreciation) on: |
|
|
|
|
|
|
|
|
|
|
|
Investments |
|
|
2,704,901 |
|
|
(997,236 |
) |
|
— |
|
|
Investments in affiliates |
|
|
138,719 |
|
|
(431,920 |
) |
|
266,232 |
|
|
|
|
|
|
|
||||||
|
Total |
|
|
2,843,620 |
|
|
(1,429,156 |
) |
|
266,232 |
|
|
|
|
|
|
|
||||||
|
Net realized and unrealized gain (loss) |
|
|
2,922,768 |
|
|
(1,047,518 |
) |
|
127,226 |
|
|
|
|
|
|
|
||||||
|
NET INCREASE IN NET ASSETS |
||||||||||
|
RESULTING FROM OPERATIONS |
|
$ |
4,220,634 |
|
$ |
1,283,246 |
|
$ |
541,737 |
|
|
|
|
|
|
|
||||||
|
1 Commencement of operations. |
||||||||||
See notes to financial statements.
124
|
|
|
GuideMarkSM Funds &
GuidePathSM Funds |
|
|
|
|
|
|
|
|
|
|
|
|
|
|
|
|
|
|
|
|
Large Cap Growth Fund |
|
|
Large Cap Value Fund |
|
|||||||
|
|
|
|
|
|
|||||||||
|
|
|
Year Ended |
|
Year Ended |
|
Year Ended |
|
Year Ended |
|
||||
|
|
|
|
|
|
|
||||||||
|
OPERATIONS: |
|
|
|
|
|
|
|
|
|
|
|
|
|
|
Net investment income (loss) |
|
$ |
615,990 |
|
$ |
(449,570 |
) |
$ |
2,778,763 |
|
$ |
2,298,446 |
|
|
Net realized gain on investment transactions |
|
|
12,907,901 |
|
|
25,379,781 |
|
|
1,243,514 |
|
|
33,842,641 |
|
|
Change in unrealized appreciation
(depreciation) |
|
|
(6,127,721 |
) |
|
(12,286,197 |
) |
|
19,933,765 |
|
|
(28,443,449 |
) |
|
|
|
|
|
|
|
||||||||
|
Net increase in net assets resulting from operations |
|
|
7,396,170 |
|
|
12,644,014 |
|
|
23,956,042 |
|
|
7,697,638 |
|
|
|
|
|
|
|
|
||||||||
|
CAPITAL SHARE TRANSACTIONS: |
|
|
|
|
|
|
|
|
|
|
|
|
|
|
Institutional Shares |
|
|
|
|
|
|
|
|
|
|
|
|
|
|
Shares sold |
|
|
21,114,514 |
|
|
31,939,165 |
|
|
28,863,915 |
|
|
41,284,965 |
|
|
Shares issued to holders in reinvestment of dividends |
|
|
245,969 |
|
|
— |
|
|
973,550 |
|
|
559,662 |
|
|
Shares redeemed |
|
|
(10,260,736 |
) |
|
(3,895,350 |
) |
|
(15,604,223 |
) |
|
(5,173,389 |
) |
|
|
|
|
|
|
|
||||||||
|
Net increase |
|
|
11,099,747 |
|
|
28,043,815 |
|
|
14,233,242 |
|
|
36,671,238 |
|
|
|
|
|
|
|
|
||||||||
|
Service Shares |
|
|
|
|
|
|
|
|
|
|
|
|
|
|
Shares sold |
|
|
21,361,024 |
|
|
112,113,323 |
|
|
20,957,853 |
|
|
114,824,850 |
|
|
Shares issued to holders in reinvestment of dividends |
|
|
236,843 |
|
|
— |
|
|
1,840,459 |
|
|
1,676,458 |
|
|
Shares redeemed |
|
|
(58,405,005 |
) |
|
(163,945,672 |
) |
|
(61,447,421 |
) |
|
(155,967,475 |
) |
|
|
|
|
|
|
|
||||||||
|
Net decrease |
|
|
(36,807,138 |
) |
|
(51,832,349 |
) |
|
(38,649,109 |
) |
|
(39,466,167 |
) |
|
|
|
|
|
|
|
||||||||
|
DIVIDENDS AND DISTRIBUTIONS TO |
|
|
|
|
|
|
|
|
|
|
|
|
|
|
Net investment income – Institutional Shares |
|
|
(245,969 |
) |
|
— |
|
|
(973,550 |
) |
|
(559,662 |
) |
|
Net investment income – Service Shares |
|
|
(236,885 |
) |
|
— |
|
|
(1,840,687 |
) |
|
(1,676,610 |
) |
|
|
|
|
|
|
|
||||||||
|
Total dividends and distributions |
|
|
(482,854 |
) |
|
— |
|
|
(2,814,237 |
) |
|
(2,236,272 |
) |
|
|
|
|
|
|
|
||||||||
|
INCREASE (DECREASE) IN NET ASSETS |
|
|
(18,794,075 |
) |
|
(11,144,520 |
) |
|
(3,274,062 |
) |
|
2,666,437 |
|
|
NET ASSETS: |
|
|
|
|
|
|
|
|
|
|
|
|
|
|
Beginning of year |
|
|
199,984,668 |
|
|
211,129,188 |
|
|
202,798,778 |
|
|
200,132,341 |
|
|
|
|
|
|
|
|
||||||||
|
End of year (including undistributed
net investment |
|
$ |
181,190,593 |
|
$ |
199,984,668 |
|
$ |
199,524,716 |
|
$ |
202,798,778 |
|
|
|
|
|
|
|
|
||||||||
|
CHANGES IN SHARES OUTSTANDING |
|
|
|
|
|
|
|
|
|
|
|
|
|
|
Institutional Shares |
|
|
|
|
|
|
|
|
|
|
|
|
|
|
Shares sold |
|
|
2,048,776 |
|
|
3,362,999 |
|
|
3,437,991 |
|
|
5,351,797 |
|
|
Shares issued to holders in reinvestment of dividends |
|
|
24,044 |
|
|
— |
|
|
115,350 |
|
|
74,821 |
|
|
Shares redeemed |
|
|
(991,010 |
) |
|
(428,892 |
) |
|
(1,875,144 |
) |
|
(694,851 |
) |
|
|
|
|
|
|
|
||||||||
|
Net increase |
|
|
1,081,810 |
|
|
2,934,107 |
|
|
1,678,197 |
|
|
4,731,767 |
|
|
|
|
|
|
|
|
||||||||
|
Service Shares |
|
|
|
|
|
|
|
|
|
|
|
|
|
|
Shares sold |
|
|
2,059,739 |
|
|
11,684,957 |
|
|
2,429,746 |
|
|
14,492,557 |
|
|
Shares issued to holders in reinvestment of dividends |
|
|
23,288 |
|
|
— |
|
|
215,763 |
|
|
221,754 |
|
|
Shares redeemed |
|
|
(5,725,792 |
) |
|
(16,938,911 |
) |
|
(7,295,530 |
) |
|
(19,524,651 |
) |
|
|
|
|
|
|
|
||||||||
|
Net decrease |
|
|
(3,642,765 |
) |
|
(5,253,954 |
) |
|
(4,650,021 |
) |
|
(4,810,340 |
) |
|
|
|
|
|
|
|
||||||||
See notes to financial statements.
125
|
|
|
GuideMarkSM
Funds & GuidePathSM Funds |
|
|
|
|
|
|
|
|
|
|
|
|
|
|
|
|
|
|
|
|
Small/Mid Cap Core Fund |
|
World ex-US Fund |
|
||||||||
|
|
|
|
|
||||||||||
|
|
|
Year Ended |
|
Year Ended |
|
Year Ended |
|
Year Ended |
|
||||
|
|
|
|
|
|
|
||||||||
|
OPERATIONS: |
|
|
|
|
|
|
|
|
|
|
|
|
|
|
Net investment income (loss) |
|
$ |
273,437 |
|
$ |
(371,574 |
) |
$ |
2,903,141 |
|
$ |
2,645,204 |
|
|
Net realized gain (loss) on investment transactions |
|
|
5,068,942 |
|
|
3,417,901 |
|
|
(4,179,666 |
) |
|
(789,893 |
) |
|
Change in unrealized appreciation
(depreciation) |
|
|
7,546,233 |
|
|
(3,661,311 |
) |
|
25,818,039 |
|
|
(23,504,431 |
) |
|
|
|
|
|
|
|
||||||||
|
Net increase (decrease) in net assets
resulting |
|
|
12,888,612 |
|
|
(614,984 |
) |
|
24,541,514 |
|
|
(21,649,120 |
) |
|
|
|
|
|
|
|
||||||||
|
CAPITAL SHARE TRANSACTIONS: |
|
|
|
|
|
|
|
|
|
|
|
|
|
|
Institutional Shares |
|
|
|
|
|
|
|
|
|
|
|
|
|
|
Shares sold |
|
|
22,445,768 |
|
|
35,637,119 |
|
|
52,506,550 |
|
|
47,752,548 |
|
|
Shares issued to holders in reinvestment of dividends |
|
|
341,432 |
|
|
— |
|
|
644,419 |
|
|
536,257 |
|
|
Shares redeemed |
|
|
(14,900,622 |
) |
|
(7,995,819 |
) |
|
(14,909,881 |
) |
|
(8,429,463 |
) |
|
|
|
|
|
|
|
||||||||
|
Net increase |
|
|
7,886,578 |
|
|
27,641,300 |
|
|
38,241,088 |
|
|
39,859,342 |
|
|
|
|
|
|
|
|
||||||||
|
Service Shares |
|
|
|
|
|
|
|
|
|
|
|
|
|
|
Shares sold |
|
|
5,372,925 |
|
|
55,798,047 |
|
|
68,395,204 |
|
|
54,279,153 |
|
|
Shares issued to holders in reinvestment of dividends |
|
|
126,113 |
|
|
— |
|
|
1,440,442 |
|
|
2,278,571 |
|
|
Shares redeemed |
|
|
(18,874,352 |
) |
|
(47,522,395 |
) |
|
(74,045,567 |
) |
|
(115,730,785 |
) |
|
|
|
|
|
|
|
||||||||
|
Net increase (decrease) |
|
|
(13,375,314 |
) |
|
8,275,652 |
|
|
(4,209,921 |
) |
|
(59,173,061 |
) |
|
|
|
|
|
|
|
||||||||
|
DIVIDENDS AND DISTRIBUTIONS TO |
|
|
|
|
|
|
|
|
|
|
|
|
|
|
Net investment income – Institutional Shares |
|
|
(341,432 |
) |
|
— |
|
|
(644,419 |
) |
|
(536,257 |
) |
|
Net investment income – Service Shares |
|
|
(126,133 |
) |
|
— |
|
|
(1,441,139 |
) |
|
(2,279,735 |
) |
|
|
|
|
|
|
|
||||||||
|
Total dividends and distributions |
|
|
(467,565 |
) |
|
— |
|
|
(2,085,558 |
) |
|
(2,815,992 |
) |
|
|
|
|
|
|
|
||||||||
|
INCREASE (DECREASE) IN NET ASSETS |
|
|
6,932,311 |
|
|
35,301,968 |
|
|
56,487,123 |
|
|
(43,778,831 |
) |
|
NET ASSETS: |
|
|
|
|
|
|
|
|
|
|
|
|
|
|
Beginning of year |
|
|
78,050,757 |
|
|
42,748,789 |
|
|
225,923,238 |
|
|
269,702,069 |
|
|
|
|
|
|
|
|
||||||||
|
End of year (including undistributed
net investment |
|
$ |
84,983,068 |
|
$ |
78,050,757 |
|
$ |
282,410,361 |
|
$ |
225,923,238 |
|
|
|
|
|
|
|
|
||||||||
|
CHANGES IN SHARES OUTSTANDING |
|
|
|
|
|
|
|
|
|
|
|
|
|
|
Institutional Shares |
|
|
|
|
|
|
|
|
|
|
|
|
|
|
Shares sold |
|
|
1,934,772 |
|
|
3,418,942 |
|
|
7,113,356 |
|
|
6,489,227 |
|
|
Shares issued to holders in reinvestment of dividends |
|
|
28,862 |
|
|
— |
|
|
82,301 |
|
|
81,251 |
|
|
Shares redeemed |
|
|
(1,284,015 |
) |
|
(814,996 |
) |
|
(2,030,934 |
) |
|
(1,169,799 |
) |
|
|
|
|
|
|
|
||||||||
|
Net increase |
|
|
679,619 |
|
|
2,603,946 |
|
|
5,164,723 |
|
|
5,400,679 |
|
|
|
|
|
|
|
|
||||||||
|
Service Shares |
|
|
|
|
|
|
|
|
|
|
|
|
|
|
Shares sold |
|
|
456,562 |
|
|
4,905,502 |
|
|
9,665,692 |
|
|
7,284,429 |
|
|
Shares issued to holders in reinvestment of dividends |
|
|
10,697 |
|
|
— |
|
|
183,965 |
|
|
344,195 |
|
|
Shares redeemed |
|
|
(1,615,250 |
) |
|
(4,419,198 |
) |
|
(9,919,664 |
) |
|
(15,197,691 |
) |
|
|
|
|
|
|
|
||||||||
|
Net increase (decrease) |
|
|
(1,147,991 |
) |
|
486,304 |
|
|
(70,007 |
) |
|
(7,569,067 |
) |
|
|
|
|
|
|
|
||||||||
See notes to financial statements.
126
|
|
|
GuideMarkSM
Funds & GuidePathSM Funds |
|
|
|
|
|
|
|
|
|
|
|
|
|
|
|
|
|
|
|
|
Opportunistic Equity Fund |
|
Global Real Return Fund |
|
||||||||
|
|
|
|
|
||||||||||
|
|
|
Year Ended |
|
Year Ended |
|
Year Ended |
|
Year Ended |
|
||||
|
|
|
|
|
|
|
||||||||
|
OPERATIONS: |
|
|
|
|
|
|
|
|
|
|
|
|
|
|
Net investment income (loss) |
|
$ |
746,058 |
|
$ |
(122,977 |
) |
$ |
897,253 |
|
$ |
974,947 |
|
|
Net realized gain (loss) on investment transactions |
|
|
4,854,198 |
|
|
(12,577,311 |
) |
|
(4,756,580 |
) |
|
(4,165,500 |
) |
|
Change in unrealized appreciation
(depreciation) |
|
|
13,201,143 |
|
|
10,647,956 |
|
|
4,879,279 |
|
|
(5,019,398 |
) |
|
|
|
|
|
|
|
||||||||
|
Net increase (decrease) in net assets
resulting |
|
|
18,801,399 |
|
|
(2,052,332 |
) |
|
1,019,952 |
|
|
(8,209,951 |
) |
|
|
|
|
|
|
|
||||||||
|
CAPITAL SHARE TRANSACTIONS: |
|
|
|
|
|
|
|
|
|
|
|
|
|
|
Institutional Shares |
|
|
|
|
|
|
|
|
|
|
|
|
|
|
Shares sold |
|
|
29,457,609 |
|
|
52,372,060 |
|
|
8,619,468 |
|
|
10,727,543 |
|
|
Shares issued to holders in reinvestment of dividends |
|
|
394,887 |
|
|
— |
|
|
134,336 |
|
|
134,132 |
|
|
Shares redeemed |
|
|
(17,215,858 |
) |
|
(9,512,689 |
) |
|
(7,635,480 |
) |
|
(458,265 |
) |
|
|
|
|
|
|
|
||||||||
|
Net increase |
|
|
12,636,638 |
|
|
42,859,371 |
|
|
1,118,324 |
|
|
10,403,410 |
|
|
|
|
|
|
|
|
||||||||
|
Service Shares |
|
|
|
|
|
|
|
|
|
|
|
|
|
|
Shares sold |
|
|
9,325,458 |
|
|
182,674,884 |
|
|
11,349,361 |
|
|
169,097,947 |
|
|
Shares issued to holders in reinvestment of dividends |
|
|
191,398 |
|
|
— |
|
|
733,867 |
|
|
1,004,029 |
|
|
Shares redeemed |
|
|
(46,106,624 |
) |
|
(63,026,524 |
) |
|
(44,895,468 |
) |
|
(57,155,937 |
) |
|
|
|
|
|
|
|
||||||||
|
Net increase (decrease) |
|
|
(36,589,768 |
) |
|
119,648,360 |
|
|
(32,812,240 |
) |
|
112,946,039 |
|
|
|
|
|
|
|
|
||||||||
|
DIVIDENDS AND DISTRIBUTIONS TO |
|
|
|
|
|
|
|
|
|
|
|
|
|
|
Net investment income – Institutional Shares |
|
|
(394,887 |
) |
|
— |
|
|
(134,336 |
) |
|
(126,411 |
) |
|
Net investment income – Service Shares |
|
|
(191,398 |
) |
|
— |
|
|
(733,867 |
) |
|
(946,234 |
) |
|
Return of capital – Institutional Shares |
|
|
— |
|
|
— |
|
|
— |
|
|
(7,721 |
) |
|
Return of capital – Service Shares |
|
|
— |
|
|
— |
|
|
— |
|
|
(57,795 |
) |
|
|
|
|
|
|
|
||||||||
|
Total dividends and distributions |
|
|
(586,285 |
) |
|
— |
|
|
(868,203 |
) |
|
(1,138,161 |
) |
|
|
|
|
|
|
|
||||||||
|
INCREASE (DECREASE) IN NET ASSETS |
|
|
(5,738,016 |
) |
|
160,455,399 |
|
|
(31,542,167 |
) |
|
114,001,337 |
|
|
NET ASSETS: |
|
|
|
|
|
|
|
|
|
|
|
|
|
|
Beginning of year |
|
|
160,455,399 |
|
|
— |
|
|
114,003,337 |
|
|
2,000 |
|
|
|
|
|
|
|
|
||||||||
|
End of year (including undistributed
net investment |
|
$ |
154,717,383 |
|
$ |
160,455,399 |
|
$ |
82,461,170 |
|
$ |
114,003,337 |
|
|
|
|
|
|
|
|
||||||||
|
CHANGES IN SHARES OUTSTANDING |
|
|
|
|
|
|
|
|
|
|
|
|
|
|
Institutional Shares |
|
|
|
|
|
|
|
|
|
|
|
|
|
|
Shares sold |
|
|
3,050,070 |
|
|
5,777,090 |
|
|
938,852 |
|
|
1,149,354 |
|
|
Shares issued to holders in reinvestment of dividends |
|
|
39,568 |
|
|
— |
|
|
14,261 |
|
|
15,418 |
|
|
Shares redeemed |
|
|
(1,795,557 |
) |
|
(1,109,784 |
) |
|
(823,384 |
) |
|
(50,346 |
) |
|
|
|
|
|
|
|
||||||||
|
Net increase |
|
|
1,294,081 |
|
|
4,667,306 |
|
|
129,729 |
|
|
1,114,426 |
|
|
|
|
|
|
|
|
||||||||
|
Service Shares |
|
|
|
|
|
|
|
|
|
|
|
|
|
|
Shares sold |
|
|
938,744 |
|
|
18,575,216 |
|
|
1,216,621 |
|
|
16,979,915 |
|
|
Shares issued to holders in reinvestment of dividends |
|
|
19,255 |
|
|
— |
|
|
77,494 |
|
|
114,746 |
|
|
Shares redeemed |
|
|
(4,813,453 |
) |
|
(6,986,890 |
) |
|
(4,803,833 |
) |
|
(6,075,142 |
) |
|
|
|
|
|
|
|
||||||||
|
Net increase (decrease) |
|
|
(3,855,454 |
) |
|
11,588,326 |
|
|
(3,509,718 |
) |
|
11,019,519 |
|
|
|
|
|
|
|
|
||||||||
See notes to financial statements.
127
|
|
|
GuideMarkSM Funds & GuidePathSM Funds |
|
STATEMENTS OF CHANGES IN NET ASSETS (Continued) |
|
|
|
|
|
|
|
|
|
|
|
|
|
|
|
|
|
|
|
|
Core Fixed Income Fund |
|
Tax-Exempt Fixed Income Fund |
|
||||||||
|
|
|
|
|
||||||||||
|
|
|
Year Ended |
|
Year Ended |
|
Year Ended |
|
Year Ended |
|
||||
|
|
|
|
|
|
|
||||||||
|
OPERATIONS: |
|
|
|
|
|
|
|
|
|
|
|
|
|
|
Net investment income |
|
$ |
5,023,485 |
|
$ |
7,479,078 |
|
$ |
2,257,558 |
|
$ |
2,972,685 |
|
|
Net realized gain on investment transactions |
|
|
8,953,451 |
|
|
11,539,240 |
|
|
1,992,488 |
|
|
1,394,371 |
|
|
Change in unrealized appreciation
(depreciation) |
|
|
3,790,201 |
|
|
6,673,590 |
|
|
(279,838 |
) |
|
5,756,168 |
|
|
|
|
|
|
|
|
||||||||
|
Net increase in net assets resulting from operations |
|
|
17,767,137 |
|
|
25,691,908 |
|
|
3,970,208 |
|
|
10,123,224 |
|
|
|
|
|
|
|
|
||||||||
|
CAPITAL SHARE TRANSACTIONS: |
|
|
|
|
|
|
|
|
|
|
|
|
|
|
Institutional Shares |
|
|
|
|
|
|
|
|
|
|
|
|
|
|
Shares sold |
|
|
126,671,176 |
|
|
68,940,739 |
|
|
— |
|
|
— |
|
|
Shares issued to holders in reinvestment of dividends |
|
|
3,059,578 |
|
|
584,438 |
|
|
— |
|
|
— |
|
|
Shares redeemed |
|
|
(26,205,403 |
) |
|
(38,116,152 |
) |
|
— |
|
|
— |
|
|
|
|
|
|
|
|
||||||||
|
Net increase |
|
|
103,525,351 |
|
|
31,409,025 |
|
|
— |
|
|
— |
|
|
|
|
|
|
|
|
||||||||
|
Service Shares |
|
|
|
|
|
|
|
|
|
|
|
|
|
|
Shares sold |
|
|
119,713,756 |
|
|
229,985,171 |
|
|
22,814,112 |
|
|
24,438,594 |
|
|
Shares issued to holders in reinvestment of dividends |
|
|
7,857,792 |
|
|
7,246,292 |
|
|
2,125,734 |
|
|
2,989,714 |
|
|
Shares redeemed |
|
|
(289,441,078 |
) |
|
(401,161,022 |
) |
|
(32,323,200 |
) |
|
(123,481,858 |
) |
|
|
|
|
|
|
|
||||||||
|
Net decrease |
|
|
(161,869,530 |
) |
|
(163,929,559 |
) |
|
(7,383,354 |
) |
|
(96,053,550 |
) |
|
|
|
|
|
|
|
||||||||
|
DIVIDENDS AND DISTRIBUTIONS TO |
|||||||||||||
|
SHAREHOLDERS: |
|
|
|
|
|
|
|
|
|
|
|
|
|
|
Net investment income – Institutional Shares |
|
|
(1,990,436 |
) |
|
(584,438 |
) |
|
— |
|
|
— |
|
|
Net investment income – Service Shares |
|
|
(5,184,619 |
) |
|
(7,246,797 |
) |
|
(2,255,871 |
) |
|
(2,990,928 |
) |
|
Net realized gains – Institutional Shares |
|
|
(1,069,143 |
) |
|
— |
|
|
— |
|
|
— |
|
|
Net realized gains – Service Shares |
|
|
(2,916,872 |
) |
|
— |
|
|
— |
|
|
— |
|
|
|
|
|
|
|
|
||||||||
|
Total dividends and distributions |
|
|
(11,161,070 |
) |
|
(7,831,235 |
) |
|
(2,255,871 |
) |
|
(2,990,928 |
) |
|
|
|
|
|
|
|
||||||||
|
DECREASE IN NET ASSETS |
|
|
(51,738,112 |
) |
|
(114,659,861 |
) |
|
(5,669,017 |
) |
|
(88,921,254 |
) |
|
NET ASSETS: |
|
|
|
|
|
|
|
|
|
|
|
|
|
|
Beginning of year |
|
|
467,281,101 |
|
|
581,940,962 |
|
|
81,408,890 |
|
|
170,330,144 |
|
|
|
|
|
|
|
|
||||||||
|
|
|||||||||||||
|
End of year (including undistributed
net investment |
|
$ |
415,542,989 |
|
$ |
467,281,101 |
|
$ |
75,739,873 |
|
$ |
81,408,890 |
|
|
|
|
|
|
|
|
||||||||
|
CHANGES IN SHARES OUTSTANDING |
|
|
|
|
|
|
|
|
|
|
|
|
|
|
Institutional Shares |
|
|
|
|
|
|
|
|
|
|
|
|
|
|
Shares sold |
|
|
12,665,350 |
|
|
7,100,674 |
|
|
— |
|
|
— |
|
|
Shares issued to holders in reinvestment of dividends |
|
|
308,449 |
|
|
59,987 |
|
|
— |
|
|
— |
|
|
Shares redeemed |
|
|
(2,622,197 |
) |
|
(3,884,464 |
) |
|
— |
|
|
— |
|
|
|
|
|
|
|
|
||||||||
|
Net increase |
|
|
10,351,602 |
|
|
3,276,197 |
|
|
— |
|
|
— |
|
|
|
|
|
|
|
|
||||||||
|
Service Shares |
|
|
|
|
|
|
|
|
|
|
|
|
|
|
Shares sold |
|
|
12,019,198 |
|
|
23,714,369 |
|
|
1,938,340 |
|
|
2,176,388 |
|
|
Shares issued to holders in reinvestment of dividends |
|
|
789,690 |
|
|
746,764 |
|
|
181,911 |
|
|
266,512 |
|
|
Shares redeemed |
|
|
(28,860,816 |
) |
|
(42,102,151 |
) |
|
(2,745,670 |
) |
|
(11,311,366 |
) |
|
|
|
|
|
|
|
||||||||
|
Net decrease |
|
|
(16,051,928 |
) |
|
(17,641,018 |
) |
|
(625,419 |
) |
|
(8,868,466 |
) |
|
|
|
|
|
|
|
||||||||
See notes to financial statements.
128
|
|
|
GuideMarkSM Funds & GuidePathSM Funds |
|
STATEMENTS OF CHANGES IN NET ASSETS (Continued) |
|
|
|
|
|
|
|
|
|
|
|
|
|
|
|
|
|
|
|
|
Opportunistic Fixed Income Fund |
|
Strategic Asset Allocation Fund |
|
||||||||
|
|
|
|
|
||||||||||
|
|
|
Year Ended |
|
Year Ended |
|
Year Ended |
|
April 29, 20111 |
|
||||
|
|
|
|
|
|
|
||||||||
|
OPERATIONS: |
|
|
|
|
|
|
|
|
|
|
|
|
|
|
Net investment income |
|
$ |
9,763,909 |
|
$ |
8,223,478 |
|
$ |
1,555,251 |
|
$ |
791,099 |
|
|
Net realized gain (loss) on investment transactions |
|
|
3,938,357 |
|
|
(5,030,191 |
) |
|
(106,631 |
) |
|
(1,102,775 |
) |
|
Change in unrealized appreciation (depreciation) |
|||||||||||||
|
on investments |
|
|
11,212,581 |
|
|
(2,198,514 |
) |
|
20,464,754 |
|
|
9,428,473 |
|
|
|
|
|
|
|
|
||||||||
|
Net increase in net assets resulting from operations |
|
|
24,914,847 |
|
|
994,773 |
|
|
21,913,374 |
|
|
9,116,797 |
|
|
|
|
|
|
|
|
||||||||
|
CAPITAL SHARE TRANSACTIONS: |
|
|
|
|
|
|
|
|
|
|
|
|
|
|
Institutional Shares |
|
|
|
|
|
|
|
|
|
|
|
|
|
|
Shares sold |
|
|
97,626,601 |
|
|
64,598,842 |
|
|
923,730 |
|
|
— |
|
|
Shares issued to holders in reinvestment of dividends |
|
|
3,893,635 |
|
|
1,095,080 |
|
|
5,179 |
|
|
— |
|
|
Shares redeemed |
|
|
(40,949,711 |
) |
|
(27,299,114 |
) |
|
(88,985 |
) |
|
— |
|
|
|
|
|
|
|
|
||||||||
|
Net increase |
|
|
60,570,525 |
|
|
38,394,808 |
|
|
839,924 |
|
|
— |
|
|
|
|
|
|
|
|
||||||||
|
Service Shares |
|
|
|
|
|
|
|
|
|
|
|
|
|
|
Shares sold |
|
|
59,196,660 |
|
|
307,026,836 |
|
|
138,739,675 |
|
|
147,611,371 |
|
|
Shares issued to holders in reinvestment of dividends |
|
|
5,215,889 |
|
|
6,865,088 |
|
|
1,635,557 |
|
|
1,067,171 |
|
|
Shares redeemed |
|
|
(127,923,371 |
) |
|
(102,815,560 |
) |
|
(57,129,975 |
) |
|
(12,102,934 |
) |
|
|
|
|
|
|
|
||||||||
|
Net increase (decrease) |
|
|
(63,510,822 |
) |
|
211,076,364 |
|
|
83,245,257 |
|
|
136,575,608 |
|
|
|
|
|
|
|
|
||||||||
|
DIVIDENDS AND DISTRIBUTIONS TO |
|||||||||||||
|
SHAREHOLDERS: |
|
|
|
|
|
|
|
|
|
|
|
|
|
|
Net investment income – Institutional Shares |
|
|
(3,893,635 |
) |
|
(1,095,080 |
) |
|
(5,179 |
) |
|
— |
|
|
Net investment income – Service Shares |
|
|
(5,953,564 |
) |
|
(6,865,088 |
) |
|
(1,635,557 |
) |
|
(1,058,402 |
) |
|
Return of capital – Service Shares |
|
|
— |
|
|
— |
|
|
— |
|
|
(8,769 |
) |
|
|
|
|
|
|
|
||||||||
|
Total dividends and distributions |
|
|
(9,847,199 |
) |
|
(7,960,168 |
) |
|
(1,640,736 |
) |
|
(1,067,171 |
) |
|
|
|
|
|
|
|
||||||||
|
INCREASE IN NET ASSETS |
|
|
12,127,351 |
|
|
242,505,777 |
|
|
104,357,819 |
|
|
144,625,234 |
|
|
NET ASSETS: |
|
|
|
|
|
|
|
|
|
|
|
|
|
|
Beginning of year |
|
|
242,507,777 |
|
|
2,000 |
|
|
144,649,234 |
|
|
24,000 |
|
|
|
|
|
|
|
|
||||||||
|
|
|||||||||||||
|
End of year (including distributions in
excess of net |
|
$ |
254,635,128 |
|
$ |
242,507,777 |
|
$ |
249,007,053 |
|
$ |
144,649,234 |
|
|
|
|
|
|
|
|
||||||||
|
CHANGES IN SHARES OUTSTANDING |
|
|
|
|
|
|
|
|
|
|
|
|
|
|
Institutional Shares |
|
|
|
|
|
|
|
|
|
|
|
|
|
|
Shares sold |
|
|
9,870,100 |
|
|
6,736,982 |
|
|
94,646 |
|
|
— |
|
|
Shares issued to holders in reinvestment of dividends |
|
|
387,161 |
|
|
115,534 |
|
|
544 |
|
|
— |
|
|
Shares redeemed |
|
|
(4,072,647 |
) |
|
(2,895,278 |
) |
|
(8,908 |
) |
|
— |
|
|
|
|
|
|
|
|
||||||||
|
Net increase |
|
|
6,184,614 |
|
|
3,957,238 |
|
|
86,282 |
|
|
— |
|
|
|
|
|
|
|
|
||||||||
|
Service Shares |
|
|
|
|
|
|
|
|
|
|
|
|
|
|
Shares sold |
|
|
5,969,660 |
|
|
30,996,452 |
|
|
14,796,202 |
|
|
16,559,127 |
|
|
Shares issued to holders in reinvestment of dividends |
|
|
525,275 |
|
|
721,132 |
|
|
171,442 |
|
|
126,143 |
|
|
Shares redeemed |
|
|
(12,887,729 |
) |
|
(10,686,604 |
) |
|
(6,078,952 |
) |
|
(1,394,712 |
) |
|
|
|
|
|
|
|
||||||||
|
Net increase (decrease) |
|
|
(6,392,794 |
) |
|
21,030,980 |
|
|
8,888,692 |
|
|
15,290,558 |
|
|
|
|
|
|
|
|
||||||||
|
1 Date of inception. |
|||||||||||||
See notes to financial statements.
129
|
|
|
GuideMarkSM Funds & GuidePathSM Funds |
|
STATEMENTS OF CHANGES IN NET ASSETS (Continued) |
|
|
|
|
|
|
|
|
|
|
|
|
|
|
|
|
|
|
|
|
Tactical ConstrainedSM |
|
Tactical UnconstrainedSM |
|
||||||||
|
|
|
|
|
||||||||||
|
|
|
Year Ended |
|
April 29, 20111 |
|
Year Ended |
|
April 29, 20111 |
|
||||
|
|
|
|
|
|
|
||||||||
|
OPERATIONS: |
|
|
|
|
|
|
|
|
|
|
|
|
|
|
Net investment income |
|
$ |
1,843,422 |
|
$ |
935,052 |
|
$ |
2,359,870 |
|
$ |
846,897 |
|
|
Net realized gain (loss) on investment transactions |
|
|
1,312,731 |
|
|
(1,442,718 |
) |
|
4,089,310 |
|
|
(4,037,929 |
) |
|
Change in unrealized appreciation on investments |
|
|
14,384,272 |
|
|
8,925,206 |
|
|
19,251,032 |
|
|
11,009,636 |
|
|
|
|
|
|
|
|
||||||||
|
Net increase in net assets resulting from operations |
|
|
17,540,425 |
|
|
8,417,540 |
|
|
25,700,212 |
|
|
7,818,604 |
|
|
|
|
|
|
|
|
||||||||
|
CAPITAL SHARE TRANSACTIONS: |
|
|
|
|
|
|
|
|
|
|
|
|
|
|
Institutional Shares |
|
|
|
|
|
|
|
|
|
|
|
|
|
|
Shares sold |
|
|
927,302 |
|
|
— |
|
|
846,923 |
|
|
— |
|
|
Shares issued to holders in reinvestment of dividends |
|
|
7,493 |
|
|
— |
|
|
7,543 |
|
|
— |
|
|
Shares redeemed |
|
|
(88,557 |
) |
|
— |
|
|
(83,079 |
) |
|
— |
|
|
|
|
|
|
|
|
||||||||
|
Net increase |
|
|
846,238 |
|
|
— |
|
|
771,387 |
|
|
— |
|
|
|
|
|
|
|
|
||||||||
|
Service Shares |
|
|
|
|
|
|
|
|
|
|
|
|
|
|
Shares sold |
|
|
134,707,886 |
|
|
147,249,517 |
|
|
183,929,465 |
|
|
195,854,836 |
|
|
Shares issued to holders in reinvestment of dividends |
|
|
2,344,322 |
|
|
920,562 |
|
|
3,611,304 |
|
|
667,199 |
|
|
Shares redeemed |
|
|
(66,447,400 |
) |
|
(12,545,943 |
) |
|
(83,970,383 |
) |
|
(18,994,002 |
) |
|
|
|
|
|
|
|
||||||||
|
Net increase |
|
|
70,604,808 |
|
|
135,624,136 |
|
|
103,570,386 |
|
|
177,528,033 |
|
|
|
|
|
|
|
|
||||||||
|
DIVIDENDS AND DISTRIBUTIONS TO |
|||||||||||||
|
SHAREHOLDERS: |
|
|
|
|
|
|
|
|
|
|
|
|
|
|
Net investment income – Institutional Shares |
|
|
(6,307 |
) |
|
— |
|
|
(6,002 |
) |
|
— |
|
|
Net investment income – Service Shares |
|
|
(1,820,997 |
) |
|
(920,562 |
) |
|
(2,613,278 |
) |
|
(667,199 |
) |
|
From net realized gains – Institutional Shares |
|
|
(1,186 |
) |
|
— |
|
|
(1,541 |
) |
|
— |
|
|
From net realized gains – Service Shares |
|
|
(523,324 |
) |
|
— |
|
|
(998,026 |
) |
|
— |
|
|
|
|
|
|
|
|
||||||||
|
Total dividends and distributions |
|
|
(2,351,814 |
) |
|
(920,562 |
) |
|
(3,618,847 |
) |
|
(667,199 |
) |
|
|
|
|
|
|
|
||||||||
|
INCREASE IN NET ASSETS |
|
|
86,639,657 |
|
|
143,121,114 |
|
|
126,423,138 |
|
|
184,679,438 |
|
|
NET ASSETS: |
|
|
|
|
|
|
|
|
|
|
|
|
|
|
Beginning of year |
|
|
143,145,114 |
|
|
24,000 |
|
|
184,703,438 |
|
|
24,000 |
|
|
|
|
|
|
|
|
||||||||
|
|
|||||||||||||
|
End of year (including undistributed
net investment |
|
$ |
229,784,771 |
|
$ |
143,145,114 |
|
$ |
311,126,576 |
|
$ |
184,703,438 |
|
|
|
|
|
|
|
|
||||||||
|
CHANGES IN SHARES OUTSTANDING |
|
|
|
|
|
|
|
|
|
|
|
|
|
|
Institutional Shares |
|
|
|
|
|
|
|
|
|
|
|
|
|
|
Shares sold |
|
|
92,258 |
|
|
— |
|
|
86,652 |
|
|
— |
|
|
Shares issued to holders in reinvestment of dividends |
|
|
764 |
|
|
— |
|
|
794 |
|
|
— |
|
|
Shares redeemed |
|
|
(8,686 |
) |
|
— |
|
|
(8,358 |
) |
|
— |
|
|
|
|
|
|
|
|
||||||||
|
Net increase |
|
|
84,336 |
|
|
— |
|
|
79,088 |
|
|
— |
|
|
|
|
|
|
|
|
||||||||
|
CHANGES IN SHARES OUTSTANDING |
|
|
|
|
|
|
|
|
|
|
|
|
|
|
Service Shares |
|
|
|
|
|
|
|
|
|
|
|
|
|
|
Shares sold |
|
|
13,855,679 |
|
|
15,938,306 |
|
|
19,247,387 |
|
|
21,367,013 |
|
|
Shares issued to holders in reinvestment of dividends |
|
|
238,244 |
|
|
103,318 |
|
|
378,941 |
|
|
75,732 |
|
|
Shares redeemed |
|
|
(6,831,572 |
) |
|
(1,382,825 |
) |
|
(8,763,079 |
) |
|
(2,081,801 |
) |
|
|
|
|
|
|
|
||||||||
|
Net increase |
|
|
7,262,351 |
|
|
14,658,799 |
|
|
10,863,249 |
|
|
19,360,944 |
|
|
|
|
|
|
|
|
||||||||
|
1 Date of inception. |
|||||||||||||
See notes to financial statements.
130
|
|
|
GuideMarkSM Funds & GuidePathSM Funds |
|
STATEMENTS OF CHANGES IN NET ASSETS (Continued) |
|
|
|
|
|
|
|
|
|
|
|
|
|
|
|
|
|
Absolute Return |
|
Multi-Asset Income |
|
|||||
|
|
|
|
|
|||||||
|
|
|
Year Ended |
|
April 29, 20111 |
|
August 31, 20121 |
|
|||
|
|
|
|
|
|
||||||
|
OPERATIONS: |
|
|
|
|
|
|
|
|
|
|
|
Net investment income |
|
$ |
7,295,580 |
|
$ |
1,871,070 |
|
$ |
1,297,866 |
|
|
Net realized gain (loss) on investment transactions |
|
|
(2,028,557 |
) |
|
(599,718 |
) |
|
79,148 |
|
|
Change in unrealized appreciation on investments |
|
|
6,221,621 |
|
|
2,560,783 |
|
|
2,843,620 |
|
|
|
|
|
|
|
||||||
|
Net increase in net assets resulting from operations |
|
|
11,488,644 |
|
|
3,832,135 |
|
|
4,220,634 |
|
|
|
|
|
|
|
||||||
|
CAPITAL SHARE TRANSACTIONS: |
|
|
|
|
|
|
|
|
|
|
|
Institutional Shares |
|
|
|
|
|
|
|
|
|
|
|
Shares sold |
|
|
632,867 |
|
|
— |
|
|
— |
|
|
Shares issued to holders in reinvestment of dividends |
|
|
5,204 |
|
|
— |
|
|
— |
|
|
Shares redeemed |
|
|
(66,753 |
) |
|
— |
|
|
— |
|
|
|
|
|
|
|
||||||
|
Net increase |
|
|
571,318 |
|
|
— |
|
|
— |
|
|
|
|
|
|
|
||||||
|
Service Shares |
|
|
|
|
|
|
|
|
|
|
|
Shares sold |
|
|
389,126,244 |
|
|
259,307,338 |
|
|
78,226,314 |
|
|
Shares issued to holders in reinvestment of dividends |
|
|
6,375,492 |
|
|
1,125,858 |
|
|
920,397 |
|
|
Shares redeemed |
|
|
(129,561,042 |
) |
|
(24,508,776 |
) |
|
(9,177,326 |
) |
|
|
|
|
|
|
||||||
|
Net increase |
|
|
265,940,694 |
|
|
235,924,420 |
|
|
69,969,385 |
|
|
|
|
|
|
|
||||||
|
DIVIDENDS AND DISTRIBUTIONS TO |
||||||||||
|
SHAREHOLDERS: |
|
|
|
|
|
|
|
|
|
|
|
Net investment income – Institutional Shares |
|
|
(5,017 |
) |
|
— |
|
|
— |
|
|
Net investment income – Service Shares |
|
|
(6,075,492 |
) |
|
(1,125,858 |
) |
|
(920,397 |
) |
|
Net realized gains – Institutional Shares |
|
|
(187 |
) |
|
— |
|
|
— |
|
|
Net realized gains – Service Shares |
|
|
(300,000 |
) |
|
— |
|
|
— |
|
|
|
|
|
|
|
||||||
|
Total dividends and distributions |
|
|
(6,380,696 |
) |
|
(1,125,858 |
) |
|
(920,397 |
) |
|
|
|
|
|
|
||||||
|
INCREASE IN NET ASSETS |
|
|
271,619,960 |
|
|
238,630,697 |
|
|
73,269,622 |
|
|
NET ASSETS: |
|
|
|
|
|
|
|
|
|
|
|
Beginning of year |
|
|
238,654,697 |
|
|
24,000 |
|
|
— |
|
|
|
|
|
|
|
||||||
|
|
||||||||||
|
End of year (including undistributed
net investment |
|
$ |
510,274,657 |
|
$ |
238,654,697 |
|
$ |
73,269,622 |
|
|
|
|
|
|
|
||||||
|
CHANGES IN SHARES OUTSTANDING |
|
|
|
|
|
|
|
|
|
|
|
Institutional Shares |
|
|
|
|
|
|
|
|
|
|
|
Shares sold |
|
|
62,118 |
|
|
— |
|
|
— |
|
|
Shares issued to holders in reinvestment of dividends |
|
|
515 |
|
|
— |
|
|
— |
|
|
Shares redeemed |
|
|
(6,565 |
) |
|
— |
|
|
— |
|
|
|
|
|
|
|
||||||
|
Net increase |
|
|
56,068 |
|
|
— |
|
|
— |
|
|
|
|
|
|
|
||||||
|
CHANGES IN SHARES OUTSTANDING |
|
|
|
|
|
|
|
|
|
|
|
Service Shares |
|
|
|
|
|
|
|
|
|
|
|
Shares sold |
|
|
38,501,638 |
|
|
26,122,395 |
|
|
7,722,970 |
|
|
Shares issued to holders in reinvestment of dividends |
|
|
629,989 |
|
|
114,300 |
|
|
90,324 |
|
|
Shares redeemed |
|
|
(12,779,147 |
) |
|
(2,465,204 |
) |
|
(891,074 |
) |
|
|
|
|
|
|
||||||
|
Net increase |
|
|
26,352,480 |
|
|
23,771,491 |
|
|
6,922,220 |
|
|
|
|
|
|
|
||||||
|
1 Commencement of operations. |
||||||||||
See notes to financial statements.
131
|
GuideMarkSM Funds & GuidePathSM Funds |
|
STATEMENTS OF CHANGES IN NET ASSETS (Continued) |
|
|
|
|
|
|
|
|
|
|
|
|
|
|
Fixed Income |
|
Altegris ® Multi-Strategy |
|
||
|
|
|
|
|
||||
|
|
|
August 31, 20121 |
|
August 31, 20121 |
|
||
|
|
|
|
|
||||
|
OPERATIONS: |
|
|
|
|
|
|
|
|
Net investment income |
|
$ |
2,330,764 |
|
$ |
414,511 |
|
|
Net realized gain (loss) on investment transactions |
|
|
381,638 |
|
|
(139,006 |
) |
|
Change in unrealized appreciation (depreciation) |
|||||||
|
on investments |
|
|
(1,429,156 |
) |
|
266,232 |
|
|
|
|
|
|
||||
|
Net increase in net assets resulting from operations |
|
|
1,283,246 |
|
|
541,737 |
|
|
|
|
|
|
||||
|
CAPITAL SHARE TRANSACTIONS: |
|
|
|
|
|
|
|
|
Institutional Shares |
|
|
|
|
|
|
|
|
Shares sold |
|
|
573,305 |
|
|
564,274 |
|
|
Shares issued to holders in reinvestment of dividends |
|
|
2,558 |
|
|
1,070 |
|
|
Shares redeemed |
|
|
(70,389 |
) |
|
(54,444 |
) |
|
|
|
|
|
||||
|
Net increase |
|
|
505,474 |
|
|
510,900 |
|
|
|
|
|
|
||||
|
Service Shares |
|
|
|
|
|
|
|
|
Shares sold |
|
|
272,311,878 |
|
|
185,187,805 |
|
|
Shares issued to holders in reinvestment of dividends |
|
|
1,762,362 |
|
|
395,082 |
|
|
Shares redeemed |
|
|
(45,778,257 |
) |
|
(24,501,818 |
) |
|
|
|
|
|
||||
|
Net increase |
|
|
228,295,983 |
|
|
161,081,069 |
|
|
|
|
|
|
||||
|
DIVIDENDS AND DISTRIBUTIONS TO |
|||||||
|
SHAREHOLDERS: |
|
|
|
|
|
|
|
|
Net investment income – Institutional Shares |
|
|
(2,522 |
) |
|
(1,070 |
) |
|
Net investment income – Service Shares |
|
|
(1,731,753 |
) |
|
(395,082 |
) |
|
Net realized gains – Institutional Shares |
|
|
(36 |
) |
|
— |
|
|
Net realized gains – Service Shares |
|
|
(30,609 |
) |
|
— |
|
|
|
|
|
|
||||
|
Total dividends and distributions |
|
|
(1,764,920 |
) |
|
(396,152 |
) |
|
|
|
|
|
||||
|
INCREASE IN NET ASSETS |
|
|
228,319,783 |
|
|
161,737,554 |
|
|
NET ASSETS: |
|
|
|
|
|
|
|
|
Beginning of year |
|
|
— |
|
|
— |
|
|
|
|
|
|
||||
|
|
|||||||
|
End of year (including undistributed
net investment |
|
$ |
228,319,783 |
|
$ |
161,737,554 |
|
|
|
|
|
|
||||
|
CHANGES IN SHARES OUTSTANDING |
|
|
|
|
|
|
|
|
Institutional Shares |
|
|
|
|
|
|
|
|
Shares sold |
|
|
57,171 |
|
|
56,750 |
|
|
Shares issued to holders in reinvestment of dividends |
|
|
256 |
|
|
109 |
|
|
Shares redeemed |
|
|
(7,036 |
) |
|
(5,477 |
) |
|
|
|
|
|
||||
|
Net increase |
|
|
50,391 |
|
|
51,382 |
|
|
|
|
|
|
||||
|
CHANGES IN SHARES OUTSTANDING |
|
|
|
|
|
|
|
|
Service Shares |
|
|
|
|
|
|
|
|
Shares sold |
|
|
27,217,672 |
|
|
18,551,917 |
|
|
Shares issued to holders in reinvestment of dividends |
|
|
176,236 |
|
|
40,315 |
|
|
Shares redeemed |
|
|
(4,573,134 |
) |
|
(2,469,547 |
) |
|
|
|
|
|
||||
|
Net increase |
|
|
22,820,774 |
|
|
16,122,685 |
|
|
|
|
|
|
||||
|
1 Commencement of operations. |
|||||||
See notes to financial statements.
132
|
|
|
GuideMarkSM Funds & GuidePathSM Funds |
|
FINANCIAL HIGHLIGHTS |
|
|
|
|
|
|
|
|
|
|
|
|
|
|
Large Cap Growth Fund |
|
||||
|
|
|
|
|||||
|
|
|
Institutional |
|
||||
|
|
|
|
|||||
|
|
|
Year Ended |
|
April 29, 20111 |
|
||
|
|
|
|
|
||||
|
Per share data
for a share of capital stock |
|
|
|
|
|
|
|
|
Net asset value, beginning of year |
|
|
$10.68 |
|
|
$10.32 |
|
|
Income from investment operations: |
|
|
|
|
|
|
|
|
Net investment income |
|
|
0.08 |
|
|
0.01 |
|
|
Net realized and
unrealized gains |
|
|
0.51 |
|
|
0.35 |
|
|
|
|
|
|
||||
|
Total from investment operations |
|
|
0.59 |
|
|
0.36 |
|
|
|
|
|
|
||||
|
Less distributions: |
|
|
|
|
|
|
|
|
Dividends from net investment income |
|
|
(0.07 |
) |
|
— |
|
|
|
|
|
|
||||
|
Total distributions |
|
|
(0.07 |
) |
|
— |
|
|
|
|
|
|
||||
|
Net asset value, end of year |
|
|
$11.20 |
|
|
$10.68 |
|
|
|
|
|
|
||||
|
Total return |
|
|
5.54 |
% |
|
3.49 |
%2 |
|
Supplemental data and ratios: |
|
|
|
|
|
|
|
|
Net assets, end of year |
|
|
$44,994,114 |
|
|
$31,330,264 |
|
|
Ratio of expenses to average net assets |
|
|
|
|
|
|
|
|
Before expense
reimbursement |
|
|
0.92 |
% |
|
0.93 |
%3 |
|
After expense
reimbursement |
|
|
0.89 |
% |
|
0.92 |
%3 |
|
Ratio of net
investment income to |
|
|
|
|
|
|
|
|
Before expense
reimbursement |
|
|
0.81 |
% |
|
0.33 |
%3 |
|
After expense
reimbursement |
|
|
0.84 |
% |
|
0.34 |
%3 |
|
Portfolio turnover rate |
|
|
60.92 |
% |
|
126.61 |
% |
|
|
|
|
Portfolio Turnover is calculated for the Fund as a whole. |
|
|
1 |
Commencement of operations. |
|
2 |
Not annualized. |
|
3 |
Annualized. |
See notes to financial statements.
133
|
|
|
GuideMarkSM Funds & GuidePathSM Funds |
|
FINANCIAL HIGHLIGHTS |
|
|
|
|
|
|
|
|
|
|
|
|
|
|
|
|
|
|
|
|
|
|
|
Large Cap Growth Fund |
|
|||||||||||||
|
|
|
|
||||||||||||||
|
|
|
Service |
|
|||||||||||||
|
|
|
|
||||||||||||||
|
|
|
Year Ended |
|
Year Ended |
|
Year Ended |
|
Year Ended |
|
Year Ended |
|
|||||
|
|
|
|
|
|
|
|
||||||||||
|
Per share data
for a share of capital stock |
|
|
|
|
|
|
|
|
|
|
|
|
|
|
|
|
|
Net asset value, beginning of year |
|
|
$10.61 |
|
|
$9.99 |
|
|
$8.41 |
|
|
$5.67 |
|
|
$8.81 |
|
|
Income from investment operations: |
|
|
|
|
|
|
|
|
|
|
|
|
|
|
|
|
|
Net investment income (loss) |
|
|
0.02 |
|
|
(0.03 |
) |
|
(0.01 |
) |
|
0.01 |
|
|
— |
|
|
|
||||||||||||||||
|
Net realized and
unrealized gains (losses) |
|
|
0.51 |
|
|
0.65 |
|
|
1.59 |
|
|
2.75 |
|
|
(3.14 |
) |
|
|
|
|
|
|
|
|
||||||||||
|
Total from investment operations |
|
|
0.53 |
|
|
0.62 |
|
|
1.58 |
|
|
2.76 |
|
|
(3.14 |
) |
|
|
|
|
|
|
|
|
||||||||||
|
Less distributions: |
|
|
|
|
|
|
|
|
|
|
|
|
|
|
|
|
|
Dividends from net investment income |
|
|
(0.02 |
) |
|
— |
|
|
— |
|
|
(0.01 |
) |
|
— |
|
|
Dividends from net realized gains |
|
|
— |
|
|
— |
|
|
— |
|
|
— |
|
|
— |
* |
|
Return of capital |
|
|
— |
|
|
— |
|
|
— |
|
|
(0.01 |
) |
|
— |
|
|
|
|
|
|
|
|
|
||||||||||
|
Total distributions |
|
|
(0.02 |
) |
|
— |
|
|
— |
|
|
(0.02 |
) |
|
— |
|
|
|
|
|
|
|
|
|
||||||||||
|
Net asset value, end of year |
|
|
$11.12 |
|
|
$10.61 |
|
|
$9.99 |
|
|
$8.41 |
|
|
$5.67 |
|
|
|
|
|
|
|
|
|
||||||||||
|
Total return |
|
|
5.00 |
% |
|
6.21 |
% |
|
18.79 |
% |
|
48.60 |
% |
|
-35.63 |
% |
|
Supplemental data and ratios: |
|
|
|
|
|
|
|
|
|
|
|
|
|
|
|
|
|
Net assets, end of year |
|
|
$136,196,479 |
|
|
$168,654,404 |
|
|
$211,129,188 |
|
|
$207,928,223 |
|
|
$203,479,219 |
|
|
Ratio of expenses to average net assets |
|
|
|
|
|
|
|
|
|
|
|
|
|
|
|
|
|
Before expense
reimbursement |
|
|
1.52 |
% |
|
1.54 |
% |
|
1.45 |
% |
|
1.46 |
% |
|
1.40 |
% |
|
After expense
reimbursement |
|
|
1.49 |
% |
|
1.49 |
% |
|
1.43 |
% |
|
1.41 |
% |
|
1.27 |
% |
|
Ratio of net
investment income (loss) to |
|
|
|
|
|
|
|
|
|
|
|
|
|
|
|
|
|
Before expense
reimbursement |
|
|
0.18 |
% |
|
-0.32 |
% |
|
-0.13 |
% |
|
0.09 |
% |
|
-0.15 |
% |
|
After expense
reimbursement |
|
|
0.21 |
% |
|
-0.27 |
% |
|
-0.11 |
% |
|
0.14 |
% |
|
-0.02 |
% |
|
Portfolio turnover rate |
|
|
60.92 |
% |
|
126.61 |
% |
|
63.33 |
% |
|
69.83 |
% |
|
98.67 |
% |
|
|
|
|
Portfolio Turnover is calculated for the Fund as a whole. |
|
|
* |
Amount represents less than $0.01 per share. |
See notes to financial statements.
134
|
|
|
GuideMarkSM Funds & GuidePathSM Funds |
|
FINANCIAL HIGHLIGHTS |
|
|
|
|
|
|
|
|
|
|
|
|
|
|
Large Cap Value Fund |
|
||||
|
|
|
|
|||||
|
|
|
Institutional |
|
||||
|
|
|
|
|||||
|
|
|
Year Ended |
|
April 29, 20111 |
|
||
|
|
|
|
|
||||
|
Per share data
for a share of capital stock |
|
|
|
|
|
|
|
|
Net asset value, beginning of year |
|
|
$8.39 |
|
|
$8.54 |
|
|
Income from investment operations: |
|
|
|
|
|
|
|
|
Net investment income |
|
|
0.18 |
|
|
0.13 |
|
|
Net realized and
unrealized gains (losses) |
|
|
1.03 |
|
|
(0.09 |
) |
|
|
|
|
|
||||
|
Total from investment operations |
|
|
1.21 |
|
|
0.04 |
|
|
|
|
|
|
||||
|
Less distributions: |
|
|
|
|
|
|
|
|
Dividends from net investment income |
|
|
(0.17 |
) |
|
(0.19 |
) |
|
|
|
|
|
||||
|
Total distributions |
|
|
(0.17 |
) |
|
(0.19 |
) |
|
|
|
|
|
||||
|
Net asset value, end of year |
|
|
$9.43 |
|
|
$8.39 |
|
|
|
|
|
|
||||
|
Total return |
|
|
14.70 |
% |
|
0.70 |
%2 |
|
Supplemental data and ratios: |
|
|
|
|
|
|
|
|
Net assets, end of year |
|
|
$60,452,681 |
|
|
$39,721,680 |
|
|
Ratio of expenses to average net assets |
|
|
|
|
|
|
|
|
Before expense
reimbursement |
|
|
0.92 |
% |
|
0.93 |
%3 |
|
After expense
reimbursement |
|
|
0.91 |
% |
|
0.92 |
%3 |
|
Ratio of net
investment income to |
|
|
|
|
|
|
|
|
Before expense
reimbursement |
|
|
1.89 |
% |
|
1.89 |
%3 |
|
After expense
reimbursement |
|
|
1.90 |
% |
|
1.90 |
%3 |
|
Portfolio turnover rate |
|
|
27.02 |
% |
|
95.12 |
% |
|
|
|
|
Portfolio Turnover is calculated for the Fund as a whole. |
|
|
1 |
Commencement of operations. |
|
2 |
Not annualized. |
|
3 |
Annualized. |
See notes to financial statements.
135
|
|
|
GuideMarkSM Funds & GuidePathSM Funds |
|
FINANCIAL HIGHLIGHTS |
|
|
|
|
|
|
|
|
|
|
|
|
|
|
|
|
|
|
|
|
|
|
|
Large Cap Value Fund |
|
|||||||||||||
|
|
|
|
||||||||||||||
|
|
|
Service |
|
|||||||||||||
|
|
|
|
||||||||||||||
|
|
|
Year Ended |
|
Year Ended |
|
Year Ended |
|
Year Ended |
|
Year Ended |
|
|||||
|
|
|
|
|
|
|
|
||||||||||
|
Per share data
for a share of capital stock |
|
|
|
|
|
|
|
|
|
|
|
|
|
|
|
|
|
Net asset value, beginning of year |
|
|
$8.47 |
|
|
$8.32 |
|
|
$7.44 |
|
|
$4.85 |
|
|
$9.85 |
|
|
Income from investment operations: |
|
|
|
|
|
|
|
|
|
|
|
|
|
|
|
|
|
Net investment income |
|
|
0.14 |
|
|
0.10 |
|
|
0.09 |
|
|
0.10 |
|
|
0.19 |
|
|
Net realized and
unrealized gains (losses) |
|
|
1.03 |
|
|
0.13 |
|
|
0.88 |
|
|
2.60 |
|
|
(4.99 |
) |
|
|
|
|
|
|
|
|
||||||||||
|
Total from investment operations |
|
|
1.17 |
|
|
0.23 |
|
|
0.97 |
|
|
2.70 |
|
|
(4.80 |
) |
|
|
|
|
|
|
|
|
||||||||||
|
Less distributions: |
|
|
|
|
|
|
|
|
|
|
|
|
|
|
|
|
|
Dividends from net investment income |
|
|
(0.12 |
) |
|
(0.08 |
) |
|
(0.09 |
) |
|
(0.11 |
) |
|
(0.20 |
) |
|
Dividends from net realized gains |
|
|
— |
|
|
— |
|
|
— |
|
|
— |
|
|
— |
* |
|
|
|
|
|
|
|
|
||||||||||
|
Total distributions |
|
|
(0.12 |
) |
|
(0.08 |
) |
|
(0.09 |
) |
|
(0.11 |
) |
|
(0.20 |
) |
|
|
|
|
|
|
|
|
||||||||||
|
Net asset value, end of year |
|
|
$9.52 |
|
|
$8.47 |
|
|
$8.32 |
|
|
$7.44 |
|
|
$4.85 |
|
|
|
|
|
|
|
|
|
||||||||||
|
Total return |
|
|
13.96 |
% |
|
2.87 |
% |
|
13.15 |
% |
|
55.37 |
% |
|
-48.85 |
% |
|
Supplemental data and ratios: |
|
|
|
|
|
|
|
|
|
|
|
|
|
|
|
|
|
Net assets, end of year |
|
|
$139,072,035 |
|
|
$163,077,098 |
|
|
$200,132,341 |
|
|
$200,627,939 |
|
|
$180,181,364 |
|
|
Ratio of expenses to average net assets |
|
|
|
|
|
|
|
|
|
|
|
|
|
|
|
|
|
Before expense
reimbursement |
|
|
1.49 |
% |
|
1.51 |
% |
|
1.44 |
% |
|
1.44 |
% |
|
1.38 |
% |
|
After expense
reimbursement |
|
|
1.49 |
% |
|
1.49 |
% |
|
1.42 |
% |
|
1.40 |
% |
|
1.22 |
% |
|
Ratio of net
investment income to |
|
|
|
|
|
|
|
|
|
|
|
|
|
|
|
|
|
Before expense
reimbursement |
|
|
1.33 |
% |
|
1.13 |
% |
|
1.13 |
% |
|
1.27 |
% |
|
1.60 |
% |
|
After expense
reimbursement |
|
|
1.33 |
% |
|
1.15 |
% |
|
1.15 |
% |
|
1.31 |
% |
|
1.76 |
% |
|
Portfolio turnover rate |
|
|
27.02 |
% |
|
95.12 |
% |
|
16.35 |
% |
|
26.85 |
% |
|
58.45 |
% |
|
|
|
|
Portfolio Turnover is calculated for the Fund as a whole. |
|
|
* |
Amount represents less than $0.01 per share. |
See notes to financial statements.
136
|
|
|
GuideMarkSM Funds & GuidePathSM Funds |
|
FINANCIAL HIGHLIGHTS |
|
|
|
|
|
|
|
|
|
|
|
|
|
|
Small/Mid Cap Core Fund |
|
||||
|
|
|
|
|||||
|
|
|
Institutional |
|
||||
|
|
|
|
|||||
|
|
|
Year Ended |
|
April 29, 20111 |
|
||
|
|
|
|
|
||||
|
Per share data
for a share of capital stock |
|
|
|
|
|
|
|
|
Net asset value, beginning of year |
|
|
$11.56 |
|
|
$11.99 |
|
|
Income from investment operations: |
|
|
|
|
|
|
|
|
Net investment income |
|
|
0.07 |
|
|
— |
|
|
Net realized and
unrealized gains (losses) |
|
|
1.99 |
|
|
(0.43 |
) |
|
|
|
|
|
||||
|
Total from investment operations |
|
|
2.06 |
|
|
(0.43 |
) |
|
|
|
|
|
||||
|
Less distributions: |
|
|
|
|
|
|
|
|
Dividends from net investment income |
|
|
(0.11 |
) |
|
— |
|
|
|
|
|
|
||||
|
Total distributions |
|
|
(0.11 |
) |
|
— |
|
|
|
|
|
|
||||
|
Net asset value, end of year |
|
|
$13.51 |
|
|
$11.56 |
|
|
|
|
|
|
||||
|
Total return |
|
|
17.95 |
% |
|
-3.59 |
%2 |
|
Supplemental data and ratios: |
|
|
|
|
|
|
|
|
Net assets, end of year |
|
|
$44,361,656 |
|
|
$30,106,471 |
|
|
Ratio of expenses to average net assets |
|
|
|
|
|
|
|
|
Before expense
reimbursement |
|
|
1.09 |
% |
|
1.22 |
%3 |
|
After expense
reimbursement |
|
|
1.05 |
% |
|
1.09 |
%3 |
|
Ratio of net
investment income (loss) to |
|
|
|
|
|
|
|
|
Before expense
reimbursement |
|
|
0.61 |
% |
|
-0.10 |
%3 |
|
After expense reimbursement |
|
|
0.65 |
% |
|
0.03 |
%3 |
|
Portfolio turnover rate |
|
|
143.14 |
% |
|
245.95 |
% |
|
|
|
|
Portfolio Turnover is calculated for the Fund as a whole. |
|
|
1 |
Commencement of operations. |
|
2 |
Not annualized. |
|
3 |
Annualized. |
See notes to financial statements.
137
|
|
|
GuideMarkSM Funds & GuidePathSM Funds |
|
FINANCIAL HIGHLIGHTS |
|
|
|
|
|
|
|
|
|
|
|
|
|
|
|
|
|
|
|
|
|
|
|
Small/Mid Cap Core Fund |
|
|||||||||||||
|
|
|
|
||||||||||||||
|
|
|
Service |
|
|||||||||||||
|
|
|
|
||||||||||||||
|
|
|
Year Ended |
|
Year Ended |
|
Year Ended |
|
Year Ended |
|
Year Ended |
|
|||||
|
|
|
|
|
|
|
|
||||||||||
|
Per share data for a share of capital stock |
|
|
|
|
|
|
|
|
|
|
|
|
|
|
|
|
|
Net asset value, beginning of year |
|
|
$11.50 |
|
|
$11.61 |
|
|
$9.46 |
|
|
$5.69 |
|
|
$9.24 |
|
|
Income from investment operations: |
|
|
|
|
|
|
|
|
|
|
|
|
|
|
|
|
|
Net investment income (loss) |
|
|
— |
|
|
(0.09 |
) |
|
(0.05 |
) |
|
0.01 |
|
|
0.08 |
|
|
Net realized and unrealized gains (losses) |
|
|
1.99 |
|
|
(0.02 |
) |
|
2.20 |
|
|
3.78 |
|
|
(3.56 |
) |
|
|
|
|
|
|
|
|
||||||||||
|
Total from investment operations |
|
|
1.99 |
|
|
(0.11 |
) |
|
2.15 |
|
|
3.79 |
|
|
(3.48 |
) |
|
|
|
|
|
|
|
|
||||||||||
|
Less distributions: |
|
|
|
|
|
|
|
|
|
|
|
|
|
|
|
|
|
Dividends from net investment income |
|
|
(0.04 |
) |
|
— |
|
|
— |
|
|
—* |
|
|
(0.07 |
) |
|
Return of capital |
|
|
— |
|
|
— |
|
|
— |
|
|
(0.02 |
) |
|
—* |
|
|
|
|
|
|
|
|
|
||||||||||
|
Total distributions |
|
|
(0.04 |
) |
|
— |
|
|
— |
|
|
(0.02 |
) |
|
(0.07 |
) |
|
|
|
|
|
|
|
|
||||||||||
|
Net asset value, end of year |
|
|
$13.45 |
|
|
$11.50 |
|
|
$11.61 |
|
|
$9.46 |
|
|
$5.69 |
|
|
|
|
|
|
|
|
|
||||||||||
|
Total return |
|
|
17.32 |
% |
|
-0.95 |
% |
|
22.73 |
% |
|
66.39 |
% |
|
-37.59 |
% |
|
Supplemental data and ratios: |
|
|
|
|
|
|
|
|
|
|
|
|
|
|
|
|
|
Net assets, end of year |
|
|
$40,621,412 |
|
|
$47,944,286 |
|
|
$42,748,789 |
|
|
$42,649,488 |
|
|
$45,179,654 |
|
|
Ratio of expenses to average net assets |
|
|
|
|
|
|
|
|
|
|
|
|
|
|
|
|
|
Before expense reimbursement |
|
|
1.66 |
% |
|
1.74 |
% |
|
1.71 |
% |
|
1.67 |
% |
|
1.59 |
% |
|
After expense reimbursement |
|
|
1.59 |
% |
|
1.59 |
% |
|
1.59 |
% |
|
1.59 |
% |
|
1.28 |
% |
|
Ratio of net investment income (loss) |
|
|
|
|
|
|
|
|
|
|
|
|
|
|
|
|
|
Before expense reimbursement |
|
|
0.01 |
% |
|
-0.82 |
% |
|
-0.66 |
% |
|
-0.06 |
% |
|
0.58 |
% |
|
After expense reimbursement |
|
|
0.08 |
% |
|
-0.67 |
% |
|
-0.54 |
% |
|
0.02 |
% |
|
0.89 |
% |
|
Portfolio turnover rate |
|
|
143.14 |
% |
|
245.95 |
% |
|
44.75 |
% |
|
52.31 |
% |
|
65.97 |
% |
|
|
|
|
Portfolio Turnover is calculated for the Fund as a whole. |
|
|
* |
Amount represents less than $0.01 per share. |
See notes to financial statements.
138
|
|
|
GuideMarkSM Funds & GuidePathSM Funds |
|
FINANCIAL HIGHLIGHTS |
|
|
|
|
|
|
|
|
|
|
|
|
|
|
World ex-US Fund |
|
||||
|
|
|
|
|||||
|
|
|
Institutional |
|
||||
|
|
|
|
|||||
|
|
|
Year Ended |
|
April 29, 20111 |
|
||
|
|
|
|
|
||||
|
Per share data for a share of capital stock |
|
|
|
|
|
|
|
|
Net asset value, beginning of year |
|
|
$7.52 |
|
|
$8.75 |
|
|
Income from investment operations: |
|
|
|
|
|
|
|
|
Net investment income |
|
|
0.13 |
|
|
0.07 |
|
|
Net realized and unrealized gains (losses) |
|
|
0.48 |
|
|
(1.17 |
) |
|
|
|
|
|
||||
|
Total from investment operations |
|
|
0.61 |
|
|
(1.10 |
) |
|
|
|
|
|
||||
|
Less distributions: |
|
|
|
|
|
|
|
|
Dividends from net investment income |
|
|
(0.07 |
) |
|
(0.13 |
) |
|
|
|
|
|
||||
|
Total distributions |
|
|
(0.07 |
) |
|
(0.13 |
) |
|
|
|
|
|
||||
|
Net asset value, end of year |
|
|
$8.06 |
|
|
$7.52 |
|
|
|
|
|
|
||||
|
Total return |
|
|
8.09 |
% |
|
-12.34 |
%2 |
|
Supplemental data and ratios: |
|
|
|
|
|
|
|
|
Net assets, end of year |
|
|
$85,157,441 |
|
|
$40,623,156 |
|
|
Ratio of expenses to average net assets |
|
|
|
|
|
|
|
|
Before expense reimbursement |
|
|
1.09 |
% |
|
1.08 |
%3 |
|
After expense reimbursement |
|
|
1.09 |
% |
|
1.08 |
%3 |
|
Ratio of net investment income to |
|
|
|
|
|
|
|
|
Before expense reimbursement |
|
|
1.44 |
% |
|
1.13 |
%3 |
|
After expense reimbursement |
|
|
1.44 |
% |
|
1.13 |
%3 |
|
Portfolio turnover rate |
|
|
75.34 |
% |
|
164.90 |
% |
|
|
|
|
Portfolio Turnover is calculated for the Fund as a whole. |
|
|
1 |
Commencement of operations. |
|
2 |
Not annualized. |
|
3 |
Annualized. |
See notes to financial statements.
139
|
|
|
GuideMarkSM Funds & GuidePathSM Funds |
|
FINANCIAL HIGHLIGHTS |
|
|
|
|
|
|
|
|
|
|
|
|
|
|
|
|
|
|
|
|
|
|
|
World ex-US Fund |
|
|||||||||||||
|
|
|
|
||||||||||||||
|
|
|
Service |
|
|||||||||||||
|
|
|
|
||||||||||||||
|
|
|
Year Ended |
|
Year Ended |
|
Year Ended |
|
Year Ended |
|
Year Ended |
|
|||||
|
|
|
|
|
|
|
|
||||||||||
|
Per share data for a share of capital stock |
|
|
|
|
|
|
|
|
|
|
|
|
|
|
|
|
|
Net asset value, beginning of year |
|
|
$7.54 |
|
|
$8.39 |
|
|
$8.01 |
|
|
$5.80 |
|
|
$11.96 |
|
|
Income from investment operations: |
|
|
|
|
|
|
|
|
|
|
|
|
|
|
|
|
|
Net investment income |
|
|
0.08 |
|
|
0.12 |
|
|
0.11 |
|
|
0.20 |
|
|
0.25 |
|
|
Net realized and unrealized gains (losses) |
|
|
0.49 |
|
|
(0.88 |
) |
|
0.40 |
|
|
2.22 |
|
|
(6.26 |
) |
|
|
|
|
|
|
|
|
||||||||||
|
Total from investment operations |
|
|
0.57 |
|
|
(0.76 |
) |
|
0.51 |
|
|
2.42 |
|
|
(6.01 |
) |
|
|
|
|
|
|
|
|
||||||||||
|
Less distributions: |
|
|
|
|
|
|
|
|
|
|
|
|
|
|
|
|
|
Dividends from net investment income |
|
|
(0.06 |
) |
|
(0.09 |
) |
|
(0.13 |
) |
|
(0.21 |
) |
|
(0.07 |
) |
|
Dividends from net realized gains |
|
|
— |
|
|
— |
|
|
— |
|
|
— |
|
|
(0.08 |
) |
|
|
|
|
|
|
|
|
||||||||||
|
Total distributions |
|
|
(0.06 |
) |
|
(0.09 |
) |
|
(0.13 |
) |
|
(0.21 |
) |
|
(0.15 |
) |
|
|
|
|
|
|
|
|
||||||||||
|
Net asset value, end of year |
|
|
$8.05 |
|
|
$7.54 |
|
|
$8.39 |
|
|
$8.01 |
|
|
$5.80 |
|
|
|
|
|
|
|
|
|
||||||||||
|
Total return |
|
|
7.53 |
% |
|
-8.92 |
% |
|
6.48 |
% |
|
41.68 |
% |
|
-50.42 |
% |
|
Supplemental data and ratios: |
|
|
|
|
|
|
|
|
|
|
|
|
|
|
|
|
|
Net assets, end of year |
|
|
$197,252,920 |
|
|
$185,300,082 |
|
|
$269,702,069 |
|
|
$269,621,569 |
|
|
$223,339,201 |
|
|
Ratio of expenses to average net assets |
|
|
|
|
|
|
|
|
|
|
|
|
|
|
|
|
|
Before expense reimbursement |
|
|
1.66 |
% |
|
1.66 |
% |
|
1.50 |
% |
|
1.53 |
% |
|
1.53 |
% |
|
After expense reimbursement |
|
|
1.59 |
% |
|
1.59 |
% |
|
1.50 |
% |
|
1.53 |
% |
|
1.52 |
% |
|
Ratio of net investment income to |
|
|
|
|
|
|
|
|
|
|
|
|
|
|
|
|
|
Before expense reimbursement |
|
|
0.93 |
% |
|
1.11 |
% |
|
1.34 |
% |
|
2.01 |
% |
|
1.94 |
% |
|
After expense reimbursement |
|
|
1.00 |
% |
|
1.18 |
% |
|
1.34 |
% |
|
2.01 |
% |
|
1.95 |
% |
|
Portfolio turnover rate |
|
|
75.34 |
% |
|
164.90 |
% |
|
47.34 |
% |
|
65.33 |
% |
|
144.98 |
% |
Portfolio Turnover is calculated for the Fund as a whole.
See notes to financial statements.
140
|
|
|
GuideMarkSM Funds & GuidePathSM Funds |
|
FINANCIAL HIGHLIGHTS |
|
|
|
|
|
|
|
|
|
|
|
|
|
|
|
|
|
|
|
|
Opportunistic Equity Fund |
|
||||||||||
|
|
|
|
|||||||||||
|
|
|
Institutional |
|
Service |
|
||||||||
|
|
|
|
|
||||||||||
|
|
|
Year Ended |
|
April 29, 20111 |
|
Year Ended |
|
Year Ended |
|
||||
|
|
|
|
|
|
|
||||||||
|
Per share data for a share of capital
stock |
|
|
|
|
|
|
|
|
|
|
|
|
|
|
Net asset value, beginning of year |
|
|
$9.91 |
|
|
$10.21 |
|
|
$9.86 |
|
|
$10.00 |
|
|
Income from investment operations: |
|
|
|
|
|
|
|
|
|
|
|
|
|
|
Net investment income (loss) |
|
|
0.08 |
|
|
0.02 |
|
|
0.03 |
|
|
(0.02 |
) |
|
Net realized and unrealized gains
(losses) |
|
|
1.42 |
|
|
(0.32 |
) |
|
1.40 |
|
|
(0.12 |
) |
|
|
|
|
|
|
|
||||||||
|
Total from investment operations |
|
|
1.50 |
|
|
(0.30 |
) |
|
1.43 |
|
|
(0.14 |
) |
|
|
|
|
|
|
|
||||||||
|
Less distributions: |
|
|
|
|
|
|
|
|
|
|
|
|
|
|
Dividends from net investment income |
|
|
(0.07 |
) |
|
— |
|
|
(0.02 |
) |
|
— |
|
|
|
|
|
|
|
|
||||||||
|
Total distributions |
|
|
(0.07 |
) |
|
— |
|
|
(0.02 |
) |
|
— |
|
|
|
|
|
|
|
|
||||||||
|
Net asset value, end of year |
|
|
$11.34 |
|
|
$9.91 |
|
|
$11.27 |
|
|
$9.86 |
|
|
|
|
|
|
|
|
||||||||
|
Total return |
|
|
15.22 |
% |
|
-2.94 |
%2 |
|
14.56 |
% |
|
-1.40 |
% |
|
Supplemental data and ratios: |
|
|
|
|
|
|
|
|
|
|
|
|
|
|
Net assets, end of year |
|
$67,574,510 |
|
$46,233,165 |
|
$87,142,873 |
|
$114,222,234 |
|
||||
|
Ratio of expenses to average net assets |
|
|
|
|
|
|
|
|
|
|
|
|
|
|
Before expense reimbursement |
|
|
1.06 |
% |
|
1.05 |
%3 |
|
1.63 |
% |
|
1.63 |
% |
|
After expense reimbursement |
|
|
1.05 |
% |
|
1.03 |
%3 |
|
1.60 |
% |
|
1.60 |
% |
|
Ratio of net investment income (loss) |
|
|
|
|
|
|
|
|
|
|
|
|
|
|
Before expense reimbursement |
|
|
0.86 |
% |
|
0.45 |
%3 |
|
0.26 |
% |
|
-0.19 |
% |
|
After expense reimbursement |
|
|
0.87 |
% |
|
0.47 |
%3 |
|
0.29 |
% |
|
-0.16 |
% |
|
Portfolio turnover rate |
|
|
78.58 |
% |
|
91.59 |
% |
|
78.58 |
% |
|
91.59 |
% |
|
|
|
|
Portfolio Turnover is calculated for the Fund as a whole. |
|
|
1 |
Commencement of operations. |
|
2 |
Not annualized. |
|
3 |
Annualized. |
See notes to financial statements.
141
|
|
|
GuideMarkSM Funds & GuidePathSM Funds |
|
FINANCIAL HIGHLIGHTS |
|
|
|
|
|
|
|
|
|
|
|
|
|
|
|
|
|
|
|
|
Global Real Return Fund |
|
||||||||||
|
|
|
|
|||||||||||
|
|
|
Institutional |
|
Service |
|
||||||||
|
|
|
|
|
||||||||||
|
|
|
Year Ended |
|
April 29, 20111 |
|
Year Ended |
|
Year Ended |
|
||||
|
|
|
|
|
|
|
||||||||
|
Per share data for a share of capital
stock |
|
|
|
|
|
|
|
|
|
|
|
|
|
|
Net asset value, beginning of year |
|
|
$9.35 |
|
|
$10.31 |
|
|
$9.40 |
|
|
$10.00 |
|
|
Income from investment operations: |
|
|
|
|
|
|
|
|
|
|
|
|
|
|
Net investment income |
|
|
0.14 |
|
|
0.10 |
|
|
0.08 |
|
|
0.07 |
|
|
Net realized and unrealized gains
(losses) |
|
|
0.02 |
|
|
(0.88 |
) |
|
0.02 |
|
|
(0.59 |
) |
|
|
|
|
|
|
|
||||||||
|
Total from investment operations |
|
|
0.16 |
|
|
(0.78 |
) |
|
0.10 |
|
|
(0.52 |
) |
|
|
|
|
|
|
|
||||||||
|
Less distributions: |
|
|
|
|
|
|
|
|
|
|
|
|
|
|
Dividends from net investment income |
|
|
(0.12 |
) |
|
(0.17 |
) |
|
(0.08 |
) |
|
(0.08 |
) |
|
Return of capital |
|
|
— |
|
|
(0.01 |
) |
|
— |
|
|
— |
* |
|
|
|
|
|
|
|
||||||||
|
Total distributions |
|
|
(0.12 |
) |
|
(0.18 |
) |
|
(0.08 |
) |
|
(0.08 |
) |
|
|
|
|
|
|
|
||||||||
|
Net asset value, end of year |
|
|
$9.39 |
|
|
$9.35 |
|
|
$9.42 |
|
|
$9.40 |
|
|
|
|
|
|
|
|
||||||||
|
Total return |
|
|
1.73 |
% |
|
-7.48 |
%2 |
|
1.05 |
% |
|
-5.09 |
% |
|
Supplemental data and ratios: |
|
|
|
|
|
|
|
|
|
|
|
|
|
|
Net assets, end of year |
|
|
$11,681,383 |
|
|
$10,423,221 |
|
|
$70,779,787 |
|
$103,580,116 |
|
|
|
Ratio of expenses to average net assets |
|
|
|
|
|
|
|
|
|
|
|
|
|
|
Before expense reimbursement |
|
|
0.88 |
% |
|
0.89 |
%3 |
|
1.45 |
% |
|
1.47 |
% |
|
After expense reimbursement |
|
|
0.80 |
% |
|
0.82 |
%3 |
|
1.37 |
% |
|
1.44 |
% |
|
Ratio of net investment income to |
|
|
|
|
|
|
|
|
|
|
|
|
|
|
Before expense reimbursement |
|
|
1.22 |
% |
|
1.08 |
%3 |
|
0.76 |
% |
|
0.72 |
% |
|
After expense reimbursement |
|
|
1.30 |
% |
|
1.15 |
%3 |
|
0.84 |
% |
|
0.75 |
% |
|
Portfolio turnover rate |
|
|
35.26 |
% |
|
55.11 |
% |
|
35.26 |
% |
|
55.11 |
% |
|
|
|
|
Portfolio Turnover is calculated for the Fund as a whole. |
|
|
1 |
Commencement of operations. |
|
2 |
Not annualized. |
|
3 |
Annualized. |
|
* |
Amount represents less than $0.01 per share. |
See notes to financial statements.
142
|
|
|
GuideMarkSM Funds & GuidePathSM Funds |
|
FINANCIAL HIGHLIGHTS |
|
|
|
|
|
|
|
|
|
|
|
|
|
|
Core Fixed Income Fund |
|
||||
|
|
|
|
|||||
|
|
|
Institutional |
|
||||
|
|
|
|
|||||
|
|
|
Year Ended |
|
April 29, 20111 |
|
||
|
|
|
|
|
||||
|
Per share data for a share of capital
stock |
|
|
|
|
|
|
|
|
Net asset value, beginning of year |
|
|
$9.77 |
|
|
$9.48 |
|
|
Income from investment operations: |
|
|
|
|
|
|
|
|
Net investment income |
|
|
0.17 |
|
|
0.21 |
|
|
Net realized and unrealized gains |
|
|
0.23 |
|
|
0.31 |
|
|
|
|
|
|
||||
|
Total from investment operations |
|
|
0.40 |
|
|
0.52 |
|
|
|
|
|
|
||||
|
Less distributions: |
|
|
|
|
|
|
|
|
Dividends from net investment income |
|
|
(0.21 |
) |
|
(0.23 |
) |
|
Dividends from net realized gains |
|
|
(0.10 |
) |
|
— |
|
|
|
|
|
|
||||
|
Total distributions |
|
|
(0.31 |
) |
|
(0.23 |
) |
|
|
|
|
|
||||
|
Net asset value, end of year |
|
|
$9.86 |
|
|
$9.77 |
|
|
|
|
|
|
||||
|
Total return |
|
|
4.12 |
% |
|
5.56 |
%2 |
|
Supplemental data and ratios: |
|
|
|
|
|
|
|
|
Net assets, end of year |
|
|
$134,362,492 |
|
|
$31,999,581 |
|
|
Ratio of expenses to average net assets |
|
|
|
|
|
|
|
|
Before expense reimbursement |
|
|
0.72 |
% |
|
0.70 |
%3 |
|
After expense reimbursement |
|
|
0.72 |
% |
|
0.69 |
%3 |
|
Ratio of net investment income to |
|
|
|
|
|
|
|
|
Before expense reimbursement |
|
|
1.53 |
% |
|
2.14 |
%3 |
|
After expense reimbursement |
|
|
1.53 |
% |
|
2.15 |
%3 |
|
Portfolio turnover rate |
|
213.80 |
% |
427.36 |
% |
||
|
|
|
|
Portfolio Turnover is calculated for the Fund as a whole. |
|
|
1 |
Commencement of operations. |
|
2 |
Not annualized. |
|
3 |
Annualized. |
See notes to financial statements.
143
|
|
|
GuideMarkSM Funds & GuidePathSM Funds |
|
FINANCIAL HIGHLIGHTS |
|
|
|
|
|
|
|
|
|
|
|
|
|
|
|
|
|
|
|
|
|
|
|
Core Fixed Income Fund |
|
|||||||||||||
|
|
|
|
||||||||||||||
|
|
|
Service |
|
|||||||||||||
|
|
|
|
||||||||||||||
|
|
|
Year Ended |
|
Year Ended |
|
Year Ended |
|
Year Ended |
|
Year Ended |
|
|||||
|
|
|
|
|
|
|
|
||||||||||
|
Per share data for a share of capital
stock |
|
|
|
|
|
|
|
|
|
|
|
|
|
|
|
|
|
Net asset value, beginning of year |
|
|
$9.78 |
|
|
$9.36 |
|
|
$9.10 |
|
|
$7.92 |
|
|
$9.20 |
|
|
Income from investment operations: |
|
|
|
|
|
|
|
|
|
|
|
|
|
|
|
|
|
Net investment income |
|
|
0.11 |
|
|
0.17 |
|
|
0.21 |
|
|
0.33 |
|
|
0.41 |
|
|
Net realized and unrealized gains
(losses) |
|
|
0.24 |
|
|
0.42 |
|
|
0.29 |
|
|
1.17 |
|
|
(1.11 |
) |
|
|
|
|
|
|
|
|
||||||||||
|
Total from investment operations |
|
|
0.35 |
|
|
0.59 |
|
|
0.50 |
|
|
1.50 |
|
|
(0.70 |
) |
|
|
|
|
|
|
|
|
||||||||||
|
Less distributions: |
|
|
|
|
|
|
|
|
|
|
|
|
|
|
|
|
|
Dividends from net investment income |
|
|
(0.15 |
) |
|
(0.17 |
) |
|
(0.24 |
) |
|
(0.32 |
) |
|
(0.40 |
) |
|
Dividends from net realized gains |
|
|
(0.10 |
) |
|
— |
|
|
— |
|
|
— |
|
|
(0.18 |
) |
|
|
|
|
|
|
|
|
||||||||||
|
Total distributions |
|
|
(0.25 |
) |
|
(0.17 |
) |
|
(0.24 |
) |
|
(0.32 |
) |
|
(0.58 |
) |
|
|
|
|
|
|
|
|
||||||||||
|
Net asset value, end of year |
|
|
$9.88 |
|
|
$9.78 |
|
|
$9.36 |
|
|
$9.10 |
|
|
$7.92 |
|
|
|
|
|
|
|
|
|
||||||||||
|
Total return |
|
|
3.55 |
% |
|
6.35 |
% |
|
5.58 |
% |
|
19.21 |
% |
|
-7.57 |
% |
|
Supplemental data and ratios: |
|
|
|
|
|
|
|
|
|
|
|
|
|
|
|
|
|
Net assets, end of year |
|
|
$281,180,497 |
|
|
$435,281,520 |
|
|
$581,940,962 |
|
|
$547,963,751 |
|
|
$504,451,429 |
|
|
Ratio of expenses to average net assets |
|
|
|
|
|
|
|
|
|
|
|
|
|
|
|
|
|
Before expense reimbursement |
|
|
1.30 |
% |
|
1.28 |
% |
|
1.25 |
% |
|
1.28 |
% |
|
1.26 |
% |
|
After expense reimbursement |
|
|
1.29 |
% |
|
1.26 |
% |
|
1.24 |
% |
|
1.25 |
% |
|
1.18 |
% |
|
Ratio of net investment income to |
|
|
|
|
|
|
|
|
|
|
|
|
|
|
|
|
|
Before expense reimbursement |
|
|
1.02 |
% |
|
1.68 |
% |
|
2.23 |
% |
|
3.71 |
% |
|
4.54 |
% |
|
After expense reimbursement |
|
|
1.03 |
% |
|
1.70 |
% |
|
2.24 |
% |
|
3.74 |
% |
|
4.62 |
% |
|
Portfolio turnover rate |
|
213.80 |
% |
427.36 |
% |
485.40 |
% |
224.89 |
% |
261.77 |
% |
|||||
Portfolio Turnover is calculated for the Fund as a whole.
See notes to financial statements.
144
|
|
|
GuideMarkSM Funds & GuidePathSM Funds |
|
FINANCIAL HIGHLIGHTS |
|
|
|
|
|
|
|
|
|
|
|
|
|
|
|
|
|
|
|
|
|
|
|
Tax-Exempt Fixed Income Fund |
|
|||||||||||||
|
|
|
|
||||||||||||||
|
|
|
Service |
|
|||||||||||||
|
|
|
|
||||||||||||||
|
|
|
Year Ended |
|
Year Ended |
|
Year Ended |
|
Year Ended |
|
Year Ended |
|
|||||
|
|
|
|
|
|
|
|
||||||||||
|
Per share data for a share of capital
stock |
|
|
|
|
|
|
|
|
|
|
|
|
|
|
|
|
|
Net asset value, beginning of year |
|
|
$11.47 |
|
|
$10.67 |
|
|
$10.94 |
|
|
$10.27 |
|
|
$10.64 |
|
|
Income from investment operations: |
|
|
|
|
|
|
|
|
|
|
|
|
|
|
|
|
|
Net investment income |
|
|
0.33 |
|
|
0.37 |
|
|
0.36 |
|
|
0.36 |
|
|
0.34 |
|
|
Net realized and unrealized gains
(losses) |
|
|
0.23 |
|
|
0.80 |
|
|
(0.26 |
) |
|
0.66 |
|
|
(0.37 |
) |
|
|
|
|
|
|
|
|
||||||||||
|
Total from investment operations |
|
|
0.56 |
|
|
1.17 |
|
|
0.10 |
|
|
1.02 |
|
|
(0.03 |
) |
|
|
|
|
|
|
|
|
||||||||||
|
Less distributions: |
|
|
|
|
|
|
|
|
|
|
|
|
|
|
|
|
|
Dividends from net investment income |
|
|
(0.33 |
) |
|
(0.37 |
) |
|
(0.37 |
) |
|
(0.35 |
) |
|
(0.34 |
) |
|
|
|
|
|
|
|
|
||||||||||
|
Total distributions |
|
|
(0.33 |
) |
|
(0.37 |
) |
|
(0.37 |
) |
|
(0.35 |
) |
|
(0.34 |
) |
|
|
|
|
|
|
|
|
||||||||||
|
Net asset value, end of year |
|
|
$11.70 |
|
|
$11.47 |
|
|
$10.67 |
|
|
$10.94 |
|
|
$10.27 |
|
|
|
|
|
|
|
|
|
||||||||||
|
Total return |
|
|
4.93 |
% |
|
11.10 |
% |
|
0.89 |
% |
|
10.06 |
% |
|
-0.25 |
% |
|
Supplemental data and ratios: |
|
|
|
|
|
|
|
|
|
|
|
|
|
|
|
|
|
Net assets, end of year |
|
|
$75,739,873 |
|
|
$81,408,890 |
|
|
$170,330,144 |
|
|
$195,328,951 |
|
|
$193,579,910 |
|
|
Ratio of expenses to average net assets |
|
|
|
|
|
|
|
|
|
|
|
|
|
|
|
|
|
Before expense reimbursement |
|
|
1.36 |
% |
|
1.31 |
% |
|
1.29 |
% |
|
1.30 |
% |
|
1.30 |
% |
|
After expense reimbursement |
|
|
1.29 |
% |
|
1.29 |
% |
|
1.29 |
% |
|
1.29 |
% |
|
1.29 |
% |
|
Ratio of net investment income to |
|
|
|
|
|
|
|
|
|
|
|
|
|
|
|
|
|
Before expense reimbursement |
|
|
2.72 |
% |
|
3.16 |
% |
|
3.25 |
% |
|
3.30 |
% |
|
3.09 |
% |
|
After expense reimbursement |
|
|
2.79 |
% |
|
3.18 |
% |
|
3.25 |
% |
|
3.31 |
% |
|
3.10 |
% |
|
Portfolio turnover rate |
|
|
30.36 |
% |
|
38.80 |
% |
|
38.01 |
% |
|
57.44 |
% |
|
44.37 |
% |
See notes to financial statements.
145
|
|
|
GuideMarkSM Funds & GuidePathSM Funds |
|
FINANCIAL HIGHLIGHTS |
|
|
|
|
|
|
|
|
|
|
|
|
|
|
|
|
|
|
|
|
Opportunistic Fixed Income Fund |
|
||||||||||
|
|
|
|
|||||||||||
|
|
|
Institutional |
|
Service |
|
||||||||
|
|
|
|
|
||||||||||
|
|
|
Year Ended |
|
April 29, 20111 |
|
Year Ended |
|
Year Ended |
|
||||
|
|
|
|
|
|
|
||||||||
|
Per share data for a share of capital
stock |
|
|
|
|
|
|
|
|
|
|
|
|
|
|
Net asset value, beginning of year |
|
|
$9.70 |
|
|
$10.07 |
|
|
$9.70 |
|
|
$10.00 |
|
|
Income from investment operations: |
|
|
|
|
|
|
|
|
|
|
|
|
|
|
Net investment income |
|
|
0.42 |
|
|
0.35 |
|
|
0.36 |
|
|
0.34 |
|
|
Net realized and unrealized gains
(losses) |
|
|
0.57 |
|
|
(0.34 |
) |
|
0.58 |
|
|
(0.31 |
) |
|
|
|
|
|
|
|
||||||||
|
Total from investment operations |
|
|
0.99 |
|
|
0.01 |
|
|
0.94 |
|
|
0.03 |
|
|
|
|
|
|
|
|
||||||||
|
Less distributions: |
|
|
|
|
|
|
|
|
|
|
|
|
|
|
Dividends from net investment income |
|
|
(0.42 |
) |
|
(0.38 |
) |
|
(0.36 |
) |
|
(0.33 |
) |
|
|
|
|
|
|
|
||||||||
|
Total distributions |
|
|
(0.42 |
) |
|
(0.38 |
) |
|
(0.36 |
) |
|
(0.33 |
) |
|
|
|
|
|
|
|
||||||||
|
Net asset value, end of year |
|
|
$10.27 |
|
|
$9.70 |
|
|
$10.28 |
|
|
$9.70 |
|
|
|
|
|
|
|
|
||||||||
|
Total return |
|
|
10.33 |
% |
|
0.29 |
%2 |
|
9.64 |
% |
|
0.56 |
% |
|
Supplemental data and ratios: |
|
|
|
|
|
|
|
|
|
|
|
|
|
|
Net assets, end of year |
|
|
$104,141,739 |
|
|
$38,403,168 |
|
|
$150,493,389 |
|
|
$204,104,609 |
|
|
Ratio of expenses to average net assets |
|
|
|
|
|
|
|
|
|
|
|
|
|
|
Before expense reimbursement |
|
|
1.03 |
% |
|
1.13 |
%3 |
|
1.61 |
% |
|
1.63 |
% |
|
After expense reimbursement |
|
|
1.05 |
% |
|
1.05 |
%3 |
|
1.55 |
% |
|
1.55 |
% |
|
Ratio of net investment income to |
|
|
|
|
|
|
|
|
|
|
|
|
|
|
Before expense reimbursement |
|
|
4.17 |
% |
|
4.20 |
%3 |
|
3.52 |
% |
|
3.49 |
% |
|
After expense reimbursement |
|
|
4.15 |
% |
|
4.28 |
%3 |
|
3.58 |
% |
|
3.57 |
% |
|
Portfolio turnover rate |
|
|
101.49 |
% |
|
86.54 |
% |
|
101.49 |
% |
|
86.54 |
% |
|
|
|
|
Portfolio Turnover is calculated for the Fund as a whole. |
|
|
1 |
Commencement of operations. |
|
2 |
Not annualized. |
|
3 |
Annualized. |
See notes to financial statements.
146
|
|
|
GuideMarkSM Funds & GuidePathSM Funds |
|
FINANCIAL HIGHLIGHTS |
|
|
|
|
|
|
|
|
|
|
|
|
|
|
|
|
|
|
|
|
|
|
|
|
|
|
Strategic Asset Allocation Fund |
|
Tactical ConstrainedSM Asset Allocation Fund |
|
||||||||||||||
|
|
|
|
|
||||||||||||||||
|
|
|
Institutional |
|
Service |
|
Institutional |
|
Service |
|
||||||||||
|
|
|
|
|
|
|
||||||||||||||
|
|
|
September 13, |
|
Year Ended |
|
April 29, 20111 |
|
September 13, |
|
Year Ended |
|
April 29, 20111 |
|
||||||
|
|
|
|
|
|
|
|
|
||||||||||||
|
Per share data for a share of capital
stock |
|
|
|
|
|
|
|
|
|
|
|
|
|
|
|
|
|
|
|
|
Net asset value, beginning of year |
|
|
$9.63 |
|
|
$9.46 |
|
|
$10.00 |
|
|
$9.98 |
|
|
$9.76 |
|
|
$10.00 |
|
|
Income from investment operations: |
|
|
|
|
|
|
|
|
|
|
|
|
|
|
|
|
|
|
|
|
Net investment income |
|
|
0.11 |
|
|
0.07 |
|
|
0.08 |
|
|
0.14 |
|
|
0.09 |
|
|
0.09 |
|
|
Net realized and unrealized gains
(losses) |
|
|
0.62 |
|
|
0.80 |
|
|
(0.52 |
) |
|
0.48 |
|
|
0.71 |
|
|
(0.24 |
) |
|
|
|
|
|
|
|
|
|
||||||||||||
|
Total from investment operations |
|
|
0.73 |
|
|
0.87 |
|
|
(0.44 |
) |
|
0.62 |
|
|
0.80 |
|
|
(0.15 |
) |
|
|
|
|
|
|
|
|
|
||||||||||||
|
Less distributions: |
|
|
|
|
|
|
|
|
|
|
|
|
|
|
|
|
|
|
|
|
Dividends from net investment income |
|
|
(0.11 |
) |
|
(0.07 |
) |
|
(0.10 |
) |
|
(0.14 |
) |
|
(0.09 |
) |
|
(0.09 |
) |
|
Dividends from net realized gains |
|
|
— |
|
|
— |
|
|
— |
|
|
(0.03 |
) |
|
(0.03 |
) |
|
— |
|
|
Return of capital |
|
|
— |
|
|
— |
|
|
— |
* |
|
— |
|
|
— |
|
|
— |
|
|
|
|
|
|
|
|
|
|
||||||||||||
|
Total distributions |
|
|
(0.11 |
) |
|
(0.07 |
) |
|
(0.10 |
) |
|
(0.17 |
) |
|
(0.12 |
) |
|
(0.09 |
) |
|
|
|
|
|
|
|
|
|
||||||||||||
|
Net asset value, end of year |
|
|
$10.25 |
|
|
$10.26 |
|
|
$9.46 |
|
|
$10.43 |
|
|
$10.44 |
|
|
$9.76 |
|
|
|
|
|
|
|
|
|
|
||||||||||||
|
Total return |
|
|
7.68 |
%2 |
|
9.30 |
% |
|
-4.30 |
%2 |
|
6.29 |
%2 |
|
8.25 |
% |
|
-1.43 |
%2 |
|
Supplemental data and ratios: |
|
|
|
|
|
|
|
|
|
|
|
|
|
|
|
|
|
|
|
|
Net assets, end of year |
|
|
$884,658 |
|
|
$248,122,395 |
|
|
$144,649,234 |
|
|
$879,348 |
|
|
$228,905,423 |
|
|
$143,145,114 |
|
|
Ratio of expenses to average net assets |
|
|
|
|
|
|
|
|
|
|
|
|
|
|
|
|
|
|
|
|
Before expense reimbursement |
|
|
0.42 |
%3 |
|
1.04 |
% |
|
1.22 |
%3 |
|
0.43 |
%3 |
|
1.05 |
% |
|
1.25 |
%3 |
|
After expense reimbursement |
|
|
0.40 |
%3 |
|
1.00 |
% |
|
1.00 |
%3 |
|
0.38 |
%3 |
|
1.00 |
% |
|
1.00 |
%3 |
|
Ratio of net investment income to |
|
|
|
|
|
|
|
|
|
|
|
|
|
|
|
|
|
|
|
|
Before expense reimbursement |
|
|
1.84 |
%3 |
|
0.76 |
% |
|
1.12 |
%3 |
|
2.10 |
%3 |
|
0.94 |
% |
|
1.33 |
%3 |
|
After expense reimbursement |
|
|
1.86 |
%3 |
|
0.80 |
% |
|
1.34 |
%3 |
|
2.15 |
%3 |
|
0.99 |
% |
|
1.58 |
%3 |
|
Portfolio turnover rate |
|
|
18.44 |
% |
|
18.44 |
% |
|
14.40 |
%2 |
|
67.22 |
% |
|
67.22 |
% |
|
50.86 |
%2 |
|
|
|
|
Portfolio Turnover is calculated for the Fund as a whole. |
|
|
1 |
Commencement of operations. |
|
2 |
Not annualized. |
|
3 |
Annualized. |
|
* |
Amount represents less than $0.01 per share. |
See notes to financial statements.
147
|
|
|
GuideMarkSM Funds & GuidePathSM Funds |
|
FINANCIAL HIGHLIGHTS |
|
|
|
|
|
|
|
|
|
|
|
|
|
|
|
|
|
|
|
|
|
|
|
|
|
|
Tactical Unconstrained SM Asset Allocation Fund |
|
Absolute Return Asset Allocation Fund |
|
||||||||||||||
|
|
|
|
|
||||||||||||||||
|
|
|
Institutional |
|
Service |
|
Institutional |
|
Service |
|
||||||||||
|
|
|
|
|
|
|
||||||||||||||
|
|
|
September 13, |
|
Year Ended |
|
April 29, 20111 |
|
September 13, |
|
Year Ended |
|
April 29, 20111 |
|
||||||
|
|
|
|
|
|
|
|
|
||||||||||||
|
Per share data for a share of capital
stock |
|
|
|
|
|
|
|
|
|
|
|
|
|
|
|
|
|
|
|
|
Net asset value, beginning of year |
|
|
$9.75 |
|
|
$9.54 |
|
|
$10.00 |
|
|
$10.19 |
|
|
$10.04 |
|
|
$10.00 |
|
|
Income from investment operations: |
|
|
|
|
|
|
|
|
|
|
|
|
|
|
|
|
|
|
|
|
Net investment income |
|
|
0.13 |
|
|
0.09 |
|
|
0.06 |
|
|
0.18 |
|
|
0.14 |
|
|
0.09 |
|
|
Net realized and unrealized gains
(losses) |
|
|
0.55 |
|
|
0.78 |
|
|
(0.47 |
) |
|
(0.02 |
) |
|
0.13 |
|
|
0.01 |
|
|
|
|
|
|
|
|
|
|
||||||||||||
|
Total from investment operations |
|
|
0.68 |
|
|
0.87 |
|
|
(0.41 |
) |
|
0.16 |
|
|
0.27 |
|
|
0.10 |
|
|
|
|
|
|
|
|
|
|
||||||||||||
|
Less distributions: |
|
|
|
|
|
|
|
|
|
|
|
|
|
|
|
|
|
|
|
|
Dividends from net investment income |
|
|
(0.14 |
) |
|
(0.10 |
) |
|
(0.05 |
) |
|
(0.18 |
) |
|
(0.13 |
) |
|
(0.06 |
) |
|
Dividends from net realized gains |
|
|
(0.04 |
) |
|
(0.04 |
) |
|
— |
|
|
(0.01 |
) |
|
(0.01 |
) |
|
— |
|
|
|
|
|
|
|
|
|
|
||||||||||||
|
Total distributions |
|
|
(0.18 |
) |
|
(0.14 |
) |
|
(0.05 |
) |
|
(0.19 |
) |
|
(0.14 |
) |
|
(0.06 |
) |
|
|
|
|
|
|
|
|
|
||||||||||||
|
Net asset value, end of year |
|
|
$10.25 |
|
|
$10.27 |
|
|
$9.54 |
|
|
$10.16 |
|
|
$10.17 |
|
|
$10.04 |
|
|
|
|
|
|
|
|
|
|
||||||||||||
|
Total return |
|
|
7.11 |
%2 |
|
9.15 |
% |
|
-4.09 |
%2 |
|
1.53 |
%2 |
|
2.71 |
% |
|
1.01 |
%2 |
|
Supplemental data and ratios: |
|
|
|
|
|
|
|
|
|
|
|
|
|
|
|
|
|
|
|
|
Net assets, end of year |
|
|
$810,333 |
|
|
$310,316,243 |
|
|
$184,703,438 |
|
|
$569,773 |
|
|
$509,704,884 |
|
|
$238,654,697 |
|
|
Ratio of expenses to average net assets |
|
|
|
|
|
|
|
|
|
|
|
|
|
|
|
|
|
|
|
|
Before expense reimbursement |
|
|
0.52 |
%3 |
|
1.15 |
% |
|
1.32 |
%3 |
|
0.51 |
%3 |
|
1.13 |
% |
|
1.28 |
%3 |
|
After expense reimbursement |
|
|
0.46 |
%3 |
|
1.10 |
% |
|
1.10 |
%3 |
|
0.47 |
%3 |
|
1.10 |
% |
|
1.10 |
%3 |
|
Ratio of net investment income to |
|
|
|
|
|
|
|
|
|
|
|
|
|
|
|
|
|
|
|
|
Before expense reimbursement |
|
|
1.89 |
%3 |
|
0.90 |
% |
|
0.90 |
%3 |
|
2.59 |
%3 |
|
1.80 |
% |
|
1.54 |
%3 |
|
After expense reimbursement |
|
|
1.95 |
%3 |
|
0.95 |
% |
|
1.12 |
%3 |
|
2.63 |
%3 |
|
1.83 |
% |
|
1.72 |
%3 |
|
Portfolio turnover rate |
|
|
195.89 |
% |
|
195.89 |
% |
|
293.90 |
%2 |
|
64.86 |
% |
|
64.86 |
% |
|
136.33 |
%2 |
|
|
|
|
Portfolio Turnover is calculated for the Fund as a whole. |
|
|
1 |
Commencement of operations. |
|
2 |
Not annualized. |
|
3 |
Annualized. |
See notes to financial statements.
148
|
|
|
GuideMarkSM Funds & GuidePathSM Funds |
|
FINANCIAL HIGHLIGHTS |
|
|
|
|
|
|
|
|
|
|
|
|
|
|
|
|
|
|
|
|
|
|
|
Multi-Asset |
|
Fixed Income |
|
Altegris® Multi-Strategy |
|
|||||||||
|
|
|
|
|
|
||||||||||||
|
|
|
Service |
|
Institutional |
|
Service |
|
Institutional |
|
Service |
|
|||||
|
|
|
|
|
|
|
|
||||||||||
|
|
|
August 31, |
|
September 13, |
|
August 31, |
|
September 13, |
|
August 31, |
|
|||||
|
|
|
|
|
|
|
|
||||||||||
|
Per share data for a share of capital stock |
|
|
|
|
|
|
|
|
|
|
|
|
|
|
|
|
|
Net asset value, beginning of year |
|
|
$10.00 |
|
|
$10.01 |
|
|
$10.00 |
|
|
$10.07 |
|
|
$10.00 |
|
|
Income from investment operations: |
|
|
|
|
|
|
|
|
|
|
|
|
|
|
|
|
|
Net investment income |
|
|
0.22 |
|
|
0.13 |
|
|
0.10 |
|
|
0.05 |
|
|
0.03 |
|
|
Net realized and unrealized gains (losses) |
|
|
0.53 |
|
|
(0.04 |
) |
|
(0.04 |
) |
|
(0.07 |
) |
|
0.00 |
|
|
|
|
|
|
|
|
|
||||||||||
|
Total from investment operations |
|
|
0.75 |
|
|
0.09 |
|
|
0.06 |
|
|
(0.02 |
) |
|
0.03 |
|
|
|
|
|
|
|
|
|
||||||||||
|
Less distributions: |
|
|
|
|
|
|
|
|
|
|
|
|
|
|
|
|
|
Dividends from net investment income |
|
|
(0.17 |
) |
|
(0.10 |
) |
|
(0.08 |
) |
|
(0.04 |
) |
|
(0.03 |
) |
|
Dividends from net realized gains |
|
|
— |
|
|
— |
* |
|
— |
* |
|
— |
|
|
— |
|
|
|
|
|
|
|
|
|
||||||||||
|
Total distributions |
|
|
(0.17 |
) |
|
(0.10 |
) |
|
(0.08 |
) |
|
(0.04 |
) |
|
(0.03 |
) |
|
|
|
|
|
|
|
|
||||||||||
|
Net asset value, end of year |
|
|
$10.58 |
|
|
$10.00 |
|
|
$9.98 |
|
|
$10.01 |
|
|
$10.00 |
|
|
|
|
|
|
|
|
|
||||||||||
|
Total return |
|
|
7.55 |
%2 |
|
0.88 |
%2 |
|
0.59 |
%2 |
|
-0.19 |
%2 |
|
0.26 |
%2 |
|
Supplemental data and ratios: |
|
|
|
|
|
|
|
|
|
|
|
|
|
|
|
|
|
Net assets, end of year |
|
|
$73,269,622 |
|
|
$503,918 |
|
|
$227,815,865 |
|
|
$514,104 |
|
|
$161,223,450 |
|
|
Ratio of expenses to average net assets |
|
|
|
|
|
|
|
|
|
|
|
|
|
|
|
|
|
Before expense reimbursement |
|
|
1.33 |
%3 |
|
0.50 |
%3 |
|
1.09 |
%3 |
|
0.30 |
%3 |
|
0.72 |
%3 |
|
After expense reimbursement |
|
|
1.10 |
%3 |
|
0.43 |
%3 |
|
1.03 |
%3 |
|
0.30 |
%3 |
|
0.72 |
%3 |
|
Ratio of net investment income to |
|
|
|
|
|
|
|
|
|
|
|
|
|
|
|
|
|
Before expense reimbursement |
|
|
3.66 |
%3 |
|
2.44 |
%3 |
|
1.78 |
%3 |
|
0.84 |
%3 |
|
0.47 |
%3 |
|
After expense reimbursement |
|
|
3.89 |
%3 |
|
2.51 |
%3 |
|
1.84 |
%3 |
|
0.84 |
%3 |
|
0.47 |
%3 |
|
Portfolio turnover rate |
|
|
21.35 |
%2 |
|
18.75 |
%2 |
|
18.75 |
%2 |
|
16.16 |
%2 |
|
16.16 |
%2 |
|
|
|
|
Portfolio Turnover is calculated for the Fund as a whole. |
|
|
1 |
Commencement of operations. |
|
2 |
Not annualized. |
|
3 |
Annualized. |
|
* |
Amount represents less than $0.01 per share. |
See notes to financial statements.
149
|
|
|
GuideMarkSM Funds & GuidePathSM Funds |
|
NOTES TO FINANCIAL STATEMENTS |
|
March 31, 2013 |
|
|
|
|
1. |
Organization |
|
|
|
|
|
GPS Funds I (formerly, AssetMark Funds) and GPS Funds II (the “Trusts”) are organized as Delaware statutory trusts under Declarations of Trust dated January 2, 2001 and October 20, 2010, respectively. The Trusts are registered under the Investment Company Act of 1940, as amended (the “1940 Act”), as open-end management investment companies. GPS Funds I is comprised of the following 7 funds: GuideMarkSM Large Cap Growth Fund, GuideMarkSM Large Cap Value Fund, GuideMarkSM Small/Mid Cap Core Fund, GuideMarkSM World ex-US Fund, GuideMarkSM Opportunistic Equity Fund, GuideMarkSM Core Fixed Income Fund, and GuideMarkSM Tax-Exempt Fixed Income Fund. GPS Funds II is comprised of the following 9 funds: GuideMarkSM Global Real Return Fund, GuideMarkSM Opportunistic Fixed Income Fund, GuidePathSM Strategic Asset Allocation Fund, GuidePathSM Tactical ConstrainedSM Asset Allocation Fund, GuidePathSM Tactical UnconstrainedSM Asset Allocation Fund, GuidePathSM Absolute Return Asset Allocation Fund, GuidePathSM Multi-Asset Income Asset Allocation Fund, GuidePathSM Fixed Income Allocation Fund and GuidePathSM Altegris Multi-Strategy Alternative Asset Allocation Fund (collectively, the “Funds”). All of the Funds, except for the GuideMarkSM Opportunistic Equity Fund, GuideMarkSM Opportunistic Fixed Income Fund, GuidePathSM Multi-Asset Income Asset Allocation Fund, GuidePathSM Fixed Income Allocation Fund and GuidePathSM Altegris® Multi-Strategy Alternative Asset Allocation Fund, are classified and operate as diversified funds under the 1940 Act. The GuideMarkSM Opportunistic Equity Fund, GuideMarkSM Opportunistic Fixed Income Fund, GuidePathSM Multi-Asset Income Asset Allocation Fund, GuidePathSM Fixed Income Allocation Fund, and GuidePathSM Altegris® Multi-Strategy Alternative Asset Allocation Fund, are classified as non-diversified. Each Fund represents a distinct portfolio with its own investment objectives and policies. The assets of each Fund are segregated, and a shareholder’s interest is limited to the Fund in which shares are held. The GuideMarkSM Global Real Return Fund, GuideMarkSM Opportunistic Fixed Income Fund, GuidePathSM Strategic Asset Allocation Fund, |
|
|
|
|
|
|
GuidePathSM Tactical ConstrainedSM Asset Allocation Fund, GuidePathSM Tactical UnconstrainedSM Asset Allocation Fund and GuidePathSM Absolute Return Asset Allocation Fund were seeded on March 4, 2011 and the prospectus went effective on April 1, 2011. The GuideMarkSM Opportunistic Equity Fund, GuideMarkSM Global Real Return Fund and GuideMarkSM Opportunistic Fixed Income Fund commenced operations on April 1, 2011. The GuidePathSM Strategic Asset Allocation Fund, GuidePathSM Tactical ConstrainedSM Asset Allocation Fund, GuidePathSM Tactical UnconstrainedSM Asset Allocation Fund and GuidePathSM Absolute Return Asset Allocation Fund commenced operations on April 29, 2011. The GuidePathSM Multi-Asset Income Asset Allocation Fund, GuidePathSM Fixed Income Allocation Fund and GuidePathSM Altegris Multi-Strategy Alternative Asset Allocation Fund commenced operations on August 31, 2012. Each Fund offers two classes of shares: Service Shares and Institutional Shares. |
|
|
|
|
|
|
2. |
Significant Accounting Policies |
|
|
|
|
|
|
|
The following is a summary of significant accounting policies consistently followed by the Funds in the preparation of the financial statements. These policies are in conformity with U.S. generally accepted accounting principals (“GAAP”). |
|
|
|
|
|
|
|
(a) |
Investment Valuation |
|
|
|
|
|
|
|
Portfolio securities listed on a national or foreign securities exchange, except those listed on NASDAQ, for which market quotations are available are valued at the last quoted sale price on each business day. Portfolio securities traded on NASDAQ are valued at the NASDAQ Official Closing Price (“NOCP”) on each business day. If there is no reported sale on an exchange or NASDAQ, the portfolio security will be valued at the mean between the most recent quoted bid and asked price. Price information on listed securities is taken from the exchange where the security is primarily traded. |
|
|
|
|
|
|
|
All equity securities that are not traded on a listed exchange are valued at the last sale price in the over-the-counter market. If a non-exchange traded security does not trade on a particular day, then the |
150
|
|
|
GuideMarkSM Funds & GuidePathSM Funds |
|
NOTES TO FINANCIAL STATEMENTS (Continued) |
|
March 31, 2013 |
|
|
|
|
|
|
|
mean between the last quoted closing bid and asked price will be used. Non-exchange traded ADRs are priced with an evaluated price as determined by the current evaluated pricing procedures of, and provided by, the pricing vendor. |
|
|
|
|
|
|
|
Fixed income securities that have a maturity of greater than 60 days are generally valued on the basis of evaluations obtained from third party pricing services, which take into account appropriate factors such as institutional sized trading in similar groups of securities, yield, quality, coupon rate, maturity, type of issue, trading characteristics and other market data. Short term investments having a maturity of less than 60 days are valued at amortized cost. |
|
|
|
|
|
|
|
Investments in mutual funds are valued at the closing net asset value per share of each mutual fund on the day of valuation. |
|
|
|
|
|
|
|
To assess the continuing appropriateness of security valuation, the Adviser regularly compares prior day prices with current day prices and transaction prices. When the comparison results exceed pre-defined thresholds, the Adviser challenges the prices exceeding tolerance levels with the pricing service or broker. Securities for which no market quotations are readily available or when a significant event has occurred between the time of the security’s last close and the time that a Fund next calculates its net asset value will be valued at their fair value as determined by the applicable Fund’s Valuation Committee. Securities for which no market prices are readily available will be valued at their fair value as determined by the Valuation Committee under procedures adopted by the applicable Board of Trustees. |
|
|
|
|
|
|
Security Valuation |
|
|
|
|
|
|
|
|
The Funds have adopted authoritative fair valuation accounting standards which establish an authoritative definition of fair value and set out a hierarchy for measuring fair value. These standards require additional disclosures about the various inputs and valuation techniques used to develop the measurements of fair value and a discussion in changes in valuation techniques and related inputs, if any, during the period. |
|
|
|
|
|
|
|
In addition, these standards require expanded disclosure for each major category of assets. These inputs are summarized in the three broad levels listed below: |
|
|
|
|
|
|
|
Level 1 – Quoted prices in active markets for identical securities. |
|
|
|
|
|
|
|
Level 2 – Other significant observable inputs (including quoted prices for similar securities, interest rates, prepayment speeds, credit risk, etc.). |
|
|
|
|
|
|
|
Level 3 – Significant unobservable inputs (including the Fund’s own assumptions in determining the fair value of investments). |
|
|
|
|
|
|
|
During the period, certain of the securities and other instruments held by the Funds were categorized as Level 2 or Level 3 based upon the inputs and methodologies used to determine the fair value of the security or instrument. Descriptions of the inputs and valuation methodologies used to determine the fair values of each class of investments within Level 2 and Level 3 are set forth below. |
|
|
|
|
|
|
|
Level 2 Investments. The Funds’ investments that were categorized as Level 2 include: (1) certain fixed income securities, including asset-backed securities, bank loans, collateralized mortgage obligations, convertible obligations, corporate obligations, U.S. and foreign government obligations, mortgage-backed securities and municipal obligations; (2) certain common stocks, convertible preferred stocks, preferred stocks, and real estate investment trusts; and (3) certain over-the-counter derivative instruments, including forward currency contracts and swaps. |
|
|
|
|
|
|
|
Fixed income securities are normally valued by pricing vendors that use broker-dealer quotations, reported trades or valuation estimates from their internal pricing models. The service providers’ internal models typically use inputs that are observable such as institutional sized trading in similar groups of securities, yield, credit quality, coupon rate, maturity, type of issue, trading characteristics and other market data. |
|
|
|
|
|
|
|
Certain common stocks that trade on foreign exchanges are subject to valuation adjustments. |
151
|
|
|
GuideMarkSM Funds & GuidePathSM Funds |
|
NOTES TO FINANCIAL STATEMENTS (Continued) |
|
March 31, 2013 |
|
|
|
|
|
|
These valuation adjustments are applied to the foreign exchange-traded common stocks to account for the market movement between the close of the foreign market in which the security is traded and the close of the New York Stock Exchange. These securities are valued using pricing vendors that consider the correlation patterns of price movements of the foreign security to the intraday trading in the U.S. markets. |
|
|
|
|
|
|
|
Foreign currency contracts derive their value from underlying asset prices, indices, reference rates, and other inputs or a combination of these factors. These instruments are normally valued using pricing vendors. Depending upon the instrument, its value may be provided by a pricing vendor using a series of techniques, including pricing models. The pricing models typically use inputs that are observed from active markets such as indices, spreads, interest rates, curves, dividends and exchange rates. |
|
|
|
|
|
|
|
Level 3 Investments. The Funds’ investments that were categorized as Level 3 include: (1) fair valued securities and certain investments purchased as securities lending collateral. |
|
|
|
|
|
|
|
Investments purchased as securities lending collateral and warrants are normally valued by pricing vendors using relevant observable inputs, as described above. Fair valued securities are normally valued by pricing vendors using relevant observable inputs, as described above. In certain circumstances, the types of observable inputs that are typically used by a pricing service may be unavailable or deemed by the pricing service to be unreliable. In these instances, the pricing vendor may value the security based upon significant unobservable inputs, or the pricing vendor may not provide a value for the security. To the extent that a pricing vendor does not provide a value for a particular security, or the pricing vendor provides a value that the Valuation Committee does not believe accurately reflects the value of the security, the security will be valued by the Valuation Committee based upon the information available to the Committee at the time of valuation and in accordance with procedures adopted by the Board. These methodologies may require subjective judgments and determinations about the value of a particular security. When significant unobservable inputs are used to value a security, the security is categorized as Level 3. To verify Level 3 unobservable inputs, the Adviser uses a variety of techniques as appropriate to substantiate these valuation approaches including a regular review of key inputs and assumptions, transaction back-testing or disposition analysis and review of related market activity. |
|
|
|
|
|
|
|
The inputs or methodology used for valuing securities are not an indication of the risk associated with investing in those securities. The following is a summary of the inputs used to value the Funds’ net assets as of March 31, 2013: |
|
|
|
|
|
|
|
GuideMarkSM Large Cap Growth Fund |
|
|
|
|
|
|
|
|
|
|
|
|
|
|
|
|
|
|
|
Level 1 |
|
Level 2 |
|
Level 3 |
|
Total |
|
||||
|
|
|
|
|
|
|
||||||||
|
Common Stocks |
|
$ |
180,684,124 |
|
$ |
— |
|
$ |
— |
|
$ |
180,684,124 |
|
|
Short Term Investments |
|
|
243,645 |
|
|
— |
|
|
— |
|
|
243,645 |
|
|
Investments Purchased as Securities Lending Collateral |
|
|
5,985,204 |
|
|
— |
|
|
792 |
|
|
5,985,996 |
|
|
|
|
|
|
|
|
||||||||
|
Total Investments in Securities |
|
$ |
186,912,973 |
|
$ |
— |
|
$ |
792 |
|
$ |
186,913,765 |
|
|
|
|
|
|
|
|
||||||||
|
|
|
|
|
For further information regarding security characteristics, see the Schedule of Investments. There were no transfers in or out of Levels 1 and 2 during the year ended March 31, 2013. |
|
|
|
|
|
There was no activity in the Level 3 assets during the year ended March 31, 2013. The ending balance as of March 31, 2013 was unchanged from the ending balance as of March 31, 2012. The Level 3 investments as of March 31, 2013 represented 0.00% of net assets and did not warrant a disclosure of significant unobservable valuation inputs. |
152
|
|
|
GuideMarkSM Funds & GuidePathSM Funds |
|
NOTES TO FINANCIAL STATEMENTS (Continued) |
|
March 31, 2013 |
|
|
|
|
|
|
|
|
|
|
|
|
|
|
|
|
GuideMarkSM Large Cap Value Fund |
|
|
|
|
|
|
|
|
|
|
|
|
|
|
|
|
|
|
|
|
|
|
|
|
|
|
|
|
|
|
|
Level 1 |
|
Level 2 |
|
Level 3 |
|
Total |
|
||||
|
|
|
|
|
|
|
||||||||
|
Common Stocks |
|
$ |
196,879,429 |
|
$ |
— |
|
$ |
— |
|
$ |
196,879,429 |
|
|
Short Term Investments |
|
|
2,211,047 |
|
|
— |
|
|
— |
|
|
2,211,047 |
|
|
Investments Purchased as Securities Lending Collateral |
|
|
7,402,486 |
|
|
— |
|
|
906 |
|
|
7,403,392 |
|
|
|
|
|
|
|
|
||||||||
|
Total Investments in Securities |
|
$ |
206,492,962 |
|
$ |
— |
|
$ |
906 |
|
$ |
206,493,868 |
|
|
|
|
|
|
|
|
||||||||
|
|
|
|
|
For further information regarding security characteristics, see the Schedule of Investments. There were no transfers in or out of Levels 1 and 2 during the year ended March 31, 2013. |
|
|
|
|
|
There was no activity in the Level 3 assets during the year ended March 31, 2013. The ending balance as of March 31, 2013 was unchanged from the ending balance as of March 31, 2012. The Level 3 investments as of March 31, 2013 represented 0.00% of net assets and did not warrant a disclosure of significant unobservable valuation inputs. |
|
|
|
|
|
|
|
|
|
|
|
|
|
|
|
|
GuideMarkSM Small/Mid Cap Core Fund |
|
|
|
|
|
|
|
|
|
|
|
|
|
|
|
|
|
|
|
|
|
|
|
|
|
|
|
|
|
|
|
Level 1 |
|
Level 2 |
|
Level 3 |
|
Total |
|
||||
|
|
|
|
|
|
|
||||||||
|
Common Stocks |
|
$ |
78,496,297 |
|
$ |
— |
|
$ |
— |
|
$ |
78,496,297 |
|
|
Real Estate Investment Trusts |
|
|
5,048,789 |
|
|
— |
|
|
— |
|
|
5,048,789 |
|
|
Short Term Investments |
|
|
1,324,970 |
|
|
— |
|
|
— |
|
|
1,324,970 |
|
|
Investments Purchased as Securities Lending Collateral |
|
|
8,220,480 |
|
|
— |
|
|
247 |
|
|
8,220,727 |
|
|
|
|
|
|
|
|
||||||||
|
Total Investments in Securities |
|
$ |
93,090,536 |
|
$ |
— |
|
$ |
247 |
|
$ |
93,090,783 |
|
|
|
|
|
|
|
|
||||||||
|
|
|
|
|
For further information regarding security characteristics, see the Schedule of Investments. There were no transfers in or out of Levels 1 and 2 during the year ended March 31, 2013. |
|
|
|
|
|
There was no activity in the Level 3 assets during the year ended March 31, 2013. The ending balance as of March 31, 2013 was unchanged from the ending balance as of March 31, 2012. The Level 3 investments as of March 31, 2013 represented 0.00% of net assets and did not warrant a disclosure of significant unobservable valuation inputs. |
153
|
|
|
GuideMarkSM Funds & GuidePathSM Funds |
|
NOTES TO FINANCIAL STATEMENTS (Continued) |
|
March 31, 2013 |
|
|
|
|
|
|
|
|
|
|
|
|
|
|
|
|
GuideMarkSM World ex-US Fund |
|
|
|
|
|
|
|
|
|
|
|
|
|
|
|
|
|
|
|
|
|
|
|
|
|
|
|
|
|
|
|
Level 1 |
|
Level 2 |
|
Level 3 |
|
Total |
|
||||
|
|
|
|
|
|
|
||||||||
|
Common Stocks |
|
$ |
33,519,199 |
|
$ |
233,478,646 |
|
$ |
— |
|
$ |
266,997,845 |
|
|
Investment Companies |
|
|
3,754,946 |
|
|
— |
|
|
— |
|
|
3,754,946 |
|
|
Preferred Stocks |
|
|
4,733,450 |
|
|
— |
|
|
— |
|
|
4,733,450 |
|
|
Real Estate Investment Trusts |
|
|
— |
|
|
320,396 |
|
|
— |
|
|
320,396 |
|
|
Rights |
|
|
16,925 |
|
|
— |
|
|
— |
|
|
16,925 |
|
|
Short Term Investments |
|
|
3,465,923 |
|
|
— |
|
|
— |
|
|
3,465,923 |
|
|
Investments Purchased as Securities Lending Collateral |
|
|
297,792 |
|
|
— |
|
|
216 |
|
|
298,008 |
|
|
|
|
|
|
|
|
||||||||
|
Total Investments in Securities |
|
$ |
45,788,235 |
|
$ |
233,799,042 |
|
$ |
216 |
|
$ |
279,587,493 |
|
|
|
|
|
|
|
|
||||||||
|
|
|
|
|
For further information regarding security characteristics, see the Schedule of Investments. |
|
|
|
|
|
Below is a reconciliation that details the transfer of securities between Level 1 and Level 2 during the reporting period. |
|
|
|
|
|
|
|
|
Description |
|
|
Investments |
|
|
|
|
|
|
|||
|
Transfers into Level 1 |
|
$ |
3,054,728 |
|
|
|
Transfers out of Level 1 |
|
|
957,037 |
|
|
|
|
|
|
|||
|
Net Transfers into/(out of) Level 1 |
|
$ |
4,011,765 |
|
|
|
|
|
|
|||
|
Transfers into Level 2 |
|
$ |
957,037 |
|
|
|
Transfers out of Level 2 |
|
|
3,054,728 |
|
|
|
|
|
|
|||
|
Net Transfers into/(out of) Level 2 |
|
$ |
4,011,765 |
|
|
|
|
|
|
|||
|
|
|
|
|
Transfers were made due to valuation adjustments on foreign common stocks to account for the market movement between the close of a foreign market and the close of the New York Stock Exchange. Transfers between levels are recognized at the end of the reporting period. |
|
|
|
|
|
There was no activity in the Level 3 assets during the year ended March 31, 2013. The ending balance as of March 31, 2013 was unchanged from the ending balance as of March 31, 2012. The Level 3 investments as of March 31, 2013 represented 0.00% of net assets and did not warrant a disclosure of significant unobservable valuation inputs. |
154
|
|
|
GuideMarkSM Funds & GuidePathSM Funds |
|
NOTES TO FINANCIAL STATEMENTS (Continued) |
|
March 31, 2013 |
|
|
|
|
|
|
|
|
|
|
|
|
|
|
|
|
GuideMarkSM Opportunistic Equity Fund |
|||||||||||||
|
|
|||||||||||||
|
|
|
Level 1 |
|
Level 2 |
|
Level 3 |
|
Total |
|
||||
|
|
|
|
|
|
|
||||||||
|
Common Stocks |
|
$ |
147,535,156 |
|
$ |
— |
|
$ |
— |
|
$ |
147,535,156 |
|
|
Preferred Stocks |
|
|
549,608 |
|
|
— |
|
|
— |
|
|
549,608 |
|
|
Real Estate Investment Trusts |
|
|
1,601,320 |
|
|
— |
|
|
— |
|
|
1,601,320 |
|
|
Short Term Investments |
|
|
4,481,280 |
|
|
— |
|
|
— |
|
|
4,481,280 |
|
|
Investments Purchased
as Securities |
|
|
5,228,051 |
|
|
— |
|
|
— |
|
|
5,228,051 |
|
|
|
|
|
|
|
|
||||||||
|
Total Investments in Securities |
|
$ |
159,395,415 |
|
$ |
— |
|
$ |
— |
|
$ |
159,395,415 |
|
|
|
|
|
|
|
|
||||||||
|
|
|
|
|
For further information regarding security characteristics, see the Schedule of Investments. There were no transfers in or out of Levels 1 and 2 during the year ended March 31, 2013. |
|
|
|
|
|
|
|
|
|
|
|
|
|
|
|
|
GuideMarkSM Global Real Return Fund |
|||||||||||||
|
|
|||||||||||||
|
|
|
Level 1 |
|
Level 2 |
|
Level 3 |
|
Total |
|
||||
|
|
|
|
|
|
|
||||||||
|
Investment Companies |
|
$ |
82,355,888 |
|
$ |
— |
|
$ |
— |
|
$ |
82,355,888 |
|
|
Short Term Investments |
|
|
333,219 |
|
|
— |
|
|
— |
|
|
333,219 |
|
|
Investments Purchased
as Securities |
|
|
31,804,600 |
|
|
— |
|
|
— |
|
|
31,804,600 |
|
|
|
|
|
|
|
|
||||||||
|
Total Investments in Securities |
|
$ |
114,493,707 |
|
$ |
— |
|
$ |
— |
|
$ |
114,493,707 |
|
|
|
|
|
|
|
|
||||||||
|
|
|
|
|
For further information regarding security characteristics, see the Schedule of Investments. There were no transfers in or out of Levels 1 and 2 during the year ended March 31, 2013. |
|
|
|
|
|
|
|
|
|
|
|
|
|
|
|
|
GuideMarkSM Core Fixed Income Fund |
|||||||||||||
|
|
|||||||||||||
|
|
|
Level 1 |
|
Level 2 |
|
Level 3 |
|
Total |
|
||||
|
|
|
|
|
|
|
||||||||
|
Fixed Income |
|
|
|
|
|
|
|
|
|
|
|
|
|
|
Asset Backed Securities |
|
$ |
— |
|
$ |
14,213,541 |
|
$ |
— |
|
$ |
14,213,541 |
|
|
Collateralized Mortgage Obligations |
|
|
— |
|
|
21,431,109 |
|
|
— |
|
|
21,431,109 |
|
|
Corporate Obligations |
|
|
— |
|
|
164,684,864 |
|
|
— |
|
|
164,684,864 |
|
|
Foreign Government Debt Obligations |
|
|
— |
|
|
484,090 |
|
|
— |
|
|
484,090 |
|
|
Mortgage Backed Securities |
|
|
— |
|
|
107,338,606 |
|
|
— |
|
|
107,338,606 |
|
|
Municipal Debt Obligations |
|
|
— |
|
|
1,531,525 |
|
|
— |
|
|
1,531,525 |
|
|
U.S. Government Agency Issues |
|
|
— |
|
|
5,160,595 |
|
|
— |
|
|
5,160,595 |
|
|
U.S. Treasury Obligations |
|
|
— |
|
|
86,606,268 |
|
|
— |
|
|
86,606,268 |
|
|
|
|
|
|
|
|
||||||||
|
Total Fixed Income |
|
|
— |
|
|
401,450,598 |
|
|
— |
|
|
401,450,598 |
|
|
Short Term Investments |
|
|
11,520,091 |
|
|
— |
|
|
— |
|
|
11,520,091 |
|
|
Investments Purchased
as Securities |
|
|
1,565,877 |
|
|
— |
|
|
191 |
|
|
1,566,068 |
|
|
|
|
|
|
|
|
||||||||
|
Total Investments in Securities |
|
$ |
13,085,968 |
|
$ |
401,450,598 |
|
$ |
191 |
|
$ |
414,536,757 |
|
|
|
|
|
|
|
|
||||||||
|
|
|
|
|
For further information regarding security characteristics, see the Schedule of Investments. There were no transfers in or out of Levels 1 and 2 during the year ended March 31, 2013. |
155
|
|
|
GuideMarkSM Funds & GuidePathSM Funds |
|
NOTES TO FINANCIAL STATEMENTS (Continued) |
|
March 31, 2013 |
|
|
|
|
|
There was no activity in the Level 3 assets during the year ended March 31, 2013. The ending balance as of March 31, 2013 was unchanged from the ending balance as of March 31, 2012. The Level 3 investments as of March 31, 2013 represented 0.00% of net assets and did not warrant a disclosure of significant unobservable valuation inputs. |
|
|
|
|
|
|
|
|
|
|
|
|
|
|
|
|
GuideMarkSM Tax-Exempt Fixed Income Fund |
|||||||||||||
|
|
|||||||||||||
|
|
|
Level 1 |
|
Level 2 |
|
Level 3 |
|
Total |
|
||||
|
|
|
|
|
|
|
||||||||
|
Municipal Obligations |
|
$ |
— |
|
$ |
73,865,744 |
|
$ |
— |
|
$ |
73,865,744 |
|
|
Short Term Investments |
|
|
1,226,791 |
|
|
— |
|
|
— |
|
|
1,226,791 |
|
|
|
|
|
|
|
|
||||||||
|
Total Investments in Securities |
|
$ |
1,226,791 |
|
$ |
73,865,744 |
|
$ |
— |
|
$ |
75,092,535 |
|
|
|
|
|
|
|
|
||||||||
|
|
|
|
|
For further information regarding security characteristics, see the Schedule of Investments. There were no transfers in or out of Levels 1 and 2 during the year ended March 31, 2013. |
|
|
|
|
|
|
|
|
|
|
|
|
|
|
|
|
GuideMarkSM Opportunistic Fixed Income Fund |
|||||||||||||
|
|
|||||||||||||
|
|
|
Level 1 |
|
Level 2 |
|
Level 3 |
|
Total |
|
||||
|
|
|
|
|
|
|
||||||||
|
Equity |
|
|
|
|
|
|
|
|
|
|
|
|
|
|
Common Stock |
|
$ |
3,962,420 |
|
$ |
— |
|
$ |
— |
|
$ |
3,962,420 |
|
|
Convertible Preferred Stock |
|
|
793,028 |
|
|
204,875 |
|
|
— |
|
|
997,903 |
|
|
Preferred Stock |
|
|
59,539 |
|
|
744,717 |
|
|
— |
|
|
804,256 |
|
|
|
|
|
|
|
|
||||||||
|
Total Equity |
|
|
4,814,987 |
|
|
949,592 |
|
|
— |
|
|
5,764,579 |
|
|
Fixed Income |
|
|
|
|
|
|
|
|
|
|
|
|
|
|
Asset Backed Securities |
|
|
— |
|
|
850,317 |
|
|
— |
|
|
850,317 |
|
|
Bank Loans |
|
|
— |
|
|
6,079,329 |
|
|
— |
|
|
6,079,329 |
|
|
Collateralized Mortgage Obligations |
|
|
— |
|
|
34,223,495 |
|
|
— |
|
|
34,223,495 |
|
|
Convertible Obligations |
|
|
— |
|
|
3,519,884 |
|
|
— |
|
|
3,519,884 |
|
|
Corporate Obligations |
|
|
— |
|
|
45,745,659 |
|
|
— |
|
|
45,745,659 |
|
|
Foreign Government Obligations |
|
|
— |
|
|
68,919,973 |
|
|
— |
|
|
68,919,973 |
|
|
Mortgage Backed Securities |
|
|
— |
|
|
51,010,900 |
|
|
— |
|
|
51,010,900 |
|
|
|
|
|
|
|
|
||||||||
|
Total Fixed Income |
|
|
— |
|
|
210,349,557 |
|
|
— |
|
|
210,349,557 |
|
|
Short Term Investments |
|
|
24,045,212 |
|
|
5,304,440 |
|
|
— |
|
|
29,349,652 |
|
|
|
|
|
|
|
|
||||||||
|
Total Investments in Securities |
|
$ |
28,860,199 |
|
$ |
216,603,589 |
|
$ |
— |
|
$ |
245,463,788 |
|
|
|
|
|
|
|
|
||||||||
|
Other Financial Instruments* |
|
|
|
|
|
|
|
|
|
|
|
|
|
|
Forward Currency Contracts |
|
$ |
— |
|
$ |
3,853,087 |
|
$ |
— |
|
$ |
3,853,087 |
|
|
Futures |
|
|
(130,503 |
) |
|
— |
|
|
— |
|
|
(130,503 |
) |
|
Swaps |
|
|
— |
|
|
(66,940 |
) |
|
— |
|
|
(66,940 |
) |
|
|
|
|
|
|
|
||||||||
|
Total |
|
$ |
(130,503 |
) |
$ |
3,786,147 |
|
$ |
— |
|
$ |
3,655,644 |
|
|
|
|
|
|
|
|
||||||||
|
|
|
|
|
|
* |
Other financial instruments are derivative instruments not reflected in the Schedule of Investments, such as forward currency contracts, futures, and swaps. These instruments are reflected at the unrealized appreciation (depreciation) on the instrument. |
|
|
|
|
|
|
For further information regarding security characteristics, see the Schedule of Investments. There were no transfers in or out of Levels 1 and 2 during the year ended March 31, 2013. |
|
156
|
|
|
GuideMarkSM Funds & GuidePathSM Funds |
|
NOTES TO FINANCIAL STATEMENTS (Continued) |
|
March 31, 2013 |
|
|
|
|
|
|
|
|
|
|
|
|
|
|
|
|
GuidePathSM Strategic Asset Allocation Fund |
|||||||||||||
|
|
|
|
|
|
|
|
|
|
|
|
|
|
|
|
|
|
Level 1 |
|
Level 2 |
|
Level 3 |
|
Total |
|
||||
|
|
|
|
|
|
|
||||||||
|
Investment Companies |
|
$ |
242,335,075 |
|
$ |
— |
|
$ |
— |
|
$ |
242,335,075 |
|
|
Short Term Investments |
|
|
5,991,979 |
|
|
— |
|
|
— |
|
|
5,991,979 |
|
|
Investments Purchased
as Securities |
|
|
21,329,599 |
|
|
— |
|
|
— |
|
|
21,329,599 |
|
|
|
|
|
|
|
|
||||||||
|
Total Investments in Securities |
|
$ |
269,656,653 |
|
$ |
— |
|
$ |
— |
|
$ |
269,656,653 |
|
|
|
|
|
|
|
|
||||||||
|
|
|
|
|
For further information regarding security characteristics, see the Schedule of Investments. There were no transfers in or out of Levels 1 and 2 during the year ended March 31, 2013. |
|
|
|
|
|
|
|
|
|
|
|
|
|
|
|
|
GuidePathSM Tactical ConstrainedSM Asset Allocation Fund |
|||||||||||||
|
|
|
|
|
|
|
|
|
|
|
|
|
|
|
|
|
|
Level 1 |
|
Level 2 |
|
Level 3 |
|
Total |
|
||||
|
|
|
|
|
|
|
||||||||
|
Investment Companies |
|
$ |
223,615,399 |
|
$ |
— |
|
$ |
— |
|
$ |
223,615,399 |
|
|
Short Term Investments |
|
|
5,548,455 |
|
|
— |
|
|
— |
|
|
5,548,455 |
|
|
Investments Purchased
as Securities |
|
|
15,311,873 |
|
|
— |
|
|
— |
|
|
15,311,873 |
|
|
|
|
|
|
|
|
||||||||
|
Total Investments in Securities |
|
$ |
244,475,727 |
|
$ |
— |
|
$ |
— |
|
$ |
244,475,727 |
|
|
|
|
|
|
|
|
||||||||
|
|
|
|
|
For further information regarding security characteristics, see the Schedule of Investments. There were no transfers in or out of Levels 1 and 2 during the year ended March 31, 2013. |
|
|
|
|
|
|
|
|
|
|
|
|
|
|
|
|
GuidePathSM Tactical UnconstrainedSM Asset Allocation Fund |
|||||||||||||
|
|
|
|
|
|
|
|
|
|
|
|
|
|
|
|
|
|
Level 1 |
|
Level 2 |
|
Level 3 |
|
Total |
|
||||
|
|
|
|
|
|
|
||||||||
|
Investment Companies |
|
$ |
303,792,474 |
|
$ |
— |
|
$ |
— |
|
$ |
303,792,474 |
|
|
Short Term Investments |
|
|
7,476,129 |
|
|
— |
|
|
— |
|
|
7,476,129 |
|
|
Investments Purchased
as Securities |
|
|
24,743,125 |
|
|
— |
|
|
— |
|
|
24,743,125 |
|
|
|
|
|
|
|
|
||||||||
|
Total Investments in Securities |
|
$ |
336,011,728 |
|
$ |
— |
|
$ |
— |
|
$ |
336,011,728 |
|
|
|
|
|
|
|
|
||||||||
|
|
|
|
|
For further information regarding security characteristics, see the Schedule of Investments. There were no transfers in or out of Levels 1 and 2 during the year ended March 31, 2013. |
|
|
|
|
|
|
|
|
|
|
|
|
|
|
|
|
GuidePathSM Absolute Return Asset Allocation Fund |
|||||||||||||
|
|
|
|
|
|
|
|
|
|
|
|
|
|
|
|
|
|
Level 1 |
|
Level 2 |
|
Level 3 |
|
Total |
|
||||
|
|
|
|
|
|
|
||||||||
|
Investment Companies |
|
$ |
499,148,627 |
|
$ |
— |
|
$ |
— |
|
$ |
499,148,627 |
|
|
Short Term Investments |
|
|
11,658,838 |
|
|
— |
|
|
— |
|
|
11,658,838 |
|
|
Investments Purchased
as Securities |
|
|
21,172,507 |
|
|
— |
|
|
— |
|
|
21,172,507 |
|
|
|
|
|
|
|
|
||||||||
|
Total Investments in Securities |
|
$ |
531,979,972 |
|
$ |
— |
|
$ |
— |
|
$ |
531,979,972 |
|
|
|
|
|
|
|
|
||||||||
|
|
|
|
|
For further information regarding security characteristics, see the Schedule of Investments. There were no transfers in or out of Levels 1 and 2 during the year ended March 31, 2013. |
157
|
|
|
GuideMarkSM Funds & GuidePathSM Funds |
|
NOTES TO FINANCIAL STATEMENTS (Continued) |
|
March 31, 2013 |
|
|
|
|
|
|
|
|
|
|
|
|
|
|
|
|
GuidePathSM Multi-Asset Income Asset Allocation Fund |
|||||||||||||
|
|
|
|
|
|
|
|
|
|
|
|
|
|
|
|
|
|
Level 1 |
|
Level 2 |
|
Level 3 |
|
Total |
|
||||
|
|
|
|
|
|
|
||||||||
|
Investment Companies |
|
$ |
71,189,685 |
|
$ |
— |
|
$ |
— |
|
$ |
71,189,685 |
|
|
Short Term Investments |
|
|
2,531,910 |
|
|
— |
|
|
— |
|
|
2,531,910 |
|
|
Investments Purchased as Securities |
|
|
13,230,715 |
|
|
— |
|
|
— |
|
|
13,230,715 |
|
|
|
|
|
|
|
|
||||||||
|
Total Investments in Securities |
|
$ |
86,952,310 |
|
$ |
— |
|
$ |
— |
|
$ |
86,952,310 |
|
|
|
|
|
|
|
|
||||||||
|
|
|
|
|
For further information regarding security characteristics, see the Schedule of Investments. There were no transfers in or out of Levels 1 and 2 during the year ended March 31, 2013. |
|
|
|
|
|
|
|
|
|
|
|
|
|
|
|
|
GuidePathSM Fixed Income Allocation Fund |
|
|
|
|
|
|
|
|
|
|
|
|
|
|
|
|
|
|
|
|
|
|
|
|
|
|
|
|
|
|
|
Level 1 |
|
Level 2 |
|
Level 3 |
|
Total |
|
||||
|
|
|
|
|
|
|
||||||||
|
Investment Companies |
|
$ |
223,606,364 |
|
$ |
— |
|
$ |
— |
|
$ |
223,606,364 |
|
|
Short Term Investments |
|
|
3,940,201 |
|
|
— |
|
|
— |
|
|
3,940,201 |
|
|
Investments Purchased as Securities |
|
|
21,608,881 |
|
|
— |
|
|
— |
|
|
21,608,881 |
|
|
|
|
|
|
|
|
||||||||
|
Total Investments in Securities |
|
$ |
249,155,446 |
|
$ |
— |
|
$ |
— |
|
$ |
249,155,446 |
|
|
|
|
|
|
|
|
||||||||
|
|
|
|
|
For further information regarding security characteristics, see the Schedule of Investments. There were no transfers in or out of Levels 1 and 2 during the year ended March 31, 2013. |
|
|
|
|
|
|
|
|
|
|
|
|
|
|
|
|
|
|
|
|
|
|
|
|
|
|
|
|
|
|
|
GuidePathSM Altegris® Multi-Strategy Alternative Allocation Fund |
|||||||||||||
|
|
|
|
|
|
|
|
|
|
|
|
|
|
|
|
|
|
Level 1 |
|
Level 2 |
|
Level 3 |
|
Total |
|
||||
|
|
|
|
|
|
|
||||||||
|
Investment Companies |
|
$ |
158,062,304 |
|
$ |
— |
|
$ |
— |
|
$ |
158,062,304 |
|
|
Short Term Investments |
|
|
3,561,497 |
|
|
— |
|
|
— |
|
|
3,561,497 |
|
|
|
|
|
|
|
|
||||||||
|
Total Investments in Securities |
|
$ |
161,623,801 |
|
$ |
— |
|
$ |
— |
|
$ |
161,623,801 |
|
|
|
|
|
|
|
|
||||||||
|
|
|
|
|
For further information regarding security characteristics, see the Schedule of Investments. There were no transfers in or out of Levels 1 and 2 during the year ended March 31, 2013. |
158
|
|
|
GuideMarkSM Funds & GuidePathSM Funds |
|
NOTES TO FINANCIAL STATEMENTS (Continued) |
|
March 31, 2013 |
|
|
|
Derivative Instruments and Hedging Activities |
|
|
|
Each Trust has adopted derivative instruments disclosure standards, in order to enable the investor to understand how and why an entity used derivatives, how derivatives are accounted for, and how derivative instruments affect an entity’s results of operations and financial position. |
|
|
|
GuideMarkSM Core Fixed Income Fund |
|
|
|
During the period, the Fund used money market and fixed income derivatives including futures for both hedging and investment purposes, primarily duration management and the pursuit of relative value opportunities. Futures contracts used in the Fund during the period included those based on 90-day Eurodollars: short, medium, and long-term U.S. debt, medium and long-term German debt, long-term Australian debt, and long-term debt of the United Kingdom. |
|
|
|
In general, the use of derivatives may increase the risk within the Fund. The use of over-the-counter derivatives involves the risk that the counterparty to the contract will fail to make required payments or otherwise comply with the terms of the contract. The results achieved by the use of derivatives in the Fund may not match or fully offset changes in the value of the underlying financial assets being hedged or the investment opportunity the Fund was pursuing, thereby failing to achieve, to an extent, the original purpose for using the derivatives. Certain types of derivatives may create leverage insofar as a Fund may receive returns (or suffer losses) exceeding the initial amounts the Fund committed in connection with the derivatives. The use of derivatives can result in losses or gains to a Fund exceeding the amount the Fund would have experienced in the absence of using derivatives. A relatively small price movement in a derivative may result in an immediate and substantial loss, or gain, to the Fund. |
|
|
|
The Fund used futures contracts during the period primarily to manage interest rate risk. |
|
|
|
There were no derivatives held at March 31, 2013. |
|
|
|
|
|
The Effect of Derivative Instruments on the Statement of Operations for the Year Ended March 31, 2013 |
||
|
Amount of Realized Loss on Derivatives Recognized in Income |
||
|
|
Futures |
|
|
Interest Rate Contracts |
$460,104 |
|
|
Total |
$460,104 |
|
|
|
|
|
|
Change in Unrealized Appreciation on Derivatives Recognized in Income |
||
|
|
Futures |
|
|
Interest Rate Contracts |
$198,569 |
|
|
Total |
$198,569 |
|
159
|
|
|
GuideMarkSM Funds & GuidePathSM Funds |
|
NOTES TO FINANCIAL STATEMENTS (Continued) |
|
March 31, 2013 |
GuideMarkSM Opportunistic Fixed Income Fund
The Trust has adopted derivative instruments disclosure standards, in order to enable the investor to understand how and why an entity used derivatives, how derivatives are accounted for, and how derivative instruments affect an entity’s results of operations and financial position.
The Fund invested in derivatives in order to manage risk or gain exposure to various other investments or markets. Derivatives may contain various risks, including the potential inability of the counterparty to fulfill their obligations under the terms of the contract, the potential for an illiquid secondary market, and the potential for market movements which may expose the Fund to gains or losses.
The Fund seeks to maximize total investment returns, consisting of interest income, capital appreciation and currency gains, through exposure to investments in fixed-income securities, equity securities, and currency instruments. The Fund expects that its exposure to these asset classes will often be obtained substantially through the use of swap agreements. The Fund entered into swap agreements to manage and/or gain exposures to credit risk. The Fund entered into financial futures contracts primarily to manage interest rate risk. The Fund entered into forward exchange contracts primarily to manage and/or gain exposure to certain foreign currencies. The Fund entered into option contracts to gain investment exposures in accordance with its objective.
The Fund used currency forwards during the period for the purpose of hedging exposures within the Fund to non-dollar-denominated assets. In general, the use of currency derivative contracts for hedging may reduce the overall risk level of the Fund, albeit at a cost that may lower overall performance. In general, the use of currency derivatives for hedging purposes will not lead to leverage within the Fund.
Balance Sheet — Values of Derivative Instruments as of March 31, 2013
|
|
|
|
|
|
|
|
|
|
|
|
|
|
|
|
Asset Derivatives |
|
Liability Derivatives |
|
||||||
|
|
|
|
|||||||||
|
|
|
Balance Sheet Location |
|
Value |
|
Balance Sheet Location |
|
Value |
|
||
|
Credit Contracts — Swaps |
|
Appreciation
on Swap |
|
$ |
88,084 |
|
Depreciation
on Swap |
|
$ |
155,024 |
|
|
Foreign
Exchange Contracts — |
|
Appreciation
of forward |
|
|
5,380,715 |
|
Depreciation
of forward |
|
|
1,527,628 |
|
|
Equity Contracts — Futures* |
|
Variation
margin on |
|
|
— |
|
Variation
margin on |
|
|
41,354 |
|
|
Interest Rate Contracts — Futures* |
|
Variation
margin on |
|
|
7,494 |
|
Variation
margin on |
|
|
96,643 |
|
|
Total |
|
|
|
$ |
5,476,293 |
|
|
|
$ |
1,820,649 |
|
|
|
|||||||||||
|
* Includes cumulative appreciation/depreciation as reported in Schedule of Investments. |
|||||||||||
160
|
|
|
GuideMarkSM Funds & GuidePathSM Funds |
|
NOTES TO FINANCIAL STATEMENTS (Continued) |
|
March 31, 2013 |
|
|
|
|
|
|
|
|
|
|
|
|
|
|
|
|
|
|
|
|
|
|
|
The Effect of Derivative Instruments on the Statement of Operations for the Year Ended March 31, 2013 |
||||||||||||||||||||
|
|
|
|
|
|
|
|
|
|
|
|
|
|
|
|
|
|
|
|
|
|
|
Amount of Realized Gain or (Loss) on Derivatives Recognized in Income |
||||||||||||||||||||
|
|
|
|
Futures |
|
Forward Currency Contracts |
|
Options |
|
Purchased |
|
Swaps |
|
Total |
|
||||||
|
Interest Rate Contracts |
|
$ |
(160,014 |
) |
$ |
— |
|
$ |
— |
|
$ |
— |
|
$ |
— |
|
$ |
(160,014 |
) |
|
|
Foreign Exchange Contracts |
|
|
— |
|
|
4,235,304 |
|
|
144,323 |
|
|
(312,379 |
) |
|
— |
|
|
4,067,248 |
|
|
|
Equity Contracts |
|
|
(282,181 |
) |
|
— |
|
|
39,648 |
|
|
(106,944 |
) |
|
— |
|
|
(349,477 |
) |
|
|
Credit Contracts |
|
|
— |
|
|
— |
|
|
— |
|
|
— |
|
|
(1,712,489 |
) |
|
(1,712,489 |
) |
|
|
Total |
|
$ |
(442,195 |
) |
$ |
4,235,304 |
|
$ |
183,971 |
|
$ |
(419,323 |
) |
$ |
(1,712,489 |
) |
$ |
1,845,268 |
|
|
|
|
|
|
|
|
|
|
|
|
|
|
|
|
|
|
|
|
|
|
|
|
|
Change in Unrealized Appreciation or (Depreciation) on Derivatives Recognized in Income |
||||||||||||||||||||
|
|
|
|
Futures |
|
Forward Currency |
|
Options |
|
Purchased |
|
Swaps |
|
Total |
|
||||||
|
Interest Rate Contracts |
|
$ |
(90,028 |
) |
$ |
— |
|
$ |
— |
|
$ |
— |
|
$ |
— |
|
$ |
(90,028 |
) |
|
|
Foreign Exchange Contracts |
|
|
— |
|
|
2,397,330 |
|
|
(141,680 |
) |
|
238,218 |
|
|
— |
|
|
2,493,868 |
|
|
|
Equity Contracts |
|
|
(13,420 |
) |
|
— |
|
|
441 |
|
|
5,223 |
|
|
— |
|
|
(7,756 |
) |
|
|
Credit Contracts |
|
|
— |
|
|
— |
|
|
— |
|
|
— |
|
|
(16,597 |
) |
|
(16,597 |
) |
|
|
Total |
|
$ |
(103,448 |
) |
$ |
2,397,330 |
|
$ |
(141,239 |
) |
$ |
243,441 |
|
$ |
(16,597 |
) |
$ |
2,379,487 |
|
|
The average monthly market value of purchased and written options during the year ended March 31, 2013 were as follows:
|
|
|
|
|
|
|
|
|
|
|
|
GuideMarkSM |
|
GuideMarkSM |
|
||
|
Purchased Options |
|
$ |
— |
|
$ |
120,494 |
|
|
Written Options |
|
$ |
— |
|
$ |
22,453 |
|
|
|
|
|
|
|
|
|
|
|
The average monthly notional amount of futures, forwards, and swaps during the period ended March 31, 2013 were as follows: |
|||||||
|
|
|
|
|
|
|
|
|
|
Long Positions |
|
GuideMarkSM |
|
GuideMarkSM |
|
||
|
Futures |
|
$ |
19,711,804 |
|
$ |
112,712 |
|
|
Forwards |
|
$ |
— |
|
$ |
72,585,519 |
|
|
Swaps |
|
$ |
— |
|
$ |
32,233,635 |
|
|
|
|
|
|
|
|
|
|
|
Short Positions |
|
GuideMarkSM |
|
GuideMarkSM |
|
||
|
Futures |
|
$ |
12,238,271 |
|
$ |
10,391,596 |
|
|
Forwards |
|
$ |
— |
|
$ |
63,938,061 |
|
|
|
|
|
|
|
|
|
|
|
Cross |
|
GuideMarkSM |
|
GuideMarkSM |
|
||
|
Forwards |
|
$ |
— |
|
$ |
28,704,287 |
|
|
|
|
|
|
|
|
|
|
|
Derivative Risks |
|||||||
|
|
|
|
|
|
|
|
|
|
The risks of using the various types of derivatives in which the Funds may engage include: the risk that movements in the value of the derivative may not fully offset or complement instruments currently held in the Fund in the manner intended by the Advisor or sub-advisor; the risk that the counterparty to a derivative contract may fail to comply with its obligations to the Fund; the risk that there may not be a liquid secondary |
|||||||
161
|
|
|
GuideMarkSM Funds & GuidePathSM Funds |
|
NOTES TO FINANCIAL STATEMENTS (Continued) |
|
March 31, 2013 |
market for the derivative at a time when the Fund would look to disengage the position; the risk that additional capital from the Fund may be called upon to fulfill the conditions of the derivative contract; the risk that the use of derivatives in the Fund may induce leverage in the Fund, and the risk that the cost of the derivative contracts may reduce the overall returns experienced by the Fund.
|
|
|
|
|
|
(b) |
Subsequent Events Evaluation. |
|
|
|
In preparing these financial statements, the Funds have evaluated events and transactions for potential recognition or disclosure resulting from subsequent events. This evaluation did not result in any subsequent events that necessitated disclosures and/or adjustments other than the below. |
|
|
|
|
|
|
|
Genworth Holdings, Inc. (formerly named Genworth Financial, Inc.) (“Genworth”), the parent company of: (i) Genworth Financial Wealth Management, Inc. (“GFWM”), the investment advisor of each Fund; and (ii) Altegris Advisors, LLC (“Altegris”), sub-advisor of the GuidePathSM Altegris® Multi-Strategy Alternative Allocation Fund, has agreed to enter into a transaction (the “Transaction”) whereby private equity funds managed by Aquiline Capital Partners LLC and Genstar Capital, LLC and certain other investors (together the “Buyer”) would acquire GFWM and Altegris. The closing of the Transaction is expected to occur in the second half of 2013 (the “Closing”), provided all of the conditions to the Closing are met. Upon the Closing, GFWM and Altegris will be indirect wholly owned subsidiaries of the Buyer. |
|
|
|
|
|
|
|
In order to provide cost and operational efficiencies moving forward, shareholders of GPS Funds I and GPS Funds II are being asked to approve a new slate of Trustees so that the Board of each of GPS Funds I and GPS Funds II will consist of the same individuals. |
|
|
|
|
|
|
|
The Portfolios are subject to claims and suits that arise from time to time in the ordinary course of business (for example, in The Tribune Company Bankruptcy, certain creditors have filed actions against all shareholders of The Tribune Company, which included the GuideMarkSM Large Cap Value Fund, who tendered shares when the Tribune |
|
|
|
|
|
|
|
Company went private in 2007 in a leveraged buy-out transaction, seeking the return of proceeds received by the shareholders). Although management currently believes that resolving claims against us, individually or in aggregate, will not have a material adverse impact on our financial position, our results of operations, or our cash flows, these matters are subject to inherent uncertainties and management’s view of these matters may change in the future. |
|
|
|
|
|
|
(c) |
Repurchase Agreements |
|
|
|
Each Fund may enter into repurchase agreements with banks and securities dealers. These transactions involve the purchase of securities with a simultaneous commitment to sell the securities to the bank or the dealer at an agreed-upon date and price. A repurchase agreement is accounted for as an investment by the Fund, collateralized by securities, which are delivered to the Fund’s Custodian or to an agent bank under a tri-party agreement. The securities are marked-to-market daily and additional securities are acquired as needed, to ensure that their value equals or exceeds the repurchase price plus accrued interest. |
|
|
|
|
|
|
(d) |
Federal Income Taxes |
|
|
|
The Funds intend to continue to comply with the requirements of sub-chapter M of the Internal Revenue Code necessary to qualify as regulated investment companies and to make the requisite distributions of income and capital gains to their shareholders sufficient to relieve the Funds from all or substantially all Federal income taxes. Therefore, no Federal income tax provision is required. |
|
|
|
|
|
|
|
The Funds have adopted financial reporting rules regarding recognition and measurement of tax positions taken or expected to be taken on a tax return. The Funds have reviewed all open tax years and major jurisdictions and concluded that no provision for income tax would be required in the Funds’ financial statements. The Funds’ Federal and state income and Federal excise tax returns for tax years for which the applicable statutes of limitations have not expired are subject to examination by the Internal Revenue Service and state departments of revenue. |
162
|
|
|
GuideMarkSM Funds & GuidePathSM Funds |
|
NOTES TO FINANCIAL STATEMENTS (Continued) |
|
March 31, 2013 |
|
|
|
|
|
|
(e) |
Use of Estimates |
|
|
|
The preparation of financial statements in conformity with GAAP requires management to make estimates and assumptions that affect the reported amounts of assets and liabilities and disclosure of contingent assets and liabilities at the date of the financial statements and the reported amounts of revenues and expenses during the reported period. Actual results could differ from those estimates. |
|
|
|
|
|
|
(f) |
Indemnifications |
|
|
|
Under each Trust’s organizational documents, its officers and trustees are indemnified against certain liability arising out of their performance of their duties to the Funds. In addition, in the normal course of business, the Funds enter into contracts that contain a variety of representations and warranties that provide general indemnifications. The Funds’ maximum exposure under these arrangements are unknown as this would involve future claims that may be made against the Funds that have not yet occurred. However, the Funds expect the risk of loss to be remote. |
|
|
|
|
|
|
(g) |
Expenses |
|
|
|
Many expenses of the Funds can be directly attributed to a specific Fund. Additionally, some expenses can be directly attributed to a specific Trust, in which case the expense is apportioned among the Funds within that Trust based on relative net assets. Expenses that cannot be directly attributed to a specific Fund or Trust are apportioned among all the Funds based on relative net assets. |
|
|
|
|
|
|
(h) |
Organization and Offering Costs |
|
|
|
Organization costs consist of costs incurred to establish a Trust and enable it legally to do business. The Fund expenses organizational costs as incurred. These expenses were advanced by the Advisor, and the Advisor has agreed to reimburse the Funds for these expenses, subject to potential recovery (see Note 3). Offering costs are accounted for as deferred costs until operations begin. Offering costs include legal fees regarding the preparation of the initial registration statement. Offering costs are then amortized to expense over twelve months on a straight-line basis. |
|
|
|
|
|
|
(i) |
Security Transactions and Income Recognition |
|
|
|
Security transactions are accounted for on trade date. Dividend income is recognized on the ex-dividend date, and the interest income recorded using the effective yield method is accrued daily. Realized gains and losses on investment transactions are determined using the high cost method. Return of capital distributions received from REIT securities are recorded as an adjustment to the cost of the security and thus may impact unrealized or realized gains or losses on the security. Gains and losses from paydowns on mortgage and asset backed securities are recorded as adjustments to interest income. |
|
|
|
|
|
|
(j) |
Distributions to shareholders |
|
|
|
The Funds, with the exception of the Core Fixed Income Fund, Tax-Exempt Fixed Income Fund, and Opportunistic Fixed Income Fund, will distribute any net investment income at least annually. The Core Fixed Income Fund, Tax-Exempt Fixed Income Fund, and Opportunistic Fixed Income Fund will distribute any net investment income quarterly. All of the Funds will distribute any net realized long or short-term capital gains at least annually. Distributions to shareholders are recorded on the ex-dividend date. The Funds may also pay a special distribution at the end of the calendar year to comply with Federal tax requirements. |
|
|
|
|
|
|
(k) |
Derivatives |
|
|
|
Each Fund may invest in derivative securities including call and put options, futures, forward currency contracts and swaps. These instruments may be used by a Fund for hedging purposes as well as direct investment. |
|
|
|
|
|
|
|
Forward Currency Contracts |
|
|
|
The Funds may enter into forward currency contracts, obligating the Funds to deliver and receive currency at a specified future date. Transactions involving forward currency contracts may serve as long hedges (for example, if a Fund seeks to buy a security denominated in a foreign security, it may purchase a forward currency contract to lock in the U.S. dollar price of the security) or as short hedges (if a Fund |
163
|
|
|
GuideMarkSM Funds & GuidePathSM Funds |
|
NOTES TO FINANCIAL STATEMENTS (Continued) |
|
March 31, 2013 |
|
|
|
|
|
|
|
anticipates selling a security denominated in a foreign currency, it may sell a forward currency contract to lock in the U.S. dollar equivalent of the anticipated sales proceeds). Forward contracts are valued daily and unrealized appreciation or depreciation is recorded daily as the difference between the contract exchange rate and the closing forward rate applied to the face amount of the contract. |
|
|
|
|
|
|
|
Options |
|
|
|
Exchange-traded options are valued at the last reported sale price on the exchange on which the security underlying the option is principally traded. If no sales are reported on a particular day for exchange traded options, or the options are not exchange traded, the options are valued at the mean between the most recent quoted bid and asked quotations at the close of the exchange. |
|
|
|
|
|
|
|
The premium that a Fund pays when purchasing a call option or receives when writing a call option will reflect, among other things, the market price of the security, the relationship of the exercise price to the market price of the security, the relationship of the exercise price to the volatility of the security, the length of the option period and supply and demand factors. The premium is the value of an option at the date of purchase. |
|
|
|
|
|
|
|
A purchaser (holder) of a put option pays a non-refundable premium to the seller (writer) of a put option to obtain the right to sell a specified amount of a security at a fixed price (the exercise price) during a specified period (exercise period). Conversely, the seller (writer) of a put option, upon payment by the holder of the premium, has the obligation to buy the security from the holder of the put option at the exercise price during the exercise period. |
|
|
|
|
|
|
|
Futures |
|
|
|
Each Fund has the ability to buy and sell stock index futures contracts traded on domestic stock exchanges to hedge the value of its portfolio against changes in market conditions. A stock index futures contract is an agreement between two parties to take or make delivery of an amount of cash equal to a specified |
|
|
|
|
|
|
|
dollar amount, times the difference between stock index value at the close of the last trading day of the contract and the price at which the futures contract is originally struck. A stock index futures contract does not involve the physical delivery of the underlying stocks in the index. Although stock index futures contracts call for the actual taking of delivery of cash, in most cases a Fund expects to liquidate its stock index futures positions through offsetting transactions, which may result in a gain or loss, before cash settlement is required. |
|
|
|
|
|
|
|
The Core Fixed Income Fund and each of the GPS Funds II portfolios may purchase or sell other types of futures contracts, including those based on particular interest rates, securities, foreign currencies, securities indices and other financial instruments and indices. The Core Fixed Income Fund and each of the GPS Funds II portfolios may also purchase and write call and put options on such future contracts, in order to seek to increase total return or to hedge against changes in interest rates, securities prices, or currency exchange rates, or, to the extent permitted by its investment policies, to otherwise manage its portfolio of investments. |
|
|
|
|
|
|
|
Futures contracts are valued at the daily quoted settlement prices. |
|
|
|
|
|
|
|
Swaps |
|
|
|
The Core Fixed Income Fund and each of the GPS Funds II portfolios may enter into interest rate, mortgage, credit, currency and total return swaps, interest rate caps, floors and collars. The Core Fixed Income Fund and each of the GPS Funds II portfolios may also purchase and write (sell) options contracts on swaps, referred to as “swaptions”. The Funds may enter into swap transactions for hedging purposes or to seek to increase total return. Since interest rate, mortgage, credit and currency swaps and interest rate caps, floors and collars are individually negotiated, the Funds expect to achieve an acceptable degree of correlation between their portfolio investments and their swap, cap, floor and collar positions. |
164
|
GuideMarkSM Funds & GuidePathSM Funds |
|
NOTES TO FINANCIAL STATEMENTS (Continued) |
|
March 31, 2013 |
|
|
|
|
|
|
|
Swap agreements are valued daily and unrealized appreciation or depreciation is recorded daily as the difference between the prior day and current day closing price. |
|
|
|
|
|
|
(l) |
Securities Purchased or Sold on a Forward-Commitment Basis |
|
|
|
The Funds may enter into when-issued or other purchase or sale transactions that specify forward delivery of a financial security. In connection with this ability, the Funds may enter into mortgage “dollar rolls” in which a Fund sells securities in the current month for delivery and simultaneously contracts with the same counterparty to repurchase similar (same type, coupon and maturity) but not identical securities on a specified future date. The party that is obligated to buy a security in the future will retain the use of their funds, and will benefit from any interest that is earned on those funds from the day that they enter into the forward contract until the day that they take delivery and pay for the security. |
|
|
|
|
|
|
(m) |
Foreign Currency Translation |
|
|
|
The accounting records of the Funds are maintained in U.S. dollars. Investment securities and all other assets and liabilities of the Funds denominated in a foreign currency are translated into U.S. dollars at current exchange rates. Purchases and sales of securities, income receipts, and expense payments are translated into U.S. dollars at the exchange rate in effect on the dates of the respected transactions. The Funds do not isolate the portion of the fluctuations on investments resulting from changes in foreign currency exchange rates from the fluctuations in market prices of investments held. Such fluctuations are included with the net realized and unrealized gain or loss from investments. |
|
|
|
|
|
|
(n) |
Restricted and Illiquid Securities |
|
|
|
Each Fund may invest up to 15% of its net assets in securities that are illiquid at the time of purchase, which includes securities with legal or contractual restrictions on their disposition, and securities for which there are no readily available market quotations. The Advisor, with the assistance of the |
|
|
|
|
|
|
|
sub-advisors and/or pricing services, will determine the value of such securities in good faith pursuant to procedures adopted by the applicable Board of Trustees. Illiquid securities present the risks that a Fund may have difficulty valuing these holdings and/or may be unable to sell these holdings at the time or price desired. There are no restrictions on each Fund’s ability to invest in restricted securities (that is, securities that are not registered pursuant to the Securities Act of 1933), except to the extent such securities may be considered illiquid. Securities issued pursuant to Rule 144A of the Securities Act of 1933 will be considered liquid if determined to be so under procedures adopted by the Board of Trustees. |
|
|
|
|
|
|
(o) |
Auction Rate Securities |
|
|
|
The Core Fixed Income Fund, Tax-Exempt Fixed Income Fund, and each of the GPS Funds II portfolios each may invest in auction rate municipal securities. Auction rate securities usually permit the holder to sell the securities in an auction at par value at specified intervals. The dividend is reset by “Dutch” auction in which bids are made by broker-dealers and other institutions for a certain amount of securities at a specified minimum yield. The dividend rate set by the auction is the lowest interest or dividend rate that covers all securities offered for sale. While this process is designed to permit auction rate securities to be traded at par value, there is a risk that an auction will fail due to insufficient demand for the securities. |
|
|
|
|
|
|
(p) |
Short Sales |
|
|
|
Although not currently part of any Fund’s principal investment strategies, each Fund has the ability to make short sales. Short sales are transactions where a Fund sells securities it does not own in anticipation of a decline in the value of the securities. |
|
|
|
|
|
|
(q) |
Trustee Compensation |
|
|
|
Each Trust has its own Board of Trustees. For the services performed as Trustees of GPS Funds I, the Independent Trustees receive a retainer fee of $45,000 per year and $4,500 per in person meeting attended, as well as reimbursement for expenses incurred in |
165
|
|
|
GuideMarkSM Funds & GuidePathSM Funds |
|
NOTES TO FINANCIAL STATEMENTS (Continued) |
|
March 31, 2013 |
|
|
|
|
|
|
|
connection with attendance at such meetings. The Lead Independent Trustee receives an additional retainer fee of $10,000 per year. The Audit Committee Chair receives an additional retainer fee of $5,000 per year. Telephonic meeting fees are determined according to the length of the meeting as follows: $2,000 for one to two hours, $3,000 for two to three hours and $4,000 for three hours or longer. For the services performed as Trustees of GPS Funds II the Independent Trustees receive a retainer fee of $55,000 per year, $2,500 per quarterly meeting attended in person, $3,000 per special meeting attended in person, and $1,000 per special meeting attended telephonically, as well as reimbursement for expenses incurred in connection with attendance at such meetings. The fees are allocated proportionally to each Fund within the Trust based on total assets under management. |
|
|
|
|
|
|
The “interested persons” who serve as Trustees of the Trusts receive no compensation from the Trusts for their services as Trustees. The Funds reimburse the Advisor an allocated amount for the compensation and related expenses of certain officers of the Trusts who provide compliance services to the Funds. The aggregate amount of all such reimbursements is determined by the Trustees. No other compensation or retirement benefits are received by any Trustee or officer from the Funds. |
|
|
|
|
|
|
3. |
Investment Advisor |
|
|
|
|
|
|
|
Each Trust has entered into an Investment Advisory Agreement (collectively, the “Agreement”) with Genworth Financial Wealth Management, Inc. (the “Advisor” or “GFWM”), with whom certain officers and trustees of the Trust are affiliated, to furnish investment advisory services to the Fund. Under the terms of the Agreement, the Funds compensate the Advisor for its management services at the following contractual rates, based on each Fund’s average daily net assets: |
|
|
|
|
|
|
|
|
Large Cap Growth Fund |
|
0.70% |
|
|
Large Cap Value Fund |
|
0.70% |
|
|
Small/Mid Cap Core Fund |
|
0.75% |
|
|
World ex-US Fund |
|
0.70% |
|
|
Opportunistic Equity Fund |
|
0.80% |
|
|
Global Real Return Fund |
|
0.65% |
|
|
|
|
|
|
|
Core Fixed Income Fund |
|
0.50% |
|
|
Tax-Exempt Fixed Income Fund |
|
0.50% |
|
|
Opportunistic Fixed Income Fund |
|
0.70% |
|
|
Strategic Asset Allocation Fund |
|
0.25% |
|
|
Tactical ConstrainedSM Asset Allocation Fund |
|
0.25% |
|
|
Tactical UnconstrainedSM Asset Allocation Fund |
|
0.35% |
|
|
Absolute Return Asset Allocation Fund |
|
0.35% |
|
|
Multi-Asset Income Asset Allocation Fund |
|
0.35% |
|
|
Fixed Income Allocation Fund |
|
0.25% |
|
|
Altegris® Multi-Strategy
Alternative |
|
0.15% |
|
|
|
|
|
GFWM also provides certain administrative services to the Service Shares of the Funds, pursuant to Administrative Services Agreements between the Funds and GFWM, for which GFWM receives a fee of 0.25% of the average daily net assets of the Service Shares of the Funds. Effective October 26, 2012, GFWM is voluntarily waiving the Investment Advisory Fee and Administrative Services fee in the GuidePath® Altegris Multi-Strategy Alternative Allocation Fund. The administrative services may include development and maintenance of a web-based software platform for both investment advisers and shareholders; creation of a customized full-color client quarterly performance review for each individual client; facilitating the initiation and setup of new account and related asset transfers; reviewing and following up on custodial paperwork; attending to shareholder correspondence, requests and inquiries, and other communications with shareholders and their representatives; assisting with the processing of purchases and redemptions of shares; and monitoring and overseeing non-advisory relationships with entities providing services to the Service Shares; including the transfer agent and custodian. |
|
|
|
|
|
In addition, GPS Funds I and the Advisor have also entered into a Fee Waiver Agreement designed to provide Fund shareholders with the economic benefits of economies of scale that may be realized as Fund assets increase. Under the Fee Waiver Agreement, the Advisor has contractually agreed to waive 0.025% of each Fund’s annual advisory fee on assets in excess of $6 billion, and an additional 0.025% of each Fund’s annual advisory fee on assets in excess of $12 billion. |
166
|
|
|
GuideMarkSM Funds & GuidePathSM Funds |
|
NOTES TO FINANCIAL STATEMENTS (Continued) |
|
March 31, 2013 |
|
|
|
|
|
Each Fund and the Advisor have also entered into an Expense Waiver and Reimbursement Agreement under which the Advisor has agreed to waive, through July 31, 2013, its management fee and/or reimburse each Fund’s other expenses to the extent necessary to ensure that the Fund’s net annual operating expenses (excluding Distribution (12b-1) Fees, Administrative Service Fees, taxes, interest, trading costs, acquired fund expenses, expenses paid with securities lending expense offset credits and non-routine expenses) do not exceed the following rates, based on each Fund’s average daily net assets: |
|
|
|
|
|
|
|
Large Cap Growth Fund |
|
0.99% |
|
|
Large Cap Value Fund |
|
0.99% |
|
|
Small/Mid Cap Core Fund |
|
1.09% |
|
|
|
|
|
|
|
World ex-US Fund |
|
1.09% |
|
|
Opportunistic Equity Fund |
|
1.10% |
|
|
Global Real Return Fund |
|
1.05% |
|
|
Core Fixed Income Fund |
|
0.79% |
|
|
Tax-Exempt Fixed Income Fund |
|
0.79% |
|
|
Opportunistic Fixed Income Fund |
|
1.05% |
|
|
Strategic Asset Allocation Fund |
|
0.50% |
|
|
Tactical ConstrainedSM Asset Allocation Fund |
|
0.50% |
|
|
Tactical UnconstrainedSM Asset Allocation Fund |
|
0.60% |
|
|
Absolute Return Asset Allocation Fund |
|
0.60% |
|
|
Multi-Asset Income Asset Allocation Fund |
|
0.60% |
|
|
Fixed Income Allocation Fund |
|
0.55% |
|
|
Altegris® Multi-Strategy
Alternative |
|
0.50% |
|
|
|
|
|
Any such waiver or reimbursement is subject to later adjustment to allow the Advisor to recoup amounts waived or reimbursed to the extent actual fees and expenses for a fiscal period are less than each Fund’s expense limitation cap, provided, however, that the Advisor shall only be entitled to recoup such amounts for a period of three years after the end of the fiscal year in which the fee or expense was waived or reimbursed. As of March 31, 2013, Large Cap Value Fund, Global Real Return Fund, Fixed Income Allocation Fund and Altegris® Multi-Strategy Alternative Allocation Fund have recouped all potential recoverable waivers or reimbursed expenses. |
|
|
|
|
|
The Advisor is currently waiving fees and, in some cases, reimbursing expenses in the Funds listed below in order to keep these Funds at their expense cap. Waived expenses subject to potential recovery are as follows: |
|
|
|
|
|
|
|
|
|
|
|
|
|
|
Year of |
|
Year of |
|
Year of |
|
|
|
|
|
|
|
|
|||
|
|
Large Cap Growth |
|
— |
|
27,516 |
|
18,182 |
|
|
|
Small/Mid Cap Core Fund |
|
21,243 |
|
46,007 |
|
15,486 |
|
|
|
World ex-US Fund |
|
— |
|
142,535 |
|
142,200 |
|
|
|
Opportunistic Equity Fund |
|
— |
|
1,804 |
|
18,376 |
|
|
|
Core Fixed Income Fund |
|
— |
|
— |
|
24,268 |
|
|
|
Tax-Exempt Fixed Income Fund |
|
21,611 |
|
26,492 |
|
53,717 |
|
|
|
Opportunistic Fixed Income Fund |
|
— |
|
199,792 |
|
100,926 |
|
|
|
Strategic Asset Allocation Fund |
|
28,403 |
|
109,544 |
|
26,716 |
|
|
|
Tactical ConstrainedSM Asset Allocation Fund |
|
20,506 |
|
129,239 |
|
33,542 |
|
|
|
Tactical UnconstrainedSM Asset Allocation Fund |
|
4,119 |
|
116,347 |
|
49,063 |
|
|
|
Absolute Return Asset Allocation Fund |
|
— |
|
141,125 |
|
37,054 |
|
|
|
Multi-Asset Income Asset Allocation Fund |
|
— |
|
— |
|
20,380 |
|
|
|
|
|
|
Sub-advisory services are provided to certain of the Funds, pursuant to agreements between the Advisor and various sub-advisors. Under the terms of these sub-advisory agreements, the Advisor compensates each sub-advisor based on the portion of each Fund’s average daily net assets that is allocated to the sub-advisor. |
167
|
|
|
GuideMarkSM Funds & GuidePathSM Funds |
|
NOTES TO FINANCIAL STATEMENTS (Continued) |
|
March 31, 2013 |
|
|
|
|
4. |
Distribution Plan |
|
|
|
|
|
Each Trust, on behalf of the Service Shares class of its Funds, has adopted a distribution plan pursuant to Rule 12b-1 under the 1940 Act (the “12b-1 Plan”), which provides for each Fund to pay distribution fees at an annual rate of 0.25% of the average daily net assets of the Funds. Payments under the 12b-1 Plan shall be used to compensate persons (including affiliates of the Trust) who provide support services in connection with the distribution of the Funds’ Service Shares class and servicing of the Funds’ Service Shares class shareholders. For example, these amounts are paid to financial intermediaries that perform back office shareholder servicing and recordkeeping services that facilitate the operation of the Genworth Financial Wealth Management Program through which the Funds are primarily distributed. The Advisor (and its affiliates) similarly receive portions of such payments for their services provided to facilitate the operation of the program. These financial intermediaries and affiliates of the Trust also receive payments from the Trust outside of the 12b-1 Plan for shareholder services that are unrelated to distribution services. Capital Brokerage Corp., an affiliate of the Advisor, serves as principal underwriter and distributor for the Funds. |
|
|
|
|
5. |
Service and Custody Agreements |
|
|
|
|
|
The Funds have entered into Service Agreements with U.S. Bancorp Fund Services, LLC (“USBFS”) and a Custody Agreement with U.S. Bank, N.A., an affiliate of USBFS. Under these agreements, USBFS and U.S. Bank, N.A. provide certain transfer agency, administrative, accounting and custody services. |
|
|
|
|
|
Additionally, the Opportunistic Fixed Income Fund has entered into a Custody Agreement with the Bank of New York Mellon for certain custody services. |
|
|
|
|
6. |
Securities Lending |
|
|
|
|
|
The Trusts, on behalf of certain of the Funds, entered into securities lending arrangements with U.S. Bank, N.A. (the “Custodian”). Under the term of the agreement, the Custodian is authorized to loan securities on behalf of the Funds to approved brokers. In exchange, under normal market conditions, the Funds receive cash collateral in the amount of at least 102% of the value of securities loaned. The cash collateral is invested in short term instruments as noted in the Schedule of Investments. Although risk is mitigated by the collateral, the Funds could experience a delay in recovering their securities and possible loss of income or value if the borrower fails to return the borrowed securities. In addition, the Funds bear the risk of loss associated with the investment of cash collateral received. After predetermined rebates to brokers, a percentage of the net securities lending revenue is credited to the Funds to be used as an offset against custody costs and other charges incurred by the Funds. The Custodian is paid a fee for administering a securities lending program for the Funds, equal to the remaining percentage of the net securities lending revenues generated under the agreement. |
|
|
|
|
|
As of March 31, 2013, the Funds (excluding the Tax-Exempt Fixed Income Fund, Opportunistic Fixed Income Fund and Altegris Multi-Strategy Alternative Allocation Fund) had loaned securities that were collateralized by cash. The cash collateral received was invested in securities as listed in each Fund’s Schedule of Investments. Income earned from these investments is allocated to each Fund based on each Fund’s portion of total cash collateral received. Securities lending income is disclosed in each Fund’s Statement of Operations as a securities lending offset. |
168
|
|
|
GuideMarkSM Funds & GuidePathSM Funds |
|
NOTES TO FINANCIAL STATEMENTS (Continued) |
|
March 31, 2013 |
|
|
|
As of March 31, 2013, the values of securities loaned and collateral received were as follows: |
|
|
|
|
|
|
|
|
|
|
|
|
|
|
|
|
|
|
|
|
|
|
|
|
Value of |
|
Payable for |
|
Collateral |
|
Cost of |
|
Unrealized |
|
Value |
|
||||||
|
|
|
|
|
|
|
|
|
||||||||||||
|
Large Cap |
|
$ |
5,513,907 |
|
$ |
6,000,926 |
|
$ |
4,786 |
|
$ |
6,002,896 |
|
$ |
(16,900 |
) |
$ |
5,985,996 |
|
|
Large Cap |
|
|
7,234,414 |
|
|
7,421,930 |
|
|
4,016 |
|
|
7,422,729 |
|
|
(19,337 |
) |
|
7,403,392 |
|
|
Small/Mid Cap |
|
|
7,965,827 |
|
|
8,242,073 |
|
|
(15,207 |
) |
|
8,225,987 |
|
|
(5,260 |
) |
|
8,220,727 |
|
|
World ex-US Fund |
|
|
275,830 |
|
|
297,792 |
|
|
5,588 |
|
|
302,615 |
|
|
(4,607 |
) |
|
298,008 |
|
|
Opportunistic |
|
|
5,101,789 |
|
|
5,228,051 |
|
|
— |
|
|
5,228,051 |
|
|
— |
|
|
5,228,051 |
|
|
Global Real |
|
|
30,817,207 |
|
|
31,804,600 |
|
|
— |
|
|
31,804,600 |
|
|
— |
|
|
31,804,600 |
|
|
Core Fixed |
|
|
1,530,699 |
|
|
1,569,991 |
|
|
817 |
|
|
1,570,132 |
|
|
(4,064 |
) |
|
1,566,068 |
|
|
Strategic Asset |
|
|
20,668,407 |
|
|
21,329,599 |
|
|
— |
|
|
21,329,599 |
|
|
— |
|
|
21,329,599 |
|
|
Tactical ConstrainedSM |
|
|
14,936,110 |
|
|
15,311,873 |
|
|
— |
|
|
15,311,873 |
|
|
— |
|
|
15,311,873 |
|
|
Tactical UnconstrainedSM |
|
|
24,185,761 |
|
|
24,743,125 |
|
|
— |
|
|
24,743,125 |
|
|
— |
|
|
24,743,125 |
|
|
Absolute Return Asset |
|
|
20,691,438 |
|
|
21,172,507 |
|
|
— |
|
|
21,172,507 |
|
|
— |
|
|
21,172,507 |
|
|
Multi-Asset Income |
|
|
12,924,266 |
|
|
13,230,715 |
|
|
— |
|
|
13,230,715 |
|
|
— |
|
|
13,230,715 |
|
|
Fixed Income |
|
|
21,080,267 |
|
|
21,608,881 |
|
|
— |
|
|
21,608,881 |
|
|
— |
|
|
21,608,881 |
|
|
|
|
|
|||||||||||||||||
|
|
|
$ |
172,925,922 |
|
$ |
177,962,063 |
|
$ |
— |
|
$ |
177,953,710 |
|
$ |
(50,168 |
) |
$ |
177,903,542 |
|
|
|
|
|
|||||||||||||||||
169
|
|
|
GuideMarkSM Funds & GuidePathSM Funds |
|
NOTES TO FINANCIAL STATEMENTS (Continued) |
|
March 31, 2013 |
|
|
|
|
7. |
Investment Transactions |
|
|
|
|
|
The aggregate purchases and sales of securities, excluding short-term investments, for the period ended March 31, 2013 are summarized below. |
|
|
|
|
|
|
|
|
|
|
|
|
Purchases |
|
Sales |
|
||
|
|
|
|
|
||||
|
Large Cap Growth Fund |
|
$ |
107,636,961 |
|
$ |
131,998,858 |
|
|
Large Cap Value Fund |
|
|
50,525,895 |
|
|
71,758,721 |
|
|
Small/Mid Cap Core |
|
|
111,547,546 |
|
|
115,875,765 |
|
|
World ex-US Fund |
|
|
224,114,787 |
|
|
192,704,011 |
|
|
Opportunistic Equity |
|
|
110,900,837 |
|
|
127,237,625 |
|
|
Global Real Return Fund |
|
|
35,375,861 |
|
|
66,712,009 |
|
|
Core Fixed Income |
|
|
935,148,941 |
|
|
1,000,464,022 |
|
|
Tax-Exempt Fixed |
|
|
24,122,218 |
|
|
32,607,527 |
|
|
Opportunistic Fixed |
|
|
225,398,031 |
|
|
228,850,921 |
|
|
Strategic Asset |
|
|
116,018,072 |
|
|
35,078,344 |
|
|
Tactical ConstrainedSM |
|
|
190,904,960 |
|
|
122,414,200 |
|
|
Tactical UnconstrainedSM |
|
|
575,069,984 |
|
|
474,001,028 |
|
|
Absolute Return Asset |
|
|
513,698,453 |
|
|
251,296,061 |
|
|
Multi-Asset Income |
|
|
80,362,900 |
|
|
12,073,168 |
|
|
Fixed Income |
|
|
264,732,452 |
|
|
39,663,193 |
|
|
Altegris® Multi-Strategy |
|
|
181,693,619 |
|
|
23,758,971 |
|
|
|
|
|
* |
Included in these amounts were $214,720,835 of purchases and $257,224,611 of sales of U.S. Government Securities. |
|
|
|
|
8. |
Option Contracts Written |
|
|
|
|
|
The premium amount and number of option contracts written during the period ended March 31, 2013 in the Opportunistic Fixed Income Fund, were as follows: |
|
|
|
|
|
|
|
|
|
|
|
|
|
|
|
Amount of |
|
Number of |
|
Notional |
|
|||
|
|
|
|
|
|
||||||
|
Outstanding at 3/31/12 |
|
$ |
218,467 |
|
|
1,600 |
|
$ |
5,600,000 |
|
|
Options written |
|
|
25,275 |
|
|
484 |
|
|
— |
|
|
Options expired |
|
|
— |
|
|
— |
|
|
— |
|
|
Options exercised |
|
|
— |
|
|
— |
|
|
— |
|
|
Options closed |
|
|
(243,742 |
) |
|
(2,084 |
) |
|
(5,600,000 |
) |
|
|
|
|
|
|
||||||
|
Outstanding at 3/31/13 |
|
|
— |
|
|
— |
|
|
— |
|
|
|
|
|
|
|
||||||
|
|
|
|
9. |
New Accounting Pronouncements |
|
|
|
|
|
In December 2011, FASB issued ASU No. 2011-11 related to disclosures about offsetting assets and liabilities. The amendments in this ASU require an entity to disclose information about offsetting and related arrangements to enable users of its financial statements to understand the effect of those arrangements of its financial position. The ASU is effective for annual reporting periods beginning on or after January 1, 2013, and interim periods within those annual periods. The guidance requires retrospective applications for all comparative periods presented. Management is currently evaluating the impact ASU 2011-11 will have on the financial statements disclosures. |
|
|
|
|
10. |
Other Tax Information |
|
|
|
|
|
Net Investment Income and realized gains and losses for Federal income tax purposes may differ from that reported on the financial statements because of permanent book-to-tax differences. GAAP requires that permanent differences between financial reporting and tax reporting be reclassified between various components of net assets. |
170
|
|
|
GuideMarkSM Funds & GuidePathSM Funds |
|
NOTES TO FINANCIAL STATEMENTS (Continued) |
|
March 31, 2013 |
|
|
|
|
|
These differences are primarily due to foreign currency, Passive Foreign Investment Companies, Partnerships and paydown reclassifications. On the Statement of Assets and Liabilities, the following adjustments were made: |
|
|
|
|
|
|
|
|
|
|
|
|
|
|
|
Accumulated |
|
Accumulated
|
|
Capital
|
|
|||
|
|
|
|
|
|
||||||
|
Large Cap Growth Fund |
|
$ |
— |
|
$ |
— |
|
$ |
— |
|
|
Large Cap Value Fund |
|
|
— |
|
|
— |
|
|
— |
|
|
Small/Mid Cap Core Fund |
|
|
166,742 |
|
|
(166,210 |
) |
|
(532 |
) |
|
World ex-US Fund |
|
|
(55,881 |
) |
|
55,881 |
|
|
— |
|
|
Opportunistic Equity Fund |
|
|
— |
|
|
— |
|
|
— |
|
|
Global Real Return Fund |
|
|
38,765 |
|
|
— |
|
|
(38,765 |
) |
|
Core Fixed Income Fund |
|
|
1,407,791 |
|
|
(1,407,791 |
) |
|
— |
|
|
Tax-Exempt Fixed Income Fund |
|
|
— |
|
|
— |
|
|
— |
|
|
Opportunistic Fixed Income Fund |
|
|
304,827 |
|
|
(304,827 |
) |
|
— |
|
|
Strategic Asset Allocation Fund |
|
|
18,338 |
|
|
(18,338 |
) |
|
— |
|
|
Tactical ConstrainedSM Asset Allocation Fund |
|
|
(6,735 |
) |
|
6,735 |
|
|
— |
|
|
Tactical UnconstrainedSM Asset Allocation Fund |
|
|
7,324 |
|
|
(7,324 |
) |
|
— |
|
|
Absolute Return Asset Allocation Fund |
|
|
(22,414 |
) |
|
22,414 |
|
|
— |
|
|
Multi-Asset Income Asset Allocation Fund |
|
|
— |
|
|
— |
|
|
— |
|
|
Fixed Income Allocation Fund |
|
|
— |
|
|
— |
|
|
— |
|
|
Altegris® Multi-Strategy Alternative Allocation Fund |
|
|
— |
|
|
— |
|
|
— |
|
|
|
|
|
|
The Funds intend to utilize capital loss carryforwards to offset future realized capital gains. Indefinite carryovers must be used first, resulting in a greater likelihood that pre-enactment losses may expire. Capital loss carryforwards available for Federal income tax purposes are as follows: |
|
|
|
|
|
|
|
|
|
|
|
|
|
|
|
|
|
|
|
|
|
Capital losses expiring: |
|
|||||||||||||
|
|
|
|
||||||||||||||
|
|
|
|
|
|
|
|
|
Indefinite* |
|
|||||||
|
|
|
|
|
|
|
|
|
|
||||||||
|
|
|
3/31/17 |
|
3/31/18 |
|
3/31/19 |
|
Short Term |
|
Long Term |
|
|||||
|
|
|
|
|
|
|
|
||||||||||
|
Large Cap Growth Fund |
|
$ |
— |
|
$ |
58,944,515 |
|
$ |
— |
|
$ |
— |
|
$ |
— |
|
|
Large Cap Value Fund |
|
|
23,475,667 |
|
|
146,948,668 |
|
|
— |
|
|
— |
|
|
— |
|
|
Small/Mid Cap Core Fund |
|
|
11,195,066 |
|
|
12,866,943 |
|
|
— |
|
|
— |
|
|
— |
|
|
World ex-US Fund |
|
|
63,053,726 |
|
|
139,582,037 |
|
|
— |
|
|
2,504,250 |
|
|
5,502,519 |
|
|
Opportunistic Equity Fund |
|
|
— |
|
|
— |
|
|
— |
|
|
6,107,898 |
|
|
— |
|
|
Global Real Return Fund |
|
|
— |
|
|
— |
|
|
— |
|
|
2,414,659 |
|
|
2,876,816 |
|
|
Core Fixed Income Fund |
|
|
— |
|
|
— |
|
|
— |
|
|
— |
|
|
— |
|
|
Tax-Exempt Fixed Income Fund |
|
|
1,973,444 |
|
|
2,354,785 |
|
|
— |
|
|
— |
|
|
— |
|
|
Opportunistic Fixed Income Fund |
|
|
— |
|
|
— |
|
|
— |
|
|
— |
|
|
— |
|
|
Strategic Asset Allocation Fund |
|
|
— |
|
|
— |
|
|
— |
|
|
— |
|
|
— |
|
|
Tactical ConstrainedSM Asset Allocation Fund |
|
|
— |
|
|
— |
|
|
— |
|
|
— |
|
|
— |
|
|
Tactical UnconstrainedSM Asset Allocation Fund |
|
|
— |
|
|
— |
|
|
— |
|
|
— |
|
|
— |
|
|
Absolute Return Asset Allocation Fund |
|
|
— |
|
|
— |
|
|
— |
|
|
— |
|
|
— |
|
|
Multi-Asset Income Asset Allocation Fund |
|
|
— |
|
|
— |
|
|
— |
|
|
— |
|
|
— |
|
|
Fixed Income Allocation Fund |
|
|
— |
|
|
— |
|
|
— |
|
|
— |
|
|
— |
|
|
Altegris® Multi-Strategy Alternative |
|
|
|
|
|
|
|
|
|
|
|
|
|
|
|
|
|
Allocation Fund |
|
|
— |
|
|
— |
|
|
— |
|
|
— |
|
|
— |
|
|
|
|
|
* |
The Regulated Investment Company Modernization Act of 2010 (the “Act”) provides an unlimited carryforward period for newly generated capital losses and their character is retained as short-term or long-term losses. |
171
|
|
|
GuideMarkSM Funds & GuidePathSM Funds |
|
NOTES TO FINANCIAL STATEMENTS (Continued) |
|
March 31, 2013 |
Additionally, at March 31, 2013, the Funds deferred on a tax basis post-October losses as follows:
|
|
|
|
|
|
|
|
|
|
|
|
Ordinary Late |
|
Capital Loss |
|
||
|
|
|
|
|
||||
|
Large Cap Growth Fund |
|
$ |
— |
|
$ |
1,073,605 |
|
|
Large Cap Value Fund |
|
|
— |
|
|
— |
|
|
Small/Mid Cap Core Fund |
|
|
62,048 |
|
|
— |
|
|
World ex-US Fund |
|
|
— |
|
|
6,987,092 |
|
|
Opportunistic Equity Fund |
|
|
— |
|
|
— |
|
|
Global Real Return Fund |
|
|
258,192 |
|
|
802,868 |
|
|
Core Fixed Income Fund |
|
|
— |
|
|
— |
|
|
Tax-Exempt Fixed Income Fund |
|
|
— |
|
|
— |
|
|
Opportunistic Fixed Income Fund |
|
|
— |
|
|
— |
|
|
Strategic Asset Allocation Fund |
|
|
261,467 |
|
|
— |
|
|
Tactical ConstrainedSM Asset Allocation Fund |
|
|
— |
|
|
— |
|
|
Tactical UnconstrainedSM Asset Allocation Fund |
|
|
— |
|
|
— |
|
|
Absolute Return Asset Allocation Fund |
|
|
— |
|
|
1,027,798 |
|
|
Multi-Asset Income Asset Allocation Fund |
|
|
— |
|
|
— |
|
|
Fixed Income Allocation Fund |
|
|
— |
|
|
— |
|
|
Altegris® Multi-Strategy Alternative Allocation Fund |
|
|
— |
|
|
— |
|
|
|
|
|
|
The qualified late year ordinary loss is the excess of the sum of the specified losses attributable to the portion of the taxable year after October 31, and the ordinary losses attributable to the portion of the taxable year after December 31, over the sum of the specified gains attributable to the portion of the taxable year after October 31, and other ordinary income attributable to the portion of the taxable year after December 31. |
|
|
|
|
|
The tax components of distributions paid during the fiscal years ended March 31, 2013 and March 31, 2012 are as follows: |
|
|
|
|
|
|
|
|
|
|
|
|
|
|
|
Year Ended March 31, 2013 |
|
|||||||
|
|
|
|
||||||||
|
|
|
Ordinary |
|
Long-Term |
|
Return
of |
|
|||
|
|
|
|
|
|
||||||
|
Large Cap Growth Fund |
|
$ |
482,854 |
|
$ |
— |
|
$ |
— |
|
|
Large Cap Value Fund |
|
|
2,814,237 |
|
|
— |
|
|
— |
|
|
Small/Mid Cap Core Fund |
|
|
467,565 |
|
|
— |
|
|
— |
|
|
World ex-US Fund |
|
|
2,085,558 |
|
|
— |
|
|
— |
|
|
Opportunistic Equity Fund |
|
|
586,285 |
|
|
— |
|
|
— |
|
|
Global Real Return Fund |
|
|
826,381 |
|
|
— |
|
|
41,822 |
|
|
Core Fixed Income Fund |
|
|
9,154,978 |
|
|
2,006,092 |
|
|
— |
|
|
Tax-Exempt Fixed Income Fund* |
|
|
2,255,871 |
|
|
— |
|
|
— |
|
|
Opportunistic Fixed Income Fund |
|
|
9,847,199 |
|
|
— |
|
|
— |
|
|
Strategic Asset Allocation Fund |
|
|
1,640,736 |
|
|
— |
|
|
— |
|
|
Tactical ConstrainedSM Asset Allocation Fund |
|
|
2,351,814 |
|
|
— |
|
|
— |
|
|
Tactical UnconstrainedSM Asset Allocation Fund |
|
|
3,618,847 |
|
|
— |
|
|
— |
|
|
Absolute Return Asset Allocation Fund |
|
|
6,299,046 |
|
|
81,650 |
|
|
— |
|
|
Multi-Asset Income Asset Allocation Fund |
|
|
920,397 |
|
|
— |
|
|
— |
|
|
Fixed Income Allocation Fund |
|
|
1,764,920 |
|
|
— |
|
|
— |
|
|
Altegris® Multi-Strategy Alternative Allocation Fund |
|
|
396,152 |
|
|
— |
|
|
— |
|
|
|
||||||||||
172
|
|
|
GuideMarkSM Funds & GuidePathSM Funds |
|
NOTES TO FINANCIAL STATEMENTS (Continued) |
|
March 31, 2013 |
|
|
|
|
|
|
|
|
|
|
|
|
|
|
|
Year Ended March 31, 2012 |
|
|||||||
|
|
|
|
||||||||
|
|
|
Ordinary |
|
Long-Term |
|
Return
of |
|
|||
|
|
|
|
|
|
||||||
|
Large Cap Growth Fund |
|
$ |
— |
|
$ |
— |
|
$ |
— |
|
|
Large Cap Value Fund |
|
|
2,236,272 |
|
|
— |
|
|
— |
|
|
Small/Mid Cap Core Fund |
|
|
— |
|
|
— |
|
|
— |
|
|
World ex-US Fund |
|
|
2,815,992 |
|
|
— |
|
|
— |
|
|
Opportunistic Equity Fund |
|
|
— |
|
|
— |
|
|
— |
|
|
Global Real Return Fund |
|
|
1,072,645 |
|
|
— |
|
|
65,516 |
|
|
Core Fixed Income Fund |
|
|
7,831,235 |
|
|
— |
|
|
— |
|
|
Tax-Exempt Fixed Income Fund* |
|
|
2,990,928 |
|
|
— |
|
|
— |
|
|
Opportunistic Fixed Income Fund |
|
|
7,960,168 |
|
|
— |
|
|
— |
|
|
Strategic Asset Allocation Fund |
|
|
1,058,402 |
|
|
— |
|
|
8,769 |
|
|
Tactical ConstrainedSM Asset Allocation Fund |
|
|
920,562 |
|
|
— |
|
|
— |
|
|
Tactical UnconstrainedSM Asset Allocation Fund |
|
|
667,199 |
|
|
— |
|
|
— |
|
|
Absolute Return Asset Allocation Fund |
|
|
1,125,858 |
|
|
— |
|
|
— |
|
|
|
||||||||||
|
|
|
|
|
At March 31, 2013, the components of accumulated earnings (losses) on a tax basis were as follows: |
|
|
|
|
|
|
|
|
|
|
|
|
|
|
|
|
|
|
|
|
|
|
|
|
Large
Cap |
|
Large
Cap |
|
Small/Mid |
|
World |
|
Opportunistic |
|
Global |
|
||||||
|
|
|
|
|
|
|
|
|
||||||||||||
|
Cost of Investments |
|
|
148,282,933 |
|
|
163,791,640 |
|
|
78,273,310 |
|
|
254,022,396 |
|
|
137,111,210 |
|
|
117,153,092 |
|
|
Gross Unrealized |
|
|
41,778,829 |
|
|
47,243,576 |
|
|
16,662,447 |
|
|
39,923,843 |
|
|
25,656,735 |
|
|
4,946,974 |
|
|
Gross Unrealized |
|
|
(3,147,997 |
) |
|
(4,541,348 |
) |
|
(1,844,974 |
) |
|
(14,358,746 |
) |
|
(3,372,530 |
) |
|
(7,606,359 |
) |
|
|
|
|
|
|
|
|
|
||||||||||||
|
Net Unrealized |
|
|
38,630,832 |
|
|
42,702,228 |
|
|
14,817,473 |
|
|
25,565,097 |
|
|
22,284,205 |
|
|
(2,659,385 |
) |
|
|
|
|
|
|
|
|
|
||||||||||||
|
Undistributed |
|
|
— |
|
|
— |
|
|
— |
|
|
— |
|
|
— |
|
|
— |
|
|
Undistributed |
|
|
62,114 |
|
|
525,829 |
|
|
— |
|
|
3,464,187 |
|
|
159,773 |
|
|
— |
|
|
Undistributed |
|
|
— |
|
|
— |
|
|
— |
|
|
— |
|
|
— |
|
|
— |
|
|
|
|
|
|
|
|
|
|
||||||||||||
|
Total Distributable |
|
|
62,114 |
|
|
525,829 |
|
|
— |
|
|
3,464,187 |
|
|
159,773 |
|
|
— |
|
|
|
|
|
|
|
|
|
|
||||||||||||
|
Other Accumulated |
|
|
(60,018,120 |
) |
|
(170,424,335 |
) |
|
(24,124,057 |
) |
|
(217,641,237 |
) |
|
(6,107,898 |
) |
|
(6,387,926 |
) |
|
|
|
|
|
|
|
|
|
||||||||||||
|
Total Accumulated |
|
|
(21,325,174 |
) |
|
(127,196,278 |
) |
|
(9,306,584 |
) |
|
(188,611,953 |
) |
|
16,336,080 |
|
|
(9,047,311 |
) |
|
|
|
|
|
|
|
|
|
||||||||||||
173
|
|
|
GuideMarkSM Funds & GuidePathSM Funds |
|
NOTES TO FINANCIAL STATEMENTS (Continued) |
|
March 31, 2013 |
|
|
|
|
|
|
|
|
|
|
|
|
|
|
|
|
|
|
|
|
|
|
|
|
Core |
|
Tax-Exempt |
|
Opportunistic |
|
Strategic |
|
Tactical |
|
Tactical |
|
||||||
|
|
|
|
|
|
|
|
|
||||||||||||
|
Cost of Investments |
|
|
403,407,097 |
|
|
68,889,301 |
|
|
240,127,511 |
|
|
242,124,304 |
|
|
223,082,002 |
|
|
308,501,808 |
|
|
Gross Unrealized |
|
|
13,001,397 |
|
|
6,341,928 |
|
|
9,235,761 |
|
|
30,296,259 |
|
|
24,091,267 |
|
|
30,518,731 |
|
|
Gross Unrealized |
|
|
(1,871,737 |
) |
|
(138,694 |
) |
|
(3,899,484 |
) |
|
(2,763,910 |
) |
|
(2,697,542 |
) |
|
(3,008,811 |
) |
|
|
|
|
|
|
|
|
|
||||||||||||
|
Net Unrealized |
|
|
11,129,660 |
|
|
6,203,234 |
|
|
5,336,277 |
|
|
27,532,349 |
|
|
21,393,725 |
|
|
27,509,920 |
|
|
|
|
|
|
|
|
|
|
||||||||||||
|
Undistributed |
|
|
— |
|
|
— |
|
|
— |
|
|
— |
|
|
— |
|
|
— |
|
|
Undistributed |
|
|
244,092 |
|
|
68,147 |
|
|
1,823,259 |
|
|
403,266 |
|
|
1,046,256 |
|
|
1,721,193 |
|
|
Undistributed |
|
|
1,135,333 |
|
|
— |
|
|
321,238 |
|
|
729,058 |
|
|
317,781 |
|
|
74,379 |
|
|
|
|
|
|
|
|
|
|
||||||||||||
|
Total Distributable |
|
|
1,379,425 |
|
|
68,147 |
|
|
2,144,497 |
|
|
1,132,324 |
|
|
1,364,037 |
|
|
1,795,572 |
|
|
|
|
|
|
|
|
|
|
||||||||||||
|
Other Accumulated |
|
|
8 |
|
|
(4,328,229 |
) |
|
663,193 |
|
|
(292,420 |
) |
|
(30,953 |
) |
|
(30,953 |
) |
|
|
|
|
|
|
|
|
|
||||||||||||
|
Total Accumulated |
|
|
12,509,093 |
|
|
1,943,152 |
|
|
8,143,967 |
|
|
28,372,253 |
|
|
22,726,809 |
|
|
29,274,539 |
|
|
|
|
|
|
|
|
|
|
||||||||||||
174
|
|
|
GuideMarkSM Funds & GuidePathSM Funds |
|
NOTES TO FINANCIAL STATEMENTS (Continued) |
|
March 31, 2013 |
|
|
|
|
|
|
|
|
|
|
|
|
|
|
|
|
|
|
Absolute |
|
Multi-Asset |
|
Fixed
Income |
|
Altegris® |
|
||||
|
|
|
|
|
|
|
||||||||
|
Cost of Investments |
|
|
525,075,818 |
|
|
84,141,475 |
|
|
250,787,903 |
|
|
161,548,024 |
|
|
Gross Unrealized |
|
|
10,578,730 |
|
|
3,133,638 |
|
|
1,038,705 |
|
|
3,793,975 |
|
|
Gross Unrealized |
|
|
(3,674,576 |
) |
|
(322,803 |
) |
|
(2,671,162 |
) |
|
(3,718,198 |
) |
|
|
|
|
|
|
|
||||||||
|
Net Unrealized |
|
|
6,904,154 |
|
|
2,810,835 |
|
|
(1,632,457 |
) |
|
75,777 |
|
|
|
|
|
|
|
|
||||||||
|
Undistributed |
|
|
— |
|
|
— |
|
|
— |
|
|
— |
|
|
Undistributed |
|
|
2,010,042 |
|
|
475,390 |
|
|
754,317 |
|
|
69,808 |
|
|
Undistributed |
|
|
— |
|
|
14,012 |
|
|
396,466 |
|
|
— |
|
|
|
|
|
|
|
|
||||||||
|
Total Distributable |
|
|
2,010,042 |
|
|
489,402 |
|
|
1,150,783 |
|
|
69,808 |
|
|
|
|
|
|
|
|
||||||||
|
Other Accumulated |
|
|
(1,058,751 |
) |
|
— |
|
|
— |
|
|
— |
|
|
|
|
|
|
|
|
||||||||
|
Total Accumulated |
|
|
7,855,445 |
|
|
3,300,237 |
|
|
(481,674 |
) |
|
145,585 |
|
|
|
|
|
|
|
|
||||||||
175
|
|
|
GuideMarkSM Funds & GuidePathSM Funds |
|
REPORT OF INDEPENDENT REGISTERED PUBLIC ACCOUNTING FIRM |
|
|
The Board of Trustees and Shareholders of the GPS Funds I and GPS Funds II:
We have audited the accompanying statements of assets and liabilities of the GuideMark Large Cap Growth Fund, GuideMark Large Cap Value Fund, GuideMark Small/Mid Cap Core Fund, GuideMark World Ex-US Fund, GuideMark Opportunistic Equity Fund, GuideMark Global Real Return Fund, GuideMark Core Fixed Income Fund, GuideMark Tax-Exempt Fixed Income Fund, GuideMark Opportunistic Fixed Income Fund, GuidePath Strategic Asset Allocation Fund, GuidePath Tactical Constrained Asset Allocation Fund, GuidePath Tactical Unconstrained Asset Allocation Fund, GuidePath Absolute Return Asset Allocation Fund, GuidePath Multi-Asset Income Asset Allocation Fund, GuidePath Fixed Income Allocation Fund, and the GuidePath Altegris Multi-Strategy Alternative Allocation Fund (collectively referred to as the Funds), including the schedules of investments, as of March 31, 2013, and the related statements of operations for the year or period then ended, the statements of changes in net assets for each of the years or periods in the two-year period then ended, and the financial highlights for each of the years or periods in the five-year period then ended. These financial statements and financial highlights are the responsibility of the Funds’ management. Our responsibility is to express an opinion on these financial statements and financial highlights based on our audits.
We conducted our audits in accordance with the standards of the Public Company Accounting Oversight Board (United States). Those standards require that we plan and perform the audit to obtain reasonable assurance about whether the financial statements and financial highlights are free of material misstatement. An audit includes examining, on a test basis, evidence supporting the amounts and disclosures in the financial statements. Our procedures included confirmation of securities owned as of March 31, 2013, by correspondence with custodians and brokers. An audit also includes assessing the accounting principles used and significant estimates made by management, as well as evaluating the overall financial statement presentation. We believe that our audits provide a reasonable basis for our opinion.
In our opinion, the financial statements and financial highlights referred to above present fairly, in all material respects, the financial position of the Funds as of March 31, 2013, the results of its operations, the changes in its net assets, and the financial highlights for the periods described in the first paragraph above, in conformity with U.S. generally accepted accounting principles.
[signed] KPMG LLP
Minneapolis, Minnesota
May 30, 2013
176
|
|
|
GuideMarkSM Funds & GuidePathSM Funds |
|
ADDITIONAL INFORMATION |
|
March 31, 2013 |
|
|
|
|
Additional Information |
|
|
|
|
|
1. |
Shareholder Notification of Federal Tax Status (Unaudited) |
|
|
The Funds designated the following percentages of dividends during the fiscal year 2013 as dividends qualifying for the dividends received deduction available to corporate shareholders and as dividends from net investment income that are qualifying income under the Jobs and Growth Tax Relief Reconciliation Act of 2003, respectively: |
|
|
|
|
|
|
|
|
|
|
|
|
Dividends received |
|
% of dividends as |
|
||
|
|
|
|
|
||||
|
Large Cap Growth Fund |
|
100.00 |
% |
|
100.00 |
% |
|
|
Large Cap Value Fund |
|
100.00 |
% |
|
100.00 |
% |
|
|
Small/Mid Cap Core Fund |
|
92.12 |
% |
|
100.00 |
% |
|
|
World ex-US Fund |
|
0.14 |
% |
|
100.00 |
% |
|
|
Opportunistic Equity Fund |
|
100.00 |
% |
|
100.00 |
% |
|
|
Global Real Return Fund |
|
21.62 |
% |
|
87.64 |
% |
|
|
Core Fixed Income Fund |
|
0.16 |
% |
|
0.13 |
% |
|
|
Tax-Exempt Fixed Income Fund |
|
0.00 |
% |
|
0.00 |
% |
|
|
Opportunistic Fixed Income Fund |
|
11.11 |
% |
|
3.12 |
% |
|
|
Strategic Asset Allocation Fund |
|
100.00 |
% |
|
100.00 |
% |
|
|
Tactical ConstrainedSM Asset Allocation Fund |
|
13.04 |
% |
|
19.47 |
% |
|
|
Tactical UnconstrainedSM Asset Allocation Fund |
|
27.36 |
% |
|
42.43 |
% |
|
|
Absolute Return Asset Allocation Fund |
|
12.73 |
% |
|
12.98 |
% |
|
|
Multi-Asset Income Asset Allocation Fund |
|
13.67 |
% |
|
25.82 |
% |
|
|
Fixed Income Allocation Fund |
|
1.75 |
% |
|
1.94 |
% |
|
|
Altegris® Multi-Strategy Alternative Allocation Fund |
|
0.00 |
% |
|
6.24 |
% |
|
|
|
|
|
2. |
Foreign Tax Credit Pass Through (Unaudited) |
|
|
Pursuant to Section 853 of the Internal Revenue Code, the GuideMarkSM World ex-US Fund and GuideMarkSM Opportunistic Fixed Income Fund designate the following amounts as foreign taxes paid for the year ended March 31, 2013. Foreign taxes paid for purposes of Section 853 may be less than actual foreign taxes paid for financial statement purposes. |
|
|
|
|
|
|
|
|
|
|
|
|
Creditable Foreign |
|
Per Share |
|
Portion of Ordinary
Income Distribution |
|
|
|
|
|
|
|
|||
|
World ex-US Fund |
|
$496,646 |
|
$0.0142 |
|
99.41% |
|
|
|
|
|
* |
The Fund listed above did not derive any income from “ineligible foreign sources” as defined under Section 901(j) of the Internal Revenue Code. |
|
|
|
|
|
Foreign taxes paid or withheld should be included in taxable income with an offsetting deduction from gross income or as a credit for taxes paid to foreign governments. |
|
|
|
|
|
Above figures may differ from those cited elsewhere in this report due to differences in the calculation of income and gains under U.S. generally accepted accounting principles (book) purposes and Internal Revenue Service (tax) purposes. |
|
|
|
|
|
Shareholders are strongly advised to consult their own tax advisers with respect to the tax consequences of their investments in the Funds. In January, shareholders, excluding corporate shareholders, receive an IRS 1099-DIV regarding the Federal tax status of the dividends and distributions they received in the calendar year. |
177
|
|
|
GuideMarkSM Funds & GuidePathSM Funds |
|
ADDITIONAL INFORMATION (Continued) |
|
March 31, 2013 |
3. Disclosure Regarding Fund Trustees and Officers (Unaudited)
|
|
|
|
|
|
|
|
|
|
|
|
|
Name, Address |
|
Position(s) |
|
Term of Office |
|
Principal |
|
# of |
|
Other |
|
|
|
|
|
|
||||||
|
|
|
|
|
|
|
|
|
|
|
|
|
GPS Funds I |
|
|
|
|
|
|
|
|
|
|
|
Independent Trustees |
|
|
|
|
|
|
|
|
|
|
|
|
|
|
|
|
|
|
|
|
|
|
|
William J.
Klipp |
|
Lead Independent Trustee |
|
Indefinite Term since January 2001. Lead Independent Trustee since May 2007. |
|
Retired (1990-present). Formerly, President andChief Operating Officer, Charles Schwab Investment Management, Inc. and Executive Vice President, Schwab Funds (1993-1999). |
|
7 |
|
Trustee, Adelante Real Estate Fund (2000 to 2010). |
|
|
|
|
|
|
|
|
|
|
|
|
|
R. Thomas
DeBerry |
|
Independent Trustee |
|
Indefinite Term since January 2001. |
|
Retired; President, DeBerry Consulting (a securities consulting firm) (1988 to present). |
|
7 |
|
None. |
|
|
|
|
|
|
|
|
|
|
|
|
|
Dennis G.
Schmal |
|
Independent Trustee |
|
Indefinite Term since July 2007. |
|
Self-employed consultant (1999-present); formerly, Partner, Arthur Andersen LLP (audit services) (1972-1999). |
|
7 |
|
Director, Sitoa Global Inc (2011 to present); Director, Wells Fargo ASGI Hedge Funds (closed-end hedge funds) (2008 to present); Director/Chairman, Pacific Metrics Corp. (educational services) (2005 to present); Director, Merriman Holdings, Inc. (financial services) (2003 to present); Director, Grail Advisors ETF Trust (2009 to 2011); Director, Varian Semiconductor Equipment Associates, Inc. (2004 to 2011); Director, North Bay Bancorp (2006 to 2007). |
178
|
|
|
GuideMarkSM
Funds & GuidePathSM Funds |
|
March 31, 2013 |
|
|
|
|
|
|
|
|
|
|
|
|
|
Name, Address |
|
Position(s) |
|
Term of Office |
|
Principal |
|
# of |
|
Other |
|
|
|
|
|
|
||||||
|
|
|
|
|
|
|
|
|
|
|
|
|
Interested Trustee |
|
|
|
|
|
|
|
|
|
|
|
|
|
|
|
|
|
|
|
|
|
|
|
Ronald Cordes* |
|
Chairman of the Board and Trustee |
|
Indefinite Term since January 2001. |
|
Co-Chairman, Genworth Financial Wealth Management (“GFWM”) (formerly, AssetMark Investment Services) (2006-present); President, GPS Funds I (formerly AssetMark Funds) (2012 to present); (2001-2008); Principal, AssetMark Investment Servcies (1994 to 2008); President, Chairman and Chief Compliance Officer, AssetMark Capital Corporation (1994-2008). |
|
7 |
|
Director, Microvest Capital Management, (investment company) (2012 to present); Director, Encore.org (nonprofit organization) Director, US Global Leadership Coalition (nonprofit organization) (2012 to present); Managing Member, Opportunity Collaboration, LLC (conference convener) (2012 to present); Director, ImpactAssets, (nonprofit organization) (2012 to present); Chairman, FairTrade USA (nonprofit organization) (2010 to present); Vice Chairman, Sarona Frontier General Partner, Inc. (investment fund) (2010 to present); Board of Regents, University of the Pacific (2009 to present); Director, East Bay Community Foundation (2007 to present); Director, ThinkImpact (nonprofit organization) (2010 to 2012); Katalysis Bootstrap Fund (nonprofit organization) (2005 to 2012); Investment Committee Member, Microvest Fund I (investment fund) (2009 to 2011). |
179
|
|
|
GuideMarkSM
Funds & GuidePathSM Funds |
|
March 31, 2013 |
|
|
|
|
|
|
|
|
|
|
|
|
|
Name, Address |
|
Position(s) |
|
Term of Office |
|
Principal |
|
# of |
|
Other |
|
|
|
|
|
|
||||||
|
|
|
|
|
|
|
|
|
|
|
|
|
GPS Funds II |
|
|
|
|
|
|
|
|
|
|
|
Independent Trustees |
|
|
|
|
|
|
|
|
|
|
|
|
|
|
|
|
|
|
|
|
|
|
|
David M. Dunford |
|
Independent Trustee |
|
Indefinite Term since 2011. |
|
Retired; formerly, Senior Vice President, Merrill Lynch Insurance Group (1989-2001). |
|
9 |
|
Director, New England Bancorp (2006-present); Trustee, Genworth Variable Insurance Trust (“GVIT”) (2008-2012); Director, Hospice and Palliative Care of Cape Cod (2006-2011). |
|
|
|
|
|
|
|
|
|
|
|
|
|
Paul S. Feinberg |
|
Independent Trustee |
|
Indefinite Term since 2011. |
|
Retired; formerly, President, CitiStreet Funds, Inc. (2000-2005); Executive Vice President and General Counsel, CitiStreet Associates LLC (insurance agency), CitiStreet Equities LLC (broker-dealer), CitiStreet Financial Services LLC (registered investment advisor) and CitiStreet Funds Management LLC (registered investment advisor) (1990-2005) |
|
9 |
|
Trustee, GVIT (2008-2012); Trustee, Blue Fund Group (2006-2008). |
|
|
|
|
|
|
|
|
|
|
|
|
|
John A. Fibiger |
|
Independent Trustee |
|
Indefinite Term since 2011. |
|
Retired; formerly, Chairman, TransAmerica Life Companies (“TransAmerica”) (insurance company) (1994-1997); President, TransAmerica (1993-1994); Chief Financial Officer, TransAmerica (1990-1993); President, New England Mutual Life Insurance Company (life insurance company) (1981-1989); New England Mutual Life Insurance Company (1974-1980). |
|
10 |
|
Director, Members Mutual Holding Co. (2008-present); Trustee, Genworth Financial Asset Management Funds (“GFAM”) (2006-present); Director, Fidelity Life Association (life insurance company) (2006-present); Trustee, GVIT (2008-2012); Member, Executive Committee, Austin Symphony Orchestra Board of Directors; Life Trustee, Museum of Science, Boston, Massachusetts. |
180
|
|
|
GuideMarkSM
Funds & GuidePathSM Funds |
|
March 31, 2013 |
|
|
|
|
|
|
|
|
|
|
|
|
|
Name, Address |
|
Position(s) |
|
Term of Office |
|
Principal |
|
# of |
|
Other |
|
|
|
|
|
|
||||||
|
|
|
|
|
|
|
|
|
|
|
|
|
Interested Trustee |
|
|
|
|
|
|
|
|
|
|
|
|
|
|
|
|
|
|
|
|
|
|
|
Gurinder S. Ahluwalia** |
|
Interested Trustee |
|
Indefinite Term since 2011. |
|
President and CEO of Genworth Financial Wealth Management (“GFWM”) (2009-present); Co-Chairman, GFWM (2008-2009); Vice-Chairman, AssetMark Investment Services, Inc. (2006-2008); President, GFAM (2004-2008); President and Chairman, Genworth Financial Asset Management, Inc. (2004-2008). |
|
10 |
|
Trustee, GFAM (2005- present); Genworth Financial Trust Company (2004- present); Altegris Portfolio Management, Inc. (d/b/a Altegris Funds) (2011-present); Ensaaf (nonprofit organization) (2011- present); Quantuvis Consulting, Inc. (2008- present); Trustee, GVIT (2008-2012); Centurion Capital Group Inc.; Centurion Financial Advisers Inc.; GFWM, formerly, AssetMark Investment Services, Inc.; Genworth Financial Asset Management, Inc. |
181
|
|
|
GuideMarkSM
Funds & GuidePathSM Funds |
|
March 31, 2013 |
|
|
|
|
|
|
|
|
|
Name, Address |
|
Position(s) |
|
Term of Office |
|
Principal Occupation During Past Five Years |
|
|
|
|
||||
|
|
|
|
|
|
|
|
|
Officers |
|
|
|
|
|
|
|
|
|
|
|
|
|
|
|
Carrie E. Hansen |
|
President |
|
Renewed 1-Year Term since May 2007. |
|
President, GPS Funds I (formerly, AssetMark Funds) (2007-present) and GPS Funds II (2001-present); President, Genworth Financial Asset Management Funds (“GFAM”) and Genworth Variable Insurance Trust (“GVIT”) (2008- 2012); Senior Vice President and Chief Operations Officer, GFWM (2008- present); Chairman, Genworth Financial Trust Company (2008-present); Senior Vice President and Managing Director, of the Trust, (2007-2008); Treasurer and Chief Compliance Officer, GFAM (2007-2008); Chief Compliance Officer of the Trust, (2005-2008); Treasurer of the Trust, (2001-2008); Senior Vice President, Chief Financial Officer and Chief Compliance Officer, GFWM, formerly, AssetMark Investment Services, Inc., (2004-2007). |
|
|
|
|
|
|
|
|
|
John Koval |
|
Chief Compliance Officer and AML Compliance Officer |
|
Since 2012. |
|
Senior Compliance Officer, Genworth Financial Wealth Management (2011 to present); Chief Operating Officer, SEAL Capital, Inc. (2009 to 2010); Chief Compliance Officer, Cliffwood Partners LLC (2004 to 2009). |
|
|
|
|
|
|
|
|
|
Starr E. Frohlich |
|
Vice President and Treasurer |
|
1-Year term since March 2010. |
|
Vice President and Treasurer, GPS Funds I (formerly, AssetMark Funds) (2010-present), GPS Funds II (2011-present), and GFAM (2010-present); Director of Fund Administration, GFWM (2010-present); Vice President, U.S. Bancorp Fund Services, LLC (1997-2010). |
|
|
|
|
|
|
|
|
|
Christine Villas-Chernak |
|
Deputy Chief Compliance Officer; Secretary |
|
Since 2009. |
|
Deputy Chief Compliance Officer, GPS Funds I (formerly, AssetMark Funds) (2009-present) and GPS Funds II (2011-present); Secretary, GPS Funds I (2006-present), GPS Funds II (2011-present), GFAM (2009-2010) and GVIT (2008-2010); Senior Compliance Officer, GFWM (2005-2009); |
|
|
|
|
|
|
|
|
|
Robert J. Bannon |
|
Vice President and Chief Risk Officer |
|
Since 2010. |
|
Vice President and Chief Risk Officer, GPS Funds I (formerly, AssetMark Funds) (2010 to present), GPS Funds II (2011 to present) and GFAM (2010 to present); Senior Vice President and Chief Risk Officer, GFWM (2007-present). |
|
|
|
|
* |
Ronald Cordes is an “interested person” of the Trust as defined in the 1940 Act because he is the Chairman of the Board for GFWM and serves as Director for GFWM and Quantuvis. |
|
|
|
|
** |
Mr. Ahluwalia is a Trustee who is an “interested person” of the Trust as defined in the 1940 Act because he is an officer of GFWM or certain of its affiliates. |
The Statement of Additional Information includes additional information about the Funds’ Trustees and is available free of charge upon request by calling the Funds toll free at (888) 278-5809.
182
|
|
|
GuideMarkSM Funds & GuidePathSM Funds |
|
ADDITIONAL INFORMATION (Continued) |
|
March 31, 2013 |
|
|
|
|
4. |
Proxy Voting Policies and Procedures and Proxy Voting Record (Unaudited) |
|
|
A description of the policies and procedures that the Funds use to determine how to vote proxies related to the Funds’ portfolio securities as well as information regarding how the Funds voted proxies relating to portfolio securities during the most recent 12-month period ended June 30 is available without charge, upon request by calling (888) 278-5809. Furthermore, you can obtain the Fund’s proxy voting records on the SEC’s website at http://www.sec.gov. |
|
|
|
|
5. |
Availability of Quarterly Portfolio Holdings Schedules (unaudited) |
|
|
The Funds file their complete schedules of portfolio holdings with the SEC for their first and third fiscal quarters on Form N-Q. Once filed, the Funds’ Form N-Q is available without charge, upon request on the SEC’s website (http://www.sec.gov) and is available by calling (888) 278-5809. You can also obtain copies of Form N-Q by (i) visiting the SEC’s Public Reference Room in Washington, D.C. (information on the operation of the Public Reference Room may be obtained by calling 1-800-SEC-0330); (ii) sending your request and a duplicating fee to the SEC’s Public Reference Room, Washington, D.C. 20549-0102; or (iii) sending your request electronically to publicinfo@sec.gov. |
|
|
|
|
6. |
Statement Regarding the Basis for Approval of Investment Advisory Agreement and Sub-Advisory Agreements (Unaudited). |
|
|
|
|
|
GPS FUNDS I: |
|
|
|
|
|
Annual Consideration and Approval of Investment Advisory and Sub-Advisory Agreements |
|
|
|
|
|
At the meeting of the Board of Trustees (the “Board” or the “Trustees”) of GPS Funds I (the “Trust”) held on March 5, 2013, the Board conducted its review and renewal of the investment advisory agreement between Genworth Financial Wealth Management, Inc. (“GFWM”) and the Trust, on behalf of each series of the Trust (collectively, the “Funds”) (the “Advisory Agreement”). Additionally, the Board considered the renewal of the investment sub-advisory agreements between (i) Delaware Management Company (“Delaware”) and GFWM, on behalf of the GuideMarkSM Tax-Exempt Fixed Income Fund; (ii) Nuveen Asset Management (“Nuveen”) and GFWM, on behalf of the GuideMarkSM Tax-Exempt Fixed Income Fund; (iii) Barrow, Hanley, Mewhinney & Strauss (“Barrow Hanley”) and GFWM, on behalf of the GuideMarkSM Core Fixed Income Fund and the GuideMarkSM Large Cap Value Fund; (iv) Wellington Management Company (“Wellington”) and GFWM, on behalf of the GuideMarkSM Large Cap Growth Fund; Pyramis Global Advisors (“Pyramis”) and GFWM, on behalf of the GuideMarkSM Small/Mid Cap Core Fund and the GuideMarkSM World ex-US Fund; (vi) Diamond Hill Capital Management (“Diamond Hill”) and GFWM, on behalf of the GuideMarkSM Opportunistic Equity Fund; and (vii) Westfield Capital Management Company (“Westfield”) and GFWM, on behalf of the GuideMarkSM Opportunistic Equity Fund (collectively, the “Sub-Advisory Agreements”). Hereinafter, Delaware, Nuveen, Barrow Hanley, Wellington, Pyramis, Diamond Hill and Westfield are collectively referred to as the “Sub-Advisors” and the above-listed Funds are collectively referred to as the “Sub-Advised Funds.” The Advisory Agreement and Sub-Advisory Agreements are collectively referred to herein as the “Agreements.” |
|
|
|
|
|
The Funds are managed using a “manager-of-managers” structure that generally involves the use of one or more sub-advisors to manage allocated portions of the Funds’ portfolios. Under this structure, GFWM is responsible for evaluating and selecting sub-advisors on an ongoing basis and making any decisions to recommend hiring, retaining, or replacing sub-advisors. The Board is engaged in monitoring this process in connection with its meetings held throughout the year, and under the manager-of-managers structure, all parties understand that sub-advisors are being monitored and evaluated, and are subject to replacement, at all times. |
183
|
|
|
GuideMarkSM Funds & GuidePathSM Funds |
|
ADDITIONAL INFORMATION (Continued) |
|
March 31, 2013 |
|
|
|
|
|
The Board — including a majority of the independent Trustees - determined to approve the continuance of the Advisory Agreement and the Sub-Advisory Agreements. The material factors considered and the conclusions that formed the basis of the Board’s approval of the renewal of the Agreements are described below. This summary describes the most significant, but not all, of the factors evaluated by the Board. Prior to considering the approval of the renewal of the Agreements, the Trustees requested, received, and reviewed information relevant to their consideration of the Agreements. The Trustees also received assistance and advice regarding legal and industry standards from independent counsel to the independent Trustees. The determination to approve the renewal of the Agreements was based on a comprehensive evaluation of all of the information available to the Trustees and was not the result of any particular information or any single factor. Moreover, each Trustee may have afforded different weight to various information and factors in reaching his conclusions with respect to the renewal of the Agreements. |
|
|
|
|
|
The Advisory Agreement |
|
|
|
|
|
Materials Reviewed and the Review Process |
|
|
|
|
|
Prior to voting to approve the renewal of the Advisory Agreement, the Trustees - assisted by independent legal counsel -specifically requested and were furnished with materials for purposes of their review of the Advisory Agreement. The materials provided to the Board with regard to the Funds related to, among other items: (a) the terms and conditions of the Advisory Agreement; (b) information describing the nature, extent, and quality of the services that GFWM provides to the Funds, the fees that GFWM charges to the Funds for these services, and a comparison of those fees to the fees paid by a peer group of other investment companies having investment objectives similar to the investment objectives of the Funds and that were identified as competitors; (c) information regarding GFWM’s business and operations, financial position, investment team, and compliance program; (d) information describing each Fund’s expense ratios compared to the Fund’s peer group of other registered investment companies with investment objectives similar to the investment objective(s) of the Fund; (e) information describing each Fund’s performance compared to the Fund’s peer group of other investment companies with investment objectives similar to the investment objective(s) of the Fund; (f) information regarding GFWM’s profitability in managing each Fund; and (g) other information relevant to the approval of the Advisory Agreement. The Trustees also considered presentations made by and discussions held with representatives of GFWM throughout the course of the year at regularly scheduled Board meetings. |
|
|
|
|
|
The Trustees received assistance and advice regarding legal and industry standards from both independent counsel to the independent Trustees and from counsel to the Trust, which included detailed memoranda that described the Trustees’ legal duties and obligations in considering whether to approve the Agreements. The independent Trustees discussed the Agreements in communications prior to their meeting and during the course of their meeting in executive sessions with independent counsel, at which no representatives of GFWM were present. |
|
|
|
|
|
Factors Considered |
|
|
|
|
|
The Trustees considered and reached conclusions on a number of factors in making the decision to approve the Advisory Agreement. These factors and conclusions are described below. |
|
|
|
|
|
Nature, Extent and Quality of Services Provided |
|
|
|
|
|
With respect to the nature, extent and quality of the services that GFWM provides to the Funds, the Board considered the fact that, as an investment advisor operating within a manager-of-managers structure, GFWM maintains a primary focus on the selection, evaluation, and oversight of the Funds’ various Sub-Advisors and considered the Advisory Agreement in this context. |
184
|
|
|
GuideMarkSM Funds & GuidePathSM Funds |
|
ADDITIONAL INFORMATION (Continued) |
|
March 31, 2013 |
|
|
|
|
|
The Trustees considered GFWM’s investment team and its capabilities, including with respect to the administrative and compliance services provided to the Funds, and GFWM’s selection and oversight of sub-advisors to the Funds. The Trustees considered the experience, capability, and integrity of GFWM’s management and other personnel, the role of GFWM’s senior management and the extent of its involvement with the Funds, and GFWM’s willingness to add personnel over time in order to ensure that appropriate staffing levels are maintained. |
|
|
|
|
|
The Trustees also considered (a) the financial position of GFWM; (b) the quality of GFWM’s regulatory and legal compliance policies, procedures, and systems; (c) the nature, extent, and quality of administrative and shareholder services provided by GFWM to the Funds; and (d) GFWM’s supervision of the Funds’ third-party service providers. |
|
|
|
|
|
The Board considered the breadth and quality of services that GFWM provides to the Funds. The Trustees also considered that the Funds are an integral part of GFWM’s program of asset allocation and shareholder services. Additionally, the Trustees considered GFWM’s ability to provide administrative and compliance-related services in connection with GFWM’s (a) oversight of the Sub-Advisors’ compliance with the Funds’ respective investment objectives, policies, and restrictions; (b) review of trading and brokerage matters; and (c) other oversight activities. |
|
|
|
|
|
Based on the factors described above, among others, as well as the information provided to the Board in advance of their meeting and throughout the past year, the Trustees concluded that they were satisfied with the nature, extent, and quality of the services provided by GFWM to each Fund, which will continue to be provided to each Fund and its shareholders. |
|
|
|
|
|
Investment Performance of the Funds |
|
|
|
|
|
The Board considered the overall investment performance of the Funds and evaluated the Funds’ performance in the context of the manager-of-managers structure and the special considerations that such a structure requires. The Trustees considered whether the Funds operated within their investment objectives and styles, and considered each Fund’s record of compliance with its respective investment restrictions. |
|
|
|
|
|
The Trustees also considered each Fund’s investment performance relative to its respective benchmark index and relative to the performance of funds with comparable investment strategies selected by a third-party information provider. The Trustees also considered all of the performance-related data that it had reviewed throughout the past year. |
|
|
|
|
|
The Trustees considered each Fund’s performance for the fiscal year ended December 31, 2012 as compared to its benchmark and its peers selected by a third party information provider: the GuideMarkSM Large Cap Growth Fund had underperformed its benchmark and had performed in the fourth quartile of its peers; the GuideMarkSM Large Cap Value Fund had underperformed its benchmark and had performed in the third quartile of its peers; the GuideMarkSM Opportunistic Equity Fund had underperformed its benchmark and had performed in the second quartile of its peers; the GuideMarkSM Small/Mid Cap Core Fund and the GuideMarkSM Tax-Exempt Fixed Income Fund had outperformed their respective benchmarks and had performed in the top quartile of their respective peers; the GuideMarkSM World ex-US Fund had outperformed its benchmark and had performed in the third quartile of its peers; and the GuideMarkSM Core Fixed Income Fund had outperformed its benchmark and had performed in the fourth quartile of its peers. The Trustees considered that GFWM continued to be proactive in seeking to replace and/or add sub-advisors, to reallocate assets among sub-advisors, and to implement new investment strategies, with a view to improving Fund performance over the long term. |
|
|
|
|
|
The Trustees considered that they had reviewed Fund performance, including the primary contributors to and detractors from performance, with GFWM and concluded that GFWM’s performance record in managing each of the Funds demonstrates that its continued management of the Funds, directly or through sub-advisors, will benefit each Fund and its shareholders. |
185
|
|
|
GuideMarkSM Funds & GuidePathSM Funds |
|
ADDITIONAL INFORMATION (Continued) |
|
March 31, 2013 |
|
|
|
|
|
Advisory Fees and Total Expenses |
|
|
|
|
|
The Board considered a detailed analysis of the Funds’ fees and expenses. The materials considered by the Trustees included (i) a comparison of the advisory fees and total expenses of each Fund (as a percentage of average net assets) with the fees and expenses of a group of funds selected by a third-party information provider; (ii) comparisons of each Fund’s expenses to industry averages; and (iii) fee schedules for the Sub-Advisors. |
|
|
|
|
|
With respect to expense ratios, the Trustees considered that, as of December 31, 2012, each of GuideMarkSM Large Cap Value Fund, GuideMarkSM World ex-US Fund, GuideMarkSM Opportunistic Equity Fund, GuideMarkSM Core Fixed Income Fund and GuideMarkSM Tax-Exempt Fixed Income Fund had expense ratios that were above the applicable industry averages. The GuideMarkSM Large Cap Growth Fund and GuideMarkSM Small/Mid Cap Core Fund had expense ratios that were below the applicable industry averages. The Trustees considered the expense limitation arrangement under which GFWM had agreed to limit the Funds’ expenses since their inception, as well as GFWM’s other efforts to reduce overall Fund expenses, including attempts to improve asset flows, implementing programs such as securities lending and negotiating strategic contracts with service providers. |
|
|
|
|
|
With respect to advisory fee levels, the Trustees considered that, as of December 31, 2012, each of GuideMarkSM Large Cap Growth Fund, GuideMarkSM Large Cap Value Fund, GuideMarkSM World ex-US Fund, GuideMarkSM Opportunistic Equity Fund, GuideMarkSM Core Fixed Income Fund and GuideMarkSM Tax-Exempt Fixed Income Fund had advisory fees that were higher than the applicable industry averages. The advisory fees charged to the GuideMarkSM Small/Mid Cap Core Fund were lower than the applicable industry average. The Trustees also considered GFWM’s agreement, when Trust assets are above certain levels, to waive a portion of its advisory fee. |
|
|
|
|
|
In analyzing the Funds’ fee levels as compared to other similar funds, the Trustees considered the Funds’ fee levels in light of the Funds’ special distribution structure, under which the Funds were distributed as part of a suite of services with asset allocation modeling, full performance reporting and other services that are not typically provided with mutual funds. After comparing each Fund’s fees and total expenses with those of other comparable funds, and in light of the nature, extent, and quality of services provided to the Funds by GFWM, as well as the costs incurred by GFWM in rendering those services, the Trustees concluded that the level of the fees charged by GFWM to each Fund was reasonable in relation to the services provided by GFWM, and that the total expenses of each Fund were reasonable in light of the circumstances. |
|
|
|
|
|
Advisor Costs, Level of Profits, Economies of Scale and Ancillary Benefits |
|
|
|
|
|
The Board reviewed and discussed the financial information presented by GFWM, including information relating to the financial stability of GFWM and its historical and anticipated profitability with respect to its management of the Funds. The Board discussed the methods used by GFWM to allocate expenses to the Funds under its profitability analysis, and the Board considered the individual profitability of GFWM with respect to each Fund under this methodology. The Board noted that GFWM reported that the profitability of the Funds to GFWM for the quarter ended December 31, 2012 had decreased compared to the prior year. |
|
|
|
|
|
The Trustees considered GFWM’s agreement to waive advisory fees received from the Funds and/or pay Fund expenses to the extent necessary to ensure that the Funds’ overall expenses do not exceed certain levels. The Trustees also considered GFWM’s agreement to waive advisory fees received from the Funds for breakpoint thresholds based on the Funds’ assets under management. |
|
|
|
|
|
In evaluating GFWM’s profitability, the Trustees acknowledged that the Funds are distributed in connection with GFWM providing a package of administrative and other services as the sponsor of the GFWM investment platform, and considered the benefits that flow to Fund shareholders as a result of these services. |
186
|
|
|
GuideMarkSM Funds & GuidePathSM Funds |
|
ADDITIONAL INFORMATION (Continued) |
|
March 31, 2013 |
|
|
|
|
|
The Trustees considered benefits received by GFWM as a result of its relationship with the Funds, including the benefits of offering an integrated set of investment options as an integral part of GFWM’s asset allocation investment programs and the related marketing rebates received by GFWM. The Trustees concluded that these benefits were reasonable. |
|
|
|
|
|
The Trustees considered the anticipated effect of asset growth on each Fund’s expenses and other information that might suggest the potential for realizing economies of scale that could be shared with Fund shareholders. |
|
|
|
|
|
The Trustees concluded, in light of the foregoing factors, that GFWM’s level of profitability is reasonable. Additionally, the Trustees concluded that the economies of scale being realized by GFWM, if any, do not mandate the implementation of new breakpoints or other changes in the fee structure for any Fund at this time. |
|
|
|
|
|
Conclusion |
|
|
|
|
|
The Trustees indicated that, while the consideration of the continuance of the Advisory Agreement is an annual exercise, the Board engages in a detailed analysis of each of these factors throughout the course of the year. Based upon all of the foregoing factors and such other matters as were deemed relevant, the Trustees concluded to approve the Advisory Agreement on behalf of the Funds. No single factor was determinative to the decision of the Trustees. |
|
|
|
|
|
The Sub-Advisory Agreements |
|
|
|
|
|
Materials Reviewed and the Review Process |
|
|
|
|
|
Assisted by independent legal counsel, the Trustees specifically requested and were furnished with materials for purposes of their review of the Sub-Advisory Agreements. The materials provided to the Board related to, among other items: (a) the terms and conditions of the Sub-Advisory Agreements; (b) the nature, quality, and scope of the services to be provided by the Sub-Advisors, as well as the schedule of fees charged for such services; (c) each Sub-Advisor’s investment performance compared to an industry peer group as well as other sub-advisor client accounts; (d) comparative sub-advisory fee information; (e) information regarding each Sub-Advisor’s personnel, operations, financial position, and business operations; (f) information regarding each Sub-Advisor’s brokerage and compliance practices; and (g) information regarding each Sub-Advisor’s interactions with GFWM regarding management of the Sub-Advised Funds. |
|
|
|
|
|
Additionally, during the course of the year, the Trustees received information relating to, among other items: (a) the quantitative performance of each Sub-Advisor; (b) GFWM’s evaluation, in accordance with its role as a “manager-of-managers,” of the nature, extent, and quality of the services provided by each Sub-Advisor; (c) GFWM’s profitability in managing each Fund and other information that might suggest the potential for realizing economies of scale that could be shared with Fund shareholders; and (d) benefits to each Sub-Advisor, such as receipt of research from brokers, that might result from the Sub-Advisor’s relationship with a Sub-Advised Fund. The Trustees considered and evaluated this information for purposes of determining whether to approve the Sub-Advisory Agreements. |
|
|
|
|
|
The Trustees received assistance and advice regarding legal and industry standards from both independent counsel and from counsel to the Trust, which included detailed memoranda that described the Trustees’ legal duties and obligations in considering the renewal of the Sub-Advisory Agreements. The Trustees discussed the approval of the Sub-Advisory Agreements in communications prior to their meeting and, during the course of their meeting, in executive sessions with independent counsel at which no representatives of GFWM or the Sub-Advisors were present. |
|
|
|
|
|
Factors Considered |
|
|
|
|
|
The Trustees considered and reached conclusions on a number of factors in making the decision to approve the Sub-Advisory Agreements. In so doing, the Trustees considered GFWM’s active role as a “manager-of-managers,” which includes, among other functions, monitoring and evaluating the performance of the Sub-Advisors, recommending that any |
187
|
|
|
GuideMarkSM Funds & GuidePathSM Funds |
|
ADDITIONAL INFORMATION (Continued) |
|
March 31, 2013 |
|
|
|
|
|
|
|
|
sub-advisor not performing as expected be replaced, and negotiating advantageous fee arrangements that could permit the Funds to realize economies of scale without compromising the quality of services. These factors and the Board’s conclusions are set forth below. |
|
|
|
|
|
|
|
Nature, Extent and Quality of Services Provided |
|
|
|
|
|
|
|
The Trustees considered each Sub-Advisor’s investment management process, including (a) the experience, capability, and integrity of the Sub-Advisor’s management, investment professionals, and other personnel; (b) the financial position of the Sub-Advisor; (c) the quality and commitment of the Sub-Advisor’s regulatory and legal compliance policies, procedures, and systems; and (d) the Sub-Advisor’s brokerage and trading practices. |
|
|
|
|
|
|
|
The Trustees specifically considered the qualifications, experience and track record of the individuals and portfolio management teams at each Sub-Advisor that are responsible for the day-to-day management of each Fund’s portfolio. The Trustees also considered, with respect to each Sub-Advisor, the specific investment approach and level of expertise within its particular asset class. The Trustees considered each Sub-Advisor’s performance record compared to the relevant benchmark(s). |
|
|
|
|
|
|
|
The Trustees concluded that the nature, extent, and quality of the services provided by each Sub-Advisor has benefited —and will continue to benefit — each Sub-Advised Fund and its shareholders and that these factors supported the Board’s determination to approve each Sub-Advisory Agreement. |
|
|
|
|
|
|
|
Sub-Advisor Investment Performance |
|
|
|
|
|
|
|
The Trustees considered whether each Sub-Advisor operated within its respective Sub-Advised Fund’s investment objective and style and considered each Sub-Advisor’s record of compliance with applicable investment restrictions. The Trustees also considered each Sub-Advisor’s investment performance for the fiscal year ended December 31, 2012 relative to a benchmark index or indices and its peers selected by a third party information provider: |
|
|
|
|
|
|
|
(i) |
Wellington, on behalf of the GuideMarkSM Large Cap Growth Fund, and Diamond Hill, on behalf of the GuideMarkSM Opportunistic Equity Fund, had each underperformed their respective benchmark and had performed in the third quartile of their respective peers; |
|
|
|
|
|
|
(ii) |
Barrow Hanley, on behalf of the GuideMarkSM Large Cap Value Fund, had underperformed its benchmark and had performed in the second quartile of its peers; |
|
|
|
|
|
|
(iii) |
Delaware and Nuveen, on behalf of the GuideMarkSM Tax Exempt Fixed Income Fund, had each outperformed their respective benchmark and had performed in the top quartile of their peers; |
|
|
|
|
|
|
(iv) |
Pyramis, on behalf of the GuideMarkSM World ex-US Fund, had outperformed its benchmark and had performed in the second quartile of its peers; |
|
|
|
|
|
|
(v) |
Westfield, on behalf of the GuideMarkSM Opportunistic Equity Fund, and Pyramis, on behalf of the GuideMarkSM Small/Mid Cap Core Fund, had each outperformed their respective benchmark and had performed in the top quartile of their respective peers; and |
|
|
|
|
|
|
(vi) |
Barrow Hanley, on behalf of the GuideMarkSM Core Fixed Income Fund, had outperformed its benchmark and had performed in the fourth quartile of its peers. |
|
|
|
|
|
|
The Trustees further considered that Wellington had not been managing the GuideMarkSM Core Fixed Income Fund prior to the fiscal quarter ended December 31, 2012, and that it had outperformed its benchmark for that quarter and had performed in the third quartile of its peers. |
|
188
|
|
|
GuideMarkSM Funds & GuidePathSM Funds |
|
ADDITIONAL INFORMATION (Continued) |
|
March 31, 2013 |
|
|
|
|
|
|
|
The Trustees considered that they had reviewed each Sub-Advisor, including the primary contributors to and detractors from performance, with GFWM and concluded that each Sub-Advisor’s performance record indicates that its continued management will benefit the respective Sub-Advised Fund(s) and its shareholders. |
|
|
|
|
|
Sub-Advisory Fees, Level of Profits, Economies of Scale and Ancillary Benefits |
|
|
|
|
|
The Trustees considered the fee paid to each Sub-Advisor by GFWM and other information that might suggest the potential for realizing economies of scale that could be shared with Fund shareholders. The Trustees did not consider the profitability of the Sub-Advisors to be a material factor based on representations from GFWM that it negotiates sub-advisory fees with the Sub-Advisors on an arm’s-length basis. The Trustees also considered individual reports prepared with regard to each Sub-Advisor containing comparative information regarding fees. The Trustees concluded that each Sub-Advisor’s fees were generally similar to the fees charged by each Sub-Advisor to other comparable funds and accounts and that they were fair in light of the relevant Sub-Advised Fund’s performance and asset levels. |
|
|
|
|
|
The Trustees considered the anticipated effect of asset growth on each Fund’s expenses and other information that might suggest the potential for realizing economies of scale that could be shared with Fund shareholders. In this regard, the Trustees noted that certain of the Sub-Advisory Agreements’ fee schedules contain breakpoints which present potential economies of scale that could be shared with the Sub-Advised Funds’ shareholders as assets of those Sub-Advised Funds grow. |
|
|
|
|
|
The Trustees concluded that the fees to be paid to each Sub-Advisor by GFWM are reasonable in light of the services performed for the Sub-Advised Funds by the Sub-Advisors, and that the economies of scale being realized by the Sub-Advisors, if any, do not mandate the implementation of breakpoints or other changes in the fee structure for any Fund at this time. |
|
|
|
|
|
Conclusion |
|
|
|
|
|
Based on their evaluation of the relevant factors, the Board — including the independent Trustees - concluded to approve the renewal of each Sub-Advisory Agreement. The Board also concluded that the fees to be paid to each Sub-Advisor are reasonable and that renewal of the Sub-Advisory Agreements is in the best interests of the Sub-Advised Funds and their shareholders. No single factor was determinative to the decision of the Trustees. |
|
|
|
|
|
Consideration and Approval of a New Sub-Advisory Agreement with River Road |
|
|
|
|
|
At the meeting of the Board of the Trust held on December 18, 2012, the Board approved a new sub-advisory agreement (the “River Road Sub-Advisory Agreement”) between River Road Asset Management, LLC (“River Road”) and GFWM, on behalf of the GuideMarkSM Opportunistic Equity Fund. |
|
|
|
|
|
As noted above, the GuideMarkSM Opportunistic Equity Fund is managed using a “manager-of-managers” structure that generally involves the use of one or more sub-advisors to manage allocated portions of the Fund’s portfolio. Under this structure, GFWM is responsible for evaluating and selecting sub-advisors on an ongoing basis and making any decisions to recommend hiring, retaining, or replacing sub-advisors. The Board is engaged in monitoring this process in connection with its meetings held throughout the year and, under the manager-of-managers structure, all parties understand that sub-advisors are being monitored and evaluated, and are subject to replacement, at all times. |
|
|
|
|
|
The Board — including a majority of the independent Trustees — determined to approve the River Road Sub-Advisory Agreement. The material factors considered and the conclusions that formed the basis of the Board’s approval of the agreement are described below. This summary describes the most significant, but not all, of the factors evaluated by the Board. In preparation for their meeting, the Trustees requested, received, and reviewed information relevant to their consideration of the River Road Sub-Advisory Agreement. The Trustees also received assistance and advice regarding legal |
189
|
|
|
GuideMarkSM Funds & GuidePathSM Funds |
|
ADDITIONAL INFORMATION (Continued) |
|
March 31, 2013 |
|
|
|
|
|
|
|
and industry standards from independent counsel to the independent Trustees. In deciding to approve the agreement, the Board did not identify any particular information or any single factor or conclusion that was controlling. |
|
|
|
|
|
Materials Reviewed and the Review Process |
|
|
|
|
|
The Trustees, including the independent Trustees, considered various materials requested by counsel on behalf of the independent Trustees related to the River Road Sub-Advisory Agreement that included, among other items: (1) a copy of the proposed form of sub-advisory agreement between River Road and GFWM, on behalf of the Fund; (2) River Road’s responses to GFWM’s due diligence questionnaire, including information on River Road’s investment process; (3) River Road’s Form ADV disclosures; (4) a description of GFWM’s selection and recommendation process with respect to River Road, and the reasons for such recommendation; (5) information describing the nature, quality and extent of services that River Road would provide to the Fund, and the proposed sub-advisory fee schedule for such services; (6) comparative sub-advisory fee information; (7) information concerning River Road’s business and operations, investment team, compliance program and internal procedures, including biographical information for the investment professionals that would be responsible for the day-to-day management of River Road’s allocated portion of the Fund’s portfolio; (8) information regarding the financial condition of River Road; and (9) the historical investment performance of River Road’s two investment strategies. |
|
|
|
|
|
The Trustees also considered the methods and resources that GFWM utilizes in its efforts to identify and engage sub-advisors for the Funds. GFWM confirmed that its recommendation of River Road was made after evaluating a number of other possible investment managers and was based on a number of factors, including GFWM’s objective to find a sub-advisor that would employ an investment strategy complementary to that currently employed by the Fund’s other sub-advisors, Westfield and Diamond Hill. |
|
|
|
|
|
The Trustees received assistance and advice regarding legal and industry standards from both independent counsel and from counsel to the Trust, which included a detailed memorandum that described the Trustees’ legal duties and obligations in considering the River Road Sub-Advisory Agreement. The Trustees discussed the approval of the River Road Sub-Advisory Agreement before and during the course of their meeting in executive sessions with independent counsel at which no representatives of GFWM or River Road were present. |
|
|
|
|
|
Factors Considered |
|
|
|
|
|
In considering the River Road Sub-Advisory Agreement, the Trustees considered the following factors, to the extent they were applicable: (1) the nature, quality and extent of the services to be provided by River Road; (2) the investment performance of River Road; (3) the costs of the services to be provided and profits to be realized by River Road and its affiliates from the relationship with the Fund, including any “fall-out” benefits; (4) the extent to which economies of scale would be realized as the Fund grows; and (5) whether fee levels reflect those economies of scale for the benefit of Fund investors. |
|
|
|
|
|
The independent Trustees relied upon the advice of independent counsel and their own business judgment in determining the material factors to be considered in evaluating the River Road Sub-Advisory Agreement and the weight to be given to each such factor. The conclusions reached by the independent Trustees were based on a comprehensive evaluation of all of the information provided and were not the result of any one factor. Moreover, each independent Trustee may have afforded different weight to the various factors in reaching his conclusions with respect to the River Road Sub-Advisory Agreement. |
190
|
|
|
GuideMarkSM Funds & GuidePathSM Funds |
|
ADDITIONAL INFORMATION (Continued) |
|
March 31, 2013 |
|
|
|
|
|
|
|
Nature, Quality and Extent of Services to be Provided |
|
|
|
|
|
The Trustees considered the nature, quality and extent of services that River Road would provide to the Fund. The Trustees discussed the specific investment process to be employed by River Road in managing its allocated portion of the Fund, the qualifications of River Road’s portfolio management team with regard to implementing the Fund’s investment mandate and River Road’s performance record as compared to a relevant benchmark. The Trustees considered River Road’s organization, personnel and operations. The Trustees also considered GFWM’s review and selection process with respect to River Road and GFWM’s favorable assessment as to the nature and quality of the sub-advisory services expected to be provided by River Road. |
|
|
|
|
|
Based on their consideration and review of the foregoing factors, the Trustees concluded that the nature, quality and extent of the sub-advisory services to be provided by River Road, as well as River Road’s ability to render such services based on its experience, organization and resources, were appropriate for the Fund in light of the Fund’s investment objective, policies and strategies. |
|
|
|
|
|
Sub-Advisor Investment Performance |
|
|
|
|
|
Because River Road had not commenced providing sub-advisory services to the Fund at the time of the Trustees’ consideration of the River Road Sub-Advisory Agreement, the Trustees could not consider River Road’s investment performance with respect to its management of the Fund as a factor in evaluating the River Road Sub-Advisory Agreement. However, the Trustees did consider River Road’s historical performance record in managing other funds and accounts, including the historical performance of funds and accounts with the intended investment strategy recommended by GFWM for the Fund, compared to the Fund’s benchmark. |
|
|
|
|
|
Sub-Advisory Fees, Level of Profits, Economies of Scale and Ancillary Benefits |
|
|
|
|
|
The Trustees considered the compensation to be paid to River Road by GFWM in conjunction with the services that would be rendered to the Fund. The Trustees also considered comparisons of the fees to be paid by GFWM to River Road with fees charged by River Road to its other clients. In addition, the Trustees considered the recommendation of GFWM with respect to River Road and GFWM’s representation that the fees to be paid to River Road were the result of an arms-length negotiation. The Trustees considered that the sub-advisory fees would be paid by GFWM to River Road and would not be additional fees borne by the Fund. |
|
|
|
|
|
The Trustees also considered the anticipated effect of asset growth on the expenses and other information that might suggest the potential for realizing economies of scale that could be shared with Fund shareholders. The Trustees noted that River Road’s fee schedule would contain breakpoints, which presents potential economies of scale that could be shared with the Fund’s shareholders as the Fund’s assets grow. The Trustees concluded that, in light of the quality and extent of the services to be provided, the proposed fees to be paid to River Road were reasonable. |
|
|
|
|
|
The Trustees also considered “fall-out” or ancillary benefits that may potentially accrue to River Road or its affiliates in the future because of its relationship with the Fund. The Trustees concluded that the benefits that might accrue to River Road or its affiliates were reasonable. |
|
|
|
|
|
Conclusion |
|
|
|
|
|
After consideration of the foregoing factors, and such other matters as were deemed relevant, and with no single factor being determinative to their decision, the Trustees-including a majority of the independent Trustees—with the assistance of independent counsel concluded to approve the River Road Sub-Advisory Agreement, including the fees payable thereunder. |
191
|
|
|
GuideMarkSM Funds & GuidePathSM Funds |
|
ADDITIONAL INFORMATION (Continued) |
|
March 31, 2013 |
|
|
|
|
|
|
|
GPS FUNDS II: |
|
|
|
|
|
Annual Consideration and Approval of Investment Advisory and Sub-Advisory Agreements |
|
|
|
|
|
At the meeting of the Board of Trustees (the “Board” or the “Trustees”) of GPS Funds II (the “Trust”) held on March 28, 2013, the Board considered the renewal of the investment advisory agreement between Genworth Financial Wealth Management, Inc. (the “Advisor” or “GFWM”) and the Trust, on behalf of each series of the Trust (collectively, the “Funds”) (the “Advisory Agreement”). Additionally, the Board considered the renewal of the investment sub-advisory agreements between (i) SSgA Funds Management (“SSgA FM”) and GFWM, on behalf of the GuideMarkSM Global Real Return Fund; (ii) Franklin Advisers (“Franklin”) and GFWM, on behalf of the GuideMarkSM Opportunistic Fixed Income Fund; and (iii) Loomis, Sayles & Co. (“Loomis Sayles”) and GFWM, on behalf of the GuideMarkSM Opportunistic Fixed Income Fund (collectively, the “Sub-Advisory Agreements”). Hereinafter, the above-listed Funds are collectively referred to as the “Sub-Advised Funds.” The Advisory Agreement and Sub-Advisory Agreements are collectively referred to herein as the “Agreements.” |
|
|
|
|
|
The Sub-Advised Funds are managed using a “manager-of-managers” structure that generally involves the use of one or more sub-advisors to manage allocated portions of the Funds’ portfolios. For those Funds, GFWM is responsible for evaluating and selecting sub-advisors on an ongoing basis and making any decisions to recommend hiring, retaining, or replacing sub-advisors. The Board is engaged in monitoring this process in connection with its meetings held throughout the year, and under the manager-of-managers structure, all parties understand that sub-advisors are being monitored and evaluated, and are subject to replacement, at all times. |
|
|
|
|
|
The Board — including a majority of the independent Trustees — determined to approve the continuance of the Agreements for the applicable Funds. The material factors considered and the conclusions that formed the basis of the Board’s approval of the renewal of the Agreements are described below. Prior to considering the approval of the renewal of the Agreements, the Trustees requested, received, and reviewed information relevant to their consideration of the Agreements. The Trustees also received assistance and advice regarding legal and industry standards from independent counsel to the independent Trustees (“Independent Counsel”). The determination to approve the renewal of the Agreements was based on a comprehensive evaluation of all of the information available to the Trustees and was not the result of any particular information or any single factor. Moreover, each Trustee may have afforded different weight to various information and factors in reaching his conclusions with respect to the renewal of the Agreements. |
|
|
|
|
|
The Advisory Agreement |
|
|
|
|
|
Materials Reviewed and the Review Process |
|
|
|
|
|
Prior to voting to approve the renewal of the Agreements, the Trustees — assisted by Independent Counsel — specifically requested and were furnished with materials for purposes of their review of the Agreements. The materials provided to the Board with regard to the Funds related to, among other items: (a) the terms and conditions of the Advisory Agreement, including confirmation from GFWM that no change to the existing terms of any Agreement were proposed; (b) information describing the nature, extent, and quality of the services that GFWM provides to the Funds, the fees that GFWM charges to the Funds for these services, and a comparison of those fees to the fees paid by a peer group of other investment companies having investment objectives similar to the investment objectives of the Funds and that were identified as competitors; (c) information regarding GFWM’s business and operations, financial position, investment team, and compliance program; (d) information describing each Fund’s expense ratios compared to the Fund’s peer group of other registered investment companies with investment objectives similar to the investment objective(s) of the Fund; (e) information describing each Fund’s performance compared to the Fund’s peer group of other investment companies with investment objectives similar |
192
|
|
|
GuideMarkSM Funds & GuidePathSM Funds |
|
ADDITIONAL INFORMATION (Continued) |
|
March 31, 2013 |
|
|
|
|
|
|
|
to the investment objective(s) of the Fund; (f) information about the performance of GFWM’s investment strategies and the effect of their active management services; (g) information regarding GFWM’s profitability in managing each Fund; and (h) other information relevant to the approval of the Advisory Agreement. The Trustees also considered presentations made by and discussions held with representatives of GFWM throughout the course of the year at regularly scheduled Board meetings. |
|
|
|
|
|
The Trustees received assistance and advice regarding legal and industry standards from both Independent Counsel and from counsel to the Trust, which included detailed memoranda that described the Trustees’ legal duties and obligations in considering whether to approve the Agreements. The independent Trustees discussed the Agreements in communications prior to their meeting and during the course of their meeting in executive session with Independent Counsel, at which no representatives of GFWM were present. |
|
|
|
|
|
Factors Considered |
|
|
|
|
|
The Trustees considered and reached conclusions on a number of factors in making the decision to approve the Advisory Agreement. These factors and conclusions are described below. |
|
|
|
|
|
Nature, Extent and Quality of Services Provided |
|
|
|
|
|
The Trustees considered the nature, extent and quality of the services that GFWM provides to the Funds. With respect to the Sub-Advised Funds, the Board considered the fact that, as an investment advisor operating within a manager-of-managers structure, GFWM maintains a primary focus on the selection, evaluation, and oversight of the Funds’ various Sub-Advisors and considered the Advisory Agreement in this context. |
|
|
|
|
|
The Trustees considered GFWM’s investment team and its capabilities, including with respect to the administrative and compliance services provided to the Funds, and GFWM’s selection and oversight of sub-advisors to the Funds. The Trustees considered the experience, capability, and integrity of GFWM’s management and other personnel, the role of GFWM’s senior management and the extent of its involvement with the Funds, and GFWM’s willingness to add personnel over time in order to ensure that appropriate staffing levels are maintained. |
|
|
|
|
|
The Trustees also considered (a) the financial position of GFWM; (b) the quality of GFWM’s regulatory and legal compliance policies, procedures, and systems; (c) the nature, extent, and quality of administrative and shareholder services provided by GFWM to the Funds; and (d) GFWM’s supervision of the Funds’ third-party service providers. |
|
|
|
|
|
The Board considered the breadth and quality of services that GFWM provides to the Funds. The Trustees also considered that the Funds are an integral part of GFWM’s program of asset allocation and shareholder services. Additionally, with respect to the Sub-Advised Funds, the Trustees considered GFWM’s ability to provide administrative and compliance-related services in connection with GFWM’s (a) oversight of the Sub-Advisors’ compliance with the Funds’ respective investment objectives, policies, and restrictions; (b) review of trading and brokerage matters; and (c) other oversight activities. |
|
|
|
|
|
Based on the factors described above, among others, as well as the information provided to the Board in advance of their meeting and throughout the past year, the Trustees concluded that they were satisfied with the nature, extent, and quality of the services provided by GFWM to each Fund, which will continue to be provided to each Fund. |
|
|
|
|
|
Investment Performance of the Funds |
|
|
|
|
|
The Board considered the overall investment performance of the Funds and, with respect to the Sub-Advised Funds, evaluated the Funds’ performance in the context of the manager-of-managers structure. The Trustees considered whether |
193
|
|
|
GuideMarkSM Funds & GuidePathSM Funds |
|
ADDITIONAL INFORMATION (Continued) |
|
March 31, 2013 |
|
|
|
|
|
|
|
the Funds operated within their investment objectives and styles, and considered each Fund’s record of compliance with its respective investment restrictions. |
|
|
|
|
|
The Trustees also considered each Fund’s investment performance relative to its respective benchmark index or indices and relative to the performance of funds with comparable investment strategies selected by a third-party information provider. The Trustees also considered performance-related data received throughout the past year at and in connection with meetings of the Board. |
|
|
|
|
|
The Trustees considered that for the fiscal year ended December 31, 2012, the GuideMarkSM Opportunistic Fixed income Fund had outperformed its benchmark and had performed in the top quartile of its peers selected by a third-party information provider. The GuideMarkSM Global Real Return Fund had outperformed its benchmarks and had performed in the second quartile of its peers. The GuidePathSM Strategic Asset Allocation Fund and GuidePathSM Tactical Constrained Asset Allocation Fund had underperformed their respective benchmarks but had performed in the top quartile of their respective peers. The GuidePathSM Tactical Unconstrained Asset Allocation Fund had underperformed its benchmark and had performed in the second quartile of its peers. The GuidePathSM Absolute Return Asset Allocation Fund had outperformed its benchmark but had performed in the fourth quartile of its peers. |
|
|
|
|
|
For the GuidePathSM Multi-Asset Income Asset Allocation Fund, GuidePathSM Fixed Income Allocation Fund and GuidePathSM Altegris Multi-Strategy Alternative Allocation Fund, the Trustees reviewed the comparative performance for the three-month period ended December 31, 2012 for which the Funds had actual performance; however, the Trustees noted the relatively short period and determined that more time is necessary to evaluate GFWM’s investment performance with respect to these Funds. The Trustees noted that the GuidePathSM Multi-Asset Income Asset Allocation Fund had outperformed its benchmarks and had performed in the top quartile of its peers. The GuidePathSM Fixed Income Allocation Fund had outperformed its benchmark and had performed in the fourth quartile of its peers. And finally, the GuidePathSMAltegris Multi-Strategy Alternative Allocation Fund had underperformed its benchmark and had performed in the fourth quartile of its peers. |
|
|
|
|
|
The Trustees considered that, as applicable, GFWM continued to be proactive in seeking to replace and/or add sub-advisors or underlying Funds, to reallocate assets among sub-advisors or underlying Funds, and to implement new investment strategies, with a view to improving Fund performance over the long term. |
|
|
|
|
|
The Trustees considered that they had reviewed Fund performance, including the primary contributors to and detractors from performance, with GFWM and concluded that GFWM’s performance record in managing each of the Funds is satisfactory and supported a decision to approve the renewal of the Agreements. |
|
|
|
|
|
Advisory Fees and Total Expenses |
|
|
|
|
|
The Board considered a detailed analysis of the Funds’ fees and expenses. The materials considered by the Trustees included (i) a comparison of the advisory fees and total expenses of each Fund (as a percentage of average net assets) with the fees and expenses of a group of funds selected by a third-party information provider; (ii) comparisons of each Fund’s expenses to industry averages; and (iii) fee schedules for the Funds’ Sub-Advisors, as applicable. |
|
|
|
|
|
With respect to expense ratios, the Trustees considered that, as of December 31, 2012, each Fund’s expense ratio was higher than the applicable industry averages. The Trustees considered the expense limitation arrangement under which GFWM had agreed to limit the Funds’ expenses since their inception, as well as GFWM’s other efforts to reduce overall Fund expenses, including attempts to improve asset flows, implementing programs such as securities lending and negotiating strategic contracts with service providers. |
194
|
|
|
GuideMarkSM Funds & GuidePathSM Funds |
|
ADDITIONAL INFORMATION (Continued) |
|
March 31, 2013 |
|
|
|
|
|
|
|
With respect to advisory fee levels, the Trustees considered that, as of December 31, 2012, each Fund’s advisory fee level is higher than the applicable industry averages. |
|
|
|
|
|
In analyzing the Funds’ fee levels as compared to other similar funds, the Trustees considered the Funds’ fee levels in light of the Funds’ special distribution structure, under which the Funds were distributed as part of a suite of products and services with asset allocation modeling, full performance reporting and other services that are not typically provided with mutual funds. After comparing each Fund’s fees and total expenses with those of other comparable funds, and in light of the nature, extent, and quality of services provided to the Funds by GFWM, as well as the costs incurred by GFWM in rendering those services, the Trustees concluded that the level of the fees charged by GFWM to each Fund was reasonable. |
|
|
|
|
|
Advisor Costs, Level of Profits, Economies of Scale and Ancillary Benefits |
|
|
|
|
|
The Board reviewed and discussed the financial information presented by GFWM, including information relating to the financial stability of GFWM and its historical and anticipated profitability with respect to its management of the Funds. The Board discussed the methods used by GFWM to allocate expenses to the Funds under its profitability analysis, and the Board considered the individual profitability of GFWM with respect to each Fund under this methodology. |
|
|
|
|
|
The Trustees considered GFWM’s agreement to waive advisory fees received from the Funds and/or pay Fund expenses to the extent necessary to ensure that the Funds’ overall expenses do not exceed certain levels. |
|
|
|
|
|
In evaluating GFWM’s profitability, the Trustees acknowledged that the Funds are distributed in connection with GFWM providing a package of administrative and other services as the sponsor of the GFWM investment platform, and considered the benefits that flow to Fund shareholders as a result of these services. |
|
|
|
|
|
The Trustees considered ancillary benefits received by GFWM as a result of its relationship with the Funds, including the benefits of offering an integrated set of investment options as an integral part of GFWM’s asset allocation investment programs and the related marketing rebates received by GFWM. The Trustees concluded that these benefits were reasonable. |
|
|
|
|
|
The Trustees considered the anticipated effect of asset growth on each Fund’s expenses, and other information that might suggest the potential for realizing economies of scale that could be shared with Fund shareholders. |
|
|
|
|
|
The Trustees concluded, in light of the foregoing factors, that GFWM’s level of profitability is reasonable. Additionally, the Trustees concluded that the economies of scale being realized by GFWM, if any, do not mandate the implementation of new breakpoints or other changes in the fee structure for any Fund at this time. |
|
|
|
|
|
Conclusion |
|
|
|
|
|
Based upon all of the foregoing factors and such other matters as were deemed relevant, the Trustees concluded to approve the renewal of the Advisory Agreement on behalf of the Funds. |
|
|
|
|
|
The Sub-Advisory Agreements |
|
|
|
|
|
Materials Reviewed and the Review Process |
|
|
|
|
|
Assisted by Independent Counsel, the Trustees specifically requested and were furnished with materials for purposes of their review of each Sub-Advisory Agreement. The materials provided to the Board related to, among other items: (a) the terms and conditions of the Sub-Advisory Agreements; (b) the nature, quality, and scope of the services to be provided by the Sub-Advisors, as well as the schedule of fees charged for such services; (c) each Sub-Advisor’s investment performance compared to an industry peer group as well as other sub-advisor client accounts; (d) comparative sub-advisory fee information; (e) information regarding each Sub-Advisor’s personnel, operations, financial position, and business |
195
|
|
|
GuideMarkSM Funds & GuidePathSM Funds |
|
ADDITIONAL INFORMATION (Continued) |
|
March 31, 2013 |
|
|
|
|
|
operations; (f) information regarding each Sub-Advisor’s brokerage and compliance practices; and (g) information regarding each Sub-Advisor’s interactions with GFWM regarding management of the Sub-Advised Funds. |
|
|
|
|
|
Additionally, during the course of the year, the Trustees received information relating to, among other items: (a) the quantitative performance of each Sub-Advisor; (b) GFWM’s evaluation, in accordance with its role as a “manager-of-managers,” of the nature, extent, and quality of the services provided by each Sub-Advisor; (c) GFWM’s profitability in managing each Fund and other information that might suggest the potential for realizing economies of scale that could be shared with Fund shareholders; and (d) benefits to each Sub-Advisor, such as receipt of research from brokers, that might result from the Sub-Advisor’s relationship with a Sub-Advised Fund. |
|
|
|
|
|
The Trustees received assistance and advice regarding legal and industry standards from both Independent Counsel and from counsel to the Trust, which included detailed memoranda that described the Trustees’ legal duties and obligations in considering the renewal of the Sub-Advisory Agreements. The Trustees discussed the approval of the Sub-Advisory Agreements in communications prior to their meeting and, during the course of their meeting, in executive session with Independent Counsel at which no representatives of GFWM or the Sub-Advisors were present. |
|
|
|
|
|
Factors Considered |
|
|
|
|
|
The Trustees considered and reached conclusions on a number of factors in making the decision to approve the Sub-Advisory Agreements. In so doing, the Trustees considered GFWM’s role as a “manager-of-managers,” which includes, among other functions, monitoring and evaluating the performance of the Sub-Advisors, recommending that any sub-advisor not performing as expected be replaced, and negotiating advantageous fee arrangements that could permit the Funds to realize economies of scale without compromising the quality of services. These factors and the Board’s conclusions are set forth below. |
|
|
|
|
|
Nature, Extent and Quality of Services Provided |
|
|
|
|
|
The Trustees considered each Sub-Advisor’s investment management process, including (a) the experience, capability, and integrity of the Sub-Advisor’s management, investment professionals, and other personnel; (b) the financial position of the Sub-Advisor; (c) the quality and commitment of the Sub-Advisor’s regulatory and legal compliance policies, procedures, and systems; and (d) the Sub-Advisor’s brokerage and trading practices. |
|
|
|
|
|
The Trustees specifically considered the qualifications, experience and track record of the individuals and portfolio management teams at each Sub-Advisor that are responsible for the day-to-day management of each Fund’s portfolio. The Trustees also considered, with respect to each Sub-Advisor, the specific investment approach and level of expertise within its particular asset class. The Trustees considered each Sub-Advisor’s performance record to the relevant benchmark(s). |
|
|
|
|
|
The Trustees concluded that the nature, extent, and quality of the services provided by each Sub-Advisor to its respective Sub-Advised Fund is satisfactory. |
|
|
|
|
|
Sub-Advisor Investment Performance |
|
|
|
|
|
The Trustees considered whether each Sub-Advisor operated within its respective Sub-Advised Fund’s investment objective and style and considered each Sub-Advisor’s record of compliance with applicable investment restrictions. The Trustees also considered each Sub-Advisor’s investment performance relative to benchmark indices. The Trustees considered that, for the fiscal year ended December 31, 2012, SSgA FM, on behalf of the GuideMarkSM Global Real Return Fund, and Franklin and Loomis Sayles, on behalf of the GuideMarkSM Opportunistic Fixed Income Fund, outperformed their respective benchmarks and had performed in the top quartile of their peers selected by a third-party information provider. |
196
|
|
|
GuideMarkSM Funds & GuidePathSM Funds |
|
ADDITIONAL INFORMATION (Continued) |
|
March 31, 2013 |
|
|
|
|
|
The Trustees considered that for all relevant periods, each Sub-Advisor had outperformed its relevant benchmark(s) and had performed in the top quartile of its respective peers selected by a third-party information provider. |
|
|
|
|
|
The Trustees considered that they had reviewed each Sub-Advisor, including the primary contributors to and detractors from performance, with GFWM and concluded that each Sub-Advisor’s performance record is satisfactory. |
|
|
|
|
|
Sub-Advisory Fees, Level of Profits, Economies of Scale and Ancillary Benefits |
|
|
|
|
|
The Trustees considered the fee paid to each Sub-Advisor by GFWM and other information that might suggest the potential for realizing economies of scale that could be shared with Fund shareholders. The Trustees did not consider the profitability of the Sub-Advisors to be a material factor based on representations from GFWM that it negotiates sub-advisory fees with the Sub-Advisors on an arm’s-length basis. The Trustees also considered individual reports prepared with regard to each Sub-Advisor, containing comparative information regarding fees. The Trustees noted that each Sub-Advisor’s fees were generally similar to the fees charged by each Sub-Advisor to other comparable funds and accounts and that they were fair in light of Fund performance and asset levels. |
|
|
|
|
|
The Trustees considered the anticipated effect of asset growth on each Fund’s expenses, and other information that might suggest the potential for realizing economies of scale that could be shared with Fund shareholders. In this regard, the Trustees noted that certain of the Sub-Advisory Agreements’ fee schedules contain breakpoints which present potential economies of scale that could be shared with the Sub-Advised Funds’ shareholders as assets of the Sub-Advised Fund grow. |
|
|
|
|
|
The Trustees concluded that the fees to be paid to each Sub-Advisor by GFWM are reasonable in light of the services performed for the Sub-Advised Funds by the Sub-Advisors, and that the economies of scale being realized by the Sub-Advisors, if any, do not mandate the implementation of breakpoints or other changes in the fee structure for any Fund at this time. |
|
|
|
|
|
The Trustees considered that there was no allocation of Fund brokerage to brokers affiliated with a Sub-Advisor. They noted that only Loomis Sayles uses “soft dollar” commissions to pay for research and brokerage services, and considered the benefits to Loomis Sayles from its use of soft dollars. The Trustees also considered any other ancillary benefits that accrue to a Sub-Advisor or any affiliate by virtue of the Sub-Advisor’s relationship with the Fund, and concluded that such benefits, if any, were reasonable. |
|
|
|
|
|
Conclusion |
|
|
|
|
|
Based on their evaluation of the relevant factors, the Board - including the independent Trustees - concluded to approve the renewal of each Sub-Advisory Agreement. |
197
GuideMarkSM Funds
GuidePathSM Funds
|
|
|
|
|
|
|
GUIDEMARKSM FUNDS & GUIDEPATHSM FUNDS | |
|
|
|
|
|
|
|
GuideMarkSM Large Cap Growth Fund |
|
|
GuideMarkSM Large Cap Value Fund |
|
|
GuideMarkSM Small/Mid Cap Core Fund |
|
|
GuideMarkSM World ex-US Fund |
|
|
GuideMarkSM Opportunistic Equity Fund |
|
|
GuideMarkSM Global Real Return Fund |
|
|
GuideMarkSM Core Fixed Income Fund |
|
|
GuideMarkSM Tax-Exempt Fixed Income Fund |
|
|
GuideMarkSM Opportunistic Fixed Income Fund |
|
|
GuidePathSM Strategic Asset Allocation Fund |
|
|
GuidePathSM Tactical ConstrainedSM Asset Allocation Fund |
|
|
GuidePathSM Tactical UnconstrainedSM Asset Allocation Fund |
|
|
GuidePathSM Absolute Return Asset Allocation Fund |
|
|
GuidePathSM Multi-Asset Income Asset Allocation Fund |
|
|
GuidePathSM Fixed Income Allocation Fund |
|
|
GuidePathSM Altegris® Multi-Strategy Alternative Allocation Fund |
|
|
|
|
|
Investment Advisor |
|
|
Genworth Financial Wealth Management, Inc. |
|
|
2300 Contra Costa Blvd., Suite 600 |
|
|
Pleasant Hill, CA 94523 |
|
|
|
|
|
Legal Counsel |
|
|
Stradley Ronon Stevens & Young, LLP |
This document must be |
|
2005 Market Street, Suite 2600 | |
|
Philadelphia, PA 19103 | |
|
| |
|
Independent Registered Public Accounting Firm | |
|
KPMG LLP | |
|
4200 Wells Fargo Center | |
|
90 South Seventh Street | |
|
Minneapolis, MN 55402 | |
|
| |
|
Transfer Agent, Fund Accountant | |
|
and Fund Administrator | |
|
U.S. Bancorp Fund Services, LLC | |
|
615 East Michigan Street | |
|
Milwaukee, WI 53202 |
|
|
|
|
|
Custodians |
|
|
U.S. Bank, N.A. BNY Mellon Asset Servicing |
|
|
1555 North RiverCenter Drive, Suite 302 One Wall Street |
|
|
Milwaukee, WI 53212 New York, NY 10286 |
|
|
|
|
|
Distributor |
Annual Report |
|
Capital Brokerage Corporation | |
|
(dba Genworth Financial Brokerage Corporation in Indiana) | |
|
6620 West Broad Street Building 2 | |
|
Richmond, VA 23230 | |
|
Member FINRA | |
|
|
|
Item 2. Code of Ethics.
The registrant has adopted a code of ethics that applies to the registrant’s principal executive officer and principal financial officer. The registrant has not made any amendments to its code of ethics during the period covered by this report. The registrant has not granted any waivers from any provisions of the code of ethics during the period covered by this report.
A copy of the registrant’s Code of Ethics is filed herewith.
Item 3. Audit Committee Financial Expert.
The registrant’s board of trustees has determined that there is at least one audit committee financial expert serving on its audit committee. Dennis Schmal is the “audit committee financial expert” and is considered to be “independent” as each term is defined in Item 3 of Form N-CSR.
Item 4. Principal Accountant Fees and Services.
(a) Audit Fees
For the fiscal year ended March 31, 2013, the registrant’s principal accountant billed the registrant $182,900 for professional services rendered for the audit of the registrant’s annual financial statements or services that are normally provided by the principal accountant in connection with statutory and regulatory filings or engagements.
For the fiscal year ended March 31, 2012, the registrant’s principal accountant billed the registrant $149,000 for professional services rendered for the audit of the registrant’s annual financial statements or services that are normally provided by the principal accountant in connection with statutory and regulatory filings or engagements.
(b) Audit-Related Fees
None.
c) Tax Fees
For the fiscal year ended March 31, 2013, the registrant’s principal accountant billed the registrant $38,570 for professional services rendered for tax compliance, tax advice and tax planning.
For the fiscal year ended March 31, 2012, the registrant’s principal accountant billed the registrant $30,000 for professional services rendered for tax compliance, tax advice and tax planning.
(d) All Other Fees
1
None.
|
|
|
|
|
(e)(1) |
The registrant’s audit committee charter provides that the audit committee is responsible for the approval, prior to appointment, of the engagement of auditors annually to audit and to provide their opinion on the registrant’s financial statements. The audit committee charter also provides that the audit committee is responsible for the approval, prior to appointment, of the engagement of the auditor to provide other audit services to the registrant or to provide non-audit services to the registrant, its investment adviser or any entity controlling, controlled by, or under common control with the investment adviser that provides ongoing services to the registrant, if the engagement relates directly to the operations and financial reporting of the registrant. |
|
|
|
|
|
|
(e)(2) |
There were no services in paragraphs (b) through (d) above (including services required to be approved by the audit committee pursuant to paragraph (c)(7)(ii) of Rule 2-01 of Regulation S-X) that were approved pursuant to the waiver provision of paragraph (c)(7)(i)(C) of Rule 2-01 of Regulation S-X. |
|
|
|
|
|
|
(f) |
None of the hours expended on the principal accountant’s engagement to audit the registrant’s financial statements for the fiscal year ended March 31, 2013 were attributable to work performed by persons other than the principal accountant’s full-time, permanent employees. |
|
|
|
|
|
|
(g) |
The aggregate non-audit fees billed by the registrant’s principal accountant for services rendered to the registrant’s investment adviser and any entity controlling, controlled by, or under common control with the investment adviser that provides ongoing services to the registrant for the fiscal years ended March 31, 20132 and March 31, 2012, were $0 and $0, respectively. |
|
|
|
|
|
|
(h) |
The registrant’s audit committee has considered whether the provision of non-audit services that were rendered to the registrant’s investment adviser, and any entity controlling, controlled by, or under common control with the investment adviser that provides ongoing services to the registrant, that were not pre-approved pursuant to paragraph (c)(7)(ii) of Rule 2-01 of Regulation S-X is compatible with maintaining the principal accountant’s independence. |
|
Item 5. Audit Committee of Listed Registrants.
Not applicable to registrants who are not listed issuers (as defined in Rule 10A-3 under the Securities Exchange Act of 1934).
Item 6. Investments.
Schedule of Investments is included as part of the report to shareholders filed under Item 1 of this Form.
Item 7. Disclosure of Proxy Voting Policies and Procedures for Closed-End Management Investment Companies.
Not applicable to open-end investment companies.
2
Item 8. Portfolio Managers of Closed-End Management Investment Companies.
Not applicable to open-end investment companies.
Item 9. Purchases of Equity Securities by Closed-End Management Investment Company and Affiliated Purchasers.
Not applicable to open-end investment companies.
Item 10. Submission of Matters to a Vote of Security Holders.
None.
Item 11. Controls and Procedures.
|
|
|
|
(a) |
The Registrant’s President/Principal Executive Officer and Treasurer/Principal Financial Officer have reviewed the Registrant’s disclosure controls and procedures (as defined in Rule 30a-3(c) under the Investment Company Act of 1940 (the “Act”)) as of a date within 90 days of the filing of this report, as required by Rule 30a-3(b) under the Act and Rules 13a-15(b) or 15d-15(b) under the Securities Exchange Act of 1934. Based on their review, such officers have concluded that the disclosure controls and procedures are effective in ensuring that information required to be disclosed in this report is appropriately recorded, processed, summarized and reported and made known to them by others within the Registrant and by the Registrant’s service provider. |
|
|
|
|
(b) |
There were no changes in the Registrant’s internal control over financial reporting (as defined in Rule 30a-3(d) under the Act) that occurred during the second fiscal quarter of the period covered by this report that has materially affected, or is reasonably likely to materially affect, the Registrant’s internal control over financial reporting. |
Item 12. Exhibits.
|
|
|
|
(a) |
(1) Any code of ethics or amendment thereto, that is the subject of the disclosure required by Item 2, to the extent that the registrant intends to satisfy Item 2 requirements through filing an exhibit. Filed herewith. |
|
|
|
|
|
(2) A separate certification for each principal executive and principal financial officer pursuant to Section 302 of the Sarbanes-Oxley Act of 2002. Filed herewith. |
|
|
|
|
|
(3) Any written solicitation to purchase securities under Rule 23c-1 under the Investment Company Act of 1940 sent or given during the period covered by the report by or on behalf of the registrant to 10 or more persons. Not applicable. |
|
|
|
|
(b) |
Certifications pursuant to Section 906 of the Sarbanes-Oxley Act of 2002. Furnished herewith. |
3
SIGNATURES
Pursuant to the requirements of the Securities Exchange Act of 1934 and the Investment Company Act of 1940, the registrant has duly caused this report to be signed on its behalf by the undersigned, thereunto duly authorized.
|
|
|
|
|
|
|
|
|
(Registrant) |
GPS Funds I |
|
||
|
|
|
|
|||
|
|
|
|
|
||
|
|
By (Signature and Title) |
/s/ Carrie E. Hansen |
|
||
|
|
|
|
|||
|
|
|
Carrie E. Hansen, Principal Executive Officer/President |
|||
|
|
|
|
|
||
|
|
Date |
5/28/13 |
|
||
|
|
|
|
|||
|
|
|
|
|
|
|
Pursuant to the requirements of the Securities Exchange Act of 1934 and the Investment Company Act of 1940, this report has been signed below by the following persons on behalf of the registrant and in the capacities and on the dates indicated.
|
|
|
|
|
|
|
|
|
By (Signature and Title) |
/s/ Carrie E. Hansen |
|
||
|
|
|
|
|||
|
|
|
Carrie E. Hansen, Principal Executive Officer/President |
|
||
|
|
|
|
|
||
|
|
Date |
5/28/13 |
|
||
|
|
|
|
|||
|
|
|||||
|
|
By (Signature and Title) |
/s/ Starr E. Frohlich |
|
||
|
|
|
|
|||
|
|
|
Starr E. Frohlich, Principal Financial Officer/Treasurer |
|
||
|
|
|
|
|
||
|
|
Date |
5/28/13 |
|
||
|
|
|
|
|||
4