Exhibit 99.1
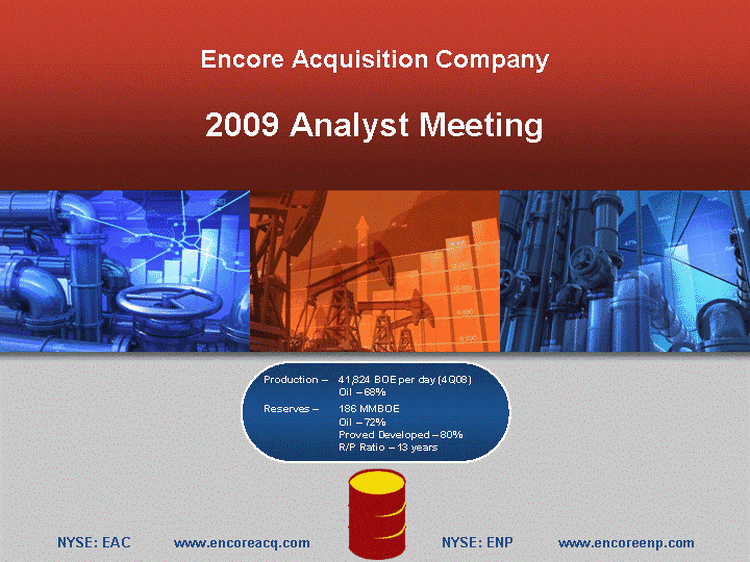
| Encore Acquisition Company 2009 Analyst Meeting NYSE: EAC www.encoreacq.com NYSE: ENP www.encoreenp.com Production - 41,824 BOE per day (4Q08) Oil - 68% Reserves - 186 MMBOE Oil - 72% Proved Developed - 80% R/P Ratio - 13 years |
| Cautionary Statement This presentation includes forward-looking statements, which give Encore's current expectations or forecasts of future events based on currently available information. Forward-looking statements in this presentation relate to, among other things, the likelihood and benefits of acquisitions and joint venture arrangements; strategic objectives for 2009; drilling opportunities, plans, and results; expectations regarding new plays (including, without limitation, the Bakken, Haynesville and TMS); expected oil and natural gas production; the amount of original oil in place at Encore's fields; the potential value of reserves; reserve potential or upside; reserves by location; estimated decline rates; expected cash flows; expected revenues and expenses; projected differentials; expected capital expenditures (including location and amounts); rates of return; ability to develop various plays (including the Bakken and Haynesville plays); ability to maintain our rig program; ability to bring CO2 to the Cedar Creek Anticline or Bell Creek and the benefits therefrom; future drilling locations and the benefits and costs associated therewith; the impact of the net profits interest; analyst expectations for 2009 and beyond; ability to pay down debt; the benefits of a master limited partnership; the ability of Encore Energy Partners LP to maintain or raise its distribution; and the cost and benefits of the stock repurchase program and derivative financial instruments. The assumptions of management and the future performance of Encore are subject to a wide range of business risks and uncertainties and there is no assurance that these statements and projections will be met. Factors that could affect Encore's business include, but are not limited to: the risks associated with drilling of oil and natural gas wells; Encore's ability to find, acquire, market, develop, and produce new properties; the risk of drilling dry holes; oil and natural gas price volatility; derivative transactions (including the costs associated therewith and the ability of counterparties to perform thereunder); uncertainties in the estimation of proved, probable, and possible reserves and in the projection of future rates of production and reserve growth; inaccuracies in Encore's assumptions regarding items of income and expense and the level of capital expenditures; uncertainties in the timing of exploitation expenditures; operating hazards attendant to the oil and natural gas business; risks related to Encore's high-pressure air program; drilling and completion losses that are generally not recoverable from third parties or insurance; potential mechanical failure or underperformance of significant wells; climatic conditions; availability and cost of material and equipment; the risks associated with operating in a limited number of geographic areas; actions or inactions of third-party operators of Encore's properties; Encore's ability to find and retain skilled personnel; diversion of management's attention from existing operations while pursuing acquisitions or joint ventures; availability of capital; the ability of lenders and derivative counterparties to fulfill their commitments; the strength and financial resources of Encore's competitors; regulatory developments; environmental risks; uncertainties in the capital markets; uncertainties with respect to asset sales; general economic and business conditions (including the effects of the worldwide economic recession); industry trends; and other factors detailed in the most recent Form 10-K of Encore Acquisition Company and Encore Energy Partners LP, and other filings with the Securities and Exchange Commission (SEC). If one or more of these risks or uncertainties materialize (or the consequences of such a development changes), or should underlying assumptions prove incorrect, actual outcomes may vary materially from those forecasted or expected. Encore undertakes no obligation to publicly update or revise any forward-looking statements. The SEC permits oil and natural gas entities, in their filings with the SEC, to disclose only proved reserves that an entity has demonstrated by actual production or conclusive formation tests to be economically and legally producible under existing economic and operating conditions. Encore uses certain terms in this presentation such as "possible", "probable", "potential", "upside", or other descriptions of volumes of reserves potentially recoverable through additional drilling or recovery techniques (such as waterfloods and CO2) that the SEC's guidelines would prohibit Encore from including in filings with the SEC. These estimates are by their nature more speculative than estimates of proved reserves and, accordingly, are subject to substantially greater risk of being actually realized by Encore. Investors are urged to consider closely the disclosure in our Form 10-K and Forms 10-Q, File No. 1-16295, available from Encore at Encore Acquisition Company, 777 Main Street, Suite 1400, Fort Worth, Texas 76102, Attention: Corporate Secretary. You can also obtain these forms on the SEC's website at www.sec.gov. |
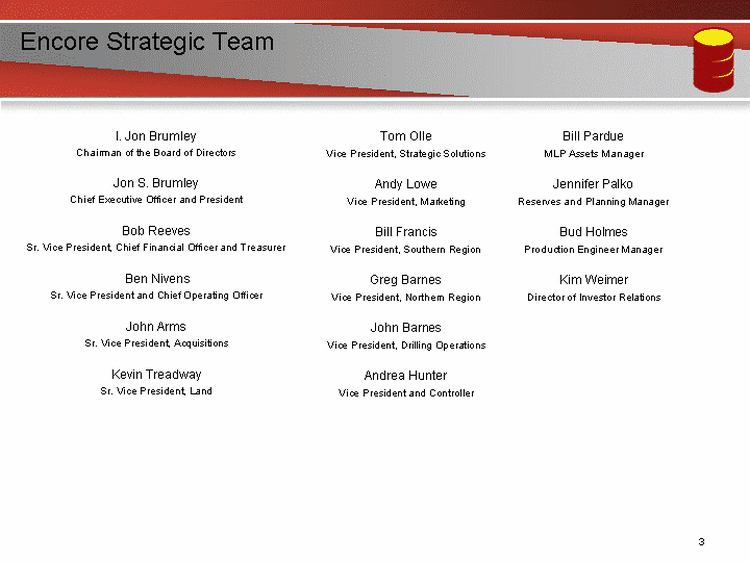
| Encore Strategic Team I. Jon Brumley Chairman of the Board of Directors Jon S. Brumley Chief Executive Officer and President Bob Reeves Sr. Vice President, Chief Financial Officer and Treasurer Ben Nivens Sr. Vice President and Chief Operating Officer John Arms Sr. Vice President, Acquisitions Kevin Treadway Sr. Vice President, Land Tom Olle Vice President, Strategic Solutions Andy Lowe Vice President, Marketing Bill Francis Vice President, Southern Region Greg Barnes Vice President, Northern Region John Barnes Vice President, Drilling Operations Andrea Hunter Vice President and Controller Bill Pardue MLP Assets Manager Jennifer Palko Reserves and Planning Manager Bud Holmes Production Engineer Manager Kim Weimer Director of Investor Relations |
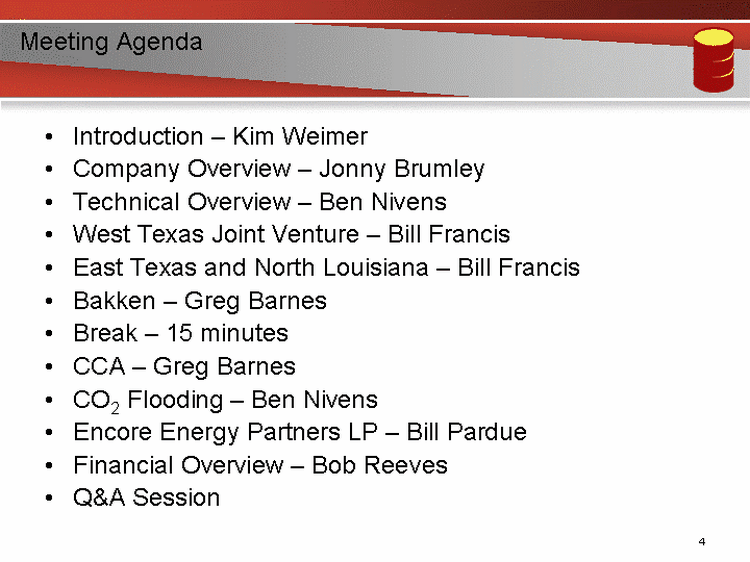
| Meeting Agenda Introduction - Kim Weimer Company Overview - Jonny Brumley Technical Overview - Ben Nivens West Texas Joint Venture - Bill Francis East Texas and North Louisiana - Bill Francis Bakken - Greg Barnes Break - 15 minutes CCA - Greg Barnes CO2 Flooding - Ben Nivens Encore Energy Partners LP - Bill Pardue Financial Overview - Bob Reeves Q&A Session |

| Encore's strategy is conservative and simple Build a portfolio of properties that the production can be held flat for half of cash flow Makes you oily Leads you to waterfloods Largest independent oil producer in the Rockies 70% oil and like it Conservative 2009 plan and budget Generate $175 to $225 million cash surplus Keep our options open Budget may be small but includes high impact wells Late 2009 decisions - let the smoke clear and reduce debt Reduce debt Acquisition More drilling Share repurchase Do the right thing with the cash surplus Focus on our three successful plays Bakken Haynesville West TX JV We are opportunity rich especially at higher oil prices * Original oil in place and the percent recovered is based on internal estimates. Original oil in place is not an estimate of the amount of recoverable oil in place. Production - 41,824 BOE per day (4Q08) Oil - 68% Reserves - 186 MMBOE Oil - 72% Proved Developed - 80% R/P Ratio - 13 years |
| The strategy gets us in position when prices increase Close out hedges Reduces debt Eliminates counterparty risk We are better off with less debt than a balance sheet item Invest at or below discretionary cash flow even at low prices - we will cut the budget if prices fall further Very conservative budget - the best of the best at a slow rate Bakken - Charlson Arklatex - Haynesville and Cotton Valley Lime West TX JV - Pegasus, Block 16, and Coyanosa Only run 5 rigs to be very efficient Encore's long life properties allow for this strategy |
| Our 2009 capital budget is strategic 2009 Goal: Generate a cash surplus of $175 to $225 million Operational objectives Reduce debt Reduce capital costs Reduce LOE Keep production relatively flat to 2008 Maintain key position in Bakken Test Haynesville and Bossier Exploit Pegasus and Coyanosa fields in the XOM JV Opportunities Enhance acreage positions in the Bakken and Haynesville play Contract CO2 for Bell Creek and Cedar Creek EOR |

| Our 2009 capital budget is conservative Drilling & Development Land, Seismic & Other Cash Surplus $275MM $35MM $200 Million @ $50/$6 Low-risk High rate-of-return Repeatable Expand both Bakken and Haynesville acreage positions Debt reduction Acquisitions Drilling and workovers Stock repurchase Drilling & Development 54% Land 7% Cash Surplus 39% Bakken/ Sanish Haynesville/ Cotton Valley/ Travis Peak W TX JV Mid-Continent Other Rockies Other West Texas $85MM 31% $60MM 22% $50MM 18% $40MM 15% $25MM 9% $15MM 5% |

| We are in position Solid strategy makes Encore more resilient Shallow declining properties Strong balance sheet Plenty of liquidity A large project inventory for "Bull" commodity price cycles Large drilling inventory in low risk areas Large CO2 target in Williston Basin High impact inventory Bakken Haynesville West TX JV TMS has huge potential |
| Encore Acquisition Company Technical Overview Ben Nivens NYSE: EAC www.encoreacq.com NYSE: ENP www.encoreenp.com |
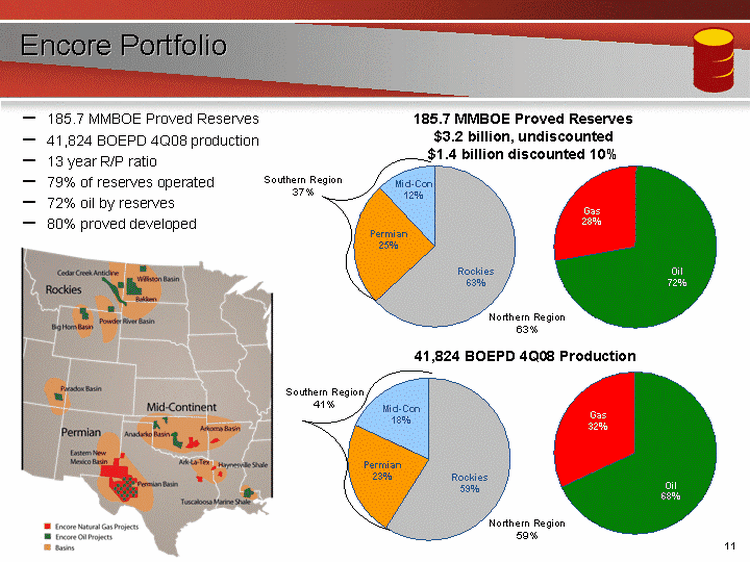
| Encore Portfolio 185.7 MMBOE Proved Reserves 41,824 BOEPD 4Q08 production 13 year R/P ratio 79% of reserves operated 72% oil by reserves 80% proved developed Permian Mid-Con Rockies Production 23 18 59 Permian Mid-Con Rockies Production 25 12 63 Gas Oil Reserves 28 72 Gas Oil Reserves 32 68 185.7 MMBOE Proved Reserves $3.2 billion, undiscounted $1.4 billion discounted 10% 41,824 BOEPD 4Q08 Production Southern Region 37% Northern Region 63% Southern Region 41% Northern Region 59% Mid-Con 12% Rockies 63% Permian 25% Mid-Con 18% Rockies 59% Permian 23% Oil 68% Gas 32% Oil 72% Gas 28% |

| Long-Life Oil Fields Make EAC More Stable and Safe 65% of Production and Reserves Waterflood PDP Natural Decline rate ~8% Implemented waterflood projects have significant uplift Current projects will develop 17 million barrels Inventory of 228 million barrels additional remaining Large CO2 Enhanced Oil Recovery potential in the Rockies Actual CCA & Bell Creek (Before Net Profits Interest) Permian Basin & Oklahoma Forecast (1) Original oil in place and the percent recovered is based on internal estimates. Original oil in place is not an estimate of the amount of recoverable oil in place. |

| 2009 Development Program 2009 Development Program |
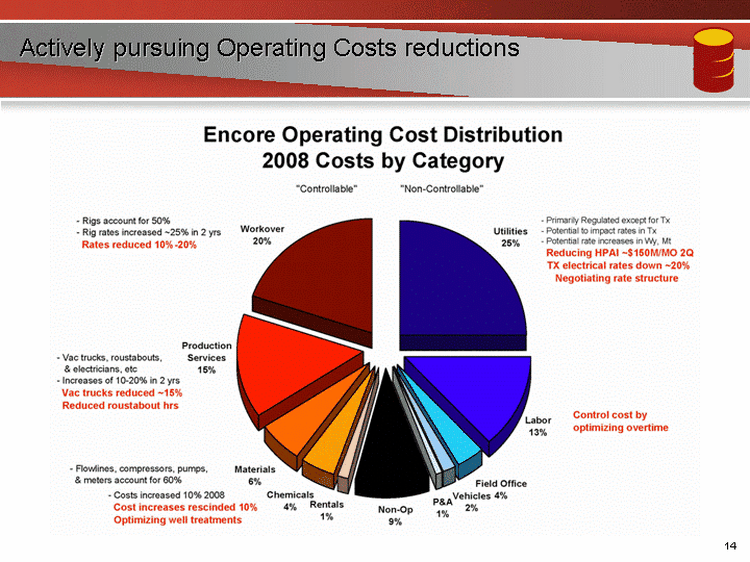
| Actively pursuing Operating Costs reductions |

| Development costs are improving Permian Devonian Well - Drilling Cost Cost Item % Savings $ Savings Rig Rate 25 480,000 Fuel 40 125,000 Tubulars 15 180,000 Bits 15 25,000 Cement 20 30,000 Directional 30 120,000 Rentals 25 150,000 Stimulation 40 340,000 Total 18 1,450,000 Pegasus 3904H 2008 Cost Estimate: $8,202M Pegasus 3904H 2009 Cost Estimate - All Savings Realized: $6,752M |

| CO2 Reserves Potential in the Rockies Existing CO2 Lines Proposed CO2 Lines EAC Operated Fields Other Fields CO2 Sources Existing Proposed Power Plants Ethanol Plants Coal to Gas or Liquids DGC Beulah ELK BASIN CEDAR CREEK ANTICLINE BELL CREEK STADIUM ELAND LaBarge Lost Cabin Montana Montana Wyoming Wyoming North Dakota North Dakota South Dakota South Dakota Nebraska Nebraska Idaho Idaho Utah Utah Minnesota Minnesota Existing CO2 Lines Proposed CO2 Lines EAC Operated Fields Other Fields CO2 Sources Existing Proposed Power Plants Ethanol Plants Coal to Gas or Liquids |
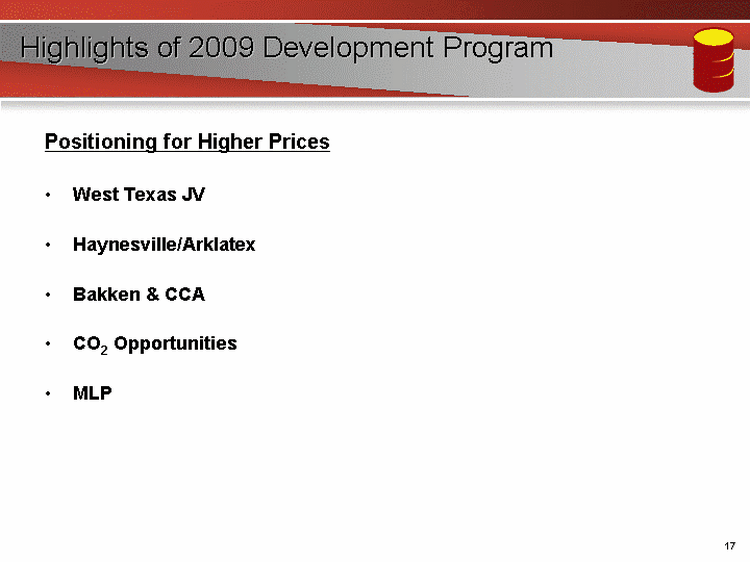
| Highlights of 2009 Development Program West Texas JV Haynesville/Arklatex Bakken & CCA CO2 Opportunities MLP Positioning for Higher Prices |

| Encore Acquisition Company West Texas ExxonMobil JV Bill Francis NYSE: EAC www.encoreacq.com NYSE: ENP www.encoreenp.com |

| ExxonMobil JV - Positioned for the Future JV assets provide predictable, solid results Best gas fields in the Permian Basin Minimal capital investment in 2009 Take advantage of the drilling hiatus to build inventory and reduce well costs EAC will be positioned to resume a vigorous drilling program when: Commodity prices strengthen Cost of goods and services decrease |

| West Texas JV - Enters a New Phase Joint venture with Includes 7 of the best gas fields in the Permian Basin EAC 30% WI / 22.5% NRI per agreement (Heads-up) Actual Working Interest = 69% 40-75 MMBOE or 240-450 BCFE of upside potential 77 wells drilled to date 2008 exit rate 27 net mmcfepd vs. budgeted rate 21 net mmcfepd 2009 Agreement with XOM allows EAC to hold JV with less capital 2009 Capital: $53MM Gomez Puckett Coyanosa Sawyer Brown-Bassett Top 15 Permian Gas Fields By Cumulative Production Emperor Lockridge Headlee Waha JM Block 16 Eumont Sand Hills Ozona Ozona NE 100,000+ Gross acres Plant curtailment (Hurricane Ike) |
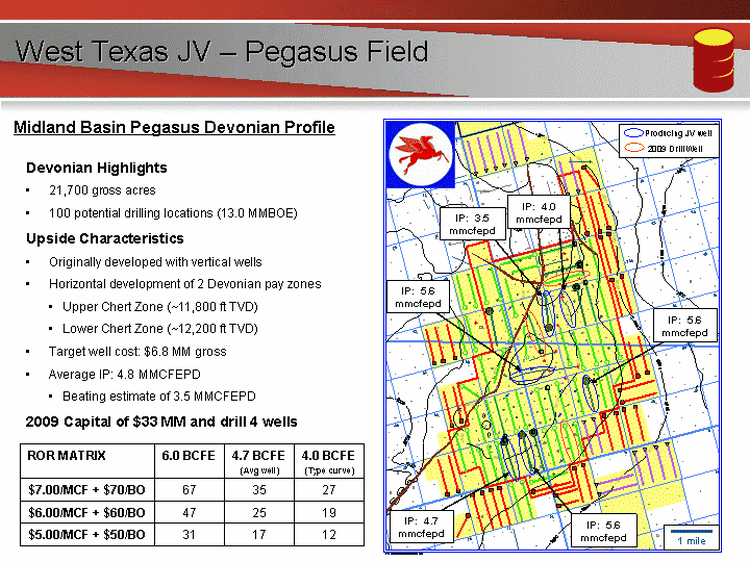
| Producing JV well 2009 Drill Well 1 mile West Texas JV - Pegasus Field Midland Basin Pegasus Devonian Profile Devonian Highlights 21,700 gross acres 100 potential drilling locations (13.0 MMBOE) Upside Characteristics Originally developed with vertical wells Horizontal development of 2 Devonian pay zones Upper Chert Zone (~11,800 ft TVD) Lower Chert Zone (~12,200 ft TVD) Target well cost: $6.8 MM gross Average IP: 4.8 MMCFEPD Beating estimate of 3.5 MMCFEPD 2009 Capital of $33 MM and drill 4 wells ROR MATRIX 6.0 BCFE 4.7 BCFE (Avg well) 4.0 BCFE (Type curve) $7.00/MCF + $70/BO 67 35 27 $6.00/MCF + $60/BO 47 25 19 $5.00/MCF + $50/BO 31 17 12 IP: 5.6 mmcfepd IP: 4.7 mmcfepd IP: 5.6 mmcfepd IP: 5.6 mmcfepd IP: 3.5 mmcfepd IP: 4.0 mmcfepd |
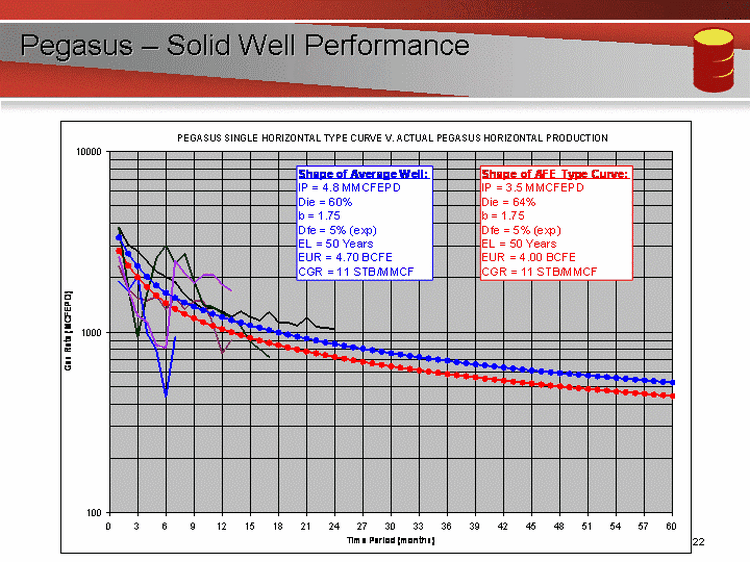
| Pegasus - Solid Well Performance Pegasus - Solid Well Performance |
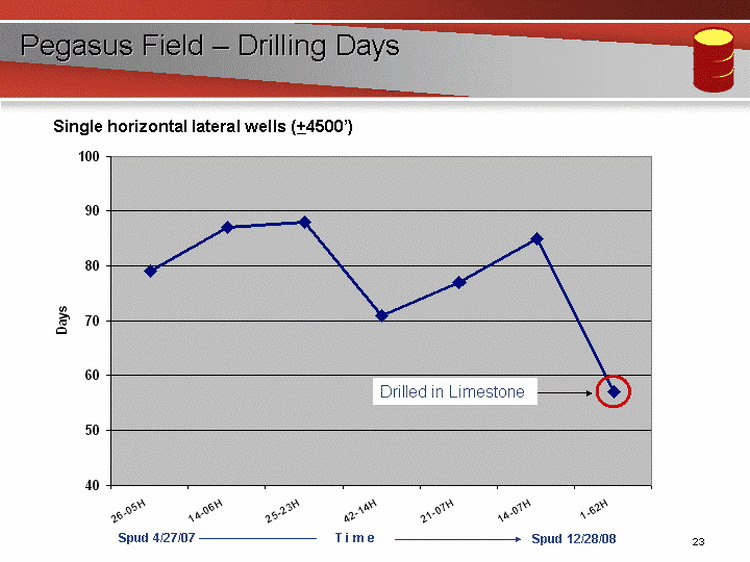
| Pegasus Field - Drilling Days Single horizontal lateral wells (+4500') Spud 4/27/07 Spud 12/28/08 T i m e Drilled in Limestone |
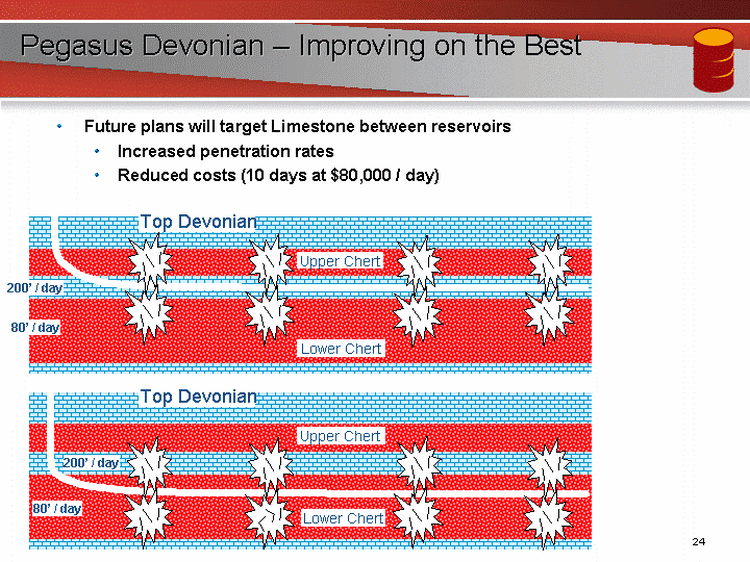
| Pegasus Devonian - Improving on the Best Future plans will target Limestone between reservoirs Increased penetration rates Reduced costs (10 days at $80,000 / day) Lower Chert Upper Chert Top Devonian 200' / day 80' / day Lower Chert Upper Chert Top Devonian 200' / day 80' / day |

| Pegasus 1-62H - Drilling Curves (Limestone) Pegasus 1-62H - Drilling Curves (Limestone) Drilling Time Curve Drilling Cost Curve Drilling Cost Curve |

| Pegasus Production Profile - 1 Rig Program Pegasus Production Profile - 1 Rig Program Pegasus Field Devonian 50 PUD Locations 50 PUD Locations 50 PUD Locations |

| West Texas Joint Venture - Delaware Basin Delaware Basin Montoya Profile Montoya Highlights 14,000 gross acres 39 low risk drilling locations (7.3 MMBOE) First horizontal Montoya well (Pyote Gas Unit 3-3H): IP: 12.7 MMcfe/D EUR: 9 BCF Approximate depth: 13,500 ft. Target well cost: $10.8 MM gross Additional potential in Permian, Pennsylvanian, and Mississippian (5.5 MMBOE) 2009 Capital of $8.5 MM and drill 2 wells 1 Montoya and 1 Mississippian well Montoya ROR Matrix 10.0 BCFE 9.0 BCFE (1st well) 8.0 BCFE (Type curve) $7.00/MCF + $70/BO 62 48 36 $6.00/MCF + $60/BO 42 33 24 $5.00/MCF + $50/BO 27 21 15 $5.00/MCF + $50/BO 27 21 15 $5.00/MCF + $50/BO 27 21 15 $5.00/MCF + $50/BO 27 21 15 $5.00/MCF + $50/BO 27 21 15 $5.00/MCF + $50/BO 27 21 15 $5.00/MCF + $50/BO 27 21 15 $5.00/MCF + $50/BO 27 21 15 $5.00/MCF + $50/BO 27 21 15 $5.00/MCF + $50/BO 27 21 15 $5.00/MCF + $50/BO 27 21 15 $5.00/MCF + $50/BO 27 21 15 $5.00/MCF + $50/BO 27 21 15 Block 16 Offset Location - Spud 12/14/2008 - Currently drilling lateral 1 mile Pyote Gas Unit 3-3H - Encore's Largest IP: 12.7 MMcfe/D |

| Montoya Production Profile - 1 Rig Program Delaware Basin Montoya (39 wells) |

| ExxonMobil JV - Positioned for the Future JV assets provide predictable, solid results Best gas fields in the Permian Basin Minimal capital investment in 2009 Take advantage of the drilling hiatus to build inventory and reduce well costs EAC will be positioned to resume a vigorous drilling program when: Commodity prices strengthen Cost of goods and services decrease |
| Encore Acquisition Company East Texas and North Louisiana Bill Francis NYSE: EAC www.encoreacq.com NYSE: ENP www.encoreenp.com |

| Ark-La-Tex - Opportunities in Emerging Plays Many locations in multiple developing plays Stacked pay zones lowers risk 1st Haynesville well drilled in 49 days 11 days under estimate Minimal capital investment in 2009 Limited to testing concepts and holding acreage Haynesville Fractured Cotton Valley Lime Proving and building inventory in 2009 EAC will be ready to implement when: Commodity prices strengthen Cost of goods and services decrease |
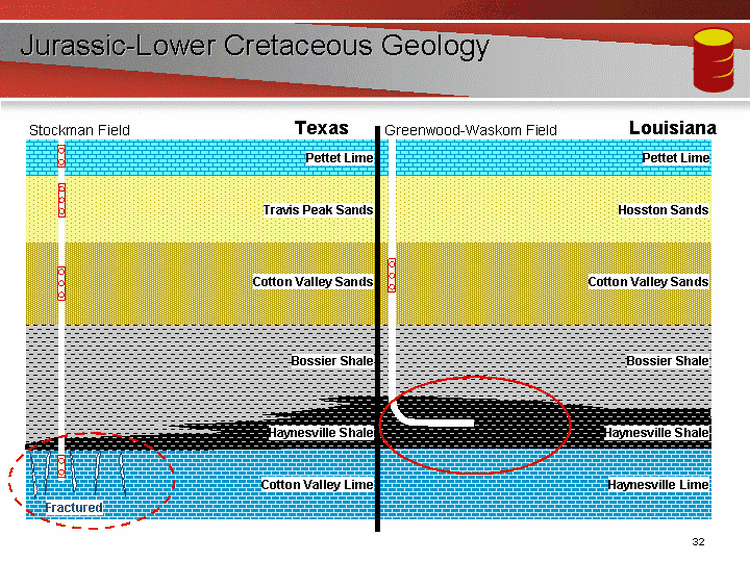
| Jurassic-Lower Cretaceous Geology Texas Louisiana Haynesville Lime Cotton Valley Sands Bossier Shale Hosston Sands Haynesville Shale Pettet Lime Greenwood-Waskom Field Stockman Field Cotton Valley Lime Cotton Valley Sands Bossier Shale Travis Peak Sands Haynesville Shale Pettet Lime Fractured |

| Northwest Louisiana - Haynesville Play Greenwood Waskom (5,005 Net Ac.) Caspiana (5,216 Net Ac.) Kingston (344 Net Ac) Chesapeake Petrohawk Camterra Encana Comstock Penn Virginia Haynesville Isopach: CI = 25 ' Goodrich IP up to 15 MMcfpd . . Haynesville wells IP up to 28 MMcfpd IP up to 8 MMcfpd IP up to 16 MMcfpd Elm Grove (1,979 Net Ac.) Encore's acreage is well positioned in the Haynesville play Haynesville 47,596 gross acres in heart of play 12,544 net acres in heart of play Additional 6,700 in extensional areas 300 gross horizontal locations 160 acre spacing IP's range from 2 - 28 mmcfepd Average reserves estimated at 6 BCF per horizontal well Target well cost: $8.6 MM gross 78 MMBOE net upside reserves |
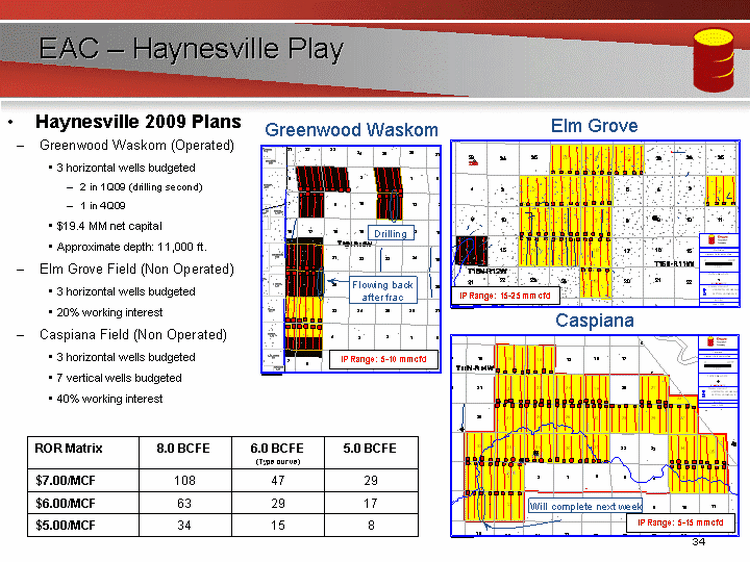
| EAC - Haynesville Play Haynesville 2009 Plans Greenwood Waskom (Operated) 3 horizontal wells budgeted 2 in 1Q09 (drilling second) 1 in 4Q09 $19.4 MM net capital Approximate depth: 11,000 ft. Elm Grove Field (Non Operated) 3 horizontal wells budgeted 20% working interest Caspiana Field (Non Operated) 3 horizontal wells budgeted 7 vertical wells budgeted 40% working interest Caspiana ROR Matrix 8.0 BCFE 6.0 BCFE (Type curve) 5.0 BCFE $7.00/MCF 108 47 29 $6.00/MCF 63 29 17 $5.00/MCF 34 15 8 Flowing back after frac Drilling IP Range: 5-10 mmcfd IP Range: 15-25 mmcfd IP Range: 5-15 mmcfd |
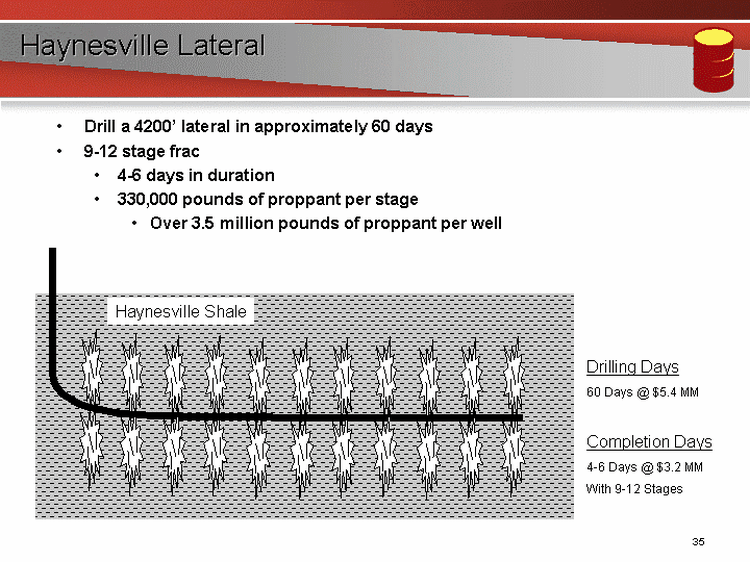
| Haynesville Lateral Haynesville Shale Drilling Days 60 Days @ $5.4 MM Completion Days 4-6 Days @ $3.2 MM With 9-12 Stages Drill a 4200' lateral in approximately 60 days 9-12 stage frac 4-6 days in duration 330,000 pounds of proppant per stage Over 3.5 million pounds of proppant per well |
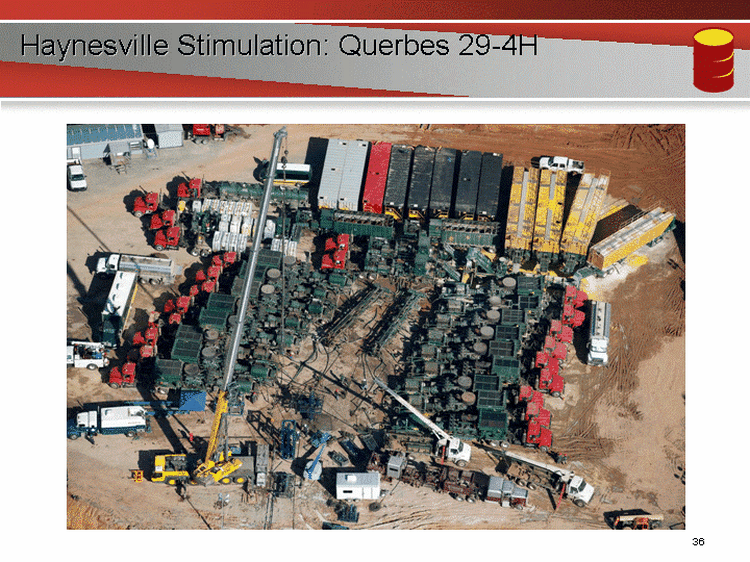
| Haynesville Stimulation: Querbes 29-4H Haynesville Stimulation: Querbes 29-4H |

| Haynesville Production Profile: 1 Rig Program 1 Rig drilling program in Stateline Area (160 acre spacing) |

| Jurassic-Lower Cretaceous Geology Texas Louisiana Haynesville Lime Cotton Valley Sands Bossier Shale Hosston Sands Haynesville Shale Pettet Lime Greenwood-Waskom Field Stockman Field Cotton Valley Lime Cotton Valley Sands Bossier Shale Travis Peak Sands Haynesville Shale Pettet Lime Fractured |
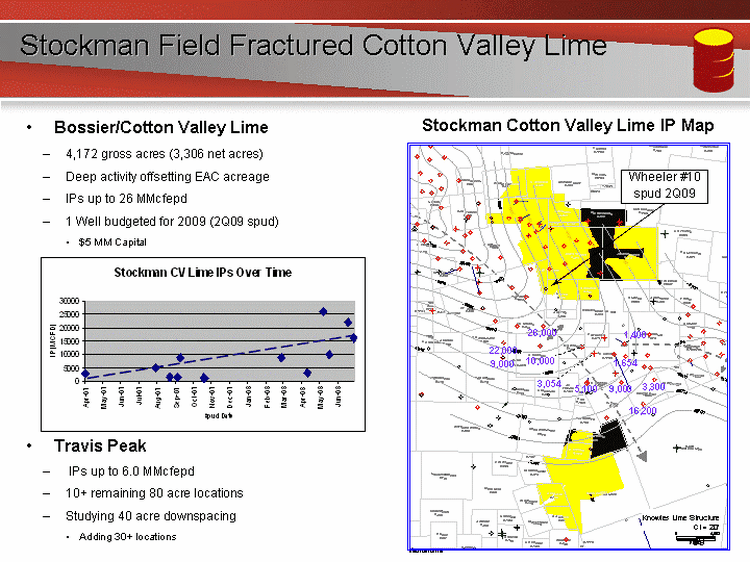
| Stockman Field Fractured Cotton Valley Lime Travis Peak IPs up to 6.0 MMcfepd 10+ remaining 80 acre locations Studying 40 acre downspacing Adding 30+ locations Bossier/Cotton Valley Lime 4,172 gross acres (3,306 net acres) Deep activity offsetting EAC acreage IPs up to 26 MMcfepd 1 Well budgeted for 2009 (2Q09 spud) $5 MM Capital Stockman Cotton Valley Lime IP Map Stockman Cotton Valley Lime IP Map Knowles Lime Structure CI = 20' Wheeler #10 spud 2Q09 |

| Ark-La-Tex - Opportunities in Emerging Plays Many locations in multiple developing plays Stacked pay zones lowers risk 1st Haynesville well drilled in 49 days 11 days under estimate Minimal capital investment in 2009 Limited to testing concepts and holding acreage Haynesville Fractured Cotton Valley Lime Proving and building inventory in 2009 EAC will be ready to implement when: Commodity prices strengthen Cost of goods and services decrease |

| Encore Acquisition Company Bakken Greg Barnes NYSE: EAC www.encoreacq.com NYSE: ENP www.encoreenp.com |

| Encore's North Dakota Bakken - Well Positioned Bakken resource play is biggest oil play in US Over 300,000 net acres in the play 3.75 billion barrels of oil in place in its acreage Drilled 24 wells in several areas in North Dakota Bakken: Avg IP 411 BOPD Activity levels have dropped with oil prices Focused on reducing costs Testing extensional areas, high grading inventory Drilling low risk development opportunities Continue highly successful re-frac program |
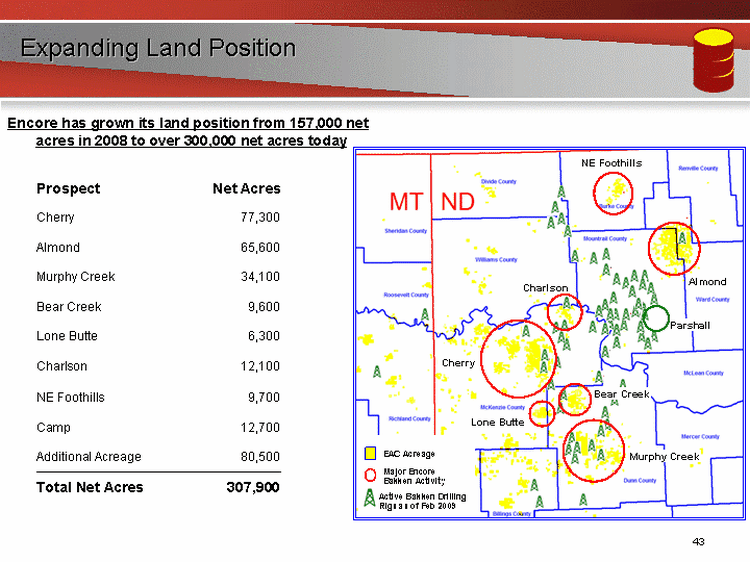
| Expanding Land Position Encore has grown its land position from 157,000 net acres in 2008 to over 300,000 net acres today Prospect Net Acres Cherry 77,300 Almond 65,600 Murphy Creek 34,100 Bear Creek 9,600 Lone Butte 6,300 Charlson 12,100 NE Foothills 9,700 Camp 12,700 Additional Acreage 80,500 Total Net Acres 307,900 Cherry Charlson Almond Bear Creek Murphy Creek Parshall NE Foothills Lone Butte |

| Encore's North Dakota Bakken/Sanish Potential Encore is targeting both the Middle Bakken and Sanish with horizontal wells Encore's land position contains a large OOIP target Over 3.75 billion barrels under Encore's acreage Average of 16 million barrels per 1280 acre spacing unit Recovery of only 1.9% of oil in place per well based on 300 MBO per well Low recovery presents opportunities Down spacing Improved drilling and completion techniques EOR |
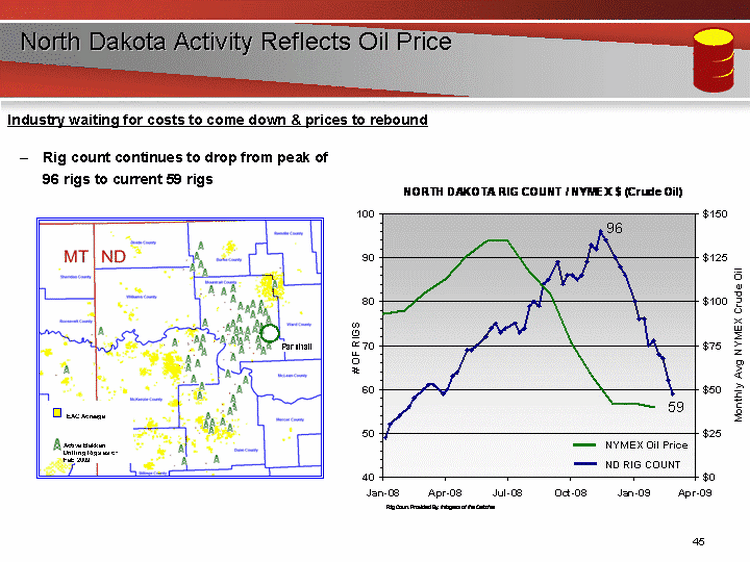
| EAC Acreage Active Bakken Drilling Rigs as of Feb 2009 Parshall North Dakota Activity Reflects Oil Price Rig count continues to drop from peak of 96 rigs to current 59 rigs Industry waiting for costs to come down & prices to rebound 96 59 NYMEX Oil Price ND RIG COUNT |
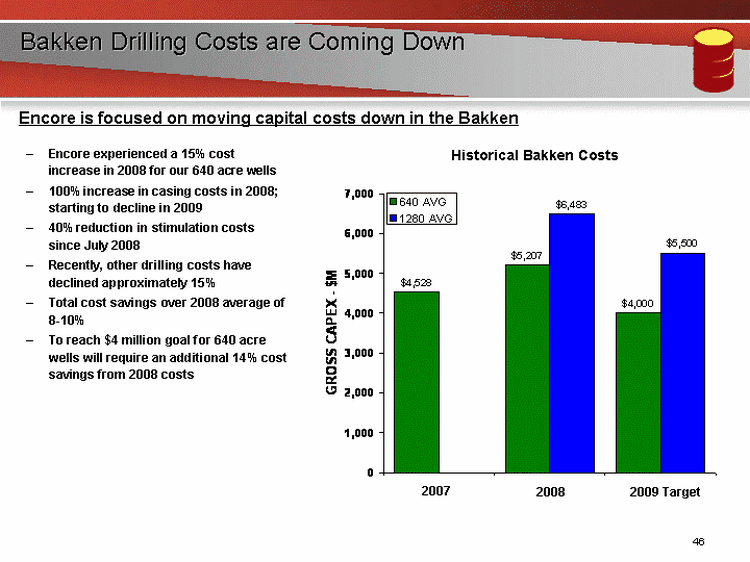
| Bakken Drilling Costs are Coming Down Encore experienced a 15% cost increase in 2008 for our 640 acre wells 100% increase in casing costs in 2008; starting to decline in 2009 40% reduction in stimulation costs since July 2008 Recently, other drilling costs have declined approximately 15% Total cost savings over 2008 average of 8-10% To reach $4 million goal for 640 acre wells will require an additional 14% cost savings from 2008 costs Encore is focused on moving capital costs down in the Bakken 2007 2008 2009 Target Historical Bakken Costs Historical Bakken Costs |
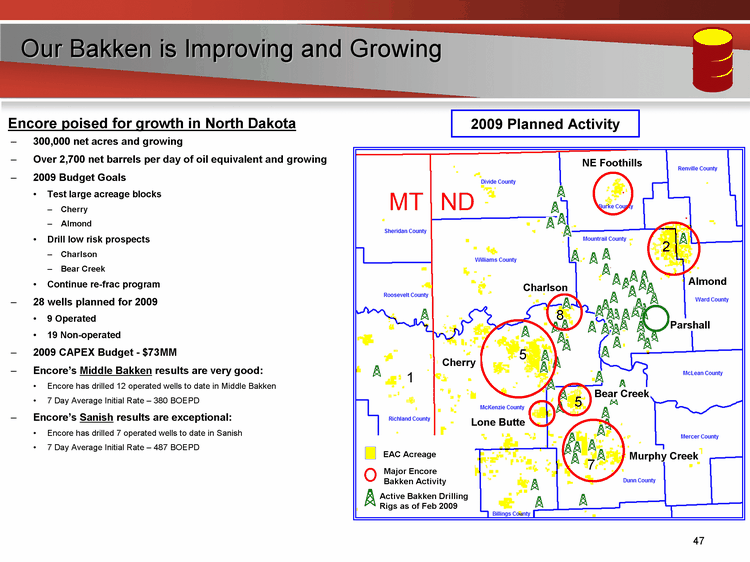
| Our Bakken is Improving and Growing 300,000 net acres and growing Over 2,700 net barrels per day of oil equivalent and growing 2009 Budget Goals Test large acreage blocks Cherry Almond Drill low risk prospects Charlson Bear Creek Continue re-frac program 28 wells planned for 2009 9 Operated 19 Non-operated 2009 CAPEX Budget - $73MM Encore's Middle Bakken results are very good: Encore has drilled 12 operated wells to date in Middle Bakken 7 Day Average Initial Rate - 380 BOEPD Encore's Sanish results are exceptional: Encore has drilled 7 operated wells to date in Sanish 7 Day Average Initial Rate - 487 BOEPD Encore poised for growth in North Dakota 2009 Planned Activity Cherry Charlson Almond Bear Creek Murphy Creek Parshall NE Foothills 5 5 7 8 2 1 Lone Butte |

| Large Bakken Inventory Cherry 191 locations based on 1280's 200-250 MBO / well Testing Sanish & Middle Bakken Almond 192 locations based on 1280's Wildcat / Extension acreage Offset EOG well is 300+ MBO Charlson 30 locations based on 640's 250 - 750 MBO / well Prolific Sanish wells Bear Creek 22 locations - 640's & 1280's 250 MBO / well Mix of Sanish & Middle Bakken Murphy Creek 95 locations based on 1280's 200 - 275 MBO / well Most wells are Middle Bakken Encore has interest in 530 identified locations in its major activity areas Cherry Charlson Almond Bear Creek Murphy Creek Parshall NE Foothills Lone Butte |
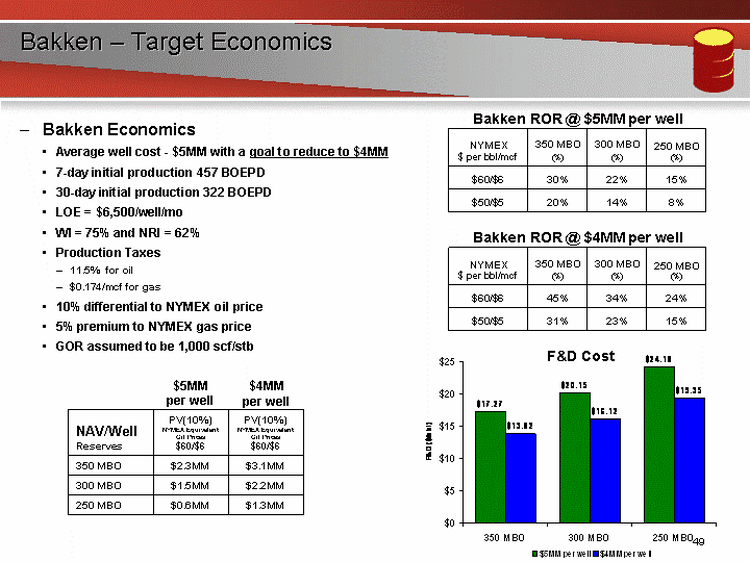
| Bakken Economics Average well cost - $5MM with a goal to reduce to $4MM 7-day initial production 457 BOEPD 30-day initial production 322 BOEPD LOE = $6,500/well/mo WI = 75% and NRI = 62% Production Taxes 11.5% for oil $0.174/mcf for gas 10% differential to NYMEX oil price 5% premium to NYMEX gas price GOR assumed to be 1,000 scf/stb Bakken ROR @ $5MM per well Bakken - Target Economics F&D Cost NYMEX $ per bbl/mcf 350 MBO (%) 300 MBO (%) 250 MBO (%) $60/$6 30% 22% 15% $50/$5 20% 14% 8% NAV/Well Reserves PV(10%) NYMEX Equivalent Oil Prices $60/$6 PV(10%) NYMEX Equivalent Oil Prices $60/$6 350 MBO $2.3MM $3.1MM 300 MBO $1.5MM $2.2MM 250 MBO $0.6MM $1.3MM Bakken ROR @ $4MM per well NYMEX $ per bbl/mcf 350 MBO (%) 300 MBO (%) 250 MBO (%) $60/$6 45% 34% 24% $50/$5 31% 23% 15% $5MM per well $4MM per well |

| Re-Frac Potential 7 Re-Fracs in Murphy Creek 1 Re-Frac in Bear Creek Elm Coulee Field (Montana) Several re-fracs with sustained production uplift 2008 Average EAC Results Incremental production = 85 BOEPD Incremental reserves = 80 MBOE Estimated cost = $500M ROR >100% F&D = $8.00/BOE Additional upside on non-operated wells Other operators are beginning re-fracs as well Re-Fracs have sustained production uplift!! (1) Assumes an average NRI of 80% (1) Re-Fracs 9 to 18 months after initial production Bear Creek 1 Re-Frac 75 to 375 BOEPD Murphy Creek 7 Re-Fracs 50 to 135 BOEPD |
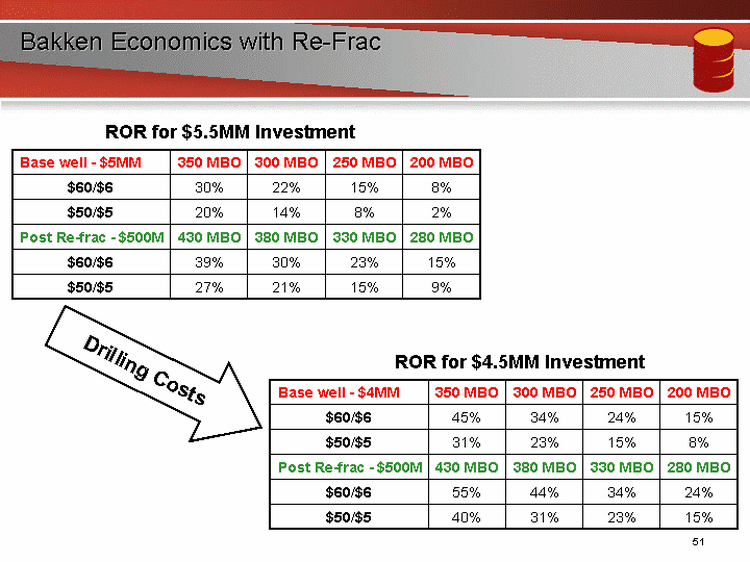
| Bakken Economics with Re-Frac ROR for $5.5MM Investment Base well - $5MM 350 MBO 300 MBO 250 MBO 200 MBO $60/$6 30% 22% 15% 8% $50/$5 20% 14% 8% 2% Post Re-frac - $500M 430 MBO 380 MBO 330 MBO 280 MBO $60/$6 39% 30% 23% 15% $50/$5 27% 21% 15% 9% ROR for $4.5MM Investment Base well - $4MM 350 MBO 300 MBO 250 MBO 200 MBO $60/$6 45% 34% 24% 15% $50/$5 31% 23% 15% 8% Post Re-frac - $500M 430 MBO 380 MBO 330 MBO 280 MBO $60/$6 55% 44% 34% 24% $50/$5 40% 31% 23% 15% Drilling Costs |
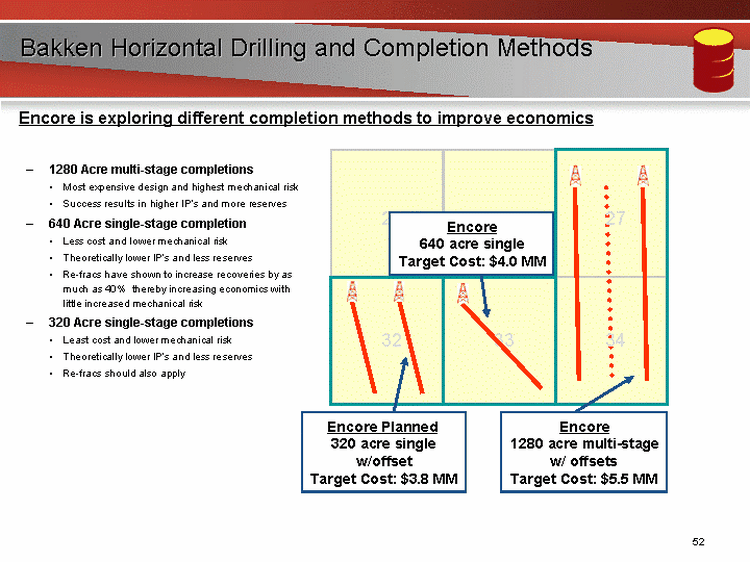
| Bakken Horizontal Drilling and Completion Methods 29 27 28 33 32 34 1280 Acre multi-stage completions Most expensive design and highest mechanical risk Success results in higher IP's and more reserves 640 Acre single-stage completion Less cost and lower mechanical risk Theoretically lower IP's and less reserves Re-fracs have shown to increase recoveries by as much as 40% thereby increasing economics with little increased mechanical risk 320 Acre single-stage completions Least cost and lower mechanical risk Theoretically lower IP's and less reserves Re-fracs should also apply Encore is exploring different completion methods to improve economics Encore Planned 320 acre single w/offset Target Cost: $3.8 MM Encore 640 acre single Target Cost: $4.0 MM Encore 1280 acre multi-stage w/ offsets Target Cost: $5.5 MM |

| Encore's North Dakota Bakken - Well Positioned Large acreage position - over 300,000 net acres Huge oil in place - over 3.75 billion barrels within Encore's acreage Reducing drilling costs to $4 million per well for 640 acre single laterals Testing the Almond and Cherry prospects High grading large inventory of over 500 wells Continue drilling low risk wells in current market Continue highly successful refrac program Positioning for higher prices Positioning for higher prices Positioning for higher prices Positioning for higher prices Positioning for higher prices Positioning for higher prices Positioning for higher prices Positioning for higher prices Positioning for higher prices Positioning for higher prices Positioning for higher prices Positioning for higher prices Positioning for higher prices Positioning for higher prices Positioning for higher prices Positioning for higher prices Positioning for higher prices Positioning for higher prices Encore's McCoy 44-36H in McKenzie County, North Dakota |
| Encore Acquisition Company Cedar Creek Anticline Greg Barnes NYSE: EAC www.encoreacq.com NYSE: ENP www.encoreenp.com |
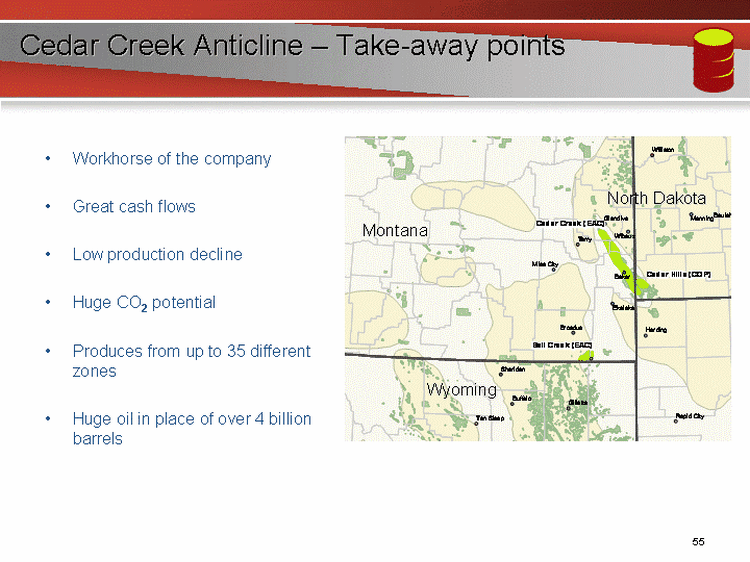
| Cedar Creek Anticline - Take-away points Cedar Creek Anticline - Take-away points Workhorse of the company Great cash flows Low production decline Huge CO2 potential Produces from up to 35 different zones Huge oil in place of over 4 billion barrels |

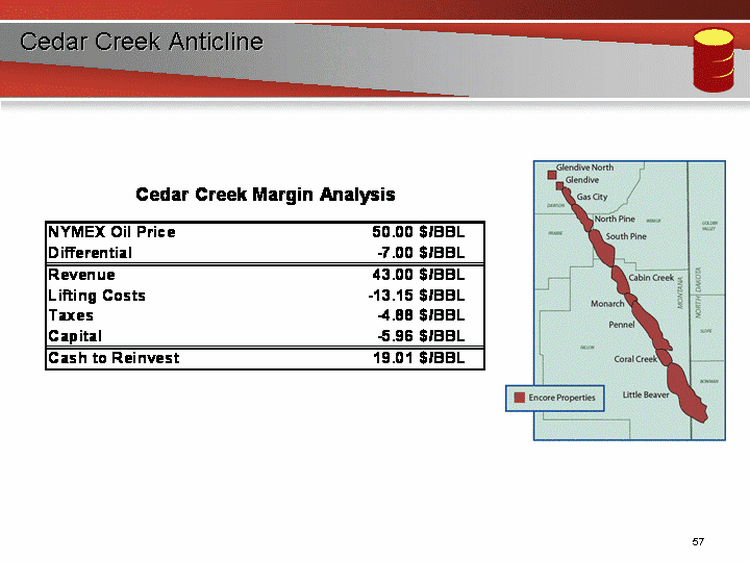
| Cedar Creek Anticline Cedar Creek Anticline Net Production Before Net Profits Interest Metrics 2008 Annual Operating Income = $275MM 13,000 BOPD Net Production Low Decline Rate 7% 30% of Company Production 40% of Company Reserves Enhanced Oil Recovery Excellent Candidate for Future CO2 Injection Actual/2008 Budget Actual/2008 Budget |
| Cedar Creek Anticline Cedar Creek Anticline |

| Cedar Creek Anticline 2009 and Beyond 2009 CAPEX Budget - $23MM Improving Waterflood Performance Workovers/recompletions 2009 Goal - Reduce Operating Costs by 10% 10% cost reduction in workover rigs 15% in water hauling 8% reduction in treating costs Total cost savings over 2008 of $4MM 2009 Focus on Base Production and Lowering Operating Costs Huge Potential in CO2, Waterflood and non-Red River U4 development 200 MMBO in CO2 potential 10 MBO in additional waterflood potential 108 drilling locations mostly in non-Red River U4 zones 51 horizontal re-entries & 57 new drill locations EUR's range from 50 MBO on re-entries to 300 MBO on new wells |
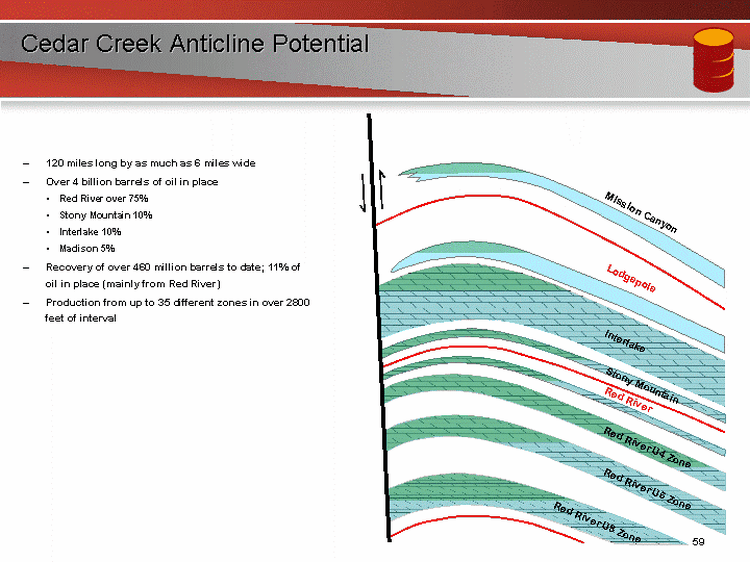
| Cedar Creek Anticline Potential Mission Canyon Interlake Red River Stony Mountain Red River U4 Zone Red River U6 Zone Red River U8 Zone Lodgepole 120 miles long by as much as 6 miles wide Over 4 billion barrels of oil in place Red River over 75% Stony Mountain 10% Interlake 10% Madison 5% Recovery of over 460 million barrels to date; 11% of oil in place (mainly from Red River) Production from up to 35 different zones in over 2800 feet of interval |
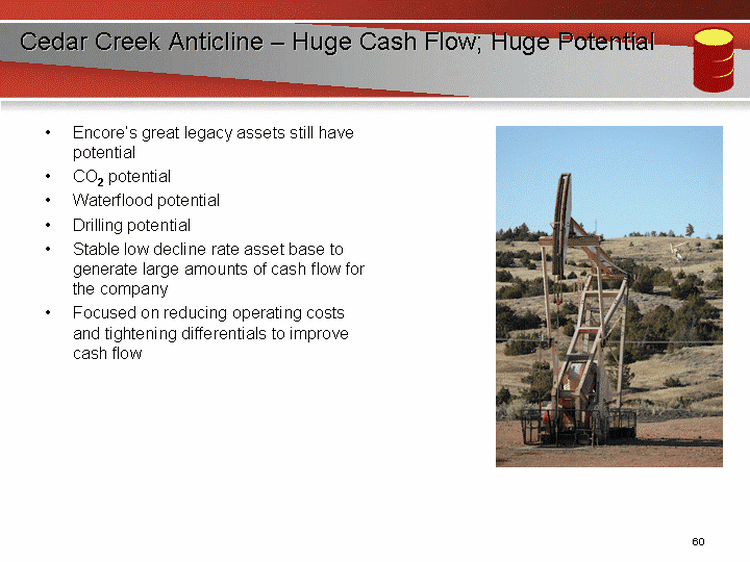
| Cedar Creek Anticline - Huge Cash Flow; Huge Potential Encore's great legacy assets still have potential CO2 potential Waterflood potential Drilling potential Stable low decline rate asset base to generate large amounts of cash flow for the company Focused on reducing operating costs and tightening differentials to improve cash flow |
| Encore Acquisition Company Carbon Dioxide Flooding Projects and Reserves Potential Ben Nivens NYSE: EAC www.encoreacq.com NYSE: ENP www.encoreenp.com |
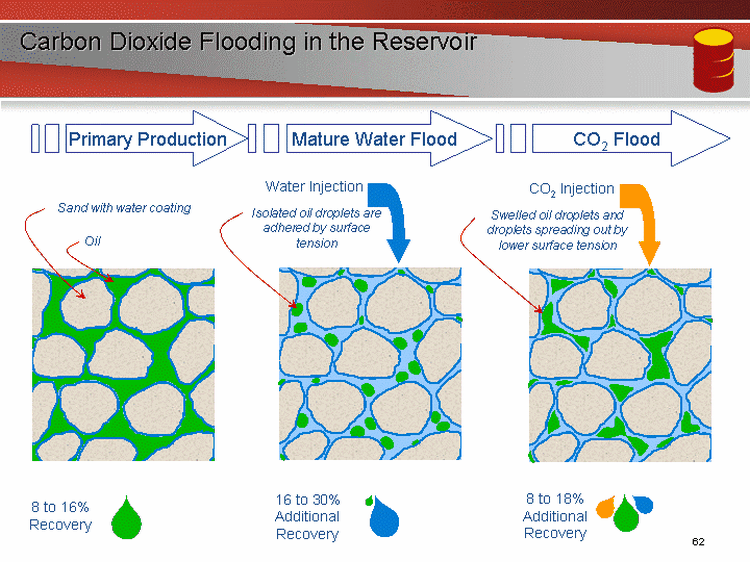
| Carbon Dioxide Flooding in the Reservoir Water Injection CO2 Injection Sand with water coating Oil Primary Production Mature Water Flood CO2 Flood Isolated oil droplets are adhered by surface tension Swelled oil droplets and droplets spreading out by lower surface tension 8 to 16% Recovery 16 to 30% Additional Recovery 8 to 18% Additional Recovery |

| Overview of the Carbon Dioxide Flooding Process Water CO2 Water + Oil CO2 Mixing Zone CO2 + Oil + Water Oil Bank Alternating cycles of water and CO2 injection Injection Production |

| South Pine Carbon Dioxide Flooding South Pine Field Pilot location Proof of concept - CO2 Pilot or Mini-Test Field Volumetrics and Reserves Additional zones for development Flood Development Plan |

| South Pine CO2 Flooding - Existing Pilot South Pine CO2 Flooding - Existing Pilot South Pine CO2 Flooding - Existing Pilot The Pilot was a 11/4 year test initiated in February 1984 The Pilot was a 11/4 year test initiated in February 1984 |

| South Pine CO2 Flooding - Pilot Results Results were outstanding Concept was proved Injectivity of CO2 better than expected CO2 flood conformance was as good as the waterflood Waterflooded pilot until no more oil was produced then recovered incremental oil after injecting CO2 Recovered 18.4% of the original oil in place due to CO2 injection Data suggests 13 to 17% incremental recoveries for full field development with CO2 Subsequent computer modeling by Encore verified these conclusions |
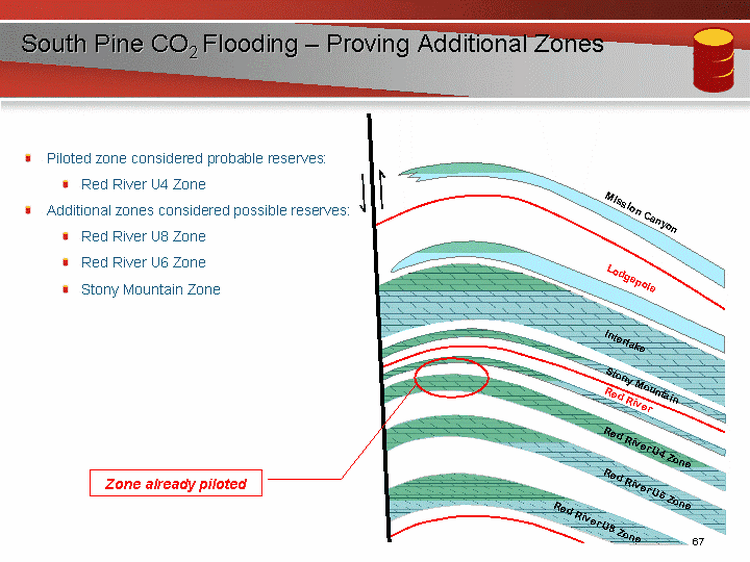
| South Pine CO2 Flooding - Proving Additional Zones Mission Canyon Interlake Red River Stony Mountain Red River U4 Zone Red River U6 Zone Red River U8 Zone Piloted zone considered probable reserves: Red River U4 Zone Additional zones considered possible reserves: Red River U8 Zone Red River U6 Zone Stony Mountain Zone Lodgepole |

| South Pine CO2 Flooding - Field Volumetric Results * * Piloted zone which could be booked as proven undeveloped reserves with a CO2 contract * Piloted zone which could be booked as proven undeveloped reserves with a CO2 contract |

| South Pine CO2 Flooding - Red River U4 Zone Development Plan Pilot Test Area Initial Development Full field well plan in the Red River U4 Zone 71 Production wells 45 Injection wells Develops U4 probable reserves Upon signing a CO2 purchase agreement, reserves can be classified as proven undeveloped |
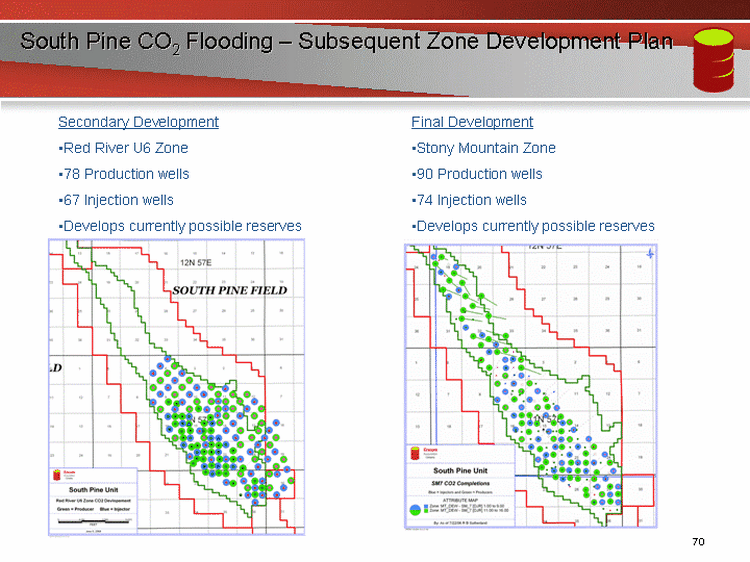
| South Pine CO2 Flooding - Subsequent Zone Development Plan Secondary Development Red River U6 Zone 78 Production wells 67 Injection wells Develops currently possible reserves Develops currently possible reserves Develops currently possible reserves Develops currently possible reserves Develops currently possible reserves Develops currently possible reserves Final Development Stony Mountain Zone 90 Production wells 74 Injection wells Develops currently possible reserves Develops currently possible reserves Develops currently possible reserves Develops currently possible reserves Develops currently possible reserves Develops currently possible reserves |
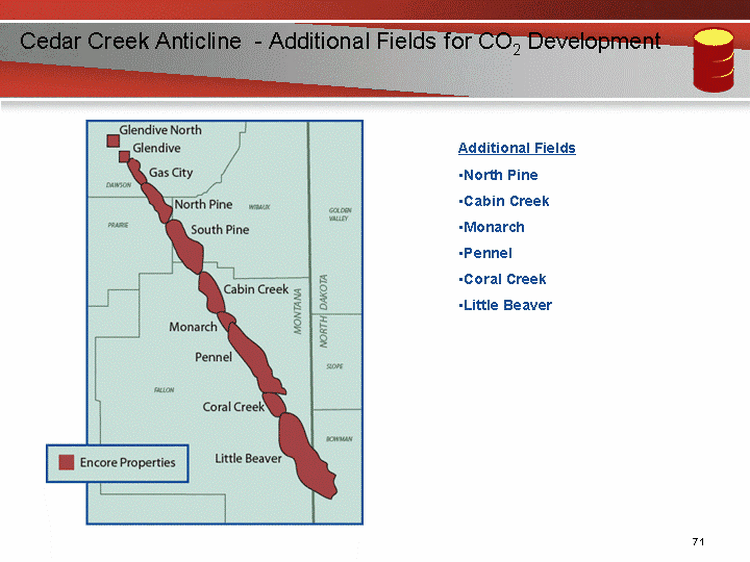
| Cedar Creek Anticline - Additional Fields for CO2 Development Cedar Creek Anticline - Additional Fields for CO2 Development Additional Fields North Pine Cabin Creek Monarch Pennel Coral Creek Little Beaver |
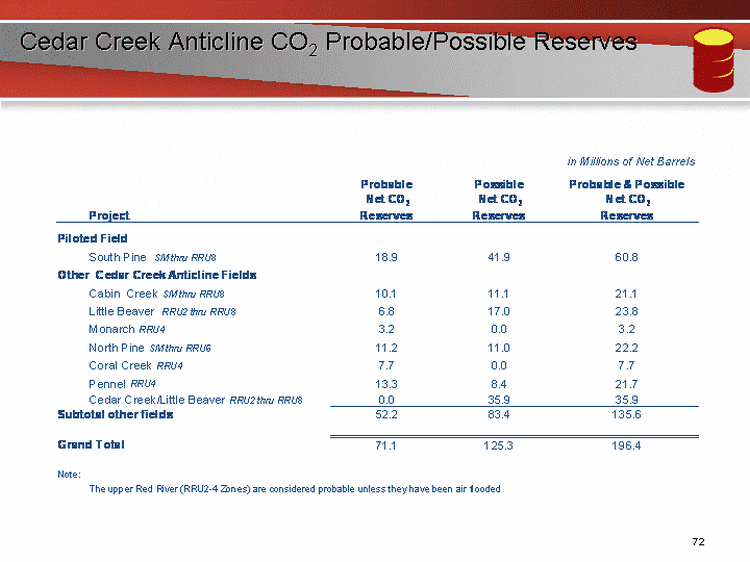
| Cedar Creek Anticline CO2 Probable/Possible Reserves |
| Bell Creek Field Bell Creek field Field location Field history CO2 reserves potential |

| Bell Creek Field Data & Location Bell Creek Field Data & Location Encore Operated: (WI=100%, NRI=85.3%) 21,771 acres(15 X 3.5 miles) Current Production 1233 BOPD Great Waterflood & CO2 Flood Potential |
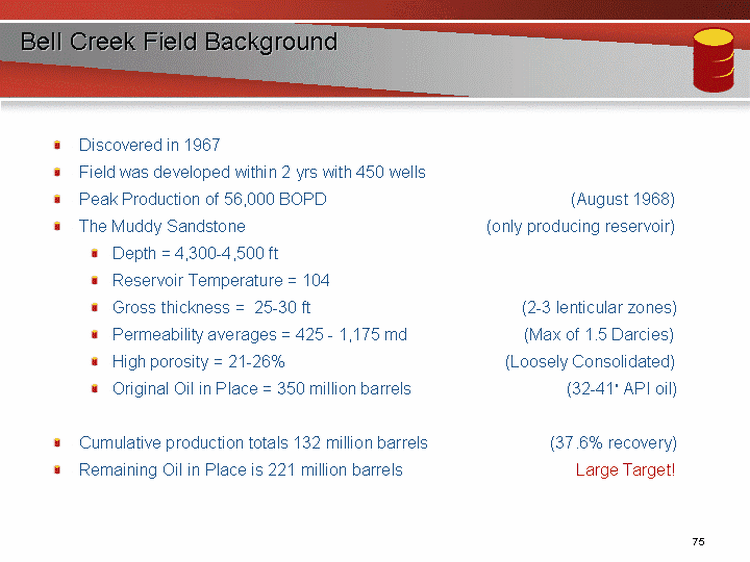
| Bell Creek Field Background Discovered in 1967 Field was developed within 2 yrs with 450 wells Peak Production of 56,000 BOPD (August 1968) The Muddy Sandstone (only producing reservoir) Depth = 4,300-4,500 ft Reservoir Temperature = 104 Gross thickness = 25-30 ft (2-3 lenticular zones) Permeability averages = 425 - 1,175 md (Max of 1.5 Darcies) High porosity = 21-26% (Loosely Consolidated) Original Oil in Place = 350 million barrels (32-41^ API oil) Cumulative production totals 132 million barrels (37.6% recovery) Remaining Oil in Place is 221 million barrels Large Target! |
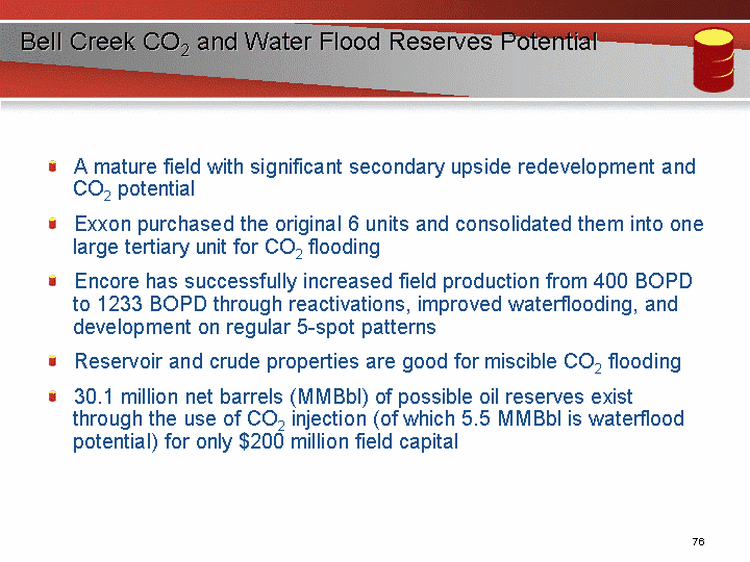
| Bell Creek CO2 and Water Flood Reserves Potential A mature field with significant secondary upside redevelopment and CO2 potential Exxon purchased the original 6 units and consolidated them into one large tertiary unit for CO2 flooding Encore has successfully increased field production from 400 BOPD to 1233 BOPD through reactivations, improved waterflooding, and development on regular 5-spot patterns Reservoir and crude properties are good for miscible CO2 flooding 30.1 million net barrels (MMBbl) of possible oil reserves exist through the use of CO2 injection (of which 5.5 MMBbl is waterflood potential) for only $200 million field capital |
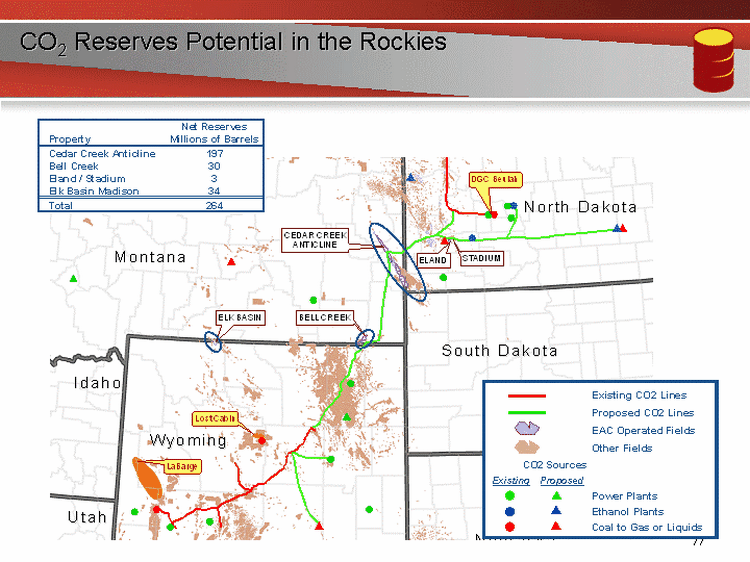
| CO2 Reserves Potential in the Rockies Nebraska Nebraska Existing CO2 Lines Proposed CO2 Lines EAC Operated Fields Other Fields CO2 Sources Existing Proposed Power Plants Ethanol Plants Coal to Gas or Liquids |
| NYSE: ENP www.encoreenp.com |
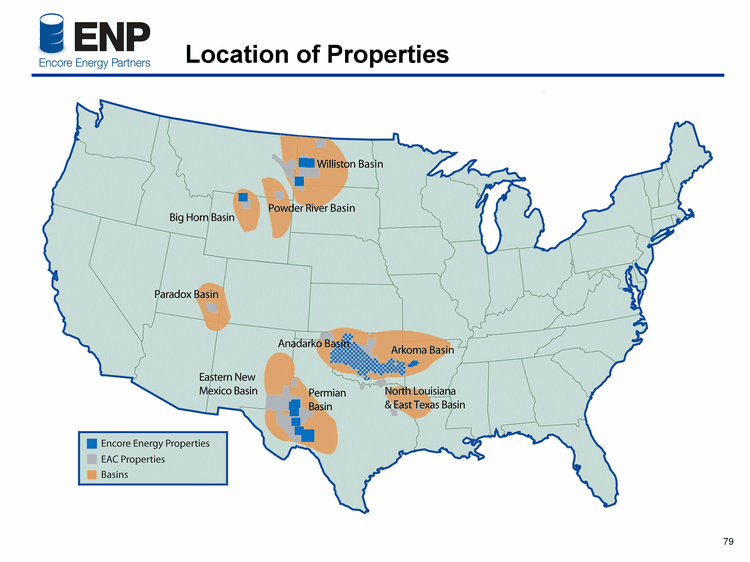
| Location of Properties |

| WTX Big Horn CCA Williston Production 49.2 43.5 4.9 2.4 26.1 MMBOE Proved Reserves 6,139 BOEPD 4Q08 production 11.6 year R/P ratio 76% of reserves operated 64% oil by reserves 89% proved developed WTX Big Horn CCA Williston Production 38.6 55.7 3.9 1.8 2372 3418 239 111 Gas Oil Reserves 36 64 Gas Oil Reserves 29 71 26.1 MMBOE Proved Reserves $410 million, undiscounted $205.8 million, discounted 10% 6,139 BOEPD 4Q08 Production Elk Basin 43.5% CCA 4.9% WTX 49.2% Elk Basin 55.7% CCA 3.9% WTX 38.6% Oil 71% Gas 29% Oil 64% Gas 36% ENP Portfolio Williston 2.4% Williston 1.8% Keep production flat with operations and grow through drop-downs & acquisitions Sure and Steady |
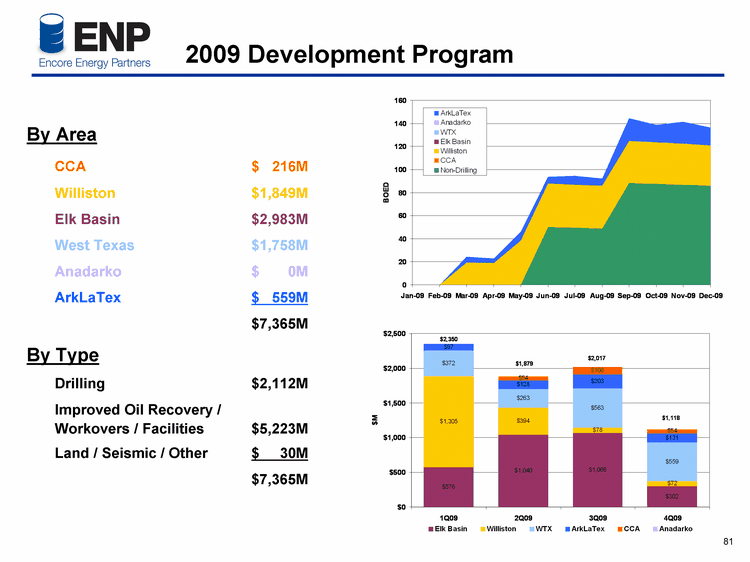
| By Area CCA $ 216M Williston $1,849M Elk Basin $2,983M West Texas $1,758M Anadarko $ 0M ArkLaTex $ 559M $7,365M By Type Drilling $2,112M Improved Oil Recovery / Workovers / Facilities $5,223M Land / Seismic / Other $ 30M $7,365M 2009 Development Program |
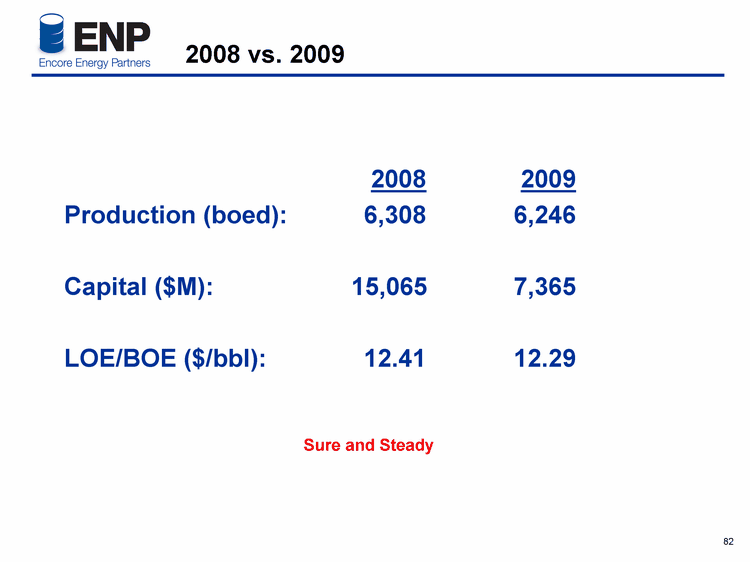
| 2008 vs. 2009 2008 2009 Production (boed): 6,308 6,246 Capital ($M): 15,065 7,365 LOE/BOE ($/bbl): 12.41 12.29 Sure and Steady |

| 2009 Key Points Drop-down of Anadarko and Ark-La-Tex properties Scrutinize capital investments and LOE Change Angus and Henderson field rules with Texas Railroad Commission for G-10 testing, saving $250M/yr LOE and increasing production Dynamic capital management Delayed drilling of second non-op Williston well Additional Arkansas drilling activity |

| Elk Basin OOIP = 1,300 MMBOE Shallow, stable declining PDP Remaining upside opportunities Operated by ENP Largest asset / capital swing property in MLP Elk Basin |
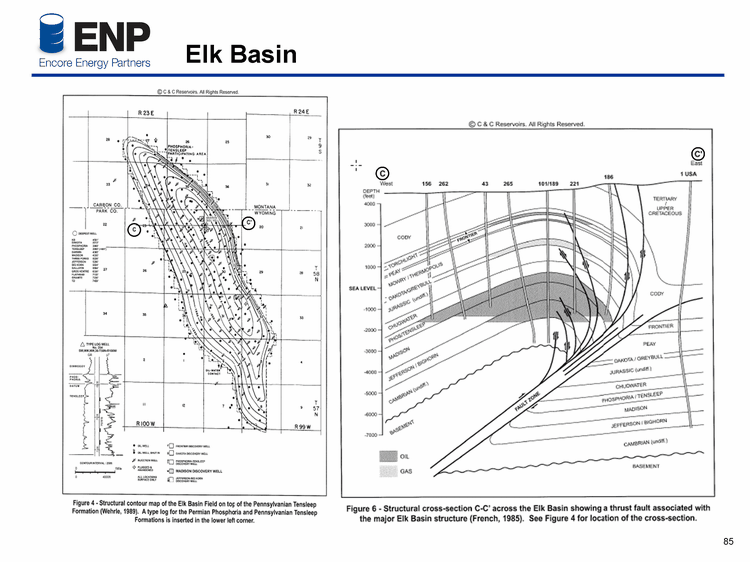
| Elk Basin |
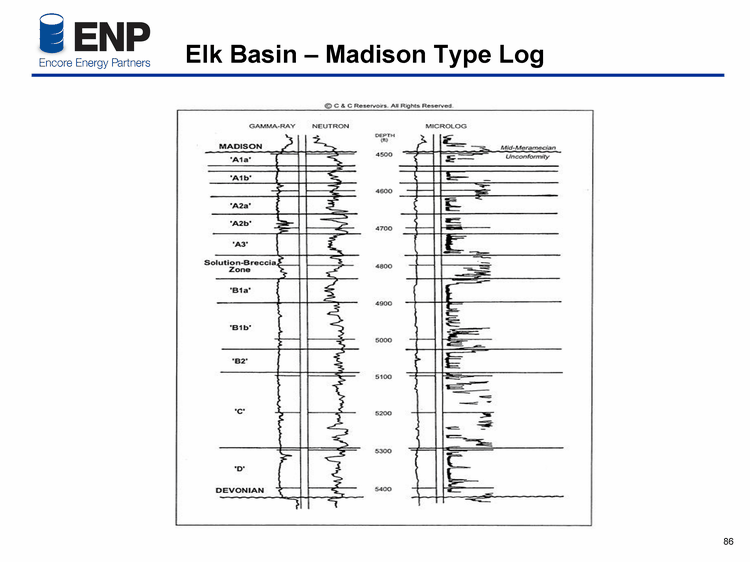
| Elk Basin - Madison Type Log |
| Elk Basin - 2009 Key Points Elk Basin Build inventory of projects Madison waterflood study ongoing Tensleep flood design South Elk Basin gas opportunities Scrutinize Capital and LOE Nitrogen Rejection Unit project Artificial lift optimization |

| West Texas Base |

| Crockett County Ozona Hunt-Baggett Davidson Ranch Angus/Henderson |

| IP 1614 MCFD IP 1589 MCFD IP 1531 MCFD IP 2500 MCFD IP 1500 MCFD IP 3900 MCFD Crockett Operated Canyon and Strawn Play PUD's Strawn Net Pay Map |

| Crockett Non-Operated Canyon & Strawn Play PUD's Canyon F3 Net Pay Map |
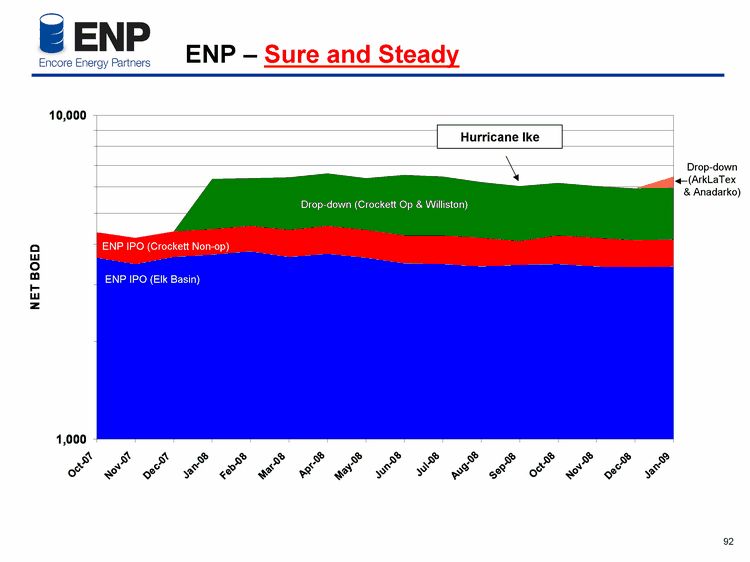
| ENP - Sure and Steady Hurricane Ike ENP IPO (Elk Basin) ENP IPO (Crockett Non-op) Drop-down (Crockett Op & Williston) Drop-down (ArkLaTex & Anadarko) |
| Financial Overview Bob Reeves NYSE: EAC www.encoreacq.com NYSE: ENP www.encoreenp.com |

| Hedge Summary - ENP ENP Distribution Deficit Surplus Dynamic hedging position affords ENP enormous flexibility |

| Hedge Summary - ENP ENP Hedge Philosophy Purchase put options for approximately one-third of production Enter into costless structures for one-third of production Swaps Collars We will then have a fixed floor price for two-thirds of production and a fixed ceiling price for only one-third of production This strategy allows us to participate in commodity price increases while protecting two-thirds of our production if prices fall Recent Drop-Down |

| Oil Weight - Reserves |
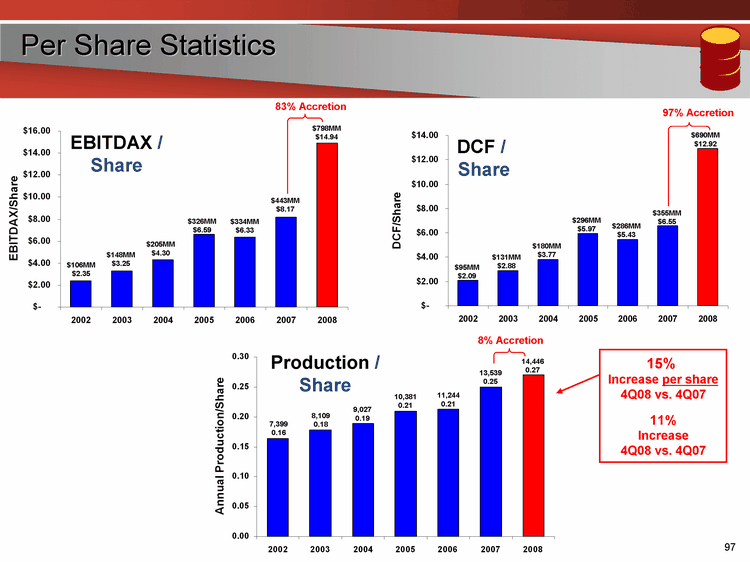
| Per Share Statistics EBITDAX / Share DCF / Share Production / Share $798MM $14.94 $443MM $8.17 $334MM $6.33 $326MM $6.59 $205MM $4.30 $148MM $3.25 $106MM $2.35 7,399 0.16 8,109 0.18 9,027 0.19 10,381 0.21 11,244 0.21 13,539 0.25 14,446 0.27 $690MM $12.92 $355MM $6.55 $286MM $5.43 $296MM $5.97 $180MM $3.77 $131MM $2.88 $95MM $2.09 8% Accretion 83% Accretion 97% Accretion 15% Increase per share 4Q08 vs. 4Q07 11% Increase 4Q08 vs. 4Q07 |
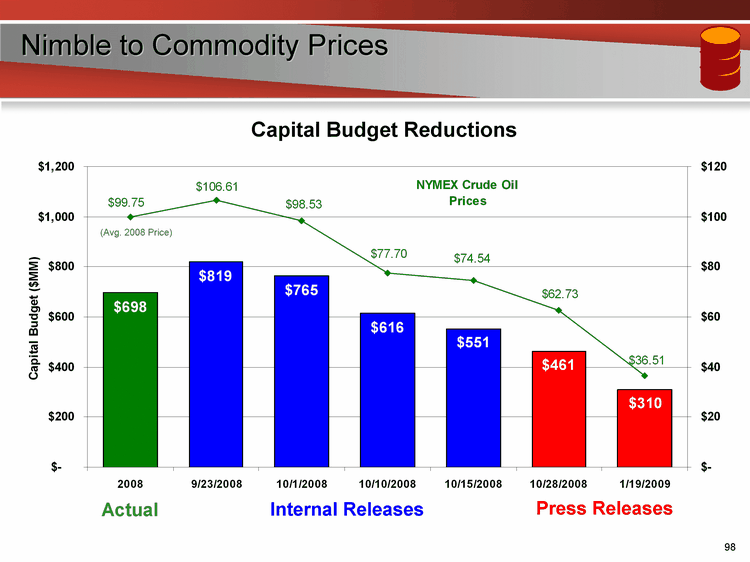
| Nimble to Commodity Prices Internal Releases Press Releases Capital Budget Reductions Actual (Avg. 2008 Price) |
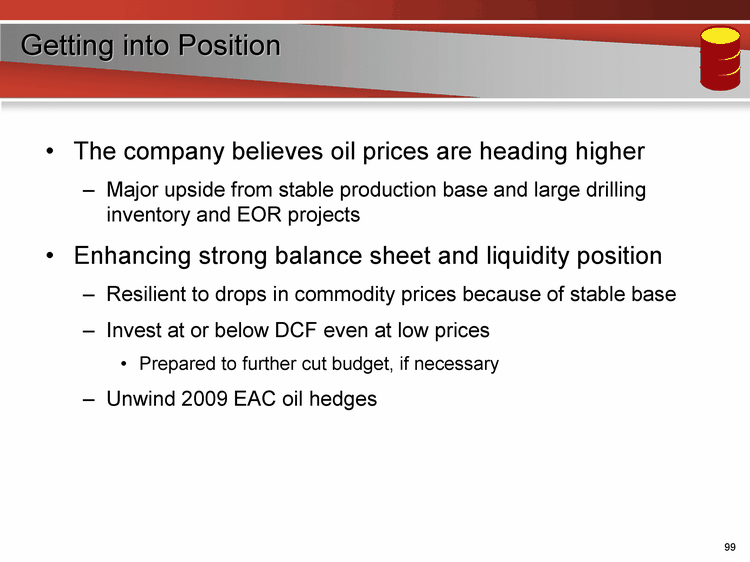
| Getting into Position The company believes oil prices are heading higher Major upside from stable production base and large drilling inventory and EOR projects Enhancing strong balance sheet and liquidity position Resilient to drops in commodity prices because of stable base Invest at or below DCF even at low prices Prepared to further cut budget, if necessary Unwind 2009 EAC oil hedges |
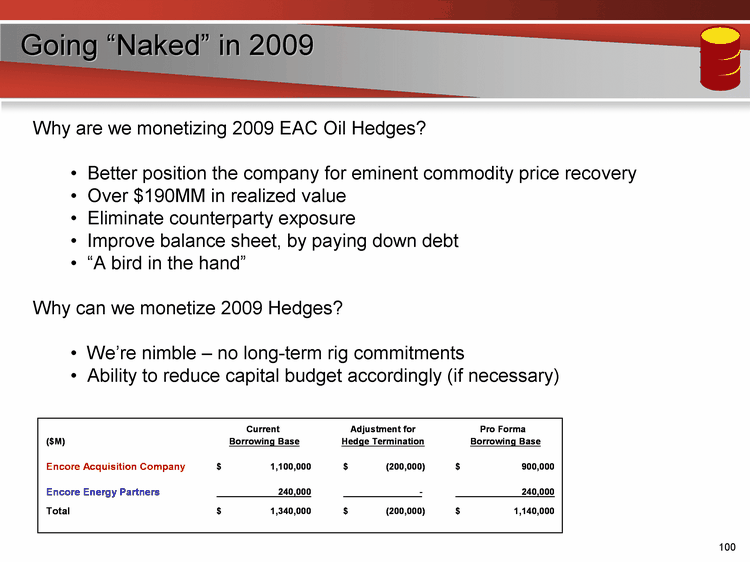
| Going "Naked" in 2009 Why are we monetizing 2009 EAC Oil Hedges? Better position the company for eminent commodity price recovery Over $190MM in realized value Eliminate counterparty exposure Improve balance sheet, by paying down debt "A bird in the hand" Why can we monetize 2009 Hedges? We're nimble - no long-term rig commitments Ability to reduce capital budget accordingly (if necessary) |
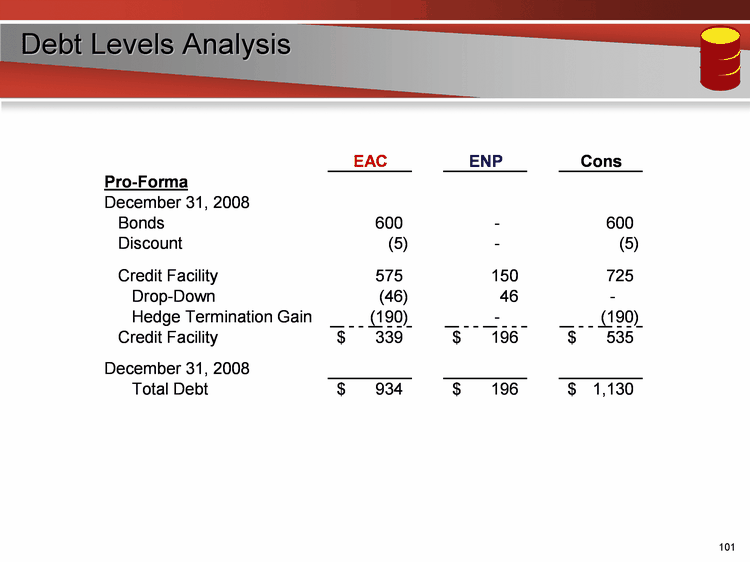
| Debt Levels Analysis |
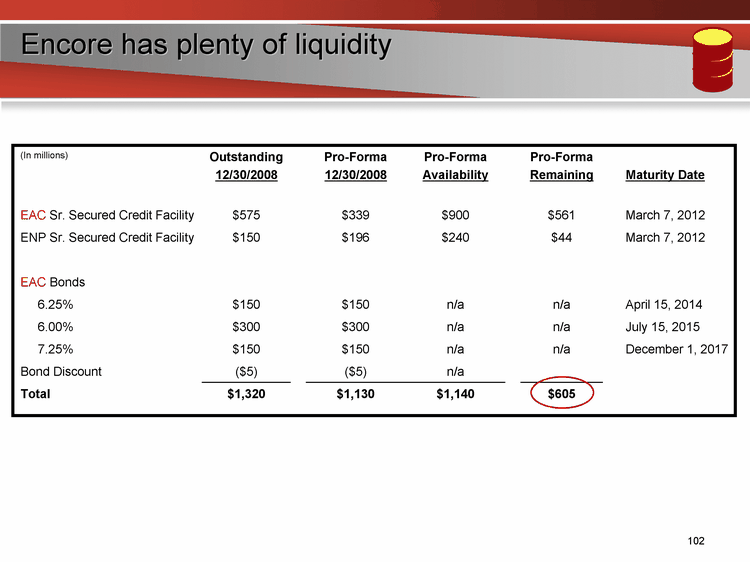
| Encore has plenty of liquidity (In millions) Outstanding 12/30/2008 Pro-Forma 12/30/2008 Pro-Forma Availability Pro-Forma Remaining Maturity Date EAC Sr. Secured Credit Facility $575 $339 $900 $561 March 7, 2012 ENP Sr. Secured Credit Facility $150 $196 $240 $44 March 7, 2012 EAC Bonds 6.25% $150 $150 n/a n/a April 15, 2014 6.00% $300 $300 n/a n/a July 15, 2015 7.25% $150 $150 n/a n/a December 1, 2017 Bond Discount ($5) ($5) n/a Total $1,320 $1,130 $1,140 $605 |
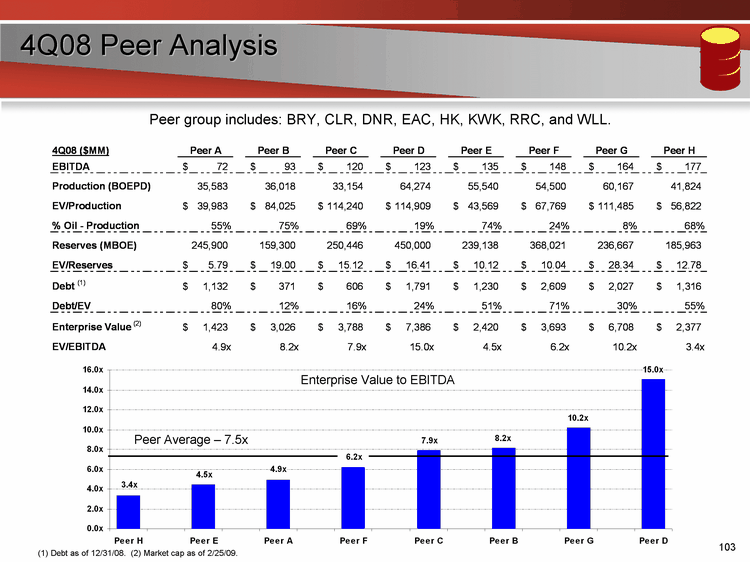
| 4Q08 Peer Analysis Enterprise Value to EBITDA (1) Debt as of 12/31/08. (2) Market cap as of 2/25/09. Peer Average - 7.5x Peer group includes: BRY, CLR, DNR, EAC, HK, KWK, RRC, and WLL. |
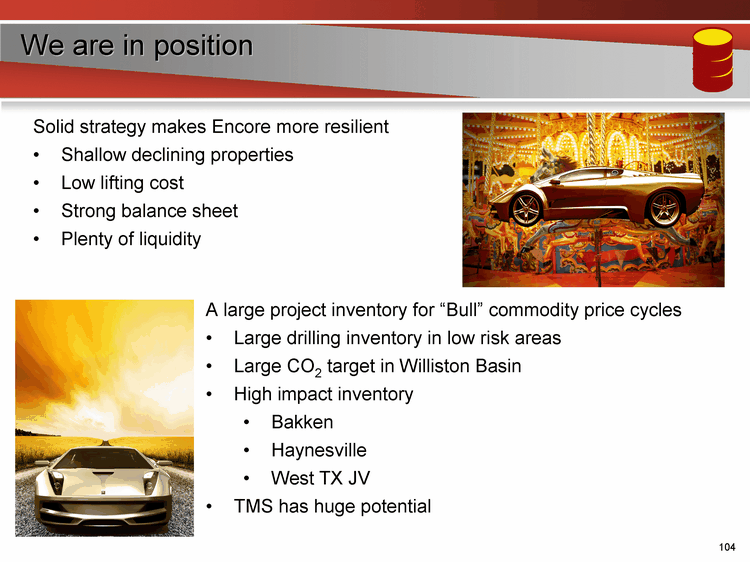
| We are in position Solid strategy makes Encore more resilient Shallow declining properties Low lifting cost Strong balance sheet Plenty of liquidity A large project inventory for "Bull" commodity price cycles Large drilling inventory in low risk areas Large CO2 target in Williston Basin High impact inventory Bakken Haynesville West TX JV TMS has huge potential |
| Appendix NYSE: EAC www.encoreacq.com NYSE: ENP www.encoreenp.com |

| Non-GAAP Reconciliation |