Exhibit 99.1

Beacon Roofing Supply Reports Third Quarter 2016 Results
| · | Record third quarter net sales of $1.15 billion (over 60% growth), the Company’s first billion dollar quarter |
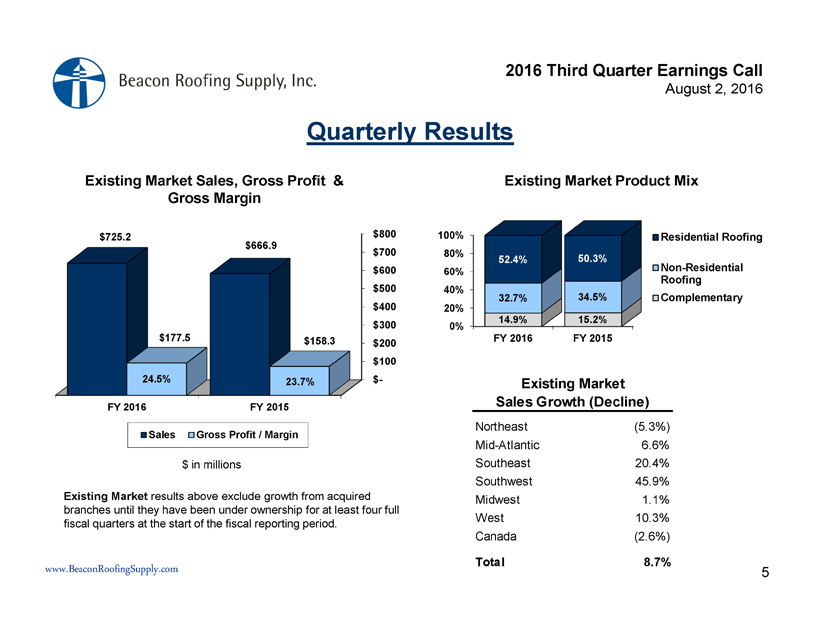
| · | Organic growth of 8.7% in existing markets (13.2% growth in residential roofing) |
| · | Record third quarter EPS of $0.68 ($0.77 Adjusted) vs. $0.56 in prior year |
| · | Third quarter net income grew to $41.1 million from $28.3 million in the prior year |
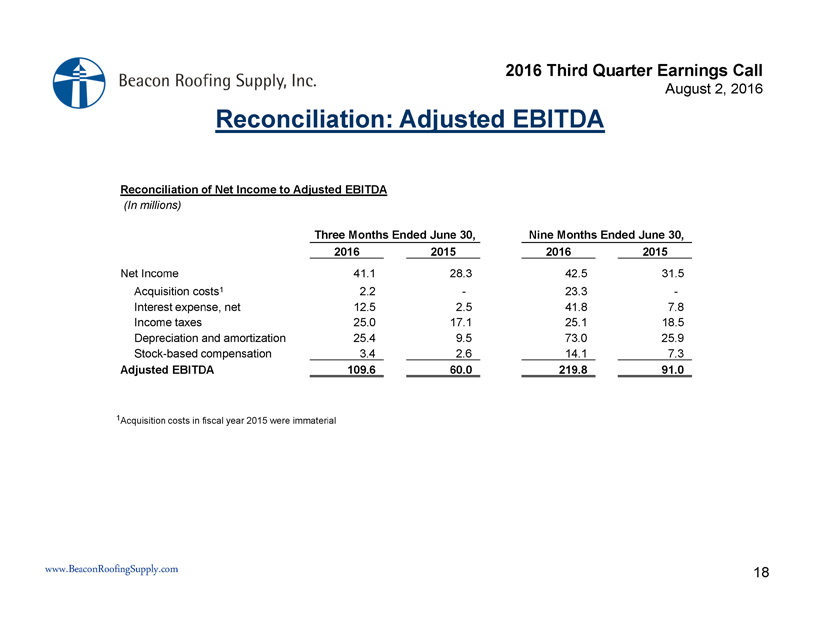
| · | Third quarter Adjusted EBITDA grew to $109.6 million from $60.0 million in the prior year |
| · | Record nine month net sales of $2.95 billion vs. $1.73 billion in prior year (71% growth) |
| · | Four acquisitions in the quarter, increasing U.S. presence to 46 states. |
HERNDON, VA. — (BUSINESS WIRE) — August 2, 2016 — Beacon Roofing Supply, Inc. (NASDAQ: BECN) announced results today for its third quarter ended June 30, 2016 and nine months ended June 30, 2016 of the fiscal year ending September 30, 2016 ("Fiscal 2016").
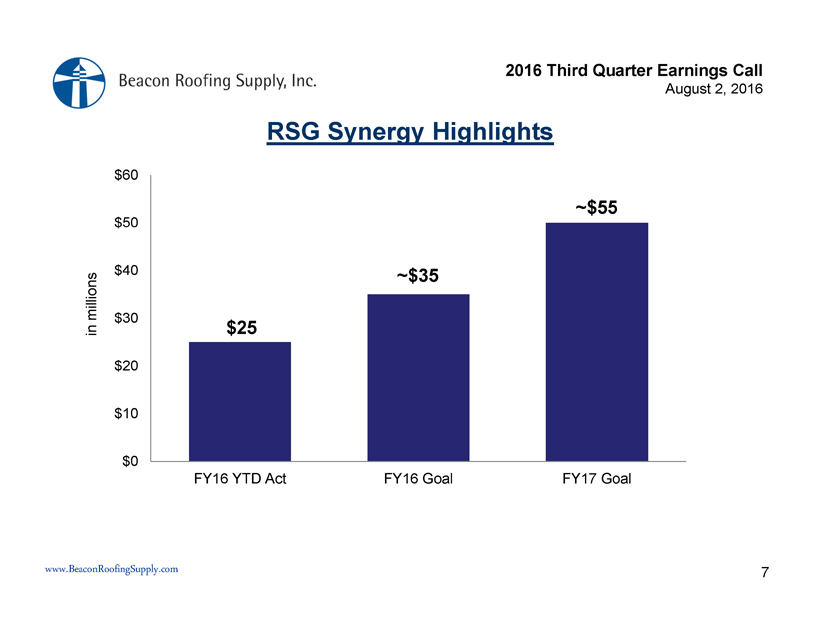
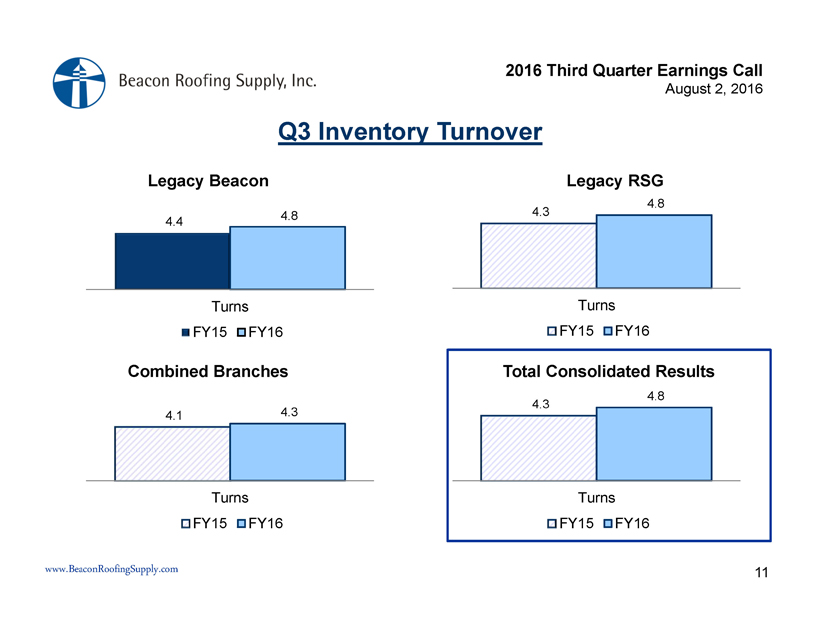
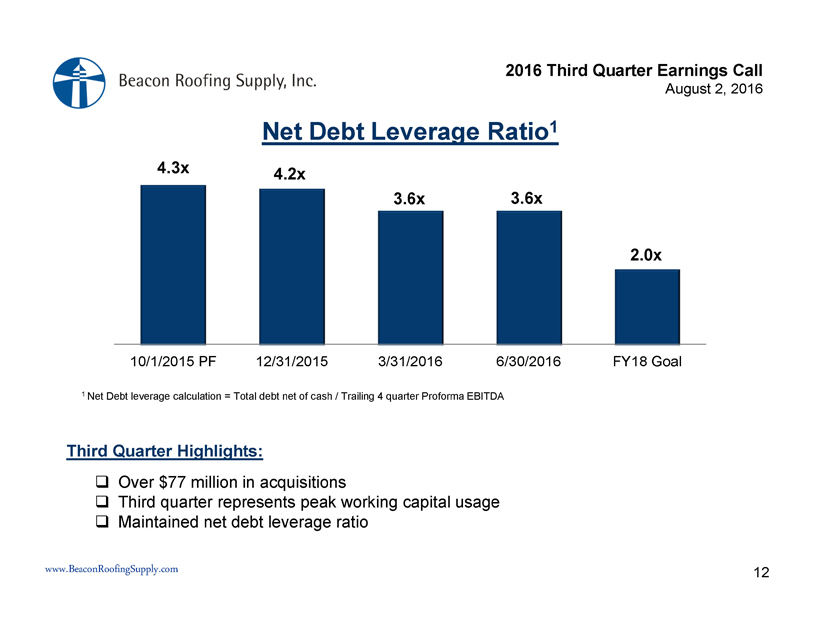
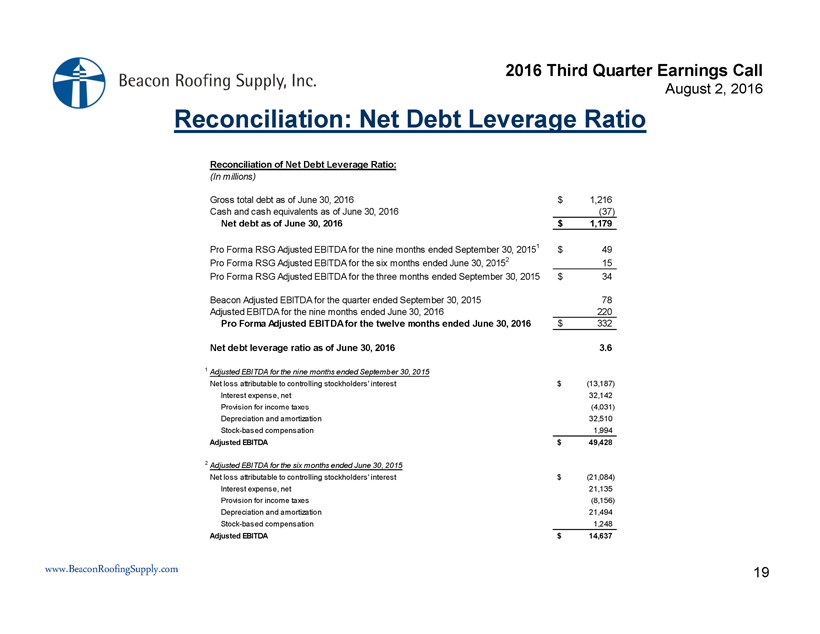
Paul Isabella, the Company’s President and Chief Executive Officer, stated: “I am excited to announce another record breaking quarter and continued strong results for the year. In the third quarter Beacon achieved a milestone with our first ever billion dollar quarter. Sales grew over 60 percent in the quarter, mainly from the RSG and the seven additional acquisitions made this year. Organic sales grew 8.7 percent in the quarter, driven by our greenfield investments over the last four years and the increased storm activity in the Dallas metropolitan area. Aided by the continued shift to more residential sales, our gross margin grew to 24.5 percent of sales, up 90 basis points over the prior year and 70 basis points over the second quarter. We are continuing to see margin and operating expense benefit from the RSG synergies. Our balance sheet remains strong as our net debt leverage ratio remained at 3.6 times during our seasonal working capital peak. I am also pleased with the management of inventory at our branches as inventory turns have increased to 4.8 times vs. 4.3 times in the prior year. Adjusted EPS of $0.77 is another record and represents over 35 percent growth from the prior year. We continued our acquisition strategy by closing on four deals in the quarter and our pipeline remains robust. In order to finish our year strong we will continue executing on the core deliverables of customer service excellence, strategic growth and superior financial results.”
Third Quarter
Total sales increased 60.5% to a third quarter record of $1.15 billion in Fiscal 2016, from $718.2 million in 2015. Residential roofing product sales increased 73.0%, non-residential roofing product sales increased 43.9%, and complementary product sales increased 57.8% over the prior year. Existing market sales, excluding acquisitions, increased 8.7% for the quarter. The third quarter of Fiscal 2016 and 2015 each had 64 business days.
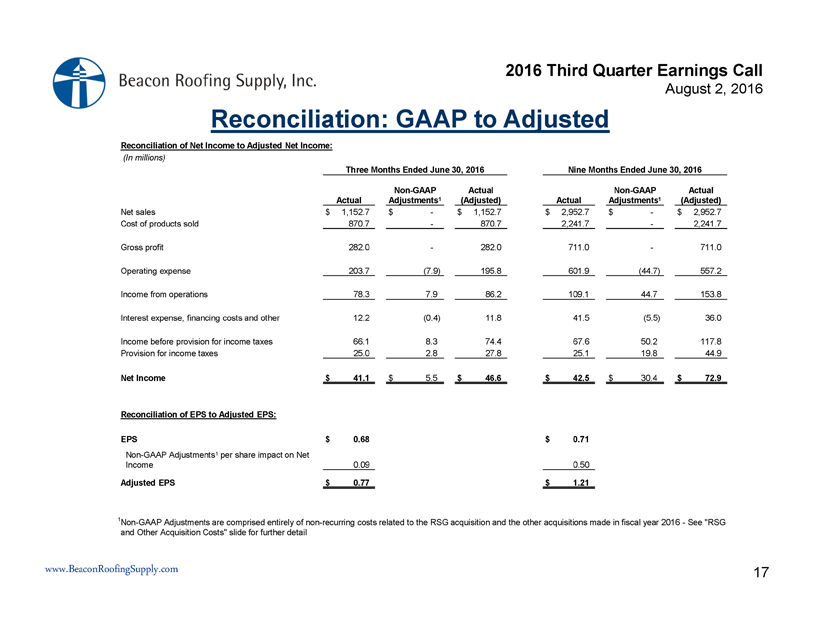
Net income for the third quarter was $41.1 million, compared to $28.3 million in 2015. Third quarter EPS was $0.68, compared to $0.56 in 2015. Adjusted Net Income, after removing the impact of non-recurring RSG acquisition-related costs and other current year acquisition costs, was $46.6 million in the third quarter 2016, with Adjusted EPS of $0.77 (see included financial tables for a definition and reconciliation of “Adjusted”). Net income for the quarter was favorably impacted by higher volumes and gross margins which improved by 90 basis points over the prior year. This was offset by increased operating expenses driven by the incremental costs associated with the RSG acquisition made this fiscal year.
Nine Months
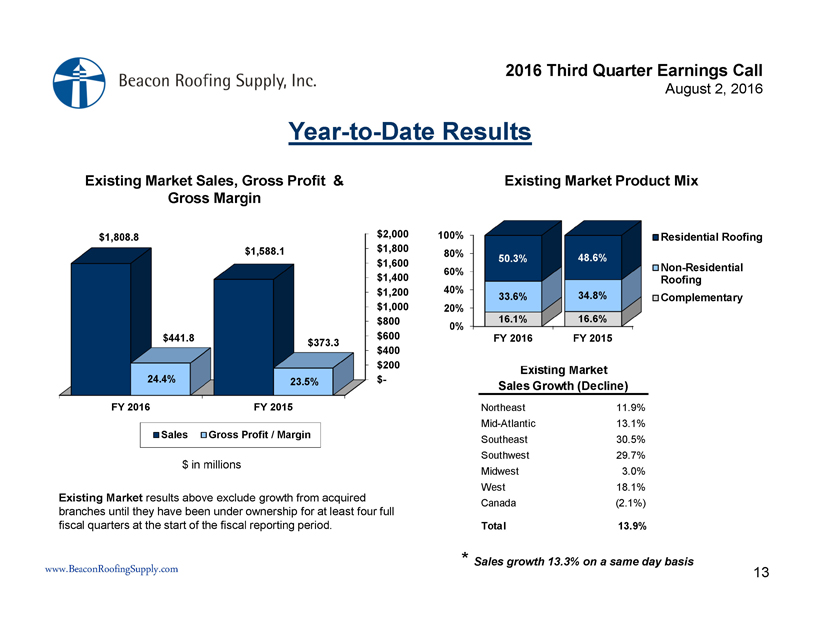
Total sales increased 70.9% to a nine month record of $2.95 billion in Fiscal 2016, from $1.73 billion in 2015. Residential roofing product sales increased 83.4%, non-residential roofing product sales increased 61.0%, and complementary product sales increased 54.7% over the prior year. Existing market sales, excluding acquisitions, increased 13.9% year to date. The nine months of Fiscal 2016 and 2015 had 190 and 189 business days, respectively.
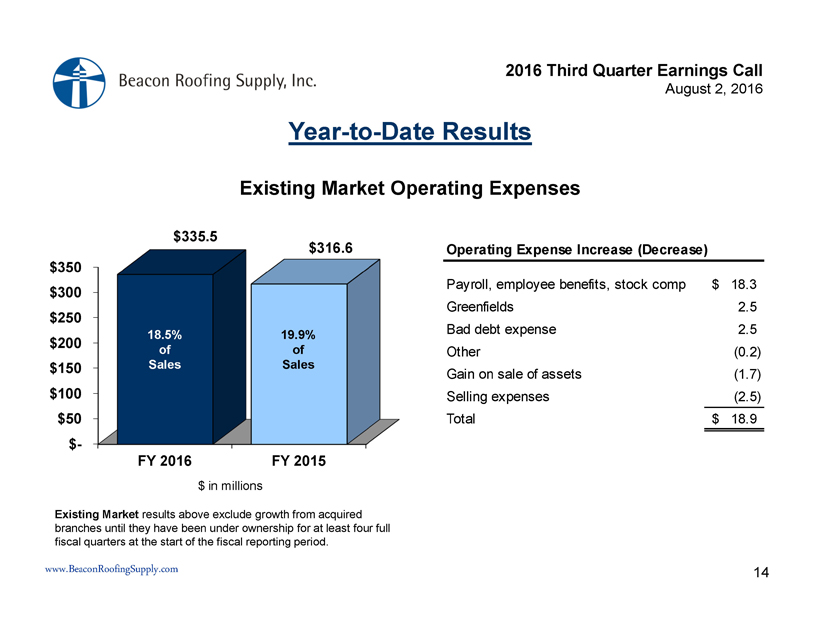
Net income for the nine months was $42.5 million, compared to $31.5 million in 2015. The nine month EPS was $0.71, compared to $0.63 in 2015. Adjusted Net Income, after removing the impact of non-recurring RSG acquisition-related costs and other current year acquisition costs, was $72.9 million year to date, with Adjusted EPS of $1.21 (see included financial tables for a definition and reconciliation of “Adjusted”). Net income for the nine months was favorably impacted by warmer weather in our second quarter and higher volume and gross margins which improved by 70 basis points over the prior year. This was offset by increased operating expenses driven by the incremental costs associated with the RSG acquisition made this fiscal year.
The Company will host a webcast and conference call today at 5:00 p.m. (EST) to discuss these results. The webcast link and call-in details are as follows:
| What: | Beacon Roofing Supply Third Quarter 2016 Earnings Results Webcast and Conference Call | |
| When: | Tuesday, August 2, 2016 | |
| Time: | 5:00 p.m. EST | |
| Webcast: | http://ir.beaconroofingsupply.com/events.cfm (live and replay) | |
| Live Call: | 720-634-9063 |
To assure timely access, conference call participants should call in prior to the 5:00pm start time.
Forward-Looking Statements
This release contains information about management's view of the Company's future expectations, plans and prospects that constitute forward-looking statements for purposes of the safe harbor provisions under the Private Securities Litigation Reform Act of 1995. Actual results may differ materially from those indicated by such forward-looking statements as a result of various important factors, including, but not limited to, those set forth in the "Risk Factors" section of the Company's latest Form 10-K. In addition, the forward-looking statements included in this press release represent the Company's views as of the date of this press release and these views could change. However, while the Company may elect to update these forward-looking statements at some point, the Company specifically disclaims any obligation to do so, other than as required by federal securities laws. These forward-looking statements should not be relied upon as representing the Company's views as of any date subsequent to the date of this press release.
About Beacon Roofing Supply
Founded in 1928, Beacon Roofing Supply, Inc. is the largest publicly traded distributor of residential and commercial roofing materials and complementary building products, operating 369 branches throughout 46 states in the U.S. and six provinces in Canada. To learn more about Beacon and its family of regional brands, please visit www.becn.com.
BECN-F
Beacon Roofing Supply, Inc.
Joseph Nowicki, Executive VP & CFO
571-323-3940
JNowicki@becn.com
BEACON ROOFING SUPPLY, INC
Consolidated Statements of Operations
(Unaudited; In thousands, except share and per share amounts)
| Three Months Ended June 30, | Nine Months Ended June 30, | |||||||||||||||||||||||||||||||
| 20161 | %
of Net Sales | 2015 | %
of Net Sales | 20161 | %
of Net Sales | 2015 | %
of Net Sales | |||||||||||||||||||||||||
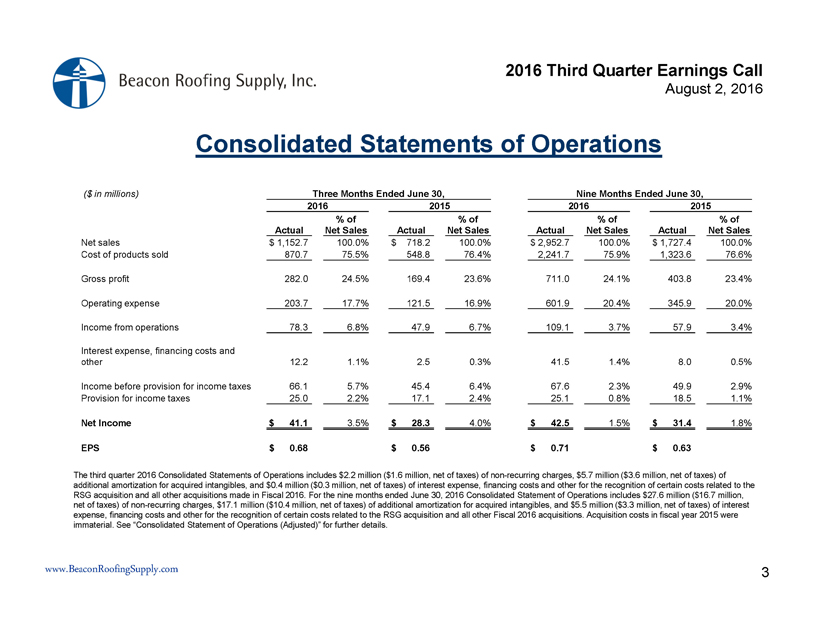
| Net sales | $ | 1,152,726 | 100.0 | % | $ | 718,214 | 100.0 | % | $ | 2,952,743 | 100.0 | % | $ | 1,727,440 | 100.0 | % | ||||||||||||||||
| Cost of products sold | 870,651 | 75.5 | % | 548,778 | 76.4 | % | 2,241,716 | 75.9 | % | 1,323,666 | 76.6 | % | ||||||||||||||||||||
| Gross profit | 282,075 | 24.5 | % | 169,436 | 23.6 | % | 711,027 | 24.1 | % | 403,774 | 23.4 | % | ||||||||||||||||||||
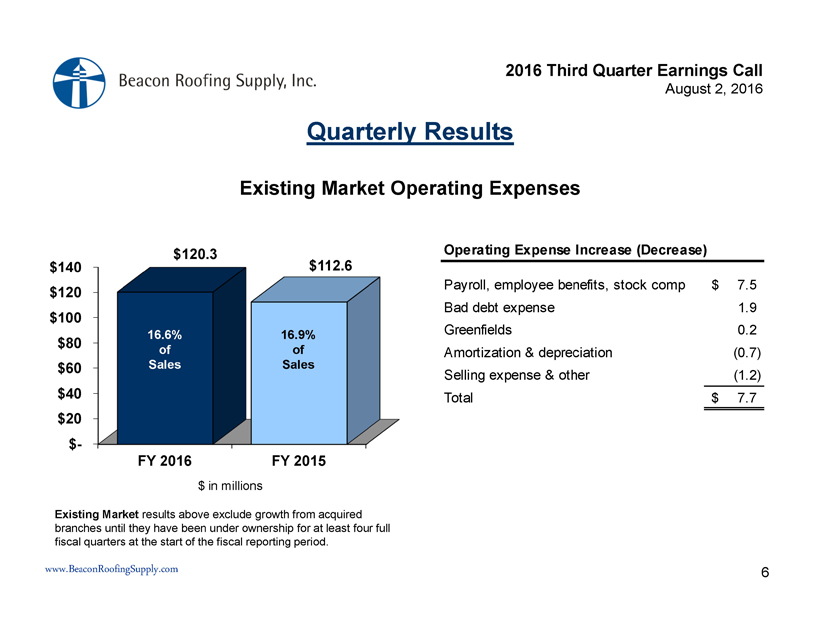
| Operating expense | 203,696 | 17.7 | % | 121,445 | 16.9 | % | 601,921 | 20.4 | % | 345,852 | 20.0 | % | ||||||||||||||||||||
| Income from operations | 78,379 | 6.8 | % | 47,991 | 6.7 | % | 109,106 | 3.7 | % | 57,922 | 3.4 | % | ||||||||||||||||||||
| Interest expense, financing costs and other | 12,226 | 1.1 | % | 2,494 | 0.3 | % | 41,508 | 1.4 | % | 7,988 | 0.5 | % | ||||||||||||||||||||
| Income before provision for income taxes | 66,153 | 5.7 | % | 45,497 | 6.4 | % | 67,598 | 2.3 | % | 49,934 | 2.9 | % | ||||||||||||||||||||
| Provision for income taxes | 25,027 | 2.2 | % | 17,148 | 2.4 | % | 25,073 | 0.8 | % | 18,464 | 1.1 | % | ||||||||||||||||||||
| Net income | $ | 41,126 | 3.5 | % | $ | 28,349 | 4.0 | % | $ | 42,525 | 1.5 | % | $ | 31,470 | 1.8 | % | ||||||||||||||||
| Weighted-average common stock outstanding: | ||||||||||||||||||||||||||||||||
| Basic | 59,615,121 | 49,638,251 | 59,293,500 | 49,526,436 | ||||||||||||||||||||||||||||
| Diluted | 60,619,809 | 50,199,126 | 60,276,695 | 50,089,987 | ||||||||||||||||||||||||||||
| Net income per share: | ||||||||||||||||||||||||||||||||
| Basic | $ | 0.69 | $ | 0.57 | $ | 0.72 | $ | 0.64 | ||||||||||||||||||||||||
| Diluted | $ | 0.68 | $ | 0.56 | $ | 0.71 | $ | 0.63 | ||||||||||||||||||||||||
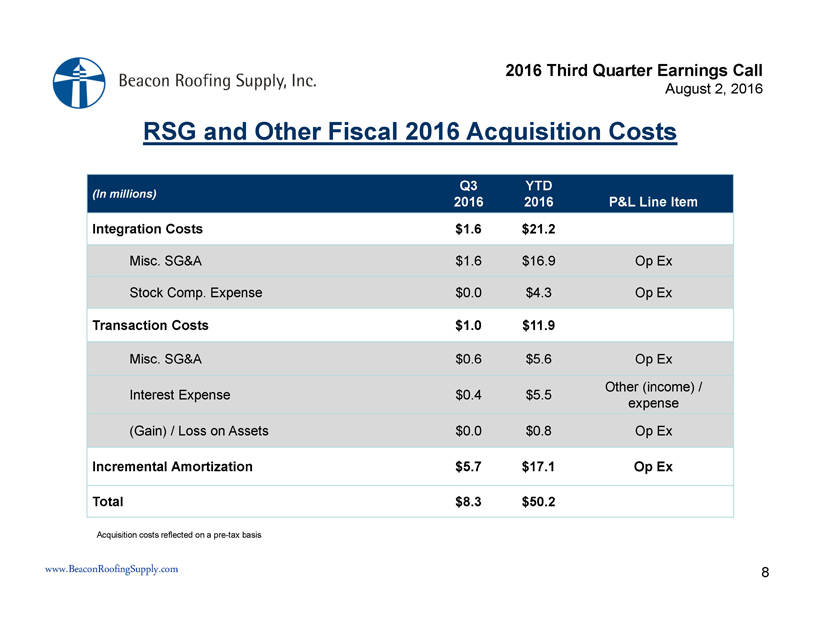
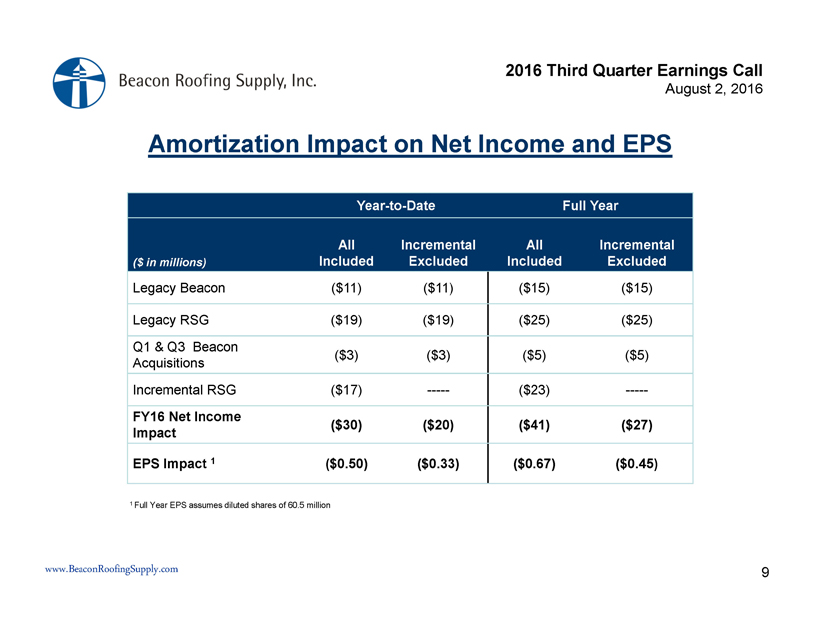
| (1) | The third quarter 2016 Consolidated Statements of Operations includes $2.2 million ($1.6 million, net of taxes) of non-recurring charges, $5.7 million ($3.6 million, net of taxes) of additional amortization for acquired intangibles, and $0.4 million ($0.3 million, net of taxes) of interest expense, financing costs and other for the recognition of certain costs related to the RSG acquisition and all other acquisitions made in Fiscal 2016. For the nine months ended June 30, 2016 Consolidated Statement of Operations includes $27.6 million ($16.7 million, net of taxes) of non-recurring charges, $17.1 million ($10.4 million, net of taxes) of additional amortization for acquired intangibles, and $5.5 million ($3.3 million, net of taxes) of interest expense, financing costs and other for the recognition of certain costs related to the RSG acquisition and all other Fiscal 2016 acquisitions. See “Adjusted Net Income and Adjusted EPS” table for further details. |
BEACON ROOFING SUPPLY, INC
Consolidated Balance Sheets
(In thousands)
| June 30, 2016 | September 30, 2015 | June 30, 2015 | ||||||||||
| (unaudited) | (audited) | (unaudited) | ||||||||||
| Assets | ||||||||||||
| Current assets | ||||||||||||
| Cash and cash equivalents | $ | 36,536 | $ | 45,661 | $ | 17,594 | ||||||
| Accounts receivable, net | 640,101 | 399,732 | 389,499 | |||||||||
| Inventories | 620,908 | 320,999 | 386,812 | |||||||||
| Prepaid expenses and other current assets | 205,073 | 97,928 | 99,505 | |||||||||
| Total current assets | 1,502,618 | 864,320 | 893,410 | |||||||||
| Property and equipment, net | 153,389 | 90,405 | 88,868 | |||||||||
| Goodwill | 1,200,206 | 496,415 | 498,499 | |||||||||
| Intangible assets, net | 477,250 | 87,055 | 91,419 | |||||||||
| Other assets, net | 1,430 | 1,233 | 1,233 | |||||||||
| Total Assets | $ | 3,334,893 | $ | 1,539,428 | $ | 1,573,429 | ||||||
| Liabilities and Stockholders' Equity | ||||||||||||
| Current liabilities: | ||||||||||||
| Accounts payable | $ | 563,332 | $ | 244,891 | $ | 257,656 | ||||||
| Accrued expenses | 205,412 | 124,794 | 105,756 | |||||||||
| Borrowings under revolver lines of credit | - | 11,240 | 74,110 | |||||||||
| Current portion of long-term obligations | 12,605 | 16,320 | 16,474 | |||||||||
| Total current liabilities | 781,349 | 397,245 | 453,996 | |||||||||
| Borrowings under revolving lines of credit | 416,207 | - | - | |||||||||
| Long-term debt, net of current | 721,630 | 170,200 | 175,278 | |||||||||
| Deferred income taxes | 106,337 | 66,500 | 68,099 | |||||||||
| Long-term obligations under equipment financing and other, net of current | 39,720 | 22,367 | 23,602 | |||||||||
| Total liabilities | 2,065,243 | 656,312 | 720,975 | |||||||||
| Commitments and contingencies | ||||||||||||
| Stockholders' equity: | ||||||||||||
| Common stock | 597 | 497 | 496 | |||||||||
| Undesignated preferred stock | - | - | - | |||||||||
| Additional paid-in capital | 686,943 | 345,934 | 340,468 | |||||||||
| Retained earnings | 599,930 | 557,405 | 526,598 | |||||||||
| Accumulated other comprehensive loss | (17,820 | ) | (20,720 | ) | (15,108 | ) | ||||||
| Total stockholders' equity | 1,269,650 | 883,116 | 852,454 | |||||||||
| Total Liabilities and Stockholders' Equity | $ | 3,334,893 | $ | 1,539,428 | $ | 1,573,429 | ||||||
BEACON ROOFING SUPPLY, INC
Consolidated Statements of Cash Flows
(Unaudited; In thousands)
| Nine Months Ended June 30, | ||||||||
| 2016 | 2015 | |||||||
| Operating activities: | ||||||||
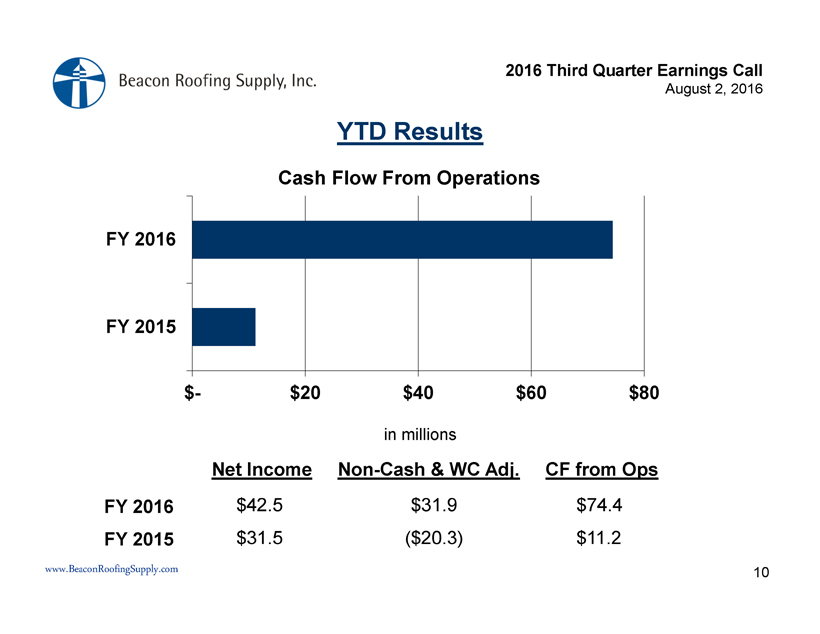
| Net income | $ | 42,525 | $ | 31,470 | ||||
| Adjustments to reconcile net income to net cash provided by operating activities: | ||||||||
| Depreciation and amortization | 73,027 | 25,920 | ||||||
| Stock-based compensation | 14,070 | 7,305 | ||||||
| Certain interest expense and other financing costs | 5,113 | 814 | ||||||
| Gain on sale of fixed assets | (838 | ) | (609 | ) | ||||
| Deferred income taxes | 1,460 | (589 | ) | |||||
| Adjustment of liability for contingent consideration and other | (359 | ) | 286 | |||||
| Changes in assets and liabilities, net of the effects of businesses acquired: | ||||||||
| Accounts receivable | (43,060 | ) | (20,581 | ) | ||||
| Inventories | (96,363 | ) | (73,717 | ) | ||||
| Prepaid expenses and other assets | (56,764 | ) | (7,168 | ) | ||||
| Accounts payable and accrued expenses | 135,548 | 48,091 | ||||||
| Net cash provided by operating activities | 74,359 | 11,222 | ||||||
| Investing activities: | ||||||||
| Purchases of property and equipment | (21,553 | ) | (13,787 | ) | ||||
| Acquisition of businesses | (1,018,658 | ) | (85,301 | ) | ||||
| Proceeds from sales of assets | 969 | 804 | ||||||
| Net cash used in investing activities | (1,039,242 | ) | (98,284 | ) | ||||
| Financing activities: | ||||||||
| Borrowings under revolving lines of credit, net of repayments | 403,052 | 56,778 | ||||||
| Borrowings under term loan, net of repayments | 261,000 | (8,438 | ) | |||||
| Borrowings under Senior Notes | 300,000 | - | ||||||
| Repayments under equipment financing facilities and other | (3,847 | ) | (4,114 | ) | ||||
| Payment of deferred financing costs | (27,813 | ) | - | |||||
| Proceeds from exercise of options | 20,213 | 5,107 | ||||||
| Excess tax benefit from stock-based compensation | 4,024 | 1,245 | ||||||
| Net cash provided by financing activities | 956,629 | 50,578 | ||||||
| Effect of exchange rate changes on cash | (871 | ) | (394 | ) | ||||
| Net decrease in cash and cash equivalents | (9,125 | ) | (36,878 | ) | ||||
| Cash and cash equivalents, beginning of period | 45,661 | 54,472 | ||||||
| Cash and cash equivalents, end of period | $ | 36,536 | $ | 17,594 | ||||
BEACON ROOFING SUPPLY, INC
Consolidated Sales by Product Line
(Unaudited; Dollars in thousands)
| Consolidated Sales by Product Line | ||||||||||||||||||||||||
| Three Months Ended June 30, | ||||||||||||||||||||||||
| 2016 | 2015 | Change | ||||||||||||||||||||||
| Net Sales | Mix % | Net Sales | Mix % | $ | % | |||||||||||||||||||
| Residential roofing products | $ | 621,742 | 53.9 | % | $ | 359,455 | 50.0 | % | $ | 262,287 | 73.0 | % | ||||||||||||
| Non-residential roofing products | 363,675 | 31.5 | % | 252,718 | 35.2 | % | 110,957 | 43.9 | % | |||||||||||||||
| Complementary building products | 167,309 | 14.6 | % | 106,041 | 14.8 | % | 61,268 | 57.8 | % | |||||||||||||||
| $ | 1,152,726 | 100.0 | % | $ | 718,214 | 100.0 | % | $ | 434,512 | 60.5 | % | |||||||||||||
| Consolidated Sales by Product Line for Existing Markets1 | ||||||||||||||||||||||||
| Three Months Ended June 30, | ||||||||||||||||||||||||
| 2016 | 2015 | Change | ||||||||||||||||||||||
| Net Sales | Mix % | Net Sales | Mix % | $ | % | |||||||||||||||||||
| Residential roofing products | $ | 379,987 | 52.4 | % | $ | 335,713 | 50.3 | % | $ | 44,274 | 13.2 | % | ||||||||||||
| Non-residential roofing products | 236,984 | 32.7 | % | 229,982 | 34.5 | % | 7,002 | 3.0 | % | |||||||||||||||
| Complementary building products | 108,242 | 14.9 | % | 101,235 | 15.2 | % | 7,007 | 6.9 | % | |||||||||||||||
| $ | 725,213 | 100.0 | % | $ | 666,930 | 100.0 | % | $ | 58,283 | 8.7 | % | |||||||||||||
| Existing Market Sales By Business Day2 | ||||||||||||||||||||||||
| Three Months Ended June 30, | ||||||||||||||||||||||||
| 2016 | 2015 | Change | ||||||||||||||||||||||
| Net Sales | Mix % | Net Sales | Mix % | $ | % | |||||||||||||||||||
| Residential roofing products | $ | 5,937 | 52.4 | % | $ | 5,246 | 50.3 | % | $ | 691 | 13.2 | % | ||||||||||||
| Non-residential roofing products | 3,703 | 32.7 | % | 3,593 | 34.5 | % | 110 | 3.0 | % | |||||||||||||||
| Complementary building products | 1,691 | 14.9 | % | 1,582 | 15.2 | % | 109 | 6.9 | % | |||||||||||||||
| $ | 11,331 | 100.0 | % | $ | 10,421 | 100.0 | % | $ | 910 | 8.7 | % | |||||||||||||
| 1 | Excludes branches acquired during the four quarters prior to the start of the third quarter of Fiscal 2016 |
| 2 | There were 64 business days in the quarters ended June 30, 2016 and 2015, respectively |
BEACON ROOFING SUPPLY, INC
Consolidated Sales by Product Line
(Unaudited; Dollars in thousands)
| Consolidated Sales by Product Line | ||||||||||||||||||||||||
| Nine Months Ended June 30, | ||||||||||||||||||||||||
| 2016 | 2015 | Change | ||||||||||||||||||||||
| Net Sales | Mix % | Net Sales | Mix % | $ | % | |||||||||||||||||||
| Residential roofing products | $ | 1,547,483 | 52.4 | % | $ | 843,805 | 48.8 | % | $ | 703,678 | 83.4 | % | ||||||||||||
| Non-residential roofing products | 980,910 | 33.2 | % | 609,379 | 35.3 | % | 371,531 | 61.0 | % | |||||||||||||||
| Complementary building products | 424,350 | 14.4 | % | 274,256 | 15.9 | % | 150,094 | 54.7 | % | |||||||||||||||
| $ | 2,952,743 | 100.0 | % | $ | 1,727,440 | 100.0 | % | $ | 1,225,303 | 70.9 | % | |||||||||||||
| Consolidated Sales by Product Line for Existing Markets1 | ||||||||||||||||||||||||
| Nine Months Ended June 30, | ||||||||||||||||||||||||
| 2016 | 2015 | Change | ||||||||||||||||||||||
| Net Sales | Mix % | Net Sales | Mix % | $ | % | |||||||||||||||||||
| Residential roofing products | $ | 909,287 | 50.3 | % | $ | 772,425 | 48.6 | % | $ | 136,862 | 17.7 | % | ||||||||||||
| Non-residential roofing products | 607,933 | 33.6 | % | 552,462 | 34.8 | % | 55,471 | 10.0 | % | |||||||||||||||
| Complementary building products | 291,555 | 16.1 | % | 263,225 | 16.6 | % | 28,330 | 10.8 | % | |||||||||||||||
| $ | 1,808,775 | 100.0 | % | $ | 1,588,112 | 100.0 | % | $ | 220,663 | 13.9 | % | |||||||||||||
| Existing Market Sales By Business Day2 | ||||||||||||||||||||||||
| Nine Months Ended June 30, | ||||||||||||||||||||||||
| 2016 | 2015 | Change | ||||||||||||||||||||||
| Net Sales | Mix % | Net Sales | Mix % | $ | % | |||||||||||||||||||
| Residential roofing products | $ | 4,786 | 50.3 | % | $ | 4,087 | 48.6 | % | $ | 699 | 17.1 | % | ||||||||||||
| Non-residential roofing products | 3,200 | 33.6 | % | 2,923 | 34.8 | % | 277 | 9.5 | % | |||||||||||||||
| Complementary building products | 1,535 | 16.1 | % | 1,393 | 16.6 | % | 142 | 10.2 | % | |||||||||||||||
| $ | 9,521 | 100.0 | % | $ | 8,403 | 100.0 | % | $ | 1,118 | 13.3 | % | |||||||||||||
| 1 | Excludes branches acquired during the four quarters prior to the start of Fiscal 2016 |
| 2 | There were 190 and 189 business days for the nine months ended June 30, 2016 and 2015, respectively |
BEACON ROOFING SUPPLY, INC
Adjusted Net Income1 and Adjusted EPS2
(Unaudited; In thousands except per share amounts)
| Three Months Ended June 30, | Nine Months Ended June 30, | |||||||||||||||||||||||||||||||
| 2016 | 2015 | 2016 | 2015 | |||||||||||||||||||||||||||||
| Amount | Per
Share | Amount | Per
Share | Amount | Per
Share | Amount | Per
Share | |||||||||||||||||||||||||
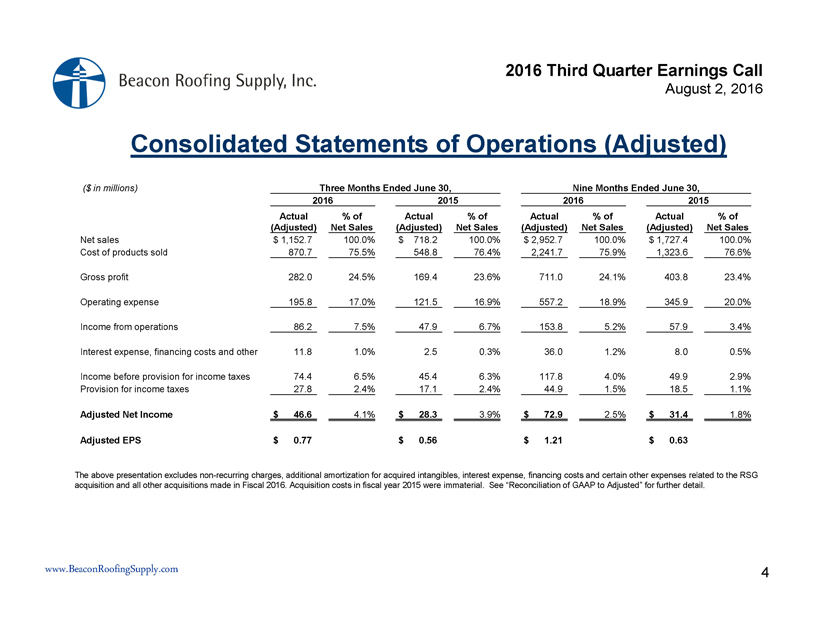
| Net income | $ | 41,126 | $ | 0.68 | $ | 28,349 | $ | 0.56 | $ | 42,525 | $ | 0.71 | $ | 31,470 | $ | 0.63 | ||||||||||||||||
| Company adjustments, net of income taxes: | ||||||||||||||||||||||||||||||||
| Acquisition costs3 | 5,444 | 0.09 | - | - | 30,405 | 0.50 | - | - | ||||||||||||||||||||||||
| Adjusted Net Income | $ | 46,570 | $ | 0.77 | $ | 28,349 | $ | 0.56 | $ | 72,930 | $ | 1.21 | $ | 31,470 | $ | 0.63 | ||||||||||||||||
| (1) | The Company’s management believes that “Adjusted Net Income”, which excludes non-recurring costs related to the RSG acquisition and the other acquisitions made in Fiscal 2016, and incremental amortization of acquired intangibles, is useful to investors because it permits investors to better understand year-over-year changes in underlying operating performance. |
| (2) | Adjusted Net Income Per Share (“Adjusted Earnings Per Share” or “Adjusted EPS”) is calculated by dividing the Adjusted Net Income for the period by the weighted-average diluted shares outstanding for the period (see “Consolidated Statements of Operations” for amounts). |
| (3) | Acquisition costs in fiscal year 2015 were immaterial |
While we believe Adjusted Net Income and Adjusted EPS are useful measures for investors, these are not measurements presented in accordance with United States generally accepted accounting principles (“GAAP”). You should not consider Adjusted Net Income or Adjusted EPS in isolation or as a substitute for net income (loss) or diluted net income per share calculated in accordance with GAAP.
BEACON ROOFING SUPPLY, INC
Adjusted EBITDA1
(Unaudited; In thousands)
| Three Months Ended June 30, | Nine Months Ended June 30, | |||||||||||||||
| 2016 | 2015 | 2016 | 2015 | |||||||||||||
| Net Income | $ | 41,126 | $ | 28,349 | $ | 42,525 | $ | 31,470 | ||||||||
| Acquisition costs2 | 2,157 | - | 23,310 | - | ||||||||||||
| Interest expense, net | 12,508 | 2,476 | 41,836 | 7,760 | ||||||||||||
| Income taxes | 25,027 | 17,148 | 25,073 | 18,464 | ||||||||||||
| Depreciation and amortization | 25,375 | 9,490 | 73,019 | 25,920 | ||||||||||||
| Stock-based compensation | 3,374 | 2,561 | 14,070 | 7,305 | ||||||||||||
| Adjusted EBITDA | $ | 109,567 | $ | 60,024 | $ | 219,833 | $ | 90,919 | ||||||||
| (1) | Adjusted EBITDA is defined as net income plus interest expense (net of interest income), income taxes, depreciation and amortization, adjustments to contingent consideration, stock-based compensation and RSG and other Fiscal 2016 non-recurring acquisitions costs. EBITDA is a measure commonly used in the distribution industry, and we present Adjusted EBITDA to enhance your understanding of our operating performance. Adjusted EBITDA is used in our bank covenants and we use Adjusted EBITDA as an internal performance measurement and as one criterion for evaluating our performance relative to that of our peers. We believe that Adjusted EBITDA is an operating performance measure that provides investors and analysts with a measure of operating results unaffected by differences in capital structures, capital investment cycles, and ages of related assets among otherwise comparable companies. Further, we believe that Adjusted EBITDA is a useful measure because it improves comparability of results of operations, since purchase accounting used for acquisitions can render depreciation and amortization non-comparable between periods. We use these supplemental measures to evaluate performance period over period and to analyze the underlying trends in the Company’s business and to establish operational goals and forecasts that are used in allocating resources. We expect to compute our non-GAAP financial measures using the same consistent method from quarter to quarter and year to year. |
| (2) | RSG and other Fiscal 2016 acquisition costs reflect all non-recurring charges related to the acquisition (excluding the impact of tax) that are not embedded in other balances of the table. Additional RSG and other Fiscal 2016 acquisition costs are included in interest expense, income taxes, depreciation and amortization, and stock-based compensation in the table above. Acquisition costs in fiscal year 2015 were immaterial. |
While we believe Adjusted EBITDA is a useful measure for investors, it is not a measurement presented in accordance GAAP. You should not consider Adjusted EBITDA in isolation or as a substitute for net income, cash flows from operations, or any other items calculated in accordance with GAAP. In addition, Adjusted EBITDA has inherent material limitations as a performance measure. It does not include interest expense, because we have borrowed money, interest expense is a necessary element of our costs. In addition, Adjusted EBITDA does not include depreciation and amortization expense. Because we have capital and intangible assets, depreciation and amortization expense is a necessary element of our costs. Adjusted EBITDA also does not include stock-based compensation, which is a necessary element of our costs since we make stock awards to key members of management as an important incentive to maximize overall company performance and as a benefit. Moreover, Adjusted EBITDA does not include taxes, and payment of taxes is a necessary element of our operations. Accordingly, since Adjusted EBITDA excludes these items, it has material limitations as a performance measure. We separately monitor capital expenditures, which impact depreciation expense, as well as amortization expense, interest expense, and income tax expense. Because not all companies use identical calculations, our presentation of Adjusted EBITDA may not be comparable to other similarly titled measures of other companies.