UNITED STATES
SECURITIES AND EXCHANGE COMMISSION
Washington, DC 20549
FORM N-CSR
CERTIFIED SHAREHOLDER REPORT OF REGISTERED MANAGEMENT
INVESTMENT COMPANIES
Investment Company Act file number 811-10085
Hillman Capital Management Investment Trust
(Exact name of registrant as specified in charter)
116 South Franklin Street, Post Office Box 69, Rocky Mount, North Carolina 27802
(Address of principal executive offices) (Zip code)
Terrence O. Davis
116 South Franklin Street, Post Office Box 69, Rocky Mount, North Carolina 27802
(Name and address of agent for service)
Registrant's telephone number, including area code: 252-972-9922
Date of fiscal year end: September 30
Date of reporting period: September 30, 2013
Item 1. REPORTS TO STOCKHOLDERS.
Annual Report 2013
September 30, 2013
The Hillman Focused Advantage Fund
No Load Shares

This report and the financial statements contained herein are submitted for the general information of the shareholders of The Hillman Focused Advantage Fund (“Fund”). The Fund’s shares are not deposits or obligations of, or guaranteed by, any depository institution. The Fund’s shares are not insured by the FDIC, Federal Reserve Board or any other agency, and are subject to investment risks, including possible loss of principal amount invested. Neither the Fund nor the Fund’s distributor is a bank.
The Hillman Focused Advantage Fund is distributed by Capital Investment Group, Inc., Member FINRA/SIPC, 17 Glenwood Ave, Raleigh, NC, 27603. There is no affiliation between The Hillman Focused Advantage Fund, including its principals, and Capital Investment Group, Inc.
Statements in this Annual Report that reflect projections or expectations of future financial or economic performance of The Hillman Focused Advantage Fund (“Fund”) and of the market in general and statements of the Fund’s plans and objectives for future operations are forward-looking statements. No assurance can be given that actual results or events will not differ materially from those projected, estimated, assumed or anticipated in any such forward-looking statements. Important factors that could result in such differences, in addition to the other factors noted with such forward-looking statements, include, without limitation, general economic conditions such as inflation, recession and interest rates. Past performance is not a guarantee of future results.
Investments in the Fund are subject to investment risks, including the possible loss of some or the entire principal amount invested. There can be no assurance that the Fund will be successful in meeting its investment objective. Investment in the Fund is subject to the following risks: market risk, management style risk, investment advisor risk, operating risk, non-diversified status risk, sector focus risk, small-cap and mid-cap companies risk, and risks from writing options. More information about these risks and other risks can be found in the Fund’s prospectus.
The performance information quoted in this annual report represents past performance, which is not a guarantee of future results. Investment return and principal value of an investment will fluctuate so that an investor’s shares, when redeemed, may be worth more or less than their original cost. Current performance may be lower or higher than the performance data quoted. An investor may obtain performance data current to the most recent month-end by visiting hillmancapital.com.
An investor should consider the investment objectives, risks, charges and expenses of the Fund carefully before investing. The prospectus contains this and other information about the Fund. A copy of the prospectus is available at hillmancapital.com or by calling Shareholder Services at 800-773-3863. The prospectus should be read carefully before investing.
This Annual Report was first distributed to shareholders on or about November 29, 2013.
For More Information on Your Hillman Focused Advantage Fund:
See Our Website @ hillmancapital.com
or
Call Our Shareholder Services Group at 800-773-3863

Letter to Shareholders
Dear Hillman Fund Shareholder,
We are pleased to provide the annual report for the Hillman Focused Advantage Fund for the year ended September 30, 2013.
We have enclosed the attached commentary to remind our shareholders of Hillman Capital Management’s approach and to share some perspective on current economic conditions.
On behalf of the team at Hillman Capital Management, I thank you for your ongoing confidence. It is our hope that we may continue to serve you throughout the years to come.
Sincerely,

Mark A. Hillman
President and Chief Investment Officer
Hillman Capital Management, Inc.
Performance Summary
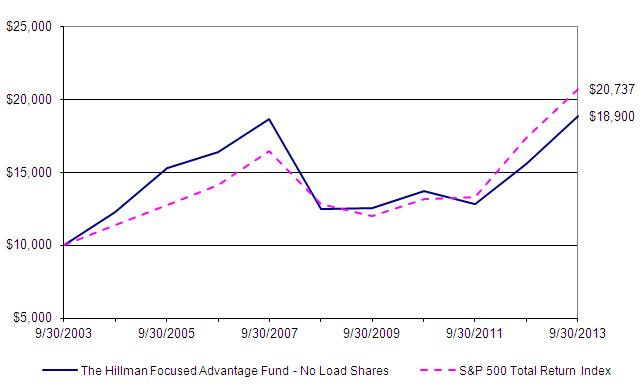
For the year ended September 30, 2013, the Hillman Focused Advantage Equity Fund returned 21.38% versus a return of 19.34% for the S&P 500 Total Return Index (“The Index”). I believe that the recent addition of option writing to the Fund’s strategy has been beneficial and I will continue to pursue opportunities that I feel could potentially enhance returns and dampen volatility. It is my belief that the US economy is still in the early stages of a long and slow economic recovery. It appears that participants in capital markets are beginning to believe that the private sector economy may soon be able to support reasonable growth and employment levels without requiring further heroics from the Federal Reserve. To wit, the yield on the Ten Year US Treasury Note rose from 1.87% at the end of the first calendar quarter of 2013 to 2.62% at the end of the third calendar quarter. I would not be surprised to see further increases.
I believe that continued fiscal and monetary challenges within many developed economies are likely to dampen economic activity, resulting in a slow, but positive, economic growth environment. Through this period, we will continue to focus our energies on making prudent long term investment decisions within the context of our clients’ needs. Our equity strategies continue to be driven by our core belief that competitively advantaged companies will outperform their peers through economic cycles and market cycles. Our goal is to invest in great enterprises at attractive prices. We will continue to invest according to this precept for the long-term interests of our clients.
Disclosure:
Past performance is not indicative of future results. An investment in the Fund is subject to investment risks, including the possible loss of some or all of the principal amount invested. There can be no assurance that the Fund will be successful in meeting its investment objective. Investment in the Fund is subject to the following risks: market risk, management style risk, investment advisor risk, operating risk, non-diversified status risk, sector focus risk, small-cap and mid-cap companies risk, and risks from writing options. More information about these risks and other risks can be found in the Fund’s prospectus. The S&P 500 Total Return Index is the Standard & Poor’s Composite Index of 500 stocks and is a widely recognized, unmanaged index of common stock prices. It is not possible to invest in this index.
An investor should consider the investment objectives, risks, and charges and expenses of the Fund carefully before investing. The prospectus contains this and other information about the Fund. A copy of the prospectus is available at ncfunds.com or by calling Shareholder Services at 1-800-773-3863. The prospectus should be read carefully before investing.
Statements in this Annual Report reflect projections or expectations of future financial or economic performance of the Fund and of the market in general and statements of the Fund’s plans and objectives for future operations are forward-looking statements. No assurance can be given that actual results or events will not differ materially from those projected, estimated, assumed or anticipated in any such forward-looking statements. Important factors that could result in such differences, in addition to the other factors noted with such forward-looking statements, include general economic conditions such as inflation, recession and interest rates.
Underwriter and Distributor: Capital Investment Group, Inc.
116 South Franklin Street
Rocky Mount, NC 27804
Phone (800) 773-3863
There is no affiliation between Capital Investment Group, Inc. and Hillman Capital Management, Inc.
|
The Hillman Focused Advantage Fund - No Load Shares
|
|||||||||||||||||||
|
Performance Update (Unaudited)
|
|||||||||||||||||||
|
For the period from September 30, 2003 to September 30, 2013
|
|||||||||||||||||||
|
Comparison of the Change in Value of a $10,000 Investment
|
|||||||||||||||||||
 |
|||||||||||||||||||
|
This graph assumes an initial investment of $10,000 and represents the reinvestment of dividends and capital gains distributions. This graph depicts the performance of No Load Shares versus the S&P 500 Total Return Index. It is important to note that the Fund is a professionally managed mutual fund while the index is not available for investment and is unmanaged. The comparison is shown for illustrative purposes only.
|
|||||||||||||||||||
|
Average Annual Total Returns
|
|||||||||||||||||||
|
Gross
|
|||||||||||||||||||
|
As of
|
One
|
Five
|
Ten
|
Expense
|
|||||||||||||||
|
September 30, 2013
|
Year
|
Year
|
Year
|
Ratio*
|
|||||||||||||||
|
No Load Shares
|
21.38%
|
8.58%
|
6.57%
|
2.36%
|
|||||||||||||||
|
S&P 500 Total Return Index
|
19.34%
|
10.02%
|
7.57%
|
N/A
|
|||||||||||||||
|
* The gross expense ratio shown is from the Fund's prospectus dated January 28, 2013, and includes acquired
|
|||||||||||||||||||
|
fund fees and expenses.
|
|||||||||||||||||||
|
Performance quoted above represents past performance, which is no guarantee of future results. Investment return and principal value will fluctuate so that shares, when redeemed, may be worth more or less than their original cost. Current performance may be lower or higher than the performance data quoted. An investor may obtain performance data, current to the most recent month-end, by visiting hillmancapital.com.
|
|||||||||||||||||||
|
The graph and table do not reflect the deduction of taxes that a shareholder would pay on Fund distributions or the redemption of Fund shares. Average annual total returns are historical in nature and measure net investment income and capital gain or loss from portfolio investments assuming reinvestments of dividends and distributions.
|
|||||||||||||||||||
|
The Hillman Focused Advantage Fund
|
||||||||||
|
Schedule of Investments
|
||||||||||
|
As of September 30, 2013
|
||||||||||
|
Shares
|
Value (Note 1)
|
|||||||||
|
COMMON STOCKS - 91.72%
|
||||||||||
|
Consumer Discretionary - 7.70%
|
||||||||||
|
|
Nordstrom, Inc.
|
11,000
|
$
|
618,200
|
||||||
|
|
PetSmart, Inc.
|
11,000
|
838,860
|
|||||||
|
|
Yum! Brands, Inc.
|
10,000
|
713,900
|
|||||||
|
2,170,960
|
||||||||||
|
Consumer Staples - 4.10%
|
||||||||||
|
Sysco Corp.
|
20,000
|
636,600
|
||||||||
|
|
Wal-Mart Stores, Inc.
|
7,000
|
517,720
|
|||||||
|
1,154,320
|
||||||||||
|
Energy - 3.81%
|
||||||||||
|
|
Exxon Mobil Corp.
|
6,600
|
567,864
|
|||||||
|
†
|
Transocean Ltd.
|
11,400
|
507,300
|
|||||||
|
1,075,164
|
||||||||||
|
Financials - 16.32%
|
||||||||||
|
|
Allstate Corp., The
|
16,000
|
808,800
|
|||||||
|
American Express Co.
|
10,000
|
755,200
|
||||||||
|
|
Bank of America Corp.
|
55,000
|
759,000
|
|||||||
|
|
Goldman Sachs Group, Inc., The
|
4,800
|
759,408
|
|||||||
|
†
|
JPMorgan Chase & Co.
|
14,900
|
770,181
|
|||||||
|
|
Western Union Co., The
|
40,000
|
746,400
|
|||||||
|
4,598,989
|
||||||||||
|
Health Care - 14.85%
|
||||||||||
|
Aetna, Inc.
|
11,000
|
704,220
|
||||||||
|
|
Amgen, Inc.
|
6,600
|
738,705
|
|||||||
|
†
|
Johnson & Johnson
|
8,700
|
754,203
|
|||||||
|
*
|
Laboratory Corp of America Holdings
|
6,000
|
594,840
|
|||||||
|
|
Merck & Co., Inc.
|
15,000
|
714,135
|
|||||||
|
|
Pfizer, Inc.
|
23,700
|
680,783
|
|||||||
|
4,186,886
|
||||||||||
|
Industrials - 12.20%
|
||||||||||
|
|
Boeing Co., The
|
6,000
|
705,000
|
|||||||
|
|
General Electric Co.
|
32,900
|
785,981
|
|||||||
|
†
|
Joy Global, Inc.
|
12,000
|
612,480
|
|||||||
|
|
Norfolk Southern Corp.
|
9,000
|
696,150
|
|||||||
|
|
United Parcel Service, Inc. - Cl. B.
|
7,000
|
639,590
|
|||||||
|
3,439,201
|
||||||||||
|
Information Technology - 23.62%
|
||||||||||
|
|
Apple, Inc.
|
2,300
|
1,096,525
|
|||||||
|
|
Cisco Systems, Inc.
|
30,400
|
712,302
|
|||||||
|
|
Corning, Inc.
|
45,000
|
656,550
|
|||||||
|
|
EMC Corp.
|
27,700
|
708,012
|
|||||||
|
†
|
Hewlett-Packard Co.
|
31,000
|
650,690
|
|||||||
|
(Continued)
|
||||||||||
|
The Hillman Focused Advantage Fund
|
||||||||||
|
Schedule of Investments
|
||||||||||
|
As of September 30, 2013
|
||||||||||
|
Shares
|
Value (Note 1)
|
|||||||||
|
Information Technology - continued
|
||||||||||
|
|
Intel Corp.
|
30,300
|
$
|
694,506
|
||||||
|
|
International Business Machines Corp.
|
4,000
|
740,720
|
|||||||
|
Microsoft Corp.
|
20,000
|
665,600
|
||||||||
|
†
|
Oracle Corp.
|
22,000
|
729,740
|
|||||||
|
*
|
Yahoo!, Inc.
|
100
|
3,317
|
|||||||
|
6,657,962
|
||||||||||
|
Materials - 7.20%
|
||||||||||
|
|
Compass Minerals International, Inc.
|
8,000
|
610,160
|
|||||||
|
|
EI du Pont de Nemours & Co.
|
10,000
|
585,600
|
|||||||
|
|
Nucor Corp.
|
17,000
|
833,340
|
|||||||
|
2,029,100
|
||||||||||
|
Telecommunication Services - 1.92%
|
||||||||||
|
|
AT&T, Inc.
|
16,000
|
541,120
|
|||||||
|
541,120
|
||||||||||
|
Total Common Stocks (Cost $24,331,089)
|
25,853,702
|
|||||||||
|
SHORT-TERM INVESTMENT - 11.51%
|
||||||||||
|
§
|
Federated Prime Obligations Fund, 0.03%
|
3,244,357
|
3,244,357
|
|||||||
|
Total Short-Term Investment (Cost $3,244,357)
|
3,244,357
|
|||||||||
|
Total Value of Investments (Cost $27,575,446) - 103.23%
|
$
|
29,098,059
|
||||||||
|
Put Options Written (Premiums Received $66,051) - (0.27)%
|
(76,642)
|
|||||||||
|
Liabilities in Excess of Other Assets - (2.96)%
|
(834,897)
|
|||||||||
|
Net Assets - 100.00%
|
$
|
28,186,520
|
||||||||
|
†
|
All or a portion of security is pledged as collateral for options written.
|
|||||||||
|
*
|
Non-income producing investment
|
|||||||||
|
§
|
Represents 7 day effective yield as of September 30, 2013
|
|||||||||
|
Summary of Investments
|
||||||||||
|
% of Net
|
||||||||||
|
Assets
|
Value
|
|||||||||
|
Consumer Discretionary
|
7.70%
|
$
|
2,170,960
|
|||||||
|
Consumer Staples
|
4.10%
|
1,154,320
|
||||||||
|
Energy
|
3.81%
|
1,075,164
|
||||||||
|
Financials
|
16.32%
|
4,598,989
|
||||||||
|
Health Care
|
14.85%
|
4,186,886
|
||||||||
|
Industrials
|
12.20%
|
3,439,201
|
||||||||
|
Information Technology
|
23.62%
|
6,657,962
|
||||||||
|
Materials
|
7.20%
|
2,029,100
|
||||||||
|
Telecommunication Services
|
1.92%
|
541,120
|
||||||||
|
Short-Term Investment
|
11.51%
|
3,244,357
|
||||||||
|
Total
|
103.23%
|
$
|
29,098,059
|
(Continued)
|
||||||
|
The Hillman Focused Advantage Fund
|
||||||||||
|
Schedule of Investments
|
||||||||||
|
As of September 30, 2013
|
||||||||||
|
Number of
Contracts*
|
Exercise Price
|
Maturity Date
|
Value (Note 1)
|
|||||||
|
PUT OPTIONS WRITTEN - (0.27%)
|
||||||||||
|
Campbell Soup Co.
|
160
|
$ |
41.00
|
10/19/2013
|
$
|
16,800
|
||||
|
Caterpillar, Inc.
|
80
|
82.50
|
10/19/2013
|
10,200
|
||||||
|
Kellogg Co.
|
120
|
60.00
|
10/19/2013
|
18,300
|
||||||
|
Parker-Hannifin Corp.
|
70
|
95.00
|
10/19/2013
|
1,400
|
||||||
|
Raytheon Co.
|
8
|
75.00
|
10/19/2013
|
496
|
||||||
|
Raytheon Co.
|
92
|
77.50
|
10/19/2013
|
13,846
|
||||||
|
Target Corp.
|
100
|
62.50
|
10/19/2013
|
4,600
|
||||||
|
Universal Display Corp.
|
200
|
30.00
|
10/19/2013
|
11,000
|
||||||
|
Total Put Options Written (Premiums Received $66,051)
|
$
|
76,642
|
||||||||
|
*
|
One contract allows the holder to sell 100 shares of the underlying security at the stated exercise price.
|
|||||||||
|
See Notes to Financial Statements
|
||||||||||
|
The Hillman Focused Advantage Fund
|
||||||
|
Statement of Assets and Liabilities
|
||||||
|
As of September 30, 2013
|
||||||
|
Assets:
|
||||||
| Investments in securities, at value (cost $27,575,446) |
$
|
29,098,059
|
||||
| Cash |
150,431
|
|||||
| Cash at Broker |
97,063
|
|||||
| Receivables: | ||||||
| Fund shares sold |
4,307
|
|||||
| Dividends and interest |
30,341
|
|||||
| Total assets |
29,380,201
|
|||||
|
Liabilities:
|
||||||
| Options written, at value (premiums received $66,051) |
76,642
|
|||||
| Payables: | ||||||
|
Investments purchased
|
1,081,288
|
|||||
| Accrued expenses: | ||||||
| Administration fees |
11,642
|
|||||
| Advisory fees |
23,331
|
|||||
| Other expenses |
778
|
|||||
| Total liabilities |
1,193,681
|
|||||
|
Net Assets
|
$
|
28,186,520
|
||||
|
Net Assets Consist of:
|
||||||
| Paid in capital |
$
|
50,010,542
|
||||
| Undistributed net investment income |
108,744
|
|||||
| Accumulated net realized loss on investments |
(23,444,788)
|
|||||
| Net unrealized appreciation on investments and options written |
1,512,022
|
|||||
| Total Net Assets |
$
|
28,186,520
|
||||
| No Load Shares Outstanding, no par value (unlimited authorized shares) |
1,974,622
|
|||||
| Net Asset Value, Offering Price and Redemption Price Per Share |
$
|
14.27
|
||||
|
See Notes to Financial Statements
|
||||||
|
The Hillman Focused Advantage Fund
|
|||||||
|
Statement of Operations
|
|||||||
|
For the year ended September 30, 2013
|
|||||||
|
Investment Income:
|
|||||||
|
Dividends
|
$
|
521,547
|
|||||
|
Total Investment Income
|
521,547
|
||||||
|
Expenses:
|
|||||||
| Advisory fees (note 2) |
275,309
|
||||||
| Administration fees (note 2) |
87,605
|
||||||
| Distribution and service fees (note 3) |
49,775
|
||||||
| Other operating expenses |
115
|
||||||
| Total Expenses |
412,804
|
||||||
|
Net Investment Income
|
108,743
|
||||||
|
Net Realized and Unrealized Gains/(losses) on Investments:
|
|||||||
|
Net realized gain from:
|
|||||||
|
Investments
|
3,458,859
|
||||||
|
Options written
|
965,653
|
||||||
|
Change in unrealized appreciation (depreciation) on:
|
|||||||
|
Investments
|
955,140
|
||||||
|
Options written
|
(17,186)
|
||||||
|
Net Realized and Unrealized Gain on Investments
|
5,362,466
|
||||||
|
Net Increase in Net Assets Resulting from Operations
|
$
|
5,471,209
|
|||||
|
See Notes to Financial Statements
|
|||||||
|
The Hillman Focused Advantage Fund
|
|||||||||||
|
Statements of Changes in Net Assets
|
|||||||||||
|
For the year ended September 30,
|
2013
|
2012
|
|||||||||
|
Operations:
|
|||||||||||
| Net investment income |
$
|
108,743
|
$
|
65,305
|
|||||||
| Net realized gain (loss) from investments and options written |
4,424,512
|
(167,690)
|
|||||||||
| Change in unrealized appreciation on investments and options written |
937,954
|
2,942,070
|
|
||||||||
|
Net Increase in Net Assets Resulting from Operations
|
5,471,209
|
2,839,685
|
|
||||||||
|
Distributions to Shareholders:
|
|||||||||||
| Net investment income |
(65,304)
|
(79,694)
|
|
||||||||
|
Decrease in Net Assets Resulting from Distributions
|
(65,304)
|
(79,694)
|
|
||||||||
|
Capital Share Transactions:
|
|||||||||||
|
No Load Shares
|
|||||||||||
|
Shares sold
|
8,006,288
|
14,480,977
|
|||||||||
|
Reinvested distributions
|
63,503
|
77,386
|
|||||||||
|
Shares repurchased
|
(9,105,988)
|
(4,096,395)
|
|||||||||
|
Class A Shares
|
|||||||||||
|
Shares sold
|
-
|
941,641
|
|||||||||
|
Reinvested distributions
|
-
|
-
|
|||||||||
|
Shares repurchased
|
-
|
(1,157,663)
|
|||||||||
|
Class C Shares
|
|||||||||||
|
Shares sold
|
-
|
19,461
|
|||||||||
|
Reinvested distributions
|
-
|
-
|
|||||||||
|
Shares repurchased
|
-
|
(368,947)
|
|||||||||
|
Increase (Decrease) from Capital Share Transactions
|
(1,036,197)
|
9,896,460
|
|
||||||||
|
Net Increase in Net Assets
|
4,369,708
|
12,656,451
|
|
||||||||
|
Net Assets:
|
|||||||||||
| Beginning of Year |
23,816,812
|
11,160,361
|
|
||||||||
| End of Year |
$
|
28,186,520
|
$
|
23,816,812
|
|||||||
|
Undistributed Net Investment Income
|
$
|
108,744
|
$
|
65,305
|
|
||||||
| (Continued) | |||||||||||
|
The Hillman Focused Advantage Fund
|
|||||||||||
|
Statements of Changes in Net Assets
|
|||||||||||
|
For the year ended September 30,
|
2013
|
2012
|
|||||||||
|
Share Information:
|
|||||||||||
|
No Load Shares
|
|||||||||||
|
Shares sold
|
621,465
|
1,276,910
|
|||||||||
|
Reinvested distributions
|
5,400
|
6,717
|
|||||||||
|
Shares repurchased
|
(672,425)
|
(353,493)
|
|||||||||
|
Net Increase (Decrease) in Capital Shares
|
(45,560)
|
930,134
|
|
||||||||
|
Shares Outstanding, Beginning of Year
|
2,020,182
|
1,090,048
|
|||||||||
|
Shares Outstanding, End of Year
|
1,974,622
|
2,020,182
|
|
||||||||
|
Class A Shares
|
|||||||||||
|
Shares sold
|
-
|
79,245
|
|||||||||
|
Reinvested distributions
|
-
|
-
|
|||||||||
|
Shares repurchased
|
-
|
(100,959)
|
|||||||||
|
Net Decrease in Capital Shares
|
-
|
(21,714)
|
|||||||||
|
Shares Outstanding, Beginning of Year
|
-
|
21,714
|
|||||||||
|
Shares Outstanding, End of Year
|
-
|
-
|
|||||||||
|
Class C Shares
|
|||||||||||
|
Shares sold
|
-
|
1,653
|
|||||||||
|
Reinvested distributions
|
-
|
-
|
|||||||||
|
Shares repurchased
|
-
|
(32,484)
|
|||||||||
|
Net Decrease in Capital Shares
|
-
|
(30,831)
|
|||||||||
|
Shares Outstanding, Beginning of Year
|
-
|
30,831
|
|||||||||
|
Shares Outstanding, End of Year
|
-
|
-
|
|||||||||
|
See Notes to Financial Statements
|
|||||||||||
|
The Hillman Focused Advantage Fund
|
||||||||||||||
|
Financial Highlights
|
||||||||||||||
|
For a share outstanding during the
|
||||||||||||||
|
year ended September 30,
|
2013
|
|
2012
|
|
2011
|
|
2010
|
2009
|
||||||
|
Net Asset Value, Beginning of Year
|
$
|
11.79
|
$
|
9.77
|
$
|
10.46
|
$
|
9.68
|
$
|
9.76
|
||||
|
Income (Loss) from Investment Operations:
|
|
|||||||||||||
|
Net investment income
|
0.03
|
0.05
|
(c)
|
0.07
|
0.04
|
0.13
|
||||||||
|
Net realized and unrealized gain (loss)
|
||||||||||||||
|
on investments
|
2.48
|
2.01
|
(0.73)
|
0.85
|
(0.11)
|
|||||||||
|
Total from Investment Operations
|
2.51
|
2.06
|
(0.66)
|
0.89
|
0.02
|
|||||||||
|
Less Distributions:
|
||||||||||||||
|
Dividends (from net investment income)
|
(0.03)
|
(0.04)
|
(0.03)
|
(0.11)
|
(0.06)
|
|||||||||
|
Distributions (from capital gains)
|
-
|
-
|
-
|
-
|
(0.04)
|
|||||||||
|
Total Distributions
|
(0.03)
|
(0.04)
|
(0.03)
|
(0.11)
|
(0.10)
|
|||||||||
|
Net Asset Value, End of Year (a)
|
$
|
14.27
|
$
|
11.79
|
$
|
9.77
|
$
|
10.46
|
$
|
9.68
|
||||
|
Total Return (a)
|
21.38%
|
21.09%
|
(6.38)%
|
9.15%
|
0.43%
|
|||||||||
|
Net Assets, End of Year (in thousands)
|
$
|
28,187
|
$
|
23,817
|
$
|
10,651
|
$
|
13,747
|
$
|
17,445
|
||||
|
Ratios of:
|
||||||||||||||
|
Gross Expenses to Average Net Assets (b)
|
1.50%
|
1.50%
|
1.50%
|
2.91%
|
2.89%
|
|||||||||
|
Net Expenses to Average Net Assets (b)
|
1.50%
|
1.50%
|
1.50%
|
2.05%
|
1.45%
|
|||||||||
|
Net Investment Income to Average Net Assets
|
0.39%
|
0.41%
|
0.58%
|
0.23%
|
1.29%
|
|||||||||
|
Portfolio turnover rate
|
118.67%
|
39.09%
|
16.10%
|
13.84%
|
29.79%
|
|||||||||
|
(a)
|
Includes adjustments in accordance with accounting principles generally accepted in the United States of America,
|
|||||||||||||
|
and, consequently, the net asset value for financial reporting purposes and the total returns based upon those net
|
||||||||||||||
|
asset values may differ from the net asset values and total returns for shareholder transactions.
|
||||||||||||||
|
(b)
|
The expense ratios listed reflect total expenses prior to any waivers and reimbursements (gross expense ratio)
|
|||||||||||||
|
and after any waivers and reimbursements (net expense ratio).
|
||||||||||||||
|
(c)
|
Per share amounts calculated using the average shares method, which appropriately represents the per share
|
|||||||||||||
|
data for the period.
|
||||||||||||||
|
See Notes to Financial Statements
|
||||||||||||||
The Hillman Focused Advantage Fund
Notes to Financial Statements
|
1.
|
Organization and Significant Accounting Policies
|
The Hillman Focused Advantage Fund (the “Fund”) is a series of the Hillman Capital Management Investment Trust (the “Trust”), which was organized as a Delaware Business Statutory Trust and is registered under the Investment Company Act of 1940, (the “1940 Act”), as amended, as an open-ended management investment company.
The Fund commenced operations on December 29, 2000. The investment objective of the Fund is to seek long-term capital appreciation.
The following is a summary of significant accounting policies consistently followed by the Fund. The policies are in conformity with accounting principles generally accepted in the United States of America (“GAAP”).
Investment Valuation
Securities listed on an exchange or quoted on a national market system are valued at the last sales price as of 4:00 p.m. Eastern Time. Securities traded in the NASDAQ over-the-counter market are generally valued at the NASDAQ Official Closing Price. Listed securities and other securities traded in the over-the-counter market for which no sale was reported on that date are valued at the most recent bid price. Instruments with maturities of 60 days or less are valued at amortized cost, which approximates market value. Securities and assets for which representative market quotations are not readily available (e.g., if the exchange on which the portfolio security is principally traded closes early or if trading of the particular portfolio security is halted during the day and does not resume prior to the Fund’s net asset value calculation) or which cannot be accurately valued using the Fund’s normal pricing procedures are valued at fair value as determined in good faith by either a valuation committee or the Fund’s Investment Advisor in accordance with procedures established by, and under the supervision of, the Fund’s Trustees. A portfolio security’s “fair value” price may differ from the price next available for that portfolio security using the Fund’s normal pricing procedures.
Option Valuation
Exchange-listed options are valued at their last quoted sales price as reported on their primary exchange as of 4:00 p.m. Eastern Time (the “Valuation Time”). For purposes of determining the primary exchange for each exchange-traded portfolio option the following shall apply: (i) if the option is traded on the Chicago Board Options Exchange (“CBOE”), the CBOE shall be considered the primary exchange for such option, unless the Advisor instructs the Administrator in writing to use a different exchange as the primary exchange for such option; and (ii) if the option does not trade on the CBOE, the Advisor shall instruct the Administrator in writing as to the primary exchange for such option. If an option is not traded on the valuation date, the option shall be priced at the mean of the last quoted bid and ask prices as of the Valuation Time. An option may be valued using Fair Valuation when (i) the option does not trade on the valuation date; and (ii) reliable last quoted bid and ask prices as of the Valuation Time are not readily available.
Fair Value Measurement
Various inputs are used in determining the value of the Fund's investments. GAAP establishes a hierarchy that prioritizes inputs to valuations methods. These inputs are summarized in the three broad levels listed below:
|
a.
|
Level 1: quoted prices in active markets for identical securities
|
|
b.
|
Level 2: other significant observable inputs (including quoted prices for similar securities and identical securities in inactive markets, interest rates, credit risk, etc.)
|
|
c.
|
Level 3: significant unobservable inputs (including the Fund’s own assumptions in determining fair value of investments)
|
The availability of observable inputs can vary from security to security and is affected by a wide variety of factors, including, for example, the type of security, whether the security is new and not yet established in the marketplace, the liquidity of markets, and other characteristics particular to the security. To the extent that valuation is based on models or inputs that are less observable or unobservable in the market, the determination of fair value requires more judgment. Accordingly, the degree of judgment exercised in determining fair value is greatest for instruments categorized in Level 3.
(Continued)
The Hillman Focused Advantage Fund
Notes to Financial Statements
The inputs or methodology used for valuing securities are not necessarily an indication of the risk associated with investing in those securities. The following tables summarize the inputs as of September 30, 2013 for the Fund’s investments:
|
Investments in Securities (a)
|
Total
|
Level 1
|
Level 2
|
Level 3
|
||||
|
Assets
|
||||||||
|
Common Stocks*
|
$
|
25,853,702
|
$
|
25,853,702
|
$
|
-
|
$
|
-
|
|
Short-Term Investment
|
3,244,357
|
3,244,357
|
-
|
-
|
||||
|
Total Assets
|
$
|
29,098,059
|
$
|
29,098,059
|
$
|
-
|
$
|
-
|
|
Liabilities
|
||||||||
|
Put Options Written
|
$
|
76,642
|
$
|
-
|
$
|
76,642
|
$
|
-
|
|
Total Liabilities
|
$
|
76,642
|
$
|
-
|
$
|
76,642
|
$
|
-
|
(a) The Fund did not hold any Level 3 securities during the year. There were no transfers into or out of Level 1 and Level 2 during the year. It is the Fund’s policy to recognize transfers into or out of Level 1 and Level 2 at the end of the reporting year.
*For a detailed breakout by sector, please refer to the Schedule of Investments.
Derivative Financial Instruments
The Fund may invest in derivative financial instruments (derivatives) in order to manage risk or gain exposure to various other investments or markets. Derivatives may contain various risks including the potential inability of the counterparty to fulfill their obligations under the terms of the contract, the potential for an illiquid secondary market, and the potential for market movements which may expose the Fund to gains or losses in excess of the amounts shown on the Statement of Assets and Liabilities.
Derivatives are marked to market daily based upon quotations from market makers or the Fund’s independent pricing services and the Fund’s net benefit or obligation under the contract, as measured by the fair market value of the contract, is included in net assets on the Statement of Assets and Liabilities. Realized gain and loss and unrealized appreciation and depreciation on these derivatives for the year are included in the Statement of Operations.
The following table sets forth the effect of the option contracts on the Statement of Assets and Liabilities for the year ended September 30, 2013:
|
Derivative Type
|
Location
|
Value
|
|
|
Equity Contracts – written options
|
Options written, at value
|
$76,642
|
The following table sets forth the effect of the option contracts on the Statement of Operations for the year ended September 30, 2013:
|
Derivative Type
|
Location
|
Gains (Losses)
|
|
|
Equity Contracts – written options
|
Net realized gain from options written
|
$965,653
|
|
|
Equity Contracts – written options
|
Change in unrealized depreciation on options written
|
(17,186) )
|
(Continued)
The Hillman Focused Advantage Fund
Notes to Financial Statements
Investment Transactions and Investment Income
Investment transactions are accounted for as of the date purchased or sold (trade date). Dividend income is recorded on the ex-dividend date. Interest income is recorded on the accrual basis and includes accretion and amortization of discounts and premiums. Gains and losses are determined on the identified cost basis, which is the same basis used for federal income tax purposes.
Expenses
The Fund bears expenses incurred specifically on its behalf and Trust level expenses, which are allocated according to methods reviewed annually by the Trustees.
Distributions
The Fund may declare and distribute dividends from net investment income (if any) quarterly. Distributions from capital gains (if any) are generally declared and distributed annually. Dividends and distributions to shareholders are recorded on ex-date.
Estimates
The preparation of financial statements in conformity with GAAP requires management to make estimates and assumptions that affect the reported amounts of assets and liabilities and disclosure of contingent assets and liabilities at the date of the financial statements and the reported amounts of increases and decreases in the net assets from operations during the reporting period. Actual results could differ from those estimates.
Federal Income Taxes
No provision for income taxes is included in the accompanying financial statements, as the Fund intends to distribute to shareholders all taxable investment income and realized gains and otherwise comply with Subchapter M of the Internal Revenue Code applicable to regulated investment companies.
Option Writing
When the Fund writes an option, an amount equal to the premium received by the Fund is recorded as a liability and is subsequently adjusted to the current fair value of the option written. Premiums received from writing options that expire unexercised are treated by the Fund on the expiration date as realized gains from options written. The difference between the premium and the amount paid on effecting a closing purchase transaction, including brokerage commissions, is also treated as a realized gain or loss (depending on if the premium is less than the amount paid for the closing purchase transaction). If a call option is exercised, the premium is added to the proceeds from the sale of the underlying security or currency in determining whether the Fund has realized a gain or loss. If a put option is exercised, the premium reduces the cost basis of the securities purchased by the Fund. The Fund, as the writer of an option, bears the market risk of an unfavorable change in the price of the security underlying the written option. Written options are non-income producing securities.
|
2.
|
Transactions with Affiliates
|
Advisor
The Fund pays monthly advisory fees to Hillman Capital Management, Inc. (the “Advisor”) based upon the average daily net assets and calculated at an annual rate of 1.00%. For the fiscal year ended September 30, 2013, the Fund incurred advisory fees in the amount of $275,309.
Administrator
Fund Accounting and Administration Agreement: The Nottingham Company (“Administrator”) provides the Fund with administrative, fund accounting, and compliance services. The Administrator receives compensation from the Fund at a maximum annual rate of 0.499% and is responsible for the coordination and payment of vendor services and other Fund expenses for such compensation. Prior to June 28, 2013, the maximum annual rate was 0.249%. Pursuant to this arrangement, the Administrator pays the following expenses: (i) compensation and expenses of any employees of the Trust and of any other persons rendering any services to the Fund; (ii) clerical and
(Continued)
The Hillman Focused Advantage Fund
Notes to Financial Statements
Operating Plan: The Advisor has entered into an Operating Plan with the Administrator under which it has agreed make the following payments to the Administrator: (i) when the Fund’s assets are below $40 million ($13 million prior to June 28, 2013) the Advisor pays the Administrator a fee based on the daily average net assets of the Fund; and (ii) when the consolidated fee collected by the Administrator is less than a designated minimum operating cost, then the Advisor pays the Administrator a fee that makes up the difference. The Advisor is also obligated to pay the following Fund expenses under the Operating Plan: (i) marketing, distribution, and servicing expenses related to the sale or promotion of Fund shares that the Fund is not authorized to pay pursuant to the Investment Company Act; (ii) expenses incurred in connection with the organization and initial registration of shares of the Fund; (iii) expenses incurred in connection with the dissolution and liquidation of the Fund; (iv) expenses related to shareholder meetings and proxy solicitations; (v) fees and expenses related to legal, auditing, and accounting services that are outside of the scope of ordinary services; and (vi) hiring employees and retaining advisers and experts as contemplated by Rule 0-1(a)(7)(vii) of the Investment Company Act.
The Operating Plan may be terminated by either party at the conclusion of the then current term upon: (i) written notice of non-renewal to the other party not less than sixty days prior to the end of the term, or (ii) mutual written agreement of the parties. The Advisor cannot recoup from the Fund any amounts paid by the Advisor to the Fund’s administrator under the Operating Plan. If the Operating Plan is terminated when the Fund is at lower asset levels, the administrator would likely need to terminate the Fund Accounting and Administration Agreement in order to avoid incurring expenses without reimbursement from the Advisor. Unless other expense limitation arrangements were put in place, the Fund’s expenses would likely increase.
Compliance Services
Nottingham Compliance Services, LLC (“NCS”), a fully owned affiliate of the Administrator, provides services which assist the Trust’s Chief Compliance Officer in monitoring and testing the policies and procedures of the Trust in conjunction with requirements under Rule 38a-1 of the 1940 Act. NCS is entitled to receive compensation from the Administrator pursuant to the Administrator’s fee arrangements with the Fund.
Transfer Agent
Nottingham Shareholder Services, LLC (the “Transfer Agent”) serves as transfer, dividend paying, and shareholder servicing agent for the Fund. For its services, the Transfer Agent is entitled to receive compensation from the Administrator pursuant to the Administrator’s fee arrangements with the Fund.
Distributor
Capital Investment Group, Inc. (the “Distributor”) serves as the Fund’s principal underwriter and distributor. For its services, the Distributor is entitled to receive compensation from the Administrator pursuant to the Administrator’s fee arrangements with the Fund.
(Continued)
The Hillman Focused Advantage Fund
Notes to Financial Statements
Certain Trustees and officers of the Trust are also officers of the Advisor, the Distributor or the Administrator.
|
3.
|
Distribution and Service Fees
|
The Trustees, including a majority of the Trustees who are not “interested persons” of the Trust as defined in the 1940 Act and who have no direct or indirect financial interest in such plan or in any agreement related to such plan, adopted a distribution plan pursuant to Rule 12b-1 of the 1940 Act (the “Plan”). The 1940 Act regulates the manner in which a regulated investment company may assume expenses of distributing and promoting the sales of its shares and servicing of its shareholder accounts. The Plan provides that the Fund may incur certain expenses, which may not exceed 0.25% per annum of the Fund’s average daily net assets for each year elapsed subsequent to adoption of the Plan, for payment to the Distributor and others for items such as advertising expenses, selling expenses, commissions, travel or other expenses reasonably intended to result in sales of shares of the Fund or support servicing of shareholder accounts. For the fiscal year ended September 30, 2013, $49,775 in fees were incurred by the Fund. The Plan was terminated as of June 28, 2013.
|
4.
|
Purchases and Sales of Investment Securities
|
For the fiscal year ended September 30, 2013, the aggregate cost of purchases and proceeds from sales of investment securities (excluding short-term securities) were as follows:
|
Fiscal Year Ended
|
Purchases of
Securities
|
Proceeds from
Sales of Securities
|
|
September 30, 2013
|
$32,148,601
|
$25,829,721
|
There were no long-term purchases or sales of U.S Government Obligations during the fiscal year ended September 30, 2013.
|
5.
|
Option Writing
|
A summary of option contracts written by the Fund during the fiscal year ended September 30, 2013 were as follows:
|
Call Options
|
Put Options
|
||||||
|
Number
of Contracts
|
Premiums
Received
|
Number
of Contracts
|
Premiums
Received
|
||||
|
Options Outstanding, Beginning of Year
|
279
|
$ 14,933
|
1,568
|
$ 77,522
|
|||
|
Options written
|
4,661
|
309,253
|
10,075
|
802,296
|
|||
|
Options exercised
|
(1,888)
|
(139,267)
|
(2,612)
|
(227,180)
|
|||
|
Options expired
|
(3,052)
|
(184,919)
|
(8,201)
|
(586,587)
|
|||
|
Options Outstanding, End of Year
|
-
|
$ -
|
830
|
$ 66,051
|
|
6.
|
Federal Income Tax
|
Distributions are determined in accordance with Federal income tax regulations, which differ from GAAP, and, therefore, may differ significantly in amount or character from net investment income and realized gains for financial reporting purposes. Financial reporting records are adjusted for permanent book/tax differences to reflect tax character but are not adjusted for temporary differences.
Management reviewed the Fund’s tax positions to be taken on federal income tax returns for the open tax years of 2010, 2011, and 2012, and as of and during the fiscal year ended September 30, 2013, and determined that the Fund does not have a liability for uncertain tax positions. The Fund recognizes interest and penalties, if any, related to unrecognized tax benefits as income tax expense in the Statement of Operations. During the period, the Fund did not incur any interest or penalties.
(Continued)
The Hillman Focused Advantage Fund
Notes to Financial Statements
Distributions during the fiscal year ended were characterized for tax purposes as follows:
|
September 30, 2013
|
September 30, 2012
|
|
|
Ordinary Income
|
$65,304
|
$79,694
|
At September 30, 2013, the tax-basis cost of investments and components of distributable earnings (deficit) were as follows:
|
Cost of Investments
|
$ 27,749,227
|
|||||
|
Unrealized Appreciation
|
2,586,163
|
|||||
|
Unrealized Depreciation
|
(1,313,973)
|
|||||
|
Net Unrealized Appreciation
|
1,272,190
|
|||||
|
Undistributed Net Investment Income
|
108,744
|
|||||
|
Accumulated Net Realized Losses on Investments
|
(23,204,956)
|
|||||
|
Accumulated Deficit
|
|
$ (21,824,022)
|
||||
The difference between book-basis and tax-basis net unrealized appreciation (depreciation) and accumulated realized losses is attributable to the tax deferral of losses from wash sales.
Captial Loss Carryforwards
Under the Regulated Investment Company Modernization Act of 2010 (“the Modernization Act”), net capital losses recognized in tax years beginning after December 22, 2010 may be carried forward indefinitely, and the character of the losses is retained as short‐term and/or long‐term. Under the law in effect prior to the Modernization Act, net capital losses were carried forward for eight years and treated as short‐term. As a transition rule, the Modernization Act requires that post‐enactment net capital losses be used before pre‐enactment net capital losses. Additionally, post‐enactment capital losses that are carried forward will retain their character as either short‐term or long‐term losses rather than being considered all short‐term as under previous law. Accumulated capital losses noted below represent pre‐enactment net capital loss carryforwards, as of September 30, 2013, that may be available to offset future realized capital gains and thereby reduce future taxable gains distributions. Short-term capital loss carryforwards in the amounts of $16,340,618 and $6,864,338, are set to expire September 30, 2017, and September 30, 2018, respectively.
|
7.
|
Commitments and Contingencies
|
Under the Trust’s organizational documents, its officers and Trustees are indemnified against certain liabilities arising out of the performance of their duties to the Fund. In addition, in the normal course of business, the Fund enters into contracts with its vendors and others that provide for general indemnifications. The Fund’s maximum exposure under these arrangements is unknown, as this would involve future claims that may be made against the Fund. However, based on experience, the Fund expects the risk of loss to be remote.
|
8.
|
New Accounting Pronouncements
|
In December 2011, the Financial Accounting Standards Board (“FASB”) issued Accounting Standards Update (“ASU”) No. 2011-11 related to “Disclosures About Offsetting Assets and Liabilities.” The amendments in this ASU require an entity to disclose information about offsetting and related arrangements to enable users of its financial statements to understand the effect of those arrangements on its financial position. The ASU is effective for annual reporting periods beginning on or after January 1, 2013, and interim periods within those annual periods. The guidance requires retrospective application for all comparative periods presented.
(Continued)
The Hillman Focused Advantage Fund
Notes to Financial Statements
In January 2013, the FASB issued ASU No. 2013-01 “Clarifying the Scope of Disclosures about Offsetting Assets and Liabilities.” ASU No. 2013-01 clarifies that ordinary trade receivables and payables are not included in the scope of ASU No. 2011-11. ASU No. 2011-11 applies only to derivatives, repurchase agreements and reverse repurchase agreements, and securities borrowing and lending that are offset in accordance with specific criteria contained in the FASB Accounting Standards codification.
Management is currently evaluating the impact ASU No. 2011-11 and ASU No. 2013-01 will have on the Fund’s financial statements and disclosures.
|
9.
|
Subsequent Events
|
The Fund has evaluated the need for disclosures and/or adjustments resulting from subsequent events through the date of issuance of these financial statements. This evaluation did not result in any subsequent events that necessitated disclosures and/or adjustments.
(Continued)

REPORT OF INDEPENDENT REGISTERED PUBLIC ACCOUNTING FIRM
To the Shareholders of The Hillman Focused Advantage Fund and
the Board of Trustees of Hillman Capital Management Investment Trust
We have audited the accompanying statement of assets and liabilities of The Hillman Focused Advantage Fund, a series of shares of Hillman Capital Management Investment Trust, including the schedule of investments, as of September 30, 2013, and the related statement of operations for the year then ended, the statements of changes in net assets for each of the years in the two-year period then ended, and the financial highlights for each of the years in the five-year period then ended. These financial statements and financial highlights are the responsibility of the Fund’s management. Our responsibility is to express an opinion on these financial statements and financial highlights based on our audits.
We conducted our audits in accordance with the standards of the Public Company Accounting Oversight Board (United States). Those standards require that we plan and perform the audits to obtain reasonable assurance about whether the financial statements and financial highlights are free of material misstatement. An audit includes examining, on a test basis, evidence supporting the amounts and disclosures in the financial statements. Our procedures included confirmation of securities owned as of September 30, 2013 by correspondence with the custodian and broker and by other appropriate auditing procedures where responses by brokers were not received. An audit also includes assessing the accounting principles used and significant estimates made by management, as well as evaluating the overall financial statement presentation. We believe that our audits provide a reasonable basis for our opinion.
In our opinion, the financial statements and financial highlights referred to above present fairly, in all material respects, the financial position of The Hillman Focused Advantage Fund as of September 30, 2013, the results of its operations for the year then ended, the changes in its net assets for each of the years in the two-year period then ended, and its financial highlights for each of the years in the five-year period then ended, in conformity with accounting principles generally accepted in the United States of America.

BBD, LLP
Philadelphia, Pennsylvania
November 26, 2013
The Hillman Focused Advantage Fund
Additional Information (Unaudited)
|
1.
|
Proxy Voting Policies and Voting Record
|
A copy of the Trust’s Proxy Voting and Disclosure Policy and the Advisor’s Proxy Voting and Disclosure Policy are included as Appendix B to the Fund’s Statement of Additional Information and are available, (1) without charge, upon request, by calling 1-800-773-3863 and (2) on the Securities and Exchange Commission’s (“SEC”) website at sec.gov. Information regarding how the Fund voted proxies relating to portfolio securities during the most recent 12-month period ended June 30 will be available (1) without charge, upon request, by calling the Fund at the number above and (2) on the SEC’s website at sec.gov.
|
2.
|
Quarterly Portfolio Holdings
|
The Fund files its complete schedule of portfolio holdings with the SEC for the first and third quarters of each fiscal year on Form N-Q. The Fund’s Forms N-Q is available on the SEC’s website at sec.gov. You may review and make copies at the SEC’s Public Reference Room in Washington, D.C. Information on the operation of the Public Reference Room may be obtained by calling the SEC at 800-SEC-0330. You may also obtain copies without charge, upon request, by calling the Fund at 800-773-3863.
|
3.
|
Tax Information
|
We are required to advise you within 60 days of the Fund’s fiscal year-end regarding the federal tax status of certain distributions received by shareholders during each fiscal year. The following information is provided for the Fund’s fiscal year ended September 30, 2013.
During the fiscal year, no long-term capital gain distributions were paid from the Fund.
Dividend and distributions received by retirement plans such as IRAs, Keogh-type plans, and 403(b) plans need not be reported as taxable income. However, many retirement plans may need this information for their annual information meeting.
|
4.
|
Meeting of Shareholders
|
A Special Meeting of Shareholders of the Hillman Focused Advantage Fund, a series of the Hillman Capital Management Investment Trust, was held on May 15, 2013 for the purposes of electing four nominees to serve as members of the Board of Trustees of the Trust, each to hold office for an indefinite term, and until his successor is duly elected and qualified. The Chairman stated that approval of this item required the approval of a plurality of the votes cast at the Meeting, which meant that the four nominees receiving the highest number of affirmative votes cast at the meeting will be elected. Thereafter, upon motion duly made and seconded, the item was submitted to the shareholders of the Fund for consideration. The Chairman announced that a plurality of shares had been voted in favor of the election of Theo H. Pitt, Jr., James H. Speed, Jr., Jack E. Brinson, and Mark A. Hillman. Accordingly, Mr. Pitt, Mr. Speed, Mr. Brinson, and Mr. Hillman were elected as member of the Board of Trustees of the Trust.
|
5.
|
Schedule of Shareholder Expenses
|
As a shareholder of the Fund, you incur two types of costs: (1) transaction costs, and (2) ongoing costs, including investment advisory fees; distribution (12b-1) fees; and other Fund expenses. This example is intended to help you understand your ongoing costs (in dollars) of investing in the Fund and to compare these costs with the ongoing costs of investing in other mutual funds. The example is based on an investment of $1,000 invested at the beginning of the period and held for the entire period as indicated below.
Actual Expenses – The first line of the table below provides information about the actual account values and actual expenses. You may use the information in this line, together with the amount you invested, to estimate the expenses that you paid over the period. Simply divide your account value by $1,000 (for example, an $8,600 account value divided by $1,000 = 8.6), then multiply the result by the number in the first line under the heading entitled “Expenses Paid During Period” to estimate the expenses you paid on your account during this period.
(Continued)
The Hillman Focused Advantage Fund
Additional Information (Unaudited)
|
Beginning
Account Value
April 1, 2013
|
Ending
Account Value
September 30, 2013
|
Expenses Paid
During Period*
|
|
|
Actual
Hypothetical (5% annual return before expenses)
|
|||
|
$1,000.00
|
$ 1,096.80
|
$7.88
|
|
|
$1,000.00
|
$ 1,017.55
|
$7.59
|
*Expenses are equal to the average account value over the period multiplied by the Fund’s annualized expense ratio of 1.50%, multiplied by 183/365 (to reflect the one-half year period).
|
6.
|
Information about Trustees and Officers
|
The business and affairs of the Fund and the Trust are managed under the direction of the Trustees. Information concerning the Trustees and officers of the Trust and Fund is set forth below. Generally, each Trustee and officer serves an indefinite term or until certain circumstances such as their resignation, death, or otherwise as specified in the Trust’s organizational documents. Any Trustee may be removed at a meeting of shareholders by a vote meeting the requirements of the Trust’s organizational documents. The Statement of Additional Information of the Fund includes additional information about the Trustees and officers and is available, without charge, upon request by calling the Fund toll-free at 1-800-773-3863. The address of each Trustee and officer, unless otherwise indicated below, is 116 South Franklin Street, Rocky Mount, North Carolina 27804. The Independent Trustees received aggregate compensation of $6,200 during the fiscal year ended September 30, 2013 from each Fund for their services to the Fund and Trust. The Interested Trustee and officers did not receive compensation from the Fund for their services to the Fund and Trust.
(Continued)
The Hillman Focused Advantage Fund
Additional Information (Unaudited)
|
Name, Age,
and Address
|
Position(s)
held with
Fund/Trust
|
Length of
Time
Served
|
Principal Occupation(s)
During Past 5 Years
|
Number of
Portfolios in
Fund
Complex
Overseen by
Trustee
|
Other Directorships
Held by Trustee
During Past 5 Years
|
|
Independent Trustees
|
|||||
|
Jack E. Brinson, 81
|
Trustee
|
Since 12/2000
|
Retired since January 2000; Previously, President, Brinson Investment Co. (personal investments) and President, Brinson Chevrolet, Inc. (auto dealership).
|
1
|
Independent Trustee of the following: The Brown Capital Management Funds for the three series of the trust; DGHM Investment Trust for the two series of that trust; Gardner Lewis Investment Trust for the two series of that trust; and Tilson Investment Trust for the one series of that trust (all registered investment companies); previously, Independent Trustee of New Providence Investment Trust for its one series from inception until 2011.
|
|
James H. Speed, Jr., 60
|
Trustee
|
Since 3/2009
|
President and CEO of NC Mutual Insurance Company (insurance company) since May 2003; President of Speed Financial Group, Inc. (consulting/private investments) from March 2000 to April 2003.
|
1
|
Independent Trustee of the following The Brown Capital Management Funds for the three series of the trust; Starboard Investment Trust for the twenty-three series of that trust; and Tilson Investment Trust for the one series of that trust (all registered investment companies). Member of Board of Directors of NC Mutual Life Insurance Company. Member of Board of Directors of M&F Bancorp. Previously, Independent Trustee of New Providence Investment Trust for its one series from 2009 until 2011 (registered investment company).
|
(Continued)
The Hillman Focused Advantage Fund
Additional Information (Unaudited)
|
Name, Age,
and Address
|
Position(s)
held with
Fund/Trust
|
Length of
Time
Served
|
Principal Occupation(s)
During Past 5 Years
|
Number of
Portfolios in
Fund
Complex
Overseen by
Trustee
|
Other Directorships
Held by Trustee
During Past 5 Years
|
|
Theo H. Pitt, Jr.
Age: 77
|
Independent Trustee
|
Independent Trust since 5/2013
|
Senior Partner, Community Financial Institutions Consulting (financial consulting) since 1999; Partner, Pikar Properties (real estate) since 2001; Account Administrator, Holden Wealth Management Group of Wachovia Securities (money management firm) from 2003-2008.
|
1
|
Independent Trustee of DGHM Investment Trust for its two series, Gardner Lewis Investment Trust for its two series, Hanna Investment Trust for its one series, Starboard Investment Trust for its twenty-three series, and World Funds Trust for its one series (all registered investment companies); previously, Independent Trustee of NCM Capital Investment Trust for its one series from 2007 to 2009, New Providence Investment Trust from 2008 to 2009, and Tilson Investment Trust for its one series from 2004 to 2009 (all registered investment companies).
|
|
Interested Trustee*
|
|||||
|
Mark A. Hillman, 51
4350 East West Highway
Suite 502
Bethesda, MD 20814
|
Trustee and President (Principal Executive Officer)
|
Trustee and President since 12/2000
|
President, Hillman Capital Management, Inc. (investment advisor to the Fund); previously, Chief Investment Officer, Menocal Capital Management, Inc. (investment advisor).
|
1
|
None
|
|
* Basis of Interestedness. Mr. Hillman is an Interested Trustee because he is an officer of Hillman Capital Management, Inc., the investment advisor to the Fund.
|
|||||
|
Other Officers
|
|||||
|
C. Frank Watson III, 43
1330 St. Mary’s Street
Suite 400
Raleigh, NC 27605
|
Treasurer (Principal Financial Officer)
|
Since 10/2011
|
President, Fairview Investment Services, LLC since 2005; previously, President and Chief Operating Officer, The Nottingham Company (administrator to the Fund).
|
n/a
|
n/a
|
|
Greyson L. Davis, 35
|
Chief Compliance Officer
|
Since 11/2011
|
Fund Accounting Team Manager, The Nottingham Company since 2001.
|
n/a
|
n/a
|
|
T. Lee Hale, Jr. 35
|
Assistant Secretary
|
Since 1/2011
|
Financial Reporting Manager for The Nottingham Company (fund administrator) since 2009; previously, principal of Lee Hale Contracting (marine industry consulting).
|
n/a
|
n/a
|
|
A. Vason Hamrick, 36
|
Secretary and Assistant Treasurer
|
Since 3/2007
|
Corporate Counsel, The Nottingham Company since 2004.
|
n/a
|
n/a
|
(Continued)
The Hillman Focused Advantage Fund
|
is a series of the
|
|
Hillman Capital Management Investment Trust
|
|
For Shareholder Service Inquiries:
|
For Investment Advisor Inquiries:
|
|
Nottingham Shareholder Services, LLC
|
Hillman Capital Management, Inc.
|
|
116 South Franklin Street
|
4350 East West Highway
|
|
Post Office Drawer 4365
|
Suite 502
|
|
Rocky Mount, North Carolina 27803
|
Bethesda, Maryland 20814
|
|
Telephone:
|
Telephone:
|
|
800-773-3863
|
800-773-3863
|
|
World Wide Web @:
|
World Wide Web @:
|
|
ncfunds.com
|
hillmancapital.com
|
|
Item 2.
|
CODE OF ETHICS.
|
|
(a)
|
The registrant, as of the end of the period covered by this report, has adopted a code of ethics that applies to its Principal Executive Officer, Principal Financial Officer, and Principal Accounting Officer(s), or persons performing similar functions, regardless of whether these individuals are employed by the registrant or a third party.
|
|
(c)
|
There have been no substantive amendments during the period covered by this report.
|
|
(d)
|
The registrant has not granted, during the period covered by this report, any waivers, including an implicit waiver.
|
|
(f)(1)
|
A copy of the code of ethics that applies to the registrant’s Principal Executive Officer and Principal Financial Officer is filed pursuant to Item 12.(a)(1) below.
|
|
Item 3.
|
AUDIT COMMITTEE FINANCIAL EXPERT.
|
The registrant’s Board of Trustees has determined that the registrant has an audit committee financial expert, as defined in Item 3 of Form N-CSR, serving on its audit committee.
As of the date of this report, September 30, 2013, the registrant’s audit committee financial expert is Mr. James H. Speed, Jr. Mr. Speed is “independent” for purposes of Item 3 of Form N-CSR.
|
Item 4.
|
PRINCIPAL ACCOUNTANT FEES AND SERVICES.
|
|
(a)
|
Audit Fees – Audit fees billed for the registrant for the fiscal years ended September 30, 2012 and September 30, 2013 are reflected in the table below. These amounts represent aggregate fees billed by the registrant’s independent accountant, BBD, LLP (“Accountant”), in connection with the annual audits of the registrant’s financial statements and for services normally provided by the Accountant in connection with the registrant’s statutory and regulatory filings.
|
|
Fund
|
2012
|
2013
|
|
The Hillman Focused Advantage Fund
|
$11,500
|
$11,500
|
|
(b)
|
Audit-Related Fees – There were no additional fees billed in the fiscal years ended September 30, 2012 and September 30, 2013 for assurance and related services by the Accountant that were reasonably related to the performance of the audit of the registrant’s financial statements that were not reported under paragraph (a) of this Item.
|
|
(c)
|
Tax Fees – The tax fees billed in the fiscal years ended for September 30, 2012 and September 30, 2013 for professional services rendered by the Accountant for tax compliance, tax advice, and tax planning are reflected in the table below. These services were for the completion of each fund’s federal, state, and excise tax returns and assistance with distribution calculations.
|
|
Fund
|
2012
|
2013
|
|
The Hillman Focused Advantage Fund
|
$2,000
|
$2,000
|
|
(d)
|
All Other Fees –There were no other fees billed by the Accountant which were not disclosed in Items (a) through (c) above during the fiscal years ended September 30, 2012 and September 30, 2013.
|
| (e) |
(1)
|
The registrant’s Board of Trustees pre-approved the engagement of the Accountant for the last two fiscal years at an audit committee meeting of the Board of Trustees called for such purpose and will pre-approve the Accountant for each fiscal year thereafter at an audit committee meeting called for such purpose. The charter of the audit committee states that the audit committee should pre-approve any audit services and, when appropriate, evaluate and pre-approve any non-audit services provided by the Accountant to the registrant and to pre-approve, when appropriate, any non-audit services provided by the Accountant to the registrant’s investment adviser, or any entity controlling, controlled by, or under common control with the investment adviser that provides ongoing services to the registrant if the engagement relates directly to the operations and financial reporting of the registrant.
|
|
(2)
|
There were no services as described in each of paragraph (b) through (d) of this Item that were approved by the audit committee pursuant to paragraph (c)(7)(i)(C) of Rule 2-01 of Regulation S-X.
|
|
(f)
|
Not Applicable.
|
|
(g)
|
Aggregate non-audit fees billed by the Accountant to the registrant for services rendered during the fiscal years ended September 30, 2012 and September 30, 2013 were $2,000, respectively. There were no non-audit fees billed by the Accountant for services rendered to the registrant’s investment adviser, or any other entity controlling, controlled by, or under common control with the registrant’s investment adviser.
|
|
(h)
|
Not applicable.
|
|
Item 5.
|
AUDIT COMMITTEE OF LISTED REGISTRANTS.
|
|
|
Not applicable.
|
|
Item 6.
|
SCHEDULE OF INVESTMENTS.
|
|
|
A copy of the schedule of investments of unaffiliated issuers as of the close of the reporting period is included as part of the report to shareholders filed under Item 1 of this Form.
|
|
Item 7.
|
DISCLOSURE OF PROXY VOTING POLICIES AND PROCEDURES FOR CLOSED-END MANAGEMENT INVESTMENT COMPANIES.
|
|
|
Not applicable.
|
|
Item 8.
|
PORTFOLIO MANAGERS OF CLOSED-END MANAGEMENT INVESTMENT COMPANIES.
|
|
|
Not applicable.
|
|
Item 9.
|
PURCHASES OF EQUITY SECURITIES BY CLOSED-END MANAGEMENT INVESTMENT COMPANY AND AFFILIATED PURCHASERS.
|
|
|
Not applicable.
|
|
Item 10.
|
SUBMISSION OF MATTERS TO A VOTE OF SECURITY HOLDERS.
|
|
|
None.
|
|
Item 11.
|
CONTROLS AND PROCEDURES.
|
|
(a)
|
The Principal Executive Officer and the Principal Financial Officer have concluded that the registrant’s disclosure controls and procedures are effective based on their evaluation of the disclosure controls and procedures as of a date within 90 days of the filing of this report.
|
|
(b)
|
There were no changes in the registrant's internal control over financial reporting that occurred during the registrant’s second fiscal quarter of the period covered by this report that have materially affected, or are reasonably likely to materially affect, the registrant’s internal control over financial reporting.
|
|
Item 12.
|
EXHIBITS.
|
|
(a)(1)
|
Code of Ethics required by Item 2 of Form N-CSR is filed herewith as Exhibit 12.(a)(1).
|
|
(a)(2)
|
Certifications required by Item 12.(a)(2) of Form N-CSR are filed herewith as Exhibit 12.(a)(2).
|
|
(a)(3)
|
Not applicable.
|
|
(b)
|
Certifications required by Item 12.(b) of Form N-CSR are filed herewith as Exhibit 12.(b).
|
SIGNATURES
Pursuant to the requirements of the Securities Exchange Act of 1934 and the Investment Company Act of 1940, the registrant has duly caused this report to be signed on its behalf by the undersigned, thereunto duly authorized.
Hillman Capital Management Investment Trust
|
By: (Signature and Title)
|
/s/ Mark A. Hillman
|
|
Mark A. Hillman, Trustee, President and
|
|
|
Principal Executive Officer
|
|
|
Date: November 30, 2013
|
Pursuant to the requirements of the Securities Exchange Act of 1934 and the Investment Company Act of 1940, this report has been signed below by the following persons on behalf of the registrant and in the capacities and on the dates indicated.
|
By: (Signature and Title)
|
/s/ Mark A. Hillman
|
|
Mark A. Hillman, Trustee, President and
|
|
|
Principal Executive Officer
|
|
|
Date: November 30, 2013
|
|
By: (Signature and Title)
|
/s/ C. Frank Watson III
|
|
C. Frank Watson III, Treasurer and
|
|
|
Principal Financial Officer
|
|
|
Date: November 29, 2013
|