UNITED STATES
SECURITIES AND EXCHANGE COMMISSION
Washington, D.C. 20549
_____________________
Form 8-K
_____________________
CURRENT REPORT
Pursuant to Section 13 or 15(d) of the Securities Exchange Act of 1934
Date of Report (Date of earliest event Reported): February 26, 2019
BROADWIND ENERGY, INC.
(Exact Name of Registrant as Specified in Charter)
Delaware | 001-34278 | 88-0409160 |
(State or Other Jurisdiction of Incorporation) | (Commission File Number) | (I.R.S. Employer Identification Number) |
3240 South Central Avenue, Cicero, Illinois 60804 |
(Address of Principal Executive Offices) (Zip Code) |
(708) 780-4800
(Registrant's telephone number, including area code)
Not Applicable
(Former name or former address, if changed since last report)
Check the appropriate box below if the Form 8-K filing is intended to simultaneously satisfy the filing obligation of the registrant under any of the following provisions: | ||
[ ] | Written communications pursuant to Rule 425 under the Securities Act (17 CFR 230.425) | |
[ ] | Soliciting material pursuant to Rule 14a-12 under the Exchange Act (17 CFR 240.14a-12) | |
[ ] | Pre-commencement communications pursuant to Rule 14d-2(b) under the Exchange Act (17 CFR 240.14d-2(b)) | |
[ ] | Pre-commencement communications pursuant to Rule 13e-4(c) under the Exchange Act (17 CFR 240.13e-4(c)) |
Indicate by check mark whether the registrant is an emerging growth company as defined in Rule 405 of the Securities Act of 1933 (17 CFR §230.405) or Rule 12b-2 of the Securities Exchange Act of 1934 (17 CFR §240.12b-2). Emerging growth company [ ]
If an emerging growth company, indicate by check mark if the registrant has elected not to use the extended transition period for complying with any new or revised financial accounting standards provided pursuant to Section 13(a) of the Exchange Act. [ ]
Item 2.02. Results of Operations and Financial Condition.
On February 26, 2019, Broadwind Energy, Inc. (the “Company”) issued a press release announcing its financial results as of and for the quarter ended December 31, 2018. The press release is incorporated herein by reference and is attached hereto as Exhibit 99.1. The information contained in, or incorporated into, this Item 2.02 of this Current Report on Form 8-K (this “Report”), including Exhibit 99.1, is furnished under Item 2.02 of Form 8-K and shall not be deemed “filed” for the purposes of Section 18 of the Securities Exchange Act of 1934, as amended (the “Exchange Act”) or otherwise subject to the liabilities of that section, and shall not be deemed to be incorporated by reference into the filings of the Company under the Securities Act of 1933, as amended (the “Securities Act”) or the Exchange Act regardless of any general incorporation language in such filings.
Item 7.01. Regulation FD Disclosure.
An Investor Presentation dated February 26, 2019 is incorporated herein by reference and attached hereto as Exhibit 99.2. The information contained in, or incorporated into, this Item 7.01 of this Report, including Exhibit 99.2 attached hereto, is furnished under Item 7.01 of Form 8-K and shall not be deemed “filed” for the purposes of Section 18 of the Exchange Act or otherwise subject to the liabilities of that section, and shall not be deemed to be incorporated by reference into the filings of the Company under the Securities Act or the Exchange Act regardless of any general incorporation language in such filings. This Report shall not be deemed an admission as to the materiality of any information in this Report that is being disclosed pursuant to Regulation FD. Please refer to Exhibit 99.2 for a discussion of certain forward-looking statements included therein and the risks and uncertainties related thereto.
Item 9.01. Financial Statements and Exhibits.
(d)
Exhibits
EXHIBIT
NUMBER
DESCRIPTION
99.1
Press Release dated February 26, 2019
99.2
Investor Presentation dated February 26, 2019
SIGNATURE
Pursuant to the requirements of the Securities Exchange Act of 1934, the registrant has duly caused this report to be signed on its behalf by the undersigned hereunto duly authorized.
BROADWIND ENERGY, INC. | ||
Date: February 26, 2019 | By: | /s/ Stephanie K. Kushner |
Stephanie K. Kushner | ||
Chief Executive Officer (Principal Executive Officer) | ||
EXHIBIT INDEX
EXHIBIT
NUMBER
DESCRIPTION
99.1
Press Release dated February 26, 2019
99.2
Investor Presentation dated February
EXHIBIT 99.1
Broadwind Energy Announces Q4 and Full Year 2018 Results
Highlights:
CICERO, Ill., Feb. 26, 2019 (GLOBE NEWSWIRE) -- Broadwind Energy, Inc. (NASDAQ: BWEN) reported sales of $27.2 million in Q4 2018, up 53% compared to $17.8 million in Q4 2017. The increase was primarily attributable to $6.5M higher Towers and Heavy Fabrication sales due to a 113% increase in tower sections sold following a near shutdown at year-end 2017 when our major customer rebalanced inventories. In addition to the tower volume increase, Gearing sales increased 28% to $10.9M, due primarily to strong demand from oil and gas and mining customers.
The Company reported a net loss of $12.4 million, or $.79 per share, in Q4 2018, compared to a loss of $7.0 million, or $.46 per share, in Q4 2017. The current year loss included a $7.6M non-cash write-down of customer intangibles associated with the Red Wolf acquisition. Partially offsetting were improved operating results for Towers and Heavy Fabrications and Gearing.
The Company reported a non-GAAP adjusted EBITDA (earnings before interest, taxes, depreciation, amortization, share-based payments, restructuring costs and impairment expense) loss of $1.7 million in Q4 2018, compared to a loss $4.0 million in Q4 2017 (please refer to the reconciliation of GAAP measures to non-GAAP measures at the end of this release). The narrowed loss was due primarily to improved Towers and Heavy Fabrication and Gearing operating results as noted above.
Broadwind CEO Stephanie Kushner stated, “Gearing delivered a second consecutive strong quarter and its first profitable year. Operational and organizational changes initiated earlier in 2018 have shifted the trajectory of the business and we are gaining market share and have a healthy backlog. We expect to capitalize on strong second half results and deliver solid profit margins in 2019.
Our tower business is recovering in the strong near-term domestic wind market, and our capacity utilization is rising. However, margins remain under pressure from imported towers which use significantly cheaper Asian steel. Our production of other heavy fabrications, particularly for mining and construction products, was up three-fold in 2018, and continues to be a diversification focus for the business.”
Our Process Systems segment has been challenged by Red Wolf’s reliance on a single gas turbine customer, but we have had some initial success with customer diversification and continue to make this a priority for the business. We expect the segment to perform much better in 2019.”
Kushner concluded, “Our 2019 outlook is for quarterly revenue at or above $40 million, and average EBITDA of about $2 million per quarter. First quarter EBITDA is expected to be $1.0-$1.5 million, impacted by the cost of ramping up tower production. Our expanded credit line will provide the capital to support our significant top-line recovery.”
For the full year of 2018, revenue totaled $125.4 million, compared to $146.8 million in 2017. The 15% decrease was due primarily to $34.6 million lower sales in the Towers and Heavy Fabrications segment due primarily to a 34% decrease in tower volumes, partially offset by increased sales of other heavy fabrications due to growth in demand from mining and construction customers. Gearing segment revenues increased $12.4 million resulting from the growth in demand from oil and gas and mining customers. Process Systems segment revenue increased modestly by $.9M, as increased industrial demand offset weaker demand for natural gas turbine content.
Net loss for 2018 totaled $24.1 million, versus a net loss of $3.6 million in 2017. The increased loss is attributable to non-cash impairment charges of $12.6 million in the current year and the absence of a $5.0 million income tax benefit recorded in 2017 associated with the Red Wolf acquisition, as well as the reduction in tower sales. The current year results also benefited from the improved operating results from Gearing and the $2.2 million impact of the New Markets Tax Credit loan forgiveness.
The Company reported non-GAAP adjusted EBITDA loss of $1.0 million for full year 2018 compared to income of $2.8 million in 2017. The decrease was due primarily to the lower capacity utilization in our tower plants, partially offset by the Gearing segment recovery (please refer to the reconciliation of GAAP measures to non-GAAP measures at the end of this release).
Orders and Backlog
The Company booked $16.7 million of net new orders in Q4 2018, up 36% from $12.3 million in Q4 2017. Gearing orders totaled $8.5 million in Q4 2018, up from $7.4 million in Q4 2017 due primarily to strong demand from wind and mining customers. Process Systems orders more than doubled to $5.8 million in Q4 2018 compared to $2.4 million in Q4 2017 due primarily to higher demand from mining and other industrial customers. Towers and Heavy Fabrications orders were essentially flat, at $2.4 million in Q4 2018, compared to $2.5 million in Q4 2017.
Full year 2018 orders totaled $83.2 million, compared to $87.6 million in 2017. At December 31, 2018, total backlog was $96.5 million, compared to backlog of $138.2 million at December 31, 2017, consistent with entering the final year of a 3-year tower supply agreement. Future tower orders are expected to be on a spot basis, reflecting a shift in procurement practices in the industry.
Segment Results
Towers and Heavy Fabrications
Broadwind Energy produces fabrications for wind, oil and gas, mining and other industrial applications, specializing in the production of wind turbine towers.
Towers and Heavy Fabrications segment sales totaled $10.7 million in Q4 2018, compared to $4.2 million in Q4 2017 when our tower production was curtailed as our key customer realigned inventories. The increase was due primarily to a 113% increase in tower sections sold and higher heavy fabrications revenue as a result of strong demand from mining and other industrial customers.
Towers and Heavy Fabrications segment operating loss narrowed to $2.8 million in Q4 2018 compared to $4.5 million in Q4 2017. Net loss for the Towers and Heavy Fabrications segment narrowed to $2.2 million in Q4 2018, compared to $4.2 million in Q4 2017. The non-GAAP adjusted EBITDA loss in Q4 2018 was $1.3 million compared to non-GAAP adjusted EBITDA loss of $3.0 million in Q4 2017 due primarily to the factors described above (please refer to the reconciliation of GAAP measures to non-GAAP measures at the end of this release).
Towers and Heavy Fabrications segment sales for full year 2018 totaled $68.8 million, down 33% from $103.4 million in 2017, due primarily to a reduction in tower volumes coupled with a lower average sales price on the product mix sold. The decreased tower demand was partially offset by an increase in sales of heavy fabrications due primarily to strong demand from mining and construction customers.
The full year operating income decreased from $2.7 million in 2017 to an operating loss of $4.3 million in 2018. The decrease was primarily attributable to lower capacity utilization, a lower margin product mix and start-up costs associated with restoring production levels as we ramped up activity during the first quarter following a near shutdown in late 2017. For the full year, the net loss for the Towers and Heavy Fabrications segment totaled $3.3 million compared to net income of $.9 million for 2017. Non-GAAP adjusted EBITDA totaled $1.4 million in 2018 down from $7.8 million in 2017 due to the factors described above (please refer to the reconciliation of GAAP measures to non-GAAP measures at the end of this release).
Gearing
Broadwind Energy engineers, builds and remanufactures precision gears and gearboxes for oil and gas, mining, steel, wind and other specialized applications.
Gearing segment sales totaled $10.9 million in Q4 2018, up 28% from $8.5 million in Q4 2017. The $2.4 million increase was due primarily to continued strong sales to oil and gas and mining customers, attributable to strong market demand and the expansion of our customer base.
Operating income for Q4 2018 totaled $1.0 million, compared to an operating loss of $.1 million in Q4 2017. The improvement was due primarily to improved plant utilization, higher labor productivity and greater manufacturing efficiencies. Partially offsetting these factors was the absence of the $.7 million environmental reserve reversal that occurred in 2017, as well as increased overhead costs to support higher production levels. Net income for the Gearing segment totaled $.9 million in Q4 2018, compared to a net loss of $.1 million in Q4 2017. Non-GAAP adjusted EBITDA was $1.6 million in Q4 2018 compared to $.6 million in Q4 2017 due mainly to the factors described above (please refer to the reconciliation of GAAP measures to non-GAAP measures at the end of this release).
Gearing segment revenue for full year 2018 totaled $38.4 million, up 48% from $26.0 million for 2017. The increase was due primarily to the continued strong sales to oil and gas customers.
The Gearing segment had full year operating income of $.1 million in 2018, a significant improvement compared to a loss of $2.6 million in 2017. The full year 2018 had break-even net income, versus a net loss of $2.6 million in 2017. For full year 2018, non-GAAP adjusted EBITDA was $2.6 million compared to breakeven non-GAAP adjusted EBITDA in 2017 due mainly to the factors described above (please refer to the reconciliation of GAAP measures to non-GAAP measures at the end of this release).
Process Systems
Broadwind Energy designs and manufactures custom, modular systems for compression, filtration and other specialized process applications for the global market. On February 1, 2017, the Company acquired Red Wolf which has been combined with the Abilene-based compressed natural gas (“CNG”) and fabrication business, previously reported as a part of Towers and Heavy Fabrications, to form the Process Systems segment.
Process Systems revenue totaled $5.6 million in Q4 2018 compared to $5.1 million in Q4 2017 due to higher sales to other industrial customers, partially offset by lower customer demand for natural gas turbine content. The operating loss totaled $8.9 million in Q4 2018 compared to operating loss of $.5 million in Q4 2017 due primarily to a non-cash impairment of a portion of the intangible value of Red Wolf’s customer relationship, because the business’s large gas turbine customer’s demand has declined significantly in a weaker global market.
Process Systems full year revenue totaled $18.3 million in 2018 compared to $17.4 million in 2017 due primarily to the recovery in mining and other industrial markets.
Process Systems full year operating loss totaled $16.4 million in 2018, which includes $12.6 million of impairment charges resulting from the write-off of intangible assets and $.7 million of restructuring costs related to the Abilene production facility. Net loss for full year 2018 totaled $16.0 million compared to net loss of $2.2 million in 2017 due mainly to the factors described above. Non-GAAP adjusted EBITDA loss for full year 2018 totaled $1.4 million compared to $.5 million in 2017 due to the factors described above (please refer to the reconciliation of GAAP measures to non-GAAP measures at the end of this release).
Corporate
Corporate and other expenses decreased to $1.5 million in Q4 2018 compared to $1.6 million in Q4 2017 due primarily to lower compensation costs.
Corporate and other expenses for the full year totaled $4.3 million in 2018, down 17% from $5.2 million in 2017. The reduction was due primarily to $.8 million lower salaries and benefits expense, partially offset by the $.3 million reduction in the Red Wolf earn-out release in 2018 compared to 2017.
Cash and Liquidity
During Q4 2018, operating working capital (accounts receivable and inventory, net of accounts payable and customer deposits) improved $13.1 million to $5.0 million due primarily to an increase in customer deposits in support of higher 2019 tower production levels.
Debt and capital leases totaled $14.9 million at December 31, 2018. The Company’s $25 million line of credit with CIBC Bank USA had a balance of $11.0 million at December 31, 2018 and $10.3 million of availability.
On February, 25, 2019, the Company executed an Amended and Restated Loan and Security Agreement, with CIBC Bank USA and other lenders, which expanded our credit line to $35 million from $25 million and extended the term of the agreement to February 25, 2022. The agreement includes minimum EBITDA covenants through September 30, 2019 and introduces a Fixed Charge Coverage Ratio thereafter.
About Broadwind Energy, Inc.
Broadwind Energy, Inc. (NASDAQ: BWEN) is a precision manufacturer of structures, equipment and components for clean tech and other specialized applications. From gears and gearing systems for wind, oil and gas and mining applications, to wind towers and industrial weldments, we have solutions for the clean tech, energy and infrastructure needs of the future. With facilities throughout the U.S., Broadwind Energy's talented team is committed to helping customers maximize performance of their investments—quicker, easier and smarter. Find out more at www.bwen.com
Forward-Looking Statements
This release contains “forward looking statements”—that is, statements related to future, not past, events—as defined in Section 21E of the Securities Exchange Act of 1934, as amended, that reflect our current expectations regarding our future growth, results of operations, financial condition, cash flows, performance, business prospects and opportunities, as well as assumptions made by, and information currently available to, our management. Forward looking statements include any statement that does not directly relate to a current or historical fact. We have tried to identify forward looking statements by using words such as “anticipate,” “believe,” “expect,” “intend,” “will,” “should,” “may,” “plan” and similar expressions, but these words are not the exclusive means of identifying forward looking statements.
Our forward-looking statements may include or relate to our beliefs, expectations, plans and/or assumptions with respect to the following: (i) state, local and federal regulatory frameworks affecting the industries in which we compete, including the wind energy industry, and the related extension, continuation or renewal of federal tax incentives and grants and state renewable portfolio standards; (ii) our customer relationships and our substantial dependency on a few significant customers and our efforts to diversify our customer base and sector focus and leverage relationships across business units; (iii) our ability to continue to grow our business organically and through acquisitions; (iv) the production, sales, collections, customer deposits and revenues generated by new customer orders and our ability to realize the resulting cash flows; (v) the sufficiency of our liquidity and alternate sources of funding, if necessary; (vi) our ability to realize revenue from customer orders and backlog; (vii) our ability to operate our business efficiently, comply with our debt obligations, manage capital expenditures and costs effectively, and generate cash flow; (viii) the economy and the potential impact it may have on our business, including our customers; (ix) the state of the wind energy market and other energy and industrial markets generally and the impact of competition and economic volatility in those markets; (x) the effects of market disruptions and regular market volatility, including fluctuations in the price of oil, gas and other commodities; (xi) the effects of the change of administrations in the U.S. federal government; (xii) our ability to successfully integrate and operate companies and to identify, negotiate and execute future acquisitions; and (xiii) the potential loss of tax benefits if we experience an “ownership change” under Section 382 of the Internal Revenue Code of 1986, as amended; (xiv) the limited trading market for our securities and the volatility of market price for our securities; and (xv) the impact of future sales of our common stock or securities convertible into our common stock on our stock price. These statements are based on information currently available to us and are subject to various risks, uncertainties and other factors that could cause our actual results to be materially different from the forward-looking statements including, but not limited to, those set forth under the caption “Risk Factors” in Item 1A of our Annual Report on Form 10-K for the year ended December 31, 2018. We are under no duty to update any of these statements. You should not consider any list of such factors to be an exhaustive statement of all of the risks, uncertainties or other factors that could cause our current beliefs, expectations, plans and/or assumptions to change.
BWEN INVESTOR CONTACT: Jason Bonfigt, 708.780.4821 jason.bonfigt@bwen.com
BROADWIND ENERGY, INC. AND SUBSIDIARIES
CONSOLIDATED BALANCE SHEETS
(IN THOUSANDS)
December 31, | December 31, | ||||||||||
2018 | 2017 | ||||||||||
ASSETS | |||||||||||
CURRENT ASSETS: | |||||||||||
Cash and cash equivalents | $ | 1,177 | $ | 78 | |||||||
Accounts receivable, net | 17,455 | 13,644 | |||||||||
Inventories, net | 22,670 | 19,279 | |||||||||
Prepaid expenses and other current assets | 1,776 | 1,798 | |||||||||
Current assets held for sale | - | 580 | |||||||||
Total current assets | 43,078 | 35,379 | |||||||||
LONG-TERM ASSETS: | |||||||||||
Property and equipment, net | 49,087 | 55,693 | |||||||||
Goodwill | - | 4,993 | |||||||||
Other intangible assets, net | 6,602 | 16,078 | |||||||||
Other assets | 398 | 207 | |||||||||
TOTAL ASSETS | $ | 99,165 | $ | 112,350 | |||||||
LIABILITIES AND STOCKHOLDERS' EQUITY | |||||||||||
CURRENT LIABILITIES: | |||||||||||
Line of credit, NMTC and other notes payable | $ | 11,930 | $ | 14,138 | |||||||
Current maturities of long-term debt | - | 114 | |||||||||
Current portions of capital lease obligations | 967 | 762 | |||||||||
Accounts payable | 11,618 | 11,756 | |||||||||
Accrued liabilities | 3,806 | 4,393 | |||||||||
Customer deposits | 23,507 | 9,791 | |||||||||
Current liabilities held for sale | 27 | 30 | |||||||||
Total current liabilities | 51,855 | 40,984 | |||||||||
LONG-TERM LIABILITIES: | |||||||||||
Long-term debt, net of current maturities | 1,408 | 797 | |||||||||
Long-term capital lease obligations, net of current portions | 571 | 941 | |||||||||
Other | 1,969 | 3,557 | |||||||||
Total long-term liabilities | 3,948 | 5,295 | |||||||||
COMMITMENTS AND CONTINGENCIES | |||||||||||
STOCKHOLDERS' EQUITY: | |||||||||||
Preferred stock, $0 001 par value; 10,000,000 shares authorized; no shares issued | |||||||||||
or outstanding | - | - | |||||||||
Common stock, $0 001 par value; 30,000,000 shares authorized; 15,982,622 | |||||||||||
and 15,480,299 shares issued as of December 31, 2018 and | |||||||||||
December 31, 2017, respectively | 16 | 15 | |||||||||
Treasury stock, at cost, 273,937 shares as of December 31, 2018 and December 31, 2017, | |||||||||||
respectively | (1,842 | ) | (1,842 | ) | |||||||
Additional paid-in capital | 381,441 | 380,005 | |||||||||
Accumulated deficit | (336,253 | ) | (312,107 | ) | |||||||
Total stockholders' equity | 43,362 | 66,071 | |||||||||
TOTAL LIABILITIES AND STOCKHOLDERS' EQUITY | $ | 99,165 | $ | 112,350 | |||||||
BROADWIND ENERGY, INC. AND SUBSIDIARIES
CONSOLIDATED STATEMENTS OF OPERATIONS
(IN THOUSANDS, EXCEPT PER SHARE DATA)
(UNAUDITED)
Three Months Ended December 31, | Twelve Months Ended December 31, | ||||||||||||||||||
2018 | 2017 | 2018 | 2017 | ||||||||||||||||
Revenues | $ | 27,187 | $ | 17,768 | $ | 125,380 | $ | 146,785 | |||||||||||
Cost of sales | 27,456 | 20,869 | 121,684 | 138,626 | |||||||||||||||
Restructuring | 243 | - | 631 | - | |||||||||||||||
Gross profit | (512 | ) | (3,101 | ) | 3,065 | 8,159 | |||||||||||||
OPERATING EXPENSES: | |||||||||||||||||||
Selling, general and administrative | 3,605 | 3,117 | 13,625 | 13,828 | |||||||||||||||
Impairment charges | 7,592 | - | 12,585 | - | |||||||||||||||
Intangible amortization | 471 | 471 | 1,884 | 1,764 | |||||||||||||||
Restructuring | 1 | - | 37 | - | |||||||||||||||
Total operating expenses | 11,669 | 3,588 | 28,131 | 15,592 | |||||||||||||||
Operating loss | (12,181 | ) | (6,689 | ) | (25,066 | ) | (7,433 | ) | |||||||||||
OTHER (EXPENSE) INCOME, net: | |||||||||||||||||||
Interest expense, net | (474 | ) | (214 | ) | (1,496 | ) | (798 | ) | |||||||||||
Other, net | 112 | (14 | ) | 2,355 | 3 | ||||||||||||||
Total other (expense) income, net | (362 | ) | (228 | ) | 859 | (795 | ) | ||||||||||||
Net loss before provision (benefit) for income taxes | (12,543 | ) | (6,917 | ) | (24,207 | ) | (8,228 | ) | |||||||||||
(Benefit) provision for income taxes | (185 | ) | 11 | (205 | ) | (5,045 | ) | ||||||||||||
LOSS FROM CONTINUING OPERATIONS | (12,358 | ) | (6,928 | ) | (24,002 | ) | (3,183 | ) | |||||||||||
LOSS FROM DISCONTINUED OPERATIONS | (51 | ) | (53 | ) | (144 | ) | (458 | ) | |||||||||||
NET LOSS | $ | (12,409 | ) | $ | (6,981 | ) | $ | (24,146 | ) | $ | (3,641 | ) | |||||||
NET LOSS PER COMMON SHARE - BASIC: | |||||||||||||||||||
Loss from continuing operations | $ | (0.79 | ) | $ | (0.46 | ) | $ | (1.55 | ) | $ | (0.21 | ) | |||||||
Loss from discontinued operations | (0.00 | ) | (0.00 | ) | (0.01 | ) | (0.03 | ) | |||||||||||
Net loss | $ | (0.79 | ) | $ | (0.46 | ) | $ | (1.56 | ) | $ | (0.24 | ) | |||||||
WEIGHTED AVERAGE COMMON SHARES OUTSTANDING - BASIC | 15,652 | 15,171 | 15,469 | 15,053 | |||||||||||||||
NET LOSS PER COMMON SHARE - DILUTED: | |||||||||||||||||||
Loss from continuing operations | $ | (0.79 | ) | $ | (0.46 | ) | $ | (1.55 | ) | $ | (0.21 | ) | |||||||
Loss from discontinued operations | (0.00 | ) | (0.00 | ) | (0.01 | ) | (0.03 | ) | |||||||||||
Net loss | $ | (0.79 | ) | $ | (0.46 | ) | $ | (1.56 | ) | $ | (0.24 | ) | |||||||
WEIGHTED AVERAGE COMMON SHARES OUTSTANDING - DILUTED | 15,652 | 15,171 | 15,469 | 15,053 | |||||||||||||||
BROADWIND ENERGY, INC. AND SUBSIDIARIES
CONSOLIDATED STATEMENTS OF CASH FLOWS
(IN THOUSANDS)
(UNAUDITED)
Year Ended December 31, | ||||||||||
2018 | 2017 | |||||||||
CASH FLOWS FROM OPERATING ACTIVITIES: | ||||||||||
Net loss | $ | (24,146 | ) | $ | (3,641 | ) | ||||
Loss from discontinued operations | (144 | ) | (458 | ) | ||||||
Loss from continuing operations | (24,002 | ) | (3,183 | ) | ||||||
Adjustments to reconcile net cash provided by (used in) operating activities: | ||||||||||
Depreciation and amortization expense | 9,183 | 8,999 | ||||||||
Impairment charges | 12,585 | 80 | ||||||||
Deferred income taxes | (307 | ) | (5,045 | ) | ||||||
Remeasurement of contingent consideration | (1,140 | ) | (1,394 | ) | ||||||
Stock-based compensation | 803 | 813 | ||||||||
Extinguishment of New Markets Tax Credit obligation | (2,249 | ) | - | |||||||
Allowance for doubtful accounts | (35 | ) | 37 | |||||||
Common stock issued under defined contribution 401(k) plan | 685 | 316 | ||||||||
Gain on disposal of assets | (116 | ) | (12 | ) | ||||||
Changes in operating assets and liabilities, net of acquisition: | ||||||||||
Accounts receivable | (3,776 | ) | 884 | |||||||
Inventories | (2,944 | ) | 7,057 | |||||||
Prepaid expenses and other current assets | 22 | 651 | ||||||||
Accounts payable | 801 | (5,287 | ) | |||||||
Accrued liabilities | 553 | (4,921 | ) | |||||||
Customer deposits | 13,716 | (8,219 | ) | |||||||
Other non-current assets and liabilities | (1,734 | ) | (126 | ) | ||||||
Net cash provided by (used in) operating activities of continued operations | 2,045 | (9,350 | ) | |||||||
CASH FLOWS FROM INVESTING ACTIVITIES: | ||||||||||
Cash paid in acquisition | - | (16,449 | ) | |||||||
Sales of available for sale securities . | - | 2,221 | ||||||||
Maturities of available for sale securities . | - | 950 | ||||||||
Purchases of property and equipment . | (2,324 | ) | (6,688 | ) | ||||||
Proceeds from disposals of property and equipment | 676 | 72 | ||||||||
Net cash used in investing activities of continued operations | (1,648 | ) | (19,894 | ) | ||||||
CASH FLOWS FROM FINANCING ACTIVITIES: | ||||||||||
Proceeds from line of credit | 141,414 | 158,856 | ||||||||
Payments on line of credit | (141,040 | ) | (148,009 | ) | ||||||
Proceeds from long-term debt | 2,060 | 457 | ||||||||
Payments on long-term debt | (761 | ) | - | |||||||
Principal payments on capital leases | (814 | ) | (644 | ) | ||||||
Proceeds from sale of common stock, net | (52 | ) | - | |||||||
Net cash provided by financing activities of continued operations | 807 | 10,660 | ||||||||
DISCONTINUED OPERATIONS: | ||||||||||
Operating cash flows | (105 | ) | (78 | ) | ||||||
Net cash used in discontinued operations | (105 | ) | (78 | ) | ||||||
Add: Cash balance of discontinued operations, beginning of period | - | 2 | ||||||||
NET INCREASE (DECREASE) IN CASH & CASH EQUIVALENTS | 1,099 | (18,660 | ) | |||||||
CASH AND CASH EQUIVALENTS beginning of the period | 78 | 18,738 | ||||||||
CASH AND CASH EQUIVALENTS end of the period | $ | 1,177 | $ | 78 | ||||||
Supplemental cash flow information: | ||||||||||
Interest paid . | $ | 1,168 | $ | 585 | ||||||
Income taxes paid | $ | 116 | $ | 44 | ||||||
Non-cash activities: | ||||||||||
Issuance of restricted stock grants | $ | 803 | $ | 813 | ||||||
Equipment additions via capital lease | $ | 650 | $ | 844 | ||||||
Non-cash purchases of property and equipment | $ | 64 | $ | 1,003 | ||||||
Contingent consideration related to business acquisition | $ | - | $ | 2,534 | ||||||
Red Wolf acquisition: | ||||||||||
Assets acquired . | $ | - | 26,602 | |||||||
Liabilities assumed | $ | - | 7,619 | |||||||
BROADWIND ENERGY, INC. AND SUBSIDIARIES
SELECTED SEGMENT FINANCIAL INFORMATION
(IN THOUSANDS)
(UNAUDITED)
Three Months Ended | Twelve Months Ended | |||||||||||||||||
December 31, | December 31, | |||||||||||||||||
2018 | 2017 | 2018 | 2017 | |||||||||||||||
ORDERS: | ||||||||||||||||||
Towers and Heavy Fabrications | $ | 2,431 | $ | 2,543 | $ | 23,511 | $ | 34,873 | ||||||||||
Gearing | 8,532 | 7,398 | 41,576 | 36,928 | ||||||||||||||
Process Systems | 5,763 | 2,358 | 18,154 | 15,761 | ||||||||||||||
Total orders | $ | 16,726 | $ | 12,299 | $ | 83,241 | $ | 87,562 | ||||||||||
REVENUES: | ||||||||||||||||||
Towers and Heavy Fabrications | $ | 10,676 | $ | 4,195 | $ | 68,815 | $ | 103,389 | ||||||||||
Gearing | 10,882 | 8,495 | 38,376 | 26,006 | ||||||||||||||
Process Systems | 5,639 | 5,078 | 18,319 | 17,390 | ||||||||||||||
Corporate and Other | (10 | ) | - | (130 | ) | - | ||||||||||||
Total revenues | $ | 27,187 | $ | 17,768 | $ | 125,380 | $ | 146,785 | ||||||||||
OPERATING (LOSS)/PROFIT: | ||||||||||||||||||
Towers and Heavy Fabrications | $ | (2,811 | ) | $ | (4,522 | ) | $ | (4,346 | ) | $ | 2,667 | |||||||
Gearing | 992 | (71 | ) | 51 | (2,632 | ) | ||||||||||||
Process Systems | (8,861 | ) | (463 | ) | (16,442 | ) | (2,269 | ) | ||||||||||
Corporate and Other | (1,501 | ) | (1,633 | ) | (4,329 | ) | (5,199 | ) | ||||||||||
Total operating (loss)/profit | $ | (12,181 | ) | $ | (6,689 | ) | $ | (25,066 | ) | $ | (7,433 | ) | ||||||
Non-GAAP Financial Measure
The Company provides non-GAAP adjusted EBITDA (earnings before interest, taxes, depreciation, amortization, share-based payments, restructuring costs and impairment expense) as supplemental information regarding the Company’s business performance. The Company’s management uses adjusted EBITDA when it internally evaluates the performance of the Company’s business, reviews financial trends and makes operating and strategic decisions. The Company believes that this non-GAAP financial measure is useful to investors because it provides investors with a better understanding of the Company’s past financial performance and future results, and it allows investors to evaluate the Company’s performance using the same methodology and information as used by the Company’s management. The Company's definition of adjusted EBITDA may be different from similar non-GAAP financial measures used by other companies and/or analysts.
BROADWIND ENERGY, INC. AND SUBSIDIARIES
RECONCILIATION OF NON-GAAP FINANCIAL MEASURES
(IN THOUSANDS)
(UNAUDITED)
Consolidated | Three Months Ended December 31, | Twelve Months Ended December 31, | |||||||||||||||||
2018 | 2017 | 2018 | 2017 | ||||||||||||||||
Net (Loss) from continuing operations | $ | (12,358 | ) | $ | (6,928 | ) | # | $ | (24,000 | ) | $ | (3,184 | ) | ||||||
Interest Expense | 475 | 214 | 1,494 | 798 | |||||||||||||||
Income Tax (Benefit)/Provision | (184 | ) | 11 | (204 | ) | (5,045 | ) | ||||||||||||
Depreciation and Amortization | 2,193 | 2,427 | 9,183 | 8,999 | |||||||||||||||
Share-based Compensation and Other Stock Payments | 290 | 323 | 1,504 | 1,223 | |||||||||||||||
Restructuring Costs | 243 | - | 668 | - | |||||||||||||||
Impairment Charges | 7,592 | - | 12,585 | - | |||||||||||||||
NMTC Extinguishment Gain | - | - | (2,249 | ) | - | ||||||||||||||
Adjusted EBITDA (Non-GAAP) | $ | (1,749 | ) | $ | (3,953 | ) | $ | (1,019 | ) | $ | 2,791 | ||||||||
Towers and Heavy Fabrications Segment | Three Months Ended December 31, | Twelve Months Ended December 31, | |||||||||||||||
2018 | 2017 | 2018 | 2017 | ||||||||||||||
Net (Loss)/Income | $ | (2,195 | ) | $ | (4,207 | ) | $ | (3,273 | ) | $ | 919 | ||||||
Interest Expense | 66 | 26 | 194 | 89 | |||||||||||||
Income Tax (Benefit)/Provision | (567 | ) | (337 | ) | (1,154 | ) | 1,666 | ||||||||||
Depreciation and Amortization | 1,213 | 1,355 | 4,986 | 4,638 | |||||||||||||
Share-based Compensation and Other Stock Payments | 139 | 127 | 606 | 440 | |||||||||||||
Adjusted EBITDA (Non-GAAP) | $ | (1,344 | ) | $ | (3,036 | ) | $ | 1,359 | $ | 7,752 | |||||||
Gearing Segment | Three Months Ended December 31, | Twelve Months Ended December 31, | |||||||||||||||
2018 | 2017 | 2018 | 2017 | ||||||||||||||
Net Income/(Loss) | $ | 915 | $ | (70 | ) | $ | (34 | ) | $ | (2,638 | ) | ||||||
Interest Expense | 67 | 3 | 74 | 12 | |||||||||||||
Income Tax Provision/(Benefit) | 10 | (4 | ) | 11 | (6 | ) | |||||||||||
Depreciation and Amortization | 513 | 583 | 2,255 | 2,430 | |||||||||||||
Share-based Compensation and Other Stock Payments | 66 | 64 | 286 | 178 | |||||||||||||
Adjusted EBITDA (Non-GAAP) | $ | 1,571 | $ | 576 | $ | 2,592 | $ | (24 | ) | ||||||||
Process Systems | Three Months Ended December 31, | Twelve Months Ended December 31, | ||||||||||||||||
2018 | 2017 | 2018 | 2017 | |||||||||||||||
Net (Loss) | $ | (8,501 | ) | $ | (390 | ) | $ | (16,003 | ) | $ | (2,207 | ) | ||||||
Interest Expense | 3 | 1 | 6 | 5 | ||||||||||||||
Income Tax (Benefit) | (365 | ) | (78 | ) | (453 | ) | (88 | ) | ||||||||||
Depreciation and Amortization | 405 | 428 | 1,709 | 1,706 | ||||||||||||||
Share-based Compensation and Other Stock Payments | 20 | 20 | 89 | 53 | ||||||||||||||
Restructuring Expense | 243 | - | 668 | - | ||||||||||||||
Impairment Expense | 7,592 | - | 12,585 | - | ||||||||||||||
Adjusted EBITDA (Non-GAAP) | $ | (603 | ) | $ | (19 | ) | $ | (1,399 | ) | $ | (531 | ) | ||||||
Corporate and Other | Three Months Ended December 31, | Twelve Months Ended December 31, | ||||||||||||||||
2018 | 2017 | 2018 | 2017 | |||||||||||||||
Net(Loss)/Income | $ | (2,577 | ) | $ | (2,261 | ) | $ | (4,690 | ) | $ | 742 | |||||||
Interest Expense | 339 | 184 | 1,220 | 692 | ||||||||||||||
Income Tax Provision/(Benefit) | 738 | 430 | 1,392 | (6,617 | ) | |||||||||||||
Depreciation and Amortization | 62 | 61 | 233 | 225 | ||||||||||||||
Share-based Compensation and Other Stock Payments | 65 | 112 | 523 | 552 | ||||||||||||||
NMTC Extinguishment Gain | - | - | (2,249 | ) | - | |||||||||||||
Adjusted EBITDA (Non-GAAP) | $ | (1,373 | ) | $ | (1,474 | ) | $ | (3,571 | ) | $ | (4,406 | ) | ||||||
EXHIBIT 99.2
Q4 2018 Earnings Call February 26, 2019
Industry Data and Forward - Looking Statements Disclaimer ▪ Broadwind obtained the industry and market data used throughout this presentation from our own research, internal surveys and st udies conducted by third parties, independent industry associations or general publications and other publicly available informatio n. Independent industry publications and surveys generally state that they have obtained information from sources believed to be reliable, but do not gu arantee the accuracy or completeness of such information. Forecasts are particularly likely to be inaccurate, especially over long periods of time. W e a re not aware of any misstatements in the industry data we have presented herein, but estimates involve risks and uncertainties and a re subject to change based on various factors beyond our control. ▪ Our forward - looking statements may include or relate to our beliefs, expectations, plans and/or assumptions with respect to the following: ( i ) state, local and federal regulatory frameworks affecting the industries in which we compete, including the wind energy industry, and th e related extension, continuation or renewal of federal tax incentives and grants and state renewable portfolio standards; (ii) our customer relat ion ships and our substantial dependency on a few significant customers and our efforts to diversify our customer base and sector focus and lev era ge relationships across business units; (iii) our ability to continue to grow our business organically and through acquisitions; (iv) our prod uct ion, sales, collections, customer deposits and revenues generated by new customer orders and the resulting cash flows; (v) the sufficiency of our liqu idi ty and alternate sources of funding, if necessary; (vi) our ability to realize revenue from customer orders and backlog; (vii) our ability to ope rate our business efficiently, manage capital expenditures and costs effectively, and generate cash flow; (viii) the economy and the potential imp act it may have on our business, including our customers; (ix) the state of the wind energy market and other energy and industrial markets gener all y and the impact of competition and economic volatility in those markets; (x) the effects of market disruptions and regular market volatility, in clu ding fluctuations in the price of oil, gas and other commodities; (xi) the effects of the change of administrations in the U.S. federal government; (x ii) our ability to successfully integrate and operate the business of Red Wolf Company, LLC and to identify, negotiate and execute future acquis iti ons; and (xiii) the potential loss of tax benefits if we experience an “ownership change” under Section 382 of the Internal Revenue Code of 1986, as amended; and (xiv) the impact of future sales of our common stock or securities convertible into our common stock on our stock price. These statements are based on information currently available to us and are subject to various risks, uncertainties and other factors. We are unde r n o duty to update any of these statements. You should not consider any list of such factors to be an exhaustive statement of all of the risks, unce rta inties or other factors that could cause our current beliefs, expectations, plans and/or assumptions to change. ▪ This presentation contains non - GAAP financial information. We believe that certain non - GAAP financial measures may provide users of this financial information with meaningful comparisons between current results and results in prior operating periods. We believe tha t these non - GAAP financial measures can provide additional meaningful reflection of underlying trends of the business because they provide a c omp arison of historical information that excludes certain infrequently occurring or non - operational items that impact the overall comparabili ty. Non - GAAP financial measures should be viewed in addition to, and not as an alternative to, our reported results prepared in accordance wi th GAAP. Please see our earnings release dated February 26, 2019 for a reconciliation of certain non - GAAP measures presented in this presentation. February 26, 2019 2
Highlights ▪ Achieved targeted $40M customer diversification in 2018 ▪ Debt reduced 18% in 2018 – credit line expanded and extended post year end ▪ 1 st profitable year for Gearing ▪ Q4 Revenue and EBITDA in line with guidance ▪ Tower order book building despite steel tariffs ▪ 2019 Outlook confirmed – >30% revenue recovery February 26, 2019 3
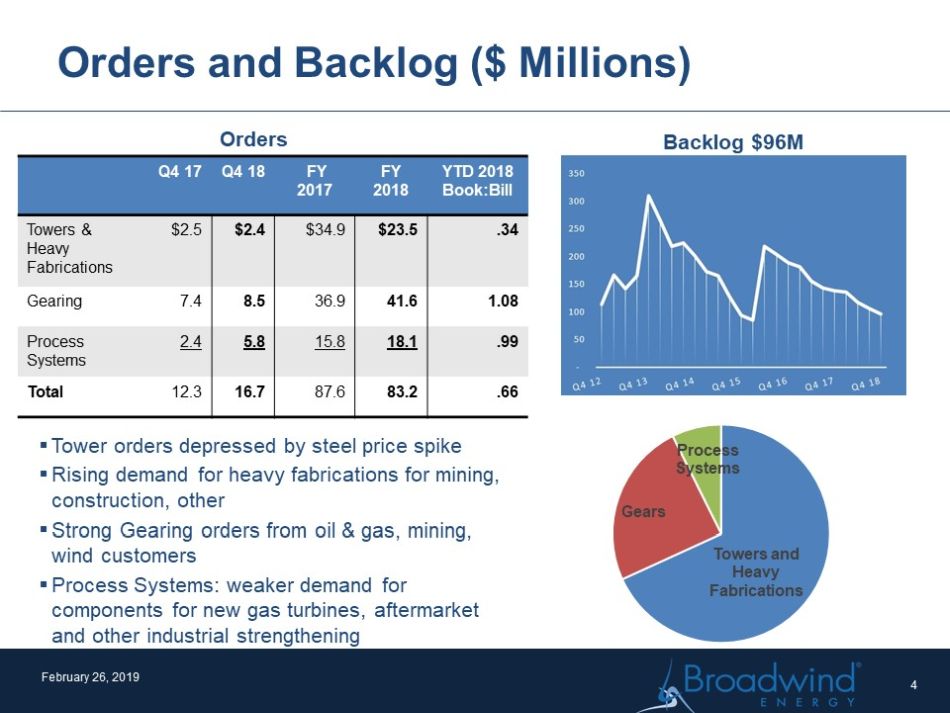
Orders and Backlog ($ Millions) Orders ▪ Tower orders depressed by steel price spike ▪ Rising demand for heavy fabrications for mining, construction, other ▪ Strong Gearing orders from oil & gas, mining, wind customers ▪ Process Systems: weaker demand for components for new gas turbines, aftermarket and other industrial strengthening Backlog $96M February 26, 2019 Q4 17 Q4 18 FY 2017 FY 2018 YTD 2018 Book:Bill Towers & Heavy Fabrications $2.5 $2.4 $34.9 $23.5 .34 Gearing 7.4 8.5 36.9 41.6 1.08 Process Systems 2.4 5.8 15.8 18.1 .99 Total 12.3 16.7 87.6 83.2 .66 4 Towers and Heavy Fabrications Gears Process Systems
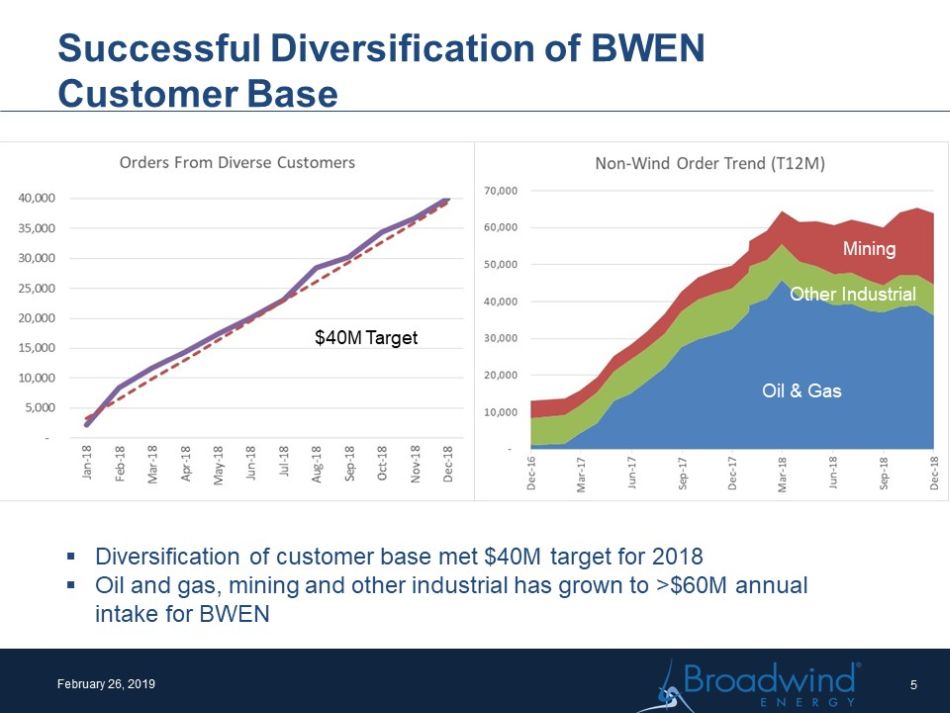
Successful Diversification of BWEN Customer Base February 26, 2019 5 ▪ Diversification of customer base met $40M target for 2018 ▪ Oil and gas, mining and other industrial has grown to >$60M annual intake for BWEN $40M target YTD Orders Oth . Industrial Mining YTD Orders $40M target $40M Target Oil & Gas Other Industrial Mining
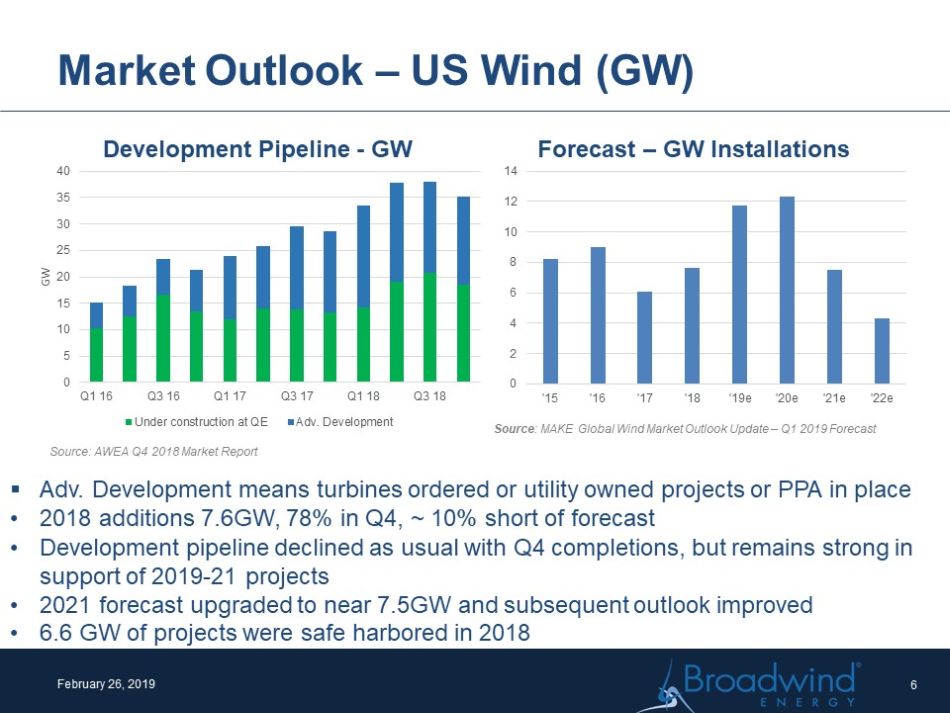
Market Outlook – US Wind (GW) Source : MAKE Global Wind Market Outlook Update – Q1 2019 Forecast Development Pipeline - GW Source: AWEA Q4 2018 Market Report February 26, 2019 6 ▪ Adv . Development means turbines ordered or utility owned projects or PPA in place • 2018 additions 7.6GW, 78% in Q4, ~ 10% short of forecast • Development pipeline declined as usual with Q4 completions, but remains strong in support of 2019 - 21 projects • 2021 forecast upgraded to near 7.5GW and subsequent outlook improved • 6.6 GW of projects were safe harbored in 2018 Forecast – GW Installations 0 5 10 15 20 25 30 35 40 Q1 16 Q3 16 Q1 17 Q3 17 Q1 18 Q3 18 GW Under construction at QE Adv. Development 0 2 4 6 8 10 12 14 '15 '16 '17 '18 '19e '20e '21e '22e
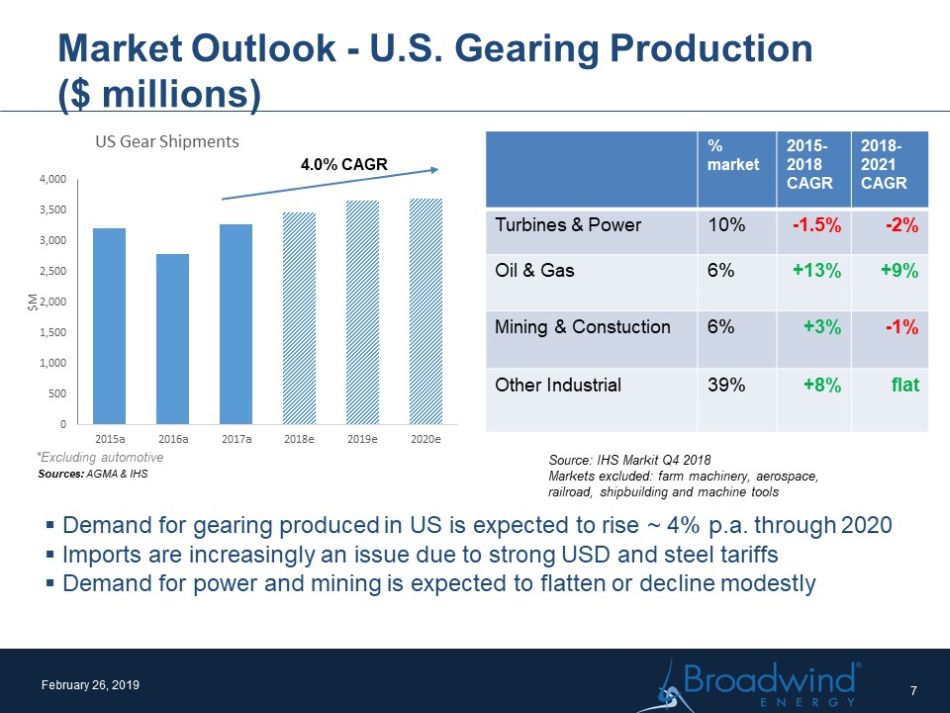
Market Outlook - U.S. Gearing Production ($ millions) *Excluding automotive Sources: AGMA & IHS 7 February 26, 2019 ▪ Demand for gearing produced in US is expected to rise ~ 4% p.a. through 2020 ▪ I mports are increasingly an issue due to strong USD and steel tariffs ▪ Demand for power and mining is expected to flatten or decline modestly 0 500 1,000 1,500 2,000 2,500 3,000 3,500 4,000 2015a 2016a 2017a 2018e 2019e 2020e $M US Gear Shipments 4 .0% CAGR Source: IHS Markit Q4 2018 Markets excluded: farm machinery, aerospace, railroad, shipbuilding and machine tools % market 2015 - 2018 CAGR 2018 - 2021 CAGR Turbines & Power 10% - 1.5% - 2% Oil & Gas 6% +13% +9% Mining & Constuction 6% +3% - 1% Other Industrial 39% +8% flat
2019 Priorities February 26, 2019 8 ▪ Continue focus on customer diversification - $60M target ▪ Restructure systems to support changing sales mix ▪ Continuous improvement to offset margin compression ▪ Adjust steel procurement strategy to support strong 2019 production ▪ Reduce average cash conversion cycle by ~20%
Towers and Heavy Fabrications Q4 2017 Q4 2018 FY 2017 FY 2018 Orders ($M) $2.5 $2.4 $34.9 $23.5 Sections Sold (#) 30 64 820 540 Revenue ($M) 4.2 10.7 103.4 68.8 Operating Inc/(Loss) ($M) (4.5) (2.8) 2.7 (4.3) - % of Sales (107.8%) (26.3%) 2.6% (6.3%) EBITDA* ($M) (3.0) (1.3) 7.8 1.4 - % of Sales (71.4%) (12.1%) 7.5% 2.0% Q4 Results ▪ M ining and industrial demand continues to be strong, Tower quoting activities increasing ▪ Q4 18 tower sections sold up slightly but down FY ▪ Operating loss narrowed comparatively – higher production volumes, better plant utilization Priorities ▪ Diversify tower customer base and grow heavy fabrications business ▪ Cost out to offset margin pressure ▪ Build capabilities and customer base for heavy fabrications ▪ Balance trade - off between near - term tower demand spike and longer term diversification focus February 26, 2019 * Reconciliation to non - GAAP measure included in Appendix 9 356 352 344 387 400 264 126 30 143 201 132 64 Q1 16 Q2 16 Q3 16 Q4 16 Q1 17 Q2 17 Q3 17 Q4 17 Q1 18 Q2 18 Q3 18 Q4 18 Quarterly Tower Section Sales Capacity
Gearing Q4 2017 Q4 2018 FY 2017 FY 2018 Orders ($M) $7.4 $8.5 $36.9 $41.6 Revenue ($M) 8.5 10.9 26.0 38.4 Operating (Loss)/ Income ($M) (0.1) 1.0 (2.6) .1 EBITDA* ($M) 0.6 1.6 0.0 2.6 Q4 Results ▪ Orders up due primarily due to demand from wind and mining customers ▪ Revenue up 28% compared to Q4 17 ▪ EBITDA $1.6M – increased plant utilization and productivity ▪ Achieved full year profitability milestone February 26, 2019 Priorities ▪ Continue diversification of customer base ▪ Grow and optimize Gearbox production ▪ Continuous Improvement focused on maintenance and scheduling systems ▪ Optimize first article production process to accommodate increasing demand * Reconciliation to non - GAAP measure included in Appendix 10 0.0 2.0 4.0 6.0 8.0 10.0 12.0 2013 2014 2015 2016 2017 Q1 18 Q2 18 Q3 18 Q4 18 $M Gearing Revenue by Market Oil & Gas Mining Wind Industrial Steel
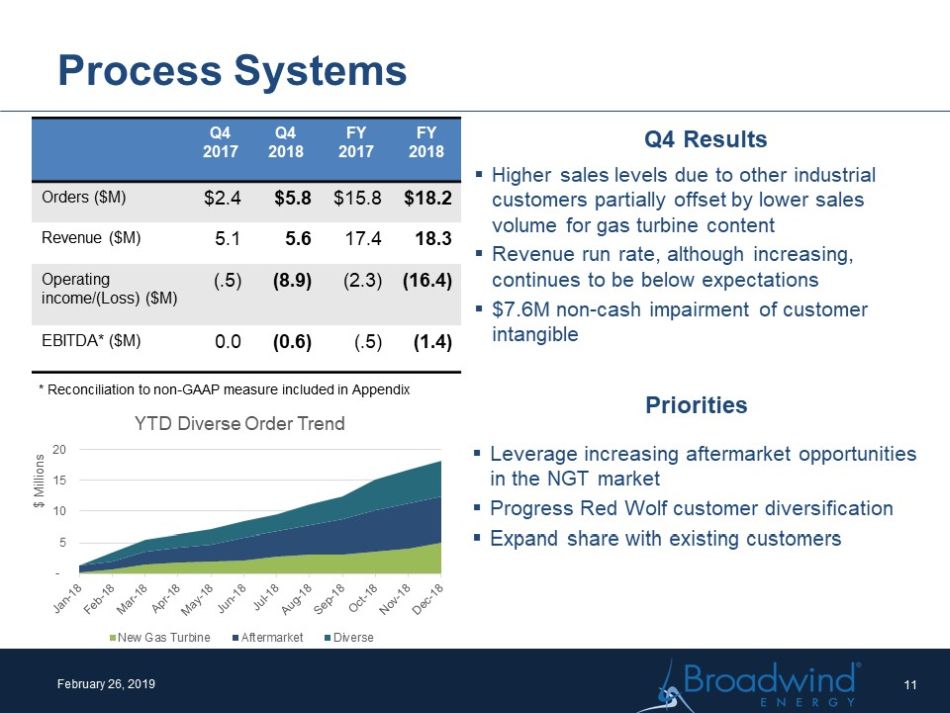
February 26, 2019 Process Systems Q4 2017 Q4 2018 FY 2017 FY 2018 Orders ($M) $2.4 $5.8 $15.8 $18.2 Revenue ($M) 5.1 5.6 17.4 18.3 Operating income/(Loss) ($M) (.5) (8.9) (2.3) (16.4) EBITDA* ($M) 0.0 (0.6) (.5) (1.4) * Reconciliation to non - GAAP measure included in Appendix Q4 Results ▪ Higher sales levels due to other industrial customers partially offset by lower sales volume for gas turbine content ▪ Revenue run rate, although increasing, continues to be below expectations ▪ $7.6M non - cash impairment of customer intangible Priorities ▪ Leverage increasing aftermarket opportunities in the NGT market ▪ Progress Red Wolf customer diversification ▪ Expand share with existing customers 11 - 5 10 15 20 $ Millions YTD Diverse Order Trend New Gas Turbine Aftermarket Diverse
BWEN Consolidated Financial Results February 26, 2019 Q4 Comparison: ▪ S ales across each segment up YoY due to customer and end market diversification ▪ Gross profit up YoY due to improved productivity and plant utilization in Towers and Fabrications and Gearing. ▪ $.49/share non - cash impairment of Red Wolf Customer Intangible value 12 Q4 17 Q4 18 FY 17 FY 18 Total Sales $17.8 $27.2 $146.8 $125.4 Gross Profit (3.1) (.5) 8.2 3.1 Gross Profit % (17.4%) (1.8%) 5.6% 2.5% Recurring Operating Expense 4.3 4.1 17.7 16.6 One - time items (.7) 7.6 (2.1) 11.5 Total Operating Expenses 3.6 11.7 15.6 28.1 Operating (Loss) (6.7) (12.2) (7.4) (25.1) % of sales (37.7%) (44.8%) (5.1%) (20.0%) Adj. EBITDA (4.0) (1.7) 2.8 (1.0) % of sales (22.5%) (6.3%) 1.9% (.8%) EPS, Continuing (.46) (.79) (.21) (1.55) $M except as noted otherwise
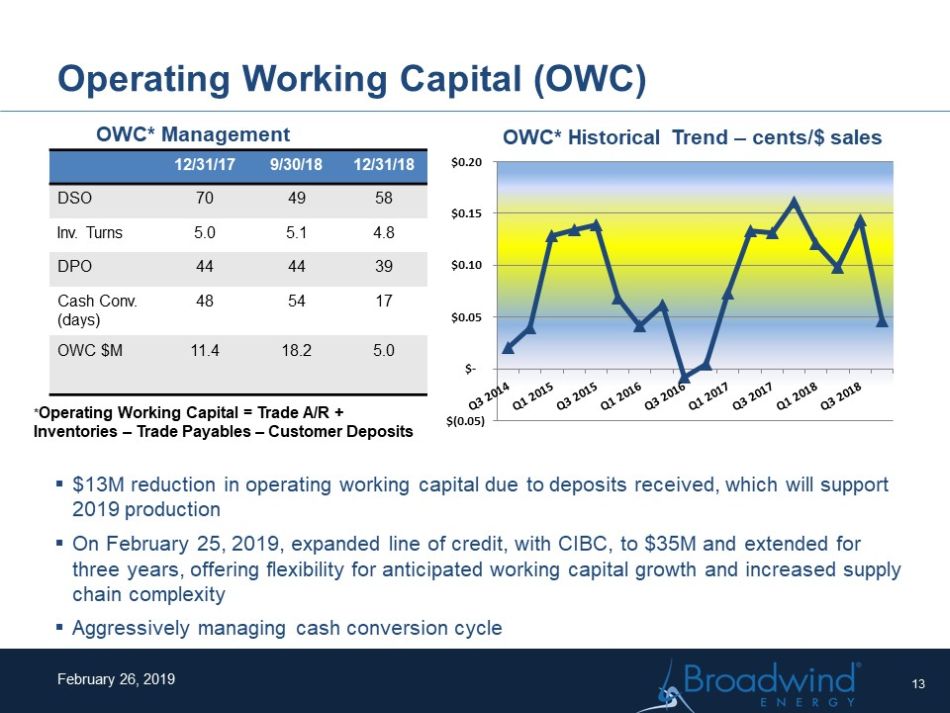
Operating Working Capital (OWC) February 26, 2019 ▪ $13M reduction in operating working capital due to deposits received, which will support 2019 production ▪ On February 25, 2019, expanded line of credit, with CIBC, to $35M and extended for three years, offering flexibility for anticipated working capital growth and increased supply chain complexity ▪ Aggressively managing cash conversion cycle * Operating Working Capital = Trade A/R + Inventories – Trade Payables – Customer Deposits 12/31/17 9/30/18 12/31/18 DSO 70 49 58 Inv. Turns 5.0 5.1 4.8 DPO 44 44 39 Cash Conv. (days) 48 54 17 OWC $M 11.4 18.2 5.0 OWC* Historical Trend – cents/$ sales OWC* Management 13 $(0.05) $- $0.05 $0.10 $0.15 $0.20
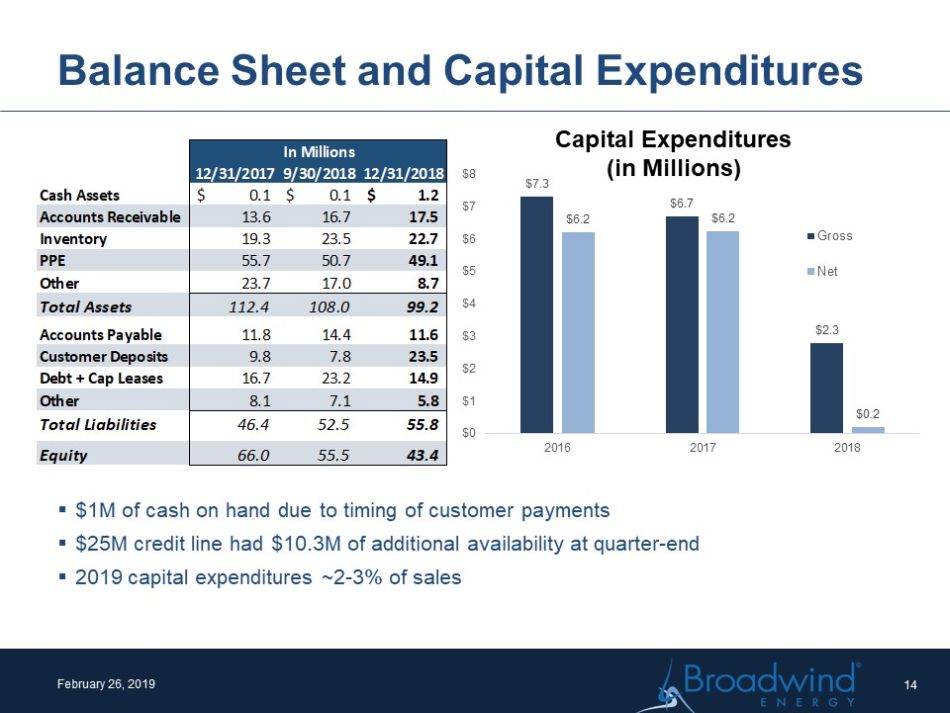
Balance Sheet and Capital Expenditures February 26, 2019 Capital Expenditures (in Millions) ▪ $1M of cash on hand due to timing of customer payments ▪ $25M credit line had $10.3M of additional availability at quarter - end ▪ 2019 capital expenditures ~2 - 3% of sales 14 12/31/20179/30/201812/31/2018 Cash Assets 0.1$ 0.1$ 1.2$ Accounts Receivable 13.6 16.7 17.5 Inventory 19.3 23.5 22.7 PPE 55.7 50.7 49.1 Other 23.7 17.0 8.7 Total Assets 112.4 108.0 99.2 Accounts Payable 11.8 14.4 11.6 Customer Deposits 9.8 7.8 23.5 Debt + Cap Leases 16.7 23.2 14.9 Other 8.1 7.1 5.8 Total Liabilities 46.4 52.5 55.8 Equity 66.0 55.5 43.4 In Millions $7.3 $6.7 $2.3 $6.2 $6.2 $0.2 $0 $1 $2 $3 $4 $5 $6 $7 $8 2016 2017 2018 Gross Net
Q4 Summary and Guidance ▪ Q4 2018: As guided – Gearing progress offset by rescheduled tower production ▪ 2019: Average quarterly revenue >$40M, consistent positive EBITDA ▪ Q1 2019: Gears segment continues to perform…rebuilding Towers, but margin pressures remain - Revenue $40M and EBITDA $1 - 1.5M February 26, 2019 15
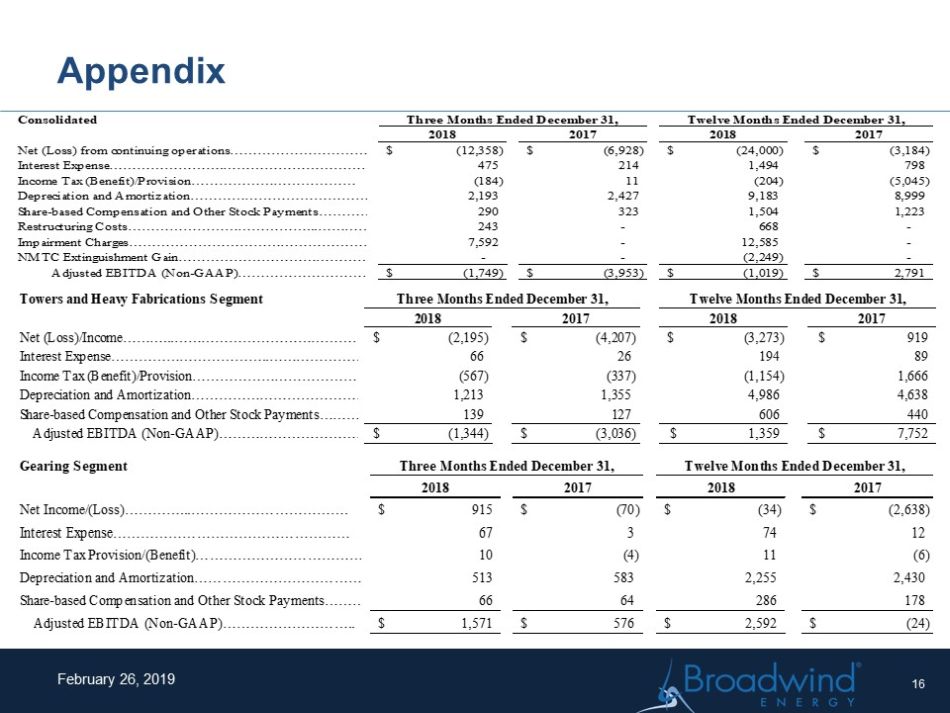
Appendix February 26, 2019 16 Consolidated 2018 2017 2018 2017 Net (Loss) from continuing operations……………………………. (12,358)$ (6,928)$ (24,000)$ (3,184)$ Interest Expense…………………….……………………………………. 475 214 1,494 798 Income Tax (Benefit)/Provision……………………………… (184) 11 (204) (5,045) Depreciation and Amortization………………………………………………………………2,193 2,427 9,183 8,999 Share-based Compensation and Other Stock Payments………………………………………………………………290 323 1,504 1,223 Restructuring Costs…………………………………...……………………. 243 - 668 - Impairment Charges…………………………………………………. 7,592 - 12,585 - NMTC Extinguishment Gain……………………………………. - - (2,249) - Adjusted EBITDA (Non-GAAP)…………………………. (1,749)$ (3,953)$ (1,019)$ 2,791$ Three Months Ended December 31, Twelve Months Ended December 31, Towers and Heavy Fabrications Segment 2018 2017 2018 2017 Net (Loss)/Income………...……………………………………. (2,195)$ (4,207)$ (3,273)$ 919$ Interest Expense……………………………..……………………. 66 26 194 89 Income Tax (Benefit)/Provision……………………………… (567) (337) (1,154) 1,666 Depreciation and Amortization………………………………………………………………1,213 1,355 4,986 4,638 Share-based Compensation and Other Stock Payments………………………………………………………………139 127 606 440 Adjusted EBITDA (Non-GAAP)…………………………….. (1,344)$ (3,036)$ 1,359$ 7,752$ Three Months Ended December 31, Twelve Months Ended December 31, Gearing Segment 2018 2017 2018 2017 Net Income/(Loss)…………...……………………………. 915$ (70)$ (34)$ (2,638)$ Interest Expense…………………………………………… 67 3 74 12 Income Tax Provision/(Benefit)……………………………… 10 (4) 11 (6) Depreciation and Amortization………………………………………………………………513 583 2,255 2,430 Share-based Compensation and Other Stock Payments………………………………………………………………66 64 286 178 Adjusted EBITDA (Non-GAAP)……………………….. 1,571$ 576$ 2,592$ (24)$ Three Months Ended December 31, Twelve Months Ended December 31,
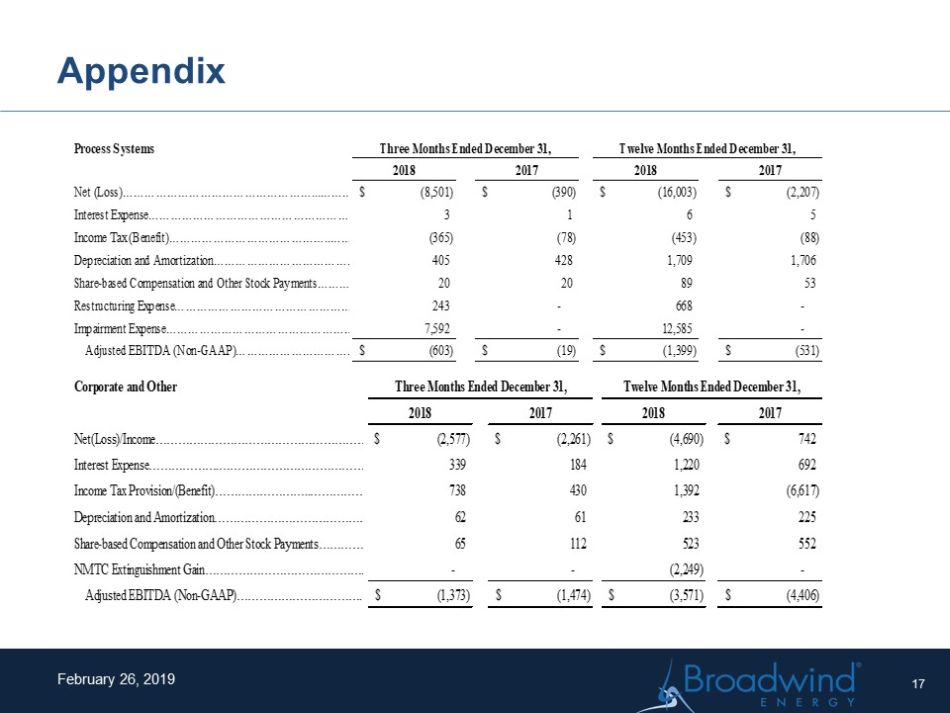
Appendix February 26, 2019 17 Process Systems 2018 2017 2018 2017 Net (Loss)……………………………………………...…………… (8,501)$ (390)$ (16,003)$ (2,207)$ Interest Expense……………………………………………………. 3 1 6 5 Income Tax (Benefit)……………………………………..……… (365) (78) (453) (88) Depreciation and Amortization……………………………………. 405 428 1,709 1,706 Share-based Compensation and Other Stock Payments………… 20 20 89 53 Restructuring Expense……………………………………………. 243 - 668 - Impairment Expense………………………………………………… 7,592 - 12,585 - Adjusted EBITDA (Non-GAAP)……………………………… (603)$ (19)$ (1,399)$ (531)$ Three Months Ended December 31, Twelve Months Ended December 31, Corporate and Other 2018 2017 2018 2017 Net(Loss)/Income………………………………………………….. (2,577)$ (2,261)$ (4,690)$ 742$ Interest Expense……………….…………………………………… 339 184 1,220 692 Income Tax Provision/(Benefit)……………………..…………… 738 430 1,392 (6,617) Depreciation and Amortization………………………………………………………………62 61 233 225 Share-based Compensation and Other Stock Payments………………………………………………………………65 112 523 552 NMTC Extinguishment Gain……………………………………. - - (2,249) - Adjusted EBITDA (Non-GAAP)……………………………. (1,373)$ (1,474)$ (3,571)$ (4,406)$ Three Months Ended December 31, Twelve Months Ended December 31,
Broadwind Energy is a precision manufacturer of structures, equipment & components for clean tech and other specialized applications . www.BWEN.com February 26, 2019 18
1-EETS!^L%FYF9\1$9X"AFV
M%A._E94L]6 MH8S. .0%5F
MP(W#HMHY3&6*^QQ\>.X41:W=/B<8]HX6DW!8UE :X-V\4GR.X*H2R4Z@N] #N(]4Z7<
MWDM(4)E(Z5GSYO46LB7//KPJC\DN/"
MN.*NY$LOL:,^5\U![X!QN6=)(XBRJILFR5NL:,'D:-67.KNH3GDCJJ8V[>2H
MG$ \*EC1#R,NORG.[\*%TE]U6+Z4N/$Z86" !U5;4B=S8%R:7*V(6MZGE1O?
M&SN$TQ->Y7>ZDQTE!$KFDV#U4$IIMVJ2,VZ)#*F&15M_S33(5:B1U"=SU&7_
M #4+GIA>JVD;R<2)_G<*GOY1NX1M%O9:\WYIIDYZJON2AR>T>XGWV@.4.Y *
M5!N+ >GM?2K!R<'\I-#4BSOM (4&Y.#DJ*3)C280"D#N5;P,;SY1N-,'52^.
M65%6Z1GN!!X%J"5[O1=1-BP#AC5G2X\37$_P4QFF.6)KR81>[YIOF%;,C8^S
M0HW1,(Y:%=F>Q^YE[BX*6-A=2M^6VN&I0P-0)1:(!$4IBKJIKHICSR@8S8C:
MEZH[IT*Q ".RZ'Q#"W3L#3M. F$?O$_KN=R!]PI1^$19*E#0/FD#@G $T .J3*I K>/([L+5C3\"23E[1M^:
MU(,*"&]HY^:RGD2-X8GW,T?&TWP5/&T;0T NM7G0PD_9Y3?-9%Q06>^^QKLK
MN-AQQ8+N%K8T;10%4LJ.=KW=5?AE:0+*SG9I"C78/AH!+N&VBJ\>2 V@HWSA
MSOFL*9M:+D=-Z)[Y=K2!:K1R@@)L\[6@DFDN['V&39,A< XTT=E&_(NR.RS\
MC,!>>57&51ZV%NH<&+ER:7G'NXJ>/+('+BL5V3?-I1DB^J;B"E1N'-#1;B /
MFL36]6_U;'W]ZJ9V0) ''CT64^$N.YUJ\>-+EF>3(WPA/-W.YY*M1M! Z*H
M&M;TZIS92.RZ'SV,(\=S3B#0K+*6,W*VN5J+*;7)Y6;3-E)&HV@5WOL\'^CI
M".\KEYG[\P<6O2_9J[?HV\=#(X_Q7#K$U#DZ]-);N#0\;_U1)?J/YK@YG6*7
M;^/W[-#F=Z$?S7G'OC'=U&E3VE:B2W#W--JM,QOWIS\IE&BL_)S!T!7=%,Y)
M22+D3PP$*6.;:1;J"Q/>23U2F=SA3>5ILON9=0[+%U2 1ACB2?4KH,+46#$:
M&6"?5>90MD:X%Q*W,#*
J:^0>JR6YHJ[2>]7W4* ]YI>
M9M%@IC\TM')6>[)H
NKI,YNM$ZL2,;U=RE=D,/5P7"YNLR,=3#:H.UG)L_&J6E;(>KC'@]"FSHV
M,-$+%S=69&"=UGT7)2ZO,YI;N5*3(+S;G$E:0TU=S&>LOL;^1K+G'_!4Y-1W
M>JQW3?-,=,%NL:1S/-)]V;;-0KJ\ICM3\'U2Z*8+5->3MHM>;1 <5*WQ!75Y*X4Y%="D]X/J4
MOAXC^-DCT#'\1N<2''@*T/$( ^TO-FY3AT*>[^CJ\CP;HNCXYEU/.GR7-%EK*C;?U/*R-&\238FI@:+I+1I8:??(
M8_TDDD7=Q3T7&9.;/E2;\F>29WJ]Q*[WV/#?FZTXBP,%_]ZQS:>4<;EDE;
M-\&JC+*HXXTB[K/@&;.T_P#/'AK*9J&'("\1-&U[!Z5ZCT7G$S7Q/5[EX-/D^R'(?ZLF/\UX
[
M8?5;>E_I&'JO.4JSM9T58Q-M:!C:Y,.-S=KTU(\EPOP4Q WJIFQMJMH5ID
MZ6K4&.PCD(