UNITED STATES
SECURITIES AND EXCHANGE COMMISSION
Washington, D.C. 20549
FORM 8-K
CURRENT REPORT
Pursuant to Section 13 or 15(d) of the Securities Exchange Act of 1934
`
Date of report (Date of earliest event reported): August 1, 2017
BROADWIND ENERGY, INC.
(Exact Name of Registrant as Specified in Its Charter)
Delaware | 001-34278 | 88-0409160 | ||
(State or Other Jurisdiction of | (Commission File Number) | (IRS Employer Identification No.) | ||
Incorporation) |
3240 South Central Avenue, Cicero, Illinois 60804
(Address of Principal Executive Offices) (Zip Code)
Registrant’s Telephone Number, Including Area Code: (708) 780-4800
Not Applicable
(Former Name or Former Address, if Changed Since Last Report)
Check the appropriate box below if the Form 8-K filing is intended to simultaneously satisfy the filing obligation of the registrant under any of the following provisions:
☐ Written communications pursuant to Rule 425 under the Securities Act (17 CFR 230.425)
☐ Soliciting material pursuant to Rule 14a-12 under the Exchange Act (17 CFR 240.14a-12)
☐ Pre-commencement communications pursuant to Rule 14d-2(b) under the Exchange Act (17 CFR 240.14d-2(b))
☐ Pre-commencement communications pursuant to Rule 13e-4(c) under the Exchange Act (17 CFR 240.13e-4(c))
Indicate by check mark whether the registrant is an emerging growth company as defined in Rule 405 of the Securities Act of 1933 (17 CFR §230.405) or Rule 12b-2 of the Securities Exchange Act of 1934 (17 CFR §240.12b-2). Emerging growth company ☐
If an emerging growth company, indicate by check mark if the registrant has elected not to use the extended transition period for complying with any new or revised financial accounting standards provided pursuant to Section 13(a) of the Exchange Act. ☐
Item 2.02. Results of Operations and Financial Condition.
On August 1, 2017, Broadwind Energy, Inc. (the “Company”) issued a press release announcing its financial results as of and for the quarter ended June 30, 2017. The press release is incorporated herein by reference and is attached hereto as Exhibit 99.1.
The information contained in, or incorporated into, this Item 2.02 of this Current Report on Form 8-K (this “Report”), including Exhibit 99.1, is furnished under Item 2.02 of Form 8-K and shall not be deemed “filed” for the purposes of Section 18 of the Securities Exchange Act of 1934, as amended (the “Exchange Act”) or otherwise subject to the liabilities of that section, and shall not be deemed to be incorporated by reference into the filings of the Company under the Securities Act of 1933, as amended (the “Securities Act”) or the Exchange Act regardless of any general incorporation language in such filings.
Item 7.01. Regulation FD Disclosure.
An Investor Presentation dated August 1, 2017 is incorporated herein by reference and attached hereto as Exhibit 99.2.
The information contained in, or incorporated into, this Item 7.01 of this Report, including Exhibit 99.2 attached hereto, is furnished under Item 7.01 of Form 8-K and shall not be deemed “filed” for the purposes of Section 18 of the Exchange Act or otherwise subject to the liabilities of that section, and shall not be deemed to be incorporated by reference into the filings of the Company under the Securities Act or the Exchange Act regardless of any general incorporation language in such filings.
This Report shall not be deemed an admission as to the materiality of any information in this Report that is being disclosed pursuant to Regulation FD.
Please refer to Exhibit 99.2 for a discussion of certain forward-looking statements included therein and the risks and uncertainties related thereto.
Item 9.01. Financial Statements and Exhibits.
(d) | Exhibits | |
EXHIBIT NUMBER |
DESCRIPTION | |
99.1 | Press Release dated August 1, 2017 | |
99.2 | Investor Presentation dated August 1, 2017 |
2
SIGNATURE
Pursuant to the requirements of the Securities Exchange Act of 1934, the registrant has duly caused this report to be signed on its behalf by the undersigned hereunto duly authorized.
BROADWIND ENERGY, INC. | ||
August 1, 2017 | By: | /s/ Stephanie K. Kushner |
Stephanie K. Kushner | ||
Chief Executive Officer and Chief Financial Officer | ||
(Principal Executive Officer and Principal Financial Officer) |
3
EXHIBIT INDEX
EXHIBIT NUMBER |
DESCRIPTION | |
99.1 | Press Release dated August 1, 2017 | |
99.2 | Investor Presentation dated August 1, 2017 |
4
EXHIBIT 99.1
Broadwind Energy Announces Q2 2017 Results
Highlights:
CICERO, Ill., Aug. 01, 2017 (GLOBE NEWSWIRE) -- Broadwind Energy, Inc. (NASDAQ:BWEN) reported sales of $43.4 million in Q2 2017, flat compared to Q2 2016. Towers and Weldments segment revenue was down 10% due to lower sales volumes compared to the prior year, partially offset by higher pass-through material content. Offsetting the weaker tower revenue was $3.0 million of sales from the Process Systems segment due primarily to the acquisition of Red Wolf Company, LLC earlier this year.
The Company reported a net loss from continuing operations of $.7 million, or $.05 per share, in Q2 2017, compared to break-even in Q2 2016, largely due to the addition of amortization expenses associated with the acquisition of Red Wolf.
The Company reported near break-even results from discontinued operations in Q2 2017, compared to a net loss from discontinued operations of $.5 million, or $.03 per share in Q2 2016, as activities in the discontinued segment have substantially wound down.
The Company reported non-GAAP adjusted EBITDA (earnings before interest, taxes, depreciation, amortization, share-based payments and restructuring costs) of $2.0 million in Q2 2017, essentially flat compared to $2.1 million in Q2 2016 (please refer to the reconciliation of GAAP measures to non-GAAP measures at the end of this release).
Broadwind CEO Stephanie Kushner stated, “We had a strong first half and our second quarter results were in line with expectations. Despite lower tower volumes, we produced consistently and reliably and delivered solid segment profits on fewer, more complex towers. The productivity gains and cost management demonstrated by towers management are critical as our turbine customers are facing increasing cost pressure from windfarm developers.
“In Gearing, we are seeing the initial impact of a recovery in oil and gas volumes. Importantly, as our operating performance has improved in this business, we have added some significant new customers. The market recovery and new customer wins resulted in slightly higher revenue during the second quarter, but we expect quarterly revenues to rise to the $8 million run rate beginning in Q3, and position us for profitability in this segment.”
Ms. Kushner continued, “Integration of the Red Wolf acquisition is continuing. Our second quarter results in the Process Systems segment were weaker than expected, due in part to shipping delays in both Red Wolf and for compressed natural gas (CNG) units. We expect quarterly revenues to recover to the $5 million or more range during the second half of this year. First half sales for Red Wolf have been impacted by lower demand for certain types of aftermarket kits and unanticipated variability in shipment patterns. We expect some recovery in the second half and remain excited by the opportunities presented by this business segment.
“In the third quarter we expect a further reduction in tower volumes, offset by growth in the other segments, with total revenues in the $30 million range, and EBITDA of approximately $1 million. We are working with our customers to support a reduction in their component inventories during the next few quarters, and expect to see recovery in their offtake beginning in mid-2018. All indications point to a strong market through at least 2020.”
For the six months ended June 30, 2017, revenue totaled $99.4 million, compared to $90.1 million for the six months ended June 30, 2016. The 10% increase was due primarily to $6.3 million of sales from the Process Systems segment due to the acquisition of Red Wolf earlier this year and higher sales in the Towers and Weldments segment. The increased sales in the Towers and Weldments segment was driven by higher shipments in Q1 2017 in advance of the 100% safe harbor production tax credit deadline and significantly improved production flow in the Abilene, Texas tower plant.
Net income from continuing operations for the six months ended June 30, 2017 totaled $5.8 million, or $.39 per share, compared to a net loss from continuing operations of $.3 million, or $.02 per share, for the six months ended June 30, 2016. The current year net income includes a $5.1 million, or $.34 per share, income tax benefit due primarily to the partial release of a tax valuation allowance related to the Red Wolf acquisition. The remaining $.05 per share improvement was due to improved production flow in the Towers and Weldments segment. Net loss from discontinued operations for the six months ended June 30, 2017 totaled $.2 million compared to $.5 million for the same period in 2016. The Company reported Non-GAAP adjusted EBITDA of $5.9 million for the six months ended June 30, 2017, compared to $3.9 million for the same period in 2016. The increase was due primarily to the productivity improvements in the Towers and Weldments segment (please refer to the reconciliation of GAAP measures to non-GAAP measures at the end of this release).
Orders and Backlog
The Company booked $17.6 million of net new orders in Q2 2017, down significantly from $176.2 million of net new orders booked in Q2 2016 which included initial bookings under a 3-year tower framework agreement. Orders in the Towers and Weldments segment totaled $1.5 million in Q2 2017 reflecting the weaker demand for towers as customers utilize inventories built to support the terms of the production tax credit qualification period. Gearing segment orders totaled $11.6 million in Q2 2017, more than double Q2 2016 orders of $5.6 million, due to recovery in the oil and gas industry, and the expansion of the commercial organization. Process Systems segment orders totaled $4.4 million in Q2 2017.
At June 30, 2017, total backlog was $155.9 million, compared to a backlog of $218.9 million at June 30, 2016.
Segment Results
Towers and Weldments
Broadwind Energy produces fabrications for wind, oil and gas, mining and other industrial applications, specializing in the production of wind turbine towers.
Towers and Weldments segment sales totaled $34.3 million in Q2 2017, compared to $38.0 million in Q2 2016. The decrease in sales was due to a 19% decrease in tower production versus the prior year, partly offset by higher prices due to a more complex tower design and higher material costs, which are generally passed through to customers. Near-term demand for towers has declined as key customers are reducing inventories built in 2016 and early 2017 to support the qualification terms of the production tax credit.
Despite reduced volume, Towers and Weldments operating income increased by $.1 million to $2.8 million in Q2 2017, compared to $2.7 million in Q2 2016 due to an improved production mix, higher labor productivity and successful cost reduction initiatives. Towers and Weldments segment net income in Q2 2017 totaled $2.0 million compared to $1.8 million in Q2 2016. Non-GAAP adjusted EBITDA totaled $3.9 million in Q2 2017, flat compared to Q2 2016 due mainly to the factors described above (please refer to the reconciliation of GAAP measures to non-GAAP measures at the end of this release).
Gearing
Broadwind Energy engineers, builds and remanufactures precision gears and gearboxes for oil and gas, mining, steel and wind applications.
Gearing segment sales totaled $6.1 million in Q2 2017, compared to $5.4 million in Q2 2016 due to stronger sales to oil and gas customers, partially offset by lower sales to wind customers.
Gearing segment operating loss totaled $.6 million in Q2 2017, significantly below a $1.2 million loss in Q2 2016. The improvement was due to the initial impact of the increase in volume, significant productivity improvements and the absence of a $.3 million severance expense from Q2 2016. Net loss for the Gearing segment narrowed similarly to $.6 million compared to $1.2 million in Q2 2016. Non-GAAP adjusted EBITDA for Q2 2017 was slightly positive, compared to Non-GAAP adjusted EBITDA loss of $.5 million in Q2 2016, due to the factors described above (please refer to the reconciliation of GAAP measures to non-GAAP measures at the end of this release).
Process Systems
Broadwind Energy designs and manufactures custom, modular systems for compression, filtration and other specialized process applications for the global market. On February 1, 2017 the Company acquired Red Wolf which has been combined with the Abilene-based CNG and fabrication business, previously reported as a part of Towers and Weldments, to form the Process Systems segment.
Process Systems sales for Q2 2017 totaled $3.0 million, reflecting $1 million of shipping curtailments imposed by a key customer at quarter-end. For Q2 2017, Process Systems net loss totaled $1.1 million, due to low Red Wolf volumes and no CNG unit completions, and including $.4 million of amortization associated with acquisition accounting. The non-GAAP adjusted EBITDA loss totaled $.6 million in Q2 2017 (please refer to the reconciliation of GAAP measures to non-GAAP measures at the end of this release).
Corporate
Corporate and other expenses totaled $1.6 million in Q2 2017, compared to $1.4 million in Q2 2016, due to increased insurance expense, partially offset by a reduction in incentive compensation.
Cash and Liquidity
During Q2 2017, operating working capital (accounts receivable and inventory, net of accounts payable and customer deposits) increased to $23.0 million, or 13% of sales, due to declining customer deposits and the timing of customer receipts.
Capital expenditures, net of disposals, in Q2 2017 totaled $1.0 million. Expenditures included investments to upgrade the coatings systems in the tower plants, and outlays associated with the expansion of the Abilene, Texas tower plant.
Cash assets (cash and short-term investments) totaled $.2 million at June 30, 2017, essentially unchanged from March 31, 2017.
Debt and capital leases totaled $19.1 million at June 30, 2017, including the $2.6 million New Markets Tax Credit loan, which is expected to be substantially forgiven when it matures in 2018. The Company’s $25 million credit line with The PrivateBank and Trust Company had a balance of $13.7 million at June 30, 2017 and $10.1million of availability.
About Broadwind Energy, Inc.
Broadwind Energy (NASDAQ:BWEN) is a precision manufacturer of structures, equipment and components for clean tech and other specialized applications. From gears and gearing systems for wind, oil and gas and mining applications, to wind towers and industrial weldments, we have solutions for the clean tech, energy and infrastructure needs of the future. With facilities throughout the U.S., Broadwind Energy's talented team is committed to helping customers maximize performance of their investments—quicker, easier and smarter. Find out more at www.bwen.com
Forward-Looking Statements
This release contains “forward looking statements”—that is, statements related to future, not past, events—as defined in Section 21E of the Securities Exchange Act of 1934, as amended, that reflect our current expectations regarding our future growth, results of operations, financial condition, cash flows, performance, business prospects and opportunities, as well as assumptions made by, and information currently available to, our management. Forward looking statements include any statement that does not directly relate to a current or historical fact. We have tried to identify forward looking statements by using words such as “anticipate,” “believe,” “expect,” “intend,” “will,” “should,” “may,” “plan” and similar expressions, but these words are not the exclusive means of identifying forward looking statements. Forward looking statements include any statement that does not directly relate to a current or historical fact. Our forward-looking statements may include or relate to our beliefs, expectations, plans and/or assumptions with respect to the following: (i) state, local and federal regulatory frameworks affecting the industries in which we compete, including the wind energy industry, and the related extension, continuation or renewal of federal tax incentives and grants and state renewable portfolio standards; (ii) our customer relationships and our substantial dependency on a few significant customers and our efforts to diversify our customer base and sector focus and leverage relationships across business units; (iii) our ability to continue to grow our business organically and through acquisitions; (iv) the sufficiency of our liquidity and alternate sources of funding, if necessary; (v) our ability to realize revenue from customer orders and backlog; (vi) our ability to operate our business efficiently, manage capital expenditures and costs effectively, and generate cash flow; (vii) the economy and the potential impact it may have on our business, including our customers; (viii) the state of the wind energy market and other energy and industrial markets generally and the impact of competition and economic volatility in those markets; (ix) the effects of market disruptions and regular market volatility, including fluctuations in the price of oil, gas and other commodities; (x) the effects of the recent change of administrations in the U.S. federal government; (xi) our ability to successfully integrate and operate the business of Red Wolf Company, LLC and to identify, negotiate and execute future acquisitions; and (xii) the potential loss of tax benefits if we experience an “ownership change” under Section 382 of the Internal Revenue Code of 1986, as amended. These statements are based on information currently available to us and are subject to various risks, uncertainties and other factors that could cause our actual growth, results of operations, financial condition, cash flows, performance, business prospects and opportunities to differ materially from those expressed in, or implied by, these statements. We are under no duty to update any of these statements. You should not consider any list of such factors to be an exhaustive statement of all of the risks, uncertainties or other factors that could cause our current beliefs, expectations, plans and/or assumptions to change.
BROADWIND ENERGY, INC. AND SUBSIDIARIES | ||||||||
CONSOLIDATED BALANCE SHEETS | ||||||||
(IN THOUSANDS) | ||||||||
June 30, | December 31, | |||||||
2017 | 2016 | |||||||
ASSETS | (Unaudited) | |||||||
CURRENT ASSETS: | ||||||||
Cash and cash equivalents | $ | 182 | $ | 18,699 | ||||
Short-term investments | - | 3,171 | ||||||
Restricted cash | - | 39 | ||||||
Accounts receivable, net of allowance for doubtful accounts of $193 and $145 as of June 30, 2017 and December 31, 2016, respectively | 21,471 | 11,865 | ||||||
Inventories, net | 21,349 | 21,159 | ||||||
Prepaid expenses and other current assets | 1,620 | 2,449 | ||||||
Current assets held for sale | 474 | 808 | ||||||
Total current assets | 45,096 | 58,190 | ||||||
LONG-TERM ASSETS: | ||||||||
Property and equipment, net | 57,398 | 54,606 | ||||||
Goodwill | 5,218 | - | ||||||
Other intangible assets, net | 17,020 | 4,572 | ||||||
Other assets | 253 | 294 | ||||||
TOTAL ASSETS | $ | 124,985 | $ | 117,662 | ||||
LIABILITIES AND STOCKHOLDERS' EQUITY | ||||||||
CURRENT LIABILITIES: | ||||||||
Line of credit and notes payable | $ | 13,713 | $ | - | ||||
Current portions of capital lease obligations | 979 | 465 | ||||||
Accounts payable | 14,595 | 15,852 | ||||||
Accrued liabilities | 7,421 | 8,430 | ||||||
Customer deposits | 5,184 | 18,011 | ||||||
Current liabilities held for sale | 438 | 493 | ||||||
Total current liabilities | 42,330 | 43,251 | ||||||
LONG-TERM LIABILITIES: | ||||||||
Long-term debt, net of current maturities | 2,600 | 2,600 | ||||||
Long-term capital lease obligations, net of current portions | 1,789 | 1,038 | ||||||
Other | 3,674 | 2,190 | ||||||
Total long-term liabilities | 8,063 | 5,828 | ||||||
COMMITMENTS AND CONTINGENCIES | ||||||||
STOCKHOLDERS' EQUITY: | ||||||||
Preferred stock, $0.001 par value; 10,000,000 shares authorized; no shares issued or outstanding | - | - | ||||||
Common stock, $0.001 par value; 30,000,000 shares authorized; 15,310,090 and 15,175,767 shares issued as of June 30, 2017 and December 31, 2016, respectively | 15 | 15 | ||||||
Treasury stock, at cost, 273,937 shares as of June 30, 2017 and December 31, 2016, respectively | (1,842 | ) | (1,842 | ) | ||||
Additional paid-in capital | 379,338 | 378,876 | ||||||
Accumulated deficit | (302,919 | ) | (308,466 | ) | ||||
Total stockholders' equity | 74,592 | 68,583 | ||||||
TOTAL LIABILITIES AND STOCKHOLDERS' EQUITY | $ | 124,985 | $ | 117,662 |
BROADWIND ENERGY, INC. AND SUBSIDIARIES | ||||||||||||||||
CONSOLIDATED STATEMENTS OF OPERATIONS | ||||||||||||||||
(IN THOUSANDS, EXCEPT PER SHARE DATA) | ||||||||||||||||
(UNAUDITED) | ||||||||||||||||
Three Months Ended June 30, | Six Months Ended June 30, | |||||||||||||||
2017 | 2016 | 2017 | 2016 | |||||||||||||
Revenues | $ | 43,362 | $ | 43,380 | $ | 99,422 | $ | 90,137 | ||||||||
Cost of sales | 39,490 | 39,238 | 89,176 | 82,033 | ||||||||||||
Gross profit | 3,872 | 4,142 | 10,246 | 8,104 | ||||||||||||
OPERATING EXPENSES: | ||||||||||||||||
Selling, general and administrative | 3,917 | 3,850 | 8,337 | 7,925 | ||||||||||||
Intangible amortization | 471 | 111 | 822 | 222 | ||||||||||||
Total operating expenses | 4,388 | 3,961 | 9,159 | 8,147 | ||||||||||||
Operating (loss) income | (516 | ) | 181 | 1,087 | (43 | ) | ||||||||||
OTHER (EXPENSE) INCOME, net: | ||||||||||||||||
Interest expense, net | (217 | ) | (152 | ) | (356 | ) | (306 | ) | ||||||||
Other, net | 29 | 5 | 29 | 17 | ||||||||||||
Total other expense, net | (188 | ) | (147 | ) | (327 | ) | (289 | ) | ||||||||
Net (loss) income before benefit for income taxes | (704 | ) | 34 | 760 | (332 | ) | ||||||||||
Benefit for income taxes | (16 | ) | (8 | ) | (5,034 | ) | (16 | ) | ||||||||
(LOSS) INCOME FROM CONTINUING OPERATIONS | (688 | ) | 42 | 5,794 | (316 | ) | ||||||||||
LOSS FROM DISCONTINUED OPERATIONS | (92 | ) | (516 | ) | (247 | ) | (535 | ) | ||||||||
NET (LOSS) INCOME | $ | (780 | ) | $ | (474 | ) | $ | 5,547 | $ | (851 | ) | |||||
NET INCOME (LOSS) PER COMMON SHARE - BASIC: | ||||||||||||||||
(Loss) income from continuing operations | $ | (0.05 | ) | $ | 0.00 | $ | 0.39 | $ | (0.02 | ) | ||||||
Loss from discontinued operations | (0.00 | ) | (0.03 | ) | (0.02 | ) | (0.04 | ) | ||||||||
Net (loss) income | $ | (0.05 | ) | $ | (0.03 | ) | $ | 0.37 | $ | (0.06 | ) | |||||
WEIGHTED AVERAGE COMMON SHARES OUTSTANDING - BASIC | 15,014 | 14,835 | 14,972 | 14,797 | ||||||||||||
NET (LOSS) INCOME PER COMMON SHARE - DILUTED: | ||||||||||||||||
(Loss) income from continuing operations | $ | (0.05 | ) | $ | 0.00 | $ | 0.38 | $ | (0.02 | ) | ||||||
Loss from discontinued operations | (0.00 | ) | (0.03 | ) | (0.02 | ) | (0.04 | ) | ||||||||
Net (loss) income | $ | (0.05 | ) | $ | (0.03 | ) | $ | 0.36 | $ | (0.06 | ) | |||||
WEIGHTED AVERAGE COMMON SHARES OUTSTANDING - DILUTED | 15,014 | 14,835 | 15,322 | 14,797 |
BROADWIND ENERGY, INC. AND SUBSIDIARIES | |||||||
CONSOLIDATED STATEMENTS OF CASH FLOWS | |||||||
(IN THOUSANDS) | |||||||
(UNAUDITED) | |||||||
Six Months Ended June 30, | |||||||
2017 | 2016 | ||||||
CASH FLOWS FROM OPERATING ACTIVITIES: | |||||||
Net income (loss) | $ | 5,547 | $ | (851 | ) | ||
Loss from discontinued operations | (247 | ) | (535 | ) | |||
Income (loss) from continuing operations | 5,794 | (316 | ) | ||||
Adjustments to reconcile net cash used in operating activities: | |||||||
Depreciation and amortization expense | 4,304 | 3,443 | |||||
Deferred income taxes | (5,034 | ) | - | ||||
Stock-based compensation | 462 | 432 | |||||
Allowance for doubtful accounts | 5 | 75 | |||||
Gain on disposal of assets | (12 | ) | (138 | ) | |||
Changes in operating assets and liabilities: | |||||||
Accounts receivable | (6,846 | ) | (7,165 | ) | |||
Inventories | 4,586 | 3,171 | |||||
Prepaid expenses and other current assets | 829 | 189 | |||||
Accounts payable | (2,609 | ) | 1,891 | ||||
Accrued liabilities | (3,177 | ) | (476 | ) | |||
Customer deposits | (12,833 | ) | 1,433 | ||||
Other non-current assets and liabilities | 28 | (751 | ) | ||||
Net cash (used in) provided by operating activities of continuing operations | (14,503 | ) | 1,788 | ||||
CASH FLOWS FROM INVESTING ACTIVITIES: | |||||||
Cash paid in acquisition | (16,449 | ) | - | ||||
Purchases of available for sale securities | - | (3,581 | ) | ||||
Sales of available for sale securities | 2,221 | 95 | |||||
Maturities of available for sale securities | 950 | 6,060 | |||||
Purchases of property and equipment | (4,304 | ) | (1,966 | ) | |||
Proceeds from disposals of property and equipment | 67 | 554 | |||||
Net cash (used in) provided by investing activities of continuing operations | (17,515 | ) | 1,162 | ||||
CASH FLOWS FROM FINANCING ACTIVITIES: | |||||||
Net proceeds from lines of credit and notes payable | 13,713 | - | |||||
Payments on long-term debt | - | (2,799 | ) | ||||
Principal payments on capital leases | (317 | ) | (328 | ) | |||
Net cash provided by (used in) financing activities of continuing operations | 13,396 | (3,127 | ) | ||||
DISCONTINUED OPERATIONS: | |||||||
Operating cash flows | 64 | 907 | |||||
Investing cash flows | - | 303 | |||||
Financing cash flows | - | (12 | ) | ||||
Net cash provided by discontinued operations | 64 | 1,198 | |||||
Add: Cash balance of discontinued operations, beginning of period | 2 | - | |||||
Less: Cash balance of discontinued operations, end of period | - | - | |||||
NET (DECREASE) INCREASE IN CASH, CASH EQUIVALENTS, AND RESTRICTED CASH | (18,556 | ) | 1,021 | ||||
CASH, CASH EQUIVALENTS, AND RESTRICTED CASH beginning of the period | 18,738 | 6,519 | |||||
CASH, CASH EQUIVALENTS, AND RESTRICTED CASH end of the period | $ | 182 | $ | 7,540 | |||
Supplemental cash flow information: | |||||||
Interest paid | $ | 217 | $ | 267 | |||
Income taxes paid | $ | 22 | $ | 12 | |||
Contingent consideration related to business acquisition | $ | 2,534 | $ | - | |||
Non-cash investing and financing activities: | |||||||
Issuance of restricted stock grants | $ | 462 | $ | 432 | |||
Red Wolf acquisition: | |||||||
Assets acquired | $ | 26,491 | $ | - | |||
Liabilities assumed | $ | 7,508 | $ | - |
BROADWIND ENERGY, INC. AND SUBSIDIARIES | ||||||||||||||||
SELECTED SEGMENT FINANCIAL INFORMATION | ||||||||||||||||
(IN THOUSANDS) | ||||||||||||||||
(UNAUDITED) | ||||||||||||||||
Three Months Ended | Six Months Ended | |||||||||||||||
June 30, | June 30, | |||||||||||||||
2017 | 2016 | 2017 | 2016 | |||||||||||||
ORDERS: | ||||||||||||||||
Towers and Weldments | $ | 1,478 | $ | 170,637 | $ | 30,567 | $ | 206,072 | ||||||||
Gearing | 11,644 | 5,588 | 18,963 | 9,129 | ||||||||||||
Process Systems | 4,444 | - | 8,058 | - | ||||||||||||
Total orders | $ | 17,566 | $ | 176,225 | $ | 57,588 | $ | 215,201 | ||||||||
REVENUES: | ||||||||||||||||
Towers and Weldments | $ | 34,327 | $ | 37,963 | $ | 83,222 | $ | 79,978 | ||||||||
Gearing | 6,071 | 5,417 | 9,942 | 10,177 | ||||||||||||
Process Systems | 2,964 | - | 6,258 | - | ||||||||||||
Corporate and Other | - | - | (18 | ) | ||||||||||||
Total revenues | $ | 43,362 | $ | 43,380 | $ | 99,422 | $ | 90,137 | ||||||||
OPERATING PROFIT/(LOSS): | ||||||||||||||||
Towers and Weldments | $ | 2,801 | $ | 2,725 | $ | 8,649 | $ | 5,966 | ||||||||
Gearing | (634 | ) | (1,189 | ) | (2,165 | ) | (2,392 | ) | ||||||||
Process Systems | (1,099 | ) | - | (1,921 | ) | - | ||||||||||
Corporate and Other | (1,584 | ) | (1,355 | ) | (3,476 | ) | (3,617 | ) | ||||||||
Total operating profit/(loss) | $ | (516 | ) | $ | 181 | $ | 1,087 | $ | (43 | ) | ||||||
Non-GAAP Financial Measure
The Company provides non-GAAP adjusted EBITDA (earnings before interest, income taxes, depreciation, amortization, share based compensation, and other stock payments) as supplemental information regarding the Company’s business performance. The Company’s management uses adjusted EBITDA when it internally evaluates the performance of the Company’s business, reviews financial trends and makes operating and strategic decisions. The Company believes that this non-GAAP financial measure is useful to investors because it provides investors with a better understanding of the Company’s past financial performance and future results, and it allows investors to evaluate the Company’s performance using the same methodology and information as used by the Company’s management. The Company's definition of adjusted EBITDA may be different from similar non-GAAP financial measures used by other companies and/or analysts.
BROADWIND ENERGY, INC. AND SUBSIDIARIES | |||||||||||||||
RECONCILIATION OF NON-GAAP FINANCIAL MEASURES | |||||||||||||||
(IN THOUSANDS) | |||||||||||||||
(UNAUDITED) | |||||||||||||||
Consolidated | Three Months Ended June 30, | Six Months Ended June 30, | |||||||||||||
2017 | 2016 | 2017 | 2016 | ||||||||||||
Net Income/(Loss) from continuing operations | $ | (688 | ) | $ | 42 | $ | 5,794 | $ | (316 | ) | |||||
Interest Expense | 217 | 152 | 356 | 306 | |||||||||||
Income Tax Provision/(Benefit) | (16 | ) | (8 | ) | (5,034 | ) | (16 | ) | |||||||
Depreciation and Amortization | 2,203 | 1,787 | 4,304 | 3,443 | |||||||||||
Share-based Compensation and Other Stock Payments | 241 | 174 | 462 | 433 | |||||||||||
Restructuring Expense | - | - | - | - | |||||||||||
Adjusted EBITDA (Non-GAAP) | $ | 1,957 | $ | 2,147 | $ | 5,882 | $ | 3,850 |
Towers and Weldments Segment | Three Months Ended June 30, | Six Months Ended June 30, | |||||||||
2017 | 2016 | 2017 | 2016 | ||||||||
Net Income | $ | 2,024 | $ | 1,801 | $ | 6,028 | $ | 3,941 | |||
Interest Expense/(Benefit) | 20 | 6 | 35 | 16 | |||||||
Income Tax Provision/(Benefit) | 772 | 923 | 2,603 | 2,027 | |||||||
Depreciation and Amortization | 1,070 | 1,094 | 2,162 | 2,060 | |||||||
Share-based Compensation and Other Stock Payments | 58 | 37 | 115 | 75 | |||||||
Adjusted EBITDA (Non-GAAP) | $ | 3,944 | $ | 3,861 | $ | 10,943 | $ | 8,119 |
Gearing Segment | Three Months Ended June 30, | Six Months Ended June 30, | |||||||||||||
2017 | 2016 | 2017 | 2016 | ||||||||||||
Net Loss | $ | (638 | ) | $ | (1,194 | ) | $ | (2,175 | ) | $ | (2,401 | ) | |||
Interest Expense | 2 | 3 | 6 | 7 | |||||||||||
Income Tax Provision/(Benefit) | 2 | 1 | 4 | 2 | |||||||||||
Depreciation and Amortization | 612 | 641 | 1,238 | 1,280 | |||||||||||
Share-based Compensation and Other Stock Payments | 23 | 25 | 41 | 72 | |||||||||||
Adjusted EBITDA (Non-GAAP) | $ | 1 | $ | (524 | ) | $ | (886 | ) | $ | (1,040 | ) |
Process Systems | Three Months Ended June 30, | Six Months Ended June 30, | |||||||||||
2017 | 2016 | 2017 | 2016 | ||||||||||
Net Income/(Loss) | $ | (1,103 | ) | $ | - | $ | (5,769 | ) | $ | - | |||
Interest Expense | 1 | - | 3 | - | |||||||||
Income Tax Provision/(Benefit) | - | - | 3,841 | - | |||||||||
Depreciation and Amortization | 467 | - | 801 | - | |||||||||
Share-based Compensation and Other Stock Payments | 10 | - | 15 | - | |||||||||
Adjusted EBITDA (Non-GAAP) | $ | (625 | ) | $ | - | $ | (1,109 | ) | $ | - |
Corporate and Other | Three Months Ended June 30, | Six Months Ended June 30, | |||||||||||||
2017 | 2016 | 2017 | 2016 | ||||||||||||
Net Income/(Loss) | $ | (971 | ) | $ | (565 | ) | $ | 7,710 | $ | (1,856 | ) | ||||
Interest Expense | 194 | 143 | 312 | 283 | |||||||||||
Income Tax Provision/(Benefit) | (790 | ) | (932 | ) | (11,482 | ) | (2,045 | ) | |||||||
Depreciation and Amortization | 54 | 52 | 103 | 103 | |||||||||||
Share-based Compensation and Other Stock Payments | 150 | 112 | 291 | 286 | |||||||||||
Adjusted EBITDA (Non-GAAP) | $ | (1,363 | ) | $ | (1,190 | ) | $ | (3,066 | ) | $ | (3,229 | ) |
BWEN INVESTOR CONTACT: Joni Konstantelos, 708.780.4819 joni.konstantelos@bwen.com
EXHIBIT 99.2
Q2 2017 Earnings Call August 1, 2017
Industry Data and Forward - Looking Statements Disclaimer ▪ Broadwind obtained the industry and market data used throughout this presentation from our own research, internal surveys and st udies conducted by third parties, independent industry associations or general publications and other publicly available informatio n. Independent industry publications and surveys generally state that they have obtained information from sources believed to be reliable, but do not gu arantee the accuracy or completeness of such information. Forecasts are particularly likely to be inaccurate, especially over long periods of time. W e a re not aware of any misstatements in the industry data we have presented herein, but estimates involve risks and uncertainties and a re subject to change based on various factors beyond our control. ▪ This presentation contains “forward - looking statements ”, as defined in Section 21E of the Securities Exchange Act of 1934, as amended. Forward - looking statements include any statement that does not directly relate to a current or historical fact. Our forward - look ing statements may include or relate to our beliefs, expectations, plans and/or assumptions with respect to the following: (i ) state, local and federal regulatory frameworks affecting the industries in which we compete, including the wind energy industry, and the related extension, conti nua tion or renewal of federal tax incentives and grants and state renewable portfolio standards; (ii) our customer relationships and efforts to div ers ify our customer base and sector focus and leverage customer relationships across business units; (iii) our ability to continue to grow our busines s o rganically and through acquisitions; (iv) the sufficiency of our liquidity and alternate sources of funding, if necessary; (v) our ability t o r ealize revenue from customer orders and backlog; (vi) our ability to operate our business efficiently, manage capital expenditures and costs effe cti vely, and generate cash flow; (vii) the economy and the potential impact it may have on our business, including our customers; (viii) the state of the wind energy market and other energy and industrial markets generally and the impact of competition and economic volatility in those marke ts; (ix) the effects of market disruptions and regular market volatility, including fluctuations in the price of oil, gas and other commodities; (x) the effects of the recent change of administrations in the U.S. federal government; (xi) our ability to successfully integrate and operate the business of Red Wolf Company, LLC and to identify, negotiate and execute future acquisitions; and (xii) the potential loss of tax benefits if we experience an “ownership change” under Section 382 of the Internal Revenue Code of 1986, as amended. These statements are based on information currently available to us and are subject to various risks, uncertainties and other factors. We are under no duty to update any of these statements. You sh oul d not consider any list of such factors to be an exhaustive statement of all of the risks, uncertainties or other factors that could cause our c urr ent beliefs, expectations, plans and/or assumptions to change. ▪ This presentation contains non - GAAP financial information. We believe that certain non - GAAP financial measures may provide users of this financial information with meaningful comparisons between current results and results in prior operating periods. We believe tha t these non - GAAP financial measures can provide additional meaningful reflection of underlying trends of the business because they provide a c omp arison of historical information that excludes certain infrequently occurring or non - operational items that impact the overall comparabili ty. Non - GAAP financial measures should be viewed in addition to, and not as an alternative to, our reported results prepared in accordance wi th GAAP. Please see our earnings release dated August 1, 2017 for a reconciliation of certain non - GAAP measures presented in this presentation. August 1, 2017 2
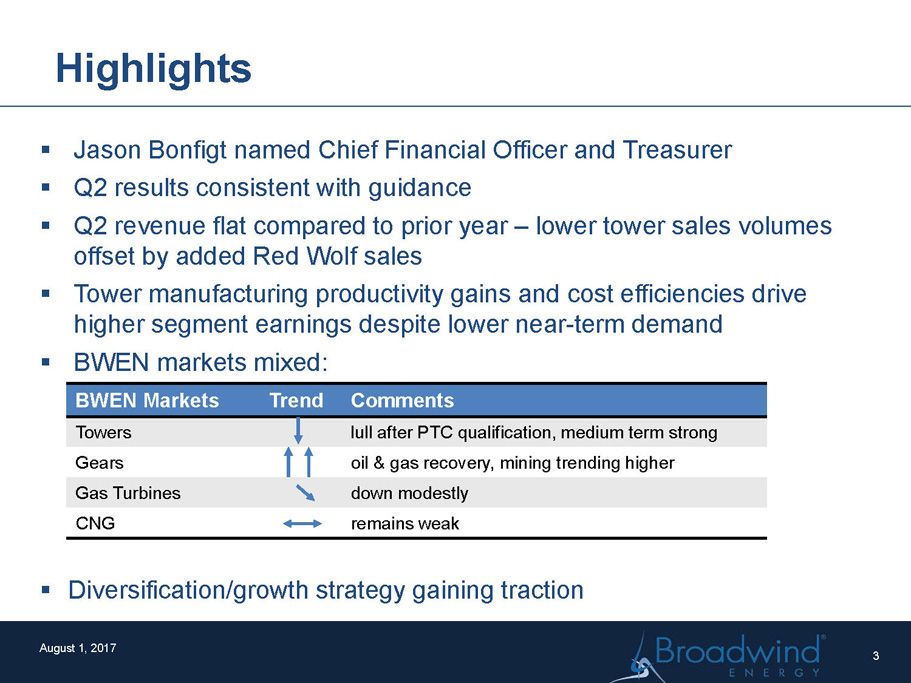
Highlights August 1, 2017 ▪ Jason Bonfigt named Chief Financial Officer and Treasurer ▪ Q2 results consistent with guidance ▪ Q2 revenue flat compared to prior year – lower tower sales volumes offset by added Red Wolf sales ▪ Tower manufacturing productivity gains and cost efficiencies drive higher segment earnings despite lower near - term demand ▪ BWEN markets mixed: ▪ Diversification/growth strategy gaining traction 3 BWEN Markets Trend Comments Towers lull after PTC qualification, medium term strong Gears oil & gas recovery, mining trending higher Gas Turbines down modestly CNG remains weak
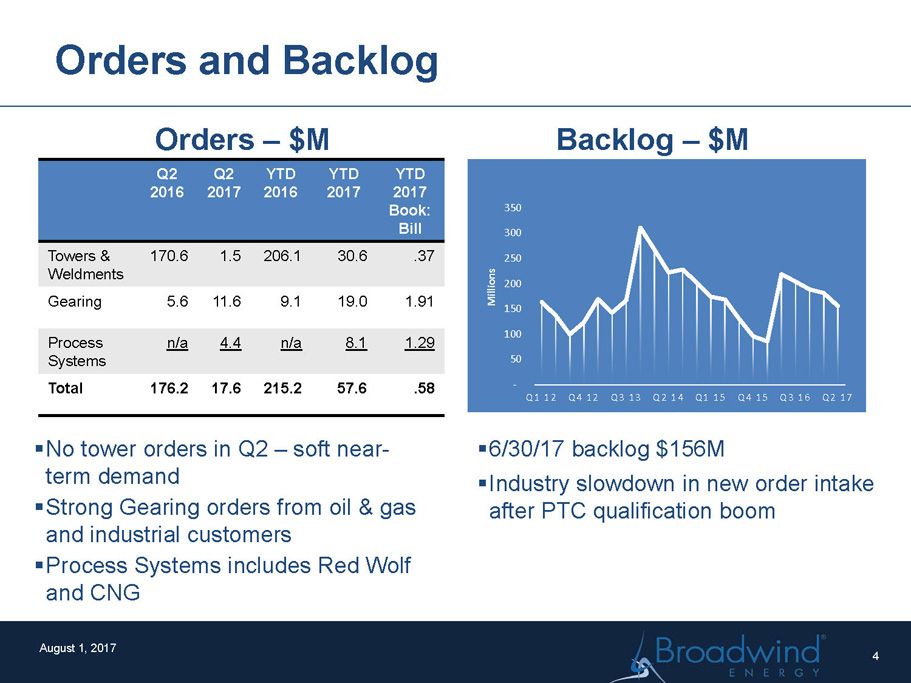
Orders and Backlog Orders – $M ▪ No tower orders in Q2 – soft near - term demand ▪ Strong Gearing orders from oil & gas and industrial customers ▪ Process Systems includes Red Wolf and CNG Backlog – $M ▪ 6/30/17 backlog $156M ▪ Industry slowdown in new order intake after PTC qualification boom August 1, 2017 - 50 100 150 200 250 300 350 Q1 12 Q4 12 Q3 13 Q2 14 Q1 15 Q4 15 Q3 16 Q2 17 Millions Q2 2016 Q2 2017 YTD 2016 YTD 2017 YTD 2017 Book: Bill Towers & Weldments 170.6 1.5 206.1 30.6 .37 Gearing 5.6 11.6 9.1 19.0 1.91 Process Systems n/a 4.4 n/a 8.1 1.29 Total 176.2 17.6 215.2 57.6 .58 4
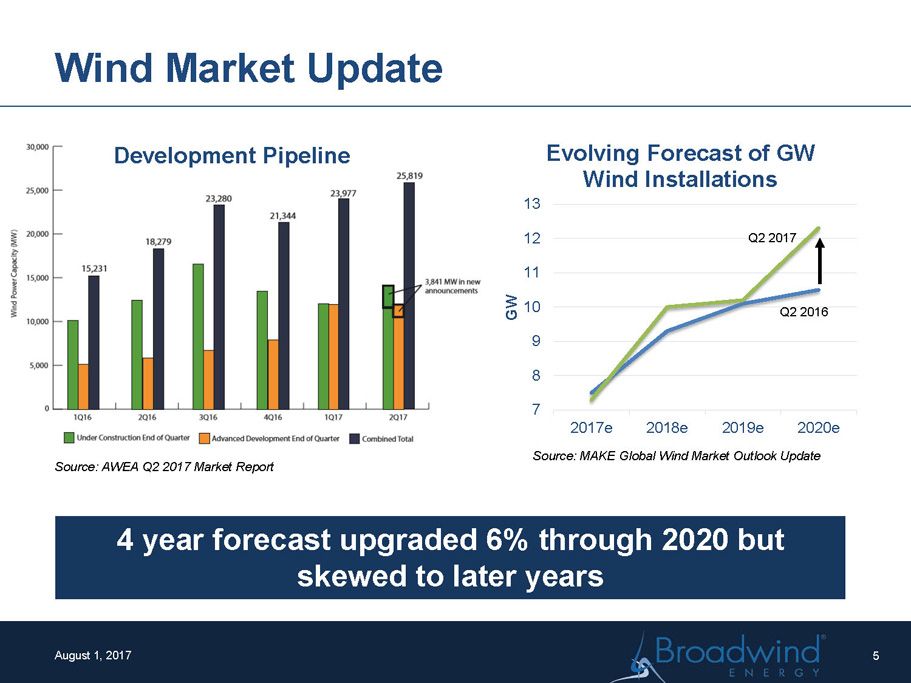
Wind Market Update August 1, 2017 7 8 9 10 11 12 13 2017e 2018e 2019e 2020e GW Evolving Forecast of GW Wind Installations Q2 2017 Q2 2016 Source: MAKE Global Wind Market Outlook Update 4 year forecast upgraded 6% through 2020 but skewed to later years Development Pipeline Source: AWEA Q2 2017 Market Report 5
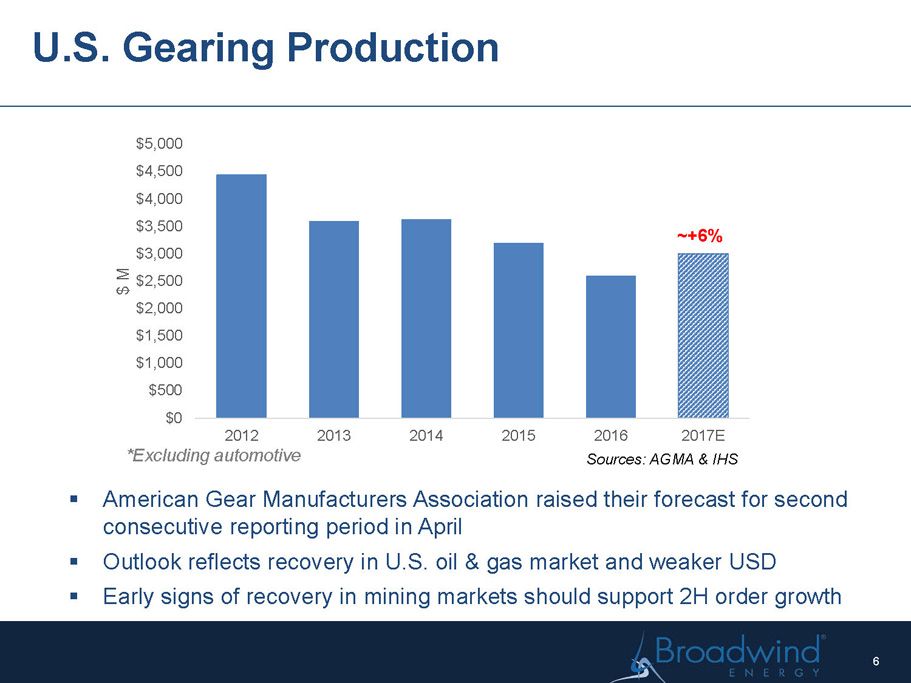
$0 $500 $1,000 $1,500 $2,000 $2,500 $3,000 $3,500 $4,000 $4,500 $5,000 2012 2013 2014 2015 2016 2017E $ M *Excluding automotive 6 U.S. Gearing Production ▪ American Gear Manufacturers Association raised their forecast for second consecutive reporting period in April ▪ Outlook reflects recovery in U.S. oil & gas market and weaker USD ▪ Early signs of recovery in mining markets should support 2H order growth Sources: AGMA & IHS ~+6%
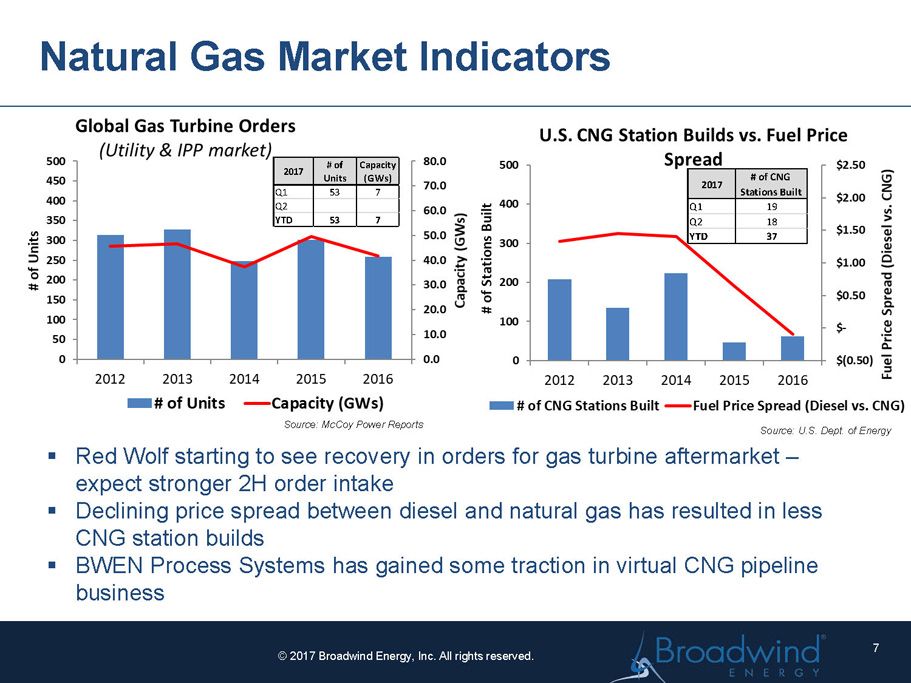
7 © 2017 Broadwind Energy, Inc. All rights reserved. Natural Gas Market Indicators 2017 # of Units Capacity (GWs) Q1 53 7 Q2 YTD 53 7 2017 # of CNG Stations Built Q1 19 Q2 18 YTD 37 Source: McCoy Power Reports Source: U.S. Dept. of Energy ▪ Red Wolf starting to see recovery in orders for gas turbine aftermarket – expect stronger 2H order intake ▪ Declining price spread between diesel and natural gas has resulted in less CNG station builds ▪ BWEN Process Systems has gained some traction in virtual CNG pipeline business
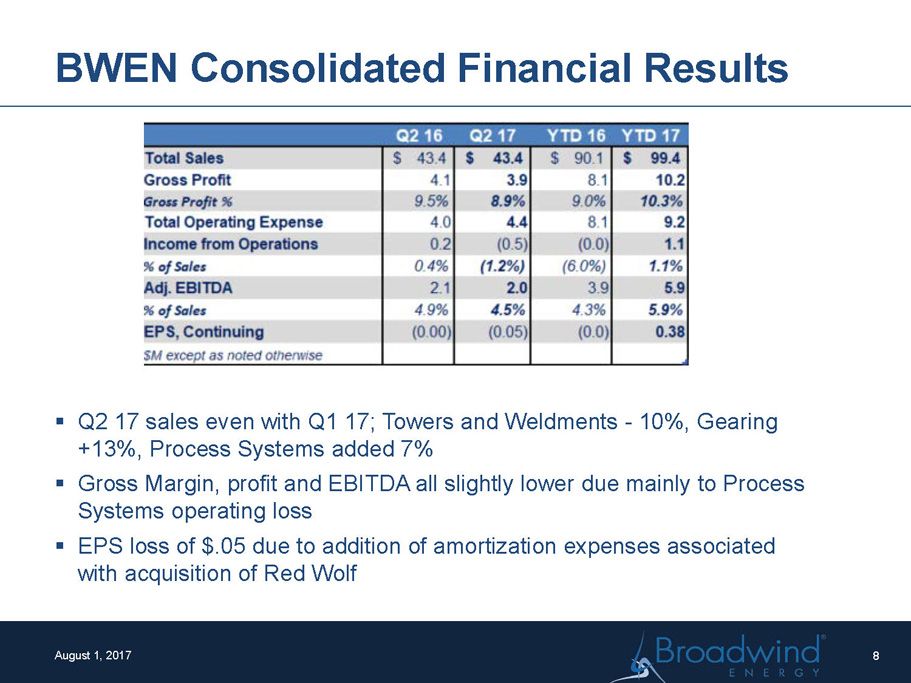
BWEN Consolidated Financial Results August 1, 2017 ▪ Q2 17 sales even with Q1 17; Towers and Weldments - 10%, Gearing +13%, Process Systems added 7% ▪ Gross Margin, profit and EBITDA all slightly lower due mainly to Process Systems operating loss ▪ EPS loss of $.05 due to addition of amortization expenses associated with acquisition of Red Wolf 8
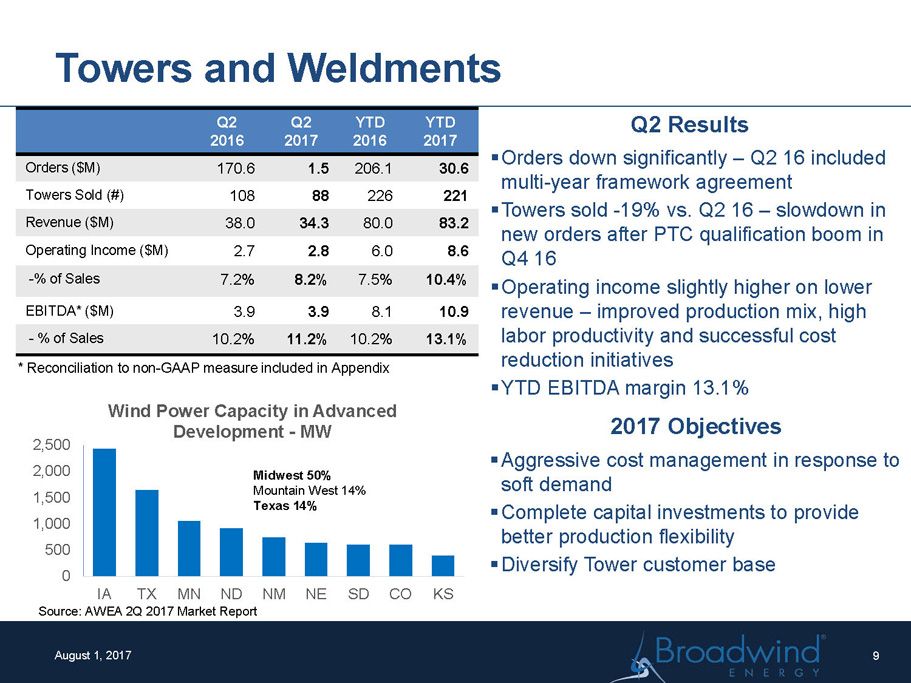
Towers and Weldments Q2 2016 Q2 2017 YTD 2016 YTD 2017 Orders ($M) 170.6 1.5 206.1 30.6 Towers Sold (#) 108 88 226 221 Revenue ($M) 38.0 34.3 80.0 83.2 Operating Income ($M) 2.7 2.8 6.0 8.6 - % of Sales 7.2% 8.2% 7.5% 10.4% EBITDA* ($M) 3.9 3.9 8.1 10.9 - % of Sales 10.2% 11.2% 10.2% 13.1% Q2 Results ▪ Orders down significantly – Q2 16 included multi - year framework agreement ▪ Towers sold - 19% vs. Q2 16 – slowdown in new orders after PTC qualification boom in Q4 16 ▪ Operating income slightly higher on lower revenue – improved production mix, high labor productivity and successful cost reduction initiatives ▪ YTD EBITDA margin 13.1% 2017 Objectives ▪ Aggressive cost management in response to soft demand ▪ Complete capital investments to provide better production flexibility ▪ Diversify Tower customer base August 1, 2017 * Reconciliation to non - GAAP measure included in Appendix 9 0 500 1,000 1,500 2,000 2,500 IA TX MN ND NM NE SD CO KS Wind Power Capacity in Advanced Development - MW Midwest 50% Mountain West 14% Texas 14% Source: AWEA 2Q 2017 Market Report
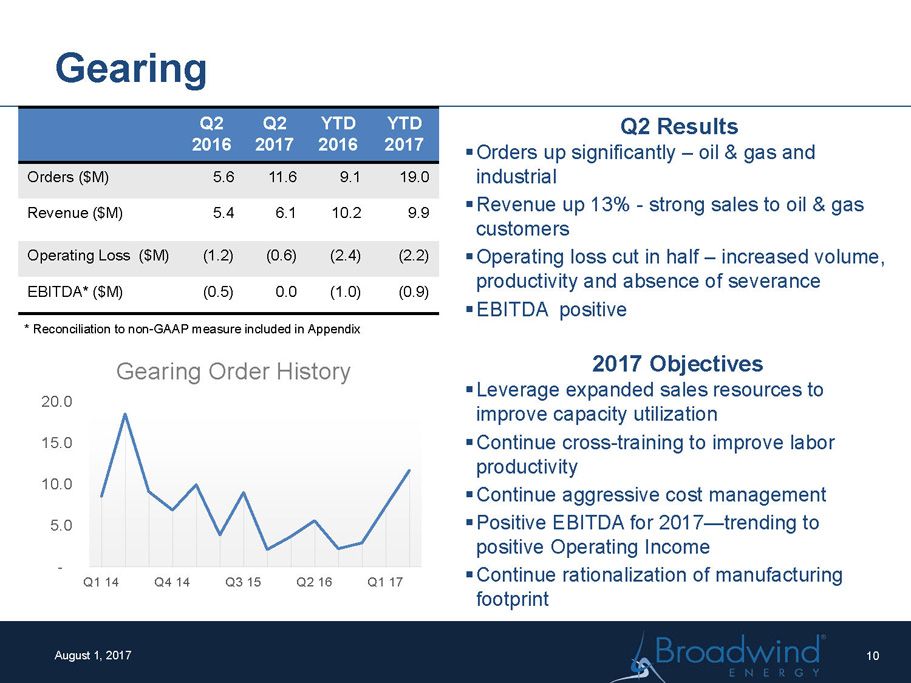
Gearing Q2 2016 Q2 2017 YTD 2016 YTD 2017 Orders ($M) 5.6 11.6 9.1 19.0 Revenue ($M) 5.4 6.1 10.2 9.9 Operating Loss ($M) (1.2) (0.6) (2.4) (2.2) EBITDA* ($M) (0.5) 0.0 (1.0) (0.9) Q2 Results ▪ Orders up significantly – oil & gas and industrial ▪ Revenue up 13% - strong sales to oil & gas customers ▪ Operating loss cut in half – increased volume, productivity and absence of severance ▪ EBITDA positive August 1, 2017 2017 Objectives ▪ Leverage expanded sales resources to improve capacity utilization ▪ Continue cross - training to improve labor productivity ▪ Continue aggressive cost management ▪ Positive EBITDA for 2017 — trending to positive Operating Income ▪ Continue rationalization of manufacturing footprint * Reconciliation to non - GAAP measure included in Appendix - 5.0 10.0 15.0 20.0 Q1 14 Q4 14 Q3 15 Q2 16 Q1 17 Gearing Order History 10
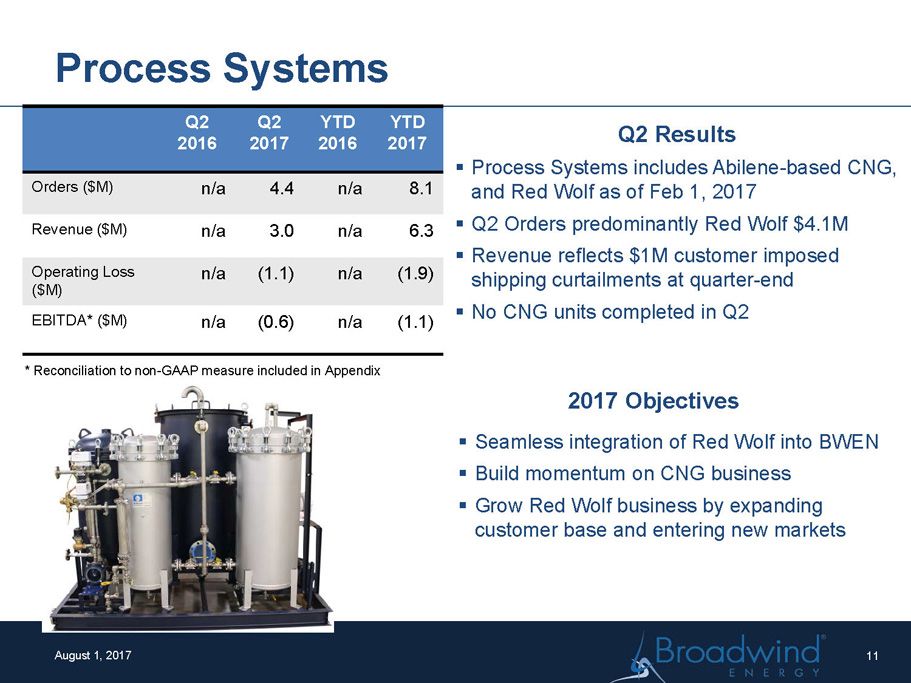
August 1, 2017 Process Systems Q2 2016 Q2 2017 YTD 2016 YTD 2017 Orders ($M) n/a 4.4 n/a 8.1 Revenue ($M) n/a 3.0 n/a 6.3 Operating Loss ($M) n/a (1.1) n/a (1.9) EBITDA* ($M) n/a (0.6) n/a (1.1) * Reconciliation to non - GAAP measure included in Appendix Q2 Results ▪ Process Systems includes Abilene - based CNG, and Red Wolf as of Feb 1, 2017 ▪ Q2 Orders predominantly Red Wolf $4.1M ▪ Revenue reflects $1M customer imposed shipping curtailments at quarter - end ▪ No CNG units completed in Q2 2017 Objectives ▪ Seamless integration of Red Wolf into BWEN ▪ Build momentum on CNG business ▪ Grow Red Wolf business by expanding customer base and entering new markets 11
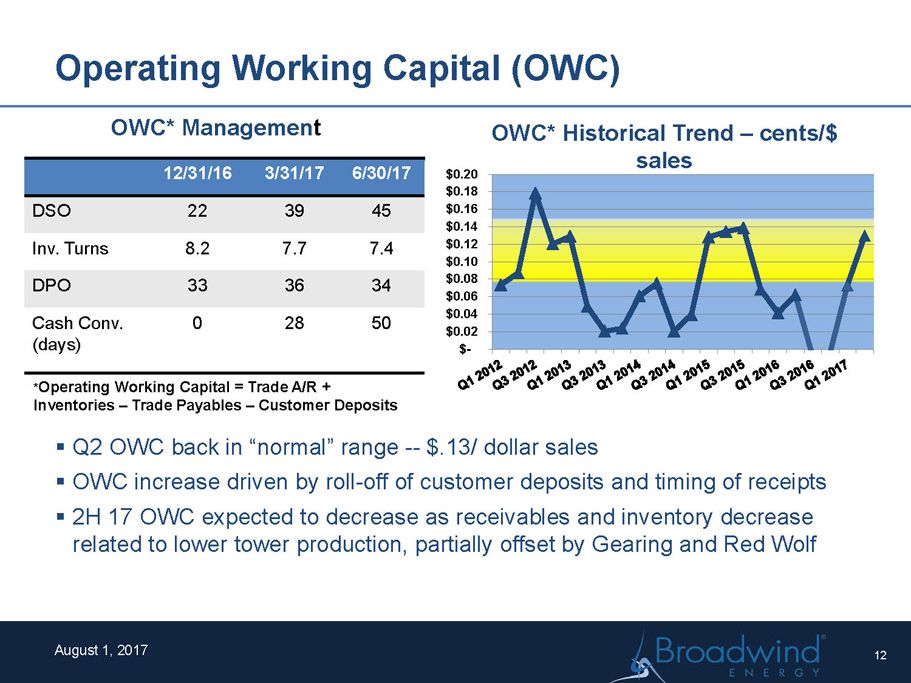
Operating Working Capital (OWC) August 1, 2017 ▪ Q2 OWC back in “normal” range -- $.13/ dollar sales ▪ OWC increase driven by roll - off of customer deposits and timing of receipts ▪ 2H 17 OWC expected to decrease as receivables and inventory decrease related to lower tower production, partially offset by Gearing and Red Wolf * Operating Working Capital = Trade A/R + Inventories – Trade Payables – Customer Deposits 12/31/16 3/31/17 6/30/17 DSO 22 39 45 Inv. Turns 8.2 7.7 7.4 DPO 33 36 34 Cash Conv. (days) 0 28 50 $- $0.02 $0.04 $0.06 $0.08 $0.10 $0.12 $0.14 $0.16 $0.18 $0.20 OWC* Historical Trend – cents/$ sales OWC* Managemen t 12
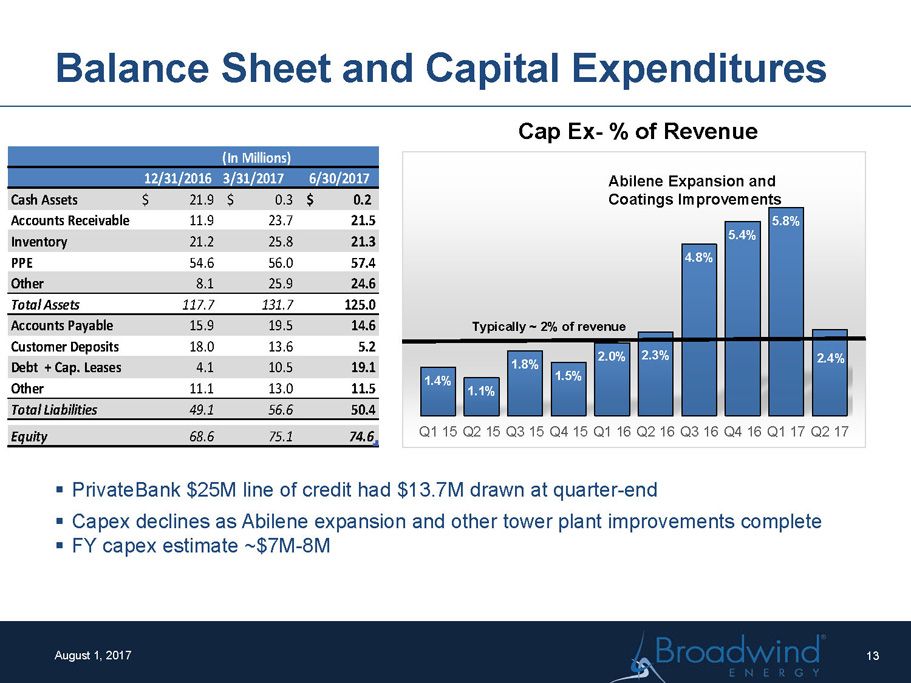
Balance Sheet and Capital Expenditures August 1, 2017 1.4% 1.1% 1.8% 1.5% 2.0% 2.3% 4.8% 5.4% 5.8% 2.4% Q1 15 Q2 15 Q3 15 Q4 15 Q1 16 Q2 16 Q3 16 Q4 16 Q1 17 Q2 17 Cap Ex - % of Revenue Typically ~ 2% of revenue Abilene Expansion and Coatings Improvements ▪ PrivateBank $25M line of credit had $13.7M drawn at quarter - end ▪ Capex declines as Abilene expansion and other tower plant improvements complete ▪ FY capex estimate ~$7M - 8M 12/31/2016 3/31/2017 6/30/2017 Cash Assets 21.9$ 0.3$ 0.2$ Accounts Receivable 11.9 23.7 21.5 Inventory 21.2 25.8 21.3 PPE 54.6 56.0 57.4 Other 8.1 25.9 24.6 Total Assets 117.7 131.7 125.0 Accounts Payable 15.9 19.5 14.6 Customer Deposits 18.0 13.6 5.2 Debt + Cap. Leases 4.1 10.5 19.1 Other 11.1 13.0 11.5 Total Liabilities 49.1 56.6 50.4 Equity 68.6 75.1 74.6 (In Millions) 13
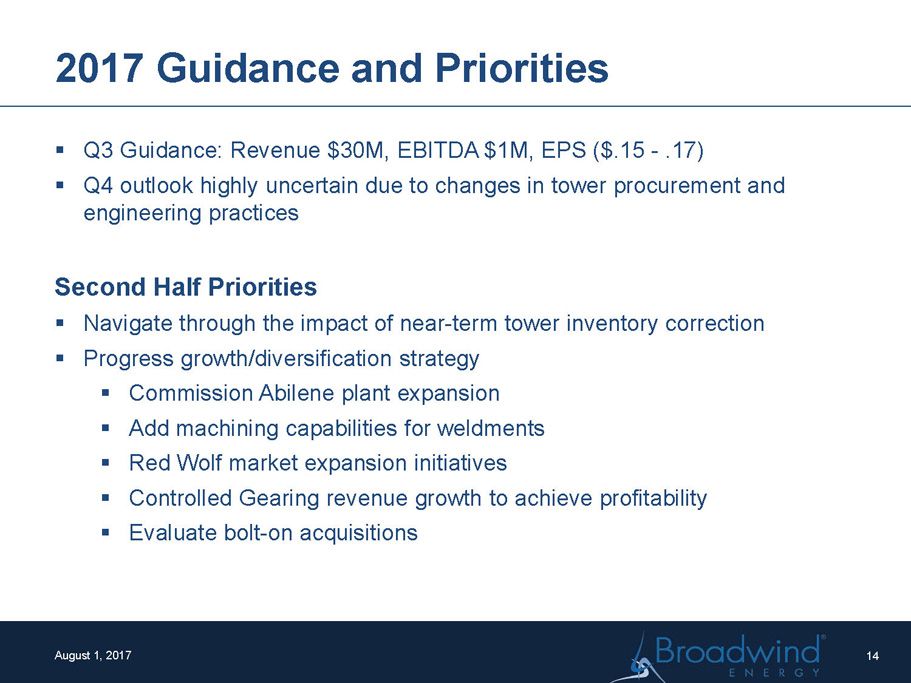
2017 Guidance and Priorities August 1, 2017 ▪ Q3 Guidance: Revenue $30M, EBITDA $1M, EPS ($.15 - .17) ▪ Q4 outlook highly uncertain due to changes in tower procurement and engineering practices Second Half Priorities ▪ Navigate through the impact of near - term tower inventory correction ▪ Progress growth/diversification strategy ▪ Commission Abilene plant expansion ▪ Add machining capabilities for weldments ▪ Red Wolf market expansion initiatives ▪ Controlled Gearing revenue growth to achieve profitability ▪ Evaluate bolt - on acquisitions 14
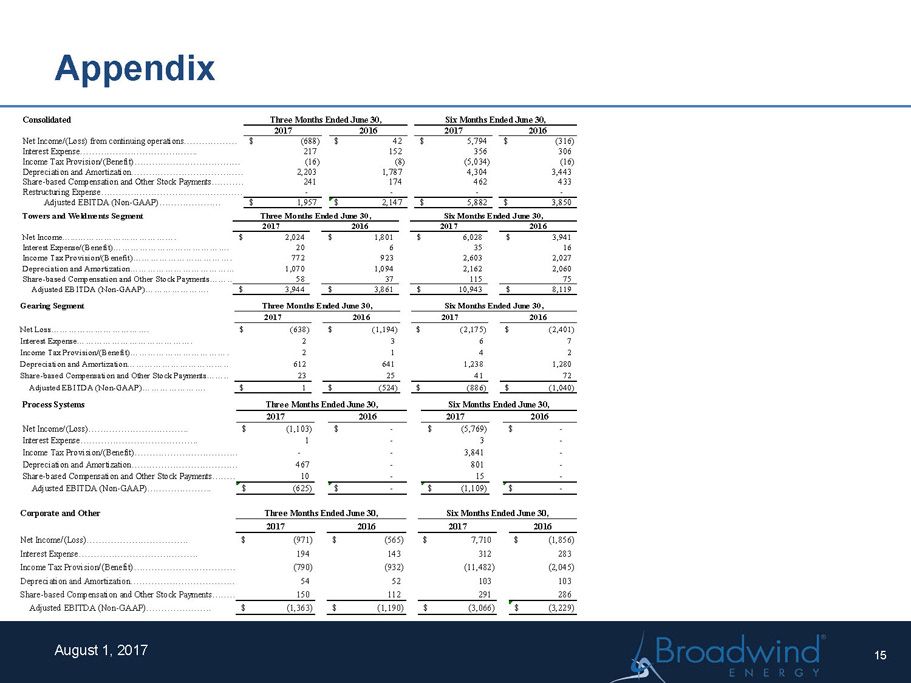
Appendix August 1, 2017 15 Consolidated 2017 2016 2017 2016 Net Income/(Loss) from continuing operations……………………………. (688)$ 42$ 5,794$ (316)$ Interest Expense…………………………………. 217 152 356 306 Income Tax Provision/(Benefit)……………………………… (16) (8) (5,034) (16) Depreciation and Amortization………………………………………………………………2,203 1,787 4,304 3,443 Share-based Compensation and Other Stock Payments………………………………………………………………241 174 462 433 Restructuring Expense…………………………………………………... - - - - Adjusted EBITDA (Non-GAAP)………………… 1,957$ 2,147$ 5,882$ 3,850$ Three Months Ended June 30, Six Months Ended June 30, Towers and Weldments Segment 2017 2016 2017 2016 Net Income…...……………………………. 2,024$ 1,801$ 6,028$ 3,941$ Interest Expense/(Benefit)…………………………………. 20 6 35 16 Income Tax Provision/(Benefit)……………………………… 772 923 2,603 2,027 Depreciation and Amortization………………………………………………………………1,070 1,094 2,162 2,060 Share-based Compensation and Other Stock Payments………………………………………………………………58 37 115 75 Adjusted EBITDA (Non-GAAP)…………………. 3,944$ 3,861$ 10,943$ 8,119$ Three Months Ended June 30, Six Months Ended June 30, Gearing Segment 2017 2016 2017 2016 Net Loss……………………………. (638)$ (1,194)$ (2,175)$ (2,401)$ Interest Expense…………………………………. 2 3 6 7 Income Tax Provision/(Benefit)……………………………… 2 1 4 2 Depreciation and Amortization………………………………………………………………612 641 1,238 1,280 Share-based Compensation and Other Stock Payments………………………………………………………………23 25 41 72 Adjusted EBITDA (Non-GAAP)…………………. 1$ (524)$ (886)$ (1,040)$ Three Months Ended June 30, Six Months Ended June 30, Process Systems 2017 2016 2017 2016 Net Income/(Loss)……………………………. (1,103)$ -$ (5,769)$ -$ Interest Expense…………………………………. 1 - 3 - Income Tax Provision/(Benefit)……………………………… - - 3,841 - Depreciation and Amortization………………………………………………………………467 - 801 - Share-based Compensation and Other Stock Payments………………………………………………………………10 - 15 - Adjusted EBITDA (Non-GAAP)…………………. (625)$ -$ (1,109)$ -$ Three Months Ended June 30, Six Months Ended June 30, Corporate and Other 2017 2016 2017 2016 Net Income/(Loss)……………………………. (971)$ (565)$ 7,710$ (1,856)$ Interest Expense…………………………………. 194 143 312 283 Income Tax Provision/(Benefit)……………………………… (790) (932) (11,482) (2,045) Depreciation and Amortization………………………………………………………………54 52 103 103 Share-based Compensation and Other Stock Payments………………………………………………………………150 112 291 286 Adjusted EBITDA (Non-GAAP)…………………. (1,363)$ (1,190)$ (3,066)$ (3,229)$ Three Months Ended June 30, Six Months Ended June 30,
Broadwind Energy is a precision manufacturer of structures, equipment & components for clean tech and other specialized applications . www.BWEN.com August 1, 2017 16
PH7;JDC_,)O@2;9?P7/ -W%F&72X\JJ:L\XC\+XX=MD9\P[^JP_$&B-P27M&UO2AT)7JN1C@&Z61JV
MDG-A/L#V7H8/:$MZ I(47E&N0
MD=%8JE/PE6S6@U%SF =5=Q\T[@7'A86/&6\6KS#PLIQCX-8R9U./JA 8[A3
M,RVO'SFUS,4FWNK3,@M7,\:\&ZROR;SY8@TOZ<+,EE:ZS?557Y) 9&ED97H50DR"X]56,
MA)Y*C+B5M&"1C+)98,I!ZI?/([JJ"?1, 3D&9[I)39*S/-'8I'S&B;73'$H]CGEDI%]CT+2-3=-3'!KF70(6^(VR"PN;T+1WXC(M@
M=UY+BNJB9M8 %XV9QW?">OBW;?B(/+