UNITED STATES
SECURITIES AND EXCHANGE COMMISSION
Washington, D.C. 20549
_____________________
Form 8-K
_____________________
CURRENT REPORT
Pursuant to Section 13 or 15(d) of the Securities Exchange Act of 1934
Date of Report (Date of earliest event Reported): October 28, 2016
Broadwind Energy
(Exact Name of Registrant as Specified in Charter)
DELAWARE | 001-34278 | 88-0409160 |
(State or Other Jurisdiction of Incorporation) | (Commission File Number) | (I.R.S. Employer Identification Number) |
3240 S. Central Ave., Cicero, IL 60804 |
(Address of Principal Executive Offices) (Zip Code) |
708-780-4800
(Registrant's telephone number, including area code)
Not Applicable
(Former name or former address, if changed since last report)
Check the appropriate box below if the Form 8-K filing is intended to simultaneously satisfy the filing obligation of the registrant under any of the following provisions: | ||
[ ] | Written communications pursuant to Rule 425 under the Securities Act (17 CFR 230.425) | |
[ ] | Soliciting material pursuant to Rule 14a-12 under the Exchange Act (17 CFR 240.14a-12) | |
[ ] | Pre-commencement communications pursuant to Rule 14d-2(b) under the Exchange Act (17 CFR 240.14d-2(b)) | |
[ ] | Pre-commencement communications pursuant to Rule 13e-4(c) under the Exchange Act (17 CFR 240.13e-4(c)) |
Item 2.02. Results of Operations and Financial Condition.
On October 28, 2016, Broadwind Energy, Inc. (the “Company”) issued a press release announcing its financial results as of and for the quarter ended September 30, 2016. The press release is incorporated herein by reference and is attached hereto as Exhibit 99.1. The information contained in, or incorporated into, this Item 2.02 of this Current Report on Form 8-K (this “Report”), including Exhibit 99.1, is furnished under Item 2.02 of Form 8-K and shall not be deemed “filed” for the purposes of Section 18 of the Securities Exchange Act of 1934, as amended (the “Exchange Act”) or otherwise subject to the liabilities of that section, and shall not be deemed to be incorporated by reference into the filings of the Company under the Securities Act of 1933, as amended (the “Securities Act”) or the Exchange Act regardless of any general incorporation language in such filings.
Item 7.01. Regulation FD Disclosure.
An Investor Presentation dated October 28, 2016 is incorporated herein by reference and attached hereto as Exhibit 99.2. The information contained in, or incorporated into, this Item 7.01 of this Report, including Exhibit 99.2 attached hereto, is furnished under Item 7.01 of Form 8-K and shall not be deemed “filed” for the purposes of Section 18 of the Exchange Act or otherwise subject to the liabilities of that section, and shall not be deemed to be incorporated by reference into the filings of the Company under the Securities Act or the Exchange Act regardless of any general incorporation language in such filings. This Report shall not be deemed an admission as to the materiality of any information in this Report that is being disclosed pursuant to Regulation FD. Please refer to Exhibit 99.2 for a discussion of certain forward-looking statements included therein and the risks and uncertainties related thereto.
Item 9.01. Financial Statements and Exhibits.
(d) Exhibits EXHIBIT 99.1 Press Release dated October 28, 2016 99.2 Investor Presentation dated October 28, 2016
NUMBER
DESCRIPTION
SIGNATURE
Pursuant to the requirements of the Securities Exchange Act of 1934, the registrant has duly caused this report to be signed on its behalf by the undersigned hereunto duly authorized.
Broadwind Energy | ||
Date: October 28, 2016 | By: | /s/ Stephanie K. Kushner |
Stephanie K. Kushner | ||
Chief Executive Officer and Chief Financial Officer (Principal Executive Officer and Principal Financial Officer) | ||
EXHIBIT INDEX
EXHIBIT |
|
|
99.1 |
| Press Release dated October 28, 2016 |
99.2 |
| Investor Presentation dated October 28, 2016 |
EXHIBIT 99.1
Broadwind Energy Announces Third-Quarter 2016 Results
Improved Operating Efficiencies and Successful Cost Management Evident
Highlights:
CICERO, Ill., Oct. 28, 2016 (GLOBE NEWSWIRE) -- Broadwind Energy, Inc. (NASDAQ:BWEN) reported sales of $42.6 million in Q3 2016, down 14% compared to $49.8 million in Q3 2015 as a result of lower Towers and Weldments segment revenue, due to lower steel and other material costs which are generally passed through to the customer, and reduced Gearing segment revenue due to lower demand from oil & gas and mining customers.
The Company reported income from continuing operations of $1.2 million, or $.08 per share, in Q3 2016, compared to net loss from continuing operations of $2.4 million, or $.16 per share, in Q3 2015. The $.24 per share improvement was due to significant operational improvements in the Towers and Weldments segment and successful cost management actions across the Company.
The Company reported a net loss from discontinued operations of $.4 million, or $.03 per share, in Q3 2016, compared to a net loss from discontinued operations of $5.2 million, or $.36 per share, in Q3 2015.
The Company reported non-GAAP adjusted EBITDA (earnings before interest, taxes, depreciation, amortization, share-based payments and restructuring costs) of $3.3 million in Q3 2016, compared to $1.4 million in Q3 2015 (please refer to the reconciliation of GAAP measures to non-GAAP measures at the end of this release). The $1.9 million increase was mainly attributable to the factors described above.
Broadwind CEO Stephanie Kushner stated, “Broadwind had a strong third quarter. The investments we’ve made to systematize our production processes have significantly improved the operations and raised productivity and margins in our tower plants. Our Gearing business was cash neutral in a weak revenue environment. Our Company-wide cost management efforts are ahead of plan. Employees at all levels are contributing their ideas to our cost reduction program. It’s exciting to see the creativity of our workforce.”
Ms. Kushner continued, “The expansion of our Abilene tower facility is progressing on target. When this project is completed in mid-2017, our capacity at this plant will increase by 30%. We are focused on securing remaining orders for 2017, continued cost management efforts and making additional gains in operational efficiencies. For the fourth - quarter, our production mix is less favorable, and we expect to earn approximately $500,000 on revenue of $44-46 million.”
For the nine months ended September 30, 2016, revenue totaled $132.7 million, compared to $161.6 million for the nine months ended September 30, 2015. The 18% reduction was due primarily to lower Towers and Weldments revenue attributable to lower steel and other material costs and 2% lower volumes and lower Gearing revenue related to reduced demand from oil & gas and mining customers.
Net income from continuing operations for the nine months ended September 30, 2016 was $.9 million, or $.06 per share, compared with net loss from continuing operations of $1.5 million, or $.10 per share, for the nine months ended September 30, 2015. The increase was due to significantly improved operating efficiencies in the Towers and Weldments segment and successful cost containment efforts Company-wide which more than offset the reduction in revenue. Net loss from discontinued operations for the nine months ended September 30, 2016 totaled $.9 million, or $.06 per share, compared to net loss from discontinued operations of $9.5 million, or $.65 per share, for the nine months ended September 30, 2015. The Company reported non-GAAP adjusted EBITDA of $7.1 million for the nine months ended September 30, 2016 (please refer to the reconciliation of GAAP measures to non-GAAP measures at the end of this release).
Orders and Backlog
The Company booked $27.5 million of net new orders in Q3 2016, more than double Q3 2015 orders which totaled $12.2 million. Towers and Weldments orders, which vary considerably from quarter to quarter, totaled $25.3 million in Q3 2016, up substantially from $3.2 million in Q3 2015. Gearing orders totaled $2.2 million in Q3 2016, compared to $9.0 million in Q3 2015, (which included a multi-year buy from a wind gearing customer). At September 30, 2016, total backlog was $204.2 million, up significantly from backlog of $130.7 million at September 30, 2015.
Segment Results
Towers and Weldments
Broadwind Energy produces fabrications for wind, oil and gas, mining and other industrial applications, specializing in the production of wind turbine towers.
Towers and Weldments segment sales totaled $38.0 million in Q3 2016, compared to $42.9 million in Q3 2015, due mainly to $5.5 million in lower steel and other material costs, which are generally passed through to customers.
Towers and Weldments segment operating income in Q3 2016 totaled $4.1 million, compared to $2.2 million in Q3 2015. The $1.9 million increase was due to significantly improved operating efficiencies, including higher labor productivity and better cost management which more than offset the reduction in revenue described above. Towers and Weldments segment net income in Q3 2016 totaled $2.8 million, compared to $1.4 million in Q3 2015. Non-GAAP adjusted EBITDA totaled $5.1 million in Q3 2016, compared to non-GAAP adjusted EBITDA of $3.5 million in Q3 2015, as a result of the factors described above (please refer to the reconciliation of GAAP measures to non-GAAP measures at the end of this release).
Gearing
Broadwind Energy engineers, builds and remanufactures precision gears and gearboxes for oil and gas, mining, steel and wind applications.
Gearing segment sales totaled $4.6 million in Q3 2016, compared to $7.2 million in Q3 2015. The 36% reduction in sales was due to weaker demand from oil & gas and mining customers.
Despite the lower revenue, Gearing segment operating loss narrowed to $.7 million in Q3 2016, compared to an operating loss of $2.6 million in Q3 2015. The improvement was due to the absence of a $.9 million environmental remediation expense incurred in Q3 2015, successful cost management which led to an overall reduction in manufacturing overhead and operating expenses, and a $.6 million reduction in depreciation expense. Net loss for the Gearing segment declined to $.7 million in Q3 2016 compared to $2.6 million in Q3 2015. The Gearing segment reported breakeven non-GAAP adjusted EBITDA for Q3 2016, compared to a non-GAAP adjusted EBITDA loss of $.5 million in Q3 2015 (please refer to the reconciliation of GAAP measures to non-GAAP measures at the end of this release). The change was primarily due to strong cost management efforts as described above.
Corporate
Corporate and other expenses totaled $2.0 million in Q3 2016, compared to $1.7 million in Q3 2015. The increase was due mainly to higher incentive compensation in the current year period, partially offset by lower professional fees and other successful cost reductions.
Cash and Liquidity
During Q3 2016, operating working capital (accounts receivable and inventory, net of accounts payable and customer deposits) decreased $12.2 million due to the timing of customer receipts. Operating working capital is expected to normalize before 2016 year-end, and increase by $9-10 million in the fourth quarter.
Capital expenditures, net of disposals, in Q3 2016 totaled $2.2 million, bringing year-to-date expenditures to $3.5 million. Expenditures included investments to upgrade the coatings systems in the tower plants, and initial outlays associated with the expansion of the Abilene tower plant.
Cash assets (cash and short-term investments) increased sharply to $24.3 million at September 30, 2016, compared to $11.1 million at June 30, 2016, due to the temporary reduction in operating working capital described above. Debt and capital leases totaled $3.2 million, including the $2.6 million New Markets Tax Credit loan which is expected to be substantially forgiven when it matures in 2018.
The Company’s credit line with AloStar Bank of Commerce was undrawn at September 30, 2016.
Subsequent to quarter-end, the Company retired the credit line with AloStar and entered into a new three-year $20 million asset-based credit line with The PrivateBank. Under the terms of the new credit line, the Company may elect, with the lender’s consent, to increase the size of the commitment by up to $5 million if it achieves minimum EBITDA of $7 million for fiscal year 2016. The new credit line provides enhanced borrowing availability and more favorable terms overall, including a lower borrowing cost.
About Broadwind Energy, Inc.
Broadwind Energy (NASDAQ:BWEN) applies decades of deep industrial expertise to innovate integrated solutions for customers in the energy and infrastructure markets. From gears and gearing systems for wind, oil and gas and mining applications, to wind towers and industrial weldments, we have solutions for the energy needs of the future. With facilities throughout the central U.S., Broadwind Energy's talented team is committed to helping customers maximize performance of their investments—quicker, easier and smarter. Find out more at www.bwen.com.
Forward-Looking Statements
This release contains “forward‑looking statements”—that is, statements related to future, not past, events—as defined in Section 21E of the Securities Exchange Act of 1934, as amended, that reflect our current expectations regarding our future growth, results of operations, financial condition, cash flows, performance, business prospects and opportunities, as well as assumptions made by, and information currently available to, our management. Forward‑looking statements include any statement that does not directly relate to a current or historical fact. We have tried to identify forward‑looking statements by using words such as “anticipate,” “believe,” “expect,” “intend,” “will,” “should,” “may,” “plan” and similar expressions, but these words are not the exclusive means of identifying forward‑looking statements. Our forward‑looking statements may include or relate to our beliefs, expectations, plans and/or assumptions with respect to the following: (i) state, local and federal regulatory frameworks affecting the industries in which we compete, including the wind energy industry, and the related extension, continuation or renewal of federal tax incentives and grants and state renewable portfolio standards; (ii) our customer relationships and efforts to diversify our customer base and sector focus and leverage customer relationships across business units; (iii) our ability to continue to grow our business organically; (iv) the sufficiency of our liquidity and our plans to evaluate alternate sources of funding if necessary; (v) our restructuring efforts, including estimated costs and saving opportunities; (vi) our ability to realize revenue from customer orders and backlog; (vii) our ability to operate our business efficiently, manage capital expenditures and costs effectively, and generate cash flow; (viii) the economy and the potential impact it may have on our business, including our customers; (ix) the state of the wind energy market and other energy and industrial markets generally and the impact of competition and economic volatility in those markets; (x) the effects of market disruptions and regular market volatility, including fluctuations in the price of oil, gas and other commodities; and (xi) the potential loss of tax benefits if we experience an “ownership change” under Section 382 of the Internal Revenue Code of 1986, as amended. These statements are based on information currently available to us and are subject to various risks, uncertainties and other factors that could cause our actual growth, results of operations, financial condition, cash flows, performance, business prospects and opportunities to differ materially from those expressed in, or implied by, these statements. We are under no duty to update any of these forward-looking statements after the date of this release to conform such statements to actual results. You should not consider any list of such factors to be an exhaustive statement of all of the risks, uncertainties or potentially inaccurate assumptions that could cause our current beliefs, expectations, plans and/or assumptions to change.
BROADWIND ENERGY, INC. AND SUBSIDIARIES CONSOLIDATED BALANCE SHEETS (IN THOUSANDS) | |||||||||||||
September 30, | December 31, | ||||||||||||
2016 | 2015 | ||||||||||||
ASSETS | |||||||||||||
CURRENT ASSETS: | |||||||||||||
Cash and cash equivalents | $ | 8,091 | $ | 6,436 | |||||||||
Short-term investments | 16,213 | 6,179 | |||||||||||
Restricted cash | 39 | 83 | |||||||||||
Accounts receivable, net of allowance for doubtful accounts of $161 | |||||||||||||
and $84 as of September 30, 2016 and December 31, 2015, respectively | 14,926 | 9,784 | |||||||||||
Inventories, net | 26,231 | 24,219 | |||||||||||
Prepaid expenses and other current assets | 2,503 | 1,530 | |||||||||||
Current assets held for sale | 866 | 4,403 | |||||||||||
Total current assets | 68,869 | 52,634 | |||||||||||
LONG-TERM ASSETS: | |||||||||||||
Property and equipment, net | 51,761 | 51,906 | |||||||||||
Intangible assets, net | 4,683 | 5,016 | |||||||||||
Other assets | 323 | 351 | |||||||||||
TOTAL ASSETS | $ | 125,636 | $ | 109,907 | |||||||||
LIABILITIES AND STOCKHOLDERS' EQUITY | |||||||||||||
CURRENT LIABILITIES: | |||||||||||||
Current maturities of long-term debt | $ | - | $ | 2,799 | |||||||||
Current portions of capital lease obligations | 156 | 447 | |||||||||||
Accounts payable | 21,062 | 13,822 | |||||||||||
Accrued liabilities | 8,916 | 8,134 | |||||||||||
Customer deposits | 21,493 | 9,940 | |||||||||||
Current liabilities held for sale | 538 | 1,613 | |||||||||||
Total current liabilities | 52,165 | 36,755 | |||||||||||
LONG-TERM LIABILITIES: | |||||||||||||
Long-term debt, net of current maturities | 2,600 | 2,600 | |||||||||||
Long-term capital lease obligations, net of current portions | 416 | - | |||||||||||
Other | 2,331 | 3,060 | |||||||||||
Total long-term liabilities | 5,347 | 5,660 | |||||||||||
COMMITMENTS AND CONTINGENCIES | |||||||||||||
STOCKHOLDERS' EQUITY: | |||||||||||||
Preferred stock, $0.001 par value; 10,000,000 shares authorized; no shares issued | |||||||||||||
or outstanding | - | - | |||||||||||
Common stock, $0.001 par value; 30,000,000 shares authorized; 15,172,245 | |||||||||||||
and 15,012,789 shares issued as of September 30, 2016 and | |||||||||||||
December 31, 2015, respectively | 15 | 15 | |||||||||||
Treasury stock, at cost, 273,937 shares as of September 30, 2016 and December 31, 2015, | |||||||||||||
respectively | (1,842 | ) | (1,842 | ) | |||||||||
Additional paid-in capital | 378,715 | 378,104 | |||||||||||
Accumulated deficit | (308,764 | ) | (308,785 | ) | |||||||||
Total stockholders' equity | 68,124 | 67,492 | |||||||||||
TOTAL LIABILITIES AND STOCKHOLDERS' EQUITY | $ | 125,636 | $ | 109,907 | |||||||||
BROADWIND ENERGY, INC. AND SUBSIDIARIES CONSOLIDATED STATEMENTS OF OPERATIONS (IN THOUSANDS, EXCEPT PER SHARE DATA) (UNAUDITED) | |||||||||||||||||||||
Three Months Ended September 30, | Nine Months Ended September 30, | ||||||||||||||||||||
2016 | 2015 | 2016 | 2015 | ||||||||||||||||||
Revenues | $ | 42,552 | $ | 49,791 | $ | 132,689 | $ | 161,583 | |||||||||||||
Cost of sales | 37,221 | 46,960 | 119,254 | 147,507 | |||||||||||||||||
Gross profit | 5,331 | 2,831 | 13,435 | 14,076 | |||||||||||||||||
OPERATING EXPENSES: | |||||||||||||||||||||
Selling, general and administrative | 3,860 | 3,981 | 11,785 | 13,752 | |||||||||||||||||
Intangible amortization | 111 | 111 | 333 | 333 | |||||||||||||||||
Restructuring | - | 874 | - | 874 | |||||||||||||||||
Total operating expenses | 3,971 | 4,966 | 12,118 | 14,959 | |||||||||||||||||
Operating income (loss) | 1,360 | (2,135 | ) | 1,317 | (883 | ) | |||||||||||||||
OTHER (EXPENSE) INCOME, net: | |||||||||||||||||||||
Interest expense, net | (125 | ) | (210 | ) | (431 | ) | (611 | ) | |||||||||||||
Other, net | 10 | (64 | ) | 27 | (36 | ) | |||||||||||||||
Total other (expense), net | (115 | ) | (274 | ) | (404 | ) | (647 | ) | |||||||||||||
Net income (loss) before benefit for income taxes | 1,245 | (2,409 | ) | 913 | (1,530 | ) | |||||||||||||||
Benefit for income taxes | - | (26 | ) | (16 | ) | (11 | ) | ||||||||||||||
INCOME (LOSS) FROM CONTINUING OPERATIONS | 1,245 | (2,383 | ) | 929 | (1,519 | ) | |||||||||||||||
LOSS FROM DISCONTINUED OPERATIONS, NET OF TAX | (373 | ) | (5,230 | ) | (908 | ) | (9,494 | ) | |||||||||||||
NET INCOME (LOSS) | $ | 872 | $ | (7,613 | ) | $ | 21 | $ | (11,013 | ) | |||||||||||
NET INCOME (LOSS) PER COMMON SHARE - BASIC: | |||||||||||||||||||||
Income (loss) from continuing operations | $ | 0.08 | $ | (0.16 | ) | $ | 0.06 | $ | (0.10 | ) | |||||||||||
Loss from discontinued operations | (0.03 | ) | (0.36 | ) | (0.06 | ) | (0.65 | ) | |||||||||||||
Net income (loss) | $ | 0.06 | $ | (0.52 | ) | $ | 0.00 | $ | (0.75 | ) | |||||||||||
WEIGHTED AVERAGE COMMON SHARES OUTSTANDING - BASIC | 14,876 | 14,708 | 14,824 | 14,656 | |||||||||||||||||
NET INCOME (LOSS) PER COMMON SHARE - DILUTED: | |||||||||||||||||||||
Income (loss) from continuing operations | $ | 0.08 | $ | (0.16 | ) | $ | 0.06 | $ | (0.10 | ) | |||||||||||
Loss from discontinued operations | (0.02 | ) | (0.36 | ) | (0.06 | ) | (0.65 | ) | |||||||||||||
Net income (loss) | $ | 0.06 | $ | (0.52 | ) | $ | 0.00 | $ | (0.75 | ) | |||||||||||
WEIGHTED AVERAGE COMMON SHARES OUTSTANDING - DILUTED | 15,121 | 14,708 | 15,038 | 14,656 | |||||||||||||||||
BROADWIND ENERGY, INC. AND SUBSIDIARIES CONSOLIDATED STATEMENTS OF CASH FLOWS (IN THOUSANDS) (UNAUDITED) | |||||||||||
Nine Months Ended September 30, | |||||||||||
2016 | 2015 | ||||||||||
CASH FLOWS FROM OPERATING ACTIVITIES: | |||||||||||
Net income | $ | 21 | $ | (11,013 | ) | ||||||
Loss from discontinued operations | (908 | ) | (9,494 | ) | |||||||
Income (loss) income from continuing operations | 929 | (1,519 | ) | ||||||||
Adjustments to reconcile net cash used in operating activities: | |||||||||||
Depreciation and amortization expense | 5,138 | 6,860 | |||||||||
Impairment charges | - | 38 | |||||||||
Stock-based compensation | 592 | 900 | |||||||||
Allowance for doubtful accounts | 45 | 55 | |||||||||
Gain on disposal of assets | (147 | ) | (110 | ) | |||||||
Changes in operating assets and liabilities: | |||||||||||
Accounts receivable | (5,187 | ) | (129 | ) | |||||||
Inventories | (2,013 | ) | (2,943 | ) | |||||||
Prepaid expenses and other current assets | (982 | ) | 10 | ||||||||
Accounts payable | 7,118 | (655 | ) | ||||||||
Accrued liabilities | 777 | (995 | ) | ||||||||
Customer deposits | 11,541 | (15,772 | ) | ||||||||
Other non-current assets and liabilities | (744 | ) | (468 | ) | |||||||
Net cash provided by (used in) operating activities of continuing operations | 17,067 | (14,728 | ) | ||||||||
CASH FLOWS FROM INVESTING ACTIVITIES: | |||||||||||
Purchases of available for sale securities | (19,207 | ) | (1,884 | ) | |||||||
Sales of available for sale securities | 167 | 5,083 | |||||||||
Maturities of available for sale securities | 9,005 | 4,825 | |||||||||
Purchases of property and equipment | (4,007 | ) | (2,282 | ) | |||||||
Proceeds from disposals of property and equipment | 479 | 1,156 | |||||||||
Decrease in restricted cash | 44 | - | |||||||||
Net cash (used in) provided by investing activities of continuing operations | (13,519 | ) | 6,898 | ||||||||
CASH FLOWS FROM FINANCING ACTIVITIES: | |||||||||||
Net proceeds from issuance of stock | 19 | - | |||||||||
Payments on lines of credit and notes payable | - | (118,212 | ) | ||||||||
Proceeds from lines of credit and notes payable | - | 118,212 | |||||||||
Proceeds from long-term debt | - | 5,000 | |||||||||
Payments on long-term debt | (2,799 | ) | (119 | ) | |||||||
Principal payments on capital leases | (500 | ) | (598 | ) | |||||||
Net cash (used in) provided by financing activities of continuing operations | (3,280 | ) | 4,283 | ||||||||
DISCONTINUED OPERATIONS: | |||||||||||
Operating cash flows | 786 | (3,484 | ) | ||||||||
Investing cash flows | 615 | (368 | ) | ||||||||
Financing cash flows | (12 | ) | (7 | ) | |||||||
Net cash provided by (used in) discontinued operations | 1,389 | (3,859 | ) | ||||||||
Add: Cash balance of discontinued operations, beginning of period | - | 93 | |||||||||
Less: Cash balance of discontinued operations, end of period | 2 | 1 | |||||||||
NET INCREASE (DECREASE) IN CASH AND CASH EQUIVALENTS | 1,655 | (7,314 | ) | ||||||||
CASH AND CASH EQUIVALENTS, beginning of the period | 6,436 | 12,057 | |||||||||
CASH AND CASH EQUIVALENTS, end of the period | $ | 8,091 | $ | 4,743 | |||||||
Supplemental cash flow information: | |||||||||||
Interest paid | $ | 371 | $ | 647 | |||||||
Income taxes paid | $ | 22 | $ | 35 | |||||||
Non-cash investing and financing activities: | |||||||||||
Issuance of restricted stock grants | $ | 592 | $ | 900 | |||||||
BROADWIND ENERGY, INC. AND SUBSIDIARIES SELECTED SEGMENT FINANCIAL INFORMATION (IN THOUSANDS) (UNAUDITED) | ||||||||||||||||||
Three Months Ended | Nine Months Ended | |||||||||||||||||
September 30, | September 30, | |||||||||||||||||
2016 | 2015 | 2016 | 2015 | |||||||||||||||
ORDERS: | ||||||||||||||||||
Towers and Weldments | $ | 25,329 | $ | 3,167 | $ | 231,401 | $ | 66,330 | ||||||||||
Gearing | 2,162 | 8,997 | 11,307 | 22,493 | ||||||||||||||
Total orders | $ | 27,491 | $ | 12,164 | $ | 242,708 | $ | 88,823 | ||||||||||
REVENUES: | ||||||||||||||||||
Towers and Weldments | $ | 37,390 | $ | 42,943 | $ | 117,948 | $ | 139,003 | ||||||||||
Gearing | 4,582 | 7,184 | 14,759 | 23,758 | ||||||||||||||
Corporate and Other | 580 | (336 | ) | (18 | ) | (1,178 | ) | |||||||||||
Total revenues | $ | 42,552 | $ | 49,791 | $ | 132,689 | $ | 161,583 | ||||||||||
OPERATING PROFIT/(LOSS): | ||||||||||||||||||
Towers and Weldments | $ | 4,050 | $ | 2,235 | $ | 10,016 | $ | 10,525 | ||||||||||
Gearing | (692 | ) | (2,646 | ) | (3,083 | ) | (5,380 | ) | ||||||||||
Corporate and Other | (1,998 | ) | (1,724 | ) | (5,616 | ) | (6,028 | ) | ||||||||||
Total operating profit/(loss) | $ | 1,360 | $ | (2,135 | ) | $ | 1,317 | $ | (883 | ) | ||||||||
Non-GAAP Financial Measure
The Company provides non-GAAP adjusted EBITDA (earnings before interest, income taxes, depreciation, amortization, and stock compensation) as supplemental information regarding the Company’s business performance. The Company’s management uses adjusted EBITDA when it internally evaluates the performance of the Company’s business, reviews financial trends and makes operating and strategic decisions. The Company believes that this non-GAAP financial measure is useful to investors because it provides investors with a better understanding of the Company’s past financial performance and future results allows investors to evaluate the Company’s performance using the same methodology and information as used by the Company’s management. The Company's definition of adjusted EBITDA may be different from similar non-GAAP financial measures used by other companies and/or analysts.
BROADWIND ENERGY, INC. AND SUBSIDIARIES RECONCILIATION OF NON-GAAP FINANCIAL MEASURES (IN THOUSANDS) (UNAUDITED) | ||||||||||||||||||
Consolidated | Three Months Ended September 30, | Nine Months Ended September 30, | ||||||||||||||||
2016 | 2015 | 2016 | 2015 | |||||||||||||||
Net Income/(Loss) from continuing operations | $ | 1,245 | $ | (2,383 | ) | $ | 929 | $ | (1,519 | ) | ||||||||
Interest Expense | 125 | 210 | 431 | 611 | ||||||||||||||
Income Tax Provision/(Benefit) | - | (26 | ) | (16 | ) | (11 | ) | |||||||||||
Depreciation and Amortization | 1,695 | 2,400 | 5,138 | 6,860 | ||||||||||||||
Share-based Compensation and Other Stock Payments | 195 | 310 | 628 | 897 | ||||||||||||||
Restructuring Expense | - | 874 | - | 874 | ||||||||||||||
Adjusted EBITDA (Non-GAAP) | $ | 3,260 | $ | 1,385 | $ | 7,110 | $ | 7,712 |
Towers and Weldments Segment | Three Months Ended September 30, | Nine Months Ended September 30, | ||||||||||||||
2016 | 2015 | 2016 | 2015 | |||||||||||||
Net Income | $ | 2,797 | $ | 1,366 | $ | 6,738 | $ | 6,877 | ||||||||
Interest Expense | 5 | - | 21 | 4 | ||||||||||||
Income Tax Provision/(Benefit) | 1,259 | 880 | 3,285 | 3,759 | ||||||||||||
Depreciation and Amortization | 1,007 | 1,132 | 3,066 | 2,961 | ||||||||||||
Share-based Compensation and Other Stock Payments | 79 | 72 | 154 | 106 | ||||||||||||
Adjusted EBITDA (Non-GAAP) | $ | 5,147 | $ | 3,450 | $ | 13,264 | $ | 13,707 |
Gearing Segment | Three Months Ended September 30, | Nine Months Ended September 30, | |||||||||||||||
2016 | 2015 | 2016 | 2015 | ||||||||||||||
Net Loss | $ | (697 | ) | $ | (2,643 | ) | $ | (3,099 | ) | $ | (5,380 | ) | |||||
Interest Expense | 1 | 8 | 8 | 29 | |||||||||||||
Income Tax Provision/(Benefit) | 5 | (9 | ) | 7 | (5 | ) | |||||||||||
Depreciation and Amortization | 638 | 1,216 | 1,918 | 3,757 | |||||||||||||
Share-based Compensation and Other Stock Payments | 17 | 44 | 89 | 183 | |||||||||||||
Restructuring Expense | - | 874 | - | 874 | |||||||||||||
Adjusted EBITDA (Non-GAAP) | $ | (36 | ) | $ | (510 | ) | $ | (1,077 | ) | $ | (542 | ) |
Corporate and Other | Three Months Ended September 30, | Nine Months Ended September 30, | ||||||||||||||
2016 | 2015 | 2016 | 2015 | |||||||||||||
Net Income/(Loss) | $ | (855 | ) | $ | (1,106 | ) | $ | (2,710 | ) | $ | (3,016 | ) | ||||
Interest Expense | 119 | 201 | 402 | 578 | ||||||||||||
Income Tax Provision/(Benefit) | (1,264 | ) | (897 | ) | (3,308 | ) | (3,765 | ) | ||||||||
Depreciation and Amortization | 50 | 52 | 154 | 142 | ||||||||||||
Share-based Compensation and Other Stock Payments | 99 | 194 | 385 | 608 | ||||||||||||
Adjusted EBITDA (Non-GAAP) | $ | (1,851 | ) | $ | (1,555 | ) | $ | (5,077 | ) | $ | (5,453 | ) | ||||
BWEN INVESTOR CONTACT: Joni Konstantelos, 708.780.4819 joni.konstantelos@bwen.com
EXHIBIT 99.2
Q3 2016 Earnings Conference Call October 28, 2016
Industry Data and Forward-Looking Statements Disclaimer ▪Broadwind obtained the industry and market data used throughout this presentation from our own research, internal surveys andstudies conducted by third parties, independent industry associations or general publications and other publicly available information. Independent industry publications and surveys generally state that they have obtained information from sources believed to be reliable, but do not guarantee the accuracy or completeness of such information. Forecasts are particularly likely to be inaccurate, especially over long periods of time. We are not aware of any misstatements in the industry data we have presented herein, but estimates involve risks anduncertainties and are subject to change based on various factors beyond our control. ▪This presentation contains “forward-looking statements”, as defined in Section21E of the Securities Exchange Act of 1934, as amended. Forward-looking statements include any statement that does not directly relate to a current or historical fact. Our forward-looking statements may include or relate to our beliefs, expectations, plans and/or assumptions with respect to the following: (i) state, local and federal regulatory frameworks affecting the industries in which we compete, including the wind energy industry, and the related extension, continuation or renewal of federal tax incentives and grants and state renewable portfolio standards; (ii) our customer relationships and efforts to diversify our customer base and sector focus and leverage customer relationships across business units; (iii) our ability to continue to grow our business organically; (iv) the sufficiency of our liquidity and availability of alternate sources of funding, if necessary; (v) our restructuring efforts, including estimated costs and saving opportunities; (vi) our ability to realize revenue from customer orders and backlog; (vii) our ability to operate our business efficiently, manage capital expenditures and costs effectively, and generate cash flow; (viii) the economy and the potential impact it may have on our business, including our customers; (ix) the state of the wind energy market and other energy and industrial markets generally and the impact of competition and economic volatility in those markets; (x) the effects of market disruptions and regular market volatility, including fluctuations in the price of oil, gas and other commodities; and (xi) the potential loss of tax benefits if we experience an “ownership change” under Section 382 of the Internal Revenue Code of 1986, as amended. These statements are based on information currently available to us and are subject to various risks, uncertainties and other factors that could cause our actual results to be materially different from the forward-looking statements, including, but not limited to, those set forth under the caption “Risk Factors” in Item 1A of our Annual Report on Form 10-K for the year ended December 31, 2015. We are under no duty to update any of these statements. You should not consider any list of such factors to be an exhaustive statement of all of the risks, uncertaintiesorother factors that could cause our current beliefs, expectations, plans and/or assumptions to change. ▪This presentation contains non-GAAP financial information. Webelieve that certain non-GAAP financial measures may provide users of this financial information with meaningful comparisons between current results and results in prior operating periods. We believe that these non- GAAP financial measures can provide additional meaningful reflection of underlying trends of the business because they provide a comparison of historical information that excludes certain infrequently occurring or non-operational items that impact the overall comparability. Non-GAAP financial measures should be viewed in addition to, and not as an alternative to, our reported results prepared in accordance with GAAP. Please see our earnings release dated October 28, 2016 for a reconciliation of certain non-GAAP measures presented in this presentation. 10/28/2016 © 2016 Broadwind Energy, Inc. All rights reserved. 2
Q3 2016 Highlights ▪Revenue of $43M -on plan ▪Gross Profit Margin rises to 12.5% in Q3 2016, more than double Q3 2015 ▪Cost reductions on track -$6.5M of savings YTD 2016 ▪Income from continuing operations of $1.2M, or $.08 per share ▪Cash and short-term investments totaled $24M at quarter end; credit line remains undrawn ▪Closed on $20M asset-based credit line with The PrivateBank 10/28/2016 © 2016 Broadwind Energy, Inc. All rights reserved. 3
Progress on Priorities 10/28/2016 © 2016 Broadwind Energy, Inc. All rights reserved. 4 ▪Double Order Intake xYTD 2016 orders totaled $243M –more than last 2 years combined ▪Maintain Consistent Tower Production xBoth plants operating at plant design rate ▪Aggressively Manage Costs xYTD 2016 manufacturing overhead reduced $4M vs.YTD 2015 xYTD 2016 operating expenses reduced $3M vs YTD 2015
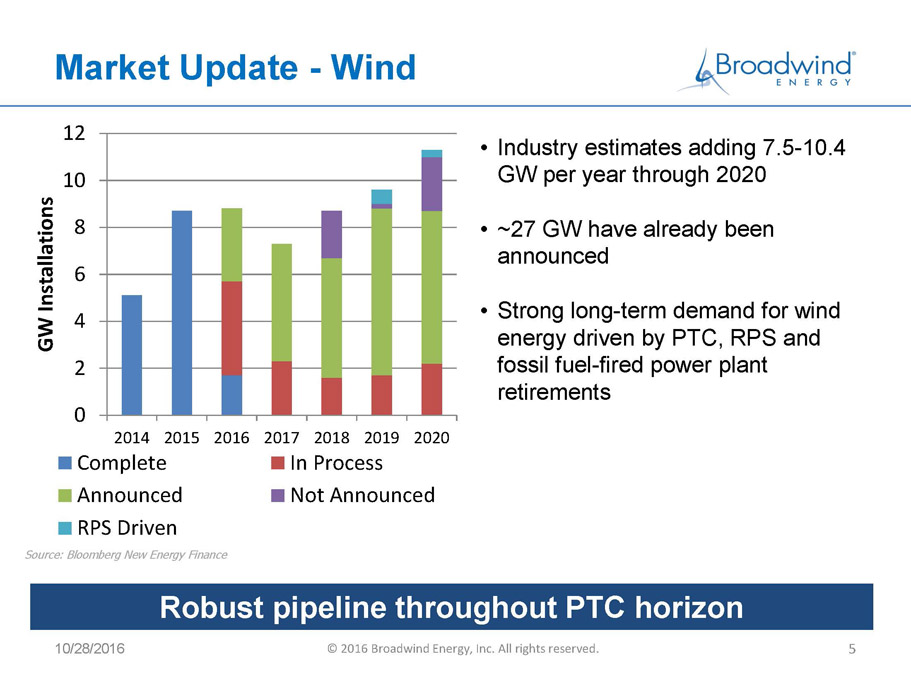
Market Update -Wind 10/28/2016 © 2016 Broadwind Energy, Inc. All rights reserved. 5 •Industry estimates adding 7.5-10.4 GW per year through 2020 •~27 GW have already been announced •Strong long-term demand for wind energy driven by PTC, RPS and fossil fuel-fired power plant retirements 0 2 4 6 8 10 12 2014 2015 2016 2017 2018 2019 2020 G W I n s t a l l a t i o n s Complete In Process Announced Not Announced RPS Driven Source: Bloomberg NewEnergy Finance Robust pipeline throughout PTC horizon
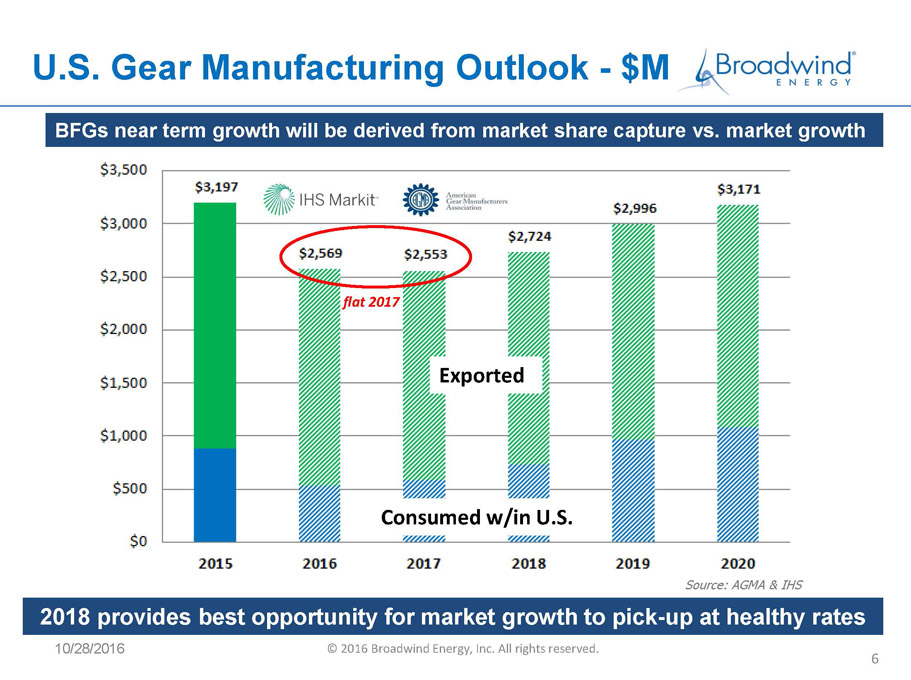
U.S. Gear Manufacturing Outlook -$M 2018 provides best opportunity for market growth to pick-up at healthy rates Exported Source: AGMA & IHS 6 Consumed w/in U.S. flat 2017 BFGs near term growth will be derived from market share capture vs. market growth 10/28/2016 © 2016 Broadwind Energy, Inc. All rights reserved.
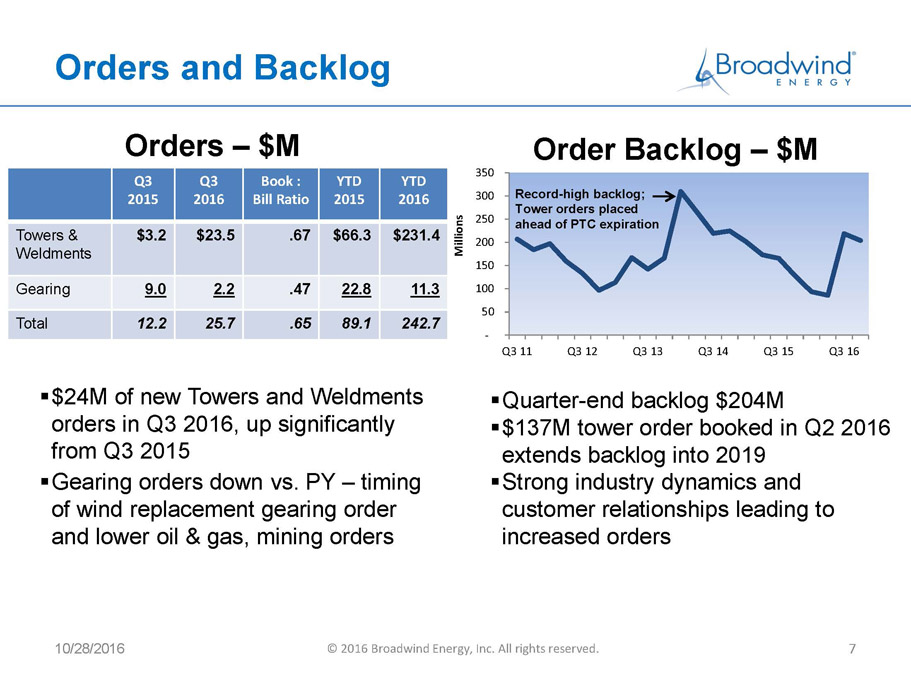
- 50 100 150 200 250 300 350 Q3 11 Q3 12 Q3 13 Q3 14 Q3 15 Q3 16 M i l l i o n s Orders and Backlog Orders –$M ▪$24M of new Towers and Weldments orders in Q3 2016, up significantly from Q3 2015 ▪Gearing orders down vs. PY –timing of wind replacement gearing order and lower oil & gas, mining orders Order Backlog –$M ▪Quarter-end backlog $204M ▪$137M tower order booked in Q2 2016 extends backlog into 2019 ▪Strong industry dynamics and customer relationships leading to increased orders Q3 2015 Q3 2016 Book : Bill Ratio YTD 2015 YTD 2016 Towers & Weldments $3.2 $23.5 .67 $66.3 $231.4 Gearing 9.0 2.2 .47 22.8 11.3 Total 12.2 25.7 .65 89.1 242.7 10/28/2016 © 2016 Broadwind Energy, Inc. All rights reserved. 7 Record-high backlog; Tower orders placed ahead of PTC expiration
Consolidated Financial Results 10/28/2016 © 2016 Broadwind Energy, Inc. All rights reserved. 8 ▪Q3 2016 sales down 14% from prior year: Towers and Weldments -11%, Gearing -36%; lower steel prices, lower Gearing sales to oil & gas and mining customers ▪Q3 2016 gross margin, profit and EPS all higher than PY due primarily to significant operational efficiency improvements in the Towers and Weldments segment and successful cost management actions across the Company * Reconciliation to non-GAAP measure included in Appendix 2015 2016 # 2015 2016 Total Sales 49.8 42.6 161.6 132.7 Gross Profit 2.8 5.3 14.1 13.4 Gross Profit % 5.7% 12.5% 8.7% 10.1% Total Operating Expense 5.0 4.0 15.0 12.1 Income from Operations -2.1 1.4 -0.9 1.3 % of Sales -4.3% 3.2% -0.5% 1.0% Adj. EBITDA 1.4 3.3 7.7 7.1 EPS, Continuing ($0.16) $0.08 ($0.10) $0.06 Memo: Net I/(L) incl. Disc. Ops. ($0.52) $0.06 ($0.75) ($0.06) $M except per share data Q3 YTD
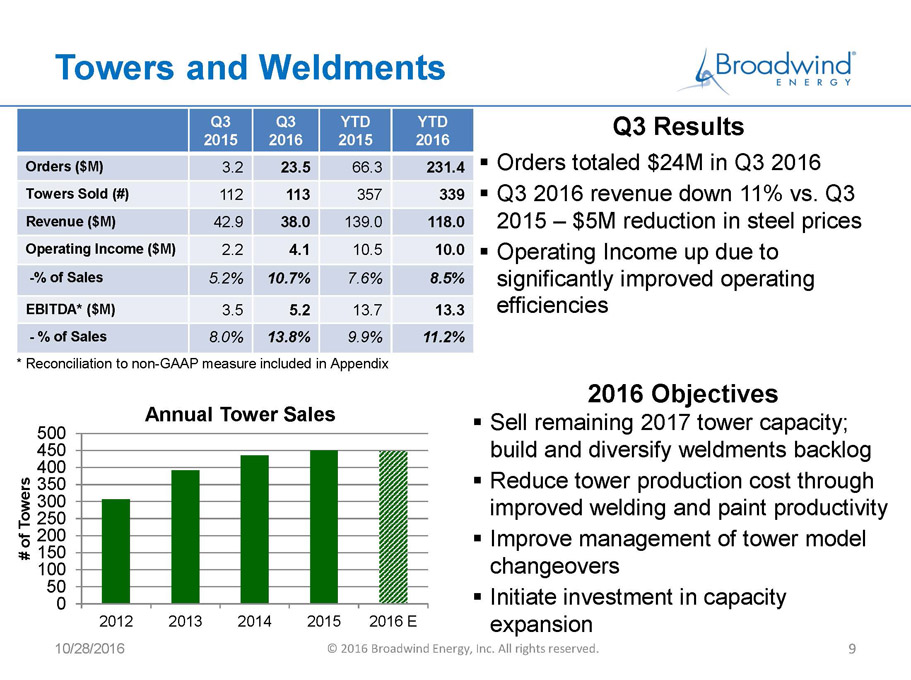
Towers and Weldments Q3 2015 Q3 2016 YTD 2015 YTD 2016 Orders ($M) 3.2 23.5 66.3 231.4 Towers Sold (#) 112 113 357 339 Revenue ($M) 42.9 38.0 139.0 118.0 Operating Income($M) 2.2 4.1 10.5 10.0 -% of Sales 5.2% 10.7% 7.6% 8.5% EBITDA* ($M) 3.5 5.2 13.7 13.3 -% of Sales 8.0% 13.8% 9.9% 11.2% Q3 Results ▪Orders totaled $24M in Q3 2016 ▪Q3 2016 revenue down 11% vs. Q3 2015 –$5M reduction in steel prices ▪Operating Income up due to significantly improved operating efficiencies 2016 Objectives ▪Sell remaining 2017 tower capacity; build and diversify weldments backlog ▪Reduce tower production cost through improved welding and paint productivity ▪Improve management of tower model changeovers ▪Initiate investment in capacity expansion 10/28/2016 © 2016 Broadwind Energy, Inc. All rights reserved. 9 0 50 100 150 200 250 300 350 400 450 500 2012 2013 2014 2015 2016 E # o f T o w e r s Annual Tower Sales * Reconciliation to non-GAAP measure included in Appendix
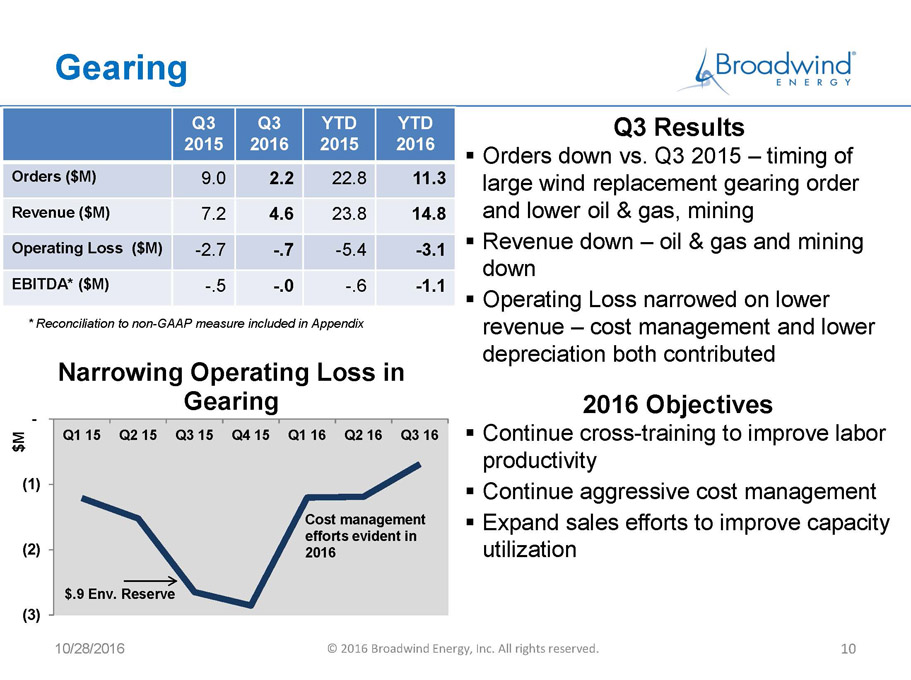
Gearing Q3 2015 Q3 2016 YTD 2015 YTD 2016 Orders ($M) 9.0 2.2 22.8 11.3 Revenue ($M) 7.2 4.6 23.8 14.8 Operating Loss ($M) -2.7 -.7 -5.4 -3.1 EBITDA* ($M) -.5 -.0 -.6 -1.1 Q3 Results ▪Orders down vs. Q3 2015 –timing of large wind replacement gearing order and lower oil & gas, mining ▪Revenue down –oil & gas and mining down ▪Operating Loss narrowed on lower revenue –cost management and lower depreciation both contributed 10/28/2016 © 2016 Broadwind Energy, Inc. All rights reserved. 10 2016 Objectives ▪Continue cross-training to improve labor productivity ▪Continue aggressive cost management ▪Expand sales efforts to improve capacity utilization * Reconciliation to non-GAAP measure included in Appendix (3) (2) (1) - Q1 15 Q2 15 Q3 15 Q4 15 Q1 16 Q2 16 Q3 16 $ M Narrowing Operating Loss in Gearing $.9 Env. Reserve Cost management efforts evident in 2016
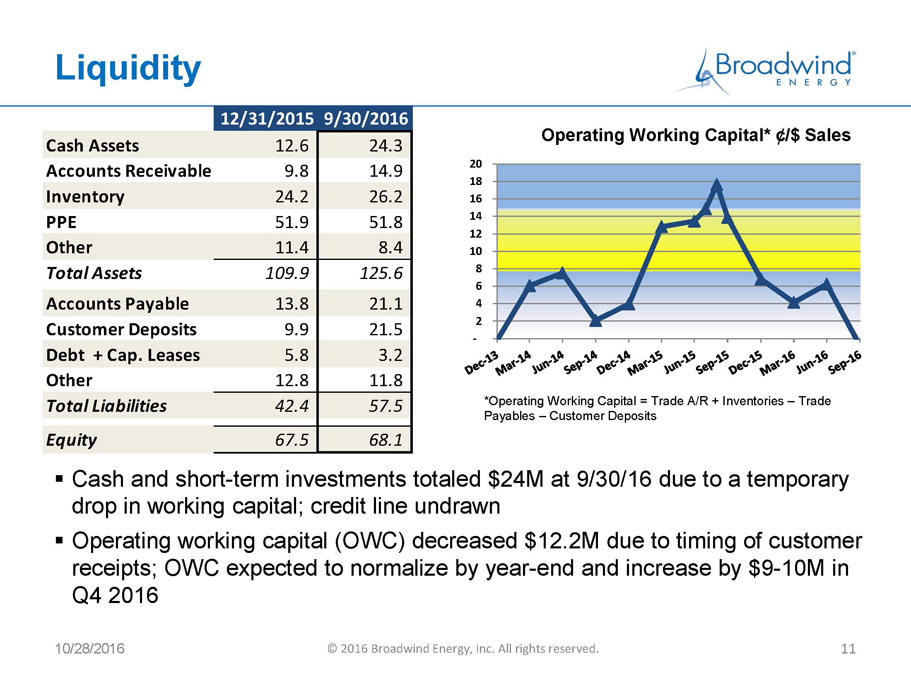
Liquidity 10/28/2016 © 2016 Broadwind Energy, Inc. All rights reserved. 11 ▪Cash and short-term investments totaled $24M at 9/30/16 due to a temporary drop in working capital; credit line undrawn ▪Operating working capital (OWC) decreased $12.2M due to timing of customer receipts; OWC expected to normalize by year-end and increase by $9-10M in Q4 2016 *Operating Working Capital = Trade A/R + Inventories –Trade Payables –Customer Deposits Operating Working Capital* ¢/$ Sales - 2 4 6 8 10 12 14 16 18 20 12/31/20159/30/2016 Cash Assets 12.6 24.3 Accounts Receivable 9.8 14.9 Inventory 24.2 26.2 PPE 51.9 51.8 Other 11.4 8.4 Total Assets 109.9 125.6 Accounts Payable 13.8 21.1 Customer Deposits 9.9 21.5 Debt + Cap. Leases 5.8 3.2 Other 12.8 11.8 Total Liabilities 42.4 57.5 Equity 67.5 68.1
Summary 10/28/2016 © 2016 Broadwind Energy, Inc. All rights reserved. 12 ▪ Tower production consistent, delivering ahead of schedule ▪ Wind market dynamics strong –good visibility ▪ Gearing continues to manage well through oil & gas and mining downturn; savings from consolidation in effect, aggressive cost management continues ▪ Cost reduction and continuous improvement remain primary focus areas ▪ Q4 2016 outlook: Revenue $44-46M, Net Income -Continuing $.5M
Appendix –Non-GAAP Financial Measure Non-GAAP Financial Measure The Company provides non-GAAP adjusted EBITDA (earnings before interest, income taxes, depreciation, amortization, stock compensation and restructuring) as supplemental information regarding the Company’s business performance. The Company believes that this non-GAAP financial measure is useful to investors because it provides investors with a better understanding of the Company’s past financial performance and future results. The Company’s management uses adjusted EBITDA when it internally evaluates the performance of the Company’s business, reviews financial trends and makes operating and strategic decisions. The Company believes that providing this non-GAAP financial measure to its investors is useful because it allows investors to evaluate the Company’s performance using the same methodology and information as the Company’s management. The Company's definition of adjusted EBITDA may be different from similar non-GAAP financial measures used by other companies and/or analysts. 10/28/2016 © 2016 Broadwind Energy, Inc. All rights reserved. 13 Consolidated 2016 2015 2016 2015 Net Income/(Loss) from continuing operations……………………………. 1,245$ (2,383)$ 929$ (1,519)$ Interest Expense…………………………………. 125 210 431 611 Income Tax Provision/(Benefit)……………………………… - (26) (16) (11) Depreciation and Amortization………………………………………………………………1,695 2,400 5,138 6,860 Share-based Compensation and Other Stock Payments………………………………………………………………195 310 628 897 Restructuring Expense…………………………………………………... - 874 - 874 Adjusted EBITDA (Non-GAAP)………………… 3,260$ 1,385$ 7,110$ 7,712$ Three Months Ended September 30, Nine Months Ended September 30, Towers and Weldments Segment 2016 2015 2016 2015 Net Income……………………………. 2,797$ 1,366$ 6,738$ 6,877$ Interest Expense…………………………………. 5 - 21 4 Income Tax Provision/(Benefit)……………………………… 1,259 880 3,285 3,759 Depreciation and Amortization………………………………………………………………1,007 1,132 3,066 2,961 Share-based Compensation and Other Stock Payments………………………………………………………………79 72 154 106 Adjusted EBITDA (Non-GAAP)…………………… 5,147$ 3,450$ 13,264$ 13,707$ Three Months Ended September 30, Nine Months Ended September 30,
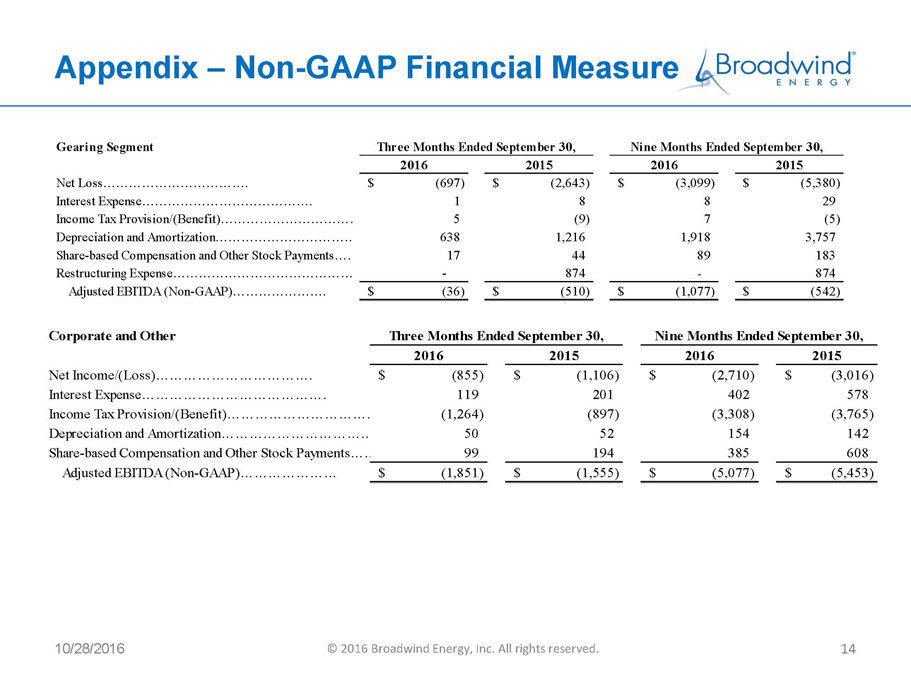
Appendix –Non-GAAP Financial Measure 10/28/2016 © 2016 Broadwind Energy, Inc. All rights reserved. 14 Gearing Segment 2016 2015 2016 2015 Net Loss……………………………. (697)$ (2,643)$ (3,099)$ (5,380)$ Interest Expense…………………………………. 1 8 8 29 Income Tax Provision/(Benefit)……………………………… 5 (9) 7 (5) Depreciation and Amortization………………………………………………………………638 1,216 1,918 3,757 Share-based Compensation and Other Stock Payments………………………………………………………………17 44 89 183 Restructuring Expense…………………………………………………... - 874 - 874 Adjusted EBITDA (Non-GAAP)…………………. (36)$ (510)$ (1,077)$ (542)$ Three Months Ended September 30, Nine Months Ended September 30, Corporate and Other 2016 2015 2016 2015 Net Income/(Loss)……………………………. (855)$ (1,106)$ (2,710)$ (3,016)$ Interest Expense…………………………………. 119 201 402 578 Income Tax Provision/(Benefit)……………………………… (1,264) (897) (3,308) (3,765) Depreciation and Amortization………………………………………………………………50 52 154 142 Share-based Compensation and Other Stock Payments………………………………………………………………99 194 385 608 Adjusted EBITDA (Non-GAAP)………………… (1,851)$ (1,555)$ (5,077)$ (5,453)$ Three Months Ended September 30, Nine Months Ended September 30,
Click to edit Master title style ▪ Click to edit Master text styles –Second level • Third level – Fourth level » Fifth level Broadwind Energy is committed to helping customers maximize performance of their energy and infrastructure investments— quicker, easier and smarter. 10/28/2016 © 2016 Broadwind Energy, Inc. All rights reserved. 15
G)E4WI.5&-Z:V,Y9"(_
M/@H\>#IX;7!M971A('AM;&YS.G@](F%D;V)E.FYS.FUE=&$O(B!X.GAM<'1K
M/2(S+C$N,2TQ,3$B/@H@(" \ [\F&XD@U;R\UD["A%Y;_ %2=-!>PLM+A
M=OM2FZM(25]V# 0OL @K^H8:5-++2O-URPXVDP)[E:'\2,K(*LBM-/\Y:?1
MY+:<*!U$9?\ 47/-VKVCK'= ]:WDG6R&EK&3S>X99)57L3Q
MV%?#* HCPSNGG?_0I?Y7'87>L5_YBXO\ JAFT_P!$
M.HY"OD?UNK_D'3>?S'ZET?\ SB5^5\;AVN-6E4=8WNXPI^?&$'\<'\O:KR^3
M+^0M-YO1O)OY7^1O(E7\LZ/#:W++P>\8M- HIA?Y;_E-Y8_*
MRWU"#RT]U(-2:-[AKR42FL(95"\40 48YEZO6Y-2;R.'I=%CTPJ+/1T&8+GO
M._S!_)KRG^9.KZ=K/F![M+O2T]*#ZI,(E>/F).+@HU?B'8KFPTO:&;3PE&%5
M)UNJ[/Q:B<92YQ>@QK0<>R[#Y9KJ[W8@CHQ?SG^7?E'S]:K:^:-,CO#&"(+D
M$QW$0/7A*E&'RK3,K!JLN W N-J-)BSCUAX[>?\ .'ODJ:X,MIKFIVT!-?18
M02T7PY,@.;H>T&HKD/DZ678&G)NRS3R7_P X\_EQY*N8]1@LGU35(=X[O4F$
MP5NM5B $8/@>/(=CF!J>U=1G%$U[G.T_9>GP;U?O3#0_R6\H^7?/=Y^8FGF[
M_3UZUQ))'),K6R/=_P!X50(#OVJQIE6;M'/EPQPFN&+9A[/PX;:_\ F;J?F:"73?)PDT72WVG\P7492ZEC;JMC
M VXJ-O6D'^JO?*SD #<,5I%H&@/+#;Z-HED4>/EP< <^)->3$_$6)J6=FRK&
M3+FVR BSO0?+-H(6T/3F$EBTBKYDU6,FEPZ?%]2@;N@(_?/_ +'JQS-%TXDC
M?)Z(TZ6Z+%$O!%4(JC90%V% .F!@FFEOZEJ&/7DP_'%4;BKL5=BKL5=BKL5=
MBKL5=BKL5=BKL5=BKL5=BKL5=BKL5=BKL5=BKL5=BKL5=BKL5=BKL5=BKL5=
MBKL5=BK_ /_1X\;-9-^ (^[*F/"J+IL8(/ICB=^HQ9)A9VZQ;T"^PPIM.(KA
M%54&["O7?K@4E5>^2!">5=NGA3KBA(Y;^_U>_CTS2(_6OYB%C0&@4=V<]E&6
M1BKWCR5Y=MO+.DQV,+>K<2'U+VX(H99B-_\ 8CHOMEPV4[N_,/SS<>0/+T?F
M-=)&KZ3',8-8B23@T4$H"H]*$%2U4?EM]G^;%J?#GF6ZTJXUW4=1\I1/;Z++
M<2265A,ZM=00N:A&9?A<#"H0^GVPF992@,3?;1=A4]P.H^C) (D0R2WA6,!%
M% -@,M:0C4C-:CJ!D.)L >@?E;YNN/)?FFVUFSTF#6+\+Z-K;7 9N,LIXJ\?
M U$G4+\\K.[,;/T(\OW6L7^B6-SK]BFFZS/$&NK&*3UEBCGM8XV;ET!!]
M\9=S7#9-/,U@8W$BK6*0]1E%.4&$2PB*5D8?%O0#NIRJ3([L \TZ5+#=I>6C
MF-U836DZ[4D3?\!UR6Q&['DSSR7YM@U^ PW!6+4XJ+
=[*15
M(9/$$'?*S&BR$D5'YHL35ED +;L0.OSP<*>)0F\UV<9Y))4>PR)BO$E&H>>(
M4J1,% ZUQ$6^,F&ZOY_=B4@
7\)UK1_
M,+S0:WJ,#EX9(G8L9I>6Z,C_ !"O^JN2ER2^H[_5X5>7A(([@?"7!Z@=O'Z#
MD %85?3R2S%D?D3T]\-D-@>M_E;.)_*J,'#E;B=&8=*JU#OWP-;-<5=BKL5=
MBKL5=BKL5=BKL5=BKL5=BKL5=BKL5=BKL5=BKL5=BKL5=BKL5=BKL5=BKL5=
MBKL5=BKL5=BKL5?_U^0>7+65-
BOW-*
>?+>C7KZ;>W+F\A427$5O!-=
M&%&%09?01^%1N.6]/BZ9".*1%AG+-$&BGUI=6U];17EG*D]I.HD@FC8,CHPJ
M&4C8@C*R*V;@0185L"78J[%78J[%78J[%78J[%78J[%78J[%78J[%78J[%78
MJ__5XW/ "O%QN-@?'WSR1*7
M;\!DL<3*0B.9+5DGPQ,CR MY?_SCM%WXR.V.19QY'_ .