UNITED STATES
SECURITIES AND EXCHANGE COMMISSION
Washington, D.C. 20549
FORM 8-K
CURRENT REPORT
Pursuant to Section 13 or 15(d) of the Securities Exchange Act of 1934
Date of report (Date of earliest event reported): April 28, 2016
BROADWIND ENERGY, INC.
(Exact Name of Registrant as Specified in Its Charter)
Delaware | 001-34278 | 88-0409160 | ||
(State or Other Jurisdiction of | (Commission File Number) | (IRS Employer Identification No.) | ||
Incorporation) |
3240 South Central Avenue, Cicero, Illinois 60804
(Address of Principal Executive Offices) (Zip Code)
Registrant’s Telephone Number, Including Area Code: (708) 780-4800
Not Applicable
(Former Name or Former Address, if Changed Since Last Report)
Check the appropriate box below if the Form 8-K filing is intended to simultaneously satisfy the filing obligation of the registrant under any of the following provisions:
o Written communications pursuant to Rule 425 under the Securities Act (17 CFR 230.425)
o Soliciting material pursuant to Rule 14a-12 under the Exchange Act (17 CFR 240.14a-12)
o Pre-commencement communications pursuant to Rule 14d-2(b) under the Exchange Act (17 CFR 240.14d-2(b))
o Pre-commencement communications pursuant to Rule 13e-4(c) under the Exchange Act (17 CFR 240.13e-4(c))
Item 2.02. Results of Operations and Financial Condition.
On April 28, 2016, Broadwind Energy, Inc. (the “Company”) issued a press release announcing its financial results as of and for the quarter ended March 31, 2016. The press release is incorporated herein by reference and is attached hereto as Exhibit 99.1.
The information contained in, or incorporated into, this Item 2.02 of this Current Report on Form 8-K (this “Report”), including Exhibit 99.1, is furnished under Item 2.02 of Form 8-K and shall not be deemed “filed” for the purposes of Section 18 of the Securities Exchange Act of 1934, as amended (the “Exchange Act”) or otherwise subject to the liabilities of that section, and shall not be deemed to be incorporated by reference into the filings of the Company under the Securities Act of 1933, as amended (the “Securities Act”) or the Exchange Act regardless of any general incorporation language in such filings.
Item 7.01. Regulation FD Disclosure.
An Investor Presentation dated April 28, 2016 is incorporated herein by reference and attached hereto as Exhibit 99.2.
The information contained in, or incorporated into, this Item 7.01 of this Report, including Exhibit 99.2 attached hereto, is furnished under Item 7.01 of Form 8-K and shall not be deemed “filed” for the purposes of Section 18 of the Exchange Act or otherwise subject to the liabilities of that section, and shall not be deemed to be incorporated by reference into the filings of the Company under the Securities Act or the Exchange Act regardless of any general incorporation language in such filings.
This Report shall not be deemed an admission as to the materiality of any information in this Report that is being disclosed pursuant to Regulation FD.
Please refer to Exhibit 99.2 for a discussion of certain forward-looking statements included therein and the risks and uncertainties related thereto.
Item 9.01. Financial Statements and Exhibits.
(d) | Exhibits | |
EXHIBIT NUMBER |
DESCRIPTION | |
99.1 | Press Release dated April 28, 2016 | |
99.2 | Investor Presentation dated April 28, 2016 |
SIGNATURE
Pursuant to the requirements of the Securities Exchange Act of 1934, the registrant has duly caused this report to be signed on its behalf by the undersigned hereunto duly authorized.
BROADWIND ENERGY, INC. | ||
April 28, 2016 | By: | /s/ Stephanie K. Kushner |
Stephanie K. Kushner | ||
Chief Financial Officer | ||
(Principal Financial Officer) |
EXHIBIT INDEX
EXHIBIT NUMBER |
DESCRIPTION | |
99.1 | Press Release dated April 28, 2016 | |
99.2 | Investor Presentation dated April 28, 2016 |
EXHIBIT 99.1
Broadwind Energy Announces First-Quarter 2016 Results
Highlights:
CICERO, Ill., April 28, 2016 (GLOBE NEWSWIRE) -- Broadwind Energy, Inc. (NASDAQ:BWEN) reported sales of $46.8 million in Q1 2016, down 5% compared to $49.2 million in Q1 2015 mainly due to lower steel prices and reduced demand for gearing from oil & gas and mining customers.
The Company reported a net loss from continuing operations of $.4 million, or $.02 per share, in Q1 2016, compared to a net loss from continuing operations of $2.5 million, or $.17 per share, in Q1 2015. The $.15 per share improvement was due primarily to significantly improved operating efficiencies in the Company’s Abilene, TX tower facility compared to a weak prior-year quarter associated with production challenges faced in Q1 2015, a $.7 million reduction in depreciation expense, and a $.9 million reduction in operating expense attributable to cost management initiatives.
The Company reported break-even results for discontinued operations in Q1 2016, compared to a net loss from discontinued operations of $2.5 million, or $.17 per share, in Q1 2015.
The Company reported non-GAAP adjusted EBITDA (earnings before interest, taxes, depreciation, amortization, share-based payments and restructuring costs) of $1.7 million in Q1 2016, compared to $.2 million in Q1 2015 (see attached reconciliation of non-GAAP financial measure). The $1.5 million increase was mainly attributable to the operating improvements in the Abilene, TX tower facility and $.9 million lower operating expense, as discussed above.
Broadwind Interim CEO Stephanie Kushner stated, “Broadwind is off to a solid start in 2016, nearly doubling our order intake compared to Q1 2015 and generating $3 million of free cash flow during the quarter. Our Towers and Weldments segment has recovered soundly from the production challenges we faced predominantly in the Abilene facility for most of last year, and tower production is once again flowing at plant designed rates. In the Gearing segment, we continue to manage our costs judiciously amidst significantly lower sales to oil & gas and mining customers. Due in part to our stringent cost management across the Company, the consolidated operating loss for the quarter was reduced by $2 million compared to Q1 2015. We remain on track to reduce fixed overhead and SGA expenses by $8 million in 2016, compared to 2015.”
Ms. Kushner continued, “We continue to be focused on improving production and tightly managing costs across the Company. For Q2, we expect $42-44 million in revenue and a small operating loss, consistent with Q1 2016.”
Orders and Backlog
The Company booked $39 million of net new orders in Q1 2016, nearly double the $21.7 million of orders booked in Q1 2015, due primarily to the timing of large tower orders. Towers and Weldments orders, which vary considerably from quarter to quarter, totaled $35.4 million in Q1 2016, up substantially from $11.8 million in Q1 2015. Gearing orders totaled $3.5 million in Q1 2016, down from $9.9 million in Q1 2015 mainly due to weaker demand from oil & gas and mining customers.
At March 31, 2016, total backlog was $86.0 million, representing about six months of projected 2016 shipments. This is down significantly from backlog of $174.1 million at March 31, 2015 due in part to a general reduction in order lead times, the impact of reduced steel costs on orders in backlog and reduced orders for oil & gas and mining customers.
Segment Results
Towers and Weldments
Broadwind Energy produces fabrications for wind, oil and gas, mining and other industrial applications, specializing in the production of wind turbine towers.
Towers and Weldments segment sales totaled $42.0 million in Q1 2016, compared to $41.0 million in Q1 2015. Q1 2016 tower unit sales increased 15% compared to Q1 2015, due to improved production flow, partially offset by lower steel material costs which are generally passed through to the customer. Additionally, weldments revenue decreased $1.1 million in Q1 2016 compared to Q1 2015, due to weak demand from oil & gas and mining customers, partially offset by sales to compressed natural gas customers in Q1 2016.
Towers and Weldments segment operating income in Q1 2016 totaled $3.2 million compared to $1.1 million in Q1 2015, reflecting increased tower sales volume compared to Q1 2015 when $5.0 million of towers produced were held in inventory at quarter-end pending customer acceptance. In addition, improved material margins and significantly improved operating efficiencies in the Abilene, TX tower facility also contributed to the increase in operating income compared to Q1 2015. Non-GAAP adjusted EBITDA totaled $4.3 million in Q1 2016, compared to non-GAAP adjusted EBITDA of $2.2 million in Q1 2015, as a result of the factors described above. (see attached reconciliation of non-GAAP financial measure).
Gearing
Broadwind Energy engineers, builds and remanufactures precision gears and gearboxes for oil and gas, mining, steel and wind applications.
Gearing segment sales totaled $4.8 million in Q1 2016, compared to $8.6 million in Q1 2015. The reduction in sales was due to lower production volumes associated with weaker demand from oil & gas and mining customers.
Despite the significant decline in revenue, Gearing segment operating loss in Q1 2016 of $1.2 million was essentially unchanged compared to Q1 2015. The impact of the decrease in revenue was offset primarily by lower salaried headcount and incentive compensation, $.7 million lower depreciation due to a change in the accounting estimate for equipment salvage value, and a $.2 million gain on the sale of excess equipment. Non-GAAP adjusted EBITDA loss for Q1 2016 was $.5 million, compared to non-GAAP adjusted EBITDA of $.1 million in Q1 2015. (see attached reconciliation of non-GAAP financial measure). The decrease was primarily due to lower volumes, offset by strong cost control efforts in response to sharply lower revenues.
Corporate
Corporate and other expenses totaled $2.3 million in Q1 2016, essentially unchanged as compared to Q1 2015. Lower employee compensation costs and other cost savings initiatives were offset by increased company-wide self-insurance costs in Q1 2016.
Cash and Liquidity
During Q1 2016, operating working capital (accounts receivable and inventory, net of accounts payable and customer deposits) decreased by $2.5 million to $7.8 million, or 4% of Q1 2016 annualized sales, mainly due to a $5.3 million decrease in raw materials inventory due in part to increased operating productivity. This was partially offset by a $2.7 million increase in receivables during Q1 2016.
Capital expenditures in Q1 2016 totaled $1.0 million, up from $.7 million in Q1 2015.
Cash assets (cash and short-term investments) totaled $15.4 million at March 31, 2016, compared to $12.8 million at December 31, 2015, and the Company’s credit line was undrawn at March 31, 2016.
At March 31, 2016, debt and capital lease obligations totaled $5.5 million, down from $5.9 million at December 31, 2015.
About Broadwind Energy, Inc.
Broadwind Energy (NASDAQ:BWEN) applies decades of deep industrial expertise to innovate integrated solutions for customers in the energy and infrastructure markets. From gears and gearing systems for wind, oil and gas and mining applications, to wind towers and industrial weldments, we have solutions for the energy needs of the future. With facilities throughout the central U.S., Broadwind Energy's talented team is committed to helping customers maximize performance of their investments—quicker, easier and smarter. Find out more at www.bwen.com.
Forward-Looking Statements
This release contains “forward‑looking statements”—that is, statements related to future, not past, events—as defined in Section 21E of the Securities Exchange Act of 1934, as amended, that reflect our current expectations regarding our future growth, results of operations, financial condition, cash flows, performance, business prospects and opportunities, as well as assumptions made by, and information currently available to, our management. Forward‑looking statements include any statement that does not directly relate to a current or historical fact. We have tried to identify forward‑looking statements by using words such as “anticipate,” “believe,” “expect,” “intend,” “will,” “should,” “may,” “plan” and similar expressions, but these words are not the exclusive means of identifying forward‑looking statements. Our forward‑looking statements may include or relate to the following: (i) our expectations relating to state, local and federal regulatory frameworks affecting the industries in which we compete, including the wind energy industry, and the related extension, continuation or renewal of federal tax incentives and grants and state renewable portfolio standards; (ii) our expectations with respect to our customer relationships and efforts to diversify our customer base and sector focus and leverage customer relationships across business units; (iii) our plans to continue to grow our business organically; (iv) our beliefs with respect to the sufficiency of our liquidity and our plans to evaluate alternate sources of funding if necessary; (v) our plans and assumptions, including estimated costs and saving opportunities, regarding our restructuring efforts; (vi) our beliefs regarding our ability to realize revenue from customer orders and backlog; (vii) our beliefs regarding our ability to operate our business efficiently, manage capital expenditures and costs effectively, and generate cash flow; (viii) our beliefs and expectations relating to the economy and the potential impact it may have on our business, including our customers; (ix) our beliefs regarding the state of the wind energy market and other energy and industrial markets generally and the impact of competition and economic volatility in those markets; (x) our beliefs and expectations relating to the effects of market disruptions and regular market volatility, including fluctuations in the price of oil, gas and other commodities; and (xi) our beliefs regarding the potential loss of tax benefits if we experience an “ownership change” under Section 382 of the Internal Revenue Code of 1986, as amended. These statements are based on information currently available to us and are subject to various risks, uncertainties and other factors that could cause our actual growth, results of operations, financial condition, cash flows, performance, business prospects and opportunities to differ materially from those expressed in, or implied by, these statements. We are under no duty to update any of these forward-looking statements after the date of this release to conform such statements to actual results. You should not consider any list of such factors to be an exhaustive statement of all of the risks, uncertainties or potentially inaccurate assumptions that could cause our current expectations or beliefs to change.
BROADWIND ENERGY, INC. AND SUBSIDIARIES | |||||||||||||||||
CONSOLIDATED BALANCE SHEETS | |||||||||||||||||
(IN THOUSANDS) | |||||||||||||||||
March 31, | December 31, | ||||||||||||||||
2016 | 2015 | ||||||||||||||||
ASSETS | (Unaudited) | ||||||||||||||||
CURRENT ASSETS: | |||||||||||||||||
Cash and cash equivalents | $ | 9,711 | $ | 6,436 | |||||||||||||
Short-term investments | 5,696 | 6,179 | |||||||||||||||
Restricted cash | 39 | 83 | |||||||||||||||
Accounts receivable, net of allowance for doubtful accounts of $164 | |||||||||||||||||
and $84 as of March 31, 2016 and December 31, 2015, respectively | 12,459 | 9,784 | |||||||||||||||
Inventories, net | 18,870 | 24,219 | |||||||||||||||
Prepaid expenses and other current assets | 1,565 | 1,530 | |||||||||||||||
Current assets held for sale | 2,662 | 4,403 | |||||||||||||||
Total current assets | 51,002 | 52,634 | |||||||||||||||
LONG-TERM ASSETS: | |||||||||||||||||
Property and equipment, net | 51,451 | 51,906 | |||||||||||||||
Intangible assets, net | 4,905 | 5,016 | |||||||||||||||
Other assets | 357 | 351 | |||||||||||||||
TOTAL ASSETS | $ | 107,715 | $ | 109,907 | |||||||||||||
LIABILITIES AND STOCKHOLDERS' EQUITY | |||||||||||||||||
CURRENT LIABILITIES: | |||||||||||||||||
Current maturities of long-term debt | 2,620 | 2,799 | |||||||||||||||
Current portions of capital lease obligations | 300 | 447 | |||||||||||||||
Accounts payable | 15,790 | 13,822 | |||||||||||||||
Accrued liabilities | 8,005 | 8,134 | |||||||||||||||
Customer deposits | 7,777 | 9,940 | |||||||||||||||
Current liabilities held for sale | 700 | 1,613 | |||||||||||||||
Total current liabilities | 35,192 | 36,755 | |||||||||||||||
LONG-TERM LIABILITIES: | |||||||||||||||||
Long-term debt, net of current maturities | 2,600 | 2,600 | |||||||||||||||
Other | 2,549 | 3,060 | |||||||||||||||
Total long-term liabilities | 5,149 | 5,660 | |||||||||||||||
COMMITMENTS AND CONTINGENCIES | |||||||||||||||||
STOCKHOLDERS' EQUITY: | |||||||||||||||||
Preferred stock, $0.001 par value; 10,000,000 shares authorized; no shares issued | |||||||||||||||||
or outstanding | - | - | |||||||||||||||
Common stock, $0.001 par value; 30,000,000 shares authorized; 15,076,588 | |||||||||||||||||
and 15,012,789 shares issued as of March 31, 2016 and | |||||||||||||||||
December 31, 2015, respectively | 15 | 15 | |||||||||||||||
Treasury stock, at cost, 273,937 shares as of March 31, 2016 and December 31, 2015, | |||||||||||||||||
respectively | (1,842 | ) | (1,842 | ) | |||||||||||||
Additional paid-in capital | 378,363 | 378,104 | |||||||||||||||
Accumulated deficit | (309,162 | ) | (308,785 | ) | |||||||||||||
Total stockholders' equity | 67,374 | 67,492 | |||||||||||||||
TOTAL LIABILITIES AND STOCKHOLDERS' EQUITY | $ | 107,715 | $ | 109,907 |
BROADWIND ENERGY, INC. AND SUBSIDIARIES | |||||||||||||
CONSOLIDATED STATEMENTS OF OPERATIONS | |||||||||||||
(IN THOUSANDS, EXCEPT PER SHARE DATA) | |||||||||||||
(UNAUDITED) | |||||||||||||
Three Months Ended March 31, | |||||||||||||
2016 | 2015 | ||||||||||||
Revenues | $ | 46,757 | $ | 49,229 | |||||||||
Cost of sales | 42,795 | 46,484 | |||||||||||
Restructuring | - | - | |||||||||||
Gross profit | 3,962 | 2,745 | |||||||||||
OPERATING EXPENSES: | |||||||||||||
Selling, general and administrative | 4,075 | 5,015 | |||||||||||
Intangible amortization | 111 | 111 | |||||||||||
Restructuring | - | (17 | ) | ||||||||||
Total operating expenses | 4,186 | 5,109 | |||||||||||
Operating loss | (224 | ) | (2,364 | ) | |||||||||
OTHER (EXPENSE) INCOME, net: | |||||||||||||
Interest expense, net | (154 | ) | (154 | ) | |||||||||
Other, net | 12 | 110 | |||||||||||
Gain on sale of assets and restructuring | - | (38 | ) | ||||||||||
Total other (expense), net | (142 | ) | (82 | ) | |||||||||
Net loss before (benefit) provision for income taxes | (366 | ) | (2,446 | ) | |||||||||
(Benefit) provision for income taxes | (8 | ) | 77 | ||||||||||
LOSS FROM CONTINUING OPERATIONS | (358 | ) | (2,523 | ) | |||||||||
LOSS FROM DISCONTINUED OPERATIONS, NET OF TAX | (19 | ) | (2,492 | ) | |||||||||
NET LOSS | $ | (377 | ) | $ | (5,015 | ) | |||||||
NET LOSS PER COMMON SHARE - BASIC AND DILUTED: | |||||||||||||
Loss from continuing operations | $ | (0.02 | ) | $ | (0.17 | ) | |||||||
Loss from discontinued operations | $ | (0.00 | ) | (0.17 | ) | ||||||||
Net loss | $ | (0.03 | ) | $ | (0.34 | ) | |||||||
WEIGHTED AVERAGE COMMON SHARES OUTSTANDING - BASIC AND DILUTED | 14,758 | 14,597 |
BROADWIND ENERGY, INC. AND SUBSIDIARIES | ||||||||||
CONSOLIDATED STATEMENTS OF CASH FLOWS | ||||||||||
(IN THOUSANDS) | ||||||||||
(UNAUDITED) | ||||||||||
Three Months Ended March 31, | ||||||||||
2016 | 2015 | |||||||||
CASH FLOWS FROM OPERATING ACTIVITIES: | ||||||||||
Net loss | $ | (377 | ) | $ | (5,015 | ) | ||||
Loss from discontinued operations | (19 | ) | (2,492 | ) | ||||||
Loss from continuing operations | (358 | ) | (2,523 | ) | ||||||
Adjustments to reconcile net cash used in operating activities: | ||||||||||
Depreciation and amortization expense | 1,657 | 2,256 | ||||||||
Impairment charges | - | 38 | ||||||||
Stock-based compensation | 259 | 255 | ||||||||
Allowance for doubtful accounts | 80 | 1 | ||||||||
Gain on disposal of assets | (138 | ) | - | |||||||
Changes in operating assets and liabilities: | ||||||||||
Accounts receivable | (2,753 | ) | (3,895 | ) | ||||||
Inventories | 5,348 | (11,077 | ) | |||||||
Prepaid expenses and other current assets | (55 | ) | 64 | |||||||
Accounts payable | 1,848 | 3,792 | ||||||||
Accrued liabilities | (129 | ) | (1,729 | ) | ||||||
Customer deposits | (2,163 | ) | (6,553 | ) | ||||||
Other non-current assets and liabilities | (535 | ) | (501 | ) | ||||||
Net cash provided by (used in) operating activities of continuing operations | 3,061 | (19,872 | ) | |||||||
CASH FLOWS FROM INVESTING ACTIVITIES: | ||||||||||
Purchases of available for sale securities | (1,978 | ) | (1,884 | ) | ||||||
Sales of available for sale securities | 36 | 5,083 | ||||||||
Maturities of available for sale securities | 2,425 | 4,825 | ||||||||
Purchases of property and equipment | (950 | ) | (668 | ) | ||||||
Decrease in restricted cash | 44 | - | ||||||||
Net cash (used in) provided by investing activities of continuing operations | (423 | ) | 7,356 | |||||||
CASH FLOWS FROM FINANCING ACTIVITIES: | ||||||||||
Payments on lines of credit and notes payable | (18,400 | ) | (17,162 | ) | ||||||
Proceeds from lines of credit and notes payable | 18,400 | 18,400 | ||||||||
Payments on long-term debt | (179 | ) | - | |||||||
Principal payments on capital leases | (147 | ) | (241 | ) | ||||||
Net cash (used in) provided by financing activities of continuing operations | (326 | ) | 997 | |||||||
DISCONTINUED OPERATIONS: | ||||||||||
Operating cash flows | 826 | (169 | ) | |||||||
Investing cash flows | 151 | (171 | ) | |||||||
Financing cash flows | (12 | ) | (142 | ) | ||||||
Net cash provided by (used in) discontinued operations | 965 | (482 | ) | |||||||
Add: Cash balance of discontinued operations, beginning of period | - | 93 | ||||||||
Less: Cash balance of discontinued operations, end of period | 2 | 10 | ||||||||
NET INCREASE (DECREASE) IN CASH AND CASH EQUIVALENTS | 3,275 | (11,918 | ) | |||||||
CASH AND CASH EQUIVALENTS, beginning of the period | 6,436 | 12,057 | ||||||||
CASH AND CASH EQUIVALENTS, end of the period | $ | 9,711 | $ | 139 |
BROADWIND ENERGY, INC. AND SUBSIDIARIES | ||||||||||||
SELECTED SEGMENT FINANCIAL INFORMATION | ||||||||||||
(IN THOUSANDS) | ||||||||||||
(UNAUDITED) | ||||||||||||
Three Months Ended | ||||||||||||
March 31, | ||||||||||||
2016 | 2015 | |||||||||||
ORDERS: | ||||||||||||
Towers and Weldments | $ | 35,436 | $ | 11,770 | ||||||||
Gearing | 3,540 | 9,918 | ||||||||||
Total orders | $ | 38,976 | $ | 21,688 | ||||||||
REVENUES: | ||||||||||||
Towers and Weldments | $ | 42,015 | $ | 41,028 | ||||||||
Gearing | 4,760 | 8,608 | ||||||||||
Corporate and Other | (18 | ) | (407 | ) | ||||||||
Total revenues | $ | 46,757 | $ | 49,229 | ||||||||
OPERATING (LOSS) PROFIT: | ||||||||||||
Towers and Weldments | $ | 3,241 | $ | 1,135 | ||||||||
Gearing | (1,202 | ) | (1,211 | ) | ||||||||
Corporate and Other | (2,263 | ) | (2,288 | ) | ||||||||
Total operating (loss) profit | $ | (224 | ) | $ | (2,364 | ) | ||||||
Non-GAAP Financial Measure
The Company provides non-GAAP adjusted EBITDA (earnings before interest, income taxes, depreciation, amortization, and stock compensation) as supplemental information regarding the Company’s business performance. The Company’s management uses adjusted EBITDA when it internally evaluates the performance of the Company’s business, reviews financial trends and makes operating and strategic decisions. The Company believes that this non-GAAP financial measure is useful to investors because it provides investors with a better understanding of the Company’s past financial performance and future results allows investors to evaluate the Company’s performance using the same methodology and information as used by the Company’s management. The Company's definition of adjusted EBITDA may be different from similar non-GAAP financial measures used by other companies and/or analysts.
BROADWIND ENERGY, INC. AND SUBSIDIARIES | ||||||||||||
RECONCILIATION OF NON-GAAP FINANCIAL MEASURES | ||||||||||||
(IN THOUSANDS) | ||||||||||||
(UNAUDITED) | ||||||||||||
Consolidated | Three Months Ended March 31, | |||||||||||
2016 | 2015 | |||||||||||
Operating (Loss) | $ | (224 | ) | $ | (2,364 | ) | ||||||
Depreciation and Amortization | 1,657 | 2,256 | ||||||||||
Share-based Compensation and Other Stock Payments | 259 | 255 | ||||||||||
Other Income | 12 | 110 | ||||||||||
Restructuring Expense | - | (17 | ) | |||||||||
Adjusted EBITDA (Non-GAAP) | $ | 1,704 | $ | 240 |
Towers and Weldments Segment | Three Months Ended March 31, | |||||||
2016 | 2015 | |||||||
Operating Profit | $ | 3,241 | $ | 1,135 | ||||
Depreciation | 966 | 914 | ||||||
Share-based Compensation and Other Stock Payments | 38 | 15 | ||||||
Other Income | 12 | 110 | ||||||
Restructuring Expense | (17 | ) | ||||||
Adjusted EBITDA (Non-GAAP) | $ | 4,257 | $ | 2,157 |
Three Months Ended March 31, | |||||||||
Gearing Segment | 2016 | 2015 | |||||||
Operating (Loss) | $ | (1,202 | ) | $ | (1,211 | ) | |||
Depreciation | 528 | 1,185 | |||||||
Amortization | 111 | 111 | |||||||
Share-based Compensation and Other Stock Payments | 48 | 62 | |||||||
Adjusted EBITDA (Non-GAAP) | $ | (515 | ) | $ | 147 |
Corporate and Other | Three Months Ended March 31, | |||||||
2016 | 2015 | |||||||
Operating (Loss) | $ | (2,263 | ) | $ | (2,288 | ) | ||
Depreciation | 52 | 46 | ||||||
Share-based Compensation and Other Stock Payments | 173 | 178 | ||||||
Adjusted EBITDA (Non-GAAP) | $ | (2,038 | ) | $ | (2,064 | ) |
BWEN INVESTOR CONTACT:
Joni Konstantelos
708.780.4819
joni.konstantelos@bwen.com
EXHIBIT 99.2
Q1 2016 Earnings Conference Call April 28, 2016
Industry Data and Forward-Looking Statements Disclaimer ▪ Broadwindobtained the industry and market data used throughout this presentation from our own research, internal surveys and studies conducted by third parties, independent industry associations or general publications and other publicly available information. Independent industry publications and surveys generally state that they have obtained information from sources believed to be reliable, but do not guarantee the accuracy or completeness of such information. Forecasts are particularly likely to be inaccurate, especially over long periods of time. We are not aware of any misstatements in the industry data we have presented herein, but estimates involve risks and uncertainties and are subject to change based on various factors beyond our control. ▪ This presentation contains “forward-looking statements”—that is, statements related to future, not past, events—as defined in Section21E of the Securities Exchange Act of 1934, as amended, that reflect our current expectations regarding our future growth, results of operations, financial condition, cash flows, performance, business prospects and opportunities, as well as assumptions made by, and information currently available to, our management. Forward-looking statements include any statement that does not directly relate to a current or historical fact. We have tried toidentify forward-looking statements by using words such as “anticipate,” “believe,” “expect,” “intend,” “will,” “should,” “may,” “plan” and similar expressions, but these words are not the exclusive means of identifying forward-looking statements. Our forward-looking statements may include or relate to the following: (i)our expectations relating to state, local and federal regulatory frameworks affecting the industries in which we compete, including the wind energy industry, and the related extension, continuation or renewal of federal tax incentives and grants and state renewable portfolio standards; (ii) our expectations with respect to our customer relationships and efforts to diversify our customer base and sector focus and leverage customer relationships acrossbusiness units; (iii)our plans to continue to grow our business organically; (iv)our beliefs with respect to the sufficiency of our liquidity and our plans toevaluate alternate sources of funding if necessary; (v)our plans and assumptions, including estimated costs and saving opportunities, regarding our restructuring efforts; (vi)our beliefs regarding our ability to realize revenue from customer orders and backlog; (vii)our beliefs regarding our ability to operate our business efficiently, manage capital expenditures and costs effectively, and generate cash flow; (viii)our beliefs and expectations relating to the economy and the potential impact it may have on our business, including our customers; (ix)our beliefs regarding the state of the wind energy market and other energy and industrial markets generally and the impact of competition and economic volatility in those markets; (x)our beliefs and expectations relating to the effects of market disruptions and regular market volatility, including fluctuations in the price of oil, gas and other commodities; and (xi) our beliefs regarding the potential loss of tax benefits if we experience an “ownership change” under Section382 of the Internal Revenue Code of 1986, as amended. Thesestatements are based on information currently available to us and are subject to various risks, uncertainties and other factors that could cause our actual growth, results of operations, financial condition, cash flows, performance, business prospects and opportunities to differ materially from those expressed in, or implied by, these statements. We are under no duty to update any of these forward-looking statements after the date of this release to conform such statements to actual results. You should not consider any list of such factors to be an exhaustive statement of all of the risks, uncertainties or potentially inaccurate assumptions that could cause our current expectations or beliefs to change. ▪ This presentation contains non-GAAP financial information. Webelieve that certain non-GAAP financial measures may provide users of this financial information with meaningful comparisons between current results and results in prior operating periods. We believe that thesenon-GAAP financial measures can provide additional meaningful reflection of underlying trends of the business because they provide a comparison of historical information that excludes certain infrequently occurring or non-operational items that impact the overall comparability. Non-GAAP financial measures should be viewed in addition to, and not as an alternative to, our reported results prepared in accordance with GAAP. Please see our earnings release dated April 28, 2016 for a reconciliation of certain non-GAAP measures presented in this presentation. 4/28/16 © 2016 Broadwind Energy, Inc. All rights reserved. 2
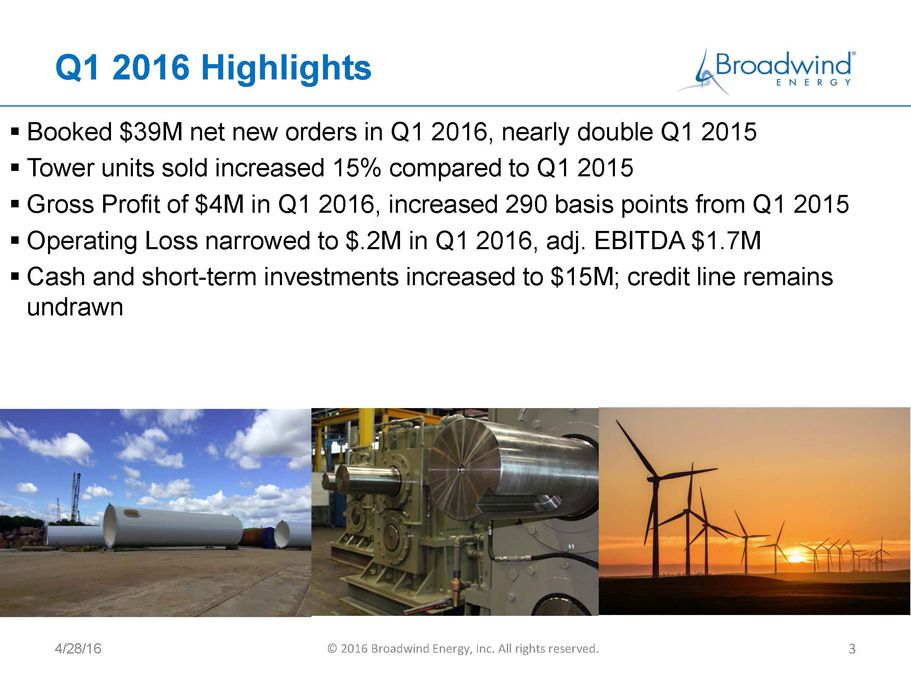
Q1 2016 Highlights ▪Booked $39M net new orders in Q1 2016, nearly double Q1 2015 ▪Tower units sold increased 15% compared to Q1 2015 ▪Gross Profit of $4M in Q1 2016, increased 290 basis points from Q1 2015 ▪Operating Loss narrowed to $.2M in Q1 2016, adj. EBITDA $1.7M ▪Cash and short-term investments increased to $15M; credit line remains undrawn 4/28/16 © 2016 Broadwind Energy, Inc. All rights reserved. 3
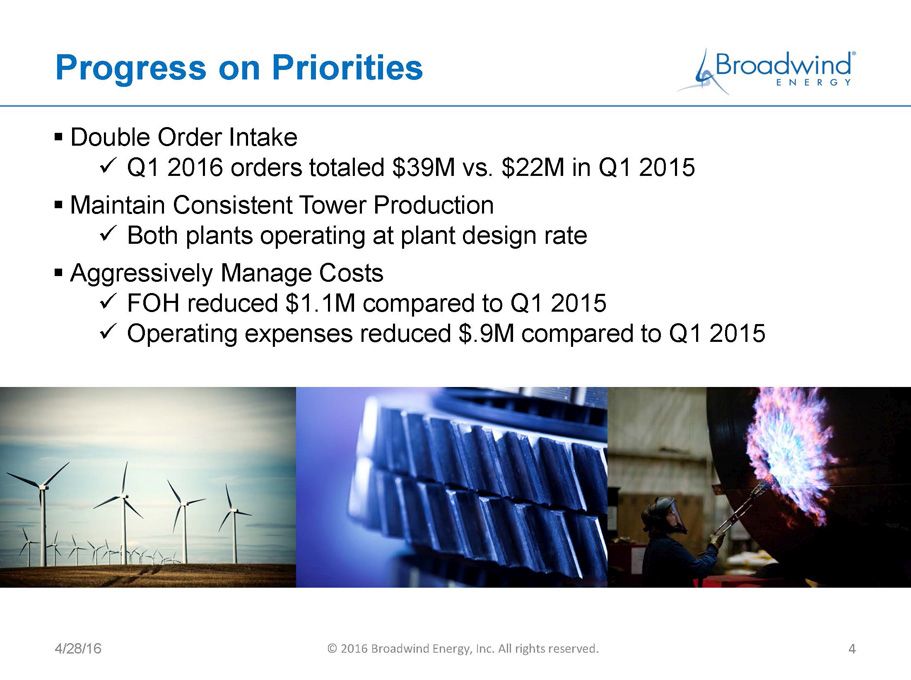
Progress on Priorities 4/28/16 © 2016 Broadwind Energy, Inc. All rights reserved. 4 ▪Double Order Intake xQ1 2016 orders totaled $39M vs. $22M in Q1 2015 ▪Maintain Consistent Tower Production xBoth plants operating at plant design rate ▪Aggressively Manage Costs xFOH reduced $1.1M compared to Q1 2015 xOperating expenses reduced $.9M compared to Q1 2015
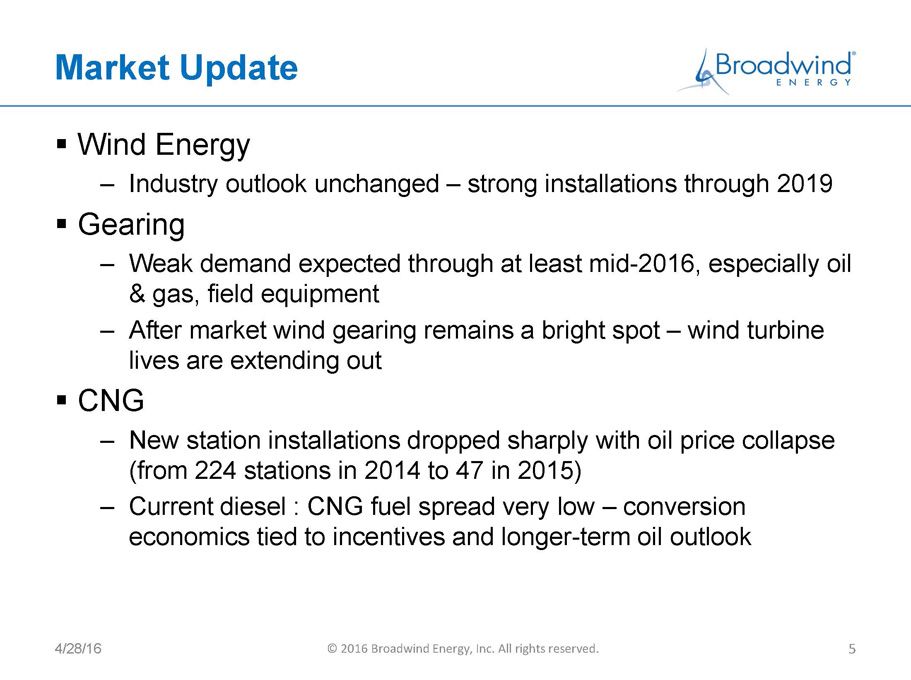
Market Update ▪Wind Energy – Industry outlook unchanged –strong installations through 2019 ▪Gearing – Weak demand expected through at least mid-2016, especially oil & gas, field equipment – After market wind gearing remains a bright spot –wind turbine lives are extending out ▪CNG – New station installations dropped sharply with oil price collapse (from 224 stations in 2014 to 47 in 2015) – Current diesel : CNG fuel spread very low –conversion economics tied to incentives and longer-term oil outlook 4/28/16 © 2016 Broadwind Energy, Inc. All rights reserved. 5
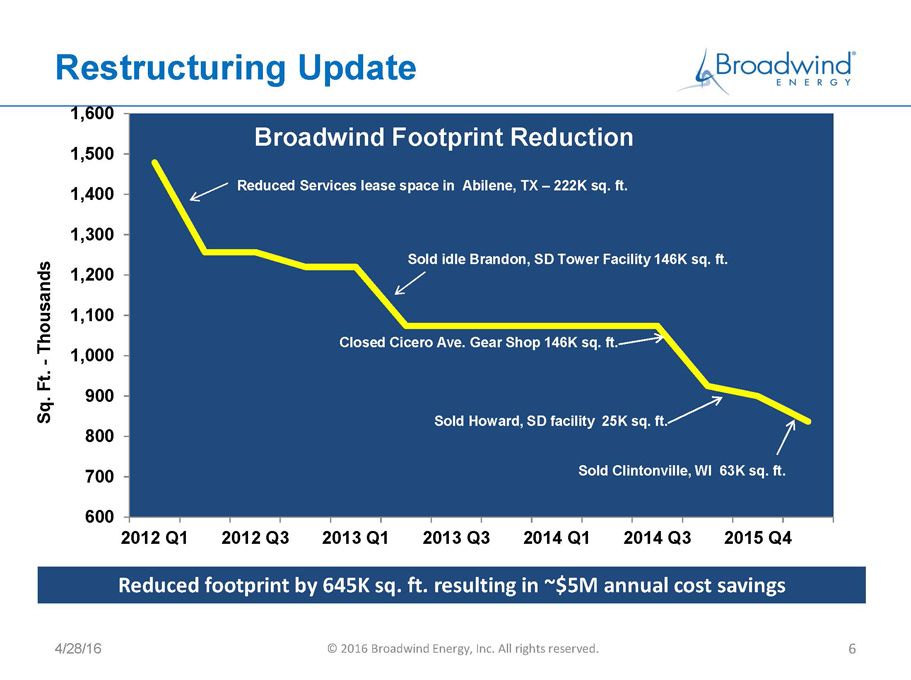
Restructuring Update 4/28/16 © 2016 Broadwind Energy, Inc. All rights reserved. 6 600 700 800 900 1,000 1,100 1,200 1,300 1,400 1,500 1,600 2012 Q1 2012 Q3 2013 Q1 2013 Q3 2014 Q1 2014 Q3 2015 Q4 S q . F t . - T h o u s a n d s BroadwindFootprint Reduction Sold idle Brandon, SD Tower Facility 146K sq. ft. Closed Cicero Ave.Gear Shop 146K sq. ft. Sold Howard, SD facility 25K sq. ft. Sold Clintonville, WI 63K sq. ft. Reduced Services lease space in Abilene, TX –222K sq. ft. Reduced footprint by 645K sq. ft. resulting in ~$5M annual cost savings
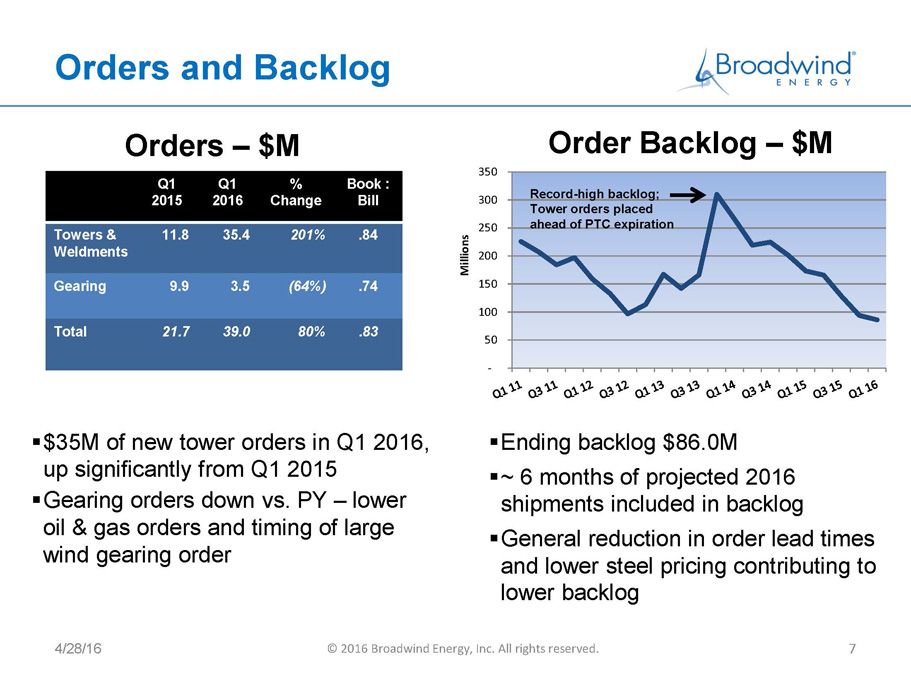
Orders and Backlog Orders –$M ▪$35M of new tower orders in Q1 2016, up significantly from Q1 2015 ▪Gearing orders down vs. PY –lower oil & gas orders and timing of large wind gearing order Order Backlog –$M ▪Ending backlog $86.0M ▪~ 6 months of projected 2016 shipments included in backlog ▪General reduction in order lead times and lower steel pricing contributing to lower backlog Q1 2015 Q1 2016 % Change Book : Bill Towers & Weldments 11.8 35.4 201% .84 Gearing 9.9 3.5 (64%) .74 Total 21.7 39.0 80% .83 4/28/16 © 2016 Broadwind Energy, Inc. All rights reserved. 7 - 50 100 150 200 250 300 350 M i l l i o n s Record-high backlog; Tower orders placed ahead of PTC expiration
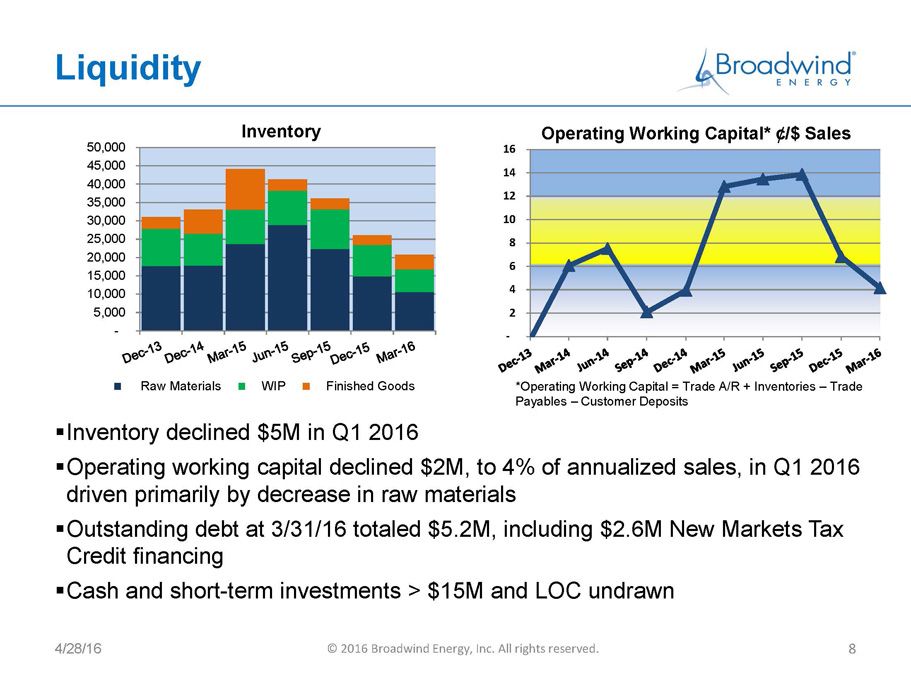
- 2 4 6 8 10 12 14 16 Liquidity 4/28/16 © 2016 BroadwindEnergy, Inc. All rights reserved. 8 ▪Inventory declined $5M in Q1 2016 ▪Operating working capital declined $2M, to 4% of annualized sales, in Q1 2016 driven primarily by decrease in raw materials ▪Outstanding debt at 3/31/16 totaled $5.2M, including $2.6M New Markets Tax Credit financing ▪Cash and short-term investments >$15M and LOC undrawn Inventory Operating Working Capital* ¢/$ Sales *Operating Working Capital = Trade A/R + Inventories –Trade Payables –Customer Deposits - 5,000 10,000 15,000 20,000 25,000 30,000 35,000 40,000 45,000 50,000 Raw Materials WIP Finished Goods
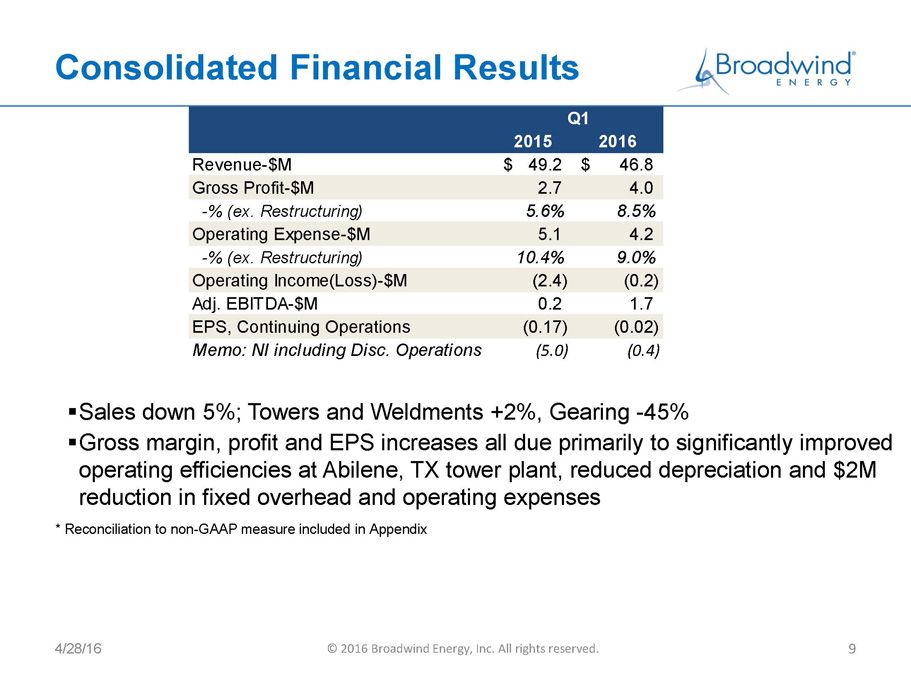
Consolidated Financial Results 4/28/16 © 2016 Broadwind Energy, Inc. All rights reserved. 9 ▪Sales down 5%; Towers and Weldments +2%, Gearing -45% ▪Gross margin, profit and EPS increases all due primarily to significantly improved operating efficiencies at Abilene, TX tower plant, reduced depreciation and $2M reduction in fixed overhead and operating expenses * Reconciliation to non-GAAP measure included in Appendix 2015 2016 Revenue-$M 49.2$ 46.8$ Gross Profit-$M 2.7 4.0 -% (ex. Restructuring) 5.6% 8.5% Operating Expense-$M 5.1 4.2 -% (ex. Restructuring) 10.4% 9.0% Operating Income(Loss)-$M (2.4) (0.2) Adj. EBITDA-$M 0.2 1.7 EPS, Continuing Operations (0.17) (0.02) Memo: NI including Disc. Operations (5.0) (0.4) Q1
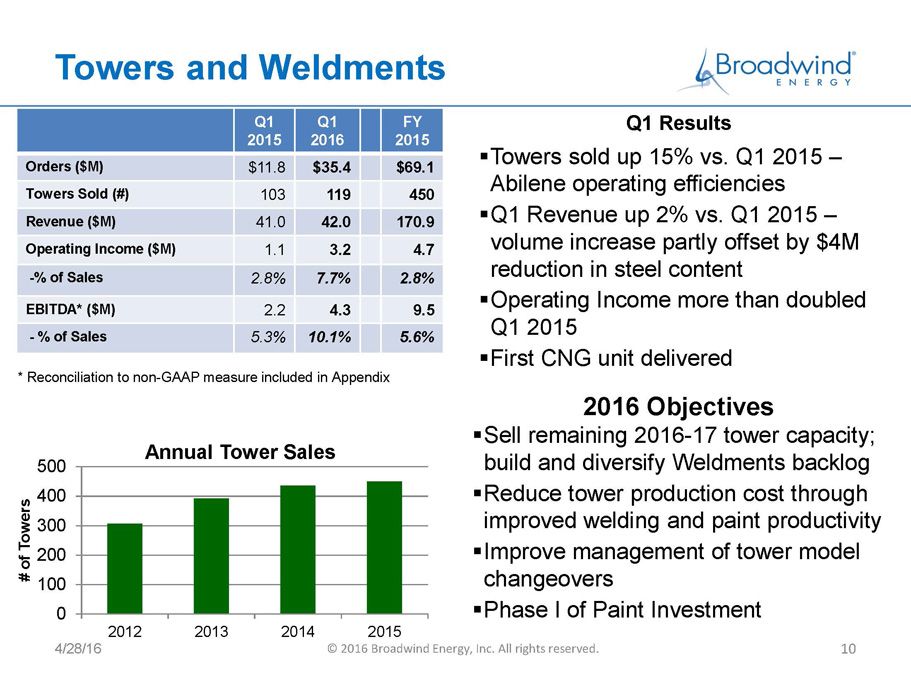
Towers and Weldments Q1 2015 Q1 2016 FY 2015 Orders ($M) $11.8 $35.4 $69.1 Towers Sold (#) 103 119 450 Revenue ($M) 41.0 42.0 170.9 Operating Income($M) 1.1 3.2 4.7 -% of Sales 2.8% 7.7% 2.8% EBITDA* ($M) 2.2 4.3 9.5 -% of Sales 5.3% 10.1% 5.6% Q1 Results ▪Towers sold up 15% vs. Q1 2015 – Abilene operating efficiencies ▪Q1 Revenue up 2% vs. Q1 2015 – volume increase partly offset by $4M reduction in steel content ▪Operating Income more than doubled Q1 2015 ▪First CNG unit delivered 2016 Objectives ▪Sell remaining 2016-17 tower capacity; build and diversify Weldments backlog ▪Reduce tower production cost through improved welding and paint productivity ▪Improve management of tower model changeovers ▪Phase I of Paint Investment 4/28/16 © 2016 Broadwind Energy, Inc. All rights reserved. 10 0 100 200 300 400 500 2012 2013 2014 2015 # o f T o w e r s Annual Tower Sales * Reconciliation to non-GAAP measure included in Appendix
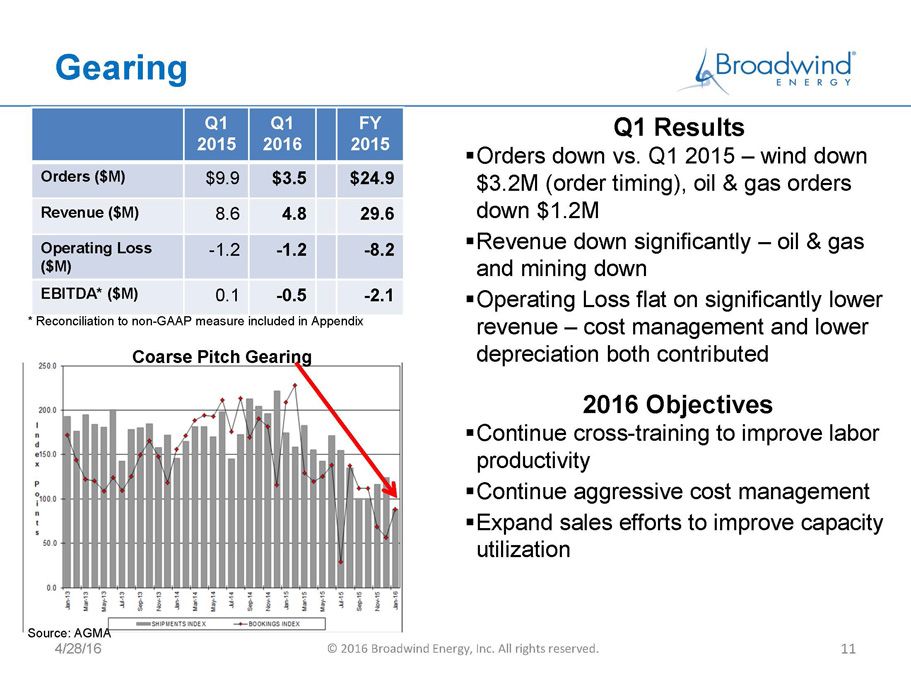
Gearing Q1 2015 Q1 2016 FY 2015 Orders ($M) $9.9 $3.5 $24.9 Revenue ($M) 8.6 4.8 29.6 Operating Loss ($M) -1.2 -1.2 -8.2 EBITDA* ($M) 0.1 -0.5 -2.1 Q1 Results ▪Orders down vs. Q1 2015 –wind down $3.2M (order timing), oil & gas orders down $1.2M ▪Revenue down significantly –oil & gas and mining down ▪Operating Loss flat on significantly lower revenue –cost management and lower depreciation both contributed 4/28/16 © 2016 Broadwind Energy, Inc. All rights reserved. 11 2016 Objectives ▪Continue cross-training to improve labor productivity ▪Continue aggressive cost management ▪Expand sales efforts to improve capacity utilization * Reconciliation to non-GAAP measure included in Appendix Source: AGMA Coarse Pitch Gearing
Summary 4/28/16 © 2016 Broadwind Energy, Inc. All rights reserved. 12 ▪Tower production stabilized ▪Gearing continues to manage well through oil & gas and mining downturn; savings from consolidation in effect, aggressive cost management continues ▪Cost reduction and continuous improvement remain primary focus areas ▪Q2 Outlook: $42-44M Revenue, small operating loss consistent with Q1 2016
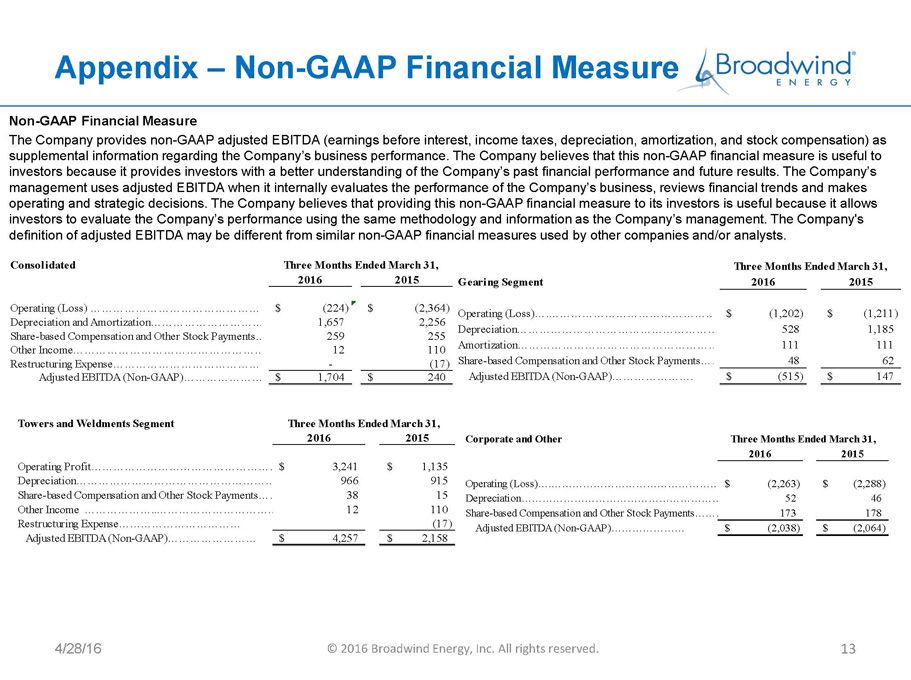
Appendix –Non-GAAP Financial Measure Non-GAAP Financial Measure The Company provides non-GAAP adjusted EBITDA (earnings before interest, income taxes, depreciation, amortization, and stock compensation) as supplemental information regarding the Company’s business performance. The Company believes that this non-GAAP financial measureis useful to investors because it provides investors with a better understanding of the Company’s past financial performance and future results. The Company’s management uses adjusted EBITDA when it internally evaluates the performance of the Company’s business, reviews financial trendsand makes operating and strategic decisions. The Company believes that providing this non-GAAP financial measure to its investors is useful because it allows investors to evaluate the Company’s performance using the same methodology and information as the Company’s management. The Company's definition of adjusted EBITDA may be different from similar non-GAAP financial measures used by other companies and/or analysts. 4/28/16 © 2016 Broadwind Energy, Inc. All rights reserved. 13 Towers and Weldments Segment 2016 2015 Operating Profit……………………………………………….. 3,241$ 1,135$ Depreciation………………………………………………………. 966 915 Share-based Compensation and Other Stock Payments………………………………………………………………38 15 Other Income ………………..………………………………………….. 12 110 Restructuring Expense…………………………… (17) Adjusted EBITDA (Non-GAAP)…………………… 4,257$ 2,158$ Three Months Ended March 31, Gearing Segment 2016 2015 Operating (Loss)….………………………………………………………(1,202)$ (1,211)$ Depreciation………………………………………………………… 528 1,185 Amortization………………………………………………………….. 111 111 Share-based Compensation and Other Stock Payments………………………………………………………………48 62 Adjusted EBITDA (Non-GAAP)…………………. (515)$ 147$ Three Months Ended March 31, Consolidated 2016 2015 Operating (Loss) ………………………………………………………………(224)$ (2,364)$ Depreciation and Amortization………………………………………………………………1,657 2,256 Share-based Compensation and Other Stock Payments………………………………………………………………259 255 Other Income…………………………………………………... 12 110 Restructuring Expense…………………………………………………... - (17) Adjusted EBITDA……………………………………………………………… Adjusted EBITDA (Non-GAAP)………………… 1,704$ 240$ Three Months Ended March 31, Corporate and Other 2016 2015 Operating (Loss)….………………………………………………………(2,263)$ (2,288)$ Depreciation………………………………………………………. 52 46 Share-based Compensation and Other Stock Payments………………………………………………………………173 178 Adjusted EBITDA (Non-GAAP)………………… (2,038)$ (2,064)$ Three Months Ended March 31,
Click to edit Master title style ▪ Click to edit Master text styles –Second level • Third level – Fourth level » Fifth level Broadwind Energy is committed to helping customers maximize performance of their energy and infrastructure investments— quicker, easier and smarter. 4/28/16 © 2016 Broadwind Energy, Inc. All rights reserved. 14
\/XBNE1<:QD,55.07&!FB-Q SCH[96TB)F
M.R+N8>\TR@M(VSC=2JT0.@A ;,)(SN/(K7T<+Y'A\K!(!MEVY^/BM[31MC:&
ML '0*:5T6MMM;+'4ON$3:*1L50YV&O<.>XE
M^IV^3GD3X*+1UVUC)$XXIZ2M\;QGNJ"?&-+G1GXX*WG"M0)*9H!Z#[E8XHH_
M:;!4ENTD.)1YXY_8M3P96 /T>!5XZU83W2"OCQ/(//(6EN0.EV'9R,*17AN-
M+QR(43NCR8FGKMD!<]FU90FDF-'Q#3RN]UCGF-Y/@[;^Y3N6!KXB#R=EI4+O
M]'L7M^B[P\5)^&Z]MSMD;Y#B:,ED@_I!5M'FFO=SFU0U'#/%LC&YQ'*'19Y$
M Y:3Y=/BNX<%VBR4=-55]BI60/N3Q+4.#B27CIY8.1A0^_V05\+G%@,K!MM]
M+R*QN$KQ5VJJ<(H\D[30.=AK\; CP=MSY'KXK2+;A6:ZG<.B<362W\06]]#=
M8&S4Y^B>3F.\6GH5PR^_@]4T^AY^HR/-9AI]$P=AQ.P&-PFY[(0WLR[*.'^ C[311NJKF]OO5=0 7-
M'@T A6TX ^)K39"QMRK&12.Y1@%S_7
M2-\>:]V/B*UWP.-LK&3.;])F"UX'B6G?'GR0;=%K;Q?+;9NZ_&E9%3=[G1KS
M[V,9^\+777C&RVMT0JZYH=,P2,8QCGDM(R"<#8'S02-%AVJY4EUHV55OG9/
M[8.;T/@1T/DK%[OENLD#9;E5,@:_(8#DN>0,D #3?-WBIB-C=\!V>2+_P!J5[<54@_),=SC
M;XGS/V*:5-0ZEH*FHB@=/)#$Z01,.'2$#.!Y\UB4_NXQDDC.PW7->.>. **B
MN_"=X#*RFF,%10R#WBWGJ+#S((QZ%71*(]I5]M7$-S@NG#[ZF&KFC(K(I?#8YYGU'7U7B>0W&LEJ/H3R/=(_2,-+B
"U4U++4UA:P/E;E
MPZ <^6_)?4% 9A2015TD+JX1-,PCV&K&^!T&=E$^JT('7PS6"Z%@),#O>8[\
MX=/BIS8KE%64HCD((=MS7NY6R&Z4KH:IF[
J;*YX'>.;[C1GGG[=E]C0Q?BZVP4]3*)
M:UL;6:!OC U.\#MR2=3.H&L]CM]))*VT4E)0-<#[14PPM8XC?(! W*YW9NT
M6U<3=H/[EZJC X??&Z"%LS2#+,#]8'H0"!Z97B/CB_TO:K36VX6F6EM,V:>)
MA9G47$?E
([@PFEI)._:T[@.Y1,^ &?AYKDX
M7'X-[9,D?@_=V<5D\:E<5/\ O^SKW9YPZWACA2CM^EO?AO>5#A]:1V[O[O@N
M0\.;?A$U'Z74?V;E]"%?/?#G_P#(FH_2ZC^S*<':;1FM/>81Q58K;%$>4OH.
M;^#?_5*^3NS;AR+BCC:&AJ1FDC+YYVC8EC3R\LD@+ZQF_@W_ -4KY^_!UC:>
M+[T\CWFTV,]=Y!_
;+7O$ZCY=6.;_FR8L=NT]?KT==L7#UKL=&RF
MME#! QHYM8-3O,GF2J7SAVUWRE?3W.A@F8YN,E@#F^8=S"W&4RO.B]HGFB>K
MTN2LQRS'1\C=IG"C^$+_ #40>Z2DE89J=[CN6G;!\P1CY+ZGX;_B_;/T6+]0
M+C'X33XN_L;!@S=W,X_U?=_:NS\-_P 7[9^BQ?J!>CQN2
%$2\OB<=HS3,)<:
MV4'?4%05[_'[%DRB-CW,):YS#I)'(D*V1$3[SGGL]*ZDN#;C&
MUH9[4U[7]X1L22W;.1T4WI6(W7>OG!CO,SRVUOY2V>%CS5,,+XV2S1QO><-:
M]P!+Q60HIVA\-?NEL$D$+N[N$!$]'*#@LE;N-^@/)5I$3.K3J%KS-8W6-R
MDDT\<,;GRO9&QO-SR !\U[B>V1@>QP
U['#+7-.01ZKBW"
M_"U3QN:R[7BNE8XOT-