Exhibit 99.1

Broadwind Energy Announces Q4 and Full Year 2014 Results
Q4 Highlights:
· Booked $30 million in new orders; ending backlog totaled $202 million
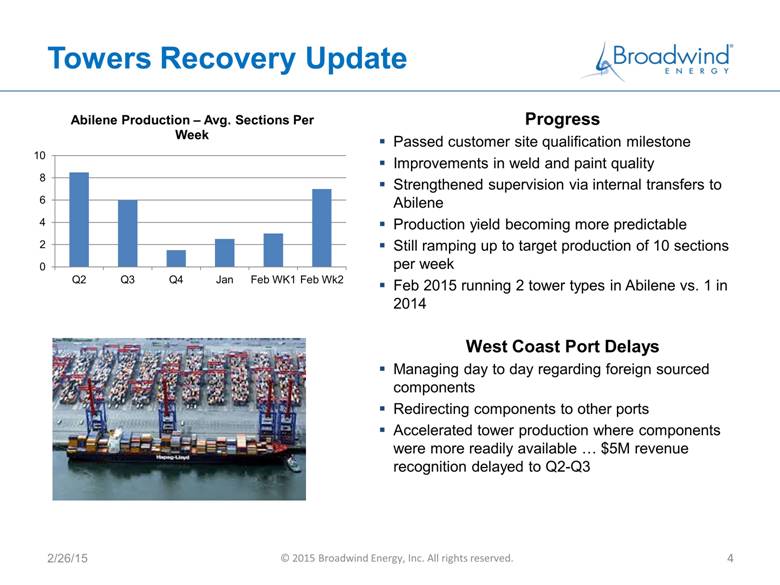
· Revenue of $53.8 million down 5% from Q4 2013 due to short-term production issues in Abilene tower facility
· SGA expenses declined 12% to $5.0 million from Q4 2013
· Gearing and Services operating losses reduced dramatically compared to Q4 2013
Full-Year Highlights:
· Revenue of $241.3 million, up 12% compared to 2013
· Operating loss reduced from $13.2 million in 2013 to $5.9 million in 2014
· Gearing showed $2.7 million improvement in non-GAAP Adjusted EBITDA compared to 2013; operating loss reduced by 47% compared to 2013
· Three-year $13.7 million restructuring investment completed
Cicero, Ill., February 26, 2015 — Broadwind Energy, Inc. (NASDAQ: BWEN) reported sales of $53.8 million for the fourth quarter of 2014, down 5% compared to $56.4 million in the fourth quarter of 2013, reflecting lower tower production partly offset by increased activity in the Services segment.
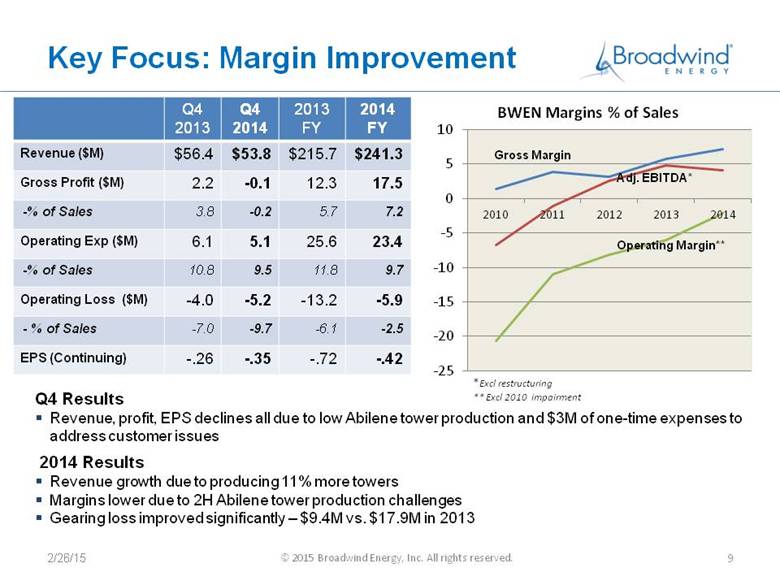
The Company reported a net loss of $5.2 million or $.35 per share in the fourth quarter of 2014, compared to a net loss of $3.7 million or $.26 per share in the fourth quarter of 2013. The $.09 per share reduction was due to weaker Towers and Weldments segment results largely offset by improvements in the Company’s other business segments, mainly Gearing. Towers and Weldments segment operating income was down $5.2 million from the prior-year period due to delayed production associated with a new customer and new tower design qualification in the Company’s Abilene, TX tower facility. The Company reported a non-GAAP adjusted EBITDA (earnings before interest, taxes, depreciation, amortization, share-based payments and restructuring costs) loss of $1.8 million in the fourth quarter of 2014, compared to non-GAAP adjusted EBITDA of $2.8 million in the fourth quarter of 2013. The $4.6 million decrease was due mainly to the operational issues in Towers and Weldments.
Full-year 2014 sales totaled $241.3 million, which exceeded full-year 2013 sales by $25.6 million, or 12%, reflecting an 11% increase in tower production volume. For the full-year 2014, the Company’s net loss narrowed to $6.2 million, or $.42 per share, compared to a net loss of $10.5 million, or $.73 per share, reported in 2013. The sharp improvement was due mainly to $5.0 million lower restructuring charges in the current year due to the conclusion of the plant consolidation and improved results in the Gearing segment partly offset by weaker Towers and
Weldments results in the second half of the year, and by the absence of a $3.6 million gain from the 2013 sale of an idle tower facility located in South Dakota. The Company reported non-GAAP adjusted EBITDA of $8.9 million for the full-year 2014 down from $10.3 million in 2013 due to the production issues in Towers and Weldments, somewhat offset by improvements in the Gearing and Services segments.
Peter Duprey, President and Chief Executive Officer, stated, “The fourth quarter and full-year results were significantly affected by the production issues in the Abilene tower facility. The entire team in our towers business has worked tirelessly to resolve these short-term production issues and move beyond them. The customer has certified the Abilene facility for normal production going forward and through-put has improved significantly from the fourth quarter. We are implementing a robust advanced product quality process (APQP) to ensure that future product introduction risks are addressed well in advance of production.”
Mr. Duprey continued, “Our performance in 2014 was not what it should have been, and this was an expensive learning experience for the business. Even with the temporary set-back at our Abilene facility, Broadwind continued to show year-over-year improvement; 2014 total revenue increased 12% compared to the prior year and our loss per share was reduced significantly. Our Gearing segment cut its operating loss by nearly half and its near break-even EBITDA was an improvement of 74% compared to the prior year.”
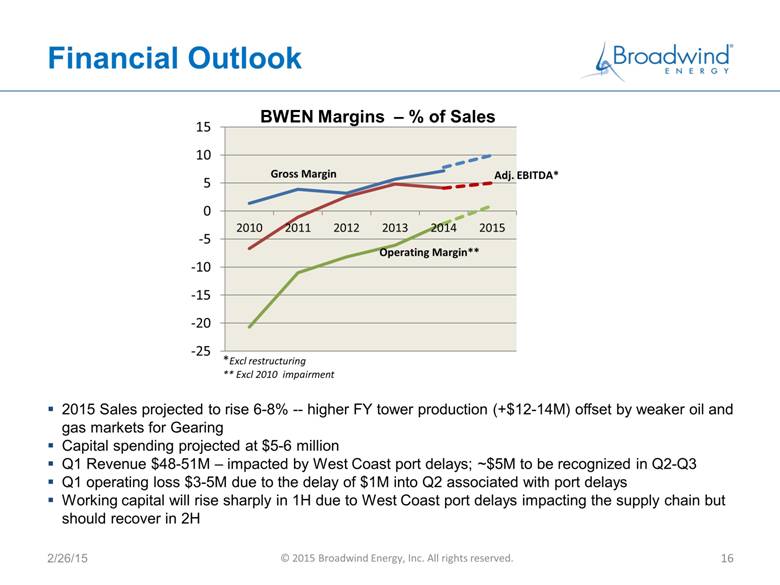
Mr. Duprey concluded, “With the tower qualification process behind us and production resuming to more typical levels, we expect to fulfill our 2015 order book of approximately 500 towers. Our three-year plant consolidation investment is complete, and we believe our Gearing and Services businesses will continue to make progress, contributing solid improvements to the top and bottom lines. We are confident in our ability to continue our improving trends and are therefore expecting to report 2015 sales of $255-$260 million and positive EPS.”
Orders and Backlog
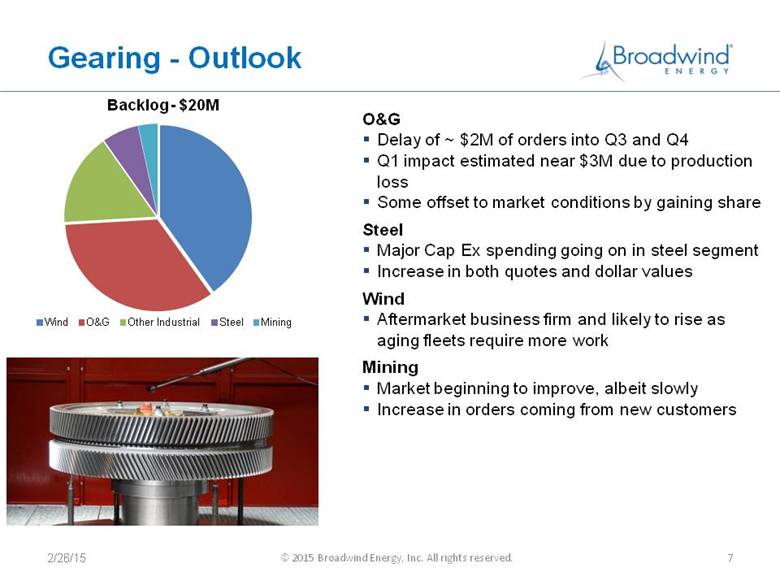
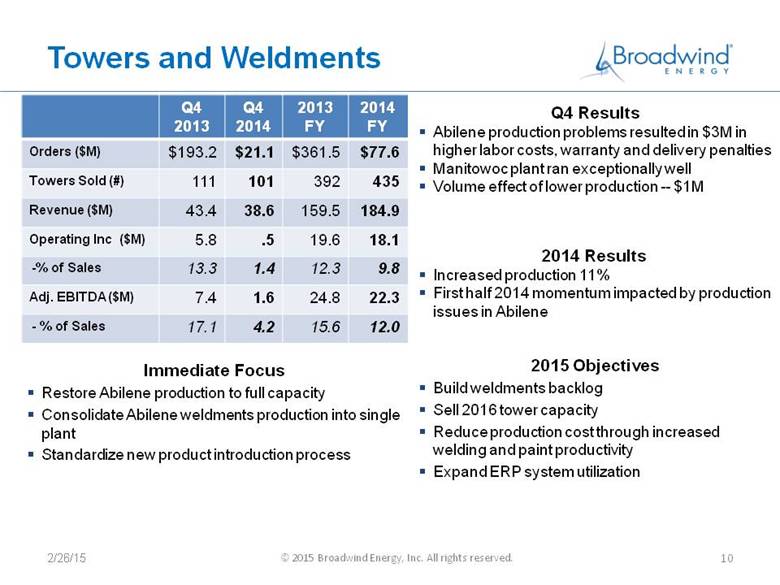
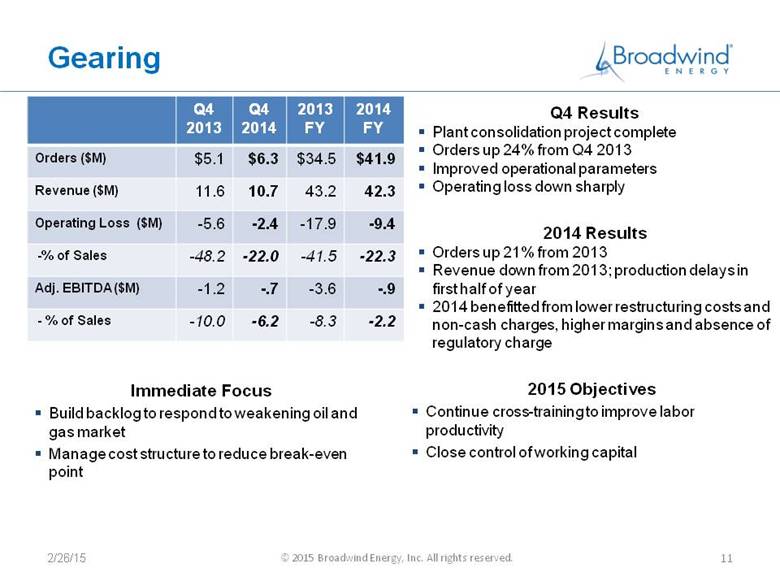
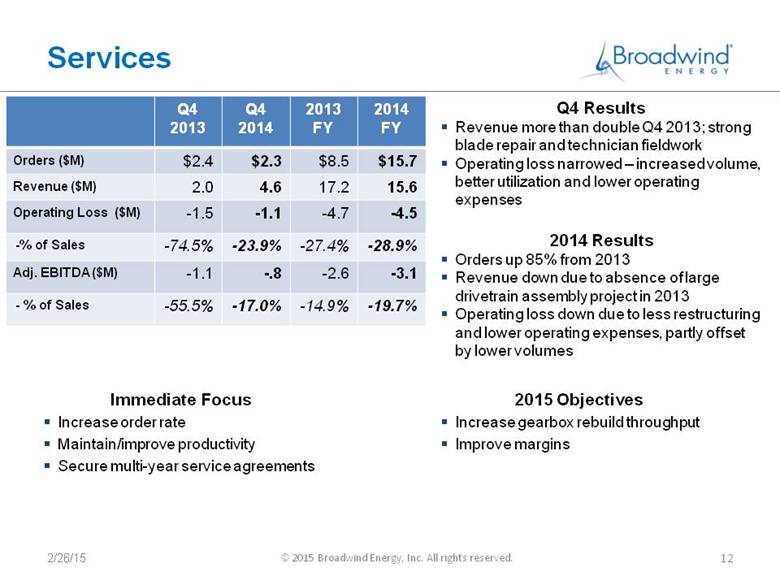
The Company booked $29.7 million in net new orders in the fourth quarter of 2014, down from a record $200.7 million in the fourth quarter of 2013. Towers and Weldments orders, which vary considerably from quarter to quarter, totaled $21.1 million, down from $193.2 million in the fourth quarter of 2013. Gearing orders totaled $6.3 million, up 22% from the fourth quarter of 2013. Services orders totaled $2.3 million, in line with orders from the prior-year fourth quarter.
Full-year orders totaled $135.1 million, down from a record $404.4 million in 2013. Towers and Weldments 2014 orders totaled $77.6 million, down from $361.5 million in 2013. Gearing orders totaled $41.9 million, a 21% increase over full year 2013 Gearing orders. Services orders totaled $15.7 million, a sharp improvement over $8.5 million in 2013.
At December 31, 2014, total backlog was $202.4 million, down 35% from the record-high backlog at December 31, 2013.
Segment Results
Towers and Weldments
Broadwind Energy produces fabrications for wind, oil and gas, mining and other industrial applications, specializing in the production of wind turbine towers.
Towers and Weldments segment sales totaled $38.6 million for the fourth quarter of 2014, down 11% from fourth quarter 2013 sales of $43.4 million. Tower volume decreased 9% due primarily to production issues in the Abilene, TX tower plant carried over from the third quarter related to a new customer qualification on a new tower design. Towers and Weldments operating income for the fourth quarter of 2014 totaled $.5 million or 1% of sales, down sharply from $5.8 million, or 13% of sales, in the prior year fourth quarter related to lower volumes, higher labor costs and a customer accommodation charge associated with the tower model changeover as well as unplanned warranty work and maintenance expense. Non-GAAP adjusted EBITDA in the fourth quarter of 2014 was $1.6 million, compared to $7.4 million in the fourth quarter of 2013 due to the factors described above.
Towers and Weldments sales for the full year 2014 totaled $184.9 million, an increase of 16% over 2013 reported sales. The increase was due primarily to an 11% increase in tower volume in the current year, partially offset by a $3.3 million decrease in weldments revenue. Operating income for 2014 totaled $18.1 million, or 10% of sales, down 8% from 2013, due primarily to the operational issues experienced in the second half of 2014. Non-GAAP adjusted EBITDA totaled $22.3 million in 2014, down 10% from 2013, due to the operational factors described above.
Gearing
Broadwind Energy engineers, builds and remanufactures precision gears and gearboxes for oil and gas, mining, steel and wind applications.
Gearing segment sales totaled $10.7 million in the fourth quarter of 2014, down $.9 million compared to the fourth quarter of 2013. Sales to oil and gas customers increased but were offset by lower sales of wind turbine replacement gearing and sales to other industrial customers. The Gearing segment operating loss narrowed to $2.4 million in the fourth quarter of 2014, compared to $5.6 million in the fourth quarter of 2013, due mainly to lower restructuring and other non-cash charges in the fourth quarter of 2014. The current quarter improvement also reflected favorable production variances and a higher margin production mix mainly for oil and gas customers compared to the fourth quarter of 2013. Gearing non-GAAP adjusted EBITDA loss was $.7 million in the fourth quarter of 2014, compared to a non-GAAP adjusted EBITDA loss of $1.2 million in the fourth quarter of 2013, due to the factors described above.
Gearing revenue for 2014 totaled $42.3 million, compared to $43.2 million in 2013. Despite higher orders, the 2% decrease was due to production delays attributable to the plant consolidation and inventory reduction projects and the transition to more complex gearbox production. Gearing operating loss totaled $9.4 million in 2014, a 47% reduction from the $17.9 million operating loss reported in 2013. The significant improvement was due to $3.8 million lower restructuring expense due to the completion of the plant consolidation in the second half of the year and improved margins, mainly for sales to oil and gas customers. Also contributing were lower non-cash charges due to the aging capital base, and the absence of a $1.5 million regulatory charge in 2013. Non-GAAP adjusted EBITDA loss totaled $.9 million in 2014,
compared to a non-GAAP adjusted EBITDA loss of $3.6 million in 2013. The 74% non-GAAP adjusted EBITDA improvement was due to the factors described above.
Services
Broadwind Energy specializes in non-routine drivetrain and blade maintenance services and offers comprehensive field services to the wind industry.
Fourth quarter Services segment revenue was $4.6 million, more than double the prior year fourth quarter sales of $2.0 million, due to strong demand for blade service and other technician fieldwork. Services’ operating loss for the fourth quarter of 2014 was $1.1 million, compared to an operating loss of $1.5 million in the fourth quarter 2013. The 20% improvement was due to increased sales and better utilization of technicians and lower operating expenses, partially offset by higher fixed costs. Services’ non-GAAP adjusted EBITDA loss for the fourth quarter of 2014 totaled $.8 million, compared to a non-GAAP adjusted EBITDA loss of $1.1 million in the fourth quarter of 2013, due to the factors described above.
Services’ revenue for the full year 2014 totaled $15.6 million, down 10% from the full year 2013 due to the absence of a large drivetrain assembly project completed in the first half of 2013, partially offset by an increase in blade services revenue. Operating loss for 2014 totaled $4.5 million, compared to an operating loss of $4.7 million in 2013. The $.2 million improvement was due mainly to the absence of restructuring expense in 2014 and lower operating expenses in the current year, partly offset by lower volumes. Non-GAAP adjusted EBITDA loss for 2014 totaled $3.1 million, compared to a non-GAAP adjusted EBITDA loss of $2.6 million for 2013. The $.5 million increased loss was due to the factors described above.
Corporate and Other
Corporate and other expenses totaled $2.3 million in the fourth quarter of 2014, down 13% from $2.7 million in the fourth quarter of 2013 due primarily to lower incentive compensation and insurance expense.
For the full year 2014, corporate and other expenses totaled $10.1 million, essentially flat compared to the full year 2013.
Cash and Liquidity
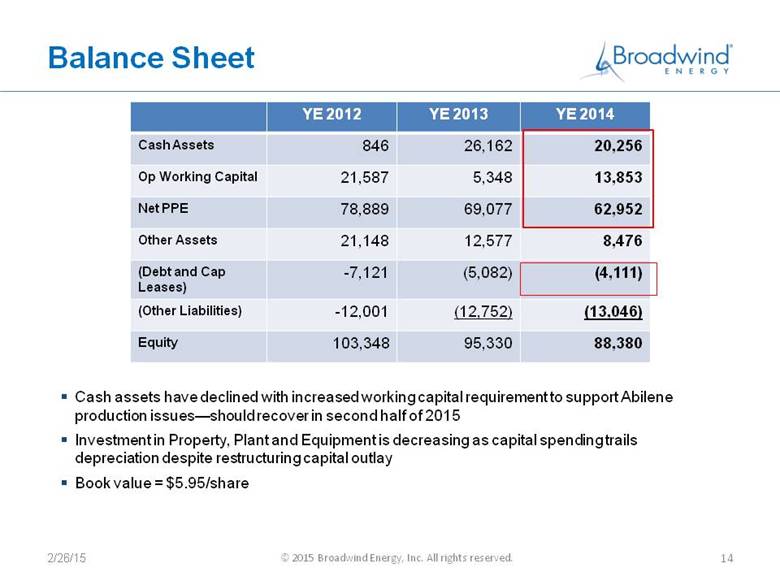
During the quarter, operating working capital (accounts receivable and inventory, net of accounts payable and customer deposits) increased $2.4 million to $13.9 million or 6% of annualized fourth-quarter sales, due to a reduction in trade payables and increased inventory.
Full-year capital spending, net of asset sales, totaled $5.4 million or 2.3% of sales.
Cash assets (cash and short-term investments) totaled $20.2 million at December 31, 2014, a decrease of $7.7 million from September 30, 2014. At December 31, 2014, the Company’s $20 million credit line was undrawn and debt and capital leases totaled $4.1 million.
During the quarter, the Company repurchased 273,937 shares of equity securities at a weighted average price per share of $6.73.
About Broadwind Energy, Inc.
Broadwind Energy (NASDAQ: BWEN) applies decades of deep industrial expertise to innovate integrated solutions for customers in the energy and infrastructure markets. From gears and gearing systems for wind, steel, oil and gas and mining applications, to wind towers, to comprehensive remanufacturing of gearboxes and blades, to operations and maintenance services and industrial weldments, we have solutions for the energy needs of the future. With facilities throughout the U.S., Broadwind Energy’s talented team of nearly 900 employees is committed to helping customers maximize performance of their investments — quicker, easier and smarter. Find out more at www.bwen.com.
Forward-Looking Statements
This release contains “forward-looking statements” within the meaning of Section 27A of the Securities Act of 1933 and Section 21E of the Securities Exchange Act of 1934 that involve risks, uncertainties and assumptions, such as statements regarding our future financial condition or results of operations, cash flows, performance, business prospects, and opportunities, as well as assumptions made by, and information currently available to, our management, and our prospects and strategies for future growth, including with respect to estimated 2015 guidance. Forward-looking statements include any statement that does not directly relate to a current or historical fact. We have tried to identify forward-looking statements by using words such as “anticipate,” “believe,” “expect,” “intend,” “will,” “should,” “may,” “plan” and similar expressions, but these words are not the exclusive means of identifying forward-looking statements. These statements are based on current expectations, and we undertake no obligation to update these statements to reflect events or circumstances occurring after this release. Such statements are subject to various risks and uncertainties that could cause actual results to vary materially from those stated. Such risks and uncertainties include, but are not limited to: expectations regarding our business, end-markets, relationships with customers and our ability to diversify our customer base; the impact of competition and economic volatility on the industries in which we compete; our ability to realize revenue from customer orders and backlog; the impact of regulation on our end-markets, including the wind energy industry in particular; the sufficiency of our liquidity and working capital and our plans to evaluate alternative sources of funding if necessary; our restructuring plans and the associated cost savings; our ability to preserve and utilize our tax net operating loss carry-forwards; our plans to continue to grow our business through organic growth; our plans with respect to the use of proceeds from financing activities and our ability to operate our business efficiently, manage capital expenditures and costs effectively, and generate cash flow; and other risks and uncertainties described in our filings with the Securities and Exchange Commission, including those contained in Part I, Item 1A “Risk Factors” of our Annual Reports on Form 10-K.
BWEN INVESTOR CONTACT: Joni Konstantelos, 708.780.4819 joni.konstantelos@bwen.com
BROADWIND ENERGY, INC. AND SUBSIDIARIES
CONSOLIDATED BALANCE SHEETS
(IN THOUSANDS)
(UNAUDITED)
|
|
|
As of December 31, |
| ||||
|
|
|
2014 |
|
2013 |
| ||
|
ASSETS |
|
|
|
|
| ||
|
CURRENT ASSETS: |
|
|
|
|
| ||
|
Cash and cash equivalents |
|
$ |
12,149 |
|
$ |
24,936 |
|
|
Short-term investments |
|
8,024 |
|
1,143 |
| ||
|
Restricted cash |
|
83 |
|
83 |
| ||
|
Accounts receivable, net |
|
20,012 |
|
18,735 |
| ||
|
Inventories, net |
|
34,921 |
|
37,143 |
| ||
|
Prepaid expenses and other current assets |
|
1,815 |
|
2,325 |
| ||
|
Assets held for sale |
|
738 |
|
1,970 |
| ||
|
Total current assets |
|
77,742 |
|
86,335 |
| ||
|
LONG-TERM ASSETS: |
|
|
|
|
| ||
|
Property and equipment, net |
|
62,952 |
|
69,077 |
| ||
|
Intangible assets, net |
|
5,459 |
|
5,903 |
| ||
|
Other assets |
|
464 |
|
2,379 |
| ||
|
TOTAL ASSETS |
|
$ |
146,617 |
|
$ |
163,694 |
|
|
|
|
|
|
|
| ||
|
LIABILITIES AND STOCKHOLDERS’ EQUITY |
|
|
|
|
| ||
|
CURRENT LIABILITIES: |
|
|
|
|
| ||
|
Current maturities of long-term debt |
|
$ |
268 |
|
$ |
201 |
|
|
Current portions of capital lease obligations |
|
766 |
|
933 |
| ||
|
Accounts payable |
|
18,461 |
|
27,537 |
| ||
|
Accrued liabilities |
|
9,553 |
|
8,115 |
| ||
|
Customer deposits |
|
22,619 |
|
22,993 |
| ||
|
Liabilities held for sale |
|
— |
|
749 |
| ||
|
Total current liabilities |
|
51,667 |
|
60,528 |
| ||
|
|
|
|
|
|
| ||
|
LONG-TERM LIABILITIES: |
|
|
|
|
| ||
|
Long-term debt, net of current maturities |
|
2,650 |
|
2,755 |
| ||
|
Long-term capital lease obligations, net of current portions |
|
427 |
|
1,193 |
| ||
|
Other |
|
3,493 |
|
3,888 |
| ||
|
Total long-term liabilities |
|
6,570 |
|
7,836 |
| ||
|
|
|
|
|
|
| ||
|
COMMITMENTS AND CONTINGENCIES |
|
|
|
|
| ||
|
|
|
|
|
|
| ||
|
STOCKHOLDERS’ EQUITY: |
|
|
|
|
| ||
|
Preferred stock, $0.001 par value; 10,000,000 shares authorized; no shares issued or outstanding |
|
— |
|
— |
| ||
|
Common stock, $0.001 par value; 30,000,000 shares authorized; 14,844,307 and 14,627,990 shares issued as of December 31, 2014 and 2013, respectively |
|
15 |
|
15 |
| ||
|
Treasury stock, at cost, 273,937 shares and 0 shares at December 31, 2014 and 2013, respectively |
|
(1,842 |
) |
— |
| ||
|
Additional paid-in capital |
|
377,185 |
|
376,125 |
| ||
|
Accumulated deficit |
|
(286,978 |
) |
(280,810 |
) | ||
|
Total stockholders’ equity |
|
88,380 |
|
95,330 |
| ||
|
TOTAL LIABILITIES AND STOCKHOLDERS’ EQUITY |
|
$ |
146,617 |
|
$ |
163,694 |
|
BROADWIND ENERGY, INC. AND SUBSIDIARIES
CONSOLIDATED STATEMENTS OF OPERATIONS
(IN THOUSANDS, EXCEPT PER SHARE DATA)
(UNAUDITED)
|
|
|
Three Months Ended December 31, |
|
For the Years Ended December 31, |
| ||||||||
|
|
|
2014 |
|
2013 |
|
2014 |
|
2013 |
| ||||
|
|
|
|
|
|
|
|
|
|
| ||||
|
Revenues |
|
$ |
53,798 |
|
$ |
56,397 |
|
$ |
241,268 |
|
$ |
215,710 |
|
|
Cost of sales |
|
53,561 |
|
52,012 |
|
222,497 |
|
198,379 |
| ||||
|
Restructuring |
|
329 |
|
2,229 |
|
1,281 |
|
4,986 |
| ||||
|
Gross profit |
|
(92 |
) |
2,156 |
|
17,490 |
|
12,345 |
| ||||
|
|
|
|
|
|
|
|
|
|
| ||||
|
OPERATING EXPENSES: |
|
|
|
|
|
|
|
|
| ||||
|
Selling, general and administrative |
|
5,015 |
|
5,693 |
|
21,181 |
|
21,414 |
| ||||
|
Impairment charges |
|
— |
|
— |
|
— |
|
— |
| ||||
|
Intangible amortization |
|
111 |
|
111 |
|
444 |
|
1,552 |
| ||||
|
Regulatory settlement |
|
— |
|
— |
|
1,566 |
|
1,500 |
| ||||
|
Restructuring |
|
11 |
|
302 |
|
233 |
|
1,089 |
| ||||
|
Total operating expenses |
|
5,137 |
|
6,106 |
|
23,424 |
|
25,555 |
| ||||
|
Operating loss |
|
(5,229 |
) |
(3,950 |
) |
(5,934 |
) |
(13,210 |
) | ||||
|
|
|
|
|
|
|
|
|
|
| ||||
|
OTHER INCOME (EXPENSE), net: |
|
|
|
|
|
|
|
|
| ||||
|
Interest expense, net |
|
(207 |
) |
(190 |
) |
(728 |
) |
(985 |
) | ||||
|
Other income, net |
|
77 |
|
489 |
|
226 |
|
1,000 |
| ||||
|
Gain (loss) on sale of assets and restructuring |
|
(83 |
) |
(87 |
) |
36 |
|
2,878 |
| ||||
|
Total other (expense) income, net |
|
(213 |
) |
212 |
|
(466 |
) |
2,893 |
| ||||
|
|
|
|
|
|
|
|
|
|
| ||||
|
Net loss from continuing operations before (benefit) provision for income taxes |
|
(5,442 |
) |
(3,738 |
) |
(6,400 |
) |
(10,317 |
) | ||||
|
(Benefit) provision for income taxes |
|
(271 |
) |
8 |
|
(232 |
) |
72 |
| ||||
|
LOSS FROM CONTINUING OPERATIONS |
|
(5,171 |
) |
(3,746 |
) |
(6,168 |
) |
(10,389 |
) | ||||
|
LOSS FROM DISCONTINUED OPERATIONS, NET OF TAX |
|
— |
|
— |
|
— |
|
(110 |
) | ||||
|
NET LOSS |
|
$ |
(5,171 |
) |
$ |
(3,746 |
) |
$ |
(6,168 |
) |
$ |
(10,499 |
) |
|
|
|
|
|
|
|
|
|
|
| ||||
|
NET LOSS PER COMMON SHARE - BASIC AND DILUTED: |
|
|
|
|
|
|
|
|
| ||||
|
Loss from continuing operations |
|
$ |
(0.35 |
) |
$ |
(0.26 |
) |
$ |
(0.42 |
) |
$ |
(0.72 |
) |
|
Loss from discontinued operations |
|
— |
|
— |
|
— |
|
(0.01 |
) | ||||
|
Net Loss |
|
$ |
(0.35 |
) |
$ |
(0.26 |
) |
$ |
(0.42 |
) |
$ |
(0.73 |
) |
|
|
|
|
|
|
|
|
|
|
| ||||
|
WEIGHTED AVERAGE COMMON SHARES OUTSTANDING - Basic and diluted |
|
14,677 |
|
14,605 |
|
14,715 |
|
14,457 |
| ||||
BROADWIND ENERGY, INC. AND SUBSIDIARIES
CONSOLIDATED STATEMENTS OF CASH FLOWS
(IN THOUSANDS)
(UNAUDITED)
|
|
|
For the Years Ended December 31, |
| ||||
|
|
|
2014 |
|
2013 |
| ||
|
|
|
|
|
|
| ||
|
CASH FLOWS FROM OPERATING ACTIVITIES: |
|
|
|
|
| ||
|
Net loss |
|
$ |
(6,168 |
) |
$ |
(10,499 |
) |
|
Loss from discontinued operations |
|
— |
|
110 |
| ||
|
Loss from continuing operations |
|
(6,168 |
) |
(10,389 |
) | ||
|
|
|
|
|
|
| ||
|
Adjustments to reconcile net cash used in operating activities: |
|
|
|
|
| ||
|
Depreciation and amortization expense |
|
12,183 |
|
14,856 |
| ||
|
Impairment charges |
|
84 |
|
2,365 |
| ||
|
Stock-based compensation |
|
886 |
|
1,821 |
| ||
|
(Recovery of) allowance for doubtful accounts |
|
65 |
|
(436 |
) | ||
|
Common stock issued under defined contribution 401(k) plan |
|
163 |
|
681 |
| ||
|
(Gain) loss on disposal of assets |
|
(154 |
) |
(3,503 |
) | ||
|
Changes in operating assets and liabilities: |
|
|
|
|
| ||
|
Accounts receivable |
|
(1,266 |
) |
1,808 |
| ||
|
Inventories |
|
2,222 |
|
(15,155 |
) | ||
|
Prepaid expenses and other current assets |
|
2,228 |
|
1,411 |
| ||
|
Accounts payable |
|
(8,578 |
) |
11,671 |
| ||
|
Accrued liabilities |
|
1,438 |
|
2,208 |
| ||
|
Customer deposits |
|
(323 |
) |
18,930 |
| ||
|
Other non-current assets and liabilities |
|
(279 |
) |
(14 |
) | ||
|
Net cash provided by (used in) operating activities of continued operations |
|
2,501 |
|
26,254 |
| ||
|
|
|
|
|
|
| ||
|
CASH FLOWS FROM INVESTING ACTIVITIES: |
|
|
|
|
| ||
|
Proceeds from the sale of logistics business and related note receivable |
|
— |
|
250 |
| ||
|
Purchases of available for sale securities |
|
(15,088 |
) |
(1,983 |
) | ||
|
Sales of available for sale securities |
|
1,101 |
|
60 |
| ||
|
Maturities of available for sale securities |
|
7,106 |
|
780 |
| ||
|
Purchases of property and equipment |
|
(6,504 |
) |
(6,950 |
) | ||
|
Proceeds from disposals of property and equipment |
|
1,065 |
|
13,249 |
| ||
|
Decrease (increase) in restricted cash |
|
— |
|
248 |
| ||
|
Net cash provided by (used in) investing activities of continued operations |
|
(12,320 |
) |
5,654 |
| ||
|
|
|
|
|
|
| ||
|
CASH FLOWS FROM FINANCING ACTIVITIES: |
|
|
|
|
| ||
|
Net proceeds from issuance of stock |
|
9 |
|
18 |
| ||
|
Net proceeds from repurchases of common stock |
|
(1,842 |
) |
— |
| ||
|
Payments on lines of credit and notes payable |
|
(16,051 |
) |
(80,376 |
) | ||
|
Payments on related party notes payable |
|
— |
|
— |
| ||
|
Proceeds from lines of credit and notes payable |
|
15,850 |
|
75,208 |
| ||
|
Payments for debt issuance costs |
|
— |
|
— |
| ||
|
Principal payments on capital leases |
|
(934 |
) |
(2,338 |
) | ||
|
Net cash (used in) provided by financing activities of continued operations |
|
(2,968 |
) |
(7,488 |
) | ||
|
|
|
|
|
|
| ||
|
NET INCREASE (DECREASE) IN CASH AND CASH EQUIVALENTS |
|
(12,787 |
) |
24,420 |
| ||
|
CASH AND CASH EQUIVALENTS, beginning of the year |
|
24,936 |
|
516 |
| ||
|
CASH AND CASH EQUIVALENTS, end of the year |
|
$ |
12,149 |
|
$ |
24,936 |
|
|
|
|
|
|
|
| ||
|
Supplemental cash flow information: |
|
|
|
|
| ||
|
Interest paid |
|
$ |
601 |
|
$ |
789 |
|
|
Income taxes paid |
|
$ |
62 |
|
$ |
22 |
|
|
Non-cash investing and financing activities: |
|
|
|
|
| ||
|
Issuance of restricted stock grants |
|
$ |
661 |
|
$ |
1,328 |
|
|
Equipment addition via capital lease |
|
$ |
— |
|
$ |
1,485 |
|
BROADWIND ENERGY, INC. AND SUBSIDIARIES
SELECTED SEGMENT FINANCIAL INFORMATION
(IN THOUSANDS)
|
|
|
Three Months Ended |
|
Twelve Months Ended |
| ||||||||
|
|
|
December 31, |
|
December 31, |
| ||||||||
|
|
|
2014 |
|
2013 |
|
2014 |
|
2013 |
| ||||
|
|
|
(unaudited) |
|
(unaudited) |
| ||||||||
|
ORDERS: |
|
|
|
|
|
|
|
|
| ||||
|
Towers and Weldments |
|
$ |
21,051 |
|
$ |
193,168 |
|
$ |
77,557 |
|
$ |
361,451 |
|
|
Gearing |
|
6,265 |
|
5,133 |
|
41,857 |
|
34,451 |
| ||||
|
Services |
|
2,338 |
|
2,385 |
|
15,680 |
|
8,511 |
| ||||
|
Total revenues |
|
$ |
29,654 |
|
$ |
200,686 |
|
$ |
135,094 |
|
$ |
404,413 |
|
|
|
|
(unaudited) |
|
(unaudited) |
| ||||||||
|
REVENUES: |
|
|
|
|
|
|
|
|
| ||||
|
Towers and Weldments |
|
$ |
38,620 |
|
$ |
43,433 |
|
$ |
184,904 |
|
$ |
159,478 |
|
|
Gearing |
|
10,720 |
|
11,597 |
|
42,253 |
|
43,150 |
| ||||
|
Services |
|
4,615 |
|
1,991 |
|
15,560 |
|
17,244 |
| ||||
|
Corporate and Other |
|
(157 |
) |
(624 |
) |
(1,449 |
) |
(4,162 |
) | ||||
|
Total revenues |
|
$ |
53,798 |
|
$ |
56,397 |
|
$ |
241,268 |
|
$ |
215,710 |
|
|
|
|
(unaudited) |
|
(unaudited) |
| ||||||||
|
OPERATING (LOSS) PROFIT: |
|
|
|
|
|
|
|
|
| ||||
|
Towers and Weldments |
|
$ |
542 |
|
$ |
5,771 |
|
$ |
18,065 |
|
$ |
19,550 |
|
|
Gearing |
|
(2,363 |
) |
(5,588 |
) |
(9,423 |
) |
(17,915 |
) | ||||
|
Services |
|
(1,103 |
) |
(1,483 |
) |
(4,493 |
) |
(4,721 |
) | ||||
|
Corporate and Other |
|
(2,305 |
) |
(2,650 |
) |
(10,083 |
) |
(10,124 |
) | ||||
|
Total operating loss |
|
$ |
(5,229 |
) |
$ |
(3,950 |
) |
$ |
(5,934 |
) |
$ |
(13,210 |
) |
BROADWIND ENERGY, INC. AND SUBSIDIARIES
RECONCILIATION OF NON-GAAP FINANCIAL MEASURES
(IN THOUSANDS)
Consolidated
|
|
|
Three Months Ended |
|
Twelve Months Ended |
| ||||||||
|
|
|
December 31, |
|
December 31, |
| ||||||||
|
|
|
2014 |
|
2013 |
|
2014 |
|
2013 |
| ||||
|
|
|
(unaudited) |
|
(unaudited) |
| ||||||||
|
Operating loss |
|
$ |
(5,229 |
) |
$ |
(3,950 |
) |
$ |
(5,934 |
) |
$ |
(13,210 |
) |
|
Impairment charges |
|
— |
|
— |
|
— |
|
— |
| ||||
|
Depreciation and amortization |
|
2,607 |
|
3,136 |
|
12,183 |
|
13,962 |
| ||||
|
Share-based compensation and other stock payments |
|
372 |
|
548 |
|
888 |
|
2,519 |
| ||||
|
Other income |
|
77 |
|
489 |
|
226 |
|
1,000 |
| ||||
|
Restructuring |
|
340 |
|
2,531 |
|
1,514 |
|
6,075 |
| ||||
|
Adjusted EBITDA |
|
$ |
(1,833 |
) |
$ |
2,754 |
|
$ |
8,877 |
|
$ |
10,346 |
|
The Company reports its financial results in accordance with U.S. generally accepted accounting principles (GAAP). However, the Company’s management believes that certain non-GAAP financial measures may provide users of this financial information with meaningful comparisons between current results and results in prior operating periods. Management believes that these non-GAAP financial measures can provide additional meaningful reflection of underlying trends of the business because they provide a comparison of historical information that excludes certain infrequently occurring or non-operational items that impact the overall
comparability. See the table below for supplemental financial data and corresponding reconciliations to GAAP financial measures for the three and twelve months ended December 31, 2014 and 2013. Non-GAAP financial measures should be viewed in addition to, and not as an alternative for, the Company’s reported results prepared in accordance with GAAP.
Towers and Weldments Segment
|
|
|
Three Months Ended December 31, |
|
Twelve Months Ended December 31, |
| ||||||||
|
|
|
2014 |
|
2013 |
|
2014 |
|
2013 |
| ||||
|
|
|
(unaudited) |
|
(unaudited) |
| ||||||||
|
|
|
|
|
|
|
|
|
|
| ||||
|
Operating Profit |
|
$ |
542 |
|
$ |
5,771 |
|
$ |
18,065 |
|
$ |
19,550 |
|
|
Depreciation |
|
941 |
|
1,031 |
|
3,993 |
|
3,872 |
| ||||
|
Share-based compensation and other stock payments |
|
54 |
|
112 |
|
99 |
|
464 |
| ||||
|
Other Income |
|
84 |
|
487 |
|
71 |
|
753 |
| ||||
|
Restructuring Expense |
|
7 |
|
11 |
|
47 |
|
176 |
| ||||
|
Total Adjusted EBITDA (Non-GAAP) |
|
$ |
1,628 |
|
$ |
7,412 |
|
$ |
22,275 |
|
$ |
24,815 |
|
Gearing Segment
|
|
|
Three Months Ended December 31, |
|
Twelve Months Ended December 31, |
| ||||||||
|
|
|
2014 |
|
2013 |
|
2014 |
|
2013 |
| ||||
|
|
|
(unaudited) |
|
(unaudited) |
| ||||||||
|
Operating Loss |
|
$ |
(2,363 |
) |
$ |
(5,588 |
) |
$ |
(9,423 |
) |
$ |
(17,915 |
) |
|
Depreciation |
|
1,193 |
|
1,648 |
|
6,372 |
|
7,089 |
| ||||
|
Amortization |
|
111 |
|
111 |
|
444 |
|
1,552 |
| ||||
|
Share-based compensation and other stock payments |
|
62 |
|
136 |
|
191 |
|
469 |
| ||||
|
Other Income (Expense) |
|
— |
|
10 |
|
3 |
|
4 |
| ||||
|
Restructuring Expense |
|
333 |
|
2,520 |
|
1,466 |
|
5,203 |
| ||||
|
Total Adjusted EBITDA (Non-GAAP) |
|
$ |
(664 |
) |
$ |
(1,163 |
) |
$ |
(947 |
) |
$ |
(3,598 |
) |
Services Segment
|
|
|
Three Months Ended December 31, |
|
Twelve Months Ended December 31, |
| ||||||||
|
|
|
2014 |
|
2013 |
|
2014 |
|
2013 |
| ||||
|
|
|
(unaudited) |
|
(unaudited) |
| ||||||||
|
Operating Loss |
|
$ |
(1,103 |
) |
$ |
(1,483 |
) |
$ |
(4,493 |
) |
$ |
(4,721 |
) |
|
Depreciation |
|
307 |
|
333 |
|
1,239 |
|
1,398 |
| ||||
|
Share-based compensation and other stock payments |
|
18 |
|
52 |
|
36 |
|
279 |
| ||||
|
Other Income (Expense) |
|
(7 |
) |
(8 |
) |
153 |
|
243 |
| ||||
|
Restructuring Expense |
|
— |
|
— |
|
— |
|
234 |
| ||||
|
Total Adjusted EBITDA (Non-GAAP) |
|
$ |
(785 |
) |
$ |
(1,106 |
) |
$ |
(3,065 |
) |
$ |
(2,567 |
) |
Corporate and Other
|
|
|
Three Months Ended December 31, |
|
Twelve Months Ended December 31, |
| ||||||||
|
|
|
2014 |
|
2013 |
|
2014 |
|
2013 |
| ||||
|
|
|
(unaudited) |
|
(unaudited) |
| ||||||||
|
Operating Loss |
|
$ |
(2,305 |
) |
$ |
(2,650 |
) |
$ |
(10,083 |
) |
$ |
(10,124 |
) |
|
Depreciation |
|
55 |
|
13 |
|
135 |
|
51 |
| ||||
|
Share-based compensation and other stock payments |
|
238 |
|
248 |
|
562 |
|
1,307 |
| ||||
|
Other Income (Expense) |
|
— |
|
— |
|
— |
|
— |
| ||||
|
Restructuring Expense |
|
— |
|
— |
|
— |
|
462 |
| ||||
|
Total Adjusted EBITDA (Non-GAAP) |
|
$ |
(2,012 |
) |
$ |
(2,389 |
) |
$ |
(9,386 |
) |
$ |
(8,304 |
) |