UNITED STATES
SECURITIES AND EXCHANGE COMMISSION
Washington, D.C. 20549
FORM N-CSR
CERTIFIED SHAREHOLDER REPORT OF REGISTERED MANAGEMENT
INVESTMENT COMPANIES
|
Investment Company Act file number |
811-09903 | |||||
|
|
| |||||
|
|
BNY Mellon Funds Trust |
| ||||
|
|
(Exact name of Registrant as specified in charter) |
| ||||
|
|
|
| ||||
|
|
c/o The Dreyfus Corporation 200 Park Avenue New York, New York 10166 |
| ||||
|
|
(Address of principal executive offices) |
| ||||
|
|
|
| ||||
|
|
John Pak, Esq. 200 Park Avenue New York, New York 10166 |
| ||||
|
|
(Name and address of agent for service) |
| ||||
|
| ||||||
|
Registrant's telephone number, including area code: |
(212) 922-6000 | |||||
|
|
| |||||
|
Date of fiscal year end:
|
8/31 |
| ||||
|
Date of reporting period: |
8/31/13 |
| ||||
BNY Mellon Large Cap Stock Fund
BNY Mellon Large Cap Market Opportunities Fund
BNY Mellon Tax-Sensitive Large Cap Multi-Strategy Fund
BNY Mellon Income Stock Fund
BNY Mellon Mid Cap Multi-Strategy Fund
BNY Mellon Small Cap Multi-Strategy Fund
BNY Mellon Focused Equity Opportunities Fund
BNY Mellon Small/Mid Cap Fund
BNY Mellon International Fund
BNY Mellon Emerging Markets Fund
BNY Mellon International Appreciation Fund
BNY Mellon International Equity Income Fund
BNY Mellon Asset Allocation Fund
ANNUAL REPORT August 31, 2013

The Funds 3
DISCUSSION OF FUND PERFORMANCE (continued)
4
FUND PERFORMANCE
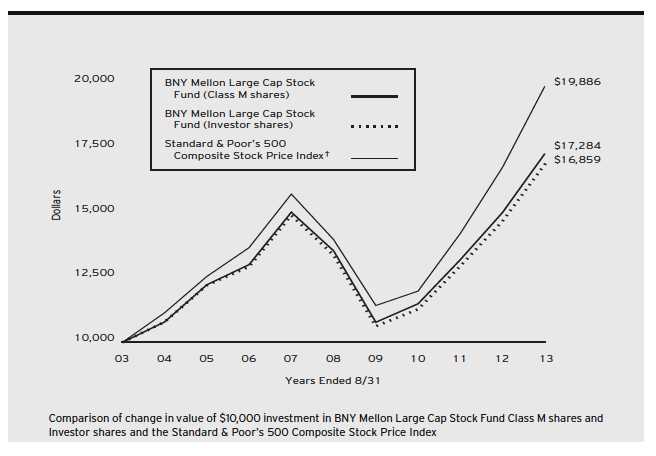
| Average Annual Total Returns as of 8/31/13 | ||||||
| 1 Year | 5 Years | 10 Years | ||||
| Class M shares | 15.16 | % | 5.01 | % | 5.62 | % |
| Investor shares | 14.87 | % | 4.74 | % | 5.36 | % |
| Standard & Poor’s 500 | ||||||
| Composite Stock Price Index | 18.70 | % | 7.31 | % | 7.12 | % |
| † Source: Lipper Inc. |
| Past performance is not predictive of future performance.The fund’s performance shown in the graph and table does not reflect the deduction of taxes that a shareholder |
| would pay on fund distributions or the redemption of fund shares. |
| The above graph compares a $10,000 investment made in Class M shares and Investor shares of BNY Mellon Large Cap Stock Fund on 8/31/03 to a $10,000 |
| investment made in the Standard & Poor’s 500 Composite Stock Price Index (the “Index”) on that date.All dividends and capital gain distributions are reinvested. |
| The fund’s performance shown in the line graph above takes into account all applicable fees and expenses for Class M and Investor shares.The Index is a widely |
| accepted, unmanaged index of U.S. stock market performance. Unlike a mutual fund, the Index is not subject to charges, fees and other expenses. Investors cannot invest |
| directly in any index. Further information relating to fund performance, including expense reimbursements, if applicable, is contained in the Financial Highlights section |
| of the prospectus and elsewhere in this report. |
The Funds 5
DISCUSSION OF FUND PERFORMANCE (continued)
6
The Funds 7
FUND PERFORMANCE
| Average Annual Total Returns as of 8/31/13 | |||||
| Inception | From | ||||
| Date | 1 Year | Inception | |||
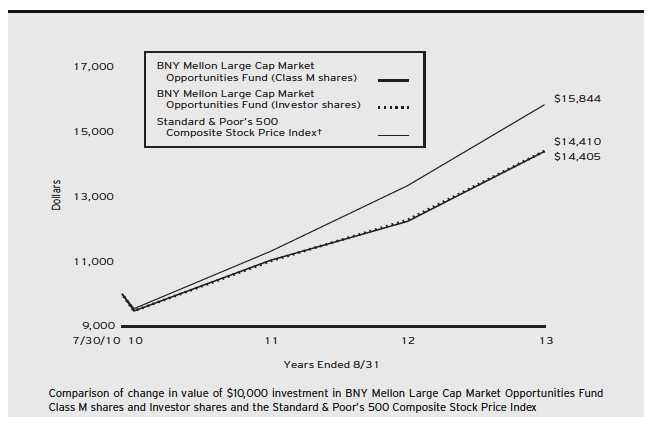
| Class M shares | 7/30/10 | 17.64 | % | 12.54 | % |
| Investor shares | 7/30/10 | 17.29 | % | 12.55 | % |
| Standard & Poor’s 500 | |||||
| Composite Stock Price Index | 7/31/10 | 18.70 | % | 16.10 | % |
| † Source: Lipper Inc. |
| Past performance is not predictive of future performance.The fund’s performance shown in the graph and table does not reflect the deduction of taxes that a shareholder |
| would pay on fund distributions or the redemption of fund shares. |
| The above graph compares a $10,000 investment made in Class M shares and Investor shares of BNY Mellon Large Cap Market Opportunities Fund on 7/30/10 |
| (inception date) to a $10,000 investment made in the Standard & Poor’s 500 Composite Stock Price Index (the “Index”) on that date.All dividends and capital |
| gain distributions are reinvested. |
| The fund’s performance shown in the line graph above takes into account all applicable fees and expenses for Class M and Investor shares.The Index is a widely |
| accepted, unmanaged index of U.S. stock market performance. Unlike a mutual fund, the Index is not subject to charges, fees and other expenses. Investors cannot invest |
| directly in any index. Further information relating to fund performance, including expense reimbursements, if applicable, is contained in the Financial Highlights section |
| of the prospectus and elsewhere in this report. |
8
The Funds 9
DISCUSSION OF FUND PERFORMANCE (continued)
10
FUND PERFORMANCE
![]()
| Average Annual Total Returns as of 8/31/13 | |||||
| Inception | From | ||||
| Date | 1 Year | Inception | |||
| Class M shares | 7/30/10 | 16.60 | % | 13.31 | % |
| Investor shares | 7/30/10 | 17.97 | % | 13.27 | % |
| Standard & Poor’s 500 | |||||
| Composite Stock Price Index | 7/31/10 | 18.70 | % | 16.10 | % |
The Funds 11
DISCUSSION OF FUND PERFORMANCE (continued)
12
The Funds 13
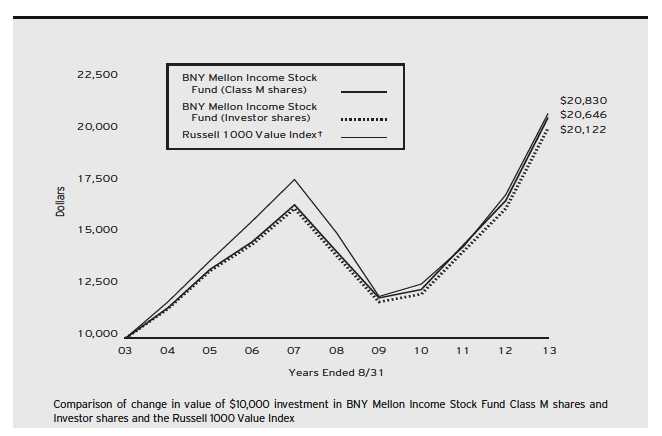
FUND PERFORMANCE
| Average Annual Total Returns as of 8/31/13 | ||||||
| 1 Year | 5 Years | 10 Years | ||||
| Class M shares | 24.01 | % | 7.82 | % | 7.52 | % |
| Investor shares | 23.84 | % | 7.57 | % | 7.24 | % |
| Russell 1000 Value Index | 23.10 | % | 6.69 | % | 7.61 | % |
| † Source: Lipper Inc. |
| Past performance is not predictive of future performance.The fund’s performance shown in the graph and table does not reflect the deduction of taxes that a shareholder |
| would pay on fund distributions or the redemption of fund shares. |
| The above graph compares a $10,000 investment made in Class M shares and Investor shares of BNY Mellon Income Stock Fund on 8/31/03 to a $10,000 |
| investment made in the Russell 1000 Value Index (the “Russell Index”) on that date.All dividends and capital gain distributions are reinvested. |
| Effective 3/15/11, the fund changed its benchmark from the Russell Index to the Dow Jones U.S. Select Dividend Index (the “Dow Jones Index”) to better reflect |
| the fund’s sector weightings and risk characteristics. The Dow Jones Index was first calculated on 11/3/03.Accordingly, the fund will continue to report the |
| performance of the Russell Index until the Dow Jones Index has been calculated for a 10-year period. Performance information for the fund versus the Dow Jones |
| Index is included in the graph and table on the next page. |
| The fund’s performance shown in the line graph above takes into account all applicable fees and expenses for Class M and Investor shares.The Russell Index is an |
| unmanaged index which measures the performance of the large-cap value segment of the U.S. equity universe. It includes those Russell 1000 Index companies with |
| lower price-to-book ratios and lower expected growth values. Unlike a mutual fund, the Russell Index is not subject to charges, fees and other expenses. Investors cannot |
| invest directly in any index. Further information relating to fund performance, including expense reimbursements, if applicable, is contained in the Financial Highlights |
| section of the prospectus and elsewhere in this report. |
14
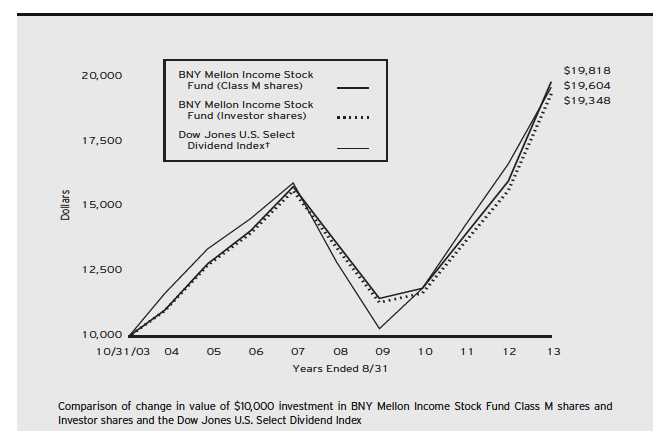
| Average Annual Total Returns as of 8/31/13 | |||||||
| Inception | From | ||||||
| Date | 1 Year | 5 Years | Inception | ||||
| Class M shares | 10/31/03 | 24.01 | % | 7.82 | % | 7.21 | % |
| Investor shares | 10/31/03 | 23.84 | % | 7.57 | % | 6.95 | % |
| Dow Jones U.S. Select Dividend Index | 11/3/03 | 17.72 | % | 8.76 | % | 7.09 | % |
| † Source: Lipper Inc. |
| Past performance is not predictive of future performance.The fund’s performance shown in the graph and table does not reflect the deduction of taxes that a shareholder |
| would pay on fund distributions or the redemption of fund shares. |
| The above graph compares a $10,000 investment made in Class M shares and Investor shares of BNY Mellon Income Stock Fund on 11/3/03 (inception date of |
| Dow Jones Index) to a $10,000 investment made in the Dow Jones U.S. Select Dividend Index (the “Dow Jones Index”) on that date.All dividends and capital |
| gain distributions are reinvested. |
| Effective 3/15/11, the fund changed its benchmark from the Russell 1000 Value Index (the “Russell Index”) to the Dow Jones Index to better reflect the fund’s |
| sector weightings and risk characteristics. The Dow Jones Index was first calculated on 11/3/03. Accordingly, the fund will continue to report the performance of |
| the Russell Index until the Dow Jones Index has been calculated for a 10-year period. |
| The fund’s performance shown in the line graph above takes into account all applicable fees and expenses for Class M and Investor shares.The Dow Jones Index is an |
| unmanaged index which represents the country’s leading stocks by dividend yield. Unlike a mutual fund, the Dow Jones Index is not subject to charges, fees and other |
| expenses. Investors cannot invest directly in any index. Further information relating to fund performance, including expense reimbursements, if applicable, is contained in |
| the Financial Highlights section of the prospectus and elsewhere in this report. |
The Funds 15
DISCUSSION OF FUND PERFORMANCE (continued)
16
The Funds 17
FUND PERFORMANCE
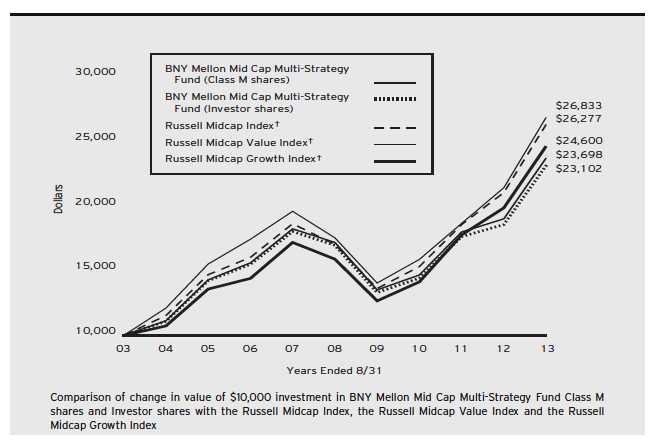
| Average Annual Total Returns as of 8/31/13 | ||||||
| 1 Year | 5 Years | 10 Years | ||||
| Class M shares | 24.74 | % | 6.64 | % | 9.01 | % |
| Investor shares | 24.46 | % | 6.38 | % | 8.73 | % |
| Russell Midcap Index | 24.91 | % | 9.08 | % | 10.14 | % |
| Russell Midcap Value Index | 25.37 | % | 8.87 | % | 10.37 | % |
| Russell Midcap Growth Index | 23.97 | % | 9.14 | % | 9.42 | % |
| † Source: Lipper Inc. |
| Past performance is not predictive of future performance.The fund’s performance shown in the graph and table does not reflect the deduction of taxes that a shareholder |
| would pay on fund distributions or the redemption of fund shares. |
| The above graph compares a $10,000 investment made in Class M shares and Investor shares of BNY Mellon Mid Cap Multi-Strategy Fund on 8/31/03 to a |
| $10,000 investment made in each of the (1) the Russell Midcap Index, (2) the Russell Midcap Value Index and (3) the Russell Midcap Growth Index on that date. |
| All dividends and capital gain distributions are reinvested. |
| The fund changed its investment strategy on August 20, 2012. Prior to that date, the fund generally had a single primary portfolio manager and investment |
| strategy — selecting stocks of mid cap domestic companies through a disciplined investment process that combined computer modeling techniques, fundamental |
| analysis and risk management. Different investment strategies may lead to different performance results. The fund’s performance for periods prior to August 20, |
| 2012, reflects the fund’s investment strategy in effect prior to that date. |
| The fund’s performance shown in the line graph above takes into account all applicable fees and expenses for Class M and Investor shares.The Russell Midcap Index |
| is a widely accepted, unmanaged index of medium-cap stock market performance.The Russell Midcap Value Index is a widely accepted, unmanaged index of medium- |
| cap stock market performance and measures the performance of those Russell Midcap companies with lower price-to-book ratios and lower forecasted growth values.The |
| Russell Midcap Growth Index measures the performance of those companies among the 800 smallest companies in the Russell 1000 Index with higher price-to-book |
| ratios and higher forecasted growth values.The Russell 1000 Index measures the performance of the largest 1,000 publicly traded U.S. companies. Unlike a mutual |
| fund, the indices are not subject to charges, fees and other expenses. Investors cannot invest directly in any index. Further information relating to fund performance, |
| including expense reimbursements, if applicable, is contained in the Financial Highlights section of the prospectus and elsewhere in this report. |
18
The Funds 19
DISCUSSION OF FUND PERFORMANCE (continued)
20
FUND PERFORMANCE
![]()
| Average Annual Total Returns as of 8/31/13 | ||||||
| 1 Year | 5 Years | 10 Years | ||||
| Class M shares | 28.51 | % | 6.21 | % | 6.85 | % |
| Investor shares | 28.10 | % | 6.06 | % | 6.64 | % |
| Russell 2000 Index | 26.27 | % | 7.98 | % | 8.76 | % |
| Russell 2000 Value Index | 24.38 | % | 6.88 | % | 8.55 | % |
| Russell 2000 Growth Index | 28.14 | % | 9.01 | % | 8.84 | % |
| † Source: Lipper Inc. |
| Past performance is not predictive of future performance.The fund’s performance shown in the graph and table does not reflect the deduction of taxes that a shareholder |
| would pay on fund distributions or the redemption of fund shares. |
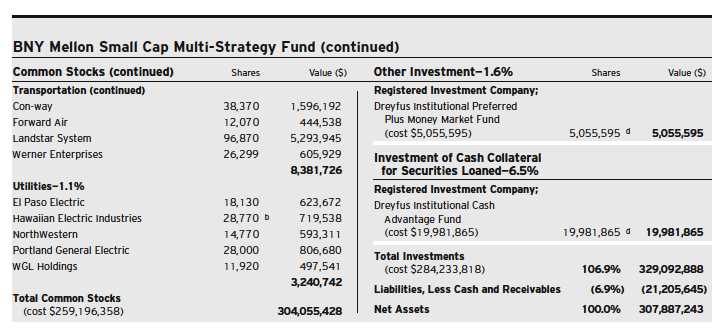
| The above graph compares a $10,000 investment made in Class M shares and Investor shares of BNY Mellon Small Cap Multi-Strategy Fund on 8/31/03 to a |
| $10,000 investment made in each of the (1) the Russell 2000 Index, (2) the Russell 2000 Value Index and (3) the Russell 2000 Growth Index on that date.All |
| dividends and capital gain distributions are reinvested. |
| The fund changed its investment strategy on August 20, 2012. Prior to that date, the fund generally had a single primary portfolio manager and investment |
| strategy — selecting stocks of small cap domestic companies through a disciplined investment process that combined computer modeling techniques, fundamental |
| analysis and risk management. Different investment strategies may lead to different performance results. The fund’s performance for periods prior to August 20, |
| 2012, reflects the fund’s investment strategy in effect prior to that date. |
| The fund’s performance shown in the line graph above takes into account all applicable fees and expenses for Class M and Investor shares.The Russell 2000 Index is |
| an unmanaged index and is composed of the 2,000 smallest companies in the Russell 3000 Index.The Russell 3000 Index measures the performance of the largest |
| 3,000 U.S. companies representing approximately 98% of the investable U.S. equity market.The Russell 2000 Value Index is an unmanaged index which measures |
| the performance of those Russell 2000 companies with lower price-to-book ratios and lower forecasted growth values.The Russell 2000 Growth Index is an |
| unmanaged index which measures the performance of those Russell 2000 companies with higher price-to-book ratios and higher forecasted growth values. Unlike a |
| mutual fund, the indices are not subject to charges, fees and other expenses. Investors cannot invest directly in any index. Further information relating to fund |
| performance, including expense reimbursements, if applicable, is contained in the Financial Highlights section of the prospectus and elsewhere in this report. |
The Funds 21
DISCUSSION OF FUND PERFORMANCE (continued)
22
The Funds 23
FUND PERFORMANCE
| Average Annual Total Returns as of 8/31/13 | |||||
| Inception | From | ||||
| Date | 1 Year | Inception | |||
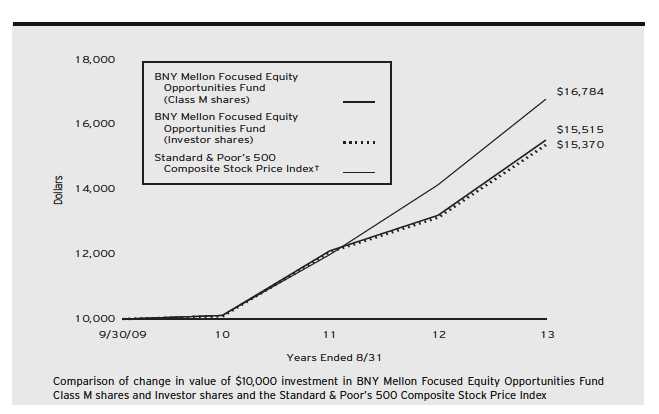
| Class M shares | 9/30/09 | 17.54 | % | 11.86 | % |
| Investor shares | 9/30/09 | 17.12 | % | 11.59 | % |
| Standard & Poor’s 500 | |||||
| Composite Stock Price Index | 9/30/09 | 18.70 | % | 14.13 | % |
| † Source: Lipper Inc. |
| Past performance is not predictive of future performance.The fund’s performance shown in the graph and table does not reflect the deduction of taxes that a shareholder |
| would pay on fund distributions or the redemption of fund shares. |
| The above graph compares a $10,000 investment made in Class M shares and Investor shares of BNY Mellon Focused Equity Opportunities Fund on 9/30/09 |
| (inception date) to a $10,000 investment made in the Standard & Poor’s 500 Composite Stock Price Index (the “Index “) on that date.All dividends and capital |
| gain distributions are reinvested. |
| The fund’s performance shown in the line graph above takes into account all applicable fees and expenses for Class M and Investor shares.The Index is a widely |
| accepted, unmanaged index of U.S. stock market performance. Unlike a mutual fund, the Index is not subject to charges, fees and other expenses. Investors cannot |
| invest directly in any index. Further information relating to fund performance, including expense reimbursements, if applicable, is contained in the Financial Highlights |
| section of the prospectus and elsewhere in this report. |
24
The Funds 25
DISCUSSION OF FUND PERFORMANCE (continued)
26
FUND PERFORMANCE
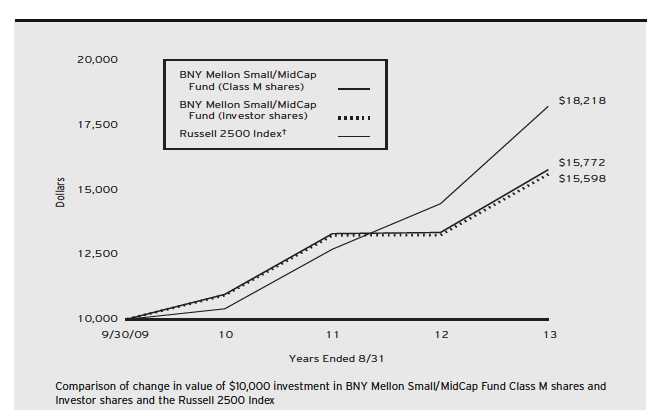
| Average Annual Total Returns as of 8/31/13 | |||||
| Inception | From | ||||
| Date | 1 Year | Inception | |||
| Class M shares | 9/30/09 | 18.07 | % | 12.33 | % |
| Investor shares | 9/30/09 | 17.65 | % | 12.01 | % |
| Russell 2500 Index | 9/30/09 | 25.96 | % | 16.55 | % |
| † Source: Lipper Inc. |
| Past performance is not predictive of future performance.The fund’s performance shown in the graph and table does not reflect the deduction of taxes that a shareholder |
| would pay on fund distributions or the redemption of fund shares. |
| The above graph compares a $10,000 investment made in Class M shares and Investor shares of BNY Mellon Small/MidCap Fund on 9/30/09 (inception date) |
| to a $10,000 investment made in the Russell 2500 Index (the “Index”) on that date.All dividends and capital gain distributions are reinvested. |
| The fund’s performance shown in the line graph above takes into account all applicable fees and expenses for Class M and Investor shares.The Index is an |
| unmanaged index designed to track the performance of small- to mid-cap U.S. stocks. Unlike a mutual fund, the Index is not subject to charges, fees and other |
| expenses. Investors cannot invest directly in any index. Further information relating to fund performance, including expense reimbursements, if applicable, is contained |
| in the Financial Highlights section of the prospectus and elsewhere in this report. |
The Funds 27
DISCUSSION OF FUND PERFORMANCE (continued)
28

The Funds 29
FUND PERFORMANCE
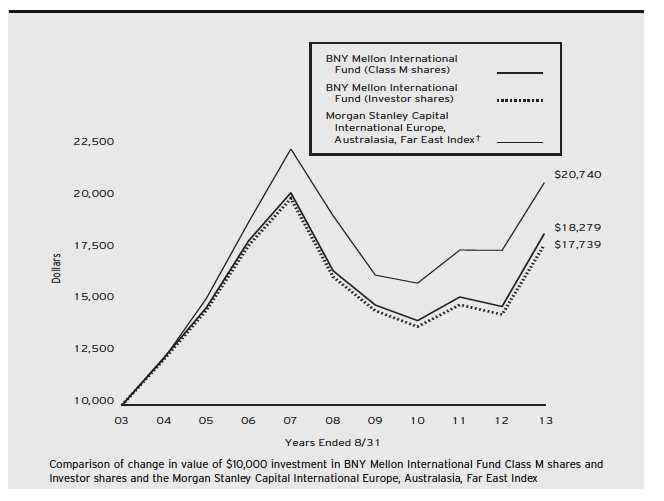
| Average Annual Total Returns as of 8/31/13 | ||||||
| 1 Year | 5 Years | 10 Years | ||||
| Class M shares | 23.74 | % | 2.09 | % | 6.22 | % |
| Investor shares | 23.36 | % | 1.83 | % | 5.90 | % |
| Morgan Stanley Capital International | ||||||
| Europe, Australasia, Far East Index | 18.66 | % | 1.62 | % | 7.57 | % |
| † Source: Lipper Inc. |
| Past performance is not predictive of future performance.The fund’s performance shown in the graph and table does not reflect the deduction of taxes that a shareholder |
| would pay on fund distributions or the redemption of fund shares. |
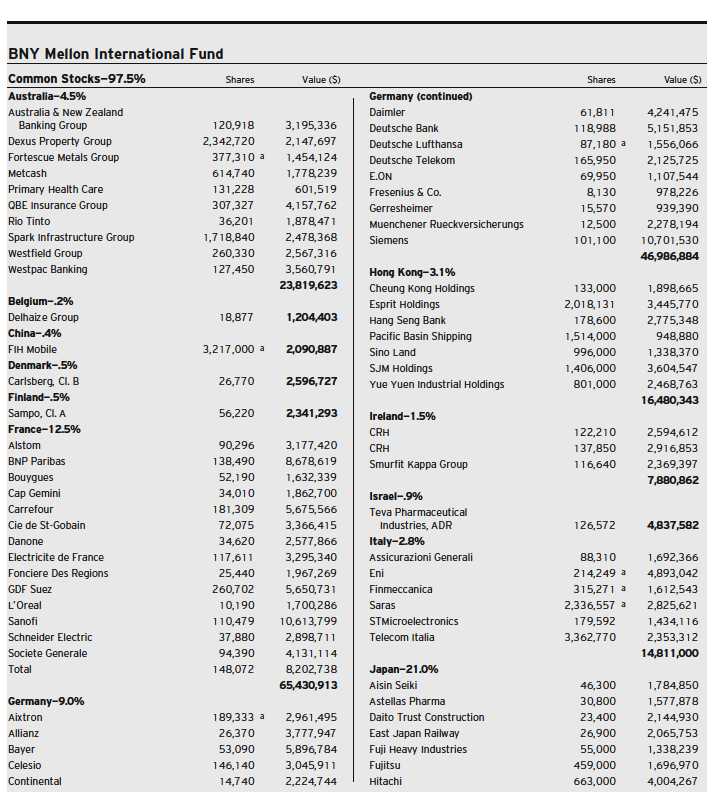
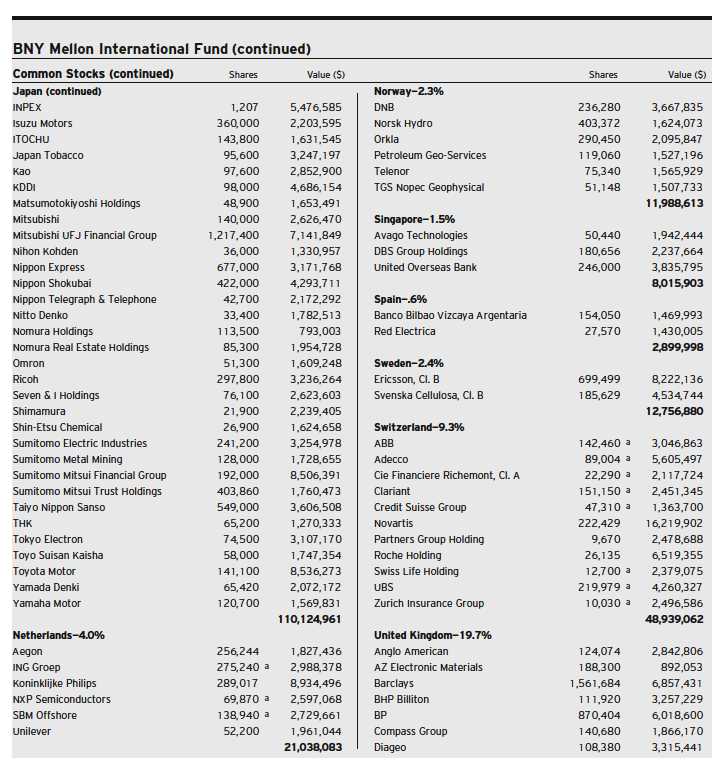
| The above graph compares a $10,000 investment made in Class M shares and Investor shares of BNY Mellon International Fund on 8/31/03 to a $10,000 |
| investment made in the Morgan Stanley Capital International Europe,Australasia, Far East Index (the “Index”) on that date.All dividends and capital gain |
| distributions are reinvested. |
| The fund’s performance shown in the line graph above takes into account all applicable fees and expenses for Class M and Investor shares.The Index is an unmanaged |
| index composed of a sample of companies representative of the market structure of European and Pacific Basin countries. Unlike a mutual fund, the Index is not subject |
| to charges, fees and other expenses. Investors cannot invest directly in any index. Further information relating to fund performance, including expense reimbursements, if |
| applicable, is contained in the Financial Highlights section of the prospectus and elsewhere in this report. |
30
The Funds 31
DISCUSSION OF FUND PERFORMANCE (continued)

32
FUND PERFORMANCE

| Average Annual Total Returns as of 8/31/13 | ||||||
| 1 Year | 5 Years | 10 Years | ||||
| Class M shares | 0.09 | % | 1.03 | % | 10.52 | % |
| Investor shares | –0.19 | % | 0.75 | % | 10.24 | % |
| Morgan Stanley Capital International | ||||||
| Emerging Markets Index | 0.54 | % | 1.88 | % | 12.17 | % |
| † Source: Lipper Inc. |
| Past performance is not predictive of future performance.The fund’s performance shown in the graph and table does not reflect the deduction of taxes that a shareholder |
| would pay on fund distributions or the redemption of fund shares. |
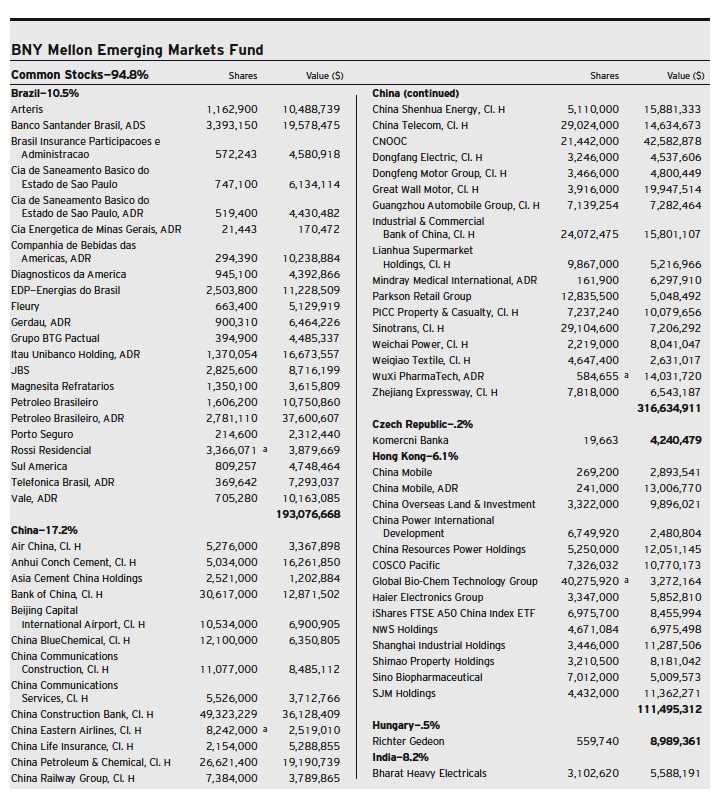
| The above graph compares a $10,000 investment made in Class M shares and Investor shares of BNY Mellon Emerging Markets Fund on 8/31/03 to a |
| $10,000 investment made in the Morgan Stanley Capital International Emerging Markets Index (the “Index”) on that date. All dividends and capital gain |
| distributions are reinvested. |
| The fund’s performance shown in the line graph above takes into account all applicable fees and expenses for Class M and Investor shares.The Index is a market |
| capitalization-weighted index composed of companies representative of the market structure of select designated emerging market countries in Europe, Latin America and |
| the Pacific Basin.The Index excludes closed markets and those shares in otherwise free markets, which are not purchasable by foreigners.The Index includes gross |
| dividends reinvested and does not take into account charges, fees and other expenses.These factors can contribute to the Index potentially outperforming the fund. Unlike |
| a mutual fund, the Index is not subject to charges, fees and other expenses. Investors cannot invest directly in any index. Further information relating to fund |
| performance, including expense reimbursements, if applicable, is contained in the Financial Highlights section of the prospectus and elsewhere in this report. |
The Funds 33
DISCUSSION OF FUND PERFORMANCE (continued)
34
The Funds 35
FUND PERFORMANCE
| Average Annual Total Returns as of 8/31/13 | ||||||
| 1 Year | 5 Years | 10 Years | ||||
| Class M shares | 18.39 | % | 1.24 | % | 6.56 | % |
| Investor shares | 18.13 | % | 0.99 | % | 6.30 | % |
| Morgan Stanley Capital International | ||||||
| Europe, Australasia, Far East Index | 18.66 | % | 1.62 | % | 7.57 | % |
| † Source: Lipper Inc. |
| Past performance is not predictive of future performance.The fund’s performance shown in the graph and table does not reflect the deduction of taxes that a shareholder |
| would pay on fund distributions or the redemption of fund shares. |
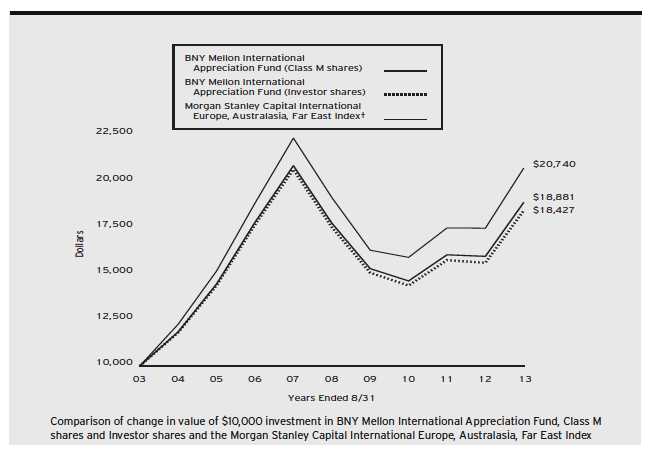
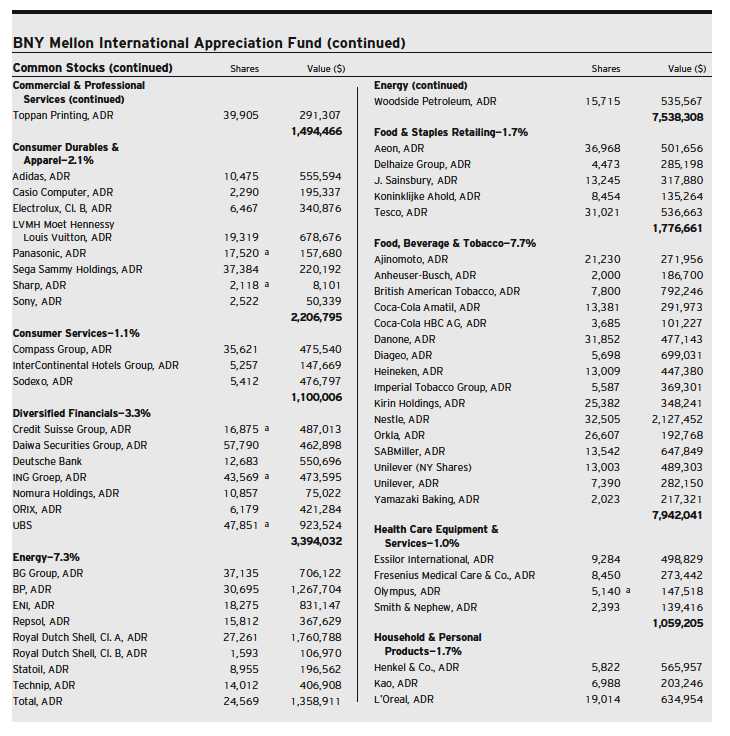
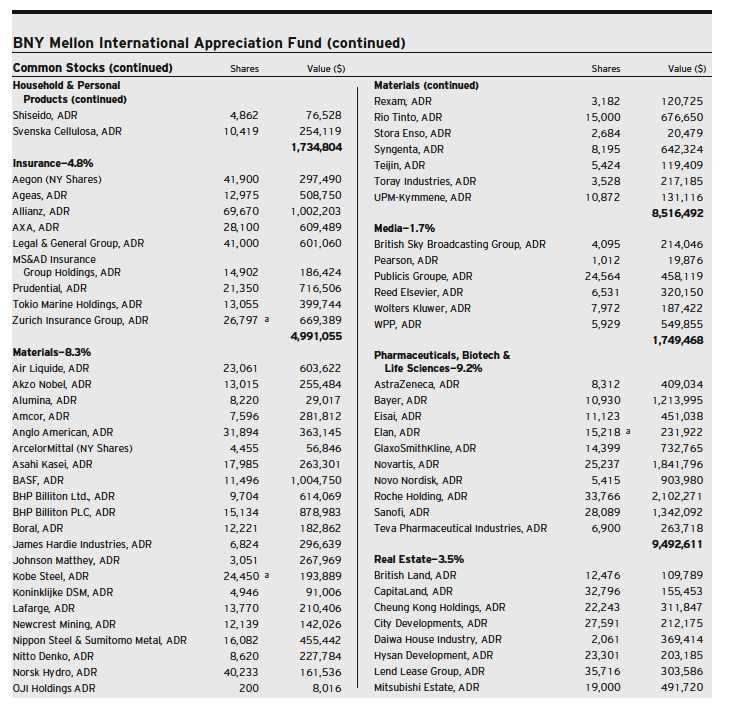
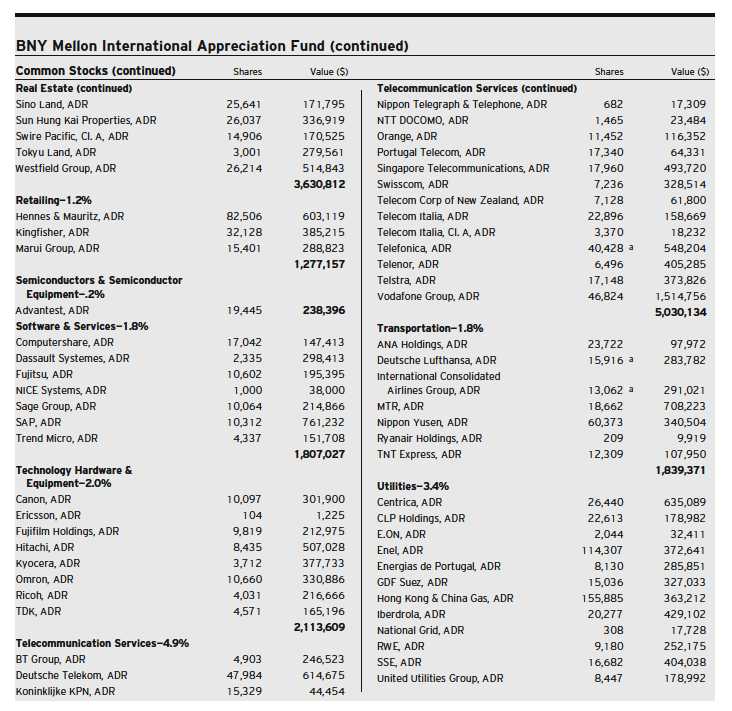
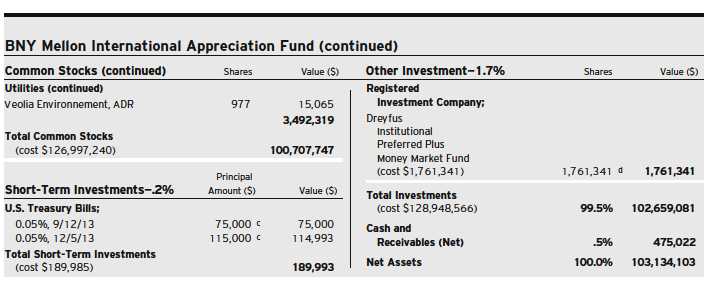
| The above graph compares a $10,000 investment made in Class M shares and Investor shares of BNY Mellon International Appreciation Fund on 8/31/03 to a |
| $10,000 investment made in the Morgan Stanley Capital International Europe,Australasia, Far East Index (the “Index”) on that date.All dividends and capital |
| gain distributions are reinvested. |
| As of the close of business on September 12, 2008, substantially all of the assets of another investment company advised by an affiliate of the fund’s investment |
| adviser, BNY Hamilton International Equity Fund (the “predecessor fund”), a series of BNY Hamilton Funds, Inc., were transferred to BNY Mellon International |
| Appreciation Fund in a tax-free reorganization and the fund commenced operations.The performance figures for the fund’s Class M shares represent the performance |
| of the predecessor fund’s Institutional shares prior to the commencement of operations for BNY Mellon International Appreciation Fund and the performance of BNY |
| Mellon International Appreciation Fund’s Class M shares thereafter.The performance figures for Investor shares represent the performance of the predecessor fund’s |
| Class A shares prior to the commencement of operations for BNY Mellon International Appreciation Fund and the performance of BNY Mellon International |
| Appreciation Fund’s Investor shares thereafter. Investor shares are subject to a Shareholder Services Plan. |
| The fund’s performance shown in the line graph above takes into account all applicable fees and expenses for Class M and Investor shares.The Index is an |
| unmanaged index composed of a sample of companies representative of the market structure of European and Pacific Basin countries. Unlike a mutual fund, the Index |
| is not subject to charges, fees and other expenses. Investors cannot invest directly in any index. Further information relating to fund performance, including expense |
| reimbursements, if applicable, is contained in the Financial Highlights section of the prospectus and elsewhere in this report. |
36
The Funds 37
DISCUSSION OF FUND PERFORMANCE (continued)
38
FUND PERFORMANCE
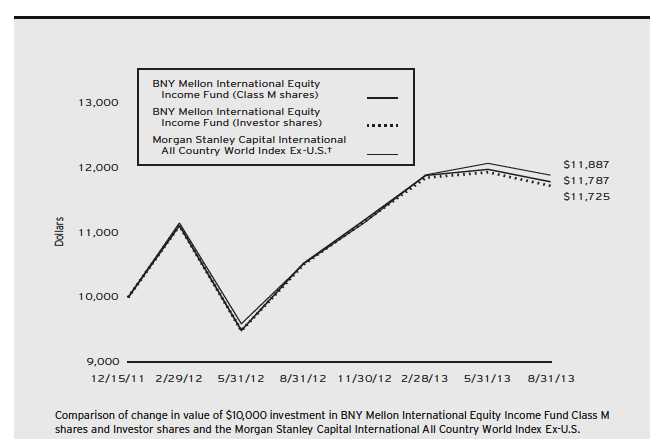
| Actual Aggregate Total Returns as of 8/31/13 | |||||
| Inception | From | ||||
| Date | 1 Year | Inception | |||
| Class M shares | 12/15/11 | 11.96 | % | 17.87 | % |
| Investor shares | 12/15/11 | 11.56 | % | 17.25 | % |
| Morgan Stanley Capital International | |||||
| All Country World Index Ex-U.S. | 11/30/11 | 12.98 | %†† | 18.87 | % |
| † Source: Lipper Inc. |
| Past performance is not predictive of future performance.The fund’s performance shown in the graph and table does not reflect the deduction of taxes that a shareholder |
| would pay on fund distributions or the redemption of fund shares. |
| The above graph compares a $10,000 investment made in Class M shares and Investor shares of BNY Mellon International Equity Income Fund on 12/15/11 |
| (inception date) to a $10,000 investment made in the Morgan Stanley Capital International All Country World Index ex USA (the “Index”) on that date.All |
| dividends and capital gain distributions are reinvested. |
| The fund’s performance shown in the line graph above takes into account all applicable fees and expenses for Class M and Investor shares.The Index captures large |
| and mid cap representation across 23 of 24 Developed Markets (DM) countries (excluding the US) and 21 Emerging Markets (EM) countries. Unlike a mutual |
| fund, the Index is not subject to charges, fees and other expenses. Investors cannot invest directly in any index. Further information relating to fund performance, |
| including expense reimbursements, if applicable, is contained in the Financial Highlights section of the prospectus and elsewhere in this report. |
| † For comparative purposes, the value of the Index on 11/30/11 is used as the beginning value on 12/15/11. |
The Funds 39
DISCUSSION OF FUND PERFORMANCE (continued)
40
The Funds 41
FUND PERFORMANCE
| Average Annual Total Returns as of 8/31/13 | ||||||
| 1 Year | 5 Years | 10 Years | ||||
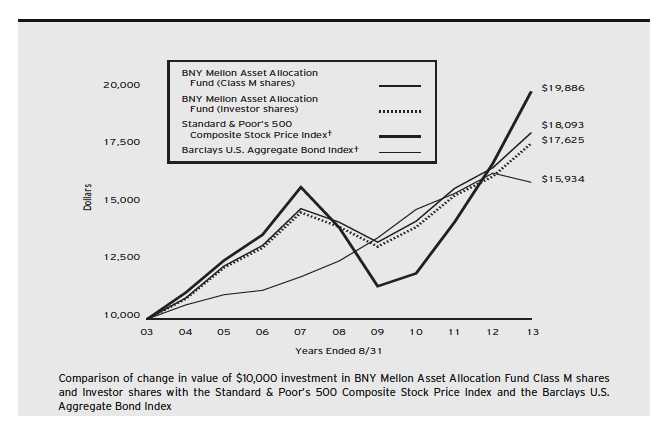
| Class M shares | 9.20 | % | 4.97 | % | 6.11 | % |
| Investor shares | 8.86 | % | 4.72 | % | 5.83 | % |
| Standard & Poor’s 500 | ||||||
| Composite Stock Price Index | 18.70 | % | 7.31 | % | 7.12 | % |
| Barclays U.S. Aggregate Bond Index | –2.47 | % | 4.93 | % | 4.77 | % |
| † Source: Lipper Inc. |
| Past performance is not predictive of future performance.The fund’s performance shown in the graph and table does not reflect the deduction of taxes that a shareholder |
| would pay on fund distributions or the redemption of fund shares. |
| The above graph compares a $10,000 investment made in Class M shares and Investor shares of BNY Mellon Asset Allocation Fund on 8/31/03 to a $10,000 |
| investment made in two different indices: (1) the Standard & Poor’s 500 Composite Stock Price Index (the “S&P 500 Index”) and (2) the Barclays U.S.Aggregate |
| Bond Index (the “Barclays Index”) on that date.All dividends and capital gain distributions are reinvested. |
| The fund changed its investment strategy on September 15, 2011. Prior to that date, the fund invested in individual securities and BNY Mellon funds only and its |
| target allocation was 60% of its assets invested in equity securities (directly and through underlying funds) and 40% of its assets invested in bonds and money market |
| instruments (directly), with a range of 15% above or below such target amount. Different investment strategies may lead to different performance results.The fund’s |
| performance for periods prior to September 15, 2011, reflects the fund’s investment strategy in effect prior to that date. |
| The fund’s performance shown in the line graph above takes into account all applicable fees and expenses for Class M and Investor shares.The S&P 500 Index is a |
| widely accepted, unmanaged index of U.S. stock market performance.The Barclays Index is a widely accepted, unmanaged index of corporate, government and |
| government agency debt instruments, mortgage-backed securities and asset-backed securities with an average maturity of 1-10 years. Unlike a mutual fund, the indices |
| are not subject to charges, fees and other expenses. Investors cannot invest directly in any index. Further information relating to fund performance, including expense |
| reimbursements, if applicable, is contained in the Financial Highlights section of the prospectus and elsewhere in this report. |
42
UNDERSTANDING YOUR FUND’S EXPENSES (Unaudited)
As a mutual fund investor, you pay ongoing expenses, such as management fees and other expenses. Using the information below, you can estimate how these expenses affect your investment and compare them with the expenses of other funds.You also may pay one-time transaction expenses, including sales charges (loads) and redemptions fees, which are not shown in this section and would have resulted in higher total expenses. For more information, see your fund’s prospectus or talk to your financial adviser.
Review your fund’s expenses
The table below shows the expenses you would have paid on a $1,000 investment in each class of each BNY Mellon equity fund from March 1, 2013 to August 31, 2013. It also shows how much a $1,000 investment would be worth at the close of the period, assuming actual returns and expenses.
Expenses and Value of a $1,000 Investment
assuming actual returns for the six months ended August 31, 2013
| Class M Shares | Investor Shares | |||
| BNY Mellon Large Cap Stock Fund | ||||
| Expenses paid per $1,000† | $ | 4.18 | $ | 5.53 |
| Ending value (after expenses) | $ | 1,073.40 | $ | 1,071.00 |
| Annualized expense ratio (%) | .80 | 1.06 | ||
| BNY Mellon Large Cap Market | ||||
| Opportunities Fund | ||||
| Expenses paid per $1,000† | $ | 4.06 | $ | 5.54 |
| Ending value (after expenses) | $ | 1,093.90 | $ | 1,091.80 |
| Annualized expense ratio (%) | .77 | 1.05 | ||
| BNY Mellon Tax-Sensitive | ||||
| Large Cap Multi-Strategy Fund | ||||
| Expenses paid per $1,000† | $ | 4.00 | $ | 5.46 |
| Ending value (after expenses) | $ | 1,085.60 | $ | 1,084.40 |
| Annualized expense ratio (%) | .76 | 1.04 | ||
| BNY Mellon Income Stock Fund | ||||
| Expenses paid per $1,000† | $ | 4.30 | $ | 5.67 |
| Ending value (after expenses) | $ | 1,104.00 | $ | 1,103.20 |
| Annualized expense ratio (%) | .81 | 1.07 | ||
| BNY Mellon Mid Cap Multi-Strategy Fund | ||||
| Expenses paid per $1,000† | $ | 4.77 | $ | 6.14 |
| Ending value (after expenses) | $ | 1,100.70 | $ | 1,099.30 |
| Annualized expense ratio (%) | .90 | 1.16 | ||
| BNY Mellon Small Cap Multi-Strategy Fund | ||||
| Expenses paid per $1,000† | $ | 5.68 | $ | 7.03 |
| Ending value (after expenses) | $ | 1,147.50 | $ | 1,146.00 |
| Annualized expense ratio (%) | 1.05 | 1.30 | ||
| BNY Mellon Focused | ||||
| Equity Opportunities Fund | ||||
| Expenses paid per $1,000† | $ | 4.56 | $ | 6.03 |
| Ending value (after expenses) | $ | 1,102.00 | $ | 1,100.00 |
| Annualized expense ratio (%) | .86 | 1.14 |
The Funds 43
DISCUSSION OF FUND PERFORMANCE (continued)
| Expenses and Value of a $1,000 Investment (continued) | ||||
| assuming actual returns for the six months ended August 31, 2013 | ||||
| Class M Shares | Investor Shares | |||
| BNY Mellon Small/Mid Cap Fund | ||||
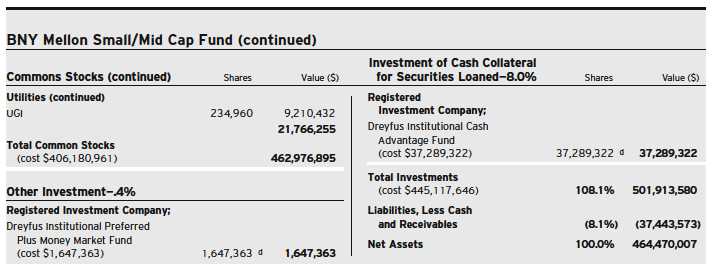
| Expenses paid per $1,000† | $ | 4.78 | $ | 6.09 |
| Ending value (after expenses) | $ | 1,084.10 | $ | 1,082.10 |
| Annualized expense ratio (%) | .91 | 1.16 | ||
| BNY Mellon International Fund | ||||
| Expenses paid per $1,000† | $ | 5.38 | $ | 6.68 |
| Ending value (after expenses) | $ | 1,073.20 | $ | 1,071.60 |
| Annualized expense ratio (%) | 1.03 | 1.28 | ||
| BNY Mellon Emerging Markets Fund | ||||
| Expenses paid per $1,000† | $ | 6.67 | $ | 7.85 |
| Ending value (after expenses) | $ | 888.80 | $ | 887.70 |
| Annualized expense ratio (%) | 1.40 | 1.65 | ||
| BNY Mellon International Appreciation Fund | ||||
| Expenses paid per $1,000† | $ | 4.27 | $ | 5.60 |
| Ending value (after expenses) | $ | 1,041.20 | $ | 1,039.90 |
| Annualized expense ratio (%) | .83 | 1.09 | ||
| BNY Mellon International Equity Income Fund | ||||
| Expenses paid per $1,000† | $ | 5.67 | $ | 7.02 |
| Ending value (after expenses) | $ | 991.90 | $ | 989.60 |
| Annualized expense ratio (%) | 1.13 | 1.40 | ||
| BNY Mellon Asset Allocation Fund | ||||
| Expenses paid per $1,000† | $ | 1.28 | $ | 2.55 |
| Ending value (after expenses) | $ | 1,024.50 | $ | 1,022.00 |
| Annualized expense ratio (%) | .25 | .50 | ||
| † Expenses are equal to each fund’s annualized expense ratios as shown above, multiplied by the average account value over the period, multiplied by 184/365 (to reflect the |
| one-half year period). |
44
COMPARING YOUR FUND’S EXPENSES WITH THOSE OF OTHER FUNDS (Unaudited)
Using the SEC’s method to compare expenses
The Securities and Exchange Commission (SEC) has established guidelines to help investors assess fund expenses. Per these guidelines, the table below shows your fund’s expenses based on a $1,000 investment, assuming a hypothetical 5% annualized return.You can use this information to compare the ongoing expenses (but not transaction expenses or total cost) of investing in each fund with those of other funds. All mutual fund shareholder reports will provide this information to help you make this comparison. Please note that you cannot use this information to estimate your actual ending account balance and expenses paid during the period.
Expenses and Value of a $1,000 Investment
assuming a hypothetical 5% annualized return for the six months ended August 31, 2013
| Class M Shares | Investor Shares | |||
| BNY Mellon Large Cap Stock Fund | ||||
| Expenses paid per $1,000† | $ | 4.08 | $ | 5.40 |
| Ending value (after expenses) | $ | 1,021.17 | $ | 1,019.86 |
| Annualized expense ratio (%) | .80 | 1.06 | ||
| BNY Mellon Large Cap Market | ||||
| Opportunities Fund | ||||
| Expenses paid per $1,000† | $ | 3.92 | $ | 5.35 |
| Ending value (after expenses) | $ | 1,021.32 | $ | 1,019.91 |
| Annualized expense ratio (%) | .77 | 1.05 | ||
| BNY Mellon Tax-Sensitive | ||||
| Large Cap Multi-Strategy Fund | ||||
| Expenses paid per $1,000† | $ | 3.87 | $ | 5.30 |
| Ending value (after expenses) | $ | 1,021.37 | $ | 1,019.96 |
| Annualized expense ratio (%) | .76 | 1.04 | ||
| BNY Mellon Income Stock Fund | ||||
| Expenses paid per $1,000† | $ | 4.13 | $ | 5.45 |
| Ending value (after expenses) | $ | 1,021.12 | $ | 1,019.81 |
| Annualized expense ratio (%) | .81 | 1.07 | ||
| BNY Mellon Mid Cap Multi-Strategy Fund | ||||
| Expenses paid per $1,000† | $ | 4.58 | $ | 5.90 |
| Ending value (after expenses) | $ | 1,020.67 | $ | 1,019.36 |
| Annualized expense ratio (%) | .90 | 1.16 | ||
| BNY Mellon Small Cap Multi-Strategy Fund | ||||
| Expenses paid per $1,000† | $ | 5.35 | $ | 6.61 |
| Ending value (after expenses) | $ | 1,019.91 | $ | 1,018.65 |
| Annualized expense ratio (%) | 1.05 | 1.30 | ||
| BNY Mellon Focused | ||||
| Equity Opportunities Fund | ||||
| Expenses paid per $1,000† | $ | 4.38 | $ | 5.80 |
| Ending value (after expenses) | $ | 1,020.87 | $ | 1,019.46 |
| Annualized expense ratio (%) | .86 | 1.14 |
The Funds 45
DISCUSSION OF FUND PERFORMANCE (continued)
| Expenses and Value of a $1,000 Investment (continued) | ||||
| assuming a hypothetical 5% annualized return for the six months ended August 31, 2013 | ||||
| Class M Shares | Investor Shares | |||
| BNY Mellon Small/Mid Cap Fund | ||||
| Expenses paid per $1,000† | $ | 4.63 | $ | 5.90 |
| Ending value (after expenses) | $ | 1,020.62 | $ | 1,019.36 |
| Annualized expense ratio (%) | .91 | 1.16 | ||
| BNY Mellon International Fund | ||||
| Expenses paid per $1,000† | $ | 5.24 | $ | 6.51 |
| Ending value (after expenses) | $ | 1,020.01 | $ | 1,018.75 |
| Annualized expense ratio (%) | 1.03 | 1.28 | ||
| BNY Mellon Emerging Markets Fund | ||||
| Expenses paid per $1,000† | $ | 7.12 | $ | 8.39 |
| Ending value (after expenses) | $ | 1,018.15 | $ | 1,016.89 |
| Annualized expense ratio (%) | 1.40 | 1.65 | ||
| BNY Mellon International Appreciation Fund | ||||
| Expenses paid per $1,000† | $ | 4.23 | $ | 5.55 |
| Ending value (after expenses) | $ | 1,021.02 | $ | 1,019.71 |
| Annualized expense ratio (%) | .83 | 1.09 | ||
| BNY Mellon International Equity Income Fund | ||||
| Expenses paid per $1,000† | $ | 5.75 | $ | 7.12 |
| Ending value (after expenses) | $ | 1,019.51 | $ | 1,018.15 |
| Annualized expense ratio (%) | 1.13 | 1.40 | ||
| BNY Mellon Asset Allocation Fund | ||||
| Expenses paid per $1,000† | $ | 1.28 | $ | 2.55 |
| Ending value (after expenses) | $ | 1,023.95 | $ | 1,022.68 |
| Annualized expense ratio (%) | .25 | .50 | ||
| † Expenses are equal to each fund’s annualized expense ratios as shown above, multiplied by the average account value over the period, multiplied by 184/365 (to reflect the |
| one-half year period). |
46
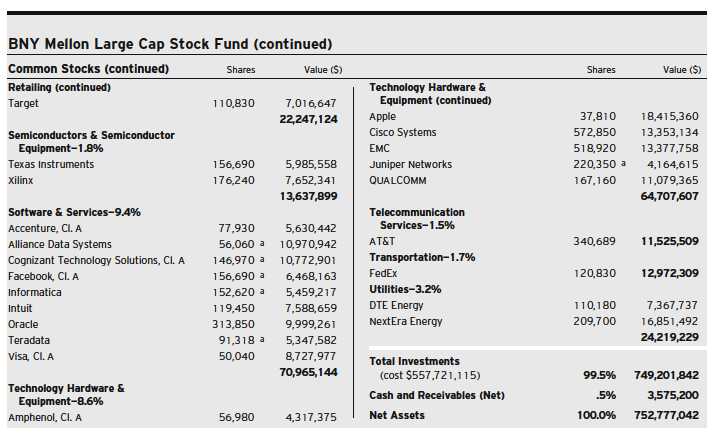
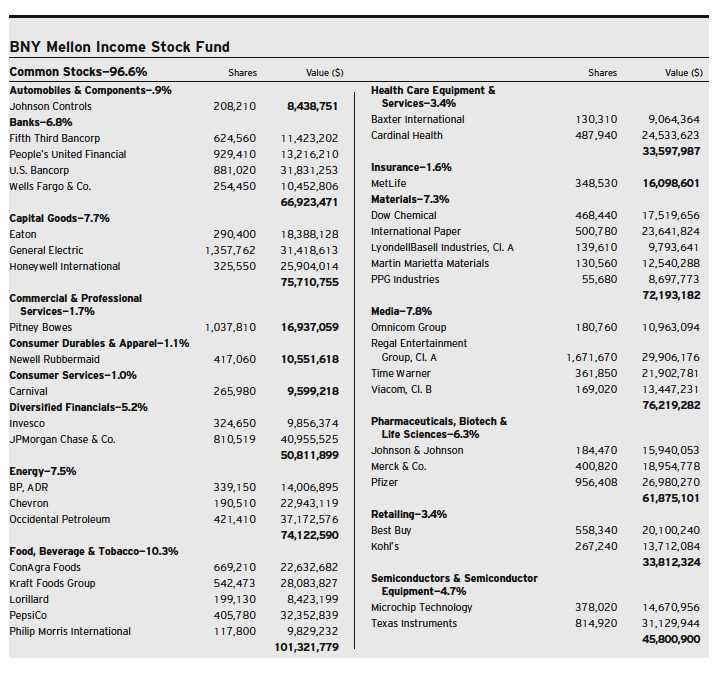
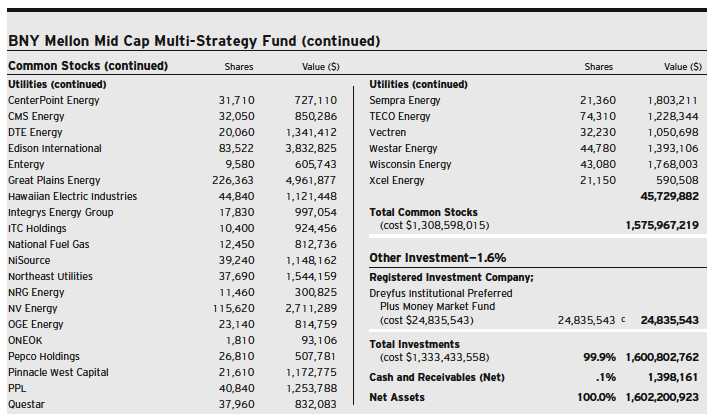
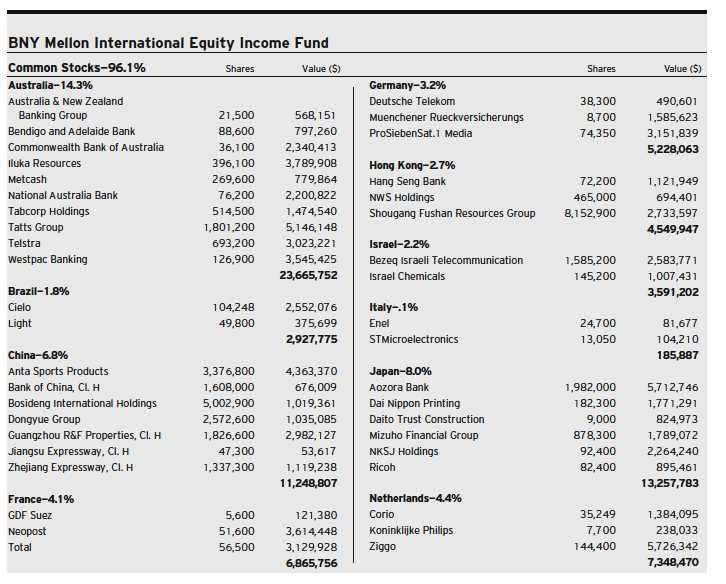
STATEMENT OF INVESTMENTS
August 31, 2013
The Funds 47
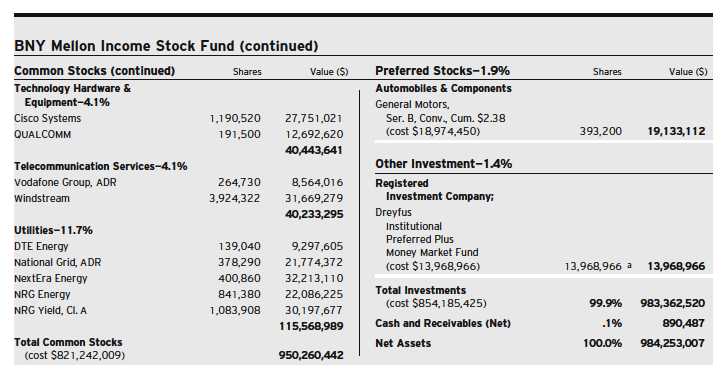
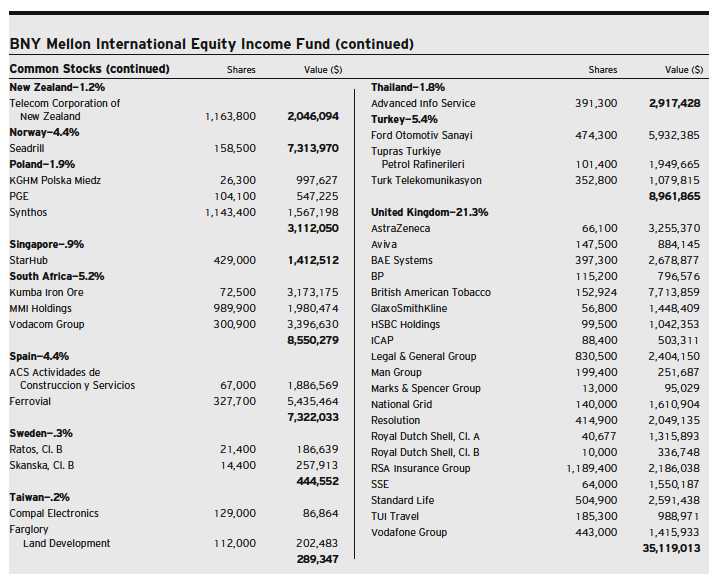
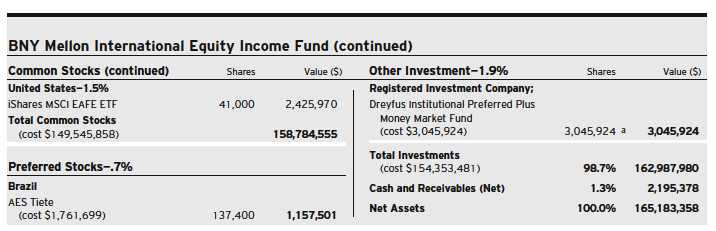
STATEMENT OF INVESTMENTS (continued)
| ADR—American Depository Receipts | |
| ETF—Exchange-Traded Fund | |
| a | Non-income producing security. |
| b | Investment in real estate investment trust. |
| c | Investment in affiliated money market mutual fund. |
| Portfolio Summary (Unaudited) † | |||
| Value (%) | Value (%) | ||
| Diversified Financials | 10.1 | Insurance | 2.7 |
| Food, Beverage & Tobacco | 9.7 | Banks | 2.4 |
| Pharmaceuticals, Biotech & Life Sciences | 9.7 | Materials | 2.3 |
| Software & Services | 9.4 | Commercial & Professional Services | 2.0 |
| Energy | 9.1 | Semiconductors & Semiconductor Equipment | 1.8 |
| Technology Hardware & Equipment | 8.6 | Consumer Durables & Apparel | 1.7 |
| Media | 7.1 | Transportation | 1.7 |
| Health Care Equipment & Services | 4.2 | Telecommunication Services | 1.5 |
| Capital Goods | 4.1 | Exchange-Traded Funds | 1.0 |
| Food & Staples Retailing | 3.3 | Real Estate | .9 |
| Utilities | 3.2 | ||
| Retailing | 3.0 | 99.5 | |
| † Based on net assets. |
| See notes to financial statements. |
48
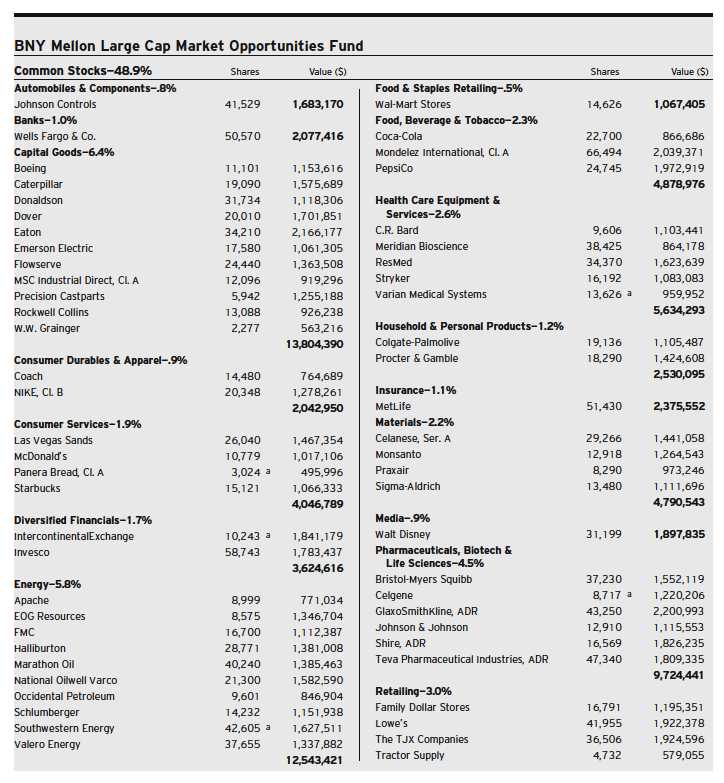
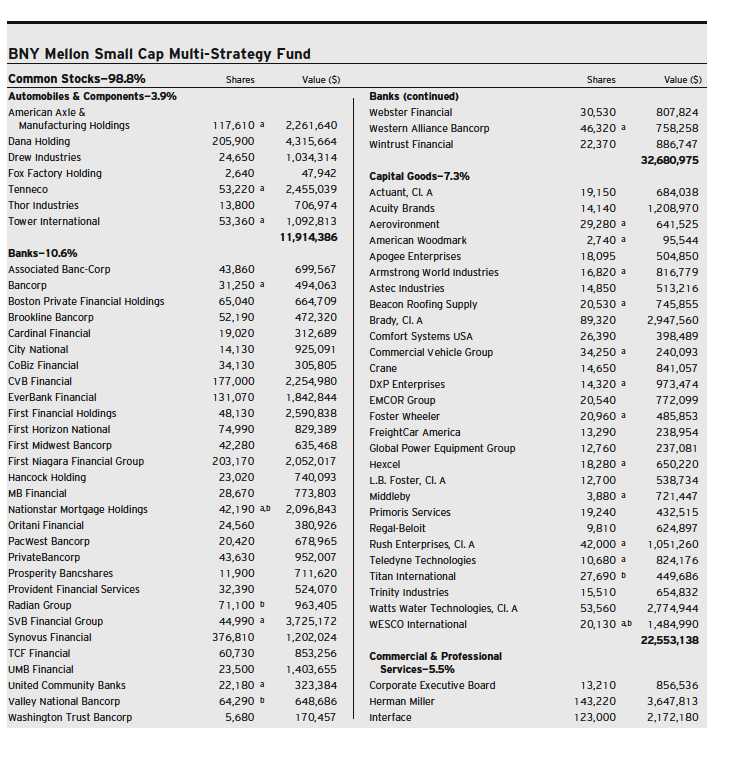
STATEMENT OF INVESTMENTS
August 31, 2013
The Funds 49
STATEMENT OF INVESTMENTS (continued)
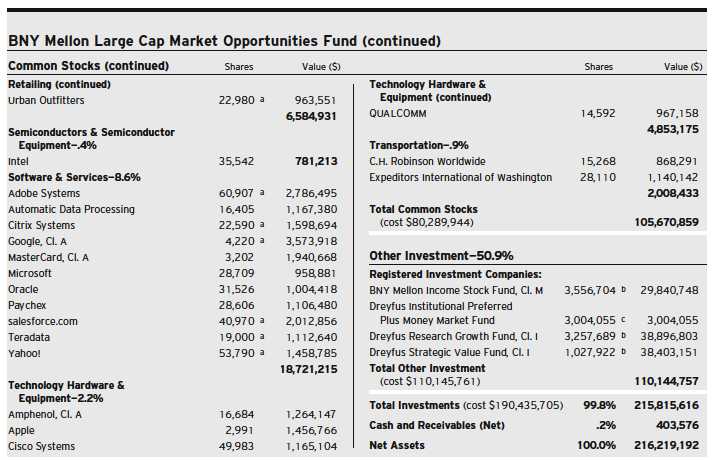
| ADR—American Depository Receipts | |
| a | Non-income producing security. |
| b | Investment in affiliated mutual fund. |
| c | Investment in affiliated money market mutual fund. |
| Portfolio Summary (Unaudited) † | |||
| Value (%) | Value (%) | ||
| Mutual Funds: Domestic | 49.5 | Money Market Investment | 1.4 |
| Software & Services | 8.6 | Household & Personal Products | 1.2 |
| Capital Goods | 6.4 | Insurance | 1.1 |
| Energy | 5.8 | Banks | 1.0 |
| Pharmaceuticals, Biotech & Life Sciences | 4.5 | Consumer Durables & Apparel | .9 |
| Retailing | 3.0 | Media | .9 |
| Health Care Equipment & Services | 2.6 | Transportation | .9 |
| Food, Beverage & Tobacco | 2.3 | Automobiles & Components | .8 |
| Materials | 2.2 | Food & Staples Retailing | .5 |
| Technology Hardware & Equipment | 2.2 | Semiconductors & Semiconductor Equipment | .4 |
| Consumer Services | 1.9 | ||
| Diversified Financials | 1.7 | 99.8 | |
| † Based on net assets. |
| See notes to financial statements. |
50
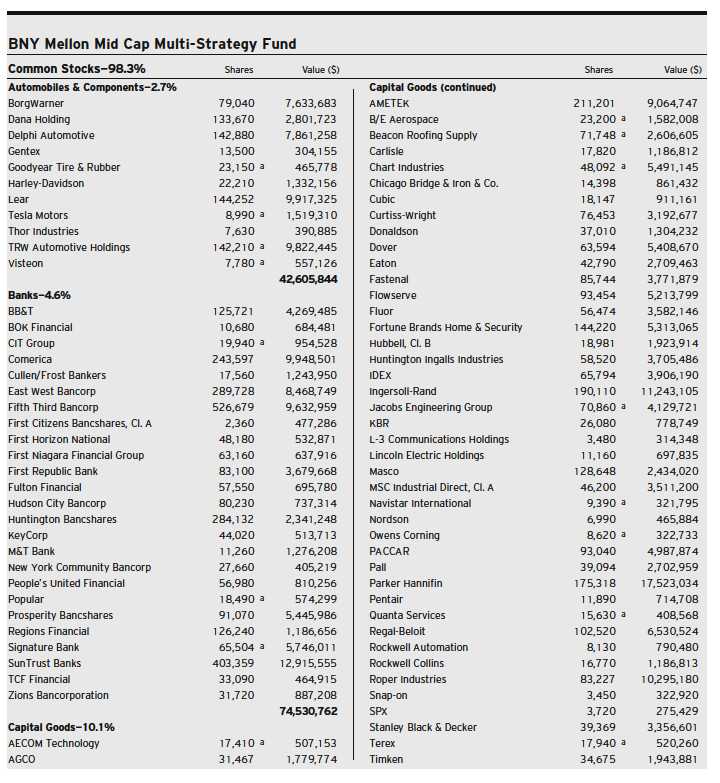
STATEMENT OF INVESTMENTS
August 31, 2013
The Funds 51
STATEMENT OF INVESTMENTS (continued)
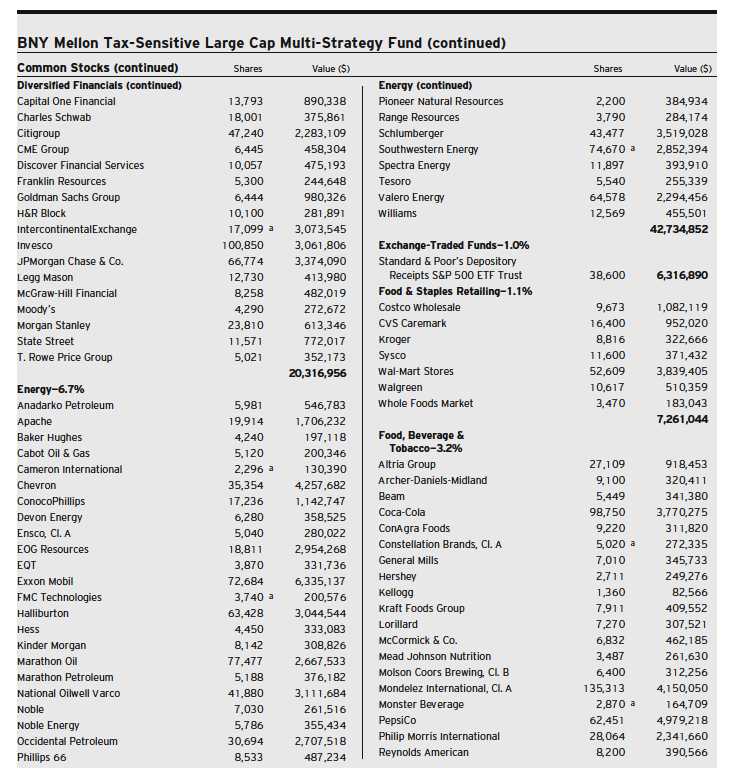
52
The Funds 53
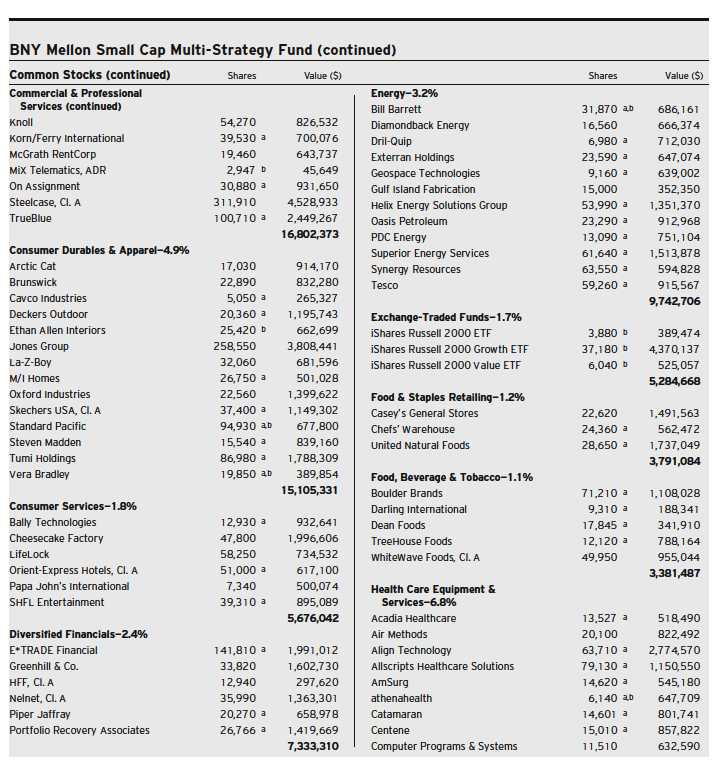
STATEMENT OF INVESTMENTS (continued)
54
The Funds 55
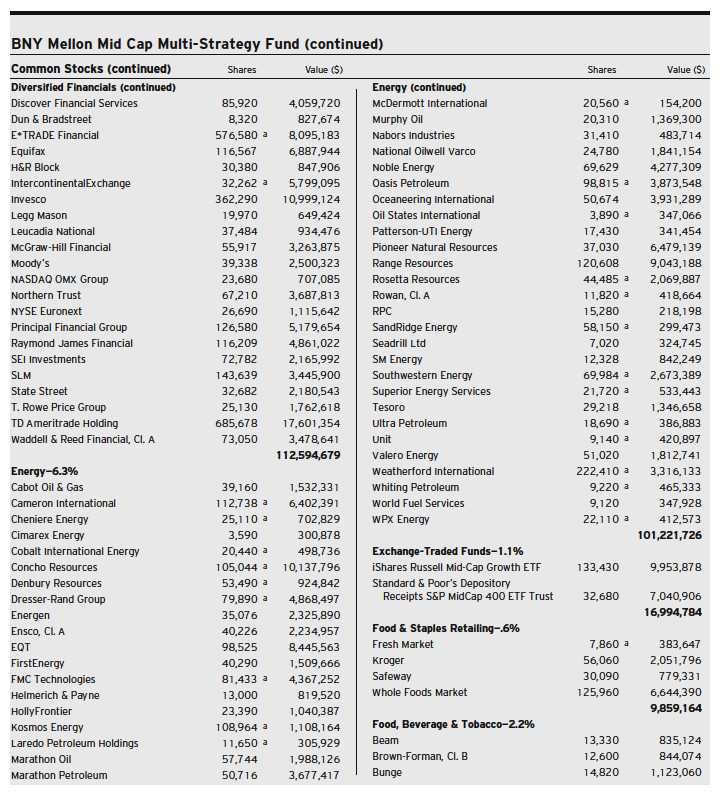
STATEMENT OF INVESTMENTS (continued)
| ADR—American Depository Receipts | |
| ETF—Exchange Traded Fund | |
| a | Non-income producing security. |
| b | Investment in real estate investment trust. |
| c | Investment in affiliated mutual fund. |
| d | Investment in affiliated money market mutual fund. |
| Portfolio Summary (Unaudited) † | |||
| Value (%) | Value (%) | ||
| Mutual Funds: Domestic | 36.0 | Consumer Services | 1.6 |
| Software & Services | 7.4 | Household & Personal Products | 1.5 |
| Energy | 6.7 | Utilities | 1.3 |
| Capital Goods | 6.2 | Food & Staples Retailing | 1.1 |
| Pharmaceuticals, Biotech & Life Sciences | 5.5 | Transportation | 1.1 |
| Technology Hardware & Equipment | 3.9 | Exchange-Traded Funds | 1.0 |
| Retailing | 3.3 | Telecommunication Services | 1.0 |
| Diversified Financials | 3.2 | Consumer Durables & Apparel | .9 |
| Food, Beverage & Tobacco | 3.2 | Semiconductors & Semiconductor Equipment | .9 |
| Health Care Equipment & Services | 2.9 | Automobiles & Components | .8 |
| Materials | 2.7 | Real Estate | .8 |
| Insurance | 2.2 | Money Market Investment | .7 |
| Banks | 2.0 | Commercial & Professional Services | .2 |
| Media | 1.8 | 99.9 | |
| † Based on net assets. |
| See notes to financial statements. |
56
STATEMENT OF INVESTMENTS
August 31, 2013
The Funds 57
STATEMENT OF INVESTMENTS (continued)
| ADR—American Depository Receipts |
| a Investment in affiliated money market mutual fund. |
| Portfolio Summary (Unaudited) † | |||
| Value (%) | Value (%) | ||
| Utilities | 11.7 | Telecommunication Services | 4.1 |
| Food, Beverage & Tobacco | 10.3 | Health Care Equipment & Services | 3.4 |
| Media | 7.8 | Retailing | 3.4 |
| Capital Goods | 7.7 | Automobiles & Components | 2.8 |
| Energy | 7.5 | Commercial & Professional Services | 1.7 |
| Materials | 7.3 | Insurance | 1.6 |
| Banks | 6.8 | Money Market Investment | 1.4 |
| Pharmaceuticals, Biotech & Life Sciences | 6.3 | Consumer Durables & Apparel | 1.1 |
| Diversified Financials | 5.2 | Consumer Services | 1.0 |
| Semiconductors & Semiconductor Equipment | 4.7 | ||
| Technology Hardware & Equipment | 4.1 | 99.9 | |
| † Based on net assets. |
| See notes to financial statements. |
58
STATEMENT OF OPTIONS WRITTEN
August 31, 2013
| Number of Contracts |
Value ($) | |||
| BNY Mellon Income Stock Fund | ||||
| Call Options: | ||||
| Lorillard, | ||||
| September 2013 @ $47.50 | 1,740 | a | (10,440 | ) |
| (premium received $145,548) | ||||
| a Non-income producing security. |
| See notes to financial statements. |
The Funds 59
STATEMENT OF INVESTMENTS
August 31, 2013
60
The Funds 61
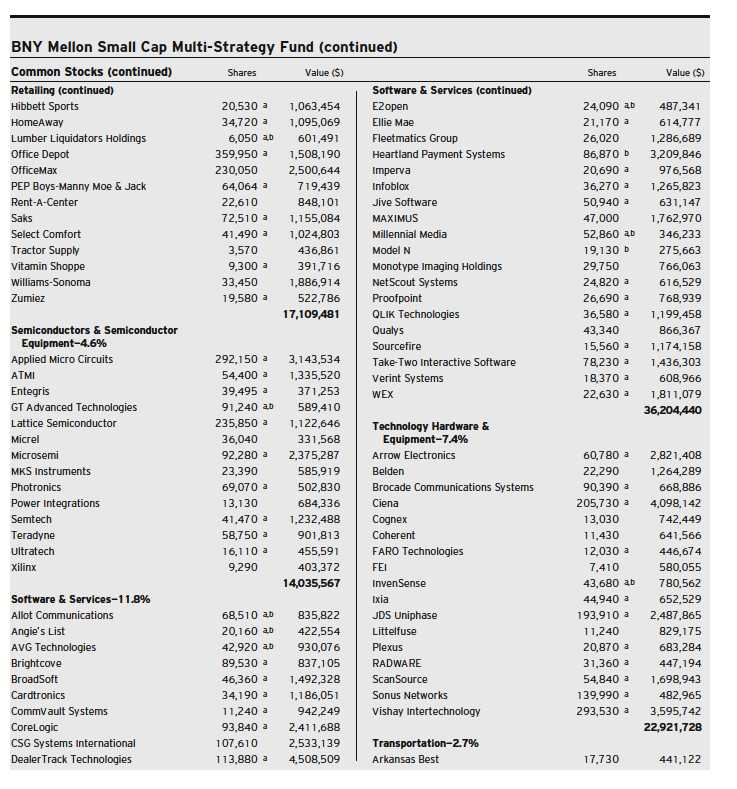
STATEMENT OF INVESTMENTS (continued)
62
The Funds 63
STATEMENT OF INVESTMENTS (continued)
64
The Funds 65
STATEMENT OF INVESTMENTS (continued)

66
The Funds 67
STATEMENT OF INVESTMENTS (continued)
| ETF—Exchange Traded Funds | |
| a | Non-income producing security. |
| b | Investment in real estate investment trust. |
| c | Investment in affiliated money market mutual fund. |
Portfolio Summary (Unaudited) †
| Value (%) | Value (%) | ||
| Capital Goods | 10.1 | Automobiles & Components | 2.7 |
| Software & Services | 8.3 | Commercial & Professional Services | 2.7 |
| Health Care Equipment & Services | 7.3 | Food, Beverage & Tobacco | 2.2 |
| Diversified Financials | 7.0 | Semiconductors & Semiconductor Equipment | 2.1 |
| Retailing | 6.6 | Media | 1.8 |
| Technology Hardware & Equipment | 6.5 | Money Market Investment | 1.6 |
| Energy | 6.3 | Transportation | 1.6 |
| Pharmaceuticals, Biotech & Life Sciences | 5.0 | Consumer Services | 1.4 |
| Banks | 4.6 | Exchange-Traded Funds | 1.1 |
| Materials | 4.6 | Household & Personal Products | .9 |
| Consumer Durables & Apparel | 4.3 | Food & Staples Retailing | .6 |
| Real Estate | 4.0 | Telecommunication Services | .5 |
| Insurance | 3.2 | ||
| Utilities | 2.9 | 99.9 |
| † Based on net assets. |
| See notes to financial statements. |
68
STATEMENT OF INVESTMENTS
August 31, 2013
The Funds 69
STATEMENT OF INVESTMENTS (continued)
70
The Funds 71
STATEMENT OF INVESTMENTS (continued)
72
| ADR—American Depository Receipts |
| ETF—Exchange Traded Funds |
| a Non-income producing security. |
| b Security, or portion thereof, on loan.At August 31, 2013, the value of the fund’s securities on loan was $18,551,679 and the value of the collateral held by the fund was |
| $19,981,865. |
| c Investment in real estate investment trust. |
| d Investment in affiliated money market mutual fund. |
Portfolio Summary (Unaudited) †
| Value (%) | Value (%) | ||
| Software & Services | 11.8 | Energy | 3.2 |
| Banks | 10.6 | Transportation | 2.7 |
| Money Market Investments | 8.1 | Diversified Financials | 2.4 |
| Technology Hardware & Equipment | 7.4 | Real Estate | 2.2 |
| Capital Goods | 7.3 | Media | 1.9 |
| Health Care Equipment & Services | 6.8 | Consumer Services | 1.8 |
| Pharmaceuticals, Biotech & Life Sciences | 5.7 | Exchange-Traded Funds | 1.7 |
| Retailing | 5.6 | Food & Staples Retailing | 1.2 |
| Commercial & Professional Services | 5.5 | Food, Beverage & Tobacco | 1.1 |
| Consumer Durables & Apparel | 4.9 | Insurance | 1.1 |
| Semiconductors & Semiconductor Equipment | 4.6 | Utilities | 1.1 |
| Automobiles & Components | 3.9 | Household & Personal Products | .4 |
| Materials | 3.9 | 106.9 |
| † Based on net assets. |
| See notes to financial statements. |
The Funds 73
STATEMENT OF INVESTMENTS
August 31, 2013
74
| ADR—American Depository Receipts |
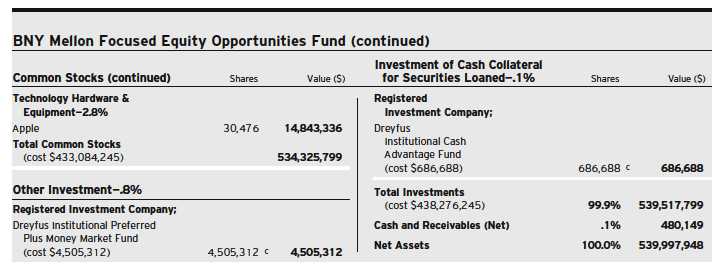
| a Security, or portion thereof, on loan.At August 31, 2013, the value of the fund’s securities on loan was $949,799 and the value of the collateral held by the fund was $972,077, |
| consisting of cash collateral of $686,688 and U.S. Government and Agency securities valued at $285,389. |
| b Non-income producing security. |
| c Investment in affiliated money market mutual fund. |
Portfolio Summary (Unaudited) †
| Value (%) | Value (%) | ||
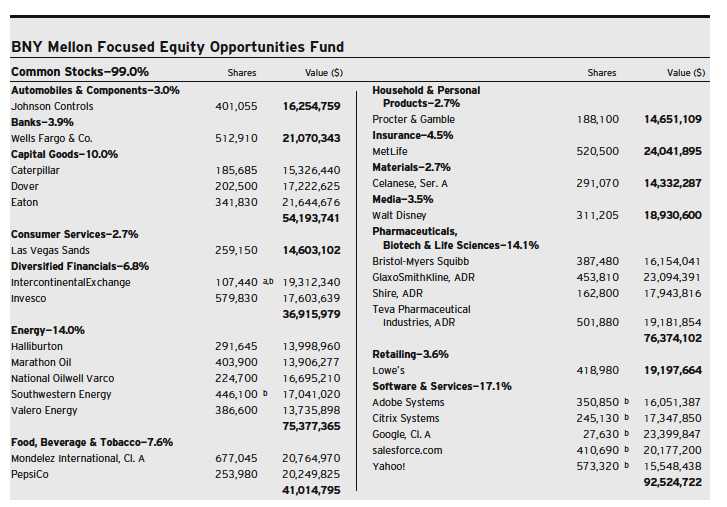
| Software & Services | 17.1 | Media | 3.5 |
| Pharmaceuticals, Biotech & Life Sciences | 14.1 | Automobiles & Components | 3.0 |
| Energy | 14.0 | Technology Hardware & Equipment | 2.8 |
| Capital Goods | 10.0 | Consumer Services | 2.7 |
| Food, Beverage & Tobacco | 7.6 | Household & Personal Products | 2.7 |
| Diversified Financials | 6.8 | Materials | 2.7 |
| Insurance | 4.5 | Money Market Investments | .9 |
| Banks | 3.9 | ||
| Retailing | 3.6 | 99.9 |
| † Based on net assets. |
| See notes to financial statements. |
The Funds 75
STATEMENT OF INVESTMENTS
August 31, 2013
76

The Funds 77
STATEMENT OF INVESTMENTS (continued)
| ETF—Exchange Traded Funds |
| a Non-income producing security. |
| b Security, or portion thereof, on loan.At August 31, 2013, the value of the fund’s securities on loan was $35,891,826 and the value of the collateral held by the fund was |
| $37,289,322. |
| c Investment in real estate investment trust. |
| d Investment in affiliated money market mutual fund. |
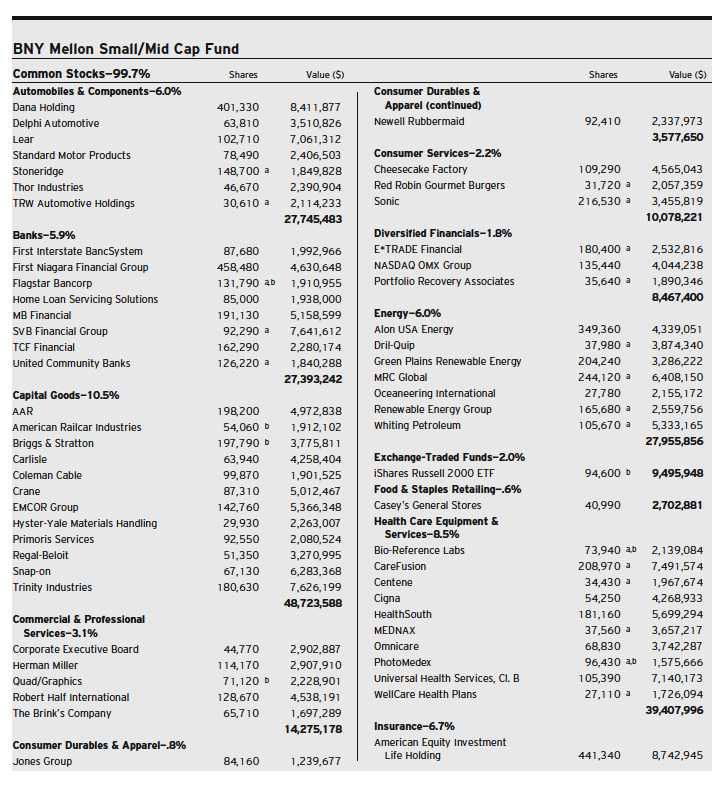
Portfolio Summary (Unaudited) †
| Value (%) | Value (%) | ||
| Capital Goods | 10.5 | Utilities | 4.7 |
| Health Care Equipment & Services | 8.5 | Retailing | 4.4 |
| Money Market Investments | 8.4 | Commercial & Professional Services | 3.1 |
| Insurance | 6.7 | Semiconductors & Semiconductor Equipment | 2.8 |
| Materials | 6.5 | Consumer Services | 2.2 |
| Technology Hardware & Equipment | 6.4 | Exchange-Traded Funds | 2.0 |
| Pharmaceuticals, Biotech & Life Sciences | 6.3 | Transportation | 2.0 |
| Software & Services | 6.3 | Diversified Financials | 1.8 |
| Real Estate | 6.2 | Consumer Durables & Apparel | .8 |
| Automobiles & Components | 6.0 | Food & Staples Retailing | .6 |
| Energy | 6.0 | ||
| Banks | 5.9 | 108.1 |
| † Based on net assets. |
| See notes to financial statements. |
78
STATEMENT OF INVESTMENTS
August 31, 2013
The Funds 79
STATEMENT OF INVESTMENTS (continued)
80
| ADR—American Depository Receipts | |
| ETF—Exchange Traded Fund | |
| a | Non-income producing security. |
| b | Investment in affiliated money market mutual fund. |
Portfolio Summary (Unaudited) †
| Value (%) | Value (%) | ||
| Financial | 25.1 | Information Technology | 6.6 |
| Industrial | 11.8 | Utilities | 3.6 |
| Health Care | 10.8 | Telecommunication Services | 3.5 |
| Consumer Discretionary | 9.9 | Money Market Investment | 1.6 |
| Consumer Staples | 9.4 | Exchange-Traded Fund | .8 |
| Energy | 8.6 | ||
| Materials | 7.4 | 99.1 |
| † Based on net assets. |
| See notes to financial statements. |
The Funds 81
STATEMENT OF INVESTMENTS
August 31, 2013
82
The Funds 83
STATEMENT OF INVESTMENTS (continued)
84
| ADR—American Depository Receipts |
| ADS—American Depository Shares |
| ETF—Exchange-Traded Funds |
| GDR—Global Depository Receipts |
| a Non-income producing security. |
| b Securities exempt from registration pursuant to Rule 144A under the Securities Act of 1933.These securities may be resold in transactions exempt from registration, normally to |
| qualified institutional buyers.At August 31, 2013, these securities were valued at $7,942,164 or .4% of net assets. |
| c The valuation of this security has been determined in good faith by management under the direction of the Board of Directors.At August 31, 2013, the value of this security |
| amounted to $11,960,741 or .6% of net assets. |
| d Investment in affiliated money market mutual fund. |
Portfolio Summary (Unaudited) †
| Value (%) | Value (%) | ||
| Financial | 27.2 | Consumer Staples | 4.9 |
| Information Technology | 15.0 | Utilities | 3.3 |
| Energy | 13.0 | Health Care | 2.5 |
| Consumer Discretionary | 8.9 | Exchange-Traded Funds | .5 |
| Industrial | 7.8 | Money Market Investment | .2 |
| Materials | 7.8 | ||
| Telecommunication Services | 7.2 | 98.3 |
| † Based on net assets. |
| See notes to financial statements. |
The Funds 85
STATEMENT OF INVESTMENTS
August 31, 2013
86
The Funds 87
STATEMENT OF INVESTMENTS (continued)
88
The Funds 89
STATEMENT OF INVESTMENTS (continued)
| ADR—American Depository Receipts |
| a Non-income producing security. |
| b Security exempt from registration pursuant to Rule 144A under the Securities Act of 1933.This security may be resold in transactions exempt from registration, normally to |
| qualified institutional buyers.At August 31, 2013, this security was valued at $1,327,920 or 1.3% of net assets. |
| c Held by or on behalf of a counterparty for open financial futures contracts. |
| d Investment in affiliated money market mutual fund. |
Portfolio Summary (Unaudited) †
| Value (%) | Value (%) | ||
| Banks | 12.9 | Technology Hardware & Equipment | 2.0 |
| Capital Goods | 9.2 | Short-Term/Money Market Investments | 1.9 |
| Pharmaceuticals, Biotech & Life Sciences | 9.2 | Software & Services | 1.8 |
| Materials | 8.3 | Transportation | 1.8 |
| Food, Beverage & Tobacco | 7.7 | Food & Staples Retailing | 1.7 |
| Energy | 7.3 | Household & Personal Products | 1.7 |
| Automobiles & Components | 5.3 | Media | 1.7 |
| Telecommunication Services | 4.9 | Commercial & Professional Services | 1.5 |
| Insurance | 4.8 | Retailing | 1.2 |
| Real Estate | 3.5 | Consumer Services | 1.1 |
| Utilities | 3.4 | Health Care Equipment & Services | 1.0 |
| Diversified Financials | 3.3 | Semiconductors & Semiconductor Equipment | .2 |
| Consumer Durables & Apparel | 2.1 | 99.5 |
| † Based on net assets. |
| See notes to financial statements. |
90
STATEMENT OF FINANCIAL FUTURES
August 31, 2013
The Funds 91
STATEMENT OF INVESTMENTS
August 31, 2013
92
The Funds 93
STATEMENT OF INVESTMENTS (continued)
| ETF—Exchange Traded Funds |
| a Investment in affiliated money market mutual fund. |
Portfolio Summary (Unaudited) †
| Value (%) | Value (%) | ||
| Financial | 25.5 | Utilities | 3.3 |
| Telecommunication Services | 14.6 | Health Care | 2.8 |
| Consumer Discretionary | 13.4 | Information Technology | 2.2 |
| Industrial | 10.7 | Money Market Investment | 1.9 |
| Energy | 9.0 | Exchange Traded Fund | 1.5 |
| Materials | 8.7 | ||
| Consumer Staples | 5.1 | 98.7 |
| † Based on net assets. |
| See notes to financial statements. |
94
STATEMENT OF INVESTMENTS
August 31, 2013
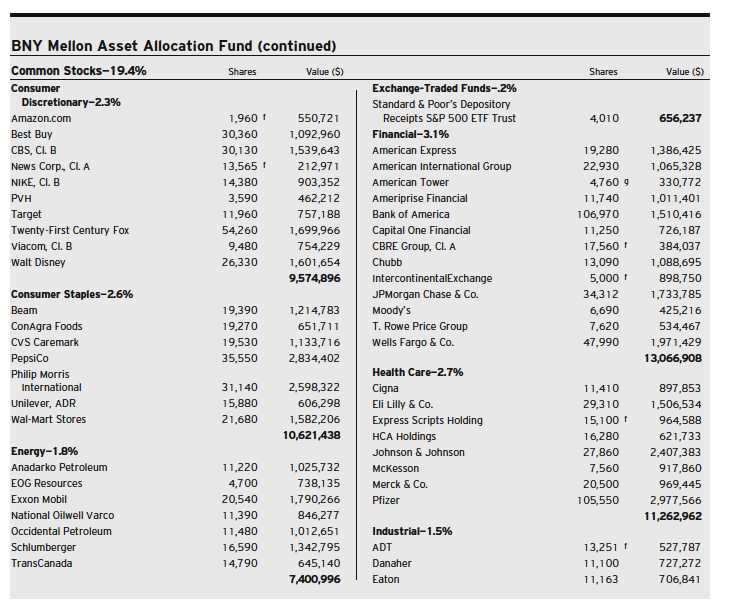
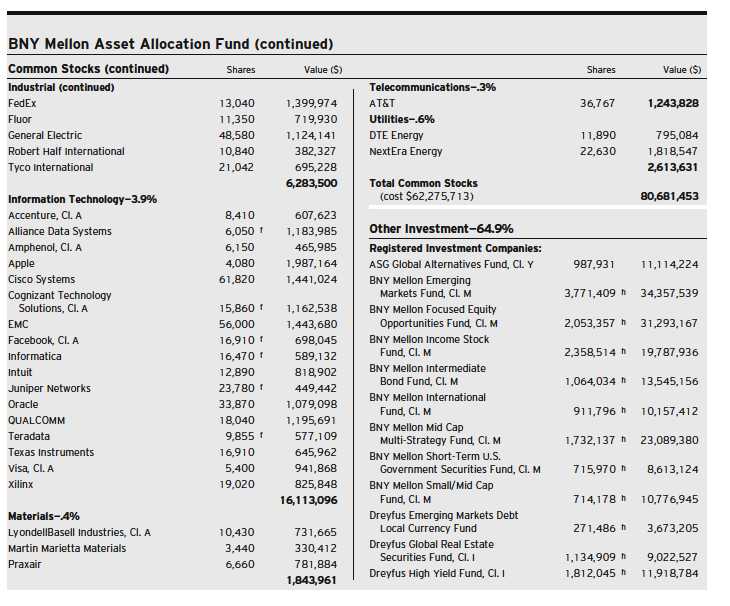
| BNY Mellon Asset Allocation Fund | |||||
| Coupon | Maturity | Principal | |||
| Bonds and Notes—15.7% | Rate (%) | Date | Amount ($) | Value ($) | |
| Asset-Backed Ctfs./Auto Receivables—.2% | |||||
| Americredit Automobile Receivables Trust, Ser. 2013-2, Cl. A3 | 0.65 | 12/8/17 | 375,000 | 373,241 | |
| AmeriCredit Automobile Receivables Trust, Ser. 2011-3, Cl. A3 | 1.17 | 1/8/16 | 270,392 | 270,704 | |
| Nissan Auto Receivables Owner Trust, Ser. 2010-A, Cl. A4 | 1.31 | 9/15/16 | 354,509 | 355,552 | |
| 999,497 | |||||
| Casinos—.2% | |||||
| Agua Caliente Band of Cahuilla Indians, Sr. Scd. Notes | 6.08 | 10/1/16 | 204,000 | a | 197,539 |
| Agua Caliente Band of Cahuilla Indians, Sr. Scd. Notes | 6.44 | 10/1/16 | 174,000 | a | 166,570 |
| Seminole Indian Tribe of Florida, Sr. Scd. Notes | 5.80 | 10/1/13 | 265,000 | a | 265,331 |
| Seminole Indian Tribe of Florida, Scd. Notes | 7.75 | 10/1/17 | 105,000 | a | 111,956 |
| 741,396 | |||||
| Commercial Mortgage Pass-Through Ctfs.—.3% | |||||
| UBS Commercial Mortgage Trust, Ser. 2012-C1, Cl. A3 | 3.40 | 5/10/45 | 155,000 | 151,383 | |
| WFRBS Commercial Mortgage Trust, Ser. 2011-C5, Cl. A2 | 2.68 | 11/15/44 | 80,000 | 82,315 | |
| WF-RBS Commerical Mortgage Trust, Ser. 2013-C13, Cl. A4 | 3.00 | 5/15/45 | 890,000 | 827,446 | |
| 1,061,144 | |||||
| Consumer Discretionary—.6% | |||||
| Amazon.com, Sr. Unscd. Notes | 2.50 | 11/29/22 | 345,000 | 312,248 | |
| Comcast, Gtd. Notes | 3.13 | 7/15/22 | 615,000 | 596,440 | |
| Johnson Controls, Sr. Unscd. Notes | 3.75 | 12/1/21 | 440,000 | 437,694 | |
| News America, Gtd. Notes | 6.15 | 3/1/37 | 265,000 | 288,298 | |
| Time Warner Cable, Gtd. Notes | 4.13 | 2/15/21 | 565,000 | 537,807 | |
| Time Warner, Gtd. Notes | 4.00 | 1/15/22 | 350,000 | 351,120 | |
| 2,523,607 | |||||
| Consumer Staples—.3% | |||||
| Anheuser-Busch InBev Worldwide, Gtd. Notes | 2.50 | 7/15/22 | 305,000 | 280,957 | |
| ConAgra Foods, Sr. Unscd. Notes | 3.20 | 1/25/23 | 150,000 | 140,409 | |
| PepsiCo, Sr. Unscd. Notes | 4.50 | 1/15/20 | 375,000 | 409,292 | |
| Pernod-Ricard, Sr. Unscd. Notes | 4.45 | 1/15/22 | 290,000 | a | 296,613 |
| Walgreen, Sr. Unscd. Notes | 3.10 | 9/15/22 | 330,000 | 309,970 | |
| 1,437,241 | |||||
| Energy—.1% | |||||
| BP Capital Markets, Gtd. Notes | 3.88 | 3/10/15 | 290,000 | 304,073 | |
| Petrobras International Finance, Gtd. Notes | 5.38 | 1/27/21 | 125,000 | 122,685 | |
| 426,758 | |||||
| Financial—2.4% | |||||
| American International Group, Sr. Unscd. Notes | 5.85 | 1/16/18 | 450,000 | 508,611 | |
| Bank of America, Sub. Notes | 5.49 | 3/15/19 | 970,000 | 1,049,396 | |
| BBVA US Senior, Bank Gtd. Notes | 3.25 | 5/16/14 | 370,000 | 373,298 | |
| Bear Stearns, Sub. Notes | 5.55 | 1/22/17 | 395,000 | 434,744 | |
| BlackRock, Sr. Unscd. Notes | 6.25 | 9/15/17 | 420,000 | 490,117 | |
| Boston Properties, Sr. Unscd. Notes | 4.13 | 5/15/21 | 360,000 | 368,714 |
The Funds 95
STATEMENT OF INVESTMENTS (continued)
| BNY Mellon Asset Allocation Fund (continued) | |||||
| Coupon | Maturity | Principal | |||
| Bonds and Notes (continued) | Rate (%) | Date | Amount ($) | Value ($) | |
| Financial (continued) | |||||
| Citigroup, Sub. Notes | 5.00 | 9/15/14 | 415,000 | 431,327 | |
| Citigroup, Sr. Unscd. Notes | 6.13 | 11/21/17 | 195,000 | 223,730 | |
| Ford Motor Credit, Sr. Unscd. Notes | 3.00 | 6/12/17 | 320,000 | 322,695 | |
| General Electric Capital, Jr. Sub. Cap. Secs., Ser. C | 5.25 | 6/29/49 | 270,000 | b | 248,400 |
| General Electric Capital, Sub. Notes | 5.30 | 2/11/21 | 295,000 | 319,163 | |
| Goldman Sachs Group, Sub. Notes | 6.75 | 10/1/37 | 445,000 | 460,625 | |
| HSBC Finance, Sub. Notes | 6.68 | 1/15/21 | 582,000 | 658,074 | |
| Jefferies Group, Sr. Unscd. Notes | 5.13 | 4/13/18 | 115,000 | 122,766 | |
| Jefferies Group, Sr. Unscd. Notes | 8.50 | 7/15/19 | 335,000 | 407,572 | |
| MetLife, Sr. Unscd. Notes | 7.72 | 2/15/19 | 345,000 | 431,438 | |
| Morgan Stanley, Sub. Notes | 4.88 | 11/1/22 | 625,000 | 618,186 | |
| NYSE Euronext, Sr. Unscd. Notes | 2.00 | 10/5/17 | 385,000 | 383,012 | |
| Prudential Financial, Sr. Unscd. Notes | 4.75 | 9/17/15 | 395,000 | 425,168 | |
| Rabobank Nederland, Gtd. Notes | 4.50 | 1/11/21 | 440,000 | 462,623 | |
| RBS Citizens Financial Group, Sub. Notes | 4.15 | 9/28/22 | 445,000 | a | 426,719 |
| Simon Property Group, Sr. Unscd. Notes | 5.65 | 2/1/20 | 450,000 | 503,850 | |
| TD Ameritrade Holding, Gtd. Notes | 4.15 | 12/1/14 | 335,000 | 349,661 | |
| 10,019,889 | |||||
| Foreign/Governmental—.2% | |||||
| Mexican Government, Sr. Unscd. Notes | 5.63 | 1/15/17 | 315,000 | 351,540 | |
| Mexican Government, Sr. Unscd. Notes | 6.63 | 3/3/15 | 185,000 | 200,263 | |
| Province of Ontario Canada, Sr. Unscd. Bonds | 4.00 | 10/7/19 | 330,000 | 356,041 | |
| 907,844 | |||||
| Health Care—.2% | |||||
| Amgen, Sr. Unscd. Notes | 5.65 | 6/15/42 | 410,000 | 425,345 | |
| Thermo Fisher Scientific, Sr. Unscd. Notes | 3.60 | 8/15/21 | 290,000 | 282,665 | |
| 708,010 | |||||
| Industrial—.2% | |||||
| ABB Finance USA, Gtd. Notes | 2.88 | 5/8/22 | 575,000 | 548,124 | |
| CRH America, Gtd. Notes | 5.30 | 10/15/13 | 405,000 | 407,030 | |
| 955,154 | |||||
| Information Technology—.3% | |||||
| Intel, Sr. Unscd. Notes | 2.70 | 12/15/22 | 575,000 | 531,283 | |
| Oracle, Sr. Unscd. Notes | 5.75 | 4/15/18 | 520,000 | 602,925 | |
| 1,134,208 | |||||
| Materials—.1% | |||||
| Eastman Chemical, Sr. Unscd. Notes | 3.60 | 8/15/22 | 365,000 | 353,996 | |
| Municipal Bonds—.9% | |||||
| Chicago, GO | 7.78 | 1/1/35 | 340,000 | 378,046 | |
| Florida Hurricane Catastrophe Fund Finance Corporation, Revenue | 3.00 | 7/1/20 | 750,000 | 693,570 | |
| Illinois, GO | 4.42 | 1/1/15 | 440,000 | 455,831 | |
| Los Angeles Community College District, GO (Build America Bonds) | 6.75 | 8/1/49 | 655,000 | 812,010 |
96
| BNY Mellon Asset Allocation Fund (continued) | |||||
| Coupon | Maturity | Principal | |||
| Bonds and Notes (continued) | Rate (%) | Date | Amount ($) | Value ($) | |
| Municipal Bonds (continued) | |||||
| Massachusetts, GO (Build America Bonds) | 4.20 | 12/1/21 | 210,000 | 218,841 | |
| New York City Municipal Water Finance Authority, | |||||
| Water and Sewer System Second General | |||||
| Resolution Revenue (Build America Bonds) | 6.28 | 6/15/42 | 320,000 | 354,563 | |
| Oakland Unified School District, GO (Build America Bonds) | 9.50 | 8/1/34 | 180,000 | 204,844 | |
| Puerto Rico Commonwealth Government | |||||
| Development Bank, Revenue Bonds | 3.67 | 5/1/14 | 415,000 | 415,506 | |
| University of California Regents, Medical Center | |||||
| Pooled Revenue (Build America Bonds) | 5.44 | 5/15/23 | 135,000 | 148,794 | |
| 3,682,005 | |||||
| Telecommunication Services—.5% | |||||
| AT&T, Sr. Unscd. Notes | 4.45 | 5/15/21 | 450,000 | 477,223 | |
| Rogers Communications, Gtd. Notes | 6.38 | 3/1/14 | 380,000 | 390,746 | |
| Telefonica Emisiones, Gtd. Notes | 5.13 | 4/27/20 | 495,000 | 501,334 | |
| Verizon Communications, Sr. Unscd. Notes | 5.50 | 2/15/18 | 550,000 | 621,399 | |
| 1,990,702 | |||||
| U.S. Government Agencies/Mortgage-Backed—4.6% | |||||
| Federal Home Loan Mortgage Corp.: | |||||
| 2.50%, 7/1/28 | 751,549 | c | 746,382 | ||
| 3.00%, 7/1/28—11/1/42 | 1,688,242 | c | 1,668,198 | ||
| 3.50%, 6/1/43 | 1,118,101 | c | 1,116,002 | ||
| 4.00%, 4/1/24 | 402,974 | c | 424,036 | ||
| 4.50%, 5/1/39—11/1/41 | 2,775,405 | c | 2,940,484 | ||
| 5.00%, 7/1/40 | 758,709 | c | 815,968 | ||
| 5.50%, 12/1/37—12/1/38 | 832,990 | c | 898,513 | ||
| Federal National Mortgage Association: | |||||
| 2.50%, 3/1/28 | 406,114 | c | 404,182 | ||
| 3.00%, 7/1/27—5/1/43 | 2,276,612 | c | 2,247,614 | ||
| 3.32%, 4/1/41 | 276,835 | b,c | 289,549 | ||
| 3.50%, 9/1/26—6/1/43 | 2,246,968 | c | 2,294,852 | ||
| 4.00%, 2/1/41—11/1/42 | 1,608,153 | c | 1,664,051 | ||
| 4.50%, 6/1/23—7/1/24 | 226,464 | c | 240,697 | ||
| 5.00%, 12/1/21—2/1/41 | 1,380,928 | c | 1,496,479 | ||
| 5.50%, 4/1/36—3/1/38 | 945,893 | c | 1,031,158 | ||
| 6.00%, 4/1/33—10/1/38 | 749,762 | c | 826,687 | ||
| 6.50%, 10/1/36 | 53,347 | c | 58,620 | ||
| 19,163,472 | |||||
| U.S. Government Securities—4.5% | |||||
| U.S. Treasury Inflation Protected Securities: | |||||
| Bonds, 2.38%, 1/15/27 | 752,564 | d,e | 890,847 | ||
| Notes 0.13%, 4/15/18 | 767,646 | d,e | 783,299 | ||
| Notes 0.13%, 1/15/23 | 642,328 | d | 612,796 | ||
| Notes, 0.63%, 7/15/21 | 616,390 | d | 629,537 | ||
| Notes, 1.38%, 7/15/18 | 595,518 | d,e | 647,486 | ||
| Notes, 1.38%, 1/15/20 | 502,070 | d,e | 542,569 | ||
| Notes, 2.38%, 1/15/17 | 752,564 | d,e | 831,994 | ||
The Funds 97
STATEMENT OF INVESTMENTS (continued)
| BNY Mellon Asset Allocation Fund (continued) | |||||
| Coupon | Maturity | Principal | |||
| Bonds and Notes (continued) | Rate (%) | Date | Amount ($) | Value ($) | |
| U.S. Government Securities (continued) | |||||
| U.S. Treasury Notes: | |||||
| 0.25%, 1/15/15 | 490,000 | 490,115 | |||
| 0.25%, 8/15/15 | 2,045,000 | e | 2,039,448 | ||
| 0.25%, 9/15/15 | 770,000 | e | 767,594 | ||
| 0.25%, 12/15/15 | 715,000 | e | 711,062 | ||
| 0.25%, 4/15/16 | 530,000 | 524,969 | |||
| 0.38%, 4/15/15 | 865,000 | e | 866,030 | ||
| 0.38%, 2/15/16 | 255,000 | 253,904 | |||
| 0.38%, 3/15/16 | 345,000 | 343,194 | |||
| 0.50%, 6/15/16 | 465,000 | e | 462,657 | ||
| 0.63%, 7/15/16 | 245,000 | 244,301 | |||
| 0.63%, 8/15/16 | 405,000 | 403,465 | |||
| 0.63%, 9/30/17 | 515,000 | e | 501,542 | ||
| 0.63%, 4/30/18 | 315,000 | e | 302,708 | ||
| 0.75%, 10/31/17 | 650,000 | 635,070 | |||
| 0.88%, 12/31/16 | 475,000 | 473,961 | |||
| 0.88%, 1/31/18 | 250,000 | 244,297 | |||
| 1.00%, 5/31/18 | 675,000 | e | 658,995 | ||
| 1.25%, 4/30/19 | 590,000 | 571,770 | |||
| 1.25%, 10/31/19 | 25,000 | 23,953 | |||
| 1.38%, 2/28/19 | 220,000 | e | 215,445 | ||
| 1.50%, 6/30/16 | 500,000 | e | 510,996 | ||
| 1.50%, 7/31/16 | 510,000 | e | 520,997 | ||
| 1.75%, 7/31/15 | 750,000 | 769,526 | |||
| 1.75%, 5/15/23 | 975,000 | e | 891,821 | ||
| 2.25%, 7/31/18 | 180,000 | 185,801 | |||
| 18,552,149 | |||||
| Utilities—.1% | |||||
| Boston Gas, | |||||
| Sr. Unscd. Notes | 4.49 | 2/15/42 | 250,000 | a | 238,668 |
| Hydro-Quebec, | |||||
| Gov’t Gtd. Notes | 2.00 | 6/30/16 | 280,000 | 287,645 | |
| 526,313 | |||||
| Total Bonds and Notes | |||||
| (cost $64,519,078) | 65,183,385 | ||||
98
The Funds 99
STATEMENT OF INVESTMENTS (continued)
100
| ADR—American Depository Receipts |
| ETF—Exchange Traded Funds |
| GO—General Obligation |
| a Securities exempt from registration pursuant to Rule 144A under the Securities Act of 1933.These securities may be resold in transactions exempt from registration, normally to |
| qualified institutional buyers.At August 31, 2013, these securities were valued at $1,703,396 or .4% of net assets. |
| b Variable rate security—interest rate subject to periodic change. |
| c The Federal Housing Finance Agency (“FHFA”) placed Federal Home Loan Mortgage Corporation and Federal National Mortgage Association into conservatorship with FHFA |
| as the conservator.As such, the FHFA oversees the continuing affairs of these companies. |
| d Principal amount for accrual purposes is periodically adjusted based on changes in the Consumer Price Index. |
| e Security, or portion thereof, on loan.At August 31, 2013, the value of the fund’s securities on loan was $10,834,234 and the value of the collateral held by the fund was |
| $11,139,404, consisting of U.S. Government and Agency securities. |
| f Non-income producing security. |
| g Investment in real estate investment trust. |
| h Investment in affiliated mutual fund. |
| i Investment in affiliated money market mutual fund. |
Portfolio Summary (Unaudited) †
| Value (%) | Value (%) | ||
| Mutual Funds: Domestic | 40.6 | Municipal Bonds | .9 |
| Mutual Funds: Foreign | 23.2 | Commercial Mortgage-Backed | .3 |
| Common Stocks | 19.2 | Asset-Backed | .2 |
| U.S. Government Agencies/Mortgage-Backed | 9.1 | Exchange-Traded Funds | .2 |
| Corporate Bonds | 5.0 | Foreign/Governmental | .2 |
| Money Market Investment | 1.1 | 100.0 |
| † Based on net assets. |
| See notes to financial statements. |
The Funds 101
STATEMENTS OF ASSETS AND LIABILITIES
August 31, 2013
| BNY Mellon | BNY Mellon | BNY Mellon | BNY Mellon | |
| Large Cap | Large Cap Market | Tax-Sensitive Large Cap | Income | |
| Stock Fund | Opportunities Fund | Multi-Strategy Fund | Stock Fund | |
| Assets ($): | ||||
| Investments in securities— | ||||
| See Statement of Investments:† | ||||
| Unaffiliated issuers | 749,201,842 | 105,670,859 | 404,281,879 | 969,393,554 |
| Affiliated issuers | — | 110,144,757 | 234,257,167 | 13,968,966 |
| Cash | — | 253,854 | 117,500 | 298,613 |
| Receivable for investment securities sold | 11,530,499 | — | — | — |
| Dividends receivable | 1,416,264 | 267,751 | 961,922 | 2,390,942 |
| Receivable for shares of | ||||
| Beneficial Interest subscribed | 2,500 | 109,872 | 220,651 | 1,506,935 |
| Prepaid expenses | 18,267 | 15,744 | 17,746 | 17,771 |
| 762,169,372 | 216,462,837 | 639,856,865 | 987,576,781 | |
| Liabilities ($): | ||||
| Due to The Dreyfus Corporation | ||||
| and affiliates—Note 4(b) | 467,580 | 114,927 | 343,270 | 547,916 |
| Due to Administrator—Note 4(a) | 81,973 | 15,453 | 52,360 | 99,014 |
| Cash overdraft due to Custodian | 1,006,752 | — | — | — |
| Payable for investment securities purchased | 7,567,701 | — | — | 2,327,124 |
| Payable for shares of | ||||
| Beneficial Interest redeemed | 214,891 | 61,922 | 83,706 | 239,061 |
| Interest payable—Note 3 | 347 | — | — | — |
| Outstanding options written, at value | ||||
| (premiums received $145,548 for | ||||
| BNY Mellon Income Stock Fund)—See | ||||
| statement of Options Written—Note 5 | — | — | — | 10,440 |
| Accrued expenses | 53,086 | 51,343 | 96,146 | 100,219 |
| 9,392,330 | 243,645 | 575,482 | 3,323,774 | |
| Net Assets ($) | 752,777,042 | 216,219,192 | 639,281,383 | 984,253,007 |
102
| BNY Mellon | BNY Mellon | BNY Mellon | BNY Mellon | |
| Large Cap | Large Cap Market | Tax-Sensitive Large Cap | Income | |
| Stock Fund | Opportunities Fund | Multi-Strategy Fund | Stock Fund | |
| Composition of Net Assets ($): | ||||
| Paid-in capital | 444,315,144 | 176,399,833 | 564,724,269 | 833,114,720 |
| Accumulated undistributed investment income—net | 154,239 | 783,030 | 3,549,629 | 175,655 |
| Accumulated net realized gain (loss) on investments | 116,826,932 | 13,656,418 | 19,763,786 | 21,650,429 |
| Accumulated net unrealized appreciation | ||||
| (depreciation) on investments | 191,480,727 | 25,379,911 | 51,243,699 | — |
| Accumulated net unrealized appreciation (depreciation) | ||||
| on investment and options transactions | — | — | — | 129,312,203 |
| Net Assets ($) | 752,777,042 | 216,219,192 | 639,281,383 | 984,253,007 |
| Net Asset Value Per Share | ||||
| Class M Shares | ||||
| Net Assets ($) | 732,611,598 | 216,116,456 | 638,085,256 | 981,444,391 |
| Shares Outstanding | 73,506,064 | 15,213,122 | 44,161,259 | 116,960,480 |
| Net Asset Value Per Share ($) | 9.97 | 14.21 | 14.45 | 8.39 |
| Investor Shares | ||||
| Net Assets ($) | 20,165,444 | 102,736 | 1,196,127 | 2,808,616 |
| Shares Outstanding | 2,022,448 | 7,194 | 81,676 | 332,196 |
| Net Asset Value Per Share ($) | 9.97 | 14.28 | 14.64 | 8.45 |
| † Investments at cost ($): | ||||
| Unaffiliated issuers | 557,721,115 | 80,289,944 | 352,426,469 | 840,216,459 |
| Affiliated issuers | — | 110,145,761 | 234,868,878 | 13,968,966 |
| See notes to financial statements. |
The Funds 103
STATEMENTS OF ASSETS AND LIABILITIES (continued)
| BNY Mellon | BNY Mellon | BNY Mellon | ||
| Mid Cap | Small Cap | Focused Equity | BNY Mellon | |
| Multi-Strategy Fund | Multi-Strategy Fund | Opportunities Fund | Small/Mid Cap Fund | |
| Assets ($): | ||||
| Investments in securities— | ||||
| See Statement of Investments† | ||||
| (including securities on loan)††—Note 2(c): | ||||
| Unaffiliated issuers | 1,575,967,219 | 304,055,428 | 534,325,799 | 462,976,895 |
| Affiliated issuers | 24,835,543 | 25,037,460 | 5,192,000 | 38,936,685 |
| Cash | 303,527 | 195,748 | 685,737 | 90,000 |
| Receivable for investment securities sold | 5,113,842 | 1,130,691 | — | — |
| Dividends receivable | 1,635,822 | — | — | — |
| Receivable for shares of | ||||
| Beneficial Interest subscribed | 846,453 | 116,128 | 535,026 | 70,866 |
| Dividends and securities lending | ||||
| income receivable | — | 103,296 | 1,093,504 | 360,054 |
| Prepaid expenses | 39,189 | 18,829 | 5,167 | 5,311 |
| 1,608,741,595 | 330,657,580 | 541,837,233 | 502,439,811 | |
| Liabilities ($): | ||||
| Due to The Dreyfus Corporation | ||||
| and affiliates—Note 4(b) | 1,108,873 | 268,173 | 346,858 | 330,423 |
| Due to Administrator—Note 4(a) | 172,779 | 33,383 | 57,502 | 50,891 |
| Payable for investment securities purchased | 4,771,215 | 2,279,263 | — | — |
| Payable for shares of | ||||
| Beneficial Interest redeemed | 418,115 | 158,588 | 690,453 | 241,162 |
| Liability for securities on loan—Note 2(c) | — | 19,981,865 | 686,688 | 37,289,322 |
| Interest payable—Note 3 | — | — | — | 34 |
| Accrued expenses | 69,690 | 49,065 | 57,784 | 57,972 |
| 6,540,672 | 22,770,337 | 1,839,285 | 37,969,804 | |
| Net Assets ($) | 1,602,200,923 | 307,887,243 | 539,997,948 | 464,470,007 |
104
| BNY Mellon | BNY Mellon | BNY Mellon | |||
| Mid Cap | Small Cap | Focused Equity | BNY Mellon | ||
| Multi-Strategy Fund | Multi-Strategy Fund | Opportunities Fund | Small/Mid Cap Fund | ||
| Composition of Net Assets ($): | |||||
| Paid-in capital | 1,271,150,531 | 302,157,935 | 408,162,417 | 387,538,834 | |
| Accumulated undistributed (distribution in | |||||
| excess of) investment income—net | 4,972,064 | (423,571 | ) | 3,758,775 | 437,489 |
| Accumulated net realized | |||||
| gain (loss) on investments | 58,709,124 | (38,706,191 | ) | 26,835,202 | 19,697,750 |
| Accumulated net unrealized appreciation | |||||
| (depreciation) on investments | 267,369,204 | 44,859,070 | 101,241,554 | 56,795,934 | |
| Net Assets ($) | 1,602,200,923 | 307,887,243 | 539,997,948 | 464,470,007 | |
| Net Asset Value Per Share | |||||
| Class M Shares | |||||
| Net Assets ($) | 1,572,562,027 | 299,415,071 | 539,019,344 | 464,031,159 | |
| Shares Outstanding | 117,998,213 | 20,264,798 | 35,376,423 | 30,746,920 | |
| Net Asset Value Per Share ($) | 13.33 | 14.78 | 15.24 | 15.09 | |
| Investor Shares | |||||
| Net Assets ($) | 29,638,896 | 8,472,172 | 978,604 | 438,848 | |
| Shares Outstanding | 2,250,582 | 589,945 | 64,469 | 29,213 | |
| Net Asset Value Per Share ($) | 13.17 | 14.36 | 15.18 | 15.02 | |
| † Investments at cost ($): | |||||
| Unaffiliated issuers | 1,308,598,015 | 259,196,358 | 433,084,245 | 406,180,961 | |
| Affiliated issuers | 24,835,543 | 25,037,460 | 5,192,000 | 38,936,685 | |
| ††Value of securities on loan ($) | — | 18,551,679 | 949,799 | 35,891,826 |
| See notes to financial statements. |
The Funds 105
STATEMENTS OF ASSETS AND LIABILITIES (continued)
| BNY Mellon | BNY Mellon | BNY Mellon | BNY Mellon | ||
| BNY Mellon | Emerging | International | International | Asset Allocation | |
| International Fund | Markets Fund | Appreciation Fund | Equity Income Fund | Fund | |
| Assets ($): | |||||
| Investments in securities— | |||||
| See Statement of Investments† | |||||
| (including securities on loan)††—Note 2(c): | |||||
| Unaffiliated issuers | 511,447,384 | 1,806,924,588 | 100,897,740 | 159,942,056 | 164,444,339 |
| Affiliated issuers | 8,318,742 | 3,563,342 | 1,761,341 | 3,045,924 | 251,658,294 |
| Cash | 344,712 | 1,236,135 | 16,298 | 443,528 | — |
| Cash denominated in foreign currencies††† | 2,054,691 | 14,205,713 | — | 699,941 | — |
| Dividends receivable | 2,404,863 | 6,472,086 | 328,672 | 1,240,203 | — |
| Receivable for investment securities sold | 1,184,319 | 22,794,537 | — | — | — |
| Receivable for shares of | |||||
| Beneficial Interest subscribed | 86,500 | 1,393,805 | — | 82,007 | 43,900 |
| Unrealized appreciation on forward foreign | |||||
| currency exchange contracts—Note 5 | — | 2,088 | — | — | — |
| Dividends, interest and securities | |||||
| lending income receivable | — | — | — | — | 556,243 |
| Prepaid expenses and other assets | 849,446 | 22,916 | 310,906 | 4,133 | 17,099 |
| 526,690,657 | 1,856,615,210 | 103,314,957 | 165,457,792 | 416,719,875 | |
| Liabilities ($): | |||||
| Due to The Dreyfus Corporation | |||||
| and affiliates—Note 4(b) | 518,368 | 2,604,533 | 57,749 | 167,481 | 81,630 |
| Due to Administrator—Note 4(a) | 57,070 | 197,243 | 11,241 | 17,633 | 15,498 |
| Cash overdraft due to Custodian | — | — | — | — | 404,930 |
| Payable for investment securities purchased | 1,161,554 | 9,957,032 | — | — | — |
| Payable for shares of | |||||
| Beneficial Interest redeemed | 513,262 | 2,117,230 | 21,771 | 43,172 | 23,626 |
| Unrealized depreciation on forward foreign | |||||
| currency exchange contracts—Note 5 | 332 | 66,888 | — | — | — |
| Interest payable—Note 3 | — | 894 | — | — | — |
| Payable for futures variation margin—Note 5 | — | — | 24,699 | — | — |
| Accrued expenses | 43,715 | 53,293 | 65,394 | 46,148 | 41,358 |
| 2,294,301 | 14,997,113 | 180,854 | 274,434 | 567,042 | |
| Net Assets ($) | 524,396,356 | 1,841,618,097 | 103,134,103 | 165,183,358 | 416,152,833 |
106
| BNY Mellon | BNY Mellon | BNY Mellon | BNY Mellon | |||||||
| BNY Mellon | Emerging | International | International | Asset Allocation | ||||||
| International Fund | Markets Fund | Appreciation Fund | Equity Income Fund | Fund | ||||||
| Composition of Net Assets ($): | ||||||||||
| Paid-in capital | 1,168,190,480 | 2,139,192,099 | 170,154,828 | 161,639,941 | 356,694,740 | |||||
| Accumulated undistributed | ||||||||||
| investment income—net | 9,338,567 | 21,173,888 | 1,827,550 | 2,236,471 | 672,651 | |||||
| Accumulated net realized | ||||||||||
| gain (loss) on investments | (628,742,508 | ) | (250,819,847 | ) | (42,475,998 | ) | (7,309,461 | ) | 7,579,133 | |
| Accumulated net unrealized appreciation | ||||||||||
| (depreciation) on investments and | ||||||||||
| foreign currency transactions | (24,390,183 | ) | (67,928,043 | ) | — | 8,616,407 | — | |||
| Accumulated net unrealized appreciation | ||||||||||
| (depreciation) on investments [including | ||||||||||
| ($82,792) net unrealized (depreciation) | ||||||||||
| on financial futures for BNY Mellon | ||||||||||
| International Appreciation Fund] | — | — | (26,372,277 | ) | — | 51,206,309 | ||||
| Net Assets ($) | 524,396,356 | 1,841,618,097 | 103,134,103 | 165,183,358 | 416,152,833 | |||||
| Net Asset Value Per Share | ||||||||||
| Class M Shares | ||||||||||
| Net Assets ($) | 519,964,048 | 1,830,754,312 | 98,361,422 | 165,132,249 | 411,214,089 | |||||
| Shares Outstanding | 46,686,323 | 201,005,356 | 7,943,105 | 11,953,410 | 35,214,953 | |||||
| Net Asset Value Per Share ($) | 11.14 | 9.11 | 12.38 | 13.81 | 11.68 | |||||
| Investor Shares | ||||||||||
| Net Assets ($) | 4,432,308 | 10,863,785 | 4,772,681 | 51,109 | 4,938,744 | |||||
| Shares Outstanding | 374,913 | 1,164,353 | 389,803 | 3,679 | 420,527 | |||||
| Net Asset Value Per Share ($) | 11.82 | 9.33 | 12.24 | 13.89 | 11.74 | |||||
| † | Investments at cost ($): | |||||||||
| Unaffiliated issuers | 535,795,909 | 1,874,664,920 | 127,187,225 | 151,307,557 | 145,132,548 | |||||
| Affiliated issuers | 8,318,742 | 3,563,342 | 1,761,341 | 3,045,924 | 219,763,776 | |||||
| †† | Value of securities on loan ($) | — | — | — | — | 10,834,234 | ||||
| ††† | Cash denominated in | |||||||||
| foreign currencies (cost) ($) | 2,065,708 | 14,249,002 | — | 712,093 | — | |||||
| See notes to financial statements. |
The Funds 107
STATEMENTS OF OPERATIONS
Year Ended August 31, 2013
| BNY Mellon | BNY Mellon | BNY Mellon | BNY Mellon | |||||
| Large Cap | Large Cap Market | Tax-Sensitive Large Cap | Income | |||||
| Stock Fund | Opportunities Fund | Multi-Strategy Fund | Stock Fund | |||||
| Investment Income ($): | ||||||||
| Income: | ||||||||
| Cash dividends (net of $244,021, $12,063, $26,185 and | ||||||||
| $245,727 foreign taxes withheld at source for BNY Mellon | ||||||||
| Large Cap Stock Fund, BNY Mellon Large Cap Market | ||||||||
| Opportunities Fund, BNY Mellon Tax-Sensitive Large Cap | ||||||||
| Multi-Strategy Fund and BNY Mellon Income | ||||||||
| Stock Fund, respectively): | ||||||||
| Unaffiliated issuers | 17,384,468 | 2,681,162 | 7,132,550 | 26,284,553 | ||||
| Affiliated issuers | 1,004 | 172,456 | 370,153 | 11,846 | ||||
| Income from securities lending—Note 2(c) | 61,123 | — | — | 562,825 | ||||
| Total Income | 17,446,595 | 2,853,618 | 7,502,703 | 26,859,224 | ||||
| Expenses: | ||||||||
| Investment advisory fees—Note 4(a) | 5,586,679 | 1,112,489 | 2,678,782 | 4,543,075 | ||||
| Administration fees—Note 4(a) | 1,062,574 | 187,956 | 458,066 | 864,152 | ||||
| Custodian fees—Note 4(b) | 69,793 | 27,189 | 45,749 | 54,819 | ||||
| Professional fees | 57,959 | 51,167 | 44,010 | 62,746 | ||||
| Trustees’ fees and expenses—Note 4(c) | 50,692 | 11,051 | 27,608 | 38,769 | ||||
| Shareholder servicing costs—Note 4(b) | 33,300 | 124 | 1,645 | 4,988 | ||||
| Registration fees | 30,025 | 33,557 | 90,733 | 73,903 | ||||
| Interest expense—Note 3 | 9,552 | — | 2,276 | 135 | ||||
| Prospectus and shareholders’ reports | 9,075 | 4,876 | 5,273 | 6,899 | ||||
| Loan commitment fees—Note 3 | 7,768 | 1,451 | 2,980 | 6,747 | ||||
| Miscellaneous | 27,767 | 18,567 | 20,365 | 34,836 | ||||
| Total Expenses | 6,945,184 | 1,448,427 | 3,377,487 | 5,691,069 | ||||
| Less—reduction in expenses due to | ||||||||
| undertaking—Note 4(a) | — | — | (77 | ) | — | |||
| Less—reduction in fees due to | ||||||||
| earnings credits—Note 4(b) | (9 | ) | (1 | ) | (1 | ) | (5 | ) |
| Net Expenses | 6,945,175 | 1,448,426 | 3,377,409 | 5,691,064 | ||||
| Investment Income—Net | 10,501,420 | 1,405,192 | 4,125,294 | 21,168,160 | ||||
| Realized and Unrealized Gain (Loss) | ||||||||
| on Investments—Note 5 ($): | ||||||||
| Net realized gain (loss) on investments: | ||||||||
| Unaffiliated issuers | 121,918,119 | 14,565,931 | 19,606,143 | 25,207,553 | ||||
| Affiliated issuers | — | 4,257,180 | 5,935,895 | — | ||||
| Net realized gain (loss) on financial futures | 1,141,265 | (1,286,824 | ) | (2,658,151 | ) | (113,759 | ) | |
| Net realized gain (loss) on options transactions | — | — | — | 477,040 | ||||
| Net Realized Gain (Loss) | 123,059,384 | 17,536,287 | 22,883,887 | 25,570,834 | ||||
| Net unrealized appreciation (depreciation) on investments: | ||||||||
| Unaffiliated issuers | (10,138,306 | ) | 12,292,051 | 38,106,213 | 91,945,140 | |||
| Affiliated issuers | — | (1,531,858 | ) | (1,775,458 | ) | — | ||
| Net unrealized appreciation (depreciation) | ||||||||
| on options transactions | — | — | — | 135,108 | ||||
| Net Unrealized Appreciation (Depreciation) | (10,138,306 | ) | 10,760,193 | 36,330,755 | 92,080,248 | |||
| Net Realized and Unrealized Gain (Loss) on Investments | 112,921,078 | 28,296,480 | 59,214,642 | 117,651,082 | ||||
| Net Increase in Net Assets Resulting from Operations | 123,422,498 | 29,701,672 | 63,339,936 | 138,819,242 |
| See notes to financial statements. |
108
| BNY Mellon | BNY Mellon | BNY Mellon | ||||||
| Mid Cap | Small Cap | Focused Equity | BNY Mellon | |||||
| Multi-Strategy Fund | Multi-Strategy Fund | Opportunities Fund | Small/Mid Cap Fund | |||||
| Investment Income ($): | ||||||||
| Income: | ||||||||
| Cash dividends (net of $71,070 and $90,387 | ||||||||
| foreign taxes withheld at source for | ||||||||
| BNY Mellon Mid Cap Multi-Strategy Fund and | ||||||||
| BNY Mellon Focused Equity Opportunities Fund): | ||||||||
| Unaffiliated issuers | 20,576,946 | 2,857,695 | 9,742,909 | 7,815,757 | ||||
| Affiliated issuers | 40,707 | 4,235 | 3,723 | 2,141 | ||||
| Income from securities lending—Note 2(c) | 441,810 | 196,570 | 5,918 | 591,485 | ||||
| Interest | 927 | — | — | — | ||||
| Total Income | 21,060,390 | 3,058,500 | 9,752,550 | 8,409,383 | ||||
| Expenses: | ||||||||
| Investment advisory fees—Note 4(a) | 10,470,475 | 2,285,623 | 3,437,574 | 3,602,029 | ||||
| Administration fees—Note 4(a) | 1,725,985 | 332,445 | 607,141 | 593,765 | ||||
| Professional fees | 204,023 | 49,642 | 52,461 | 68,765 | ||||
| Custodian fees—Note 4(b) | 131,406 | 78,118 | 39,174 | 46,154 | ||||
| Trustees’ fees and expenses—Note 4(c) | 91,730 | 13,954 | 35,689 | 25,007 | ||||
| Prospectus and shareholders’ reports | 81,335 | 8,516 | 8,691 | 7,897 | ||||
| Shareholder servicing costs—Note 4(b) | 65,614 | 18,089 | 1,096 | 1,841 | ||||
| Registration fees | 32,848 | 31,517 | 28,610 | 28,449 | ||||
| Loan commitment fees—Note 3 | 10,265 | 1,826 | 4,165 | 3,116 | ||||
| Interest expense—Note 3 | — | — | 82 | 6,579 | ||||
| Miscellaneous | 39,257 | 26,068 | 19,842 | 21,661 | ||||
| Total Expenses | 12,852,938 | 2,845,798 | 4,234,525 | 4,405,263 | ||||
| Less—reduction in fees due to | ||||||||
| earnings credits—Note 4(b) | (162 | ) | (49 | ) | (2 | ) | (3 | ) |
| Net Expenses | 12,852,776 | 2,845,749 | 4,234,523 | 4,405,260 | ||||
| Investment Income—Net | 8,207,614 | 212,751 | 5,518,027 | 4,004,123 | ||||
| Realized and Unrealized Gain (Loss) | ||||||||
| on Investments—Note 5 ($): | ||||||||
| Net realized gain (loss) on investments | 118,809,988 | 40,450,262 | 43,676,106 | 59,865,850 | ||||
| Net realized gain (loss) on financial futures | 13,155,107 | 170,463 | 765,209 | — | ||||
| Net Realized Gain (Loss) | 131,965,095 | 40,620,725 | 44,441,315 | 59,865,850 | ||||
| Net unrealized appreciation | ||||||||
| (depreciation) on investments | 160,206,921 | 26,641,935 | 28,992,705 | 13,695,989 | ||||
| Net unrealized appreciation | ||||||||
| (depreciation) on financial futures | 167,924 | 11,374 | — | — | ||||
| Net Unrealized Appreciation (Depreciation) | 160,374,845 | 26,653,309 | 28,992,705 | 13,695,989 | ||||
| Net Realized and Unrealized | ||||||||
| Gain (Loss) on Investments | 292,339,940 | 67,274,034 | 73,434,020 | 73,561,839 | ||||
| Net Increase in Net Assets | ||||||||
| Resulting from Operations | 300,547,554 | 67,486,785 | 78,952,047 | 77,565,962 |
| See notes to financial statements. |
The Funds 109
STATEMENTS OF OPERATIONS (continued)
| BNY Mellon | BNY Mellon | BNY Mellon | BNY Mellon | |||||||
| BNY Mellon | Emerging | International | International | Asset Allocation | ||||||
| International Fund | Markets Fund | Appreciation Fund | Equity Income Fund | Fund | ||||||
| Investment Income ($): | ||||||||||
| Income: | ||||||||||
| Cash dividends (net of $1,370,664, | ||||||||||
| $6,901,959, $249,346, $633,659 and | ||||||||||
| $19,691 foreign taxes withheld at source | ||||||||||
| for BNY Mellon International Fund, | ||||||||||
| BNY Mellon Emerging Markets Fund, | ||||||||||
| BNY Mellon International Appreciation | ||||||||||
| Fund, BNY Mellon International Equity | ||||||||||
| Income Fund and BNY Mellon Asset | ||||||||||
| Allocation Fund, respectively): | ||||||||||
| Unaffiliated issuers | 15,234,238 | 55,942,323 | 3,496,748 | 7,435,962 | 2,059,902 | |||||
| Affiliated issuers | 4,223 | 21,039 | 997 | 2,175 | 3,897,671 | |||||
| Interest | 8,585 | 416 | 195 | 160 | 1,989,009 | |||||
| Income from securities lending—Note 2(c) | — | — | — | — | 7,900 | |||||
| Total Income | 15,247,046 | 55,963,778 | 3,497,940 | 7,438,297 | 7,954,482 | |||||
| Expenses: | ||||||||||
| Investment advisory fees—Note 4(a) | 4,590,418 | 24,809,201 | 564,493 | 1,104,360 | 1,161,127 | |||||
| Administration fees—Note 4(a) | 667,645 | 2,666,690 | 139,573 | 160,619 | 176,345 | |||||
| Custodian fees—Note 4(b) | 224,094 | 1,900,146 | 12,019 | 74,263 | 16,009 | |||||
| Professional fees | 53,515 | 132,074 | 39,092 | 59,229 | 51,619 | |||||
| Trustees’ fees and expenses—Note 4(c) | 32,606 | 135,740 | 8,186 | 7,673 | 25,961 | |||||
| Registration fees | 29,683 | 28,421 | 29,063 | 49,021 | 29,951 | |||||
| Shareholder servicing costs—Note 4(b) | 10,437 | 38,572 | 11,208 | 155 | 12,665 | |||||
| Prospectus and shareholders’ reports | 7,187 | 7,903 | 12,546 | 9,680 | 38 | |||||
| Loan commitment fees—Note 3 | 4,773 | 18,332 | 818 | 659 | 3,152 | |||||
| Interest expense—Note 3 | 3,801 | 7,148 | 88 | 432 | — | |||||
| ADR fees | — | — | 95,458 | — | — | |||||
| Miscellaneous | 53,246 | 629,080 | 31,761 | 29,471 | 38,519 | |||||
| Total Expenses | 5,677,405 | 30,373,307 | 944,305 | 1,495,562 | 1,515,386 | |||||
| Less—reduction in expenses | ||||||||||
| due to undertaking—Note 4(a) | — | — | — | — | (480,444 | ) | ||||
| Less—reduction in fees due to | ||||||||||
| earnings credits—Note 4(b) | (9 | ) | (24 | ) | (20 | ) | (2 | ) | (2 | ) |
| Net Expenses | 5,677,396 | 30,373,283 | 944,285 | 1,495,560 | 1,034,940 | |||||
| Investment Income—Net | 9,569,650 | 25,590,495 | 2,553,655 | 5,942,737 | 6,919,542 |
110
| BNY Mellon | BNY Mellon | BNY Mellon | BNY Mellon | |||||
| BNY Mellon | Emerging | International | International | Asset Allocation | ||||
| International Fund | Markets Fund | Appreciation Fund | Equity Income Fund | Fund | ||||
| Realized and Unrealized Gain (Loss) | ||||||||
| on Investments—Note 5 ($): | ||||||||
| Net realized gain (loss) on investments | ||||||||
| and foreign currency transactions | 38,386,939 | (33,952,783 | ) | (3,534,829 | ) | (5,722,276 | ) | — |
| Net realized gain (loss) on forward | ||||||||
| foreign currency exchange contracts | 65,990 | (1,029,858 | ) | 32,961 | (102,719 | ) | — | |
| Net realized gain (loss) on financial futures | — | — | 371,385 | — | — | |||
| Net realized gain (loss) on investments: | ||||||||
| Unaffiliated issuers | — | — | — | — | 4,349,505 | |||
| Affiliated issuers | — | — | — | — | 2,530,193 | |||
| Capital gain distributions: | ||||||||
| Unaffiliated issuers | — | — | — | — | 361,572 | |||
| Affiliated issuers | — | — | — | — | 2,476,173 | |||
| Net Realized Gain (Loss) | 38,452,929 | (34,982,641 | ) | (3,130,483 | ) | (5,824,995 | ) | 9,717,443 |
| Net unrealized appreciation (depreciation) | ||||||||
| on investments and foreign | ||||||||
| currency transactions | 67,363,737 | 23,340,900 | 20,482,232 | 10,065,227 | — | |||
| Net unrealized appreciation (depreciation) | ||||||||
| on forward foreign currency | ||||||||
| exchange contracts | 16,409 | (19,926 | ) | (18,881 | ) | — | — | |
| Net unrealized appreciation | ||||||||
| (depreciation) on financial futures | — | — | (56,228 | ) | — | — | ||
| Net unrealized appreciation | ||||||||
| (depreciation) on investments: | ||||||||
| Unaffiliated issuers | — | — | — | — | 1,666,868 | |||
| Affiliated issuers | — | — | — | — | 17,530,727 | |||
| Net Unrealized Appreciation (Depreciation) | 67,380,146 | 23,320,974 | 20,407,123 | 10,065,227 | 19,197,595 | |||
| Net Realized and Unrealized | ||||||||
| Gain (Loss) on Investments | 105,833,075 | (11,661,667 | ) | 17,276,640 | 4,240,232 | 28,915,038 | ||
| Net Increase in Net Assets | ||||||||
| Resulting from Operations | 115,402,725 | 13,928,828 | 19,830,295 | 10,182,969 | 35,834,580 | |||
| See notes to financial statements. |
The Funds 111
STATEMENTS OF CHANGES IN NET ASSETS
| BNY Mellon Large Cap | ||||||||
| BNY Mellon Large Cap Stock Fund | Market Opportunities Fund | |||||||
| Year Ended August 31, | Year Ended August 31, | |||||||
| 2013 | 2012 | 2013 | 2012 | |||||
| Operations ($): | ||||||||
| Investment income—net | 10,501,420 | 9,616,967 | 1,405,192 | 736,707 | ||||
| Net realized gain (loss) on investments | 123,059,384 | 64,410,207 | 17,536,287 | (3,284,871 | ) | |||
| Net unrealized appreciation (depreciation) on investments | (10,138,306 | ) | 54,209,338 | 10,760,193 | 17,095,144 | |||
| Net Increase (Decrease) in Net Assets | ||||||||
| Resulting from Operations | 123,422,498 | 128,236,512 | 29,701,672 | 14,546,980 | ||||
| Dividends to Shareholders from ($): | ||||||||
| Investment income—net: | ||||||||
| Class M Shares | (10,402,918 | ) | (9,461,194 | ) | (1,053,761 | ) | (385,167 | ) |
| Investor Shares | (132,786 | ) | (90,719 | ) | (178 | ) | — | |
| Net realized gain on investments: | ||||||||
| Class M Shares | (41,986,273 | ) | — | — | — | |||
| Investor Shares | (546,696 | ) | — | — | — | |||
| Total Dividends | (53,068,673 | ) | (9,551,913 | ) | (1,053,939 | ) | (385,167 | ) |
| Beneficial Interest Transactions ($): | ||||||||
| Net proceeds from shares sold: | ||||||||
| Class M Shares | 77,759,660 | 58,258,330 | 70,144,183 | 66,139,968 | ||||
| Investor Shares | 14,649,638 | 8,552,499 | 98,998 | 308,238 | ||||
| Dividends reinvested: | ||||||||
| Class M Shares | 30,201,050 | 1,226,758 | 133,186 | 50,769 | ||||
| Investor Shares | 557,896 | 74,959 | 100 | — | ||||
| Cost of shares redeemed: | ||||||||
| Class M Shares | (416,800,568 | ) | (297,872,740 | ) | (35,261,770 | ) | (45,901,357 | ) |
| Investor Shares | (8,136,515 | ) | (10,755,874 | ) | (28,772 | ) | (279,204 | ) |
| Increase (Decrease) in Net Assets from | ||||||||
| Beneficial Interest Transactions | (301,768,839 | ) | (240,516,068 | ) | 35,085,925 | 20,318,414 | ||
| Total Increase (Decrease) in Net Assets | (231,415,014 | ) | (121,831,469 | ) | 63,733,658 | 34,480,227 | ||
| Net Assets ($): | ||||||||
| Beginning of Period | 984,192,056 | 1,106,023,525 | 152,485,534 | 118,005,307 | ||||
| End of Period | 752,777,042 | 984,192,056 | 216,219,192 | 152,485,534 | ||||
| Undistributed investment income—net | 154,239 | 188,523 | 783,030 | 431,777 | ||||
| Capital Share Transactions (Shares): | ||||||||
| Class M Shares | ||||||||
| Shares sold | 8,219,711 | 6,758,013 | 5,322,811 | 5,853,905 | ||||
| Shares issued for dividends reinvested | 3,394,443 | 144,190 | 10,655 | 4,701 | ||||
| Shares redeemed | (44,138,261 | ) | (35,109,525 | ) | (2,658,868 | ) | (4,049,515 | ) |
| Net Increase (Decrease) in Shares Outstanding | (32,524,107 | ) | (28,207,322 | ) | 2,674,598 | 1,809,091 | ||
| Investor Shares | ||||||||
| Shares sold | 1,467,244 | 1,002,451 | 7,053 | 27,572 | ||||
| Shares issued for dividends reinvested | 61,989 | 8,769 | 8 | — | ||||
| Shares redeemed | (852,776 | ) | (1,259,168 | ) | (2,151 | ) | (26,288 | ) |
| Net Increase (Decrease) in Shares Outstanding | 676,457 | (247,948 | ) | 4,910 | 1,284 | |||
| See notes to financial statements. |
112
| BNY Mellon Tax-Sensitive | ||||||||
| Large Cap Multi-Strategy Fund | BNY Mellon Income Stock Fund | |||||||
| Year Ended August 31, | Year Ended August 31, | |||||||
| 2013 | 2012 | 2013 | 2012 | |||||
| Operations ($): | ||||||||
| Investment income—net | 4,125,294 | 781,061 | 21,168,160 | 12,540,050 | ||||
| Net realized gain (loss) on investments | 22,883,887 | (2,567,846 | ) | 25,570,834 | 10,895,373 | |||
| Net unrealized appreciation (depreciation) on investments | 36,330,755 | 13,822,380 | 92,080,248 | 31,353,852 | ||||
| Net Increase (Decrease) in Net Assets | ||||||||
| Resulting from Operations | 63,339,936 | 12,035,595 | 138,819,242 | 54,789,275 | ||||
| Dividends to Shareholders from ($): | ||||||||
| Investment income—net: | ||||||||
| Class M Shares | (1,087,759 | ) | (415,070 | ) | (21,080,259 | ) | (12,444,436 | ) |
| Investor Shares | — | — | (53,777 | ) | (39,030 | ) | ||
| Net realized gain on investments: | ||||||||
| Class M Shares | — | — | (473,022 | ) | — | |||
| Investor Shares | — | — | (1,451 | ) | — | |||
| Total Dividends | (1,087,759 | ) | (415,070 | ) | (21,608,509 | ) | (12,483,466 | ) |
| Beneficial Interest Transactions ($): | ||||||||
| Net proceeds from shares sold: | ||||||||
| Class M Shares | 495,682,964 | 57,619,035 | 413,807,788 | 371,580,235 | ||||
| Investor Shares | 3,026,866 | 104,518 | 4,038,516 | 1,672,126 | ||||
| Dividends reinvested: | ||||||||
| Class M Shares | 83,182 | 36,517 | 4,266,679 | 2,028,416 | ||||
| Investor Shares | — | — | 46,170 | 36,246 | ||||
| Cost of shares redeemed: | ||||||||
| Class M Shares | (43,118,721 | ) | (21,350,864 | ) | (95,126,887 | ) | (78,969,231 | ) |
| Investor Shares | (1,907,243 | ) | (105,044 | ) | (2,828,774 | ) | (1,656,281 | ) |
| Increase (Decrease) in Net Assets from | ||||||||
| Beneficial Interest Transactions | 453,767,048 | 36,304,162 | 324,203,492 | 294,691,511 | ||||
| Total Increase (Decrease) in Net Assets | 516,019,225 | 47,924,687 | 441,414,225 | 336,997,320 | ||||
| Net Assets ($): | ||||||||
| Beginning of Period | 123,262,158 | 75,337,471 | 542,838,782 | 205,841,462 | ||||
| End of Period | 639,281,383 | 123,262,158 | 984,253,007 | 542,838,782 | ||||
| Undistributed investment income—net | 3,549,629 | 528,869 | 175,655 | 141,531 | ||||
| Capital Share Transactions (Shares): | ||||||||
| Class M Shares | ||||||||
| Shares sold | 37,436,918 | 4,930,627 | 51,216,956 | 56,409,960 | ||||
| Shares issued for dividends reinvested | 6,504 | 3,314 | 554,014 | 303,189 | ||||
| Shares redeemed | (3,140,007 | ) | (1,837,974 | ) | (12,338,735 | ) | (11,796,291 | ) |
| Net Increase (Decrease) in Shares Outstanding | 34,303,415 | 3,095,967 | 39,432,235 | 44,916,858 | ||||
| Investor Shares | ||||||||
| Shares sold | 224,259 | 8,893 | 512,596 | 245,187 | ||||
| Shares issued for dividends reinvested | — | — | 5,965 | 5,440 | ||||
| Shares redeemed | (143,583 | ) | (8,893 | ) | (361,839 | ) | (241,961 | ) |
| Net Increase (Decrease) in Shares Outstanding | 80,676 | — | 156,722 | 8,666 | ||||
| See notes to financial statements. |
The Funds 113
STATEMENTS OF CHANGES IN NET ASSETS (continued)
| BNY Mellon Mid Cap Multi-Strategy Fund | BNY Mellon Small Cap Multi-Strategy Fund | |||||||
| Year Ended August 31, | Year Ended August 31, | |||||||
| 2013 | 2012 | a | 2013 | 2012 | ||||
| Operations ($): | ||||||||
| Investment income (loss)—net | 8,207,614 | 1,092,299 | 212,751 | (39,965 | ) | |||
| Net realized gain (loss) on investments | 131,965,095 | 24,838,862 | 40,620,725 | (3,176,973 | ) | |||
| Net unrealized appreciation (depreciation) on investments | 160,374,845 | 39,555,770 | 26,653,309 | 31,452,582 | ||||
| Net Increase (Decrease) in Net Assets | ||||||||
| Resulting from Operations | 300,547,554 | 65,486,931 | 67,486,785 | 28,235,644 | ||||
| Dividends to Shareholders from ($): | ||||||||
| Investment income—net: | ||||||||
| Class M Shares | (2,758,781 | ) | (4,780,233 | ) | (580,713 | ) | (8,801,501 | ) |
| Investor Shares | — | (42,885 | ) | — | (192,431 | ) | ||
| Net realized gain on investments: | ||||||||
| Class M Shares | (97,703,444 | ) | (35,311,699 | ) | — | — | ||
| Investor Shares | (2,035,528 | ) | (818,540 | ) | — | — | ||
| Dreyfus Premier Shares | — | (12,100 | ) | — | — | |||
| Total Dividends | (102,497,753 | ) | (40,965,457 | ) | (580,713 | ) | (8,993,932 | ) |
| Beneficial Interest Transactions ($): | ||||||||
| Net proceeds from shares sold: | ||||||||
| Class M Shares | 335,912,212 | 153,113,475 | 45,917,357 | 13,590,917 | ||||
| Investor Shares | 9,448,413 | 12,230,890 | 2,962,065 | 2,583,340 | ||||
| Dreyfus Premier Shares | — | 99 | — | — | ||||
| Dividends reinvested: | ||||||||
| Class M Shares | 57,479,998 | 22,249,585 | 129,939 | 1,724,380 | ||||
| Investor Shares | 1,690,809 | 724,845 | — | 174,027 | ||||
| Dreyfus Premier Shares | — | 5,005 | — | — | ||||
| Cost of shares redeemed: | ||||||||
| Class M Shares | (203,744,439 | ) | (291,866,833 | ) | (44,862,742 | ) | (152,356,466 | ) |
| Investor Shares | (10,243,456 | ) | (16,185,413 | ) | (2,514,418 | ) | (4,545,765 | ) |
| Dreyfus Premier Shares | — | (461,467 | ) | — | — | |||
| Increase (Decrease) in Net Assets from | ||||||||
| Beneficial Interest Transactions | 190,543,537 | (120,189,814 | ) | 1,632,201 | (138,829,567 | ) | ||
| Total Increase (Decrease) in Net Assets | 388,593,338 | (95,668,340 | ) | 68,538,273 | (119,587,855 | ) | ||
| Net Assets ($): | ||||||||
| Beginning of Period | 1,213,607,585 | 1,309,275,925 | 239,348,970 | 358,936,825 | ||||
| End of Period | 1,602,200,923 | 1,213,607,585 | 307,887,243 | 239,348,970 | ||||
| Undistributed (distribution in excess of) | ||||||||
| investment income—net | 4,972,064 | 774,591 | (423,571 | ) | 125,135 | |||
114
| BNY Mellon Mid Cap Multi-Strategy Fund | BNY Mellon Small Cap Multi-Strategy Fund | |||||||
| Year Ended August 31, | Year Ended August 31, | |||||||
| 2013 | 2012 | a | 2013 | 2012 | ||||
| Capital Share Transactions: | ||||||||
| Class M Shares | ||||||||
| Shares sold | 27,543,848 | 13,367,721 | 3,557,454 | 1,249,465 | ||||
| Shares issued for dividends reinvested | 5,234,972 | 2,065,885 | 11,192 | 163,673 | ||||
| Shares redeemed | (16,777,547 | ) | (25,688,434 | ) | (3,510,292 | ) | (13,781,151 | ) |
| Net Increase (Decrease) in Shares Outstanding | 16,001,273 | (10,254,828 | ) | 58,354 | (12,368,013 | ) | ||
| Investor Sharesb | ||||||||
| Shares sold | 765,173 | 1,084,492 | 223,795 | 242,974 | ||||
| Shares issued for dividends reinvested | 155,548 | 67,933 | — | 16,964 | ||||
| Shares redeemed | (864,387 | ) | (1,447,462 | ) | (204,693 | ) | (434,403 | ) |
| Net Increase (Decrease) in Shares Outstanding | 56,334 | (295,037 | ) | 19,102 | (174,465 | ) | ||
| Dreyfus Premier Sharesb | ||||||||
| Shares sold | — | 10 | — | — | ||||
| Shares issued for dividends reinvested | — | 504 | — | — | ||||
| Shares redeemed | — | (41,920 | ) | — | — | |||
| Net Increase (Decrease) in Shares Outstanding | — | (41,406 | ) | — | — | |||
| a Effective March 13, 2012, BNY Mellon Mid Cap Multi-Strategy Fund no longer offers Premier shares. |
| b During the period ended August 31, 2012, 32,858 Dreyfus Premier shares of BNY Mellon Mid Cap Multi-Strategy Fund representing $366,736 were automatically converted |
| to 30,526 Investor shares. |
| See notes to financial statements. |
The Funds 115
STATEMENTS OF CHANGES IN NET ASSETS (continued)
| BNY Mellon Focused Equity | ||||||||
| Opportunities Fund | BNY Mellon Small/Mid Cap Fund | |||||||
| Year Ended August 31, | Year Ended August 31, | |||||||
| 2013 | 2012 | 2013 | 2012 | |||||
| Operations ($): | ||||||||
| Investment income—net | 5,518,027 | 2,679,907 | 4,004,123 | 1,977,680 | ||||
| Net realized gain (loss) on investments | 44,441,315 | (16,790,167 | ) | 59,865,850 | (23,204,523 | ) | ||
| Net unrealized appreciation (depreciation) on investments | 28,992,705 | 48,921,471 | 13,695,989 | 17,072,191 | ||||
| Net Increase (Decrease) in Net Assets | ||||||||
| Resulting from Operations | 78,952,047 | 34,811,211 | 77,565,962 | (4,154,652 | ) | |||
| Dividends to Shareholders from ($): | ||||||||
| Investment income—net: | ||||||||
| Class M Shares | (4,210,323 | ) | (648,379 | ) | (7,566,379 | ) | (6,813,784 | ) |
| Investor Shares | (1,896 | ) | (353 | ) | (10,362 | ) | (5,491 | ) |
| Net realized gain on investments: | ||||||||
| Class M Shares | — | (904,880 | ) | — | — | |||
| Investor Shares | — | (934 | ) | — | — | |||
| Total Dividends | (4,212,219 | ) | (1,554,546 | ) | (7,576,741 | ) | (6,819,275 | ) |
| Beneficial Interest Transactions ($): | ||||||||
| Net proceeds from shares sold: | ||||||||
| Class M Shares | 178,147,579 | 124,858,793 | 56,761,726 | 184,345,178 | ||||
| Investor Shares | 1,593,152 | 1,463,419 | 1,655,396 | 2,054,420 | ||||
| Dividends reinvested: | ||||||||
| Class M Shares | 769,049 | 762,262 | 1,058,234 | 1,101,837 | ||||
| Investor Shares | 1,861 | 948 | 10,104 | 4,161 | ||||
| Cost of shares redeemed: | ||||||||
| Class M Shares | (182,464,987 | ) | (115,962,387 | ) | (190,139,885 | ) | (158,527,610 | ) |
| Investor Shares | (894,288 | ) | (1,315,616 | ) | (2,305,372 | ) | (1,582,412 | ) |
| Increase (Decrease) in Net Assets from | ||||||||
| Beneficial Interest Transactions | (2,847,634 | ) | 9,807,419 | (132,959,797 | ) | 27,395,574 | ||
| Total Increase (Decrease) in Net Assets | 71,892,194 | 43,064,084 | (62,970,576 | ) | 16,421,647 | |||
| Net Assets ($): | ||||||||
| Beginning of Period | 468,105,754 | 425,041,670 | 527,440,583 | 511,018,936 | ||||
| End of Period | 539,997,948 | 468,105,754 | 464,470,007 | 527,440,583 | ||||
| Undistributed investment income—net | 3,758,775 | 2,452,967 | 437,489 | 4,468,734 | ||||
| Capital Share Transactions (Shares): | ||||||||
| Class M Shares | ||||||||
| Shares sold | 12,698,505 | 10,196,685 | 4,110,875 | 14,058,726 | ||||
| Shares issued for dividends reinvested | 58,483 | 69,296 | 81,907 | 93,773 | ||||
| Shares redeemed | (13,143,120 | ) | (9,790,498 | ) | (13,975,928 | ) | (12,466,688 | ) |
| Net Increase (Decrease) in Shares Outstanding | (386,132 | ) | 475,483 | (9,783,146 | ) | 1,685,811 | ||
| Investor Shares | ||||||||
| Shares sold | 111,122 | 121,170 | 119,537 | 158,468 | ||||
| Shares issued for dividends reinvested | 142 | 86 | 784 | 355 | ||||
| Shares redeemed | (62,345 | ) | (107,834 | ) | (165,048 | ) | (123,527 | ) |
| Net Increase (Decrease) in Shares Outstanding | 48,919 | 13,422 | (44,727 | ) | 35,296 | |||
| See notes to financial statements. |
116
| BNY Mellon International Fund | BNY Mellon Emerging Markets Fund | |||||||
| Year Ended August 31, | Year Ended August 31, | |||||||
| 2013 | 2012 | 2013 | 2012 | |||||
| Operations ($): | ||||||||
| Investment income—net | 9,569,650 | 16,504,119 | 25,590,495 | 26,139,973 | ||||
| Net realized gain (loss) on investments | 38,452,929 | (59,810,635 | ) | (34,982,641 | ) | (186,152,134 | ) | |
| Net unrealized appreciation (depreciation) on investments | 67,380,146 | 6,905,880 | 23,320,974 | (94,824,770 | ) | |||
| Net Increase (Decrease) in Net Assets | ||||||||
| Resulting from Operations | 115,402,725 | (36,400,636 | ) | 13,928,828 | (254,836,931 | ) | ||
| Dividends to Shareholders from ($): | ||||||||
| Investment income—net: | ||||||||
| Class M Shares | (16,766,463 | ) | (26,606,906 | ) | (21,707,909 | ) | (23,405,669 | ) |
| Investor Shares | (109,039 | ) | (220,200 | ) | (115,068 | ) | (211,928 | ) |
| Net realized gain on investments: | ||||||||
| Class M Shares | — | — | — | (65,641,307 | ) | |||
| Investor Shares | — | — | — | (697,390 | ) | |||
| Total Dividends | (16,875,502 | ) | (26,827,106 | ) | (21,822,977 | ) | (89,956,294 | ) |
| Beneficial Interest Transactions ($): | ||||||||
| Net proceeds from shares sold: | ||||||||
| Class M Shares | 46,553,758 | 112,895,726 | 426,526,076 | 664,128,793 | ||||
| Investor Shares | 3,227,291 | 6,282,213 | 12,387,403 | 21,398,624 | ||||
| Dividends reinvested: | ||||||||
| Class M Shares | 3,256,938 | 5,380,959 | 4,437,020 | 46,472,969 | ||||
| Investor Shares | 93,855 | 187,542 | 86,532 | 601,542 | ||||
| Cost of shares redeemed: | ||||||||
| Class M Shares | (177,223,174 | ) | (385,294,395 | ) | (730,431,847 | ) | (582,928,145 | ) |
| Investor Shares | (3,756,896 | ) | (8,113,921 | ) | (18,129,975 | ) | (24,504,155 | ) |
| Increase (Decrease) in Net Assets from | ||||||||
| Beneficial Interest Transactions | (127,848,228 | ) | (268,661,876 | ) | (305,124,791 | ) | 125,169,628 | |
| Total Increase (Decrease) in Net Assets | (29,321,005 | ) | (331,889,618 | ) | (313,018,940 | ) | (219,623,597 | ) |
| Net Assets ($): | ||||||||
| Beginning of Period | 553,717,361 | 885,606,979 | 2,154,637,037 | 2,374,260,634 | ||||
| End of Period | 524,396,356 | 553,717,361 | 1,841,618,097 | 2,154,637,037 | ||||
| Undistributed investment income—net | 9,338,567 | 16,050,808 | 21,173,888 | 18,723,861 | ||||
| Capital Share Transactions (Shares): | ||||||||
| Class M Shares | ||||||||
| Shares sold | 4,373,736 | 12,130,857 | 43,117,963 | 69,114,145 | ||||
| Shares issued for dividends reinvested | 326,020 | 626,421 | 438,441 | 5,299,084 | ||||
| Shares redeemed | (17,177,788 | ) | (42,094,378 | ) | (75,161,840 | ) | (62,578,705 | ) |
| Net Increase (Decrease) in Shares Outstanding | (12,478,032 | ) | (29,337,100 | ) | (31,605,436 | ) | 11,834,524 | |
| Investor Shares | ||||||||
| Shares sold | 288,218 | 640,603 | 1,237,791 | 2,148,836 | ||||
| Shares issued for dividends reinvested | 8,829 | 20,590 | 8,328 | 66,838 | ||||
| Shares redeemed | (340,516 | ) | (828,547 | ) | (1,816,084 | ) | (2,499,990 | ) |
| Net Increase (Decrease) in Shares Outstanding | (43,469 | ) | (167,354 | ) | (569,965 | ) | (284,316 | ) |
| See notes to financial statements. |
The Funds 117
STATEMENTS OF CHANGES IN NET ASSETS (continued)
| BNY Mellon | BNY Mellon International | |||||||
| International Appreciation Fund | Equity Income Fund | |||||||
| Year Ended August 31, | Year Ended August 31, | |||||||
| 2013 | 2012 | 2013 | 2012 | a | ||||
| Operations ($): | ||||||||
| Investment income—net | 2,553,655 | 4,108,206 | 5,942,737 | 3,015,416 | ||||
| Net realized gain (loss) on investments | (3,130,483 | ) | (22,862,234 | ) | (5,824,995 | ) | (1,753,710 | ) |
| Net unrealized appreciation (depreciation) on investments | 20,407,123 | 14,620,021 | 10,065,227 | (1,448,820 | ) | |||
| Net Increase (Decrease) in Net Assets | ||||||||
| Resulting from Operations | 19,830,295 | (4,134,007 | ) | 10,182,969 | (187,114 | ) | ||
| Dividends to Shareholders from ($): | ||||||||
| Investment income—net: | ||||||||
| Class M Shares | (3,637,873 | ) | (6,416,671 | ) | (4,924,144 | ) | (1,534,538 | ) |
| Investor Shares | (133,114 | ) | (134,033 | ) | (1,414 | ) | (183 | ) |
| Total Dividends | (3,770,987 | ) | (6,550,704 | ) | (4,925,558 | ) | (1,534,721 | ) |
| Beneficial Interest Transactions ($): | ||||||||
| Net proceeds from shares sold: | ||||||||
| Class M Shares | 1,777,503 | 7,950,174 | 108,163,369 | 94,866,096 | ||||
| Investor Shares | 843,940 | 1,043,469 | 320,785 | 26,541 | ||||
| Dividends reinvested: | ||||||||
| Class M Shares | 169,947 | 283,334 | 1,337,922 | 319,558 | ||||
| Investor Shares | 131,579 | 115,340 | 1,043 | — | ||||
| Cost of shares redeemed: | ||||||||
| Class M Shares | (38,790,868 | ) | (76,113,808 | ) | (30,656,835 | ) | (12,431,214 | ) |
| Investor Shares | (818,947 | ) | (973,159 | ) | (284,973 | ) | (14,510 | ) |
| Increase (Decrease) in Net Assets from | ||||||||
| Beneficial Interest Transactions | (36,686,846 | ) | (67,694,650 | ) | 78,881,311 | 82,766,471 | ||
| Total Increase (Decrease) in Net Assets | (20,627,538 | ) | (78,379,361 | ) | 84,138,722 | 81,044,636 | ||
| Net Assets ($): | ||||||||
| Beginning of Period | 123,761,641 | 202,141,002 | 81,044,636 | — | ||||
| End of Period | 103,134,103 | 123,761,641 | 165,183,358 | 81,044,636 | ||||
| Undistributed investment income—net | 1,827,550 | 2,992,014 | 2,236,471 | 1,320,137 | ||||
| Capital Share Transactions (Shares): | ||||||||
| Class M Shares | ||||||||
| Shares sold | 149,651 | 754,028 | 7,738,685 | 7,274,226 | ||||
| Shares issued for dividends reinvested | 14,727 | 29,331 | 97,599 | 27,863 | ||||
| Shares redeemed | (3,308,031 | ) | (7,218,048 | ) | (2,181,574 | ) | (1,003,389 | ) |
| Net Increase (Decrease) in Shares Outstanding | (3,143,653 | ) | (6,434,689 | ) | 5,654,710 | 6,298,700 | ||
| Investor Shares | ||||||||
| Shares sold | 72,626 | 101,517 | 24,109 | 1,994 | ||||
| Shares issued for dividends reinvested | 11,512 | 12,052 | 74 | — | ||||
| Shares redeemed | (71,746 | ) | (95,438 | ) | (21,304 | ) | (1,194 | ) |
| Net Increase (Decrease) in Shares Outstanding | 12,392 | 18,131 | 2,879 | 800 | ||||
| a From December 15, 2011 (commencement of operations) to August 31, 2012. |
| See notes to financial statements. |
118
| BNY Mellon Asset Allocation Fund | ||||
| Year Ended August 31, | ||||
| 2013 | 2012 | |||
| Operations ($): | ||||
| Investment income—net | 6,919,542 | 6,046,631 | ||
| Net realized gain (loss) on investments | 9,717,443 | 1,837,150 | ||
| Net unrealized appreciation (depreciation) on investments | 19,197,595 | 13,518,865 | ||
| Net Increase (Decrease) in Net Assets | ||||
| Resulting from Operations | 35,834,580 | 21,402,646 | ||
| Dividends to Shareholders from ($): | ||||
| Investment income—net: | ||||
| Class M Shares | (9,168,546 | ) | (7,223,957 | ) |
| Investor Shares | (102,392 | ) | (77,321 | ) |
| Net realized gain on investments: | ||||
| Class M Shares | (939,855 | ) | (1,683,683 | ) |
| Investor Shares | (11,962 | ) | (19,091 | ) |
| Total Dividends | (10,222,755 | ) | (9,004,052 | ) |
| Beneficial Interest Transactions ($): | ||||
| Net proceeds from shares sold: | ||||
| Class M Shares | 36,319,448 | 59,173,349 | ||
| Investor Shares | 1,672,893 | 1,700,033 | ||
| Dividends reinvested: | ||||
| Class M Shares | 1,363,476 | 1,782,388 | ||
| Investor Shares | 103,441 | 85,945 | ||
| Cost of shares redeemed: | ||||
| Class M Shares | (44,707,793 | ) | (45,887,130 | ) |
| Investor Shares | (2,248,956 | ) | (1,140,312 | ) |
| Increase (Decrease) in Net Assets from | ||||
| Beneficial Interest Transactions | (7,497,491 | ) | 15,714,273 | |
| Total Increase (Decrease) in Net Assets | 18,114,334 | 28,112,867 | ||
| Net Assets ($): | ||||
| Beginning of Period | 398,038,499 | 369,925,632 | ||
| End of Period | 416,152,833 | 398,038,499 | ||
| Undistributed investment income—net | 672,651 | 1,629,201 | ||
| Capital Share Transactions (Shares): | ||||
| Class M Shares | ||||
| Shares sold | 3,154,967 | 5,570,116 | ||
| Shares issued for dividends reinvested | 121,436 | 173,015 | ||
| Shares redeemed | (3,896,907 | ) | (4,314,255 | ) |
| Net Increase (Decrease) in Shares Outstanding | (620,504 | ) | 1,428,876 | |
| Investor Shares | ||||
| Shares sold | 143,907 | 160,057 | ||
| Shares issued for dividends reinvested | 9,131 | 8,184 | ||
| Shares redeemed | (194,197 | ) | (105,598 | ) |
| Net Increase (Decrease) in Shares Outstanding | (41,159 | ) | 62,643 | |
| See notes to financial statements. |
The Funds 119
FINANCIAL HIGHLIGHTS
The following tables describe the performance for each share class of each BNY Mellon equity fund for the fiscal periods indicated. All information (except portfolio turnover rate) reflects financial results for a single fund share.Total return shows how much your investment in each fund would have increased (or decreased) during each period, assuming you had reinvested all dividends and distributions.These figures have been derived from each fund’s financial statements.
| Class M Shares | ||||||||||
| Year Ended August 31, | ||||||||||
| BNY Mellon Large Cap Stock Fund | 2013 | 2012 | 2011 | 2010 | 2009 | |||||
| Per Share Data ($): | ||||||||||
| Net asset value, beginning of period | 9.17 | 8.14 | 7.16 | 6.77 | 8.77 | |||||
| Investment Operations: | ||||||||||
| Investment income—neta | .12 | .08 | .09 | .06 | .09 | |||||
| Net realized and unrealized | ||||||||||
| gain (loss) on investments | 1.21 | 1.03 | .98 | .39 | (1.91 | ) | ||||
| Total from Investment Operations | 1.33 | 1.11 | 1.07 | .45 | (1.82 | ) | ||||
| Distributions: | ||||||||||
| Dividends from investment income—net | (.12 | ) | (.08 | ) | (.09 | ) | (.06 | ) | (.09 | ) |
| Dividends from net realized gain on investments | (.41 | ) | — | — | — | (.09 | ) | |||
| Total Distributions | (.53 | ) | (.08 | ) | (.09 | ) | (.06 | ) | (.18 | ) |
| Net asset value, end of period | 9.97 | 9.17 | 8.14 | 7.16 | 6.77 | |||||
| Total Return (%) | 15.16 | 13.73 | 14.86 | 6.62 | (20.39 | ) | ||||
| Ratios/Supplemental Data (%): | ||||||||||
| Ratio of total expenses to average net assets | .80 | .81 | .80 | .80 | .81 | |||||
| Ratio of net expenses to average net assets | .80 | .81 | .80 | .80 | .81 | |||||
| Ratio of net investment income | ||||||||||
| to average net assets | 1.23 | .95 | .98 | .81 | 1.51 | |||||
| Portfolio Turnover Rate | 50.96 | 76.82 | 86.71 | 71.61 | 109.39 | |||||
| Net Assets, end of period ($ x 1,000) | 732,612 | 971,849 | 1,093,037 | 1,178,235 | 1,449,565 | |||||
| a Based on average shares outstanding at each month end. |
| See notes to financial statements. |
120
| Investor Shares | ||||||||||
| Year Ended August 31, | ||||||||||
| BNY Mellon Large Cap Stock Fund | 2013 | 2012 | 2011 | 2010 | 2009 | |||||
| Per Share Data ($): | ||||||||||
| Net asset value, beginning of period | 9.17 | 8.15 | 7.16 | 6.78 | 8.78 | |||||
| Investment Operations: | ||||||||||
| Investment income—neta | .09 | .06 | .06 | .04 | .08 | |||||
| Net realized and unrealized | ||||||||||
| gain (loss) on investments | 1.21 | 1.02 | 1.00 | .38 | (1.91 | ) | ||||
| Total from Investment Operations | 1.30 | 1.08 | 1.06 | .42 | (1.83 | ) | ||||
| Distributions: | ||||||||||
| Dividends from investment income—net | (.09 | ) | (.06 | ) | (.07 | ) | (.04 | ) | (.08 | ) |
| Dividends from net realized gain on investments | (.41 | ) | — | — | — | (.09 | ) | |||
| Total Distributions | (.50 | ) | (.06 | ) | (.07 | ) | (.04 | ) | (.17 | ) |
| Net asset value, end of period | 9.97 | 9.17 | 8.15 | 7.16 | 6.78 | |||||
| Total Return (%) | 14.87 | 13.33 | 14.78 | 6.21 | (20.56 | ) | ||||
| Ratios/Supplemental Data (%): | ||||||||||
| Ratio of total expenses to average net assets | 1.06 | 1.06 | 1.05 | 1.05 | 1.06 | |||||
| Ratio of net expenses to average net assets | 1.06 | 1.06 | 1.05 | 1.05 | 1.06 | |||||
| Ratio of net investment income | ||||||||||
| to average net assets | .99 | .71 | .68 | .56 | 1.25 | |||||
| Portfolio Turnover Rate | 50.96 | 76.82 | 86.71 | 71.61 | 109.39 | |||||
| Net Assets, end of period ($ x 1,000) | 20,165 | 12,344 | 12,986 | 7,473 | 8,274 |
| a Based on average shares outstanding at each month end. |
| See notes to financial statements. |
The Funds 121
FINANCIAL HIGHLIGHTS (continued)
| Class M Shares | ||||||||
| Year Ended August 31, | ||||||||
| BNY Mellon Large Cap Market Opportunities Fund | 2013 | 2012 | 2011 | 2010 | a | |||
| Per Share Data ($): | ||||||||
| Net asset value, beginning of period | 12.16 | 11.00 | 9.48 | 10.00 | ||||
| Investment Operations: | ||||||||
| Investment income—netb | .10 | .06 | .02 | .00 | c | |||
| Net realized and unrealized | ||||||||
| gain (loss) on investments | 2.03 | 1.13 | 1.55 | (.52 | ) | |||
| Total from Investment Operations | 2.13 | 1.19 | 1.57 | (.52 | ) | |||
| Distributions: | ||||||||
| Dividends from investment income—net | (.08 | ) | (.03 | ) | (.02 | ) | — | |
| Dividends from net realized gain on investments | — | — | (.03 | ) | — | |||
| Total Distributions | (.08 | ) | (.03 | ) | (.05 | ) | — | |
| Net asset value, end of period | 14.21 | 12.16 | 11.00 | 9.48 | ||||
| Total Return (%) | 17.64 | 10.89 | 16.48 | (5.20 | )d | |||
| Ratios/Supplemental Data (%): | ||||||||
| Ratio of total expenses to average net assetse | .79 | .78 | .94 | 15.54 | f | |||
| Ratio of net expenses to average net assetse | .79 | .78 | .75 | .98 | f | |||
| Ratio of net investment income | ||||||||
| to average net assetse | .76 | .55 | .21 | .48 | f | |||
| Portfolio Turnover Rate | 78.41 | 43.61 | 22.06 | 2.12 | d | |||
| Net Assets, end of period ($ x 1,000) | 216,116 | 152,458 | 117,994 | 5,074 | ||||
| a | From July 30, 2010 (commencement of operations) to August 31, 2010. |
| b | Based on average shares outstanding at each month end. |
| c | Amount represents less than $.01 per share. |
| d | Not annualized. |
| e | Amount does not include the activity of the underlying funds. |
| f | Annualized. |
| See notes to financial statements. | |
122
| Investor Shares | |||||||
| Year Ended August 31, | |||||||
| BNY Mellon Large Cap Market Opportunities Fund | 2013 | 2012 | 2011 | 2010 | a | ||
| Per Share Data ($): | |||||||
| Net asset value, beginning of period | 12.25 | 10.98 | 9.48 | 10.00 | |||
| Investment Operations: | |||||||
| Investment income—netb | .07 | .13 | .00 | c | .00 | c | |
| Net realized and unrealized | |||||||
| gain (loss) on investments | 2.04 | 1.14 | 1.54 | (.52 | ) | ||
| Total from Investment Operations | 2.11 | 1.27 | 1.54 | (.52 | ) | ||
| Distributions: | |||||||
| Dividends from investment income—net | (.08 | ) | — | (.01 | ) | — | |
| Dividends from net realized gain on investments | — | — | (.03 | ) | — | ||
| Total Distributions | (.08 | ) | — | (.04 | ) | — | |
| Net asset value, end of period | 14.28 | 12.25 | 10.98 | 9.48 | |||
| Total Return (%) | 17.29 | 11.57 | 16.16 | (5.20 | )d | ||
| Ratios/Supplemental Data (%): | |||||||
| Ratio of total expenses to average net assetse | 1.05 | 1.02 | 1.24 | 9.38 | f | ||
| Ratio of net expenses to average net assetse | 1.05 | 1.02 | 1.00 | 1.23 | f | ||
| Ratio of net investment income | |||||||
| to average net assetse | .48 | .95 | .03 | .16 | f | ||
| Portfolio Turnover Rate | 78.41 | 43.61 | 22.06 | 2.12 | d | ||
| Net Assets, end of period ($ x 1,000) | 103 | 28 | 11 | 9 | |||
| a | From July 30, 2010 (commencement of operations) to August 31, 2010. |
| b | Based on average shares outstanding at each month end. |
| c | Amount represents less than $.01 per share. |
| d | Not annualized. |
| e | Amount does not include the activity of the underlying funds. |
| f | Annualized. |
| See notes to financial statements. | |
The Funds 123
FINANCIAL HIGHLIGHTS (continued)
| Class M Shares | ||||||||
| Year Ended August 31, | ||||||||
| BNY Mellon Tax-Sensitive Large Cap Multi-Strategy Fund | 2013 | 2012 | 2011 | 2010 | a | |||
| Per Share Data ($): | ||||||||
| Net asset value, beginning of period | 12.50 | 11.14 | 9.52 | 10.00 | ||||
| Investment Operations: | ||||||||
| Investment income—netb | .13 | .09 | .06 | .01 | ||||
| Net realized and unrealized | ||||||||
| gain (loss) on investments | 1.93 | 1.32 | 1.61 | (.49 | ) | |||
| Total from Investment Operations | 2.06 | 1.41 | 1.67 | (.48 | ) | |||
| Distributions: | ||||||||
| Dividends from investment income—net | (.11 | ) | (.05 | ) | (.02 | ) | — | |
| Dividends from net realized gain on investments | — | — | (.03 | ) | — | |||
| Total Distributions | (.11 | ) | (.05 | ) | (.05 | ) | — | |
| Net asset value, end of period | 14.45 | 12.50 | 11.14 | 9.52 | ||||
| Total Return (%) | 16.60 | 12.75 | 17.54 | (4.80 | )c | |||
| Ratios/Supplemental Data (%): | ||||||||
| Ratio of total expenses to average net assetsd | .79 | .87 | 1.28 | 8.12 | e | |||
| Ratio of net expenses to average net assetsd | .79 | .87 | .88 | .99 | e | |||
| Ratio of net investment income | ||||||||
| to average net assetsd | .97 | .78 | .51 | .91 | e | |||
| Portfolio Turnover Rate | 82.04 | 32.62 | 29.24 | 1.53 | c | |||
| Net Assets, end of period ($ x 1,000) | 638,085 | 123,250 | 75,326 | 10,337 | ||||
| a | From July 30, 2010 (commencement of operations) to August 31, 2010. |
| b | Based on average shares outstanding at each month end. |
| c | Not annualized. |
| d | Amount does not include the activity of the underlying funds. |
| e | Annualized. |
| See notes to financial statements. | |
124
| Investor Shares | ||||||
| Year Ended August 31, | ||||||
| BNY Mellon Tax-Sensitive Large Cap Multi-Strategy Fund | 2013 | 2012 | 2011 | 2010 | a | |
| Per Share Data ($): | ||||||
| Net asset value, beginning of period | 12.41 | 11.04 | 9.52 | 10.00 | ||
| Investment Operations: | ||||||
| Investment income—netb | .13 | .06 | .03 | .01 | ||
| Net realized and unrealized | ||||||
| gain (loss) on investments | 2.10 | 1.31 | 1.54 | (.49 | ) | |
| Total from Investment Operations | 2.23 | 1.37 | 1.57 | (.48 | ) | |
| Distributions: | ||||||
| Dividends from investment income—net | — | — | (.02 | ) | — | |
| Dividends from net realized gain on investments | — | — | (.03 | ) | — | |
| Total Distributions | — | — | (.05 | ) | — | |
| Net asset value, end of period | 14.64 | 12.41 | 11.04 | 9.52 | ||
| Total Return (%) | 17.97 | 12.51 | 16.31 | (4.80 | )c | |
| Ratios/Supplemental Data (%): | ||||||
| Ratio of total expenses to average net assetsd | 1.05 | 1.11 | 1.77 | 5.88 | e | |
| Ratio of net expenses to average net assetsd | 1.03 | 1.11 | 1.13 | 1.24 | e | |
| Ratio of net investment income | ||||||
| to average net assetsd | .89 | .46 | .26 | .65 | e | |
| Portfolio Turnover Rate | 82.04 | 32.62 | 29.24 | 1.53 | c | |
| Net Assets, end of period ($ x 1,000) | 1,196 | 12 | 11 | 10 | ||
| a | From July 30, 2010 (commencement of operations) to August 31, 2010. |
| b | Based on average shares outstanding at each month end. |
| c | Not annualized. |
| d | Amount does not include the activity of the underlying funds. |
| e | Annualized. |
| See notes to financial statements. | |
The Funds 125
FINANCIAL HIGHLIGHTS (continued)
| Class M Shares | ||||||||||
| Year Ended August 31, | ||||||||||
| BNY Mellon Income Stock Fund | 2013 | 2012 | 2011 | 2010 | 2009 | |||||
| Per Share Data ($): | ||||||||||
| Net asset value, beginning of period | 6.99 | 6.28 | 5.49 | 5.39 | 7.22 | |||||
| Investment Operations: | ||||||||||
| Investment income—neta | .24 | .21 | .17 | .09 | .12 | |||||
| Net realized and unrealized | ||||||||||
| gain (loss) on investments | 1.41 | .70 | .79 | .10 | (1.35 | ) | ||||
| Total from Investment Operations | 1.65 | .91 | .96 | .19 | (1.23 | ) | ||||
| Distributions: | ||||||||||
| Dividends from investment income—net | (.24 | ) | (.20 | ) | (.17 | ) | (.09 | ) | (.13 | ) |
| Dividends from net realized gain on investments | (.01 | ) | — | — | — | (.47 | ) | |||
| Total Distributions | (.25 | ) | (.20 | ) | (.17 | ) | (.09 | ) | (.60 | ) |
| Net asset value, end of period | 8.39 | 6.99 | 6.28 | 5.49 | 5.39 | |||||
| Total Return (%) | 24.01 | 14.80 | 17.41 | 3.44 | (15.73 | ) | ||||
| Ratios/Supplemental Data (%): | ||||||||||
| Ratio of total expenses to average net assets | .81 | .82 | .86 | .86 | .87 | |||||
| Ratio of net expenses to average net assets | .81 | .82 | .86 | .86 | .87 | |||||
| Ratio of net investment income | ||||||||||
| to average net assets | 3.03 | 3.17 | 2.71 | 1.55 | 2.47 | |||||
| Portfolio Turnover Rate | 41.79 | 35.60 | 72.27 | 66.78 | 65.88 | |||||
| Net Assets, end of period ($ x 1,000) | 981,444 | 541,604 | 204,785 | 90,645 | 126,763 | |||||
| a Based on average shares outstanding at each month end. |
| See notes to financial statements. |
126
| Investor Shares | ||||||||||
| Year Ended August 31, | ||||||||||
| BNY Mellon Income Stock Fund | 2013 | 2012 | 2011 | 2010 | 2009 | |||||
| Per Share Data ($): | ||||||||||
| Net asset value, beginning of period | 7.04 | 6.33 | 5.54 | 5.44 | 7.27 | |||||
| Investment Operations: | ||||||||||
| Investment income—neta | .22 | .19 | .15 | .08 | .11 | |||||
| Net realized and unrealized | ||||||||||
| gain (loss) on investments | 1.43 | .71 | .80 | .10 | (1.35 | ) | ||||
| Total from Investment Operations | 1.65 | .90 | .95 | .18 | (1.24 | ) | ||||
| Distributions: | ||||||||||
| Dividends from investment income—net | (.23 | ) | (.19 | ) | (.16 | ) | (.08 | ) | (.12 | ) |
| Dividends from net realized gain on investments | (.01 | ) | — | — | — | (.47 | ) | |||
| Total Distributions | (.24 | ) | (.19 | ) | (.16 | ) | (.08 | ) | (.59 | ) |
| Net asset value, end of period | 8.45 | 7.04 | 6.33 | 5.54 | 5.44 | |||||
| Total Return (%) | 23.84 | 14.45 | 17.02 | 3.19 | (15.84 | ) | ||||
| Ratios/Supplemental Data (%): | ||||||||||
| Ratio of total expenses to average net assets | 1.06 | 1.06 | 1.12 | 1.11 | 1.12 | |||||
| Ratio of net expenses to average net assets | 1.06 | 1.06 | 1.12 | 1.11 | 1.12 | |||||
| Ratio of net investment income | ||||||||||
| to average net assets | 2.80 | 2.91 | 2.32 | 1.29 | 2.19 | |||||
| Portfolio Turnover Rate | 41.79 | 35.60 | 72.27 | 66.78 | 65.88 | |||||
| Net Assets, end of period ($ x 1,000) | 2,809 | 1,235 | 1,056 | 988 | 1,045 |
| a Based on average shares outstanding at each month end. |
| See notes to financial statements. |
The Funds 127
FINANCIAL HIGHLIGHTS (continued)
| Class M Shares | ||||||||||
| Year Ended August 31, | ||||||||||
| BNY Mellon Mid Cap Multi-Strategy Fund | 2013 | 2012 | 2011 | 2010 | 2009 | |||||
| Per Share Data ($): | ||||||||||
| Net asset value, beginning of period | 11.65 | 11.41 | 9.31 | 8.64 | 11.11 | |||||
| Investment Operations: | ||||||||||
| Investment income (loss)—neta | .07 | .01 | (.00 | )b | .05 | .07 | ||||
| Net realized and unrealized | ||||||||||
| gain (loss) on investments | 2.60 | .60 | 2.10 | .68 | (2.46 | ) | ||||
| Total from Investment Operations | 2.67 | .61 | 2.10 | .73 | (2.39 | ) | ||||
| Distributions: | ||||||||||
| Dividends from investment income—net | (.03 | ) | (.04 | ) | (.00 | )b | (.06 | ) | (.06 | ) |
| Dividends from net realized gain on investments | (.96 | ) | (.33 | ) | — | — | (.02 | ) | ||
| Total Distributions | (.99 | ) | (.37 | ) | (.00 | )b | (.06 | ) | (.08 | ) |
| Net asset value, end of period | 13.33 | 11.65 | 11.41 | 9.31 | 8.64 | |||||
| Total Return (%) | 24.74 | 5.66 | 22.59 | 8.49 | (21.33 | ) | ||||
| Ratios/Supplemental Data (%): | ||||||||||
| Ratio of total expenses to average net assets | .92 | .90 | .90 | .90 | .92 | |||||
| Ratio of net expenses to average net assets | .92 | .90 | .90 | .90 | .92 | |||||
| Ratio of net investment income | ||||||||||
| (loss) to average net assets | .59 | .09 | (.01 | ) | .53 | .86 | ||||
| Portfolio Turnover Rate | 106.59 | 156.98 | 132.20 | 123.41 | 147.50 | |||||
| Net Assets, end of period ($ x 1,000) | 1,572,562 | 1,188,324 | 1,280,742 | 1,162,906 | 1,185,376 | |||||
| a | Based on average shares outstanding at each month end. |
| b | Amount represents less than $.01 per share. |
| See notes to financial statements. | |
128
| Investor Shares | ||||||||||
| Year Ended August 31, | ||||||||||
| BNY Mellon Mid Cap Multi-Strategy Fund | 2013 | 2012 | 2011 | 2010 | 2009 | |||||
| Per Share Data ($): | ||||||||||
| Net asset value, beginning of period | 11.52 | 11.29 | 9.24 | 8.57 | 11.00 | |||||
| Investment Operations: | ||||||||||
| Investment income (loss)—neta | .04 | (.02 | ) | (.03 | ) | .03 | .05 | |||
| Net realized and unrealized | ||||||||||
| gain (loss) on investments | 2.57 | .60 | 2.08 | .68 | (2.43 | ) | ||||
| Total from Investment Operations | 2.61 | .58 | 2.05 | .71 | (2.38 | ) | ||||
| Distributions: | ||||||||||
| Dividends from investment income—net | — | (.02 | ) | — | (.04 | ) | (.03 | ) | ||
| Dividends from net realized gain on investments | (.96 | ) | (.33 | ) | — | — | (.02 | ) | ||
| Total Distributions | (.96 | ) | (.35 | ) | — | (.04 | ) | (.05 | ) | |
| Net asset value, end of period | 13.17 | 11.52 | 11.29 | 9.24 | 8.57 | |||||
| Total Return (%) | 24.46 | 5.36 | 22.19 | 8.30 | (21.51 | ) | ||||
| Ratios/Supplemental Data (%): | ||||||||||
| Ratio of total expenses to average net assets | 1.17 | 1.15 | 1.15 | 1.15 | 1.17 | |||||
| Ratio of net expenses to average net assets | 1.17 | 1.15 | 1.15 | 1.15 | 1.17 | |||||
| Ratio of net investment income | ||||||||||
| (loss) to average net assets | .37 | (.16 | ) | (.26 | ) | .27 | .63 | |||
| Portfolio Turnover Rate | 106.59 | 156.98 | 132.20 | 123.41 | 147.50 | |||||
| Net Assets, end of period ($ x 1,000) | 29,639 | 25,283 | 28,098 | 20,733 | 19,785 | |||||
| a Based on average shares outstanding at each month end. |
| See notes to financial statements. |
The Funds 129
FINANCIAL HIGHLIGHTS (continued)
| Class M Shares | ||||||||||
| Year Ended August 31, | ||||||||||
| BNY Mellon Small Cap Multi-Strategy Fund | 2013 | 2012 | 2011 | 2010 | 2009 | |||||
| Per Share Data ($): | ||||||||||
| Net asset value, beginning of period | 11.53 | 10.78 | 8.94 | 8.57 | 11.44 | |||||
| Investment Operations: | ||||||||||
| Investment income (loss)—neta | .01 | (.00 | )b | (.02 | ) | .00 | b | .07 | ||
| Net realized and unrealized | ||||||||||
| gain (loss) on investments | 3.27 | 1.05 | 1.86 | .38 | (2.85 | ) | ||||
| Total from Investment Operations | 3.28 | 1.05 | 1.84 | .38 | (2.78 | ) | ||||
| Distributions: | ||||||||||
| Dividends from investment income—net | (.03 | ) | (.30 | ) | — | (.01 | ) | (.08 | ) | |
| Dividends from net realized gain on investments | — | — | — | — | (.01 | ) | ||||
| Total Distributions | (.03 | ) | (.30 | ) | — | (.01 | ) | (.09 | ) | |
| Net asset value, end of period | 14.78 | 11.53 | 10.78 | 8.94 | 8.57 | |||||
| Total Return (%) | 28.51 | 10.05 | 20.58 | 4.45 | (24.11 | ) | ||||
| Ratios/Supplemental Data (%): | ||||||||||
| Ratio of total expenses to average net assets | 1.05 | 1.04 | 1.01 | 1.00 | 1.03 | |||||
| Ratio of net expenses to average net assets | 1.05 | 1.04 | 1.01 | .98 | .99 | |||||
| Ratio of net investment income | ||||||||||
| (loss) to average net assets | .09 | (.01 | ) | (.16 | ) | .01 | .88 | |||
| Portfolio Turnover Rate | 128.11 | 148.75 | 161.05 | 183.41 | 159.78 | |||||
| Net Assets, end of period ($ x 1,000) | 299,415 | 232,952 | 351,122 | 412,824 | 610,567 | |||||
| a | Based on average shares outstanding at each month end. |
| b | Amount represents less than $.01 per share. |
| See notes to financial statements. | |
130
| Investor Shares | ||||||||||
| Year Ended August 31, | ||||||||||
| BNY Mellon Small Cap Multi-Strategy Fund | 2013 | 2012 | 2011 | 2010 | 2009 | |||||
| Per Share Data ($): | ||||||||||
| Net asset value, beginning of period | 11.21 | 10.49 | 8.72 | 8.36 | 11.11 | |||||
| Investment Operations: | ||||||||||
| Investment income (loss)—neta | (.02 | ) | (.03 | ) | (.04 | ) | (.02 | ) | .05 | |
| Net realized and unrealized | ||||||||||
| gain (loss) on investments | 3.17 | 1.03 | 1.81 | .38 | (2.72 | ) | ||||
| Total from Investment Operations | 3.15 | 1.00 | 1.77 | .36 | (2.67 | ) | ||||
| Distributions: | ||||||||||
| Dividends from investment income—net | — | (.28 | ) | — | — | (.07 | ) | |||
| Dividends from net realized gain on investments | — | — | — | — | (.01 | ) | ||||
| Total Distributions | — | (.28 | ) | — | — | (.08 | ) | |||
| Net asset value, end of period | 14.36 | 11.21 | 10.49 | 8.72 | 8.36 | |||||
| Total Return (%) | 28.10 | 9.76 | 20.30 | 4.31 | (23.92 | ) | ||||
| Ratios/Supplemental Data (%): | ||||||||||
| Ratio of total expenses to average net assets | 1.30 | 1.29 | 1.26 | 1.25 | 1.28 | |||||
| Ratio of net expenses to average net assets | 1.30 | 1.29 | 1.26 | 1.23 | 1.23 | |||||
| Ratio of net investment income | ||||||||||
| (loss) to average net assets | (.16 | ) | (.26 | ) | (.39 | ) | (.24 | ) | .61 | |
| Portfolio Turnover Rate | 128.11 | 148.75 | 161.05 | 183.41 | 159.78 | |||||
| Net Assets, end of period ($ x 1,000) | 8,472 | 6,397 | 7,815 | 6,022 | 6,277 | |||||
| a Based on average shares outstanding at each month end. |
| See notes to financial statements. |
The Funds 131
FINANCIAL HIGHLIGHTS (continued)
| Class M Shares | ||||||||
| Year Ended August 31, | ||||||||
| BNY Mellon Focused Equity Opportunities Fund | 2013 | 2012 | 2011 | 2010 | a | |||
| Per Share Data ($): | ||||||||
| Net asset value, beginning of period | 13.08 | 12.04 | 10.09 | 10.00 | ||||
| Investment Operations: | ||||||||
| Investment income—netb | .16 | .08 | .04 | .06 | ||||
| Net realized and unrealized | ||||||||
| gain (loss) on investments | 2.12 | 1.01 | 1.96 | .04 | ||||
| Total from Investment Operations | 2.28 | 1.09 | 2.00 | .10 | ||||
| Distributions: | ||||||||
| Dividends from investment income—net | (.12 | ) | (.02 | ) | (.05 | ) | (.01 | ) |
| Dividends from net realized gain on investments | — | (.03 | ) | — | (.00 | )c | ||
| Total Distributions | (.12 | ) | (.05 | ) | (.05 | ) | (.01 | ) |
| Net asset value, end of period | 15.24 | 13.08 | 12.04 | 10.09 | ||||
| Total Return (%) | 17.54 | 9.07 | 19.82 | 1.01 | d | |||
| Ratios/Supplemental Data (%): | ||||||||
| Ratio of total expenses to average net assets | .86 | .87 | .87 | .98 | e | |||
| Ratio of net expenses to average net assets | .86 | .87 | .87 | .89 | e | |||
| Ratio of net investment income | ||||||||
| to average net assets | 1.12 | .62 | .29 | .59 | e | |||
| Portfolio Turnover Rate | 77.03 | 59.71 | 58.98 | 64.75 | d | |||
| Net Assets, end of period ($ x 1,000) | 539,019 | 467,903 | 425,016 | 238,332 | ||||
| a | From September 30, 2009 (commencement of operations) to August 31, 2010. |
| b | Based on average shares outstanding at each month end. |
| c | Amount represents less than $.01 per share. |
| d | Not annualized. |
| e | Annualized. |
| See notes to financial statements. | |
132
| Investor Shares | ||||||||
| Year Ended August 31, | ||||||||
| BNY Mellon Focused Equity Opportunities Fund | 2013 | 2012 | 2011 | 2010 | a | |||
| Per Share Data ($): | ||||||||
| Net asset value, beginning of period | 13.05 | 12.04 | 10.07 | 10.00 | ||||
| Investment Operations: | ||||||||
| Investment income—netb | .12 | .06 | .00 | c | .02 | |||
| Net realized and unrealized | ||||||||
| gain (loss) on investments | 2.10 | .99 | 1.99 | .06 | ||||
| Total from Investment Operations | 2.22 | 1.05 | 1.99 | .08 | ||||
| Distributions: | ||||||||
| Dividends from investment income—net | (.09 | ) | (.01 | ) | (.02 | ) | (.01 | ) |
| Dividends from net realized gain on investments | — | (.03 | ) | — | (.00 | )c | ||
| Total Distributions | (.09 | ) | (.04 | ) | (.02 | ) | (.01 | ) |
| Net asset value, end of period | 15.18 | 13.05 | 12.04 | 10.07 | ||||
| Total Return (%) | 17.12 | 8.73 | 19.80 | .75 | d | |||
| Ratios/Supplemental Data (%): | ||||||||
| Ratio of total expenses to average net assets | 1.13 | 1.13 | 1.12 | 1.53 | e | |||
| Ratio of net expenses to average net assets | 1.13 | 1.13 | 1.12 | 1.14 | e | |||
| Ratio of net investment income | ||||||||
| to average net assets | .90 | .52 | .00 | f | .23 | e | ||
| Portfolio Turnover Rate | 77.03 | 59.71 | 58.98 | 64.75 | d | |||
| Net Assets, end of period ($ x 1,000) | 979 | 203 | 26 | 13 | ||||
| a | From September 30, 2009 (commencement of operations) to August 31, 2010. |
| b | Based on average shares outstanding at each month end. |
| c | Amount represents less than $.01 per share. |
| d | Not annualized. |
| e | Annualized. |
| f | Amount represents less than .01%. |
| See notes to financial statements. | |
The Funds 133
FINANCIAL HIGHLIGHTS (continued)
| Class M Shares | ||||||||
| Year Ended August 31, | ||||||||
| BNY Mellon Small/Mid Cap Fund | 2013 | 2012 | 2011 | 2010 | a | |||
| Per Share Data ($): | ||||||||
| Net asset value, beginning of period | 12.99 | 13.14 | 10.92 | 10.00 | ||||
| Investment Operations: | ||||||||
| Investment income—netb | .12 | .05 | .04 | .01 | ||||
| Net realized and unrealized | ||||||||
| gain (loss) on investments | 2.19 | (.02 | ) | 2.31 | .95 | |||
| Total from Investment Operations | 2.31 | .03 | 2.35 | .96 | ||||
| Distributions: | ||||||||
| Dividends from investment income—net | (.21 | ) | (.18 | ) | (.04 | ) | (.01 | ) |
| Dividends from net realized gain on investments | — | — | (.09 | ) | (.03 | ) | ||
| Total Distributions | (.21 | ) | (.18 | ) | (.13 | ) | (.04 | ) |
| Net asset value, end of period | 15.09 | 12.99 | 13.14 | 10.92 | ||||
| Total Return (%) | 18.07 | .34 | 21.41 | 9.65 | c | |||
| Ratios/Supplemental Data (%): | ||||||||
| Ratio of total expenses to average net assets | .92 | .92 | .92 | 1.07 | d | |||
| Ratio of net expenses to average net assets | .92 | .92 | .92 | .92 | d | |||
| Ratio of net investment income | ||||||||
| to average net assets | .83 | .38 | .29 | .06 | d | |||
| Portfolio Turnover Rate | 169.30 | 149.30 | 107.81 | 109.25 | c | |||
| Net Assets, end of period ($ x 1,000) | 464,031 | 526,484 | 510,512 | 222,034 | ||||
| a | From September 30, 2009 (commencement of operations) to August 31, 2010. |
| b | Based on average shares outstanding at each month end. |
| c | Not annualized. |
| d Annualized. | |
| See notes to financial statements. | |
134
| Investor Shares | ||||||||
| Year Ended August 31, | ||||||||
| BNY Mellon Small/Mid Cap Fund | 2013 | 2012 | 2011 | 2010 | a | |||
| Per Share Data ($): | ||||||||
| Net asset value, beginning of period | 12.94 | 13.11 | 10.89 | 10.00 | ||||
| Investment Operations: | ||||||||
| Investment income—netb | .09 | .00 | c | .01 | .01 | |||
| Net realized and unrealized | ||||||||
| gain (loss) on investments | 2.17 | (.01 | ) | 2.30 | .92 | |||
| Total from Investment Operations | 2.26 | (.01 | ) | 2.31 | .93 | |||
| Distributions: | ||||||||
| Dividends from investment income—net | (.18 | ) | (.16 | ) | — | (.01 | ) | |
| Dividends from net realized gain on investments | — | — | (.09 | ) | (.03 | ) | ||
| Total Distributions | (.18 | ) | (.16 | ) | (.09 | ) | (.04 | ) |
| Net asset value, end of period | 15.02 | 12.94 | 13.11 | 10.89 | ||||
| Total Return (%) | 17.65 | .08 | 21.14 | 9.34 | d | |||
| Ratios/Supplemental Data (%): | ||||||||
| Ratio of total expenses to average net assets | 1.17 | 1.17 | 1.20 | 2.35 | e | |||
| Ratio of net expenses to average net assets | 1.17 | 1.17 | 1.20 | 1.20 | e | |||
| Ratio of net investment income | ||||||||
| to average net assets | .64 | .04 | .06 | .08 | e | |||
| Portfolio Turnover Rate | 169.30 | 149.30 | 107.81 | 109.25 | d | |||
| Net Assets, end of period ($ x 1,000) | 439 | 957 | 507 | 16 | ||||
| a | From September 30, 2009 (commencement of operations) to August 31, 2010. |
| b | Based on average shares outstanding at each month end. |
| c | Amount represents less than $.01 per share. |
| d | Not annualized. |
| e | Annualized. |
| See notes to financial statements. | |
The Funds 135
FINANCIAL HIGHLIGHTS (continued)
| Class M Shares | ||||||||||
| Year Ended August 31, | ||||||||||
| BNY Mellon International Fund | 2013 | 2012 | 2011 | 2010 | 2009 | |||||
| Per Share Data ($): | ||||||||||
| Net asset value, beginning of period | 9.29 | 9.94 | 9.38 | 10.12 | 12.11 | |||||
| Investment Operations: | ||||||||||
| Investment income—neta | .19 | .22 | .22 | .18 | .22 | |||||
| Net realized and unrealized | ||||||||||
| gain (loss) on investments | 1.98 | (.54 | ) | .55 | (.67 | ) | (1.54 | ) | ||
| Total from Investment Operations | 2.17 | (.32 | ) | .77 | (.49 | ) | (1.32 | ) | ||
| Distributions: | ||||||||||
| Dividends from investment income—net | (.32 | ) | (.33 | ) | (.21 | ) | (.25 | ) | (.41 | ) |
| Dividends from net realized gain on investments | — | — | — | — | (.26 | ) | ||||
| Total Distributions | (.32 | ) | (.33 | ) | (.21 | ) | (.25 | ) | (.67 | ) |
| Net asset value, end of period | 11.14 | 9.29 | 9.94 | 9.38 | 10.12 | |||||
| Total Return (%) | 23.74 | (2.98 | ) | 8.05 | (5.07 | ) | (9.95 | ) | ||
| Ratios/Supplemental Data (%): | ||||||||||
| Ratio of total expenses to average net assets | 1.05 | 1.04 | 1.02 | 1.09 | 1.14 | |||||
| Ratio of net expenses to average net assets | 1.05 | 1.04 | 1.02 | 1.09 | 1.03 | |||||
| Ratio of net investment income | ||||||||||
| to average net assets | 1.77 | 2.35 | 2.07 | 1.79 | 2.52 | |||||
| Portfolio Turnover Rate | 55.78 | 44.62 | 57.38 | 67.16 | 102.83 | |||||
| Net Assets, end of period ($ x 1,000) | 519,964 | 549,601 | 879,450 | 996,647 | 1,247,441 | |||||
| a Based on average shares outstanding at each month end. |
| See notes to financial statements. |
136
| Investor Shares | ||||||||||
| Year Ended August 31, | ||||||||||
| BNY Mellon International Fund | 2013 | 2012 | 2011 | 2010 | 2009 | |||||
| Per Share Data ($): | ||||||||||
| Net asset value, beginning of period | 9.84 | 10.51 | 9.92 | 10.69 | 12.70 | |||||
| Investment Operations: | ||||||||||
| Investment income—neta | .17 | .18 | .21 | .16 | .20 | |||||
| Net realized and unrealized | ||||||||||
| gain (loss) on investments | 2.10 | (.54 | ) | .56 | (.70 | ) | (1.60 | ) | ||
| Total from Investment Operations | 2.27 | (.36 | ) | .77 | (.54 | ) | (1.40 | ) | ||
| Distributions: | ||||||||||
| Dividends from investment income—net | (.29 | ) | (.31 | ) | (.18 | ) | (.23 | ) | (.35 | ) |
| Dividends from net realized gain on investments | — | — | — | — | (.26 | ) | ||||
| Total Distributions | (.29 | ) | (.31 | ) | (.18 | ) | (.23 | ) | (.61 | ) |
| Net asset value, end of period | 11.82 | 9.84 | 10.51 | 9.92 | 10.69 | |||||
| Total Return (%) | 23.36 | (3.20 | ) | 7.67 | (5.26 | ) | (10.11 | ) | ||
| Ratios/Supplemental Data (%): | ||||||||||
| Ratio of total expenses to average net assets | 1.30 | 1.29 | 1.27 | 1.34 | 1.38 | |||||
| Ratio of net expenses to average net assets | 1.30 | 1.29 | 1.27 | 1.34 | 1.28 | |||||
| Ratio of net investment income | ||||||||||
| to average net assets | 1.51 | 1.85 | 1.79 | 1.46 | 2.27 | |||||
| Portfolio Turnover Rate | 55.78 | 44.62 | 57.38 | 67.16 | 102.83 | |||||
| Net Assets, end of period ($ x 1,000) | 4,432 | 4,116 | 6,157 | 4,319 | 5,099 |
| a Based on average shares outstanding at each month end. |
| See notes to financial statements. |
The Funds 137
FINANCIAL HIGHLIGHTS (continued)
| Class M Shares | ||||||||||
| Year Ended August 31, | ||||||||||
| BNY Mellon Emerging Markets Fund | 2013 | 2012 | 2011 | 2010 | 2009 | |||||
| Per Share Data ($): | ||||||||||
| Net asset value, beginning of period | 9.19 | 10.65 | 10.02 | 8.71 | 16.89 | |||||
| Investment Operations: | ||||||||||
| Investment income—neta | .12 | .12 | .14 | .08 | .14 | |||||
| Net realized and unrealized | ||||||||||
| gain (loss) on investments | (.10 | ) | (1.16 | ) | .54 | 1.31 | (3.58 | ) | ||
| Total from Investment Operations | .02 | (1.04 | ) | .68 | 1.39 | (3.44 | ) | |||
| Distributions: | ||||||||||
| Dividends from investment income—net | (.10 | ) | (.11 | ) | (.05 | ) | (.08 | ) | (.42 | ) |
| Dividends from net realized gain on investments | — | (.31 | ) | — | — | (4.32 | ) | |||
| Total Distributions | (.10 | ) | (.42 | ) | (.05 | ) | (.08 | ) | (4.74 | ) |
| Net asset value, end of period | 9.11 | 9.19 | 10.65 | 10.02 | 8.71 | |||||
| Total Return (%) | .09 | (9.55 | ) | 6.77 | 15.92 | (6.07 | ) | |||
| Ratios/Supplemental Data (%): | ||||||||||
| Ratio of total expenses to average net assets | 1.41 | 1.40 | 1.41 | 1.54 | 1.64 | |||||
| Ratio of net expenses to average net assets | 1.41 | 1.40 | 1.41 | 1.54 | 1.64 | |||||
| Ratio of net investment income | ||||||||||
| to average net assets | 1.19 | 1.21 | 1.20 | .85 | 1.76 | |||||
| Portfolio Turnover Rate | 53.25 | 67.21 | 77.45 | 76.34 | 119.72 | |||||
| Net Assets, end of period ($ x 1,000) | 1,830,754 | 2,138,311 | 2,352,233 | 1,796,274 | 1,097,296 | |||||
| a Based on average shares outstanding at each month end. |
| See notes to financial statements. |
138
| Investor Shares | ||||||||||
| Year Ended August 31, | ||||||||||
| BNY Mellon Emerging Markets Fund | 2013 | 2012 | 2011 | 2010 | 2009 | |||||
| Per Share Data ($): | ||||||||||
| Net asset value, beginning of period | 9.41 | 10.91 | 10.27 | 8.94 | 17.05 | |||||
| Investment Operations: | ||||||||||
| Investment income—neta | .09 | .09 | .13 | .06 | .11 | |||||
| Net realized and unrealized | ||||||||||
| gain (loss) on investments | (.10 | ) | (1.19 | ) | .55 | 1.33 | (3.55 | ) | ||
| Total from Investment Operations | (.01 | ) | (1.10 | ) | .68 | 1.39 | (3.44 | ) | ||
| Distributions: | ||||||||||
| Dividends from investment income—net | (.07 | ) | (.09 | ) | (.04 | ) | (.06 | ) | (.35 | ) |
| Dividends from net realized gain on investments | — | (.31 | ) | — | — | (4.32 | ) | |||
| Total Distributions | (.07 | ) | (.40 | ) | (.04 | ) | (.06 | ) | (4.67 | ) |
| Net asset value, end of period | 9.33 | 9.41 | 10.91 | 10.27 | 8.94 | |||||
| Total Return (%) | (.19 | ) | (9.86 | ) | 6.59 | 15.56 | (6.32 | ) | ||
| Ratios/Supplemental Data (%): | ||||||||||
| Ratio of total expenses to average net assets | 1.65 | 1.65 | 1.67 | 1.77 | 1.91 | |||||
| Ratio of net expenses to average net assets | 1.65 | 1.65 | 1.67 | 1.77 | 1.91 | |||||
| Ratio of net investment income | ||||||||||
| to average net assets | .90 | .87 | 1.10 | .54 | 1.32 | |||||
| Portfolio Turnover Rate | 53.25 | 67.21 | 77.45 | 76.34 | 119.72 | |||||
| Net Assets, end of period ($ x 1,000) | 10,864 | 16,326 | 22,027 | 7,091 | 4,476 |
| a Based on average shares outstanding at each month end. |
| See notes to financial statements. |
The Funds 139
FINANCIAL HIGHLIGHTS (continued)
| Class M Shares | ||||||||||||
| BNY Mellon International | Year Ended August 31, | Eight Months Ended | Year Ended | |||||||||
| Appreciation Fund† | 2013 | 2012 | 2011 | 2010 | August 31, 2009a | December 31, 2008 | ||||||
| Per Share Data ($): | ||||||||||||
| Net asset value, beginning of period | 10.80 | 11.31 | 10.54 | 11.35 | 9.40 | 16.58 | ||||||
| Investment Operations: | ||||||||||||
| Investment income—netb | .27 | .28 | .36 | .26 | .23 | .45 | ||||||
| Net realized and unrealized | ||||||||||||
| gain (loss) on investments | 1.69 | (.39 | ) | .68 | (.73 | ) | 1.73 | (7.17 | ) | |||
| Total from Investment Operations | 1.96 | (.11 | ) | 1.04 | (.47 | ) | 1.96 | (6.72 | ) | |||
| Distributions: | ||||||||||||
| Dividends from investment income—net | (.38 | ) | (.40 | ) | (.27 | ) | (.34 | ) | (.01 | ) | (.46 | ) |
| Net asset value, end of period | 12.38 | 10.80 | 11.31 | 10.54 | 11.35 | 9.40 | ||||||
| Total Return (%) | 18.39 | (.55 | ) | 9.75 | (4.35 | ) | 20.93 | c | (41.12 | ) | ||
| Ratios/Supplemental Data (%): | ||||||||||||
| Ratio of total expenses to average net assets | .83 | .83 | .70 | .68 | .70 | d | .70 | |||||
| Ratio of net expenses to average net assets | .83 | .83 | .70 | .66 | .66 | d | .67 | |||||
| Ratio of net investment income | ||||||||||||
| to average net assets | 2.27 | 2.66 | 2.94 | 2.29 | 3.80 | d | 3.32 | |||||
| Portfolio Turnover Rate | 1.24 | 1.49 | 9.39 | 2.71 | 2.63 | c | 10.62 | |||||
| Net Assets, end of period ($ x 1,000) | 98,361 | 119,730 | 198,122 | 218,067 | 256,140 | 267,393 | ||||||
| † Represents information for Institutional shares of the fund’s predecessor, BNY Hamilton International Equity Fund, through September 12, 2008. |
| a The fund had changed its fiscal year end from December 31 to August 31. |
| b Based on average shares outstanding at each month end. |
| c Not annualized. |
| d Annualized. |
| See notes to financial statements. |
140
| Investor Shares | ||||||||||||
| BNY Mellon International | Year Ended August 31, | Eight Months Ended | Year Ended | |||||||||
| Appreciation Fund† | 2013 | 2012 | 2011 | 2010 | August 31, 2009a | December 31, 2008 | ||||||
| Per Share Data ($): | ||||||||||||
| Net asset value, beginning of period | 10.68 | 11.19 | 10.43 | 11.24 | 9.31 | 16.37 | ||||||
| Investment Operations: | ||||||||||||
| Investment income—netb | .25 | .27 | .33 | .23 | .22 | .40 | ||||||
| Net realized and unrealized | ||||||||||||
| gain (loss) on investments | 1.66 | (.41 | ) | .67 | (.72 | ) | 1.71 | (7.06 | ) | |||
| Total from Investment Operations | 1.91 | (.14 | ) | 1.00 | (.49 | ) | 1.93 | (6.66 | ) | |||
| Distributions: | ||||||||||||
| Dividends from investment income—net | (.35 | ) | (.37 | ) | (.24 | ) | (.32 | ) | — | (.40 | ) | |
| Net asset value, end of period | 12.24 | 10.68 | 11.19 | 10.43 | 11.24 | 9.31 | ||||||
| Total Return (%) | 18.13 | (.85 | ) | 9.50 | (4.60 | ) | 20.73 | c | (41.21 | ) | ||
| Ratios/Supplemental Data (%): | ||||||||||||
| Ratio of total expenses to average net assets | 1.08 | 1.09 | .95 | .93 | .95 | d | .95 | |||||
| Ratio of net expenses to average net assets | 1.08 | 1.09 | .95 | .90 | .91 | d | .92 | |||||
| Ratio of net investment income | ||||||||||||
| to average net assets | 2.08 | 2.52 | 2.75 | 2.08 | 3.56 | d | 3.02 | |||||
| Portfolio Turnover Rate | 1.24 | 1.49 | 9.39 | 2.71 | 2.63 | c | 10.62 | |||||
| Net Assets, end of period ($ x 1,000) | 4,773 | 4,032 | 4,019 | 3,462 | 4,171 | 3,179 | ||||||
| † Represents information for Class A shares of the fund’s predecessor, BNY Hamilton International Equity Fund, through September 12, 2008. |
| a The fund had changed its fiscal year end from December 31 to August 31. |
| b Based on average shares outstanding at each month end. |
| c Not annualized. |
| d Annualized. |
| See notes to financial statements. |
The Funds 141
FINANCIAL HIGHLIGHTS (continued)
| Class M Shares | ||||
| Year Ended August 31, | ||||
| BNY Mellon International Equity Income Fund | 2013 | 2012 | a | |
| Per Share Data ($): | ||||
| Net asset value, beginning of period | 12.87 | 12.50 | ||
| Investment Operations: | ||||
| Investment income—netb | .64 | .65 | ||
| Net realized and unrealized | ||||
| gain (loss) on investments | .87 | (.02 | ) | |
| Total from Investment Operations | 1.51 | .63 | ||
| Distributions: | ||||
| Dividends from investment income—net | (.57 | ) | (.26 | ) |
| Net asset value, end of period | 13.81 | 12.87 | ||
| Total Return (%) | 11.96 | 5.28 | c | |
| Ratios/Supplemental Data (%): | ||||
| Ratio of total expenses to average net assets | 1.15 | 1.62 | d | |
| Ratio of net expenses to average net assets | 1.15 | 1.20 | d | |
| Ratio of net investment income | ||||
| to average net assets | 4.57 | 7.38 | d | |
| Portfolio Turnover Rate | 74.80 | 95.27 | c | |
| Net Assets, end of period ($ x 1,000) | 165,132 | 81,034 | ||
| a | From December 15, 2011 (commencement of operations) to August 31, 2012. |
| b | Based on average shares outstanding at each month end. |
| c | Not annualized. |
| d Annualized. | |
| See notes to financial statements. | |
142
| Investor Shares | ||||
| Year Ended August 31, | ||||
| BNY Mellon International Equity Income Fund | 2013 | 2012 | a | |
| Per Share Data ($): | ||||
| Net asset value, beginning of period | 12.88 | 12.50 | ||
| Investment Operations: | ||||
| Investment income—netb | .98 | .65 | ||
| Net realized and unrealized | ||||
| gain (loss) on investments | .49 | (.04 | ) | |
| Total from Investment Operations | 1.47 | .61 | ||
| Distributions: | ||||
| Dividends from investment income—net | (.46 | ) | (.23 | ) |
| Net asset value, end of period | 13.89 | 12.88 | ||
| Total Return (%) | 11.56 | 5.10 | c | |
| Ratios/Supplemental Data (%): | ||||
| Ratio of total expenses to average net assets | 1.42 | 2.10 | d | |
| Ratio of net expenses to average net assets | 1.42 | 1.45 | d | |
| Ratio of net investment income | ||||
| to average net assets | 5.34 | 7.14 | d | |
| Portfolio Turnover Rate | 74.80 | 95.27 | c | |
| Net Assets, end of period ($ x 1,000) | 51 | 10 | ||
| a | From December 15, 2011 (commencement of operations) to August 31, 2012. |
| b | Based on average shares outstanding at each month end. |
| c | Not annualized. |
| d Annualized. | |
| See notes to financial statements. | |
The Funds 143
FINANCIAL HIGHLIGHTS (continued)
| Class M Shares | ||||||||||
| Year Ended August 31, | ||||||||||
| BNY Mellon Asset Allocation Fund | 2013 | 2012 | 2011 | 2010 | 2009 | |||||
| Per Share Data ($): | ||||||||||
| Net asset value, beginning of period | 10.97 | 10.63 | 9.85 | 9.44 | 10.93 | |||||
| Investment Operations: | ||||||||||
| Investment income—neta | .19 | .17 | .16 | .19 | .24 | |||||
| Net realized and unrealized | ||||||||||
| gain (loss) on investments | .81 | .43 | .83 | .46 | (1.01 | ) | ||||
| Total from Investment Operations | 1.00 | .60 | .99 | .65 | (.77 | ) | ||||
| Distributions: | ||||||||||
| Dividends from investment income—net | (.26 | ) | (.21 | ) | (.21 | ) | (.24 | ) | (.27 | ) |
| Dividends from net realized gain on investments | (.03 | ) | (.05 | ) | — | — | (.45 | ) | ||
| Total Distributions | (.29 | ) | (.26 | ) | (.21 | ) | (.24 | ) | (.72 | ) |
| Net asset value, end of period | 11.68 | 10.97 | 10.63 | 9.85 | 9.44 | |||||
| Total Return (%) | 9.20 | 5.72 | 10.00 | 6.84 | (6.08 | ) | ||||
| Ratios/Supplemental Data (%): | ||||||||||
| Ratio of total expenses to average net assetsb | .37 | .37 | .53 | .57 | .60 | |||||
| Ratio of net expenses to average net assetsb | .25 | .27 | .53 | .57 | .60 | |||||
| Ratio of net investment income | ||||||||||
| to average net assetsb | 1.69 | 1.59 | 1.49 | 1.78 | 2.81 | |||||
| Portfolio Turnover Rate | 27.39 | c | 81.55 | 71.08 | 69.81 | 78.44 | c | |||
| Net Assets, end of period ($ x 1,000) | 411,214 | 392,948 | 365,661 | 335,138 | 301,643 | |||||
| a Based on average shares outstanding at each month end. |
| b Amount does not include the activity of the underlying funds. |
| c The portfolio turnover rates excluding mortgage dollar roll transactions for the periods ended August 31, 2013 and 2009 were 27.03% and 77.77%, respectively. |
| See notes to financial statements. |
144
| Investor Shares | ||||||||||
| Year Ended August 31, | ||||||||||
| BNY Mellon Asset Allocation Fund | 2013 | 2012 | 2011 | 2010 | 2009 | |||||
| Per Share Data ($): | ||||||||||
| Net asset value, beginning of period | 11.03 | 10.69 | 9.90 | 9.50 | 10.98 | |||||
| Investment Operations: | ||||||||||
| Investment income—neta | .17 | .14 | .14 | .17 | .23 | |||||
| Net realized and unrealized | ||||||||||
| gain (loss) on investments | .80 | .43 | .83 | .44 | (1.01 | ) | ||||
| Total from Investment Operations | .97 | .57 | .97 | .61 | (.78 | ) | ||||
| Distributions: | ||||||||||
| Dividends from investment income—net | (.23 | ) | (.18 | ) | (.18 | ) | (.21 | ) | (.25 | ) |
| Dividends from net realized gain on investments | (.03 | ) | (.05 | ) | — | — | (.45 | ) | ||
| Total Distributions | (.26 | ) | (.23 | ) | (.18 | ) | (.21 | ) | (.70 | ) |
| Net asset value, end of period | 11.74 | 11.03 | 10.69 | 9.90 | 9.50 | |||||
| Total Return (%) | 8.86 | 5.44 | 9.77 | 6.44 | (6.11 | ) | ||||
| Ratios/Supplemental Data (%): | ||||||||||
| Ratio of total expenses to average net assetsb | .62 | .62 | .78 | .82 | .85 | |||||
| Ratio of net expenses to average net assetsb | .50 | .53 | .78 | .82 | .85 | |||||
| Ratio of net investment income | ||||||||||
| to average net assetsb | 1.45 | 1.28 | 1.23 | 1.54 | 2.57 | |||||
| Portfolio Turnover Rate | 27.39 | c | 81.55 | 71.08 | 69.81 | 78.44 | c | |||
| Net Assets, end of period ($ x 1,000) | 4,939 | 5,091 | 4,265 | 4,015 | 4,412 |
| a Based on average shares outstanding at each month end. |
| b Amount does not include the activity of the underlying funds. |
| c The portfolio turnover rates excluding mortgage dollar roll transactions for the periods ended August 31, 2013 and 2009 were 27.03% and 77.77%, respectively. |
| See notes to financial statements. |
The Funds 145
NOTES TO FINANCIAL STATEMENTS
146
The Funds 147
NOTES TO FINANCIAL STATEMENTS (continued)
148
Table 1—Fair Value Measurements
| Investments in Securities | ||||||||
| Level 1— | Level 2—Other | Level 3—Significant | ||||||
| Unadjusted | Significant | Unobservable | ||||||
| Quoted Prices | Observable Inputs | Inputs | ||||||
| Assets ($) | Liabilities ($) | Assets ($) | Liabilities ($) | Assets ($) | Liabilities ($) | Total ($) | ||
| BNY Mellon Large Cap | ||||||||
| Stock Fund | ||||||||
| Equity Securities— | ||||||||
| Domestic | ||||||||
| Common Stocks† | 730,051,068 | — | — | — | — | — | 730,051,068 | |
| Equity Securities—Foreign | ||||||||
| Common Stocks† | 11,596,690 | — | — | — | — | — | 11,596,690 | |
| Exchange-Traded Funds | 7,554,084 | — | — | — | — | — | 7,554,084 | |
| BNY Mellon Large Cap | ||||||||
| Market Opportunities Fund | ||||||||
| Equity Securities— | ||||||||
| Domestic | ||||||||
| Common Stocks† | 99,834,296 | — | — | — | — | — | 99,834,296 | |
| Equity Securities—Foreign | ||||||||
| Common Stocks† | 5,836,563 | — | — | — | — | — | 5,836,563 | |
| Mutual Funds | 110,144,757 | — | — | — | — | — | 110,144,757 | |
| BNY Mellon | ||||||||
| Tax-Sensitive Large Cap | ||||||||
| Multi-Strategy Fund | ||||||||
| Equity Securities— | ||||||||
| Domestic | ||||||||
| Common Stocks† | 389,215,760 | — | — | — | — | — | 389,215,760 | |
| Equity Securities—Foreign | ||||||||
| Common Stocks† | 8,749,229 | — | — | — | — | — | 8,749,229 | |
| Exchange-Traded Funds | 6,316,890 | — | — | — | — | — | 6,316,890 | |
| Mutual Funds | 234,257,167 | — | — | — | — | — | 234,257,167 | |
| BNY Mellon | ||||||||
| Income Stock Fund | ||||||||
| Equity Securities— | ||||||||
| Domestic | ||||||||
| Common Stocks† | 905,915,159 | — | — | — | — | — | 905,915,159 | |
| Equity Securities—Foreign | ||||||||
| Common Stocks† | 44,345,283 | — | — | — | — | — | 44,345,283 | |
| Mutual Funds | 13,968,966 | — | — | — | — | — | 13,968,966 | |
| Preferred Stocks† | 19,133,112 | — | — | — | — | — | 19,133,112 | |
| Other Financial | ||||||||
| Instruments: | ||||||||
| Options Written | — | (10,440) | — | — | — | — | (10,440 | ) |
The Funds 149
NOTES TO FINANCIAL STATEMENTS (continued)
Table 1—Fair Value Measurements (continued)
| Investments in Securities | ||||||||
| Level 1— | Level 2—Other | Level 3— Significant | ||||||
| Unadjusted | Significant | Unobservable | ||||||
| Quoted Prices | Observable Inputs | Inputs | ||||||
| Assets ($) | Liabilities ($) | Assets ($) | Liabilities ($) | Assets ($) | Liabilities ($) | Total ($) | ||
| BNY Mellon Mid Cap | ||||||||
| Multi-Strategy Fund | ||||||||
| Equity Securities— | ||||||||
| Domestic | ||||||||
| Common Stocks† | 1,539,377,009 | — | — | — | — | — | 1,539,377,009 | |
| Equity Securities— | ||||||||
| Foreign | ||||||||
| Common Stocks† | 19,595,426 | — | — | — | — | — | 19,595,426 | |
| Exchange-Traded Funds | 16,994,784 | — | — | — | — | — | 16,994,784 | |
| Mutual Funds | 24,835,543 | — | — | — | — | — | 24,835,543 | |
| BNY Mellon Small Cap | ||||||||
| Multi-Strategy Fund | ||||||||
| Equity Securities—Domestic | ||||||||
| Common Stocks† | 294,608,230 | — | — | — | — | — | 294,608,230 | |
| Equity Securities—Foreign | ||||||||
| Common Stocks† | 4,162,530 | — | — | — | — | — | 4,162,530 | |
| Exchange-Traded Funds | 5,284,668 | — | — | — | — | — | 5,284,668 | |
| Mutual Funds | 25,037,460 | — | — | — | — | — | 25,037,460 | |
| BNY Mellon Focused | ||||||||
| Equity Opportunities Fund | ||||||||
| Equity Securities—Domestic | ||||||||
| Common Stocks† | 474,105,738 | — | — | — | — | — | 474,105,738 | |
| Equity Securities—Foreign | ||||||||
| Common Stocks† | 60,220,061 | — | — | — | — | — | 60,220,061 | |
| Mutual Funds | 5,192,000 | — | — | — | — | — | 5,192,000 | |
| BNY Mellon | ||||||||
| Small/Mid Cap Fund | ||||||||
| Equity Securities—Domestic | ||||||||
| Common Stocks† | 445,614,358 | — | — | — | — | — | 445,614,358 | |
| Equity Securities—Foreign | ||||||||
| Common Stocks† | 7,866,589 | — | — | — | — | — | 7,866,589 | |
| Exchange-Traded Funds | 9,495,948 | — | — | — | — | — | 9,495,948 | |
| Mutual Funds | 38,936,685 | — | — | — | — | — | 38,936,685 | |
| BNY Mellon | ||||||||
| International Fund | ||||||||
| Equity Securities—Foreign | ||||||||
| Common Stocks† | 507,477,669 | — | — | — | — | — | 507,477,669 | |
| Exchange-Traded Funds | 3,969,715 | — | — | — | — | — | 3,969,715 | |
| Mutual Funds | 8,318,742 | — | — | — | — | — | 8,318,742 | |
| Other Financial | ||||||||
| Instruments: | ||||||||
| Forward Foreign | ||||||||
| Currency Exchange | ||||||||
| Contracts†† | — | — | — | (332) | — | — | (332 | ) |
150
Table 1—Fair Value Measurements (continued)
| Investments in Securities | ||||||||
| Level 1— | Level 2—Other | Level 3— Significant | ||||||
| Unadjusted | Significant | Unobservable | ||||||
| Quoted Prices | Observable Inputs | Inputs | ||||||
| Assets ($) | Liabilities ($) | Assets ($) | Liabilities ($) | Assets ($) | Liabilities ($) | Total ($) | ||
| BNY Mellon | ||||||||
| Emerging Markets Fund | ||||||||
| Equity Securities—Foreign | ||||||||
| Common Stocks† | 1,725,196,170 | — | 11,960,741 | — | — | — | 1,737,156,911 | |
| Exchange-Traded Funds | 8,455,994 | — | — | — | — | — | 8,455,994 | |
| Mutual Funds | 3,563,342 | — | — | — | — | — | 3,563,342 | |
| Preferred Stocks† | 61,311,683 | — | — | — | — | — | 61,311,683 | |
| Other Financial | ||||||||
| Instruments: | ||||||||
| Forward Foreign | ||||||||
| Currency Exchange | ||||||||
| Contracts†† | — | — | 2,088 | (66,888) | — | — | (64,800 | ) |
| BNY Mellon International | ||||||||
| Appreciation Fund | ||||||||
| Equity Securities—Foreign | ||||||||
| Common Stocks† | 100,707,747 | — | — | — | — | — | 100,707,747 | |
| Mutual Funds | 1,761,341 | — | — | — | — | — | 1,761,341 | |
| U.S. Treasury | — | — | 189,993 | — | — | — | 189,993 | |
| Other Financial Instruments: | ||||||||
| Financial Futures†† | — | (82,792) | — | — | — | — | (82,792 | ) |
| BNY Mellon International | ||||||||
| Equity Income Fund | ||||||||
| Equity Securities—Foreign | ||||||||
| Common Stocks† | 156,358,585 | — | — | — | — | — | 156,358,585 | |
| Exchange-Traded Funds | 2,425,970 | — | — | — | — | — | 2,425,970 | |
| Mutual Funds | 3,045,924 | — | — | — | — | — | 3,045,924 | |
| Preferred Stocks† | 1,157,501 | — | — | — | — | — | 1,157,501 | |
| BNY Mellon | ||||||||
| Asset Allocation Fund | ||||||||
| Asset—Backed | — | — | 999,497 | — | — | — | 999,497 | |
| Commercial | ||||||||
| Mortgage—Backed | — | — | 1,061,144 | — | — | — | 1,061,144 | |
| Corporate Bonds† | — | — | 20,817,274 | — | — | — | 20,817,274 | |
| Equity Securities—Domestic | ||||||||
| Common Stocks† | 78,773,778 | — | — | — | — | — | 78,773,778 | |
| Equity Securities—Foreign | ||||||||
| Common Stocks† | 1,251,438 | — | — | — | — | — | 1,251,438 | |
| Exchange-Traded Funds | 656,237 | — | — | — | — | — | 656,237 | |
| Foreign Government | — | — | 907,844 | — | — | — | 907,844 | |
| Municipal Bonds | — | — | 3,682,005 | — | — | — | 3,682,005 | |
| Mutual Funds | 270,237,795 | — | — | — | — | — | 270,237,795 | |
| U.S. Government | ||||||||
| Agencies/ | ||||||||
| Mortgage—Backed | — | — | 19,163,472 | — | — | — | 19,163,472 | |
| U.S. Treasury | — | — | 18,552,149 | — | — | — | 18,552,149 | |
| † See Statement of Investments for additional detailed categorizations. |
| †† Amount shown represents unrealized appreciation (depreciation) at period end. |
The Funds 151
NOTES TO FINANCIAL STATEMENTS (continued)
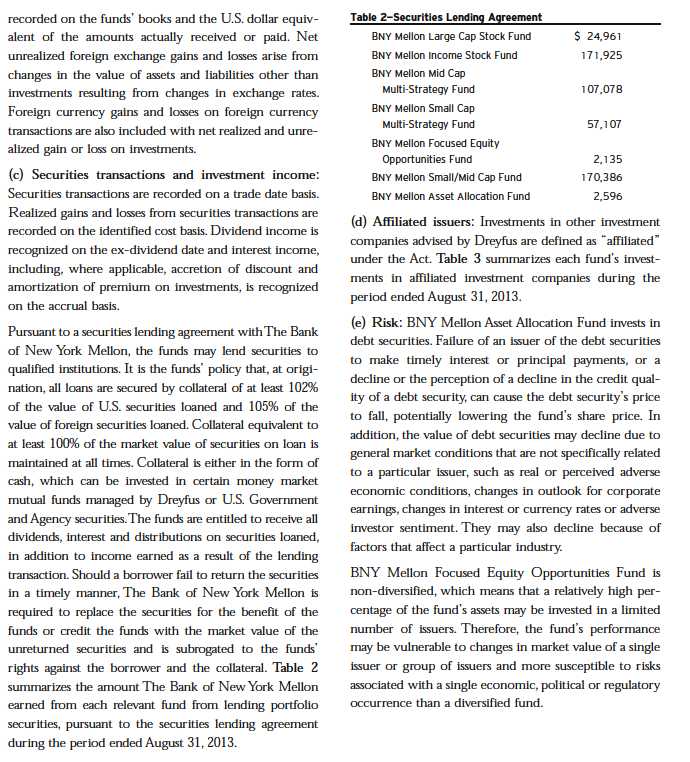
152
Table 3—Affiliated Investment Companies
| Net Unrealized | |||||||||||
| Affiliated | Value | Net Realized | Appreciation | Value | Net | Dividends/ | |||||
| Investment Companies | 8/31/2012 ($) | Purchases ($)† | Sales ($) | Gain (Loss) ($) | (Depreciation) ($) | 8/31/2013 ($) | Assets (%) | Distributions ($) | |||
| BNY Mellon Large Cap | |||||||||||
| Stock Fund | |||||||||||
| Dreyfus Institutional | |||||||||||
| Preferred Plus Money | |||||||||||
| Market Fund | 89,911 | 77,995,952 | 78,085,863 | — | — | — | — | — | |||
| Dreyfus Institutional Cash | |||||||||||
| Advantage Fund | 17,903,427 | 158,736,621 | 176,640,048 | — | — | — | — | — | |||
| Total | 17,993,338 | 236,732,573 | 254,725,911 | — | — | — | — | — | |||
| BNY Mellon | |||||||||||
| Large Cap Market | |||||||||||
| Opportunities Fund | |||||||||||
| BNY Mellon Income | |||||||||||
| Stock Fund, CI. M | — | 30,539,073 | — | — | (698,325 | ) | 29,840,748 | 13.8 | 39,073 | ||
| BNY Mellon U.S. Core | |||||||||||
| Equity 130/30 | |||||||||||
| Fund, CI. M | 15,541,034 | 2,281,942 | 20,532,922 | 4,257,180 | (1,547,234 | ) | — | — | 76,942 | ||
| Dreyfus Institutional | |||||||||||
| Preferred Plus | |||||||||||
| Money Market Fund | 3,619,171 | 51,747,014 | 52,362,130 | — | — | 3,004,055 | 1.4 | — | |||
| Dreyfus Research | |||||||||||
| Growth Fund, Cl. I | 8,922,714 | 28,413,539 | — | — | 1,560,550 | 38,896,803 | 18.0 | 53,280 | |||
| Dreyfus Strategic | |||||||||||
| Value Fund, Cl. I | — | 39,250,000 | — | — | (846,849 | ) | 38,403,151 | 17.7 | — | ||
| Total | 28,082,919 | 152,231,568 | 72,895,052 | 4,257,180 | (1,531,858) 110,144,757 | 50.9 | 169,295 | ||||
| BNY Mellon | |||||||||||
| Tax-Sensitive | |||||||||||
| Large Cap | |||||||||||
| Multi-Strategy Fund | |||||||||||
| BNY Mellon Income | |||||||||||
| Stock Fund, Cl. M | — | 78,099,995 | — | — | (1,731,379 | ) | 76,368,616 | 12.0 | 99,995 | ||
| BNY Mellon U.S. Core | |||||||||||
| Equity 130/30 | |||||||||||
| Fund, CI. M | 9,212,362 | 31,604,667 | 45,584,057 | 5,935,895 | (1,168,867 | ) | — | — | 44,667 | ||
| Dreyfus Institutional | |||||||||||
| Preferred Plus | |||||||||||
| Money Market Fund | 1,942,377 | 2,099,337,464 | 2,096,926,815 | — | — | 4,353,026 | .7 | — | |||
| Dreyfus Research | |||||||||||
| Growth Fund, Cl. I | 6,198,317 | 68,212,420 | — | — | 2,848,968 | 77,259,705 | 12.1 | 151,342 | |||
| Dreyfus Strategic | |||||||||||
| Value, Cl. I | — | 78,000,000 | — | — | (1,724,180 | ) | 76,275,820 | 11.9 | — | ||
| Total | 17,353,056 | 2,355,254,546 | 2,142,510,872 | 5,935,895 | (1,775,458) 234,257,167 | 36.7 | 296,004 | ||||
| BNY Mellon Income | |||||||||||
| Stock Fund | |||||||||||
| Dreyfus Institutional | |||||||||||
| Preferred Plus | |||||||||||
| Money Market Fund | 6,406,257 | 303,174,794 | 295,612,085 | — | — | 13,968,966 | 1.4 | — | |||
| Dreyfus Institutional Cash | |||||||||||
| Advantage Fund | 71,135,350 | 260,003,618 | 331,138,968 | — | — | — | — | — | |||
| Total | 77,541,607 | 563,178,412 | 626,751,053 | — | — | 13,968,966 | 1.4 | — | |||
The Funds 153
NOTES TO FINANCIAL STATEMENTS (continued)
Table 3—Affiliated Investment Companies (continued)
| Net Unrealized | ||||||||||
| Affiliated | Value | Net Realized | Appreciation | Value | Net | Dividends/ | ||||
| Investment Companies | 8/31/2012 ($) | Purchases ($)† | Sales ($) | Gain (Loss) ($) | (Depreciation) ($) | 8/31/2013 ($) | Assets (%) | Distributions ($) | ||
| BNY Mellon Mid Cap | ||||||||||
| Multi-Strategy Fund | ||||||||||
| Dreyfus Institutional | ||||||||||
| Preferred Plus | ||||||||||
| Money Market Fund | 202,961,050 | 807,207,082 | 985,332,589 | — | — | 24,835,543 | 1.6 | — | ||
| Dreyfus Institutional Cash | ||||||||||
| Advantage Fund | 37,136,636 | 320,699,655 | 357,836,291 | — | — | — | — | — | ||
| Total | 240,097,686 | 1,127,906,737 | 1,343,168,880 | — | — | 24,835,543 | 1.6 | — | ||
| BNY Mellon Small Cap | ||||||||||
| Multi-Strategy Fund | ||||||||||
| Dreyfus Institutional | ||||||||||
| Preferred Plus | ||||||||||
| Money Market Fund | 12,351,731 | 75,197,701 | 82,493,837 | — | — | 5,055,595 | 1.6 | — | ||
| Dreyfus Institutional Cash | ||||||||||
| Advantage Fund | 17,350,832 | 178,789,959 | 176,158,926 | — | — | 19,981,865 | 6.5 | — | ||
| Total | 29,702,563 | 253,987,660 | 258,652,763 | — | — | 25,037,460 | 8.1 | — | ||
| BNY Mellon Focused | ||||||||||
| Equity Opportunities Fund | ||||||||||
| Dreyfus Institutional | ||||||||||
| Preferred Plus | ||||||||||
| Money Market Fund | 1,074,547 | 144,650,351 | 141,219,586 | — | — | 4,505,312 | .8 | — | ||
| Dreyfus Institutional Cash | ||||||||||
| Advantage Fund | — | 51,731,778 | 51,045,090 | — | — | 686,688 | .1 | — | ||
| Total | 1,074,547 | 196,382,129 | 192,264,676 | — | — | 5,192,000 | .9 | — | ||
| BNY Mellon | ||||||||||
| Small/Mid Cap Fund | ||||||||||
| Dreyfus Institutional | ||||||||||
| Preferred Plus | ||||||||||
| Money Market Fund | 2,287,790 | 140,585,984 | 141,226,411 | — | — | 1,647,363 | .4 | — | ||
| Dreyfus Institutional Cash | ||||||||||
| Advantage Fund | 49,509,775 | 271,229,106 | 283,449,559 | — | — | 37,289,322 | 8.0 | — | ||
| Total | 51,797,565 | 411,815,090 | 424,675,970 | — | — | 38,936,685 | 8.4 | — | ||
| BNY Mellon | ||||||||||
| International Fund | ||||||||||
| Dreyfus Institutional | ||||||||||
| Preferred Plus | ||||||||||
| Money Market Fund | 175,101 | 112,439,291 | 104,295,650 | — | — | 8,318,742 | 1.6 | — | ||
| BNY Mellon | ||||||||||
| Emerging Markets Fund | ||||||||||
| Dreyfus Institutional | ||||||||||
| Preferred Plus | ||||||||||
| Money Market Fund | 6,816,020 | 426,964,861 | 430,217,539 | — | — | 3,563,342 | .2 | — | ||
| BNY Mellon International | ||||||||||
| Appreciation Fund | ||||||||||
| Dreyfus Institutional | ||||||||||
| Preferred Plus | ||||||||||
| Money Market Fund | 1,396,388 | 28,089,922 | 27,724,969 | — | — | 1,761,341 | 1.7 | — | ||
| BNY Mellon International | ||||||||||
| Equity Income Fund | ||||||||||
| Dreyfus Institutional | ||||||||||
| Preferred Plus | ||||||||||
| Money Market Fund | 1,160,763 | 86,691,088 | 84,805,927 | — | — | 3,045,924 | 1.9 | — | ||
154
Table 3—Affiliated Investment Companies (continued)
| Net Unrealized | ||||||||||||
| Affiliated | Value | Net Realized | Appreciation | Value | Net | Dividends/ | ||||||
| Investment Companies | 8/31/2012 ($) | Purchases ($)† | Sales ($) | Gain (Loss) ($) | (Depreciation) ($) | 8/31/2013 ($) | Assets (%) | Distributions ($) | ||||
| BNY Mellon | ||||||||||||
| Asset Allocation Fund | ||||||||||||
| BNY Mellon Emerging | ||||||||||||
| Markets Fund, CI. M | 34,919,996 | 1,606,162 | 1,693,000 | (271,496 | ) | (204,123 | ) | 34,357,539 | 8.3 | 386,161 | ||
| BNY Mellon Focused | ||||||||||||
| Equity Opportunities | ||||||||||||
| Fund, CI. M | 26,623,065 | 236,107 | — | — | 4,433,995 | 31,293,167 | 7.5 | 236,107 | ||||
| BNY Mellon Income | ||||||||||||
| Stock Fund, CI. M | — | 18,083,363 | — | — | 1,704,573 | 19,787,936 | 4.7 | 225,363 | ||||
| BNY Mellon Intermediate | ||||||||||||
| Bond Fund, CI. M | 13,770,808 | 334,108 | — | — | (559,760 | ) | 13,545,156 | 3.2 | 334,109 | |||
| BNY Mellon International | ||||||||||||
| Fund, CI. M | 8,208,635 | 281,692 | — | — | 1,667,085 | 10,157,412 | 2.4 | 281,691 | ||||
| BNY Mellon Mid Cap | ||||||||||||
| Multi-Strategy | ||||||||||||
| Fund, CI. M | 18,232,902 | 2,403,188 | 401,000 | (66,592 | ) | 2,920,882 | 23,089,380 | 5.5 | 1,550,188 | |||
| BNY Mellon Short-Term | ||||||||||||
| U.S. Government | ||||||||||||
| Securities Fund, CI. M | 15,004,958 | 113,170 | 6,335,000 | (73,416 | ) | (96,588 | ) | 8,613,124 | 2.1 | 113,170 | ||
| BNY Mellon Small/Mid | ||||||||||||
| Cap Fund, CI. M | 8,434,294 | 990,714 | — | — | 1,351,937 | 10,776,945 | 2.6 | 137,715 | ||||
| BNY Mellon | ||||||||||||
| U.S. Core Equity | ||||||||||||
| 130/30 Fund, CI. M | 11,731,343 | 56,457 | 12,770,519 | 2,489,254 | (1,506,535 | ) | — | — | 56,456 | |||
| Dreyfus Emerging | ||||||||||||
| Markets Debt Local | ||||||||||||
| Currency Fund, CI. I | 4,720,739 | 145,810 | 966,000 | 58,911 | (286,255 | ) | 3,673,205 | 0.9 | 145,810 | |||
| Dreyfus Global Real Estate | ||||||||||||
| Securities Fund, CI. I | 8,596,005 | 500,017 | — | — | (73,495 | ) | 9,022,527 | 2.2 | 500,017 | |||
| Dreyfus High Yield | ||||||||||||
| Fund, CI. I | 12,392,832 | 787,878 | 1,407,000 | 48,406 | 96,668 | 11,918,784 | 2.9 | 790,112 | ||||
| Dreyfus | ||||||||||||
| Inflation Adjusted | ||||||||||||
| Securities Fund, CI. I | 11,532,917 | 662,927 | 2,132,000 | (170,008 | ) | (1,264,738 | ) | 8,629,098 | 2.1 | 662,463 | ||
| Dreyfus Institutional | ||||||||||||
| Cash Advantage Fund | — | 2,706,206 | 2,706,206 | — | — | — | — | — | ||||
| Dreyfus Institutional | ||||||||||||
| Preferred Plus | ||||||||||||
| Money Market Fund | 6,438,816 | 49,726,180 | 51,621,612 | — | — | 4,543,384 | 1.1 | — | ||||
| Dreyfus Select Managers | ||||||||||||
| Small Cap Growth | ||||||||||||
| Fund, CI. I | 7,755,778 | 1,279,001 | 1,003,000 | 10,196 | 1,982,118 | 10,024,093 | 2.4 | — | ||||
| Dreyfus Select Managers | ||||||||||||
| Small Cap Value | ||||||||||||
| Fund, CI. I | 9,952,273 | 1,412,383 | — | — | 2,135,234 | 13,499,890 | 3.2 | 559,383 | ||||
| Dreyfus U.S. Equity | ||||||||||||
| Fund, CI. I | 19,269,275 | 196,262 | 4,522,000 | 387,200 | 2,679,054 | 18,009,791 | 4.3 | 196,261 | ||||
| Dreyfus/Newton | ||||||||||||
| International | ||||||||||||
| Equity Fund, CI. I | 4,089,966 | 65,906 | — | — | 669,798 | 4,825,670 | 1.2 | 65,906 | ||||
| Global Stock Fund, CI. I | 14,605,058 | 127,520 | 840,000 | 117,738 | 1,880,877 | 15,891,193 | 3.8 | 127,520 | ||||
| Total | 236,279,660 | 81,715,051 | 86,397,337 | 2,530,193 | 17,530,727 | 251,658,294 | 60.4 | 6,368,432 | ||||
| † | Includes reinvested dividends/distributions. |
The Funds 155
NOTES TO FINANCIAL STATEMENTS (continued)
156
Table 4—Components of Accumulated Earnings
| Undistributed | Accumulated | Undistributed | Unrealized | Capital (Losses) | ||||
| Ordinary | Capital | Capital | Appreciation | Realized After | ||||
| Income ($) | (Losses) ($) | Gains ($) | (Depreciation) ($) | October 31, 2012 ($)† | ||||
| BNY Mellon Large Cap Stock Fund | 16,835,511 | — | 101,799,357 | 189,827,030 | — | |||
| BNY Mellon Large Cap | ||||||||
| Market Opportunities Fund | 1,244,552 | — | 13,245,335 | 25,329,472 | — | |||
| BNY Mellon Tax-Sensitive | ||||||||
| Large Cap Multi-Strategy Fund | 21,230,178 | — | 2,258,220 | 51,068,716 | — | |||
| BNY Mellon Income Stock Fund | 9,911,382 | — | 13,834,530 | 127,392,375 | — | |||
| BNY Mellon Mid Cap Multi-Strategy Fund | 47,088,019 | — | 21,092,633 | 262,869,740 | — | |||
| BNY Mellon Small Cap Multi-Strategy Fund | — | (37,538,302 | ) | — | 43,746,433 | (478,823) | †† | |
| BNY Mellon Focused | ||||||||
| Equity Opportunities Fund | 3,758,775 | — | 28,571,381 | 99,505,375 | — | |||
| BNY Mellon Small/Mid Cap Fund | 673,863 | — | 20,063,040 | 56,194,270 | — | |||
| BNY Mellon International Fund | 9,484,794 | (619,503,091 | ) | — | (33,775,827 | ) | — | |
| BNY Mellon Emerging Markets Fund | 21,198,132 | (215,265,865 | ) | — | (103,506,269 | ) | — | |
| BNY Mellon International Appreciation Fund | 1,877,000 | (42,071,264 | ) | — | (26,826,461 | ) | — | |
| BNY Mellon International Equity Income Fund | 2,242,837 | (6,634,757 | ) | — | 7,935,337 | — | ||
| BNY Mellon Asset Allocation Fund | 1,006,846 | — | 7,994,082 | 50,457,165 | — |
| † These losses were deferred for tax purposes to the first day of the following fiscal year. |
| †† Late year ordinary losses deferred for tax purposes to the first day of the following fiscal year. |
Table 5—Capital Loss Carryover
| Post-Enactment | Post-Enactment | ||||||
| Short-Term | Long-Term | ||||||
| 2017 ($) | † | 2018 ($) | † | Losses ($)†† | Losses ($)††† | Total ($) | |
| BNY Mellon Small Cap Multi-Strategy Fund | — | 37,538,302 | — | — | 37,538,302 | ||
| BNY Mellon International Fund | 108,136,812 | 462,294,170 | — | 49,072,109 | 619,503,091 | ||
| BNY Mellon Emerging Markets Fund | — | — | 85,813,368 | 129,452,497 | 215,265,865 | ||
| BNY Mellon International Appreciation Fund | 15,657,135 | — | 699,913 | 25,714,216 | 42,071,264 | ||
| BNY Mellon International Equity Income Fund | — | — | 5,550,002 | 1,084,755 | 6,634,757 |
| † | If not applied, the carryovers expire in the above fiscal years. |
| †† | Post-enactment short-term losses which can be carried forward for an unlimited period. |
| ††† Post-enactment long-term losses which can be carried forward for an unlimited period. | |
The Funds 157
NOTES TO FINANCIAL STATEMENTS (continued)
Table 6—Tax Character of Distributions Paid
| Long-Term | ||||
| Ordinary Income ($) | Capital Gains ($) | |||
| 2013 | 2012 | 2013 | 2012 | |
| BNY Mellon Large Cap Stock Fund | 11,137,684 | 9,551,913 | 41,930,989 | — |
| BNY Mellon Large Cap Market Opportunities Fund | 1,053,939 | 385,167 | — | — |
| BNY Mellon Tax-Sensitive Large Cap Multi-Strategy Fund | 1,087,759 | 415,070 | — | — |
| BNY Mellon Income Stock Fund | 21,134,036 | 12,483,466 | 474,473 | — |
| BNY Mellon Mid Cap Multi-Strategy Fund | 27,846,244 | 4,817,548 | 74,651,509 | 36,147,909 |
| BNY Mellon Small Cap Multi-Strategy Fund | 580,713 | 8,993,932 | — | — |
| BNY Mellon Focused Equity Opportunities Fund | 4,212,219 | 650,631 | — | 903,915 |
| BNY Mellon Small/Mid Cap Fund | 7,576,741 | 6,819,275 | — | — |
| BNY Mellon International Fund | 16,875,502 | 26,827,106 | — | — |
| BNY Mellon Emerging Markets Fund | 21,822,977 | 23,631,029 | — | 66,325,265 |
| BNY Mellon International Appreciation Fund | 3,770,987 | 6,550,704 | — | — |
| BNY Mellon International Equity Income Fund | 4,925,558 | 1,534,721 | — | — |
| BNY Mellon Asset Allocation Fund | 9,449,181 | 7,301,278 | 773,574 | 1,702,774 |
Table 7—Return of Capital Statement of Position
| Accumulated | Accumulated | ||||||
| Undistributed | Net Realized | Paid-in | |||||
| Investment Income—Net ($) | Gain (Loss) ($) | Capital ($) | |||||
| BNY Mellon Tax-Sensitive Large Cap Multi-Strategy Fund | (16,775 | ) | 16,775 | — | |||
| BNY Mellon Mid Cap Multi-Strategy Fund | (1,251,360 | ) | 1,251,360 | — | |||
| BNY Mellon Small Cap Multi-Strategy Fund | (180,744 | ) | 181,265 | (521 | ) | ||
| BNY Mellon Small/Mid Cap Fund | (458,627 | ) | 458,627 | — | |||
| BNY Mellon International Fund | 593,611 | (593,611 | ) | — | |||
| BNY Mellon Emerging Markets Fund | (1,317,491 | ) | 1,317,491 | — | |||
| BNY Mellon International Appreciation Fund | 52,868 | (52,868 | ) | — | |||
| BNY Mellon International Equity Income Fund | (100,845 | ) | 100,845 | — | |||
| BNY Mellon Asset Allocation Fund | 1,394,846 | (1,394,846 | ) | — |
158
The Funds 159
NOTES TO FINANCIAL STATEMENTS (continued)
160
The Funds 161
NOTES TO FINANCIAL STATEMENTS (continued)
162
Table 10—Cash Management Agreement Fees
| The Bank of | The Bank of | Dreyfus Transfer, Inc. | ||||
| New York Mellon | New York Mellon | Cash Management | Dreyfus Transfer, Inc. | |||
| Cash Management Fees ($) | Earnings Credits ($) | Fees ($) | Earnings Credits ($) | |||
| BNY Mellon Large Cap Stock Fund | 38 | — | 71 | (9 | ) | |
| BNY Mellon Large Cap | ||||||
| Market Opportunities Fund | 3 | — | 6 | (1 | ) | |
| BNY Mellon Tax-Sensitive | ||||||
| Large Cap Multi-Strategy Fund | 4 | — | 10 | (1 | ) | |
| BNY Mellon Income Stock Fund | 21 | — | 42 | (5 | ) | |
| BNY Mellon Mid Cap Multi-Strategy Fund | 692 | (5 | ) | 1,234 | (157 | ) |
| BNY Mellon Small Cap Multi-Strategy Fund | 209 | (1 | ) | 393 | (48 | ) |
| BNY Mellon Focused Equity Opportunities Fund | 8 | — | 15 | (2 | ) | |
| BNY Mellon Small/Mid Cap Fund | 12 | — | 23 | (3 | ) | |
| BNY Mellon International Fund | 39 | — | 71 | (9 | ) | |
| BNY Mellon Emerging Markets Fund | 101 | (1 | ) | 172 | (23 | ) |
| BNY Mellon International Appreciation Fund | 87 | — | 165 | (20 | ) | |
| BNY Mellon International Equity Income Fund | 7 | — | 14 | (2 | ) | |
| BNY Mellon Asset Allocation Fund | 10 | — | 19 | (2 | ) | |
Table 11—Due to The Dreyfus Corporation and Affiliates
| Investment | Shareholder | Chief | ||||
| Advisory | Services | Custodian | Compliance | Less Expense | ||
| Fees ($) | Plan Fees ($) | Fees ($) | Officer Fees ($) | Reimbursement ($) | ||
| BNY Mellon Large Cap Stock Fund | 429,350 | 4,346 | 27,712 | 6,172 | — | |
| BNY Mellon Large Cap Market Opportunities Fund | 96,351 | 23 | 12,381 | 6,172 | — | |
| BNY Mellon Tax-Sensitive Large Cap Multi-Strategy Fund | 315,343 | 310 | 21,445 | 6,172 | — | |
| BNY Mellon Income Stock Fund | 518,601 | 583 | 22,560 | 6,172 | — | |
| BNY Mellon Mid Cap Multi-Strategy Fund | 1,044,180 | 6,255 | 52,266 | 6,172 | — | |
| BNY Mellon Small Cap Multi-Strategy Fund | 228,646 | 1,803 | 31,552 | 6,172 | — | |
| BNY Mellon Focused Equity Opportunities Fund | 324,344 | 161 | 16,181 | 6,172 | — | |
| BNY Mellon Small/Mid Cap Fund | 307,560 | 118 | 16,573 | 6,172 | — | |
| BNY Mellon International Fund | 390,883 | 927 | 120,386 | 6,172 | — | |
| BNY Mellon Emerging Markets Fund | 1,827,775 | 2,369 | 768,217 | 6,172 | — | |
| BNY Mellon International Appreciation Fund | 45,290 | 1,044 | 5,243 | 6,172 | — | |
| BNY Mellon International Equity Income Fund | 120,784 | 12 | 40,513 | 6,172 | — | |
| BNY Mellon Asset Allocation Fund | 102,327 | 1,071 | 8,825 | 6,172 | (36,765 | ) |
The Funds 163
NOTES TO FINANCIAL STATEMENTS (continued)
Table 12—Purchases and Sales
| Purchases ($) | Sales ($) | |
| BNY Mellon Large Cap Stock Fund | 433,571,957 | 779,819,483 |
| BNY Mellon Large Cap Market Opportunities Fund | 175,669,146 | 140,985,404 |
| BNY Mellon Tax-Sensitive Large Cap Multi-Strategy Fund | 800,484,154 | 349,152,680 |
| BNY Mellon Income Stock Fund | 602,465,702 | 287,113,870 |
| BNY Mellon Mid Cap Multi-Strategy Fund | 1,744,970,063 | 1,440,239,042 |
| BNY Mellon Small Cap Multi-Strategy Fund | 345,492,444 | 338,281,555 |
| BNY Mellon Focused Equity Opportunities Fund | 372,469,456 | 377,577,276 |
| BNY Mellon Small/Mid Cap Fund | 807,738,251 | 940,907,159 |
| BNY Mellon International Fund | 294,273,093 | 436,820,533 |
| BNY Mellon Emerging Markets Fund | 1,119,361,712 | 1,434,689,572 |
| BNY Mellon International Appreciation Fund | 1,378,215 | 39,314,010 |
| BNY Mellon International Equity Income Fund | 171,268,062 | 93,632,740 |
| BNY Mellon Asset Allocation Fund | ||
| Transactions without Mortgage Dollar Rolls | 109,349,133 | 114,801,257 |
| Mortgage Dollar Rolls transactions | 1,444,866 | 1,447,693 |
| 110,793,999 | 116,248,950 |
164
Table 13—Derivatives and Hedging
Fair value of derivative instruments for BNY Mellon International Appreciation Fund as of August 31, 2013 is shown below:
| Derivative | Derivative | |||
| Assets ($) | Liabilities ($) | |||
| Equity risk | — | Equity risk1 | (82,792 | ) |
| Gross fair value of derivatives contracts | — | (82,792 | ) |
| Statement of Assets and Liabilities location: |
| 1 Includes cumulative appreciation (depreciation) on financial futures as reported in the Statement of Financial Futures, but only the unpaid variation margin is reported in |
| the Statement of Assets and Liabilities. |
The effect of derivative instruments in the Statement of Operations for BNY Mellon International Appreciation Fund during the period ended August 31, 2013 is shown below:
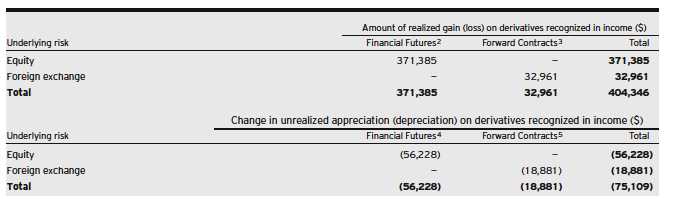
| Statement of Operations location: | |
| 2 | Net realized gain (loss) on financial futures. |
| 3 | Net realized gain (loss) on forward foreign currency exchange contracts. |
| 4 | Net unrealized appreciation (depreciation) on financial futures. |
| 5 | Net unrealized appreciation (depreciation) on forward foreign currency exchange contracts. |
The Funds 165
NOTES TO FINANCIAL STATEMENTS (continued)
Table 14—Options Written
| BNY Mellon Income Stock Fund | Options Terminated | |||
| Number of | Premiums | Net Realized | ||
| Options Written | Contracts | Received ($) | Cost ($) | Gain ($) |
| Contracts outstanding August 31, 2012 | — | — | ||
| Contracts written | 10,956 | 643,262 | ||
| Contracts terminated: | ||||
| Contracts closed | 3,540 | 195,439 | 20,674 | 174,765 |
| Contracts expired | 5,676 | 302,275 | — | 302,275 |
| Total contracts terminated | 9,216 | 497,714 | 20,674 | 477,040 |
| Contracts outstanding August 31, 2013 | 1,740 | 145,548 | ||
166
Table 15—Forward Foreign Currency Exchange Contracts
| BNY Mellon International Fund | |||||
| Foreign | |||||
| Currency | Unrealized | ||||
| Forward Foreign Currency Exchange Contracts | Amounts | Cost ($) | Value ($) | (Depreciation) | ($) |
| Purchases: | |||||
| Australian Dollar, Expiring 9/3/2013a | 159,569 | 142,356 | 142,024 | (332 | ) |
| Counterparty: |
| a Barclays Bank |
Table 15—Forward Foreign Currency Exchange Contracts (continued)
| BNY Mellon Emerging Markets Fund | |||||
| Foreign | Unrealized | ||||
| Currency | Appreciation | ||||
| Forward Foreign Currency Exchange Contracts | Amounts | Cost ($) | Value ($) | (Depreciation) | ($) |
| Purchases: | |||||
| Brazilian Real, Expiring 9/3/2013a | 69,392 | 28,937 | 29,083 | 146 | |
| Malaysian Ringgit, Expiring 9/3/2013b | 2,002,441 | 611,806 | 609,617 | (2,189 | ) |
| South Korean Won, Expiring 9/3/2013b | 890,761,572 | 809,048 | 802,452 | (6,596 | ) |
| Thai Baht, Expiring 9/4/2013b | 40,388,168 | 1,259,375 | 1,254,681 | (4,694 | ) |
| Sales; | Proceeds ($) | ||||
| Czech Koruna, Expiring 9/3/2013a | 3,645,393 | 187,424 | 187,180 | 244 | |
| Euro, Expiring 9/3/2013a | 1,622,693 | 2,146,271 | 2,144,632 | 1,639 | |
| Hong Kong Dollar, Expiring 9/3/2013c | 9,874,679 | 1,273,221 | 1,273,421 | (200 | ) |
| Indian Rupee, Expiring 9/3/2013d | 87,293,722 | 1,307,869 | 1,321,231 | (13,362 | ) |
| Indonesian Rupiah, Expiring: | |||||
| 9/3/2013b | 3,429,304,149 | 296,909 | 314,039 | (17,130 | ) |
| 9/4/2013b | 1,494,082,237 | 127,699 | 136,821 | (9,122 | ) |
| South African Rand, Expiring 9/3/2013e | 53,233,199 | 5,163,976 | 5,177,571 | (13,595 | ) |
| South Korean Won, Expiring 9/3/2013b | 1,556,356,767 | 1,402,119 | 1,402,060 | 59 | |
| Gross Unrealized Appreciation | 2,088 | ||||
| Gross Unrealized Depreciation | (66,888 | ) |
| Counterparties: | |
| a | Citigroup |
| b | HSBC |
| c | Morgan Stanley Capital Services |
| d | Deutsche Bank |
| e | UBS |
The Funds 167
NOTES TO FINANCIAL STATEMENTS (continued)
Table 16—Average Market Value of Derivatives
| Average | |
| Market Value ($) | |
| BNY Mellon Income Stock Fund | |
| Equity options contracts | 45,210 |
| BNY Mellon Mid Cap Multi-Strategy Fund | |
| Equity financial futures | 15,157,402 |
| BNY Mellon International Fund | |
| Forward contracts | 3,720,043 |
| BNY Mellon Emerging Markets Fund | |
| Forward contracts | 9,022,067 |
| BNY Mellon International Appreciation Fund | |
| Equity financial futures | 1,642,020 |
| Forward contracts | 477,750 |
| BNY Mellon International Equity Income Fund | |
| Forward contracts | 1,727,052 |
Table 17—Accumulated Net Unrealized Appreciation (Depreciation)
| Cost of | Gross | Gross | |||
| Investments ($) | Appreciation ($) | Depreciation ($) | Net ($) | ||
| BNY Mellon Large Cap Stock Fund | 559,374,812 | 193,535,925 | 3,708,895 | 189,827,030 | |
| BNY Mellon Large Cap Market Opportunities Fund | 190,486,144 | 27,444,032 | 2,114,560 | 25,329,472 | |
| BNY Mellon Tax-Sensitive | |||||
| Large Cap Multi-Strategy Fund | 587,470,330 | 56,499,450 | 5,430,734 | 51,068,716 | |
| BNY Mellon Income Stock Fund | 856,105,253 | 138,030,480 | 10,773,213 | 127,257,267 | |
| BNY Mellon Mid Cap Multi-Strategy Fund | 1,337,933,022 | 278,825,513 | 15,955,773 | 262,869,740 | |
| BNY Mellon Small Cap Multi-Strategy Fund | 285,346,455 | 49,906,725 | 6,160,292 | 43,746,433 | |
| BNY Mellon Focused Equity Opportunities Fund | 440,012,424 | 104,936,549 | 5,431,174 | 99,505,375 | |
| BNY Mellon Small/Mid Cap Fund | 445,719,310 | 67,293,345 | 11,099,075 | 56,194,270 | |
| BNY Mellon International Fund | 553,500,295 | 40,695,652 | 74,429,821 | (33,734,169 | ) |
| BNY Mellon Emerging Markets Fund | 1,913,806,488 | 210,001,512 | 313,320,070 | (103,318,558 | ) |
| BNY Mellon International Appreciation Fund | 129,485,542 | 13,346,801 | 40,173,262 | (26,826,461 | ) |
| BNY Mellon International Equity Income Fund | 155,034,551 | 15,960,358 | 8,006,929 | 7,953,429 | |
| BNY Mellon Asset Allocation Fund | 365,645,468 | 54,525,866 | 4,068,701 | 50,457,165 |
168
REPORT OF INDEPENDENT REGISTERED PUBLIC ACCOUNTING FIRM
The Funds 169
IMPORTANT TAX INFORMATION (Unaudited)
170
The Funds 171
IMPORTANT TAX INFORMATION (Unaudited) (continued)
172
The Funds 173
INFORMATION ABOUT THE RENEWAL OF EACH FUND’S INVESTMENT
ADVISORY AGREEMENT AND ADMINISTRATION AGREEMENT (Unaudited)
174
The Funds 175
INFORMATION ABOUT THE RENEWAL OF EACH FUND’S INVESTMENT ADVISORY
AGREEMENT AND ADMINISTRATION AGREEMENT (Unaudited) (continued)
176
The Funds 177
INFORMATION ABOUT THE RENEWAL OF EACH FUND’S INVESTMENT ADVISORY
AGREEMENT AND ADMINISTRATION AGREEMENT (Unaudited) (continued)
178
The Funds 179
INFORMATION ABOUT THE RENEWAL OF EACH FUND’S INVESTMENT ADVISORY
AGREEMENT AND ADMINISTRATION AGREEMENT (Unaudited) (continued)
180
INFORMATION ABOUT THE APPROVAL OF THE
GENEVA SUB-ADVISORY AGREEMENT (Unaudited)
![]()
The Funds 181
INFORMATION ABOUT THE APPROVAL OF THE GENEVA
SUB-ADVISORY AGREEMENT (Unaudited) (continued)

182
INFORMATION ABOUT THE APPROVAL OF THE
NEW ROBECO SUB-ADVISORY AGREEMENT (Unaudited)
The Funds 183
INFORMATION ABOUT THE APPROVAL OF THE NEW ROBECO SUB-ADVISORY AGREEMENT (Unaudited) (continued)
184

The Funds 185
BOARD MEMBERS INFORMATION (Unaudited)
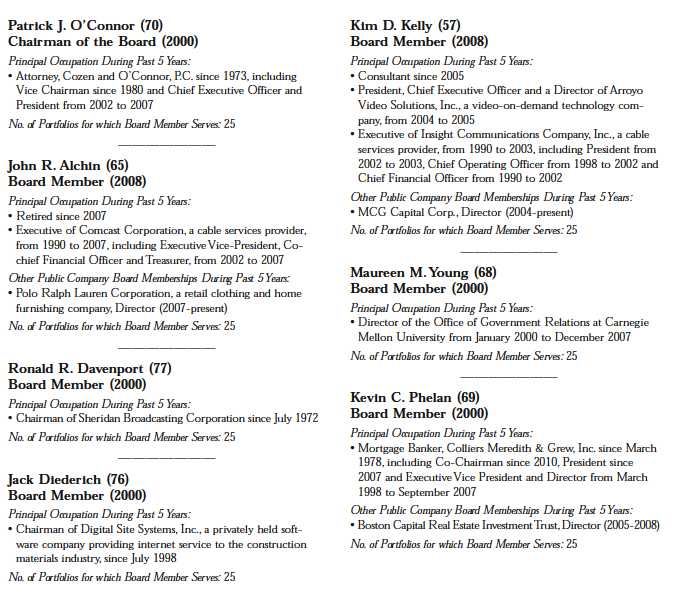
186
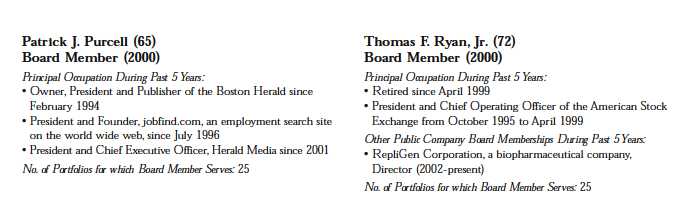
Once elected all Board Members serve for an indefinite term.The address of the Board Members and Officers is c/o The Dreyfus Corporation, 200 Park Avenue, New York, NewYork 10166.Additional information about the Board Members is available in the fund’s Statement of Additional Information which can be obtained from Dreyfus free of charge by calling this toll free number: 1-800-DREYFUS. For individual account holders for Private Wealth Management clients, please contact your account officer or call 1-888-281-7350.
The Funds 187
OFFICERS OF THE FUND (Unaudited)

188

The Funds 189
NOTES
BNY Mellon Bond Fund
BNY Mellon Intermediate Bond Fund
BNY Mellon Corporate Bond Fund
BNY Mellon Short-Term U.S. Government Securities Fund
ANNUAL REPORT August 31, 2013

The Funds 3
DISCUSSION OF FUND PERFORMANCE (continued)
4
FUND PERFORMANCE
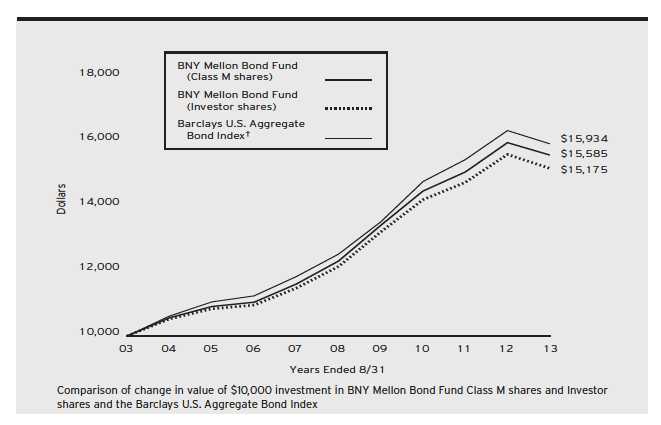
Average Annual Total Returns as of 8/31/13
| 1 Year | 5 Years | 10 Years | ||||
| Class M shares | –2.41 | % | 4.82 | % | 4.54 | % |
| Investor shares | –2.74 | % | 4.56 | % | 4.26 | % |
| Barclays U.S. Aggregate Bond Index | –2.47 | % | 4.93 | % | 4.77 | % |
| † Source: Lipper Inc. |
| Past performance is not predictive of future performance.The fund’s performance shown in the graph and table does not reflect the deduction of taxes that a shareholder |
| would pay on fund distributions or the redemption of fund shares. |
| The above graph compares a $10,000 investment made in Class M shares and Investor shares of BNY Mellon Bond Fund on 8/31/03 to a $10,000 investment |
| made in the Barclays U.S.Aggregate Bond Index (the “Index”) on that date.All dividends and capital gain distributions are reinvested. |
| The fund’s performance shown in the line graph above takes into account all applicable fees and expenses for Class M and Investor shares. The Index is a widely |
| accepted, unmanaged index of corporate, government and government agency debt instruments, mortgage-backed securities, and asset-backed securities with an |
| average maturity of 1-10 years. Unlike a mutual fund, the Index is not subject to charges, fees and other expenses. Investors cannot invest directly in any index. |
| Further information relating to fund performance, including expense reimbursements, if applicable, is contained in the Financial Highlights section of the prospectus |
| and elsewhere in this report. |
The Funds 5
6
The Funds 7
FUND PERFORMANCE
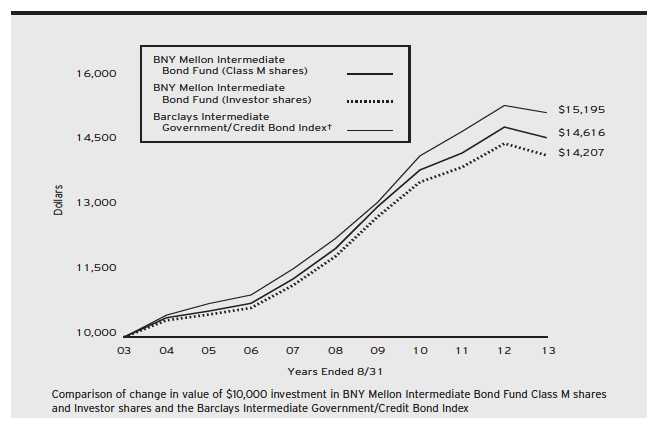
Average Annual Total Returns as of 8/31/13
| 1 Year | 5 Years | 10 Years | ||||
| Class M shares | –1.64 | % | 3.94 | % | 3.87 | % |
| Investor shares | –1.91 | % | 3.67 | % | 3.57 | % |
| Barclays Intermediate | ||||||
| Government/Credit Bond Index | –1.06 | % | 4.35 | % | 4.27 | % |
| † Source: Lipper Inc. |
| Past performance is not predictive of future performance.The fund’s performance shown in the graph and table does not reflect the deduction of taxes that a shareholder |
| would pay on fund distributions or the redemption of fund shares. |
| The above graph compares a $10,000 investment made in Class M shares and Investor shares of BNY Mellon Intermediate Bond Fund on 8/31/03 to a $10,000 |
| investment made in the Barclays Intermediate Government/Credit Bond Index (the “Index”) on that date.All dividends and capital gain distributions are reinvested. |
| The fund’s performance shown in the line graph above takes into account all applicable fees and expenses for Class M and Investor shares.The Index is a widely |
| accepted, unmanaged index of Government and credit bond market performance composed of U.S. Government,Treasury and Agency securities, fixed-income securities |
| and nonconvertible investment-grade credit debt, with an average maturity of 1-10 years. Unlike a mutual fund, the Index is not subject to charges, fees and other |
| expenses. Investors cannot invest directly in any index. Further information relating to fund performance, including expense reimbursements, if applicable, is contained in |
| the Financial Highlights section of the prospectus and elsewhere in this report. |
8

The Funds 9
DISCUSSION OF FUND PERFORMANCE (continued)
10
FUND PERFORMANCE
![]()
| Average Annual Total Returns as of 8/31/13 |
| Inception Date | 1 Year | From Inception | |||
| Class M shares | 3/2/12 | 0.02 | % | 2.92 | % |
| Investor shares | 3/2/12 | –0.24 | % | 2.68 | % |
| Barclays U.S. Intermediate Credit Bond Index | 2/29/12 | –0.14 | % | 2.27 | %†† |
| † Source: Lipper Inc. |
| Past performance is not predictive of future performance.The fund’s performance shown in the graph and table does not reflect the deduction of taxes that a shareholder |
| would pay on fund distributions or the redemption of fund shares. |
| The above graph compares a $10,000 investment made in Class M shares and Investor shares of BNY Mellon Corporate Bond Fund on 3/2/12 (inception date) to |
| a $10,000 investment made in the Barclays U.S. Intermediate Credit Index (the “Index”) on that date.All dividends and capital gain distributions are reinvested. |
| The fund’s performance shown in the line graph above takes into account all applicable fees and expenses for Class M and Investor shares.The Index is an unmanaged |
| index that consists of dollar denominated, investment grade, publicly issued securities with a maturity of between one and ten years and that are issued by both |
| corporate issuers and non-corporate issuers. Unlike a mutual fund, the Index is not subject to charges, fees and other expenses. Investors cannot invest directly in any |
| index. Further information relating to fund performance, including expense reimbursements, if applicable, is contained in the Financial Highlights section of the |
| prospectus and elsewhere in this report. |
| †† For comparative purposes, the value of the Index as of 02/29/12 is used as the beginning value on 3/2/12. |
The Funds 11
DISCUSSION OF FUND PERFORMANCE (continued)
12
The Funds 13
FUND PERFORMANCE
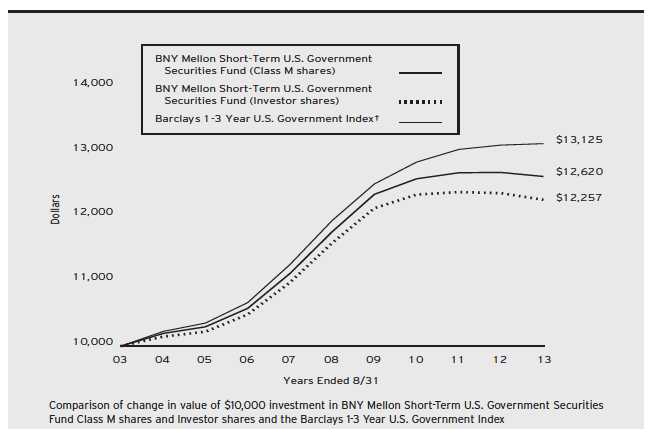
Average Annual Total Returns as of 8/31/13
| 1 Year | 5 Years | 10 Years | ||||
| Class M shares | –0.49 | % | 1.41 | % | 2.36 | % |
| Investor shares | –0.84 | % | 1.12 | % | 2.06 | % |
| Barclays 1-3 Year U.S. Government Index | 0.16 | % | 1.91 | % | 2.76 | % |
| † Source: Lipper Inc. |
| Past performance is not predictive of future performance.The fund’s performance shown in the graph and table does not reflect the deduction of taxes that a shareholder |
| would pay on fund distributions or the redemption of fund shares. |
| The above graph compares a $10,000 investment made in Class M shares and Investor shares of BNY Mellon Short-Term U. S. Government Securities Fund |
| on 8/31/03 to a $10,000 investment made in the Barclays 1-3 Year U. S. Government Index (the “Index”) on that date. All dividends and capital gain |
| distributions are reinvested. |
| The fund’s performance shown in the line graph above takes into account all applicable fees and expenses for Class M and Investor shares.The Index is a widely |
| accepted, unmanaged index of government bond market performance composed of U.S.Treasury and agency securities with maturities of 1-3 years. Unlike a mutual |
| fund, the Index is not subject to charges, fees and other expenses. Investors cannot invest directly in any index. Further information relating to fund performance, |
| including expense reimbursements, if applicable, is contained in the Financial Highlights section of the prospectus and elsewhere in this report. |
14
UNDERSTANDING YOUR FUND’S EXPENSES (Unaudited)
As a mutual fund investor, you pay ongoing expenses, such as management fees and other expenses. Using the information below, you can estimate how these expenses affect your investment and compare them with the expenses of other funds.You also may pay one-time transaction expenses, including sales charges (loads) and redemption fees, which are not shown in this section and would have resulted in higher total expenses. For more information, see your fund’s prospectus or talk to your financial adviser.
Review your fund’s expenses
The table below shows the expenses you would have paid on a $1,000 investment in each class of each BNY Mellon fixed income fund from March 1, 2013 to August 31, 2013. It also shows how much as $1,000 investment would be worth at the close of the period assuming actual returns and expenses.
Expenses and Value of a $1,000 Investment
assuming actual returns for the six months ended August 31, 2013
| Class M Shares | Investor Shares | |||
| BNY Mellon Bond Fund | ||||
| Expenses paid per $1,000† | $2.73 | $3.96 | ||
| Ending value (after expenses) | $967.50 | $965.50 | ||
| Annualized expense ratio (%) | .55 | .80 | ||
| BNY Mellon Intermediate Bond Fund | ||||
| Expenses paid per $1,000† | $2.84 | $4.08 | ||
| Ending value (after expenses) | $976.80 | $975.40 | ||
| Annualized expense ratio (%) | .57 | .82 | ||
| BNY Mellon Corporate Bond Fund | ||||
| Expenses paid per $1,000† | $2.84 | $4.23 | ||
| Ending value (after expenses) | $974.40 | $973.10 | ||
| Annualized expense ratio (%) | .57 | .85 | ||
| BNY Mellon Short-Term U.S. Government Securities Fund | ||||
| Expenses paid per $1,000† | $2.67 | $3.92 | ||
| Ending value (after expenses) | $996.60 | $994.40 | ||
| Annualized expense ratio (%) | .53 | .78 | ||
| † Expenses are equal to each fund’s annualized expense ratios as shown above, multiplied by the average account value over the period, multiplied by 184/365 (to reflect the |
| one-half year period). |
The Funds 15
COMPARING YOUR FUND’S EXPENSES WITH THOSE OF OTHER FUNDS (Unaudited)
Using the SEC’s method to compare expenses
The Securities and Exchange Commission (SEC) has established guidelines to help investors assess fund expenses. Per these guidelines, the table below shows your fund’s expenses based on a $1,000 investment, assuming a hypothetical 5% annualized return.You can use this information to compare the ongoing expenses (but not transaction expenses or total cost) of investing in the fund with those of other funds. All mutual fund shareholder reports will provide this information to help you make this comparison. Please note that you cannot use this information to estimate your actual ending account balance and expenses paid during the period.
Expenses and Value of a $1,000 Investment
assuming a hypothetical 5% annualized return for the six months ended August 31, 2013
| Class M Shares | Investor Shares | |||
| BNY Mellon Bond Fund | ||||
| Expenses paid per $1,000† | $2.80 | $4.08 | ||
| Ending value (after expenses) | $1,022.43 | $ | 1,021.17 | |
| Annualized expense ratio (%) | .55 | .80 | ||
| BNY Mellon Intermediate Bond Fund | ||||
| Expenses paid per $1,000† | $2.91 | $4.18 | ||
| Ending value (after expenses) | $1,022.33 | $ | 1,021.07 | |
| Annualized expense ratio (%) | .57 | .82 | ||
| BNY Mellon Corporate Bond Fund | ||||
| Expenses paid per $1,000† | $2.91 | $4.33 | ||
| Ending value (after expenses) | $1,022.33 | $ | 1,020.92 | |
| Annualized expense ratio (%) | .57 | .85 | ||
| BNY Mellon Short-Term U.S. Government Securities Fund | ||||
| Expenses paid per $1,000† | $2.70 | $3.97 | ||
| Ending value (after expenses) | $1,022.53 | $ | 1,021.27 | |
| Annualized expense ratio (%) | .53 | .78 | ||
| † Expenses are equal to each fund’s annualized expense ratios as shown above, multiplied by the average account value over the period, multiplied by 184/365 (to reflect the |
| one-half year period). |
16
STATEMENT OF INVESTMENTS
August 31, 2013
| BNY Mellon Bond Fund | |||||
| Coupon | Maturity | Principal | |||
| Bonds and Notes—99.1% | Rate (%) | Date | Amount ($) | Value ($) | |
| Asset-Backed Ctfs./Auto Receivables—1.0% | |||||
| AmeriCredit Automobile Receivables Trust, Ser. 2013-2, Cl. A3 | 0.65 | 12/8/17 | 7,160,000 | 7,126,412 | |
| AmeriCredit Automobile Receivables Trust, Ser. 2011-3, Cl. A3 | 1.17 | 1/8/16 | 836,264 | 837,228 | |
| Nissan Auto Receivables Owner Trust, Ser. 2010-A, Cl. A4 | 1.31 | 9/15/16 | 3,904,520 | 3,916,015 | |
| 11,879,655 | |||||
| Casinos—.7% | |||||
| Agua Caliente Band of Cahuilla Indians, Sr. Scd. Notes | 6.08 | 10/1/16 | 1,351,000 | a | 1,308,214 |
| Agua Caliente Band of Cahuilla Indians, Scd. Notes | 6.35 | 10/1/15 | 1,097,000 | a | 1,080,359 |
| Agua Caliente Band of Cahuilla Indians, Sr. Scd. Notes | 6.44 | 10/1/16 | 1,608,000 | a | 1,539,338 |
| Seminole Indian Tribe of Florida, Sr. Scd. Notes | 5.80 | 10/1/13 | 3,296,000 | a | 3,300,120 |
| Seminole Indian Tribe of Florida, Scd. Notes | 7.75 | 10/1/17 | 1,130,000 | a | 1,204,863 |
| 8,432,894 | |||||
| Commercial Mortgage Pass-Through Ctfs.—1.8% | |||||
| Commercial Mortgage Asset Trust, Ser. 1999-C1, Cl. D | 7.35 | 1/17/32 | 2,260,000 | b | 2,268,991 |
| UBS Commercial Mortgage Trust, Ser. 2012-C1, Cl. A3 | 3.40 | 5/10/45 | 8,670,000 | 8,467,686 | |
| WFRBS Commercial Mortgage Trust, Ser. 2011-C5, Cl. A2 | 2.68 | 11/15/44 | 1,110,000 | 1,142,118 | |
| WF-RBS Commerical Mortgage Trust, Ser. 2013-C13, Cl. A4 | 3.00 | 5/15/45 | 9,045,000 | 8,409,268 | |
| 20,288,063 | |||||
| Consumer Discretionary—4.6% | |||||
| Amazon.com, Sr. Unscd. Notes | 2.50 | 11/29/22 | 6,675,000 | 6,041,322 | |
| Comcast, Gtd. Notes | 3.13 | 7/15/22 | 11,887,000 | 11,528,262 | |
| Johnson Controls, Sr. Unscd. Notes | 3.75 | 12/1/21 | 8,110,000 | 8,067,504 | |
| News America, Gtd. Notes | 6.15 | 3/1/37 | 5,054,000 | 5,498,333 | |
| Time Warner Cable, Gtd. Notes | 4.13 | 2/15/21 | 10,550,000 | 10,042,228 | |
| Time Warner, Gtd. Notes | 4.00 | 1/15/22 | 6,125,000 | 6,144,600 | |
| Walgreen, Sr. Unscd. Notes | 3.10 | 9/15/22 | 6,735,000 | 6,326,212 | |
| 53,648,461 | |||||
| Consumer Staples—1.9% | |||||
| Anheuser-Busch InBev Worldwide, Gtd. Notes | 2.50 | 7/15/22 | 6,160,000 | 5,674,401 | |
| ConAgra Foods, Sr. Unscd. Notes | 3.20 | 1/25/23 | 2,795,000 | 2,616,293 | |
| PepsiCo, Sr. Unscd. Notes | 4.50 | 1/15/20 | 7,040,000 | 7,683,766 | |
| Pernod-Ricard, Sr. Unscd. Notes | 4.45 | 1/15/22 | 5,610,000 | a | 5,737,930 |
| 21,712,390 | |||||
| Energy—.7% | |||||
| BP Capital Markets, Gtd. Notes | 3.88 | 3/10/15 | 5,565,000 | 5,835,064 | |
| Petrobras International Finance, Gtd. Notes | 5.38 | 1/27/21 | 2,500,000 | 2,453,707 | |
| 8,288,771 |
The Funds 17
STATEMENT OF INVESTMENTS (continued)
| BNY Mellon Bond Fund (continued) | |||||
| Coupon | Maturity | Principal | |||
| Bonds and Notes (continued) | Rate (%) | Date | Amount ($) | Value ($) | |
| Financial—16.5% | |||||
| American International Group, Sr. Unscd. Notes | 5.85 | 1/16/18 | 8,300,000 | 9,381,042 | |
| Bank of America, Sub. Notes | 5.49 | 3/15/19 | 19,975,000 | 21,609,994 | |
| BBVA US Senior, Bank Gtd. Notes | 3.25 | 5/16/14 | 6,655,000 | 6,714,316 | |
| Bear Stearns, Sub. Notes | 5.55 | 1/22/17 | 5,681,000 | 6,252,605 | |
| BlackRock, Sr. Unscd. Notes | 6.25 | 9/15/17 | 7,860,000 | 9,172,196 | |
| Boston Properties, Sr. Unscd. Notes | 4.13 | 5/15/21 | 7,185,000 | 7,358,913 | |
| Citigroup, Sub. Notes | 5.00 | 9/15/14 | 6,815,000 | 7,083,116 | |
| Citigroup, Sr. Unscd. Notes | 6.13 | 11/21/17 | 3,135,000 | 3,596,898 | |
| Ford Motor Credit, Sr. Unscd. Notes | 3.00 | 6/12/17 | 6,225,000 | 6,277,421 | |
| General Electric Capital, | |||||
| Jr. Sub. Cap. Secs., Ser. C | 5.25 | 6/29/49 | 4,930,000 | b | 4,535,600 |
| General Electric Capital, Sub. Notes | 5.30 | 2/11/21 | 8,285,000 | 8,963,608 | |
| Goldman Sachs Group, Sub. Notes | 6.75 | 10/1/37 | 8,270,000 | 8,560,376 | |
| HSBC Finance, Sub. Notes | 6.68 | 1/15/21 | 10,510,000 | 11,883,773 | |
| Jefferies Group, Sr. Unscd. Notes | 5.13 | 4/13/18 | 4,055,000 | 4,328,854 | |
| Jefferies Group, Sr. Unscd. Notes | 8.50 | 7/15/19 | 5,163,000 | 6,281,481 | |
| MetLife, Sr. Unscd. Notes | 7.72 | 2/15/19 | 6,865,000 | 8,584,998 | |
| Morgan Stanley, Sub. Notes | 4.88 | 11/1/22 | 11,490,000 | 11,364,736 | |
| NYSE Euronext, Sr. Unscd. Notes | 2.00 | 10/5/17 | 7,340,000 | 7,302,104 | |
| Prudential Financial, Sr. Unscd. Notes | 4.75 | 9/17/15 | 7,135,000 | 7,679,943 | |
| Rabobank Nederland, Gtd. Notes | 4.50 | 1/11/21 | 8,060,000 | 8,474,413 | |
| RBS Citizens Financial Group, Sub. Notes | 4.15 | 9/28/22 | 8,555,000 | a | 8,203,561 |
| Simon Property Group, Sr. Unscd. Notes | 5.65 | 2/1/20 | 8,782,000 | 9,832,916 | |
| TD Ameritrade Holding, Gtd. Notes | 4.15 | 12/1/14 | 6,630,000 | 6,920,162 | |
| 190,363,026 | |||||
| Foreign/Governmental—1.3% | |||||
| Mexican Government, Sr. Unscd. Notes | 5.63 | 1/15/17 | 5,975,000 | 6,668,100 | |
| Mexican Government, Sr. Unscd. Notes | 6.63 | 3/3/15 | 1,480,000 | 1,602,100 | |
| Province of Ontario Canada, Sr. Unscd. Bonds | 4.00 | 10/7/19 | 6,500,000 | 7,012,928 | |
| 15,283,128 | |||||
| Health Care—1.2% | |||||
| Amgen, Sr. Unscd. Notes | 5.65 | 6/15/42 | 7,955,000 | 8,252,732 | |
| Thermo Fisher Scientific, Sr. Unscd. Notes | 3.60 | 8/15/21 | 5,500,000 | 5,360,894 | |
| 13,613,626 | |||||
| Industrial—.9% | |||||
| ABB Finance USA, Gtd. Notes | 2.88 | 5/8/22 | 11,060,000 | 10,543,045 | |
| Information Technology—1.9% | |||||
| Intel, Sr. Unscd. Notes | 2.70 | 12/15/22 | 10,900,000 | 10,071,273 |
18
| BNY Mellon Bond Fund (continued) | |||||
| Coupon | Maturity | Principal | |||
| Bonds and Notes (continued) | Rate (%) | Date | Amount ($) | Value ($) | |
| Information Technology (continued) | |||||
| Oracle, Sr. Unscd. Notes | 5.75 | 4/15/18 | 10,410,000 | 12,070,093 | |
| 22,141,366 | |||||
| Materials—1.2% | |||||
| CRH America, Gtd. Notes | 5.30 | 10/15/13 | 7,100,000 | 7,135,592 | |
| Eastman Chemical, Sr. Unscd. Notes | 3.60 | 8/15/22 | 7,075,000 | 6,861,696 | |
| 13,997,288 | |||||
| Municipal Bonds—5.8% | |||||
| Chicago, GO | 7.78 | 1/1/35 | 6,460,000 | 7,182,874 | |
| Florida Hurricane Catastrophe Fund | |||||
| Finance Corporation, Revenue Bonds | 3.00 | 7/1/20 | 14,000,000 | 12,946,640 | |
| Illinois, GO | 4.42 | 1/1/15 | 4,935,000 | 5,112,561 | |
| Los Angeles Community College District, | |||||
| GO (Build America Bonds) | 6.75 | 8/1/49 | 13,725,000 | 17,015,020 | |
| Massachusetts, GO (Build America Bonds) | 4.20 | 12/1/21 | 3,985,000 | 4,152,768 | |
| New York City Municipal Water Finance Authority, | |||||
| Water and Sewer System Second General | |||||
| Resolution Revenue (Build America Bonds) | 6.28 | 6/15/42 | 5,430,000 | 6,016,494 | |
| Oakland Unified School District, GO (Build America Bonds) | 9.50 | 8/1/34 | 3,550,000 | 4,039,971 | |
| Puerto Rico Commonwealth Government | |||||
| Development Bank, Revenue Bonds | 3.67 | 5/1/14 | 8,010,000 | 8,019,772 | |
| University of California Regents, Medical Center | |||||
| Pooled Revenue (Build America Bonds) | 5.44 | 5/15/23 | 2,715,000 | 2,992,419 | |
| 67,478,519 | |||||
| Telecommunications—3.2% | |||||
| AT&T, Sr. Unscd. Notes | 4.45 | 5/15/21 | 7,980,000 | 8,462,750 | |
| Rogers Communications, Gtd. Notes | 6.38 | 3/1/14 | 6,810,000 | 7,002,580 | |
| Telefonica Emisiones, Gtd. Notes | 5.13 | 4/27/20 | 9,395,000 | 9,515,218 | |
| Verizon Communications, Sr. Unscd. Notes | 5.50 | 2/15/18 | 10,755,000 | 12,151,182 | |
| 37,131,730 | |||||
| U.S. Government Agencies/ | |||||
| Mortgage-Backed—29.3% | |||||
| Federal Home Loan Mortgage Corp.: | |||||
| 2.50%, 7/1/28 | 13,372,193 | c | 13,280,257 | ||
| 3.00%, 7/1/28—11/1/42 | 27,885,961 | c | 27,615,862 | ||
| 3.50%, 6/1/43 | 18,914,123 | c | 18,878,611 | ||
| 4.00%, 4/1/24 | 7,327,315 | c | 7,710,303 | ||
| 4.50%, 5/1/39—11/1/41 | 51,307,946 | c | 54,344,119 | ||
| 5.00%, 12/1/39—7/1/40 | 14,068,154 | c | 15,211,684 | ||
| 5.50%, 12/1/37—12/1/38 | 11,030,998 | c | 11,887,549 | ||
| 6.00%, 5/1/38 | 2,045,966 | c | 2,227,266 |
The Funds 19
STATEMENT OF INVESTMENTS (continued)
| BNY Mellon Bond Fund (continued) | |||||
| Coupon | Maturity | Principal | |||
| Bonds and Notes (continued) | Rate (%) | Date | Amount ($) | Value ($) | |
| U.S. Government Agencies/ | |||||
| Mortgage-Backed (continued) | |||||
| Federal National Mortgage Association: | |||||
| 2.50%, 3/1/28 | 7,232,694 | c | 7,198,285 | ||
| 3.00%, 7/1/27—5/1/43 | 40,984,622 | c | 40,464,042 | ||
| 3.32%, 4/1/41 | 6,330,166 | b,c | 6,620,885 | ||
| 3.50%, 9/1/26—6/1/43 | 40,632,922 | c | 41,506,094 | ||
| 4.00%, 2/1/41—11/1/42 | 28,674,062 | c | 29,673,379 | ||
| 4.50%, 3/1/23—7/1/24 | 4,347,483 | c | 4,622,466 | ||
| 5.00%, 12/1/21—2/1/41 | 15,595,434 | c | 16,862,218 | ||
| 5.50%, 2/1/38—5/1/38 | 13,415,254 | c | 14,600,930 | ||
| 6.00%, 4/1/33—10/1/38 | 10,820,973 | c | 11,949,508 | ||
| REMIC, Ser. 2011-8, Cl. PV, 4.00%, 1/25/30 | 3,777,000 | c | 3,902,738 | ||
| Government National Mortgage Association I; | |||||
| 5.00%, 11/15/34—3/15/36 | 8,852,458 | 9,624,280 | |||
| 338,180,476 | |||||
| U.S. Government Securities—26.6% | |||||
| U.S. Treasury Inflation Protected Securities: | |||||
| Bonds, 2.38%, 1/15/27 | 14,605,521 | d,e | 17,289,285 | ||
| Notes, 0.13%, 4/15/18 | 11,807,601 | d,e | 12,048,370 | ||
| Notes, 0.13%, 1/15/23 | 12,204,230 | d | 11,643,116 | ||
| Notes, 0.63%, 7/15/21 | 8,722,699 | d,e | 8,908,737 | ||
| Notes, 1.38%, 7/15/18 | 13,512,845 | d,e | 14,692,057 | ||
| Notes, 1.38%, 1/15/20 | 10,802,599 | d,e | 11,673,979 | ||
| Notes, 2.38%, 1/15/17 | 15,172,838 | d,e | 16,774,285 | ||
| U.S. Treasury Notes: | |||||
| 0.25%, 1/15/15 | 10,180,000 | e | 10,182,382 | ||
| 0.25%, 8/15/15 | 41,950,000 | e | 41,836,106 | ||
| 0.25%, 9/15/15 | 22,000,000 | e | 21,931,250 | ||
| 0.25%, 12/15/15 | 14,250,000 | e | 14,171,511 | ||
| 0.25%, 4/15/16 | 12,000,000 | 11,886,096 | |||
| 0.38%, 4/15/15 | 15,500,000 | e | 15,518,460 | ||
| 0.38%, 3/15/16 | 27,500,000 | 27,356,065 | |||
| 0.50%, 6/15/16 | 7,750,000 | e | 7,710,948 | ||
| 0.63%, 8/15/16 | 2,000,000 | 1,992,422 | |||
| 0.63%, 9/30/17 | 4,530,000 | e | 4,411,618 | ||
| 0.88%, 12/31/16 | 5,250,000 | 5,238,513 | |||
| 1.00%, 5/31/18 | 2,520,000 | e | 2,460,248 | ||
| 1.50%, 7/31/16 | 12,995,000 | e | 13,275,198 | ||
| 1.75%, 7/31/15 | 14,560,000 | e | 14,939,070 | ||
| 1.75%, 5/15/23 | 23,795,000 | 21,765,001 | |||
| 307,704,717 | |||||
| Utilities—.5% | |||||
| Hydro-Quebec, Gov’t Gtd. Notes | 2.00 | 6/30/16 | 5,130,000 | 5,270,070 | |
| Total Bonds and Notes | |||||
| (cost $1,130,872,208) | 1,145,957,225 | ||||
20
| BNY Mellon Bond Fund (continued) | |||
| Other Investment—.6% | Shares | Value ($) | |
| Registered Investment Company; | |||
| Dreyfus Institutional Preferred Plus Money Market Fund | |||
| (cost $7,366,145) | 7,366,145 | f | 7,366,145 |
| Total Investments (cost $1,138,238,353) | 99.7 | % | 1,153,323,370 |
| Cash and Receivables (Net) | .3 | % | 3,096,103 |
| Net Assets | 100.0 | % | 1,156,419,473 |
| GO—General Obligation |
| REMIC—Real Estate Mortgage Investment Conduit |
| a Securities exempt from registration pursuant to Rule 144A under the Securities Act of 1933.These securities may be resold in transactions exempt from registration, normally to |
| qualified institutional buyers.At August 31, 2013, these securities were valued at $22,374,385 or 1.9% of net assets. |
| b Variable rate security—interest rate subject to periodic change. |
| c The Federal Housing Finance Agency (“FHFA”) placed Federal Home Loan Mortgage Corporation and Federal National Mortgage Association into conservatorship with FHFA |
| as the conservator.As such, the FHFA oversees the continuing affairs of these companies. |
| d Principal amount for accrual purposes is periodically adjusted based on changes in the Consumer Price Index. |
| e Security, or portion thereof, on loan.At August 31, 2013, the value of the fund’s securities on loan was $178,891,253 and the value of the collateral held by the fund was |
| $183,854,301, consisting of U.S. Government and Agency securities. |
| f Investment in affiliated money market mutual fund. |
| Portfolio Summary (Unaudited)† | ||||
| Value (%) | Value (%) | |||
| U.S. Government Agencies/Mortgage-Backed | 55.9 | Foreign/Governmental | 1.3 | |
| Corporate Bonds | 33.3 | Asset-Backed | 1.0 | |
| Municipal Bonds | 5.8 | Money Market Investment | .6 | |
| Commercial Mortgage-Backed | 1.8 | 99.7 |
| † Based on net assets. |
| See notes to financial statements. |
The Funds 21
STATEMENT OF INVESTMENTS
August 31, 2013
| BNY Mellon Intermediate Bond Fund | |||||
| Coupon | Maturity | Principal | |||
| Bonds and Notes—99.5% | Rate (%) | Date | Amount ($) | Value ($) | |
| Casinos—.6% | |||||
| Agua Caliente Band of Cahuilla Indians, Sr. Scd. Notes | 6.08 | 10/1/16 | 1,007,000 | a | 975,108 |
| Agua Caliente Band of Cahuilla Indians, Scd. Notes | 6.35 | 10/1/15 | 539,000 | a | 530,823 |
| Agua Caliente Band of Cahuilla Indians, Sr. Scd. Notes | 6.44 | 10/1/16 | 1,228,000 | a | 1,175,564 |
| Seminole Indian Tribe of Florida, Sr. Scd. Notes | 5.80 | 10/1/13 | 2,255,000 | a | 2,257,819 |
| Seminole Indian Tribe of Florida, Scd. Notes | 7.75 | 10/1/17 | 765,000 | a | 815,681 |
| 5,754,995 | |||||
| Consumer Discretionary—5.6% | |||||
| Daimler Finance North America, Gtd. Notes | 6.50 | 11/15/13 | 4,385,000 | 4,434,371 | |
| Grupo Televisa, Sr. Unscd. Notes | 6.00 | 5/15/18 | 6,010,000 | 6,740,756 | |
| Johnson Controls, Sr. Unscd. Notes | 5.50 | 1/15/16 | 6,075,000 | 6,646,694 | |
| NBCUniversal Media, Gtd. Notes | 4.38 | 4/1/21 | 7,050,000 | 7,551,974 | |
| Stanford University, Unscd. Bonds | 4.75 | 5/1/19 | 5,000,000 | 5,645,310 | |
| Time Warner Cable, Gtd. Notes | 4.13 | 2/15/21 | 7,500,000 | 7,139,025 | |
| Time Warner, Gtd. Notes | 4.00 | 1/15/22 | 7,400,000 | 7,423,680 | |
| Wal-Mart Stores, Sr. Unscd. Notes | 3.63 | 7/8/20 | 7,920,000 | 8,306,860 | |
| 53,888,670 | |||||
| Consumer Staples—4.9% | |||||
| Anheuser-Busch InBev Worldwide, Gtd. Notes | 1.38 | 7/15/17 | 3,430,000 | 3,394,517 | |
| ConAgra Foods, Sr. Unscd. Notes | 3.20 | 1/25/23 | 4,887,000 | 4,574,535 | |
| Diageo Capital, Gtd. Notes | 1.50 | 5/11/17 | 5,300,000 | 5,256,174 | |
| Dr. Pepper Snapple Group, Gtd. Notes | 2.60 | 1/15/19 | 6,145,000 | 6,147,188 | |
| Kroger, Sr. Unscd. Notes | 2.20 | 1/15/17 | 4,230,000 | 4,266,606 | |
| McDonald’s, Sr. Unscd. Notes | 5.80 | 10/15/17 | 4,460,000 | 5,153,726 | |
| Mondelez International, Sr. Unscd. Notes | 4.13 | 2/9/16 | 6,930,000 | 7,378,898 | |
| Pernod-Ricard, Sr. Unscd. Notes | 4.45 | 1/15/22 | 4,520,000 | a | 4,623,074 |
| Walgreen, Sr. Unscd. Notes | 1.80 | 9/15/17 | 6,010,000 | 5,970,033 | |
| 46,764,751 | |||||
| Energy—1.6% | |||||
| BP Capital Markets, Gtd. Notes | 3.20 | 3/11/16 | 6,250,000 | 6,565,087 | |
| Occidental Petroleum, Sr. Unscd. Notes | 4.13 | 6/1/16 | 3,005,000 | 3,242,644 | |
| Petrobras International Finance, Gtd. Notes | 3.88 | 1/27/16 | 5,000,000 | 5,155,955 | |
| 14,963,686 | |||||
| Financial—16.6% | |||||
| American Express Credit, Sr. Unscd. Notes | 2.75 | 9/15/15 | 5,010,000 | 5,194,954 | |
| American International Group, Sr. Unscd. Notes | 5.85 | 1/16/18 | 5,925,000 | 6,696,707 | |
| Bank of America, Sub. Notes | 5.49 | 3/15/19 | 10,965,000 | 11,862,507 | |
| BBVA US Senior, Bank Gtd. Notes | 3.25 | 5/16/14 | 5,000,000 | 5,044,565 | |
| Bear Stearns, Sub. Notes | 5.55 | 1/22/17 | 121,000 | 133,175 | |
| Caterpillar Financial Services, Sr. Unscd. Notes | 6.13 | 2/17/14 | 4,975,000 | 5,106,539 | |
| Citigroup, Sub. Notes | 5.00 | 9/15/14 | 7,780,000 | 8,086,081 | |
| Citigroup, Sr. Unscd. Notes | 6.13 | 11/21/17 | 3,590,000 | 4,118,936 |
22
| BNY Mellon Intermediate Bond Fund (continued) | |||||
| Coupon | Maturity | Principal | |||
| Bonds and Notes (continued) | Rate (%) | Date | Amount ($) | Value ($) | |
| Financial (continued) | |||||
| Ford Motor Credit, Sr. Unscd. Notes | 3.00 | 6/12/17 | 5,035,000 | 5,077,400 | |
| General Electric Capital, Sr. Unscd. Notes | 1.88 | 9/16/13 | 7,675,000 | 7,678,845 | |
| General Electric Capital, Jr. Sub. Cap. Secs., Ser. C | 5.25 | 6/29/49 | 3,550,000 | b | 3,266,000 |
| Goldman Sachs Group, Sr. Unscd. Notes | 3.30 | 5/3/15 | 7,780,000 | 8,055,871 | |
| HSBC Finance, Sub. Notes | 6.68 | 1/15/21 | 9,502,000 | 10,744,016 | |
| Jefferies Group, Sr. Unscd. Notes | 8.50 | 7/15/19 | 8,835,000 | 10,748,961 | |
| John Deere Capital, Sr. Unscd. Notes | 1.25 | 12/2/14 | 3,000,000 | 3,030,486 | |
| JPMorgan Chase & Co., Sub. Notes | 3.38 | 5/1/23 | 7,895,000 | 7,185,492 | |
| MetLife, Sr. Unscd. Notes | 6.75 | 6/1/16 | 4,450,000 | 5,098,872 | |
| Morgan Stanley, Sub. Notes | 4.88 | 11/1/22 | 7,610,000 | 7,527,036 | |
| NYSE Euronext, Sr. Unscd. Notes | 2.00 | 10/5/17 | 5,800,000 | 5,770,055 | |
| Private Export Funding, Gov’t Gtd. Notes, Ser. Z | 4.38 | 3/15/19 | 1,065,000 | 1,189,142 | |
| Prudential Financial, Sr. Unscd. Notes | 4.75 | 9/17/15 | 4,735,000 | 5,096,640 | |
| Rabobank Nederland, Bank Gtd. Notes | 3.38 | 1/19/17 | 5,825,000 | 6,138,962 | |
| Royal Bank of Canada, Covered Bonds | 1.20 | 9/19/18 | 3,330,000 | 3,257,276 | |
| Royal Bank of Scotland Group, Sr. Unscd. Notes | 2.55 | 9/18/15 | 5,920,000 | 6,038,376 | |
| Simon Property Group, Sr. Unscd. Notes | 4.20 | 2/1/15 | 6,682,000 | 6,946,895 | |
| TD Ameritrade Holding, Gtd. Notes | 4.15 | 12/1/14 | 3,650,000 | 3,809,742 | |
| Wachovia, Sub. Notes | 5.25 | 8/1/14 | 6,210,000 | 6,469,553 | |
| 159,373,084 | |||||
| Foreign/Governmental—1.5% | |||||
| Mexican Government, Sr. Unscd. Notes | 6.63 | 3/3/15 | 1,064,000 | 1,151,780 | |
| Province of Nova Scotia Canada, Sr. Unscd. Bonds | 5.13 | 1/26/17 | 5,430,000 | 6,106,252 | |
| Province of Ontario Canada, Sr. Unscd. Bonds | 4.00 | 10/7/19 | 6,515,000 | 7,029,112 | |
| 14,287,144 | |||||
| Health Care—3.1% | |||||
| Amgen, Sr. Unscd. Notes | 5.70 | 2/1/19 | 2,905,000 | 3,322,838 | |
| AstraZeneca, Sr. Unscd. Notes | 5.90 | 9/15/17 | 6,090,000 | 7,044,626 | |
| GlaxoSmithKline Capital, Gtd. Bonds | 5.65 | 5/15/18 | 5,853,000 | 6,753,695 | |
| Pfizer, Sr. Unscd. Notes | 6.20 | 3/15/19 | 4,050,000 | 4,850,924 | |
| Thermo Fisher Scientific, | |||||
| Sr. Unscd. Notes | 3.20 | 3/1/16 | 7,090,000 | 7,360,143 | |
| 29,332,226 | |||||
| Industrial—.8% | |||||
| ABB Finance USA, Gtd. Notes | 1.63 | 5/8/17 | 5,065,000 | 5,033,126 | |
| United Technologies, Sr. Unscd. Notes | 6.13 | 2/1/19 | 1,860,000 | 2,203,795 | |
| 7,236,921 | |||||
| Information Technology—3.3% | |||||
| Adobe Systems, Sr. Unscd. Notes | 4.75 | 2/1/20 | 4,504,000 | 4,839,377 | |
| Apple, Sr. Unscd. Notes | 1.00 | 5/3/18 | 5,915,000 | 5,657,443 | |
| EMC, Sr. Unscd. Notes | 1.88 | 6/1/18 | 5,710,000 | 5,646,539 |
The Funds 23
STATEMENT OF INVESTMENTS (continued)
| BNY Mellon Intermediate Bond Fund (continued) | |||||
| Coupon | Maturity | Principal | |||
| Bonds and Notes (continued) | Rate (%) | Date | Amount ($) | Value ($) | |
| Information Technology (continued) | |||||
| Intel, Sr. Unscd. Notes | 1.35 | 12/15/17 | 7,930,000 | 7,773,200 | |
| Oracle, Sr. Unscd. Notes | 5.75 | 4/15/18 | 7,000,000 | 8,116,297 | |
| 32,032,856 | |||||
| Materials—1.2% | |||||
| CRH America, Gtd. Notes | 5.30 | 10/15/13 | 4,784,000 | 4,807,982 | |
| Dow Chemical, Sr. Unscd. Notes | 4.25 | 11/15/20 | 6,545,000 | 6,833,726 | |
| 11,641,708 | |||||
| Municipal Bonds—5.1% | |||||
| California, GO (Various Purpose) | 5.95 | 4/1/16 | 3,255,000 | 3,604,815 | |
| Florida Hurricane Catastrophe Fund | |||||
| Finance Corporation, Revenue | 3.00 | 7/1/20 | 11,000,000 | 10,172,360 | |
| Illinois, GO | 4.42 | 1/1/15 | 4,750,000 | 4,920,905 | |
| Massachusetts, GO (Build America Bonds) | 4.20 | 12/1/21 | 9,625,000 | 10,030,213 | |
| North Texas Tollway Authority, | |||||
| Special Projects System Revenue, BAN | 2.44 | 9/1/13 | 9,020,000 | 9,020,541 | |
| Puerto Rico Commonwealth Government | |||||
| Development Bank, Revenue Bonds | 3.67 | 5/1/14 | 5,830,000 | 5,837,113 | |
| University of California Regents, | |||||
| General Revenue | 1.80 | 7/1/19 | 5,675,000 | 5,463,720 | |
| 49,049,667 | |||||
| Telecommunication Services—2.6% | |||||
| AT&T, Sr. Unscd. Notes | 4.45 | 5/15/21 | 6,960,000 | 7,381,045 | |
| Rogers Communications, Gtd. Notes | 6.38 | 3/1/14 | 4,934,000 | 5,073,529 | |
| Telefonica Emisiones, Gtd. Notes | 3.99 | 2/16/16 | 6,635,000 | 6,868,081 | |
| Verizon Communications, Sr. Unscd. Notes | 8.75 | 11/1/18 | 4,244,000 | 5,428,793 | |
| 24,751,448 | |||||
| U.S. Government Agencies—.7% | |||||
| Federal National Mortgage Association, Notes | 0.52 | 2/22/16 | 705,000 | c | 702,083 |
| Federal National Mortgage Association, Notes | 0.75 | 12/19/14 | 1,000,000 | c | 1,006,380 |
| Federal National Mortgage Association, Notes | 3.00 | 9/16/14 | 4,895,000 | c | 5,040,993 |
| 6,749,456 |
24
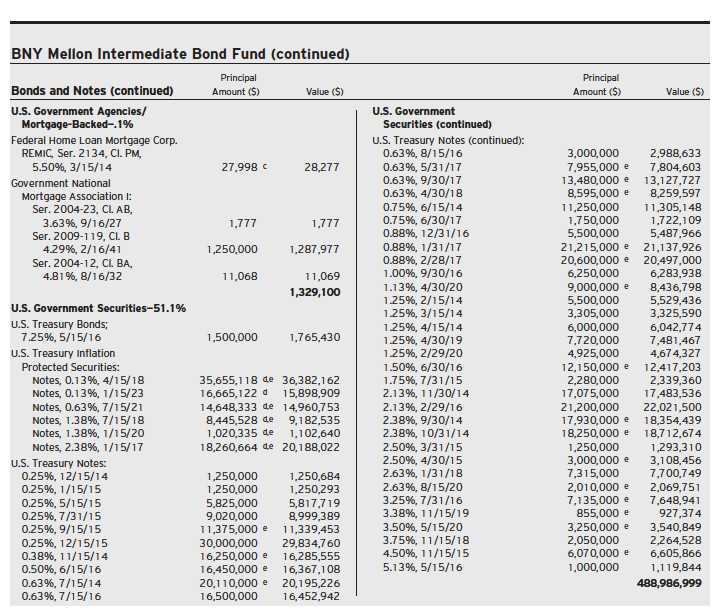
The Funds 25
STATEMENT OF INVESTMENTS (continued)
| BNY Mellon Intermediate Bond Fund (continued) | ||||||
| Coupon | Maturity | Principal | ||||
| Bonds and Notes (continued) | Rate (%) | Date | Amount ($) | Value ($) | ||
| Utilities—.7% | ||||||
| Duke Energy Carolinas, First Mortgage Bonds | 1.75 | 12/15/16 | 3,010,000 | 3,066,790 | ||
| Hydro-Quebec, Gov’t Gtd. Notes | 2.00 | 6/30/16 | 3,655,000 | 3,754,796 | ||
| 6,821,586 | ||||||
| Total Bonds and Notes | ||||||
| (cost $943,046,608) | 952,964,297 | |||||
| Other Investment—.9% | Shares | Value ($) | ||||
| Registered Investment Company; | ||||||
| Dreyfus Institutional Preferred Plus Money Market Fund | ||||||
| (cost $7,922,597) | 7,922,597 | f | 7,922,597 | |||
| Total Investments (cost $950,969,205) | 100.4 | % | 960,886,894 | |||
| Liabilities, Less Cash and Receivables | (.4 | %) | (3,394,400 | ) | ||
| Net Assets | 100.0 | % | 957,492,494 | |||
| BAN—Bond Anticipation Notes |
| GO—General Obligation |
| REMIC—Real Estate Mortgage Investment Conduit |
| a Securities exempt from registration pursuant to Rule 144A under the Securities Act of 1933.These securities may be resold in transactions exempt from registration, normally to |
| qualified institutional buyers.At August 31, 2013, these securities were valued at $10,378,069 or 1.1% of net assets. |
| b Variable rate security—interest rate subject to periodic change. |
| c The Federal Housing Finance Agency (“FHFA”) placed Federal Home Loan Mortgage Corporation and Federal National Mortgage Association into conservatorship with FHFA |
| as the conservator.As such, the FHFA oversees the continuing affairs of these companies. |
| d Principal amount for accrual purposes is periodically adjusted based on changes in the Consumer Price Index. |
| e Security, or portion thereof, on loan.At August 31, 2013, the value of the fund’s securities on loan was $206,001,317 and the value of the collateral held by the fund was |
| $212,186,162, consisting of U.S. Government and Agency securities. |
| f Investment in affiliated money market mutual fund. |
| Portfolio Summary (Unaudited)† | ||||
| Value (%) | Value (%) | |||
| U.S. Government Agencies/Mortgage-Backed | 51.9 | Foreign/Governmental | 1.5 | |
| Corporate Bonds | 41.0 | Money Market Investment | .9 | |
| Municipal Bonds | 5.1 | 100.4 |
| † Based on net assets. |
| See notes to financial statements. |
26
STATEMENT OF INVESTMENTS
August 31, 2013
| BNY Mellon Corporate Bond Fund | |||||
| Coupon | Maturity | Principal | |||
| Bonds and Notes—98.4% | Rate (%) | Date | Amount ($) | Value ($) | |
| Automobiles & Components—1.3% | |||||
| Johnson Controls, Sr. Unscd. Notes | 3.75 | 12/1/21 | 4,150,000 | 4,128,254 | |
| Volkswagen International Finance, Gtd. Notes | 1.15 | 11/20/15 | 3,000,000 | a | 3,013,461 |
| 7,141,715 | |||||
| Banks—13.7% | |||||
| American Express Centurion Bank, Sr. Unscd. Notes | 0.71 | 11/13/15 | 2,375,000 | b | 2,377,033 |
| Bank of America, Sr. Unscd. Notes | 3.88 | 3/22/17 | 1,000,000 | 1,055,008 | |
| Bank of America, Sub. Notes | 5.49 | 3/15/19 | 4,450,000 | 4,814,241 | |
| Barclays Bank, Sr. Unscd. Notes | 2.75 | 2/23/15 | 4,500,000 | 4,615,798 | |
| BBVA US Senior, Bank Gtd. Notes | 3.25 | 5/16/14 | 5,250,000 | 5,296,793 | |
| Citigroup, Sr. Unscd. Notes | 6.13 | 11/21/17 | 5,000,000 | 5,736,680 | |
| Goldman Sachs Group, Sub. Notes | 5.63 | 1/15/17 | 2,000,000 | 2,179,794 | |
| Goldman Sachs Group, Sr. Unscd. Notes | 6.15 | 4/1/18 | 3,800,000 | 4,300,388 | |
| Morgan Stanley, Sub. Notes | 4.88 | 11/1/22 | 6,000,000 | 5,934,588 | |
| Rabobank Nederland, Bank Gtd. Notes | 3.38 | 1/19/17 | 5,000,000 | 5,269,495 | |
| RBS Citizens Financial Group, Sub. Notes | 4.15 | 9/28/22 | 6,000,000 | a | 5,753,520 |
| Royal Bank of Scotland Group, Sr. Unscd. Notes | 2.55 | 9/18/15 | 3,200,000 | 3,263,987 | |
| Santander Issuances, Bank Gtd. Notes | 5.91 | 6/20/16 | 5,750,000 | a | 6,070,672 |
| Santander US Debt, Bank Gtd. Notes | 2.99 | 10/7/13 | 5,000,000 | a | 5,009,465 |
| Societe Generale, Bank Gtd. Notes | 2.75 | 10/12/17 | 6,000,000 | c | 6,102,102 |
| Wachovia, Sub. Notes | 5.25 | 8/1/14 | 1,860,000 | 1,937,741 | |
| Wells Fargo & Co., Sub. Notes | 5.13 | 9/15/16 | 1,000,000 | 1,100,920 | |
| Westpac Banking, Sub. Notes | 4.63 | 6/1/18 | 4,750,000 | 5,083,640 | |
| 75,901,865 | |||||
| Capital Goods—4.4% | |||||
| ABB Finance USA, Gtd. Notes | 2.88 | 5/8/22 | 2,000,000 | 1,906,518 | |
| CRH America, Gtd. Notes | 4.13 | 1/15/16 | 250,000 | 262,592 | |
| CRH America, Gtd. Notes | 6.00 | 9/30/16 | 5,500,000 | 6,186,455 | |
| GATX, Sr. Unscd. Notes | 4.75 | 6/15/22 | 3,000,000 | 3,037,596 | |
| GATX, Sr. Unscd. Notes | 8.75 | 5/15/14 | 2,255,000 | 2,369,901 | |
| Textron, Sr. Unscd. Notes | 4.63 | 9/21/16 | 4,500,000 | 4,849,731 | |
| Valmont Industries, Gtd. Notes | 6.63 | 4/20/20 | 5,000,000 | 5,610,400 | |
| 24,223,193 | |||||
| Casinos—.2% | |||||
| Seminole Indian Tribe of Florida, Scd. Notes | 7.75 | 10/1/17 | 1,000,000 | a | 1,066,250 |
| Commercial & Professional Services—1.1% | |||||
| Republic Services, Gtd. Notes | 3.55 | 6/1/22 | 3,000,000 | 2,913,183 | |
| Waste Management, Gtd. Notes | 4.75 | 6/30/20 | 2,750,000 | 2,954,375 | |
| 5,867,558 |
The Funds 27
STATEMENT OF INVESTMENTS (continued)
| BNY Mellon Corporate Bond Fund (continued) | |||||
| Coupon | Maturity | Principal | |||
| Bonds and Notes (continued) | Rate (%) | Date | Amount ($) | Value ($) | |
| Consumer Durables & Apparel—1.4% | |||||
| Mattel, Sr. Unscd. Notes | 1.70 | 3/15/18 | 2,000,000 | 1,949,306 | |
| NVR, Sr. Unscd. Notes | 3.95 | 9/15/22 | 6,100,000 | 5,855,835 | |
| 7,805,141 | |||||
| Consumer Services—1.8% | |||||
| Brinker International, Sr. Unscd. Notes | 2.60 | 5/15/18 | 1,400,000 | 1,372,455 | |
| George Washington University, Unscd. Notes | 1.83 | 9/15/17 | 3,000,000 | 2,915,583 | |
| International Game Technology, Sr. Unscd. Notes | 7.50 | 6/15/19 | 5,100,000 | 5,814,000 | |
| 10,102,038 | |||||
| Diversified Financials—12.0% | |||||
| American Express, Sr. Unscd. Notes | 7.00 | 3/19/18 | 3,250,000 | 3,895,040 | |
| Bear Stearns, Sub. Notes | 5.55 | 1/22/17 | 4,800,000 | 5,282,962 | |
| Blackstone Holdings Finance, Gtd. Notes | 4.75 | 2/15/23 | 3,000,000 | a | 3,124,122 |
| Blackstone Holdings Finance, Gtd. Notes | 6.63 | 8/15/19 | 2,000,000 | a | 2,347,694 |
| Carlyle Holdings Finance, Gtd. Notes | 3.88 | 2/1/23 | 5,736,000 | a | 5,570,861 |
| Caterpillar Financial Services, | |||||
| Sr. Unscd. Notes, Ser. G | 1.25 | 11/6/17 | 3,355,000 | 3,274,228 | |
| Ford Motor Credit, Sr. Unscd. Notes | 4.25 | 2/3/17 | 5,500,000 | 5,773,625 | |
| General Electric Capital, Jr. Sub. Cap. Secs., Ser. C | 5.25 | 6/29/49 | 6,250,000 | b | 5,750,000 |
| HSBC Finance, Sub. Notes | 6.68 | 1/15/21 | 5,500,000 | 6,218,911 | |
| Hyundai Capital America, Unscd. Notes | 1.88 | 8/9/16 | 3,000,000 | a | 2,999,430 |
| Jefferies Group, Sr. Unscd. Notes | 6.88 | 4/15/21 | 2,000,000 | 2,233,230 | |
| Jefferies Group, Sr. Unscd. Notes | 8.50 | 7/15/19 | 3,450,000 | 4,197,387 | |
| John Deere Capital, Sr. Unscd. Notes | 2.80 | 9/18/17 | 4,000,000 | 4,145,136 | |
| MassMutual Global Funding II, Sr. Scd. Notes | 2.00 | 4/5/17 | 600,000 | a | 596,856 |
| Moody’s, Sr. Unscd. Notes | 4.50 | 9/1/22 | 5,000,000 | 4,954,750 | |
| NYSE Euronext, Sr. Unscd. Notes | 2.00 | 10/5/17 | 4,500,000 | 4,476,767 | |
| TD Ameritrade Holding, Gtd. Notes | 4.15 | 12/1/14 | 1,750,000 | 1,826,589 | |
| 66,667,588 | |||||
| Energy—5.1% | |||||
| Devon Energy, Sr. Unscd. Notes | 1.88 | 5/15/17 | 3,250,000 | 3,208,975 | |
| Petrobras International Finance, Gtd. Notes | 5.38 | 1/27/21 | 5,250,000 | 5,152,786 | |
| Pioneer Natural Resources, Sr. Unscd. Notes | 3.95 | 7/15/22 | 5,500,000 | 5,441,365 | |
| Rowan Companies, Gtd. Notes | 5.00 | 9/1/17 | 1,050,000 | 1,134,444 | |
| Rowan Companies, Gtd. Notes | 7.88 | 8/1/19 | 3,000,000 | 3,605,487 | |
| Schlumberger Investment, Gtd. Notes | 1.25 | 8/1/17 | 3,000,000 | a | 2,916,057 |
| Sunoco Logistics Partners Operations, Gtd. Notes | 3.45 | 1/15/23 | 5,000,000 | 4,629,785 | |
| Weatherford International, Gtd. Notes | 5.13 | 9/15/20 | 2,252,000 | 2,339,524 | |
| 28,428,423 | |||||
| Food & Staples Retailing—.7% | |||||
| Walgreen, Sr. Unscd. Notes | 3.10 | 9/15/22 | 4,225,000 | 3,968,559 |
28
| BNY Mellon Corporate Bond Fund (continued) | |||||
| Coupon | Maturity | Principal | |||
| Bonds and Notes (continued) | Rate (%) | Date | Amount ($) | Value ($) | |
| Food, Beverage & Tobacco—4.9% | |||||
| Anheuser-Busch InBev Finance, Gtd. Notes | 1.25 | 1/17/18 | 5,000,000 | 4,863,885 | |
| Anheuser-Busch InBev Worldwide, Gtd. Notes | 1.38 | 7/15/17 | 1,000,000 | 989,655 | |
| Campbell Soup, Sr. Unscd. Notes | 0.57 | 8/1/14 | 400,000 | b | 400,752 |
| ConAgra Foods, Sr. Unscd. Notes | 3.20 | 1/25/23 | 4,000,000 | 3,744,248 | |
| Flowers Foods, Sr. Unscd. Notes | 4.38 | 4/1/22 | 2,850,000 | 2,751,202 | |
| General Mills, Sr. Unscd. Notes | 0.56 | 1/29/16 | 2,000,000 | b | 1,998,930 |
| Kraft Foods Group, Sr. Unscd. Notes | 1.63 | 6/4/15 | 3,500,000 | 3,551,307 | |
| Kroger, Sr. Unscd. Notes | 3.40 | 4/15/22 | 3,500,000 | 3,391,861 | |
| Pernod-Ricard, Sr. Unscd. Notes | 4.45 | 1/15/22 | 1,000,000 | a | 1,022,804 |
| Pernod-Ricard, Sr. Unscd. Bonds | 5.75 | 4/7/21 | 4,000,000 | a | 4,455,756 |
| 27,170,400 | |||||
| Foreign/Governmental—1.9% | |||||
| Petroleos Mexicanos, Gtd. Notes, Ser. WI | 2.29 | 7/18/18 | 5,000,000 | 5,087,500 | |
| Spanish Government, Sr. Unscd. Notes | 4.00 | 3/6/18 | 5,500,000 | a | 5,452,700 |
| 10,540,200 | |||||
| Health Care Equipment & Services—2.3% | |||||
| Dignity Health, Unscd. Notes | 3.13 | 11/1/22 | 5,000,000 | 4,564,690 | |
| UnitedHealth Group, Sr. Unscd. Notes | 1.40 | 10/15/17 | 3,000,000 | 2,928,990 | |
| WellPoint, Sr. Unscd. Notes | 1.25 | 9/10/15 | 5,000,000 | 5,028,010 | |
| 12,521,690 | |||||
| Insurance—3.6% | |||||
| American International Group, Sr. Unscd. Notes | 5.85 | 1/16/18 | 4,750,000 | 5,368,668 | |
| Fidelity National Financial, Sr. Unscd. Notes | 5.50 | 9/1/22 | 5,075,000 | 5,285,191 | |
| MetLife, Sr. Unscd. Notes | 1.76 | 12/15/17 | 4,685,000 | b | 4,620,647 |
| Prudential Financial, Sr. Unscd. Notes | 4.75 | 9/17/15 | 4,250,000 | 4,574,598 | |
| 19,849,104 | |||||
| Materials—2.1% | |||||
| Allegheny Technologies, Sr. Unscd. Notes | 5.88 | 8/15/23 | 3,000,000 | 2,913,990 | |
| Dow Chemical, Sr. Unscd. Notes | 4.13 | 11/15/21 | 5,000,000 | 5,091,880 | |
| Eastman Chemical, Sr. Unscd. Notes | 3.60 | 8/15/22 | 3,000,000 | 2,909,553 | |
| Vale Overseas, Gtd. Notes | 4.38 | 1/11/22 | 600,000 | 561,332 | |
| 11,476,755 | |||||
| Media—5.5% | |||||
| British Sky Broadcasting Group, Gtd. Notes | 3.13 | 11/26/22 | 3,500,000 | a | 3,210,984 |
| Comcast, Gtd. Notes | 3.13 | 7/15/22 | 4,250,000 | 4,121,739 | |
| Grupo Televisa, Sr. Unscd. Notes | 6.00 | 5/15/18 | 5,982,000 | 6,709,351 | |
| News America, Gtd. Notes | 4.50 | 2/15/21 | 3,250,000 | 3,403,953 | |
| Thomson Reuters, Sr. Unscd. Notes | 0.88 | 5/23/16 | 3,000,000 | 2,981,055 | |
| Time Warner Cable, Gtd. Notes | 4.13 | 2/15/21 | 5,500,000 | 5,235,285 |
The Funds 29
STATEMENT OF INVESTMENTS (continued)
| BNY Mellon Corporate Bond Fund (continued) | |||||
| Coupon | Maturity | Principal | |||
| Bonds and Notes (continued) | Rate (%) | Date | Amount ($) | Value ($) | |
| Media (continued) | |||||
| Time Warner, Gtd. Notes | 4.00 | 1/15/22 | 5,000,000 | 5,016,000 | |
| 30,678,367 | |||||
| Municipal Bonds—7.5% | |||||
| Connecticut, GO | 2.55 | 10/15/22 | 3,035,000 | 2,841,337 | |
| Florida Hurricane Catastrophe Fund | |||||
| Finance Corporation, Revenue | 3.00 | 7/1/20 | 7,500,000 | 6,935,700 | |
| Illinois, GO | 4.42 | 1/1/15 | 5,000,000 | 5,179,900 | |
| JobsOhio Beverage System, | |||||
| Statewide Senior Lien Liquor Profits Revenue | 1.82 | 1/1/18 | 5,000,000 | 4,887,600 | |
| New Jersey Economic Development Authority, | |||||
| School Facilities Construction Revenue | 1.06 | 3/1/16 | 4,500,000 | 4,463,685 | |
| New Jersey Transportation Trust Fund | |||||
| Authority, (Transportation System) | 1.76 | 12/15/18 | 5,000,000 | 4,779,200 | |
| Oakland Unified School District, GO (Build America Bonds) | 9.50 | 8/1/34 | 2,500,000 | 2,845,050 | |
| Puerto Rico Commonwealth Government | |||||
| Development Bank, Revenue Bonds | 3.67 | 5/1/14 | 4,560,000 | 4,565,563 | |
| University of California Regents, General Revenue | 1.80 | 7/1/19 | 2,905,000 | 2,796,847 | |
| West Contra Costa Unified School District, | |||||
| GO (Build America Bonds) | 8.46 | 8/1/34 | 2,250,000 | 2,625,075 | |
| 41,919,957 | |||||
| Pharmaceuticals, Biotech & Life Sciences—2.3% | |||||
| AbbVie, Sr. Unscd. Notes | 1.75 | 11/6/17 | 5,000,000 | 4,933,885 | |
| Amgen, Sr. Unscd. Notes | 3.88 | 11/15/21 | 3,500,000 | 3,519,225 | |
| AstraZeneca, Sr. Unscd. Notes | 5.90 | 9/15/17 | 1,750,000 | 2,024,318 | |
| Teva Pharmaceutical Finance IV, Gtd. Notes | 2.25 | 3/18/20 | 2,320,000 | 2,185,129 | |
| 12,662,557 | |||||
| Real Estate—7.8% | |||||
| Boston Properties, Sr. Unscd. Notes | 3.70 | 11/15/18 | 4,990,000 | 5,214,211 | |
| Camden Property Trust, Sr. Unscd. Notes | 5.00 | 6/15/15 | 1,170,000 | 1,246,913 | |
| Corporate Office Properties, Gtd. Notes | 3.60 | 5/15/23 | 4,000,000 | a | 3,667,900 |
| CubeSmart, Gtd. Notes | 4.80 | 7/15/22 | 5,255,000 | 5,406,512 | |
| Essex Portfolio, Gtd. Notes | 3.25 | 5/1/23 | 2,000,000 | 1,818,468 | |
| First Industrial, Sr. Unscd. Notes | 5.95 | 5/15/17 | 1,500,000 | 1,583,472 | |
| First Industrial, Sr. Unscd. Notes | 6.42 | 6/1/14 | 1,720,000 | 1,775,805 | |
| Liberty Property, Sr. Unscd. Notes | 5.50 | 12/15/16 | 2,000,000 | 2,205,440 | |
| Liberty Property, Sr. Unscd. Notes | 6.63 | 10/1/17 | 2,500,000 | 2,854,935 | |
| ProLogis, Gtd. Notes | 2.75 | 2/15/19 | 3,000,000 | 2,977,083 | |
| Realty Income, Sr. Unscd. Notes | 4.65 | 8/1/23 | 3,000,000 | 3,040,908 | |
| UDR, Gtd. Notes, Ser. 1 | 4.63 | 1/10/22 | 2,250,000 | 2,311,295 | |
| WEA Finance, Gtd. Notes | 7.13 | 4/15/18 | 5,500,000 | a | 6,526,669 |
| Weingarten Realty Investors, Sr. Unscd. Notes | 3.50 | 4/15/23 | 3,000,000 | 2,762,535 | |
| 43,392,146 |
30
| BNY Mellon Corporate Bond Fund (continued) | |||||
| Coupon | Maturity | Principal | |||
| Bonds and Notes (continued) | Rate (%) | Date | Amount ($) | Value ($) | |
| Retailing—.9% | |||||
| Staples, Sr. Unscd. Notes | 4.38 | 1/12/23 | 5,500,000 | c | 5,295,466 |
| Semiconductors & Semiconductor Equipment—.5% | |||||
| Intel, Sr. Unscd. Notes | 1.35 | 12/15/17 | 3,000,000 | 2,940,681 | |
| Software & Services—6.5% | |||||
| Adobe Systems, Sr. Unscd. Notes | 4.75 | 2/1/20 | 5,000,000 | 5,372,310 | |
| Broadridge Financial Solutions, Sr. Unscd. Notes | 3.95 | 9/1/20 | 3,000,000 | 3,006,453 | |
| CA, Sr. Unscd. Notes | 2.88 | 8/15/18 | 3,000,000 | 2,987,979 | |
| eBay, Sr. Unscd. Notes | 1.35 | 7/15/17 | 2,000,000 | 1,973,750 | |
| Fidelity National Information Services, Gtd. Notes | 3.50 | 4/15/23 | 3,250,000 | 2,945,381 | |
| Fiserv, Gtd. Notes | 3.50 | 10/1/22 | 5,500,000 | 5,162,696 | |
| IBM, Sr. Unscd. Notes | 0.55 | 2/6/15 | 2,000,000 | 2,002,022 | |
| Oracle, Sr. Unscd. Notes | 5.75 | 4/15/18 | 2,000,000 | 2,318,942 | |
| Symantec, Sr. Unscd. Notes | 2.75 | 6/15/17 | 4,500,000 | 4,540,608 | |
| Symantec, Sr. Unscd. Notes | 4.20 | 9/15/20 | 1,830,000 | 1,879,975 | |
| Total System Services, Sr. Unscd. Notes | 2.38 | 6/1/18 | 4,000,000 | 3,874,280 | |
| 36,064,396 | |||||
| Technology Hardware & Equipment—3.3% | |||||
| Arrow Electronics, Sr. Unscd. Notes | 3.00 | 3/1/18 | 6,500,000 | 6,491,179 | |
| Avnet, Sr. Unscd. Notes | 4.88 | 12/1/22 | 5,500,000 | 5,447,563 | |
| Jabil Circuit, Sr. Unscd. Notes | 5.63 | 12/15/20 | 4,000,000 | 4,160,000 | |
| NetApp, Sr. Unscd. Notes | 2.00 | 12/15/17 | 1,000,000 | 975,742 | |
| Seagate, Gtd. Notes | 7.00 | 11/1/21 | 1,000,000 | 1,087,500 | |
| Xerox, Sr. Unscd. Notes | 1.67 | 9/13/13 | 250,000 | b | 250,090 |
| 18,412,074 | |||||
| Telecommunication Services—5.2% | |||||
| America Movil, Gtd. Notes | 5.63 | 11/15/17 | 4,500,000 | 5,134,549 | |
| AT&T, Sr. Unscd. Notes | 1.70 | 6/1/17 | 1,750,000 | 1,740,385 | |
| AT&T, Sr. Unscd. Notes | 4.45 | 5/15/21 | 2,000,000 | 2,120,990 | |
| British Telecommunications, Sr. Unscd. Notes | 2.00 | 6/22/15 | 3,000,000 | 3,052,107 | |
| CenturyLink, Sr. Unscd. Notes, Ser. T | 5.80 | 3/15/22 | 2,000,000 | 1,900,000 | |
| Telefonica Emisiones, Gtd. Notes | 5.13 | 4/27/20 | 6,000,000 | 6,076,776 | |
| Verizon Communications, Sr. Unscd. Notes | 6.35 | 4/1/19 | 4,000,000 | 4,671,060 | |
| Vivendi, Sr. Unscd. Notes | 3.45 | 1/12/18 | 4,000,000 | a | 4,033,448 |
| 28,729,315 | |||||
| Transportation—.4% | |||||
| ERAC USA Finance, Gtd. Notes | 1.40 | 4/15/16 | 2,000,000 | a | 1,985,666 |
| Utilities—2.0% | |||||
| CMS Energy, Sr. Unscd. Notes | 4.25 | 9/30/15 | 1,400,000 | 1,478,196 | |
| CMS Energy, Sr. Unscd. Notes | 5.05 | 3/15/22 | 1,500,000 | 1,615,746 | |
| Dominion Resources, Sr. Unscd. Notes | 2.25 | 9/1/15 | 2,050,000 | 2,102,857 | |
| Duke Energy, Sr. Unscd. Notes | 1.63 | 8/15/17 | 2,000,000 | 1,978,998 |
The Funds 31
STATEMENT OF INVESTMENTS (continued)
| BNY Mellon Corporate Bond Fund (continued) | ||||||
| Coupon | Maturity | Principal | ||||
| Bonds and Notes (continued) | Rate (%) | Date | Amount ($) | Value ($) | ||
| Utilities (continued) | ||||||
| Georgia Power, Sr. Unscd. Notes | 0.75 | 8/10/15 | 2,500,000 | 2,499,595 | ||
| Northeast Utilities, Sr. Unscd. Notes | 1.02 | 9/20/13 | 300,000 | b | 300,092 | |
| PSEG Power, Gtd. Notes | 2.75 | 9/15/16 | 1,000,000 | 1,036,516 | ||
| 11,012,000 | ||||||
| Total Bonds and Notes | ||||||
| (cost $555,975,749) | 545,823,104 | |||||
| Other Investment—.6% | Shares | Value ($) | ||||
| Registered Investment Company; | ||||||
| Dreyfus Institutional Preferred Plus Money Market Fund | ||||||
| (cost $3,067,808) | 3,067,808 | d | 3,067,808 | |||
| Investment of Cash Collateral for | ||||||
| Securities Loaned—1.9% | ||||||
| Registered Investment Company; | ||||||
| Dreyfus Institutional Cash Advantage Fund | ||||||
| (cost $10,674,810) | 10,674,810 | d | 10,674,810 | |||
| Total Investments (cost $569,718,367) | 100.9 | % | 559,565,722 | |||
| Liabilities, Less Cash and Receivables | (0.9 | %) | (4,837,953 | ) | ||
| Net Assets | 100.0 | % | 554,727,769 | |||
| GO—General Obligation |
| a Securities exempt from registration pursuant to Rule 144A under the Securities Act of 1933.These securities may be resold in transactions exempt from registration, normally to |
| qualified institutional buyers.At August 31, 2013, these securities were valued at $68,824,315 or 12.4% of net assets. |
| b Variable rate security—interest rate subject to periodic change. |
| c Security, or portion thereof, on loan.At August 31, 2013, the value of the fund’s securities on loan was $10,356,768 and the value of the collateral held by the fund was $10,674,810. |
| d Investment in affiliated money market mutual fund. |
| Portfolio Summary (Unaudited)† | ||||
| Value (%) | Value (%) | |||
| Corporate Bonds | 89.0 | Foreign/Governmental | 1.9 | |
| Municipal Bonds | 7.5 | |||
| Money Market Investments | 2.5 | 100.9 |
| † Based on net assets. |
| See notes to financial statements. |
32
STATEMENT OF INVESTMENTS
August 31, 2013
| BNY Mellon Short-Term U.S. Government Securities Fund | |||||
| Coupon | Maturity | Principal | |||
| Bonds and Notes—97.0% | Rate (%) | Date | Amount ($) | Value ($) | |
| Commercial Mortgage Pass-Through Ctfs.—1.5% | |||||
| Citigroup/Deutsche Bank Commercial | |||||
| Mortgage Trust, Ser. 2005-CD1, Cl. A3 | 5.39 | 7/15/44 | 1,194,941 | a | 1,207,309 |
| JP Morgan Chase Commercial Mortgage | |||||
| Securities Trust, Ser. 2005-LDP1, Cl. A2 | 4.63 | 3/15/46 | 288,804 | 290,412 | |
| JP Morgan Chase Commericial Mortgage | |||||
| Securities Trust, Ser. 2013-FL3, Cl. A2 | 0.88 | 4/15/28 | 2,000,000 | a,b | 1,997,646 |
| Morgan Stanley Capital I Trust, Ser. 2006-HQ8, Cl. AAB | 5.60 | 3/12/44 | 818,838 | a | 819,103 |
| 4,314,470 | |||||
| Municipal Bonds—5.6% | |||||
| California, GO (Various Purpose) | 1.05 | 2/1/16 | 1,000,000 | 1,003,050 | |
| Florida Hurricane Catastrophe Fund | |||||
| Finance Corporation, Revenue | 1.30 | 7/1/16 | 2,745,000 | 2,718,730 | |
| Grand Parkway Transportation Corporation, | |||||
| Grand Parkway System Subordinate Tier Toll | |||||
| Revenue (Toll Equity Loan Agreement Supported) | 1.00 | 2/15/14 | 500,000 | 500,180 | |
| Illinois, GO | 4.42 | 1/1/15 | 1,700,000 | 1,761,166 | |
| Nassau County Interim Finance Authority, | |||||
| Sales Tax Secured Revenue | 0.86 | 11/15/15 | 2,500,000 | 2,493,250 | |
| New York City, GO | 5.13 | 12/1/15 | 1,100,000 | 1,197,966 | |
| Regional Transportation Authority of Illinois, | |||||
| GO Working Cash Notes | 1.06 | 6/1/14 | 3,000,000 | 3,004,740 | |
| University of California Regents, General Revenue | 0.77 | 7/1/14 | 3,000,000 | a | 3,000,930 |
| 15,680,012 | |||||
| U.S. Government Agencies—10.9% | |||||
| Federal Farm Credit Bank, Bonds | 0.50 | 6/23/15 | 3,500,000 | 3,507,312 | |
| Federal Home Loan Mortgage Corp., Notes | 0.50 | 9/14/15 | 3,250,000 | c | 3,248,242 |
| Federal Home Loan Mortgage Corp., Notes | 0.63 | 8/21/15 | 2,750,000 | c | 2,755,893 |
| Federal Home Loan Mortgage Corp., Notes | 0.75 | 10/5/16 | 3,000,000 | c | 2,985,438 |
| Federal National Mortgage Association, Notes, Ser. 0002 | 0.70 | 1/30/18 | 2,500,000 | a,c | 2,441,160 |
| Federal National Mortgage Association, Notes | 0.48 | 1/29/16 | 6,600,000 | c | 6,574,003 |
| Federal National Mortgage Association, Notes | 0.50 | 11/22/17 | 2,500,000 | c | 2,454,898 |
| Federal National Mortgage Association, Notes | 0.52 | 2/22/16 | 4,700,000 | c | 4,680,552 |
| Federal National Mortgage Association, Notes | 0.65 | 2/27/17 | 2,000,000 | c | 1,963,644 |
| 30,611,142 | |||||
| U.S. Government Agencies/Mortgage-Backed—33.7% | |||||
| Federal Home Loan Mortgage Corp.: | |||||
| REMIC, Ser. 3565, Cl. XA, 4.00%, 8/15/22 | 857,286 | c | 875,980 | ||
| REMIC, Ser. 3689, Cl. AB, 2.00%, 12/15/27 | 291,937 | c | 294,130 | ||
| REMIC, Ser. 4079, Cl. WA, 2.00%, 8/15/40 | 4,465,064 | c | 4,385,248 | ||
| REMIC, Ser. 2627, Cl. KW, 3.14%, 11/15/17 | 147,764 | c | 148,207 | ||
| REMIC, Ser. 2675, Cl. CK, 4.00%, 9/15/18 | 240,767 | c | 254,575 | ||
| REMIC, Ser. 3653, Cl. DL, 4.00%, 7/15/22 | 457,638 | c | 463,761 | ||
| REMIC, Ser. 3986, Cl. P, 4.00%, 3/15/39 | 1,531,865 | c | 1,567,116 | ||
The Funds 33
STATEMENT OF INVESTMENTS (continued)
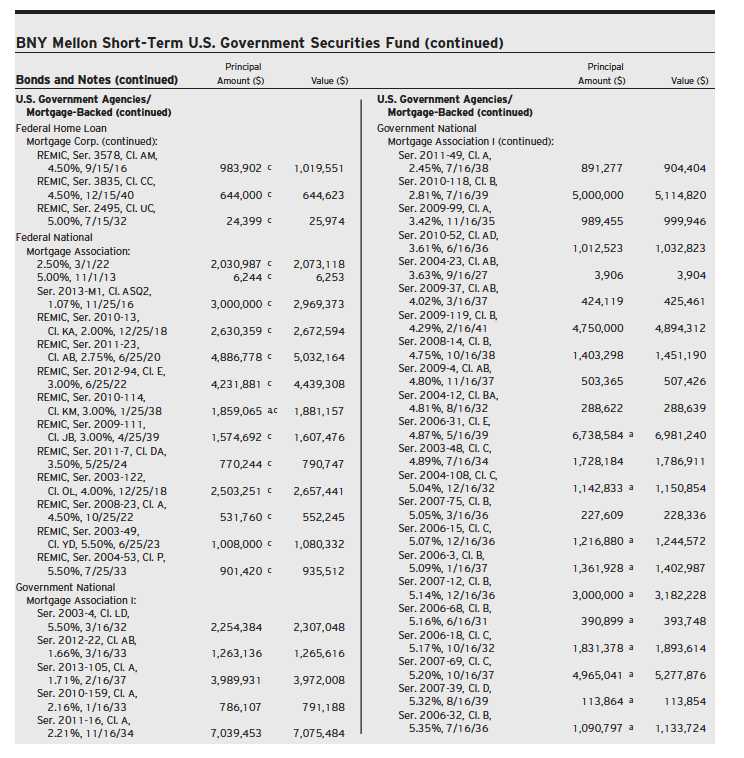
34
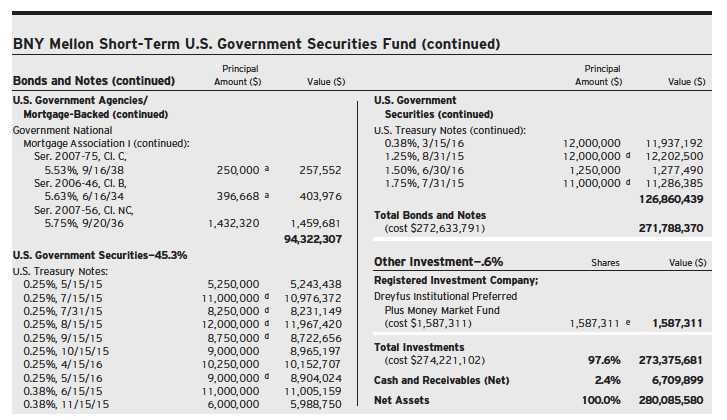
| GO—General Obligation |
| REMIC—Real Estate Mortagage Investment Conduit |
| a Variable rate security—interest rate subject to periodic change. |
| b Security exempt from registration pursuant to Rule 144A under the Securities Act of 1933.This security may be resold in transactions exempt from registration, normally to |
| qualified institutional buyers.At August 31, 2013, this security was valued at $1,997,646 or .7% of net assets. |
| c The Federal Housing Finance Agency (“FHFA”) placed Federal Home Loan Mortgage Corporation and Federal National Mortgage Association into conservatorship with FHFA |
| as the conservator.As such, the FHFA oversees the continuing affairs of these companies. |
| d Security, or portion thereof, on loan.At August 31, 2013, the value of the fund’s securities on loan was $53,591,745 and the value of the collateral held by the fund was |
| $55,488,545, consisting of U.S. Government & Agency securities. |
| e Investment in affiliated money market mutual fund. |
| Portfolio Summary (Unaudited)† | ||||
| Value (%) | Value (%) | |||
| U.S. Government & Agencies/Mortgage-Backed | 89.9 | Money Market Investment | .6 | |
| Municipal Bonds | 5.6 | |||
| Commercial Mortgage-Backed | 1.5 | 97.6 |
| † Based on net assets. |
| See notes to financial statements. |
The Funds 35
STATEMENTS OF ASSETS AND LIABILITIES
August 31, 2013
| BNY Mellon | |||||||
| BNY Mellon | BNY Mellon | Short-Term | |||||
| BNY Mellon | Intermediate | Corporate | U.S. Government | ||||
| Bond Fund | Bond Fund | Bond Fund | Securities Fund | ||||
| Assets ($): | |||||||
| Investments in securities— | |||||||
| See Statement of Investments† | |||||||
| (including securities on loan)††—Note 2(b): | |||||||
| Unaffiliated issuers | 1,145,957,225 | 952,964,297 | 545,823,104 | 271,788,370 | |||
| Affiliated issuers | 7,366,145 | 7,922,597 | 13,742,618 | 1,587,311 | |||
| Cash | — | — | — | 4,710,051 | |||
| Dividends, interest and securities lending income receivable | 7,003,350 | 6,497,917 | 5,762,540 | 537,285 | |||
| Receivable for shares of Beneficial Interest subscribed | 299,117 | 311,338 | 1,168,135 | 870,891 | |||
| Receivable for investment securities sold | — | 3,017,965 | — | 3,742,666 | |||
| Prepaid expenses | 19,704 | 21,417 | 9,682 | 16,587 | |||
| 1,160,645,541 | 970,735,531 | 566,506,079 | 283,253,161 | ||||
| Liabilities ($): | |||||||
| Due to The Dreyfus Corporation and affiliates—Note 4(b) | 440,505 | 365,967 | 210,499 | 97,276 | |||
| Due to Administrator—Note 4(a) | 123,309 | 101,309 | 58,444 | 28,755 | |||
| Cash overdraft due to Custodian | 2,170,621 | 1,189,737 | 552,881 | — | |||
| Payable for shares of Beneficial Interest redeemed | 1,418,826 | 1,206,427 | 200,926 | 175,190 | |||
| Payable for investment securities purchased | — | 10,285,795 | — | 2,826,608 | |||
| Liability for securities on loan—Note 2(b) | — | — | 10,674,810 | — | |||
| Accrued expenses | 72,807 | 93,802 | 80,750 | 39,752 | |||
| 4,226,068 | 13,243,037 | 11,778,310 | 3,167,581 | ||||
| Net Assets ($) | 1,156,419,473 | 957,492,494 | 554,727,769 | 280,085,580 | |||
| Composition of Net Assets ($): | |||||||
| Paid-in capital | 1,134,090,721 | 949,061,385 | 567,955,857 | 295,098,795 | |||
| Accumulated investment income—net | 654,694 | 132,194 | 477,272 | 61,578 | |||
| Accumulated net realized gain (loss) on investments | 6,589,041 | (1,618,774 | ) | (3,552,715 | ) | (14,229,372 | ) |
| Accumulated net unrealized appreciation | |||||||
| (depreciation) on investments | 15,085,017 | 9,917,689 | (10,152,645 | ) | (845,421 | ) | |
| Net Assets ($) | 1,156,419,473 | 957,492,494 | 554,727,769 | 280,085,580 | |||
| Net Asset Value Per Share | |||||||
| Class M Shares | |||||||
| Net Assets ($) | 1,148,032,143 | 949,095,419 | 554,152,382 | 279,191,614 | |||
| Shares Outstanding | 89,082,656 | 74,564,296 | 44,360,301 | 23,201,297 | |||
| Net Asset Value Per Share ($) | 12.89 | 12.73 | 12.49 | 12.03 | |||
| Investor Shares | |||||||
| Net Assets ($) | 8,387,330 | 8,397,075 | 575,387 | 893,966 | |||
| Shares Outstanding | 652,149 | 659,498 | 46,059 | 74,411 | |||
| Net Asset Value Per Share ($) | 12.86 | 12.73 | 12.49 | 12.01 | |||
| † Investments at cost ($): | |||||||
| Unaffiliated issuers | 1,130,872,208 | 943,046,608 | 555,975,749 | 272,633,791 | |||
| Affiliated issuers | 7,366,145 | 7,922,597 | 13,742,618 | 1,587,311 | |||
| ††Value of securities on loan ($) | 178,891,253 | 206,001,317 | 10,356,768 | 53,591,745 |
| See notes to financial statements. |
36
STATEMENTS OF OPERATIONS
Year Ended August 31, 2013
| BNY Mellon | ||||||||
| BNY Mellon | BNY Mellon | Short-Term | ||||||
| BNY Mellon | Intermediate | Corporate | U.S. Government | |||||
| Bond Fund | Bond Fund | Bond Fund | Securities Fund | |||||
| Investment Income ($): | ||||||||
| Income: | ||||||||
| Interest | 37,218,005 | 22,382,157 | 13,817,088 | 1,071,823 | ||||
| Income from securities lending—Note 2(b) | 124,168 | 158,892 | 59,297 | 51,604 | ||||
| Cash dividends; | ||||||||
| Affiliated issuers | 29,758 | 9,944 | 8,166 | 4,983 | ||||
| Total Income | 37,371,931 | 22,550,993 | 13,884,551 | 1,128,410 | ||||
| Expenses: | ||||||||
| Investment advisory fee—Note 4(a) | 5,071,438 | 3,869,382 | 1,920,684 | 987,830 | ||||
| Administration fee—Note 4(a) | 1,567,360 | 1,196,208 | 593,581 | 348,915 | ||||
| Trustees’ fees and expenses—Note 4(c) | 97,714 | 61,885 | 33,792 | 13,586 | ||||
| Custodian fees—Note 4(b) | 82,151 | 69,783 | 36,689 | 23,485 | ||||
| Professional fees | 73,762 | 122,456 | 57,335 | 40,552 | ||||
| Registration fees | 30,633 | 36,226 | 94,050 | 29,964 | ||||
| Shareholder servicing costs—Note 4(b) | 25,271 | 16,906 | 869 | 2,324 | ||||
| Loan commitment fees—Note 3 | 13,774 | 8,675 | 2,604 | 3,150 | ||||
| Prospectus and shareholders’ reports | 5,802 | 6,674 | 7,488 | 7,504 | ||||
| Miscellaneous | 52,730 | 51,367 | 46,960 | 36,942 | ||||
| Total Expenses | 7,020,635 | 5,439,562 | 2,794,052 | 1,494,252 | ||||
| Less—reduction in fees | ||||||||
| due to earnings credits—Note 4(b) | (22 | ) | (15 | ) | (2 | ) | (4 | ) |
| Net Expenses | 7,020,613 | 5,439,547 | 2,794,050 | 1,494,248 | ||||
| Investment Income (Loss)—Net | 30,351,318 | 17,111,446 | 11,090,501 | (365,838 | ) | |||
| Realized and Unrealized Gain (Loss) | ||||||||
| on Investments—Note 5 ($): | ||||||||
| Net realized gain (loss) on investments | 15,818,003 | 11,874,965 | 1,662,231 | 378,855 | ||||
| Net unrealized appreciation (depreciation) on investments | (75,665,848 | ) | (45,403,973 | ) | (17,491,893 | ) | (1,336,409 | ) |
| Net Realized and Unrealized Gain (Loss) on Investments | (59,847,845 | ) | (33,529,008 | ) | (15,829,662 | ) | (957,554 | ) |
| Net (Decrease) in Net Assets Resulting from Operations | (29,496,527 | ) | (16,417,562 | ) | (4,739,161 | ) | (1,323,392 | ) |
| See notes to financial statements. |
The Funds 37
STATEMENTS OF CHANGES IN NET ASSETS
| BNY Mellon Bond Fund | BNY Mellon Intermediate Bond Fund | |||||||
| Year Ended August 31, | Year Ended August 31, | |||||||
| 2013 | 2012 | 2013 | 2012 | |||||
| Operations ($): | ||||||||
| Investment income—net | 30,351,318 | 37,583,808 | 17,111,446 | 21,837,339 | ||||
| Net realized gain (loss) on investments | 15,818,003 | 20,816,573 | 11,874,965 | 9,517,595 | ||||
| Net unrealized appreciation (depreciation) on investments | (75,665,848 | ) | 21,012,734 | (45,403,973 | ) | 8,478,802 | ||
| Net Increase (Decrease) in Net Assets | ||||||||
| Resulting from Operations | (29,496,527 | ) | 79,413,115 | (16,417,562 | ) | 39,833,736 | ||
| Dividends to Shareholders from ($): | ||||||||
| Investment income—net: | ||||||||
| Class M Shares | (36,591,932 | ) | (43,014,121 | ) | (21,686,175 | ) | (27,226,012 | ) |
| Investor Shares | (263,362 | ) | (288,668 | ) | (135,126 | ) | (114,080 | ) |
| Net realized gain on investments: | ||||||||
| Class M Shares | (10,432,257 | ) | (2,808,023 | ) | (1,640,163 | ) | (60,140 | ) |
| Investor Shares | (81,840 | ) | (18,581 | ) | (8,152 | ) | (260 | ) |
| Total Dividends | (47,369,391 | ) | (46,129,393 | ) | (23,469,616 | ) | (27,400,492 | ) |
| Beneficial Interest Transactions ($): | ||||||||
| Net proceeds from shares sold: | ||||||||
| Class M Shares | 177,159,834 | 206,008,402 | 205,882,674 | 176,135,350 | ||||
| Investor Shares | 9,156,676 | 11,350,777 | 8,031,994 | 7,416,300 | ||||
| Net assets received in connection | ||||||||
| with reorganization—Note 1 | — | — | 41,803,155 | — | ||||
| Dividends reinvested: | ||||||||
| Class M Shares | 11,754,220 | 7,167,581 | 4,613,966 | 4,791,137 | ||||
| Investor Shares | 316,118 | 243,191 | 130,516 | 106,927 | ||||
| Cost of shares redeemed: | ||||||||
| Class M Shares | (291,087,372 | ) | (273,348,411 | ) | (218,287,829 | ) | (215,758,016 | ) |
| Investor Shares | (9,725,407 | ) | (13,669,368 | ) | (7,584,448 | ) | (6,832,189 | ) |
| Increase (Decrease) in Net Assets from | ||||||||
| Beneficial Interest Transactions | (102,425,931 | ) | (62,247,828 | ) | 34,590,028 | (34,140,491 | ) | |
| Total Increase (Decrease) in Net Assets | (179,291,849 | ) | (28,964,106 | ) | (5,297,150 | ) | (21,707,247 | ) |
| Net Assets ($): | ||||||||
| Beginning of Period | 1,335,711,322 | 1,364,675,428 | 962,789,644 | 984,496,891 | ||||
| End of Period | 1,156,419,473 | 1,335,711,322 | 957,492,494 | 962,789,644 | ||||
| Undistributed investment income—net | 654,694 | 1,019,133 | 132,194 | 184,015 | ||||
| Capital Share Transactions (Shares): | ||||||||
| Class M Shares | ||||||||
| Shares sold | 13,126,571 | 15,291,765 | 15,694,611 | 13,417,074 | ||||
| Shares received in connection | ||||||||
| with reorganization—Note 1 | — | — | 2,936,786 | — | ||||
| Shares issued for dividends reinvested | 871,263 | 534,095 | 352,062 | 365,506 | ||||
| Shares redeemed | (21,635,993 | ) | (20,296,590 | ) | (16,647,387 | ) | (16,437,359 | ) |
| Net Increase (Decrease) in Shares Outstanding | (7,638,159 | ) | (4,470,730 | ) | 2,336,072 | (2,654,779 | ) | |
| Investor Shares | ||||||||
| Shares sold | 679,405 | 845,985 | 616,052 | 564,496 | ||||
| Shares received in connection | ||||||||
| with reorganization—Note 1 | — | — | 238,458 | — | ||||
| Shares issued for dividends reinvested | 23,525 | 18,109 | 9,989 | 8,081 | ||||
| Shares redeemed | (725,716 | ) | (1,019,276 | ) | (582,853 | ) | (520,154 | ) |
| Net Increase (Decrease) in Shares Outstanding | (22,786 | ) | (155,182 | ) | 281,646 | 52,423 | ||
| See notes to financial statements. |
38
| BNY Mellon | BNY Mellon Short-Term | |||||||
| Corporate Bond Fund | U.S. Government Securities Fund | |||||||
| Year Ended August 31, | Year Ended August 31, | |||||||
| 2013 | 2012 | a | 2013 | 2012 | ||||
| Operations ($): | ||||||||
| Investment income (loss)—net | 11,090,501 | 1,714,638 | (365,838 | ) | (9,542 | ) | ||
| Net realized gain (loss) on investments | 1,662,231 | 640,915 | 378,855 | 1,164,338 | ||||
| Net unrealized appreciation (depreciation) on investments | (17,491,893 | ) | 7,339,248 | (1,336,409 | ) | (1,044,804 | ) | |
| Net Increase (Decrease) in Net Assets | ||||||||
| Resulting from Operations | (4,739,161 | ) | 9,694,801 | (1,323,392 | ) | 109,992 | ||
| Dividends to Shareholders from ($): | ||||||||
| Investment income—net: | ||||||||
| Class M Shares | (14,502,105 | ) | (2,227,253 | ) | (3,007,148 | ) | (2,267,874 | ) |
| Investor Shares | (9,627 | ) | (169 | ) | (7,068 | ) | (8,604 | ) |
| Net realized gain on investments: | ||||||||
| Class M Shares | (1,451,053 | ) | — | — | — | |||
| Investor Shares | (504 | ) | — | — | — | |||
| Total Dividends | (15,963,289 | ) | (2,227,422 | ) | (3,014,216 | ) | (2,276,478 | ) |
| Beneficial Interest Transactions ($): | ||||||||
| Net proceeds from shares sold: | ||||||||
| Class M Shares | 349,530,512 | 321,812,668 | 142,068,306 | 135,465,998 | ||||
| Investor Shares | 1,150,432 | 40,000 | 1,686,738 | 2,846,663 | ||||
| Dividends reinvested: | ||||||||
| Class M Shares | 3,805,589 | 392,006 | 622,803 | 449,790 | ||||
| Investor Shares | 9,126 | 70 | 6,982 | 8,308 | ||||
| Cost of shares redeemed: | ||||||||
| Class M Shares | (90,737,308 | ) | (17,440,215 | ) | (161,931,227 | ) | (180,982,763 | ) |
| Investor Shares | (600,040 | ) | — | (1,929,155 | ) | (2,869,079 | ) | |
| Increase (Decrease) in Net Assets from | ||||||||
| Beneficial Interest Transactions | 263,158,311 | 304,804,529 | (19,475,553 | ) | (45,081,083 | ) | ||
| Total Increase (Decrease) in Net Assets | 242,455,861 | 312,271,908 | (23,813,161 | ) | (47,247,569 | ) | ||
| Net Assets ($): | ||||||||
| Beginning of Period | 312,271,908 | — | 303,898,741 | 351,146,310 | ||||
| End of Period | 554,727,769 | 312,271,908 | 280,085,580 | 303,898,741 | ||||
| Undistributed investment income—net | 477,272 | 91,992 | 61,578 | 81,455 | ||||
| Capital Share Transactions (Shares): | ||||||||
| Class M Shares | ||||||||
| Shares sold | 26,939,469 | 25,542,828 | 11,707,053 | 11,065,111 | ||||
| Shares issued for dividends reinvested | 295,195 | 30,735 | 51,361 | 36,763 | ||||
| Shares redeemed | (7,056,632 | ) | (1,391,294 | ) | (13,330,341 | ) | (14,785,231 | ) |
| Net Increase (Decrease) in Shares Outstanding | 20,178,032 | 24,182,269 | (1,571,927 | ) | (3,683,357 | ) | ||
| Investor Shares | ||||||||
| Shares sold | 89,203 | 3,129 | 139,586 | 232,479 | ||||
| Shares issued for dividends reinvested | 711 | 6 | 576 | 665 | ||||
| Shares redeemed | (46,990 | ) | — | (159,351 | ) | (234,861 | ) | |
| Net Increase (Decrease) in Shares Outstanding | 42,924 | 3,135 | (19,189 | ) | (1,717 | ) | ||
| a From March 2, 2012 (commencement of operations) to August 31, 2012. |
| See notes to financial statements. |
The Funds 39
FINANCIAL HIGHLIGHTS
The following tables describe the performance for each share class of each BNY Mellon fixed income fund for the fiscal periods indicated. All information (except portfolio turnover rate) reflects financial results for a single fund share. Total return shows how much your investment in each fund would have increased (or decreased) during the period, assuming you had reinvested all dividends and distributions.These figures have been derived from each fund’s financial statements.
| Class M Shares | ||||||||||
| Year Ended August 31, | ||||||||||
| BNY Mellon Bond Fund | 2013 | 2012 | 2011 | 2010 | 2009 | |||||
| Per Share Data ($): | ||||||||||
| Net asset value, beginning of period | 13.71 | 13.38 | 13.36 | 12.90 | 12.38 | |||||
| Investment Operations: | ||||||||||
| Investment income—neta | .32 | .38 | .39 | .43 | .52 | |||||
| Net realized and unrealized | ||||||||||
| gain (loss) on investments | (.64 | ) | .42 | .14 | .56 | .56 | ||||
| Total from Investment Operations | (.32 | ) | .80 | .53 | .99 | 1.08 | ||||
| Distributions: | ||||||||||
| Dividends from investment income—net | (.39 | ) | (.44 | ) | (.49 | ) | (.53 | ) | (.56 | ) |
| Dividends from net realized gain on investments | (.11 | ) | (.03 | ) | (.02 | ) | — | — | ||
| Total Distributions | (.50 | ) | (.47 | ) | (.51 | ) | (.53 | ) | (.56 | ) |
| Net asset value, end of period | 12.89 | 13.71 | 13.38 | 13.36 | 12.90 | |||||
| Total Return (%) | (2.41 | ) | 6.05 | 4.06 | 7.84 | 8.95 | ||||
| Ratios/Supplemental Data (%): | ||||||||||
| Ratio of total expenses to average net assets | .55 | .55 | .55 | .55 | .56 | |||||
| Ratio of net expenses to average net assets | .55 | .55 | .55 | .55 | .56 | |||||
| Ratio of net investment income | ||||||||||
| to average net assets | 2.40 | 2.80 | 2.98 | 3.29 | 4.15 | |||||
| Portfolio Turnover Rate | 66.14 | b | 76.43 | 86.75 | b | 99.66 | 62.19 | |||
| Net Assets, end of period ($ x 1,000) | 1,148,032 | 1,326,472 | 1,353,593 | 1,455,913 | 1,340,824 | |||||
| a Based on average shares outstanding at each month end. |
| b The portfolio turnover rates excluding mortgage dollar roll transactions for the period ended August 31, 2013 and 2011 were 65.03% and 79.13%, respectively. |
| See notes to financial statements. |
40
| Investor Shares | ||||||||||
| Year Ended August 31, | ||||||||||
| BNY Mellon Bond Fund | 2013 | 2012 | 2011 | 2010 | 2009 | |||||
| Per Share Data ($): | ||||||||||
| Net asset value, beginning of period | 13.69 | 13.35 | 13.34 | 12.88 | 12.36 | |||||
| Investment Operations: | ||||||||||
| Investment income—neta | .29 | .34 | .35 | .39 | .50 | |||||
| Net realized and unrealized | ||||||||||
| gain (loss) on investments | (.65 | ) | .43 | .13 | .57 | .54 | ||||
| Total from Investment Operations | (.36 | ) | .77 | .48 | .96 | 1.04 | ||||
| Distributions: | ||||||||||
| Dividends from investment income—net | (.36 | ) | (.40 | ) | (.45 | ) | (.50 | ) | (.52 | ) |
| Dividends from net realized gain on investments | (.11 | ) | (.03 | ) | (.02 | ) | — | — | ||
| Total Distributions | (.47 | ) | (.43 | ) | (.47 | ) | (.50 | ) | (.52 | ) |
| Net asset value, end of period | 12.86 | 13.69 | 13.35 | 13.34 | 12.88 | |||||
| Total Return (%) | (2.74 | ) | 5.87 | 3.72 | 7.60 | 8.74 | ||||
| Ratios/Supplemental Data (%): | ||||||||||
| Ratio of total expenses to average net assets | .80 | .80 | .80 | .81 | .81 | |||||
| Ratio of net expenses to average net assets | .80 | .80 | .80 | .81 | .81 | |||||
| Ratio of net investment income | ||||||||||
| to average net assets | 2.16 | 2.55 | 2.73 | 3.03 | 3.88 | |||||
| Portfolio Turnover Rate | 66.14 | b | 76.43 | 86.75 | b | 99.66 | 62.19 | |||
| Net Assets, end of period ($ x 1,000) | 8,387 | 9,240 | 11,083 | 12,971 | 6,696 |
| a Based on average shares outstanding at each month end. |
| b The portfolio turnover rates excluding mortgage dollar roll transactions for the period ended August 31, 2013 and 2011 were 65.03% and 79.13%, respectively. |
| See notes to financial statements. |
The Funds 41
FINANCIAL HIGHLIGHTS (continued)
| Class M Shares | ||||||||||
| Year Ended August 31, | ||||||||||
| BNY Mellon Intermediate Bond Fund | 2013 | 2012 | 2011 | 2010 | 2009 | |||||
| Per Share Data ($): | ||||||||||
| Net asset value, beginning of period | 13.26 | 13.09 | 13.15 | 12.81 | 12.37 | |||||
| Investment Operations: | ||||||||||
| Investment income—neta | .23 | .29 | .32 | .35 | .46 | |||||
| Net realized and unrealized | ||||||||||
| gain (loss) on investments | (.44 | ) | .25 | .04 | .47 | .50 | ||||
| Total from Investment Operations | (.21 | ) | .54 | .36 | .82 | .96 | ||||
| Distributions: | ||||||||||
| Dividends from investment income—net | (.30 | ) | (.37 | ) | (.42 | ) | (.48 | ) | (.52 | ) |
| Dividends from net realized gain on investments | (.02 | ) | (.00 | )b | — | — | — | |||
| Total Distributions | (.32 | ) | (.37 | ) | (.42 | ) | (.48 | ) | (.52 | ) |
| Net asset value, end of period | 12.73 | 13.26 | 13.09 | 13.15 | 12.81 | |||||
| Total Return (%) | (1.64 | ) | 4.18 | 2.84 | 6.52 | 8.07 | ||||
| Ratios/Supplemental Data (%): | ||||||||||
| Ratio of total expenses to average net assets | .56 | .55 | .55 | .55 | .56 | |||||
| Ratio of net expenses to average net assets | .56 | .55 | .55 | .55 | .56 | |||||
| Ratio of net investment income | ||||||||||
| to average net assets | 1.77 | 2.23 | 2.42 | 2.72 | 3.75 | |||||
| Portfolio Turnover Rate | 44.76 | 39.00 | 45.15 | 44.58 | 53.05 | |||||
| Net Assets, end of period ($ x 1,000) | 949,095 | 957,778 | 980,237 | 988,555 | 856,808 | |||||
| a | Based on average shares outstanding at each month end. |
| b | Amount represents less than $.01 per share. |
| See notes to financial statements. | |
42
| Investor Shares | ||||||||||
| Year Ended August 31, | ||||||||||
| BNY Mellon Intermediate Bond Fund | 2013 | 2012 | 2011 | 2010 | 2009 | |||||
| Per Share Data ($): | ||||||||||
| Net asset value, beginning of period | 13.26 | 13.09 | 13.15 | 12.81 | 12.36 | |||||
| Investment Operations: | ||||||||||
| Investment income—neta | .20 | .26 | .29 | .31 | .43 | |||||
| Net realized and unrealized | ||||||||||
| gain (loss) on investments | (.45 | ) | .24 | .04 | .48 | .51 | ||||
| Total from Investment Operations | (.25 | ) | .50 | .33 | .79 | .94 | ||||
| Distributions: | ||||||||||
| Dividends from investment income—net | (.26 | ) | (.33 | ) | (.39 | ) | (.45 | ) | (.49 | ) |
| Dividends from net realized gain on investments | (.02 | ) | (.00 | )b | — | — | — | |||
| Total Distributions | (.28 | ) | (.33 | ) | (.39 | ) | (.45 | ) | (.49 | ) |
| Net asset value, end of period | 12.73 | 13.26 | 13.09 | 13.15 | 12.81 | |||||
| Total Return (%) | (1.91 | ) | 3.91 | 2.57 | 6.26 | 7.78 | ||||
| Ratios/Supplemental Data (%): | ||||||||||
| Ratio of total expenses to average net assets | .82 | .81 | .80 | .81 | .81 | |||||
| Ratio of net expenses to average net assets | .82 | .81 | .80 | .81 | .81 | |||||
| Ratio of net investment income | ||||||||||
| to average net assets | 1.51 | 1.98 | 2.18 | 2.44 | 3.48 | |||||
| Portfolio Turnover Rate | 44.76 | 39.00 | 45.15 | 44.58 | 53.05 | |||||
| Net Assets, end of period ($ x 1,000) | 8,397 | 5,012 | 4,260 | 4,768 | 2,740 | |||||
| a | Based on average shares outstanding at each month end. |
| b | Amount represents less than $.01 per share. |
| See notes to financial statements. | |
The Funds 43
FINANCIAL HIGHLIGHTS (continued)
| Class M Shares | ||||
| Year Ended | Period Ended | |||
| BNY Mellon Corporate Bond Fund | August 31, 2013 | August 31, 2012a | ||
| Per Share Data ($): | ||||
| Net asset value, beginning of period | 12.91 | 12.50 | ||
| Investment Operations: | ||||
| Investment income—netb | .30 | .12 | ||
| Net realized and unrealized | ||||
| gain (loss) on investments | (.29 | ) | .43 | |
| Total from Investment Operations | .01 | .55 | ||
| Distributions: | ||||
| Dividends from investment income—net | (.39 | ) | (.14 | ) |
| Dividends from net realized gain on investments | (.04 | ) | — | |
| Total Distributions | (.43 | ) | (.14 | ) |
| Net asset value, end of period | 12.49 | 12.91 | ||
| Total Return (%) | .02 | 4.40 | c | |
| Ratios/Supplemental Data (%): | ||||
| Ratio of total expenses to average net assets | .58 | .70 | d | |
| Ratio of net expenses to average net assets | .58 | .60 | d | |
| Ratio of net investment income | ||||
| to average net assets | 2.31 | 2.25 | d | |
| Portfolio Turnover Rate | 36.99 | 34.08 | c | |
| Net Assets, end of period ($ x 1,000) | 554,152 | 312,231 | ||
| a | From March 2, 2012 (commencement of operations) to August 31, 2012. |
| b | Based on average shares outstanding at each month end. |
| c | Not annualized. |
| d | Annualized. |
| See notes to financial statements. | |
44
| Investor Shares | ||||
| Year Ended | Period Ended | |||
| BNY Mellon Corporate Bond Fund | August 31, 2013 | August 31, 2012a | ||
| Per Share Data ($): | ||||
| Net asset value, beginning of period | 12.91 | 12.50 | ||
| Investment Operations: | ||||
| Investment income—netb | .26 | .07 | ||
| Net realized and unrealized | ||||
| gain (loss) on investments | (.29 | ) | .46 | |
| Total from Investment Operations | (.03 | ) | .53 | |
| Distributions: | ||||
| Dividends from investment income—net | (.35 | ) | (.12 | ) |
| Dividends from net realized gain on investments | (.04 | ) | — | |
| Total Distributions | (.39 | ) | (.12 | ) |
| Net asset value, end of period | 12.49 | 12.91 | ||
| Total Return (%) | (.24 | ) | 4.29 | c |
| Ratios/Supplemental Data (%): | ||||
| Ratio of total expenses to average net assets | .85 | 1.12 | d | |
| Ratio of net expenses to average net assets | .85 | .85 | d | |
| Ratio of net investment income | ||||
| to average net assets | 2.05 | 1.67 | d | |
| Portfolio Turnover Rate | 36.99 | 34.08 | c | |
| Net Assets, end of period ($ x 1,000) | 575 | 40 | ||
| a | From March 2, 2012 (commencement of operations) to August 31, 2012. |
| b | Based on average shares outstanding at each month end. |
| c | Not annualized. |
| d | Annualized. |
| See notes to financial statements. | |
The Funds 45
FINANCIAL HIGHLIGHTS (continued)
| Class M Shares | ||||||||||
| Year Ended August 31, | ||||||||||
| BNY Mellon Short-Term U.S. Government Securities Fund | 2013 | 2012 | 2011 | 2010 | 2009 | |||||
| Per Share Data ($): | ||||||||||
| Net asset value, beginning of period | 12.22 | 12.30 | 12.40 | 12.39 | 12.19 | |||||
| Investment Operations: | ||||||||||
| Investment income (loss)—neta | (.02 | ) | (.00 | )b | .07 | .13 | .29 | |||
| Net realized and unrealized | ||||||||||
| gain (loss) on investments | (.04 | ) | .01 | .02 | .11 | .30 | ||||
| Total from Investment Operations | (.06 | ) | .01 | .09 | .24 | .59 | ||||
| Distributions: | ||||||||||
| Dividends from investment income—net | (.13 | ) | (.09 | ) | (.19 | ) | (.23 | ) | (.39 | ) |
| Net asset value, end of period | 12.03 | 12.22 | 12.30 | 12.40 | 12.39 | |||||
| Total Return (%) | (.49 | ) | .07 | .71 | 1.96 | 4.90 | ||||
| Ratios/Supplemental Data (%): | ||||||||||
| Ratio of total expenses to average net assets | .53 | .52 | .52 | .53 | .56 | |||||
| Ratio of net expenses to average net assets | .53 | .52 | .52 | .53 | .56 | |||||
| Ratio of net investment income | ||||||||||
| (loss) to average net assets | (.13 | ) | (.00 | )c | .56 | 1.07 | 2.32 | |||
| Portfolio Turnover Rate | 125.01 | 152.13 | 143.65 | 59.58 | 117.43 | |||||
| Net Assets, end of period ($ x 1,000) | 279,192 | 302,756 | 349,975 | 304,707 | 177,005 | |||||
| a | Based on average shares outstanding at each month end. |
| b | Amount represents less than $.01 per share. |
| c | Amount represents less than .01%. |
| See notes to financial statements. | |
46
| Investor Shares | ||||||||||
| Year Ended August 31, | ||||||||||
| BNY Mellon Short-Term U.S. Government Securities Fund | 2013 | 2012 | 2011 | 2010 | 2009 | |||||
| Per Share Data ($): | ||||||||||
| Net asset value, beginning of period | 12.21 | 12.29 | 12.40 | 12.39 | 12.20 | |||||
| Investment Operations: | ||||||||||
| Investment income (loss)—neta | (.05 | ) | (.04 | ) | .04 | .11 | .23 | |||
| Net realized and unrealized | ||||||||||
| gain (loss) on investments | (.05 | ) | .02 | .00 | b | .10 | .32 | |||
| Total from Investment Operations | (.10 | ) | (.02 | ) | .04 | .21 | .55 | |||
| Distributions: | ||||||||||
| Dividends from investment income—net | (.10 | ) | (.06 | ) | (.15 | ) | (.20 | ) | (.36 | ) |
| Net asset value, end of period | 12.01 | 12.21 | 12.29 | 12.40 | 12.39 | |||||
| Total Return (%) | (.84 | ) | (.15 | ) | .34 | 1.73 | 4.63 | |||
| Ratios/Supplemental Data (%): | ||||||||||
| Ratio of total expenses to average net assets | .78 | .78 | .78 | .78 | .82 | |||||
| Ratio of net expenses to average net assets | .78 | .78 | .78 | .78 | .82 | |||||
| Ratio of net investment income | ||||||||||
| (loss) to average net assets | (.40 | ) | (.29 | ) | .34 | .84 | 1.93 | |||
| Portfolio Turnover Rate | 125.01 | 152.13 | 143.65 | 59.58 | 117.43 | |||||
| Net Assets, end of period ($ x 1,000) | 894 | 1,142 | 1,171 | 987 | 837 | |||||
| a | Based on average shares outstanding at each month end. |
| b | Amount represents less than $.01 per share. |
| See notes to financial statements. | |
The Funds 47
NOTES TO FINANCIAL STATEMENTS
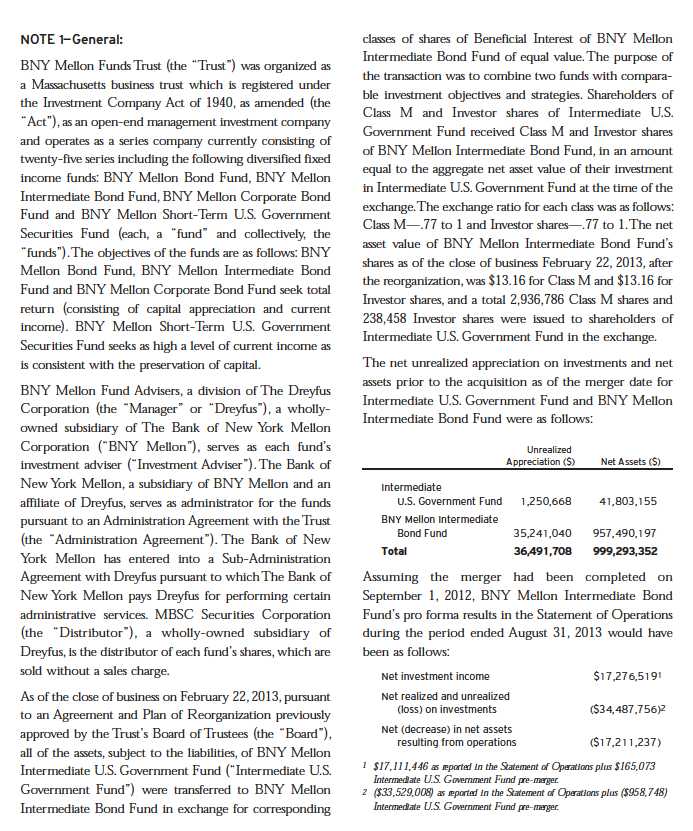
48
The Funds 49
NOTES TO FINANCIAL STATEMENTS (continued)
50
| Table 1—Fair Value Measurements | |||||||
| Investments in Securities | |||||||
| Level 1—Unadjusted | Level 2—Other Significant | Level 3—Significant | |||||
| Quoted Prices | Observable Inputs | Unobservable Inputs | |||||
| Assets ($) | Liabilities ($) | Assets ($) | Liabilities ($) | Assets ($) | Liabilities ($) | Total ($) | |
| BNY Mellon Bond Fund | |||||||
| Asset-Backed | — | — | 11,879,655 | — | — | — | 11,879,655 |
| Commercial | |||||||
| Mortgage-Backed | — | — | 20,288,063 | — | — | — | 20,288,063 |
| Corporate Bonds† | — | — | 385,142,667 | — | — | — | 385,142,667 |
| Foreign Government | — | — | 15,283,128 | — | — | — | 15,283,128 |
| Municipal Bonds | — | — | 67,478,519 | — | — | — | 67,478,519 |
| Mutual Funds | 7,366,145 | — | — | — | — | — | 7,366,145 |
| U.S. Government | |||||||
| Agencies/ | |||||||
| Mortgage-Backed | — | — | 338,180,476 | — | — | — | 338,180,476 |
| U.S. Treasury | — | — | 307,704,717 | — | — | — | 307,704,717 |
| BNY Mellon | |||||||
| Intermediate Bond Fund | |||||||
| Corporate Bonds† | — | — | 392,561,931 | — | — | — | 392,561,931 |
| Foreign Government | — | — | 14,287,144 | — | — | — | 14,287,144 |
| Municipal Bonds | — | — | 49,049,667 | — | — | — | 49,049,667 |
| Mutual Funds | 7,922,597 | — | — | — | — | — | 7,922,597 |
| U.S. Government | |||||||
| Agencies/ | |||||||
| Mortgage-Backed | — | — | 8,078,556 | — | — | — | 8,078,556 |
| U.S. Treasury | — | — | 488,986,999 | — | — | — | 488,986,999 |
| BNY Mellon | |||||||
| Corporate Bond Fund | |||||||
| Corporate Bonds† | — | — | 493,362,947 | — | — | — | 493,362,947 |
| Municipal Bonds | — | — | 41,919,957 | — | — | — | 41,919,957 |
| Foreign Government | — | — | 10,540,200 | — | — | — | 10,540,200 |
| Mutual Funds | 13,742,618 | — | — | — | — | — | 13,742,618 |
| BNY Mellon Short-Term | |||||||
| U.S. Government | |||||||
| Securities Fund | |||||||
| Commercial | |||||||
| Mortgage-Backed | — | — | 4,314,470 | — | — | — | 4,314,470 |
| Municipal Bonds | — | — | 15,680,012 | — | — | — | 15,680,012 |
| Mutual Funds | 1,587,311 | — | — | — | — | — | 1,587,311 |
| U.S. Government | |||||||
| Agencies/ | |||||||
| Mortgage-Backed | — | — | 124,933,449 | — | — | — | 124,933,449 |
| U.S. Treasury | — | — | 126,860,439 | — | — | — | 126,860,439 |
| † | See Statements of Investments for additional detailed categorizations. |
The Funds 51
NOTES TO FINANCIAL STATEMENTS (continued)
| Table 3—Affiliated Investment Companies | |||||||
| Value | Value | Net | |||||
| 8/31/2012 ($) | Purchases ($) | Sales ($) | 8/31/2013 ($) | Assets (%) | |||
| BNY Mellon Bond Fund | |||||||
| Dreyfus Institutional Preferred | |||||||
| Plus Money Market Fund | 19,144,189 | 435,167,338 | 446,945,382 | 7,366,145 | .6 | ||
| Dreyfus Institutional Cash Advantage Fund | 10,261,300 | 39,646,158 | 49,907,458 | — | — | ||
| Total | 29,405,489 | 474,813,496 | 496,852,840 | 7,366,145 | .6 | ||
| BNY Mellon Intermediate Bond Fund | |||||||
| Dreyfus Institutional Preferred | |||||||
| Plus Money Market Fund | 6,814,149 | 187,251,389 | 186,142,941 | 7,922,597 | .9 | ||
| Dreyfus Institutional Cash Advantage Fund | 6,403,950 | 36,002,906 | 42,406,856 | — | — | ||
| Total | 13,218,099 | 223,254,295 | 228,549,797 | 7,922,597 | .9 | ||
| BNY Mellon Corporate Bond Fund | |||||||
| Dreyfus Institutional Preferred | |||||||
| Plus Money Market Fund | 10,709,490 | 195,025,236 | 202,666,918 | 3,067,808 | .6 | ||
| Dreyfus Institutional Cash Advantage Fund | 4,547,500 | 113,581,573 | 107,454,263 | 10,674,810 | 1.9 | ||
| Total | 15,256,990 | 308,606,809 | 310,121,181 | 13,742,618 | 2.5 | ||
| BNY Mellon Short-Term | |||||||
| U.S. Government Securities Fund | |||||||
| Dreyfus Institutional Preferred | |||||||
| Plus Money Market Fund | 2,433,767 | 203,817,641 | 204,664,097 | 1,587,311 | .6 | ||
| Dreyfus Institutional Cash Advantage Fund | — | 10,891,189 | 10,891,189 | — | — | ||
| Total | 2,433,767 | 214,708,830 | 215,555,286 | 1,587,311 | .6 | ||
52
Table 4—Components of Accumulated Earnings
| Undistributed | Accumulated | Undistributed | Unrealized | Capital (Losses) | ||||
| Ordinary | Capital | Capital | Appreciation | Realized After | ||||
| Income ($) | (Losses) ($) | Gains ($) | (Depreciation) ($) | October 31, 2012 ($)† | ||||
| BNY Mellon Bond Fund | 654,694 | — | 9,303,290 | 12,370,768 | — | |||
| BNY Mellon Intermediate Bond Fund | 132,194 | — | 6,409,757 | 2,870,693 | (981,535 | ) | ||
| BNY Mellon Corporate Bond Fund | 613,864 | — | — | (13,841,953 | ) | — | ||
| BNY Mellon Short-Term | ||||||||
| U.S. Government Securities Fund | 61,578 | (13,798,166 | ) | — | (1,276,627 | ) | — |
| † | These losses were deferred for tax purposes to the first day of the following fiscal year. |
| Table 5—Capital Loss Carryover | |||||||||||
| Post-Enactment | Post-Enactment | ||||||||||
| Expiring in fiscal year | Short-Term | Long-Term | |||||||||
| 2014 ($)† | 2015 ($)† | 2018 ($)† | 2019 ($)† | Losses ($)†† | Losses ($)††† | Total ($) | |||||
| BNY Mellon Short-Term | |||||||||||
| U.S. Government Securities Fund | 2,822,720 | 4,701,996 | 28,529 | 64,834 | 4,273,825 | 1,906,262 | 13,798,166 | ||||
| † | If not applied, the carryover expires in the above year. |
| †† | Post-enactment short-term losses that can be carried forward for an unlimited period. |
| ††† Post-enactment long-term losses that can be carried forward for an unlimited period. | |
The Funds 53
NOTES TO FINANCIAL STATEMENTS (continued)
| Table 6—Tax Character of Distributions Paid | ||||
| Ordinary Income ($) | Long-Term Capital Gains ($) | |||
| 2013 | 2012 | 2013 | 2012 | |
| BNY Mellon Bond Fund | 36,855,294 | 43,302,789 | 10,514,097 | 2,826,604 |
| BNY Mellon Intermediate Bond Fund | 22,268,904 | 27,343,037 | 1,200,712 | 57,455 |
| BNY Mellon Corporate Bond Fund | 15,963,289 | 2,227,422 | — | — |
| BNY Mellon Short-Term | ||||
| U.S. Government Securities Fund | 3,014,216 | 2,276,478 | — | — |
| Table 7—Return of Capital Statement of Position | |||
| Accumulated | |||
| Undistributed | Accumulated | ||
| Investment | Net Realized | ||
| Income—Net ($) | Gain (Loss) ($) | ||
| BNY Mellon Bond Fund | 6,139,537 | (6,139,537 | ) |
| BNY Mellon Intermediate Bond Fund | 4,658,034 | (4,658,034 | ) |
| BNY Mellon Corporate Bond Fund | 3,806,511 | (3,806,511 | ) |
| BNY Mellon Short-Term U.S. Government Securities Fund | 3,360,177 | (3,360,177 | ) |
54
The Funds 55
NOTES TO FINANCIAL STATEMENTS (continued)
Table 10—Cash Management Agreement Fees
| The Bank of New York | The Bank of | |||||
| Dreyfus Transfer, Inc. | Dreyfus Transfer, Inc. | Mellon Cash | New York Mellon | |||
| Cash Management Fees ($) | Earnings Credits ($) | Management Fees ($) | Earnings Credits ($) | |||
| BNY Mellon Bond Fund | 177 | (21 | ) | 94 | (1 | ) |
| BNY Mellon Intermediate Bond Fund | 123 | (15 | ) | 56 | — | |
| BNY Mellon Corporate Bond Fund | 15 | (2 | ) | 7 | — | |
| BNY Mellon Short-Term | ||||||
| U.S. Government Securities Fund | 28 | (4 | ) | 15 | — |
Table 11—Due to The Dreyfus Corporation and Affiliates
| Investment | Shareholder | Chief | ||
| Advisory | Custodian | Services | Compliance | |
| Fees ($) | Fees ($) | Plan Fees ($) | Officer Fees ($) | |
| BNY Mellon Bond Fund | 397,446 | 35,000 | 1,887 | 6,172 |
| BNY Mellon Intermediate Bond Fund | 326,890 | 30,900 | 2,005 | 6,172 |
| BNY Mellon Corporate Bond Fund | 188,374 | 15,852 | 101 | 6,172 |
| BNY Mellon Short-Term | ||||
| U.S. Government Securities Fund | 81,097 | 9,795 | 212 | 6,172 |
56
| Table 12—Purchases and Sales | ||
| Purchases ($) | Sales ($) | |
| BNY Mellon Intermediate Bond Fund | 427,909,750 | 428,192,398 |
| BNY Mellon Corporate Bond Fund | 438,718,923 | 171,867,675 |
| BNY Mellon Short-Term U.S. Government Securities Fund | 350,182,995 | 374,533,138 |
| BNY Mellon Bond Fund: | ||
| Transactions without mortgage dollar rolls | 809,431,863 | 908,965,629 |
| Mortgage dollar rolls transactions | 13,799,282 | 13,826,785 |
| Total | 823,231,145 | 922,792,414 |
| Table 13—Accumulated Net Unrealized Appreciation (Depreciation) | ||||||
| Cost of | Gross | Gross | ||||
| Investments ($) | Appreciation ($) | Depreciation ($) | Net ($) | |||
| BNY Mellon Bond Fund | 1,140,952,602 | 35,439,383 | (23,068,615 | ) | 12,370,768 | |
| BNY Mellon Intermediate Bond Fund | 958,016,201 | 21,259,894 | (18,389,201 | ) | 2,870,693 | |
| BNY Mellon Corporate Bond Fund | 573,407,675 | 3,206,292 | (17,048,245 | ) | (13,841,953 | ) |
| BNY Mellon Short-Term U.S. Government Securities Fund | 274,652,308 | 271,142 | (1,547,769 | ) | (1,276,627 | ) |
The Funds 57
REPORT OF INDEPENDENT REGISTERED PUBLIC ACCOUNTING FIRM
58
IMPORTANT TAX INFORMATION (Unaudited)
The Funds 59
INFORMATION ABOUT THE RENEWAL OF EACH FUND’S
INVESTMENT ADVISORY AND ADMINISTRATION AGREEMENTS (Unaudited)
60
The Funds 61
INFORMATION ABOUT THE RENEWAL OF EACH FUND’S INVESTMENT ADVISORY
AND ADMINISTRATION AGREEMENTS (Unaudited) (continued)

62
The Funds 63
BOARD MEMBERS INFORMATION (Unaudited)
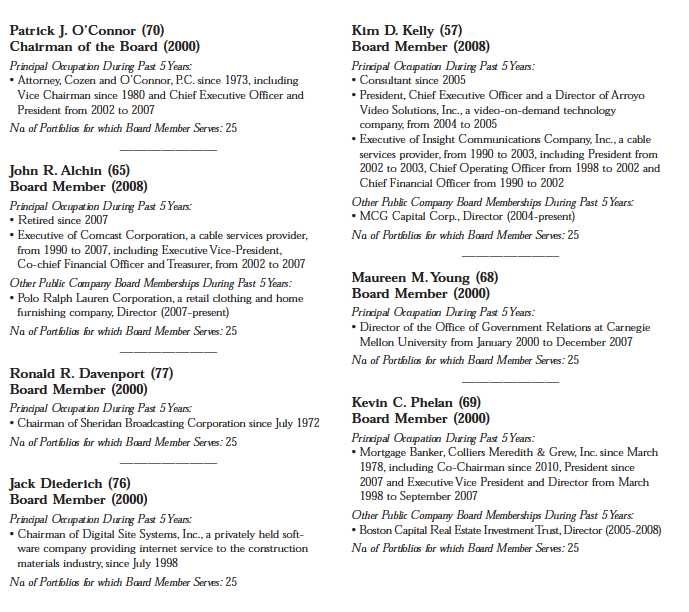
64
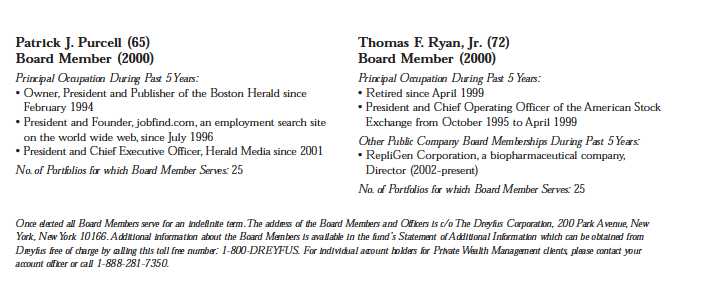
The Funds 65
OFFICERS OF THE TRUST (Unaudited)
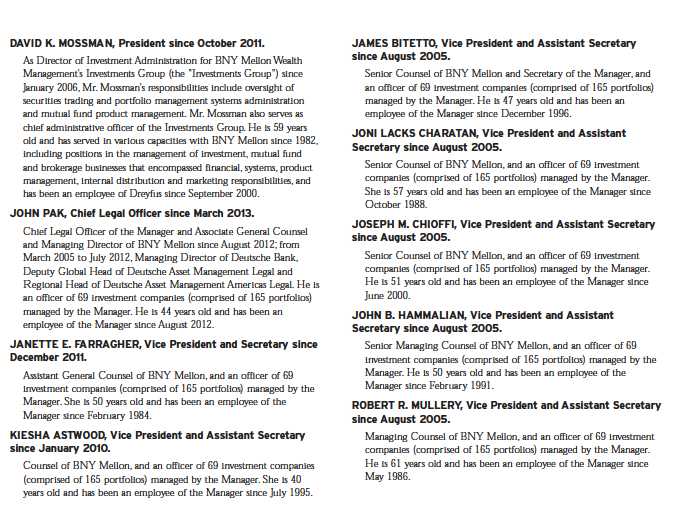
66

The Funds 67
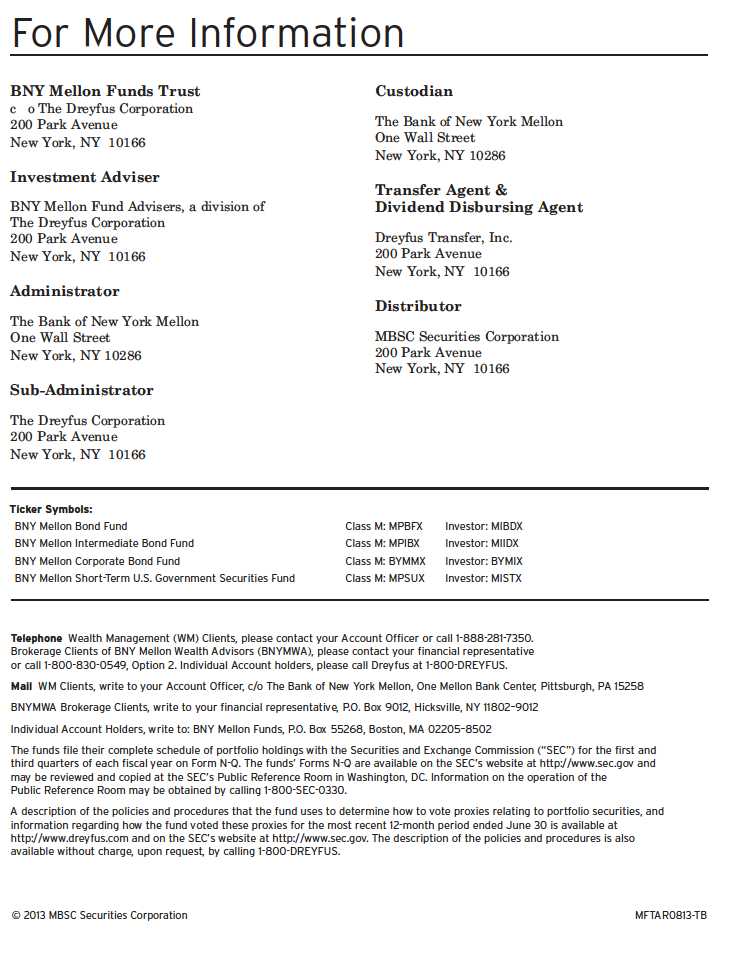
BNY Mellon National Intermediate Municipal Bond Fund
BNY Mellon National Short-Term Municipal Bond Fund
BNY Mellon Pennsylvania Intermediate Municipal Bond Fund
BNY Mellon Massachusetts Intermediate Municipal Bond Fund
BNY Mellon New York Intermediate Tax-Exempt Bond Fund
BNY Mellon Municipal Opportunities Fund
ANNUAL REPORT August 31, 2013

The Funds 3
DISCUSSION OF FUND PERFORMANCE (continued)
4
FUND PERFORMANCE
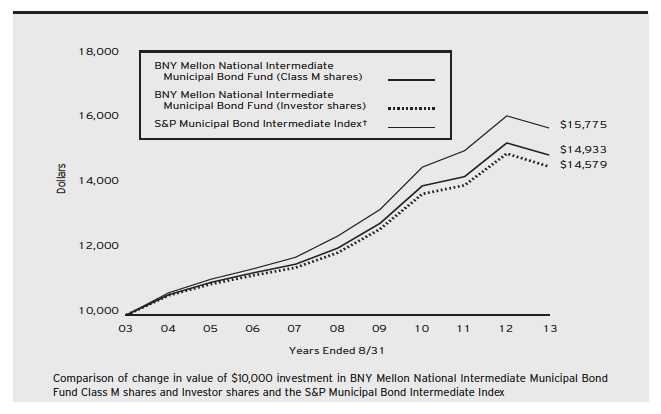
Average Annual Total Returns as of 8/31/13
| 1 Year | 5 Years | 10 Years | ||||
| Class M shares | –2.43 | % | 4.36 | % | 4.09 | % |
| Investor shares | –2.68 | % | 4.11 | % | 3.84 | % |
| S&P Municipal Bond Intermediate Index | –2.26 | % | 4.87 | % | 4.66 | % |
| † Source: Lipper Inc. |
| Past performance is not predictive of future performance.The fund’s performance shown in the graph and table does not reflect the deduction of taxes that a shareholder |
| would pay on fund distributions or the redemption of fund shares. |
| The above graph compares a $10,000 investment made in Class M shares and Investor shares of BNY Mellon National Intermediate Municipal Bond Fund on |
| 8/31/03 to a $10,000 investment made in the S&P Municipal Bond Intermediate Index on that date.All dividends and capital gain distributions are reinvested. |
| Effective 7/1/2013, the fund changed its benchmark from the S&P Municipal Bond Intermediate Index to the S&P Municipal Bond Investment Grade Intermediate |
| Index because the new benchmark index is more reflective of the credit quality of the fund’s portfolio holdings.The S&P Municipal Bond Investment Grade |
| Intermediate Index was launched on 3/19/13.Accordingly, the fund will continue to report the performance of the S&P Municipal Bond Intermediate Index until the |
| S&P Municipal Bond Investment Grade Intermediate Index has been calculated for a 10-year period. Performance information for the fund versus the S&P Municipal |
| Bond Investment Grade Intermediate Index is included in the graph and table on the next page. |
| The fund’s performance shown in the line graph above takes into account all applicable fees and expenses for Class M and Investor shares.The S&P Municipal Bond |
| Intermediate Index is comprised of bonds in the S&P Municipal Bond Index with a minimum maturity of 3 years and a maximum maturity of up to, but not |
| including 15 years as measured from the date on which the Index is rebalanced. Unlike a mutual fund, the S&P Municipal Bond Intermediate Index is not subject to |
| charges, fees and other expenses. Investors cannot invest directly in any index. Further information relating to fund performance, including expense reimbursements, if |
| applicable, is contained in the Financial Highlights section of the prospectus and elsewhere in this report. |
The Funds 5
FUND PERFORMANCE

Average Annual Total Returns as of 8/31/13
| Inception | From | ||
| Date | Inception | ||
| Class M shares | 3/31/13 | –3.74% | |
| Investor shares | 3/31/13 | –3.78% | |
| S&P Municipal Bond Investment | |||
| Grade Intermediate Index | 3/31/13 | –3.90% |
| †† Source: Bloomberg L.P. |
| Past performance is not predictive of future performance.The fund’s performance shown in the graph and table does not reflect the deduction of taxes that a shareholder |
| would pay on fund distributions or the redemption of fund shares. |
| The above graph compares a $10,000 investment made in Class M shares and Investor shares of BNY Mellon National Intermediate Municipal Bond Fund on |
| 3/31/13 to a $10,000 investment made in the S&P Municipal Bond Investment Grade Intermediate Index on that date.All dividends and capital gain |
| distributions are reinvested. |
| Effective 7/1/2013, the fund changed its benchmark from the S&P Municipal Bond Intermediate Index to the S&P Municipal Bond Investment Grade Intermediate |
| Index because the new benchmark index is more reflective of the credit quality of the fund’s portfolio holdings.The S&P Municipal Bond Investment Grade |
| Intermediate Index was launched on 3/19/13.Accordingly, the fund will continue to report the performance of the S&P Municipal Bond Intermediate Index until the |
| S&P Municipal Bond Investment Grade Intermediate Index has been calculated for a 10-year period. |
| The fund’s performance shown in the line graph above takes into account all applicable fees and expenses for Class M and Investor shares.The S&P Municipal Bond |
| Investment Grade Intermediate Index is comprised of bonds in the S&P Municipal Bond Index that are rated at least BBB- by Standard & Poor’s Ratings Services, |
| Baa3 by Moody’s Investor Services, Inc. or BBB- by Fitch Ratings with a minimum maturity of 3 years and a maximum maturity of up to, but not including, 15 |
| years as measured from the date on which the Index is rebalanced. Unlike a mutual fund, the S&P Municipal Bond Investment Grade Intermediate Index is not |
| subject to charges, fees and other expenses. Investors cannot invest directly in any index. Further information relating to fund performance, including expense |
| reimbursements, if applicable, is contained in the Financial Highlights section of the prospectus and elsewhere in this report. |
6
The Funds 7
DISCUSSION OF FUND PERFORMANCE (continued)
8
FUND PERFORMANCE
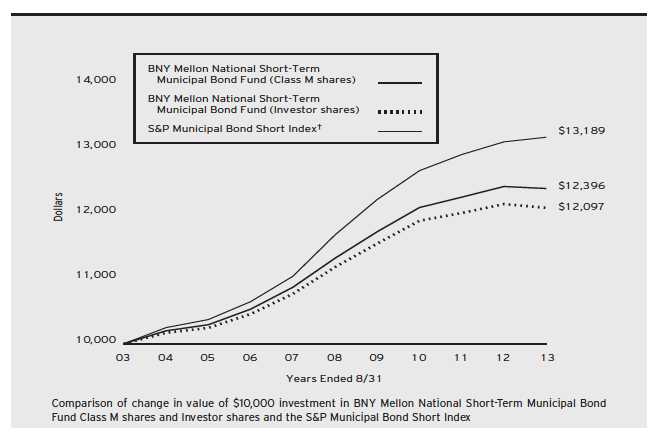
Average Annual Total Returns as of 8/31/13
| 1 Year | 5 Years | 10 Years | ||||
| Class M shares | –0.27 | % | 1.83 | % | 2.17 | % |
| Investor shares | –0.52 | % | 1.58 | % | 1.92 | % |
| S&P Municipal Bond Short Index | 0.56 | % | 2.46 | % | 2.81 | % |
| † Source: Lipper Inc. |
| Past performance is not predictive of future performance.The fund’s performance shown in the graph and table does not reflect the deduction of taxes that a shareholder |
| would pay on fund distributions or the redemption of fund shares. |
| The above graph compares a $10,000 investment made in Class M shares and Investor shares of BNY Mellon National Short-Term Municipal Bond Fund on |
| 8/31/03 to a $10,000 investment made in the S&P Municipal Bond Short Index on that date.All dividends and capital gain distributions are reinvested. |
| Effective 7/1/2013, the fund changed its benchmark from the S&P Municipal Bond Short Index to the S&P Municipal Bond Investment Grade Short Index |
| because the new benchmark index is more reflective of the credit quality of the fund’s portfolio holdings.The S&P Municipal Bond Investment Grade Short Index was |
| launched on 3/19/13.Accordingly, the fund will continue to report the performance of the S&P Municipal Bond Short Index until the S&P Municipal Bond |
| Investment Grade Short Index has been calculated for a 10-year period. Performance information for the fund versus the S&P Municipal Bond Investment Grade |
| Short Index is included in the graph and table on the next page. |
| The fund’s performance shown in the line graph above takes into account all applicable fees and expenses for Class M and Investor shares.The S&P Municipal Bond |
| Short Index is comprised of bonds in the S&P Municipal Bond Index with a minimum maturity of 6 months and a maximum maturity of up to, but not including 4 |
| years as measured from the date on which the Index is rebalanced. Unlike a mutual fund, the S&P Municipal Bond Short Index is not subject to charges, fees and |
| other expenses. Investors cannot invest directly in any index. Further information relating to fund performance, including expense reimbursements, if applicable, is |
| contained in the Financial Highlights section of the prospectus and elsewhere in this report. |
The Funds 9
FUND PERFORMANCE
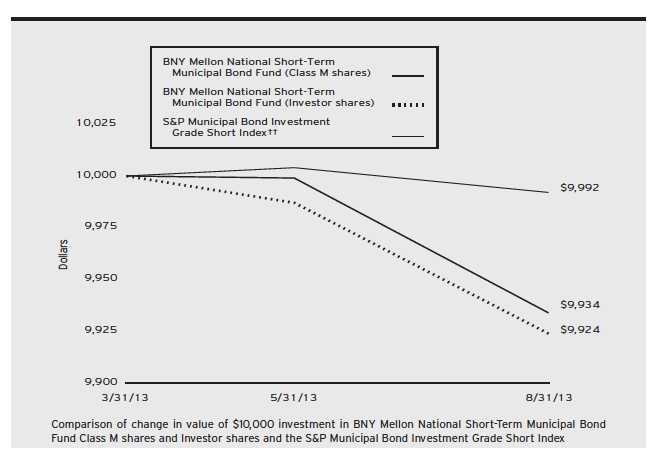
Average Annual Total Returns as of 8/31/13
| Inception | From | ||
| Date | Inception | ||
| Class M shares | 3/31/13 | –0.66 | % |
| Investor shares | 3/31/13 | –0.76 | % |
| S&P Municipal Bond Investment | |||
| Grade Short Index | 3/31/13 | –0.08 | % |
| †† Source: Bloomberg L.P. |
| Past performance is not predictive of future performance.The fund’s performance shown in the graph and table does not reflect the deduction of taxes that a shareholder |
| would pay on fund distributions or the redemption of fund shares. |
| The above graph compares a $10,000 investment made in Class M shares and Investor shares of BNY Mellon National Short-Term Municipal Bond Fund on |
| 3/31/13 to a $10,000 investment made in the S&P Municipal Bond Investment Grade Short Index on that date. All dividends and capital gain distributions |
| are reinvested. |
| Effective 7/1/2013, the fund changed its benchmark from the S&P Municipal Bond Short Index to the S&P Municipal Bond Investment Grade Short Index |
| because the new benchmark index is more reflective of the credit quality of the fund’s portfolio holdings.The S&P Municipal Bond Investment Grade Short Index was |
| launched on 3/19/13.Accordingly, the fund will continue to report the performance of the S&P Municipal Bond Short Index until the S&P Municipal Bond |
| Investment Grade Short Index has been calculated for a 10-year period. |
| The fund’s performance shown in the line graph above takes into account all applicable fees and expenses for Class M and Investor shares.The S&P Municipal Bond |
| Investment Grade Short Index is comprised of bonds in the S&P Municipal Bond Index that are rated at least BBB- by S&P, Baa3 by Moody’s or BBB- by Fitch |
| with a minimum maturity of 6 months and a maximum maturity of up to, but not including, 4 years as measured from the date on which the Index is rebalanced. |
| Unlike a mutual fund, the S&P Municipal Bond Investment Grade Short Index is not subject to charges, fees and other expenses. Investors cannot invest directly in |
| any index. Further information relating to fund performance, including expense reimbursements, if applicable, is contained in the Financial Highlights section of the |
| prospectus and elsewhere in this report. |
10
The Funds 11
DISCUSSION OF FUND PERFORMANCE (continued)
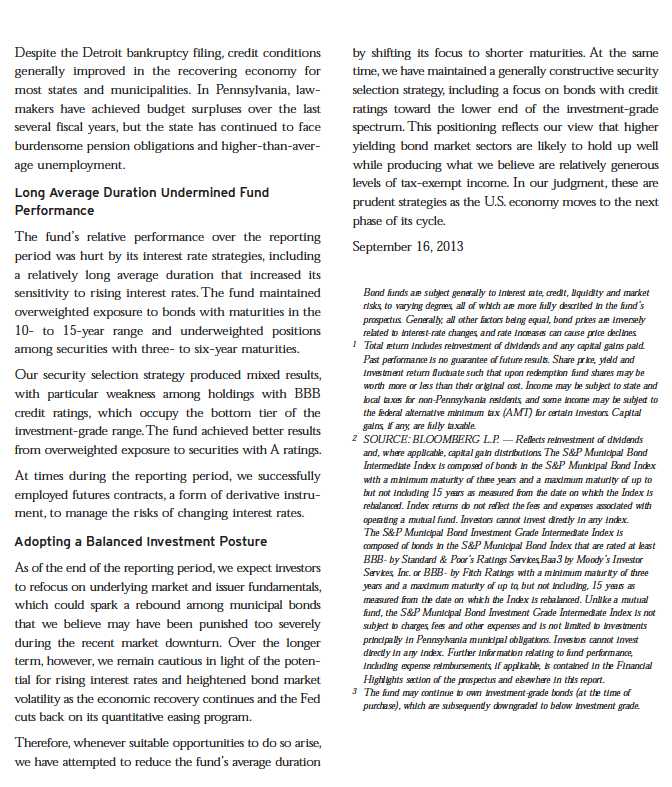
12
FUND PERFORMANCE
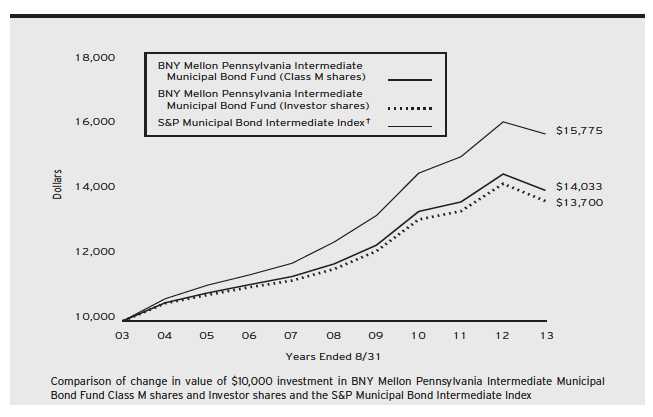
Average Annual Total Returns as of 8/31/13
| 1 Year | 5 Years | 10 Years | ||||
| Class M shares | –3.47 | % | 3.60 | % | 3.45 | % |
| Investor shares | –3.71 | % | 3.38 | % | 3.20 | % |
| S&P Municipal Bond Intermediate Index | –2.26 | % | 4.87 | % | 4.66 | % |
| † Source: Lipper Inc. |
| Past performance is not predictive of future performance.The fund’s performance shown in the graph and table does not reflect the deduction of taxes that a shareholder |
| would pay on fund distributions or the redemption of fund shares. |
| The above graph compares a $10,000 investment made in Class M shares and Investor shares of BNY Mellon Pennsylvania Intermediate Municipal Bond Fund on |
| 8/31/03 to a $10,000 investment made in the S&P Municipal Bond Intermediate Index on that date.All dividends and capital gain distributions are reinvested. |
| Effective 7/1/2013, the fund changed its benchmark from the S&P Municipal Bond Intermediate Index to the S&P Municipal Bond Investment Grade Intermediate |
| Index because the new benchmark index is more reflective of the credit quality of the fund’s portfolio holdings.The S&P Municipal Bond Investment Grade |
| Intermediate Index was launched on 3/19/13.Accordingly, the fund will continue to report the performance of the S&P Municipal Bond Intermediate Index until the |
| S&P Municipal Bond Investment Grade Intermediate Index has been calculated for a 10-year period. Performance information for the fund versus the S&P Municipal |
| Bond Investment Grade Intermediate Index is included in the graph and table on the next page. |
| The fund invests primarily in Pennsylvania investment-grade municipal bonds.The fund’s performance shown in the line graph above takes into account all applicable |
| fees and expenses for Class M and Investor shares.The S&P Municipal Bond Intermediate Index is comprised of bonds in the S&P Municipal Bond Index with a |
| minimum maturity of 3 years and a maximum maturity of up to, but not including 15 years as measured from the date on which the Index is rebalanced. Unlike a |
| mutual fund, the S&P Municipal Bond Intermediate Index is are not subject to charges, fees and other expenses and is not limited to investments principally in |
| Pennsylvania municipal obligations. Investors cannot invest directly in any index. Further information relating to fund performance, including expense reimbursements, if |
| applicable, is contained in the Financial Highlights section of the prospectus and elsewhere in this report. |
The Funds 13
FUND PERFORMANCE
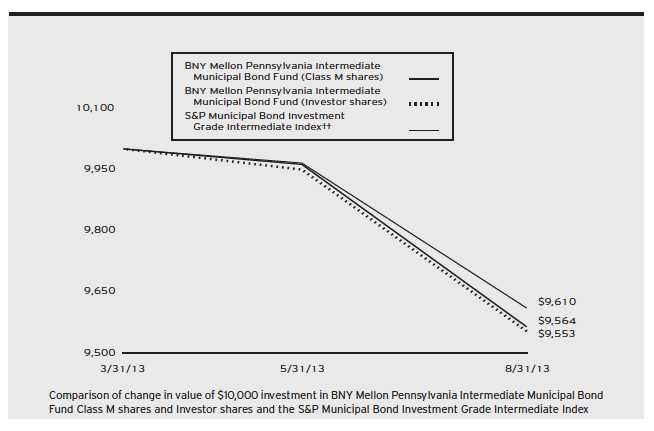
Average Annual Total Returns as of 8/31/13
| Inception | From | ||
| Date | Inception | ||
| Class M shares | 3/31/13 | –4.47 | % |
| Investor shares | 3/31/13 | –4.36 | % |
| S&P Municipal Bond Investment | |||
| Grade Intermediate Index | 3/31/13 | –3.90 | % |
| †† Source: Bloomberg L.P. |
| Past performance is not predictive of future performance.The fund’s performance shown in the graph and table does not reflect the deduction of taxes that a shareholder |
| would pay on fund distributions or the redemption of fund shares. |
| The above graph compares a $10,000 investment made in Class M shares and Investor shares of BNY Mellon Pennsylvania Intermediate Municipal Bond Fund on |
| 3/31/13 to a $10,000 investment made in the S&P Municipal Bond Investment Grade Intermediate Index on that date.All dividends and capital gain |
| distributions are reinvested. |
| Effective 7/1/2013, the fund changed its benchmark from the S&P Municipal Bond Intermediate Index to the S&P Municipal Bond Investment Grade Intermediate |
| Index because the new benchmark index is more reflective of the credit quality of the fund’s portfolio holdings.The S&P Municipal Bond Investment Grade |
| Intermediate Index was launched on 3/19/13.Accordingly, the fund will continue to report the performance of the S&P Municipal Bond Intermediate Index until the |
| S&P Municipal Bond Investment Grade Intermediate Index has been calculated for a 10-year period. |
| The fund invests primarily in Pennsylvania investment-grade municipal bonds.The fund’s performance shown in the line graph above takes into account all applicable |
| fees and expenses for Class M and Investor shares.The S&P Municipal Bond Investment Grade Intermediate Index is comprised of bonds in the S&P Municipal |
| Bond Index that are rated at least BBB- by Standard & Poor’s Ratings Services, Baa3 by Moody’s Investor Services, Inc. or BBB- by Fitch Ratings with a |
| minimum maturity of 3 years and a maximum maturity of up to, but not including, 15 years as measured from the date on which the Index is rebalanced. Unlike a |
| mutual fund, the S&P Municipal Bond Investment Grade Intermediate Index is are not subject to charges, fees and other expenses and is not limited to investments |
| principally in Pennsylvania municipal obligations. Investors cannot invest directly in any index. Further information relating to fund performance, including expense |
| reimbursements, if applicable, is contained in the Financial Highlights section of the prospectus and elsewhere in this report. |
14
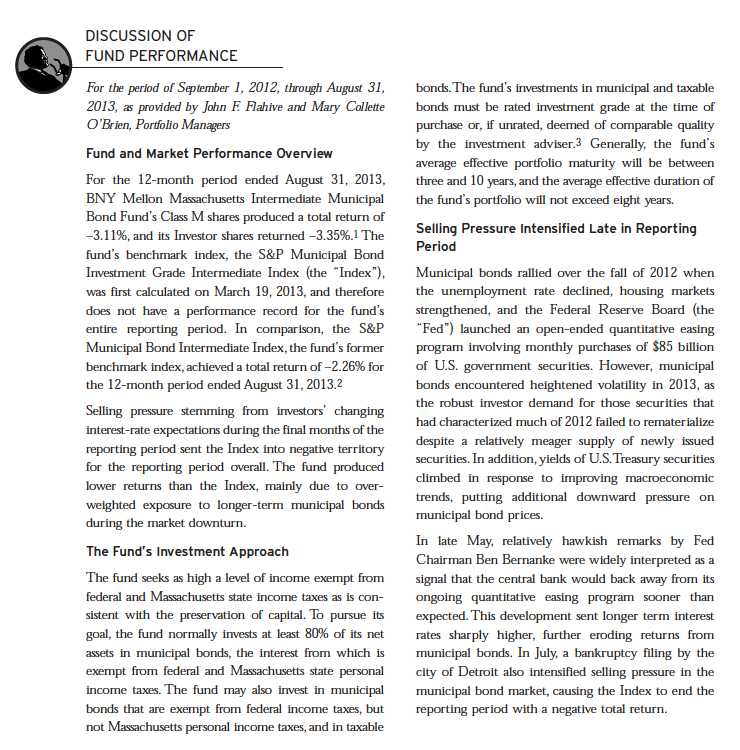
The Funds 15
DISCUSSION OF FUND PERFORMANCE (continued)
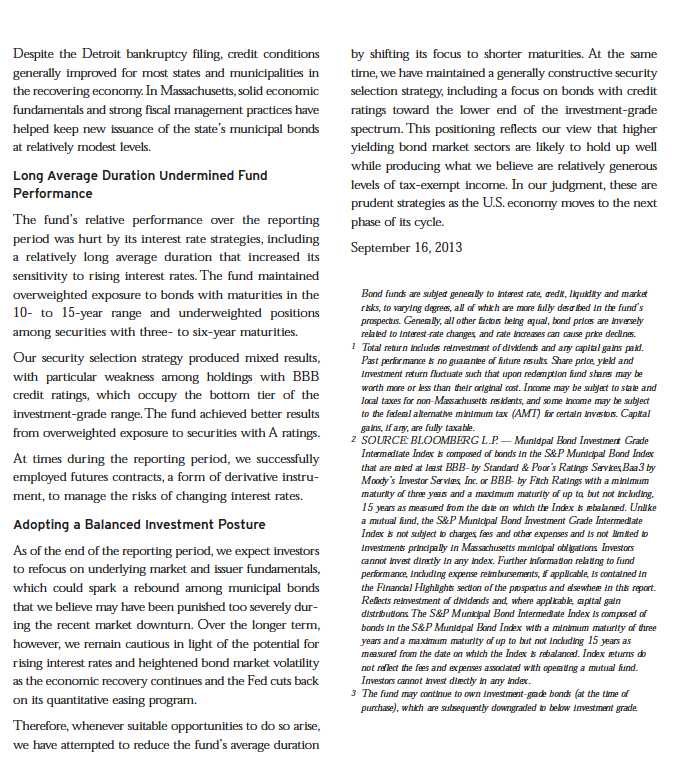
16
FUND PERFORMANCE
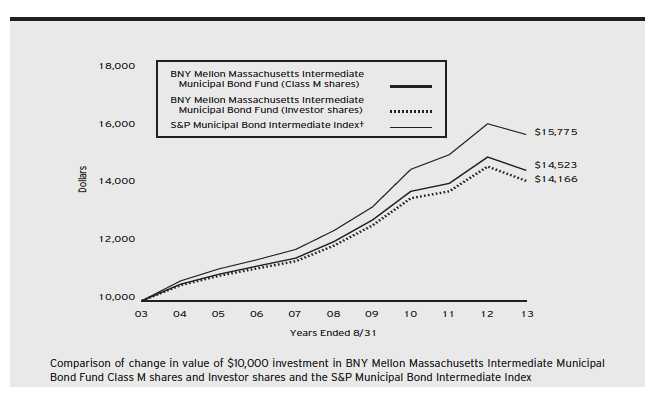
Average Annual Total Returns as of 8/31/13
| 1 Year | 5 Years | 10 Years | ||||
| Class M shares | –3.11 | % | 3.79 | % | 3.80 | % |
| Investor shares | –3.35 | % | 3.53 | % | 3.54 | % |
| S&P Municipal Bond Intermediate Index | –2.26 | % | 4.87 | % | 4.66 | % |
| † Source: Lipper Inc. |
| Past performance is not predictive of future performance. |
| The above graph compares a $10,000 investment made in Class M shares and Investor shares of BNY Mellon Massachusetts Intermediate Municipal Bond Fund on |
| 8/31/03 to a $10,000 investment made in the S&P Municipal Bond Intermediate Index on that date.All dividends and capital gain distributions are reinvested. |
| Effective 7/1/2013, the fund changed its benchmark from the S&P Municipal Bond Intermediate Index to the S&P Municipal Bond Investment Grade Intermediate |
| Index because the new benchmark index is more reflective of the credit quality of the fund’s portfolio holdings.The S&P Municipal Bond Investment Grade |
| Intermediate Index was launched on 3/19/13.Accordingly, the fund will continue to report the performance of the S&P Municipal Bond Intermediate Index until the |
| S&P Municipal Bond Investment Grade Intermediate Index has been calculated for a 10-year period. Performance information for the fund versus the S&P Municipal |
| Bond Investment Grade Intermediate Index is included in the graph and table on the next page. |
| The fund’s performance shown in the line graph above takes into account all applicable fees and expenses for Class M and Investor shares.The S&P Municipal Bond |
| Intermediate Index is comprised of bonds in the S&P Municipal Bond Index with a minimum maturity of 3 years and a maximum maturity of up to, but not |
| including 15 years as measured from the date on which the Index is rebalanced. Unlike a mutual fund, the S&P Municipal Bond Intermediate Index is not subject to |
| charges, fees and other expenses and is not limited to investments principally in Massachusetts municipal obligations. Investors cannot invest directly in any index. |
| Further information relating to fund performance, including expense reimbursements, if applicable, is contained in the Financial Highlights section of the prospectus and |
| elsewhere in this report. |
The Funds 17
FUND PERFORMANCE
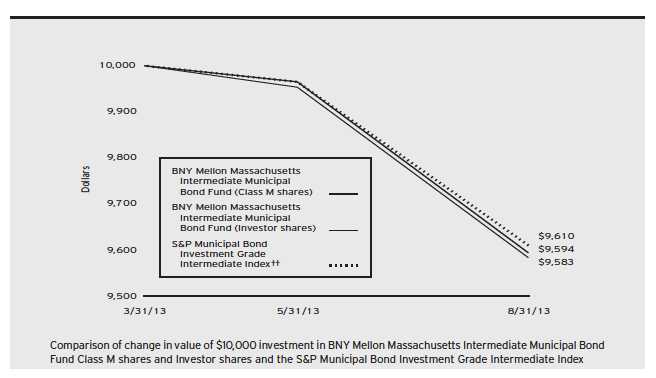
Average Annual Total Returns as of 8/31/13
| Inception | From | ||
| Date | Inception | ||
| Class M shares | 3/31/13 | –4.07 | % |
| Investor shares | 3/31/13 | –4.17 | % |
| S&P Municipal Bond Investment | |||
| Grade Intermediate Index | 3/31/13 | –3.90 | % |
| †† Source: Bloomberg L.P. |
| Past performance is not predictive of future performance. |
| The above graph compares a $10,000 investment made in Class M shares and Investor shares of BNY Mellon Massachusetts Intermediate Municipal Bond Fund on |
| 3/31/13 to a $10,000 investment made in the S&P Municipal Bond Investment Grade Intermediate Index on that date.All dividends and capital gain |
| distributions are reinvested. |
| Effective 7/1/2013, the fund changed its benchmark from the S&P Municipal Bond Intermediate Index to the S&P Municipal Bond Investment Grade Intermediate |
| Index because the new benchmark index is more reflective of the credit quality of the fund’s portfolio holdings.The S&P Municipal Bond Investment Grade |
| Intermediate Index was launched on 3/19/13.Accordingly, the fund will continue to report the performance of the S&P Municipal Bond Intermediate Index until the |
| S&P Municipal Bond Investment Grade Intermediate Index has been calculated for a 10-year period. |
| The fund’s performance shown in the line graph above takes into account all applicable fees and expenses for Class M and Investor shares.The S&P Municipal Bond |
| Investment Grade Intermediate Index is comprised of bonds in the S&P Municipal Bond Index that are rated at least BBB- by Standard & Poor’s Ratings Services, |
| Baa3 by Moody’s Investor Services, Inc. or BBB- by Fitch Ratings with a minimum maturity of 3 years and a maximum maturity of up to, but not including, 15 |
| years as measured from the date on which the Index is rebalanced. Unlike a mutual fund, the S&P Municipal Bond Investment Grade Intermediate Index is not |
| subject to charges, fees and other expenses and is not limited to investments principally in Massachusetts municipal obligations. Investors cannot invest directly in any |
| index. Further information relating to fund performance, including expense reimbursements, if applicable, is contained in the Financial Highlights section of the |
| prospectus and elsewhere in this report. |
18
The Funds 19
DISCUSSION OF FUND PERFORMANCE (continued)
20
FUND PERFORMANCE
![]()
Average Annual Total Returns as of 8/31/13
| 1 Year | 5 Years | 10 Years | ||||
| Class M shares | –3.40 | % | 3.98 | % | 3.82 | % |
| Investor shares | –3.63 | % | 3.72 | % | 3.57 | % |
| S&P Municipal Bond Intermediate Index | –2.26 | % | 4.87 | % | 4.66 | % |
| † Source: Lipper Inc. |
| Past performance is not predictive of future performance.The fund’s performance shown in the graph and table does not reflect the deduction of taxes that a shareholder |
| would pay on fund distributions or the redemption of fund shares. |
| The above graph compares a $10,000 investment made in Class M shares and Investor shares of BNY Mellon NewYork Intermediate Tax-Exempt Bond Fund on |
| 8/31/03 to a $10,000 investment made in the S&P Municipal Bond Intermediate Index on that date.All dividends and capital gain distributions are reinvested. |
| Effective 7/1/2013, the fund changed its benchmark from the S&P Municipal Bond Intermediate Index to the S&P Municipal Bond Investment Grade Intermediate |
| Index because the new benchmark index is more reflective of the credit quality of the fund’s portfolio holdings.The S&P Municipal Bond Investment Grade |
| Intermediate Index was launched on 3/19/13.Accordingly, the fund will continue to report the performance of the S&P Municipal Bond Intermediate Index until the |
| S&P Municipal Bond Investment Grade Intermediate Index has been calculated for a 10-year period. Performance information for the fund versus the S&P Municipal |
| Bond Investment Grade Intermediate Index is included in the graph and table on the next page. |
| As of the close of business on September 12, 2008, substantially all of the assets of another investment company advised by an affiliate of the fund’s investment adviser, |
| BNY Hamilton NewYork Intermediate Tax-Exempt Fund (the “predecessor fund”), a series of BNY Hamilton Funds, Inc., were transferred to BNY Mellon NewYork |
| Intermediate Tax-Exempt Bond Fund in a tax-free reorganization and the fund commenced operations.The performance figures for the fund’s Class M shares represent |
| the performance of the predecessor fund’s Institutional shares prior to the commencement of operations for BNY Mellon NewYork Intermediate Tax-Exempt Bond Fund |
| and the performance of BNY Mellon NewYork Intermediate Tax-Exempt Bond Fund’s Class M shares thereafter.The performance figures for Investor shares represent |
| the performance of the predecessor fund’s Class A shares prior to the commencement of operations for BNY Mellon NewYork Intermediate Tax-Exempt Bond Fund and |
| the performance of BNY Mellon NewYork Intermediate Tax-Exempt Bond Fund’s Investor shares thereafter. Investor shares are subject to a Shareholder Services Plan. |
| The fund’s performance shown in the line graph above takes into account all applicable fees and expenses for Class M and Investor shares.The S&P Municipal Bond |
| Intermediate Index is comprised of bonds in the S&P Municipal Bond Index with a minimum maturity of 3 years and a maximum maturity of up to, but not including |
| 15 years as measured from the date on which the Index is rebalanced. Unlike a mutual fund, the S&P Municipal Bond Intermediate Index is not subject to charges, fees |
| and other expenses and is not limited to investments principally in NewYork municipal obligations. Investors cannot invest directly in any index. Further information |
| relating to fund performance, including expense reimbursements, if applicable, is contained in the Financial Highlights section of the prospectus and elsewhere in this report. |
The Funds 21
FUND PERFORMANCE
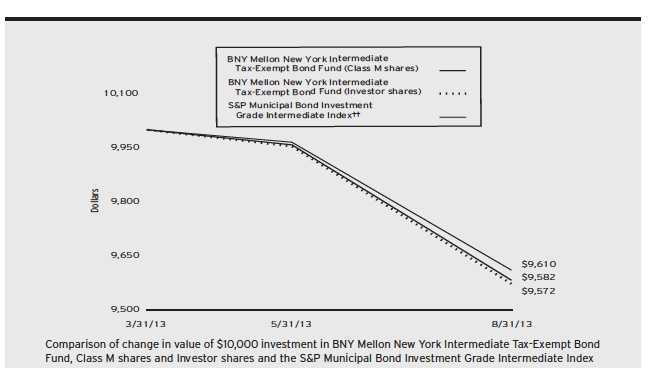
Average Annual Total Returns as of 8/31/13
| Inception | From | ||
| Date | Inception | ||
| Class M shares | 3/31/13 | –4.18 | % |
| Investor shares | 3/31/13 | –4.28 | % |
| S&P Municipal Bond Investment | |||
| Grade Intermediate Index | 3/31/13 | –3.90 | % |
| †† Source: Bloomberg L.P. |
| Past performance is not predictive of future performance.The fund’s performance shown in the graph and table does not reflect the deduction of taxes that a shareholder |
| would pay on fund distributions or the redemption of fund shares. |
| The above graph compares a $10,000 investment made in Class M shares and Investor shares of BNY Mellon New York Intermediate Tax-Exempt Bond Fund |
| on 3/31/13 to a $10,000 investment made in the S&P Municipal Bond Investment Grade Intermediate Index on that date. All dividends and capital gain |
| distributions are reinvested. |
| Effective 7/1/2013, the fund changed its benchmark from the S&P Municipal Bond Intermediate Index to the S&P Municipal Bond Investment Grade Intermediate |
| Index because the new benchmark index is more reflective of the credit quality of the fund’s portfolio holdings.The S&P Municipal Bond Investment Grade |
| Intermediate Index was launched on 3/19/13.Accordingly, the fund will continue to report the performance of the S&P Municipal Bond Intermediate Index until the |
| S&P Municipal Bond Investment Grade Intermediate Index has been calculated for a 10-year period. |
| As of the close of business on September 12, 2008, substantially all of the assets of another investment company advised by an affiliate of the fund’s investment adviser, |
| BNY Hamilton NewYork Intermediate Tax-Exempt Fund (the “predecessor fund”), a series of BNY Hamilton Funds, Inc., were transferred to BNY Mellon NewYork |
| Intermediate Tax-Exempt Bond Fund in a tax-free reorganization and the fund commenced operations.The performance figures for the fund’s Class M shares represent |
| the performance of the predecessor fund’s Institutional shares prior to the commencement of operations for BNY Mellon NewYork Intermediate Tax-Exempt Bond Fund |
| and the performance of BNY Mellon NewYork Intermediate Tax-Exempt Bond Fund’s Class M shares thereafter.The performance figures for Investor shares represent |
| the performance of the predecessor fund’s Class A shares prior to the commencement of operations for BNY Mellon NewYork Intermediate Tax-Exempt Bond Fund and |
| the performance of BNY Mellon NewYork Intermediate Tax-Exempt Bond Fund’s Investor shares thereafter. Investor shares are subject to a Shareholder Services Plan. |
| The fund’s performance shown in the line graph above takes into account all applicable fees and expenses for Class M and Investor shares.The S&P Municipal Bond |
| Investment Grade Intermediate Index is comprised of bonds in the S&P Municipal Bond Index that are rated at least BBB- by Standard & Poor’s Ratings Services, Baa3 |
| by Moody’s Investor Services, Inc. or BBB- by Fitch Ratings with a minimum maturity of 3 years and a maximum maturity of up to, but not including, 15 years as |
| measured from the date on which the Index is rebalanced. Unlike a mutual fund, the S&P Municipal Bond Investment Grade Intermediate Index is not subject to charges, |
| fees and other expenses and is not limited to investments principally in NewYork municipal obligations. Investors cannot invest directly in any index. Further information |
| relating to fund performance, including expense reimbursements, if applicable, is contained in the Financial Highlights section of the prospectus and elsewhere in this report. |
22

The Funds 23
DISCUSSION OF FUND PERFORMANCE (continued)
24
FUND PERFORMANCE
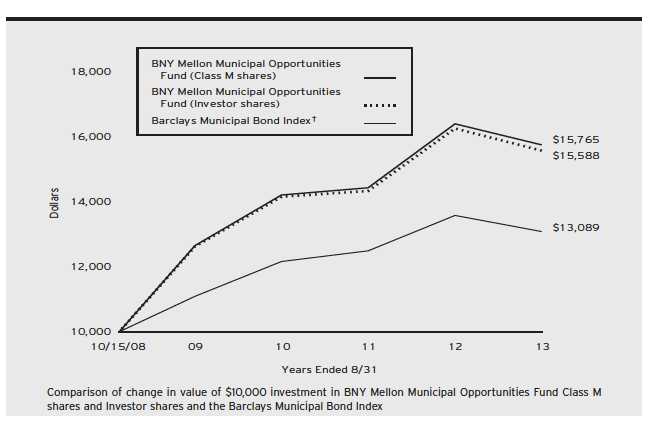
Average Annual Total Returns as of 8/31/13
| Inception Date | 1 Year | From Inception | |||
| Class M shares | 10/15/08 | –3.95 | % | 9.78 | % |
| Investor shares | 10/15/08 | –4.19 | % | 9.52 | % |
| Barclays Municipal Bond Index | 9/30/08 | –3.70 | % | 5.63 | %†† |
| † Source: Lipper Inc. |
| Past performance is not predictive of future performance.The fund’s performance shown in the graph and table does not reflect the deduction of taxes that a shareholder |
| would pay on fund distributions or the redemption of fund shares. |
| The above graph compares a $10,000 investment made in Class M shares and Investor shares of BNY Mellon Municipal Opportunities Fund on 10/15/08 (inception |
| date) to a $10,000 investment made in the Barclays Municipal Bond Index (the “Index”) on that date.All dividends and capital gain distributions are reinvested. |
| The fund’s performance shown in the line graph above takes into account all applicable fees and expenses for Class M and Investor shares.The Index is an unmanaged |
| total return performance benchmark for the long-term, investment-grade, tax-exempt bond market. Unlike a mutual fund, the Index is not subject to charges, fees and |
| other expenses. Investors cannot invest directly in any index. Further information relating to fund performance, including expense reimbursements, if applicable, is |
| contained in the Financial Highlights section of the prospectus and elsewhere in this report. |
| †† For comparative purposes, the value of the Index as of 9/30/08 is used as the beginning value on 10/15/08. |
The Funds 25
UNDERSTANDING YOUR FUND’S EXPENSES (Unaudited)
As a mutual fund investor, you pay ongoing expenses, such as management fees and other expenses. Using the information below, you can estimate how these expenses affect your investment and compare them with the expenses of other funds.You also may pay one-time transaction expenses, including sales charges (loads) and redemptions fees, which are not shown in this section and would have resulted in higher total expenses. For more information, see your fund’s prospectus or talk to your financial adviser.
Review your fund’s expenses
The table below shows the expenses you would have paid on a $1,000 investment in each class of each BNY Mellon municipal bond fund from March 1, 2013 to August 31, 2013. It also shows how much a $1,000 investment would be worth at the close of the period, assuming actual returns and expenses.
Expenses and Value of a $1,000 Investment
assuming actual returns for the six months ended August 31, 2013
| Class M Shares | Investor Shares | |||||
| BNY Mellon National Intermediate | ||||||
| Municipal Bond Fund | ||||||
| Expenses paid per $1,000† | $ | 2.47 | $ | 3.70 | ||
| Ending value (after expenses) | $ | 958.50 | $ | 957.20 | ||
| Annualized expense ratio (%) | .50 | .75 | ||||
| BNY Mellon National Short-Term | ||||||
| Municipal Bond Fund | ||||||
| Expenses paid per $1,000† | $ | 2.51 | $ | 3.82 | ||
| Ending value (after expenses) | $ | 993.30 | $ | 992.00 | ||
| Annualized expense ratio (%) | .50 | .76 | ||||
| BNY Mellon Pennsylvania | ||||||
| Intermediate Municipal Bond Fund | ||||||
| Expenses paid per $1,000† | $ | 3.29 | $ | 4.51 | ||
| Ending value (after expenses) | $ | 951.00 | $ | 950.50 | ||
| Annualized expense ratio (%) | .67 | .92 | ||||
| BNY Mellon Massachusetts | ||||||
| Intermediate Municipal Bond Fund | ||||||
| Expenses paid per $1,000† | $ | 2.61 | $ | 3.84 | ||
| Ending value (after expenses) | $ | 954.90 | $ | 953.70 | ||
| Annualized expense ratio (%) | .53 | .78 | ||||
| BNY Mellon New York | ||||||
| Intermediate Tax-Exempt Bond Fund | ||||||
| Expenses paid per $1,000† | $ | 2.91 | $ | 4.13 | ||
| Ending value (after expenses) | $ | 953.50 | $ | 952.30 | ||
| Annualized expense ratio (%) | .59 | .84 | ||||
| BNY Mellon Municipal | ||||||
| Opportunities Fund | ||||||
| Expenses paid per $1,000† | $ | 3.40 | $ | 4.66 | ||
| Ending value (after expenses) | $ | 924.70 | $ | 924.30 | ||
| Annualized expense ratio (%) | .70 | .96 | ||||
| † Expenses are equal to each fund’s annualized expense ratio as shown above, multiplied by the average account value over the period, multiplied by 184/365 (to reflect the one-half |
| year period). |
26
COMPARING YOUR FUND’S EXPENSES WITH THOSE OF OTHER FUNDS (Unaudited)
Using the SEC’s method to compare expenses
The Securities and Exchange Commission (SEC) has established guidelines to help investors assess fund expenses. Per these guidelines, the table below shows your fund’s expenses based on a $1,000 investment, assuming a hypothetical 5% annualized return.You can use this information to compare the ongoing expenses (but not transaction expenses or total cost) of investing in the fund with those of other funds.All mutual fund shareholder reports will provide this information to help you make this comparison. Please note that you cannot use this information to estimate your actual ending account balance and expenses paid during the period.
Expenses and Value of a $1,000 Investment
assuming a hypothetical 5% annualized return for the six months ended August 31, 2013
| Class M Shares | Investor Shares | |||
| BNY Mellon National Intermediate | ||||
| Municipal Bond Fund | ||||
| Expenses paid per $1,000† | $ | 2.55 | $ | 3.82 |
| Ending value (after expenses) | $ | 1,022.68 | $ | 1,021.42 |
| Annualized expense ratio (%) | .50 | .75 | ||
| BNY Mellon National Short-Term | ||||
| Municipal Bond Fund | ||||
| Expenses paid per $1,000† | $ | 2.55 | $ | 3.87 |
| Ending value (after expenses) | $ | 1,022.68 | $ | 1,021.37 |
| Annualized expense ratio (%) | .50 | .76 | ||
| BNY Mellon Pennsylvania | ||||
| Intermediate Municipal Bond Fund | ||||
| Expenses paid per $1,000† | $ | 3.40 | $ | 4.67 |
| Ending value (after expenses) | $ | 1,021.77 | $ | 1,020.51 |
| Annualized expense ratio (%) | .67 | .92 | ||
| BNY Mellon Massachusetts | ||||
| Intermediate Municipal Bond Fund | ||||
| Expenses paid per $1,000† | $ | 2.70 | $ | 3.97 |
| Ending value (after expenses) | $ | 1,022.53 | $ | 1,021.27 |
| Annualized expense ratio (%) | .53 | .78 | ||
| BNY Mellon New York | ||||
| Intermediate Tax-Exempt Bond Fund | ||||
| Expenses paid per $1,000† | $ | 3.01 | $ | 4.28 |
| Ending value (after expenses) | $ | 1,022.23 | $ | 1,020.97 |
| Annualized expense ratio (%) | .59 | .84 | ||
| BNY Mellon Municipal | ||||
| Opportunities Fund | ||||
| Expenses paid per $1,000† | $ | 3.57 | $ | 4.89 |
| Ending value (after expenses) | $ | 1,021.68 | $ | 1,020.37 |
| Annualized expense ratio (%) | .70 | .96 | ||
| † Expenses are equal to each fund’s annualized expense ratio as shown above, multiplied by the average account value over the period, multiplied by 184/365 (to reflect the one-half |
| year period). |
The Funds 27
STATEMENT OF INVESTMENTS
August 31, 2013
| BNY Mellon National Intermediate Municipal Bond Fund | |||||
| Long-Term Municipal | Coupon | Maturity | Principal | ||
| Investments—96.5% | Rate (%) | Date | Amount ($) | Value ($) | |
| Alabama—1.7% | |||||
| Alabama 21st Century Authority, Tobacco Settlement Revenue | 5.00 | 6/1/20 | 1,500,000 | 1,666,665 | |
| Alabama 21st Century Authority, Tobacco Settlement Revenue | 5.00 | 6/1/21 | 1,240,000 | 1,362,723 | |
| Birmingham Special Care Facilities Financing Authority-Baptist | |||||
| Medical Centers, Revenue (Baptist Health System, Inc.) | 5.00 | 11/15/15 | 5,000,000 | 5,280,850 | |
| Jefferson County, Limited Obligation School Warrants | 5.25 | 1/1/15 | 1,180,000 | 1,174,430 | |
| Jefferson County, Limited Obligation School Warrants | 5.25 | 1/1/16 | 4,810,000 | 4,788,163 | |
| Jefferson County, Limited Obligation School Warrants | |||||
| (Insured; Assured Guaranty Municipal Corp.) | 5.00 | 1/1/24 | 13,325,000 | 13,082,752 | |
| Montgomery BMC Special Care Facilities Financing | |||||
| Authority, Revenue (Baptist Health) (Insured; | |||||
| National Public Finance Guarantee Corp.) | 5.00 | 11/15/14 | 2,500,000 | 2,642,850 | |
| Alaska—1.0% | |||||
| Alaska Industrial Development and Export Authority, | |||||
| Revolving Fund Revenue | 5.25 | 4/1/27 | 2,295,000 | 2,464,394 | |
| Valdez, Marine Terminal Revenue (BP Pipelines (Alaska) Inc. Project) | 5.00 | 1/1/16 | 5,000,000 | 5,458,150 | |
| Valdez, Marine Terminal Revenue (BP Pipelines (Alaska) Inc. Project) | 5.00 | 1/1/18 | 8,000,000 | 9,055,920 | |
| Arizona—4.1% | |||||
| Arizona Board of Regents, Arizona State University | |||||
| System Revenue (Polytechnic Campus Project) | 6.00 | 7/1/25 | 2,500,000 | 2,892,300 | |
| Arizona Board of Regents, Arizona State University | |||||
| System Revenue (Polytechnic Campus Project) | 6.00 | 7/1/26 | 1,000,000 | 1,141,180 | |
| Arizona Board of Regents, Arizona State University | |||||
| System Revenue (Polytechnic Campus Project) | 6.00 | 7/1/28 | 1,100,000 | 1,243,770 | |
| Arizona Transportation Board, Highway Revenue | 5.00 | 7/1/26 | 5,000,000 | 5,384,950 | |
| Arizona Transportation Board, Highway Revenue (Prerefunded) | 5.00 | 7/1/16 | 15,000,000 | a | 16,801,200 |
| Arizona Transportation Board, Subordinated Highway Revenue | 5.00 | 7/1/31 | 4,335,000 | 4,529,945 | |
| Arizona Water Infrastructure Finance | |||||
| Authority, Water Quality Revenue | 5.00 | 10/1/21 | 3,000,000 | 3,494,610 | |
| Glendale, Senior Lien Water and Sewer Revenue Obligations | 5.00 | 7/1/25 | 6,325,000 | 6,840,614 | |
| Glendale, Senior Lien Water and Sewer Revenue Obligations | 5.00 | 7/1/26 | 4,425,000 | 4,715,811 | |
| Phoenix, GO | 6.25 | 7/1/16 | 1,250,000 | 1,441,400 | |
| Phoenix Civic Improvement Corporation, Junior Lien Airport Revenue | 5.00 | 7/1/29 | 5,000,000 | 5,074,850 | |
| Phoenix Civic Improvement Corporation, Transit Excise Tax | |||||
| Revenue (Light Rail Project) (Insured; AMBAC) (Prerefunded) | 5.00 | 7/1/14 | 6,000,000 | a | 6,236,580 |
| Salt River Project Agricultural Improvement and | |||||
| Power District, Salt River Project Electric System Revenue | 5.00 | 12/1/26 | 2,000,000 | 2,169,780 | |
| University Medical Center Corporation, HR | 5.25 | 7/1/16 | 2,310,000 | 2,380,386 | |
| University of Arizona Board of Regents, System Revenue | 6.20 | 6/1/16 | 5,850,000 | 6,275,470 | |
| California—16.3% | |||||
| Alameda Corridor Transportation Authority, | |||||
| Subordinate Lien Revenue (Insured; AMBAC) | 5.25 | 10/1/21 | 5,000,000 | 5,389,550 | |
| California, Economic Recovery Bonds | 5.00 | 7/1/15 | 2,950,000 | 3,066,083 | |
28
| BNY Mellon National Intermediate Municipal Bond Fund (continued) | |||||
| Long-Term Municipal | Coupon | Maturity | Principal | ||
| Investments (continued) | Rate (%) | Date | Amount ($) | Value ($) | |
| California (continued) | |||||
| California, GO | 0.74 | 5/1/15 | 7,500,000 | b | 7,529,625 |
| California, GO (Various Purpose) | 5.00 | 2/1/21 | 4,000,000 | 4,596,040 | |
| California, GO (Various Purpose) | 5.00 | 9/1/21 | 11,200,000 | 12,900,608 | |
| California, GO (Various Purpose) | 5.00 | 9/1/21 | 5,000,000 | 5,759,200 | |
| California, GO (Various Purpose) | 5.25 | 10/1/23 | 5,000,000 | 5,643,350 | |
| California, GO (Various Purpose) | 5.00 | 10/1/26 | 3,350,000 | 3,601,317 | |
| California, GO (Various Purpose) | 5.25 | 9/1/29 | 20,000,000 | 21,347,000 | |
| California, GO (Various Purpose) | 6.00 | 3/1/33 | 11,445,000 | 12,904,810 | |
| California, GO (Various Purpose) | 6.50 | 4/1/33 | 8,750,000 | 10,182,025 | |
| California, GO (Various Purpose) | 5.50 | 3/1/40 | 7,950,000 | 8,226,263 | |
| California Department of Water | |||||
| Resources, Power Supply Revenue | 5.00 | 5/1/22 | 5,000,000 | 5,662,200 | |
| California Department of Water Resources, Power Supply | |||||
| Revenue (Insured; Assured Guaranty Municipal Corp.) | 5.00 | 5/1/21 | 11,985,000 | 13,520,638 | |
| California Department of Water Resources, | |||||
| Water System Revenue (Central Valley Project) | 5.00 | 12/1/19 | 5,000,000 | 5,902,550 | |
| California Health Facilities Financing Authority, | |||||
| Revenue (City of Hope) | 5.00 | 11/15/23 | 1,500,000 | 1,628,805 | |
| California Health Facilities Financing Authority, | |||||
| Revenue (City of Hope) | 5.00 | 11/15/24 | 1,600,000 | 1,717,200 | |
| California Health Facilities Financing Authority, | |||||
| Revenue (Providence Health and Services) | 6.25 | 10/1/24 | 8,500,000 | 9,954,520 | |
| California Health Facilities Financing Authority, | |||||
| Revenue (Providence Health and Services) | 6.25 | 10/1/28 | 4,000,000 | 4,570,360 | |
| California Health Facilities Financing Authority, | |||||
| Revenue (Providence Health and Services) | 6.50 | 10/1/38 | 3,440,000 | 3,913,860 | |
| California Health Facilities Financing Authority, Revenue | |||||
| (Providence Health and Services) (Prerefunded) | 6.50 | 10/1/18 | 60,000 | a | 74,479 |
| California Health Facilities Financing Authority, | |||||
| Revenue (Saint Joseph Health System) | 5.00 | 10/17/17 | 5,000,000 | 5,650,800 | |
| California Infrastructure and Economic Development Bank, | |||||
| Revenue (California Independent System | |||||
| Operator Corporation Project) | 6.00 | 2/1/30 | 8,000,000 | 8,369,360 | |
| California Pollution Control Financing Authority, | |||||
| SWDR (Waste Management, Inc. Project) | 5.00 | 1/1/22 | 2,250,000 | 2,258,550 | |
| California Pollution Control Financing Authority, | |||||
| SWDR (Waste Management, Inc. Project) | 5.00 | 7/1/27 | 2,000,000 | 1,984,100 | |
| California State Public Works Board, LR (Department of | |||||
| General Services) (Capitol East End Complex—Blocks | |||||
| 171-174 and 225) (Insured; AMBAC) | 5.25 | 12/1/19 | 5,000,000 | 5,017,600 | |
| California State Public Works Board, LR (Department of | |||||
| General Services) (Capitol East End Complex—Blocks | |||||
| 171-174 and 225) (Insured; AMBAC) | 5.00 | 12/1/23 | 4,000,000 | 4,011,680 | |
The Funds 29
STATEMENT OF INVESTMENTS (continued)
| BNY Mellon National Intermediate Municipal Bond Fund (continued) | |||||
| Long-Term Municipal | Coupon | Maturity | Principal | ||
| Investments (continued) | Rate (%) | Date | Amount ($) | Value ($) | |
| California (continued) | |||||
| California State Public Works Board, LR (Various Capital Projects) | 5.00 | 4/1/19 | 8,760,000 | 10,045,442 | |
| California State Public Works Board, LR (Various Capital Projects) | 5.00 | 10/1/20 | 2,000,000 | 2,279,580 | |
| California State Public Works Board, LR (Various Capital Projects) | 5.00 | 11/1/20 | 1,350,000 | 1,539,108 | |
| California Statewide Communities Development Authority, | |||||
| Mortgage Revenue (Methodist Hospital of | |||||
| Southern California Project) (Collateralized; FHA) | 6.25 | 8/1/24 | 4,325,000 | 5,090,049 | |
| California Statewide Communities Development Authority, | |||||
| Revenue (Saint Joseph Health System) | |||||
| (Insured; Assured Guaranty Municipal Corp.) | 4.50 | 7/1/18 | 2,675,000 | 2,844,622 | |
| Los Angeles County Metropolitan Transportation Authority, | |||||
| Proposition A First Tier Senior Sales Tax Revenue | 5.00 | 7/1/20 | 7,165,000 | 8,389,642 | |
| Los Angeles Department of Airports, Senior | |||||
| Revenue (Los Angeles International Airport) | 5.25 | 5/15/26 | 15,520,000 | 16,604,072 | |
| Los Angeles Unified School District, GO | |||||
| (Insured; Assured Guaranty Municipal Corp.) | 5.00 | 7/1/24 | 2,395,000 | 2,669,036 | |
| Los Angeles Unified School District, GO | |||||
| (Insured; National Public Finance Guarantee Corp.) | 5.75 | 7/1/16 | 2,000,000 | 2,281,300 | |
| New Haven Unified School District, GO | |||||
| (Insured; Assured Guaranty Corp.) | 0.00 | 8/1/33 | 4,000,000 | c | 1,270,800 |
| Oakland Joint Powers Financing Authority, LR | |||||
| (Oakland Convention Centers) (Insured; AMBAC) | 5.50 | 10/1/13 | 1,500,000 | 1,505,055 | |
| Port of Oakland, Revenue | 5.00 | 5/1/18 | 1,835,000 | 2,054,062 | |
| Port of Oakland, Revenue | 5.00 | 5/1/19 | 2,250,000 | 2,514,960 | |
| Port of Oakland, Revenue | 5.00 | 5/1/20 | 3,000,000 | 3,314,370 | |
| Port of Oakland, Revenue | 5.00 | 5/1/21 | 2,785,000 | 3,044,283 | |
| Port of Oakland, Revenue | 5.00 | 5/1/23 | 1,875,000 | 1,981,669 | |
| Rancho Santiago Community College District, GO | 5.00 | 9/1/25 | 8,000,000 | 8,848,800 | |
| Riverside County Transportation Commission, Sales Tax Revenue | 5.25 | 6/1/25 | 4,635,000 | 5,261,142 | |
| Riverside County Transportation | |||||
| Commission, Sales Tax Revenue | 5.25 | 6/1/28 | 5,000,000 | 5,453,900 | |
| Sacramento County Water Financing Authority, | |||||
| Revenue (Sacramento County Water Agency | |||||
| Zones 40 and 41 Water System Project) (Insured; | |||||
| National Public Finance Guarantee Corp.) | 0.73 | 6/1/34 | 8,000,000 | b | 6,390,080 |
| San Francisco City and County Airport Commission, | |||||
| Second Series Revenue (San Francisco International Airport) | 5.00 | 5/1/25 | 5,000,000 | 5,350,000 | |
| San Francisco City and County Airport Commission, | |||||
| Second Series Revenue (San Francisco International Airport) | 5.00 | 5/1/26 | 5,000,000 | 5,287,750 | |
| Southern California Public Power Authority, | |||||
| Gas Project Revenue (Project Number 1) | 5.25 | 11/1/20 | 4,000,000 | 4,369,760 | |
| Westside Unified School District, GO (Insured; AMBAC) | 6.00 | 8/1/14 | 385,000 | 400,927 | |
30
| BNY Mellon National Intermediate Municipal Bond Fund (continued) | |||||
| Long-Term Municipal | Coupon | Maturity | Principal | ||
| Investments (continued) | Rate (%) | Date | Amount ($) | Value ($) | |
| Colorado—4.3% | |||||
| City and County of Denver, Airport System | |||||
| Revenue (Insured: Assured Guaranty Corp. | |||||
| and National Public Finance GuaranteeCorp.) | 5.25 | 11/15/19 | 4,445,000 | 4,980,756 | |
| Colorado Health Facilities Authority, | |||||
| Revenue (Catholic Health Initiatives) | 6.00 | 10/1/23 | 2,000,000 | 2,317,560 | |
| Colorado Health Facilities Authority, | |||||
| Revenue (Catholic Health Initiatives) | 6.25 | 10/1/33 | 1,600,000 | 1,804,304 | |
| Colorado Health Facilities Authority, | |||||
| Revenue (Vail Valley Medical Center Project) | 5.00 | 1/15/20 | 280,000 | 285,774 | |
| Colorado Health Facilities Authority, Revenue | |||||
| (Vail Valley Medical Center Project) (Prerefunded) | 5.00 | 1/15/15 | 970,000 | a | 1,030,577 |
| Colorado Housing and Finance Authority, Single Family | |||||
| Program Senior and Subordinate Bonds | 6.75 | 4/1/15 | 10,000 | 10,402 | |
| Colorado Housing and Finance Authority, Single Family | |||||
| Program Senior and Subordinate Bonds | 6.05 | 10/1/16 | 15,000 | 15,094 | |
| E-470 Public Highway Authority, Senior Revenue | |||||
| (Insured; National Public Finance Guarantee Corp.) | 5.00 | 9/1/16 | 3,565,000 | 3,823,569 | |
| E-470 Public Highway Authority, Senior Revenue | |||||
| (Insured; National Public Finance Guarantee Corp.) | 5.25 | 9/1/16 | 5,000,000 | 5,398,600 | |
| E-470 Public Highway Authority, Senior Revenue | |||||
| (Insured; National Public Finance Guarantee Corp.) | 1.81 | 9/1/17 | 5,000,000 | b | 5,000,350 |
| E-470 Public Highway Authority, Senior Revenue | |||||
| (Insured; National Public Finance Guarantee Corp.) | 5.00 | 9/1/17 | 3,500,000 | 3,779,335 | |
| Northwest Parkway Public Highway Authority, | |||||
| Revenue (Insured; AMBAC) (Prerefunded) | 5.45 | 6/15/16 | 7,690,000 | a | 8,676,396 |
| Northwest Parkway Public Highway Authority, | |||||
| Revenue (Insured; AMBAC) (Prerefunded) | 5.70 | 6/15/16 | 7,345,000 | a | 8,337,750 |
| Northwest Parkway Public Highway Authority, | |||||
| Revenue (Insured; Assured Guaranty | |||||
| Municipal Corp.) (Prerefunded) | 5.55 | 6/15/16 | 10,960,000 | a | 12,396,089 |
| Public Authority for Colorado Energy, | |||||
| Natural Gas Purchase Revenue | 5.75 | 11/15/18 | 2,515,000 | 2,796,051 | |
| Public Authority for Colorado Energy, | |||||
| Natural Gas Purchase Revenue | 6.13 | 11/15/23 | 5,350,000 | 6,019,124 | |
| Regional Transportation District, COP | 5.00 | 6/1/19 | 1,750,000 | 1,982,120 | |
| Regional Transportation District, COP | 5.00 | 6/1/20 | 2,700,000 | 3,042,252 | |
| Regional Transportation District, COP | 5.50 | 6/1/22 | 2,200,000 | 2,461,668 | |
| Connecticut—1.1% | |||||
| Connecticut, GO | 5.00 | 4/15/22 | 5,000,000 | 5,726,200 | |
| Connecticut, GO | 5.00 | 5/15/23 | 10,000,000 | 11,179,400 | |
| Connecticut, GO (Insured; AMBAC) | 5.25 | 6/1/18 | 1,500,000 | 1,757,310 | |
The Funds 31
STATEMENT OF INVESTMENTS (continued)
| BNY Mellon National Intermediate Municipal Bond Fund (continued) | |||||
| Long-Term Municipal | Coupon | Maturity | Principal | ||
| Investments (continued) | Rate (%) | Date | Amount ($) | Value ($) | |
| Delaware—.7% | |||||
| Delaware, GO | 5.00 | 2/1/23 | 5,000,000 | 5,721,950 | |
| University of Delaware, Revenue | 5.00 | 11/1/27 | 5,440,000 | 5,956,147 | |
| District of Columbia—.7% | |||||
| District of Columbia, GO (Insured; | |||||
| Assured Guaranty Municipal Corp.) | 2.36 | 6/1/16 | 5,000,000 | b | 5,217,450 |
| Metropolitan Washington Airports Authority, | |||||
| Airport System Revenue | 5.00 | 10/1/23 | 4,250,000 | 4,569,897 | |
| Metropolitan Washington Airports Authority, | |||||
| Airport System Revenue | 5.00 | 10/1/24 | 2,500,000 | 2,650,325 | |
| Florida—6.0% | |||||
| Florida Department of Transportation, | |||||
| State Infrastructure Bank Revenue | 5.00 | 7/1/19 | 4,220,000 | 4,683,778 | |
| Florida Department of Transportation, | |||||
| State Infrastructure Bank Revenue | 5.00 | 7/1/20 | 2,500,000 | 2,742,575 | |
| Florida Hurricane Catastrophe Fund | |||||
| Finance Corporation, Revenue | 5.00 | 7/1/15 | 10,000,000 | 10,774,500 | |
| Florida Municipal Loan Council, Revenue (Insured; | |||||
| National Public Finance Guarantee Corp.) | 5.75 | 11/1/15 | 45,000 | 45,200 | |
| Hillsborough County Aviation Authority, Revenue | |||||
| (Tampa International Airport) (Insured; AMBAC) | 5.13 | 10/1/20 | 3,540,000 | 3,842,245 | |
| Hillsborough County Aviation Authority, Revenue | |||||
| (Tampa International Airport) (Insured; AMBAC) | 5.13 | 10/1/21 | 3,675,000 | 3,976,019 | |
| Jacksonville, Better Jacksonville Sales Tax Revenue | 5.00 | 10/1/17 | 2,000,000 | 2,278,960 | |
| Jacksonville, Better Jacksonville Sales Tax Revenue | 5.00 | 10/1/21 | 2,500,000 | 2,837,375 | |
| Jacksonville Electric Authority, Revenue | |||||
| (Saint Johns River Power Park System) | 5.00 | 10/1/18 | 8,500,000 | 9,816,225 | |
| Jacksonville Electric Authority, Revenue | |||||
| (Saint Johns River Power Park System) | 5.00 | 10/1/21 | 2,000,000 | 2,242,220 | |
| Jacksonville Electric Authority, Revenue | |||||
| (Saint Johns River Power Park System) | 5.00 | 10/1/22 | 1,625,000 | 1,799,753 | |
| Jacksonville Electric Authority, Revenue | |||||
| (Saint Johns River Power Park System) | 5.00 | 10/1/24 | 1,000,000 | 1,084,120 | |
| Lee County, Airport Revenue | 5.50 | 10/1/23 | 2,500,000 | 2,702,525 | |
| Lee County, Airport Revenue | 5.50 | 10/1/24 | 5,000,000 | 5,331,250 | |
| Miami-Dade County, Aviation Revenue | |||||
| (Miami International Airport) | 5.50 | 10/1/25 | 4,175,000 | 4,516,473 | |
| Miami-Dade County, Subordinate Special Obligation | |||||
| Bonds (Insured; National Public Finance Guarantee Corp.) | 0/5.00 | 10/1/22 | 2,000,000 | d | 2,120,660 |
| Orlando Utilities Commission, Utility System Revenue | 2.80 | 10/1/16 | 13,400,000 | b | 13,851,580 |
| Orlando Utilities Commission, Utility System Revenue | 5.00 | 10/1/21 | 3,000,000 | 3,466,320 | |
32
| BNY Mellon National Intermediate Municipal Bond Fund (continued) | |||||
| Long-Term Municipal | Coupon | Maturity | Principal | ||
| Investments (continued) | Rate (%) | Date | Amount ($) | Value ($) | |
| Florida (continued) | |||||
| Orlando-Orange County Expressway Authority, Revenue | 5.00 | 7/1/40 | 6,405,000 | 6,247,501 | |
| Sarasota County, Revenue (Environmentally | |||||
| Sensitive Lands and Parkland Program) | 5.25 | 10/1/24 | 1,790,000 | 1,861,475 | |
| Sarasota County, Revenue (Environmentally | |||||
| Sensitive Lands and Parkland Program) | 5.25 | 10/1/25 | 6,170,000 | 6,356,828 | |
| Sarasota County, Revenue (Environmentally | |||||
| Sensitive Lands and Parkland Program) | 5.25 | 10/1/28 | 2,105,000 | 2,127,334 | |
| Sarasota County, Revenue (Environmentally | |||||
| Sensitive Lands and Parkland Program) | 5.25 | 10/1/29 | 1,085,000 | 1,089,264 | |
| Sarasota County, Revenue (Environmentally | |||||
| Sensitive Lands and Parkland Program) (Prerefunded) | 5.25 | 10/1/18 | 240,000 | a | 283,944 |
| Sarasota County, Revenue (Environmentally Sensitive | |||||
| Lands and Parkland Program) (Prerefunded) | 5.25 | 10/1/18 | 210,000 | a | 248,451 |
| Sarasota County, Revenue (Environmentally Sensitive | |||||
| Lands and Parkland Program) (Prerefunded) | 5.25 | 10/1/18 | 725,000 | a | 857,747 |
| Sarasota County, Revenue (Environmentally Sensitive | |||||
| Lands and Parkland Program) (Prerefunded) | 5.25 | 10/1/18 | 245,000 | a | 289,859 |
| Tampa Bay Water, A Regional Water Supply | |||||
| Authority, Utility System Revenue | 5.00 | 10/1/20 | 5,000,000 | 5,795,550 | |
| Georgia—2.7% | |||||
| Burke County Development Authority, PCR | |||||
| (Georgia Power Company Plant Vogtle Project) | 1.40 | 4/1/15 | 5,000,000 | 5,034,950 | |
| Burke County Development Authority, PCR | |||||
| (Oglethorpe Power Corporation Vogtle Project) | 7.00 | 1/1/23 | 6,000,000 | 6,997,920 | |
| Chatham County Hospital Authority, HR Improvement | |||||
| (Memorial Health University Medical Center, Inc.) (Prerefunded) | 5.75 | 1/1/14 | 5,000,000 | a | 5,091,900 |
| Crisp County Development Authority, EIR | |||||
| (International Paper Company Project) | 5.55 | 2/1/15 | 1,000,000 | 1,046,400 | |
| DeKalb County, Water and Sewerage Revenue | 5.25 | 10/1/36 | 3,500,000 | 3,555,125 | |
| Georgia, GO | 4.00 | 11/1/27 | 4,000,000 | 4,048,080 | |
| Main Street Natural Gas Inc., Gas Project Revenue | 6.38 | 7/15/38 | 1,335,000 | e | 386,709 |
| Monroe County Development Authority, PCR | |||||
| (Oglethorpe Power Corporation Scherer Project) | 2.40 | 4/1/20 | 13,500,000 | 12,828,375 | |
| Municipal Electric Authority of Georgia, GO | |||||
| (Project One Subordinated Bonds) | 5.75 | 1/1/20 | 5,000,000 | 5,701,450 | |
| Private Colleges and Universities Authority, | |||||
| Revenue (Emory University) | 5.00 | 9/1/18 | 2,000,000 | 2,170,100 | |
| Hawaii—.7% | |||||
| Hawaii, GO | 5.00 | 12/1/16 | 5,000,000 | 5,669,950 | |
| Hawaii, GO | 5.00 | 12/1/17 | 5,000,000 | 5,768,650 | |
The Funds 33
STATEMENT OF INVESTMENTS (continued)
| BNY Mellon National Intermediate Municipal Bond Fund (continued) | ||||
| Long-Term Municipal | Coupon | Maturity | Principal | |
| Investments (continued) | Rate (%) | Date | Amount ($) | Value ($) |
| Idaho—.7% | ||||
| University of Idaho Regents, General Revenue | 5.25 | 4/1/21 | 10,200,000 | 11,272,938 |
| Illinois—5.2% | ||||
| Chicago, GO | 5.00 | 1/1/20 | 5,000,000 | 5,378,500 |
| Chicago, GO (Modern Schools Across | ||||
| Chicago Program) (Insured; AMBAC) | 5.00 | 12/1/17 | 1,110,000 | 1,201,941 |
| Cook County, GO | 5.00 | 11/15/24 | 7,500,000 | 7,923,075 |
| Illinois, GO | 5.00 | 8/1/18 | 19,900,000 | 21,861,941 |
| Illinois, GO | 5.00 | 8/1/19 | 10,000,000 | 10,863,400 |
| Illinois, GO | 5.00 | 9/1/19 | 7,500,000 | 7,783,125 |
| Illinois, GO | 5.50 | 7/1/25 | 7,000,000 | 7,318,780 |
| Illinois, GO | ||||
| (Insured; Assured Guaranty Municipal Corp.) | 5.00 | 1/1/20 | 5,000,000 | 5,410,850 |
| Illinois Finance Authority, Gas Supply Revenue | ||||
| (The Peoples Gas Light and Coke Company | ||||
| Project) (Insured; AMBAC) | 4.30 | 6/1/16 | 2,500,000 | 2,707,725 |
| Railsplitter Tobacco Settlement Authority, | ||||
| Tobacco Settlement Revenue | 5.00 | 6/1/15 | 3,500,000 | 3,742,340 |
| Railsplitter Tobacco Settlement Authority, | ||||
| Tobacco Settlement Revenue | 6.25 | 6/1/24 | 10,000,000 | 10,791,000 |
| Will County Forest Preserve District, | ||||
| GO Unlimited Tax Bonds | 5.00 | 12/15/20 | 4,000,000 | 4,602,000 |
| Indiana—.4% | ||||
| Indiana Finance Authority, Acquisition Revenue | ||||
| (National Collegiate Athletic Association Project) | 5.00 | 5/1/15 | 1,000,000 | 1,074,860 |
| Indiana Finance Authority, | ||||
| State Revolving Fund Program Bonds | 5.00 | 2/1/24 | 5,000,000 | 5,613,400 |
| Kansas—1.9% | ||||
| Harvey County Unified School District Number 373, | ||||
| GO Improvement Bonds (Insured; National | ||||
| Public Finance Guarantee Corp.) | 5.00 | 9/1/21 | 1,700,000 | 1,866,719 |
| Kansas Development Finance Authority, | ||||
| Revenue (University of Kansas Projects) | 4.00 | 5/1/21 | 3,370,000 | 3,601,789 |
| Kansas Development Finance Authority, | ||||
| Revenue (University of Kansas Projects) | 4.00 | 5/1/24 | 3,850,000 | 3,949,676 |
| Wichita, Water and Sewer Utility Revenue | 5.00 | 10/1/21 | 7,990,000 | 9,182,188 |
| Wichita, Water and Sewer Utility Revenue | 5.00 | 10/1/22 | 8,390,000 | 9,499,745 |
| Wyandotte County/Kansas City Unified Government, | ||||
| Utility System Revenue (Insured; AMBAC) | 5.65 | 9/1/22 | 4,700,000 | 5,154,678 |
| Kentucky—.2% | ||||
| Kentucky Housing Corporation, Housing Revenue | 4.80 | 7/1/20 | 2,025,000 | 2,052,621 |
| Kentucky Property and Buildings Commission, | ||||
| Revenue (Project Number 100) | 5.00 | 8/1/21 | 1,785,000 | 2,028,688 |
34
| BNY Mellon National Intermediate Municipal Bond Fund (continued) | |||||
| Long-Term Municipal | Coupon | Maturity | Principal | ||
| Investments (continued) | Rate (%) | Date | Amount ($) | Value ($) | |
| Louisiana—2.4% | |||||
| Jefferson Sales Tax District, | |||||
| Special Sales Tax Revenue (Insured; AMBAC) | 5.25 | 12/1/21 | 4,000,000 | 4,534,320 | |
| Louisiana Citizens Property Insurance Corporation, | |||||
| Assessment Revenue (Insured; AMBAC) | 5.00 | 6/1/21 | 5,500,000 | 5,950,010 | |
| Louisiana Citizens Property Insurance Corporation, | |||||
| Assessment Revenue (Insured; Assured Guaranty Corp.) | 6.13 | 6/1/25 | 14,500,000 | 16,076,585 | |
| Louisiana Local Government Environmental Facilities | |||||
| and Community Development Authority, Revenue | |||||
| (Louisiana Community and Technical College | |||||
| System Facilities Corporation Project) | 5.00 | 10/1/22 | 5,000,000 | 5,506,500 | |
| Louisiana Public Facilities Authority, | |||||
| Revenue (CHRISTUS Health Obligated Group) | 6.00 | 7/1/29 | 2,000,000 | 2,123,360 | |
| Louisiana Stadium and Exposition District, Senior Revenue | 5.00 | 7/1/28 | 3,650,000 | 3,729,461 | |
| Louisiana Stadium and Exposition District, Senior Revenue | 5.00 | 7/1/29 | 2,750,000 | 2,781,790 | |
| Maryland—1.1% | |||||
| Anne Arundel County, Consolidated General Improvements GO | 5.00 | 4/1/28 | 2,480,000 | 2,702,580 | |
| Anne Arundel County, Consolidated General Improvements GO | 5.00 | 4/1/29 | 4,640,000 | 5,017,789 | |
| Anne Arundel County, Consolidated General Improvements GO | 5.00 | 4/1/30 | 4,640,000 | 4,987,165 | |
| Howard County, Consolidated Public Improvement GO | 5.00 | 8/15/17 | 5,030,000 | 5,788,222 | |
| Massachusetts—1.5% | |||||
| Massachusetts, GO | 0.64 | 11/1/18 | 2,000,000 | b | 1,980,980 |
| Massachusetts, GO (Insured; | |||||
| National Public Finance Guarantee Corp.) | 5.50 | 10/1/20 | 3,285,000 | 3,932,441 | |
| Massachusetts Development Finance Agency, Revenue (Combined | |||||
| Jewish Philanthropies of Greater Boston, Inc. Project) | 4.75 | 2/1/15 | 1,320,000 | 1,361,527 | |
| Massachusetts Health and Educational Facilities | |||||
| Authority, Revenue (Simmons College Issue) | 7.50 | 10/1/22 | 2,000,000 | 2,398,280 | |
| Massachusetts Health and Educational Facilities | |||||
| Authority, Revenue (Simmons College Issue) | 8.00 | 10/1/29 | 5,000,000 | 5,554,350 | |
| Massachusetts Health and Educational Facilities | |||||
| Authority, Revenue (Simmons College Issue) | 8.00 | 10/1/39 | 1,500,000 | 1,659,990 | |
| Massachusetts Housing Finance Agency, Housing Revenue | 5.13 | 12/1/34 | 350,000 | 343,420 | |
| Massachusetts School Building Authority, | |||||
| Dedicated Sales Tax Revenue (Insured; AMBAC) | 5.00 | 8/15/20 | 6,000,000 | 6,792,060 | |
| Massachusetts School Building Authority, Dedicated Sales | |||||
| Tax Revenue (Insured; Assured Guaranty Municipal Corp.) | 5.00 | 8/15/30 | 60,000 | 62,473 | |
| Massachusetts School Building Authority, Dedicated | |||||
| Sales Tax Revenue (Insured; Assured Guaranty | |||||
| Municipal Corp.) (Prerefunded) | 5.00 | 8/15/15 | 190,000 | a | 206,906 |
| Massachusetts School Building Authority, Dedicated | |||||
| Sales Tax Revenue (Insured; Assured Guaranty | |||||
| Municipal Corp.) (Prerefunded) | 5.00 | 8/15/15 | 1,250,000 | a | 1,361,225 |
The Funds 35
STATEMENT OF INVESTMENTS (continued)
| BNY Mellon National Intermediate Municipal Bond Fund (continued) | |||||
| Long-Term Municipal | Coupon | Maturity | Principal | ||
| Investments (continued) | Rate (%) | Date | Amount ($) | Value ($) | |
| Massachusetts (continued) | |||||
| Massachusetts Water Pollution Abatement Trust (Pool Program) | 5.25 | 8/1/17 | 275,000 | 286,998 | |
| Massachusetts Water Pollution Abatement Trust, | |||||
| Water Pollution Abatement Revenue (MWRA Program) | 5.75 | 8/1/29 | 380,000 | 381,243 | |
| Michigan—1.1% | |||||
| Detroit, Water Supply System Second Lien Revenue (Insured; FGIC) | 5.75 | 7/1/22 | 7,000,000 | 7,196,490 | |
| Michigan, Grant Anticipation Bonds (Insured; | |||||
| Assured Guaranty Municipal Corp.) | 5.25 | 9/15/23 | 7,500,000 | 8,185,800 | |
| Michigan Building Authority, Revenue (Facilities Program) | 5.00 | 10/15/22 | 2,400,000 | 2,624,016 | |
| Michigan Municipal Bond Authority, | |||||
| Drinking Water Revolving Fund Revenue | 5.50 | 10/1/15 | 1,000,000 | 1,103,070 | |
| Minnesota—1.2% | |||||
| Minneapolis, Health Care System | |||||
| Revenue (Fairview Health Services) | 6.63 | 11/15/28 | 12,000,000 | 13,875,600 | |
| University of Minnesota Regents, Special Purpose | |||||
| Revenue (State Supported Stadium Debt) | 5.00 | 8/1/19 | 6,300,000 | 7,013,223 | |
| Mississippi—.1% | |||||
| Mississippi Home Corporation, SFMR | |||||
| (Collateralized: FHLMC, FNMA and GNMA) | 4.38 | 12/1/18 | 1,045,000 | 1,103,060 | |
| Mississippi State University Educational Building Corporation, | |||||
| Revenue (Insured; National Public Finance Guarantee Corp.) | 5.25 | 8/1/16 | 400,000 | 449,836 | |
| Missouri—.1% | |||||
| Missouri Environmental Improvement and | |||||
| Energy Resource Authority, Water PCR | |||||
| (State Revolving Fund Program—Master Trust) | 5.50 | 7/1/14 | 1,250,000 | 1,284,550 | |
| Nebraska—.1% | |||||
| Nebraska Investment Finance Authority, SFHR | |||||
| (Collateralized: FHLMC, FNMA and GNMA) | 4.70 | 9/1/21 | 35,000 | 35,004 | |
| Omaha City, GO (City of Omaha | |||||
| Convention Center/Arena Project) | 6.50 | 12/1/16 | 1,000,000 | 1,181,810 | |
| Nevada—1.4% | |||||
| Clark County, Highway Revenue (Motor Vehicle Fuel Tax) | 5.00 | 7/1/28 | 10,000,000 | 10,485,700 | |
| Clark County School District, GO (Insured; | |||||
| National Public Finance Guarantee Corp.) | 5.00 | 6/15/20 | 12,930,000 | 14,473,713 | |
| New Hampshire—.1% | |||||
| New Hampshire Business Finance Authority, PCR | |||||
| (Central Maine Power Company) | 5.38 | 5/1/14 | 1,000,000 | 1,028,170 | |
| New Jersey—4.7% | |||||
| Garden State Preservation Trust, Open Space and | |||||
| Farmland Preservation Revenue (Insured; | |||||
| Assured Guaranty Municipal Corp.) | 5.13 | 11/1/16 | 1,000,000 | 1,134,610 | |
| Garden State Preservation Trust, Open Space and | |||||
| Farmland Preservation Revenue (Insured; | |||||
| Assured Guaranty Municipal Corp.) (Prerefunded) | 5.80 | 11/1/15 | 5,000,000 | a | 5,561,600 |
36
| BNY Mellon National Intermediate Municipal Bond Fund (continued) | |||||
| Long-Term Municipal | Coupon | Maturity | Principal | ||
| Investments (continued) | Rate (%) | Date | Amount ($) | Value ($) | |
| New Jersey (continued) | |||||
| Garden State Preservation Trust, Open Space and | |||||
| Farmland Preservation Revenue (Insured; | |||||
| Assured Guaranty Municipal Corp.) (Prerefunded) | 5.80 | 11/1/15 | 5,000,000 | a | 5,561,600 |
| Garden State Preservation Trust, Open Space and | |||||
| Farmland Preservation Revenue (Insured; | |||||
| Assured Guaranty Municipal Corp.) (Prerefunded) | 5.80 | 11/1/15 | 5,000,000 | a | 5,561,600 |
| Garden State Preservation Trust, Open Space and | |||||
| Farmland Preservation Revenue (Insured; | |||||
| Assured Guaranty Municipal Corp.) (Prerefunded) | 5.80 | 11/1/15 | 2,500,000 | a | 2,780,800 |
| New Jersey Economic Development | |||||
| Authority, Cigarette Tax Revenue | 5.38 | 6/15/15 | 4,400,000 | 4,789,488 | |
| New Jersey Economic Development Authority, | |||||
| School Facilities Construction Revenue | 2.03 | 2/1/18 | 10,000,000 | b | 10,373,200 |
| New Jersey Economic Development Authority, | |||||
| School Facilities Construction Revenue | 5.00 | 9/1/20 | 5,555,000 | 6,278,094 | |
| New Jersey Economic Development Authority, | |||||
| School Facilities Construction Revenue | 5.00 | 3/1/25 | 13,000,000 | 13,959,530 | |
| New Jersey Economic Development Authority, | |||||
| School Facilities Construction Revenue (Prerefunded) | 5.00 | 3/1/15 | 2,000,000 | a | 2,138,920 |
| New Jersey Economic Development Authority, | |||||
| School Facilities Construction Revenue (Prerefunded) | 5.00 | 3/1/15 | 1,000,000 | a | 1,069,460 |
| New Jersey Educational Facilities Authority, Revenue (University | |||||
| of Medicine and Dentistry of New Jersey Issue) (Prerefunded) | 7.50 | 6/1/19 | 3,750,000 | a | 4,889,212 |
| New Jersey Health Care Facilities Financing | |||||
| Authority, Revenue (Barnabas Health Issue) | 5.00 | 7/1/22 | 1,830,000 | 1,956,581 | |
| New Jersey Health Care Facilities Financing | |||||
| Authority, Revenue (Barnabas Health Issue) | 5.00 | 7/1/24 | 1,000,000 | 1,041,990 | |
| New Jersey Health Care Facilities Financing Authority, | |||||
| Revenue (Meridian Health System Obligated Group Issue) | 5.00 | 7/1/19 | 2,000,000 | 2,245,640 | |
| New Jersey Transportation Trust Fund | |||||
| Authority (Transportation System) | 0.00 | 12/15/29 | 10,000,000 | c | 4,138,100 |
| New Jersey Transportation Trust Fund | |||||
| Authority (Transportation System) | 5.50 | 6/15/31 | 5,000,000 | 5,258,100 | |
| Rutgers, The State University, GO | 5.00 | 5/1/21 | 2,000,000 | 2,295,860 | |
| New Mexico—.4% | |||||
| New Mexico Finance Authority, Revenue | |||||
| (Public Project Revolving Fund) (Insured; AMBAC) | 5.25 | 6/1/17 | 1,000,000 | 1,034,850 | |
| New Mexico Finance Authority, | |||||
| State Transportation Senior Lien Revenue | 5.00 | 6/15/18 | 5,000,000 | 5,795,000 | |
| New York—6.8% | |||||
| Albany Industrial Development Agency, Civic Facility | |||||
| Revenue (Saint Peter’s Hospital of the City of Albany Project) | 5.75 | 11/15/22 | 1,000,000 | 1,083,360 | |
| Greece Central School District, GO (Insured; FGIC) | 6.00 | 6/15/15 | 950,000 | 1,045,228 | |
The Funds 37
STATEMENT OF INVESTMENTS (continued)
| BNY Mellon National Intermediate Municipal Bond Fund (continued) | |||||
| Long-Term Municipal | Coupon | Maturity | Principal | ||
| Investments (continued) | Rate (%) | Date | Amount ($) | Value ($) | |
| New York (continued) | |||||
| Metropolitan Transportation Authority, | |||||
| Dedicated Tax Fund Revenue (Insured; | |||||
| National Public Finance Guarantee Corp.) | 5.00 | 11/15/28 | 2,880,000 | 3,076,013 | |
| Metropolitan Transportation Authority, | |||||
| State Service Contract Revenue | 5.75 | 1/1/18 | 1,500,000 | 1,752,180 | |
| Metropolitan Transportation Authority, Transportation Revenue | 5.00 | 11/15/24 | 5,000,000 | 5,240,750 | |
| Metropolitan Transportation Authority, Transportation Revenue | 6.50 | 11/15/28 | 12,000,000 | 13,972,800 | |
| Metropolitan Transportation Authority, | |||||
| Transportation Revenue (Insured; | |||||
| Assured Guaranty Municipal Corp.) | 0.37 | 11/1/22 | 10,000,000 | b | 9,650,000 |
| New York City, GO | 5.13 | 12/1/24 | 5,000,000 | 5,533,250 | |
| New York City Transitional Finance Authority, | |||||
| Future Tax Secured Subordinate Revenue | 5.00 | 2/1/23 | 13,000,000 | 14,553,760 | |
| New York Liberty Development Corporation, | |||||
| Revenue (Goldman Sachs Headquarters Issue) | 5.00 | 10/1/15 | 1,000,000 | 1,056,030 | |
| New York State Dormitory Authority, Revenue | |||||
| (Consolidated City University System) (Insured; | |||||
| Assured Guaranty Municipal Corp.) | 5.75 | 7/1/18 | 200,000 | 224,742 | |
| New York State Dormitory Authority, | |||||
| State Personal Income Tax Revenue (Education) | 5.00 | 3/15/35 | 4,190,000 | 4,224,567 | |
| New York State Dormitory Authority, | |||||
| State Personal Income Tax Revenue (General Purpose) | 5.00 | 12/15/24 | 7,000,000 | 7,858,270 | |
| New York State Dormitory Authority, | |||||
| State Personal Income Tax Revenue (General Purpose) | 5.00 | 12/15/25 | 8,000,000 | 8,853,440 | |
| New York State Dormitory Authority, Third General Resolution | |||||
| Revenue (State University Educational Facilities Issue) | 5.00 | 5/15/24 | 5,000,000 | 5,516,300 | |
| New York State Dormitory Authority, Third General Resolution | |||||
| Revenue (State University Educational Facilities Issue) | 5.00 | 5/15/25 | 3,000,000 | 3,265,350 | |
| New York State Thruway Authority, | |||||
| Second General Highway and Bridge Trust Fund Bonds | 5.00 | 4/1/16 | 5,000,000 | 5,558,250 | |
| New York State Thruway Authority, | |||||
| Second General Highway and Bridge Trust Fund Bonds | 5.00 | 4/1/21 | 5,000,000 | 5,671,700 | |
| New York State Thruway Authority, Second General | |||||
| Highway and Bridge Trust Fund Bonds | |||||
| (Insured; Assured Guaranty Municipal Corp.) | 5.00 | 4/1/24 | 4,500,000 | 5,047,290 | |
| Port Authority of New York and New Jersey | |||||
| (Consolidated Bonds, 139th Series) (Insured; | |||||
| National Public Finance Guarantee Corp. ) | 5.00 | 10/1/16 | 5,440,000 | 5,851,754 | |
| Tobacco Settlement Financing Corporation of | |||||
| New York, Asset-Backed Revenue Bonds | |||||
| (State Contingency Contract Secured) | 5.50 | 6/1/19 | 3,900,000 | 3,935,139 | |
| Triborough Bridge and Tunnel Authority, | |||||
| Subordinate Revenue (MTA Bridges and Tunnels) | 0.00 | 11/15/29 | 10,000,000 | c | 4,551,300 |
38
| BNY Mellon National Intermediate Municipal Bond Fund (continued) | ||||
| Long-Term Municipal | Coupon | Maturity | Principal | |
| Investments (continued) | Rate (%) | Date | Amount ($) | Value ($) |
| North Carolina—3.3% | ||||
| North Carolina, GO | 5.00 | 5/1/21 | 1,500,000 | 1,764,840 |
| North Carolina Eastern Municipal Power | ||||
| Agency, Power System Revenue | 5.00 | 1/1/17 | 8,050,000 | 8,815,877 |
| North Carolina Eastern Municipal Power | ||||
| Agency, Power System Revenue | 5.00 | 1/1/17 | 8,000,000 | 8,982,720 |
| North Carolina Eastern Municipal Power | ||||
| Agency, Power System Revenue | 5.25 | 1/1/20 | 5,000,000 | 5,565,900 |
| North Carolina Eastern Municipal Power | ||||
| Agency, Power System Revenue | 5.00 | 1/1/26 | 18,000,000 | 18,953,460 |
| North Carolina Municipal Power Agency | ||||
| Number 1, Catawba Electric Revenue | 5.00 | 1/1/24 | 5,500,000 | 5,912,005 |
| Wake County, LOR | 5.00 | 1/1/24 | 5,955,000 | 6,812,818 |
| Ohio—.7% | ||||
| Columbus, GO (Various Purpose Limited Tax) | 5.00 | 7/1/21 | 3,005,000 | 3,513,326 |
| Hamilton County, Sewer System Improvement | ||||
| Revenue (The Metropolitan Sewer | ||||
| District of Greater Cincinnati) | 5.00 | 12/1/26 | 3,500,000 | 3,848,740 |
| Montgomery County, Revenue (Catholic Health Initiatives) | 6.00 | 10/1/23 | 3,055,000 | 3,519,635 |
| Ohio Housing Finance Agency, MFHR (Uptown | ||||
| Towers Apartments Project) (Collateralized; GNMA) | 4.75 | 10/20/15 | 455,000 | 471,043 |
| Toledo-Lucas County Port Authority, | ||||
| Port Facilities Revenue (Cargill, Inc. Project) | 4.50 | 12/1/15 | 900,000 | 945,324 |
| Oregon—2.6% | ||||
| Oregon, GO | 5.00 | 11/1/18 | 5,000,000 | 5,850,400 |
| Oregon, GO | 5.00 | 11/1/19 | 5,000,000 | 5,868,400 |
| Oregon, GO | 5.00 | 11/1/20 | 3,100,000 | 3,637,075 |
| Oregon, GO (Oregon Department of Transportation Project) | 5.00 | 5/1/17 | 7,565,000 | 8,639,911 |
| Tri-County Metropolitan Transportation District, | ||||
| Payroll Tax and Grant Receipt Revenue | 5.00 | 11/1/18 | 5,000,000 | 5,639,950 |
| Tri-County Metropolitan Transportation District, | ||||
| Payroll Tax and Grant Receipt Revenue | 3.00 | 11/1/19 | 15,000,000 | 15,581,100 |
| Pennsylvania—2.0% | ||||
| Allegheny County Hospital Development Authority, | ||||
| Revenue (University of Pittsburgh Medical Center) | 5.25 | 6/15/15 | 1,620,000 | 1,748,579 |
| Pennsylvania Turnpike Commission, | ||||
| Turnpike Subordinate Revenue | 5.00 | 6/1/18 | 5,000,000 | 5,595,850 |
| Pennsylvania Turnpike Commission, | ||||
| Turnpike Subordinate Revenue | 5.00 | 12/1/20 | 3,675,000 | 4,116,735 |
| Pennsylvania Turnpike Commission, | ||||
| Turnpike Subordinate Revenue | 5.00 | 12/1/21 | 3,740,000 | 4,137,899 |
| Philadelphia School District, GO (Insured; AMBAC) | 5.00 | 4/1/17 | 2,165,000 | 2,290,527 |
The Funds 39
STATEMENT OF INVESTMENTS (continued)
| BNY Mellon National Intermediate Municipal Bond Fund (continued) | |||||
| Long-Term Municipal | Coupon | Maturity | Principal | ||
| Investments (continued) | Rate (%) | Date | Amount ($) | Value ($) | |
| Pennsylvania (continued) | |||||
| Pittsburgh, GO | 5.00 | 9/1/25 | 10,000,000 | 10,581,700 | |
| State Public School Building Authority, School Lease | |||||
| Revenue (The School District of Philadelphia Project) | 5.00 | 4/1/22 | 1,000,000 | 1,090,460 | |
| State Public School Building Authority, School Lease | |||||
| Revenue (The School District of Philadelphia Project) | 5.00 | 4/1/24 | 1,750,000 | 1,849,347 | |
| State Public School Building Authority, School Lease | |||||
| Revenue (The School District of Philadelphia Project) | 5.00 | 4/1/25 | 2,750,000 | 2,859,890 | |
| South Carolina—.3% | |||||
| Greenville County School District, Installment | |||||
| Purchase Revenue (Building Equity Sooner for Tomorrow) | 5.50 | 12/1/18 | 3,000,000 | 3,528,030 | |
| Newberry Investing in Children’s Education, | |||||
| Installment Purchase Revenue (School District of | |||||
| Newberry County, South Carolina Project) | 5.25 | 12/1/20 | 1,000,000 | 1,071,510 | |
| South Dakota—.1% | |||||
| South Dakota Educational Enhancement Funding | |||||
| Corporation, Tobacco Settlement Revenue | 5.00 | 6/1/25 | 1,800,000 | 1,915,416 | |
| South Dakota Educational Enhancement Funding | |||||
| Corporation, Tobacco Settlement Revenue | 5.00 | 6/1/27 | 500,000 | 521,200 | |
| Tennessee—.6% | |||||
| Metropolitan Government of Nashville and | |||||
| Davidson County, GO Improvement Bonds | 5.00 | 7/1/25 | 10,000,000 | 10,929,300 | |
| Texas—7.9% | |||||
| Dallas and Fort Worth, Joint Revenue | |||||
| (Dallas/Fort Worth International Airport) | 5.00 | 11/1/26 | 3,000,000 | 3,102,600 | |
| Dallas and Fort Worth, Joint Revenue | |||||
| (Dallas/Fort Worth International Airport) | 5.00 | 11/1/27 | 3,400,000 | 3,480,648 | |
| Forney Independent School District, Unlimited Tax School | |||||
| Building Bonds (Permanent School Fund Guarantee Program) | 5.75 | 8/15/33 | 1,000,000 | 1,118,430 | |
| Harris County, Toll Road Senior Lien Revenue | 5.00 | 8/15/23 | 12,500,000 | 13,944,875 | |
| Harris County, Unlimited Tax Road Bonds | 5.00 | 10/1/21 | 13,705,000 | 15,417,851 | |
| Harris County Health Facilities Development Corporation, | |||||
| HR (Memorial Hermann Healthcare System) (Prerefunded) | 7.00 | 12/1/18 | 5,000,000 | a | 6,381,200 |
| Houston, Public Improvement GO | 5.00 | 3/1/18 | 5,000,000 | 5,743,400 | |
| Houston, Public Improvement GO (Insured; AMBAC) (Prerefunded) | 5.00 | 9/1/15 | 3,895,000 | a | 4,243,953 |
| Houston Community College System, Limited Tax Bonds | 5.00 | 2/15/21 | 2,250,000 | 2,593,800 | |
| Katy Independent School District, Unlimited Tax Refunding | |||||
| Bonds (Permanent School Fund Guarantee Program) | 0.00 | 2/15/16 | 1,505,000 | c | 1,469,693 |
| Lower Colorado River Authority, Junior Lien | |||||
| Revenue (Seventh Supplemental Series) | |||||
| (Insured; Assured Guaranty Municipal Corp.) | 5.00 | 1/1/15 | 1,135,000 | 1,204,734 | |
| Lower Colorado River Authority, Revenue | 5.00 | 5/15/16 | 15,000 | 16,674 | |
40
| BNY Mellon National Intermediate Municipal Bond Fund (continued) | |||||
| Long-Term Municipal | Coupon | Maturity | Principal | ||
| Investments (continued) | Rate (%) | Date | Amount ($) | Value ($) | |
| Texas (continued) | |||||
| Lower Colorado River Authority, Revenue | 5.00 | 5/15/16 | 35,000 | 38,956 | |
| Lower Colorado River Authority, Revenue | 5.00 | 5/15/16 | 13,950,000 | 15,482,268 | |
| San Antonio, Electric and Gas Systems Revenue | 5.00 | 2/1/17 | 5,000,000 | 5,655,100 | |
| San Antonio, Electric and | |||||
| Gas Systems Revenue (Prerefunded) | 5.00 | 2/1/16 | 10,000,000 | a | 11,051,300 |
| Texas Public Finance Authority, GO | 5.00 | 10/1/23 | 9,385,000 | 10,662,298 | |
| Texas Public Finance Authority, Unemployment | |||||
| Compensation Obligation Assessment Revenue | 5.00 | 7/1/17 | 7,500,000 | 8,205,525 | |
| Texas Public Finance Authority, Unemployment | |||||
| Compensation Obligation Assessment Revenue | 5.00 | 1/1/20 | 5,325,000 | 5,420,158 | |
| Texas Transportation Commission, | |||||
| State Highway Fund First Tier Revenue | 5.00 | 4/1/20 | 15,000,000 | 16,887,000 | |
| Texas Water Development Board, | |||||
| State Revolving Fund Subordinate Lien Revenue | 5.00 | 7/15/24 | 3,650,000 | 4,134,501 | |
| Utah—1.7% | |||||
| Utah, GO | 5.00 | 7/1/20 | 20,000,000 | 23,570,800 | |
| Utah Associated Municipal Power Systems, | |||||
| Revenue (Payson Power Project) | 5.00 | 4/1/22 | 5,675,000 | 6,312,246 | |
| Virginia—2.7% | |||||
| Virginia, GO | 5.00 | 6/1/23 | 5,490,000 | 6,313,939 | |
| Virginia College Building Authority, Educational Facilities | |||||
| Revenue (21st Century College and Equipment Programs) | 5.00 | 2/1/19 | 7,000,000 | 8,089,480 | |
| Virginia College Building Authority, Educational Facilities | |||||
| Revenue (21st Century College and Equipment Programs) | 5.00 | 2/1/21 | 2,235,000 | 2,575,994 | |
| Virginia College Building Authority, Educational Facilities | |||||
| Revenue (21st Century College and Equipment Programs) | 5.00 | 2/1/23 | 11,285,000 | 12,697,318 | |
| Virginia Public Building Authority, Public Facilities Revenue | 5.00 | 8/1/18 | 8,370,000 | 9,679,319 | |
| Virginia Public Building Authority, Public Facilities Revenue | 5.00 | 8/1/19 | 6,950,000 | 8,079,653 | |
| Washington—1.9% | |||||
| Energy Northwest, Electric Revenue | |||||
| (Columbia Generating Station) | 5.00 | 7/1/20 | 10,955,000 | 12,692,134 | |
| FYI Properties, LR (State of Washington | |||||
| Department of Information Services Project) | 5.25 | 6/1/29 | 5,625,000 | 5,882,738 | |
| King County Public Hospital District Number 1, Limited Tax GO | 5.25 | 12/1/37 | 5,000,000 | 5,040,100 | |
| Washington, Motor Vehicle Fuel Tax GO | 5.00 | 8/1/23 | 3,570,000 | 4,022,105 | |
| Washington Health Care Facilities Authority, | |||||
| Revenue (Providence Health and Services) | 5.00 | 10/1/21 | 5,000,000 | 5,557,550 | |
| West Virginia—.2% | |||||
| Monongalia County Building Commission, HR | |||||
| (Monongalia General Hospital) | 5.25 | 7/1/20 | 2,870,000 | 2,954,034 | |
The Funds 41
STATEMENT OF INVESTMENTS (continued)
| BNY Mellon National Intermediate Municipal Bond Fund (continued) | |||||
| Long-Term Municipal | Coupon | Maturity | Principal | ||
| Investments (continued) | Rate (%) | Date | Amount ($) | Value ($) | |
| West Virginia (continued) | |||||
| West Virginia Economic Development Authority, PCR | |||||
| (Appalachian Power Company—Amos Project) | 4.85 | 9/4/13 | 1,000,000 | 1,000,340 | |
| Wisconsin—1.1% | |||||
| Wisconsin, GO | 5.00 | 5/1/20 | 5,800,000 | 6,595,760 | |
| Wisconsin, Transportation Revenue (Insured; National | |||||
| Public Finance Guarantee Corp.) (Prerefunded) | 5.00 | 7/1/15 | 11,825,000 | a | 12,815,580 |
| U.S. Related—2.7% | |||||
| A.B. Won International Airport Authority of Guam, General Revenue | 5.00 | 10/1/23 | 1,625,000 | 1,641,608 | |
| A.B. Won International Airport Authority of Guam, | |||||
| General Revenue (Insured; Assured Guaranty Municipal Corp.) | 5.50 | 10/1/33 | 1,000,000 | 995,140 | |
| Puerto Rico Commonwealth, Public Improvement GO | 5.50 | 7/1/19 | 5,715,000 | 5,418,220 | |
| Puerto Rico Electric Power Authority, Power Revenue | 5.25 | 7/1/18 | 5,000,000 | 4,850,400 | |
| Puerto Rico Electric Power Authority, Power Revenue | 5.25 | 7/1/23 | 5,000,000 | 4,220,350 | |
| Puerto Rico Electric Power Authority, Power Revenue | |||||
| (Insured; National Public Finance Guarantee Corp.) | 5.00 | 7/1/17 | 3,940,000 | 3,928,298 | |
| Puerto Rico Government Development Bank, Senior Notes | 5.00 | 12/1/13 | 4,000,000 | 4,011,000 | |
| Puerto Rico Public Buildings Authority, | |||||
| Government Facilities Revenue | 5.50 | 7/1/14 | 1,000,000 | 1,010,270 | |
| Puerto Rico Public Buildings Authority, | |||||
| Government Facilities Revenue | 5.50 | 7/1/15 | 995,000 | 1,011,776 | |
| Puerto Rico Public Buildings Authority, | |||||
| Government Facilities Revenue | 5.50 | 7/1/15 | 5,000 | 5,458 | |
| Puerto Rico Public Buildings Authority, | |||||
| Government Facilities Revenue | 5.50 | 7/1/16 | 5,000 | 5,657 | |
| Puerto Rico Public Buildings Authority, | |||||
| Government Facilities Revenue | 5.50 | 7/1/16 | 1,995,000 | 2,018,302 | |
| Puerto Rico Public Buildings Authority, | |||||
| Government Facilities Revenue | 5.75 | 7/1/17 | 1,940,000 | 1,957,441 | |
| Puerto Rico Public Buildings Authority, | |||||
| Government Facilities Revenue | 5.75 | 7/1/17 | 5,000 | 5,866 | |
| Puerto Rico Public Buildings Authority, | |||||
| Government Facilities Revenue | 5.75 | 7/1/22 | 2,500,000 | 2,217,775 | |
| Puerto Rico Sales Tax Financing Corporation, | |||||
| Sales Tax Revenue (First Subordinate Series) | 0/6.75 | 8/1/32 | 11,000,000 | d | 9,105,690 |
| Puerto Rico Sales Tax Financing Corporation, | |||||
| Sales Tax Revenue (First Subordinate Series) | 0/6.25 | 8/1/33 | 2,500,000 | d | 1,610,950 |
| Puerto Rico Sales Tax Financing Corporation, | |||||
| Sales Tax Revenue (First Subordinate Series) | 6.50 | 8/1/44 | 2,500,000 | 2,366,600 | |
| Total Long-Term Municipal Investments | |||||
| (cost $1,632,050,350) | 1,669,179,741 | ||||
42
| BNY Mellon National Intermediate Municipal Bond Fund (continued) | |||||
| Short-Term Municipal | Coupon | Maturity | Principal | ||
| Investments—1.5% | Rate (%) | Date | Amount ($) | Value ($) | |
| Florida—.0% | |||||
| Orange County School Board, COP (Master Lease | |||||
| Purchase Agreement) (LOC; Wells Fargo Bank) | 0.06 | 9/3/13 | 700,000 | f | 700,000 |
| Illinois—.1% | |||||
| Chicago, GO Notes, Refunding (LOC; Barclays Bank PLC) | 0.06 | 9/3/13 | 1,600,000 | f | 1,600,000 |
| Iowa—.4% | |||||
| Iowa Finance Authority, Private College Revenue, | |||||
| Refunding (Drake University Project) (LOC; Wells Fargo Bank) | 0.06 | 9/3/13 | 3,190,000 | f | 3,190,000 |
| Iowa Higher Education Loan Authority, | |||||
| Private College Faciliity Revenue, Refunding | |||||
| (Des Moines University Project) (LOC; Allied Irish Banks) | 0.06 | 9/3/13 | 4,200,000 | f | 4,200,000 |
| Massachusetts—1.0% | |||||
| Massachusetts, GO Notes (Consolidated Loan) | 0.51 | 9/7/13 | 5,000,000 | f | 5,006,050 |
| Massachusetts, GO Notes, Refunding | 0.35 | 9/7/13 | 10,000,000 | f | 9,969,300 |
| Mississippi—.0% | |||||
| Mississippi Business Finance Corporation, | |||||
| Gulf Opportunity Zone IDR (Chevron U.S.A. Inc. Project) | 0.05 | 9/3/13 | 100,000 | f | 100,000 |
| Missouri—.0% | |||||
| Missouri Health and Educational Facilities Authority, | |||||
| Educational Facilities Revenue (The Washington | |||||
| University) (Liquidity Facility; JPMorgan Chase Bank) | 0.05 | 9/3/13 | 200,000 | f | 200,000 |
| Missouri Health and Educational Facilities Authority, | |||||
| Educational Facilities Revenue (The Washington | |||||
| University) (SBPA; JPMorgan Chase Bank) | 0.05 | 9/3/13 | 300,000 | f | 300,000 |
| Pennsylvania—.0% | |||||
| Pennsylvania Economic Development Financing Authority, | |||||
| Revenue (Northwestern Human Services—Allegheny | |||||
| Valley School, LLC Issue) (LOC; TD Bank) | 0.06 | 9/3/13 | 500,000 | f | 500,000 |
| Total Short-Term Municipal Investments | |||||
| (cost $25,790,000) | 25,765,350 | ||||
| Total Investments (cost $1,657,840,350) | 98.0 | % | 1,694,945,091 |
| Cash and Receivables (Net) | 2.0 | % | 34,936,000 |
| Net Assets | 100.0 | % | 1,729,881,091 |
| a These securities are prerefunded; the date shown represents the prerefunded date. Bonds which are prerefunded are collateralized by U.S. Government securities which are held in |
| escrow and are used to pay principal and interest on the municipal issue and to retire the bonds in full at the earliest refunding date. |
| b Variable rate security—interest rate subject to periodic change. |
| c Security issued with a zero coupon. Income is recognized through the accretion of discount. |
| d Zero coupon until a specified date at which time the stated coupon rate becomes effective until maturity. |
| e Non-income producing—security in default. |
| f Variable rate demand note—rate shown is the interest rate in effect at August 31, 2013. Maturity date represents the next demand date, or the ultimate maturity date if earlier. |
The Funds 43
STATEMENT OF INVESTMENTS (continued)
| Summary of Abbreviations | |||
| ABAG | Association of Bay Area Governments | ACA | American Capital Access |
| AGC | ACE Guaranty Corporation | AGIC | Asset Guaranty Insurance Company |
| AMBAC | American Municipal Bond Assurance Corporation | ARRN | Adjustable Rate Receipt Notes |
| BAN | Bond Anticipation Notes | BPA | Bond Purchase Agreement |
| CIFG | CDC Ixis Financial Guaranty | COP | Certificate of Participation |
| CP | Commercial Paper | DRIVERS | Derivative Inverse Tax-Exempt Receipts |
| EDR | Economic Development Revenue | EIR | Environmental Improvement Revenue |
| FGIC | Financial Guaranty Insurance Company | FHA | Federal Housing Administration |
| FHLB | Federal Home Loan Bank | FHLMC | Federal Home Loan Mortgage Corporation |
| FNMA | Federal National Mortgage Association | GAN | Grant Anticipation Notes |
| GIC | Guaranteed Investment Contract | GNMA | Government National Mortgage Association |
| GO | General Obligation | HR | Hospital Revenue |
| IDB | Industrial Development Board | IDC | Industrial Development Corporation |
| IDR | Industrial Development Revenue | LIFERS | Long Inverse Floating Exempt Receipts |
| LOC | Letter of Credit | LOR | Limited Obligation Revenue |
| LR | Lease Revenue | MERLOTS | Municipal Exempt Receipts Liquidity Option Tender |
| MFHR | Multi-Family Housing Revenue | MFMR | Multi-Family Mortgage Revenue |
| PCR | Pollution Control Revenue | P-FLOATS | Puttable Floating Option Tax-Exempt Receipts |
| PILOT | Payment in Lieu of Taxes | PUTTERS | Puttable Tax-Exempt Receipts |
| RAC | Revenue Anticipation Certificates | RAN | Revenue Anticipation Notes |
| RAW | Revenue Anticipation Warrants | ROCS | Reset Options Certificates |
| RRR | Resources Recovery Revenue | SAAN | State Aid Anticipation Notes |
| SBPA | Standby Bond Purchase Agreement | SFHR | Single Family Housing Revenue |
| SFMR | Single Family Mortgage Revenue | SONYMA | State of New York Mortgage Agency |
| SPEARS | Short Puttable Exempt Adjustable Receipts | SWDR | Solid Waste Disposal Revenue |
| TAN | Tax Anticipation Notes | TAW | Tax Anticipation Warrants |
| TRAN | Tax and Revenue Anticipation Notes | XLCA | XL Capital Assurance |
| Summary of Combined Ratings (Unaudited) | |||||
| Fitch | or | Moody’s | or | Standard & Poor’s | Value (%)† |
| AAA | Aaa | AAA | 15.4 | ||
| AA | Aa | AA | 44.2 | ||
| A | A | A | 32.5 | ||
| BBB | Baa | BBB | 5.8 | ||
| B | B | B | .4 | ||
| F1 | MIG1/P1 | SP1/A1 | .6 | ||
| Not Ratedg | Not Ratedg | Not Ratedg | 1.1 | ||
| 100.0 | |||||
| † Based on total investments. |
| g Securities which, while not rated by Fitch, Moody’s and Standard & Poor’s, have been determined by the Manager to be of comparable quality to those rated securities in which the |
| fund may invest. |
| See notes to financial statements. |
44
STATEMENT OF FINANCIAL FUTURES
August 31, 2013
| Market Value | Unrealized | |||||
| BNY Mellon National | Covered by | Appreciation | ||||
| Intermediate Municipal Bond Fund | Contracts | Contracts ($) | Expiration | at 8/31/2013 ($) | ||
| Financial Futures Short | ||||||
| U.S. Treasury 10 Year Notes | 340 | (42,616,875 | ) | September 2013 | 1,429,063 | |
| See notes to financial statements. |
The Funds 45
STATEMENT OF INVESTMENTS
August 31, 2013
| BNY Mellon National Short-Term Municipal Bond Fund | |||||
| Long-Term Municipal | Coupon | Maturity | Principal | ||
| Investments—94.5% | Rate (%) | Date | Amount ($) | Value ($) | |
| Alabama—.2% | |||||
| Alabama 21st Century Authority, Tobacco Settlement Revenue | 4.00 | 6/1/16 | 1,000,000 | 1,072,200 | |
| Jefferson County, Limited Obligation School Warrants | |||||
| (Insured; Assured Guaranty Municipal Corp.) | 5.50 | 2/15/16 | 1,055,000 | 1,033,024 | |
| Alaska—1.2% | |||||
| Alaska Industrial Development and Export | |||||
| Authority, Revolving Fund Revenue | 5.00 | 4/1/14 | 2,370,000 | 2,436,644 | |
| North Slope Borough, GO | 2.50 | 6/30/14 | 3,400,000 | 3,464,362 | |
| Valdez, Marine Terminal Revenue | |||||
| (BP Pipelines (Alaska) Inc. Project) | 5.00 | 1/1/14 | 2,000,000 | 2,030,680 | |
| Valdez, Marine Terminal Revenue | |||||
| (BP Pipelines (Alaska) Inc. Project) | 5.00 | 1/1/16 | 2,500,000 | 2,729,075 | |
| Valdez, Marine Terminal Revenue | |||||
| (BP Pipelines (Alaska) Inc. Project) | 5.00 | 1/1/18 | 3,000,000 | 3,395,970 | |
| Arizona—2.0% | |||||
| Arizona Transportation Board, Subordinated Highway Revenue | 5.00 | 7/1/14 | 1,110,000 | 1,153,767 | |
| Arizona Transportation Board, Subordinated Highway Revenue | 5.00 | 7/1/14 | 1,055,000 | 1,097,147 | |
| Arizona Transportation Board, Subordinated Highway Revenue | 5.00 | 7/1/15 | 9,380,000 | 10,156,758 | |
| Arizona Transportation Board, Subordinated Highway Revenue | 5.00 | 7/1/16 | 5,000,000 | 5,586,150 | |
| Arizona Transportation Board, Transportation Excise Tax | |||||
| Revenue (Maricopa County Regional Area Road Fund) | 5.00 | 7/1/16 | 2,300,000 | 2,573,769 | |
| University of Arizona Board of Regents, System Revenue | 6.20 | 6/1/16 | 2,925,000 | 3,137,735 | |
| California—10.9% | |||||
| California, GO (Economic Recovery) | |||||
| (Insured; National Public Finance Guarantee Corp.) | 5.25 | 7/1/14 | 6,820,000 | 7,109,032 | |
| California, GO (Various Purpose) | 4.00 | 10/1/15 | 17,050,000 | 18,294,139 | |
| California, GO (Various Purpose) | 5.00 | 9/1/16 | 10,000,000 | 11,246,700 | |
| California Health Facilities Financing Authority, | |||||
| Revenue (Cedars-Sinai Medical Center) | 5.00 | 8/15/15 | 1,000,000 | 1,085,640 | |
| California Health Facilities Financing Authority, Revenue | |||||
| (Lucile Salter Packard Children’s Hospital at Stanford) | 1.45 | 3/15/17 | 3,000,000 | 2,983,680 | |
| California Infrastructure and Economic Development | |||||
| Bank, Revenue (The J. Paul Getty Trust) | 0.34 | 4/1/16 | 5,000,000 | a | 5,000,100 |
| California Municipal Finance Authority, SWDR | |||||
| (Waste Management, Inc. Project) | 0.70 | 2/3/14 | 3,000,000 | 2,982,810 | |
| California Municipal Finance Authority, SWDR | |||||
| (Waste Management, Inc. Project) | 2.00 | 9/2/14 | 4,000,000 | 4,059,080 | |
| California Statewide Communities Development Authority, | |||||
| MFHR (Clara Park/Cypress Sunrise/Wysong | |||||
| Plaza Apartments) (Collateralized; GNMA) | 4.55 | 1/20/16 | 565,000 | 583,854 | |
| California Statewide Communities Development | |||||
| Authority, Revenue (Kaiser Permanente) | 5.00 | 4/1/14 | 1,000,000 | 1,028,160 | |
| California Statewide Communities Development | |||||
| Authority, Revenue (Kaiser Permanente) | 5.00 | 5/1/17 | 3,500,000 | 3,971,800 | |
46
| BNY Mellon National Short-Term Municipal Bond Fund (continued) | |||||
| Long-Term Municipal | Coupon | Maturity | Principal | ||
| Investments (continued) | Rate (%) | Date | Amount ($) | Value ($) | |
| California (continued) | |||||
| California Statewide Communities Development Authority, | |||||
| Student Housing Revenue (University of California, Irvine | |||||
| East Campus Apartments, Phase 1 Refunding—CHF—Irvine, L.L.C.) | 4.00 | 5/15/14 | 900,000 | 920,007 | |
| California Statewide Communities Development Authority, | |||||
| Student Housing Revenue (University of California, Irvine | |||||
| East Campus Apartments, Phase 1 Refunding —CHF—Irvine, L.L.C.) | 4.00 | 5/15/15 | 1,150,000 | 1,202,336 | |
| California Statewide Communities Development Authority, | |||||
| Student Housing Revenue (University of California, Irvine | |||||
| East Campus Apartments, Phase 1 Refunding—CHF—Irvine, L.L.C.) | 4.00 | 5/15/16 | 1,450,000 | 1,534,332 | |
| Chula Vista, IDR (San Diego Gas and Electric Company) | 1.65 | 7/1/18 | 10,000,000 | 9,900,300 | |
| Contra Costa Transportation Authority, | |||||
| Sales Tax Revenue (Limited Tax Bonds) | 0.50 | 12/15/15 | 4,000,000 | a | 3,988,520 |
| Golden Empire Schools Financing Authority, LR | |||||
| (Kern High School District Projects) | 0.36 | 5/1/14 | 12,000,000 | a | 12,001,440 |
| Irvine Reassessment District Number 12-1, | |||||
| Limited Obligation Improvement Bonds | 3.00 | 9/2/16 | 2,000,000 | 2,096,400 | |
| Los Angeles Department of Water and | |||||
| Power, Power System Revenue | 5.00 | 1/1/16 | 10,000,000 | 10,931,600 | |
| Los Angeles Unified School District, GO | 4.00 | 7/1/16 | 4,000,000 | 4,366,480 | |
| Metropolitan Water District of Southern California, Water Revenue | 3.50 | 10/1/16 | 5,900,000 | 6,337,603 | |
| Sacramento County Sanitation Districts Financing | |||||
| Authority, Revenue (Sacramento Regional County | |||||
| Sanitation District) (Insured; AMBAC) (Prerefunded) | 5.00 | 12/1/14 | 1,000,000 | b | 1,059,720 |
| Sacramento Municipal Utility District, Electric Revenue | 5.00 | 8/15/15 | 3,500,000 | 3,808,245 | |
| Sacramento Municipal Utility District, Electric Revenue | 5.00 | 8/15/16 | 6,610,000 | 7,411,396 | |
| South San Francisco Unified School District, GO, BAN (Measure J) | 4.00 | 6/15/18 | 6,000,000 | 6,566,400 | |
| Colorado—2.0% | |||||
| City and County of Denver, Airport System Revenue | 4.00 | 11/15/14 | 1,310,000 | 1,365,609 | |
| City and County of Denver, Airport System Revenue | 4.00 | 11/15/15 | 1,000,000 | 1,067,910 | |
| City and County of Denver, Airport System Revenue | 5.00 | 11/15/16 | 1,000,000 | 1,112,840 | |
| Colorado Health Facilities Authority, Revenue | |||||
| (Catholic Health Initiatives) (Prerefunded) | 5.00 | 11/12/13 | 100,000 | b | 100,958 |
| Denver Urban Renewal Authority, | |||||
| Stapleton Senior Tax Increment Revenue | 5.00 | 12/1/16 | 1,850,000 | 2,072,296 | |
| Denver Urban Renewal Authority, | |||||
| Stapleton Senior Tax Increment Revenue | 5.00 | 12/1/17 | 4,005,000 | 4,551,923 | |
| E-470 Public Highway Authority, Senior Revenue | |||||
| (Insured; National Public Finance Guarantee Corp.) | 1.81 | 8/31/17 | 8,000,000 | a | 8,000,560 |
| Regional Transportation District of Colorado, | |||||
| COP (Lease Purchase Agreement) | 5.00 | 6/1/18 | 5,000,000 | 5,648,750 | |
| Connecticut—2.6% | |||||
| Bridgeport, GO | 4.00 | 8/15/18 | 2,000,000 | 2,151,380 | |
| Connecticut, GO (Economic Recovery) | 5.00 | 1/1/16 | 8,425,000 | 9,285,698 | |
The Funds 47
STATEMENT OF INVESTMENTS (continued)
| BNY Mellon National Short-Term Municipal Bond Fund (continued) | |||||
| Long-Term Municipal | Coupon | Maturity | Principal | ||
| Investments (continued) | Rate (%) | Date | Amount ($) | Value ($) | |
| Connecticut (continued) | |||||
| Connecticut, Special Tax Obligation Revenue | |||||
| (Transportation Infrastructure Purposes) | 5.00 | 12/1/16 | 2,900,000 | 3,288,571 | |
| Connecticut Development Authority, PCR | |||||
| (The Connecticut Light and Power Company Project) | 1.25 | 9/3/13 | 2,600,000 | 2,600,208 | |
| Connecticut Health and Educational Facilities | |||||
| Authority, Revenue (Yale University Issue) | 1.35 | 7/21/16 | 10,000,000 | 10,060,700 | |
| New Haven, GO | 4.00 | 11/1/15 | 3,000,000 | 3,195,720 | |
| Florida—6.5% | |||||
| Citizens Property Insurance Corporation, Personal Lines | |||||
| Account/Commercial Lines Account Senior Secured Revenue | 1.31 | 6/1/15 | 5,000,000 | a | 5,070,800 |
| Citizens Property Insurance Corporation, Personal Lines | |||||
| Account/Commercial Lines Account Senior Secured Revenue | 5.00 | 6/1/16 | 10,000,000 | 11,014,300 | |
| Florida Hurricane Catastrophe Fund Finance Corporation, Revenue | 5.00 | 7/1/15 | 10,000,000 | 10,774,500 | |
| Florida State Board of Education, Lottery Revenue (Insured; AMBAC) | 5.25 | 7/1/14 | 5,000,000 | 5,209,100 | |
| Florida State Board of Education, | |||||
| Public Education Capital Outlay Bonds | 5.00 | 6/1/16 | 10,000,000 | 11,162,900 | |
| Jacksonville, Special Revenue | 5.00 | 10/1/16 | 3,000,000 | 3,364,230 | |
| Jacksonville Electric Authority, Revenue | |||||
| (Saint Johns River Power Park System) | 5.00 | 10/1/16 | 5,000,000 | 5,620,050 | |
| Kissimmee Utility Authority, Electric System Revenue | 4.00 | 10/1/14 | 1,250,000 | 1,297,250 | |
| Miami-Dade County, Double-Barreled Aviation GO | 5.00 | 7/1/14 | 1,000,000 | 1,039,170 | |
| Orange County School Board, COP | |||||
| (Master Lease Purchase Agreement) | 5.00 | 8/1/15 | 1,500,000 | 1,622,565 | |
| Orlando, Waste Water System Revenue | |||||
| (Insured; National Public Finance Guarantee Corp.) | 4.00 | 10/1/14 | 3,025,000 | 3,148,813 | |
| Orlando-Orange County Expressway Authority, Junior Lien | |||||
| Revenue (Insured; National Public Finance Guarantee Corp.) | 8.25 | 7/1/15 | 8,360,000 | 9,513,262 | |
| Palm Beach County School Board, COP | |||||
| (Master Lease Purchase Agreement) | |||||
| (Insured; Assured Guaranty Municipal Corp.) | 5.00 | 8/1/17 | 5,000,000 | 5,405,700 | |
| Putnam County Development Authority, PCR | |||||
| (Seminole Electric Cooperative, Inc. Project) (Insured; AMBAC) | 5.35 | 5/1/18 | 2,250,000 | 2,564,190 | |
| Georgia—2.1% | |||||
| Atlanta, Water and Wastewater Revenue | 5.00 | 11/1/15 | 5,000,000 | 5,468,650 | |
| Burke County Development Authority, PCR | |||||
| (Georgia Power Company Plant Vogtle Project) | 1.40 | 4/1/15 | 5,000,000 | 5,034,950 | |
| Floyd County Development Authority, PCR | |||||
| (Georgia Power Company Plant Hammond Project) | 0.85 | 11/19/15 | 5,000,000 | 5,017,600 | |
| Fulton County, Water and Sewerage Revenue | 5.00 | 1/1/16 | 1,550,000 | 1,707,201 | |
| Monroe County Development Authority, PCR | |||||
| (Gulf Power Company Plant Scherer Project) | 2.00 | 6/21/18 | 7,000,000 | 6,867,140 | |
| Municipal Electric Authority of Georgia, Revenue | |||||
| (Project One Subordinated Bonds) | 5.00 | 1/1/17 | 1,000,000 | 1,121,790 | |
48
| BNY Mellon National Short-Term Municipal Bond Fund (continued) | ||||
| Long-Term Municipal | Coupon | Maturity | Principal | |
| Investments (continued) | Rate (%) | Date | Amount ($) | Value ($) |
| Illinois—9.5% | ||||
| Central Lake County Joint Action Water Agency, Water Revenue | 4.00 | 5/1/17 | 5,430,000 | 5,935,370 |
| Chicago, General Airport Senior Lien Revenue | ||||
| (Chicago O’Hare International Airport) | 5.00 | 1/1/17 | 4,000,000 | 4,457,960 |
| Chicago, Second Lien Revenue | ||||
| (Chicago Midway Airport) (Insured; AMBAC) | 5.00 | 1/1/17 | 4,110,000 | 4,308,760 |
| Chicago Board of Education, Unlimited Tax GO | ||||
| (Dedicated Revenues) (Insured; AMBAC) | 5.25 | 12/1/15 | 1,425,000 | 1,546,595 |
| Chicago Board of Education, Unlimited Tax GO | ||||
| (Dedicated Revenues) (Insured; National | ||||
| Public Finance Guarantee Corp.) | 5.00 | 12/1/14 | 2,000,000 | 2,100,360 |
| Chicago Board of Education, Unlimited Tax GO (Dedicated | ||||
| Revenues) (Insured; National Public Finance Guarantee Corp.) | 5.00 | 12/1/15 | 5,000,000 | 5,223,400 |
| Chicago Board of Education, Unlimited Tax GO (Dedicated | ||||
| Revenues) (Insured; National Public Finance Guarantee Corp.) | 5.00 | 12/1/16 | 17,000,000 | 17,741,370 |
| Chicago Park District, GO Limited Tax Bonds (Insured; AMBAC) | 5.00 | 1/1/16 | 2,100,000 | 2,179,359 |
| Chicago Transit Authority, Capital Grant Receipts | ||||
| Revenue (Federal Transit Administration | ||||
| Section 5307 Formula Funds) (Insured; AMBAC) | 5.00 | 6/1/14 | 3,815,000 | 3,936,317 |
| Cook County, GO | 5.00 | 11/15/15 | 1,500,000 | 1,631,490 |
| Cook County, GO | 5.00 | 11/15/16 | 5,400,000 | 6,026,022 |
| Cook County, GO (Capital Equipment Bonds) | 5.00 | 11/15/15 | 1,000,000 | 1,087,660 |
| Illinois, GO | 5.00 | 1/1/14 | 1,415,000 | 1,437,739 |
| Illinois, GO | 5.00 | 1/1/14 | 4,585,000 | 4,649,832 |
| Illinois, GO | 4.00 | 7/1/16 | 3,000,000 | 3,182,100 |
| Illinois, GO | 5.00 | 7/1/17 | 3,150,000 | 3,457,566 |
| Illinois, GO | 4.00 | 7/1/18 | 5,000,000 | 5,262,650 |
| Illinois, GO (Insured; Assured Guaranty Municipal Corp.) | 5.00 | 1/1/16 | 7,500,000 | 8,096,625 |
| Illinois, GO (Insured; National Public Finance Guarantee Corp.) | 5.38 | 4/1/16 | 4,465,000 | 4,877,521 |
| Illinois Department of Employment Security, Unemployment | ||||
| Insurance Fund Building Receipts Revenue | 5.00 | 6/15/18 | 5,000,000 | 5,642,950 |
| Illinois Department of Employment Security, Unemployment | ||||
| Insurance Fund Building Receipts Revenue | 5.00 | 6/15/17 | 2,000,000 | 2,246,340 |
| Illinois Development Finance Authority, Revenue | ||||
| (Saint Vincent de Paul Center Project) | 1.88 | 3/1/19 | 3,500,000 | 3,286,745 |
| Illinois Toll Highway Authority, Toll Highway Senior Revenue | 5.00 | 12/1/18 | 2,000,000 | 2,290,600 |
| Kane, McHenry, Cook and DeKalb Counties Community Unit | ||||
| School District Number 300, GO (Insured; XLCA) | 5.00 | 12/1/17 | 3,145,000 | 3,371,534 |
| Railsplitter Tobacco Settlement Authority, | ||||
| Tobacco Settlement Revenue | 5.00 | 6/1/15 | 8,330,000 | 8,906,769 |
| Indiana—1.7% | ||||
| Indiana Finance Authority, EIR (Southern Indiana | ||||
| Gas and Electric Company Project) | 1.95 | 9/14/17 | 2,500,000 | 2,493,300 |
The Funds 49
STATEMENT OF INVESTMENTS (continued)
| BNY Mellon National Short-Term Municipal Bond Fund (continued) | |||||
| Long-Term Municipal | Coupon | Maturity | Principal | ||
| Investments (continued) | Rate (%) | Date | Amount ($) | Value ($) | |
| Indiana (continued) | |||||
| Indiana Finance Authority, Second Lien Water | |||||
| Utility Revenue (Citizens Energy Group Project) | 3.00 | 10/1/14 | 2,000,000 | 2,054,700 | |
| Indiana Health Facility Financing Authority, | |||||
| Revenue (Ascension Health Credit Group) | 1.50 | 8/1/14 | 2,000,000 | 2,023,040 | |
| Indiana Health Facility Financing Authority, | |||||
| Revenue (Ascension Health Credit Group) | 1.60 | 2/1/17 | 2,500,000 | 2,482,900 | |
| Indiana Health Facility Financing Authority, Revenue | |||||
| (Ascension Health Subordinate Credit Group) | 1.70 | 9/1/14 | 1,500,000 | 1,521,690 | |
| Indiana Health Facility Financing Authority, Revenue | |||||
| (Ascension Health Subordinate Credit Group) | 5.00 | 7/28/16 | 2,000,000 | 2,218,100 | |
| Indiana Transportation Finance Authority, | |||||
| Highway Revenue (Insured; FGIC) (Prerefunded) | 5.25 | 6/1/14 | 1,000,000 | b | 1,038,080 |
| Whiting, Environmental Facilities Revenue | |||||
| (BP Products North America, Inc.) | 2.80 | 6/2/14 | 6,000,000 | 6,102,480 | |
| Iowa—.1% | |||||
| Iowa Higher Education Loan Authority, Private College | |||||
| Facility Revenue (Grinnell College Project) | 4.00 | 12/1/13 | 1,000,000 | 1,009,610 | |
| Kentucky—.8% | |||||
| Kentucky Property and Buildings Commission, | |||||
| Revenue (Project Number 99) | 5.00 | 11/1/17 | 4,200,000 | 4,810,134 | |
| Louisville/Jefferson County Metro Government, PCR | |||||
| (Louisville Gas and Electric Company Project) | 1.65 | 4/3/17 | 4,940,000 | 4,927,897 | |
| Louisiana—.9% | |||||
| England District Sub-District Number 1, Revenue | |||||
| (State of Louisiana—Economic Development Project) | 5.00 | 8/15/17 | 3,055,000 | 3,464,553 | |
| Louisiana Offshore Terminal Authority, | |||||
| Deepwater Port Revenue (LOOP LLC Project) | 1.88 | 10/1/13 | 2,000,000 | 2,002,620 | |
| Louisiana Public Facilities Authority, Revenue | |||||
| (Loyola University Project) (Insured; National | |||||
| Public Finance Guarantee Corp.) | 5.25 | 10/1/16 | 5,000,000 | 5,611,650 | |
| Maryland—.6% | |||||
| Maryland Health and Higher Educational Facilities | |||||
| Authority, Revenue (The Johns Hopkins | |||||
| Health System Obligated Group Issue) | 1.28 | 11/15/16 | 2,245,000 | a | 2,261,321 |
| University System of Maryland, | |||||
| Revolving Loan Program Bonds | 1.25 | 6/1/18 | 5,000,000 | 4,883,900 | |
| Massachusetts—3.1% | |||||
| Massachusetts Bay Transportation Authority, | |||||
| Assessment Revenue (Prerefunded) | 5.00 | 7/1/14 | 12,705,000 | b | 13,219,171 |
| Massachusetts Development Finance Agency, | |||||
| Recovery Zone Facility Revenue (Dominion | |||||
| Energy Brayton Point Issue) (Prerefunded) | 2.25 | 9/1/16 | 5,000,000 | b | 5,212,600 |
| Massachusetts Development Finance Agency, | |||||
| Revenue (Brandeis University Issue) | 3.00 | 10/1/13 | 1,140,000 | 1,142,702 | |
50
| BNY Mellon National Short-Term Municipal Bond Fund (continued) | ||||
| Long-Term Municipal | Coupon | Maturity | Principal | |
| Investments (continued) | Rate (%) | Date | Amount ($) | Value ($) |
| Massachusetts (continued) | ||||
| Massachusetts Development Finance Agency, | ||||
| Revenue (UMass Memorial Issue) | 4.00 | 7/1/14 | 4,525,000 | 4,638,668 |
| Massachusetts Health and Educational Facilities | ||||
| Authority, Revenue (Amherst College Issue) | 1.00 | 11/1/14 | 1,850,000 | 1,867,594 |
| Massachusetts Health and Educational Facilities | ||||
| Authority, Revenue (Amherst College Issue) | 1.70 | 11/1/16 | 2,915,000 | 2,949,543 |
| Massachusetts Health and Educational Facilities | ||||
| Authority, Revenue (Partners HealthCare System Issue) | 5.00 | 7/1/14 | 1,600,000 | 1,661,840 |
| Massachusetts Health and Educational Facilities | ||||
| Authority, Revenue (Simmons College Issue) | 6.13 | 10/1/14 | 1,000,000 | 1,052,720 |
| Massachusetts Municipal Wholesale Electric Company, | ||||
| Power Supply Project Revenue (Project Number 6 Issue) | 5.00 | 7/1/16 | 4,160,000 | 4,615,478 |
| Michigan—2.8% | ||||
| Detroit School District, School Building and | ||||
| Site Improvement Bonds (GO— Unlimited Tax) | 5.00 | 5/1/16 | 1,490,000 | 1,611,539 |
| Michigan Finance Authority, Unemployment | ||||
| Obligation Assessment Revenue | 5.00 | 7/1/17 | 10,000,000 | 11,430,700 |
| Michigan Hospital Finance Authority, Project Revenue | ||||
| (Ascension Health Senior Credit Group) | 1.50 | 3/1/17 | 12,000,000 | 11,883,240 |
| Michigan State Building Authority, Revenue (Facilities Program) | 5.00 | 10/15/16 | 3,500,000 | 3,876,005 |
| Wayne County Airport Authority, Airport Revenue | ||||
| (Detroit Metropolitan Wayne County Airport) | ||||
| (Insured; Assured Guaranty Corp.) | 4.75 | 12/1/18 | 4,000,000 | 4,244,040 |
| Minnesota—.9% | ||||
| Minnesota, GO | 5.00 | 8/1/16 | 5,200,000 | 5,841,212 |
| Minnesota, GO (Various Purpose) | 5.00 | 8/1/15 | 4,000,000 | 4,352,400 |
| Missouri—.3% | ||||
| Missouri State Environmental Improvement and Energy Resources | ||||
| Authority, EIR (Kansas City Power and Light Company Project) | 2.88 | 7/2/18 | 3,400,000 | 3,372,596 |
| Nebraska—.2% | ||||
| Lincoln, GO | 4.00 | 12/1/15 | 2,035,000 | 2,195,684 |
| Nevada—3.8% | ||||
| Clark County, Limited Tax GO Public Safety Bonds | ||||
| (Insured; Assured Guaranty Municipal Corp.) | 5.00 | 1/1/14 | 1,000,000 | 1,016,200 |
| Clark County, Passenger Facility Charge Revenue | ||||
| (Las Vegas-McCarran International Airport) | 5.00 | 7/1/14 | 2,500,000 | 2,594,925 |
| Clark County School District, Limited Tax GO | 5.00 | 6/15/16 | 10,000,000 | 11,101,800 |
| Clark County School District, Limited Tax GO | ||||
| (Insured; National Public Finance Guarantee Corp.) | 5.00 | 6/15/15 | 6,800,000 | 7,329,448 |
| Clark County School District, Limited Tax GO | ||||
| (Insured; National Public Finance Guarantee Corp.) | 5.25 | 6/15/15 | 4,075,000 | 4,410,372 |
| Las Vegas Convention and Visitors Authority, | ||||
| Revenue (Insured; AMBAC) | 5.00 | 7/1/16 | 3,500,000 | 3,770,060 |
The Funds 51
STATEMENT OF INVESTMENTS (continued)
| BNY Mellon National Short-Term Municipal Bond Fund (continued) | |||||
| Long-Term Municipal | Coupon | Maturity | Principal | ||
| Investments (continued) | Rate (%) | Date | Amount ($) | Value ($) | |
| Nevada (continued) | |||||
| Las Vegas Valley Water District, GO | |||||
| (Additionally Secured by Pledged Revenues) | 5.00 | 6/1/17 | 13,640,000 | 14,667,638 | |
| Las Vegas Valley Water District, GO (Additionally Secured by | |||||
| Southern Nevada Water Authority Pledged Revenues) | 5.00 | 6/1/14 | 450,000 | 465,948 | |
| New Hampshire—1.6% | |||||
| New Hampshire, Turnpike System Revenue | 4.00 | 10/1/14 | 5,315,000 | 5,526,909 | |
| New Hampshire, Turnpike System Revenue | 5.00 | 10/1/15 | 5,565,000 | 6,070,636 | |
| New Hampshire, Turnpike System Revenue | 5.00 | 2/1/17 | 6,000,000 | 6,744,300 | |
| New Hampshire Business Finance Authority, | |||||
| SWDR (Waste Management, Inc. Project) | 2.13 | 6/1/18 | 1,000,000 | 957,410 | |
| New Jersey—4.3% | |||||
| New Jersey, GO | 5.00 | 8/15/15 | 10,000,000 | 10,884,800 | |
| New Jersey Economic Development | |||||
| Authority, Cigarette Tax Revenue | 5.38 | 6/15/14 | 2,935,000 | 3,055,452 | |
| New Jersey Economic Development Authority, | |||||
| Exempt Facilities Revenue (Waste Management | |||||
| of New Jersey, Inc. Project) | 2.20 | 11/1/13 | 2,000,000 | 2,003,400 | |
| New Jersey Economic Development Authority, | |||||
| School Facilities Construction Revenue | 5.00 | 3/1/17 | 4,475,000 | 5,028,871 | |
| New Jersey Economic Development Authority, | |||||
| School Facilities Construction Revenue (Insured; AMBAC) | 5.00 | 9/1/17 | 5,000,000 | 5,396,100 | |
| New Jersey Educational Facilities Authority, | |||||
| Revenue (Princeton University) | 5.00 | 7/1/14 | 2,185,000 | 2,273,427 | |
| New Jersey Sports and Exposition Authority, | |||||
| State Contract Bonds | 5.00 | 9/1/16 | 1,665,000 | 1,854,693 | |
| New Jersey Transportation Trust Fund | |||||
| Authority (Transportation System) | 5.00 | 6/15/15 | 1,800,000 | 1,943,172 | |
| New Jersey Transportation Trust Fund | |||||
| Authority (Transportation System) | 5.00 | 6/15/16 | 2,000,000 | 2,224,460 | |
| New Jersey Transportation Trust Fund Authority | |||||
| (Transportation System) (Insured; Assured | |||||
| Guaranty Municipal Corp.) | 5.75 | 12/15/14 | 2,820,000 | 3,018,754 | |
| New Jersey Transportation Trust Fund Authority | |||||
| (Transportation System) (Insured; National | |||||
| Public Finance Guarantee Corp.) (Prerefunded) | 5.25 | 6/15/15 | 5,000,000 | b | 5,428,650 |
| New Jersey Turnpike Authority, Turnpike Revenue | 5.00 | 1/1/19 | 6,885,000 | 7,869,073 | |
| New Mexico—.5% | |||||
| New Mexico Educational Assistance | |||||
| Foundation, Education Loan Revenue | 0.98 | 12/1/20 | 2,515,000 | a | 2,501,671 |
| New Mexico Finance Authority, Subordinate Lien | |||||
| Public Project Revolving Fund Revenue (Insured; | |||||
| National Public Finance Guarantee Corp.) | 5.25 | 6/15/18 | 2,605,000 | 2,929,401 | |
| New York—9.9% | |||||
| Long Island Power Authority, Electric System General Revenue | 5.00 | 5/1/15 | 5,400,000 | 5,746,950 | |
52
| BNY Mellon National Short-Term Municipal Bond Fund (continued) | |||||
| Long-Term Municipal | Coupon | Maturity | Principal | ||
| Investments (continued) | Rate (%) | Date | Amount ($) | Value ($) | |
| New York (continued) | |||||
| Metropolitan Transportation Authority, Transportation Revenue | 5.00 | 11/15/13 | 11,125,000 | 11,230,799 | |
| Nassau County, GO (Insured; Assured Guaranty Municipal Corp.) | 5.00 | 7/1/16 | 4,595,000 | 5,097,417 | |
| Nassau County Interim Finance Authority, | |||||
| Sales Tax Secured Revenue | 4.00 | 11/15/15 | 7,820,000 | 8,426,128 | |
| Nassau Health Care Corporation, RAN | |||||
| (Insured; Assured Guaranty Municipal Corp.) | 2.25 | 12/15/13 | 7,500,000 | 7,541,775 | |
| New York City, GO | 5.00 | 8/1/14 | 4,000,000 | 4,177,280 | |
| New York City, GO | 5.00 | 8/1/15 | 1,000,000 | 1,086,820 | |
| New York City, GO | 5.25 | 8/1/16 | 4,670,000 | 4,874,172 | |
| New York City Transitional Finance Authority, | |||||
| Future Tax Secured Revenue | 5.00 | 11/1/14 | 10,000,000 | 10,558,900 | |
| New York City Transitional Finance Authority, Future Tax Secured | |||||
| Revenue (Insured; National Public Finance Guarantee Corp.) | 5.50 | 11/1/14 | 240,000 | 241,063 | |
| New York City Transitional Finance Authority, | |||||
| Future Tax Secured Subordinate Revenue | 5.00 | 11/1/16 | 2,590,000 | 2,928,513 | |
| New York City Transitional Finance Authority, | |||||
| Future Tax Secured Subordinate Revenue | 5.00 | 11/1/16 | 765,000 | 859,653 | |
| New York State Dormitory Authority, Revenue | |||||
| (Mental Health Services Facilities Improvement) | 5.00 | 8/15/15 | 5,000 | 5,443 | |
| New York State Dormitory Authority, Revenue | |||||
| (Mental Health Services Facilities Improvement) | 5.00 | 8/15/15 | 995,000 | 1,080,182 | |
| New York State Dormitory Authority, Revenue | |||||
| (School Districts Revenue Financing Program) | |||||
| (Insured; National Public Finance Guarantee Corp.) | 5.75 | 10/1/17 | 25,000 | 25,115 | |
| New York State Dormitory Authority, State | |||||
| Personal Income Tax Revenue (General Purpose) | 5.00 | 8/15/15 | 11,380,000 | 12,390,203 | |
| New York State Dormitory Authority, Third General Resolution | |||||
| Revenue (State University Educational Facilities Issue) | 4.00 | 5/15/17 | 4,825,000 | 5,289,889 | |
| New York State Environmental Facilities Corporation, | |||||
| SWDR (Waste Management, Inc. Project) | 2.75 | 7/1/17 | 2,000,000 | 1,974,460 | |
| New York State Thruway Authority, Second General Highway and | |||||
| Bridge Trust Fund Bonds (Insured; AMBAC) (Prerefunded) | 5.00 | 4/1/14 | 1,475,000 | b | 1,516,403 |
| New York State Urban Development Corporation, | |||||
| Correctional Capital Facilities Revenue (Insured; | |||||
| Assured Guaranty Municipal Corp.) | 5.25 | 1/1/14 | 375,000 | 381,405 | |
| New York State Urban Development Corporation, | |||||
| Service Contract Revenue | 5.00 | 1/1/15 | 5,610,000 | 5,953,893 | |
| Port Authority of New York and New Jersey | |||||
| (Consolidated Bonds, 139th Series) (Insured; | |||||
| National Public Finance Guarantee Corp. ) | 5.00 | 10/1/16 | 5,000,000 | 5,378,450 | |
| Rockland County, GO Notes, RAN | 1.75 | 6/27/14 | 10,000,000 | 10,049,200 | |
| Tobacco Settlement Financing Corporation of | |||||
| New York, Asset-Backed Revenue Bonds | |||||
| (State Contingency Contract Secured) | 5.00 | 6/1/14 | 3,000,000 | 3,107,010 | |
The Funds 53
STATEMENT OF INVESTMENTS (continued)
| BNY Mellon National Short-Term Municipal Bond Fund (continued) | |||||
| Long-Term Municipal | Coupon | Maturity | Principal | ||
| Investments (continued) | Rate (%) | Date | Amount ($) | Value ($) | |
| New York (continued) | |||||
| Triborough Bridge and Tunnel Authority, | |||||
| General Revenue (MTA Bridges and Tunnels) | 4.00 | 11/15/16 | 2,500,000 | 2,742,450 | |
| Triborough Bridge and Tunnel Authority, | |||||
| General Revenue (MTA Bridges and Tunnels) | 5.00 | 11/15/16 | 1,900,000 | 2,152,586 | |
| Triborough Bridge and Tunnel Authority, | |||||
| General Revenue (MTA Bridges and Tunnels) | 4.00 | 11/15/17 | 3,500,000 | 3,880,275 | |
| North Carolina—1.3% | |||||
| Charlotte, Water and Sewer System Revenue | 3.00 | 12/1/14 | 1,250,000 | 1,292,987 | |
| North Carolina Medical Care Commission, Health Care | |||||
| Facilities Revenue (Wake Forest Baptist Obligated Group) | 0.80 | 12/1/17 | 2,500,000 | a | 2,486,250 |
| Wake County, GO | 4.00 | 2/1/15 | 10,560,000 | 11,112,922 | |
| Ohio—3.3% | |||||
| Cleveland, GO (Various Purpose) (Insured; AMBAC) | 5.25 | 10/1/14 | 5,050,000 | 5,313,458 | |
| Cleveland, Water Revenue | 5.00 | 1/1/16 | 3,000,000 | 3,303,510 | |
| Ohio, Common Schools GO Bonds | 5.00 | 9/15/16 | 5,780,000 | 6,509,263 | |
| Ohio, GO Highway Capital Improvements Bonds | |||||
| (Full Faith and Credit/Highway User Receipts) | |||||
| (Buckeye Savers Bond Program) | 5.00 | 5/1/16 | 4,650,000 | 5,173,962 | |
| Ohio Building Authority, State Facilities Revenue | |||||
| (Administrative Building Fund Projects) | |||||
| (Insured; National Public Finance Guarantee Corp.) | 5.00 | 10/1/16 | 3,585,000 | 4,030,723 | |
| Ohio Water Development Authority, | |||||
| Drinking Water Assistance Fund Revenue | 5.00 | 12/1/17 | 1,925,000 | 2,221,797 | |
| Ohio Water Development Authority, Solid Waste | |||||
| Revenue (Waste Management, Inc. Project) | 2.25 | 11/2/15 | 6,000,000 | 6,032,940 | |
| Ohio Water Development Authority, SWDR | |||||
| (Waste Management Project) | 2.25 | 7/1/16 | 1,000,000 | 1,003,000 | |
| Ohio Water Development Authority, | |||||
| Water Pollution Control Loan Fund Notes | 0.46 | 7/15/15 | 5,000,000 | a | 5,000,900 |
| Oklahoma—.3% | |||||
| Oklahoma Capitol Improvement Authority, | |||||
| State Highway Capital Improvement Revenue | 4.00 | 10/1/16 | 2,960,000 | 3,248,600 | |
| Oregon—.4% | |||||
| Oregon Department of Transportation, | |||||
| Highway User Tax Revenue (Prerefunded) | 5.25 | 11/15/14 | 4,375,000 | b | 4,641,481 |
| Pennsylvania—4.7% | |||||
| Allegheny County Hospital Development Authority, | |||||
| Revenue (University of Pittsburgh Medical Center) | 5.00 | 5/15/14 | 2,875,000 | 2,968,869 | |
| Berks County Municipal Authority, Revenue | |||||
| (The Reading Hospital and Medical Center Project) | 5.00 | 11/1/13 | 3,035,000 | 3,058,643 | |
| Chester County Industrial Development Authority, Student Housing | |||||
| Revenue, BAN (University Student Housing, LLC Project at | |||||
| West Chester University of Pennsylvania) | 1.60 | 2/1/15 | 2,600,000 | 2,611,544 | |
54
| BNY Mellon National Short-Term Municipal Bond Fund (continued) | ||||
| Long-Term Municipal | Coupon | Maturity | Principal | |
| Investments (continued) | Rate (%) | Date | Amount ($) | Value ($) |
| Pennsylvania (continued) | ||||
| Jim Thorpe Area School District, GO (Insured; | ||||
| National Public Finance Guarantee Corp.) | 5.30 | 3/15/16 | 1,000,000 | 1,041,220 |
| Monroeville Finance Authority, Revenue | ||||
| (University of Pittsburgh Medical Center) | 4.00 | 2/15/16 | 1,000,000 | 1,069,700 |
| Pennsylvania, GO | 5.00 | 7/15/14 | 6,740,000 | 7,025,843 |
| Pennsylvania, GO | 5.00 | 9/1/16 | 5,000,000 | 5,230,900 |
| Pennsylvania Economic Development Financing | ||||
| Authority, SWDR (Waste Management, Inc. Project) | 1.75 | 12/1/15 | 2,000,000 | 1,986,400 |
| Pennsylvania Economic Development Financing | ||||
| Authority, Unemployment Compensation Revenue | 5.00 | 7/1/16 | 10,000,000 | 11,202,300 |
| Philadelphia, Airport Revenue | 5.00 | 6/15/15 | 1,000,000 | 1,070,190 |
| Philadelphia, Water and Wastewater Revenue | ||||
| (Insured; Assured Guaranty Municipal Corp.) | 5.00 | 8/1/17 | 3,690,000 | 4,202,467 |
| Pittsburgh, GO (Insured; Assured Guaranty Municipal Corp.) | 5.00 | 9/1/13 | 5,000,000 | 5,000,650 |
| State Public School Building Authority, College Revenue | ||||
| (Northampton County Area Community College Project) | 4.00 | 3/1/14 | 2,165,000 | 2,202,173 |
| State Public School Building Authority, School | ||||
| Revenue (Chester Upland School District Project) | ||||
| (Insured; Assured Guaranty Municipal Corp.) | 4.00 | 9/15/14 | 1,810,000 | 1,873,422 |
| Woodland Hills School District, GO | 5.00 | 9/1/17 | 5,010,000 | 5,632,643 |
| South Carolina—.5% | ||||
| Piedmont Municipal Power Agency, Electric Revenue | 5.00 | 1/1/15 | 2,000,000 | 2,116,500 |
| Piedmont Municipal Power Agency, Electric Revenue | 5.00 | 1/1/17 | 1,060,000 | 1,185,038 |
| South Carolina Jobs-Economic Development Authority, | ||||
| EDR (Waste Management of South Carolina, Inc. Project) | 2.88 | 2/1/15 | 2,100,000 | 2,142,168 |
| Tennessee—2.1% | ||||
| Memphis-Shelby County Airport Authority, Airport Revenue | 5.00 | 7/1/16 | 4,105,000 | 4,504,252 |
| Memphis-Shelby County Airport Authority, Airport Revenue | 5.00 | 7/1/17 | 4,905,000 | 5,442,931 |
| Memphis-Shelby County Airport Authority, Airport Revenue | 5.38 | 7/1/18 | 3,175,000 | 3,575,241 |
| Metropolitan Government of Nashville and | ||||
| Davidson County, GO Improvement Bonds | 5.00 | 7/1/16 | 5,750,000 | 6,441,323 |
| Metropolitan Government of Nashville and Davidson | ||||
| County, Subordinate Lien Water and Sewer Revenue | 5.00 | 7/1/16 | 1,250,000 | 1,392,813 |
| Tennessee, GO | 5.00 | 8/1/16 | 3,100,000 | 3,486,105 |
| Texas—8.1% | ||||
| Frisco Independent School District, Unlimited Tax School | ||||
| Building Bonds (Permanent School Fund Guarantee Program) | 5.00 | 8/15/15 | 1,000,000 | 1,089,650 |
| Grand Parkway Transportation Corporation, Grand Parkway | ||||
| System Subordinate Tier Toll Revenue (Toll Equity | ||||
| Loan Agreement—Interim Construction Financing) | 2.00 | 2/15/14 | 13,000,000 | 13,090,610 |
| Gulf Coast Waste Disposal Authority, Environmental Facilities | ||||
| Revenue (BP Products North America, Inc. Project) | 2.30 | 9/3/13 | 4,000,000 | 4,000,600 |
The Funds 55
STATEMENT OF INVESTMENTS (continued)
| BNY Mellon National Short-Term Municipal Bond Fund (continued) | |||||
| Long-Term Municipal | Coupon | Maturity | Principal | ||
| Investments (continued) | Rate (%) | Date | Amount ($) | Value ($) | |
| Texas (continued) | |||||
| Harris County, Toll Road Senior Lien Revenue (Insured; | |||||
| National Public Finance Guarantee Corp.) (Prerefunded) | 5.00 | 8/15/14 | 1,500,000 | b | 1,569,045 |
| Houston, Combined Utility System First Lien Revenue | 5.00 | 11/15/16 | 3,750,000 | 4,246,575 | |
| Houston Convention and Entertainment Facilities | |||||
| Department, Hotel Occupancy Tax and Special Revenue | 4.88 | 9/1/17 | 5,000,000 | 5,467,650 | |
| Houston Independent School District, Limited Tax Schoolhouse | |||||
| Bonds (Permament School Fund Guarantee Program) | 1.50 | 6/1/15 | 10,000,000 | 10,129,400 | |
| Houston Independent School District, Limited Tax Schoolhouse | |||||
| Bonds (Permament School Fund Guarantee Program) | 2.00 | 6/1/16 | 6,000,000 | 6,148,200 | |
| Katy Independent School District, Unlimited Tax Bonds | |||||
| (Permament School Fund Guarantee Program) | 1.60 | 8/15/17 | 2,000,000 | 2,000,160 | |
| Katy Independent School District, Unlimited Tax Bonds | |||||
| (Permament School Fund Guarantee Program) | 5.00 | 8/15/17 | 4,000,000 | 4,548,720 | |
| Lower Colorado River Authority, Revenue | |||||
| (Insured; Assured Guaranty Municipal Corp.) | 5.88 | 5/15/15 | 1,070,000 | 1,074,858 | |
| North Central Texas Health Facilities Development | |||||
| Corporation, HR (Children’s Medical Center of Dallas Project) | 5.00 | 8/15/17 | 1,000,000 | 1,130,890 | |
| Northside Independent School District, | |||||
| Unlimited Tax School Building Bonds | |||||
| (Permanent School Fund Guarantee Program) | 1.35 | 6/1/18 | 12,500,000 | 12,143,625 | |
| Plano, GO | 5.25 | 9/1/14 | 1,225,000 | 1,286,961 | |
| Richardson Independent School District, Unlimited Tax Bonds | |||||
| (Permanent School Fund Guarantee Program) | 4.00 | 2/15/15 | 1,000,000 | 1,053,690 | |
| Sam Rayburn Municipal Power Agency, | |||||
| Power Supply System Revenue | 5.00 | 10/1/16 | 2,320,000 | 2,570,815 | |
| San Antonio, Electric and Gas Systems Junior Lien Revenue | 2.00 | 12/1/16 | 3,000,000 | 3,086,340 | |
| Tarrant Regional Water District, A Water Control | |||||
| and Improvement District, Water Revenue | 5.00 | 3/1/15 | 1,650,000 | 1,764,956 | |
| Tarrant Regional Water District, A Water Control | |||||
| and Improvement District, Water Revenue | 5.00 | 3/1/16 | 1,500,000 | 1,662,135 | |
| Texas Municipal Gas Acquisition and Supply | |||||
| Corporation I, Gas Supply Revenue | 5.00 | 12/15/13 | 720,000 | 728,568 | |
| Texas Municipal Power Agency, Revenue | |||||
| (Insured; National Public Finance Guarantee Corp.) | 0.00 | 9/1/14 | 5,000,000 | c | 4,975,400 |
| Texas Public Finance Authority, GO | 5.00 | 10/1/14 | 2,000,000 | 2,104,880 | |
| Texas Public Finance Authority, Unemployment | |||||
| Compensation Obligation Assessment Revenue | 5.00 | 7/1/15 | 6,000,000 | 6,501,480 | |
| Trinity River Authority, | |||||
| Regional Wastewater System Revenue | 5.00 | 8/1/15 | 3,280,000 | 3,558,833 | |
56
| BNY Mellon National Short-Term Municipal Bond Fund (continued) | |||||
| Long-Term Municipal | Coupon | Maturity | Principal | ||
| Investments (continued) | Rate (%) | Date | Amount ($) | Value ($) | |
| Utah—.2% | |||||
| Timpanogos Special Service District, Sewer Revenue | |||||
| (Insured; Assured Guaranty Municipal Corp.) | 5.00 | 6/1/14 | 1,775,000 | 1,837,622 | |
| Virginia—2.4% | |||||
| Roanoke Economic Development Authority, HR | |||||
| (Carilion Clinic Obligated Group) | 5.00 | 7/1/15 | 2,000,000 | 2,152,200 | |
| Tobacco Settlement Financing Corporation of Virginia, | |||||
| Tobacco Settlement Asset-Backed Bonds (Prerefunded) | 5.63 | 6/1/15 | 12,500,000 | b | 13,626,500 |
| Virginia College Building Authority, Educational Facilities | |||||
| Revenue (Public Higher Education Financing Program) | 5.00 | 9/1/16 | 5,000,000 | 5,625,500 | |
| Virginia Commonwealth Transportation Board, | |||||
| Federal Transportation Grant Anticipation Revenue Notes | 5.00 | 9/15/16 | 1,000,000 | 1,128,430 | |
| Virginia Public Building Authority, Public Facilities Revenue | 5.00 | 8/1/15 | 5,000,000 | 5,437,100 | |
| Washington—.4% | |||||
| Energy Northwest, Electric Revenue (Project 1) | 5.25 | 7/1/16 | 2,500,000 | 2,815,075 | |
| Energy Northwest, Electric Revenue (Project 3) | 5.00 | 7/1/16 | 2,255,000 | 2,523,413 | |
| West Virginia—.2% | |||||
| West Virginia Economic Development Authority, PCR | |||||
| (Appalachian Power Company—Amos Project) | 4.85 | 9/4/13 | 1,000,000 | 1,000,340 | |
| West Virginia Economic Development Authority, PCR | |||||
| (Appalachian Power Company—Amos Project) | 4.85 | 9/4/13 | 1,600,000 | 1,600,544 | |
| Wisconsin—.1% | |||||
| Wisconsin Health and Educational Facilities Authority, | |||||
| Revenue (Ascension Health Alliance Senior Credit Group) | 4.00 | 3/1/18 | 1,500,000 | 1,624,215 | |
| U.S. Related—2.0% | |||||
| A.B. Won International Airport | |||||
| Authority of Guam, General Revenue | 3.00 | 10/1/14 | 2,000,000 | 2,021,800 | |
| A.B. Won International Airport | |||||
| Authority of Guam, General Revenue | 5.00 | 10/1/16 | 2,500,000 | 2,659,175 | |
| Puerto Rico Commonwealth, Public Improvement GO | 5.50 | 7/1/17 | 1,795,000 | 1,795,808 | |
| Puerto Rico Government Development Bank, Senior Notes | 5.00 | 12/1/13 | 3,530,000 | 3,539,708 | |
| Puerto Rico Government Development Bank, Senior Notes | 5.00 | 12/1/14 | 5,520,000 | 5,566,754 | |
| Puerto Rico Highways and Transportation | |||||
| Authority, Transportation Revenue | 5.00 | 7/1/17 | 5,385,000 | 5,295,447 | |
| Puerto Rico Highways and Transportation | |||||
| Authority, Transportation Revenue (Insured; FGIC) | 5.25 | 7/1/14 | 465,000 | 466,460 | |
| University of Puerto Rico, University System Revenue | 5.00 | 6/1/14 | 2,930,000 | 2,935,831 | |
| Total Long-Term Municipal Investments | |||||
| (cost $1,117,845,167) | 1,121,006,775 | ||||
The Funds 57
STATEMENT OF INVESTMENTS (continued)
| BNY Mellon National Short-Term Municipal Bond Fund (continued) | |||||
| Short-Term Municipal | Coupon | Maturity | Principal | ||
| Investments—5.5% | Rate (%) | Date | Amount ($) | Value ($) | |
| California—.1% | |||||
| California Pollution Control Financing Authority, | |||||
| SWDR (Waste Management, Inc. Project) | 0.85 | 5/1/14 | 1,700,000 | 1,695,495 | |
| Colorado—.2% | |||||
| Colorado Educational and Cultural Facilities Authority Revenue | |||||
| (National Jewish Federation Bond Program) (LOC; TD Bank) | 0.06 | 9/3/13 | 1,350,000 | d | 1,350,000 |
| Colorado Educational and Cultural Facilities Authority, | |||||
| Revenue (National Jewish Federation Bond | |||||
| Program) (LOC; JPMorgan Chase Bank) | 0.06 | 9/3/13 | 100,000 | d | 100,000 |
| Colorado Educational and Cultural Facilities Authority, Revenue | |||||
| (National Jewish Federation Bond Program) (LOC; TD Bank) | 0.06 | 9/3/13 | 1,000,000 | d | 1,000,000 |
| Florida—.3% | |||||
| Orange County School Board, COP (Master Lease | |||||
| Purchase Agreement) (LOC; Wells Fargo Bank) | 0.06 | 9/3/13 | 3,900,000 | d | 3,900,000 |
| Illinois—.3% | |||||
| Chicago, GO Notes, Refunding (LOC; Barclays Bank PLC) | 0.06 | 9/3/13 | 3,600,000 | d | 3,600,000 |
| Indiana—.3% | |||||
| Indianapolis, Thermal Energy System First Lien Revenue | 0.73 | 8/1/14 | 4,000,000 | 4,000,480 | |
| Iowa—.7% | |||||
| Iowa Finance Authority, Educational Facilities Revenue | |||||
| (Holy Family Catholic Schools Project) (LOC; Wells Fargo Bank) | 0.06 | 9/3/13 | 1,100,000 | d | 1,100,000 |
| Iowa Finance Authority, Health Facilities Revenue (Great River | |||||
| Medical Center Project) (LOC; JPMorgan Chase Bank) | 0.07 | 9/3/13 | 4,905,000 | d | 4,905,000 |
| Iowa Finance Authority, Private College Revenue, | |||||
| Refunding (Drake University Project) (LOC; Wells Fargo Bank) | 0.06 | 9/3/13 | 2,400,000 | d | 2,400,000 |
| Kentucky—.1% | |||||
| Trimble County, Lease Program Revenue (Kentucky | |||||
| Association of Counties Leasing Trust) (LOC; U.S. Bank NA) | 0.05 | 9/3/13 | 1,600,000 | d | 1,600,000 |
| Massachusetts—1.1% | |||||
| Massachusetts, GO Notes, Refunding | 0.35 | 9/7/13 | 6,000,000 | d | 5,981,580 |
| Massachusetts, GO Notes, Refunding | 0.59 | 9/7/13 | 3,700,000 | d | 3,700,000 |
| Massachusetts Water Resources Authority, | |||||
| Subordinated General Revenue, Refunding | |||||
| (LOC; Landesbank Hessen-Thuringen Girozentrale) | 0.07 | 9/3/13 | 3,400,000 | d | 3,400,000 |
| Michigan—.3% | |||||
| Michigan Finance Authority, State Aid Revenue | |||||
| Notes (School District of the City of Detroit) | 4.38 | 8/20/14 | 3,500,000 | 3,521,140 | |
58
| BNY Mellon National Short-Term Municipal Bond Fund (continued) | |||||
| Short-Term Municipal | Coupon | Maturity | Principal | ||
| Investments (continued) | Rate (%) | Date | Amount ($) | Value ($) | |
| Mississippi—.6% | |||||
| Jackson County, Port Facility Revenue, | |||||
| Refunding (Chevron U.S.A. Inc. Project) | 0.05 | 9/3/13 | 1,600,000 | d | 1,600,000 |
| Mississippi Business Finance Corporation, Gulf Opportunity | |||||
| Zone IDR (Chevron U.S.A. Inc. Project) | 0.05 | 9/3/13 | 5,000,000 | d | 5,000,000 |
| Vermont—.2% | |||||
| Vermont Educational and Health Buildings Financing | |||||
| Agency, HR (Northeastern Vermont Regional | |||||
| Hospital Project) (LOC; TD Bank) | 0.06 | 9/3/13 | 2,030,000 | d | 2,030,000 |
| Virginia—.1% | |||||
| King George County Economic Development | |||||
| Authority, SWDR (King George Landfill, Inc. Project) | 0.85 | 5/1/14 | 1,500,000 | 1,494,615 | |
| Washington—.3% | |||||
| Washington Health Care Facilities Authority, Revenue | |||||
| (MultiCare Health System) (LOC; Barclays Bank PLC) | 0.07 | 9/3/13 | 3,255,000 | d | 3,255,000 |
| Wisconsin—.9% | |||||
| Wisconsin Health and Educational Facilities Authority, | |||||
| Revenue (Edgewood College) (LOC; U.S. Bank NA) | 0.06 | 9/3/13 | 2,500,000 | d | 2,500,000 |
| Wisconsin Health and Educational Facilities Authority, | |||||
| Revenue (Fort Healthcare, Inc.) (LOC; JPMorgan Chase Bank) | 0.07 | 9/3/13 | 7,600,000 | d | 7,600,000 |
| Total Short-Term Municipal Investments | |||||
| (cost $65,740,000) | 65,733,310 | ||||
| Total Investments (cost $1,183,585,167) | 100.0 | % | 1,186,740,085 | |
| Liabilities, Less Cash and Receivables | (.0 | %) | (273,245 | ) |
| Net Assets | 100.0 | % | 1,186,466,840 |
| a Variable rate security—interest rate subject to periodic change. |
| b These securities are prerefunded; the date shown represents the prerefunded date. Bonds which are prerefunded are collateralized by U.S. Government securities which are held in |
| escrow and are used to pay principal and interest on the municipal issue and to retire the bonds in full at the earliest refunding date. |
| c Security issued with a zero coupon. Income is recognized through the accretion of discount. |
| d Variable rate demand note—rate shown is the interest rate in effect at August 31, 2013. Maturity date represents the next demand date, or the ultimate maturity date if earlier. |
The Funds 59
STATEMENT OF INVESTMENTS (continued)
| Summary of Abbreviations | |||
| ABAG | Association of Bay Area Governments | ACA | American Capital Access |
| AGC | ACE Guaranty Corporation | AGIC | Asset Guaranty Insurance Company |
| AMBAC | American Municipal Bond Assurance Corporation | ARRN | Adjustable Rate Receipt Notes |
| BAN | Bond Anticipation Notes | BPA | Bond Purchase Agreement |
| CIFG | CDC Ixis Financial Guaranty | COP | Certificate of Participation |
| CP | Commercial Paper | DRIVERS | Derivative Inverse Tax-Exempt Receipts |
| EDR | Economic Development Revenue | EIR | Environmental Improvement Revenue |
| FGIC | Financial Guaranty Insurance Company | FHA | Federal Housing Administration |
| FHLB | Federal Home Loan Bank | FHLMC | Federal Home Loan Mortgage Corporation |
| FNMA | Federal National Mortgage Association | GAN | Grant Anticipation Notes |
| GIC | Guaranteed Investment Contract | GNMA | Government National Mortgage Association |
| GO | General Obligation | HR | Hospital Revenue |
| IDB | Industrial Development Board | IDC | Industrial Development Corporation |
| IDR | Industrial Development Revenue | LIFERS | Long Inverse Floating Exempt Receipts |
| LOC | Letter of Credit | LOR | Limited Obligation Revenue |
| LR | Lease Revenue | MERLOTS | Municipal Exempt Receipts Liquidity Option Tender |
| MFHR | Multi-Family Housing Revenue | MFMR | Multi-Family Mortgage Revenue |
| PCR | Pollution Control Revenue | P-FLOATS | Puttable Floating Option Tax-Exempt Receipts |
| PILOT | Payment in Lieu of Taxes | PUTTERS | Puttable Tax-Exempt Receipts |
| RAC | Revenue Anticipation Certificates | RAN | Revenue Anticipation Notes |
| RAW | Revenue Anticipation Warrants | ROCS | Reset Options Certificates |
| RRR | Resources Recovery Revenue | SAAN | State Aid Anticipation Notes |
| SBPA | Standby Bond Purchase Agreement | SFHR | Single Family Housing Revenue |
| SFMR | Single Family Mortgage Revenue | SONYMA | State of New York Mortgage Agency |
| SPEARS | Short Puttable Exempt Adjustable Receipts | SWDR | Solid Waste Disposal Revenue |
| TAN | Tax Anticipation Notes | TAW | Tax Anticipation Warrants |
| TRAN | Tax and Revenue Anticipation Notes | XLCA | XL Capital Assurance |
| Summary of Combined Ratings (Unaudited) | |||||
| Fitch | or | Moody’s | or | Standard & Poor’s | Value (%)† |
| AAA | Aaa | AAA | 19.4 | ||
| AA | Aa | AA | 40.0 | ||
| A | A | A | 27.2 | ||
| BBB | Baa | BBB | 6.3 | ||
| F1 | MIG1/P1 | SP1/A1 | 5.4 | ||
| F2 | VMIG2/MIG2/P2 | SP2/A2 | .5 | ||
| Not Ratede | Not Ratede | Not Ratede | 1.2 | ||
| 100.0 | |||||
| † Based on total investments. |
| e Securities which, while not rated by Fitch, Moody’s and Standard & Poor’s, have been determined by the Manager to be of comparable quality to those rated securities in which |
| the fund may invest. |
| See notes to financial statements. |
60
STATEMENT OF INVESTMENTS
August 31, 2013
| BNY Mellon Pennsylvania Intermediate Municipal Bond Fund | |||||
| Long-Term Municipal | Coupon | Maturity | Principal | ||
| Investments—95.3% | Rate (%) | Date | Amount ($) | Value ($) | |
| Alabama—1.6% | |||||
| Jefferson County, Limited Obligation School Warrants | 5.25 | 1/1/15 | 2,500,000 | 2,488,200 | |
| Jefferson County, Limited Obligation School Warrants | |||||
| (Insured; Assured Guaranty Municipal Corp.) | 5.50 | 1/1/21 | 3,500,000 | 3,453,065 | |
| Arizona—1.7% | |||||
| Phoenix Civic Improvement Corporation, | |||||
| Junior Lien Airport Revenue | 5.00 | 7/1/29 | 5,000,000 | 5,074,850 | |
| University Medical Center Corporation, HR | 5.25 | 7/1/15 | 1,160,000 | 1,199,788 | |
| California—3.0% | |||||
| Agua Caliente Band, Cahuilla Indians Revenue | 6.00 | 7/1/18 | 1,500,000 | a | 1,454,070 |
| Alameda Corridor Transportation Authority, | |||||
| Subordinate Lien Revenue (Insured; AMBAC) | 5.25 | 10/1/21 | 2,000,000 | 2,155,820 | |
| California, GO (Various Purpose) | 6.50 | 4/1/33 | 1,000,000 | 1,163,660 | |
| Foothill/Eastern Transportation Corridor Agency, Toll Road | |||||
| Revenue (Insured; National Public Finance Guarantee Corp.) | 5.88 | 1/15/27 | 6,000,000 | 6,054,300 | |
| Colorado—1.6% | |||||
| Northwest Parkway Public Highway Authority, | |||||
| Revenue (Insured; AMBAC) (Prerefunded) | 5.70 | 6/15/16 | 5,000,000 | b | 5,675,800 |
| Florida—1.3% | |||||
| Lake County School Board, COP | |||||
| (Master Lease Purchase Agreement) | 5.00 | 6/1/27 | 1,620,000 | 1,658,135 | |
| Miami-Dade County School Board, COP (Master Lease Purchase | |||||
| Agreement) (Insured; National Public Finance Guarantee Corp.) | 5.00 | 5/1/25 | 3,000,000 | 3,133,350 | |
| Georgia—.7% | |||||
| Monroe County Development Authority, PCR | |||||
| (Oglethorpe Power Corporation Scherer Project) | 2.40 | 4/1/20 | 2,500,000 | 2,375,625 | |
| Illinois—.3% | |||||
| Illinois, GO (Insured; National Public Finance Guarantee Corp.) | 5.50 | 8/1/17 | 1,000,000 | 1,117,050 | |
| Massachusetts—.1% | |||||
| Massachusetts Housing Finance Agency, Housing Revenue | 5.13 | 12/1/34 | 350,000 | 343,420 | |
| Michigan—.6% | |||||
| Detroit City School District, School Buildings and | |||||
| Site Improvement Bonds (Insured; FGIC) | 5.25 | 5/1/17 | 2,000,000 | 2,203,760 | |
| New York—.7% | |||||
| New York City, GO | 5.00 | 8/1/31 | 2,500,000 | 2,594,975 | |
| Ohio—.9% | |||||
| Ohio, HR (Cleveland Clinic Health System Obligated Group) | 5.00 | 1/1/25 | 3,000,000 | 3,230,430 | |
| Pennsylvania—73.7% | |||||
| Allegheny County Airport Authority, Airport Revenue (Pittsburgh | |||||
| International Airport) (Insured; Assured Guaranty Municipal Corp.) | 5.00 | 1/1/17 | 1,000,000 | 1,109,660 | |
| Allegheny County Hospital Development Authority, | |||||
| Revenue (University of Pittsburgh Medical Center) | 5.00 | 10/15/22 | 1,250,000 | 1,377,562 | |
The Funds 61
STATEMENT OF INVESTMENTS (continued)
| BNY Mellon Pennsylvania Intermediate Municipal Bond Fund (continued) | |||||
| Long-Term Municipal | Coupon | Maturity | Principal | ||
| Investments (continued) | Rate (%) | Date | Amount ($) | Value ($) | |
| Pennsylvania (continued) | |||||
| Allegheny County Port Authority, Special Transportation Revenue | 5.25 | 3/1/24 | 5,000,000 | 5,443,400 | |
| Allegheny County Sanitary Authority, Sewer Revenue | |||||
| (Insured; National Public Finance Guarantee Corp.) | 5.00 | 12/1/18 | 2,560,000 | 2,785,997 | |
| Allegheny County Sanitary Authority, Sewer Revenue | |||||
| (Insured; National Public Finance Guarantee Corp.) | 5.00 | 12/1/21 | 4,815,000 | 5,211,948 | |
| Allentown School District, GO | 5.00 | 2/15/22 | 5,875,000 | 6,507,444 | |
| Beaver County Hospital Authority, Revenue | |||||
| (Heritage Valley Health System, Inc.) | 5.00 | 5/15/19 | 1,205,000 | 1,355,480 | |
| Beaver County Hospital Authority, Revenue | |||||
| (Heritage Valley Health System, Inc.) | 5.00 | 5/15/23 | 1,370,000 | 1,474,353 | |
| Beaver County Hospital Authority, Revenue | |||||
| (Heritage Valley Health System, Inc.) | 5.00 | 5/15/25 | 1,250,000 | 1,307,875 | |
| Berks County Municipal Authority, Revenue | |||||
| (The Reading Hospital and Medical Center Project) | 5.00 | 11/1/19 | 2,000,000 | 2,259,300 | |
| Bucks County, GO | 4.00 | 12/1/19 | 1,000,000 | 1,111,890 | |
| Bucks County, GO | 5.00 | 6/1/23 | 1,955,000 | 2,214,213 | |
| Central Bucks School District, GO (Prerefunded) | 5.00 | 5/15/18 | 5,000,000 | b | 5,818,550 |
| Central Dauphin School District, GO (Insured; | |||||
| National Public Finance Guarantee Corp.) (Prerefunded) | 6.75 | 2/1/16 | 5,000,000 | b | 5,725,000 |
| Central Dauphin School District, GO (Insured; | |||||
| National Public Finance Guarantee Corp.) (Prerefunded) | 7.00 | 2/1/16 | 1,630,000 | b | 1,876,114 |
| Chester County, GO | 5.00 | 8/15/18 | 4,545,000 | 4,932,870 | |
| Chester County, GO | 5.00 | 7/15/25 | 3,060,000 | 3,331,759 | |
| Chester County, GO (Prerefunded) | 5.00 | 7/15/19 | 1,940,000 | b | 2,287,978 |
| Commonwealth Financing Authority of Pennsylvania, Revenue | 5.00 | 6/1/24 | 5,000,000 | 5,415,550 | |
| Delaware County Authority, University | |||||
| Revenue (Villanova University) (Insured; AMBAC) | 5.00 | 8/1/20 | 2,095,000 | 2,312,419 | |
| Downingtown Area School District, GO | 5.00 | 11/1/18 | 2,010,000 | 2,336,645 | |
| Easton Area School District, GO | |||||
| (Insured; Assured Guaranty Municipal Corp.) | 7.50 | 4/1/18 | 1,000,000 | 1,161,230 | |
| Easton Area School District, GO | |||||
| (Insured; Assured Guaranty Municipal Corp.) | 7.50 | 4/1/21 | 3,000,000 | 3,431,490 | |
| Easton Area School District, GO | |||||
| (Insured; Assured Guaranty Municipal Corp.) | 7.50 | 4/1/22 | 3,000,000 | 3,431,490 | |
| Easton Area School District, GO | |||||
| (Insured; Assured Guaranty Municipal Corp.) | 5.50 | 4/1/23 | 2,260,000 | 2,588,875 | |
| Erie County, GO (Insured; | |||||
| National Public Finance Guarantee Corp.) | 5.50 | 9/1/22 | 1,640,000 | 1,924,376 | |
| Greater Johnstown School District, GO | |||||
| (Insured; Assured Guaranty Municipal Corp.) | 5.00 | 8/1/23 | 3,545,000 | 3,850,756 | |
| Lower Merion School District, GO | 5.00 | 5/15/18 | 4,735,000 | 5,493,831 | |
| Lower Merion School District, GO | 5.00 | 9/1/22 | 2,980,000 | 3,376,519 | |
62
| BNY Mellon Pennsylvania Intermediate Municipal Bond Fund (continued) | |||||
| Long-Term Municipal | Coupon | Maturity | Principal | ||
| Investments (continued) | Rate (%) | Date | Amount ($) | Value ($) | |
| Pennsylvania (continued) | |||||
| Montgomery County, GO | 5.00 | 12/15/17 | 2,025,000 | 2,335,696 | |
| Montgomery County, GO | 5.00 | 12/15/24 | 2,890,000 | 3,186,601 | |
| Montgomery County Industrial Development Authority, | |||||
| FHA Insured Mortgage Revenue (New Regional | |||||
| Medical Center Project) | 5.50 | 8/1/25 | 1,000,000 | 1,081,740 | |
| Pennsylvania, GO | 5.00 | 4/1/20 | 5,000,000 | 5,804,900 | |
| Pennsylvania, GO | 5.00 | 7/1/20 | 10,000,000 | 11,633,500 | |
| Pennsylvania Economic Development Financing Authority, | |||||
| Exempt Facilities Revenue (Amtrak Project) | 5.00 | 11/1/26 | 1,000,000 | 1,020,820 | |
| Pennsylvania Economic Development Financing Authority, | |||||
| Exempt Facilities Revenue (Amtrak Project) | 5.00 | 11/1/27 | 1,535,000 | 1,560,113 | |
| Pennsylvania Economic Development Financing Authority, | |||||
| Exempt Facilities Revenue (Amtrak Project) | 5.00 | 11/1/32 | 2,425,000 | 2,360,689 | |
| Pennsylvania Economic Development Financing Authority, | |||||
| Governmental LR (Forum Place Project) | 5.00 | 3/1/25 | 1,000,000 | 1,069,530 | |
| Pennsylvania Economic Development Financing Authority, | |||||
| Unemployment Compensation Revenue | 5.00 | 7/1/20 | 5,000,000 | 5,734,750 | |
| Pennsylvania Economic Development Financing Authority, | |||||
| Unemployment Compensation Revenue | 5.00 | 1/1/22 | 5,000,000 | 5,566,800 | |
| Pennsylvania Higher Educational Facilities Authority, | |||||
| Revenue (Saint Joseph’s University) | 5.00 | 11/1/25 | 2,010,000 | 2,115,726 | |
| Pennsylvania Higher Educational Facilities Authority, | |||||
| Revenue (State System of Higher Education) | 5.25 | 6/15/24 | 5,000,000 | 5,682,850 | |
| Pennsylvania Higher Educational Facilities Authority, | |||||
| Revenue (State System of Higher Education) | 5.00 | 6/15/30 | 1,875,000 | 1,942,144 | |
| Pennsylvania Higher Educational Facilities Authority, | |||||
| Revenue (The Trustees of the University of Pennsylvania) | 5.00 | 9/1/19 | 10,140,000 | 11,917,339 | |
| Pennsylvania Higher Educational Facilities Authority, | |||||
| Revenue (Thomas Jefferson University) (Insured; AMBAC) | 5.25 | 9/1/17 | 1,700,000 | 1,920,592 | |
| Pennsylvania Higher Educational Facilities Authority, | |||||
| Revenue (Thomas Jefferson University) (Insured; AMBAC) | 5.25 | 9/1/18 | 1,485,000 | 1,688,623 | |
| Pennsylvania Industrial Development Authority, EDR | 5.00 | 7/1/19 | 3,000,000 | 3,437,400 | |
| Pennsylvania Industrial Development Authority, EDR | 5.00 | 7/1/21 | 3,450,000 | 3,910,644 | |
| Pennsylvania Intergovernmental Cooperation Authority, | |||||
| Special Tax Revenue (City of Philadelphia Funding Program) | 5.00 | 6/15/22 | 3,395,000 | 3,772,218 | |
| Pennsylvania State University, GO | 5.00 | 3/1/27 | 1,195,000 | 1,275,806 | |
| Pennsylvania State University, GO | 5.00 | 3/1/28 | 2,980,000 | 3,123,249 | |
| Pennsylvania Turnpike Commission, Registration Fee | |||||
| Revenue (Insured; Assured Guaranty Municipal Corp.) | 5.25 | 7/15/24 | 2,500,000 | 2,784,350 | |
| Pennsylvania Turnpike Commission, Registration Fee | |||||
| Revenue (Insured; Assured Guaranty Municipal Corp.) | 5.25 | 7/15/25 | 5,000,000 | 5,507,800 | |
| Pennsylvania Turnpike Commission, Turnpike Revenue | 1.21 | 12/1/19 | 2,000,000 | c | 2,011,280 |
The Funds 63
STATEMENT OF INVESTMENTS (continued)
| BNY Mellon Pennsylvania Intermediate Municipal Bond Fund (continued) | ||||
| Long-Term Municipal | Coupon | Maturity | Principal | |
| Investments (continued) | Rate (%) | Date | Amount ($) | Value ($) |
| Pennsylvania (continued) | ||||
| Pennsylvania Turnpike Commission, | ||||
| Turnpike Revenue (Insured; AMBAC) | 5.00 | 12/1/29 | 5,000,000 | 5,090,500 |
| Pennsylvania Turnpike Commission, Turnpike Subordinate Revenue | 5.00 | 12/1/19 | 2,195,000 | 2,469,551 |
| Pennsylvania Turnpike Commission, Turnpike Subordinate Revenue | 5.00 | 6/1/26 | 5,000,000 | 5,164,100 |
| Pennsylvania Turnpike Commission, Turnpike | ||||
| Subordinate Revenue (Insured; Assured Guaranty Corp.) | 6.00 | 6/1/28 | 1,500,000 | 1,680,915 |
| Philadelphia, Airport Revenue | 5.00 | 6/15/20 | 1,750,000 | 1,917,632 |
| Philadelphia, Airport Revenue | ||||
| (Insured; Assured Guaranty Municipal Corp.) | 5.00 | 6/15/18 | 1,370,000 | 1,545,511 |
| Philadelphia, Water and Wastewater Revenue | 5.00 | 11/1/18 | 1,100,000 | 1,265,715 |
| Philadelphia, Water and Wastewater Revenue | ||||
| (Insured; Assured Guaranty Municipal Corp.) | 5.25 | 7/1/18 | 5,000,000 | 5,332,100 |
| Philadelphia School District, GO | 5.00 | 9/1/20 | 1,805,000 | 2,015,734 |
| Philadelphia School District, GO (Insured; AMBAC) | 5.00 | 4/1/17 | 5,000,000 | 5,289,900 |
| Pittsburgh, GO | 5.00 | 9/1/25 | 2,000,000 | 2,116,340 |
| Pittsburgh, GO | 5.00 | 9/1/26 | 5,000,000 | 5,231,100 |
| Pittsburgh School District GO | ||||
| (Insured; Assured Guaranty Municipal Corp.) | 5.50 | 9/1/16 | 4,000,000 | 4,505,720 |
| Pittsburgh School District GO | ||||
| (Insured; Assured Guaranty Municipal Corp.) | 5.50 | 9/1/18 | 1,000,000 | 1,161,860 |
| Pocono Mountain School District, GO | ||||
| (Insured; Assured Guaranty Municipal Corp.) | 5.00 | 9/1/22 | 5,270,000 | 5,580,561 |
| Saint Mary Hospital Authority, Health System | ||||
| Revenue (Catholic Health East Issue) | 5.00 | 11/15/17 | 2,085,000 | 2,346,417 |
| Saint Mary Hospital Authority, Health System | ||||
| Revenue (Catholic Health East Issue) | 5.00 | 11/15/21 | 1,000,000 | 1,016,940 |
| Saint Mary Hospital Authority, Health System | ||||
| Revenue (Catholic Health East Issue) | 5.00 | 11/15/22 | 1,500,000 | 1,600,485 |
| Saint Mary Hospital Authority, Health System | ||||
| Revenue (Catholic Health East Issue) | 5.25 | 11/15/23 | 2,000,000 | 2,140,700 |
| Southeastern Pennsylvania Transportation Authority, | ||||
| Capital Grant Receipts Bonds (Federal Transit Administration | ||||
| Section 5309 Fixed Guideway Modernization Formula Funds) | 5.00 | 6/1/23 | 2,000,000 | 2,193,200 |
| Southeastern Pennsylvania | ||||
| Transportation Authority, Revenue | 5.00 | 3/1/26 | 3,000,000 | 3,187,410 |
| State Public School Building Authority, School Lease | ||||
| Revenue (The School District of Philadelphia Project) | 5.00 | 4/1/21 | 1,000,000 | 1,094,660 |
| State Public School Building Authority, School Revenue | ||||
| (Chester Upland School District Project) (Insured; | ||||
| Assured Guaranty Municipal Corp.) | 5.25 | 9/15/24 | 5,780,000 | 6,292,975 |
| Susquehanna Area Regional Airport Authority, | ||||
| Airport System Revenue | 5.00 | 1/1/22 | 1,000,000 | 1,023,900 |
64
| BNY Mellon Pennsylvania Intermediate Municipal Bond Fund (continued) | |||||
| Long-Term Municipal | Coupon | Maturity | Principal | ||
| Investments (continued) | Rate (%) | Date | Amount ($) | Value ($) | |
| Pennsylvania (continued) | |||||
| Susquehanna Area Regional Airport Authority, | |||||
| Airport System Revenue | 5.00 | 1/1/23 | 1,500,000 | 1,523,400 | |
| Susquehanna Area Regional Airport Authority, | |||||
| Airport System Revenue | 5.00 | 1/1/27 | 2,500,000 | 2,501,675 | |
| University of Pittsburgh—of the Commonwealth System of | |||||
| Higher Education, University Capital Project Bonds | 5.50 | 9/15/21 | 2,500,000 | 2,874,600 | |
| University of Pittsburgh—of the Commonwealth System of | |||||
| Higher Education, University Capital Project Bonds | 5.00 | 9/15/28 | 1,580,000 | 1,694,961 | |
| West Mifflin Area School District, GO | |||||
| (Insured; Assured Guaranty Municipal Corp.) | 5.50 | 4/1/24 | 1,060,000 | 1,175,932 | |
| Westmoreland County, GO (Insured; | |||||
| National Public Finance Guarantee Corp.) | 0.00 | 12/1/15 | 1,500,000 | d | 1,435,215 |
| South Carolina—.7% | |||||
| Greenville County School District, Installment Purchase | |||||
| Revenue (Building Equity Sooner for Tomorrow) | 5.50 | 12/1/18 | 2,000,000 | 2,352,020 | |
| Texas—.3% | |||||
| Katy Independent School District, Unlimited School Building | |||||
| Bonds (Permanent School Fund Guarantee Program) | 5.00 | 2/15/29 | 1,000,000 | 1,073,200 | |
| Washington—.7% | |||||
| King County Public Hospital District Number 1, Limited Tax GO | 5.25 | 12/1/37 | 2,500,000 | 2,520,050 | |
| U.S. Related—7.4% | |||||
| Guam, Business Privilege Tax Revenue | 5.00 | 1/1/24 | 1,500,000 | 1,613,070 | |
| Guam, LOR (Section 30) | 5.63 | 12/1/29 | 1,000,000 | 1,024,490 | |
| Puerto Rico Commonwealth, | |||||
| Public Improvement GO (Insured; AMBAC) | 5.50 | 7/1/19 | 3,000,000 | 2,844,210 | |
| Puerto Rico Commonwealth, | |||||
| Public Improvement GO (Insured; FGIC) | 5.50 | 7/1/18 | 5,000,000 | 4,912,500 | |
| Puerto Rico Electric Power Authority, Power Revenue | 5.38 | 7/1/24 | 2,000,000 | 1,660,900 | |
| Puerto Rico Electric Power Authority, Power Revenue | |||||
| (Insured; National Public Finance Guarantee Corp.) | 5.25 | 7/1/14 | 5,000,000 | 5,057,600 | |
| Puerto Rico Government Development Bank, Senior Notes | 5.00 | 12/1/15 | 1,870,000 | 1,882,679 | |
| Puerto Rico Infrastructure Financing Authority, | |||||
| Revenue (Ports Authority Project) | 6.00 | 12/15/26 | 2,500,000 | 2,120,375 | |
| Puerto Rico Infrastructure Financing | |||||
| Authority, Special Tax Revenue | 5.00 | 7/1/21 | 5,000,000 | 4,378,250 | |
| Puerto Rico Sales Tax Financing Corporation, | |||||
| Sales Tax Revenue (First Subordinate Series) | 0/6.75 | 8/1/32 | 1,000,000 | e | 827,790 |
| Puerto Rico Sales Tax Financing Corporation, | |||||
| Sales Tax Revenue (First Subordinate Series) | 0/6.25 | 8/1/33 | 500,000 | e | 322,190 |
| Total Long-Term Municipal Investments | |||||
| (cost $339,165,788) | 344,335,065 | ||||
The Funds 65
STATEMENT OF INVESTMENTS (continued)
| BNY Mellon Pennsylvania Intermediate Municipal Bond Fund (continued) | |||||
| Short-Term Municipal | Coupon | Maturity | Principal | ||
| Investments—2.7% | Rate (%) | Date | Amount ($) | Value ($) | |
| Kentucky—.1% | |||||
| Breckinridge County, Lease Program Revenue (Kentucky | |||||
| Association of Counties Leasing Trust) (LOC; U.S. Bank NA) | 0.05 | 9/3/13 | 400,000 | f | 400,000 |
| Massachusetts—.1% | |||||
| Massachusetts Health and Educational Facilities | |||||
| Authority, Revenue (Museum of Fine Arts Issue) | |||||
| (Liquidity Facility; Bank of America) | 0.09 | 9/3/13 | 500,000 | f | 500,000 |
| Missouri—.7% | |||||
| Missouri Health and Educational Facilities Authority, | |||||
| Educational Facilities Revenue (The Washington | |||||
| University) (Liquidity Facility; JPMorgan Chase Bank) | 0.04 | 9/3/13 | 2,600,000 | f | 2,600,000 |
| Pennsylvania—1.6% | |||||
| Pennsylvania Economic Development Financing Authority, | |||||
| Revenue (Northwestern Human Services—Allegheny | |||||
| Valley School, LLC Issue) (LOC; TD Bank) | 0.06 | 9/3/13 | 5,800,000 | f | 5,800,000 |
| Texas—.2% | |||||
| Dallas Performing Arts Cultural Facilities Corporation, | |||||
| Cultural Facility Revenue (Dallas Center for the Performing | |||||
| Arts Foundation, Inc. Project) (LOC; JPMorgan Chase Bank) | 0.05 | 9/3/13 | 600,000 | f | 600,000 |
| Total Short-Term Municipal Investments | |||||
| (cost $9,900,000) | 9,900,000 | ||||
| Total Investments (cost $349,065,788) | 98.0 | % | 354,235,065 |
| Cash and Receivables (Net) | 2.0 | % | 7,395,668 |
| Net Assets | 100.0 | % | 361,630,733 |
| a Security exempt from registration pursuant to Rule 144A under the Securities Act of 1933.This security may be resold in transactions exempt from registration, normally to |
| qualified institutional buyers.At August 31, 2013, this security was valued at $1,454,070 or .4% of net assets. |
| b These securities are prerefunded; the date shown represents the prerefunded date. Bonds which are prerefunded are collateralized by U.S. Government securities which are held in |
| escrow and are used to pay principal and interest on the municipal issue and to retire the bonds in full at the earliest refunding date. |
| c Variable rate security—interest rate subject to periodic change. |
| d Security issued with a zero coupon. Income is recognized through the accretion of discount. |
| e Zero coupon until a specified date at which time the stated coupon rate becomes effective until maturity. |
| f Variable rate demand note—rate shown is the interest rate in effect at August 31, 2013. Maturity date represents the next demand date, or the ultimate maturity date if earlier. |
66
| Summary of Abbreviations | |||
| ABAG | Association of Bay Area Governments | ACA | American Capital Access |
| AGC | ACE Guaranty Corporation | AGIC | Asset Guaranty Insurance Company |
| AMBAC | American Municipal Bond Assurance Corporation | ARRN | Adjustable Rate Receipt Notes |
| BAN | Bond Anticipation Notes | BPA | Bond Purchase Agreement |
| CIFG | CDC Ixis Financial Guaranty | COP | Certificate of Participation |
| CP | Commercial Paper | DRIVERS | Derivative Inverse Tax-Exempt Receipts |
| EDR | Economic Development Revenue | EIR | Environmental Improvement Revenue |
| FGIC | Financial Guaranty Insurance Company | FHA | Federal Housing Administration |
| FHLB | Federal Home Loan Bank | FHLMC | Federal Home Loan Mortgage Corporation |
| FNMA | Federal National Mortgage Association | GAN | Grant Anticipation Notes |
| GIC | Guaranteed Investment Contract | GNMA | Government National Mortgage Association |
| GO | General Obligation | HR | Hospital Revenue |
| IDB | Industrial Development Board | IDC | Industrial Development Corporation |
| IDR | Industrial Development Revenue | LIFERS | Long Inverse Floating Exempt Receipts |
| LOC | Letter of Credit | LOR | Limited Obligation Revenue |
| LR | Lease Revenue | MERLOTS | Municipal Exempt Receipts Liquidity Option Tender |
| MFHR | Multi-Family Housing Revenue | MFMR | Multi-Family Mortgage Revenue |
| PCR | Pollution Control Revenue | P-FLOATS | Puttable Floating Option Tax-Exempt Receipts |
| PILOT | Payment in Lieu of Taxes | PUTTERS | Puttable Tax-Exempt Receipts |
| RAC | Revenue Anticipation Certificates | RAN | Revenue Anticipation Notes |
| RAW | Revenue Anticipation Warrants | ROCS | Reset Options Certificates |
| RRR | Resources Recovery Revenue | SAAN | State Aid Anticipation Notes |
| SBPA | Standby Bond Purchase Agreement | SFHR | Single Family Housing Revenue |
| SFMR | Single Family Mortgage Revenue | SONYMA | State of New York Mortgage Agency |
| SPEARS | Short Puttable Exempt Adjustable Receipts | SWDR | Solid Waste Disposal Revenue |
| TAN | Tax Anticipation Notes | TAW | Tax Anticipation Warrants |
| TRAN | Tax and Revenue Anticipation Notes | XLCA | XL Capital Assurance |
| Summary of Combined Ratings (Unaudited) | |||||
| Fitch | or | Moody’s | or | Standard & Poor’s | Value (%)† |
| AAA | Aaa | AAA | 9.9 | ||
| AA | Aa | AA | 45.9 | ||
| A | A | A | 30.3 | ||
| BBB | Baa | BBB | 7.7 | ||
| BB | Ba | BB | .4 | ||
| B | B | B | .7 | ||
| F1 | MIG1/P1 | SP1/A1 | 2.8 | ||
| Not Ratedg | Not Ratedg | Not Ratedg | 2.3 | ||
| 100.0 | |||||
| † Based on total investments. |
| g Securities which, while not rated by Fitch, Moody’s and Standard & Poor’s, have been determined by the Manager to be of comparable quality to those rated securities in which the |
| fund may invest. |
| See notes to financial statements. |
The Funds 67
STATEMENT OF FINANCIAL FUTURES
August 31, 2013
| Market Value | Unrealized | |||||
| BNY Mellon Pennsylvania | Covered by | Appreciation | ||||
| Intermediate Municipal Bond Fund | Contracts | Contracts ($) | Expiration | at 8/31/2013 ($) | ||
| Financial Futures Short | ||||||
| U.S. Treasury 10 Year Notes | 90 | (11,280,938 | ) | September 2013 | 378,281 | |
| See notes to financial statements. |
68
STATEMENT OF INVESTMENTS
August 31, 2013
| BNY Mellon Massachusetts Intermediate Municipal Bond Fund | |||||
| Long-Term Municipal | Coupon | Maturity | Principal | ||
| Investments—93.3% | Rate (%) | Date | Amount ($) | Value ($) | |
| Massachusetts—85.2% | |||||
| Barnstable, GO | 4.00 | 9/15/21 | 580,000 | 639,148 | |
| Barnstable, GO | 4.00 | 9/15/22 | 560,000 | 610,596 | |
| Boston, GO | 4.00 | 4/1/18 | 3,000,000 | 3,334,410 | |
| Boston, GO | 4.00 | 10/1/19 | 910,000 | 1,015,724 | |
| Boston, GO | 5.00 | 4/1/20 | 5,000,000 | 5,878,250 | |
| Boston, GO | 5.00 | 3/1/21 | 2,000,000 | 2,241,380 | |
| Boston Water and Sewer Commission, General Revenue | 5.00 | 11/1/17 | 2,000,000 | 2,305,620 | |
| Boston Water and Sewer Commission, General Revenue | 5.00 | 11/1/18 | 1,500,000 | 1,743,765 | |
| Boston Water and Sewer Commission, General Revenue | 5.00 | 11/1/24 | 1,000,000 | 1,131,390 | |
| Boston Water and Sewer Commission, General Revenue | 5.00 | 11/1/25 | 2,500,000 | 2,747,800 | |
| Boston Water and Sewer Commission, General Revenue | 5.00 | 11/1/26 | 2,480,000 | 2,693,354 | |
| Brockton, GO (Municipal Purpose Loan) (Insured; AMBAC) | 5.00 | 6/1/19 | 1,430,000 | 1,523,565 | |
| Everett, GO (Insured; | |||||
| National Public Finance Guarantee Corp.) | 5.38 | 12/15/17 | 1,250,000 | 1,325,450 | |
| Falmouth, GO (Municipal Purpose Loan) | 4.00 | 11/15/19 | 625,000 | 692,531 | |
| Falmouth, GO (Municipal Purpose Loan) | 4.00 | 11/15/20 | 605,000 | 665,089 | |
| Groton-Dunstable Regional School District, GO | 5.00 | 9/1/20 | 725,000 | 827,747 | |
| Haverhill, GO (State Qualified Municipal Purpose Loan) | |||||
| (Insured; National Public Finance Guarantee Corp.) | 5.00 | 6/1/16 | 1,580,000 | 1,759,978 | |
| Haverhill, GO (State Qualified Municipal Purpose Loan) | |||||
| (Insured; National Public Finance Guarantee Corp.) | 5.00 | 6/1/18 | 505,000 | 557,778 | |
| Hopedale, GO (Insured; AMBAC) | 5.00 | 11/15/19 | 650,000 | 692,556 | |
| Mansfield, GO (Insured; AMBAC) | 5.00 | 8/15/17 | 1,395,000 | 1,510,339 | |
| Massachusetts, GO | 0.64 | 11/1/18 | 2,500,000 | a | 2,476,225 |
| Massachusetts, GO | 5.25 | 8/1/20 | 3,000,000 | 3,537,690 | |
| Massachusetts, GO | 5.25 | 8/1/21 | 1,975,000 | 2,324,476 | |
| Massachusetts, GO | 5.25 | 8/1/22 | 2,000,000 | 2,351,560 | |
| Massachusetts, GO | 5.25 | 8/1/23 | 1,000,000 | 1,171,800 | |
| Massachusetts, GO (Consolidated Loan) | 5.00 | 8/1/20 | 4,000,000 | 4,568,520 | |
| Massachusetts, GO (Consolidated Loan) | 5.00 | 8/1/23 | 310,000 | 352,228 | |
| Massachusetts, GO (Consolidated Loan) | 5.00 | 8/1/26 | 5,000,000 | 5,442,850 | |
| Massachusetts, GO (Consolidated Loan) (Insured; | |||||
| Assured Guaranty Municipal Corp.) (Prerefunded) | 5.25 | 8/1/17 | 5,825,000 | b | 6,753,913 |
| Massachusetts, GO (Consolidated Loan) (Insured; FGIC) | 5.50 | 8/1/18 | 1,035,000 | 1,222,801 | |
| Massachusetts, GO (Consolidated Loan) (Prerefunded) | 5.00 | 8/1/16 | 1,000,000 | b | 1,123,830 |
| Massachusetts, GO (Insured; AMBAC) | 5.50 | 10/1/18 | 225,000 | 266,789 | |
| Massachusetts, Special Obligation Dedicated Tax Revenue | |||||
| (Insured; National Public Finance Guarantee Corp.) | 2.66 | 1/1/16 | 3,540,000 | a | 3,702,982 |
| Massachusetts Bay Transportation Authority, | |||||
| Assessment Revenue | 5.00 | 7/1/18 | 4,000,000 | 4,619,440 | |
The Funds 69
STATEMENT OF INVESTMENTS (continued)
| BNY Mellon Massachusetts Intermediate Municipal Bond Fund (continued) | |||||
| Long-Term Municipal | Coupon | Maturity | Principal | ||
| Investments (continued) | Rate (%) | Date | Amount ($) | Value ($) | |
| Massachusetts (continued) | |||||
| Massachusetts Bay Transportation Authority, | |||||
| Senior Sales Tax Revenue | 5.50 | 7/1/16 | 105,000 | 119,144 | |
| Massachusetts Bay Transportation Authority, | |||||
| Senior Sales Tax Revenue | 5.25 | 7/1/18 | 1,250,000 | 1,461,838 | |
| Massachusetts Bay Transportation Authority, | |||||
| Senior Sales Tax Revenue | 5.25 | 7/1/21 | 2,500,000 | 2,945,600 | |
| Massachusetts Bay Transportation Authority, | |||||
| Senior Sales Tax Revenue | 5.25 | 7/1/21 | 2,000,000 | 2,356,480 | |
| Massachusetts Bay Transportation Authority, | |||||
| Senior Sales Tax Revenue | 5.25 | 7/1/22 | 2,430,000 | 2,853,671 | |
| Massachusetts Clean Energy Cooperative Corporation, | |||||
| Massachusetts Clean Energy Cooperative Revenue | 5.00 | 7/1/26 | 2,965,000 | 3,206,559 | |
| Massachusetts College Building Authority, Project Revenue | 5.00 | 5/1/23 | 1,000,000 | 1,113,390 | |
| Massachusetts Development Finance Agency, | |||||
| Education Revenue (Dexter School Project) | 5.00 | 5/1/23 | 1,400,000 | 1,462,482 | |
| Massachusetts Development Finance Agency, | |||||
| Education Revenue (Dexter School Project) | 5.00 | 5/1/24 | 1,465,000 | 1,514,151 | |
| Massachusetts Development Finance Agency, | |||||
| Higher Education Revenue (Emerson College Issue) | 5.00 | 1/1/16 | 1,000,000 | 1,075,480 | |
| Massachusetts Development Finance Agency, | |||||
| Higher Education Revenue (Emerson College Issue) | 5.00 | 1/1/19 | 1,055,000 | 1,126,307 | |
| Massachusetts Development Finance Agency, | |||||
| Higher Education Revenue (Emerson College Issue) | 5.00 | 1/1/22 | 2,000,000 | 2,081,440 | |
| Massachusetts Development Finance Agency, | |||||
| Recovery Zone Facility Revenue (Dominion | |||||
| Energy Brayton Point Issue) (Prerefunded) | 2.25 | 9/1/16 | 2,560,000 | b | 2,668,851 |
| Massachusetts Development Finance Agency, | |||||
| Revenue (Boston College Issue) | 5.00 | 7/1/20 | 1,000,000 | 1,123,740 | |
| Massachusetts Development Finance Agency, | |||||
| Revenue (College of the Holy Cross Issue) | 5.00 | 9/1/21 | 1,800,000 | 2,034,864 | |
| Massachusetts Development Finance Agency, | |||||
| Revenue (Curry College Issue) (Insured; ACA) | 4.75 | 3/1/20 | 530,000 | 553,426 | |
| Massachusetts Development Finance Agency, | |||||
| Revenue (Curry College Issue) (Insured; ACA) | 5.25 | 3/1/26 | 1,000,000 | 1,012,300 | |
| Massachusetts Development Finance Agency, | |||||
| Revenue (Curry College Issue) (Insured; ACA) | 5.00 | 3/1/36 | 1,000,000 | 927,390 | |
| Massachusetts Development Finance Agency, | |||||
| Revenue (Emerson College Issue) | 4.00 | 1/1/14 | 225,000 | 227,275 | |
| Massachusetts Development Finance Agency, | |||||
| Revenue (Harvard University Issue) | 5.00 | 10/15/20 | 1,700,000 | 2,008,601 | |
| Massachusetts Development Finance Agency, | |||||
| Revenue (Partners HealthCare System Issue) | 5.00 | 7/1/25 | 1,825,000 | 1,952,367 | |
70
| BNY Mellon Massachusetts Intermediate Municipal Bond Fund (continued) | |||||
| Long-Term Municipal | Coupon | Maturity | Principal | ||
| Investments (continued) | Rate (%) | Date | Amount ($) | Value ($) | |
| Massachusetts (continued) | |||||
| Massachusetts Development Finance Agency, | |||||
| Revenue (Partners HealthCare System Issue) | 5.00 | 7/1/26 | 2,000,000 | 2,119,500 | |
| Massachusetts Development Finance Agency, Revenue | |||||
| (Southcoast Health System Obligated Group Issue) | 4.00 | 7/1/20 | 530,000 | 569,824 | |
| Massachusetts Development Finance Agency, Revenue | |||||
| (Southcoast Health System Obligated Group Issue) | 5.00 | 7/1/27 | 500,000 | 521,890 | |
| Massachusetts Development Finance Agency, | |||||
| Revenue (The Broad Institute Issue) | 5.25 | 4/1/23 | 3,675,000 | 4,062,198 | |
| Massachusetts Development Finance Agency, | |||||
| Revenue (The Broad Institute Issue) | 5.25 | 4/1/24 | 2,500,000 | 2,727,425 | |
| Massachusetts Development Finance Agency, | |||||
| Revenue (The Park School Issue) | 5.00 | 9/1/21 | 300,000 | 329,484 | |
| Massachusetts Development Finance Agency, | |||||
| Revenue (Tufts Medical Center Issue) | 5.00 | 1/1/15 | 600,000 | 627,132 | |
| Massachusetts Development Finance Agency, | |||||
| Revenue (Tufts Medical Center Issue) | 5.00 | 1/1/17 | 925,000 | 1,003,958 | |
| Massachusetts Development Finance Agency, | |||||
| Revenue (UMass Memorial Issue) | 5.00 | 7/1/17 | 2,500,000 | 2,760,950 | |
| Massachusetts Development Finance Agency, | |||||
| Revenue (UMass Memorial Issue) | 5.00 | 7/1/19 | 2,000,000 | 2,218,280 | |
| Massachusetts Development Finance Agency, | |||||
| Revenue (Williams College Issue) | 4.00 | 7/1/21 | 2,000,000 | 2,195,880 | |
| Massachusetts Development Finance Agency, Revenue | |||||
| (Worcester City Campus Corporation Issue) | |||||
| (University of Massachusetts Project) | 4.00 | 10/1/17 | 730,000 | 807,183 | |
| Massachusetts Development Finance Agency, Revenue | |||||
| (Worcester City Campus Corporation Issue) | |||||
| (University of Massachusetts Project) | 5.00 | 10/1/19 | 910,000 | 1,054,098 | |
| Massachusetts Development Finance Agency, Revenue | |||||
| (Worcester City Campus Corporation Issue) | |||||
| (University of Massachusetts Project) | 5.00 | 10/1/20 | 905,000 | 1,048,361 | |
| Massachusetts Development Finance Agency, Revenue | |||||
| (Worcester City Campus Corporation Issue) | |||||
| (University of Massachusetts Project) | 5.00 | 10/1/21 | 830,000 | 957,073 | |
| Massachusetts Development Finance Agency, | |||||
| RRR (Waste Management, Inc. Project) | 2.13 | 12/1/15 | 1,250,000 | 1,253,688 | |
| Massachusetts Development Finance Agency, SWDR | |||||
| (Dominion Energy Brayton Point Issue) (Prerefunded) | 5.75 | 5/1/19 | 2,000,000 | b | 2,415,020 |
| Massachusetts Development Finance Agency, | |||||
| SWDR (Waste Management, Inc. Project) | 5.45 | 6/1/14 | 1,000,000 | 1,023,110 | |
| Massachusetts Health and Educational Facilities Authority, | |||||
| Revenue (Berklee College of Music Issue) | 5.00 | 10/1/24 | 2,155,000 | 2,308,048 | |
The Funds 71
STATEMENT OF INVESTMENTS (continued)
| BNY Mellon Massachusetts Intermediate Municipal Bond Fund (continued) | ||||
| Long-Term Municipal | Coupon | Maturity | Principal | |
| Investments (continued) | Rate (%) | Date | Amount ($) | Value ($) |
| Massachusetts (continued) | ||||
| Massachusetts Health and Educational Facilities Authority, | ||||
| Revenue (Berklee College of Music Issue) | 5.00 | 10/1/32 | 2,000,000 | 2,046,760 |
| Massachusetts Health and Educational Facilities Authority, | ||||
| Revenue (Berklee College of Music Issue) | 5.00 | 10/1/37 | 3,250,000 | 3,264,137 |
| Massachusetts Health and Educational Facilities | ||||
| Authority, Revenue (Cape Cod Healthcare Obligated | ||||
| Group Issue) (Insured; Assured Guaranty Corp.) | 5.13 | 11/15/35 | 1,000,000 | 977,870 |
| Massachusetts Health and Educational Facilities | ||||
| Authority, Revenue (CareGroup Issue) | 5.00 | 7/1/18 | 690,000 | 788,725 |
| Massachusetts Health and Educational Facilities Authority, | ||||
| Revenue (CareGroup Issue) (Capital Asset Program) | ||||
| (Insured; National Public Finance Guarantee Corp.) | 5.38 | 2/1/27 | 1,650,000 | 1,740,255 |
| Massachusetts Health and Educational Facilities Authority, | ||||
| Revenue (CareGroup Issue) (Insured; National | ||||
| Public Finance Guarantee Corp.) | 5.25 | 7/1/20 | 1,000,000 | 1,107,290 |
| Massachusetts Health and Educational Facilities | ||||
| Authority, Revenue (CareGroup Issue) (Insured; | ||||
| National Public Finance Guarantee Corp.) | 5.25 | 7/1/23 | 1,325,000 | 1,442,408 |
| Massachusetts Health and Educational Facilities Authority, | ||||
| Revenue (Dana-Farber Cancer Institute Issue) | 5.25 | 12/1/22 | 2,750,000 | 3,031,077 |
| Massachusetts Health and Educational Facilities Authority, | ||||
| Revenue (Dana-Farber Cancer Institute Issue) | 5.25 | 12/1/27 | 2,000,000 | 2,122,520 |
| Massachusetts Health and Educational Facilities Authority, | ||||
| Revenue (Dana-Farber Cancer Institute Issue) | 5.00 | 12/1/37 | 2,500,000 | 2,480,700 |
| Massachusetts Health and Educational Facilities Authority, | ||||
| Revenue (Harvard University Issue) | 5.00 | 12/15/25 | 2,500,000 | 2,797,400 |
| Massachusetts Health and Educational Facilities Authority, | ||||
| Revenue (Harvard University Issue) | 5.00 | 12/15/27 | 3,230,000 | 3,551,256 |
| Massachusetts Health and Educational Facilities Authority, | ||||
| Revenue (Isabella Stewart Gardner Museum Issue) | 5.00 | 5/1/21 | 1,400,000 | 1,543,696 |
| Massachusetts Health and Educational Facilities Authority, | ||||
| Revenue (Isabella Stewart Gardner Museum Issue) | 5.00 | 5/1/26 | 2,525,000 | 2,665,592 |
| Massachusetts Health and Educational Facilities Authority, | ||||
| Revenue (Isabella Stewart Gardner Museum Issue) | 5.00 | 5/1/27 | 1,000,000 | 1,055,260 |
| Massachusetts Health and Educational Facilities Authority, | ||||
| Revenue (Massachusetts Eye and Ear Infirmary Issue) | 5.00 | 7/1/14 | 500,000 | 515,005 |
| Massachusetts Health and Educational Facilities Authority, | ||||
| Revenue (Massachusetts Eye and Ear Infirmary Issue) | 5.00 | 7/1/15 | 500,000 | 529,830 |
| Massachusetts Health and Educational Facilities Authority, | ||||
| Revenue (Massachusetts Institute of Technology Issue) | 5.50 | 7/1/22 | 1,800,000 | 2,189,106 |
| Massachusetts Health and Educational Facilities Authority, | ||||
| Revenue (Massachusetts Institute of Technology Issue) | 5.00 | 7/1/23 | 3,335,000 | 3,918,091 |
72
| BNY Mellon Massachusetts Intermediate Municipal Bond Fund (continued) | ||||
| Long-Term Municipal | Coupon | Maturity | Principal | |
| Investments (continued) | Rate (%) | Date | Amount ($) | Value ($) |
| Massachusetts (continued) | ||||
| Massachusetts Health and Educational Facilities Authority, | ||||
| Revenue (Massachusetts Institute of Technology Issue) | 5.00 | 7/1/38 | 1,000,000 | 1,034,280 |
| Massachusetts Health and Educational Facilities Authority, | ||||
| Revenue (Milford Regional Medical Center Issue) | 5.00 | 7/15/22 | 500,000 | 506,775 |
| Massachusetts Health and Educational Facilities Authority, | ||||
| Revenue (Northeastern University Issue) | 5.00 | 10/1/24 | 2,495,000 | 2,693,053 |
| Massachusetts Health and Educational Facilities Authority, | ||||
| Revenue (Northeastern University Issue) | 5.00 | 10/1/24 | 1,000,000 | 1,089,630 |
| Massachusetts Health and Educational Facilities Authority, | ||||
| Revenue (Northeastern University Issue) | 5.63 | 10/1/29 | 3,000,000 | 3,280,230 |
| Massachusetts Health and Educational Facilities Authority, | ||||
| Revenue (Northeastern University Issue) | 5.00 | 10/1/30 | 3,000,000 | 3,084,540 |
| Massachusetts Health and Educational Facilities Authority, | ||||
| Revenue (Partners HealthCare System Issue) | 5.00 | 7/1/16 | 95,000 | 95,343 |
| Massachusetts Health and Educational Facilities Authority, | ||||
| Revenue (Partners HealthCare System Issue) | 5.00 | 7/1/18 | 1,500,000 | 1,670,925 |
| Massachusetts Health and Educational Facilities Authority, | ||||
| Revenue (Partners HealthCare System Issue) | 5.00 | 7/1/21 | 1,235,000 | 1,363,761 |
| Massachusetts Health and Educational Facilities Authority, | ||||
| Revenue (Partners HealthCare System Issue) | 5.00 | 7/1/22 | 250,000 | 271,447 |
| Massachusetts Health and Educational Facilities | ||||
| Authority, Revenue (Simmons College Issue) | 7.50 | 10/1/22 | 1,000,000 | 1,199,140 |
| Massachusetts Health and Educational Facilities | ||||
| Authority, Revenue (Simmons College Issue) | 8.00 | 10/1/29 | 1,800,000 | 1,999,566 |
| Massachusetts Health and Educational Facilities | ||||
| Authority, Revenue (Simmons College Issue) | 8.00 | 10/1/39 | 1,500,000 | 1,659,990 |
| Massachusetts Health and Educational Facilities | ||||
| Authority, Revenue (Suffolk University Issue) | 6.25 | 7/1/30 | 2,100,000 | 2,256,534 |
| Massachusetts Health and Educational Facilities | ||||
| Authority, Revenue (Tufts University Issue) | 5.25 | 8/15/23 | 1,000,000 | 1,137,880 |
| Massachusetts Health and Educational Facilities | ||||
| Authority, Revenue (Tufts University Issue) | 5.38 | 8/15/38 | 2,000,000 | 2,175,200 |
| Massachusetts Health and Educational Facilities | ||||
| Authority, Revenue (UMass Memorial Issue) | 5.25 | 7/1/25 | 2,000,000 | 2,028,060 |
| Massachusetts Housing Finance Agency, Housing Revenue | 4.00 | 6/1/19 | 3,195,000 | 3,329,701 |
| Massachusetts Housing Finance Agency, Housing Revenue | 5.13 | 12/1/34 | 200,000 | 196,240 |
| Massachusetts Port Authority, Revenue | 4.00 | 7/1/20 | 1,000,000 | 1,096,680 |
| Massachusetts Port Authority, Revenue | 5.00 | 7/1/28 | 2,500,000 | 2,680,850 |
| Massachusetts Port Authority, Revenue (Insured; AMBAC) | 5.00 | 7/1/19 | 5,000,000 | 5,386,300 |
| Massachusetts School Building Authority, | ||||
| Dedicated Sales Tax Revenue (Insured; AMBAC) | 5.00 | 8/15/20 | 4,000,000 | 4,528,040 |
The Funds 73
STATEMENT OF INVESTMENTS (continued)
| BNY Mellon Massachusetts Intermediate Municipal Bond Fund (continued) | |||||
| Long-Term Municipal | Coupon | Maturity | Principal | ||
| Investments (continued) | Rate (%) | Date | Amount ($) | Value ($) | |
| Massachusetts (continued) | |||||
| Massachusetts School Building Authority, | |||||
| Senior Dedicated Sales Tax Revenue | 5.00 | 8/15/26 | 4,000,000 | 4,383,440 | |
| Massachusetts School Building Authority, | |||||
| Senior Dedicated Sales Tax Revenue | 5.00 | 8/15/29 | 4,400,000 | 4,667,212 | |
| Massachusetts Turnpike Authority, | |||||
| Turnpike Revenue (Insured; National | |||||
| Public Finance Guarantee Corp.) | 5.00 | 1/1/20 | 5,000,000 | 5,654,550 | |
| Massachusetts Water Pollution Abatement Trust (Pool Program) | 5.00 | 8/1/18 | 75,000 | 75,292 | |
| Massachusetts Water Pollution Abatement Trust (Pool Program) | 5.00 | 8/1/21 | 2,625,000 | 2,976,461 | |
| Massachusetts Water Pollution Abatement Trust (Pool Program) | 5.25 | 8/1/23 | 1,500,000 | 1,792,185 | |
| Massachusetts Water Pollution Abatement Trust (Pool Program) | 5.00 | 8/1/32 | 605,000 | 606,609 | |
| Massachusetts Water Pollution Abatement Trust, | |||||
| State Revolving Fund Bonds | 5.00 | 8/1/18 | 3,120,000 | 3,630,494 | |
| Massachusetts Water Pollution Abatement Trust, | |||||
| Water Pollution Abatement Revenue (MWRA Program) | 5.75 | 8/1/29 | 155,000 | 155,507 | |
| Massachusetts Water Resources Authority, General Revenue | 5.00 | 8/1/19 | 2,475,000 | 2,877,286 | |
| Massachusetts Water Resources Authority, General Revenue | 5.00 | 8/1/27 | 5,000,000 | 5,433,200 | |
| Massachusetts Water Resources Authority, General Revenue | |||||
| (Insured; National Public Finance Guarantee Corp.) | 5.25 | 8/1/19 | 1,405,000 | 1,611,071 | |
| Massachusetts Water Resources Authority, General Revenue | |||||
| (Insured; National Public Finance Guarantee Corp.) | 5.25 | 8/1/21 | 935,000 | 1,066,377 | |
| Massachusetts Water Resources Authority, General Revenue | |||||
| (Insured; National Public Finance Guarantee Corp.) | 5.25 | 8/1/24 | 2,340,000 | 2,656,462 | |
| Massachusetts Water Resources Authority, | |||||
| General Revenue (Insured; National Public | |||||
| Finance Guarantee Corp.) (Prerefunded) | 5.25 | 8/1/17 | 95,000 | b | 110,150 |
| Massachusetts Water Resources Authority, | |||||
| General Revenue (Insured; National Public | |||||
| Finance Guarantee Corp.) (Prerefunded) | 5.25 | 8/1/17 | 65,000 | b | 75,366 |
| Massachusetts Water Resources Authority, | |||||
| General Revenue (Insured; National Public | |||||
| Finance Guarantee Corp.) (Prerefunded) | 5.25 | 8/1/17 | 160,000 | b | 185,515 |
| Metropolitan Boston Transit Parking Corporation, | |||||
| Systemwide Senior Lien Parking Revenue | 5.00 | 7/1/25 | 1,000,000 | 1,073,630 | |
| Middleborough, GO (Insured; | |||||
| National Public Finance Guarantee Corp.) | 5.00 | 12/15/16 | 1,000,000 | 1,127,500 | |
| Middleborough, GO (Insured; | |||||
| National Public Finance Guarantee Corp.) | 5.00 | 12/15/18 | 1,275,000 | 1,423,091 | |
| Milton, GO School Bonds | 5.00 | 3/1/23 | 500,000 | 532,440 | |
| Milton, GO School Bonds | 5.00 | 3/1/24 | 500,000 | 532,205 | |
| Milton, GO School Bonds | 5.00 | 3/1/25 | 500,000 | 531,970 | |
74
| BNY Mellon Massachusetts Intermediate Municipal Bond Fund (continued) | ||||
| Long-Term Municipal | Coupon | Maturity | Principal | |
| Investments (continued) | Rate (%) | Date | Amount ($) | Value ($) |
| Massachusetts (continued) | ||||
| Northbridge, GO (Insured; AMBAC) | 5.25 | 2/15/17 | 60,000 | 60,544 |
| Pembroke, GO (Insured; | ||||
| National Public Finance Guarantee Corp.) | 5.00 | 8/1/20 | 960,000 | 1,062,538 |
| Randolph, GO (Insured; AMBAC) | 5.00 | 9/1/24 | 490,000 | 514,554 |
| Springfield Water and Sewer Commission, | ||||
| General Revenue (Insured; AMBAC) | 5.00 | 7/15/22 | 1,175,000 | 1,284,674 |
| Springfield Water and Sewer Commission, | ||||
| General Revenue (Insured; AMBAC) | 5.00 | 7/15/23 | 1,235,000 | 1,331,552 |
| University of Massachusetts Building Authority, Project Revenue | 5.00 | 11/1/18 | 1,370,000 | 1,585,295 |
| Waltham, GO (Municipal Purpose Loan) | 5.00 | 2/1/19 | 1,195,000 | 1,384,981 |
| Westwood, GO | 4.00 | 6/1/18 | 1,105,000 | 1,228,274 |
| Worcester, GO (Insured; National Public Finance Guarantee Corp.) | 5.25 | 8/15/16 | 1,000,000 | 1,054,810 |
| Worcester, GO (Insured; National Public Finance Guarantee Corp.) | 5.00 | 4/1/18 | 625,000 | 666,444 |
| U.S. Related—8.1% | ||||
| Guam, Business Privilege Tax Revenue | 5.00 | 1/1/25 | 1,500,000 | 1,588,995 |
| Guam, Hotel Occupancy Tax Revenue | 6.00 | 11/1/26 | 500,000 | 535,535 |
| Guam, LOR (Section 30) | 5.63 | 12/1/29 | 1,000,000 | 1,024,490 |
| Puerto Rico Commonwealth, Public Improvement GO | 5.50 | 7/1/18 | 2,250,000 | 2,210,625 |
| Puerto Rico Commonwealth, Public Improvement GO | 5.25 | 7/1/22 | 1,500,000 | 1,282,890 |
| Puerto Rico Commonwealth, Public Improvement GO | ||||
| (Insured; National Public Finance Guarantee Corp.) | 5.50 | 7/1/15 | 1,135,000 | 1,158,143 |
| Puerto Rico Commonwealth, Public Improvement GO | ||||
| (Insured; National Public Finance Guarantee Corp.) | 5.50 | 7/1/19 | 1,000,000 | 959,720 |
| Puerto Rico Electric Power Authority, Power Revenue | 5.25 | 7/1/23 | 2,000,000 | 1,688,140 |
| Puerto Rico Electric Power Authority, Power Revenue | ||||
| (Insured; National Public Finance Guarantee Corp.) | 5.00 | 7/1/17 | 1,000,000 | 997,030 |
| Puerto Rico Government Development Bank, Senior Notes | 5.25 | 1/1/15 | 2,000,000 | 2,022,860 |
| Puerto Rico Government Development Bank, Senior Notes | 5.00 | 12/1/15 | 1,090,000 | 1,097,390 |
| Puerto Rico Highways and Transportation Authority, | ||||
| Highway Revenue (Insured; FGIC) | 5.50 | 7/1/16 | 3,265,000 | 3,702,804 |
| Puerto Rico Highways and Transportation Authority, | ||||
| Transportation Revenue (Insured; FGIC) | 5.25 | 7/1/15 | 305,000 | 305,869 |
| Puerto Rico Highways and Transportation Authority, | ||||
| Transportation Revenue (Insured; FGIC) | 5.25 | 7/1/16 | 330,000 | 330,940 |
| Puerto Rico Infrastructure Financing Authority, | ||||
| Revenue (Ports Authority Project) | 6.00 | 12/15/26 | 2,500,000 | 2,120,375 |
| Puerto Rico Infrastructure Financing Authority, | ||||
| Special Tax Revenue | 5.00 | 7/1/20 | 2,260,000 | 2,033,435 |
| Puerto Rico Public Buildings Authority, | ||||
| Government Facilities Revenue | 5.75 | 7/1/22 | 1,780,000 | 1,579,056 |
The Funds 75
STATEMENT OF INVESTMENTS (continued)
| BNY Mellon Massachusetts Intermediate Municipal Bond Fund (continued) | |||||
| Long-Term Municipal | Coupon | Maturity | Principal | ||
| Investments (continued) | Rate (%) | Date | Amount ($) | Value ($) | |
| U.S. Related (continued) | |||||
| Puerto Rico Sales Tax Financing Corporation, | |||||
| Sales Tax Revenue (First Subordinate Series) | 0/6.75 | 8/1/32 | 1,000,000 | c | 827,790 |
| Puerto Rico Sales Tax Financing Corporation, | |||||
| Sales Tax Revenue (First Subordinate Series) | 0/6.25 | 8/1/33 | 750,000 | c | 483,285 |
| Total Long-Term Municipal Investments | |||||
| (cost $292,433,306) | 299,472,226 | ||||
| Short-Term Municipal Investments—6.0% | |||||
| Massachusetts; | |||||
| Massachusetts, GO Notes (Consolidated Loan) | 0.40 | 9/7/13 | 3,500,000 | d | 3,476,970 |
| Massachusetts, GO Notes (Consolidated Loan) | 0.49 | 9/7/13 | 1,500,000 | d | 1,490,430 |
| Massachusetts, GO Notes (Consolidated Loan) | |||||
| (Liquidity Facility; Wells Fargo Bank) | 0.04 | 9/3/13 | 4,200,000 | d | 4,200,000 |
| Massachusetts Health and Educational Facilities | |||||
| Authority, Revenue (Baystate Medical Center Issue) | |||||
| (LOC; JPMorgan Chase Bank) | 0.06 | 9/3/13 | 2,350,000 | d | 2,350,000 |
| Massachusetts Health and Educational Facilities Authority, | |||||
| Revenue (Children’s Hospital Issue) (LOC; JPMorgan Chase Bank) | 0.05 | 9/3/13 | 900,000 | d | 900,000 |
| Massachusetts Health and Educational Facilities | |||||
| Authority, Revenue (Museum of Fine Arts Issue) | |||||
| (Liquidity Facility; Bank of America) | 0.09 | 9/3/13 | 2,600,000 | d | 2,600,000 |
| Massachusetts Health and Educational Facilities | |||||
| Authority, Revenue (Tufts University Issue) | |||||
| (Liquidity Facility; Bank of America) | 0.04 | 9/3/13 | 4,200,000 | d | 4,200,000 |
| Total Short-Term Municipal Investments | |||||
| (cost $19,250,000) | 19,217,400 | ||||
| Total Investments (cost $311,683,306) | 99.3 | % | 318,689,626 |
| Cash and Receivables (Net) | .7 | % | 2,211,582 |
| Net Assets | 100.0 | % | 320,901,208 |
| a Variable rate security—interest rate subject to periodic change. |
| b These securities are prerefunded; the date shown represents the prerefunded date. Bonds which are prerefunded are collateralized by U.S. Government securities which are held in |
| escrow and are used to pay principal and interest on the municipal issue and to retire the bonds in full at the earliest refunding date. |
| c Zero coupon until a specified date at which time the stated coupon rate becomes effective until maturity. |
| d Variable rate demand note—rate shown is the interest rate in effect at August 31, 2013. Maturity date represents the next demand date, or the ultimate maturity date if earlier. |
76
| Summary of Abbreviations | |||
| ABAG | Association of Bay Area Governments | ACA | American Capital Access |
| AGC | ACE Guaranty Corporation | AGIC | Asset Guaranty Insurance Company |
| AMBAC | American Municipal Bond Assurance Corporation | ARRN | Adjustable Rate Receipt Notes |
| BAN | Bond Anticipation Notes | BPA | Bond Purchase Agreement |
| CIFG | CDC Ixis Financial Guaranty | COP | Certificate of Participation |
| CP | Commercial Paper | DRIVERS | Derivative Inverse Tax-Exempt Receipts |
| EDR | Economic Development Revenue | EIR | Environmental Improvement Revenue |
| FGIC | Financial Guaranty Insurance Company | FHA | Federal Housing Administration |
| FHLB | Federal Home Loan Bank | FHLMC | Federal Home Loan Mortgage Corporation |
| FNMA | Federal National Mortgage Association | GAN | Grant Anticipation Notes |
| GIC | Guaranteed Investment Contract | GNMA | Government National Mortgage Association |
| GO | General Obligation | HR | Hospital Revenue |
| IDB | Industrial Development Board | IDC | Industrial Development Corporation |
| IDR | Industrial Development Revenue | LIFERS | Long Inverse Floating Exempt Receipts |
| LOC | Letter of Credit | LOR | Limited Obligation Revenue |
| LR | Lease Revenue | MERLOTS | Municipal Exempt Receipts Liquidity Option Tender |
| MFHR | Multi-Family Housing Revenue | MFMR | Multi-Family Mortgage Revenue |
| PCR | Pollution Control Revenue | P-FLOATS | Puttable Floating Option Tax-Exempt Receipts |
| PILOT | Payment in Lieu of Taxes | PUTTERS | Puttable Tax-Exempt Receipts |
| RAC | Revenue Anticipation Certificates | RAN | Revenue Anticipation Notes |
| RAW | Revenue Anticipation Warrants | ROCS | Reset Options Certificates |
| RRR | Resources Recovery Revenue | SAAN | State Aid Anticipation Notes |
| SBPA | Standby Bond Purchase Agreement | SFHR | Single Family Housing Revenue |
| SFMR | Single Family Mortgage Revenue | SONYMA | State of New York Mortgage Agency |
| SPEARS | Short Puttable Exempt Adjustable Receipts | SWDR | Solid Waste Disposal Revenue |
| TAN | Tax Anticipation Notes | TAW | Tax Anticipation Warrants |
| TRAN | Tax and Revenue Anticipation Notes | XLCA | XL Capital Assurance |
| Summary of Combined Ratings (Unaudited) | |||||
| Fitch | or | Moody’s | or | Standard & Poor’s | Value (%)† |
| AAA | Aaa | AAA | 18.3 | ||
| AA | Aa | AA | 44.7 | ||
| A | A | A | 17.0 | ||
| BBB | Baa | BBB | 15.5 | ||
| F1 | MIG1/P1 | SP1/A1 | 4.5 | ||
| 100.0 | |||||
| † Based on total investments. |
| See notes to financial statements. |
The Funds 77
STATEMENT OF FINANCIAL FUTURES
August 31, 2013
| Market Value | Unrealized | |||||
| BNY Mellon Massachusetts | Covered by | Apepreciation | ||||
| Intermediate Municipal Bond Fund | Contracts | Contracts ($) | Expiration | at 8/31/2013 ($) | ||
| Financial Futures Short | ||||||
| U.S. Treasury 10 Year Notes | 70 | (8,774,063 | ) | September 2013 | 294,219 | |
| See notes to financial statements. |
78
STATEMENT OF INVESTMENTS
August 31, 2013
| BNY Mellon New York Intermediate Tax-Exempt Bond Fund | |||||
| Long-Term Municipal | Coupon | Maturity | Principal | ||
| Investments—92.9% | Rate (%) | Date | Amount ($) | Value ($) | |
| New York—85.7% | |||||
| Albany County Airport Authority, Airport Revenue | |||||
| (Insured; Assured Guaranty Municipal Corp.) | 5.00 | 12/15/23 | 1,500,000 | 1,608,270 | |
| Albany Industrial Development Agency, Civic Facility Revenue | |||||
| (Saint Peter’s Hospital of the City of Albany Project) | 5.75 | 11/15/22 | 2,500,000 | 2,708,400 | |
| Buffalo, General Improvement GO | 4.00 | 4/1/21 | 2,175,000 | 2,279,813 | |
| Erie County Fiscal Stability Authority, | |||||
| Sales Tax and State Aid Secured Revenue | 5.00 | 12/1/24 | 2,000,000 | 2,222,020 | |
| Erie County Industrial Development Agency, | |||||
| Revenue (City School District of the City of Buffalo Project) | 5.00 | 5/1/17 | 2,500,000 | 2,829,475 | |
| Hempstead, Public Improvement GO | 5.00 | 8/15/20 | 1,255,000 | 1,475,177 | |
| Long Island Power Authority, Electric System General Revenue | 5.00 | 5/1/21 | 1,000,000 | 1,112,460 | |
| Long Island Power Authority, Electric System General Revenue | 5.00 | 9/1/26 | 2,000,000 | 2,077,340 | |
| Long Island Power Authority, Electric System General | |||||
| Revenue (Insured; National Public Finance Guarantee Corp.) | 5.00 | 12/1/17 | 2,780,000 | 3,073,902 | |
| Long Island Power Authority, Electric System General | |||||
| Revenue (Insured; National Public Finance Guarantee Corp.) | 5.00 | 12/1/18 | 1,000,000 | 1,103,300 | |
| Metropolitan Transportation Authority, Dedicated Tax Fund Revenue | 5.00 | 11/15/29 | 1,550,000 | 1,624,477 | |
| Metropolitan Transportation Authority, Dedicated Tax Fund | |||||
| Revenue (Insured; National Public Finance Guarantee Corp.) | 5.00 | 11/15/28 | 5,000,000 | 5,340,300 | |
| Metropolitan Transportation Authority, Transportation Revenue | 5.00 | 11/15/17 | 1,000,000 | 1,108,230 | |
| Metropolitan Transportation Authority, Transportation Revenue | 6.25 | 11/15/23 | 300,000 | 355,365 | |
| Metropolitan Transportation Authority, Transportation Revenue | 5.00 | 11/15/28 | 2,375,000 | 2,470,807 | |
| Metropolitan Transportation Authority, Transportation Revenue | 5.00 | 11/15/30 | 1,190,000 | 1,220,500 | |
| Metropolitan Transportation Authority, Transportation | |||||
| Revenue (Insured; Assured Guaranty Municipal Corp.) | 0.37 | 11/1/22 | 2,500,000 | a | 2,412,500 |
| Monroe County Industrial Development Corporation, | |||||
| Revenue (Saint John Fisher College Project) | 5.00 | 6/1/17 | 1,740,000 | 1,907,910 | |
| Nassau County, General Improvement GO | 4.00 | 10/1/16 | 1,545,000 | 1,678,117 | |
| Nassau County, General Improvement GO | 5.00 | 10/1/18 | 1,310,000 | 1,495,051 | |
| Nassau County, GO | 5.00 | 10/1/20 | 2,000,000 | 2,220,060 | |
| Nassau County, GO (Insured; Assured Guaranty Municipal Corp.) | 5.00 | 7/1/22 | 1,000,000 | 1,107,360 | |
| Nassau County Sewer and Storm Water Finance Authority, System | |||||
| Revenue (Insured; Berkshire Hathaway Assurance Corporation) | 5.38 | 11/1/28 | 1,000,000 | 1,096,880 | |
| New York City, GO | 5.00 | 8/1/17 | 1,535,000 | 1,752,755 | |
| New York City, GO | 5.00 | 8/1/18 | 1,000,000 | 1,110,160 | |
| New York City, GO | 5.13 | 12/1/22 | 1,000,000 | 1,114,480 | |
| New York City, GO | 5.25 | 9/1/23 | 1,000,000 | 1,121,220 | |
| New York City Industrial Development Agency, Civic Facility | |||||
| Revenue (United Jewish Appeal—Federation of Jewish | |||||
| Philanthropies of New York, Inc. Project) | 5.00 | 7/1/27 | 1,250,000 | 1,281,587 | |
The Funds 79
STATEMENT OF INVESTMENTS (continued)
| BNY Mellon New York Intermediate Tax-Exempt Bond Fund (continued) | ||||
| Long-Term Municipal | Coupon | Maturity | Principal | |
| Investments (continued) | Rate (%) | Date | Amount ($) | Value ($) |
| New York (continued) | ||||
| New York City Industrial Development Agency, PILOT | ||||
| Revenue (Queens Baseball Stadium Project) | ||||
| (Insured; Assured Guaranty Corp.) | 6.50 | 1/1/46 | 325,000 | 349,131 |
| New York City Industrial Development Agency, | ||||
| PILOT Revenue (Yankee Stadium Project) | ||||
| (Insured; Assured Guaranty Corp.) | 7.00 | 3/1/49 | 1,000,000 | 1,157,120 |
| New York City Industrial Development Agency, Special | ||||
| Revenue (New York City—New York Stock Exchange Project) | 5.00 | 5/1/21 | 1,000,000 | 1,099,910 |
| New York City Municipal Water Finance Authority, | ||||
| Water and Sewer System Second General Resolution Revenue | 5.00 | 6/15/20 | 2,500,000 | 2,841,725 |
| New York City Transitional Finance Authority, | ||||
| Building Aid Revenue | 5.25 | 1/15/25 | 1,545,000 | 1,744,877 |
| New York City Transitional Finance Authority, | ||||
| Building Aid Revenue | 5.25 | 1/15/27 | 1,650,000 | 1,830,197 |
| New York City Transitional Finance Authority, | ||||
| Future Tax Secured Revenue | 5.50 | 11/15/17 | 5,000 | 5,022 |
| New York City Transitional Finance Authority, | ||||
| Future Tax Secured Subordinate Revenue | 5.00 | 11/1/18 | 1,750,000 | 2,029,545 |
| New York City Transitional Finance Authority, | ||||
| Future Tax Secured Subordinate Revenue | 5.00 | 11/1/20 | 1,000,000 | 1,165,370 |
| New York City Transitional Finance Authority, | ||||
| Future Tax Secured Subordinate Revenue | 5.00 | 8/1/22 | 255,000 | 283,713 |
| New York City Transitional Finance Authority, | ||||
| Future Tax Subordinate Revenue | 5.25 | 11/1/27 | 3,000,000 | 3,294,330 |
| New York City Trust for Cultural Resources, | ||||
| Revenue (Lincoln Center for the Performing Arts, Inc.) | 5.75 | 12/1/16 | 1,000,000 | 1,136,400 |
| New York City Trust for Cultural Resources, | ||||
| Revenue (The Juilliard School) | 5.00 | 1/1/34 | 2,000,000 | 2,059,560 |
| New York City Trust for Cultural Resources, | ||||
| Revenue (The Juilliard School) | 5.00 | 1/1/39 | 2,500,000 | 2,535,825 |
| New York City Trust for Cultural Resources, | ||||
| Revenue (The Museum of Modern Art) | 5.00 | 4/1/25 | 1,150,000 | 1,254,937 |
| New York City Trust for Cultural Resources, | ||||
| Revenue (The Museum of Modern Art) | 5.00 | 4/1/31 | 1,965,000 | 2,086,221 |
| New York City Trust for Cultural Resources, | ||||
| Revenue (Whitney Museum of American Art) | 5.00 | 7/1/21 | 4,000,000 | 4,443,960 |
| New York Liberty Development Corporation, | ||||
| Liberty Revenue (7 World Trade Center Project) | 5.00 | 9/15/29 | 5,000,000 | 5,211,600 |
| New York Liberty Development Corporation, | ||||
| Revenue (Goldman Sachs Headquarters Issue) | 5.00 | 10/1/15 | 3,175,000 | 3,352,895 |
| New York Local Government Assistance | ||||
| Corporation, Senior Lien Revenue | 5.00 | 4/1/18 | 2,500,000 | 2,810,475 |
80
| BNY Mellon New York Intermediate Tax-Exempt Bond Fund (continued) | ||||
| Long-Term Municipal | Coupon | Maturity | Principal | |
| Investments (continued) | Rate (%) | Date | Amount ($) | Value ($) |
| New York (continued) | ||||
| New York Local Government Assistance | ||||
| Corporation, Subordinate Lien Revenue | 5.00 | 4/1/17 | 1,150,000 | 1,311,322 |
| New York Local Government Assistance | ||||
| Corporation, Subordinate Lien Revenue | 5.00 | 4/1/19 | 2,500,000 | 2,907,500 |
| New York State, GO | 5.00 | 3/1/19 | 1,000,000 | 1,108,430 |
| New York State, GO | 5.00 | 2/15/26 | 2,600,000 | 2,894,450 |
| New York State Dormitory Authority, Consolidated | ||||
| Fifth General Resolution Revenue (City University System) | 5.00 | 7/1/19 | 1,000,000 | 1,109,570 |
| New York State Dormitory Authority, Consolidated | ||||
| Revenue (City University System) (Insured; | ||||
| National Public Finance Guarantee Corp.) | 5.75 | 7/1/18 | 2,370,000 | 2,584,295 |
| New York State Dormitory Authority, LR | ||||
| (State University Dormitory Facilities Issue) | 5.00 | 7/1/18 | 1,000,000 | 1,057,250 |
| New York State Dormitory Authority, | ||||
| Mental Health Services Facilities Improvement | ||||
| Revenue (Insured; Assured Guaranty Municipal Corp.) | 5.00 | 2/15/17 | 1,460,000 | 1,641,580 |
| New York State Dormitory Authority, | ||||
| Mental Health Services Facilities Improvement | ||||
| Revenue (Insured; Assured Guaranty Municipal Corp.) | 5.00 | 2/15/27 | 2,005,000 | 2,135,245 |
| New York State Dormitory Authority, | ||||
| Revenue (Columbia University) | 5.00 | 7/1/18 | 1,500,000 | 1,671,060 |
| New York State Dormitory Authority, | ||||
| Revenue (Columbia University) | 5.00 | 10/1/20 | 1,000,000 | 1,181,140 |
| New York State Dormitory Authority, Revenue | ||||
| (Convent of the Sacred Heart) (Insured; | ||||
| Assured Guaranty Municipal Corp.) | 5.63 | 11/1/35 | 1,000,000 | 1,046,460 |
| New York State Dormitory Authority, Revenue | ||||
| (Memorial Sloan-Kettering Cancer Center) | ||||
| (Insured; National Public Finance Guarantee Corp.) | 5.50 | 7/1/23 | 2,000,000 | 2,324,080 |
| New York State Dormitory Authority, Revenue | ||||
| (Mount Sinai Hospital Obligated Group) | 5.00 | 7/1/26 | 3,000,000 | 3,131,220 |
| New York State Dormitory Authority, Revenue (New York | ||||
| University) (Insured; National Public Finance Guarantee Corp.) | 5.00 | 7/1/21 | 1,500,000 | 1,551,030 |
| New York State Dormitory Authority, Revenue | ||||
| (Rochester Institute of Technology) | 5.00 | 7/1/23 | 1,000,000 | 1,085,730 |
| New York State Dormitory Authority, Revenue | ||||
| (School Districts Revenue Financing Program) | 5.00 | 10/1/18 | 3,040,000 | 3,467,850 |
| New York State Dormitory Authority, Revenue | ||||
| (State University Educational Facilities) | ||||
| (Insured; National Public Finance Guarantee Corp.) | 5.25 | 5/15/15 | 500,000 | 522,740 |
| New York State Dormitory Authority, Revenue | ||||
| (State University of New York Dormitory Facilities) | 5.00 | 7/1/19 | 1,500,000 | 1,714,290 |
The Funds 81
STATEMENT OF INVESTMENTS (continued)
| BNY Mellon New York Intermediate Tax-Exempt Bond Fund (continued) | ||||
| Long-Term Municipal | Coupon | Maturity | Principal | |
| Investments (continued) | Rate (%) | Date | Amount ($) | Value ($) |
| New York (continued) | ||||
| New York State Dormitory Authority, | ||||
| Revenue (The Rockefeller University) | 5.00 | 7/1/25 | 1,000,000 | 1,105,630 |
| New York State Dormitory Authority, | ||||
| Revenue (The Rockefeller University) | 5.00 | 7/1/40 | 3,000,000 | 3,110,340 |
| New York State Dormitory Authority, | ||||
| Revenue (Yeshiva University) | 5.00 | 11/1/20 | 3,190,000 | 3,500,738 |
| New York State Dormitory Authority, | ||||
| State Personal Income Tax Revenue (Education) | 5.75 | 3/15/36 | 1,000,000 | 1,111,370 |
| New York State Dormitory Authority, | ||||
| State Personal Income Tax Revenue (General Purpose) | 5.00 | 2/15/20 | 1,000,000 | 1,156,230 |
| New York State Dormitory Authority, | ||||
| State Personal Income Tax Revenue (General Purpose) | 5.00 | 3/15/20 | 1,000,000 | 1,157,420 |
| New York State Environmental Facilities Corporation, State Clean | ||||
| Water and Drinking Water Revolving Funds Revenue | ||||
| (New York City Municipal Water Finance Authority Projects) | 5.00 | 6/15/23 | 3,000,000 | 3,401,250 |
| New York State Environmental Facilities Corporation, State Clean | ||||
| Water and Drinking Water Revolving Funds Revenue | ||||
| (New York City Municipal Water Finance Authority Projects) | 5.00 | 6/15/30 | 1,000,000 | 1,024,930 |
| New York State Medical Care Facilities Finance Agency, | ||||
| Secured Mortgage Revenue (Collateralized; SONYMA) | 6.38 | 11/15/20 | 210,000 | 210,966 |
| New York State Thruway Authority, General Revenue | 5.00 | 1/1/20 | 1,500,000 | 1,711,830 |
| New York State Thruway Authority, General Revenue | ||||
| (Insured; National Public Finance Guarantee Corp.) | 5.00 | 1/1/24 | 1,000,000 | 1,081,680 |
| New York State Thruway Authority, Second General | ||||
| Highway and Bridge Trust Fund Bonds (Insured; AMBAC) | 5.00 | 4/1/25 | 2,000,000 | 2,154,280 |
| New York State Thruway Authority, | ||||
| State Personal Income Tax Revenue (Transportation) | 5.00 | 3/15/25 | 2,325,000 | 2,543,411 |
| New York State Urban Development Corporation, | ||||
| Revenue (Insured; Assured Guaranty Corp.) | 5.50 | 1/1/19 | 1,140,000 | 1,332,774 |
| New York State Urban Development Corporation, | ||||
| Service Contract Revenue | 5.00 | 1/1/20 | 2,075,000 | 2,374,547 |
| New York State Urban Development Corporation, | ||||
| Service Contract Revenue | 5.25 | 1/1/24 | 2,375,000 | 2,653,231 |
| Onondaga County Trust for Cultural Resources, | ||||
| Revenue (Syracuse University Project) | 5.00 | 12/1/19 | 2,500,000 | 2,861,275 |
| Oyster Bay, Public Improvement GO | 5.00 | 2/15/16 | 1,000,000 | 1,092,040 |
| Oyster Bay, Public Improvement GO | 3.00 | 8/15/16 | 2,000,000 | 2,096,620 |
| Port Authority of New York and New Jersey | ||||
| (Consolidated Bonds, 142nd Series) | 5.00 | 7/15/21 | 1,000,000 | 1,093,970 |
82
| BNY Mellon New York Intermediate Tax-Exempt Bond Fund (continued) | |||||
| Long-Term Municipal | Coupon | Maturity | Principal | ||
| Investments (continued) | Rate (%) | Date | Amount ($) | Value ($) | |
| New York (continued) | |||||
| Port Authority of New York and New Jersey | |||||
| (Consolidated Bonds, 173rd Series) | 5.00 | 12/1/18 | 1,000,000 | 1,162,340 | |
| Sales Tax Asset Receivable Corporation, Sales Tax Asset | |||||
| Revenue (Insured; National Public Finance Guarantee Corp.) | 5.00 | 10/15/25 | 1,450,000 | 1,512,089 | |
| Suffolk County, GO | 5.00 | 4/1/19 | 1,400,000 | 1,580,656 | |
| Suffolk County Industrial Development Agency, Civic | |||||
| Facility Revenue (New York Institute of Technology Project) | 5.00 | 3/1/26 | 750,000 | 752,708 | |
| Triborough Bridge and Tunnel Authority, | |||||
| General Purpose Revenue (Prerefunded) | 5.25 | 1/1/22 | 1,000,000 | b | 1,184,660 |
| Westchester County Health Care | |||||
| Corporation, Senior Lien Revenue | 5.00 | 11/1/20 | 1,400,000 | 1,558,480 | |
| Westchester County Health Care | |||||
| Corporation, Senior Lien Revenue | 5.00 | 11/1/24 | 1,500,000 | 1,577,385 | |
| Westchester County Health Care | |||||
| Corporation, Senior Lien Revenue | 5.00 | 11/1/30 | 1,500,000 | 1,507,395 | |
| U.S. Related—7.2% | |||||
| A.B. Won International Airport | |||||
| Authority of Guam, General Revenue | 5.00 | 10/1/23 | 1,500,000 | 1,515,330 | |
| Guam, Business Privilege Tax Revenue | 5.00 | 1/1/24 | 1,000,000 | 1,075,380 | |
| Guam, Hotel Occupancy Tax Revenue | 5.00 | 11/1/16 | 1,000,000 | 1,082,450 | |
| Puerto Rico Commonwealth, Public Improvement GO | |||||
| (Insured; National Public Finance Guarantee Corp.) | 5.50 | 7/1/19 | 2,500,000 | 2,399,300 | |
| Puerto Rico Electric Power Authority, Power Revenue | 5.38 | 7/1/24 | 1,000,000 | 830,450 | |
| Puerto Rico Electric Power Authority, | |||||
| Power Revenue (Insured; XLCA) | 5.50 | 7/1/17 | 1,000,000 | 998,750 | |
| Puerto Rico Government Development Bank, Senior Notes | 5.00 | 12/1/15 | 3,500,000 | 3,523,730 | |
| Puerto Rico Housing Finance Authority, Capital Fund Program | |||||
| Revenue (Puerto Rico Housing Administration Projects) | 5.00 | 12/1/18 | 260,000 | 264,155 | |
| Puerto Rico Housing Finance Authority, Capital Fund Program | |||||
| Revenue (Puerto Rico Housing Administration Projects) | 5.00 | 12/1/19 | 270,000 | 274,315 | |
| Puerto Rico Public Buildings Authority, | |||||
| Government Facilities Revenue | 5.75 | 7/1/22 | 1,000,000 | 887,110 | |
| Puerto Rico Sales Tax Financing Corporation, | |||||
| Sales Tax Revenue (First Subordinate Series) | 0/6.75 | 8/1/32 | 1,700,000 | c | 1,407,243 |
| Puerto Rico Sales Tax Financing Corporation, | |||||
| Sales Tax Revenue (First Subordinate Series) | 0/6.25 | 8/1/33 | 500,000 | c | 322,190 |
| Total Long-Term Municipal Investments | |||||
| (cost $184,577,893) | 188,236,619 | ||||
The Funds 83
STATEMENT OF INVESTMENTS (continued)
| BNY Mellon New York Intermediate Tax-Exempt Bond Fund (continued) | |||||
| Short-Term Municipal | Coupon | Maturity | Principal | ||
| Investments—6.5% | Rate (%) | Date | Amount ($) | Value ($) | |
| New York; | |||||
| New York City, GO Notes (LOC; Fortis Bank) | 0.05 | 9/3/13 | 3,800,000 | d | 3,800,000 |
| New York City, GO Notes (LOC; JPMorgan Chase Bank) | 0.06 | 9/3/13 | 1,000,000 | d | 1,000,000 |
| New York City, GO Notes (LOC; JPMorgan Chase Bank) | 0.06 | 9/3/13 | 2,200,000 | d | 2,200,000 |
| New York City, GO Notes (LOC; JPMorgan Chase Bank) | 0.06 | 9/3/13 | 1,300,000 | d | 1,300,000 |
| New York City, GO Notes (LOC; JPMorgan Chase Bank) | 0.06 | 9/3/13 | 2,000,000 | d | 2,000,000 |
| New York City Transitional Finance Authority, | |||||
| Revenue (New York City Recovery) | |||||
| (Liquidity Facility; JPMorgan Chase Bank) | 0.05 | 9/3/13 | 1,900,000 | d | 1,900,000 |
| New York City Trust for Cultural Resources, | |||||
| Revenue, Refunding (Lincoln Center for the | |||||
| Performing Arts, Inc.) (LOC; Bank of America) | 0.06 | 9/3/13 | 900,000 | d | 900,000 |
| Total Short-Term Municipal Investments | |||||
| (cost $13,100,000) | 13,100,000 | ||||
| Total Investments (cost $197,677,893) | 99.4 | % | 201,336,619 |
| Cash and Receivables (Net) | .6 | % | 1,250,802 |
| Net Assets | 100.0 | % | 202,587,421 |
| a Variable rate security—interest rate subject to periodic change. |
| b This security is prerefunded; the date shown represents the prerefunded date. Bonds which are prerefunded are collateralized by U.S. Government securities which are held in escrow |
| and are used to pay principal and interest on the municipal issue and to retire the bonds in full at the earliest refunding date. |
| c Zero coupon until a specified date at which time the stated coupon rate becomes effective until maturity. |
| d Variable rate demand note—rate shown is the interest rate in effect at August 31, 2013. Maturity date represents the next demand date, or the ultimate maturity date if earlier. |
84
| Summary of Abbreviations | |||
| ABAG | Association of Bay Area Governments | ACA | American Capital Access |
| AGC | ACE Guaranty Corporation | AGIC | Asset Guaranty Insurance Company |
| AMBAC | American Municipal Bond Assurance Corporation | ARRN | Adjustable Rate Receipt Notes |
| BAN | Bond Anticipation Notes | BPA | Bond Purchase Agreement |
| CIFG | CDC Ixis Financial Guaranty | COP | Certificate of Participation |
| CP | Commercial Paper | DRIVERS | Derivative Inverse Tax-Exempt Receipts |
| EDR | Economic Development Revenue | EIR | Environmental Improvement Revenue |
| FGIC | Financial Guaranty Insurance Company | FHA | Federal Housing Administration |
| FHLB | Federal Home Loan Bank | FHLMC | Federal Home Loan Mortgage Corporation |
| FNMA | Federal National Mortgage Association | GAN | Grant Anticipation Notes |
| GIC | Guaranteed Investment Contract | GNMA | Government National Mortgage Association |
| GO | General Obligation | HR | Hospital Revenue |
| IDB | Industrial Development Board | IDC | Industrial Development Corporation |
| IDR | Industrial Development Revenue | LIFERS | Long Inverse Floating Exempt Receipts |
| LOC | Letter of Credit | LOR | Limited Obligation Revenue |
| LR | Lease Revenue | MERLOTS | Municipal Exempt Receipts Liquidity Option Tender |
| MFHR | Multi-Family Housing Revenue | MFMR | Multi-Family Mortgage Revenue |
| PCR | Pollution Control Revenue | P-FLOATS | Puttable Floating Option Tax-Exempt Receipts |
| PILOT | Payment in Lieu of Taxes | PUTTERS | Puttable Tax-Exempt Receipts |
| RAC | Revenue Anticipation Certificates | RAN | Revenue Anticipation Notes |
| RAW | Revenue Anticipation Warrants | ROCS | Reset Options Certificates |
| RRR | Resources Recovery Revenue | SAAN | State Aid Anticipation Notes |
| SBPA | Standby Bond Purchase Agreement | SFHR | Single Family Housing Revenue |
| SFMR | Single Family Mortgage Revenue | SONYMA | State of New York Mortgage Agency |
| SPEARS | Short Puttable Exempt Adjustable Receipts | SWDR | Solid Waste Disposal Revenue |
| TAN | Tax Anticipation Notes | TAW | Tax Anticipation Warrants |
| TRAN | Tax and Revenue Anticipation Notes | XLCA | XL Capital Assurance |
| Summary of Combined Ratings (Unaudited) | |||||
| Fitch | or | Moody’s | or | Standard & Poor’s | Value (%)† |
| AAA | Aaa | AAA | 17.8 | ||
| AA | Aa | AA | 41.9 | ||
| A | A | A | 30.0 | ||
| BBB | Baa | BBB | 5.7 | ||
| F1 | MIG1/P1 | SP1/A1 | 4.6 | ||
| 100.0 | |||||
| † Based on total investments. |
| See notes to financial statements. |
The Funds 85
STATEMENT OF FINANCIAL FUTURES
August 31, 2013
| Market Value | Unrealized | |||||
| BNY Mellon New York | Covered by | Appreciation | ||||
| Intermediate Tax-Exempt Bond Fund | Contracts | Contracts ($) | Expiration | at 8/31/2013 ($) | ||
| Financial Futures Short | ||||||
| U.S. Treasury 10 Year Notes | 40 | (5,013,750 | ) | September 2013 | 168,125 |
| See notes to financial statements. |
86
STATEMENT OF INVESTMENTS
August 31, 2013
| BNY Mellon Municipal Opportunities Fund | |||||
| Long-Term Municipal | Coupon | Maturity | Principal | ||
| Investments—100.0% | Rate (%) | Date | Amount ($) | Value ($) | |
| Alabama—1.0% | |||||
| Jefferson County, Limited Obligation School Warrants | |||||
| (Insured; Assured Guaranty Municipal Corp.) | 5.50 | 2/15/16 | 3,850,000 | 3,769,804 | |
| Jefferson County, Limited Obligation School Warrants | |||||
| (Insured; Assured Guaranty Municipal Corp.) | 5.25 | 1/1/18 | 5,000,000 | 4,956,350 | |
| Tuscaloosa Public Educational Building Authority, Student Housing | |||||
| Revenue (Ridgecrest Student Housing, LLC University of Alabama | |||||
| Ridgecrest Residential Project) (Insured; Assured Guaranty Corp.) | 6.75 | 7/1/33 | 1,100,000 | 1,230,977 | |
| Arizona—.5% | |||||
| Arizona Board of Regents, Arizona State University | |||||
| System Revenue (Polytechnic Campus Project) | 6.00 | 7/1/27 | 750,000 | 850,193 | |
| Arizona Health Facilities Authority, HR (Phoenix Children’s Hospital) | 5.00 | 2/1/43 | 1,500,000 | 1,330,545 | |
| University Medical Center Corporation, HR | 6.00 | 7/1/39 | 2,500,000 | 2,542,700 | |
| California—17.2% | |||||
| Bay Area Toll Authority, San Francisco Bay Area | |||||
| Subordinate Lien Toll Bridge Revenue | 5.00 | 4/1/43 | 3,000,000 | 2,945,310 | |
| California, GO (Various Purpose) | 6.50 | 4/1/33 | 6,700,000 | 7,796,522 | |
| California, GO (Various Purpose) | 5.50 | 3/1/40 | 7,950,000 | 8,226,263 | |
| California, GO (Various Purpose) | 5.00 | 9/1/41 | 5,000,000 | 4,985,050 | |
| California Health Facilities Financing Authority, | |||||
| Revenue (Providence Health and Services) | 6.50 | 10/1/38 | 490,000 | 557,498 | |
| California Health Facilities Financing Authority, | |||||
| Revenue (Providence Health and Services) (Prerefunded) | 6.50 | 10/1/18 | 10,000 | a | 12,413 |
| California Health Facilities Financing Authority, | |||||
| Revenue (Saint Joseph Health System) | 5.00 | 7/1/37 | 2,270,000 | 2,199,176 | |
| California Infrastructure and Economic Development Bank, | |||||
| Revenue (The J. David Gladstone Institutes Project) | 5.25 | 10/1/34 | 750,000 | 746,175 | |
| California Municipal Finance Authority, Charter School | |||||
| Revenue (Partnerships to Uplift Communities Project) | 5.00 | 8/1/32 | 675,000 | 599,927 | |
| California Municipal Finance Authority, | |||||
| Revenue (Emerson College Issue) | 6.00 | 1/1/42 | 6,000,000 | 6,438,300 | |
| California Municipal Finance Authority, | |||||
| Revenue (Southwestern Law School) | 6.50 | 11/1/31 | 300,000 | 326,286 | |
| California Pollution Control Financing Authority, | |||||
| Water Furnishing Revenue (San Diego County | |||||
| Water Authority Desalination Project Pipeline) | 5.00 | 11/21/45 | 16,000,000 | 13,769,120 | |
| California State Public Works Board, LR (Judicial | |||||
| Council of California) (Various Judicial Council Projects) | 5.00 | 12/1/31 | 2,000,000 | 1,990,380 | |
| California Statewide Communities Development Authority, | |||||
| Mortgage Revenue (Methodist Hospital of Southern | |||||
| California Project) (Collateralized; FHA) | 6.75 | 2/1/38 | 2,230,000 | 2,573,264 | |
| California Statewide Communities Development | |||||
| Authority, Revenue (Sutter Health) | 6.00 | 8/15/42 | 6,000,000 | 6,610,320 | |
| California Statewide Communities Development Authority, | |||||
| Student Housing Revenue (University of California, Irvine East | |||||
| Campus Apartments, Phase 1 Refunding—CHF—Irvine, L.L.C.) | 5.38 | 5/15/38 | 1,500,000 | 1,470,720 |
The Funds 87
STATEMENT OF INVESTMENTS (continued)
| BNY Mellon Municipal Opportunities Fund (continued) | |||||
| Long-Term Municipal | Coupon | Maturity | Principal | ||
| Investments (continued) | Rate (%) | Date | Amount ($) | Value ($) | |
| California (continued) | |||||
| Capistrano Unified School District Community Facilities District | |||||
| Number 90-2, Special Tax Bonds (Improvement Area | |||||
| Number 2002-1) (Insured; Assured Guaranty Municipal Corp.) | 5.00 | 9/1/32 | 4,000,000 | 3,815,920 | |
| East Bay Municipal Utility District, Water System Revenue | 5.00 | 6/1/20 | 1,125,000 | 1,320,919 | |
| East Bay Municipal Utility District, Water System Revenue | 5.00 | 6/1/21 | 1,285,000 | 1,506,663 | |
| Galt Redevelopment Agency, Tax Allocation | |||||
| Revenue (Galt Redevelopment Project) | 7.38 | 9/1/33 | 3,300,000 | 3,608,781 | |
| Gilroy School Facilities Financing Authority, GO Revenue | 5.00 | 8/1/46 | 5,000,000 | 4,706,000 | |
| Golden State Tobacco Securitization Corporation, | |||||
| Enhanced Tobacco Settlement Asset-Backed Bonds | 5.00 | 6/1/29 | 2,000,000 | 2,009,040 | |
| Golden State Tobacco Securitization Corporation, | |||||
| Enhanced Tobacco Settlement Asset-Backed Bonds | 5.00 | 6/1/30 | 2,000,000 | 1,988,620 | |
| Grant Joint Union High School District, GO | |||||
| (Insured; Assured Guaranty Municipal Corp.) | 0.00 | 8/1/29 | 2,080,000 | b | 848,827 |
| Grant Joint Union High School District, GO | |||||
| (Insured; Assured Guaranty Municipal Corp.) | 0.00 | 2/1/33 | 4,380,000 | b | 1,416,054 |
| Irvine Reassessment District Number 12-1, | |||||
| Limited Obligation Improvement Bonds | 4.00 | 9/2/29 | 1,000,000 | 907,170 | |
| JPMorgan Chase Putters/Drivers Trust (Series 3847) | |||||
| (Los Angeles Department of Airports, Senior | |||||
| Revenue (Los Angeles International Airport)) | 5.25 | 5/15/18 | 10,000,000 | c,d | 10,698,500 |
| Los Angeles County Public Works Financing | |||||
| Authority, LR (Multiple Capitals Projects II) | 5.00 | 8/1/37 | 2,500,000 | 2,425,250 | |
| Los Angeles County Public Works Financing | |||||
| Authority, LR (Multiple Capitals Projects II) | 5.00 | 8/1/42 | 1,805,000 | 1,727,836 | |
| Los Angeles Unified School District, GO | 5.00 | 1/1/34 | 1,000,000 | 1,007,990 | |
| Metropolitan Water District of Southern California, | |||||
| Water Revenue (Build America Bonds) | 6.54 | 7/1/39 | 4,600,000 | 5,062,530 | |
| New Haven Unified School District, GO | |||||
| (Insured; Assured Guaranty Corp.) | 0.00 | 8/1/32 | 2,500,000 | b | 847,525 |
| Newport Beach, Revenue (Hoag Memorial | |||||
| Hospital Presbyterian) (Prerefunded) | 6.00 | 12/1/21 | 4,630,000 | a | 5,822,549 |
| Northern California Gas Authority | |||||
| Number 1, Gas Project Revenue | 0.90 | 7/1/27 | 660,000 | e | 538,586 |
| Oakland Unified School District, GO (Build America Bonds) | 9.50 | 8/1/34 | 10,000,000 | 11,380,200 | |
| Riverside County Transportation Commission, Sales Tax Revenue | 5.25 | 6/1/30 | 2,000,000 | 2,148,280 | |
| Riverside County Transportation Commission, Sales Tax Revenue | 5.25 | 6/1/31 | 2,000,000 | 2,131,860 | |
| Riverside County Transportation Commission, Sales Tax Revenue | 5.25 | 6/1/33 | 2,000,000 | 2,123,720 | |
| Riverside County Transportation Commission, Sales Tax Revenue | 5.25 | 6/1/39 | 7,500,000 | 7,795,350 | |
| Riverside County Transportation Commission, | |||||
| Senior Lien Toll Revenue | 5.75 | 6/1/44 | 2,000,000 | 1,943,640 | |
| Riverside County Transportation Commission, | |||||
| Senior Lien Toll Revenue | 5.75 | 6/1/48 | 5,000,000 | 4,816,350 | |
88
| BNY Mellon Municipal Opportunities Fund (continued) | |||||
| Long-Term Municipal | Coupon | Maturity | Principal | ||
| Investments (continued) | Rate (%) | Date | Amount ($) | Value ($) | |
| California (continued) | |||||
| Sacramento Transportation Authority, | |||||
| Limited Tax Measure A Sales Tax Revenue | 5.00 | 10/1/24 | 1,000,000 | 1,098,900 | |
| Sacramento Transportation Authority, | |||||
| Limited Tax Measure A Sales Tax Revenue | 5.00 | 10/1/26 | 1,250,000 | 1,337,762 | |
| San Diego Regional Building Authority, LR (County Operations | |||||
| Center and Annex Redevelopment Project) | 5.38 | 2/1/36 | 2,000,000 | 2,117,240 | |
| San Diego Unified School District, GO | 0.00 | 7/1/25 | 4,000,000 | b | 2,275,040 |
| San Francisco City and County Redevelopment Agency | |||||
| Community Facilities District Number 6, Special Tax | |||||
| Revenue (Mission Bay South Public Improvements) | 0.00 | 8/1/38 | 2,000,000 | b | 374,240 |
| San Francisco City and County Redevelopment Agency | |||||
| Community Facilities District Number 6, Special Tax | |||||
| Revenue (Mission Bay South Public Improvements) | 0.00 | 8/1/43 | 2,835,000 | b | 373,540 |
| San Francisco City and County Redevelopment Financing Authority, | |||||
| Tax Allocation Revenue (San Francisco Redevelopment Projects) | 6.63 | 8/1/41 | 1,250,000 | 1,333,875 | |
| South Bayside Waste Management Authority, Solid Waste | |||||
| Enterprise Revenue (Shoreway Environmental Center) | 6.00 | 9/1/36 | 1,000,000 | 1,031,960 | |
| West Contra Costa Unified School District, | |||||
| GO (Build America Bonds) | 8.46 | 8/1/34 | 9,250,000 | 10,791,975 | |
| Colorado—.4% | |||||
| City and County of Denver, Airport System Revenue | 5.00 | 11/15/21 | 1,500,000 | 1,653,645 | |
| City and County of Denver, Airport System Revenue | |||||
| (Insured: Assured Guaranty Corp. and National | |||||
| Public Finance GuaranteeCorp.) | 5.25 | 11/15/19 | 1,000,000 | 1,120,530 | |
| Colorado Health Facilities Authority, | |||||
| Revenue (Catholic Health Initiatives) | 6.00 | 10/1/23 | 500,000 | 579,390 | |
| Connecticut—.8% | |||||
| Bridgeport, GO | 5.00 | 2/15/32 | 2,175,000 | 2,159,405 | |
| Connecticut Health and Educational Facilities | |||||
| Authority, Revenue (Yale University Issue) | 5.05 | 7/1/42 | 5,000,000 | 5,159,400 | |
| Delaware—2.1% | |||||
| Delaware, GO | 5.00 | 2/1/23 | 6,340,000 | 7,255,433 | |
| JPMorgan Chase Putters/Drivers Trust | |||||
| (Series 4359) (University of Delaware, Revenue) | 5.00 | 5/1/21 | 12,230,000 | c,d | 12,607,635 |
| District of Columbia—.9% | |||||
| District of Columbia, Revenue | |||||
| (Friendship Public Charter School, Inc. Issue) | 5.00 | 6/1/32 | 3,000,000 | 2,756,490 | |
| District of Columbia, Revenue | |||||
| (Friendship Public Charter School, Inc. Issue) | 5.00 | 6/1/42 | 2,000,000 | 1,732,280 | |
| District of Columbia, Revenue (Knowledge is | |||||
| Power Program, District of Columbia Issue) | 6.00 | 7/1/33 | 900,000 | 915,327 | |
| District of Columbia, Revenue (Knowledge is | |||||
| Power Program, District of Columbia Issue) | 6.00 | 7/1/43 | 1,700,000 | 1,711,815 | |
The Funds 89
STATEMENT OF INVESTMENTS (continued)
| BNY Mellon Municipal Opportunities Fund (continued) | |||||
| Long-Term Municipal | Coupon | Maturity | Principal | ||
| Investments (continued) | Rate (%) | Date | Amount ($) | Value ($) | |
| District of Columbia (continued) | |||||
| District of Columbia, Revenue (Knowledge is | |||||
| Power Program, District of Columbia Issue) | 6.00 | 7/1/48 | 1,450,000 | 1,443,548 | |
| Florida—2.3% | |||||
| Brevard County Health Facilities Authority, | |||||
| Health Facilities Revenue (Health First, Inc. Project) | 7.00 | 4/1/39 | 1,675,000 | 1,827,492 | |
| Florida Municipal Power Agency, | |||||
| All-Requirements Power Supply Project Revenue | 6.25 | 10/1/31 | 1,000,000 | 1,132,110 | |
| Higher Educational Facilities Financing | |||||
| Authority, Revenue (The University of Tampa Project) | 5.25 | 4/1/42 | 2,500,000 | 2,362,250 | |
| Jacksonville, Better Jacksonville Sales Tax Revenue | 5.00 | 10/1/30 | 500,000 | 501,065 | |
| Miami Beach Health Facilities Authority, | |||||
| HR (Mount Sinai Medical Center of Florida) | 5.00 | 11/15/29 | 1,000,000 | 952,410 | |
| Miami-Dade County, Aviation Revenue (Miami International Airport) | 5.50 | 10/1/41 | 1,200,000 | 1,226,760 | |
| Miami-Dade County Educational Facilities Authority, | |||||
| Revenue (University of Miami Issue) (Insured; | |||||
| Berkshire Hathaway Assurance Corporation) | 5.50 | 4/1/38 | 600,000 | 626,094 | |
| Miami-Dade County Expressway Authority, Toll System Revenue | 5.00 | 7/1/40 | 650,000 | 630,344 | |
| Orlando-Orange County Expressway Authority, Revenue | 5.00 | 7/1/29 | 10,000,000 | 10,162,500 | |
| Sarasota County Public Hospital District, | |||||
| HR (Sarasota Memorial Hospital Project) | 5.63 | 7/1/39 | 2,000,000 | 2,016,640 | |
| Georgia—.3% | |||||
| Burke County Development Authority, PCR | |||||
| (Oglethorpe Power Corporation Vogtle Project) | 7.00 | 1/1/23 | 1,000,000 | 1,166,320 | |
| DeKalb County, GO | 5.00 | 1/1/19 | 500,000 | 507,090 | |
| DeKalb County, GO (Special Transportation, | |||||
| Parks and Greenspace and Libraries Tax District) | 5.00 | 12/1/18 | 750,000 | 810,608 | |
| Hawaii—3.3% | |||||
| Hawaii Department of Budget and Finance, Special Purpose Revenue | |||||
| (Hawaiian Electric Company, Inc. and Subsidiary Projects) | 6.50 | 7/1/39 | 6,000,000 | 6,415,800 | |
| Hawaii Department of Budget and Finance, | |||||
| Special Purpose Senior Living Revenue (Kahala Nui) | 5.13 | 11/15/32 | 1,000,000 | 970,200 | |
| Hawaii Department of Budget and Finance, | |||||
| Special Purpose Senior Living Revenue (Kahala Nui) | 5.25 | 11/15/37 | 1,000,000 | 959,580 | |
| JPMorgan Chase Putters/Drivers Trust (Series 4007) (Hawaii, GO) | 5.00 | 12/1/19 | 20,000,000 | c,d | 22,539,469 |
| Illinois—4.0% | |||||
| Chicago, Customer Facility Charge Senior Lien Revenue | |||||
| (Chicago O’Hare International Airport) (Insured; | |||||
| Assured Guaranty Municipal Corp.) | 5.50 | 1/1/43 | 4,000,000 | 3,864,200 | |
| Chicago, General Airport Third Lien Revenue | |||||
| (Chicago O’Hare International Airport) | 5.75 | 1/1/39 | 2,500,000 | 2,558,300 | |
| Chicago, General Airport Third Lien Revenue | |||||
| (Chicago O’Hare International Airport) | 6.50 | 1/1/41 | 5,000,000 | 5,783,150 | |
| Illinois, GO | 5.50 | 7/1/33 | 2,500,000 | 2,417,800 | |
| Illinois, GO | 5.50 | 7/1/38 | 2,500,000 | 2,370,275 | |
90
| BNY Mellon Municipal Opportunities Fund (continued) | |||||
| Long-Term Municipal | Coupon | Maturity | Principal | ||
| Investments (continued) | Rate (%) | Date | Amount ($) | Value ($) | |
| Illinois (continued) | |||||
| Illinois Finance Authority, Revenue (Franciscan Communities, Inc.) | 5.13 | 5/15/43 | 2,650,000 | 2,212,193 | |
| Illinois Finance Authority, Revenue (Franciscan Communities, Inc.) | 5.25 | 5/15/47 | 4,250,000 | 3,541,865 | |
| Illinois Finance Authority, Revenue | |||||
| (Lutheran Home and Services Obligated Group) | 5.63 | 5/15/42 | 3,000,000 | 2,658,420 | |
| Illinois Finance Authority, Revenue | |||||
| (Northwestern Memorial HealthCare) | 5.00 | 8/15/43 | 1,500,000 | 1,474,800 | |
| Illinois Finance Authority, Revenue | |||||
| (Rehabilitation Institute of Chicago) | 5.50 | 7/1/28 | 1,360,000 | 1,346,985 | |
| Illinois Finance Authority, Revenue | |||||
| (Rehabilitation Institute of Chicago) | 6.50 | 7/1/34 | 2,140,000 | 2,209,892 | |
| Illinois Finance Authority, Revenue | |||||
| (Rehabilitation Institute of Chicago) | 6.00 | 7/1/43 | 5,000,000 | 5,056,900 | |
| Illinois Finance Authority, Revenue | |||||
| (The Art Institute of Chicago) | 6.00 | 3/1/38 | 1,000,000 | 1,044,660 | |
| Metropolitan Pier and Exposition Authority, | |||||
| Revenue (McCormick Place Expansion Project) | |||||
| (Insured; Assured Guaranty Municipal Corp.) | 0.00 | 6/15/26 | 2,000,000 | b | 1,031,060 |
| Kentucky—.2% | |||||
| Kentucky Property and Buildings Commission, | |||||
| Revenue (Project Number 90) | 5.38 | 11/1/23 | 1,500,000 | 1,724,580 | |
| Louisiana—1.7% | |||||
| Jefferson Parish Hospital Service District Number 2, | |||||
| HR (East Jefferson General Hospital) | 6.25 | 7/1/31 | 5,000,000 | 5,250,250 | |
| Louisiana Citizens Property Insurance Corporation, | |||||
| Assessment Revenue (Insured; Assured Guaranty Corp.) | 6.13 | 6/1/25 | 4,000,000 | 4,434,920 | |
| Louisiana Public Facilities Authority, | |||||
| Revenue (CHRISTUS Health Obligated Group) | 6.00 | 7/1/29 | 1,000,000 | 1,061,680 | |
| Louisiana State University and Agricultural Mechanical | |||||
| College Board of Supervisors, Auxiliary Revenue | 5.00 | 7/1/37 | 2,000,000 | 1,997,100 | |
| New Orleans Aviation Board, Revenue | |||||
| (Insured; Assured Guaranty Corp.) | 6.00 | 1/1/23 | 2,000,000 | 2,239,280 | |
| Tobacco Settlement Financing Corporation of Louisiana, | |||||
| Tobacco Settlement Asset-Backed Bonds | 5.25 | 5/15/35 | 1,000,000 | 945,460 | |
| Maine—.8% | |||||
| Maine Health and Higher Educational Facilities Authority, | |||||
| Revenue (MaineGeneral Medical Center Issue) | 6.00 | 7/1/26 | 825,000 | 895,414 | |
| Maine Health and Higher Educational Facilities Authority, | |||||
| Revenue (MaineGeneral Medical Center Issue) | 6.75 | 7/1/41 | 2,500,000 | 2,713,925 | |
| Maine Health and Higher Educational Facilities Authority, | |||||
| Revenue (MaineGeneral Medical Center Issue) | 7.00 | 7/1/41 | 3,950,000 | 4,350,411 | |
| Maryland—3.8% | |||||
| Maryland, GO (State and Local Facilities Loan) | 4.00 | 3/15/25 | 27,810,000 | 29,016,398 | |
| Maryland Economic Development Corporation, | |||||
| EDR (Terminal Project) | 5.75 | 6/1/35 | 3,500,000 | 3,507,980 | |
The Funds 91
STATEMENT OF INVESTMENTS (continued)
| BNY Mellon Municipal Opportunities Fund (continued) | |||||
| Long-Term Municipal | Coupon | Maturity | Principal | ||
| Investments (continued) | Rate (%) | Date | Amount ($) | Value ($) | |
| Maryland (continued) | |||||
| Maryland Economic Development Corporation, Port Facilities | |||||
| Revenue (CNX Marine Terminals Inc. Port of Baltimore Facility) | 5.75 | 9/1/25 | 1,000,000 | 1,029,280 | |
| Maryland Health and Higher Educational Facilities Authority, | |||||
| Revenue (Anne Arundel Health System Issue) | 6.75 | 7/1/29 | 2,000,000 | 2,340,300 | |
| Maryland Health and Higher Educational Facilities Authority, | |||||
| Revenue (University of Maryland Medical System Issue) | 5.13 | 7/1/39 | 250,000 | 241,307 | |
| Massachusetts—5.1% | |||||
| JPMorgan Chase Putters/Drivers Trust (Series 3896) | |||||
| (Massachusetts, GO (Consolidated Loan)) | 5.00 | 4/1/19 | 15,000,000 | c,d | 16,836,975 |
| JPMorgan Chase Putters/Drivers Trust (Series 4357) (Massachusetts | |||||
| School Building Authority, Senior Dedicated Sales Tax Revenue) | 5.00 | 8/15/20 | 10,000,000 | c,d | 10,538,469 |
| Massachusetts, GO (Consolidated Loan) | 4.00 | 6/1/28 | 8,400,000 | 8,264,592 | |
| Massachusetts Development Finance Agency, | |||||
| HR (Cape Cod Healthcare Obligated Group Issue) | 5.25 | 11/15/41 | 4,370,000 | 4,235,273 | |
| Massachusetts Development Finance Agency, | |||||
| Revenue (Tufts Medical Center Issue) | 7.25 | 1/1/32 | 3,090,000 | 3,476,961 | |
| Massachusetts Development Finance Agency, | |||||
| Revenue (Tufts Medical Center Issue) | 6.75 | 1/1/36 | 1,165,000 | 1,268,312 | |
| Massachusetts Development Finance Agency, | |||||
| Revenue (Tufts Medical Center Issue) | 6.88 | 1/1/41 | 1,000,000 | 1,088,590 | |
| Massachusetts Health and Educational Facilities | |||||
| Authority, Revenue (Simmons College Issue) | 7.50 | 10/1/22 | 500,000 | 599,570 | |
| Massachusetts Health and Educational Facilities | |||||
| Authority, Revenue (Simmons College Issue) | 8.00 | 10/1/39 | 2,000,000 | 2,213,320 | |
| Massachusetts Water Pollution Abatement Trust, | |||||
| Water Pollution Abatement Revenue (MWRA Program) | 5.75 | 8/1/29 | 50,000 | 50,163 | |
| Michigan—1.9% | |||||
| Detroit, Water Supply System Second Lien Revenue | |||||
| (Insured; Assured Guaranty Municipal Corp.) | 5.00 | 7/1/22 | 950,000 | 923,505 | |
| Michigan Building Authority, Revenue (Facilities Program) | 5.00 | 10/15/33 | 6,760,000 | 6,751,077 | |
| Michigan Building Authority, Revenue (Facilities Program) | 5.38 | 10/15/41 | 3,000,000 | 3,036,210 | |
| Michigan Finance Authority, Revenue | |||||
| (School District of the City of Detroit) | 5.00 | 6/1/19 | 1,000,000 | 1,083,180 | |
| Michigan Finance Authority, Revenue | |||||
| (School District of the City of Detroit) | 5.00 | 6/1/20 | 500,000 | 537,080 | |
| Michigan Strategic Fund, LOR (State of Michigan | |||||
| Cadillac Place Office Building Project) | 5.25 | 10/15/31 | 5,500,000 | 5,448,905 | |
| Minnesota—3.4% | |||||
| JPMorgan Chase Putters/Drivers Trust | |||||
| (Series 3844) (Minnesota, GO (Various Purpose)) | 5.00 | 8/1/18 | 17,125,000 | c,d | 19,722,508 |
| JPMorgan Chase Putters/Drivers Trust | |||||
| (Series 3845) (Minnesota, GO (Various Purpose)) | 5.00 | 8/1/18 | 10,000,000 | c,d | 11,731,200 |
| Minneapolis, Health Care System | |||||
| Revenue (Fairview Health Services) | 6.63 | 11/15/28 | 1,000,000 | 1,156,300 | |
92
| BNY Mellon Municipal Opportunities Fund (continued) | |||||
| Long-Term Municipal | Coupon | Maturity | Principal | ||
| Investments (continued) | Rate (%) | Date | Amount ($) | Value ($) | |
| Mississippi—.4% | |||||
| Mississippi Development Bank, Special Obligation Revenue | |||||
| (Jackson, Water and Sewer System Revenue Bond | |||||
| Project) (Insured; Assured Guaranty Municipal Corp.) | 6.88 | 12/1/40 | 1,625,000 | 1,921,059 | |
| Warren County, Gulf Opportunity Zone Revenue | |||||
| (International Paper Company Projects) | 5.80 | 5/1/34 | 1,500,000 | 1,518,870 | |
| Nevada—1.1% | |||||
| Clark County, Airport System | |||||
| Revenue (Build America Bonds) | 6.88 | 7/1/42 | 10,000,000 | 10,859,500 | |
| New Jersey—5.2% | |||||
| New Jersey, COP (Equipment Lease Purchase Agreement) | 5.25 | 6/15/28 | 1,000,000 | 1,040,900 | |
| New Jersey Economic Development Authority, | |||||
| Cigarette Tax Revenue | 5.00 | 6/15/26 | 2,500,000 | 2,491,350 | |
| New Jersey Economic Development Authority, | |||||
| Cigarette Tax Revenue | 5.00 | 6/15/28 | 2,000,000 | 1,934,880 | |
| New Jersey Economic Development Authority, | |||||
| School Facilities Construction Revenue | 5.00 | 3/1/26 | 7,000,000 | 7,405,300 | |
| New Jersey Economic Development Authority, | |||||
| School Facilities Construction Revenue (Insured; AMBAC) | 5.25 | 12/15/20 | 5,000,000 | 5,734,900 | |
| New Jersey Educational Facilities Authority, | |||||
| Revenue (University of Medicine and | |||||
| Dentistry of New Jersey Issue) (Prerefunded) | 7.50 | 6/1/19 | 2,000,000 | a | 2,607,580 |
| New Jersey Health Care Facilities Financing Authority, | |||||
| Revenue (Saint Peter’s University Hospital | |||||
| Obligated Group Issue) | 6.25 | 7/1/35 | 1,500,000 | 1,520,685 | |
| New Jersey Transportation Trust Fund | |||||
| Authority (Transportation System) | 5.00 | 6/15/20 | 8,500,000 | 9,634,580 | |
| New Jersey Transportation Trust Fund | |||||
| Authority (Transportation System) | 0.00 | 12/15/29 | 5,000,000 | b | 2,069,050 |
| New Jersey Turnpike Authority, Turnpike Revenue | 5.00 | 1/1/28 | 10,000,000 | 10,400,300 | |
| New Jersey Turnpike Authority, Turnpike Revenue | 5.00 | 1/1/38 | 5,000,000 | 4,985,700 | |
| New York—13.2% | |||||
| Albany Industrial Development Agency, Civic Facility | |||||
| Revenue (Saint Peter’s Hospital of the City of Albany Project) | 5.75 | 11/15/22 | 4,225,000 | 4,577,196 | |
| Brooklyn Arena Local Development Corporation, | |||||
| PILOT Revenue (Barclays Center Project) | 6.00 | 7/15/30 | 8,000,000 | 8,498,800 | |
| Hudson Yards Infrastructure Corporation, | |||||
| Hudson Yards Senior Revenue | 5.75 | 2/15/47 | 5,000,000 | 5,146,800 | |
| Metropolitan Transportation Authority, | |||||
| Dedicated Tax Fund Revenue | 0.00 | 11/15/30 | 10,000,000 | b | 4,239,100 |
| Metropolitan Transportation Authority, Transportation Revenue | 5.00 | 11/15/26 | 6,065,000 | 6,427,323 | |
| Metropolitan Transportation Authority, Transportation Revenue | 6.50 | 11/15/28 | 665,000 | 774,326 | |
| Metropolitan Transportation Authority, Transportation | |||||
| Revenue (Insured; Assured Guaranty Municipal Corp.) | 0.37 | 11/1/22 | 12,500,000 | e | 12,062,500 |
| New York City, GO | 6.00 | 10/15/23 | 500,000 | 579,785 | |
The Funds 93
STATEMENT OF INVESTMENTS (continued)
| BNY Mellon Municipal Opportunities Fund (continued) | |||||
| Long-Term Municipal | Coupon | Maturity | Principal | ||
| Investments (continued) | Rate (%) | Date | Amount ($) | Value ($) | |
| New York (continued) | |||||
| New York City Industrial Development Agency, PILOT | |||||
| Revenue (Queens Baseball Stadium Project) | |||||
| (Insured; Assured Guaranty Corp.) | 6.50 | 1/1/46 | 325,000 | 349,131 | |
| New York City Industrial Development Agency, PILOT Revenue | |||||
| (Yankee Stadium Project) (Insured; Assured Guaranty Corp.) | 7.00 | 3/1/49 | 1,300,000 | 1,504,256 | |
| New York City Industrial Development Agency, PILOT | |||||
| Revenue (Yankee Stadium Project) (Insured; FGIC) | 2.54 | 3/1/20 | 5,000,000 | e | 4,709,700 |
| New York City Municipal Water Finance Authority, Water and | |||||
| Sewer System Revenue (Citigroup Series RR II R-11931) | 5.75 | 12/15/16 | 9,000,000 | c,d | 9,930,510 |
| New York City Municipal Water Finance Authority, Water and | |||||
| Sewer System Revenue (Citigroup Series RR II R-11931-1) | 5.75 | 12/15/16 | 5,090,000 | c,d | 5,616,244 |
| New York City Municipal Water Finance Authority, Water and | |||||
| Sewer System Second General Resolution Revenue | 5.00 | 6/15/34 | 10,000,000 | 10,256,300 | |
| New York Liberty Development Corporation, | |||||
| Liberty Revenue (4 World Trade Center Project) | 5.75 | 11/15/51 | 5,000,000 | 5,259,850 | |
| New York Liberty Development Corporation, | |||||
| Liberty Revenue (7 World Trade Center Project) | 5.00 | 3/15/44 | 2,000,000 | 1,825,320 | |
| New York State Dormitory Authority, Revenue (Pace University) | 5.00 | 5/1/38 | 500,000 | 460,105 | |
| New York State Dormitory Authority, Revenue (Pace University) | 4.25 | 5/1/42 | 1,000,000 | 792,070 | |
| New York State Dormitory Authority, Revenue (Yeshiva University) | 5.00 | 11/1/40 | 500,000 | 474,360 | |
| New York State Dormitory Authority, | |||||
| State Personal Income Tax Revenue (Education) | 5.75 | 3/15/36 | 1,000,000 | 1,111,370 | |
| New York State Dormitory Authority, Third General Resolution | |||||
| Revenue (State University Educational Facilities Issue) | |||||
| (Citigroup Series RR II R-14007-1) | 5.00 | 11/15/19 | 10,000,000 | c,d | 11,201,400 |
| New York State Energy Research and Development Authority, | |||||
| PCR (New York State Electric and Gas Corporation Project) | |||||
| (Insured; National Public Finance Guarantee Corp.) | 0.51 | 4/1/34 | 17,410,000 | e | 15,669,000 |
| Port Authority of New York and New Jersey, Special Project | |||||
| Revenue (JFK International Air Terminal LLC Project) | 6.00 | 12/1/42 | 5,000,000 | 5,469,050 | |
| Triborough Bridge and Tunnel Authority, | |||||
| General Revenue (MTA Bridges and Tunnels) | 0.00 | 11/15/27 | 2,000,000 | b | 1,071,140 |
| Triborough Bridge and Tunnel Authority, | |||||
| General Revenue (MTA Bridges and Tunnels) | 0.00 | 11/15/28 | 4,715,000 | b | 2,354,152 |
| Triborough Bridge and Tunnel Authority, | |||||
| General Revenue (MTA Bridges and Tunnels) | 0.00 | 11/15/30 | 2,415,000 | b | 1,041,010 |
| Triborough Bridge and Tunnel Authority, | |||||
| General Revenue (MTA Bridges and Tunnels) | 0.00 | 11/15/32 | 4,000,000 | b | 1,541,000 |
| Triborough Bridge and Tunnel Authority, | |||||
| Subordinate Revenue (MTA Bridges and Tunnels) | 0.00 | 11/15/31 | 5,000,000 | b | 1,980,800 |
| Triborough Bridge and Tunnel Authority, | |||||
| Subordinate Revenue (MTA Bridges and Tunnels) | 0.00 | 11/15/32 | 3,000,000 | b | 1,122,390 |
94
| BNY Mellon Municipal Opportunities Fund (continued) | |||||
| Long-Term Municipal | Coupon | Maturity | Principal | ||
| Investments (continued) | Rate (%) | Date | Amount ($) | Value ($) | |
| North Carolina—1.3% | |||||
| North Carolina Eastern Municipal Power Agency, | |||||
| Power System Revenue | 5.00 | 1/1/26 | 11,415,000 | 12,019,653 | |
| North Carolina Eastern Municipal Power Agency, | |||||
| Power System Revenue (Insured; Assured Guaranty Corp.) | 6.00 | 1/1/19 | 250,000 | 276,782 | |
| Ohio—4.4% | |||||
| Columbus, Unlimited Tax GO (Various Purpose) | 5.00 | 7/1/26 | 18,130,000 | 20,208,242 | |
| Columbus, Unlimited Tax GO (Various Purpose) | 5.00 | 7/1/27 | 12,600,000 | 13,874,112 | |
| Montgomery County, Revenue (Catholic Health Initiatives) | 6.25 | 10/1/33 | 1,000,000 | 1,119,780 | |
| Ohio Higher Educational Facility Commission, | |||||
| Higher Educational Facility Revenue (Kenyon College Project) | 5.00 | 7/1/37 | 4,500,000 | 4,401,585 | |
| Ohio Turnpike and Infrastructure Commission, | |||||
| Turnpike Junior Lien Revenue (Infrastructure Projects) | 0/5.70 | 2/15/34 | 3,000,000 | f | 1,710,630 |
| Oregon—.2% | |||||
| Oregon Health and Science University, Revenue | 5.75 | 7/1/39 | 2,000,000 | 2,155,420 | |
| Pennsylvania—1.5% | |||||
| Clairton Municipal Authority, Sewer Revenue | 5.00 | 12/1/42 | 1,000,000 | 902,140 | |
| JPMorgan Chase Putters/Drivers Trust (Series 4358) | |||||
| (Commonwealth Financing Authority of Pennsylvania, Revenue) | 5.00 | 6/1/20 | 10,000,000 | c,d | 9,702,500 |
| Pennsylvania Higher Educational Facilities Authority, Revenue | |||||
| (The Foundation for Indiana University of Pennsylvania | |||||
| Student Housing Project at Indiana University of Pennsylvania) | 5.00 | 7/1/32 | 650,000 | 620,191 | |
| Pennsylvania Higher Educational Facilities Authority, | |||||
| Revenue (University of Pennsylvania Health System) | 5.75 | 8/15/41 | 2,550,000 | 2,648,812 | |
| South Carolina—1.7% | |||||
| Charleston Educational Excellence Finance Corporation, | |||||
| Installment Purchase Revenue (Charleston County | |||||
| School District, South Carolina Project) | 5.00 | 12/1/25 | 3,000,000 | 3,284,010 | |
| South Carolina Public Service Authority, | |||||
| Revenue Obligations (Santee Cooper) | 5.00 | 12/1/36 | 10,635,000 | 10,634,149 | |
| Spartanburg Sanitary Sewer District, Sewer System Revenue | 5.00 | 3/1/38 | 2,000,000 | 2,001,500 | |
| Texas—12.8% | |||||
| Central Texas Regional Mobility Authority, | |||||
| Senior Lien Revenue | 6.00 | 1/1/41 | 5,000,000 | 4,959,700 | |
| Clifton Higher Education Finance Corporation, | |||||
| Education Revenue (IDEA Public Schools) | 5.50 | 8/15/31 | 1,250,000 | 1,200,388 | |
| Clifton Higher Education Finance Corporation, | |||||
| Education Revenue (IDEA Public Schools) | 5.00 | 8/15/32 | 2,000,000 | 1,794,080 | |
| Clifton Higher Education Finance Corporation, | |||||
| Education Revenue (IDEA Public Schools) | 5.75 | 8/15/41 | 1,000,000 | 952,000 | |
| Clifton Higher Education Finance Corporation, | |||||
| Education Revenue (IDEA Public Schools) | 5.00 | 8/15/42 | 2,750,000 | 2,321,440 | |
The Funds 95
STATEMENT OF INVESTMENTS (continued)
| BNY Mellon Municipal Opportunities Fund (continued) | |||||
| Long-Term Municipal | Coupon | Maturity | Principal | ||
| Investments (continued) | Rate (%) | Date | Amount ($) | Value ($) | |
| Texas (continued) | |||||
| Clifton Higher Education Finance Corporation, | |||||
| Education Revenue (Uplift Education) | 3.95 | 12/1/32 | 1,800,000 | 1,315,692 | |
| Clifton Higher Education Finance Corporation, | |||||
| Education Revenue (Uplift Education) | 4.35 | 12/1/42 | 4,360,000 | 3,074,105 | |
| Dallas and Fort Worth, Joint Improvement | |||||
| Revenue (Dallas/Fort Worth International Airport) | 5.00 | 11/1/32 | 10,000,000 | 9,594,400 | |
| Forney Independent School District, Unlimited Tax School | |||||
| Building Bonds (Permanent School Fund Guarantee Program) | 5.75 | 8/15/33 | 1,000,000 | 1,118,430 | |
| Grand Parkway Transportation Corporation, | |||||
| Grand Parkway System First Tier Toll Revenue | 5.50 | 4/1/53 | 4,500,000 | 4,225,185 | |
| Grand Parkway Transportation Corporation, | |||||
| Grand Parkway System Subordinate Toll | |||||
| Revenue (Toll Equity Loan Agreement Supported) | 0/5.20 | 10/1/31 | 2,000,000 | f | 1,173,520 |
| Grand Parkway Transportation Corporation, | |||||
| Grand Parkway System Subordinate Tier Toll | |||||
| Revenue (Toll Equity Loan Agreement Supported) | 0/5.40 | 10/1/33 | 2,500,000 | f | 1,454,200 |
| Grand Parkway Transportation Corporation, | |||||
| Grand Parkway System Subordinate Toll | |||||
| Revenue (Toll Equity Loan Agreement Supported) | 0/5.45 | 10/1/34 | 2,235,000 | f | 1,293,439 |
| Grand Parkway Transportation Corporation, | |||||
| Grand Parkway System Subordinate Toll | |||||
| Revenue (Toll Equity Loan Agreement Supported) | 5.25 | 10/1/51 | 7,000,000 | 6,808,760 | |
| Grand Parkway Transportation Corporation, | |||||
| Grand Parkway System Subordinate Toll | |||||
| Revenue (Toll Equity Loan Agreement Supported) | 5.00 | 4/1/53 | 3,000,000 | 2,767,980 | |
| Harris County Cultural Education Facilities Finance | |||||
| Corporation, Revenue (Young Men’s Christian | |||||
| Association of the Greater Houston Area) | 5.00 | 6/1/38 | 2,500,000 | 2,250,800 | |
| Harris County Health Facilities Development Corporation, | |||||
| HR (Memorial Hermann Healthcare System) (Prerefunded) | 7.00 | 12/1/18 | 1,000,000 | a | 1,276,240 |
| Houston, Airport System Subordinate Lien Revenue | 5.00 | 7/1/32 | 500,000 | 470,305 | |
| Houston, Airport System Subordinate Lien Revenue | |||||
| (Insured; Assured Guaranty Municipal Corp.) | 0.10 | 7/1/30 | 350,000 | e | 308,875 |
| Houston, Airport System Subordinate Lien Revenue | |||||
| (Insured; Assured Guaranty Municipal Corp.) | 0.20 | 7/1/30 | 3,800,000 | e | 3,353,500 |
| Houston, Airport System Subordinate Lien Revenue | |||||
| (Insured; Assured Guaranty Municipal Corp.) | 0.20 | 7/1/30 | 11,525,000 | e | 10,170,812 |
| Houston, Combined Utility System First Lien Revenue | 5.00 | 11/15/30 | 5,350,000 | 5,617,714 | |
| Houston Higher Education Finance Corporation, | |||||
| Higher Education Revenue (Cosmos Foundation, Inc.) | 5.88 | 5/15/21 | 915,000 | 986,041 | |
| Houston Higher Education Finance Corporation, | |||||
| Higher Education Revenue (Cosmos Foundation, Inc.) | 6.50 | 5/15/31 | 2,800,000 | 3,044,580 | |
| Houston Higher Education Finance Corporation, | |||||
| Higher Education Revenue (Cosmos Foundation, Inc.) | 6.88 | 5/15/41 | 3,000,000 | 3,308,850 | |
96
| BNY Mellon Municipal Opportunities Fund (continued) | |||||
| Long-Term Municipal | Coupon | Maturity | Principal | ||
| Investments (continued) | Rate (%) | Date | Amount ($) | Value ($) | |
| Texas (continued) | |||||
| Matagorda County Navigation District Number 1, PCR | |||||
| (AEP Texas Central Company Project) | 4.00 | 6/1/30 | 7,000,000 | 5,934,880 | |
| North Texas Education Finance Corporation, | |||||
| Education Revenue (Uplift Education) | 4.88 | 12/1/32 | 3,630,000 | 3,185,942 | |
| North Texas Tollway Authority, First Tier System Revenue | 5.00 | 1/1/38 | 1,375,000 | 1,340,886 | |
| North Texas Tollway Authority, First Tier System Revenue | 6.00 | 1/1/38 | 7,000,000 | 7,337,330 | |
| North Texas Tollway Authority, | |||||
| Special Projects System Revenue | 5.50 | 9/1/41 | 8,500,000 | 8,891,510 | |
| Texas Private Activity Bond Surface Transportation | |||||
| Corporation, Senior Lien Revenue (LBJ Infrastructure | |||||
| Group LLC IH-635 Managed Lanes Project) | 7.00 | 6/30/40 | 7,000,000 | 7,565,880 | |
| Texas Private Activity Bond Surface Transportation Corporation, | |||||
| Senior Lien Revenue (NTE Mobility Partners LLC North | |||||
| Tarrant Express Managed Lanes Project) | 7.50 | 12/31/31 | 2,500,000 | 2,783,850 | |
| Waco Education Finance Corporation, | |||||
| Revenue (Baylor University Issue) | 5.00 | 3/1/43 | 10,000,000 | 9,923,700 | |
| Utah—.5% | |||||
| University of Utah State Board of Regents, General Revenue | 5.00 | 8/1/43 | 5,000,000 | 5,081,950 | |
| Virginia—1.7% | |||||
| Chesapeake, Transportation System Senior Toll Road Revenue | 0/4.88 | 7/15/40 | 2,000,000 | f | 809,820 |
| Chesapeake, Transportation System Senior Toll Road Revenue | 5.00 | 7/15/47 | 2,000,000 | 1,729,140 | |
| Route 460 Funding Corporation of Virginia, | |||||
| Toll Road Senior Lien Revenue | 5.13 | 7/1/49 | 3,300,000 | 2,664,486 | |
| Virginia Small Business Financing Authority, Senior Lien | |||||
| Revenue (Elizabeth River Crossing Opco, LLC Project) | 5.25 | 1/1/32 | 4,000,000 | 3,574,720 | |
| Virginia Small Business Financing Authority, Senior Lien | |||||
| Revenue (Elizabeth River Crossing Opco, LLC Project) | 6.00 | 1/1/37 | 2,000,000 | 1,896,580 | |
| Virginia Small Business Financing Authority, Senior Lien | |||||
| Revenue (Elizabeth River Crossing Opco, LLC Project) | 5.50 | 1/1/42 | 6,155,000 | 5,340,755 | |
| Washington—.6% | |||||
| King County Public Hospital District Number 1, Limited Tax GO | 5.25 | 12/1/37 | 2,750,000 | 2,772,055 | |
| Washington, GO (Motor Vehicle Fuel Tax) | 4.00 | 8/1/29 | 3,000,000 | 2,870,220 | |
| Wisconsin—.6% | |||||
| Oneida Tribe of Indians, Retail Sales Revenue | 6.50 | 2/1/31 | 1,325,000 | d | 1,406,408 |
| Wisconsin, General Fund Annual Appropriation Bonds | 5.38 | 5/1/25 | 1,000,000 | 1,121,220 | |
| Wisconsin, General Fund Annual Appropriation Bonds | 5.75 | 5/1/33 | 1,500,000 | 1,626,345 | |
| Wisconsin, General Fund Annual Appropriation Bonds | 6.00 | 5/1/33 | 1,000,000 | 1,103,210 | |
| U.S. Related—5.1% | |||||
| A.B. Won International Airport Authority of Guam, General Revenue | 6.25 | 10/1/34 | 1,000,000 | 998,770 | |
| A.B. Won International Airport Authority of Guam, General Revenue | 6.38 | 10/1/43 | 1,000,000 | 996,610 | |
| A.B. Won International Airport Authority of Guam, | |||||
| General Revenue (Insured; Assured Guaranty Municipal Corp.) | 6.00 | 10/1/34 | 2,000,000 | 1,995,140 | |
The Funds 97
STATEMENT OF INVESTMENTS (continued)
| BNY Mellon Municipal Opportunities Fund (continued) | |||||
| Long-Term Municipal | Coupon | Maturity | Principal | ||
| Investments (continued) | Rate (%) | Date | Amount ($) | Value ($) | |
| U.S. Related (continued) | |||||
| A.B. Won International Airport Authority of Guam, | |||||
| General Revenue (Insured; Assured Guaranty Municipal Corp.) | 6.13 | 10/1/43 | 2,000,000 | 1,979,520 | |
| Guam, Business Privilege Tax Revenue | 5.13 | 1/1/42 | 1,500,000 | 1,427,850 | |
| Guam, Hotel Occupancy Tax Revenue | 6.00 | 11/1/26 | 2,500,000 | 2,677,675 | |
| Guam, Hotel Occupancy Tax Revenue | 6.13 | 11/1/31 | 5,000,000 | 5,231,100 | |
| Guam, Hotel Occupancy Tax Revenue | 6.50 | 11/1/40 | 2,000,000 | 2,142,960 | |
| Guam Government Department of Education, | |||||
| COP (John F. Kennedy High School Project) | 6.63 | 12/1/30 | 1,000,000 | 1,019,290 | |
| Puerto Rico Electric Power Authority, Power Revenue | 5.00 | 7/1/21 | 500,000 | 448,945 | |
| Puerto Rico Electric Power Authority, Power Revenue | 5.00 | 7/1/22 | 2,000,000 | 1,701,760 | |
| Puerto Rico Electric Power Authority, Power Revenue | 6.75 | 7/1/36 | 10,000,000 | 8,724,700 | |
| Puerto Rico Electric Power Authority, Power Revenue | 7.00 | 7/1/43 | 12,235,000 | 10,826,017 | |
| Puerto Rico Electric Power Authority, Power Revenue | |||||
| (Insured; National Public Finance Guarantee Corp.) | 5.00 | 7/1/17 | 750,000 | 747,772 | |
| Puerto Rico Sales Tax Financing Corporation, | |||||
| Sales Tax Revenue (First Subordinate Series) | 0/6.75 | 8/1/32 | 6,000,000 | f | 4,966,740 |
| Puerto Rico Sales Tax Financing Corporation, | |||||
| Sales Tax Revenue (First Subordinate Series) | 0/6.25 | 8/1/33 | 750,000 | f | 483,285 |
| Virgin Islands Public Finance Authority, Subordinated Revenue | |||||
| (Virgin Islands Matching Fund Loan Note— Diageo Project) | 6.75 | 10/1/37 | 2,000,000 | 2,184,340 | |
| Total Long-Term Municipal Investments | |||||
| (cost $971,712,289) | 949,526,135 | ||||
| Short-Term Municipal Investments—4.5% | |||||
| Colorado—.9% | |||||
| Colorado Educational and Cultural Facilities Authority, Revenue | |||||
| (National Jewish Federation Bond Program) (LOC; TD Bank) | 0.06 | 9/3/13 | 2,000,000 | g | 2,000,000 |
| Colorado Educational and Cultural Facilities Authority, | |||||
| Revenue (National Jewish Federation Bond | |||||
| Program) (LOC; Northern Trust Company) | 0.06 | 9/3/13 | 1,280,000 | g | 1,280,000 |
| Pitkin County, IDR, Refunding (Aspen Skiing | |||||
| Company Project) (LOC; JPMorgan Chase Bank) | 0.06 | 9/3/13 | 5,800,000 | g | 5,800,000 |
| Iowa—.2% | |||||
| Hills, Health Facilities Revenue (Mercy Hospital | |||||
| Project) (LOC; U.S. Bank NA) | 0.06 | 9/3/13 | 2,015,000 | g | 2,015,000 |
| Kentucky—.4% | |||||
| Christian County, Lease Program Revenue (Kentucky | |||||
| Association of Counties Leasing Trust) (LOC; U.S. Bank NA) | 0.05 | 9/3/13 | 3,800,000 | g | 3,800,000 |
| Louisiana—.5% | |||||
| Louisiana Public Facilities Authority, HR, Refunding | |||||
| (Franciscan Missionaries of Our Lady Health | |||||
| System Project) (LOC; U.S. Bank NA) | 0.05 | 9/3/13 | 4,600,000 | g | 4,600,000 |
98
| BNY Mellon Municipal Opportunities Fund (continued) | |||||
| Short-Term Municipal | Coupon | Maturity | Principal | ||
| Investments (continued) | Rate (%) | Date | Amount ($) | Value ($) | |
| Missouri—.5% | |||||
| Missouri Development Finance Board, Cultural | |||||
| Facilities Revenue (The Nelson Gallery Foundation) | |||||
| (Liquidity Facility; Northern Trust Company) | 0.05 | 9/3/13 | 1,800,000 | g | 1,800,000 |
| Missouri Health and Educational Facilities Authority, Health | |||||
| Facilities Revenue (SSM Health Care) (LOC; PNC Bank NA) | 0.04 | 9/3/13 | 3,300,000 | g | 3,300,000 |
| New Hampshire—.3% | |||||
| New Hampshire Health and Education Facilities | |||||
| Authority, Revenue (Dartmouth College Issue) | |||||
| (Liquidity Facility; JPMorgan Chase Bank) | 0.04 | 9/3/13 | 2,500,000 | g | 2,500,000 |
| New Jersey—.2% | |||||
| Rutgers, The State University, GO Notes, | |||||
| Refunding (Liquidity Facility; TD Bank) | 0.05 | 9/3/13 | 1,600,000 | g | 1,600,000 |
| Ohio—.3% | |||||
| Cleveland-Cuyahoga County Port Authority, Educational Facility | |||||
| Revenue (Laurel School Project) (LOC; JPMorgan Chase Bank) | 0.07 | 9/3/13 | 2,605,000 | g | 2,605,000 |
| Texas—.5% | |||||
| Dallas Performing Arts Cultural Facilities Corporation, | |||||
| Cultural Facility Revenue (Dallas Center for the Performing | |||||
| Arts Foundation, Inc. Project) (LOC; JPMorgan Chase Bank) | 0.05 | 9/3/13 | 4,300,000 | g | 4,300,000 |
| Vermont—.7% | |||||
| Vermont Educational and Health Buildings Financing Agency, | |||||
| Revenue (Brattleboro Memorial Hospital Project) (LOC; TD Bank) | 0.06 | 9/3/13 | 1,200,000 | g | 1,200,000 |
| Vermont Educational and Health Buildings Financing Agency, | |||||
| Revenue (Landmark College Project) (LOC; TD Bank) | 0.06 | 9/3/13 | 1,100,000 | g | 1,100,000 |
| Vermont Educational and Health Buildings Financing | |||||
| Agency, Revenue (Northeastern Vermont | |||||
| Regional Hospital Project) (LOC; TD Bank) | 0.06 | 9/3/13 | 1,500,000 | g | 1,500,000 |
| Vermont Educational and Health Buildings Financing | |||||
| Agency, Revenue (Southwestern Vermont | |||||
| Medical Center Project) (LOC; TD Bank) | 0.06 | 9/3/13 | 3,750,000 | g | 3,750,000 |
| Total Short-Term Municipal Investments | |||||
| (cost $43,150,000) | 43,150,000 | ||||
| Total Investments (cost $1,014,862,289) | 104.5 | % | 992,676,135 | |
| Liabilities, Less Cash and Receivables | (4.5 | %) | (42,989,789 | ) |
| Net Assets | 100.0 | % | 949,686,346 |
| a These securities are prerefunded; the date shown represents the prerefunded date. Bonds which are prerefunded are collateralized by U.S. Government securities which are held in |
| escrow and are used to pay principal and interest on the municipal issue and to retire the bonds in full at the earliest refunding date. |
| b Security issued with a zero coupon. Income is recognized through the accretion of discount. |
| c Collateral for floating rate borrowings. |
| d Securities exempt from registration pursuant to Rule 144A under the Securities Act of 1933.These securities may be resold in transactions exempt from registration, normally to |
| qualified institutional buyers.At August 31, 2013, these securities were valued at $142,531,818 or 15.0% of net assets. |
| e Variable rate security—interest rate subject to periodic change. |
| f Zero coupon until a specified date at which time the stated coupon rate becomes effective until maturity. |
| g Variable rate demand note—rate shown is the interest rate in effect at August 31, 2013. Maturity date represents the next demand date, or the ultimate maturity date if earlier. |
The Funds 99
STATEMENT OF INVESTMENTS (continued)
| Summary of Abbreviations | |||
| ABAG | Association of Bay Area Governments | ACA | American Capital Access |
| AGC | ACE Guaranty Corporation | AGIC | Asset Guaranty Insurance Company |
| AMBAC | American Municipal Bond Assurance Corporation | ARRN | Adjustable Rate Receipt Notes |
| BAN | Bond Anticipation Notes | BPA | Bond Purchase Agreement |
| CIFG | CDC Ixis Financial Guaranty | COP | Certificate of Participation |
| CP | Commercial Paper | DRIVERS | Derivative Inverse Tax-Exempt Receipts |
| EDR | Economic Development Revenue | EIR | Environmental Improvement Revenue |
| FGIC | Financial Guaranty Insurance Company | FHA | Federal Housing Administration |
| FHLB | Federal Home Loan Bank | FHLMC | Federal Home Loan Mortgage Corporation |
| FNMA | Federal National Mortgage Association | GAN | Grant Anticipation Notes |
| GIC | Guaranteed Investment Contract | GNMA | Government National Mortgage Association |
| GO | General Obligation | HR | Hospital Revenue |
| IDB | Industrial Development Board | IDC | Industrial Development Corporation |
| IDR | Industrial Development Revenue | LIFERS | Long Inverse Floating Exempt Receipts |
| LOC | Letter of Credit | LOR | Limited Obligation Revenue |
| LR | Lease Revenue | MERLOTS | Municipal Exempt Receipts Liquidity Option Tender |
| MFHR | Multi-Family Housing Revenue | MFMR | Multi-Family Mortgage Revenue |
| PCR | Pollution Control Revenue | P-FLOATS | Puttable Floating Option Tax-Exempt Receipts |
| PILOT | Payment in Lieu of Taxes | PUTTERS | Puttable Tax-Exempt Receipts |
| RAC | Revenue Anticipation Certificates | RAN | Revenue Anticipation Notes |
| RAW | Revenue Anticipation Warrants | ROCS | Reset Options Certificates |
| RRR | Resources Recovery Revenue | SAAN | State Aid Anticipation Notes |
| SBPA | Standby Bond Purchase Agreement | SFHR | Single Family Housing Revenue |
| SFMR | Single Family Mortgage Revenue | SONYMA | State of New York Mortgage Agency |
| SPEARS | Short Puttable Exempt Adjustable Receipts | SWDR | Solid Waste Disposal Revenue |
| TAN | Tax Anticipation Notes | TAW | Tax Anticipation Warrants |
| TRAN | Tax and Revenue Anticipation Notes | XLCA | XL Capital Assurance |
| Summary of Combined Ratings (Unaudited) | |||||
| Fitch | or | Moody’s | or | Standard & Poor’s | Value (%)† |
| AAA | Aaa | AAA | 10.1 | ||
| AA | Aa | AA | 32.3 | ||
| A | A | A | 27.3 | ||
| BBB | Baa | BBB | 23.7 | ||
| BB | Ba | BB | .3 | ||
| B | B | B | .1 | ||
| F1 | MIG1/P1 | SP1/A1 | 4.6 | ||
| Not Ratedh | Not Ratedh | Not Ratedh | 1.6 | ||
| 100.0 | |||||
| † Based on total investments. |
| h Securities which, while not rated by Fitch, Moody’s and Standard & Poor’s, have been determined by the Manager to be of comparable quality to those rated securities in which the |
| fund may invest. |
| See notes to financial statements. |
100
STATEMENT OF FINANCIAL FUTURES
August 31, 2013
| Market Value | Unrealized | |||||
| BNY Mellon | Covered by | Appreciation | ||||
| Municipal Opportunities Fund | Contracts | Contracts ($) | Expiration | at 8/31/2013 ($) | ||
| Financial Futures Short | ||||||
| U.S. Treasury 10 Year Notes | 1,700 | (213,084,375 | ) | September 2013 | 4,262,500 | |
| U.S. Treasury 30 Year Bonds | 200 | (26,668,750 | ) | September 2013 | 206,250 | |
| Gross Unrealized Appreciation | 4,468,750 | |||||
| See notes to financial statements. |
The Funds 101
STATEMENTS OF ASSETS AND LIABILITIES
August 31, 2013
| BNY Mellon | BNY Mellon | BNY Mellon | BNY Mellon | |
| National | National | Pennsylvania | Massachusetts | |
| Intermediate | Short-Term | Intermediate | Intermediate | |
| Municipal Bond Fund | Municipal Bond Fund | Municipal Bond Fund | Municipal Bond Fund | |
| Assets ($): | ||||
| Investments in securities— | ||||
| See Statement of Investments† | 1,694,945,091 | 1,186,740,085 | 354,235,065 | 318,689,626 |
| Cash | — | 1,640,352 | — | — |
| Cash on Initial Margin—Note 5 | 501,500 | — | 132,750 | 103,250 |
| Receivable for investment securites sold | 46,108,202 | 1,985,795 | 40,000 | 50,000 |
| Interest receivable | 21,144,697 | 10,395,923 | 4,386,569 | 2,989,059 |
| Receivable for shares of Beneficial Interest subscribed | 475,406 | — | 7,000,613 | — |
| Receivable for futures variation margin—Note 5 | 53,125 | — | 14,063 | 10,937 |
| Prepaid expenses | 21,727 | 19,283 | 16,811 | 14,908 |
| 1,763,249,748 | 1,200,781,438 | 365,825,871 | 321,857,780 | |
| Liabilities ($): | ||||
| Due to The Dreyfus Corporation and affiliates—Note 4(c) | 575,571 | 391,603 | 176,143 | 116,057 |
| Due to Administrator—Note 4(a) | 184,986 | 124,174 | 38,685 | 34,262 |
| Cash overdraft due to Custodian | 1,916,548 | — | 793,148 | 578,284 |
| Payable for investment securities purchased | 28,989,694 | 12,676,725 | 3,113,378 | — |
| Payable for shares of Beneficial Interest redeemed | 1,609,530 | 1,075,039 | 35,921 | 181,732 |
| Accrued expenses | 92,328 | 47,057 | 37,863 | 46,237 |
| 33,368,657 | 14,314,598 | 4,195,138 | 956,572 | |
| Net Assets ($) | 1,729,881,091 | 1,186,466,840 | 361,630,733 | 320,901,208 |
| Composition of Net Assets ($): | ||||
| Paid—in capital | 1,691,091,594 | 1,182,534,662 | 355,435,315 | 312,934,039 |
| Accumulated undistributed investment income—net | 141,449 | 26,376 | 28,962 | 24,640 |
| Accumulated net realized gain (loss) on investments | 114,244 | 750,884 | 618,898 | 641,990 |
| Accumulated net unrealized appreciation (depreciation) | ||||
| on investments (including $1,429,063 appreciation | ||||
| on financial futures for BNY Mellon National | ||||
| Intermediate Municipal Bond Fund, $378,281 | ||||
| appreciation on financial futures for BNY Mellon | ||||
| Pennsylvania Intermediate Municipal Bond Fund | ||||
| and $294,219 appreciation on financial futures | ||||
| for BNY Mellon Massachusetts Intermediate | ||||
| Municipal Bond Fund) | 38,533,804 | 3,154,918 | 5,547,558 | 7,300,539 |
| Net Assets ($) | 1,729,881,091 | 1,186,466,840 | 361,630,733 | 320,901,208 |
| Net Asset Value Per Share | ||||
| Class M Shares | ||||
| Net Assets ($) | 1,692,785,670 | 1,181,987,774 | 357,430,974 | 312,640,289 |
| Shares Outstanding | 128,095,713 | 91,880,059 | 29,139,408 | 24,763,853 |
| Net Asset Value Per Share ($) | 13.22 | 12.86 | 12.27 | 12.62 |
| Investor Shares | ||||
| Net Assets ($) | 37,095,421 | 4,479,066 | 4,199,759 | 8,260,919 |
| Shares Outstanding | 2,810,101 | 348,521 | 342,790 | 654,440 |
| Net Asset Value Per Share ($) | 13.20 | 12.85 | 12.25 | 12.62 |
| † Investments at cost ($) | 1,657,840,350 | 1,183,585,167 | 349,065,788 | 311,683,306 |
| See notes to financial statements. |
102
| BNY Mellon | BNY Mellon | ||
| New York Intermediate | Municipal | ||
| Tax-Exempt Bond Fund | Opportunities Fund | ||
| Assets ($): | |||
| Investments in securities—See Statement of Investments† | 201,336,619 | 992,676,135 | |
| Cash on Initial Margin—Note 5 | 59,000 | 3,007,500 | |
| Receivable for investment securites sold | 2,832,894 | 48,896,424 | |
| Interest receivable | 2,273,776 | 10,421,219 | |
| Receivable for shares of Beneficial Interest subscribed | 155,000 | 587,850 | |
| Receivable for futures variation margin—Note 5 | 6,250 | 221,875 | |
| Prepaid expenses | 15,828 | 5,886 | |
| 206,679,367 | 1,055,816,889 | ||
| Liabilities ($): | |||
| Due to The Dreyfus Corporation and affiliates—Note 4(c) | 86,647 | 446,188 | |
| Due to Administrator—Note 4(a) | 21,569 | 101,023 | |
| Cash overdraft due to Custodian | 404,981 | 1,728,866 | |
| Payable for floating rate notes issued—Note 5 | — | 82,040,000 | |
| Payable for investment securities purchased | 3,225,360 | 21,091,726 | |
| Payable for shares of Beneficial Interest redeemed | 302,792 | 547,058 | |
| Interest and expense payable related | |||
| to floating rate notes issued—Note 5 | — | 125,496 | |
| Accrued expenses | 50,597 | 50,186 | |
| 4,091,946 | 106,130,543 | ||
| Net Assets ($) | 202,587,421 | 949,686,346 | |
| Composition of Net Assets ($): | |||
| Paid—in capital | 197,307,040 | 962,979,798 | |
| Accumulated undistributed (distributions in excess of) investment income—net | 14,594 | (5,976 | ) |
| Accumulated net realized gain (loss) on investments | 1,438,936 | 4,429,928 | |
| Accumulated net unrealized appreciation (depreciation) on investments | |||
| (including $168,125 appreciation on financial futures for BNY Mellon | |||
| New York Intermediate Tax-Exempt Bond Fund and $4,468,750 appreciation | |||
| on financial futures for BNY Mellon Municipal Opportunities Fund) | 3,826,851 | (17,717,404 | ) |
| Net Assets ($) | 202,587,421 | 949,686,346 | |
| Net Asset Value Per Share | |||
| Class M Shares | |||
| Net Assets ($) | 184,657,425 | 946,739,453 | |
| Shares Outstanding | 16,613,415 | 76,498,426 | |
| Net Asset Value Per Share ($) | 11.11 | 12.38 | |
| Investor Shares | |||
| Net Assets ($) | 17,929,996 | 2,946,893 | |
| Shares Outstanding | 1,612,184 | 238,068 | |
| Net Asset Value Per Share ($) | 11.12 | 12.38 | |
| † Investments at cost ($) | 197,677,893 | 1,014,862,289 |
| See notes to financial statements. |
The Funds 103
STATEMENT OF OPERATIONS
Year Ended August 31, 2013
| BNY Mellon | BNY Mellon | BNY Mellon | BNY Mellon | |||||
| National | National | Pennsylvania | Massachusetts | |||||
| Intermediate | Short-Term | Intermediate | Intermediate | |||||
| Municipal Bond Fund | Municipal Bond Fund | Municipal Bond Fund | Municipal Bond Fund | |||||
| Investment Income ($): | ||||||||
| Interest Income | 62,306,012 | 17,324,798 | 13,743,082 | 11,513,860 | ||||
| Expenses: | ||||||||
| Investment advisory fee—Note 4(a) | 6,348,799 | 4,346,833 | 1,978,879 | 1,212,631 | ||||
| Administration fee—Note 4(a) | 2,242,406 | 1,535,360 | 489,270 | 428,311 | ||||
| Trustees’ fees and expenses—Note 4(c) | 107,557 | 75,603 | 24,073 | 18,344 | ||||
| Shareholder servicing costs—Note 4(b) | 101,276 | 11,685 | 13,897 | 23,118 | ||||
| Custodian fees—Note 4(b) | 94,789 | 82,876 | 31,348 | 27,589 | ||||
| Professional fees | 86,837 | 62,871 | 52,145 | 55,144 | ||||
| Registration fees | 46,591 | 30,541 | 29,682 | 28,978 | ||||
| Loan commitment fees—Note 3 | 16,263 | 11,984 | 4,015 | 2,970 | ||||
| Prospectus and shareholders’ reports | 7,113 | 10,793 | 6,483 | 5,362 | ||||
| Interest expense—Note 3 | — | 109 | — | — | ||||
| Miscellaneous | 104,146 | 86,341 | 42,274 | 52,150 | ||||
| Total Expenses | 9,155,777 | 6,254,996 | 2,672,066 | 1,854,597 | ||||
| Less—reduction in fees due to | ||||||||
| earnings credits—Note 4(b) | (36 | ) | (5 | ) | (4 | ) | (12 | ) |
| Net Expenses | 9,155,741 | 6,254,991 | 2,672,062 | 1,854,585 | ||||
| Investment Income—Net | 53,150,271 | 11,069,807 | 11,071,020 | 9,659,275 | ||||
| Realized and Unrealized Gain (Loss) | ||||||||
| on Investments—Note 5 ($): | ||||||||
| Net realized gain (loss) on investments | (3,246,665 | ) | 831,719 | 1,038,718 | 591,265 | |||
| Net realized gain (loss) on financial futures | 290,764 | (41,616 | ) | 76,967 | 59,863 | |||
| Net Realized Gain (Loss) | (2,955,901 | ) | 790,103 | 1,115,685 | 651,128 | |||
| Net unrealized appreciation | ||||||||
| (depreciation) on investments | (97,173,416 | ) | (14,689,097 | ) | (25,623,791 | ) | (21,081,751 | ) |
| Net unrealized appreciation | ||||||||
| (depreciation) on financial futures | 1,625,626 | — | 430,313 | 334,688 | ||||
| Net Unrealized Appreciation (Depreciation) | (95,547,790 | ) | (14,689,097 | ) | (25,193,478 | ) | (20,747,063 | ) |
| Net Realized and Unrealized | ||||||||
| Gain (Loss) on Investments | (98,503,691 | ) | (13,898,994 | ) | (24,077,793 | ) | (20,095,935 | ) |
| Net (Decrease) in Net Assets | ||||||||
| Resulting from Operations | (45,353,420 | ) | (2,829,187 | ) | (13,006,773 | ) | (10,436,660 | ) |
| See notes to financial statements. |
104
| BNY Mellon | BNY Mellon | |||
| New York Intermediate | Municipal | |||
| Tax-Exempt Bond Fund | Opportunities Fund | |||
| Investment Income ($): | ||||
| Interest Income | 6,920,633 | 35,385,205 | ||
| Expenses: | ||||
| Investment advisory fee—Note 4(a) | 1,094,679 | 4,498,363 | ||
| Administration fee—Note 4(a) | 270,654 | 1,112,108 | ||
| Interest and expense for floating rate notes issued—Note 5 | — | 446,320 | ||
| Professional fees | 48,325 | 58,279 | ||
| Shareholder servicing costs—Note 4(c) | 46,991 | 7,175 | ||
| Registration fees | 29,654 | 74,970 | ||
| Custodian fees—Note 4(c) | 19,041 | 71,309 | ||
| Trustees’ fees and expenses—Note 4(d) | 13,861 | 61,313 | ||
| Prospectus and shareholders’ reports | 7,663 | 6,438 | ||
| Loan commitment fees—Note 3 | 2,179 | 7,892 | ||
| Interest expense—Note 3 | — | 575 | ||
| Miscellaneous | 51,851 | 68,003 | ||
| Total Expenses | 1,584,898 | 6,412,745 | ||
| Less—reduction in expenses due to undertaking—Note 4(a) | (243,508 | ) | — | |
| Less—reduction in fees due to earnings credits—Note 4(c) | (46 | ) | (4 | ) |
| Net Expenses | 1,341,344 | 6,412,741 | ||
| Investment Income—Net | 5,579,289 | 28,972,464 | ||
| Realized and Unrealized Gain (Loss) on Investments—Note 5 ($): | ||||
| Net realized gain (loss) on investments | 1,491,732 | (6,453,035 | ) | |
| Net realized gain (loss) on financial futures | 34,208 | 16,261,854 | ||
| Net realized gain (loss) options transactions | — | (270,473 | ) | |
| Net realized gain (loss) on swap transactions | — | 950,000 | ||
| Net Realized Gain (Loss) | 1,525,940 | 10,488,346 | ||
| Net unrealized appreciation (depreciation) on investments | (14,467,658 | ) | (93,337,353 | ) |
| Net unrealized appreciation (depreciation) on financial futures | 191,250 | 5,657,813 | ||
| Net Unrealized Appreciation (Depreciation) | (14,276,408 | ) | (87,679,540 | ) |
| Net Realized and Unrealized Gain (Loss) on Investments | (12,750,468 | ) | (77,191,194 | ) |
| Net (Decrease) in Net Assets Resulting from Operations | (7,171,179 | ) | (48,218,730 | ) |
| See notes to financial statements. |
The Funds 105
STATEMENT OF CASH FLOWS
August 31, 2013
| BNY Mellon Municipal Opportunities Fund | ||||
| Cash Flows from Operating Activities ($): | ||||
| Purchases of portfolio securities | (1,107,266,255 | ) | ||
| Proceeds from sales of portfolio securities | 791,047,635 | |||
| Financial futures transactions | 21,439,228 | |||
| Options/Swap transactions | 679,527 | |||
| Net purchase of short–term portfolio securities | (7,095,000 | ) | ||
| Interest received | 37,677,128 | |||
| Operating expenses paid | (1,810,104 | ) | ||
| Cash paid to The Dreyfus Corporation for investment advisory fee | (4,383,585 | ) | ||
| Net Cash Used by Operating Activities | (269,711,426 | ) | ||
| Cash Flows from Financing Activities ($): | ||||
| Net Beneficial Interest transactions | 296,103,187 | |||
| Dividends paid | (23,158,721 | ) | ||
| Decrease in cash overdraft due to Custodian | (3,233,040 | ) | ||
| Net cash provided by financing activities | 269,711,426 | |||
| Net change in cash | 0 | |||
| Cash at beginning of period | 0 | |||
| Cash at end of period | 0 | |||
| Reconciliation of Net Decrease in Net Assets Resulting from | ||||
| Operations to Net Cash Used by Operating Activities ($): | ||||
| Net Decrease in Net Assets Resulting From Operations | (48,218,730 | ) | ||
| Adjustments to reconcile net decrease in net assets resulting | ||||
| from operations to net cash used by operating activities ($): | ||||
| Purchases of portfolio securities | (1,107,266,255 | ) | ||
| Proceeds from sales of portfolio securities | 791,047,635 | |||
| Financial futures transactions | 21,439,228 | |||
| Options/Swap transactions | 679,527 | |||
| Net purchase of short-term portfolio securities | (7,095,000 | ) | ||
| Increase in interest receivable | (2,282,122 | ) | ||
| Increase in accrued operating expenses | 50,186 | |||
| Decrease in prepaid expenses | 29,210 | |||
| Increase in Due to The Dreyfus Corporation | 114,778 | |||
| Increase in Due to Administrator | 24,878 | |||
| Increase in interest and expense payable related to floating rate notes issued | 1,212 | |||
| Net realized gain on investments, financial futures,options and swap transactions | (10,488,346 | ) | ||
| Net unrealized depreciation on investments and financial futures | 87,679,540 | |||
| Net amortization of premiums on investments | 4,572,833 | |||
| Net Cash Used by Operating Activities | (269,711,426 | ) | ||
| Supplemental non-cash financing disclosure: | ||||
| Reinvestment of dividends | 11,913,759 |
106
STATEMENT OF CHANGES IN NET ASSETS
| BNY Mellon National Intermediate | BNY Mellon National Short-Term | |||||||
| Municipal Bond Fund | Municipal Bond Fund | |||||||
| Year Ended August 31, | Year Ended August 31, | |||||||
| 2013 | 2012 | a | 2013 | 2012 | ||||
| Operations ($): | ||||||||
| Investment income—net | 53,150,271 | 52,398,260 | 11,069,807 | 13,700,305 | ||||
| Net realized gain (loss) on investments | (2,955,901 | ) | 6,028,731 | 790,103 | 993,238 | |||
| Net unrealized appreciation (depreciation) on investments | (95,547,790 | ) | 57,136,300 | (14,689,097 | ) | 984,819 | ||
| Net Increase (Decrease) in Net Assets | ||||||||
| Resulting from Operations | (45,353,420 | ) | 115,563,291 | (2,829,187 | ) | 15,678,362 | ||
| Dividends to Shareholders from ($): | ||||||||
| Investment income—net: | ||||||||
| Class M Shares | (49,834,763 | ) | (50,905,720 | ) | (10,983,597 | ) | (13,635,591 | ) |
| Investor Shares | (1,041,900 | ) | (1,155,316 | ) | (28,813 | ) | (32,144 | ) |
| Dreyfus Premier Shares | — | (1,170 | ) | — | — | |||
| Net realized gain on investments: | ||||||||
| Class M Shares | (6,792,322 | ) | (58,171 | ) | — | — | ||
| Investor Shares | (168,134 | ) | (1,569 | ) | — | — | ||
| Dreyfus Premier Shares | — | (3 | ) | — | — | |||
| Total Dividends | (57,837,119 | ) | (52,121,949 | ) | (11,012,410 | ) | (13,667,735 | ) |
| Beneficial Interest Transactions ($): | ||||||||
| Net proceeds from shares sold: | ||||||||
| Class M Shares | 485,500,300 | 388,344,807 | 902,337,667 | 752,779,194 | ||||
| Investor Shares | 18,989,323 | 18,114,581 | 10,907,456 | 8,153,985 | ||||
| Dreyfus Premier Shares | — | 237 | — | — | ||||
| Dividends reinvested: | ||||||||
| Class M Shares | 10,289,542 | 6,244,171 | 2,626,274 | 3,431,867 | ||||
| Investor Shares | 817,405 | 699,051 | 24,109 | 23,413 | ||||
| Cost of shares redeemed: | ||||||||
| Class M Shares | (399,600,859 | ) | (294,488,925 | ) | (950,340,471 | ) | (605,418,416 | ) |
| Investor Shares | (18,513,418 | ) | (23,562,985 | ) | (10,385,328 | ) | (8,196,436 | ) |
| Dreyfus Premier Shares | — | (105,177 | ) | — | — | |||
| Increase (Decrease) in Net Assets from | ||||||||
| Beneficial Interest Transactions | 97,482,293 | 95,245,760 | (44,830,293 | ) | 150,773,607 | |||
| Total Increase (Decrease) in Net Assets | (5,708,246 | ) | 158,687,102 | (58,671,890 | ) | 152,784,234 | ||
| Net Assets ($): | ||||||||
| Beginning of Period | 1,735,589,337 | 1,576,902,235 | 1,245,138,730 | 1,092,354,496 | ||||
| End of Period | 1,729,881,091 | 1,735,589,337 | 1,186,466,840 | 1,245,138,730 | ||||
| Undistributed investment income—net | 141,449 | — | 26,376 | — | ||||
The Funds 107
STATEMENT OF CHANGES IN NET ASSETS (continued)
| BNY Mellon National Intermediate | BNY Mellon National Short-Term | |||||||
| Municipal Bond Fund | Municipal Bond Fund | |||||||
| Year Ended August 31, | Year Ended August 31, | |||||||
| 2013 | 2012 | a | 2013 | 2012 | ||||
| Capital Share Transactions: | ||||||||
| Class M Shares | ||||||||
| Shares sold | 34,944,891 | 28,248,506 | 69,552,896 | 57,983,432 | ||||
| Shares issued for dividends reinvested | 741,039 | 453,507 | 202,542 | 264,380 | ||||
| Shares redeemed | (29,008,348 | ) | (21,411,046 | ) | (73,268,112 | ) | (46,629,162 | ) |
| Net Increase (Decrease) in Shares Outstanding | 6,677,582 | 7,290,967 | (3,512,674 | ) | 11,618,650 | |||
| Investor Sharesb | ||||||||
| Shares sold | 1,381,566 | 1,323,229 | 841,370 | 628,933 | ||||
| Shares issued for dividends reinvested | 59,050 | 50,854 | 1,863 | 1,805 | ||||
| Shares redeemed | (1,356,254 | ) | (1,716,591 | ) | (803,237 | ) | (632,148 | ) |
| Net Increase (Decrease) in Shares Outstanding | 84,362 | (342,508 | ) | 39,996 | (1,410 | ) | ||
| Dreyfus Premier Sharesb | ||||||||
| Shares sold | — | 17 | — | — | ||||
| Shares redeemed | — | (7,669 | ) | — | — | |||
| Net Increase (Decrease) in Shares Outstanding | — | (7,652 | ) | — | — | |||
| a Effective as of the close of business on March 13, 2012, the fund no longer offers Dreyfus Premier shares. |
| b During the period ended August 31, 2012, 1 Dreyfus Premier share of BNY Mellon National Intermediate Municipal Bond Fund representing $17 was automatically converted |
| to 1 Investor share. |
| See notes to financial statements. |
108
| BNY Mellon Pennsylvania Intermediate Municipal Bond Fund | ||||
| Year Ended August 31, | ||||
| 2013 | 2012 | |||
| Operations ($): | ||||
| Investment income—net | 11,071,020 | 13,584,565 | ||
| Net realized gain (loss) on investments | 1,115,685 | 4,827,446 | ||
| Net unrealized appreciation (depreciation) on investments | (25,193,478 | ) | 7,653,982 | |
| Net Increase (Decrease) in Net Assets | ||||
| Resulting from Operations | (13,006,773 | ) | 26,065,993 | |
| Dividends to Shareholders from ($): | ||||
| Investment income—net: | ||||
| Class M Shares | (10,874,551 | ) | (13,289,825 | ) |
| Investor Shares | (141,559 | ) | (268,889 | ) |
| Net realized gain on investments: | ||||
| Class M Shares | (2,706,194 | ) | — | |
| Investor Shares | (34,536 | ) | — | |
| Total Dividends | (13,756,840 | ) | (13,558,714 | ) |
| Beneficial Interest Transactions ($): | ||||
| Net proceeds from shares sold: | ||||
| Class M Shares | 36,503,372 | 34,679,794 | ||
| Investor Shares | 1,446,499 | 2,084,794 | ||
| Dividends reinvested: | ||||
| Class M Shares | 2,201,734 | 662,149 | ||
| Investor Shares | 110,542 | 98,474 | ||
| Cost of shares redeemed: | ||||
| Class M Shares | (58,186,969 | ) | (64,834,148 | ) |
| Investor Shares | (5,572,056 | ) | (3,046,840 | ) |
| Increase (Decrease) in Net Assets from | ||||
| Beneficial Interest Transactions | (23,496,878 | ) | (30,355,777 | ) |
| Total Increase (Decrease) in Net Assets | (50,260,491 | ) | (17,848,498 | ) |
| Net Assets ($): | ||||
| Beginning of Period | 411,891,224 | 429,739,722 | ||
| End of Period | 361,630,733 | 411,891,224 | ||
| Undistributed investment income—net | 28,962 | — | ||
| Capital Share Transactions (Shares): | ||||
| Class M Shares | ||||
| Shares sold | 2,800,978 | 2,673,353 | ||
| Shares issued for dividends reinvested | 168,469 | 50,980 | ||
| Shares redeemed | (4,495,344 | ) | (5,000,188 | ) |
| Net Increase (Decrease) in Shares Outstanding | (1,525,897 | ) | (2,275,855 | ) |
| Investor Shares | ||||
| Shares sold | 112,024 | 157,871 | ||
| Shares issued for dividends reinvested | 8,540 | 7,595 | ||
| Shares redeemed | (426,206 | ) | (234,744 | ) |
| Net Increase (Decrease) in Shares Outstanding | (305,642 | ) | (69,278 | ) |
The Funds 109
STATEMENT OF CHANGES IN NET ASSETS (continued)
| BNY Mellon Massachusetts Intermediate Municipal Bond Fund | ||||
| Year Ended August 31, | ||||
| 2013 | 2012 | a | ||
| Operations ($): | ||||
| Investment income—net | 9,659,275 | 10,962,315 | ||
| Net realized gain (loss) on investments | 651,128 | 3,690,166 | ||
| Net unrealized appreciation (depreciation) on investments | (20,747,063 | ) | 7,610,276 | |
| Net Increase (Decrease) in Net Assets | ||||
| Resulting from Operations | (10,436,660 | ) | 22,262,757 | |
| Dividends to Shareholders from ($): | ||||
| Investment income—net: | ||||
| Class M Shares | (9,398,874 | ) | (10,709,968 | ) |
| Investor Shares | (235,761 | ) | (252,170 | ) |
| Dreyfus Premier Shares | — | (177 | ) | |
| Net realized gain on investments: | ||||
| Class M Shares | (3,698,997 | ) | (132,840 | ) |
| Investor Shares | (104,182 | ) | (3,141 | ) |
| Dreyfus Premier Shares | — | (8 | ) | |
| Total Dividends | (13,437,814 | ) | (11,098,304 | ) |
| Beneficial Interest Transactions ($): | ||||
| Net proceeds from shares sold: | ||||
| Class M Shares | 51,508,436 | 49,070,188 | ||
| Investor Shares | 4,144,022 | 2,348,637 | ||
| Dividends reinvested: | ||||
| Class M Shares | 4,119,877 | 2,779,118 | ||
| Investor Shares | 261,386 | 209,532 | ||
| Dreyfus Premier Shares | — | 178 | ||
| Cost of shares redeemed: | ||||
| Class M Shares | (66,422,157 | ) | (65,862,538 | ) |
| Investor Shares | (4,589,879 | ) | (2,152,642 | ) |
| Dreyfus Premier Shares | — | (20,751 | ) | |
| Increase (Decrease) in Net Assets from | ||||
| Beneficial Interest Transactions | (10,978,315 | ) | (13,628,278 | ) |
| Total Increase (Decrease) in Net Assets | (34,852,789 | ) | (2,463,825 | ) |
| Net Assets ($): | ||||
| Beginning of Period | 355,753,997 | 358,217,822 | ||
| End of Period | 320,901,208 | 355,753,997 | ||
| Undistributed investment income—net | 24,640 | — | ||
110
| BNY Mellon Massachusetts Intermediate Municipal Bond Fund | ||||
| Year Ended August 31, | ||||
| 2013 | 2012 | a | ||
| Capital Share Transactions (Shares): | ||||
| Class M Shares | ||||
| Shares sold | 3,859,357 | 3,667,157 | ||
| Shares issued for dividends reinvested | 308,262 | 208,041 | ||
| Shares redeemed | (5,001,396 | ) | (4,937,793 | ) |
| Net Increase (Decrease) in Shares Outstanding | (833,777 | ) | (1,062,595 | ) |
| Investor Sharesb | ||||
| Shares sold | 311,223 | 175,459 | ||
| Shares issued for dividends reinvested | 19,592 | 15,664 | ||
| Shares redeemed | (348,961 | ) | (161,128 | ) |
| Net Increase (Decrease) in Shares Outstanding | (18,146 | ) | 29,995 | |
| Dreyfus Premier Sharesb | ||||
| Shares issued for dividends reinvested | — | 13 | ||
| Shares redeemed | — | (1,554 | ) | |
| Net Increase (Decrease) in Shares Outstanding | — | (1,541 | ) | |
| a Effective as of the close of business on January 5, 2012, the fund no longer offers Dreyfus Premier shares. |
| b During the period ended August 31, 2012, 1,554 Dreyfus Premier shares of BNY Mellon Massachusetts Intermediate Municipal Bond Fund representing $20,745 were |
| automatically converted to 1,557 Investor shares. |
| See notes to financial statements. |
The Funds 111
STATEMENT OF CHANGES IN NET ASSETS (continued)
| BNY Mellon New York Intermediate Tax-Exempt Bond Fund | ||||
| Year Ended August 31, | ||||
| 2013 | 2012 | |||
| Operations ($): | ||||
| Investment income—net | 5,579,289 | 6,302,334 | ||
| Net realized gain (loss) on investments | 1,525,940 | 2,163,412 | ||
| Net unrealized appreciation (depreciation) on investments | (14,276,408 | ) | 6,400,523 | |
| Net Increase (Decrease) in Net Assets | ||||
| Resulting from Operations | (7,171,179 | ) | 14,866,269 | |
| Dividends to Shareholders from ($): | ||||
| Investment income—net: | ||||
| Class M Shares | (5,104,571 | ) | (5,768,871 | ) |
| Investor Shares | (436,856 | ) | (517,357 | ) |
| Net realized gain on investments: | ||||
| Class M Shares | (2,118,837 | ) | (423,352 | ) |
| Investor Shares | (198,769 | ) | (40,654 | ) |
| Total Dividends | (7,859,033 | ) | (6,750,234 | ) |
| Beneficial Interest Transactions ($): | ||||
| Net proceeds from shares sold: | ||||
| Class M Shares | 30,937,709 | 45,176,021 | ||
| Investor Shares | 3,170,548 | 4,430,027 | ||
| Dividends reinvested: | ||||
| Class M Shares | 1,787,615 | 826,208 | ||
| Investor Shares | 510,973 | 431,771 | ||
| Cost of shares redeemed: | ||||
| Class M Shares | (38,115,417 | ) | (32,145,416 | ) |
| Investor Shares | (3,539,017 | ) | (3,693,098 | ) |
| Increase (Decrease) in Net Assets from | ||||
| Beneficial Interest Transactions | (5,247,589 | ) | 15,025,513 | |
| Total Increase (Decrease) in Net Assets | (20,277,801 | ) | 23,141,548 | |
| Net Assets ($): | ||||
| Beginning of Period | 222,865,222 | 199,723,674 | ||
| End of Period | 202,587,421 | 222,865,222 | ||
| Undistributed investment income—net | 14,594 | — | ||
| Capital Share Transactions (Shares): | ||||
| Class M Shares | ||||
| Shares sold | 2,629,856 | 3,850,572 | ||
| Shares issued for dividends reinvested | 151,302 | 70,843 | ||
| Shares redeemed | (3,262,649 | ) | (2,752,217 | ) |
| Net Increase (Decrease) in Shares Outstanding | (481,491 | ) | 1,169,198 | |
| Investor Shares | ||||
| Shares sold | 269,998 | 380,692 | ||
| Shares issued for dividends reinvested | 43,524 | 36,867 | ||
| Shares redeemed | (302,528 | ) | (314,001 | ) |
| Net Increase (Decrease) in Shares Outstanding | 10,994 | 103,558 | ||
| See notes to financial statements. |
112
| BNY Mellon Municipal Opportunities Fund | ||||
| Year Ended August 31, | ||||
| 2013 | 2012 | |||
| Operations ($): | ||||
| Investment income—net | 28,972,464 | 24,488,246 | ||
| Net realized gain (loss) on investments | 10,488,346 | 9,621,583 | ||
| Net unrealized appreciation (depreciation) on investments | (87,679,540 | ) | 43,842,061 | |
| Net Increase (Decrease) in Net Assets | ||||
| Resulting from Operations | (48,218,730 | ) | 77,951,890 | |
| Dividends to Shareholders from ($): | ||||
| Investment income—net: | ||||
| Class M Shares | (28,517,581 | ) | (24,108,462 | ) |
| Investor Shares | (83,551 | ) | (67,339 | ) |
| Net realized gain on investments: | ||||
| Class M Shares | (6,451,408 | ) | — | |
| Investor Shares | (19,941 | ) | — | |
| Total Dividends | (35,072,481 | ) | (24,175,801 | ) |
| Beneficial Interest Transactions ($): | ||||
| Net proceeds from shares sold: | ||||
| Class M Shares | 414,934,700 | 214,900,164 | ||
| Investor Shares | 3,786,582 | 3,016,344 | ||
| Dividends reinvested: | ||||
| Class M Shares | 11,827,421 | 6,161,952 | ||
| Investor Shares | 86,338 | 56,348 | ||
| Cost of shares redeemed: | ||||
| Class M Shares | (118,973,112 | ) | (57,764,262 | ) |
| Investor Shares | (2,954,766 | ) | (2,063,395 | ) |
| Increase (Decrease) in Net Assets from | ||||
| Beneficial Interest Transactions | 308,707,163 | 164,307,151 | ||
| Total Increase (Decrease) in Net Assets | 225,415,952 | 218,083,240 | ||
| Net Assets ($): | ||||
| Beginning of Period | 724,270,394 | 506,187,154 | ||
| End of Period | 949,686,346 | 724,270,394 | ||
| Distributions in excess of investment income—net | (5,976 | ) | — | |
| Capital Share Transactions (Shares): | ||||
| Class M Shares | ||||
| Shares sold | 30,815,706 | 16,614,946 | ||
| Shares issued for dividends reinvested | 886,429 | 474,189 | ||
| Shares redeemed | (8,980,195 | ) | (4,483,416 | ) |
| Net Increase (Decrease) in Shares Outstanding | 22,721,940 | 12,605,719 | ||
| Investor Shares | ||||
| Shares sold | 284,075 | 233,679 | ||
| Shares issued for dividends reinvested | 6,477 | 4,346 | ||
| Shares redeemed | (225,877 | ) | (158,561 | ) |
| Net Increase (Decrease) in Shares Outstanding | 64,675 | 79,464 | ||
The Funds 113
FINANCIAL HIGHLIGHTS
The following tables describe the performance for each share class of each BNY Mellon municipal bond fund for the fiscal periods indicated.All information (except portfolio turnover rate) reflects financial results for a single fund share.Total return shows how much your investment in each fund would have increased (or decreased) during the period, assuming you had reinvested all dividends and distributions.These figures have been derived from each fund’s financial statements.
| Class M Shares | ||||||||||
| Year Ended August 31, | ||||||||||
| BNY Mellon National Intermediate Municipal Bond Fund | 2013 | 2012 | 2011 | 2010 | 2009 | |||||
| Per Share Data ($): | ||||||||||
| Net asset value, beginning of period | 13.98 | 13.45 | 13.75 | 13.10 | 12.84 | |||||
| Investment Operations: | ||||||||||
| Investment income—neta | .41 | .43 | .48 | .50 | .52 | |||||
| Net realized and unrealized | ||||||||||
| gain (loss) on investments | (.73 | ) | .53 | (.22 | ) | .65 | .27 | |||
| Total from Investment Operations | (.32 | ) | .96 | .26 | 1.15 | .79 | ||||
| Distributions: | ||||||||||
| Dividends from investment income—net | (.39 | ) | (.43 | ) | (.48 | ) | (.50 | ) | (.52 | ) |
| Dividends from net realized gain on investments | (.05 | ) | (.00 | )b | (.08 | ) | — | (.01 | ) | |
| Total Distributions | (.44 | ) | (.43 | ) | (.56 | ) | (.50 | ) | (.53 | ) |
| Net asset value, end of period | 13.22 | 13.98 | 13.45 | 13.75 | 13.10 | |||||
| Total Return (%) | (2.43 | ) | 7.25 | 2.07 | 8.96 | 6.37 | ||||
| Ratios/Supplemental Data (%): | ||||||||||
| Ratio of total expenses to average net assets | .50 | .50 | .50 | .50 | .51 | |||||
| Ratio of net expenses to average net assets | .50 | .50 | .50 | .50 | .51 | |||||
| Ratio of net investment income | ||||||||||
| to average net assets | 2.94 | 3.16 | 3.65 | 3.76 | 4.11 | |||||
| Portfolio Turnover Rate | 24.05 | 25.31 | 39.88 | 42.75 | 42.82 | |||||
| Net Assets, end of period ($ x 1,000) | 1,692,786 | 1,697,522 | 1,535,563 | 1,638,004 | 1,366,960 | |||||
| a | Based on average shares outstanding at each month end. |
| b | Amount represents less than $.01 per share. |
| See notes to financial statements. | |
114
| Investor Shares | ||||||||||
| Year Ended August 31, | ||||||||||
| BNY Mellon National Intermediate Municipal Bond Fund | 2013 | 2012 | 2011 | 2010 | 2009 | |||||
| Per Share Data ($): | ||||||||||
| Net asset value, beginning of period | 13.97 | 13.44 | 13.73 | 13.09 | 12.83 | |||||
| Investment Operations: | ||||||||||
| Investment income—neta | .37 | .40 | .45 | .47 | .49 | |||||
| Net realized and unrealized | ||||||||||
| gain (loss) on investments | (.74 | ) | .53 | (.21 | ) | .64 | .27 | |||
| Total from Investment Operations | (.37 | ) | .93 | .24 | 1.11 | .76 | ||||
| Distributions: | ||||||||||
| Dividends from investment income—net | (.35 | ) | (.40 | ) | (.45 | ) | (.47 | ) | (.49 | ) |
| Dividends from net realized gain on investments | (.05 | ) | (.00 | )b | (.08 | ) | — | (.01 | ) | |
| Total Distributions | (.40 | ) | (.40 | ) | (.53 | ) | (.47 | ) | (.50 | ) |
| Net asset value, end of period | 13.20 | 13.97 | 13.44 | 13.73 | 13.09 | |||||
| Total Return (%) | (2.68 | ) | 6.99 | 1.90 | 8.61 | 6.11 | ||||
| Ratios/Supplemental Data (%): | ||||||||||
| Ratio of total expenses to average net assets | .75 | .75 | .75 | .75 | .76 | |||||
| Ratio of net expenses to average net assets | .75 | .75 | .75 | .75 | .76 | |||||
| Ratio of net investment income | ||||||||||
| to average net assets | 2.68 | 2.92 | 3.41 | 3.51 | 3.88 | |||||
| Portfolio Turnover Rate | 24.05 | 25.31 | 39.88 | 42.75 | 42.82 | |||||
| Net Assets, end of period ($ x 1,000) | 37,095 | 38,067 | 41,237 | 33,931 | 26,368 | |||||
| a | Based on average shares outstanding at each month end. |
| b | Amount represents less than $.01 per share. |
| See notes to financial statements. | |
The Funds 115
FINANCIAL HIGHLIGHTS (continued)
| Class M Shares | ||||||||||
| Year Ended August 31, | ||||||||||
| BNY Mellon National Short-Term Municipal Bond Fund | 2013 | 2012 | 2011 | 2010 | 2009 | |||||
| Per Share Data ($): | ||||||||||
| Net asset value, beginning of period | 13.01 | 12.99 | 13.01 | 12.80 | 12.69 | |||||
| Investment Operations: | ||||||||||
| Investment income—neta | .12 | .15 | .18 | .21 | .31 | |||||
| Net realized and unrealized | ||||||||||
| gain (loss) on investments | (.15 | ) | .02 | (.02 | ) | .21 | .14 | |||
| Total from Investment Operations | (.03 | ) | .17 | .16 | .42 | .45 | ||||
| Distributions: | ||||||||||
| Dividends from investment income—net | (.12 | ) | (.15 | ) | (.18 | ) | (.21 | ) | (.34 | ) |
| Net asset value, end of period | 12.86 | 13.01 | 12.99 | 13.01 | 12.80 | |||||
| Total Return (%) | (.27 | ) | 1.34 | 1.31 | 3.22 | 3.61 | ||||
| Ratios/Supplemental Data (%): | ||||||||||
| Ratio of total expenses to average net assets | .50 | .51 | .51 | .51 | .54 | |||||
| Ratio of net expenses to average net assets | .50 | .51 | .51 | .51 | .54 | |||||
| Ratio of net investment income | ||||||||||
| to average net assets | .89 | 1.18 | 1.38 | 1.60 | 2.50 | |||||
| Portfolio Turnover Rate | 41.94 | 34.17 | 24.33 | 16.46 | 12.61 | |||||
| Net Assets, end of period ($ x 1,000) | 1,181,988 | 1,241,129 | 1,088,334 | 1,060,685 | 536,597 | |||||
| a Based on average shares outstanding at each month end. |
| See notes to financial statements. |
116
| Investor Shares | ||||||||||
| Year Ended August 31, | ||||||||||
| BNY Mellon National Short-Term Municipal Bond Fund | 2013 | 2012 | 2011 | 2010 | 2009 | |||||
| Per Share Data ($): | ||||||||||
| Net asset value, beginning of period | 13.00 | 12.97 | 12.99 | 12.78 | 12.68 | |||||
| Investment Operations: | ||||||||||
| Investment income—neta | .08 | .12 | .15 | .19 | .31 | |||||
| Net realized and unrealized | ||||||||||
| gain (loss) on investments | (.15 | ) | .03 | (.02 | ) | .20 | .10 | |||
| Total from Investment Operations | (.07 | ) | .15 | .13 | .39 | .41 | ||||
| Distributions: | ||||||||||
| Dividends from investment income—net | (.08 | ) | (.12 | ) | (.15 | ) | (.18 | ) | (.31 | ) |
| Net asset value, end of period | 12.85 | 13.00 | 12.97 | 12.99 | 12.78 | |||||
| Total Return (%) | (.52 | ) | 1.17 | .98 | 3.05 | 3.28 | ||||
| Ratios/Supplemental Data (%): | ||||||||||
| Ratio of total expenses to average net assets | .76 | .76 | .77 | .77 | .80 | |||||
| Ratio of net expenses to average net assets | .76 | .76 | .77 | .77 | .80 | |||||
| Ratio of net investment income | ||||||||||
| to average net assets | .63 | .92 | 1.15 | 1.39 | 2.38 | |||||
| Portfolio Turnover Rate | 41.94 | 34.17 | 24.33 | 16.46 | 12.61 | |||||
| Net Assets, end of period ($ x 1,000) | 4,479 | 4,009 | 4,021 | 2,356 | 1,420 |
| a Based on average shares outstanding at each month end. |
| See notes to financial statements. |
The Funds 117
FINANCIAL HIGHLIGHTS (continued)
| Class M Shares | ||||||||||
| Year Ended August 31, | ||||||||||
| BNY Mellon Pennsylvania Intermediate Municipal Bond Fund | 2013 | 2012 | 2011 | 2010 | 2009 | |||||
| Per Share Data ($): | ||||||||||
| Net asset value, beginning of period | 13.15 | 12.77 | 12.96 | 12.40 | 12.35 | |||||
| Investment Operations: | ||||||||||
| Investment income—neta | .36 | .42 | .46 | .46 | .48 | |||||
| Net realized and unrealized | ||||||||||
| gain (loss) on investments | (.79 | ) | .38 | (.19 | ) | .56 | .09 | |||
| Total from Investment Operations | (.43 | ) | .80 | .27 | 1.02 | .57 | ||||
| Distributions: | ||||||||||
| Dividends from investment income—net | (.36 | ) | (.42 | ) | (.46 | ) | (.46 | ) | (.48 | ) |
| Dividends from net realized gain on investments | (.09 | ) | — | — | (.00 | )b | (.04 | ) | ||
| Total Distributions | (.45 | ) | (.42 | ) | (.46 | ) | (.46 | ) | (.52 | ) |
| Net asset value, end of period | 12.27 | 13.15 | 12.77 | 12.96 | 12.40 | |||||
| Total Return (%) | (3.47 | ) | 6.34 | 2.21 | 8.44 | 4.90 | ||||
| Ratios/Supplemental Data (%): | ||||||||||
| Ratio of total expenses to average net assets | .67 | .67 | .66 | .66 | .67 | |||||
| Ratio of net expenses to average net assets | .67 | .67 | .66 | .66 | .67 | |||||
| Ratio of net investment income | ||||||||||
| to average net assets | 2.80 | 3.23 | 3.67 | 3.68 | 4.02 | |||||
| Portfolio Turnover Rate | 29.10 | 27.16 | 9.72 | 7.11 | 12.75 | |||||
| Net Assets, end of period ($ x 1,000) | 357,431 | 403,371 | 420,586 | 500,892 | 501,978 | |||||
| a | Based on average shares outstanding at each month end. |
| b | Amount represents less than $.01 per share. |
| See notes to financial statements. | |
118
| Investor Shares | ||||||||||
| Year Ended August 31, | ||||||||||
| BNY Mellon Pennsylvania Intermediate Municipal Bond Fund | 2013 | 2012 | 2011 | 2010 | 2009 | |||||
| Per Share Data ($): | ||||||||||
| Net asset value, beginning of period | 13.14 | 12.75 | 12.94 | 12.39 | 12.33 | |||||
| Investment Operations: | ||||||||||
| Investment income—neta | .33 | .38 | .43 | .44 | .46 | |||||
| Net realized and unrealized | ||||||||||
| gain (loss) on investments | (.80 | ) | .41 | (.19 | ) | .54 | .09 | |||
| Total from Investment Operations | (.47 | ) | .79 | .24 | .98 | .55 | ||||
| Distributions: | ||||||||||
| Dividends from investment income—net | (.33 | ) | (.40 | ) | (.43 | ) | (.43 | ) | (.45 | ) |
| Dividends from net realized gain on investments | (.09 | ) | — | — | (.00 | )b | (.04 | ) | ||
| Total Distributions | (.42 | ) | (.40 | ) | (.43 | ) | (.43 | ) | (.49 | ) |
| Net asset value, end of period | 12.25 | 13.14 | 12.75 | 12.94 | 12.39 | |||||
| Total Return (%) | (3.71 | ) | 6.28 | 1.95 | 8.08 | 4.72 | ||||
| Ratios/Supplemental Data (%): | ||||||||||
| Ratio of total expenses to average net assets | .92 | .92 | .91 | .92 | .92 | |||||
| Ratio of net expenses to average net assets | .92 | .92 | .91 | .92 | .92 | |||||
| Ratio of net investment income | ||||||||||
| to average net assets | 2.58 | 2.97 | 3.42 | 3.42 | 3.76 | |||||
| Portfolio Turnover Rate | 29.10 | 27.16 | 9.72 | 7.11 | 12.75 | |||||
| Net Assets, end of period ($ x 1,000) | 4,200 | 8,520 | 9,153 | 9,385 | 2,563 |
| a | Based on average shares outstanding at each month end. |
| b | Amount represents less than $.01 per share. |
| See notes to financial statements. | |
The Funds 119
FINANCIAL HIGHLIGHTS (continued)
| Class M Shares | ||||||||||
| Year Ended August 31, | ||||||||||
| BNY Mellon Massachusetts Intermediate Municipal Bond Fund | 2013 | 2012 | 2011 | 2010 | 2009 | |||||
| Per Share Data ($): | ||||||||||
| Net asset value, beginning of period | 13.54 | 13.12 | 13.39 | 12.86 | 12.57 | |||||
| Investment Operations: | ||||||||||
| Investment income—neta | .37 | .41 | .45 | .45 | .46 | |||||
| Net realized and unrealized | ||||||||||
| gain (loss) on investments | (.77 | ) | .44 | (.20 | ) | .53 | .29 | |||
| Total from Investment Operations | (.40 | ) | .85 | .25 | .98 | .75 | ||||
| Distributions: | ||||||||||
| Dividends from investment income—net | (.37 | ) | (.42 | ) | (.45 | ) | (.45 | ) | (.46 | ) |
| Dividends from net realized gain on investments | (.15 | ) | (.01 | ) | (.07 | ) | — | — | ||
| Total Distributions | (.52 | ) | (.43 | ) | (.52 | ) | (.45 | ) | (.46 | ) |
| Net asset value, end of period | 12.62 | 13.54 | 13.12 | 13.39 | 12.86 | |||||
| Total Return (%) | (3.11 | ) | 6.50 | 2.02 | 7.75 | 6.18 | ||||
| Ratios/Supplemental Data (%): | ||||||||||
| Ratio of total expenses to average net assets | .53 | .53 | .53 | .52 | .54 | |||||
| Ratio of net expenses to average net assets | .53 | .53 | .52 | .52 | .54 | |||||
| Ratio of net investment income | ||||||||||
| to average net assets | 2.79 | 3.11 | 3.49 | 3.44 | 3.70 | |||||
| Portfolio Turnover Rate | 21.16 | 29.39 | 10.43 | 21.44 | 16.78 | |||||
| Net Assets, end of period ($ x 1,000) | 312,640 | 346,647 | 349,768 | 407,667 | 381,129 | |||||
| a Based on average shares outstanding at each month end. |
| See notes to financial statements. |
120
| Investor Shares | ||||||||||
| Year Ended August 31, | ||||||||||
| BNY Mellon Massachusetts Intermediate Municipal Bond Fund | 2013 | 2012 | 2011 | 2010 | 2009 | |||||
| Per Share Data ($): | ||||||||||
| Net asset value, beginning of period | 13.54 | 13.12 | 13.39 | 12.86 | 12.57 | |||||
| Investment Operations: | ||||||||||
| Investment income—neta | .34 | .38 | .42 | .42 | .43 | |||||
| Net realized and unrealized | ||||||||||
| gain (loss) on investments | (.77 | ) | .43 | (.20 | ) | .53 | .29 | |||
| Total from Investment Operations | (.43 | ) | .81 | .22 | .95 | .72 | ||||
| Distributions: | ||||||||||
| Dividends from investment income—net | (.34 | ) | (.38 | ) | (.42 | ) | (.42 | ) | (.43 | ) |
| Dividends from net realized gain on investments | (.15 | ) | (.01 | ) | (.07 | ) | — | — | ||
| Total Distributions | (.49 | ) | (.39 | ) | (.49 | ) | (.42 | ) | (.43 | ) |
| Net asset value, end of period | 12.62 | 13.54 | 13.12 | 13.39 | 12.86 | |||||
| Total Return (%) | (3.35 | ) | 6.23 | 1.77 | 7.49 | 5.92 | ||||
| Ratios/Supplemental Data (%): | ||||||||||
| Ratio of total expenses to average net assets | .78 | .78 | .78 | .77 | .79 | |||||
| Ratio of net expenses to average net assets | .78 | .78 | .77 | .77 | .79 | |||||
| Ratio of net investment income | ||||||||||
| to average net assets | 2.55 | 2.86 | 3.24 | 3.20 | 3.45 | |||||
| Portfolio Turnover Rate | 21.16 | 29.39 | 10.43 | 21.44 | 16.78 | |||||
| Net Assets, end of period ($ x 1,000) | 8,261 | 9,107 | 8,430 | 8,143 | 9,096 |
| a Based on average shares outstanding at each month end. |
| See notes to financial statements. |
The Funds 121
FINANCIAL HIGHLIGHTS (continued)
| Class M Shares† | ||||||||||||
| BNY Mellon New York Intermediate | Year Ended August 31, | Eight Months Ended | Year Ended | |||||||||
| Tax-Exempt Bond Fund | 2013 | 2012 | 2011 | 2010 | August 31, 2009a | December 31, 2008 | ||||||
| Per Share Data ($): | ||||||||||||
| Net asset value, beginning of period | 11.92 | 11.46 | 11.60 | 11.16 | 10.71 | 10.81 | ||||||
| Investment Operations: | ||||||||||||
| Investment income—netb | .30 | .36 | .38 | .38 | .25 | .37 | ||||||
| Net realized and unrealized | ||||||||||||
| gain (loss) on investments | (.69 | ) | .49 | (.13 | ) | .44 | .45 | (.09 | ) | |||
| Total from Investment Operations | (.39 | ) | .85 | .25 | .82 | .70 | .28 | |||||
| Distributions: | ||||||||||||
| Dividends from investment income—net | (.30 | ) | (.36 | ) | (.38 | ) | (.38 | ) | (.25 | ) | (.37 | ) |
| Dividends from net realized gain on investments | (.12 | ) | (.03 | ) | (.01 | ) | (.00 | )c | (.00 | )c | (.01 | ) |
| Total Distributions | (.42 | ) | (.39 | ) | (.39 | ) | (.38 | ) | (.25 | ) | (.38 | ) |
| Net asset value, end of period | 11.11 | 11.92 | 11.46 | 11.60 | 11.16 | 10.71 | ||||||
| Total Return (%) | (3.40 | ) | 7.48 | 2.31 | 7.45 | 6.58 | d | 2.64 | ||||
| Ratios/Supplemental Data (%): | ||||||||||||
| Ratio of total expenses to average net assets | .70 | .71 | .70 | .72 | .72 | e | .75 | |||||
| Ratio of net expenses to average net assets | .59 | .59 | .59 | .59 | .59 | e | .59 | |||||
| Ratio of net investment income | ||||||||||||
| to average net assets | 2.57 | 3.06 | 3.41 | 3.33 | 3.40 | e | 3.49 | |||||
| Portfolio Turnover Rate | 39.32 | 30.96 | 21.91 | 4.80 | 1.47 | d | 6 | |||||
| Net Assets, end of period ($ x 1,000) | 184,657 | 203,768 | 182,547 | 196,795 | 153,785 | 113,699 | ||||||
| † Represents information for Institutional shares of the fund’s predecessor, BNY Hamilton Intermediate NewYork Tax-Exempt Fund, through September 12, 2008. |
| a The fund has changed its fiscal year end from December 31 to August 31. |
| b Based on average shares outstanding at each month end. |
| c Amount represents less than $.01 per share. |
| d Not annualized. |
| e Annualized. |
| See notes to financial statements. |
122
| Investor Shares† | ||||||||||||
| BNY Mellon New York Intermediate | Year Ended August 31, | Eight Months Ended | Year Ended | |||||||||
| Tax-Exempt Bond Fund | 2013 | 2012 | 2011 | 2010 | August 31, 2009a | December 31, 2008 | ||||||
| Per Share Data ($): | ||||||||||||
| Net asset value, beginning of period | 11.93 | 11.47 | 11.61 | 11.17 | 10.72 | 10.82 | ||||||
| Investment Operations: | ||||||||||||
| Investment income—netb | .27 | .33 | .36 | .35 | .23 | .34 | ||||||
| Net realized and unrealized | ||||||||||||
| gain (loss) on investments | (.69 | ) | .49 | (.14 | ) | .44 | .45 | (.08 | ) | |||
| Total from Investment Operations | (.42 | ) | .82 | .22 | .79 | .68 | .26 | |||||
| Distributions: | ||||||||||||
| Dividends from investment income—net | (.27 | ) | (.33 | ) | (.35 | ) | (.35 | ) | (.23 | ) | (.35 | ) |
| Dividends from net realized gain on investments | (.12 | ) | (.03 | ) | (.01 | ) | (.00 | )c | (.00 | )c | (.01 | ) |
| Total Distributions | (.39 | ) | (.36 | ) | (.36 | ) | (.35 | ) | (.23 | ) | (.36 | ) |
| Net asset value, end of period | 11.12 | 11.93 | 11.47 | 11.61 | 11.17 | 10.72 | ||||||
| Total Return (%) | (3.63 | ) | 7.20 | 2.05 | 7.17 | 6.40 | d | 2.39 | e | |||
| Ratios/Supplemental Data (%): | ||||||||||||
| Ratio of total expenses to average net assets | .95 | .96 | .95 | .97 | .96 | f | 1.00 | |||||
| Ratio of net expenses to average net assets | .84 | .84 | .84 | .84 | .84 | f | .84 | |||||
| Ratio of net investment income | ||||||||||||
| to average net assets | 2.32 | 2.81 | 3.16 | 3.08 | 3.15 | f | 3.24 | |||||
| Portfolio Turnover Rate | 39.32 | 30.96 | 21.91 | 4.80 | 1.47 | d | 6 | |||||
| Net Assets, end of period ($ x 1,000) | 17,930 | 19,097 | 17,177 | 17,352 | 16,810 | 16,198 | ||||||
| † Represents information for Class A shares of the fund’s predecessor, BNY Hamilton Intermediate NewYork Tax-Exempt Fund, through September 12, 2008. |
| a The fund has changed its fiscal year end from December 31 to August 31. |
| b Based on average shares outstanding at each month end. |
| c Amount represents less than $.01 per share. |
| d Not annualized. |
| e Exclusive of sales charge. |
| f Annualized. |
| See notes to financial statements. |
The Funds 123
FINANCIAL HIGHLIGHTS (continued)
| Class M Shares | ||||||||||
| Year Ended August 31, | ||||||||||
| BNY Mellon Municipal Opportunities Fund | 2013 | 2012 | 2011 | 2010 | 2009 | a | ||||
| Per Share Data ($): | ||||||||||
| Net asset value, beginning of period | 13.42 | 12.27 | 12.78 | 12.22 | 10.00 | |||||
| Investment Operations: | ||||||||||
| Investment income—netb | .43 | .50 | .52 | .50 | .43 | |||||
| Net realized and unrealized | ||||||||||
| gain (loss) on investments | (.92 | ) | 1.15 | (.35 | ) | .95 | 2.19 | |||
| Total from Investment Operations | (.49 | ) | 1.65 | .17 | 1.45 | 2.62 | ||||
| Distributions: | ||||||||||
| Dividends from investment income—net | (.43 | ) | (.50 | ) | (.50 | ) | (.52 | ) | (.39 | ) |
| Dividends from net realized gain on investments | (.12 | ) | — | (.18 | ) | (.37 | ) | (.01 | ) | |
| Total Distributions | (.55 | ) | (.50 | ) | (.68 | ) | (.89 | ) | (.40 | ) |
| Net asset value, end of period | 12.38 | 13.42 | 12.27 | 12.78 | 12.22 | |||||
| Total Return (%) | (3.95 | ) | 13.65 | 1.54 | 12.38 | 26.58 | c | |||
| Ratios/Supplemental Data (%): | ||||||||||
| Ratio of total expenses to average net assets | .71 | .73 | .73 | .71 | .87 | d | ||||
| Ratio of net expenses to average net assets | .71 | .73 | .73 | .71 | .75 | d | ||||
| Ratio of interest and expense related to | ||||||||||
| floating rate notes issued to average net assets | .05 | .06 | .06 | .01 | — | |||||
| Ratio of net investment income | ||||||||||
| to average net assets | 3.22 | 3.84 | 4.22 | 4.12 | 4.36 | d | ||||
| Portfolio Turnover Rate | 93.04 | 119.90 | 129.00 | 145.57 | 161.70 | c | ||||
| Net Assets, end of period ($ x 1,000) | 946,739 | 721,943 | 505,035 | 384,933 | 140,887 | |||||
| a | From October 15, 2008 (commencement of initial offering) to August 31, 2009. |
| b | Based on average shares outstanding at each month end. |
| c | Not annualized. |
| d | Annualized. |
| See notes to financial statements. | |
124
| Investor Shares | ||||||||||
| Year Ended August 31, | ||||||||||
| BNY Mellon Municipal Opportunities Fund | 2013 | 2012 | 2011 | 2010 | 2009 | a | ||||
| Per Share Data ($): | ||||||||||
| Net asset value, beginning of period | 13.43 | 12.27 | 12.79 | 12.22 | 10.00 | |||||
| Investment Operations: | ||||||||||
| Investment income—netb | .40 | .47 | .48 | .50 | .42 | |||||
| Net realized and unrealized | ||||||||||
| gain (loss) on investments | (.93 | ) | 1.16 | (.35 | ) | .93 | 2.18 | |||
| Total from Investment Operations | (.53 | ) | 1.63 | .13 | 1.43 | 2.60 | ||||
| Distributions: | ||||||||||
| Dividends from investment income—net | (.40 | ) | (.47 | ) | (.47 | ) | (.49 | ) | (.37 | ) |
| Dividends from net realized gain on investments | (.12 | ) | — | (.18 | ) | (.37 | ) | (.01 | ) | |
| Total Distributions | (.52 | ) | (.47 | ) | (.65 | ) | (.86 | ) | (.38 | ) |
| Net asset value, end of period | 12.38 | 13.43 | 12.27 | 12.79 | 12.22 | |||||
| Total Return (%) | (4.19 | ) | 13.46 | 1.21 | 12.19 | 26.29 | c | |||
| Ratios/Supplemental Data (%): | ||||||||||
| Ratio of total expenses to average net assets | .96 | .99 | .98 | .96 | 1.11 | d | ||||
| Ratio of net expenses to average net assets | .96 | .99 | .98 | .95 | .99 | d | ||||
| Ratio of interest and expense related to | ||||||||||
| floating rate notes issued to average net assets | .05 | .06 | .06 | .01 | — | |||||
| Ratio of net investment income | ||||||||||
| to average net assets | 2.98 | 3.63 | 3.93 | 4.00 | 4.48 | d | ||||
| Portfolio Turnover Rate | 93.04 | 119.90 | 129.00 | 145.57 | 161.70 | c | ||||
| Net Assets, end of period ($ x 1,000) | 2,947 | 2,328 | 1,152 | 1,157 | 1,208 | |||||
| a | From October 15, 2008 (commencement of initial offering) to August 31, 2009. |
| b | Based on average shares outstanding at each month end. |
| c | Not annualized. |
| d Annualized. | |
| See notes to financial statements. | |
The Funds 125
NOTES TO FINANCIAL STATEMENTS
126
The Funds 127
NOTES TO FINANCIAL STATEMENTS (continued)
| Table 1—Fair Value Measurements | |||||||||
| Investments in Securities | |||||||||
| Level 1—Unadjusted | Level 2—Other | Level 3— | |||||||
| Quoted | Significant | Significant | |||||||
| Prices | Observable Inputs | Unobservable Inputs | |||||||
| Assets ($) | Liabilities ($) | Assets ($) | Liabilities ($) | Assets ($) | Liabilities ($) | Total | |||
| BNY Mellon National | |||||||||
| Intermediate Municipal | |||||||||
| Bond Fund | |||||||||
| Municipal Bonds | — | — | 1,694,945,091 | — | — | — | 1,694,945,091 | ||
| Other Financial Instruments: | |||||||||
| Financial Futures† | 1,429,063 | — | — | — | — | — | 1,429,063 | ||
| BNY Mellon National | |||||||||
| Short-Term Municipal | |||||||||
| Bond Fund | |||||||||
| Municipal Bonds | — | — | 1,186,740,085 | — | — | — | 1,186,740,085 | ||
| BNY Mellon Pennsylvania | |||||||||
| Intermediate Municipal | |||||||||
| Bond Fund | |||||||||
| Municipal Bonds | — | — | 354,235,065 | — | — | — | 354,235,065 | ||
| Other Financial Instruments: | |||||||||
| Financial Futures† | 378,281 | — | — | — | — | — | 378,281 | ||
| BNY Mellon Massachusetts | |||||||||
| Intermediate Municipal | |||||||||
| Bond Fund | |||||||||
| Municipal Bonds | — | — | 318,689,626 | — | — | — | 318,689,626 | ||
| Other Financial Instruments: | |||||||||
| Financial Futures† | 294,219 | — | — | — | — | — | 294,219 | ||
| BNY Mellon New York | |||||||||
| Intermediate Tax-Exempt | |||||||||
| Bond Fund | |||||||||
| Municipal Bonds | — | — | 201,336,619 | — | — | — | 201,336,619 | ||
| Other Financial Instruments: | |||||||||
| Financial Futures† | 168,125 | — | — | — | — | — | 168,125 | ||
| BNY Mellon Municipal | |||||||||
| Opportunities Fund | |||||||||
| Municipal Bonds | — | — | 992,676,135 | — | — | — | 992,676,135 | ||
| Floating Rate Notes†† | — | — | — | (82,040,000 | ) | — | — | (82,040,000 | ) |
| Other Financial Instruments: | |||||||||
| Financial Futures† | 4,468,750 | — | — | — | — | — | 4,468,750 | ||
| † Amount shown represents unrealized appreciation at period end. |
| †† Certain of the fund’s liabilities are held at carrying amount, which approximates fair value for financial reporting purposes. |
128
Table 2—Components of Accumulated Earnings
| Undistributed | Undistributed | Unrealized | Capital Losses | |||
| Tax-Exempt | Ordinary | Undistributed | Appreciation | Realized After | ||
| Income ($) | Income ($) | Capital Gains ($) | (Depreciation) ($) | October 31, 2012† | ||
| BNY Mellon National Intermediate | ||||||
| Municipal Bond Fund | 504,157 | — | — | 38,672,644 | 24,596 | |
| BNY Mellon National Short-Term | ||||||
| Municipal Bond Fund | 106,159 | 22,914 | 624,707 | 3,258,181 | — | |
| BNY Mellon Pennsylvania Intermediate | ||||||
| Municipal Bond Fund | 177,323 | — | 3,150,268 | 5,293,906 | 2,277,718 | |
| BNY Mellon Massachusetts Intermediate | ||||||
| Municipal Bond Fund | 38,868 | — | 2,047,965 | 6,996,320 | 1,101,756 | |
| BNY Mellon New York Intermediate | ||||||
| Tax-Exempt Bond Fund | 15,263 | — | 2,922,641 | 3,696,699 | 1,353,553 | |
| BNY Mellon Municipal Opportunities Fund | 96,999 | 148,079 | 18,460,298 | (21,393,163 | ) | 10,502,690 |
| Ü These losses were deferred for tax purposes to the first day of the following fiscal year. |
The Funds 129
NOTES TO FINANCIAL STATEMENTS (continued)
| Table 3—Tax Character of Distributions Paid | ||||||
| Tax-Exempt | Ordinary | Long-Term | ||||
| Income ($) | Income ($) | Capital Gains ($) | ||||
| 2013 | 2012 | 2013 | 2012 | 2013 | 2012 | |
| BNY Mellon National Intermediate | ||||||
| Municipal Bond Fund | 50,845,315 | 52,062,206 | 37,809 | — | 6,953,995 | 59,743 |
| BNY Mellon National Short-Term | ||||||
| Municipal Bond Fund | 11,012,410 | 13,667,735 | — | — | — | — |
| BNY Mellon Pennsylvania Intermediate | ||||||
| Municipal Bond Fund | 11,016,110 | 13,517,783 | 176,204 | 40,931 | 2,564,526 | — |
| BNY Mellon Massachusetts Intermediate | ||||||
| Municipal Bond Fund | 9,634,635 | 10,962,315 | 19,250 | — | 3,783,929 | 135,989 |
| BNY Mellon New York Intermediate | ||||||
| Tax-Exempt Bond Fund | 5,541,427 | 6,286,228 | 521,643 | — | 1,795,963 | 464,006 |
| BNY Mellon Municipal Opportunities Fund | 26,669,978 | 22,994,410 | 6,779,359 | 1,181,391 | 1,623,144 | — |
| Table 4—Return of Capital Statement of Position | |||||
| Accumulated | Accumulated | ||||
| Undistributed | Net Realized | Paid-in | |||
| Investment Income—Net ($) | Gain (Loss) ($) | Capital ($) | |||
| BNY Mellon National Intermediate Municipal Bond Fund | (2,132,159 | ) | 2,096,157 | 36,002 | |
| BNY Mellon National Short-Term Municipal Bond Fund | (31,021 | ) | 27,635 | 3,386 | |
| BNY Mellon Pennsylvania Intermediate Municipal Bond Fund | (25,948 | ) | 25,948 | — | |
| BNY Mellon New York Intermediate Tax-Exempt Bond Fund | (23,268 | ) | 23,268 | — | |
| BNY Mellon Municipal Opportunities Fund | (377,308 | ) | 324,683 | 52,625 | |
130
The Funds 131
NOTES TO FINANCIAL STATEMENTS (continued)
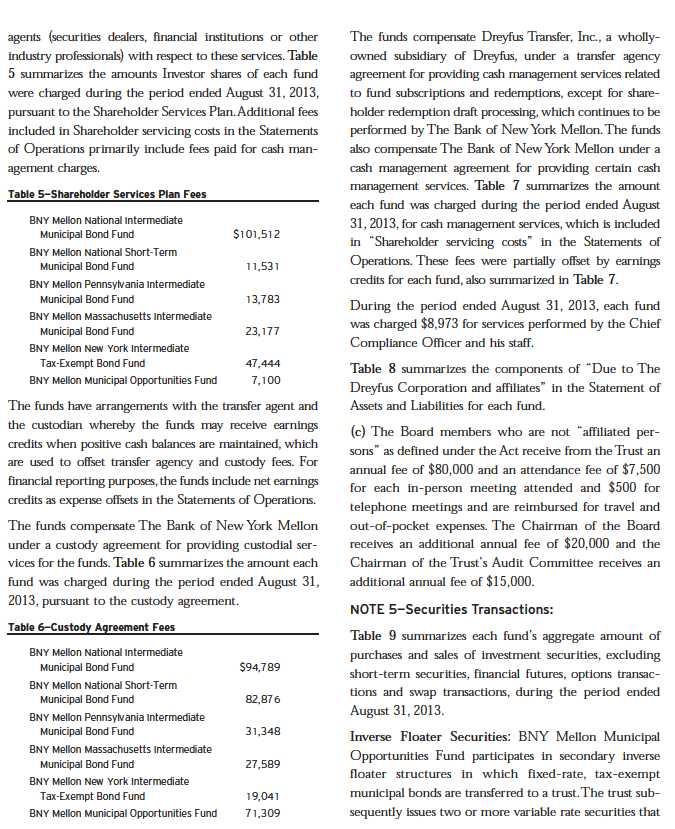
132
| Table 7—Cash Management Agreement Fees | ||||||
| The Bank of New York | The Bank of | |||||
| Dreyfus Transfer, Inc. | Dreyfus Transfer, Inc. | Mellon Cash | New York Mellon | |||
| Cash Management Fees ($) | Earnings Credits ($) | Management Fees ($) | Earnings Credits ($) | |||
| BNY Mellon National Intermediate | ||||||
| Municipal Bond Fund | 290 | (35 | ) | 155 | (1 | ) |
| BNY Mellon National Short-Term | ||||||
| Municipal Bond Fund | 39 | (5 | ) | 21 | — | |
| BNY Mellon Pennsylvania Intermediate | ||||||
| Municipal Bond Fund | 30 | (4 | ) | 15 | — | |
| BNY Mellon Massachusetts Intermediate | ||||||
| Municipal Bond Fund | 98 | (12 | ) | 53 | — | |
| BNY Mellon New York Intermediate | ||||||
| Tax-Exempt Bond Fund | 371 | (45 | ) | 199 | (1 | ) |
| BNY Mellon Municipal Opportunities Fund | 34 | (4 | ) | 18 | — | |
| Table 8—Due to The Dreyfus Corporation and Affiliates | ||||||
| Investment | Shareholder | Chief | ||||
| Advisory | Services | Custodian | Compliance | Less Expense | ||
| Fees ($) | Plan Fees ($) | Fees ($) | Officer Fees ($) | Reimbursement ($) | ||
| BNY Mellon National Intermediate | ||||||
| Municipal Bond Fund | 521,711 | 7,833 | 39,855 | 6,172 | — | |
| BNY Mellon National Short-Term | ||||||
| Municipal Bond Fund | 350,157 | 997 | 34,277 | 6,172 | — | |
| BNY Mellon Pennsylvania Intermediate | ||||||
| Municipal Bond Fund | 155,961 | 908 | 13,102 | 6,172 | — | |
| BNY Mellon Massachusetts Intermediate | ||||||
| Municipal Bond Fund | 96,630 | 1,794 | 11,461 | 6,172 | — | |
| BNY Mellon New York Intermediate | ||||||
| Tax-Exempt Bond Fund | 86,899 | 3,851 | 7,836 | 6,172 | (18,111 | ) |
| BNY Mellon Municipal Opportunities Fund | 407,018 | 641 | 32,357 | 6,172 | — | |
| Table 9—Purchases and Sales | ||
| Purchases ($) | Sales ($) | |
| BNY Mellon National Intermediate Municipal Bond Fund | 505,599,699 | 423,549,553 |
| BNY Mellon National Short-Term Municipal Bond Fund | 504,477,616 | 503,919,935 |
| BNY Mellon Pennsylvania Intermediate Municipal Bond Fund | 112,471,980 | 146,150,700 |
| BNY Mellon Massachusetts Intermediate Municipal Bond Fund | 70,687,891 | 95,479,519 |
| BNY Mellon New York Intermediate Tax-Exempt Bond Fund | 83,266,264 | 96,020,273 |
| BNY Mellon Municipal Opportunities Fund | 1,051,890,064 | 787,113,482 |
The Funds 133
NOTES TO FINANCIAL STATEMENTS (continued)
134

The Funds 135
NOTES TO FINANCIAL STATEMENTS (continued)
| Table 11—Accumulated Net Unrealized Appreciation (Depreciation) | |||||
| Cost of | Gross | Gross | |||
| Investments ($) | Appreciation ($) | Depreciation ($) | Net ($) | ||
| BNY Mellon National Intermediate Municipal Bond Fund | 1,656,272,447 | 65,855,476 | 27,182,832 | 38,672,644 | |
| BNY Mellon National Short-Term Municipal Bond Fund | 1,183,481,904 | 7,831,750 | 4,573,569 | 3,258,181 | |
| BNY Mellon Pennsylvania Intermediate Municipal Bond Fund | 348,941,159 | 11,151,240 | 5,857,334 | 5,293,906 | |
| BNY Mellon Massachusetts Intermediate Municipal Bond Fund | 311,693,306 | 11,485,812 | 4,489,492 | 6,996,320 | |
| BNY Mellon New York Intermediate Tax-Exempt Bond Fund | 197,639,920 | 6,104,139 | 2,407,440 | 3,696,699 | |
| BNY Mellon Municipal Opportunities Fund | 932,029,298 | 22,475,318 | 43,868,481 | (21,393,163 | ) |
136
REPORT OF INDEPENDENT REGISTERED PUBLIC ACCOUNTING FIRM
The Funds 137
IMPORTANT TAX INFORMATION (Unaudited)
138
The Funds 139
INFORMATION ABOUT THE RENEWAL OF EACH FUND’S INVESTMENT
ADVISORY AGREEMENT AND ADMINISTRATIVE AGREEMENT (Unaudited)
140
The Funds 141
INFORMATION ABOUT THE RENEWAL OF EACH FUND’S INVESTMENT ADVISORY
AGREEMENT AND ADMINISTRATIVE AGREEMENT (Unaudited) (continued)
142
The Funds 143
INFORMATION ABOUT THE RENEWAL OF EACH FUND’S INVESTMENT ADVISORY
AGREEMENT AND ADMINISTRATIVE AGREEMENT (Unaudited) (continued)
144
BOARD MEMBERS INFORMATION (Unaudited)
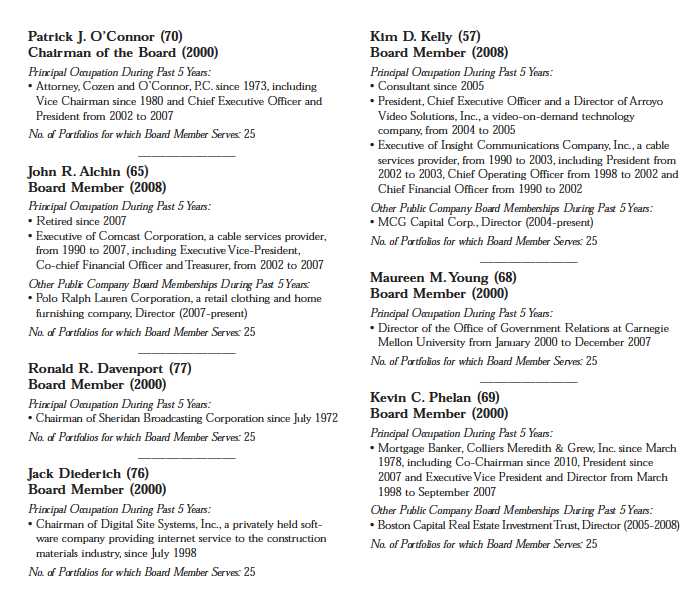
The Funds 145
BOARD MEMBERS INFORMATION (Unaudited) (continued)

| Once elected all Board Members serve for an indefinite term.The address of the Board Members and Officers is c/o The Dreyfus Corporation, 200 Park Avenue, New |
| York, NewYork 10166.Additional information about the Board Members is available in the fund’s Statement of Additional Information which can be obtained from |
| Dreyfus free of charge by calling this toll free number: 1-800-DREYFUS. For individual account holders for Private Wealth Management clients, please contact your |
| account officer or call 1-888-281-7350. |
146
OFFICERS OF THE FUND (Unaudited)

The Funds 147
OFFICERS OF THE FUND (Unaudited) (continued)

148
NOTES
BNY Mellon Money Market Fund
BNY Mellon National Municipal Money Market Fund
ANNUAL REPORT August 31, 2013

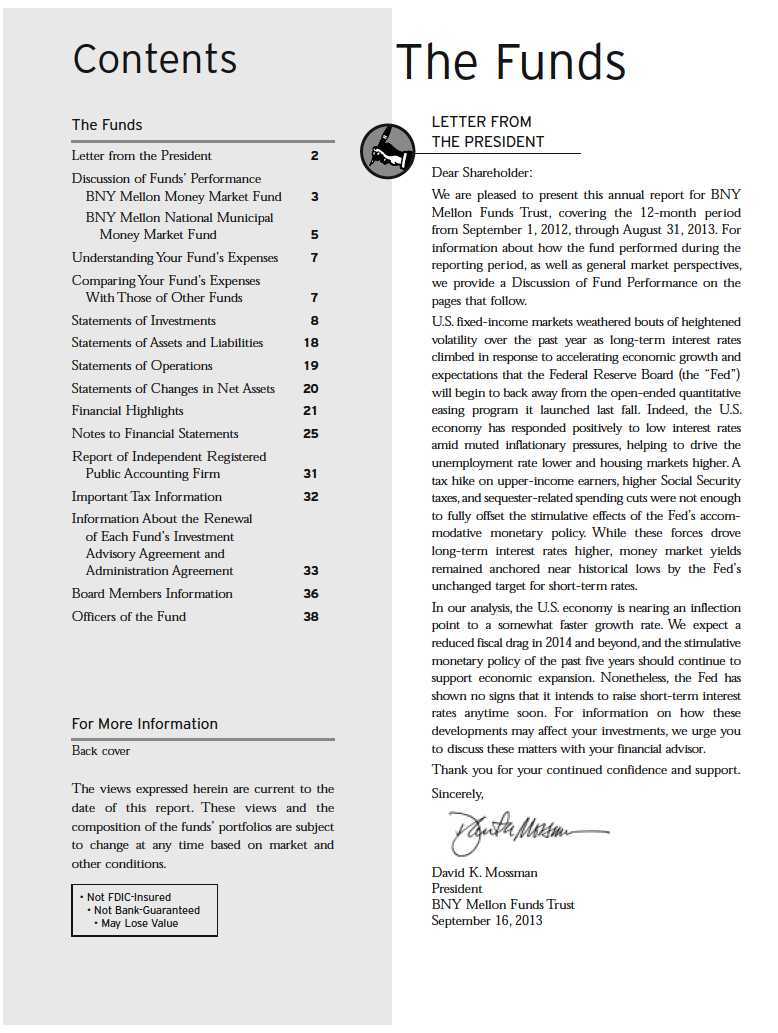
The Funds 3
DISCUSSION OF FUND PERFORMANCE (continued)
4
The Funds 5
DISCUSSION OF FUND PERFORMANCE (continued)
6
UNDERSTANDING YOUR FUND’S EXPENSES (Unaudited)
As a mutual fund investor, you pay ongoing expenses, such as management fees and other expenses. Using the information below, you can estimate how these expenses affect your investment and compare them with the expenses of other funds.You also may pay one-time transaction expenses, including sales charges (loads) and redemption fees, which are not shown in this section and would have resulted in higher total expenses. For more information, see your fund’s prospectus or talk to your financial adviser.
Review your fund’s expenses
The table below shows the expenses you would have paid on a $1,000 investment in each class of each BNY Mellon money market fund from March 1, 2013 to August 31, 2013. It also shows how much a $1,000 investment would be worth at the close of the period, assuming actual returns and expenses.
Expenses and Value of a $1,000 Investment
assuming actual returns for the six months ended August 31, 2013
| Class M Shares | Investor Shares | |||
| BNY Mellon Money Market Fund | ||||
| Expenses paid per $1,000† | $ | .91 | $ | .86 |
| Ending value (after expenses) | $ | 1,000.00 | $ | 1,000.00 |
| Annualized expense ratio (%) | .18 | .17 | ||
| BNY Mellon National Municipal Money Market Fund | ||||
| Expenses paid per $1,000† | $ | 1.06 | $ | 1.16 |
| Ending value (after expenses) | $ | 1,000.00 | $ | 1,000.00 |
| Annualized expense ratio (%) | .21 | .23 | ||
COMPARING YOUR FUND’S EXPENSES WITH THOSE OF OTHER FUNDS (Unaudited)
Using the SEC’s method to compare expenses
The Securities and Exchange Commission (SEC) has established guidelines to help investors assess fund expenses. Per these guidelines, the table below shows your fund’s expenses based on a $1,000 investment, assuming a hypothetical 5% annualized return.You can use this information to compare the ongoing expenses (but not transaction expenses or total cost) of investing in each fund with those of other funds.All mutual fund shareholder reports will provide this information to help you make this comparison. Please note that you cannot use this information to estimate your actual ending account balance and expenses paid during the period.
Expenses and Value of a $1,000 Investment
assuming a hypothetical 5% annualized return for the six months ended August 31, 2013
| Class M Shares | Investor Shares | |||
| BNY Mellon Money Market Fund | ||||
| Expenses paid per $1,000† | $ | .92 | $ | .87 |
| Ending value (after expenses) | $ | 1,024.30 | $ | 1,024.35 |
| Annualized expense ratio (%) | .18 | .17 | ||
| BNY Mellon National Municipal Money Market Fund | ||||
| Expenses paid per $1,000† | $ | 1.07 | $ | 1.17 |
| Ending value (after expenses) | $ | 1,024.15 | $ | 1,024.05 |
| Annualized expense ratio (%) | .21 | .23 | ||
| † Expenses are equal to each fund’s annualized expense ratios as shown above, multiplied by the average account value over the period, multiplied by 184/365 (to reflect the |
| one-half year period). |
The Funds 7
STATEMENT OF INVESTMENTS
August 31, 2013
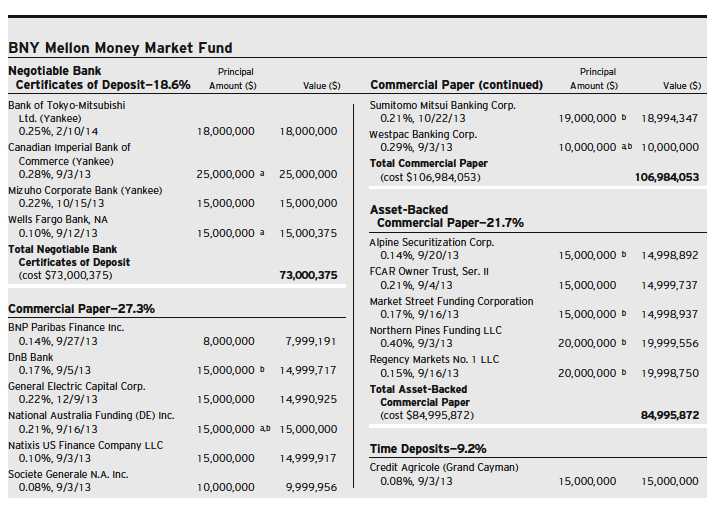
8
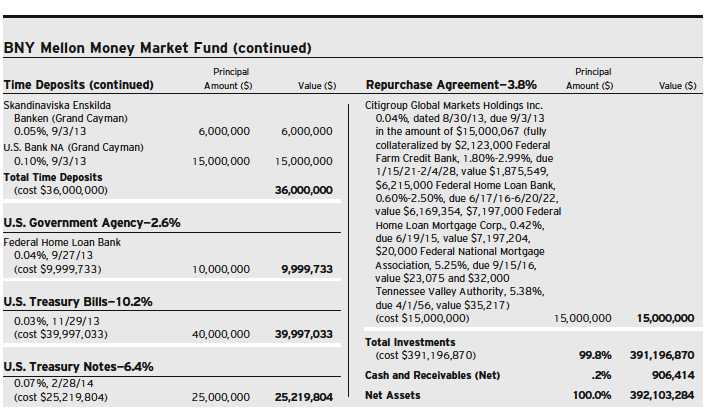
| a Variable rate security—interest rate subject to periodic change. |
| b Securities exempt from registration pursuant to Rule 144A under the Securities Act of 1933.These securities may be resold in transactions exempt from registration, normally to |
| qualified institutional buyers.At August 31, 2013, these securities amounted to $128,990,199 or 32.9% of net assets. |
| Portfolio Summary (Unaudited) † | |||
| Value (%) | Value (%) | ||
| Banking | 51.3 | Asset-Backed/Single Seller | 3.8 |
| U.S. Government/Agency | 19.2 | Finance | 3.8 |
| Asset-Backed/Banking | 9.0 | Repurchase Agreement | 3.8 |
| Asset-Backed/Multi-Seller Programs | 8.9 | 99.8 | |
| † Based on net assets. |
| See notes to financial statements. |
The Funds 9
STATEMENT OF INVESTMENTS
August 31, 2013
| BNY Mellon National Municipal Money Market Fund | |||||
| Coupon | Maturity | Principal | |||
| Short-Term Investments—100.9% | Rate (%) | Date | Amount ($) | Value ($) | |
| California—1.1% | |||||
| California Health Facilities Financing Authority, | |||||
| Revenue, CP (Kaiser Permanente) | 0.18 | 11/19/13 | 10,765,000 | 10,765,000 | |
| Colorado—1.0% | |||||
| Colorado Educational and Cultural Facilities Authority, | |||||
| Revenue (The Nature Conservancy Project) | 0.08 | 9/7/13 | 9,540,000 | a,b | 9,540,000 |
| Parker Automotive Metropolitan District, | |||||
| GO Notes (LOC; U.S. Bank NA) | 0.07 | 9/7/13 | 850,000 | a | 850,000 |
| Connecticut—3.0% | |||||
| Connecticut Health and Educational Facilities Authority, | |||||
| Revenue (Westminster School Issue) (LOC; Bank of America) | 0.13 | 9/7/13 | 2,200,000 | a,b | 2,200,000 |
| Connecticut Housing Finance Authority, Revenue | |||||
| (Housing Mortgage Finance Program) | |||||
| (Liquidity Facility; JPMorgan Chase Bank) | 0.06 | 9/3/13 | 27,940,000 | a | 27,940,000 |
| Florida—.9% | |||||
| Deutsche Bank Spears/Lifers Trust (Series DBE-594) | |||||
| (University of North Florida Financing Corporation, | |||||
| Capital Improvement Revenue (Housing Project)) (Liquidity | |||||
| Facility; Deutsche Bank AG and LOC; Deutsche Bank AG) | 0.16 | 9/7/13 | 5,170,000 | a,c,d | 5,170,000 |
| Jacksonville, IDR (University of Florida Health Sciences | |||||
| Center Clinic) (LOC; Branch Banking and Trust Co.) | 0.07 | 9/7/13 | 3,300,000 | a | 3,300,000 |
| Palm Beach County, IDR (Gulfstream Goodwill | |||||
| Industries, Inc. Project) (LOC; Wells Fargo Bank) | 0.16 | 9/7/13 | 950,000 | a | 950,000 |
| Georgia—1.0% | |||||
| Fulton County Development Authority, Revenue (King’s Ridge | |||||
| Christian School Project) (LOC; Branch Banking and Trust Co.) | 0.06 | 9/7/13 | 9,645,000 | a,b | 9,645,000 |
| Illinois—7.1% | |||||
| Deutsche Bank Spears/Lifers Trust (Series DBE-472) | |||||
| (Village of Bolingbrook, Will and DuPage Counties, GO Notes) | |||||
| (Liquidity Facility; Deutsche Bank AG and LOC; Deutsche Bank AG) | 0.16 | 9/7/13 | 9,210,000 | a,c,d | 9,210,000 |
| Deutsche Bank Spears/Lifers Trust (Series DBE-555) | |||||
| (DeWitt, Ford, Livingston, Logan, McLean and Tazewell | |||||
| Counties and Illinois Community College District Number 540, | |||||
| Community College GO Notes) (Liquidity Facility; | |||||
| Deutsche Bank AG and LOC; Deutsche Bank AG) | 0.16 | 9/7/13 | 3,120,000 | a,c,d | 3,120,000 |
| Galesburg, Revenue (Knox College Project) (LOC; PNC Bank NA) | 0.07 | 9/7/13 | 3,100,000 | a,b | 3,100,000 |
| Illinois Development Finance Authority, Revenue | |||||
| (Evanston Northwestern Healthcare Corporation) | |||||
| (Liquidity Facility; Wells Fargo Bank) | 0.05 | 9/3/13 | 22,000,000 | a,b | 22,000,000 |
| Illinois Educational Facilities Authority, Revenue | |||||
| (The Lincoln Park Society) (LOC; Citibank NA) | 0.17 | 9/7/13 | 600,000 | a | 600,000 |
| Illinois Finance Authority, Revenue (Joan W. and Irving B. Harris | |||||
| Theater for Music and Dance Project) (LOC; PNC Bank NA) | 0.08 | 9/7/13 | 14,000,000 | a | 14,000,000 |
10
| BNY Mellon National Municipal Money Market Fund (continued) | |||||
| Coupon | Maturity | Principal | |||
| Short-Term Investments (continued) | Rate (%) | Date | Amount ($) | Value ($) | |
| Illinois (continued) | |||||
| Illinois Finance Authority, Revenue (Kohl Children’s Museum of | |||||
| Greater Chicago Inc. Project) (LOC; Northern Trust Company) | 0.07 | 9/7/13 | 2,275,000 | a | 2,275,000 |
| Illinois Finance Authority, Revenue (Saint Ignatius | |||||
| College Preparatory Project) (LOC; PNC Bank NA) | 0.08 | 9/7/13 | 13,000,000 | a,b | 13,000,000 |
| Illinois Finance Authority, Revenue (Village of Oak Park | |||||
| Residence Corporation Project) (LOC; PNC Bank NA) | 0.06 | 9/7/13 | 4,300,000 | a | 4,300,000 |
| Indiana—4.6% | |||||
| Deutsche Bank Spears/Lifers Trust (Series DBE-565) | |||||
| (Indiana Bond Bank, Special Program Revenue) (Liquidity | |||||
| Facility; Deutsche Bank AG and LOC; Deutsche Bank AG) | 0.17 | 9/7/13 | 5,800,000 | a,c,d | 5,800,000 |
| Goshen, EDR (Goshen College Project) | |||||
| (LOC; JPMorgan Chase Bank) | 0.09 | 9/7/13 | 19,350,000 | a,b | 19,350,000 |
| Indiana Finance Authority, Lease Appropriation Revenue | |||||
| (Stadium Project) (Liquidity Facility; JPMorgan Chase Bank) | 0.05 | 9/3/13 | 16,875,000 | a | 16,875,000 |
| Lawrence, Fort Harrison Reuse Authority, Tax Increment Revenue | |||||
| (Fort Harrison Military Base Reuse District) (LOC; PNC Bank NA) | 0.07 | 9/7/13 | 4,200,000 | a | 4,200,000 |
| Iowa—3.9% | |||||
| Hills, Health Facilities Revenue (Mercy Hospital | |||||
| Project) (LOC; U.S. Bank NA) | 0.06 | 9/3/13 | 20,455,000 | a | 20,455,000 |
| Iowa Higher Education Loan Authority, Private College Facility | |||||
| Revenue (Des Moines University Project) (LOC; U.S. Bank NA) | 0.06 | 9/3/13 | 19,270,000 | a,b | 19,270,000 |
| Kansas—.4% | |||||
| Wamego, PCR, Refunding (UtiliCorp | |||||
| United Inc. Project) (LOC; Bank of America) | 0.16 | 9/7/13 | 3,800,000 | a | 3,800,000 |
| Kentucky—.8% | |||||
| Louisville and Jefferson County Metropolitan Sewer District, | |||||
| Sewer and Drainage System Subordinated Revenue, BAN | 2.00 | 12/4/13 | 5,000,000 | 5,022,667 | |
| Mason County National Rural Utilities Cooperative | |||||
| Finance Corporation, PCR (East Kentucky Power | |||||
| Cooperative, Inc. Project) (Liquidity Facility; | |||||
| National Rural Utilities Cooperative Finance Corporation) | 0.32 | 9/7/13 | 2,325,000 | a | 2,325,000 |
| Mason County National Rural Utilities Cooperative Finance | |||||
| Corporation, PCR (East Kentucky Power Cooperative, Inc. | |||||
| Project) (Liquidity Facility; National Rural Utilities | |||||
| Cooperative Finance Corporation) | 0.32 | 9/7/13 | 600,000 | a | 600,000 |
| Louisiana—3.0% | |||||
| Deutsche Bank Spears/Lifers Trust (Series DBE-577) | |||||
| (Jefferson Sales Tax District, Special Sales Tax | |||||
| Revenue) (Liquidity Facility; Deutsche Bank AG | |||||
| and LOC; Deutsche Bank AG) | 0.16 | 9/7/13 | 4,180,000 | a,c,d | 4,180,000 |
| Louisiana Public Facilities Authority, | |||||
| Revenue (Air Products and Chemicals Project) | 0.05 | 9/3/13 | 17,100,000 | a | 17,100,000 |
The Funds 11
STATEMENT OF INVESTMENTS (continued)
| BNY Mellon National Municipal Money Market Fund (continued) | |||||
| Coupon | Maturity | Principal | |||
| Short-Term Investments (continued) | Rate (%) | Date | Amount ($) | Value ($) | |
| Louisiana (continued) | |||||
| Louisiana Public Facilities Authority, Revenue | |||||
| (Tiger Athletic Foundation Project) (LOC; FHLB) | 0.06 | 9/7/13 | 9,590,000 | a,b | 9,590,000 |
| Maryland—5.8% | |||||
| Baltimore Mayor and City Council Industrial Development | |||||
| Authority, Revenue (City of Baltimore Capital Acquisition | |||||
| Program) (LOC; Bayerische Landesbank) | 0.11 | 9/7/13 | 17,300,000 | a | 17,300,000 |
| Maryland Economic Development Corporation, EDR | |||||
| (Catholic Relief Services Facility) (LOC; Bank of America) | 0.13 | 9/7/13 | 15,075,000 | a | 15,075,000 |
| Maryland Health and Higher Educational Facilities | |||||
| Authority, Revenue (Stella Maris Issue) (LOC; M&T Trust) | 0.08 | 9/7/13 | 9,695,000 | a | 9,695,000 |
| Montgomery County, EDR (George Meany Center for | |||||
| Labor Studies—The National Labor College | |||||
| Facility) (LOC; Bank of America) | 0.12 | 9/7/13 | 16,655,000 | a,b | 16,655,000 |
| Massachusetts—2.5% | |||||
| Massachusetts Health and Educational Facilities | |||||
| Authority, Revenue (Hillcrest Extended Care | |||||
| Services Issue) (LOC; Bank of America) | 0.12 | 9/7/13 | 15,525,000 | a | 15,525,000 |
| Massachusetts Health and Educational Facilities Authority, | |||||
| Revenue (Tufts University Issue) (Liquidity Facility; U.S. Bank NA) | 0.05 | 9/3/13 | 10,000,000 | a,b | 10,000,000 |
| Michigan—3.7% | |||||
| Lenawee County Economic Development Corporation, Revenue, | |||||
| Refunding (Siena Heights University Project) (LOC; FHLB) | 0.07 | 9/7/13 | 7,675,000 | a,b | 7,675,000 |
| Michigan Higher Education Facilities Authority, | |||||
| LOR (Adrian College Project) (LOC; Comerica Bank) | 0.10 | 9/7/13 | 11,875,000 | a,b | 11,875,000 |
| University of Michigan Regents, General Revenue | 0.04 | 9/3/13 | 17,880,000 | a,b | 17,880,000 |
| Minnesota—1.1% | |||||
| Minnesota Higher Education Facilities Authority, | |||||
| Revenue (Macalester College) | 0.12 | 9/7/13 | 8,565,000 | a,b | 8,565,000 |
| Saint Paul Port Authority, Tax Increment Bonds (Westgate | |||||
| Office and Industrial Center Project) (LOC; U.S. Bank NA) | 0.08 | 9/7/13 | 2,230,000 | a | 2,230,000 |
| Mississippi—3.2% | |||||
| Mississippi Business Finance Corporation, | |||||
| Gulf Opportunity Zone IDR (Chevron U.S.A. Inc. Project) | 0.05 | 9/3/13 | 21,250,000 | a | 21,250,000 |
| Mississippi Business Finance Corporation, | |||||
| Gulf Opportunity Zone IDR (Chevron U.S.A. Inc. Project) | 0.05 | 9/3/13 | 9,490,000 | a | 9,490,000 |
| Mississippi Development Bank, Special Obligation | |||||
| Revenue, Refunding (Harrison County GO | |||||
| Bonds Refunding Project) (LOC; Bank of America) | 0.12 | 9/7/13 | 2,110,000 | a | 2,110,000 |
| Missouri—1.3% | |||||
| Saint Charles County Public Water Supply District | |||||
| Number 2, COP (Project Lease Agreement) | 0.10 | 9/7/13 | 13,350,000 | a | 13,350,000 |
| Nebraska—1.3% | |||||
| Lancaster County Hospital Authority Number 1, HR, | |||||
| Refunding (BryanLGH Medical Center) (LOC; U.S. Bank NA) | 0.06 | 9/3/13 | 13,060,000 | a | 13,060,000 |
12
| BNY Mellon National Municipal Money Market Fund (continued) | |||||
| Coupon | Maturity | Principal | |||
| Short-Term Investments (continued) | Rate (%) | Date | Amount ($) | Value ($) | |
| Nevada—2.2% | |||||
| Clark County, Airport System Junior Subordinate Lien Revenue | 2.00 | 7/1/14 | 3,900,000 | 3,953,257 | |
| Deutsche Bank Spears/Lifers Trust (Series DBE-668) (Clark | |||||
| County School District, Limited Tax Building Bonds GO) (Liquidity | |||||
| Facility; Deutsche Bank AG and LOC; Deutsche Bank AG) | 0.19 | 9/7/13 | 17,975,000 | a,b,c,d | 17,975,000 |
| New Jersey—7.8% | |||||
| Bergenfield Borough, GO Notes, BAN | 1.00 | 2/28/14 | 6,390,000 | 6,400,870 | |
| Burlington County Bridge Commission, County-Guaranteed | |||||
| Pooled Loan Revenue, Refunding (Governmental Loan Program) | 3.00 | 10/15/13 | 1,045,000 | 1,048,439 | |
| Cumberland County, GO Notes, BAN | 1.50 | 12/27/13 | 1,833,000 | 1,837,969 | |
| Deutsche Bank Spears/Lifers Trust (Series DBE-511) | |||||
| (Newark Housing Authority, Marine Terminal | |||||
| Additional Rent-Backed Revenue, Refunding | |||||
| (City of Newark Redevelopment Projects)) (Liquidity | |||||
| Facility; Deutsche Bank AG and LOC; Deutsche Bank AG) | 0.16 | 9/7/13 | 3,000,000 | a,c,d | 3,000,000 |
| Garfield, GO Notes, BAN (General Bond Anticipation | |||||
| Notes and Water Utility Bond Anticipation Notes) | 1.00 | 10/15/13 | 11,433,000 | 11,439,840 | |
| Kearny Board of Education, GO Notes, GAN | 1.25 | 10/11/13 | 3,000,000 | b | 3,001,137 |
| New Jersey Economic Development Authority, EDR | |||||
| (Diocese of Metuchen Project) (LOC; Bank of America) | 0.14 | 9/7/13 | 2,000,000 | a,b | 2,000,000 |
| New Jersey Economic Development Authority, EDR, Refunding | |||||
| (Stolthaven Perth Amboy Inc. Project) (LOC; Citibank NA) | 0.07 | 9/7/13 | 23,000,000 | a | 23,000,000 |
| New Jersey Economic Development Authority, Revenue | |||||
| (Job Haines Home Project) (LOC; PNC Bank NA) | 0.08 | 9/7/13 | 3,500,000 | a | 3,500,000 |
| New Jersey Economic Development Authority, Revenue | |||||
| (The Peddie School Project) (Liquidity Facility; U.S Bank NA) | 0.06 | 9/7/13 | 995,000 | a,b | 995,000 |
| New Jersey Economic Development Authority, Revenue | |||||
| (The Peddie School Project) (Liquidity Facility; U.S. Bank NA) | 0.06 | 9/7/13 | 2,250,000 | a,b | 2,250,000 |
| New Jersey Economic Development Authority, | |||||
| Revenue (Visiting Nurse Association Home Care, Inc. | |||||
| Project) (LOC; Wells Fargo Bank) | 0.11 | 9/7/13 | 1,000,000 | a | 1,000,000 |
| Rahway, GO Notes, BAN | 1.25 | 10/2/13 | 8,000,000 | 8,003,843 | |
| Sussex County Municipal Utilities Authority, Project Note | |||||
| (Paulins Kill Basin Water Reclamation System) | 1.50 | 2/14/14 | 2,750,000 | 2,762,817 | |
| Wood-Ridge Borough, GO Notes, BAN | 1.13 | 1/17/14 | 8,500,000 | 8,516,702 | |
| New York—7.6% | |||||
| Albany Industrial Development Agency, Civic Facility | |||||
| Revenue (Albany Medical Center Hospital | |||||
| Project) (LOC; Bank of America) | 0.15 | 9/7/13 | 6,315,000 | a | 6,315,000 |
| Albany Industrial Development Agency, Civic Facility Revenue | |||||
| (Renaissance Corporation of Albany Project) (LOC; M&T Trust) | 0.11 | 9/7/13 | 2,700,000 | a | 2,700,000 |
| Amherst Industrial Development Agency, Civic Facility | |||||
| Revenue (Daemen College Project) (LOC; M&T Trust) | 0.11 | 9/7/13 | 12,000,000 | a,b | 12,000,000 |
| Dutchess County Industrial Development Agency, Civic Facility | |||||
| Revenue (Brookview, Inc. Project) (LOC; M&T Trust) | 0.11 | 9/7/13 | 8,250,000 | a | 8,250,000 |
The Funds 13
STATEMENT OF INVESTMENTS (continued)
| BNY Mellon National Municipal Money Market Fund (continued) | |||||
| Coupon | Maturity | Principal | |||
| Short-Term Investments (continued) | Rate (%) | Date | Amount ($) | Value ($) | |
| New York (continued) | |||||
| Erie County Industrial Development Agency, Civic Facility | |||||
| Revenue (The Canisius High School of Buffalo, N.Y. | |||||
| Project) (LOC; M&T Trust) | 0.11 | 9/7/13 | 18,830,000 | a,b | 18,830,000 |
| New York City Capital Resource Corporation, Recovery Zone | |||||
| Facility Revenue (WytheHotel Project) (LOC; M&T Trust) | 0.12 | 9/7/13 | 3,700,000 | a | 3,700,000 |
| New York City Industrial Development Agency, Civic Facility | |||||
| Revenue (French Institute-Alliance Francaise de | |||||
| New York—Federation of French Alliances in the | |||||
| United States Project) (LOC; M&T Trust) | 0.12 | 9/7/13 | 3,475,000 | a,b | 3,475,000 |
| New York State Dormitory Authority, Revenue | |||||
| (Beverwyck, Inc.) (LOC; Bank of America) | 0.13 | 9/7/13 | 3,700,000 | a | 3,700,000 |
| New York State Housing Finance Agency, Housing | |||||
| Revenue (25 Washington Street) (LOC; M&T Trust) | 0.16 | 9/7/13 | 7,800,000 | a | 7,800,000 |
| Onondaga County Industrial Development Agency, | |||||
| Civic Facility Revenue (Syracuse Research | |||||
| Corporation Facility) (LOC; M&T Trust) | 0.11 | 9/7/13 | 3,640,000 | a | 3,640,000 |
| Tompkins County Industrial Development Agency, | |||||
| Civic Facility Revenue (Community Development | |||||
| Properties Ithaca, Inc. Project) (LOC; M&T Trust) | 0.16 | 9/7/13 | 6,100,000 | a | 6,100,000 |
| North Carolina—.5% | |||||
| North Carolina Capital Facilities Finance Agency, Educational | |||||
| Facilities Revenue (High Point University Project) | |||||
| (LOC; Branch Banking and Trust Co.) | 0.06 | 9/7/13 | 5,025,000 | a,b | 5,025,000 |
| Ohio—3.1% | |||||
| Dayton City School District, School Facilities Construction | |||||
| and Improvement Unlimited Tax GO Notes, Refunding | 0.75 | 10/15/13 | 9,000,000 | b | 9,004,847 |
| Hamilton County, Hospital Facilities Revenue (The Elizabeth Gamble | |||||
| Deaconess Home Association) (LOC; Northern Trust Company) | 0.09 | 9/7/13 | 14,300,000 | a | 14,300,000 |
| Union Township, GO Notes, Refunding, BAN (Various Purpose) | 1.00 | 9/11/13 | 8,200,000 | 8,201,230 | |
| Pennsylvania—2.4% | |||||
| Deutsche Bank Spears/Lifers Trust (Series DBE-1021) | |||||
| (Pennsylvania Higher Education Facilities Authority, Revenue | |||||
| (Student Association, Inc. Student Housing Project at | |||||
| California University of Pennsylvania)) (Liquidity Facility; | |||||
| Deutsche Bank AG and LOC; Deutsche Bank AG) | 0.16 | 9/7/13 | 16,325,000 | a,b,c,d | 16,325,000 |
| Northampton County Higher Education Authority, | |||||
| College Revenue (Lafayette College Project) | |||||
| (Liquidity Facility; JPMorgan Chase Bank) | 0.09 | 9/7/13 | 2,300,000 | a,b | 2,300,000 |
| Philadelphia Authority for Industrial Development, | |||||
| Educational Facilities Revenue (Chestnut Hill | |||||
| College Project) (LOC; Wells Fargo Bank) | 0.16 | 9/7/13 | 5,425,000 | a,b | 5,425,000 |
14
| BNY Mellon National Municipal Money Market Fund (continued) | |||||
| Coupon | Maturity | Principal | |||
| Short-Term Investments (continued) | Rate (%) | Date | Amount ($) | Value ($) | |
| South Carolina—2.3% | |||||
| South Carolina Jobs-Economic Development Authority, EDR | |||||
| (Ashley Hall Project) (LOC; Branch Banking and Trust Co.) | 0.08 | 9/7/13 | 19,460,000 | a | 19,460,000 |
| South Carolina Jobs-Economic Development Authority, EDR | |||||
| (Lexington-Richland Alcohol and Drug Abuse Council, Inc. | |||||
| Project) (LOC; Branch Banking and Trust Co.) | 0.08 | 9/7/13 | 4,225,000 | a | 4,225,000 |
| South Dakota—1.9% | |||||
| South Dakota Health and Educational Facilities Authority, | |||||
| Revenue (Regional Health) (LOC; U.S. Bank NA) | 0.06 | 9/3/13 | 18,835,000 | a | 18,835,000 |
| Tennessee—2.2% | |||||
| Blount County Public Building Authority, Local Government | |||||
| Public Improvement Revenue (Liquidity Facility; | |||||
| Branch Banking and Trust Co.) | 0.06 | 9/7/13 | 11,850,000 | a | 11,850,000 |
| Blount County Public Building Authority, | |||||
| Local Government Public Improvement | |||||
| Revenue (LOC; Branch Banking and Trust Co.) | 0.06 | 9/7/13 | 10,300,000 | a | 10,300,000 |
| Texas—19.4% | |||||
| Atascosa County Industrial Development Corporation, PCR, | |||||
| Refunding (San Miguel Electric Cooperative, Inc. Project) | |||||
| (LOC; National Rural Utilities Cooperative Finance Corporation) | 0.13 | 9/7/13 | 34,200,000 | a | 34,200,000 |
| Crawford Education Facilities Corporation, Higher | |||||
| Education Revenue (Southwestern University Project) | 0.21 | 9/7/13 | 19,040,000 | a,b | 19,040,000 |
| El Paso, Water and Sewer Revenue, CP | |||||
| (Liquidity Facility; JPMorgan Chase Bank) | 0.16 | 9/16/13 | 10,000,000 | 10,000,000 | |
| Gulf Coast Industrial Development Authority, | |||||
| Revenue (ExxonMobil Project) | 0.03 | 9/3/13 | 11,855,000 | a | 11,855,000 |
| Harris County Cultural Education Facilities Finance | |||||
| Corporation, Revenue (The Methodist Hospital System) | 0.04 | 9/3/13 | 10,720,000 | a | 10,720,000 |
| Harris County Cultural Education Facilities Finance | |||||
| Corporation, Revenue (The Methodist Hospital System) | 0.04 | 9/3/13 | 17,375,000 | a | 17,375,000 |
| Harris County Health Facilities Development Corporation, | |||||
| Revenue, Refunding (The Methodist Hospital System) | 0.04 | 9/3/13 | 17,000,000 | a | 17,000,000 |
| Jefferson County Industrial Development Corporation, | |||||
| Hurricane Ike Disaster Area Revenue (Jefferson | |||||
| Refinery, L.L.C. Project) (LOC; Branch Banking and Trust Co.) | 0.45 | 9/25/13 | 28,900,000 | 28,900,000 | |
| Jefferson County Industrial Development Corporation, | |||||
| Hurricane Ike Disaster Area Revenue (Jefferson | |||||
| Refinery, L.L.C. Project) (LOC; Branch Banking and Trust Co.) | 0.45 | 9/25/13 | 3,000,000 | 3,000,000 | |
| Lower Colorado River Authority, Revenue, CP (Lower Colorado | |||||
| River Authority Transportation Services Corporation) | |||||
| (Liquidity Facility; JPMorgan Chase Bank) | 0.18 | 10/3/13 | 3,000,000 | 3,000,000 | |
The Funds 15
STATEMENT OF INVESTMENTS (continued)
| BNY Mellon National Municipal Money Market Fund (continued) | |||||
| Coupon | Maturity | Principal | |||
| Short-Term Investments (continued) | Rate (%) | Date | Amount ($) | Value ($) | |
| Texas (continued) | |||||
| Lower Colorado River Authority, Revenue, CP (Lower Colorado | |||||
| River Authority Transportation Services Corporation) | |||||
| (Liquidity Facility; JPMorgan Chase Bank) | 0.18 | 11/8/13 | 5,000,000 | 5,000,000 | |
| Texas, TRAN | 2.00 | 8/28/14 | 24,000,000 | 24,424,440 | |
| Texas Water Development Board, State Revolving Fund | |||||
| Subordinate Lien Revenue, Refunding (Liquidity | |||||
| Facility; JPMorgan Chase Bank) | 0.06 | 9/3/13 | 13,025,000 | a | 13,025,000 |
| Utah—.3% | |||||
| Utah Housing Corporation, MFHR | |||||
| (Timbergate Apartments Project) (LOC; FHLMC) | 0.11 | 9/7/13 | 3,125,000 | a | 3,125,000 |
| Virginia—1.5% | |||||
| Alexandria Industrial Development Authority, | |||||
| Revenue (Institute for Defense Analyses Project) | |||||
| (LOC; Branch Banking and Trust Co.) | 0.07 | 9/7/13 | 9,875,000 | a | 9,875,000 |
| Virginia College Building Authority, Educational Facilities | |||||
| Revenue (21st Century College and Equipment | |||||
| Programs) (Liquidity Facility; Wells Fargo Bank) | 0.06 | 9/3/13 | 5,505,000 | a,b | 5,505,000 |
| Washington—2.8% | |||||
| King County Housing Authority, Pooled Housing Revenue, | |||||
| Refunding (Liquidity Facility; FHLMC and LOC; FHLMC) | 0.06 | 9/7/13 | 24,715,000 | a | 24,715,000 |
| Squaxin Island Tribe, Tribal Infrastructure | |||||
| Revenue (LOC; Bank of America) | 0.18 | 9/7/13 | 3,725,000 | a | 3,725,000 |
| Wisconsin—1.2% | |||||
| Wisconsin Health and Educational Facilities Authority, | |||||
| Revenue (Cedar Crest, Inc.) (LOC; Bank of Montreal) | 0.06 | 9/7/13 | 6,985,000 | a | 6,985,000 |
| Wisconsin Rural Water Construction Loan | |||||
| Program Commission, Revenue, BAN | 1.00 | 10/1/13 | 5,500,000 | 5,503,020 | |
| Total Investments (cost $1,021,686,078) | 100.9 | % | 1,021,686,078 | |
| Liabilities, Less Cash and Receivables | (.9 | %) | (8,847,986 | ) |
| Net Assets | 100.0 | % | 1,012,838,092 |
| a Variable rate demand note—rate shown is the interest rate in effect at August 31, 2013. Maturity date represents the next demand date, or the ultimate maturity date if earlier. |
| b At August 31, 2013, the fund had $303,495,984 or 30.0% of net assets invested in securities whose payment of principal and interest is dependent upon revenues generated |
| from education. |
| c Securities exempt from registration pursuant to Rule 144A under the Securities Act of 1933.These securities may be resold in transactions exempt from registration, normally to |
| qualified institutional buyers.At August 31, 2013, these securities amounted to $64,780,000 or 6.4% of net assets. |
| d The fund does not directly own the municipal security indicated; the fund owns an interest in a special purpose entity that, in turn, owns the underlying municipal security.The |
| special purpose entity permits the fund to own interests in underlying assets, but in a manner structured to provide certain advantages not inherent in the underlying bonds (e.g., |
| enhanced liquidity, yields linked to short-term rates). |
16
| Summary of Abbreviations | |||
| ABAG | Association of Bay Area Governments | ACA | American Capital Access |
| AGC | ACE Guaranty Corporation | AGIC | Asset Guaranty Insurance Company |
| AMBAC | American Municipal Bond Assurance Corporation | ARRN | Adjustable Rate Receipt Notes |
| BAN | Bond Anticipation Notes | BPA | Bond Purchase Agreement |
| CIFG | CDC Ixis Financial Guaranty | COP | Certificate of Participation |
| CP | Commercial Paper | DRIVERS | Derivative Inverse Tax-Exempt Receipts |
| EDR | Economic Development Revenue | EIR | Environmental Improvement Revenue |
| FGIC | Financial Guaranty Insurance Company | FHA | Federal Housing Administration |
| FHLB | Federal Home Loan Bank | FHLMC | Federal Home Loan Mortgage Corporation |
| FNMA | Federal National Mortgage Association | GAN | Grant Anticipation Notes |
| GIC | Guaranteed Investment Contract | GNMA | Government National Mortgage Association |
| GO | General Obligation | HR | Hospital Revenue |
| IDB | Industrial Development Board | IDC | Industrial Development Corporation |
| IDR | Industrial Development Revenue | LIFERS | Long Inverse Floating Exempt Receipts |
| LOC | Letter of Credit | LOR | Limited Obligation Revenue |
| LR | Lease Revenue | MERLOTS | Municipal Exempt Receipts Liquidity Option Tender |
| MFHR | Multi-Family Housing Revenue | MFMR | Multi-Family Mortgage Revenue |
| PCR | Pollution Control Revenue | P-FLOATS | Puttable Floating Option Tax-Exempt Receipts |
| PILOT | Payment in Lieu of Taxes | PUTTERS | Puttable Tax-Exempt Receipts |
| RAC | Revenue Anticipation Certificates | RAN | Revenue Anticipation Notes |
| RAW | Revenue Anticipation Warrants | ROCS | Reset Options Certificates |
| RRR | Resources Recovery Revenue | SAAN | State Aid Anticipation Notes |
| SBPA | Standby Bond Purchase Agreement | SFHR | Single Family Housing Revenue |
| SFMR | Single Family Mortgage Revenue | SONYMA | State of New York Mortgage Agency |
| SPEARS | Short Puttable Exempt Adjustable Receipts | SWDR | Solid Waste Disposal Revenue |
| TAN | Tax Anticipation Notes | TAW | Tax Anticipation Warrants |
| TRAN | Tax and Revenue Anticipation Notes | XLCA | XL Capital Assurance |
| Summary of Combined Ratings (Unaudited) | ||||||
| Fitch | or | Moody’s | or | Standard & Poor’s | Value (%)† | |
| F1+,F1 | VMIG1,MIG1,P1 | SP1+,SP1,A1+,A1 | 87.4 | |||
| F2 | VMIG2,MIG2,P2 | SP2,A2 | 4.9 | |||
| AAA,AA,Ae | Aaa,Aa,Ae | AAA,AA,Ae | 1.3 | |||
| Not Ratedf | Not Ratedf | Not Ratedf | 6.4 | |||
| 100.0 | ||||||
| † Based on total investments. |
| e Notes which are not F, MIG and SP rated are represented by bond ratings of the issuers. |
| f Securities which, while not rated by Fitch, Moody’s and Standard & Poor’s, have been determined by the Manager to be of comparable quality to those rated securities in which the |
| fund may invest. |
| See notes to financial statements. |
The Funds 17
STATEMENTS OF ASSETS AND LIABILITIES
August 31, 2013
| BNY Mellon | BNY Mellon | ||
| Money Market | National Municipal | ||
| Fund | Money Market Fund | ||
| Assets ($): | |||
| Investments in securities—See Statement of Investments† | |||
| (including a Repurchase Agreement of $15,000,000 | |||
| for BNY Mellon Money Market Fund)—Note 2(c) | 391,196,870 | 1,021,686,078 | |
| Cash | 708,002 | 749,179 | |
| Interest receivable | 314,239 | 608,278 | |
| Receivable for investment securities sold | — | 14,400,000 | |
| Prepaid expenses | 6,994 | 8,620 | |
| 392,226,105 | 1,037,452,155 | ||
| Liabilities ($): | |||
| Due to The Dreyfus Corporation and affiliates—Note 3(b) | 32,150 | 26,062 | |
| Due to Administrator—Note 3(a) | 42,221 | 104,146 | |
| Payable for shares of investment securities purchased | — | 24,424,440 | |
| Accrued expenses | 48,450 | 59,415 | |
| 122,821 | 24,614,063 | ||
| Net Assets ($) | 392,103,284 | 1,012,838,092 | |
| Composition of Net Assets ($): | |||
| Paid-in capital | 392,099,770 | 1,014,254,580 | |
| Accumulated net realized gain (loss) on investments | 3,514 | (1,416,488 | ) |
| Net Assets ($) | 392,103,284 | 1,012,838,092 | |
| Net Asset Value Per Share | |||
| Class M Shares | |||
| Net Assets ($) | 387,462,821 | 1,009,973,289 | |
| Shares Outstanding | 387,462,129 | 1,011,386,670 | |
| Net Asset Value Per Share ($) | 1.00 | 1.00 | |
| Investor Shares | |||
| Net Assets ($) | 4,640,463 | 2,864,803 | |
| Shares Outstanding | 4,640,435 | 2,868,825 | |
| Net Asset Value Per Share ($) | 1.00 | 1.00 | |
| † Investments at cost ($) | 391,196,870 | 1,021,686,078 |
| See notes to financial statements. |
18
STATEMENTS OF OPERATIONS
Year Ended August 31, 2013
| BNY Mellon | BNY Mellon | |||
| Money Market | National Municipal | |||
| Fund | Money Market Fund | |||
| Investment Income ($): | ||||
| Interest Income | 1,268,253 | 2,729,473 | ||
| Expenses: | ||||
| Investment advisory fee—Note 3(a) | 949,796 | 1,788,265 | ||
| Administration fee—Note 3(a) | 782,673 | 1,473,603 | ||
| Custodian fees—Note 3(b) | 70,173 | 81,736 | ||
| Professional fees | 47,645 | 66,789 | ||
| Trustees’ fees and expenses—Note 3(c) | 36,483 | 69,691 | ||
| Registration fees | 30,281 | 30,533 | ||
| Shareholder servicing costs—Note 3(b) | 12,287 | 3,577 | ||
| Prospectus and shareholders’ reports | 10,392 | 8,370 | ||
| Miscellaneous | 27,584 | 49,450 | ||
| Total Expenses | 1,967,314 | 3,572,014 | ||
| Less—reduction in expenses due to undertakings—Note 3(a) | (698,293 | ) | (844,331 | ) |
| Less—reduction in fees due to earnings credits—Note 3(b) | (1,022 | ) | (1 | ) |
| Net Expenses | 1,267,999 | 2,727,682 | ||
| Investment Income—Net | 254 | 1,791 | ||
| Net Realized Gain (Loss) on Investments—Note 2(b) ($) | 5,547 | 43,129 | ||
| Net Increase in Net Assets Resulting from Operations | 5,801 | 44,920 |
| See notes to financial statements. |
The Funds 19
STATEMENTS OF CHANGES IN NET ASSETS
| BNY Mellon National Municipal | ||||||||
| BNY Mellon Money Market Fund | Money Market Fund | |||||||
| Year Ended August 31, | Year Ended August 31, | |||||||
| 2013 | 2012 | 2013 | 2012 | |||||
| Operations ($): | ||||||||
| Investment income—net | 254 | 357 | 1,791 | 1,109 | ||||
| Net realized gain (loss) from investments | 5,547 | 600 | 43,129 | 20,434 | ||||
| Net Increase (Decrease) in Net Assets | ||||||||
| Resulting from Operations | 5,801 | 957 | 44,920 | 21,543 | ||||
| Dividends to Shareholders from ($): | ||||||||
| Investment income—net: | ||||||||
| Class M Shares | (849 | ) | (3,143 | ) | (1,791 | ) | (1,109 | ) |
| Investor Shares | (5 | ) | (8 | ) | — | — | ||
| Total Dividends | (854 | ) | (3,151 | ) | (1,791 | ) | (1,109 | ) |
| Beneficial Interest Transactions ($1.00 per share): | ||||||||
| Net proceeds from shares sold: | ||||||||
| Class M Shares | 933,333,326 | 1,815,675,115 | 2,093,516,866 | 2,470,726,782 | ||||
| Investor Shares | 12,316,323 | 22,198,820 | 7,122,756 | 4,424,263 | ||||
| Dividends reinvested: | ||||||||
| Investor Shares | 4 | 8 | — | — | ||||
| Cost of shares redeemed: | ||||||||
| Class M Shares | (1,403,475,897 | ) | (1,964,183,372 | ) | (2,400,255,910 | ) | (2,506,842,284 | ) |
| Investor Shares | (18,015,562 | ) | (13,381,228 | ) | (5,276,615 | ) | (3,673,895 | ) |
| Increase (Decrease) in Net Assets from | ||||||||
| Beneficial Interest Transactions | (475,841,806 | ) | (139,690,657 | ) | (304,892,903 | ) | (35,365,134 | ) |
| Total Increase (Decrease) In Net Assets | (475,836,859 | ) | (139,692,851 | ) | (304,849,774 | ) | (35,344,700 | ) |
| Net Assets ($): | ||||||||
| Beginning of Period | 867,940,143 | 1,007,632,994 | 1,317,687,866 | 1,353,032,566 | ||||
| End of Period | 392,103,284 | 867,940,143 | 1,012,838,092 | 1,317,687,866 | ||||
| See notes to financial statements. |
20
FINANCIAL HIGHLIGHTS
The following tables describe the performance for each share class of each BNY Mellon money market fund for the fiscal periods indicated.All information reflects financial results for a single fund share.Total return shows how much your investment in each fund would have increased (or decreased) during each period, assuming you had reinvested all dividends and distributions. These figures have been derived from the funds’ financial statements.
| Class M Shares | ||||||||||
| Year Ended August 31, | ||||||||||
| BNY Mellon Money Market Fund | 2013 | 2012 | 2011 | 2010 | 2009 | |||||
| Per Share Data ($): | ||||||||||
| Net asset value, beginning of period | 1.00 | 1.00 | 1.00 | 1.00 | 1.00 | |||||
| Investment Operations: | ||||||||||
| Investment income—net | .000 | a | .000 | a | .000 | a | .001 | .012 | ||
| Distributions: | ||||||||||
| Dividends from investment income—net | (.000 | )a | (.000 | )a | (.000 | )a | (.001 | ) | (.012 | ) |
| Net asset value, end of period | 1.00 | 1.00 | 1.00 | 1.00 | 1.00 | |||||
| Total Return (%) | .00 | b | .00 | b | .02 | .07 | 1.24 | |||
| Ratios/Supplemental Data (%): | ||||||||||
| Ratio of total expenses to average net assets | .31 | .30 | .30 | .30 | .33 | |||||
| Ratio of net expenses to average net assets | .20 | .21 | .26 | .29 | .33 | |||||
| Ratio of net investment income to average net assets | .00 | b | .00 | b | .02 | .07 | 1.08 | |||
| Net Assets, end of period ($ x 1,000) | 387,463 | 857,600 | 1,006,111 | 1,092,771 | 1,934,739 | |||||
| a | Amount represents less than $.001 per share. |
| b | Amount represents less than .01%. |
| See notes to financial statements. | |
The Funds 21
FINANCIAL HIGHLIGHTS (continued)
| Investor Shares | ||||||||||
| Year Ended August 31, | ||||||||||
| BNY Mellon Money Market Fund | 2013 | 2012 | 2011 | 2010 | 2009 | |||||
| Per Share Data ($): | ||||||||||
| Net asset value, beginning of period | 1.00 | 1.00 | 1.00 | 1.00 | 1.00 | |||||
| Investment Operations: | ||||||||||
| Investment income—net | .000 | a | .000 | a | .000 | a | .000 | a | .010 | |
| Distributions: | ||||||||||
| Dividends from investment income—net | (.000 | )a | (.000 | )a | (.000 | )a | (.000 | )a | (.010 | ) |
| Net asset value, end of period | 1.00 | 1.00 | 1.00 | 1.00 | 1.00 | |||||
| Total Return (%) | .00 | b | .00 | b | .00 | b | .00 | b | .99 | |
| Ratios/Supplemental Data (%): | ||||||||||
| Ratio of total expenses to average net assets | .56 | .58 | .55 | .55 | .58 | |||||
| Ratio of net expenses to average net assets | .19 | .22 | .26 | .38 | .58 | |||||
| Ratio of net investment income to average net assets | .00 | b | .00 | b | .00 | b | .00 | b | .97 | |
| Net Assets, end of period ($ x 1,000) | 4,640 | 10,340 | 1,522 | 312 | 1,701 | |||||
| a | Amount represents less than $.001 per share. |
| b | Amount represents less than .01%. |
| See notes to financial statements. | |
22
| Class M Shares | ||||||||||
| Year Ended August 31, | ||||||||||
| BNY Mellon National Municipal Money Market Fund | 2013 | 2012 | 2011 | 2010 | 2009 | |||||
| Per Share Data ($): | ||||||||||
| Net asset value, beginning of period | 1.00 | 1.00 | 1.00 | 1.00 | 1.00 | |||||
| Investment Operations: | ||||||||||
| Investment income—net | .000 | a | .000 | a | .000 | a | .000 | a | .008 | |
| Distributions: | ||||||||||
| Dividends from investment income—net | (.000 | )a | (.000 | )a | (.000 | )a | (.000 | )a | (.008 | ) |
| Net asset value, end of period | 1.00 | 1.00 | 1.00 | 1.00 | 1.00 | |||||
| Total Return (%) | .00 | b | .00 | b | .03 | .05 | .79 | |||
| Ratios/Supplemental Data (%): | ||||||||||
| Ratio of total expenses to average net assets | .30 | .30 | .29 | .30 | .35 | |||||
| Ratio of net expenses to average net assets | .23 | .22 | .26 | .28 | .34 | |||||
| Ratio of net investment income to average net assets | .00 | b | .00 | b | .03 | .04 | .80 | |||
| Net Assets, end of period ($ x 1,000) | 1,009,973 | 1,316,666 | 1,352,760 | 1,551,274 | 1,770,608 | |||||
| a | Amount represents less than $.001 per share. |
| b | Amount represents less than .01%. |
| See notes to financial statements. | |
The Funds 23
FINANCIAL HIGHLIGHTS (continued)
| Investor Shares | ||||||||||
| Year Ended August 31, | ||||||||||
| BNY Mellon National Municipal Money Market Fund | 2013 | 2012 | 2011 | 2010 | 2009 | |||||
| Per Share Data ($): | ||||||||||
| Net asset value, beginning of period | 1.00 | 1.00 | 1.00 | 1.00 | 1.00 | |||||
| Investment Operations: | ||||||||||
| Investment income—net | .000 | a | .000 | a | .000 | a | .000 | a | .006 | |
| Distributions: | ||||||||||
| Dividends from investment income—net | (.000 | )a | (.000 | )a | (.000 | )a | (.000 | )a | (.006 | ) |
| Net asset value, end of period | 1.00 | 1.00 | 1.00 | 1.00 | 1.00 | |||||
| Total Return (%) | .00 | b | .00 | b | .00 | b | .00 | b | .60 | |
| Ratios/Supplemental Data (%): | ||||||||||
| Ratio of total expenses to average net assets | .57 | .56 | .54 | .55 | .60 | |||||
| Ratio of net expenses to average net assets | .24 | .23 | .29 | .33 | .53 | |||||
| Ratio of net investment income to average net assets | .00 | b | .00 | b | .00 | b | .00 | b | .57 | |
| Net Assets, end of period ($ x 1,000) | 2,865 | 1,022 | 272 | 1 | 1 | |||||
| a | Amount represents less than $.001 per share. |
| b | Amount represents less than .01%. |
| See notes to financial statements. | |
24
NOTES TO FINANCIAL STATEMENTS
The Funds 25
NOTES TO FINANCIAL STATEMENTS (continued)
26
The Funds 27
NOTES TO FINANCIAL STATEMENTS (continued)
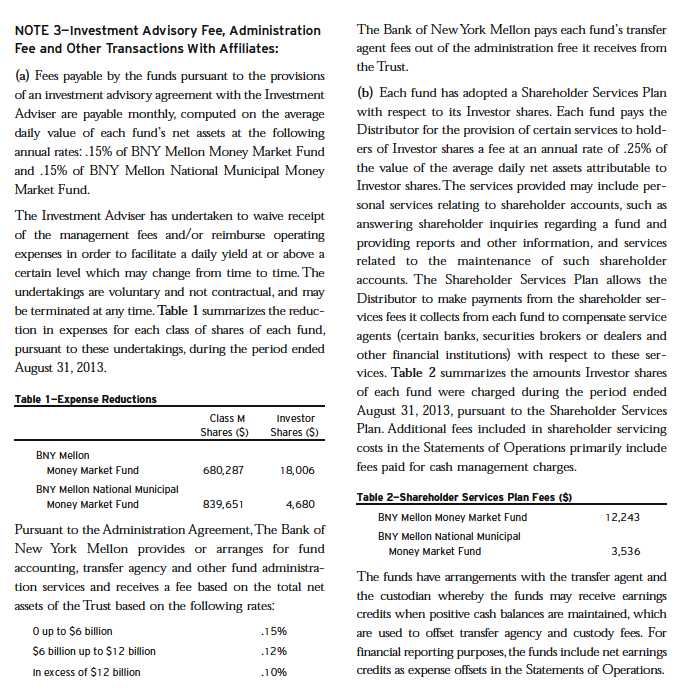
28
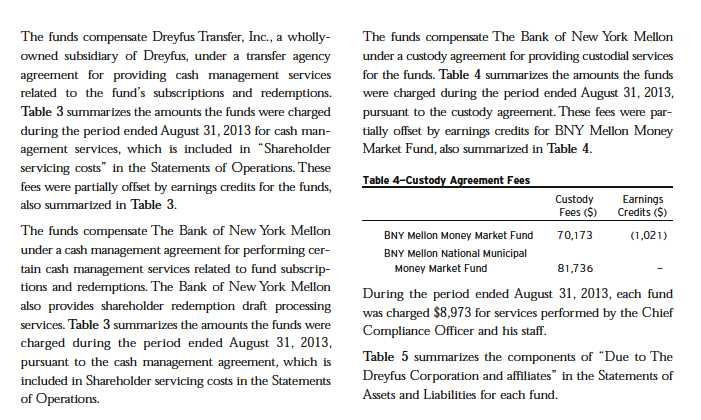
| Table 3—Cash Management Agreement Fees | |||
| Dreyfus Transfer, Inc. | The Bank of New York | ||
| Cash Management | Dreyfus Transfer, Inc. | Mellon Cash | |
| Fees ($) | Earnings Credits ($) | Management Fees ($) | |
| BNY Mellon Money Market Fund | 7 | 1 | 4 |
| BNY Mellon National Municipal Money Market Fund | 5 | 1 | 2 |
| Table 5—Due to The Dreyfus Corporation and Affiliates | ||||||
| Investment | Shareholder | Chief | ||||
| Advisory | Services | Custody | Compliance | Less Expense | ||
| Fees ($) | Plan Fees ($) | Fees ($) | Officer Fees ($) | Reimbursement ($) | ||
| BNY Mellon Money Market Fund | 50,978 | 977 | 24,571 | 6,172 | (50,548 | ) |
| BNY Mellon National Municipal Money Market Fund | 125,881 | 443 | 31,994 | 6,172 | (138,428 | ) |
The Funds 29
NOTES TO FINANCIAL STATEMENTS (continued)
30
REPORT OF INDEPENDENT REGISTERED PUBLIC ACCOUNTING FIRM
![]()
The Funds 31
IMPORTANT TAX INFORMATION (Unaudited)
32
INFORMATION ABOUT THE RENEWAL OF EACH FUND’S INVESTMENT
ADVISORY AGREEMENT AND ADMINISTRATION AGREEMENT (Unaudited)
The Funds 33
INFORMATION ABOUT THE RENEWAL OF EACH FUND’S INVESTMENT ADVISORY AGREEMENT
AND ADMINISTRATION AGREEMENT (Unaudited) (continued)
34
The Funds 35
BOARD MEMBERS INFORMATION (Unaudited)
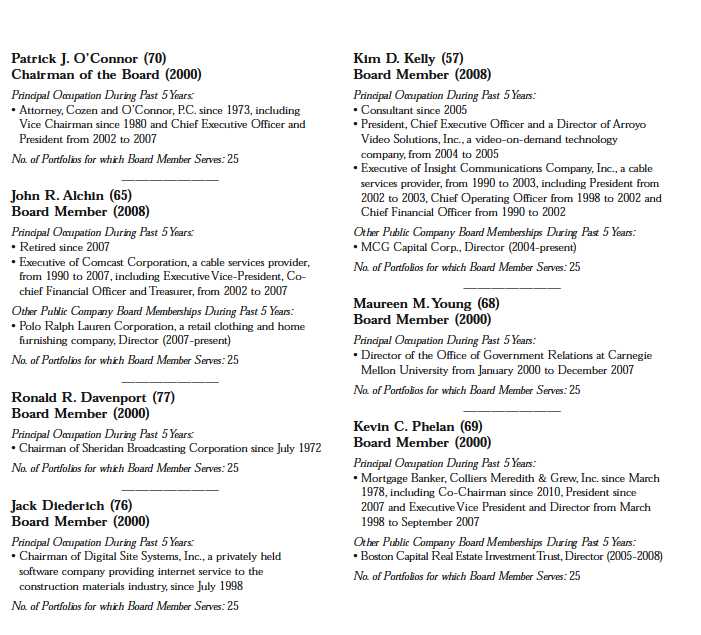
36
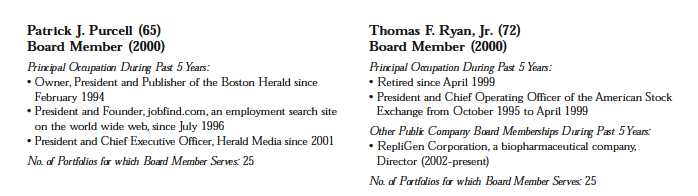
| Once elected all Board Members serve for an indefinite term.The address of the Board Members and Officers is c/o The Dreyfus Corporation, 200 Park Avenue, New |
| York, NewYork 10166.Additional information about the Board Members is available in the fund’s Statement of Additional Information which can be obtained from |
| Dreyfus free of charge by calling this toll free number: 1-800-DREYFUS. For individual account holders for Private Wealth Management clients, please contact your |
| account officer or call 1-888-281-7350. |
The Funds 37
OFFICERS OF THE FUND (Unaudited)
38

The Funds 39
Item 2. Code of Ethics.
The Registrant has adopted a code of ethics that applies to the Registrant's principal executive officer, principal financial officer, principal accounting officer or controller, or persons performing similar functions. There have been no amendments to, or waivers in connection with, the Code of Ethics during the period covered by this Report.
Item 3. Audit Committee Financial Expert.
The Registrant's Board has determined that Thomas F. Ryan, a member of the Audit Committee of the Board, is an audit committee financial expert as defined by the Securities and Exchange Commission (the "SEC"). Mr. Ryan is "independent" as defined by the SEC for purposes of audit committee financial expert determinations.
Item 4. Principal Accountant Fees and Services.
(a) Audit Fees. The aggregate fees billed for each of the last two fiscal years (the "Reporting Periods") for professional services rendered by the Registrant's principal accountant (the "Auditor") for the audit of the Registrant's annual financial statements or services that are normally provided by the Auditor in connection with the statutory and regulatory filings or engagements for the Reporting Periods, were $619,485 in 2012 and $606,600 in 2013.
(b) Audit-Related Fees. The aggregate fees billed in the Reporting Periods for assurance and related services by the Auditor that are reasonably related to the performance of the audit of the Registrant's financial statements and are not reported under paragraph (a) of this Item 4 were $90,570 in 2012 and $93,980 in 2013. These services consisted of one or more of the following: (i) agreed upon procedures related to compliance with Internal Revenue Code section 817(h), (ii) security counts required by Rule 17f-2 under the Investment Company Act of 1940, as amended, (iii) advisory services as to the accounting or disclosure treatment of Registrant transactions or events and (iv) advisory services to the accounting or disclosure treatment of the actual or potential impact to the Registrant of final or proposed rules, standards or interpretations by the Securities and Exchange Commission, the Financial Accounting Standards Boards or other regulatory or standard-setting bodies.
The aggregate fees billed in the Reporting Periods for non-audit assurance and related services by the Auditor to the Registrant's investment adviser (not including any sub-investment adviser whose role is primarily portfolio management and is subcontracted with or overseen by another investment adviser), and any entity controlling, controlled by or under common control with the investment adviser that provides ongoing services to the Registrant ("Service Affiliates"), that were reasonably related to the performance of the annual audit of the Service Affiliate, which required pre-approval by the Audit Committee were $0 in 2012 and $0 in 2013.
(c) Tax Fees. The aggregate fees billed in the Reporting Periods for professional services rendered by the Auditor for tax compliance, tax advice, and tax planning ("Tax Services") were $60,810 in 2012 and $62,640 in 2013. These services consisted of the review or preparation of U.S. federal, state, local and excise tax returns. The aggregate fees billed in the Reporting Periods for Tax Services by the Auditor to Service Affiliates, which required pre-approval by the Audit Committee were $0 in 2012 and $0 in 2013.
(d) All Other Fees. The aggregate fees billed in the Reporting Periods for products and services provided by the Auditor, other than the services reported in paragraphs (a) through (c) of this Item, were $0 in 2012 and $0 in 2013.
The aggregate fees billed in the Reporting Periods for Non-Audit Services by the Auditor to Service Affiliates, other than the services reported in paragraphs (b) through (c) of this Item, which required pre-approval by the Audit Committee, were $0 in 2012 and $0 in 2013.
(e)(1) Audit Committee Pre-Approval Policies and Procedures. The Registrant’s Audit Committee has established policies and procedures (the Policy”) for pre-approval (within specified fee limits) of the Auditor’s engagements for non-audit services to the Registrant and Service Affiliates without specific case-by-case consideration. The pre-approved services in the Policy can include pre-approved audit services, pre-approved audit-related services, pre-approved tax services and pre-approved all other services. Pre-approval considerations include whether the proposed services are compatible with maintaining the Auditor’s independence. Pre-approvals pursuant to the Policy are considered annually.
(e)(2)None of the services described in paragraphs (b) through (d) of this Item 4 were approved by the Audit Committee pursuant to paragraph (c)(7)(i)(C) of Rule 2-01 of Regulation S-X.
(f) None of the hours expended on the principal accountant’s engagement to audit the registrant’s financial statements for the most recent fiscal year were attributed to work performed by persons other than the principal account’s full-time, permanent employees.
Non-Audit Fees. The aggregate non-audit fees billed by the Auditor for services rendered to the Registrant, and rendered to Service Affiliates, for the Reporting Periods were $11,572,646 in 2012 and $13,902,636 in 2013.
Auditor Independence. The Registrant's Audit Committee has considered whether the provision of non-audit services that were rendered to Service Affiliates, which were not pre-approved (not requiring pre-approval), is compatible with maintaining the Auditor's independence.
Item 5. Audit Committee of Listed Registrants.
Not applicable.
Item 6. Investments.
(a) Not applicable.
Item 7. Disclosure of Proxy Voting Policies and Procedures for Closed-End Management Investment Companies.
Not applicable.
Item 8. Portfolio Managers of Closed-End Management Investment Companies.
Not applicable.
Item 9. Purchases of Equity Securities by Closed-End Management Investment Companies and Affiliated Purchasers.
Not applicable.
Item 10. Submission of Matters to a Vote of Security Holders.
There have been no material changes to the procedures applicable to Item 10.
Item 11. Controls and Procedures.
(a) The Registrant's principal executive and principal financial officers have concluded, based on their evaluation of the Registrant's disclosure controls and procedures as of a date within 90 days of the filing date of this report, that the Registrant's disclosure controls and procedures are reasonably designed to ensure that information required to be disclosed by the Registrant on Form N-CSR is recorded, processed, summarized and reported within the required time periods and that information required to be disclosed by the Registrant in the reports that it files or submits on Form N-CSR is accumulated and communicated to the Registrant's management, including its principal executive and principal financial officers, as appropriate to allow timely decisions regarding required disclosure.
(b) There were no changes to the Registrant's internal control over financial reporting that occurred during the second fiscal quarter of the period covered by this report that have materially affected, or are reasonably likely to materially affect, the Registrant's internal control over financial reporting.
Item 12. Exhibits.
(a)(1) Code of ethics referred to in Item 2.
(a)(2) Certifications of principal executive and principal financial officers as required by Rule 30a-2(a) under the Investment Company Act of 1940.
(a)(3) Not applicable.
(b) Certification of principal executive and principal financial officers as required by Rule 30a-2(b) under the Investment Company Act of 1940.
SIGNATURES
Pursuant to the requirements of the Securities Exchange Act of 1934 and the Investment Company Act of 1940, the Registrant has duly caused this Report to be signed on its behalf by the undersigned, thereunto duly authorized.
BNY Mellon Funds Trust
|
By: /s/ David K. Mossman | |
|
David K. Mossman, President
| |
|
Date: |
October 22, 2013 |
|
| |
|
Pursuant to the requirements of the Securities Exchange Act of 1934 and the Investment Company Act of 1940, this Report has been signed below by the following persons on behalf of the Registrant and in the capacities and on the dates indicated. | |
|
| |
|
By: /s/ David K. Mossman | |
|
David K. Mossman, President
| |
|
Date: |
October 22, 2013 |
|
| |
|
By: /s/ James Windels | |
|
James Windels, Treasurer
| |
|
Date: |
October 22, 2013 |
|
| |
EXHIBIT INDEX
(a)(1) Code of ethics referred to in Item 2.
(a)(2) Certifications of principal executive and principal financial officers as required by Rule 30a-2(a) under the Investment Company Act of 1940. (EX-99.CERT)
(b) Certification of principal executive and principal financial officers as required by Rule 30a-2(b) under the Investment Company Act of 1940. (EX-99.906CERT)