UNITED STATES
SECURITIES AND EXCHANGE COMMISSION
WASHINGTON, D.C. 20549
FORM 10-K
(Mark One)
x | ANNUAL REPORT PURSUANT TO SECTION 13 OR 15(d) OF THE SECURITIES EXCHANGE ACT OF 1934 |
For the fiscal year ended December 31, 2015
OR
¨ | TRANSITION REPORT PURSUANT TO SECTION 13 OR 15(d) OF THE SECURITIES EXCHANGE ACT OF 1934 |
For the transition period from to
Commission file number 0-30777
PACIFIC MERCANTILE BANCORP
(Exact name of Registrant as specified in its charter)
California | 33-0898238 | |
(State or other jurisdiction of incorporation or organization) | (I.R.S. Employer Identification No.) | |
949 South Coast Drive, Suite 300, Costa Mesa, California | 92626 | |
(Address of principal executive offices) | (Zip Code) | |
(714) 438-2500
(Registrant’s telephone number, including area code)
Securities registered pursuant to Section 12(b) of the Act:
Title of each class registered | Name of each Exchange on which registered | |
Common Stock without par value | NASDAQ Global Select Market | |
Securities registered pursuant to Section 12(g) of the Act: None
Indicate by check mark if the registrant is a well-known seasoned issuer, as defined in Rule 405 of the Securities Act. Yes ¨ No x.
Indicate by check mark if the registrant is not required to file reports pursuant to Section 13 of 15(d) of the Act. Yes ¨ No x.
Indicate by check mark whether the registrant (1) has filed all reports required to be filed by Section 13 or 15(d) of the Securities Exchange Act of 1934 during the preceding 12 months (or for such shorter period that the registrant was required to file such reports); and (2) has been subject to such filing requirements for the past 90 days. Yes x No ¨
Indicate by check mark whether the registrant has submitted electronically and posted on its corporate Web site, if any, every Interactive Data File required to be submitted and posted pursuant to Rule 405 of Regulation S-T (§232.405 of this chapter) during the preceding 12 months (or for such shorter period that the registrant was required to submit and post such files). Yes x No ¨.
Indicate by check mark if disclosure of delinquent filers pursuant to Item 405 of Regulation S-K is not contained herein, and will not be contained, to the best of registrant’s knowledge, in definitive proxy or information statements incorporated by reference in Part III of this Form 10-K or any amendment to this Form 10-K. ¨
Indicate by check mark whether the registrant is a large accelerated filer, an accelerated filer, a non-accelerated filer or a smaller reporting company. See definitions of “large accelerated filer,” “accelerated filer,” “non-accelerated filer,” and “smaller reporting company” in Rule 12b-2 of the Exchange Act. (Check one):
Large accelerated filer | o | Accelerated filer | x | |||
Non-accelerated filer | o | Smaller reporting company | o | |||
Indicate by check mark whether the registrant is a shell company (as defined in Securities Exchange Act Rule 12b-2). Yes ¨ No x
The aggregate market value of voting shares held by non-affiliates of registrant as of the last business day of the registrant's most recently completed second fiscal quarter, which was determined on the basis of the closing price of registrant’s shares of common stock on June 30, 2015, was approximately $96,915,852.
As of March 9, 2016, there were 22,912,299 shares of Common Stock outstanding.
DOCUMENTS INCORPORATED BY REFERENCE
Except as otherwise stated therein, Part III of the Form 10-K is incorporated by reference from the Registrant’s Definitive Proxy Statement which is expected to be filed with the Commission on or before April 29, 2016 for its 2016 Annual Meeting of Shareholders.
PACIFIC MERCANTILE BANCORP
ANNUAL REPORT ON FORM 10K
FOR THE YEAR ENDED DECEMBER 31, 2015
TABLE OF CONTENTS
Page No. | ||
i
FORWARD LOOKING STATEMENTS
Statements contained in this Annual Report on Form 10-K (this “Report”) that are not historical facts or that discuss our expectations, beliefs or views regarding our future operations or future financial performance, or financial or other trends in our business or in the markets in which we operate, constitute “forward-looking statements” within the meaning of Section 27A of the Securities Act of 1933, as amended (the "Securities Act"), and Section 21E of the Securities Exchange Act of 1934, as amended (the "Exchange Act"). Forward-looking statements can be identified by the fact that they do not relate strictly to historical or current facts. Often, they include words such as “believe,” “expect,” “anticipate,” “intend,” “plan,” “estimate,” “project,” “forecast,” or words of similar meaning, or future or conditional verbs such as “will,” “would,” “should,” “could,” or “may.” The information contained in such forward-looking statements is based on current information available to us and on assumptions that we make about future economic and market conditions and other events over which we do not have control. In addition, our business and the markets in which we operate are subject to a number of risks and uncertainties. Such risks and uncertainties, and the occurrence of events in the future or changes in circumstances that had not been anticipated, could cause our financial condition or actual operating results in the future to differ materially from our expected financial condition or operating results that are set forth in the forward-looking statements contained in this Report and could, therefore, also affect the price performance of our shares.
In addition to the risk of incurring loan losses, which is an inherent risk of the banking business, these risks and uncertainties include, but are not limited to, the following: the risk that the economic recovery in the United States, which is improving but still relatively fragile, will be adversely affected by domestic or international economic conditions, which could cause us to incur additional loan losses and adversely affect our results of operations in the future; the risk that our interest margins and, therefore, our net interest income will be adversely affected by changes in prevailing interest rates; the risk that we will not succeed in further reducing our remaining nonperforming assets, in which event we would face the prospect of further loan charge-offs and write-downs of assets; the risk that we will not be able to manage our interest rate risks effectively, in which event our operating results could be harmed; the prospect that government regulation of banking and other financial services organizations will increase, causing our costs of doing business to increase and restricting our ability to take advantage of business and growth opportunities; the risk that our efforts to develop a robust commercial banking platform may not succeed; and the risk that we may be unable to realize our expected level of increasing deposit inflows. See Item 1A “Risk Factors” in this Report for additional information regarding these and other risks and uncertainties to which our business is subject.
Due to the risks and uncertainties we face, readers are cautioned not to place undue reliance on the forward-looking statements contained in this Report, which speak only as of the date of this Report, or to make predictions about future performance based solely on historical financial performance. We also disclaim any obligation to update forward-looking statements contained in this Report as a result of new information, future events or otherwise, except as may otherwise be required by law.
1
PART I
ITEM 1. BUSINESS
Background
Pacific Mercantile Bancorp is a California corporation that owns 100% of the stock of Pacific Mercantile Bank, a California state chartered commercial bank (which, for convenience, will sometimes be referred to in this report as the “Bank”). The capital stock of the Bank is our principal asset and substantially all of our business operations are conducted and substantially all of our assets are owned by the Bank which, as a result, accounts for substantially all of our revenues, expenses and income. As the owner of a commercial bank, Pacific Mercantile Bancorp is registered as a bank holding company under the Bank Holding Company Act of 1956, as amended (the “Bank Holding Company Act”), and, as such, our operations are regulated by the Board of Governors of the Federal Reserve System (the “Federal Reserve Board” or the “FRB”) and the Federal Reserve Bank of San Francisco (“FRBSF”) under delegated authority from the FRB. See “Supervision and Regulation” below in this Item 1 of this Report. PM Asset Resolution, Inc. (“PMAR”) is a wholly owned subsidiary of Pacific Mercantile Bancorp, which exists for the purpose of purchasing certain non-performing loans and other real estate from the Bank and thereafter collecting on or disposing of those assets. For ease of reference, we will sometimes use the terms “Company,” “we,” “our,” or “us” in this Report to refer to Pacific Mercantile Bancorp on a consolidated basis and “PM Bancorp,” “Bancorp”or “PMBC” to refer to Pacific Mercantile Bancorp on a “stand-alone” or unconsolidated basis.
The Bank, which is headquartered in Orange County, California, approximately 40 miles south of Los Angeles, conducts a commercial banking business in Orange, Los Angeles, San Bernardino and San Diego counties in Southern California. The Bank is also a member of the Federal Reserve System and its deposits are insured, to the maximum extent permitted by law, by the Federal Deposit Insurance Corporation (the “FDIC”).
The Bank commenced business in March 1999, with the opening of its first financial center, located in Newport Beach, California, and in April 1999 it launched its online banking site at www.pmbank.com. Between August 1999 and July 2005, we opened six additional financial centers as part of an expansion of our banking franchise into Los Angeles, San Diego and San Bernardino counties in Southern California. Set forth below is information regarding our current financial centers.
Banking and Financial Center | County | Date Opened for Business | |
Newport Beach, California | Orange | March 1999 | |
San Juan Capistrano, California | Orange | August 1999 | |
Costa Mesa, California | Orange | June 2001 | |
Beverly Hills, California | Los Angeles | July 2001 | |
La Jolla, California | San Diego | June 2002 | |
La Habra, California | Orange | September 2003 | |
Ontario, California | San Bernardino | July 2005 | |
The Bank's commercial lending solutions include working capital lines of credit and asset based lending, 7(a) and 504 Small Business Administration ("SBA") loans, commercial real estate loans, growth capital loans, equipment financing, letters of credit and corporate credit cards. The Bank's depository and corporate banking services include cash and treasury management solutions, interest-bearing term deposit accounts, checking accounts, automated clearinghouse (“ACH”) payment and wire solutions, fraud protection, remote deposit capture, courier services, and online banking. Additionally, the Bank serves clients operating in the global marketplace through services including letters of credit and import/export financing.
The Bank attracts the majority of its loan and deposit business from the numerous small and middle market companies located in the Southern California region. The Bank reserves the right to change its business plan at any time, and no assurance can be given that, if the Bank's proposed business plan is followed, it will prove successful.
Our Business Strategy
We plan to expand our business by adhering to a business plan that is focused on building and growing a banking organization offering our customers the best attributes of a community bank, which are personalized and responsive service, while also offering the more sophisticated services of the big banks.
We will continue to focus our services and offer products primarily to small to mid-size businesses in order to achieve internal growth of our banking franchise. We believe this focus will enable us to grow our loan portfolio and other earning assets and increase our core deposits (consisting of non-interest bearing demand, and lower cost savings and money market deposits), with a goal to increase our net interest margin and improve our profitability. We also believe that, with our technology systems in
2
place, we have the capability to significantly increase the volume of banking transactions without having to incur the cost or disruption of a major computer enhancement program.
Following our transition to a commercial banking model, it has become clear that our current client base is well served through our treasury management tools and rarely makes use of full-service branches. We are exploring opportunities to reduce the size of certain branches and redeploy the cost savings to expand our business development team. As we add more relationship managers, we believe we can better penetrate our core markets and accelerate the growth of our commercial customer base.
Our Commercial Banking Operations
We seek to meet the banking needs of small and mid-size businesses and professional firms by providing our customers with:
• | A broad range of loan and deposit products and banking and financial services, more typically offered by larger banks, in order to gain a competitive advantage over independent or community banks that do not provide the same range or breadth of services that we are able to provide to our customers; and |
• | A high level of personal service and responsiveness, more typical of independent and community banks, which we believe gives us a competitive advantage over large out-of-state and other large multi-regional banks that are unable, or unwilling, due to the expense involved, to provide that same level of personal service to this segment of the banking market. |
Deposit Products
Deposits are a bank’s principal source of funds for making loans and acquiring other interest earning assets. Additionally, the interest expense that a bank must incur to attract and maintain deposits has a significant impact on its operating results. A bank’s interest expense, in turn, will be determined in large measure by the types of deposits that it offers to, and is able to attract from, its customers. Generally, banks seek to attract “core deposits” which consist of demand deposits that bear no interest and low cost interest-bearing checking, savings and money market deposits. By comparison, time deposits (also sometimes referred to as “certificates of deposit”), including those in denominations of $100,000 or more, usually bear much higher interest rates and are more interest-rate sensitive and volatile than core deposits. A bank that is not able to attract significant amounts of core deposits must rely on more expensive time deposits or alternative sources of cash, such as Federal Home Loan Bank (“FHLB”) borrowings, to fund interest-earning assets, which means that its costs of funds are likely to be higher and, as a result, its net interest margin is likely to be lower than a bank with a higher proportion of core deposits. See “MANAGEMENT’S DISCUSSION AND ANALYSIS OF FINANCIAL CONDITION AND RESULTS OF OPERATIONS — Results of Operations-Net Interest Income” in Item 7 of this Report.
The following table sets forth information regarding the composition, by type of deposits, maintained by our customers during the year ended and as of December 31, 2015:
Year-to-Date Average Balance December 31, 2015 | Balance at December 31, 2015 | ||||||
(Dollars in thousands) | |||||||
Type of Deposit | |||||||
Noninterest-bearing checking accounts(1) | $ | 237,371 | $ | 249,676 | |||
Interest-bearing checking accounts | 40,916 | 51,210 | |||||
Money market and savings deposits | 300,088 | 312,628 | |||||
Certificates of deposit(2) | 308,529 | 280,326 | |||||
Totals | $ | 886,904 | $ | 893,840 | |||
(1) | Excludes noninterest bearing deposits maintained at the Bank by the Company with an annual average balance of $11.0 million for the year ended December 31, 2015 and a balance of $9.5 million at December 31, 2015. Excludes noninterest bearing deposits maintained at the Bank by PMAR with an annual average balance of $5.9 million for the year ended December 31, 2015 and a balance of $4.4 million at December 31, 2015. |
(2) | Comprised of time certificates of deposit in varying denominations under and over $100,000. Excludes certificates of deposit maintained by the Company at the Bank with an average balance of $250,000 for the year ended December 31, 2015 and a balance at December 31, 2015 of $250,000. Excludes certificates of deposit maintained by PMAR at the Bank with an average balance of $101,000 for the year ended December 31, 2015 and a balance at December 31, 2015 of $101,000. |
Loan Products
We offer our customers a number of different loan products, including commercial loans and credit lines, accounts receivable and inventory financing, SBA guaranteed business loans, and owner-occupied commercial real estate loans. The following table sets forth the types and the amounts of our loans that were outstanding as of December 31, 2015:
3
At December 31, 2015 | ||||||
Amount | Percent of Total | |||||
(Dollars in thousands) | ||||||
Commercial loans | $ | 347,300 | 40.3 | % | ||
Commercial real estate loans – owner occupied | 195,554 | 22.7 | % | |||
Commercial real estate loans – all other | 146,641 | 17.0 | % | |||
Residential mortgage loans – multi-family | 81,487 | 9.5 | % | |||
Residential mortgage loans – single family(1) | 52,072 | 6.0 | % | |||
Land development loans | 10,001 | 1.2 | % | |||
Consumer loans | 28,663 | 3.3 | % | |||
Gross loans | $ | 861,718 | 100.0 | % | ||
(1) | These loans originated prior to our exit from the mortgage business and are retained in our loan portfolio as a loan diversification strategy. |
Commercial Loans
The commercial loans we offer generally include short-term secured and unsecured business and commercial loans with maturities ranging from 12 to 24 months, accounts receivable financing for terms of up to 24 months, equipment loans which generally amortize over a period of up to 7 years, and SBA guaranteed business loans with terms of up to 10 years. The interest rates on these loans generally are adjustable and usually are indexed to The Wall Street Journal’s prime rate and will vary based on market conditions and credit risk. In order to mitigate the risk of borrower default, we generally require collateral to support the credit or, in the case of loans made to businesses, we often require personal guarantees from their owners, or both. In addition, all such loans must have well-defined primary and secondary sources of repayment.
We also offer asset-based lending products made to businesses that are growing rapidly, but cannot internally fund their growth without borrowings. These loans are collateralized by a security interest in all business assets with specific advance rates made against the borrower's accounts receivable and inventory. We control our risk by generally requiring loan-to-value ratios of not more than 80% and by closely and regularly monitoring the amount and value of the collateral in order to maintain that ratio.
Commercial loan growth is important to the growth and profitability of our banking franchise because commercial loan borrowers typically establish noninterest-bearing (demand) and interest-bearing transaction deposit accounts and banking services relationships with us. Those deposit accounts help us to reduce our overall cost of funds and those banking services relationships provide us with a source of non-interest income.
Commercial Real Estate Loans
The majority of our commercial real estate loans are secured by first trust deeds on nonresidential real property. Loans secured by nonresidential real estate often involve loan balances to single borrowers or groups of related borrowers. Payments on these loans depend to a large degree on the rental income stream from the properties and the global cash flows of the borrowers, which are generated from a wide variety of businesses and industries. As a result, repayment of these loans can be affected adversely by changes in the economy in general or by the real estate market more specifically. Accordingly, the nature of this type of loan makes it more difficult to monitor and evaluate. Consequently, we typically require personal guarantees from the owners of the businesses to which we make such loans.
Business Banking Services
We offer an array of banking and financial services designed to support the needs of our business banking clients. Those services include:
• | Our online business banking portal allows our clients to conduct online transactions and access account information; features include the ability to: |
◦ | View account balances and activity, including statements |
◦ | Transfer funds between accounts |
◦ | Access wires, ACH and bill pay capabilities |
◦ | View check images |
◦ | Setup account alerts |
◦ | Prepare customizable reports and dashboards views |
◦ | Download activity into Intuit QuickBooks and Quicken |
4
• | Our mobile banking platform allows our clients to conduct transactions and access account information from their mobile device; features include the ability to: |
◦ | View available balances, transactions and transaction details |
◦ | Create one time balance transfers |
◦ | Create bill payments for existing payees |
◦ | Schedule future dated bill payments |
◦ | Cancel scheduled bill payments |
◦ | View recent payments |
◦ | Approve wires, ACH, and balance transfer transactions |
◦ | Deposit checks |
◦ | Find bank locations |
• | Collection services such as remote deposit capture services (PMB xPress Deposit), remittance payments (Lockbox), and incoming ACH & wire reporting and notification. |
• | Payable services such as checks, wire transfer and ACH origination, business bill pay service, and business credit cards. We also provide courier and onsite vault services for those clients with cash needs. |
• | Fraud prevention services such as Positive Pay, ACH Positive Pay, and transactional alerts. |
Discontinuation of Our Mortgage Banking Business
On December 9, 2013, we determined that we would discontinue our mortgage banking business, which we had commenced during the second quarter of 2009. This determination followed our decision to discontinue originating mortgage loans through our wholesale mortgage channel and focus strictly on the direct to consumer channel, which occurred in August of 2012. The full impact of our exit from the wholesale mortgage loan channel, which resulted in a dramatic decrease in loan origination volume, was realized during the first half of 2013, and led to further evaluation of our mortgage banking business and our decision to exit the business entirely. We stopped accepting mortgage applications after December 20, 2013 and continued to process and fund all applications that were accepted on or before that date. We completed the wind down of the Bank's consumer mortgage operations in the third quarter of 2014.
These actions with respect to our mortgage banking business in 2012 and 2013 were taken (i) to enable us to redeploy some of our capital resources that were committed to the mortgage business to our core commercial lending business in anticipation of a strengthening of the economy, (ii) to reduce and control our staffing costs and operating expenses, which had grown significantly due primarily to the growth of our wholesale mortgage business, and (iii) to manage and limit the interest rate and other risks inherent in the residential mortgage businesses, including risks posed by the increase in government regulation of the mortgage industry.
Security Measures
Our ability to provide customers with secure and uninterrupted financial services is of paramount importance to our business. We believe our computer banking systems, services and software meet the highest standards of bank and electronic systems security. The following are among the security measures that we have implemented:
Bank-Wide Security Measures
• | Service Continuity. In order to better ensure continuity of service, we have located our critical servers and telecommunications systems at an offsite hardened and secure data center. This center provides the physical environment necessary to keep servers up and running 24 hours a day, 7 days a week. This data center has raised floors, temperature control systems with separate cooling zones, seismically braced racks, and generators to keep the system operating during power outages and has been designed to withstand fires and major earthquakes. The center also has a wide range of physical security features, including smoke detection and fire suppression systems, motion sensors, and 24/7 secured access, as well as video camera surveillance and security breach alarms. The center is connected to the Internet by redundant high speed data circuits with advanced capacity monitoring. |
• | Physical Security. All servers and network computers reside in secure facilities. Only employees with proper identification may enter the primary server areas. |
• | Monitoring. Customer transactions on online servers and internal computer systems produce one or more entries into transactional logs. Our personnel routinely review these logs as a means of identifying and taking appropriate action with respect to any abnormal or unusual activity. |
5
Internet Security Measures
We maintain electronic and procedural safeguards that comply with federal regulations to guard nonpublic personal information. We regularly assess and update our systems to improve our technology for protecting information. Our security measures include:
• | Transport Layer Security; |
• | Digital certificates; |
• | Multi-factor authentication; |
• | Data loss prevention systems; |
• | Anti-virus, anti-malware, and patch management systems; |
• | Intrusion detection/prevention systems; and |
• | Firewall protection. |
We believe the risk of fraud presented by online banking is not materially different from the risk of fraud inherent in any banking relationship. Potential security breaches can arise from any of the following circumstances:
• | misappropriation of a customer’s account number or password; |
• | compromise of the customer’s computer system; |
• | penetration of our servers by an outside “hacker;” |
• | fraud committed by a new customer in completing his or her loan application or opening a deposit account with us; and |
• | fraud committed by employees or service providers. |
Both traditional banks and internet banks are vulnerable to these types of fraud. By establishing the security measures described above, we believe we can minimize, to the extent practicable, our vulnerability to the first three types of fraud. To counteract fraud by new customers, employees and service providers, we have established internal procedures and policies designed to ensure that, as in any bank, proper control and supervision is exercised over new customers, employees and service providers. We also maintain insurance to protect us from losses due to fraud committed by employees or through breaches in our cyber security.
Additionally, the adequacy of our security measures is reviewed periodically by the FRBSF and the California Department of Business Oversight (“CDBO”), which are the federal and state government agencies, respectively, with supervisory authority over the Bank. We also retain the services of third party computer security firms to conduct periodic tests of our computer and online banking systems to identify potential threats to the security of our systems and to recommend additional actions that we can take to improve our security measures.
Competition
Competitive Conditions in the Traditional Banking Environment
The banking business in California generally, and in our service area in particular, is highly competitive and is dominated by a relatively small number of large multi-state and California-based banks that have numerous banking offices operating over wide geographic areas. We compete for deposits and loans with those banks, with community banks that are based or have branch offices in our market areas, and with savings banks (also sometimes referred to as “thrifts”), credit unions, money market and other mutual funds, stock brokerage firms, insurance companies, and other traditional and nontraditional financial service organizations. We also compete for customers’ funds with governmental and private entities issuing debt or equity securities or other forms of investments which may offer different and potentially higher yields than those available through bank deposits.
Major financial institutions that operate throughout California and that have offices in our service areas include Bank of America, Wells Fargo Bank, JPMorgan Chase, Union Bank of California, Bank of the West, U. S. Bancorp, Comerica Bank and Citibank. Larger independent banks and other financial institutions with offices in our service areas include, among others, OneWest Bank, City National Bank, Citizens Business Bank, Manufacturers Bank, and California Bank and Trust.
These banks, as well as many other financial institutions in our service areas, have the financial capability to conduct extensive advertising campaigns and to shift their resources to regions or activities of greater potential profitability. Many of them also offer diversified financial services which we do not presently offer directly. The larger banks and financial institutions also have substantially more capital and higher lending limits than our Bank.
6
In order to compete with the banks and other financial institutions operating in our service areas, we rely on our ability to provide flexible, more convenient and more personalized service to customers, including online banking services and financial tools. At the same time, we:
• | emphasize personal contacts with existing and potential new customers by our directors, officers and other employees; |
• | develop and participate in local promotional activities; and |
• | seek to develop specialized or streamlined services for customers. |
To the extent customers desire loans in excess of our lending limits or services not offered by us, we attempt to assist them in obtaining such loans or other services through participations with other banks or assistance from our correspondent banks or third party vendors.
Competitive Conditions in Online Banking
There are a number of banks that offer services exclusively over the internet, such as E*TRADE Bank, and other banks, such as Bank of America and Wells Fargo Bank, that market their internet banking services to their customers nationwide. We believe that only the larger of the commercial banks with which we compete offer the comprehensive set of online banking tools and services that we offer to our customers. However, an increasing number of community banks offer internet banking services to their customers by relying on third party vendors to provide the functionality they need to provide such services. Additionally, many of the larger banks have greater market presence and greater financial resources to market their internet banking services than do we. Moreover, new competitors and competitive factors are likely to emerge, particularly in view of the rapid development of internet commerce. We believe that these findings support our strategic decision, made at the outset of our business, to offer customers the benefits of both traditional and online banking services. We also believe that this strategy has been an important factor in our growth to date and will contribute to our growth in the future. See “BUSINESS — Our Business Strategy” earlier in this Item 1 of this Report.
Impact of Economic Conditions, Government Policies and Legislation on our Business
Government Monetary Policies. Our profitability, like that of most financial institutions, is affected to a significant extent by our net interest income, which is the difference between the interest income we generate on interest-earning assets, such as loans and investment securities, and the interest we pay on deposits and other interest-bearing liabilities, such as borrowings. Our interest income and interest expense, and hence our net interest income, depends to a great extent on prevailing market rates of interest, which are highly sensitive to many factors that are beyond our control, including inflation, recession and unemployment. Moreover, it is often difficult to predict with any assurance how changes in economic conditions of this nature will affect our future financial performance.
Our net interest income and operating results also are affected by monetary and fiscal policies of the federal government and the policies of regulatory agencies, particularly the Federal Reserve Board. The Federal Reserve Board implements national monetary policies to curb inflation, or to stimulate borrowing and spending in response to economic downturns, through its open-market operations by adjusting the required level of reserves that banks and other depository institutions must maintain, and by varying the target federal funds and discount rates on borrowings by banks and other depository institutions. These actions affect the growth of bank loans, investments and deposits and the interest earned on interest-earning assets and paid on interest-bearing liabilities. The nature and impact of any future changes in monetary and fiscal policies on us cannot be predicted with any assurance.
Legislation Generally. From time to time, federal and state legislation is enacted which can affect our operations and our operating results by materially increasing the costs of doing business, limiting or expanding the activities in which banks and other financial institutions may engage, or altering the competitive balance between banks and other financial services providers.
Economic Conditions and Recent Legislation and Other Government Actions.
The recent economic recession, which is reported to have begun at the end of 2007, created wide ranging consequences and difficulties for the banking and financial services industry, in particular, and the economy in general. The recession led to significant write-downs of the assets and an erosion of the capital of a large number of banks and other lending and financial institutions which, in turn, significantly and adversely affected the operating results of banking and other financial institutions and led to steep declines in their stock prices. In addition, bank regulatory agencies have been very aggressive in responding to concerns and trends identified in their bank examinations, which has resulted in the increased issuance of enforcement orders requiring banks to take actions to address credit quality, liquidity and risk management and capital adequacy, as well as other safety and soundness concerns. All of these conditions, moreover, led the U.S. Congress, the U.S. Treasury Department and the federal banking regulators, including the FDIC, to take broad actions, to address systemic risks and volatility in the U.S. banking system.
7
A description of some of the regulatory and other actions taken, and their impact on the Company, are described below under “Supervision and Regulation” below.
Supervision and Regulation
Both federal and state laws extensively regulate bank holding companies and banks. Such regulation is intended primarily for the protection of depositors and the FDIC’s deposit insurance fund and is not for the benefit of shareholders. Set forth below is a summary description of the material laws and regulations that affect or bear on our operations. The description does not purport to be complete and is qualified in its entirety by reference to the laws and regulations that are summarized below.
Pacific Mercantile Bancorp
PM Bancorp is a registered bank holding company subject to regulation under the Bank Holding Company Act. Pursuant to the Bank Holding Company Act, we are subject to supervision and periodic examination by, and are required to file periodic reports with, the Federal Reserve Board. We are also a bank holding company within the meaning of the California Financial Code. As such, we and our subsidiaries are subject to supervision and periodic examination by, and may be required to file reports with, the CDBO.
As a bank holding company, we are allowed to engage, directly or indirectly, only in banking and other activities that the Federal Reserve Board deems to be so closely related to banking or managing or controlling banks as to be a proper incident thereto. Bank holding companies that meet certain eligibility requirements prescribed by the Bank Holding Company Act and elect and retain "financial holding company" status may engage in broader securities, insurance, merchant banking and other activities that are determined to be "financial in nature" or are incidental or complementary to activities that are financial in nature without prior FRB approval. We have not elected financial holding company status and neither we nor the Bank has engaged in any activities for which financial holding company status is required.
As a bank holding company, we also are required to obtain the prior approval of the Federal Reserve Board for the acquisition of more than 5% of the outstanding shares of any class of voting securities, or of substantially all of the assets, by merger or purchases of (i) any bank or other bank holding company and (ii) any other entities engaged in banking-related businesses or that provide banking-related services.
Under Federal Reserve Board regulations, a bank holding company is required to serve as a source of financial and managerial strength to its subsidiary banks and may not conduct its operations in an unsafe or unsound manner. In addition, it is the Federal Reserve Board’s policy that, in serving as a source of strength to its subsidiary banks, a bank holding company should stand ready to use available resources to provide adequate capital funds to its subsidiary banks during periods of financial stress or adversity and should maintain the financial flexibility and capital-raising capacity to obtain additional resources for assisting its subsidiary banks. For that reason, among others, the Federal Reserve Board requires all bank holding companies to maintain capital at or above certain prescribed levels. A bank holding company’s failure to meet these requirements will generally be considered by the Federal Reserve Board to be an unsafe and unsound banking practice or a violation of the Federal Reserve Board’s regulations or both, which could lead to the imposition of restrictions on the offending bank holding company, including restrictions on its further growth. See the discussion below under the caption “Prompt Corrective Action.”
Additionally, the Federal Reserve Board may require any bank holding company to terminate an activity or terminate control of, or liquidate or divest itself of, any subsidiary or affiliated company that the Federal Reserve Board determines constitutes a significant risk to the financial safety, soundness or stability of the bank holding company or any of its banking subsidiaries. The Federal Reserve Board also has the authority to regulate provisions of a bank holding company’s debt, including authority to impose interest ceilings and reserve requirements on such debt. Subject to certain exceptions, bank holding companies also are required to file written notice and obtain approval from the Federal Reserve Board prior to purchasing or redeeming their common stock or other equity securities. A bank holding company and its non-banking subsidiaries also are prohibited from implementing so-called tying arrangements whereby customers may be required to use or purchase services or products from the bank holding company or any of its non-bank subsidiaries in order to obtain a loan or other services from any of the holding company’s subsidiary banks.
Pacific Mercantile Bank
General. The Bank is subject to primary supervision, periodic examination and regulation by (i) the Federal Reserve Board, which is its primary federal banking regulator, because the Bank is a member of the Federal Reserve System and (ii) the CDBO, because the Bank is a California state chartered bank. The Bank also is subject to certain of the regulations promulgated by the FDIC, because its deposits are insured by the FDIC.
Various requirements and restrictions under the Federal and California banking laws affect the operations of the Bank. These laws and the implementing regulations, which are promulgated by Federal and State regulatory agencies, cover most aspects of a bank’s operations, including the reserves a bank must maintain against deposits and for possible loan losses and other
8
contingencies; the types of deposits it obtains and the interest it is permitted to pay on different types of deposit accounts; the loans and investments that a bank may make; the borrowings that a bank may incur; the number and location of banking offices that a bank may establish; the rate at which it may grow its assets; the acquisition and merger activities of a bank; the amount of dividends that a bank may pay; and the capital requirements that a bank must satisfy, which can determine the extent of supervisory control to which a bank will be subject by its federal and state bank regulators. A more detailed discussion regarding capital requirements that are applicable to us and the Bank is set forth below under the caption “Prompt Corrective Action.”
Permissible Activities and Subsidiaries. California law permits state chartered commercial banks to engage in any activity permissible for national banks. Those permissible activities include conducting many so-called “closely related to banking” or “nonbanking” activities either directly or through their operating subsidiaries.
Interstate Banking and Branching. Under the Riegle-Neal Interstate Banking and Branching Efficiency Act of 1994, bank holding companies and banks generally have the ability to acquire or merge with banks in other states; and, subject to certain state restrictions, banks may also acquire or establish new branches outside their home states. Interstate branches are subject to certain laws of the states in which they are located. The Bank presently does not have any interstate branches.
Federal Home Loan Bank System. The Bank is a member of the FHLB of San Francisco. Among other benefits, each FHLB serves as a reserve or central bank for its members within its assigned region and makes available loans or advances to its member banks. Each FHLB is financed primarily from the sale of consolidated obligations of the FHLB system. As an FHLB member, the Bank is required to own a certain amount of capital stock in the FHLB. At December 31, 2015, the Bank was in compliance with the FHLB’s stock ownership requirement. Historically, the FHLB has paid dividends on its capital stock to its members.
FRB Deposit Reserve Requirements. The Federal Reserve Board requires all federally-insured depository institutions to maintain noninterest bearing reserves at specified levels against their transaction accounts. At December 31, 2015, the Bank was in compliance with these requirements.
Single Borrower Loan Limitations. With certain limited exceptions, the maximum amount of obligations, secured or unsecured, that any borrower (including certain related entities) may owe to a California state bank at any one time may not exceed 25% of the sum of the shareholders’ equity, allowance for loan and lease losses, capital notes and debentures of the bank. Unsecured obligations may not exceed 15% of the sum of the shareholders’ equity, allowance for loan and lease losses, capital notes and debentures of the bank.
Restrictions on Transactions between the Bank and the Company and its other Affiliates. The Bank is subject to restrictions imposed by federal law on any extensions of credit to, or the issuance of a guarantee or letter of credit on behalf of, the Company or any of its other subsidiaries; the purchase of, or investments in, Company stock or other Company securities and the taking of such securities as collateral for loans; and the purchase of assets from the Company or any of its other subsidiaries. These restrictions prevent the Company and any of its subsidiaries from borrowing from the Bank unless the loans are secured by marketable obligations in designated amounts, and such secured loans and investments by the Bank in the Company or any of its subsidiaries are limited, individually, to 10% of the Bank’s capital and surplus (as defined by federal regulations) and, in the aggregate, for all loans made to and investments made in the Company and its other subsidiaries, to 20% of the Bank’s capital and surplus. California law also imposes restrictions with respect to transactions involving the Company and other persons deemed under that law to control the Bank. In 2014, the FDIC and the other banking agencies updated a 1998 interagency policy statement on tax sharing agreements between a bank holding company and subsidiary bank that file consolidated tax returns. Those entities must have a tax sharing agreement under which any refund received by the holding company must be allocated between the holding company and the bank in proportion to their respective income, losses and other tax characteristics as if they had filed on a stand-alone basis and, until the bank’s share is paid to it (which should be done promptly upon receipt), its share must be held in trust or as agent for the benefit of the bank, and not merely owed by the holding company as a debt to the bank.
Enforcement. If, as a result of an examination of a federally regulated bank, its primary federal bank regulatory agency were to determine that the financial condition, capital resources, asset quality, earnings prospects, management, liquidity, or other aspects of a bank’s operations had become unsatisfactory or that the bank or its management was in violation of any law or regulation, that agency has the authority to take a number of different remedial actions as it deems appropriate under the circumstances. These actions include the power to enjoin “unsafe or unsound” banking practices; to require that affirmative action be taken to correct any conditions resulting from any violation or practice; to issue an administrative order that can be judicially enforced; to require the bank to increase its capital; to restrict the bank’s growth; to assess civil monetary penalties against the bank or its officers or directors; to remove officers and directors of the bank; and, if the federal agency concludes that such conditions cannot be corrected or there is an imminent risk of loss to depositors, to terminate a bank’s deposit insurance, which in the case of a California chartered bank would result in revocation of its charter and require it to cease its banking operations. Additionally, under California law the CDBO has many of the same remedial powers with respect to the Bank, because it is a California state chartered bank.
Dividends
9
Cash dividends from the Bank constitute the primary source of cash available to PM Bancorp for its operations and to fund any cash dividends that the board of directors might declare in the future. PM Bancorp is a legal entity separate and distinct from the Bank and the Bank is subject to various statutory and regulatory restrictions on its ability to pay cash dividends to PM Bancorp. Those restrictions would prohibit the Bank, subject to certain limited exceptions, from paying cash dividends in amounts that would cause the Bank to become undercapitalized. Additionally, the Federal Reserve Board and the CDBO have the authority to prohibit the Bank from paying dividends, if either of those authorities deems the payment of dividends by the Bank to be an unsafe or unsound practice. See “Regulatory Action by the FRBSF and CDBO” below and “Dividend Policy and Restrictions on the Payment of Dividends” in Item 5 of this Report.
Additionally, it is FRB policy that bank holding companies should generally pay dividends on common stock only out of income available over the past year, and only if prospective earnings retention is consistent with the organization’s expected future needs and financial condition. It is also an FRB policy that bank holding companies should not maintain dividend levels that undermine their ability to be a source of strength to their banking subsidiaries. Additionally, due to the current financial and economic environment, the FRB has indicated that bank holding companies should carefully review their dividend policies and has discouraged dividend payment ratios that are at maximum allowable levels unless both asset quality and capital are very strong.
Safety and Soundness Standards
Banking institutions may be subject to potential enforcement actions by the federal regulators for unsafe or unsound practices or for violating any law, rule, regulation, or any condition imposed in writing by its primary federal banking regulatory agency or any written agreement with that agency. The federal banking agencies have adopted guidelines designed to identify and address potential safety and soundness concerns that could, if not corrected, lead to deterioration in the quality of a bank’s assets, liquidity or capital. Those guidelines set forth operational and managerial standards relating to such matters as:
•internal controls, information systems and internal audit systems;
•loan documentation;
•credit underwriting;
•asset growth;
•earnings; and
•compensation, fees and benefits.
In addition, federal banking agencies have adopted safety and soundness guidelines with respect to asset quality. These guidelines provide standards for establishing and maintaining a system to identify problem assets and prevent those assets from deteriorating. Under these standards, an FDIC-insured depository institution is expected to:
• | conduct periodic asset quality reviews to identify problem assets, estimate the inherent losses in problem assets and establish reserves that are sufficient to absorb those estimated losses; |
• | compare problem asset totals to capital; |
• | take appropriate corrective action to resolve problem assets; |
• | consider the size and potential risks of material asset concentrations; and |
• | provide periodic asset quality reports with adequate information for the Bank's management and the board of directors to assess the level of asset risk. |
These guidelines also establish standards for evaluating and monitoring earnings and for ensuring that earnings are sufficient for the maintenance of adequate capital and reserves.
Capital Requirements
The Company and the Bank are subject to the regulatory capital requirements administered by the Federal Reserve Board, and, for the Bank, the FDIC. The federal regulatory authorities’ current risk-based capital guidelines are based upon the 1988 capital accord (“Basel I”) of the Basel Committee on Banking Supervision (the “Basel Committee”). The Basel Committee is a committee of central banks and bank supervisors/regulators from the major industrialized countries that develops broad policy guidelines for use by each country’s supervisors in determining the supervisory policies they apply. The requirements are intended to ensure that banking organizations have adequate capital given the risk levels of assets and off-balance sheet financial instruments. Under the requirements, banking organizations are required to maintain minimum ratios for Tier 1 capital and total capital to risk-weighted assets (including certain off-balance sheet items, such as letters of credit). For purposes of calculating the ratios, a banking
10
organization’s assets and some of its specified off-balance sheet commitments and obligations are assigned to various risk categories. A bank’s or bank holding company’s capital, in turn, is classified in one of two tiers, depending on type:
• | Core Capital (Tier 1). Tier 1 capital includes common equity, retained earnings, qualifying non-cumulative perpetual preferred stock, minority interests in equity accounts of consolidated subsidiaries (and, under existing standards, a limited amount of qualifying trust preferred securities and qualifying cumulative perpetual preferred stock at the holding company level), less goodwill, most intangible assets and certain other assets. |
• | Supplementary Capital (Tier 2). Tier 2 capital includes, among other things, perpetual preferred stock and trust preferred securities not meeting the Tier 1 definition, qualifying mandatory convertible debt securities, qualifying subordinated debt, and allowances for loan and lease losses, subject to limitations. |
These capital requirements were modified as of January 1, 2015 in connection with commencement of Basel III Capital Rules described below. Through 2014, we were required to maintain Tier 1 capital and “total capital” (the sum of Tier 1 and Tier 2 capital) equal to at least 4.0% and 8.0%, respectively, of our total risk-weighted assets (including various off-balance-sheet items, such as letters of credit). The Bank, like other depository institutions, was required to maintain similar capital levels under capital adequacy guidelines. In addition, for a depository institution to be considered “well capitalized” under the regulatory framework for prompt corrective action, its Tier 1 and total capital ratios must have been at least 6.0% and 10.0% on a risk-adjusted basis, respectively.
Bank holding companies and banks are also required to comply with minimum leverage ratio requirements. The leverage ratio is the ratio of a banking organization’s Tier 1 capital to its total adjusted quarterly average assets (as defined for regulatory purposes). Through 2014, the requirements necessitated a minimum leverage ratio of 3.0% for bank holding companies and banks that either have the highest supervisory rating or have implemented the appropriate federal regulatory authority’s risk-adjusted measure for market risk. All other bank holding companies and banks are required to maintain a minimum leverage ratio of 4.0%, unless a different minimum is specified by an appropriate regulatory authority. In addition, for a depository institution to be considered “well capitalized” under the regulatory framework for prompt corrective action, its leverage ratio must be at least 5.0%. As of December 31, 2014, the Company and the Bank meet all capital adequacy requirements under Basel I.
Basel III Capital Rules. As of January 1, 2015, the Basel III Capital Rules establishing a new comprehensive capital framework for U.S. banking organizations took effect. The rules implement the Basel Committee’s December 2010 framework known as “Basel III” for strengthening international capital standards as well as certain provisions of the Dodd-Frank Act. The Basel III Capital Rules substantially revise the risk-based capital requirements applicable to bank holding companies and depository institutions, including the Company and the Bank, compared to the current U.S. risk-based capital rules. The Basel III Capital Rules define the components of capital and address other issues affecting the numerator in banking institutions’ regulatory capital ratios. The Basel III Capital Rules also address risk weights and other issues affecting the denominator in banking institutions’ regulatory capital ratios and replace the existing risk-weighting approach, which was derived from the Basel I capital accords of the Basel Committee, with a more risk-sensitive approach based, in part, on the standardized approach in the Basel Committee’s 2004 “Basel II” capital accords. The Basel III Capital Rules also implement the requirements of Section 939A of the Dodd-Frank Act to remove references to credit ratings from the federal banking agencies’ rules. The Basel III Capital Rules were effective for the Company and the Bank on January 1, 2015 (subject to a phase-in period).
The Basel III Capital Rules, among other things, (i) introduce a new capital measure called “Common Equity Tier 1” (“CET1”), (ii) specify that Tier 1 capital consists of CET1 and “Additional Tier 1 capital” instruments meeting specified requirements, (iii) define CET1 narrowly by requiring that most deductions/adjustments to regulatory capital measures be made to CET1 and not to the other components of capital and (iv) expand the scope of the deductions/adjustments as compared to existing regulations.
When fully phased in on January 1, 2019, the Basel III Capital Rules will require the Company and the Bank to maintain (i) a minimum ratio of CET1 to risk-weighted assets of at least 4.5%, plus a 2.5% “capital conservation buffer” (which is added to the 4.5% CET1 ratio as that buffer is phased in, effectively resulting in a minimum ratio of CET1 to risk-weighted assets of at least 7% upon full implementation), (ii) a minimum ratio of Tier 1 capital to risk-weighted assets of at least 6.0%, plus the capital conservation buffer (which is added to the 6.0% Tier 1 capital ratio as that buffer is phased in, effectively resulting in a minimum Tier 1 capital ratio of 8.5% upon full implementation), (iii) a minimum ratio of Total capital (that is, Tier 1 plus Tier 2) to risk-weighted assets of at least 8.0%, plus the capital conservation buffer (which is added to the 8.0% total capital ratio as that buffer is phased in, effectively resulting in a minimum total capital ratio of 10.5% upon full implementation), and (iv) a minimum leverage ratio of 4%, calculated as the ratio of Tier 1 capital to average assets (as compared to a current minimum leverage ratio of 3% for banking organizations that either have the highest supervisory rating or have implemented the appropriate federal regulatory authority’s risk-adjusted measure for market risk).
11
The capital conservation buffer is designed to absorb losses during periods of economic stress. Banking institutions with a ratio of CET1 to risk-weighted assets above the minimum but below the conservation buffer (or below the combined capital conservation buffer and countercyclical capital buffer, when the latter is applied) will face constraints on dividends, equity repurchases and compensation based on the amount of the shortfall.
The Basel III Capital Rules also provides for a “countercyclical capital buffer” that is applicable to only certain covered institutions and is not expected to have any current applicability to the Company or the Bank.
Under the Basel III Capital Rules, the initial minimum capital ratios (including the applicable increment of the capital conservation buffer) as of January 1, 2016 were as follows:
• | 6.625% Tier 1 capital to risk-weighted assets. |
• | 8.625% Total capital to risk-weighted assets. |
• | 4.0% Tier 1 capital to average assets. |
The Basel III Capital Rules provide for a number of deductions from and adjustments to CET1 for mortgage servicing rights, certain deferred tax assets, significant investments in non-consolidated financial entities and the effects of accumulated other comprehensive income. The Basel III Capital Rules also preclude certain hybrid securities, such as trust preferred securities, as Tier 1 capital of bank holding companies, subject to phase-out, but institutions with less than $15 billion in assets are exempted from this new rule.
With respect to the Bank, the Basel III Capital Rules also revise the “prompt corrective action” regulations as discussed below under “Prompt Corrective Action.”
The Basel III Capital Rules prescribe a standardized approach for risk weightings that expand the risk-weighting categories from the current four Basel I-derived categories (0%, 20%, 50% and 100%) to a much larger and more risk-sensitive number of categories, depending on the nature of the assets, generally ranging from 0% for U.S. government and agency securities, to 600% for certain equity exposures, and resulting in higher risk weights for a variety of asset categories.
In addition, the Basel III Capital Rules provide more advantageous risk weights for derivatives and repurchase-style transactions cleared through a qualifying central counterparty and increase the scope of eligible guarantors and eligible collateral for purposes of credit risk mitigation.
Liquidity Requirements
Historically, the regulation and monitoring of bank and bank holding company liquidity has been addressed as a supervisory matter, without required formulaic measures. In September 2013, the federal banking agencies adopted rules to impose quantitative liquidity requirements consistent with the liquidity coverage ratio standard established by the Basel Committee. These rules would apply to larger (over $250 billion in assets, with less stringent requirements for institutions over $50 billion in assets) and internationally active institutions but, as adopted, do not apply to the Company or the Bank.
Prompt Corrective Action
The Federal Deposit Insurance Act, as amended (“FDIA”), requires among other things, the federal banking agencies to take “prompt corrective action” in respect of depository institutions that do not meet minimum capital requirements. The FDIA includes the following five capital tiers: “well capitalized,” “adequately capitalized,” “undercapitalized,” “significantly undercapitalized” and “critically undercapitalized.” A depository institution’s capital tier will depend upon how its capital levels compare with various relevant capital measures and certain other factors, as established by regulation. The relevant capital measures are the total capital ratio, the Tier 1 capital ratio and the leverage ratio. The Basel III rules affect the capital requirements for prompt corrective action purposes also.
As of January 1, 2015, a bank will be (i) “well capitalized” if the institution has a total risk-based capital ratio of 10.0% or greater, a Tier 1 risk-based capital ratio of 8.0% or greater, a CET1 ratio of 6.5% or greater and a leverage ratio of 5.0% or greater, and is not subject to any order or written directive by any such regulatory authority to meet and maintain a specific capital level for any capital measure; (ii) “adequately capitalized” if the institution has a total risk-based capital ratio of 8.0% or greater, a Tier 1 risk-based capital ratio of 4.0% or greater, a CET1 ratio of 4.5% or greater and a leverage ratio of 4.0% or greater and is not “well capitalized”; (iii) “undercapitalized” if the institution has a total risk-based capital ratio that is less than 8.0%, a Tier 1 risk-based capital ratio of less than 4.0%, a CET1 ratio of less than 4.5% or a leverage ratio of less than 4.0%; (iv) “significantly undercapitalized” if the institution has a total risk-based capital ratio of less than 6.0%, a Tier 1 risk-based capital ratio of less than 3.0%, a CET1 ratio of less than 3.0% or a leverage ratio of less than 3.0%; and (v) “critically undercapitalized” if the institution’s
12
tangible equity is equal to or less than 2.0% of average quarterly tangible assets. An institution may be downgraded to, or deemed to be in, a capital category that is lower than indicated by its capital ratios if it is determined to be in an unsafe or unsound condition or if it receives an unsatisfactory examination rating with respect to certain matters. A bank’s capital category is determined solely for the purpose of applying prompt corrective action regulations, and the capital category may not constitute an accurate representation of the bank’s overall financial condition or prospects for other purposes.
Phase-in of the capital conservation buffer over four years will increase these minimum capital levels (other than the leverage ratio) by 0.625% per year beginning January 1, 2016.
The FDIA generally prohibits a depository institution from making any capital distributions (including payment of a dividend) or paying any management fee to its parent holding company if the depository institution would thereafter be “undercapitalized.” “Undercapitalized” institutions are subject to growth limitations and are required to submit a capital restoration plan. The agencies may not accept such a plan without determining, among other things, that the plan is based on realistic assumptions and is likely to succeed in restoring the depository institution’s capital. In addition, for a capital restoration plan to be acceptable, the depository institution’s parent holding company must guarantee that the institution will comply with such capital restoration plan. The bank holding company must also provide appropriate assurances of performance. The aggregate liability of the parent holding company is limited to the lesser of (i) an amount equal to 5.0% of the depository institution’s total assets at the time it became undercapitalized and (ii) the amount which is necessary (or would have been necessary) to bring the institution into compliance with all capital standards applicable with respect to such institution as of the time it fails to comply with the plan. If a depository institution fails to submit an acceptable plan, it is treated as if it is “significantly undercapitalized.”
“Significantly undercapitalized” depository institutions may be subject to a number of requirements and restrictions, including orders to sell sufficient voting stock to become “adequately capitalized,” requirements to reduce total assets, and cessation of receipt of deposits from correspondent banks. “Critically undercapitalized” institutions are subject to the appointment of a receiver or conservator.
The appropriate agency is also permitted to require an adequately capitalized or undercapitalized institution to comply with the supervisory provisions as if the institution were in the next lower category (but not treat a significantly undercapitalized institution as critically undercapitalized) based on supervisory information other than the capital levels of the institution.
The following table sets forth, as of December 31, 2015, the regulatory capital ratios of the Company (on a consolidated basis) and the Bank (on a stand-alone basis) and compares those capital ratios to the federally established capital requirements that must be met for a bank holding company or a bank to be deemed “adequately capitalized” or “well capitalized” under the prompt corrective action regulations that are described above:
Applicable Federal Regulatory Requirement | ||||||||||||||||||
At December 31, 2015 | Actual Capital | For Capital Adequacy Purposes | To be Categorized As Well Capitalized | |||||||||||||||
Amount | Ratio | Amount | Ratio | Amount | Ratio | |||||||||||||
(Dollars in thousands) | ||||||||||||||||||
Total Capital to Risk Weighted Assets: | ||||||||||||||||||
Company | $ | 154,884 | 16.8 | % | $ | 73,871 | At least 8.0 | N/A | N/A | |||||||||
Bank | 136,457 | 15.0 | % | 72,672 | At least 8.0 | $ | 90,841 | At least 10.0 | ||||||||||
Common Equity Tier 1 Capital to Risk Weighted Assets: | ||||||||||||||||||
Company | 131,188 | 14.2 | % | 41,552 | At least 4.5 | N/A | N/A | |||||||||||
Bank | 125,018 | 13.8 | % | 40,878 | At least 4.5 | 59,046 | At least 6.5 | |||||||||||
Tier 1 Capital to Risk Weighted Assets: | ||||||||||||||||||
Company | $ | 143,260 | 15.5 | % | $ | 55,403 | At least 6.0 | N/A | N/A | |||||||||
Bank | 125,018 | 13.8 | % | 54,504 | At least 6.0 | $ | 72,672 | At least 8.0 | ||||||||||
Tier 1 Capital to Average Assets: | ||||||||||||||||||
Company | $ | 143,260 | 13.3 | % | $ | 42,984 | At least 4.0 | N/A | N/A | |||||||||
Bank | 125,018 | 11.8 | % | 42,319 | At least 4.0 | $ | 52,899 | At least 5.0 | ||||||||||
At December 31, 2015 the Bank (on a stand-alone basis) continued to qualify as a well-capitalized institution, and the Company continued to exceed the minimum required capital ratios applicable to it, under the capital adequacy guidelines described above.
13
FDIC Deposit Insurance
The FDIC is an independent federal agency that insures deposits, up to prescribed statutory limits, of federally insured banks and savings institutions in order to safeguard the safety and soundness of the banking and savings industries. The FDIC insures customer deposits through the Deposit Insurance Fund (the “DIF”) up to prescribed limits for each depositor. The Dodd-Frank Act increased the maximum deposit insurance amount from $100,000 to $250,000. The DIF is funded primarily by FDIC assessments paid by each DIF member institution. The amount of each DIF member’s assessment is based on its relative risk of default as measured by regulatory capital ratios and other supervisory factors. Pursuant to the Federal Deposit Insurance Reform Act of 2005, the FDIC is authorized to set the reserve ratio for the DIF annually at between 1.15% and 1.50% of estimated insured deposits. The FDIC may increase or decrease the assessment rate schedule on a semi-annual basis. The Dodd-Frank Act increased the minimum reserve ratio (the ratio of the net worth of the DIF to estimated insured deposits) from 1.15% of estimated deposits to 1.35% of estimated deposits (or a comparable percentage of the asset-based assessment base described above). The Dodd-Frank Act requires the FDIC to offset the effect of the increase in the minimum reserve ratio when setting assessments for insured depository institutions with less than $10 billion in total consolidated assets, such as the Bank. The FDIC has until September 30, 2020 to achieve the new minimum reserve ratio of 1.35%.
Additionally, all FDIC-insured institutions are required to pay assessments to the FDIC to fund interest payments on bonds issued by the Financing Corporation (“FICO”), an agency of the Federal government established to recapitalize the predecessor to the DIF. The FICO assessment rates, which are determined quarterly, averaged 0.0060% of insured deposits in fiscal 2015. These assessments will continue until the FICO bonds mature in 2017 through 2019.
The FDIC may terminate a depository institution’s deposit insurance upon a finding that the institution’s financial condition is unsafe or unsound or that the institution has engaged in unsafe or unsound practices that pose a risk to the DIF or that may prejudice the interest of the bank’s depositors. Pursuant to California law, the termination of a California state chartered bank’s FDIC deposit insurance would result in the revocation of the bank’s charter, forcing it to cease conducting banking operations.
Community Reinvestment Act and Fair Lending Developments
The Bank is subject to fair lending requirements and the evaluation of its small business operations under the Community Reinvestment Act (“CRA”). That Act generally requires the federal banking agencies to evaluate the record of a bank in meeting the credit needs of its local communities, including those of low- and moderate-income neighborhoods in its service area. A bank may be subject to substantial penalties and corrective measures for a violation of fair lending laws. Federal banking agencies also may take compliance with fair lending laws into account when regulating and supervising other activities of a bank or its bank holding company.
A bank’s compliance with its CRA obligations is based on a performance-based evaluation system which determines the bank’s CRA ratings on the basis of its community lending and community development performance. When a bank holding company files an application for approval to acquire a bank or another bank holding company, the Federal Reserve Board will review the CRA assessment of each of the subsidiary banks of the applicant bank holding company, and a low CRA rating may be the basis for denying the application.
USA Patriot Act of 2001
In October 2001, the Uniting and Strengthening America by Providing Appropriate Tools Required to Intercept and Obstruct Terrorism (“USA Patriot Act”) of 2001 was enacted into law in response to the September 11, 2001 terrorist attacks. The USA Patriot Act was adopted to strengthen the ability of U.S. law enforcement and intelligence agencies to work cohesively to combat terrorism on a variety of fronts.
Of particular relevance to banks and other federally insured depository institutions are the USA Patriot Act’s sweeping anti-money laundering and financial transparency provisions and various related implementing regulations that:
• | establish due diligence requirements for financial institutions that administer, maintain, or manage private bank accounts and foreign correspondent accounts; |
• | prohibit U.S. institutions from providing correspondent accounts to foreign shell banks; |
• | establish standards for verifying customer identification at account opening; and |
• | set rules to promote cooperation among financial institutions, regulatory agencies and law enforcement entities in identifying parties that may be involved in terrorism or money laundering. |
14
Under implementing regulations issued by the U.S. Treasury Department, banking institutions are required to incorporate a customer identification program into their written money laundering plans that includes procedures for:
• | verifying the identity of any person seeking to open an account, to the extent reasonable and practicable; |
• | maintaining records of the information used to verify the person’s identity; and |
• | determining whether the person appears on any list of known or suspected terrorists or terrorist organizations. |
Consumer Laws
The Company and the Bank are subject to a broad range of federal and state consumer protection laws and regulations prohibiting unfair or fraudulent business practices, untrue or misleading advertising and unfair competition. Those laws and regulations include:
• | The Home Ownership and Equity Protection Act of 1994, which requires additional disclosures and consumer protections to borrowers designed to protect them against certain lending practices, such as practices deemed to constitute “predatory lending.” |
• | Laws and regulations requiring banks to establish privacy policies which limit the disclosure of nonpublic information about consumers to nonaffiliated third parties. |
• | The Fair Credit Reporting Act, as amended by the Fair and Accurate Credit Transactions Act, which requires banking institutions and financial services businesses to adopt practices and procedures designed to help deter identity theft, including developing appropriate fraud response programs, and provides consumers with greater control of their credit data. |
• | The Truth in Lending Act, which requires that credit terms be disclosed in a meaningful and consistent way so that consumers may compare credit terms more readily and knowledgeably. |
• | The Equal Credit Opportunity Act, which generally prohibits, in connection with any consumer or business credit transaction, discrimination on the basis of race, color, religion, national origin, sex, marital status, age (except in limited circumstances), or the fact that a borrower is receiving income from public assistance programs. |
• | The Fair Housing Act, which regulates many lending practices, including making it unlawful for any lender to discriminate in its housing-related lending activities against any person because of race, color, religion, national origin, sex, handicap or familial status. |
• | The Home Mortgage Disclosure Act, which includes a “fair lending” aspect that requires the collection and disclosure of data about applicant and borrower characteristics as a way of identifying possible discriminatory lending patterns and enforcing anti-discrimination statutes. |
• | The Real Estate Settlement Procedures Act, which requires lenders to provide borrowers with disclosures regarding the nature and cost of real estate settlements and prohibits certain abusive practices, such as kickbacks. |
• | The National Flood Insurance Act, which requires homes in flood-prone areas with mortgages from a federally regulated lender to have flood insurance. |
• | The Secure and Fair Enforcement for Mortgage Licensing Act of 2008, which requires mortgage loan originator employees of federally insured institutions to register with the Nationwide Mortgage Licensing System and Registry, a database created by the states to support the licensing of mortgage loan originators, prior to originating residential mortgage loans. |
Regulation W
The FRB has adopted Regulation W to comprehensively implement Sections 23A and 23B of the Federal Reserve Act.
Sections 23A and 23B and Regulation W limit transactions between a bank and its affiliates and limit a bank’s ability to transfer to its affiliates the benefits arising from the bank’s access to insured deposits, the payment system and the discount window and other benefits of the Federal Reserve system. The statute and regulation impose quantitative and qualitative limits on the ability of a bank to extend credit to, or engage in certain other transactions with, an affiliate (and a non-affiliate if an affiliate benefits from the transaction). However, certain transactions that generally do not expose a bank to undue risk or abuse the safety net are exempted from coverage under Regulation W.
15
Historically, a subsidiary of a bank was not considered an affiliate for purposes of Sections 23A and 23B, since their activities were limited to activities permissible for the bank itself. However, the Gramm-Leach-Bliley Act of 1999 authorized “financial subsidiaries” that may engage in activities not permissible for a bank. These financial subsidiaries are now considered affiliates. Certain transactions between a financial subsidiary and another affiliate of a bank are also covered by Sections 23A and 23B and under Regulation W.
Privacy
The Gramm-Leach-Bliley Act of 1999 and the California Financial Information Privacy Act require financial institutions to implement policies and procedures regarding the disclosure of nonpublic personal information about consumers to non-affiliated third parties. In general, the statutes require explanations to consumers on policies and procedures regarding the disclosure of such nonpublic personal information and, except as otherwise required by law, prohibit disclosing such information except as provided in the Bank's policies and procedures. We have implemented privacy policies addressing these restrictions which are distributed regularly to all existing and new customers of the Bank.
Customer Information Security
The FRB and other bank regulatory agencies have adopted guidelines for safeguarding confidential, personal customer information. These guidelines require each financial institution, under the supervision and ongoing oversight of its board of directors or an appropriate committee thereof, to create, implement and maintain a comprehensive written information security program designed to ensure the security and confidentiality of customer information, protect against any anticipated threats or hazard to the security or integrity of such information and protect against unauthorized access to or use of such information that could result in substantial harm or inconvenience to any customer. We have adopted a customer information security program to comply with such requirements.
Incentive Compensation
In June 2010, the FRB and the FDIC issued comprehensive final guidance on incentive compensation policies intended to ensure that the incentive compensation policies of banking organizations do not undermine the safety and soundness of such organizations by encouraging excessive risk-taking. The guidance, which covers all employees that have the ability to materially affect the risk profile of an organization, either individually or as part of a group, is based upon the key principles that a banking organization's incentive compensation arrangements should (i) provide incentives that do not encourage risk-taking beyond the organization's ability to effectively identify and manage risks, (ii) be compatible with effective internal controls and risk management, and (iii) be supported by strong corporate governance, including active and effective oversight by the organization's board of directors. These three principles are incorporated into proposed joint compensation regulations under the Dodd-Frank Act that would prohibit incentive-based payment arrangements at specified regulated entities having at least $1 billion in total assets that encourage inappropriate risks. The FRB will review, as part of its regular, risk-focused examination process, the incentive compensation arrangements of banking organizations, such as the Company, that are not "large, complex banking organizations." These reviews will be tailored to each organization based on the scope and complexity of the organization's activities and the prevalence of incentive compensation arrangements. The findings of the supervisory initiatives will be included in reports of examination. Deficiencies will be incorporated into the organization's supervisory ratings, which can affect the organization's ability to make acquisitions and take other actions. Enforcement actions may be taken against a banking organization if its incentive compensation arrangements, or related risk-management control or governance processes, pose a risk to the organization's safety and soundness and the organization is not taking prompt and effective measures to correct the deficiency.
Legislative and Regulatory Initiatives
From time to time, various legislative and regulatory initiatives are introduced in the U.S. Congress and state legislatures, as well as by regulatory agencies. Such initiatives may include proposals to expand or contract the powers of bank holding companies and depository institutions or proposals to substantially change the financial institution regulatory system. Such legislation could change banking statutes and our operating environment in substantial and unpredictable ways. If enacted, such legislation could increase or decrease the cost of doing business, limit or expand permissible activities or affect the competitive balance among banks, savings associations, credit unions, and other financial institutions. We cannot predict whether any such legislation will be enacted, and, if enacted, the effect that it, or any implementing regulations, would have on our financial condition, results of operations or cash flows. A change in statutes, regulations or regulatory policies applicable to the Company or any of its subsidiaries could have a material effect on our business.
16
Employees
As of December 31, 2015, we employed 156 persons on a full-time equivalent basis and 4 persons on a part-time basis for a total of 160 persons. None of our employees are covered by a collective bargaining agreement. We believe relations with our employees are good.
Information Available on our Website
Our Internet address is www.pmbank.com. We make available on our website, free of charge, our filings made with the SEC electronically, including those on Form 10-K, Form 10-Q, and Form 8-K, and any amendments to those filings. Copies of these filings are available as soon as reasonably practicable after we have filed or furnished these documents to the SEC (at www.sec.gov).
ITEM 1A. RISK FACTORS
Our business is subject to a number of risks and uncertainties, including those described below, that could cause our financial condition or operating results in the future to differ significantly from our expected financial condition or operating results that are set forth in the forward looking statements contained in this Report. The risks discussed below are not the only ones facing our business but do represent those risks that we believe are material to us. Additional risks and uncertainties not presently known to us or that we currently deem immaterial may also harm our business.
Our business may be adversely affected by conditions in the financial markets and economic conditions generally.
Our business, earnings and profitability are affected by the financial markets and economic conditions in the United States generally and, more specifically, in Southern California where a substantial portion of our business is generated, including factors such as the level and volatility of short-term and long-term interest rates, inflation, home prices, unemployment and under-employment levels, bankruptcies, household income, consumer spending, fluctuations in both debt and equity capital markets, liquidity of the global financial markets, the availability and cost of capital and credit, investor sentiment and confidence in the financial markets and the sustainability of economic growth both in the United States and globally. The deterioration of any of these conditions could adversely affect the financial performance and/or condition of our borrowers, the demand for credit and other banking products, the ability of borrowers to pay interest on and repay principal on outstanding loans and the value of collateral securing those loans, which could lead to decreased loan utilization rates, increased delinquencies and defaults and changes to our customers’ ability to meet certain credit obligations. If any of these events occur, we could experience one or more of the following adverse effects on our business:
• | a decline in the demand for loans, which would cause a decline in interest income and our net interest margin; |
• | a decline in the value of our loans or other assets secured by residential or commercial real estate or by trading assets of our borrowers; |
• | a decrease in deposit balances due to overall reductions in the accounts of customers, which would adversely impact our liquidity position; |
• | an impairment of our investment securities and other real estate owned (“OREO”); and |
• | an increase in the volume of loans that become delinquent or the number of borrowers that file for protection under bankruptcy laws or default on their home loans or commercial loan obligations to us, either of which could result in a higher level of non-performing assets and cause us to increase our ALLL, thereby reducing our earnings. |
In addition, because the substantial majority of our customers and the assets securing a large proportion of our loans are located in Southern California, any regional or local economic downturn that affects Southern California, including the financial condition of our existing or prospective borrowers or property values in Southern California, may affect us and our profitability more significantly and more adversely than our competitors whose operations are less geographically focused.
We could incur losses on the loans we make.
Loan defaults and the incurrence of losses on the loans we make are an inherent risk of the banking business. That risk previously had been exacerbated by the significant slowdown in the housing markets and significant increases in real estate loan foreclosures in Los Angeles, Orange, Riverside, San Bernardino and San Diego counties of California where most of our customers are based. This slowdown was attributable to declining real estate prices, excess inventories of unsold homes, high vacancy rates at commercial properties and increases in unemployment and a resulting loss of confidence about the future among businesses and consumers that had combined to adversely affect business and consumer spending. These conditions led to increases in our non-performing assets in prior periods, which required us to record loan charge-offs and write-downs in the carrying values of real properties that we acquired by or in lieu of foreclosure and caused us to incur losses in those periods. While conditions in the housing markets have improved, including increased real estate prices, lower vacancy rates at commercial properties and continued
17
improvement in unemployment, further weakness in economic conditions could result in additional loan charge-offs and asset write-downs that would require us to increase the provisions we make for loan losses and losses on real estate owned that would have a material adverse effect on our future operating results, financial condition and capital.
A portion of our loan portfolio is secured by real estate, and events that negatively impact the real estate market could adversely affect asset quality and profitability for our loans secured by real property.
Many of the loans in our portfolio are secured by real estate. For instance, the majority of our commercial real estate loans, which represented 39.7% of our total loans outstanding as of December 31, 2015, are secured by first trust deeds on nonresidential real property. Payments on these loans depend to a large degree on the rental income stream from the properties and the global cash flows of the borrowers. A downturn in the economy, generally, or in the real estate market where the collateral for a real estate loan is located specifically, could negatively affect the borrower's ability to repay the loan and the value of the collateral securing the loan, which, in turn, could have an adverse effect on our profitability and asset quality. In addition, unexpected decreases in commercial real estate prices coupled with slow economic growth and elevated levels of unemployment could drive losses beyond that provided for in our allowance for loan and lease losses (“ALLL”), which could adversely affect our operating results and financial condition.
We may be required to increase our ALLL which would adversely affect our financial performance in the future.
On a quarterly basis we evaluate and conduct an analysis to determine the probable and estimable losses inherent in our loan portfolio. However, this evaluation requires us to make a number of estimates and judgments regarding the financial condition of a significant number of our borrowers, the fair value of the properties collateralizing our outstanding loans and economic trends that could affect the ability of borrowers to meet their payment obligations to us. Based on those estimates and judgments, we make determinations, which are necessarily subjective, with respect to (i) the adequacy of our ALLL to provide for write-downs in the carrying values and charge-offs of loans that may be required in the future and (ii) the need to increase the ALLL by means of a charge to income (commonly referred to as the provision for loan and lease losses). If, due to circumstances outside of our control, those estimates or judgments prove to have been incorrect or the Bank’s regulators come to a different conclusion regarding the adequacy of the Bank’s ALLL, we would have to increase the provisions we make for loan losses, which would reduce our income or could cause us to incur operating losses in the future.
Liquidity risk could adversely affect our ability to fund operations and hurt our financial condition.
Liquidity is essential to our business, as we use cash to fund loans and investments and other interest-earning assets and deposit withdrawals that occur in the ordinary course of our business. Our principal sources of liquidity include deposits, FHLB borrowings, sales of loans or investment securities held for sale, repayments to the Bank of loans it makes to borrowers and sales of equity securities by us. If our ability to obtain funds from these sources becomes limited or the costs to us of those funds increases, whether due to factors that affect us specifically, including our financial performance or the imposition of regulatory restrictions on us, or due to factors that affect the financial services industry in general, including weakening economic conditions or negative views and expectations about the prospects for the financial services industry as a whole, then, our ability to grow our banking business would be adversely affected and our financial condition and results of operations could be harmed.
We face intense competition from other banks, financial institutions and non-banking institutions that could hurt our business.
We conduct our business operations in Southern California, where the banking business is highly competitive and is dominated by large multi-state and in-state banks with operations and offices covering wide geographic areas. We also compete with other financial service businesses, mutual fund companies, and securities brokerage and investment banking firms that offer competitive banking and financial products and services, including online and mobile banking services, as well as products and services that we do not offer. The larger banks and many of those other financial institutions have greater financial and other resources that enable them to conduct extensive advertising campaigns and to shift resources to regions or activities of greater potential profitability. They also have substantially more capital and higher lending limits than we do, which enable them to attract larger customers and offer financial products and services that we are unable to offer, putting us at a disadvantage in competing with them for loans and deposits. In addition, technology and other changes are allowing parties to complete financial transactions, which historically have involved banks, through alternative methods. For example, consumers can now maintain funds that would have historically been held as bank deposits in brokerage accounts or mutual funds. Consumers can also complete transactions such as paying bills and/or transferring funds directly without the assistance of banks. The process of eliminating banks as intermediaries could result in the loss of fee income, as well as the loss of customer deposits. Increased competition may prevent us (i) from achieving increases, or could even result in decreases, in our loan volume or deposit balances, or (ii) from increasing interest rates on the loans we make or reducing the interest rates we pay to attract or retain deposits, either or both of which could cause a decline in our interest income or an increase in our interest expense and, therefore, lead to reductions in our net interest income and earnings.
18
A higher risk of natural disasters in Southern California could disproportionately harm our business.
Historically, California, in which a substantial portion of our business is located, has been susceptible to natural disasters such as earthquakes, floods, droughts and wild fires and is currently in the midst of an ongoing drought. The nature and level of natural disasters cannot be predicted and may be exacerbated by global climate change. In the event of a major natural disaster, many of our borrowers may suffer uninsured property damage, experience interruption of their businesses or lose their jobs, which may negatively impact the ability of these borrowers to repay their loans or negatively impact the values of collateral securing our loans, either of which could result in losses and increased provisions for credit losses. Additionally, the occurrence of natural disasters could harm our operations through interference with communications, including the interruption or loss of our computer systems, which could prevent or impede us from gathering deposits, originating loans and processing and controlling our business flow, as well as through the destruction of facilities and our operational, financial and management information systems.
Our business is subject to interest rate risk and variations in interest rates may negatively affect our financial performance.
A substantial portion of our income is derived from the differential or “spread” between the interest we earn on loans, securities and other interest-earning assets, and the interest we pay on deposits, borrowings and other interest-bearing liabilities. Due to the differences in the maturities and repricing characteristics of our interest-earning assets and interest-bearing liabilities, changes in interest rates do not produce equivalent changes in interest income earned on interest-earning assets and interest paid on interest-bearing liabilities. Accordingly, fluctuations in interest rates could adversely affect our interest rate spread and, in turn, our profitability. In addition, as a general rule, loan origination volumes are affected by market interest rates. Rising interest rates, generally, are associated with a lower volume of loan originations while lower interest rates are usually associated with higher loan originations. Conversely, in rising interest rate environments, loan repayment rates may decline and in falling interest rate environments, loan repayment rates may increase. Also, in a rising interest rate environment, we may need to accelerate the pace of rate increases on our deposit accounts as compared to the pace of increases in short-term market rates. Accordingly, changes in market interest rates could materially and adversely affect our net interest spread, asset quality and loan origination volume.
For the past several years, the banking industry has operated in an extremely low interest rate environment relative to historical averages, and the Federal Reserve has pursued highly accommodative monetary policies (including a very low Federal funds rate and substantial purchases of long-term U.S. Treasury and agency securities) in an effort to facilitate growth in the U.S. economy and a reduction in levels of unemployment. This environment has placed downward pressure on the net interest margin of U.S. banks, including the Bank. Despite the fact that interest rates are relatively low, loan demand has been relatively weak due largely to the financial difficulties encountered by prospective borrowers as a result of the economic recession and the weakness of the economic recovery, the unwillingness of businesses and consumers to borrow due to uncertainties and a lack of confidence about future economic conditions and generally tightened loan underwriting standards by us, as well as other banks and lending institutions, in response to these conditions. As a result, it has become more difficult to predict the impact that changes in interest rates will have on interest rate spreads and on the future financial performance of banks, including our Bank, which has added to the volatility of and adversely affected the stock prices of many banking institutions, including our own. It is not possible to predict how long these conditions will continue to affect us.
We have adopted an interest rate risk management strategy for the purpose of protecting us against interest rate changes. Developing an effective interest rate risk management strategy, however, is complex and no risk management strategy can completely insulate us from risks associated with interest rate changes.
Government regulations may impair our operations, restrict our growth or increase our operating costs.
We are subject to extensive supervision and regulation by federal and state bank regulatory agencies, including the Board of Governors of the Federal Reserve System (“FRB”) and the Federal Reserve Bank of San Francisco under the delegated authority from the FRB, and the California Department of Business Oversight. The primary objective of these agencies is to protect bank depositors and other customers and consumers and not shareholders, whose respective interests often differ. Congress and these federal agencies continually review banking laws, regulations and policies for possible changes. Changes to statutes, regulations or regulatory policies, including changes in interpretation or implementation of statutes, regulations or policies, could affect the Company in substantial and unpredictable ways. The regulatory agencies have the legal authority to impose restrictions which they believe are needed to protect depositors and customers of banking institutions, even if those restrictions would adversely affect the ability of the banking institution to expand its business or pay cash dividends, or result in increases in its costs of doing business or hinder its ability to compete with less regulated financial services companies. Additionally, due to the complex and technical nature of many of the government regulations to which banking organizations are subject, inadvertent violations of those regulations may and sometimes do occur. In such an event, we would be required to correct or implement measures to prevent a recurrence of such violations. If more serious violations were to occur, the regulatory agencies could limit our activities or growth or fine us, or ultimately put us out of business in the event we were to encounter severe liquidity problems or a significant erosion of our capital below the minimum amounts required under applicable bank regulatory guidelines.
19
The enactment of the Dodd-Frank Act poses uncertainties for our business and has increased, and is likely to continue to increase, our costs of doing business.
On July 21, 2010, the President signed the Dodd-Frank Act into law. The Dodd-Frank Act represents a comprehensive overhaul of the financial services industry within the United States, established the Consumer Financial Protection Bureau (the “CFPB”) and requires the CFPB and other federal agencies to implement many new and significant rules and regulations. Certain provisions of the Dodd-Frank Act were made effective immediately. However, much of the Dodd-Frank Act is subject to further rulemaking and/or studies. As a result, the enactment of the Dodd-Frank Act poses uncertainties for our business and has increased, and is likely to continue to increase, our costs of doing business. However, due to uncertainties concerning the timing and extent of future rulemaking, it is difficult to assess the extent to which the Dodd-Frank Act, or the resulting rules and regulations, will further impact our business and financial performance. Compliance with these new laws and regulations will result in additional costs, which could be significant, and may have a material and adverse effect on our results of operations. In addition, the Dodd-Frank Act permits states to adopt consumer protection laws and standards that are more stringent than those adopted at the federal level. We cannot predict whether California state agencies will adopt consumer protection laws and standards that are more stringent than those adopted at the federal level or, if any are adopted, what impact they may have on us, our business or our results of operations.
Potential changes in U.S. accounting standards may adversely affect our financial statements.
We prepare our financial statements in accordance with generally accepted accounting principles in the United States (“GAAP”). From time to time we are required to adopt new or revised accounting standards issued by recognized authoritative bodies, including the Financial Accounting Standards Board. It is possible that future accounting standards that we are required to adopt could change the current accounting treatment that we apply to our consolidated statements and that such changes could have a materially adverse effect on our results of operations and financial condition. For information regarding new accounting pronouncements and the impact, if any, on our financial position or results of operations, see Note 2 to the Notes to the consolidated financial statement in this Report.
Premiums for federal deposit insurance have increased and may increase even more.
The Dodd-Frank Act broadens the base for FDIC insurance assessments. The FDIC insures deposits at FDIC-insured financial institutions, including the Bank. The FDIC charges insured financial institutions premiums to maintain the DIF at a specific level. In addition, the Dodd-Frank Act increased the minimum target DIF ratio from 1.15% of estimated insured deposits to 1.35% of estimated insured deposits and the FDIC must seek to achieve the 1.35% ratio by September 30, 2020. The FDIC has issued regulations to implement these provisions of the Dodd-Frank Act. It has, in addition, established a higher reserve ratio of 2% as a long-term goal beyond what is required by statute, although there is no implementation deadline for the 2% ratio. The FDIC may increase the assessment rates or impose additional special assessments in the future to keep the DIF at the statutory target level. The Bank’s FDIC insurance premiums increased substantially beginning in 2009, and have returned to more normal levels with the improved condition of the Bank. Any increase in our FDIC premiums could have a materially adverse effect on the Bank’s financial condition and results of operations.
The loss of key personnel could hurt our financial performance.
Our success depends to a great extent on the continued availability of our existing management and, in particular, on Thomas M. Vertin our President and Chief Executive Officer. In addition to their skills and experience as bankers, our executive officers provide us with extensive community ties upon which our competitive strategy is partially based. As a result, the loss of the services of any of these officers could harm our ability to implement our business strategy or our future operating results.
We rely on communications, information, operating and financial control systems technology from third-party service providers, and we may suffer an interruption in those systems.
We rely heavily on third-party service providers for much of our communications, information, operating and financial control systems technology, including our online banking services and data processing systems. Any failure or interruption, or breaches in security, of these systems could result in failures or interruptions in our customer relationship management, general ledger, deposit, servicing and/or loan origination systems and, therefore, could harm our business, operating results and financial condition. Additionally, interruptions in service and security breaches could lead existing customers to terminate their banking relationships with us and could make it more difficult for us to attract new banking customers.
A breach in the security of our systems could disrupt our business, result in the disclosure of confidential information, damage our reputation and create significant financial and legal exposure to us.
20
We rely heavily on communications and information systems to conduct our business. Although we devote significant resources to maintain and regularly upgrade our systems and processes that are designed to protect the security of our computer systems, software, networks and other technology assets and the confidentiality, integrity and availability of information belonging to us and our customers, there is no assurance that all of our security measures will provide absolute security. Information security risks for financial institutions have generally increased in recent years in part because of the proliferation of new technologies, the use of the Internet and telecommunications technologies to conduct financial transactions, and the increased sophistication and activities of organized crime, hackers, terrorists or other external parties. Those parties may also attempt to fraudulently induce employees, customers or other users of our systems to disclose sensitive information in order to gain access to our data or that of our customers. For example, other financial services institutions and companies engaged in data processing have reported breaches in the security of their websites or other systems, some of which have involved sophisticated and targeted attacks intended to obtain unauthorized access to confidential information, destroy data, disrupt or degrade service, sabotage systems or cause other damage, often through the introduction of computer viruses or malware, cyberattacks and other means.
Despite our efforts to ensure the integrity of our systems, it is possible that we may not be able to anticipate or to implement effective preventive measures against all security breaches of these types, especially because the techniques used change frequently or are not recognized until launched. These risks may increase in the future as we continue to increase our internet-based product offerings and expand our internal usage of web-based products and applications. A successful penetration or circumvention of the security of our systems could cause serious negative consequences for us, including significant disruption of our operations, misappropriation of our confidential information or that of our customers, or damage to our computers or systems and those of our customers and counterparties, and could result in violations of applicable privacy and other laws, financial loss to us or our customers, loss of confidence in our security measures, customer dissatisfaction, significant litigation exposure, and harm to our reputation, all of which could have a material adverse effect on us.
We are exposed to risk of environmental liabilities with respect to real properties which we may acquire.
If borrowers are unable to meet their loan repayment obligations, we will initiate foreclosure proceedings with respect to and may take actions to acquire title to the personal and real property that collateralized their loans. As an owner of such properties, we could become subject to environmental liabilities and incur substantial costs for any property damage, personal injury, investigation and clean-up that may be required due to any environmental contamination that may be found to exist at any of those properties, even though we did not engage in the activities that led to such contamination. In addition, if we are the owner or former owner of a contaminated site, we may be subject to common law claims by third parties seeking damages for environmental contamination emanating from the site. If we were to become subject to significant environmental liabilities or costs, our business, financial condition, results of operations and prospects could be adversely affected.
Managing reputational risk is important to attracting and maintaining customers, investors and employees.
Threats to our reputation can come from many sources, including adverse sentiment about financial institutions generally, unethical practices, employee misconduct, failure to deliver minimum standards of service or quality, compliance deficiencies and questionable or fraudulent activities of our customers. We have policies and procedures in place to promote
ethical conduct and protect our reputation. However, these policies and procedures may not be fully effective. Negative publicity regarding our business, employees, or customers, with or without merit, may result in the loss of customers, investors and employees, costly litigation, a decline in revenues and increased governmental regulation.
The price of our common stock may be volatile or may decline, which may make it more difficult to realize a profit on your investment in our shares of common stock.
The trading prices of our common stock may fluctuate widely as a result of a number of factors, many of which are outside our control. Our stock price in the future could be adversely affected by other factors including:
• | quarterly fluctuations in our operating results or financial condition; |
• | failure to meet analysts’ revenue or earnings estimates; |
• | the restrictions, described below, on our ability to pay cash dividends on our common stock; |
• | the imposition of additional regulatory restrictions on our business and operations or an inability to meet regulatory requirements; |
• | an inability to successfully implement our growth strategy; |
• | strategic actions by us or our competitors, such as acquisitions or restructurings; |
• | fluctuations in the stock prices and operating results of our competitors; |
• | general market conditions and, in particular, developments related to market conditions for the financial services industry stocks; |
21
• | proposed or newly adopted legislative or regulatory changes or developments aimed at the financial services industry; |
• | any future proceedings or litigation that may involve or affect us; and |
• | continuing concerns and a lack of confidence among investors that economic and market conditions will improve. |
As a bank holding company that conducts substantially all of our operations through our subsidiary, the Bank, our ability to pay dividends, repurchase shares of our common stock or to repay our indebtedness depends upon liquid assets held by the holding company and the results of operations of our subsidiaries.
We are a separate and distinct legal entity from our subsidiaries and we receive substantially all of our revenue from dividends paid from the Bank. There are legal limitations on the extent to which the Bank may extend credit, pay dividends or otherwise supply funds to, or engage in transactions with, us. Our inability to receive dividends from the Bank could adversely affect our business, financial condition, results of operations and prospects.
Various statutory provisions restrict the amount of dividends the Bank can pay to us without regulatory approval. The Bank may not pay cash dividends if that payment could reduce the amount of its capital below that necessary to meet the “adequately capitalized” level in accordance with regulatory capital requirements. It is also possible that, depending upon the financial condition of the Bank and other factors, regulatory authorities could conclude that payment of dividends or other payments, including payments to us, is an unsafe or unsound practice and impose restrictions on or prohibit such payments. The FRB has issued a policy statement on the payment of cash dividends by bank holding companies, which expresses the FRB’s view that a bank holding company should pay cash dividends only to the extent that its net income for the past year is sufficient to cover both the cash dividends and a rate of earnings retention that is consistent with the holding company’s capital needs, asset quality and overall financial condition.
Our principal shareholders and management own a significant percentage of our voting shares and are able to exercise significant influence over our business and have the power to block transactions that could benefit our other shareholders.
As of December 31, 2015, Carpenter Community Bancfund, L.P. and Carpenter Community Bancfund-A, L.P. (collectively, the “Carpenter Funds”) own a total of approximately 32.5% of our outstanding shares of voting stock and together constitute our largest shareholder. Further, pursuant to an agreement we have entered into with the Carpenter Funds, three individuals designated by the Carpenter Funds have been appointed to serve on the respective Boards of Directors of both the Company and the Bank. As a result, the Carpenter Funds have the ability to significantly influence the outcome of matters requiring approval of our Board of Directors and matters requiring the approval of our shareholders. Consequently, the Carpenter Funds have significant influence over our operations and outcome of shareholder votes on the approval of mergers and acquisitions or changes in corporate control which, among other things, could (i) discourage potential acquirers from attempting to acquire the Company, thereby impeding or preventing the consummation of acquisition or change of control transactions in which our shareholders might otherwise receive a premium for their shares, and (ii) make it more difficult for us to sell additional shares at prices in excess of those paid by the Carpenter Funds for their shares of common stock, even if our financial performance significantly improves.
If we sell additional shares of our common stock in the future, our shareholders could suffer significant dilution in their share ownership and voting power.
Subject to market conditions and other factors, we may determine from time to time to issue additional shares of our common stock or pursue other equity financings to meet capital requirements or support the growth of our business. Further issuance of any shares of our common stock and/or preferred stock would dilute the ownership interests of any holders of our common stock at the time of such issuance. In addition, we have issued, and may continue to issue, stock options, warrants, or other stock grants under our equity incentive plan. It is probable that options will be exercised during their respective terms if the stock price exceeds the exercise price of the particular option. If the options are exercised, share ownership will be diluted.
Certain banking laws and provisions of our articles of incorporation could discourage a third party from making a takeover offer that may be beneficial to our shareholders.
Provisions of federal banking laws, including regulatory approval requirements, could make it difficult for a third party to acquire us, even if doing so would be perceived to be beneficial to our shareholders. Acquisition of 10% or more of any class of voting stock of a bank holding company or depository institution, including shares of our common stock, generally creates a rebuttable presumption that the acquirer “controls” the bank holding company or depository institution. Also, a bank holding company must obtain the prior approval of the FRB before, among other things, acquiring direct or indirect ownership or control of more than 5% of the voting shares of any bank, including us.
Additionally, our Board of Directors has the power, under our articles of incorporation, to create and authorize the sale of one or more new series of preferred stock without having to obtain shareholder approval for such action. As a result, the Board
22
could authorize the issuance of and issue shares of a new series of preferred stock to implement a shareholders rights plan (often referred to as a “poison pill”) or could sell and issue preferred shares with special voting rights or conversion rights that could deter or delay attempts by our shareholders to remove or replace management, and attempts of third parties to engage in proxy contests and effectuate changes in control of us.
ITEM 1B. UNRESOLVED STAFF COMMENTS
None.
ITEM 2. PROPERTIES
We lease office space in various cities throughout Southern California, including Costa Mesa, Newport Beach, San Juan Capistrano, Beverly Hills, La Jolla, La Habra and Ontario. We believe our leased facilities are adequate for us to conduct our business.
ITEM 3. LEGAL PROCEEDINGS
We are subject to legal actions that arise from time to time in the ordinary course of our business. Currently, neither we nor any of our subsidiaries is a party to, and none of our or our subsidiaries' property is the subject of, any material legal proceeding.
ITEM 4. MINE SAFETY DISCLOSURES
Not applicable.
23
PART II
ITEM 5. | MARKET FOR REGISTRANT’S COMMON EQUITY, RELATED STOCKHOLDER MATTERS AND ISSUER PURCHASES OF EQUITY SECURITIES |
Trading Market for the Company’s Shares
Our common stock is traded on the NASDAQ Global Select Market under the symbol “PMBC.” The following table presents the high and low sales prices of our common stock, as reported on the NASDAQ Global Select Market, for each of the calendar quarters indicated below:
High | Low | ||||||
Year Ended December 31, 2015 | |||||||
First Quarter | $ | 7.25 | $ | 6.83 | |||
Second Quarter | $ | 7.94 | $ | 6.16 | |||
Third Quarter | $ | 7.77 | $ | 6.41 | |||
Fourth Quarter | $ | 7.22 | $ | 6.48 | |||
Year Ended December 31, 2014 | |||||||
First Quarter | $ | 6.65 | $ | 6.00 | |||
Second Quarter | $ | 6.82 | $ | 6.16 | |||
Third Quarter | $ | 7.20 | $ | 6.59 | |||
Fourth Quarter | $ | 7.25 | $ | 5.48 | |||
The high and low per share sale prices of our common stock on the NASDAQ Global Select Market on March 9, 2016, were $7.09 and $6.88 per share, respectively and, as of that same date, there were approximately 95 holders of record of our common stock.
Recent Sales of Unregistered Securities and Use of Proceeds
None.
Stock Performance Graph
The following graph compares the percentage change in our cumulative total shareholder return on our common stock, in each of the years in the five year period ended December 31, 2015, with the cumulative total return of: (i) the Russell 2000 Index, which measures the performance of the smallest 2,000 members, by market capitalization, of the Russell 3,000 Index, and (ii) an index published by SNL Securities L.C. (“SNL”) and known as the SNL Western Bank Index, which is comprised of 48 banks and bank holding companies (including the Company), the shares of which are listed on NASDAQ or the New York Stock Exchange and most of which are based in California and the remainder of which are based in six other western states.
The stock performance graph assumes that $100 was invested in Company common stock at the close of market on December 31, 2010, and, at that same date, in the Russell 2000 Index and the SNL Western Bank Index and that any dividends paid in the indicated periods were reinvested. Shareholder returns shown in the stock performance graph are not necessarily indicative of future stock price performance.
24
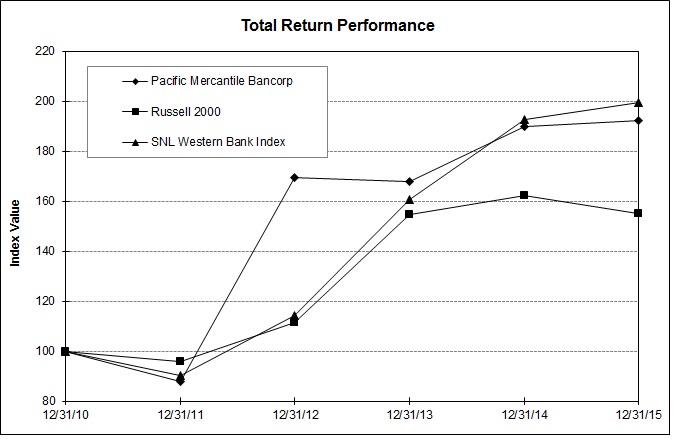
(1) | The source of the above graph and chart is SNL. |
Period Ending | |||||||||||||||||
Index | 12/31/10 | 12/31/11 | 12/31/12 | 12/31/13 | 12/31/14 | 12/31/15 | |||||||||||
Pacific Mercantile Bancorp | 100.00 | 87.87 | 169.54 | 167.65 | 189.76 | 192.18 | |||||||||||
Russell 2000 Index | 100.00 | 95.82 | 111.49 | 154.78 | 162.35 | 155.18 | |||||||||||
SNL Western Bank Index | 100.00 | 90.34 | 114.01 | 160.41 | 192.51 | 199.46 | |||||||||||
The above performance graph shall not be deemed “filed” for purposes of Section 18 of the Exchange Act or otherwise subject to the liabilities under that section and shall not be deemed to be incorporated by reference into any of our filings under the Securities Act or the Exchange Act.
Dividend Policy and Restrictions on the Payment of Dividends
We have not declared or paid any cash dividends on our common stock since 2008.
Cash dividends from the Bank represent the principal source of funds available to Bancorp to pay cash dividends to shareholders. Therefore, government regulations, including the laws of the State of California, as they pertain to the payment of cash dividends by California state chartered banks, limit the amount of funds that the Bank would be permitted to dividend to Bancorp. As a result, those laws also affect our ability to pay cash dividends to our shareholders. In particular, under California law, cash dividends by a California state chartered bank may not exceed, in any calendar year, the lesser of (i) the sum of its net income for the year and its retained net income from the preceding two years (after deducting all dividends paid during the period), or (ii) the amount of its retained earnings. See Note 14, Shareholders' Equity in the notes to our consolidated financial statements for more detail regarding the regulatory restrictions on our and the Bank's ability to pay dividends.
Additionally, because the payment of cash dividends has the effect of reducing capital, the capital requirements imposed on bank holding companies and commercial banks often operate, as a practical matter, to preclude the payment, or limit the amount of, cash dividends that might otherwise be permitted by California law; and the federal bank regulatory agencies, as part of their supervisory powers, generally require insured banks to adopt dividend policies which limit the payment of cash dividends much more strictly than do applicable state laws.
25
Even if legal or regulatory restrictions do not prevent us from paying dividends to our shareholders, our Board of Directors follows a policy of retaining earnings to maintain capital, enhance the Bank's liquidity and support the growth of our banking franchise. Accordingly, we do not expect to pay cash dividends for the foreseeable future.
Restrictions on Inter-Company Transactions
Section 23(a) of the Federal Reserve Act limits the amounts that a bank may loan to its bank holding company to an aggregate of no more than 10% of the bank subsidiary’s capital surplus and retained earnings and requires that such loans be secured by specified assets of the bank holding company—See “BUSINESS—Supervision and Regulation–Restrictions on Transactions between the Bank and the Company and its other Affiliates”. We do not have any present intention to obtain any borrowings from the Bank.
26
ITEM 6. SELECTED FINANCIAL DATA
The selected statement of operations data for the fiscal years ended December 31, 2015, 2014 and 2013, the selected balance sheet data as of December 31, 2015 and 2014, and the selected financial ratios (other than book value per share), that follow below were derived from our audited consolidated financial statements included in Item 8 of this Report and should be read in conjunction with those audited consolidated financial statements, together with the notes thereto, and with Management’s Discussion and Analysis of Financial Condition and Results of Operations set forth in Item 7 of this Report. The selected statement of operations data for the years ended December 31, 2012 and 2011, the selected balance sheet data as of December 31, 2013, 2012 and 2011, and the selected financial ratios (other than book value per share) for the periods prior to January 1, 2013 are derived from audited consolidated financial statements that are not included in this Report. The data for the previous years has been adjusted to reflect discontinued operations.
Year Ended December 31, | |||||||||||||||||||
2015 | 2014 | 2013 | 2012 | 2011 | |||||||||||||||
(Dollars in thousands except per share data) | |||||||||||||||||||
Selected Statement of Operations Data: | |||||||||||||||||||
Total interest income | $ | 38,797 | $ | 38,290 | $ | 35,651 | $ | 38,426 | $ | 43,107 | |||||||||
Total interest expense | 5,269 | 5,829 | 5,317 | 8,049 | 11,058 | ||||||||||||||
Net interest income | 33,528 | 32,461 | 30,334 | 30,377 | 32,049 | ||||||||||||||
Provision for loan and lease losses | — | 1,500 | 4,505 | 1,950 | (833 | ) | |||||||||||||
Net interest income after provision for loan and lease losses | 33,528 | 30,961 | 25,829 | 28,427 | 32,882 | ||||||||||||||
Total noninterest income | 2,686 | 4,370 | 1,193 | 3,762 | 1,946 | ||||||||||||||
Total noninterest expense | 35,324 | 36,808 | 36,346 | 36,470 | 29,536 | ||||||||||||||
Income (loss) from continuing operations before income taxes | 890 | (1,477 | ) | (9,324 | ) | (4,281 | ) | 5,292 | |||||||||||
Income tax (benefit) provision | (11,551 | ) | (608 | ) | 5,610 | (6,920 | ) | (6,425 | ) | ||||||||||
Net income (loss) from continuing operations | $ | 12,441 | $ | (869 | ) | $ | (14,934 | ) | $ | 2,639 | $ | 11,717 | |||||||
Net income (loss) from discontinued operations | — | 1,226 | (7,282 | ) | 7,015 | (85 | ) | ||||||||||||
Accumulated declared dividends on preferred stock | — | (547 | ) | (538 | ) | (941 | ) | — | |||||||||||
Accumulated undeclared dividends on preferred stock | — | (616 | ) | (544 | ) | (17 | ) | (440 | ) | ||||||||||
Dividends on preferred stock | (927 | ) | — | — | — | — | |||||||||||||
Inducements for exchange of the preferred stock | (512 | ) | — | — | — | — | |||||||||||||
Net income (loss) allocable to common shareholders | $ | 11,002 | $ | (806 | ) | $ | (23,298 | ) | $ | 8,696 | $ | 11,192 | |||||||
Per share data-basic: | |||||||||||||||||||
Net income (loss) from continuing operations | $ | 0.54 | $ | (0.11 | ) | $ | (0.88 | ) | $ | 0.11 | $ | 0.99 | |||||||
Net income (loss) allocable to common shareholders | $ | 0.54 | $ | (0.04 | ) | $ | (1.28 | ) | $ | 0.57 | $ | 0.99 | |||||||
Per share data-diluted: | |||||||||||||||||||
Net income (loss) from continuing operations | $ | 0.53 | $ | (0.11 | ) | $ | (0.88 | ) | $ | 0.15 | $ | 0.99 | |||||||
Net income (loss) allocable to common shareholders | $ | 0.53 | $ | (0.04 | ) | $ | (1.28 | ) | $ | 0.55 | $ | 0.98 | |||||||
Weighted average shares outstanding | |||||||||||||||||||
Basic | 20,516,575 | 19,230,913 | 18,240,891 | 15,386,106 | 11,361,389 | ||||||||||||||
Diluted | 20,675,279 | 19,230,913 | 18,240,891 | 17,674,974 | 11,371,524 | ||||||||||||||
Dividends per share | — | — | — | — | — | ||||||||||||||
December 31, | |||||||||||||||||||
2015 | 2014 | 2013 | 2012 | 2011 | |||||||||||||||
(Dollars in thousands except for per share information) | |||||||||||||||||||
Selected Balance Sheet Data: | |||||||||||||||||||
Cash and cash equivalents(1) | $ | 113,921 | $ | 177,135 | $ | 106,940 | $ | 128,208 | $ | 96,467 | |||||||||
Total loans, net | 849,733 | 824,197 | 765,426 | 719,257 | 641,962 | ||||||||||||||
Total assets | 1,062,389 | 1,099,610 | 996,583 | 1,053,941 | 1,024,552 | ||||||||||||||
Total deposits | 893,840 | 916,309 | 780,225 | 845,395 | 862,047 | ||||||||||||||
Junior subordinated debentures | 17,527 | 17,527 | 17,527 | 17,527 | 17,527 | ||||||||||||||
Total shareholders’ equity | 133,916 | 119,281 | 115,158 | 122,876 | 86,625 | ||||||||||||||
Book value per share | $ | 5.87 | $ | 5.53 | $ | 5.47 | $ | 6.75 | $ | 6.26 | |||||||||
(1) | Cash and cash equivalents include cash and due from banks and federal funds sold. |
27
For the Year Ended December 31, | ||||||||||||||
2015 | 2014 | 2013 | 2012 | 2011 | ||||||||||
(unaudited) | ||||||||||||||
Selected Financial Ratios: | ||||||||||||||
Return on average assets | 1.17 | % | (0.08 | )% | (1.59 | )% | 0.27 | % | 1.19 | % | ||||
Return on average equity | 10.23 | % | (0.74 | )% | (11.47 | )% | 2.55 | % | 16.63 | % | ||||
Ratio of average equity to average assets | 11.48 | % | 11.30 | % | 13.82 | % | 10.77 | % | 7.16 | % | ||||
28
ITEM 7. | MANAGEMENT’S DISCUSSION AND ANALYSIS OF FINANCIAL CONDITION AND RESULTS OF OPERATIONS |
Overview
The following discussion presents information about our consolidated results of operations, financial condition, liquidity and capital resources and should be read in conjunction with our consolidated financial statements and the notes thereto included in Item 8 of this Report.
Our principal operating subsidiary is Pacific Mercantile Bank (the “Bank”), which is a California state chartered bank. The Bank accounts for substantially all of our consolidated revenues, expenses and income and our consolidated assets and liabilities. Accordingly, the following discussion focuses primarily on the Bank’s results of operations and financial condition.
As of December 31, 2015, our total assets, net loans and total deposits were $1.1 billion, $850 million and $894 million, respectively.
The Bank, which is headquartered in Orange County, California, approximately 40 miles south of Los Angeles, conducts a commercial banking business in Orange, Los Angeles, San Bernardino and San Diego counties in Southern California. The Bank is also a member of the Federal Reserve System and its deposits are insured, to the maximum extent permitted by law, by the Federal Deposit Insurance Corporation (the “FDIC”). For the years ended December 31, 2015, 2014 and 2013, we operated as one reportable segment, Commercial Banking, and one non-reportable segment, Discontinued Operations.
Unless the context otherwise requires, the “Company,” “we,” “our,” “ours,” and “us” refer to Pacific Mercantile Bancorp and its consolidated subsidiaries.
Current Developments
During the first quarter of 2015, the Company made the strategic decision to discontinue its business of funding broker-originated Small Business Administration (“SBA”) loans. The Bank employed a group that was originally hired in May 2012 which focused on originating loans through the SBA 504 and 7(a) lending programs (“SBA Group”). The SBA Group sourced loans through broker relationships, which generally did not result in the Bank having the borrower's full banking relationship. We concluded that the transactional nature of the business model in the SBA Group was not in line with our strategy of transitioning to a relationship-oriented commercial banking model. As a result of this decision, during the first quarter of 2015, we terminated the 15 employees within the SBA Group and we incurred total personnel expense including severance pay of $611 thousand, which is recorded within noninterest expense for the year ended December 31, 2015 and will be nonrecurring. We do not expect any additional expenses to be incurred as a result of this decision. The Bank continues to be in good standing with the SBA as a Preferred Lender and we will continue to originate SBA 504 and 7(a) loans through our core relationship banking strategy. We intend to sell the guaranteed portion of the 7(a) loans in the secondary market from time to time.
On August 28, 2015, we entered into an Exchange Agreement (the “Exchange Agreement”) with SBAV, LP, an affiliate of Clinton Group, Inc. (“SBAV”), and Carpenter Community BancFund, L.P. and Carpenter Community BancFund-A, L.P. (together, the “Carpenter Funds”) pursuant to which SBAV and the Carpenter Funds exchanged an aggregate of 112,000 shares of the Company’s Series B Convertible 8.4% Noncumulative Preferred Stock (the “Series B Shares”), 35,225 shares of the Series C 8.4% Noncumulative Preferred Stock (the “Series C Shares”) and warrants to purchase 761,278 shares of the Company’s common stock (the “Warrants”) for an aggregate of 3,009,148 shares of the Company’s common stock (the “Exchange Transaction”). The Series B Shares, Series C Shares and Warrants exchanged by SBAV and the Carpenter Funds in the Exchange Transaction comprised all of the Company’s outstanding shares of preferred stock and warrants to purchase shares of the Company’s common stock. The Exchange Transaction closed on September 30, 2015.
Results of Operations
Discontinued Operations
In connection with our exit from the mortgage banking business in 2013, the revenues and expenses of our mortgage banking division have been classified as discontinued operations for all periods presented. As a result, all comparisons below reflect results from continuing operations. Income from discontinued operations was zero for the year ended December 31, 2015, while our income from discontinued operations was $1.2 million for the year ended December 31, 2014. We had no income from discontinued operations during the year ended December 31, 2015 as a result of the final wind down of the mortgage banking division during 2014. During the year ended December 31, 2014, we recorded a gain in the amount of $558 thousand on the sale of the mortgage servicing rights that we sold in April 2014, which is included in income from discontinued operations in the
29
consolidated statements of operations. This compares to a loss of $7.3 million for the year ended December 31, 2013 from the mortgage banking operations as a result of the decision to discontinue the mortgage banking business.
Operating Results for the Years Ended December 31, 2015, 2014, and 2013
Our operating results for the year ended December 31, 2015, compared to December 31, 2014, and for the year ended December 31, 2014, compared to December 31, 2013, were as follows:
Year Ended December 31, | ||||||||||||||
2015 | 2014 | 2013 | 2015 vs. 2014 % Change | 2014 vs. 2013 % Change | ||||||||||
(Dollars in thousands) | ||||||||||||||
Interest income | 38,797 | 38,290 | 35,651 | 1.3 | % | 7.4 | % | |||||||
Interest expense | 5,269 | 5,829 | 5,317 | (9.6 | )% | 9.6 | % | |||||||
Provision for loan and lease losses | — | 1,500 | 4,505 | (100.0 | )% | (66.7 | )% | |||||||
Non-interest income | 2,686 | 4,370 | 1,193 | (38.5 | )% | 266.3 | % | |||||||
Non-interest expense | 35,324 | 36,808 | 36,346 | (4.0 | )% | 1.3 | % | |||||||
Income tax (benefit) provision | (11,551 | ) | (608 | ) | 5,610 | 1,799.8 | % | (110.8 | )% | |||||
Net income (loss) from continuing operations | 12,441 | (869 | ) | (14,934 | ) | (1,531.6 | )% | (94.2 | )% | |||||
Net income (loss) from discontinued operations | — | 1,226 | (7,282 | ) | (100.0 | )% | (116.8 | )% | ||||||
Net income (loss) allocable to common shareholders | 11,002 | (806 | ) | (23,298 | ) | (1,465.0 | )% | (96.5 | )% | |||||
Interest Income
2015 vs. 2014.
Total interest income increased 1.3% to $38.8 million for the year ended December 31, 2015 from $38.3 million for the year ended December 31, 2014. This increase is primarily due to an increase in interest income on loans during the year ended December 31, 2015 compared to the prior year due to an increase in average loan balances, partially offset by a decline in the average yield on loans. During the year ended December 31, 2015 and 2014, interest income on loans was $36.7 million and $36.3 million, respectively, yielding 4.43% and 4.54% on average loan balances of $827.9 million and $799.9 million, respectively. The increase in the average loan balances is attributable to an increase in loan demand. The decrease in loan yield is primarily attributable to the actions of the Board of Governors of the Federal Reserve System (“Federal Reserve Board”) to keep short-term interest rates low. The average yield on interest-earning assets was 3.76% for the year ended December 31, 2015 compared to 3.81% for the year ended December 31, 2014.
During the year ended December 31, 2015 and 2014, interest income from our securities available-for-sale and stock, was $1.7 million and $1.6 million, yielding 2.63% and 2.27% on average balances of $65.0 million and $71.2 million, respectively. The investment yield increase is primarily due to our receipt of a cash dividend paid on our FHLB stock during the year ended December 31, 2015. The average securities balances decreased as a result of maturities of, and payments on, securities which we did not fully replace due to liquidity needs. Interest income from our short-term investments, including our federal funds sold and interest-bearing deposits, was $370 thousand and $333 thousand for the year ended December 31, 2015 and 2014, respectively, yielding 0.27% and 0.25% on average balances of $139.3 million and $134.6 million, respectively. The increase in interest income from our short-term investments was primarily attributable to an increase in the average yield during the year ended December 31, 2015 as compared to the year ended December 31, 2014, as well as an increase in the average investment balances for the same period. The increase in the average yield is attributable to the Federal Reserve Board raising interest rates by 25 basis points in the fourth quarter of 2015. As a result, total interest income on investments increased for the year ended December 31, 2015.
2014 vs. 2013.
Total interest income increased 7.4% to $38.3 million for the year ended December 31, 2014 from $35.7 million for the year ended December 31, 2013. This increase is primarily due to an increase in interest income on loans during the year ended December 31, 2014 compared to the prior year due to an increase in average loan balances, partially offset by a decline in the average yield on loans. During the year ended December 31, 2014 and 2013, interest income on loans was $36.3 million and $33.8 million, respectively, yielding 4.54% and 4.74% on average loan balances of $799.9 million and $713.9 million, respectively. The increase in the average loan balances is attributable to an increase in loan demand. The decrease in loan yield is primarily attributable to the actions of the Federal Reserve Board to keep short-term interest rates low. The average yield on interest-earning assets was 3.81% for the year ended December 31, 2014 compared to 4.01% for the year ended December 31, 2013.
During the year ended December 31, 2014 and 2013, interest income from our securities available-for-sale and stock, was $1.6 million and $1.6 million, respectively, yielding 2.27% and 1.96% on average balances of $71.2 million and $81.5 million,
30
respectively. The average securities balances decreased as a result of maturities of, and payments on, securities which we did not fully replace due to liquidity needs. The investment yield increase is primarily due to lower premium amortization attributable to slower projected prepayment speeds on our securities available-for-sale, returning our prepayment speed to a more historically normal level as compared to the accelerated prepayment speed seen in the prior year. Interest income from our short-term investments, including our federal funds sold and interest-bearing deposits, was $333 thousand and $233 thousand for the years ended December 31, 2014 and 2013, respectively, yielding 0.25% in each year on average balances of $134.6 million and $93.1 million, respectively. The increase in interest income from our short-term investments was primarily attributable to an increase in the average investment balances during the year ended December 31, 2014 as compared to the year ended December 31, 2013. As a result, total interest income on investments increased for the year ended December 31, 2014.
Interest Expense
2015 vs. 2014.
Total interest expense decreased 9.6% to $5.3 million for the year ended December 31, 2015 from $5.8 million for the year ended December 31, 2014. The decrease was primarily due to a decrease in the cost of funds of our interest-bearing liabilities to 0.76% at December 31, 2015 from 0.82% at December 31, 2014, which consisted of deposits, borrowings and junior subordinated debentures. The decrease in interest expense was primarily the result of a decrease in the volume of certificates of deposit. Interest expense on our certificates of deposit for the years ended December 31, 2015 and 2014 was $2.8 million and $4.1 million, respectively, with a cost of funds of 0.90% and 0.96% on average balances of $308.5 million and $431.8 million, respectively. The decrease in our interest expense was partially offset by an increase in the volume of and rates of interest paid on our savings and money market accounts.
2014 vs. 2013.
Total interest expense increased 9.6% to $5.8 million for the year ended December 31, 2014 from $5.3 million for the year ended December 31, 2013. The increase was primarily due to an increase in average interest-bearing liabilities to $707.7 million at December 31, 2014 from $616.4 million at December 31, 2013, with a cost of funds of 0.82% and 0.86%, respectively, which consisted of deposits, borrowings and junior subordinated debentures. The increase in interest expense was partially offset by a decrease in the rates of interest paid on certificates of deposit. Interest expense on our certificates of deposit for the years ended December 31, 2014 and 2013 was $4.1 million and $3.8 million, respectively, with a cost of funds of 0.96% and 1.06%, on average balances of $431.8 million and $354.7 million, respectively.
Net Interest Margin
One of the principal determinants of a bank’s income is its net interest income, which is the difference between (i) the interest that a bank earns on loans, investment securities and other interest earning assets, on the one hand, and (ii) its interest expense, which consists primarily of the interest it must pay to attract and retain deposits and the interest that it pays on borrowings and other interest-bearing liabilities, on the other hand. As a general rule, all other things being equal, the greater the difference or "spread" between the amount of our interest income and the amount of our interest expense, the greater will be our net income; whereas, a decline in that difference or "spread" will generally result in a decline in our net income.
A bank’s interest income and interest expense are affected by a number of factors, some of which are outside of its control, including national and local economic conditions and the monetary policies of the Federal Reserve Board which affect interest rates, competition in the market place for loans and deposits, the demand for loans and the ability of borrowers to meet their loan payment obligations. Net interest income, when expressed as a percentage of total average interest earning assets, is a banking organization’s “net interest margin.”
The following tables set forth information regarding our average balance sheet, yields on interest earning assets, interest expense on interest-bearing liabilities, the interest rate spread and the interest rate margin for the years ended December 31, 2015, 2014 and 2013. Average balances are calculated based on average daily balances.
31
Year Ended December 31, | ||||||||||||||||||||||||||||||||
2015 | 2014 | 2013 | ||||||||||||||||||||||||||||||
Average Balance | Interest Earned/ Paid | Average Yield/ Rate | Average Balance | Interest Earned/ Paid | Average Yield/ Rate | Average Balance | Interest Earned/ Paid | Average Yield/ Rate | ||||||||||||||||||||||||
(Dollars in thousands) | ||||||||||||||||||||||||||||||||
Interest earning assets | ||||||||||||||||||||||||||||||||
Short-term investments(1) | $ | 139,341 | $ | 370 | 0.27 | % | $ | 134,641 | $ | 333 | 0.25 | % | $ | 93,147 | $ | 233 | 0.25 | % | ||||||||||||||
Securities available for sale and stock(2) | 64,960 | 1,710 | 2.63 | % | 71,202 | 1,613 | 2.27 | % | 81,493 | 1,599 | 1.96 | % | ||||||||||||||||||||
Loans(3) | 827,900 | 36,717 | 4.43 | % | 799,900 | 36,344 | 4.54 | % | 713,894 | 33,819 | 4.74 | % | ||||||||||||||||||||
Total interest-earning assets | 1,032,201 | 38,797 | 3.76 | % | 1,005,743 | 38,290 | 3.81 | % | 888,534 | 35,651 | 4.01 | % | ||||||||||||||||||||
Noninterest-earning assets | ||||||||||||||||||||||||||||||||
Cash and due from banks | 16,621 | 12,947 | 12,330 | |||||||||||||||||||||||||||||
All other assets | 10,113 | 21,121 | 41,061 | |||||||||||||||||||||||||||||
Total assets | $ | 1,058,935 | $ | 1,039,811 | $ | 941,925 | ||||||||||||||||||||||||||
Interest-bearing liabilities: | ||||||||||||||||||||||||||||||||
Interest-bearing checking accounts | $ | 40,916 | $ | 95 | 0.23 | % | $ | 36,281 | $ | 100 | 0.28 | % | $ | 33,447 | 93 | 0.28 | % | |||||||||||||||
Money market and savings accounts | 300,088 | 1,699 | 0.57 | % | 170,047 | 585 | 0.34 | % | 155,352 | 565 | 0.36 | % | ||||||||||||||||||||
Certificates of deposit | 308,529 | 2,765 | 0.90 | % | 431,789 | 4,133 | 0.96 | % | 354,720 | 3,763 | 1.06 | % | ||||||||||||||||||||
Other borrowings | 26,164 | 203 | 0.78 | % | 52,031 | 437 | 0.84 | % | 55,318 | 352 | 0.64 | % | ||||||||||||||||||||
Junior subordinated debentures | 17,527 | 507 | 2.89 | % | 17,527 | 574 | 3.27 | % | 17,527 | 544 | 3.10 | % | ||||||||||||||||||||
Total interest bearing liabilities | 693,224 | 5,269 | 0.76 | % | 707,675 | 5,829 | 0.82 | % | 616,364 | 5,317 | 0.86 | % | ||||||||||||||||||||
Noninterest-bearing liabilities | ||||||||||||||||||||||||||||||||
Demand deposits | 237,371 | 206,295 | 188,696 | |||||||||||||||||||||||||||||
Accrued expenses and other liabilities | 6,773 | 8,355 | 6,645 | |||||||||||||||||||||||||||||
Shareholders' equity | 121,567 | 117,486 | 130,220 | |||||||||||||||||||||||||||||
Total liabilities and shareholders' equity | $ | 1,058,935 | $ | 1,039,811 | $ | 941,925 | ||||||||||||||||||||||||||
Net interest income | $ | 33,528 | $ | 32,461 | $ | 30,334 | ||||||||||||||||||||||||||
Net interest income/spread | 3.00 | % | 2.99 | % | 3.15 | % | ||||||||||||||||||||||||||
Net interest margin | 3.25 | % | 3.23 | % | 3.41 | % | ||||||||||||||||||||||||||
(1) | Short-term investments consist of federal funds sold and interest bearing deposits that we maintain at other financial institutions. |
(2) | Stock consists of Federal Home Loan Bank (“FHLB”) stock and Federal Reserve Bank stock. |
(3) | Loans include the average balance of nonaccrual loans and loan fees. |
The following table sets forth changes in interest income, including loan fees, and interest paid in each of the years ended December 31, 2015, 2014 and 2013 and the extent to which those changes were attributable to changes in (i) the volumes of or in the rates of interest earned on interest-earning assets and (ii) the volumes of or in the rates of interest paid on our interest-bearing liabilities.
32
2015 Compared to 2014 Increase (Decrease) due to Changes in | 2014 Compared to 2013 Increase (Decrease) due to Changes in | ||||||||||||||||||||||
Volume | Rates | Total Increase (Decrease) | Volume | Rates | Total Increase (Decrease) | ||||||||||||||||||
(Dollars in thousands) | |||||||||||||||||||||||
Interest income | |||||||||||||||||||||||
Short-term investments(1) | $ | 12 | $ | 25 | $ | 37 | $ | 103 | $ | (3 | ) | $ | 100 | ||||||||||
Securities available for sale and stock(2) | (149 | ) | 246 | 97 | (216 | ) | 230 | 14 | |||||||||||||||
Loans | 1,254 | (881 | ) | 373 | 3,950 | (1,425 | ) | 2,525 | |||||||||||||||
Total earning assets | 1,117 | (610 | ) | 507 | 3,837 | (1,198 | ) | 2,639 | |||||||||||||||
Interest expense | |||||||||||||||||||||||
Interest-bearing checking accounts | 12 | (17 | ) | (5 | ) | 8 | (1 | ) | 7 | ||||||||||||||
Money market and savings accounts | 604 | 510 | 1,114 | 52 | (32 | ) | 20 | ||||||||||||||||
Certificates of deposit | (1,118 | ) | (250 | ) | (1,368 | ) | 762 | (392 | ) | 370 | |||||||||||||
Borrowings | (203 | ) | (31 | ) | (234 | ) | (22 | ) | 107 | 85 | |||||||||||||
Junior subordinated debentures | — | (67 | ) | (67 | ) | — | 30 | 30 | |||||||||||||||
Total interest-bearing liabilities | (705 | ) | 145 | (560 | ) | 800 | (288 | ) | 512 | ||||||||||||||
Net interest income | $ | 1,822 | $ | (755 | ) | $ | 1,067 | $ | 3,037 | $ | (910 | ) | $ | 2,127 | |||||||||
(1) | Short-term investments consist of federal funds sold and interest bearing deposits that we maintain at financial institutions. |
(2) | Stock consists of FHLB stock and Federal Reserve Bank stock. |
Provision for Loan and Lease Losses
We maintain reserves to provide for loan losses that occur in the ordinary course of the banking business. When it is determined that the payment in full of a loan has become unlikely, the carrying value of the loan is reduced ("written down") to what management believes is its realizable value or, if it is determined that a loan no longer has any realizable value, the carrying value of the loan is written off in its entirety (a loan "charge-off"). Loan charge-offs and write-downs are charged against our allowance for loan and lease losses (“ALLL”). The amount of the ALLL is increased periodically to replenish the ALLL after it has been reduced due to loan write-downs or charge-offs. The ALLL also is increased or decreased periodically to reflect increases or decreases in the volume of outstanding loans and to take account of changes in the risk of probable loan losses due to financial performance of borrowers, the value of collateral securing non-performing loans or changing economic conditions. Increases in the ALLL are made through a "provision for loan and lease losses" that is recorded as an expense in the statement of operations. Increases in the ALLL are also recognized through the recovery of charged-off loans which are added back to the ALLL. As such, recoveries are a direct offset for a provision for loan and lease losses that would otherwise be needed to replenish or increase the ALLL.
We employ economic models and data that conform to bank regulatory guidelines and reflect sound industry practices as well as our own historical loan loss experience to determine the sufficiency of the ALLL and any provisions needed to increase or replenish the ALLL. Those determinations involve judgments and assumptions about current economic conditions and external events that can impact the ability of borrowers to meet their loan obligations. However, the duration and impact of these factors cannot be determined with any certainty. As such, unanticipated changes in economic or market conditions, bank regulatory guidelines or the sound practices that are used to determine the sufficiency of the ALLL, could require us to record additional, and possibly significant, provisions to increase the ALLL. This would have the effect of reducing reportable income or, in the most extreme circumstance, creating a reportable loss. In addition, the Federal Reserve Bank and the California Department of Business Oversight (“CDBO”), as an integral part of their regulatory oversight, periodically review the adequacy of our ALLL. These agencies may require us to make additional provisions for perceived potential loan losses, over and above the provisions that we have already made, the effect of which would be to reduce our income or increase any losses we might incur.
The provision for loan and lease losses decreased $1.5 million for the year ended December 31, 2015 as compared to the year ended December 31, 2014, primarily as a result of improving asset quality evidenced by lower levels of classified loans and generally positive asset quality trends which more than offset the portfolio growth. Nonperforming assets remained stable as compared to the prior year.
See "—Financial Condition—Nonperforming Loans and the Allowance for Loan and Lease Losses" below in this Item 7 for additional information regarding the ALLL.
33
Noninterest Income
The following table identifies the components of and the percentage changes in noninterest income in the years ended December 31, 2015, 2014 and 2013:
Year Ended December 31, | |||||||||||||||||
Amount | Amount | Amount | Percentage Change | Percentage Change | |||||||||||||
2015 | 2014 | 2013 | 2015 vs. 2014 | 2014 vs. 2013 | |||||||||||||
(Dollars in thousands) | |||||||||||||||||
Service fees on deposits and other banking services | $ | 918 | $ | 896 | $ | 801 | 2.5 | % | 11.9 | % | |||||||
Net gains on sale of securities available for sale | — | — | 44 | — | % | (100.0 | )% | ||||||||||
Net gain on sale of small business administration loans | — | 2,074 | — | (100.0 | )% | 100.0 | % | ||||||||||
Other noninterest income | 1,768 | 1,400 | 348 | 26.3 | % | 302.3 | % | ||||||||||
Total noninterest income | $ | 2,686 | $ | 4,370 | $ | 1,193 | (38.5 | )% | 266.3 | % | |||||||
2015 vs. 2014.
During the year ended December 31, 2015, noninterest income decreased by $1.7 million, or 38.5%, to $2.7 million from $4.4 million for the year ended December 31, 2014, primarily as a result of:
• | A decrease of $2.1 million in net gain on sale of SBA loans for the year ended December 31, 2015 as compared to the same period in 2014; partially offset by |
• | A $200 thousand recovery during the year ended December 31, 2015 on a charged off loan in excess of the amount previously charged off against the ALLL; and |
• | An increase in loan servicing and referral fees during the year ended December 31, 2015 as compared to the same period in 2014. |
2014 vs. 2013.
During the year ended December 31, 2014, noninterest income increased by $3.2 million, or 266.3%, to $4.4 million from $1.2 million for the year ended December 31, 2013, primarily as a result of:
• | An increase of $2.1 million in net gain on sale of SBA loans for the year ended December 31, 2014 as compared to the same period in 2013; and |
• | No sales of non-SBA loans during the year ended December 31, 2014 as compared to a net loss on sale of non-SBA loans of $448 thousand included in other noninterest income during the year ended December 31, 2013. |
Noninterest Expense
The following table sets forth the principal components and the amounts of, and the percentage changes in, noninterest expense in the years ended December 31, 2015, 2014 and 2013.
Year Ended December 31, | |||||||||||||||||
2015 | 2014 | 2013 | 2015 vs. 2014 | 2014 vs. 2013 | |||||||||||||
Amount | Amount | Amount | Percent Change | Percent Change | |||||||||||||
(Dollars in thousands) | |||||||||||||||||
Salaries and employee benefits | $ | 22,002 | $ | 22,571 | $ | 19,585 | (2.5 | )% | 15.2 | % | |||||||
Occupancy | 2,871 | 2,499 | 2,234 | 14.9 | % | 11.9 | % | ||||||||||
Equipment and depreciation | 1,652 | 1,541 | 1,609 | 7.2 | % | (4.2 | )% | ||||||||||
Data processing | 1,035 | 931 | 786 | 11.2 | % | 18.4 | % | ||||||||||
FDIC expense | 1,250 | 1,336 | 1,769 | (6.4 | )% | (24.5 | )% | ||||||||||
Other real estate owned expense, net | 365 | 1,962 | 3,233 | (81.4 | )% | (39.3 | )% | ||||||||||
Professional fees | 2,514 | 2,434 | 2,936 | 3.3 | % | (17.1 | )% | ||||||||||
Business development | 488 | 262 | 340 | 86.3 | % | (22.9 | )% | ||||||||||
Loan related expense | 414 | 532 | 355 | (22.2 | )% | 49.9 | % | ||||||||||
Insurance | 341 | 484 | 578 | (29.5 | )% | (16.3 | )% | ||||||||||
Other operating expenses (1) | 2,392 | 2,256 | 2,921 | 6.0 | % | (22.8 | )% | ||||||||||
Total noninterest expense | $ | 35,324 | $ | 36,808 | $ | 36,346 | (4.0 | )% | 1.3 | % | |||||||
(1) | Other operating expenses primarily consist of telephone, investor relations, promotional, regulatory expenses, and correspondent bank fees. |
34
2015 vs. 2014.
During the year ended December 31, 2015, noninterest expense decreased by $1.5 million, or 4.0%, to $35.3 million from $36.8 million for the year ended December 31, 2014, primarily as a result of:
• | A decrease of $1.6 million in the carrying costs and other costs associated with real properties acquired by or in lieu of loan foreclosures (commonly referred to as other real estate owned or “OREO”) and other expenses related to OREO during the year ended December 31, 2015 as compared to the same period in 2014; |
• | A decrease of $569 thousand in salaries and employee benefits primarily related to decreases in our workmen's compensation premium, employment agency fees, and consulting fees and forfeitures in our 401(k) plan; partially offset by |
• | An increase in various expense accounts related to the normal course of operating, including expenses related to an increase in the square footage of our leased premises, the implementation of our mobile banking platform and the roll out of our new credit card platform. |
2014 vs. 2013.
During the year ended December 31, 2014, noninterest expense increased by $462 thousand, or 1.3%, to $36.8 million from $36.3 million for the year ended December 31, 2013, primarily as a result of:
• | An increase of $3.0 million in salaries and employee benefits primarily related to the hiring of key employees during 2013 and 2014 and an increase in the year-end incentive compensation accrual for the year ended December 31, 2014; partially offset by |
• | A decrease of $1.3 million in OREO expenses attributable to the reduction in OREO properties during the year ended December 31, 2014; |
• | An increase of $502 thousand in professional fees related to recoveries on legal disputes during the year ended December 31, 2013, partially offset by decreased legal expenses due to the resolution of certain lawsuits and other disputes and a decline in legal costs related to nonperforming loans; |
• | A decrease of $433 thousand in our FDIC expense as a result of lower insurance required based upon improvement in the Bank's financial condition; and |
Provision for (Benefit from) Income Tax
For the year ended December 31, 2015, we recorded an $11.6 million income tax benefit, as compared to an income tax benefit of $608 thousand for the year ended December 31, 2014 and income tax expense of $5.6 million for the year ended December 31, 2013. Management evaluated the positive and negative evidence and determined that there was enough positive evidence to support the full realization of the deferred tax asset and that no valuation allowance was needed. Positive evidence included projected taxable income utilizing objective assumptions based on 2015 actual results, tax planning strategies, improvement in economic conditions and at least 17 years remaining on the life of our $8.3 million deferred tax asset generated from our net operating loss carryforward. Additionally, the Company has generated positive core earnings for the trailing six quarters which demonstrates the ability to be profitable in what is considered to be the Company's core business. While the decision to exit the mortgage business in 2013 did not necessarily ensure that the Company would become profitable, the results provide positive evidence that the decision to exit the unprofitable business is sufficient to overcome the losses incurred in recent years. Negative evidence we considered in making this determination included our three-year cumulative loss deficit and our accumulated deficit. Management determined that the expectation of future taxable income supported by our recent history of positive core earnings after adjusting for aberrational items that caused our cumulative loss condition, including discontinued operations, provided enough positive evidence to outweigh the negative evidence. Therefore, we concluded that it is more-likely-than-not that the existing $17.6 million net deferred tax asset will be realized, resulting in the reversal of the entire valuation allowance against the Company's deferred tax asset. Although we do not expect to be required to pay income tax to the appropriate taxing authorities of any sizeable amount until we have depleted our net operating loss carryforwards, we expect to recognize income tax expense in our financial statements beginning in 2016 at a combined rate of approximately 41% on our pretax income.
During the year ended December 31, 2014, we recorded an income tax benefit of $608 thousand. Per Financial Accounting Standards Board's (“FASB”) Accounting Standards Codification (“ASC”) 740-20-45-7 all sources of pre-tax income must be considered in determining the tax benefit that results from a loss from continuing operations and that shall be allocated to continuing operations. This benefit is the result of an intraperiod tax allocation where the benefit of the income tax provision that is recorded in discontinued operations and other comprehensive income created a tax benefit in continuing operations. On a net basis we recorded no income tax provision. Based on the analysis performed, and the positive and negative evidence considered, management chose not to release any portion of the $12.1 million valuation allowance as of December 31, 2014. Positive evidence included improvement in our asset quality, tax planning strategies, projected taxable income, and improvement in economic conditions. Negative evidence included historical operating losses. Management determined the negative evidence was significant enough
35
that until such time as we are in continuous periods of pre-tax income we would not make any reversals of our valuation allowance; however, we did conclude that it is more-likely-than-not that the existing $5.9 million net deferred tax asset will be realized.
During the year ended December 31, 2013, management analyzed the positive and negative evidence in determining whether our deferred tax assets were more-likely-than-not to be realized. Based on this analysis, we reestablished a $12.5 million valuation allowance against a substantial portion of our net deferred tax assets when we determined that there was significant negative evidence with respect to our ability to realize such assets. Positive evidence included improvement in our asset quality, tax planning strategies, projected taxable income, and improvement in economic conditions. Negative evidence we considered in making this determination included the history of operating losses, which then diminished our ability to rely on projected taxable income and created uncertainty regarding the realization of a portion of the deferred tax assets at future points in time. As a result, we increased the valuation allowance against our deferred tax asset, which resulted in the recognition of a non-cash income tax charge in the amount of $5.6 million.
See "–Critical Accounting Policies - Utilization and Valuation of Deferred Income Tax Benefits” below for additional information regarding our deferred tax asset.
Financial Condition
Assets
Our total consolidated assets increased by $37 million to $1.1 billion at December 31, 2015 from $1.1 billion at December 31, 2014. The following table sets forth the composition of our interest earning assets at:
December 31, 2015 | December 31, 2014 | ||||||
(Dollars in thousands) | |||||||
Interest-bearing deposits with financial institutions (1) | $ | 103,276 | $ | 167,138 | |||
Interest-bearing time deposits with financial institutions | 4,665 | 4,668 | |||||
Federal Reserve Bank of San Francisco and Federal Home Loan Bank Stock, at cost | 8,170 | 8,137 | |||||
Securities available for sale, at fair value | 52,249 | 60,926 | |||||
Loans (net of allowances of $12,716 and $13,833, respectively) | 849,733 | 824,197 | |||||
(1) | Includes interest-earning balances maintained at the Federal Reserve Bank of San Francisco (“FRBSF”). |
Securities Available for Sale
Securities Available for Sale. Securities that we intend to hold for an indefinite period of time, but which may be sold in response to changes in liquidity needs, interest rates, or prepayment risks or other similar factors, are classified as “securities available for sale”. Such securities are recorded on our balance sheet at their respective fair values and increases or decreases in those values are recorded as unrealized gains or losses, respectively, and are reported as Other Comprehensive Income (Loss) on our accompanying consolidated balance sheet, rather than included in or deducted from our earnings.
The following is a summary of the major components of securities available for sale and a comparison of the amortized cost, estimated fair values and the gross unrealized gains and losses attributable to those securities, as of December 31, 2015, 2014 and 2013:
36
(Dollars in thousands) | Amortized Cost | Gross Unrealized Gain | Gross Unrealized Loss | Estimated Fair Value | |||||||||||
Securities available for sale at December 31, 2015: | |||||||||||||||
Residential mortgage backed securities issued by U.S. Agencies | $ | 46,126 | $ | 4 | $ | (976 | ) | $ | 45,154 | ||||||
Residential collateralized mortgage obligations issued by non agencies | 646 | — | (14 | ) | 632 | ||||||||||
Asset backed security | 2,027 | — | (547 | ) | 1,480 | ||||||||||
Mutual funds | 5,000 | 33 | (50 | ) | 4,983 | ||||||||||
Total securities available for sale | $ | 53,799 | $ | 37 | $ | (1,587 | ) | $ | 52,249 | ||||||
Securities available for sale at December 31, 2014: | |||||||||||||||
Residential mortgage backed securities issued by U.S. Agencies | 54,653 | 26 | (940 | ) | 53,739 | ||||||||||
Residential collateralized mortgage obligations issued by non agencies | 790 | — | (13 | ) | 777 | ||||||||||
Asset backed security | 2,083 | — | (433 | ) | 1,650 | ||||||||||
Mutual funds | 4,750 | 45 | (35 | ) | 4,760 | ||||||||||
Total securities available for sale | $ | 62,276 | $ | 71 | $ | (1,421 | ) | $ | 60,926 | ||||||
Securities available for sale at December 31, 2013: | |||||||||||||||
U.S. Treasury securities | $ | 700 | $ | — | $ | — | $ | 700 | |||||||
Residential mortgage backed securities issued by U.S. Agencies | 60,514 | 13 | (2,719 | ) | 57,808 | ||||||||||
Residential collateralized mortgage obligations issued by non agencies | 1,572 | — | (48 | ) | 1,524 | ||||||||||
Asset backed security | 2,218 | — | (906 | ) | 1,312 | ||||||||||
Mutual funds | 4,645 | — | — | 4,645 | |||||||||||
Total securities available for sale | $ | 69,649 | $ | 13 | $ | (3,673 | ) | $ | 65,989 | ||||||
At December 31, 2015, 2014 and 2013, U.S. agency mortgage backed securities and collateralized mortgage obligations with an aggregate fair market value of $2.9 million, $3.6 million and $9.5 million, respectively, were pledged to secure FHLB borrowings, repurchase agreements, local agency deposits and treasury, tax and loan accounts.
The amortized cost of securities available for sale at December 31, 2015 is shown in the table below by contractual maturities taking into consideration historical prepayments based on the prior twelve months of principal payments. Expected maturities will differ from contractual maturities and historical prepayments, particularly with respect to collateralized mortgage obligations, primarily because prepayment rates are affected by changes in conditions in the interest rate market and, therefore, future prepayment rates may differ from historical prepayment rates.
37
December 31, 2015 Maturing in | ||||||||||||||||||||||||||||||||||
One year or less | Over one year through five years | Over five years through ten years | Over ten years | Total | ||||||||||||||||||||||||||||||
(Dollars in thousands) | Amortized Cost | Weighted Average Yield | Amortized Cost | Weighted Average Yield | Amortized Cost | Weighted Average Yield | Amortized Cost | Weighted Average Yield | Amortized Cost | Weighted Average Yield | ||||||||||||||||||||||||
Securities available for sale: | ||||||||||||||||||||||||||||||||||
Residential mortgage backed securities issued by U.S. Agencies | $ | 7,115 | 1.51 | % | $ | 21,178 | 1.53 | % | $ | 14,164 | 1.60 | % | $ | 3,669 | 1.66 | % | $ | 46,126 | 1.56 | % | ||||||||||||||
Residential collateralized mortgage obligations issued by non agencies | 646 | 2.94 | % | — | — | % | — | — | % | — | — | % | 646 | 2.94 | % | |||||||||||||||||||
Asset backed security | — | — | % | — | — | % | — | — | % | 2,027 | 2.76 | % | 2,027 | 2.76 | % | |||||||||||||||||||
Mutual funds | — | — | % | 5,000 | 1.93 | % | — | — | % | — | — | % | 5,000 | 1.93 | % | |||||||||||||||||||
Total Securities Available for sale | $ | 7,761 | 1.63 | % | $ | 26,178 | 1.60 | % | $ | 14,164 | 1.60 | % | $ | 5,696 | 2.05 | % | $ | 53,799 | 1.65 | % | ||||||||||||||
The table below indicates, as of December 31, 2015, the gross unrealized losses and fair values of our investments, aggregated by investment category, and length of time that the individual securities have been in a continuous unrealized loss position.
Securities with Unrealized Loss at December 31, 2015 | |||||||||||||||||||||||
Less than 12 months | 12 months or more | Total | |||||||||||||||||||||
(Dollars in thousands) | Fair Value | Unrealized Loss | Fair Value | Unrealized Loss | Fair Value | Unrealized Loss | |||||||||||||||||
Residential mortgage backed securities issued by U.S. Agencies | $ | 20,597 | $ | (197 | ) | $ | 23,865 | $ | (779 | ) | $ | 44,462 | $ | (976 | ) | ||||||||
Residential collateralized mortgage obligations issued by non agencies | — | — | 631 | (14 | ) | 631 | (14 | ) | |||||||||||||||
Asset backed security | — | — | 1,480 | (547 | ) | 1,480 | (547 | ) | |||||||||||||||
Mutual funds | 1,728 | (23 | ) | 973 | (27 | ) | 2,701 | (50 | ) | ||||||||||||||
Total | $ | 22,325 | $ | (220 | ) | $ | 26,949 | $ | (1,367 | ) | $ | 49,274 | $ | (1,587 | ) | ||||||||
We regularly monitor investments for significant declines in fair value. We have determined that declines in the fair values of these investments below their respective amortized costs, as set forth in the tables above, are temporary because (i) those declines were due to interest rate changes and not to a deterioration in the creditworthiness of the issuers of those investment securities, and (ii) we have the ability to hold those securities until there is a recovery in their values or until their maturity.
We recognize other-than-temporary impairments (“OTTI”) to our available-for-sale debt securities in accordance with ASC 320-10. When there are credit losses associated with, but we have no intention to sell, an impaired debt security, and it is more likely than not that we will not have to sell the security before recovery of its cost basis, we will separate the amount of impairment, or OTTI, between the amount that is credit related and the amount that is related to non-credit factors. Credit-related impairments are recognized in our consolidated statements of operations. Any non-credit-related impairments are recognized and reflected in other comprehensive income (loss).
Through the impairment assessment process, we determined that the available-for-sale securities discussed below were other-than-temporarily impaired at December 31, 2015. We recorded no credit-related impairment on available-for-sale securities in our consolidated statements of operations for the year ended December 31, 2015. The OTTI related to factors other than credit losses, in the aggregate amount of $534 thousand, was recognized as other comprehensive loss in our accompanying consolidated statement of financial condition.
38
The table below presents, for the year ended December 31, 2015, a roll-forward of OTTI in those instances when a portion of the OTTI was attributable to non-credit related factors and, therefore, was recognized in other comprehensive loss:
(Dollars in thousands) | Gross Other- Than- Temporary Impairments | Other-Than- Temporary Impairments Included in Other Comprehensive Loss | Net Other-Than- Temporary Impairments Included in Retained Earnings (Deficit) | ||||||||
Balance – December 31, 2013 | $ | (1,459 | ) | $ | (906 | ) | $ | (553 | ) | ||
Changes in market value on securities for which an OTTI was previously recognized | 455 | 455 | — | ||||||||
Principal received on OTTI security | 18 | 18 | — | ||||||||
Balance – December 31, 2014 | $ | (986 | ) | $ | (433 | ) | $ | (553 | ) | ||
Change in market value on a security for which an OTTI was previously recognized | (153 | ) | (153 | ) | — | ||||||
Principal received on OTTI security | 52 | 52 | — | ||||||||
Balance – December 31, 2015 | $ | (1,087 | ) | $ | (534 | ) | $ | (553 | ) | ||
In determining the component of OTTI related to credit losses, we compare the amortized cost basis of each OTTI security to the present value of its expected cash flows, discounted using the effective interest rate implicit in the security at the date of acquisition.
As a part of our OTTI assessment process with respect to securities held for sale with unrealized losses, we consider available information about (i) the performance of the collateral underlying each such security, including any credit enhancements, (ii) historical prepayment speeds, (iii) delinquency and default rates, (iv) loss severities, (v) the age or “vintage” of the security, and, (vi) any rating agency reports on the security. Significant judgments are required with respect to these and other factors in order to make a determination of the future cash flows that can be expected to be generated by the security.
Based on our OTTI assessment process, we determined that there is one asset-backed security in our portfolio of securities available for sale that was impaired as of December 31, 2015. This security is a multi-class, cash flow collateralized bond obligation backed by a pool of trust preferred securities issued by a diversified pool of 56 issuers that consisted of 45 U.S. depository institutions and 11 insurance companies at the time of the security’s issuance in November 2007. We purchased $3.0 million face amount of this security in November 2007 at a price of 95.21% for a total purchase price of $2.9 million, out of a total of $363 million of this security sold at the time of issuance. The security that we own (CUSIP 74042CAE8) is the mezzanine class B piece security with a variable interest rate of 3 month LIBOR plus 60 basis points, which had a rating of Aa2 and AA by Moody’s and Fitch, respectively, at the time of issuance in 2007.
As of December 31, 2015 the amortized cost of this security was $2.0 million with a fair value of $1.5 million, for an unrealized loss of approximately $547 thousand. As of December 31, 2015, the security had a Baa3 rating from Moody’s and a B rating from Fitch and had experienced $42.5 million in defaults (12.5% of total current collateral) and $7.0 million in deferring securities (2.1% of total current collateral) from issuance to December 31, 2015. As of December 31, 2015, the mezzanine class B tranche had $59.5 million in excess subordination.
We have made a determination that the remainder of our securities with respect to which there were unrealized losses as of December 31, 2015 are not other-than-temporarily impaired, because we have concluded that we have the ability to continue to hold those securities until their respective fair market values increase above their respective amortized costs or, if necessary, until their respective maturities. In reaching that conclusion we considered a number of factors and other information, which included: (i) the significance of each such security, (ii) the amount of the unrealized losses attributable to each such security, (iii) our liquidity position, (iv) the impact that retention of those securities could have on our capital position, and (v) our evaluation of the expected future performance of these securities (based on the criteria discussed above).
39
Loans
The following table sets forth the composition, by loan category, of our loan portfolio at December 31, 2015, 2014, 2013, 2012 and 2011:
At December 31, | ||||||||||||||||||||||||||||||||||
2015 | 2014 | 2013 | 2012 | 2011 | ||||||||||||||||||||||||||||||
Amount | Percent | Amount | Percent | Amount | Percent | Amount | Percent | Amount | Percent | |||||||||||||||||||||||||
(Dollars in thousands) | ||||||||||||||||||||||||||||||||||
Commercial loans | $ | 347,300 | 40.3 | % | $ | 301,746 | 36.0 | % | $ | 226,450 | 29.2 | % | $ | 170,792 | 23.4 | % | $ | 179,305 | 27.2 | % | ||||||||||||||
Commercial real estate loans – owner occupied | 195,554 | 22.7 | % | 212,515 | 25.4 | % | 174,221 | 22.4 | % | 165,922 | 22.7 | % | 170,960 | 26.0 | % | |||||||||||||||||||
Commercial real estate loans – all other | 146,641 | 17.0 | % | 146,676 | 17.5 | % | 177,884 | 22.9 | % | 150,189 | 20.6 | % | 121,813 | 18.5 | % | |||||||||||||||||||
Residential mortgage loans – multi-family | 81,487 | 9.5 | % | 95,276 | 11.4 | % | 96,565 | 12.4 | % | 105,119 | 14.4 | % | 65,545 | 10.0 | % | |||||||||||||||||||
Residential mortgage loans – single family | 52,072 | 6.0 | % | 64,326 | 7.7 | % | 75,660 | 9.7 | % | 87,263 | 11.9 | % | 68,613 | 10.4 | % | |||||||||||||||||||
Construction loans | — | — | — | — | % | — | — | % | — | — | % | 2,120 | 0.3 | % | ||||||||||||||||||||
Land development loans | 10,001 | 1.2 | % | 7,745 | 0.9 | % | 18,458 | 2.4 | % | 24,018 | 3.3 | % | 25,638 | 3.9 | % | |||||||||||||||||||
Consumer loans | 28,663 | 3.3 | % | 9,687 | 1.2 | % | 7,599 | 1.0 | % | 27,296 | 3.7 | % | 24,285 | 3.7 | % | |||||||||||||||||||
Total loans | 861,718 | 100.0 | % | 837,971 | 100.0 | % | 776,837 | 100.0 | % | 730,599 | 100.0 | % | 658,279 | 100.0 | % | |||||||||||||||||||
Deferred fee (income) costs, net | 731 | 59 | (53 | ) | (461 | ) | (690 | ) | ||||||||||||||||||||||||||
Allowance for loan and lease losses | (12,716 | ) | (13,833 | ) | (11,358 | ) | (10,881 | ) | (15,627 | ) | ||||||||||||||||||||||||
Loans, net | $ | 849,733 | $ | 824,197 | $ | 765,426 | $ | 719,257 | $ | 641,962 | ||||||||||||||||||||||||
Commercial loans are loans to businesses to finance capital purchases or improvements, or to provide cash flow for operations. Real estate and residential mortgage loans are loans secured by trust deeds on real properties, including commercial properties and single family and multi-family residences. Construction loans are interim loans to finance specific construction projects. Consumer loans include installment loans to consumers.
The following table sets forth the maturity distribution of our loan portfolio (excluding single and multi-family residential mortgage loans and consumer loans) at December 31, 2015:
December 31, 2015 | |||||||||||||||
One Year or Less | Over One Year Through Five Years | Over Five Years | Total | ||||||||||||
(Dollars in thousands) | |||||||||||||||
Real estate loans(1) | |||||||||||||||
Floating rate | $ | 30,027 | $ | 25,901 | $ | 147,083 | $ | 203,011 | |||||||
Fixed rate | 18,266 | 53,077 | 77,842 | 149,185 | |||||||||||
Commercial loans | |||||||||||||||
Floating rate | 109,434 | 63,951 | 22,258 | 195,643 | |||||||||||
Fixed rate | 91,477 | 53,873 | 6,307 | 151,657 | |||||||||||
Total | $ | 249,204 | $ | 196,802 | $ | 253,490 | $ | 699,496 | |||||||
(1) | Does not include mortgage loans on single or multi-family residences or consumer loans, which totaled $133.6 million and $28.7 million, respectively, at December 31, 2015. |
Nonperforming Assets and Allowance for Loan and Lease Losses
Nonperforming Assets. Non-performing loans consist of (i) loans on non-accrual status which are loans on which the accrual of interest has been discontinued and include restructured loans when there has not been a history of past performance on debt service in accordance with the contractual terms of the restructured loans, and (ii) loans 90 days or more past due and still accruing interest. Non-performing assets are comprised of non-performing loans and OREO, which consists of real properties which we have acquired by or in lieu of foreclosure and which we intend to offer for sale.
40
Loans are placed on non-accrual status when, in our opinion, the full timely collection of principal or interest is in doubt. Generally, the accrual of interest is discontinued when principal or interest payments become more than 90 days past due, unless we believe the loan is adequately collateralized and the loan is in the process of collection. However, in certain instances, we may place a particular loan on non-accrual status earlier, depending upon the individual circumstances involved in that loan’s delinquency. When a loan is placed on non-accrual status, previously accrued but unpaid interest is reversed against current income. Subsequent collections of unpaid amounts on such a loan are applied to reduce principal when received, except when the ultimate collectability of principal is probable, in which case such payments are applied to interest and are credited to income. Non-accrual loans may be restored to accrual status if and when principal and interest become current and full repayment is expected. Interest income is recognized on the accrual basis for impaired loans which, based on our non-accrual policy, do not require non-accrual treatment.
The following table sets forth information regarding our nonperforming assets, as well as information regarding restructured loans, at December 31, 2015 and December 31, 2014:
At December 31, 2015 | At December 31, 2014 | ||||||
(Dollars in thousands) | |||||||
Nonaccrual loans: | |||||||
Commercial loans | $ | 12,284 | $ | 16,182 | |||
Commercial real estate | 10,083 | 4,288 | |||||
Residential real estate | 1,148 | 1,472 | |||||
Land development | 1,618 | 2,111 | |||||
Total nonaccrual loans | $ | 25,133 | $ | 24,053 | |||
Loans past due 90 days and still accruing interest: | |||||||
Total loans past due 90 days and still accruing interest | $ | — | $ | — | |||
Other real estate owned (OREO): | |||||||
Residential real estate | $ | 650 | $ | 962 | |||
Construction and land development | — | 630 | |||||
Total other real estate owned | $ | 650 | $ | 1,592 | |||
Total nonperforming assets | $ | 25,783 | $ | 25,645 | |||
Restructured loans: | |||||||
Accruing loans | $ | 724 | $ | 11,084 | |||
Nonaccruing loans (included in nonaccrual loans above) | 20,070 | 5,935 | |||||
Total restructured loans | $ | 20,794 | $ | 17,019 | |||
As the above table indicates, total nonperforming assets increased by approximately $138 thousand, or 0.5%, to $25.8 million as of December 31, 2015 from $25.6 million as of December 31, 2014, primarily attributable to an increase in our nonaccrual loans as a result of the deterioration of two legacy loans that are both well collateralized. These loans have been renegotiated and are operating under forbearance agreements with terms requiring full repayment of principal and interest by the second quarter of 2016. This increase is partially offset by the sale of a portion of our OREO property, regular payment amortizations and payoffs, and the charge off of loans that were no longer deemed collectible in the ordinary course of business.
Information Regarding Impaired Loans. At December 31, 2015, loans deemed impaired totaled $25.9 million as compared to $35.1 million at December 31, 2014. We had an average investment in impaired loans of $28.8 million for the year ended December 31, 2015 as compared to $28.5 million for the year ended December 31, 2014. The interest that would have been earned during the year ended December 31, 2015 had the nonaccruing impaired loans remained current in accordance with their original terms was approximately $899 thousand.
The following table sets forth the amount of impaired loans to which a portion of the ALLL has been specifically allocated, and the aggregate amount so allocated, in accordance with ASC 310-10, and the amount of the ALLL and the amount of impaired loans for which no such allocations were made, in each case at December 31, 2015 and December 31, 2014:
December 31, 2015 | December 31, 2014 | ||||||||||||||||||||
Loans | Reserves for Loan Losses | % of Reserves to Loans | Loans | Reserves for Loan Losses | % of Reserves to Loans | ||||||||||||||||
(Dollars in thousands) | |||||||||||||||||||||
Impaired loans with specific reserves | $ | 1,621 | $ | 484 | 29.9 | % | $ | 2,554 | $ | 1,532 | 60.0 | % | |||||||||
Impaired loans without specific reserves | 24,236 | — | — | 32,583 | — | — | |||||||||||||||
Total impaired loans | $ | 25,857 | $ | 484 | 1.9 | % | $ | 35,137 | $ | 1,532 | 4.4 | % | |||||||||
41
The $9.3 million decrease in impaired loans to $25.9 million at December 31, 2015 from $35.1 million at December 31, 2014 was primarily attributable to paydowns of $17.1 million and net charge-offs of $2.6 million, partially offset by the addition of 15 impaired loans totaling $11.0 million, consisting of six commercial loans, four commercial real estate - owner occupied loans, three commercial real estate - all other loans and two multi-family loans. Accruing restructured loans were comprised of four loans performing in accordance with modified terms, which included lowering of interest rates, deferral of payments, or modifications to payment terms. Based on an internal analysis, using the current estimated fair values of the collateral or the discounted present values of the future estimated cash flows of the impaired loans, we concluded that, at December 31, 2015, $484 thousand of specific reserves were required on one impaired loan and that all remaining impaired loans were well secured and adequately collateralized with no specific reserves required.
Allowance for Loan and Lease Losses. The ALLL totaled $12.7 million, representing 1.48% of loans outstanding, at December 31, 2015, as compared to $13.8 million, or 1.65% of loans outstanding, at December 31, 2014.
The adequacy of the ALLL is determined through periodic evaluations of the loan portfolio and other factors that can reasonably be expected to affect the ability of borrowers to meet their loan obligations. Those factors are inherently subjective as the process for determining the adequacy of the ALLL involves some significant estimates and assumptions about such matters such as (i) economic conditions and trends and the amounts and timing of expected future cash flows of borrowers which can affect their ability to meet their loan obligations to us, (ii) the fair value of the collateral securing non-performing loans, (iii) estimates of losses that we may incur on non-performing loans, which are determined on the basis of historical loss experience and industry loss factors and bank regulatory guidelines, which are subject to change, and (iv) various qualitative factors. Since those factors are subject to changes in economic and other conditions and changes in regulatory guidelines or other circumstances over which we have no control, the amount of the ALLL may prove to be insufficient to cover all of the loan losses we might incur in the future. In such an event, it may become necessary for us to increase the ALLL from time to time to maintain its adequacy. Such increases are effectuated by means of a charge to income, referred to as the “provision for loan and lease losses”, in our statements of our operations. See “—Results of Operations— Provision for Loan and Lease Losses, above in this Item 7.
The amount of the ALLL is first determined by assigning reserve ratios for all loans. All non-accrual loans and other loans classified as “Special Mention,” “Substandard” or “Doubtful” (“classified loans” or “classification categories”) and not fully collateralized are then assigned specific reserves within the ALLL, with greater reserve allocations made to loans deemed to be of a higher risk. These ratios are determined based on prior loss history and industry guidelines and loss factors, by type of loan, adjusted for current economic factors and current economic trends. Refer to Note 5, Loans and Allowance for Loan and Lease Losses for definitions related to our credit quality indicators stated above.
On a quarterly basis, we utilize a classification based loan loss migration model as well as review individual loans in determining the adequacy of the ALLL. Our loss migration analysis tracks 16 quarters of loan loss history and industry loss factors to determine historical losses by classification category for each loan type, except certain consumer loans (automobile, mortgage and credit cards), which are analyzed as homogeneous loan pools. These calculated loss factors are then applied to outstanding loan balances. We analyze impaired loans individually.
In determining whether and the extent to which we will make adjustments to our loan loss migration model for purposes of determining the ALLL, we also consider a number of qualitative factors that can affect the performance and the collectability of the loans in our loan portfolio. Such qualitative factors include:
• | The effects of changes that we may make in our loan policies or underwriting standards on the quality of the loans and the risks in our loan portfolios; |
• | Trends and changes in local, regional and national economic conditions, as well as changes in industry specific conditions, and any other reasonably foreseeable events that could affect the performance or the collectability of the loans in our loan portfolios; |
• | Material changes that may occur in the mix or in the volume of the loans in our loan portfolios that could alter, whether positively or negatively, the risk profile of those portfolios; |
• | Changes in management or loan personnel or other circumstances that could, either positively or negatively, impact the application of our loan underwriting standards, the monitoring of nonperforming loans or our loan collection efforts; and |
• | External factors that, in addition to economic conditions, can affect the ability of borrowers to meet their loan obligations, such as fires, earthquakes and terrorist attacks. |
Determining the effects that these qualitative factors may have on the performance of each category of loans in our loan portfolio requires numerous judgments, assumptions and estimates about conditions, trends and events which may subsequently prove to have been incorrect due to circumstances outside of our control. Moreover, the effects of qualitative factors such as these
42
on the performance of our loan portfolios are often difficult to quantify. As a result, we may sustain loan losses in any particular period that are sizable in relation to the ALLL or that may even exceed the ALLL.
In response to the economic recession, we (i) implemented more stringent loan underwriting standards, (ii) strengthened loan underwriting and approval processes, and (iii) added personnel with experience in addressing problem assets.
Set forth below is information regarding loan balances and the related ALLL, by portfolio type, for the years ended December 31, 2015, 2014, 2013, 2012 and 2011 (excluding mortgage loans held for sale).
43
(Dollars in thousands) | Commercial | Real Estate | Land Development | Consumer and Single Family Mortgages | Total | ||||||||||||||
ALLL for the year ended December 31, 2015: | |||||||||||||||||||
Balance at beginning of year | $ | 7,670 | $ | 5,133 | $ | 296 | $ | 734 | $ | 13,833 | |||||||||
Charge offs | (2,643 | ) | — | (85 | ) | (199 | ) | (2,927 | ) | ||||||||||
Recoveries | 1,798 | 4 | — | 8 | 1,810 | ||||||||||||||
Provision | (186 | ) | (28 | ) | 71 | 143 | — | ||||||||||||
Balance at end of year | $ | 6,639 | $ | 5,109 | $ | 282 | $ | 686 | $ | 12,716 | |||||||||
Allowance for loan and lease losses as a percentage of average total loans | 1.54 | % | |||||||||||||||||
Allowance for loan and lease losses as a percentage of total outstanding loans | 1.48 | % | |||||||||||||||||
Ratio of net charge-offs to average loans outstanding during the period | 0.13 | % | |||||||||||||||||
ALLL for the year ended December 31, 2014: | |||||||||||||||||||
Balance at beginning of year | $ | 5,812 | $ | 4,517 | $ | 165 | $ | 864 | $ | 11,358 | |||||||||
Charge offs | (551 | ) | — | — | (102 | ) | (653 | ) | |||||||||||
Recoveries | 1,467 | 76 | — | 85 | 1,628 | ||||||||||||||
Provision | 942 | 540 | 131 | (113 | ) | 1,500 | |||||||||||||
Balance at end of year | $ | 7,670 | $ | 5,133 | $ | 296 | $ | 734 | $ | 13,833 | |||||||||
Allowance for loan and lease losses as a percentage of average total loans | 1.73 | % | |||||||||||||||||
Allowance for loan and lease losses as a percentage of total outstanding loans | 1.65 | % | |||||||||||||||||
Ratio of net charge-offs to average loans outstanding during the period | (0.12 | )% | |||||||||||||||||
ALLL for the year ended December 31, 2013: | |||||||||||||||||||
Balance at beginning of year | $ | 6,340 | $ | 3,487 | $ | 248 | $ | 806 | $ | 10,881 | |||||||||
Charge offs | (5,945 | ) | (308 | ) | (5 | ) | (200 | ) | (6,458 | ) | |||||||||
Recoveries | 2,337 | 5 | 54 | 34 | 2,430 | ||||||||||||||
Provision | 3,080 | 1,333 | (132 | ) | 224 | 4,505 | |||||||||||||
Balance at end of year | $ | 5,812 | $ | 4,517 | $ | 165 | $ | 864 | $ | 11,358 | |||||||||
Allowance for loan and lease losses as a percentage of average total loans | 1.59 | % | |||||||||||||||||
Allowance for loan and lease losses as a percentage of total outstanding loans | 1.46 | % | |||||||||||||||||
Ratio of net charge-offs to average loans outstanding during the period | 0.56 | % | |||||||||||||||||
ALLL for the year ended December 31, 2012: | |||||||||||||||||||
Balance at beginning of year | $ | 8,908 | $ | 5,777 | $ | 316 | $ | 626 | $ | 15,627 | |||||||||
Charge offs | (6,664 | ) | (1,184 | ) | (158 | ) | (568 | ) | (8,574 | ) | |||||||||
Recoveries | 1,657 | 198 | — | 23 | 1,878 | ||||||||||||||
Provision | 2,439 | (1,304 | ) | 90 | 725 | 1,950 | |||||||||||||
Balance at end of year | $ | 6,340 | $ | 3,487 | $ | 248 | $ | 806 | $ | 10,881 | |||||||||
Allowance for loan and lease losses as a percentage of average total loans | 1.56 | % | |||||||||||||||||
Allowance for loan and lease losses as a percentage of total outstanding loans | 1.49 | % | |||||||||||||||||
Ratio of net charge-offs to average loans outstanding during the period | 0.96 | % | |||||||||||||||||
ALLL for the year ended December 31, 2011: | |||||||||||||||||||
Balance at beginning of year | $ | 10,017 | $ | 6,351 | $ | 830 | $ | 903 | $ | 18,101 | |||||||||
Charge offs | (1,218 | ) | (1,315 | ) | (138 | ) | (65 | ) | (2,736 | ) | |||||||||
Recoveries | 1,067 | 3 | — | 25 | 1,095 | ||||||||||||||
Provision | (958 | ) | 738 | (376 | ) | (237 | ) | (833 | ) | ||||||||||
Balance at end of year | $ | 8,908 | $ | 5,777 | $ | 316 | $ | 626 | $ | 15,627 | |||||||||
Allowance for loan and lease losses as a percentage of average total loans | 2.20 | % | |||||||||||||||||
Allowance for loan and lease losses as a percentage of total outstanding loans | 2.37 | % | |||||||||||||||||
Ratio of net charge-offs to average loans outstanding during the period | 0.23 | % | |||||||||||||||||
44
The ALLL decreased $1.1 million from December 31, 2014 to December 31, 2015 primarily as a result of the full and partial charge offs of several loans that largely had specific reserves. These charge offs were partially offset by loss recoveries or additional provisions during the same period. The decrease in the provision for loan and lease losses from December 31, 2014 to December 31, 2015 was primarily a result of improving asset quality trends evidenced by lower levels of classified loans and a 26% decline in impaired loans which more than offset the portfolio growth.
We classify our loan portfolios using asset quality ratings. The credit quality table in Note 5, Loans and Allowance for Loan and Lease Losses below in Item 8, provides a summary of loans by portfolio type and asset quality ratings as of December 31, 2015 and December 31, 2014. Loans totaled approximately $861.7 million at December 31, 2015, an increase of $23.7 million from $838.0 million at December 31, 2014. The disaggregation of the loan portfolio by risk rating in the credit quality table located in Note 5 reflects the following changes that occurred between December 31, 2014 and December 31, 2015:
• | Loans rated "Pass" totaled $816.3 million, an increase of $25.5 million from $790.8 million at December 31, 2014. The increase was primarily attributable to new loan growth, partially offset by the planned exit of one syndicated loan, downgrades and other paydowns. |
• | Loans rated "Special Mention" totaled $15.3 million, an increase of $7.9 million from $7.4 million at December 31, 2014. The increase was primarily the result of the downgrade of five commercial real estate loans and four commercial loans from "Pass", partially offset by the payoff of one commercial loan and the downgrade to "Substandard" of a related multi-family loan. |
• | Loans rated "Substandard" totaled $30.2 million, a decrease of $8.0 million from $38.2 million at December 31, 2014. This decrease was primarily the result of principal payments of $3.0 million, payoffs of $12.7 million, the foreclosure and transfer to OREO of a $280 thousand land development loan and $825 thousand of loans charged off, partially offset by $8.9 million downgraded from "Pass" and "Special Mention". |
• | Loans rated "Doubtful" totaled $0, a decrease of $1.6 million from $1.6 million at December 31, 2014. The decrease is attributable to the charge off of one commercial loan of $1.0 million and the write down of $584 thousand on a commercial loan. |
Our loss migration analysis currently utilizes a series of twelve staggered 16-quarter migration periods, which was increased during the second quarter of 2015 from four staggered 16-quarter migration periods in order to broaden the loss experience incorporated into the analysis. As a result, for purposes of determining applicable loss factors at December 31, 2015, our migration analysis covered the period from December 1, 2010 to December 31, 2015. We believe this was consistent with and reasonably reflects current economic conditions, portfolio trends and the risks that were inherent in our loan portfolio at December 31, 2015.
The table below sets forth loan delinquencies, by quarter, from December 31, 2015 to December 31, 2014.
December 31, 2015 | September 30, 2015 | June 30, 2015 | March 31, 2015 | December 31, 2014 | |||||||||||||||
Loans Delinquent: | (Dollars in thousands) | ||||||||||||||||||
90 days or more: | |||||||||||||||||||
Commercial loans | $ | 8,766 | $ | 10,383 | $ | 12,132 | $ | — | $ | — | |||||||||
Commercial real estate | 6,004 | 2,579 | — | — | 2,117 | ||||||||||||||
Residential mortgages | 535 | 535 | 763 | 733 | 285 | ||||||||||||||
Land development loans | 1,618 | 1,640 | 1,685 | — | 364 | ||||||||||||||
16,923 | 15,137 | 14,580 | 733 | 2,766 | |||||||||||||||
30-89 days: | |||||||||||||||||||
Commercial loans | 3,018 | 5,346 | 527 | 24,143 | 553 | ||||||||||||||
Commercial real estate | 316 | 1,255 | 4,847 | 891 | 20 | ||||||||||||||
Residential mortgages | — | — | — | 181 | 835 | ||||||||||||||
Land development loans | — | — | — | 1,717 | — | ||||||||||||||
Consumer loans | — | — | — | — | 17 | ||||||||||||||
3,334 | 6,601 | 5,374 | 26,932 | 1,425 | |||||||||||||||
Total Past Due(1): | $ | 20,257 | $ | 21,738 | $ | 19,954 | $ | 27,665 | $ | 4,191 | |||||||||
(1) | Past due balances include nonaccrual loans. |
As the above table indicates, total past due loans increased by $16.1 million, to $20.3 million at December 31, 2015 from $4.2 million at December 31, 2014. Loans past due 90 days or more increased by $14.2 million, to $16.9 million at December 31, 2015, from $2.8 million at December 31, 2014 attributable to the addition of six loan relationships for a total of $15.8 million, including one loan relationship of $9.6 million, partially offset by payments received on a $1.8 million loan relationship during
45
the year ended December 31, 2015 and the foreclosure and transfer to OREO of a $280 thousand nonaccrual land development loan.
Loans 30-89 days past due increased by $1.9 million to $3.3 million at December 31, 2015 from $1.4 million at December 31, 2014 primarily attributable to two commercial loan relationships totaling $3.0 million partially offset by two delinquent loan relationships of $973 thousand as of December 31, 2014 which are now more than 90 days past due.
Deposits
Average Balances of and Average Interest Rates Paid on Deposits
Set forth below are the average amounts of, and the average rates paid on, deposits for the years ended December 31, 2015, 2014 and 2013:
Year Ended December 31, | ||||||||||||||||||||
2015 | 2014 | 2013 | ||||||||||||||||||
Average Balance | Average Rate | Average Balance | Average Rate | Average Balance | Average Rate | |||||||||||||||
(Dollars in thousands) | ||||||||||||||||||||
Noninterest bearing demand deposits | $ | 237,371 | — | $ | 206,295 | — | $ | 188,696 | — | |||||||||||
Interest-bearing checking accounts | 40,916 | 0.23 | % | 36,281 | 0.28 | % | 33,447 | 0.28 | % | |||||||||||
Money market and savings deposits | 300,088 | 0.57 | % | 170,047 | 0.34 | % | 155,352 | 0.36 | % | |||||||||||
Time deposits(1) | 308,529 | 0.90 | % | 431,789 | 0.96 | % | 354,720 | 1.06 | % | |||||||||||
Total deposits | $ | 886,904 | 0.51 | % | $ | 844,412 | 0.57 | % | $ | 732,215 | 0.60 | % | ||||||||
(1) | Comprised of time certificates of deposit in denominations of less than and more than $100,000. |
Deposit Totals
Deposits totaled $893.8 million at December 31, 2015 as compared to $916.3 million at December 31, 2014. The following table provides information regarding the mix of our deposits at December 31, 2015 and December 31, 2014:
At December 31, 2015 | At December 31, 2014 | ||||||||||||
Amounts | % of Total Deposits | Amounts | % of Total Deposits | ||||||||||
(Dollars in thousands) | |||||||||||||
Core deposits | |||||||||||||
Noninterest bearing demand deposits | $ | 249,676 | 27.9 | % | $ | 237,491 | 25.9 | % | |||||
Savings and other interest-bearing transaction deposits | 363,838 | 40.7 | % | 318,096 | 34.7 | % | |||||||
Time deposits | 280,326 | 31.4 | % | 360,722 | 39.4 | % | |||||||
Total deposits | $ | 893,840 | 100.0 | % | $ | 916,309 | 100.0 | % | |||||
At December 31, 2015, noninterest-bearing deposits totaled $249.7 million, and 27.9% of total deposits, as compared to $237.5 million, and 25.9% of total deposits at December 31, 2014. Certificates of deposit in denominations of $100,000 or more, on which we pay higher rates of interest than on other deposits, aggregated $245.2 million, or 27.4%, of total deposits at December 31, 2015, as compared to $315.0 million, and 34.4%, of total deposits at December 31, 2014.
Set forth below is a maturity schedule of domestic time certificates of deposit outstanding at December 31, 2015 and December 31, 2014:
46
December 31, 2015 | December 31, 2014 | ||||||||||||||
Maturities | Certificates of Deposit Under $ 100,000 | Certificates of Deposit $100,000 or more | Certificates of Deposit Under $100,000 | Certificates of Deposit $100,000 or more | |||||||||||
(Dollars in thousands) | |||||||||||||||
Three months or less | $ | 13,419 | $ | 109,179 | $ | 16,841 | $ | 118,302 | |||||||
Over three and through six months | 5,453 | 31,336 | 6,740 | 29,933 | |||||||||||
Over six and through twelve months | 12,286 | 83,252 | 13,707 | 96,507 | |||||||||||
Over twelve months | 3,957 | 21,444 | 8,433 | 70,259 | |||||||||||
Total | $ | 35,115 | $ | 245,211 | $ | 45,721 | $ | 315,001 | |||||||
Liquidity
We actively manage our liquidity needs to ensure that sufficient funds are available to meet our needs for cash, including to fund new loans to and deposit withdrawals by our customers. We project the future sources and uses of funds and maintain liquid funds for unanticipated events. Our primary sources of cash include cash we have on deposit at other financial institutions, payments from borrowers on their loans, proceeds from sales or maturities of securities held for sale, sales of residential mortgage loans, increases in deposits and increases in borrowings principally from the FHLB. The primary uses of cash include funding new loans and making advances on existing lines of credit, purchasing investments, including securities available for sale, funding new residential mortgage loans, funding deposit withdrawals and paying operating expenses. We maintain funds in overnight federal funds and other short-term investments to provide for short-term liquidity needs. We also have obtained credit lines from the FHLB and other financial institutions to meet any additional liquidity requirements we might have. See "—Contractual Obligations—Borrowings" below for additional information related to our borrowings from the FHLB.
Our liquid assets, which included cash and due from banks, federal funds sold, interest earning deposits that we maintain with financial institutions and unpledged securities available for sale (excluding Federal Reserve Bank and FHLB stock) totaled $155.9 million, which represented 15% of total assets, at December 31, 2015. We believe that our cash and cash equivalent resources, together with available borrowings under our credit facilities, will be sufficient to meet normal operating requirements for at least the next twelve months, including to enable us to meet any increase in deposit withdrawals that might occur in the foreseeable future.
Cash Flow Provided by Operating Activities. In 2015, operating activities provided net cash of $1.9 million primarily attributable to net income of $12.4 million, partially offset by the reversal of our deferred tax asset valuation allowance of $11.6 million. In 2014, operating activities provided net cash of $8.8 million, comprised primarily of $8.7 million provided by our discontinued operations.
Cash Flow Used in Investing Activities. In 2015, investing activities used net cash of $14.4 million, primarily attributable to $25.2 million used to fund an increase in loans, partially offset by $8.4 million of cash from maturities of and principal payments on securities available for sale, $2.1 million of cash from principal payments on other investments and $1.2 million of proceeds from sales of OREO. In 2014, investing activities used net cash of $45.4 million, primarily attributable to $65.7 million used to fund an increase in loans, $1.9 million for purchases of securities available for sale, and a $2.2 million increase in our interest bearing time deposits with financial institutions, partially offset by $9.0 million of cash from maturities and principal payments on securities available for sale and $15.3 million of proceeds from sales of OREO.
Cash Flow (Used in) Provided by Financing Activities. In 2015, financing activities used net cash of $50.8 million, consisting primarily of a $34.7 million net decrease in interest bearing deposits, which resulted from a decision to increase our core deposit base, which included the transition of a portion of our certificates of deposit customers to savings account customers, and a $29.5 million decrease in borrowings, partially offset by an increase in noninterest bearing deposits of $12.2 million. In 2014, financing activities provided net cash of $106.8 million, consisting primarily of a $102.5 million net increase in interest bearing deposits, which resulted from a decision to increase the rates of interest we pay on our certificates of deposit in order to decrease our loan-to-deposit ratio and increase our liquidity, and an increase in noninterest bearing deposits of $33.5 million, partially offset by a $30.5 million decrease in borrowings.
Ratio of Loans to Deposits. The relationship between gross loans and total deposits can provide a useful measure of a bank’s liquidity. Since repayment of loans tends to be less predictable than the maturity of investments and other liquid resources, the higher the loan-to-deposit ratio the less liquid are our assets. On the other hand, since we realize greater yields on loans than we do on investments, a lower loan-to-deposit ratio can adversely affect interest income and earnings. As a result, our goal is to achieve a loan-to-deposit ratio that appropriately balances the requirements of liquidity and the need to generate a fair return on our assets. At December 31, 2015 and 2014, the loan-to-deposit ratio was 96% and 91%, respectively.
47
Capital Resources
Regulatory Capital Requirements Applicable to Banking Institutions
Under federal banking regulations that apply to all United States based bank holding companies and federally insured banks, the Company (on a consolidated basis) and the Bank (on a stand-alone basis) must meet specific capital adequacy requirements that, for the most part, involve quantitative measures, primarily in terms of the ratios of their capital to their assets, liabilities, and certain off-balance sheet items, calculated under regulatory accounting practices. Under those regulations, each bank holding company must meet a minimum capital ratio and each federally insured bank is determined by its primary federal bank regulatory agency to come within one of the following capital adequacy categories on the basis of its capital ratios:
• | well capitalized |
• | adequately capitalized |
• | undercapitalized |
• | significantly undercapitalized; or |
• | critically undercapitalized |
Certain qualitative assessments also are made by a banking institution’s primary federal regulatory agency that could lead the agency to determine that the banking institution should be assigned to a lower capital category than the one indicated by the quantitative measures used to assess the institution’s capital adequacy. At each successive lower capital category, a banking institution is subject to greater operating restrictions and increased regulatory supervision by its federal bank regulatory agency.
Quantitative measures established by regulation to ensure capital adequacy require the Company and Bank to maintain minimum amounts and ratios (set forth in the following table) of total capital, common equity Tier 1 capital and Tier I capital (as defined in the regulations) to risk-weighted assets (as defined), and of Tier I capital (as defined) to average assets (as defined). We believe that, as of December 31, 2015, the Company and the Bank met all capital adequacy requirements to which they are subject and have not been notified by any regulatory agency that would require the Company or the Bank to maintain additional capital.
The actual capital amounts and ratios of the Company and the Bank at December 31, 2015 are presented in the following table:
Applicable Federal Regulatory Requirement | ||||||||||||||||||
At December 31, 2015 | Actual Capital | For Capital Adequacy Purposes | To be Categorized As Well Capitalized | |||||||||||||||
Amount | Ratio | Amount | Ratio | Amount | Ratio | |||||||||||||
(Dollars in thousands) | ||||||||||||||||||
Total Capital to Risk Weighted Assets: | ||||||||||||||||||
Company | $ | 154,884 | 16.8 | % | $ | 73,871 | At least 8.0 | N/A | N/A | |||||||||
Bank | 136,457 | 15.0 | % | 72,672 | At least 8.0 | $ | 90,841 | At least 10.0 | ||||||||||
Common Equity Tier 1 Capital to Risk Weighted Assets: | ||||||||||||||||||
Company | 131,188 | 14.2 | % | 41,552 | At least 4.5 | N/A | N/A | |||||||||||
Bank | 125,018 | 13.8 | % | 40,878 | At least 4.5 | 59,046 | At least 6.5 | |||||||||||
Tier 1 Capital to Risk Weighted Assets: | ||||||||||||||||||
Company | $ | 143,260 | 15.5 | % | $ | 55,403 | At least 6.0 | N/A | N/A | |||||||||
Bank | 125,018 | 13.8 | % | 54,504 | At least 6.0 | $ | 72,672 | At least 8.0 | ||||||||||
Tier 1 Capital to Average Assets: | ||||||||||||||||||
Company | $ | 143,260 | 13.3 | % | $ | 42,984 | At least 4.0 | N/A | N/A | |||||||||
Bank | 125,018 | 11.8 | % | 42,319 | At least 4.0 | $ | 52,899 | At least 5.0 | ||||||||||
As the above table indicates, at December 31, 2015, the Bank (on a stand-alone basis) qualified as a “well—capitalized” institution, and the capital ratios of the Company (on a consolidated basis) exceeded the capital ratios mandated for bank holding companies, under federally mandated capital standards and federally established prompt corrective action regulations. Since December 31, 2015, there have been no events or circumstances known to us which have changed or which are expected to result in a change in the Company’s or the Bank’s classification as well-capitalized institutions.
48
In early July 2013, the Federal Reserve Board and the FDIC issued final rules implementing the Basel III regulatory capital framework and related Dodd-Frank Wall Street Reform and Consumer Protection Act changes. The rules revise minimum capital requirements and adjust prompt corrective action thresholds. The final rules revise the regulatory capital elements, add a new common equity Tier 1 capital ratio, increase the minimum Tier 1 capital ratio requirement, and implement a new capital conservation buffer. The rules also permit certain banking organizations to retain, through a one-time election, the existing treatment for accumulated other comprehensive income. The final rules took effect for community banks on January 1, 2015, subject to a transition period for certain parts of the rules. At December 31, 2015 the Bank (on a stand-alone basis) continued to qualify as a well-capitalized institution, and the Company continued to exceed the minimum required capital ratios applicable to it, under the capital adequacy guidelines described above.
The consolidated total capital and Tier 1 capital of the Company at December 31, 2015 includes an aggregate of $17.0 million principal amount of the $17.5 million of 30-year junior subordinated debentures that we issued in 2002 and 2004 (the “Debentures”). See “—Contractual Obligations—Junior Subordinated Debentures” below for additional information. We contributed the net proceeds from the sales of the Debentures to the Bank, thereby providing it with additional cash to fund the growth of its banking operations and, at the same time, to increase its total capital and Tier 1 capital.
Quarterly interest payments on the Debentures require prior approval of the FRBSF. As of December 31, 2015, we were current on all interest payments.
Sales of Common Stock
As previously reported, in March 2013, we sold an additional 2,222,222 shares of our common stock, at a purchase price of $6.75 per shares in cash, to Carpenter Community Bancfund L.P. and Carpenter Community Bancfund-A, L.P. (collectively, the “Carpenter Funds”) for approximately $15.0 million. The purchase price of $6.75 per share of common stock was equal to our tangible book value per share of common stock as of December 31, 2012 and represented a 15% premium over the closing price of our shares on the last trading day immediately preceding the date the sale was consummated. The proceeds from the sale of those shares were contributed by us to capitalize a new wholly-owned asset management subsidiary, PM Asset Resolution, Inc. (“PMAR”), which used those proceeds to fund the purchase of $15.8 million of non-performing loans and foreclosed properties from the Bank.
Dividend Policy and Share Repurchase Programs.
It is, and since the beginning of 2009 it has been, the policy of the Boards of Directors of the Company and the Bank to preserve cash to enhance our capital positions and the Bank's liquidity. Accordingly, we do not expect to pay dividends or make share repurchases for the foreseeable future.
The principal source of cash available to a bank holding company consists of cash dividends from its bank subsidiaries. There are currently several restrictions on the Bank’s ability to pay us cash dividends. Government regulations, including the laws of the State of California, as they pertain to the payment of cash dividends by California state chartered banks, limits the amount of funds that the Bank is permitted to dividend to us. Further, Section 23(a) of the Federal Reserve Act limits the amounts that a bank may loan to its bank holding company to an aggregate of no more than 10% of the bank subsidiary’s capital surplus and retained earnings and requires that such loans be secured by specified assets of the bank holding company. See Note 14, Shareholders’ Equity, in the notes to our consolidated financial statements for more detail regarding the restrictions on dividends and inter-company transactions. While restrictions on the payment of dividends from the Bank to us exist, there are no restrictions on the dividends that PMAR may pay us. PMAR has approximately $14.7 million in assets and could provide us with additional cash if required. In addition, we currently have sufficient cash on hand to meet our cash obligations. As a result, we do not expect that these restrictions will impact our ability to meet our cash obligations.
49
Off Balance Sheet Arrangements
Loan Commitments and Standby Letters of Credit. To meet the financing needs of our customers in the normal course of business, we are a party to financial instruments with off-balance sheet risk. These financial instruments include commitments to extend credit and standby letters of credit. At December 31, 2015 and 2014, we were committed to fund certain loans including letters of credit amounting to approximately $193 million and $148 million, respectively.
Commitments to extend credit and standby letters of credit generally have fixed expiration dates or other termination clauses and the customer may be required to pay a fee and meet other conditions in order to draw on those commitments or standby letters of credit. We expect, based on historical experience, that many of the commitments will expire without being drawn upon and, therefore, the total commitment amounts do not necessarily represent future cash requirements.
To varying degrees, commitments to extend credit involve elements of credit and interest rate risk for us that are in excess of the amounts recognized in our balance sheets. Our maximum exposure to credit loss in the event of nonperformance by the customers to whom such commitments are made could potentially be equal to the amount of those commitments. As a result, before making such a commitment to a customer, we evaluate the customer’s creditworthiness using the same underwriting standards that we would apply if we were approving loans to the customer. In addition, we often require the customer to secure its payment obligations for amounts drawn on such commitments with collateral such as accounts receivable, inventory, property, plant and equipment, income-producing commercial properties, residential properties and properties under construction. As a consequence, our exposure to credit and interest rate risk on such commitments is not different in character or amount than risks inherent in the outstanding loans in our loan portfolio.
Standby letters of credit are conditional commitments issued by the Bank to guarantee a payment obligation of a customer to a third party. The credit risk involved in issuing letters of credit is essentially the same as that involved in extending loan commitments to customers.
Contractual Obligations
The following table summarizes the contractual obligations as of December 31, 2015:
Maturity/Obligation by Period | |||||||||||||||||||
Total | Less than 1 year | 1 - 3 years | 3 - 5 years | More than 5 years | |||||||||||||||
(Dollars in thousands) | |||||||||||||||||||
Deposits | $ | 893,840 | $ | 869,005 | $ | 23,904 | $ | 931 | $ | — | |||||||||
FHLB Borrowings | 10,000 | 10,000 | — | — | — | ||||||||||||||
Junior Subordinated Debentures | 17,527 | — | — | — | 17,527 | ||||||||||||||
Operating Leases | 6,943 | 2,302 | 2,794 | 1,847 | — | ||||||||||||||
Total | $ | 928,310 | $ | 881,307 | $ | 26,698 | $ | 2,778 | $ | 17,527 | |||||||||
FHLB Borrowings. As of December 31, 2015, we had $10.0 million of outstanding short-term borrowings that we had obtained from the FHLB. The table below sets forth the amounts of, the interest rates we pay on and the maturity dates of these FHLB borrowings. These borrowings had a weighted-average annualized interest rate of 1.02% for the year ended December 31, 2015.
Principal Amounts | Interest Rate | Maturity Dates | |||||
(Dollars in thousands) | |||||||
$ | 5,000 | 1.08 | % | September 19, 2016 | |||
5,000 | 0.96 | % | September 30, 2016 | ||||
At December 31, 2015, $523.4 million of loans were pledged to secure these FHLB borrowings and to support our unfunded borrowing capacity. At December 31, 2015, we had unused borrowing capacity of $241 million with the FHLB.
The highest amount of borrowings outstanding at any month-end during the year ended December 31, 2015 was $39.5 million, which consisted of borrowings from the FHLB. By comparison, the highest amount of borrowings outstanding at any month end in 2014 consisted of $70 million of borrowings from the FHLB.
Junior Subordinated Debentures. Pursuant to rulings of the FRB, bank holding companies were permitted to issue long term subordinated debt instruments that, subject to certain conditions, would qualify as and, therefore, augment capital for regulatory
50
purposes. At December 31, 2015, we had outstanding approximately $17.5 million principal amount of 30-year junior subordinated floating rate debentures (the “Debentures”).
Set forth below is certain information regarding the Debentures:
Original Issue Dates | Principal Amount | Interest Rates | Maturity Dates | ||||
September 2002 | $ | 7,217 | LIBOR plus 3.40% | September 2032 | |||
October 2004 | 10,310 | LIBOR plus 2.00% | October 2034 | ||||
Total | $ | 17,527 | |||||
(1) | Subject to the receipt of prior regulatory approval, we may redeem the Debentures, in whole or in part, without premium or penalty, at any time prior to maturity. |
These Debentures require quarterly interest payments, which are used to make quarterly distributions required to be paid on the corresponding trust preferred securities. Subject to certain conditions, we have the right, at our discretion, to defer those interest payments, and the corresponding distributions on the trust preferred securities, for up to five years. Exercise of this deferral right does not constitute a default of our obligations to pay the interest on the Debentures or the corresponding distributions that are payable on the trust preferred securities. As of December 31, 2015, we were current on all interest payments.
Operating Lease Obligations. We lease certain facilities and equipment under various non-cancelable operating leases, which include escalation clauses ranging between 2% and 6% per annum. Future minimum non-cancelable lease commitments, were as follows:
At December 31, 2015 | |||
(Dollars in thousands) | |||
2016 | $ | 2,302 | |
2017 | 1,467 | ||
2018 | 1,327 | ||
2019 | 1,340 | ||
2020 and beyond | 507 | ||
Total | $ | 6,943 | |
Maturing Time Certificates of Deposits. Set forth below is a maturity schedule, as of December 31, 2015, of time certificates of deposit of $100,000 or more:
At December 31, 2015 | |||
(In thousands) | |||
2016 | $ | 223,767 | |
2017 | 17,884 | ||
2018 | 2,771 | ||
2019 | 789 | ||
2020 and beyond | — | ||
Total | $ | 245,211 | |
Credit Risk
Credit risk is the risk of loss arising from adverse changes in a client’s or counterparty’s ability to meet its financial obligations under agreed-upon terms. Credit risk primarily exists in our loan and investment portfolio. The degree of credit risk will vary based on many factors including the duration of the transaction, the financial capacity of the client, the contractual terms of the agreement and the availability and quality of collateral. We manage credit risk by limiting the total amount of credit extended to a single borrower relationship, by verification of its business operations and assets and with a thorough understanding of the nature and scope of the business activities in which they are engaged.
As appropriate, management and Board level committees evaluate and approve credit standards and oversee the credit risk management function related to loans and investments. These committees’ primary responsibilities include ensuring the adequacy of our credit risk management infrastructure, overseeing credit risk management strategies and methodologies,
51
monitoring economic and market conditions that may impact our credit-related activities, and finally, evaluating and monitoring overall portfolio credit risk.
We maintain a comprehensive credit policy that includes specific underwriting guidelines as well as standards for loan origination and reporting as well as portfolio management. The credit policy is developed by credit management and approved by the Board of Directors, which also reviews it at least annually. In addition, the credit policy sets forth requirements that ensure compliance with all applicable laws and regulatory guidance.
Our underwriting guidelines outline specific standards and risk management criteria for each lending product offered. Loan types are further segmented into subsections where the inherent credit risk warrants detailed transaction and monitoring parameters, as follows:
• | Loan structures, which includes the lien priority, amortization terms and loan tenors; |
• | Collateral requirements, coverage margins and valuation methods; |
• | Underwriting considerations which include recommended due diligence and verification requirements; and |
• | Specific credit performance standards. Examples include minimum debt service coverage ratios, liquidity requirements as well as limits on financial leverage. |
We measure and document each loan’s compliance with our policy criteria at underwriting. If an exception to these criteria exists, an explanation of the factors that mitigate this additional risk is considered before an approval is granted. A report of loans with policy exceptions is reported to the Credit Policy Committee of the Board of Directors of the Bank on a monthly basis.
We continuously monitor a client’s ability to perform under its obligations. Reporting requirements and loan covenants are set forth in each loan approval and compliance with these items are monitored on at least an annual basis or more frequently as conditions warrant. Loan covenant compliance is tracked and results are reported to credit management.
Under our credit risk management structure, each loan is assigned an internal asset quality rating that is based on defined credit standards. While the criteria may vary by product, each rating focuses on the borrower’s inherent operating risks, the quality of management, historical financial performance, financial capacity, the stability of profits and cash flow, and the adequacy of the secondary repayment sources. Asset quality ratings for each loan are monitored and reassessed on an ongoing basis. If necessary, ratings are adjusted to reflect changes in the client’s financial condition, cash flow or financial position. Regular reporting to management and the Board includes the aggregated portfolio exposure by asset quality rating as one measure of credit risk within the loan portfolio. Refer to “Financial Condition — Allowance for Loan and Lease Losses” above in this Item 7 for further detail regarding our internal asset quality ratings.
The Bank recognizes that substantial risks are posed by concentrations of credit assets. As such, it maintains a diversified loan portfolio by limiting exposures by loan structure, business type or purpose, collateral type, and perceived asset quality. Credit management defines areas of concentration, recommends appropriate thresholds to the Board of Directors and takes action if needed to manage potential risk where asset concentrations exist.
Market Risk
Market risk is the risk that values of assets and liabilities or revenues will be adversely affected by changes in market conditions such as interest rate fluctuations. This risk is inherent in the financial instruments associated with our operations and/or activities, including loans, securities and short-term borrowings.
The primary market risk to which we are exposed is interest rate risk, which is inherent in the financial instruments associated with our operations, primarily including our loans, deposits and borrowings. Interest rate risk is the exposure of a company’s financial condition, both earnings and the market value of assets and liabilities, to adverse movements in interest rates. Interest rate risk results from differences in the maturity or timing of interest earning assets and interest bearing liabilities, changes in the slope of the yield curve over time, imperfect correlation in the adjustment of rates earned and paid on different instruments with otherwise similar characteristics (e.g. three-month Treasury bill versus three-month LIBOR) and from interest-rate-related options embedded in bank products (e.g. loan prepayments, floors and caps, callable investment securities, customers redeploying non-interest bearing to interest bearing deposits, etc.).
The potential impact of interest rate risk is significant because of the liquidity and capital adequacy consequences that reduced earnings or net operating losses caused by a reduction in net interest income imply. We recognize and accept that interest rate risk is a routine part of bank operations and will from time to time impact our profits and capital position. The objective of interest rate risk management is to control exposure of net interest income to risks associated with interest rate movements in the market, to achieve consistent growth in net interest income and to profit from favorable market opportunities.
52
We measure interest rate risk and the effect of changes in market interest rates using a net interest income simulation analysis. The analysis incorporates our balance sheet as of December 31, 2015 and assumptions that reflect the current interest rate environment. The analysis estimates the interest rate impact of a parallel increase in interest rates over a twelve-month horizon.
The analysis below incorporates our assumptions for the market yield curve, pricing sensitivities on loans and deposits, reinvestment of asset and liability cash flows, and prepayments on loans and securities. The new loans, investment securities, borrowings and deposits are assumed to have interest rates that reflect our forecast of prevailing market terms. We also assumed that LIBOR and prime rates do not fall below 0% for loans and borrowings. FHLB borrowings are assumed to convert to cash as they run off. Actual results may differ from forecasted results due to changes in market conditions as well as changes in management strategies.
The estimated changes in net interest income for a twelve-month period based on changes in the interest rates applied as of December 31, 2015 were as follows:
Change in Market Interest Rates (basis points) | Amount ($) | Percent (%) | |||||
(in thousands) | |||||||
+200 | $ | 1,447 | 4.24 | % | |||
+100 | 309 | 0.91 | % | ||||
-100 | 401 | 1.17 | % | ||||
In addition to net interest income (“NII”) simulation, we measure the impact of market interest rate changes on our economic value of equity (“EVE”). EVE is defined as the net present value of assets, less the net present value of liabilities, adjusted for any off-balance sheet items.
The estimated changes in EVE in the following table are based on a discounted cash flow analysis which incorporates the impacts of changes in market interest rates. The model simulations and calculations are highly assumption-dependent and will change regularly as our asset/liability structure changes, as interest rate environments evolve, and as we change our assumptions in response to relevant market or business circumstances. These calculations do not reflect the changes that we anticipate or may make to reduce our EVE exposure in response to a change in market interest rates as part of our overall interest rate risk management strategy. As with any method of measuring interest rate risk, certain limitations are inherent in the method of analysis presented in the preceding table. We are exposed to yield curve risk, prepayment risk and basis risk, which cannot be fully modeled and expressed using the above methodology. Accordingly, the results in the following table should not be relied upon as a precise indicator of actual results in the event of changing market interest rates. Additionally, the resulting changes in EVE and NII estimates are not intended to represent, and should not be construed to represent, the underlying value.
The estimated changes in EVE based on interest rates applied as of December 31, 2015 were as follows:
Change in Market Interest Rates (basis points) | Amount ($) | Percent (%) | |||||
(in thousands) | |||||||
+200 | $ | 5,975 | 3.95 | % | |||
+100 | 3,347 | 2.21 | % | ||||
-100 | (5,042 | ) | (3.33 | )% | |||
Critical Accounting Policies
Our consolidated financial statements are prepared in accordance with generally accepted accounting principles in the United States (“GAAP”) and general practices in the banking industry. Certain of those accounting policies are considered critical accounting policies, because they require us to make assumptions and judgments regarding circumstances or trends that could affect the carrying value of our material assets, such as, for example, assumptions regarding economic conditions or trends that could impact our ability to fully collect our loans or ultimately realize the carrying value of certain of our other assets, such as securities available for sale and our deferred tax asset. Those assumptions and judgments are based on current information available to us regarding those economic conditions or trends or other circumstances. If adverse changes were to occur in the conditions, trends or other events on which our assumptions or judgments had been based, then under GAAP it could become necessary for us to reduce the carrying values of any affected assets on our balance sheet. In addition, because reductions in the carrying value of assets are sometimes effectuated by or require charges to income, such reductions also may have the effect of reducing our income.
53
Our critical accounting policies consist of the accounting policies and practices we follow in determining (i) the sufficiency of the allowance we establish for loan and lease losses, (ii) the fair values of our investment securities that we hold for sale and financial instruments related to our mortgage banking assets and liabilities, and (iii) the amount of our deferred tax asset, consisting primarily of tax loss carryforwards and tax credits that we believe will be able to offset income taxes in future periods.
Allowance for Loan and Lease Losses. We maintain reserves to provide for loan and lease losses that occur in the ordinary course of the banking business. When it is determined that the payment in full of a loan has become unlikely, the carrying value of the loan is reduced ("written down") to what management believes is its realizable value or, if it is determined that a loan no longer has any realizable value, the carrying value of the loan is written off in its entirety (a loan "charge-off"). Loan charge-offs and write-downs are charged against our ALLL. The amount of the ALLL is increased periodically to replenish the ALLL after it has been reduced due to loan write-downs or charge-offs. The ALLL also is increased or decreased periodically to reflect increases or decreases in the volume of outstanding loans and to take account of changes in the risk of potential loan losses due to a deterioration or improvement in the condition of borrowers or in the value of properties securing non-performing loans or adverse changes or improvements in economic conditions. Increases in the ALLL are made through a charge, recorded as an expense in the statement of operations, referred to as the "provision for loan and lease losses." Recoveries of loans previously charged-off are added back to and, therefore, to that extent increase the ALLL and reduce the amount of the provision for loan losses that might otherwise have had to be made to replenish or increase the ALLL. See "—Financial Condition—Nonperforming Loans and the Allowance for Loan and Lease Losses" above in this Item 7 for additional information regarding the ALLL.
Fair Value of Securities Available for Sale. Under applicable accounting principles, we are required to recognize any unrealized loss or gain on the securities we hold for sale. An unrealized gain occurs when the fair value of a security available for sale increases above its amortized cost as recorded on our balance sheet. An unrealized loss occurs when the fair value of a security available for sale declines below its amortized cost as recorded on our balance sheet. As a result, we make determinations, on a quarterly basis, of the fair values of the securities available for sale in order to determine if there are any unrealized losses in those securities. When there is an active market for such a security, the determination of its fair value is based on market prices. If there is no active trading market, but such securities do trade from time to time, we rely primarily on quotes we obtain from third party vendors and securities brokers to determine the fair values of those securities. However, quotes are not always available for some securities and, in those instances, we make those fair value determinations on the basis of a variety of industry standard pricing methodologies, such as discounted cash flow analyses, matrix pricing, and option adjusted spread models, as well as fundamental analysis of the creditworthiness of the obligors under those securities. These methodologies require us to make various assumptions relating to such matters as future prepayment speeds, yield, duration, Federal Reserve Board monetary policies and the supply and demand for the individual securities. Consequently, if changes were to occur in market or other conditions or the circumstances on which our earlier assumptions or judgments were based, it could become necessary for us to reduce the fair values of such securities, which would result in charges to accumulated other comprehensive income (loss) on our balance sheet. Moreover, if we conclude that reductions in the fair values of any securities are other than temporary, it would be necessary for us to recognize an impairment loss to noninterest income in our statement of operations.
Fair Value of Financial Instruments. FASB ASC 820-10-35 defines fair value, establishes a framework for measuring fair value and outlines a fair value hierarchy based on the inputs to valuation techniques used to measure fair value. Fair value is defined as the price that would be received to sell an asset or paid to transfer a liability in an orderly transaction between market participants at the measurement date (also referred to as an exit price). Fair value measurements are categorized into a three-level hierarchy based on the extent to which the measurement relies on observable market inputs in measuring fair value. Level 1, which is the highest priority in the fair value hierarchy, is based on unadjusted quoted prices in active markets for identical assets or liabilities. Level 2 is based upon quoted prices in active markets for identical assets or liabilities. Level 3, which is the lowest priority in the fair value hierarchy, is based on unobservable inputs. Assets and liabilities are classified within this hierarchy in their entirety based on the lowest level of any input that is significant to the fair value measurement.
The use of fair value to measure our financial instruments is fundamental to our financial statements and is a critical accounting estimate because a substantial portion of our mortgage banking assets and liabilities (included in discontinued operations) are recorded at estimated fair value. Financial instruments classified as Level 3 are generally based on unobservable inputs, and the process to determine fair value is generally more subjective and involves a high degree of management judgment and assumptions. These assumptions may have a significant effect on our estimates of fair value, and the use of different assumptions, as well as changes in market conditions and interest rates, could have a material effect on our results of operations or financial condition. The most subjective mortgage banking assets and liabilities include mortgage servicing rights and derivative financial instruments as discussed below:
Utilization and Valuation of Deferred Income Tax Benefits. We record as a “deferred tax asset” on our balance sheet an amount equal to the tax credit and tax loss carryforwards and tax deductions (“tax benefits”) that we believe will be available to us to offset or reduce income taxes in future periods. Under applicable federal and state income tax laws and regulations, in most cases such tax benefits will expire, if they cannot be used, within specified periods of time. Accordingly, the ability to fully use
54
our deferred tax asset to reduce income taxes in the future depends on the amount of taxable income that we generate during those time periods. At least once each year, or more frequently, if circumstances warrant, we make estimates of future taxable income that we believe we are likely to generate during those future periods. If we conclude, on the basis of those estimates and the amount of the tax benefits available to us, that it is more likely, than not, that we will be able to fully utilize those tax benefits prior to their expiration, we recognize the deferred tax asset in full on our balance sheet. On the other hand, if we conclude, instead, that it has become more likely, than not, that we will be unable to utilize those tax benefits in full prior to their expiration, then, we would establish, or increase any existing, reserves (commonly referred to as a “valuation allowance”) to reduce the deferred tax asset on our balance sheet to the amount with respect to which we believe it is still more likely, than not, that we will be able to use to offset or reduce taxes in the future. The establishment of or an increase in that valuation allowance is implemented by recognizing a non-cash charge that would have the effect of increasing the provision, or reducing any credit, for income taxes that we would otherwise have recorded in our statements of operations. The determination of whether and the extent to which we will be able to utilize our deferred tax asset involves significant judgments and assumptions that are subject to period to period changes as a result of changes in tax laws, changes in market or economic conditions that could affect our operating results or variances between our actual operating results and the operating results that we had projected for any such period, as well as other factors.
ITEM 7A. | QUANTITATIVE AND QUALITATIVE DISCLOSURES ABOUT MARKET RISK |
We are exposed to certain financial risks, which are discussed in detail in Management's Discussion and Analysis of Financial Condition and Results of Operations in the Credit Risk and Market Risk sections.
55
REPORT OF INDEPENDENT REGISTERED PUBLIC ACCOUNTING
FIRM ON INTERNAL CONTROL OVER FINANCIAL REPORTING
To the Board of Directors and Shareholders
Pacific Mercantile Bancorp
We have audited Pacific Mercantile Bancorp and subsidiaries’ (Pacific Mercantile Bancorp) internal control over financial reporting as of December 31, 2015, based on criteria established in Internal Control-Integrated Framework issued by the Committee of Sponsoring Organizations of the Treadway Commission in 2013. Pacific Mercantile Bancorp’s management is responsible for maintaining effective internal control over financial reporting and for its assessment of the effectiveness of internal control over financial reporting included in the accompanying Management’s Annual Report on Internal Control Over Financial Reporting. Our responsibility is to express an opinion on the Company’s internal control over financial reporting based on our audit.
We conducted our audit in accordance with the standards of the Public Company Accounting Oversight Board (United States). Those standards require that we plan and perform the audit to obtain reasonable assurance about whether effective internal control over financial reporting was maintained in all material respects. Our audit included obtaining an understanding of internal control over financial reporting, assessing the risk that a material weakness exists, and testing and evaluating the design and operating effectiveness of internal control based on the assessed risk. Our audit also included performing such other procedures as we considered necessary in the circumstances. We believe that our audit provides a reasonable basis for our opinion.
A company’s internal control over financial reporting is a process designed to provide reasonable assurance regarding the reliability of financial reporting and the preparation of financial statements for external purposes in accordance with generally accepted accounting principles. A company’s internal control over financial reporting includes those policies and procedures that (a) pertain to the maintenance of records that, in reasonable detail, accurately and fairly reflect the transactions and dispositions of the assets of the company; (b) provide reasonable assurance that transactions are recorded as necessary to permit preparation of financial statements in accordance with generally accepted accounting principles, and that receipts and expenditures of the company are being made only in accordance with authorizations of management and directors of the company; and (c) provide reasonable assurance regarding prevention or timely detection of unauthorized acquisition, use, or disposition of the company’s assets that could have a material effect on the financial statements.
Because of its inherent limitations, internal control over financial reporting may not prevent or detect misstatements. Also, projections of any evaluation of effectiveness to future periods are subject to the risk that controls may become inadequate because of changes in conditions, or that the degree of compliance with the policies or procedures may deteriorate.
In our opinion, Pacific Mercantile Bancorp maintained, in all material respects, effective internal control over financial reporting as of December 31, 2015, based on criteria established in Internal Control-Integrated Framework issued by the Committee of Sponsoring Organizations of the Treadway Commission in 2013.
We have also audited, in accordance with the standards of the Public Company Accounting Oversight Board (United States), the consolidated statement of financial condition of Pacific Mercantile Bancorp and the related consolidated statements of operations, comprehensive income (loss), shareholders’ equity and cash flows, and our report dated March 11, 2016 expressed an unqualified opinion.
/s/ RSM US LLP
Los Angeles, CA
March 11, 2016
56
ITEM 8. | FINANCIAL STATEMENTS |
INDEX TO CONSOLIDATED FINANCIAL STATEMENTS
Page No. | |
57
REPORT OF INDEPENDENT REGISTERED PUBLIC ACCOUNTING FIRM
To the Board of Directors and Shareholders
Pacific Mercantile Bancorp
We have audited the accompanying consolidated statements of financial condition of Pacific Mercantile Bancorp and subsidiaries (the Company) as of December 31, 2015 and 2014 and the related consolidated statements of operations, comprehensive income (loss), shareholders’ equity and cash flows for the years then ended. These consolidated financial statements are the responsibility of the Company’s management. Our responsibility is to express an opinion on these consolidated financial statements based on our audit.
We conducted our audits in accordance with the standards of the Public Company Accounting Oversight Board (United States). Those standards require that we plan and perform the audit to obtain reasonable assurance about whether the consolidated financial statements are free of material misstatement. An audit includes examining, on a test basis, evidence supporting the amounts and disclosures in the consolidated financial statements. An audit also includes assessing the accounting principles used and significant estimates made by management, as well as evaluating the overall financial statement presentation. We believe that our audits provide a reasonable basis for our opinion.
In our opinion, the consolidated financial statements referred to above present fairly, in all material respects, the financial position of Pacific Mercantile Bancorp and subsidiaries, and the results of their operations and their cash flows for the years ended December 31, 2015 and 2014, in conformity with U.S. generally accepted accounting principles.
We have also audited, in accordance with the standards of the Public Company Accounting Oversight Board (United States), the Company’s internal control over financial reporting as of December 31, 2015, based on criteria established in Internal Control-Integrated Framework issued by the Committee of Sponsoring Organizations of the Treadway Commission in 2013, and our report dated March 11, 2016 expressed an unqualified opinion on the effectiveness of the Company’s internal control over financial reporting.
/s/ RSM US LLP
Los Angeles, CA
March 14, 2016
58
REPORT OF INDEPENDENT REGISTERED PUBLIC ACCOUNTING FIRM
Board of Directors and Shareholders
Pacific Mercantile Bancorp and Subsidiaries
We have audited the accompanying consolidated statements of operations, comprehensive income (loss), shareholders' equity, and cash flows of Pacific Mercantile Bancorp (a California Corporation) and subsidiaries (collectively, the “Company”) for the year ended December 31, 2013. These financial statements are the responsibility of the Company's management. Our responsibility is to express an opinion on these financial statements based on our audit.
We conducted our audit in accordance with the standards of the Public Company Accounting Oversight Board (United States). Those standards require that we plan and perform the audit to obtain reasonable assurance about whether the financial statements are free of material misstatement. The Company is not required to have, nor were we engaged to perform, an audit of its internal control over financial reporting. Our audit included consideration of internal control over financial reporting as a basis for designing audit procedures that are appropriate in the circumstances, but not for the purpose of expressing an opinion on the effectiveness of the Company's internal control over financial reporting. Accordingly, we express no such opinion. An audit includes examining, on a test basis, evidence supporting the amounts and disclosures in the financial statements. An audit also includes assessing the accounting principles used and significant estimates made by management, as well as evaluating the overall financial statement presentation. We believe that our audit provides a reasonable basis for our opinion.
In our opinion, the financial statements referred to above present fairly, in all material respects, the consolidated results of operations and cash flows of Pacific Mercantile Bancorp and subsidiaries for the year ended December 31, 2013 in conformity with accounting principles generally accepted in the United States of America.
/s/ SQUAR MILNER LLP (Formerly SQUAR, MILNER, PETERSON, MIRANDA & WILLIAMSON, LLP)
Newport Beach, California
March 14, 2014
59
PACIFIC MERCANTILE BANCORP AND SUBSIDIARIES
CONSOLIDATED STATEMENTS OF FINANCIAL CONDITION
(Dollars in thousands, except for per share data)
December 31, | |||||||
2015 | 2014 | ||||||
ASSETS | |||||||
Cash and due from banks | $ | 10,645 | $ | 9,997 | |||
Interest bearing deposits with financial institutions | 103,276 | 167,138 | |||||
Cash and cash equivalents | 113,921 | 177,135 | |||||
Interest-bearing time deposits with financial institutions | 4,665 | 4,668 | |||||
Federal Reserve Bank of San Francisco and Federal Home Loan Bank Stock, at cost | 8,170 | 8,137 | |||||
Securities available for sale, at fair value | 52,249 | 60,926 | |||||
Loans (net of allowances of $12,716 and $13,833, respectively) | 849,733 | 824,197 | |||||
Other real estate owned | 650 | 1,592 | |||||
Accrued interest receivable | 2,266 | 2,436 | |||||
Premises and equipment, net | 1,142 | 1,092 | |||||
Net deferred tax assets | 17,576 | 5,933 | |||||
Other assets | 12,017 | 13,494 | |||||
Total assets | $ | 1,062,389 | $ | 1,099,610 | |||
LIABILITIES AND SHAREHOLDERS’ EQUITY | |||||||
Deposits: | |||||||
Noninterest-bearing | $ | 249,676 | $ | 237,491 | |||
Interest-bearing | 644,164 | 678,818 | |||||
Total deposits | 893,840 | 916,309 | |||||
Borrowings | 10,000 | 39,500 | |||||
Accrued interest payable | 255 | 222 | |||||
Other liabilities | 6,851 | 6,771 | |||||
Junior subordinated debentures | 17,527 | 17,527 | |||||
Total liabilities | 928,473 | 980,329 | |||||
Commitments and contingencies (Note 15) | |||||||
Shareholders’ equity: | |||||||
Preferred stock, no par value, 2,000,000 shares authorized: | |||||||
Series B Convertible 8.4% Noncumulative Preferred Stock, 300,000 shares authorized; 0 and 112,000 issued and outstanding at December 31, 2015 and 2014, respectively; liquidation preference $100 per share, plus accumulated but undeclared dividends at December 31, 2014 | — | 8,747 | |||||
Series C 8.4% Noncumulative Preferred Stock, 300,000 shares authorized; 0 and 29,308 issued and outstanding at December 31, 2015 and 2014, respectively; liquidation preference $100 per share plus accumulated but undeclared dividends at December 31, 2014 | — | 2,930 | |||||
Common stock, no par value, 85,000,000 shares authorized; 22,820,332 and 19,462,561 shares issued and outstanding at December 31, 2015 and 2014, respectively | 147,202 | 131,181 | |||||
Accumulated deficit | (12,476 | ) | (22,885 | ) | |||
Accumulated other comprehensive loss | (810 | ) | (692 | ) | |||
Total shareholders’ equity | 133,916 | 119,281 | |||||
Total liabilities and shareholders’ equity | $ | 1,062,389 | $ | 1,099,610 | |||
The accompanying notes are an integral part of these consolidated financial statements.
60
PACIFIC MERCANTILE BANCORP AND SUBSIDIARIES
CONSOLIDATED STATEMENTS OF OPERATIONS
(Dollars in thousands, except for per share data)
Year Ended December 31, | |||||||||||
2015 | 2014 | 2013 | |||||||||
Interest income: | |||||||||||
Loans, including fees | $ | 36,717 | $ | 36,344 | $ | 33,819 | |||||
Securities available for sale and stock | 1,710 | 1,613 | 1,599 | ||||||||
Interest-bearing deposits with financial institutions | 370 | 333 | 233 | ||||||||
Total interest income | 38,797 | 38,290 | 35,651 | ||||||||
Interest expense: | |||||||||||
Deposits | 4,559 | 4,817 | 4,421 | ||||||||
Borrowings | 710 | 1,012 | 896 | ||||||||
Total interest expense | 5,269 | 5,829 | 5,317 | ||||||||
Net interest income | 33,528 | 32,461 | 30,334 | ||||||||
Provision for loan and lease losses | — | 1,500 | 4,505 | ||||||||
Net interest income after provision for loan and lease losses | 33,528 | 30,961 | 25,829 | ||||||||
Noninterest income | |||||||||||
Service fees on deposits and other banking services | 918 | 896 | 801 | ||||||||
Net gains on sale of securities available for sale | — | — | 44 | ||||||||
Net gain on sale of small business administration loans | — | 2,074 | — | ||||||||
Other noninterest income | 1,768 | 1,400 | 348 | ||||||||
Total noninterest income | 2,686 | 4,370 | 1,193 | ||||||||
Noninterest expense | |||||||||||
Salaries and employee benefits | 22,002 | 22,571 | 19,585 | ||||||||
Occupancy | 2,871 | 2,499 | 2,234 | ||||||||
Equipment and depreciation | 1,652 | 1,541 | 1,609 | ||||||||
Data processing | 1,035 | 931 | 786 | ||||||||
FDIC expense | 1,250 | 1,336 | 1,769 | ||||||||
Other real estate owned expense, net | 365 | 1,962 | 3,233 | ||||||||
Professional fees | 2,514 | 2,434 | 2,936 | ||||||||
Business development | 488 | 262 | 340 | ||||||||
Loan related expense | 414 | 532 | 355 | ||||||||
Insurance | 341 | 484 | 578 | ||||||||
Other operating expense | 2,392 | 2,256 | 2,921 | ||||||||
Total noninterest expense | 35,324 | 36,808 | 36,346 | ||||||||
Income (loss) from continuing operations before income taxes | 890 | (1,477 | ) | (9,324 | ) | ||||||
Income tax (benefit) provision | (11,551 | ) | (608 | ) | 5,610 | ||||||
Net income (loss) from continuing operations | 12,441 | (869 | ) | (14,934 | ) | ||||||
Discontinued Operations | |||||||||||
Income (loss) from discontinued operations before income taxes | — | 1,937 | (7,721 | ) | |||||||
Income tax provision (benefit) | — | 711 | (439 | ) | |||||||
Net income (loss) from discontinued operations | — | 1,226 | (7,282 | ) | |||||||
Net income (loss) | 12,441 | 357 | (22,216 | ) | |||||||
Accumulated declared dividends on preferred stock | — | (547 | ) | (538 | ) | ||||||
Accumulated undeclared dividends on preferred stock | — | (616 | ) | (544 | ) | ||||||
Dividends on preferred stock | (927 | ) | — | — | |||||||
Inducements for exchange of the preferred stock | (512 | ) | — | — | |||||||
Net income (loss) allocable to common shareholders | $ | 11,002 | $ | (806 | ) | $ | (23,298 | ) | |||
Basic income (loss) per common share: | |||||||||||
Net income (loss) from continuing operations | $ | 0.54 | $ | (0.11 | ) | $ | (0.88 | ) | |||
Net income (loss) available to common shareholders | $ | 0.54 | $ | (0.04 | ) | $ | (1.28 | ) | |||
Diluted income (loss) per common share: | |||||||||||
Net income (loss) from continuing operations | $ | 0.53 | $ | (0.11 | ) | $ | (0.88 | ) | |||
Net income (loss) available to common shareholders | $ | 0.53 | $ | (0.04 | ) | $ | (1.28 | ) | |||
Weighted average number of common shares outstanding: | |||||||||||
Basic | 20,516,575 | 19,230,913 | 18,240,891 | ||||||||
Diluted | 20,675,279 | 19,230,913 | 18,240,891 | ||||||||
The accompanying notes are an integral part of these consolidated financial statements.
61
PACIFIC MERCANTILE BANCORP AND SUBSIDIARIES
CONSOLIDATED STATEMENT OF COMPREHENSIVE INCOME (LOSS)
(Dollars in thousands)
Year Ended December 31, | |||||||||||
2015 | 2014 | 2013 | |||||||||
Net income (loss) | $ | 12,441 | $ | 357 | $ | (22,216 | ) | ||||
Other comprehensive income (loss), net of tax: | |||||||||||
Change in unrealized (loss) gain on securities available for sale | (118 | ) | 1,462 | (1,609 | ) | ||||||
Change in net unrealized gain and prior service benefit on supplemental executive retirement plan | — | — | 20 | ||||||||
Total comprehensive income (loss) | $ | 12,323 | $ | 1,819 | $ | (23,805 | ) | ||||
The accompanying notes are an integral part of these consolidated financial statements.
62
PACIFIC MERCANTILE BANCORP AND SUBSIDIARIES
CONSOLIDATED STATEMENTS OF SHAREHOLDERS’ EQUITY
(Shares and dollars in thousands)
For the Three Years Ended December 31, 2015
Series A, B, and C Preferred stock | Common stock | Retained earnings (accumulated deficit) | Accumulated other comprehensive income (loss) | Total | |||||||||||||||||||||
Number of shares | Amount | Number of shares | Amount | ||||||||||||||||||||||
Balance at December 31, 2012 | 125 | $ | 10,027 | 16,677 | $ | 112,790 | $ | 624 | $ | (565 | ) | $ | 122,876 | ||||||||||||
Issuance of common stock | — | — | 2,222 | 14,978 | — | — | 14,978 | ||||||||||||||||||
Conversion of Series A Preferred Stock to common stock | — | — | 141 | — | — | — | — | ||||||||||||||||||
Series C Preferred Stock issued as a stock dividend on Series B Preferred Stock | 5 | 538 | — | — | (538 | ) | — | — | |||||||||||||||||
Common stock based compensation expense | — | — | — | 804 | — | — | 804 | ||||||||||||||||||
Common stock options exercised | — | — | 95 | 305 | — | — | 305 | ||||||||||||||||||
Net loss | — | — | — | — | (22,216 | ) | — | (22,216 | ) | ||||||||||||||||
Other comprehensive loss | — | — | — | — | — | (1,589 | ) | (1,589 | ) | ||||||||||||||||
Balance at December 31, 2013 | 130 | $ | 10,565 | 19,135 | $ | 128,877 | $ | (22,130 | ) | $ | (2,154 | ) | $ | 115,158 | |||||||||||
Issuance of restricted stock | — | — | 51 | — | — | — | — | ||||||||||||||||||
Tax effect from vesting of restricted stock | — | — | (12 | ) | (52 | ) | — | — | (52 | ) | |||||||||||||||
Series C Preferred Stock issued as a stock dividend on Series B Preferred Stock | 11 | 1,112 | — | — | (1,112 | ) | — | — | |||||||||||||||||
Common Stock based compensation expense | — | — | — | 1,139 | — | — | 1,139 | ||||||||||||||||||
Common stock options exercised | — | — | 289 | 1,217 | — | — | 1,217 | ||||||||||||||||||
Net income | — | — | — | — | 357 | — | 357 | ||||||||||||||||||
Other comprehensive income | — | — | — | — | — | 1,462 | 1,462 | ||||||||||||||||||
Balance at December 31, 2014 | 141 | $ | 11,677 | 19,463 | $ | 131,181 | $ | (22,885 | ) | $ | (692 | ) | $ | 119,281 | |||||||||||
Exchange of Series B Preferred Stock for common stock | (112 | ) | (8,747 | ) | 2,105 | 8,747 | — | — | — | ||||||||||||||||
Exchange of Series C Preferred Stock for common stock | (35 | ) | (3,523 | ) | 662 | 3,523 | — | — | — | ||||||||||||||||
Dividends on preferred stock exchanged for common stock | — | — | 174 | 927 | (927 | ) | — | — | |||||||||||||||||
Inducement for exchange of preferred stock for common stock | — | — | 68 | 512 | (512 | ) | — | — | |||||||||||||||||
Costs related to the exchange of preferred stock for common stock | — | — | — | (324 | ) | — | — | (324 | ) | ||||||||||||||||
Issuance of restricted stock, net | — | — | 68 | — | — | — | — | ||||||||||||||||||
Tax effect from vesting of restricted stock | — | — | (16 | ) | (109 | ) | — | — | (109 | ) | |||||||||||||||
Series C Preferred Stock issued as a stock dividend on Series B Preferred Stock | 6 | 593 | — | — | (593 | ) | — | — | |||||||||||||||||
Common Stock based compensation expense | — | — | — | 1,234 | — | — | 1,234 | ||||||||||||||||||
Common stock options exercised | — | — | 296 | 1,511 | — | — | 1,511 | ||||||||||||||||||
Net income | — | — | — | — | 12,441 | — | 12,441 | ||||||||||||||||||
Other comprehensive loss | — | — | — | — | — | (118 | ) | (118 | ) | ||||||||||||||||
Balance at December 31, 2015 | — | $ | — | 22,820 | $ | 147,202 | $ | (12,476 | ) | $ | (810 | ) | $ | 133,916 | |||||||||||
The accompanying notes are an integral part of these consolidated financial statements.
63
PACIFIC MERCANTILE BANCORP AND SUBSIDIARIES
CONSOLIDATED STATEMENTS OF CASH FLOW
(Dollars in thousands)
Year Ended December 31, | |||||||||||
2015 | 2014 | 2013 | |||||||||
Cash Flows From Operating Activities: | |||||||||||
Net income (loss) | $ | 12,441 | $ | 357 | $ | (22,216 | ) | ||||
Adjustments to reconcile net income (loss) to net cash provided by operating activities: | |||||||||||
Depreciation and amortization | 525 | 462 | 536 | ||||||||
Provision for loan and lease losses | — | 1,500 | 4,505 | ||||||||
Amortization of premium on securities | 319 | 331 | 462 | ||||||||
Net gains on sales of securities available for sale | — | — | (44 | ) | |||||||
Other | — | (105 | ) | 262 | |||||||
Net amortization of deferred fees and unearned income on loans | (607 | ) | (662 | ) | (386 | ) | |||||
Net (gain) loss on sales of other real estate owned | (44 | ) | 296 | (1,324 | ) | ||||||
Net gain on sale of premises and equipment | (27 | ) | (56 | ) | (14 | ) | |||||
Net gain on sale of small business administration loans | — | (2,074 | ) | — | |||||||
Small business administration loan originations | — | (27,097 | ) | — | |||||||
Proceeds from sale of small business administration loans | — | 29,245 | — | ||||||||
Write down of other real estate owned | 85 | 343 | 1,922 | ||||||||
Stock-based compensation expense | 1,234 | 1,139 | 804 | ||||||||
Tax effect of restricted stock vesting | (109 | ) | (52 | ) | — | ||||||
Changes in operating assets and liabilities: | |||||||||||
Net decrease (increase) in accrued interest receivable | 170 | (419 | ) | 225 | |||||||
Net (increase) decrease in other assets | (561 | ) | (696 | ) | 958 | ||||||
Net (increase) decrease in deferred taxes | (11,562 | ) | 1,620 | 4,165 | |||||||
Net (increase) decrease in income taxes receivable | (49 | ) | (691 | ) | 1,605 | ||||||
Net increase (decrease) in accrued interest payable | 33 | (2,063 | ) | 453 | |||||||
Net increase (decrease) in other liabilities | 80 | (1,304 | ) | 97 | |||||||
Net cash provided by discontinued operations | — | 8,702 | 43,574 | ||||||||
Net cash provided by operating activities | 1,928 | 8,776 | 35,584 | ||||||||
Cash Flows From Investing Activities: | |||||||||||
Net decrease (increase) in interest-bearing time deposits with financial institutions | 3 | (2,245 | ) | — | |||||||
Maturities of and principal payments received on securities available for sale and other stock | 8,409 | 9,403 | 13,256 | ||||||||
Purchase of securities available for sale and other stock | (283 | ) | (1,863 | ) | (1,215 | ) | |||||
Proceeds from sale of securities available for sale and other stock | — | — | 6,689 | ||||||||
Principal payments received on other investments | 2,087 | — | — | ||||||||
Proceeds from sale of other real estate owned | 1,181 | 15,269 | 10,405 | ||||||||
Capitalized cost of other real estate owned | — | (21 | ) | (308 | ) | ||||||
Net increase in loans | (25,209 | ) | (65,668 | ) | (50,245 | ) | |||||
Purchases of premises and equipment | (575 | ) | (334 | ) | (618 | ) | |||||
Proceeds from sale of premises and equipment | 27 | 77 | 71 | ||||||||
Net cash used in investing activities | (14,360 | ) | (45,382 | ) | (21,965 | ) | |||||
Cash Flows From Financing Activities: | |||||||||||
Proceeds from sale of common stock | — | — | 14,978 | ||||||||
Payments for exchange of preferred stock for common stock | (324 | ) | — | — | |||||||
Net (decrease) increase in deposits | (22,469 | ) | 136,084 | (65,170 | ) | ||||||
Proceeds from borrowings | — | — | 35,000 | ||||||||
Payments of borrowings | (29,500 | ) | (30,500 | ) | (20,000 | ) | |||||
Proceeds from exercise of common stock options | 1,511 | 1,217 | 305 | ||||||||
Net cash (used in) provided by financing activities | (50,782 | ) | 106,801 | (34,887 | ) | ||||||
Net (decrease) increase in cash and cash equivalents | (63,214 | ) | 70,195 | (21,268 | ) | ||||||
Cash and Cash Equivalents, beginning of period | 177,135 | 106,940 | 128,208 | ||||||||
Cash and Cash Equivalents, end of period | $ | 113,921 | $ | 177,135 | $ | 106,940 | |||||
Supplementary Cash Flow Information: | |||||||||||
Cash paid for interest on deposits and other borrowings | $ | 5,236 | $ | 7,892 | $ | 4,864 | |||||
Cash paid for income taxes | $ | 58 | $ | — | $ | — | |||||
The accompanying notes are an integral part of these consolidated financial statements.
64
(Dollars in thousands) | Year Ended December 31, | ||||||||||
2015 | 2014 | 2013 | |||||||||
Non-Cash Investing Activities: | |||||||||||
Transfer of loans into other real estate owned | $ | 280 | $ | 5,188 | $ | 5,276 | |||||
Transfer of loans held for sale to loans held for investment | $ | — | $ | — | $ | 5,319 | |||||
Non-Cash Financing Activities: | |||||||||||
Series C Preferred Stock issued in connection with dividends on Series B Preferred Stock | $ | 593 | $ | 1,112 | $ | 538 | |||||
Exchange of Series B and Series C Preferred Stock for common stock | $ | 13,709 | $ | — | $ | — | |||||
The accompanying notes are an integral part of these consolidated financial statements.
65
PACIFIC MERCANTILE BANCORP AND SUBSIDIARIES
NOTES TO CONSOLIDATED FINANCIAL STATEMENTS
1. Nature of Business
Organization
Pacific Mercantile Bancorp (“PMBC”) is a bank holding company which, through its wholly owned subsidiary, Pacific Mercantile Bank (the “Bank”), is engaged in the commercial banking business in Southern California. PMBC is registered as a one bank holding company under the United States Bank Holding Company Act of 1956, as amended, and, as such, is regulated by the Board of Governors of the Federal Reserve System (the “Federal Reserve Board”) and the Federal Reserve Bank of San Francisco (“FRBSF”) under delegated authority from the Federal Reserve Board. Substantially all of our operations are conducted and substantially all of our assets are owned by the Bank, which accounts for substantially all of our consolidated revenues, expenses, and income. The Bank provides a full range of banking services to small and medium-size businesses and professionals in Orange, Los Angeles, San Bernardino and San Diego counties in Southern California and is subject to competition from other banks and financial institutions and from financial services organizations conducting operations in those same markets. The Bank is chartered by the California Department of Business Oversight under the Division of Financial Institutions and is a member of the FRBSF. In addition, the deposit accounts of the Bank’s customers are insured by the Federal Deposit Insurance Corporation up to the maximum amount allowed by law.
During the first quarter of 2013, PMBC organized a new wholly-owned subsidiary, PM Asset Resolution, Inc. ("PMAR"), for the purpose of purchasing certain non-performing loans and other real estate from the Bank and thereafter collecting or disposing of those assets. During the fourth quarter of 2013, the Bank announced the closure of our mortgage banking business, which was completed in the third quarter of 2014. The Bank operated a direct-to-consumer retail mortgage banking business, originating and funding residential mortgage loans and selling those loans, generally within the succeeding 30 days. Our mortgage banking operations are classified as discontinued operations within the financial statements and footnotes for all presented periods.
PMBC, the Bank and PMAR are sometimes referred to, together, on a consolidated basis, in this report as the “Company” or as “we”, “us” or “our”.
2. Significant Accounting Policies
The accompanying consolidated financial statements have been prepared in accordance with the instructions of the U.S. Securities and Exchange Commission (the “SEC”) to Form 10-K and in accordance with generally accepted accounting principles in effect in the United States (“GAAP”), on a basis consistent with prior periods.
Use of Estimates
The preparation of the financial statements in conformity with GAAP requires us to make certain estimates and assumptions that could affect the reported amounts of certain of our assets, liabilities, and contingencies at the date of the financial statements and the reported amounts of our revenues and expenses during the reporting periods. For the fiscal periods covered by this Report, those estimates related primarily to our determinations of the allowance for loan and lease losses (“ALLL”), the fair values of securities available for sale, repurchase reserves on mortgage loans sold, and the determination of reserves pertaining to deferred tax assets. If circumstances or financial trends on which those estimates were based were to change in the future or there were to occur any currently unanticipated events affecting the amounts of those estimates, our future financial position or results of operations could differ, possibly materially, from those expected at the current time.
Principles of Consolidation
Our consolidated financial statements for the years ended December 31, 2015, 2014 and 2013 include the accounts of PMBC, the Bank and PMAR. All significant intercompany balances and transactions were eliminated in consolidation.
Discontinued Operations
The revenues and expenses of our mortgage banking division are reported in the consolidated statements of operations as discontinued operations for all periods presented. In determining whether the revenues and expenses are reported as discontinued operations, we evaluate whether we have any significant continuing involvement in the management of any of the mortgage banking operations. If we were to determine that we had any significant continuing involvement, the revenues and expenses of the respective operations would not be recorded in discontinued operations. As of December 31, 2015 and 2014, we determined that the mortgage repurchase reserves are a liability of the Bank and are not included within the liabilities of discontinued operations. The repurchase reserves are included within other liabilities of the consolidated statements of financial condition.
66
PACIFIC MERCANTILE BANCORP AND SUBSIDIARIES
NOTES TO CONSOLIDATED FINANCIAL STATEMENTS
Cash and Cash Equivalents
For purposes of the statements of cash flow, cash and cash equivalents consist of cash and due from banks, interest bearing demand deposits with the FRBSF, federal funds sold and interest-bearing deposits, with original maturities of 90 days or less, with financial institutions. Generally, federal funds are sold for one-day periods. As of December 31, 2015 and 2014 the Bank maintained required reserves with FRBSF of approximately $1,356,000 and $724,000, respectively, which are included in cash and due from banks in the accompanying consolidated statements of financial condition.
Federal Home Loan Bank Stock and Federal Reserve Bank Stock
The Bank, as a member of the Federal Home Loan Bank System, is required to maintain an investment in capital stock of the Federal Home Loan Bank of San Francisco (“FHLB”) in varying amounts based on asset size and on amounts borrowed from the FHLB. Because no ready market exists and there is no quoted market value for this stock, the Bank’s investment in this stock is carried at cost.
The Bank also maintains an investment in capital stock of the FRBSF, which is carried at cost because no ready market exists and there is no quoted market value for this stock.
Securities Available for Sale, at Fair Value
Securities available for sale are those which we intend to hold for an indefinite period of time, but which may be sold in response to changes in liquidity needs, changes in interest rates, changes in prepayment risks and other similar factors. These securities are recorded at fair value, with unrealized gains and losses excluded from earnings and reported as other comprehensive income or loss, net of taxes. Purchased premiums and discounts are recognized as interest income using the interest method over the term of these securities. Gains and losses on the sale of securities are recorded on the trade date and are determined using the specific identification method.
Declines in the fair value of these securities below their cost which are other-than-temporary are reflected in earnings as realized losses. In determining other-than-temporary losses, we consider a number of factors, including: (1) the length of time and the extent to which the fair value has been less than cost, (2) the financial condition and near-term prospects of the issuer, (3) whether the market decline was affected by macroeconomic conditions, and (4) whether we have the intent to sell the security or it is more likely than not that we will be required to sell the security before its anticipated recovery. A high degree of subjectivity and judgment is involved in assessing whether an other-than-temporary decline exists and such assessments are based on information available to us at the time we make such assessments.
Loan Loss Obligation on Loans Previously Sold
Upon a sale of mortgage loans held for sale (“LHFS”) that we have originated, the risk of loss due to default by the borrower is generally transferred to the investor. However, we are required to make certain representations to the purchasers of such loans relating to credit information, loan documentation and collateral. These representations and warranties may extend through the contractual life of the loan. If subsequent to the sale of such a loan, any underwriting deficiencies, borrower fraud or documentation defects are discovered with respect to the loan, we may become obligated to repurchase the loan or indemnify the investors for any losses from borrower defaults if such deficiencies or defects cannot be cured within the specified cure periods following their discovery. The obligation for losses attributable to any erroneous representations and warranties or other deficiencies or defects is recorded at its estimate of expected future losses using historical and projected loss frequency and loss severity ratios to estimate our exposure to such losses. In the case of early loan payoffs and early defaults on certain loans, we may be required to repay all or a portion of any premium initially paid by the purchaser of the loan at the time of sale. The obligations associated with early loan payoffs and early defaults on mortgage loans are estimated on the basis of historical loss experience by type of loan.
Loans and Allowance for Loan and Lease Losses
Loans that we intend and have the ability to hold for the foreseeable future or until maturity or pay-off are stated at their respective principal amounts outstanding, net of unearned income. Interest is accrued daily as earned, except where reasonable doubt exists as to collectability of the loan. A loan with principal or interest that is 90 days or more past due, based on its contractual payment due dates, is placed on nonaccrual status, in which case accrual of interest is discontinued, except that we may elect to continue the accrual of interest when the estimated net realizable value of collateral securing the loan is expected to be sufficient to enable us to recover both principal and accrued interest and those loans are in the process of collection. Generally, interest payments received on nonaccrual loans are applied to principal. Once all principal has been received by us, any additional interest payments are recognized as interest income on a cash basis.
67
PACIFIC MERCANTILE BANCORP AND SUBSIDIARIES
NOTES TO CONSOLIDATED FINANCIAL STATEMENTS
An ALLL is established by means of a provision for loan and lease losses that is charged against income. If we conclude that the collection, in full, of the carrying amount of a loan has become unlikely, the loan, or the portion thereof that is believed to be uncollectible, is charged against the ALLL. We carefully monitor changing economic conditions, the loan portfolio by category, the financial condition of borrowers and the history of the performance of the loan portfolio in determining the adequacy of the ALLL. Additionally, as the volume of loans increases, additional provisions for loan losses may be required to maintain the allowance at levels deemed adequate. Moreover, if economic conditions were to deteriorate, causing the risk of loan losses to increase, it would become necessary to increase the allowance to an even greater extent, which would necessitate additional provisions that would be charged to income. We also evaluate the unfunded portion of loan commitments and establish a loss reserve, included in other liabilities, for such unfunded commitments through a charge against noninterest expense. The loss reserve for unfunded loan commitments was $275,000 at each of December 31, 2015 and 2014.
The ALLL is based on estimates, and ultimate loan losses may vary from current estimates. These estimates are reviewed periodically and, as adjustments become necessary, they are recorded in earnings in the periods in which they become known.
Impaired Loans
A loan is generally classified as impaired when, in management’s opinion, the principal or interest will not be collectible in accordance with its contractual terms. We measure and reserve for impairment on a loan-by-loan basis using either the present value of expected future cash flows discounted at the loan’s effective interest rate, or the fair value of the collateral if the loan is collateral dependent. We exclude smaller, homogeneous loans, such as consumer installment loans and lines of credit, from these impairment calculations. Also, loans that experience insignificant payment delays or shortfalls are generally not considered impaired.
Restructured Loans
We sometimes modify or restructure loans when the borrower is experiencing financial difficulties by making a concession to the borrower in the form of changes in the amortization terms, reductions in the interest rates, the acceptance of interest only payments and, in limited cases, concessions to the outstanding loan balances. These loans are classified as troubled debt restructurings (“TDRs”) and considered impaired loans. TDRs are loans modified for the purpose of alleviating temporary impairments to the borrower’s financial condition or cash flows. A workout plan between us and the borrower is designed to provide a bridge for borrower cash flow shortfalls in the near term. A TDR loan may be returned to accrual status when the loan is brought current, has performed in accordance with the contractual restructured terms for a time frame of at least six months and the ultimate collectability of the total contractual restructured principal and interest in no longer in doubt. These loans, while no longer considered a TDR, are still considered impaired loans.
Loan Origination Fees and Costs
Loan origination fees and related direct costs for loans held for investment are deferred and amortized to interest income as an adjustment to yield over the respective lives of the loans using the effective interest method, except for loans that are revolving or short-term in nature for which the straight line method is used, which approximates the interest method.
Investment in Unconsolidated Subsidiaries
Investment in unconsolidated subsidiaries is stated at cost. The unconsolidated subsidiaries are comprised of two grantor trusts established in 2002 and 2004 in connection with our issuance of subordinated debentures in each of those years. Prior to 2004, we organized two business trusts, under the names PMB Statutory Trust III and PMB Capital Trust III, to facilitate our issuance of $7.2 million and $10.3 million, respectively, principal amount of junior subordinated debentures with maturity dates in 2032 and 2034, respectively. The principal amounts remain outstanding as of December 31, 2015.
Other Real Estate Owned
Other real estate owned (“OREO”) consists of real properties acquired by us through foreclosure or in lieu of foreclosure in satisfaction of loans. OREO is recorded at fair value less estimated selling costs at the time of acquisition or foreclosure. Loan balances in excess of fair value, less selling costs, are charged to the ALLL prior to foreclosure. Any subsequent operating expenses or income, reductions in estimated fair values and gains or losses on disposition of such properties are charged or credited to current operations.
68
PACIFIC MERCANTILE BANCORP AND SUBSIDIARIES
NOTES TO CONSOLIDATED FINANCIAL STATEMENTS
Premises and Equipment
Premises and equipment are stated at cost, less accumulated depreciation and amortization which are charged to expense on a straight-line basis over the estimated useful lives of the assets or, in the case of leasehold improvements, over the term of the leases, whichever is shorter. For income tax purposes, accelerated depreciation methods are used. Maintenance and repairs are charged directly to expense as incurred. Improvements to premises and equipment that extend their useful lives are capitalized.
When such an asset is disposed of, the applicable costs and accumulated depreciation thereon are removed from the accounts and any resulting gain or loss is included in current operations. Rates of depreciation and amortization are based on the following estimated useful lives:
Furniture and equipment | Three to seven years |
Leasehold improvements | Lesser of the lease term or estimated useful life |
Income Taxes
Deferred income taxes and liabilities are determined using the asset and liability method. Under this method, the net deferred tax asset or liability is determined based on the tax effects of the temporary differences between the book and tax basis of the various balance sheet assets and liabilities and gives current recognition to changes in tax rates and laws.
We record as a deferred tax asset on our balance sheet an amount equal to the tax credit and tax loss carryforwards and tax deductions ("tax benefits") that we believe will be available to us to offset or reduce the amount of our income taxes in future periods. Under applicable federal and state income tax laws and regulations, such tax benefits will expire if not used within specified periods of time. Accordingly, the ability to fully use our deferred tax asset depends on the amount of taxable income that we generate during those time periods. At least once each year, or more frequently, if warranted, we make estimates of future taxable income that we believe we are likely to generate during those future periods. If we conclude, on the basis of those estimates and the amount of the tax benefits available to us, that it is more likely than not that we will be able to fully utilize those tax benefits prior to their expiration, we recognize the deferred tax asset in full on our balance sheet. On the other hand, if we conclude on the basis of those estimates and the amount of the tax benefits available to us that it has become more likely than not that we will be unable to utilize those tax benefits in full prior to their expiration, then, we would establish (or increase any existing) valuation allowance to reduce the deferred tax asset on our balance sheet to the amount which we believe we are more likely than not to be able to utilize. Such a reduction is implemented by recognizing a non-cash charge that would have the effect of increasing the provision, or reducing any credit, for income taxes that we would otherwise have recorded in our statement of operations. The determination of whether and the extent to which we will be able to utilize our deferred tax asset involves significant management judgments and assumptions that are subject to period to period changes as a result of changes in tax laws, changes in market or economic conditions that could affect our operating results or variances between our actual operating results and our projected operating results, as well as other factors.
Uncertain tax positions that meet the more likely than not recognition threshold are measured to determine the amount of benefit to recognize. An uncertain tax position is measured at the largest amount of benefit that management believes has a greater than 50% likelihood of realization upon settlement.
Earnings (Loss) Per Share
Basic income (loss) per share for any fiscal period is computed by dividing net income (loss) allocable to our common shareholders for such period by the weighted average number of common shares outstanding during that period. Fully diluted income (loss) per share reflects the potential dilution that could have occurred assuming the conversion of any convertible securities into common stock at conversion prices, and the exercise of all outstanding options and warrants to purchase shares of our common stock at exercise prices, that were less than the market price of our shares, thereby increasing the number of shares outstanding during the period, and is determined using the treasury method. Although accumulated undeclared dividends on our preferred stock are not recorded in the accompanying consolidated statement of operations, such dividends are included for purposes of computing earnings (loss) per share available to our common shareholders.
Stock Option Plans
We follow Financial Accounting Standards Board (“FASB”) Accounting Standard Codification (“ASC”) 718-10, Share-Based Payment, which requires entities that grant stock options or other equity compensation awards to employees to recognize in their financial statements the fair values of those options or share awards as compensation cost over their requisite service (vesting) periods of those options or share awards. Since stock-based compensation cost that is recognized in the statements of
69
PACIFIC MERCANTILE BANCORP AND SUBSIDIARIES
NOTES TO CONSOLIDATED FINANCIAL STATEMENTS
operations is to be determined based on the equity compensation awards that we expect will ultimately vest, that compensation expense is reduced for estimated forfeitures of unvested options or unvested share awards that typically occur due primarily to terminations of employment of optionees or recipients of such share awards. Forfeitures are required to be estimated at the time of the grant of options or other share awards and are revised, if necessary, in subsequent periods if actual forfeitures differ from those earlier estimates. For purposes of the determination of stock-based compensation expense for the year ended December 31, 2015, we estimated forfeitures of 11.9% of the options that were granted to officers and other employees.
Comprehensive Income (Loss)
Accounting principles generally require that recognized revenue, expenses, gains and losses be included in net income. However, certain changes in assets and liabilities, such as unrealized gains and losses on securities available for sale, are reported as a separate component of the equity in the accompanying consolidated statement of financial condition, net of income taxes, and such items, along with net income, are components of comprehensive income (loss).
Segment Reporting
During the years ended December 31, 2015, 2014 and 2013, we had one reportable segment, which was our commercial banking division, and one non-reportable segment which was our discontinued operations related to our mortgage banking division. In connection with our exit from the mortgage banking business in 2013, the revenues and expenses of our mortgage banking division have been classified as discontinued operations for all periods presented.
Recent Accounting Pronouncements
In February 2014, the FASB issued Accounting Standards Update (“ASU”) 2014-04, “Receivables — Troubled Debt Restructurings by Creditors (Subtopic 310-40) — Reclassification of Residential Real Estate Collateralized Consumer Mortgage Loans upon Foreclosure,” which amended its guidance to clarify when a creditor should be considered to have received physical possession of residential real estate property collateralizing a consumer mortgage loan such that the loan should be derecognized and the real estate recognized. This guidance is effective for interim and annual periods beginning after December 15, 2014. Early adoption is permitted. We adopted this guidance on January 1, 2015 and it did not have a material effect on our consolidated financial statements.
In April 2014, the FASB issued ASU 2014-08, “Presentation of Financial Statements (Topic 205) and Property, Plant, and Equipment (Topic 360): Reporting Discontinued Operations and Disclosures of Disposals of Components of an Entity,” which amended its guidance on classification and reporting of discontinued operations. The amendments clarify when an entity should classify a component as discontinued operations, how to report the balances related to discontinued operations for prior periods, and additional disclosure requirements for discontinued operations. This guidance is effective for interim and annual periods beginning after December 15, 2014. Early adoption is permitted only for disposals which have not been previously reported. We adopted this guidance on January 1, 2015 and it did not have a material effect on our consolidated financial statements.
In May 2014, the FASB issued ASU 2014-09, “Revenue from Contracts with Customers (Topic 606),” which amended its guidance on revenue recognition to conform with international accounting guidance under the International Accounting Standards Board. The ASU provides a framework for addressing revenue recognition and replaces most existing revenue recognition guidance, as well as requires increased disclosure requirements. In August 2015, the FASB issued ASU 2015-14 to defer the effective date of ASU 2014-09 by one year. Accordingly, this guidance is effective for interim and annual periods beginning after December 15, 2017 with early adoption permitted for interim and annual periods beginning after December 15, 2016. We will adopt this guidance on January 1, 2018. We are currently evaluating the expected impact on our consolidated financial statements.
In June 2014, the FASB issued ASU 2014-11, “Accounting for Share-Based Payments When the Terms of an Award Provide That a Performance Target Could Be Achieved after the Requisite Service Period,” which amended its guidance on how to account for certain performance related share-based compensation plans. The amendments clarify the guidance on how to account for performance based awards when the requisite service period is met prior to potential performance targets being achieved. This guidance is effective for interim and annual periods beginning after December 15, 2015. Early adoption is permitted. We adopted this guidance on January 1, 2016 and it did not have a material effect on our consolidated financial statements.
In August 2014, the FASB issued ASU 2014-15, “Presentation of Financial Statements — Going Concern (Subtopic 205-40): Disclosure of Uncertainties about an Entity's Ability to Continue as a Going Concern,” which defines management's responsibility to evaluate whether there is substantial doubt about an organization's ability to continue as a going concern and clarifies when to provide related footnote disclosure. This guidance is effective for interim and annual periods beginning after
70
PACIFIC MERCANTILE BANCORP AND SUBSIDIARIES
NOTES TO CONSOLIDATED FINANCIAL STATEMENTS
December 15, 2016. Early adoption is permitted. We will adopt this guidance on January 1, 2017 and do not expect it to have a material effect on our consolidated financial statements.
In January 2015, the FASB issued ASU 2015-01, “Income Statement - Extraordinary and Unusual Items (Subtopic 225-20): Simplifying Income Statement Presentation by Eliminating the Concept of Extraordinary Items,” which eliminated the concept of extraordinary items from GAAP. This guidance is effective for interim and annual periods beginning after December 15, 2015. Early adoption is permitted. We adopted this guidance on January 1, 2015 and it did not have an impact on our consolidated financial statements.
In February 2015, the FASB issued ASU 2015-02, “Consolidation (Topic 810): Amendments to the Consolidation Analysis,” amends the guidance for assessing how relationships of related parties affect the consolidation analysis, eliminates the presumption that a general partner should consolidate a limited partnership, eliminates the consolidation model specific to limited partnerships, clarifies when fees paid to a decision maker should be a factor in consolidation of a variable interest entity, and reduces the number of variable interest entity consolidation models. This guidance is effective for interim and annual periods beginning after December 15, 2015. Early adoption is permitted. We adopted this guidance on January 1, 2016 and it did not have an impact on our consolidated financial statements.
In April 2015, the FASB issued ASU 2015-03, “Interest - Imputation of Interest (Subtopic 835-30): Simplifying the Presentation of Debt Issuance Costs,” which requires that the debt issuance costs related to a recognized debt liability be presented in the balance sheet as a direct deduction from the carrying amount of that debt liability. This simplifies the presentation of debt issuance costs and makes the presentation consistent with the presentation of debt discounts. This guidance is effective for interim and annual periods beginning after December 15, 2015. Early adoption is permitted. We adopted this guidance on January 1, 2016 and it did not have a material impact on our consolidated financial statements.
In August 2015, the FASB issued ASU 2015-15, “Interest - Imputation of Interest (Subtopic 835-30): Presentation and Subsequent Measurement of Debt Issuance Costs Associated with Line-of-Credit Arrangements — Amendments to SEC Paragraphs Pursuant to Staff Announcement at June 18, 2015 EITF Meeting,” which clarifies the accounting for debt issuance costs for line-of-credit arrangements. We adopted this guidance on January 1, 2016 and it did not have a material impact on our consolidated financial statements.
In January 2016, the FASB issued ASU 2016-01, “Financial Instruments - Overall (Subtopic 825-10): Recognition and Measurement of Financial Assets and Financial Liabilities,” which enhances the reporting model for financial instruments to provide users of financial statements with more useful information. Some of the provisions include: requiring equity investments to be measured at fair value with changes in fair value recognized in net income, simplifying the impairment assessment of equity investments without readily determinable fair values, eliminating the requirement to disclose the method and significant assumptions used to estimate fair value on financial instruments measured at amortized cost on the balance sheet, requiring public business entities to use the exit price notion when measuring the fair value of financial instruments, requiring the reporting organization to present separately in other comprehensive income the portion of the total change in the fair value of a liability resulting from a change in the instrument-specific credit risk when the organization has elected to measure the liability at fair value in accordance with the fair value option, requiring separate presentation of financial assets and liabilities by measurement category and form of financial asset on the balance sheet or notes to the financial statements, and clarifying that the reporting organization should evaluate the need for a valuation allowance on a deferred tax asset related to available-for-sale securities in combination with the organization's other deferred tax assets. This guidance is effective for interim and annual periods beginning after December 15, 2017. Early adoption is not permitted for public companies. We will adopt this guidance on January 1, 2018 and do not expect it to have a material impact on our consolidated financial statements.
In February 2016, the FASB issued ASU 2016-02, “Leases (Topic 842),” which requires lessees to recognize the following for all leases (with the exception of short-term leases) at the commencement date: a lease liability measured on a discounted basis and a right-of-use asset a specified asset for the lease term. Under the new guidance, lessor account is largely unchanged and the the accounting for sale and leaseback transactions were simplified. This guidance is effective for interim and annual periods beginning after December 15, 2018. Early adoption is permitted. We will adopt this guidance on January 1, 2019 and do not expect it to have a material impact on our consolidated financial statements and our disclosures related to leases.
Subsequent Events
Subsequent events are events or transactions that occur after the balance sheet date but before financial statements are issued. The Company recognizes in the financial statements the effects of all subsequent events that provide additional evidence about conditions that existed at the date of the balance sheet, including the estimates inherent in the process of preparing the financial statements. The Company’s financial statements do not recognize subsequent events that provide evidence about
71
PACIFIC MERCANTILE BANCORP AND SUBSIDIARIES
NOTES TO CONSOLIDATED FINANCIAL STATEMENTS
conditions that did not exist at the date of the balance sheet but arose after the balance sheet date and before financial statements are available to be issued.
The Company has evaluated events subsequent through the date these consolidated financial statements were filed with the SEC.
3. Fair Value Measurements
Under FASB ASC 820-10, we group assets and liabilities at fair value in three levels, based on the markets in which the assets and liabilities are traded and the reliability of the assumptions used to determine fair value. These levels are:
Level 1 | Valuation is based upon quoted prices for identical instruments traded in active markets. |
Level 2 | Valuation is based upon quoted prices for similar instruments in active markets, quoted prices for identical or similar instruments in markets that are not active, and model-based valuation techniques for which all significant assumptions are observable in the market. |
Level 3 | Valuation is generated from model-based techniques that use at least one significant assumption not observable in the market. These unobservable assumptions reflect estimates of assumptions that market participants would use in pricing the asset or liability. Valuation techniques include use of option pricing models, discounted cash flow models and similar techniques. |
Risks with Fair Value Measurements
Fair value estimates are made at a discrete point in time based on relevant market information and other information about the financial instruments. Because no active market exists for a significant portion of our financial instruments, fair value estimates are based in large part on judgments we make primarily regarding current economic conditions, risk characteristics of various financial instruments, prepayment rates, and future expected loss experience. These estimates are subjective in nature and invariably involve some inherent uncertainties. Additionally, the occurrence of unexpected events or changes in circumstances can occur that could require us to make changes to our assumptions and which, in turn, could significantly affect and require us to make changes to our previous estimates of fair value.
In addition, the fair value estimates are based on existing on and off-balance sheet financial instruments without attempting to estimate the value of existing and anticipated future customer relationships and the value of assets and liabilities that are not considered financial instruments, such as premises and equipment and OREO.
Measurement Methodology
Cash and Cash Equivalents. The fair value of cash and cash equivalents approximates its carrying value.
Interest-Bearing Deposits with Financial Institutions. The fair values of interest-bearing deposits maturing within one year approximate their carrying values.
FHLB and FRBSF Stock. The Bank is a member of the FHLB and the FRBSF. As members, we are required to own stock of the FHLB and the FRBSF, the amount of which is based primarily on the level of our borrowings from those institutions. We also have the right to acquire additional shares of stock in either or both of the FHLB and the FRBSF. During the year ended December 31, 2015, we purchased $33 thousand in value of FHLB stock and no shares of FRBSF stock. The fair values of the FHLB and FRBSF stock are equal to their respective carrying amounts, are classified as restricted securities and are periodically evaluated for impairment based on our assessment of the ultimate recoverability of our investments in that stock. Any cash or stock dividends paid to us on such stock are reported as income.
Investment Securities Available for Sale. Fair value measurement for our investment securities available for sale is based upon quoted prices, if available. If quoted prices are not available, fair values are measured using independent pricing models or other model-based valuation techniques such as the present value of future cash flows, adjusted for the security’s credit rating, prepayment assumptions and other factors such as credit loss assumptions. Level 1 investment securities include those traded on an active exchange, such as the New York Stock Exchange, U.S. Treasury securities that are traded by dealers or brokers in active over-the- counter markets and money market funds. Level 2 investment securities include mortgage-backed securities issued by government sponsored entities, municipal bonds and corporate debt securities. Securities classified as Level 3 include asset-backed securities in less liquid markets.
Impaired Loans. Loans measured for impairment are measured at an observable market price (if available), or the fair value of the loan’s collateral (if the loan is collateral dependent). The fair value of an impaired loan may be estimated using one of several methods, including collateral value, market value of similar debt, liquidation value and discounted cash flows. Those
72
PACIFIC MERCANTILE BANCORP AND SUBSIDIARIES
NOTES TO CONSOLIDATED FINANCIAL STATEMENTS
impaired loans not requiring a specific loan loss reserve represent loans for which the fair value of the expected repayments or collateral exceeds the recorded investments in such loans. When the fair value of the collateral is based on an observable market price or a current appraised value, we record the impaired loan at Level 2. When an appraised value is not available or we determine that the fair value of the collateral is further impaired below the appraised value and there is no observable market price, we record the impaired loan at Level 3.
Loans. The fair value for loans with variable interest rates less a credit discount is the carrying amount. The fair value of fixed rate loans is derived by calculating the discounted value of future cash flows expected to be received by the various homogeneous categories of loans. All loans have been adjusted to reflect changes in credit risk. Changes are not recorded directly as an adjustment to current earnings or comprehensive income, but rather as an adjustment component in determining the overall adequacy of the loan loss reserve.
Other Real Estate Owned. OREO is reported at its net realizable value (fair value less estimated costs to sell) at the time any real estate collateral is acquired by the Bank in satisfaction of a loan. Subsequently, OREO is carried at the lower of carrying value or fair value less estimated costs to sell. Fair value is determined based upon independent market prices, appraised values of the collateral or management’s estimation of the value of the collateral. When the fair value of the collateral is based on an observable market price or a current appraised value, we record the foreclosed asset at Level 2. When an appraised value is not available or management determines the fair value of the collateral is further impaired below the appraised value and there is no observable market price, we record the foreclosed asset at Level 3.
Deposits. Deposits are carried at historical cost. The carrying amounts of deposits from savings and money market accounts are deemed to approximate fair value as they either have no stated maturities or short-term maturities. Certificates of deposit are estimated utilizing discounted cash flow techniques. The interest rates applied are rates currently being offered for similar certificates of deposit.
Borrowings. The fair value of borrowings is the carrying amount for those borrowings that mature on a daily basis. The fair value of term borrowings is derived by calculating the discounted value of future cash flows expected to be paid out by the Company.
Junior Subordinated Debentures. The fair value of the junior subordinated debentures is based on quoted market prices of the underlying securities. These securities are variable rate in nature and repriced quarterly.
Commitments to Extend Credit and Standby Letters of Credit. The fair value of commitments to extend credit and standby letters of credit are based on fees currently charged to enter into similar agreements, taking into account the remaining terms of the agreements and the counterparties’ credit standing.
Interest Receivable and Interest Payable. The carrying amounts of our accrued interest receivable and accrued interest payable are deemed to approximate fair value.
Assets Recorded at Fair Value on a Recurring Basis
The following tables show the recorded amounts of assets and liabilities measured at fair value on a recurring basis at December 31, 2015 and 2014.
At December 31, 2015 | |||||||||||||||
(Dollars in thousands) | Total | Level 1 | Level 2 | Level 3 | |||||||||||
Assets and Liabilities at Fair Value: | |||||||||||||||
Investment securities available for sale | |||||||||||||||
Mortgage backed securities issued by U.S. agencies | $ | 45,154 | $ | — | $ | 45,154 | $ | — | |||||||
Collateralized mortgage obligations issued by non-agency | 632 | — | 632 | — | |||||||||||
Asset-backed securities | 1,480 | — | — | 1,480 | |||||||||||
Mutual funds | 4,983 | 4,983 | — | — | |||||||||||
Total securities available for sale at fair value | $ | 52,249 | $ | 4,983 | $ | 45,786 | $ | 1,480 | |||||||
73
PACIFIC MERCANTILE BANCORP AND SUBSIDIARIES
NOTES TO CONSOLIDATED FINANCIAL STATEMENTS
At December 31, 2014 | |||||||||||||||
(Dollars in thousands) | Total | Level 1 | Level 2 | Level 3 | |||||||||||
Assets and Liabilities at Fair Value: | |||||||||||||||
Investment securities available for sale | |||||||||||||||
Mortgage backed securities issued by U.S. agencies | $ | 53,739 | $ | — | $ | 53,739 | $ | — | |||||||
Collateralized mortgage obligations issued by non agency | 777 | — | 777 | — | |||||||||||
Asset-backed securities | 1,650 | — | — | 1,650 | |||||||||||
Mutual funds | 4,760 | 4,760 | — | — | |||||||||||
Total securities available for sale at fair value | $ | 60,926 | $ | 4,760 | $ | 54,516 | $ | 1,650 | |||||||
The changes in Level 3 assets measured at fair value on a recurring basis are summarized as follows for the year ended December 31, 2015:
Asset Backed Securities | |||
(Dollars in thousands) | |||
Balance of recurring Level 3 instruments at December 31, 2014 | $ | 1,650 | |
Total gains or losses (realized/unrealized): | |||
Included in other comprehensive income | (114 | ) | |
Settlements | (56 | ) | |
Transfers in and/or out of Level 3 | — | ||
Balance of Level 3 assets at December 31, 2015 | $ | 1,480 | |
Assets Recorded at Fair Value on a Nonrecurring Basis
We may be required, from time to time, to measure certain assets at fair value on a nonrecurring basis in accordance with GAAP. These nonrecurring fair value adjustments typically involve application of lower of cost or market accounting or write-downs of individual assets. Information regarding assets measured at fair value on a nonrecurring basis is set forth in the table below.
At December 31, 2015 | |||||||||||||||
Total | Level 1 | Level 2 | Level 3 | ||||||||||||
Assets at Fair Value: | (Dollars in thousands) | ||||||||||||||
Impaired loans | $ | 25,857 | $ | — | $ | — | $ | 25,857 | |||||||
Other real estate owned | 650 | — | 650 | — | |||||||||||
Total | $ | 26,507 | $ | — | $ | 650 | $ | 25,857 | |||||||
There were no transfers in or out of Level 3 measurements for nonrecurring items during the year ended December 31, 2015.
Significant Unobservable Inputs and Valuation Techniques of Level 3 Fair Value Measurements
For our fair value measurements classified in Level 3 of the fair value hierarchy as of December 31, 2015, a summary of the significant unobservable inputs and valuation techniques is as follows:
Fair Value Measurement as of December 31, 2015 | Valuation Techniques | Unobservable Inputs | Range | Weighted Average | |||||||
(Dollars in thousands) | |||||||||||
Assets | |||||||||||
Asset-backed security | $ | 1,480 | Third-Party Pricing | Marketability discount | N/A (1) | ||||||
Illiquidity discount | N/A (1) | ||||||||||
Impaired loans | 25,857 | Third-Party Pricing | Appraisals | N/A (2) | |||||||
$ | 27,337 | ||||||||||
74
PACIFIC MERCANTILE BANCORP AND SUBSIDIARIES
NOTES TO CONSOLIDATED FINANCIAL STATEMENTS
(1) | Information is unavailable as valuation was obtained from third-party pricing services. |
(2) | We obtain appraisals for our various properties included within impaired loans which primarily rely upon market comparisons. These market comparisons support our assumption that the carrying value of the respective loans either requires or does not require additional impairment. |
Fair Value Measurements for Other Financial Instruments
The table below provides estimated fair values and related carrying amounts of our financial instruments as of December 31, 2015 and December 31, 2014, excluding financial assets and liabilities which are recorded at fair value on a recurring basis.
Estimated Fair Value | ||||||||||||||||||||||||||||||||||||
At December 31, 2015 | At December 31, 2014 | |||||||||||||||||||||||||||||||||||
Carrying Value | Total | Level 1 | Level 2 | Level 3 | Carrying Value | Total | Level 1 | Level 2 | Level 3 | |||||||||||||||||||||||||||
(Dollars in thousands) | ||||||||||||||||||||||||||||||||||||
Financial assets: | ||||||||||||||||||||||||||||||||||||
Cash and cash equivalents | $ | 113,921 | $ | 113,921 | $ | 113,921 | $ | — | $ | — | $ | 177,135 | $ | 177,135 | 177,135 | — | — | |||||||||||||||||||
Interest-bearing deposits with financial institutions | 4,665 | 4,665 | 4,665 | — | — | 4,668 | 4,668 | 4,668 | — | — | ||||||||||||||||||||||||||
Federal Reserve Bank of San Francisco and Federal Home Loan Bank stock | 8,170 | 8,170 | 8,170 | — | — | 8,137 | 8,137 | 8,137 | — | — | ||||||||||||||||||||||||||
Loans, net | 849,733 | 846,690 | — | — | 846,690 | 824,197 | 818,547 | — | — | 818,547 | ||||||||||||||||||||||||||
Accrued interest receivable | 2,266 | 2,266 | 2,266 | — | — | 2,436 | 2,436 | 2,436 | — | — | ||||||||||||||||||||||||||
Financial liabilities: | ||||||||||||||||||||||||||||||||||||
Noninterest bearing deposits | 249,676 | 249,676 | 249,676 | — | — | 237,491 | 237,491 | 237,491 | — | — | ||||||||||||||||||||||||||
Interest-bearing deposits | 644,164 | 643,935 | — | 643,935 | — | 678,818 | 678,890 | — | 678,890 | — | ||||||||||||||||||||||||||
Borrowings | 10,000 | 9,999 | — | 9,999 | — | 39,500 | 39,418 | — | 39,418 | — | ||||||||||||||||||||||||||
Junior subordinated debentures | 17,527 | 17,527 | — | 17,527 | — | 17,527 | 17,527 | — | 17,527 | — | ||||||||||||||||||||||||||
Accrued interest payable | 255 | 255 | 255 | — | — | 222 | 222 | 222 | — | — | ||||||||||||||||||||||||||
4. Investments
Securities Available For Sale, at Fair Value
The following table sets forth the major components of securities available for sale and compares the amortized costs and estimated fair market values of, and the gross unrealized gains and losses on, these securities at December 31, 2015 and 2014:
(Dollars in thousands) | December 31, 2015 | December 31, 2014 | |||||||||||||||||||||||||||||
Amortized Cost | Gross Unrealized | Estimated Fair Value | Amortized Cost | Gross Unrealized | Estimated Fair Value | ||||||||||||||||||||||||||
Gain | Loss | Gain | Loss | ||||||||||||||||||||||||||||
Securities Available for Sale | |||||||||||||||||||||||||||||||
Mortgage backed securities issued by U.S. Agencies(1) | $ | 46,126 | $ | 4 | $ | (976 | ) | $ | 45,154 | $ | 54,653 | $ | 26 | $ | (940 | ) | $ | 53,739 | |||||||||||||
Collateralized mortgage obligations issued by non agencies(1) | 646 | — | (14 | ) | 632 | 790 | — | (13 | ) | 777 | |||||||||||||||||||||
Asset backed security(2) | 2,027 | — | (547 | ) | 1,480 | 2,083 | — | (433 | ) | 1,650 | |||||||||||||||||||||
Mutual funds(3) | 5,000 | 33 | (50 | ) | 4,983 | 4,750 | 45 | (35 | ) | 4,760 | |||||||||||||||||||||
Total | $ | 53,799 | $ | 37 | $ | (1,587 | ) | $ | 52,249 | $ | 62,276 | $ | 71 | $ | (1,421 | ) | $ | 60,926 | |||||||||||||
(1) | Secured by closed-end first liens on 1-4 family residential mortgages. |
(2) | Comprised of a security that represents an interest in a pool of trust preferred securities issued by U.S.-based banks and insurance companies. |
(3) | Consists primarily of mutual fund investments in closed-end first lien 1-4 family residential mortgages. |
At December 31, 2015 and 2014, U.S. agency mortgage backed securities and collateralized mortgage obligations with an aggregate fair market value of $2.9 million and $3.6 million, respectively, were pledged to secure FHLB borrowings, repurchase agreements, local agency deposits and treasury, tax and loan accounts.
The amortized cost and estimated fair values of securities available for sale at December 31, 2015 and December 31, 2014 are shown in the tables below by contractual maturities taking into consideration historical prepayments based on the prior
75
PACIFIC MERCANTILE BANCORP AND SUBSIDIARIES
NOTES TO CONSOLIDATED FINANCIAL STATEMENTS
twelve months of principal payments. Expected maturities will differ from contractual maturities and historical prepayments, particularly with respect to collateralized mortgage obligations, primarily because prepayment rates are affected by changes in conditions in the interest rate market and, therefore, future prepayment rates may differ from historical prepayment rates.
At December 31, 2015 Maturing in | |||||||||||||||||||
(Dollars in thousands) | One year or less | Over one year through five years | Over five years through ten years | Over ten Years | Total | ||||||||||||||
Securities available for sale, amortized cost | $ | 7,761 | $ | 26,178 | $ | 14,164 | $ | 5,696 | $ | 53,799 | |||||||||
Securities available for sale, estimated fair value | 7,599 | 25,716 | 13,857 | 5,077 | 52,249 | ||||||||||||||
Weighted average yield | 1.63 | % | 1.60 | % | 1.60 | % | 2.05 | % | 1.65 | % | |||||||||
At December 31, 2014 Maturing in | |||||||||||||||||||
(Dollars in thousands) | One year or less | Over one year through five years | Over five years through ten years | Over ten Years | Total | ||||||||||||||
Securities available for sale, amortized cost | $ | 7,483 | $ | 29,008 | $ | 17,448 | $ | 8,337 | $ | 62,276 | |||||||||
Securities available for sale, estimated fair value | 7,359 | 28,614 | 17,148 | 7,805 | 60,926 | ||||||||||||||
Weighted average yield | 1.54 | % | 1.64 | % | 1.60 | % | 1.83 | % | 1.64 | % | |||||||||
We had no sales of securities available for sale during the years ended December 31, 2015 and December 31, 2014. We recognized net gains on sales of securities available for sale of $44 thousand on sale proceeds of $6.7 million during the year ended December 31, 2013.
The tables below indicate, as of December 31, 2015 and 2014, the gross unrealized losses and fair values of our investments, aggregated by investment category, and length of time that the individual securities have been in a continuous unrealized loss position.
Securities with Unrealized Loss at December 31, 2015 | |||||||||||||||||||||||
Less than 12 months | 12 months or more | Total | |||||||||||||||||||||
(Dollars in thousands) | Fair Value | Unrealized Loss | Fair Value | Unrealized Loss | Fair Value | Unrealized Loss | |||||||||||||||||
Residential mortgage backed securities issued by U.S. Agencies | $ | 20,597 | $ | (197 | ) | $ | 23,865 | $ | (779 | ) | $ | 44,462 | $ | (976 | ) | ||||||||
Non-agency collateralized mortgage obligations | — | — | 631 | (14 | ) | 631 | (14 | ) | |||||||||||||||
Asset backed security | — | — | 1,480 | (547 | ) | 1,480 | (547 | ) | |||||||||||||||
Mutual funds | 1,728 | (23 | ) | 973 | (27 | ) | 2,701 | (50 | ) | ||||||||||||||
Total | $ | 22,325 | $ | (220 | ) | $ | 26,949 | $ | (1,367 | ) | $ | 49,274 | $ | (1,587 | ) | ||||||||
Securities With Unrealized Loss as of December 31, 2014 | |||||||||||||||||||||||
Less than 12 months | 12 months or more | Total | |||||||||||||||||||||
(Dollars In thousands) | Fair Value | Unrealized Loss | Fair Value | Unrealized Loss | Fair Value | Unrealized Loss | |||||||||||||||||
Residential mortgage backed securities issued by U.S. Agencies | $ | — | $ | — | $ | 50,697 | $ | (940 | ) | $ | 50,697 | $ | (940 | ) | |||||||||
Non-agency collateralized mortgage obligations | — | — | 776 | (13 | ) | 776 | (13 | ) | |||||||||||||||
Asset backed security | — | — | 1,651 | (433 | ) | 1,651 | (433 | ) | |||||||||||||||
Mutual funds | 2,464 | (35 | ) | — | — | 2,464 | (35 | ) | |||||||||||||||
Total | $ | 2,464 | $ | (35 | ) | $ | 53,124 | $ | (1,386 | ) | $ | 55,588 | $ | (1,421 | ) | ||||||||
We regularly monitor investments for significant declines in fair value. We have determined that declines in the fair values of these investments below their respective amortized costs, as set forth in the tables above, are temporary because (i) those declines were due to interest rate changes and not to a deterioration in the creditworthiness of the issuers of those investment securities, and (ii) we have the intent and ability to hold those securities until there is a recovery in their values or until their maturity.
We recognize other-than-temporary impairments (“OTTI”) to our available-for-sale debt securities in accordance with FASB ASC 320-10. When there are credit losses associated with, but we have no intention to sell, an impaired debt security, and it is more likely than not that we will not have to sell the security before recovery of its cost basis, we will separate the amount of
76
PACIFIC MERCANTILE BANCORP AND SUBSIDIARIES
NOTES TO CONSOLIDATED FINANCIAL STATEMENTS
impairment, or OTTI, between the amount that is credit related and the amount that is related to non-credit factors. Credit-related impairments are recognized in our consolidated statements of operations. Any non-credit-related impairments are recognized and reflected in other comprehensive income (loss).
Through the impairment assessment process, we determined that the available-for-sale securities discussed below were other-than-temporarily impaired at December 31, 2015. We recorded no impairment credit losses on available-for-sale securities in our consolidated statements of operations for the years ended December 31, 2015 and 2014. The OTTI related to factors other than credit losses, in the aggregate amount of $534 thousand, was recognized as other comprehensive loss in our accompanying consolidated statement of financial condition.
The table below presents, for the years ended December 31, 2015 and 2014, a roll-forward of OTTI in those instances when a portion of the OTTI was attributable to non-credit related factors and, therefore, was recognized in other comprehensive loss:
(Dollars in thousands) | Gross Other- Than- Temporary Impairments | Other-Than- Temporary Impairments Included in Other Comprehensive Loss | Net Other-Than- Temporary Impairments Included in Retained Earnings (Deficit) | ||||||||
Balance – December 31, 2013 | $ | (1,459 | ) | $ | (906 | ) | $ | (553 | ) | ||
Changes in market value on securities for which an OTTI was previously recognized | 455 | 455 | — | ||||||||
Principal received on OTTI security | 18 | 18 | — | ||||||||
Balance – December 31, 2014 | $ | (986 | ) | $ | (433 | ) | $ | (553 | ) | ||
Change in market value on a security for which an OTTI was previously recognized | (153 | ) | (153 | ) | — | ||||||
Principal received on OTTI security | 52 | 52 | — | ||||||||
Balance – December 31, 2015 | $ | (1,087 | ) | $ | (534 | ) | $ | (553 | ) | ||
In determining the component of OTTI related to credit losses, we compare the amortized cost basis of each OTTI security to the present value of its expected cash flows, discounted using the effective interest rate implicit in the security at the date of acquisition.
As a part of our OTTI assessment process with respect to securities held for sale with unrealized losses, we consider available information about (i) the performance of the collateral underlying each such security, including any credit enhancements, (ii) historical prepayment speeds, (iii) delinquency and default rates, (iv) loss severities, (v) the age or “vintage” of the security, and (vi) any rating agency reports on the security. Significant judgments are required with respect to these and other factors in order to make a determination of the future cash flows that can be expected to be generated by the security.
Based on our OTTI assessment process, we determined that there is one asset-backed security in our portfolio of securities held for sale that was impaired as of December 31, 2015. This security is a multi-class, cash flow collateralized bond obligation backed by a pool of trust preferred securities issued by a diversified pool of 56 issuers that consisted of 45 U.S. depository institutions and 11 insurance companies at the time of the security’s issuance in November 2007. We purchased $3.0 million face amount of this security in November 2007 at a price of 95.21% for a total purchase price of $2.9 million, out of a total of $363 million of this security sold at the time of issuance. The security that we own (CUSIP 74042CAE8) is the mezzanine class B piece security with a variable interest rate of 3 month LIBOR plus 60 basis points, which had a rating of Aa2 and AA by Moody’s and Fitch, respectively, at the time of issuance in 2007.
As of December 31, 2015 the amortized cost of this security was $2.0 million with a fair value of $1.5 million, for an unrealized loss of approximately $547 thousand. As of December 31, 2015, the security had a Baa3 rating from Moody’s and a B rating from Fitch and had experienced $42.5 million in defaults (12.5% of total current collateral) and $7.0 million in deferring securities (2.1% of total current collateral) from issuance to December 31, 2015. As of December 31, 2015, the mezzanine class B tranche had $59.5 million in excess subordination.
We have made a determination that the remainder of our securities with respect to which there were unrealized losses as of December 31, 2015 are not other-than-temporarily impaired, because we have concluded that we have the intent and ability to continue to hold those securities until their respective fair market values increase above their respective amortized costs or, if
77
PACIFIC MERCANTILE BANCORP AND SUBSIDIARIES
NOTES TO CONSOLIDATED FINANCIAL STATEMENTS
necessary, until their respective maturities. In reaching that conclusion we considered a number of factors and other information, which included: (i) the significance of each such security, (ii) the amount of the unrealized losses attributable to each such security, (iii) our liquidity position, (iv) the impact that retention of those securities could have on our capital position and (v) our evaluation of the expected future performance of these securities (based on the criteria discussed above).
Other Investments
As of December 31, 2014, we had one investment in a limited partnership which was accounted for under the equity method of accounting and included within other assets on the consolidated statements of financial condition. During the year ended December 31, 2015, we redeemed 100% of our investment in the limited partnership for a return of capital of $2.1 million. As of December 31, 2015 and December 31, 2014, our other investment was as follows:
December 31, | |||||||
2015 | 2014 | ||||||
(Dollars in thousands) | |||||||
Investments accounted for under the equity method | $ | — | $ | 2,081 | |||
5. Loans and Allowance for Loan and Lease Losses
The loan portfolio consisted of the following at:
December 31, 2015 | December 31, 2014 | ||||||||||||
(Dollars in thousands) | Amount | Percent | Amount | Percent | |||||||||
Commercial loans | $ | 347,300 | 40.3 | % | $ | 301,746 | 36.0 | % | |||||
Commercial real estate loans – owner occupied | 195,554 | 22.7 | % | 212,515 | 25.4 | % | |||||||
Commercial real estate loans – all other | 146,641 | 17.0 | % | 146,676 | 17.5 | % | |||||||
Residential mortgage loans – multi-family | 81,487 | 9.5 | % | 95,276 | 11.4 | % | |||||||
Residential mortgage loans – single family | 52,072 | 6.0 | % | 64,326 | 7.7 | % | |||||||
Land development loans | 10,001 | 1.2 | % | 7,745 | 0.9 | % | |||||||
Consumer loans | 28,663 | 3.3 | % | 9,687 | 1.2 | % | |||||||
Gross loans | 861,718 | 100.0 | % | 837,971 | 100.0 | % | |||||||
Deferred fee (income) costs, net | 731 | 59 | |||||||||||
Allowance for loan and lease losses | (12,716 | ) | (13,833 | ) | |||||||||
Loans, net | $ | 849,733 | $ | 824,197 | |||||||||
At December 31, 2015 and 2014, real estate loans of approximately $523.4 million and $424.5 million, respectively, were pledged to secure borrowings obtained from the FHLB.
Allowance for Loan and Lease Losses
The ALLL represents our estimate of credit losses in our loan and lease portfolio that are probable and estimable at the balance sheet date. We employ economic models that are based on bank regulatory guidelines, industry standards and our own historical loan loss experience, as well as a number of more subjective qualitative factors, to determine both the sufficiency of the ALLL and the amount of the provisions that are required to increase or replenish the ALLL.
The ALLL is first determined by (i) analyzing all classified loans (graded as “Substandard” or “Doubtful” under our internal asset quality grading parameters) on non-accrual status for loss exposure and (ii) establishing specific reserves as needed. ASC 310-10 defines loan impairment as the existence of uncertainty concerning collection of all principal and interest in accordance with the contractual terms of a loan. For collateral dependent loans, impairment is typically measured by comparing the loan amount to the fair value of collateral, less estimated costs to sell, with any “shortfall” amount charged off. Other methods can be used in estimating impairment, including market price and the present value of expected future cash flows discounted at the loan’s original interest rate. We are an active lender with the U.S. Small Business Administration and collection of a percentage of the loan balance of many of the loans originated is guaranteed. The ALLL reserves are calculated against the non-guaranteed loan balances.
78
PACIFIC MERCANTILE BANCORP AND SUBSIDIARIES
NOTES TO CONSOLIDATED FINANCIAL STATEMENTS
On a quarterly basis, we utilize a classification based loan loss migration model as well as review individual loans in determining the adequacy of the ALLL for homogenous pools of loans that are not subject to specific reserve allocations. Our loss migration analysis tracks 16 quarters of loan loss history and industry loss factors to determine historical losses by classification category for each loan type, except certain consumer loans (automobile, mortgage and credit cards). We then apply these calculated loss factors, together with qualitative factors based on external economic conditions and trends and internal assessments, to the outstanding loan balances in each homogenous group of loans, and then, using our internal asset quality grading parameters, we grade the loans as “Pass,” “Special Mention,” “Substandard” or “Doubtful”. We analyze impaired loans individually. This grading is based on the credit classifications of assets as prescribed by government regulations and industry standards and is separated into the following groups:
• | Pass: Loans classified as pass include current loans performing in accordance with contractual terms, installment/consumer loans that are not individually risk rated, and loans which exhibit certain risk factors that require greater than usual monitoring by management. |
• | Special Mention: Loans classified as special mention, while generally not delinquent, have potential weaknesses that deserve management’s close attention. If left uncorrected, these potential weaknesses may result in deterioration of the repayment prospects for the loan or in the Bank’s credit position at some future date. |
• | Substandard: Loans classified as substandard have a well-defined weakness or weaknesses that jeopardize the liquidation of the debt. There is a distinct possibility that the Bank will sustain some loss if the deficiencies are not corrected. |
• | Doubtful: Loans classified as doubtful have all the weaknesses inherent in a substandard loan, and may also be at delinquency status and have defined weaknesses based on currently existing facts, conditions and values making collection or liquidation in full highly questionable and improbable. |
Set forth below is a summary of the activity in the ALLL, by portfolio type, during the years ended December 31, 2015, 2014 and 2013.
(Dollars in thousands) | Commercial | Real Estate | Land Development | Consumer and Single Family Mortgages | Total | ||||||||||||||
ALLL in the year ended December 31, 2015: | |||||||||||||||||||
Balance at beginning of year | $ | 7,670 | $ | 5,133 | $ | 296 | $ | 734 | $ | 13,833 | |||||||||
Charge offs | (2,643 | ) | — | (85 | ) | (199 | ) | (2,927 | ) | ||||||||||
Recoveries | 1,798 | 4 | — | 8 | 1,810 | ||||||||||||||
Provision | (186 | ) | (28 | ) | 71 | 143 | — | ||||||||||||
Balance at end of year | $ | 6,639 | $ | 5,109 | $ | 282 | $ | 686 | $ | 12,716 | |||||||||
ALLL in the year ended December 31, 2014: | |||||||||||||||||||
Balance at beginning of year | $ | 5,812 | $ | 4,517 | $ | 165 | $ | 864 | $ | 11,358 | |||||||||
Charge offs | (551 | ) | — | — | (102 | ) | (653 | ) | |||||||||||
Recoveries | 1,467 | 76 | — | 85 | 1,628 | ||||||||||||||
Provision | 942 | 540 | 131 | (113 | ) | 1,500 | |||||||||||||
Balance at end of year | $ | 7,670 | $ | 5,133 | $ | 296 | $ | 734 | $ | 13,833 | |||||||||
ALLL in the year ended December 31, 2013: | |||||||||||||||||||
Balance at beginning of year | $ | 6,340 | $ | 3,487 | $ | 248 | $ | 806 | $ | 10,881 | |||||||||
Charge offs | (5,945 | ) | (308 | ) | (5 | ) | (200 | ) | (6,458 | ) | |||||||||
Recoveries | 2,337 | 5 | 54 | 34 | 2,430 | ||||||||||||||
Provision | 3,080 | 1,333 | (132 | ) | 224 | 4,505 | |||||||||||||
Balance at end of year | $ | 5,812 | $ | 4,517 | $ | 165 | $ | 864 | $ | 11,358 | |||||||||
79
PACIFIC MERCANTILE BANCORP AND SUBSIDIARIES
NOTES TO CONSOLIDATED FINANCIAL STATEMENTS
Set forth below is information regarding loan balances and the related ALLL, by portfolio type, as of December 31, 2015 and December 31, 2014.
(Dollars in thousands) | Commercial | Real Estate | Land Development | Consumer and Single Family Mortgages | Total | ||||||||||||||
ALLL balance at December 31, 2015 related to: | |||||||||||||||||||
Loans individually evaluated for impairment | $ | — | $ | 484 | $ | — | $ | — | $ | 484 | |||||||||
Loans collectively evaluated for impairment | $ | 6,639 | $ | 4,625 | $ | 282 | $ | 686 | $ | 12,232 | |||||||||
Total | $ | 6,639 | $ | 5,109 | $ | 282 | $ | 686 | $ | 12,716 | |||||||||
Loans balance at December 31, 2015 related to: | |||||||||||||||||||
Loans individually evaluated for impairment | $ | 12,431 | $ | 11,107 | $ | 1,618 | $ | 701 | $ | 25,857 | |||||||||
Loans collectively evaluated for impairment | 334,869 | 412,575 | 8,383 | 80,034 | 835,861 | ||||||||||||||
Total | $ | 347,300 | $ | 423,682 | $ | 10,001 | $ | 80,735 | $ | 861,718 | |||||||||
ALLL balance at December 31, 2014 related to: | |||||||||||||||||||
Loans individually evaluated for impairment | $ | 995 | $ | 537 | $ | — | $ | — | $ | 1,532 | |||||||||
Loans collectively evaluated for impairment | $ | 6,675 | $ | 4,596 | $ | 296 | $ | 734 | $ | 12,301 | |||||||||
Total | $ | 7,670 | $ | 5,133 | $ | 296 | $ | 734 | $ | 13,833 | |||||||||
Loans balance at December 31, 2014 related to: | |||||||||||||||||||
Loans individually evaluated for impairment | $ | 21,117 | $ | 7,536 | $ | 2,111 | $ | 4,373 | $ | 35,137 | |||||||||
Loans collectively evaluated for impairment | 280,629 | 446,931 | 5,634 | 69,640 | 802,834 | ||||||||||||||
Total | $ | 301,746 | $ | 454,467 | $ | 7,745 | $ | 74,013 | $ | 837,971 | |||||||||
Credit Quality
The amounts of nonperforming assets and delinquencies that occur within our loan portfolio factors in our evaluation of the adequacy of the ALLL.
The following table provides a summary of the delinquency status of loans by portfolio type at December 31, 2015 and 2014:
80
PACIFIC MERCANTILE BANCORP AND SUBSIDIARIES
NOTES TO CONSOLIDATED FINANCIAL STATEMENTS
(Dollars in thousands) | 30-59 Days Past Due | 60-89 Days Past Due | 90 Days and Greater | Total Past Due | Current | Total Loans Outstanding | Loans >90 Days and Accruing | ||||||||||||||||||||
At December 31, 2015 | |||||||||||||||||||||||||||
Commercial loans | $ | 2,010 | $ | 1,008 | $ | 8,766 | $ | 11,784 | $ | 335,516 | $ | 347,300 | $ | — | |||||||||||||
Commercial real estate loans – owner-occupied | — | — | 797 | 797 | 194,757 | 195,554 | — | ||||||||||||||||||||
Commercial real estate loans – all other | 316 | — | 5,207 | 5,523 | 141,118 | 146,641 | — | ||||||||||||||||||||
Residential mortgage loans – multi-family | — | — | — | — | 81,487 | 81,487 | — | ||||||||||||||||||||
Residential mortgage loans – single family | — | — | 535 | 535 | 51,537 | 52,072 | — | ||||||||||||||||||||
Land development loans | — | — | 1,618 | 1,618 | 8,383 | 10,001 | — | ||||||||||||||||||||
Consumer loans | — | — | — | — | 28,663 | 28,663 | — | ||||||||||||||||||||
Total(1) | $ | 2,326 | $ | 1,008 | $ | 16,923 | $ | 20,257 | $ | 841,461 | $ | 861,718 | $ | — | |||||||||||||
At December 31, 2014 | |||||||||||||||||||||||||||
Commercial loans | $ | 553 | $ | — | $ | — | $ | 553 | $ | 301,193 | $ | 301,746 | $ | — | |||||||||||||
Commercial real estate loans – owner-occupied | — | — | — | — | 212,515 | 212,515 | — | ||||||||||||||||||||
Commercial real estate loans – all other | 20 | — | 2,117 | 2,137 | 144,539 | 146,676 | — | ||||||||||||||||||||
Residential mortgage loans – multi-family | — | — | — | — | 95,276 | 95,276 | — | ||||||||||||||||||||
Residential mortgage loans – single family | 835 | — | 285 | 1,120 | 63,206 | 64,326 | — | ||||||||||||||||||||
Land development loans | — | — | 364 | 364 | 7,381 | 7,745 | — | ||||||||||||||||||||
Consumer loans | 17 | — | — | 17 | 9,670 | 9,687 | — | ||||||||||||||||||||
Total | $ | 1,425 | $ | — | $ | 2,766 | $ | 4,191 | $ | 833,780 | $ | 837,971 | $ | — | |||||||||||||
(1) Loans 90 days or more past due included one consumer mortgage loan collateralized by residential real estate with a recorded investment of $535 thousand which is in the process of foreclosure.
Generally, the accrual of interest on a loan is discontinued when principal or interest payments become more than 90 days past due, unless we believe that the loan is adequately collateralized and it is in the process of collection. There were no loans 90 days or more past due and still accruing interest at December 31, 2015 or December 31, 2014. In certain instances, when a loan is placed on non-accrual status, previously accrued but unpaid interest is reversed against current income. Subsequent collections of cash are applied as principal reductions when received, except when the ultimate collectability of principal is probable, in which case such payments are applied to accrued and unpaid interest, which is credited to income. Non-accrual loans may be restored to accrual status when principal and interest become current and full repayment becomes expected.
The following table provides information with respect to loans on nonaccrual status, by portfolio type, as of December 31, 2015 and 2014:
December 31, | |||||||
2015 | 2014 | ||||||
(Dollars in thousands) | |||||||
Nonaccrual loans: | |||||||
Commercial loans | $ | 12,284 | $ | 16,182 | |||
Commercial real estate loans – owner occupied | 3,815 | 2,171 | |||||
Commercial real estate loans – all other | 6,268 | 2,117 | |||||
Residential mortgage loans - multi family | 447 | — | |||||
Residential mortgage loans – single family | 701 | 1,472 | |||||
Land development loans | 1,618 | 2,111 | |||||
Total(1) | $ | 25,133 | $ | 24,053 | |||
(1) Nonaccrual loans may include loans that are currently considered performing loans.
81
PACIFIC MERCANTILE BANCORP AND SUBSIDIARIES
NOTES TO CONSOLIDATED FINANCIAL STATEMENTS
We classify our loan portfolio using internal credit quality ratings. The following table provides a summary of loans by portfolio type and our internal credit quality ratings as of December 31, 2015 and 2014, respectively.
December 31, | |||||||||||
(Dollars in thousands) | 2015 | 2014 | Increase (Decrease) | ||||||||
Pass: | |||||||||||
Commercial loans | $ | 329,192 | $ | 280,102 | $ | 49,090 | |||||
Commercial real estate loans – owner occupied | 189,944 | 208,687 | (18,743 | ) | |||||||
Commercial real estate loans – all other | 127,702 | 128,974 | (1,272 | ) | |||||||
Residential mortgage loans – multi family | 81,040 | 94,817 | (13,777 | ) | |||||||
Residential mortgage loans – single family | 51,371 | 62,854 | (11,483 | ) | |||||||
Land development loans | 8,383 | 5,634 | 2,749 | ||||||||
Consumer loans | 28,663 | 9,687 | 18,976 | ||||||||
Total pass loans | $ | 816,295 | $ | 790,755 | $ | 25,540 | |||||
Special Mention: | |||||||||||
Commercial loans | $ | 5,626 | $ | 351 | $ | 5,275 | |||||
Commercial real estate loans – owner occupied | 177 | — | 177 | ||||||||
Commercial real estate loans – all other | 9,452 | 6,588 | 2,864 | ||||||||
Residential mortgage loans – multi family | — | 459 | (459 | ) | |||||||
Total special mention loans | $ | 15,255 | $ | 7,398 | $ | 7,857 | |||||
Substandard: | |||||||||||
Commercial loans | $ | 12,482 | $ | 19,655 | $ | (7,173 | ) | ||||
Commercial real estate loans – owner occupied | 5,433 | 3,828 | 1,605 | ||||||||
Commercial real estate loans – all other | 9,487 | 11,114 | (1,627 | ) | |||||||
Residential mortgage loans – multi family | 447 | — | 447 | ||||||||
Residential mortgage loans – single family | 701 | 1,472 | (771 | ) | |||||||
Land development loans | 1,618 | 2,111 | (493 | ) | |||||||
Total substandard loans | $ | 30,168 | $ | 38,180 | $ | (8,012 | ) | ||||
Doubtful: | |||||||||||
Commercial loans | $ | — | $ | 1,638 | $ | (1,638 | ) | ||||
Total doubtful loans | $ | — | $ | 1,638 | $ | (1,638 | ) | ||||
Total Loans: | $ | 861,718 | $ | 837,971 | $ | 23,747 | |||||
Impaired Loans
A loan generally is classified as impaired and placed on nonaccrual status when, in our opinion, principal or interest is not likely to be collected in accordance with the contractual terms of the loan agreement. We measure for impairments on a loan-by-loan basis, using either the present value of expected future cash flows discounted at the loan’s effective interest rate, or the fair value of the collateral if the loan is collateral dependent.
The following table sets forth information regarding impaired loans, at December 31, 2015 and December 31, 2014:
December 31, | |||||||
(Dollars in thousands) | 2015 | 2014 | |||||
Impaired loans: | |||||||
Nonaccruing loans | $ | 5,063 | $ | 18,118 | |||
Nonaccruing restructured loans | 20,070 | 5,935 | |||||
Accruing restructured loans (1) | 724 | 11,084 | |||||
Accruing impaired loans | — | — | |||||
Total impaired loans | $ | 25,857 | $ | 35,137 | |||
Impaired loans less than 90 days delinquent and included in total impaired loans | $ | 6,584 | $ | 32,371 | |||
(1) | See "Troubled Debt Restructurings" below for a description of accruing restructured loans at December 31, 2015 and December 31, 2014. |
82
PACIFIC MERCANTILE BANCORP AND SUBSIDIARIES
NOTES TO CONSOLIDATED FINANCIAL STATEMENTS
The table below contains additional information with respect to impaired loans, by portfolio type, as of December 31, 2015 and 2014:
December 31, 2015 | December 31, 2014 | ||||||||||||||||||||||
Recorded Investment | Unpaid Principal Balance | Related Allowance (1) | Recorded Investment | Unpaid Principal Balance | Related Allowance (1) | ||||||||||||||||||
(Dollars in thousands) | |||||||||||||||||||||||
No allowance recorded: | |||||||||||||||||||||||
Commercial loans | $ | 12,431 | $ | 14,137 | $ | — | $ | 18,563 | $ | 18,839 | $ | — | |||||||||||
Commercial real estate loans – owner occupied | 2,371 | 2,515 | — | 2,171 | 2,440 | — | |||||||||||||||||
Commercial real estate loans – all other | 6,668 | 6,806 | — | 5,365 | 5,423 | — | |||||||||||||||||
Residential mortgage loans – multi-family | 447 | 450 | — | — | — | — | |||||||||||||||||
Residential mortgage loans – single family | 701 | 1,037 | — | 4,373 | 4,610 | — | |||||||||||||||||
Land development loans | 1,618 | 1,732 | — | 2,111 | 2,146 | — | |||||||||||||||||
Total | 24,236 | 26,677 | — | 32,583 | 33,458 | — | |||||||||||||||||
With allowance recorded: | |||||||||||||||||||||||
Commercial loans | $ | — | $ | — | $ | — | $ | 2,554 | $ | 2,983 | $ | 1,532 | |||||||||||
Commercial real estate loans – owner occupied | 1,621 | 1,872 | 484 | — | — | — | |||||||||||||||||
Total | 1,621 | 1,872 | 484 | 2,554 | 2,983 | 1,532 | |||||||||||||||||
Total | |||||||||||||||||||||||
Commercial loans | $ | 12,431 | $ | 14,137 | $ | — | $ | 21,117 | $ | 21,822 | $ | 1,532 | |||||||||||
Commercial real estate loans – owner occupied | 3,992 | 4,387 | 484 | 2,171 | 2,440 | — | |||||||||||||||||
Commercial real estate loans – all other | 6,668 | 6,806 | — | 5,365 | 5,423 | — | |||||||||||||||||
Residential mortgage loans – multi-family | 447 | 450 | — | — | — | — | |||||||||||||||||
Residential mortgage loans – single family | 701 | 1,037 | — | 4,373 | 4,610 | — | |||||||||||||||||
Land development loans | 1,618 | 1,732 | — | 2,111 | 2,146 | — | |||||||||||||||||
Total | 25,857 | 28,549 | 484 | 35,137 | 36,441 | 1,532 | |||||||||||||||||
(1) | When the discounted cash flows, collateral value or market price equals or exceeds the recorded investment in the loan, then specific reserves are not required to be set aside for the loan within the ALLL. This typically occurs when the impaired loans have been partially charged-off and/or there have been interest payments received and applied to the balance of the principal outstanding. |
At December 31, 2015 and December 31, 2014 there were $24.2 million and $32.6 million, respectively, of impaired loans for which no specific reserves had been allocated because these loans, in our judgment, were sufficiently collateralized. Of the impaired loans at December 31, 2015 for which no specific reserves were allocated, $14.2 million had been deemed impaired in the prior year.
Average balances and interest income recognized on impaired loans, by portfolio type, for the year ended December 31, 2015, 2014 and 2013 were as follows:
83
PACIFIC MERCANTILE BANCORP AND SUBSIDIARIES
NOTES TO CONSOLIDATED FINANCIAL STATEMENTS
Year Ended December 31, | |||||||||||||||||||||||
2015 | 2014 | 2013 | |||||||||||||||||||||
Average Balance | Interest Income Recognized | Average Balance | Interest Income Recognized | Average Balance | Interest Income Recognized | ||||||||||||||||||
No allowance recorded: | |||||||||||||||||||||||
Commercial loans | $ | 13,455 | $ | 178 | $ | 12,590 | $ | 782 | $ | 8,691 | $ | 496 | |||||||||||
Commercial real estate loans – owner occupied | 2,494 | 115 | 2,088 | 18 | 3,121 | — | |||||||||||||||||
Commercial real estate loans – all other | 6,256 | 337 | 6,442 | 290 | 12,119 | 188 | |||||||||||||||||
Residential mortgage loans – multi-family | 451 | 13 | — | — | — | — | |||||||||||||||||
Residential mortgage loans – single family | 3,137 | — | 3,732 | 148 | 1,716 | 187 | |||||||||||||||||
Land development loans | 1,665 | 7 | 1,246 | 91 | 302 | 12 | |||||||||||||||||
Total | 27,458 | 650 | 26,098 | 1,329 | 25,949 | 883 | |||||||||||||||||
With allowance recorded: | |||||||||||||||||||||||
Commercial loans | 528 | — | 2,298 | 34 | — | — | |||||||||||||||||
Commercial real estate loans – owner occupied | 815 | — | 121 | — | — | — | |||||||||||||||||
Total | 1,343 | — | 2,419 | 34 | — | — | |||||||||||||||||
Total | |||||||||||||||||||||||
Commercial loans | 13,983 | 178 | 14,888 | 816 | 8,691 | 496 | |||||||||||||||||
Commercial real estate loans – owner occupied | 3,309 | 115 | 2,209 | 18 | 3,121 | — | |||||||||||||||||
Commercial real estate loans – all other | 6,256 | 337 | 6,442 | 290 | 12,119 | 188 | |||||||||||||||||
Residential mortgage loans – multi-family | 451 | 13 | — | — | — | — | |||||||||||||||||
Residential mortgage loans – single family | 3,137 | — | 3,732 | 148 | 1,716 | 187 | |||||||||||||||||
Land development loans | 1,665 | 7 | 1,246 | 91 | 302 | 12 | |||||||||||||||||
Total | $ | 28,801 | $ | 650 | $ | 28,517 | $ | 1,363 | $ | 25,949 | $ | 883 | |||||||||||
The interest that would have been earned had the impaired loans remained current in accordance with their original terms was $899 thousand in 2015, $384 thousand in 2014 and $490 thousand in 2013.
Troubled Debt Restructurings
Pursuant to the FASB's ASU No. 2011-2, A Creditor's Determination of whether a Restructuring is a Troubled Debt Restructuring, the Company's TDRs totaled $20.8 million and $17.0 million at December 31, 2015 and December 31, 2014, respectively. TDRs consist of loans to which modifications have been made for the purpose of alleviating temporary impairments of the borrower's financial condition and cash flows. Those modifications have come in the forms of changes in amortization terms, reductions in interest rates, interest only payments and, in limited cases, concessions to outstanding loan balances. The modifications are made as part of workout plans we enter into with the borrower that are designed to provide a bridge for the borrower's cash flow shortfalls in the near term. If a borrower works through the near term issues, then in most cases, the original contractual terms of the borrower's loan will be reinstated.
Of the $20.8 million of TDRs outstanding at December 31, 2015, $724 thousand were performing in accordance with their terms and accruing interest and $20.1 million were not. Of the $20.1 million nonperforming TDRs, three loan relationships made up $15.7 million of the amount outstanding as of December 31, 2015. Our impairment analysis determined no specific reserves were required on the TDR balances outstanding at December 31, 2015.
The following table presents loans restructured as TDRs during the years ended December 31, 2015, 2014 and 2013:
84
PACIFIC MERCANTILE BANCORP AND SUBSIDIARIES
NOTES TO CONSOLIDATED FINANCIAL STATEMENTS
Year Ended December 31, | ||||||||||||||||||||||||||||||||
2015 | 2014 | 2013 | ||||||||||||||||||||||||||||||
(Dollars in thousands) | Number of loans | Pre-Modification Outstanding Recorded Investment | Post-Modification Outstanding Recorded Investment | Number of loans | Pre-Modification Outstanding Recorded Investment | Post-Modification Outstanding Recorded Investment | Number of loans | Pre-Modification Outstanding Recorded Investment | Post-Modification Outstanding Recorded Investment | |||||||||||||||||||||||
Performing | ||||||||||||||||||||||||||||||||
Commercial loans | 2 | $ | 147 | $ | 147 | — | $ | — | $ | — | 1 | $ | 177 | $ | 177 | |||||||||||||||||
Commercial real estate - owner occupied | 1 | 177 | 177 | — | — | — | — | — | — | |||||||||||||||||||||||
Commercial real estate – all other | 1 | 400 | 400 | — | — | — | 1 | 613 | 303 | |||||||||||||||||||||||
4 | 724 | 724 | — | — | — | 2 | 790 | 480 | ||||||||||||||||||||||||
Nonperforming | ||||||||||||||||||||||||||||||||
Commercial loans | 3 | 2,634 | 2,634 | 3 | 2,716 | 2,672 | 3 | 1,357 | 1,118 | |||||||||||||||||||||||
Commercial real estate – owner occupied | 2 | 1,778 | 1,778 | — | — | — | — | — | — | |||||||||||||||||||||||
Commercial real estate – all other | 1 | 4,114 | 4,114 | — | — | — | — | — | — | |||||||||||||||||||||||
Residential mortgage loans – single family | — | — | — | 1 | 244 | 242 | — | — | — | |||||||||||||||||||||||
Land development loans | — | — | — | — | — | — | 1 | 439 | 391 | |||||||||||||||||||||||
6 | 8,526 | 8,526 | 4 | 2,960 | 2,914 | 4 | 1,796 | 1,509 | ||||||||||||||||||||||||
Total troubled debt restructurings | 10 | $ | 9,250 | $ | 9,250 | 4 | $ | 2,960 | $ | 2,914 | 6 | $ | 2,586 | $ | 1,989 | |||||||||||||||||
During the years ended December 31, 2015, 2014 and 2013, TDRs that were modified within the preceding 12-month period which subsequently defaulted were as follows:
Year Ended December 31, | ||||||||||||||||||||
2015 | 2014 | 2013 | ||||||||||||||||||
Number of loans | Recorded Investment | Number of loans | Recorded Investment | Number of loans | Recorded Investment | |||||||||||||||
(Dollars in thousands) | ||||||||||||||||||||
Commercial loans | — | $ | — | — | $ | — | 2 | $ | 65 | |||||||||||
Commercial real estate – all other | 1 | 4,114 | — | — | — | — | ||||||||||||||
Total | 1 | $ | 4,114 | — | $ | — | 2 | $ | 65 | |||||||||||
6. Premises and Equipment
The major classes of premises and equipment are as follows:
(Dollars in thousands) | December 31, | ||||||
2015 | 2014 | ||||||
Furniture and equipment | $ | 8,371 | $ | 8,380 | |||
Leasehold improvements | 1,910 | 2,036 | |||||
10,281 | 10,416 | ||||||
Accumulated depreciation and amortization | (9,139 | ) | (9,324 | ) | |||
Total | $ | 1,142 | $ | 1,092 | |||
The amount of depreciation and amortization included in operating expense was $525,000, $462,000 and $400,000 for the years ended December 31, 2015, 2014 and 2013, respectively.
7. Deposits
Asset
At December 31, 2015, we had $103.3 million in interest bearing deposits at other financial institutions, as compared to $167.1 million at December 31, 2014. The weighted average percentage yields on these deposits for each of the years ended
85
PACIFIC MERCANTILE BANCORP AND SUBSIDIARIES
NOTES TO CONSOLIDATED FINANCIAL STATEMENTS
December 31, 2015 and December 31, 2014 was 0.26% and 0.25%, respectively. Interest bearing deposits with financial institutions can be withdrawn on demand and are considered cash equivalents for purposes of the consolidated statements of cash flows.
At each of December 31, 2015 and December 31, 2014, we had $4.7 million of interest-bearing time deposits at other financial institutions, which were scheduled to mature within one year or had no stated maturity date. The weighted average percentage yields on these deposits were 0.53% and 0.32% for the years ended December 31, 2015 and December 31, 2014, respectively.
Liability
The aggregate amount of time deposits in denominations of $250,000 or more at December 31, 2015 and 2014 was $58.8 million and $97.8 million, respectively.
The scheduled maturities of all time certificates of deposit at December 31, 2015 were as follows:
(Dollars in thousands) | At December 31, 2015 | ||
2016 | $ | 255,491 | |
2017 | 20,798 | ||
2018 | 3,106 | ||
2019 | 919 | ||
2020 and beyond | 12 | ||
Total | $ | 280,326 | |
8. Borrowings and Contractual Obligations
At December 31, 2015 and 2014, our borrowings and contractual obligations consisted of the following:
December 31, | |||||||
(Dollars in thousands) | 2015 | 2014 | |||||
FHLB advances—short-term | $ | 10,000 | $ | 29,500 | |||
FHLB advances—long-term | — | 10,000 | |||||
$ | 10,000 | $ | 39,500 | ||||
The table below sets forth the amounts of, the interest rates we pay on, and the maturity dates of these FHLB borrowings. These borrowings had a weighted-average annualized interest rate of 1.02% for the year ended December 31, 2015.
Principal Amounts | Interest Rate | Maturity Dates | ||
(Dollars in thousands) | ||||
$5,000 | 1.08% | September 19, 2016 | ||
5,000 | 0.96% | September 30, 2016 | ||
At December 31, 2015, $523 million of loans were pledged to secure these FHLB borrowings and to support our unfunded borrowing capacity.
As of December 31, 2015, we had unused borrowing capacity of $241 million with the FHLB. The highest amount of borrowings outstanding at any month-end during the year ended December 31, 2015 was $39.5 million.
As of December 31, 2014, we had $29.5 million of outstanding short-term borrowings and $10.0 million of outstanding long-term borrowings that we had obtained from the FHLB. These borrowings had a weighted-average annualized interest rate of 0.75% for the year ended December 31, 2014.
As of December 31, 2014 we had unused borrowing capacity of $175 million with the FHLB. The highest amount of borrowings outstanding at any month-end during the year ended December 31, 2014 was $70 million.
These FHLB borrowings were obtained in accordance with the Company’s asset/liability management objective to reduce the Company’s exposure to interest rate fluctuations and increase our contingent funding.
Junior Subordinated Debentures. We formed two grantor trusts to sell and issue to institutional investors floating junior trust preferred securities ("trust preferred securities"). The net proceeds from the sales of the trust preferred securities was used in
86
PACIFIC MERCANTILE BANCORP AND SUBSIDIARIES
NOTES TO CONSOLIDATED FINANCIAL STATEMENTS
exchange for our issuance to the grantor trusts for the principal amount of our junior subordinated floating rate debentures (the "Debentures"). The payment terms of the Debentures are used by the grantor trusts to make the payments that come due to the holders of the trust preferred securities pursuant to the terms of those securities. The Debentures also were pledged by the grantor trusts as security for the payment obligations of the grantor trusts under the trust preferred securities.
Set forth below are the respective principal amounts, and certain other information regarding the terms of the Debentures that remained outstanding as of December 31, 2015 and 2014:
Original Issue Dates | Principal Amount | Interest Rate(1) | Maturity Dates | ||||
(In thousands) | |||||||
September 2002 | $ | 7,217 | LIBOR plus 3.40% | September 2032 | |||
October 2004 | 10,310 | LIBOR plus 2.00% | October 2034 | ||||
Total | $ | 17,527 | |||||
(1) | Interest rate resets quarterly. |
These Debentures require quarterly interest payments, which are used to make quarterly distributions required to be paid on the corresponding trust preferred securities. Subject to certain conditions, we have the right, at our discretion, to defer those interest payments, and the corresponding distributions on the trust preferred securities, for up to five years. Exercise of this deferral right does not constitute a default of our obligations to pay the interest on the Debentures or the corresponding distributions that are payable on the trust preferred securities. As of December 31, 2015, we were current on all interest payments.
Under the Federal Reserve Board rulings, the borrowings evidenced by the Debentures, which are subordinated to all of our other borrowings that are outstanding or which we may obtain in the future, are eligible (subject to certain dollar limitations) to qualify and, at December 31, 2015 and 2014, $17.0 million of those Debentures qualified as Tier I capital, for regulatory purposes.
9. Related Party Transactions
Per ASC 850-10-20, a related party is defined under GAAP to include: affiliates, principal owners and their immediate family members, management and their immediate families, other parties with which the entity may deal if one party controls or can significantly influence the management or operating policies of the other to an extent that one of the transacting parties might be prevented from fully pursuing its own separate interests, and other parties that can significantly influence the management or operating policies of the transacting parties or that have an ownership interest in one of the transacting parties and can significantly influence the other to an extent that one or more of the transacting parties might be prevented from fully pursuing its own separate interests. GAAP requires disclosure of all material related party transactions, excluding compensation arrangements, expense allowances, and items eliminated in consolidation. Excluding the equity transactions described in Note 14, Shareholders' Equity, and the transactions noted below, we have no other related party transactions.
Previously, we conducted banking transactions with and made loans to and entered into loan commitments with members of our Board of Directors and certain of the businesses with which they are affiliated or associated. All such loans and loan commitments were made in accordance with applicable laws and government regulations and on substantially the same terms, including interest rates and collateral, as those prevailing at the same time for comparable transactions with persons of similar creditworthiness that are not affiliated with us and, when made, did not present any undue risk of collectability. As of December 31, 2015, we are no longer making loans or entering into loan commitments with members of our Board of Directors and their affiliates. As a result, the outstanding loan balance from December 31, 2014 of loans entered into with members of our Board of Directors was paid in full during the year ended December 31, 2015.
The following is a summary of loan transactions with members of the Board of Directors and certain of their affiliates and associates:
87
PACIFIC MERCANTILE BANCORP AND SUBSIDIARIES
NOTES TO CONSOLIDATED FINANCIAL STATEMENTS
Year Ended December 31, | |||||||
(Dollars in thousands) | 2015 | 2014(1) | |||||
Beginning balance | $ | 96 | $ | 653 | |||
New loans granted | — | 124 | |||||
Principal repayments | (96 | ) | (111 | ) | |||
Transfers out(2) | — | (570 | ) | ||||
Ending balance | $ | — | $ | 96 | |||
(1) | No loans made to executive officers who are not also directors. |
(2) | Related to loans that no longer meet the qualifications of a related party. |
Deposits maintained by members of the Board of Directors and executive officers at the Bank totaled $240 thousand and $197 thousand at December 31, 2015 and 2014, respectively.
10. Income Taxes
The components of income tax expense (benefit) from continuing operations consisted of the following for the years ended December 31:
(Dollars in thousands) | 2015 | 2014 | 2013 | ||||||||
Current taxes: | |||||||||||
Federal | $ | 5 | $ | 7 | $ | 957 | |||||
State | 4 | — | 289 | ||||||||
Total current taxes | 9 | 7 | 1,246 | ||||||||
Deferred taxes: | |||||||||||
Federal | (8,490 | ) | (455 | ) | 3,150 | ||||||
State | (3,070 | ) | (160 | ) | 1,214 | ||||||
Total deferred taxes | (11,560 | ) | (615 | ) | 4,364 | ||||||
Total income tax (benefit) expense | $ | (11,551 | ) | $ | (608 | ) | $ | 5,610 | |||
The reasons for the differences between the statutory federal income tax rates and our effective tax rates are summarized in the following table:
Year Ended December 31, | ||||||||
2015 | 2014 | 2013 | ||||||
Federal income tax based on statutory rate | 34.0 | % | 34.0 | % | 34.0 | % | ||
State franchise tax net of federal income tax benefit | 7.1 | 6.3 | 7.0 | |||||
Permanent differences | — | (4.1 | ) | (0.6 | ) | |||
Other | 3.9 | 2.1 | 0.2 | |||||
Valuation allowance | (1,343.5 | ) | 2.9 | (100.8 | ) | |||
Total income tax (benefit) expense | (1,298.5 | )% | 41.2 | % | (60.2 | )% | ||
At December 31, 2015, we have a net deferred tax asset of $17.6 million, as compared with $5.9 million at December 31, 2014. Adjustments to our deferred tax valuation allowance could be required in the future if we were to conclude, on the basis of our assessment of the realizability of the deferred tax asset, that the amount of that asset which is more likely, than not, to be available to offset or reduce future taxes has decreased. Any such decrease could result in an increase in our provision for income taxes or reductions to our income tax benefits. The components of our net deferred tax asset are as follows at:
88
PACIFIC MERCANTILE BANCORP AND SUBSIDIARIES
NOTES TO CONSOLIDATED FINANCIAL STATEMENTS
(Dollars in thousands) | December 31, | ||||||
2015 | 2014 | ||||||
Deferred tax asset: | |||||||
Allowance for loan and lease losses | $ | 5,253 | $ | 5,740 | |||
Other than temporary impairment on securities | 78 | 78 | |||||
Deferred compensation | 1,098 | 1,159 | |||||
Other accrued expenses | 1,421 | 1,196 | |||||
Charitable contributions | 208 | 220 | |||||
Reserve for unfunded commitments | 113 | 113 | |||||
Tax credits | 158 | 161 | |||||
Net operating loss carry forward | 8,313 | 8,254 | |||||
Stock based compensation | 651 | 587 | |||||
Depreciation and amortization | 177 | 208 | |||||
Unrealized losses on securities and deferred compensation | 637 | 556 | |||||
Total deferred tax assets | 18,107 | 18,272 | |||||
Deferred tax liabilities: | |||||||
State taxes | (230 | ) | (230 | ) | |||
Other | (301 | ) | (25 | ) | |||
Total deferred tax liabilities | (531 | ) | (255 | ) | |||
Valuation allowance | — | (12,084 | ) | ||||
Total net deferred tax asset | $ | 17,576 | $ | 5,933 | |||
During the year ended December 31, 2013, management analyzed the positive and negative evidence in determining whether our deferred tax assets were more-likely-than-not to be realized. Based on this analysis, we reestablished a $12.5 million valuation allowance against a substantial portion of our net deferred tax assets when we determined that there was significant negative evidence with respect to our ability to realize such assets. Positive evidence included improvement in our asset quality, tax planning strategies, projected taxable income, and improvement in economic conditions. Negative evidence we considered in making this determination included the history of operating losses, which then diminished our ability to rely on projected taxable income and created uncertainty regarding the realization of a portion of the deferred tax assets at future points in time. As a result, we increased the valuation allowance against our deferred tax asset, which resulted in the recognition of a non-cash income tax charge in the amount of $5.6 million.
During the year ended December 31, 2014, we recorded an income tax benefit of $608 thousand. Per ASC 740-20-45-7 all sources of pre-tax income must be considered in determining the tax benefit that results from a loss from continuing operations and that shall be allocated to continuing operations. This benefit is the result of an intraperiod tax allocation where the benefit of the income tax provision that is recorded in discontinued operations and other comprehensive income created a tax benefit in continuing operations. On a net basis we recorded no income tax provision. Based on the analysis performed, and the positive and negative evidence considered, management chose not to release any portion of the $12.1 million valuation allowance as of December 31, 2014. Positive evidence included improvement in our asset quality, tax planning strategies, projected taxable income, and improvement in economic conditions. Negative evidence included historical operating losses. Management determined the negative evidence was significant enough that until such time as we are in continuous periods of pre-tax income we would not make any reversals of our valuation allowance; however, we did conclude that it is more-likely-than-not that the existing $5.9 million net deferred tax asset will be realized.
During the year ended December 31, 2015, we recorded an $11.6 million income tax benefit. Management evaluated the positive and negative evidence and determined that there was enough positive evidence to support the full realization of the deferred tax asset and that no valuation allowance was needed. Positive evidence included projected taxable income utilizing objective assumptions based on 2015 actual results, tax planning strategies, improvement in economic conditions and at least 17 years remaining on the life of our $8.3 million deferred tax asset generated from our net operating loss carryforward. Additionally, the Company has generated positive core earnings for the trailing six quarters which demonstrates the ability to be profitable in what is considered to be the Company's core business (as defined in Note 18, Business Segment Information as our commercial banking segment). While the decision to exit the mortgage business in 2013 did not necessarily ensure that the Company would become profitable, the results provide positive evidence that the decision to exit the unprofitable business is sufficient to overcome the losses incurred in recent years. Negative evidence we considered in making this determination included our three-year cumulative loss deficit and our accumulated deficit. Management determined that the expectation of future taxable income supported by our
89
PACIFIC MERCANTILE BANCORP AND SUBSIDIARIES
NOTES TO CONSOLIDATED FINANCIAL STATEMENTS
recent history of positive core earnings after adjusting for aberrational items that caused our cumulative loss condition, including discontinued operations, provided enough positive evidence to outweigh the negative evidence. Therefore, we concluded that it is more-likely-than-not that the existing $17.6 million net deferred tax asset will be realized, resulting in the reversal of the entire valuation allowance against the Company's deferred tax asset.
Our deferred tax assets as of December 31, 2015 do not include $202 thousand of excess tax benefits from stock based compensation expenses that are a component of our net operating loss carryforwards. If and when such excess tax benefits are realized, stockholders equity will be increased.
We file income tax returns with the U.S. federal government and the state of California. As of December 31, 2015, we were subject to examination by the Internal Revenue Service with respect to our U.S. federal tax returns for the 2012 to 2014 tax years and Franchise Tax Board for California state income tax returns for the 2011 to 2014 tax years. Net operating losses on our U.S. federal and California state income tax returns may be carried forward twenty years. As of December 31, 2015, we do not believe there will be any material adverse changes in our unrecognized tax benefits over the next 12 months.
Our policy is to recognize interest and penalties accrued on any unrecognized tax benefits as a component of tax expense. We did not have any accrued interest or penalties associated with any unrecognized tax benefits, and no interest expense was recognized during the years ended 2015, 2014 and 2013.
11. Stock-Based Employee Compensation Plans
In May 2010, our shareholders approved the adoption of our 2010 Equity Incentive Plan (the “2010 Incentive Plan”), which authorized and set aside a total of 400,000 shares of our common stock for issuance on the exercise of stock options or the grant of restricted stock or other equity incentives to our officers, and other key employees and directors. An additional 158,211 shares of common stock were also set aside which was equal to the total of the shares that were available for the grant of equity incentives under our shareholder-approved 2008 and 2004 Equity Incentive Plans (the "Previously Approved Plans") at the time of the adoption of the 2010 Incentive Plan. Options to purchase a total of 444,812 shares of our common stock granted under the Previously Approved Plans were outstanding at December 31, 2015. The 2010 Incentive Plan provides that if any of these outstanding options under the Previously Approved Plans expire or are terminated for any reason, then the number of shares that would become available for grants or awards of equity incentives under the 2010 Incentive Plan would be increased by an equivalent number of shares. At the Annual Shareholders meeting held in May 2013, our shareholders approved an additional 800,000 share increase in the maximum number of shares of our common stock that may be issued pursuant to grants or exercises of options or restricted shares or other equity incentives under the 2010 Incentive Plan, of which 80,709 shares of restricted stock vested during the year ended December 31, 2015, thereby decreasing the maximum number of shares authorized under the 2010 Incentive Plan. As a result, as of December 31, 2015, the maximum number of shares that were authorized for the grant of options or other equity incentives under the 2010 Incentive Plan totaled 1,693,526 (assuming that all 444,812 shares of our common stock subject to options under the Previously Approved Plans expire or are terminated), or approximately 7% of the shares of our common stock then outstanding.
A stock option entitles the recipient to purchase shares of our common stock at a price per share that may not be less than 100% of the fair market value of the Company’s shares on the date the option is granted. Restricted shares may be granted at such purchase prices and on such other terms, including restrictions and Company repurchase or reacquisition rights, as are fixed by the Compensation Committee at the time rights to purchase such restricted shares are granted. Stock Appreciation Rights ("SARs") entitle the recipient to receive a cash payment in an amount equal to the difference between the fair market value of the Company’s shares on the date of vesting and a “base price” (which, in most cases, will be equal to the fair market value of the Company’s shares on the date the SAR is granted), subject to the right of the Company to make such payment in shares of its common stock at their then fair market value. Options, restricted shares and SARs may vest immediately or in installments over various periods generally ranging up to five years, subject to the recipient’s continued employment or service or the achievement of specified performance goals, as determined by the Compensation Committee at the time it grants or awards the options, the restricted shares or the SARs. Stock options and SARs may be granted for terms of up to 10 years after the date of grant, but will terminate sooner upon or shortly after a termination of service occurring prior to the expiration of the term of the option or SAR. The Company will become entitled to repurchase any unvested restricted shares, at the same price that was paid for the shares by the recipient, or to cancel those shares in the event of a termination of employment or service of the holder of such shares or if any performance goals specified in the award are not satisfied. To date, the Company has not granted any SARs.
Under FASB ASC 718-10, we are required to recognize, in our financial statements, the fair value of the options or any restricted shares that we grant as compensation cost over their respective service periods. The fair values of the options that were outstanding at December 31, 2015 under the 2010 Incentive Plan were estimated as of their respective dates of grant using the Black-Scholes option-pricing model. The Company, under the 2010 Incentive Plan, granted restricted stock for the benefit of its
90
PACIFIC MERCANTILE BANCORP AND SUBSIDIARIES
NOTES TO CONSOLIDATED FINANCIAL STATEMENTS
employees. These restricted shares vest over a period of three years. The recipients of restricted shares have the right to vote all shares subject to such grant and receive all dividends with respect to such shares whether or not the shares have vested. The recipients do not pay any cash consideration for the shares.
Stock Options
The table below summarizes the weighted average assumptions used to determine the fair values of the options granted during the following periods:
Year Ended December 31, | |||||||||||
Assumptions with respect to: | 2015 | 2014 | 2013 | ||||||||
Expected volatility | 44 | % | 44 | % | 44 | % | |||||
Risk-free interest rate | 1.82 | % | 2.15 | % | 1.72 | % | |||||
Expected dividends | — | % | 0.61 | % | 1.00 | % | |||||
Expected term (years) | 6.0 | 6.7 | 3.1-7.4 | ||||||||
Weighted average fair value of options granted during period | $ | 3.13 | $ | 2.84 | $ | 2.56 | |||||
The following table summarizes the stock option activity under the Company’s equity incentive plans during the years ended December 31, 2015, 2014 and 2013, respectively.
Number of Shares | Weighted- Average Exercise Price Per Share | Number of Shares | Weighted- Average Exercise Price Per Share | Number of Shares | Weighted- Average Exercise Price Per Share | |||||||||||||||
2015 | 2014 | 2013 | ||||||||||||||||||
Outstanding – January 1, | 1,257,390 | $ | 6.51 | 1,821,000 | $ | 6.88 | 1,566,965 | $ | 6.90 | |||||||||||
Granted | 112,828 | 7.09 | 58,970 | 6.38 | 632,000 | 6.15 | ||||||||||||||
Exercised | (296,100 | ) | 5.15 | (288,892 | ) | 4.24 | (94,244 | ) | 3.23 | |||||||||||
Forfeited/Canceled | (235,422 | ) | 9.59 | (333,688 | ) | 10.47 | (283,721 | ) | 6.66 | |||||||||||
Outstanding – December 31, | 838,696 | 6.20 | 1,257,390 | 6.51 | 1,821,000 | 6.88 | ||||||||||||||
Options Exercisable – December 31, | 622,770 | 6.06 | 788,886 | 6.69 | 1,035,434 | 7.50 | ||||||||||||||
Options Vested – December 31, | 622,770 | $ | 6.06 | 788,886 | $ | 6.69 | 1,035,434 | $ | 7.50 | |||||||||||
Options to purchase 296,100, 288,892, and 94,244 shares of our common stock were exercised during the years ended December 31, 2015, 2014 and 2013, respectively. The aggregate intrinsic value of options exercised during the year ended December 31, 2015, 2014 and 2013, was $556 thousand, $558 thousand and $290 thousand, respectively. The fair values of options vested during the years ended December 31, 2015, 2014 and 2013 were $655 thousand, $831 thousand and $599 thousand, respectively.
The following table provides additional information regarding the vested and unvested options that were outstanding at December 31, 2015.
Options Outstanding as of December 31, 2015 | Options Exercisable as of December 31, 2015(1) | |||||||||||||||||
Vested | Unvested | Weighted Average Exercise Price | Weighted Average Remaining Contractual Life (Years) | Shares | Weighted Average Exercise Price | |||||||||||||
$2.97 – $5.99 | 186,981 | 2,600 | $ | 3.92 | 4.96 | 186,981 | $ | 3.91 | ||||||||||
$6.00 – $9.99 | 410,989 | 213,326 | 6.48 | 7.72 | 410,989 | 6.39 | ||||||||||||
$10.00 – $17.99 | 14,800 | — | 15.93 | 0.87 | 14,800 | 15.93 | ||||||||||||
$18.00 – $18.84 | 10,000 | — | 18.00 | 0.11 | 10,000 | 18.00 | ||||||||||||
622,770 | 215,926 | $ | 6.20 | 6.89 | 622,770 | $ | 6.06 | |||||||||||
(1) | The weighted average remaining contractual life of the options that were exercisable as of December 31, 2015 was 6.38 years. |
91
PACIFIC MERCANTILE BANCORP AND SUBSIDIARIES
NOTES TO CONSOLIDATED FINANCIAL STATEMENTS
The aggregate intrinsic values of options that were outstanding and exercisable under the 2010 Incentive Plan at December 31, 2015 and 2014 was $904 thousand and $1.2 million, respectively.
A summary of the status of the unvested options outstanding as of December 31, 2015, 2014 and 2013, and changes in the weighted average grant date fair values of the unvested options during the years ended December 31, 2015, 2014 and 2013, are set forth in the following table.
For the year ended | ||||||||||||||||||||
2015 | 2014 | 2013 | ||||||||||||||||||
Number of Shares Subject to Options | Weighted Average Grant Date Fair Value | Number of Shares Subject to Options | Weighted Average Grant Date Fair Value | Number of Shares Subject to Options | Weighted Average Grant Date Fair Value | |||||||||||||||
Unvested at the beginning of the year | 468,504 | $ | 2.68 | 785,566 | $ | 2.57 | 635,706 | $ | 2.30 | |||||||||||
Granted | 112,828 | 3.13 | 58,970 | 2.84 | 632,000 | 2.56 | ||||||||||||||
Vested | (248,406 | ) | 2.63 | (338,558 | ) | 2.45 | (290,766 | ) | 2.06 | |||||||||||
Forfeited/Canceled | (117,000 | ) | 2.78 | (37,474 | ) | 2.57 | (191,374 | ) | 2.38 | |||||||||||
Unvested at the end of the year | 215,926 | $ | 2.93 | 468,504 | $ | 2.68 | 785,566 | $ | 2.57 | |||||||||||
At December 31, 2015, the weighted average period over which nonvested awards were expected to be recognized was 1.99 years.
Restricted Stock
We issued 98,829 shares of restricted stock under the 2010 Incentive Plan during the year ended December 31, 2015, at a price of $7.11 that vest on an annual prorated basis over the next three years. The following table summarizes the activity related to restricted stock granted, vested and forfeited under our equity incentive plans during the years ended December 31, 2015 and 2014.
For the year ended | |||||||||||||
2015 | 2014 | ||||||||||||
Number of Shares | Average Grant Date Fair Value | Number of Shares | Average Grant Date Fair Value | ||||||||||
Outstanding at the beginning of the year | 141,254 | $ | 6.29 | 141,284 | $ | 6.23 | |||||||
Granted | 98,829 | 7.11 | 51,256 | 6.37 | |||||||||
Vested | (80,709 | ) | 6.48 | (45,000 | ) | 6.24 | |||||||
Forfeited | (30,091 | ) | 6.44 | (6,286 | ) | 6.21 | |||||||
Outstanding at the end of the year | 129,283 | $ | 6.75 | 141,254 | $ | 6.29 | |||||||
Compensation Expense
We expect that the compensation expense that will be recognized during the periods presented below in respect of stock options and restricted stock outstanding at December 31, 2015, will be as follows:
Estimated Stock Based Compensation Expense Stock Options | Estimated Stock Based Compensation Expense Restricted Stock | Estimated Stock Based Compensation Expense Total | |||||||||
(Dollars in thousands) | |||||||||||
For the years ending December 31, | |||||||||||
2016 | $ | 226 | $ | 387 | $ | 613 | |||||
2017 | 113 | 166 | 279 | ||||||||
2018 | 35 | 20 | 55 | ||||||||
2019 | 7 | — | 7 | ||||||||
2020 and beyond | — | — | — | ||||||||
$ | 381 | $ | 573 | $ | 954 | ||||||
92
PACIFIC MERCANTILE BANCORP AND SUBSIDIARIES
NOTES TO CONSOLIDATED FINANCIAL STATEMENTS
The aggregate amounts of stock based compensation expense recognized in our consolidated statements of operations for the years ended December 31, 2015, 2014 and 2013 were $1.2 million, $1.1 million and $804 thousand respectively, in each case net of taxes.
12. Employee Benefit Plans
The Company has a 401(k) plan that covers substantially all full-time employees. That plan permits voluntary contributions by employees, a portion of which are sometimes matched by the Company. The Company’s expenses relating to its contributions to the 401(k) plan for the years ended December 31, 2015, 2014 and 2013 were $164 thousand, $356 thousand, and $324 thousand, respectively.
In January 2001, the Company established an unfunded Supplemental Retirement Plan (“SERP”) for our former CEO, Raymond E. Dellerba, who retired from that position in April 2013. The SERP was amended and restated in April 2006 to comply with the requirements of new Section 409A of Internal Revenue Code. The SERP provides that, subject to meeting certain vesting requirements described below, upon reaching age 65, Mr. Dellerba will become entitled to receive 180 equal successive monthly retirement payments, each in an amount equal to 60% of his average monthly base salary during the three years immediately preceding his reaching 65 years old (the “Monthly SERP Benefit”). Mr. Dellerba reached the age of 65 in January 2013 and, as a result, a monthly benefit payment under the SERP to Mr. Dellerba commenced on February 1, 2013.
The Company follows FASB ASC 715-30-35, which requires us to recognize in our balance sheet the funded status of any post-retirement plans that we maintain and to recognize, in other comprehensive income, changes in funded status of any such plans in any year in which changes occur.
93
PACIFIC MERCANTILE BANCORP AND SUBSIDIARIES
NOTES TO CONSOLIDATED FINANCIAL STATEMENTS
The changes in the projected benefit obligations under the SERP during 2015, 2014 and 2013, its funded status at December 31, 2015, 2014 and 2013, and the amounts recognized in our consolidated statements of financial condition at each of those dates were as follows:
At December 31, | |||||||||||
(Dollars in thousands) | 2015 | 2014 | 2013 | ||||||||
Change in benefit obligation: | |||||||||||
Benefit obligation at beginning of period | $ | 2,815 | $ | 2,954 | $ | 3,042 | |||||
Service cost | — | — | 18 | ||||||||
Interest cost | 159 | 168 | 175 | ||||||||
Actuarial loss/(gain) | — | — | — | ||||||||
(Benefits paid) | (307 | ) | (307 | ) | (281 | ) | |||||
Benefit obligation at end of period | $ | 2,667 | $ | 2,815 | $ | 2,954 | |||||
Funded status: | |||||||||||
Amounts recognized in the Statement of Financial Condition | |||||||||||
Unfunded accrued SERP liability—current | $ | (299 | ) | $ | (299 | ) | $ | (299 | ) | ||
Unfunded accrued SERP liability—noncurrent | (2,368 | ) | (2,516 | ) | (2,655 | ) | |||||
Total unfunded accrued SERP liability | $ | (2,667 | ) | $ | (2,815 | ) | $ | (2,954 | ) | ||
Net amount recognized in accumulated other comprehensive income | |||||||||||
Prior service cost/(benefit) | $ | — | $ | — | $ | — | |||||
Net actuarial loss/(gain) | — | — | — | ||||||||
Total net amount recognized in accumulated other comprehensive income | $ | — | $ | — | $ | — | |||||
Accumulated benefit obligation | $ | 2,667 | $ | 2,815 | $ | 2,954 | |||||
Components of net periodic SERP cost year to date: | |||||||||||
Service cost | $ | — | $ | — | $ | 18 | |||||
Interest cost | 159 | 168 | 175 | ||||||||
Amortization of prior service cost/(benefit) | — | — | 1 | ||||||||
Amortization of net actuarial loss/(gain) | — | — | 30 | ||||||||
Net periodic SERP cost | $ | 159 | $ | 168 | $ | 224 | |||||
Recognized in other comprehensive income year to date: | |||||||||||
Prior service cost/(benefit) | |||||||||||
Net actuarial loss/(gain) | — | — | — | ||||||||
Amortization of prior service cost/(benefit) | — | — | (1 | ) | |||||||
Amortization of net actuarial loss/(gain) | — | — | (30 | ) | |||||||
Total recognized year to date in other comprehensive (loss) income | $ | — | $ | — | $ | (31 | ) | ||||
Assumptions as of December 31: | |||||||||||
Assumed discount rate | — | % | — | % | 6.00 | % | |||||
Rate of compensation increase | — | % | — | % | — | % | |||||
As of December 31, 2015, $1.5 million benefits are expected to be paid in the next five years and a total of $1.5 million of benefits are expected to be paid from year 2021 through year 2025. In 2016, $150,000 is expected to be recognized in net periodic benefit cost.
13. Earnings Per Share (“EPS”)
Basic EPS excludes dilution and is computed by dividing net income or loss available to common shareholders by the weighted average number of common shares outstanding for the period. Diluted EPS reflects the potential dilution that could occur if stock options or other contracts to issue common stock were exercised or converted into common stock that would then share in our earnings.
94
PACIFIC MERCANTILE BANCORP AND SUBSIDIARIES
NOTES TO CONSOLIDATED FINANCIAL STATEMENTS
The following table shows how we computed basic and diluted EPS for the years ended December 31, 2015, 2014 and 2013.
(In thousands, except per share data) | For the Year Ended December 31, | ||||||||||
2015 | 2014 | 2013 | |||||||||
Numerator: | |||||||||||
Net income (loss) from continuing operations | $ | 12,441 | $ | (869 | ) | $ | (14,934 | ) | |||
Accumulated declared dividends on preferred stock | — | (547 | ) | (538 | ) | ||||||
Accumulated undeclared dividends on preferred stock | — | (616 | ) | (544 | ) | ||||||
Dividends on preferred stock | (927 | ) | — | — | |||||||
Inducements for exchange of the preferred stock | (512 | ) | — | — | |||||||
Numerator for basic and diluted net income (loss) from continuing operations | 11,002 | (2,032 | ) | (16,016 | ) | ||||||
Net income (loss) from discontinued operations | — | 1,226 | (7,282 | ) | |||||||
Numerator for basic and diluted net income (loss) available to common shareholders | $ | 11,002 | $ | (806 | ) | $ | (23,298 | ) | |||
Denominator: | |||||||||||
Basic weighted average outstanding shares of common stock | 20,517 | 19,231 | 18,241 | ||||||||
Dilutive effect of employee stock options and contingently issuable shares | 159 | — | — | ||||||||
Diluted weighted average common stock and common stock equivalents | 20,675 | 19,231 | 18,241 | ||||||||
Basic income (loss) per common share(1): | |||||||||||
Net income (loss) from continuing operations | $ | 0.54 | $ | (0.11 | ) | $ | (0.88 | ) | |||
Net income (loss) from discontinued operations | $ | — | $ | 0.07 | $ | (0.40 | ) | ||||
Net income (loss) available to common shareholders | $ | 0.54 | $ | (0.04 | ) | $ | (1.28 | ) | |||
Diluted income (loss) per common share(1): | |||||||||||
Net income (loss) from continuing operations | $ | 0.53 | $ | (0.11 | ) | $ | (0.88 | ) | |||
Net income (loss) from discontinued operations | $ | — | $ | 0.07 | $ | (0.40 | ) | ||||
Net income (loss) available to common shareholders | $ | 0.53 | $ | (0.04 | ) | $ | (1.28 | ) | |||
(1) | The basic and diluted earnings per share amounts for the year ended December 31, 2015 are the same under both the Treasury Stock Method and the Two-Class Method as prescribed in FASB ASC 260-10, Earnings Per Share. The Two-Class Method is not required for the years ended December 31, 2014 and 2013. |
The weighted average shares that have an antidilutive effect in the calculation of diluted net income (loss) per share and have been excluded from the computations above were as follows:
For the Year Ended December 31, | ||||||||
2015 | 2014 | 2013 | ||||||
Stock options(1)(2) | 360,600 | 1,746,696 | 1,612,495 | |||||
Convertible securities(3) | — | 2,602,707 | 2,396,504 | |||||
Shares subject to stock purchase warrants(4) | — | 761,278 | 761,278 | |||||
(1) | Stock options were excluded from the computation of diluted earnings per common share for the year ended December 31, 2015 because the options were either “out-of-the-money” or the effect of exercise would have been antidilutive. |
(2) | Stock options were excluded from the computation of diluted earnings per common share for the years ended December 31, 2014 and 2013 as we reported a net loss from continuing operations. |
(3) | Convertible securities were excluded from the computation of diluted earnings per common share for the years ended December 31, 2014 and 2013 as we reported a net loss from continuing operations. |
(4) | Stock purchase warrants were excluded from the computation of diluted earnings per common share for the years ended December 31, 2014 and 2013 because the exercisability of those warrants was conditioned on the happening of certain future events. |
14. Shareholders’ Equity
Common Stock
As previously reported, in March 2013, we sold an additional 2,222,222 shares of our common stock, at a purchase price of $6.75 per shares in cash, to Carpenter Community Bancfund L.P. and Carpenter Community Bancfund-A, L.P. (collectively,
95
PACIFIC MERCANTILE BANCORP AND SUBSIDIARIES
NOTES TO CONSOLIDATED FINANCIAL STATEMENTS
the “Carpenter Funds”) for approximately $15.0 million. The purchase price of $6.75 per share of common stock was equal to our tangible book value per share of common stock as of December 31, 2012 and represented a 15% premium over the closing price of our shares on the last trading day immediately preceding the date the sale was consummated. The proceeds from the sale of those shares were contributed by us to capitalize a new wholly-owned asset management subsidiary, PMAR, which used those proceeds to fund the purchase of $15.8 million of non-performing loans and foreclosed properties from the Bank. As a result of the previous stock purchased by the Carpenter Funds, this transaction is considered to be a related party transaction.
Preferred Stock and Warrants
On August 28, 2015, we entered into an Exchange Agreement (the “Exchange Agreement”) with SBAV, LP, an affiliate of Clinton Group, Inc. (“SBAV”), and the Carpenter Funds pursuant to which SBAV and the Carpenter Funds exchanged an aggregate of 112,000 shares of the Company’s Series B Convertible 8.4% Noncumulative Preferred Stock (the “Series B Shares”), 35,225 shares of the Series C 8.4% Noncumulative Preferred Stock (the “Series C Shares”) and warrants to purchase 761,278 shares of the Company’s common stock (the “Warrants”) for an aggregate of 3,009,148 shares of the Company’s common stock (the “Exchange Transaction”). The Series B Shares, Series C Shares and Warrants exchanged by SBAV and the Carpenter Funds in the Exchange Transaction comprised all of the Company’s outstanding shares of preferred stock and warrants to purchase shares of the Company’s common stock. The Exchange Transaction closed on September 30, 2015. Due to the ownership interests of SBAV and the Carpenter Funds, this transaction is considered to be a related party transaction.
Accumulated Other Comprehensive Income, net
Accumulated other comprehensive income, net as of December 31, 2015, 2014 and 2013 was as follows:
Unrealized Gain (Loss) on Securities Available-for-Sale, net of tax | Unrealized Gain (Loss) on Supplemental Executive Plan Expense, net | Accumulated Other Comprehensive Income, Net | |||||||||
(Dollars in thousands) | |||||||||||
Beginning balance as of January 1, 2013 | $ | (545 | ) | $ | (20 | ) | $ | (565 | ) | ||
Other comprehensive income (loss) before reclassifications, net of tax benefit of $1,141 thousand (1) | (1,635 | ) | — | (1,635 | ) | ||||||
Amounts reclassified from accumulated other comprehensive income, net of tax provision of $18 thousand and tax provision of $10 thousand, respectively (2) | 26 | 20 | 46 | ||||||||
Other comprehensive (loss) income, net of tax benefit of $1,123 thousand and tax provision of $10 thousand, respectively | (1,609 | ) | 20 | (1,589 | ) | ||||||
Ending balance as of December 31, 2013 | $ | (2,154 | ) | $ | — | $ | (2,154 | ) | |||
Other comprehensive income before reclassifications, net of tax provision of $847 thousand (1) | 1,462 | — | 1,462 | ||||||||
Amounts reclassified from accumulated other comprehensive income, net of tax | — | — | — | ||||||||
Other comprehensive income, net of tax provision of $847 thousand | 1,462 | — | 1,462 | ||||||||
Ending balance as of December 31, 2014 | $ | (692 | ) | $ | — | $ | (692 | ) | |||
Other comprehensive income before reclassifications, net of tax provision of $81 thousand (1) | (118 | ) | — | (118 | ) | ||||||
Amounts reclassified from accumulated other comprehensive income, net of tax | — | — | — | ||||||||
Other comprehensive income, net of tax provision of $81 thousand | (118 | ) | — | (118 | ) | ||||||
Ending balance as of December 31, 2015 | $ | (810 | ) | $ | — | $ | (810 | ) | |||
(1) | Tax impact included in Deferred tax assets. |
(2) | Gross amounts related to Unrealized Gain (Loss) on Securities Available-for-Sale, net of tax are included in Net gains on sale of securities available for sale. Gross amounts related to Unrealized Gain (Loss) on Supplemental Executive Plan Expense, net are included in Salaries and employee benefits. Related tax impact amounts are included in Income tax provision (benefit). |
96
PACIFIC MERCANTILE BANCORP AND SUBSIDIARIES
NOTES TO CONSOLIDATED FINANCIAL STATEMENTS
Dividends
Payment of Cash Dividends by the Company. California laws place restrictions on the ability of California corporations to pay cash dividends on preferred or common stock. Subject to certain limited exceptions, a California corporation may pay cash dividends only to the extent of (i) the amount of its retained earnings or (ii) the amount by which the fair value of the corporation’s assets exceeds its liabilities. The Company's ability to pay dividends is also limited by the ability of the Bank to pay cash dividends to the Company. See “—Payment of Dividends by the Bank to the Company” below. During the years ended December 31, 2015, 2014 and 2013, we issued 5,917, 11,123, and 5,382 Series C Shares, respectively, in lieu of accumulated declared and undeclared dividends on the Series B Shares. As of December 31, 2015, we had no outstanding Series C Shares or Series B Shares as a result of the Exchange Transaction noted above in “Preferred Stock and Warrants.”
Payment of Dividends by the Bank to the Company. Generally, the principal source of cash available to a bank holding company consists of cash dividends from its bank subsidiaries. Under California law, the Board of Directors of the Bank may declare and pay cash dividends to the Company, which is its sole shareholder, subject to the restriction that the amount available for the payment of cash dividends may not exceed the lesser of (i) the Bank’s retained earnings or (ii) its net income for its last three fiscal years (less the amount of any dividends paid during such period). Cash dividends by the Bank to the Company in excess of that amount may be made only with the prior approval of the California Commissioner of Financial Institutions (“Commissioner”). If the Commissioner finds that the shareholders’ equity of the Bank is not adequate, or that the payment by the Bank of cash dividends to the Company would be unsafe or unsound for the Bank, the Commissioner can order the Bank not to pay such dividends.
The ability of the Bank to pay dividends is further restricted under the Federal Deposit Insurance Corporation Improvement Act of 1991, which prohibits an FDIC-insured bank from paying dividends if, after making such payment, the bank would fail to meet any of its minimum capital requirements. Under the Financial Institutions Supervisory Act and Federal Financial Institutions Reform, Recovery and Enforcement Act of 1989, federal banking regulators also have authority to prohibit FDIC-insured financial institutions from engaging in business practices which are considered to be unsafe or unsound. Under the authority of these acts, federal bank regulatory agencies, as part of their supervisory powers, generally require FDIC insured banks to adopt dividend policies which limit the payment of cash dividends.
As a result, it is not expected that the Bank will be permitted to pay cash dividends for the foreseeable future.
While restrictions on the payment of dividends from the Bank to us exist, there are no restrictions on the dividends that PMAR may pay to the Company. PMAR has approximately $14.7 million in assets and could provide the Company with additional cash if required.
15. Commitments and Contingencies
Leases
We lease certain facilities and equipment under various non-cancelable operating leases, which generally include 2% to 6% escalation clauses in the lease agreements. Rent expense for the years ended December 31, 2015, 2014 and 2013 was $2.8 million, $2.6 million, and $2.7 million, respectively.
Future minimum non-cancelable lease commitments were as follows at December 31, 2015:
(Dollars in thousands) | |||
2016 | $ | 2,302 | |
2017 | 1,467 | ||
2018 | 1,327 | ||
2019 | 1,340 | ||
2020 and beyond | 507 | ||
Total | $ | 6,943 | |
Repurchase Reserves
We have historically maintained reserves for possible repurchases that we may have been required to make of certain of the mortgage loans which we sold as a result of deficiencies or defects that may be found to exist in such loans. Our repurchase reserve also covered returns of any premiums earned and administrative fees pertaining to the repurchase of mortgage loans that did not meet investor guidelines, including potential loss of advances on Veterans Affairs or Federal Housing Authority Ginnie Mae loans. As a result of our exit from the mortgage banking business and no longer being subject to potential loss for anything
97
PACIFIC MERCANTILE BANCORP AND SUBSIDIARIES
NOTES TO CONSOLIDATED FINANCIAL STATEMENTS
other than mortgage fraud, we have undertaken an analysis of our accrual. Our analysis assumes that the repurchase liability exposure will decrease over time as mortgage loans are paid off and as we are no longer originating new mortgage loans. We repurchased $619 thousand and $1.3 million of loans during the years ended December 31, 2015 and 2014, respectively. We review the repurchase reserves throughout the year for adequacy. The following table sets forth information, at December 31, 2015 and 2014, with respect to our reserves:
2015 | 2014 | ||||||
Beginning balance | $ | 381 | $ | 1,883 | |||
Provision for repurchases | (1 | ) | (1,502 | ) | |||
Settlements | (66 | ) | — | ||||
Total repurchases reserve | $ | 314 | $ | 381 | |||
Commitments
To meet the financing needs of our customers in the normal course of business, we are a party to financial instruments with off-balance sheet risk. These financial instruments include commitments to extend credit and standby letters of credit. These instruments involve, to varying degrees, elements of credit and interest rate risk in excess of the amount recognized in the consolidated financial statements. At December 31, 2015 and 2014, we were committed to fund certain loans including letters of credit amounting to approximately $193 million and $148 million, respectively. The contractual amounts of a credit-related financial instrument, such as a commitment to extend credit, a credit-card arrangement or a letter of credit, represents the amount of potential accounting loss should the commitment be fully drawn upon, the customer were to default, and the value of any existing collateral securing the customer’s payment obligation becomes worthless. The loss reserve for unfunded loan commitments was $275,000 at each of December 31, 2015 and 2014.
As a result, we use the same credit policies in making commitments to extend credit and conditional obligations as we do for on-balance sheet instruments. Commitments generally have fixed expiration dates; however, since many of the commitments are expected to expire without being drawn upon, the total commitment amounts do not necessarily represent future cash requirements. We evaluate each customer’s creditworthiness on a case-by-case basis, using the same credit underwriting standards that are employed in making commercial loans. The amount of collateral obtained, if any, upon an extension of credit is based on our evaluation of the creditworthiness of the customer. Collateral held varies, but may include accounts receivable, inventory, property, plant and equipment, residential real estate and income-producing commercial properties.
We are required to purchase stock in the FRBSF in an amount equal to 6% of our capital, one-half of which must be paid currently with the balance due upon request.
The Bank is a member of the FHLB and therefore, is required to purchase FHLB stock in an amount equal to the lesser of 1% of the Bank’s real estate loans that are secured by residential properties, or 5% of total advances.
Litigation, Claims and Assessments
We are a defendant in or a party to a number of legal actions or proceedings that arise in the ordinary course of business. In some of these actions and proceedings, claims for monetary damages are asserted against us.
In accordance with applicable accounting guidance, we establish an accrued liability for lawsuits or other legal proceedings when they present loss contingencies that are both probable and estimable. We estimate any potential loss based upon currently available information and significant judgments and a variety of assumptions, and known and unknown uncertainties. Moreover, the facts and circumstances on which such estimates are based will change over time. Therefore, the amount of any losses we might incur in any lawsuits or other legal proceedings may exceed amounts which we had accrued based on our estimates and those estimates do not represent the maximum loss exposure that we may have in connection with any lawsuits or other legal proceedings.
Based on our evaluation of the lawsuits and other proceedings that were pending against us as of December 31, 2015, the outcomes in those suits or other proceedings are not expected to have, either individually or in the aggregate, a material adverse effect on our consolidated financial position, results of operations or cash flows. However, in light of the inherent uncertainties involved, some of which are beyond our control, and the very large or indeterminate damages often sought in such legal actions or proceedings, an adverse outcome in one or more of these suits or proceedings could be material to our results of operations or cash flows for any particular reporting period.
16. Capital/Operating Plans
98
PACIFIC MERCANTILE BANCORP AND SUBSIDIARIES
NOTES TO CONSOLIDATED FINANCIAL STATEMENTS
The Company and the Bank are subject to various regulatory capital requirements administered by the federal and state banking agencies. A failure to meet minimum capital requirements is likely to lead to the imposition by federal and state regulators of (i) certain requirements, such as an order requiring additional capital to be raised, and (ii) operational restrictions that could have a direct and material adverse effect on operating results. Under capital adequacy guidelines and the regulatory framework for prompt corrective action, the Company and the Bank must meet specific capital guidelines that involve quantitative measures of assets, liabilities, and certain off-balance sheet items as calculated under regulatory accounting practices. The capital amounts and classifications are also subject to qualitative judgments by the regulators about components, risk weightings, and other factors.
Quantitative measures established by regulation to ensure capital adequacy require the Company and Bank to maintain minimum amounts and ratios (set forth in the following table) of total capital, common equity Tier 1 capital and Tier I capital (as defined in the regulations) to risk-weighted assets (as defined), and of Tier I capital (as defined) to average assets (as defined). We believe that, as of December 31, 2015, the Company and the Bank met all capital adequacy requirements to which they are subject and have not been notified by any regulatory agency that would require the Company or the Bank to maintain additional capital.
The actual capital amounts and ratios of the Company and the Bank at December 31, 2015 and December 31, 2014 are presented in the following tables:
Applicable Federal Regulatory Requirement | ||||||||||||||||||
At December 31, 2015 | Actual Capital | For Capital Adequacy Purposes | To be Categorized As Well Capitalized | |||||||||||||||
Amount | Ratio | Amount | Ratio | Amount | Ratio | |||||||||||||
(Dollars in thousands) | ||||||||||||||||||
Total Capital to Risk Weighted Assets: | ||||||||||||||||||
Company | $ | 154,884 | 16.8 | % | $ | 73,871 | At least 8.0 | N/A | N/A | |||||||||
Bank | 136,457 | 15.0 | % | 72,672 | At least 8.0 | $ | 90,841 | At least 10.0 | ||||||||||
Common Equity Tier 1 Capital to Risk Weighted Assets: | ||||||||||||||||||
Company | 131,188 | 14.2 | % | 41,552 | At least 4.5 | N/A | N/A | |||||||||||
Bank | 125,018 | 13.8 | % | 40,878 | At least 4.5 | 59,046 | At least 6.5 | |||||||||||
Tier 1 Capital to Risk Weighted Assets: | ||||||||||||||||||
Company | $ | 143,260 | 15.5 | % | $ | 55,403 | At least 6.0 | N/A | N/A | |||||||||
Bank | 125,018 | 13.8 | % | 54,504 | At least 6.0 | $ | 72,672 | At least 8.0 | ||||||||||
Tier 1 Capital to Average Assets: | ||||||||||||||||||
Company | $ | 143,260 | 13.3 | % | $ | 42,984 | At least 4.0 | N/A | N/A | |||||||||
Bank | 125,018 | 11.8 | % | 42,319 | At least 4.0 | $ | 52,899 | At least 5.0 | ||||||||||
Applicable Federal Regulatory Requirement | ||||||||||||||||||
At December 31, 2014 | Actual Capital | For Capital Adequacy Purposes | To be Categorized As Well Capitalized | |||||||||||||||
Amount | Ratio | Amount | Ratio | Amount | Ratio | |||||||||||||
(Dollars in thousands) | ||||||||||||||||||
Total Capital to Risk Weighted Assets: | ||||||||||||||||||
Company | $ | 142,142 | 17.0 | % | $ | 66,924 | At least 8.0 | N/A | N/A | |||||||||
Bank | 122,930 | 14.8 | % | 66,524 | At least 8.0 | $ | 83,155 | At least 10.0 | ||||||||||
Tier 1 Capital to Risk Weighted Assets: | ||||||||||||||||||
Company | $ | 131,635 | 15.7 | % | $ | 33,462 | At least 4.0 | N/A | N/A | |||||||||
Bank | 112,485 | 13.5 | % | 33,262 | At least 4.0 | $ | 49,893 | At least 6.0 | ||||||||||
Tier 1 Capital to Average Assets: | ||||||||||||||||||
Company | $ | 131,635 | 12.2 | % | $ | 43,055 | At least 4.0 | N/A | N/A | |||||||||
Bank | 112,485 | 10.5 | % | 42,806 | At least 4.0 | $ | 53,508 | At least 5.0 | ||||||||||
As the above tables indicate, at December 31, 2015 and 2014, the Bank (on a stand-alone basis) qualified as a “well—capitalized” institution, and the capital ratios of the Company (on a consolidated basis) exceeded the capital ratios mandated for bank holding companies, under federally mandated capital standards and federally established prompt corrective action regulations.
99
PACIFIC MERCANTILE BANCORP AND SUBSIDIARIES
NOTES TO CONSOLIDATED FINANCIAL STATEMENTS
Since December 31, 2015, there have been no events or circumstances known to us which have changed or which are expected to result in a change in the Company’s or the Bank’s classification as well-capitalized institutions.
In early July 2013, the Federal Reserve Board and the FDIC issued final rules implementing the Basel III regulatory capital framework and related Dodd-Frank Wall Street Reform and Consumer Protection Act changes. The rules revise minimum capital requirements and adjust prompt corrective action thresholds. The final rules revise the regulatory capital elements, add a new common equity Tier 1 capital ratio, increase the minimum Tier 1 capital ratio requirement, and implement a new capital conservation buffer. The rules also permit certain banking organizations to retain, through a one-time election, the existing treatment for accumulated other comprehensive income. The final rules took effect for community banks on January 1, 2015, subject to a transition period for certain parts of the rules. At December 31, 2015 the Bank (on a stand-alone basis) continued to qualify as a well-capitalized institution, and the Company continued to exceed the minimum required capital ratios applicable to it, under the capital adequacy guidelines described above.
17. Parent Company Only Information
Condensed Statements of Financial Condition
December 31, | |||||||
(Dollars in thousands) | 2015 | 2014 | |||||
Assets: | |||||||
Due from banks and interest-bearing deposits with financial institutions | $ | 9,736 | $ | 8,805 | |||
Investment in subsidiaries | 141,197 | 127,419 | |||||
Other assets | 649 | 641 | |||||
Total assets | $ | 151,582 | $ | 136,865 | |||
Liabilities and shareholders’ equity: | |||||||
Liabilities | $ | 139 | $ | 57 | |||
Junior subordinated debentures | 17,527 | 17,527 | |||||
Shareholders’ equity | 133,916 | 119,281 | |||||
Total liabilities and shareholders’ equity | $ | 151,582 | $ | 136,865 | |||
Condensed Statements of Operations
Year Ended December 31, | |||||||||||
(Dollars in thousands) | 2015 | 2014 | 2013 | ||||||||
Interest income | $ | 9 | $ | 10 | $ | 60 | |||||
Interest expense | (507 | ) | (580 | ) | (544 | ) | |||||
Other income | 28 | 81 | — | ||||||||
Other expenses | (984 | ) | (849 | ) | (1,934 | ) | |||||
Equity in undistributed earnings of subsidiaries | 13,895 | 1,695 | (19,798 | ) | |||||||
Net (loss) income | $ | 12,441 | $ | 357 | $ | (22,216 | ) | ||||
100
PACIFIC MERCANTILE BANCORP AND SUBSIDIARIES
NOTES TO CONSOLIDATED FINANCIAL STATEMENTS
Condensed Statements of Cash Flows
Year Ended December 31, | |||||||||||
(Dollars in thousands) | 2015 | 2014 | 2013 | ||||||||
Cash Flows from Operating Activities: | |||||||||||
Net income (loss) | $ | 12,441 | $ | 357 | $ | (22,216 | ) | ||||
Adjustments to reconcile net income (loss) to net cash used in operating activities: | |||||||||||
Net increase in other assets | (7 | ) | (47 | ) | (2 | ) | |||||
Stock-based compensation expense | 1,233 | 1,139 | 804 | ||||||||
Undistributed (income) loss of subsidiary | (13,895 | ) | (1,695 | ) | 19,798 | ||||||
Net increase (decrease) in interest payable | 81 | (2,055 | ) | 544 | |||||||
Net (decrease) increase in other liabilities | — | (220 | ) | 220 | |||||||
Net cash used in operating activities | (147 | ) | (2,521 | ) | (852 | ) | |||||
Cash Flows from Investing Activities: | |||||||||||
Proceeds from dissolution of trust preferred securities | — | — | 155 | ||||||||
Net cash provided by investing activities | — | — | 155 | ||||||||
Cash Flows from Financing Activities: | |||||||||||
Proceeds from sale of common stock | (324 | ) | — | 14,978 | |||||||
Common stock options exercised | 1,511 | 1,218 | 303 | ||||||||
Tax effect included in stockholders equity of restricted stock vesting | (109 | ) | (52 | ) | — | ||||||
Capital contribution to subsidiaries | — | — | (17,000 | ) | |||||||
Net cash provided by (used in) financing activities | 1,078 | 1,166 | (1,719 | ) | |||||||
Net increase (decrease) in cash and cash equivalents | 931 | (1,355 | ) | (2,416 | ) | ||||||
Cash and Cash Equivalents, beginning of period | 8,805 | 10,160 | 12,576 | ||||||||
Cash and Cash Equivalents, end of period | $ | 9,736 | $ | 8,805 | $ | 10,160 | |||||
18. Business Segment Information
We have one reportable business segment, commercial banking. The commercial banking segment provides small and medium-size businesses, professional firms and individuals with a diversified range of products and services such as various types of deposit accounts, various types of commercial and consumer loans, cash management services, and online banking services. We also have one non-reportable segment, discontinued operations, which is comprised of our mortgage banking business. Our mortgage banking business originated mortgage loans that, for the most part, were resold within 30 days to long-term investors in the secondary residential mortgage market.
Since our operating segment derives all of its revenues from interest and noninterest income and interest expense constitutes its most significant expense, this segment, as well as our discontinued operations, are reported below using net interest income (interest income less interest expense) and noninterest income (primarily net gains on sales of SBA loans and fee income). We do not allocate general and administrative expenses or income taxes to our operating segment.
101
PACIFIC MERCANTILE BANCORP AND SUBSIDIARIES
NOTES TO CONSOLIDATED FINANCIAL STATEMENTS
The following table sets forth information regarding the net interest income and noninterest income for our commercial banking and discontinued operations segments, respectively, for the years ended December 31, 2015, 2014 and 2013.
(Dollars in thousands) | Commercial | Other | Total from continuing operations | Discontinued Operations | Total including discontinued operations | ||||||||||||||
Net interest income for the year ended December 31, | |||||||||||||||||||
2015 | $ | 33,932 | $ | (404 | ) | $ | 33,528 | $ | — | $ | 33,528 | ||||||||
2014 | $ | 32,702 | $ | (241 | ) | $ | 32,461 | $ | 77 | $ | 32,538 | ||||||||
2013 | $ | 30,652 | $ | (318 | ) | $ | 30,334 | $ | 488 | $ | 30,822 | ||||||||
Noninterest income for the year ended December 31, | |||||||||||||||||||
2015 | $ | 2,658 | $ | 28 | $ | 2,686 | $ | — | $ | 2,686 | |||||||||
2014 | $ | 4,289 | $ | 81 | $ | 4,370 | $ | 1,039 | $ | 5,409 | |||||||||
2013 | $ | 806 | $ | 387 | $ | 1,193 | $ | 5,691 | $ | 6,884 | |||||||||
Segment Assets at: | |||||||||||||||||||
December 31, 2015 | $ | 1,051,501 | $ | 10,888 | $ | 1,062,389 | $ | — | $ | 1,062,389 | |||||||||
December 31, 2014 | $ | 1,094,120 | $ | 5,490 | $ | 1,099,610 | $ | — | $ | 1,099,610 | |||||||||
19. Unaudited Quarterly Information
Unaudited quarterly information for each of the three months in the years ended December 31, 2015 and 2014 was as follows:
Three Months Ended | |||||||||||||||
December 31, 2015 | September 30, 2015 | June 30, 2015 | March 31, 2015 | ||||||||||||
(in thousands, except per share data) | |||||||||||||||
Total interest income | $ | 9,860 | $ | 9,653 | $ | 9,813 | $ | 9,471 | |||||||
Total interest expense | 1,281 | 1,342 | 1,324 | 1,322 | |||||||||||
Net interest income | 8,579 | 8,311 | 8,489 | 8,149 | |||||||||||
Provision for loan and lease losses | — | — | — | — | |||||||||||
Net interest income after provision for loan and lease losses | 8,579 | 8,311 | 8,489 | 8,149 | |||||||||||
Total noninterest income | 626 | 562 | 616 | 882 | |||||||||||
Total noninterest expense | 8,689 | 8,552 | 8,967 | 9,116 | |||||||||||
Income (loss) from continuing operations before income taxes | 516 | 321 | 138 | (85 | ) | ||||||||||
Income tax (benefit) provision | (11,551 | ) | — | — | — | ||||||||||
Net income (loss) from continuing operations | $ | 12,067 | $ | 321 | $ | 138 | $ | (85 | ) | ||||||
Accumulated undeclared dividends on preferred stock | — | — | (309 | ) | (309 | ) | |||||||||
Dividends on preferred stock | — | (309 | ) | — | — | ||||||||||
Inducements for exchange of the preferred stock | — | (512 | ) | — | — | ||||||||||
Net loss allocable to common shareholders | $ | 12,067 | $ | (500 | ) | $ | (171 | ) | $ | (394 | ) | ||||
Per share data-basic: | |||||||||||||||
Net (loss) income from continuing operations | $ | 0.53 | $ | (0.03 | ) | $ | (0.01 | ) | $ | (0.02 | ) | ||||
Net (loss) income allocable to common shareholders | $ | 0.53 | $ | (0.03 | ) | $ | (0.01 | ) | $ | (0.02 | ) | ||||
Per share data-diluted: | |||||||||||||||
Net (loss) income from continuing operations | $ | 0.53 | $ | (0.03 | ) | $ | (0.01 | ) | $ | (0.02 | ) | ||||
Net (loss) income allocable to common shareholders | $ | 0.53 | $ | (0.03 | ) | $ | (0.01 | ) | $ | (0.02 | ) | ||||
102
PACIFIC MERCANTILE BANCORP AND SUBSIDIARIES
NOTES TO CONSOLIDATED FINANCIAL STATEMENTS
Three Months Ended | |||||||||||||||
December 31, 2014 | September 30, 2014 | June 30, 2014 | March 31, 2014 | ||||||||||||
(in thousands, except per share data) | |||||||||||||||
Total interest income | $ | 10,205 | $ | 9,664 | $ | 9,134 | $ | 9,287 | |||||||
Total interest expense | 1,525 | 1,353 | 1,508 | 1,443 | |||||||||||
Net interest income | 8,680 | 8,311 | 7,626 | 7,844 | |||||||||||
Provision for loan and lease losses | — | 450 | 600 | 450 | |||||||||||
Net interest income after provision for loan and lease losses | 8,680 | 7,861 | 7,026 | 7,394 | |||||||||||
Total noninterest income | 1,238 | 854 | 984 | 1,294 | |||||||||||
Total noninterest expense | 9,580 | 9,029 | 8,778 | 9,421 | |||||||||||
Income (loss) from continuing operations before income taxes | 338 | (314 | ) | (768 | ) | (733 | ) | ||||||||
Income tax (benefit) provision | (608 | ) | — | — | — | ||||||||||
Net income (loss) from continuing operations | $ | 946 | $ | (314 | ) | $ | (768 | ) | $ | (733 | ) | ||||
Net (loss) income from discontinued operations | (659 | ) | (71 | ) | 772 | 1,184 | |||||||||
Accumulated declared dividends on preferred stock | — | — | — | — | |||||||||||
Accumulated undeclared dividends on preferred stock | (251 | ) | (308 | ) | (308 | ) | (296 | ) | |||||||
Net loss allocable to common shareholders | $ | 36 | $ | (693 | ) | $ | (304 | ) | $ | 155 | |||||
Per share data-basic: | |||||||||||||||
Net (loss) income from continuing operations | $ | 0.01 | $ | (0.03 | ) | $ | (0.06 | ) | $ | (0.05 | ) | ||||
Net (loss) income allocable to common shareholders | $ | 0.01 | $ | (0.04 | ) | $ | (0.02 | ) | $ | 0.01 | |||||
Per share data-diluted: | |||||||||||||||
Net (loss) income from continuing operations | $ | 0.01 | $ | (0.03 | ) | $ | (0.06 | ) | $ | (0.05 | ) | ||||
Net (loss) income allocable to common shareholders | $ | 0.01 | $ | (0.04 | ) | $ | (0.02 | ) | $ | 0.01 | |||||
ITEM 9. | CHANGES IN AND DISAGREEMENTS WITH ACCOUNTANTS ON ACCOUNTING AND FINANCIAL DISCLOSURES |
None.
ITEM 9A. CONTROLS AND PROCEDURES
Disclosure Controls and Procedures
We maintain disclosure controls and procedures that are designed to ensure that information required to be disclosed in our reports under the Securities Exchange Act of 1934, as amended (the “Exchange Act”) is recorded, processed, summarized and reported within the time periods specified in the rules and forms of the SEC, and that such information is accumulated and communicated to our management, including our Chief Executive Officer and Chief Financial Officer, to allow timely decisions regarding required disclosure. In designing and evaluating our disclosure controls and procedures, our management recognized that any system of controls and procedures, no matter how well designed and operated, can provide only reasonable assurance of achieving the desired control objectives, as ours are designed to do, and management necessarily was required to apply its judgment in evaluating the cost-benefit relationship of possible controls and procedures.
As required by SEC rules, an evaluation was performed under the supervision and with the participation of our Chief Executive Officer and Chief Financial Officer of the effectiveness, as of December 31, 2015, of the Company’s disclosure controls and procedures (as defined in Rule 13a-15(e) under the Exchange Act). Based on that evaluation, our Chief Executive Officer and Chief Financial Officer concluded that, as of December 31, 2015, the Company’s disclosure controls and procedures were effective to provide reasonable assurance that information required to be disclosed in the reports that we file under the Exchange Act is recorded, processed, summarized and reported within the time periods specified in the SEC’s rules and forms and that such information is accumulated and communicated to management, including our Chief Executive Officer and Chief Financial Officer, to allow timely decisions regarding required disclosure.
103
Internal Control Over Financial Reporting
Management’s Annual Report on Internal Control Over Financial Reporting
Management of Pacific Mercantile Bancorp is responsible for establishing and maintaining adequate internal control over financial reporting as defined in Rules 13a-15(f) and 15d-15(f) under the Securities Exchange Act of 1934. Our internal control over financial reporting is a process designed to provide reasonable assurance regarding the reliability of financial reporting and the preparation of financial statements for external purposes in accordance with accounting principles generally accepted in the United States of America. Internal control over financial reporting includes those written policies and procedures that:
• | pertain to the maintenance of records that, in reasonable detail, accurately and fairly reflect the transactions and dispositions of our assets; |
• | provide reasonable assurance that transactions are recorded as necessary to permit preparation of financial statements in accordance with accounting principles generally accepted in the United States of America; |
• | provide reasonable assurance that our receipts and expenditures are being made only in accordance with authorization of our management and board of directors; and |
• | provide reasonable assurance regarding prevention or timely detection of unauthorized acquisition, use or disposition of assets that could have a material effect on our consolidated financial statements. |
Internal control over financial reporting includes the controls themselves, monitoring and internal auditing practices and actions taken to correct deficiencies as identified. Because of its inherent limitations, internal control over financial reporting may not prevent or detect misstatements. Also, projections of any evaluation of effectiveness to future periods are subject to the risks that controls may become inadequate because of changes in conditions or because the degree of compliance with the policies or procedures may deteriorate.
Our management assessed the effectiveness of the Company’s internal control over financial reporting as of December 31, 2015, based on criteria for effective internal control over financial reporting described in “Internal Control – Integrated Framework” (2013) issued by the Committee of Sponsoring Organizations of the Treadway Commission. Management’s assessment included an evaluation of the design and the testing of the operational effectiveness of the Company’s internal control over financial reporting. Management reviewed the results of its assessment with the Audit Committee of our Board of Directors.
Based on that assessment, management concluded that the Company's internal control over financial reporting was effective as of December 31, 2015.
The Company's independent registered public accounting firm, RSM US LLP, has issued an audit report regarding its assessment of the Company's internal control over financial reporting as of December 31, 2015, which appears on page 55 herein.
Changes in Internal Control Over Financial Reporting
There have been no changes in our internal control over financial reporting during the quarter ended December 31, 2015 that materially affected, or are reasonably likely to materially affect, our internal control over financial reporting.
ITEM 9B. OTHER INFORMATION
None.
104
PART III
ITEM 10. DIRECTORS, EXECUTIVE OFFICERS AND CORPORATE GOVERNANCE
Except for the information regarding our Code of Business and Ethical Conduct below, the information required by this Item 10 is hereby incorporated by reference to Pacific Mercantile Bancorp’s definitive proxy statement, expected to be filed with the SEC on or before April 29, 2016, for its Annual Meeting of Shareholders.
Our Board has adopted a Code of Business and Ethical Conduct (the "Code") that applies to all of our officers and employees and also includes specific ethical policies and principles, that apply to our Chief Executive Officer, Chief Financial Officer, the Bank's Chief Operating Officer and other key accounting and finance personnel. The Code, as applied to our principal executive officer, principal financial officer and principal accounting officer, constitutes our "code of ethics" within the meaning of Section 406 of the Sarbanes-Oxley Act and is our "code of conduct" within the meaning of the listing standards of the NASDAQ Stock Market LLC.
The Code is available in the Investor Relations section of our website at www.pmbank.com. To the extent required by applicable rules of the SEC and the NASDAQ Stock Market LLC, we will disclose on our website any amendments to the Code and any waivers of the requirements of the Code that may be granted to our executive officers, including our principal executive officer, principal financial officer, principal accounting officer or persons performing similar functions.
ITEM 11. EXECUTIVE COMPENSATION
The information required by this Item 11 is hereby incorporated by reference to Pacific Mercantile Bancorp’s definitive proxy statement, expected to be filed with the SEC on or before April 29, 2016, for its Annual Meeting of Shareholders.
ITEM 12. | SECURITY OWNERSHIP OF CERTAIN BENEFICIAL OWNERS AND MANAGEMENT AND RELATED STOCKHOLDER MATTERS |
The information required by Item 12 is incorporated herein by reference from our definitive proxy statement expected to be filed with the SEC on or before April 29, 2016, for its Annual Meeting of Shareholders.
ITEM 13. | CERTAIN RELATIONSHIPS AND RELATED TRANSACTIONS, AND DIRECTOR INDEPENDENCE |
The information required by this Item 13 is hereby incorporated by reference to Pacific Mercantile Bancorp’s definitive proxy statement expected to be filed with the SEC on or before April 29, 2016, for its Annual Meeting of Shareholders.
ITEM 14. PRINCIPAL ACCOUNTING FEES AND SERVICES
The information required by this Item 14 is hereby incorporated by reference to Pacific Mercantile Bancorp’s definitive proxy statement expected to be filed with the SEC on or before April 29, 2016, for its Annual Meeting of Shareholders.
105
PART IV
ITEM 15. EXHIBITS AND FINANCIAL STATEMENT SCHEDULES
The following documents are filed as part of this Report:
(1) | Financial Statements. The Consolidated Financial Statements of Pacific Mercantile Bancorp: See Index to Consolidated Financial Statements on Page 57 of this Annual Report. |
(2) | Financial Statement Schedules. No financial statement schedules are included in this Annual Report as such schedules are not required or the information that would be included in such schedules is not material or is otherwise furnished. |
(3) | Exhibits. See Index to Exhibits, elsewhere in this Report, for a list and description of (i) exhibits previously filed by the Company with the Commission and (ii) the exhibits being filed with this Report. |
106
SIGNATURES
Pursuant to the requirements of Section 13 or 15(d) of the Securities Exchange Act of 1934, the registrant has duly caused this report to be signed on its behalf by the undersigned, thereunto duly authorized, on March 14, 2016.
PACIFIC MERCANTILE BANCORP | ||
By: | /S/ THOMAS M. VERTIN | |
Thomas M. Vertin | ||
President and Chief Executive Officer | ||
POWER OF ATTORNEY
Each person whose signature appears below hereby appoints Thomas M. Vertin and Curt Christianssen, and each of them individually, to act severally as his or her attorneys-in-fact and agent, with full power and authority, including the power of substitution and resubstitution, to sign and file on his or her behalf and in each capacity stated below, all amendments and/or supplements to this Annual Report on Form 10-K, which amendments or supplements may make changes and additions to this Report as such attorneys-in-fact, or any of them, may deem necessary or appropriate.
Pursuant to the requirements of the Securities Exchange Act of 1934, this Report on Form 10-K has been signed below by the following persons in their respective capacities and on the date or dates indicated below.
/S/ THOMAS M. VERTIN | President, Chief Executive Officer and Director (Principal Executive Officer) | March 14, 2016 | ||
Thomas M. Vertin | ||||
/S/ CURT CHRISTIANSSEN | Chief Financial Officer (Principal Financial Officer) | March 14, 2016 | ||
Curt Christianssen | ||||
/S/ NANCY GRAY | Chief Accounting Officer (Principal Accounting Officer) | March 14, 2016 | ||
Nancy Gray | ||||
/s/ EDWARD J. CARPENTER | Chairman of the Board and Director | March 14, 2016 | ||
Edward J. Carpenter | ||||
/S/ ROMIR BOSU | Director | March 14, 2016 | ||
Romir Bosu | ||||
/S/ WARREN T. FINLEY | Director | March 14, 2016 | ||
Warren T. Finley | ||||
/S/ JOHN D. FLEMMING | Director | March 14, 2016 | ||
John D. Flemming | ||||
/s/ MICHAEL P. HOOPIS | Director | March 14, 2016 | ||
Michael P. Hoopis | ||||
/s/ DENIS KALSCHEUR | Director | March 14, 2016 | ||
Denis Kalscheur | ||||
/s/ DAVID J. MUNIO | Director | March 14, 2016 | ||
David Munio | ||||
/S/ JOHN THOMAS, M.D. | Director | March 14, 2016 | ||
John Thomas, M.D | ||||
/S/ STEPHEN P. YOST | Director | March 14, 2016 | ||
Stephen P. Yost | ||||
S-1
EXHIBIT INDEX
Exhibit No. | Description of Exhibit | |
3.1 | Articles of Incorporation of Pacific Mercantile Bancorp. (Incorporated by reference to the same numbered exhibit to the Company’s Registration Statement (No. 333-33452) on Form S-1 filed with the Commission on March 28, 2000.) | |
3.2 | Certificate of Amendment of Articles of Incorporation of Pacific Mercantile Bancorp (Incorporated by reference to Exhibit 3.1 to the Quarterly Report on Form 10-Q filed with the Commission on August 14, 2001.) | |
3.3 | Certificate of Amendment of Articles of Incorporation of Pacific Mercantile Bancorp (Incorporated by reference to Exhibit 3.1 to the Current Report on Form 8-K dated January 26, 2012 and filed with the Commission on February 1, 2012.) | |
3.4 | Certificate of Determination of Rights, Preferences, Privileges and Restrictions of Series A Convertible 10% Cumulative Preferred Stock of Pacific Mercantile Bancorp. (Incorporated by reference to Exhibit 3.1 to the Current Report on Form 8-K (No. 000-30777) dated October 13, 2009.) | |
3.5 | Certificate of Amendment of Certificate of Determination of Rights, Preferences, Privileges and Restrictions of the Series A Convertible 10% Cumulative Preferred Stock of Pacific Mercantile Bancorp. (Incorporated by reference to Exhibit 3.2 to the Current Report on Form 8-K dated January 26, 2012 and filed with the Commission on February 1, 2012.) | |
3.6 | Certificate of Determination of Rights, Preferences, Privileges and Restrictions of the Series B Convertible 8.4% Noncumulative Preferred Stock of Pacific Mercantile Bancorp. (Incorporated by reference to Exhibit 3.1 to the Current Report on Form 8-K (No. 000-30777) dated August 22, 2011.) | |
3.7 | Certificate of Determination of Rights, Preferences, Privileges and Restrictions of the Series C 8.4% Noncumulative Preferred Stock of Pacific Mercantile Bancorp. (Incorporated by reference to Exhibit 3.2 to the Current Report on Form 8-K (No. 000-30777) dated August 22, 2011.) | |
3.8 | Pacific Mercantile Bancorp Bylaws, Amended and Restated as of January 22, 2014. (Incorporated by reference Exhibit 3.1 to the Current Report on Form 8-K dated January 27, 2014.) | |
4.1 | Specimen form of Pacific Mercantile Bancorp Common Stock Certificate. (Incorporated by reference to the same numbered exhibit to the Company’s Registration Statement (No. 333-33452) on Form S-1 filed with the Commission on June 14, 2000.) | |
10.1 | Common Stock Purchase Agreement, dated August 26, 2011, between the Company, Carpenter Community Bancfund, L.P. and Carpenter Community Bancfund-A, L.P. (Incorporated by reference to Exhibit 10.6 to the Current Report on Form 8-K (No. 000-30777) dated August 30, 2011.) | |
10.2 | Exchange Agreement, dated as of August 28, 2015, by and among Pacific Mercantile Bancorp, SBAV, LP, Carpenter Community BancFund, L.P. and Carpenter Community BancFund-A, L.P. (Incorporated by reference to Exhibit 10.1 to the Current Report on Form 8-K dated August 28, 2015 and filed with the Commission on August 31, 2015.) | |
10.3 | Registration Rights Agreement, dated as of August 28, 2015, by and among Pacific Mercantile Bancorp, SBAV, LP, Carpenter Community BancFund, L.P. and Carpenter Community BancFund-A, L.P. (Incorporated by reference to Exhibit 10.2 to the Current Report on Form 8-K dated August 28, 2015 and filed with the Commission on August 31, 2015.) | |
10.4+ | Form of Indemnification Agreement. (Incorporated by reference to Exhibit 10.1 to the Registration Statement (No. 333-177141) on Form S-8 dated October 3, 2011.) | |
10.5+ | Pacific Mercantile Bancorp 2004 Stock Incentive Plan (Incorporated by reference to Exhibit 10.19 to the Company’s Annual Report on Form 10-K (No. 000-30777) for the year ended December 31, 2004.) | |
10.6+ | Pacific Mercantile Bancorp 2008 Equity Incentive Plan. (Incorporated by reference to Appendix A to the Company’s 2008 Definitive Proxy Statement filed with the Commission on April 18, 2008.) | |
10.7+ | Pacific Mercantile Bancorp 2010 Equity Incentive Plan, as amended June 5, 2013. (Incorporated by reference to Exhibit 10.1 to the Company’s Quarterly Report on Form 10-Q for the quarter ended September 30, 2013.) | |
10.8 | Stock Purchase Agreement effective as of February 27, 2013 by and between the Company and the Carpenter Funds. (Incorporated by reference to Exhibit 10.1 to the Current Report on Form 8-K dated February 27, 2013 and filed with the Commission on March 5, 2013. | |
E-1
10.9+ | Employment Agreement between Pacific Mercantile Bank and Steven K. Buster dated April 18, 2013. (Incorporated by reference to Exhibit 10.97 to the Current Report on Form 8-K dated April 23, 2013.) | |
10.10+ | Pacific Mercantile Bancorp Change in Control Severance Plan. (Incorporated by reference to Exhibit 10.1 to the Current Report on Form 8-K dated January 27, 2014.) | |
10.11+ | Pacific Mercantile Bancorp Change in Control Severance Plan Participation Agreement. (Incorporated by reference to Exhibit 10.2 to the Current Report on Form 8-K dated January 27, 2014.) | |
10.12+ | Employment Agreement between Pacific Mercantile Bank and Curt A. Christianssen dated January 20, 2015. (Incorporated by reference to Exhibit 10.97 to the Current Report on Form 8-K dated January 20, 2015.) | |
10.13+ | Employment Agreement between Pacific Mercantile Bank and Robert J. Stevens dated April 4, 2014 (Incorporated by reference to Exhibit 10.1 to the Quarterly Report on Form 10-Q filed with the Commission on May 8, 2015.) | |
10.14+ | Employment Agreement between Pacific Mercantile Bank and Thomas M. Vertin dated December 8, 2015 (Incorporated by reference to Exhibit 10.1 to the Current Report on Form 8-K dated December 8, 2015 and filed with the Commission on December 10, 2015.) | |
10.15+ | Transition Agreement between Pacific Mercantile Bank and Steven K. Buster, dated December 8, 2015 (Incorporated by reference to Exhibit 10.2 to the Current Report on Form 8-K dated December 8, 2015 and filed with the Commission on December 10, 2015.) | |
21* | Subsidiaries of the Company | |
23.1* | Consent of RSM US LLP, Independent Registered Public Accounting Firm | |
23.2* | Consent of Squar Milner LLP, Independent Registered Public Accounting Firm | |
24.1 | Power of Attorney (contained on the Signature Page of this Annual Report on Form 10-K) | |
31.1* | Certification of Chief Executive Officer pursuant to Section 302 of the Sarbanes-Oxley Act of 2002 | |
31.2* | Certification of Chief Financial Officer pursuant to Section 302 of the Sarbanes-Oxley Act of 2002 | |
32.1** | Certification of Chief Executive Officer pursuant to Section 906 of the Sarbanes-Oxley Act of 2002 | |
32.2** | Certification of Chief Financial Officer pursuant to Section 906 of the Sarbanes-Oxley Act of 2002 | |
Exhibit 101.INS* | XBRL Instance Document | |
Exhibit 101.SCH* | XBRL Taxonomy Extension Schema Document | |
Exhibit 101.CAL* | XBRL Taxonomy Extension Calculation Linkbase Document | |
Exhibit 101.DEF* | XBRL Taxonomy Extension Definition Linkbase Document | |
Exhibit 101.LAB* | XBRL Taxonomy Extension Labels Linkbase Document | |
Exhibit 101.PRE* | XBRL Taxonomy Extension Presentation Linkbase Document | |
* Filed herewith.
** Furnished herewith.
+ Management contract or compensatory plan or arrangement required to be filed as an exhibit pursuant to applicable rules of the Securities and Exchange Commission.
E-2