Exhibit 99.1

April 20, 2021
PACWEST BANCORP ANNOUNCES RESULTS FOR THE FIRST QUARTER OF 2021
FOR IMMEDIATE RELEASE
FIRST QUARTER 2021 RESULTS

FIRST QUARTER 2021 HIGHLIGHTS | |
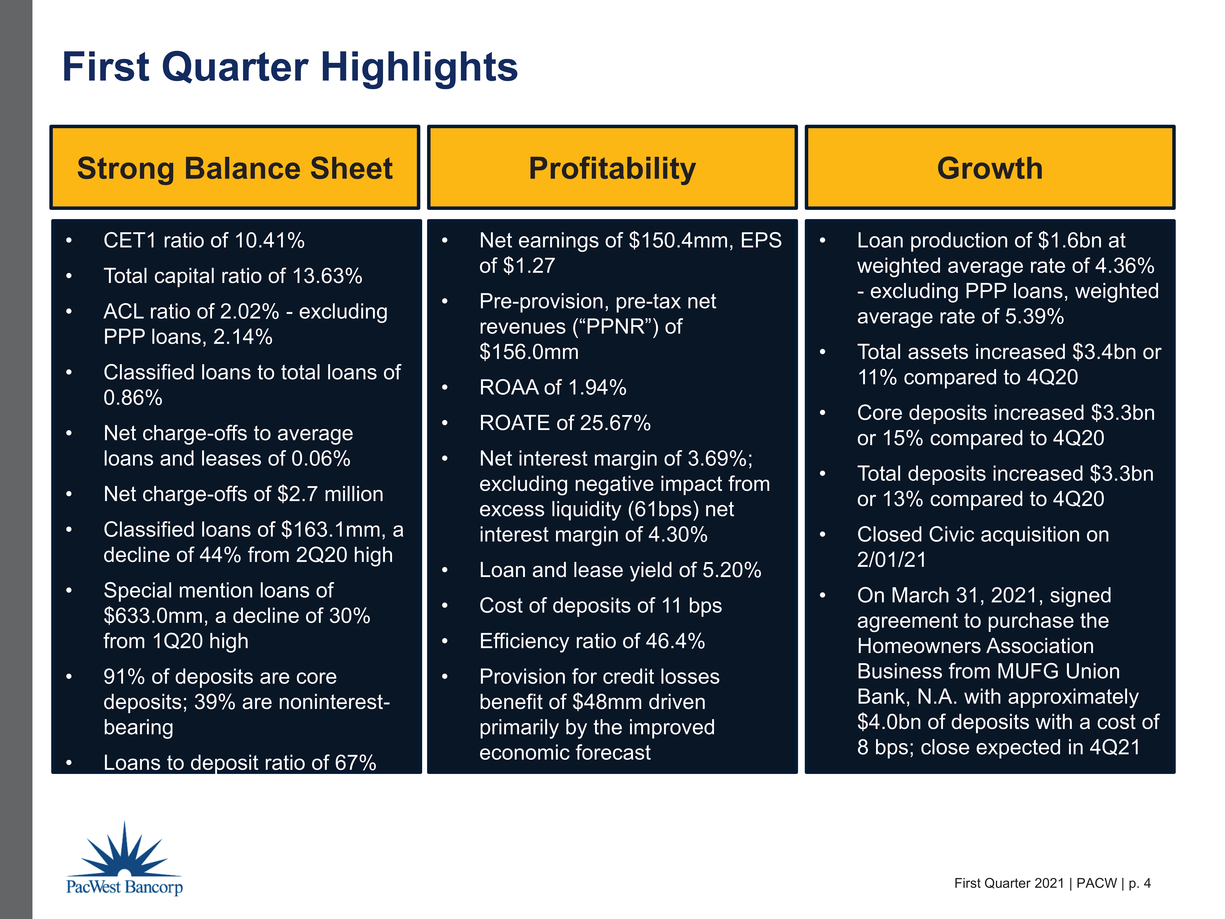
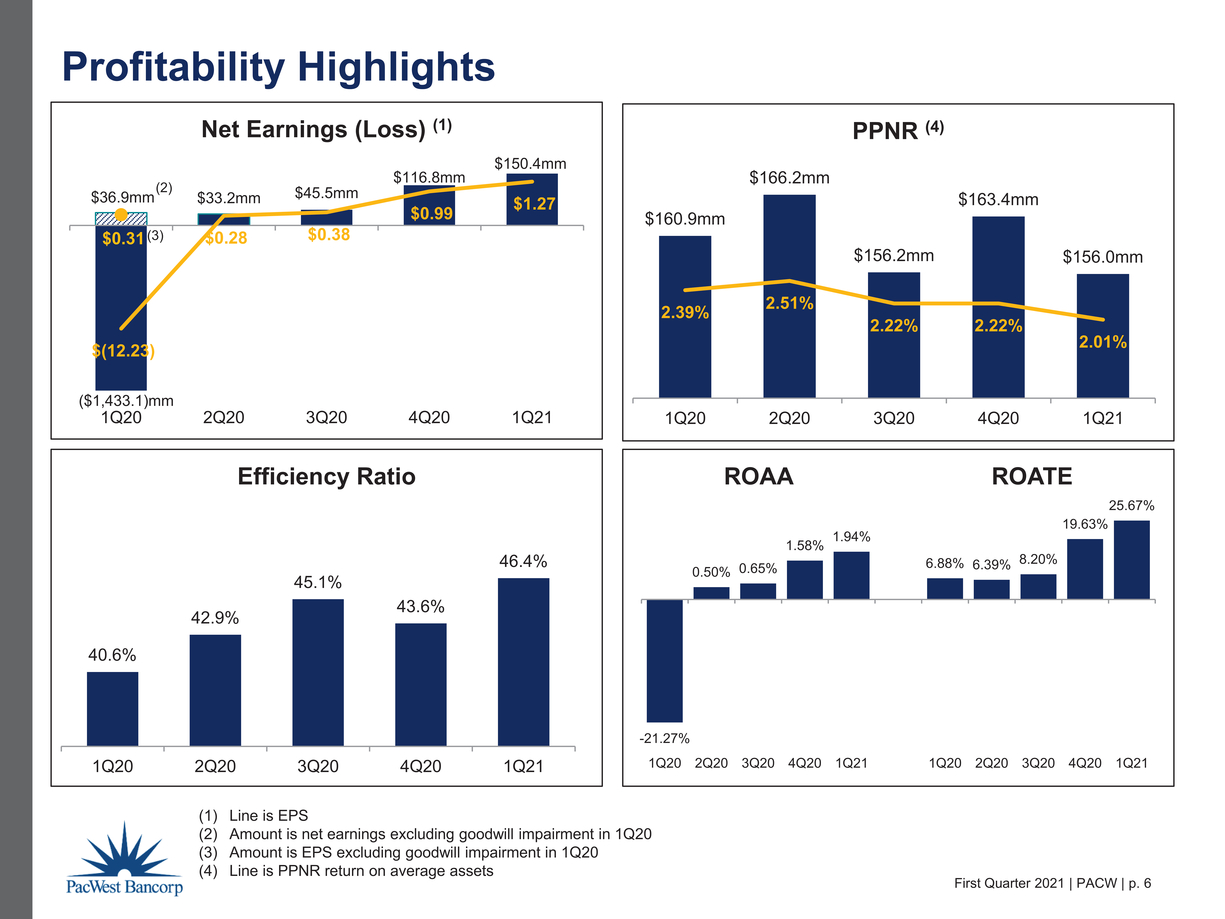
| • | Net Earnings of $150.4 Million or $1.27 Per Diluted Share |
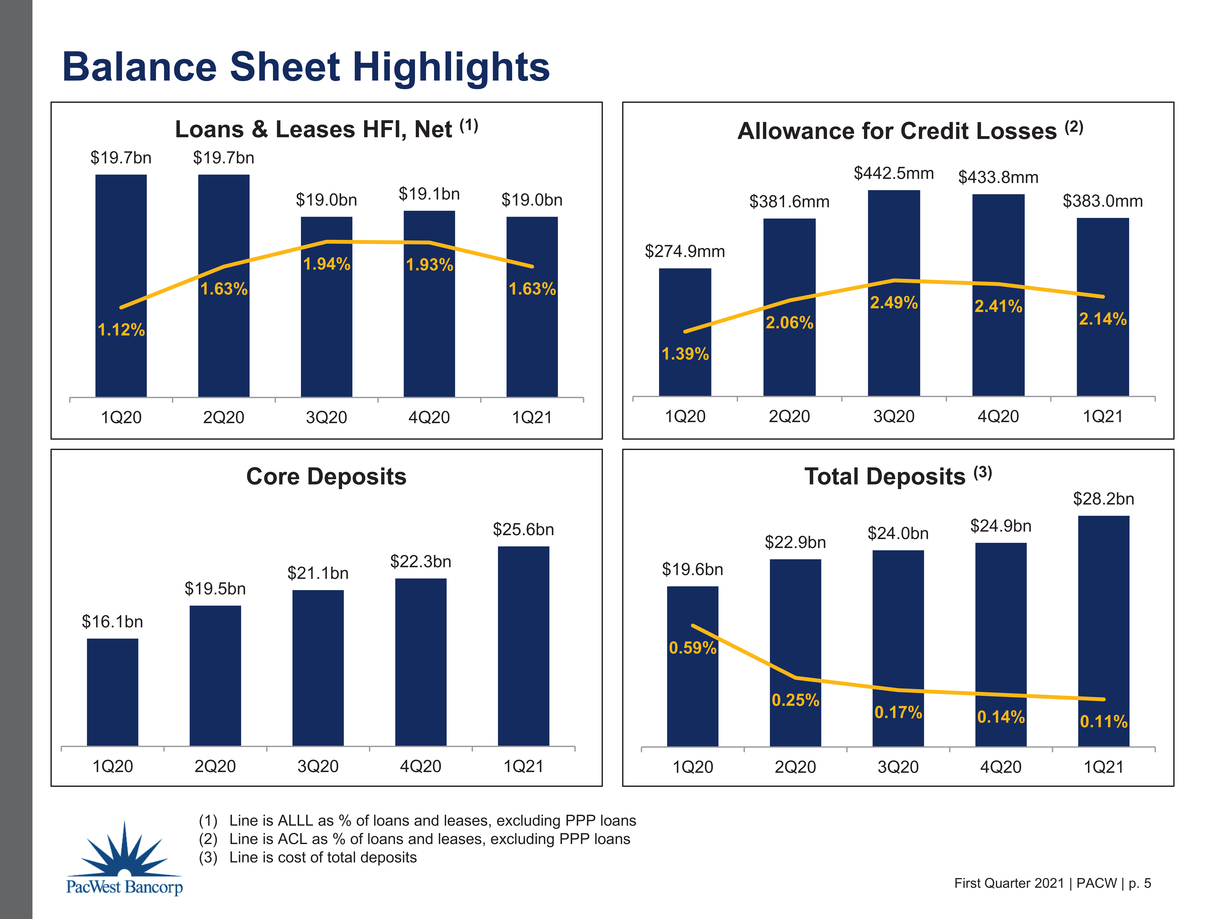
| • | Core Deposits Up $3.3 Billion or 15% in 1Q21; Represents 91% of Total Deposits |
| • | Provision for Credit Losses Benefit of $48.0 Million in 1Q21 Compared to Provision of $10.0 Million in 4Q20 |
| • | Net Interest Income (TE) of $264.6 Million, Compared With $262.1 Million in 4Q20 |
| • | Noninterest Income of $44.8 Million, Up 12% From 4Q20, With Continued Strength in Warrant Income As Well As a $10.1 Million Gain on an Equity Investment |
| • | Noninterest Expense of $150.1 Million, Up 11% From 4Q20, Driven By Two Months of Civic Financial Services (“Civic”) Operations, Higher Acquisition Costs, and a Legal Settlement |
| • | Classified and Special Mention Loans Fell $102.1 Million and $88.3 Million, Respectively, From 4Q20 |
| • | ACL Ratio of 2.02% and ALLL Ratio of 1.54%; Excluding PPP Loans, ACL Ratio of 2.14% and ALLL Ratio of 1.63% |
| • | Net Charge-offs to Average Loans/Leases of 6 bps |
| • | Cost of Deposits Decreased 3 bps to 11 bps |
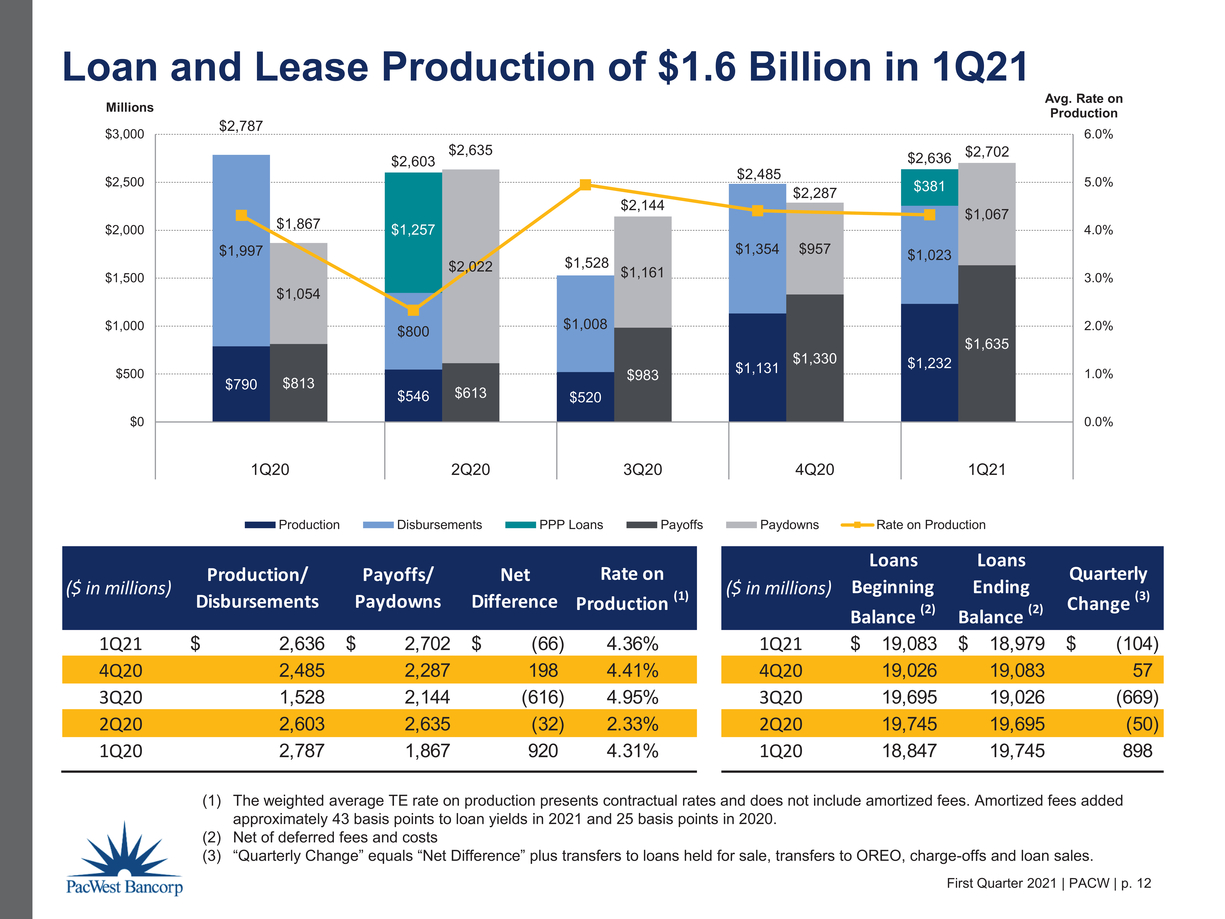
| • | Loan and Lease Production of $1.6 Billion Up From $1.1 Billion in 4Q20; WAC of 5.39% (Excluding PPP Loans) vs. 4.41% in 4Q20 |
| • | Net Loans and Leases of $19.0 Billion, Down Slightly From 4Q20 As Production Was Offset With Payoffs and Paydowns As Well As Further Reduction in the Security Monitoring Portfolio |
| • | Originated $381 Million of PPP Loans in 1Q21 |
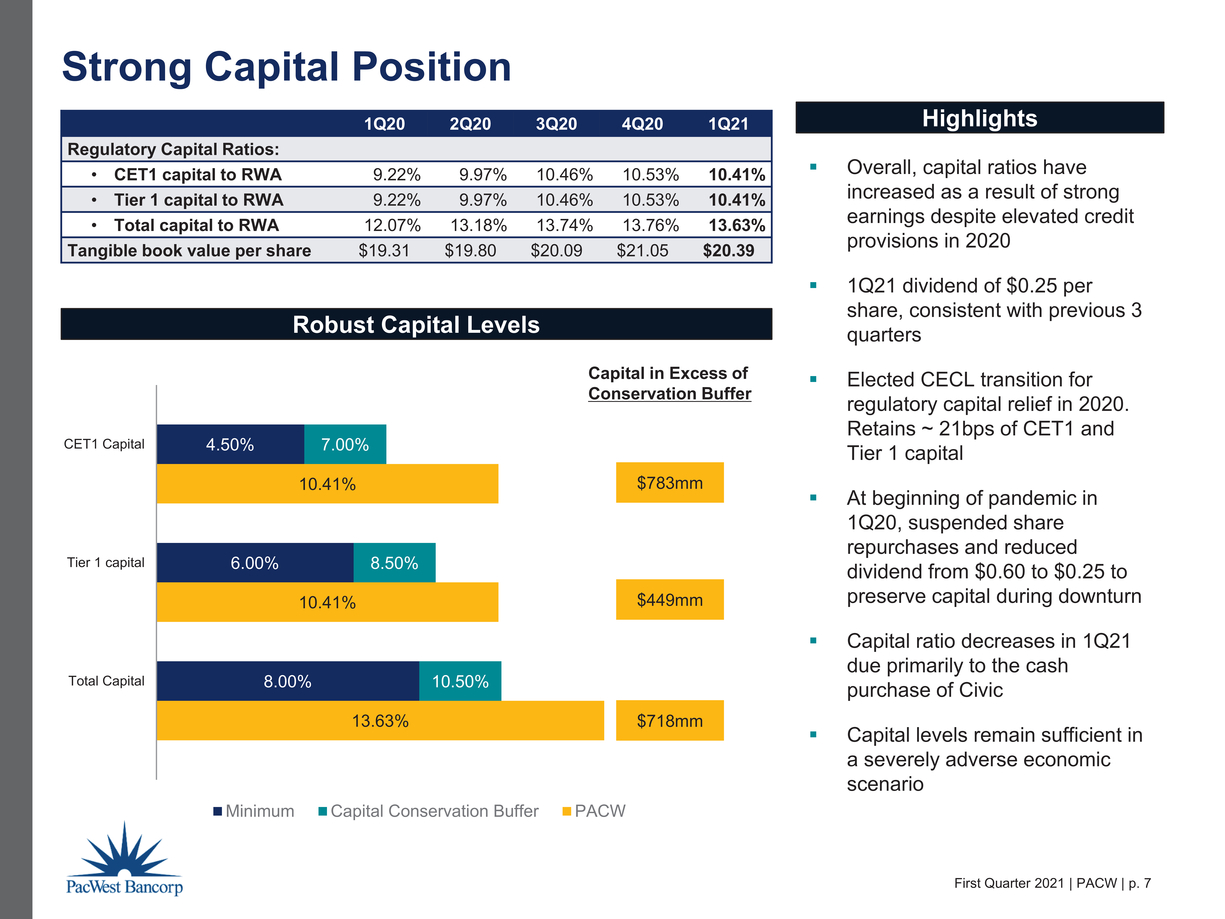
| • | Strong Capital Position – CET1 Ratio of 10.41% |
| • | Civic Acquisition Completed on February 1, 2021 |
| • | On March 31, 2021, Signed Agreement to Purchase the Homeowners Association Business from MUFG Union Bank, N.A. With Approximately $4.0 Billion of Deposits With a Cost of 8 bps; Close Expected in 4Q21 |
CEO COMMENTARY
Matt Wagner, President and CEO, commented, “Our continued focus on growing net interest income produced strong first quarter earnings boosted by continued deposit driven balance sheet growth and improved credit costs as a result of improved economic conditions. Our first quarter results produced a return on assets of 1.94% and a return on tangible equity of 25.67%.”
“We experienced strong deposit growth again in the first quarter driven by outstanding growth from our venture banking clients as well as our commercial bank. This increasing liquidity has expanded our average balance of deposits at the Fed, which grew to $4.8 billion in the first quarter with a yield of 13 basis points. While our focus is on managing net interest income, this excess liquidity continues to be a drag on our net interest margin, which had a negative impact of 61 basis points in the first quarter.”
“Credit quality continued to improve as we experienced decreases in nonaccrual, special mention, and classified loans and leases in the first quarter, while net charge-offs were $2.7 million.”
“We closed the Civic acquisition on February 1, 2021 and in two months Civic originated $231 million of loans. We expect Civic loan production to remain strong and, as their loan portfolio continues to grow, it will help sustain our loan yields and drive loan growth.”

| Page 1 |
FINANCIAL HIGHLIGHTS
| ` | At or For the | At or For the | ||||||||||||||||||||||
| Three Months Ended | Three Months Ended | |||||||||||||||||||||||
| March 31, | December 31, | Increase | March 31, | Increase | ||||||||||||||||||||
| Financial Highlights (1) | 2021 | 2020 | (Decrease) | 2021 | 2020 | (Decrease) | ||||||||||||||||||
| (Dollars in thousands, except per share data) | ||||||||||||||||||||||||
| Net earnings (loss) | $ | 150,406 | $ | 116,830 | $ | 33,576 | $ | 150,406 | $ | (1,433,111 | ) | $ | 1,583,517 | |||||||||||
| Diluted earnings (loss) per share | $ | 1.27 | $ | 0.99 | $ | 0.28 | $ | 1.27 | $ | (12.23 | ) | $ | 13.50 | |||||||||||
| Pre-provision, pre-goodwill impairment, pre-tax net revenue ("PPNR") (2) | $ | 155,962 | $ | 163,376 | $ | (7,414 | ) | $ | 155,962 | $ | 160,877 | $ | (4,915 | ) | ||||||||||
| Return on average assets | 1.94 | % | 1.58 | % | 0.36 | 1.94 | % | (21.27 | )% | 23.21 | ||||||||||||||
| PPNR return on average assets (2) | 2.01 | % | 2.22 | % | (0.21 | ) | 2.01 | % | 2.39 | % | (0.38 | ) | ||||||||||||
| Return on average tangible equity (2) | 25.67 | % | 19.63 | % | 6.04 | 25.67 | % | 6.88 | % | 18.79 | ||||||||||||||
| Yield on average loans and leases (tax equivalent) | 5.20 | % | 5.15 | % | 0.05 | 5.20 | % | 5.54 | % | (0.34 | ) | |||||||||||||
| Cost of average total deposits | 0.11 | % | 0.14 | % | (0.03 | ) | 0.11 | % | 0.59 | % | (0.48 | ) | ||||||||||||
| Net interest margin ("NIM") (tax equivalent) | 3.69 | % | 3.83 | % | (0.14 | ) | 3.69 | % | 4.31 | % | (0.62 | ) | ||||||||||||
| Efficiency ratio | 46.4 | % | 43.6 | % | 2.8 | 46.4 | % | 40.6 | % | 5.8 | ||||||||||||||
| Total assets | $ | 32,856,533 | $ | 29,498,442 | $ | 3,358,091 | $ | 32,856,533 | $ | 26,143,267 | $ | 6,713,266 | ||||||||||||
| Loans and leases held for investment, net of deferred fees | $ | 18,979,228 | $ | 19,083,377 | $ | (104,149 | ) | $ | 18,979,228 | $ | 19,745,305 | $ | (766,077 | ) | ||||||||||
| Noninterest-bearing demand deposits | $ | 11,017,462 | $ | 9,193,827 | $ | 1,823,635 | $ | 11,017,462 | $ | 7,510,218 | $ | 3,507,244 | ||||||||||||
| Core deposits | $ | 25,576,348 | $ | 22,264,480 | $ | 3,311,868 | $ | 25,576,348 | $ | 16,050,522 | $ | 9,525,826 | ||||||||||||
| Total deposits | $ | 28,223,291 | $ | 24,940,717 | $ | 3,282,574 | $ | 28,223,291 | $ | 19,575,837 | $ | 8,647,454 | ||||||||||||
| As percentage of total deposits: | ||||||||||||||||||||||||
| Noninterest-bearing demand deposits | 39 | % | 37 | % | 2 | 39 | % | 38 | % | 1 | ||||||||||||||
| Core deposits | 91 | % | 89 | % | 2 | 91 | % | 82 | % | 9 | ||||||||||||||
| Equity to assets ratio | 11.12 | % | 12.19 | % | (1.07 | ) | 11.12 | % | 12.97 | % | (1.85 | ) | ||||||||||||
| Common equity tier 1 capital ratio | 10.41 | % | 10.53 | % | (0.12 | ) | 10.41 | % | 9.22 | % | 1.19 | |||||||||||||
| Total capital ratio | 13.63 | % | 13.76 | % | (0.13 | ) | 13.63 | % | 12.07 | % | 1.56 | |||||||||||||
| Tangible common equity ratio (2) | 7.68 | % | 8.78 | % | (1.10 | ) | 7.68 | % | 9.10 | % | (1.42 | ) | ||||||||||||
| Book value per share | $ | 30.68 | $ | 30.36 | $ | 0.32 | $ | 30.68 | $ | 28.75 | $ | 1.93 | ||||||||||||
| Tangible book value per | ||||||||||||||||||||||||
| share (2) | $ | 20.39 | $ | 21.05 | $ | (0.66 | ) | $ | 20.39 | $ | 19.31 | $ | 1.08 | |||||||||||
(1) The operations of Civic are included from its February 1, 2021 acquisition date.
(2) Non-GAAP measure.
| Page 2 |
INCOME STATEMENT HIGHLIGHTS
NET INTEREST INCOME
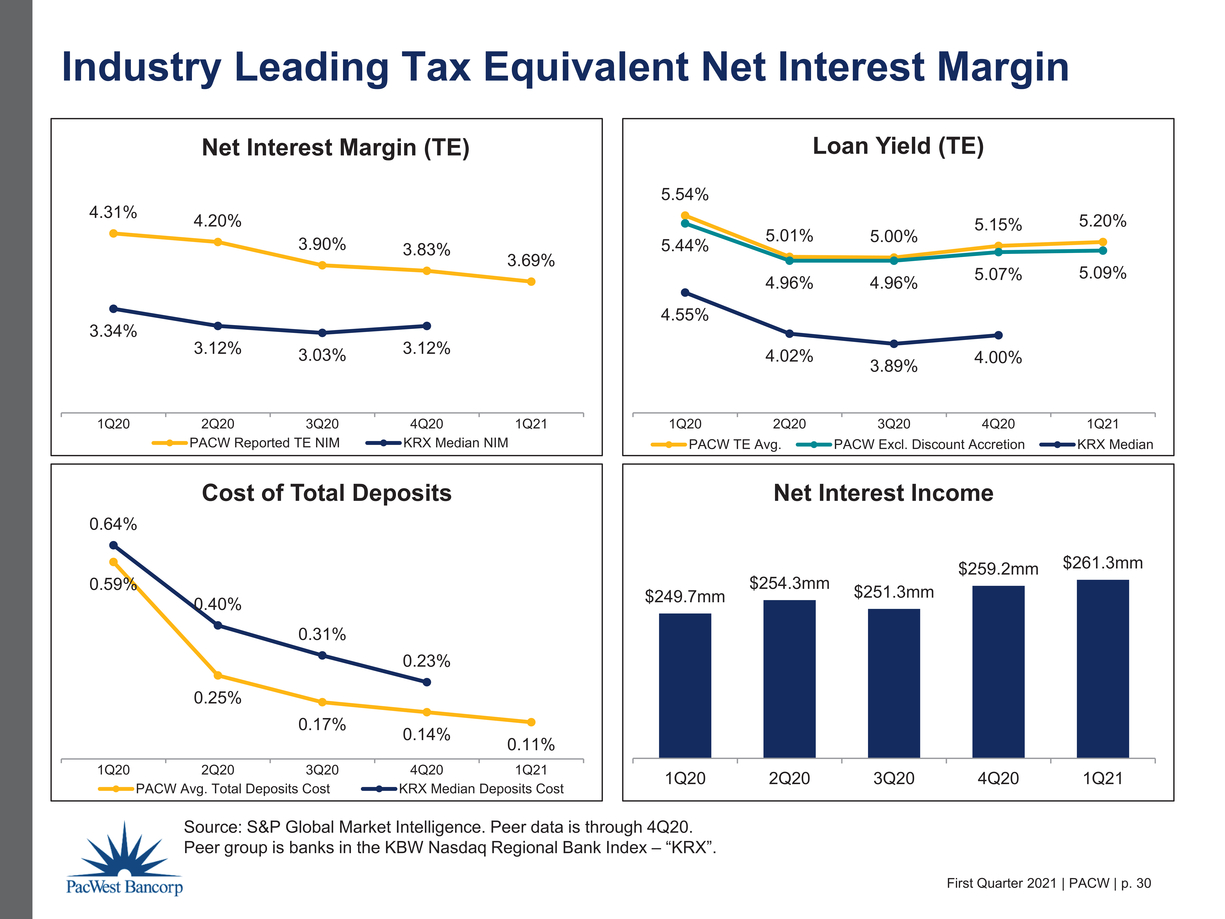
Net interest income increased by $2.1 million to $261.3 million for the first quarter of 2021 compared to $259.2 million for the fourth quarter of 2020 due mainly to higher income on investment securities and lower interest expense, partially offset by lower income on loans and leases and the negative impact on net interest income due to the change in the earning assets mix. The tax equivalent yield on average loans and leases was 5.20% for the first quarter of 2021 compared to 5.15% for the fourth quarter of 2020. The increase in the tax equivalent yield on average loans and leases was primarily due to higher loan discount accretion of $1.5 million and higher amortized loan fee income of $2.9 million mainly from higher PPP loan forgiveness in the first quarter of 2021 as compared to the fourth quarter of 2020.
The tax equivalent NIM was 3.69% for the first quarter of 2021 compared to 3.83% for the fourth quarter of 2020. The decrease in the NIM was primarily due to the change in the earning assets mix. The average balance of deposits in financial institutions increased by $1.2 billion, the average balance of investment securities increased by $494.1 million, and the average balance of loans and leases increased by $158.1 million in the first quarter of 2021. This excess liquidity had a negative impact on the first quarter tax equivalent NIM of 61 basis points.
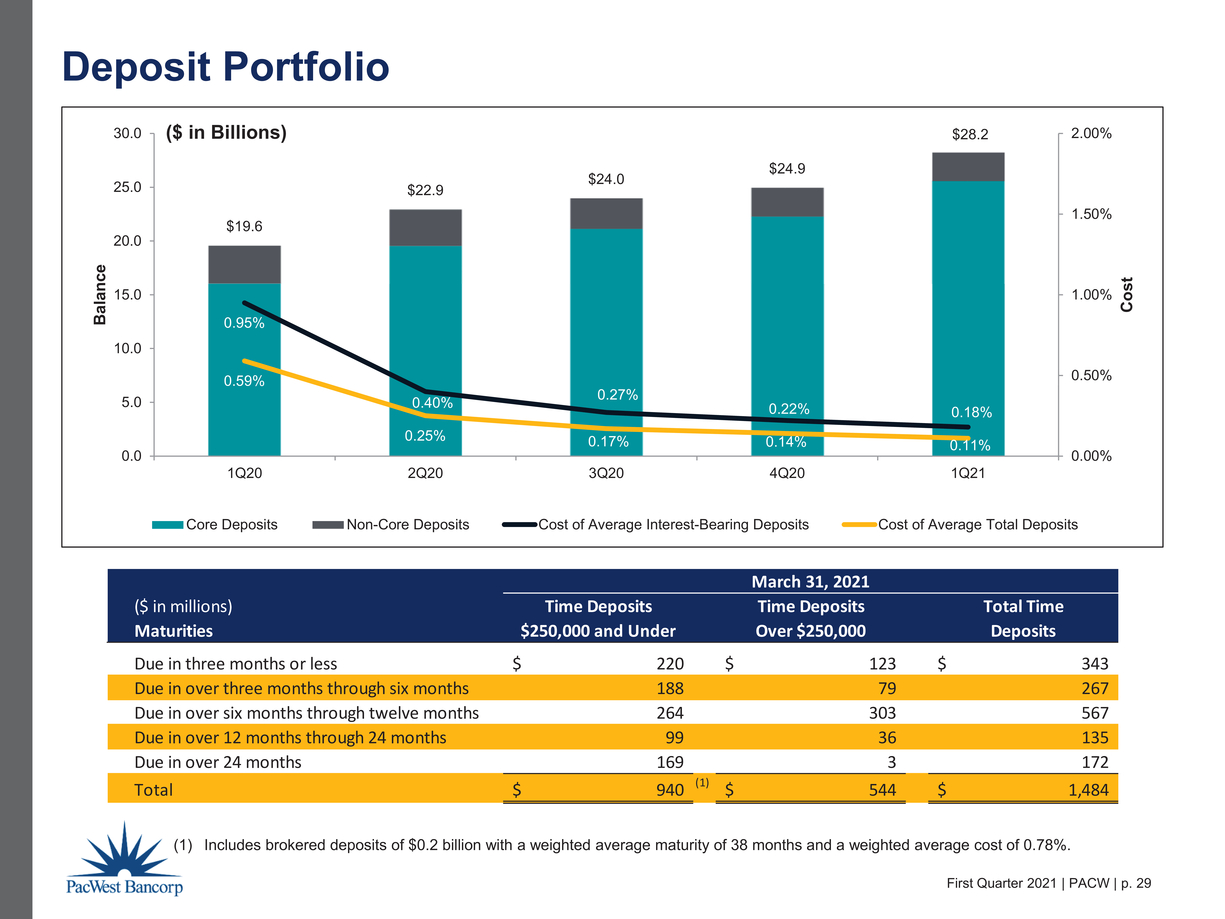
The cost of average total deposits decreased to 0.11% in the first quarter of 2021 from 0.14% for the fourth quarter of 2020. The lower cost of average total deposits was due primarily to the repricing of maturing brokered time deposits and the increased average balance of noninterest-bearing deposits.
PROVISION FOR CREDIT LOSSES
The following table presents details of the provision for credit losses for the periods indicated:
| Three Months Ended | ||||||||||||
| March 31, | December 31, | Increase | ||||||||||
| Provision for Credit Losses | 2021 | 2020 | (Decrease) | |||||||||
| (In thousands) | ||||||||||||
| (Reduction in) addition to allowance for loan and lease losses | $ | (53,000 | ) | $ | 21,000 | $ | (74,000 | ) | ||||
| Addition to (reduction in) reserve for unfunded loan commitments | 5,000 | (11,000 | ) | 16,000 | ||||||||
| Total provision for credit losses | $ | (48,000 | ) | $ | 10,000 | $ | (58,000 | ) | ||||
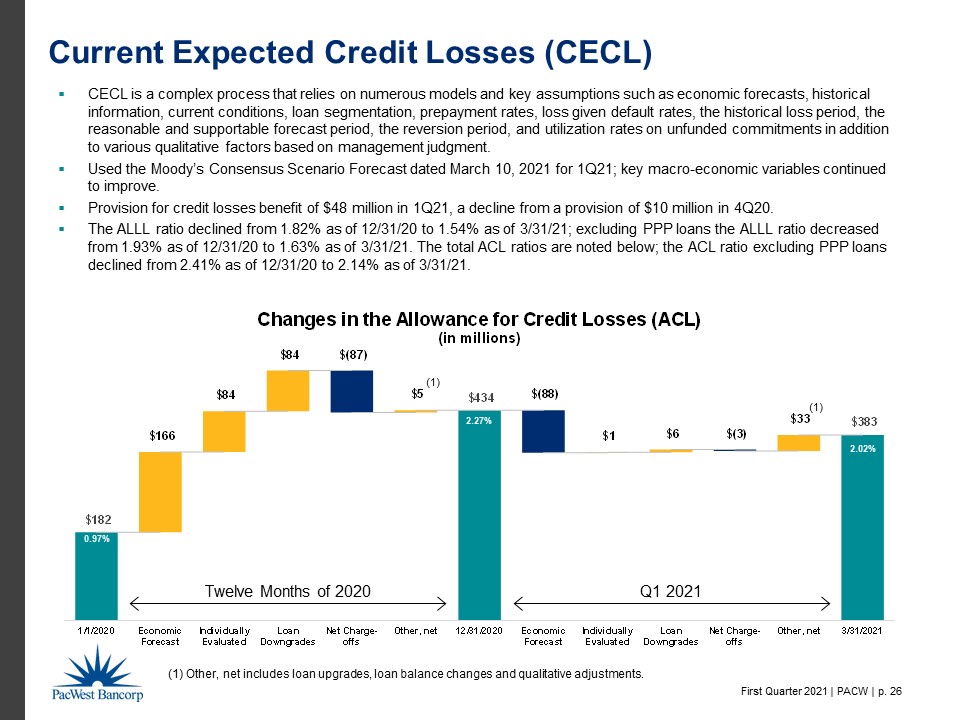
The provision for credit losses decreased by $58.0 million to a benefit of $48.0 million for the first quarter of 2021 compared to a $10.0 million provision for the fourth quarter of 2020. This reduction reflected improvement in certain key macro-economic forecast variables and decreased provisions for individually evaluated loans and leases, partially offset by a higher provision for unfunded commitments which grew by $526.6 million.
| Page 3 |
Noninterest Income
The following table presents details of noninterest income for the periods indicated:
| Three Months Ended | ||||||||||||
| March 31, | December 31, | Increase | ||||||||||
| Noninterest Income | 2021 | 2020 | (Decrease) | |||||||||
| (In thousands) | ||||||||||||
| Service charges on deposit accounts | $ | 2,934 | $ | 3,119 | $ | (185 | ) | |||||
| Other commissions and fees | 9,158 | 9,974 | (816 | ) | ||||||||
| Leased equipment income | 11,354 | 9,440 | 1,914 | |||||||||
| Gain on sale of loans and leases | 139 | 1,671 | (1,532 | ) | ||||||||
| Gain on sale of securities | 101 | 4 | 97 | |||||||||
| Other income: | ||||||||||||
| Dividends and gains on equity investments | 10,904 | 5,064 | 5,840 | |||||||||
| Warrant income | 6,123 | 7,299 | (1,176 | ) | ||||||||
| Other | 4,116 | 3,279 | 837 | |||||||||
| Total noninterest income | $ | 44,829 | $ | 39,850 | $ | 4,979 | ||||||
Noninterest income increased by $5.0 million to $44.8 million for the first quarter of 2021 compared to $39.9 million for the fourth quarter of 2020 due primarily to an increase of $5.8 million in dividends and gains on equity investments and a $1.9 million increase in leased equipment income, offset partially by decreases of $1.5 million in gain on sale of loans and leases and $1.2 million in warrant income. The increase in dividends and gains on equity investments was due primarily to a $10.1 million gain on one equity investment, offset partially by lower net fair value gains on equity investments still held. The increase in leased equipment income was due primarily to a higher average balance of equipment leased to others under operating leases. The decrease in the gain on sale of loans and leases resulted from the sales of $72.6 million of loans for gains of $0.1 million in the first quarter of 2021 compared to sales of $119.9 million for gains of $1.7 million in the fourth quarter of 2020. The decrease in warrant income was primarily attributable to lower gains from exercised warrants after record gains in the fourth quarter of 2020.
Noninterest Expense
The following table presents details of noninterest expense for the periods indicated:
| Three Months Ended | ||||||||||||
| March 31, | December 31, | Increase | ||||||||||
| Noninterest Expense | 2021 | 2020 | (Decrease) | |||||||||
| (In thousands) | ||||||||||||
| Compensation | $ | 79,882 | $ | 73,171 | $ | 6,711 | ||||||
| Occupancy | 14,054 | 14,083 | (29 | ) | ||||||||
| Data processing | 6,957 | 6,718 | 239 | |||||||||
| Other professional services | 5,126 | 6,800 | (1,674 | ) | ||||||||
| Insurance and assessments | 4,903 | 5,064 | (161 | ) | ||||||||
| Intangible asset amortization | 3,079 | 3,172 | (93 | ) | ||||||||
| Leased equipment depreciation | 8,969 | 7,501 | 1,468 | |||||||||
| Foreclosed assets (income) expense, net | 1 | (272 | ) | 273 | ||||||||
| Acquisition, integration and reorganization costs | 3,425 | 1,060 | 2,365 | |||||||||
| Customer related expense | 4,818 | 4,430 | 388 | |||||||||
| Loan expense | 3,193 | 3,926 | (733 | ) | ||||||||
| Other | 15,729 | 10,029 | 5,700 | |||||||||
| Total noninterest expense | $ | 150,136 | $ | 135,682 | $ | 14,454 | ||||||
| Page 4 |
Noninterest expense increased by $14.5 million to $150.1 million for the first quarter of 2021 compared to $135.7 million for the fourth quarter of 2020 due primarily to increases of $6.7 million in compensation expense, $5.7 million in other expense, $2.4 million in acquisition, integration and reorganization costs, and $1.5 million in leased equipment depreciation, offset partially by a decrease of $1.7 million in other professional expense. The increase in compensation expense was mostly due to compensation expense related to the Civic operations, while, in total, Civic’s noninterest expenses added $10.8 million to total noninterest expense. The increase in other expense was largely due to a legal settlement in excess of amounts previously accrued. The increase in acquisition, integration and reorganization costs was due to advisory services and integration expenses related to the closed Civic acquisition and the pending acquisition of MUFG Union Bank’s Homeowners Association Services Division. The increase in leased equipment depreciation was due primarily to an increase in the average balance of equipment leased to others under operating leases. The decrease in other professional expense was due primarily to lower consulting expense.
Income Taxes
The effective income tax rate was 26.3% in the first quarter of 2021 compared to 23.8% for the fourth quarter of 2020. The increase was primarily due to higher pre-tax income in relation to discrete items for the quarter. The effective income tax rate for the full year 2021 is currently estimated to be in the range of 25% to 27%.
BALANCE SHEET HIGHLIGHTS
Deposits and Client Investment Funds
The following table presents the composition of our deposit portfolio as of the dates indicated:
| March 31, 2021 | December 31, 2020 | March 31, 2020 | ||||||||||||||||||||||
| % of | % of | % of | ||||||||||||||||||||||
| Deposit Composition | Balance | Total | Balance | Total | Balance | Total | ||||||||||||||||||
| (Dollars in thousands) | ||||||||||||||||||||||||
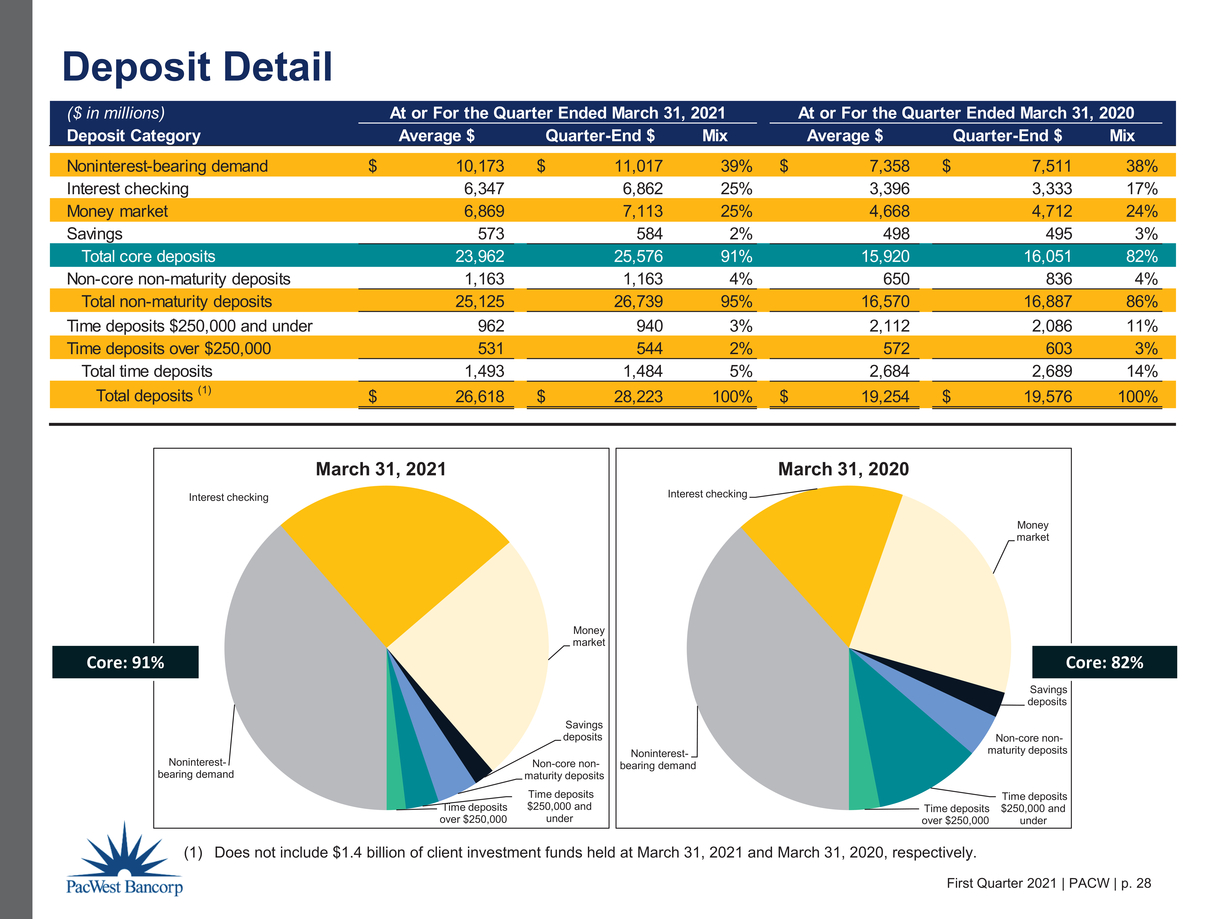
| Noninterest-bearing demand | $ | 11,017,462 | 39 | % | $ | 9,193,827 | 37 | % | $ | 7,510,218 | 38 | % | ||||||||||||
| Interest checking | 6,862,398 | 25 | % | 5,974,910 | 24 | % | 3,333,147 | 17 | % | |||||||||||||||
| Money market | 7,112,610 | 25 | % | 6,532,917 | 26 | % | 4,712,118 | 24 | % | |||||||||||||||
| Savings | 583,878 | 2 | % | 562,826 | 2 | % | 495,039 | 3 | % | |||||||||||||||
| Total core deposits | 25,576,348 | 91 | % | 22,264,480 | 89 | % | 16,050,522 | 82 | % | |||||||||||||||
| Non-core non-maturity deposits | 1,162,590 | 4 | % | 1,149,467 | 5 | % | 836,157 | 4 | % | |||||||||||||||
| Total non-maturity deposits | 26,738,938 | 95 | % | 23,413,947 | 94 | % | 16,886,679 | 86 | % | |||||||||||||||
| Time deposits $250,000 and under | 940,340 | 3 | % | 994,197 | 4 | % | 2,086,188 | 11 | % | |||||||||||||||
| Time deposits over $250,000 | 544,013 | 2 | % | 532,573 | 2 | % | 602,970 | 3 | % | |||||||||||||||
| Total time deposits | 1,484,353 | 5 | % | 1,526,770 | 6 | % | 2,689,158 | 14 | % | |||||||||||||||
| Total deposits | $ | 28,223,291 | 100 | % | $ | 24,940,717 | 100 | % | $ | 19,575,837 | 100 | % | ||||||||||||
At March 31, 2021, core deposits totaled $25.6 billion or 91% of total deposits, including $11.0 billion of noninterest-bearing demand deposits or 39% of total deposits. Core deposits increased by $3.3 billion or 15% in the first quarter of 2021 driven by continued strong deposit growth from our venture banking clients.
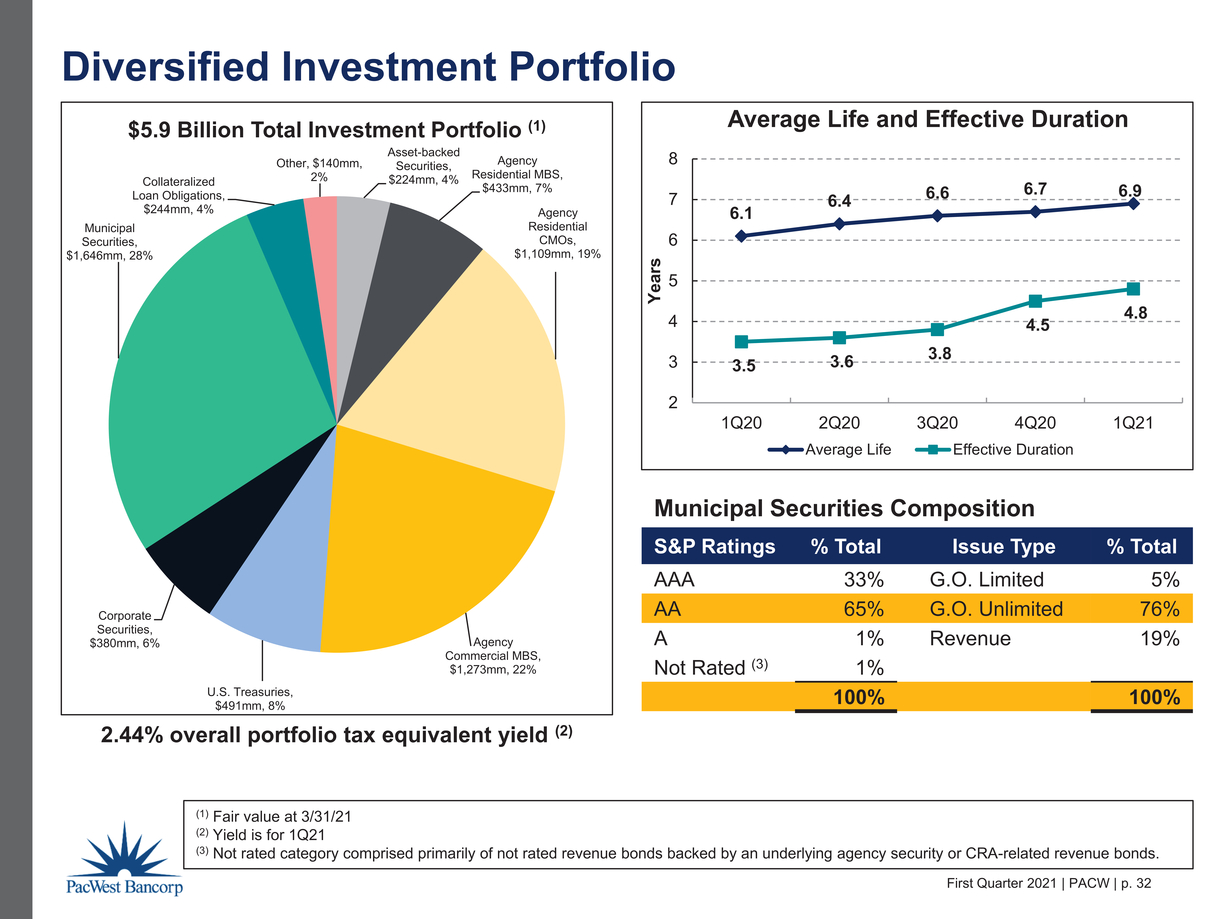
In addition to deposit products, we also offer alternative, non-depository cash investment options for select clients. These alternative options include investments managed by Pacific Western Asset Management Inc. (“PWAM”), our registered investment advisor subsidiary, and third-party sweep products. Total off-balance sheet client investment funds at March 31, 2021 were $1.4 billion, of which $0.9 billion was managed by PWAM.
| Page 5 |
Loans and Leases
The following table presents roll forwards of loans and leases held for investment, net of deferred fees, for the periods indicated:
| Three Months Ended | ||||||||
| Roll Forward of Loans and Leases Held | March 31, | December 31, | ||||||
| for Investment, Net of Deferred Fees (1) | 2021 | 2020 | ||||||
| (Dollars in thousands) | ||||||||
| Balance, beginning of period | $ | 19,083,377 | $ | 19,026,200 | ||||
| Additions: | ||||||||
| Production | 1,612,777 | 1,131,165 | ||||||
| Disbursements | 1,022,986 | 1,354,038 | ||||||
| Total production and disbursements | 2,635,763 | 2,485,203 | ||||||
| Reductions: | ||||||||
| Payoffs | (1,635,264 | ) | (1,330,321 | ) | ||||
| Paydowns | (1,067,418 | ) | (957,075 | ) | ||||
| Total payoffs and paydowns | (2,702,682 | ) | (2,287,396 | ) | ||||
| Sales | (72,641 | ) | (119,931 | ) | ||||
| Transfers to foreclosed assets | (647 | ) | (385 | ) | ||||
| Charge-offs | (3,988 | ) | (20,314 | ) | ||||
| Transfers to loans held for sale | (25,554 | ) | - | |||||
| Total reductions | (2,805,512 | ) | (2,428,026 | ) | ||||
| Loans acquired through Civic acquisition | 65,600 | - | ||||||
| Net increase (decrease) | (104,149 | ) | 57,177 | |||||
| Balance, end of period | $ | 18,979,228 | $ | 19,083,377 | ||||
| Weighted average rate on production (2) | 4.36 | % | 4.41 | % | ||||
(1) Includes direct financing leases but excludes equipment leased to others under operating leases.
(2) The weighted average rate on production presents contractual rates on a tax equivalent basis and excludes amortized fees. Amortized fees added approximately 43 basis points to loan yields in 2021.
Loans and leases held for investment, net of deferred fees, decreased by $104.1 million in the first quarter of 2021 to $19.0 billion at March 31, 2021. The decrease in the loans and leases balance for the first quarter of 2021 was primarily due to a $123.5 million decrease in the security monitoring portfolio, for which new originations have been discontinued since the fourth quarter of 2019. The weighted average rate on first quarter of 2021 production decreased to 4.36% due to first quarter production including $381 million of PPP loans at a coupon rate of 1%, while the fourth quarter of 2020 included no PPP loan production. Excluding PPP loans, the weighted average rate on new production for the first quarter of 2021 was 5.39%.
| Page 6 |
The following table presents the composition of loans and leases held for investment by loan portfolio segment and class, net of deferred fees, as of the dates indicated:
| March 31, 2021 | December 31, 2020 | March 31, 2020 | ||||||||||||||||||||||
| % of | % of | % of | ||||||||||||||||||||||
| Loan and Lease Portfolio | Balance | Total | Balance | Total | Balance | Total | ||||||||||||||||||
| (In thousands) | ||||||||||||||||||||||||
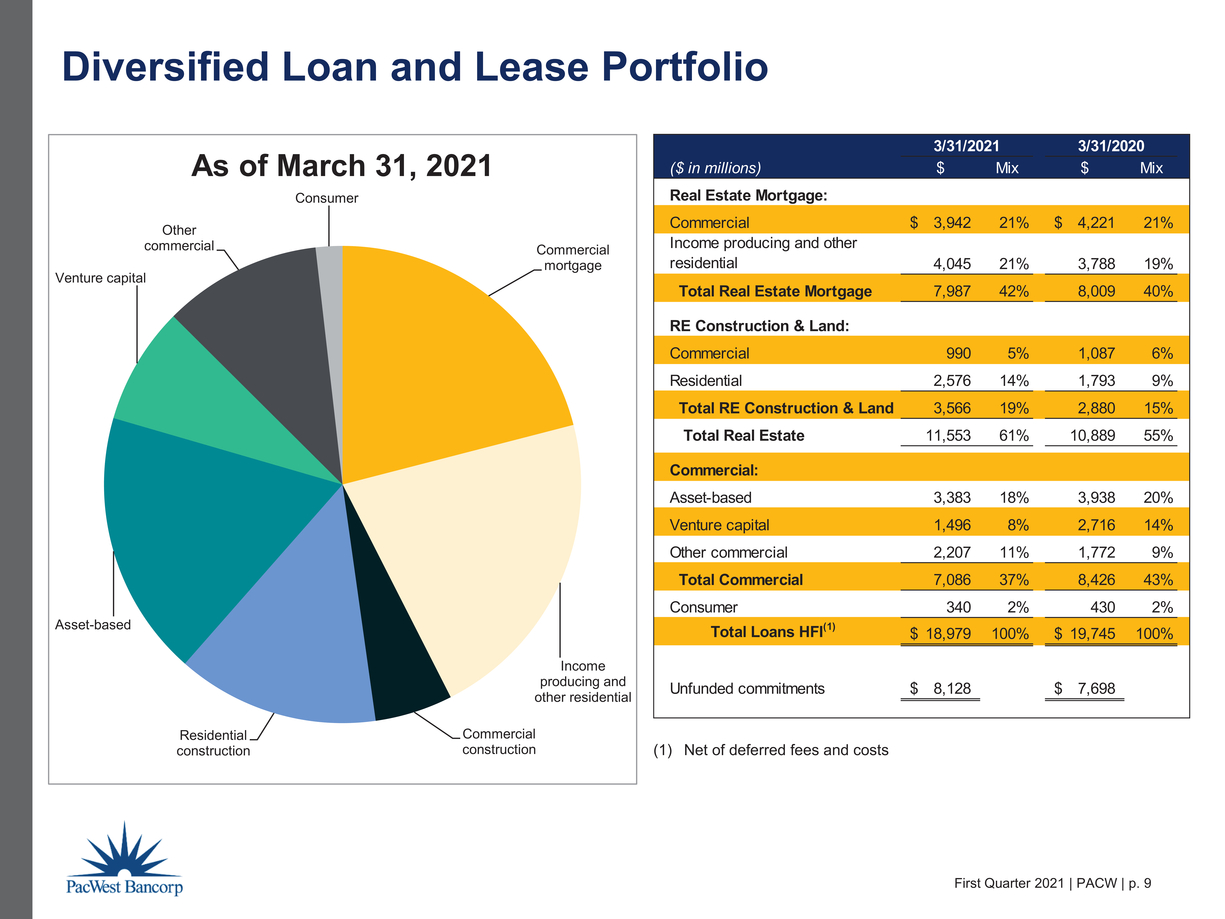
| Real estate mortgage: | ||||||||||||||||||||||||
| Commercial | $ | 3,941,610 | 21 | % | $ | 4,096,671 | 21 | % | $ | 4,220,649 | 21 | % | ||||||||||||
| Income producing and other residential | 4,045,603 | 21 | % | 3,803,265 | 20 | % | 3,788,295 | 19 | % | |||||||||||||||
| Total real estate mortgage | 7,987,213 | 42 | % | 7,899,936 | 41 | % | 8,008,944 | 40 | % | |||||||||||||||
| Real estate construction and land: | ||||||||||||||||||||||||
| Commercial | 990,035 | 5 | % | 1,117,121 | 6 | % | 1,087,505 | 6 | % | |||||||||||||||
| Residential | 2,575,788 | 14 | % | 2,243,160 | 12 | % | 1,792,748 | 9 | % | |||||||||||||||
| Total real estate construction and land | 3,565,823 | 19 | % | 3,360,281 | 18 | % | 2,880,253 | 15 | % | |||||||||||||||
| Total real estate | 11,553,036 | 61 | % | 11,260,217 | 59 | % | 10,889,197 | 55 | % | |||||||||||||||
| Commercial: | ||||||||||||||||||||||||
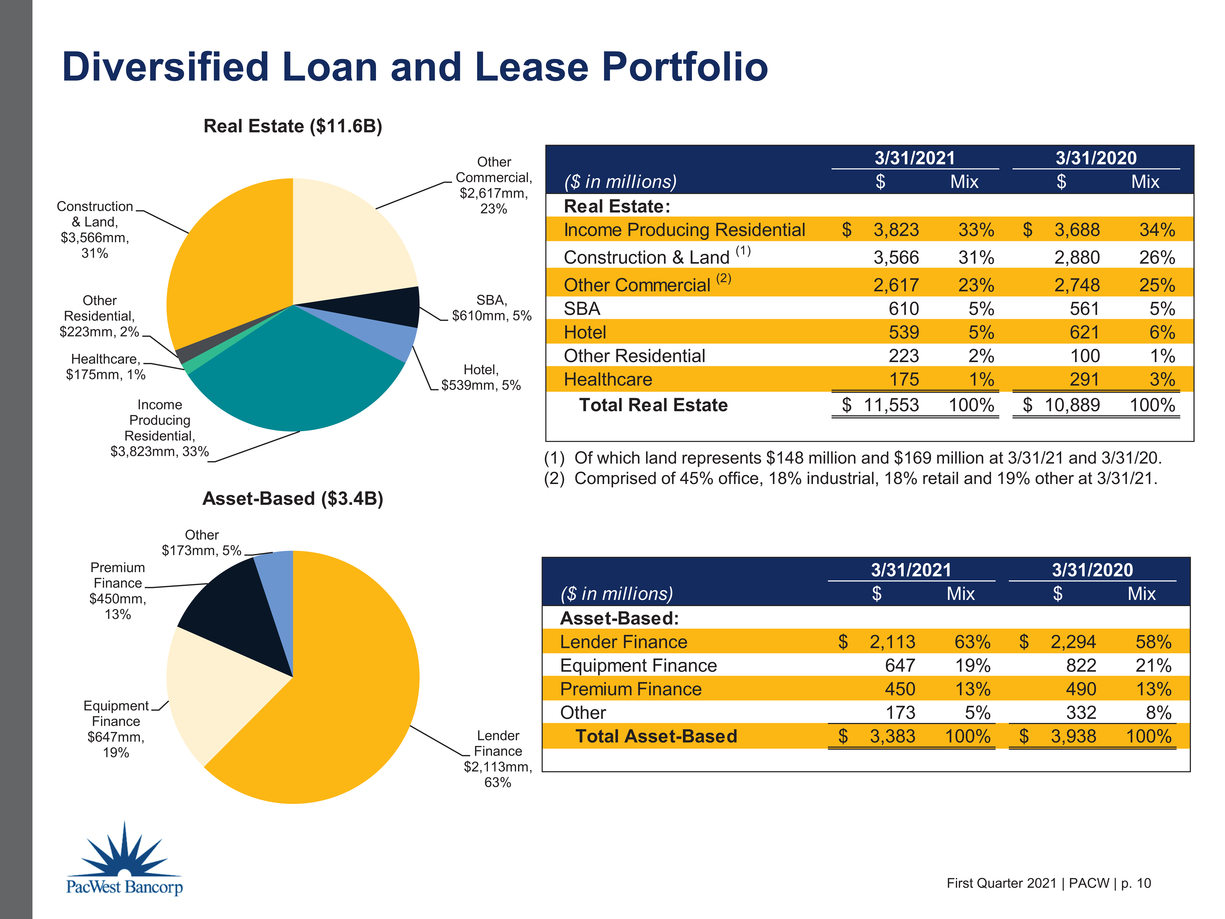
| Asset-based | 3,383,403 | 18 | % | 3,429,283 | 18 | % | 3,938,402 | 20 | % | |||||||||||||||
| Venture capital | 1,495,798 | 8 | % | 1,698,508 | 9 | % | 2,715,837 | 14 | % | |||||||||||||||
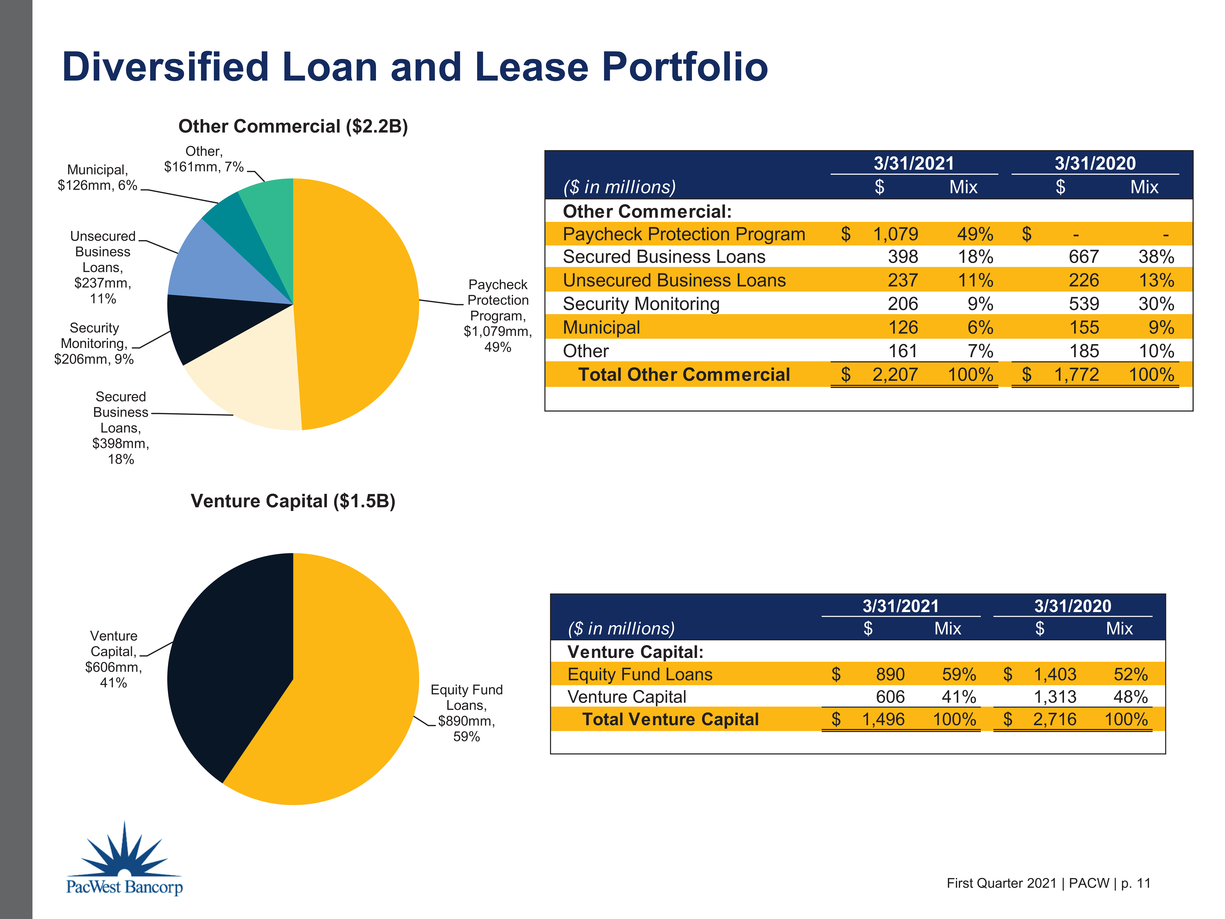
| Other commercial | 2,206,639 | 11 | % | 2,375,114 | 12 | % | 1,771,985 | 9 | % | |||||||||||||||
| Total commercial | 7,085,840 | 37 | % | 7,502,905 | 39 | % | 8,426,224 | 43 | % | |||||||||||||||
| Consumer | 340,352 | 2 | % | 320,255 | 2 | % | 429,884 | 2 | % | |||||||||||||||
| Total loans and leases held for investment, net of deferred fees | $ | 18,979,228 | 100 | % | $ | 19,083,377 | 100 | % | $ | 19,745,305 | 100 | % | ||||||||||||
| Total unfunded loan commitments | $ | 8,127,999 | $ | 7,601,390 | $ | 7,697,724 | ||||||||||||||||||
Allowance for Credit Losses
The following tables present roll forwards of the allowance for credit losses for the periods indicated:
| Three Months Ended March 31, 2021 | ||||||||||||
| Allowance for | Reserve for | Total | ||||||||||
| Allowance for Credit | Loan and | Unfunded Loan | Allowance for | |||||||||
| Losses Rollforward | Lease Losses | Commitments | Credit Losses | |||||||||
| (In thousands) | ||||||||||||
| Beginning balance | $ | 348,181 | $ | 85,571 | $ | 433,752 | ||||||
| Charge-offs | (3,988 | ) | - | (3,988 | ) | |||||||
| Recoveries | 1,252 | - | 1,252 | |||||||||
| Net charge-offs | (2,736 | ) | - | (2,736 | ) | |||||||
| Provision | (53,000 | ) | 5,000 | (48,000 | ) | |||||||
| Ending balance | $ | 292,445 | $ | 90,571 | $ | 383,016 | ||||||
| Three Months Ended December 31, 2020 | ||||||||||||
| Allowance for | Reserve for | Total | ||||||||||
| Allowance for Credit | Loan and | Unfunded Loan | Allowance for | |||||||||
| Losses Rollforward | Lease Losses | Commitments | Credit Losses | |||||||||
| (In thousands) | ||||||||||||
| Beginning balance | $ | 345,966 | $ | 96,571 | $ | 442,537 | ||||||
| Charge-offs | (20,314 | ) | - | (20,314 | ) | |||||||
| Recoveries | 1,529 | - | 1,529 | |||||||||
| Net charge-offs | (18,785 | ) | - | (18,785 | ) | |||||||
| Provision | 21,000 | (11,000 | ) | 10,000 | ||||||||
| Ending balance | $ | 348,181 | $ | 85,571 | $ | 433,752 | ||||||
Page 7
The following table presents allowance for credit losses information as of and for the dates and periods indicated:
| March 31, | December 31, | Increase | ||||||||||
| Allowance for Credit Losses | 2021 | 2020 | (Decrease) | |||||||||
| (Dollars in thousands) | ||||||||||||
| Allowance for loan and lease losses | $ | 292,445 | $ | 348,181 | $ | (55,736 | ) | |||||
| Reserve for unfunded loan commitments | 90,571 | 85,571 | 5,000 | |||||||||
| Allowance for credit losses | $ | 383,016 | $ | 433,752 | $ | (50,736 | ) | |||||
| Provision for credit losses (for the quarter) | $ | (48,000 | ) | $ | 10,000 | $ | (58,000 | ) | ||||
| Net charge-offs (for the quarter) | $ | 2,736 | $ | 18,785 | $ | (16,049 | ) | |||||
| Net charge-offs to average loans and leases (for the quarter) | 0.06 | % | 0.40 | % | ||||||||
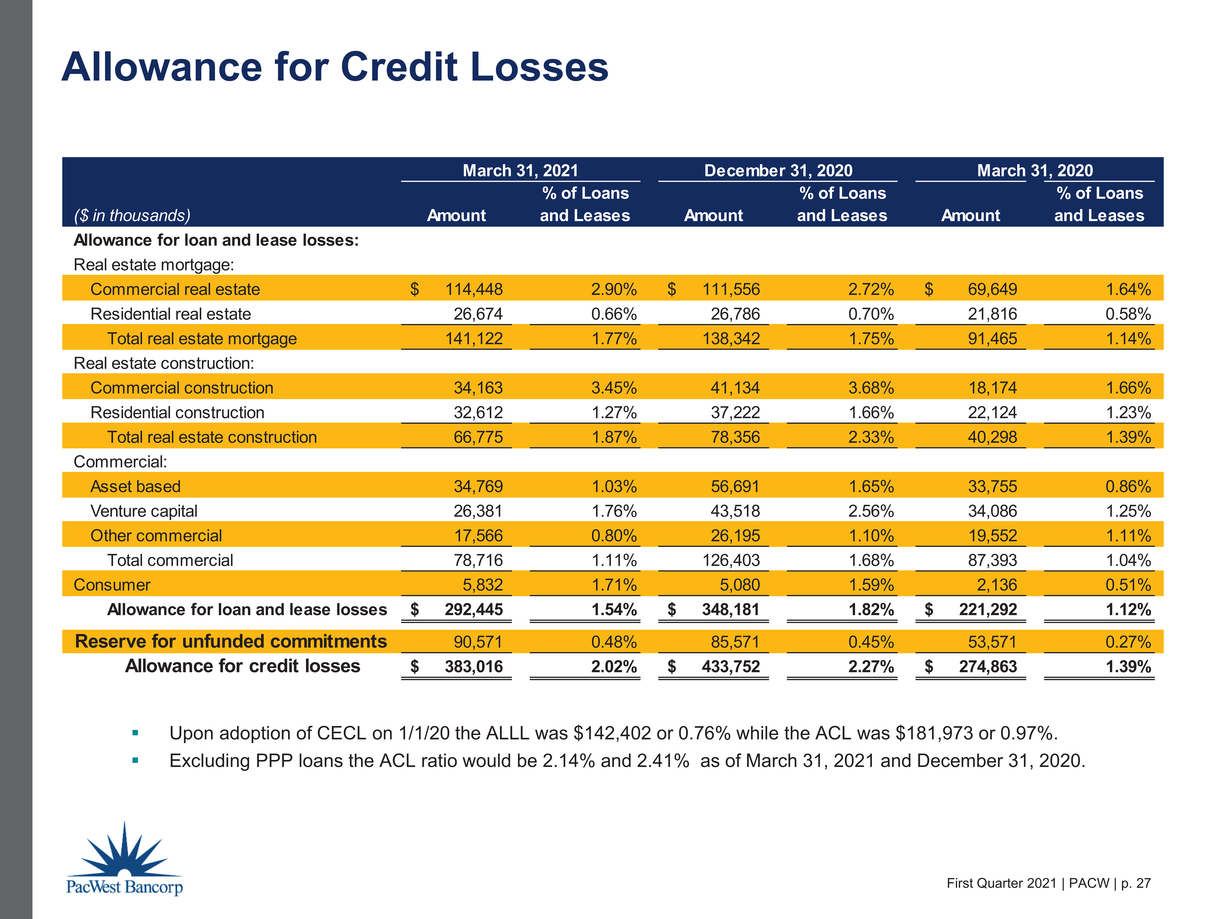
| Allowance for loan and lease losses to loans and leases held for investment | 1.54 | % | 1.82 | % | ||||||||
| Allowance for loan and lease losses to loans and leases held for investment, excluding PPP loans | 1.63 | % | 1.93 | % | ||||||||
| Allowance for credit losses to loans and leases held for investment | 2.02 | % | 2.27 | % | ||||||||
| Allowance for credit losses to loans and leases held for investment, excluding PPP loans | 2.14 | % | 2.41 | % | ||||||||
The allowance for credit losses decreased by $50.7 million in the first quarter of 2021 to $383.0 million at March 31, 2021. The decrease in the allowance for credit losses during the first quarter of 2021 was attributable to a provision for credit losses benefit of $48.0 million and $2.7 million in net charge-offs.
Net charge-offs were $2.7 million for the first quarter of 2021. Gross charge-offs of $4.0 million were reduced by recoveries of $1.3 million.
Net charge-offs were $18.8 million for the fourth quarter of 2020. Gross charge-offs of $20.3 million were reduced by recoveries of $1.5 million. The most significant charge-off was $15.5 million related to a security monitoring loan.
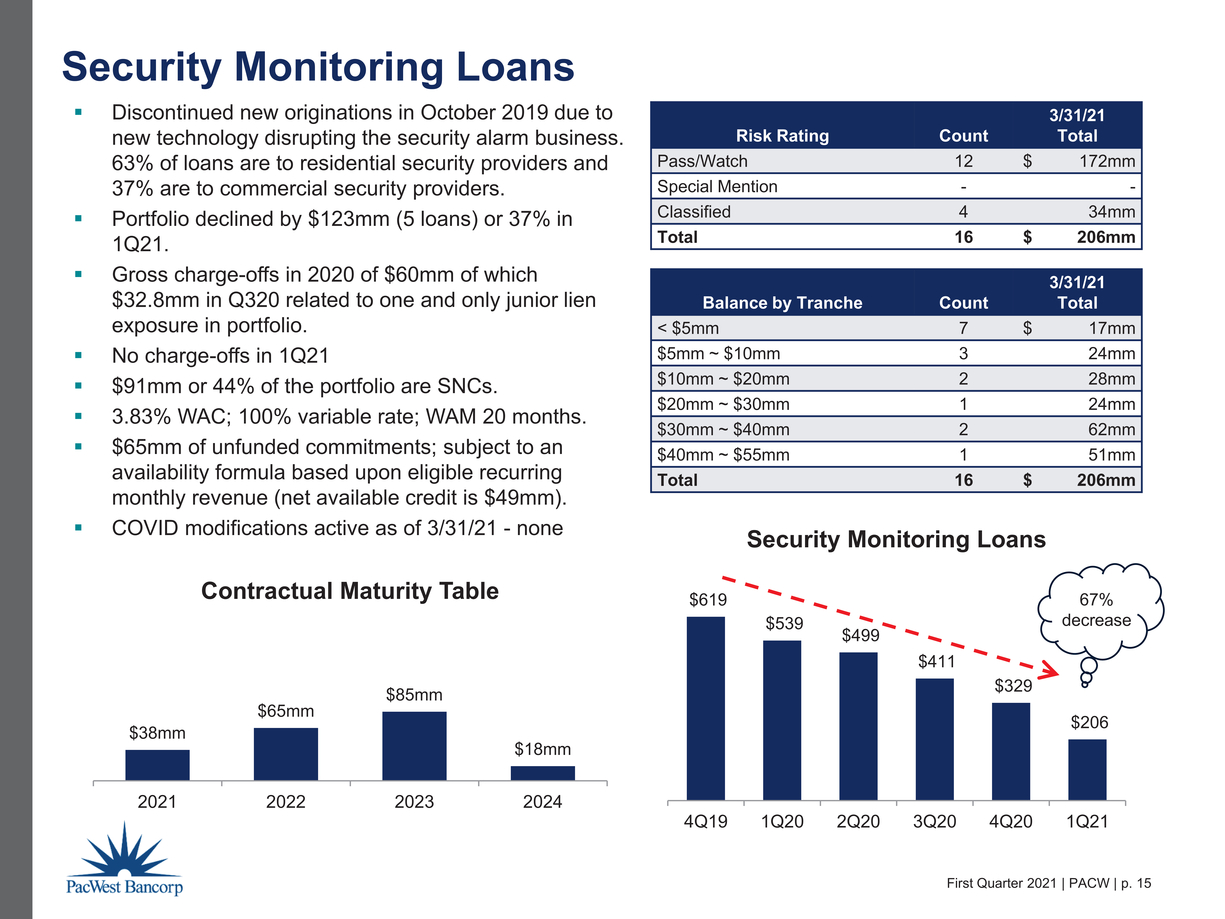
Security monitoring loans decreased by 38% from $329.3 million as of December 31, 2020 to $205.8 million as of March 31, 2021, as the Company continues to actively reduce the remaining loans. As of March 31, 2021, $172.1 million or 84% of these security monitoring loans are performing and pass-rated, while $33.7 million are classified, of which $6.1 million are on nonaccrual.
Page 8
CREDIT QUALITY
The following table presents loan and lease credit quality metrics as of the dates indicated:
| March 31, | December 31, | Increase | ||||||||||
| Credit Quality Metrics | 2021 | 2020 | (Decrease) | |||||||||
| (Dollars in thousands) | ||||||||||||
| NPAs and Performing TDRs: | ||||||||||||
| Nonaccrual loans and leases held for investment (1) | $ | 67,652 | $ | 91,163 | $ | (23,511 | ) | |||||
| Accruing loans contractually past due 90 days or more | - | - | - | |||||||||
| Foreclosed assets, net | 14,298 | 14,027 | 271 | |||||||||
| Total nonperforming assets ("NPAs") | $ | 81,950 | $ | 105,190 | $ | (23,240 | ) | |||||
| Performing TDRs held for investment | $ | 27,999 | $ | 14,254 | $ | 13,745 | ||||||
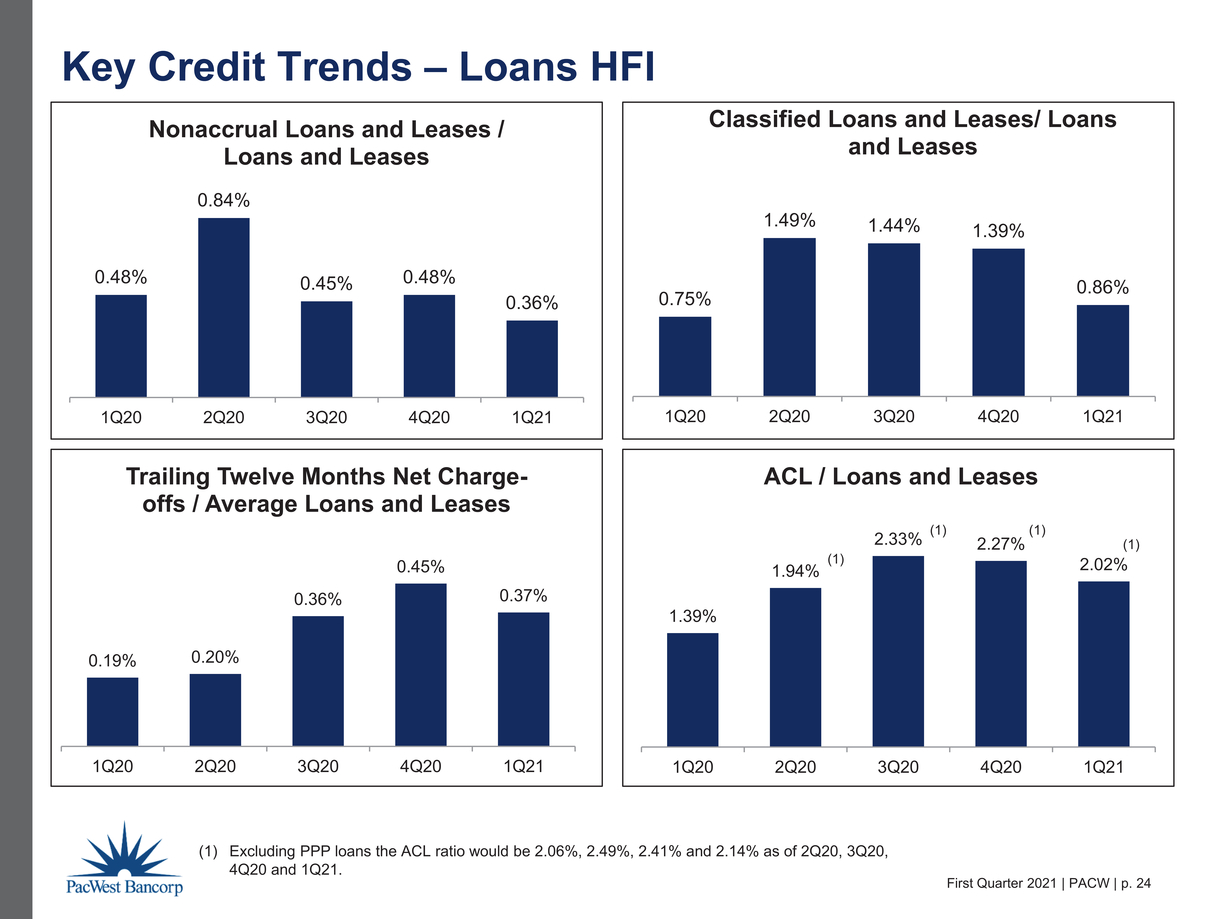
| Nonaccrual loans and leases held for investment to loans and leases held for investment | 0.36 | % | 0.48 | % | ||||||||
| Nonperforming assets to loans and leases held for investment and foreclosed assets | 0.43 | % | 0.55 | % | ||||||||
| Allowance for credit losses to nonaccrual loans and leases held for investment | 566.2 | % | 475.8 | % | ||||||||
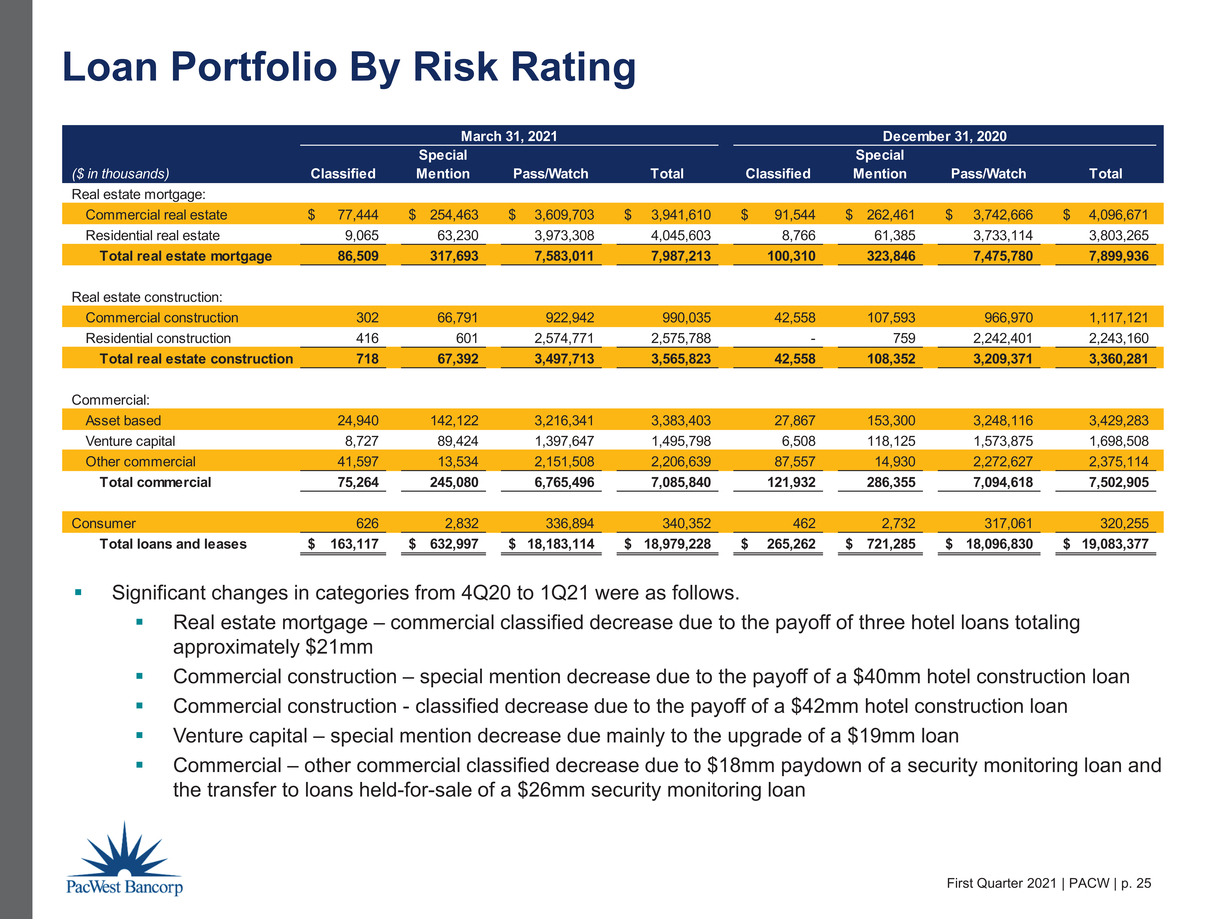
| Loan and Lease Credit Risk Ratings: | ||||||||||||
| Pass | $ | 18,183,114 | $ | 18,096,830 | $ | 86,284 | ||||||
| Special mention | 632,997 | 721,285 | (88,288 | ) | ||||||||
| Classified | 163,117 | 265,262 | (102,145 | ) | ||||||||
| Total loans and leases held for investment, net of deferred fees | $ | 18,979,228 | $ | 19,083,377 | $ | (104,149 | ) | |||||
| Classified loans and leases held for investment to loans and leases held for investment | 0.86 | % | 1.39 | % | ||||||||
| (1) Nonaccrual loans include guaranteed amounts of $18.4 million at March 31, 2021 and $13.9 million at December 31, 2020. |
Since pro-actively downgrading certain loans at the onset of the pandemic in the first quarter of 2020, special mention loans and leases have decreased $265.7 million from their peak in the first quarter of 2020, while classified loans and leases have decreased $130.1 million from their peak in the second quarter of 2020, and each have continued their decline in the first quarter of 2021.
Page 9
The following table presents nonaccrual loans and leases and accruing loans and leases past due between 30 and 89 days by loan portfolio segment and class as of the dates indicated:
| March 31, 2021 | December 31, 2020 | Increase (Decrease) | ||||||||||||||||||||||
| Accruing | Accruing | Accruing | ||||||||||||||||||||||
| and 30-89 | and 30-89 | and 30-89 | ||||||||||||||||||||||
| Days Past | Days Past | Days Past | ||||||||||||||||||||||
| Nonaccrual | Due | Nonaccrual | Due | Nonaccrual | Due | |||||||||||||||||||
| (Dollars in thousands) | ||||||||||||||||||||||||
| Real estate mortgage: | ||||||||||||||||||||||||
| Commercial | $ | 46,436 | $ | 5 | $ | 43,731 | $ | 3,636 | $ | 2,705 | $ | (3,631 | ) | |||||||||||
| Income producing and other residential | 2,471 | 6,339 | 1,826 | 600 | 645 | 5,739 | ||||||||||||||||||
| Total real estate mortgage | 48,907 | 6,344 | 45,557 | 4,236 | 3,350 | 2,108 | ||||||||||||||||||
| Real estate construction and land: | ||||||||||||||||||||||||
| Commercial | 302 | - | 315 | - | (13 | ) | - | |||||||||||||||||
| Residential | 416 | 1,241 | - | 759 | 416 | 482 | ||||||||||||||||||
| Total real estate construction and land | 718 | 1,241 | 315 | 759 | 403 | 482 | ||||||||||||||||||
| Commercial: | ||||||||||||||||||||||||
| Asset-based | 2,379 | - | 2,679 | - | (300 | ) | - | |||||||||||||||||
| Venture capital | 2,432 | 6,750 | 1,980 | 540 | 452 | 6,210 | ||||||||||||||||||
| Other commercial | 12,660 | 1,251 | 40,243 | 2,078 | (27,583 | ) | (827 | ) | ||||||||||||||||
| Total commercial | 17,471 | 8,001 | 44,902 | 2,618 | (27,431 | ) | 5,383 | |||||||||||||||||
| Consumer | 556 | 954 | 389 | 1,260 | 167 | (306 | ) | |||||||||||||||||
| Total held for investment | $ | 67,652 | $ | 16,540 | $ | 91,163 | $ | 8,873 | $ | (23,511 | ) | $ | 7,667 | |||||||||||
During the first quarter of 2021, nonaccrual loans and leases decreased by $23.5 million due primarily to one security monitoring loan for $25.6 million being moved to held for sale at March 31, 2021. The sale of this loan was completed in early April 2021 and resulted in a gain of $1.4 million.
CAPITAL
The following table presents certain actual capital ratios and ratios excluding PPP loans:
| March 31, 2021 | |||||||||||||||
| Excluding | December 31, | ||||||||||||||
| PPP | 2020 | ||||||||||||||
| Actual (1) | Loans (1) | Actual | |||||||||||||
| PacWest Bancorp Consolidated: | |||||||||||||||
| Tier 1 leverage capital ratio | 7.95 | % | 8.25 | % | (3) | 8.55 | % | ||||||||
| Common equity tier 1 capital ratio | 10.41 | % | 10.41 | % | 10.53 | % | |||||||||
| Total capital ratio | 13.63 | % | 13.63 | % | 13.76 | % | |||||||||
| Tangible common equity ratio (2) | 7.68 | % | 7.95 | % | (3) | 8.78 | % | ||||||||
(1) Capital information for March 31, 2021 is preliminary.
(2) Non-GAAP measure.
(3) PPP loans have been excluded from total assets in denominator as they are zero risk-weighted.
Page 10
ABOUT PACWEST BANCORP
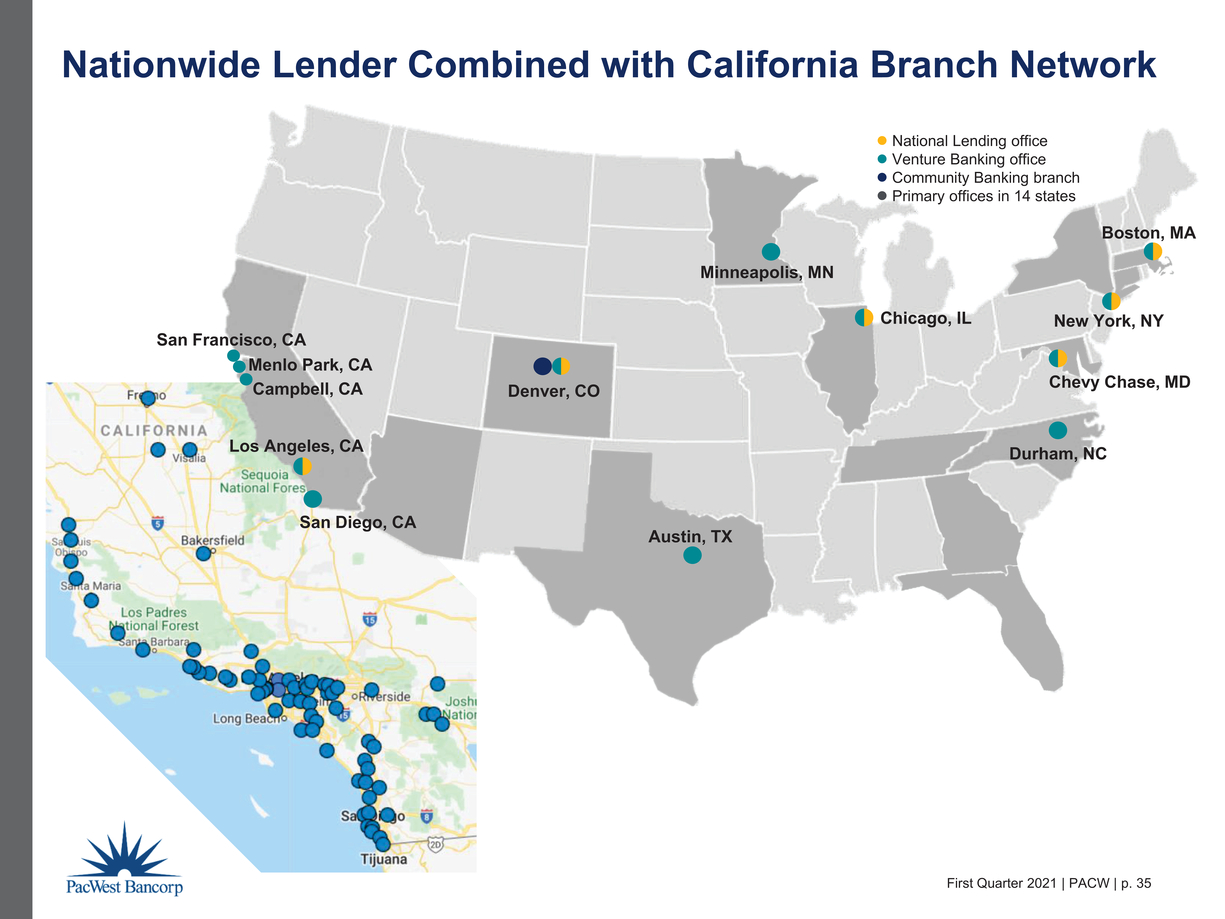
PacWest Bancorp (“PacWest”) is a bank holding company with over $32 billion in assets headquartered in Los Angeles, California, with an executive office in Denver, Colorado, with one wholly-owned banking subsidiary, Pacific Western Bank (the “Bank”). The Bank has 70 full-service branches located in California, one branch located in Durham, North Carolina, and one branch located in Denver, Colorado. The Bank provides community banking products including lending and comprehensive deposit and treasury management services to small and medium-sized businesses conducted primarily through our California-based branch offices and Denver, Colorado branch office. The Bank offers national lending products including asset-based, equipment, and real estate loans and treasury management services to established middle-market businesses on a national basis. The Bank also offers venture banking products including a comprehensive suite of financial services focused on entrepreneurial and venture-backed businesses and their venture capital and private equity investors, with offices located in key innovative hubs across the United States. For more information about PacWest Bancorp or Pacific Western Bank, visit www.pacwest.com.
FORWARD LOOKING STATEMENTS
This communication contains certain forward-looking information about PacWest that is intended to be covered by the safe harbor for “forward-looking statements” provided by the Private Securities Litigation Reform Act of 1995. Statements that are not historical or current facts, including statements about future financial and operational results, expectations, or intentions are forward-looking statements. Such statements are based on information available at the time of the communication and are based on current beliefs and expectations of the Company’s management and are subject to significant risks, uncertainties and contingencies, many of which are beyond our control. The COVID-19 pandemic is adversely affecting PacWest, its employees, customers and third-party service providers, and the ultimate extent of the impacts on its business, financial position, results of operations, liquidity and prospects is uncertain. The length of the COVID-19 pandemic and the severity of its impact on key macro-economic indicators such as unemployment and GDP may have a material impact on our allowance for credit losses and related provision for credit losses. Continued deterioration in general business and economic conditions could adversely affect PacWest’s revenues and the values of its assets, including goodwill, and liabilities, lead to a tightening of credit, and increase stock price volatility. In addition, PacWest’s results could be adversely affected by changes in interest rates, sustained high unemployment rates, deterioration in the credit quality of its loan portfolio or in the value of the collateral securing those loans, deterioration in the value of its investment securities, the magnitude of individual loan losses on security monitoring loans, and legal and regulatory developments. Actual results may differ materially from those set forth or implied in the forward-looking statements due to a variety of factors, including the risk factors described in documents filed by PacWest with the U.S. Securities and Exchange Commission.
We are under no obligation (and expressly disclaim any such obligation) to update or alter our forward-looking statements, whether as a result of new information, future events or otherwise, except as required by law.
Page 11
| PACWEST BANCORP AND SUBSIDIARIES | ||||||||||||
| CONDENSED CONSOLIDATED BALANCE SHEET | ||||||||||||
| March 31, | December 31, | March 31, | ||||||||||
| 2021 | 2020 | 2020 | ||||||||||
| (Dollars in thousands, except per share data) | ||||||||||||
| ASSETS: | ||||||||||||
| Cash and due from banks | $ | 177,199 | $ | 150,464 | $ | 172,570 | ||||||
| Interest-earning deposits in financial institutions | 5,517,667 | 3,010,197 | 439,690 | |||||||||
| Total cash and cash equivalents | 5,694,866 | 3,160,661 | 612,260 | |||||||||
| Securities available-for-sale, at estimated fair value | 5,941,690 | 5,235,591 | 3,757,663 | |||||||||
| Federal Home Loan Bank stock, at cost | 17,250 | 17,250 | 54,244 | |||||||||
| Total investment securities | 5,958,940 | 5,252,841 | 3,811,907 | |||||||||
| Loans held for sale | 25,554 | - | - | |||||||||
| Gross loans and leases held for investment | 19,055,165 | 19,153,357 | 19,806,394 | |||||||||
| Deferred fees, net | (75,937 | ) | (69,980 | ) | (61,089 | ) | ||||||
| Total loans and leases held for investment, net of deferred fees | 18,979,228 | 19,083,377 | 19,745,305 | |||||||||
| Allowance for loan and lease losses | (292,445 | ) | (348,181 | ) | (221,292 | ) | ||||||
| Total loans and leases held for investment, net | 18,686,783 | 18,735,196 | 19,524,013 | |||||||||
| Equipment leased to others under operating leases | 327,413 | 333,846 | 306,530 | |||||||||
| Premises and equipment, net | 39,622 | 39,234 | 39,799 | |||||||||
| Foreclosed assets, net | 14,298 | 14,027 | 1,701 | |||||||||
| Goodwill | 1,204,092 | 1,078,670 | 1,078,670 | |||||||||
| Core deposit and customer relationship intangibles, net | 21,312 | 23,641 | 34,446 | |||||||||
| Other assets | 883,653 | 860,326 | 733,941 | |||||||||
| Total assets | $ | 32,856,533 | $ | 29,498,442 | $ | 26,143,267 | ||||||
| LIABILITIES: | ||||||||||||
| Noninterest-bearing deposits | $ | 11,017,462 | $ | 9,193,827 | $ | 7,510,218 | ||||||
| Interest-bearing deposits | 17,205,829 | 15,746,890 | 12,065,619 | |||||||||
| Total deposits | 28,223,291 | 24,940,717 | 19,575,837 | |||||||||
| Borrowings | 19,750 | 5,000 | 2,295,000 | |||||||||
| Subordinated debentures | 465,814 | 465,812 | 458,994 | |||||||||
| Accrued interest payable and other liabilities | 493,541 | 491,962 | 423,047 | |||||||||
| Total liabilities | 29,202,396 | 25,903,491 | 22,752,878 | |||||||||
| STOCKHOLDERS' EQUITY (1) | 3,654,137 | 3,594,951 | 3,390,389 | |||||||||
| Total liabilities and stockholders’ equity | $ | 32,856,533 | $ | 29,498,442 | $ | 26,143,267 | ||||||
| Book value per share | $ | 30.68 | $ | 30.36 | $ | 28.75 | ||||||
| Tangible book value per share (2) | $ | 20.39 | $ | 21.05 | $ | 19.31 | ||||||
| Shares outstanding | 119,105,642 | 118,414,853 | 117,916,789 | |||||||||
| (1) Includes net unrealized gain on securities available-for-sale, net | $ | 106,381 | $ | 172,523 | $ | 90,916 | ||||||
| (2) Non-GAAP measure. |
Page 12
| PACWEST BANCORP AND SUBSIDIARIES | ||||||||||||
| CONDENSED CONSOLIDATED STATEMENT OF EARNINGS (LOSS) | ||||||||||||
| Three Months Ended | ||||||||||||
| March 31, | December 31, | March 31, | ||||||||||
| 2021 | 2020 | 2020 | ||||||||||
| (Dollars in thousands, except per share data) | ||||||||||||
| Interest income: | ||||||||||||
| Loans and leases | $ | 241,544 | $ | 242,198 | $ | 262,278 | ||||||
| Investment securities | 30,265 | 28,843 | 27,446 | |||||||||
| Deposits in financial institutions | 1,528 | 1,135 | 1,608 | |||||||||
| Total interest income | 273,337 | 272,176 | 291,332 | |||||||||
| Interest expense: | ||||||||||||
| Deposits | 7,500 | 8,454 | 28,247 | |||||||||
| Borrowings | 193 | 37 | 6,778 | |||||||||
| Subordinated debentures | 4,375 | 4,477 | 6,560 | |||||||||
| Total interest expense | 12,068 | 12,968 | 41,585 | |||||||||
| Net interest income | 261,269 | 259,208 | 249,747 | |||||||||
| Provision for credit losses | (48,000 | ) | 10,000 | 112,000 | ||||||||
| Net interest income after provision for credit losses | 309,269 | 249,208 | 137,747 | |||||||||
| Noninterest income: | ||||||||||||
| Service charges on deposit accounts | 2,934 | 3,119 | 2,658 | |||||||||
| Other commissions and fees | 9,158 | 9,974 | 9,721 | |||||||||
| Leased equipment income | 11,354 | 9,440 | 12,251 | |||||||||
| Gain on sale of loans and leases | 139 | 1,671 | 87 | |||||||||
| Gain on sale of securities | 101 | 4 | 182 | |||||||||
| Other income | 21,143 | 15,642 | 4,201 | |||||||||
| Total noninterest income | 44,829 | 39,850 | 29,100 | |||||||||
| Noninterest expense: | ||||||||||||
| Compensation | 79,882 | 73,171 | 61,282 | |||||||||
| Occupancy | 14,054 | 14,083 | 14,207 | |||||||||
| Data processing | 6,957 | 6,718 | 6,454 | |||||||||
| Other professional services | 5,126 | 6,800 | 4,258 | |||||||||
| Insurance and assessments | 4,903 | 5,064 | 4,249 | |||||||||
| Intangible asset amortization | 3,079 | 3,172 | 3,948 | |||||||||
| Leased equipment depreciation | 8,969 | 7,501 | 7,205 | |||||||||
| Foreclosed assets (income) expense, net | 1 | (272 | ) | 66 | ||||||||
| Acquisition, integration and reorganization costs | 3,425 | 1,060 | - | |||||||||
| Customer related expense | 4,818 | 4,430 | 3,932 | |||||||||
| Loan expense | 3,193 | 3,926 | 2,650 | |||||||||
| Goodwill impairment | - | - | 1,470,000 | |||||||||
| Other expense | 15,729 | 10,029 | 9,719 | |||||||||
| Total noninterest expense | 150,136 | 135,682 | 1,587,970 | |||||||||
| Earnings (loss) before income taxes | 203,962 | 153,376 | (1,421,123 | ) | ||||||||
| Income tax expense | 53,556 | 36,546 | 11,988 | |||||||||
| Net earnings (loss) | $ | 150,406 | $ | 116,830 | $ | (1,433,111 | ) | |||||
| Basic and diluted earnings (loss) per share | $ | 1.27 | $ | 0.99 | $ | (12.23 | ) | |||||
| Dividends declared and paid per share | $ | 0.25 | $ | 0.25 | $ | 0.60 | ||||||
Page 13
| PACWEST BANCORP AND SUBSIDIARIES | ||||||||||||
| NET EARNINGS (LOSS) PER SHARE CALCULATIONS | ||||||||||||
| Three Months Ended | ||||||||||||
| March 31, | December 31, | March 31, | ||||||||||
| 2021 | 2020 | 2020 | ||||||||||
| (In thousands, except per share data) | ||||||||||||
| Basic Earnings (Loss) Per Share: | ||||||||||||
| Net earnings (loss) | $ | 150,406 | $ | 116,830 | $ | (1,433,111 | ) | |||||
| Less: earnings allocated to unvested restricted stock (1) | (2,355 | ) | (1,398 | ) | (939 | ) | ||||||
| Net earnings (loss) allocated to common shares | $ | 148,051 | $ | 115,432 | $ | (1,434,050 | ) | |||||
| Weighted-average basic shares and unvested restricted stock outstanding | 118,852 | 118,446 | 118,775 | |||||||||
| Less: weighted-average unvested restricted stock outstanding | (2,003 | ) | (1,652 | ) | (1,495 | ) | ||||||
| Weighted-average basic shares outstanding | 116,849 | 116,794 | 117,280 | |||||||||
| Basic earnings (loss) per share | $ | 1.27 | $ | 0.99 | $ | (12.23 | ) | |||||
| Diluted Earnings (Loss) Per Share: | ||||||||||||
| Net earnings (loss) allocated to common shares | $ | 148,051 | $ | 115,432 | $ | (1,434,050 | ) | |||||
| Weighted-average diluted shares outstanding | 116,849 | 116,794 | 117,280 | |||||||||
| Diluted earnings (loss) per share | $ | 1.27 | $ | 0.99 | $ | (12.23 | ) | |||||
| (1) Represents cash dividends paid to holders of unvested stock, net of forfeitures, plus undistributed earnings amounts available to holders of unvested restricted stock, if any. |
Page 14
| PACWEST BANCORP AND SUBSIDIARIES | ||
| AVERAGE BALANCE SHEET AND YIELD ANALYSIS |
| Three Months Ended | ||||||||||||||||||||||||||||||||||||
| March 31, 2021 | December 31, 2020 | March 31, 2020 | ||||||||||||||||||||||||||||||||||
| Interest | Average | Interest | Average | Interest | Average | |||||||||||||||||||||||||||||||
| Average | Income/ | Yield/ | Average | Income/ | Yield/ | Average | Income/ | Yield/ | ||||||||||||||||||||||||||||
| Balance | Expense | Cost | Balance | Expense | Cost | Balance | Expense | Cost | ||||||||||||||||||||||||||||
| (Dollars in thousands) | ||||||||||||||||||||||||||||||||||||
| Assets: | ||||||||||||||||||||||||||||||||||||
| Loans and leases (1)(2) | $ | 18,927,314 | $ | 242,846 | 5.20 | % | $ | 18,769,214 | $ | 243,188 | 5.15 | % | $ | 19,065,035 | $ | 262,764 | 5.54 | % | ||||||||||||||||||
| Investment securities (3) | 5,383,140 | 32,329 | 2.44 | % | 4,888,993 | 30,757 | 2.50 | % | 3,853,217 | 28,641 | 2.99 | % | ||||||||||||||||||||||||
| Deposits in financial institutions | 4,790,231 | 1,528 | 0.13 | % | 3,576,335 | 1,135 | 0.13 | % | 537,384 | 1,608 | 1.20 | % | ||||||||||||||||||||||||
| Total interest-earning assets (1) | 29,100,685 | 276,703 | 3.86 | % | 27,234,542 | 275,080 | 4.02 | % | 23,455,636 | 293,013 | 5.02 | % | ||||||||||||||||||||||||
| Other assets | 2,315,197 | 2,100,247 | 3,643,404 | |||||||||||||||||||||||||||||||||
| Total assets | $ | 31,415,882 | $ | 29,334,789 | $ | 27,099,040 | ||||||||||||||||||||||||||||||
| Liabilities and Stockholders' Equity: | ||||||||||||||||||||||||||||||||||||
| Interest checking | $ | 6,401,869 | 2,232 | 0.14 | % | $ | 5,191,435 | 2,064 | 0.16 | % | $ | 3,466,812 | 7,135 | 0.83 | % | |||||||||||||||||||||
| Money market | 7,975,996 | 3,278 | 0.17 | % | 7,636,220 | 3,225 | 0.17 | % | 5,247,866 | 10,016 | 0.77 | % | ||||||||||||||||||||||||
| Savings | 572,959 | 35 | 0.02 | % | 567,646 | 35 | 0.02 | % | 497,959 | 160 | 0.13 | % | ||||||||||||||||||||||||
| Time | 1,493,267 | 1,955 | 0.53 | % | 1,650,150 | 3,130 | 0.75 | % | 2,684,143 | 10,936 | 1.64 | % | ||||||||||||||||||||||||
| Total interest-bearing deposits | 16,444,091 | 7,500 | 0.18 | % | 15,045,451 | 8,454 | 0.22 | % | 11,896,780 | 28,247 | 0.95 | % | ||||||||||||||||||||||||
| Borrowings | 226,053 | 193 | 0.35 | % | 237,098 | 37 | 0.06 | % | 2,026,749 | 6,778 | 1.35 | % | ||||||||||||||||||||||||
| Subordinated debentures | 466,101 | 4,375 | 3.81 | % | 463,951 | 4,477 | 3.84 | % | 458,399 | 6,560 | 5.76 | % | ||||||||||||||||||||||||
| Total interest-bearing liabilities | 17,136,245 | 12,068 | 0.29 | % | 15,746,500 | 12,968 | 0.33 | % | 14,381,928 | 41,585 | 1.16 | % | ||||||||||||||||||||||||
| Noninterest-bearing demand deposits | 10,173,459 | 9,589,789 | 7,357,717 | |||||||||||||||||||||||||||||||||
| Other liabilities | 488,930 | 462,075 | 402,617 | |||||||||||||||||||||||||||||||||
| Total liabilities | 27,798,634 | 25,798,364 | 22,142,262 | |||||||||||||||||||||||||||||||||
| Stockholders' equity | 3,617,248 | 3,536,425 | 4,956,778 | |||||||||||||||||||||||||||||||||
| Total liabilities and stockholders' equity | $ | 31,415,882 | $ | 29,334,789 | $ | 27,099,040 | ||||||||||||||||||||||||||||||
| Net interest income (1) | $ | 264,635 | $ | 262,112 | $ | 251,428 | ||||||||||||||||||||||||||||||
| Net interest spread (1) | 3.57 | % | 3.69 | % | 3.86 | % | ||||||||||||||||||||||||||||||
| Net interest margin (1) | 3.69 | % | 3.83 | % | 4.31 | % | ||||||||||||||||||||||||||||||
| Total deposits (4) | $ | 26,617,550 | $ | 7,500 | 0.11 | % | $ | 24,635,240 | $ | 8,454 | 0.14 | % | $ | 19,254,497 | $ | 28,247 | 0.59 | % | ||||||||||||||||||
| (1) Tax equivalent. | |
| (2) Includes discount accretion on acquired loans of $5.4 million, $3.8 million, and $4.8 million for the three months ended March 31, 2021, | |
| December 31, 2020, and March 31, 2020, respectively. | |
| (3) Includes tax-equivalent adjustments of $2.1 million, $1.9 million, and $1.2 million for the three months ended March 31, 2021, | |
| December 31, 2020, and March 31, 2020 related to tax-exempt income on investment securities. | |
| The federal statutory tax rate utilized was 21%. | |
| (4) Total deposits is the sum of total interest-bearing deposits and noninterest-bearing demand deposits. The cost of total deposits is | |
| calculated as annualized interest expense on total deposits divided by average total deposits. | |
Page 15
| PACWEST BANCORP AND SUBSIDIARIES | |||||||||
| FIVE QUARTER BALANCE SHEET |
| March 31, | December 31, | September 30, | June 30, | March 31, | ||||||||||||||||
| 2021 | 2020 | 2020 | 2020 | 2020 | ||||||||||||||||
| (Dollars in thousands, except per share data) | ||||||||||||||||||||
| ASSETS: | ||||||||||||||||||||
| Cash and due from banks | $ | 177,199 | $ | 150,464 | $ | 187,176 | $ | 174,059 | $ | 172,570 | ||||||||||
| Interest-earning deposits in financial institutions | 5,517,667 | 3,010,197 | 2,766,020 | 1,747,077 | 439,690 | |||||||||||||||
| Total cash and cash equivalents | 5,694,866 | 3,160,661 | 2,953,196 | 1,921,136 | 612,260 | |||||||||||||||
| Securities available-for-sale | 5,941,690 | 5,235,591 | 4,532,614 | 3,851,141 | 3,757,663 | |||||||||||||||
| Federal Home Loan Bank stock | 17,250 | 17,250 | 17,250 | 17,250 | 54,244 | |||||||||||||||
| Total investment securities | 5,958,940 | 5,252,841 | 4,549,864 | 3,868,391 | 3,811,907 | |||||||||||||||
| Loans held for sale | 25,554 | - | - | - | - | |||||||||||||||
| Gross loans and leases held for investment | 19,055,165 | 19,153,357 | 19,101,680 | 19,780,476 | 19,806,394 | |||||||||||||||
| Deferred fees, net | (75,937 | ) | (69,980 | ) | (75,480 | ) | (85,845 | ) | (61,089 | ) | ||||||||||
| Total loans and leases held for investment, net of deferred fees | 18,979,228 | 19,083,377 | 19,026,200 | 19,694,631 | 19,745,305 | |||||||||||||||
| Allowance for loan and lease losses | (292,445 | ) | (348,181 | ) | (345,966 | ) | (301,050 | ) | (221,292 | ) | ||||||||||
| Total loans and leases held for investment, net | 18,686,783 | 18,735,196 | 18,680,234 | 19,393,581 | 19,524,013 | |||||||||||||||
| Equipment leased to others under operating leases | 327,413 | 333,846 | 286,425 | 295,191 | 306,530 | |||||||||||||||
| Premises and equipment, net | 39,622 | 39,234 | 40,544 | 42,299 | 39,799 | |||||||||||||||
| Foreclosed assets, net | 14,298 | 14,027 | 13,747 | 1,449 | 1,701 | |||||||||||||||
| Goodwill | 1,204,092 | 1,078,670 | 1,078,670 | 1,078,670 | 1,078,670 | |||||||||||||||
| Core deposit and customer relationship intangibles, net | 21,312 | 23,641 | 26,813 | 30,564 | 34,446 | |||||||||||||||
| Other assets | 883,653 | 860,326 | 797,223 | 734,457 | 733,941 | |||||||||||||||
| Total assets | $ | 32,856,533 | $ | 29,498,442 | $ | 28,426,716 | $ | 27,365,738 | $ | 26,143,267 | ||||||||||
| LIABILITIES: | ||||||||||||||||||||
| Noninterest-bearing deposits | $ | 11,017,462 | $ | 9,193,827 | $ | 9,346,744 | $ | 8,629,543 | $ | 7,510,218 | ||||||||||
| Interest-bearing deposits | 17,205,829 | 15,746,890 | 14,618,951 | 14,299,036 | 12,065,619 | |||||||||||||||
| Total deposits | 28,223,291 | 24,940,717 | 23,965,695 | 22,928,579 | 19,575,837 | |||||||||||||||
| Borrowings | 19,750 | 5,000 | 60,000 | 60,000 | 2,295,000 | |||||||||||||||
| Subordinated debentures | 465,814 | 465,812 | 463,282 | 460,772 | 458,994 | |||||||||||||||
| Accrued interest payable and other liabilities | 493,541 | 491,962 | 451,508 | 463,489 | 423,047 | |||||||||||||||
| Total liabilities | 29,202,396 | 25,903,491 | 24,940,485 | 23,912,840 | 22,752,878 | |||||||||||||||
| STOCKHOLDERS' EQUITY (1) | 3,654,137 | 3,594,951 | 3,486,231 | 3,452,898 | 3,390,389 | |||||||||||||||
| Total liabilities and stockholders’ equity | $ | 32,856,533 | $ | 29,498,442 | $ | 28,426,716 | $ | 27,365,738 | $ | 26,143,267 | ||||||||||
| Book value per share | $ | 30.68 | $ | 30.36 | $ | 29.42 | $ | 29.17 | $ | 28.75 | ||||||||||
| Tangible book value per share (2) | $ | 20.39 | $ | 21.05 | $ | 20.09 | $ | 19.80 | $ | 19.31 | ||||||||||
| Shares outstanding | 119,105,642 | 118,414,853 | 118,489,927 | 118,374,603 | 117,916,789 | |||||||||||||||
| (1) Includes net unrealized gain on securities available-for-sale, net | $ | 106,381 | $ | 172,523 | $ | 155,474 | $ | 145,038 | $ | 90,916 | ||||||||||
| (2) Non-GAAP measure. |
Page 16
| PACWEST BANCORP AND SUBSIDIARIES | |||||||||
| FIVE QUARTER STATEMENT OF EARNINGS (LOSS) | |||||||||
| Three Months Ended | ||||||||||||||||||||
| March 31, | December 31, | September 30, | June 30, | March 31, | ||||||||||||||||
| 2021 | 2020 | 2020 | 2020 | 2020 | ||||||||||||||||
| (Dollars in thousands, except per share data) | ||||||||||||||||||||
| Interest income: | ||||||||||||||||||||
| Loans and leases | $ | 241,544 | $ | 242,198 | $ | 240,811 | $ | 247,851 | $ | 262,278 | ||||||||||
| Investment securities | 30,265 | 28,843 | 24,443 | 26,038 | 27,446 | |||||||||||||||
| Deposits in financial institutions | 1,528 | 1,135 | 654 | 186 | 1,608 | |||||||||||||||
| Total interest income | 273,337 | 272,176 | 265,908 | 274,075 | 291,332 | |||||||||||||||
| Interest expense: | ||||||||||||||||||||
| Deposits | 7,500 | 8,454 | 9,887 | 13,075 | 28,247 | |||||||||||||||
| Borrowings | 193 | 37 | 27 | 1,319 | 6,778 | |||||||||||||||
| Subordinated debentures | 4,375 | 4,477 | 4,670 | 5,402 | 6,560 | |||||||||||||||
| Total interest expense | 12,068 | 12,968 | 14,584 | 19,796 | 41,585 | |||||||||||||||
| Net interest income | 261,269 | 259,208 | 251,324 | 254,279 | 249,747 | |||||||||||||||
| Provision for credit losses | (48,000 | ) | 10,000 | 97,000 | 120,000 | 112,000 | ||||||||||||||
| Net interest income after provision for credit losses | 309,269 | 249,208 | 154,324 | 134,279 | 137,747 | |||||||||||||||
| Noninterest income: | ||||||||||||||||||||
| Service charges on deposit accounts | 2,934 | 3,119 | 2,570 | 2,004 | 2,658 | |||||||||||||||
| Other commissions and fees | 9,158 | 9,974 | 10,541 | 10,111 | 9,721 | |||||||||||||||
| Leased equipment income | 11,354 | 9,440 | 9,900 | 12,037 | 12,251 | |||||||||||||||
| Gain on sale of loans and leases | 139 | 1,671 | 35 | 346 | 87 | |||||||||||||||
| Gain on sale of securities | 101 | 4 | 5,270 | 7,715 | 182 | |||||||||||||||
| Other income | 21,143 | 15,642 | 9,936 | 6,645 | 4,201 | |||||||||||||||
| Total noninterest income | 44,829 | 39,850 | 38,252 | 38,858 | 29,100 | |||||||||||||||
| Noninterest expense: | ||||||||||||||||||||
| Compensation | 79,882 | 73,171 | 75,131 | 61,910 | 61,282 | |||||||||||||||
| Occupancy | 14,054 | 14,083 | 14,771 | 14,494 | 14,207 | |||||||||||||||
| Data processing | 6,957 | 6,718 | 6,505 | 7,102 | 6,454 | |||||||||||||||
| Other professional services | 5,126 | 6,800 | 4,713 | 4,146 | 4,258 | |||||||||||||||
| Insurance and assessments | 4,903 | 5,064 | 3,939 | 9,373 | 4,249 | |||||||||||||||
| Intangible asset amortization | 3,079 | 3,172 | 3,751 | 3,882 | 3,948 | |||||||||||||||
| Leased equipment depreciation | 8,969 | 7,501 | 7,057 | 7,102 | 7,205 | |||||||||||||||
| Foreclosed assets (income) expense, net | 1 | (272 | ) | 335 | (146 | ) | 66 | |||||||||||||
| Acquisition, integration and reorganization costs | 3,425 | 1,060 | - | - | - | |||||||||||||||
| Customer related expense | 4,818 | 4,430 | 4,762 | 4,408 | 3,932 | |||||||||||||||
| Loan expense | 3,193 | 3,926 | 3,499 | 3,379 | 2,650 | |||||||||||||||
| Goodwill impairment | - | - | - | - | 1,470,000 | |||||||||||||||
| Other expense | 15,729 | 10,029 | 8,939 | 11,315 | 9,719 | |||||||||||||||
| Total noninterest expense | 150,136 | 135,682 | 133,402 | 126,965 | 1,587,970 | |||||||||||||||
| Earnings (loss) before income taxes | 203,962 | 153,376 | 59,174 | 46,172 | (1,421,123 | ) | ||||||||||||||
| Income tax expense | 53,556 | 36,546 | 13,671 | 12,968 | 11,988 | |||||||||||||||
| Net earnings (loss) | $ | 150,406 | $ | 116,830 | $ | 45,503 | $ | 33,204 | $ | (1,433,111 | ) | |||||||||
| Basic and diluted earnings (loss) per share | $ | 1.27 | $ | 0.99 | $ | 0.38 | $ | 0.28 | $ | (12.23 | ) | |||||||||
| Dividends declared and paid per share | $ | 0.25 | $ | 0.25 | $ | 0.25 | $ | 0.25 | $ | 0.60 | ||||||||||
Page 17
| PACWEST BANCORP AND SUBSIDIARIES | |||||||||
| FIVE QUARTER SELECTED FINANCIAL DATA | |||||||||
| At or For the Three Months Ended | ||||||||||||||||||||
| March 31, | December 31, | September 30, | June 30, | March 31, | ||||||||||||||||
| 2021 | 2020 | 2020 | 2020 | 2020 | ||||||||||||||||
| (Dollars in thousands) | ||||||||||||||||||||
| Performance Ratios: | ||||||||||||||||||||
| Return on average assets (1) | 1.94 | % | 1.58 | % | 0.65 | % | 0.50 | % | (21.27 | )% | ||||||||||
| Pre-provision, pre-goodwill impairment, pre-tax net revenue ("PPNR") return on average assets (1)(2) | 2.01 | % | 2.22 | % | 2.22 | % | 2.51 | % | 2.39 | % | ||||||||||
| Return on average equity (1) | 16.86 | % | 13.14 | % | 5.18 | % | 3.87 | % | (116.28 | )% | ||||||||||
| Return on average tangible equity (1)(2) | 25.67 | % | 19.63 | % | 8.20 | % | 6.39 | % | 6.88 | % | ||||||||||
| Efficiency ratio | 46.4 | % | 43.6 | % | 45.1 | % | 42.9 | % | 40.6 | % | ||||||||||
| Noninterest expense as a percentage of average assets (1) | 1.94 | % | 1.84 | % | 1.90 | % | 1.92 | % | 23.57 | % | ||||||||||
| Average Yields/Costs (1): | ||||||||||||||||||||
| Yield on: | ||||||||||||||||||||
| Average loans and leases (3) | 5.20 | % | 5.15 | % | 5.01 | % | 5.01 | % | 5.54 | % | ||||||||||
| Average interest-earning assets (3) | 3.86 | % | 4.02 | % | 4.13 | % | 4.53 | % | 5.02 | % | ||||||||||
| Cost of: | ||||||||||||||||||||
| Average interest-bearing deposits | 0.18 | % | 0.22 | % | 0.27 | % | 0.40 | % | 0.95 | % | ||||||||||
| Average total deposits | 0.11 | % | 0.14 | % | 0.17 | % | 0.25 | % | 0.59 | % | ||||||||||
| Average interest-bearing liabilities | 0.29 | % | 0.33 | % | 0.38 | % | 0.55 | % | 1.16 | % | ||||||||||
| Net interest spread (3) | 3.57 | % | 3.69 | % | 3.75 | % | 3.98 | % | 3.86 | % | ||||||||||
| Net interest margin (3) | 3.69 | % | 3.83 | % | 3.90 | % | 4.20 | % | 4.31 | % | ||||||||||
| Average Balances: | ||||||||||||||||||||
| Assets: | ||||||||||||||||||||
| Loans and leases, net of deferred fees | $ | 18,927,314 | $ | 18,769,214 | $ | 19,195,737 | $ | 19,951,603 | $ | 19,065,035 | ||||||||||
| Interest-earning assets | 29,100,685 | 27,234,542 | 25,858,001 | 24,531,204 | 23,455,636 | |||||||||||||||
| Total assets | 31,415,882 | 29,334,789 | 27,935,193 | 26,621,227 | 27,099,040 | |||||||||||||||
| Liabilities: | ||||||||||||||||||||
| Noninterest-bearing deposits | 10,173,459 | 9,589,789 | 8,812,391 | 8,292,151 | 7,357,717 | |||||||||||||||
| Interest-bearing deposits | 16,444,091 | 15,045,451 | 14,516,923 | 13,116,297 | 11,896,780 | |||||||||||||||
| Total deposits | 26,617,550 | 24,635,240 | 23,329,314 | 21,408,448 | 19,254,497 | |||||||||||||||
| Borrowings | 226,053 | 237,098 | 181,315 | 871,110 | 2,026,749 | |||||||||||||||
| Subordinated debentures | 466,101 | 463,951 | 462,375 | 459,466 | 458,399 | |||||||||||||||
| Interest-bearing liabilities | 17,136,245 | 15,746,500 | 15,160,613 | 14,446,873 | 14,381,928 | |||||||||||||||
| Stockholders' equity | 3,617,248 | 3,536,425 | 3,497,869 | 3,446,850 | 4,956,778 | |||||||||||||||
| (1) Annualized. | ||||||||||||||||||||
| (2) Non-GAAP measure. | ||||||||||||||||||||
| (3) Tax equivalent. |
Page 18
| PACWEST BANCORP AND SUBSIDIARIES | ||||||||||||||||||||
| FIVE QUARTER SELECTED FINANCIAL DATA | ||||||||||||||||||||
| At or For the Three Months Ended | ||||||||||||||||||||
| March 31, | December 31, | September 30, | June 30, | March 31, | ||||||||||||||||
| 2021 | 2020 | 2020 | 2020 | 2020 | ||||||||||||||||
| (Dollars in thousands) | ||||||||||||||||||||
| Credit Quality Ratios: | ||||||||||||||||||||
Nonaccrual loans and leases held for investment to loans and leases held for investment | 0.36 | % | 0.48 | % | 0.45 | % | 0.84 | % | 0.48 | % | ||||||||||
Nonperforming assets to loans and leases held for investment and foreclosed assets | 0.43 | % | 0.55 | % | 0.52 | % | 0.85 | % | 0.49 | % | ||||||||||
Classified loans and leases held for investment to loans and leases held for investment | 0.86 | % | 1.39 | % | 1.44 | % | 1.49 | % | 0.75 | % | ||||||||||
Provision for credit losses (for the quarter) to average loans and leases held for investment (annualized) | (1.03 | )% | 0.21 | % | 2.01 | % | 2.42 | % | 2.36 | % | ||||||||||
Net charge-offs (for the quarter) to average loans and leases held for investment (annualized) | 0.06 | % | 0.40 | % | 0.75 | % | 0.27 | % | 0.40 | % | ||||||||||
Trailing 12 months net charge-offs to average loans and leases held for investment | 0.37 | % | 0.45 | % | 0.36 | % | 0.20 | % | 0.19 | % | ||||||||||
Allowance for loan and lease losses to loans and leases held for investment | 1.54 | % | 1.82 | % | 1.82 | % | 1.53 | % | 1.12 | % | ||||||||||
Allowance for credit losses to loans and leases held for investment | 2.02 | % | 2.27 | % | 2.33 | % | 1.94 | % | 1.39 | % | ||||||||||
Allowance for credit losses to nonaccrual loans and leases held for investment | 566.2 | % | 475.8 | % | 516.9 | % | 229.7 | % | 287.5 | % | ||||||||||
| PacWest Bancorp Consolidated: | ||||||||||||||||||||
| Tier 1 leverage capital ratio (1) | 7.95 | % | 8.55 | % | 8.66 | % | 8.93 | % | 8.63 | % | ||||||||||
| Common equity tier 1 capital ratio (1) | 10.41 | % | 10.53 | % | 10.45 | % | 9.97 | % | 9.22 | % | ||||||||||
| Tier 1 capital ratio (1) | 10.41 | % | 10.53 | % | 10.45 | % | 9.97 | % | 9.22 | % | ||||||||||
| Total capital ratio (1) | 13.63 | % | 13.76 | % | 13.74 | % | 13.18 | % | 12.07 | % | ||||||||||
| Risk-weighted assets (1) | $ | 22,968,958 | $ | 22,837,693 | $ | 22,114,040 | $ | 22,781,836 | $ | 24,214,209 | ||||||||||
| Equity to assets ratio | 11.12 | % | 12.19 | % | 12.26 | % | 12.62 | % | 12.97 | % | ||||||||||
| Tangible common equity ratio (2) | 7.68 | % | 8.78 | % | 8.71 | % | 8.93 | % | 9.10 | % | ||||||||||
| Book value per share | $ | 30.68 | $ | 30.36 | $ | 29.42 | $ | 29.17 | $ | 28.75 | ||||||||||
| Tangible book value per share (2) | $ | 20.39 | $ | 21.05 | $ | 20.09 | $ | 19.80 | $ | 19.31 | ||||||||||
| Pacific Western Bank: | ||||||||||||||||||||
| Tier 1 leverage capital ratio (1) | 8.83 | % | 9.53 | % | 9.70 | % | 10.03 | % | 9.71 | % | ||||||||||
| Common equity tier 1 capital ratio (1) | 11.57 | % | 11.73 | % | 11.70 | % | 11.18 | % | 10.38 | % | ||||||||||
| Tier 1 capital ratio (1) | 11.57 | % | 11.73 | % | 11.70 | % | 11.18 | % | 10.38 | % | ||||||||||
| Total capital ratio (1) | 12.82 | % | 12.99 | % | 12.95 | % | 12.44 | % | 11.39 | % | ||||||||||
(1) Capital information for March 31, 2021 is preliminary.
(2) Non-GAAP measure.
Page 19
GAAP TO NON-GAAP RECONCILIATIONS
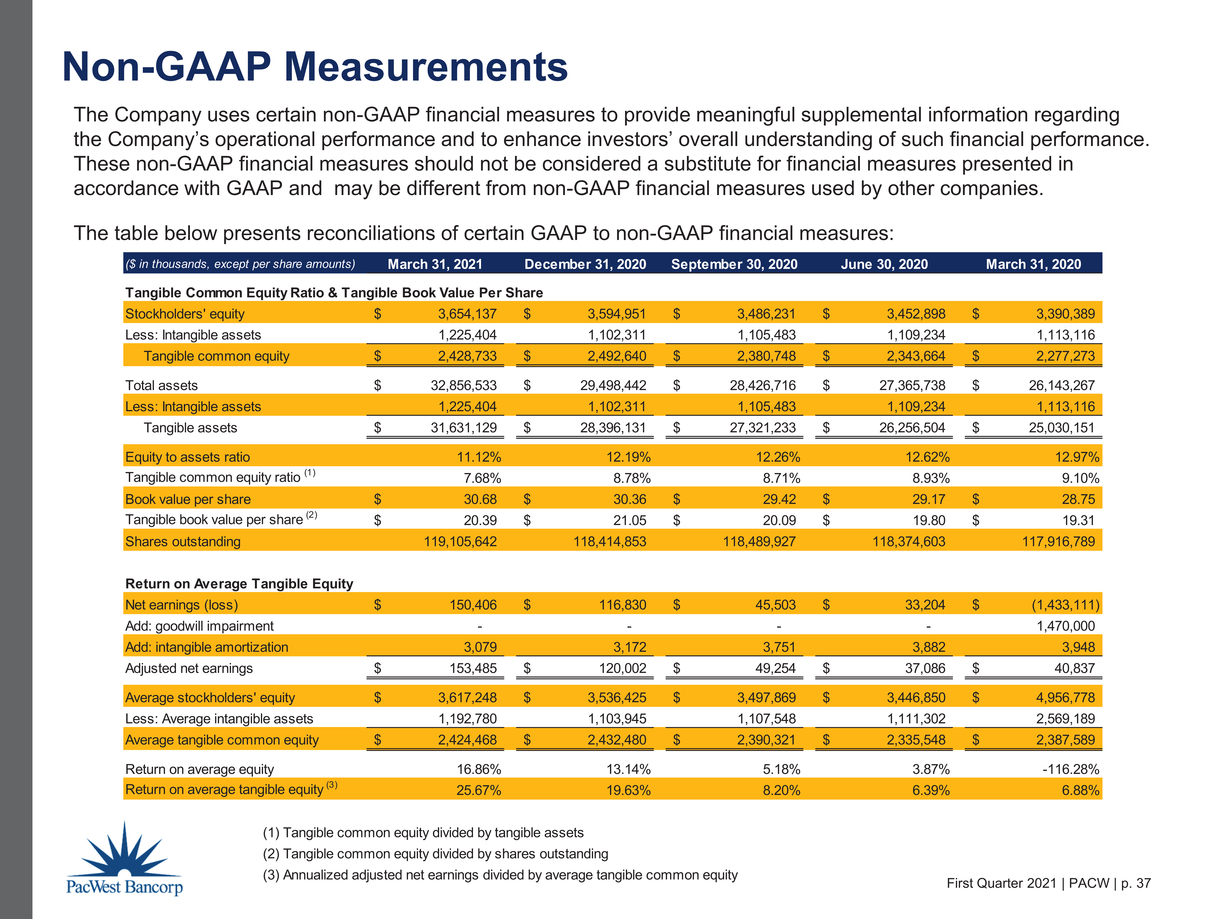
This press release contains certain non-GAAP financial disclosures for: (1) Pre-provision, pre-goodwill impairment, pre-tax net revenue (“PPNR”), (2) PPNR return on average assets (3) return on average tangible equity, (4) tangible common equity ratio, and (5) tangible book value per share. The Company uses these non-GAAP financial measures to provide meaningful supplemental information regarding the Company’s operational performance and to enhance investors’ overall understanding of such financial performance. In particular, the use of return on average tangible equity, tangible common equity ratio, tangible book value per share, and PPNR is prevalent among banking regulators, investors, and analysts. Accordingly, we disclose the non-GAAP measures in addition to the related GAAP measures of: (1) net earnings, (2) return on average assets, (3) return on average equity, (4) equity to assets ratio, and (5) book value per share.
The tables below present the reconciliations of these GAAP financial measures to the related non-GAAP financial measures:
| Three Months Ended | ||||||||||||
| PPNR and PPNR Return | March 31, | December 31, | March 31, | |||||||||
| on Average Assets | 2021 | 2020 | 2020 | |||||||||
| (Dollars in thousands) | ||||||||||||
| Net earnings (loss) | $ | 150,406 | $ | 116,830 | $ | (1,433,111 | ) | |||||
| Add: Provision for credit losses | (48,000 | ) | 10,000 | 112,000 | ||||||||
| Add: Goodwill impairment | - | - | 1,470,000 | |||||||||
| Add: Income tax expense | 53,556 | 36,546 | 11,988 | |||||||||
Pre-provision, pre-goodwill impairment, pre-tax net revenue ("PPNR") | $ | 155,962 | $ | 163,376 | $ | 160,877 | ||||||
| Average assets | $ | 31,415,882 | $ | 29,334,789 | $ | 27,099,040 | ||||||
| Return on average assets (1) | 1.94 | % | 1.58 | % | (21.27 | )% | ||||||
| PPNR return on average assets (2) | 2.01 | % | 2.22 | % | 2.39 | % | ||||||
(1) Annualized net earnings (loss) divided by average assets.
(2) Annualized PPNR divided by average assets.
| Three Months Ended | ||||||||||||
| March 31, | December 31, | March 31, | ||||||||||
| Return on Average Tangible Equity | 2021 | 2020 | 2020 | |||||||||
| (Dollars in thousands) | ||||||||||||
| Net earnings (loss) | $ | 150,406 | $ | 116,830 | $ | (1,433,111 | ) | |||||
| Add: Intangible asset amortization | 3,079 | 3,172 | 3,948 | |||||||||
| Add: Goodwill impairment | - | - | 1,470,000 | |||||||||
| Adjusted net earnings | $ | 153,485 | $ | 120,002 | $ | 40,837 | ||||||
| Average stockholders' equity | $ | 3,617,248 | $ | 3,536,425 | $ | 4,956,778 | ||||||
| Less: Average intangible assets | 1,192,780 | 1,103,945 | 2,569,189 | |||||||||
| Average tangible common equity | $ | 2,424,468 | $ | 2,432,480 | $ | 2,387,589 | ||||||
| Return on average equity (1) | 16.86 | % | 13.14 | % | (116.28 | )% | ||||||
| Return on average tangible equity (2) | 25.67 | % | 19.63 | % | 6.88 | % | ||||||
(1) Annualized net earnings divided by average stockholders' equity.
(2) Annualized adjusted net earnings divided by average tangible common equity.
Page 20
| Tangible Common Equity Ratio/ | March 31, | December 31, | September 30, | June 30, | March 31, | |||||||||||||||
| Tangible Book Value Per Share | 2021 | 2020 | 2020 | 2020 | 2020 | |||||||||||||||
| (Dollars in thousands, except per share data) | ||||||||||||||||||||
| Stockholders' equity | $ | 3,654,137 | $ | 3,594,951 | $ | 3,486,231 | $ | 3,452,898 | $ | 3,390,389 | ||||||||||
| Less: Intangible assets | 1,225,404 | 1,102,311 | 1,105,483 | 1,109,234 | 1,113,116 | |||||||||||||||
| Tangible common equity | $ | 2,428,733 | $ | 2,492,640 | $ | 2,380,748 | $ | 2,343,664 | $ | 2,277,273 | ||||||||||
| Total assets | $ | 32,856,533 | $ | 29,498,442 | $ | 28,426,716 | $ | 27,365,738 | $ | 26,143,267 | ||||||||||
| Less: Intangible assets | 1,225,404 | 1,102,311 | 1,105,483 | 1,109,234 | 1,113,116 | |||||||||||||||
| Tangible assets | $ | 31,631,129 | $ | 28,396,131 | $ | 27,321,233 | $ | 26,256,504 | $ | 25,030,151 | ||||||||||
| Equity to assets ratio | 11.12 | % | 12.19 | % | 12.26 | % | 12.62 | % | 12.97 | % | ||||||||||
| Tangible common equity ratio (1) | 7.68 | % | 8.78 | % | 8.71 | % | 8.93 | % | 9.10 | % | ||||||||||
| Book value per share | $ | 30.68 | $ | 30.36 | $ | 29.42 | $ | 29.17 | $ | 28.75 | ||||||||||
| Tangible book value per share (2) | $ | 20.39 | $ | 21.05 | $ | 20.09 | $ | 19.80 | $ | 19.31 | ||||||||||
| Shares outstanding | 119,105,642 | 118,414,853 | 118,489,927 | 118,374,603 | 117,916,789 | |||||||||||||||
(1) Tangible common equity divided by tangible assets.
(2) Tangible common equity divided by shares outstanding.
CONTACTS
|
Matthew P. Wagner President and CEO 303.802.8900 |
Bart R. Olson EVP and CFO 714.989.4149 |
William J. Black EVP Strategy and Corporate Development 919.597.7466 |
Page 21