Exhibit 99.1
|
|
Filed by PacWest Bancorp pursuant to Rule 425 |
|
|
under the Securities Act of 1933 and deemed |
|
|
filed pursuant to Rule 14a-12 under the Securities |
|
|
Act of 1934 |
|
|
Subject Company: CU Bancorp |
|
|
Commission File No.: 001-35683 |
PRESS RELEASE
|
PacWest Bancorp |
|
|
(Nasdaq: PACW) |
|
|
|
|
|
|
Contact: |
Donald D. Destino |
|
|
|
Executive Vice President |
|
|
|
Corporate Development and Investor Relations |
|
|
Phone: |
310-887-8521 |
|
|
FOR IMMEDIATE RELEASE |
July 18, 2017 |
PACWEST BANCORP ANNOUNCES RESULTS
FOR THE SECOND QUARTER 2017
Highlights
· Net Earnings of $93.6 Million, or $0.77 Per Diluted Share
· New Loan and Lease Production of $1.1 Billion
· Core Deposits Increase of $449 Million and Represent 78% of Total Deposits
· Tax Equivalent Net Interest Margin Increased Five Basis Points to 5.21%
· Classified Loans and Leases Reduced by 20%
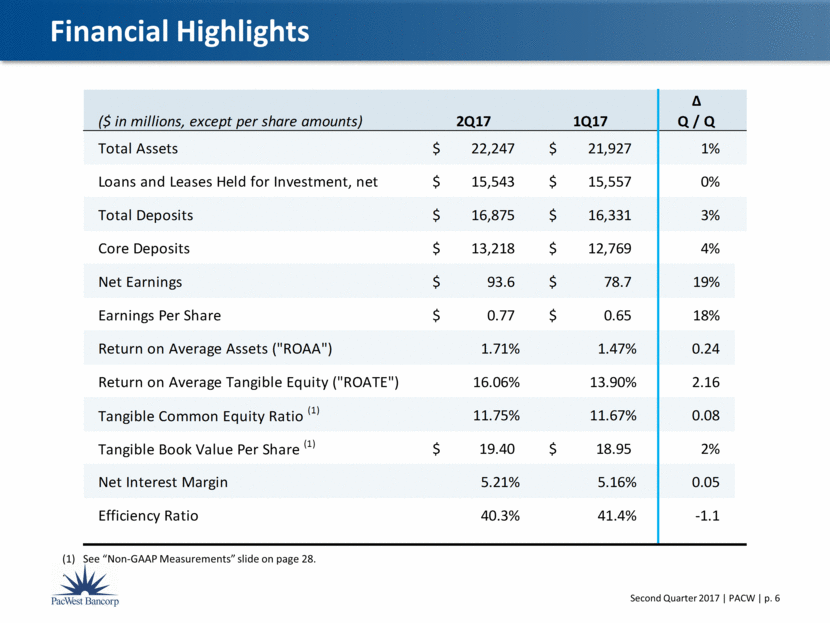
Los Angeles, California . . . PacWest Bancorp (Nasdaq: PACW) today announced net earnings for the second quarter of 2017 of $93.6 million, or $0.77 per diluted share, compared to net earnings for first quarter of 2017 of $78.7 million, or $0.65 per diluted share. The increase in net earnings from the prior quarter was primarily due to an increase in interest income from higher average balances of interest-earning assets and a lower provision for credit losses.
Matt Wagner, President and CEO, commented, “We delivered outstanding performance in the second quarter and continued to demonstrate our earning power. Our strong second quarter results produced a return on assets of 1.71% and a return on tangible equity of 16.06%. We also continue to proactively
manage credit risk. During the second quarter we sold or contracted to sell loans totaling $221.1 million, including $159.4 million of healthcare cash flow loans. All of these sales have since closed. As a result, our healthcare cash flow loan portfolio today includes only one non-pass rated loan.” Patrick Rusnak, Executive Vice President and CFO stated, “Our second quarter tax equivalent NIM increased five basis points to 5.21%. While the NIM benefitted from the repricing of variable-rate loans, this was partially offset by higher rates on non-core interest-bearing deposits and borrowings.”
Mr. Wagner continued, “We continue to look forward to closing the CU Bancorp acquisition in the fourth quarter of 2017, as we expect regulatory and shareholder approvals to come in the normal course. The date of the CU Bancorp special shareholders meeting has been set and management of both organizations are working on the integration plan.”
1
FINANCIAL HIGHLIGHTS
|
|
|
At or For the Three Months Ended |
|
At or For the Six Months Ended |
|
|
|
|
June 30, |
|
March 31, |
|
|
|
June 30, |
|
|
|
|
Financial Highlights |
|
2017 |
|
2017 |
|
Change |
|
2017 |
|
2016 |
|
Change |
|
|
|
|
(Dollars in thousands, except per share data) |
|
|
Net earnings |
|
$ |
93,647 |
|
$ |
78,668 |
|
$ |
14,979 |
|
$ |
172,315 |
|
$ |
172,624 |
|
$ |
(309 |
) |
|
Diluted earnings per share |
|
$ |
0.77 |
|
$ |
0.65 |
|
$ |
0.12 |
|
$ |
1.42 |
|
$ |
1.42 |
|
$ |
— |
|
|
Return on average assets |
|
1.71 |
% |
1.47 |
% |
0.24 |
|
1.59 |
% |
1.65 |
% |
(0.06 |
) |
|
Return on average tangible equity (1) |
|
16.06 |
% |
13.90 |
% |
2.16 |
|
15.00 |
% |
15.52 |
% |
(0.52 |
) |
|
|
|
|
|
|
|
|
|
|
|
|
|
|
|
|
Net interest margin (tax equivalent) |
|
5.21 |
% |
5.16 |
% |
0.05 |
|
5.19 |
% |
5.43 |
% |
(0.24 |
) |
|
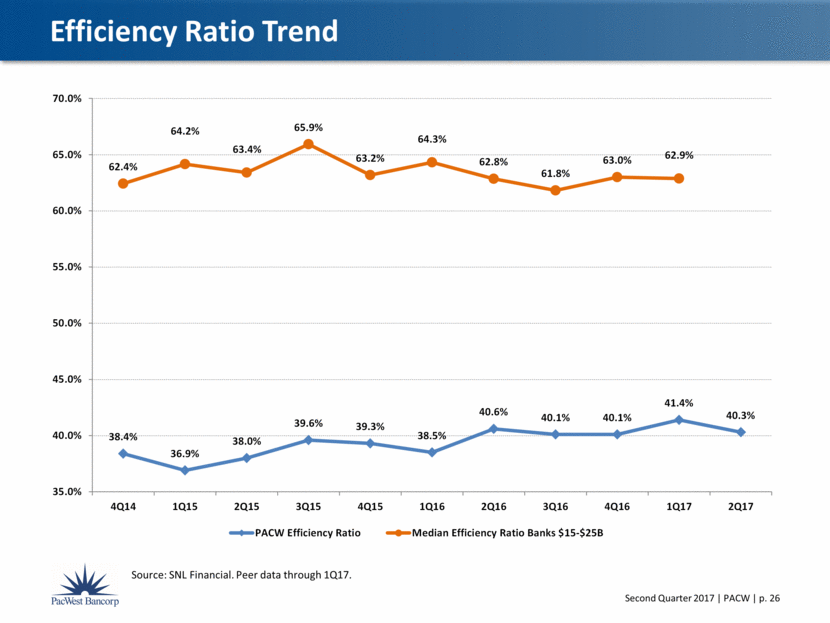
Efficiency ratio |
|
40.3 |
% |
41.4 |
% |
(1.1 |
) |
40.8 |
% |
39.5 |
% |
1.3 |
|
|
|
|
|
|
|
|
|
|
|
|
|
|
|
|
|
Total assets |
|
$ |
22,246,877 |
|
$ |
21,927,254 |
|
$ |
319,623 |
|
$ |
22,246,877 |
|
$ |
21,147,139 |
|
$ |
1,099,738 |
|
|
Loans and leases held for investment, net of deferred fees |
|
$ |
15,543,457 |
|
$ |
15,556,689 |
|
$ |
(13,232 |
) |
$ |
15,543,457 |
|
$ |
14,641,460 |
|
$ |
901,997 |
|
|
Noninterest-bearing deposits |
|
$ |
6,701,039 |
|
$ |
6,789,808 |
|
$ |
(88,769 |
) |
$ |
6,701,039 |
|
$ |
6,222,696 |
|
$ |
478,343 |
|
|
Core deposits |
|
$ |
13,217,574 |
|
$ |
12,769,073 |
|
$ |
448,501 |
|
$ |
13,217,574 |
|
$ |
11,411,992 |
|
$ |
1,805,582 |
|
|
Total deposits |
|
$ |
16,874,977 |
|
$ |
16,331,008 |
|
$ |
543,969 |
|
$ |
16,874,977 |
|
$ |
15,148,009 |
|
$ |
1,726,968 |
|
|
|
|
|
|
|
|
|
|
|
|
|
|
|
|
|
Noninterest-bearing deposits as percentage of total deposits |
|
40 |
% |
42 |
% |
(2 |
) |
40 |
% |
41 |
% |
(1 |
) |
|
Core deposits as percentage of total deposits |
|
78 |
% |
78 |
% |
— |
|
78 |
% |
75 |
% |
3 |
|
|
|
|
|
|
|
|
|
|
|
|
|
|
|
|
|
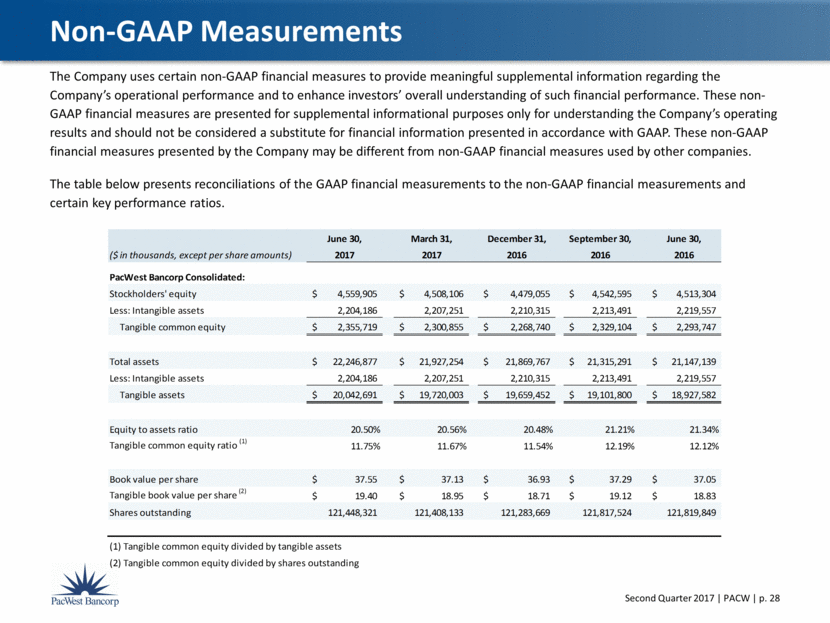
Equity to assets ratio |
|
20.50 |
% |
20.56 |
% |
(0.06 |
) |
20.50 |
% |
21.34 |
% |
(0.84 |
) |
|
Tangible common equity ratio (1) |
|
11.75 |
% |
11.67 |
% |
0.08 |
|
11.75 |
% |
12.12 |
% |
(0.37 |
) |
|
Book value per share |
|
$ |
37.55 |
|
$ |
37.13 |
|
$ |
0.42 |
|
$ |
37.55 |
|
$ |
37.05 |
|
$ |
0.50 |
|
|
Tangible book value per share (1) |
|
$ |
19.40 |
|
$ |
18.95 |
|
$ |
0.45 |
|
$ |
19.40 |
|
$ |
18.83 |
|
$ |
0.57 |
|
(1) Non-GAAP measure.
2
INCOME STATEMENT HIGHLIGHTS
Net Interest Income
Net interest income increased by $10.0 million to $242.5 million in the second quarter of 2017 compared to $232.5 million in the first quarter of 2017 due to higher average yields and balances of loans and leases. The loan and lease yield for the second quarter of 2017 was 6.07% compared to 5.94% for the first quarter of 2017. The increase in the loan and lease yield was principally due to the higher yields on average loans and leases as a result of the repricing of variable-rate loans due to the increase in market rates during the first half of 2017.
The tax equivalent NIM for the second quarter of 2017 was 5.21% compared to 5.16% for the first quarter of 2017. The increase in the NIM was mostly due to higher yields on loans and leases due to the upward repricing of variable-rate loans, partially offset by a higher cost of interest-bearing liabilities.
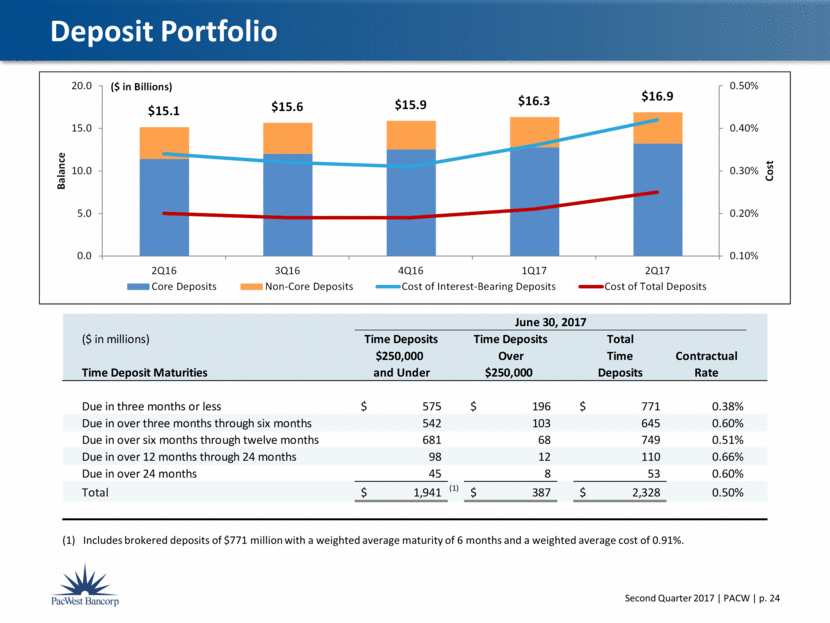
The cost of total deposits increased to 0.25% in the second quarter of 2017 from 0.21% in the first quarter of 2017 due to a higher cost and average balance of non-core deposits.
Noninterest Income
Noninterest income increased by $0.2 million to $35.3 million in the second quarter of 2017 compared to $35.1 million in the first quarter of 2017 due mainly to a $2.2 million increase in leased equipment income due to higher gains on early lease terminations, a $1.8 million increase in gain on sale of securities, and a $0.7 million increase in warrant income, offset by a $4.5 million decrease in other income attributable mainly to a $5.0 million legal settlement with a former borrower recorded in the first quarter of 2017.
The following table presents details of noninterest income for the periods indicated:
|
|
|
Three Months Ended |
|
|
|
|
June 30, |
|
March 31, |
|
Increase |
|
|
Noninterest Income |
|
2017 |
|
2017 |
|
(Decrease) |
|
|
|
|
(In thousands) |
|
|
Service charges on deposit accounts |
|
$ |
3,510 |
|
$ |
3,758 |
|
$ |
(248 |
) |
|
Other commissions and fees |
|
10,583 |
|
10,390 |
|
193 |
|
|
Leased equipment income |
|
11,635 |
|
9,475 |
|
2,160 |
|
|
Gain on sale of loans and leases |
|
649 |
|
712 |
|
(63 |
) |
|
Gain (loss) on sale of securities |
|
1,651 |
|
(99 |
) |
1,750 |
|
|
Other income: |
|
|
|
|
|
|
|
|
Dividends and realized gains on equity investments |
|
1,587 |
|
1,345 |
|
242 |
|
|
Warrant income |
|
815 |
|
155 |
|
660 |
|
|
Other |
|
4,852 |
|
9,378 |
|
(4,526 |
) |
|
Total noninterest income |
|
$ |
35,282 |
|
$ |
35,114 |
|
$ |
168 |
|
3
Noninterest Expense
Noninterest expense increased by $1.2 million to $117.7 million in the second quarter of 2017 compared to $116.5 million in the first quarter of 2017 due mostly to a $1.2 million increase in acquisition, integration, and reorganization costs and a $1.1 million charge related to the sale of the unfunded commitments portion of the healthcare loan sale.
The following table presents details of noninterest expense for the periods indicated:
|
|
|
Three Months Ended |
|
|
|
|
June 30, |
|
March 31, |
|
Increase |
|
|
Noninterest Expense |
|
2017 |
|
2017 |
|
(Decrease) |
|
|
|
|
(In thousands) |
|
|
Compensation |
|
$ |
65,288 |
|
$ |
64,880 |
|
$ |
408 |
|
|
Occupancy |
|
11,811 |
|
11,608 |
|
203 |
|
|
Data processing |
|
6,337 |
|
7,015 |
|
(678 |
) |
|
Other professional services |
|
3,976 |
|
3,378 |
|
598 |
|
|
Insurance and assessments |
|
4,856 |
|
4,791 |
|
65 |
|
|
Intangible asset amortization |
|
3,065 |
|
3,064 |
|
1 |
|
|
Leased equipment depreciation |
|
5,232 |
|
5,625 |
|
(393 |
) |
|
Foreclosed assets (income) expense, net |
|
(157 |
) |
143 |
|
(300 |
) |
|
Acquisition, integration and reorganization costs |
|
1,700 |
|
500 |
|
1,200 |
|
|
Other expense: |
|
|
|
|
|
|
|
|
Loan expense |
|
3,884 |
|
3,387 |
|
497 |
|
|
Other |
|
11,715 |
|
12,153 |
|
(438 |
) |
|
Total noninterest expense |
|
$ |
117,707 |
|
$ |
116,544 |
|
$ |
1,163 |
|
Income Taxes
The overall effective income tax rate was 37.0% in the second quarter of 2017 and 37.7% in the first quarter of 2017. The estimated effective tax rate for the full year 2017 is approximately 38%.
BALANCE SHEET HIGHLIGHTS
Loans and Leases
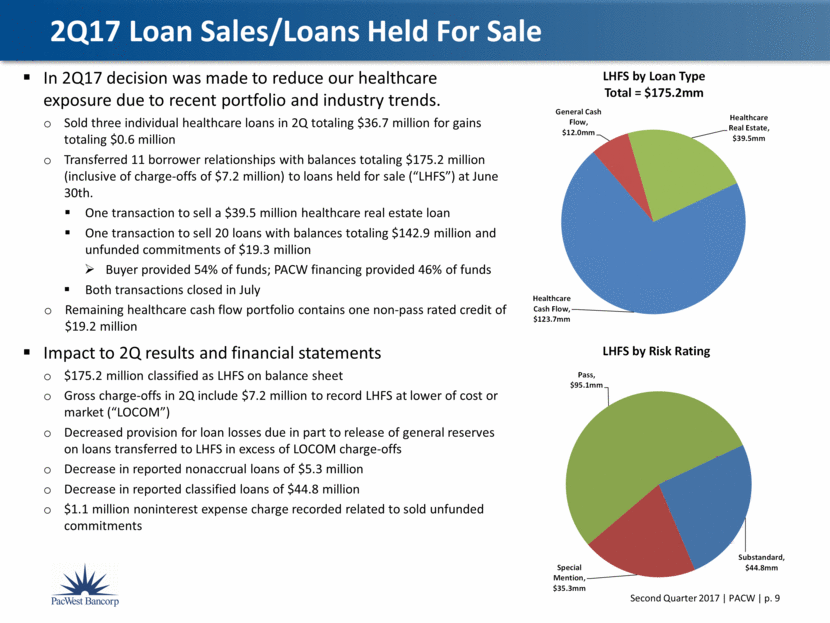
Total loans and leases held for investment decreased by $13.2 million in the second quarter to $15.5 billion at June 30, 2017. The net decrease was driven by principal repayments of $843.1 million, an increase in loans held for sale of $175.2 million, and loan sales of $46.0 million, partially offset by second quarter new production of $1.1 billion. In the second quarter, we sold $46.0 million of loans consisting primarily of loans from our healthcare portfolios. Additionally, we entered into two agreements to sell loans with balances totaling $175.2 million and the associated unfunded commitments of $19.3 million, primarily from our healthcare portfolios. The $175.2 million of loans were reported as held for sale at June 30, 2017 and the sales were completed in July. As a result of the second quarter loan sales and transfers to loans held for sale, our healthcare cash flow portfolio held for investment decreased from $740.6 million at March 31, 2017 to $514.7 million, including one non-pass rated credit of $19.2 million, at June 30, 2017.
4
The following table presents a roll forward of loans and leases held for investment for the periods indicated:
|
|
|
Three Months Ended |
|
|
|
|
June 30, |
|
March 31, |
|
|
Loan and Lease Roll Forward (1) |
|
2017 |
|
2017 |
|
|
|
|
(Dollars in thousands) |
|
|
Loans and leases held for investment, start of period |
|
$ |
15,556,689 |
|
$ |
15,455,954 |
|
|
New production |
|
1,077,929 |
|
1,048,841 |
|
|
Existing loans and leases: |
|
|
|
|
|
|
Principal repayments, net (2) |
|
(843,115 |
) |
(888,409 |
) |
|
Loan sales |
|
(45,976 |
) |
(36,461 |
) |
|
Transfers to foreclosed assets |
|
(502 |
) |
(78 |
) |
|
Charge-offs |
|
(26,410 |
) |
(23,158 |
) |
|
Transfers to loans held for sale |
|
(175,158 |
) |
— |
|
|
Loans and leases held for investment, end of period |
|
$ |
15,543,457 |
|
$ |
15,556,689 |
|
|
|
|
|
|
|
|
|
Weighted average rate on new production |
|
4.93 |
% |
4.91 |
% |
(1) Includes direct financing leases but excludes equipment leased to others under operating leases.
(2) Includes principal disbursements/repayments on existing loans, changes in revolving lines of credit (repayments and draws), loan participation sales and other changes within the loan portfolio.
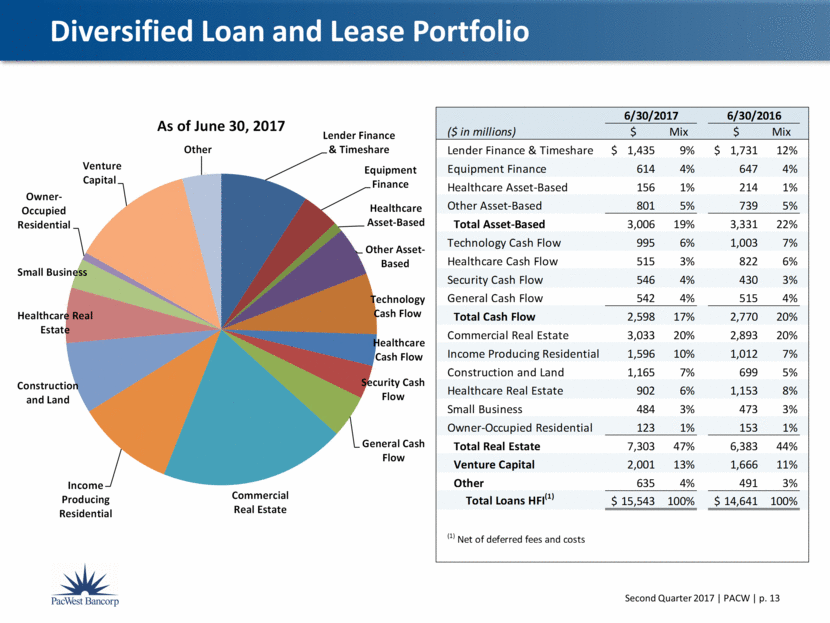
The following table presents the composition of loans and leases held for investment as of the dates indicated:
|
|
|
June 30, |
|
March 31, |
|
December 31, |
|
June 30, |
|
|
Loan and Lease Portfolio |
|
2017 |
|
2017 |
|
2016 |
|
2016 |
|
|
|
|
(In thousands) |
|
|
Real estate mortgage: |
|
|
|
|
|
|
|
|
|
|
Commercial |
|
$ |
4,418,463 |
|
$ |
4,420,923 |
|
$ |
4,396,696 |
|
$ |
4,519,209 |
|
|
Residential |
|
1,719,269 |
|
1,554,946 |
|
1,314,036 |
|
1,164,784 |
|
|
Total real estate mortgage |
|
6,137,732 |
|
5,975,869 |
|
5,710,732 |
|
5,683,993 |
|
|
Real estate construction and land: |
|
|
|
|
|
|
|
|
|
|
Commercial |
|
691,828 |
|
668,510 |
|
581,246 |
|
417,144 |
|
|
Residential |
|
473,282 |
|
442,051 |
|
384,001 |
|
281,788 |
|
|
Total real estate construction and land |
|
1,165,110 |
|
1,110,561 |
|
965,247 |
|
698,932 |
|
|
Total real estate loans |
|
7,302,842 |
|
7,086,430 |
|
6,675,979 |
|
6,382,925 |
|
|
Commercial: |
|
|
|
|
|
|
|
|
|
|
Cash flow |
|
2,834,966 |
|
3,138,196 |
|
3,112,890 |
|
3,048,439 |
|
|
Asset-based |
|
2,392,203 |
|
2,391,161 |
|
2,611,796 |
|
2,683,913 |
|
|
Venture capital |
|
2,001,427 |
|
1,934,949 |
|
1,987,900 |
|
1,666,352 |
|
|
Equipment finance |
|
613,550 |
|
623,237 |
|
691,967 |
|
646,940 |
|
|
Total commercial |
|
7,842,146 |
|
8,087,543 |
|
8,404,553 |
|
8,045,644 |
|
|
Consumer |
|
398,469 |
|
382,716 |
|
375,422 |
|
212,891 |
|
|
Total loans and leases held for investment, net of deferred fees |
|
$ |
15,543,457 |
|
$ |
15,556,689 |
|
$ |
15,455,954 |
|
$ |
14,641,460 |
|
|
|
|
|
|
|
|
|
|
|
|
|
Total unfunded loan commitments |
|
$ |
4,926,743 |
|
$ |
4,497,373 |
|
$ |
4,166,703 |
|
$ |
3,888,686 |
|
5
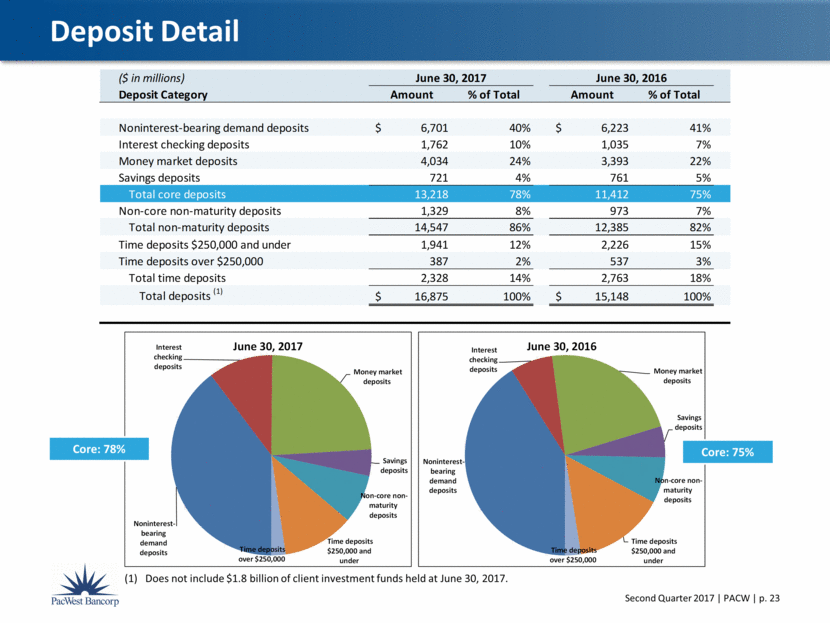
Deposits and Client Investment Funds
The following table presents the composition of our deposit portfolio as of the dates indicated:
|
|
|
June 30, |
|
March 31, |
|
December 31, |
|
June 30, |
|
|
Deposit Category |
|
2017 |
|
2017 |
|
2016 |
|
2016 |
|
|
|
|
(Dollars in thousands) |
|
|
Noninterest-bearing demand deposits |
|
$ |
6,701,039 |
|
$ |
6,789,808 |
|
$ |
6,659,016 |
|
$ |
6,222,696 |
|
|
Interest checking deposits |
|
1,762,016 |
|
1,509,902 |
|
1,448,394 |
|
1,035,395 |
|
|
Money market deposits |
|
4,033,471 |
|
3,758,962 |
|
3,705,385 |
|
3,392,811 |
|
|
Savings deposits |
|
721,048 |
|
710,401 |
|
711,039 |
|
761,090 |
|
|
Total core deposits |
|
13,217,574 |
|
12,769,073 |
|
12,523,834 |
|
11,411,992 |
|
|
Non-core non-maturity deposits |
|
1,329,324 |
|
1,154,070 |
|
1,174,487 |
|
972,820 |
|
|
Total non-maturity deposits |
|
14,546,898 |
|
13,923,143 |
|
13,698,321 |
|
12,384,812 |
|
|
Time deposits $250,000 and under |
|
1,940,872 |
|
1,998,597 |
|
1,758,434 |
|
2,226,066 |
|
|
Time deposits over $250,000 |
|
387,207 |
|
409,268 |
|
413,856 |
|
537,131 |
|
|
Total time deposits |
|
2,328,079 |
|
2,407,865 |
|
2,172,290 |
|
2,763,197 |
|
|
Total deposits |
|
$ |
16,874,977 |
|
$ |
16,331,008 |
|
$ |
15,870,611 |
|
$ |
15,148,009 |
|
|
|
|
|
|
|
|
|
|
|
|
|
Noninterest-bearing demand deposits as percentage of total deposits |
|
40 |
% |
42 |
% |
42 |
% |
41 |
% |
|
Core deposits as percentage of total deposits |
|
78 |
% |
78 |
% |
79 |
% |
75 |
% |
At June 30, 2017, core deposits totaled $13.2 billion, or 78% of total deposits, including $6.7 billion of noninterest-bearing demand deposits, or 40% of total deposits.
In addition to deposit products, we also offer alternative non-depository cash investment options for select clients; these alternatives include investments managed by Square 1 Asset Management, Inc. (“S1AM”), our registered investment advisor subsidiary, and third-party sweep products. Total off-balance sheet client investment funds at June 30, 2017 were $1.8 billion, of which $1.6 billion was managed by S1AM.
PROVISION AND ALLOWANCE FOR CREDIT LOSSES
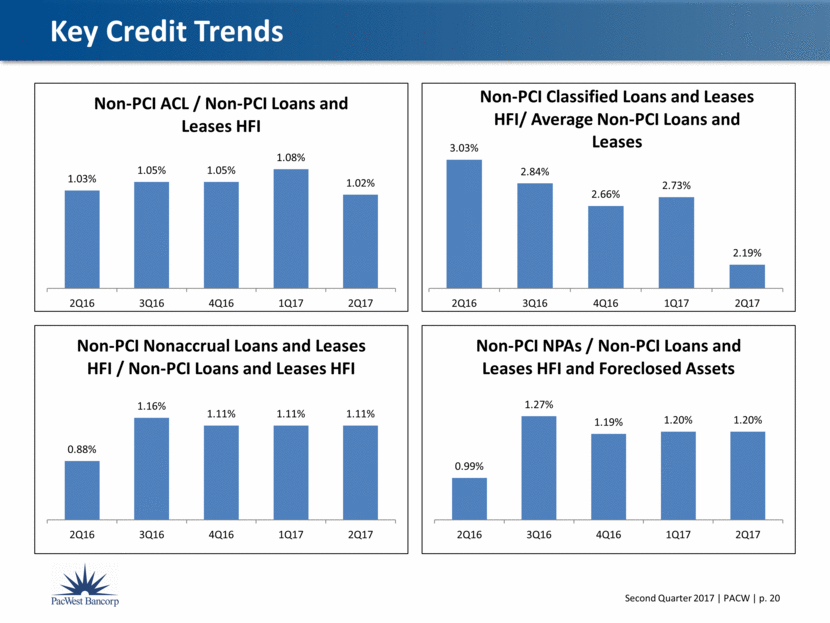
A provision for credit losses of $11.5 million was recorded in the second quarter of 2017 compared to $24.7 million in the first quarter of 2017. The second quarter provision consisted of $12.5 million for non-purchased credit impaired (“Non-PCI”) loans and leases and a $1.0 negative provision for PCI loans; this compares to provisions of $24.5 million and $0.2 million, respectively, for the first quarter of 2017. The lower provision for the second quarter of 2017 was mainly attributable to lower general reserves being required because of the decreased levels of classified loans and healthcare cash flow loans, both of which carry greater than average general reserve levels due to charge-off experience. In addition, the prior quarter provision was higher due to general provisions from increased general reserve loss factors which were influenced by net charge-off experience. The allowance for Non-PCI credit losses to Non-PCI loans and leases held for investment coverage ratio was 1.02% and 1.08% at June 30, 2017 and March 31, 2017.
6
The following tables show roll forwards of the allowance for credit losses for the periods indicated:
|
|
|
Three Months Ended June 30, 2017 |
|
|
|
|
Non-PCI |
|
|
|
|
|
|
|
|
|
|
Allowance for Credit |
|
Loans and |
|
Unfunded |
|
Total |
|
PCI |
|
|
|
|
Losses Rollforward |
|
Leases |
|
Commitments |
|
Non-PCI |
|
Loans |
|
Total |
|
|
|
|
(In thousands) |
|
|
Beginning balance |
|
$ |
149,826 |
|
$ |
17,763 |
|
$ |
167,589 |
|
$ |
11,481 |
|
$ |
179,070 |
|
|
Charge-offs |
|
(22,951 |
) |
— |
|
(22,951 |
) |
(3,459 |
) |
(26,410 |
) |
|
Recoveries |
|
2,004 |
|
— |
|
2,004 |
|
58 |
|
2,062 |
|
|
Net charge-offs |
|
(20,947 |
) |
— |
|
(20,947 |
) |
(3,401 |
) |
(24,348 |
) |
|
Provision |
|
10,000 |
|
2,500 |
|
12,500 |
|
(1,001 |
) |
11,499 |
|
|
Ending balance |
|
$ |
138,879 |
|
$ |
20,263 |
|
$ |
159,142 |
|
$ |
7,079 |
|
$ |
166,221 |
|
|
|
|
Three Months Ended March 31, 2017 |
|
|
|
|
Non-PCI |
|
|
|
|
|
|
|
|
|
|
Allowance for Credit |
|
Loans and |
|
Unfunded |
|
Total |
|
PCI |
|
|
|
|
Losses Rollforward |
|
Leases |
|
Commitments |
|
Non-PCI |
|
Loans |
|
Total |
|
|
|
|
(In thousands) |
|
|
Beginning balance |
|
$ |
143,755 |
|
$ |
17,523 |
|
$ |
161,278 |
|
$ |
13,483 |
|
$ |
174,761 |
|
|
Charge-offs |
|
(20,928 |
) |
— |
|
(20,928 |
) |
(2,230 |
) |
(23,158 |
) |
|
Recoveries |
|
2,739 |
|
— |
|
2,739 |
|
— |
|
2,739 |
|
|
Net charge-offs |
|
(18,189 |
) |
— |
|
(18,189 |
) |
(2,230 |
) |
(20,419 |
) |
|
Provision |
|
24,260 |
|
240 |
|
24,500 |
|
228 |
|
24,728 |
|
|
Ending balance |
|
$ |
149,826 |
|
$ |
17,763 |
|
$ |
167,589 |
|
$ |
11,481 |
|
$ |
179,070 |
|
The gross charge-offs for the second quarter of 2017 included approximately $10.9 million for venture capital loans and $7.2 million related to the recording of the healthcare portfolio loans at the lower of cost or market value at the time of transfer to loans held for sale. The transfer of loans to held for sale also decreased reported nonaccrual loans by $5.3 million and classified loans by $44.8 million. The annualized ratio of net charge-offs to total average loans for the quarter ended June 30, 2017 was 0.54%.
7
CREDIT QUALITY
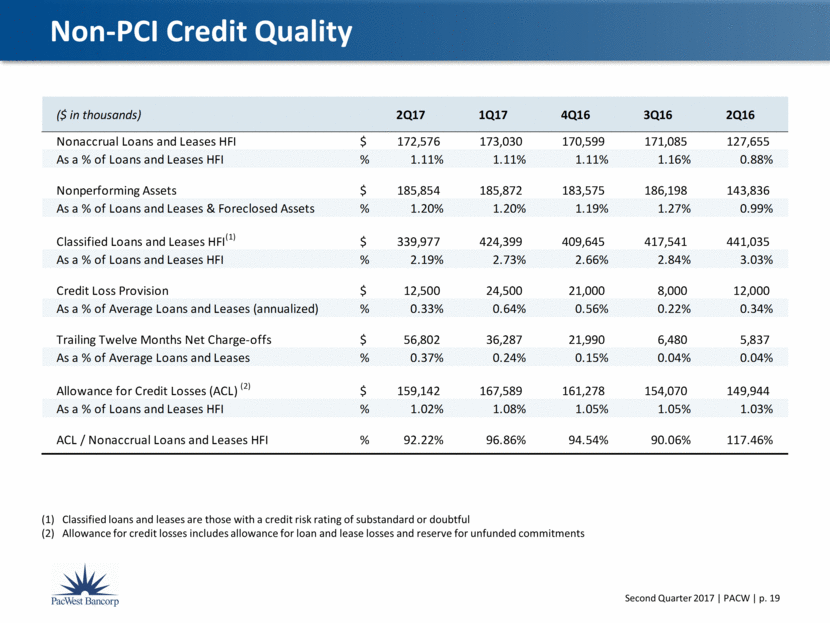
The following table presents Non-PCI loan and lease credit quality metrics as of the dates indicated:
|
|
|
June 30, |
|
March 31, |
|
|
Non-PCI Credit Quality Metrics |
|
2017 |
|
2017 |
|
|
|
|
(Dollars in thousands) |
|
|
Nonaccrual loans and leases (1) |
|
$ |
172,576 |
|
$ |
173,030 |
|
|
Classified loans and leases (1) |
|
339,977 |
|
424,399 |
|
|
Performing troubled debt restructured loans |
|
55,910 |
|
56,501 |
|
|
Allowance for credit losses |
|
159,142 |
|
167,589 |
|
|
Net charge-offs (for the quarter) |
|
20,947 |
|
18,189 |
|
|
Provision for credit losses (for the quarter) |
|
12,500 |
|
24,500 |
|
|
Allowance for credit losses to loans and leases held for investment |
|
1.02 |
% |
1.08 |
% |
|
Allowance for credit losses to nonaccrual loans and leases held for investment |
|
92.2 |
% |
96.9 |
% |
|
Nonaccrual loans and leases held for investment to loans and leases held for investment |
|
1.11 |
% |
1.11 |
% |
|
Nonperforming assets to loans and leases held for investment and foreclosed assets |
|
1.20 |
% |
1.20 |
% |
|
Classified loans and leases held for investment to loans and leases held for investment |
|
2.19 |
% |
2.73 |
% |
|
|
|
|
|
|
|
|
(1) Includes loans and leases held for investment; excludes loans held for sale carried at lower of cost or fair value.
The following table presents Non-PCI nonaccrual loans and leases and accruing loans and leases past due between 30 and 89 days by portfolio segment and class as of the dates indicated:
|
|
|
Non-PCI Nonaccrual Loans and Leases |
|
Non-PCI Accruing and |
|
|
|
|
June 30, 2017 |
|
March 31, 2017 |
|
30-89 Days Past Due |
|
|
|
|
|
|
% of |
|
|
|
% of |
|
June 30, |
|
March 31, |
|
|
|
|
|
|
Loan |
|
|
|
Loan |
|
2017 |
|
2017 |
|
|
|
|
Amount |
|
Category |
|
Amount |
|
Category |
|
Amount |
|
Amount |
|
|
|
|
(Dollars in thousands) |
|
|
Real estate mortgage: |
|
|
|
|
|
|
|
|
|
|
|
|
|
|
Commercial |
|
$ |
65,599 |
|
1.5 |
% |
$ |
66,216 |
|
1.5 |
% |
$ |
3,734 |
|
$ |
7,383 |
|
|
Residential |
|
5,229 |
|
0.3 |
% |
5,826 |
|
0.4 |
% |
46 |
|
640 |
|
|
Total real estate mortgage |
|
70,828 |
|
1.2 |
% |
72,042 |
|
1.2 |
% |
3,780 |
|
8,023 |
|
|
Real estate construction and land: |
|
|
|
|
|
|
|
|
|
|
|
|
|
|
Commercial |
|
— |
|
0.0 |
% |
— |
|
0.0 |
% |
— |
|
— |
|
|
Residential |
|
— |
|
0.0 |
% |
362 |
|
0.1 |
% |
— |
|
— |
|
|
Total real estate construction and land |
|
— |
|
0.0 |
% |
362 |
|
0.0 |
% |
— |
|
— |
|
|
Commercial: |
|
|
|
|
|
|
|
|
|
|
|
|
|
|
Cash flow |
|
43,169 |
|
1.5 |
% |
53,611 |
|
1.7 |
% |
201 |
|
394 |
|
|
Asset-based |
|
1,718 |
|
0.1 |
% |
1,165 |
|
0.0 |
% |
— |
|
— |
|
|
Venture capital |
|
25,278 |
|
1.3 |
% |
15,289 |
|
0.8 |
% |
23,171 |
|
13,265 |
|
|
Equipment finance |
|
31,111 |
|
5.1 |
% |
30,388 |
|
4.9 |
% |
— |
|
115 |
|
|
Total commercial |
|
101,276 |
|
1.3 |
% |
100,453 |
|
1.2 |
% |
23,372 |
|
13,774 |
|
|
Consumer |
|
472 |
|
0.1 |
% |
173 |
|
0.0 |
% |
— |
|
49 |
|
|
Total (1) |
|
$ |
172,576 |
|
1.1 |
% |
$ |
173,030 |
|
1.1 |
% |
$ |
27,152 |
|
$ |
21,846 |
|
(1) Includes loans and leases held for investment; excludes loans held for sale carried at lower of cost or fair value.
8
The following table presents nonperforming assets as of the dates indicated:
|
|
|
June 30, |
|
March 31, |
|
|
Nonperforming Assets |
|
2017 |
|
2017 |
|
|
|
|
(Dollars in thousands) |
|
|
Nonaccrual Non-PCI loans and leases (1) |
|
$ |
172,576 |
|
$ |
173,030 |
|
|
Nonaccrual PCI loans |
|
1,980 |
|
2,404 |
|
|
Total nonaccrual loans and leases |
|
174,556 |
|
175,434 |
|
|
Foreclosed assets, net |
|
13,278 |
|
12,842 |
|
|
Total nonperforming assets |
|
$ |
187,834 |
|
$ |
188,276 |
|
|
|
|
|
|
|
|
|
Nonaccrual loans and leases held for investment to loans and leases held for investment |
|
1.12 |
% |
1.12 |
% |
|
Nonperforming assets to loans and leases held for investment and foreclosed assets |
|
1.20 |
% |
1.20 |
% |
(1) Includes loans and leases held for investment; excludes loans held for sale carried at lower of cost or fair value.
CU BANCORP MERGER ANNOUNCEMENT
On April 6, 2017, PacWest announced the signing of a definitive agreement and plan of merger (the “Agreement”) whereby PacWest will acquire CU Bancorp in a transaction valued at approximately $705 million.
CU Bancorp, headquartered in Los Angeles, California, is the parent of California United Bank, a California state-chartered non-member bank, with approximately $3.1 billion in assets and nine branches located in Los Angeles, Orange, Ventura, and San Bernardino counties at March 31, 2017. In connection with the transaction, California United Bank will be merged into Pacific Western Bank, the principal operating subsidiary of PacWest Bancorp.
The transaction, which was approved by the PacWest and CU Bancorp boards of directors, is expected to close in the fourth quarter of 2017 and is subject to customary closing conditions, including obtaining approval by CU Bancorp’s shareholders and bank regulatory authorities.
ABOUT PACWEST BANCORP
PacWest Bancorp (“PacWest”) is a bank holding company with over $22 billion in assets with one wholly-owned banking subsidiary, Pacific Western Bank (the “Bank”). The Bank has 74 full-service branches located throughout the state of California and one branch in Durham, North Carolina. We provide commercial banking services, including real estate, construction, and commercial loans, and comprehensive deposit and treasury management services to small and medium-sized businesses. We offer additional products and services through our CapitalSource and Square 1 Bank divisions. Our CapitalSource Division provides cash flow, asset-based, equipment and real estate loans and treasury management services to established middle market businesses on a national basis. Our Square 1 Bank Division offers a comprehensive suite of financial services focused on entrepreneurial businesses and their venture capital and private equity investors, with offices located in key innovation hubs across the United States. For more information about PacWest Bancorp, visit www.pacwestbancorp.com, or to learn more about Pacific Western Bank, visit www.pacificwesternbank.com.
9
FORWARD LOOKING STATEMENTS
This release contains certain “forward-looking statements” about the Company and its subsidiaries within the meaning of the Private Securities Litigation Reform Act of 1995, including forward-looking statements relating to the Company’s current business plans and expectations regarding future operating results and metrics and including statements about our expectations regarding our pending merger between the Company and CU Bancorp. All statements contained in this release that are not clearly historical in nature are forward-looking, and the words “anticipate,” “assume,” “intend,” “believe,” “forecast,” “expect,” “estimate,” “plan,” “continue,” “will,” “should,” “look forward” and similar expressions are generally intended to identify forward-looking statements. All forward-looking statements (including statements regarding future financial and operating results and future transactions and their results) involve risks, uncertainties and contingencies, many of which are beyond our control, which may cause actual results, performance, or achievements to differ materially from anticipated results, performance or achievements. These risks and uncertainties include, but are not limited to, our ability to compete effectively against other financial institutions in our banking markets; the impact of changes in interest rates or levels of market activity, especially on our loan and investment portfolios; deterioration, weaker than expected improvement, or other changes in the state of the economy or the markets in which we conduct business (including the levels of IPOs and M&A activities); changes in credit quality and the effect of credit quality on our provision for loan and lease losses and allowance for loan and leases losses; our ability to attract deposits and other sources of funding or liquidity; our capital requirements and our ability to generate capital internally or raise capital on favorable terms; the costs and effects of legal, compliance and regulatory actions, changes and developments, including the impact of adverse judgments or settlements in litigation, the initiation and resolution of regulatory or other governmental inquiries or investigations, and/or the results of regulatory examinations or reviews; the Company’s ability to complete the proposed CU Bancorp transaction, including by obtaining regulatory approvals and approval by the shareholders of CU Bancorp, or any future transaction, successfully integrate such acquired entities, or achieve expected beneficial synergies and/or operating efficiencies, in each case within expected timeframes or at all; changes in the Company’s stock price before completion of the CU Bancorp merger, including as a result of the financial performance of the Company or CU Bancorp before closing; and our success at managing the risks involved in the foregoing items and all other factors set forth in the Company’s public reports, including the Annual Report on Form 10-K for the year ended December 31, 2016, and particularly the discussion of risk factors within that document.
All forward-looking statements included in this release are based on information available at the time of the release. We are under no obligation to (and expressly disclaim any such obligation to) update or alter our forward-looking statements, whether as a result of new information, future events or otherwise except as required by law.
10
ADDITIONAL INFORMATION ABOUT THE PROPOSED TRANSACTION AND WHERE TO FIND IT
Investors and security holders are urged to carefully review and consider each of PacWest’s and CU Bancorp’s public filings with the SEC, including but not limited to their Annual Reports on Form 10-K, their proxy statements, their Current Reports on Form 8-K and their Quarterly Reports on Form 10-Q. The documents filed by PacWest with the SEC may be obtained free of charge at PacWest’s website at www.pacwestbancorp.com or at the SEC’s website at www.sec.gov. These documents may also be obtained free of charge from PacWest by requesting them in writing to PacWest Bancorp, 9701 Wilshire Boulevard, Suite 700, Beverly Hills, CA 90212; Attention: Investor Relations, by submitting an email request to investor-relations@pacwestbancorp.com or by telephone at (310) 887-8521.
The documents filed by CU Bancorp with the SEC may be obtained free of charge at CU Bancorp’s website at www.cubancorp.com or at the SEC’s website at www.sec.gov. These documents may also be obtained free of charge from CU Bancorp by requesting them in writing to CU Bancorp, 818 W. 7th Street, Suite 220, Los Angeles, CA 90017; Attention: Investor Relations, or by telephone at 818-257-7700.
PacWest has filed a registration statement with the SEC which includes a proxy statement of CU Bancorp and a prospectus of PacWest, and each party will file other documents regarding the proposed transaction with the SEC. Before making any voting or investment decision, investors and security holders of CU Bancorp are urged to carefully read the entire registration statement and proxy statement/prospectus, as well as any amendments or supplements to these documents, because they will contain important information about the proposed transaction. A definitive proxy statement/prospectus will be sent to the shareholders of CU Bancorp seeking any required shareholder approvals. Investors and security holders are able to obtain the registration statement and the proxy statement/prospectus free of charge from the SEC’s website or from PacWest or CU Bancorp by writing to the addresses provided for each company set forth in the paragraphs above.
PacWest, CU Bancorp, their directors, executive officers and certain other persons may be deemed to be participants in the solicitation of proxies from CU Bancorp shareholders in favor of the approval of the transaction. Information about the directors and executive officers of PacWest and their ownership of PacWest common stock is set forth in the proxy statement for PacWest’s 2017 annual meeting of stockholders, as previously filed with the SEC. Information about the directors and executive officers of CU Bancorp and their ownership of CU Bancorp common shares is set forth in the proxy statement for CU Bancorp’s 2016 annual meeting of shareholders, as previously filed with the SEC. Shareholders may obtain additional information regarding the interests of such participants by reading the registration statement and the proxy statement/prospectus.
11
PACWEST BANCORP AND SUBSIDIARIES
CONDENSED CONSOLIDATED BALANCE SHEET
|
|
|
June 30, |
|
March 31, |
|
December 31, |
|
|
|
|
2017 |
|
2017 |
|
2016 |
|
|
|
|
(Dollars in thousands, except per share data) |
|
|
ASSETS: |
|
|
|
|
|
|
|
|
Cash and due from banks |
|
$ |
180,330 |
|
$ |
184,608 |
|
$ |
337,965 |
|
|
Interest-earning deposits in financial institutions |
|
107,150 |
|
111,892 |
|
81,705 |
|
|
Total cash and cash equivalents |
|
287,480 |
|
296,500 |
|
419,670 |
|
|
|
|
|
|
|
|
|
|
|
Securities available-for-sale, at estimated fair value |
|
3,474,560 |
|
3,336,992 |
|
3,223,830 |
|
|
Federal Home Loan Bank stock, at cost |
|
22,059 |
|
17,901 |
|
21,870 |
|
|
Total investment securities |
|
3,496,619 |
|
3,354,893 |
|
3,245,700 |
|
|
|
|
|
|
|
|
|
|
|
Loans held for sale |
|
175,158 |
|
— |
|
— |
|
|
|
|
|
|
|
|
|
|
|
Non-PCI loans and leases |
|
15,536,735 |
|
15,526,518 |
|
15,412,092 |
|
|
PCI loans |
|
72,445 |
|
96,353 |
|
108,445 |
|
|
Total gross loans and leases held for investment |
|
15,609,180 |
|
15,622,871 |
|
15,520,537 |
|
|
Deferred fees, net |
|
(65,723 |
) |
(66,182 |
) |
(64,583 |
) |
|
Total loans and leases held for investment, net of deferred fees |
|
15,543,457 |
|
15,556,689 |
|
15,455,954 |
|
|
Allowance for loan and lease losses |
|
(145,958 |
) |
(161,307 |
) |
(157,238 |
) |
|
Total loans and leases held for investment, net |
|
15,397,499 |
|
15,395,382 |
|
15,298,716 |
|
|
|
|
|
|
|
|
|
|
|
Equipment leased to others under operating leases |
|
203,212 |
|
224,580 |
|
229,905 |
|
|
Premises and equipment, net |
|
29,108 |
|
28,908 |
|
38,594 |
|
|
Foreclosed assets, net |
|
13,278 |
|
12,842 |
|
12,976 |
|
|
Deferred tax asset, net |
|
70,354 |
|
88,765 |
|
94,112 |
|
|
Goodwill |
|
2,173,949 |
|
2,173,949 |
|
2,173,949 |
|
|
Core deposit and customer relationship intangibles, net |
|
30,237 |
|
33,302 |
|
36,366 |
|
|
Other assets |
|
369,983 |
|
318,133 |
|
319,779 |
|
|
Total assets |
|
$ |
22,246,877 |
|
$ |
21,927,254 |
|
$ |
21,869,767 |
|
|
|
|
|
|
|
|
|
|
|
LIABILITIES: |
|
|
|
|
|
|
|
|
Noninterest-bearing deposits |
|
$ |
6,701,039 |
|
$ |
6,789,808 |
|
$ |
6,659,016 |
|
|
Interest-bearing deposits |
|
10,173,938 |
|
9,541,200 |
|
9,211,595 |
|
|
Total deposits |
|
16,874,977 |
|
16,331,008 |
|
15,870,611 |
|
|
Borrowings |
|
217,454 |
|
460,609 |
|
905,812 |
|
|
Subordinated debentures |
|
445,743 |
|
442,516 |
|
440,744 |
|
|
Accrued interest payable and other liabilities |
|
148,798 |
|
185,015 |
|
173,545 |
|
|
Total liabilities |
|
17,686,972 |
|
17,419,148 |
|
17,390,712 |
|
|
STOCKHOLDERS’ EQUITY (1) |
|
4,559,905 |
|
4,508,106 |
|
4,479,055 |
|
|
Total liabilities and stockholders’ equity |
|
$ |
22,246,877 |
|
$ |
21,927,254 |
|
$ |
21,869,767 |
|
|
|
|
|
|
|
|
|
|
|
Book value per share |
|
$ |
37.55 |
|
$ |
37.13 |
|
$ |
36.93 |
|
|
Tangible book value per share (2) |
|
$ |
19.40 |
|
$ |
18.95 |
|
$ |
18.71 |
|
|
Shares outstanding |
|
121,448,321 |
|
121,408,133 |
|
121,283,669 |
|
|
(1) Includes net unrealized gain on securities available-for-sale, net |
|
$ |
29,729 |
|
$ |
12,718 |
|
$ |
5,982 |
|
|
(2) Non-GAAP measure. |
|
|
|
|
|
|
|
12
PACWEST BANCORP AND SUBSIDIARIES
CONDENSED CONSOLIDATED STATEMENT OF EARNINGS
|
|
|
Three Months Ended |
|
Six Months Ended |
|
|
|
|
June 30, |
|
March 31, |
|
June 30, |
|
June 30, |
|
|
|
|
2017 |
|
2017 |
|
2016 |
|
2017 |
|
2016 |
|
|
|
|
(Dollars in thousands, except per share data) |
|
|
Interest income: |
|
|
|
|
|
|
|
|
|
|
|
|
Loans and leases |
|
$ |
234,618 |
|
$ |
224,178 |
|
$ |
224,326 |
|
$ |
458,796 |
|
$ |
460,701 |
|
|
Investment securities |
|
24,689 |
|
23,039 |
|
22,420 |
|
47,728 |
|
44,967 |
|
|
Deposits in financial institutions |
|
237 |
|
192 |
|
308 |
|
429 |
|
616 |
|
|
Total interest income |
|
259,544 |
|
247,409 |
|
247,054 |
|
506,953 |
|
506,284 |
|
|
|
|
|
|
|
|
|
|
|
|
|
|
|
Interest expense: |
|
|
|
|
|
|
|
|
|
|
|
|
Deposits |
|
10,205 |
|
8,377 |
|
7,823 |
|
18,582 |
|
16,896 |
|
|
Borrowings |
|
1,066 |
|
1,018 |
|
352 |
|
2,084 |
|
933 |
|
|
Subordinated debentures |
|
5,800 |
|
5,562 |
|
5,122 |
|
11,362 |
|
10,104 |
|
|
Total interest expense |
|
17,071 |
|
14,957 |
|
13,297 |
|
32,028 |
|
27,933 |
|
|
|
|
|
|
|
|
|
|
|
|
|
|
|
Net interest income |
|
242,473 |
|
232,452 |
|
233,757 |
|
474,925 |
|
478,351 |
|
|
Provision for credit losses |
|
11,499 |
|
24,728 |
|
13,903 |
|
36,227 |
|
34,043 |
|
|
Net interest income after provision for credit losses |
|
230,974 |
|
207,724 |
|
219,854 |
|
438,698 |
|
444,308 |
|
|
|
|
|
|
|
|
|
|
|
|
|
|
|
Noninterest income: |
|
|
|
|
|
|
|
|
|
|
|
|
Service charges on deposit accounts |
|
3,510 |
|
3,758 |
|
3,633 |
|
7,268 |
|
7,489 |
|
|
Other commissions and fees |
|
10,583 |
|
10,390 |
|
11,073 |
|
20,973 |
|
22,562 |
|
|
Leased equipment income |
|
11,635 |
|
9,475 |
|
8,523 |
|
21,110 |
|
16,767 |
|
|
Gain on sale of loans and leases |
|
649 |
|
712 |
|
388 |
|
1,361 |
|
633 |
|
|
Gain (loss) on sale of securities |
|
1,651 |
|
(99 |
) |
478 |
|
1,552 |
|
8,588 |
|
|
FDIC loss sharing expense, net |
|
— |
|
— |
|
(6,502 |
) |
— |
|
(8,917 |
) |
|
Other income |
|
7,254 |
|
10,878 |
|
4,528 |
|
18,132 |
|
9,538 |
|
|
Total noninterest income |
|
35,282 |
|
35,114 |
|
22,121 |
|
70,396 |
|
56,660 |
|
|
|
|
|
|
|
|
|
|
|
|
|
|
|
Noninterest expense: |
|
|
|
|
|
|
|
|
|
|
|
|
Compensation |
|
65,288 |
|
64,880 |
|
62,174 |
|
130,168 |
|
123,239 |
|
|
Occupancy |
|
11,811 |
|
11,608 |
|
12,193 |
|
23,419 |
|
24,825 |
|
|
Data processing |
|
6,337 |
|
7,015 |
|
5,644 |
|
13,352 |
|
11,548 |
|
|
Other professional services |
|
3,976 |
|
3,378 |
|
3,401 |
|
7,354 |
|
6,973 |
|
|
Insurance and assessments |
|
4,856 |
|
4,791 |
|
4,951 |
|
9,647 |
|
9,916 |
|
|
Intangible asset amortization |
|
3,065 |
|
3,064 |
|
4,371 |
|
6,129 |
|
9,117 |
|
|
Leased equipment depreciation |
|
5,232 |
|
5,625 |
|
5,286 |
|
10,857 |
|
10,310 |
|
|
Foreclosed assets (income) expense, net |
|
(157 |
) |
143 |
|
(3 |
) |
(14 |
) |
(564 |
) |
|
Acquisition, integration and reorganization costs |
|
1,700 |
|
500 |
|
— |
|
2,200 |
|
200 |
|
|
Other expense |
|
15,599 |
|
15,540 |
|
12,064 |
|
31,139 |
|
25,205 |
|
|
Total noninterest expense |
|
117,707 |
|
116,544 |
|
110,081 |
|
234,251 |
|
220,769 |
|
|
|
|
|
|
|
|
|
|
|
|
|
|
|
Earnings before income taxes |
|
148,549 |
|
126,294 |
|
131,894 |
|
274,843 |
|
280,199 |
|
|
Income tax expense |
|
(54,902 |
) |
(47,626 |
) |
(49,726 |
) |
(102,528 |
) |
(107,575 |
) |
|
Net earnings |
|
$ |
93,647 |
|
$ |
78,668 |
|
$ |
82,168 |
|
$ |
172,315 |
|
$ |
172,624 |
|
|
|
|
|
|
|
|
|
|
|
|
|
|
|
Basic and diluted earnings per share |
|
$ |
0.77 |
|
$ |
0.65 |
|
$ |
0.68 |
|
$ |
1.42 |
|
$ |
1.42 |
|
13
PACWEST BANCORP AND SUBSIDIARIES
NET EARNINGS PER SHARE CALCULATIONS
|
|
|
Three Months Ended |
|
Six Months Ended |
|
|
|
|
June 30, |
|
March 31, |
|
June 30, |
|
June 30, |
|
|
|
|
2017 |
|
2017 |
|
2016 |
|
2017 |
|
2016 |
|
|
|
|
(In thousands, except per share data) |
|
|
Basic Earnings Per Share: |
|
|
|
|
|
|
|
|
|
|
|
|
Net earnings |
|
$ |
93,647 |
|
$ |
78,668 |
|
$ |
82,168 |
|
$ |
172,315 |
|
$ |
172,624 |
|
|
Less: earnings allocated to unvested restricted stock (1) |
|
(1,080 |
) |
(999 |
) |
(863 |
) |
(2,082 |
) |
(1,933 |
) |
|
Net earnings allocated to common shares |
|
$ |
92,567 |
|
$ |
77,669 |
|
$ |
81,305 |
|
$ |
170,233 |
|
$ |
170,691 |
|
|
|
|
|
|
|
|
|
|
|
|
|
|
|
Weighted-average basic shares and unvested restricted stock outstanding |
|
121,422 |
|
121,346 |
|
121,799 |
|
121,384 |
|
121,698 |
|
|
Less: weighted-average unvested restricted stock outstanding |
|
(1,455 |
) |
(1,503 |
) |
(1,481 |
) |
(1,479 |
) |
(1,436 |
) |
|
Weighted-average basic shares outstanding |
|
119,967 |
|
119,843 |
|
120,318 |
|
119,905 |
|
120,262 |
|
|
|
|
|
|
|
|
|
|
|
|
|
|
|
Basic earnings per share |
|
$ |
0.77 |
|
$ |
0.65 |
|
$ |
0.68 |
|
$ |
1.42 |
|
$ |
1.42 |
|
|
|
|
|
|
|
|
|
|
|
|
|
|
|
Diluted Earnings Per Share: |
|
|
|
|
|
|
|
|
|
|
|
|
Net earnings allocated to common shares |
|
$ |
92,567 |
|
$ |
77,669 |
|
$ |
81,305 |
|
$ |
170,233 |
|
$ |
170,691 |
|
|
|
|
|
|
|
|
|
|
|
|
|
|
|
Weighted-average basic shares outstanding |
|
119,967 |
|
119,843 |
|
120,318 |
|
119,905 |
|
120,262 |
|
|
|
|
|
|
|
|
|
|
|
|
|
|
|
Diluted earnings per share |
|
$ |
0.77 |
|
$ |
0.65 |
|
$ |
0.68 |
|
$ |
1.42 |
|
$ |
1.42 |
|
(1) Represents cash dividends paid to holders of unvested stock, net of forfeitures, plus undistributed earnings amounts available to holders of unvested restricted stock, if any.
14
PACWEST BANCORP AND SUBSIDIARIES
AVERAGE BALANCE SHEET AND YIELD ANALYSIS
|
|
|
Three Months Ended |
|
|
|
|
June 30, 2017 |
|
March 31, 2017 |
|
June 30, 2016 |
|
|
|
|
|
|
Interest |
|
Average |
|
|
|
Interest |
|
Average |
|
|
|
Interest |
|
Average |
|
|
|
|
Average |
|
Income/ |
|
Yield/ |
|
Average |
|
Income/ |
|
Yield/ |
|
Average |
|
Income/ |
|
Yield/ |
|
|
|
|
Balance |
|
Expense |
|
Cost |
|
Balance |
|
Expense |
|
Cost |
|
Balance |
|
Expense |
|
Cost |
|
|
|
|
(Dollars in thousands) |
|
|
Assets: |
|
|
|
|
|
|
|
|
|
|
|
|
|
|
|
|
|
|
|
|
PCI loans |
|
$ |
68,759 |
|
$ |
4,643 |
|
27.08 |
% |
$ |
89,335 |
|
$ |
4,250 |
|
19.29 |
% |
$ |
147,270 |
|
$ |
8,484 |
|
23.17 |
% |
|
Non-PCI loans and leases |
|
15,429,162 |
|
229,975 |
|
5.98 |
% |
15,207,709 |
|
219,928 |
|
5.86 |
% |
14,321,320 |
|
215,842 |
|
6.06 |
% |
|
Total loans and leases |
|
15,497,921 |
|
234,618 |
|
6.07 |
% |
15,297,044 |
|
224,178 |
|
5.94 |
% |
14,468,590 |
|
224,326 |
|
6.24 |
% |
|
Investment securities (1) |
|
3,436,785 |
|
29,538 |
|
3.45 |
% |
3,257,448 |
|
27,822 |
|
3.46 |
% |
3,288,819 |
|
27,330 |
|
3.34 |
% |
|
Deposits in financial institutions |
|
96,087 |
|
237 |
|
0.99 |
% |
100,751 |
|
192 |
|
0.77 |
% |
245,666 |
|
308 |
|
0.50 |
% |
|
Total interest-earning assets |
|
19,030,793 |
|
264,393 |
|
5.57 |
% |
18,655,243 |
|
252,192 |
|
5.48 |
% |
18,003,075 |
|
251,964 |
|
5.63 |
% |
|
Other assets |
|
2,905,809 |
|
|
|
|
|
2,990,291 |
|
|
|
|
|
2,996,867 |
|
|
|
|
|
|
Total assets |
|
$ |
21,936,602 |
|
|
|
|
|
$ |
21,645,534 |
|
|
|
|
|
$ |
20,999,942 |
|
|
|
|
|
|
|
|
|
|
|
|
|
|
|
|
|
|
|
|
|
|
|
|
|
|
|
Liabilities and Stockholders’ Equity: |
|
|
|
|
|
|
|
|
|
|
|
|
|
|
|
|
|
|
|
|
Interest checking |
|
$ |
1,709,699 |
|
1,697 |
|
0.40 |
% |
$ |
1,505,439 |
|
1,167 |
|
0.31 |
% |
$ |
1,024,763 |
|
501 |
|
0.20 |
% |
|
Money market |
|
4,907,865 |
|
4,993 |
|
0.41 |
% |
4,866,720 |
|
4,410 |
|
0.37 |
% |
4,321,533 |
|
2,886 |
|
0.27 |
% |
|
Savings |
|
708,389 |
|
296 |
|
0.17 |
% |
711,529 |
|
298 |
|
0.17 |
% |
766,309 |
|
412 |
|
0.22 |
% |
|
Time |
|
2,366,399 |
|
3,219 |
|
0.55 |
% |
2,246,547 |
|
2,502 |
|
0.45 |
% |
3,086,492 |
|
4,024 |
|
0.52 |
% |
|
Total interest-bearing deposits |
|
9,692,352 |
|
10,205 |
|
0.42 |
% |
9,330,235 |
|
8,377 |
|
0.36 |
% |
9,199,097 |
|
7,823 |
|
0.34 |
% |
|
Borrowings |
|
457,774 |
|
1,066 |
|
0.93 |
% |
596,903 |
|
1,018 |
|
0.69 |
% |
300,428 |
|
352 |
|
0.47 |
% |
|
Subordinated debentures |
|
443,756 |
|
5,800 |
|
5.24 |
% |
441,521 |
|
5,562 |
|
5.11 |
% |
439,081 |
|
5,122 |
|
4.69 |
% |
|
Total interest-bearing liabilities |
|
10,593,882 |
|
17,071 |
|
0.65 |
% |
10,368,659 |
|
14,957 |
|
0.59 |
% |
9,938,606 |
|
13,297 |
|
0.54 |
% |
|
Noninterest-bearing demand deposits |
|
6,646,349 |
|
|
|
|
|
6,595,346 |
|
|
|
|
|
6,437,720 |
|
|
|
|
|
|
Other liabilities |
|
151,095 |
|
|
|
|
|
177,854 |
|
|
|
|
|
140,023 |
|
|
|
|
|
|
Total liabilities |
|
17,391,326 |
|
|
|
|
|
17,141,859 |
|
|
|
|
|
16,516,349 |
|
|
|
|
|
|
Stockholders’ equity |
|
4,545,276 |
|
|
|
|
|
4,503,675 |
|
|
|
|
|
4,483,593 |
|
|
|
|
|
|
Total liabilities and stockholders’ equity |
|
$ |
21,936,602 |
|
|
|
|
|
$ |
21,645,534 |
|
|
|
|
|
$ |
20,999,942 |
|
|
|
|
|
|
Net interest income (2) |
|
|
|
$ |
247,322 |
|
|
|
|
|
$ |
237,235 |
|
|
|
|
|
$ |
238,667 |
|
|
|
|
Net interest spread (2) |
|
|
|
|
|
4.92 |
% |
|
|
|
|
4.89 |
% |
|
|
|
|
5.09 |
% |
|
Net interest margin (2) |
|
|
|
|
|
5.21 |
% |
|
|
|
|
5.16 |
% |
|
|
|
|
5.33 |
% |
|
|
|
|
|
|
|
|
|
|
|
|
|
|
|
|
|
|
|
|
|
|
Total deposits (3) |
|
$ |
16,338,701 |
|
$ |
10,205 |
|
0.25 |
% |
$ |
15,925,581 |
|
$ |
8,377 |
|
0.21 |
% |
$ |
15,636,817 |
|
$ |
7,823 |
|
0.20 |
% |
|
Funding sources (4) |
|
$ |
17,240,231 |
|
$ |
17,071 |
|
0.40 |
% |
$ |
16,964,005 |
|
$ |
14,957 |
|
0.36 |
% |
$ |
16,376,326 |
|
$ |
13,297 |
|
0.33 |
% |
(1) Includes tax equivalent adjustments of $4.9 million, $4.8 million, and $4.9 million for the three months ended June 30, 2017, March 31, 2017, and June 30, 2016 related to tax exempt income on municipal securities. The federal statutory tax rate utilized was 35% for the periods.
(2) Tax equivalent.
(3) Total deposits is the sum of total interest-bearing deposits and noninterest-bearing demand deposits. The cost of total deposits is calculated as annualized interest expense on deposits divided by average total deposits.
(4) Funding sources is the sum of total interest-bearing liabilities and noninterest-bearing demand deposits. The cost of funding sources is calculated as annualized total interest expense divided by average funding sources.
15
PACWEST BANCORP AND SUBSIDIARIES
FIVE QUARTER BALANCE SHEET
|
|
|
June 30, |
|
March 31, |
|
December 31, |
|
September 30, |
|
June 30, |
|
|
|
|
2017 |
|
2017 |
|
2016 |
|
2016 |
|
2016 |
|
|
|
|
(Dollars in thousands, except per share data) |
|
|
ASSETS: |
|
|
|
|
|
|
|
|
|
|
|
|
Cash and due from banks |
|
$ |
180,330 |
|
$ |
184,608 |
|
$ |
337,965 |
|
$ |
286,371 |
|
$ |
226,471 |
|
|
Interest-earning deposits in financial institutions |
|
107,150 |
|
111,892 |
|
81,705 |
|
253,994 |
|
218,882 |
|
|
Total cash and cash equivalents |
|
287,480 |
|
296,500 |
|
419,670 |
|
540,365 |
|
445,353 |
|
|
|
|
|
|
|
|
|
|
|
|
|
|
|
Securities available-for-sale |
|
3,474,560 |
|
3,336,992 |
|
3,223,830 |
|
3,341,335 |
|
3,347,546 |
|
|
Federal Home Loan Bank stock |
|
22,059 |
|
17,901 |
|
21,870 |
|
19,386 |
|
24,214 |
|
|
Total investment securities |
|
3,496,619 |
|
3,354,893 |
|
3,245,700 |
|
3,360,721 |
|
3,371,760 |
|
|
|
|
|
|
|
|
|
|
|
|
|
|
|
Loans held for sale |
|
175,158 |
|
— |
|
— |
|
— |
|
— |
|
|
|
|
|
|
|
|
|
|
|
|
|
|
|
Non-PCI loans and leases |
|
15,536,735 |
|
15,526,518 |
|
15,412,092 |
|
14,686,206 |
|
14,566,425 |
|
|
PCI loans |
|
72,445 |
|
96,353 |
|
108,445 |
|
120,221 |
|
136,901 |
|
|
Total gross loans and leases held for investment |
|
15,609,180 |
|
15,622,871 |
|
15,520,537 |
|
14,806,427 |
|
14,703,326 |
|
|
Deferred fees, net |
|
(65,723 |
) |
(66,182 |
) |
(64,583 |
) |
(63,581 |
) |
(61,866 |
) |
|
Total loans and leases held for investment, net of deferred fees |
|
15,543,457 |
|
15,556,689 |
|
15,455,954 |
|
14,742,846 |
|
14,641,460 |
|
|
Allowance for loan and lease losses |
|
(145,958 |
) |
(161,307 |
) |
(157,238 |
) |
(147,976 |
) |
(143,289 |
) |
|
Total loans and leases held for investment, net |
|
15,397,499 |
|
15,395,382 |
|
15,298,716 |
|
14,594,870 |
|
14,498,171 |
|
|
|
|
|
|
|
|
|
|
|
|
|
|
|
Equipment leased to others under operating leases |
|
203,212 |
|
224,580 |
|
229,905 |
|
198,931 |
|
204,062 |
|
|
Premises and equipment, net |
|
29,108 |
|
28,908 |
|
38,594 |
|
38,977 |
|
38,718 |
|
|
Foreclosed assets, net |
|
13,278 |
|
12,842 |
|
12,976 |
|
15,113 |
|
16,181 |
|
|
Deferred tax asset, net |
|
70,354 |
|
88,765 |
|
94,112 |
|
27,073 |
|
24,413 |
|
|
Goodwill |
|
2,173,949 |
|
2,173,949 |
|
2,173,949 |
|
2,173,949 |
|
2,175,791 |
|
|
Core deposit and customer relationship intangibles, net |
|
30,237 |
|
33,302 |
|
36,366 |
|
39,542 |
|
43,766 |
|
|
Other assets |
|
369,983 |
|
318,133 |
|
319,779 |
|
325,750 |
|
328,924 |
|
|
Total assets |
|
$ |
22,246,877 |
|
$ |
21,927,254 |
|
$ |
21,869,767 |
|
$ |
21,315,291 |
|
$ |
21,147,139 |
|
|
|
|
|
|
|
|
|
|
|
|
|
|
|
LIABILITIES: |
|
|
|
|
|
|
|
|
|
|
|
|
Noninterest-bearing deposits |
|
$ |
6,701,039 |
|
$ |
6,789,808 |
|
$ |
6,659,016 |
|
$ |
6,521,946 |
|
$ |
6,222,696 |
|
|
Interest-bearing deposits |
|
10,173,938 |
|
9,541,200 |
|
9,211,595 |
|
9,123,722 |
|
8,925,313 |
|
|
Total deposits |
|
16,874,977 |
|
16,331,008 |
|
15,870,611 |
|
15,645,668 |
|
15,148,009 |
|
|
Borrowings |
|
217,454 |
|
460,609 |
|
905,812 |
|
541,011 |
|
918,208 |
|
|
Subordinated debentures |
|
445,743 |
|
442,516 |
|
440,744 |
|
441,112 |
|
439,322 |
|
|
Accrued interest payable and other liabilities |
|
148,798 |
|
185,015 |
|
173,545 |
|
144,905 |
|
128,296 |
|
|
Total liabilities |
|
17,686,972 |
|
17,419,148 |
|
17,390,712 |
|
16,772,696 |
|
16,633,835 |
|
|
STOCKHOLDERS’ EQUITY (1) |
|
4,559,905 |
|
4,508,106 |
|
4,479,055 |
|
4,542,595 |
|
4,513,304 |
|
|
Total liabilities and stockholders’ equity |
|
$ |
22,246,877 |
|
$ |
21,927,254 |
|
$ |
21,869,767 |
|
$ |
21,315,291 |
|
$ |
21,147,139 |
|
|
|
|
|
|
|
|
|
|
|
|
|
|
|
Book value per share |
|
$ |
37.55 |
|
$ |
37.13 |
|
$ |
36.93 |
|
$ |
37.29 |
|
$ |
37.05 |
|
|
Tangible book value per share (2) |
|
$ |
19.40 |
|
$ |
18.95 |
|
$ |
18.71 |
|
$ |
19.12 |
|
$ |
18.83 |
|
|
Shares outstanding |
|
121,448,321 |
|
121,408,133 |
|
121,283,669 |
|
121,817,524 |
|
121,819,849 |
|
|
(1) Includes net unrealized gain on securities available-for-sale, net |
|
$ |
29,729 |
|
$ |
12,718 |
|
$ |
5,982 |
|
$ |
72,073 |
|
$ |
81,744 |
|
|
(2) Non-GAAP measure. |
|
|
|
|
|
|
|
|
|
|
|
16
PACWEST BANCORP AND SUBSIDIARIES
FIVE QUARTER STATEMENT OF EARNINGS
|
|
|
Three Months Ended |
|
|
|
|
June 30, |
|
March 31, |
|
December 31, |
|
September 30, |
|
June 30, |
|
|
|
|
2017 |
|
2017 |
|
2016 |
|
2016 |
|
2016 |
|
|
|
|
(Dollars in thousands, except per share data) |
|
|
Interest income: |
|
|
|
|
|
|
|
|
|
|
|
|
Loans and leases |
|
$ |
234,618 |
|
$ |
224,178 |
|
$ |
238,223 |
|
$ |
225,370 |
|
$ |
224,326 |
|
|
Investment securities |
|
24,689 |
|
23,039 |
|
23,403 |
|
22,187 |
|
22,420 |
|
|
Deposits in financial institutions |
|
237 |
|
192 |
|
147 |
|
298 |
|
308 |
|
|
Total interest income |
|
259,544 |
|
247,409 |
|
261,773 |
|
247,855 |
|
247,054 |
|
|
|
|
|
|
|
|
|
|
|
|
|
|
|
Interest expense: |
|
|
|
|
|
|
|
|
|
|
|
|
Deposits |
|
10,205 |
|
8,377 |
|
7,369 |
|
7,247 |
|
7,823 |
|
|
Borrowings |
|
1,066 |
|
1,018 |
|
631 |
|
695 |
|
352 |
|
|
Subordinated debentures |
|
5,800 |
|
5,562 |
|
5,468 |
|
5,278 |
|
5,122 |
|
|
Total interest expense |
|
17,071 |
|
14,957 |
|
13,468 |
|
13,220 |
|
13,297 |
|
|
|
|
|
|
|
|
|
|
|
|
|
|
|
Net interest income |
|
242,473 |
|
232,452 |
|
248,305 |
|
234,635 |
|
233,757 |
|
|
Provision for credit losses |
|
11,499 |
|
24,728 |
|
23,215 |
|
8,471 |
|
13,903 |
|
|
Net interest income after provision for credit losses |
|
230,974 |
|
207,724 |
|
225,090 |
|
226,164 |
|
219,854 |
|
|
|
|
|
|
|
|
|
|
|
|
|
|
|
Noninterest income: |
|
|
|
|
|
|
|
|
|
|
|
|
Service charges on deposit accounts |
|
3,510 |
|
3,758 |
|
3,557 |
|
3,488 |
|
3,633 |
|
|
Other commissions and fees |
|
10,583 |
|
10,390 |
|
12,036 |
|
12,528 |
|
11,073 |
|
|
Leased equipment income |
|
11,635 |
|
9,475 |
|
8,614 |
|
8,538 |
|
8,523 |
|
|
Gain on sale of loans and leases |
|
649 |
|
712 |
|
119 |
|
157 |
|
388 |
|
|
Gain (loss) on sale of securities |
|
1,651 |
|
(99 |
) |
515 |
|
382 |
|
478 |
|
|
FDIC loss sharing expense, net |
|
— |
|
— |
|
— |
|
— |
|
(6,502 |
) |
|
Other income |
|
7,254 |
|
10,878 |
|
4,054 |
|
1,827 |
|
4,528 |
|
|
Total noninterest income |
|
35,282 |
|
35,114 |
|
28,895 |
|
26,920 |
|
22,121 |
|
|
|
|
|
|
|
|
|
|
|
|
|
|
|
Noninterest expense: |
|
|
|
|
|
|
|
|
|
|
|
|
Compensation |
|
65,288 |
|
64,880 |
|
66,013 |
|
62,661 |
|
62,174 |
|
|
Occupancy |
|
11,811 |
|
11,608 |
|
12,076 |
|
12,010 |
|
12,193 |
|
|
Data processing |
|
6,337 |
|
7,015 |
|
6,574 |
|
6,234 |
|
5,644 |
|
|
Other professional services |
|
3,976 |
|
3,378 |
|
4,880 |
|
4,625 |
|
3,401 |
|
|
Insurance and assessments |
|
4,856 |
|
4,791 |
|
4,124 |
|
4,324 |
|
4,951 |
|
|
Intangible asset amortization |
|
3,065 |
|
3,064 |
|
3,176 |
|
4,224 |
|
4,371 |
|
|
Leased equipment depreciation |
|
5,232 |
|
5,625 |
|
5,291 |
|
5,298 |
|
5,286 |
|
|
Foreclosed assets (income) expense, net |
|
(157 |
) |
143 |
|
2,693 |
|
(248 |
) |
(3 |
) |
|
Acquisition, integration and reorganization costs |
|
1,700 |
|
500 |
|
— |
|
— |
|
— |
|
|
Other expense |
|
15,599 |
|
15,540 |
|
13,795 |
|
11,582 |
|
12,064 |
|
|
Total noninterest expense |
|
117,707 |
|
116,544 |
|
118,622 |
|
110,710 |
|
110,081 |
|
|
|
|
|
|
|
|
|
|
|
|
|
|
|
Earnings before income taxes |
|
148,549 |
|
126,294 |
|
135,363 |
|
142,374 |
|
131,894 |
|
|
Income tax expense |
|
(54,902 |
) |
(47,626 |
) |
(49,716 |
) |
(48,479 |
) |
(49,726 |
) |
|
Net earnings |
|
$ |
93,647 |
|
$ |
78,668 |
|
$ |
85,647 |
|
$ |
93,895 |
|
$ |
82,168 |
|
|
|
|
|
|
|
|
|
|
|
|
|
|
|
Basic and diluted earnings per share |
|
$ |
0.77 |
|
$ |
0.65 |
|
$ |
0.71 |
|
$ |
0.77 |
|
$ |
0.68 |
|
17
PACWEST BANCORP AND SUBSIDIARIES
FIVE QUARTER SELECTED FINANCIAL DATA
|
|
|
At or For the Three Months Ended |
|
|
|
|
June 30, |
|
March 31, |
|
December 31, |
|
September 30, |
|
June 30, |
|
|
|
|
2017 |
|
2017 |
|
2016 |
|
2016 |
|
2016 |
|
|
|
|
(Dollars in thousands) |
|
|
Performance Ratios: |
|
|
|
|
|
|
|
|
|
|
|
|
Return on average assets (1) |
|
1.71 |
% |
1.47 |
% |
1.59 |
% |
1.77 |
% |
1.57 |
% |
|
Return on average equity (1) |
|
8.26 |
% |
7.08 |
% |
7.57 |
% |
8.24 |
% |
7.37 |
% |
|
Return on average tangible equity (1)(2) |
|
16.06 |
% |
13.90 |
% |
14.88 |
% |
16.15 |
% |
14.61 |
% |
|
|
|
|
|
|
|
|
|
|
|
|
|
|
Yield on average loans and leases (1) |
|
6.07 |
% |
5.94 |
% |
6.31 |
% |
6.17 |
% |
6.24 |
% |
|
Yield on average interest-earning assets (1)(3) |
|
5.57 |
% |
5.48 |
% |
5.76 |
% |
5.55 |
% |
5.63 |
% |
|
Cost of average total deposits (1) |
|
0.25 |
% |
0.21 |
% |
0.19 |
% |
0.19 |
% |
0.20 |
% |
|
Cost of average time deposits (1) |
|
0.55 |
% |
0.45 |
% |
0.40 |
% |
0.45 |
% |
0.52 |
% |
|
Cost of average interest-bearing liabilities (1) |
|
0.65 |
% |
0.59 |
% |
0.52 |
% |
0.52 |
% |
0.54 |
% |
|
Cost of average funding sources (1) |
|
0.40 |
% |
0.36 |
% |
0.32 |
% |
0.32 |
% |
0.33 |
% |
|
Net interest rate spread (1)(3) |
|
4.92 |
% |
4.89 |
% |
5.24 |
% |
5.03 |
% |
5.09 |
% |
|
Net interest margin (1)(3) |
|
5.21 |
% |
5.16 |
% |
5.47 |
% |
5.26 |
% |
5.33 |
% |
|
|
|
|
|
|
|
|
|
|
|
|
|
|
Efficiency ratio |
|
40.3 |
% |
41.4 |
% |
40.1 |
% |
40.1 |
% |
40.6 |
% |
|
Noninterest expense as a percentage of average assets (1) |
|
2.15 |
% |
2.18 |
% |
2.20 |
% |
2.09 |
% |
2.11 |
% |
|
|
|
|
|
|
|
|
|
|
|
|
|
|
Average Balances: |
|
|
|
|
|
|
|
|
|
|
|
|
Loans and leases |
|
$ |
15,497,921 |
|
$ |
15,297,044 |
|
$ |
15,008,268 |
|
$ |
14,534,951 |
|
$ |
14,468,590 |
|
|
Interest-earning assets |
|
19,030,793 |
|
18,655,243 |
|
18,413,189 |
|
18,111,585 |
|
18,003,075 |
|
|
Total assets |
|
21,936,602 |
|
21,645,534 |
|
21,427,950 |
|
21,072,053 |
|
20,999,942 |
|
|
Noninterest-bearing deposits |
|
6,646,349 |
|
6,595,346 |
|
6,496,221 |
|
6,274,294 |
|
6,437,720 |
|
|
Interest-bearing deposits |
|
9,692,352 |
|
9,330,235 |
|
9,327,080 |
|
9,107,305 |
|
9,199,097 |
|
|
Total deposits |
|
16,338,701 |
|
15,925,581 |
|
15,823,301 |
|
15,381,599 |
|
15,636,817 |
|
|
Borrowings and subordinated debentures |
|
901,530 |
|
1,038,424 |
|
946,474 |
|
1,023,952 |
|
739,509 |
|
|
Interest-bearing liabilities |
|
10,593,882 |
|
10,368,659 |
|
10,273,554 |
|
10,131,257 |
|
9,938,606 |
|
|
Funding sources |
|
17,240,231 |
|
16,964,005 |
|
16,769,775 |
|
16,405,551 |
|
16,376,326 |
|
|
Stockholders’ equity |
|
4,545,276 |
|
4,503,675 |
|
4,501,948 |
|
4,530,701 |
|
4,483,593 |
|
|
|
|
|
|
|
|
|
|
|
|
|
|
|
|
|
|
(1) Annualized.
(2) Non-GAAP measure.
(3) Tax equivalent.
18
PACWEST BANCORP AND SUBSIDIARIES
FIVE QUARTER SELECTED FINANCIAL DATA
|
|
|
At or For the Three Months Ended |
|
|
|
|
June 30, |
|
March 31, |
|
December 31, |
|
September 30, |
|
June 30, |
|
|
|
|
2017 |
|
2017 |
|
2016 |
|
2016 |
|
2016 |
|
|
|
|
(Dollars in thousands) |
|
|
Non-PCI Credit Quality: |
|
|
|
|
|
|
|
|
|
|
|
|
Allowance for credit losses to loans and leases held for investment |
|
1.02 |
% |
1.08 |
% |
1.05 |
% |
1.05 |
% |
1.03 |
% |
|
Allowance for credit losses to nonaccrual loans and leases held for investment |
|
92.2 |
% |
96.9 |
% |
94.5 |
% |
90.1 |
% |
117.5 |
% |
|
Nonaccrual loans and leases held for investment to loans and leases held for investment |
|
1.11 |
% |
1.11 |
% |
1.11 |
% |
1.16 |
% |
0.88 |
% |
|
Nonperforming assets to loans and leases held for investment and foreclosed assets |
|
1.20 |
% |
1.20 |
% |
1.19 |
% |
1.27 |
% |
0.99 |
% |
|
Nonperforming assets to total assets |
|
0.84 |
% |
0.85 |
% |
0.84 |
% |
0.87 |
% |
0.68 |
% |
|
Trailing twelve month net charge-offs to average loans and leases held for investment |
|
0.37 |
% |
0.24 |
% |
0.15 |
% |
0.04 |
% |
0.04 |
% |
|
|
|
|
|
|
|
|
|
|
|
|
|
|
PacWest Bancorp Consolidated Capital: |
|
|
|
|
|
|
|
|
|
|
|
|
Tier 1 leverage ratio (1) |
|
11.90 |
% |
11.87 |
% |
11.91 |
% |
12.13 |
% |
11.92 |
% |
|
Common equity tier 1 capital ratio (1) |
|
12.28 |
% |
12.31 |
% |
12.31 |
% |
12.83 |
% |
12.72 |
% |
|
Tier 1 capital ratio (1) |
|
12.28 |
% |
12.31 |
% |
12.31 |
% |
12.83 |
% |
12.72 |
% |
|
Total capital ratio (1) |
|
15.42 |
% |
15.56 |
% |
15.56 |
% |
16.18 |
% |
16.08 |
% |
|
Risk-weighted assets (1) |
|
$ |
19,084,824 |
|
$ |
18,732,723 |
|
$ |
18,568,622 |
|
$ |
17,713,506 |
|
$ |
17,520,609 |
|
|
|
|
|
|
|
|
|
|
|
|
|
|
|
Equity to assets ratio |
|
20.50 |
% |
20.56 |
% |
20.48 |
% |
21.31 |
% |
21.34 |
% |
|
Tangible common equity ratio (2) |
|
11.75 |
% |
11.67 |
% |
11.54 |
% |
12.19 |
% |
12.12 |
% |
|
Book value per share |
|
$ |
37.55 |
|
$ |
37.13 |
|
$ |
36.93 |
|
$ |
37.29 |
|
$ |
37.05 |
|
|
Tangible book value per share (2) |
|
$ |
19.40 |
|
$ |
18.95 |
|
$ |
18.71 |
|
$ |
19.12 |
|
$ |
18.83 |
|
|
|
|
|
|
|
|
|
|
|
|
|
|
|
Pacific Western Bank Capital: |
|
|
|
|
|
|
|
|
|
|
|
|
Tier 1 leverage ratio (1) |
|
11.41 |
% |
11.36 |
% |
11.40 |
% |
11.54 |
% |
11.38 |
% |
|
Common equity tier 1 capital ratio (1) |
|
11.79 |
% |
11.79 |
% |
11.78 |
% |
12.21 |
% |
12.13 |
% |
|
Tier 1 capital ratio (1) |
|
11.79 |
% |
11.79 |
% |
11.78 |
% |
12.21 |
% |
12.13 |
% |
|
Total capital ratio (1) |
|
12.66 |
% |
12.74 |
% |
12.72 |
% |
13.15 |
% |
13.06 |
% |
|
|
|
|
|
|
|
|
|
|
|
|
|
|
Equity to assets ratio |
|
20.07 |
% |
20.11 |
% |
20.02 |
% |
20.77 |
% |
20.82 |
% |
|
Tangible common equity ratio (2) |
|
11.27 |
% |
11.16 |
% |
11.02 |
% |
11.56 |
% |
11.51 |
% |
(1) Capital information for June 30, 2017 is preliminary.
(2) Non-GAAP measure.
19
GAAP TO NON-GAAP RECONCILIATION
This press release contains certain non-GAAP financial disclosures for: (1) return on average tangible equity, (2) tangible common equity ratio, and (3) tangible book value per share. The Company uses these non-GAAP financial measures to provide meaningful supplemental information regarding the Company’s operational performance and to enhance investors’ overall understanding of such financial performance. In particular, the use of return on average tangible equity, tangible common equity ratio, and tangible book value per share is prevalent among banking regulators, investors and analysts. Accordingly, we disclose the non-GAAP measures in addition to the related GAAP measures of: (1) return on average equity, (2) equity to assets ratio, and (3) book value per share.
The reconciliations for the following GAAP financial measures to the non-GAAP financial measures are presented below: (1) return on average equity to return on average tangible equity, (2) equity to assets ratio to tangible common equity ratio, and (3) book value per share to tangible book value per share.
PACWEST BANCORP AND SUBSIDIARIES
GAAP TO NON-GAAP RECONCILIATION
|
|
|
Three Months Ended |
|
Six Months Ended |
|
|
|
|
June 30, |
|
March 31, |
|
June 30, |
|
June 30, |
|
|
Return on Average Tangible Equity |
|
2017 |
|
2017 |
|
2016 |
|
2017 |
|
2016 |
|
|
|
|
(Dollars in thousands) |
|
|
Net earnings |
|
$ |
93,647 |
|
$ |
78,668 |
|
$ |
82,168 |
|
$ |
172,315 |
|
$ |
172,624 |
|
|
|
|
|
|
|
|
|
|
|
|
|
|
|
Average stockholders’ equity |
|
$ |
4,545,276 |
|
$ |
4,503,675 |
|
$ |
4,483,593 |
|
$ |
4,524,591 |
|
$ |
4,461,097 |
|
|
Less: Average intangible assets |
|
2,205,814 |
|
2,209,112 |
|
2,222,007 |
|
2,207,454 |
|
2,224,764 |
|
|
Average tangible common equity |
|
$ |
2,339,462 |
|
$ |
2,294,563 |
|
$ |
2,261,586 |
|
$ |
2,317,137 |
|
$ |
2,236,333 |
|
|
|
|
|
|
|
|
|
|
|
|
|
|
|
Return on average equity (1) |
|
8.26 |
% |
7.08 |
% |
7.37 |
% |
7.68 |
% |
7.78 |
% |
|
Return on average tangible equity (2) |
|
16.06 |
% |
13.90 |
% |
14.61 |
% |
15.00 |
% |
15.52 |
% |
(1) Annualized net earnings divided by average stockholders’ equity.
(2) Annualized net earnings divided by average tangible common equity.
20
PACWEST BANCORP AND SUBSIDIARIES
GAAP TO NON-GAAP RECONCILIATION
|
Tangible Common Equity Ratio/ |
|
June 30, |
|
March 31, |
|
December 31, |
|
September 30, |
|
June 30, |
|
|
Tangible Book Value Per Share |
|
2017 |
|
2017 |
|
2016 |
|
2016 |
|
2016 |
|
|
|
|
(Dollars in thousands, except per share data) |
|
|
PacWest Bancorp Consolidated: |
|
|
|
|
|
|
|
|
|
|
|
|
Stockholders’ equity |
|
$ |
4,559,905 |
|
$ |
4,508,106 |
|
$ |
4,479,055 |
|
$ |
4,542,595 |
|
$ |
4,513,304 |
|
|
Less: Intangible assets |
|
2,204,186 |
|
2,207,251 |
|
2,210,315 |
|
2,213,491 |
|
2,219,557 |
|
|
Tangible common equity |
|
$ |
2,355,719 |
|
$ |
2,300,855 |
|
$ |
2,268,740 |
|
$ |
2,329,104 |
|
$ |
2,293,747 |
|
|
|
|
|
|
|
|
|
|
|
|
|
|
|
Total assets |
|
$ |
22,246,877 |
|
$ |
21,927,254 |
|
$ |
21,869,767 |
|
$ |
21,315,291 |
|
$ |
21,147,139 |
|
|
Less: Intangible assets |
|
2,204,186 |
|
2,207,251 |
|
2,210,315 |
|
2,213,491 |
|
2,219,557 |
|
|
Tangible assets |
|
$ |
20,042,691 |
|
$ |
19,720,003 |
|
$ |
19,659,452 |
|
$ |
19,101,800 |
|
$ |
18,927,582 |
|
|
|
|
|
|
|
|
|
|
|
|
|
|
|
Equity to assets ratio |
|
20.50 |
% |
20.56 |
% |
20.48 |
% |
21.31 |
% |
21.34 |
% |
|
Tangible common equity ratio (1) |
|
11.75 |
% |
11.67 |
% |
11.54 |
% |
12.19 |
% |
12.12 |
% |
|
|
|
|
|
|
|
|
|
|
|
|
|
|
Book value per share |
|
$ |
37.55 |
|
$ |
37.13 |
|
$ |
36.93 |
|
$ |
37.29 |
|
$ |
37.05 |
|
|
Tangible book value per share (2) |
|
$ |
19.40 |
|
$ |
18.95 |
|
$ |
18.71 |
|
$ |
19.12 |
|
$ |
18.83 |
|
|
Shares outstanding |
|
121,448,321 |
|
121,408,133 |
|
121,283,669 |
|
121,817,524 |
|
121,819,849 |
|
|
|
|
|
|
|
|
|
|
|
|
|
|
|
Pacific Western Bank: |
|
|
|
|
|
|
|
|
|
|
|
|
Stockholder’s equity |
|
$ |
4,460,911 |
|
$ |
4,405,770 |
|
$ |
4,374,478 |
|
$ |
4,416,623 |
|
$ |
4,390,928 |
|
|
Less: Intangible assets |
|
2,204,186 |
|
2,207,251 |
|
2,210,315 |
|
2,213,491 |
|
2,219,557 |
|
|
Tangible common equity |
|
$ |
2,256,725 |
|
$ |
2,198,519 |
|
$ |
2,164,163 |
|
$ |
2,203,132 |
|
$ |
2,171,371 |
|
|
|
|
|
|
|
|
|
|
|
|
|
|
|
Total assets |
|
$ |
22,223,320 |
|
$ |
21,910,720 |
|
$ |
21,848,644 |
|
$ |
21,266,705 |
|
$ |
21,084,950 |
|
|
Less: Intangible assets |
|
2,204,186 |
|
2,207,251 |
|
2,210,315 |
|
2,213,491 |
|
2,219,557 |
|
|
Tangible assets |
|
$ |
20,019,134 |
|
$ |
19,703,469 |
|
$ |
19,638,329 |
|
$ |
19,053,214 |
|
$ |
18,865,393 |
|
|
|
|
|
|
|
|
|
|
|
|
|
|
|
Equity to assets ratio |
|
20.07 |
% |
20.11 |
% |
20.02 |
% |
20.77 |
% |
20.82 |
% |
|
Tangible common equity ratio (1) |
|
11.27 |
% |
11.16 |
% |
11.02 |
% |
11.56 |
% |
11.51 |
% |
(1) Tangible common equity divided by tangible assets.
(2) Tangible common equity divided by shares outstanding.
21