Earnings Summary February 2, 2021 Fourth Quarter 2020 Exhibit 99.2
This presentation contains forward-looking statements. The words “believe,” “expect,” “anticipate,” “intend,” “estimate,” “forecast,” “project,” “should,” “may,” “will,” “would” or the negative thereof and similar expressions are intended to identify such forward-looking statements. These forward-looking statements include statements related to future period guidance; future net revenue, operating expenses, net income, diluted earnings per common share, non-GAAP operating expenses, non-GAAP net income, diluted non-GAAP earnings per common share, and other financial metrics; future repayments under the Company's credit facilities; the Company’s performance relative to its markets, including the drivers of such performance; the impact, financial or otherwise, of any organizational changes; market and technology trends, including the expected impact of the Covid-19 pandemic; the development of new products and the success of their introductions; the Company's capital allocation strategy, which may be modified at any time for any reason, including share repurchases, dividends, debt repayments and potential acquisitions; the impact of the acquisitions the Company has made and commercial partnerships the Company has established; the Company’s ability to execute on its strategies; and other matters. These statements involve risks and uncertainties, and actual results may differ materially from those projected in the forward-looking statements. These risks and uncertainties include, but are not limited to, risks related to the Covid-19 pandemic on the global economy and financial markets, as well as on the Company, our customers and suppliers, which may impact our sales, gross margin, customer demand and our ability to supply our products to our customers; weakening of global and/or regional economic conditions, generally or specifically in the semiconductor industry, which could decrease the demand for the Company’s products and solutions; the Company’s ability to meet rapid demand shifts; the Company’s ability to continue technological innovation and introduce new products to meet customers' rapidly changing requirements; the Company’s concentrated customer base; the Company’s ability to identify, complete and integrate acquisitions, joint ventures or other transactions; the Company’s ability to effectively implement any organizational changes; the Company’s ability to protect and enforce intellectual property rights; operational, political and legal risks of the Company’s international operations; the Company’s dependence on sole source and limited source suppliers; the increasing complexity of certain manufacturing processes; raw material shortages, supply constraints and price increases; changes in government regulations of the countries in which the Company operates; fluctuation of currency exchange rates; fluctuations in the market price of the Company’s stock; the level of, and obligations associated with, the Company’s indebtedness; and other risk factors and additional information described in the Company’s filings with the Securities and Exchange Commission, including under the heading “Risks Factors" in Item 1A of the Company’s Annual Report on Form 10-K for the fiscal year ended December 31, 2019, filed on February 7, 2020, and in the Company’s other periodic filings. The Company assumes no obligation to update any forward-looking statements or information, which speak as of their respective dates. This presentation contains references to “Adjusted EBITDA,” “Adjusted EBITDA – as a % of Net Sales,” “Adjusted Operating Income,” “Adjusted Operating Margin,” “Adjusted Gross Profit,” “Adjusted Gross Margin – as a % of Net Sales,” “Adjusted Segment Profit,” “Adjusted Segment Profit Margin,” “Non-GAAP Operating Expenses,” "Non-GAAP Tax Rate," “Non-GAAP Net Income,” “Diluted Non-GAAP Earnings per Common Share” and "Free Cash Flow" that are not presented in accordance GAAP. The non-GAAP financial measures should not be considered in isolation or as a substitute for GAAP financial measures but should instead be read in conjunction with the GAAP financial measures. Further information with respect to and reconciliations of such measures to the most directly comparable GAAP financial measure can be found attached to this presentation. 2 Safe Harbor
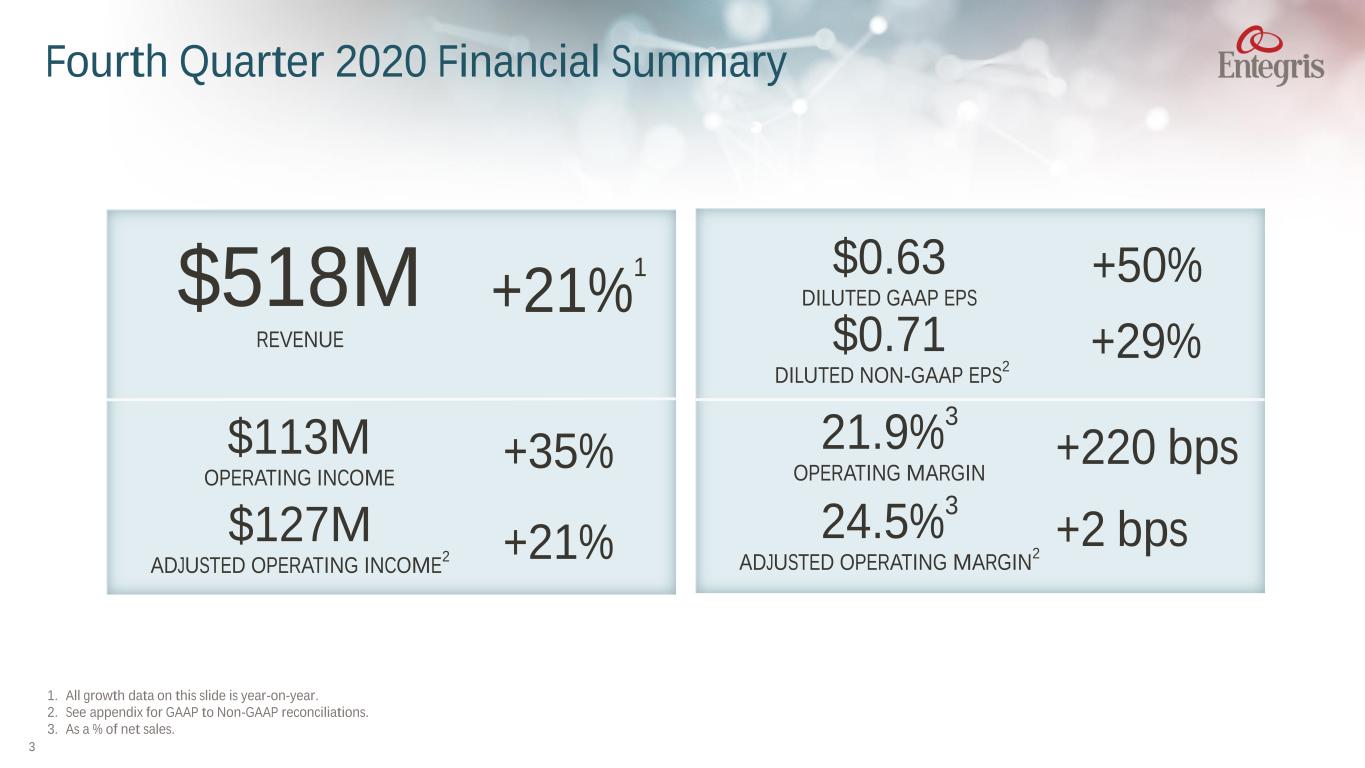
+21% 1$518M REVENUE +35%$113M OPERATING INCOME +50% $0.71 DILUTED NON-GAAP EPS 2 +220 bps21.9% 3 OPERATING MARGIN 1. All growth data on this slide is year-on-year. 2. See appendix for GAAP to Non-GAAP reconciliations. 3. As a % of net sales. 3 $0.63 DILUTED GAAP EPS +29% Fourth Quarter 2020 Financial Summary $127M ADJUSTED OPERATING INCOME 2 +21% 24.5% 3 ADJUSTED OPERATING MARGIN 2 +2 bps
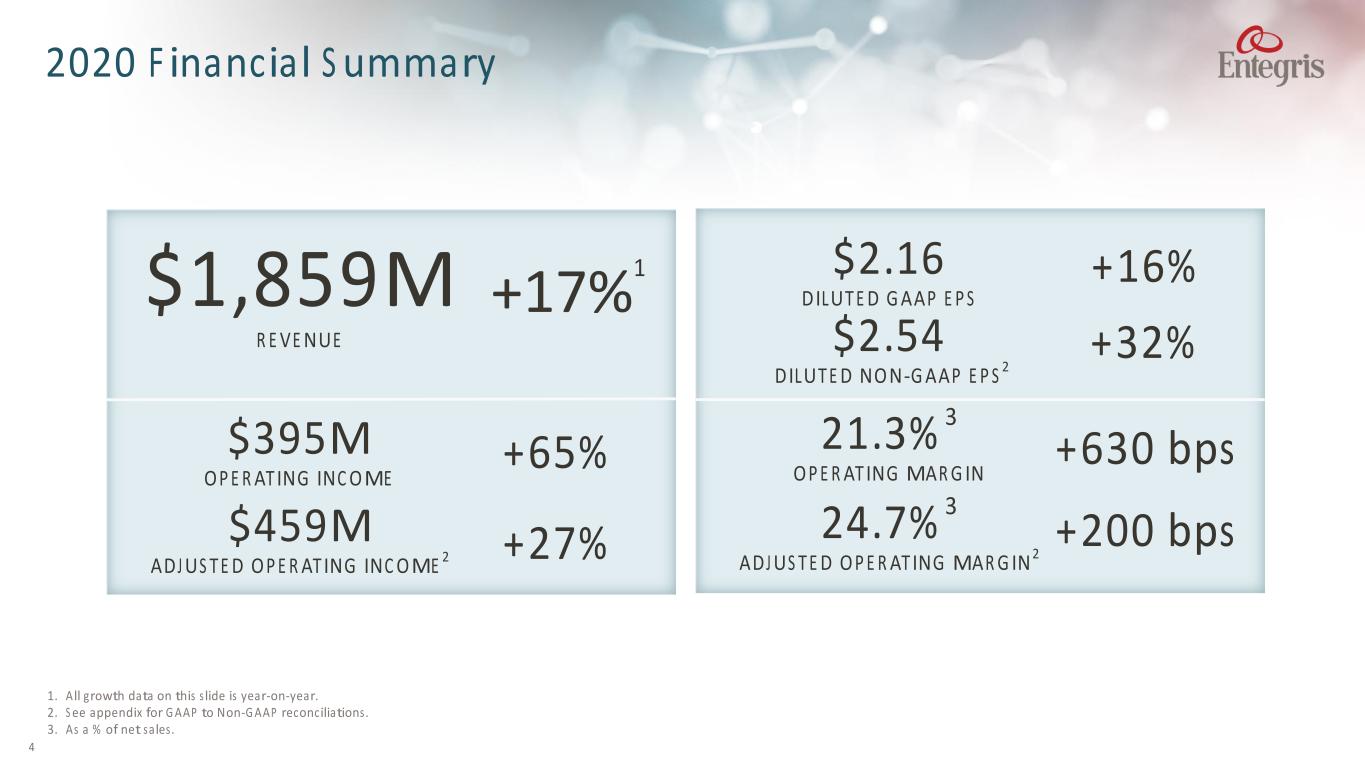
+17% 1$1,859M REVENUE +65%$395M OPERATING INCOME +16% $2.54 DILUTED NON-GAAP EPS 2 +630 bps21.3% 3 OPERATING MARGIN 1. All growth data on this slide is year-on-year. 2. See appendix for GAAP to Non-GAAP reconciliations. 3. As a % of net sales. 4 $2.16 DILUTED GAAP EPS +32% 2020 Financial Summary $459M ADJUSTED OPERATING INCOME 2 +27% 24.7% 3 ADJUSTED OPERATING MARGIN 2 +200 bps
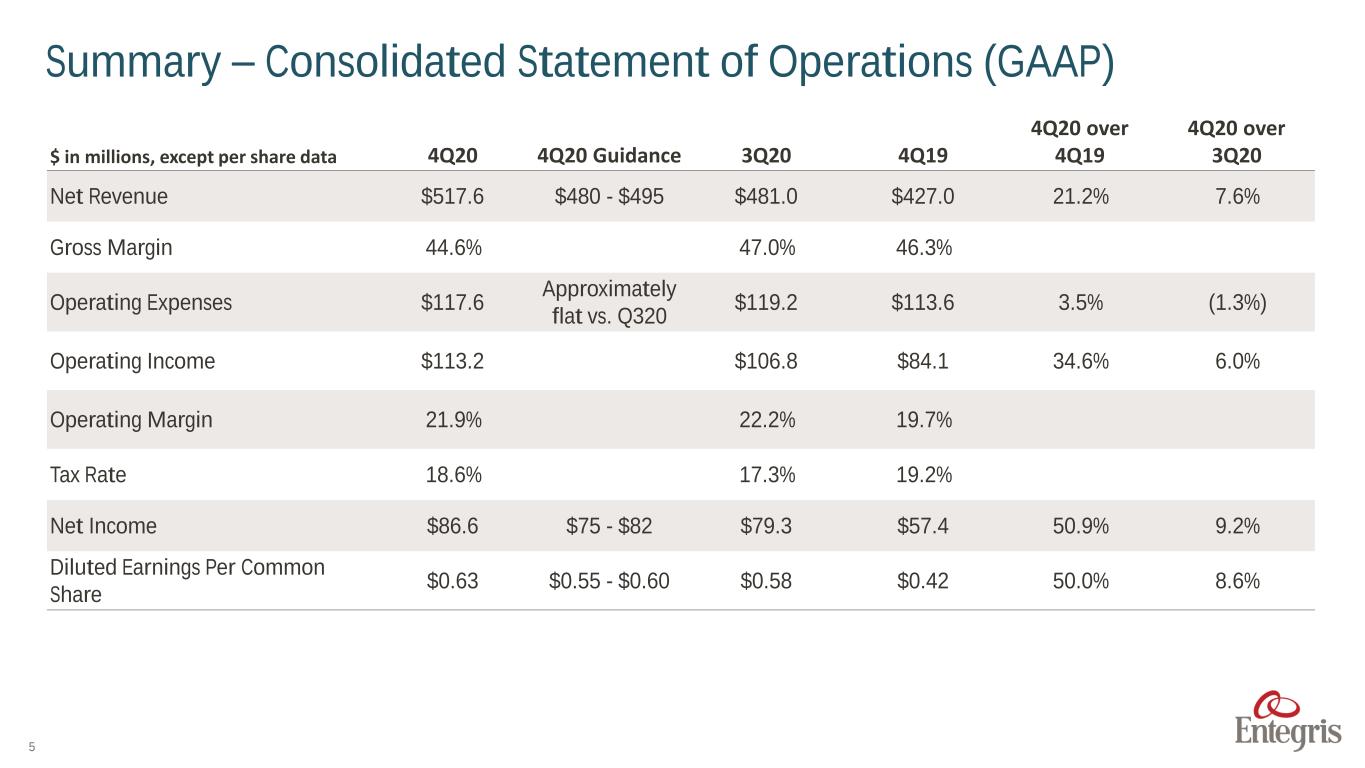
5 $ in millions, except per share data 4Q20 4Q20 Guidance 3Q20 4Q19 4Q20 over 4Q19 4Q20 over 3Q20 Net Revenue $517.6 $480 - $495 $481.0 $427.0 21.2% 7.6% Gross Margin 44.6% 47.0% 46.3% Operating Expenses $117.6 Approximately flat vs. Q320 $119.2 $113.6 3.5% (1.3%) Operating Income $113.2 $106.8 $84.1 34.6% 6.0% Operating Margin 21.9% 22.2% 19.7% Tax Rate 18.6% 17.3% 19.2% Net Income $86.6 $75 - $82 $79.3 $57.4 50.9% 9.2% Diluted Earnings Per Common Share $0.63 $0.55 - $0.60 $0.58 $0.42 50.0% 8.6% Summary – Consolidated Statement of Operations (GAAP)
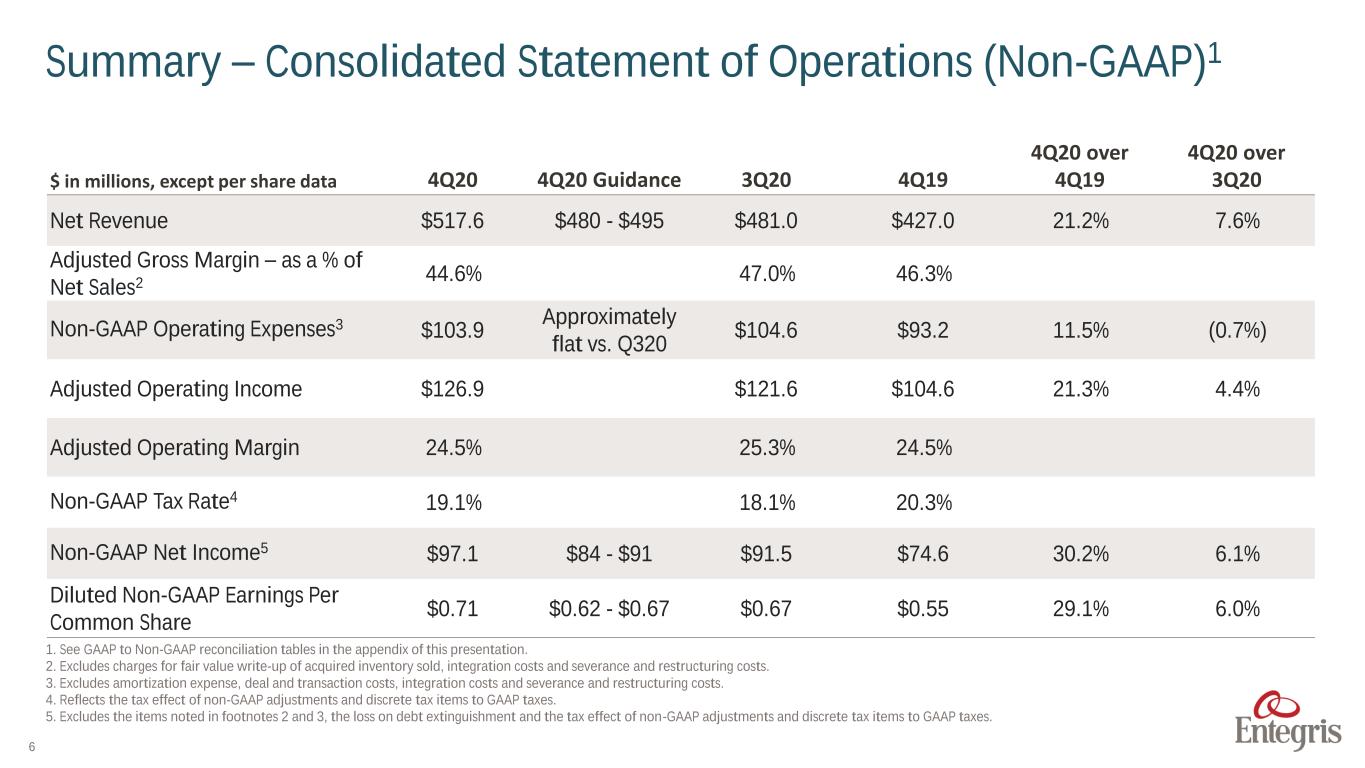
6 $ in millions, except per share data 4Q20 4Q20 Guidance 3Q20 4Q19 4Q20 over 4Q19 4Q20 over 3Q20 Net Revenue $517.6 $480 - $495 $481.0 $427.0 21.2% 7.6% Adjusted Gross Margin – as a % of Net Sales2 44.6% 47.0% 46.3% Non-GAAP Operating Expenses3 $103.9 Approximately flat vs. Q320 $104.6 $93.2 11.5% (0.7%) Adjusted Operating Income $126.9 $121.6 $104.6 21.3% 4.4% Adjusted Operating Margin 24.5% 25.3% 24.5% Non-GAAP Tax Rate4 19.1% 18.1% 20.3% Non-GAAP Net Income5 $97.1 $84 - $91 $91.5 $74.6 30.2% 6.1% Diluted Non-GAAP Earnings Per Common Share $0.71 $0.62 - $0.67 $0.67 $0.55 29.1% 6.0% Summary – Consolidated Statement of Operations (Non-GAAP)1 1. See GAAP to Non-GAAP reconciliation tables in the appendix of this presentation. 2. Excludes charges for fair value write-up of acquired inventory sold, integration costs and severance and restructuring costs. 3. Excludes amortization expense, deal and transaction costs, integration costs and severance and restructuring costs. 4. Reflects the tax effect of non-GAAP adjustments and discrete tax items to GAAP taxes. 5. Excludes the items noted in footnotes 2 and 3, the loss on debt extinguishment and the tax effect of non-GAAP adjustments and discrete tax items to GAAP taxes.
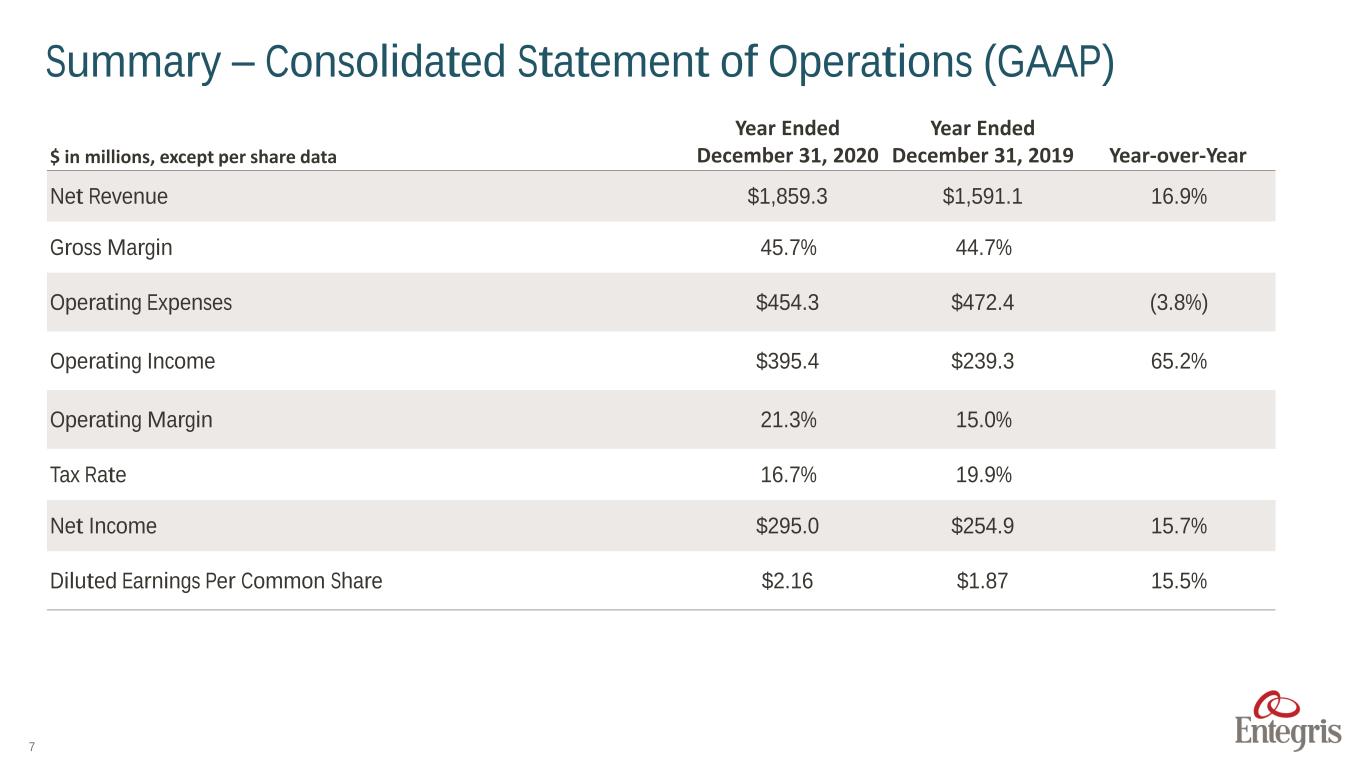
7 $ in millions, except per share data Year Ended December 31, 2020 Year Ended December 31, 2019 Year-over-Year Net Revenue $1,859.3 $1,591.1 16.9% Gross Margin 45.7% 44.7% Operating Expenses $454.3 $472.4 (3.8%) Operating Income $395.4 $239.3 65.2% Operating Margin 21.3% 15.0% Tax Rate 16.7% 19.9% Net Income $295.0 $254.9 15.7% Diluted Earnings Per Common Share $2.16 $1.87 15.5% Summary – Consolidated Statement of Operations (GAAP)
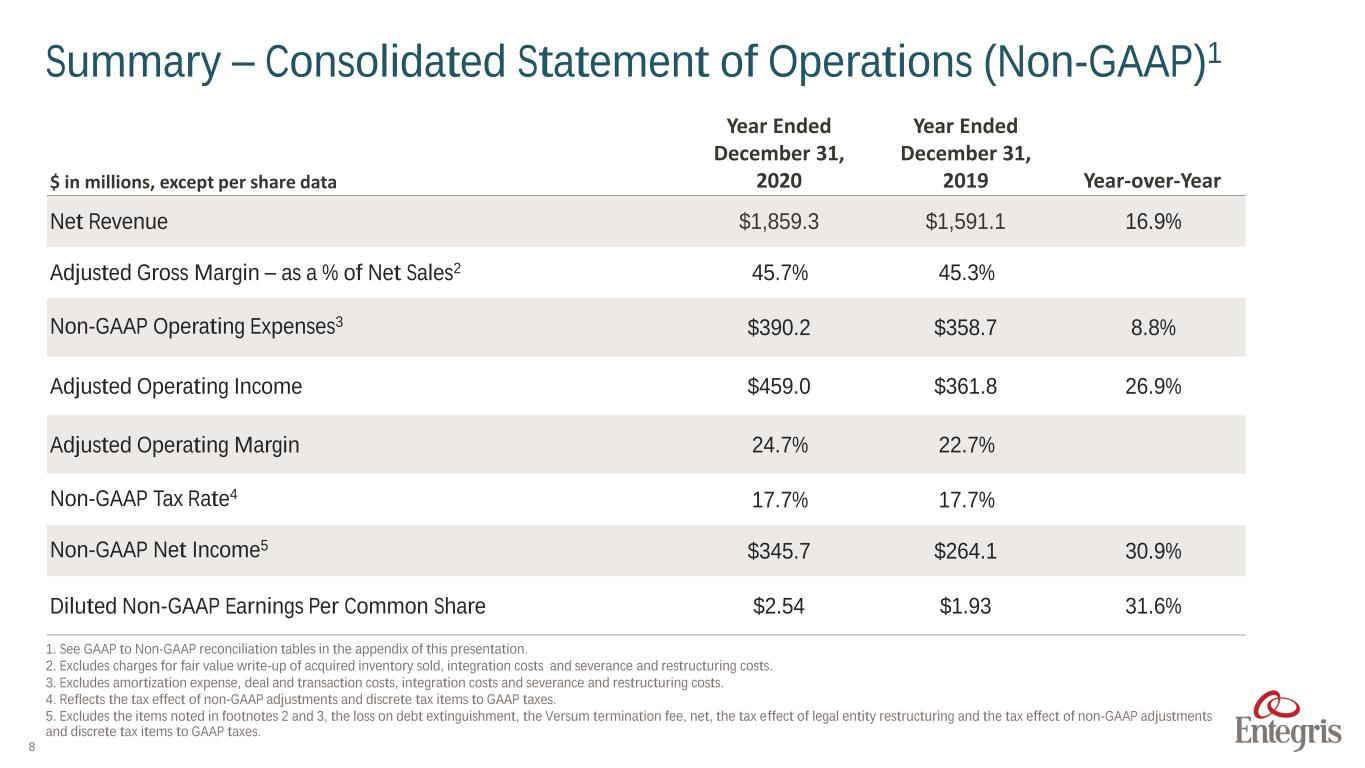
8 $ in millions, except per share data Year Ended December 31, 2020 Year Ended December 31, 2019 Year-over-Year Net Revenue $1,859.3 $1,591.1 16.9% Adjusted Gross Margin – as a % of Net Sales2 45.7% 45.3% Non-GAAP Operating Expenses3 $390.2 $358.7 8.8% Adjusted Operating Income $459.0 $361.8 26.9% Adjusted Operating Margin 24.7% 22.7% Non-GAAP Tax Rate4 17.7% 17.7% Non-GAAP Net Income5 $345.7 $264.1 30.9% Diluted Non-GAAP Earnings Per Common Share $2.54 $1.93 31.6% Summary – Consolidated Statement of Operations (Non-GAAP)1 1. See GAAP to Non-GAAP reconciliation tables in the appendix of this presentation. 2. Excludes charges for fair value write-up of acquired inventory sold, integration costs and severance and restructuring costs. 3. Excludes amortization expense, deal and transaction costs, integration costs and severance and restructuring costs. 4. Reflects the tax effect of non-GAAP adjustments and discrete tax items to GAAP taxes. 5. Excludes the items noted in footnotes 2 and 3, the loss on debt extinguishment, the Versum termination fee, net, the tax effect of legal entity restructuring and the tax effect of non-GAAP adjustments and discrete tax items to GAAP taxes.
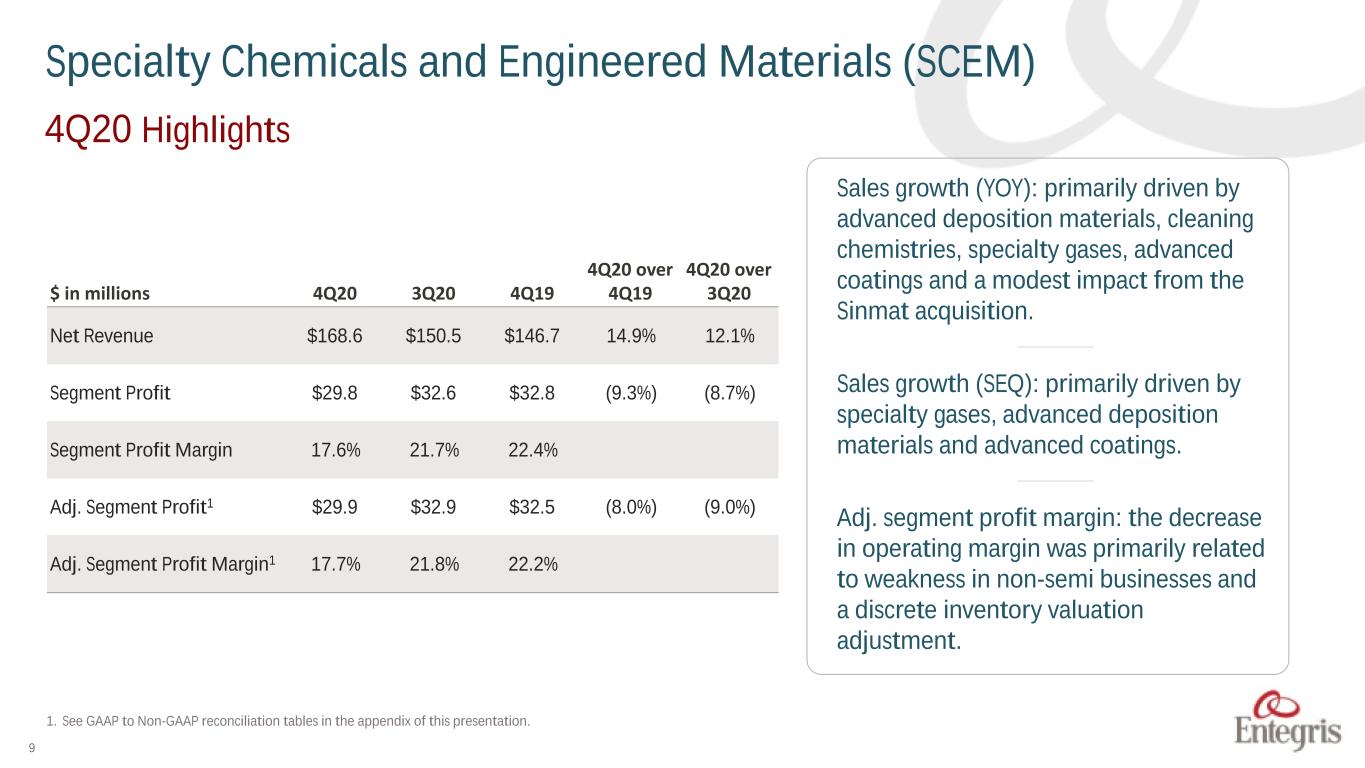
9 1. See GAAP to Non-GAAP reconciliation tables in the appendix of this presentation. Sales growth (YOY): primarily driven by advanced deposition materials, cleaning chemistries, specialty gases, advanced coatings and a modest impact from the Sinmat acquisition. –––––– Sales growth (SEQ): primarily driven by specialty gases, advanced deposition materials and advanced coatings. –––––– Adj. segment profit margin: the decrease in operating margin was primarily related to weakness in non-semi businesses and a discrete inventory valuation adjustment. $ in millions 4Q20 3Q20 4Q19 4Q20 over 4Q19 4Q20 over 3Q20 Net Revenue $168.6 $150.5 $146.7 14.9% 12.1% Segment Profit $29.8 $32.6 $32.8 (9.3%) (8.7%) Segment Profit Margin 17.6% 21.7% 22.4% Adj. Segment Profit1 $29.9 $32.9 $32.5 (8.0%) (9.0%) Adj. Segment Profit Margin1 17.7% 21.8% 22.2% Specialty Chemicals and Engineered Materials (SCEM) 4Q20 Highlights
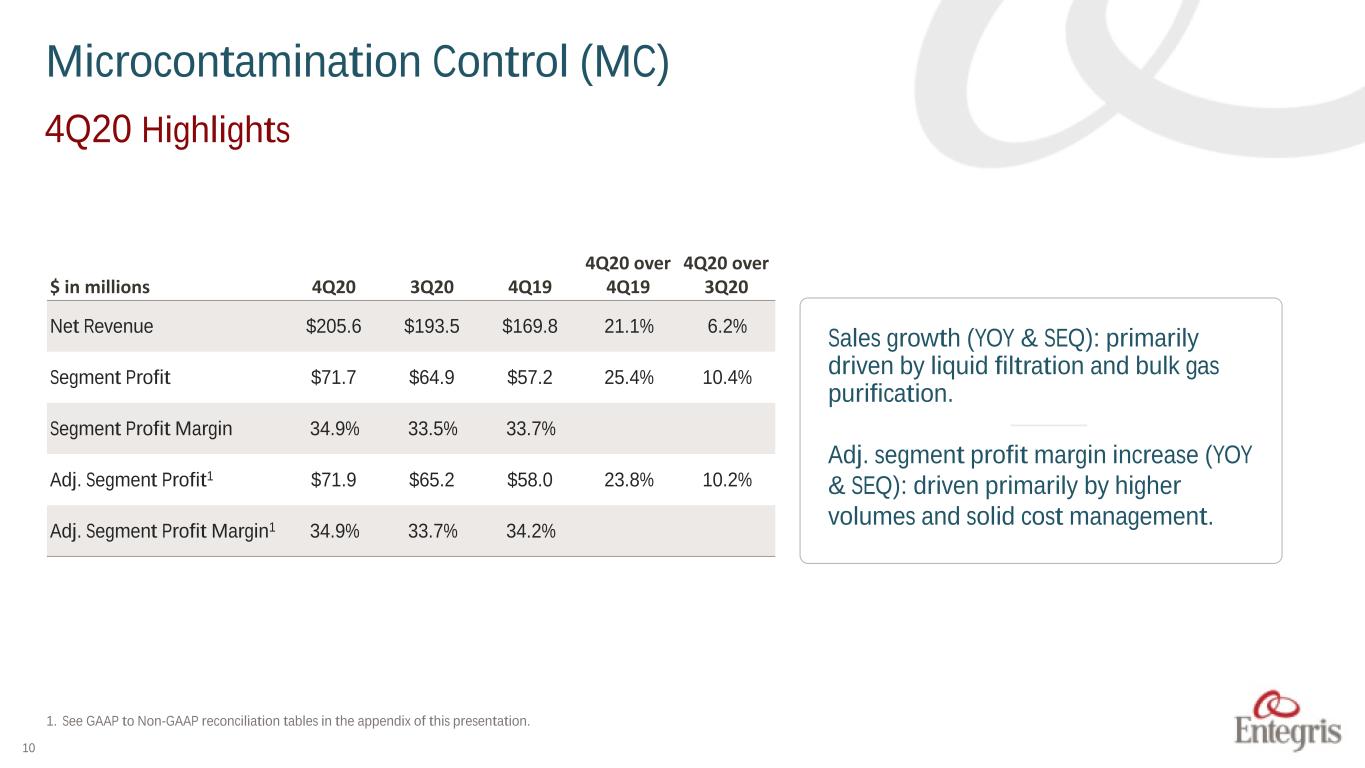
10 1. See GAAP to Non-GAAP reconciliation tables in the appendix of this presentation. Microcontamination Control (MC) 4Q20 Highlights $ in millions 4Q20 3Q20 4Q19 4Q20 over 4Q19 4Q20 over 3Q20 Net Revenue $205.6 $193.5 $169.8 21.1% 6.2% Segment Profit $71.7 $64.9 $57.2 25.4% 10.4% Segment Profit Margin 34.9% 33.5% 33.7% Adj. Segment Profit1 $71.9 $65.2 $58.0 23.8% 10.2% Adj. Segment Profit Margin1 34.9% 33.7% 34.2% Sales growth (YOY & SEQ): primarily driven by liquid filtration and bulk gas purification. –––––– Adj. segment profit margin increase (YOY & SEQ): driven primarily by higher volumes and solid cost management.
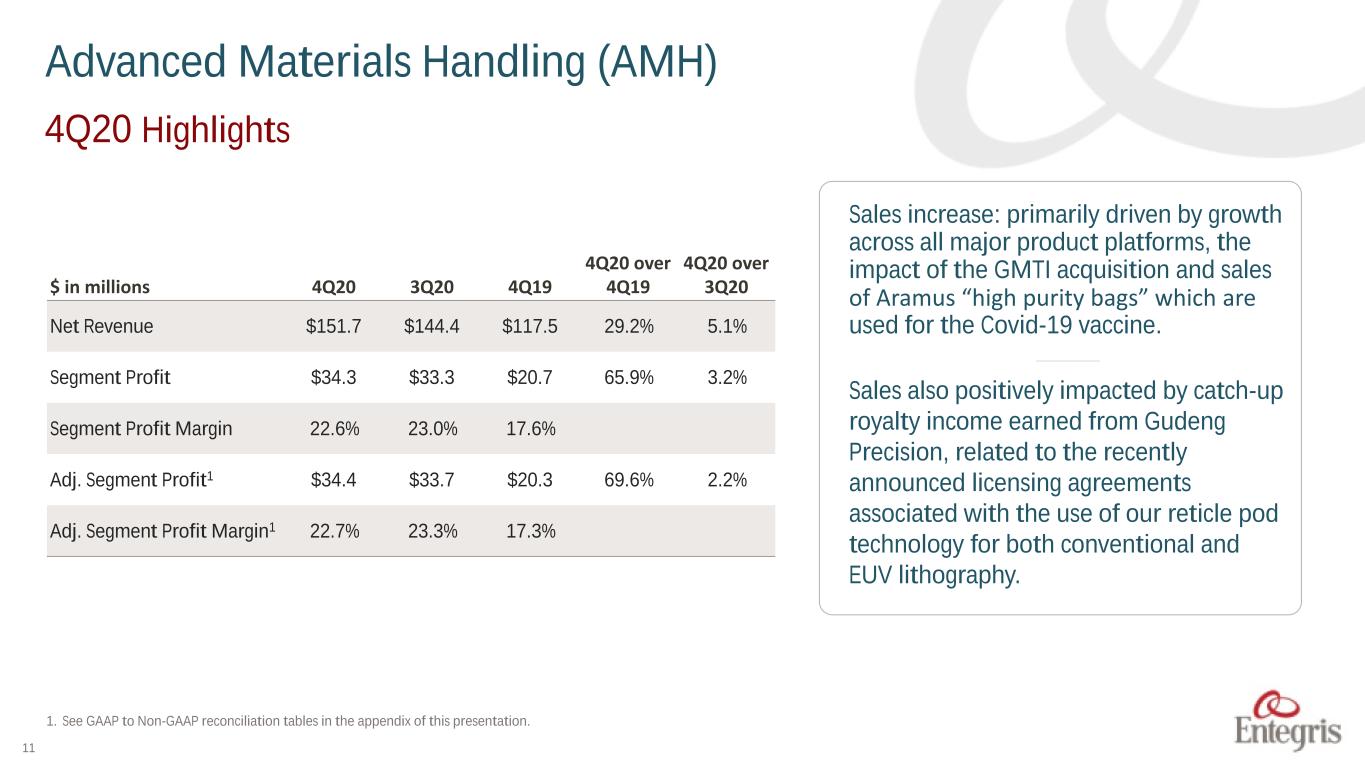
11 1. See GAAP to Non-GAAP reconciliation tables in the appendix of this presentation. Advanced Materials Handling (AMH) 4Q20 Highlights $ in millions 4Q20 3Q20 4Q19 4Q20 over 4Q19 4Q20 over 3Q20 Net Revenue $151.7 $144.4 $117.5 29.2% 5.1% Segment Profit $34.3 $33.3 $20.7 65.9% 3.2% Segment Profit Margin 22.6% 23.0% 17.6% Adj. Segment Profit1 $34.4 $33.7 $20.3 69.6% 2.2% Adj. Segment Profit Margin1 22.7% 23.3% 17.3% Sales increase: primarily driven by growth across all major product platforms, the impact of the GMTI acquisition and sales of Aramus “high purity bags” which are used for the Covid-19 vaccine. ––––– Sales also positively impacted by catch-up royalty income earned from Gudeng Precision, related to the recently announced licensing agreements associated with the use of our reticle pod technology for both conventional and EUV lithography.
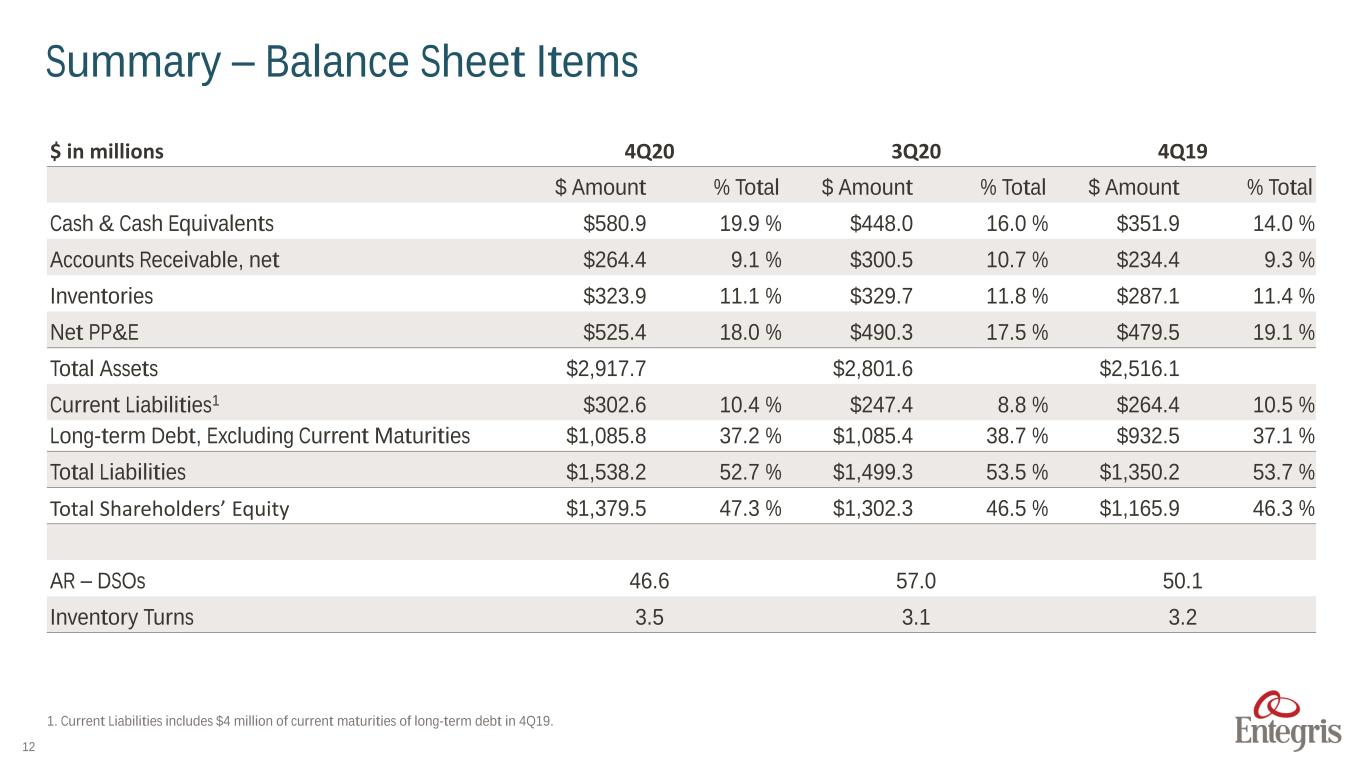
12 $ in millions 4Q20 3Q20 4Q19 $ Amount % Total $ Amount % Total $ Amount % Total Cash & Cash Equivalents $580.9 19.9 % $448.0 16.0 % $351.9 14.0 % Accounts Receivable, net $264.4 9.1 % $300.5 10.7 % $234.4 9.3 % Inventories $323.9 11.1 % $329.7 11.8 % $287.1 11.4 % Net PP&E $525.4 18.0 % $490.3 17.5 % $479.5 19.1 % Total Assets $2,917.7 $2,801.6 $2,516.1 Current Liabilities1 $302.6 10.4 % $247.4 8.8 % $264.4 10.5 % Long-term Debt, Excluding Current Maturities $1,085.8 37.2 % $1,085.4 38.7 % $932.5 37.1 % Total Liabilities $1,538.2 52.7 % $1,499.3 53.5 % $1,350.2 53.7 % Total Shareholders’ Equity $1,379.5 47.3 % $1,302.3 46.5 % $1,165.9 46.3 % AR – DSOs 46.6 57.0 50.1 Inventory Turns 3.5 3.1 3.2 1. Current Liabilities includes $4 million of current maturities of long-term debt in 4Q19. Summary – Balance Sheet Items
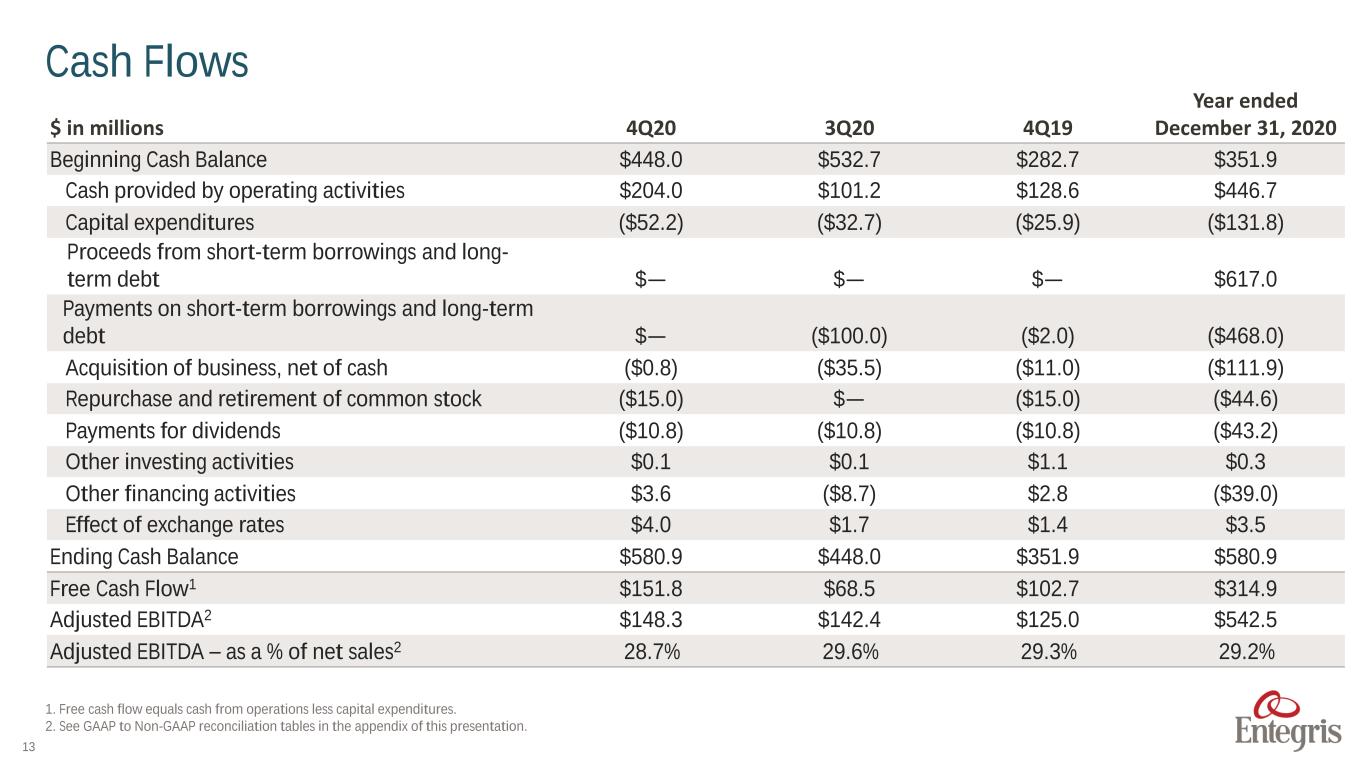
13 $ in millions 4Q20 3Q20 4Q19 Year ended December 31, 2020 Beginning Cash Balance $448.0 $532.7 $282.7 $351.9 Cash provided by operating activities $204.0 $101.2 $128.6 $446.7 Capital expenditures ($52.2) ($32.7) ($25.9) ($131.8) Proceeds from short-term borrowings and long- term debt $— $— $— $617.0 Payments on short-term borrowings and long-term debt $— ($100.0) ($2.0) ($468.0) Acquisition of business, net of cash ($0.8) ($35.5) ($11.0) ($111.9) Repurchase and retirement of common stock ($15.0) $— ($15.0) ($44.6) Payments for dividends ($10.8) ($10.8) ($10.8) ($43.2) Other investing activities $0.1 $0.1 $1.1 $0.3 Other financing activities $3.6 ($8.7) $2.8 ($39.0) Effect of exchange rates $4.0 $1.7 $1.4 $3.5 Ending Cash Balance $580.9 $448.0 $351.9 $580.9 Free Cash Flow1 $151.8 $68.5 $102.7 $314.9 Adjusted EBITDA2 $148.3 $142.4 $125.0 $542.5 Adjusted EBITDA – as a % of net sales2 28.7% 29.6% 29.3% 29.2% Cash Flows 1. Free cash flow equals cash from operations less capital expenditures. 2. See GAAP to Non-GAAP reconciliation tables in the appendix of this presentation.
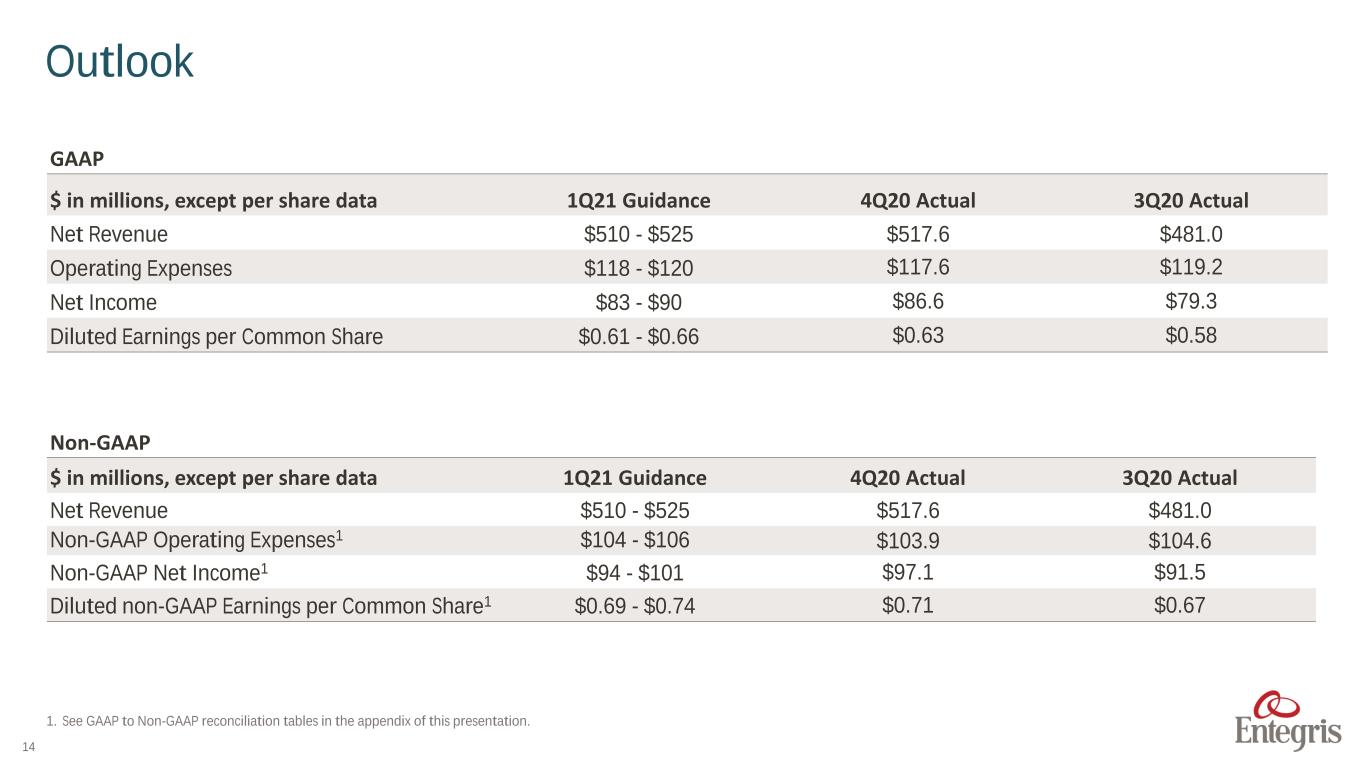
14 GAAP $ in millions, except per share data 1Q21 Guidance 4Q20 Actual 3Q20 Actual Net Revenue $510 - $525 $517.6 $481.0 Operating Expenses $118 - $120 $117.6 $119.2 Net Income $83 - $90 $86.6 $79.3 Diluted Earnings per Common Share $0.61 - $0.66 $0.63 $0.58 Non-GAAP $ in millions, except per share data 1Q21 Guidance 4Q20 Actual 3Q20 Actual Net Revenue $510 - $525 $517.6 $481.0 Non-GAAP Operating Expenses1 $104 - $106 $103.9 $104.6 Non-GAAP Net Income1 $94 - $101 $97.1 $91.5 Diluted non-GAAP Earnings per Common Share1 $0.69 - $0.74 $0.71 $0.67 Outlook 1. See GAAP to Non-GAAP reconciliation tables in the appendix of this presentation.

Entegris®, the Entegris Rings Design®, and other product names are trademarks of Entegris, Inc. as listed on entegris.com/trademarks. All product names, logos, and company names are trademarks or registered trademarks of their respective owners. Use of them does not imply any affiliation, sponsorship, or endorsement by the trademark owner. ©2020 Entegris, Inc. All rights reserved. 15

Appendix 16
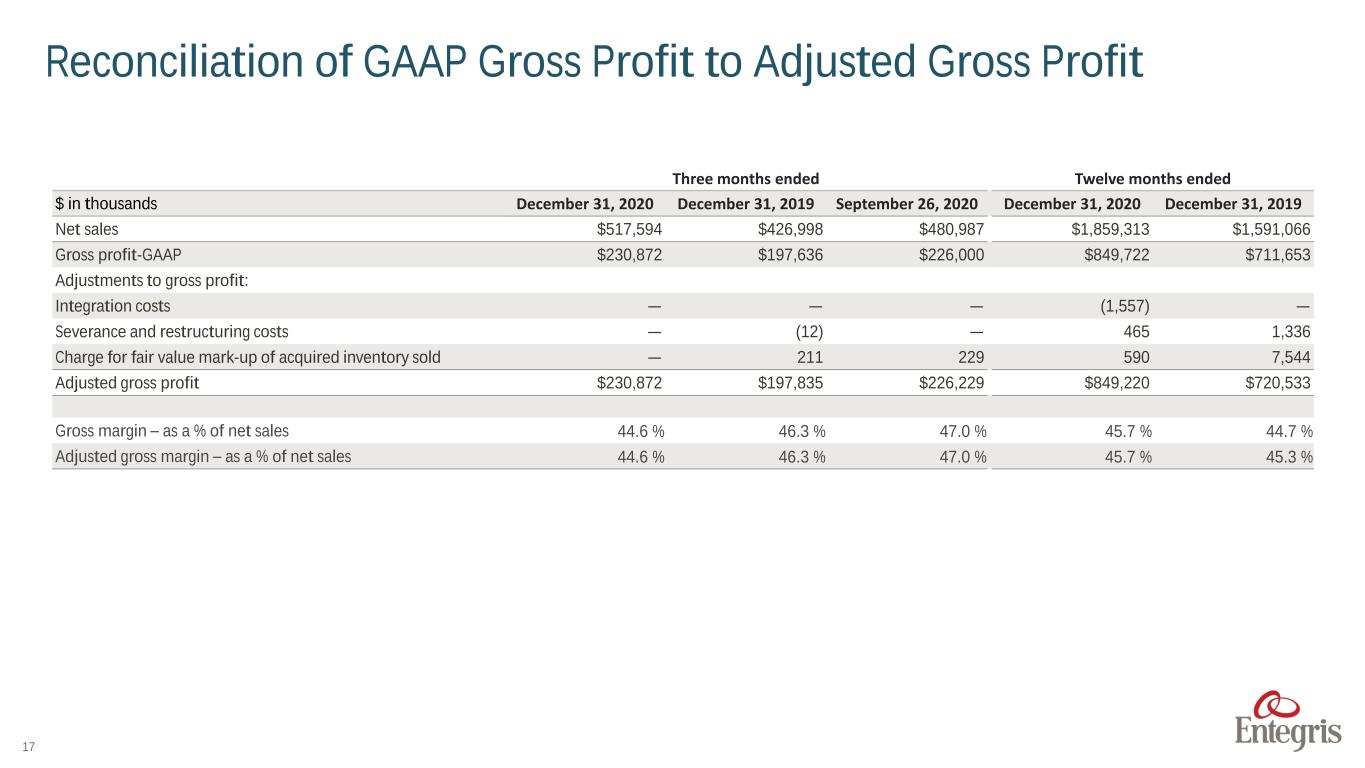
17 Reconciliation of GAAP Gross Profit to Adjusted Gross Profit Three months ended Twelve months ended $ in thousands December 31, 2020 December 31, 2019 September 26, 2020 December 31, 2020 December 31, 2019 Net sales $517,594 $426,998 $480,987 $1,859,313 $1,591,066 Gross profit-GAAP $230,872 $197,636 $226,000 $849,722 $711,653 Adjustments to gross profit: Integration costs — — — (1,557) — Severance and restructuring costs — (12) — 465 1,336 Charge for fair value mark-up of acquired inventory sold — 211 229 590 7,544 Adjusted gross profit $230,872 $197,835 $226,229 $849,220 $720,533 Gross margin – as a % of net sales 44.6 % 46.3 % 47.0 % 45.7 % 44.7 % Adjusted gross margin – as a % of net sales 44.6 % 46.3 % 47.0 % 45.7 % 45.3 %
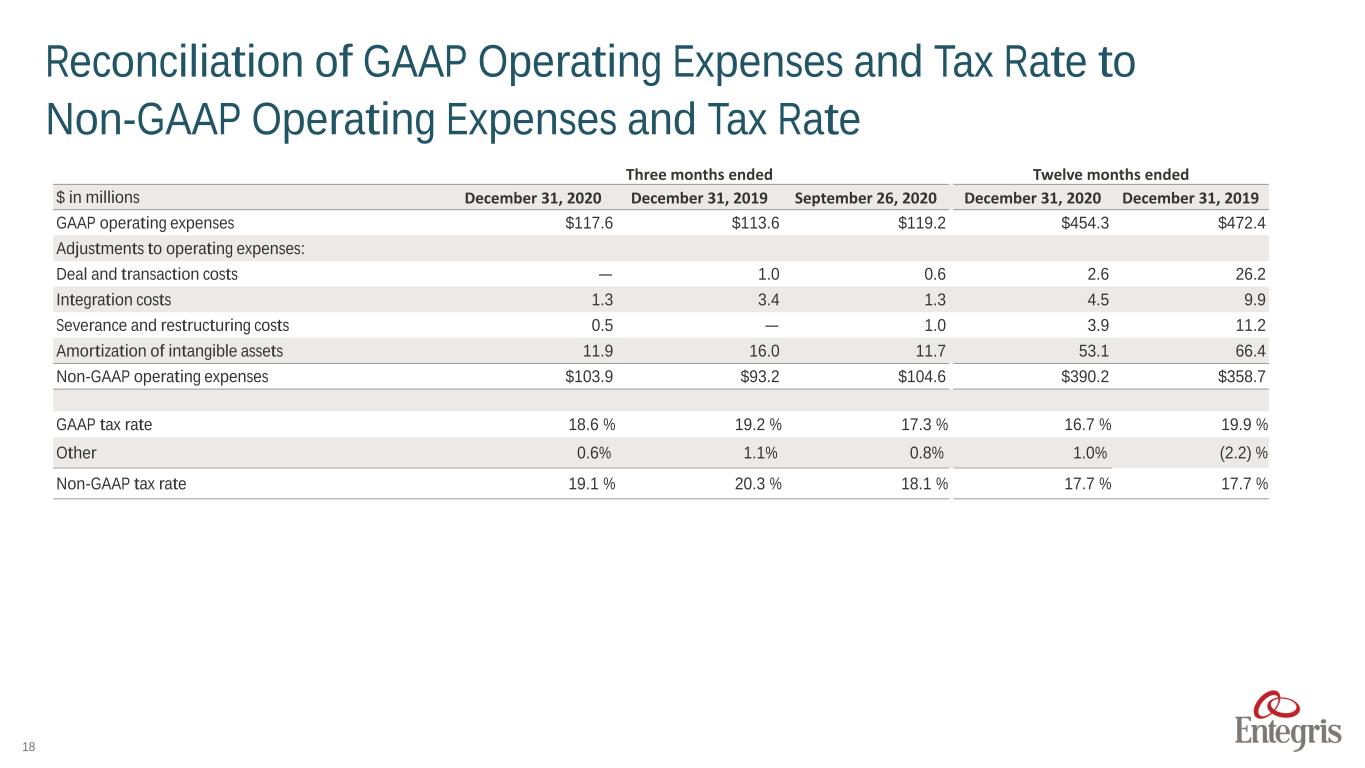
18 Reconciliation of GAAP Operating Expenses and Tax Rate to Non-GAAP Operating Expenses and Tax Rate Three months ended Twelve months ended $ in millions December 31, 2020 December 31, 2019 September 26, 2020 December 31, 2020 December 31, 2019 GAAP operating expenses $117.6 $113.6 $119.2 $454.3 $472.4 Adjustments to operating expenses: Deal and transaction costs — 1.0 0.6 2.6 26.2 Integration costs 1.3 3.4 1.3 4.5 9.9 Severance and restructuring costs 0.5 — 1.0 3.9 11.2 Amortization of intangible assets 11.9 16.0 11.7 53.1 66.4 Non-GAAP operating expenses $103.9 $93.2 $104.6 $390.2 $358.7 GAAP tax rate 18.6 % 19.2 % 17.3 % 16.7 % 19.9 % Other 0.6% 1.1% 0.8% 1.0% (2.2) % Non-GAAP tax rate 19.1 % 20.3 % 18.1 % 17.7 % 17.7 %

19 $ in thousands Three months ended Twelve months ended Adjusted segment profit December 31, 2020 December 31, 2019 September 26, 2020 December 31, 2020 December 31, 2019 SCEM segment profit $29,761 $32,822 $32,600 $127,969 $98,327 Integration costs — — — (1,557) — Severance and restructuring costs 155 184 277 1,061 2,846 Charge for fair value write-up of acquired inventory sold — (476) — 235 4,822 SCEM adjusted segment profit $29,916 $32,530 $32,877 $127,708 $105,995 MC segment profit $71,691 $57,157 $64,915 $248,910 $194,398 Severance and restructuring costs 167 195 301 1,152 3,896 Charge for fair value write-up of acquired inventory sold — 687 — 126 2,722 MC adjusted segment profit $71,858 $58,039 $65,216 $250,188 $201,016 AMH segment profit $34,321 $20,686 $33,266 $111,028 $75,173 Severance and restructuring costs 121 (379) 213 1,283 3,334 Charge for fair value write-up of acquired inventory sold — — 229 229 — AMH adjusted segment profit $34,442 $20,307 $33,708 $112,540 $78,507 Unallocated general and administrative expenses $10,629 $10,552 $12,271 $39,370 $62,192 Unallocated deal and integration costs (1,300) (4,323) (1,902) (7,096) (36,096) Unallocated severance and restructuring costs (58) — (180) (868) (2,418) Adjusted unallocated general and administrative expenses $9,271 $6,229 $10,189 $31,406 $23,678 Total adjusted segment profit $136,216 $110,876 $131,801 $490,436 $385,518 Adjusted amortization of intangible assets — — — — — Adjusted unallocated general and administrative expenses 9,271 6,229 10,189 31,406 23,678 Total adjusted operating income $126,945 $104,647 $121,612 $459,030 $361,840 $ in thousands Three Months Ended Twelve months ended Segment profit-GAAP December 31, 2020 December 31, 2019 September 26, 2020 December 31, 2020 December 31, 2019 Specialty Chemicals and Engineered Materials (SCEM) $29,761 $32,822 $32,600 $127,969 $98,327 Microcontamination Control (MC) 71,691 57,157 64,915 248,910 194,398 Advanced Materials Handling (AMH) 34,321 20,686 33,266 111,028 75,173 Total segment profit 135,773 110,665 130,781 487,907 367,898 Amortization of intangible assets 11,916 16,028 11,749 53,092 66,428 Unallocated expenses 10,629 10,552 12,271 39,370 62,192 Total operating income $113,228 $84,085 $106,761 $395,445 $239,278 Reconciliation of GAAP Segment Profit to Adjusted Operating Income and Adjusted Segment Profit
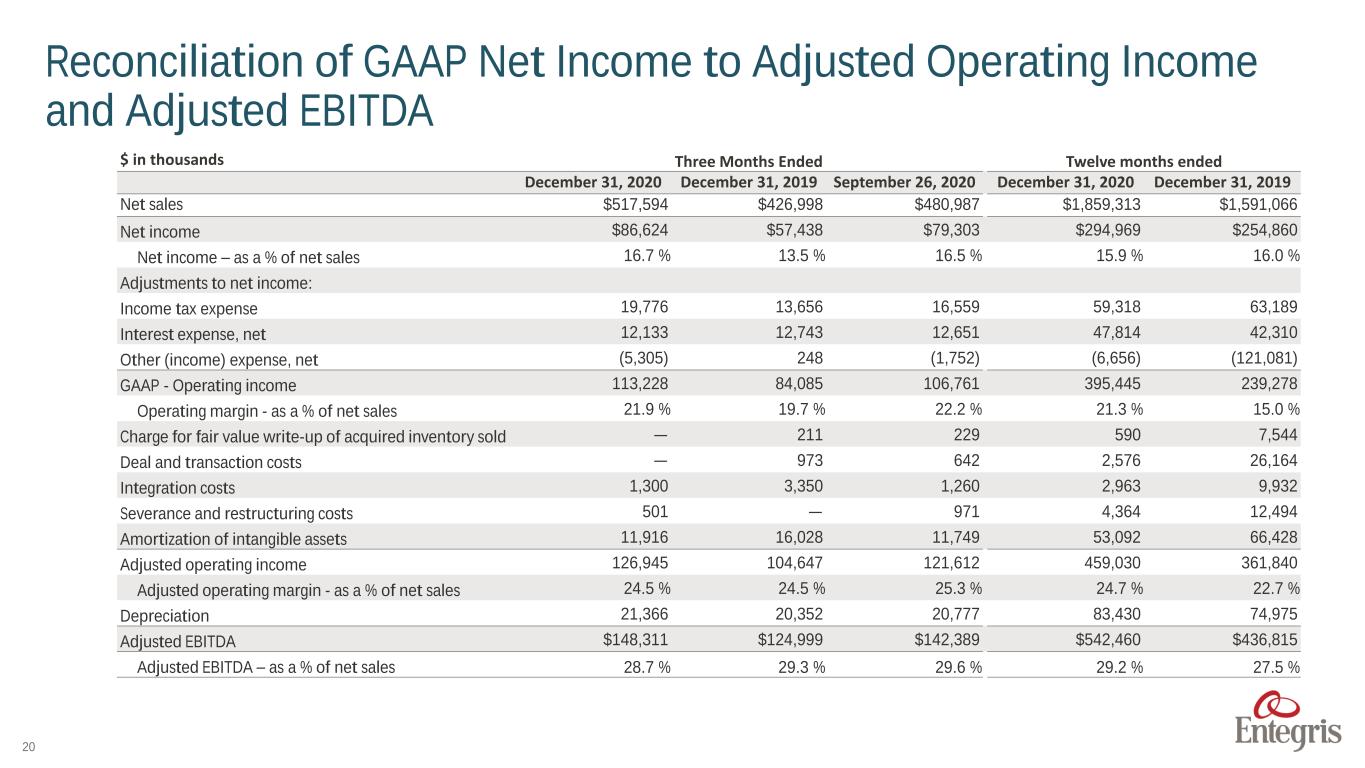
20 $ in thousands Three Months Ended Twelve months ended December 31, 2020 December 31, 2019 September 26, 2020 December 31, 2020 December 31, 2019 Net sales $517,594 $426,998 $480,987 $1,859,313 $1,591,066 Net income $86,624 $57,438 $79,303 $294,969 $254,860 Net income – as a % of net sales 16.7 % 13.5 % 16.5 % 15.9 % 16.0 % Adjustments to net income: Income tax expense 19,776 13,656 16,559 59,318 63,189 Interest expense, net 12,133 12,743 12,651 47,814 42,310 Other (income) expense, net (5,305) 248 (1,752) (6,656) (121,081) GAAP - Operating income 113,228 84,085 106,761 395,445 239,278 Operating margin - as a % of net sales 21.9 % 19.7 % 22.2 % 21.3 % 15.0 % Charge for fair value write-up of acquired inventory sold — 211 229 590 7,544 Deal and transaction costs — 973 642 2,576 26,164 Integration costs 1,300 3,350 1,260 2,963 9,932 Severance and restructuring costs 501 — 971 4,364 12,494 Amortization of intangible assets 11,916 16,028 11,749 53,092 66,428 Adjusted operating income 126,945 104,647 121,612 459,030 361,840 Adjusted operating margin - as a % of net sales 24.5 % 24.5 % 25.3 % 24.7 % 22.7 % Depreciation 21,366 20,352 20,777 83,430 74,975 Adjusted EBITDA $148,311 $124,999 $142,389 $542,460 $436,815 Adjusted EBITDA – as a % of net sales 28.7 % 29.3 % 29.6 % 29.2 % 27.5 % Reconciliation of GAAP Net Income to Adjusted Operating Income and Adjusted EBITDA
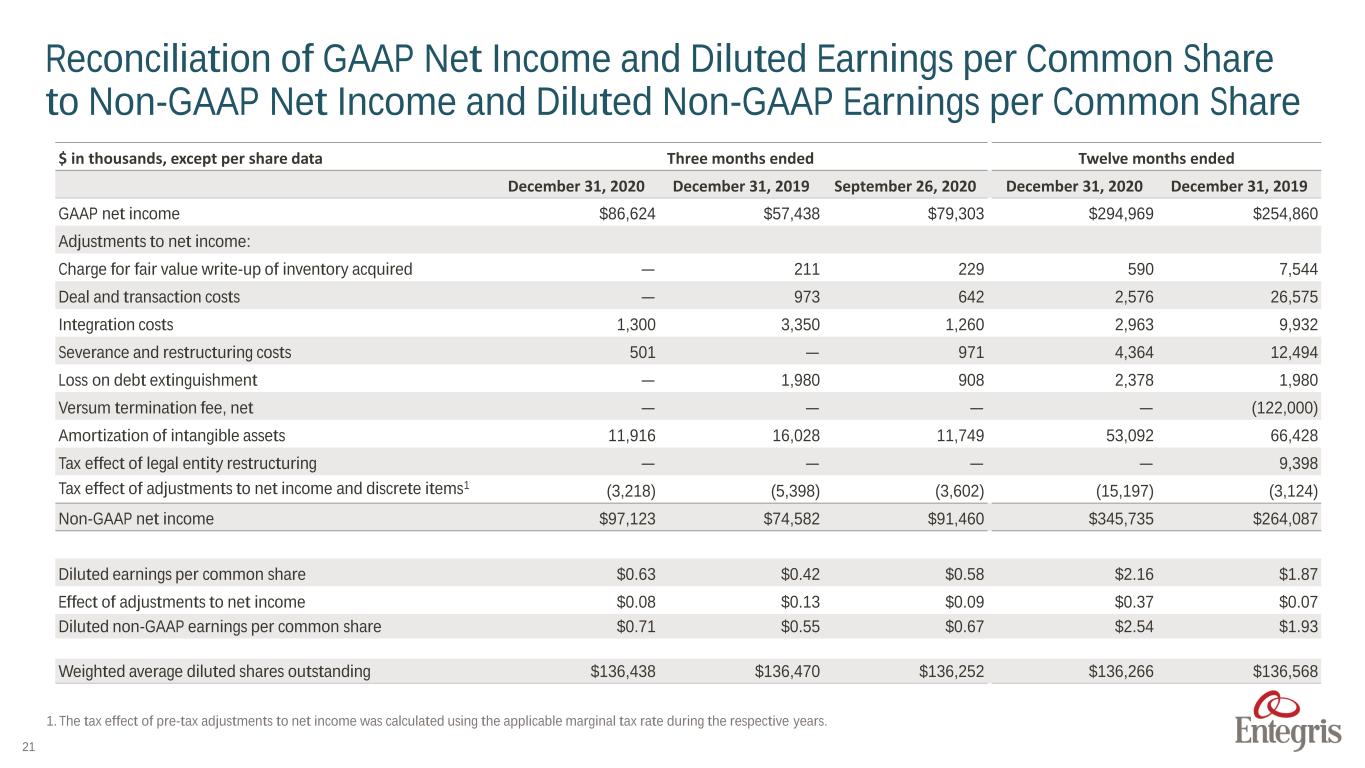
21 $ in thousands, except per share data Three months ended Twelve months ended December 31, 2020 December 31, 2019 September 26, 2020 December 31, 2020 December 31, 2019 GAAP net income $86,624 $57,438 $79,303 $294,969 $254,860 Adjustments to net income: Charge for fair value write-up of inventory acquired — 211 229 590 7,544 Deal and transaction costs — 973 642 2,576 26,575 Integration costs 1,300 3,350 1,260 2,963 9,932 Severance and restructuring costs 501 — 971 4,364 12,494 Loss on debt extinguishment — 1,980 908 2,378 1,980 Versum termination fee, net — — — — (122,000) Amortization of intangible assets 11,916 16,028 11,749 53,092 66,428 Tax effect of legal entity restructuring — — — — 9,398 Tax effect of adjustments to net income and discrete items1 (3,218) (5,398) (3,602) (15,197) (3,124) Non-GAAP net income $97,123 $74,582 $91,460 $345,735 $264,087 Diluted earnings per common share $0.63 $0.42 $0.58 $2.16 $1.87 Effect of adjustments to net income $0.08 $0.13 $0.09 $0.37 $0.07 Diluted non-GAAP earnings per common share $0.71 $0.55 $0.67 $2.54 $1.93 Weighted average diluted shares outstanding $136,438 $136,470 $136,252 $136,266 $136,568 Reconciliation of GAAP Net Income and Diluted Earnings per Common Share to Non-GAAP Net Income and Diluted Non-GAAP Earnings per Common Share 1. The tax effect of pre-tax adjustments to net income was calculated using the applicable marginal tax rate during the respective years.
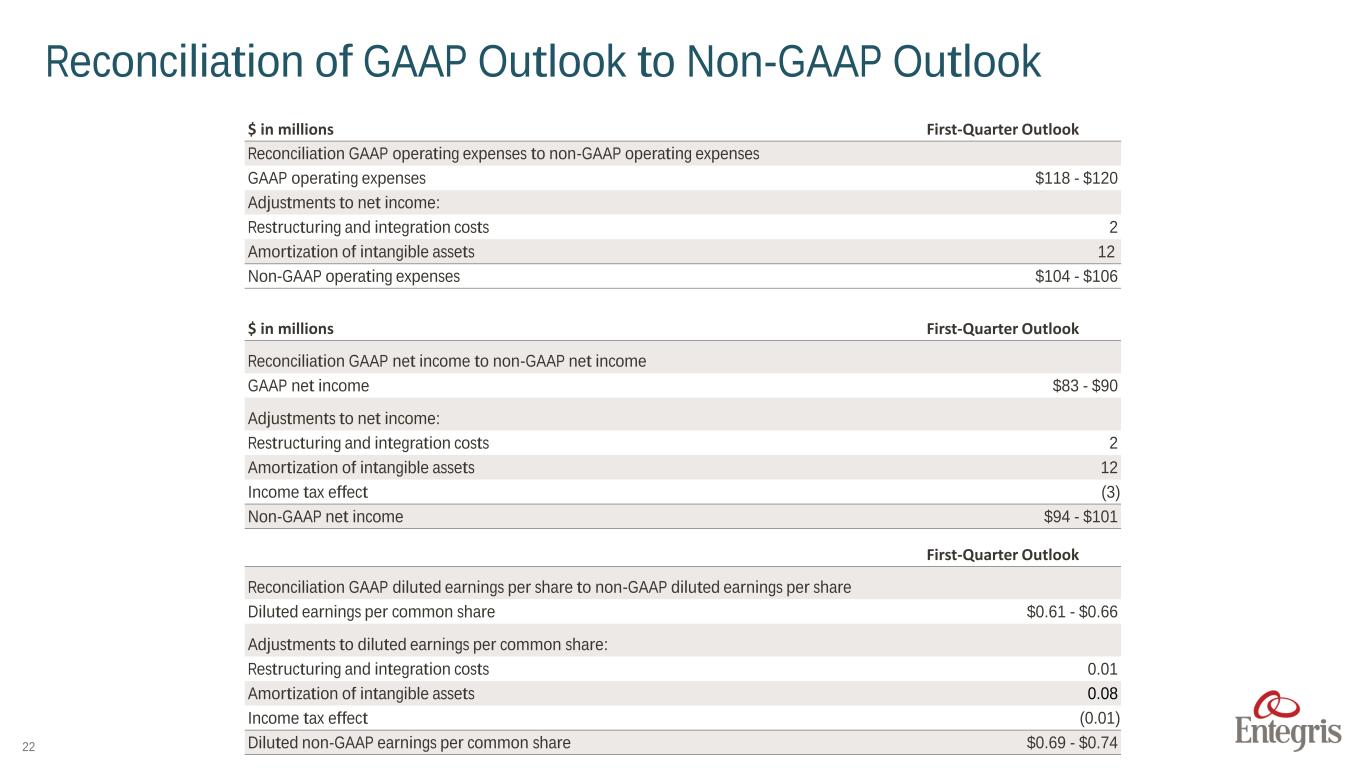
22 $ in millions First-Quarter Outlook Reconciliation GAAP net income to non-GAAP net income GAAP net income $83 - $90 Adjustments to net income: Restructuring and integration costs 2 Amortization of intangible assets 12 Income tax effect (3) Non-GAAP net income $94 - $101 First-Quarter Outlook Reconciliation GAAP diluted earnings per share to non-GAAP diluted earnings per share Diluted earnings per common share $0.61 - $0.66 Adjustments to diluted earnings per common share: Restructuring and integration costs 0.01 Amortization of intangible assets 0.08 Income tax effect (0.01) Diluted non-GAAP earnings per common share $0.69 - $0.74 $ in millions First-Quarter Outlook Reconciliation GAAP operating expenses to non-GAAP operating expenses GAAP operating expenses $118 - $120 Adjustments to net income: Restructuring and integration costs 2 Amortization of intangible assets 12 Non-GAAP operating expenses $104 - $106 Reconciliation of GAAP Outlook to Non-GAAP Outlook
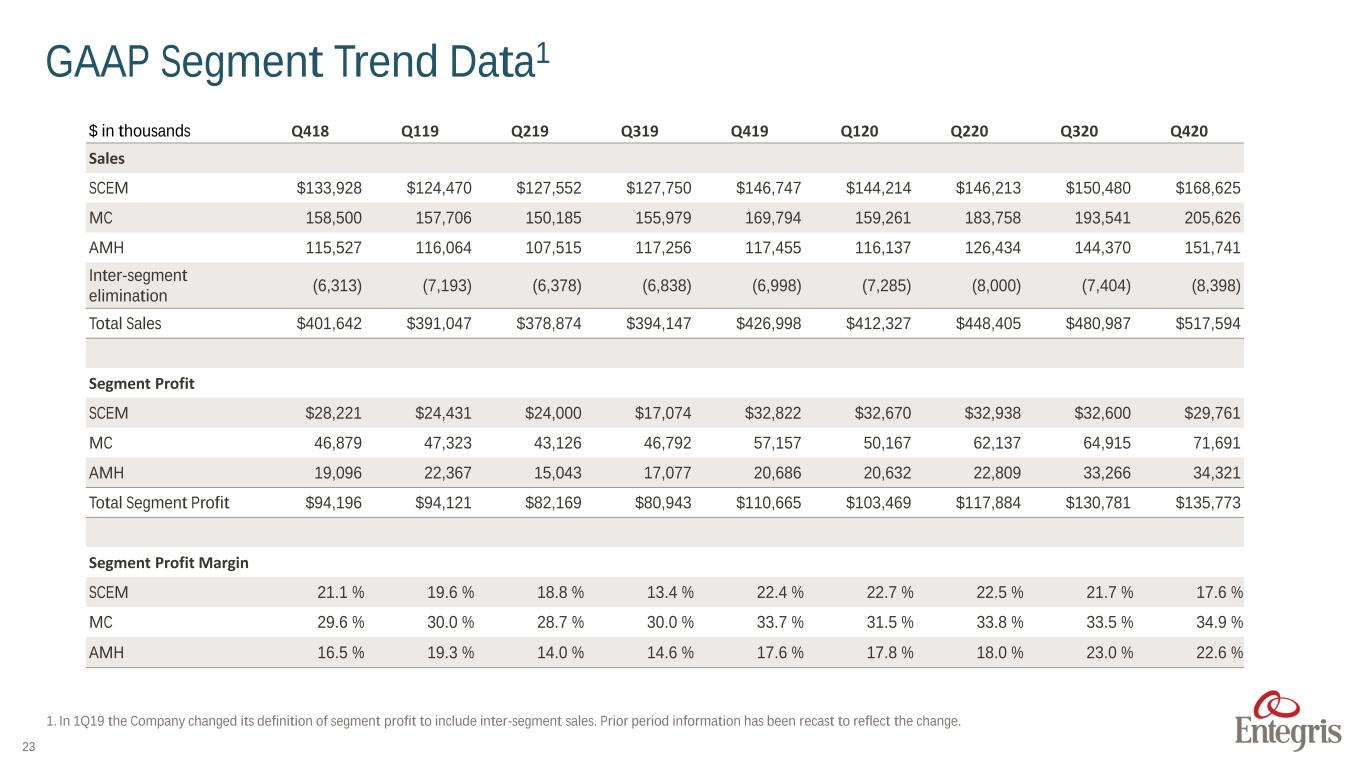
23 $ in thousands Q418 Q119 Q219 Q319 Q419 Q120 Q220 Q320 Q420 Sales SCEM $133,928 $124,470 $127,552 $127,750 $146,747 $144,214 $146,213 $150,480 $168,625 MC 158,500 157,706 150,185 155,979 169,794 159,261 183,758 193,541 205,626 AMH 115,527 116,064 107,515 117,256 117,455 116,137 126,434 144,370 151,741 Inter-segment elimination (6,313) (7,193) (6,378) (6,838) (6,998) (7,285) (8,000) (7,404) (8,398) Total Sales $401,642 $391,047 $378,874 $394,147 $426,998 $412,327 $448,405 $480,987 $517,594 Segment Profit SCEM $28,221 $24,431 $24,000 $17,074 $32,822 $32,670 $32,938 $32,600 $29,761 MC 46,879 47,323 43,126 46,792 57,157 50,167 62,137 64,915 71,691 AMH 19,096 22,367 15,043 17,077 20,686 20,632 22,809 33,266 34,321 Total Segment Profit $94,196 $94,121 $82,169 $80,943 $110,665 $103,469 $117,884 $130,781 $135,773 Segment Profit Margin SCEM 21.1 % 19.6 % 18.8 % 13.4 % 22.4 % 22.7 % 22.5 % 21.7 % 17.6 % MC 29.6 % 30.0 % 28.7 % 30.0 % 33.7 % 31.5 % 33.8 % 33.5 % 34.9 % AMH 16.5 % 19.3 % 14.0 % 14.6 % 17.6 % 17.8 % 18.0 % 23.0 % 22.6 % GAAP Segment Trend Data1 1. In 1Q19 the Company changed its definition of segment profit to include inter-segment sales. Prior period information has been recast to reflect the change.
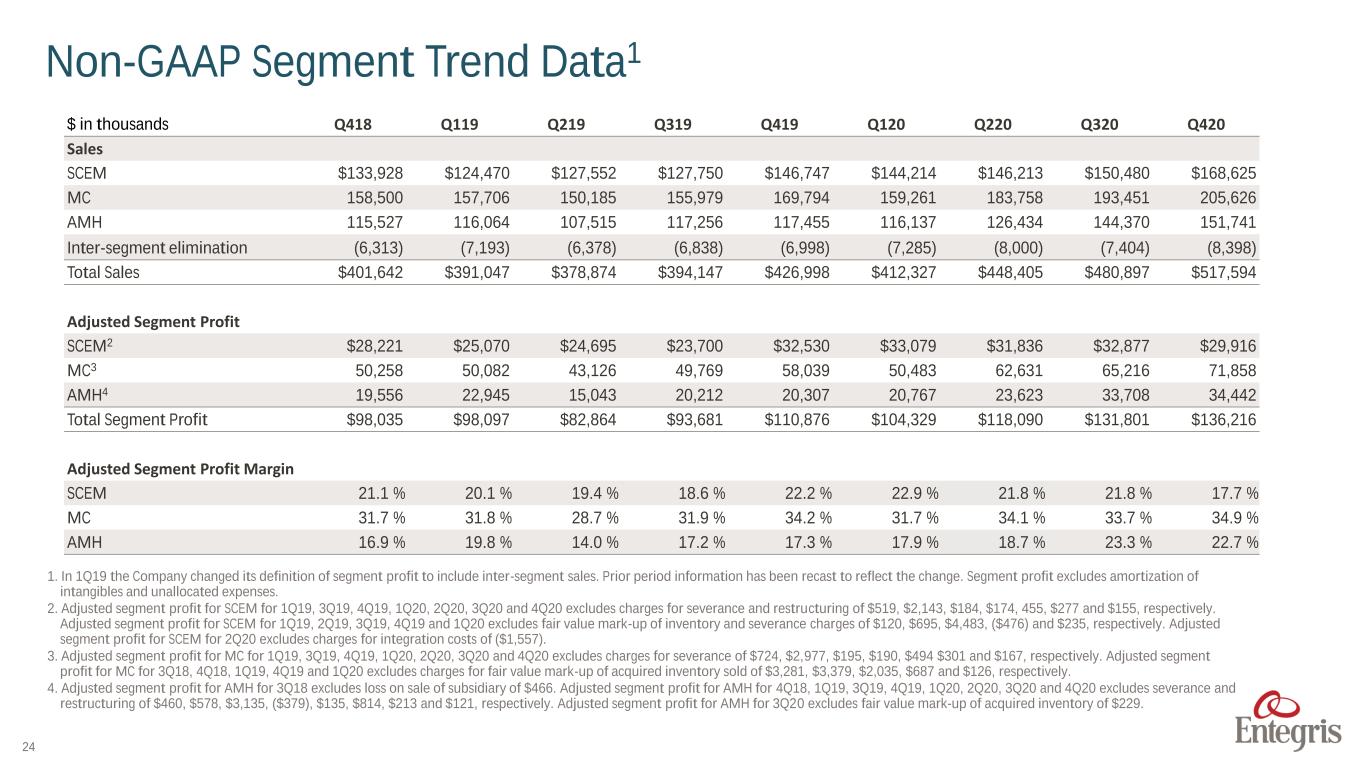
24 1. In 1Q19 the Company changed its definition of segment profit to include inter-segment sales. Prior period information has been recast to reflect the change. Segment profit excludes amortization of intangibles and unallocated expenses. 2. Adjusted segment profit for SCEM for 1Q19, 3Q19, 4Q19, 1Q20, 2Q20, 3Q20 and 4Q20 excludes charges for severance and restructuring of $519, $2,143, $184, $174, 455, $277 and $155, respectively. Adjusted segment profit for SCEM for 1Q19, 2Q19, 3Q19, 4Q19 and 1Q20 excludes fair value mark-up of inventory and severance charges of $120, $695, $4,483, ($476) and $235, respectively. Adjusted segment profit for SCEM for 2Q20 excludes charges for integration costs of ($1,557). 3. Adjusted segment profit for MC for 1Q19, 3Q19, 4Q19, 1Q20, 2Q20, 3Q20 and 4Q20 excludes charges for severance of $724, $2,977, $195, $190, $494 $301 and $167, respectively. Adjusted segment profit for MC for 3Q18, 4Q18, 1Q19, 4Q19 and 1Q20 excludes charges for fair value mark-up of acquired inventory sold of $3,281, $3,379, $2,035, $687 and $126, respectively. 4. Adjusted segment profit for AMH for 3Q18 excludes loss on sale of subsidiary of $466. Adjusted segment profit for AMH for 4Q18, 1Q19, 3Q19, 4Q19, 1Q20, 2Q20, 3Q20 and 4Q20 excludes severance and restructuring of $460, $578, $3,135, ($379), $135, $814, $213 and $121, respectively. Adjusted segment profit for AMH for 3Q20 excludes fair value mark-up of acquired inventory of $229. $ in thousands Q418 Q119 Q219 Q319 Q419 Q120 Q220 Q320 Q420 Sales SCEM $133,928 $124,470 $127,552 $127,750 $146,747 $144,214 $146,213 $150,480 $168,625 MC 158,500 157,706 150,185 155,979 169,794 159,261 183,758 193,451 205,626 AMH 115,527 116,064 107,515 117,256 117,455 116,137 126,434 144,370 151,741 Inter-segment elimination (6,313) (7,193) (6,378) (6,838) (6,998) (7,285) (8,000) (7,404) (8,398) Total Sales $401,642 $391,047 $378,874 $394,147 $426,998 $412,327 $448,405 $480,897 $517,594 Adjusted Segment Profit SCEM2 $28,221 $25,070 $24,695 $23,700 $32,530 $33,079 $31,836 $32,877 $29,916 MC3 50,258 50,082 43,126 49,769 58,039 50,483 62,631 65,216 71,858 AMH4 19,556 22,945 15,043 20,212 20,307 20,767 23,623 33,708 34,442 Total Segment Profit $98,035 $98,097 $82,864 $93,681 $110,876 $104,329 $118,090 $131,801 $136,216 Adjusted Segment Profit Margin SCEM 21.1 % 20.1 % 19.4 % 18.6 % 22.2 % 22.9 % 21.8 % 21.8 % 17.7 % MC 31.7 % 31.8 % 28.7 % 31.9 % 34.2 % 31.7 % 34.1 % 33.7 % 34.9 % AMH 16.9 % 19.8 % 14.0 % 17.2 % 17.3 % 17.9 % 18.7 % 23.3 % 22.7 % Non-GAAP Segment Trend Data1
