UNITED STATES
SECURITIES AND EXCHANGE COMMISSION
Washington, D.C. 20549
FORM N-CSR
CERTIFIED SHAREHOLDER REPORT OF REGISTERED
MANAGEMENT INVESTMENT COMPANIES
Investment Company Act file number 811-09729
iShares Trust
(Exact name of registrant as specified in charter)
c/o BlackRock Fund Advisors
400 Howard Street, San Francisco, CA 94105
(Address of principal executive offices) (Zip code)
The Corporation Trust Company
1209 Orange Street, Wilmington, DE 19801
(Name and address of agent for service)
Registrant’s telephone number, including area code: (415) 670-2000
Date of fiscal year end: February 29, 2024
Date of reporting period: February 29, 2024
| Item 1. | Reports to Stockholders. |
(a) The Report to Shareholders is attached herewith.
|
|
FEBRUARY 29, 2024 |

|
|
2024 Annual Report
| |
iShares Trust
· iShares ESG Aware 1-5 Year USD Corporate Bond ETF | SUSB | NASDAQ
· iShares ESG Aware U.S. Aggregate Bond ETF | EAGG | NYSE Arca
· iShares ESG Aware USD Corporate Bond ETF | SUSC | NASDAQ
Dear Shareholder,
The combination of continued economic growth and cooling inflation provided a supportive backdrop for investors during the 12-month reporting period ended February 29, 2024. Significantly tighter monetary policy helped to rein in inflation, and the Consumer Price Index decelerated substantially while remaining above pre-pandemic levels. A moderating labor market helped ease inflationary pressure, although wages continued to grow. Wage and job growth powered robust consumer spending, backstopping the economy. On October 7, 2023, Hamas launched a horrific attack on Israel. The ensuing war will have a significant humanitarian impact and could lead to heightened economic and market volatility. We see geopolitics as a structural market risk going forward. See our geopolitical risk dashboard at blackrock.com for more details.
Equity returns were robust during the period, as interest rates stabilized and the economy proved to be more resilient than many investors expected. The U.S. economy continued to show strength, and growth further accelerated in the second half of 2023. Large-capitalization U.S. stocks posted particularly substantial gains, supported by the performance of a few notable technology companies, while small-capitalization U.S. stocks advanced at a significantly slower pace. Meanwhile, international developed market equities also gained strongly, while emerging market stocks advanced at a more modest pace.
The 10-year U.S. Treasury yield rose during the reporting period, as investors reacted to elevated inflation and attempted to anticipate future interest rate changes. However, higher yields drove positive returns overall for 10-year U.S. Treasuries and solid gains in shorter-duration U.S. Treasuries. The corporate bond market benefited from improving economic sentiment, although high-yield corporate bond prices fared significantly better than investment-grade bonds as demand from yield-seeking investors remained strong.
The U.S. Federal Reserve (the “Fed”), attempting to manage persistent inflation, raised interest rates three times during the 12-month period, but paused its tightening after its July meeting. The Fed also continued to reduce its balance sheet by not replacing some of the securities that reach maturity.
Supply constraints appear to have become an embedded feature of the new macroeconomic environment, making it difficult for developed economies to increase production without sparking higher inflation. Geopolitical fragmentation and an aging population risk further exacerbating these constraints, keeping the labor market tight and wage growth high. Although the Fed has stopped tightening for now, we believe that the new economic regime means that the Fed will need to maintain high rates for an extended period despite the market’s hopes for rapid interest rate cuts, as reflected in the recent rally. In this new regime, we anticipate greater volatility and dispersion of returns, creating more opportunities for selective portfolio management.
Looking at developed market stocks, we have an overweight stance on U.S. stocks overall, particularly given the promise of emerging AI technologies. We are also overweight Japanese stocks as shareholder-friendly policies generate increased investor interest, although we maintain an underweight stance on European stocks. In credit, there are selective opportunities in the near term despite tighter credit and financial conditions. For fixed income investing with a six- to twelve-month horizon, we see the most attractive investments in short-term U.S. Treasuries and hard-currency emerging market bonds.
Overall, our view is that investors need to think globally, position themselves to be prepared for a decarbonizing economy, and be nimble as market conditions change. We encourage you to talk with your financial advisor and visit iShares.com for further insight about investing in today’s markets.

Rob Kapito
President, BlackRock Inc.

Rob Kapito
President, BlackRock Inc.
| Total Returns as of February 29, 2024
|
||||||||
|
6-Month
|
12-Month
|
|||||||
| U.S. large cap equities |
13.93% | 30.45% | ||||||
| U.S. small cap equities |
8.97 | 10.05 | ||||||
| International equities |
9.23 | 14.41 | ||||||
| Emerging market equities |
4.93 | 8.73 | ||||||
| 3-month Treasury bills |
2.69 | 5.22 | ||||||
| U.S. Treasury securities |
0.58 | 0.69 | ||||||
| U.S. investment grade bonds |
2.35 | 3.33 | ||||||
| Tax-exempt municipal bonds |
4.33 | 5.42 | ||||||
| U.S. high yield bonds |
6.18 | 11.01 | ||||||
| Past performance is not an indication of future results. Index performance is shown for illustrative purposes only. You cannot invest directly in an index.
|
| |||||||
| 2 | T H I S P A G E I S N O T P A R T O F Y O U R F U N D R E P O R T |
| Page | ||||
|
|
||||
| 2 | ||||
| Annual Report: |
||||
| 4 | ||||
| 5 | ||||
| 11 | ||||
| 11 | ||||
| 12 | ||||
| Financial Statements |
||||
| 125 | ||||
| 126 | ||||
| 127 | ||||
| 129 | ||||
| 132 | ||||
| 141 | ||||
| 142 | ||||
| 143 | ||||
| 144 | ||||
| 145 | ||||
| 147 | ||||
| 148 | ||||
iShares Trust
U.S. Bond Market Overview
U.S. investment-grade bonds produced a gain of 3.33% during the 12 months ended February 29, 2024 (the “reporting period”), as measured by the Bloomberg U.S. Aggregate Bond Index. Income made a sizable contribution to performance, and strength in credit-oriented market segments provided an additional boost to returns.
The 12-month gain for the index belies the challenging environment for the bond market through the first eight months of the period. During this time, yields drifted steadily higher (as prices fell) in response to better-than-expected economic growth and continued interest rate increases by the U.S. Federal Reserve (Fed). The Fed raised rates by a quarter-point at its meetings in March, May, and July 2023, moving its benchmark fed funds rate to a range of 5.25% - 5.50%. Although the Fed’s aggressive actions contributed to a decline in inflation, U.S. economic growth remained robust behind persistent strength in the labor market. This trend gave rise to expectations that the central bank would need to keep rates “higher for longer,” fueling a sharp sell-off in the bond market in the span from August through October 2023.
The investment backdrop improved considerably in the final two months of 2023, touching off a rally that helped the fixed-income market quickly recover its earlier losses. The headline Consumer Price Index fell to its lowest levels since early 2021 in the November report, surprising the markets and causing the consensus to shift toward the view that the Fed was in fact finished raising rates. In December, Fed Chairman Jerome Powell provided another positive surprise with his suggestion that rate cuts could begin as early as the first half of 2024. Bond prices moved surged in response, with the credit sectors leading the way amid a pronounced improvement in investor sentiment. While yields crept higher in January and February, the Bloomberg U.S. Aggregate Bond Index finished in positive territory on the strength of its earlier advance.
These trends were reflected in the U.S. Treasury market, where the yield on the two-year note entered the annual period at 4.81%, reached a high of 5.19% in mid-October, and subsequently finished February 2024 at 4.64%. The 10-year issue followed a similar path, climbing from 3.92% at the start of the period to a high of 4.98% before sliding to 4.25% on February 29, 2024. One result of these moves was that the yield curve’s inversion—i.e., the extent to which short-term rates exceeded those of longer-term issues—gradually moderated from the unusually high level reached in early 2023. Short-term Treasuries were the strongest performers on a total return basis, followed by intermediate-term issues. However, longer-dated government bonds (those with maturities of 10 years and above) posted a loss.
Investment-grade corporate bonds were the best performing segment of the index during the 12-month period. The asset class was helped by a larger contribution from yield, together with a decline in yield spreads relative to U.S. Treasuries. Securitized assets—a category that encompasses mortgage-backed securities (MBS), asset backed securities (ABS) and commercial mortgage-backed securities (CMBS)—underperformed the index. While ABS and CMBS both held up well, agency MBS failed to keep pace with the broader fixed-income market due to the combination of the Fed’s ongoing balance sheet reduction and lower buying demand from banks.
| 4 | 2 0 2 4 I S H A R E S A N N U A L R E P O R T T O S H A R E H O L D E R S |
| Fund Summary as of February 29, 2024 | iShares® ESG Aware 1-5 Year USD Corporate Bond ETF |
Investment Objective
The iShares ESG Aware 1-5 Year USD Corporate Bond ETF (the “Fund”) seeks to track the investment results of an index composed of U.S. dollar-denominated, investment-grade corporate bonds having remaining maturities between one and five years and issued by companies that have positive environmental, social and governance characteristics while seeking to exhibit risk and return characteristics similar to those of the parent index of such index, as represented by the Bloomberg MSCI US Corporate 1-5 Year ESG Focus Index (the “Index”). The Fund invests in a representative sample of securities included in the Index that collectively has an investment profile similar to the Index. Due to the use of representative sampling, the Fund may or may not hold all of the securities that are included in the Index.
Performance
| Average Annual Total Returns | Cumulative Total Returns | |||||||||||||||||||||||||||
| 1 Year | 5 Years | Since Inception |
1 Year | 5 Years | Since Inception |
|||||||||||||||||||||||
| Fund NAV |
5.58 | % | 1.87 | % | 1.82 | % | 5.58 | % | 9.73 | % | 12.74 | % | ||||||||||||||||
| Fund Market |
5.53 | 1.81 | 1.82 | 5.53 | 9.41 | 12.72 | ||||||||||||||||||||||
| Index |
5.71 | 2.09 | 2.04 | 5.71 | 10.91 | 14.36 | ||||||||||||||||||||||
GROWTH OF $10,000 INVESTMENT
(SINCE INCEPTION AT NET ASSETVALUE)
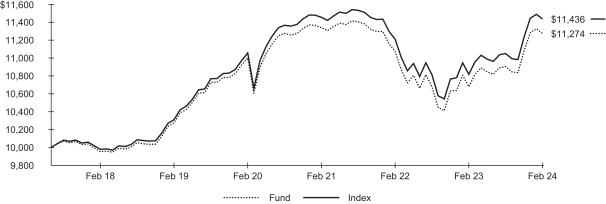
The inception date of the Fund was July 11, 2017. The first day of secondary market trading was July 13, 2017.
Past performance is not an indication of future results. Performance results do not reflect the deduction of taxes that a shareholder would pay on fund distributions or on the redemption or sale of fund shares. See “About Fund Performance” for more information.
Expense Example
| Actual | Hypothetical 5% Return | |||||||||||||||||||||||||||
|
|
|
|
|
|||||||||||||||||||||||||
| |
Beginning Account Value (09/01/23) |
|
|
Ending Account Value (02/29/24) |
|
|
Expenses Paid During the Period |
(a) |
|
Beginning Account Value (09/01/23) |
|
|
Ending Account Value (02/29/24) |
|
|
Expenses Paid During the Period |
(a) |
|
Annualized Expense Ratio |
| ||||||||
| $ 1,000.00 | $ 1,033.90 | $ 0.61 | $ 1,000.00 | $ 1,024.30 | $ 0.60 | 0.12 | % | |||||||||||||||||||||
| (a) | Expenses are equal to the annualized expense ratio, multiplied by the average account value over the period, multiplied by 182/366 (to reflect the one-half year period shown). Other fees, such as brokerage commissions and other fees to financial intermediaries, may be paid which are not reflected in the tables and examples above. See “Disclosure of Expenses” for more information. |
| F U N D S U M M A R Y |
5 |
| Fund Summary as of February 29, 2024 (continued) | iShares® ESG Aware 1-5 Year USD Corporate Bond ETF |
Portfolio Management Commentary
Returns for shorter-maturity, investment grade corporate bonds with positive environmental, social and governance (“ESG”) characteristics were positive during the12-month reporting period despite market volatility driven by shifting expectations around inflation and Federal Reserve (Fed) interest rate policy. In this vein, the yield on the two-year Treasury note entered the annual period at 4.81%, reached a high of 5.19% in mid-October of 2023, and subsequently declined on an improved outlook for Fed rate cuts, ending the period at 4.64%. Corporate bonds were the best performing segment of the investment grade market as credit sentiment remained firm and yield spreads relative to U.S. Treasuries narrowed.
The Bloomberg MSCI US 1-5 Year Corporate ESG Focus Index (“the Index”) performed in line with the broader short-term investment grade corporate bond market as represented by the Bloomberg US Corporate 1-5 Year Index. Within the Index, performance was led by lower quality issues in the Moody’s Baa rating category, while bonds rated Aaa were the biggest laggards while still posting positive returns. Relative to the broader market, the ESG selection process leads to overweight and underweight positions in bonds with higher or lower ESG characteristics, respectively. Consequently, the Index achieved an ESG quality score that was higher than the broader market, with lower exposure to carbon intensive companies.
Portfolio Information
| CREDIT QUALITY ALLOCATION |
| |||
|
|
||||
| Moody’s Credit Rating* | Percent of Total Investments(a) |
|||
|
|
||||
| Aaa |
1.7% | |||
| Aa |
3.5 | |||
| A |
47.7 | |||
| Baa |
44.5 | |||
| Ba |
1.2 | |||
| Not Rated |
1.4 | |||
|
|
||||
MATURITY ALLOCATION
|
|
||||
| Maturity | Percent of Total Investments(a) |
|||
|
|
||||
| 1-2 Years |
25.9% | |||
| 2-3 Years |
23.8 | |||
| 3-4 Years |
24.5 | |||
| 4-5 Years |
21.6 | |||
| 5-6 Years |
4.0 | |||
| 7-8 Years |
0.1 | |||
| 21-22 Years |
0.1 | |||
|
|
||||
| * | Credit quality ratings shown reflect the ratings assigned by Moody’s Investors Service (“Moody’s”), a widely used independent, nationally recognized statistical rating organization. Moody’s credit ratings are opinions of the credit quality of individual obligations or of an issuer’s general creditworthiness. Investment grade ratings are credit ratings of Baa or higher. Below investment grade ratings are credit ratings of Ba or lower. Unrated investments do not necessarily indicate low credit quality. Credit quality ratings are subject to change. |
| (a) | Excludes money market funds. |
| 6 | 2 0 2 4 I S H A R E S A N N U A L R E P O R T T O S H A R E H O L D E R S |
| Fund Summary as of February 29, 2024 | iShares® ESG Aware U.S. Aggregate Bond ETF |
Investment Objective
The iShares ESG Aware U.S. Aggregate Bond ETF (the “Fund”) seeks to track the investment results of an index composed of U.S. dollar-denominated, investment-grade bonds from issuers generally evaluated for favorable environmental, social and governance practices while seeking to exhibit risk and return characteristics similar to those of the broad U.S. dollar-denominated investment-grade bond market, as represented by the Bloomberg MSCI US Aggregate ESG Focus Index (the “Index”). The Fund invests in a representative sample of securities included in the Index that collectively has an investment profile similar to the Index. Due to the use of representative sampling, the Fund may or may not hold all of the securities that are included in the Index.
Performance
| Average Annual Total Returns | Cumulative Total Returns | |||||||||||||||||||||||||||
| 1 Year | 5 Years | Since Inception |
1 Year | 5 Years | Since Inception |
|||||||||||||||||||||||
| Fund NAV |
3.22 | % | 0.46 | % | 1.07 | % | 3.22 | % | 2.34 | % | 5.88 | % | ||||||||||||||||
| Fund Market |
3.27 | 0.46 | 1.08 | 3.27 | 2.32 | 5.96 | ||||||||||||||||||||||
| Index |
3.33 | 0.60 | 1.18 | 3.33 | 3.01 | 6.51 | ||||||||||||||||||||||
GROWTH OF $10,000 INVESTMENT
(SINCE INCEPTION AT NET ASSETVALUE)
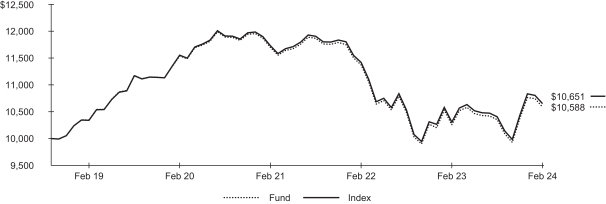
The inception date of the Fund was October 18, 2018. The first day of secondary market trading was October 23, 2018.
Past performance is not an indication of future results. Performance results do not reflect the deduction of taxes that a shareholder would pay on fund distributions or on the redemption or sale of fund shares. See “About Fund Performance” for more information.
Expense Example
| Actual | Hypothetical 5% Return | |||||||||||||||||||||||||||
|
|
|
|
|
|||||||||||||||||||||||||
| |
Beginning Account Value (09/01/23) |
|
|
Ending Account Value |
|
|
Expenses Paid During |
|
|
Beginning Account Value |
|
|
Ending Account Value |
|
|
Expenses Paid During the Period |
(a) |
|
Annualized Expense Ratio |
| ||||||||
| $ 1,000.00 | $ 1,022.80 | $ 0.45 | $ 1,000.00 | $ 1,024.40 | $ 0.45 | 0.09 | % | |||||||||||||||||||||
| (a) | Expenses are equal to the annualized expense ratio, multiplied by the average account value over the period, multiplied by 182/366 (to reflect the one-half year period shown). Other fees, such as brokerage commissions and other fees to financial intermediaries, may be paid which are not reflected in the tables and examples above. See “Disclosure of Expenses” for more information. |
| F U N D S U M M A R Y |
7 |
| Fund Summary as of February 29, 2024 (continued) | iShares® ESG Aware U.S. Aggregate Bond ETF |
Portfolio Management Commentary
Returns for investment-grade bonds with positive environmental, social and governance (“ESG”) characteristics were positive during the 12-month reporting period despite market volatility driven by shifting expectations around inflation and Federal Reserve (Fed) interest rate policy. In this vein, the yield on the 10-year Treasury bond began the period at 3.92% and rose more than 100 basis points to 4.98% before declining on an improved outlook for Fed rate cuts, ultimately ending the period at 4.25%. The Bloomberg MSCI US Aggregate ESG Focus Index (“the Index”) performed in line with the broader bond market as represented by the Bloomberg U.S. Aggregate Index.
Investment grade corporate bonds were the best performing segment of the Index during the period as credit sentiment remained firm and yield spreads relative to U.S. Treasuries narrowed. Returns for Treasuries were positive but lagged those for corporate bonds as longer-term Treasury yields finished the period modestly higher. Securitized assets including mortgage-backed securities, asset backed securities and commercial mortgage-backed securities also finished in positive territory while underperforming corporate bonds. In particular, demand for agency mortgage-backed securities was negatively impacted by the Fed’s post-pandemic balance sheet reduction efforts. In addition, banks curtailed their purchases given extended durations for the sector with the rise in mortgage rates seen since the beginning of the Fed’s hiking cycle along with an inverted yield curve that hurt net interest margins.
Portfolio Information
| CREDIT QUALITY ALLOCATION |
| |||
|
|
||||
| Moody’s Credit Rating* | Percent of Total Investments(a) |
|||
|
|
||||
| Aaa |
71.8% | |||
| Aa |
1.5 | |||
| A |
11.6 | |||
| Baa |
12.4 | |||
| Ba |
0.4 | |||
| Not Rated |
2.3 | |||
|
|
||||
PORTFOLIO COMPOSITION
|
|
||||
| Investment Type | Percent of Total Investments(a) |
|||
|
|
||||
| U.S. Government & Agency Obligations |
69.4% | |||
| Corporate Bonds & Notes |
26.1 | |||
| Foreign Government Obligations |
3.4 | |||
| Collaterized Mortgage Obligations |
1.0 | |||
| Asset-Backed Securities |
0.5 | |||
| Municipal Debt Obligations |
—(b) | |||
| TBA Sales Commitments |
(0.4) | |||
|
|
||||
| * | Credit quality ratings shown reflect the ratings assigned by Moody’s Investors Service (“Moody’s”), a widely used independent, nationally recognized statistical rating organization. Moody’s credit ratings are opinions of the credit quality of individual obligations or of an issuer’s general creditworthiness. Investment grade ratings are credit ratings of Baa or higher. Below investment grade ratings are credit ratings of Ba or lower. Unrated investments do not necessarily indicate low credit quality. Credit quality ratings are subject to change. |
| (a) | Excludes money market funds. |
| (b) | Rounds to less than 0.1% |
| 8 | 2 0 2 4 I S H A R E S A N N U A L R E P O R T T O S H A R E H O L D E R S |
| Fund Summary as of February 29, 2024 | iShares® ESG Aware USD Corporate Bond ETF |
Investment Objective
The iShares ESG Aware USD Corporate Bond ETF (the “Fund”) seeks to track the investment results of an index composed of U.S. dollar-denominated, investment-grade corporate bonds issued by companies that have positive environmental, social and governance characteristics while seeking to exhibit risk and return characteristics similar to those of the parent index of such index, as represented by the Bloomberg MSCI US Corporate ESG Focus Index (the “Index”). The Fund invests in a representative sample of securities included in the Index that collectively has an investment profile similar to the Index. Due to the use of representative sampling, the Fund may or may not hold all of the securities that are included in the Index.
Performance
| Average Annual Total Returns | Cumulative Total Returns | |||||||||||||||||||||||||||
| 1 Year | 5 Years | Since Inception |
1 Year | 5 Years | Since Inception |
|||||||||||||||||||||||
| Fund NAV |
5.82 | % | 1.61 | % | 1.55 | % | 5.82 | % | 8.32 | % | 10.75 | % | ||||||||||||||||
| Fund Market |
5.91 | 1.54 | 1.56 | 5.91 | 7.95 | 10.80 | ||||||||||||||||||||||
| Index |
5.99 | 1.91 | 1.83 | 5.99 | 9.94 | 12.80 | ||||||||||||||||||||||
GROWTH OF $10,000 INVESTMENT
(SINCE INCEPTION AT NET ASSETVALUE)
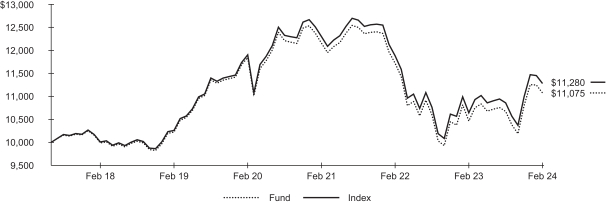
The inception date of the Fund was July 11, 2017. The first day of secondary market trading was July 13, 2017.
Past performance is not an indication of future results. Performance results do not reflect the deduction of taxes that a shareholder would pay on fund distributions or on the redemption or sale of fund shares. See “About Fund Performance” for more information.
Expense Example
| Actual | Hypothetical 5% Return | |||||||||||||||||||||||||||
|
|
|
|
|
|||||||||||||||||||||||||
| |
Beginning Account Value |
|
|
Ending Account Value |
|
|
Expenses Paid During |
|
|
Beginning Account Value |
|
|
Ending Account Value |
|
|
Expenses Paid During |
|
|
Annualized Expense Ratio |
| ||||||||
| $ 1,000.00 | $ 1,037.60 | $ 0.91 | $ 1,000.00 | $ 1,024.00 | $ 0.91 | 0.18 | % | |||||||||||||||||||||
| (a) | Expenses are equal to the annualized expense ratio, multiplied by the average account value over the period, multiplied by 182/366 (to reflect the one-half year period shown). Other fees, such as brokerage commissions and other fees to financial intermediaries, may be paid which are not reflected in the tables and examples above. See “Disclosure of Expenses” for more information. |
| F U N D S U M M A R Y |
9 |
| Fund Summary as of February 29, 2024 (continued) | iShares® ESG Aware USD Corporate Bond ETF |
Portfolio Management Commentary
Returns for investment-grade corporate bonds with positive environmental, social and governance (“ESG”) characteristics were positive during the 12-month reporting period despite market volatility driven by shifting expectations around inflation and Federal Reserve (Fed) interest rate policy. In this vein, the yield on the 10-year Treasury bond began the period at 3.92% and rose more than 100 basis points to 4.98% before declining on an improved outlook for Fed rate cuts, ultimately ending the period at 4.25%. Corporate bonds were the best performing segment of the investment grade market as credit sentiment remained firm and yield spreads relative to U.S. Treasuries narrowed.
The Bloomberg MSCI US Corporate ESG Focus Index (“the Index”) performed in line with the broader market as represented by the Bloomberg US Corporate Index. Within the Index, performance was strongest for the lowest rated segment within the investment grade corporate bond market as represented by issues rated Baa byMoody’s Ratings. In terms of maturity, bonds with maturities of 10 years or longer make up the largest proportion of the Index and contributed the most to return for the period.
Relative to the broader market, the ESG selection process leads to overweight and underweight positions in bonds with higher or lower ESG characteristics, respectively. Consequently, the Index achieved an ESG quality score that was higher than the broader market, with lower exposure to carbon intensive companies.
Portfolio Information
| CREDIT QUALITY ALLOCATION |
| |||
|
|
||||
| Moody’s Credit Rating* | Percent of Total Investments(a) |
|||
|
|
||||
| Aaa |
1.6% | |||
| Aa |
4.3 | |||
| A |
45.5 | |||
| Baa |
46.0 | |||
| Ba |
1.6 | |||
| Not Rated |
1.0 | |||
|
|
||||
MATURITY ALLOCATION
|
|
||||
| Maturity | Percent of Total Investments(a) |
|||
|
|
||||
| 1-5 Years |
36.3% | |||
| 5-10 Years |
27.8 | |||
| 10-15 Years |
8.2 | |||
| 15-20 Years |
5.7 | |||
| More than 20 Years |
22.0 | |||
|
|
||||
| * | Credit quality ratings shown reflect the ratings assigned by Moody’s Investors Service (“Moody’s”), a widely used independent, nationally recognized statistical rating organization. Moody’s credit ratings are opinions of the credit quality of individual obligations or of an issuer’s general creditworthiness. Investment grade ratings are credit ratings of Baa or higher. Below investment grade ratings are credit ratings of Ba or lower. Unrated investments do not necessarily indicate low credit quality. Credit quality ratings are subject to change. |
| (a) | Excludes money market funds. |
| 10 | 2 0 2 4 I S H A R E S A N N U A L R E P O R T T O S H A R E H O L D E R S |
Past performance is not an indication of future results. Financial markets have experienced extreme volatility and trading in many instruments has been disrupted. These circumstances may continue for an extended period of time and may continue to affect adversely the value and liquidity of each Fund’s investments. As a result, current performance may be lower or higher than the performance data quoted. Performance data current to the most recent month-end is available at iShares.com. Performance results assume reinvestment of all dividends and capital gain distributions and do not reflect the deduction of taxes that a shareholder would pay on fund distributions or on the redemption or sale of fund shares. The investment return and principal value of shares will vary with changes in market conditions. Shares may be worth more or less than their original cost when they are redeemed or sold in the market. Performance for certain funds may reflect a waiver of a portion of investment advisory fees. Without such a waiver, performance would have been lower.
Net asset value or “NAV” is the value of one share of a fund as calculated in accordance with the standard formula for valuing mutual fund shares. Beginning August 10, 2020, the price used to calculate market return (“Market Price”) is the closing price. Prior to August 10, 2020, Market Price was determined using the midpoint between the highest bid and the lowest ask on the primary stock exchange on which shares of a fund are listed for trading, as of the time that such fund’s NAV is calculated. Since shares of a fund may not trade in the secondary market until after the fund’s inception, for the period from inception to the first day of secondary market trading in shares of the fund, the NAV of the fund is used as a proxy for the Market Price to calculate market returns. Market and NAV returns assume that dividends and capital gain distributions have been reinvested at Market Price and NAV, respectively.
An index is a statistical composite that tracks a specified financial market or sector. Unlike a fund, an index does not actually hold a portfolio of securities and therefore does not incur the expenses incurred by a fund. These expenses negatively impact fund performance. Also, index returns do not include brokerage commissions that may be payable on secondary market transactions. If brokerage commissions were included, index returns would be lower.
Shareholders of each Fund may incur the following charges: (1) transactional expenses, including brokerage commissions on purchases and sales of fund shares and (2) ongoing expenses, including management fees and other fund expenses. The expense examples shown (which are based on a hypothetical investment of $1,000 invested at the beginning of the period and held through the end of the period) are intended to assist shareholders both in calculating expenses based on an investment in each Fund and in comparing these expenses with similar costs of investing in other funds.
The expense examples provide information about actual account values and actual expenses. Annualized expense ratios reflect contractual and voluntary fee waivers, if any. In order to estimate the expenses a shareholder paid during the period covered by this report, shareholders can divide their account value by $1,000 and then multiply the result by the number under the heading entitled “Expenses Paid During the Period.”
The expense examples also provide information about hypothetical account values and hypothetical expenses based on a fund’s actual expense ratio and an assumed rate of return of 5% per year before expenses. In order to assist shareholders in comparing the ongoing expenses of investing in the Funds and other funds, compare the 5% hypothetical examples with the 5% hypothetical examples that appear in the shareholder reports of the other funds.
The expenses shown in the expense examples are intended to highlight shareholders’ ongoing costs only and do not reflect any transactional expenses, such as brokerage commissions and other fees paid on purchases and sales of fund shares. Therefore, the hypothetical examples are useful in comparing ongoing expenses only and will not help shareholders determine the relative total expenses of owning different funds. If these transactional expenses were included, shareholder expenses would have been higher.
| A B O U T F U N D P E R F O R M A N C E / D I S C L O S U R E O F E X P E N S E S |
11 |
|
February 29, 2024 |
iShares® ESG Aware 1-5 Year USD Corporate Bond ETF (Percentages shown are based on Net Assets) |
| Security | Par (000) |
Value | ||||||
| Corporate Bonds & Notes |
||||||||
| Advertising — 0.0% | ||||||||
| Interpublic Group of Companies Inc. (The), 4.65%, 10/01/28 (Call 07/01/28)(a) |
$ | 250 | $ | 244,814 | ||||
|
|
|
|||||||
| Aerospace & Defense — 0.3% | ||||||||
| Hexcel Corp. |
||||||||
| 4.20%, 02/15/27 (Call 11/15/26) |
945 | 899,686 | ||||||
| 4.95%, 08/15/25 (Call 05/15/25) |
105 | 103,623 | ||||||
| Northrop Grumman Corp., 4.60%, 02/01/29 (Call 01/01/29) |
300 | 294,002 | ||||||
| RTX Corp. |
||||||||
| 2.65%, 11/01/26 (Call 08/01/26) |
45 | 42,347 | ||||||
| 3.13%, 05/04/27 (Call 02/04/27) |
15 | 14,156 | ||||||
| 3.50%, 03/15/27 (Call 12/15/26) |
25 | 23,893 | ||||||
| 3.95%, 08/16/25 (Call 06/16/25) |
83 | 81,415 | ||||||
| 4.13%, 11/16/28 (Call 08/16/28) |
360 | 345,751 | ||||||
| 5.75%, 11/08/26 (Call 10/08/26) |
520 | 527,569 | ||||||
| 5.75%, 01/15/29 (Call 12/15/28) |
405 | 416,931 | ||||||
|
|
|
|||||||
| 2,749,373 | ||||||||
| Agriculture — 0.8% | ||||||||
| Archer-Daniels-Midland Co., 2.50%, 08/11/26 (Call 05/11/26) |
35 | 32,954 | ||||||
| Bunge Ltd. Finance Corp. |
||||||||
| 1.63%, 08/17/25 (Call 07/17/25) |
4,086 | 3,867,975 | ||||||
| 3.25%, 08/15/26 (Call 05/15/26) |
3,080 | 2,936,399 | ||||||
| 3.75%, 09/25/27 (Call 06/25/27) |
305 | 291,796 | ||||||
|
|
|
|||||||
| 7,129,124 | ||||||||
| Airlines — 0.0% | ||||||||
| Delta Air Lines Pass Through Trust, Series 2020, Class AA, 2.00%, 12/10/29(a) |
95 | 84,641 | ||||||
| Southwest Airlines Co., 5.13%, 06/15/27 (Call 04/15/27)(a) |
120 | 119,595 | ||||||
|
|
|
|||||||
| 204,236 | ||||||||
| Apparel — 0.5% | ||||||||
| PVH Corp., 4.63%, 07/10/25 (Call 06/10/25) |
957 | 943,597 | ||||||
| Ralph Lauren Corp., 3.75%, 09/15/25 (Call 07/15/25) |
333 | 325,448 | ||||||
| Tapestry Inc. |
||||||||
| 4.13%, 07/15/27 (Call 04/15/27) |
10 | 9,497 | ||||||
| 4.25%, 04/01/25 (Call 01/01/25) |
140 | 137,847 | ||||||
| 7.05%, 11/27/25 |
210 | 213,926 | ||||||
| 7.35%, 11/27/28 (Call 10/27/28) |
630 | 659,229 | ||||||
| VF Corp. |
||||||||
| 2.40%, 04/23/25 (Call 03/23/25) |
710 | 681,151 | ||||||
| 2.80%, 04/23/27 (Call 02/23/27) |
1,730 | 1,568,588 | ||||||
|
|
|
|||||||
| 4,539,283 | ||||||||
| Auto Manufacturers — 2.3% | ||||||||
| American Honda Finance Corp. |
||||||||
| 1.00%, 09/10/25 |
152 | 142,842 | ||||||
| 1.30%, 09/09/26 |
68 | 62,084 | ||||||
| 2.00%, 03/24/28 |
10 | 8,957 | ||||||
| 2.25%, 01/12/29 |
405 | 359,640 | ||||||
| 2.30%, 09/09/26 |
65 | 60,966 | ||||||
| 4.70%, 01/12/28(a) |
1,935 | 1,925,148 | ||||||
| 4.75%, 01/12/26 |
60 | 59,607 | ||||||
| 4.95%, 01/09/26 |
325 | 324,012 | ||||||
| 5.13%, 07/07/28 |
825 | 831,677 | ||||||
| 5.25%, 07/07/26(a) |
240 | 241,686 | ||||||
| 5.65%, 11/15/28 |
545 | 560,380 | ||||||
| Security | Par (000) |
Value | ||||||
| Auto Manufacturers (continued) | ||||||||
| Cummins Inc. |
||||||||
| 0.75%, 09/01/25 (Call 08/01/25) |
$ | 2,010 | $ | 1,885,443 | ||||
| 4.90%, 02/20/29 (Call 01/20/29)(a) |
800 | 796,017 | ||||||
| Ford Motor Credit Co. LLC |
||||||||
| 2.90%, 02/16/28 (Call 12/16/27)(a) |
1,930 | 1,730,164 | ||||||
| 4.13%, 08/17/27 (Call 06/17/27) |
1,455 | 1,375,202 | ||||||
| 6.80%, 11/07/28 (Call 10/07/28) |
595 | 616,134 | ||||||
| 7.35%, 11/04/27 (Call 10/04/27) |
55 | 57,470 | ||||||
| General Motors Co. |
||||||||
| 4.00%, 04/01/25 |
605 | 595,386 | ||||||
| 6.80%, 10/01/27 (Call 08/01/27) |
45 | 46,989 | ||||||
| General Motors Financial Co. Inc. |
||||||||
| 1.50%, 06/10/26 (Call 05/10/26) |
85 | 77,865 | ||||||
| 2.35%, 02/26/27 (Call 01/26/27)(a) |
895 | 820,557 | ||||||
| 2.40%, 10/15/28 (Call 08/15/28) |
210 | 184,508 | ||||||
| 2.70%, 08/20/27 (Call 06/20/27)(a) |
60 | 55,044 | ||||||
| 2.75%, 06/20/25 (Call 05/20/25)(a) |
165 | 159,248 | ||||||
| 3.85%, 01/05/28 (Call 10/05/27) |
25 | 23,730 | ||||||
| 4.00%, 10/06/26 (Call 07/06/26)(a) |
80 | 77,340 | ||||||
| 4.30%, 07/13/25 (Call 04/13/25) |
102 | 100,315 | ||||||
| 4.35%, 04/09/25 (Call 02/09/25) |
852 | 840,986 | ||||||
| 4.35%, 01/17/27 (Call 10/17/26) |
120 | 116,790 | ||||||
| 5.00%, 04/09/27 (Call 03/09/27) |
1,195 | 1,182,352 | ||||||
| 5.40%, 05/08/27 |
90 | 90,101 | ||||||
| 5.80%, 06/23/28 (Call 05/23/28) |
45 | 45,646 | ||||||
| 5.80%, 01/07/29 (Call 12/07/28) |
305 | 309,026 | ||||||
| 6.00%, 01/09/28 (Call 12/09/27) |
425 | 434,326 | ||||||
| Honda Motor Co. Ltd., 2.53%, 03/10/27 (Call 02/10/27)(a) |
50 | 46,718 | ||||||
| Toyota Motor Credit Corp. |
||||||||
| 1.15%, 08/13/27 |
590 | 522,693 | ||||||
| 1.90%, 01/13/27 |
190 | 174,965 | ||||||
| 3.00%, 04/01/25 |
698 | 681,993 | ||||||
| 3.05%, 03/22/27 |
270 | 256,040 | ||||||
| 3.20%, 01/11/27 |
175 | 167,196 | ||||||
| 3.40%, 04/14/25 |
167 | 163,662 | ||||||
| 4.55%, 09/20/27 |
880 | 872,498 | ||||||
| 5.00%, 08/14/26 |
200 | 199,962 | ||||||
| 5.25%, 09/11/28 |
175 | 177,509 | ||||||
| 5.45%, 11/10/27 |
35 | 35,694 | ||||||
|
|
|
|||||||
| 19,496,568 | ||||||||
| Auto Parts & Equipment — 0.1% | ||||||||
| BorgWarner Inc.,
2.65%, 07/01/27 |
640 | 590,725 | ||||||
| Lear Corp., 3.80%, 09/15/27 (Call 06/15/27) |
55 | 52,639 | ||||||
|
|
|
|||||||
| 643,364 | ||||||||
| Banks — 31.4% | ||||||||
| Banco Bilbao Vizcaya Argentaria SA |
||||||||
| 1.13%, 09/18/25 |
6,733 | 6,293,652 | ||||||
| 6.14%, 09/14/28 (Call 09/14/27), |
775 | 785,743 | ||||||
| Banco Santander SA |
||||||||
| 1.72%, 09/14/27 (Call 09/14/26), |
390 | 352,712 | ||||||
| 1.85%, 03/25/26 |
1,637 | 1,519,181 | ||||||
| 2.75%, 05/28/25 |
325 | 313,545 | ||||||
| 3.80%, 02/23/28(a) |
400 | 376,765 | ||||||
| 4.18%, 03/24/28 (Call 03/24/27), |
1,195 | 1,143,947 | ||||||
| 4.25%, 04/11/27(a) |
565 | 544,400 | ||||||
| 4.38%, 04/12/28 |
450 | 432,378 | ||||||
| 12 | 2 0 2 4 I S H A R E S A N N U A L R E P O R T T O S H A R E H O L D E R S |
| Schedule of Investments (continued) February 29, 2024 |
iShares® ESG Aware 1-5 Year USD Corporate Bond ETF (Percentages shown are based on Net Assets) |
| Security | Par (000) |
Value | ||||||
| Banks (continued) | ||||||||
| 5.18%, 11/19/25 |
$ | 412 | $ | 406,248 | ||||
| 5.59%, 08/08/28(a) |
800 | 806,199 | ||||||
| 6.53%, 11/07/27 (Call 11/07/26), |
400 | 409,295 | ||||||
| 6.61%, 11/07/28 |
400 | 420,293 | ||||||
| Bank of America Corp. |
||||||||
| 1.20%, 10/24/26 (Call 10/24/25), |
500 | 465,820 | ||||||
| 1.32%, 06/19/26 (Call 06/19/25), |
400 | 378,712 | ||||||
| 1.73%, 07/22/27 (Call 07/22/26), |
2,494 | 2,286,286 | ||||||
| 2.09%, 06/14/29 (Call 06/14/28), |
925 | 811,724 | ||||||
| 2.55%, 02/04/28 (Call 02/04/27), |
780 | 721,364 | ||||||
| 3.25%, 10/21/27 (Call 10/21/26)(a) |
65 | 61,399 | ||||||
| 3.38%, 04/02/26 (Call 04/02/25), |
310 | 302,721 | ||||||
| 3.42%, 12/20/28 (Call 12/20/27), |
2,130 | 1,990,436 | ||||||
| 3.56%, 04/23/27 (Call 04/23/26), |
350 | 336,611 | ||||||
| 3.59%, 07/21/28 (Call 07/21/27), |
1,030 | 975,338 | ||||||
| 3.71%, 04/24/28 (Call 04/24/27), |
2,270 | 2,161,918 | ||||||
| 3.82%, 01/20/28 (Call 01/20/27), |
1,695 | 1,628,415 | ||||||
| 3.88%, 08/01/25 |
66 | 64,945 | ||||||
| 3.97%, 02/07/30 (Call 02/07/29), |
500 | 469,915 | ||||||
| 4.25%, 10/22/26 |
165 | 161,362 | ||||||
| 4.27%, 07/23/29 (Call 07/23/28), |
495 | 475,570 | ||||||
| 4.38%, 04/27/28 (Call 04/27/27), |
1,360 | 1,323,698 | ||||||
| 4.45%, 03/03/26 |
20 | 19,669 | ||||||
| 4.83%, 07/22/26 (Call 07/22/25), |
40 | 39,658 | ||||||
| 4.95%, 07/22/28 (Call 07/22/27), |
1,050 | 1,039,437 | ||||||
| 5.08%, 01/20/27 (Call 01/20/26), |
470 | 466,992 | ||||||
| 5.20%, 04/25/29 (Call 04/25/28), |
1,505 | 1,496,482 | ||||||
| 5.82%, 09/15/29 (Call 09/15/28), |
15 | 15,291 | ||||||
| 6.20%, 11/10/28 (Call 11/10/27), |
1,235 | 1,273,276 | ||||||
| 6.22%, 09/15/26 |
20 | 20,430 | ||||||
| Series L, 3.95%, 04/21/25 |
1,292 | 1,270,645 | ||||||
| Series L, 4.18%, 11/25/27 (Call 11/25/26) |
1,390 | 1,342,257 | ||||||
| Series N, 1.66%, 03/11/27 (Call 03/11/26), |
1,413 | 1,311,856 | ||||||
| Bank of Montreal |
||||||||
| 0.95%, 01/22/27 (Call 01/22/26), |
2,310 | 2,131,353 | ||||||
| 1.25%, 09/15/26 |
1,260 | 1,146,714 | ||||||
| 1.85%, 05/01/25(a) |
222 | 213,298 | ||||||
| 2.65%, 03/08/27 |
190 | 177,272 | ||||||
| Security | Par (000) |
Value | ||||||
| Banks (continued) | ||||||||
| 3.70%, 06/07/25 |
$ | 30 | $ | 29,393 | ||||
| 3.80%, 12/15/32 (Call 12/15/27), |
70 | 64,387 | ||||||
| 5.20%, 02/01/28 (Call 01/01/28) |
1,130 | 1,134,188 | ||||||
| 5.27%, 12/11/26 |
185 | 185,446 | ||||||
| 5.30%, 06/05/26 |
190 | 190,460 | ||||||
| 5.72%, 09/25/28 (Call 08/25/28) |
545 | 558,788 | ||||||
| 5.92%, 09/25/25 |
150 | 151,546 | ||||||
| Series H, 4.70%, 09/14/27 (Call 08/14/27) |
90 | 89,097 | ||||||
| Bank of New York Mellon Corp. (The) |
||||||||
| 0.75%, 01/28/26 (Call 12/28/25)(a) |
165 | 152,188 | ||||||
| 1.05%, 10/15/26 (Call 09/15/26) |
80 | 72,263 | ||||||
| 1.60%, 04/24/25 (Call 03/24/25) |
1,870 | 1,796,443 | ||||||
| 1.65%, 07/14/28 (Call 05/14/28)(a) |
1,000 | 875,979 | ||||||
| 2.05%, 01/26/27 (Call 12/26/26) |
30 | 27,681 | ||||||
| 2.45%, 08/17/26 (Call 05/17/26) |
20 | 18,803 | ||||||
| 2.80%, 05/04/26 (Call 02/04/26) |
140 | 133,646 | ||||||
| 3.40%, 01/29/28 (Call 10/29/27) |
30 | 28,375 | ||||||
| 3.44%, 02/07/28 (Call 02/07/27), |
40 | 38,231 | ||||||
| 3.85%, 04/28/28 |
1,265 | 1,220,111 | ||||||
| 3.95%, 11/18/25 (Call 10/18/25) |
105 | 102,742 | ||||||
| 3.99%, 06/13/28 (Call 06/13/27), |
20 | 19,367 | ||||||
| 4.54%, 02/01/29 (Call 02/01/28), |
500 | 490,827 | ||||||
| 4.95%, 04/26/27 (Call 04/26/26), |
425 | 422,783 | ||||||
| 5.80%, 10/25/28 (Call 10/25/27), |
170 | 174,087 | ||||||
| 6.32%, 10/25/29 (Call 10/25/28), |
320 | 335,264 | ||||||
| Series J, 1.90%, 01/25/29 (Call 11/25/28) |
750 | 656,399 | ||||||
| Bank of Nova Scotia (The) |
||||||||
| 1.05%, 03/02/26 |
4,785 | 4,412,248 | ||||||
| 1.30%, 06/11/25 |
1,731 | 1,645,217 | ||||||
| 1.30%, 09/15/26 (Call 06/15/26) |
1,595 | 1,451,709 | ||||||
| 1.35%, 06/24/26 |
1,820 | 1,670,466 | ||||||
| 1.95%, 02/02/27 |
145 | 133,080 | ||||||
| 2.70%, 08/03/26 |
1,320 | 1,246,474 | ||||||
| 2.95%, 03/11/27 |
100 | 94,135 | ||||||
| 3.45%, 04/11/25 |
105 | 102,817 | ||||||
| 4.50%, 12/16/25 |
50 | 49,139 | ||||||
| 5.25%, 06/12/28 |
105 | 105,523 | ||||||
| 5.35%, 12/07/26(a) |
325 | 326,285 | ||||||
| 5.45%, 06/12/25 |
2,000 | 2,001,396 | ||||||
| Bank OZK, 2.75%, 10/01/31 (Call 10/01/26), |
100 | 83,199 | ||||||
| Barclays PLC |
||||||||
| 2.28%, 11/24/27 (Call 11/24/26), |
2,285 | 2,088,331 | ||||||
| 2.85%, 05/07/26 (Call 05/07/25), |
885 | 855,570 | ||||||
| 3.65%, 03/16/25 |
200 | 195,827 | ||||||
| 4.38%, 01/12/26 |
1,680 | 1,645,397 | ||||||
| 4.84%, 05/09/28 (Call 05/07/27) |
815 | 784,532 | ||||||
| 4.97%, 05/16/29 (Call 05/16/28), |
800 | 777,805 | ||||||
| 5.20%, 05/12/26 |
1,000 | 987,885 | ||||||
| 5.30%, 08/09/26 (Call 08/09/25), |
55 | 54,661 | ||||||
| S C H E D U L E O F I N V E S T M E N T S |
13 |
| Schedule of Investments (continued) February 29, 2024 |
iShares® ESG Aware 1-5 Year USD Corporate Bond ETF (Percentages shown are based on Net Assets) |
| Security | Par (000) |
Value | ||||||
| Banks (continued) | ||||||||
| 5.50%, 08/09/28 (Call 08/09/27), |
$ | 50 | $ | 49,725 | ||||
| 5.83%, 05/09/27 (Call 05/09/26), |
665 | 666,355 | ||||||
| 6.49%, 09/13/29 (Call 09/13/28), |
265 | 273,051 | ||||||
| 6.50%, 09/13/27 (Call 09/13/26), |
200 | 203,479 | ||||||
| 7.39%, 11/02/28 (Call 11/02/27), |
230 | 243,073 | ||||||
| BPCE SA, 3.38%, 12/02/26 |
175 | 167,768 | ||||||
| Canadian Imperial Bank of Commerce |
||||||||
| 0.95%, 10/23/25(a) |
950 | 887,995 | ||||||
| 1.25%, 06/22/26 (Call 05/22/26) |
235 | 215,430 | ||||||
| 3.30%, 04/07/25 |
215 | 210,030 | ||||||
| 3.95%, 08/04/25 |
230 | 225,506 | ||||||
| 5.00%, 04/28/28 (Call 03/28/28) |
355 | 353,720 | ||||||
| 5.14%, 04/28/25 |
265 | 264,097 | ||||||
| 5.62%, 07/17/26 |
160 | 161,544 | ||||||
| 5.93%, 10/02/26 |
180 | 183,187 | ||||||
| 5.99%, 10/03/28 (Call 09/03/28)(a) |
745 | 771,716 | ||||||
| Citibank NA, 5.80%, 09/29/28 (Call 08/29/28)(a) |
595 | 612,890 | ||||||
| Citigroup Inc. |
||||||||
| 1.12%, 01/28/27 (Call 01/28/26), |
3,090 | 2,848,446 | ||||||
| 1.46%, 06/09/27 (Call 06/09/26), |
1,525 | 1,397,510 | ||||||
| 3.07%, 02/24/28 (Call 02/24/27), |
1,320 | 1,236,588 | ||||||
| 3.11%, 04/08/26 (Call 04/08/25), |
1,302 | 1,267,478 | ||||||
| 3.20%, 10/21/26 (Call 07/21/26) |
95 | 90,225 | ||||||
| 3.29%, 03/17/26 (Call 03/17/25), |
70 | 68,366 | ||||||
| 3.30%, 04/27/25(a) |
518 | 506,525 | ||||||
| 3.40%, 05/01/26 |
95 | 91,406 | ||||||
| 3.52%, 10/27/28 (Call 10/27/27), |
1,010 | 948,718 | ||||||
| 3.67%, 07/24/28 (Call 07/24/27), |
190 | 180,107 | ||||||
| 3.70%, 01/12/26 |
2,050 | 1,995,830 | ||||||
| 3.88%, 03/26/25 |
165 | 161,842 | ||||||
| 3.89%, 01/10/28 (Call 01/10/27), |
1,190 | 1,143,494 | ||||||
| 4.08%, 04/23/29 (Call 04/23/28), |
500 | 477,072 | ||||||
| 4.13%, 07/25/28 |
445 | 422,328 | ||||||
| 4.30%, 11/20/26 |
25 | 24,351 | ||||||
| 4.40%, 06/10/25 |
823 | 811,024 | ||||||
| 4.45%, 09/29/27 |
1,165 | 1,128,673 | ||||||
| 4.60%, 03/09/26 |
185 | 181,957 | ||||||
| 4.66%, 05/24/28 (Call 05/24/27), |
715 | 701,963 | ||||||
| 5.17%, 02/13/30 (Call 02/13/29), |
640 | 633,492 | ||||||
| 5.50%, 09/13/25 |
482 | 480,855 | ||||||
| Citizens Bank NA |
||||||||
| 2.25%, 04/28/25 (Call 03/28/25) |
250 | 239,540 | ||||||
| 4.58%, 08/09/28 (Call 08/09/27), |
430 | 409,502 | ||||||
| Comerica Bank, 4.00%, 07/27/25 |
250 | 242,319 | ||||||
| Security | Par (000) |
Value | ||||||
| Banks (continued) | ||||||||
| Cooperatieve Rabobank UA, 4.38%, 08/04/25 |
$ | 250 | $ | 245,143 | ||||
| Cooperatieve Rabobank UA/NY, 3.38%, 05/21/25 |
30 | 29,378 | ||||||
| Credit Suisse AG/New York |
||||||||
| 2.95%, 04/09/25 |
240 | 233,095 | ||||||
| 5.00%, 07/09/27 |
770 | 762,711 | ||||||
| 7.50%, 02/15/28(a) |
1,220 | 1,314,068 | ||||||
| Deutsche Bank AG |
||||||||
| 4.10%, 01/13/26(a) |
560 | 545,940 | ||||||
| 4.50%, 04/01/25 |
45 | 44,137 | ||||||
| Deutsche Bank AG/New York |
||||||||
| 1.69%, 03/19/26 |
250 | 232,948 | ||||||
| 2.13%, 11/24/26 (Call 11/24/25), |
1,445 | 1,354,860 | ||||||
| 2.31%, 11/16/27 (Call 11/16/26), |
665 | 604,027 | ||||||
| 2.55%, 01/07/28 (Call 01/07/27), |
695 | 633,009 | ||||||
| 4.10%, 01/13/26 |
973 | 949,813 | ||||||
| 6.72%, 01/18/29 (Call 01/18/28), |
210 | 215,701 | ||||||
| 6.82%, 11/20/29 (Call 11/20/28), |
1,115 | 1,152,802 | ||||||
| 7.15%, 07/13/27 (Call 07/13/26), |
370 | 379,760 | ||||||
| Discover Bank |
||||||||
| 3.45%, 07/27/26 (Call 04/27/26) |
60 | 56,895 | ||||||
| 4.25%, 03/13/26 |
5 | 4,856 | ||||||
| 4.65%, 09/13/28 (Call 06/13/28) |
1,440 | 1,374,913 | ||||||
| Fifth Third Bancorp., 6.34%, 07/27/29 (Call 07/27/28), (1-day SOFR + 2.340%)(b) |
680 | 698,295 | ||||||
| First Horizon Corp., 4.00%, 05/26/25 (Call 04/26/25) |
177 | 172,297 | ||||||
| Goldman Sachs Group Inc. (The) |
||||||||
| 1.09%, 12/09/26 (Call 12/09/25), |
235 | 217,745 | ||||||
| 1.43%, 03/09/27 (Call 03/09/26), |
2,377 | 2,197,162 | ||||||
| 1.54%, 09/10/27 (Call 09/10/26), |
1,610 | 1,463,433 | ||||||
| 1.95%, 10/21/27 (Call 10/21/26), |
3,030 | 2,774,639 | ||||||
| 2.64%, 02/24/28 (Call 02/24/27), |
1,710 | 1,584,262 | ||||||
| 3.50%, 04/01/25 (Call 03/01/25) |
144 | 141,025 | ||||||
| 3.50%, 11/16/26 (Call 11/16/25) |
180 | 172,654 | ||||||
| 3.62%, 03/15/28 (Call 03/15/27), |
1,210 | 1,153,794 | ||||||
| 3.69%, 06/05/28 (Call 06/05/27), |
1,060 | 1,011,103 | ||||||
| 3.75%, 05/22/25 (Call 02/22/25) |
141 | 138,282 | ||||||
| 3.75%, 02/25/26 (Call 11/25/25) |
95 | 92,626 | ||||||
| 3.81%, 04/23/29 (Call 04/23/28), |
786 | 742,492 | ||||||
| 3.85%, 01/26/27 (Call 01/26/26) |
140 | 135,270 | ||||||
| 4.22%, 05/01/29 (Call 05/01/28), |
1,095 | 1,049,945 | ||||||
| 4.25%, 10/21/25 |
90 | 88,383 | ||||||
| 4.48%, 08/23/28 (Call 08/23/27), |
235 | 229,256 | ||||||
| 5.95%, 01/15/27 |
175 | 178,597 | ||||||
| 6.48%, 10/24/29 (Call 10/24/28), |
1,265 | 1,325,887 | ||||||
| 14 | 2 0 2 4 I S H A R E S A N N U A L R E P O R T T O S H A R E H O L D E R S |
| Schedule of Investments (continued) February 29, 2024 |
iShares® ESG Aware 1-5 Year USD Corporate Bond ETF (Percentages shown are based on Net Assets) |
| Security | Par (000) |
Value | ||||||
| Banks (continued) | ||||||||
| HSBC Holdings PLC |
||||||||
| 1.59%, 05/24/27 (Call 05/24/26), |
$ | 2,670 | $ | 2,444,089 | ||||
| 1.65%, 04/18/26 (Call 04/18/25), |
680 | 648,831 | ||||||
| 2.01%, 09/22/28 (Call 09/22/27), |
175 | 155,066 | ||||||
| 2.10%, 06/04/26 (Call 06/04/25), |
1,270 | 1,214,597 | ||||||
| 2.21%, 08/17/29 (Call 08/17/28), |
1,040 | 902,902 | ||||||
| 2.25%, 11/22/27 (Call 11/22/26), |
540 | 494,285 | ||||||
| 3.90%, 05/25/26 |
2,117 | 2,051,369 | ||||||
| 4.04%, 03/13/28 (Call 03/13/27), |
345 | 330,565 | ||||||
| 4.25%, 08/18/25 |
509 | 498,496 | ||||||
| 4.29%, 09/12/26 (Call 09/12/25), |
1,315 | 1,289,415 | ||||||
| 4.30%, 03/08/26 |
390 | 381,593 | ||||||
| 4.38%, 11/23/26 |
540 | 525,264 | ||||||
| 4.58%, 06/19/29 (Call 06/19/28), |
1,285 | 1,236,145 | ||||||
| 4.76%, 06/09/28 (Call 06/09/27), |
693 | 676,635 | ||||||
| 5.55%, 03/04/30 (Call 03/04/29), |
800 | 799,342 | ||||||
| 6.16%, 03/09/29 (Call 03/09/28), |
295 | 301,371 | ||||||
| 7.39%, 11/03/28 (Call 11/03/27), |
570 | 603,451 | ||||||
| Huntington Bancshares Inc./OH |
||||||||
| 4.00%, 05/15/25 (Call 04/15/25) |
545 | 535,142 | ||||||
| 4.44%, 08/04/28 (Call 08/04/27), |
325 | 312,098 | ||||||
| 6.21%, 08/21/29 (Call 08/21/28), |
205 | 208,503 | ||||||
| Huntington National Bank (The), 4.55%, 05/17/28 (Call 05/17/27), (1-day SOFR + 1.650%)(b) |
1,755 | 1,691,819 | ||||||
| ING Groep NV |
||||||||
| 1.73%, 04/01/27 (Call 04/01/26), |
2,280 | 2,110,141 | ||||||
| 3.87%, 03/28/26 (Call 03/28/25), |
200 | 196,182 | ||||||
| 3.95%, 03/29/27 |
445 | 428,446 | ||||||
| 4.02%, 03/28/28 (Call 03/28/27), |
285 | 273,549 | ||||||
| 4.55%, 10/02/28 |
20 | 19,497 | ||||||
| 6.08%, 09/11/27 (Call 09/11/26), |
200 | 202,271 | ||||||
| JPMorgan Chase & Co. |
||||||||
| 1.04%, 02/04/27 (Call 02/04/26), |
355 | 327,141 | ||||||
| 1.47%, 09/22/27 (Call 09/22/26), |
2,645 | 2,403,399 | ||||||
| 1.58%, 04/22/27 (Call 04/22/26), |
2,235 | 2,065,803 | ||||||
| 2.01%, 03/13/26 (Call 03/13/25), |
2,350 | 2,265,179 | ||||||
| 2.08%, 04/22/26 (Call 04/22/25), |
3,672 | 3,533,479 | ||||||
| Security | Par (000) |
Value | ||||||
| Banks (continued) | ||||||||
| 2.18%, 06/01/28 (Call 06/01/27), |
$ | 100 | $ | 91,080 | ||||
| 2.95%, 10/01/26 (Call 07/01/26) |
5 | 4,752 | ||||||
| 2.95%, 02/24/28 (Call 02/24/27), |
460 | 430,757 | ||||||
| 3.20%, 06/15/26 (Call 03/15/26) |
70 | 67,335 | ||||||
| 3.30%, 04/01/26 (Call 01/01/26) |
25 | 24,112 | ||||||
| 3.54%, 05/01/28 (Call 05/01/27), |
225 | 213,764 | ||||||
| 3.78%, 02/01/28 (Call 02/01/27), |
2,185 | 2,097,621 | ||||||
| 3.90%, 07/15/25 (Call 04/15/25) |
116 | 114,023 | ||||||
| 3.96%, 01/29/27 (Call 01/29/26), |
105 | 102,468 | ||||||
| 4.01%, 04/23/29 (Call 04/23/28), |
40 | 38,190 | ||||||
| 4.08%, 04/26/26 (Call 04/26/25), |
125 | 123,130 | ||||||
| 4.13%, 12/15/26 |
80 | 78,092 | ||||||
| 4.25%, 10/01/27 |
45 | 44,016 | ||||||
| 4.32%, 04/26/28 (Call 04/26/27), |
3,145 | 3,069,515 | ||||||
| 4.45%, 12/05/29 (Call 12/05/28), |
500 | 483,554 | ||||||
| 4.85%, 07/25/28 (Call 07/25/27), |
1,810 | 1,789,894 | ||||||
| 5.01%, 01/23/30 (Call 01/23/29), |
1,200 | 1,187,382 | ||||||
| 5.04%, 01/23/28 (Call 01/23/27), |
550 | 547,064 | ||||||
| 5.30%, 07/24/29 (Call 07/24/28), |
1,265 | 1,268,426 | ||||||
| 6.09%, 10/23/29 (Call 10/23/28), |
990 | 1,023,392 | ||||||
| 7.63%, 10/15/26 |
30 | 31,877 | ||||||
| 7.75%, 07/15/25(a) |
115 | 119,142 | ||||||
| 8.00%, 04/29/27(a) |
245 | 266,424 | ||||||
| KeyCorp |
||||||||
| 2.25%, 04/06/27 |
35 | 31,220 | ||||||
| 4.10%, 04/30/28(a) |
700 | 655,189 | ||||||
| Lloyds Bank PLC, 3.50%, 05/14/25 |
480 | 468,667 | ||||||
| Lloyds Banking Group PLC |
||||||||
| 1.63%, 05/11/27 (Call 05/11/26), |
570 | 522,834 | ||||||
| 3.51%, 03/18/26 (Call 03/18/25), |
25 | 24,403 | ||||||
| 3.57%, 11/07/28 (Call 11/07/27), |
315 | 293,779 | ||||||
| 3.75%, 01/11/27 |
80 | 76,751 | ||||||
| 3.75%, 03/18/28 (Call 03/18/27), |
85 | 80,544 | ||||||
| 4.45%, 05/08/25 |
200 | 197,396 | ||||||
| 4.55%, 08/16/28 |
930 | 902,291 | ||||||
| 4.58%, 12/10/25 |
1,457 | 1,427,564 | ||||||
| 4.65%, 03/24/26(a) |
2,890 | 2,831,576 | ||||||
| 5.87%, 03/06/29 (Call 03/06/28), |
315 | 318,064 | ||||||
| Mitsubishi UFJ Financial Group Inc. |
||||||||
| 1.41%, 07/17/25 |
240 | 227,389 | ||||||
| 1.64%, 10/13/27 (Call 10/13/26), |
55 | 50,095 | ||||||
| S C H E D U L E O F I N V E S T M E N T S |
15 |
| Schedule of Investments (continued) February 29, 2024 |
iShares® ESG Aware 1-5 Year USD Corporate Bond ETF (Percentages shown are based on Net Assets) |
| Security | Par (000) |
Value | ||||||
| Banks (continued) | ||||||||
| 2.34%, 01/19/28 (Call 01/19/27), |
$ | 595 | $ | 549,326 | ||||
| 3.29%, 07/25/27 |
550 | 520,104 | ||||||
| 3.78%, 03/02/25 |
78 | 76,738 | ||||||
| 3.85%, 03/01/26 |
50 | 48,743 | ||||||
| 3.96%, 03/02/28 |
580 | 558,660 | ||||||
| 4.08%, 04/19/28 (Call 04/19/27), |
965 | 932,447 | ||||||
| 5.02%, 07/20/28 (Call 07/20/27), |
435 | 431,886 | ||||||
| 5.24%, 04/19/29 (Call 04/19/28), |
335 | 335,718 | ||||||
| 5.35%, 09/13/28 (Call 09/13/27), |
410 | 411,037 | ||||||
| 5.42%, 02/22/29 (Call 02/22/28), |
470 | 473,345 | ||||||
| 5.54%, 04/17/26 (Call 04/17/25), |
200 | 199,801 | ||||||
| Mizuho Financial Group Inc. |
||||||||
| 1.23%, 05/22/27 (Call 05/22/26), |
555 | 507,060 | ||||||
| 1.55%, 07/09/27 (Call 07/09/26), |
145 | 132,742 | ||||||
| 2.23%, 05/25/26 (Call 05/25/25), |
1,380 | 1,323,765 | ||||||
| 2.84%, 09/13/26 |
20 | 18,844 | ||||||
| 3.17%, 09/11/27 |
5 | 4,674 | ||||||
| 4.02%, 03/05/28 |
550 | 528,756 | ||||||
| 4.25%, 09/11/29 (Call 09/11/28), |
310 | 297,055 | ||||||
| 5.41%, 09/13/28 (Call 09/13/27), |
65 | 65,278 | ||||||
| 5.67%, 05/27/29 (Call 05/27/28), |
495 | 501,627 | ||||||
| 5.78%, 07/06/29 (Call 07/06/28), |
855 | 870,544 | ||||||
| Morgan Stanley |
||||||||
| 0.99%, 12/10/26 (Call 12/10/25), |
3,397 | 3,134,409 | ||||||
| 1.51%, 07/20/27 (Call 07/20/26), |
1,995 | 1,824,623 | ||||||
| 1.59%, 05/04/27 (Call 05/04/26), |
3,215 | 2,964,047 | ||||||
| 2.19%, 04/28/26 (Call 04/28/25), |
1,563 | 1,504,203 | ||||||
| 2.48%, 01/21/28 (Call 01/21/27), |
1,755 | 1,623,399 | ||||||
| 3.13%, 07/27/26(a) |
1,535 | 1,463,562 | ||||||
| 3.59%, 07/22/28 (Call 07/22/27)(b) |
255 | 241,319 | ||||||
| 3.63%, 01/20/27(a) |
55 | 53,028 | ||||||
| 3.77%, 01/24/29 (Call 01/24/28), |
1,890 | 1,786,291 | ||||||
| 3.88%, 01/27/26 |
1,051 | 1,025,453 | ||||||
| 3.95%, 04/23/27 |
415 | 399,430 | ||||||
| 4.00%, 07/23/25 |
919 | 903,293 | ||||||
| 4.21%, 04/20/28 (Call 04/20/27), |
770 | 745,180 | ||||||
| 4.35%, 09/08/26 |
210 | 205,275 | ||||||
| 4.43%, 01/23/30 (Call 01/23/29), |
5 | 4,801 | ||||||
| Security | Par (000) |
Value | ||||||
| Banks (continued) | ||||||||
| 4.68%, 07/17/26 (Call 07/17/25), |
$ | 330 | $ | 326,515 | ||||
| 5.00%, 11/24/25 |
873 | 867,838 | ||||||
| 5.12%, 02/01/29 (Call 02/01/28), |
490 | 487,064 | ||||||
| 5.17%, 01/16/30 (Call 01/16/29), |
1,375 | 1,366,456 | ||||||
| 5.45%, 07/20/29 (Call 07/20/28), |
250 | 251,036 | ||||||
| 6.25%, 08/09/26 |
225 | 230,279 | ||||||
| 6.30%, 10/18/28 (Call 10/18/27), |
120 | 124,037 | ||||||
| 6.41%, 11/01/29 (Call 11/01/28), |
410 | 427,757 | ||||||
| Morgan Stanley Bank NA |
||||||||
| 4.75%, 04/21/26 (Call 03/21/26) |
350 | 347,825 | ||||||
| 4.95%, 01/14/28 (Call 01/14/27), |
640 | 636,400 | ||||||
| National Australia Bank Ltd./New York |
||||||||
| 3.91%, 06/09/27 |
265 | 256,910 | ||||||
| 4.90%, 06/13/28 |
500 | 498,839 | ||||||
| 4.94%, 01/12/28 |
250 | 249,894 | ||||||
| National Bank of Canada, 5.60%, 12/18/28 |
2,460 | 2,484,236 | ||||||
| NatWest Group PLC |
||||||||
| 1.64%, 06/14/27 (Call 06/14/26), |
1,965 | 1,796,088 | ||||||
| 3.07%, 05/22/28 (Call 05/22/27), |
1,330 | 1,234,436 | ||||||
| 4.80%, 04/05/26 |
1,185 | 1,170,338 | ||||||
| 4.89%, 05/18/29 (Call 05/18/28), |
25 | 24,327 | ||||||
| 5.08%, 01/27/30 (Call 01/27/29), |
600 | 586,585 | ||||||
| 5.52%, 09/30/28 (Call 09/30/27), |
200 | 199,834 | ||||||
| 5.58%, 03/01/28 (Call 03/01/27), |
200 | 200,156 | ||||||
| 5.81%, 09/13/29 (Call 09/13/28), |
500 | 505,041 | ||||||
| 5.85%, 03/02/27 (Call 03/02/26), |
235 | 235,932 | ||||||
| Northern Trust Corp. |
||||||||
| 3.38%, 05/08/32 (Call 05/08/27), |
5 | 4,637 | ||||||
| 3.95%, 10/30/25(a) |
378 | 370,769 | ||||||
| PNC Bank NA |
||||||||
| 3.10%, 10/25/27 (Call 09/25/27) |
500 | 464,496 | ||||||
| 3.25%, 06/01/25 (Call 05/02/25) |
277 | 269,604 | ||||||
| 3.25%, 01/22/28 (Call 12/23/27) |
30 | 27,858 | ||||||
| 3.88%, 04/10/25 (Call 03/10/25) |
2,202 | 2,160,086 | ||||||
| PNC Financial Services Group Inc. (The) |
||||||||
| 1.15%, 08/13/26 (Call 07/13/26) |
45 | 40,837 | ||||||
| 2.60%, 07/23/26 (Call 05/23/26) |
80 | 75,212 | ||||||
| 3.15%, 05/19/27 (Call 04/19/27) |
545 | 512,946 | ||||||
| 5.30%, 01/21/28 (Call 01/21/27), |
265 | 264,668 | ||||||
| 5.35%, 12/02/28 (Call 12/02/27), |
1,215 | 1,214,380 | ||||||
| 5.58%, 06/12/29 (Call 06/12/28), |
998 | 1,004,330 | ||||||
| 16 | 2 0 2 4 I S H A R E S A N N U A L R E P O R T T O S H A R E H O L D E R S |
| Schedule of Investments (continued) February 29, 2024 |
iShares® ESG Aware 1-5 Year USD Corporate Bond ETF (Percentages shown are based on Net Assets) |
| Security | Par (000) |
Value | ||||||
| Banks (continued) | ||||||||
| 6.62%, 10/20/27 (Call 10/20/26), |
$ | 480 | $ | 492,818 | ||||
| Regions Financial Corp. |
||||||||
| 1.80%, 08/12/28 (Call 06/12/28) |
470 | 400,284 | ||||||
| 2.25%, 05/18/25 (Call 04/18/25) |
695 | 665,480 | ||||||
| Royal Bank of Canada |
||||||||
| 0.88%, 01/20/26(a) |
205 | 189,775 | ||||||
| 1.15%, 06/10/25 |
1,088 | 1,033,622 | ||||||
| 1.15%, 07/14/26 |
170 | 155,308 | ||||||
| 1.20%, 04/27/26(a) |
175 | 161,043 | ||||||
| 1.40%, 11/02/26 |
200 | 181,755 | ||||||
| 2.05%, 01/21/27(a) |
55 | 50,758 | ||||||
| 3.63%, 05/04/27 |
155 | 148,546 | ||||||
| 4.24%, 08/03/27 |
120 | 116,912 | ||||||
| 4.65%, 01/27/26 |
140 | 138,603 | ||||||
| 4.88%, 01/12/26 |
160 | 159,349 | ||||||
| 4.88%, 01/19/27 |
325 | 323,395 | ||||||
| 4.90%, 01/12/28 |
1,540 | 1,534,931 | ||||||
| 4.95%, 02/01/29(a) |
1,025 | 1,018,275 | ||||||
| 5.20%, 07/20/26 |
305 | 305,954 | ||||||
| 5.20%, 08/01/28 |
975 | 980,297 | ||||||
| 6.00%, 11/01/27 |
165 | 169,900 | ||||||
| Santander Holdings USA Inc. |
||||||||
| 2.49%, 01/06/28 (Call 01/06/27), |
2,760 | 2,496,064 | ||||||
| 3.24%, 10/05/26 (Call 08/05/26) |
60 | 56,219 | ||||||
| 3.45%, 06/02/25 (Call 05/02/25) |
275 | 266,674 | ||||||
| 4.50%, 07/17/25 (Call 04/17/25) |
300 | 294,100 | ||||||
| 6.50%, 03/09/29 (Call 03/09/28), |
310 | 314,819 | ||||||
| 6.57%, 06/12/29 (Call 06/12/28), |
167 | 170,086 | ||||||
| Santander U.K. Group Holdings PLC |
||||||||
| 1.53%, 08/21/26 (Call 08/21/25), |
200 | 187,343 | ||||||
| 1.67%, 06/14/27 (Call 06/14/26), |
200 | 181,810 | ||||||
| 2.47%, 01/11/28 (Call 01/11/27), |
2,300 | 2,094,517 | ||||||
| 6.53%, 01/10/29 (Call 01/10/28), |
230 | 235,920 | ||||||
| State Street Corp. |
||||||||
| 2.65%, 05/19/26 |
25 | 23,774 | ||||||
| 3.55%, 08/18/25 |
2,635 | 2,581,471 | ||||||
| 5.10%, 05/18/26 (Call 05/18/25), |
105 | 104,611 | ||||||
| 5.68%, 11/21/29 (Call 11/21/28), |
495 | 506,077 | ||||||
| Sumitomo Mitsui Banking Corp., 3.65%, 07/23/25 |
260 | 254,196 | ||||||
| Sumitomo Mitsui Financial Group Inc. |
||||||||
| 1.40%, 09/17/26 |
205 | 186,748 | ||||||
| 1.47%, 07/08/25 |
1,535 | 1,459,117 | ||||||
| 1.90%, 09/17/28 |
1,400 | 1,218,037 | ||||||
| 2.17%, 01/14/27 |
200 | 184,659 | ||||||
| 2.47%, 01/14/29 |
625 | 555,949 | ||||||
| 2.63%, 07/14/26 |
80 | 75,523 | ||||||
| 3.01%, 10/19/26 |
100 | 94,672 | ||||||
| 3.35%, 10/18/27 |
540 | 509,325 | ||||||
| 3.36%, 07/12/27 |
155 | 146,897 | ||||||
| 3.45%, 01/11/27 |
50 | 47,885 | ||||||
| 3.54%, 01/17/28(a) |
95 | 89,979 | ||||||
| Security | Par (000) |
Value | ||||||
| Banks (continued) | ||||||||
| 3.94%, 07/19/28(a) |
$ | 700 | $ | 669,950 | ||||
| 4.31%, 10/16/28 |
60 | 58,702 | ||||||
| 5.52%, 01/13/28(a) |
1,405 | 1,427,180 | ||||||
| 5.72%, 09/14/28 |
45 | 46,004 | ||||||
| 5.80%, 07/13/28(a) |
430 | 441,649 | ||||||
| 5.88%, 07/13/26 |
220 | 223,238 | ||||||
| Synchrony Bank, 5.63%, 08/23/27 (Call 07/23/27) |
520 | 505,954 | ||||||
| Synovus Bank, 5.63%, 02/15/28 (Call 01/15/28) |
5 | 4,816 | ||||||
| Toronto-Dominion Bank (The) |
||||||||
| 0.75%, 09/11/25 |
30 | 28,110 | ||||||
| 0.75%, 01/06/26 |
50 | 46,248 | ||||||
| 1.15%, 06/12/25 |
1,244 | 1,180,821 | ||||||
| 1.20%, 06/03/26 |
530 | 486,245 | ||||||
| 1.25%, 09/10/26 |
3,558 | 3,241,742 | ||||||
| 1.95%, 01/12/27(a) |
190 | 174,876 | ||||||
| 2.80%, 03/10/27 |
195 | 182,878 | ||||||
| 3.63%, 09/15/31 (Call 09/15/26), |
830 | 792,110 | ||||||
| 3.77%, 06/06/25 |
70 | 68,752 | ||||||
| 4.11%, 06/08/27 |
190 | 184,392 | ||||||
| 4.69%, 09/15/27 |
85 | 84,030 | ||||||
| 5.26%, 12/11/26 |
185 | 186,127 | ||||||
| 5.52%, 07/17/28(a) |
995 | 1,010,920 | ||||||
| Truist Bank |
||||||||
| 1.50%, 03/10/25 (Call 02/10/25) |
50 | 48,044 | ||||||
| 3.63%, 09/16/25 (Call 08/16/25) |
250 | 242,537 | ||||||
| Truist Financial Corp. |
||||||||
| 1.13%, 08/03/27 (Call 06/03/27) |
20 | 17,407 | ||||||
| 1.20%, 08/05/25 (Call 07/03/25) |
60 | 56,438 | ||||||
| 1.27%, 03/02/27 (Call 03/02/26), |
655 | 601,223 | ||||||
| 1.89%, 06/07/29 (Call 06/07/28), |
875 | 751,492 | ||||||
| 3.70%, 06/05/25 (Call 05/05/25) |
69 | 67,481 | ||||||
| 4.00%, 05/01/25 (Call 03/01/25) |
187 | 183,615 | ||||||
| 4.87%, 01/26/29 (Call 01/26/28), |
535 | 520,672 | ||||||
| 5.44%, 01/24/30 (Call 01/24/29), |
260 | 257,411 | ||||||
| 7.16%, 10/30/29 (Call 10/30/28), |
450 | 476,377 | ||||||
| U.S. Bancorp. |
||||||||
| 1.45%, 05/12/25 (Call 04/11/25) |
50 | 47,844 | ||||||
| 3.10%, 04/27/26 (Call 03/27/26)(a) |
35 | 33,420 | ||||||
| 3.90%, 04/26/28 (Call 03/24/28) |
515 | 492,928 | ||||||
| 4.65%, 02/01/29 (Call 02/01/28), |
965 | 937,796 | ||||||
| 5.38%, 01/23/30 (Call 01/23/29), |
200 | 198,872 | ||||||
| 5.78%, 06/12/29 (Call 06/12/28), |
900 | 909,204 | ||||||
| UBS AG/London |
||||||||
| 5.65%, 09/11/28 |
1,510 | 1,540,098 | ||||||
| 5.80%, 09/11/25 |
1,000 | 1,007,069 | ||||||
| UBS Group AG |
||||||||
| 3.75%, 03/26/25 |
464 | 454,389 | ||||||
| 4.55%, 04/17/26 |
585 | 574,582 | ||||||
| Wells Fargo & Co. |
||||||||
| 2.39%, 06/02/28 (Call 06/02/27), |
3,345 | 3,051,144 | ||||||
| 3.00%, 10/23/26 |
170 | 160,628 | ||||||
| S C H E D U L E O F I N V E S T M E N T S |
17 |
| Schedule of Investments (continued) February 29, 2024 |
iShares® ESG Aware 1-5 Year USD Corporate Bond ETF (Percentages shown are based on Net Assets) |
| Security | Par (000) |
Value | ||||||
| Banks (continued) | ||||||||
| 3.20%, 06/17/27 (Call 06/17/26), |
$ | 50 | $ | 47,592 | ||||
| 3.53%, 03/24/28 (Call 03/24/27), |
275 | 260,741 | ||||||
| 3.58%, 05/22/28 (Call 05/22/27), |
869 | 823,087 | ||||||
| 3.91%, 04/25/26 (Call 04/25/25), |
10 | 9,807 | ||||||
| 4.10%, 06/03/26 |
5 | 4,868 | ||||||
| 4.30%, 07/22/27 |
270 | 262,098 | ||||||
| 4.81%, 07/25/28 (Call 07/25/27), |
2,640 | 2,593,306 | ||||||
| 5.20%, 01/23/30 (Call 01/23/29), |
935 | 926,940 | ||||||
| 5.57%, 07/25/29 (Call 07/25/28), |
360 | 362,506 | ||||||
| Westpac Banking Corp. |
||||||||
| 1.15%, 06/03/26 |
80 | 73,513 | ||||||
| 1.95%, 11/20/28 |
950 | 833,272 | ||||||
| 2.85%, 05/13/26 |
80 | 76,444 | ||||||
| 4.32%, 11/23/31 (Call 11/23/26), |
205 | 196,844 | ||||||
|
|
|
|||||||
| 271,689,648 | ||||||||
| Beverages — 3.0% | ||||||||
| Anheuser-Busch Companies LLC/Anheuser-Busch InBev Worldwide Inc., 3.65%, 02/01/26 (Call 11/01/25) |
126 | 122,847 | ||||||
| Anheuser-Busch InBev Worldwide Inc. |
||||||||
| 4.00%, 04/13/28 (Call 01/13/28) |
950 | 920,935 | ||||||
| 4.75%, 01/23/29 (Call 10/23/28) |
1,415 | 1,405,429 | ||||||
| Brown-Forman Corp., 3.50%, 04/15/25 (Call 02/15/25) |
70 | 68,577 | ||||||
| Coca-Cola Co. (The) |
||||||||
| 1.00%, 03/15/28(a) |
79 | 68,822 | ||||||
| 1.45%, 06/01/27 |
2,890 | 2,614,818 | ||||||
| 1.50%, 03/05/28 |
5 | 4,440 | ||||||
| 2.90%, 05/25/27 |
155 | 147,050 | ||||||
| 3.38%, 03/25/27 |
1,920 | 1,849,697 | ||||||
| Constellation Brands Inc. |
||||||||
| 4.35%, 05/09/27 (Call 04/09/27)(a) |
55 | 53,779 | ||||||
| 4.80%, 01/15/29 (Call 12/15/28) |
175 | 172,381 | ||||||
| Diageo Capital PLC |
||||||||
| 1.38%, 09/29/25 (Call 08/29/25) |
5,165 | 4,871,166 | ||||||
| 5.30%, 10/24/27 (Call 09/24/27) |
2,270 | 2,296,401 | ||||||
| Keurig Dr Pepper Inc. |
||||||||
| 2.55%, 09/15/26 (Call 06/15/26) |
65 | 60,957 | ||||||
| 3.43%, 06/15/27 (Call 03/15/27) |
1,725 | 1,641,905 | ||||||
| Molson Coors Beverage Co., 3.00%, 07/15/26 (Call 04/15/26) |
6,099 | 5,808,814 | ||||||
| PepsiCo Inc. |
||||||||
| 2.38%, 10/06/26 (Call 07/06/26) |
185 | 174,295 | ||||||
| 2.63%, 03/19/27 (Call 01/19/27) |
605 | 568,864 | ||||||
| 2.75%, 04/30/25 (Call 01/30/25) |
281 | 273,671 | ||||||
| 2.85%, 02/24/26 (Call 11/24/25) |
30 | 28,851 | ||||||
| 3.50%, 07/17/25 (Call 04/17/25) |
1,571 | 1,538,883 | ||||||
| 3.60%, 02/18/28 (Call 01/18/28) |
60 | 57,689 | ||||||
| 4.45%, 05/15/28 (Call 04/15/28)(a) |
500 | 498,996 | ||||||
| 5.13%, 11/10/26 (Call 10/10/26) |
335 | 337,188 | ||||||
|
|
|
|||||||
| 25,586,455 | ||||||||
| Security | Par (000) |
Value | ||||||
| Biotechnology — 1.0% | ||||||||
| Amgen Inc. |
||||||||
| 1.65%, 08/15/28 (Call 06/15/28) |
$ | 35 | $ | 30,449 | ||||
| 2.20%, 02/21/27 (Call 12/21/26) |
10 | 9,214 | ||||||
| 2.60%, 08/19/26 (Call 05/19/26) |
30 | 28,316 | ||||||
| 3.13%, 05/01/25 (Call 02/01/25) |
466 | 454,381 | ||||||
| 5.15%, 03/02/28 (Call 02/02/28) |
2,065 | 2,069,090 | ||||||
| 5.25%, 03/02/25 |
805 | 803,474 | ||||||
| Baxalta Inc., 4.00%, 06/23/25 (Call 03/23/25) |
150 | 147,290 | ||||||
| Biogen Inc., 4.05%, 09/15/25 (Call 06/15/25) |
467 | 457,807 | ||||||
| Gilead Sciences Inc. |
||||||||
| 1.20%, 10/01/27 (Call 08/01/27) |
2,650 | 2,331,101 | ||||||
| 2.95%, 03/01/27 (Call 12/01/26) |
1,520 | 1,435,621 | ||||||
| 3.65%, 03/01/26 (Call 12/01/25) |
655 | 636,146 | ||||||
| Illumina Inc., 5.75%, 12/13/27 (Call 11/13/27) |
45 | 45,323 | ||||||
|
|
|
|||||||
| 8,448,212 | ||||||||
| Building Materials — 1.9% | ||||||||
| Carrier Global Corp. |
||||||||
| 2.49%, 02/15/27 (Call 12/15/26) |
1,660 | 1,542,667 | ||||||
| 5.80%, 11/30/25 |
700 | 705,027 | ||||||
| Fortune Brands Innovations Inc., |
3,003 | 2,946,647 | ||||||
| Johnson Controls International PLC, |
4,295 | 4,185,562 | ||||||
| Lennox International Inc. |
||||||||
| 1.35%, 08/01/25 (Call 07/01/25) |
210 | 197,975 | ||||||
| 1.70%, 08/01/27 (Call 06/01/27)(a) |
1,085 | 972,466 | ||||||
| 5.50%, 09/15/28 (Call 08/15/28) |
1,205 | 1,216,211 | ||||||
| Masco Corp., 1.50%, 02/15/28 (Call 12/15/27) |
365 | 316,959 | ||||||
| Owens Corning, 3.40%, 08/15/26 (Call 05/15/26) |
900 | 858,904 | ||||||
| Trane Technologies Financing Ltd., 3.50%, 03/21/26 (Call 01/21/26) |
1,215 | 1,174,110 | ||||||
| Trane Technologies Global Holding Co. Ltd., 3.75%, 08/21/28 (Call 05/21/28) |
2,275 | 2,169,422 | ||||||
| Vulcan Materials Co., 4.50%, 04/01/25 (Call 01/01/25) |
65 | 64,309 | ||||||
|
|
|
|||||||
| 16,350,259 | ||||||||
| Chemicals — 1.7% | ||||||||
| Celanese U.S. Holdings LLC |
||||||||
| 6.05%, 03/15/25 |
49 | 49,113 | ||||||
| 6.17%, 07/15/27 (Call 06/15/27) |
935 | 949,331 | ||||||
| Dow Chemical Co. (The), 4.80%, 11/30/28 (Call 08/30/28)(a) |
1,025 | 1,017,125 | ||||||
| DuPont de Nemours Inc., 4.73%, 11/15/28 (Call 08/15/28) |
10 | 9,947 | ||||||
| Eastman Chemical Co., 3.80%, 03/15/25 (Call 12/15/24) |
45 | 44,191 | ||||||
| Ecolab Inc. |
||||||||
| 1.65%, 02/01/27 (Call 01/01/27) |
4,195 | 3,834,370 | ||||||
| 2.70%, 11/01/26 (Call 08/01/26) |
4,095 | 3,881,402 | ||||||
| 3.25%, 12/01/27 (Call 09/01/27) |
1,445 | 1,368,312 | ||||||
| 5.25%, 01/15/28 (Call 12/15/27) |
555 | 563,026 | ||||||
| EIDP Inc., 1.70%, 07/15/25 (Call 06/15/25) |
54 | 51,335 | ||||||
| International Flavors & Fragrances Inc., |
400 | 386,409 | ||||||
| LYB International Finance II BV, |
50 | 47,607 | ||||||
| Nutrien Ltd. |
||||||||
| 3.00%, 04/01/25 (Call 01/01/25) |
75 | 72,950 | ||||||
| 4.00%, 12/15/26 (Call 09/15/26) |
195 | 188,894 | ||||||
| 4.90%, 03/27/28 (Call 02/27/28) |
905 | 897,576 | ||||||
| 18 | 2 0 2 4 I S H A R E S A N N U A L R E P O R T T O S H A R E H O L D E R S |
| Schedule of Investments (continued) February 29, 2024 |
iShares® ESG Aware 1-5 Year USD Corporate Bond ETF (Percentages shown are based on Net Assets) |
| Security | Par (000) |
Value | ||||||
| Chemicals (continued) | ||||||||
| PPG Industries Inc. |
||||||||
| 1.20%, 03/15/26 (Call 02/15/26) |
$ | 1,021 | $ | 943,663 | ||||
| 3.75%, 03/15/28 (Call 12/15/27) |
20 | 19,154 | ||||||
| Sherwin-Williams Co. (The), |
115 | 112,063 | ||||||
|
|
|
|||||||
| 14,436,468 | ||||||||
| Commercial Services — 1.2% | ||||||||
| Automatic Data Processing Inc. |
||||||||
| 1.70%, 05/15/28 (Call 03/15/28)(a) |
445 | 396,178 | ||||||
| 3.38%, 09/15/25 (Call 06/15/25) |
8,145 | 7,957,421 | ||||||
| Block Financial LLC |
||||||||
| 2.50%, 07/15/28 (Call 05/15/28) |
150 | 132,115 | ||||||
| 5.25%, 10/01/25 (Call 07/01/25)(a) |
342 | 339,439 | ||||||
| GXO Logistics Inc., 1.65%, 07/15/26 (Call 06/15/26)(a) |
1,060 | 971,966 | ||||||
| Moody’s Corp., 3.75%, 03/24/25 (Call 02/24/25) |
75 | 73,742 | ||||||
| PayPal Holdings Inc. |
||||||||
| 1.65%, 06/01/25 (Call 05/01/25) |
539 | 516,055 | ||||||
| 2.65%, 10/01/26 (Call 08/01/26) |
85 | 80,150 | ||||||
| S&P Global Inc., 2.45%, 03/01/27 (Call 02/01/27) |
305 | 284,307 | ||||||
|
|
|
|||||||
| 10,751,373 | ||||||||
| Computers — 2.1% | ||||||||
| Apple Inc. |
||||||||
| 1.20%, 02/08/28 (Call 12/08/27) |
1,900 | 1,669,734 | ||||||
| 3.00%, 06/20/27 (Call 03/20/27) |
25 | 23,712 | ||||||
| 3.00%, 11/13/27 (Call 08/13/27) |
145 | 137,148 | ||||||
| 4.00%, 05/10/28 (Call 04/10/28) |
435 | 425,928 | ||||||
| Dell International LLC/EMC Corp. |
||||||||
| 4.90%, 10/01/26 (Call 08/01/26) |
350 | 346,804 | ||||||
| 6.02%, 06/15/26 (Call 03/15/26) |
360 | 363,968 | ||||||
| DXC Technology Co. |
||||||||
| 1.80%, 09/15/26 (Call 08/15/26) |
30 | 27,239 | ||||||
| 2.38%, 09/15/28 (Call 07/15/28)(a) |
460 | 396,583 | ||||||
| Hewlett Packard Enterprise Co. |
||||||||
| 1.75%, 04/01/26 (Call 03/01/26) |
1,097 | 1,019,586 | ||||||
| 4.90%, 10/15/25 (Call 07/15/25) |
2,638 | 2,621,035 | ||||||
| 5.25%, 07/01/28 (Call 06/01/28)(a) |
720 | 721,151 | ||||||
| 6.10%, 04/01/26 (Call 04/01/24)(a) |
10 | 10,003 | ||||||
| HP Inc. |
||||||||
| 1.45%, 06/17/26 (Call 05/17/26) |
45 | 41,345 | ||||||
| 2.20%, 06/17/25 (Call 05/17/25) |
1,878 | 1,802,783 | ||||||
| 3.00%, 06/17/27 (Call 04/17/27) |
195 | 182,165 | ||||||
| 4.75%, 01/15/28 (Call 12/15/27) |
40 | 39,591 | ||||||
| International Business Machines Corp. |
||||||||
| 1.70%, 05/15/27 (Call 03/15/27) |
130 | 117,349 | ||||||
| 2.20%, 02/09/27 (Call 01/09/27) |
15 | 13,866 | ||||||
| 3.30%, 05/15/26 |
670 | 645,060 | ||||||
| 3.30%, 01/27/27 |
110 | 105,087 | ||||||
| 3.45%, 02/19/26(a) |
4,505 | 4,370,222 | ||||||
| 4.50%, 02/06/26 |
355 | 351,780 | ||||||
| 4.50%, 02/06/28 (Call 01/06/28) |
155 | 152,892 | ||||||
| 7.00%, 10/30/25 |
2,200 | 2,270,784 | ||||||
| Leidos Inc., 3.63%, 05/15/25 (Call 04/15/25) |
496 | 484,319 | ||||||
|
|
|
|||||||
| 18,340,134 | ||||||||
| Cosmetics & Personal Care — 0.6% | ||||||||
| Colgate-Palmolive Co. |
||||||||
| 3.10%, 08/15/27 (Call 07/15/27) |
2,120 | 2,022,541 | ||||||
| 4.80%, 03/02/26 |
124 | 124,298 | ||||||
| Conopco Inc., Series E, 7.25%, 12/15/26 |
20 | 21,214 | ||||||
| Security | Par (000) |
Value | ||||||
| Cosmetics & Personal Care (continued) | ||||||||
| Procter & Gamble Co. (The) |
||||||||
| 2.80%, 03/25/27 |
$ | 10 | $ | 9,466 | ||||
| 2.85%, 08/11/27(a) |
20 | 18,873 | ||||||
| 4.35%, 01/29/29 |
275 | 272,641 | ||||||
| Unilever Capital Corp. |
||||||||
| 2.90%, 05/05/27 (Call 02/05/27) |
105 | 99,231 | ||||||
| 3.10%, 07/30/25 |
152 | 148,152 | ||||||
| 3.38%, 03/22/25 (Call 01/22/25) |
175 | 171,611 | ||||||
| 3.50%, 03/22/28 (Call 12/22/27) |
1,960 | 1,875,174 | ||||||
| 4.88%, 09/08/28 (Call 08/08/28) |
255 | 256,837 | ||||||
|
|
|
|||||||
| 5,020,038 | ||||||||
| Distribution & Wholesale — 0.2% | ||||||||
| LKQ Corp., 5.75%, 06/15/28 (Call 05/15/28) |
1,565 | 1,580,776 | ||||||
|
|
|
|||||||
| Diversified Financial Services — 5.3% | ||||||||
| AerCap Ireland Capital DAC/AerCap Global Aviation Trust |
||||||||
| 1.75%, 01/30/26 (Call 12/30/25) |
2,085 | 1,936,996 | ||||||
| 2.45%, 10/29/26 (Call 09/29/26) |
1,695 | 1,563,979 | ||||||
| 3.00%, 10/29/28 (Call 08/29/28) |
2,300 | 2,066,552 | ||||||
| 3.88%, 01/23/28 (Call 10/23/27) |
435 | 409,605 | ||||||
| 4.45%, 10/01/25 (Call 08/01/25) |
575 | 563,975 | ||||||
| 4.45%, 04/03/26 (Call 02/03/26) |
180 | 176,313 | ||||||
| 4.63%, 10/15/27 (Call 08/15/27) |
85 | 82,290 | ||||||
| 5.10%, 01/19/29 (Call 12/19/28)(a) |
385 | 378,475 | ||||||
| 5.75%, 06/06/28 (Call 05/06/28)(a) |
370 | 372,949 | ||||||
| 6.10%, 01/15/27 (Call 12/15/26) |
150 | 151,939 | ||||||
| 6.50%, 07/15/25 (Call 06/15/25)(a) |
677 | 683,114 | ||||||
| Affiliated Managers Group Inc., 3.50%, 08/01/25 |
50 | 48,628 | ||||||
| Air Lease Corp. |
||||||||
| 1.88%, 08/15/26 (Call 07/15/26)(a) |
105 | 96,429 | ||||||
| 2.10%, 09/01/28 (Call 07/01/28) |
390 | 338,685 | ||||||
| 2.20%, 01/15/27 (Call 12/15/26)(a) |
750 | 686,966 | ||||||
| 2.88%, 01/15/26 (Call 12/15/25)(a) |
668 | 637,246 | ||||||
| 3.25%, 03/01/25 (Call 01/01/25) |
674 | 658,067 | ||||||
| 3.38%, 07/01/25 (Call 06/01/25) |
36 | 34,979 | ||||||
| 3.63%, 04/01/27 (Call 01/01/27) |
190 | 180,411 | ||||||
| 5.10%, 03/01/29 (Call 02/01/29) |
150 | 147,414 | ||||||
| 5.30%, 02/01/28 (Call 01/01/28)(a) |
1,300 | 1,292,158 | ||||||
| Aircastle Ltd., 4.25%, 06/15/26 (Call 04/15/26)(a) |
1,270 | 1,230,804 | ||||||
| Ally Financial Inc. |
||||||||
| 2.20%, 11/02/28 (Call 09/02/28) |
20 | 16,990 | ||||||
| 4.63%, 03/30/25 |
228 | 225,098 | ||||||
| 4.75%, 06/09/27 (Call 05/09/27)(a) |
635 | 616,577 | ||||||
| 5.80%, 05/01/25 (Call 04/01/25)(a) |
15 | 14,974 | ||||||
| 6.85%, 01/03/30 (Call 01/03/29), |
430 | 439,475 | ||||||
| 6.99%, 06/13/29 (Call 06/13/28), |
10 | 10,272 | ||||||
| American Express Co. |
||||||||
| 1.65%, 11/04/26 (Call 10/04/26) |
110 | 100,574 | ||||||
| 2.55%, 03/04/27 (Call 02/01/27) |
465 | 432,001 | ||||||
| 3.13%, 05/20/26 (Call 04/20/26) |
933 | 895,390 | ||||||
| 3.30%, 05/03/27 (Call 04/03/27) |
505 | 478,750 | ||||||
| 4.20%, 11/06/25 (Call 10/06/25) |
402 | 396,538 | ||||||
| 5.10%, 02/16/28 (Call 02/16/27), |
280 | 278,883 | ||||||
| 5.28%, 07/27/29 (Call 07/27/28), |
600 | 603,429 | ||||||
| 5.39%, 07/28/27 (Call 07/28/26), |
85 | 85,234 | ||||||
| S C H E D U L E O F I N V E S T M E N T S |
19 |
| Schedule of Investments (continued) February 29, 2024 |
iShares® ESG Aware 1-5 Year USD Corporate Bond ETF (Percentages shown are based on Net Assets) |
| Security | Par (000) |
Value | ||||||
| Diversified Financial Services (continued) | ||||||||
| 5.85%, 11/05/27 (Call 10/05/27) |
$ | 1,005 | $ | 1,030,792 | ||||
| American Express Credit Corp., |
70 | 66,342 | ||||||
| Ameriprise Financial Inc., |
989 | 963,048 | ||||||
| Brookfield Finance Inc. |
||||||||
| 3.90%, 01/25/28 (Call 10/25/27)(a) |
120 | 115,069 | ||||||
| 4.25%, 06/02/26 (Call 03/02/26) |
227 | 222,880 | ||||||
| Capital One Financial Corp. |
||||||||
| 1.88%, 11/02/27 (Call 11/02/26), |
160 | 145,178 | ||||||
| 3.65%, 05/11/27 (Call 04/11/27) |
35 | 33,317 | ||||||
| 3.75%, 07/28/26 (Call 06/28/26) |
35 | 33,591 | ||||||
| 3.75%, 03/09/27 (Call 02/09/27) |
170 | 162,275 | ||||||
| 4.93%, 05/10/28 (Call 05/10/27), |
1,575 | 1,540,631 | ||||||
| 4.99%, 07/24/26 (Call 07/24/25), |
85 | 84,208 | ||||||
| 5.47%, 02/01/29 (Call 02/01/28), |
1,140 | 1,132,508 | ||||||
| 5.70%, 02/01/30 (Call 02/01/29), |
140 | 140,264 | ||||||
| 6.31%, 06/08/29 (Call 06/08/28), |
320 | 327,726 | ||||||
| Cboe Global Markets Inc., |
610 | 590,312 | ||||||
| Charles Schwab Corp. (The) |
||||||||
| 1.15%, 05/13/26 (Call 04/13/26) |
5 | 4,587 | ||||||
| 2.00%, 03/20/28 (Call 01/20/28) |
960 | 851,073 | ||||||
| 2.45%, 03/03/27 (Call 02/03/27)(a) |
95 | 88,027 | ||||||
| 3.00%, 03/10/25 (Call 12/10/24)(a) |
38 | 37,101 | ||||||
| 3.20%, 01/25/28 (Call 10/25/27) |
200 | 187,245 | ||||||
| 3.30%, 04/01/27 (Call 01/01/27) |
50 | 47,498 | ||||||
| 3.85%, 05/21/25 (Call 03/21/25) |
72 | 70,654 | ||||||
| 4.20%, 03/24/25 (Call 02/24/25)(a) |
299 | 295,688 | ||||||
| 5.64%, 05/19/29 (Call 05/19/28), |
5 | 5,063 | ||||||
| 5.88%, 08/24/26 (Call 07/24/26) |
180 | 182,823 | ||||||
| 6.20%, 11/17/29 (Call 11/17/28), |
315 | 325,304 | ||||||
| Discover Financial Services |
||||||||
| 3.75%, 03/04/25 (Call 12/04/24) |
520 | 510,373 | ||||||
| 4.10%, 02/09/27 (Call 11/09/26) |
345 | 331,573 | ||||||
| 4.50%, 01/30/26 (Call 11/30/25) |
60 | 58,957 | ||||||
| Eaton Vance Corp., 3.50%, 04/06/27 (Call 01/06/27) |
1,285 | 1,223,070 | ||||||
| Franklin Resources Inc., 2.85%, 03/30/25 |
570 | 555,311 | ||||||
| Intercontinental Exchange Inc., |
195 | 188,308 | ||||||
| Invesco Finance PLC, 3.75%, 01/15/26(a) |
478 | 464,508 | ||||||
| Janus Henderson U.S. Holdings Inc., |
2,505 | 2,475,453 | ||||||
| Legg Mason Inc., 4.75%, 03/15/26 |
535 | 531,240 | ||||||
| LPL Holdings Inc., 6.75%, 11/17/28 (Call 10/17/28) |
205 | 213,890 | ||||||
| Nasdaq Inc. |
||||||||
| 3.85%, 06/30/26 (Call 03/30/26)(a) |
140 | 135,869 | ||||||
| 5.35%, 06/28/28 (Call 05/28/28) |
1,245 | 1,257,466 | ||||||
| 5.65%, 06/28/25 |
85 | 85,275 | ||||||
| Nomura Holdings Inc. |
||||||||
| 1.65%, 07/14/26 |
1,725 | 1,577,481 | ||||||
| 1.85%, 07/16/25 |
1,140 | 1,082,386 | ||||||
| 2.17%, 07/14/28 |
710 | 618,884 | ||||||
| Security | Par (000) |
Value | ||||||
| Diversified Financial Services (continued) | ||||||||
| 2.33%, 01/22/27 |
$ | 2,030 | $ | 1,860,250 | ||||
| 2.71%, 01/22/29 |
200 | 176,242 | ||||||
| 5.71%, 01/09/26 |
200 | 200,374 | ||||||
| 5.84%, 01/18/28 |
200 | 202,743 | ||||||
| 6.07%, 07/12/28 |
295 | 302,009 | ||||||
| ORIX Corp. |
||||||||
| 3.70%, 07/18/27 |
75 | 71,709 | ||||||
| 5.00%, 09/13/27 |
5 | 4,995 | ||||||
| Radian Group Inc. |
||||||||
| 4.88%, 03/15/27 (Call 09/15/26) |
485 | 470,999 | ||||||
| 6.20%, 05/15/29 (Call 02/15/29) |
275 | 275,682 | ||||||
| 6.63%, 03/15/25 (Call 09/15/24)(a) |
760 | 761,210 | ||||||
| Synchrony Financial |
||||||||
| 3.70%, 08/04/26 (Call 05/04/26) |
230 | 217,045 | ||||||
| 3.95%, 12/01/27 (Call 09/01/27) |
1,200 | 1,111,472 | ||||||
| 4.50%, 07/23/25 (Call 04/23/25) |
915 | 894,273 | ||||||
| Voya Financial Inc., 3.65%, 06/15/26 |
37 | 35,573 | ||||||
| Western Union Co. (The), |
1,007 | 926,891 | ||||||
|
|
|
|||||||
| 45,836,874 | ||||||||
| Electric — 6.1% | ||||||||
| AEP Texas Inc., 3.95%, 06/01/28 (Call 03/01/28) |
1,450 | 1,386,062 | ||||||
| Atlantic City Electric Co., 4.00%, 10/15/28 (Call 07/15/28) |
900 | 866,087 | ||||||
| Avangrid Inc., 3.20%, 04/15/25 (Call 03/15/25) |
7,471 | 7,267,335 | ||||||
| Baltimore Gas & Electric Co., 2.40%, 08/15/26 (Call 05/15/26) |
5 | 4,712 | ||||||
| Commonwealth Edison Co. |
||||||||
| 2.55%, 06/15/26 (Call 03/15/26) |
90 | 85,150 | ||||||
| 3.70%, 08/15/28 (Call 05/15/28) |
1,540 | 1,466,634 | ||||||
| Series 122, 2.95%, 08/15/27 (Call 05/15/27) |
10 | 9,365 | ||||||
| Connecticut Light & Power Co. (The) |
||||||||
| Series A, 0.75%, 12/01/25 (Call 11/01/25) |
40 | 37,089 | ||||||
| Series A, 3.20%, 03/15/27 (Call 12/15/26) |
320 | 304,033 | ||||||
| Connecticut Light and Power Co. (The), 4.65%, 01/01/29 (Call 12/01/28) |
1,100 | 1,081,429 | ||||||
| Consumers Energy Co. |
||||||||
| 3.80%, 11/15/28 (Call 08/15/28) |
800 | 764,936 | ||||||
| 4.65%, 03/01/28 (Call 01/01/28)(a) |
70 | 69,533 | ||||||
| Edison International |
||||||||
| 4.95%, 04/15/25 (Call 03/15/25) |
148 | 146,711 | ||||||
| 5.25%, 11/15/28 (Call 10/15/28) |
550 | 547,108 | ||||||
| 5.75%, 06/15/27 (Call 04/15/27) |
675 | 681,389 | ||||||
| Enel Americas SA, 4.00%, 10/25/26 (Call 07/25/26) |
1,120 | 1,075,895 | ||||||
| Eversource Energy |
||||||||
| 2.90%, 03/01/27 (Call 02/01/27) |
2,225 | 2,081,839 | ||||||
| 4.60%, 07/01/27 (Call 06/01/27) |
55 | 53,783 | ||||||
| 5.00%, 01/01/27(a) |
150 | 148,973 | ||||||
| 5.45%, 03/01/28 (Call 02/01/28) |
135 | 135,738 | ||||||
| 5.95%, 02/01/29 (Call 01/01/29)(a) |
350 | 358,458 | ||||||
| Series Q, 0.80%, 08/15/25 (Call 07/15/25) |
271 | 252,956 | ||||||
| Series U, 1.40%, 08/15/26 (Call 07/15/26) |
2,920 | 2,651,503 | ||||||
| Exelon Corp. |
||||||||
| 3.40%, 04/15/26 (Call 01/15/26) |
127 | 122,279 | ||||||
| 3.95%, 06/15/25 (Call 03/15/25) |
579 | 568,313 | ||||||
| 5.15%, 03/15/28 (Call 02/15/28) |
780 | 778,328 | ||||||
| 5.15%, 03/15/29 (Call 02/15/29) |
85 | 84,594 | ||||||
| Florida Power & Light Co. |
||||||||
| 2.85%, 04/01/25 (Call 03/01/25) |
3,876 | 3,778,867 | ||||||
| 3.13%, 12/01/25 (Call 06/01/25) |
78 | 75,602 | ||||||
| 4.40%, 05/15/28 (Call 03/15/28) |
120 | 117,898 | ||||||
| 20 | 2 0 2 4 I S H A R E S A N N U A L R E P O R T T O S H A R E H O L D E R S |
| Schedule of Investments (continued) February 29, 2024 |
iShares® ESG Aware 1-5 Year USD Corporate Bond ETF (Percentages shown are based on Net Assets) |
| Security | Par (000) |
Value | ||||||
| Electric (continued) | ||||||||
| 5.05%, 04/01/28 (Call 03/01/28) |
$ | 125 | $ | 125,907 | ||||
| Fortis Inc./Canada, 3.06%, 10/04/26 (Call 07/04/26) |
1,740 | 1,642,681 | ||||||
| Iberdrola International BV, 5.81%, 03/15/25 |
1,170 | 1,170,025 | ||||||
| ITC Holdings Corp. |
||||||||
| 3.25%, 06/30/26 (Call 03/30/26) |
3,255 | 3,108,779 | ||||||
| 3.35%, 11/15/27 (Call 08/15/27) |
10 | 9,380 | ||||||
| National Grid PLC, 5.60%, 06/12/28 (Call 05/12/28) |
2,645 | 2,678,313 | ||||||
| National Rural Utilities Cooperative Finance Corp. |
||||||||
| 4.85%, 02/07/29 (Call 01/07/29) |
250 | 247,869 | ||||||
| 5.05%, 09/15/28 (Call 08/15/28) |
110 | 110,119 | ||||||
| 5.25%, 04/20/46 (Call 04/20/26), |
15 | 14,551 | ||||||
| NextEra Energy Capital Holdings Inc. |
||||||||
| 1.88%, 01/15/27 (Call 12/15/26) |
1,414 | 1,290,352 | ||||||
| 1.90%, 06/15/28 (Call 04/15/28) |
1,197 | 1,048,392 | ||||||
| 3.55%, 05/01/27 (Call 02/01/27) |
135 | 128,439 | ||||||
| 3.80%, 03/15/82 (Call 03/15/27), |
322 | 286,841 | ||||||
| 4.63%, 07/15/27 (Call 06/15/27)(a) |
145 | 142,662 | ||||||
| 4.80%, 12/01/77 (Call 12/01/27), |
300 | 271,655 | ||||||
| 4.90%, 02/28/28 (Call 01/28/28) |
650 | 644,607 | ||||||
| 4.90%, 03/15/29 (Call 02/15/29) |
500 | 493,792 | ||||||
| 4.95%, 01/29/26 |
500 | 496,334 | ||||||
| NSTAR Electric Co., 3.20%, 05/15/27 (Call 02/15/27)(a) |
435 | 414,407 | ||||||
| Oncor Electric Delivery Co. LLC |
||||||||
| 2.95%, 04/01/25 (Call 01/01/25) |
2,230 | 2,174,461 | ||||||
| 3.70%, 11/15/28 (Call 08/15/28) |
65 | 61,589 | ||||||
| Pacific Gas and Electric Co. |
||||||||
| 2.10%, 08/01/27 (Call 06/01/27) |
105 | 94,061 | ||||||
| 3.30%, 12/01/27 (Call 09/01/27) |
260 | 240,188 | ||||||
| 5.45%, 06/15/27 (Call 05/15/27) |
970 | 968,163 | ||||||
| 5.55%, 05/15/29 (Call 04/15/29) |
375 | 375,745 | ||||||
| Public Service Electric & Gas Co. |
||||||||
| 0.95%, 03/15/26 (Call 02/15/26) |
142 | 131,409 | ||||||
| 2.25%, 09/15/26 (Call 06/15/26) |
50 | 46,723 | ||||||
| 3.00%, 05/15/25 (Call 02/15/25) |
32 | 31,181 | ||||||
| 3.00%, 05/15/27 (Call 02/15/27) |
50 | 47,258 | ||||||
| Public Service Enterprise Group Inc. |
||||||||
| 0.80%, 08/15/25 (Call 07/15/25) |
555 | 519,702 | ||||||
| 5.85%, 11/15/27 (Call 10/15/27) |
3,840 | 3,931,349 | ||||||
| 5.88%, 10/15/28 (Call 09/15/28) |
140 | 143,676 | ||||||
| San Diego Gas & Electric Co. |
||||||||
| 2.50%, 05/15/26 (Call 02/15/26) |
145 | 137,565 | ||||||
| 4.95%, 08/15/28 (Call 07/15/28) |
285 | 284,921 | ||||||
| Sempra |
||||||||
| 3.25%, 06/15/27 (Call 03/15/27) |
30 | 28,214 | ||||||
| 4.13%, 04/01/52 (Call 01/01/27), |
505 | 463,690 | ||||||
| 5.40%, 08/01/26 (Call 07/01/26) |
175 | 175,430 | ||||||
| Southern California Edison Co. |
||||||||
| 4.88%, 02/01/27 (Call 01/01/27) |
275 | 273,580 | ||||||
| 4.90%, 06/01/26 (Call 05/01/26) |
180 | 178,763 | ||||||
| 5.30%, 03/01/28 (Call 02/01/28) |
70 | 70,673 | ||||||
| 5.35%, 03/01/26 |
275 | 275,176 | ||||||
| 5.65%, 10/01/28 (Call 09/01/28) |
525 | 537,547 | ||||||
| Series E, 3.70%, 08/01/25 (Call 06/01/25) |
235 | 229,545 | ||||||
|
|
|
|||||||
| 52,748,313 | ||||||||
| Security | Par (000) |
Value | ||||||
| Electrical Components & Equipment — 0.0% | ||||||||
| Emerson Electric Co., 3.15%, 06/01/25 (Call 03/01/25) |
$ | 149 | $ | 145,512 | ||||
|
|
|
|||||||
| Electronics — 0.7% | ||||||||
| Allegion U.S. Holding Co. Inc., 3.55%, 10/01/27 (Call 07/01/27) |
390 | 368,909 | ||||||
| Amphenol Corp., 2.05%, 03/01/25 (Call 02/01/25)(a) |
225 | 217,463 | ||||||
| Avnet Inc. |
||||||||
| 4.63%, 04/15/26 (Call 01/15/26) |
150 | 146,801 | ||||||
| 6.25%, 03/15/28 (Call 02/15/28)(a) |
240 | 244,109 | ||||||
| Flex Ltd. |
||||||||
| 3.75%, 02/01/26 (Call 01/01/26) |
1,220 | 1,179,708 | ||||||
| 4.75%, 06/15/25 (Call 03/15/25) |
197 | 194,746 | ||||||
| Fortive Corp., 3.15%, 06/15/26 (Call 03/15/26) |
80 | 76,360 | ||||||
| Honeywell International Inc. |
||||||||
| 1.10%, 03/01/27 (Call 02/01/27) |
77 | 69,186 | ||||||
| 1.35%, 06/01/25 (Call 05/01/25) |
3,095 | 2,956,966 | ||||||
| 2.50%, 11/01/26 (Call 08/01/26) |
70 | 65,968 | ||||||
| Hubbell Inc., 3.15%, 08/15/27 (Call 05/15/27) |
10 | 9,383 | ||||||
| Jabil Inc., 4.25%, 05/15/27 (Call 04/15/27) |
45 | 43,455 | ||||||
| Keysight Technologies Inc., 4.60%, 04/06/27 (Call 01/06/27) |
100 | 98,400 | ||||||
| Trimble Inc., 4.90%, 06/15/28 (Call 03/15/28)(a) |
33 | 32,703 | ||||||
| Vontier Corp., 1.80%, 04/01/26 (Call 03/01/26) |
823 | 759,225 | ||||||
|
|
|
|||||||
| 6,463,382 | ||||||||
| Environmental Control — 0.2% | ||||||||
| Republic Services Inc., 3.20%, 03/15/25 (Call 12/15/24) |
213 | 207,966 | ||||||
| Veralto Corp., 5.35%, 09/18/28 (Call 08/18/28)(c) |
1,405 | 1,414,591 | ||||||
| Waste Management Inc., 3.13%, 03/01/25 (Call 12/01/24)(a) |
60 | 58,721 | ||||||
|
|
|
|||||||
| 1,681,278 | ||||||||
| Food — 3.0% | ||||||||
| Campbell Soup Co. |
||||||||
| 3.30%, 03/19/25 (Call 12/19/24) |
198 | 193,044 | ||||||
| 3.95%, 03/15/25 (Call 01/15/25) |
197 | 193,842 | ||||||
| 4.15%, 03/15/28 (Call 12/15/27) |
450 | 434,059 | ||||||
| Conagra Brands Inc. |
||||||||
| 1.38%, 11/01/27 (Call 09/01/27) |
946 | 821,986 | ||||||
| 4.60%, 11/01/25 (Call 09/01/25) |
95 | 93,592 | ||||||
| 4.85%, 11/01/28 (Call 08/01/28)(a) |
1,020 | 1,002,335 | ||||||
| 5.30%, 10/01/26 |
105 | 105,016 | ||||||
| General Mills Inc. |
||||||||
| 3.20%, 02/10/27 (Call 11/10/26) |
5,230 | 4,971,186 | ||||||
| 4.00%, 04/17/25 (Call 02/17/25) |
603 | 593,429 | ||||||
| 4.20%, 04/17/28 (Call 01/17/28) |
10 | 9,696 | ||||||
| 4.70%, 01/30/27 (Call 12/20/26) |
275 | 272,232 | ||||||
| 5.24%, 11/18/25 (Call 03/18/24)(a) |
150 | 149,817 | ||||||
| 5.50%, 10/17/28 (Call 09/17/28) |
75 | 76,222 | ||||||
| Hershey Co. (The), 3.20%, 08/21/25 (Call 05/21/25) |
15 | 14,636 | ||||||
| Hormel Foods Corp., 1.70%, 06/03/28 (Call 04/03/28) |
535 | 472,280 | ||||||
| Ingredion Inc., 3.20%, 10/01/26 (Call 07/01/26) |
1,875 | 1,787,998 | ||||||
| J M Smucker Co. (The), 5.90%, 11/15/28 (Call 10/15/28) |
395 | 406,593 | ||||||
| Kellanova |
||||||||
| 3.25%, 04/01/26 |
5,632 | 5,413,609 | ||||||
| 3.40%, 11/15/27 (Call 08/15/27) |
2,035 | 1,915,968 | ||||||
| Kraft Heinz Foods Co. |
||||||||
| 3.00%, 06/01/26 (Call 03/01/26) |
137 | 130,718 | ||||||
| 3.88%, 05/15/27 (Call 02/15/27) |
315 | 304,032 | ||||||
| 4.63%, 01/30/29 (Call 10/30/28) |
505 | 495,272 | ||||||
| S C H E D U L E O F I N V E S T M E N T S |
21 |
| Schedule of Investments (continued) February 29, 2024 |
iShares® ESG Aware 1-5 Year USD Corporate Bond ETF (Percentages shown are based on Net Assets) |
| Security | Par (000) |
Value | ||||||
| Food (continued) | ||||||||
| Kroger Co. (The) |
||||||||
| 2.65%, 10/15/26 (Call 07/15/26)(a) |
$ | 220 | $ | 206,714 | ||||
| 3.50%, 02/01/26 (Call 11/01/25) |
105 | 101,769 | ||||||
| 3.70%, 08/01/27 (Call 05/01/27) |
1,710 | 1,640,223 | ||||||
| McCormick & Co. Inc./MD |
||||||||
| 0.90%, 02/15/26 (Call 01/15/26) |
180 | 165,600 | ||||||
| 3.40%, 08/15/27 (Call 05/15/27) |
2,505 | 2,369,467 | ||||||
| Mondelez International Inc. |
||||||||
| 1.50%, 05/04/25 (Call 04/04/25) |
1,749 | 1,672,059 | ||||||
| 4.75%, 02/20/29 (Call 01/20/29) |
275 | 271,807 | ||||||
|
|
|
|||||||
| 26,285,201 | ||||||||
| Forest Products & Paper — 0.0% | ||||||||
| Suzano International Finance BV, 5.50%, 01/17/27 |
10 | 9,986 | ||||||
|
|
|
|||||||
| Gas — 0.2% | ||||||||
| National Fuel Gas Co. |
||||||||
| 5.20%, 07/15/25 (Call 04/15/25) |
115 | 114,073 | ||||||
| 5.50%, 01/15/26 (Call 12/15/25) |
1,414 | 1,409,670 | ||||||
| 5.50%, 10/01/26 |
125 | 124,630 | ||||||
| Southern California Gas Co. |
||||||||
| 2.95%, 04/15/27 (Call 03/15/27) |
68 | 63,979 | ||||||
| 3.20%, 06/15/25 (Call 03/15/25) |
80 | 78,172 | ||||||
|
|
|
|||||||
| 1,790,524 | ||||||||
| Hand & Machine Tools — 0.1% | ||||||||
| Regal Rexnord Corp., 6.05%, 04/15/28 (Call 03/15/28)(c) |
200 | 201,156 | ||||||
| Stanley Black & Decker Inc., 4.00%, 03/15/60 (Call 03/15/25), (5-year CMT + 2.657%)(b) |
464 | 413,046 | ||||||
|
|
|
|||||||
| 614,202 | ||||||||
| Health Care - Products — 0.4% | ||||||||
| Agilent Technologies Inc., 3.05%, 09/22/26 (Call 06/22/26) |
810 | 770,235 | ||||||
| Baxter International Inc., 1.92%, 02/01/27 (Call 01/01/27) |
50 | 45,459 | ||||||
| Danaher Corp., 3.35%, 09/15/25 (Call 06/15/25) |
47 | 45,842 | ||||||
| Edwards Lifesciences Corp., 4.30%, 06/15/28 (Call 03/15/28) |
1,255 | 1,217,964 | ||||||
| HCA Inc., 3.13%, 03/15/27 (Call 02/15/27) |
840 | 789,427 | ||||||
| Zimmer Biomet Holdings Inc., 5.35%, 12/01/28 (Call 11/01/28) |
515 | 520,320 | ||||||
|
|
|
|||||||
| 3,389,247 | ||||||||
| Health Care - Services — 1.9% | ||||||||
| Centene Corp. |
||||||||
| 2.45%, 07/15/28 (Call 05/15/28) |
1,533 | 1,352,565 | ||||||
| 4.25%, 12/15/27 (Call 03/18/24) |
615 | 586,225 | ||||||
| Elevance Health Inc. |
||||||||
| 1.50%, 03/15/26 (Call 02/15/26)(a) |
1,350 | 1,254,084 | ||||||
| 3.65%, 12/01/27 (Call 09/01/27) |
1,980 | 1,893,405 | ||||||
| 4.10%, 03/01/28 (Call 12/01/27) |
710 | 686,717 | ||||||
| HCA Inc. |
||||||||
| 4.50%, 02/15/27 (Call 08/15/26) |
1,025 | 1,003,712 | ||||||
| 5.20%, 06/01/28 (Call 05/01/28)(a) |
290 | 288,806 | ||||||
| 5.25%, 04/15/25 |
217 | 216,031 | ||||||
| 5.25%, 06/15/26 (Call 12/15/25) |
125 | 124,235 | ||||||
| 5.38%, 09/01/26 (Call 03/01/26) |
392 | 390,862 | ||||||
| 5.63%, 09/01/28 (Call 03/01/28)(a) |
205 | 206,520 | ||||||
| 5.88%, 02/15/26 (Call 08/15/25) |
455 | 457,008 | ||||||
| Humana Inc. |
||||||||
| 1.35%, 02/03/27 (Call 01/03/27)(a) |
110 | 98,689 | ||||||
| 3.95%, 03/15/27 (Call 12/15/26) |
95 | 91,620 | ||||||
| Security | Par (000) |
Value | ||||||
| Health Care - Services (continued) | ||||||||
| 4.50%, 04/01/25 (Call 03/01/25) |
$ | 197 | $ | 194,960 | ||||
| 5.75%, 03/01/28 (Call 02/01/28) |
260 | 264,890 | ||||||
| 5.75%, 12/01/28 (Call 11/01/28) |
300 | 306,405 | ||||||
| IQVIA Inc., 5.70%, 05/15/28 (Call 04/15/28) |
305 | 307,368 | ||||||
| Laboratory Corp. of America Holdings |
||||||||
| 1.55%, 06/01/26 (Call 05/01/26) |
132 | 121,619 | ||||||
| 3.60%, 09/01/27 (Call 06/01/27) |
225 | 213,684 | ||||||
| Quest Diagnostics Inc. |
||||||||
| 3.45%, 06/01/26 (Call 03/01/26) |
315 | 303,060 | ||||||
| 3.50%, 03/30/25 (Call 12/30/24) |
430 | 422,155 | ||||||
| UnitedHealth Group Inc. |
||||||||
| 3.70%, 05/15/27 (Call 04/15/27) |
1,010 | 977,489 | ||||||
| 1.15%, 05/15/26 (Call 04/15/26) |
20 | 18,432 | ||||||
| 1.25%, 01/15/26 |
5 | 4,671 | ||||||
| 2.95%, 10/15/27 |
1,390 | 1,304,992 | ||||||
| 3.10%, 03/15/26 |
95 | 91,760 | ||||||
| 3.38%, 04/15/27 |
55 | 52,699 | ||||||
| 3.45%, 01/15/27 |
55 | 53,081 | ||||||
| 3.75%, 07/15/25 |
48 | 47,109 | ||||||
| 3.85%, 06/15/28 |
1,780 | 1,713,595 | ||||||
| 3.88%, 12/15/28 |
610 | 585,348 | ||||||
| 4.25%, 01/15/29 (Call 12/15/28) |
220 | 214,506 | ||||||
| 5.25%, 02/15/28 (Call 01/15/28)(a) |
1,025 | 1,041,563 | ||||||
|
|
|
|||||||
| 16,889,865 | ||||||||
| Home Builders — 0.0% | ||||||||
| Lennar Corp., 4.75%, 11/29/27 (Call 05/29/27) |
5 | 4,920 | ||||||
| Toll Brothers Finance Corp., 4.88%, 03/15/27 (Call 12/15/26) |
80 | 78,653 | ||||||
|
|
|
|||||||
| 83,573 | ||||||||
| Home Furnishings — 0.2% | ||||||||
| Harman International Industries Inc., 4.15%, 05/15/25 (Call 02/15/25) |
25 | 24,555 | ||||||
| Leggett & Platt Inc., 3.50%, 11/15/27 (Call 08/15/27) |
320 | 298,618 | ||||||
| Whirlpool Corp. |
||||||||
| 3.70%, 05/01/25 |
17 | 16,635 | ||||||
| 4.75%, 02/26/29 (Call 11/26/28) |
1,100 | 1,074,140 | ||||||
|
|
|
|||||||
| 1,413,948 | ||||||||
| Household Products & Wares — 0.7% | ||||||||
| Church & Dwight Co. Inc., 3.15%, 08/01/27 (Call 05/01/27) |
15 | 14,133 | ||||||
| Clorox Co. (The), 3.90%, 05/15/28 (Call 02/15/28) |
1,855 | 1,782,755 | ||||||
| Kimberly-Clark Corp. |
||||||||
| 1.05%, 09/15/27 (Call 07/15/27) |
3,805 | 3,347,349 | ||||||
| 2.75%, 02/15/26 |
120 | 115,486 | ||||||
| 3.05%, 08/15/25 |
510 | 495,904 | ||||||
|
|
|
|||||||
| 5,755,627 | ||||||||
| Insurance — 0.7% | ||||||||
| Aegon NV, 5.50%, 04/11/48 (Call 04/11/28), |
600 | 574,755 | ||||||
| American International Group Inc., Series A-9, 5.75%, 04/01/48 (Call 04/01/28), |
285 | 279,789 | ||||||
| Aon Corp., 8.21%, 01/01/27 |
410 | 441,205 | ||||||
| Assurant Inc., 4.90%, 03/27/28 (Call 12/27/27) |
130 | 127,335 | ||||||
| Athene Holding Ltd., 4.13%, 01/12/28 (Call 10/12/27) |
300 | 287,292 | ||||||
| Brighthouse Financial Inc., 3.70%, 06/22/27 (Call 03/22/27) |
30 | 28,288 | ||||||
| Chubb INA Holdings Inc., 3.15%, 03/15/25 |
115 | 112,428 | ||||||
| CNO Financial Group Inc., 5.25%, 05/30/25 (Call 02/28/25) |
263 | 261,410 | ||||||
| 22 | 2 0 2 4 I S H A R E S A N N U A L R E P O R T T O S H A R E H O L D E R S |
| Schedule of Investments (continued) February 29, 2024 |
iShares® ESG Aware 1-5 Year USD Corporate Bond ETF (Percentages shown are based on Net Assets) |
| Security | Par (000) |
Value | ||||||
| Insurance (continued) | ||||||||
| Equitable Holdings Inc. |
||||||||
| 4.35%, 04/20/28 (Call 01/20/28) |
$ | 335 | $ | 322,759 | ||||
| 7.00%, 04/01/28 |
70 | 74,421 | ||||||
| Lincoln National Corp. |
||||||||
| 3.35%, 03/09/25(a) |
25 | 24,395 | ||||||
| 3.80%, 03/01/28 (Call 12/01/27)(a) |
250 | 237,825 | ||||||
| Manulife Financial Corp. |
||||||||
| 2.48%, 05/19/27 (Call 03/19/27) |
85 | 78,921 | ||||||
| 4.06%, 02/24/32 (Call 02/24/27), |
175 | 166,791 | ||||||
| MetLife Inc., 3.00%, 03/01/25 |
407 | 397,860 | ||||||
| Munich Re America Corp., Series B, 7.45%, 12/15/26 |
50 | 52,978 | ||||||
| Principal Financial Group Inc., 3.40%, 05/15/25 (Call 02/15/25) |
51 | 49,811 | ||||||
| Prudential Financial Inc. |
||||||||
| 1.50%, 03/10/26 (Call 02/10/26) |
60 | 55,901 | ||||||
| 3.88%, 03/27/28 (Call 12/27/27) |
1,250 | 1,200,963 | ||||||
| 4.50%, 09/15/47 (Call 09/15/27), |
350 | 327,684 | ||||||
| 5.38%, 05/15/45 (Call 05/15/25), |
680 | 669,613 | ||||||
| 5.70%, 09/15/48 (Call 09/15/28), |
355 | 346,770 | ||||||
| Willis North America Inc., 4.50%, 09/15/28 (Call 06/15/28) |
400 | 385,977 | ||||||
|
|
|
|||||||
| 6,505,171 | ||||||||
| Internet — 0.5% | ||||||||
| Alibaba Group Holding Ltd., 3.40%, 12/06/27 (Call 09/06/27) |
880 | 830,689 | ||||||
| Amazon.com Inc. |
||||||||
| 0.80%, 06/03/25 (Call 05/03/25) |
1,015 | 963,944 | ||||||
| 1.20%, 06/03/27 (Call 04/03/27) |
95 | 84,938 | ||||||
| 3.15%, 08/22/27 (Call 05/22/27) |
110 | 104,389 | ||||||
| 4.55%, 12/01/27 (Call 11/01/27) |
1,230 | 1,225,875 | ||||||
| Booking Holdings Inc., 3.65%, 03/15/25 (Call 12/15/24) |
28 | 27,534 | ||||||
| eBay Inc. |
||||||||
| 1.40%, 05/10/26 (Call 04/10/26) |
210 | 193,639 | ||||||
| 1.90%, 03/11/25 (Call 02/11/25)(a) |
363 | 350,278 | ||||||
| 3.60%, 06/05/27 (Call 03/05/27) |
230 | 219,664 | ||||||
|
|
|
|||||||
| 4,000,950 | ||||||||
| Iron & Steel — 0.3% | ||||||||
| Nucor Corp. |
||||||||
| 2.00%, 06/01/25 (Call 05/01/25) |
188 | 180,371 | ||||||
| 3.95%, 05/01/28 (Call 02/01/28)(a) |
645 | 623,219 | ||||||
| 4.30%, 05/23/27 (Call 04/23/27) |
220 | 214,969 | ||||||
| Reliance Inc., 1.30%, 08/15/25 (Call 07/15/25) |
153 | 143,608 | ||||||
| Steel Dynamics Inc. |
||||||||
| 2.40%, 06/15/25 (Call 05/15/25) |
209 | 200,769 | ||||||
| 5.00%, 12/15/26 (Call 04/01/24) |
1,060 | 1,051,343 | ||||||
|
|
|
|||||||
| 2,414,279 | ||||||||
| Leisure Time — 0.4% | ||||||||
| Harley-Davidson Inc., 3.50%, 07/28/25 (Call 04/28/25)(a) |
3,425 | 3,324,795 | ||||||
|
|
|
|||||||
| Lodging — 0.3% | ||||||||
| Hyatt Hotels Corp. |
||||||||
| 4.85%, 03/15/26 (Call 12/15/25)(a) |
267 | 263,879 | ||||||
| 5.38%, 04/23/25 (Call 03/23/25) |
240 | 239,501 | ||||||
| Security | Par (000) |
Value | ||||||
| Lodging (continued) | ||||||||
| Marriott International Inc./MD |
||||||||
| 3.75%, 10/01/25 (Call 07/01/25) |
$ | 102 | $ | 99,385 | ||||
| 5.55%, 10/15/28 (Call 09/15/28) |
235 | 239,072 | ||||||
| Series EE, 5.75%, 05/01/25 (Call 04/01/25) |
471 | 472,684 | ||||||
| Sands China Ltd. |
||||||||
| 2.55%, 03/08/27 (Call 02/08/27) |
705 | 633,103 | ||||||
| 5.40%, 08/08/28 (Call 05/08/28) |
980 | 952,564 | ||||||
|
|
|
|||||||
| 2,900,188 | ||||||||
| Machinery — 2.1% | ||||||||
| ABB Finance USA Inc., 3.80%, 04/03/28 (Call 01/03/28) |
1,800 | 1,750,079 | ||||||
| Caterpillar Financial Services Corp. |
||||||||
| 1.10%, 09/14/27 |
20 | 17,623 | ||||||
| 1.45%, 05/15/25 |
72 | 68,857 | ||||||
| 1.70%, 01/08/27 |
55 | 50,574 | ||||||
| 3.60%, 08/12/27(a) |
15 | 14,440 | ||||||
| 4.85%, 02/27/29 |
275 | 275,234 | ||||||
| 5.05%, 02/27/26 |
325 | 325,138 | ||||||
| CNH Industrial Capital LLC |
||||||||
| 1.45%, 07/15/26 (Call 06/15/26) |
1,925 | 1,760,155 | ||||||
| 1.88%, 01/15/26 (Call 12/15/25) |
1,735 | 1,626,062 | ||||||
| 3.95%, 05/23/25 |
705 | 691,690 | ||||||
| 4.55%, 04/10/28 (Call 03/10/28)(a) |
535 | 523,429 | ||||||
| 5.50%, 01/12/29 (Call 12/12/28) |
650 | 658,630 | ||||||
| CNH Industrial NV,
3.85%, 11/15/27 |
1,845 | 1,770,278 | ||||||
| Deere & Co., 2.75%, 04/15/25 (Call 03/15/25) |
115 | 111,993 | ||||||
| John Deere Capital Corp. |
||||||||
| 1.50%, 03/06/28(a) |
65 | 57,248 | ||||||
| 1.70%, 01/11/27 |
30 | 27,486 | ||||||
| 1.75%, 03/09/27 |
78 | 71,318 | ||||||
| 2.35%, 03/08/27 |
30 | 27,953 | ||||||
| 2.80%, 09/08/27 |
10 | 9,358 | ||||||
| 3.40%, 09/11/25 |
80 | 78,114 | ||||||
| 3.45%, 03/13/25 |
59 | 57,945 | ||||||
| 4.15%, 09/15/27 |
18 | 17,640 | ||||||
| 4.75%, 01/20/28 |
745 | 744,295 | ||||||
| 4.90%, 03/03/28 |
520 | 522,527 | ||||||
| 4.95%, 07/14/28 |
1,720 | 1,729,850 | ||||||
| Oshkosh Corp., 4.60%, 05/15/28 (Call 02/15/28) |
1,665 | 1,619,016 | ||||||
| Otis Worldwide Corp. |
||||||||
| 2.06%, 04/05/25 (Call 03/05/25)(a) |
336 | 323,643 | ||||||
| 5.25%, 08/16/28 (Call 07/16/28)(a) |
160 | 161,371 | ||||||
| Rockwell Automation Inc., 2.88%, 03/01/25 (Call 12/01/24) |
80 | 78,169 | ||||||
| Westinghouse Air Brake Technologies Corp. |
||||||||
| 3.20%, 06/15/25 (Call 05/15/25) |
160 | 155,178 | ||||||
| 3.45%, 11/15/26 (Call 08/15/26) |
30 | 28,526 | ||||||
| 4.70%, 09/15/28 (Call 06/15/28) |
30 | 29,264 | ||||||
| Xylem Inc./NY |
||||||||
| 1.95%, 01/30/28 (Call 11/30/27)(a) |
817 | 729,966 | ||||||
| 3.25%, 11/01/26 (Call 08/01/26) |
2,043 | 1,950,427 | ||||||
|
|
|
|||||||
| 18,063,476 | ||||||||
| Manufacturing — 1.0% | ||||||||
| 3M Co. |
||||||||
| 2.25%, 09/19/26 (Call 06/19/26)(a) |
320 | 298,070 | ||||||
| 2.65%, 04/15/25 (Call 03/15/25)(a) |
2,591 | 2,509,751 | ||||||
| 2.88%, 10/15/27 (Call 07/15/27)(a) |
2,645 | 2,449,181 | ||||||
| 3.00%, 08/07/25(a) |
2,459 | 2,382,366 | ||||||
| Teledyne Technologies Inc., 1.60%, 04/01/26 (Call 03/01/26) |
430 | 398,718 | ||||||
| S C H E D U L E O F I N V E S T M E N T S |
23 |
| Schedule of Investments (continued) February 29, 2024 |
iShares® ESG Aware 1-5 Year USD Corporate Bond ETF (Percentages shown are based on Net Assets) |
| Security | Par (000) |
Value | ||||||
| Manufacturing (continued) | ||||||||
| Textron Inc. |
||||||||
| 3.65%, 03/15/27 (Call 12/15/26) |
$ | 30 | $ | 28,703 | ||||
| 3.88%, 03/01/25 (Call 12/01/24) |
181 | 178,156 | ||||||
|
|
|
|||||||
| 8,244,945 | ||||||||
| Media — 0.6% | ||||||||
| Charter Communications Operating LLC/Charter Communications Operating Capital |
||||||||
| 2.25%, 01/15/29 (Call 11/15/28) |
5 | 4,218 | ||||||
| 3.75%, 02/15/28 (Call 11/15/27) |
565 | 521,777 | ||||||
| 4.20%, 03/15/28 (Call 12/15/27) |
15 | 14,054 | ||||||
| 4.91%, 07/23/25 (Call 04/23/25) |
93 | 91,702 | ||||||
| Comcast Corp. |
||||||||
| 2.35%, 01/15/27 (Call 10/15/26) |
20 | 18,645 | ||||||
| 3.15%, 02/15/28 (Call 11/15/27) |
500 | 468,909 | ||||||
| 3.38%, 08/15/25 (Call 05/15/25) |
106 | 103,475 | ||||||
| Discovery Communications LLC |
||||||||
| 3.45%, 03/15/25 (Call 12/15/24) |
133 | 129,874 | ||||||
| 3.95%, 06/15/25 (Call 03/15/25) |
50 | 48,816 | ||||||
| 3.95%, 03/20/28 (Call 12/20/27)(a) |
20 | 18,698 | ||||||
| FactSet Research Systems Inc., 2.90%, 03/01/27 (Call 02/01/27) |
435 | 406,252 | ||||||
| Fox Corp., 3.05%, 04/07/25 (Call 03/07/25) |
508 | 494,411 | ||||||
| Paramount Global |
||||||||
| 2.90%, 01/15/27 (Call 10/15/26) |
857 | 772,127 | ||||||
| 3.38%, 02/15/28 (Call 11/15/27) |
300 | 262,605 | ||||||
| TWDC Enterprises 18 Corp. |
||||||||
| 2.95%, 06/15/27 |
45 | 42,617 | ||||||
| 3.15%, 09/17/25 |
363 | 352,154 | ||||||
| Walt Disney Co. (The) |
||||||||
| 2.20%, 01/13/28(a) |
960 | 875,755 | ||||||
| 3.35%, 03/24/25(a) |
781 | 765,334 | ||||||
| 3.70%, 03/23/27 |
60 | 58,105 | ||||||
|
|
|
|||||||
| 5,449,528 | ||||||||
| Mining — 0.0% | ||||||||
| Kinross Gold Corp., 4.50%, 07/15/27 (Call 04/15/27) |
25 | 24,296 | ||||||
|
|
|
|||||||
| Office & Business Equipment — 0.2% | ||||||||
| CDW LLC/CDW Finance Corp., 2.67%, 12/01/26 (Call 11/01/26) |
1,581 | 1,467,382 | ||||||
|
|
|
|||||||
| Oil & Gas — 1.7% | ||||||||
| Apache Corp., 4.38%, 10/15/28 (Call 07/15/28) |
210 | 196,753 | ||||||
| BP Capital Markets America Inc., 3.80%, 09/21/25 (Call 07/21/25) |
208 | 204,031 | ||||||
| BP Capital Markets PLC, 3.28%, 09/19/27 (Call 06/19/27) |
105 | 99,413 | ||||||
| Chevron Corp., 1.55%, 05/11/25 (Call 04/11/25) |
1,296 | 1,243,553 | ||||||
| Chevron USA Inc., 1.02%, 08/12/27 (Call 06/12/27) |
30 | 26,483 | ||||||
| Devon Energy Corp., 5.85%, 12/15/25 (Call 09/15/25) |
635 | 637,979 | ||||||
| EQT Corp. |
||||||||
| 3.90%, 10/01/27 (Call 07/01/27)(a) |
1,085 | 1,027,822 | ||||||
| 5.00%, 01/15/29 (Call 07/15/28)(a) |
500 | 487,893 | ||||||
| 5.70%, 04/01/28 (Call 03/01/28) |
40 | 40,283 | ||||||
| Hess Corp., 4.30%, 04/01/27 (Call 01/01/27) |
2,765 | 2,693,042 | ||||||
| Marathon Oil Corp., 4.40%, 07/15/27 (Call 04/15/27) |
55 | 53,411 | ||||||
| Marathon Petroleum Corp. |
||||||||
| 4.70%, 05/01/25 (Call 04/01/25) |
419 | 414,941 | ||||||
| 5.13%, 12/15/26 (Call 09/15/26) |
155 | 154,740 | ||||||
| Occidental Petroleum Corp., 8.50%, 07/15/27 (Call 01/15/27) |
5 | 5,424 | ||||||
| Security | Par (000) |
Value | ||||||
| Oil & Gas (continued) | ||||||||
| Ovintiv Inc. |
||||||||
| 5.38%, 01/01/26 (Call 10/01/25) |
$ | 1,765 | $ | 1,754,889 | ||||
| 5.65%, 05/15/28 (Call 04/15/28) |
1,045 | 1,054,190 | ||||||
| Phillips 66 |
||||||||
| 1.30%, 02/15/26 (Call 01/15/26) |
289 | 267,512 | ||||||
| 3.85%, 04/09/25 (Call 03/09/25) |
21 | 20,639 | ||||||
| 3.90%, 03/15/28 (Call 12/15/27) |
615 | 591,704 | ||||||
| Phillips 66 Co., 3.75%, 03/01/28 (Call 12/01/27) |
50 | 47,687 | ||||||
| Shell International Finance BV |
||||||||
| 2.50%, 09/12/26 |
110 | 103,886 | ||||||
| 2.88%, 05/10/26 |
170 | 162,670 | ||||||
| 3.88%, 11/13/28 (Call 08/13/28) |
810 | 781,562 | ||||||
| TotalEnergies Capital International SA, 3.46%, 02/19/29 (Call 11/19/28) |
1,000 | 939,304 | ||||||
| TotalEnergies Capital SA, 3.88%, 10/11/28 |
1,400 | 1,348,428 | ||||||
| Valero Energy Corp., 3.40%, 09/15/26 (Call 06/15/26) |
60 | 57,365 | ||||||
|
|
|
|||||||
| 14,415,604 | ||||||||
| Oil & Gas Services — 0.3% | ||||||||
| Baker Hughes Holdings LLC/Baker Hughes Co-Obligor Inc. |
||||||||
| 2.06%, 12/15/26 (Call 11/15/26) |
1,730 | 1,596,220 | ||||||
| 3.34%, 12/15/27 (Call 09/15/27) |
45 | 42,435 | ||||||
| Halliburton Co., 3.80%, 11/15/25 (Call 08/15/25) |
271 | 264,762 | ||||||
| Schlumberger Finance Canada Ltd., 1.40%, 09/17/25 (Call 08/17/25)(a) |
705 | 666,179 | ||||||
|
|
|
|||||||
| 2,569,596 | ||||||||
| Packaging & Containers — 0.2% | ||||||||
| Amcor Finance USA Inc., 3.63%, 04/28/26 (Call 01/28/26) |
1,135 | 1,092,924 | ||||||
| Amcor Flexibles North America Inc., 4.00%, 05/17/25 (Call 04/17/25) |
140 | 137,305 | ||||||
| WRKCo Inc. |
||||||||
| 3.75%, 03/15/25 (Call 01/15/25) |
120 | 117,527 | ||||||
| 3.90%, 06/01/28 (Call 03/01/28) |
265 | 251,185 | ||||||
|
|
|
|||||||
| 1,598,941 | ||||||||
| Pharmaceuticals — 3.4% | ||||||||
| AbbVie Inc. |
||||||||
| 2.95%, 11/21/26 (Call 09/21/26) |
70 | 66,380 | ||||||
| 4.80%, 03/15/29 (Call 02/15/29) |
1,150 | 1,144,789 | ||||||
| Astrazeneca Finance LLC |
||||||||
| 1.20%, 05/28/26 (Call 04/28/26) |
740 | 680,609 | ||||||
| 1.75%, 05/28/28 (Call 03/28/28) |
1,310 | 1,157,959 | ||||||
| 4.80%, 02/26/27 (Call 01/26/27) |
525 | 523,650 | ||||||
| 4.85%, 02/26/29 (Call 01/26/29) |
525 | 524,797 | ||||||
| 4.88%, 03/03/28 (Call 02/03/28) |
110 | 109,898 | ||||||
| AstraZeneca PLC |
||||||||
| 0.70%, 04/08/26 (Call 03/08/26)(a) |
3,637 | 3,329,214 | ||||||
| 3.38%, 11/16/25 |
4,550 | 4,425,372 | ||||||
| Becton Dickinson and Co. |
||||||||
| 3.70%, 06/06/27 (Call 03/06/27) |
30 | 28,766 | ||||||
| 4.69%, 02/13/28 (Call 01/13/28) |
185 | 182,286 | ||||||
| 4.87%, 02/08/29 (Call 01/08/29) |
100 | 98,741 | ||||||
| Bristol-Myers Squibb Co. |
||||||||
| 1.13%, 11/13/27 (Call 09/13/27) |
40 | 35,057 | ||||||
| 3.90%, 02/20/28 (Call 11/20/27) |
25 | 24,143 | ||||||
| 4.90%, 02/22/27 (Call 01/22/27) |
250 | 249,684 | ||||||
| 4.90%, 02/22/29 (Call 01/22/29) |
365 | 364,065 | ||||||
| 4.95%, 02/20/26 |
385 | 384,434 | ||||||
| Cardinal Health Inc. |
||||||||
| 3.41%, 06/15/27 (Call 03/15/27) |
10 | 9,477 | ||||||
| 24 | 2 0 2 4 I S H A R E S A N N U A L R E P O R T T O S H A R E H O L D E R S |
| Schedule of Investments (continued) February 29, 2024 |
iShares® ESG Aware 1-5 Year USD Corporate Bond ETF (Percentages shown are based on Net Assets) |
| Security | Par (000) |
Value | ||||||
| Pharmaceuticals (continued) | ||||||||
| 3.75%, 09/15/25 (Call 06/15/25) |
$ | 505 | $ | 492,554 | ||||
| 5.13%, 02/15/29 (Call 01/15/29) |
200 | 199,202 | ||||||
| Cencora Inc., 3.25%, 03/01/25 (Call 12/01/24) |
166 | 162,353 | ||||||
| Cigna Group (The) |
||||||||
| 1.25%, 03/15/26 (Call 02/15/26)(a) |
70 | 64,671 | ||||||
| 3.05%, 10/15/27 (Call 07/15/27) |
1,170 | 1,092,509 | ||||||
| 3.25%, 04/15/25 (Call 01/15/25) |
245 | 239,142 | ||||||
| 3.40%, 03/01/27 (Call 12/01/26)(a) |
40 | 38,091 | ||||||
| 4.38%, 10/15/28 (Call 07/15/28) |
2,509 | 2,436,635 | ||||||
| CVS Health Corp. |
||||||||
| 1.30%, 08/21/27 (Call 06/21/27) |
70 | 61,522 | ||||||
| 3.63%, 04/01/27 (Call 02/01/27)(a) |
50 | 47,934 | ||||||
| 4.10%, 03/25/25 (Call 01/25/25) |
541 | 534,322 | ||||||
| 4.30%, 03/25/28 (Call 12/25/27) |
2,030 | 1,970,874 | ||||||
| Eli Lilly & Co. |
||||||||
| 2.75%, 06/01/25 (Call 03/01/25) |
292 | 283,856 | ||||||
| 4.50%, 02/09/27 (Call 01/09/27) |
550 | 547,693 | ||||||
| 4.50%, 02/09/29 (Call 01/09/29)(a) |
550 | 547,012 | ||||||
| GlaxoSmithKline Capital Inc. |
||||||||
| 3.63%, 05/15/25 |
345 | 338,980 | ||||||
| 3.88%, 05/15/28 |
45 | 43,511 | ||||||
| Johnson & Johnson, 0.95%, 09/01/27 (Call 07/01/27) |
55 | 48,636 | ||||||
| McKesson Corp., 4.90%, 07/15/28 (Call 06/15/28) |
445 | 445,083 | ||||||
| Mead Johnson Nutrition Co., 4.13%, 11/15/25 (Call 08/15/25) |
555 | 544,523 | ||||||
| Merck & Co. Inc. |
||||||||
| 1.70%, 06/10/27 (Call 05/10/27) |
45 | 40,755 | ||||||
| 4.05%, 05/17/28 (Call 04/17/28)(a) |
280 | 274,276 | ||||||
| Novartis Capital Corp. |
||||||||
| 2.00%, 02/14/27 (Call 12/14/26) |
55 | 50,974 | ||||||
| 3.10%, 05/17/27 (Call 02/17/27) |
60 | 57,090 | ||||||
| Pfizer Investment Enterprises Pte Ltd., 4.45%, 05/19/28 (Call 04/19/28) |
905 | 887,592 | ||||||
| Shire Acquisitions Investments Ireland DAC, 3.20%, 09/23/26 (Call 06/23/26) |
55 | 52,404 | ||||||
| Utah Acquisition Sub Inc., 3.95%, 06/15/26 (Call 03/15/26) |
65 | 62,721 | ||||||
| Viatris Inc., 2.30%, 06/22/27 (Call 04/22/27)(a) |
610 | 551,642 | ||||||
| Zoetis Inc. |
||||||||
| 3.00%, 09/12/27 (Call 06/12/27) |
3,180 | 2,976,596 | ||||||
| 3.90%, 08/20/28 (Call 05/20/28) |
1,000 | 961,340 | ||||||
| 4.50%, 11/13/25 (Call 08/13/25)(a) |
175 | 172,797 | ||||||
| 5.40%, 11/14/25 (Call 10/14/25) |
100 | 100,162 | ||||||
|
|
|
|||||||
| 29,666,773 | ||||||||
| Pipelines — 2.5% | ||||||||
| Boardwalk Pipelines LP, 5.95%, 06/01/26 (Call 03/01/26) |
20 | 20,145 | ||||||
| Cheniere Corpus Christi Holdings LLC |
||||||||
| 5.13%, 06/30/27 (Call 01/01/27) |
2,070 | 2,060,048 | ||||||
| 5.88%, 03/31/25 (Call 10/02/24) |
744 | 743,760 | ||||||
| Cheniere Energy Inc., 4.63%, 10/15/28 (Call 03/11/24) |
1,134 | 1,089,157 | ||||||
| Columbia Pipeline Group Inc., 4.50%, 06/01/25 (Call 03/01/25) |
251 | 247,335 | ||||||
| DCP Midstream Operating LP, 5.63%, 07/15/27 (Call 04/15/27) |
15 | 15,077 | ||||||
| Enbridge Inc. |
||||||||
| 1.60%, 10/04/26 (Call 09/04/26) |
95 | 86,844 | ||||||
| 3.70%, 07/15/27 (Call 04/15/27) |
45 | 42,970 | ||||||
| 4.25%, 12/01/26 (Call 09/01/26) |
135 | 132,051 | ||||||
| 5.90%, 11/15/26 (Call 10/15/26) |
400 | 407,513 | ||||||
| Security | Par (000) |
Value | ||||||
| Pipelines (continued) | ||||||||
| 6.00%, 11/15/28 (Call 10/15/28) |
$ | 1,095 | $ | 1,133,855 | ||||
| Energy Transfer LP |
||||||||
| 4.40%, 03/15/27 (Call 12/15/26) |
120 | 116,874 | ||||||
| 5.55%, 02/15/28 (Call 01/15/28) |
1,010 | 1,018,451 | ||||||
| Enterprise Products Operating LLC |
||||||||
| 5.38%, 02/15/78 (Call 02/15/28), |
355 | 328,483 | ||||||
| Series E, 5.25%, 08/16/77 (Call 08/16/27), |
420 | 399,313 | ||||||
| Kinder Morgan Inc. |
||||||||
| 1.75%, 11/15/26 (Call 10/15/26) |
204 | 186,259 | ||||||
| 4.30%, 03/01/28 (Call 12/01/27) |
1,145 | 1,110,213 | ||||||
| 5.00%, 02/01/29 (Call 01/01/29) |
830 | 823,405 | ||||||
| MPLX LP |
||||||||
| 4.00%, 03/15/28 (Call 12/15/27) |
30 | 28,730 | ||||||
| 4.13%, 03/01/27 (Call 12/01/26) |
80 | 77,569 | ||||||
| 4.88%, 06/01/25 (Call 03/01/25) |
68 | 67,365 | ||||||
| ONEOK Inc. |
||||||||
| 2.20%, 09/15/25 (Call 08/15/25) |
625 | 594,473 | ||||||
| 4.00%, 07/13/27 (Call 04/13/27) |
1,270 | 1,223,576 | ||||||
| 4.55%, 07/15/28 (Call 04/15/28) |
5 | 4,885 | ||||||
| 5.55%, 11/01/26 (Call 10/01/26) |
495 | 498,558 | ||||||
| 5.65%, 11/01/28 (Call 10/01/28) |
530 | 539,378 | ||||||
| 5.85%, 01/15/26 (Call 12/15/25) |
2,823 | 2,847,923 | ||||||
| ONEOK Partners LP, 4.90%, 03/15/25 (Call 12/15/24) |
1,301 | 1,291,237 | ||||||
| Sabine Pass Liquefaction LLC |
||||||||
| 4.20%, 03/15/28 (Call 09/15/27) |
15 | 14,473 | ||||||
| 5.00%, 03/15/27 (Call 09/15/26) |
80 | 79,432 | ||||||
| 5.63%, 03/01/25 (Call 12/01/24) |
967 | 965,818 | ||||||
| Spectra Energy Partners LP |
||||||||
| 3.38%, 10/15/26 (Call 07/15/26) |
150 | 143,281 | ||||||
| 3.50%, 03/15/25 (Call 12/15/24) |
338 | 331,366 | ||||||
| Targa Resources Partners LP/Targa Resources Partners Finance Corp., 5.00%, 01/15/28 (Call 04/01/24) |
490 | 479,839 | ||||||
| TC PipeLines LP, 4.38%, 03/13/25 (Call 12/13/24) |
351 | 345,629 | ||||||
| Tennessee Gas Pipeline Co. LLC, 7.00%, 03/15/27 |
810 | 850,151 | ||||||
| Western Midstream Operating LP |
||||||||
| 4.50%, 03/01/28 (Call 12/01/27) |
650 | 622,496 | ||||||
| 4.65%, 07/01/26 (Call 04/01/26) |
25 | 24,440 | ||||||
| 4.75%, 08/15/28 (Call 05/15/28) |
75 | 72,510 | ||||||
| 6.35%, 01/15/29 (Call 12/15/28) |
705 | 727,901 | ||||||
| Williams Companies Inc. (The) |
||||||||
| 3.75%, 06/15/27 (Call 03/15/27) |
50 | 47,825 | ||||||
| 4.00%, 09/15/25 (Call 06/15/25) |
130 | 127,468 | ||||||
|
|
|
|||||||
| 21,968,076 | ||||||||
| Real Estate — 0.4% | ||||||||
| CBRE Services Inc., 4.88%, 03/01/26 (Call 12/01/25) |
2,385 | 2,356,321 | ||||||
| Jones Lang LaSalle Inc., 6.88%, 12/01/28 (Call 11/01/28) |
500 | 525,654 | ||||||
| Realty Income Corp., 2.10%, 03/15/28 (Call 01/15/28) |
215 | 190,609 | ||||||
|
|
|
|||||||
| 3,072,584 | ||||||||
| Real Estate Investment Trusts — 4.7% | ||||||||
| Alexandria Real Estate Equities Inc. |
||||||||
| 3.45%, 04/30/25 (Call 02/28/25) |
224 | 218,756 | ||||||
| 3.80%, 04/15/26 (Call 02/15/26) |
10 | 9,693 | ||||||
| 3.95%, 01/15/27 (Call 10/15/26)(a) |
5 | 4,820 | ||||||
| American Tower Corp. |
||||||||
| 1.30%, 09/15/25 (Call 08/15/25) |
53 | 49,843 | ||||||
| 1.45%, 09/15/26 (Call 08/15/26) |
1,345 | 1,222,593 | ||||||
| S C H E D U L E O F I N V E S T M E N T S |
25 |
| Schedule of Investments (continued) February 29, 2024 |
iShares® ESG Aware 1-5 Year USD Corporate Bond ETF (Percentages shown are based on Net Assets) |
| Security | Par (000) |
Value | ||||||
| Real Estate Investment Trusts (continued) | ||||||||
| 1.50%, 01/31/28 (Call 11/30/27) |
$ | 510 | $ | 442,917 | ||||
| 1.60%, 04/15/26 (Call 03/15/26) |
75 | 69,432 | ||||||
| 2.40%, 03/15/25 (Call 02/15/25) |
839 | 811,560 | ||||||
| 2.75%, 01/15/27 (Call 11/15/26) |
885 | 824,215 | ||||||
| 3.13%, 01/15/27 (Call 10/15/26) |
860 | 811,028 | ||||||
| 3.38%, 10/15/26 (Call 07/15/26) |
535 | 510,177 | ||||||
| 3.55%, 07/15/27 (Call 04/15/27) |
100 | 94,793 | ||||||
| 3.60%, 01/15/28 (Call 10/15/27) |
40 | 37,641 | ||||||
| 3.65%, 03/15/27 (Call 02/15/27) |
35 | 33,449 | ||||||
| 4.00%, 06/01/25 (Call 03/01/25) |
100 | 98,030 | ||||||
| 4.40%, 02/15/26 (Call 11/15/25)(a) |
245 | 240,917 | ||||||
| 5.25%, 07/15/28 (Call 06/15/28)(a) |
260 | 259,193 | ||||||
| 5.50%, 03/15/28 (Call 02/15/28) |
230 | 230,950 | ||||||
| 5.80%, 11/15/28 (Call 10/15/28)(a) |
5 | 5,098 | ||||||
| AvalonBay Communities Inc. |
||||||||
| 1.90%, 12/01/28 (Call 10/01/28) |
750 | 653,248 | ||||||
| 3.20%, 01/15/28 (Call 10/15/27)(a) |
200 | 187,406 | ||||||
| Boston Properties LP |
||||||||
| 2.75%, 10/01/26 (Call 07/01/26) |
95 | 87,950 | ||||||
| 3.65%, 02/01/26 (Call 11/03/25) |
680 | 653,928 | ||||||
| 4.50%, 12/01/28 (Call 09/01/28) |
1,135 | 1,072,366 | ||||||
| 6.75%, 12/01/27 (Call 11/01/27) |
655 | 676,609 | ||||||
| Brixmor Operating Partnership LP, 3.90%, 03/15/27 (Call 12/15/26)(a) |
85 | 80,978 | ||||||
| Corporate Office Properties LP |
||||||||
| 2.00%, 01/15/29 (Call 11/15/28) |
300 | 248,373 | ||||||
| 2.25%, 03/15/26 (Call 02/15/26)(a) |
315 | 294,573 | ||||||
| Crown Castle Inc. |
||||||||
| 1.05%, 07/15/26 (Call 06/15/26)(a) |
100 | 90,393 | ||||||
| 1.35%, 07/15/25 (Call 06/15/25)(a) |
90 | 85,152 | ||||||
| 2.90%, 03/15/27 (Call 02/15/27) |
1,655 | 1,541,175 | ||||||
| 3.65%, 09/01/27 (Call 06/01/27) |
645 | 608,731 | ||||||
| 3.70%, 06/15/26 (Call 03/15/26) |
85 | 81,910 | ||||||
| 3.80%, 02/15/28 (Call 11/15/27) |
3,035 | 2,857,929 | ||||||
| 4.00%, 03/01/27 (Call 12/01/26) |
65 | 62,567 | ||||||
| 4.30%, 02/15/29 (Call 11/15/28) |
500 | 475,218 | ||||||
| 4.45%, 02/15/26 (Call 11/15/25) |
138 | 135,415 | ||||||
| 4.80%, 09/01/28 (Call 08/01/28) |
530 | 516,785 | ||||||
| 5.00%, 01/11/28 (Call 12/11/27) |
620 | 610,911 | ||||||
| Digital Realty Trust LP |
||||||||
| 3.70%, 08/15/27 (Call 05/15/27)(a) |
1,070 | 1,019,776 | ||||||
| 4.45%, 07/15/28 (Call 04/15/28) |
1,465 | 1,417,461 | ||||||
| 5.55%, 01/15/28 (Call 12/15/27) |
280 | 282,835 | ||||||
| EPR Properties |
||||||||
| 4.50%, 06/01/27 (Call 03/01/27) |
385 | 363,840 | ||||||
| 4.75%, 12/15/26 (Call 09/15/26) |
500 | 480,598 | ||||||
| Equinix Inc. |
||||||||
| 1.00%, 09/15/25 (Call 08/15/25) |
1,588 | 1,484,575 | ||||||
| 1.25%, 07/15/25 (Call 06/15/25) |
543 | 512,313 | ||||||
| 1.45%, 05/15/26 (Call 04/15/26) |
979 | 901,524 | ||||||
| 1.80%, 07/15/27 (Call 05/15/27) |
15 | 13,483 | ||||||
| 2.90%, 11/18/26 (Call 09/18/26) |
95 | 89,454 | ||||||
| ERP Operating LP |
||||||||
| 3.38%, 06/01/25 (Call 03/01/25) |
51 | 49,733 | ||||||
| 3.50%, 03/01/28 (Call 12/01/27) |
250 | 236,093 | ||||||
| Essex Portfolio LP, 1.70%, 03/01/28 (Call 01/01/28) |
205 | 178,163 | ||||||
| Federal Realty OP LP |
||||||||
| 1.25%, 02/15/26 (Call 01/15/26) |
700 | 645,362 | ||||||
| 3.25%, 07/15/27 (Call 04/15/27)(a) |
1,200 | 1,120,990 | ||||||
| 5.38%, 05/01/28 (Call 04/01/28) |
1,100 | 1,096,271 | ||||||
| Security | Par (000) |
Value | ||||||
| Real Estate Investment Trusts (continued) | ||||||||
| GLP Capital LP/GLP Financing II Inc. |
||||||||
| 5.25%, 06/01/25 (Call 03/01/25) |
$ | 52 | $ | 51,574 | ||||
| 5.38%, 04/15/26 (Call 01/15/26) |
10 | 9,896 | ||||||
| Healthpeak OP LLC |
||||||||
| 1.35%, 02/01/27 (Call 01/01/27) |
625 | 562,346 | ||||||
| 2.13%, 12/01/28 (Call 10/01/28) |
730 | 635,397 | ||||||
| 3.25%, 07/15/26 (Call 05/15/26) |
120 | 114,629 | ||||||
| 4.00%, 06/01/25 (Call 03/01/25) |
368 | 361,034 | ||||||
| Highwoods Realty LP, 4.13%, 03/15/28 (Call 12/15/27)(a) |
200 | 186,550 | ||||||
| Host Hotels & Resorts LP |
||||||||
| Series E, 4.00%, 06/15/25 (Call 03/15/25) |
440 | 430,999 | ||||||
| Series F, 4.50%, 02/01/26 (Call 11/01/25) |
1,342 | 1,313,568 | ||||||
| Kilroy Realty LP, 4.38%, 10/01/25 (Call 07/01/25) |
218 | 212,484 | ||||||
| Omega Healthcare Investors Inc. |
||||||||
| 4.50%, 04/01/27 (Call 01/01/27) |
505 | 485,730 | ||||||
| 4.75%, 01/15/28 (Call 10/15/27)(a) |
180 | 172,710 | ||||||
| Physicians Realty LP, 3.95%, 01/15/28 (Call 10/15/27) |
120 | 114,168 | ||||||
| Piedmont Operating Partnership LP, 9.25%, 07/20/28 (Call 06/20/28) |
200 | 210,808 | ||||||
| Prologis LP |
||||||||
| 2.13%, 04/15/27 (Call 02/15/27) |
50 | 45,883 | ||||||
| 3.38%, 12/15/27 (Call 09/15/27) |
1,060 | 1,000,656 | ||||||
| 4.88%, 06/15/28 (Call 05/15/28) |
770 | 768,892 | ||||||
| Realty Income Corp. |
||||||||
| 3.40%, 01/15/28 (Call 11/15/27) |
520 | 488,033 | ||||||
| 3.88%, 04/15/25 (Call 02/15/25) |
513 | 504,302 | ||||||
| Sabra Health Care LP, 5.13%, 08/15/26 (Call 05/15/26) |
147 | 144,266 | ||||||
| Simon Property Group LP |
||||||||
| 1.75%, 02/01/28 (Call 11/01/27) |
715 | 632,944 | ||||||
| 3.38%, 12/01/27 (Call 09/01/27) |
620 | 584,789 | ||||||
| 3.50%, 09/01/25 (Call 06/01/25) |
180 | 175,616 | ||||||
| SITE Centers Corp., 4.25%, 02/01/26 (Call 11/01/25) |
245 | 239,086 | ||||||
| Store Capital LLC, 4.50%, 03/15/28 (Call 12/15/27) |
150 | 140,934 | ||||||
| Ventas Realty LP |
||||||||
| 3.25%, 10/15/26 (Call 07/15/26) |
305 | 287,949 | ||||||
| 3.85%, 04/01/27 (Call 01/01/27) |
815 | 776,903 | ||||||
| 4.13%, 01/15/26 (Call 10/15/25) |
95 | 92,480 | ||||||
| 4.40%, 01/15/29 (Call 10/15/28) |
110 | 105,317 | ||||||
| Welltower OP LLC |
||||||||
| 2.05%, 01/15/29 (Call 11/15/28) |
410 | 355,121 | ||||||
| 2.70%, 02/15/27 (Call 12/15/26) |
2,135 | 1,993,809 | ||||||
| 4.00%, 06/01/25 (Call 03/01/25) |
213 | 209,085 | ||||||
| 4.25%, 04/01/26 (Call 01/01/26) |
140 | 137,266 | ||||||
| 4.25%, 04/15/28 (Call 01/15/28) |
270 | 261,153 | ||||||
| Weyerhaeuser Co., 6.95%, 10/01/27 |
10 | 10,603 | ||||||
|
|
|
|||||||
| 40,706,173 | ||||||||
| Retail — 3.0% | ||||||||
| AutoZone Inc. |
||||||||
| 3.63%, 04/15/25 (Call 03/15/25)(a) |
826 | 810,921 | ||||||
| 5.05%, 07/15/26 |
180 | 179,560 | ||||||
| 6.25%, 11/01/28 (Call 10/01/28) |
180 | 187,265 | ||||||
| Best Buy Co. Inc.,
4.45%, 10/01/28 |
2,600 | 2,546,243 | ||||||
| Costco Wholesale Corp., 1.38%, 06/20/27 (Call 04/20/27) |
100 | 89,878 | ||||||
| Dollar Tree Inc., 4.00%, 05/15/25 (Call 03/15/25) |
224 | 220,073 | ||||||
| Home Depot Inc. (The) |
||||||||
| 1.50%, 09/15/28 (Call 07/15/28)(a) |
830 | 723,070 | ||||||
| 2.13%, 09/15/26 (Call 06/15/26) |
180 | 168,208 | ||||||
| 26 | 2 0 2 4 I S H A R E S A N N U A L R E P O R T T O S H A R E H O L D E R S |
| Schedule of Investments (continued) February 29, 2024 |
iShares® ESG Aware 1-5 Year USD Corporate Bond ETF (Percentages shown are based on Net Assets) |
| Security | Par (000) |
Value | ||||||
| Retail (continued) | ||||||||
| 2.50%, 04/15/27 (Call 02/15/27) |
$ | 2,485 | $ | 2,314,579 | ||||
| 2.70%, 04/15/25 (Call 03/15/25) |
57 | 55,535 | ||||||
| 2.80%, 09/14/27 (Call 06/14/27) |
880 | 824,587 | ||||||
| 2.88%, 04/15/27 (Call 03/15/27) |
810 | 764,293 | ||||||
| 3.00%, 04/01/26 (Call 01/01/26) |
270 | 260,100 | ||||||
| 3.35%, 09/15/25 (Call 06/15/25) |
391 | 381,437 | ||||||
| 3.90%, 12/06/28 (Call 09/06/28)(a) |
15 | 14,515 | ||||||
| 4.95%, 09/30/26 (Call 08/30/26) |
265 | 265,123 | ||||||
| 5.13%, 04/30/25 |
275 | 275,095 | ||||||
| Lowe’s Companies Inc. |
||||||||
| 1.70%, 09/15/28 (Call 07/15/28) |
37 | 32,149 | ||||||
| 2.50%, 04/15/26 (Call 01/15/26) |
105 | 99,674 | ||||||
| 3.10%, 05/03/27 (Call 02/03/27) |
860 | 812,725 | ||||||
| 3.35%, 04/01/27 (Call 03/01/27) |
1,975 | 1,881,744 | ||||||
| 3.38%, 09/15/25 (Call 06/15/25) |
170 | 165,376 | ||||||
| 4.00%, 04/15/25 (Call 03/15/25) |
1,091 | 1,075,243 | ||||||
| 4.40%, 09/08/25(a) |
90 | 88,904 | ||||||
| 4.80%, 04/01/26 (Call 03/01/26) |
70 | 69,539 | ||||||
| McDonald’s Corp. |
||||||||
| 3.38%, 05/26/25 (Call 02/26/25) |
37 | 36,166 | ||||||
| 4.80%, 08/14/28 (Call 07/14/28) |
75 | 74,779 | ||||||
| Starbucks Corp. |
||||||||
| 2.00%, 03/12/27 (Call 01/12/27)(a) |
50 | 45,814 | ||||||
| 3.80%, 08/15/25 (Call 06/15/25) |
13 | 12,731 | ||||||
| 4.75%, 02/15/26 (Call 01/15/26) |
50 | 49,671 | ||||||
| 4.85%, 02/08/27 (Call 01/08/27) |
200 | 198,946 | ||||||
| Target Corp. |
||||||||
| 1.95%, 01/15/27 (Call 12/15/26) |
1,440 | 1,331,085 | ||||||
| 2.25%, 04/15/25 (Call 03/15/25)(a) |
4,956 | 4,801,675 | ||||||
| 2.50%, 04/15/26 |
5,182 | 4,949,325 | ||||||
|
|
|
|||||||
| 25,806,028 | ||||||||
| Semiconductors — 2.1% | ||||||||
| Applied Materials Inc. |
||||||||
| 3.30%, 04/01/27 (Call 01/01/27)(a) |
130 | 124,436 | ||||||
| 3.90%, 10/01/25 (Call 07/01/25) |
1,558 | 1,530,668 | ||||||
| Broadcom Corp./Broadcom Cayman Finance Ltd., 3.88%, 01/15/27 (Call 10/15/26) |
65 | 62,837 | ||||||
| Intel Corp. |
||||||||
| 1.60%, 08/12/28 (Call 06/12/28) |
1,600 | 1,391,682 | ||||||
| 2.60%, 05/19/26 (Call 02/19/26) |
1,570 | 1,493,292 | ||||||
| 3.15%, 05/11/27 (Call 02/11/27) |
245 | 232,167 | ||||||
| 3.40%, 03/25/25 (Call 02/25/25) |
460 | 451,112 | ||||||
| 3.70%, 07/29/25 (Call 04/29/25) |
467 | 457,395 | ||||||
| 3.75%, 03/25/27 (Call 01/25/27) |
487 | 471,041 | ||||||
| 3.75%, 08/05/27 (Call 07/05/27) |
860 | 828,864 | ||||||
| 4.88%, 02/10/26 |
670 | 667,843 | ||||||
| 4.88%, 02/10/28 (Call 01/10/28) |
340 | 339,054 | ||||||
| Lam Research Corp. |
||||||||
| 3.75%, 03/15/26 (Call 01/15/26) |
127 | 123,941 | ||||||
| 3.80%, 03/15/25 (Call 12/15/24) |
325 | 320,238 | ||||||
| Marvell Technology Inc. |
||||||||
| 2.45%, 04/15/28 (Call 02/15/28) |
290 | 260,385 | ||||||
| 4.88%, 06/22/28 (Call 03/22/28) |
5 | 4,912 | ||||||
| 5.75%, 02/15/29 (Call 01/15/29) |
320 | 326,073 | ||||||
| Micron Technology Inc. |
||||||||
| 4.19%, 02/15/27 (Call 12/15/26) |
25 | 24,293 | ||||||
| 5.38%, 04/15/28 (Call 03/15/28) |
200 | 200,544 | ||||||
| NVIDIA Corp. |
||||||||
| 1.55%, 06/15/28 (Call 04/15/28) |
90 | 79,627 | ||||||
| 3.20%, 09/16/26 (Call 06/16/26) |
1,190 | 1,147,080 | ||||||
| Security | Par (000) |
Value | ||||||
| Semiconductors (continued) | ||||||||
| NXP BV/NXP Funding LLC |
||||||||
| 5.35%, 03/01/26 (Call 01/01/26) |
$ | 447 | $ | 446,284 | ||||
| 5.55%, 12/01/28 (Call 09/01/28) |
650 | 657,160 | ||||||
| NXP BV/NXP Funding LLC/NXP USA Inc. |
||||||||
| 2.70%, 05/01/25 (Call 04/01/25) |
141 | 136,361 | ||||||
| 3.15%, 05/01/27 (Call 03/01/27) |
260 | 244,431 | ||||||
| 3.88%, 06/18/26 (Call 04/18/26) |
85 | 82,253 | ||||||
| 4.40%, 06/01/27 (Call 05/01/27) |
410 | 400,547 | ||||||
| QUALCOMM Inc., 3.25%, 05/20/27 (Call 02/20/27)(a) |
45 | 42,904 | ||||||
| Skyworks Solutions Inc., 1.80%, 06/01/26 (Call 05/01/26) |
27 | 24,974 | ||||||
| Texas Instruments Inc. |
||||||||
| 1.13%, 09/15/26 (Call 08/15/26) |
325 | 296,582 | ||||||
| 1.38%, 03/12/25 (Call 02/12/25) |
1,202 | 1,156,213 | ||||||
| 2.90%, 11/03/27 (Call 08/03/27)(a) |
60 | 56,319 | ||||||
| 4.60%, 02/08/27 (Call 01/08/27) |
150 | 149,482 | ||||||
| 4.60%, 02/15/28 (Call 01/15/28) |
1,645 | 1,642,021 | ||||||
| 4.60%, 02/08/29 (Call 01/08/29) |
1,250 | 1,243,246 | ||||||
| TSMC Arizona Corp. |
||||||||
| 1.75%, 10/25/26 (Call 09/25/26) |
200 | 183,678 | ||||||
| 3.88%, 04/22/27 (Call 03/22/27) |
1,235 | 1,197,235 | ||||||
|
|
|
|||||||
| 18,497,174 | ||||||||
| Shipbuilding — 0.1% | ||||||||
| Huntington Ingalls Industries Inc. |
||||||||
| 2.04%, 08/16/28 (Call 06/16/28) |
480 | 417,328 | ||||||
| 3.48%, 12/01/27 (Call 09/01/27) |
675 | 632,416 | ||||||
| 3.84%, 05/01/25 (Call 04/01/25) |
195 | 190,747 | ||||||
|
|
|
|||||||
| 1,240,491 | ||||||||
| Software — 4.4% | ||||||||
| Adobe Inc., 2.15%, 02/01/27 (Call 12/01/26)(a) |
9,470 | 8,814,984 | ||||||
| Autodesk Inc. |
||||||||
| 3.50%, 06/15/27 (Call 03/15/27) |
105 | 100,395 | ||||||
| 4.38%, 06/15/25 (Call 03/15/25)(a) |
394 | 389,506 | ||||||
| Broadridge Financial Solutions Inc., 3.40%, 06/27/26 (Call 03/27/26) |
500 | 477,903 | ||||||
| Concentrix Corp.,
6.60%, 08/02/28 |
140 | 140,645 | ||||||
| Electronic Arts Inc., 4.80%, 03/01/26 (Call 12/01/25) |
140 | 139,253 | ||||||
| Fidelity National Information Services Inc. |
||||||||
| 1.15%, 03/01/26 (Call 02/01/26) |
90 | 83,242 | ||||||
| 4.70%, 07/15/27 (Call 06/15/27) |
915 | 908,091 | ||||||
| Fiserv Inc. |
||||||||
| 3.20%, 07/01/26 (Call 05/01/26) |
35 | 33,426 | ||||||
| 3.85%, 06/01/25 (Call 03/01/25) |
32 | 31,360 | ||||||
| 5.38%, 08/21/28 (Call 07/21/28) |
275 | 276,697 | ||||||
| 5.45%, 03/02/28 (Call 02/02/28) |
200 | 201,633 | ||||||
| Intuit Inc. |
||||||||
| 0.95%, 07/15/25 (Call 06/15/25) |
4,521 | 4,265,465 | ||||||
| 1.35%, 07/15/27 (Call 05/15/27) |
195 | 173,968 | ||||||
| Microsoft Corp. |
||||||||
| 2.40%, 08/08/26 (Call 05/08/26) |
3,525 | 3,336,871 | ||||||
| 3.13%, 11/03/25 (Call 08/03/25) |
2,145 | 2,084,990 | ||||||
| 3.30%, 02/06/27 (Call 11/06/26) |
6,960 | 6,722,979 | ||||||
| Oracle Corp. |
||||||||
| 1.65%, 03/25/26 (Call 02/25/26) |
60 | 55,728 | ||||||
| 2.30%, 03/25/28 (Call 01/25/28) |
1,750 | 1,567,825 | ||||||
| 2.50%, 04/01/25 (Call 03/01/25) |
140 | 135,595 | ||||||
| 2.65%, 07/15/26 (Call 04/15/26) |
47 | 44,269 | ||||||
| 2.80%, 04/01/27 (Call 02/01/27) |
2,050 | 1,912,097 | ||||||
| 2.95%, 05/15/25 (Call 02/15/25) |
107 | 103,844 | ||||||
| S C H E D U L E O F I N V E S T M E N T S |
27 |
| Schedule of Investments (continued) February 29, 2024 |
iShares® ESG Aware 1-5 Year USD Corporate Bond ETF (Percentages shown are based on Net Assets) |
| Security | Par (000) |
Value | ||||||
| Software (continued) | ||||||||
| Roper Technologies Inc. |
||||||||
| 1.00%, 09/15/25 (Call 08/15/25) |
$ | 146 | $ | 136,725 | ||||
| 1.40%, 09/15/27 (Call 07/15/27) |
370 | 326,838 | ||||||
| 3.80%, 12/15/26 (Call 09/15/26) |
15 | 14,499 | ||||||
| Salesforce Inc., 3.70%, 04/11/28 (Call 01/11/28) |
60 | 57,895 | ||||||
| Take-Two Interactive Software Inc. |
||||||||
| 3.70%, 04/14/27 (Call 03/14/27) |
355 | 339,380 | ||||||
| 4.95%, 03/28/28 (Call 02/28/28) |
285 | 282,627 | ||||||
| 5.00%, 03/28/26 |
295 | 293,397 | ||||||
| VMware LLC |
||||||||
| 1.40%, 08/15/26 (Call 07/15/26) |
3,012 | 2,738,421 | ||||||
| 4.50%, 05/15/25 (Call 04/15/25) |
1,251 | 1,237,182 | ||||||
| 4.65%, 05/15/27 (Call 03/15/27) |
30 | 29,366 | ||||||
| Workday Inc., 3.50%, 04/01/27 (Call 03/01/27) |
690 | 656,837 | ||||||
|
|
|
|||||||
| 38,113,933 | ||||||||
| Telecommunications — 2.3% | ||||||||
| AT&T Inc. |
||||||||
| 1.65%, 02/01/28 (Call 12/01/27) |
1,765 | 1,553,219 | ||||||
| 2.30%, 06/01/27 (Call 04/01/27) |
65 | 59,512 | ||||||
| 3.80%, 02/15/27 (Call 11/15/26) |
10 | 9,635 | ||||||
| 4.10%, 02/15/28 (Call 11/15/27) |
510 | 491,708 | ||||||
| 4.25%, 03/01/27 (Call 12/01/26) |
35 | 34,116 | ||||||
| British Telecommunications PLC, 5.13%, 12/04/28 (Call 09/04/28)(a) |
1,000 | 1,005,126 | ||||||
| Cisco Systems Inc. |
||||||||
| 2.50%, 09/20/26 (Call 06/20/26) |
65 | 61,338 | ||||||
| 2.95%, 02/28/26 |
55 | 53,014 | ||||||
| 3.50%, 06/15/25 |
2,224 | 2,182,416 | ||||||
| 4.80%, 02/26/27 (Call 01/26/27) |
775 | 775,180 | ||||||
| 4.85%, 02/26/29 (Call 01/26/29) |
775 | 776,240 | ||||||
| 4.90%, 02/26/26 |
490 | 490,215 | ||||||
| Nokia OYJ, 4.38%, 06/12/27 |
60 | 57,504 | ||||||
| Rogers Communications Inc. |
||||||||
| 2.90%, 11/15/26 (Call 08/15/26) |
736 | 692,675 | ||||||
| 3.20%, 03/15/27 (Call 02/15/27) |
775 | 729,684 | ||||||
| 3.63%, 12/15/25 (Call 09/15/25) |
1,465 | 1,419,702 | ||||||
| 5.00%, 02/15/29 (Call 01/15/29) |
135 | 133,744 | ||||||
| TELUS Corp. |
||||||||
| 2.80%, 02/16/27 (Call 11/16/26) |
115 | 107,736 | ||||||
| 3.70%, 09/15/27 (Call 06/15/27) |
160 | 151,870 | ||||||
| T-Mobile USA Inc. |
||||||||
| 2.05%, 02/15/28 (Call 12/15/27) |
1,345 | 1,198,139 | ||||||
| 3.75%, 04/15/27 (Call 02/15/27) |
95 | 91,070 | ||||||
| 4.80%, 07/15/28 (Call 06/15/28) |
390 | 384,801 | ||||||
| 4.95%, 03/15/28 (Call 02/15/28) |
255 | 253,439 | ||||||
| Verizon Communications Inc. |
||||||||
| 1.45%, 03/20/26 (Call 02/20/26) |
53 | 49,144 | ||||||
| 2.10%, 03/22/28 (Call 01/22/28) |
1,463 | 1,302,607 | ||||||
| 2.63%, 08/15/26 |
800 | 754,410 | ||||||
| 3.00%, 03/22/27 (Call 01/22/27) |
2,305 | 2,168,754 | ||||||
| 4.13%, 03/16/27 |
315 | 306,351 | ||||||
| 4.33%, 09/21/28(a) |
505 | 490,248 | ||||||
| Vodafone Group PLC |
||||||||
| 4.13%, 05/30/25 |
1,733 | 1,704,750 | ||||||
| 4.38%, 05/30/28(a) |
10 | 9,829 | ||||||
|
|
|
|||||||
| 19,498,176 | ||||||||
| Security | Par (000) |
Value | ||||||
| Toys, Games & Hobbies — 0.2% | ||||||||
| Hasbro Inc. |
||||||||
| 3.50%, 09/15/27 (Call 06/15/27) |
$ | 420 | $ | 394,089 | ||||
| 3.55%, 11/19/26 (Call 09/19/26) |
1,680 | 1,593,196 | ||||||
|
|
|
|||||||
| 1,987,285 | ||||||||
| Transportation — 1.0% | ||||||||
| Canadian National Railway Co. |
||||||||
| 2.75%, 03/01/26 (Call 12/01/25) |
67 | 64,261 | ||||||
| 6.90%, 07/15/28 |
600 | 646,677 | ||||||
| Canadian Pacific Railway Co., 1.75%, 12/02/26 (Call 11/02/26) |
55 | 50,425 | ||||||
| CH Robinson Worldwide Inc., 4.20%, 04/15/28 (Call 01/15/28) |
1,610 | 1,552,167 | ||||||
| Norfolk Southern Corp. |
||||||||
| 2.90%, 06/15/26 (Call 03/15/26) |
40 | 38,112 | ||||||
| 3.15%, 06/01/27 (Call 03/01/27) |
25 | 23,691 | ||||||
| 3.65%, 08/01/25 (Call 06/01/25) |
10 | 9,781 | ||||||
| Ryder System Inc. |
||||||||
| 1.75%, 09/01/26 (Call 08/01/26) |
935 | 858,946 | ||||||
| 2.85%, 03/01/27 (Call 02/01/27) |
155 | 144,947 | ||||||
| 2.90%, 12/01/26 (Call 10/01/26) |
975 | 916,092 | ||||||
| 3.35%, 09/01/25 (Call 08/01/25) |
1,721 | 1,668,080 | ||||||
| 4.30%, 06/15/27 (Call 05/15/27) |
525 | 510,936 | ||||||
| 4.63%, 06/01/25 (Call 05/01/25) |
297 | 294,199 | ||||||
| 5.25%, 06/01/28 (Call 05/01/28)(a) |
250 | 250,378 | ||||||
| 5.30%, 03/15/27 (Call 02/15/27) |
145 | 145,189 | ||||||
| 5.38%, 03/15/29 (Call 02/15/29) |
200 | 199,780 | ||||||
| 5.65%, 03/01/28 (Call 02/01/28) |
230 | 233,821 | ||||||
| 6.30%, 12/01/28 (Call 11/01/28)(a) |
425 | 442,860 | ||||||
| Union Pacific Corp. |
||||||||
| 2.15%, 02/05/27 (Call 12/05/26) |
35 | 32,445 | ||||||
| 3.00%, 04/15/27 (Call 01/15/27) |
20 | 18,925 | ||||||
| 3.25%, 08/15/25 (Call 05/15/25) |
12 | 11,687 | ||||||
| 3.75%, 07/15/25 (Call 05/15/25) |
55 | 53,976 | ||||||
| United Parcel Service Inc. |
||||||||
| 2.40%, 11/15/26 (Call 08/15/26) |
105 | 98,835 | ||||||
| 3.90%, 04/01/25 (Call 03/01/25) |
296 | 291,989 | ||||||
|
|
|
|||||||
| 8,558,199 | ||||||||
| Trucking & Leasing — 0.2% | ||||||||
| GATX Corp. |
||||||||
| 3.25%, 03/30/25 (Call 12/30/24)(a) |
33 | 32,175 | ||||||
| 3.25%, 09/15/26 (Call 06/15/26) |
10 | 9,530 | ||||||
| 3.50%, 03/15/28 (Call 12/15/27)(a) |
1,715 | 1,608,379 | ||||||
| 5.40%, 03/15/27 (Call 02/15/27) |
45 | 45,084 | ||||||
|
|
|
|||||||
| 1,695,168 | ||||||||
| Venture Capital — 0.0% | ||||||||
| Hercules Capital Inc. |
||||||||
| 2.63%, 09/16/26 (Call 08/16/26) |
55 | 49,535 | ||||||
| 3.38%, 01/20/27 (Call 12/20/26) |
285 | 258,447 | ||||||
|
|
|
|||||||
| 307,982 | ||||||||
| Water — 0.0% | ||||||||
| American Water Capital Corp., 3.40%, 03/01/25 (Call 12/01/24) |
352 | 345,113 | ||||||
|
|
|
|||||||
| Total Long-Term Investments — 98.5% |
852,759,963 | |||||||
|
|
|
|||||||
| 28 | 2 0 2 4 I S H A R E S A N N U A L R E P O R T T O S H A R E H O L D E R S |
| Schedule of Investments (continued) February 29, 2024 |
iShares® ESG Aware 1-5 Year USD Corporate Bond ETF (Percentages shown are based on Net Assets) |
| Security | Shares | Value | ||||||
|
|
||||||||
| Short-Term Securities |
||||||||
| Money Market Funds — 4.8% |
||||||||
| BlackRock Cash Funds: Institutional, SL Agency Shares, 5.50%(d)(e)(f) |
39,714,612 | $ | 39,734,469 | |||||
| BlackRock Cash Funds: Treasury, SL Agency Shares, 5.30%(d)(e) |
1,350,000 | 1,350,000 | ||||||
|
|
|
|||||||
| Total Short-Term Securities — 4.8% |
41,084,469 | |||||||
|
|
|
|||||||
| Total Investments — 103.3% |
893,844,432 | |||||||
| Liabilities in Excess of Other Assets — (3.3)% |
|
(28,496,697 | ) | |||||
|
|
|
|||||||
| Net Assets — 100.0% | $ 865,347,735 | |||||||
|
|
|
|||||||
| (a) | All or a portion of this security is on loan. |
| (b) | Variable rate security. Interest rate resets periodically. The rate shown is the effective interest rate as of period end. Security description also includes the reference rate and spread if published and available. |
| (c) | Security exempt from registration pursuant to Rule 144A under the Securities Act of 1933, as amended. These securities may be resold in transactions exempt from registration to qualified institutional investors. |
| (d) | Affiliate of the Fund. |
| (e) | Annualized 7-day yield as of period end. |
| (f) | All or a portion of this security was purchased with the cash collateral from loaned securities. |
Affiliates
Investments in issuers considered to be affiliate(s) of the Fund during the year ended February 29, 2024 for purposes of Section 2(a)(3) of the Investment Company Act of 1940, as amended, were as follows:
|
|
||||||||||||||||||||||||||||||||||||
| Affiliated Issuer | Value at 02/28/23 |
Purchases at Cost |
Proceeds from Sale |
Net Realized Gain (Loss) |
Change in Unrealized Appreciation (Depreciation) |
Value at 02/29/24 |
Shares Held at 02/29/24 |
Income | Capital Gain Distributions from Underlying Funds |
|||||||||||||||||||||||||||
|
|
||||||||||||||||||||||||||||||||||||
| BlackRock Cash Funds: Institutional, SL Agency Shares |
$ | 38,044,249 | $ | 1,700,666 | (a) | $ | — | $ | 4,955 | $ | (15,401 | ) | $ | 39,734,469 | 39,714,612 | $ | 159,855 | (b) | $ | — | ||||||||||||||||
| BlackRock Cash Funds: Treasury, SL Agency Shares |
960,000 | 390,000 | (a) | — | — | — | 1,350,000 | 1,350,000 | 100,288 | — | ||||||||||||||||||||||||||
|
|
|
|
|
|
|
|
|
|
|
|||||||||||||||||||||||||||
| $ | 4,955 | $ | (15,401 | ) | $ | 41,084,469 | $ | 260,143 | $ | — | ||||||||||||||||||||||||||
|
|
|
|
|
|
|
|
|
|
|
|||||||||||||||||||||||||||
| (a) | Represents net amount purchased (sold). |
| (b) | All or a portion represents securities lending income earned from the reinvestment of cash collateral from loaned securities, net of fees and collateral investment expenses, and other payments to and from borrowers of securities. |
Fair Value Hierarchy as of Period End
Various inputs are used in determining the fair value of financial instruments. For a description of the input levels and information about the Fund’s policy regarding valuation of financial instruments, refer to the Notes to Financial Statements.
The following table summarizes the Fund’s financial instruments categorized in the fair value hierarchy. The breakdown of the Fund’s financial instruments into major categories is disclosed in the Schedule of Investments above.
|
|
||||||||||||||||
| Level 1 | Level 2 | Level 3 | Total | |||||||||||||
|
|
||||||||||||||||
| Assets |
||||||||||||||||
| Investments |
||||||||||||||||
| Long-Term Investments |
||||||||||||||||
| Corporate Bonds & Notes |
$ | — | $ | 852,759,963 | $ | — | $ | 852,759,963 | ||||||||
| S C H E D U L E O F I N V E S T M E N T S |
29 |
| Schedule of Investments (continued) February 29, 2024 |
iShares® ESG Aware 1-5 Year USD Corporate Bond ETF |
Fair Value Hierarchy as of Period End (continued)
|
|
||||||||||||||||
| Level 1 | Level 2 | Level 3 | Total | |||||||||||||
|
|
||||||||||||||||
| Short-Term Securities |
||||||||||||||||
| Money Market Funds |
$ | 41,084,469 | $ | — | $ | — | $ | 41,084,469 | ||||||||
|
|
|
|
|
|
|
|
|
|||||||||
| $ | 41,084,469 | $ | 852,759,963 | $ | — | $ | 893,844,432 | |||||||||
|
|
|
|
|
|
|
|
|
|||||||||
See notes to financial statements.
| 30 | 2 0 2 4 I S H A R E S A N N U A L R E P O R T T O S H A R E H O L D E R S |
| Schedule of Investments February 29, 2024 |
iShares® ESG Aware U.S. Aggregate Bond ETF (Percentages shown are based on Net Assets) |
| Security | Par (000) |
Value | ||||||
| Asset-Backed Securities |
||||||||
| Ally Auto Receivables Trust, 5.07%, 04/15/27 (Call 03/15/26) |
$ | 1,780 | $ | 1,773,833 | ||||
| American Express Credit Account Master Trust |
||||||||
| 3.75%, 08/15/27 |
2,000 | 1,960,428 | ||||||
| Series 2022-2, Class A, 3.39%, 05/15/27 |
1,000 | 978,666 | ||||||
| BMW Vehicle Lease Trust, 5.99%, 09/25/26 |
320 | 322,516 | ||||||
| Capital One Multi-Asset Execution Trust, 4.95%, 10/15/27 |
5,067 | 5,051,936 | ||||||
| GM Financial Consumer Automobile Receivables Trust |
||||||||
| 4.47%, 02/16/28 (Call 12/16/26) |
1,000 | 988,251 | ||||||
| 5.78%, 08/16/28 |
1,220 | 1,237,372 | ||||||
| Series 2021-1, Class A4, 0.54%, 05/17/27 (Call 12/16/24) |
850 | 821,864 | ||||||
| Hyundai Auto Receivables Trust, 5.48%, 04/17/28 |
1,500 | 1,508,360 | ||||||
| Santander Drive Auto Receivables Trust, 5.23%, 12/15/28 |
210 | 209,506 | ||||||
| Toyota Auto Receivables Owner Trust Series 2021-B, Class A4, |
1,000 | 947,441 | ||||||
| Verizon Master Trust, 4.49%, 01/22/29 (Call 01/20/26) |
1,000 | 988,658 | ||||||
|
|
|
|||||||
| Total Asset-Backed Securities — 0.5% |
16,788,831 | |||||||
|
|
|
|||||||
| Collaterized Mortgage Obligations |
||||||||
| Mortgage-Backed Securities — 1.0% | ||||||||
| Bank |
||||||||
| Series 2017-BNK5, Class A4, 3.13%, 06/15/60 (Call 07/15/27) |
850 | 793,668 | ||||||
| Series 2019-BN19, Class A3, 3.18%, 08/15/61 (Call 07/15/29) |
1,200 | 1,050,748 | ||||||
| BBCMS Mortgage Trust |
||||||||
| 6.00%, 09/15/56 |
4,710 | 5,021,571 | ||||||
| Series 2020-C7, Class A5, 2.04%, 04/15/53 (Call 04/15/30) |
670 | 562,128 | ||||||
| Series 2021-C11, Class A5, 2.32%, 09/15/54 |
2,000 | 1,654,087 | ||||||
| Benchmark Mortgage Trust |
||||||||
| 3.93%, 03/15/52 (Call 02/15/29) |
1,454 | 1,410,285 | ||||||
| 4.44%, 05/15/55 (Call 05/15/32)(a) |
2,000 | 1,852,309 | ||||||
| Series 2018-B4, Class A5, 4.12%, 07/15/51 (Call 07/15/28)(a) |
100 | 95,294 | ||||||
| Series 2018-B4, Class ASB, 4.06%, 07/15/51 (Call 07/15/28)(a) |
223 | 217,092 | ||||||
| Series 2018-B6, Class AAB, 4.17%, 10/10/51 (Call 10/10/28) |
229 | 224,105 | ||||||
| Series 2019-B11, Class A4, 3.28%, 05/15/52 (Call 06/15/29) |
100 | 90,371 | ||||||
| Series 2020-B21, Class A4, 1.70%, 12/17/53 (Call 12/15/30) |
1,200 | 977,650 | ||||||
| Series 2020-B21, Class A5, 1.98%, 12/17/53 (Call 12/15/30) |
800 | 651,072 | ||||||
| BMO Mortgage Trust, 5.74%, 02/15/57 |
1,000 | 1,021,224 | ||||||
| CD Mortgage Trust, 3.35%, 11/10/49 (Call 08/10/27) |
1,306 | 1,268,683 | ||||||
| Commission Mortgage Trust, Series 2014-UBS3, Class A4, 3.82%, 06/10/47 (Call 06/10/24) |
720 | 716,645 | ||||||
| Security | Par (000) |
Value | ||||||
| Mortgage-Backed Securities (continued) | ||||||||
| Federal Home Loan Mortgage Corp. Multifamily Structured Pass-Through Certificates |
||||||||
| 3.78%, 11/25/32 (Call 11/25/32)(a) |
$ | 4,000 | $ | 3,716,798 | ||||
| 4.43%, 02/25/33 (Call 02/25/33)(a) |
2,400 | 2,336,769 | ||||||
| 4.65%, 08/25/28 |
1,000 | 994,833 | ||||||
| GS Mortgage Securities Trust, Series 2015-GC30, Class A4, 3.38%, 05/10/50 (Call 05/10/25) |
250 | 242,181 | ||||||
| JP Morgan Chase Commercial Mortgage Securities Trust, Series 2016-JP3, Class A5, 2.87%, 08/15/49 (Call 09/15/26) |
100 | 93,319 | ||||||
| JPMCC Commercial Mortgage Securities Trust, |
1,004 | 971,949 | ||||||
| Morgan Stanley Bank of America Merrill Lynch Trust |
||||||||
| Series 2014-C18, Class ASB, |
0 | 420 | ||||||
| Series 2015-C27, Class A4, |
250 | 241,238 | ||||||
| Series 2016-C31, Class A5, |
500 | 465,851 | ||||||
| Morgan Stanley Capital I Trust, Series 2019-L3, Class AS, 3.49%, 11/15/52 (Call 11/15/29) |
82 | 72,235 | ||||||
| MSWF Commercial Mortgage Trust, |
2,000 | 2,085,674 | ||||||
| SG Commercial Mortgage Securities |
488 | 475,905 | ||||||
| UBS Commercial Mortgage Trust, |
370 | 361,694 | ||||||
| Wells Fargo Commercial Mortgage Trust |
||||||||
| Class A4, 2.34%, 08/15/54 (Call 07/15/31) |
460 | 380,535 | ||||||
| Class ASB, 4.17%, 05/15/51 (Call 05/15/28) |
852 | 833,378 | ||||||
| Series 2015-LC22, Class A4, |
500 | 484,104 | ||||||
| Series 2017-C41, Class A4, |
1,000 | 934,495 | ||||||
| Series 2019-C51, Class A4, |
2,000 | 1,798,483 | ||||||
| Series 2020-C56, Class A5, |
130 | 111,013 | ||||||
| WFRBS Commercial Mortgage Trust, Series 2014-C21, Class A5, 3.68%, 08/15/47 (Call 08/15/24) |
635 | 629,580 | ||||||
|
|
|
|||||||
| 34,837,386 | ||||||||
|
|
|
|||||||
| Total Collaterized Mortgage Obligations — 1.0% |
|
34,837,386 | ||||||
|
|
|
|||||||
| Corporate Bonds & Notes |
||||||||
| Advertising — 0.0% | ||||||||
| Interpublic Group of Companies Inc. (The) |
||||||||
| 5.38%, 06/15/33 (Call 03/15/33) |
127 | 125,650 | ||||||
| 5.40%, 10/01/48 (Call 04/01/48) |
255 | 235,643 | ||||||
|
|
|
|||||||
| 361,293 | ||||||||
| Aerospace & Defense — 0.2% | ||||||||
| Hexcel Corp. |
||||||||
| 4.20%, 02/15/27 (Call 11/15/26) |
440 | 418,901 | ||||||
| 4.95%, 08/15/25 (Call 05/15/25) |
1,135 | 1,120,119 | ||||||
| Howmet Aerospace Inc., 5.95%, 02/01/37 |
30 | 30,633 | ||||||
| S C H E D U L E O F I N V E S T M E N T S |
31 |
| Schedule of Investments (continued) February 29, 2024 |
iShares® ESG Aware U.S. Aggregate Bond ETF (Percentages shown are based on Net Assets) |
| Security | Par (000) |
Value | ||||||
| Aerospace & Defense (continued) | ||||||||
| Northrop Grumman Corp. |
||||||||
| 4.90%, 06/01/34 (Call 03/01/34) |
$ | 500 | $ | 486,928 | ||||
| 5.20%, 06/01/54 (Call 12/01/53) |
500 | 480,675 | ||||||
| RTX Corp. |
||||||||
| 1.90%, 09/01/31 (Call 06/01/31) |
100 | 79,618 | ||||||
| 2.25%, 07/01/30 (Call 04/01/30) |
754 | 638,117 | ||||||
| 2.38%, 03/15/32 (Call 12/15/31) |
115 | 93,202 | ||||||
| 2.65%, 11/01/26 (Call 08/01/26) |
70 | 65,872 | ||||||
| 3.13%, 05/04/27 (Call 02/04/27) |
362 | 341,639 | ||||||
| 3.13%, 07/01/50 (Call 01/01/50) |
196 | 131,740 | ||||||
| 3.75%, 11/01/46 (Call 05/01/46) |
267 | 202,716 | ||||||
| 3.95%, 08/16/25 (Call 06/16/25) |
680 | 667,015 | ||||||
| 4.05%, 05/04/47 (Call 11/04/46) |
247 | 197,868 | ||||||
| 4.13%, 11/16/28 (Call 08/16/28) |
661 | 634,837 | ||||||
| 4.15%, 05/15/45 (Call 11/16/44) |
175 | 142,976 | ||||||
| 4.35%, 04/15/47 (Call 10/15/46) |
287 | 239,788 | ||||||
| 4.45%, 11/16/38 (Call 05/16/38) |
320 | 284,179 | ||||||
| 4.50%, 06/01/42 |
633 | 553,646 | ||||||
| 4.63%, 11/16/48 (Call 05/16/48) |
214 | 185,824 | ||||||
| 4.70%, 12/15/41 |
57 | 50,930 | ||||||
| 4.80%, 12/15/43 (Call 06/15/43) |
175 | 157,161 | ||||||
| 4.88%, 10/15/40 |
145 | 134,153 | ||||||
| 5.00%, 02/27/26 (Call 01/27/26) |
45 | 44,885 | ||||||
| 5.15%, 02/27/33 (Call 11/27/32) |
100 | 98,976 | ||||||
| 5.38%, 02/27/53 (Call 08/27/52) |
95 | 91,690 | ||||||
| 5.40%, 05/01/35 |
20 | 20,175 | ||||||
| 5.75%, 11/08/26 (Call 10/08/26) |
75 | 76,092 | ||||||
| 5.75%, 01/15/29 (Call 12/15/28) |
65 | 66,915 | ||||||
| 6.00%, 03/15/31 (Call 01/15/31) |
150 | 156,249 | ||||||
| 6.05%, 06/01/36 |
75 | 78,532 | ||||||
| 6.10%, 03/15/34 (Call 12/15/33) |
40 | 42,294 | ||||||
| 6.13%, 07/15/38 |
180 | 190,117 | ||||||
| 6.40%, 03/15/54 (Call 09/15/53) |
80 | 88,557 | ||||||
| 7.50%, 09/15/29 |
10 | 11,100 | ||||||
|
|
|
|||||||
| 8,304,119 | ||||||||
| Agriculture — 0.2% | ||||||||
| Archer-Daniels-Midland Co. |
||||||||
| 2.50%, 08/11/26 (Call 05/11/26) |
645 | 607,300 | ||||||
| 2.70%, 09/15/51 (Call 03/15/51) |
210 | 133,028 | ||||||
| 2.90%, 03/01/32 (Call 12/01/31) |
50 | 42,609 | ||||||
| 3.25%, 03/27/30 (Call 12/27/29) |
248 | 224,368 | ||||||
| 3.75%, 09/15/47 (Call 03/15/47) |
119 | 90,343 | ||||||
| 4.02%, 04/16/43 |
28 | 22,981 | ||||||
| 4.50%, 08/15/33 (Call 05/15/33)(b) |
160 | 152,493 | ||||||
| 4.50%, 03/15/49 (Call 09/15/48) |
55 | 48,011 | ||||||
| 4.54%, 03/26/42 |
42 | 37,697 | ||||||
| 5.94%, 10/01/32 |
107 | 113,176 | ||||||
| Bunge Ltd. Finance Corp. |
||||||||
| 1.63%, 08/17/25 (Call 07/17/25) |
1,480 | 1,401,029 | ||||||
| 2.75%, 05/14/31 (Call 02/14/31) |
1,565 | 1,331,496 | ||||||
| 3.25%, 08/15/26 (Call 05/15/26) |
1,571 | 1,497,754 | ||||||
| 3.75%, 09/25/27 (Call 06/25/27) |
889 | 850,513 | ||||||
|
|
|
|||||||
| 6,552,798 | ||||||||
| Airlines — 0.0% | ||||||||
| Southwest Airlines Co., 2.63%, 02/10/30 (Call 11/10/29) |
100 | 86,439 | ||||||
|
|
|
|||||||
| Apparel — 0.1% | ||||||||
| NIKE Inc. |
||||||||
| 3.25%, 03/27/40 (Call 09/27/39) |
70 | 55,797 | ||||||
| 3.38%, 11/01/46 (Call 05/01/46) |
85 | 64,237 | ||||||
| Security | Par (000) |
Value | ||||||
| Apparel (continued) | ||||||||
| 3.38%, 03/27/50 (Call 09/27/49)(b) |
$ | 203 | $ | 153,912 | ||||
| 3.88%, 11/01/45 (Call 05/01/45) |
247 | 204,156 | ||||||
| PVH Corp., 4.63%, 07/10/25 (Call 06/10/25) |
655 | 645,827 | ||||||
| Tapestry Inc. |
||||||||
| 4.13%, 07/15/27 (Call 04/15/27) |
72 | 68,378 | ||||||
| 4.25%, 04/01/25 (Call 01/01/25)(b) |
5 | 4,923 | ||||||
| 7.85%, 11/27/33 (Call 08/27/33) |
5 | 5,410 | ||||||
| VF Corp. |
||||||||
| 2.40%, 04/23/25 (Call 03/23/25) |
295 | 283,013 | ||||||
| 2.80%, 04/23/27 (Call 02/23/27) |
1,176 | 1,066,277 | ||||||
| 2.95%, 04/23/30 (Call 01/23/30) |
400 | 329,954 | ||||||
|
|
|
|||||||
| 2,881,884 | ||||||||
| Auto Manufacturers — 0.2% | ||||||||
| American Honda Finance Corp. |
||||||||
| 1.80%, 01/13/31 |
435 | 357,164 | ||||||
| 2.00%, 03/24/28 |
300 | 268,706 | ||||||
| 2.25%, 01/12/29 |
330 | 293,040 | ||||||
| 2.30%, 09/09/26 |
155 | 145,381 | ||||||
| 2.35%, 01/08/27 |
135 | 125,944 | ||||||
| 3.50%, 02/15/28 |
155 | 147,198 | ||||||
| 4.60%, 04/17/30 |
140 | 137,115 | ||||||
| 4.70%, 01/12/28 |
100 | 99,491 | ||||||
| 4.75%, 01/12/26 |
60 | 59,607 | ||||||
| 4.90%, 01/10/34 |
115 | 112,170 | ||||||
| 4.95%, 01/09/26 |
150 | 149,544 | ||||||
| 5.13%, 07/07/28 |
100 | 100,809 | ||||||
| 5.25%, 07/07/26 |
100 | 100,702 | ||||||
| 5.65%, 11/15/28 |
85 | 87,399 | ||||||
| Series A, 4.60%, 04/17/25 |
160 | 158,910 | ||||||
| Cummins Inc. |
||||||||
| 1.50%, 09/01/30 (Call 06/01/30) |
824 | 665,591 | ||||||
| 2.60%, 09/01/50 (Call 03/01/50)(b) |
290 | 181,873 | ||||||
| 4.88%, 10/01/43 (Call 04/01/43) |
382 | 360,465 | ||||||
| 4.90%, 02/20/29 (Call 01/20/29) |
50 | 49,751 | ||||||
| 5.15%, 02/20/34 (Call 11/20/33) |
30 | 29,970 | ||||||
| 5.45%, 02/20/54 (Call 08/20/53) |
30 | 30,157 | ||||||
| Ford Motor Co., 7.40%, 11/01/46 |
340 | 364,228 | ||||||
| Ford Motor Credit Co. LLC, |
410 | 437,410 | ||||||
| General Motors Co. |
||||||||
| 5.00%, 04/01/35 |
95 | 88,819 | ||||||
| 5.15%, 04/01/38 (Call 10/01/37) |
135 | 124,974 | ||||||
| 5.20%, 04/01/45 |
249 | 219,784 | ||||||
| 5.40%, 04/01/48 (Call 10/01/47) |
177 | 158,756 | ||||||
| 5.95%, 04/01/49 (Call 10/01/48)(b) |
235 | 225,830 | ||||||
| 6.25%, 10/02/43 |
135 | 135,494 | ||||||
| 6.60%, 04/01/36 (Call 10/01/35) |
211 | 221,203 | ||||||
| 6.75%, 04/01/46 (Call 10/01/45) |
179 | 189,194 | ||||||
| General Motors Financial Co. Inc. |
||||||||
| 2.35%, 01/08/31 (Call 10/08/30) |
15 | 12,224 | ||||||
| 2.40%, 10/15/28 (Call 08/15/28) |
35 | 30,751 | ||||||
| 2.70%, 06/10/31 (Call 03/10/31) |
75 | 61,711 | ||||||
| 3.10%, 01/12/32 (Call 10/12/31) |
150 | 125,279 | ||||||
| 3.60%, 06/21/30 (Call 03/21/30) |
40 | 35,873 | ||||||
| 4.30%, 04/06/29 (Call 02/06/29) |
55 | 52,162 | ||||||
| 5.85%, 04/06/30 (Call 02/06/30) |
25 | 25,352 | ||||||
| 6.40%, 01/09/33 (Call 10/09/32) |
300 | 311,537 | ||||||
| Honda Motor Co. Ltd., |
165 | 144,878 | ||||||
| Mercedes-Benz Finance North America LLC, |
||||||||
| 8.50%, 01/18/31 |
327 | 396,777 | ||||||
| 32 | 2 0 2 4 I S H A R E S A N N U A L R E P O R T T O S H A R E H O L D E R S |
| Schedule of Investments (continued) February 29, 2024 |
iShares® ESG Aware U.S. Aggregate Bond ETF (Percentages shown are based on Net Assets) |
| Security | Par (000) |
Value | ||||||
| Auto Manufacturers (continued) | ||||||||
| Toyota Motor Credit Corp. |
||||||||
| 2.15%, 02/13/30 |
$ | 112 | $ | 96,221 | ||||
| 3.05%, 01/11/28 |
57 | 53,658 | ||||||
| 3.20%, 01/11/27 |
130 | 124,202 | ||||||
| 3.38%, 04/01/30 |
190 | 174,636 | ||||||
| 3.65%, 01/08/29 |
176 | 166,538 | ||||||
| 4.45%, 05/18/26 |
130 | 128,630 | ||||||
| 4.55%, 09/20/27 |
50 | 49,574 | ||||||
| 4.55%, 05/17/30 |
180 | 176,241 | ||||||
| 4.63%, 01/12/28 |
65 | 64,635 | ||||||
| 4.70%, 01/12/33 |
80 | 78,888 | ||||||
|
|
|
|||||||
| 8,136,446 | ||||||||
| Auto Parts & Equipment — 0.1% | ||||||||
| Aptiv PLC |
||||||||
| 3.10%, 12/01/51 (Call 06/01/51) |
474 | 296,771 | ||||||
| 4.35%, 03/15/29 (Call 12/15/28) |
220 | 212,599 | ||||||
| 4.40%, 10/01/46 (Call 04/01/46) |
74 | 58,119 | ||||||
| 5.40%, 03/15/49 (Call 09/15/48)(b) |
287 | 260,227 | ||||||
| Aptiv PLC/Aptiv Corp. |
||||||||
| 3.25%, 03/01/32 (Call 12/01/31) |
215 | 185,393 | ||||||
| 4.15%, 05/01/52 (Call 11/01/51) |
205 | 156,477 | ||||||
| BorgWarner Inc., 4.38%, 03/15/45 (Call 09/15/44) |
61 | 49,650 | ||||||
| Lear Corp. |
||||||||
| 3.50%, 05/30/30 (Call 02/28/30) |
259 | 231,453 | ||||||
| 3.55%, 01/15/52 (Call 07/15/51) |
110 | 74,568 | ||||||
| 3.80%, 09/15/27 (Call 06/15/27) |
136 | 130,162 | ||||||
| 4.25%, 05/15/29 (Call 02/15/29) |
132 | 125,605 | ||||||
| 5.25%, 05/15/49 (Call 11/15/48) |
117 | 105,065 | ||||||
| Magna International Inc. |
||||||||
| 4.15%, 10/01/25 (Call 07/01/25) |
70 | 68,711 | ||||||
| 5.50%, 03/21/33 (Call 12/21/32) |
50 | 51,219 | ||||||
|
|
|
|||||||
| 2,006,019 | ||||||||
| Banks — 5.7% | ||||||||
| Australia & New Zealand Banking Group Ltd., 3.70%, 11/16/25 |
620 | 606,352 | ||||||
| Banco Bilbao Vizcaya Argentaria SA |
||||||||
| 1.13%, 09/18/25 |
7,357 | 6,876,935 | ||||||
| 5.86%, 09/14/26 (Call 09/14/25), |
1,020 | 1,019,672 | ||||||
| 7.88%, 11/15/34 (Call 11/15/33), |
200 | 213,044 | ||||||
| Banco Santander SA |
||||||||
| 1.72%, 09/14/27 (Call 09/14/26), |
300 | 271,317 | ||||||
| 2.96%, 03/25/31 |
200 | 170,339 | ||||||
| 3.23%, 11/22/32 (Call 08/22/31), |
445 | 367,317 | ||||||
| 4.18%, 03/24/28 (Call 03/24/27), |
785 | 751,463 | ||||||
| 4.38%, 04/12/28 |
365 | 350,707 | ||||||
| 5.18%, 11/19/25 |
200 | 197,208 | ||||||
| 5.59%, 08/08/28 |
200 | 201,550 | ||||||
| 6.92%, 08/08/33 |
445 | 462,309 | ||||||
| Bank of America Corp. |
||||||||
| 1.32%, 06/19/26 (Call 06/19/25), |
120 | 113,614 | ||||||
| 1.73%, 07/22/27 (Call 07/22/26), |
255 | 233,762 | ||||||
| 1.90%, 07/23/31 (Call 07/23/30), |
80 | 64,902 | ||||||
| Security | Par (000) |
Value | ||||||
| Banks (continued) | ||||||||
| 1.92%, 10/24/31 (Call 10/24/30), |
$ | 95 | $ | 76,660 | ||||
| 2.09%, 06/14/29 (Call 06/14/28), |
70 | 61,428 | ||||||
| 2.30%, 07/21/32 (Call 07/21/31), |
75 | 60,674 | ||||||
| 2.48%, 09/21/36 (Call 09/21/31), |
580 | 458,100 | ||||||
| 2.50%, 02/13/31 (Call 02/13/30), |
283 | 241,264 | ||||||
| 2.55%, 02/04/28 (Call 02/04/27), |
50 | 46,241 | ||||||
| 2.57%, 10/20/32 (Call 10/20/31), |
30 | 24,616 | ||||||
| 2.59%, 04/29/31 (Call 04/29/30), |
299 | 254,876 | ||||||
| 2.68%, 06/19/41 (Call 06/19/40), |
120 | 83,704 | ||||||
| 2.69%, 04/22/32 (Call 04/22/31), |
320 | 267,834 | ||||||
| 2.83%, 10/24/51 (Call 10/24/50), |
314 | 201,313 | ||||||
| 2.88%, 10/22/30 (Call 10/22/29), |
168 | 148,048 | ||||||
| 2.97%, 02/04/33 (Call 02/04/32), |
472 | 396,396 | ||||||
| 2.97%, 07/21/52 (Call 07/21/51), |
557 | 370,176 | ||||||
| 3.19%, 07/23/30 (Call 07/23/29), |
185 | 166,450 | ||||||
| 3.25%, 10/21/27 (Call 10/21/26) |
270 | 255,041 | ||||||
| 3.31%, 04/22/42 (Call 04/22/41), |
130 | 98,532 | ||||||
| 3.38%, 04/02/26 (Call 04/02/25), |
30 | 29,296 | ||||||
| 3.42%, 12/20/28 (Call 12/20/27), |
325 | 303,705 | ||||||
| 3.50%, 04/19/26 |
212 | 205,416 | ||||||
| 3.56%, 04/23/27 (Call 04/23/26), |
195 | 187,540 | ||||||
| 3.59%, 07/21/28 (Call 07/21/27), |
305 | 288,814 | ||||||
| 3.71%, 04/24/28 (Call 04/24/27), |
342 | 325,716 | ||||||
| 3.82%, 01/20/28 (Call 01/20/27), |
205 | 196,947 | ||||||
| 3.85%, 03/08/37 (Call 03/08/32), |
250 | 218,260 | ||||||
| 3.88%, 08/01/25 |
105 | 103,322 | ||||||
| 3.95%, 01/23/49 (Call 01/23/48), |
241 | 193,554 | ||||||
| 3.97%, 03/05/29 (Call 03/05/28), |
235 | 223,543 | ||||||
| 3.97%, 02/07/30 (Call 02/07/29), |
266 | 249,995 | ||||||
| 4.08%, 04/23/40 (Call 04/23/39), |
180 | 154,002 | ||||||
| 4.08%, 03/20/51 (Call 03/20/50), |
1,001 | 808,384 | ||||||
| 4.24%, 04/24/38 (Call 04/24/37), |
590 | 524,094 | ||||||
| S C H E D U L E O F I N V E S T M E N T S |
33 |
| Schedule of Investments (continued) February 29, 2024 |
iShares® ESG Aware U.S. Aggregate Bond ETF (Percentages shown are based on Net Assets) |
| Security | Par (000) |
Value | ||||||
| Banks (continued) | ||||||||
| 4.25%, 10/22/26 |
$ | 187 | $ | 182,877 | ||||
| 4.27%, 07/23/29 (Call 07/23/28), |
305 | 293,028 | ||||||
| 4.33%, 03/15/50 (Call 03/15/49), |
493 | 415,200 | ||||||
| 4.38%, 04/27/28 (Call 04/27/27), |
75 | 72,998 | ||||||
| 4.44%, 01/20/48 (Call 01/20/47), |
560 | 481,752 | ||||||
| 4.45%, 03/03/26 |
135 | 132,769 | ||||||
| 4.57%, 04/27/33 (Call 04/27/32), |
740 | 696,441 | ||||||
| 4.83%, 07/22/26 (Call 07/22/25), |
185 | 183,416 | ||||||
| 4.88%, 04/01/44 |
161 | 151,975 | ||||||
| 4.95%, 07/22/28 (Call 07/22/27), |
150 | 148,491 | ||||||
| 5.00%, 01/21/44 |
523 | 500,193 | ||||||
| 5.02%, 07/22/33 (Call 07/22/32), |
700 | 681,929 | ||||||
| 5.08%, 01/20/27 (Call 01/20/26), |
5 | 4,968 | ||||||
| 5.20%, 04/25/29 (Call 04/25/28), |
590 | 586,661 | ||||||
| 5.29%, 04/25/34 (Call 04/25/33), |
725 | 714,546 | ||||||
| 5.87%, 09/15/34 (Call 09/15/33), |
10 | 10,255 | ||||||
| 5.88%, 02/07/42 |
524 | 557,322 | ||||||
| 6.11%, 01/29/37 |
505 | 529,274 | ||||||
| 6.20%, 11/10/28 (Call 11/10/27), |
120 | 123,719 | ||||||
| 6.22%, 09/15/26 |
35 | 35,752 | ||||||
| 7.75%, 05/14/38 |
600 | 719,959 | ||||||
| Series L, 3.95%, 04/21/25 |
290 | 285,207 | ||||||
| Series L, 4.18%, 11/25/27 (Call 11/25/26) |
195 | 188,302 | ||||||
| Series L, 4.75%, 04/21/45 |
137 | 124,484 | ||||||
| Series N, 2.65%, 03/11/32 (Call 03/11/31), |
110 | 92,013 | ||||||
| Series N, 3.48%, 03/13/52 (Call 03/13/51), |
390 | 285,994 | ||||||
| Bank of America NA, 6.00%, 10/15/36 |
382 | 398,383 | ||||||
| Bank of Montreal |
||||||||
| 1.25%, 09/15/26 |
150 | 136,514 | ||||||
| 1.85%, 05/01/25 |
710 | 682,169 | ||||||
| 2.65%, 03/08/27 |
60 | 55,981 | ||||||
| 3.80%, 12/15/32 (Call 12/15/27), |
920 | 846,230 | ||||||
| 5.20%, 02/01/28 (Call 01/01/28) |
150 | 150,556 | ||||||
| 5.30%, 06/05/26 |
100 | 100,242 | ||||||
| 5.72%, 09/25/28 (Call 08/25/28) |
75 | 76,897 | ||||||
| Series H, 4.70%, 09/14/27 (Call 08/14/27) |
240 | 237,591 | ||||||
| Bank of New York Mellon Corp. (The) |
||||||||
| 1.60%, 04/24/25 (Call 03/24/25) |
423 | 406,361 | ||||||
| 2.05%, 01/26/27 (Call 12/26/26) |
190 | 175,316 | ||||||
| 2.45%, 08/17/26 (Call 05/17/26) |
333 | 313,076 | ||||||
| 2.50%, 01/26/32 (Call 10/26/31) |
100 | 83,432 | ||||||
| 2.80%, 05/04/26 (Call 02/04/26) |
346 | 330,297 | ||||||
| 3.00%, 10/30/28 (Call 07/30/28) |
249 | 228,310 | ||||||
| 3.25%, 05/16/27 (Call 02/16/27) |
122 | 115,879 | ||||||
| 3.30%, 08/23/29 (Call 05/23/29) |
425 | 389,917 | ||||||
| Security | Par (000) |
Value | ||||||
| Banks (continued) | ||||||||
| 3.40%, 01/29/28 (Call 10/29/27) |
$ | 370 | $ | 349,963 | ||||
| 3.44%, 02/07/28 (Call 02/07/27), |
734 | 701,530 | ||||||
| 3.85%, 04/28/28 |
645 | 622,112 | ||||||
| 3.85%, 04/26/29 (Call 02/26/29) |
205 | 196,242 | ||||||
| 3.95%, 11/18/25 (Call 10/18/25) |
344 | 336,603 | ||||||
| 3.99%, 06/13/28 (Call 06/13/27), |
100 | 96,836 | ||||||
| 4.54%, 02/01/29 (Call 02/01/28), |
100 | 98,165 | ||||||
| 4.71%, 02/01/34 (Call 02/01/33), |
100 | 95,661 | ||||||
| 4.95%, 04/26/27 (Call 04/26/26), |
205 | 203,931 | ||||||
| 4.97%, 04/26/34 (Call 04/26/33), |
150 | 146,163 | ||||||
| 5.80%, 10/25/28 (Call 10/25/27), |
40 | 40,962 | ||||||
| 5.83%, 10/25/33 (Call 10/25/32), |
105 | 108,887 | ||||||
| 6.32%, 10/25/29 (Call 10/25/28), |
130 | 136,201 | ||||||
| 6.47%, 10/25/34 (Call 10/25/33), |
225 | 243,414 | ||||||
| Series J, 1.90%, 01/25/29 (Call 11/25/28) |
200 | 175,040 | ||||||
| Bank of Nova Scotia (The) |
||||||||
| 1.05%, 03/02/26 |
1,380 | 1,272,498 | ||||||
| 1.30%, 06/11/25 |
1,677 | 1,593,893 | ||||||
| 1.30%, 09/15/26 (Call 06/15/26) |
300 | 273,049 | ||||||
| 1.95%, 02/02/27 |
425 | 390,063 | ||||||
| 2.15%, 08/01/31 |
1,795 | 1,466,773 | ||||||
| 2.45%, 02/02/32 |
195 | 159,962 | ||||||
| 2.70%, 08/03/26 |
1,336 | 1,261,583 | ||||||
| 2.95%, 03/11/27 |
900 | 847,216 | ||||||
| 3.45%, 04/11/25 |
800 | 783,371 | ||||||
| 4.50%, 12/16/25 |
1,456 | 1,430,934 | ||||||
| 4.75%, 02/02/26 |
100 | 99,237 | ||||||
| 4.85%, 02/01/30 |
230 | 226,871 | ||||||
| 5.25%, 06/12/28 |
125 | 125,623 | ||||||
| 5.35%, 12/07/26 |
150 | 150,593 | ||||||
| 5.45%, 06/12/25 |
120 | 120,084 | ||||||
| 5.65%, 02/01/34 |
150 | 152,365 | ||||||
| Barclays PLC |
||||||||
| 2.28%, 11/24/27 (Call 11/24/26), |
440 | 402,129 | ||||||
| 2.65%, 06/24/31 (Call 06/24/30), |
105 | 87,309 | ||||||
| 2.89%, 11/24/32 (Call 11/24/31), |
425 | 346,081 | ||||||
| 3.56%, 09/23/35 (Call 09/23/30), |
235 | 197,188 | ||||||
| 3.65%, 03/16/25 |
420 | 411,237 | ||||||
| 4.34%, 01/10/28 (Call 01/10/27) |
255 | 244,968 | ||||||
| 4.38%, 01/12/26 |
500 | 489,701 | ||||||
| 4.84%, 05/09/28 (Call 05/07/27) |
435 | 418,738 | ||||||
| 4.95%, 01/10/47 |
440 | 400,390 | ||||||
| 4.97%, 05/16/29 (Call 05/16/28), |
235 | 228,480 | ||||||
| 5.09%, 06/20/30 (Call 06/20/29), |
390 | 369,152 | ||||||
| 5.20%, 05/12/26 |
330 | 326,002 | ||||||
| 34 | 2 0 2 4 I S H A R E S A N N U A L R E P O R T T O S H A R E H O L D E R S |
| Schedule of Investments (continued) February 29, 2024 |
iShares® ESG Aware U.S. Aggregate Bond ETF (Percentages shown are based on Net Assets) |
| Security | Par (000) |
Value | ||||||
| Banks (continued) | ||||||||
| 5.25%, 08/17/45 |
$ | 75 | $ | 71,521 | ||||
| 5.30%, 08/09/26 (Call 08/09/25), (1-year CMT + 2.300%)(a) |
385 | 382,630 | ||||||
| 5.50%, 08/09/28 (Call 08/09/27), |
360 | 358,017 | ||||||
| 5.83%, 05/09/27 (Call 05/09/26), |
320 | 320,652 | ||||||
| 6.22%, 05/09/34 (Call 05/09/33), |
245 | 248,015 | ||||||
| 7.12%, 06/27/34 (Call 06/27/33), |
465 | 482,194 | ||||||
| 7.33%, 11/02/26 (Call 11/02/25), |
200 | 204,843 | ||||||
| 7.39%, 11/02/28 (Call 11/02/27), |
200 | 211,368 | ||||||
| 7.44%, 11/02/33 (Call 11/02/32), |
235 | 257,143 | ||||||
| BPCE SA, 3.38%, 12/02/26 |
940 | 901,152 | ||||||
| Canadian Imperial Bank of Commerce |
||||||||
| 3.60%, 04/07/32 (Call 03/07/32) |
60 | 53,563 | ||||||
| 3.95%, 08/04/25 |
190 | 186,287 | ||||||
| 5.00%, 04/28/28 (Call 03/28/28) |
295 | 293,936 | ||||||
| 5.14%, 04/28/25 |
140 | 139,523 | ||||||
| 5.62%, 07/17/26 |
75 | 75,724 | ||||||
| 5.93%, 10/02/26 |
25 | 25,443 | ||||||
| 5.99%, 10/03/28 (Call 09/03/28) |
90 | 93,227 | ||||||
| 6.09%, 10/03/33 (Call 07/03/33) |
555 | 576,328 | ||||||
| Citigroup Inc. |
||||||||
| 2.56%, 05/01/32 (Call 05/01/31), |
175 | 144,054 | ||||||
| 2.57%, 06/03/31 (Call 06/03/30), |
240 | 203,005 | ||||||
| 2.67%, 01/29/31 (Call 01/29/30), |
302 | 258,939 | ||||||
| 2.98%, 11/05/30 (Call 11/05/29), |
325 | 286,707 | ||||||
| 3.07%, 02/24/28 (Call 02/24/27), |
180 | 168,626 | ||||||
| 3.11%, 04/08/26 (Call 04/08/25), |
376 | 366,030 | ||||||
| 3.20%, 10/21/26 (Call 07/21/26) |
170 | 161,455 | ||||||
| 3.30%, 04/27/25 |
245 | 239,573 | ||||||
| 3.40%, 05/01/26 |
150 | 144,325 | ||||||
| 3.52%, 10/27/28 (Call 10/27/27), |
130 | 122,112 | ||||||
| 3.67%, 07/24/28 (Call 07/24/27), |
175 | 165,888 | ||||||
| 3.70%, 01/12/26 |
332 | 323,227 | ||||||
| 3.79%, 03/17/33 (Call 03/17/32), |
472 | 418,210 | ||||||
| 3.88%, 03/26/25 |
140 | 137,321 | ||||||
| 3.88%, 01/24/39 (Call 01/24/38), |
490 | 412,242 | ||||||
| 3.89%, 01/10/28 (Call 01/10/27), |
145 | 139,333 | ||||||
| 3.98%, 03/20/30 (Call 03/20/29), |
355 | 332,855 | ||||||
| 4.08%, 04/23/29 (Call 04/23/28), |
141 | 134,534 | ||||||
| 4.13%, 07/25/28 |
246 | 233,467 | ||||||
| Security | Par (000) |
Value | ||||||
| Banks (continued) | ||||||||
| 4.28%, 04/24/48 (Call 04/24/47), |
$ | 199 | $ | 168,188 | ||||
| 4.30%, 11/20/26 |
200 | 194,808 | ||||||
| 4.40%, 06/10/25 |
435 | 428,670 | ||||||
| 4.41%, 03/31/31 (Call 03/31/30), |
280 | 264,557 | ||||||
| 4.45%, 09/29/27 |
447 | 433,061 | ||||||
| 4.60%, 03/09/26 |
135 | 132,779 | ||||||
| 4.65%, 07/30/45 |
369 | 329,390 | ||||||
| 4.65%, 07/23/48 (Call 06/23/48) |
565 | 503,570 | ||||||
| 4.66%, 05/24/28 (Call 05/24/27), |
25 | 24,544 | ||||||
| 4.75%, 05/18/46 |
365 | 319,251 | ||||||
| 5.17%, 02/13/30 (Call 02/13/29), |
90 | 89,085 | ||||||
| 5.30%, 05/06/44 |
251 | 239,806 | ||||||
| 5.32%, 03/26/41 (Call 03/26/40), |
245 | 239,694 | ||||||
| 5.50%, 09/13/25 |
418 | 417,007 | ||||||
| 5.61%, 09/29/26 (Call 09/29/25), |
70 | 70,081 | ||||||
| 5.83%, 02/13/35 (Call 02/13/34), |
450 | 440,184 | ||||||
| 5.88%, 02/22/33 |
226 | 229,945 | ||||||
| 5.88%, 01/30/42 |
280 | 294,263 | ||||||
| 6.00%, 10/31/33 |
122 | 126,110 | ||||||
| 6.17%, 05/25/34 (Call 05/25/33), |
425 | 427,917 | ||||||
| 6.27%, 11/17/33 (Call 11/17/32), |
55 | 57,726 | ||||||
| 6.63%, 01/15/28 |
178 | 188,675 | ||||||
| 6.63%, 06/15/32 |
447 | 476,049 | ||||||
| 6.68%, 09/13/43 |
186 | 203,967 | ||||||
| 8.13%, 07/15/39 |
509 | 644,487 | ||||||
| Citizens Bank NA/Providence RI, |
275 | 264,258 | ||||||
| Citizens Financial Group Inc. |
||||||||
| 2.50%, 02/06/30 (Call 11/06/29) |
85 | 70,458 | ||||||
| 2.85%, 07/27/26 (Call 04/27/26) |
202 | 188,751 | ||||||
| 3.25%, 04/30/30 (Call 01/30/30) |
160 | 138,421 | ||||||
| 4.30%, 12/03/25 (Call 11/03/25) |
175 | 170,488 | ||||||
| 5.64%, 05/21/37 (Call 05/21/32), |
190 | 173,934 | ||||||
| Comerica Bank, 4.00%, 07/27/25 |
110 | 106,620 | ||||||
| Comerica Inc., 4.00%, 02/01/29 (Call 11/03/28)(b) |
254 | 228,321 | ||||||
| Cooperatieve Rabobank UA |
||||||||
| 3.75%, 07/21/26 |
305 | 292,346 | ||||||
| 4.38%, 08/04/25 |
235 | 230,434 | ||||||
| 5.25%, 05/24/41 |
196 | 198,029 | ||||||
| 5.25%, 08/04/45 |
142 | 137,690 | ||||||
| 5.75%, 12/01/43 |
227 | 227,840 | ||||||
| Cooperatieve Rabobank UA/NY, 3.38%, 05/21/25 |
335 | 328,054 | ||||||
| Credit Suisse AG/New York |
||||||||
| 2.95%, 04/09/25 |
450 | 437,054 | ||||||
| 7.50%, 02/15/28 |
390 | 420,071 | ||||||
| Deutsche Bank AG, 4.10%, 01/13/26 |
290 | 282,719 | ||||||
| Deutsche Bank AG/New York |
||||||||
| 2.13%, 11/24/26 (Call 11/24/25), |
205 | 192,212 | ||||||
| 2.31%, 11/16/27 (Call 11/16/26), |
410 | 372,408 | ||||||
| S C H E D U L E O F I N V E S T M E N T S |
35 |
| Schedule of Investments (continued) February 29, 2024 |
iShares® ESG Aware U.S. Aggregate Bond ETF (Percentages shown are based on Net Assets) |
| Security | Par (000) |
Value | ||||||
| Banks (continued) | ||||||||
|
2.55%, 01/07/28 (Call 01/07/27), |
$ | 470 | $ | 428,078 | ||||
| 3.04%, 05/28/32 (Call 05/28/31), |
265 | 219,017 | ||||||
| 3.55%, 09/18/31 (Call 09/18/30), |
650 | 563,063 | ||||||
| 4.10%, 01/13/26 |
270 | 263,566 | ||||||
| 4.88%, 12/01/32 (Call 12/01/27), |
390 | 360,669 | ||||||
| 6.72%, 01/18/29 (Call 01/18/28), |
150 | 154,072 | ||||||
| 7.08%, 02/10/34 (Call 11/10/32), |
200 | 199,640 | ||||||
| 7.15%, 07/13/27 (Call 07/13/26), |
150 | 153,957 | ||||||
| Discover Bank |
||||||||
| 2.70%, 02/06/30 (Call 11/06/29) |
165 | 139,904 | ||||||
| 3.45%, 07/27/26 (Call 04/27/26) |
235 | 222,840 | ||||||
| 4.25%, 03/13/26 |
20 | 19,424 | ||||||
| 4.65%, 09/13/28 (Call 06/13/28) |
415 | 396,242 | ||||||
| Fifth Third Bancorp. |
||||||||
| 6.36%, 10/27/28 (Call 10/27/27), |
15 | 15,285 | ||||||
| 8.25%, 03/01/38 |
201 | 237,632 | ||||||
| First Horizon Bank, 5.75%, 05/01/30 (Call 02/01/30) |
90 | 84,132 | ||||||
| Goldman Sachs Capital I, 6.35%, 02/15/34 |
195 | 199,973 | ||||||
| Goldman Sachs Group Inc. (The) |
||||||||
| 1.09%, 12/09/26 (Call 12/09/25), |
140 | 129,720 | ||||||
| 1.54%, 09/10/27 (Call 09/10/26), |
45 | 40,903 | ||||||
| 1.95%, 10/21/27 (Call 10/21/26), |
115 | 105,308 | ||||||
| 1.99%, 01/27/32 (Call 01/27/31), |
250 | 200,434 | ||||||
| 2.38%, 07/21/32 (Call 07/21/31), |
255 | 207,502 | ||||||
| 2.60%, 02/07/30 (Call 11/07/29) |
157 | 136,208 | ||||||
| 2.62%, 04/22/32 (Call 04/22/31), |
392 | 325,811 | ||||||
| 2.64%, 02/24/28 (Call 02/24/27), |
210 | 194,558 | ||||||
| 2.65%, 10/21/32 (Call 10/21/31), |
155 | 127,826 | ||||||
| 2.91%, 07/21/42 (Call 07/21/41), |
245 | 173,649 | ||||||
| 3.10%, 02/24/33 (Call 02/24/32), |
550 | 466,108 | ||||||
| 3.21%, 04/22/42 (Call 04/22/41), |
252 | 187,478 | ||||||
| 3.44%, 02/24/43 (Call 02/24/42), |
50 | 38,047 | ||||||
| 3.50%, 04/01/25 (Call 03/01/25) |
375 | 367,252 | ||||||
| 3.50%, 11/16/26 (Call 11/16/25) |
478 | 458,492 | ||||||
| 3.69%, 06/05/28 (Call 06/05/27), |
292 | 278,530 | ||||||
| 3.75%, 05/22/25 (Call 02/22/25) |
303 | 297,159 | ||||||
| 3.75%, 02/25/26 (Call 11/25/25) |
265 | 258,379 | ||||||
| 3.80%, 03/15/30 (Call 12/15/29) |
203 | 188,748 | ||||||
| Security | Par (000) |
Value | ||||||
| Banks (continued) | ||||||||
| 3.81%, 04/23/29 (Call 04/23/28), |
$ | 507 | $ | 478,936 | ||||
| 3.85%, 01/26/27 (Call 01/26/26) |
462 | 446,392 | ||||||
| 4.02%, 10/31/38 (Call 10/31/37), |
690 | 590,927 | ||||||
| 4.22%, 05/01/29 (Call 05/01/28), |
560 | 536,958 | ||||||
| 4.25%, 10/21/25 |
265 | 260,239 | ||||||
| 4.41%, 04/23/39 (Call 04/23/38), |
489 | 433,075 | ||||||
| 4.48%, 08/23/28 (Call 08/23/27), |
200 | 195,112 | ||||||
| 4.75%, 10/21/45 (Call 04/21/45) |
546 | 498,296 | ||||||
| 4.80%, 07/08/44 (Call 01/08/44) |
570 | 519,089 | ||||||
| 5.15%, 05/22/45 |
114 | 108,943 | ||||||
| 5.80%, 08/10/26 (Call 08/10/25), |
280 | 281,527 | ||||||
| 5.95%, 01/15/27 |
140 | 142,877 | ||||||
| 6.13%, 02/15/33 |
430 | 461,130 | ||||||
| 6.25%, 02/01/41 |
465 | 501,872 | ||||||
| 6.45%, 05/01/36(b) |
209 | 223,256 | ||||||
| 6.56%, 10/24/34 (Call 10/24/33), |
20 | 21,607 | ||||||
| 6.75%, 10/01/37 |
951 | 1,034,214 | ||||||
| HSBC Bank USA NA, 7.00%, 01/15/39 |
410 | 467,079 | ||||||
| HSBC Holdings PLC |
||||||||
| 1.59%, 05/24/27 (Call 05/24/26), |
580 | 530,926 | ||||||
| 1.65%, 04/18/26 (Call 04/18/25), |
525 | 500,936 | ||||||
| 2.10%, 06/04/26 (Call 06/04/25), |
95 | 90,856 | ||||||
| 2.21%, 08/17/29 (Call 08/17/28), |
100 | 86,817 | ||||||
| 2.25%, 11/22/27 (Call 11/22/26), |
750 | 686,506 | ||||||
| 2.36%, 08/18/31 (Call 08/18/30), |
130 | 106,687 | ||||||
| 2.80%, 05/24/32 (Call 05/24/31), |
485 | 400,761 | ||||||
| 2.85%, 06/04/31 (Call 06/04/30), |
130 | 110,602 | ||||||
| 2.87%, 11/22/32 (Call 11/22/31), |
15 | 12,344 | ||||||
| 3.00%, 03/10/26 (Call 03/10/25), |
105 | 102,067 | ||||||
| 3.90%, 05/25/26 |
30 | 29,070 | ||||||
| 3.97%, 05/22/30 (Call 05/22/29), |
585 | 541,954 | ||||||
| 4.04%, 03/13/28 (Call 03/13/27), |
585 | 560,524 | ||||||
| 4.25%, 08/18/25 |
360 | 352,571 | ||||||
| 4.29%, 09/12/26 (Call 09/12/25), |
300 | 294,163 | ||||||
| 4.30%, 03/08/26 |
482 | 471,610 | ||||||
| 4.38%, 11/23/26 |
130 | 126,453 | ||||||
| 4.58%, 06/19/29 (Call 06/19/28), |
385 | 370,362 | ||||||
| 4.76%, 06/09/28 (Call 06/09/27), |
200 | 195,277 | ||||||
| 4.95%, 03/31/30 |
380 | 372,074 | ||||||
| 36 | 2 0 2 4 I S H A R E S A N N U A L R E P O R T T O S H A R E H O L D E R S |
| Schedule of Investments (continued) February 29, 2024 |
iShares® ESG Aware U.S. Aggregate Bond ETF (Percentages shown are based on Net Assets) |
| Security | Par (000) |
Value | ||||||
| Banks (continued) | ||||||||
| 5.72%, 03/04/35 (Call 03/04/34), |
$ | 200 | $ | 199,295 | ||||
| 5.89%, 08/14/27 (Call 08/14/26), |
345 | 347,125 | ||||||
| 6.10%, 01/14/42 |
510 | 557,277 | ||||||
| 6.16%, 03/09/29 (Call 03/09/28), |
200 | 204,319 | ||||||
| 6.25%, 03/09/34 (Call 03/09/33), |
370 | 383,956 | ||||||
| 6.50%, 05/02/36 |
545 | 559,991 | ||||||
| 6.50%, 09/15/37 |
650 | 674,099 | ||||||
| 6.55%, 06/20/34 (Call 06/20/33), |
275 | 279,898 | ||||||
| 6.80%, 06/01/38 |
345 | 362,197 | ||||||
| 7.34%, 11/03/26 (Call 11/03/25), |
295 | 303,582 | ||||||
| 7.39%, 11/03/28 (Call 11/03/27), |
215 | 227,618 | ||||||
| 7.40%, 11/13/34 (Call 11/13/33), |
210 | 224,996 | ||||||
| 8.11%, 11/03/33 (Call 11/03/32), |
440 | 495,449 | ||||||
| Huntington Bancshares Inc./OH |
||||||||
| 2.49%, 08/15/36 (Call 08/15/31), |
230 | 173,591 | ||||||
| 2.55%, 02/04/30 (Call 11/04/29) |
499 | 419,999 | ||||||
| 4.44%, 08/04/28 (Call 08/04/27), |
65 | 62,420 | ||||||
| 5.02%, 05/17/33 (Call 05/17/32), |
162 | 153,101 | ||||||
| Huntington National Bank (The), 4.55%, 05/17/28 |
80 | 77,120 | ||||||
| ING Groep NV |
||||||||
| 2.73%, 04/01/32 (Call 04/01/31), |
425 | 357,507 | ||||||
| 3.95%, 03/29/27 |
850 | 818,379 | ||||||
| 4.05%, 04/09/29 |
155 | 146,575 | ||||||
| 4.25%, 03/28/33 (Call 03/28/32), |
210 | 193,073 | ||||||
| 4.55%, 10/02/28 |
200 | 194,972 | ||||||
| 6.11%, 09/11/34 (Call 09/11/33), |
5 | 5,159 | ||||||
| JPMorgan Chase & Co. |
||||||||
| 1.47%, 09/22/27 (Call 09/22/26), |
75 | 68,149 | ||||||
| 1.76%, 11/19/31 (Call 11/19/30), |
25 | 20,130 | ||||||
| 1.95%, 02/04/32 (Call 02/04/31), |
230 | 184,961 | ||||||
| 2.52%, 04/22/31 (Call 04/22/30), |
205 | 175,122 | ||||||
| 2.55%, 11/08/32 (Call 11/08/31), |
245 | 201,801 | ||||||
| 2.58%, 04/22/32 (Call 04/22/31), |
112 | 93,641 | ||||||
| 2.74%, 10/15/30 (Call 10/15/29), |
256 | 224,585 | ||||||
| 2.95%, 10/01/26 (Call 07/01/26) |
237 | 225,264 | ||||||
| 2.96%, 05/13/31 (Call 05/13/30), |
55 | 47,749 | ||||||
| Security | Par (000) |
Value | ||||||
| Banks (continued) | ||||||||
| 2.96%, 01/25/33 (Call 01/25/32), |
$ | 485 | $ | 409,518 | ||||
| 3.11%, 04/22/41 (Call 04/22/40), |
268 | 201,543 | ||||||
| 3.11%, 04/22/51 (Call 04/22/50), |
568 | 389,487 | ||||||
| 3.20%, 06/15/26 (Call 03/15/26) |
130 | 125,051 | ||||||
| 3.33%, 04/22/52 (Call 04/22/51), |
575 | 407,753 | ||||||
| 3.51%, 01/23/29 (Call 01/23/28), |
242 | 227,969 | ||||||
| 3.54%, 05/01/28 (Call 05/01/27), |
180 | 171,011 | ||||||
| 3.63%, 12/01/27 (Call 12/01/26) |
235 | 223,331 | ||||||
| 3.70%, 05/06/30 (Call 05/06/29), |
545 | 507,305 | ||||||
| 3.78%, 02/01/28 (Call 02/01/27), |
325 | 312,003 | ||||||
| 3.88%, 07/24/38 (Call 07/24/37), |
428 | 365,717 | ||||||
| 3.90%, 01/23/49 (Call 01/23/48), |
391 | 312,686 | ||||||
| 3.96%, 01/29/27 (Call 01/29/26), |
280 | 273,249 | ||||||
| 3.96%, 11/15/48 (Call 11/15/47), |
511 | 410,455 | ||||||
| 4.01%, 04/23/29 (Call 04/23/28), |
222 | 211,953 | ||||||
| 4.03%, 07/24/48 (Call 07/24/47), |
290 | 235,218 | ||||||
| 4.13%, 12/15/26 |
179 | 174,732 | ||||||
| 4.20%, 07/23/29 (Call 07/23/28), |
220 | 211,346 | ||||||
| 4.25%, 10/01/27 |
145 | 141,830 | ||||||
| 4.26%, 02/22/48 (Call 02/22/47), |
479 | 403,902 | ||||||
| 4.45%, 12/05/29 (Call 12/05/28), |
389 | 376,205 | ||||||
| 4.49%, 03/24/31 (Call 03/24/30), |
267 | 256,369 | ||||||
| 4.59%, 04/26/33 (Call 04/26/32), |
447 | 424,448 | ||||||
| 4.85%, 02/01/44 |
266 | 249,583 | ||||||
| 4.91%, 07/25/33 (Call 07/25/32), |
820 | 795,555 | ||||||
| 4.95%, 06/01/45 |
222 | 207,052 | ||||||
| 5.30%, 07/24/29 (Call 07/24/28), |
275 | 275,745 | ||||||
| 5.34%, 01/23/35 (Call 01/23/34), |
45 | 44,772 | ||||||
| 5.35%, 06/01/34 (Call 06/01/33), |
515 | 512,325 | ||||||
| 5.40%, 01/06/42 |
370 | 374,474 | ||||||
| 5.50%, 10/15/40 |
350 | 357,822 | ||||||
| 5.60%, 07/15/41 |
475 | 489,658 | ||||||
| 5.63%, 08/16/43 |
294 | 301,550 | ||||||
| 5.72%, 09/14/33 (Call 09/14/32), |
425 | 430,236 | ||||||
| 6.25%, 10/23/34 (Call 10/23/33), |
415 | 440,519 | ||||||
| 6.40%, 05/15/38 |
460 | 513,452 | ||||||
| S C H E D U L E O F I N V E S T M E N T S |
37 |
| Schedule of Investments (continued) February 29, 2024 |
iShares® ESG Aware U.S. Aggregate Bond ETF (Percentages shown are based on Net Assets) |
| Security | Par (000) | Value | ||||||
| Banks (continued) | ||||||||
| 7.63%, 10/15/26 |
$ | 100 | $ | 106,255 | ||||
| 7.75%, 07/15/25 |
65 | 67,341 | ||||||
| 8.00%, 04/29/27 |
10 | 10,874 | ||||||
| 8.75%, 09/01/30 |
55 | 64,772 | ||||||
| KeyBank NA/Cleveland OH |
||||||||
| 3.90%, 04/13/29 (Call 03/13/29) |
52 | 46,192 | ||||||
| 6.95%, 02/01/28 |
40 | 40,901 | ||||||
| KeyCorp |
||||||||
| 2.25%, 04/06/27 |
90 | 80,280 | ||||||
| 2.55%, 10/01/29 |
305 | 255,195 | ||||||
| 4.10%, 04/30/28 |
125 | 116,998 | ||||||
| 4.15%, 10/29/25 |
121 | 117,312 | ||||||
| Kreditanstalt fuer Wiederaufbau |
||||||||
| 0.00%, 04/18/36(c) |
1,013 | 586,798 | ||||||
| 0.00%, 06/29/37(c) |
750 | 410,379 | ||||||
| 0.38%, 07/18/25 |
1,175 | 1,104,451 | ||||||
| 0.63%, 01/22/26 |
1,980 | 1,835,230 | ||||||
| 0.75%, 09/30/30 |
590 | 469,896 | ||||||
| 1.00%, 10/01/26 |
1,125 | 1,029,395 | ||||||
| 1.75%, 09/14/29 |
1,141 | 995,829 | ||||||
| 2.00%, 05/02/25 |
2,383 | 2,301,870 | ||||||
| 2.88%, 04/03/28 |
2,132 | 2,008,287 | ||||||
| 3.00%, 05/20/27 |
130 | 124,198 | ||||||
| 3.75%, 02/15/28 |
1,665 | 1,623,151 | ||||||
| Landwirtschaftliche Rentenbank, Series 37, 2.50%, 11/15/27 |
60 | 55,982 | ||||||
| Lloyds Banking Group PLC |
||||||||
| 1.63%, 05/11/27 (Call 05/11/26), |
190 | 174,278 | ||||||
| 3.57%, 11/07/28 (Call 11/07/27), |
375 | 349,737 | ||||||
| 3.75%, 01/11/27 |
460 | 441,318 | ||||||
| 4.34%, 01/09/48 |
285 | 223,858 | ||||||
| 4.38%, 03/22/28 |
395 | 381,496 | ||||||
| 4.45%, 05/08/25 |
630 | 621,797 | ||||||
| 4.55%, 08/16/28 |
295 | 286,210 | ||||||
| 4.58%, 12/10/25 |
400 | 391,919 | ||||||
| 4.65%, 03/24/26 |
380 | 372,318 | ||||||
| 4.98%, 08/11/33 (Call 08/11/32), |
60 | 57,019 | ||||||
| 5.30%, 12/01/45 |
155 | 144,469 | ||||||
| 5.68%, 01/05/35 (Call 01/05/34), |
20 | 19,739 | ||||||
| 5.87%, 03/06/29 (Call 03/06/28), |
300 | 302,918 | ||||||
| 5.99%, 08/07/27 (Call 08/07/26), |
300 | 302,078 | ||||||
| 7.95%, 11/15/33 (Call 08/15/32), |
405 | 451,493 | ||||||
| Mitsubishi UFJ Financial Group Inc. |
||||||||
| 1.64%, 10/13/27 (Call 10/13/26), |
25 | 22,771 | ||||||
| 2.31%, 07/20/32 (Call 07/20/31), |
160 | 131,057 | ||||||
| 2.34%, 01/19/28 (Call 01/19/27), |
25 | 23,081 | ||||||
| 2.49%, 10/13/32 (Call 10/13/31), |
10 | 8,261 | ||||||
| 2.76%, 09/13/26 |
340 | 320,550 | ||||||
| 3.20%, 07/18/29 |
305 | 277,053 | ||||||
| 3.29%, 07/25/27 |
170 | 160,759 | ||||||
| Security | Par (000) |
Value | ||||||
| Banks (continued) | ||||||||
| 3.68%, 02/22/27 |
$ | 70 | $ | 67,468 | ||||
| 3.74%, 03/07/29 |
130 | 122,741 | ||||||
| 3.75%, 07/18/39 |
195 | 166,277 | ||||||
| 3.78%, 03/02/25 |
141 | 138,719 | ||||||
| 3.85%, 03/01/26 |
305 | 297,333 | ||||||
| 3.96%, 03/02/28 |
55 | 52,976 | ||||||
| 4.05%, 09/11/28 |
70 | 67,748 | ||||||
| 4.15%, 03/07/39 |
139 | 125,185 | ||||||
| 4.29%, 07/26/38 |
130 | 119,979 | ||||||
| 5.13%, 07/20/33 (Call 07/20/32), |
25 | 24,707 | ||||||
| 5.24%, 04/19/29 (Call 04/19/28), |
200 | 200,429 | ||||||
| 5.41%, 04/19/34 (Call 04/19/33), |
50 | 50,526 | ||||||
| 5.42%, 02/22/29 (Call 02/22/28), |
310 | 312,206 | ||||||
| 5.54%, 04/17/26 (Call 04/17/25), |
200 | 199,801 | ||||||
| Mizuho Financial Group Inc. |
||||||||
| 1.55%, 07/09/27 (Call 07/09/26), |
145 | 132,742 | ||||||
| 2.17%, 05/22/32 (Call 05/22/31), |
30 | 24,200 | ||||||
| 2.23%, 05/25/26 (Call 05/25/25), |
140 | 134,295 | ||||||
| 2.56%, 09/13/31 |
330 | 267,408 | ||||||
| 2.59%, 05/25/31 (Call 05/25/30), |
147 | 125,050 | ||||||
| 2.65%, 05/22/26 (Call 05/22/25), |
220 | 212,355 | ||||||
| 2.84%, 09/13/26 |
20 | 18,844 | ||||||
| 2.87%, 09/13/30 (Call 09/13/29), |
75 | 65,952 | ||||||
| 3.15%, 07/16/30 (Call 07/16/29), |
232 | 208,083 | ||||||
| 3.17%, 09/11/27 |
55 | 51,419 | ||||||
| 3.66%, 02/28/27 |
90 | 86,143 | ||||||
| 4.02%, 03/05/28 |
175 | 168,241 | ||||||
| 4.25%, 09/11/29 (Call 09/11/28), |
329 | 315,261 | ||||||
| 5.38%, 05/26/30 (Call 05/26/29), |
200 | 200,040 | ||||||
| 5.58%, 05/26/35 (Call 05/26/34), |
200 | 200,501 | ||||||
| 5.67%, 05/27/29 (Call 05/27/28), |
65 | 65,870 | ||||||
| 5.67%, 09/13/33 (Call 09/13/32), |
230 | 233,416 | ||||||
| 5.75%, 05/27/34 (Call 05/27/33), |
40 | 40,834 | ||||||
| 5.75%, 07/06/34 (Call 07/06/33), |
220 | 224,141 | ||||||
| 5.78%, 07/06/29 (Call 07/06/28), |
270 | 274,909 | ||||||
| Morgan Stanley |
||||||||
| 0.99%, 12/10/26 (Call 12/10/25), |
875 | 807,362 | ||||||
| 1.51%, 07/20/27 (Call 07/20/26), |
110 | 100,606 | ||||||
| 38 | 2 0 2 4 I S H A R E S A N N U A L R E P O R T T O S H A R E H O L D E R S |
| Schedule of Investments (continued) February 29, 2024 |
iShares® ESG Aware U.S. Aggregate Bond ETF (Percentages shown are based on Net Assets) |
| Security | Par (000) |
Value | ||||||
| Banks (continued) | ||||||||
| 1.59%, 05/04/27 (Call 05/04/26), |
$ | 810 | $ | 746,774 | ||||
| 1.79%, 02/13/32 (Call 02/13/31), |
320 | 253,383 | ||||||
| 1.93%, 04/28/32 (Call 04/28/31), |
135 | 107,163 | ||||||
| 2.19%, 04/28/26 (Call 04/28/25), |
642 | 617,849 | ||||||
| 2.24%, 07/21/32 (Call 07/21/31), |
420 | 338,614 | ||||||
| 2.48%, 01/21/28 (Call 01/21/27), |
105 | 97,126 | ||||||
| 2.48%, 09/16/36 (Call 09/16/31), |
390 | 306,478 | ||||||
| 2.51%, 10/20/32 (Call 10/20/31), |
255 | 208,849 | ||||||
| 2.70%, 01/22/31 (Call 01/22/30), |
352 | 304,712 | ||||||
| 2.80%, 01/25/52 (Call 01/25/51), |
365 | 234,637 | ||||||
| 2.94%, 01/21/33 (Call 01/21/32), |
235 | 197,136 | ||||||
| 3.13%, 07/27/26 |
240 | 228,831 | ||||||
| 3.59%, 07/22/28 (Call 07/22/27)(a) |
632 | 598,093 | ||||||
| 3.62%, 04/01/31 (Call 04/01/30), |
359 | 325,992 | ||||||
| 3.63%, 01/20/27 |
295 | 284,420 | ||||||
| 3.77%, 01/24/29 (Call 01/24/28), |
464 | 438,539 | ||||||
| 3.88%, 01/27/26 |
305 | 297,586 | ||||||
| 3.95%, 04/23/27 |
495 | 476,428 | ||||||
| 3.97%, 07/22/38 (Call 07/22/37)(a) |
850 | 724,592 | ||||||
| 4.00%, 07/23/25 |
281 | 276,197 | ||||||
| 4.30%, 01/27/45 |
690 | 598,054 | ||||||
| 4.35%, 09/08/26 |
365 | 356,787 | ||||||
| 4.38%, 01/22/47 |
552 | 475,978 | ||||||
| 4.43%, 01/23/30 (Call 01/23/29), |
232 | 222,783 | ||||||
| 4.46%, 04/22/39 (Call 04/22/38), |
400 | 361,109 | ||||||
| 4.68%, 07/17/26 (Call 07/17/25), |
165 | 163,258 | ||||||
| 4.89%, 07/20/33 (Call 07/20/32), |
45 | 43,184 | ||||||
| 5.00%, 11/24/25 |
281 | 279,338 | ||||||
| 5.05%, 01/28/27 (Call 01/28/26), |
195 | 194,307 | ||||||
| 5.12%, 02/01/29 (Call 02/01/28), |
105 | 104,371 | ||||||
| 5.16%, 04/20/29 (Call 04/20/28), |
335 | 332,665 | ||||||
| 5.17%, 01/16/30 (Call 01/16/29), |
375 | 372,670 | ||||||
| 5.25%, 04/21/34 (Call 04/21/33), |
280 | 274,838 | ||||||
| 5.30%, 04/20/37 (Call 04/20/32), |
615 | 588,124 | ||||||
| 5.42%, 07/21/34 (Call 07/21/33), |
340 | 338,346 | ||||||
| 5.45%, 07/20/29 (Call 07/20/28), |
80 | 80,332 | ||||||
| Security | Par (000) |
Value | ||||||
| Banks (continued) | ||||||||
| 5.47%, 01/18/35 (Call 01/18/34), |
$ | 75 | $ | 74,924 | ||||
| 5.60%, 03/24/51 (Call 03/24/50), |
488 | 504,915 | ||||||
| 5.94%, 02/07/39 (Call 02/07/34), |
75 | 73,875 | ||||||
| 5.95%, 01/19/38 (Call 01/19/33), |
370 | 368,901 | ||||||
| 6.25%, 08/09/26 |
465 | 475,909 | ||||||
| 6.30%, 10/18/28 (Call 10/18/27), |
20 | 20,673 | ||||||
| 6.34%, 10/18/33 (Call 10/18/32), |
305 | 323,272 | ||||||
| 6.38%, 07/24/42 |
486 | 539,885 | ||||||
| 6.41%, 11/01/29 (Call 11/01/28), |
60 | 62,599 | ||||||
| 6.63%, 11/01/34 (Call 11/01/33), |
215 | 233,308 | ||||||
| 7.25%, 04/01/32 |
734 | 836,451 | ||||||
| Morgan Stanley Bank NA |
||||||||
| 4.75%, 04/21/26 (Call 03/21/26) |
300 | 298,136 | ||||||
| 5.48%, 07/16/25 (Call 06/16/25) |
250 | 251,000 | ||||||
| 5.88%, 10/30/26 (Call 09/30/26) |
250 | 254,575 | ||||||
| National Australia Bank Ltd./New York |
||||||||
| 2.50%, 07/12/26 |
342 | 322,659 | ||||||
| 3.38%, 01/14/26 |
100 | 97,003 | ||||||
| 4.90%, 06/13/28 |
250 | 249,420 | ||||||
| 4.94%, 01/12/28 |
250 | 249,894 | ||||||
| 4.97%, 01/12/26 |
250 | 249,536 | ||||||
| National Bank of Canada, 5.60%, 12/18/28 |
2,218 | 2,239,852 | ||||||
| NatWest Group PLC |
||||||||
| 1.64%, 06/14/27 (Call 06/14/26), |
70 | 63,983 | ||||||
| 3.03%, 11/28/35 (Call 08/28/30), |
575 | 473,464 | ||||||
| 3.07%, 05/22/28 (Call 05/22/27), |
15 | 13,922 | ||||||
| 4.45%, 05/08/30 (Call 05/08/29), |
494 | 467,342 | ||||||
| 4.80%, 04/05/26 |
680 | 671,586 | ||||||
| 4.89%, 05/18/29 (Call 05/18/28), |
370 | 360,035 | ||||||
| 5.08%, 01/27/30 (Call 01/27/29), |
760 | 743,007 | ||||||
| 5.58%, 03/01/28 (Call 03/01/27), |
200 | 200,156 | ||||||
| 5.78%, 03/01/35 (Call 03/01/34), |
200 | 199,784 | ||||||
| 5.81%, 09/13/29 (Call 09/13/28), |
200 | 202,016 | ||||||
| 6.02%, 03/02/34 (Call 03/02/33), |
265 | 270,186 | ||||||
| 7.47%, 11/10/26 (Call 11/10/25), |
300 | 308,215 | ||||||
| Northern Trust Corp. |
||||||||
| 3.15%, 05/03/29 (Call 02/03/29) |
791 | 732,092 | ||||||
| 3.38%, 05/08/32 (Call 05/08/27), |
910 | 844,005 | ||||||
| 3.65%, 08/03/28 (Call 05/03/28) |
404 | 386,287 | ||||||
| 3.95%, 10/30/25 |
600 | 588,522 | ||||||
| 6.13%, 11/02/32 (Call 08/02/32) |
130 | 136,545 | ||||||
| S C H E D U L E O F I N V E S T M E N T S |
39 |
| Schedule of Investments (continued) February 29, 2024 |
iShares® ESG Aware U.S. Aggregate Bond ETF (Percentages shown are based on Net Assets) |
| Security | Par (000) |
Value | ||||||
| Banks (continued) | ||||||||
| PNC Bank NA |
||||||||
| 2.70%, 10/22/29 |
$ | 250 | $ | 215,401 | ||||
| 3.10%, 10/25/27 (Call 09/25/27) |
470 | 436,626 | ||||||
| 3.25%, 01/22/28 (Call 12/23/27) |
100 | 92,861 | ||||||
| 3.88%, 04/10/25 (Call 03/10/25) |
920 | 902,488 | ||||||
| 4.05%, 07/26/28 |
255 | 241,175 | ||||||
| 4.20%, 11/01/25 (Call 10/02/25) |
40 | 39,060 | ||||||
| PNC Financial Services Group Inc. (The) |
||||||||
| 1.15%, 08/13/26 (Call 07/13/26) |
50 | 45,374 | ||||||
| 2.55%, 01/22/30 (Call 10/24/29) |
365 | 313,208 | ||||||
| 2.60%, 07/23/26 (Call 05/23/26) |
361 | 339,392 | ||||||
| 3.15%, 05/19/27 (Call 04/19/27) |
395 | 371,768 | ||||||
| 3.45%, 04/23/29 (Call 01/23/29) |
583 | 538,327 | ||||||
| 4.63%, 06/06/33 (Call 06/06/32), |
30 | 27,791 | ||||||
| 4.76%, 01/26/27 (Call 01/26/26), |
90 | 88,920 | ||||||
| 5.07%, 01/24/34 (Call 01/24/33), |
235 | 225,781 | ||||||
| 5.30%, 01/21/28 (Call 01/21/27), |
25 | 24,969 | ||||||
| 5.35%, 12/02/28 (Call 12/02/27), |
180 | 179,908 | ||||||
| 5.58%, 06/12/29 (Call 06/12/28), |
251 | 252,592 | ||||||
| 5.68%, 01/22/35 (Call 01/22/34), |
15 | 15,035 | ||||||
| 5.81%, 06/12/26 (Call 06/12/25), |
111 | 111,143 | ||||||
| 5.94%, 08/18/34 (Call 08/18/33), |
165 | 168,000 | ||||||
| 6.04%, 10/28/33 (Call 10/28/32), |
210 | 215,583 | ||||||
| 6.62%, 10/20/27 (Call 10/20/26), |
75 | 77,003 | ||||||
| 6.88%, 10/20/34 (Call 10/20/33), |
360 | 390,229 | ||||||
| Regions Bank/Birmingham AL, 6.45%, 06/26/37 |
238 | 241,965 | ||||||
| Regions Financial Corp. |
||||||||
| 1.80%, 08/12/28 (Call 06/12/28) |
85 | 72,392 | ||||||
| 7.38%, 12/10/37 |
188 | 211,382 | ||||||
| Royal Bank of Canada |
||||||||
| 1.40%, 11/02/26 |
350 | 318,071 | ||||||
| 2.05%, 01/21/27 |
30 | 27,686 | ||||||
| 3.38%, 04/14/25 |
150 | 146,900 | ||||||
| 3.63%, 05/04/27 |
270 | 258,758 | ||||||
| 3.88%, 05/04/32 |
125 | 113,863 | ||||||
| 4.24%, 08/03/27 |
265 | 258,180 | ||||||
| 4.65%, 01/27/26 |
260 | 257,406 | ||||||
| 4.88%, 01/12/26 |
95 | 94,613 | ||||||
| 4.88%, 01/19/27 |
150 | 149,259 | ||||||
| 4.90%, 01/12/28 |
260 | 259,144 | ||||||
| 4.95%, 04/25/25 |
280 | 279,289 | ||||||
| 4.95%, 02/01/29 |
185 | 183,786 | ||||||
| 5.00%, 02/01/33 |
485 | 476,718 | ||||||
| 5.00%, 05/02/33 |
315 | 310,169 | ||||||
| 5.15%, 02/01/34(b) |
150 | 147,540 | ||||||
| 5.20%, 07/20/26 |
175 | 175,547 | ||||||
| 5.20%, 08/01/28 |
290 | 291,576 | ||||||
| 6.00%, 11/01/27 |
125 | 128,712 | ||||||
| Security | Par (000) |
Value | ||||||
| Banks (continued) | ||||||||
| Santander Holdings USA Inc. |
||||||||
| 2.49%, 01/06/28 (Call 01/06/27), |
$ | 295 | $ | 266,789 | ||||
| 3.24%, 10/05/26 (Call 08/05/26) |
536 | 502,227 | ||||||
| 4.40%, 07/13/27 (Call 04/14/27) |
1,022 | 979,446 | ||||||
| 4.50%, 07/17/25 (Call 04/17/25) |
772 | 756,817 | ||||||
| 5.81%, 09/09/26 (Call 09/09/25), |
225 | 224,462 | ||||||
| 6.50%, 03/09/29 (Call 03/09/28), |
140 | 142,176 | ||||||
| 6.57%, 06/12/29 (Call 06/12/28), |
67 | 68,238 | ||||||
| Santander U.K. Group Holdings PLC |
||||||||
| 1.53%, 08/21/26 (Call 08/21/25), |
80 | 74,937 | ||||||
| 1.67%, 06/14/27 (Call 06/14/26), |
195 | 177,264 | ||||||
| 2.47%, 01/11/28 (Call 01/11/27), |
330 | 300,518 | ||||||
| 2.90%, 03/15/32 (Call 03/15/31), |
105 | 88,439 | ||||||
| 3.82%, 11/03/28 (Call 11/03/27), |
295 | 275,361 | ||||||
| 6.53%, 01/10/29 (Call 01/10/28), |
230 | 235,920 | ||||||
| State Street Corp. |
||||||||
| 1.68%, 11/18/27 (Call 11/18/26), |
105 | 96,111 | ||||||
| 2.20%, 02/07/28 (Call 02/07/27), |
45 | 41,397 | ||||||
| 2.40%, 01/24/30 |
560 | 489,459 | ||||||
| 2.62%, 02/07/33 (Call 02/07/32), |
50 | 41,501 | ||||||
| 2.65%, 05/19/26 |
453 | 430,785 | ||||||
| 3.03%, 11/01/34 (Call 11/01/29), |
993 | 875,923 | ||||||
| 3.55%, 08/18/25 |
1,383 | 1,354,905 | ||||||
| 4.14%, 12/03/29 (Call 12/03/28), |
247 | 236,714 | ||||||
| 4.16%, 08/04/33 (Call 08/04/32), |
25 | 23,086 | ||||||
| 4.82%, 01/26/34 (Call 01/26/33), |
55 | 53,019 | ||||||
| 5.10%, 05/18/26 (Call 05/18/25), |
160 | 159,408 | ||||||
| 5.16%, 05/18/34 (Call 05/18/33), |
110 | 108,581 | ||||||
| 5.27%, 08/03/26 (Call 07/03/26) |
200 | 200,653 | ||||||
| 5.68%, 11/21/29 (Call 11/21/28), |
60 | 61,343 | ||||||
| 5.75%, 11/04/26 (Call 11/04/25), |
55 | 55,239 | ||||||
| 5.82%, 11/04/28 (Call 11/04/27), |
50 | 51,151 | ||||||
| 6.12%, 11/21/34 (Call 11/21/33), |
25 | 25,847 | ||||||
| Sumitomo Mitsui Financial Group Inc. |
||||||||
| 1.40%, 09/17/26 |
90 | 81,987 | ||||||
| 1.90%, 09/17/28 |
255 | 221,857 | ||||||
| 2.13%, 07/08/30 |
200 | 166,247 | ||||||
| 2.14%, 09/23/30 |
20 | 16,426 | ||||||
| 40 | 2 0 2 4 I S H A R E S A N N U A L R E P O R T T O S H A R E H O L D E R S |
| Schedule of Investments (continued) February 29, 2024 |
iShares® ESG Aware U.S. Aggregate Bond ETF (Percentages shown are based on Net Assets) |
| Security | Par (000) |
Value | ||||||
| Banks (continued) | ||||||||
| 2.47%, 01/14/29 |
$ | 15 | $ | 13,343 | ||||
| 2.63%, 07/14/26 |
260 | 245,449 | ||||||
| 2.72%, 09/27/29 |
100 | 88,057 | ||||||
| 2.75%, 01/15/30 |
135 | 118,031 | ||||||
| 3.01%, 10/19/26 |
285 | 269,817 | ||||||
| 3.04%, 07/16/29 |
360 | 323,607 | ||||||
| 3.20%, 09/17/29 |
172 | 154,664 | ||||||
| 3.35%, 10/18/27 |
252 | 237,685 | ||||||
| 3.36%, 07/12/27 |
253 | 239,774 | ||||||
| 3.45%, 01/11/27 |
242 | 231,762 | ||||||
| 3.54%, 01/17/28 |
150 | 142,072 | ||||||
| 3.78%, 03/09/26 |
235 | 228,580 | ||||||
| 3.94%, 07/19/28 |
165 | 157,917 | ||||||
| 4.31%, 10/16/28 |
173 | 169,258 | ||||||
| 5.52%, 01/13/28 |
135 | 137,131 | ||||||
| 5.77%, 01/13/33 |
75 | 77,379 | ||||||
| 5.78%, 07/13/33 |
200 | 206,824 | ||||||
| 5.80%, 07/13/28 |
200 | 205,418 | ||||||
| 5.81%, 09/14/33 |
30 | 31,075 | ||||||
| 5.85%, 07/13/30 |
200 | 205,934 | ||||||
| 5.88%, 07/13/26 |
200 | 202,943 | ||||||
| Synchrony Bank |
||||||||
| 5.40%, 08/22/25 (Call 07/22/25) |
60 | 59,301 | ||||||
| 5.63%, 08/23/27 (Call 07/23/27) |
435 | 423,250 | ||||||
| Toronto-Dominion Bank (The) |
||||||||
| 1.95%, 01/12/27 |
195 | 179,478 | ||||||
| 2.45%, 01/12/32 |
170 | 140,529 | ||||||
| 2.80%, 03/10/27 |
95 | 89,095 | ||||||
| 3.63%, 09/15/31 (Call 09/15/26), |
1,041 | 993,478 | ||||||
| 4.46%, 06/08/32 |
400 | 381,273 | ||||||
| 4.69%, 09/15/27 |
75 | 74,144 | ||||||
| 5.16%, 01/10/28 |
115 | 115,344 | ||||||
| 5.26%, 12/11/26 |
85 | 85,518 | ||||||
| 5.52%, 07/17/28 |
315 | 320,040 | ||||||
| Truist Bank |
||||||||
| 1.50%, 03/10/25 (Call 02/10/25) |
25 | 24,022 | ||||||
| 2.25%, 03/11/30 (Call 12/11/29) |
385 | 316,225 | ||||||
| 3.30%, 05/15/26 (Call 04/15/26) |
210 | 199,997 | ||||||
| 3.63%, 09/16/25 (Call 08/16/25) |
40 | 38,806 | ||||||
| 4.05%, 11/03/25 (Call 09/03/25) |
90 | 88,074 | ||||||
| Truist Financial Corp. |
||||||||
| 1.27%, 03/02/27 (Call 03/02/26), |
60 | 55,074 | ||||||
| 1.89%, 06/07/29 (Call 06/07/28), |
30 | 25,765 | ||||||
| 3.70%, 06/05/25 (Call 05/05/25) |
100 | 97,799 | ||||||
| 3.88%, 03/19/29 (Call 02/16/29) |
70 | 64,463 | ||||||
| 4.00%, 05/01/25 (Call 03/01/25) |
133 | 130,593 | ||||||
| 4.12%, 06/06/28 (Call 06/06/27), |
65 | 62,452 | ||||||
| 4.26%, 07/28/26 (Call 07/28/25), |
50 | 48,977 | ||||||
| 4.87%, 01/26/29 (Call 01/26/28), |
145 | 141,117 | ||||||
| 4.92%, 07/28/33 (Call 07/28/32), |
315 | 289,463 | ||||||
| 5.12%, 01/26/34 (Call 01/26/33), |
75 | 71,120 | ||||||
| 5.87%, 06/08/34 (Call 06/08/33), |
80 | 79,989 | ||||||
| Security | Par (000) |
Value | ||||||
| Banks (continued) | ||||||||
| 6.05%, 06/08/27 (Call 06/08/26), |
$ | 125 | $ | 126,212 | ||||
| U.S. Bancorp. |
||||||||
| 2.49%, 11/03/36 (Call 11/03/31), |
310 | 239,614 | ||||||
| 2.68%, 01/27/33 (Call 01/27/32), |
10 | 8,162 | ||||||
| 4.84%, 02/01/34 (Call 02/01/33), |
80 | 75,296 | ||||||
| 4.97%, 07/22/33 (Call 07/22/32), |
120 | 112,289 | ||||||
| 5.78%, 06/12/29 (Call 06/12/28), |
35 | 35,358 | ||||||
| 5.84%, 06/12/34 (Call 06/10/33), |
108 | 108,837 | ||||||
| 5.85%, 10/21/33 (Call 10/21/32), |
195 | 196,903 | ||||||
| UBS AG/London, 5.65%, 09/11/28 |
845 | 861,843 | ||||||
| UBS Group AG |
||||||||
| 3.75%, 03/26/25 |
990 | 969,495 | ||||||
| 4.55%, 04/17/26 |
435 | 427,254 | ||||||
| 4.88%, 05/15/45 |
250 | 230,512 | ||||||
| Webster Financial Corp., 4.10%, 03/25/29 (Call 12/25/28) |
179 | 162,626 | ||||||
| Wells Fargo & Co. |
||||||||
| 3.07%, 04/30/41 (Call 04/30/40), |
205 | 151,509 | ||||||
| 3.35%, 03/02/33 (Call 03/02/32), |
105 | 90,091 | ||||||
| 3.90%, 05/01/45 |
145 | 116,099 | ||||||
| 4.40%, 06/14/46 |
175 | 143,590 | ||||||
| 4.61%, 04/25/53 (Call 04/25/52), |
760 | 663,122 | ||||||
| 4.65%, 11/04/44 |
40 | 34,427 | ||||||
| 4.75%, 12/07/46 |
185 | 159,892 | ||||||
| 4.90%, 07/25/33 (Call 07/25/32), |
340 | 325,277 | ||||||
| 4.90%, 11/17/45 |
540 | 479,177 | ||||||
| 5.01%, 04/04/51 (Call 04/04/50), |
1,035 | 957,382 | ||||||
| 5.38%, 11/02/43 |
150 | 143,132 | ||||||
| 5.39%, 04/24/34 (Call 04/24/33), |
420 | 413,178 | ||||||
| 5.56%, 07/25/34 (Call 07/25/33), |
165 | 164,371 | ||||||
| 5.61%, 01/15/44 |
590 | 573,685 | ||||||
| 5.95%, 12/01/86 (Call 12/15/36) |
695 | 707,865 | ||||||
| 6.49%, 10/23/34 (Call 10/23/33), |
200 | 212,711 | ||||||
| Westpac Banking Corp. |
||||||||
| 2.67%, 11/15/35 (Call 11/15/30), |
170 | 138,518 | ||||||
| 2.70%, 08/19/26 |
305 | 289,225 | ||||||
| 2.85%, 05/13/26 |
5 | 4,778 | ||||||
| 3.02%, 11/18/36 (Call 11/18/31), |
320 | 260,504 | ||||||
| 3.35%, 03/08/27 |
258 | 246,740 | ||||||
| 3.40%, 01/25/28 |
312 | 295,445 | ||||||
| 4.11%, 07/24/34 (Call 07/24/29), |
354 | 323,359 | ||||||
| S C H E D U L E O F I N V E S T M E N T S |
41 |
| Schedule of Investments (continued) February 29, 2024 |
iShares® ESG Aware U.S. Aggregate Bond ETF (Percentages shown are based on Net Assets) |
| Security | Par (000) |
Value | ||||||
| Banks (continued) | ||||||||
| 4.32%, 11/23/31 (Call 11/23/26), |
$ | 439 | $ | 421,535 | ||||
| 5.41%, 08/10/33 (Call 08/10/32), |
75 | 73,407 | ||||||
| Wintrust Financial Corp., 4.85%, 06/06/29 |
55 | 49,608 | ||||||
|
|
|
|||||||
| 200,900,284 | ||||||||
| Beverages — 1.0% | ||||||||
| Anheuser-Busch Companies LLC/Anheuser-Busch InBev Worldwide Inc. |
||||||||
| 3.65%, 02/01/26 (Call 11/01/25) |
285 | 277,869 | ||||||
| 4.70%, 02/01/36 (Call 08/01/35) |
787 | 753,193 | ||||||
| 4.90%, 02/01/46 (Call 08/01/45) |
1,180 | 1,101,448 | ||||||
| Anheuser-Busch InBev Finance Inc. |
||||||||
| 4.63%, 02/01/44 |
195 | 175,956 | ||||||
| 4.70%, 02/01/36 (Call 08/01/35) |
681 | 649,256 | ||||||
| 4.90%, 02/01/46 (Call 08/01/45) |
328 | 303,086 | ||||||
| Anheuser-Busch InBev Worldwide Inc. |
||||||||
| 3.50%, 06/01/30 (Call 03/01/30) |
455 | 420,466 | ||||||
| 4.00%, 04/13/28 (Call 01/13/28) |
624 | 604,909 | ||||||
| 4.35%, 06/01/40 (Call 12/01/39) |
200 | 178,856 | ||||||
| 4.38%, 04/15/38 (Call 10/15/37) |
329 | 300,915 | ||||||
| 4.44%, 10/06/48 (Call 04/06/48) |
435 | 380,752 | ||||||
| 4.60%, 04/15/48 (Call 10/15/47) |
105 | 94,318 | ||||||
| 4.75%, 01/23/29 (Call 10/23/28) |
677 | 672,421 | ||||||
| 4.75%, 04/15/58 (Call 10/15/57) |
55 | 49,480 | ||||||
| 4.90%, 01/23/31 (Call 10/23/30) |
363 | 364,885 | ||||||
| 4.95%, 01/15/42 |
422 | 402,515 | ||||||
| 5.45%, 01/23/39 (Call 07/23/38) |
403 | 410,116 | ||||||
| 5.55%, 01/23/49 (Call 07/23/48) |
638 | 653,392 | ||||||
| 5.80%, 01/23/59 (Call 07/23/58) |
278 | 293,585 | ||||||
| 5.88%, 06/15/35 |
80 | 85,161 | ||||||
| 8.00%, 11/15/39 |
69 | 86,460 | ||||||
| 8.20%, 01/15/39 |
305 | 392,230 | ||||||
| Brown-Forman Corp. |
||||||||
| 3.50%, 04/15/25 (Call 02/15/25) |
257 | 251,774 | ||||||
| 4.00%, 04/15/38 (Call 10/15/37) |
58 | 50,902 | ||||||
| 4.50%, 07/15/45 (Call 01/15/45) |
159 | 141,097 | ||||||
| Coca-Cola Co. (The) |
||||||||
| 1.00%, 03/15/28 |
205 | 178,588 | ||||||
| 1.38%, 03/15/31 |
535 | 428,270 | ||||||
| 1.65%, 06/01/30 |
521 | 435,133 | ||||||
| 2.00%, 03/05/31 |
220 | 184,028 | ||||||
| 2.13%, 09/06/29 |
640 | 563,103 | ||||||
| 2.25%, 01/05/32 |
130 | 109,460 | ||||||
| 2.50%, 06/01/40 |
367 | 262,146 | ||||||
| 2.50%, 03/15/51 |
180 | 112,427 | ||||||
| 2.60%, 06/01/50 |
403 | 259,328 | ||||||
| 2.75%, 06/01/60 |
124 | 78,584 | ||||||
| 2.90%, 05/25/27 |
215 | 203,973 | ||||||
| 3.00%, 03/05/51 |
340 | 237,852 | ||||||
| 3.38%, 03/25/27 |
655 | 631,016 | ||||||
| 3.45%, 03/25/30 |
662 | 617,505 | ||||||
| 4.20%, 03/25/50 |
305 | 269,384 | ||||||
| Coca-Cola Femsa SAB de CV, 5.25%, 11/26/43 |
245 | 237,832 | ||||||
| Constellation Brands Inc. |
||||||||
| 3.75%, 05/01/50 (Call 11/01/49) |
76 | 56,857 | ||||||
| 4.10%, 02/15/48 (Call 08/15/47) |
60 | 48,029 | ||||||
| 4.50%, 05/09/47 (Call 11/09/46) |
92 | 77,499 | ||||||
| 4.90%, 05/01/33 (Call 02/01/33) |
60 | 58,245 | ||||||
| 5.25%, 11/15/48 (Call 05/15/48) |
121 | 113,957 | ||||||
| Security | Par (000) |
Value | ||||||
| Beverages (continued) | ||||||||
| Diageo Capital PLC |
||||||||
| 1.38%, 09/29/25 (Call 08/29/25) |
$ | 805 | $ | 759,204 | ||||
| 2.00%, 04/29/30 (Call 01/29/30) |
1,910 | 1,609,597 | ||||||
| 2.13%, 04/29/32 (Call 01/29/32) |
1,570 | 1,268,589 | ||||||
| 2.38%, 10/24/29 (Call 07/24/29) |
2,230 | 1,957,879 | ||||||
| 3.88%, 05/18/28 (Call 02/18/28) |
640 | 617,707 | ||||||
| 5.20%, 10/24/25 |
960 | 960,383 | ||||||
| 5.30%, 10/24/27 (Call 09/24/27) |
1,000 | 1,011,631 | ||||||
| 5.38%, 10/05/26 (Call 09/05/26) |
200 | 201,563 | ||||||
| 5.63%, 10/05/33 (Call 07/05/33) |
200 | 207,614 | ||||||
| Diageo Investment Corp. |
||||||||
| 4.25%, 05/11/42 |
145 | 128,625 | ||||||
| 7.45%, 04/15/35 |
324 | 383,135 | ||||||
| Keurig Dr Pepper Inc. |
||||||||
| 2.55%, 09/15/26 (Call 06/15/26) |
248 | 232,573 | ||||||
| 3.20%, 05/01/30 (Call 02/01/30) |
219 | 197,486 | ||||||
| 3.40%, 11/15/25 (Call 08/15/25) |
320 | 309,926 | ||||||
| 3.43%, 06/15/27 (Call 03/15/27) |
248 | 236,054 | ||||||
| 3.80%, 05/01/50 (Call 11/01/49) |
212 | 161,231 | ||||||
| 3.95%, 04/15/29 (Call 02/15/29) |
50 | 47,599 | ||||||
| 4.05%, 04/15/32 (Call 01/15/32) |
230 | 213,335 | ||||||
| 4.42%, 05/25/25 (Call 03/25/25) |
286 | 282,874 | ||||||
| 4.42%, 12/15/46 (Call 06/15/46) |
290 | 244,747 | ||||||
| 4.50%, 11/15/45 (Call 05/15/45) |
34 | 29,313 | ||||||
| 4.50%, 04/15/52 (Call 10/15/51) |
270 | 229,134 | ||||||
| 4.60%, 05/25/28 (Call 02/25/28) |
190 | 187,161 | ||||||
| Molson Coors Beverage Co. |
||||||||
| 3.00%, 07/15/26 (Call 04/15/26) |
1,455 | 1,385,772 | ||||||
| 4.20%, 07/15/46 (Call 01/15/46) |
335 | 272,925 | ||||||
| 5.00%, 05/01/42 |
312 | 289,923 | ||||||
| PepsiCo Inc. |
||||||||
| 1.95%, 10/21/31 (Call 07/21/31) |
50 | 40,929 | ||||||
| 2.25%, 03/19/25 (Call 02/19/25) |
970 | 942,032 | ||||||
| 2.38%, 10/06/26 (Call 07/06/26) |
704 | 663,262 | ||||||
| 2.63%, 03/19/27 (Call 01/19/27) |
641 | 602,714 | ||||||
| 2.63%, 07/29/29 (Call 04/29/29) |
680 | 612,590 | ||||||
| 2.63%, 10/21/41 (Call 04/21/41) |
25 | 17,915 | ||||||
| 2.75%, 04/30/25 (Call 01/30/25) |
917 | 893,084 | ||||||
| 2.75%, 03/19/30 (Call 12/19/29) |
454 | 405,002 | ||||||
| 2.85%, 02/24/26 (Call 11/24/25) |
548 | 527,012 | ||||||
| 2.88%, 10/15/49 (Call 04/15/49) |
140 | 96,316 | ||||||
| 3.00%, 10/15/27 (Call 07/15/27) |
699 | 658,941 | ||||||
| 3.38%, 07/29/49 (Call 01/29/49) |
95 | 71,461 | ||||||
| 3.45%, 10/06/46 (Call 04/06/46) |
449 | 347,607 | ||||||
| 3.50%, 07/17/25 (Call 04/17/25) |
265 | 259,582 | ||||||
| 3.50%, 03/19/40 (Call 09/19/39) |
65 | 53,367 | ||||||
| 3.60%, 02/18/28 (Call 01/18/28) |
75 | 72,111 | ||||||
| 3.60%, 08/13/42 |
75 | 60,201 | ||||||
| 3.63%, 03/19/50 (Call 09/19/49) |
241 | 189,845 | ||||||
| 3.88%, 03/19/60 (Call 09/19/59) |
45 | 35,933 | ||||||
| 3.90%, 07/18/32 (Call 04/18/32) |
70 | 65,705 | ||||||
| 4.00%, 03/05/42 |
170 | 150,432 | ||||||
| 4.00%, 05/02/47 (Call 11/02/46) |
165 | 139,165 | ||||||
| 4.20%, 07/18/52 (Call 01/18/52) |
25 | 21,650 | ||||||
| 4.45%, 05/15/28 (Call 04/15/28) |
105 | 104,789 | ||||||
| 4.45%, 02/15/33 (Call 11/15/32)(b) |
100 | 98,882 | ||||||
| 4.45%, 04/14/46 (Call 10/14/45) |
245 | 221,595 | ||||||
| 4.55%, 02/13/26 (Call 01/13/26) |
100 | 99,414 | ||||||
| 4.65%, 02/15/53 (Call 08/15/52) |
100 | 92,935 | ||||||
| 4.88%, 11/01/40 |
150 | 148,480 | ||||||
| 5.13%, 11/10/26 (Call 10/10/26) |
175 | 176,143 | ||||||
| 42 | 2 0 2 4 I S H A R E S A N N U A L R E P O R T T O S H A R E H O L D E R S |
| Schedule of Investments (continued) February 29, 2024 |
iShares® ESG Aware U.S. Aggregate Bond ETF (Percentages shown are based on Net Assets) |
| Security | Par (000) |
Value | ||||||
| Beverages (continued) | ||||||||
| 5.25%, 11/10/25 |
$ | 175 | $ | 175,739 | ||||
| 7.00%, 03/01/29 |
325 | 358,221 | ||||||
|
|
|
|||||||
| 36,087,292 | ||||||||
| Biotechnology — 0.5% | ||||||||
| Amgen Inc. |
||||||||
| 2.20%, 02/21/27 (Call 12/21/26) |
404 | 372,248 | ||||||
| 2.30%, 02/25/31 (Call 11/25/30) |
310 | 259,423 | ||||||
| 2.45%, 02/21/30 (Call 11/21/29) |
606 | 526,799 | ||||||
| 2.60%, 08/19/26 (Call 05/19/26) |
332 | 313,358 | ||||||
| 2.77%, 09/01/53 (Call 03/01/53) |
180 | 109,661 | ||||||
| 3.00%, 01/15/52 (Call 07/15/51)(b) |
335 | 223,919 | ||||||
| 3.13%, 05/01/25 (Call 02/01/25) |
296 | 288,619 | ||||||
| 3.15%, 02/21/40 (Call 08/21/39) |
305 | 228,777 | ||||||
| 3.20%, 11/02/27 (Call 08/02/27) |
437 | 410,718 | ||||||
| 3.38%, 02/21/50 (Call 08/21/49) |
285 | 203,293 | ||||||
| 4.05%, 08/18/29 (Call 06/18/29) |
300 | 286,782 | ||||||
| 4.20%, 03/01/33 (Call 12/01/32) |
315 | 291,648 | ||||||
| 4.20%, 02/22/52 (Call 08/22/51) |
85 | 68,849 | ||||||
| 4.40%, 05/01/45 (Call 11/01/44) |
375 | 320,080 | ||||||
| 4.40%, 02/22/62 (Call 08/22/61) |
130 | 104,453 | ||||||
| 4.56%, 06/15/48 (Call 12/15/47) |
309 | 267,559 | ||||||
| 4.66%, 06/15/51 (Call 12/15/50) |
328 | 284,492 | ||||||
| 4.88%, 03/01/53 (Call 09/01/52) |
200 | 179,452 | ||||||
| 4.95%, 10/01/41 |
145 | 135,111 | ||||||
| 5.15%, 03/02/28 (Call 02/02/28) |
610 | 611,208 | ||||||
| 5.15%, 11/15/41 (Call 05/15/41) |
197 | 187,551 | ||||||
| 5.25%, 03/02/25 |
640 | 638,787 | ||||||
| 5.25%, 03/02/30 (Call 01/02/30) |
640 | 644,783 | ||||||
| 5.25%, 03/02/33 (Call 12/02/32)(b) |
855 | 852,459 | ||||||
| 5.65%, 06/15/42 (Call 12/15/41) |
135 | 136,035 | ||||||
| 5.65%, 03/02/53 (Call 09/02/52) |
660 | 660,335 | ||||||
| 5.75%, 03/02/63 (Call 09/02/62) |
435 | 435,177 | ||||||
| 6.38%, 06/01/37 |
75 | 80,511 | ||||||
| 6.40%, 02/01/39 |
155 | 167,646 | ||||||
| Baxalta Inc., 5.25%, 06/23/45 (Call 12/23/44) |
250 | 240,727 | ||||||
| Biogen Inc. |
||||||||
| 2.25%, 05/01/30 (Call 02/01/30) |
495 | 414,217 | ||||||
| 3.15%, 05/01/50 (Call 11/01/49) |
437 | 288,560 | ||||||
| 3.25%, 02/15/51 (Call 08/15/50) |
145 | 98,899 | ||||||
| 4.05%, 09/15/25 (Call 06/15/25) |
922 | 903,851 | ||||||
| 5.20%, 09/15/45 (Call 03/15/45) |
342 | 321,856 | ||||||
| Gilead Sciences Inc. |
||||||||
| 1.20%, 10/01/27 (Call 08/01/27) |
240 | 211,119 | ||||||
| 1.65%, 10/01/30 (Call 07/01/30) |
550 | 448,670 | ||||||
| 2.80%, 10/01/50 (Call 04/01/50) |
321 | 206,634 | ||||||
| 2.95%, 03/01/27 (Call 12/01/26) |
788 | 744,256 | ||||||
| 3.65%, 03/01/26 (Call 12/01/25) |
850 | 825,533 | ||||||
| 4.00%, 09/01/36 (Call 03/01/36) |
244 | 215,877 | ||||||
| 4.15%, 03/01/47 (Call 09/01/46) |
510 | 420,825 | ||||||
| 4.50%, 02/01/45 (Call 08/01/44) |
350 | 307,755 | ||||||
| 4.60%, 09/01/35 (Call 03/01/35) |
455 | 430,788 | ||||||
| 4.75%, 03/01/46 (Call 09/01/45) |
401 | 363,661 | ||||||
| 4.80%, 04/01/44 (Call 10/01/43) |
513 | 471,055 | ||||||
| 5.25%, 10/15/33 (Call 07/15/33) |
125 | 126,448 | ||||||
| 5.55%, 10/15/53 (Call 04/15/53) |
100 | 101,996 | ||||||
| 5.65%, 12/01/41 (Call 06/01/41) |
285 | 290,015 | ||||||
| Illumina Inc., 2.55%, 03/23/31 (Call 12/23/30) |
165 | 135,371 | ||||||
| Regeneron Pharmaceuticals Inc., 2.80%, 09/15/50 (Call 03/15/50) |
169 | 105,291 | ||||||
|
|
|
|||||||
| 16,963,137 | ||||||||
| Security | Par (000) |
Value | ||||||
| Building Materials — 0.4% | ||||||||
| Carrier Global Corp. |
||||||||
| 2.70%, 02/15/31 (Call 11/15/30) |
$ | 405 | $ | 345,235 | ||||
| 2.72%, 02/15/30 (Call 11/15/29) |
535 | 468,203 | ||||||
| 3.38%, 04/05/40 (Call 10/05/39) |
310 | 239,148 | ||||||
| 3.58%, 04/05/50 (Call 10/05/49) |
330 | 243,176 | ||||||
| 5.80%, 11/30/25 |
325 | 327,334 | ||||||
| 5.90%, 03/15/34 (Call 12/15/33) |
75 | 78,302 | ||||||
| 6.20%, 03/15/54 (Call 09/15/53) |
75 | 81,766 | ||||||
| Fortune Brands Innovations Inc. |
||||||||
| 3.25%, 09/15/29 (Call 06/15/29) |
392 | 354,141 | ||||||
| 4.00%, 06/15/25 (Call 03/15/25) |
1,082 | 1,061,696 | ||||||
| 4.00%, 03/25/32 (Call 12/25/31) |
695 | 630,333 | ||||||
| 4.50%, 03/25/52 (Call 09/25/51) |
140 | 113,737 | ||||||
| 5.88%, 06/01/33 (Call 03/01/33) |
102 | 103,606 | ||||||
| Johnson Controls International PLC |
|
|||||||
| 3.90%, 02/14/26 (Call 11/14/25) |
1,680 | 1,637,193 | ||||||
| 4.50%, 02/15/47 (Call 08/15/46) |
87 | 74,724 | ||||||
| 4.63%, 07/02/44 (Call 01/02/44) |
150 | 131,003 | ||||||
| 4.95%, 07/02/64 (Call 01/02/64)(d) |
50 | 44,431 | ||||||
| 5.13%, 09/14/45 (Call 03/14/45) |
158 | 147,023 | ||||||
| 6.00%, 01/15/36 |
410 | 430,732 | ||||||
| Johnson Controls International PLC/Tyco Fire & Security Finance SCA |
||||||||
| 1.75%, 09/15/30 (Call 06/15/30) |
940 | 766,718 | ||||||
| 2.00%, 09/16/31 (Call 06/16/31) |
480 | 385,548 | ||||||
| Lafarge SA, 7.13%, 07/15/36 |
168 | 186,144 | ||||||
| Lennox International Inc. |
||||||||
| 1.35%, 08/01/25 (Call 07/01/25) |
735 | 692,911 | ||||||
| 1.70%, 08/01/27 (Call 06/01/27) |
385 | 345,069 | ||||||
| 5.50%, 09/15/28 (Call 08/15/28) |
200 | 201,861 | ||||||
| Martin Marietta Materials Inc. |
||||||||
| 3.20%, 07/15/51 (Call 01/15/51) |
140 | 96,904 | ||||||
| 4.25%, 12/15/47 (Call 06/15/47) |
107 | 88,920 | ||||||
| Masco Corp. |
||||||||
| 3.50%, 11/15/27 (Call 08/15/27) |
111 | 104,337 | ||||||
| 4.50%, 05/15/47 (Call 11/15/46) |
195 | 162,842 | ||||||
| Mohawk Industries Inc., 3.63%, 05/15/30 (Call 02/15/30) |
50 | 45,497 | ||||||
| Owens Corning |
||||||||
| 3.40%, 08/15/26 (Call 05/15/26) |
788 | 752,018 | ||||||
| 3.95%, 08/15/29 (Call 05/15/29) |
151 | 142,443 | ||||||
| 4.30%, 07/15/47 (Call 01/15/47) |
290 | 237,636 | ||||||
| 4.40%, 01/30/48 (Call 07/30/47) |
75 | 61,680 | ||||||
| 7.00%, 12/01/36 |
106 | 117,739 | ||||||
| Trane Technologies Financing Ltd. |
||||||||
| 3.50%, 03/21/26 (Call 01/21/26) |
727 | 702,534 | ||||||
| 3.80%, 03/21/29 (Call 12/21/28) |
605 | 571,903 | ||||||
| 4.50%, 03/21/49 (Call 09/21/48) |
150 | 132,779 | ||||||
| 4.65%, 11/01/44 (Call 05/01/44) |
177 | 158,842 | ||||||
| 5.25%, 03/03/33 (Call 12/03/32) |
1,065 | 1,075,263 | ||||||
| Trane Technologies Global Holding Co. Ltd. |
||||||||
| 3.75%, 08/21/28 (Call 05/21/28) |
1,095 | 1,044,184 | ||||||
| 4.30%, 02/21/48 (Call 08/21/47) |
80 | 68,812 | ||||||
| 5.75%, 06/15/43 |
194 | 200,494 | ||||||
| Vulcan Materials Co. |
||||||||
| 4.50%, 06/15/47 (Call 12/15/46) |
119 | 102,918 | ||||||
| 4.70%, 03/01/48 (Call 09/01/47) |
60 | 53,731 | ||||||
|
|
|
|||||||
| 15,011,510 | ||||||||
| Chemicals — 0.7% | ||||||||
| Albemarle Corp., |
230 | 209,264 | ||||||
| S C H E D U L E O F I N V E S T M E N T S |
43 |
| Schedule of Investments (continued) February 29, 2024 |
iShares® ESG Aware U.S. Aggregate Bond ETF (Percentages shown are based on Net Assets) |
| Security | Par (000) |
Value | ||||||
| Chemicals (continued) | ||||||||
| Celanese U.S. Holdings LLC |
||||||||
| 6.17%, 07/15/27 (Call 06/15/27) |
$ | 245 | $ | 248,755 | ||||
| 6.33%, 07/15/29 (Call 05/15/29) |
40 | 41,105 | ||||||
| 6.38%, 07/15/32 (Call 04/15/32) |
165 | 169,410 | ||||||
| 6.55%, 11/15/30 (Call 09/15/30) |
75 | 77,831 | ||||||
| 6.70%, 11/15/33 (Call 08/15/33) |
55 | 57,742 | ||||||
| CF Industries Inc., 5.38%, 03/15/44 |
185 | 172,272 | ||||||
| Dow Chemical Co. (The) |
||||||||
| 3.60%, 11/15/50 (Call 05/15/50) |
110 | 80,021 | ||||||
| 4.25%, 10/01/34 (Call 04/01/34) |
149 | 137,077 | ||||||
| 4.38%, 11/15/42 (Call 05/15/42) |
137 | 115,648 | ||||||
| 4.63%, 10/01/44 (Call 04/01/44) |
167 | 144,795 | ||||||
| 4.80%, 11/30/28 (Call 08/30/28) |
185 | 183,579 | ||||||
| 4.80%, 05/15/49 (Call 11/15/48) |
224 | 194,472 | ||||||
| 5.15%, 02/15/34 (Call 11/15/33)(b) |
100 | 98,489 | ||||||
| 5.25%, 11/15/41 (Call 05/15/41) |
359 | 336,209 | ||||||
| 5.55%, 11/30/48 (Call 05/30/48) |
110 | 106,953 | ||||||
| 5.60%, 02/15/54 (Call 08/15/53) |
100 | 98,035 | ||||||
| 6.30%, 03/15/33 (Call 12/15/32)(b) |
60 | 64,256 | ||||||
| 6.90%, 05/15/53 (Call 11/15/52) |
45 | 51,434 | ||||||
| 7.38%, 11/01/29 |
305 | 338,114 | ||||||
| 9.40%, 05/15/39 |
135 | 180,045 | ||||||
| DuPont de Nemours Inc. |
||||||||
| 4.49%, 11/15/25 (Call 09/15/25) |
425 | 420,055 | ||||||
| 4.73%, 11/15/28 (Call 08/15/28) |
769 | 764,951 | ||||||
| 5.32%, 11/15/38 (Call 05/15/38) |
569 | 562,870 | ||||||
| 5.42%, 11/15/48 (Call 05/15/48) |
350 | 343,601 | ||||||
| Eastman Chemical Co. |
||||||||
| 4.65%, 10/15/44 (Call 04/15/44) |
192 | 162,277 | ||||||
| 4.80%, 09/01/42 (Call 03/01/42) |
133 | 116,606 | ||||||
| Ecolab Inc. |
||||||||
| 1.30%, 01/30/31 (Call 10/30/30) |
320 | 253,185 | ||||||
| 2.13%, 02/01/32 (Call 11/01/31) |
120 | 98,296 | ||||||
| 2.70%, 11/01/26 (Call 08/01/26) |
9,535 | 9,037,648 | ||||||
| 2.70%, 12/15/51 (Call 06/15/51) |
190 | 120,010 | ||||||
| 2.75%, 08/18/55 (Call 02/18/55) |
180 | 111,881 | ||||||
| 3.25%, 12/01/27 (Call 09/01/27) |
846 | 801,102 | ||||||
| 3.95%, 12/01/47 (Call 06/01/47) |
235 | 195,167 | ||||||
| 4.80%, 03/24/30 (Call 12/24/29) |
931 | 929,340 | ||||||
| 5.25%, 01/15/28 (Call 12/15/27) |
370 | 375,351 | ||||||
| 5.50%, 12/08/41 |
40 | 40,682 | ||||||
| FMC Corp. |
||||||||
| 4.50%, 10/01/49 (Call 04/01/49) |
57 | 42,366 | ||||||
| 5.65%, 05/18/33 (Call 02/18/33)(b) |
95 | 91,974 | ||||||
| 6.38%, 05/18/53 (Call 11/18/52)(b) |
100 | 97,608 | ||||||
| International Flavors & Fragrances Inc. |
||||||||
| 4.38%, 06/01/47 (Call 12/01/46) |
40 | 29,891 | ||||||
| 4.45%, 09/26/28 (Call 06/26/28) |
555 | 536,143 | ||||||
| 5.00%, 09/26/48 (Call 03/26/48) |
86 | 72,113 | ||||||
| LYB International Finance BV |
||||||||
| 4.88%, 03/15/44 (Call 09/15/43) |
270 | 236,798 | ||||||
| 5.25%, 07/15/43 |
98 | 89,889 | ||||||
| LYB International Finance II BV, 3.50%, 03/02/27 (Call 12/02/26) |
720 | 685,545 | ||||||
| LYB International Finance III LLC |
||||||||
| 3.63%, 04/01/51 (Call 10/01/50) |
200 | 138,926 | ||||||
| 3.80%, 10/01/60 (Call 04/01/60) |
425 | 287,495 | ||||||
| 4.20%, 10/15/49 (Call 04/15/49) |
172 | 132,754 | ||||||
| 4.20%, 05/01/50 (Call 11/01/49) |
339 | 261,920 | ||||||
| 5.50%, 03/01/34 (Call 12/01/33) |
200 | 198,481 | ||||||
| 5.63%, 05/15/33 (Call 02/15/33) |
120 | 121,596 | ||||||
| Security | Par (000) |
Value | ||||||
| Chemicals (continued) | ||||||||
| LyondellBasell Industries NV, 4.63%, 02/26/55 (Call 08/26/54) |
$ | 190 | $ | 156,032 | ||||
| Mosaic Co. (The) |
||||||||
| 4.05%, 11/15/27 (Call 08/15/27) |
10 | 9,609 | ||||||
| 4.88%, 11/15/41 (Call 05/15/41) |
5 | 4,364 | ||||||
| 5.45%, 11/15/33 (Call 05/15/33) |
65 | 64,230 | ||||||
| 5.63%, 11/15/43 (Call 05/15/43) |
125 | 119,779 | ||||||
| Nutrien Ltd. |
||||||||
| 4.13%, 03/15/35 (Call 09/15/34) |
227 | 204,430 | ||||||
| 4.90%, 03/27/28 (Call 02/27/28) |
160 | 158,687 | ||||||
| 4.90%, 06/01/43 (Call 12/01/42) |
120 | 108,422 | ||||||
| 5.00%, 04/01/49 (Call 10/01/48) |
58 | 52,340 | ||||||
| 5.25%, 01/15/45 (Call 07/15/44) |
103 | 95,839 | ||||||
| 5.63%, 12/01/40 |
158 | 154,541 | ||||||
| 5.80%, 03/27/53 (Call 09/27/52) |
175 | 175,177 | ||||||
| 5.88%, 12/01/36 |
200 | 204,672 | ||||||
| 5.95%, 11/07/25 |
100 | 100,841 | ||||||
| 6.13%, 01/15/41 (Call 07/15/40) |
55 | 56,439 | ||||||
| PPG Industries Inc. |
||||||||
| 2.80%, 08/15/29 (Call 05/15/29) |
179 | 160,443 | ||||||
| 3.75%, 03/15/28 (Call 12/15/27) |
525 | 502,781 | ||||||
| Rohm & Haas Co., 7.85%, 07/15/29 |
148 | 164,325 | ||||||
| RPM International Inc. |
||||||||
| 4.25%, 01/15/48 (Call 07/15/47)(b) |
60 | 48,231 | ||||||
| 5.25%, 06/01/45 (Call 12/01/44) |
40 | 36,705 | ||||||
| Sherwin-Williams Co. (The) |
||||||||
| 2.20%, 03/15/32 (Call 12/15/31) |
120 | 97,096 | ||||||
| 3.30%, 05/15/50 (Call 11/15/49) |
60 | 41,988 | ||||||
| 3.80%, 08/15/49 (Call 02/15/49) |
140 | 108,002 | ||||||
| 4.00%, 12/15/42 (Call 06/15/42) |
48 | 39,176 | ||||||
| 4.50%, 06/01/47 (Call 12/01/46) |
329 | 283,990 | ||||||
| 4.55%, 08/01/45 (Call 02/01/45) |
70 | 60,259 | ||||||
| Westlake Corp., 3.38%, 08/15/61 (Call 02/15/61) |
120 | 74,310 | ||||||
|
|
|
|||||||
| 23,744,735 | ||||||||
| Commercial Services — 0.5% | ||||||||
| Automatic Data Processing Inc. |
||||||||
| 1.25%, 09/01/30 (Call 06/01/30) |
4,646 | 3,763,144 | ||||||
| 1.70%, 05/15/28 (Call 03/15/28) |
4,435 | 3,948,429 | ||||||
| 3.38%, 09/15/25 (Call 06/15/25) |
1,178 | 1,150,871 | ||||||
| Block Financial LLC |
||||||||
| 3.88%, 08/15/30 (Call 05/15/30) |
482 | 434,556 | ||||||
| 5.25%, 10/01/25 (Call 07/01/25) |
83 | 82,378 | ||||||
| Global Payments Inc. |
||||||||
| 4.15%, 08/15/49 (Call 02/15/49) |
122 | 93,039 | ||||||
| 5.95%, 08/15/52 (Call 02/15/52) |
85 | 83,543 | ||||||
| GXO Logistics Inc. |
||||||||
| 1.65%, 07/15/26 (Call 06/15/26) |
1,050 | 962,796 | ||||||
| 2.65%, 07/15/31 (Call 04/15/31) |
834 | 677,395 | ||||||
| Moody’s Corp. |
||||||||
| 3.10%, 11/29/61 (Call 05/29/61) |
135 | 86,360 | ||||||
| 3.25%, 01/15/28 (Call 10/15/27) |
355 | 334,008 | ||||||
| 3.25%, 05/20/50 (Call 11/20/49) |
84 | 59,540 | ||||||
| 3.75%, 03/24/25 (Call 02/24/25) |
460 | 452,287 | ||||||
| 3.75%, 02/25/52 (Call 08/25/51) |
45 | 34,824 | ||||||
| 4.25%, 02/01/29 (Call 11/01/28) |
383 | 370,988 | ||||||
| 4.25%, 08/08/32 (Call 05/08/32) |
240 | 226,703 | ||||||
| 4.88%, 12/17/48 (Call 06/17/48) |
164 | 151,299 | ||||||
| 5.25%, 07/15/44 |
145 | 141,845 | ||||||
| PayPal Holdings Inc. |
||||||||
| 2.65%, 10/01/26 (Call 08/01/26) |
90 | 84,865 | ||||||
| 2.85%, 10/01/29 (Call 07/01/29) |
10 | 8,917 | ||||||
| 44 | 2 0 2 4 I S H A R E S A N N U A L R E P O R T T O S H A R E H O L D E R S |
| Schedule of Investments (continued) February 29, 2024 |
iShares® ESG Aware U.S. Aggregate Bond ETF (Percentages shown are based on Net Assets) |
| Security | Par (000) |
Value | ||||||
| Commercial Services (continued) | ||||||||
| 3.25%, 06/01/50 (Call 12/01/49) |
$ | 316 | $ | 219,826 | ||||
| 5.05%, 06/01/52 (Call 12/01/51) |
70 | 65,683 | ||||||
| 5.25%, 06/01/62 (Call 12/01/61) |
30 | 27,926 | ||||||
| Quanta Services Inc. |
||||||||
| 2.35%, 01/15/32 (Call 10/15/31) |
305 | 244,142 | ||||||
| 2.90%, 10/01/30 (Call 07/01/30) |
500 | 433,500 | ||||||
| RELX Capital Inc. |
||||||||
| 3.00%, 05/22/30 (Call 02/22/30) |
1,585 | 1,415,048 | ||||||
| 4.00%, 03/18/29 (Call 12/18/28) |
2,423 | 2,314,107 | ||||||
| 4.75%, 05/20/32 (Call 02/20/32) |
75 | 73,652 | ||||||
| S&P Global Inc. |
||||||||
| 2.30%, 08/15/60 (Call 02/15/60) |
170 | 91,852 | ||||||
| 2.50%, 12/01/29 (Call 09/01/29) |
30 | 26,434 | ||||||
| 2.95%, 01/22/27 (Call 10/22/26) |
85 | 80,542 | ||||||
| 3.25%, 12/01/49 (Call 06/01/49) |
293 | 208,741 | ||||||
| 3.90%, 03/01/62 (Call 09/01/61) |
50 | 38,913 | ||||||
| Triton Container International Ltd./TAL International Container Corp., 3.25%, 03/15/32 (Call 12/15/31) |
655 | 521,261 | ||||||
| Verisk Analytics Inc. |
||||||||
| 4.13%, 03/15/29 (Call 12/15/28) |
5 | 4,798 | ||||||
| 5.50%, 06/15/45 (Call 12/15/44) |
26 | 24,802 | ||||||
|
|
|
|||||||
| 18,939,014 | ||||||||
| Computers — 0.5% | ||||||||
| Apple Inc. |
||||||||
| 2.55%, 08/20/60 (Call 02/20/60)(b) |
133 | 82,163 | ||||||
| 2.65%, 05/11/50 (Call 11/11/49) |
333 | 216,417 | ||||||
| 2.65%, 02/08/51 (Call 08/08/50) |
115 | 74,114 | ||||||
| 2.70%, 08/05/51 (Call 02/05/51) |
70 | 45,460 | ||||||
| 2.80%, 02/08/61 (Call 08/08/60) |
175 | 111,262 | ||||||
| 2.85%, 08/05/61 (Call 02/05/61) |
125 | 79,365 | ||||||
| 2.95%, 09/11/49 (Call 03/11/49) |
164 | 114,375 | ||||||
| 3.45%, 02/09/45 |
322 | 255,763 | ||||||
| 3.75%, 09/12/47 (Call 03/12/47) |
140 | 113,714 | ||||||
| 3.75%, 11/13/47 (Call 05/13/47) |
196 | 159,410 | ||||||
| 3.85%, 05/04/43 |
462 | 395,214 | ||||||
| 3.85%, 08/04/46 (Call 02/04/46) |
255 | 212,917 | ||||||
| 3.95%, 08/08/52 (Call 02/08/52) |
90 | 74,690 | ||||||
| 4.10%, 08/08/62 (Call 02/08/62) |
195 | 163,353 | ||||||
| 4.25%, 02/09/47 (Call 08/09/46) |
95 | 85,242 | ||||||
| 4.30%, 05/10/33 (Call 02/10/33) |
160 | 157,955 | ||||||
| 4.38%, 05/13/45 |
435 | 396,915 | ||||||
| 4.45%, 05/06/44 |
49 | 45,797 | ||||||
| 4.65%, 02/23/46 (Call 08/23/45) |
532 | 502,755 | ||||||
| 4.85%, 05/10/53 (Call 11/10/52)(b) |
160 | 156,319 | ||||||
| Dell International LLC/EMC Corp. |
||||||||
| 3.45%, 12/15/51 (Call 06/15/51) |
82 | 56,137 | ||||||
| 8.10%, 07/15/36 (Call 01/15/36) |
105 | 125,825 | ||||||
| 8.35%, 07/15/46 (Call 01/15/46) |
103 | 130,464 | ||||||
| DXC Technology Co., 2.38%, 09/15/28 (Call 07/15/28) |
5 | 4,311 | ||||||
| Hewlett Packard Enterprise Co. |
||||||||
| 1.75%, 04/01/26 (Call 03/01/26) |
836 | 777,005 | ||||||
| 4.90%, 10/15/25 (Call 07/15/25) |
1,756 | 1,744,707 | ||||||
| 5.25%, 07/01/28 (Call 06/01/28)(b) |
265 | 265,424 | ||||||
| 6.10%, 04/01/26 (Call 04/01/24) |
75 | 75,026 | ||||||
| 6.20%, 10/15/35 (Call 04/15/35) |
429 | 447,903 | ||||||
| 6.35%, 10/15/45 (Call 04/15/45) |
295 | 304,935 | ||||||
| HP Inc. |
||||||||
| 4.20%, 04/15/32 (Call 01/15/32) |
165 | 152,129 | ||||||
| 4.75%, 01/15/28 (Call 12/15/27) |
50 | 49,488 | ||||||
| Security | Par (000) |
Value | ||||||
| Computers (continued) | ||||||||
| 5.50%, 01/15/33 (Call 10/15/32)(b) |
$ | 355 | $ | 355,141 | ||||
| 6.00%, 09/15/41 |
362 | 370,171 | ||||||
| International Business Machines Corp. |
||||||||
| 3.30%, 05/15/26 |
1,077 | 1,036,909 | ||||||
| 3.30%, 01/27/27 |
455 | 434,679 | ||||||
| 3.43%, 02/09/52 (Call 08/09/51) |
140 | 99,715 | ||||||
| 3.45%, 02/19/26 |
1,042 | 1,010,826 | ||||||
| 3.50%, 05/15/29 |
895 | 835,416 | ||||||
| 4.00%, 06/20/42 |
345 | 286,837 | ||||||
| 4.15%, 07/27/27 (Call 06/27/27) |
100 | 97,433 | ||||||
| 4.15%, 05/15/39 |
162 | 141,231 | ||||||
| 4.25%, 05/15/49 |
476 | 398,691 | ||||||
| 4.40%, 07/27/32 (Call 04/27/32) |
135 | 128,930 | ||||||
| 4.70%, 02/19/46 |
165 | 149,429 | ||||||
| 4.90%, 07/27/52 (Call 01/27/52) |
55 | 50,837 | ||||||
| 5.10%, 02/06/53 (Call 08/06/52) |
65 | 61,952 | ||||||
| 5.60%, 11/30/39 |
121 | 124,409 | ||||||
| 5.88%, 11/29/32 |
335 | 354,666 | ||||||
| 6.22%, 08/01/27 |
170 | 177,353 | ||||||
| 6.50%, 01/15/28 |
362 | 382,971 | ||||||
| 7.00%, 10/30/25 |
656 | 677,107 | ||||||
| 7.13%, 12/01/96(b) |
30 | 37,673 | ||||||
| Leidos Inc. |
||||||||
| 2.30%, 02/15/31 (Call 11/15/30) |
120 | 98,310 | ||||||
| 4.38%, 05/15/30 (Call 02/15/30) |
781 | 733,919 | ||||||
| Teledyne FLIR LLC, 2.50%, 08/01/30 (Call 05/01/30) |
250 | 211,184 | ||||||
| Western Digital Corp. |
||||||||
| 2.85%, 02/01/29 (Call 12/01/28) |
345 | 290,726 | ||||||
| 4.75%, 02/15/26 (Call 11/15/25) |
305 | 298,346 | ||||||
|
|
|
|||||||
| 16,421,415 | ||||||||
| Cosmetics & Personal Care — 0.2% | ||||||||
| Colgate-Palmolive Co. |
||||||||
| 3.70%, 08/01/47 (Call 02/01/47) |
211 | 174,063 | ||||||
| 4.00%, 08/15/45 |
353 | 309,020 | ||||||
| 4.60%, 03/01/28 (Call 02/01/28) |
36 | 36,252 | ||||||
| 4.60%, 03/01/33 (Call 12/01/32) |
36 | 35,731 | ||||||
| Conopco Inc., Series E, 7.25%, 12/15/26 |
45 | 47,732 | ||||||
| Estee Lauder Companies Inc. (The) |
||||||||
| 3.13%, 12/01/49 (Call 06/01/49) |
92 | 62,723 | ||||||
| 4.38%, 06/15/45 (Call 12/15/44) |
62 | 53,286 | ||||||
| 6.00%, 05/15/37 |
25 | 26,642 | ||||||
| Procter & Gamble Co. (The) |
||||||||
| 2.45%, 11/03/26 |
306 | 289,073 | ||||||
| 2.80%, 03/25/27 |
802 | 759,203 | ||||||
| 2.85%, 08/11/27 |
805 | 759,620 | ||||||
| 3.60%, 03/25/50 |
125 | 102,539 | ||||||
| 4.10%, 01/26/26 |
150 | 148,320 | ||||||
| 5.55%, 03/05/37 |
221 | 237,081 | ||||||
| 5.80%, 08/15/34 |
65 | 72,272 | ||||||
| Unilever Capital Corp. |
||||||||
| 1.75%, 08/12/31 (Call 05/12/31) |
405 | 325,704 | ||||||
| 2.00%, 07/28/26 |
305 | 285,657 | ||||||
| 2.90%, 05/05/27 (Call 02/05/27) |
395 | 373,297 | ||||||
| 3.10%, 07/30/25 |
175 | 170,570 | ||||||
| 3.38%, 03/22/25 (Call 01/22/25) |
260 | 254,965 | ||||||
| 3.50%, 03/22/28 (Call 12/22/27) |
385 | 368,338 | ||||||
| 5.00%, 12/08/33 (Call 09/08/33) |
500 | 500,839 | ||||||
| 5.90%, 11/15/32 |
245 | 260,694 | ||||||
| S C H E D U L E O F I N V E S T M E N T S |
45 |
| Schedule of Investments (continued) February 29, 2024 |
iShares® ESG Aware U.S. Aggregate Bond ETF (Percentages shown are based on Net Assets) |
| Security | Par (000) |
Value | ||||||
| Cosmetics & Personal Care (continued) | ||||||||
| Series 30Y, 2.63%, 08/12/51 (Call 02/12/51) |
$ | 325 | $ | 209,672 | ||||
|
|
|
|||||||
| 5,863,293 | ||||||||
| Distribution & Wholesale — 0.0% | ||||||||
| LKQ Corp. |
||||||||
| 5.75%, 06/15/28 (Call 05/15/28) |
360 | 363,629 | ||||||
| 6.25%, 06/15/33 (Call 03/15/33) |
560 | 575,631 | ||||||
| WW Grainger Inc. |
||||||||
| 3.75%, 05/15/46 (Call 11/15/45) |
96 | 77,043 | ||||||
| 4.20%, 05/15/47 (Call 11/15/46) |
174 | 149,450 | ||||||
| 4.60%, 06/15/45 (Call 12/15/44) |
217 | 197,555 | ||||||
|
|
|
|||||||
| 1,363,308 | ||||||||
| Diversified Financial Services — 1.0% | ||||||||
| AerCap Ireland Capital DAC/AerCap Global |
||||||||
| Aviation Trust |
||||||||
| 2.45%, 10/29/26 (Call 09/29/26) |
470 | 433,670 | ||||||
| 3.00%, 10/29/28 (Call 08/29/28) |
337 | 302,795 | ||||||
| 3.30%, 01/30/32 (Call 10/30/31) |
852 | 721,025 | ||||||
| 3.40%, 10/29/33 (Call 07/29/33) |
520 | 432,572 | ||||||
| 3.65%, 07/21/27 (Call 04/21/27) |
485 | 456,600 | ||||||
| 3.88%, 01/23/28 (Call 10/23/27) |
510 | 480,226 | ||||||
| 4.45%, 10/01/25 (Call 08/01/25) |
525 | 514,934 | ||||||
| 4.45%, 04/03/26 (Call 02/03/26) |
445 | 435,884 | ||||||
| 4.63%, 10/15/27 (Call 08/15/27) |
350 | 338,843 | ||||||
| 5.75%, 06/06/28 (Call 05/06/28) |
150 | 151,196 | ||||||
| 6.50%, 07/15/25 (Call 06/15/25) |
810 | 817,315 | ||||||
| Affiliated Managers Group Inc. |
||||||||
| 3.30%, 06/15/30 (Call 03/15/30) |
205 | 180,401 | ||||||
| 3.50%, 08/01/25 |
65 | 63,217 | ||||||
| Air Lease Corp. |
||||||||
| 2.88%, 01/15/32 (Call 10/15/31) |
205 | 170,102 | ||||||
| 3.00%, 02/01/30 (Call 11/01/29) |
212 | 184,284 | ||||||
| 3.25%, 10/01/29 (Call 07/01/29) |
152 | 135,480 | ||||||
| 3.63%, 04/01/27 (Call 01/01/27) |
230 | 218,392 | ||||||
| 3.63%, 12/01/27 (Call 09/01/27) |
184 | 172,265 | ||||||
| 4.63%, 10/01/28 (Call 07/01/28) |
307 | 296,531 | ||||||
| Aircastle Ltd., 4.25%, 06/15/26 (Call 04/15/26) |
154 | 149,247 | ||||||
| Ally Financial Inc. |
||||||||
| 4.63%, 03/30/25 |
440 | 434,399 | ||||||
| 5.80%, 05/01/25 (Call 04/01/25) |
425 | 424,260 | ||||||
| 7.10%, 11/15/27 (Call 10/15/27) |
25 | 26,027 | ||||||
| 8.00%, 11/01/31 |
569 | 622,263 | ||||||
| American Express Co. |
||||||||
| 1.65%, 11/04/26 (Call 10/04/26) |
75 | 68,573 | ||||||
| 2.55%, 03/04/27 (Call 02/01/27) |
95 | 88,258 | ||||||
| 3.13%, 05/20/26 (Call 04/20/26) |
850 | 815,735 | ||||||
| 3.30%, 05/03/27 (Call 04/03/27) |
85 | 80,582 | ||||||
| 3.95%, 08/01/25 (Call 07/01/25) |
300 | 294,726 | ||||||
| 4.05%, 12/03/42 |
496 | 426,655 | ||||||
| 4.20%, 11/06/25 (Call 10/06/25) |
376 | 370,892 | ||||||
| 4.42%, 08/03/33 (Call 08/03/32), |
260 | 246,316 | ||||||
| 4.90%, 02/13/26 (Call 01/13/26) |
200 | 199,346 | ||||||
| 4.99%, 05/01/26 (Call 05/01/25), |
295 | 293,302 | ||||||
| 4.99%, 05/26/33 (Call 02/26/32), |
60 | 58,361 | ||||||
| 5.04%, 05/01/34 (Call 05/01/33), |
250 | 245,204 | ||||||
| 5.10%, 02/16/28 (Call 02/16/27), |
40 | 39,840 | ||||||
| Security | Par (000) |
Value | ||||||
| Diversified Financial Services (continued) | ||||||||
| 5.28%, 07/27/29 (Call 07/27/28), |
$ | 225 | $ | 226,286 | ||||
| 5.39%, 07/28/27 (Call 07/28/26), |
75 | 75,207 | ||||||
| 5.63%, 07/28/34 (Call 07/28/33), |
30 | 30,184 | ||||||
| 5.85%, 11/05/27 (Call 10/05/27) |
95 | 97,438 | ||||||
| 6.34%, 10/30/26 (Call 10/30/25), |
50 | 50,760 | ||||||
| 6.49%, 10/30/31 (Call 10/30/30), |
50 | 53,250 | ||||||
| American Express Credit Corp., 3.30%, 05/03/27 (Call 04/03/27) |
400 | 379,095 | ||||||
| Ameriprise Financial Inc. |
||||||||
| 2.88%, 09/15/26 (Call 06/15/26) |
45 | 42,692 | ||||||
| 3.00%, 04/02/25 (Call 03/02/25) |
130 | 126,589 | ||||||
| 4.50%, 05/13/32 (Call 02/13/32) |
50 | 47,971 | ||||||
| 5.15%, 05/15/33 (Call 02/15/33) |
150 | 150,195 | ||||||
| Brookfield Finance Inc. |
||||||||
| 3.50%, 03/30/51 (Call 09/30/50) |
85 | 60,364 | ||||||
| 3.63%, 02/15/52 (Call 08/15/51) |
65 | 46,333 | ||||||
| 3.90%, 01/25/28 (Call 10/25/27) |
330 | 316,440 | ||||||
| 4.25%, 06/02/26 (Call 03/02/26) |
150 | 147,278 | ||||||
| 4.35%, 04/15/30 (Call 01/15/30) |
172 | 162,916 | ||||||
| 4.70%, 09/20/47 (Call 03/20/47) |
265 | 224,859 | ||||||
| 4.85%, 03/29/29 (Call 12/29/28) |
420 | 413,981 | ||||||
| 5.97%, 03/04/54 (Call 09/04/53) |
50 | 50,466 | ||||||
| 6.35%, 01/05/34 (Call 10/05/33) |
130 | 136,620 | ||||||
| Brookfield Finance LLC/Brookfield Finance Inc., 3.45%, 04/15/50 (Call 10/15/49) |
135 | 93,700 | ||||||
| Capital One Financial Corp. |
||||||||
| 1.88%, 11/02/27 (Call 11/02/26), |
20 | 18,147 | ||||||
| 2.36%, 07/29/32 (Call 07/29/31), |
130 | 97,959 | ||||||
| 2.62%, 11/02/32 (Call 11/02/31), |
65 | 51,900 | ||||||
| 4.99%, 07/24/26 (Call 07/24/25), |
50 | 49,534 | ||||||
| 5.27%, 05/10/33 (Call 05/10/32), |
280 | 271,563 | ||||||
| 5.47%, 02/01/29 (Call 02/01/28), |
35 | 34,770 | ||||||
| 5.82%, 02/01/34 (Call 02/01/33), |
150 | 148,237 | ||||||
| 6.31%, 06/08/29 (Call 06/08/28), |
105 | 107,535 | ||||||
| 6.38%, 06/08/34 (Call 06/08/33), |
100 | 103,005 | ||||||
| Cboe Global Markets Inc., 3.65%, 01/12/27 (Call 10/12/26) |
242 | 234,189 | ||||||
| Charles Schwab Corp. (The) |
||||||||
| 1.95%, 12/01/31 (Call 09/01/31) |
15 | 11,906 | ||||||
| 2.90%, 03/03/32 (Call 12/03/31) |
380 | 321,640 | ||||||
| 3.20%, 03/02/27 (Call 12/02/26) |
40 | 37,959 | ||||||
| 3.20%, 01/25/28 (Call 10/25/27) |
51 | 47,747 | ||||||
| 3.25%, 05/22/29 (Call 02/22/29) |
105 | 96,791 | ||||||
| 4.00%, 02/01/29 (Call 11/01/28)(b) |
139 | 133,289 | ||||||
| 4.63%, 03/22/30 (Call 12/22/29)(b) |
40 | 39,485 | ||||||
| 5.85%, 05/19/34 (Call 05/19/33), |
100 | 101,497 | ||||||
| 46 | 2 0 2 4 I S H A R E S A N N U A L R E P O R T T O S H A R E H O L D E R S |
| Schedule of Investments (continued) February 29, 2024 |
iShares® ESG Aware U.S. Aggregate Bond ETF (Percentages shown are based on Net Assets) |
| Security | Par (000) |
Value | ||||||
| Diversified Financial Services (continued) | ||||||||
| 6.14%, 08/24/34 (Call 08/24/33), |
$ | 30 | $ | 31,118 | ||||
| CI Financial Corp. |
||||||||
| 3.20%, 12/17/30 (Call 09/17/30) |
209 | 166,402 | ||||||
| 4.10%, 06/15/51 (Call 12/15/50)(b) |
134 | 79,172 | ||||||
| CME Group Inc. |
||||||||
| 4.15%, 06/15/48 (Call 12/15/47) |
240 | 206,023 | ||||||
| 5.30%, 09/15/43 (Call 03/15/43) |
199 | 201,422 | ||||||
| Credit Suisse USA Inc., 7.13%, 07/15/32 |
221 | 246,621 | ||||||
| Discover Financial Services |
||||||||
| 4.10%, 02/09/27 (Call 11/09/26) |
371 | 356,561 | ||||||
| 4.50%, 01/30/26 (Call 11/30/25) |
255 | 250,568 | ||||||
| 6.70%, 11/29/32 (Call 08/29/32) |
140 | 146,502 | ||||||
| 7.96%, 11/02/34 (Call 11/02/33), |
185 | 207,327 | ||||||
| Eaton Vance Corp., 3.50%, 04/06/27 (Call 01/06/27) |
990 | 942,287 | ||||||
| Intercontinental Exchange Inc. |
||||||||
| 1.85%, 09/15/32 (Call 06/15/32) |
100 | 77,176 | ||||||
| 3.00%, 06/15/50 (Call 12/15/49) |
340 | 228,025 | ||||||
| 3.00%, 09/15/60 (Call 03/15/60) |
230 | 142,484 | ||||||
| 3.10%, 09/15/27 (Call 06/15/27) |
180 | 169,028 | ||||||
| 3.75%, 09/21/28 (Call 06/21/28) |
119 | 113,577 | ||||||
| 4.25%, 09/21/48 (Call 03/21/48) |
241 | 203,971 | ||||||
| 4.60%, 03/15/33 (Call 12/15/32) |
195 | 186,402 | ||||||
| 4.95%, 06/15/52 (Call 12/15/51) |
255 | 238,005 | ||||||
| 5.20%, 06/15/62 (Call 12/15/61) |
105 | 100,907 | ||||||
| Invesco Finance PLC |
||||||||
| 3.75%, 01/15/26 |
75 | 72,883 | ||||||
| 5.38%, 11/30/43 |
158 | 152,504 | ||||||
| Janus Henderson U.S. Holdings Inc., 4.88%, 08/01/25 (Call 05/01/25) |
770 | 760,918 | ||||||
| Jefferies Financial Group Inc. |
||||||||
| 4.15%, 01/23/30 |
172 | 160,014 | ||||||
| 6.25%, 01/15/36 |
112 | 115,079 | ||||||
| 6.50%, 01/20/43 |
65 | 67,688 | ||||||
| Legg Mason Inc. |
||||||||
| 4.75%, 03/15/26 |
346 | 343,568 | ||||||
| 5.63%, 01/15/44 |
373 | 373,709 | ||||||
| Mastercard Inc. |
||||||||
| 2.00%, 11/18/31 (Call 08/18/31) |
125 | 102,545 | ||||||
| 2.95%, 11/21/26 (Call 08/21/26) |
400 | 381,533 | ||||||
| 3.30%, 03/26/27 (Call 01/26/27) |
502 | 481,044 | ||||||
| 3.35%, 03/26/30 (Call 12/26/29) |
464 | 428,437 | ||||||
| 3.50%, 02/26/28 (Call 11/26/27) |
440 | 422,396 | ||||||
| 3.65%, 06/01/49 (Call 12/01/48) |
105 | 83,485 | ||||||
| 3.80%, 11/21/46 (Call 05/21/46) |
130 | 107,339 | ||||||
| 3.85%, 03/26/50 (Call 09/26/49) |
338 | 279,063 | ||||||
| 3.95%, 02/26/48 (Call 08/26/47) |
62 | 52,398 | ||||||
| 4.85%, 03/09/33 (Call 12/09/32) |
85 | 84,887 | ||||||
| 4.88%, 03/09/28 (Call 02/09/28) |
160 | 161,793 | ||||||
| Nasdaq Inc. |
||||||||
| 1.65%, 01/15/31 (Call 10/15/30) |
215 | 171,221 | ||||||
| 3.25%, 04/28/50 (Call 10/28/49) |
120 | 81,596 | ||||||
| 3.85%, 06/30/26 (Call 03/30/26) |
342 | 331,908 | ||||||
| 3.95%, 03/07/52 (Call 09/07/51) |
174 | 132,193 | ||||||
| 5.35%, 06/28/28 (Call 05/28/28) |
410 | 414,105 | ||||||
| 5.55%, 02/15/34 (Call 11/15/33) |
385 | 387,510 | ||||||
| 5.65%, 06/28/25 |
35 | 35,113 | ||||||
| 6.10%, 06/28/63 (Call 12/28/62) |
25 | 25,945 | ||||||
| Security | Par (000) |
Value | ||||||
| Diversified Financial Services (continued) | ||||||||
| Nomura Holdings Inc. |
||||||||
| 2.17%, 07/14/28 |
$ | 195 | $ | 169,975 | ||||
| 2.33%, 01/22/27 |
155 | 142,039 | ||||||
| 2.61%, 07/14/31 |
465 | 382,038 | ||||||
| 2.68%, 07/16/30 |
265 | 223,989 | ||||||
| 2.71%, 01/22/29 |
270 | 237,927 | ||||||
| 3.00%, 01/22/32 |
450 | 374,851 | ||||||
| 3.10%, 01/16/30 |
390 | 342,383 | ||||||
| 5.39%, 07/06/27 |
255 | 254,414 | ||||||
| 6.07%, 07/12/28 |
210 | 214,989 | ||||||
| 6.09%, 07/12/33 |
225 | 234,508 | ||||||
| ORIX Corp., 5.20%, 09/13/32 |
335 | 338,534 | ||||||
| Radian Group Inc., 4.88%, 03/15/27 (Call 09/15/26) |
20 | 19,423 | ||||||
| Raymond James Financial Inc. |
||||||||
| 3.75%, 04/01/51 (Call 10/01/50) |
60 | 44,440 | ||||||
| 4.65%, 04/01/30 (Call 01/01/30) |
89 | 87,944 | ||||||
| 4.95%, 07/15/46 |
185 | 169,944 | ||||||
| Synchrony Financial |
||||||||
| 2.88%, 10/28/31 (Call 07/28/31) |
265 | 207,829 | ||||||
| 3.70%, 08/04/26 (Call 05/04/26) |
485 | 457,683 | ||||||
| 3.95%, 12/01/27 (Call 09/01/27) |
641 | 593,711 | ||||||
| 4.50%, 07/23/25 (Call 04/23/25) |
902 | 881,568 | ||||||
| 4.88%, 06/13/25 (Call 05/13/25) |
155 | 152,518 | ||||||
| 5.15%, 03/19/29 (Call 12/19/28) |
502 | 478,881 | ||||||
| Visa Inc. |
||||||||
| 1.90%, 04/15/27 (Call 02/15/27) |
15 | 13,811 | ||||||
| 2.00%, 08/15/50 (Call 02/15/50) |
25 | 14,534 | ||||||
| 2.05%, 04/15/30 (Call 01/15/30) |
185 | 158,675 | ||||||
| 2.70%, 04/15/40 (Call 10/15/39) |
100 | 73,999 | ||||||
| 2.75%, 09/15/27 (Call 06/15/27) |
40 | 37,463 | ||||||
| 3.15%, 12/14/25 (Call 09/14/25) |
45 | 43,646 | ||||||
| 3.65%, 09/15/47 (Call 03/15/47) |
361 | 287,294 | ||||||
| 4.15%, 12/14/35 (Call 06/14/35) |
274 | 256,839 | ||||||
| 4.30%, 12/14/45 (Call 06/14/45) |
771 | 687,199 | ||||||
| Voya Financial Inc. |
||||||||
| 3.65%, 06/15/26 |
180 | 173,059 | ||||||
| 4.70%, 01/23/48 (Call 01/23/28), |
155 | 130,298 | ||||||
| 5.70%, 07/15/43 |
116 | 112,396 | ||||||
| Western Union Co. (The), 6.20%, 11/17/36 |
232 | 233,681 | ||||||
|
|
|
|||||||
| 34,966,429 | ||||||||
| Electric — 2.0% | ||||||||
| AEP Texas Inc. |
||||||||
| 3.45%, 05/15/51 (Call 11/15/50) |
870 | 599,343 | ||||||
| 4.70%, 05/15/32 (Call 02/15/32) |
315 | 300,146 | ||||||
| 5.25%, 05/15/52 (Call 11/15/51) |
350 | 327,905 | ||||||
| 5.40%, 06/01/33 (Call 03/01/33) |
50 | 49,900 | ||||||
| Series G, 4.15%, 05/01/49 (Call 11/01/48) |
135 | 105,867 | ||||||
| Series H, 3.45%, 01/15/50 (Call 07/15/49) |
240 | 167,387 | ||||||
| Avangrid Inc. |
||||||||
| 3.20%, 04/15/25 (Call 03/15/25) |
3,112 | 3,027,165 | ||||||
| 3.80%, 06/01/29 (Call 03/01/29) |
2,427 | 2,261,244 | ||||||
| Avista Corp. |
||||||||
| 4.00%, 04/01/52 (Call 10/01/51) |
350 | 267,190 | ||||||
| 4.35%, 06/01/48 (Call 12/01/47) |
329 | 270,983 | ||||||
| Baltimore Gas & Electric Co. |
||||||||
| 2.90%, 06/15/50 (Call 12/15/49) |
62 | 40,009 | ||||||
| 3.20%, 09/15/49 (Call 03/15/49) |
237 | 162,438 | ||||||
| 3.50%, 08/15/46 (Call 02/15/46) |
220 | 162,067 | ||||||
| 3.75%, 08/15/47 (Call 02/15/47) |
126 | 95,864 | ||||||
| S C H E D U L E O F I N V E S T M E N T S |
47 |
| Schedule of Investments (continued) February 29, 2024 |
iShares® ESG Aware U.S. Aggregate Bond ETF (Percentages shown are based on Net Assets) |
| Security | Par (000) |
Value | ||||||
| Electric (continued) | ||||||||
| 4.25%, 09/15/48 (Call 03/15/48) |
$ | 135 | $ | 112,599 | ||||
| 5.40%, 06/01/53 (Call 12/01/52) |
65 | 63,660 | ||||||
| 6.35%, 10/01/36 |
115 | 122,841 | ||||||
| CenterPoint Energy Houston Electric LLC |
||||||||
| 3.55%, 08/01/42 (Call 02/01/42) |
120 | 93,479 | ||||||
| 3.60%, 03/01/52 (Call 09/01/51) |
70 | 52,585 | ||||||
| 3.95%, 03/01/48 (Call 09/01/47) |
144 | 116,259 | ||||||
| 4.50%, 04/01/44 (Call 10/01/43) |
137 | 120,964 | ||||||
| 4.95%, 04/01/33 (Call 01/01/33) |
30 | 29,545 | ||||||
| Series AC, 4.25%, 02/01/49 (Call 08/01/48) |
239 | 201,500 | ||||||
| Series AD, 2.90%, 07/01/50 (Call 01/01/50) |
107 | 70,333 | ||||||
| Series K2, 6.95%, 03/15/33(b) |
45 | 50,759 | ||||||
| Cleveland Electric Illuminating Co. (The), 5.95%, 12/15/36 |
160 | 159,605 | ||||||
| Commonwealth Edison Co. |
||||||||
| 2.20%, 03/01/30 (Call 12/01/29) |
399 | 339,292 | ||||||
| 3.00%, 03/01/50 (Call 09/01/49) |
265 | 174,602 | ||||||
| 3.65%, 06/15/46 (Call 12/15/45) |
326 | 248,430 | ||||||
| 3.70%, 08/15/28 (Call 05/15/28) |
470 | 447,609 | ||||||
| 3.70%, 03/01/45 (Call 09/01/44) |
103 | 80,246 | ||||||
| 3.80%, 10/01/42 (Call 04/01/42) |
10 | 8,012 | ||||||
| 4.00%, 03/01/48 (Call 09/01/47) |
194 | 155,015 | ||||||
| 4.00%, 03/01/49 (Call 09/01/48) |
252 | 199,961 | ||||||
| 4.35%, 11/15/45 (Call 05/15/45) |
71 | 60,387 | ||||||
| 4.70%, 01/15/44 (Call 07/15/43) |
25 | 22,428 | ||||||
| 4.90%, 02/01/33 (Call 11/01/32) |
30 | 29,468 | ||||||
| 5.90%, 03/15/36 |
225 | 235,309 | ||||||
| 6.45%, 01/15/38 |
114 | 123,718 | ||||||
| Series 122, 2.95%, 08/15/27 (Call 05/15/27) |
115 | 107,703 | ||||||
| Series 123, 3.75%, 08/15/47 (Call 02/15/47) |
185 | 141,241 | ||||||
| Series 127, 3.20%, 11/15/49 (Call 05/15/49) |
234 | 160,333 | ||||||
| Series 131, 2.75%, 09/01/51 (Call 03/01/51) |
560 | 343,981 | ||||||
| Connecticut Light & Power Co. (The) |
||||||||
| 4.00%, 04/01/48 (Call 10/01/47) |
520 | 421,834 | ||||||
| 4.30%, 04/15/44 (Call 10/15/43) |
255 | 217,171 | ||||||
| 4.90%, 07/01/33 (Call 04/01/33) |
75 | 73,252 | ||||||
| 5.25%, 01/15/53 (Call 07/15/52) |
200 | 193,719 | ||||||
| Series A, 2.05%, 07/01/31 (Call 04/01/31) |
877 | 712,632 | ||||||
| Series A, 3.20%, 03/15/27 (Call 12/15/26) |
660 | 627,069 | ||||||
| Series A, 4.15%, 06/01/45 (Call 12/01/44) |
205 | 172,954 | ||||||
| Connecticut Light and Power Co. (The), 4.65%, 01/01/29 (Call 12/01/28) |
75 | 73,734 | ||||||
| Consolidated Edison Co. of New York Inc. |
||||||||
| 3.70%, 11/15/59 (Call 05/15/59) |
160 | 113,882 | ||||||
| 3.80%, 05/15/28 (Call 02/15/28) |
139 | 132,742 | ||||||
| 3.85%, 06/15/46 (Call 12/15/45) |
109 | 85,566 | ||||||
| 3.95%, 03/01/43 (Call 09/01/42) |
139 | 113,795 | ||||||
| 4.45%, 03/15/44 (Call 09/15/43) |
170 | 147,266 | ||||||
| 4.50%, 12/01/45 (Call 06/01/45) |
155 | 134,068 | ||||||
| 4.50%, 05/15/58 (Call 11/15/57) |
175 | 146,882 | ||||||
| 4.63%, 12/01/54 (Call 06/01/54) |
49 | 42,080 | ||||||
| 5.70%, 06/15/40 |
132 | 132,769 | ||||||
| Series 05-A, 5.30%, 03/01/35 |
182 | 180,787 | ||||||
| Series 06-A, 5.85%, 03/15/36 |
69 | 70,958 | ||||||
| Series 06-B, 6.20%, 06/15/36 |
85 | 90,237 | ||||||
| Series 08-B, 6.75%, 04/01/38 |
145 | 161,607 | ||||||
| Series 09-C, 5.50%, 12/01/39 |
115 | 114,560 | ||||||
| Series 12-A, 4.20%, 03/15/42 |
122 | 101,666 | ||||||
| Series 2017, 3.88%, 06/15/47 (Call 12/15/46) |
166 | 128,514 | ||||||
| Series 20A, 3.35%, 04/01/30 (Call 01/01/30) |
295 | 269,694 | ||||||
| Series 20B, 3.95%, 04/01/50 (Call 10/01/49) |
187 | 149,719 | ||||||
| Security | Par (000) |
Value | ||||||
| Electric (continued) | ||||||||
| Series A, 4.13%, 05/15/49 (Call 11/15/48) |
$ | 210 | $ | 168,738 | ||||
| Series C, 3.00%, 12/01/60 (Call 06/01/60) |
70 | 42,461 | ||||||
| Series C, 4.00%, 11/15/57 (Call 05/15/57) |
109 | 84,334 | ||||||
| Series C, 4.30%, 12/01/56 (Call 06/01/56) |
106 | 86,625 | ||||||
| Series D, 4.00%, 12/01/28 (Call 09/01/28)(b) |
279 | 269,064 | ||||||
| Series E, 4.65%, 12/01/48 (Call 06/01/48) |
160 | 139,619 | ||||||
| Constellation Energy Generation LLC |
||||||||
| 5.75%, 10/01/41 (Call 04/01/41) |
10 | 9,799 | ||||||
| 6.25%, 10/01/39 |
67 | 69,119 | ||||||
| Consumers Energy Co. |
||||||||
| 2.50%, 05/01/60 (Call 11/01/59) |
1,320 | 732,440 | ||||||
| 2.65%, 08/15/52 (Call 02/15/52) |
755 | 468,394 | ||||||
| Delmarva Power & Light Co., 4.15%, 05/15/45 (Call 11/15/44) |
80 | 64,172 | ||||||
| Edison International |
||||||||
| 4.13%, 03/15/28 (Call 12/15/27) |
205 | 195,574 | ||||||
| 5.25%, 11/15/28 (Call 10/15/28) |
60 | 59,685 | ||||||
| 5.75%, 06/15/27 (Call 04/15/27) |
140 | 141,325 | ||||||
| El Paso Electric Co. |
||||||||
| 5.00%, 12/01/44 (Call 06/01/44) |
60 | 50,933 | ||||||
| 6.00%, 05/15/35 |
127 | 127,360 | ||||||
| Enel Americas SA, 4.00%, 10/25/26 (Call 07/25/26) |
1,305 | 1,253,610 | ||||||
| Entergy Louisiana LLC |
||||||||
| 2.90%, 03/15/51 (Call 09/15/50) |
413 | 259,103 | ||||||
| 4.20%, 09/01/48 (Call 03/01/48) |
277 | 224,712 | ||||||
| 4.20%, 04/01/50 (Call 10/01/49) |
410 | 332,530 | ||||||
| 4.95%, 01/15/45 (Call 01/15/25) |
660 | 602,783 | ||||||
| Eversource Energy |
||||||||
| 3.38%, 03/01/32 (Call 12/01/31) |
710 | 609,470 | ||||||
| 3.45%, 01/15/50 (Call 07/15/49) |
410 | 279,207 | ||||||
| 4.60%, 07/01/27 (Call 06/01/27) |
120 | 117,346 | ||||||
| 4.75%, 05/15/26 |
70 | 69,111 | ||||||
| 5.00%, 01/01/27 |
75 | 74,487 | ||||||
| 5.13%, 05/15/33 (Call 02/15/33) |
100 | 96,603 | ||||||
| 5.45%, 03/01/28 (Call 02/01/28) |
155 | 155,848 | ||||||
| 5.50%, 01/01/34 (Call 10/01/33) |
200 | 197,933 | ||||||
| 5.95%, 02/01/29 (Call 01/01/29) |
175 | 179,229 | ||||||
| Series M, 3.30%, 01/15/28 (Call 10/15/27) |
805 | 749,745 | ||||||
| Series O, 4.25%, 04/01/29 (Call 01/01/29) |
605 | 576,343 | ||||||
| Series R, 1.65%, 08/15/30 (Call 05/15/30) |
1,255 | 998,607 | ||||||
| Exelon Corp. |
||||||||
| 3.40%, 04/15/26 (Call 01/15/26) |
2,080 | 2,002,677 | ||||||
| 4.05%, 04/15/30 (Call 01/15/30) |
1,660 | 1,556,972 | ||||||
| 4.10%, 03/15/52 (Call 09/15/51) |
475 | 368,433 | ||||||
| 4.45%, 04/15/46 (Call 10/15/45) |
291 | 243,576 | ||||||
| 4.70%, 04/15/50 (Call 10/15/49) |
375 | 323,854 | ||||||
| 4.95%, 06/15/35 (Call 12/15/34) |
457 | 426,957 | ||||||
| 5.10%, 06/15/45 (Call 12/15/44) |
235 | 213,813 | ||||||
| 5.15%, 03/15/28 (Call 02/15/28) |
70 | 69,850 | ||||||
| 5.30%, 03/15/33 (Call 12/15/32) |
105 | 103,986 | ||||||
| 5.45%, 03/15/34 (Call 12/15/33) |
35 | 34,847 | ||||||
| 5.60%, 03/15/53 (Call 09/15/52) |
185 | 180,391 | ||||||
| 5.63%, 06/15/35 |
345 | 342,554 | ||||||
| Florida Power & Light Co. |
||||||||
| 3.15%, 10/01/49 (Call 04/01/49) |
331 | 228,220 | ||||||
| 3.70%, 12/01/47 (Call 06/01/47) |
128 | 99,498 | ||||||
| 3.95%, 03/01/48 (Call 09/01/47) |
304 | 246,052 | ||||||
| 3.99%, 03/01/49 (Call 09/01/48) |
253 | 204,688 | ||||||
| 4.05%, 06/01/42 (Call 12/01/41) |
117 | 99,133 | ||||||
| 4.05%, 10/01/44 (Call 04/01/44) |
195 | 164,157 | ||||||
| 48 | 2 0 2 4 I S H A R E S A N N U A L R E P O R T T O S H A R E H O L D E R S |
| Schedule of Investments (continued) February 29, 2024 |
iShares® ESG Aware U.S. Aggregate Bond ETF (Percentages shown are based on Net Assets) |
| Security | Par (000) |
Value | ||||||
| Electric (continued) | ||||||||
| 4.13%, 02/01/42 (Call 08/01/41) |
$ | 220 | $ | 188,619 | ||||
| 4.13%, 06/01/48 (Call 12/01/47) |
175 | 145,341 | ||||||
| 4.40%, 05/15/28 (Call 03/15/28) |
80 | 78,599 | ||||||
| 4.45%, 05/15/26 (Call 04/15/26) |
55 | 54,435 | ||||||
| 4.63%, 05/15/30 (Call 03/15/30) |
85 | 83,650 | ||||||
| 4.80%, 05/15/33 (Call 02/15/33) |
55 | 53,786 | ||||||
| 4.95%, 06/01/35 |
120 | 118,051 | ||||||
| 5.25%, 02/01/41 (Call 08/01/40) |
245 | 241,680 | ||||||
| 5.63%, 04/01/34 |
445 | 465,166 | ||||||
| 5.65%, 02/01/37 |
117 | 120,785 | ||||||
| 5.69%, 03/01/40 |
235 | 240,777 | ||||||
| 5.95%, 02/01/38 |
180 | 191,417 | ||||||
| 5.96%, 04/01/39 |
55 | 58,975 | ||||||
| Iberdrola International BV |
||||||||
| 5.81%, 03/15/25 |
1,165 | 1,165,025 | ||||||
| 6.75%, 07/15/36 |
934 | 1,045,791 | ||||||
| ITC Holdings Corp. |
||||||||
| 3.25%, 06/30/26 (Call 03/30/26) |
725 | 692,432 | ||||||
| 3.35%, 11/15/27 (Call 08/15/27) |
564 | 529,030 | ||||||
| 5.30%, 07/01/43 (Call 01/01/43) |
384 | 359,414 | ||||||
| National Grid PLC |
||||||||
| 5.42%, 01/11/34 (Call 10/11/33) |
560 | 546,080 | ||||||
| 5.60%, 06/12/28 (Call 05/12/28) |
525 | 531,612 | ||||||
| 5.81%, 06/12/33 (Call 03/12/33) |
1,710 | 1,727,994 | ||||||
| National Grid USA, 5.80%, 04/01/35 |
970 | 956,434 | ||||||
| National Rural Utilities Cooperative Finance Corp. |
||||||||
| 2.40%, 03/15/30 (Call 12/15/29) |
184 | 158,395 | ||||||
| 4.02%, 11/01/32 (Call 05/01/32) |
55 | 50,599 | ||||||
| 4.30%, 03/15/49 (Call 09/15/48) |
87 | 72,266 | ||||||
| 4.40%, 11/01/48 (Call 05/01/48) |
100 | 84,278 | ||||||
| Series C, 8.00%, 03/01/32 |
120 | 138,964 | ||||||
| NextEra Energy Capital Holdings Inc. |
||||||||
| 2.25%, 06/01/30 (Call 03/01/30) |
1,504 | 1,265,652 | ||||||
| 2.75%, 11/01/29 (Call 08/01/29) |
1,112 | 980,079 | ||||||
| 3.50%, 04/01/29 (Call 01/01/29) |
445 | 411,512 | ||||||
| 3.55%, 05/01/27 (Call 02/01/27) |
1,409 | 1,340,519 | ||||||
| 3.80%, 03/15/82 (Call 03/15/27), |
55 | 48,995 | ||||||
| 4.63%, 07/15/27 (Call 06/15/27) |
465 | 457,502 | ||||||
| 4.80%, 12/01/77 (Call 12/01/27), |
240 | 217,324 | ||||||
| 4.90%, 02/28/28 (Call 01/28/28) |
145 | 143,797 | ||||||
| 4.90%, 03/15/29 (Call 02/15/29) |
75 | 74,069 | ||||||
| 4.95%, 01/29/26 |
75 | 74,450 | ||||||
| 5.00%, 02/28/30 (Call 12/28/29) |
150 | 148,712 | ||||||
| 5.00%, 07/15/32 (Call 04/15/32) |
215 | 209,543 | ||||||
| 5.05%, 02/28/33 (Call 11/28/32) |
150 | 146,241 | ||||||
| 5.25%, 03/15/34 (Call 12/15/33) |
75 | 73,614 | ||||||
| 5.25%, 02/28/53 (Call 08/28/52) |
60 | 55,712 | ||||||
| 5.55%, 03/15/54 (Call 09/15/53) |
225 | 218,184 | ||||||
| NSTAR Electric Co. |
||||||||
| 1.95%, 08/15/31 (Call 05/15/31) |
394 | 315,063 | ||||||
| 3.10%, 06/01/51 (Call 12/01/50) |
205 | 138,399 | ||||||
| 3.20%, 05/15/27 (Call 02/15/27) |
755 | 719,257 | ||||||
| 3.25%, 05/15/29 (Call 02/15/29) |
40 | 37,180 | ||||||
| 3.95%, 04/01/30 (Call 01/01/30) |
510 | 478,111 | ||||||
| 4.40%, 03/01/44 (Call 09/01/43) |
404 | 348,039 | ||||||
| 5.50%, 03/15/40 |
265 | 264,102 | ||||||
| Ohio Edison Co., 6.88%, 07/15/36 |
150 | 165,679 | ||||||
| Ohio Power Co. |
||||||||
| 4.00%, 06/01/49 (Call 12/01/48) |
260 | 202,905 | ||||||
| Security | Par (000) |
Value | ||||||
| Electric (continued) | ||||||||
| 4.15%, 04/01/48 (Call 10/01/47) |
$ | 215 | $ | 172,141 | ||||
| 5.00%, 06/01/33 (Call 03/01/33) |
30 | 29,424 | ||||||
| Series Q, 1.63%, 01/15/31 (Call 10/15/30) |
360 | 287,070 | ||||||
| Series R, 2.90%, 10/01/51 (Call 04/01/51) |
510 | 324,720 | ||||||
| Oncor Electric Delivery Co. LLC |
||||||||
| 2.70%, 11/15/51 (Call 05/15/51) |
400 | 248,407 | ||||||
| 3.10%, 09/15/49 (Call 03/15/49) |
165 | 113,119 | ||||||
| 3.75%, 04/01/45 (Call 10/01/44) |
214 | 169,718 | ||||||
| 3.80%, 09/30/47 (Call 03/30/47) |
78 | 60,173 | ||||||
| 3.80%, 06/01/49 (Call 12/01/48) |
165 | 129,439 | ||||||
| 4.10%, 11/15/48 (Call 05/15/48) |
165 | 135,212 | ||||||
| 4.55%, 12/01/41 (Call 06/01/41) |
40 | 36,270 | ||||||
| 4.60%, 06/01/52 (Call 12/01/51) |
105 | 92,334 | ||||||
| 5.25%, 09/30/40 |
100 | 99,241 | ||||||
| 5.30%, 06/01/42 (Call 12/01/41) |
95 | 95,932 | ||||||
| 5.65%, 11/15/33 (Call 08/15/33) |
35 | 36,088 | ||||||
| 7.00%, 05/01/32 |
76 | 84,660 | ||||||
| 7.25%, 01/15/33 |
77 | 87,618 | ||||||
| 7.50%, 09/01/38 |
70 | 83,532 | ||||||
| Pacific Gas and Electric Co. |
||||||||
| 3.50%, 08/01/50 (Call 02/01/50) |
300 | 201,820 | ||||||
| 3.95%, 12/01/47 (Call 06/01/47) |
130 | 94,403 | ||||||
| 4.20%, 06/01/41 (Call 12/01/40) |
185 | 145,352 | ||||||
| 4.25%, 03/15/46 (Call 09/15/45) |
40 | 30,602 | ||||||
| 4.30%, 03/15/45 (Call 09/15/44) |
145 | 113,130 | ||||||
| 4.45%, 04/15/42 (Call 10/15/41) |
95 | 76,429 | ||||||
| 4.50%, 07/01/40 (Call 01/01/40) |
185 | 155,423 | ||||||
| 4.55%, 07/01/30 (Call 01/01/30) |
110 | 103,458 | ||||||
| 4.60%, 06/15/43 (Call 12/15/42) |
50 | 40,983 | ||||||
| 4.75%, 02/15/44 (Call 08/15/43) |
30 | 25,010 | ||||||
| 4.95%, 07/01/50 (Call 01/01/50) |
695 | 590,253 | ||||||
| 5.25%, 03/01/52 (Call 09/01/51) |
250 | 221,336 | ||||||
| 5.90%, 06/15/32 (Call 03/15/32) |
230 | 231,157 | ||||||
| 6.70%, 04/01/53 (Call 10/01/52) |
110 | 117,962 | ||||||
| 6.75%, 01/15/53 (Call 07/15/52) |
310 | 332,259 | ||||||
| PECO Energy Co. |
||||||||
| 2.80%, 06/15/50 (Call 12/15/49) |
124 | 79,889 | ||||||
| 2.85%, 09/15/51 (Call 03/15/51) |
135 | 85,992 | ||||||
| 3.00%, 09/15/49 (Call 03/15/49) |
205 | 137,761 | ||||||
| 3.70%, 09/15/47 (Call 03/15/47) |
431 | 334,920 | ||||||
| 3.90%, 03/01/48 (Call 09/01/47) |
194 | 156,065 | ||||||
| 4.15%, 10/01/44 (Call 04/01/44) |
282 | 235,586 | ||||||
| 4.38%, 08/15/52 (Call 02/15/52) |
100 | 85,262 | ||||||
| 4.60%, 05/15/52 (Call 11/15/51) |
100 | 89,041 | ||||||
| 4.90%, 06/15/33 (Call 03/15/33) |
120 | 118,798 | ||||||
| Potomac Electric Power Co. |
||||||||
| 4.15%, 03/15/43 (Call 09/15/42) |
310 | 260,517 | ||||||
| 5.20%, 03/15/34 (Call 12/15/33) |
25 | 24,855 | ||||||
| 5.50%, 03/15/54 (Call 09/15/53) |
50 | 49,771 | ||||||
| 6.50%, 11/15/37 |
35 | 38,631 | ||||||
| PPL Electric Utilities Corp. |
||||||||
| 3.00%, 10/01/49 (Call 04/01/49) |
185 | 126,202 | ||||||
| 3.95%, 06/01/47 (Call 12/01/46) |
64 | 51,658 | ||||||
| 4.15%, 10/01/45 (Call 04/01/45) |
15 | 12,471 | ||||||
| 4.15%, 06/15/48 (Call 12/15/47) |
200 | 167,604 | ||||||
| 5.00%, 05/15/33 (Call 02/15/33) |
125 | 124,287 | ||||||
| 5.25%, 05/15/53 (Call 11/15/52) |
785 | 762,046 | ||||||
| Public Service Co. of New Hampshire |
||||||||
| 3.60%, 07/01/49 (Call 01/01/49) |
480 | 362,942 | ||||||
| 5.15%, 01/15/53 (Call 07/15/52) |
275 | 263,783 | ||||||
| 5.35%, 10/01/33 (Call 07/01/33) |
50 | 50,522 | ||||||
| S C H E D U L E O F I N V E S T M E N T S |
49 |
| Schedule of Investments (continued) February 29, 2024 |
iShares® ESG Aware U.S. Aggregate Bond ETF (Percentages shown are based on Net Assets) |
| Security | Par (000) |
Value | ||||||
| Electric (continued) | ||||||||
| Series V, 2.20%, 06/15/31 (Call 03/15/31) |
$ | 160 | $ | 131,775 | ||||
| Public Service Electric & Gas Co. |
||||||||
| 2.70%, 05/01/50 (Call 11/01/49) |
72 | 46,374 | ||||||
| 3.15%, 01/01/50 (Call 07/01/49) |
180 | 125,086 | ||||||
| 3.20%, 05/15/29 (Call 02/15/29) |
345 | 318,173 | ||||||
| 3.20%, 08/01/49 (Call 02/01/49) |
265 | 186,965 | ||||||
| 3.60%, 12/01/47 (Call 06/01/47) |
260 | 198,173 | ||||||
| 3.65%, 09/01/28 (Call 06/01/28)(b) |
335 | 318,957 | ||||||
| 3.65%, 09/01/42 (Call 03/01/42) |
105 | 82,667 | ||||||
| 3.70%, 05/01/28 (Call 02/01/28) |
362 | 346,021 | ||||||
| 3.80%, 01/01/43 (Call 07/01/42) |
65 | 52,795 | ||||||
| 3.80%, 03/01/46 (Call 09/01/45) |
415 | 327,540 | ||||||
| 3.85%, 05/01/49 (Call 11/01/48) |
175 | 139,429 | ||||||
| 3.95%, 05/01/42 (Call 11/01/41) |
25 | 20,974 | ||||||
| 4.05%, 05/01/48 (Call 11/01/47) |
75 | 62,326 | ||||||
| 4.65%, 03/15/33 (Call 12/15/32) |
70 | 67,695 | ||||||
| 4.90%, 12/15/32 (Call 09/15/32) |
100 | 98,634 | ||||||
| 5.13%, 03/15/53 (Call 09/15/52)(b) |
370 | 358,277 | ||||||
| 5.20%, 03/01/34 (Call 12/01/33) |
50 | 50,062 | ||||||
| 5.45%, 03/01/54 (Call 09/01/53) |
75 | 75,225 | ||||||
| 5.50%, 03/01/40 |
70 | 69,986 | ||||||
| 5.80%, 05/01/37 |
150 | 154,378 | ||||||
| Public Service Enterprise Group Inc. |
||||||||
| 1.60%, 08/15/30 (Call 05/15/30) |
1,677 | 1,347,090 | ||||||
| 2.45%, 11/15/31 (Call 08/15/31) |
1,020 | 829,545 | ||||||
| 6.13%, 10/15/33 (Call 07/15/33) |
260 | 271,335 | ||||||
| San Diego Gas & Electric Co. |
||||||||
| 4.15%, 05/15/48 (Call 11/15/47) |
200 | 164,611 | ||||||
| 4.50%, 08/15/40 |
92 | 81,643 | ||||||
| 4.95%, 08/15/28 (Call 07/15/28) |
200 | 199,945 | ||||||
| 6.00%, 06/01/39 |
55 | 56,919 | ||||||
| Series RRR, 3.75%, 06/01/47 (Call 12/01/46) |
159 | 122,262 | ||||||
| Series TTT, 4.10%, 06/15/49 (Call 12/15/48) |
284 | 229,073 | ||||||
| Series UUU, 3.32%, 04/15/50 (Call 10/15/49) |
157 | 108,978 | ||||||
| Series VVV, 1.70%, 10/01/30 (Call 07/01/30) |
650 | 528,936 | ||||||
| Series WWW, 2.95%, 08/15/51 (Call 02/15/51) |
90 | 59,691 | ||||||
| Sempra |
||||||||
| 3.25%, 06/15/27 (Call 03/15/27) |
312 | 293,421 | ||||||
| 3.40%, 02/01/28 (Call 11/01/27) |
303 | 285,132 | ||||||
| 3.80%, 02/01/38 (Call 08/01/37) |
399 | 327,286 | ||||||
| 4.00%, 02/01/48 (Call 08/01/47) |
369 | 286,490 | ||||||
| 4.13%, 04/01/52 (Call 01/01/27), |
350 | 321,369 | ||||||
| 5.50%, 08/01/33 (Call 05/01/33) |
100 | 99,418 | ||||||
| 6.00%, 10/15/39 |
214 | 216,002 | ||||||
| Southern California Edison Co. |
||||||||
| 2.25%, 06/01/30 (Call 03/01/30) |
105 | 88,620 | ||||||
| 2.85%, 08/01/29 (Call 05/01/29) |
167 | 149,540 | ||||||
| 3.45%, 02/01/52 (Call 08/01/51) |
40 | 27,859 | ||||||
| 3.65%, 02/01/50 (Call 08/01/49) |
303 | 221,647 | ||||||
| 4.00%, 04/01/47 (Call 10/01/46) |
287 | 223,230 | ||||||
| 4.05%, 03/15/42 (Call 09/15/41) |
159 | 130,653 | ||||||
| 4.50%, 09/01/40 (Call 03/01/40) |
30 | 26,214 | ||||||
| 4.65%, 10/01/43 (Call 04/01/43) |
121 | 105,903 | ||||||
| 4.90%, 06/01/26 (Call 05/01/26) |
65 | 64,553 | ||||||
| 5.15%, 06/01/29 (Call 05/01/29) |
50 | 50,035 | ||||||
| 5.35%, 03/01/26 |
50 | 50,032 | ||||||
| 5.50%, 03/15/40 |
99 | 97,796 | ||||||
| 5.63%, 02/01/36 |
137 | 136,946 | ||||||
| 5.75%, 04/15/54 (Call 10/15/53) |
75 | 74,544 | ||||||
| 5.88%, 12/01/53 (Call 06/01/53) |
100 | 101,615 | ||||||
| Security | Par (000) |
Value | ||||||
| Electric (continued) | ||||||||
| 6.00%, 01/15/34 |
$ | 255 | $ | 265,738 | ||||
| 6.05%, 03/15/39 |
126 | 129,777 | ||||||
| 6.65%, 04/01/29 |
180 | 188,904 | ||||||
| Series 04-G, 5.75%, 04/01/35 |
55 | 55,632 | ||||||
| Series 05-E, 5.35%, 07/15/35 |
75 | 74,598 | ||||||
| Series 06-E, 5.55%, 01/15/37 |
15 | 14,927 | ||||||
| Series 08-A, 5.95%, 02/01/38 |
82 | 84,024 | ||||||
| Series 13-A, 3.90%, 03/15/43 (Call 09/15/42) |
130 | 102,767 | ||||||
| Series B, 4.88%, 03/01/49 (Call 09/01/48) |
129 | 114,493 | ||||||
| Series C, 3.60%, 02/01/45 (Call 08/01/44) |
294 | 217,634 | ||||||
| Series C, 4.13%, 03/01/48 (Call 09/01/47) |
316 | 252,111 | ||||||
| Toledo Edison Co. (The), 6.15%, 05/15/37 |
15 | 15,791 | ||||||
|
|
|
|||||||
| 72,258,250 | ||||||||
| Electrical Components & Equipment — 0.0% | ||||||||
| Acuity Brands Lighting Inc., 2.15%, 12/15/30 (Call 09/15/30) |
225 | 184,400 | ||||||
| Emerson Electric Co. |
||||||||
| 2.75%, 10/15/50 (Call 04/15/50) |
104 | 66,378 | ||||||
| 2.80%, 12/21/51 (Call 06/21/51) |
15 | 9,651 | ||||||
| 5.25%, 11/15/39 |
50 | 50,489 | ||||||
|
|
|
|||||||
| 310,918 | ||||||||
| Electronics — 0.3% | ||||||||
| Allegion PLC, 3.50%, 10/01/29 (Call 07/01/29) |
665 | 607,251 | ||||||
| Allegion U.S. Holding Co. Inc. |
||||||||
| 3.55%, 10/01/27 (Call 07/01/27) |
215 | 203,373 | ||||||
| 5.41%, 07/01/32 (Call 04/01/32) |
245 | 244,762 | ||||||
| Amphenol Corp., 4.35%, 06/01/29 (Call 03/01/29) |
81 | 78,735 | ||||||
| Avnet Inc. |
||||||||
| 3.00%, 05/15/31 (Call 02/15/31) |
170 | 140,320 | ||||||
| 4.63%, 04/15/26 (Call 01/15/26) |
637 | 623,414 | ||||||
| 5.50%, 06/01/32 (Call 03/01/32) |
95 | 91,223 | ||||||
| 6.25%, 03/15/28 (Call 02/15/28) |
95 | 96,627 | ||||||
| Flex Ltd. |
||||||||
| 4.75%, 06/15/25 (Call 03/15/25) |
295 | 291,624 | ||||||
| 4.88%, 06/15/29 (Call 03/15/29) |
745 | 724,662 | ||||||
| 4.88%, 05/12/30 (Call 02/12/30) |
600 | 578,077 | ||||||
| 6.00%, 01/15/28 (Call 12/15/27) |
100 | 101,646 | ||||||
| Fortive Corp. |
||||||||
| 3.15%, 06/15/26 (Call 03/15/26) |
463 | 441,934 | ||||||
| 4.30%, 06/15/46 (Call 12/15/45) |
60 | 49,505 | ||||||
| Honeywell International Inc. |
||||||||
| 1.95%, 06/01/30 (Call 03/01/30) |
675 | 570,403 | ||||||
| 2.50%, 11/01/26 (Call 08/01/26) |
861 | 811,404 | ||||||
| 2.70%, 08/15/29 (Call 05/15/29) |
95 | 85,470 | ||||||
| 3.81%, 11/21/47 (Call 05/21/47) |
242 | 195,002 | ||||||
| 4.25%, 01/15/29 (Call 12/15/28) |
80 | 78,251 | ||||||
| 4.50%, 01/15/34 (Call 10/15/33) |
80 | 76,969 | ||||||
| 4.88%, 09/01/29 (Call 08/01/29) |
50 | 50,042 | ||||||
| 4.95%, 02/15/28 (Call 01/15/28) |
95 | 96,002 | ||||||
| 4.95%, 09/01/31 (Call 07/01/31) |
50 | 49,912 | ||||||
| 5.00%, 02/15/33 (Call 11/15/32) |
100 | 100,192 | ||||||
| 5.00%, 03/01/35 (Call 12/01/34) |
100 | 99,763 | ||||||
| 5.25%, 03/01/54 (Call 09/01/53) |
100 | 99,702 | ||||||
| 5.35%, 03/01/64 (Call 09/01/63) |
100 | 99,803 | ||||||
| 5.38%, 03/01/41 |
45 | 46,220 | ||||||
| 5.70%, 03/15/36 |
215 | 227,015 | ||||||
| 5.70%, 03/15/37 |
107 | 112,166 | ||||||
| Hubbell Inc. |
||||||||
| 3.15%, 08/15/27 (Call 05/15/27) |
96 | 90,076 | ||||||
| 3.35%, 03/01/26 (Call 12/01/25) |
95 | 91,652 | ||||||
| 50 | 2 0 2 4 I S H A R E S A N N U A L R E P O R T T O S H A R E H O L D E R S |
| Schedule of Investments (continued) February 29, 2024 |
iShares® ESG Aware U.S. Aggregate Bond ETF (Percentages shown are based on Net Assets) |
| Security | Par (000) |
Value | ||||||
| Electronics (continued) | ||||||||
| 3.50%, 02/15/28 (Call 11/15/27) |
$ | 65 | $ | 61,401 | ||||
| Jabil Inc., 3.95%, 01/12/28 (Call 10/12/27) |
127 | 120,105 | ||||||
| Keysight Technologies Inc. |
||||||||
| 3.00%, 10/30/29 (Call 07/30/29) |
733 | 651,865 | ||||||
| 4.60%, 04/06/27 (Call 01/06/27) |
783 | 770,471 | ||||||
| Trimble Inc., 4.90%, 06/15/28 (Call 03/15/28) |
599 | 593,612 | ||||||
| Tyco Electronics Group SA |
||||||||
| 3.13%, 08/15/27 (Call 05/15/27) |
305 | 288,296 | ||||||
| 3.70%, 02/15/26 (Call 11/15/25) |
130 | 126,545 | ||||||
| 4.50%, 02/13/26 |
50 | 49,403 | ||||||
| 7.13%, 10/01/37 |
125 | 143,488 | ||||||
| Vontier Corp. |
||||||||
| 2.40%, 04/01/28 (Call 02/01/28) |
355 | 310,779 | ||||||
| 2.95%, 04/01/31 (Call 01/01/31) |
120 | 98,783 | ||||||
|
|
|
|||||||
| 10,467,945 | ||||||||
| Entertainment — 0.1% | ||||||||
| Warnermedia Holdings Inc. |
||||||||
| 4.28%, 03/15/32 (Call 12/15/31) |
165 | 145,619 | ||||||
| 5.05%, 03/15/42 (Call 09/15/41) |
140 | 117,503 | ||||||
| 5.14%, 03/15/52 (Call 09/15/51) |
925 | 751,096 | ||||||
| 5.39%, 03/15/62 (Call 09/15/61) |
735 | 591,610 | ||||||
|
|
|
|||||||
| 1,605,828 | ||||||||
| Environmental Control — 0.0% | ||||||||
| Republic Services Inc. |
||||||||
| 3.05%, 03/01/50 (Call 09/01/49) |
75 | 51,930 | ||||||
| 5.70%, 05/15/41 (Call 11/15/40) |
10 | 10,374 | ||||||
| 6.20%, 03/01/40 |
38 | 41,401 | ||||||
| Veralto Corp., 5.45%, 09/18/33 (Call 06/18/33)(e) |
675 | 678,047 | ||||||
| Waste Connections Inc. |
||||||||
| 2.95%, 01/15/52 (Call 07/15/51) |
20 | 13,233 | ||||||
| 3.05%, 04/01/50 (Call 10/01/49) |
72 | 48,616 | ||||||
| Waste Management Inc. |
||||||||
| 4.10%, 03/01/45 (Call 09/01/44) |
5 | 4,291 | ||||||
| 4.15%, 07/15/49 (Call 01/15/49) |
97 | 81,965 | ||||||
| 4.63%, 02/15/30 (Call 12/15/29) |
100 | 98,347 | ||||||
| 4.63%, 02/15/33 (Call 11/15/32) |
55 | 53,060 | ||||||
| 4.88%, 02/15/34 (Call 11/15/33) |
85 | 83,181 | ||||||
|
|
|
|||||||
| 1,164,445 | ||||||||
| Food — 0.6% | ||||||||
| Ahold Finance USA LLC, 6.88%, 05/01/29 |
135 | 146,446 | ||||||
| Campbell Soup Co. |
||||||||
| 2.38%, 04/24/30 (Call 01/24/30) |
428 | 363,413 | ||||||
| 3.13%, 04/24/50 (Call 10/24/49) |
61 | 39,775 | ||||||
| 3.30%, 03/19/25 (Call 12/19/24) |
345 | 336,365 | ||||||
| 3.95%, 03/15/25 (Call 01/15/25) |
760 | 747,818 | ||||||
| 4.15%, 03/15/28 (Call 12/15/27) |
608 | 586,463 | ||||||
| 4.80%, 03/15/48 (Call 09/15/47) |
291 | 255,230 | ||||||
| Conagra Brands Inc. |
||||||||
| 4.60%, 11/01/25 (Call 09/01/25) |
452 | 445,300 | ||||||
| 4.85%, 11/01/28 (Call 08/01/28) |
399 | 392,090 | ||||||
| 5.30%, 10/01/26 |
100 | 100,015 | ||||||
| 5.30%, 11/01/38 (Call 05/01/38) |
225 | 212,461 | ||||||
| 5.40%, 11/01/48 (Call 05/01/48) |
201 | 185,500 | ||||||
| 7.00%, 10/01/28 |
55 | 58,756 | ||||||
| 8.25%, 09/15/30 |
345 | 396,159 | ||||||
| General Mills Inc. |
||||||||
| 2.25%, 10/14/31 (Call 07/14/31) |
715 | 585,981 | ||||||
| 2.88%, 04/15/30 (Call 01/15/30) |
456 | 402,621 | ||||||
| 3.00%, 02/01/51 (Call 08/01/50) |
150 | 96,684 | ||||||
| 3.20%, 02/10/27 (Call 11/10/26) |
488 | 463,851 | ||||||
| Security | Par (000) |
Value | ||||||
| Food (continued) | ||||||||
| 4.00%, 04/17/25 (Call 02/17/25) |
$ | 1,063 | $ | 1,046,128 | ||||
| 4.15%, 02/15/43 (Call 08/15/42) |
150 | 125,414 | ||||||
| 4.20%, 04/17/28 (Call 01/17/28) |
813 | 788,303 | ||||||
| 4.70%, 01/30/27 (Call 12/20/26) |
125 | 123,742 | ||||||
| 4.70%, 04/17/48 (Call 10/17/47) |
70 | 63,129 | ||||||
| 4.95%, 03/29/33 (Call 12/29/32) |
150 | 147,238 | ||||||
| 5.24%, 11/18/25 (Call 03/18/24) |
105 | 104,872 | ||||||
| 5.40%, 06/15/40 |
165 | 162,186 | ||||||
| 5.50%, 10/17/28 (Call 09/17/28) |
245 | 248,992 | ||||||
| Hershey Co. (The) |
||||||||
| 3.13%, 11/15/49 (Call 05/15/49) |
35 | 25,073 | ||||||
| 3.38%, 08/15/46 (Call 02/15/46) |
100 | 75,216 | ||||||
| Hormel Foods Corp., 3.05%, 06/03/51 (Call 12/03/50) |
55 | 36,908 | ||||||
| Ingredion Inc. |
||||||||
| 2.90%, 06/01/30 (Call 03/01/30) |
160 | 140,595 | ||||||
| 3.20%, 10/01/26 (Call 07/01/26) |
500 | 476,799 | ||||||
| 3.90%, 06/01/50 (Call 12/01/49) |
184 | 134,775 | ||||||
| J M Smucker Co. (The), 6.50%, 11/15/43 (Call 05/15/43) |
30 | 32,049 | ||||||
| JM Smucker Co. (The) |
||||||||
| 3.55%, 03/15/50 (Call 09/15/49) |
78 | 54,630 | ||||||
| 4.25%, 03/15/35 |
267 | 239,094 | ||||||
| 4.38%, 03/15/45 |
40 | 33,426 | ||||||
| Kellanova |
||||||||
| 2.10%, 06/01/30 (Call 03/01/30) |
835 | 702,668 | ||||||
| 3.25%, 04/01/26 |
1,427 | 1,371,665 | ||||||
| 3.40%, 11/15/27 (Call 08/15/27) |
768 | 723,078 | ||||||
| 4.30%, 05/15/28 (Call 02/15/28) |
609 | 591,405 | ||||||
| 4.50%, 04/01/46 |
259 | 222,606 | ||||||
| 5.25%, 03/01/33 (Call 12/01/32) |
260 | 258,081 | ||||||
| Series B, 7.45%, 04/01/31 |
889 | 994,604 | ||||||
| Koninklijke Ahold Delhaize NV, 5.70%, 10/01/40 |
166 | 164,656 | ||||||
| Kraft Heinz Foods Co. |
||||||||
| 4.38%, 06/01/46 (Call 12/01/45) |
185 | 153,461 | ||||||
| 4.88%, 10/01/49 (Call 04/01/49) |
305 | 272,173 | ||||||
| 5.20%, 07/15/45 (Call 01/15/45) |
440 | 410,723 | ||||||
| 5.50%, 06/01/50 (Call 12/01/49) |
350 | 340,638 | ||||||
| 6.50%, 02/09/40 |
110 | 118,654 | ||||||
| 6.88%, 01/26/39 |
255 | 285,583 | ||||||
| Kroger Co. (The) |
||||||||
| 2.65%, 10/15/26 (Call 07/15/26) |
539 | 506,449 | ||||||
| 3.50%, 02/01/26 (Call 11/01/25) |
425 | 411,924 | ||||||
| 3.70%, 08/01/27 (Call 05/01/27) |
299 | 286,799 | ||||||
| 3.88%, 10/15/46 (Call 04/15/46) |
118 | 89,545 | ||||||
| 3.95%, 01/15/50 (Call 07/15/49) |
80 | 62,664 | ||||||
| 4.45%, 02/01/47 (Call 08/01/46) |
205 | 172,902 | ||||||
| 4.50%, 01/15/29 (Call 10/15/28) |
340 | 332,325 | ||||||
| 4.65%, 01/15/48 (Call 07/15/47) |
125 | 108,899 | ||||||
| 5.00%, 04/15/42 (Call 10/15/41) |
70 | 64,926 | ||||||
| 5.15%, 08/01/43 (Call 02/01/43) |
180 | 167,258 | ||||||
| 5.40%, 07/15/40 (Call 01/15/40) |
62 | 59,962 | ||||||
| 5.40%, 01/15/49 (Call 07/15/48) |
153 | 149,207 | ||||||
| 6.90%, 04/15/38 |
57 | 63,631 | ||||||
| 7.50%, 04/01/31 |
200 | 225,618 | ||||||
| McCormick & Co. Inc./MD |
||||||||
| 1.85%, 02/15/31 (Call 11/15/30) |
255 | 204,995 | ||||||
| 3.40%, 08/15/27 (Call 05/15/27) |
520 | 491,865 | ||||||
| 4.20%, 08/15/47 (Call 02/15/47)(b) |
229 | 189,490 | ||||||
| 4.95%, 04/15/33 (Call 01/15/33)(b) |
50 | 48,800 | ||||||
| S C H E D U L E O F I N V E S T M E N T S |
51 |
| Schedule of Investments (continued) February 29, 2024 |
iShares® ESG Aware U.S. Aggregate Bond ETF (Percentages shown are based on Net Assets) |
| Security | Par (000) |
Value | ||||||
| Food (continued) | ||||||||
| Mondelez International Inc., 2.63%, 09/04/50 (Call 03/04/50) |
$ | 85 | $ | 53,097 | ||||
| Sysco Corp. |
||||||||
| 2.40%, 02/15/30 (Call 11/15/29) |
125 | 107,607 | ||||||
| 3.25%, 07/15/27 (Call 04/15/27) |
79 | 74,451 | ||||||
| 3.30%, 07/15/26 (Call 04/15/26) |
185 | 177,617 | ||||||
| 3.30%, 02/15/50 (Call 08/15/49) |
118 | 83,572 | ||||||
| 4.45%, 03/15/48 (Call 09/15/47) |
112 | 94,720 | ||||||
| 4.50%, 04/01/46 (Call 10/01/45) |
99 | 84,715 | ||||||
| 4.85%, 10/01/45 (Call 04/01/45) |
50 | 45,255 | ||||||
| 5.38%, 09/21/35 |
57 | 57,495 | ||||||
| 5.95%, 04/01/30 (Call 01/01/30) |
155 | 161,118 | ||||||
| 6.60%, 04/01/40 (Call 10/01/39) |
80 | 87,722 | ||||||
| 6.60%, 04/01/50 (Call 10/01/49) |
155 | 175,023 | ||||||
| Tyson Foods Inc. |
||||||||
| 4.55%, 06/02/47 (Call 12/02/46) |
35 | 28,339 | ||||||
| 5.10%, 09/28/48 (Call 03/28/48) |
214 | 188,715 | ||||||
| 5.15%, 08/15/44 (Call 02/15/44) |
157 | 141,388 | ||||||
|
|
|
|||||||
| 21,681,585 | ||||||||
| Forest Products & Paper — 0.0% | ||||||||
| Celulosa Arauco y Constitucion SA, 3.88%, 11/02/27 (Call 08/02/27) |
127 | 119,094 | ||||||
| International Paper Co. |
||||||||
| 4.35%, 08/15/48 (Call 02/15/48)(b) |
155 | 131,272 | ||||||
| 4.40%, 08/15/47 (Call 02/15/47)(b) |
251 | 208,602 | ||||||
| 4.80%, 06/15/44 (Call 12/15/43) |
106 | 94,381 | ||||||
| 5.00%, 09/15/35 (Call 03/15/35) |
225 | 218,114 | ||||||
| 5.15%, 05/15/46 (Call 11/15/45) |
25 | 23,199 | ||||||
| 6.00%, 11/15/41 (Call 05/15/41) |
215 | 221,453 | ||||||
| 7.30%, 11/15/39 |
10 | 11,605 | ||||||
| Suzano Austria GmbH |
||||||||
| 5.00%, 01/15/30 (Call 10/15/29) |
255 | 242,655 | ||||||
| 6.00%, 01/15/29 (Call 10/15/28) |
150 | 150,026 | ||||||
|
|
|
|||||||
| 1,420,401 | ||||||||
| Gas — 0.1% | ||||||||
| Atmos Energy Corp. |
||||||||
| 2.85%, 02/15/52 (Call 08/15/51) |
115 | 73,699 | ||||||
| 3.38%, 09/15/49 (Call 03/15/49) |
167 | 120,757 | ||||||
| 4.13%, 10/15/44 (Call 04/15/44) |
134 | 113,854 | ||||||
| 4.13%, 03/15/49 (Call 09/15/48) |
130 | 107,031 | ||||||
| 4.15%, 01/15/43 (Call 07/15/42) |
20 | 17,038 | ||||||
| 4.30%, 10/01/48 (Call 04/01/48) |
115 | 98,785 | ||||||
| 5.50%, 06/15/41 (Call 12/15/40) |
15 | 15,138 | ||||||
| 5.75%, 10/15/52 (Call 04/15/52) |
20 | 20,936 | ||||||
| National Fuel Gas Co. |
||||||||
| 2.95%, 03/01/31 (Call 12/01/30) |
147 | 122,620 | ||||||
| 3.95%, 09/15/27 (Call 06/15/27) |
50 | 47,420 | ||||||
| 4.75%, 09/01/28 (Call 06/01/28) |
145 | 140,113 | ||||||
| 5.50%, 10/01/26 |
60 | 59,823 | ||||||
| ONE Gas Inc. |
||||||||
| 4.25%, 09/01/32 (Call 06/01/32) |
150 | 142,029 | ||||||
| 4.50%, 11/01/48 (Call 05/01/48) |
265 | 227,571 | ||||||
| 4.66%, 02/01/44 (Call 08/01/43) |
115 | 102,413 | ||||||
| Piedmont Natural Gas Co. Inc. |
||||||||
| 3.35%, 06/01/50 (Call 12/01/49) |
290 | 192,714 | ||||||
| 5.05%, 05/15/52 (Call 11/15/51) |
287 | 258,612 | ||||||
| 5.40%, 06/15/33 (Call 03/15/33) |
80 | 80,237 | ||||||
| Southern California Gas Co. |
||||||||
| 3.75%, 09/15/42 (Call 03/15/42) |
160 | 126,141 | ||||||
| 5.13%, 11/15/40 |
100 | 95,559 | ||||||
| Security | Par (000) |
Value | ||||||
| Gas (continued) | ||||||||
| 5.20%, 06/01/33 (Call 03/01/33) |
$ | 100 | $ | 99,311 | ||||
| 5.75%, 06/01/53 (Call 12/01/52) |
100 | 100,954 | ||||||
| Series UU, 4.13%, 06/01/48 (Call 12/01/47) |
155 | 125,385 | ||||||
| Series VV, 4.30%, 01/15/49 (Call 07/15/48) |
145 | 118,852 | ||||||
| Series WW, 3.95%, 02/15/50 (Call 08/15/49) |
257 | 198,040 | ||||||
| Southwest Gas Corp. |
||||||||
| 3.70%, 04/01/28 (Call 01/01/28) |
65 | 61,373 | ||||||
| 3.80%, 09/29/46 (Call 03/29/46) |
135 | 98,702 | ||||||
| 4.15%, 06/01/49 (Call 12/01/48) |
191 | 146,021 | ||||||
| 5.45%, 03/23/28 (Call 02/23/28) |
35 | 35,292 | ||||||
| 5.80%, 12/01/27 (Call 11/01/27) |
100 | 101,782 | ||||||
| Washington Gas Light Co. |
||||||||
| 3.65%, 09/15/49 (Call 03/15/49) |
144 | 106,124 | ||||||
| Series K, 3.80%, 09/15/46 (Call 03/15/46) |
115 | 84,841 | ||||||
|
|
|
|||||||
| 3,439,167 | ||||||||
| Hand & Machine Tools — 0.0% | ||||||||
| Kennametal Inc., 4.63%, 06/15/28 (Call 03/15/28) |
21 | 20,421 | ||||||
| Regal Rexnord Corp. |
||||||||
| 6.30%, 02/15/30 (Call 12/15/29)(e) |
35 | 35,612 | ||||||
| 6.40%, 04/15/33 (Call 01/15/33)(e) |
75 | 76,971 | ||||||
| Snap-on Inc. |
||||||||
| 3.10%, 05/01/50 (Call 11/01/49) |
72 | 50,538 | ||||||
| 3.25%, 03/01/27 (Call 12/01/26) |
60 | 57,445 | ||||||
| 4.10%, 03/01/48 (Call 09/01/47) |
57 | 47,572 | ||||||
| Stanley Black & Decker Inc. |
||||||||
| 4.00%, 03/15/60 (Call 03/15/25), |
427 | 380,108 | ||||||
| 4.25%, 11/15/28 (Call 08/15/28) |
175 | 168,852 | ||||||
| 4.85%, 11/15/48 (Call 05/15/48) |
50 | 43,265 | ||||||
|
|
|
|||||||
| 880,784 | ||||||||
| Health Care - Products — 0.2% | ||||||||
| Abbott Laboratories |
||||||||
| 4.75%, 11/30/36 (Call 05/30/36) |
55 | 53,851 | ||||||
| 4.75%, 04/15/43 (Call 10/15/42) |
167 | 159,872 | ||||||
| 4.90%, 11/30/46 (Call 05/30/46) |
415 | 400,045 | ||||||
| 5.30%, 05/27/40 |
25 | 25,520 | ||||||
| 6.00%, 04/01/39 |
190 | 210,822 | ||||||
| 6.15%, 11/30/37 |
205 | 227,170 | ||||||
| Agilent Technologies Inc. |
||||||||
| 2.75%, 09/15/29 (Call 06/15/29) |
477 | 426,779 | ||||||
| 3.05%, 09/22/26 (Call 06/22/26) |
320 | 304,291 | ||||||
| Baxter International Inc. |
||||||||
| 2.54%, 02/01/32 (Call 11/01/31)(b) |
135 | 110,629 | ||||||
| 3.13%, 12/01/51 (Call 06/01/51) |
312 | 202,910 | ||||||
| 3.50%, 08/15/46 (Call 02/15/46) |
153 | 108,264 | ||||||
| Boston Scientific Corp. |
||||||||
| 4.70%, 03/01/49 (Call 09/01/48) |
74 | 67,752 | ||||||
| 6.50%, 11/15/35 |
2 | 2,207 | ||||||
| 7.38%, 01/15/40 |
115 | 135,073 | ||||||
| Danaher Corp. |
||||||||
| 2.60%, 10/01/50 (Call 04/01/50) |
405 | 254,987 | ||||||
| 2.80%, 12/10/51 (Call 06/10/51) |
560 | 362,880 | ||||||
| 4.38%, 09/15/45 (Call 03/15/45) |
126 | 111,641 | ||||||
| Dentsply Sirona Inc., 3.25%, 06/01/30 (Call 03/01/30) |
325 | 283,252 | ||||||
| DH Europe Finance II Sarl |
||||||||
| 3.25%, 11/15/39 (Call 05/15/39) |
220 | 174,784 | ||||||
| 3.40%, 11/15/49 (Call 05/15/49) |
477 | 355,372 | ||||||
| Edwards Lifesciences Corp., 4.30%, 06/15/28 (Call 03/15/28) |
1,049 | 1,018,043 | ||||||
| 52 | 2 0 2 4 I S H A R E S A N N U A L R E P O R T T O S H A R E H O L D E R S |
| Schedule of Investments (continued) February 29, 2024 |
iShares® ESG Aware U.S. Aggregate Bond ETF (Percentages shown are based on Net Assets) |
| Security | Par (000) |
Value | ||||||
| Health Care - Products (continued) | ||||||||
| GE HealthCare Technologies Inc., 6.38%, 11/22/52 (Call 05/22/52) |
$ | 5 | $ | 5,541 | ||||
| HCA Inc. |
||||||||
| 3.13%, 03/15/27 (Call 02/15/27) |
75 | 70,485 | ||||||
| 3.63%, 03/15/32 (Call 12/15/31) |
317 | 276,960 | ||||||
| Medtronic Inc., 4.63%, 03/15/45 |
203 | 187,950 | ||||||
| Revvity Inc. |
||||||||
| 2.25%, 09/15/31 (Call 06/15/31) |
70 | 56,895 | ||||||
| 3.30%, 09/15/29 (Call 06/15/29) |
258 | 232,262 | ||||||
| 3.63%, 03/15/51 (Call 09/15/50) |
105 | 73,063 | ||||||
| Smith & Nephew PLC, 2.03%, 10/14/30 (Call 07/14/30) |
135 | 110,721 | ||||||
| STERIS Irish FinCo UnLtd Co. |
||||||||
| 2.70%, 03/15/31 (Call 12/15/30) |
355 | 301,897 | ||||||
| 3.75%, 03/15/51 (Call 09/15/50) |
410 | 302,908 | ||||||
| Stryker Corp. |
||||||||
| 2.90%, 06/15/50 (Call 12/15/49) |
145 | 98,588 | ||||||
| 4.10%, 04/01/43 (Call 10/01/42) |
5 | 4,226 | ||||||
| 4.38%, 05/15/44 (Call 11/15/43) |
114 | 100,346 | ||||||
| 4.63%, 03/15/46 (Call 09/15/45) |
114 | 103,275 | ||||||
| Thermo Fisher Scientific Inc. |
||||||||
| 4.10%, 08/15/47 (Call 02/15/47) |
78 | 65,296 | ||||||
| 4.98%, 08/10/30 (Call 06/10/30) |
65 | 65,009 | ||||||
| 5.09%, 08/10/33 (Call 05/10/33) |
80 | 80,364 | ||||||
| 5.30%, 02/01/44 (Call 08/01/43) |
178 | 178,039 | ||||||
| Zimmer Biomet Holdings Inc. |
||||||||
| 2.60%, 11/24/31 (Call 08/24/31) |
535 | 447,509 | ||||||
| 4.45%, 08/15/45 (Call 02/15/45) |
139 | 123,174 | ||||||
| 5.35%, 12/01/28 (Call 11/01/28) |
125 | 126,291 | ||||||
| 5.75%, 11/30/39 |
75 | 74,570 | ||||||
|
|
|
|||||||
| 8,081,513 | ||||||||
| Health Care - Services — 0.7% | ||||||||
| Aetna Inc. |
||||||||
| 3.88%, 08/15/47 (Call 02/15/47) |
160 | 118,914 | ||||||
| 4.13%, 11/15/42 (Call 05/15/42) |
185 | 147,799 | ||||||
| 4.50%, 05/15/42 (Call 11/15/41) |
100 | 84,968 | ||||||
| 4.75%, 03/15/44 (Call 09/15/43) |
124 | 107,037 | ||||||
| 6.63%, 06/15/36 |
181 | 197,090 | ||||||
| 6.75%, 12/15/37 |
149 | 162,804 | ||||||
| Centene Corp. |
||||||||
| 2.50%, 03/01/31 (Call 12/01/30) |
460 | 376,862 | ||||||
| 2.63%, 08/01/31 (Call 05/01/31) |
580 | 474,661 | ||||||
| 3.00%, 10/15/30 (Call 07/15/30) |
95 | 81,136 | ||||||
| 3.38%, 02/15/30 (Call 02/15/25) |
905 | 798,435 | ||||||
| 4.63%, 12/15/29 (Call 12/15/24) |
25 | 23,674 | ||||||
| Elevance Health Inc. |
||||||||
| 2.55%, 03/15/31 (Call 12/15/30) |
160 | 135,614 | ||||||
| 2.88%, 09/15/29 (Call 06/15/29) |
166 | 148,854 | ||||||
| 3.13%, 05/15/50 (Call 11/15/49) |
103 | 70,302 | ||||||
| 3.60%, 03/15/51 (Call 09/15/50) |
210 | 156,331 | ||||||
| 3.65%, 12/01/27 (Call 09/01/27) |
85 | 81,282 | ||||||
| 3.70%, 09/15/49 (Call 03/15/49) |
195 | 147,695 | ||||||
| 4.10%, 03/01/28 (Call 12/01/27) |
235 | 227,294 | ||||||
| 4.10%, 05/15/32 (Call 02/15/32) |
220 | 202,770 | ||||||
| 4.38%, 12/01/47 (Call 06/01/47) |
246 | 208,894 | ||||||
| 4.55%, 03/01/48 (Call 09/01/47) |
327 | 284,771 | ||||||
| 4.55%, 05/15/52 (Call 11/15/51) |
175 | 151,775 | ||||||
| 4.63%, 05/15/42 |
197 | 177,254 | ||||||
| 4.65%, 01/15/43 |
295 | 266,216 | ||||||
| 4.65%, 08/15/44 (Call 02/15/44) |
87 | 77,325 | ||||||
| 4.75%, 02/15/33 (Call 11/15/32) |
200 | 193,169 | ||||||
| Security | Par (000) |
Value | ||||||
| Health Care - Services (continued) | ||||||||
| 5.10%, 01/15/44 |
$ | 166 | $ | 156,065 | ||||
| 5.13%, 02/15/53 (Call 08/15/52) |
170 | 160,917 | ||||||
| 5.35%, 10/15/25 (Call 09/15/25) |
40 | 39,954 | ||||||
| 5.50%, 10/15/32 (Call 07/15/32) |
355 | 361,586 | ||||||
| 5.85%, 01/15/36 |
60 | 62,636 | ||||||
| 5.95%, 12/15/34 |
105 | 110,308 | ||||||
| 6.38%, 06/15/37 |
49 | 52,844 | ||||||
| HCA Inc. |
||||||||
| 2.38%, 07/15/31 (Call 04/15/31) |
20 | 16,263 | ||||||
| 3.50%, 09/01/30 (Call 03/01/30) |
410 | 366,511 | ||||||
| 3.50%, 07/15/51 (Call 01/15/51) |
324 | 218,704 | ||||||
| 4.13%, 06/15/29 (Call 03/15/29) |
198 | 186,204 | ||||||
| 4.50%, 02/15/27 (Call 08/15/26) |
599 | 586,560 | ||||||
| 4.63%, 03/15/52 (Call 09/15/51) |
232 | 189,860 | ||||||
| 5.13%, 06/15/39 (Call 12/15/38) |
194 | 180,360 | ||||||
| 5.20%, 06/01/28 (Call 05/01/28) |
100 | 99,588 | ||||||
| 5.25%, 04/15/25 |
525 | 522,655 | ||||||
| 5.25%, 06/15/26 (Call 12/15/25) |
631 | 627,137 | ||||||
| 5.25%, 06/15/49 (Call 12/15/48) |
454 | 406,705 | ||||||
| 5.50%, 06/01/33 (Call 03/01/33) |
225 | 223,451 | ||||||
| 5.50%, 06/15/47 (Call 12/15/46) |
299 | 278,673 | ||||||
| 5.88%, 02/01/29 (Call 08/01/28) |
335 | 340,958 | ||||||
| 5.90%, 06/01/53 (Call 12/01/52) |
140 | 137,521 | ||||||
| 6.00%, 04/01/54 (Call 10/01/53) |
275 | 272,940 | ||||||
| 6.10%, 04/01/64 (Call 10/01/63) |
125 | 123,534 | ||||||
| Humana Inc. |
||||||||
| 3.13%, 08/15/29 (Call 05/15/29) |
130 | 117,437 | ||||||
| 3.95%, 08/15/49 (Call 02/15/49) |
146 | 114,115 | ||||||
| 4.63%, 12/01/42 (Call 06/01/42) |
222 | 192,698 | ||||||
| 4.80%, 03/15/47 (Call 09/15/46) |
230 | 200,380 | ||||||
| 4.88%, 04/01/30 (Call 01/01/30) |
169 | 166,282 | ||||||
| 4.95%, 10/01/44 (Call 04/01/44) |
280 | 252,458 | ||||||
| 5.75%, 03/01/28 (Call 02/01/28) |
60 | 61,128 | ||||||
| 5.75%, 12/01/28 (Call 11/01/28) |
25 | 25,534 | ||||||
| 5.88%, 03/01/33 (Call 12/01/32) |
70 | 71,822 | ||||||
| 5.95%, 03/15/34 (Call 12/15/33) |
25 | 25,818 | ||||||
| Laboratory Corp. of America Holdings |
||||||||
| 2.70%, 06/01/31 (Call 03/01/31) |
260 | 222,032 | ||||||
| 2.95%, 12/01/29 (Call 09/01/29) |
592 | 526,868 | ||||||
| 4.70%, 02/01/45 (Call 08/01/44) |
304 | 271,275 | ||||||
| Providence St Joseph Health Obligated Group, Series A, 3.93%, 10/01/48 (Call 04/01/48) |
100 | 77,290 | ||||||
| Quest Diagnostics Inc. |
||||||||
| 2.80%, 06/30/31 (Call 03/30/31) |
555 | 473,689 | ||||||
| 2.95%, 06/30/30 (Call 03/30/30) |
506 | 445,410 | ||||||
| 3.45%, 06/01/26 (Call 03/01/26) |
935 | 899,558 | ||||||
| 3.50%, 03/30/25 (Call 12/30/24) |
569 | 558,619 | ||||||
| 4.20%, 06/30/29 (Call 03/30/29) |
331 | 318,168 | ||||||
| 4.70%, 03/30/45 (Call 09/30/44)(b) |
250 | 220,807 | ||||||
| 6.40%, 11/30/33 (Call 08/30/33)(b) |
65 | 69,512 | ||||||
| UnitedHealth Group Inc. |
||||||||
| 2.75%, 05/15/40 (Call 11/15/39) |
40 | 28,808 | ||||||
| 2.88%, 08/15/29 |
50 | 45,321 | ||||||
| 2.90%, 05/15/50 (Call 11/15/49) |
110 | 73,005 | ||||||
| 2.95%, 10/15/27 |
65 | 61,025 | ||||||
| 3.13%, 05/15/60 (Call 11/15/59) |
177 | 115,789 | ||||||
| 3.25%, 05/15/51 (Call 11/15/50) |
235 | 165,473 | ||||||
| 3.50%, 08/15/39 (Call 02/15/39) |
100 | 80,817 | ||||||
| 3.70%, 08/15/49 (Call 02/15/49) |
186 | 143,134 | ||||||
| 3.75%, 10/15/47 (Call 04/15/47) |
190 | 147,297 | ||||||
| 3.85%, 06/15/28 |
175 | 168,471 | ||||||
| S C H E D U L E O F I N V E S T M E N T S |
53 |
| Schedule of Investments (continued) February 29, 2024 |
iShares® ESG Aware U.S. Aggregate Bond ETF (Percentages shown are based on Net Assets) |
| Security | Par (000) |
Value | ||||||
| Health Care - Services (continued) | ||||||||
| 3.88%, 12/15/28 |
$ | 105 | $ | 100,757 | ||||
| 3.88%, 08/15/59 (Call 02/15/59) |
213 | 162,104 | ||||||
| 3.95%, 10/15/42 (Call 04/15/42) |
190 | 159,706 | ||||||
| 4.00%, 05/15/29 (Call 03/15/29) |
65 | 62,463 | ||||||
| 4.20%, 05/15/32 (Call 02/15/32) |
735 | 693,497 | ||||||
| 4.20%, 01/15/47 (Call 07/15/46) |
194 | 164,005 | ||||||
| 4.25%, 01/15/29 (Call 12/15/28) |
300 | 292,508 | ||||||
| 4.25%, 03/15/43 (Call 09/15/42) |
110 | 95,892 | ||||||
| 4.25%, 04/15/47 (Call 10/15/46) |
192 | 163,549 | ||||||
| 4.25%, 06/15/48 (Call 12/15/47) |
230 | 193,591 | ||||||
| 4.38%, 03/15/42 (Call 09/15/41) |
130 | 115,886 | ||||||
| 4.45%, 12/15/48 (Call 06/15/48) |
229 | 200,277 | ||||||
| 4.50%, 04/15/33 (Call 01/15/33) |
420 | 403,349 | ||||||
| 4.63%, 07/15/35 |
236 | 227,728 | ||||||
| 4.63%, 11/15/41 (Call 05/15/41) |
116 | 105,886 | ||||||
| 4.75%, 07/15/45 |
347 | 320,824 | ||||||
| 4.75%, 05/15/52 (Call 11/15/51) |
345 | 314,358 | ||||||
| 4.95%, 05/15/62 (Call 11/15/61) |
190 | 174,630 | ||||||
| 5.05%, 04/15/53 (Call 10/15/52) |
210 | 199,809 | ||||||
| 5.20%, 04/15/63 (Call 10/15/62) |
215 | 204,958 | ||||||
| 5.25%, 02/15/28 (Call 01/15/28) |
35 | 35,566 | ||||||
| 5.30%, 02/15/30 (Call 12/15/29) |
5 | 5,094 | ||||||
| 5.35%, 02/15/33 (Call 11/15/32) |
320 | 326,220 | ||||||
| 5.70%, 10/15/40 (Call 04/15/40) |
169 | 175,453 | ||||||
| 5.80%, 03/15/36 |
170 | 179,726 | ||||||
| 5.88%, 02/15/53 (Call 08/15/52) |
215 | 229,769 | ||||||
| 5.95%, 02/15/41 (Call 08/15/40) |
105 | 110,683 | ||||||
| 6.05%, 02/15/63 (Call 08/15/62) |
175 | 189,914 | ||||||
| 6.50%, 06/15/37 |
234 | 260,531 | ||||||
| 6.63%, 11/15/37 |
205 | 230,958 | ||||||
| 6.88%, 02/15/38 |
285 | 331,008 | ||||||
|
|
|
|||||||
| 23,595,599 | ||||||||
| Home Builders — 0.0% | ||||||||
| MDC Holdings Inc. |
||||||||
| 2.50%, 01/15/31 (Call 07/15/30)(b) |
15 | 12,675 | ||||||
| 3.97%, 08/06/61 (Call 02/06/61) |
125 | 95,103 | ||||||
| 6.00%, 01/15/43 (Call 10/15/42) |
175 | 174,389 | ||||||
| PulteGroup Inc., 6.00%, 02/15/35 |
30 | 30,808 | ||||||
| Toll Brothers Finance Corp., 4.35%, 02/15/28 (Call 11/15/27) |
35 | 33,622 | ||||||
|
|
|
|||||||
| 346,597 | ||||||||
| Home Furnishings — 0.0% | ||||||||
| Leggett & Platt Inc. |
||||||||
| 3.50%, 11/15/27 (Call 08/15/27) |
212 | 197,835 | ||||||
| 3.50%, 11/15/51 (Call 05/15/51) |
105 | 72,392 | ||||||
| 4.40%, 03/15/29 (Call 12/15/28) |
285 | 270,013 | ||||||
| Whirlpool Corp. |
||||||||
| 4.50%, 06/01/46 (Call 12/01/45) |
122 | 98,086 | ||||||
| 4.60%, 05/15/50 (Call 11/15/49)(b) |
78 | 62,802 | ||||||
| 5.50%, 03/01/33 (Call 12/01/32)(b) |
300 | 297,450 | ||||||
| 5.75%, 03/01/34 (Call 12/01/33) |
75 | 74,592 | ||||||
|
|
|
|||||||
| 1,073,170 | ||||||||
| Household Products & Wares — 0.1% | ||||||||
| Avery Dennison Corp. |
||||||||
| 2.25%, 02/15/32 (Call 11/15/31) |
250 | 202,969 | ||||||
| 5.75%, 03/15/33 (Call 12/15/32) |
225 | 232,876 | ||||||
| Church & Dwight Co. Inc. |
||||||||
| 3.95%, 08/01/47 (Call 02/01/47) |
35 | 27,968 | ||||||
| 5.00%, 06/15/52 (Call 12/15/51) |
85 | 80,172 | ||||||
| Security | Par (000) |
Value | ||||||
| Household Products & Wares (continued) | ||||||||
| Clorox Co. (The) |
||||||||
| 1.80%, 05/15/30 (Call 02/15/30) |
$ | 525 | $ | 433,694 | ||||
| 3.10%, 10/01/27 (Call 07/01/27) |
876 | 821,735 | ||||||
| 3.90%, 05/15/28 (Call 02/15/28) |
369 | 354,629 | ||||||
| Kimberly-Clark Corp. |
||||||||
| 2.00%, 11/02/31 (Call 08/02/31) |
100 | 82,176 | ||||||
| 2.75%, 02/15/26 |
259 | 249,257 | ||||||
| 2.88%, 02/07/50 (Call 08/07/49) |
185 | 126,366 | ||||||
| 3.05%, 08/15/25 |
170 | 165,301 | ||||||
| 3.10%, 03/26/30 (Call 12/26/29) |
668 | 607,653 | ||||||
| 3.20%, 04/25/29 (Call 01/25/29) |
325 | 301,550 | ||||||
| 3.20%, 07/30/46 (Call 01/30/46) |
225 | 164,287 | ||||||
| 3.90%, 05/04/47 (Call 11/04/46) |
205 | 166,067 | ||||||
| 3.95%, 11/01/28 (Call 08/01/28) |
225 | 218,219 | ||||||
| 4.50%, 02/16/33 (Call 11/16/32) |
130 | 127,085 | ||||||
| 5.30%, 03/01/41 |
130 | 130,017 | ||||||
| 6.63%, 08/01/37 |
275 | 316,815 | ||||||
|
|
|
|||||||
| 4,808,836 | ||||||||
| Insurance — 0.5% | ||||||||
| ACE Capital Trust II, Series N, 9.70%, 04/01/30 |
72 | 84,576 | ||||||
| Aegon NV, 5.50%, 04/11/48 (Call 04/11/28), |
330 | 316,115 | ||||||
| Aflac Inc. |
||||||||
| 3.60%, 04/01/30 (Call 01/01/30) |
119 | 110,309 | ||||||
| 4.00%, 10/15/46 (Call 04/15/46) |
30 | 23,883 | ||||||
| 4.75%, 01/15/49 (Call 07/15/48) |
57 | 51,577 | ||||||
| Allstate Corp. (The) |
||||||||
| 5.35%, 06/01/33(b) |
38 | 38,089 | ||||||
| 6.50%, 05/15/67 (Call 05/15/37), |
20 | 20,134 | ||||||
| American Financial Group Inc./OH |
||||||||
| 4.50%, 06/15/47 (Call 12/15/46) |
37 | 30,260 | ||||||
| 5.25%, 04/02/30 (Call 01/02/30) |
65 | 63,990 | ||||||
| American International Group Inc. |
||||||||
| 3.88%, 01/15/35 (Call 07/15/34) |
35 | 30,794 | ||||||
| 4.20%, 04/01/28 (Call 01/01/28) |
90 | 87,410 | ||||||
| 4.50%, 07/16/44 (Call 01/16/44) |
130 | 114,791 | ||||||
| 4.75%, 04/01/48 (Call 10/01/47) |
306 | 279,494 | ||||||
| 4.80%, 07/10/45 (Call 01/10/45) |
235 | 215,217 | ||||||
| Series A-9, 5.75%, 04/01/48 (Call 04/01/28), |
100 | 98,172 | ||||||
| Aon Corp. |
||||||||
| 3.75%, 05/02/29 (Call 02/02/29) |
70 | 65,666 | ||||||
| 4.50%, 12/15/28 (Call 09/15/28) |
59 | 57,605 | ||||||
| 6.25%, 09/30/40 |
50 | 52,968 | ||||||
| Aon Global Ltd., 4.75%, 05/15/45 (Call 11/15/44) |
92 | 81,097 | ||||||
| Arch Capital Finance LLC, 5.03%, 12/15/46 (Call 06/15/46) |
106 | 97,452 | ||||||
| Arch Capital Group Ltd. |
||||||||
| 3.64%, 06/30/50 (Call 12/30/49) |
95 | 69,983 | ||||||
| 7.35%, 05/01/34 |
52 | 58,337 | ||||||
| Arch Capital Group U.S. Inc., 5.14%, 11/01/43 |
60 | 55,835 | ||||||
| Arthur J Gallagher & Co., 3.05%, 03/09/52 (Call 09/09/51) |
30 | 19,027 | ||||||
| Assurant Inc. |
||||||||
| 3.70%, 02/22/30 (Call 11/22/29) |
124 | 110,658 | ||||||
| 4.90%, 03/27/28 (Call 12/27/27) |
119 | 116,561 | ||||||
| Athene Holding Ltd. |
||||||||
| 4.13%, 01/12/28 (Call 10/12/27) |
25 | 23,941 | ||||||
| 6.15%, 04/03/30 (Call 01/03/30) |
86 | 88,503 | ||||||
| AXA SA, 8.60%, 12/15/30 |
860 | 1,017,610 | ||||||
| 54 | 2 0 2 4 I S H A R E S A N N U A L R E P O R T T O S H A R E H O L D E R S |
| Schedule of Investments (continued) February 29, 2024 |
iShares® ESG Aware U.S. Aggregate Bond ETF (Percentages shown are based on Net Assets) |
| Security | Par (000) |
Value | ||||||
| Insurance (continued) | ||||||||
| AXIS Specialty Finance LLC |
||||||||
| 3.90%, 07/15/29 (Call 04/15/29) |
$ | 70 | $ | 65,806 | ||||
| 4.90%, 01/15/40 (Call 01/15/30), |
50 | 44,126 | ||||||
| Berkshire Hathaway Finance Corp. |
||||||||
| 3.85%, 03/15/52 (Call 09/15/51) |
135 | 107,014 | ||||||
| 4.20%, 08/15/48 (Call 02/15/48) |
257 | 223,536 | ||||||
| 4.25%, 01/15/49 (Call 07/15/48) |
289 | 254,230 | ||||||
| Brighthouse Financial Inc., 4.70%, 06/22/47 (Call 12/22/46) |
43 | 33,321 | ||||||
| Brown & Brown Inc., 4.50%, 03/15/29 (Call 12/15/28) |
10 | 9,677 | ||||||
| Chubb Corp. (The), 6.00%, 05/11/37 |
10 | 10,732 | ||||||
| Chubb INA Holdings Inc. |
||||||||
| 3.05%, 12/15/61 (Call 06/15/61) |
10 | 6,639 | ||||||
| 4.35%, 11/03/45 (Call 05/03/45) |
100 | 88,289 | ||||||
| 6.70%, 05/15/36(b) |
50 | 56,858 | ||||||
| CNO Financial Group Inc., 5.25%, 05/30/29 (Call 02/28/29) |
186 | 180,576 | ||||||
| Enstar Finance LLC, 5.50%, 01/15/42 (Call 01/15/27), (5-year CMT + 4.006%)(a) |
70 | 63,670 | ||||||
| Enstar Group Ltd., 4.95%, 06/01/29 (Call 03/01/29) |
16 | 15,569 | ||||||
| Equitable Holdings Inc. |
||||||||
| 4.35%, 04/20/28 (Call 01/20/28) |
465 | 448,009 | ||||||
| 5.00%, 04/20/48 (Call 10/20/47) |
162 | 146,910 | ||||||
| 7.00%, 04/01/28 |
70 | 74,420 | ||||||
| Everest Reinsurance Holdings Inc. |
||||||||
| 3.13%, 10/15/52 (Call 04/15/52) |
60 | 37,599 | ||||||
| 4.87%, 06/01/44 |
35 | 31,507 | ||||||
| First American Financial Corp., 4.00%, 05/15/30 (Call 02/15/30) |
190 | 169,298 | ||||||
| Hartford Financial Services Group Inc. (The) |
||||||||
| 3.60%, 08/19/49 (Call 02/19/49) |
194 | 145,995 | ||||||
| 4.30%, 04/15/43 |
75 | 64,042 | ||||||
| 4.40%, 03/15/48 (Call 09/15/47) |
81 | 69,952 | ||||||
| 5.95%, 10/15/36 |
83 | 85,819 | ||||||
| 6.10%, 10/01/41 |
157 | 163,580 | ||||||
| Jackson Financial Inc., 3.13%, 11/23/31 (Call 08/23/31) |
5 | 4,140 | ||||||
| Lincoln National Corp. |
||||||||
| 3.05%, 01/15/30 (Call 10/15/29) |
50 | 43,767 | ||||||
| 4.35%, 03/01/48 (Call 09/01/47) |
124 | 96,033 | ||||||
| 6.30%, 10/09/37 |
52 | 53,344 | ||||||
| 7.00%, 06/15/40 |
165 | 179,914 | ||||||
| Loews Corp., 6.00%, 02/01/35 |
30 | 31,823 | ||||||
| Manulife Financial Corp. |
||||||||
| 4.06%, 02/24/32 (Call 02/24/27), |
325 | 309,755 | ||||||
| 4.15%, 03/04/26 |
546 | 535,145 | ||||||
| 5.38%, 03/04/46 |
240 | 234,900 | ||||||
| Markel Group Inc. |
||||||||
| 4.15%, 09/17/50 (Call 03/17/50) |
75 | 59,211 | ||||||
| 5.00%, 05/20/49 (Call 11/20/48) |
70 | 63,431 | ||||||
| Marsh & McLennan Companies Inc. |
||||||||
| 3.50%, 03/10/25 (Call 12/10/24) |
170 | 166,972 | ||||||
| 3.75%, 03/14/26 (Call 12/14/25) |
224 | 218,538 | ||||||
| 4.20%, 03/01/48 (Call 09/01/47) |
170 | 141,523 | ||||||
| 4.35%, 01/30/47 (Call 07/30/46) |
217 | 184,088 | ||||||
| 4.38%, 03/15/29 (Call 12/15/28) |
397 | 388,246 | ||||||
| 4.75%, 03/15/39 (Call 09/15/38) |
130 | 122,390 | ||||||
| Security | Par (000) |
Value | ||||||
| Insurance (continued) | ||||||||
| 4.90%, 03/15/49 (Call 09/15/48) |
$ | 462 | $ | 427,210 | ||||
| 5.45%, 03/15/53 (Call 09/15/52) |
35 | 34,887 | ||||||
| 5.88%, 08/01/33 |
85 | 89,717 | ||||||
| MetLife Inc. |
||||||||
| 4.05%, 03/01/45 |
243 | 200,646 | ||||||
| 4.13%, 08/13/42 |
185 | 156,434 | ||||||
| 4.55%, 03/23/30 (Call 12/23/29)(b) |
276 | 270,102 | ||||||
| 4.60%, 05/13/46 (Call 11/13/45) |
55 | 49,146 | ||||||
| 4.72%, 12/15/44 |
137 | 121,918 | ||||||
| 4.88%, 11/13/43 |
97 | 89,124 | ||||||
| 5.38%, 07/15/33 (Call 04/15/33) |
25 | 25,136 | ||||||
| 5.70%, 06/15/35 |
110 | 113,861 | ||||||
| 5.88%, 02/06/41 |
15 | 15,656 | ||||||
| 6.38%, 06/15/34 |
135 | 145,426 | ||||||
| 6.40%, 12/15/66 (Call 12/15/31) |
322 | 327,317 | ||||||
| 6.50%, 12/15/32 |
70 | 76,448 | ||||||
| 10.75%, 08/01/69 (Call 08/01/34) |
65 | 88,475 | ||||||
| Munich Re America Corp., Series B, 7.45%, 12/15/26 |
75 | 79,467 | ||||||
| Principal Financial Group Inc. |
||||||||
| 3.10%, 11/15/26 (Call 08/15/26) |
18 | 17,078 | ||||||
| 3.70%, 05/15/29 (Call 02/15/29) |
97 | 90,483 | ||||||
| 4.30%, 11/15/46 (Call 05/15/46) |
104 | 86,128 | ||||||
| 4.35%, 05/15/43 |
106 | 92,122 | ||||||
| 4.63%, 09/15/42 |
64 | 57,365 | ||||||
| 6.05%, 10/15/36 |
64 | 67,329 | ||||||
| Progressive Corp. (The) |
||||||||
| 2.45%, 01/15/27 |
96 | 89,576 | ||||||
| 3.20%, 03/26/30 (Call 12/26/29) |
225 | 203,265 | ||||||
| 3.70%, 01/26/45 |
39 | 31,548 | ||||||
| 3.95%, 03/26/50 (Call 09/26/49) |
70 | 56,987 | ||||||
| 4.00%, 03/01/29 (Call 12/01/28) |
69 | 66,371 | ||||||
| 4.13%, 04/15/47 (Call 10/15/46) |
96 | 80,622 | ||||||
| 4.20%, 03/15/48 (Call 09/15/47) |
203 | 174,504 | ||||||
| 4.35%, 04/25/44 |
115 | 101,786 | ||||||
| 4.95%, 06/15/33 (Call 03/15/33) |
80 | 79,437 | ||||||
| 6.25%, 12/01/32 |
80 | 86,845 | ||||||
| 6.63%, 03/01/29 |
109 | 117,009 | ||||||
| Prudential Financial Inc. |
||||||||
| 1.50%, 03/10/26 (Call 02/10/26) |
219 | 204,037 | ||||||
| 2.10%, 03/10/30 (Call 12/10/29) |
50 | 42,756 | ||||||
| 3.00%, 03/10/40 (Call 09/10/39) |
30 | 22,362 | ||||||
| 3.70%, 10/01/50 (Call 07/01/30), |
60 | 52,318 | ||||||
| 3.70%, 03/13/51 (Call 09/13/50) |
385 | 292,300 | ||||||
| 3.88%, 03/27/28 (Call 12/27/27) |
44 | 42,274 | ||||||
| 3.91%, 12/07/47 (Call 06/07/47) |
244 | 192,608 | ||||||
| 3.94%, 12/07/49 (Call 06/07/49) |
290 | 227,289 | ||||||
| 4.35%, 02/25/50 (Call 08/25/49) |
240 | 202,931 | ||||||
| 4.42%, 03/27/48 (Call 09/27/47) |
158 | 134,870 | ||||||
| 4.50%, 09/15/47 (Call 09/15/27), |
175 | 163,842 | ||||||
| 4.60%, 05/15/44 |
262 | 233,236 | ||||||
| 5.13%, 03/01/52 (Call 11/28/31), (5-year CMT + 3.162%)(a) |
150 | 140,156 | ||||||
| 5.38%, 05/15/45 (Call 05/15/25), |
323 | 318,066 | ||||||
| 5.70%, 12/14/36 |
520 | 536,553 | ||||||
| 5.75%, 07/15/33 |
115 | 120,664 | ||||||
| 6.00%, 09/01/52 (Call 06/01/32), |
55 | 54,824 | ||||||
| S C H E D U L E O F I N V E S T M E N T S |
55 |
| Schedule of Investments (continued) February 29, 2024 |
iShares® ESG Aware U.S. Aggregate Bond ETF (Percentages shown are based on Net Assets) |
| Security | Par (000) |
Value | ||||||
| Insurance (continued) | ||||||||
| 6.63%, 12/01/37 |
$ | 60 | $ | 66,726 | ||||
| 6.63%, 06/21/40 |
187 | 206,327 | ||||||
| 6.75%, 03/01/53 (Call 12/01/32), |
40 | 41,560 | ||||||
| Prudential Funding Asia PLC |
||||||||
| 3.13%, 04/14/30 |
100 | 89,156 | ||||||
| 3.63%, 03/24/32 (Call 12/24/31) |
230 | 205,577 | ||||||
| Selective Insurance Group Inc., 5.38%, 03/01/49 (Call 09/01/48) |
45 | 42,600 | ||||||
| Stewart Information Services Corp., 3.60%, 11/15/31 (Call 08/15/31) |
10 | 7,770 | ||||||
| Transatlantic Holdings Inc., 8.00%, 11/30/39 |
10 | 12,777 | ||||||
| Travelers Companies Inc. (The) |
||||||||
| 2.55%, 04/27/50 (Call 10/27/49) |
105 | 65,361 | ||||||
| 3.75%, 05/15/46 (Call 11/15/45) |
143 | 113,372 | ||||||
| 4.00%, 05/30/47 (Call 11/30/46) |
257 | 211,930 | ||||||
| 4.05%, 03/07/48 (Call 09/07/47) |
85 | 71,254 | ||||||
| 4.10%, 03/04/49 (Call 09/04/48) |
170 | 142,880 | ||||||
| 4.30%, 08/25/45 (Call 02/25/45) |
180 | 156,872 | ||||||
| 4.60%, 08/01/43 |
87 | 80,814 | ||||||
| 5.35%, 11/01/40 |
225 | 227,468 | ||||||
| 5.45%, 05/25/53 (Call 11/25/52) |
80 | 81,606 | ||||||
| 6.25%, 06/15/37 |
242 | 265,932 | ||||||
| 6.75%, 06/20/36 |
149 | 169,885 | ||||||
| Travelers Property Casualty Corp., 6.38%, 03/15/33 |
170 | 188,656 | ||||||
| Unum Group |
||||||||
| 4.50%, 12/15/49 (Call 06/15/49) |
35 | 27,741 | ||||||
| 5.75%, 08/15/42 |
100 | 97,087 | ||||||
| Willis North America Inc. |
||||||||
| 3.88%, 09/15/49 (Call 03/15/49) |
103 | 76,361 | ||||||
| 4.50%, 09/15/28 (Call 06/15/28) |
99 | 95,529 | ||||||
| 5.05%, 09/15/48 (Call 03/15/48) |
153 | 136,980 | ||||||
| 5.35%, 05/15/33 (Call 02/15/33) |
80 | 78,748 | ||||||
| XL Group Ltd., 5.25%, 12/15/43 |
524 | 489,466 | ||||||
|
|
|
|||||||
| 19,151,394 | ||||||||
| Internet — 0.1% | ||||||||
| Alibaba Group Holding Ltd. |
||||||||
| 3.25%, 02/09/61 (Call 08/09/60) |
205 | 129,350 | ||||||
| 4.00%, 12/06/37 (Call 06/06/37) |
220 | 189,697 | ||||||
| 4.20%, 12/06/47 (Call 06/06/47) |
145 | 117,937 | ||||||
| 4.40%, 12/06/57 (Call 06/06/57) |
170 | 138,940 | ||||||
| Alphabet Inc., 2.25%, 08/15/60 (Call 02/15/60) |
129 | 74,059 | ||||||
| Amazon.com Inc. |
||||||||
| 2.50%, 06/03/50 (Call 12/03/49) |
325 | 203,871 | ||||||
| 2.70%, 06/03/60 (Call 12/03/59) |
389 | 239,099 | ||||||
| 3.10%, 05/12/51 (Call 11/12/50) |
440 | 309,235 | ||||||
| 3.25%, 05/12/61 (Call 11/12/60) |
275 | 189,515 | ||||||
| 3.88%, 08/22/37 (Call 02/22/37) |
30 | 26,817 | ||||||
| 3.95%, 04/13/52 (Call 10/13/51) |
165 | 136,356 | ||||||
| 4.05%, 08/22/47 (Call 02/22/47) |
397 | 339,528 | ||||||
| 4.10%, 04/13/62 (Call 10/13/61) |
345 | 285,148 | ||||||
| 4.25%, 08/22/57 (Call 02/22/57) |
381 | 326,872 | ||||||
| 4.70%, 12/01/32 (Call 09/01/32) |
200 | 199,054 | ||||||
| 4.95%, 12/05/44 (Call 06/05/44) |
229 | 225,920 | ||||||
| Booking Holdings Inc. |
||||||||
| 3.55%, 03/15/28 (Call 12/15/27) |
94 | 89,451 | ||||||
| 3.60%, 06/01/26 (Call 03/01/26) |
77 | 74,623 | ||||||
| 4.63%, 04/13/30 (Call 01/13/30) |
130 | 127,749 | ||||||
| eBay Inc. |
||||||||
| 1.90%, 03/11/25 (Call 02/11/25) |
236 | 227,729 | ||||||
| Security | Par (000) |
Value | ||||||
| Internet (continued) | ||||||||
| 3.60%, 06/05/27 (Call 03/05/27) |
$ | 224 | $ | 213,933 | ||||
| 3.65%, 05/10/51 (Call 11/10/50) |
215 | 155,481 | ||||||
| 4.00%, 07/15/42 (Call 01/15/42) |
252 | 199,919 | ||||||
| JD.com Inc., 4.13%, 01/14/50 (Call 07/14/49) |
200 | 155,871 | ||||||
| Meta Platforms Inc. |
||||||||
| 4.45%, 08/15/52 (Call 02/15/52) |
15 | 13,110 | ||||||
| 4.65%, 08/15/62 (Call 02/15/62) |
10 | 8,820 | ||||||
| VeriSign Inc., 2.70%, 06/15/31 (Call 03/15/31) |
125 | 103,905 | ||||||
|
|
|
|||||||
| 4,501,989 | ||||||||
| Iron & Steel — 0.0% | ||||||||
| Nucor Corp. |
||||||||
| 2.98%, 12/15/55 (Call 06/15/55) |
350 | 225,026 | ||||||
| 4.40%, 05/01/48 (Call 11/01/47) |
120 | 105,313 | ||||||
| 5.20%, 08/01/43 (Call 02/01/43) |
142 | 138,718 | ||||||
| 6.40%, 12/01/37 |
115 | 125,771 | ||||||
| Steel Dynamics Inc. |
||||||||
| 3.25%, 10/15/50 (Call 04/15/50) |
60 | 39,295 | ||||||
| 3.45%, 04/15/30 (Call 01/15/30) |
330 | 299,893 | ||||||
|
|
|
|||||||
| 934,016 | ||||||||
| Leisure Time — 0.0% | ||||||||
| Harley-Davidson Inc. |
||||||||
| 3.50%, 07/28/25 (Call 04/28/25) |
375 | 364,029 | ||||||
| 4.63%, 07/28/45 (Call 01/28/45)(b) |
235 | 185,365 | ||||||
|
|
|
|||||||
| 549,394 | ||||||||
| Lodging — 0.0% | ||||||||
| Choice Hotels International Inc. |
||||||||
| 3.70%, 12/01/29 (Call 09/01/29) |
100 | 87,643 | ||||||
| 3.70%, 01/15/31 (Call 10/15/30) |
117 | 100,528 | ||||||
| Marriott International Inc./MD |
||||||||
| Series AA,
4.65%, 12/01/28 |
190 | 186,070 | ||||||
| Series FF, 4.63%, 06/15/30 (Call 03/15/30) |
180 | 174,179 | ||||||
| Series GG, 3.50%, 10/15/32 (Call 07/15/32) |
180 | 157,000 | ||||||
| Sands China Ltd., 3.10%, 03/08/29 (Call 01/08/29) |
160 | 137,824 | ||||||
|
|
|
|||||||
| 843,244 | ||||||||
| Machinery — 0.4% | ||||||||
| ABB Finance USA Inc., 3.80%, 04/03/28 (Call 01/03/28) |
1,260 | 1,224,675 | ||||||
| Caterpillar Financial Services Corp. |
||||||||
| 2.40%, 08/09/26(b) |
320 | 301,715 | ||||||
| 4.35%, 05/15/26 |
200 | 197,554 | ||||||
| 4.85%, 02/27/29 |
50 | 50,042 | ||||||
| 5.05%, 02/27/26 |
50 | 50,021 | ||||||
| Caterpillar Inc. |
||||||||
| 2.60%, 09/19/29 (Call 06/19/29) |
226 | 203,453 | ||||||
| 3.25%, 09/19/49 (Call 03/19/49) |
226 | 166,337 | ||||||
| 3.25%, 04/09/50 (Call 10/09/49) |
177 | 130,844 | ||||||
| 4.30%, 05/15/44 (Call 11/15/43) |
35 | 31,612 | ||||||
| 4.75%, 05/15/64 (Call 11/15/63) |
82 | 74,149 | ||||||
| 5.20%, 05/27/41 |
132 | 133,366 | ||||||
| 5.30%, 09/15/35 |
29 | 30,358 | ||||||
| 6.05%, 08/15/36 |
91 | 99,686 | ||||||
| CNH Industrial Capital LLC |
||||||||
| 1.45%, 07/15/26 (Call 06/15/26) |
890 | 813,786 | ||||||
| 1.88%, 01/15/26 (Call 12/15/25) |
555 | 520,152 | ||||||
| 3.95%, 05/23/25 |
820 | 804,519 | ||||||
| 4.55%, 04/10/28 (Call 03/10/28) |
455 | 445,159 | ||||||
| 5.45%, 10/14/25 |
130 | 130,012 | ||||||
| 5.50%, 01/12/29 (Call 12/12/28) |
100 | 101,328 | ||||||
| CNH Industrial NV, 3.85%, 11/15/27 (Call 08/15/27) |
1,007 | 966,217 | ||||||
| 56 | 2 0 2 4 I S H A R E S A N N U A L R E P O R T T O S H A R E H O L D E R S |
| Schedule of Investments (continued) February 29, 2024 |
iShares® ESG Aware U.S. Aggregate Bond ETF (Percentages shown are based on Net Assets) |
| Security | Par (000) |
Value | ||||||
| Machinery (continued) | ||||||||
| Deere & Co. |
||||||||
| 3.10%, 04/15/30 (Call 01/15/30) |
$ | 135 | $ | 122,830 | ||||
| 3.75%, 04/15/50 (Call 10/15/49) |
130 | 106,422 | ||||||
| 7.13%, 03/03/31 |
5 | 5,709 | ||||||
| Dover Corp., 5.38%, 03/01/41 (Call 12/01/40) |
30 | 29,507 | ||||||
| Flowserve Corp., 3.50%, 10/01/30 (Call 07/01/30) |
85 | 74,770 | ||||||
| IDEX Corp., 2.63%, 06/15/31 (Call 03/15/31) |
55 | 46,355 | ||||||
| John Deere Capital Corp. |
||||||||
| 1.75%, 03/09/27 |
114 | 104,233 | ||||||
| 2.25%, 09/14/26 |
290 | 271,474 | ||||||
| 2.65%, 06/10/26 |
370 | 352,646 | ||||||
| 2.80%, 09/08/27 |
128 | 119,776 | ||||||
| 2.80%, 07/18/29 |
155 | 140,892 | ||||||
| 3.05%, 01/06/28 |
129 | 121,704 | ||||||
| 4.15%, 09/15/27 |
50 | 49,001 | ||||||
| 4.35%, 09/15/32 |
100 | 96,720 | ||||||
| 4.70%, 06/10/30 |
95 | 94,240 | ||||||
| 4.75%, 06/08/26 |
120 | 119,641 | ||||||
| 4.75%, 01/20/28 |
30 | 29,972 | ||||||
| 4.80%, 01/09/26 |
35 | 34,910 | ||||||
| 4.85%, 10/11/29 |
50 | 50,262 | ||||||
| 4.95%, 07/14/28 |
25 | 25,143 | ||||||
| nVent Finance Sarl, 5.65%, 05/15/33 (Call 02/15/33) |
100 | 99,909 | ||||||
| Oshkosh Corp. |
||||||||
| 3.10%, 03/01/30 (Call 12/01/29) |
372 | 328,268 | ||||||
| 4.60%, 05/15/28 (Call 02/15/28)(b) |
813 | 790,547 | ||||||
| Rockwell Automation Inc. |
||||||||
| 2.80%, 08/15/61 (Call 02/15/61) |
25 | 14,938 | ||||||
| 3.50%, 03/01/29 (Call 12/01/28) |
399 | 380,195 | ||||||
| 4.20%, 03/01/49 (Call 09/01/48) |
82 | 69,869 | ||||||
| Westinghouse Air Brake Technologies Corp., 4.70%, 09/15/28 (Call 06/15/28) |
99 | 96,572 | ||||||
| Xylem Inc./NY |
||||||||
| 1.95%, 01/30/28 (Call 11/30/27) |
993 | 887,217 | ||||||
| 2.25%, 01/30/31 (Call 10/30/30) |
1,250 | 1,047,265 | ||||||
| 3.25%, 11/01/26 (Call 08/01/26) |
600 | 572,813 | ||||||
| 4.38%, 11/01/46 (Call 05/01/46) |
160 | 135,363 | ||||||
|
|
|
|||||||
| 12,894,148 | ||||||||
| Machinery - Diversified — 0.0% | ||||||||
| John Deere Capital Corp., 5.15%, 09/08/33(b) |
25 | 25,431 | ||||||
|
|
|
|||||||
| Manufacturing — 0.3% | ||||||||
| 3M Co. |
||||||||
| 2.25%, 09/19/26 (Call 06/19/26)(b) |
1,496 | 1,393,478 | ||||||
| 2.38%, 08/26/29 (Call 05/26/29) |
904 | 784,196 | ||||||
| 2.65%, 04/15/25 (Call 03/15/25) |
1,589 | 1,539,172 | ||||||
| 2.88%, 10/15/27 (Call 07/15/27) |
1,085 | 1,004,673 | ||||||
| 3.00%, 08/07/25 |
1,315 | 1,274,018 | ||||||
| 3.05%, 04/15/30 (Call 01/15/30)(b) |
235 | 208,463 | ||||||
| 3.38%, 03/01/29 (Call 12/01/28) |
174 | 160,241 | ||||||
| 3.63%, 09/14/28 (Call 06/14/28)(b) |
745 | 702,962 | ||||||
| 3.63%, 10/15/47 (Call 04/15/47) |
169 | 122,321 | ||||||
| 3.70%, 04/15/50 (Call 10/15/49) |
15 | 11,089 | ||||||
| 4.00%, 09/14/48 (Call 03/14/48) |
232 | 187,105 | ||||||
| 5.70%, 03/15/37(b) |
200 | 208,635 | ||||||
| Carlisle Companies Inc., 2.75%, 03/01/30 (Call 12/01/29) |
152 | 132,201 | ||||||
| Eaton Corp. |
||||||||
| 3.10%, 09/15/27 (Call 06/15/27) |
112 | 105,850 | ||||||
| 3.92%, 09/15/47 (Call 03/15/47) |
65 | 53,179 | ||||||
| Security | Par (000) |
Value | ||||||
| Manufacturing (continued) | ||||||||
| 4.00%, 11/02/32 |
$ | 137 | $ | 128,360 | ||||
| 4.15%, 03/15/33 (Call 12/15/32) |
65 | 61,229 | ||||||
| 4.15%, 11/02/42 |
85 | 73,790 | ||||||
| 4.35%, 05/18/28 (Call 04/18/28) |
40 | 39,393 | ||||||
| 4.70%, 08/23/52 (Call 02/23/52) |
60 | 55,358 | ||||||
| General Electric Co. |
||||||||
| 4.35%, 05/01/50 (Call 11/01/49) |
5 | 4,401 | ||||||
| 6.75%, 03/15/32 |
155 | 172,126 | ||||||
| Illinois Tool Works Inc. |
||||||||
| 3.90%, 09/01/42 (Call 03/01/42) |
86 | 73,223 | ||||||
| 4.88%, 09/15/41 (Call 03/15/41) |
40 | 38,649 | ||||||
| Parker-Hannifin Corp. |
||||||||
| 3.25%, 06/14/29 (Call 03/14/29) |
295 | 271,441 | ||||||
| 4.00%, 06/14/49 (Call 12/14/48) |
113 | 92,200 | ||||||
| 4.10%, 03/01/47 (Call 09/01/46) |
76 | 62,408 | ||||||
| 4.20%, 11/21/34 (Call 05/21/34) |
120 | 110,494 | ||||||
| 4.45%, 11/21/44 (Call 05/21/44) |
103 | 90,353 | ||||||
| 6.25%, 05/15/38 |
40 | 43,010 | ||||||
| Pentair Finance Sarl |
||||||||
| 4.50%, 07/01/29 (Call 04/01/29) |
460 | 443,649 | ||||||
| 5.90%, 07/15/32 (Call 04/15/32) |
380 | 389,913 | ||||||
| Teledyne Technologies Inc., 2.75%, 04/01/31 (Call 01/01/31) |
535 | 453,962 | ||||||
| Textron Inc. |
||||||||
| 3.00%, 06/01/30 (Call 03/01/30) |
71 | 62,307 | ||||||
| 3.38%, 03/01/28 (Call 12/01/27) |
95 | 89,045 | ||||||
| 3.90%, 09/17/29 (Call 06/17/29) |
117 | 109,227 | ||||||
|
|
|
|||||||
| 10,752,121 | ||||||||
| Media — 0.5% | ||||||||
| Charter Communications Operating LLC/Charter Communications Operating Capital |
||||||||
| 3.70%, 04/01/51 (Call 10/01/50) |
137 | 82,966 | ||||||
| 3.85%, 04/01/61 (Call 10/01/60) |
325 | 188,334 | ||||||
| 3.90%, 06/01/52 (Call 12/01/51) |
449 | 281,757 | ||||||
| 3.95%, 06/30/62 (Call 12/30/61) |
225 | 132,281 | ||||||
| 4.40%, 04/01/33 (Call 01/01/33)(b) |
95 | 82,967 | ||||||
| 4.40%, 12/01/61 (Call 06/01/61) |
255 | 163,645 | ||||||
| 4.80%, 03/01/50 (Call 09/01/49) |
285 | 205,912 | ||||||
| 5.13%, 07/01/49 (Call 01/01/49) |
249 | 188,564 | ||||||
| 5.25%, 04/01/53 (Call 10/01/52)(b) |
139 | 107,851 | ||||||
| 5.38%, 04/01/38 (Call 10/01/37) |
110 | 94,392 | ||||||
| 5.38%, 05/01/47 (Call 11/01/46) |
274 | 215,587 | ||||||
| 5.50%, 04/01/63 (Call 10/01/62) |
185 | 142,124 | ||||||
| 5.75%, 04/01/48 (Call 10/01/47) |
292 | 242,659 | ||||||
| 6.38%, 10/23/35 (Call 04/23/35) |
305 | 294,677 | ||||||
| 6.48%, 10/23/45 (Call 04/23/45) |
415 | 379,012 | ||||||
| 6.83%, 10/23/55 (Call 04/23/55) |
230 | 217,543 | ||||||
| Comcast Corp. |
||||||||
| 2.45%, 08/15/52 (Call 02/15/52) |
192 | 110,166 | ||||||
| 2.65%, 08/15/62 (Call 02/15/62) |
169 | 94,221 | ||||||
| 2.80%, 01/15/51 (Call 07/15/50) |
133 | 83,085 | ||||||
| 2.89%, 11/01/51 (Call 05/01/51) |
392 | 248,324 | ||||||
| 2.94%, 11/01/56 (Call 05/01/56) |
717 | 441,486 | ||||||
| 2.99%, 11/01/63 (Call 05/01/63) |
859 | 514,010 | ||||||
| 3.40%, 07/15/46 (Call 01/15/46) |
110 | 80,692 | ||||||
| 3.45%, 02/01/50 (Call 08/01/49) |
305 | 219,031 | ||||||
| 3.75%, 04/01/40 (Call 10/01/39) |
235 | 192,056 | ||||||
| 3.90%, 03/01/38 (Call 09/01/37) |
281 | 241,127 | ||||||
| 3.97%, 11/01/47 (Call 05/01/47) |
338 | 268,094 | ||||||
| 4.00%, 08/15/47 (Call 02/15/47) |
204 | 163,196 | ||||||
| 4.00%, 03/01/48 (Call 09/01/47) |
288 | 228,335 | ||||||
| S C H E D U L E O F I N V E S T M E N T S |
57 |
| Schedule of Investments (continued) February 29, 2024 |
iShares® ESG Aware U.S. Aggregate Bond ETF (Percentages shown are based on Net Assets) |
| Security | Par (000) |
Value | ||||||
| Media (continued) | ||||||||
| 4.00%, 11/01/49 (Call 05/01/49) |
$ | 286 | $ | 226,190 | ||||
| 4.05%, 11/01/52 (Call 05/01/52) |
379 | 298,927 | ||||||
| 4.60%, 10/15/38 (Call 04/15/38) |
150 | 138,018 | ||||||
| 4.60%, 08/15/45 (Call 02/15/45) |
141 | 124,645 | ||||||
| 4.65%, 02/15/33 (Call 11/15/32)(b) |
275 | 266,994 | ||||||
| 4.65%, 07/15/42 |
234 | 210,776 | ||||||
| 4.70%, 10/15/48 (Call 04/15/48) |
160 | 144,439 | ||||||
| 4.75%, 03/01/44 |
39 | 35,374 | ||||||
| 4.80%, 05/15/33 (Call 02/15/33) |
50 | 48,856 | ||||||
| 4.95%, 10/15/58 (Call 04/15/58) |
170 | 156,986 | ||||||
| 5.35%, 05/15/53 (Call 11/15/52) |
100 | 97,529 | ||||||
| 5.50%, 05/15/64 (Call 11/15/63) |
70 | 68,749 | ||||||
| 5.65%, 06/15/35 |
48 | 49,309 | ||||||
| 6.45%, 03/15/37 |
30 | 32,859 | ||||||
| 6.50%, 11/15/35 |
358 | 390,455 | ||||||
| 6.55%, 07/01/39 |
45 | 49,461 | ||||||
| 6.95%, 08/15/37 |
130 | 148,197 | ||||||
| Discovery Communications LLC |
||||||||
| 4.00%, 09/15/55 (Call 03/15/55) |
242 | 160,193 | ||||||
| 4.65%, 05/15/50 (Call 11/15/49) |
288 | 218,656 | ||||||
| 4.88%, 04/01/43 |
95 | 76,054 | ||||||
| 5.00%, 09/20/37 (Call 03/20/37) |
212 | 181,408 | ||||||
| 5.20%, 09/20/47 (Call 03/20/47) |
247 | 200,910 | ||||||
| 5.30%, 05/15/49 (Call 11/15/48) |
78 | 63,615 | ||||||
| 6.35%, 06/01/40 |
60 | 57,679 | ||||||
| FactSet Research Systems Inc., 3.45%, 03/01/32 (Call 12/01/31) |
215 | 186,905 | ||||||
| Fox Corp. |
||||||||
| 5.48%, 01/25/39 (Call 07/25/38) |
205 | 191,575 | ||||||
| 5.58%, 01/25/49 (Call 07/25/48) |
399 | 364,863 | ||||||
| Grupo Televisa SAB |
||||||||
| 5.00%, 05/13/45 (Call 11/13/44) |
230 | 192,529 | ||||||
| 6.63%, 01/15/40 |
215 | 220,897 | ||||||
| NBCUniversal Media LLC |
||||||||
| 4.45%, 01/15/43 |
241 | 210,616 | ||||||
| 6.40%, 04/30/40 |
40 | 43,380 | ||||||
| Paramount Global |
||||||||
| 3.38%, 02/15/28 (Call 11/15/27) |
32 | 28,011 | ||||||
| 3.70%, 06/01/28 (Call 03/01/28) |
65 | 56,674 | ||||||
| 4.20%, 06/01/29 (Call 03/01/29) |
120 | 105,669 | ||||||
| 4.38%, 03/15/43 |
202 | 135,311 | ||||||
| 4.60%, 01/15/45 (Call 07/15/44) |
101 | 69,160 | ||||||
| 4.85%, 07/01/42 (Call 01/01/42) |
30 | 21,594 | ||||||
| 4.90%, 08/15/44 (Call 02/15/44) |
172 | 120,736 | ||||||
| 4.95%, 01/15/31 (Call 10/15/30)(b) |
180 | 157,618 | ||||||
| 4.95%, 05/19/50 (Call 11/19/49) |
245 | 175,499 | ||||||
| 5.25%, 04/01/44 (Call 10/01/43) |
128 | 94,357 | ||||||
| 5.50%, 05/15/33 |
62 | 53,677 | ||||||
| 5.85%, 09/01/43 (Call 03/01/43) |
270 | 218,423 | ||||||
| 5.90%, 10/15/40 (Call 04/15/40)(b) |
77 | 62,398 | ||||||
| 6.88%, 04/30/36 |
207 | 189,916 | ||||||
| 7.88%, 07/30/30 |
65 | 66,358 | ||||||
| Thomson Reuters Corp. |
||||||||
| 5.50%, 08/15/35 |
70 | 71,058 | ||||||
| 5.85%, 04/15/40 |
85 | 86,286 | ||||||
| Time Warner Cable Enterprises LLC, 8.38%, 07/15/33 |
137 | 151,932 | ||||||
| Time Warner Cable LLC |
||||||||
| 5.50%, 09/01/41 (Call 03/01/41) |
182 | 149,962 | ||||||
| 5.88%, 11/15/40 (Call 05/15/40) |
124 | 106,608 | ||||||
| 6.55%, 05/01/37 |
170 | 159,591 | ||||||
| Security | Par (000) |
Value | ||||||
| Media (continued) | ||||||||
| 6.75%, 06/15/39 |
$ | 287 | $ | 270,333 | ||||
| 7.30%, 07/01/38 |
175 | 174,370 | ||||||
| TWDC Enterprises 18 Corp. |
||||||||
| 3.00%, 07/30/46 |
185 | 129,129 | ||||||
| 3.70%, 12/01/42 |
100 | 81,161 | ||||||
| 4.13%, 06/01/44 |
141 | 120,173 | ||||||
| 4.38%, 08/16/41 |
105 | 92,804 | ||||||
| Series E, 4.13%, 12/01/41 |
135 | 116,172 | ||||||
| Walt Disney Co. (The) |
||||||||
| 2.75%, 09/01/49 (Call 03/01/49) |
440 | 283,806 | ||||||
| 3.50%, 05/13/40 (Call 11/13/39) |
51 | 40,941 | ||||||
| 3.60%, 01/13/51 (Call 07/13/50) |
550 | 417,464 | ||||||
| 3.80%, 05/13/60 (Call 11/13/59) |
316 | 239,597 | ||||||
| 4.63%, 03/23/40 (Call 09/23/39) |
212 | 198,217 | ||||||
| 4.70%, 03/23/50 (Call 09/23/49)(b) |
266 | 243,351 | ||||||
| 4.75%, 09/15/44 (Call 03/15/44) |
65 | 59,732 | ||||||
| 4.75%, 11/15/46 (Call 05/15/46) |
255 | 231,169 | ||||||
| 4.95%, 10/15/45 (Call 04/15/45) |
42 | 39,315 | ||||||
| 5.40%, 10/01/43 |
152 | 152,789 | ||||||
| 6.15%, 03/01/37 |
40 | 43,207 | ||||||
| 6.15%, 02/15/41(b) |
49 | 52,892 | ||||||
| 6.20%, 12/15/34 |
90 | 98,229 | ||||||
| 6.40%, 12/15/35 |
69 | 75,847 | ||||||
| 6.65%, 11/15/37 |
315 | 356,225 | ||||||
| 7.75%, 12/01/45 |
250 | 319,913 | ||||||
|
|
|
|||||||
| 16,878,812 | ||||||||
| Metal Fabricate & Hardware — 0.0% | ||||||||
| Timken Co. (The), 4.50%, 12/15/28 (Call 09/15/28) |
64 | 62,121 | ||||||
| Valmont Industries Inc. |
||||||||
| 5.00%, 10/01/44 (Call 04/01/44) |
104 | 90,594 | ||||||
| 5.25%, 10/01/54 (Call 04/01/54) |
115 | 98,984 | ||||||
|
|
|
|||||||
| 251,699 | ||||||||
| Mining — 0.1% | ||||||||
| AngloGold Ashanti Holdings PLC, 3.75%, 10/01/30 (Call 07/01/30) |
500 | 432,749 | ||||||
| Freeport-McMoRan Inc. |
||||||||
| 4.63%, 08/01/30 (Call 08/01/25) |
200 | 190,683 | ||||||
| 5.40%, 11/14/34 (Call 05/14/34) |
15 | 14,566 | ||||||
| 5.45%, 03/15/43 (Call 09/15/42) |
55 | 51,236 | ||||||
| Kinross Gold Corp., 4.50%, 07/15/27 (Call 04/15/27) |
834 | 810,523 | ||||||
| Newmont Corp. |
||||||||
| 2.60%, 07/15/32 (Call 04/15/32) |
35 | 28,789 | ||||||
| 2.80%, 10/01/29 (Call 07/01/29) |
135 | 119,868 | ||||||
| 4.88%, 03/15/42 (Call 09/15/41) |
465 | 427,197 | ||||||
| 5.45%, 06/09/44 (Call 12/09/43) |
105 | 102,541 | ||||||
| 6.25%, 10/01/39 |
223 | 235,821 | ||||||
| Rio Tinto Finance USA Ltd., 5.20%, 11/02/40 |
190 | 186,883 | ||||||
| Rio Tinto Finance USA PLC |
||||||||
| 4.75%, 03/22/42 (Call 09/22/41) |
90 | 84,361 | ||||||
| 5.00%, 03/09/33 (Call 12/09/32)(b) |
125 | 124,837 | ||||||
| 5.13%, 03/09/53 (Call 09/09/52) |
220 | 211,406 | ||||||
| Yamana Gold Inc., 2.63%, 08/15/31 (Call 05/15/31) |
75 | 61,859 | ||||||
|
|
|
|||||||
| 3,083,319 | ||||||||
| Multi-National — 0.0% | ||||||||
| International Bank for Reconstruction & Development, 5.06%, 02/28/39 |
90 | 89,155 | ||||||
|
|
|
|||||||
| 58 | 2 0 2 4 I S H A R E S A N N U A L R E P O R T T O S H A R E H O L D E R S |
| Schedule of Investments (continued) February 29, 2024 |
iShares® ESG Aware U.S. Aggregate Bond ETF (Percentages shown are based on Net Assets) |
| Security | Par (000) |
Value | ||||||
| Office & Business Equipment — 0.0% | ||||||||
| CDW LLC/CDW Finance Corp. |
||||||||
| 3.25%, 02/15/29 (Call 04/01/24) |
$ | 175 | $ | 155,992 | ||||
| 3.57%, 12/01/31 (Call 09/01/31) |
260 | 225,466 | ||||||
| 4.25%, 04/01/28 (Call 04/01/24) |
310 | 295,156 | ||||||
|
|
|
|||||||
| 676,614 | ||||||||
| Oil & Gas — 0.7% | ||||||||
| Apache Corp. |
||||||||
| 5.10%, 09/01/40 (Call 03/01/40) |
70 | 58,583 | ||||||
| 5.25%, 02/01/42 (Call 08/01/41) |
20 | 16,605 | ||||||
| 6.00%, 01/15/37 |
100 | 97,201 | ||||||
| BP Capital Markets America Inc. |
||||||||
| 2.77%, 11/10/50 (Call 05/10/50) |
352 | 223,569 | ||||||
| 2.94%, 06/04/51 (Call 12/04/50) |
320 | 210,326 | ||||||
| 3.00%, 02/24/50 (Call 08/24/49) |
325 | 217,446 | ||||||
| 3.00%, 03/17/52 (Call 09/17/51) |
160 | 106,182 | ||||||
| 3.02%, 01/16/27 (Call 10/16/26) |
60 | 57,001 | ||||||
| 3.38%, 02/08/61 (Call 08/08/60) |
100 | 67,304 | ||||||
| 3.41%, 02/11/26 (Call 12/11/25) |
10 | 9,698 | ||||||
| 3.54%, 04/06/27 (Call 02/06/27) |
95 | 91,124 | ||||||
| 3.59%, 04/14/27 (Call 01/14/27) |
133 | 127,834 | ||||||
| 3.63%, 04/06/30 (Call 01/06/30) |
131 | 122,077 | ||||||
| 3.94%, 09/21/28 (Call 06/21/28) |
20 | 19,205 | ||||||
| 4.23%, 11/06/28 (Call 08/06/28) |
208 | 202,413 | ||||||
| 4.81%, 02/13/33 (Call 11/13/32) |
105 | 102,446 | ||||||
| 4.89%, 09/11/33 (Call 06/11/33) |
85 | 83,376 | ||||||
| BP Capital Markets PLC |
||||||||
| 3.28%, 09/19/27 (Call 06/19/27) |
140 | 132,550 | ||||||
| 3.72%, 11/28/28 (Call 08/28/28) |
110 | 104,437 | ||||||
| Burlington Resources LLC |
||||||||
| 5.95%, 10/15/36 |
65 | 68,382 | ||||||
| 7.20%, 08/15/31 |
132 | 148,943 | ||||||
| 7.40%, 12/01/31 |
177 | 202,328 | ||||||
| Chevron Corp., 3.08%, 05/11/50 (Call 11/11/49) |
359 | 253,256 | ||||||
| Chevron USA Inc., 5.25%, 11/15/43 (Call 05/15/43) |
75 | 75,610 | ||||||
| CNOOC Finance 2014 ULC, 4.88%, 04/30/44 |
200 | 192,713 | ||||||
| CNOOC Petroleum North America ULC, 6.40%, 05/15/37 |
5 | 5,561 | ||||||
| ConocoPhillips Co. |
||||||||
| 3.76%, 03/15/42 (Call 09/15/41) |
257 | 208,190 | ||||||
| 3.80%, 03/15/52 (Call 09/15/51) |
25 | 19,163 | ||||||
| 4.03%, 03/15/62 (Call 09/15/61) |
645 | 499,656 | ||||||
| 4.30%, 11/15/44 (Call 05/15/44) |
144 | 123,742 | ||||||
| 5.05%, 09/15/33 (Call 06/15/33) |
160 | 159,466 | ||||||
| 5.30%, 05/15/53 (Call 11/15/52) |
120 | 117,427 | ||||||
| 5.55%, 03/15/54 (Call 09/15/53) |
130 | 131,449 | ||||||
| 5.70%, 09/15/63 (Call 03/15/63) |
105 | 107,267 | ||||||
| 5.90%, 10/15/32 |
182 | 194,715 | ||||||
| 5.90%, 05/15/38 |
5 | 5,242 | ||||||
| 6.50%, 02/01/39 |
70 | 78,804 | ||||||
| 6.95%, 04/15/29 |
210 | 230,189 | ||||||
| Devon Energy Corp. |
||||||||
| 4.75%, 05/15/42 (Call 11/15/41) |
99 | 83,797 | ||||||
| 5.00%, 06/15/45 (Call 12/15/44) |
212 | 182,854 | ||||||
| 5.60%, 07/15/41 (Call 01/15/41) |
230 | 216,726 | ||||||
| 7.88%, 09/30/31 |
30 | 34,145 | ||||||
| Diamondback Energy Inc. |
||||||||
| 3.50%, 12/01/29 (Call 09/01/29) |
328 | 301,083 | ||||||
| 4.25%, 03/15/52 (Call 09/15/51) |
50 | 39,673 | ||||||
| 4.40%, 03/24/51 (Call 09/24/50) |
93 | 75,068 | ||||||
| 6.25%, 03/15/53 (Call 09/15/52) |
100 | 105,793 | ||||||
| Security | Par (000) |
Value | ||||||
| Oil & Gas (continued) | ||||||||
| Eni USA Inc., 7.30%, 11/15/27 |
$ | 285 | $ | 302,440 | ||||
| EOG Resources Inc. |
||||||||
| 3.90%, 04/01/35 (Call 10/01/34) |
110 | 98,599 | ||||||
| 4.38%, 04/15/30 (Call 01/15/30) |
208 | 201,709 | ||||||
| 4.95%, 04/15/50 (Call 10/15/49) |
167 | 155,685 | ||||||
| EQT Corp. |
||||||||
| 3.90%, 10/01/27 (Call 07/01/27) |
100 | 94,730 | ||||||
| 5.00%, 01/15/29 (Call 07/15/28) |
85 | 82,942 | ||||||
| 5.75%, 02/01/34 (Call 11/01/33)(b) |
125 | 122,950 | ||||||
| 7.00%, 02/01/30 (Call 11/01/29) |
470 | 497,840 | ||||||
| Equinor ASA |
||||||||
| 2.38%, 05/22/30 (Call 02/22/30) |
305 | 265,086 | ||||||
| 2.88%, 04/06/25 (Call 03/06/25) |
460 | 449,157 | ||||||
| 3.00%, 04/06/27 (Call 02/06/27) |
255 | 241,177 | ||||||
| 3.13%, 04/06/30 (Call 01/06/30) |
380 | 346,462 | ||||||
| 3.25%, 11/18/49 (Call 05/18/49) |
165 | 118,396 | ||||||
| 3.63%, 09/10/28 (Call 06/10/28) |
194 | 185,536 | ||||||
| 3.70%, 04/06/50 (Call 10/06/49) |
405 | 315,473 | ||||||
| 3.95%, 05/15/43 |
112 | 93,546 | ||||||
| 4.25%, 11/23/41 |
192 | 170,057 | ||||||
| 4.80%, 11/08/43 |
150 | 141,168 | ||||||
| 5.10%, 08/17/40 |
300 | 295,207 | ||||||
| 7.25%, 09/23/27 |
225 | 242,265 | ||||||
| Exxon Mobil Corp. |
||||||||
| 2.44%, 08/16/29 (Call 05/16/29) |
130 | 116,118 | ||||||
| 2.61%, 10/15/30 (Call 07/15/30) |
259 | 227,146 | ||||||
| 3.10%, 08/16/49 (Call 02/16/49) |
151 | 105,538 | ||||||
| 3.45%, 04/15/51 (Call 10/15/50) |
301 | 223,145 | ||||||
| 3.48%, 03/19/30 (Call 12/19/29) |
289 | 269,626 | ||||||
| 3.57%, 03/06/45 (Call 09/06/44) |
127 | 98,956 | ||||||
| 4.11%, 03/01/46 (Call 09/01/45) |
259 | 219,517 | ||||||
| 4.23%, 03/19/40 (Call 09/19/39) |
431 | 386,505 | ||||||
| 4.33%, 03/19/50 (Call 09/19/49) |
362 | 315,455 | ||||||
| Hess Corp. |
||||||||
| 4.30%, 04/01/27 (Call 01/01/27) |
570 | 555,166 | ||||||
| 5.60%, 02/15/41 |
184 | 185,399 | ||||||
| 6.00%, 01/15/40 |
277 | 289,190 | ||||||
| 7.13%, 03/15/33 |
315 | 353,225 | ||||||
| 7.30%, 08/15/31 |
403 | 452,734 | ||||||
| 7.88%, 10/01/29 |
150 | 168,196 | ||||||
| Marathon Oil Corp. |
||||||||
| 4.40%, 07/15/27 (Call 04/15/27) |
405 | 393,296 | ||||||
| 6.60%, 10/01/37 |
276 | 287,941 | ||||||
| 6.80%, 03/15/32 |
236 | 251,546 | ||||||
| Marathon Petroleum Corp. |
||||||||
| 3.80%, 04/01/28 (Call 01/01/28) |
155 | 147,567 | ||||||
| 4.50%, 04/01/48 (Call 10/01/47) |
110 | 90,494 | ||||||
| 4.70%, 05/01/25 (Call 04/01/25) |
71 | 70,312 | ||||||
| 4.75%, 09/15/44 (Call 03/15/44) |
174 | 151,839 | ||||||
| 5.00%, 09/15/54 (Call 03/15/54) |
126 | 108,276 | ||||||
| 5.13%, 12/15/26 (Call 09/15/26) |
155 | 154,740 | ||||||
| 6.50%, 03/01/41 (Call 09/01/40) |
113 | 119,937 | ||||||
| Occidental Petroleum Corp. |
||||||||
| 4.40%, 04/15/46 (Call 10/15/45) |
155 | 124,364 | ||||||
| 6.20%, 03/15/40 |
60 | 60,902 | ||||||
| 6.45%, 09/15/36 |
20 | 21,086 | ||||||
| 6.60%, 03/15/46 (Call 09/15/45)(b) |
240 | 254,975 | ||||||
| 6.63%, 09/01/30 (Call 03/01/30) |
40 | 42,093 | ||||||
| 7.50%, 05/01/31 |
50 | 55,233 | ||||||
| 7.88%, 09/15/31 |
50 | 56,296 | ||||||
| 7.95%, 06/15/39 |
30 | 34,958 | ||||||
| S C H E D U L E O F I N V E S T M E N T S |
59 |
| Schedule of Investments (continued) February 29, 2024 |
iShares® ESG Aware U.S. Aggregate Bond ETF (Percentages shown are based on Net Assets) |
| Security | Par (000) |
Value | ||||||
| Oil & Gas (continued) | ||||||||
| Ovintiv Inc. |
||||||||
| 5.38%, 01/01/26 (Call 10/01/25) |
$ | 135 | $ | 134,227 | ||||
| 5.65%, 05/15/25 |
175 | 175,022 | ||||||
| 5.65%, 05/15/28 (Call 04/15/28) |
170 | 171,495 | ||||||
| 6.25%, 07/15/33 (Call 04/15/33) |
160 | 164,509 | ||||||
| 6.50%, 08/15/34 |
260 | 272,353 | ||||||
| 6.50%, 02/01/38 |
167 | 170,984 | ||||||
| 6.63%, 08/15/37 |
195 | 201,234 | ||||||
| 7.10%, 07/15/53 (Call 01/15/53) |
100 | 108,994 | ||||||
| 7.20%, 11/01/31 |
375 | 404,716 | ||||||
| 7.38%, 11/01/31 |
547 | 596,183 | ||||||
| 8.13%, 09/15/30 |
130 | 145,868 | ||||||
| Phillips 66 |
||||||||
| 3.30%, 03/15/52 (Call 09/15/51) |
290 | 198,335 | ||||||
| 3.90%, 03/15/28 (Call 12/15/27) |
210 | 202,045 | ||||||
| 4.65%, 11/15/34 (Call 05/15/34) |
229 | 214,927 | ||||||
| 4.88%, 11/15/44 (Call 05/15/44) |
330 | 301,217 | ||||||
| 5.88%, 05/01/42 |
72 | 74,212 | ||||||
| Phillips 66 Co. |
||||||||
| 4.68%, 02/15/45 (Call 08/15/44) |
2 | 1,745 | ||||||
| 4.90%, 10/01/46 (Call 04/01/46) |
25 | 22,356 | ||||||
| 5.25%, 06/15/31 (Call 04/15/31) |
50 | 49,878 | ||||||
| 5.30%, 06/30/33 (Call 03/30/33) |
190 | 188,516 | ||||||
| 5.65%, 06/15/54 (Call 12/15/53) |
75 | 74,356 | ||||||
| Shell International Finance BV |
||||||||
| 3.00%, 11/26/51 (Call 05/26/51) |
475 | 318,343 | ||||||
| 3.13%, 11/07/49 (Call 05/07/49) |
95 | 66,056 | ||||||
| 3.25%, 04/06/50 (Call 10/06/49) |
660 | 469,104 | ||||||
| 3.75%, 09/12/46 |
175 | 137,879 | ||||||
| 4.00%, 05/10/46 |
570 | 467,979 | ||||||
| 4.13%, 05/11/35 |
465 | 429,781 | ||||||
| 4.38%, 05/11/45 |
180 | 157,253 | ||||||
| 4.55%, 08/12/43 |
5 | 4,540 | ||||||
| 6.38%, 12/15/38 |
400 | 444,617 | ||||||
| TotalEnergies Capital International SA |
||||||||
| 2.83%, 01/10/30 (Call 10/10/29) |
250 | 224,571 | ||||||
| 2.99%, 06/29/41 (Call 12/29/40) |
225 | 167,024 | ||||||
| 3.13%, 05/29/50 (Call 11/29/49) |
463 | 322,015 | ||||||
| 3.39%, 06/29/60 (Call 12/29/59) |
545 | 376,688 | ||||||
| 3.46%, 02/19/29 (Call 11/19/28) |
330 | 309,970 | ||||||
| 3.46%, 07/12/49 (Call 01/12/49) |
215 | 160,565 | ||||||
| TotalEnergies Capital SA, 3.88%, 10/11/28 |
330 | 317,844 | ||||||
| Valero Energy Corp. |
||||||||
| 3.65%, 12/01/51 (Call 06/01/51) |
380 | 267,454 | ||||||
| 4.00%, 06/01/52 (Call 12/01/51) |
45 | 33,836 | ||||||
| 4.35%, 06/01/28 (Call 03/01/28) |
188 | 183,039 | ||||||
| 4.90%, 03/15/45 |
71 | 64,153 | ||||||
| 6.63%, 06/15/37 |
365 | 390,895 | ||||||
| 7.50%, 04/15/32 |
136 | 154,707 | ||||||
|
|
|
|||||||
| 26,064,300 | ||||||||
| Oil & Gas Services — 0.1% | ||||||||
| Baker Hughes Holdings LLC, 5.13%, 09/15/40 |
466 | 451,943 | ||||||
| Baker Hughes Holdings LLC/Baker Hughes Co-Obligor Inc. |
||||||||
| 2.06%, 12/15/26 (Call 11/15/26) |
45 | 41,520 | ||||||
| 3.14%, 11/07/29 (Call 08/07/29) |
427 | 389,449 | ||||||
| 3.34%, 12/15/27 (Call 09/15/27) |
1,041 | 981,659 | ||||||
| 4.08%, 12/15/47 (Call 06/15/47) |
142 | 114,326 | ||||||
| Halliburton Co. |
||||||||
| 2.92%, 03/01/30 (Call 12/01/29) |
278 | 246,901 | ||||||
| 3.80%, 11/15/25 (Call 08/15/25) |
104 | 101,606 | ||||||
| Security | Par (000) |
Value | ||||||
| Oil & Gas Services (continued) | ||||||||
| 4.50%, 11/15/41 (Call 05/15/41) |
$ | 85 | $ | 75,001 | ||||
| 4.75%, 08/01/43 (Call 02/01/43) |
195 | 175,883 | ||||||
| 4.85%, 11/15/35 (Call 05/15/35) |
415 | 399,280 | ||||||
| 5.00%, 11/15/45 (Call 05/15/45) |
294 | 273,499 | ||||||
| 6.70%, 09/15/38 |
183 | 204,911 | ||||||
| 7.45%, 09/15/39 |
184 | 220,989 | ||||||
| NOV Inc. |
||||||||
| 3.60%, 12/01/29 (Call 09/01/29) |
321 | 292,811 | ||||||
| 3.95%, 12/01/42 (Call 06/01/42) |
125 | 93,151 | ||||||
| Schlumberger Investment SA |
||||||||
| 2.65%, 06/26/30 (Call 03/26/30) |
355 | 311,978 | ||||||
| 4.50%, 05/15/28 (Call 04/15/28) |
100 | 99,045 | ||||||
| 4.85%, 05/15/33 (Call 02/15/33)(b) |
85 | 84,116 | ||||||
|
|
|
|||||||
| 4,558,068 | ||||||||
| Packaging & Containers — 0.0% | ||||||||
| Amcor Finance USA Inc. |
||||||||
| 3.63%, 04/28/26 (Call 01/28/26) |
532 | 512,278 | ||||||
| 4.50%, 05/15/28 (Call 02/15/28) |
181 | 176,009 | ||||||
| 5.63%, 05/26/33 (Call 02/26/33)(b) |
190 | 192,977 | ||||||
| Amcor Flexibles North America Inc. |
||||||||
| 2.63%, 06/19/30 (Call 03/19/30) |
260 | 221,814 | ||||||
| 2.69%, 05/25/31 (Call 02/25/31) |
40 | 33,683 | ||||||
| 4.00%, 05/17/25 (Call 04/17/25) |
100 | 98,075 | ||||||
| Packaging Corp. of America |
||||||||
| 3.05%, 10/01/51 (Call 04/01/51) |
5 | 3,332 | ||||||
| 4.05%, 12/15/49 (Call 06/15/49) |
57 | 45,010 | ||||||
| WestRock MWV LLC, 8.20%, 01/15/30 |
55 | 62,536 | ||||||
| WRKCo Inc. |
||||||||
| 3.00%, 06/15/33 (Call 03/15/33) |
30 | 25,283 | ||||||
| 4.20%, 06/01/32 (Call 03/01/32) |
10 | 9,396 | ||||||
|
|
|
|||||||
| 1,380,393 | ||||||||
| Pharmaceuticals — 1.1% | ||||||||
| AbbVie Inc. |
||||||||
| 4.05%, 11/21/39 (Call 05/21/39) |
523 | 459,044 | ||||||
| 4.25%, 11/14/28 (Call 08/14/28) |
70 | 68,379 | ||||||
| 4.25%, 11/21/49 (Call 05/21/49) |
594 | 511,406 | ||||||
| 4.30%, 05/14/36 (Call 11/14/35) |
263 | 244,833 | ||||||
| 4.40%, 11/06/42 |
312 | 279,097 | ||||||
| 4.45%, 05/14/46 (Call 11/14/45) |
435 | 384,438 | ||||||
| 4.50%, 05/14/35 (Call 11/14/34) |
725 | 692,011 | ||||||
| 4.63%, 10/01/42 (Call 04/01/42) |
112 | 102,480 | ||||||
| 4.70%, 05/14/45 (Call 11/14/44) |
308 | 284,008 | ||||||
| 4.88%, 11/14/48 (Call 05/14/48) |
288 | 272,103 | ||||||
| Astrazeneca Finance LLC |
||||||||
| 4.88%, 03/03/28 (Call 02/03/28) |
100 | 99,907 | ||||||
| 4.88%, 03/03/33 (Call 12/03/32) |
185 | 184,180 | ||||||
| 4.90%, 03/03/30 (Call 01/03/30) |
100 | 100,173 | ||||||
| 5.00%, 02/26/34 (Call 11/26/33) |
75 | 75,278 | ||||||
| AstraZeneca PLC |
||||||||
| 3.13%, 06/12/27 (Call 03/12/27) |
390 | 370,497 | ||||||
| 3.38%, 11/16/25 |
1,052 | 1,023,185 | ||||||
| 4.00%, 01/17/29 (Call 10/17/28) |
54 | 52,132 | ||||||
| 4.00%, 09/18/42 |
314 | 268,393 | ||||||
| 4.38%, 11/16/45 |
320 | 282,876 | ||||||
| 4.38%, 08/17/48 (Call 02/17/48) |
124 | 110,100 | ||||||
| 6.45%, 09/15/37 |
645 | 726,340 | ||||||
| Becton Dickinson and Co. |
||||||||
| 3.70%, 06/06/27 (Call 03/06/27) |
270 | 258,893 | ||||||
| 3.79%, 05/20/50 (Call 11/20/49) |
74 | 57,174 | ||||||
| 4.67%, 06/06/47 (Call 12/06/46) |
242 | 214,325 | ||||||
| 60 | 2 0 2 4 I S H A R E S A N N U A L R E P O R T T O S H A R E H O L D E R S |
| Schedule of Investments (continued) February 29, 2024 |
iShares® ESG Aware U.S. Aggregate Bond ETF (Percentages shown are based on Net Assets) |
| Security | Par (000) |
Value | ||||||
| Pharmaceuticals (continued) | ||||||||
| 4.69%, 12/15/44 (Call 06/15/44) |
$ | 138 | $ | 123,826 | ||||
| Bristol-Myers Squibb Co. |
||||||||
| 2.55%, 11/13/50 (Call 05/13/50) |
145 | 87,892 | ||||||
| 2.95%, 03/15/32 (Call 12/15/31) |
10 | 8,640 | ||||||
| 3.25%, 02/27/27 |
80 | 76,775 | ||||||
| 3.25%, 08/01/42 |
153 | 115,578 | ||||||
| 3.55%, 03/15/42 (Call 09/15/41) |
10 | 7,884 | ||||||
| 3.70%, 03/15/52 (Call 09/15/51) |
285 | 215,433 | ||||||
| 3.90%, 03/15/62 (Call 09/15/61) |
325 | 242,342 | ||||||
| 4.25%, 10/26/49 (Call 04/26/49) |
438 | 366,648 | ||||||
| 4.35%, 11/15/47 (Call 05/15/47) |
308 | 261,605 | ||||||
| 4.50%, 03/01/44 (Call 09/01/43) |
20 | 17,877 | ||||||
| 4.55%, 02/20/48 (Call 08/20/47) |
445 | 391,441 | ||||||
| 5.00%, 08/15/45 (Call 02/15/45) |
160 | 152,292 | ||||||
| 5.65%, 02/22/64 (Call 08/22/63) |
325 | 328,094 | ||||||
| 6.25%, 11/15/53 (Call 05/15/53) |
95 | 105,410 | ||||||
| 6.40%, 11/15/63 (Call 05/15/63) |
95 | 105,961 | ||||||
| Cardinal Health Inc. |
||||||||
| 3.41%, 06/15/27 (Call 03/15/27) |
100 | 94,768 | ||||||
| 3.75%, 09/15/25 (Call 06/15/25) |
5 | 4,877 | ||||||
| 4.37%, 06/15/47 (Call 12/15/46) |
232 | 190,334 | ||||||
| 4.50%, 11/15/44 (Call 05/15/44) |
96 | 80,960 | ||||||
| 4.60%, 03/15/43 |
70 | 60,178 | ||||||
| 4.90%, 09/15/45 (Call 03/15/45) |
175 | 154,760 | ||||||
| 5.13%, 02/15/29 (Call 01/15/29) |
100 | 99,601 | ||||||
| 5.45%, 02/15/34 (Call 11/15/33) |
60 | 60,020 | ||||||
| Cencora Inc. |
||||||||
| 3.45%, 12/15/27 (Call 09/15/27) |
375 | 354,787 | ||||||
| 4.25%, 03/01/45 (Call 09/01/44) |
157 | 136,457 | ||||||
| 4.30%, 12/15/47 (Call 06/15/47) |
229 | 194,622 | ||||||
| Cigna Group (The) |
||||||||
| 2.40%, 03/15/30 (Call 12/15/29) |
505 | 432,932 | ||||||
| 3.20%, 03/15/40 (Call 09/15/39) |
160 | 119,493 | ||||||
| 3.40%, 03/15/50 (Call 09/15/49) |
354 | 246,352 | ||||||
| 3.40%, 03/15/51 (Call 09/15/50) |
125 | 86,925 | ||||||
| 3.88%, 10/15/47 (Call 04/15/47) |
316 | 242,815 | ||||||
| 4.38%, 10/15/28 (Call 07/15/28) |
796 | 773,042 | ||||||
| 4.80%, 08/15/38 (Call 02/15/38) |
613 | 568,509 | ||||||
| 4.80%, 07/15/46 (Call 01/16/46) |
295 | 263,665 | ||||||
| 4.90%, 12/15/48 (Call 06/15/48) |
365 | 327,909 | ||||||
| 5.00%, 05/15/29 (Call 04/15/29) |
125 | 124,103 | ||||||
| 5.13%, 05/15/31 (Call 03/15/31) |
125 | 123,581 | ||||||
| 5.25%, 02/15/34 (Call 11/15/33) |
125 | 123,471 | ||||||
| 5.40%, 03/15/33 (Call 12/15/32) |
165 | 165,989 | ||||||
| 5.60%, 02/15/54 (Call 08/15/53) |
150 | 147,693 | ||||||
| 6.13%, 11/15/41 |
159 | 168,122 | ||||||
| CVS Health Corp. |
||||||||
| 3.25%, 08/15/29 (Call 05/15/29) |
20 | 18,196 | ||||||
| 3.63%, 04/01/27 (Call 02/01/27) |
50 | 47,934 | ||||||
| 3.75%, 04/01/30 (Call 01/01/30) |
25 | 23,068 | ||||||
| 4.13%, 04/01/40 (Call 10/01/39) |
85 | 69,781 | ||||||
| 4.25%, 04/01/50 (Call 10/01/49) |
388 | 309,907 | ||||||
| 4.30%, 03/25/28 (Call 12/25/27) |
623 | 604,854 | ||||||
| 4.78%, 03/25/38 (Call 09/25/37) |
862 | 784,218 | ||||||
| 4.88%, 07/20/35 (Call 01/20/35) |
282 | 268,971 | ||||||
| 5.05%, 03/25/48 (Call 09/25/47) |
1,191 | 1,064,097 | ||||||
| 5.13%, 07/20/45 (Call 01/20/45) |
430 | 391,485 | ||||||
| 5.25%, 02/21/33 (Call 11/21/32) |
215 | 212,877 | ||||||
| 5.30%, 12/05/43 (Call 06/05/43) |
185 | 171,884 | ||||||
| 5.63%, 02/21/53 (Call 08/21/52) |
330 | 316,818 | ||||||
| 5.88%, 06/01/53 (Call 12/01/52) |
220 | 219,222 | ||||||
| Security | Par (000) |
Value | ||||||
| Pharmaceuticals (continued) | ||||||||
| 6.00%, 06/01/63 (Call 12/01/62) |
$ | 230 | $ | 230,339 | ||||
| 6.13%, 09/15/39 |
85 | 87,300 | ||||||
| 6.25%, 06/01/27 |
40 | 41,412 | ||||||
| Eli Lilly & Co. |
||||||||
| 2.50%, 09/15/60 (Call 03/15/60) |
30 | 17,454 | ||||||
| 3.10%, 05/15/27 (Call 02/15/27) |
415 | 394,844 | ||||||
| 3.70%, 03/01/45 (Call 09/01/44) |
130 | 107,403 | ||||||
| 3.95%, 03/15/49 (Call 09/15/48) |
35 | 29,348 | ||||||
| 4.15%, 03/15/59 (Call 09/15/58) |
425 | 357,357 | ||||||
| 4.70%, 02/27/33 (Call 11/27/32) |
95 | 94,201 | ||||||
| 4.88%, 02/27/53 (Call 08/27/52) |
120 | 116,319 | ||||||
| 4.95%, 02/27/63 (Call 08/27/62) |
40 | 38,498 | ||||||
| 5.50%, 03/15/27 |
155 | 158,610 | ||||||
| 5.55%, 03/15/37 |
170 | 179,260 | ||||||
| GlaxoSmithKline Capital Inc. |
||||||||
| 3.63%, 05/15/25 |
545 | 535,490 | ||||||
| 3.88%, 05/15/28 |
459 | 443,808 | ||||||
| 4.20%, 03/18/43 |
115 | 101,043 | ||||||
| 6.38%, 05/15/38 |
316 | 354,301 | ||||||
| GlaxoSmithKline Capital PLC, 3.38%, 06/01/29 (Call 03/01/29) |
279 | 261,804 | ||||||
| Johnson & Johnson |
||||||||
| 2.45%, 09/01/60 (Call 03/01/60) |
105 | 61,832 | ||||||
| 3.40%, 01/15/38 (Call 07/15/37) |
181 | 153,557 | ||||||
| 3.50%, 01/15/48 (Call 07/15/47) |
342 | 269,199 | ||||||
| 3.55%, 03/01/36 (Call 09/01/35) |
25 | 22,097 | ||||||
| 3.70%, 03/01/46 (Call 09/01/45) |
340 | 278,567 | ||||||
| 3.75%, 03/03/47 (Call 09/03/46) |
205 | 168,544 | ||||||
| 4.50%, 12/05/43 (Call 06/05/43) |
168 | 158,074 | ||||||
| 4.85%, 05/15/41 |
82 | 81,195 | ||||||
| 5.85%, 07/15/38 |
245 | 269,214 | ||||||
| 5.95%, 08/15/37 |
167 | 184,100 | ||||||
| McKesson Corp., 5.10%, 07/15/33 (Call 04/15/33) |
420 | 418,375 | ||||||
| Mead Johnson Nutrition Co. |
||||||||
| 4.13%, 11/15/25 (Call 08/15/25) |
635 | 623,013 | ||||||
| 4.60%, 06/01/44 (Call 12/01/43) |
132 | 119,435 | ||||||
| 5.90%, 11/01/39 |
218 | 227,409 | ||||||
| Merck & Co. Inc. |
||||||||
| 1.70%, 06/10/27 (Call 05/10/27) |
110 | 99,624 | ||||||
| 1.90%, 12/10/28 (Call 10/10/28) |
75 | 66,206 | ||||||
| 2.15%, 12/10/31 (Call 09/10/31) |
100 | 82,932 | ||||||
| 2.45%, 06/24/50 (Call 12/24/49) |
165 | 101,273 | ||||||
| 2.75%, 12/10/51 (Call 06/10/51) |
295 | 191,259 | ||||||
| 2.90%, 12/10/61 (Call 06/10/61) |
435 | 269,432 | ||||||
| 3.40%, 03/07/29 (Call 12/07/28) |
385 | 361,599 | ||||||
| 3.60%, 09/15/42 (Call 03/15/42) |
100 | 80,940 | ||||||
| 3.70%, 02/10/45 (Call 08/10/44) |
335 | 270,848 | ||||||
| 3.90%, 03/07/39 (Call 09/07/38) |
180 | 157,330 | ||||||
| 4.00%, 03/07/49 (Call 09/07/48) |
186 | 154,897 | ||||||
| 4.05%, 05/17/28 (Call 04/17/28) |
90 | 88,160 | ||||||
| 4.15%, 05/18/43 |
285 | 248,766 | ||||||
| 4.30%, 05/17/30 (Call 03/17/30) |
180 | 175,165 | ||||||
| 4.50%, 05/17/33 (Call 02/17/33) |
255 | 248,039 | ||||||
| 4.90%, 05/17/44 (Call 11/17/43) |
120 | 115,200 | ||||||
| 5.00%, 05/17/53 (Call 11/17/52) |
100 | 96,930 | ||||||
| 5.15%, 05/17/63 (Call 11/17/62) |
135 | 131,990 | ||||||
| 6.50%, 12/01/33 |
236 | 266,030 | ||||||
| 6.55%, 09/15/37 |
32 | 35,909 | ||||||
| Merck Sharp & Dohme Corp. |
||||||||
| 5.75%, 11/15/36 |
87 | 92,975 | ||||||
| 5.95%, 12/01/28 |
125 | 131,133 | ||||||
| S C H E D U L E O F I N V E S T M E N T S |
61 |
| Schedule of Investments (continued) February 29, 2024 |
iShares® ESG Aware U.S. Aggregate Bond ETF (Percentages shown are based on Net Assets) |
| Security | Par (000) |
Value | ||||||
| Pharmaceuticals (continued) | ||||||||
| Novartis Capital Corp. |
||||||||
| 2.75%, 08/14/50 (Call 02/14/50) |
$ | 95 | $ | 63,301 | ||||
| 4.00%, 11/20/45 (Call 05/20/45) |
45 | 38,260 | ||||||
| Pfizer Inc. |
||||||||
| 2.70%, 05/28/50 (Call 11/28/49) |
125 | 82,293 | ||||||
| 4.00%, 03/15/49 (Call 09/15/48)(b) |
175 | 144,503 | ||||||
| 4.10%, 09/15/38 (Call 03/15/38) |
125 | 111,074 | ||||||
| 4.13%, 12/15/46 |
25 | 20,965 | ||||||
| 4.20%, 09/15/48 (Call 03/15/48) |
280 | 237,973 | ||||||
| 7.20%, 03/15/39 |
140 | 166,360 | ||||||
| Pfizer Investment Enterprises Pte Ltd. |
||||||||
| 4.45%, 05/19/26 (Call 04/19/26) |
365 | 360,285 | ||||||
| 4.45%, 05/19/28 (Call 04/19/28) |
705 | 691,439 | ||||||
| 4.65%, 05/19/25 |
690 | 685,735 | ||||||
| 4.75%, 05/19/33 (Call 02/19/33) |
895 | 872,139 | ||||||
| 5.30%, 05/19/53 (Call 11/19/52) |
990 | 969,618 | ||||||
| 5.34%, 05/19/63 (Call 11/19/62) |
840 | 809,291 | ||||||
| Shire Acquisitions Investments Ireland DAC, 3.20%, 09/23/26 (Call 06/23/26) |
55 | 52,404 | ||||||
| Takeda Pharmaceutical Co. Ltd. |
||||||||
| 3.18%, 07/09/50 (Call 01/09/50) |
270 | 185,016 | ||||||
| 3.38%, 07/09/60 (Call 01/09/60) |
175 | 116,832 | ||||||
| 5.00%, 11/26/28 (Call 08/26/28) |
15 | 14,961 | ||||||
| Zoetis Inc. |
||||||||
| 3.00%, 09/12/27 (Call 06/12/27) |
1,080 | 1,010,919 | ||||||
| 3.90%, 08/20/28 (Call 05/20/28) |
261 | 250,910 | ||||||
| 3.95%, 09/12/47 (Call 03/12/47) |
375 | 302,052 | ||||||
| 4.45%, 08/20/48 (Call 02/20/48) |
136 | 118,968 | ||||||
| 4.50%, 11/13/25 (Call 08/13/25) |
2,282 | 2,253,276 | ||||||
| 4.70%, 02/01/43 (Call 08/01/42) |
510 | 465,879 | ||||||
| 5.60%, 11/16/32 (Call 08/16/32) |
315 | 325,532 | ||||||
|
|
|
|||||||
| 39,978,251 | ||||||||
| Pipelines — 0.8% | ||||||||
| Boardwalk Pipelines LP |
||||||||
| 3.40%, 02/15/31 (Call 11/15/30) |
114 | 100,592 | ||||||
| 4.80%, 05/03/29 (Call 02/03/29) |
160 | 155,465 | ||||||
| Cheniere Corpus Christi Holdings LLC |
||||||||
| 2.74%, 12/31/39 (Call 07/04/39) |
150 | 117,705 | ||||||
| 3.70%, 11/15/29 (Call 05/18/29) |
502 | 463,485 | ||||||
| 5.13%, 06/30/27 (Call 01/01/27) |
417 | 414,995 | ||||||
| 5.88%, 03/31/25 (Call 10/02/24) |
630 | 629,797 | ||||||
| Cheniere Energy Inc., 4.63%, 10/15/28 (Call 03/11/24) |
1,205 | 1,157,349 | ||||||
| Cheniere Energy Partners LP |
||||||||
| 3.25%, 01/31/32 (Call 01/31/27) |
115 | 96,116 | ||||||
| 4.00%, 03/01/31 (Call 03/01/26) |
125 | 111,640 | ||||||
| 5.95%, 06/30/33 (Call 12/30/32) |
66 | 66,263 | ||||||
| Columbia Pipeline Group Inc., 5.80%, 06/01/45 (Call 12/01/44) |
100 | 96,542 | ||||||
| Enbridge Energy Partners LP |
||||||||
| 7.38%, 10/15/45 (Call 04/15/45) |
85 | 98,119 | ||||||
| Series B, 7.50%, 04/15/38 |
55 | 63,569 | ||||||
| Enbridge Inc. |
||||||||
| 2.50%, 08/01/33 (Call 05/01/33) |
535 | 422,770 | ||||||
| 3.13%, 11/15/29 (Call 08/15/29) |
205 | 185,197 | ||||||
| 3.40%, 08/01/51 (Call 02/01/51) |
200 | 139,464 | ||||||
| 3.70%, 07/15/27 (Call 04/15/27) |
99 | 94,533 | ||||||
| 4.00%, 11/15/49 (Call 05/15/49) |
180 | 139,181 | ||||||
| 4.25%, 12/01/26 (Call 09/01/26) |
165 | 161,395 | ||||||
| 4.50%, 06/10/44 (Call 12/10/43) |
115 | 95,831 | ||||||
| 5.50%, 12/01/46 (Call 06/01/46) |
110 | 106,208 | ||||||
| Security | Par (000) |
Value | ||||||
| Pipelines (continued) | ||||||||
| 5.70%, 03/08/33 (Call 12/08/32) |
$ | 370 | $ | 374,517 | ||||
| 5.90%, 11/15/26 (Call 10/15/26) |
205 | 208,851 | ||||||
| 6.00%, 11/15/28 (Call 10/15/28) |
150 | 155,323 | ||||||
| 6.20%, 11/15/30 (Call 09/15/30) |
90 | 94,365 | ||||||
| 6.70%, 11/15/53 (Call 05/15/53) |
110 | 122,692 | ||||||
| Energy Transfer LP |
||||||||
| 4.15%, 09/15/29 (Call 06/15/29) |
175 | 164,998 | ||||||
| 4.40%, 03/15/27 (Call 12/15/26) |
35 | 34,088 | ||||||
| 5.00%, 05/15/44 (Call 11/15/43) |
71 | 61,460 | ||||||
| 5.00%, 05/15/50 (Call 11/15/49) |
325 | 280,231 | ||||||
| 5.40%, 10/01/47 (Call 04/01/47) |
25 | 22,609 | ||||||
| 6.00%, 06/15/48 (Call 12/15/47) |
95 | 92,998 | ||||||
| 6.25%, 04/15/49 (Call 10/15/48) |
40 | 40,359 | ||||||
| 6.63%, 10/15/36 |
175 | 183,897 | ||||||
| 7.50%, 07/01/38 |
205 | 232,861 | ||||||
| Enterprise Products Operating LLC |
||||||||
| 2.80%, 01/31/30 (Call 10/31/29) |
142 | 126,067 | ||||||
| 3.13%, 07/31/29 (Call 04/30/29) |
105 | 96,063 | ||||||
| 3.70%, 01/31/51 (Call 07/31/50) |
85 | 64,118 | ||||||
| 3.95%, 01/31/60 (Call 07/31/59) |
141 | 106,648 | ||||||
| 4.15%, 10/16/28 (Call 07/16/28) |
85 | 82,054 | ||||||
| 4.20%, 01/31/50 (Call 07/31/49) |
116 | 95,769 | ||||||
| 4.25%, 02/15/48 (Call 08/15/47) |
142 | 118,712 | ||||||
| 4.45%, 02/15/43 (Call 08/15/42) |
88 | 76,575 | ||||||
| 4.80%, 02/01/49 (Call 08/01/48) |
171 | 154,857 | ||||||
| 4.85%, 08/15/42 (Call 02/15/42) |
117 | 107,022 | ||||||
| 4.85%, 03/15/44 (Call 09/15/43) |
65 | 59,498 | ||||||
| 4.90%, 05/15/46 (Call 11/15/45) |
168 | 153,369 | ||||||
| 4.95%, 10/15/54 (Call 04/15/54) |
174 | 158,663 | ||||||
| 5.10%, 02/15/45 (Call 08/15/44) |
244 | 228,438 | ||||||
| 5.38%, 02/15/78 (Call 02/15/28), |
220 | 203,567 | ||||||
| 5.70%, 02/15/42 |
108 | 108,946 | ||||||
| 5.95%, 02/01/41 |
128 | 133,464 | ||||||
| 6.13%, 10/15/39 |
70 | 73,368 | ||||||
| 6.45%, 09/01/40 |
99 | 108,140 | ||||||
| 7.55%, 04/15/38 |
49 | 58,292 | ||||||
| Series D, 6.88%, 03/01/33 |
45 | 50,076 | ||||||
| Series E, 5.25%, 08/16/77 (Call 08/16/27), |
35 | 33,276 | ||||||
| Series H, 6.65%, 10/15/34 |
35 | 38,641 | ||||||
| Kinder Morgan Energy Partners LP |
||||||||
| 4.70%, 11/01/42 (Call 05/01/42) |
53 | 44,513 | ||||||
| 5.00%, 08/15/42 (Call 02/15/42) |
105 | 91,362 | ||||||
| 5.00%, 03/01/43 (Call 09/01/42) |
150 | 130,663 | ||||||
| 5.40%, 09/01/44 (Call 03/01/44) |
204 | 186,066 | ||||||
| 5.50%, 03/01/44 (Call 09/01/43) |
196 | 181,214 | ||||||
| 5.63%, 09/01/41 |
95 | 89,383 | ||||||
| 5.80%, 03/15/35 |
105 | 105,399 | ||||||
| 6.38%, 03/01/41 |
134 | 136,170 | ||||||
| 6.50%, 02/01/37 |
122 | 125,652 | ||||||
| 6.50%, 09/01/39 |
103 | 106,056 | ||||||
| 6.55%, 09/15/40 |
69 | 71,600 | ||||||
| 6.95%, 01/15/38 |
275 | 296,549 | ||||||
| 7.30%, 08/15/33 |
82 | 91,028 | ||||||
| 7.40%, 03/15/31 |
45 | 49,756 | ||||||
| 7.50%, 11/15/40 |
31 | 34,559 | ||||||
| 7.75%, 03/15/32 |
90 | 101,280 | ||||||
| Kinder Morgan Inc. |
||||||||
| 3.25%, 08/01/50 (Call 02/01/50) |
47 | 30,396 | ||||||
| 3.60%, 02/15/51 (Call 08/15/50) |
65 | 44,620 | ||||||
| 62 | 2 0 2 4 I S H A R E S A N N U A L R E P O R T T O S H A R E H O L D E R S |
| Schedule of Investments (continued) February 29, 2024 |
iShares® ESG Aware U.S. Aggregate Bond ETF (Percentages shown are based on Net Assets) |
| Security | Par (000) |
Value | ||||||
| Pipelines (continued) | ||||||||
| 4.30%, 03/01/28 (Call 12/01/27) |
$ | 137 | $ | 132,838 | ||||
| 4.80%, 02/01/33 (Call 11/01/32) |
105 | 99,075 | ||||||
| 5.00%, 02/01/29 (Call 01/01/29) |
195 | 193,451 | ||||||
| 5.05%, 02/15/46 (Call 08/15/45) |
55 | 47,831 | ||||||
| 5.20%, 06/01/33 (Call 03/01/33) |
120 | 116,723 | ||||||
| 5.20%, 03/01/48 (Call 09/01/47) |
209 | 185,665 | ||||||
| 5.30%, 12/01/34 (Call 06/01/34) |
235 | 229,026 | ||||||
| 5.40%, 02/01/34 (Call 11/01/33) |
250 | 245,683 | ||||||
| 5.45%, 08/01/52 (Call 02/01/52) |
140 | 128,947 | ||||||
| 5.55%, 06/01/45 (Call 12/01/44) |
276 | 258,946 | ||||||
| 7.75%, 01/15/32 |
132 | 148,649 | ||||||
| 7.80%, 08/01/31 |
50 | 55,917 | ||||||
| Magellan Midstream Partners LP, 3.95%, 03/01/50 (Call 09/01/49) |
100 | 72,809 | ||||||
| MPLX LP |
||||||||
| 4.00%, 03/15/28 (Call 12/15/27) |
124 | 118,752 | ||||||
| 4.25%, 12/01/27 (Call 09/01/27) |
155 | 149,865 | ||||||
| 4.50%, 04/15/38 (Call 10/15/37) |
266 | 231,784 | ||||||
| 4.70%, 04/15/48 (Call 10/15/47) |
383 | 320,640 | ||||||
| 4.80%, 02/15/29 (Call 11/15/28) |
148 | 145,092 | ||||||
| 4.90%, 04/15/58 (Call 10/15/57) |
87 | 72,032 | ||||||
| 4.95%, 03/14/52 (Call 09/14/51) |
115 | 99,038 | ||||||
| 5.20%, 03/01/47 (Call 09/01/46) |
207 | 185,894 | ||||||
| 5.50%, 02/15/49 (Call 08/15/48) |
301 | 281,838 | ||||||
| Northwest Pipeline LLC, 4.00%, 04/01/27 (Call 01/01/27) |
27 | 26,203 | ||||||
| ONEOK Inc. |
||||||||
| 2.20%, 09/15/25 (Call 08/15/25) |
1,629 | 1,549,434 | ||||||
| 3.10%, 03/15/30 (Call 12/15/29) |
205 | 181,616 | ||||||
| 3.40%, 09/01/29 (Call 06/01/29) |
105 | 95,898 | ||||||
| 4.00%, 07/13/27 (Call 04/13/27) |
439 | 422,953 | ||||||
| 4.20%, 10/03/47 (Call 04/03/47) |
125 | 95,645 | ||||||
| 4.35%, 03/15/29 (Call 12/15/28) |
160 | 154,035 | ||||||
| 4.45%, 09/01/49 (Call 03/01/49) |
205 | 163,489 | ||||||
| 4.50%, 03/15/50 (Call 09/15/49) |
128 | 102,401 | ||||||
| 4.55%, 07/15/28 (Call 04/15/28) |
413 | 403,501 | ||||||
| 4.85%, 02/01/49 |
74 | 63,145 | ||||||
| 4.95%, 07/13/47 (Call 01/06/47) |
117 | 100,717 | ||||||
| 5.20%, 07/15/48 (Call 01/15/48) |
230 | 207,646 | ||||||
| 5.55%, 11/01/26 (Call 10/01/26) |
225 | 226,617 | ||||||
| 5.65%, 11/01/28 (Call 10/01/28) |
225 | 228,981 | ||||||
| 5.80%, 11/01/30 (Call 09/01/30) |
175 | 179,140 | ||||||
| 5.85%, 01/15/26 (Call 12/15/25) |
300 | 302,649 | ||||||
| 6.00%, 06/15/35 |
115 | 115,873 | ||||||
| 6.05%, 09/01/33 (Call 06/01/33) |
220 | 226,684 | ||||||
| 6.10%, 11/15/32 (Call 08/15/32) |
140 | 145,005 | ||||||
| 6.35%, 01/15/31 (Call 10/15/30) |
180 | 188,755 | ||||||
| 7.15%, 01/15/51 (Call 07/15/50) |
107 | 118,666 | ||||||
| ONEOK Partners LP |
||||||||
| 4.90%, 03/15/25 (Call 12/15/24) |
460 | 456,548 | ||||||
| 6.13%, 02/01/41 (Call 08/01/40) |
136 | 138,197 | ||||||
| 6.20%, 09/15/43 (Call 03/15/43) |
136 | 138,809 | ||||||
| 6.65%, 10/01/36 |
260 | 274,991 | ||||||
| 6.85%, 10/15/37 |
190 | 203,719 | ||||||
| Plains All American Pipeline LP/PAA Finance Corp. |
||||||||
| 3.55%, 12/15/29 (Call 09/15/29) |
62 | 56,206 | ||||||
| 4.70%, 06/15/44 (Call 12/15/43)(b) |
102 | 84,362 | ||||||
| 4.90%, 02/15/45 (Call 08/15/44) |
20 | 16,840 | ||||||
| 5.15%, 06/01/42 (Call 12/01/41) |
120 | 105,889 | ||||||
| 6.65%, 01/15/37 |
52 | 54,875 | ||||||
| Security | Par (000) |
Value | ||||||
| Pipelines (continued) | ||||||||
| Sabine Pass Liquefaction LLC |
||||||||
| 4.20%, 03/15/28 (Call 09/15/27) |
$ | 227 | $ | 219,031 | ||||
| 4.50%, 05/15/30 (Call 11/15/29) |
236 | 225,933 | ||||||
| 5.00%, 03/15/27 (Call 09/15/26) |
252 | 250,209 | ||||||
| 5.90%, 09/15/37 (Call 03/15/37) |
60 | 62,102 | ||||||
| Spectra Energy Partners LP |
||||||||
| 3.38%, 10/15/26 (Call 07/15/26) |
190 | 181,489 | ||||||
| 3.50%, 03/15/25 (Call 12/15/24) |
130 | 127,449 | ||||||
| 4.50%, 03/15/45 (Call 09/15/44) |
149 | 124,831 | ||||||
| 5.95%, 09/25/43 (Call 03/25/43) |
257 | 255,444 | ||||||
| Targa Resources Corp. |
||||||||
| 4.20%, 02/01/33 (Call 11/01/32) |
410 | 368,900 | ||||||
| 4.95%, 04/15/52 (Call 10/15/51) |
150 | 128,355 | ||||||
| 6.13%, 03/15/33 (Call 12/15/32) |
15 | 15,456 | ||||||
| 6.15%, 03/01/29 (Call 02/01/29) |
100 | 103,101 | ||||||
| 6.50%, 03/30/34 (Call 12/30/33) |
180 | 191,111 | ||||||
| 6.50%, 02/15/53 (Call 08/15/52) |
265 | 278,950 | ||||||
| Targa Resources Partners LP/Targa Resources |
||||||||
| Partners Finance Corp. |
||||||||
| 4.00%, 01/15/32 (Call 07/15/26) |
515 | 459,611 | ||||||
| 4.88%, 02/01/31 (Call 02/01/26) |
20 | 18,979 | ||||||
| 5.50%, 03/01/30 (Call 03/01/25) |
10 | 9,885 | ||||||
| TC PipeLines LP, 3.90%, 05/25/27 (Call 02/25/27) |
120 | 114,373 | ||||||
| Tennessee Gas Pipeline Co. LLC |
||||||||
| 7.00%, 03/15/27 |
60 | 62,974 | ||||||
| 7.00%, 10/15/28 |
20 | 21,357 | ||||||
| 7.63%, 04/01/37 |
10 | 11,254 | ||||||
| Texas Eastern Transmission LP, 7.00%, 07/15/32 |
202 | 223,413 | ||||||
| TransCanada PipeLines Ltd. |
||||||||
| 4.10%, 04/15/30 (Call 01/15/30) |
169 | 158,294 | ||||||
| 4.25%, 05/15/28 (Call 02/15/28) |
145 | 139,649 | ||||||
| 4.63%, 03/01/34 (Call 12/01/33) |
207 | 191,870 | ||||||
| 4.75%, 05/15/38 (Call 11/15/37) |
110 | 99,411 | ||||||
| 4.88%, 05/15/48 (Call 11/15/47) |
189 | 164,868 | ||||||
| 5.10%, 03/15/49 (Call 09/15/48) |
229 | 209,756 | ||||||
| 5.60%, 03/31/34 |
17 | 16,976 | ||||||
| 5.85%, 03/15/36 |
95 | 94,931 | ||||||
| 6.10%, 06/01/40 |
85 | 86,828 | ||||||
| 6.20%, 10/15/37 |
234 | 240,746 | ||||||
| 7.25%, 08/15/38 |
99 | 111,603 | ||||||
| 7.63%, 01/15/39 |
135 | 157,292 | ||||||
| Transcontinental Gas Pipe Line Co. LLC |
||||||||
| 3.95%, 05/15/50 (Call 11/15/49) |
150 | 116,684 | ||||||
| 4.00%, 03/15/28 (Call 12/15/27) |
20 | 19,188 | ||||||
| 4.45%, 08/01/42 (Call 02/01/42) |
27 | 23,431 | ||||||
| 4.60%, 03/15/48 (Call 09/15/47) |
132 | 115,422 | ||||||
| 5.40%, 08/15/41 (Call 02/15/41) |
58 | 56,567 | ||||||
| Valero Energy Partners LP, 4.50%, 03/15/28 (Call 12/15/27) |
195 | 189,631 | ||||||
| Western Midstream Operating LP |
||||||||
| 4.05%, 02/01/30 (Call 11/01/29) |
135 | 124,898 | ||||||
| 5.25%, 02/01/50 (Call 08/01/49) |
275 | 243,623 | ||||||
| 5.30%, 03/01/48 (Call 09/01/47) |
50 | 43,125 | ||||||
| 5.45%, 04/01/44 (Call 10/01/43) |
85 | 76,356 | ||||||
| 5.50%, 08/15/48 (Call 02/15/48) |
110 | 96,575 | ||||||
| 6.15%, 04/01/33 (Call 01/01/33) |
465 | 472,771 | ||||||
| 6.35%, 01/15/29 (Call 12/15/28) |
30 | 30,975 | ||||||
| Williams Companies Inc. (The) |
||||||||
| 3.75%, 06/15/27 (Call 03/15/27) |
132 | 126,259 | ||||||
| 4.85%, 03/01/48 (Call 09/01/47) |
200 | 175,525 | ||||||
| 4.90%, 01/15/45 (Call 07/15/44) |
232 | 204,340 | ||||||
| S C H E D U L E O F I N V E S T M E N T S |
63 |
| Schedule of Investments (continued) February 29, 2024 |
iShares® ESG Aware U.S. Aggregate Bond ETF (Percentages shown are based on Net Assets) |
| Security | Par (000) |
Value | ||||||
| Pipelines (continued) | ||||||||
| 5.10%, 09/15/45 (Call 03/15/45) |
$ | 221 | $ | 201,791 | ||||
| 5.40%, 03/04/44 (Call 09/04/43) |
108 | 101,171 | ||||||
| 5.75%, 06/24/44 (Call 12/24/43) |
40 | 39,146 | ||||||
| 5.80%, 11/15/43 (Call 05/15/43) |
36 | 35,240 | ||||||
| 6.30%, 04/15/40 |
230 | 238,175 | ||||||
| 8.75%, 03/15/32 |
78 | 92,828 | ||||||
| Series A, 7.50%, 01/15/31 |
52 | 57,768 | ||||||
|
|
|
|||||||
| 29,695,258 | ||||||||
| Real Estate — 0.1% | ||||||||
| CBRE Services Inc. |
||||||||
| 2.50%, 04/01/31 (Call 01/01/31)(b) |
1,135 | 932,063 | ||||||
| 4.88%, 03/01/26 (Call 12/01/25) |
1,018 | 1,005,759 | ||||||
| 5.95%, 08/15/34 (Call 05/15/34) |
75 | 75,762 | ||||||
| Realty Income Corp., 3.40%, 01/15/30 (Call 10/15/29) |
60 | 54,381 | ||||||
|
|
|
|||||||
| 2,067,965 | ||||||||
| Real Estate Investment Trusts — 1.1% | ||||||||
| Alexandria Real Estate Equities Inc. |
||||||||
| 1.88%, 02/01/33 (Call 11/01/32) |
470 | 351,524 | ||||||
| 2.75%, 12/15/29 (Call 09/15/29) |
100 | 87,002 | ||||||
| 2.95%, 03/15/34 (Call 12/15/33) |
130 | 104,800 | ||||||
| 3.00%, 05/18/51 (Call 11/18/50) |
220 | 138,043 | ||||||
| 3.38%, 08/15/31 (Call 05/15/31) |
87 | 76,397 | ||||||
| 3.55%, 03/15/52 (Call 09/15/51) |
75 | 52,040 | ||||||
| 3.95%, 01/15/27 (Call 10/15/26) |
83 | 80,016 | ||||||
| 3.95%, 01/15/28 (Call 10/15/27) |
25 | 23,787 | ||||||
| 4.00%, 02/01/50 (Call 08/01/49) |
165 | 124,303 | ||||||
| 4.50%, 07/30/29 (Call 04/30/29) |
135 | 129,438 | ||||||
| 4.70%, 07/01/30 (Call 04/01/30) |
117 | 112,459 | ||||||
| 4.85%, 04/15/49 (Call 10/15/48) |
117 | 102,244 | ||||||
| 4.90%, 12/15/30 (Call 09/15/30) |
119 | 115,817 | ||||||
| 5.15%, 04/15/53 (Call 10/15/52) |
85 | 77,010 | ||||||
| American Homes 4 Rent LP |
||||||||
| 4.25%, 02/15/28 (Call 11/15/27) |
24 | 23,053 | ||||||
| 4.90%, 02/15/29 (Call 11/15/28) |
53 | 51,652 | ||||||
| American Tower Corp. |
||||||||
| 1.88%, 10/15/30 (Call 07/15/30) |
180 | 144,561 | ||||||
| 2.10%, 06/15/30 (Call 03/15/30) |
215 | 176,964 | ||||||
| 2.30%, 09/15/31 (Call 06/15/31) |
75 | 60,533 | ||||||
| 2.40%, 03/15/25 (Call 02/15/25) |
597 | 577,475 | ||||||
| 2.70%, 04/15/31 (Call 01/15/31) |
95 | 79,684 | ||||||
| 2.75%, 01/15/27 (Call 11/15/26) |
365 | 339,931 | ||||||
| 2.90%, 01/15/30 (Call 10/15/29) |
180 | 157,894 | ||||||
| 2.95%, 01/15/51 (Call 07/15/50)(b) |
305 | 193,212 | ||||||
| 3.10%, 06/15/50 (Call 12/15/49) |
319 | 208,433 | ||||||
| 3.13%, 01/15/27 (Call 10/15/26) |
310 | 292,347 | ||||||
| 3.38%, 10/15/26 (Call 07/15/26) |
430 | 410,049 | ||||||
| 3.55%, 07/15/27 (Call 04/15/27) |
295 | 279,639 | ||||||
| 3.60%, 01/15/28 (Call 10/15/27) |
510 | 479,926 | ||||||
| 3.70%, 10/15/49 (Call 04/15/49) |
287 | 209,612 | ||||||
| 3.80%, 08/15/29 (Call 05/15/29) |
315 | 291,566 | ||||||
| 3.95%, 03/15/29 (Call 12/15/28) |
181 | 169,863 | ||||||
| 4.00%, 06/01/25 (Call 03/01/25) |
607 | 595,041 | ||||||
| 4.05%, 03/15/32 (Call 12/15/31) |
65 | 59,110 | ||||||
| 4.40%, 02/15/26 (Call 11/15/25) |
565 | 555,585 | ||||||
| 5.25%, 07/15/28 (Call 06/15/28) |
90 | 89,721 | ||||||
| 5.50%, 03/15/28 (Call 02/15/28) |
140 | 140,578 | ||||||
| 5.55%, 07/15/33 (Call 04/15/33) |
250 | 249,928 | ||||||
| 5.65%, 03/15/33 (Call 12/15/32) |
140 | 140,783 | ||||||
| 5.90%, 11/15/33 (Call 08/15/33) |
55 | 56,401 | ||||||
| Security | Par (000) |
Value | ||||||
| Real Estate Investment Trusts (continued) | ||||||||
| AvalonBay Communities Inc. |
||||||||
| 2.30%, 03/01/30 (Call 12/01/29) |
$ | 77 | $ | 66,151 | ||||
| 3.20%, 01/15/28 (Call 10/15/27) |
30 | 28,111 | ||||||
| 3.30%, 06/01/29 (Call 03/01/29) |
72 | 66,380 | ||||||
| 3.90%, 10/15/46 (Call 04/15/46) |
39 | 30,460 | ||||||
| 4.35%, 04/15/48 (Call 10/18/47) |
107 | 90,289 | ||||||
| 5.00%, 02/15/33 (Call 11/15/32) |
290 | 284,427 | ||||||
| Boston Properties LP |
||||||||
| 2.45%, 10/01/33 (Call 07/01/33) |
230 | 169,739 | ||||||
| 2.55%, 04/01/32 (Call 01/01/32) |
130 | 101,017 | ||||||
| 2.75%, 10/01/26 (Call 07/01/26) |
400 | 370,317 | ||||||
| 2.90%, 03/15/30 (Call 12/15/29) |
170 | 143,689 | ||||||
| 3.25%, 01/30/31 (Call 10/30/30) |
264 | 222,265 | ||||||
| 3.40%, 06/21/29 (Call 03/21/29) |
256 | 225,911 | ||||||
| 3.65%, 02/01/26 (Call 11/03/25) |
592 | 569,302 | ||||||
| 4.50%, 12/01/28 (Call 09/01/28) |
100 | 94,482 | ||||||
| 6.50%, 01/15/34 (Call 10/15/33) |
120 | 122,698 | ||||||
| Brixmor Operating Partnership LP |
||||||||
| 3.90%, 03/15/27 (Call 12/15/26) |
65 | 61,924 | ||||||
| 4.05%, 07/01/30 (Call 04/01/30) |
304 | 279,163 | ||||||
| 4.13%, 06/15/26 (Call 03/15/26) |
40 | 38,721 | ||||||
| 4.13%, 05/15/29 (Call 02/15/29) |
20 | 18,686 | ||||||
| Camden Property Trust |
||||||||
| 2.80%, 05/15/30 (Call 02/15/30) |
90 | 79,087 | ||||||
| 3.15%, 07/01/29 (Call 04/01/29) |
55 | 50,034 | ||||||
| 3.35%, 11/01/49 (Call 05/01/49) |
30 | 21,388 | ||||||
| 4.10%, 10/15/28 (Call 07/15/28) |
15 | 14,445 | ||||||
| Corporate Office Properties LP |
||||||||
| 2.00%, 01/15/29 (Call 11/15/28) |
55 | 45,535 | ||||||
| 2.25%, 03/15/26 (Call 02/15/26) |
25 | 23,379 | ||||||
| Crown Castle Inc. |
||||||||
| 1.05%, 07/15/26 (Call 06/15/26) |
75 | 67,795 | ||||||
| 1.35%, 07/15/25 (Call 06/15/25) |
40 | 37,845 | ||||||
| 2.10%, 04/01/31 (Call 01/01/31) |
395 | 316,705 | ||||||
| 2.25%, 01/15/31 (Call 10/15/30) |
235 | 192,077 | ||||||
| 2.50%, 07/15/31 (Call 04/15/31) |
225 | 184,254 | ||||||
| 2.90%, 03/15/27 (Call 02/15/27) |
125 | 116,403 | ||||||
| 3.10%, 11/15/29 (Call 08/15/29) |
385 | 340,672 | ||||||
| 3.25%, 01/15/51 (Call 07/15/50) |
333 | 224,739 | ||||||
| 3.30%, 07/01/30 (Call 04/01/30) |
360 | 317,938 | ||||||
| 3.65%, 09/01/27 (Call 06/01/27) |
370 | 349,195 | ||||||
| 3.70%, 06/15/26 (Call 03/15/26) |
585 | 563,735 | ||||||
| 3.80%, 02/15/28 (Call 11/15/27) |
617 | 581,002 | ||||||
| 4.00%, 03/01/27 (Call 12/01/26) |
220 | 211,766 | ||||||
| 4.00%, 11/15/49 (Call 05/15/49) |
215 | 165,391 | ||||||
| 4.15%, 07/01/50 (Call 01/01/50) |
175 | 138,382 | ||||||
| 4.30%, 02/15/29 (Call 11/15/28) |
315 | 299,387 | ||||||
| 4.45%, 02/15/26 (Call 11/15/25) |
484 | 474,932 | ||||||
| 4.75%, 05/15/47 (Call 11/15/46) |
214 | 180,854 | ||||||
| 4.80%, 09/01/28 (Call 08/01/28) |
105 | 102,382 | ||||||
| 5.00%, 01/11/28 (Call 12/11/27) |
85 | 83,754 | ||||||
| 5.10%, 05/01/33 (Call 02/01/33) |
340 | 328,228 | ||||||
| 5.20%, 02/15/49 (Call 08/15/48) |
206 | 186,328 | ||||||
| 5.60%, 06/01/29 (Call 05/01/29) |
200 | 201,327 | ||||||
| 5.80%, 03/01/34 (Call 12/01/33) |
180 | 182,608 | ||||||
| CubeSmart LP |
||||||||
| 3.00%, 02/15/30 (Call 11/15/29) |
30 | 26,187 | ||||||
| 4.38%, 02/15/29 (Call 11/15/28)(b) |
5 | 4,755 | ||||||
| Digital Realty Trust LP |
||||||||
| 3.60%, 07/01/29 (Call 04/01/29) |
654 | 602,971 | ||||||
| 3.70%, 08/15/27 (Call 05/15/27) |
124 | 118,180 | ||||||
| 64 | 2 0 2 4 I S H A R E S A N N U A L R E P O R T T O S H A R E H O L D E R S |
| Schedule of Investments (continued) February 29, 2024 |
iShares® ESG Aware U.S. Aggregate Bond ETF (Percentages shown are based on Net Assets) |
| Security | Par (000) |
Value | ||||||
| Real Estate Investment Trusts (continued) | ||||||||
| 4.45%, 07/15/28 (Call 04/15/28) |
$ | 277 | $ | 268,011 | ||||
| 5.55%, 01/15/28 (Call 12/15/27) |
210 | 212,126 | ||||||
| Equinix Inc. |
||||||||
| 2.15%, 07/15/30 (Call 04/15/30) |
755 | 626,018 | ||||||
| 2.50%, 05/15/31 (Call 02/15/31) |
165 | 137,783 | ||||||
| 2.90%, 11/18/26 (Call 09/18/26) |
430 | 404,899 | ||||||
| 2.95%, 09/15/51 (Call 03/15/51) |
160 | 101,683 | ||||||
| 3.00%, 07/15/50 (Call 01/15/50) |
382 | 247,708 | ||||||
| 3.20%, 11/18/29 (Call 08/18/29) |
668 | 600,360 | ||||||
| 3.40%, 02/15/52 (Call 08/15/51) |
95 | 65,836 | ||||||
| ERP Operating LP |
||||||||
| 2.50%, 02/15/30 (Call 11/15/29) |
129 | 111,999 | ||||||
| 2.85%, 11/01/26 (Call 08/01/26) |
22 | 20,759 | ||||||
| 3.00%, 07/01/29 (Call 04/01/29) |
62 | 56,176 | ||||||
| 3.25%, 08/01/27 (Call 05/01/27) |
15 | 14,086 | ||||||
| 3.50%, 03/01/28 (Call 12/01/27) |
44 | 41,552 | ||||||
| 4.00%, 08/01/47 (Call 02/01/47) |
10 | 7,694 | ||||||
| 4.15%, 12/01/28 (Call 09/01/28) |
10 | 9,669 | ||||||
| 4.50%, 07/01/44 (Call 01/01/44) |
60 | 51,590 | ||||||
| 4.50%, 06/01/45 (Call 12/01/44) |
36 | 30,037 | ||||||
| Essex Portfolio LP |
||||||||
| 3.00%, 01/15/30 (Call 10/15/29) |
30 | 26,320 | ||||||
| 4.00%, 03/01/29 (Call 12/01/28) |
60 | 56,823 | ||||||
| 4.50%, 03/15/48 (Call 09/15/47) |
30 | 25,092 | ||||||
| Federal Realty OP LP |
||||||||
| 3.20%, 06/15/29 (Call 03/15/29) |
124 | 110,798 | ||||||
| 3.25%, 07/15/27 (Call 04/15/27) |
575 | 537,141 | ||||||
| 3.50%, 06/01/30 (Call 03/01/30) |
800 | 717,507 | ||||||
| 4.50%, 12/01/44 (Call 06/01/44) |
85 | 69,173 | ||||||
| 5.38%, 05/01/28 (Call 04/01/28) |
880 | 877,017 | ||||||
| GLP Capital LP/GLP Financing II Inc. |
||||||||
| 3.25%, 01/15/32 (Call 10/15/31) |
5 | 4,148 | ||||||
| 4.00%, 01/15/30 (Call 10/15/29) |
24 | 21,597 | ||||||
| 5.30%, 01/15/29 (Call 10/15/28) |
67 | 65,066 | ||||||
| Healthcare Realty Holdings LP, 3.10%, 02/15/30 (Call 11/15/29) |
15 | 12,925 | ||||||
| Healthpeak OP LLC |
||||||||
| 3.00%, 01/15/30 (Call 10/15/29) |
379 | 332,528 | ||||||
| 3.25%, 07/15/26 (Call 05/15/26) |
320 | 305,679 | ||||||
| 3.50%, 07/15/29 (Call 04/15/29) |
371 | 338,971 | ||||||
| 4.00%, 06/01/25 (Call 03/01/25) |
77 | 75,543 | ||||||
| 5.25%, 12/15/32 (Call 09/15/32)(b) |
110 | 107,549 | ||||||
| 6.75%, 02/01/41 (Call 08/01/40) |
155 | 169,770 | ||||||
| Highwoods Realty LP |
||||||||
| 3.05%, 02/15/30 (Call 11/15/29) |
165 | 138,132 | ||||||
| 4.20%, 04/15/29 (Call 01/15/29) |
40 | 36,055 | ||||||
| Host Hotels & Resorts LP |
||||||||
| Series F, 4.50%, 02/01/26 (Call 11/01/25) |
150 | 146,822 | ||||||
| Series H, 3.38%, 12/15/29 (Call 09/15/29) |
185 | 163,675 | ||||||
| Series I, 3.50%, 09/15/30 (Call 06/15/30) |
375 | 330,594 | ||||||
| Series J, 2.90%, 12/15/31 (Call 09/15/31) |
55 | 45,412 | ||||||
| Kilroy Realty LP |
||||||||
| 2.50%, 11/15/32 (Call 08/15/32) |
270 | 200,080 | ||||||
| 3.05%, 02/15/30 (Call 11/15/29) |
340 | 284,786 | ||||||
| 4.25%, 08/15/29 (Call 05/15/29) |
245 | 223,543 | ||||||
| 4.75%, 12/15/28 (Call 09/15/28) |
220 | 207,194 | ||||||
| Kimco Realty OP LLC |
||||||||
| 2.80%, 10/01/26 (Call 07/01/26) |
75 | 70,272 | ||||||
| 3.70%, 10/01/49 (Call 04/01/49) |
52 | 37,385 | ||||||
| 3.80%, 04/01/27 (Call 01/01/27) |
25 | 23,956 | ||||||
| 4.13%, 12/01/46 (Call 06/01/46) |
117 | 89,064 | ||||||
| Security | Par (000) |
Value | ||||||
| Real Estate Investment Trusts (continued) | ||||||||
| 4.25%, 04/01/45 (Call 10/01/44) |
$ | 80 | $ | 62,603 | ||||
| 4.45%, 09/01/47 (Call 03/01/47) |
100 | 79,623 | ||||||
| Mid-America Apartments LP |
||||||||
| 2.75%, 03/15/30 (Call 12/15/29) |
12 | 10,546 | ||||||
| 3.95%, 03/15/29 (Call 12/15/28) |
22 | 20,992 | ||||||
| 4.20%, 06/15/28 (Call 03/15/28) |
2 | 1,935 | ||||||
| NNN REIT Inc. |
||||||||
| 2.50%, 04/15/30 (Call 01/15/30) |
15 | 12,693 | ||||||
| 3.10%, 04/15/50 (Call 10/15/49) |
25 | 16,186 | ||||||
| 4.30%, 10/15/28 (Call 07/15/28) |
45 | 43,203 | ||||||
| 4.80%, 10/15/48 (Call 04/15/48) |
30 | 25,750 | ||||||
| 5.60%, 10/15/33 (Call 07/15/33) |
50 | 49,827 | ||||||
| Omega Healthcare Investors Inc. |
||||||||
| 3.25%, 04/15/33 (Call 01/15/33) |
240 | 190,781 | ||||||
| 3.38%, 02/01/31 (Call 11/01/30) |
30 | 25,255 | ||||||
| 3.63%, 10/01/29 (Call 07/01/29) |
152 | 133,485 | ||||||
| Physicians Realty LP, 3.95%, 01/15/28 (Call 10/15/27) |
5 | 4,757 | ||||||
| Piedmont Operating Partnership LP, 3.15%, 08/15/30 (Call 05/15/30) |
160 | 122,757 | ||||||
| Prologis LP |
||||||||
| 2.13%, 04/15/27 (Call 02/15/27) |
210 | 192,708 | ||||||
| 2.13%, 10/15/50 (Call 04/15/50)(b) |
100 | 54,601 | ||||||
| 2.25%, 04/15/30 (Call 01/15/30) |
234 | 200,655 | ||||||
| 2.25%, 01/15/32 (Call 10/15/31) |
15 | 12,252 | ||||||
| 2.88%, 11/15/29 (Call 08/15/29) |
30 | 26,938 | ||||||
| 3.00%, 04/15/50 (Call 10/15/49) |
106 | 71,681 | ||||||
| 3.05%, 03/01/50 (Call 09/01/49) |
66 | 44,787 | ||||||
| 3.25%, 06/30/26 (Call 03/30/26) |
27 | 25,934 | ||||||
| 3.25%, 10/01/26 (Call 07/01/26) |
32 | 30,558 | ||||||
| 3.38%, 12/15/27 (Call 09/15/27) |
10 | 9,440 | ||||||
| 3.88%, 09/15/28 (Call 06/15/28) |
375 | 358,776 | ||||||
| 4.00%, 09/15/28 (Call 06/15/28) |
20 | 19,253 | ||||||
| 4.38%, 02/01/29 (Call 11/01/28) |
70 | 68,347 | ||||||
| 4.38%, 09/15/48 (Call 03/15/48) |
125 | 106,215 | ||||||
| 4.63%, 01/15/33 (Call 10/15/32) |
135 | 129,898 | ||||||
| 4.75%, 06/15/33 (Call 03/15/33) |
185 | 179,191 | ||||||
| 4.88%, 06/15/28 (Call 05/15/28) |
85 | 84,878 | ||||||
| 5.13%, 01/15/34 (Call 10/15/33) |
100 | 98,980 | ||||||
| 5.25%, 06/15/53 (Call 12/15/52) |
50 | 48,451 | ||||||
| Realty Income Corp. |
||||||||
| 1.80%, 03/15/33 (Call 12/15/32) |
40 | 30,037 | ||||||
| 3.25%, 06/15/29 (Call 03/15/29) |
20 | 18,298 | ||||||
| 3.65%, 01/15/28 (Call 10/15/27) |
102 | 96,688 | ||||||
| 4.65%, 03/15/47 (Call 09/15/46) |
88 | 76,752 | ||||||
| 4.90%, 07/15/33 (Call 04/15/33) |
140 | 133,571 | ||||||
| Regency Centers LP |
||||||||
| 2.95%, 09/15/29 (Call 06/15/29) |
150 | 132,721 | ||||||
| 3.60%, 02/01/27 (Call 11/01/26) |
80 | 76,500 | ||||||
| 4.13%, 03/15/28 (Call 12/15/27) |
62 | 59,212 | ||||||
| 4.40%, 02/01/47 (Call 08/01/46) |
70 | 56,007 | ||||||
| 4.65%, 03/15/49 (Call 09/15/48) |
70 | 59,255 | ||||||
| Sabra Health Care LP |
||||||||
| 3.20%, 12/01/31 (Call 09/01/31) |
110 | 89,344 | ||||||
| 3.90%, 10/15/29 (Call 07/15/29) |
130 | 115,792 | ||||||
| Simon Property Group LP |
||||||||
| 2.45%, 09/13/29 (Call 06/13/29) |
210 | 182,953 | ||||||
| 3.25%, 09/13/49 (Call 03/13/49) |
235 | 163,408 | ||||||
| 3.38%, 06/15/27 (Call 03/15/27) |
20 | 18,982 | ||||||
| 3.38%, 12/01/27 (Call 09/01/27) |
175 | 165,062 | ||||||
| 3.80%, 07/15/50 (Call 01/15/50) |
144 | 108,823 | ||||||
| S C H E D U L E O F I N V E S T M E N T S |
65 |
| Schedule of Investments (continued) February 29, 2024 |
iShares® ESG Aware U.S. Aggregate Bond ETF (Percentages shown are based on Net Assets) |
| Security | Par (000) |
Value | ||||||
| Real Estate Investment Trusts (continued) | ||||||||
| 4.25%, 10/01/44 (Call 04/01/44) |
$ | 50 | $ | 40,861 | ||||
| 4.25%, 11/30/46 (Call 05/30/46) |
32 | 25,969 | ||||||
| 5.50%, 03/08/33 (Call 12/08/32)(b) |
170 | 171,449 | ||||||
| 6.75%, 02/01/40 (Call 11/01/39) |
44 | 48,414 | ||||||
| SITE Centers Corp., 4.70%, 06/01/27 (Call 03/01/27) |
137 | 134,642 | ||||||
| Store Capital LLC, 4.63%, 03/15/29 (Call 12/15/28) |
59 | 55,042 | ||||||
| UDR Inc. |
||||||||
| 3.00%, 08/15/31 (Call 05/15/31) |
100 | 85,790 | ||||||
| 3.20%, 01/15/30 (Call 10/15/29) |
45 | 40,257 | ||||||
| 3.50%, 01/15/28 (Call 10/15/27) |
30 | 27,975 | ||||||
| 4.40%, 01/26/29 (Call 10/26/28) |
45 | 43,072 | ||||||
| Ventas Realty LP |
||||||||
| 3.00%, 01/15/30 (Call 10/15/29) |
75 | 65,462 | ||||||
| 3.25%, 10/15/26 (Call 07/15/26) |
65 | 61,366 | ||||||
| 3.85%, 04/01/27 (Call 01/01/27) |
110 | 104,858 | ||||||
| 4.00%, 03/01/28 (Call 12/01/27) |
45 | 42,823 | ||||||
| 4.13%, 01/15/26 (Call 10/15/25) |
160 | 155,756 | ||||||
| 4.38%, 02/01/45 (Call 08/01/44) |
76 | 60,175 | ||||||
| 4.40%, 01/15/29 (Call 10/15/28) |
257 | 246,059 | ||||||
| 4.75%, 11/15/30 (Call 08/15/30) |
65 | 62,178 | ||||||
| 4.88%, 04/15/49 (Call 10/15/48) |
119 | 100,682 | ||||||
| 5.70%, 09/30/43 (Call 03/30/43) |
128 | 120,913 | ||||||
| VICI Properties LP |
||||||||
| 4.95%, 02/15/30 (Call 12/15/29) |
20 | 19,089 | ||||||
| 5.13%, 05/15/32 (Call 02/15/32) |
215 | 201,924 | ||||||
| 5.63%, 05/15/52 (Call 11/15/51) |
185 | 166,781 | ||||||
| Welltower OP LLC |
||||||||
| 2.70%, 02/15/27 (Call 12/15/26) |
240 | 224,128 | ||||||
| 2.75%, 01/15/31 (Call 10/15/30) |
180 | 153,435 | ||||||
| 2.75%, 01/15/32 (Call 10/15/31) |
620 | 515,463 | ||||||
| 2.80%, 06/01/31 (Call 03/01/31) |
105 | 89,085 | ||||||
| 3.10%, 01/15/30 (Call 10/15/29) |
215 | 191,721 | ||||||
| 3.85%, 06/15/32 (Call 03/15/32) |
315 | 282,397 | ||||||
| 4.00%, 06/01/25 (Call 03/01/25) |
450 | 441,728 | ||||||
| 4.13%, 03/15/29 (Call 12/15/28) |
200 | 190,140 | ||||||
| 4.25%, 04/01/26 (Call 01/01/26) |
336 | 329,438 | ||||||
| 4.25%, 04/15/28 (Call 01/15/28) |
219 | 211,824 | ||||||
| 4.95%, 09/01/48 (Call 03/01/48) |
158 | 142,072 | ||||||
| 6.50%, 03/15/41 (Call 09/15/40) |
210 | 226,919 | ||||||
| Weyerhaeuser Co. |
||||||||
| 4.00%, 11/15/29 (Call 08/15/29) |
469 | 440,443 | ||||||
| 4.00%, 04/15/30 (Call 01/15/30) |
522 | 487,835 | ||||||
| 4.75%, 05/15/26 |
35 | 34,583 | ||||||
| 6.95%, 10/01/27 |
210 | 222,670 | ||||||
| 7.38%, 03/15/32 |
270 | 304,845 | ||||||
| WP Carey Inc., 3.85%, 07/15/29 (Call 04/15/29) |
60 | 55,511 | ||||||
|
|
|
|||||||
| 37,057,531 | ||||||||
| Retail — 0.7% | ||||||||
| AutoNation Inc. |
||||||||
| 3.80%, 11/15/27 (Call 08/15/27) |
197 | 183,287 | ||||||
| 3.85%, 03/01/32 (Call 12/01/31) |
35 | 30,545 | ||||||
| 4.75%, 06/01/30 (Call 03/01/30) |
296 | 281,416 | ||||||
| AutoZone Inc., 4.75%, 02/01/33 (Call 11/01/32) |
5 | 4,789 | ||||||
| Best Buy Co. Inc. |
||||||||
| 1.95%, 10/01/30 (Call 07/01/30) |
1,930 | 1,585,144 | ||||||
| 4.45%, 10/01/28 (Call 07/01/28)(b) |
1,651 | 1,616,864 | ||||||
| Darden Restaurants Inc., 4.55%, 02/15/48 (Call 08/15/47) |
93 | 75,490 | ||||||
| Security | Par (000) |
Value | ||||||
| Retail (continued) | ||||||||
| Dollar General Corp. |
||||||||
| 4.13%, 04/03/50 (Call 10/03/49) |
$ | 144 | $ | 110,017 | ||||
| 5.20%, 07/05/28 (Call 06/05/28)(b) |
65 | 64,926 | ||||||
| 5.45%, 07/05/33 (Call 04/05/33)(b) |
80 | 79,386 | ||||||
| Dollar Tree Inc., 3.38%, 12/01/51 (Call 06/01/51) |
65 | 42,951 | ||||||
| Home Depot Inc. (The) |
||||||||
| 2.13%, 09/15/26 (Call 06/15/26) |
235 | 219,605 | ||||||
| 2.50%, 04/15/27 (Call 02/15/27) |
382 | 355,803 | ||||||
| 2.70%, 04/15/30 (Call 01/15/30) |
638 | 564,391 | ||||||
| 2.80%, 09/14/27 (Call 06/14/27) |
140 | 131,184 | ||||||
| 2.95%, 06/15/29 (Call 03/15/29) |
1,270 | 1,159,238 | ||||||
| 3.00%, 04/01/26 (Call 01/01/26) |
30 | 28,900 | ||||||
| 3.13%, 12/15/49 (Call 06/15/49) |
210 | 146,131 | ||||||
| 3.25%, 04/15/32 (Call 01/15/32) |
155 | 137,469 | ||||||
| 3.30%, 04/15/40 (Call 10/15/39) |
101 | 79,153 | ||||||
| 3.35%, 09/15/25 (Call 06/15/25) |
570 | 556,059 | ||||||
| 3.35%, 04/15/50 (Call 10/15/49) |
147 | 106,540 | ||||||
| 3.50%, 09/15/56 (Call 03/15/56) |
155 | 113,518 | ||||||
| 3.63%, 04/15/52 (Call 10/15/51) |
220 | 166,292 | ||||||
| 3.90%, 12/06/28 (Call 09/06/28) |
675 | 653,170 | ||||||
| 3.90%, 06/15/47 (Call 12/15/46) |
255 | 205,402 | ||||||
| 4.00%, 09/15/25 (Call 08/15/25) |
65 | 63,977 | ||||||
| 4.20%, 04/01/43 (Call 10/01/42) |
175 | 150,736 | ||||||
| 4.25%, 04/01/46 (Call 10/01/45) |
289 | 246,703 | ||||||
| 4.40%, 03/15/45 (Call 09/15/44) |
215 | 188,689 | ||||||
| 4.50%, 09/15/32 (Call 06/15/32) |
315 | 307,850 | ||||||
| 4.50%, 12/06/48 (Call 06/06/48) |
305 | 269,126 | ||||||
| 4.88%, 02/15/44 (Call 08/15/43) |
175 | 164,169 | ||||||
| 4.90%, 04/15/29 (Call 03/15/29) |
125 | 125,448 | ||||||
| 4.95%, 09/30/26 (Call 08/30/26) |
125 | 125,058 | ||||||
| 4.95%, 09/15/52 (Call 03/15/52)(b) |
40 | 37,850 | ||||||
| 5.13%, 04/30/25 |
125 | 125,043 | ||||||
| 5.40%, 09/15/40 (Call 03/15/40) |
155 | 155,906 | ||||||
| 5.88%, 12/16/36 |
630 | 671,097 | ||||||
| 5.95%, 04/01/41 (Call 10/01/40) |
306 | 326,474 | ||||||
| Lowe’s Companies Inc. |
||||||||
| 1.70%, 10/15/30 (Call 07/15/30) |
20 | 16,216 | ||||||
| 2.50%, 04/15/26 (Call 01/15/26) |
204 | 193,653 | ||||||
| 2.63%, 04/01/31 (Call 01/01/31) |
245 | 208,917 | ||||||
| 3.00%, 10/15/50 (Call 04/15/50) |
153 | 98,706 | ||||||
| 3.10%, 05/03/27 (Call 02/03/27) |
185 | 174,830 | ||||||
| 3.38%, 09/15/25 (Call 06/15/25) |
490 | 476,673 | ||||||
| 3.65%, 04/05/29 (Call 01/05/29) |
365 | 344,137 | ||||||
| 3.70%, 04/15/46 (Call 10/15/45) |
300 | 225,824 | ||||||
| 3.75%, 04/01/32 (Call 01/01/32) |
135 | 122,514 | ||||||
| 4.00%, 04/15/25 (Call 03/15/25) |
415 | 409,006 | ||||||
| 4.05%, 05/03/47 (Call 11/03/46) |
280 | 221,819 | ||||||
| 4.25%, 04/01/52 (Call 10/01/51) |
140 | 112,576 | ||||||
| 4.38%, 09/15/45 (Call 03/15/45) |
204 | 172,910 | ||||||
| 4.40%, 09/08/25 |
60 | 59,270 | ||||||
| 4.45%, 04/01/62 (Call 10/01/61) |
350 | 279,810 | ||||||
| 4.50%, 04/15/30 (Call 01/15/30) |
370 | 359,455 | ||||||
| 4.55%, 04/05/49 (Call 10/05/48) |
230 | 194,471 | ||||||
| 4.65%, 04/15/42 (Call 10/15/41) |
105 | 93,910 | ||||||
| 4.80%, 04/01/26 (Call 03/01/26) |
130 | 129,143 | ||||||
| 5.00%, 04/15/33 (Call 01/15/33)(b) |
260 | 256,222 | ||||||
| 5.00%, 04/15/40 (Call 10/15/39) |
129 | 122,568 | ||||||
| 5.13%, 04/15/50 (Call 10/15/49) |
141 | 130,053 | ||||||
| 5.15%, 07/01/33 (Call 04/01/33) |
175 | 174,161 | ||||||
| 5.50%, 10/15/35 |
73 | 75,080 | ||||||
| 5.63%, 04/15/53 (Call 10/15/52) |
90 | 89,427 | ||||||
| 66 | 2 0 2 4 I S H A R E S A N N U A L R E P O R T T O S H A R E H O L D E R S |
| Schedule of Investments (continued) February 29, 2024 |
iShares® ESG Aware U.S. Aggregate Bond ETF (Percentages shown are based on Net Assets) |
| Security | Par (000) |
Value | ||||||
| Retail (continued) | ||||||||
| 5.80%, 09/15/62 (Call 03/15/62) |
$ | 170 | $ | 169,705 | ||||
| 5.85%, 04/01/63 (Call 10/01/62) |
90 | 90,804 | ||||||
| 6.50%, 03/15/29 |
190 | 203,233 | ||||||
| McDonald’s Corp. |
||||||||
| 3.63%, 05/01/43 |
93 | 73,242 | ||||||
| 3.63%, 09/01/49 (Call 03/01/49) |
87 | 64,948 | ||||||
| 3.70%, 02/15/42 |
70 | 56,265 | ||||||
| 3.80%, 04/01/28 (Call 01/01/28) |
25 | 23,999 | ||||||
| 4.20%, 04/01/50 (Call 10/01/49) |
162 | 133,467 | ||||||
| 4.45%, 03/01/47 (Call 09/01/46) |
367 | 315,324 | ||||||
| 4.45%, 09/01/48 (Call 03/01/48) |
166 | 143,419 | ||||||
| 4.60%, 05/26/45 (Call 11/26/44) |
100 | 88,979 | ||||||
| 4.70%, 12/09/35 (Call 06/09/35) |
134 | 128,701 | ||||||
| 4.88%, 07/15/40 |
70 | 66,758 | ||||||
| 4.88%, 12/09/45 (Call 06/09/45) |
200 | 183,789 | ||||||
| 4.95%, 08/14/33 (Call 05/14/33) |
45 | 44,589 | ||||||
| 5.45%, 08/14/53 (Call 02/14/53) |
75 | 74,473 | ||||||
| 5.70%, 02/01/39 |
141 | 145,152 | ||||||
| 6.30%, 10/15/37 |
57 | 62,075 | ||||||
| 6.30%, 03/01/38 |
30 | 32,642 | ||||||
| O’Reilly Automotive Inc., 4.20%, 04/01/30 (Call 01/01/30) |
92 | 87,328 | ||||||
| Starbucks Corp. |
||||||||
| 2.00%, 03/12/27 (Call 01/12/27)(b) |
205 | 187,839 | ||||||
| 2.25%, 03/12/30 (Call 12/12/29) |
185 | 158,204 | ||||||
| 3.35%, 03/12/50 (Call 09/12/49) |
175 | 123,513 | ||||||
| 3.50%, 03/01/28 (Call 12/01/27) |
171 | 162,111 | ||||||
| 3.50%, 11/15/50 (Call 05/15/50) |
315 | 229,999 | ||||||
| 3.55%, 08/15/29 (Call 05/15/29) |
230 | 215,615 | ||||||
| 3.75%, 12/01/47 (Call 06/01/47) |
218 | 168,165 | ||||||
| 4.00%, 11/15/28 (Call 08/15/28) |
127 | 122,669 | ||||||
| 4.30%, 06/15/45 (Call 12/15/44) |
77 | 65,721 | ||||||
| 4.45%, 08/15/49 (Call 02/15/49) |
191 | 163,415 | ||||||
| 4.50%, 11/15/48 (Call 05/15/48) |
230 | 198,774 | ||||||
| 4.75%, 02/15/26 (Call 01/15/26) |
50 | 49,671 | ||||||
| 4.80%, 02/15/33 (Call 11/15/32)(b) |
100 | 98,598 | ||||||
| Target Corp. |
||||||||
| 2.25%, 04/15/25 (Call 03/15/25) |
487 | 471,835 | ||||||
| 2.35%, 02/15/30 (Call 11/15/29) |
226 | 197,137 | ||||||
| 2.50%, 04/15/26 |
345 | 329,509 | ||||||
| 2.65%, 09/15/30 (Call 06/15/30) |
200 | 175,413 | ||||||
| 2.95%, 01/15/52 (Call 07/15/51) |
105 | 69,703 | ||||||
| 3.38%, 04/15/29 (Call 01/15/29) |
520 | 487,359 | ||||||
| 3.63%, 04/15/46 |
221 | 172,381 | ||||||
| 3.90%, 11/15/47 (Call 05/15/47) |
100 | 81,533 | ||||||
| 4.00%, 07/01/42 |
186 | 160,058 | ||||||
| 4.40%, 01/15/33 (Call 10/15/32) |
185 | 178,532 | ||||||
| 4.80%, 01/15/53 (Call 07/15/52)(b) |
180 | 166,112 | ||||||
| 6.50%, 10/15/37 |
185 | 206,677 | ||||||
| 7.00%, 01/15/38 |
160 | 186,853 | ||||||
| TJX Companies Inc. (The) |
||||||||
| 3.88%, 04/15/30 (Call 01/15/30) |
157 | 148,855 | ||||||
| 4.50%, 04/15/50 (Call 10/15/49) |
71 | 64,684 | ||||||
| Tractor Supply Co. |
||||||||
| 1.75%, 11/01/30 (Call 08/01/30) |
349 | 281,013 | ||||||
| 5.25%, 05/15/33 (Call 02/15/33) |
340 | 337,889 | ||||||
|
|
|
|||||||
| 24,245,876 | ||||||||
| Semiconductors — 1.0% | ||||||||
| Analog Devices Inc., 5.30%, 12/15/45 (Call 06/15/45) |
20 | 19,514 | ||||||
| Security | Par (000) |
Value | ||||||
| Semiconductors (continued) | ||||||||
| Applied Materials Inc. |
||||||||
| 1.75%, 06/01/30 (Call 03/01/30) |
$ | 615 | $ | 512,894 | ||||
| 2.75%, 06/01/50 (Call 12/01/49) |
125 | 84,063 | ||||||
| 3.30%, 04/01/27 (Call 01/01/27) |
1,031 | 986,869 | ||||||
| 3.90%, 10/01/25 (Call 07/01/25) |
172 | 168,983 | ||||||
| 4.35%, 04/01/47 (Call 10/01/46) |
266 | 235,853 | ||||||
| 5.10%, 10/01/35 (Call 04/01/35) |
540 | 546,589 | ||||||
| 5.85%, 06/15/41 |
210 | 225,863 | ||||||
| Broadcom Inc. |
||||||||
| 3.14%, 11/15/35 (Call 08/15/35)(e) |
285 | 225,886 | ||||||
| 3.19%, 11/15/36 (Call 08/15/36)(e) |
114 | 89,093 | ||||||
| 3.42%, 04/15/33 (Call 01/15/33)(e) |
519 | 443,196 | ||||||
| 3.47%, 04/15/34 (Call 01/15/34)(e) |
649 | 547,976 | ||||||
| 3.50%, 02/15/41 (Call 08/15/40)(e) |
243 | 185,663 | ||||||
| 3.75%, 02/15/51 (Call 08/15/50)(e) |
149 | 111,404 | ||||||
| 4.15%, 04/15/32 (Call 01/15/32)(e) |
165 | 151,481 | ||||||
| 4.93%, 05/15/37 (Call 02/15/37)(e) |
422 | 393,204 | ||||||
| Intel Corp. |
||||||||
| 1.60%, 08/12/28 (Call 06/12/28) |
1,130 | 982,875 | ||||||
| 2.45%, 11/15/29 (Call 08/15/29) |
640 | 560,470 | ||||||
| 2.60%, 05/19/26 (Call 02/19/26) |
471 | 447,987 | ||||||
| 3.05%, 08/12/51 (Call 02/12/51) |
75 | 49,563 | ||||||
| 3.10%, 02/15/60 (Call 08/15/59) |
172 | 108,717 | ||||||
| 3.15%, 05/11/27 (Call 02/11/27) |
320 | 303,239 | ||||||
| 3.20%, 08/12/61 (Call 02/12/61) |
310 | 199,438 | ||||||
| 3.25%, 11/15/49 (Call 05/15/49) |
305 | 210,728 | ||||||
| 3.40%, 03/25/25 (Call 02/25/25) |
652 | 639,402 | ||||||
| 3.70%, 07/29/25 (Call 04/29/25) |
1,804 | 1,766,896 | ||||||
| 3.73%, 12/08/47 (Call 06/08/47) |
489 | 370,636 | ||||||
| 3.75%, 03/25/27 (Call 01/25/27) |
478 | 462,336 | ||||||
| 3.90%, 03/25/30 (Call 12/25/29) |
267 | 251,048 | ||||||
| 4.00%, 12/15/32 |
246 | 227,039 | ||||||
| 4.10%, 05/19/46 (Call 11/19/45) |
144 | 118,914 | ||||||
| 4.10%, 05/11/47 (Call 11/11/46) |
255 | 209,708 | ||||||
| 4.15%, 08/05/32 (Call 05/05/32) |
205 | 192,645 | ||||||
| 4.25%, 12/15/42 |
375 | 319,702 | ||||||
| 4.60%, 03/25/40 (Call 09/25/39) |
200 | 185,536 | ||||||
| 4.75%, 03/25/50 (Call 09/25/49) |
283 | 251,327 | ||||||
| 4.80%, 10/01/41 |
140 | 130,698 | ||||||
| 4.88%, 02/10/26 |
120 | 119,614 | ||||||
| 4.88%, 02/10/28 (Call 01/10/28) |
280 | 279,221 | ||||||
| 4.90%, 07/29/45 (Call 01/29/45) |
127 | 120,128 | ||||||
| 4.90%, 08/05/52 (Call 02/05/52) |
130 | 119,113 | ||||||
| 4.95%, 03/25/60 (Call 09/25/59) |
165 | 150,514 | ||||||
| 5.00%, 02/21/31 (Call 12/21/30) |
105 | 104,342 | ||||||
| 5.05%, 08/05/62 (Call 02/05/62) |
80 | 73,833 | ||||||
| 5.13%, 02/10/30 (Call 12/10/29) |
315 | 317,484 | ||||||
| 5.15%, 02/21/34 (Call 11/21/33) |
135 | 133,675 | ||||||
| 5.20%, 02/10/33 (Call 11/10/32) |
475 | 475,203 | ||||||
| 5.60%, 02/21/54 (Call 08/21/53) |
70 | 69,988 | ||||||
| 5.63%, 02/10/43 (Call 08/10/42) |
105 | 106,718 | ||||||
| 5.70%, 02/10/53 (Call 08/10/52) |
245 | 247,586 | ||||||
| 5.90%, 02/10/63 (Call 08/10/62) |
230 | 239,596 | ||||||
| KLA Corp. |
||||||||
| 3.30%, 03/01/50 (Call 08/28/49) |
20 | 14,356 | ||||||
| 5.00%, 03/15/49 (Call 09/15/48) |
45 | 43,251 | ||||||
| 5.25%, 07/15/62 (Call 01/15/62) |
70 | 68,013 | ||||||
| Lam Research Corp. |
||||||||
| 1.90%, 06/15/30 (Call 03/15/30) |
675 | 566,466 | ||||||
| 2.88%, 06/15/50 (Call 12/15/49) |
216 | 146,036 | ||||||
| 3.13%, 06/15/60 (Call 12/15/59) |
165 | 108,171 | ||||||
| S C H E D U L E O F I N V E S T M E N T S |
67 |
| Schedule of Investments (continued) February 29, 2024 |
iShares® ESG Aware U.S. Aggregate Bond ETF (Percentages shown are based on Net Assets) |
| Security | Par (000) |
Value | ||||||
| Semiconductors (continued) | ||||||||
| 3.75%, 03/15/26 (Call 01/15/26) |
$ | 1,064 | $ | 1,038,374 | ||||
| 3.80%, 03/15/25 (Call 12/15/24) |
274 | 269,985 | ||||||
| 4.00%, 03/15/29 (Call 12/15/28) |
351 | 338,233 | ||||||
| 4.88%, 03/15/49 (Call 09/15/48) |
210 | 197,593 | ||||||
| Micron Technology Inc. |
||||||||
| 2.70%, 04/15/32 (Call 01/15/32) |
85 | 69,731 | ||||||
| 3.48%, 11/01/51 (Call 05/01/51) |
210 | 145,876 | ||||||
| 4.19%, 02/15/27 (Call 12/15/26) |
65 | 63,161 | ||||||
| 5.33%, 02/06/29 (Call 11/06/28) |
5 | 5,005 | ||||||
| 5.88%, 02/09/33 (Call 11/09/32) |
125 | 127,569 | ||||||
| 5.88%, 09/15/33 (Call 06/15/33)(b) |
40 | 40,769 | ||||||
| NVIDIA Corp. |
||||||||
| 2.00%, 06/15/31 (Call 03/15/31) |
870 | 726,799 | ||||||
| 2.85%, 04/01/30 (Call 01/01/30) |
810 | 729,400 | ||||||
| 3.20%, 09/16/26 (Call 06/16/26) |
1,510 | 1,455,539 | ||||||
| 3.50%, 04/01/40 (Call 10/01/39) |
290 | 242,875 | ||||||
| 3.50%, 04/01/50 (Call 10/01/49) |
307 | 240,522 | ||||||
| 3.70%, 04/01/60 (Call 10/01/59) |
210 | 165,168 | ||||||
| NXP BV/NXP Funding LLC |
||||||||
| 5.35%, 03/01/26 (Call 01/01/26) |
720 | 718,847 | ||||||
| 5.55%, 12/01/28 (Call 09/01/28) |
440 | 444,846 | ||||||
| NXP BV/NXP Funding LLC/NXP USA Inc. |
||||||||
| 2.50%, 05/11/31 (Call 02/11/31) |
445 | 368,419 | ||||||
| 2.65%, 02/15/32 (Call 11/15/31) |
480 | 394,057 | ||||||
| 3.13%, 02/15/42 (Call 08/15/41) |
30 | 21,322 | ||||||
| 3.15%, 05/01/27 (Call 03/01/27) |
55 | 51,707 | ||||||
| 3.25%, 05/11/41 (Call 11/11/40) |
180 | 132,279 | ||||||
| 3.25%, 11/30/51 (Call 05/30/51) |
214 | 143,935 | ||||||
| 3.40%, 05/01/30 (Call 02/01/30) |
220 | 196,942 | ||||||
| 3.88%, 06/18/26 (Call 04/18/26) |
165 | 159,667 | ||||||
| 4.30%, 06/18/29 (Call 03/18/29) |
655 | 625,295 | ||||||
| 4.40%, 06/01/27 (Call 05/01/27) |
530 | 517,781 | ||||||
| 5.00%, 01/15/33 (Call 10/15/32) |
305 | 294,733 | ||||||
| Qorvo Inc., 4.38%, 10/15/29 (Call 10/15/24) |
260 | 241,789 | ||||||
| QUALCOMM Inc. |
||||||||
| 4.30%, 05/20/47 (Call 11/20/46) |
275 | 238,361 | ||||||
| 4.50%, 05/20/52 (Call 11/20/51) |
85 | 74,868 | ||||||
| 4.65%, 05/20/35 (Call 11/20/34) |
65 | 63,552 | ||||||
| 4.80%, 05/20/45 (Call 11/20/44) |
259 | 243,078 | ||||||
| Skyworks Solutions Inc., 3.00%, 06/01/31 (Call 03/01/31) |
10 | 8,375 | ||||||
| Texas Instruments Inc. |
||||||||
| 1.13%, 09/15/26 (Call 08/15/26) |
490 | 447,154 | ||||||
| 1.38%, 03/12/25 (Call 02/12/25) |
928 | 892,651 | ||||||
| 1.75%, 05/04/30 (Call 02/04/30) |
490 | 410,040 | ||||||
| 1.90%, 09/15/31 (Call 06/15/31) |
230 | 189,814 | ||||||
| 2.25%, 09/04/29 (Call 06/04/29) |
564 | 497,749 | ||||||
| 2.70%, 09/15/51 (Call 03/15/51) |
220 | 141,189 | ||||||
| 2.90%, 11/03/27 (Call 08/03/27) |
670 | 628,900 | ||||||
| 3.65%, 08/16/32 (Call 05/16/32) |
510 | 468,369 | ||||||
| 3.88%, 03/15/39 (Call 09/15/38) |
243 | 213,608 | ||||||
| 4.10%, 08/16/52 (Call 02/16/52) |
50 | 41,836 | ||||||
| 4.15%, 05/15/48 (Call 11/15/47) |
300 | 254,759 | ||||||
| 4.60%, 02/08/27 (Call 01/08/27) |
75 | 74,741 | ||||||
| 4.60%, 02/15/28 (Call 01/15/28) |
35 | 34,937 | ||||||
| 4.60%, 02/08/29 (Call 01/08/29) |
85 | 84,541 | ||||||
| 4.85%, 02/08/34 (Call 11/08/33) |
80 | 79,520 | ||||||
| 4.90%, 03/14/33 (Call 12/14/32) |
460 | 460,377 | ||||||
| 5.00%, 03/14/53 (Call 09/14/52) |
60 | 57,960 | ||||||
| 5.05%, 05/18/63 (Call 11/18/62) |
115 | 109,996 | ||||||
| 5.15%, 02/08/54 (Call 08/08/53) |
75 | 74,314 | ||||||
| Security | Par (000) |
Value | ||||||
| Semiconductors (continued) | ||||||||
| TSMC Arizona Corp. |
||||||||
| 1.75%, 10/25/26 (Call 09/25/26) |
$ | 120 | $ | 110,207 | ||||
| 2.50%, 10/25/31 (Call 07/25/31) |
1,245 | 1,053,922 | ||||||
| 3.25%, 10/25/51 (Call 04/25/51) |
215 | 162,980 | ||||||
| 4.25%, 04/22/32 (Call 01/22/32) |
360 | 347,655 | ||||||
| 4.50%, 04/22/52 (Call 10/22/51) |
235 | 225,935 | ||||||
|
|
|
|||||||
| 34,280,349 | ||||||||
| Shipbuilding — 0.0% | ||||||||
| Huntington Ingalls Industries Inc. |
||||||||
| 2.04%, 08/16/28 (Call 06/16/28) |
45 | 39,124 | ||||||
| 3.48%, 12/01/27 (Call 09/01/27) |
480 | 449,718 | ||||||
| 3.84%, 05/01/25 (Call 04/01/25) |
685 | 670,060 | ||||||
| 4.20%, 05/01/30 (Call 02/01/30) |
274 | 257,601 | ||||||
|
|
|
|||||||
| 1,416,503 | ||||||||
| Software — 1.0% | ||||||||
| Adobe Inc. |
||||||||
| 2.15%, 02/01/27 (Call 12/01/26) |
849 | 790,277 | ||||||
| 2.30%, 02/01/30 (Call 11/01/29) |
2,620 | 2,285,448 | ||||||
| Autodesk Inc. |
||||||||
| 2.40%, 12/15/31 (Call 09/15/31) |
770 | 638,743 | ||||||
| 2.85%, 01/15/30 (Call 10/15/29) |
485 | 429,933 | ||||||
| 3.50%, 06/15/27 (Call 03/15/27) |
828 | 791,690 | ||||||
| 4.38%, 06/15/25 (Call 03/15/25) |
540 | 533,840 | ||||||
| Broadridge Financial Solutions Inc., 3.40%, 06/27/26 (Call 03/27/26) |
1,000 | 955,806 | ||||||
| Electronic Arts Inc. |
||||||||
| 2.95%, 02/15/51 (Call 08/15/50) |
750 | 498,412 | ||||||
| 4.80%, 03/01/26 (Call 12/01/25) |
519 | 516,232 | ||||||
| Fidelity National Information Services Inc. |
||||||||
| 4.50%, 08/15/46 (Call 02/15/46) |
182 | 149,172 | ||||||
| 5.10%, 07/15/32 (Call 04/15/32)(b) |
250 | 249,848 | ||||||
| 5.63%, 07/15/52 (Call 01/15/52) |
80 | 79,125 | ||||||
| Fiserv Inc. |
||||||||
| 3.50%, 07/01/29 (Call 04/01/29) |
10 | 9,195 | ||||||
| 3.85%, 06/01/25 (Call 03/01/25) |
2 | 1,960 | ||||||
| 4.40%, 07/01/49 (Call 01/01/49) |
228 | 190,685 | ||||||
| 5.38%, 08/21/28 (Call 07/21/28) |
50 | 50,309 | ||||||
| 5.63%, 08/21/33 (Call 05/21/33) |
125 | 126,404 | ||||||
| Intuit Inc. |
||||||||
| 1.35%, 07/15/27 (Call 05/15/27) |
65 | 57,989 | ||||||
| 5.20%, 09/15/33 (Call 06/15/33) |
600 | 605,994 | ||||||
| 5.50%, 09/15/53 (Call 03/15/53) |
5 | 5,156 | ||||||
| Microsoft Corp. |
||||||||
| 2.40%, 08/08/26 (Call 05/08/26) |
3,704 | 3,506,318 | ||||||
| 2.53%, 06/01/50 (Call 12/01/49) |
595 | 383,414 | ||||||
| 2.92%, 03/17/52 (Call 09/17/51) |
1,500 | 1,035,352 | ||||||
| 3.13%, 11/03/25 (Call 08/03/25) |
3,572 | 3,472,067 | ||||||
| 3.30%, 02/06/27 (Call 11/06/26) |
2,669 | 2,578,108 | ||||||
| 3.40%, 06/15/27 (Call 03/15/27)(e) |
5 | 4,799 | ||||||
| 3.45%, 08/08/36 (Call 02/08/36) |
620 | 546,155 | ||||||
| 3.50%, 02/12/35 (Call 08/12/34) |
750 | 680,421 | ||||||
| 3.50%, 11/15/42 |
50 | 41,903 | ||||||
| 3.70%, 08/08/46 (Call 02/08/46) |
235 | 195,485 | ||||||
| 3.75%, 02/12/45 (Call 08/12/44) |
10 | 8,543 | ||||||
| 3.95%, 08/08/56 (Call 02/08/56) |
25 | 21,044 | ||||||
| 4.00%, 02/12/55 (Call 08/12/54) |
105 | 91,085 | ||||||
| 4.10%, 02/06/37 (Call 08/06/36) |
235 | 221,399 | ||||||
| 4.20%, 11/03/35 (Call 05/03/35) |
165 | 159,455 | ||||||
| 4.25%, 02/06/47 (Call 08/06/46) |
70 | 64,478 | ||||||
| 4.45%, 11/03/45 (Call 05/03/45) |
180 | 171,622 | ||||||
| 68 | 2 0 2 4 I S H A R E S A N N U A L R E P O R T T O S H A R E H O L D E R S |
| Schedule of Investments (continued) February 29, 2024 |
iShares® ESG Aware U.S. Aggregate Bond ETF (Percentages shown are based on Net Assets) |
| Security | Par (000) |
Value | ||||||
| Software (continued) | ||||||||
| 4.50%, 06/15/47 (Call 12/15/46)(e) |
$ | 64 | $ | 59,609 | ||||
| Oracle Corp. |
||||||||
| 3.60%, 04/01/40 (Call 10/01/39) |
247 | 190,704 | ||||||
| 3.60%, 04/01/50 (Call 10/01/49) |
617 | 434,250 | ||||||
| 3.80%, 11/15/37 (Call 05/15/37) |
387 | 318,306 | ||||||
| 3.85%, 07/15/36 (Call 01/15/36) |
99 | 83,222 | ||||||
| 3.85%, 04/01/60 (Call 10/01/59) |
528 | 366,791 | ||||||
| 3.90%, 05/15/35 (Call 11/15/34) |
322 | 276,394 | ||||||
| 3.95%, 03/25/51 (Call 09/25/50) |
431 | 321,238 | ||||||
| 4.00%, 07/15/46 (Call 01/15/46) |
392 | 301,527 | ||||||
| 4.00%, 11/15/47 (Call 05/15/47) |
409 | 312,704 | ||||||
| 4.10%, 03/25/61 (Call 09/25/60) |
309 | 226,166 | ||||||
| 4.13%, 05/15/45 (Call 11/15/44) |
307 | 242,543 | ||||||
| 4.30%, 07/08/34 (Call 01/08/34) |
390 | 353,608 | ||||||
| 4.38%, 05/15/55 (Call 11/15/54) |
291 | 228,021 | ||||||
| 4.50%, 05/06/28 (Call 04/06/28) |
25 | 24,522 | ||||||
| 4.50%, 07/08/44 (Call 01/08/44) |
215 | 180,451 | ||||||
| 4.65%, 05/06/30 (Call 03/06/30) |
25 | 24,320 | ||||||
| 4.90%, 02/06/33 (Call 11/06/32) |
145 | 140,008 | ||||||
| 5.38%, 07/15/40 |
302 | 288,843 | ||||||
| 5.55%, 02/06/53 (Call 08/06/52) |
275 | 263,217 | ||||||
| 6.13%, 07/08/39 |
219 | 225,367 | ||||||
| 6.25%, 11/09/32 (Call 08/09/32) |
245 | 258,701 | ||||||
| 6.50%, 04/15/38 |
206 | 220,016 | ||||||
| 6.90%, 11/09/52 (Call 05/09/52) |
495 | 558,500 | ||||||
| Roper Technologies Inc., 2.95%, 09/15/29 (Call 06/15/29) |
130 | 116,371 | ||||||
| Salesforce Inc. |
||||||||
| 2.90%, 07/15/51 (Call 01/15/51) |
425 | 282,688 | ||||||
| 3.05%, 07/15/61 (Call 01/15/61) |
130 | 83,599 | ||||||
| 3.70%, 04/11/28 (Call 01/11/28) |
4,610 | 4,448,297 | ||||||
| ServiceNow Inc., 1.40%, 09/01/30 (Call 06/01/30) |
205 | 164,443 | ||||||
| VMware LLC |
||||||||
| 3.90%, 08/21/27 (Call 05/21/27) |
920 | 877,194 | ||||||
| 4.50%, 05/15/25 (Call 04/15/25) |
756 | 747,649 | ||||||
| 4.65%, 05/15/27 (Call 03/15/27) |
425 | 416,022 | ||||||
| 4.70%, 05/15/30 (Call 02/15/30) |
338 | 325,034 | ||||||
| Workday Inc. |
||||||||
| 3.50%, 04/01/27 (Call 03/01/27) |
270 | 257,023 | ||||||
| 3.70%, 04/01/29 (Call 02/01/29) |
405 | 378,523 | ||||||
| 3.80%, 04/01/32 (Call 01/01/32) |
700 | 632,744 | ||||||
|
|
|
|||||||
| 36,776,481 | ||||||||
| Telecommunications — 1.0% | ||||||||
| America Movil SAB de CV |
||||||||
| 4.38%, 04/22/49 (Call 10/22/48) |
120 | 103,181 | ||||||
| 6.13%, 11/15/37 |
57 | 59,851 | ||||||
| 6.13%, 03/30/40 |
317 | 331,746 | ||||||
| 6.38%, 03/01/35 |
145 | 157,108 | ||||||
| AT&T Inc. |
||||||||
| 3.30%, 02/01/52 (Call 08/01/51) |
130 | 88,162 | ||||||
| 3.50%, 06/01/41 (Call 12/01/40) |
305 | 234,115 | ||||||
| 3.50%, 09/15/53 (Call 03/15/53) |
869 | 597,841 | ||||||
| 3.50%, 02/01/61 (Call 08/01/60) |
185 | 123,477 | ||||||
| 3.55%, 09/15/55 (Call 03/15/55) |
1,096 | 746,707 | ||||||
| 3.65%, 06/01/51 (Call 12/01/50) |
494 | 353,309 | ||||||
| 3.65%, 09/15/59 (Call 03/15/59) |
723 | 489,939 | ||||||
| 3.80%, 12/01/57 (Call 06/01/57) |
690 | 486,874 | ||||||
| 3.85%, 06/01/60 (Call 12/01/59) |
285 | 201,247 | ||||||
| 4.30%, 12/15/42 (Call 06/15/42) |
70 | 59,101 | ||||||
| 4.35%, 06/15/45 (Call 12/15/44) |
100 | 83,665 | ||||||
| 4.50%, 05/15/35 (Call 11/15/34) |
549 | 505,162 | ||||||
| Security | Par (000) |
Value | ||||||
| Telecommunications (continued) | ||||||||
| 4.50%, 03/09/48 (Call 09/09/47) |
$ | 337 | $ | 281,569 | ||||
| 4.55%, 03/09/49 (Call 09/09/48) |
286 | 239,937 | ||||||
| 4.65%, 06/01/44 (Call 12/01/43) |
85 | 73,095 | ||||||
| 4.75%, 05/15/46 (Call 11/15/45) |
280 | 245,123 | ||||||
| 4.85%, 03/01/39 (Call 09/01/38) |
155 | 142,693 | ||||||
| 4.85%, 07/15/45 (Call 01/15/45) |
55 | 48,678 | ||||||
| 4.90%, 08/15/37 (Call 02/14/37) |
168 | 157,076 | ||||||
| 5.15%, 03/15/42 |
167 | 159,044 | ||||||
| 5.15%, 02/15/50 (Call 08/14/49) |
261 | 238,676 | ||||||
| 5.25%, 03/01/37 (Call 09/01/36) |
232 | 225,225 | ||||||
| 5.35%, 09/01/40 |
14 | 13,492 | ||||||
| 5.40%, 02/15/34 (Call 11/15/33) |
290 | 290,386 | ||||||
| 5.45%, 03/01/47 (Call 09/01/46) |
105 | 102,023 | ||||||
| 5.55%, 08/15/41 |
40 | 39,841 | ||||||
| 5.65%, 02/15/47 (Call 08/15/46)(b) |
50 | 50,087 | ||||||
| 5.70%, 03/01/57 (Call 09/01/56) |
76 | 74,467 | ||||||
| 6.00%, 08/15/40 (Call 05/15/40) |
150 | 153,769 | ||||||
| 6.30%, 01/15/38 |
30 | 31,712 | ||||||
| 6.38%, 03/01/41 |
75 | 78,913 | ||||||
| 6.55%, 02/15/39 |
73 | 78,454 | ||||||
| Bell Telephone Co. of Canada or Bell Canada, 3.65%, 08/15/52 (Call 02/15/52) |
40 | 29,406 | ||||||
| British Telecommunications PLC |
||||||||
| 5.13%, 12/04/28 (Call 09/04/28) |
670 | 673,434 | ||||||
| 9.63%, 12/15/30 |
1,227 | 1,500,563 | ||||||
| Cisco Systems Inc. |
||||||||
| 2.50%, 09/20/26 (Call 06/20/26) |
712 | 671,887 | ||||||
| 2.95%, 02/28/26 |
485 | 467,487 | ||||||
| 3.50%, 06/15/25 |
235 | 230,606 | ||||||
| 4.80%, 02/26/27 (Call 01/26/27) |
100 | 100,023 | ||||||
| 4.85%, 02/26/29 (Call 01/26/29) |
100 | 100,160 | ||||||
| 4.90%, 02/26/26 |
65 | 65,028 | ||||||
| 4.95%, 02/26/31 (Call 12/26/30) |
75 | 75,064 | ||||||
| 5.05%, 02/26/34 (Call 11/26/33) |
75 | 75,388 | ||||||
| 5.30%, 02/26/54 (Call 08/26/53) |
125 | 126,492 | ||||||
| 5.35%, 02/26/64 (Call 08/26/63) |
135 | 135,992 | ||||||
| 5.50%, 01/15/40 |
415 | 428,435 | ||||||
| 5.90%, 02/15/39 |
452 | 485,058 | ||||||
| Corning Inc. |
||||||||
| 3.90%, 11/15/49 (Call 05/15/49) |
27 | 20,893 | ||||||
| 4.38%, 11/15/57 (Call 05/15/57) |
111 | 91,308 | ||||||
| 5.35%, 11/15/48 (Call 05/15/48) |
84 | 80,665 | ||||||
| 5.75%, 08/15/40 |
53 | 52,974 | ||||||
| Deutsche Telekom International Finance BV, 8.75%, 06/15/30 |
248 | 292,458 | ||||||
| Juniper Networks Inc., 5.95%, 03/15/41 |
144 | 142,457 | ||||||
| Koninklijke KPN NV, 8.38%, 10/01/30 |
1,520 | 1,771,733 | ||||||
| Motorola Solutions Inc. |
||||||||
| 2.30%, 11/15/30 (Call 08/15/30) |
85 | 69,999 | ||||||
| 4.60%, 02/23/28 (Call 11/23/27) |
188 | 184,417 | ||||||
| 4.60%, 05/23/29 (Call 02/23/29) |
237 | 230,398 | ||||||
| 5.50%, 09/01/44 |
60 | 57,021 | ||||||
| 5.60%, 06/01/32 (Call 03/01/32) |
135 | 135,414 | ||||||
| Nokia OYJ, 4.38%, 06/12/27 |
1,355 | 1,298,638 | ||||||
| Orange SA |
||||||||
| 5.38%, 01/13/42 |
80 | 78,682 | ||||||
| 5.50%, 02/06/44 (Call 08/06/43) |
120 | 119,731 | ||||||
| 9.00%, 03/01/31 |
850 | 1,027,161 | ||||||
| Rogers Communications Inc. |
||||||||
| 2.90%, 11/15/26 (Call 08/15/26) |
114 | 107,289 | ||||||
| 3.20%, 03/15/27 (Call 02/15/27) |
40 | 37,661 | ||||||
| S C H E D U L E O F I N V E S T M E N T S |
69 |
| Schedule of Investments (continued) February 29, 2024 |
iShares® ESG Aware U.S. Aggregate Bond ETF (Percentages shown are based on Net Assets) |
| Security | Par (000) |
Value | ||||||
| Telecommunications (continued) | ||||||||
| 3.70%, 11/15/49 (Call 05/15/49) |
$ | 175 | $ | 125,732 | ||||
| 3.80%, 03/15/32 (Call 12/15/31) |
45 | 39,978 | ||||||
| 4.30%, 02/15/48 (Call 08/15/47) |
210 | 167,775 | ||||||
| 4.35%, 05/01/49 (Call 11/01/48) |
265 | 212,838 | ||||||
| 4.50%, 03/15/42 (Call 09/15/41) |
45 | 38,640 | ||||||
| 4.50%, 03/15/43 (Call 09/15/42) |
87 | 73,576 | ||||||
| 4.55%, 03/15/52 (Call 09/15/51) |
80 | 66,023 | ||||||
| 5.00%, 03/15/44 (Call 09/15/43) |
210 | 189,404 | ||||||
| 5.45%, 10/01/43 (Call 04/01/43) |
85 | 81,292 | ||||||
| 7.50%, 08/15/38 |
87 | 100,045 | ||||||
| Sprint Capital Corp., 8.75%, 03/15/32 |
20 | 24,168 | ||||||
| Telefonica Emisiones SA |
||||||||
| 4.10%, 03/08/27 |
15 | 14,527 | ||||||
| 4.67%, 03/06/38 |
175 | 156,059 | ||||||
| 5.21%, 03/08/47 |
250 | 224,643 | ||||||
| 7.05%, 06/20/36 |
403 | 444,032 | ||||||
| Telefonica Europe BV, 8.25%, 09/15/30 |
265 | 300,780 | ||||||
| TELUS Corp. |
||||||||
| 2.80%, 02/16/27 (Call 11/16/26) |
475 | 444,996 | ||||||
| 3.70%, 09/15/27 (Call 06/15/27) |
545 | 517,306 | ||||||
| 4.30%, 06/15/49 (Call 12/15/48) |
211 | 171,451 | ||||||
| 4.60%, 11/16/48 (Call 05/16/48) |
251 | 214,490 | ||||||
| T-Mobile USA Inc. |
||||||||
| 3.00%, 02/15/41 (Call 08/15/40) |
140 | 101,034 | ||||||
| 3.30%, 02/15/51 (Call 08/15/50) |
285 | 196,038 | ||||||
| 3.40%, 10/15/52 (Call 04/15/52) |
330 | 229,179 | ||||||
| 3.60%, 11/15/60 (Call 05/15/60) |
430 | 296,330 | ||||||
| 3.88%, 04/15/30 (Call 01/15/30) |
40 | 37,142 | ||||||
| 4.38%, 04/15/40 (Call 10/15/39) |
249 | 218,268 | ||||||
| 4.50%, 04/15/50 (Call 10/15/49) |
575 | 486,055 | ||||||
| 5.65%, 01/15/53 (Call 07/15/52) |
275 | 272,983 | ||||||
| 5.75%, 01/15/54 (Call 07/15/53) |
300 | 303,383 | ||||||
| 5.80%, 09/15/62 (Call 03/15/62) |
220 | 222,725 | ||||||
| Verizon Communications Inc. |
||||||||
| 2.36%, 03/15/32 (Call 12/15/31) |
15 | 12,149 | ||||||
| 2.55%, 03/21/31 (Call 12/21/30) |
81 | 68,240 | ||||||
| 2.88%, 11/20/50 (Call 05/20/50) |
470 | 299,460 | ||||||
| 2.99%, 10/30/56 (Call 04/30/56) |
681 | 423,341 | ||||||
| 3.00%, 11/20/60 (Call 05/20/60)(b) |
671 | 407,339 | ||||||
| 3.55%, 03/22/51 (Call 09/22/50) |
595 | 432,054 | ||||||
| 3.70%, 03/22/61 (Call 09/22/60) |
667 | 474,437 | ||||||
| 3.85%, 11/01/42 (Call 05/01/42) |
321 | 258,175 | ||||||
| 4.13%, 08/15/46 |
419 | 342,917 | ||||||
| 4.40%, 11/01/34 (Call 05/01/34) |
646 | 600,444 | ||||||
| 4.50%, 08/10/33 |
489 | 460,797 | ||||||
| 4.52%, 09/15/48 |
205 | 179,369 | ||||||
| 4.67%, 03/15/55 |
540 | 476,247 | ||||||
| 4.75%, 11/01/41 |
299 | 275,158 | ||||||
| 4.81%, 03/15/39 |
317 | 295,650 | ||||||
| 4.86%, 08/21/46 |
643 | 590,287 | ||||||
| 5.01%, 04/15/49(b) |
125 | 121,513 | ||||||
| 5.01%, 08/21/54 |
390 | 361,503 | ||||||
| 5.05%, 05/09/33 (Call 02/09/33) |
110 | 108,900 | ||||||
| 5.25%, 03/16/37 |
350 | 348,923 | ||||||
| 5.50%, 03/16/47 |
82 | 82,536 | ||||||
| 5.85%, 09/15/35 |
70 | 73,099 | ||||||
| 6.55%, 09/15/43 |
80 | 89,118 | ||||||
| 7.75%, 12/01/30 |
155 | 176,832 | ||||||
| Vodafone Group PLC |
||||||||
| 4.13%, 05/30/25 |
771 | 758,432 | ||||||
| 4.25%, 09/17/50 |
235 | 185,119 | ||||||
| Security | Par (000) |
Value | ||||||
| Telecommunications (continued) | ||||||||
| 4.38%, 05/30/28 |
$ | 65 | $ | 63,886 | ||||
| 4.38%, 02/19/43 |
247 | 207,921 | ||||||
| 4.88%, 06/19/49 |
460 | 398,173 | ||||||
| 5.00%, 05/30/38 |
145 | 139,672 | ||||||
| 5.75%, 02/10/63 (Call 08/10/62) |
85 | 82,993 | ||||||
| 6.15%, 02/27/37 |
470 | 490,542 | ||||||
| 6.25%, 11/30/32 |
90 | 95,545 | ||||||
| 7.88%, 02/15/30 |
285 | 323,139 | ||||||
|
|
|
|||||||
| 33,984,469 | ||||||||
| Toys, Games & Hobbies — 0.1% | ||||||||
| Hasbro Inc. |
||||||||
| 3.50%, 09/15/27 (Call 06/15/27) |
249 | 233,638 | ||||||
| 3.55%, 11/19/26 (Call 09/19/26) |
749 | 710,300 | ||||||
| 3.90%, 11/19/29 (Call 08/19/29) |
1,106 | 1,014,835 | ||||||
| 6.35%, 03/15/40 |
55 | 55,742 | ||||||
|
|
|
|||||||
| 2,014,515 | ||||||||
| Transportation — 0.5% | ||||||||
| Burlington Northern Santa Fe LLC |
||||||||
| 2.88%, 06/15/52 (Call 12/15/51) |
15 | 9,750 | ||||||
| 3.05%, 02/15/51 (Call 08/15/50) |
57 | 38,610 | ||||||
| 3.30%, 09/15/51 (Call 03/15/51) |
15 | 10,691 | ||||||
| 3.55%, 02/15/50 (Call 08/15/49) |
53 | 39,919 | ||||||
| 3.90%, 08/01/46 (Call 02/01/46) |
82 | 65,995 | ||||||
| 4.05%, 06/15/48 (Call 12/15/47) |
162 | 133,614 | ||||||
| 4.13%, 06/15/47 (Call 12/15/46) |
82 | 68,575 | ||||||
| 4.15%, 04/01/45 (Call 10/01/44) |
87 | 73,224 | ||||||
| 4.15%, 12/15/48 (Call 06/15/48) |
143 | 119,114 | ||||||
| 4.55%, 09/01/44 (Call 03/01/44) |
40 | 35,741 | ||||||
| 4.70%, 09/01/45 (Call 03/01/45) |
30 | 27,415 | ||||||
| 4.90%, 04/01/44 (Call 10/01/43) |
80 | 75,485 | ||||||
| 5.15%, 09/01/43 (Call 03/01/43) |
92 | 89,576 | ||||||
| 5.20%, 04/15/54 (Call 10/15/53) |
195 | 190,552 | ||||||
| 5.40%, 06/01/41 (Call 12/01/40) |
70 | 70,447 | ||||||
| 5.75%, 05/01/40 (Call 11/01/39) |
55 | 57,488 | ||||||
| Canadian National Railway Co. |
||||||||
| 2.45%, 05/01/50 (Call 11/01/49) |
585 | 364,770 | ||||||
| 3.20%, 08/02/46 (Call 02/02/46) |
169 | 125,278 | ||||||
| 3.65%, 02/03/48 (Call 08/03/47) |
117 | 92,671 | ||||||
| 3.85%, 08/05/32 (Call 05/05/32) |
50 | 46,007 | ||||||
| 4.40%, 08/05/52 (Call 02/05/52) |
105 | 92,471 | ||||||
| 4.45%, 01/20/49 (Call 07/20/48) |
145 | 129,506 | ||||||
| 5.85%, 11/01/33 (Call 08/01/33) |
40 | 42,453 | ||||||
| 6.20%, 06/01/36 |
150 | 163,449 | ||||||
| 6.25%, 08/01/34 |
40 | 43,678 | ||||||
| 6.38%, 11/15/37 |
51 | 55,840 | ||||||
| Canadian Pacific Railway Co. |
||||||||
| 2.45%, 12/02/31 (Call 09/02/31) |
70 | 62,173 | ||||||
| 3.10%, 12/02/51 (Call 06/02/51) |
350 | 238,076 | ||||||
| 3.50%, 05/01/50 (Call 11/01/49) |
100 | 73,025 | ||||||
| 4.20%, 11/15/69 (Call 05/15/69) |
195 | 152,560 | ||||||
| 4.30%, 05/15/43 (Call 11/15/42) |
157 | 134,287 | ||||||
| 4.80%, 09/15/35 (Call 03/15/35) |
60 | 57,401 | ||||||
| 4.80%, 08/01/45 (Call 02/01/45) |
110 | 99,544 | ||||||
| 5.95%, 05/15/37 |
85 | 87,852 | ||||||
| 6.13%, 09/15/2115 (Call 03/15/15) |
400 | 420,422 | ||||||
| 7.13%, 10/15/31 |
110 | 122,889 | ||||||
| CH Robinson Worldwide Inc., 4.20%, 04/15/28 (Call 01/15/28) |
1,695 | 1,634,114 | ||||||
| CSX Corp. 2.40%, 02/15/30 (Call 11/15/29) |
119 | 103,289 | ||||||
| 70 | 2 0 2 4 I S H A R E S A N N U A L R E P O R T T O S H A R E H O L D E R S |
| Schedule of Investments (continued) February 29, 2024 |
iShares® ESG Aware U.S. Aggregate Bond ETF (Percentages shown are based on Net Assets) |
| Security | Par (000) |
Value | ||||||
| Transportation (continued) | ||||||||
| 2.50%, 05/15/51 (Call 11/15/50) |
$ | 40 | $ | 24,331 | ||||
| 3.35%, 09/15/49 (Call 03/15/49) |
180 | 128,913 | ||||||
| 3.80%, 11/01/46 (Call 05/01/46) |
154 | 121,256 | ||||||
| 3.80%, 04/15/50 (Call 10/15/49) |
95 | 73,775 | ||||||
| 3.95%, 05/01/50 (Call 11/01/49) |
138 | 110,279 | ||||||
| 4.10%, 11/15/32 (Call 08/15/32) |
50 | 46,653 | ||||||
| 4.10%, 03/15/44 (Call 09/15/43) |
69 | 58,011 | ||||||
| 4.25%, 11/01/66 (Call 05/01/66) |
60 | 47,799 | ||||||
| 4.30%, 03/01/48 (Call 09/01/47) |
220 | 187,658 | ||||||
| 4.40%, 03/01/43 (Call 09/01/42) |
78 | 69,143 | ||||||
| 4.50%, 03/15/49 (Call 09/15/48) |
133 | 116,093 | ||||||
| 4.50%, 11/15/52 (Call 05/15/52) |
25 | 21,871 | ||||||
| 4.50%, 08/01/54 (Call 02/01/54) |
160 | 139,202 | ||||||
| 4.65%, 03/01/68 (Call 09/01/67) |
88 | 75,629 | ||||||
| 4.75%, 05/30/42 (Call 11/30/41) |
225 | 207,199 | ||||||
| 4.75%, 11/15/48 (Call 05/15/48) |
103 | 93,755 | ||||||
| 5.50%, 04/15/41 (Call 10/15/40) |
160 | 161,448 | ||||||
| 6.00%, 10/01/36 |
82 | 87,259 | ||||||
| 6.15%, 05/01/37 |
79 | 85,584 | ||||||
| 6.22%, 04/30/40 |
110 | 119,183 | ||||||
| FedEx Corp. |
||||||||
| 3.88%, 08/01/42 |
40 | 31,755 | ||||||
| 3.90%, 02/01/35 |
79 | 69,537 | ||||||
| 4.05%, 02/15/48 (Call 08/15/47) |
210 | 165,090 | ||||||
| 4.10%, 04/15/43 |
58 | 47,264 | ||||||
| 4.10%, 02/01/45 |
155 | 124,209 | ||||||
| 4.40%, 01/15/47 (Call 07/15/46) |
155 | 128,566 | ||||||
| 4.55%, 04/01/46 (Call 10/01/45) |
278 | 236,772 | ||||||
| 4.75%, 11/15/45 (Call 05/15/45) |
243 | 212,681 | ||||||
| 4.90%, 01/15/34 |
77 | 74,780 | ||||||
| 4.95%, 10/17/48 (Call 04/17/48) |
81 | 72,926 | ||||||
| 5.10%, 01/15/44 |
160 | 147,938 | ||||||
| 5.25%, 05/15/50 (Call 11/15/49)(b) |
301 | 284,031 | ||||||
| Norfolk Southern Corp. |
||||||||
| 2.55%, 11/01/29 (Call 08/01/29) |
132 | 116,001 | ||||||
| 2.90%, 08/25/51 (Call 02/25/51) |
311 | 199,976 | ||||||
| 3.16%, 05/15/55 (Call 11/15/54) |
210 | 137,567 | ||||||
| 3.40%, 11/01/49 (Call 05/01/49) |
101 | 73,321 | ||||||
| 3.94%, 11/01/47 (Call 05/01/47) |
200 | 157,977 | ||||||
| 3.95%, 10/01/42 (Call 04/01/42) |
137 | 112,349 | ||||||
| 4.05%, 08/15/52 (Call 02/15/52) |
224 | 178,499 | ||||||
| 4.10%, 05/15/49 (Call 11/15/48) |
285 | 231,436 | ||||||
| 4.10%, 05/15/2121 (Call 11/15/20) |
10 | 7,217 | ||||||
| 4.15%, 02/28/48 (Call 08/28/47) |
249 | 205,795 | ||||||
| 4.45%, 03/01/33 (Call 12/01/32)(b) |
50 | 47,575 | ||||||
| 4.45%, 06/15/45 (Call 12/15/44) |
121 | 104,185 | ||||||
| 4.55%, 06/01/53 (Call 12/01/52) |
40 | 34,618 | ||||||
| 4.65%, 01/15/46 (Call 07/15/45) |
100 | 88,582 | ||||||
| 4.84%, 10/01/41 |
210 | 195,676 | ||||||
| 5.05%, 08/01/30 (Call 06/01/30) |
175 | 174,758 | ||||||
| 5.35%, 08/01/54 (Call 02/01/54) |
140 | 137,357 | ||||||
| Ryder System Inc. |
||||||||
| 1.75%, 09/01/26 (Call 08/01/26) |
135 | 124,019 | ||||||
| 2.85%, 03/01/27 (Call 02/01/27) |
45 | 42,081 | ||||||
| 2.90%, 12/01/26 (Call 10/01/26) |
40 | 37,583 | ||||||
| 4.30%, 06/15/27 (Call 05/15/27) |
40 | 38,928 | ||||||
| 4.63%, 06/01/25 (Call 05/01/25) |
533 | 527,973 | ||||||
| 5.25%, 06/01/28 (Call 05/01/28) |
1,105 | 1,106,670 | ||||||
| 5.30%, 03/15/27 (Call 02/15/27) |
75 | 75,098 | ||||||
| 5.38%, 03/15/29 (Call 02/15/29) |
100 | 99,890 | ||||||
| 5.65%, 03/01/28 (Call 02/01/28) |
125 | 127,077 | ||||||
| Security | Par (000) |
Value | ||||||
| Transportation (continued) | ||||||||
| 6.30%, 12/01/28 (Call 11/01/28) |
$ | 115 | $ | 119,833 | ||||
| 6.60%, 12/01/33 (Call 09/01/33) |
540 | 578,175 | ||||||
| Union Pacific Corp. |
||||||||
| 2.97%, 09/16/62 (Call 03/16/62) |
75 | 46,393 | ||||||
| 3.25%, 02/05/50 (Call 08/05/49) |
280 | 201,967 | ||||||
| 3.35%, 08/15/46 (Call 02/15/46) |
59 | 42,602 | ||||||
| 3.38%, 02/01/35 (Call 08/01/34) |
60 | 51,210 | ||||||
| 3.50%, 02/14/53 (Call 08/14/52) |
30 | 22,311 | ||||||
| 3.55%, 08/15/39 (Call 02/15/39) |
140 | 114,840 | ||||||
| 3.55%, 05/20/61 (Call 11/20/60) |
110 | 78,430 | ||||||
| 3.60%, 09/15/37 (Call 03/15/37) |
75 | 64,098 | ||||||
| 3.75%, 02/05/70 (Call 08/05/69) |
147 | 107,437 | ||||||
| 3.80%, 10/01/51 (Call 04/01/51) |
209 | 164,803 | ||||||
| 3.80%, 04/06/71 (Call 10/06/70) |
175 | 128,097 | ||||||
| 3.84%, 03/20/60 (Call 09/20/59) |
342 | 259,312 | ||||||
| 3.85%, 02/14/72 (Call 08/14/71) |
120 | 88,901 | ||||||
| 3.88%, 02/01/55 (Call 08/01/54) |
150 | 116,418 | ||||||
| 3.95%, 08/15/59 (Call 02/15/59) |
105 | 81,442 | ||||||
| 4.00%, 04/15/47 (Call 10/15/46) |
90 | 73,157 | ||||||
| 4.05%, 11/15/45 (Call 05/15/45) |
64 | 52,440 | ||||||
| 4.05%, 03/01/46 (Call 09/01/45) |
197 | 162,189 | ||||||
| 4.10%, 09/15/67 (Call 03/15/67) |
115 | 90,345 | ||||||
| 4.30%, 03/01/49 (Call 09/01/48) |
100 | 84,759 | ||||||
| 4.50%, 09/10/48 (Call 03/10/48) |
320 | 280,582 | ||||||
| 4.95%, 05/15/53 (Call 11/15/52) |
80 | 76,522 | ||||||
| United Parcel Service Inc. |
||||||||
| 3.40%, 11/15/46 (Call 05/15/46) |
161 | 122,986 | ||||||
| 3.40%, 09/01/49 (Call 03/01/49)(b) |
170 | 126,978 | ||||||
| 3.63%, 10/01/42 |
160 | 129,455 | ||||||
| 3.75%, 11/15/47 (Call 05/15/47) |
235 | 185,880 | ||||||
| 4.25%, 03/15/49 (Call 09/15/48) |
115 | 98,838 | ||||||
| 4.88%, 03/03/33 (Call 12/03/32) |
200 | 198,504 | ||||||
| 4.88%, 11/15/40 (Call 05/15/40) |
295 | 282,730 | ||||||
| 5.05%, 03/03/53 (Call 09/03/52)(b) |
100 | 96,924 | ||||||
| 5.20%, 04/01/40 (Call 10/01/39) |
150 | 149,065 | ||||||
| 5.30%, 04/01/50 (Call 10/01/49) |
188 | 188,512 | ||||||
| 6.20%, 01/15/38 |
411 | 449,456 | ||||||
|
|
|
|||||||
| 18,516,340 | ||||||||
| Trucking & Leasing — 0.1% | ||||||||
| GATX Corp. |
||||||||
| 3.10%, 06/01/51 (Call 12/01/50) |
185 | 118,896 | ||||||
| 3.25%, 03/30/25 (Call 12/30/24) |
135 | 131,623 | ||||||
| 3.25%, 09/15/26 (Call 06/15/26) |
165 | 157,243 | ||||||
| 3.50%, 03/15/28 (Call 12/15/27) |
100 | 93,783 | ||||||
| 3.50%, 06/01/32 (Call 03/01/32) |
55 | 47,558 | ||||||
| 3.85%, 03/30/27 (Call 12/30/26) |
155 | 148,691 | ||||||
| 4.55%, 11/07/28 (Call 08/07/28) |
164 | 160,136 | ||||||
| 4.70%, 04/01/29 (Call 01/01/29) |
80 | 78,210 | ||||||
| 5.20%, 03/15/44 (Call 09/15/43) |
87 | 79,405 | ||||||
| 5.40%, 03/15/27 (Call 02/15/27) |
25 | 25,047 | ||||||
| 5.45%, 09/15/33 (Call 06/15/33) |
310 | 308,726 | ||||||
| 6.05%, 03/15/34 (Call 12/15/33) |
305 | 312,231 | ||||||
| 6.90%, 05/01/34 (Call 02/01/34) |
175 | 190,321 | ||||||
|
|
|
|||||||
| 1,851,870 | ||||||||
| Venture Capital — 0.0% | ||||||||
| Hercules Capital Inc., 3.38%, 01/20/27 (Call 12/20/26) |
5 | 4,534 | ||||||
|
|
|
|||||||
| Water — 0.1% | ||||||||
| American Water Capital Corp. 2.80%, 05/01/30 (Call 02/01/30) |
139 | 121,662 | ||||||
| S C H E D U L E O F I N V E S T M E N T S |
71 |
| Schedule of Investments (continued) February 29, 2024 |
iShares® ESG Aware U.S. Aggregate Bond ETF (Percentages shown are based on Net Assets) |
| Security | Par (000) |
Value | ||||||
| Water (continued) | ||||||||
| 3.25%, 06/01/51 (Call 12/01/50) |
$ | 20 | $ | 14,075 | ||||
| 3.45%, 06/01/29 (Call 03/01/29) |
217 | 201,728 | ||||||
| 3.45%, 05/01/50 (Call 11/01/49) |
245 | 179,188 | ||||||
| 3.75%, 09/01/47 (Call 03/01/47) |
312 | 242,147 | ||||||
| 4.00%, 12/01/46 (Call 06/01/46) |
86 | 69,578 | ||||||
| 4.15%, 06/01/49 (Call 12/01/48)(b) |
198 | 163,659 | ||||||
| 4.20%, 09/01/48 (Call 03/01/48) |
126 | 105,814 | ||||||
| 4.30%, 12/01/42 (Call 06/01/42) |
50 | 43,658 | ||||||
| 4.30%, 09/01/45 (Call 03/01/45) |
30 | 25,595 | ||||||
| 5.45%, 03/01/54 (Call 09/01/53) |
75 | 73,846 | ||||||
| 6.59%, 10/15/37 |
80 | 89,828 | ||||||
| Essential Utilities Inc. |
||||||||
| 2.70%, 04/15/30 (Call 01/15/30) |
157 | 135,115 | ||||||
| 3.35%, 04/15/50 (Call 10/15/49) |
248 | 171,454 | ||||||
| 3.57%, 05/01/29 (Call 02/01/29) |
160 | 148,326 | ||||||
| 4.28%, 05/01/49 (Call 11/01/48) |
258 | 207,846 | ||||||
| 5.30%, 05/01/52 (Call 11/01/51) |
140 | 130,013 | ||||||
| 5.38%, 01/15/34 (Call 10/15/33) |
25 | 24,562 | ||||||
| United Utilities PLC, 6.88%, 08/15/28 |
40 | 42,372 | ||||||
|
|
|
|||||||
| 2,190,466 | ||||||||
|
|
|
|||||||
| Total Corporate Bonds & Notes — 25.7% |
916,438,958 | |||||||
|
|
|
|||||||
| Foreign Government Obligations |
||||||||
| Canada — 0.3% | ||||||||
| Hydro-Quebec |
||||||||
| Series HH, 8.50%, 12/01/29 |
170 | 198,364 | ||||||
| Series HK, 9.38%, 04/15/30 |
1,835 | 2,254,599 | ||||||
| Series HQ, 9.50%, 11/15/30 |
970 | 1,208,975 | ||||||
| Province of Alberta Canada |
||||||||
| 1.30%, 07/22/30 |
311 | 255,147 | ||||||
| 3.30%, 03/15/28 |
889 | 846,643 | ||||||
| 4.50%, 01/24/34 |
700 | 688,684 | ||||||
| Province of British Columbia Canada |
||||||||
| 4.20%, 07/06/33 |
2,125 | 2,053,474 | ||||||
| 4.80%, 11/15/28 |
700 | 708,134 | ||||||
| 7.25%, 09/01/36 |
90 | 109,897 | ||||||
| Province of Manitoba Canada |
||||||||
| 1.50%, 10/25/28 |
105 | 91,700 | ||||||
| 4.30%, 07/27/33 |
980 | 950,025 | ||||||
| Province of Ontario Canada |
||||||||
| 1.13%, 10/07/30 |
355 | 286,220 | ||||||
| 1.60%, 02/25/31 |
240 | 197,915 | ||||||
| 1.80%, 10/14/31 |
295 | 243,110 | ||||||
| 2.13%, 01/21/32 |
230 | 193,246 | ||||||
| Province of Quebec Canada |
||||||||
| 1.35%, 05/28/30 |
360 | 297,899 | ||||||
| 1.90%, 04/21/31 |
140 | 117,346 | ||||||
| 2.75%, 04/12/27 |
75 | 70,965 | ||||||
| 3.63%, 04/13/28 |
30 | 28,936 | ||||||
| 4.50%, 09/08/33 |
1,035 | 1,021,702 | ||||||
| Series PD, 7.50%, 09/15/29 |
379 | 432,587 | ||||||
|
|
|
|||||||
| 12,255,568 | ||||||||
| Chile — 0.0% | ||||||||
| Chile Government International Bond |
||||||||
| 2.55%, 07/27/33 (Call 04/27/33) |
200 | 161,713 | ||||||
| 3.10%, 05/07/41 (Call 11/07/40) |
325 | 238,360 | ||||||
| 3.10%, 01/22/61 (Call 07/22/60) |
390 | 244,086 | ||||||
| 3.25%, 09/21/71 (Call 03/21/71) |
220 | 137,997 | ||||||
| Security | Par (000) |
Value | ||||||
| Chile (continued) | ||||||||
| 3.50%, 01/31/34 (Call 10/31/33) |
$ | 205 | $ | 178,316 | ||||
| 3.50%, 01/25/50 (Call 07/25/49) |
372 | 269,565 | ||||||
| 3.86%, 06/21/47 |
260 | 203,831 | ||||||
| 4.95%, 01/05/36 (Call 10/05/35) |
190 | 183,634 | ||||||
|
|
|
|||||||
| 1,617,502 | ||||||||
| Hungary — 0.0% | ||||||||
| Hungary Government International Bond, 7.63%, 03/29/41 |
217 | 248,594 | ||||||
|
|
|
|||||||
| Indonesia — 0.1% | ||||||||
| Indonesia Government International Bond |
||||||||
| 3.05%, 03/12/51 |
65 | 45,317 | ||||||
| 3.20%, 09/23/61 (Call 03/23/61) |
65 | 42,286 | ||||||
| 3.35%, 03/12/71 |
110 | 71,981 | ||||||
| 3.50%, 01/11/28 |
102 | 96,663 | ||||||
| 3.50%, 02/14/50 |
125 | 92,072 | ||||||
| 3.70%, 10/30/49 |
80 | 61,395 | ||||||
| 4.10%, 04/24/28 |
300 | 289,937 | ||||||
| 4.20%, 10/15/50 |
85 | 70,632 | ||||||
| 4.30%, 03/31/52 (Call 09/30/51) |
15 | 12,655 | ||||||
| 4.35%, 01/11/48 |
80 | 69,003 | ||||||
| 4.45%, 04/15/70 |
552 | 458,288 | ||||||
| 5.35%, 02/11/49 |
145 | 144,553 | ||||||
| 5.45%, 09/20/52 (Call 03/20/52) |
10 | 9,944 | ||||||
| 5.65%, 01/11/53 (Call 07/11/52) |
520 | 536,931 | ||||||
|
|
|
|||||||
| 2,001,657 | ||||||||
| Israel — 0.0% | ||||||||
| Israel Government International Bond |
||||||||
| 3.88%, 07/03/50 |
455 | 334,688 | ||||||
| 4.13%, 01/17/48 |
275 | 214,544 | ||||||
| 4.50%, 01/17/33 |
255 | 237,074 | ||||||
| 4.50%, 01/30/43 |
105 | 90,467 | ||||||
| 4.50%, |
180 | 132,009 | ||||||
| State of Israel, 3.38%, 01/15/50 |
115 | 77,130 | ||||||
|
|
|
|||||||
| 1,085,912 | ||||||||
| Italy — 0.1% | ||||||||
| Republic of Italy Government International Bond |
||||||||
| 2.88%, 10/17/29 |
1,070 | 942,660 | ||||||
| 3.88%, 05/06/51 |
1,130 | 782,053 | ||||||
| 4.00%, 10/17/49 |
527 | 376,018 | ||||||
| 5.38%, 06/15/33 |
951 | 933,329 | ||||||
|
|
|
|||||||
| 3,034,060 | ||||||||
| Japan — 0.0% | ||||||||
| Japan Bank for International Cooperation, 1.88%, 04/15/31 |
85 | 70,546 | ||||||
|
|
|
|||||||
| Mexico — 0.2% | ||||||||
| Mexico Government International Bond |
||||||||
| 3.50%, 02/12/34 (Call 11/12/33) |
35 | 28,927 | ||||||
| 3.77%, 05/24/61 (Call 11/24/60) |
335 | 215,326 | ||||||
| 4.28%, 08/14/41 (Call 02/14/41) |
460 | 365,388 | ||||||
| 4.35%, 01/15/47 |
212 | 163,411 | ||||||
| 4.40%, 02/12/52 (Call 08/12/51) |
220 | 166,026 | ||||||
| 4.50%, 04/22/29 |
490 | 471,253 | ||||||
| 4.50%, 01/31/50 (Call 07/31/49) |
377 | 293,297 | ||||||
| 4.60%, 01/23/46 |
412 | 328,708 | ||||||
| 4.60%, 02/10/48 |
337 | 266,367 | ||||||
| 4.75%, 03/08/44 |
556 | 459,066 | ||||||
| 5.00%, 04/27/51 (Call 10/27/50) |
395 | 328,730 | ||||||
| 5.55%, 01/21/45(b) |
360 | 331,505 | ||||||
| 5.75%, |
449 | 388,199 | ||||||
| 72 | 2 0 2 4 I S H A R E S A N N U A L R E P O R T T O S H A R E H O L D E R S |
| Schedule of Investments (continued) February 29, 2024 |
iShares® ESG Aware U.S. Aggregate Bond ETF (Percentages shown are based on Net Assets) |
| Security | Par (000) |
Value | ||||||
| Mexico (continued) | ||||||||
| 6.00%, 05/07/36 (Call 02/07/36) |
$ | 40 | $ | 39,883 | ||||
| 6.05%, 01/11/40 |
423 | 414,166 | ||||||
| 6.34%, 05/04/53 (Call 11/04/52) |
470 | 459,180 | ||||||
| 6.35%, 02/09/35 (Call 11/09/34) |
320 | 327,870 | ||||||
| 6.40%, 05/07/54 (Call 11/07/53) |
200 | 197,330 | ||||||
| 6.75%, 09/27/34 |
416 | 438,686 | ||||||
| 7.50%, 04/08/33 |
540 | 606,082 | ||||||
| 8.30%, 08/15/31(b) |
365 | 431,258 | ||||||
|
|
|
|||||||
| 6,720,658 | ||||||||
| Panama — 0.1% | ||||||||
| Panama Government International Bond |
||||||||
| 2.25%, 09/29/32 (Call 06/29/32) |
5 | 3,503 | ||||||
| 3.87%, 07/23/60 (Call 01/23/60) |
455 | 254,276 | ||||||
| 4.30%, 04/29/53 |
215 | 134,990 | ||||||
| 4.50%, 05/15/47 (Call 11/15/46) |
60 | 40,058 | ||||||
| 4.50%, 04/16/50 (Call 10/16/49) |
300 | 195,257 | ||||||
| 4.50%, 04/01/56 (Call 10/01/55) |
512 | 322,795 | ||||||
| 4.50%, 01/19/63 (Call 07/19/62) |
330 | 204,684 | ||||||
| 6.40%, 02/14/35 (Call 11/14/34) |
120 | 110,808 | ||||||
| 6.70%, 01/26/36 |
572 | 540,868 | ||||||
| 9.38%, 04/01/29 |
117 | 129,262 | ||||||
|
|
|
|||||||
| 1,936,501 | ||||||||
| Peru — 0.1% | ||||||||
| Peruvian Government International Bond |
||||||||
| 2.78%, 12/01/60 (Call 06/01/60) |
430 | 246,580 | ||||||
| 3.00%, 01/15/34 (Call 10/15/33) |
235 | 191,052 | ||||||
| 3.23%, (Call 01/28/21) |
240 | 137,190 | ||||||
| 3.30%, 03/11/41 (Call 09/11/40) |
65 | 48,224 | ||||||
| 3.55%, 03/10/51 (Call 09/10/50) |
150 | 107,646 | ||||||
| 3.60%, 01/15/72 (Call 07/15/71) |
115 | 75,516 | ||||||
| 5.63%, 11/18/50 |
372 | 368,168 | ||||||
| 6.55%, 03/14/37 |
541 | 583,513 | ||||||
| 8.75%, 11/21/33 |
497 | 610,104 | ||||||
|
|
|
|||||||
| 2,367,993 | ||||||||
| Philippines — 0.1% | ||||||||
| Philippine Government International Bond |
||||||||
| 2.95%, 05/05/45 |
185 | 127,959 | ||||||
| 3.20%, 07/06/46 |
140 | 99,673 | ||||||
| 3.70%, 03/01/41 |
337 | 275,112 | ||||||
| 3.70%, 02/02/42 |
242 | 196,625 | ||||||
| 3.95%, 01/20/40 |
152 | 129,935 | ||||||
| 5.00%, 01/13/37 |
257 | 252,956 | ||||||
| 5.50%, 01/17/48 |
160 | 162,706 | ||||||
| 5.95%, 10/13/47 |
20 | 21,248 | ||||||
| 6.38%, 01/15/32 |
135 | 145,901 | ||||||
| 6.38%, 10/23/34 |
297 | 326,102 | ||||||
| 7.75%, 01/14/31 |
225 | 259,260 | ||||||
| 9.50%, 02/02/30 |
167 | 204,940 | ||||||
|
|
|
|||||||
| 2,202,417 | ||||||||
| Poland — 0.0% | ||||||||
| Republic of Poland Government International Bond |
||||||||
| 4.88%, 10/04/33 (Call 07/04/33) |
365 | 357,369 | ||||||
| 5.50%, 04/04/53 (Call 10/04/52) |
340 | 339,586 | ||||||
| 5.75%, 11/16/32 (Call 08/16/32) |
175 | 182,458 | ||||||
|
|
|
|||||||
| 879,413 | ||||||||
| Security | Par (000) |
Value | ||||||
| South Korea — 0.0% | ||||||||
| Korea International Bond |
||||||||
| 3.88%, 09/20/48 |
$ | 283 | $ | 240,805 | ||||
| 4.13%, 06/10/44 |
555 | 499,585 | ||||||
|
|
|
|||||||
| 740,390 | ||||||||
| Supranational — 2.3% | ||||||||
| Asian Development Bank |
||||||||
| 6.22%, 08/15/27 |
870 | 909,875 | ||||||
| 6.38%, 10/01/28 |
41 | 43,733 | ||||||
| Council of Europe Development Bank |
||||||||
| 0.88%, 09/22/26(b) |
2,385 | 2,172,415 | ||||||
| 3.63%, 01/26/28 |
980 | 951,210 | ||||||
| European Investment Bank |
||||||||
| 2.38%, 05/24/27 |
1,375 | 1,289,908 | ||||||
| 4.13%, 02/13/34 |
500 | 490,305 | ||||||
| 4.88%, 02/15/36 |
1,393 | 1,444,308 | ||||||
| Inter-American Development Bank |
||||||||
| 0.63%, 07/15/25 |
1,220 | 1,150,822 | ||||||
| 0.63%, 09/16/27 |
1,279 | 1,119,679 | ||||||
| 0.88%, 04/03/25 |
1,700 | 1,624,946 | ||||||
| 0.88%, 04/20/26 |
2,885 | 2,665,679 | ||||||
| 1.13%, 07/20/28 |
1,498 | 1,304,205 | ||||||
| 1.13%, 01/13/31 |
1,980 | 1,599,835 | ||||||
| 1.50%, 01/13/27 |
1,300 | 1,195,705 | ||||||
| 1.75%, 03/14/25 |
1,330 | 1,285,296 | ||||||
| 2.00%, 06/02/26 |
485 | 457,609 | ||||||
| 2.00%, 07/23/26 |
700 | 658,868 | ||||||
| 2.25%, 06/18/29 |
1,270 | 1,142,288 | ||||||
| 2.38%, 07/07/27 |
1,657 | 1,549,323 | ||||||
| 3.13%, 09/18/28 |
1,160 | 1,099,279 | ||||||
| 3.20%, 08/07/42 |
895 | 721,752 | ||||||
| 3.50%, 09/14/29 |
965 | 922,525 | ||||||
| 3.50%, 04/12/33 |
55 | 51,185 | ||||||
| 3.88%, 10/28/41 |
860 | 765,665 | ||||||
| 4.38%, 01/24/44 |
640 | 607,944 | ||||||
| 4.50%, 09/13/33 |
25 | 25,144 | ||||||
| 7.00%, 06/15/25 |
95 | 97,047 | ||||||
| International Bank for Reconstruction & Development |
||||||||
| 0.38%, 07/28/25 |
1,055 | 990,651 | ||||||
| 0.50%, 10/28/25 |
2,055 | 1,915,212 | ||||||
| 0.63%, 04/22/25 |
1,875 | 1,784,742 | ||||||
| 0.65%, 02/10/26 (Call 05/10/24)(b) |
345 | 317,192 | ||||||
| 0.75%, 03/11/25 |
1,220 | 1,167,781 | ||||||
| 0.75%, 11/24/27 |
3,580 | 3,128,969 | ||||||
| 0.75%, 08/26/30 |
3,480 | 2,766,719 | ||||||
| 0.85%, 02/10/27 (Call 05/10/24)(b) |
155 | 137,217 | ||||||
| 0.88%, 05/14/30 |
2,290 | 1,852,204 | ||||||
| 1.13%, 09/13/28 |
610 | 528,860 | ||||||
| 1.25%, 02/10/31 |
855 | 695,187 | ||||||
| 1.38%, 04/20/28 |
3,650 | 3,231,599 | ||||||
| 1.63%, 11/03/31 |
2,695 | 2,215,782 | ||||||
| 1.75%, 10/23/29 |
2,857 | 2,481,798 | ||||||
| 1.88%, 10/27/26 |
2,959 | 2,763,198 | ||||||
| 2.13%, 03/03/25 |
1,730 | 1,680,404 | ||||||
| 2.50%, 07/29/25 |
3,461 | 3,348,346 | ||||||
| 2.50%, 11/22/27 |
4,300 | 4,015,049 | ||||||
| 2.50%, 03/29/32 |
1,310 | 1,143,984 | ||||||
| 3.13%, 11/20/25 |
960 | 933,522 | ||||||
| 3.50%, 07/12/28 |
220 | 212,211 | ||||||
| 3.88%, 02/14/30 |
610 | 593,378 | ||||||
| 4.75%, 11/14/33 |
2,400 | 2,465,275 | ||||||
| S C H E D U L E O F I N V E S T M E N T S |
73 |
| Schedule of Investments (continued) February 29, 2024 |
iShares® ESG Aware U.S. Aggregate Bond ETF (Percentages shown are based on Net Assets) |
| Security | Par (000) |
Value | ||||||
| Supranational (continued) | ||||||||
| 4.75%, 02/15/35(b) |
$ | 1,869 | $ | 1,894,604 | ||||
| International Finance Corp. |
||||||||
| 0.38%, 07/16/25 |
770 | 724,016 | ||||||
| 0.75%, 10/08/26 |
1,305 | 1,184,955 | ||||||
| 0.75%, 08/27/30 |
1,280 | 1,019,773 | ||||||
| 2.13%, 04/07/26 |
735 | 698,187 | ||||||
| 3.63%, 09/15/25 |
2,810 | 2,757,923 | ||||||
| Nordic Investment Bank |
||||||||
| 0.38%, 09/11/25 |
3,190 | 2,982,061 | ||||||
| 2.63%, 04/04/25 |
2,840 | 2,766,279 | ||||||
| 3.38%, 09/08/27 |
970 | 935,204 | ||||||
|
|
|
|||||||
| 82,678,832 | ||||||||
| Uruguay — 0.1% | ||||||||
| Uruguay Government International Bond |
||||||||
| 4.13%, 11/20/45 |
225 | 195,942 | ||||||
| 4.98%, 04/20/55 |
654 | 608,983 | ||||||
| 5.10%, 06/18/50 |
657 | 630,848 | ||||||
| 5.75%, 10/28/34 (Call 07/28/34) |
100 | 105,138 | ||||||
| 7.63%, 03/21/36 |
468 | 562,125 | ||||||
|
|
|
|||||||
| 2,103,036 | ||||||||
|
|
|
|||||||
| Total Foreign Government Obligations — 3.4% |
|
119,943,079 | ||||||
|
|
|
|||||||
| Municipal Debt Obligations |
| |||||||
| California — 0.0% | ||||||||
| State of California GO BAB, 7.55%, 04/01/39(b) |
35 | 42,527 | ||||||
|
|
|
|||||||
| Illinois — 0.0% | ||||||||
| State of Illinois GO, 5.10%, 06/01/33 |
95 | 93,582 | ||||||
|
|
|
|||||||
| Total Municipal Debt Obligations — 0.0% |
|
136,109 | ||||||
|
|
|
|||||||
| U.S. Government & Agency Obligations |
| |||||||
| Mortgage-Backed Securities — 27.1% | ||||||||
| Federal Home Loan Mortgage Corp. |
||||||||
| 2.50%, 01/01/32 |
83 | 77,060 | ||||||
| 3.00%, 05/01/29 |
2,820 | 2,732,625 | ||||||
| 3.00%, 03/01/46 |
339 | 298,041 | ||||||
| 3.00%, 09/01/46 |
316 | 281,695 | ||||||
| 3.00%, 12/01/46 |
412 | 361,631 | ||||||
| 3.50%, 05/01/33 |
18 | 17,073 | ||||||
| 3.50%, 06/01/34 |
12 | 11,776 | ||||||
| 3.50%, 03/01/38 |
27 | 25,155 | ||||||
| 3.50%, 10/01/42 |
9 | 8,550 | ||||||
| 3.50%, 10/01/44 |
10 | 9,545 | ||||||
| 3.50%, 07/01/47 |
13 | 11,978 | ||||||
| 3.50%, 09/01/47 |
13 | 11,360 | ||||||
| 3.50%, 02/01/48 |
6 | 5,842 | ||||||
| 3.50%, 03/01/48 |
5 | 4,529 | ||||||
| 4.00%, 09/01/45 |
5 | 4,898 | ||||||
| 4.00%, 01/01/48 |
339 | 318,189 | ||||||
| 4.00%, 02/01/48 |
4 | 3,846 | ||||||
| 4.00%, 01/01/49 |
7 | 6,731 | ||||||
| 4.50%, 10/01/48 |
14 | 13,333 | ||||||
| 4.50%, 01/01/49 |
3 | 2,480 | ||||||
| Federal National Mortgage Association |
||||||||
| Series 2017-M11, Class A2, 2.98%, 08/25/29 |
144 | 132,407 | ||||||
| Series 2017-M8, Class A2, 3.06%, 05/25/27(a) |
1,527 | 1,453,860 | ||||||
| Security | Par (000) |
Value | ||||||
| Mortgage-Backed Securities (continued) | ||||||||
| Series 2021-M13, Class A2, 1.60%, 04/25/31(a) |
$ | 600 | $ | 485,158 | ||||
| Series 2021-M17, Class A2, 1.71%, 07/25/31(a) |
1,000 | 812,690 | ||||||
| Freddie Mac Multifamily Structured Pass Through Certificates |
||||||||
| 2.58%, 05/25/32 (Call 06/25/32) |
5,000 | 4,259,717 | ||||||
| Series K047, Class A2, 3.33%, 05/25/25 (Call 05/25/25)(a) |
200 | 195,716 | ||||||
| Series K048, Class A2, 3.28%, 06/25/25 (Call 08/25/25)(a) |
5,314 | 5,194,910 | ||||||
| Series K062, Class A2, 3.41%, 12/25/26 (Call 01/25/27) |
100 | 96,423 | ||||||
| Series K077, Class A2, 3.85%, 05/25/28 (Call 05/25/28)(a) |
2,000 | 1,931,613 | ||||||
| Series K100, Class A2, 2.67%, 09/25/29 (Call 10/25/29) |
1,000 | 898,974 | ||||||
| Series K101, Class A2, 2.52%, 10/25/29 (Call 01/25/30) |
300 | 267,663 | ||||||
| Series K115, Class A2, 1.38%, 06/25/30 (Call 07/25/30) |
1,920 | 1,570,609 | ||||||
| Series K131, Class A2, 1.85%, 07/25/31 (Call 09/25/31) |
2,000 | 1,644,310 | ||||||
| Series K735, Class A2, 2.86%, 05/25/26 (Call 06/25/26) |
2,932 | 2,812,440 | ||||||
| Series K739, Class A2, 1.34%, 09/25/27 (Call 09/25/27) |
900 | 807,903 | ||||||
| Government National Mortgage Association |
||||||||
| 1.50%, 10/20/51 |
231 | 178,516 | ||||||
| 2.00%, 07/20/50 |
72 | 58,983 | ||||||
| 2.00%, 08/20/50 |
3,302 | 2,695,454 | ||||||
| 2.00%, 09/20/50 |
3,968 | 3,238,165 | ||||||
| 2.00%, 11/20/50 |
1,644 | 1,340,980 | ||||||
| 2.00%, 12/20/50 |
1,701 | 1,386,618 | ||||||
| 2.00%, 01/20/51 |
2,900 | 2,363,763 | ||||||
| 2.00%, 02/20/51 |
3,900 | 3,178,098 | ||||||
| 2.00%, 08/20/51 |
4,103 | 3,340,344 | ||||||
| 2.00%, 10/20/51 |
3,136 | 2,551,578 | ||||||
| 2.00%, 11/20/51 |
864 | 703,047 | ||||||
| 2.00%, 12/20/51 |
3,202 | 2,604,463 | ||||||
| 2.00%, 01/20/52 |
10,308 | 8,384,401 | ||||||
| 2.00%, 03/20/52 |
1,373 | 1,116,428 | ||||||
| 2.00%, 04/20/52 |
3,987 | 3,243,475 | ||||||
| 2.00%, 03/20/54(f) |
7,819 | 6,363,014 | ||||||
| 2.50%, 12/20/46 |
106 | 91,437 | ||||||
| 2.50%, 06/20/50 |
3,791 | 3,216,038 | ||||||
| 2.50%, 08/20/50 |
314 | 262,944 | ||||||
| 2.50%, 09/20/50 |
440 | 367,193 | ||||||
| 2.50%, 01/20/51 |
1,177 | 995,668 | ||||||
| 2.50%, 02/20/51 |
6,984 | 5,921,317 | ||||||
| 2.50%, 05/20/51 |
835 | 707,664 | ||||||
| 2.50%, 07/20/51 |
2,811 | 2,380,257 | ||||||
| 2.50%, 08/20/51 |
7,328 | 6,204,701 | ||||||
| 2.50%, 11/20/51 |
2,961 | 2,505,317 | ||||||
| 2.50%, 12/20/51 |
2,753 | 2,329,706 | ||||||
| 2.50%, 02/20/52 |
2,184 | 1,846,838 | ||||||
| 2.50%, 03/20/52 |
3,761 | 3,181,018 | ||||||
| 2.50%, 04/20/52 |
3,231 | 2,732,982 | ||||||
| 2.50%, 05/20/52 |
2,011 | 1,700,817 | ||||||
| 2.50%, 07/20/52 |
663 | 560,894 | ||||||
| 2.50%, 08/20/52 |
1,591 | 1,345,945 | ||||||
| 2.50%, 03/20/54(f) |
6,585 | 5,572,724 | ||||||
| 3.00%, 07/20/45 |
52 | 46,709 | ||||||
| 74 | 2 0 2 4 I S H A R E S A N N U A L R E P O R T T O S H A R E H O L D E R S |
| Schedule of Investments (continued) February 29, 2024 |
iShares® ESG Aware U.S. Aggregate Bond ETF (Percentages shown are based on Net Assets) |
| Security | Par (000) |
Value | ||||||
| Mortgage-Backed Securities (continued) | ||||||||
| 3.00%, 11/20/45 |
$ | 244 | $ | 217,857 | ||||
| 3.00%, 12/20/45 |
42 | 37,585 | ||||||
| 3.00%, 01/20/46 |
22 | 19,670 | ||||||
| 3.00%, 03/20/46 |
387 | 344,701 | ||||||
| 3.00%, 04/20/46 |
10 | 9,156 | ||||||
| 3.00%, 05/20/46 |
26 | 23,342 | ||||||
| 3.00%, 08/20/46 |
320 | 284,263 | ||||||
| 3.00%, 09/20/46 |
768 | 683,012 | ||||||
| 3.00%, 11/20/46 |
20 | 17,618 | ||||||
| 3.00%, 02/15/47 |
24 | 20,966 | ||||||
| 3.00%, 03/20/47 |
8 | 7,105 | ||||||
| 3.00%, 06/20/47 |
25 | 22,324 | ||||||
| 3.00%, 10/20/47 |
452 | 401,992 | ||||||
| 3.00%, 02/20/48 |
17 | 15,359 | ||||||
| 3.00%, 04/20/49 |
812 | 721,649 | ||||||
| 3.00%, 10/15/49 |
139 | 122,565 | ||||||
| 3.00%, 01/20/50 |
835 | 738,673 | ||||||
| 3.00%, 02/20/50 |
175 | 154,552 | ||||||
| 3.00%, 07/20/50 |
1,490 | 1,314,121 | ||||||
| 3.00%, 08/20/50 |
260 | 229,259 | ||||||
| 3.00%, 12/20/50 |
1,138 | 1,002,383 | ||||||
| 3.00%, 08/20/51 |
2,171 | 1,905,771 | ||||||
| 3.00%, 09/20/51 |
1,613 | 1,415,735 | ||||||
| 3.00%, 10/20/51 |
3,071 | 2,693,973 | ||||||
| 3.00%, 11/20/51 |
1,379 | 1,209,205 | ||||||
| 3.00%, 12/20/51 |
1,733 | 1,519,314 | ||||||
| 3.00%, 02/20/52 |
2,491 | 2,182,562 | ||||||
| 3.00%, 03/20/52 |
2,661 | 2,308,518 | ||||||
| 3.00%, 05/20/52 |
908 | 795,394 | ||||||
| 3.00%, 07/20/52 |
887 | 777,171 | ||||||
| 3.00%, 09/20/52 |
565 | 495,371 | ||||||
| 3.00%, 03/20/54(f) |
12,238 | 10,728,115 | ||||||
| 3.50%, 09/20/42 |
33 | 30,333 | ||||||
| 3.50%, 12/20/42 |
29 | 27,289 | ||||||
| 3.50%, 09/20/45 |
2,502 | 2,300,318 | ||||||
| 3.50%, 11/20/46 |
8 | 7,046 | ||||||
| 3.50%, 01/20/47 |
7 | 6,727 | ||||||
| 3.50%, 06/20/47 |
7 | 5,975 | ||||||
| 3.50%, 08/20/47 |
115 | 105,498 | ||||||
| 3.50%, 09/20/47 |
4,433 | 4,055,345 | ||||||
| 3.50%, 11/20/47 |
28 | 25,922 | ||||||
| 3.50%, 02/20/48 |
15 | 13,828 | ||||||
| 3.50%, 08/20/48 |
28 | 25,641 | ||||||
| 3.50%, 01/20/49 |
12 | 11,075 | ||||||
| 3.50%, 03/20/49 |
1,258 | 1,151,130 | ||||||
| 3.50%, 09/20/49 |
843 | 769,322 | ||||||
| 3.50%, 10/20/49 |
597 | 545,582 | ||||||
| 3.50%, 12/20/49 |
241 | 219,907 | ||||||
| 3.50%, 01/20/50 |
553 | 504,913 | ||||||
| 3.50%, 03/20/50 |
378 | 345,131 | ||||||
| 3.50%, 08/20/50 |
185 | 167,851 | ||||||
| 3.50%, 01/20/52 |
2,510 | 2,271,561 | ||||||
| 3.50%, 02/20/52 |
547 | 494,585 | ||||||
| 3.50%, 10/20/52 |
1,400 | 1,265,282 | ||||||
| 3.50%, 05/20/53 |
1,541 | 1,405,844 | ||||||
| 3.50%, 03/20/54(f) |
11,024 | 9,970,618 | ||||||
| 4.00%, 04/20/47 |
57 | 53,355 | ||||||
| 4.00%, 07/20/47 |
64 | 60,451 | ||||||
| 4.00%, 11/20/47 |
13 | 12,529 | ||||||
| 4.00%, 04/20/48 |
3 | 2,426 | ||||||
| 4.00%, 05/15/48 |
4 | 3,740 | ||||||
| Security | Par (000) |
Value | ||||||
| Mortgage-Backed Securities (continued) | ||||||||
| 4.00%, 05/20/48 |
$ | 10 | $ | 9,199 | ||||
| 4.00%, 08/20/48 |
21 | 20,045 | ||||||
| 4.00%, 09/20/48 |
55 | 52,047 | ||||||
| 4.00%, 11/20/48 |
622 | 585,657 | ||||||
| 4.00%, 12/20/48 |
1,099 | 1,035,806 | ||||||
| 4.00%, 02/20/49 |
764 | 720,161 | ||||||
| 4.00%, 01/20/50 |
2,265 | 2,132,752 | ||||||
| 4.00%, 02/20/50 |
1,877 | 1,767,513 | ||||||
| 4.00%, 07/20/52 |
259 | 241,357 | ||||||
| 4.00%, 09/20/52 |
2,829 | 2,632,120 | ||||||
| 4.00%, 12/20/52 |
690 | 642,349 | ||||||
| 4.00%, 03/20/54(f) |
7,581 | 7,054,880 | ||||||
| 4.50%, 07/20/41 |
878 | 863,933 | ||||||
| 4.50%, 06/20/48 |
19 | 18,630 | ||||||
| 4.50%, 08/20/48 |
3 | 3,110 | ||||||
| 4.50%, 09/20/48 |
235 | 227,531 | ||||||
| 4.50%, 10/20/48 |
117 | 113,434 | ||||||
| 4.50%, 12/20/48 |
46 | 44,416 | ||||||
| 4.50%, 01/20/49 |
172 | 166,540 | ||||||
| 4.50%, 03/20/49 |
1,334 | 1,291,718 | ||||||
| 4.50%, 06/20/49 |
33 | 31,628 | ||||||
| 4.50%, 07/20/49 |
14 | 13,097 | ||||||
| 4.50%, 08/20/49 |
3 | 3,294 | ||||||
| 4.50%, 07/20/52 |
928 | 888,423 | ||||||
| 4.50%, 08/20/52 |
4,153 | 3,970,634 | ||||||
| 4.50%, 04/20/53 |
3,379 | 3,225,705 | ||||||
| 4.50%, 06/20/53 |
1,740 | 1,660,877 | ||||||
| 4.50%, 03/20/54(f) |
2,424 | 2,314,647 | ||||||
| 5.00%, 04/20/48 |
6 | 5,957 | ||||||
| 5.00%, 05/20/48 |
3 | 2,639 | ||||||
| 5.00%, 11/20/48 |
2 | 1,956 | ||||||
| 5.00%, 12/20/48 |
4 | 4,201 | ||||||
| 5.00%, 01/20/49 |
21 | 21,143 | ||||||
| 5.00%, 06/20/49 |
322 | 319,660 | ||||||
| 5.00%, 07/20/52 |
236 | 230,240 | ||||||
| 5.00%, 09/20/52 |
1,718 | 1,678,372 | ||||||
| 5.00%, 04/20/53 |
2,515 | 2,456,054 | ||||||
| 5.00%, 07/20/53 |
4,201 | 4,102,036 | ||||||
| 5.00%, 03/20/54(f) |
5,627 | 5,495,912 | ||||||
| 5.50%, 12/20/52 |
2,736 | 2,719,635 | ||||||
| 5.50%, 01/20/53 |
117 | 115,968 | ||||||
| 5.50%, 03/20/53 |
2,450 | 2,433,166 | ||||||
| 5.50%, 04/20/53 |
2,653 | 2,634,801 | ||||||
| 5.50%, 06/20/53 |
590 | 586,078 | ||||||
| 5.50%, 07/20/53 |
679 | 679,949 | ||||||
| 5.50%, 03/20/54(f) |
3,250 | 3,228,291 | ||||||
| 6.00%, 09/20/53 |
1,574 | 1,581,747 | ||||||
| 6.00%, 10/20/53 |
2,363 | 2,374,809 | ||||||
| 6.00%, 01/20/54 |
667 | 670,248 | ||||||
| 6.00%, 03/20/54(f) |
5,025 | 5,049,502 | ||||||
| 6.50%, 11/20/53 |
1,361 | 1,380,485 | ||||||
| 6.50%, 01/20/54 |
2,007 | 2,035,770 | ||||||
| 6.50%, 03/20/54(f) |
4,066 | 4,121,000 | ||||||
| Uniform Mortgage-Backed Securities |
||||||||
| 1.50%, 03/01/36 |
456 | 394,544 | ||||||
| 1.50%, 10/01/36 |
384 | 332,458 | ||||||
| 1.50%, 11/01/36 |
253 | 220,129 | ||||||
| 1.50%, 02/01/37 |
2,512 | 2,169,077 | ||||||
| 1.50%, 03/01/37 |
3,592 | 3,104,459 | ||||||
| 1.50%, 04/01/37 |
602 | 519,953 | ||||||
| 1.50%, 08/01/37 |
337 | 290,685 | ||||||
| S C H E D U L E O F I N V E S T M E N T S |
75 |
| Schedule of Investments (continued) February 29, 2024 |
iShares® ESG Aware U.S. Aggregate Bond ETF (Percentages shown are based on Net Assets) |
| Security | Par (000) |
Value | ||||||
| Mortgage-Backed Securities (continued) | ||||||||
| 1.50%, 03/18/39(f) |
$ | 4,631 | $ | 3,992,446 | ||||
| 1.50%, 11/01/50 |
435 | 325,903 | ||||||
| 1.50%, 02/01/51 |
3,296 | 2,457,315 | ||||||
| 1.50%, 04/01/51 |
1,162 | 868,774 | ||||||
| 1.50%, 05/01/51 |
2,220 | 1,658,916 | ||||||
| 1.50%, 07/01/51 |
4,446 | 3,322,473 | ||||||
| 1.50%, 11/01/51 |
1,492 | 1,114,361 | ||||||
| 1.50%, 04/01/52 |
457 | 341,398 | ||||||
| 1.50%, 03/13/54(f) |
1,000 | 745,976 | ||||||
| 2.00%, 12/01/35 |
1,545 | 1,370,354 | ||||||
| 2.00%, 02/01/36 |
4,464 | 3,965,913 | ||||||
| 2.00%, 03/01/36 |
686 | 607,486 | ||||||
| 2.00%, 05/01/36 |
1,474 | 1,308,089 | ||||||
| 2.00%, 06/01/36 |
1,322 | 1,171,739 | ||||||
| 2.00%, 08/01/36 |
1,162 | 1,029,018 | ||||||
| 2.00%, 09/01/36 |
1,965 | 1,736,160 | ||||||
| 2.00%, 10/01/36 |
562 | 496,893 | ||||||
| 2.00%, 11/01/36 |
1,158 | 1,024,054 | ||||||
| 2.00%, 12/01/36 |
1,561 | 1,379,446 | ||||||
| 2.00%, 01/01/37 |
3,300 | 2,916,700 | ||||||
| 2.00%, 02/01/37 |
5,866 | 5,179,876 | ||||||
| 2.00%, 03/01/37 |
2,841 | 2,504,660 | ||||||
| 2.00%, 04/01/37 |
7,984 | 7,036,992 | ||||||
| 2.00%, 05/01/37 |
3,071 | 2,707,107 | ||||||
| 2.00%, 06/01/37 |
2,235 | 1,970,273 | ||||||
| 2.00%, 03/18/39(f) |
12,936 | 11,410,525 | ||||||
| 2.00%, 07/01/50 |
1,255 | 995,236 | ||||||
| 2.00%, 08/01/50 |
800 | 637,102 | ||||||
| 2.00%, 09/01/50 |
3,803 | 3,015,910 | ||||||
| 2.00%, 10/01/50 |
2,655 | 2,103,944 | ||||||
| 2.00%, 11/01/50 |
4,122 | 3,261,206 | ||||||
| 2.00%, 12/01/50 |
8,084 | 6,443,881 | ||||||
| 2.00%, 01/01/51 |
3,760 | 2,983,064 | ||||||
| 2.00%, 02/01/51 |
3,019 | 2,391,190 | ||||||
| 2.00%, 03/01/51 |
4,458 | 3,530,477 | ||||||
| 2.00%, 04/01/51 |
8,364 | 6,614,638 | ||||||
| 2.00%, 05/01/51 |
12,270 | 9,701,911 | ||||||
| 2.00%, 06/01/51 |
4,012 | 3,180,533 | ||||||
| 2.00%, 07/01/51 |
2,846 | 2,251,179 | ||||||
| 2.00%, 08/01/51 |
5,571 | 4,393,012 | ||||||
| 2.00%, 09/01/51 |
1,779 | 1,402,208 | ||||||
| 2.00%, 10/01/51 |
14,080 | 11,138,145 | ||||||
| 2.00%, 11/01/51 |
12,516 | 9,883,551 | ||||||
| 2.00%, 12/01/51 |
7,990 | 6,309,183 | ||||||
| 2.00%, 01/01/52 |
12,727 | 10,042,323 | ||||||
| 2.00%, 02/01/52 |
16,363 | 12,869,408 | ||||||
| 2.00%, 03/01/52 |
385 | 302,412 | ||||||
| 2.00%, 03/01/52(g) |
26,902 | 21,152,038 | ||||||
| 2.00%, 05/01/52 |
22,625 | 17,801,377 | ||||||
| 2.00%, 03/13/54(f) |
17,235 | 13,540,924 | ||||||
| 2.00%, 04/11/54(f) |
8,610 | 6,773,991 | ||||||
| 2.50%, 01/01/32 |
68 | 63,451 | ||||||
| 2.50%, 04/01/32 |
310 | 290,267 | ||||||
| 2.50%, 06/01/32 |
120 | 112,238 | ||||||
| 2.50%, 01/01/33 |
58 | 55,128 | ||||||
| 2.50%, 11/01/34 |
374 | 341,662 | ||||||
| 2.50%, 07/01/35 |
511 | 467,066 | ||||||
| 2.50%, 10/01/35 |
2,110 | 1,924,446 | ||||||
| 2.50%, 03/01/36 |
860 | 783,348 | ||||||
| 2.50%, 05/01/36 |
1,763 | 1,600,576 | ||||||
| 2.50%, 06/01/36 |
450 | 408,810 | ||||||
| Security | Par (000) |
Value | ||||||
| Mortgage-Backed Securities (continued) | ||||||||
| 2.50%, 07/01/36 |
$ | 1,712 | $ | 1,556,070 | ||||
| 2.50%, 08/01/36 |
316 | 286,902 | ||||||
| 2.50%, 03/01/37 |
1,018 | 923,697 | ||||||
| 2.50%, 04/01/37 |
1,175 | 1,067,521 | ||||||
| 2.50%, 05/01/37 |
2,052 | 1,863,049 | ||||||
| 2.50%, 06/01/37 |
863 | 783,435 | ||||||
| 2.50%, 03/18/39(f) |
15,788 | 14,312,432 | ||||||
| 2.50%, 04/01/47 |
13 | 10,691 | ||||||
| 2.50%, 05/01/50 |
2,269 | 1,882,002 | ||||||
| 2.50%, 06/01/50 |
83 | 68,009 | ||||||
| 2.50%, 07/01/50 |
225 | 189,040 | ||||||
| 2.50%, 08/01/50 |
244 | 203,025 | ||||||
| 2.50%, 09/01/50 |
1,509 | 1,254,755 | ||||||
| 2.50%, 10/01/50 |
591 | 491,194 | ||||||
| 2.50%, 11/01/50 |
7,225 | 6,014,606 | ||||||
| 2.50%, 12/01/50 |
6,547 | 5,387,971 | ||||||
| 2.50%, 01/01/51 |
1,016 | 840,047 | ||||||
| 2.50%, 02/01/51 |
1,630 | 1,348,716 | ||||||
| 2.50%, 03/01/51 |
1,823 | 1,511,108 | ||||||
| 2.50%, 04/01/51 |
285 | 233,844 | ||||||
| 2.50%, 07/01/51 |
1,213 | 1,001,162 | ||||||
| 2.50%, 08/01/51 |
9,237 | 7,660,417 | ||||||
| 2.50%, 09/01/51 |
12,116 | 9,988,489 | ||||||
| 2.50%, 10/01/51 |
14,570 | 12,060,543 | ||||||
| 2.50%, 11/01/51 |
6,080 | 5,014,305 | ||||||
| 2.50%, 12/01/51 |
18,686 | 15,418,657 | ||||||
| 2.50%, 01/01/52 |
17,566 | 14,488,045 | ||||||
| 2.50%, 02/01/52 |
15,401 | 12,691,049 | ||||||
| 2.50%, 03/01/52 |
8,599 | 7,077,965 | ||||||
| 2.50%, 04/01/52 |
8,511 | 7,007,033 | ||||||
| 2.50%, 05/01/52 |
2,040 | 1,677,477 | ||||||
| 2.50%, 07/01/52 |
3,675 | 3,020,875 | ||||||
| 2.50%, 03/13/54(f) |
6,954 | 5,712,779 | ||||||
| 3.00%, 03/01/30 |
839 | 807,239 | ||||||
| 3.00%, 01/01/31 |
38 | 35,973 | ||||||
| 3.00%, 08/01/32 |
72 | 68,022 | ||||||
| 3.00%, 10/01/33 |
30 | 28,351 | ||||||
| 3.00%, 07/01/34 |
8 | 7,016 | ||||||
| 3.00%, 09/01/34 |
50 | 46,342 | ||||||
| 3.00%, 11/01/34 |
24 | 22,216 | ||||||
| 3.00%, 12/01/34 |
57 | 53,617 | ||||||
| 3.00%, 03/01/35 |
182 | 169,969 | ||||||
| 3.00%, 07/01/35 |
147 | 137,676 | ||||||
| 3.00%, 10/01/35 |
457 | 426,523 | ||||||
| 3.00%, 07/01/37 |
753 | 699,505 | ||||||
| 3.00%, 03/18/39(f) |
11,168 | 10,346,893 | ||||||
| 3.00%, 07/01/46 |
405 | 356,154 | ||||||
| 3.00%, 11/01/46 |
849 | 744,816 | ||||||
| 3.00%, 12/01/46 |
403 | 353,299 | ||||||
| 3.00%, 12/01/47 |
168 | 146,808 | ||||||
| 3.00%, 01/01/48 |
63 | 55,240 | ||||||
| 3.00%, 03/01/48 |
1,132 | 992,061 | ||||||
| 3.00%, 11/01/48 |
121 | 106,159 | ||||||
| 3.00%, 02/01/49 |
4,169 | 3,661,966 | ||||||
| 3.00%, 09/01/49 |
10 | 8,593 | ||||||
| 3.00%, 11/01/49 |
7 | 6,367 | ||||||
| 3.00%, 12/01/49 |
91 | 79,181 | ||||||
| 3.00%, 02/01/50 |
1,734 | 1,502,427 | ||||||
| 3.00%, 03/01/50 |
150 | 129,865 | ||||||
| 3.00%, 04/01/50 |
73 | 62,868 | ||||||
| 3.00%, 05/01/50 |
39 | 33,570 | ||||||
| 76 | 2 0 2 4 I S H A R E S A N N U A L R E P O R T T O S H A R E H O L D E R S |
| Schedule of Investments (continued) February 29, 2024 |
iShares® ESG Aware U.S. Aggregate Bond ETF (Percentages shown are based on Net Assets) |
| Security | Par (000) |
Value | ||||||
| Mortgage-Backed Securities (continued) | ||||||||
| 3.00%, 06/01/50 |
$ | 3,413 | $ | 2,934,872 | ||||
| 3.00%, 07/01/50 |
2,612 | 2,259,773 | ||||||
| 3.00%, 08/01/50 |
1,985 | 1,726,274 | ||||||
| 3.00%, 09/01/50 |
534 | 461,640 | ||||||
| 3.00%, 10/01/50 |
4,095 | 3,521,231 | ||||||
| 3.00%, 11/01/50 |
947 | 819,007 | ||||||
| 3.00%, 12/01/50 |
449 | 388,099 | ||||||
| 3.00%, 01/01/51 |
1,196 | 1,035,275 | ||||||
| 3.00%, 04/01/51 |
7,336 | 6,276,038 | ||||||
| 3.00%, 05/01/51 |
3,291 | 2,852,701 | ||||||
| 3.00%, 06/01/51 |
10,472 | 9,018,956 | ||||||
| 3.00%, 07/01/51 |
4,652 | 4,020,902 | ||||||
| 3.00%, 08/01/51 |
963 | 835,568 | ||||||
| 3.00%, 11/01/51 |
546 | 468,317 | ||||||
| 3.00%, 01/01/52 |
3,598 | 3,077,675 | ||||||
| 3.00%, 02/01/52 |
2,278 | 1,972,108 | ||||||
| 3.00%, 03/01/52 |
7,451 | 6,407,586 | ||||||
| 3.00%, 04/01/52 |
9,235 | 7,944,217 | ||||||
| 3.00%, 05/01/52 |
2,833 | 2,435,318 | ||||||
| 3.00%, 03/13/54(f) |
7,140 | 6,106,249 | ||||||
| 3.50%, 06/01/33 |
18 | 17,590 | ||||||
| 3.50%, 11/01/33 |
15 | 13,940 | ||||||
| 3.50%, 02/01/34 |
374 | 358,774 | ||||||
| 3.50%, 07/01/34 |
18 | 17,524 | ||||||
| 3.50%, 08/01/34 |
11 | 10,083 | ||||||
| 3.50%, 01/01/35 |
15 | 14,146 | ||||||
| 3.50%, 03/18/39(f) |
6,447 | 6,098,996 | ||||||
| 3.50%, 09/01/42 |
2,468 | 2,269,250 | ||||||
| 3.50%, 07/01/45 |
4,105 | 3,735,778 | ||||||
| 3.50%, 08/01/45 |
41 | 37,015 | ||||||
| 3.50%, 01/01/46 |
94 | 86,596 | ||||||
| 3.50%, 09/01/46 |
386 | 351,660 | ||||||
| 3.50%, 01/01/47 |
55 | 49,639 | ||||||
| 3.50%, 07/01/47 |
1,820 | 1,668,720 | ||||||
| 3.50%, 08/01/47 |
11 | 10,089 | ||||||
| 3.50%, 09/01/47 |
152 | 137,773 | ||||||
| 3.50%, 10/01/47 |
1,093 | 990,298 | ||||||
| 3.50%, 11/01/47 |
266 | 241,036 | ||||||
| 3.50%, 01/01/48 |
1,976 | 1,790,073 | ||||||
| 3.50%, 02/01/48 |
801 | 725,945 | ||||||
| 3.50%, 04/01/48 |
62 | 56,020 | ||||||
| 3.50%, 07/01/48 |
169 | 153,097 | ||||||
| 3.50%, 11/01/48 |
10 | 9,038 | ||||||
| 3.50%, 01/01/49 |
110 | 99,901 | ||||||
| 3.50%, 02/01/49 |
287 | 260,955 | ||||||
| 3.50%, 03/01/49 |
789 | 714,656 | ||||||
| 3.50%, 06/01/49 |
2,610 | 2,362,578 | ||||||
| 3.50%, 08/01/49 |
970 | 878,924 | ||||||
| 3.50%, 09/01/49 |
2,149 | 1,935,338 | ||||||
| 3.50%, 04/01/50 |
154 | 139,536 | ||||||
| 3.50%, 05/01/50 |
5,318 | 4,784,180 | ||||||
| 3.50%, 06/01/50 |
306 | 274,849 | ||||||
| 3.50%, 07/01/50 |
482 | 433,355 | ||||||
| 3.50%, 02/01/51 |
4,397 | 3,959,775 | ||||||
| 3.50%, 10/01/51 |
826 | 746,959 | ||||||
| 3.50%, 04/01/52 |
4,897 | 4,379,313 | ||||||
| 3.50%, 05/01/52 |
12,254 | 10,934,529 | ||||||
| 3.50%, 06/01/52 |
5,690 | 5,103,080 | ||||||
| 3.50%, 07/01/52 |
1,912 | 1,703,383 | ||||||
| 3.50%, 03/13/54(f) |
3,828 | 3,405,242 | ||||||
| 4.00%, 07/01/33 |
10 | 10,057 | ||||||
| Security | Par (000) |
Value | ||||||
| Mortgage-Backed Securities (continued) | ||||||||
| 4.00%, 08/01/37 |
$ | 218 | $ | 210,203 | ||||
| 4.00%, 09/01/37 |
304 | 293,498 | ||||||
| 4.00%, 11/01/37 |
431 | 415,173 | ||||||
| 4.00%, 02/01/38 |
230 | 221,267 | ||||||
| 4.00%, 05/01/38 |
197 | 190,239 | ||||||
| 4.00%, 11/01/38 |
124 | 119,168 | ||||||
| 4.00%, 03/18/39(f) |
3,600 | 3,467,087 | ||||||
| 4.00%, 01/01/46 |
262 | 247,238 | ||||||
| 4.00%, 10/01/46 |
8 | 7,457 | ||||||
| 4.00%, 07/01/47 |
1,730 | 1,620,069 | ||||||
| 4.00%, 08/01/47 |
324 | 305,334 | ||||||
| 4.00%, 09/01/47 |
384 | 359,428 | ||||||
| 4.00%, 05/01/48 |
2,300 | 2,148,255 | ||||||
| 4.00%, 09/01/48 |
2,538 | 2,371,573 | ||||||
| 4.00%, 10/01/48 |
5 | 4,700 | ||||||
| 4.00%, 12/01/48 |
3 | 2,394 | ||||||
| 4.00%, 01/01/49 |
1,375 | 1,284,962 | ||||||
| 4.00%, 03/01/49 |
1,560 | 1,457,269 | ||||||
| 4.00%, 05/01/49 |
15 | 13,824 | ||||||
| 4.00%, 06/01/49 |
15 | 14,140 | ||||||
| 4.00%, 07/01/49 |
2,096 | 1,957,495 | ||||||
| 4.00%, 11/01/49 |
273 | 253,751 | ||||||
| 4.00%, 12/01/49 |
9 | 8,584 | ||||||
| 4.00%, 01/01/50 |
85 | 79,636 | ||||||
| 4.00%, 04/01/50 |
1,876 | 1,747,685 | ||||||
| 4.00%, 05/01/50 |
1,102 | 1,023,406 | ||||||
| 4.00%, 05/01/51 |
269 | 251,585 | ||||||
| 4.00%, 04/01/52 |
629 | 579,825 | ||||||
| 4.00%, 05/01/52 |
1,468 | 1,352,451 | ||||||
| 4.00%, 06/01/52 |
1,675 | 1,542,704 | ||||||
| 4.00%, 07/01/52 |
3,715 | 3,424,403 | ||||||
| 4.00%, 08/01/52 |
3,829 | 3,525,335 | ||||||
| 4.00%, 09/01/52 |
563 | 518,210 | ||||||
| 4.00%, 10/01/52 |
705 | 654,144 | ||||||
| 4.00%, 12/01/52 |
5,215 | 4,795,936 | ||||||
| 4.00%, 02/01/53 |
4,337 | 4,039,603 | ||||||
| 4.00%, 03/13/54(f) |
10,300 | 9,475,744 | ||||||
| 4.50%, 03/18/39(f) |
25 | 24,455 | ||||||
| 4.50%, 10/01/47 |
9 | 8,513 | ||||||
| 4.50%, 08/01/48 |
22 | 21,014 | ||||||
| 4.50%, 10/01/48 |
418 | 400,985 | ||||||
| 4.50%, 11/01/48 |
18 | 17,389 | ||||||
| 4.50%, 12/01/48 |
22 | 21,665 | ||||||
| 4.50%, 01/01/49 |
63 | 60,265 | ||||||
| 4.50%, 02/01/49 |
85 | 82,114 | ||||||
| 4.50%, 04/01/49 |
159 | 152,995 | ||||||
| 4.50%, 05/01/49 |
11 | 10,666 | ||||||
| 4.50%, 09/01/50 |
1,270 | 1,220,555 | ||||||
| 4.50%, 05/01/52 |
454 | 436,713 | ||||||
| 4.50%, 06/01/52 |
2,086 | 1,974,150 | ||||||
| 4.50%, 07/01/52 |
228 | 216,144 | ||||||
| 4.50%, 08/01/52 |
1,861 | 1,763,077 | ||||||
| 4.50%, 09/01/52 |
4,059 | 3,859,312 | ||||||
| 4.50%, 10/01/52 |
8,840 | 8,405,300 | ||||||
| 4.50%, 11/01/52 |
1,087 | 1,028,145 | ||||||
| 4.50%, 12/01/52 |
4,525 | 4,320,451 | ||||||
| 4.50%, 08/01/53 |
969 | 918,641 | ||||||
| 4.50%, 03/13/54(f) |
7,470 | 7,070,561 | ||||||
| 5.00%, 06/01/48 |
131 | 129,290 | ||||||
| 5.00%, 04/01/49 |
10 | 10,324 | ||||||
| 5.00%, 12/01/49 |
374 | 369,293 | ||||||
| S C H E D U L E O F I N V E S T M E N T S |
77 |
| Schedule of Investments (continued) February 29, 2024 |
iShares® ESG Aware U.S. Aggregate Bond ETF (Percentages shown are based on Net Assets) |
| Security | Par (000) |
Value | ||||||
| Mortgage-Backed Securities (continued) | ||||||||
| 5.00%, 08/01/52 |
$ | 415 | $ | 404,349 | ||||
| 5.00%, 09/01/52 |
866 | 847,629 | ||||||
| 5.00%, 10/01/52 |
869 | 847,944 | ||||||
| 5.00%, 11/01/52 |
2,015 | 1,962,692 | ||||||
| 5.00%, 12/01/52 |
1,172 | 1,146,802 | ||||||
| 5.00%, 01/01/53 |
7,961 | 7,740,753 | ||||||
| 5.00%, 03/01/53 |
610 | 598,434 | ||||||
| 5.00%, 04/01/53 |
2,182 | 2,116,610 | ||||||
| 5.00%, 05/01/53 |
645 | 626,076 | ||||||
| 5.00%, 06/01/53 |
1,378 | 1,346,509 | ||||||
| 5.00%, 08/01/53 |
5,148 | 4,992,715 | ||||||
| 5.00%, 03/01/54(f) |
7,650 | 7,418,113 | ||||||
| 5.50%, 09/01/52 |
476 | 478,841 | ||||||
| 5.50%, 11/01/52 |
621 | 619,663 | ||||||
| 5.50%, 12/01/52 |
2,421 | 2,419,496 | ||||||
| 5.50%, 01/01/53 |
2,416 | 2,418,174 | ||||||
| 5.50%, 02/01/53 |
3,005 | 2,981,265 | ||||||
| 5.50%, 03/01/53 |
1,576 | 1,575,861 | ||||||
| 5.50%, 04/01/53 |
3,625 | 3,615,262 | ||||||
| 5.50%, 05/01/53 |
3,645 | 3,604,200 | ||||||
| 5.50%, 06/01/53 |
538 | 537,638 | ||||||
| 5.50%, 07/01/53 |
2,019 | 2,010,523 | ||||||
| 5.50%, 03/13/54(f) |
8,626 | 8,532,604 | ||||||
| 6.00%, 01/01/53 |
500 | 509,647 | ||||||
| 6.00%, 06/01/53 |
289 | 291,967 | ||||||
| 6.00%, 07/01/53 |
1,285 | 1,290,587 | ||||||
| 6.00%, 08/01/53 |
6,886 | 6,994,713 | ||||||
| 6.00%, 09/01/53 |
4,094 | 4,134,784 | ||||||
| 6.00%, 11/01/53 |
3,287 | 3,314,460 | ||||||
| 6.00%, 12/01/53 |
668 | 674,983 | ||||||
| 6.00%, 02/01/54 |
411 | 415,390 | ||||||
| 6.00%, 03/13/54(f) |
6,050 | 6,075,233 | ||||||
| 6.00%, 04/11/54(f) |
3,025 | 3,037,144 | ||||||
| 6.50%, 09/01/53 |
998 | 1,016,852 | ||||||
| 6.50%, 10/01/53 |
3,985 | 4,097,824 | ||||||
| 6.50%, 11/01/53 |
2,714 | 2,765,093 | ||||||
| 6.50%, 12/01/53 |
3,578 | 3,679,678 | ||||||
| 6.50%, 01/01/54 |
797 | 814,383 | ||||||
| 6.50%, 02/01/54 |
731 | 753,901 | ||||||
| 6.50%, 03/13/54(f) |
8,475 | 8,623,184 | ||||||
|
|
|
|||||||
| 963,372,730 | ||||||||
| U.S. Government Agency Obligations — 0.1% | ||||||||
| Federal Home Loan Banks, 3.25%, 11/16/28 |
510 | 488,262 | ||||||
| Federal Home Loan Mortgage Corp.,Series 1, 0.00% 11/15/38(c) |
20 | 9,839 | ||||||
| Federal National Mortgage Association |
||||||||
| 1.63%, 01/07/25 |
300 | 291,389 | ||||||
| 5.63%, 07/15/37 |
2,142 | 2,362,775 | ||||||
| 6.21%, 08/06/38 |
110 | 128,111 | ||||||
| 6.25%, 05/15/29 |
378 | 411,655 | ||||||
| 6.63%, 11/15/30 |
440 | 496,689 | ||||||
| 7.13%, 01/15/30 |
750 | 857,144 | ||||||
|
|
|
|||||||
| 5,045,864 | ||||||||
| U.S. Government Obligations — 41.3% | ||||||||
| U.S. Treasury Note/Bond |
||||||||
| 0.25%, 05/31/25 |
5,830 | 5,502,518 | ||||||
| 0.25%, 06/30/25 |
4,120 | 3,876,984 | ||||||
| 0.25%, 07/31/25 |
3,850 | 3,610,127 | ||||||
| 0.25%, 08/31/25 |
5,100 | 4,766,707 | ||||||
| 0.25%, 09/30/25 |
3,300 | 3,074,285 | ||||||
| Security | Par (000) |
Value | ||||||
| U.S. Government Obligations (continued) | ||||||||
| 0.25%, 10/31/25 |
$ | 8,390 | $ | 7,790,902 | ||||
| 0.38%, 04/30/25 |
3,400 | 3,225,352 | ||||||
| 0.38%, 11/30/25 |
7,650 | 7,097,168 | ||||||
| 0.38%, 12/31/25(b) |
7,300 | 6,753,355 | ||||||
| 0.38%, 01/31/26 |
10,250 | 9,451,221 | ||||||
| 0.38%, 09/30/27 |
5,400 | 4,692,938 | ||||||
| 0.50%, 03/31/25 |
3,400 | 3,240,094 | ||||||
| 0.50%, 02/28/26 |
6,250 | 5,761,719 | ||||||
| 0.50%, 04/30/27 |
2,350 | 2,081,770 | ||||||
| 0.50%, 05/31/27 |
1,100 | 971,523 | ||||||
| 0.50%, 06/30/27 |
1,900 | 1,673,336 | ||||||
| 0.50%, 08/31/27 |
6,300 | 5,516,438 | ||||||
| 0.50%, 10/31/27 |
9,250 | 8,052,559 | ||||||
| 0.63%, 07/31/26 |
3,000 | 2,735,156 | ||||||
| 0.63%, 03/31/27 |
1,000 | 892,344 | ||||||
| 0.63%, 11/30/27 |
7,450 | 6,499,543 | ||||||
| 0.63%, 12/31/27 |
10,300 | 8,959,391 | ||||||
| 0.63%, 05/15/30 |
1,800 | 1,445,203 | ||||||
| 0.63%, 08/15/30 |
7,300 | 5,812,055 | ||||||
| 0.75%, 04/30/26 |
3,240 | 2,986,369 | ||||||
| 0.75%, 05/31/26 |
1,350 | 1,241,051 | ||||||
| 0.75%, 08/31/26 |
7,000 | 6,385,312 | ||||||
| 0.75%, 01/31/28 |
6,300 | 5,493,797 | ||||||
| 0.88%, 06/30/26 |
7,590 | 6,983,986 | ||||||
| 0.88%, 09/30/26 |
5,700 | 5,205,703 | ||||||
| 0.88%, 11/15/30 |
7,090 | 5,707,450 | ||||||
| 1.00%, 07/31/28 |
5,000 | 4,342,578 | ||||||
| 1.13%, 10/31/26 |
1,500 | 1,374,844 | ||||||
| 1.13%, 02/28/27 |
2,850 | 2,589,270 | ||||||
| 1.13%, 02/29/28 |
4,000 | 3,533,750 | ||||||
| 1.13%, 08/31/28 |
8,750 | 7,624,121 | ||||||
| 1.13%, 02/15/31 |
14,700 | 11,987,391 | ||||||
| 1.13%, 05/15/40 |
7,900 | 4,874,547 | ||||||
| 1.13%, 08/15/40 |
8,500 | 5,192,969 | ||||||
| 1.25%, 11/30/26 |
7,200 | 6,608,250 | ||||||
| 1.25%, 12/31/26 |
8,600 | 7,879,750 | ||||||
| 1.25%, 03/31/28 |
7,100 | 6,291,266 | ||||||
| 1.25%, 04/30/28 |
5,100 | 4,508,719 | ||||||
| 1.25%, 05/31/28 |
4,700 | 4,145,914 | ||||||
| 1.25%, 06/30/28 |
7,770 | 6,839,421 | ||||||
| 1.25%, 09/30/28 |
12,200 | 10,668,328 | ||||||
| 1.25%, 08/15/31 |
12,400 | 10,040,125 | ||||||
| 1.25%, 05/15/50 |
8,550 | 4,343,133 | ||||||
| 1.38%, 01/31/25 |
5,150 | 4,979,607 | ||||||
| 1.38%, 08/31/26 |
375 | 347,490 | ||||||
| 1.38%, 10/31/28 |
5,000 | 4,390,234 | ||||||
| 1.38%, 12/31/28 |
5,750 | 5,027,656 | ||||||
| 1.38%, 11/15/31 |
11,500 | 9,336,562 | ||||||
| 1.38%, 11/15/40 |
8,650 | 5,491,398 | ||||||
| 1.38%, 08/15/50 |
4,720 | 2,478,000 | ||||||
| 1.50%, 02/15/25 |
6,100 | 5,894,840 | ||||||
| 1.50%, 08/15/26 |
3,550 | 3,302,887 | ||||||
| 1.50%, 01/31/27 |
13,900 | 12,796,687 | ||||||
| 1.50%, 11/30/28 |
5,300 | 4,672,695 | ||||||
| 1.50%, 02/15/30 |
4,200 | 3,593,625 | ||||||
| 1.63%, 02/15/26 |
3,975 | 3,752,648 | ||||||
| 1.63%, 05/15/26 |
6,500 | 6,100,859 | ||||||
| 1.63%, 10/31/26 |
3,500 | 3,251,172 | ||||||
| 1.63%, 11/30/26 |
2,800 | 2,597,219 | ||||||
| 1.63%, 08/15/29 |
665 | 581,823 | ||||||
| 1.63%, 05/15/31 |
8,500 | 7,125,391 | ||||||
| 78 | 2 0 2 4 I S H A R E S A N N U A L R E P O R T T O S H A R E H O L D E R S |
| Schedule of Investments (continued) February 29, 2024 |
iShares® ESG Aware U.S. Aggregate Bond ETF (Percentages shown are based on Net Assets) |
| Security | Par (000) |
Value | ||||||
| U.S. Government Obligations (continued) | ||||||||
| 1.63%, 11/15/50 |
$ | 6,100 | $ | 3,426,484 | ||||
| 1.75%, 03/15/25 |
4,670 | 4,515,124 | ||||||
| 1.75%, 12/31/26 |
4,750 | 4,413,789 | ||||||
| 1.75%, 01/31/29 |
7,200 | 6,400,688 | ||||||
| 1.75%, 11/15/29 |
550 | 482,324 | ||||||
| 1.75%, 08/15/41 |
8,400 | 5,595,188 | ||||||
| 1.88%, 06/30/26 |
1,175 | 1,107,070 | ||||||
| 1.88%, 02/28/27 |
5,800 | 5,389,016 | ||||||
| 1.88%, 02/28/29 |
4,400 | 3,929,406 | ||||||
| 1.88%, 02/15/32 |
10,600 | 8,902,344 | ||||||
| 1.88%, 02/15/41 |
7,700 | 5,305,781 | ||||||
| 1.88%, 02/15/51 |
7,800 | 4,671,469 | ||||||
| 1.88%, 11/15/51 |
7,750 | 4,620,938 | ||||||
| 2.00%, 02/15/25 |
1,425 | 1,383,753 | ||||||
| 2.00%, 08/15/25 |
5,520 | 5,302,003 | ||||||
| 2.00%, 11/15/26 |
4,150 | 3,890,949 | ||||||
| 2.00%, 11/15/41 |
6,900 | 4,776,094 | ||||||
| 2.00%, 02/15/50 |
4,450 | 2,771,516 | ||||||
| 2.00%, 08/15/51 |
7,000 | 4,313,750 | ||||||
| 2.13%, 05/15/25 |
480 | 464,325 | ||||||
| 2.13%, 05/31/26 |
800 | 758,750 | ||||||
| 2.25%, 11/15/25 |
8,600 | 8,251,969 | ||||||
| 2.25%, 03/31/26 |
275 | 262,281 | ||||||
| 2.25%, 02/15/27 |
4,300 | 4,043,008 | ||||||
| 2.25%, 08/15/27 |
2,100 | 1,957,758 | ||||||
| 2.25%, 11/15/27 |
5,070 | 4,707,574 | ||||||
| 2.25%, 05/15/41 |
6,300 | 4,599,984 | ||||||
| 2.25%, 08/15/46 |
6,855 | 4,656,045 | ||||||
| 2.25%, 08/15/49 |
3,400 | 2,252,500 | ||||||
| 2.25%, 02/15/52 |
7,850 | 5,138,070 | ||||||
| 2.38%, 05/15/27 |
4,650 | 4,371,363 | ||||||
| 2.38%, 03/31/29 |
6,200 | 5,666,219 | ||||||
| 2.38%, 05/15/29 |
6,090 | 5,556,173 | ||||||
| 2.38%, 02/15/42 |
7,250 | 5,330,030 | ||||||
| 2.38%, 11/15/49 |
1,690 | 1,149,728 | ||||||
| 2.38%, 05/15/51 |
6,000 | 4,050,938 | ||||||
| 2.50%, 02/28/26 |
5,400 | 5,182,945 | ||||||
| 2.50%, 03/31/27 |
3,400 | 3,215,125 | ||||||
| 2.50%, 02/15/45 |
2,250 | 1,630,898 | ||||||
| 2.50%, 02/15/46 |
6,050 | 4,341,820 | ||||||
| 2.50%, 05/15/46 |
4,950 | 3,543,117 | ||||||
| 2.63%, 03/31/25 |
600 | 585,047 | ||||||
| 2.63%, 04/15/25 |
3,130 | 3,049,671 | ||||||
| 2.63%, 12/31/25 |
4,800 | 4,628,063 | ||||||
| 2.63%, 01/31/26 |
350 | 337,094 | ||||||
| 2.63%, 05/31/27 |
5,800 | 5,490,969 | ||||||
| 2.63%, 02/15/29 |
5,215 | 4,832,023 | ||||||
| 2.63%, 07/31/29 |
2,000 | 1,842,500 | ||||||
| 2.75%, 02/28/25 |
2,280 | 2,229,413 | ||||||
| 2.75%, 05/15/25 |
3,500 | 3,410,996 | ||||||
| 2.75%, 06/30/25 |
3,900 | 3,795,035 | ||||||
| 2.75%, 08/31/25 |
3,900 | 3,783,609 | ||||||
| 2.75%, 04/30/27 |
4,000 | 3,805,938 | ||||||
| 2.75%, 07/31/27 |
7,000 | 6,640,156 | ||||||
| 2.75%, 02/15/28 |
4,225 | 3,983,053 | ||||||
| 2.75%, 05/31/29 |
6,700 | 6,224,195 | ||||||
| 2.75%, 08/15/32 |
11,000 | 9,820,937 | ||||||
| 2.75%, 08/15/42 |
1,475 | 1,147,273 | ||||||
| 2.75%, 11/15/42 |
3,425 | 2,654,375 | ||||||
| 2.75%, 08/15/47 |
4,300 | 3,196,781 | ||||||
| 2.75%, 11/15/47 |
5,500 | 4,081,172 | ||||||
| Security | Par (000) |
Value | ||||||
| U.S. Government Obligations (continued) | ||||||||
| 2.88%, 04/30/25 |
$ | 2,160 | $ | 2,109,122 | ||||
| 2.88%, 05/31/25 |
3,975 | 3,877,333 | ||||||
| 2.88%, 06/15/25 |
7,000 | 6,823,359 | ||||||
| 2.88%, 07/31/25 |
1,500 | 1,459,746 | ||||||
| 2.88%, 11/30/25 |
3,100 | 3,004,820 | ||||||
| 2.88%, 05/15/28 |
7,057 | 6,668,881 | ||||||
| 2.88%, 08/15/28 |
6,900 | 6,503,250 | ||||||
| 2.88%, 04/30/29 |
5,440 | 5,090,650 | ||||||
| 2.88%, 05/15/32 |
10,100 | 9,131,031 | ||||||
| 2.88%, 05/15/43 |
1,600 | 1,259,250 | ||||||
| 2.88%, 08/15/45 |
3,395 | 2,621,577 | ||||||
| 2.88%, 11/15/46 |
3,800 | 2,907,594 | ||||||
| 2.88%, 05/15/49 |
1,435 | 1,084,995 | ||||||
| 2.88%, 05/15/52 |
7,610 | 5,733,659 | ||||||
| 3.00%, 07/15/25 |
5,250 | 5,121,416 | ||||||
| 3.00%, 09/30/25 |
3,300 | 3,210,797 | ||||||
| 3.00%, 10/31/25 |
1,200 | 1,166,438 | ||||||
| 3.00%, 05/15/42 |
170 | 137,753 | ||||||
| 3.00%, 11/15/44 |
1,600 | 1,269,250 | ||||||
| 3.00%, 05/15/45 |
1,285 | 1,016,355 | ||||||
| 3.00%, 11/15/45 |
4,400 | 3,467,063 | ||||||
| 3.00%, 02/15/47 |
4,475 | 3,496,793 | ||||||
| 3.00%, 05/15/47 |
3,900 | 3,043,219 | ||||||
| 3.00%, 02/15/48 |
13,400 | 10,414,312 | ||||||
| 3.00%, 08/15/48 |
3,855 | 2,991,239 | ||||||
| 3.00%, 02/15/49 |
2,225 | 1,724,375 | ||||||
| 3.00%, 08/15/52 |
8,700 | 6,730,266 | ||||||
| 3.13%, 08/15/25 |
4,100 | 4,002,785 | ||||||
| 3.13%, 08/31/27 |
3,000 | 2,879,063 | ||||||
| 3.13%, 11/15/28 |
275 | 261,465 | ||||||
| 3.13%, 08/31/29 |
6,900 | 6,512,414 | ||||||
| 3.13%, 11/15/41 |
825 | 686,684 | ||||||
| 3.13%, 02/15/42 |
1,000 | 829,219 | ||||||
| 3.13%, 02/15/43 |
2,500 | 2,051,953 | ||||||
| 3.13%, 08/15/44 |
1,600 | 1,298,250 | ||||||
| 3.13%, 05/15/48 |
10,450 | 8,304,484 | ||||||
| 3.25%, 06/30/27 |
4,700 | 4,536,602 | ||||||
| 3.25%, 06/30/29 |
5,500 | 5,232,305 | ||||||
| 3.25%, 05/15/42 |
6,629 | 5,576,310 | ||||||
| 3.38%, 05/15/33 |
12,940 | 12,074,637 | ||||||
| 3.38%, 08/15/42 |
3,100 | 2,650,984 | ||||||
| 3.38%, 05/15/44 |
1,020 | 862,378 | ||||||
| 3.38%, 11/15/48 |
14,700 | 12,210,187 | ||||||
| 3.50%, 09/15/25 |
3,000 | 2,942,344 | ||||||
| 3.50%, 01/31/28 |
7,000 | 6,790,000 | ||||||
| 3.50%, 04/30/28 |
5,400 | 5,232,938 | ||||||
| 3.50%, 01/31/30 |
8,400 | 8,060,719 | ||||||
| 3.50%, 04/30/30 |
9,000 | 8,623,125 | ||||||
| 3.50%, 02/15/33 |
19,000 | 17,925,312 | ||||||
| 3.50%, 02/15/39 |
1,350 | 1,227,445 | ||||||
| 3.63%, 05/15/26 |
23,700 | 23,233,406 | ||||||
| 3.63%, 03/31/28 |
8,500 | 8,278,203 | ||||||
| 3.63%, 05/31/28 |
9,000 | 8,761,641 | ||||||
| 3.63%, 03/31/30 |
5,180 | 4,999,914 | ||||||
| 3.63%, 08/15/43 |
1,225 | 1,079,914 | ||||||
| 3.63%, 02/15/44 |
720 | 632,925 | ||||||
| 3.63%, 02/15/53 |
15,000 | 13,120,312 | ||||||
| 3.63%, 05/15/53 |
12,200 | 10,680,719 | ||||||
| 3.75%, 04/15/26 |
25,500 | 25,067,695 | ||||||
| 3.75%, 12/31/28 |
4,000 | 3,909,375 | ||||||
| 3.75%, 05/31/30 |
10,000 | 9,710,156 | ||||||
| S C H E D U L E O F I N V E S T M E N T S |
79 |
| Schedule of Investments (continued) February 29, 2024 |
iShares® ESG Aware U.S. Aggregate Bond ETF (Percentages shown are based on Net Assets) |
| Security | Par (000) |
Value | ||||||
|
|
||||||||
| U.S. Government Obligations (continued) | ||||||||
| 3.75%, 06/30/30 |
$ | 12,000 | $ | 11,649,375 | ||||
| 3.75%, 12/31/30 |
6,000 | 5,815,313 | ||||||
| 3.75%, 11/15/43 |
300 | 269,016 | ||||||
| 3.88%, 01/15/26 |
5,900 | 5,816,109 | ||||||
| 3.88%, 11/30/27 |
4,000 | 3,933,750 | ||||||
| 3.88%, 12/31/27 |
3,800 | 3,736,766 | ||||||
| 3.88%, 09/30/29 |
5,000 | 4,900,781 | ||||||
| 3.88%, 11/30/29 |
3,800 | 3,723,109 | ||||||
| 3.88%, 12/31/29 |
8,000 | 7,835,625 | ||||||
| 3.88%, 08/15/33 |
15,700 | 15,231,453 | ||||||
| 3.88%, 08/15/40 |
300 | 280,453 | ||||||
| 3.88%, 02/15/43 |
8,000 | 7,327,500 | ||||||
| 3.88%, 05/15/43 |
9,900 | 9,053,859 | ||||||
| 4.00%, 12/15/25 |
5,900 | 5,828,094 | ||||||
| 4.00%, 02/15/26 |
8,600 | 8,497,875 | ||||||
| 4.00%, 01/15/27 |
7,400 | 7,313,281 | ||||||
| 4.00%, 02/29/28 |
8,000 | 7,901,875 | ||||||
| 4.00%, 06/30/28 |
15,500 | 15,313,516 | ||||||
| 4.00%, 01/31/29(b) |
8,000 | 7,907,500 | ||||||
| 4.00%, 10/31/29 |
4,900 | 4,831,094 | ||||||
| 4.00%, 02/28/30 |
15,400 | 15,172,609 | ||||||
| 4.00%, 07/31/30 |
13,500 | 13,291,172 | ||||||
| 4.00%, 01/31/31 |
6,500 | 6,395,391 | ||||||
| 4.00%, 02/15/34 |
5,200 | 5,098,438 | ||||||
| 4.00%, 11/15/42 |
5,300 | 4,948,875 | ||||||
| 4.00%, 11/15/52 |
6,800 | 6,369,688 | ||||||
| 4.13%, 01/31/25 |
4,100 | 4,064,285 | ||||||
| 4.13%, 06/15/26 |
24,273 | 24,047,337 | ||||||
| 4.13%, 09/30/27 |
3,000 | 2,975,859 | ||||||
| 4.13%, 10/31/27 |
4,800 | 4,761,000 | ||||||
| 4.13%, 07/31/28 |
14,400 | 14,298,750 | ||||||
| 4.13%, 08/31/30 |
10,200 | 10,109,156 | ||||||
| 4.13%, 11/15/32 |
12,200 | 12,072,281 | ||||||
| 4.13%, 08/15/53 |
11,300 | 10,826,812 | ||||||
| 4.25%, 05/31/25 |
4,100 | 4,066,207 | ||||||
| 4.25%, 10/15/25 |
5,140 | 5,098,438 | ||||||
| 4.25%, 12/31/25 |
3,000 | 2,976,797 | ||||||
| 4.25%, 01/31/26(b) |
2,000 | 1,985,156 | ||||||
| 4.25%, 02/28/29 |
10,000 | 10,000,781 | ||||||
| 4.25%, 02/28/31 |
5,000 | 4,994,531 | ||||||
| 4.25%, 05/15/39 |
1,200 | 1,186,688 | ||||||
| 4.25%, 11/15/40 |
250 | 244,297 | ||||||
| 4.25%, 02/15/54 |
2,000 | 1,963,125 | ||||||
| 4.38%, 08/15/26 |
27,800 | 27,708,781 | ||||||
| 4.38%, 12/15/26 |
10,000 | 9,980,469 | ||||||
| 4.38%, 08/31/28 |
11,550 | 11,586,996 | ||||||
| 4.38%, 11/30/28 |
11,600 | 11,649,844 | ||||||
| 4.38%, 11/30/30 |
8,000 | 8,045,000 | ||||||
| 4.38%, 02/15/38 |
2,400 | 2,427,000 | ||||||
| 4.38%, 11/15/39 |
150 | 149,930 | ||||||
| 4.38%, 05/15/40 |
250 | 248,984 | ||||||
| 4.38%, 05/15/41 |
500 | 494,453 | ||||||
| 4.38%, 08/15/43 |
8,400 | 8,226,750 | ||||||
| 4.50%, 11/15/25 |
6,000 | 5,976,563 | ||||||
| 4.50%, 07/15/26 |
28,450 | 28,427,773 | ||||||
| 4.50%, 11/15/33 |
15,000 | 15,285,937 | ||||||
| 4.50%, 02/15/36 |
900 | 930,938 | ||||||
| 4.50%, 05/15/38 |
7,400 | 7,564,187 | ||||||
| 4.50%, 08/15/39 |
2,000 | 2,031,250 | ||||||
| 4.63%, 02/28/25(b) |
4,200 | 4,182,281 | ||||||
| 4.63%, 06/30/25 |
1,500 | 1,495,195 | ||||||
| Security | Par (000) |
Value | ||||||
|
|
||||||||
| U.S. Government Obligations (continued) | ||||||||
| 4.63%, 03/15/26 |
$ | 12,560 | $ | 12,560,000 | ||||
| 4.63%, 09/15/26 |
14,450 | 14,491,770 | ||||||
| 4.63%, 10/15/26 |
16,700 | 16,756,102 | ||||||
| 4.63%, 11/15/26 |
18,000 | 18,067,500 | ||||||
| 4.63%, 09/30/28 |
14,100 | 14,290,570 | ||||||
| 4.63%, 09/30/30 |
8,500 | 8,667,344 | ||||||
| 4.63%, 02/15/40 |
250 | 256,719 | ||||||
| 4.75%, 07/31/25 |
1,000 | 998,750 | ||||||
| 4.75%, 02/15/37 |
500 | 527,734 | ||||||
| 4.75%, 11/15/43 |
4,500 | 4,632,188 | ||||||
| 4.75%, 11/15/53 |
9,800 | 10,433,937 | ||||||
| 4.88%, 11/30/25 |
1,000 | 1,002,461 | ||||||
| 4.88%, 10/31/30 |
5,000 | 5,170,313 | ||||||
| 5.00%, 05/15/37 |
2,400 | 2,589,000 | ||||||
| 5.38%, 02/15/31 |
1,000 | 1,069,219 | ||||||
| 6.13%, 08/15/29(b) |
1,000 | 1,086,328 | ||||||
| 6.25%, 05/15/30 |
100 | 110,453 | ||||||
| 6.38%, 08/15/27 |
800 | 848,938 | ||||||
|
|
|
|||||||
| 1,470,314,211 | ||||||||
|
|
|
|||||||
| Total U.S. Government & Agency Obligations — 68.5% |
|
2,438,732,805 | ||||||
|
|
|
|||||||
| Total Long-Term Investments — 99.1% |
|
3,526,877,168 | ||||||
|
|
|
|||||||
| Shares | ||||||||
|
|
||||||||
| Short-Term Securities |
||||||||
| Money Market Funds — 7.0% |
||||||||
| BlackRock Cash Funds: Institutional, SL Agency Shares, 5.50%(h)(i) |
206,414,316 | 206,517,523 | ||||||
| BlackRock Cash Funds: Treasury, SL Agency Shares, 5.30%(h)(i)(j) |
42,473,063 | 42,473,063 | ||||||
|
|
|
|||||||
| Total Short-Term Securities — 7.0% |
|
248,990,586 | ||||||
|
|
|
|||||||
| Total Investments Before TBA Sales |
|
3,775,867,754 | ||||||
|
|
|
|||||||
| Par (000) |
||||||||
|
|
||||||||
| TBA Sales Commitments |
||||||||
| Mortgage-Backed Securities — (0.4)% |
|
|||||||
| Government National Mortgage Association, 2.00%, 03/20/54(f) |
$ | (2,900 | ) | (2,359,987 | ) | |||
| Uniform Mortgage-Backed Securities |
||||||||
| 2.00%, 03/13/54(f) |
(8,610 | ) | (6,764,574 | ) | ||||
| 6.00%, 03/13/54(f) |
(3,025 | ) | (3,037,617 | ) | ||||
| 6.50%, 03/13/54(f) |
(1,950 | ) | (1,984,096 | ) | ||||
|
|
|
|||||||
| Total TBA Sales Commitments — (0.4)% |
|
(14,146,274 | ) | |||||
|
|
|
|||||||
| Total Investments, Net of TBA Sales |
|
3,761,721,480 | ||||||
| Liabilities in Excess of Other Assets — (5.7)% |
|
(201,781,556 | ) | |||||
|
|
|
|||||||
| Net Assets — 100.0% |
$ | 3,559,939,924 | ||||||
|
|
|
|||||||
| 80 | 2 0 2 4 I S H A R E S A N N U A L R E P O R T T O S H A R E H O L D E R S |
| Schedule of Investments (continued) February 29, 2024 |
iShares® ESG Aware U.S. Aggregate Bond ETF |
| (a) | Variable rate security. Interest rate resets periodically. The rate shown is the effective interest rate as of period end. Security description also includes the reference rate and spread if published and available. |
| (b) | All or a portion of this security is on loan. |
| (c) | Zero-coupon bond. |
| (d) | Step coupon security. Coupon rate will either increase (step-up bond) or decrease (step-down bond) at regular intervals until maturity. Interest rate shown reflects the rate currently in effect. |
| (e) | Security exempt from registration pursuant to Rule 144A under the Securities Act of 1933, as amended. These securities may be resold in transactions exempt from registration to qualified institutional investors. |
| (f) | Represents or includes a TBA transaction. |
| (g) | All or a portion of the security has been pledged as collateral in connection with outstanding TBA commitments. |
| (h) | Affiliate of the Fund. |
| (i) | Annualized 7-day yield as of period end. |
| (j) | All or a portion of this security was purchased with the cash collateral from loaned securities. |
Affiliates
Investments in issuers considered to be affiliate(s) of the Fund during the year ended February 29, 2024 for purposes of Section 2(a)(3) of the Investment Company Act of 1940, as amended, were as follows:
|
|
||||||||||||||||||||||||||||||||||||
| Affiliated Issuer | Value at 02/28/23 |
Purchases at Cost |
Proceeds from Sale |
Net Realized Gain (Loss) |
Change in Unrealized Appreciation (Depreciation) |
Value at 02/29/24 |
Shares Held at 02/29/24 |
Income | Capital Gain Distributions from Underlying Funds |
|||||||||||||||||||||||||||
|
|
||||||||||||||||||||||||||||||||||||
| BlackRock Cash Funds: Institutional, SL Agency Shares |
$ | 156,530,457 | $ | 49,974,207 | (a) | $ | — | $ | 10,720 | $ | 2,139 | $ | 206,517,523 | 206,414,316 | $ | 11,985,825 | $ | 189 | ||||||||||||||||||
| BlackRock Cash Funds: Treasury, SL Agency Shares |
14,722,824 | 27,750,239 | (a) | — | — | — | 42,473,063 | 42,473,063 | 178,391 | (b) | — | |||||||||||||||||||||||||
|
|
|
|
|
|
|
|
|
|
|
|||||||||||||||||||||||||||
| $ | 10,720 | $ | 2,139 | $ | 248,990,586 | $ | 12,164,216 | $ | 189 | |||||||||||||||||||||||||||
|
|
|
|
|
|
|
|
|
|
|
|||||||||||||||||||||||||||
| (a) | Represents net amount purchased (sold). |
| (b) | All or a portion represents securities lending income earned from the reinvestment of cash collateral from loaned securities, net of fees and collateral investment expenses, and other payments to and from borrowers of securities. |
Fair Value Hierarchy as of Period End
Various inputs are used in determining the fair value of financial instruments. For a description of the input levels and information about the Fund’s policy regarding valuation of financial instruments, refer to the Notes to Financial Statements.
The following table summarizes the Fund’s financial instruments categorized in the fair value hierarchy. The breakdown of the Fund’s financial instruments into major categories is disclosed in the Schedule of Investments above.
|
|
||||||||||||||||
| Level 1 | Level 2 | Level 3 | Total | |||||||||||||
|
|
||||||||||||||||
| Assets |
||||||||||||||||
| Investments |
||||||||||||||||
| Long-Term Investments |
||||||||||||||||
| Asset-Backed Securities |
$ | — | $ | 16,788,831 | $ | — | $ | 16,788,831 | ||||||||
| Collaterized Mortgage Obligations |
— | 34,837,386 | — | 34,837,386 | ||||||||||||
| Corporate Bonds & Notes |
— | 916,438,958 | — | 916,438,958 | ||||||||||||
| Foreign Government Obligations |
— | 119,943,079 | — | 119,943,079 | ||||||||||||
| Municipal Debt Obligations |
— | 136,109 | — | 136,109 | ||||||||||||
| U.S. Government & Agency Obligations |
— | 2,438,732,805 | — | 2,438,732,805 | ||||||||||||
| Short-Term Securities |
||||||||||||||||
| Money Market Funds |
248,990,586 | — | — | 248,990,586 | ||||||||||||
| Liabilities |
||||||||||||||||
| Investments |
||||||||||||||||
| TBA Sales Commitments |
— | (14,146,274 | ) | — | (14,146,274 | ) | ||||||||||
|
|
|
|
|
|
|
|
|
|||||||||
| $ | 248,990,586 | $ | 3,512,730,894 | $ | — | $ | 3,761,721,480 | |||||||||
|
|
|
|
|
|
|
|
|
|||||||||
See notes to financial statements.
| S C H E D U L E O F I N V E S T M E N T S |
81 |
| Schedule of Investments February 29, 2024 |
iShares® ESG Aware USD Corporate Bond ETF (Percentages shown are based on Net Assets) |
| Security | Par (000) |
Value | ||||||
| Corporate Bonds & Notes |
||||||||
| Advertising — 0.1% |
||||||||
| Interpublic Group of Companies Inc. (The) |
||||||||
| 4.75%, 03/30/30 (Call 12/30/29) |
$ | 74 | $ | 71,968 | ||||
| 5.38%, 06/15/33 (Call 03/15/33) |
97 | 95,969 | ||||||
| 5.40%, 10/01/48 (Call 04/01/48) |
328 | 303,101 | ||||||
| Omnicom Group Inc. |
||||||||
| 2.45%, 04/30/30 (Call 01/30/30) |
17 | 14,538 | ||||||
| 4.20%, 06/01/30 (Call 03/01/30) |
17 | 16,083 | ||||||
|
|
|
|||||||
| 501,659 | ||||||||
| Aerospace & Defense — 0.9% | ||||||||
| Hexcel Corp. |
||||||||
| 4.20%, 02/15/27 (Call 11/15/26) |
690 | 656,914 | ||||||
| 4.95%, 08/15/25 (Call 05/15/25) |
920 | 907,938 | ||||||
| Howmet Aerospace Inc., 5.95%, 02/01/37 |
145 | 148,061 | ||||||
| Northrop Grumman Corp. |
||||||||
| 4.90%, 06/01/34 (Call 03/01/34) |
650 | 633,006 | ||||||
| 4.95%, 03/15/53 (Call 09/15/52) |
350 | 323,957 | ||||||
| 5.20%, 06/01/54 (Call 12/01/53) |
600 | 576,810 | ||||||
| RTX Corp. |
||||||||
| 2.25%, 07/01/30 (Call 04/01/30)(a) |
852 | 721,055 | ||||||
| 2.65%, 11/01/26 (Call 08/01/26) |
25 | 23,526 | ||||||
| 2.82%, 09/01/51 (Call 03/01/51) |
171 | 106,601 | ||||||
| 3.13%, 05/04/27 (Call 02/04/27) |
15 | 14,156 | ||||||
| 3.13%, 07/01/50 (Call 01/01/50) |
329 | 221,135 | ||||||
| 3.75%, 11/01/46 (Call 05/01/46) |
237 | 179,939 | ||||||
| 4.05%, 05/04/47 (Call 11/04/46) |
207 | 165,824 | ||||||
| 4.13%, 11/16/28 (Call 08/16/28) |
810 | 777,940 | ||||||
| 4.15%, 05/15/45 (Call 11/16/44) |
230 | 187,911 | ||||||
| 4.35%, 04/15/47 (Call 10/15/46) |
35 | 29,243 | ||||||
| 4.50%, 06/01/42 |
759 | 663,850 | ||||||
| 4.63%, 11/16/48 (Call 05/16/48) |
497 | 431,564 | ||||||
| 4.70%, 12/15/41 |
102 | 91,138 | ||||||
| 4.88%, 10/15/40 |
124 | 114,724 | ||||||
| 5.40%, 05/01/35 |
195 | 196,701 | ||||||
| 5.70%, 04/15/40 |
250 | 250,712 | ||||||
| 5.75%, 11/08/26 (Call 10/08/26) |
20 | 20,291 | ||||||
| 5.75%, 01/15/29 (Call 12/15/28) |
5 | 5,147 | ||||||
| 6.00%, 03/15/31 (Call 01/15/31) |
55 | 57,291 | ||||||
| 6.05%, 06/01/36(a) |
225 | 235,597 | ||||||
| 6.10%, 03/15/34 (Call 12/15/33) |
30 | 31,720 | ||||||
| 6.13%, 07/15/38 |
315 | 332,705 | ||||||
| 7.50%, 09/15/29 |
525 | 582,762 | ||||||
|
|
|
|||||||
| 8,688,218 | ||||||||
| Agriculture — 0.8% | ||||||||
| Archer-Daniels-Midland Co. |
||||||||
| 2.50%, 08/11/26 (Call 05/11/26)(a) |
208 | 195,842 | ||||||
| 2.70%, 09/15/51 (Call 03/15/51) |
295 | 186,872 | ||||||
| 3.25%, 03/27/30 (Call 12/27/29) |
70 | 63,330 | ||||||
| 3.75%, 09/15/47 (Call 03/15/47) |
69 | 52,384 | ||||||
| 4.02%, 04/16/43 |
128 | 105,055 | ||||||
| 4.50%, 03/15/49 (Call 09/15/48) |
135 | 117,845 | ||||||
| 4.54%, 03/26/42 |
5 | 4,488 | ||||||
| 5.38%, 09/15/35 |
134 | 134,798 | ||||||
| 5.94%, 10/01/32(a) |
222 | 234,815 | ||||||
| Bunge Ltd. Finance Corp. |
||||||||
| 1.63%, 08/17/25 (Call 07/17/25) |
4,115 | 3,895,428 | ||||||
| 2.75%, 05/14/31 (Call 02/14/31)(a) |
118 | 100,394 | ||||||
| 3.25%, 08/15/26 (Call 05/15/26) |
1,463 | 1,394,789 | ||||||
| 3.75%, 09/25/27 (Call 06/25/27) |
1,757 | 1,680,935 | ||||||
|
|
|
|||||||
| 8,166,975 | ||||||||
| Security | Par (000) |
Value | ||||||
| Airlines — 0.1% |
||||||||
| Southwest Airlines Co. |
||||||||
| 2.63%, 02/10/30 (Call 11/10/29) |
$ | 270 | $ | 233,384 | ||||
| 3.45%, 11/16/27 (Call 08/16/27)(a) |
139 | 130,672 | ||||||
| 5.13%, 06/15/27 (Call 04/15/27) |
212 | 211,284 | ||||||
|
|
|
|||||||
| 575,340 | ||||||||
| Apparel — 0.5% | ||||||||
| NIKE Inc. |
||||||||
| 2.38%, 11/01/26 (Call 08/01/26) |
540 | 508,002 | ||||||
| 2.75%, 03/27/27 (Call 01/27/27) |
135 | 127,291 | ||||||
| 2.85%, 03/27/30 (Call 12/27/29) |
34 | 30,562 | ||||||
| 3.25%, 03/27/40 (Call 09/27/39) |
18 | 14,348 | ||||||
| 3.38%, 11/01/46 (Call 05/01/46) |
56 | 42,321 | ||||||
| 3.38%, 03/27/50 (Call 09/27/49)(a) |
218 | 165,285 | ||||||
| PVH Corp., 4.63%, 07/10/25 (Call 06/10/25) |
665 | 655,687 | ||||||
| Ralph Lauren Corp. |
||||||||
| 2.95%, 06/15/30 (Call 03/15/30)(a) |
45 | 40,010 | ||||||
| 3.75%, 09/15/25 (Call 07/15/25) |
98 | 95,778 | ||||||
| Tapestry Inc. |
||||||||
| 4.13%, 07/15/27 (Call 04/15/27)(a) |
460 | 436,859 | ||||||
| 4.25%, 04/01/25 (Call 01/01/25) |
162 | 159,509 | ||||||
| 7.85%, 11/27/33 (Call 08/27/33)(a) |
300 | 324,587 | ||||||
| VF Corp. |
||||||||
| 2.40%, 04/23/25 (Call 03/23/25) |
915 | 877,821 | ||||||
| 2.80%, 04/23/27 (Call 02/23/27) |
1,358 | 1,231,296 | ||||||
| 2.95%, 04/23/30 (Call 01/23/30)(a) |
413 | 340,678 | ||||||
|
|
|
|||||||
| 5,050,034 | ||||||||
| Auto Manufacturers — 1.0% | ||||||||
| American Honda Finance Corp. |
||||||||
| 2.30%, 09/09/26 |
1,247 | 1,169,611 | ||||||
| 3.50%, 02/15/28 |
238 | 226,020 | ||||||
| 4.60%, 04/17/30(a) |
30 | 29,382 | ||||||
| 4.90%, 01/10/34 |
120 | 117,047 | ||||||
| 4.95%, 01/09/26 |
175 | 174,468 | ||||||
| 5.00%, 05/23/25(a) |
235 | 234,382 | ||||||
| 5.13%, 07/07/28 |
35 | 35,283 | ||||||
| 5.25%, 07/07/26(a) |
125 | 125,878 | ||||||
| 5.65%, 11/15/28 |
10 | 10,282 | ||||||
| Cummins Inc. |
||||||||
| 1.50%, 09/01/30 (Call 06/01/30)(a) |
1,316 | 1,063,007 | ||||||
| 2.60%, 09/01/50 (Call 03/01/50)(a) |
110 | 68,986 | ||||||
| 4.88%, 10/01/43 (Call 04/01/43) |
235 | 221,752 | ||||||
| 4.90%, 02/20/29 (Call 01/20/29) |
50 | 49,751 | ||||||
| 5.15%, 02/20/34 (Call 11/20/33) |
30 | 29,970 | ||||||
| 5.45%, 02/20/54 (Call 08/20/53) |
30 | 30,157 | ||||||
| Ford Motor Co. |
||||||||
| 3.25%, 02/12/32 (Call 11/12/31) |
40 | 32,836 | ||||||
| 7.40%, 11/01/46 |
455 | 487,422 | ||||||
| Ford Motor Credit Co. LLC |
||||||||
| 3.63%, 06/17/31 (Call 03/17/31) |
390 | 332,404 | ||||||
| 4.00%, 11/13/30 (Call 08/13/30) |
250 | 220,990 | ||||||
| 5.11%, 05/03/29 (Call 02/03/29) |
5 | 4,819 | ||||||
| 7.12%, 11/07/33 (Call 08/07/33) |
500 | 533,426 | ||||||
| General Motors Co. |
||||||||
| 5.00%, 04/01/35 |
91 | 85,079 | ||||||
| 5.15%, 04/01/38 (Call 10/01/37) |
127 | 117,568 | ||||||
| 5.20%, 04/01/45 |
190 | 167,707 | ||||||
| 5.40%, 04/01/48 (Call 10/01/47) |
151 | 135,436 | ||||||
| 5.60%, 10/15/32 (Call 07/15/32)(a) |
20 | 19,942 | ||||||
| 5.95%, 04/01/49 (Call 10/01/48)(a) |
191 | 183,547 | ||||||
| 6.25%, 10/02/43 |
256 | 256,937 | ||||||
| 82 | 2 0 2 4 I S H A R E S A N N U A L R E P O R T T O S H A R E H O L D E R S |
| Schedule of Investments (continued) February 29, 2024 |
iShares® ESG Aware USD Corporate Bond ETF (Percentages shown are based on Net Assets) |
| Security | Par (000) |
Value | ||||||
| Auto Manufacturers (continued) |
||||||||
| 6.60%, 04/01/36 (Call 10/01/35) |
$ | 283 | $ | 296,685 | ||||
| 6.75%, 04/01/46 (Call 10/01/45) |
158 | 166,998 | ||||||
| General Motors Financial Co. Inc. |
||||||||
| 2.35%, 01/08/31 (Call 10/08/30) |
35 | 28,523 | ||||||
| 2.70%, 06/10/31 (Call 03/10/31) |
185 | 152,220 | ||||||
| 3.10%, 01/12/32 (Call 10/12/31)(a) |
210 | 175,391 | ||||||
| 3.60%, 06/21/30 (Call 03/21/30) |
180 | 161,429 | ||||||
| 4.30%, 04/06/29 (Call 02/06/29) |
200 | 189,681 | ||||||
| 5.65%, 01/17/29 (Call 10/17/28) |
109 | 109,844 | ||||||
| 5.80%, 06/23/28 (Call 05/23/28) |
105 | 106,507 | ||||||
| 6.10%, 01/07/34 (Call 10/07/33) |
355 | 358,595 | ||||||
| 6.40%, 01/09/33 (Call 10/09/32) |
235 | 244,037 | ||||||
| Honda Motor Co. Ltd., 2.97%, 03/10/32 (Call 12/10/31)(a) |
310 | 272,195 | ||||||
| Mercedes-Benz Finance North America LLC, 8.50%, 01/18/31 |
548 | 664,936 | ||||||
| Toyota Motor Corp., 3.67%, 07/20/28(a) |
28 | 27,151 | ||||||
| Toyota Motor Credit Corp. |
||||||||
| 1.90%, 09/12/31 |
30 | 24,375 | ||||||
| 2.15%, 02/13/30 |
235 | 201,893 | ||||||
| 2.40%, 01/13/32 |
10 | 8,364 | ||||||
| 3.20%, 01/11/27 |
25 | 23,885 | ||||||
| 3.38%, 04/01/30 |
78 | 71,693 | ||||||
| 3.65%, 01/08/29 |
28 | 26,495 | ||||||
| 4.70%, 01/12/33(a) |
380 | 374,718 | ||||||
| 5.00%, 08/14/26 |
50 | 49,991 | ||||||
|
|
|
|||||||
| 9,899,695 | ||||||||
| Auto Parts & Equipment — 0.2% | ||||||||
| Aptiv PLC |
||||||||
| 3.10%, 12/01/51 (Call 06/01/51) |
402 | 251,692 | ||||||
| 4.35%, 03/15/29 (Call 12/15/28) |
132 | 127,559 | ||||||
| 4.40%, 10/01/46 (Call 04/01/46) |
26 | 20,420 | ||||||
| 5.40%, 03/15/49 (Call 09/15/48)(a) |
108 | 97,925 | ||||||
| Aptiv PLC/Aptiv Corp. |
||||||||
| 3.25%, 03/01/32 (Call 12/01/31) |
440 | 379,410 | ||||||
| 4.15%, 05/01/52 (Call 11/01/51) |
335 | 255,706 | ||||||
| BorgWarner Inc., 4.38%, 03/15/45 (Call 09/15/44) |
73 | 59,418 | ||||||
| Lear Corp. |
||||||||
| 3.50%, 05/30/30 (Call 02/28/30)(a) |
97 | 86,683 | ||||||
| 3.55%, 01/15/52 (Call 07/15/51) |
92 | 62,366 | ||||||
| 3.80%, 09/15/27 (Call 06/15/27)(a) |
65 | 62,210 | ||||||
| 4.25%, 05/15/29 (Call 02/15/29) |
160 | 152,248 | ||||||
| 5.25%, 05/15/49 (Call 11/15/48) |
163 | 146,373 | ||||||
| Magna International Inc., 4.15%, 10/01/25 (Call 07/01/25) |
50 | 49,079 | ||||||
|
|
|
|||||||
| 1,751,089 | ||||||||
| Banks — 22.1% | ||||||||
| Australia & New Zealand Banking Group Ltd. |
||||||||
| 3.70%, 11/16/25 |
2,067 | 2,021,500 | ||||||
| 4.75%, 01/18/27 |
250 | 249,125 | ||||||
| Banco Bilbao Vizcaya Argentaria SA 1.13%, 09/18/25 |
6,045 | 5,650,546 | ||||||
| 5.86%, 09/14/26 (Call 09/14/25), |
465 | 464,850 | ||||||
| 6.14%, 09/14/28 (Call 09/14/27), |
280 | 283,882 | ||||||
| Banco Santander SA |
||||||||
| 1.72%, 09/14/27 (Call 09/14/26), |
695 | 628,550 | ||||||
| 2.75%, 12/03/30 |
40 | 32,575 | ||||||
| Security | Par (000) |
Value | ||||||
| Banks (continued) |
||||||||
| 2.96%, 03/25/31(a) |
$ | 435 | $ | 370,488 | ||||
| 3.23%, 11/22/32 (Call 08/22/31), |
260 | 214,612 | ||||||
| 3.49%, 05/28/30 |
180 | 161,292 | ||||||
| 3.80%, 02/23/28 |
210 | 197,802 | ||||||
| 4.18%, 03/24/28 (Call 03/24/27), |
265 | 253,679 | ||||||
| 4.25%, 04/11/27 |
545 | 525,130 | ||||||
| 4.38%, 04/12/28 |
335 | 321,882 | ||||||
| 5.18%, 11/19/25 |
200 | 197,208 | ||||||
| 5.59%, 08/08/28 |
200 | 201,550 | ||||||
| 6.61%, 11/07/28 |
215 | 225,907 | ||||||
| 6.92%, 08/08/33(a) |
575 | 597,366 | ||||||
| 6.94%, 11/07/33 |
200 | 218,044 | ||||||
| Bank of America Corp. |
||||||||
| 1.90%, 07/23/31 (Call 07/23/30), |
165 | 133,861 | ||||||
| 1.92%, 10/24/31 (Call 10/24/30), |
215 | 173,493 | ||||||
| 2.09%, 06/14/29 (Call 06/14/28), |
200 | 175,508 | ||||||
| 2.30%, 07/21/32 (Call 07/21/31), |
415 | 335,728 | ||||||
| 2.48%, 09/21/36 (Call 09/21/31), |
421 | 332,518 | ||||||
| 2.50%, 02/13/31 (Call 02/13/30), |
235 | 200,343 | ||||||
| 2.55%, 02/04/28 (Call 02/04/27), |
240 | 221,958 | ||||||
| 2.57%, 10/20/32 (Call 10/20/31), |
270 | 221,547 | ||||||
| 2.59%, 04/29/31 (Call 04/29/30), |
68 | 57,965 | ||||||
| 2.68%, 06/19/41 (Call 06/19/40), |
274 | 191,123 | ||||||
| 2.69%, 04/22/32 (Call 04/22/31), |
742 | 621,040 | ||||||
| 2.83%, 10/24/51 (Call 10/24/50), |
320 | 205,160 | ||||||
| 2.88%, 10/22/30 (Call 10/22/29), |
223 | 196,516 | ||||||
| 2.97%, 02/04/33 (Call 02/04/32), |
375 | 314,933 | ||||||
| 2.97%, 07/21/52 (Call 07/21/51), |
615 | 408,722 | ||||||
| 3.19%, 07/23/30 (Call 07/23/29), |
272 | 244,727 | ||||||
| 3.25%, 10/21/27 (Call 10/21/26) |
2,123 | 2,005,376 | ||||||
| 3.31%, 04/22/42 (Call 04/22/41), |
320 | 242,540 | ||||||
| 3.38%, 04/02/26 (Call 04/02/25), |
185 | 180,656 | ||||||
| 3.42%, 12/20/28 (Call 12/20/27), |
750 | 700,858 | ||||||
| 3.50%, 04/19/26 |
75 | 72,671 | ||||||
| 3.59%, 07/21/28 (Call 07/21/27), |
138 | 130,676 | ||||||
| 3.71%, 04/24/28 (Call 04/24/27), |
302 | 287,621 | ||||||
| 3.82%, 01/20/28 (Call 01/20/27), |
238 | 228,651 | ||||||
| S C H E D U L E O F I N V E S T M E N T S |
83 |
| Schedule of Investments (continued) February 29, 2024 |
iShares® ESG Aware USD Corporate Bond ETF (Percentages shown are based on Net Assets) |
| Security | Par (000) |
Value | ||||||
| Banks (continued) |
||||||||
| 3.85%, 03/08/37 (Call 03/08/32), |
$ | 475 | $ | 414,694 | ||||
| 3.95%, 01/23/49 (Call 01/23/48), |
41 | 32,928 | ||||||
| 3.97%, 03/05/29 (Call 03/05/28), |
362 | 344,352 | ||||||
| 3.97%, 02/07/30 (Call 02/07/29), |
78 | 73,307 | ||||||
| 4.08%, 04/23/40 (Call 04/23/39), |
115 | 98,390 | ||||||
| 4.08%, 03/20/51 (Call 03/20/50), |
1,135 | 916,599 | ||||||
| 4.24%, 04/24/38 (Call 04/24/37), |
667 | 592,492 | ||||||
| 4.25%, 10/22/26 |
413 | 403,893 | ||||||
| 4.27%, 07/23/29 (Call 07/23/28), |
502 | 482,295 | ||||||
| 4.33%, 03/15/50 (Call 03/15/49), |
458 | 385,723 | ||||||
| 4.38%, 04/27/28 (Call 04/27/27), |
125 | 121,663 | ||||||
| 4.44%, 01/20/48 (Call 01/20/47), |
592 | 509,281 | ||||||
| 4.45%, 03/03/26 |
274 | 269,472 | ||||||
| 4.57%, 04/27/33 (Call 04/27/32), |
865 | 814,083 | ||||||
| 4.83%, 07/22/26 (Call 07/22/25), |
45 | 44,615 | ||||||
| 4.88%, 04/01/44 |
308 | 290,734 | ||||||
| 5.00%, 01/21/44 |
561 | 536,536 | ||||||
| 5.02%, 07/22/33 (Call 07/22/32), |
1,162 | 1,132,001 | ||||||
| 5.08%, 01/20/27 (Call 01/20/26), |
240 | 238,464 | ||||||
| 5.20%, 04/25/29 (Call 04/25/28), |
515 | 512,085 | ||||||
| 5.29%, 04/25/34 (Call 04/25/33), |
650 | 640,627 | ||||||
| 5.47%, 01/23/35 (Call 01/23/34), |
500 | 498,670 | ||||||
| 5.87%, 09/15/34 (Call 09/15/33), |
420 | 430,707 | ||||||
| 5.88%, 02/07/42 |
631 | 671,127 | ||||||
| 6.11%, 01/29/37 |
662 | 693,820 | ||||||
| 6.20%, 11/10/28 (Call 11/10/27), |
285 | 293,833 | ||||||
| 6.22%, 09/15/26 |
195 | 199,191 | ||||||
| 7.75%, 05/14/38 |
382 | 458,374 | ||||||
| Series L, 4.18%, 11/25/27 (Call 11/25/26) |
579 | 559,113 | ||||||
| Series N, 2.65%, 03/11/32 (Call 03/11/31), |
265 | 221,668 | ||||||
| Series N, 3.48%, 03/13/52 (Call 03/13/51), |
385 | 282,327 | ||||||
| Bank of America NA, 6.00%, 10/15/36 |
254 | 264,893 | ||||||
| Bank of Montreal |
||||||||
| 3.09%, 01/10/37 (Call 01/10/32), |
160 | 129,584 | ||||||
| 3.80%, 12/15/32 (Call 12/15/27), |
951 | 874,744 | ||||||
| 5.20%, 02/01/28 (Call 01/01/28) |
140 | 140,519 | ||||||
| 5.27%, 12/11/26 |
60 | 60,145 | ||||||
| Security | Par (000) |
Value | ||||||
| Banks (continued) |
||||||||
| 5.30%, 06/05/26 |
$ | 30 | $ | 30,073 | ||||
| Bank of New York Mellon Corp. (The) |
||||||||
| 1.60%, 04/24/25 (Call 03/24/25) |
2,785 | 2,675,451 | ||||||
| 2.45%, 08/17/26 (Call 05/17/26) |
2,636 | 2,478,280 | ||||||
| 2.80%, 05/04/26 (Call 02/04/26) |
1,850 | 1,766,039 | ||||||
| 3.25%, 05/16/27 (Call 02/16/27) |
503 | 477,764 | ||||||
| 3.30%, 08/23/29 (Call 05/23/29) |
281 | 257,804 | ||||||
| 3.40%, 01/29/28 (Call 10/29/27) |
951 | 899,500 | ||||||
| 3.44%, 02/07/28 (Call 02/07/27), |
985 | 941,427 | ||||||
| 3.85%, 04/28/28 |
1,153 | 1,112,085 | ||||||
| 3.95%, 11/18/25 (Call 10/18/25) |
395 | 386,506 | ||||||
| 6.32%, 10/25/29 (Call 10/25/28), |
110 | 115,247 | ||||||
| 6.47%, 10/25/34 (Call 10/25/33), |
65 | 70,320 | ||||||
| Bank of Nova Scotia (The) |
||||||||
| 1.05%, 03/02/26 |
1,868 | 1,722,482 | ||||||
| 1.30%, 06/11/25 |
5,753 | 5,467,899 | ||||||
| 1.30%, 09/15/26 (Call 06/15/26) |
50 | 45,508 | ||||||
| 1.35%, 06/24/26 |
388 | 356,121 | ||||||
| 1.95%, 02/02/27 |
333 | 305,626 | ||||||
| 2.15%, 08/01/31 |
323 | 263,937 | ||||||
| 2.70%, 08/03/26(a) |
634 | 598,685 | ||||||
| 2.95%, 03/11/27 |
630 | 593,051 | ||||||
| 4.50%, 12/16/25 |
1,765 | 1,734,614 | ||||||
| 4.75%, 02/02/26 |
1,000 | 992,371 | ||||||
| 5.25%, 06/12/28 |
320 | 321,595 | ||||||
| 5.35%, 12/07/26 |
175 | 175,692 | ||||||
| 5.65%, 02/01/34 |
90 | 91,419 | ||||||
| Bank OZK, 2.75%, 10/01/31 (Call 10/01/26), |
40 | 33,280 | ||||||
| BankUnited Inc., 5.13%, 06/11/30 (Call 03/11/30)(a) |
55 | 50,229 | ||||||
| Barclays PLC |
||||||||
| 2.67%, 03/10/32 (Call 03/10/31), |
358 | 292,286 | ||||||
| 2.89%, 11/24/32 (Call 11/24/31), |
710 | 578,159 | ||||||
| 3.56%, 09/23/35 (Call 09/23/30), |
268 | 224,878 | ||||||
| 3.65%, 03/16/25 |
15 | 14,687 | ||||||
| 4.34%, 01/10/28 (Call 01/10/27) |
200 | 192,132 | ||||||
| 4.38%, 01/12/26 |
205 | 200,778 | ||||||
| 4.84%, 05/09/28 (Call 05/07/27) |
676 | 650,729 | ||||||
| 4.95%, 01/10/47 |
202 | 183,815 | ||||||
| 4.97%, 05/16/29 (Call 05/16/28), |
432 | 420,015 | ||||||
| 5.09%, 06/20/30 (Call 06/20/29), |
823 | 779,005 | ||||||
| 5.20%, 05/12/26 |
20 | 19,758 | ||||||
| 5.25%, 08/17/45 |
285 | 271,782 | ||||||
| 5.30%, 08/09/26 (Call 08/09/25), |
930 | 924,275 | ||||||
| 6.22%, 05/09/34 (Call 05/09/33), |
200 | 202,461 | ||||||
| 6.69%, 09/13/34 (Call 09/13/33), |
70 | 73,200 | ||||||
| 7.12%, 06/27/34 (Call 06/27/33), |
485 | 502,933 | ||||||
| 7.39%, 11/02/28 (Call 11/02/27), |
505 | 533,704 | ||||||
| 84 | 2 0 2 4 I S H A R E S A N N U A L R E P O R T T O S H A R E H O L D E R S |
| Schedule of Investments (continued) February 29, 2024 |
iShares® ESG Aware USD Corporate Bond ETF (Percentages shown are based on Net Assets) |
| Security | Par (000) |
Value | ||||||
| Banks (continued) |
||||||||
| 7.44%, 11/02/33 (Call 11/02/32), |
$ | 110 | $ | 120,365 | ||||
| BPCE SA, 3.38%, 12/02/26 |
2,395 | 2,296,021 | ||||||
| Canadian Imperial Bank of Commerce |
||||||||
| 3.60%, 04/07/32 (Call 03/07/32)(a) |
160 | 142,835 | ||||||
| 5.00%, 04/28/28 (Call 03/28/28) |
105 | 104,621 | ||||||
| 5.62%, 07/17/26(a) |
20 | 20,193 | ||||||
| 5.93%, 10/02/26 |
100 | 101,771 | ||||||
| 5.99%, 10/03/28 (Call 09/03/28) |
100 | 103,586 | ||||||
| 6.09%, 10/03/33 (Call 07/03/33)(a) |
560 | 581,520 | ||||||
| Citigroup Inc. |
||||||||
| 2.56%, 05/01/32 (Call 05/01/31), |
129 | 106,189 | ||||||
| 2.57%, 06/03/31 (Call 06/03/30), |
270 | 228,381 | ||||||
| 2.67%, 01/29/31 (Call 01/29/30), |
50 | 42,871 | ||||||
| 2.98%, 11/05/30 (Call 11/05/29), |
273 | 240,834 | ||||||
| 3.06%, 01/25/33 (Call 01/25/32), |
380 | 319,273 | ||||||
| 3.11%, 04/08/26 (Call 04/08/25), |
168 | 163,545 | ||||||
| 3.20%, 10/21/26 (Call 07/21/26) |
36 | 34,191 | ||||||
| 3.30%, 04/27/25 |
138 | 134,943 | ||||||
| 3.52%, 10/27/28 (Call 10/27/27), |
314 | 294,948 | ||||||
| 3.67%, 07/24/28 (Call 07/24/27), |
333 | 315,661 | ||||||
| 3.79%, 03/17/33 (Call 03/17/32), |
823 | 729,210 | ||||||
| 3.88%, 03/26/25 |
20 | 19,617 | ||||||
| 3.88%, 01/24/39 (Call 01/24/38), |
156 | 131,244 | ||||||
| 3.89%, 01/10/28 (Call 01/10/27), |
411 | 394,938 | ||||||
| 3.98%, 03/20/30 (Call 03/20/29), |
242 | 226,904 | ||||||
| 4.08%, 04/23/29 (Call 04/23/28), |
243 | 231,857 | ||||||
| 4.13%, 07/25/28 |
282 | 267,633 | ||||||
| 4.28%, 04/24/48 (Call 04/24/47), |
458 | 387,085 | ||||||
| 4.30%, 11/20/26 |
21 | 20,455 | ||||||
| 4.40%, 06/10/25 |
111 | 109,385 | ||||||
| 4.41%, 03/31/31 (Call 03/31/30), |
676 | 638,717 | ||||||
| 4.45%, 09/29/27 |
680 | 658,796 | ||||||
| 4.60%, 03/09/26 |
45 | 44,260 | ||||||
| 4.65%, 07/30/45(a) |
386 | 344,565 | ||||||
| 4.65%, 07/23/48 (Call 06/23/48) |
575 | 512,483 | ||||||
| 4.75%, 05/18/46 |
205 | 179,305 | ||||||
| 4.91%, 05/24/33 (Call 05/24/32), |
240 | 229,884 | ||||||
| 5.17%, 02/13/30 (Call 02/13/29), |
165 | 163,322 | ||||||
| 5.30%, 05/06/44 |
150 | 143,310 | ||||||
| 5.32%, 03/26/41 (Call 03/26/40), |
230 | 225,019 | ||||||
| 5.50%, 09/13/25 |
212 | 211,496 | ||||||
| Security | Par (000) |
Value | ||||||
| Banks (continued) |
||||||||
| 5.61%, 09/29/26 (Call 09/29/25), |
$ | 85 | $ | 85,098 | ||||
| 5.83%, 02/13/35 (Call 02/13/34), |
275 | 269,001 | ||||||
| 5.88%, 02/22/33 |
167 | 169,915 | ||||||
| 5.88%, 01/30/42 |
390 | 409,867 | ||||||
| 6.00%, 10/31/33 |
259 | 267,726 | ||||||
| 6.13%, 08/25/36 |
210 | 217,073 | ||||||
| 6.17%, 05/25/34 (Call 05/25/33), |
400 | 402,745 | ||||||
| 6.27%, 11/17/33 (Call 11/17/32), |
347 | 364,199 | ||||||
| 6.63%, 01/15/28(a) |
469 | 497,126 | ||||||
| 6.63%, 06/15/32 |
334 | 355,706 | ||||||
| 6.68%, 09/13/43 |
36 | 39,477 | ||||||
| 8.13%, 07/15/39 |
633 | 801,493 | ||||||
| Citizens Bank NA/Providence RI, 3.75%, 02/18/26 (Call 11/18/25) |
160 | 153,750 | ||||||
| Citizens Financial Group Inc. |
||||||||
| 2.50%, 02/06/30 (Call 11/06/29)(a) |
82 | 67,972 | ||||||
| 2.85%, 07/27/26 (Call 04/27/26) |
67 | 62,606 | ||||||
| 3.25%, 04/30/30 (Call 01/30/30) |
159 | 137,556 | ||||||
| Comerica Bank, 4.00%, 07/27/25(a) |
985 | 954,736 | ||||||
| Comerica Inc., 4.00%, 02/01/29 (Call 11/03/28)(a) |
361 | 324,504 | ||||||
| Cooperatieve Rabobank UA |
||||||||
| 3.75%, 07/21/26 |
160 | 153,362 | ||||||
| 4.38%, 08/04/25 |
115 | 112,766 | ||||||
| 5.25%, 05/24/41(a) |
160 | 161,656 | ||||||
| 5.75%, 12/01/43 |
212 | 212,784 | ||||||
| Credit Suisse AG/New York |
||||||||
| 1.25%, 08/07/26 |
70 | 63,573 | ||||||
| 2.95%, 04/09/25 |
255 | 247,664 | ||||||
| 5.00%, 07/09/27 |
300 | 297,160 | ||||||
| 7.50%, 02/15/28(a) |
640 | 689,347 | ||||||
| Deutsche Bank AG, 4.10%, 01/13/26 |
489 | 476,722 | ||||||
| Deutsche Bank AG/New York |
||||||||
| 2.13%, 11/24/26 (Call 11/24/25), |
175 | 164,083 | ||||||
| 2.31%, 11/16/27 (Call 11/16/26), |
700 | 635,818 | ||||||
| 2.55%, 01/07/28 (Call 01/07/27), |
680 | 619,347 | ||||||
| 3.04%, 05/28/32 (Call 05/28/31), |
447 | 369,436 | ||||||
| 3.55%, 09/18/31 (Call 09/18/30), |
742 | 642,758 | ||||||
| 4.10%, 01/13/26 |
417 | 407,063 | ||||||
| 4.88%, 12/01/32 (Call 12/01/27), |
30 | 27,744 | ||||||
| 7.08%, 02/10/34 (Call 11/10/32), |
215 | 214,613 | ||||||
| 7.15%, 07/13/27 (Call 07/13/26), |
150 | 153,957 | ||||||
| Discover Bank |
||||||||
| 2.70%, 02/06/30 (Call 11/06/29) |
250 | 211,976 | ||||||
| 3.45%, 07/27/26 (Call 04/27/26) |
415 | 393,525 | ||||||
| 4.65%, 09/13/28 (Call 06/13/28) |
465 | 443,982 | ||||||
| Fifth Third Bancorp. |
||||||||
| 4.34%, 04/25/33 (Call 04/25/32), |
10 | 9,057 | ||||||
| S C H E D U L E O F I N V E S T M E N T S |
85 |
| Schedule of Investments (continued) February 29, 2024 |
iShares® ESG Aware USD Corporate Bond ETF (Percentages shown are based on Net Assets) |
| Security | Par (000) |
Value | ||||||
| Banks (continued) |
||||||||
| 4.77%, 07/28/30 (Call 07/28/29), |
$ | 25 | $ | 23,837 | ||||
| 8.25%, 03/01/38 |
283 | 334,576 | ||||||
| First Horizon Bank, 5.75%, 05/01/30 (Call 02/01/30) |
5 | 4,674 | ||||||
| Goldman Sachs Capital I, 6.35%, 02/15/34(a) |
426 | 436,865 | ||||||
| Goldman Sachs Group Inc. (The) |
||||||||
| 1.95%, 10/21/27 (Call 10/21/26), |
185 | 169,409 | ||||||
| 1.99%, 01/27/32 (Call 01/27/31), |
374 | 299,849 | ||||||
| 2.38%, 07/21/32 (Call 07/21/31), |
714 | 581,006 | ||||||
| 2.60%, 02/07/30 (Call 11/07/29) |
53 | 45,981 | ||||||
| 2.62%, 04/22/32 (Call 04/22/31), |
564 | 468,768 | ||||||
| 2.64%, 02/24/28 (Call 02/24/27), |
270 | 250,147 | ||||||
| 2.65%, 10/21/32 (Call 10/21/31), |
304 | 250,703 | ||||||
| 2.91%, 07/21/42 (Call 07/21/41), |
195 | 138,211 | ||||||
| 3.10%, 02/24/33 (Call 02/24/32), |
564 | 477,973 | ||||||
| 3.21%, 04/22/42 (Call 04/22/41), |
155 | 115,314 | ||||||
| 3.44%, 02/24/43 (Call 02/24/42), |
115 | 87,508 | ||||||
| 3.50%, 04/01/25 (Call 03/01/25) |
45 | 44,070 | ||||||
| 3.50%, 11/16/26 (Call 11/16/25) |
785 | 752,963 | ||||||
| 3.69%, 06/05/28 (Call 06/05/27), |
159 | 151,665 | ||||||
| 3.75%, 05/22/25 (Call 02/22/25) |
155 | 152,012 | ||||||
| 3.75%, 02/25/26 (Call 11/25/25) |
389 | 379,280 | ||||||
| 3.80%, 03/15/30 (Call 12/15/29) |
114 | 105,996 | ||||||
| 3.81%, 04/23/29 (Call 04/23/28), |
324 | 306,065 | ||||||
| 3.85%, 01/26/27 (Call 01/26/26) |
887 | 857,035 | ||||||
| 4.02%, 10/31/38 (Call 10/31/37), |
326 | 279,192 | ||||||
| 4.22%, 05/01/29 (Call 05/01/28), |
827 | 792,972 | ||||||
| 4.25%, 10/21/25 |
336 | 329,963 | ||||||
| 4.41%, 04/23/39 (Call 04/23/38), |
270 | 239,121 | ||||||
| 4.48%, 08/23/28 (Call 08/23/27), |
100 | 97,556 | ||||||
| 4.75%, 10/21/45 (Call 04/21/45) |
682 | 622,413 | ||||||
| 4.80%, 07/08/44 (Call 01/08/44) |
627 | 570,998 | ||||||
| 5.15%, 05/22/45 |
143 | 136,657 | ||||||
| 5.80%, 08/10/26 (Call 08/10/25), |
100 | 100,545 | ||||||
| 5.95%, 01/15/27 |
328 | 334,741 | ||||||
| 6.13%, 02/15/33(a) |
656 | 703,491 | ||||||
| 6.25%, 02/01/41 |
813 | 877,466 | ||||||
| 6.45%, 05/01/36 |
235 | 251,030 | ||||||
| 6.48%, 10/24/29 (Call 10/24/28), |
235 | 246,311 | ||||||
| 6.56%, 10/24/34 (Call 10/24/33), |
20 | 21,607 | ||||||
| 6.75%, 10/01/37 |
1,003 | 1,090,764 | ||||||
| HSBC Bank USA NA, 7.00%, 01/15/39 |
250 | 284,804 | ||||||
| Security | Par (000) |
Value | ||||||
| Banks (continued) |
||||||||
| HSBC Bank USA NA/New York |
||||||||
| 5.63%, 08/15/35 |
$ | 250 | $ | 244,997 | ||||
| 5.88%, 11/01/34 |
265 | 273,829 | ||||||
| HSBC Holdings PLC |
||||||||
| 1.59%, 05/24/27 (Call 05/24/26), |
1,101 | 1,007,843 | ||||||
| 1.65%, 04/18/26 (Call 04/18/25), |
510 | 486,624 | ||||||
| 2.21%, 08/17/29 (Call 08/17/28), |
201 | 174,503 | ||||||
| 2.25%, 11/22/27 (Call 11/22/26), |
825 | 755,157 | ||||||
| 2.36%, 08/18/31 (Call 08/18/30), |
140 | 114,894 | ||||||
| 2.80%, 05/24/32 (Call 05/24/31), |
1,097 | 906,463 | ||||||
| 2.85%, 06/04/31 (Call 06/04/30), |
205 | 174,411 | ||||||
| 2.87%, 11/22/32 (Call 11/22/31), |
290 | 238,654 | ||||||
| 3.00%, 03/10/26 (Call 03/10/25), |
630 | 612,403 | ||||||
| 3.97%, 05/22/30 (Call 05/22/29), |
995 | 921,785 | ||||||
| 4.04%, 03/13/28 (Call 03/13/27), |
308 | 295,114 | ||||||
| 4.29%, 09/12/26 (Call 09/12/25), |
585 | 573,618 | ||||||
| 4.38%, 11/23/26 |
201 | 195,515 | ||||||
| 4.58%, 06/19/29 (Call 06/19/28), |
1,011 | 972,562 | ||||||
| 4.76%, 06/09/28 (Call 06/09/27), |
150 | 146,458 | ||||||
| 4.76%, 03/29/33 (Call 03/29/32), |
195 | 178,899 | ||||||
| 4.95%, 03/31/30 |
776 | 759,815 | ||||||
| 5.40%, 08/11/33 (Call 08/11/32), |
240 | 235,811 | ||||||
| 5.72%, 03/04/35 (Call 03/04/34), |
200 | 199,295 | ||||||
| 6.10%, 01/14/42(a) |
414 | 452,378 | ||||||
| 6.25%, 03/09/34 (Call 03/09/33), |
200 | 207,544 | ||||||
| 6.50%, 05/02/36 |
365 | 383,574 | ||||||
| 6.50%, 09/15/37(a) |
480 | 505,294 | ||||||
| 6.55%, 06/20/34 (Call 06/20/33), |
505 | 513,995 | ||||||
| 7.39%, 11/03/28 (Call 11/03/27), |
30 | 31,761 | ||||||
| 7.40%, 11/13/34 (Call 11/13/33), |
215 | 230,353 | ||||||
| 8.11%, 11/03/33 (Call 11/03/32), |
402 | 452,660 | ||||||
| Huntington Bancshares Inc./OH |
||||||||
| 2.55%, 02/04/30 (Call 11/04/29) |
784 | 659,879 | ||||||
| 5.02%, 05/17/33 (Call 05/17/32), |
400 | 378,028 | ||||||
| Huntington National Bank (The), 4.55%, 05/17/28 (Call 05/17/27), (1-day SOFR + 1.650%)(b) |
465 | 448,260 | ||||||
| 86 | 2 0 2 4 I S H A R E S A N N U A L R E P O R T T O S H A R E H O L D E R S |
| Schedule of Investments (continued) February 29, 2024 |
iShares® ESG Aware USD Corporate Bond ETF (Percentages shown are based on Net Assets) |
| Security | Par (000) |
Value | ||||||
| Banks (continued) |
||||||||
| ING Groep NV |
||||||||
| 1.73%, 04/01/27 (Call 04/01/26), |
$ | 680 | $ | 629,340 | ||||
| 2.73%, 04/01/32 (Call 04/01/31), |
738 | 620,801 | ||||||
| 3.95%, 03/29/27 |
971 | 934,878 | ||||||
| 4.02%, 03/28/28 (Call 03/28/27), |
195 | 187,165 | ||||||
| 4.05%, 04/09/29 |
232 | 219,390 | ||||||
| 4.55%, 10/02/28 |
380 | 370,447 | ||||||
| JPMorgan Chase & Co. |
||||||||
| 1.05%, 06/23/27 (Call 12/23/25) |
20 | 17,429 | ||||||
| 1.95%, 02/04/32 (Call 02/04/31), |
180 | 144,752 | ||||||
| 2.08%, 04/22/26 (Call 04/22/25), |
160 | 153,964 | ||||||
| 2.52%, 04/22/31 (Call 04/22/30), |
291 | 248,588 | ||||||
| 2.53%, 11/19/41 (Call 11/19/40), |
235 | 161,660 | ||||||
| 2.55%, 11/08/32 (Call 11/08/31), |
115 | 94,723 | ||||||
| 2.58%, 04/22/32 (Call 04/22/31), |
329 | 275,069 | ||||||
| 2.74%, 10/15/30 (Call 10/15/29), |
556 | 487,771 | ||||||
| 2.96%, 05/13/31 (Call 05/13/30), |
220 | 190,995 | ||||||
| 2.96%, 01/25/33 (Call 01/25/32), |
618 | 521,819 | ||||||
| 3.11%, 04/22/41 (Call 04/22/40), |
87 | 65,426 | ||||||
| 3.11%, 04/22/51 (Call 04/22/50), |
664 | 455,316 | ||||||
| 3.16%, 04/22/42 (Call 04/22/41), |
214 | 160,246 | ||||||
| 3.20%, 06/15/26 (Call 03/15/26) |
20 | 19,239 | ||||||
| 3.30%, 04/01/26 (Call 01/01/26) |
15 | 14,467 | ||||||
| 3.33%, 04/22/52 (Call 04/22/51), |
904 | 641,058 | ||||||
| 3.51%, 01/23/29 (Call 01/23/28), |
65 | 61,231 | ||||||
| 3.54%, 05/01/28 (Call 05/01/27), |
187 | 177,661 | ||||||
| 3.63%, 12/01/27 (Call 12/01/26)(a) |
435 | 413,399 | ||||||
| 3.70%, 05/06/30 (Call 05/06/29), |
706 | 657,170 | ||||||
| 3.78%, 02/01/28 (Call 02/01/27), |
185 | 177,602 | ||||||
| 3.88%, 07/24/38 (Call 07/24/37), |
278 | 237,545 | ||||||
| 3.90%, 01/23/49 (Call 01/23/48), |
279 | 223,119 | ||||||
| 3.96%, 11/15/48 (Call 11/15/47), |
640 | 514,073 | ||||||
| 4.01%, 04/23/29 (Call 04/23/28), |
504 | 481,191 | ||||||
| 4.03%, 07/24/48 (Call 07/24/47), |
275 | 223,051 | ||||||
| 4.08%, 04/26/26 (Call 04/26/25), |
90 | 88,654 | ||||||
| Security | Par (000) |
Value | ||||||
| Banks (continued) |
||||||||
| 4.13%, 12/15/26 |
$ | 1,062 | $ | 1,036,675 | ||||
| 4.20%, 07/23/29 (Call 07/23/28), |
464 | 445,748 | ||||||
| 4.25%, 10/01/27 |
323 | 315,939 | ||||||
| 4.26%, 02/22/48 (Call 02/22/47), |
451 | 380,292 | ||||||
| 4.45%, 12/05/29 (Call 12/05/28), |
572 | 553,185 | ||||||
| 4.49%, 03/24/31 (Call 03/24/30), |
107 | 102,740 | ||||||
| 4.59%, 04/26/33 (Call 04/26/32), |
855 | 811,863 | ||||||
| 4.85%, 02/01/44 |
335 | 314,325 | ||||||
| 4.91%, 07/25/33 (Call 07/25/32), |
1,225 | 1,188,481 | ||||||
| 4.95%, 06/01/45 |
179 | 166,947 | ||||||
| 5.30%, 07/24/29 (Call 07/24/28), |
200 | 200,542 | ||||||
| 5.34%, 01/23/35 (Call 01/23/34), |
700 | 696,458 | ||||||
| 5.35%, 06/01/34 (Call 06/01/33), |
440 | 437,715 | ||||||
| 5.40%, 01/06/42 |
351 | 355,244 | ||||||
| 5.50%, 10/15/40 |
396 | 404,850 | ||||||
| 5.60%, 07/15/41 |
393 | 405,128 | ||||||
| 5.72%, 09/14/33 (Call 09/14/32), |
505 | 511,222 | ||||||
| 6.07%, 10/22/27 (Call 10/22/26), |
30 | 30,572 | ||||||
| 6.09%, 10/23/29 (Call 10/23/28), |
120 | 124,047 | ||||||
| 6.25%, 10/23/34 (Call 10/23/33), |
145 | 153,916 | ||||||
| 6.40%, 05/15/38 |
823 | 918,632 | ||||||
| 7.63%, 10/15/26 |
64 | 68,003 | ||||||
| 7.75%, 07/15/25 |
68 | 70,449 | ||||||
| 8.00%, 04/29/27 |
611 | 664,429 | ||||||
| 8.75%, 09/01/30 |
49 | 57,706 | ||||||
| KeyBank NA/Cleveland OH |
||||||||
| 3.30%, 06/01/25 |
250 | 240,376 | ||||||
| 3.40%, 05/20/26 |
265 | 249,071 | ||||||
| 6.95%, 02/01/28 |
5 | 5,113 | ||||||
| KeyCorp |
||||||||
| 2.25%, 04/06/27 |
80 | 71,360 | ||||||
| 2.55%, 10/01/29 |
608 | 508,716 | ||||||
| 4.10%, 04/30/28 |
20 | 18,720 | ||||||
| Lloyds Bank PLC, 3.50%, 05/14/25 |
200 | 195,278 | ||||||
| Lloyds Banking Group PLC |
||||||||
| 1.63%, 05/11/27 (Call 05/11/26), |
1,357 | 1,244,713 | ||||||
| 3.57%, 11/07/28 (Call 11/07/27), |
400 | 373,053 | ||||||
| 3.75%, 01/11/27 |
200 | 191,877 | ||||||
| 4.34%, 01/09/48 |
205 | 161,021 | ||||||
| 4.38%, 03/22/28 |
306 | 295,538 | ||||||
| 4.45%, 05/08/25 |
200 | 197,396 | ||||||
| 4.55%, 08/16/28 |
225 | 218,296 | ||||||
| 4.58%, 12/10/25 |
201 | 196,939 | ||||||
| 4.65%, 03/24/26 |
220 | 215,553 | ||||||
| 5.30%, 12/01/45(a) |
202 | 188,275 | ||||||
| S C H E D U L E O F I N V E S T M E N T S |
87 |
| Schedule of Investments (continued) February 29, 2024 |
iShares® ESG Aware USD Corporate Bond ETF (Percentages shown are based on Net Assets) |
| Security | Par (000) |
Value | ||||||
| Banks (continued) |
||||||||
| 5.68%, 01/05/35 (Call 01/05/34), |
$ | 300 | $ | 296,089 | ||||
| 5.87%, 03/06/29 (Call 03/06/28), |
135 | 136,313 | ||||||
| 5.99%, 08/07/27 (Call 08/07/26), |
200 | 201,385 | ||||||
| 7.95%, 11/15/33 (Call 08/15/32), |
330 | 367,883 | ||||||
| Mitsubishi UFJ Financial Group Inc. |
||||||||
| 2.05%, 07/17/30 |
125 | 103,700 | ||||||
| 2.31%, 07/20/32 (Call 07/20/31), |
329 | 269,485 | ||||||
| 2.49%, 10/13/32 (Call 10/13/31), |
200 | 165,224 | ||||||
| 2.76%, 09/13/26 |
100 | 94,279 | ||||||
| 2.85%, 01/19/33 (Call 01/19/32), |
235 | 198,137 | ||||||
| 3.29%, 07/25/27 |
67 | 63,358 | ||||||
| 3.68%, 02/22/27 |
70 | 67,468 | ||||||
| 3.74%, 03/07/29 |
432 | 407,877 | ||||||
| 3.75%, 07/18/39 |
383 | 326,586 | ||||||
| 3.85%, 03/01/26 |
115 | 112,109 | ||||||
| 3.96%, 03/02/28 |
48 | 46,234 | ||||||
| 4.05%, 09/11/28 |
245 | 237,118 | ||||||
| 4.15%, 03/07/39 |
138 | 124,284 | ||||||
| 4.29%, 07/26/38(a) |
88 | 81,216 | ||||||
| 4.32%, 04/19/33 (Call 04/19/32), |
10 | 9,354 | ||||||
| 5.13%, 07/20/33 (Call 07/20/32), |
237 | 234,218 | ||||||
| 5.41%, 04/19/34 (Call 04/19/33), |
40 | 40,421 | ||||||
| 5.44%, 02/22/34 (Call 02/22/33), |
200 | 202,273 | ||||||
| 5.47%, 09/13/33 (Call 09/13/32), |
240 | 243,643 | ||||||
| Mizuho Financial Group Inc. |
||||||||
| 2.17%, 05/22/32 (Call 05/22/31), |
200 | 161,331 | ||||||
| 2.20%, 07/10/31 (Call 07/10/30), |
220 | 181,960 | ||||||
| 2.23%, 05/25/26 (Call 05/25/25), |
200 | 191,850 | ||||||
| 2.26%, 07/09/32 (Call 07/09/31), |
60 | 48,475 | ||||||
| 2.56%, 09/13/31 |
15 | 12,155 | ||||||
| 2.59%, 05/25/31 (Call 05/25/30), |
45 | 38,281 | ||||||
| 2.84%, 09/13/26 |
115 | 108,353 | ||||||
| 2.87%, 09/13/30 (Call 09/13/29), |
5 | 4,397 | ||||||
| 3.15%, 07/16/30 (Call 07/16/29), |
82 | 73,547 | ||||||
| 3.17%, 09/11/27 |
30 | 28,047 | ||||||
| 3.66%, 02/28/27 |
115 | 110,071 | ||||||
| 4.02%, 03/05/28 |
315 | 302,833 | ||||||
| 4.25%, 09/11/29 (Call 09/11/28), |
233 | 223,270 | ||||||
| 5.38%, 05/26/30 (Call 05/26/29), |
200 | 200,040 | ||||||
| Security | Par (000) |
Value | ||||||
| Banks (continued) |
||||||||
| 5.58%, 05/26/35 (Call 05/26/34), |
$ | 200 | $ | 200,501 | ||||
| 5.67%, 05/27/29 (Call 05/27/28), |
245 | 248,280 | ||||||
| 5.67%, 09/13/33 (Call 09/13/32), |
345 | 350,124 | ||||||
| 5.75%, 05/27/34 (Call 05/27/33), |
240 | 245,003 | ||||||
| 5.75%, 07/06/34 (Call 07/06/33), |
370 | 376,964 | ||||||
| 5.78%, 07/06/29 (Call 07/06/28), |
415 | 422,545 | ||||||
| Morgan Stanley |
||||||||
| 1.51%, 07/20/27 (Call 07/20/26), |
1,065 | 974,047 | ||||||
| 1.59%, 05/04/27 (Call 05/04/26), |
315 | 290,412 | ||||||
| 1.79%, 02/13/32 (Call 02/13/31), |
660 | 522,602 | ||||||
| 1.93%, 04/28/32 (Call 04/28/31), |
610 | 484,216 | ||||||
| 2.24%, 07/21/32 (Call 07/21/31), |
660 | 532,107 | ||||||
| 2.48%, 09/16/36 (Call 09/16/31), |
887 | 697,041 | ||||||
| 2.51%, 10/20/32 (Call 10/20/31), |
145 | 118,757 | ||||||
| 2.70%, 01/22/31 (Call 01/22/30), |
242 | 209,489 | ||||||
| 2.80%, 01/25/52 (Call 01/25/51), |
290 | 186,424 | ||||||
| 2.94%, 01/21/33 (Call 01/21/32), |
65 | 54,527 | ||||||
| 3.13%, 07/27/26 |
680 | 648,353 | ||||||
| 3.59%, 07/22/28 (Call 07/22/27)(b) |
778 | 736,260 | ||||||
| 3.62%, 04/01/31 (Call 04/01/30), |
357 | 324,176 | ||||||
| 3.63%, 01/20/27 |
870 | 838,799 | ||||||
| 3.77%, 01/24/29 (Call 01/24/28), |
616 | 582,198 | ||||||
| 3.88%, 01/27/26 |
523 | 510,287 | ||||||
| 3.95%, 04/23/27 |
640 | 615,988 | ||||||
| 3.97%, 07/22/38 (Call 07/22/37)(b) |
312 | 265,968 | ||||||
| 4.00%, 07/23/25 |
19 | 18,675 | ||||||
| 4.30%, 01/27/45 |
550 | 476,710 | ||||||
| 4.35%, 09/08/26 |
624 | 609,959 | ||||||
| 4.38%, 01/22/47 |
695 | 599,284 | ||||||
| 4.43%, 01/23/30 (Call 01/23/29), |
1,029 | 988,120 | ||||||
| 4.46%, 04/22/39 (Call 04/22/38), |
141 | 127,291 | ||||||
| 4.89%, 07/20/33 (Call 07/20/32), |
15 | 14,395 | ||||||
| 5.00%, 11/24/25 |
302 | 300,214 | ||||||
| 5.12%, 02/01/29 (Call 02/01/28), |
205 | 203,772 | ||||||
| 5.16%, 04/20/29 (Call 04/20/28), |
190 | 188,676 | ||||||
| 5.25%, 04/21/34 (Call 04/21/33), |
415 | 407,349 | ||||||
| 88 | 2 0 2 4 I S H A R E S A N N U A L R E P O R T T O S H A R E H O L D E R S |
| Schedule of Investments (continued) February 29, 2024 |
iShares® ESG Aware USD Corporate Bond ETF (Percentages shown are based on Net Assets) |
| Security | Par (000) |
Value | ||||||
| Banks (continued) |
||||||||
| 5.30%, 04/20/37 (Call 04/20/32), |
$ | 300 | $ | 286,890 | ||||
| 5.42%, 07/21/34 (Call 07/21/33), |
405 | 403,030 | ||||||
| 5.45%, 07/20/29 (Call 07/20/28), |
45 | 45,187 | ||||||
| 5.47%, 01/18/35 (Call 01/18/34), |
150 | 149,849 | ||||||
| 5.60%, 03/24/51 (Call 03/24/50), |
320 | 331,092 | ||||||
| 5.94%, 02/07/39 (Call 02/07/34), (5-year CMT + 1.800%)(b) |
150 | 147,749 | ||||||
| 5.95%, 01/19/38 (Call 01/19/33), |
400 | 398,812 | ||||||
| 6.25%, 08/09/26 |
525 | 537,317 | ||||||
| 6.30%, 10/18/28 (Call 10/18/27), |
115 | 118,869 | ||||||
| 6.34%, 10/18/33 (Call 10/18/32), |
360 | 381,567 | ||||||
| 6.38%, 07/24/42(a) |
809 | 898,698 | ||||||
| 6.41%, 11/01/29 (Call 11/01/28), |
65 | 67,815 | ||||||
| 7.25%, 04/01/32(a) |
597 | 680,329 | ||||||
| National Australia Bank Ltd./New York |
||||||||
| 2.50%, 07/12/26 |
1,361 | 1,284,031 | ||||||
| 3.38%, 01/14/26 |
705 | 683,875 | ||||||
| 4.90%, 06/13/28 |
250 | 249,420 | ||||||
| National Bank of Canada, 5.60%, 12/18/28 |
1,425 | 1,439,039 | ||||||
| NatWest Group PLC |
||||||||
| 3.07%, 05/22/28 (Call 05/22/27), |
85 | 78,893 | ||||||
| 4.45%, 05/08/30 (Call 05/08/29), |
414 | 391,659 | ||||||
| 4.80%, 04/05/26 |
201 | 198,513 | ||||||
| 4.89%, 05/18/29 (Call 05/18/28), |
538 | 523,511 | ||||||
| 5.08%, 01/27/30 (Call 01/27/29), |
950 | 928,759 | ||||||
| 5.52%, 09/30/28 (Call 09/30/27), |
245 | 244,797 | ||||||
| 5.58%, 03/01/28 (Call 03/01/27), |
200 | 200,156 | ||||||
| 5.78%, 03/01/35 (Call 03/01/34), |
200 | 199,784 | ||||||
| 5.81%, 09/13/29 (Call 09/13/28), |
200 | 202,016 | ||||||
| Northern Trust Corp. |
||||||||
| 3.15%, 05/03/29 (Call 02/03/29)(a) |
1,187 | 1,098,600 | ||||||
| 3.65%, 08/03/28 (Call 05/03/28)(a) |
509 | 486,684 | ||||||
| 3.95%, 10/30/25(a) |
2,941 | 2,884,737 | ||||||
| PNC Bank NA |
||||||||
| 3.10%, 10/25/27 (Call 09/25/27) |
481 | 446,845 | ||||||
| 3.25%, 06/01/25 (Call 05/02/25) |
250 | 243,325 | ||||||
| 3.88%, 04/10/25 (Call 03/10/25) |
3,164 | 3,103,775 | ||||||
| 4.20%, 11/01/25 (Call 10/02/25) |
125 | 122,063 | ||||||
| PNC Financial Services Group Inc. (The) |
||||||||
| 2.55%, 01/22/30 (Call 10/24/29) |
176 | 151,026 | ||||||
| 2.60%, 07/23/26 (Call 05/23/26) |
51 | 47,947 | ||||||
| 3.15%, 05/19/27 (Call 04/19/27) |
502 | 472,475 | ||||||
| 3.45%, 04/23/29 (Call 01/23/29) |
303 | 279,782 | ||||||
| Security | Par (000) |
Value | ||||||
| Banks (continued) |
||||||||
| 4.63%, 06/06/33 (Call 06/06/32), |
$ | 110 | $ | 101,901 | ||||
| 5.07%, 01/24/34 (Call 01/24/33), |
410 | 393,916 | ||||||
| 5.30%, 01/21/28 (Call 01/21/27), |
65 | 64,919 | ||||||
| 5.58%, 06/12/29 (Call 06/12/28), |
253 | 254,605 | ||||||
| 5.81%, 06/12/26 (Call 06/12/25), |
28 | 28,036 | ||||||
| 5.94%, 08/18/34 (Call 08/18/33), |
200 | 203,636 | ||||||
| 6.04%, 10/28/33 (Call 10/28/32), |
435 | 446,564 | ||||||
| 6.62%, 10/20/27 (Call 10/20/26), |
55 | 56,469 | ||||||
| 6.88%, 10/20/34 (Call 10/20/33), |
385 | 417,328 | ||||||
| Regions Bank/Birmingham AL, 6.45%, 06/26/37 |
250 | 254,164 | ||||||
| Regions Financial Corp. |
||||||||
| 1.80%, 08/12/28 (Call 06/12/28) |
110 | 93,683 | ||||||
| 7.38%, 12/10/37 |
128 | 143,920 | ||||||
| Royal Bank of Canada |
||||||||
| 2.30%, 11/03/31 |
325 | 266,178 | ||||||
| 3.88%, 05/04/32 |
95 | 86,536 | ||||||
| 4.24%, 08/03/27 |
195 | 189,981 | ||||||
| 4.65%, 01/27/26 |
157 | 155,433 | ||||||
| 4.90%, 01/12/28 |
385 | 383,733 | ||||||
| 4.95%, 02/01/29 |
175 | 173,852 | ||||||
| 5.00%, 02/01/33 |
525 | 516,035 | ||||||
| 5.00%, 05/02/33(a) |
460 | 452,946 | ||||||
| 5.15%, 02/01/34 |
175 | 172,130 | ||||||
| 5.20%, 07/20/26 |
35 | 35,109 | ||||||
| 5.20%, 08/01/28(a) |
295 | 296,603 | ||||||
| 6.00%, 11/01/27 |
300 | 308,908 | ||||||
| Santander Holdings USA Inc. |
||||||||
| 2.49%, 01/06/28 (Call 01/06/27), |
775 | 700,888 | ||||||
| 3.24%, 10/05/26 (Call 08/05/26) |
33 | 30,921 | ||||||
| 4.40%, 07/13/27 (Call 04/14/27) |
962 | 921,944 | ||||||
| 4.50%, 07/17/25 (Call 04/17/25) |
1,326 | 1,299,922 | ||||||
| 6.57%, 06/12/29 (Call 06/12/28), |
37 | 37,684 | ||||||
| Santander U.K. Group Holdings PLC |
||||||||
| 1.67%, 06/14/27 (Call 06/14/26), |
260 | 236,353 | ||||||
| 2.47%, 01/11/28 (Call 01/11/27), |
380 | 346,051 | ||||||
| 2.90%, 03/15/32 (Call 03/15/31), |
242 | 203,831 | ||||||
| 3.82%, 11/03/28 (Call 11/03/27), |
100 | 93,343 | ||||||
| State Street Corp. |
||||||||
| 2.65%, 05/19/26 |
2,158 | 2,052,174 | ||||||
| 3.55%, 08/18/25 |
1,669 | 1,635,095 | ||||||
| 4.14%, 12/03/29 (Call 12/03/28), |
498 | 477,261 | ||||||
| 5.16%, 05/18/34 (Call 05/18/33), |
30 | 29,613 | ||||||
| 5.27%, 08/03/26 (Call 07/03/26)(a) |
100 | 100,327 | ||||||
| S C H E D U L E O F I N V E S T M E N T S |
89 |
| Schedule of Investments (continued) February 29, 2024 |
iShares® ESG Aware USD Corporate Bond ETF (Percentages shown are based on Net Assets) |
| Security | Par (000) |
Value | ||||||
| Banks (continued) |
||||||||
| 6.12%, 11/21/34 (Call 11/21/33), |
$ | 30 | $ | 31,016 | ||||
| Sumitomo Mitsui Financial Group Inc. |
||||||||
| 1.71%, 01/12/31 |
60 | 47,764 | ||||||
| 1.90%, 09/17/28 |
90 | 78,302 | ||||||
| 2.22%, 09/17/31 |
350 | 283,889 | ||||||
| 2.47%, 01/14/29 |
15 | 13,343 | ||||||
| 2.63%, 07/14/26 |
19 | 17,937 | ||||||
| 2.72%, 09/27/29 |
10 | 8,806 | ||||||
| 2.75%, 01/15/30 |
745 | 651,358 | ||||||
| 3.01%, 10/19/26 |
28 | 26,508 | ||||||
| 3.04%, 07/16/29 |
337 | 302,932 | ||||||
| 3.20%, 09/17/29 |
344 | 309,327 | ||||||
| 3.35%, 10/18/27 |
279 | 263,151 | ||||||
| 3.36%, 07/12/27 |
205 | 194,283 | ||||||
| 3.45%, 01/11/27(a) |
104 | 99,600 | ||||||
| 3.54%, 01/17/28 |
551 | 521,876 | ||||||
| 3.78%, 03/09/26 |
114 | 110,885 | ||||||
| 3.94%, 07/19/28(a) |
71 | 67,952 | ||||||
| 4.31%, 10/16/28 |
198 | 193,718 | ||||||
| 5.77%, 01/13/33 |
400 | 412,686 | ||||||
| 5.78%, 07/13/33 |
200 | 206,824 | ||||||
| 5.80%, 07/13/28 |
200 | 205,418 | ||||||
| 5.81%, 09/14/33 |
310 | 321,107 | ||||||
| 5.85%, 07/13/30 |
200 | 205,934 | ||||||
| 5.88%, 07/13/26 |
200 | 202,943 | ||||||
| Synchrony Bank |
||||||||
| 5.40%, 08/22/25 (Call 07/22/25) |
470 | 464,527 | ||||||
| 5.63%, 08/23/27 (Call 07/23/27) |
755 | 734,606 | ||||||
| Toronto-Dominion Bank (The) |
||||||||
| 2.00%, 09/10/31 |
516 | 419,903 | ||||||
| 2.45%, 01/12/32 |
40 | 33,066 | ||||||
| 3.20%, 03/10/32 |
390 | 340,215 | ||||||
| 3.63%, 09/15/31 (Call 09/15/26), |
1,387 | 1,323,683 | ||||||
| 4.46%, 06/08/32 |
190 | 181,104 | ||||||
| 5.16%, 01/10/28 |
250 | 250,749 | ||||||
| 5.26%, 12/11/26 |
100 | 100,609 | ||||||
| 5.52%, 07/17/28 |
220 | 223,520 | ||||||
| Truist Bank |
||||||||
| 3.63%, 09/16/25 (Call 08/16/25) |
254 | 246,417 | ||||||
| 3.80%, 10/30/26 (Call 09/30/26) |
20 | 19,100 | ||||||
| Truist Financial Corp. |
||||||||
| 1.89%, 06/07/29 (Call 06/07/28), |
40 | 34,354 | ||||||
| 1.95%, 06/05/30 (Call 03/05/30) |
355 | 289,953 | ||||||
| 3.70%, 06/05/25 (Call 05/05/25) |
4 | 3,912 | ||||||
| 3.88%, 03/19/29 (Call 02/16/29)(a) |
81 | 74,593 | ||||||
| 4.92%, 07/28/33 (Call 07/28/32), |
490 | 450,276 | ||||||
| 5.12%, 01/26/34 (Call 01/26/33), |
100 | 94,827 | ||||||
| 5.87%, 06/08/34 (Call 06/08/33), |
375 | 374,949 | ||||||
| 6.05%, 06/08/27 (Call 06/08/26), |
60 | 60,582 | ||||||
| 7.16%, 10/30/29 (Call 10/30/28), |
55 | 58,224 | ||||||
| U.S. Bancorp. |
||||||||
| 1.38%, 07/22/30 (Call 04/22/30) |
60 | 47,556 | ||||||
| Security | Par (000) |
Value | ||||||
| Banks (continued) |
||||||||
| 2.49%, 11/03/36 (Call 11/03/31), |
$ | 25 | $ | 19,324 | ||||
| 2.68%, 01/27/33 (Call 01/27/32), |
560 | 457,083 | ||||||
| 3.00%, 07/30/29 (Call 04/30/29) |
57 | 50,478 | ||||||
| 3.90%, 04/26/28 (Call 03/24/28)(a) |
91 | 87,100 | ||||||
| 4.55%, 07/22/28 (Call 07/22/27), |
515 | 502,815 | ||||||
| 4.65%, 02/01/29 (Call 02/01/28), |
110 | 106,899 | ||||||
| 4.84%, 02/01/34 (Call 02/01/33), |
30 | 28,236 | ||||||
| 4.97%, 07/22/33 (Call 07/22/32), |
550 | 514,659 | ||||||
| 5.84%, 06/12/34 (Call 06/10/33), |
135 | 136,046 | ||||||
| 5.85%, 10/21/33 (Call 10/21/32), |
255 | 257,488 | ||||||
| UBS AG/London, 5.65%, 09/11/28 |
900 | 917,939 | ||||||
| UBS Group AG |
||||||||
| 3.75%, 03/26/25 |
2,945 | 2,884,002 | ||||||
| 4.55%, 04/17/26 |
560 | 550,028 | ||||||
| Webster Financial Corp., 4.10%, 03/25/29 (Call 12/25/28)(a) |
442 | 401,567 | ||||||
| Wells Fargo & Co. |
||||||||
| 2.57%, 02/11/31 (Call 02/11/30), |
185 | 157,804 | ||||||
| 3.07%, 04/30/41 (Call 04/30/40), |
265 | 195,853 | ||||||
| 3.35%, 03/02/33 (Call 03/02/32), |
240 | 205,922 | ||||||
| 3.53%, 03/24/28 (Call 03/24/27), |
1,115 | 1,057,188 | ||||||
| 3.58%, 05/22/28 (Call 05/22/27), |
60 | 56,830 | ||||||
| 3.90%, 05/01/45 |
107 | 85,673 | ||||||
| 3.91%, 04/25/26 (Call 04/25/25), |
225 | 220,658 | ||||||
| 4.30%, 07/22/27 |
615 | 597,002 | ||||||
| 4.40%, 06/14/46 |
175 | 143,590 | ||||||
| 4.54%, 08/15/26 (Call 08/15/25), |
95 | 93,694 | ||||||
| 4.61%, 04/25/53 (Call 04/25/52), |
996 | 869,039 | ||||||
| 4.65%, 11/04/44 |
302 | 259,924 | ||||||
| 4.75%, 12/07/46 |
242 | 209,156 | ||||||
| 4.81%, 07/25/28 (Call 07/25/27), |
95 | 93,320 | ||||||
| 4.90%, 07/25/33 (Call 07/25/32), |
805 | 770,141 | ||||||
| 4.90%, 11/17/45 |
447 | 396,652 | ||||||
| 5.01%, 04/04/51 (Call 04/04/50), |
1,170 | 1,082,258 | ||||||
| 5.38%, 11/02/43 |
127 | 121,185 | ||||||
| 5.39%, 04/24/34 (Call 04/24/33), |
50 | 49,188 | ||||||
| 5.56%, 07/25/34 (Call 07/25/33), |
240 | 239,085 | ||||||
| 5.61%, 01/15/44 |
495 | 481,312 | ||||||
| 5.95%, 12/01/86 (Call 12/15/36) |
785 | 799,531 | ||||||
| 90 | 2 0 2 4 I S H A R E S A N N U A L R E P O R T T O S H A R E H O L D E R S |
| Schedule of Investments (continued) February 29, 2024 |
iShares® ESG Aware USD Corporate Bond ETF (Percentages shown are based on Net Assets) |
| Security | Par (000) |
Value | ||||||
| Banks (continued) |
||||||||
| 6.49%, 10/23/34 (Call 10/23/33), |
$ | 300 | $ | 319,067 | ||||
| Series B, 7.95%, 11/15/29 |
15 | 16,706 | ||||||
| Westpac Banking Corp. |
||||||||
| 2.65%, 01/16/30 |
136 | 120,542 | ||||||
| 2.67%, 11/15/35 (Call 11/15/30), |
331 | 269,703 | ||||||
| 2.70%, 08/19/26(a) |
811 | 769,054 | ||||||
| 2.85%, 05/13/26 |
1,322 | 1,263,231 | ||||||
| 3.02%, 11/18/36 (Call 11/18/31), |
582 | 473,792 | ||||||
| 3.35%, 03/08/27 |
1,148 | 1,097,898 | ||||||
| 3.40%, 01/25/28 |
360 | 340,898 | ||||||
| 4.11%, 07/24/34 (Call 07/24/29), |
288 | 263,072 | ||||||
| 4.32%, 11/23/31 (Call 11/23/26), |
145 | 139,231 | ||||||
| Wintrust Financial Corp., 4.85%, 06/06/29 |
99 | 89,295 | ||||||
|
|
|
|||||||
| 225,891,589 | ||||||||
| Beverages — 3.7% | ||||||||
| Anheuser-Busch Companies LLC/Anheuser-Busch InBev Worldwide Inc. |
||||||||
| 3.65%, 02/01/26 (Call 11/01/25) |
251 | 244,720 | ||||||
| 4.70%, 02/01/36 (Call 08/01/35) |
1,122 | 1,073,802 | ||||||
| 4.90%, 02/01/46 (Call 08/01/45) |
1,738 | 1,622,302 | ||||||
| Anheuser-Busch InBev Finance Inc. |
||||||||
| 4.63%, 02/01/44 |
226 | 203,929 | ||||||
| 4.70%, 02/01/36 (Call 08/01/35) |
490 | 467,159 | ||||||
| 4.90%, 02/01/46 (Call 08/01/45) |
270 | 249,491 | ||||||
| Anheuser-Busch InBev Worldwide Inc. |
||||||||
| 3.50%, 06/01/30 (Call 03/01/30) |
487 | 450,037 | ||||||
| 4.00%, 04/13/28 (Call 01/13/28) |
411 | 398,426 | ||||||
| 4.35%, 06/01/40 (Call 12/01/39) |
57 | 50,974 | ||||||
| 4.38%, 04/15/38 (Call 10/15/37) |
191 | 174,695 | ||||||
| 4.44%, 10/06/48 (Call 04/06/48) |
433 | 379,002 | ||||||
| 4.60%, 04/15/48 (Call 10/15/47) |
502 | 450,931 | ||||||
| 4.60%, 06/01/60 (Call 12/01/59) |
10 | 8,859 | ||||||
| 4.75%, 01/23/29 (Call 10/23/28) |
696 | 691,292 | ||||||
| 4.75%, 04/15/58 (Call 10/15/57)(a) |
310 | 278,884 | ||||||
| 4.90%, 01/23/31 (Call 10/23/30)(a) |
299 | 300,553 | ||||||
| 4.95%, 01/15/42 |
499 | 475,959 | ||||||
| 5.45%, 01/23/39 (Call 07/23/38) |
319 | 324,633 | ||||||
| 5.55%, 01/23/49 (Call 07/23/48) |
744 | 761,949 | ||||||
| 5.80%, 01/23/59 (Call 07/23/58) |
359 | 379,126 | ||||||
| 5.88%, 06/15/35 |
140 | 149,032 | ||||||
| 8.00%, 11/15/39 |
129 | 161,643 | ||||||
| 8.20%, 01/15/39 |
274 | 352,364 | ||||||
| Brown-Forman Corp. |
||||||||
| 3.50%, 04/15/25 (Call 02/15/25) |
142 | 139,113 | ||||||
| 4.00%, 04/15/38 (Call 10/15/37) |
19 | 16,675 | ||||||
| 4.50%, 07/15/45 (Call 01/15/45)(a) |
64 | 56,794 | ||||||
| Coca-Cola Co. (The) |
||||||||
| 1.38%, 03/15/31 |
1,240 | 992,625 | ||||||
| 1.65%, 06/01/30 |
401 | 334,910 | ||||||
| 2.00%, 03/05/31 |
510 | 426,611 | ||||||
| 2.13%, 09/06/29 |
220 | 193,567 | ||||||
| 2.25%, 01/05/32 |
1,585 | 1,334,575 | ||||||
| 2.50%, 06/01/40 |
83 | 59,286 | ||||||
| 2.50%, 03/15/51 |
336 | 209,864 | ||||||
| 2.60%, 06/01/50(a) |
315 | 202,701 | ||||||
| 2.75%, 06/01/60(a) |
220 | 139,423 | ||||||
| Security | Par (000) |
Value | ||||||
| Beverages (continued) |
||||||||
| 2.90%, 05/25/27 |
$ | 310 | $ | 294,100 | ||||
| 3.00%, 03/05/51(a) |
403 | 281,924 | ||||||
| 3.38%, 03/25/27 |
260 | 250,480 | ||||||
| 3.45%, 03/25/30 |
363 | 338,602 | ||||||
| 4.20%, 03/25/50 |
322 | 284,399 | ||||||
| Coca-Cola Femsa SAB de CV |
||||||||
| 1.85%, 09/01/32 (Call 06/01/32) |
60 | 46,702 | ||||||
| 2.75%, 01/22/30 (Call 10/22/29) |
20 | 17,685 | ||||||
| 5.25%, 11/26/43 |
200 | 194,149 | ||||||
| Constellation Brands Inc. |
||||||||
| 2.88%, 05/01/30 (Call 02/01/30) |
25 | 21,951 | ||||||
| 3.15%, 08/01/29 (Call 05/01/29) |
45 | 40,826 | ||||||
| 3.50%, 05/09/27 (Call 02/09/27) |
23 | 21,859 | ||||||
| 3.60%, 02/15/28 (Call 11/15/27) |
15 | 14,173 | ||||||
| 3.70%, 12/06/26 (Call 09/06/26) |
20 | 19,247 | ||||||
| 3.75%, 05/01/50 (Call 11/01/49) |
142 | 106,233 | ||||||
| 4.10%, 02/15/48 (Call 08/15/47) |
105 | 84,051 | ||||||
| 4.50%, 05/09/47 (Call 11/09/46) |
152 | 128,041 | ||||||
| 4.65%, 11/15/28 (Call 08/15/28) |
45 | 44,102 | ||||||
| 5.25%, 11/15/48 (Call 05/15/48) |
50 | 47,090 | ||||||
| Diageo Capital PLC |
||||||||
| 1.38%, 09/29/25 (Call 08/29/25) |
1,266 | 1,193,978 | ||||||
| 2.00%, 04/29/30 (Call 01/29/30) |
1,832 | 1,543,865 | ||||||
| 2.13%, 04/29/32 (Call 01/29/32) |
1,065 | 860,539 | ||||||
| 2.38%, 10/24/29 (Call 07/24/29) |
1,680 | 1,474,994 | ||||||
| 3.88%, 05/18/28 (Call 02/18/28)(a) |
2,015 | 1,944,811 | ||||||
| 5.20%, 10/24/25 |
445 | 445,178 | ||||||
| 5.38%, 10/05/26 (Call 09/05/26) |
200 | 201,563 | ||||||
| 5.63%, 10/05/33 (Call 07/05/33) |
200 | 207,614 | ||||||
| Diageo Investment Corp. |
||||||||
| 4.25%, 05/11/42(a) |
95 | 84,271 | ||||||
| 7.45%, 04/15/35 |
555 | 656,297 | ||||||
| Fomento Economico Mexicano SAB de CV 3.50%, 01/16/50 (Call 07/16/49) |
160 | 118,268 | ||||||
| 4.38%, 05/10/43 |
10 | 8,765 | ||||||
| Keurig Dr Pepper Inc. |
||||||||
| 2.55%, 09/15/26 (Call 06/15/26) |
55 | 51,579 | ||||||
| 3.20%, 05/01/30 (Call 02/01/30) |
40 | 36,070 | ||||||
| 3.35%, 03/15/51 (Call 09/15/50) |
120 | 83,427 | ||||||
| 3.40%, 11/15/25 (Call 08/15/25) |
118 | 114,285 | ||||||
| 3.43%, 06/15/27 (Call 03/15/27) |
82 | 78,050 | ||||||
| 3.80%, 05/01/50 (Call 11/01/49) |
179 | 136,134 | ||||||
| 4.05%, 04/15/32 (Call 01/15/32)(a) |
213 | 197,567 | ||||||
| 4.42%, 05/25/25 (Call 03/25/25)(a) |
122 | 120,667 | ||||||
| 4.42%, 12/15/46 (Call 06/15/46) |
173 | 146,004 | ||||||
| 4.50%, 11/15/45 (Call 05/15/45) |
166 | 143,117 | ||||||
| 4.50%, 04/15/52 (Call 10/15/51) |
300 | 254,593 | ||||||
| 4.60%, 05/25/28 (Call 02/25/28)(a) |
340 | 334,920 | ||||||
| 5.09%, 05/25/48 (Call 11/25/47)(a) |
75 | 70,285 | ||||||
| Molson Coors Beverage Co. |
||||||||
| 3.00%, 07/15/26 (Call 04/15/26) |
894 | 851,464 | ||||||
| 4.20%, 07/15/46 (Call 01/15/46) |
547 | 445,642 | ||||||
| 5.00%, 05/01/42 |
380 | 353,112 | ||||||
| PepsiCo Inc. |
||||||||
| 1.63%, 05/01/30 (Call 02/01/30) |
239 | 198,673 | ||||||
| 2.25%, 03/19/25 (Call 02/19/25) |
256 | 248,619 | ||||||
| 2.38%, 10/06/26 (Call 07/06/26) |
825 | 777,260 | ||||||
| 2.63%, 03/19/27 (Call 01/19/27) |
49 | 46,073 | ||||||
| 2.63%, 07/29/29 (Call 04/29/29) |
1,093 | 984,648 | ||||||
| 2.75%, 04/30/25 (Call 01/30/25) |
2,135 | 2,079,317 | ||||||
| 2.75%, 03/19/30 (Call 12/19/29) |
200 | 178,415 | ||||||
| S C H E D U L E O F I N V E S T M E N T S |
91 |
| Schedule of Investments (continued) February 29, 2024 |
iShares® ESG Aware USD Corporate Bond ETF (Percentages shown are based on Net Assets) |
| Security | Par (000) |
Value | ||||||
| Beverages (continued) |
||||||||
| 2.75%, 10/21/51 (Call 04/21/51) |
$ | 100 | $ | 65,710 | ||||
| 2.85%, 02/24/26 (Call 11/24/25) |
1,111 | 1,068,448 | ||||||
| 2.88%, 10/15/49 (Call 04/15/49)(a) |
194 | 133,466 | ||||||
| 3.00%, 10/15/27 (Call 07/15/27) |
1,458 | 1,374,443 | ||||||
| 3.38%, 07/29/49 (Call 01/29/49) |
178 | 133,895 | ||||||
| 3.50%, 07/17/25 (Call 04/17/25) |
851 | 833,602 | ||||||
| 3.50%, 03/19/40 (Call 09/19/39) |
35 | 28,736 | ||||||
| 3.63%, 03/19/50 (Call 09/19/49)(a) |
259 | 204,024 | ||||||
| 3.88%, 03/19/60 (Call 09/19/59) |
50 | 39,926 | ||||||
| 4.00%, 03/05/42 |
125 | 110,612 | ||||||
| 4.00%, 05/02/47 (Call 11/02/46) |
110 | 92,777 | ||||||
| 4.45%, 04/14/46 (Call 10/14/45) |
422 | 381,686 | ||||||
| 4.88%, 11/01/40 |
115 | 113,834 | ||||||
| 5.13%, 11/10/26 (Call 10/10/26) |
225 | 226,469 | ||||||
| 5.25%, 11/10/25 |
220 | 220,929 | ||||||
| 5.50%, 01/15/40 |
55 | 57,428 | ||||||
| 7.00%, 03/01/29(a) |
14 | 15,431 | ||||||
|
|
|
|||||||
| 37,763,000 | ||||||||
| Biotechnology — 1.8% | ||||||||
| Amgen Inc. |
||||||||
| 2.20%, 02/21/27 (Call 12/21/26)(a) |
737 | 679,076 | ||||||
| 2.30%, 02/25/31 (Call 11/25/30) |
39 | 32,637 | ||||||
| 2.45%, 02/21/30 (Call 11/21/29) |
885 | 769,334 | ||||||
| 2.60%, 08/19/26 (Call 05/19/26)(a) |
429 | 404,911 | ||||||
| 2.77%, 09/01/53 (Call 03/01/53) |
260 | 158,399 | ||||||
| 3.00%, 01/15/52 (Call 07/15/51)(a) |
300 | 200,524 | ||||||
| 3.13%, 05/01/25 (Call 02/01/25) |
937 | 913,636 | ||||||
| 3.15%, 02/21/40 (Call 08/21/39) |
30 | 22,503 | ||||||
| 3.20%, 11/02/27 (Call 08/02/27) |
638 | 599,630 | ||||||
| 3.38%, 02/21/50 (Call 08/21/49) |
245 | 174,761 | ||||||
| 4.20%, 03/01/33 (Call 12/01/32) |
310 | 287,019 | ||||||
| 4.20%, 02/22/52 (Call 08/22/51) |
150 | 121,497 | ||||||
| 4.40%, 05/01/45 (Call 11/01/44) |
531 | 453,234 | ||||||
| 4.40%, 02/22/62 (Call 08/22/61) |
190 | 152,662 | ||||||
| 4.56%, 06/15/48 (Call 12/15/47) |
362 | 313,451 | ||||||
| 4.66%, 06/15/51 (Call 12/15/50) |
853 | 739,852 | ||||||
| 4.88%, 03/01/53 (Call 09/01/52) |
60 | 53,836 | ||||||
| 4.95%, 10/01/41 |
152 | 141,634 | ||||||
| 5.15%, 03/02/28 (Call 02/02/28) |
70 | 70,139 | ||||||
| 5.15%, 11/15/41 (Call 05/15/41) |
230 | 218,968 | ||||||
| 5.25%, 03/02/33 (Call 12/02/32) |
930 | 927,236 | ||||||
| 5.65%, 06/15/42 (Call 12/15/41) |
128 | 128,981 | ||||||
| 5.65%, 03/02/53 (Call 09/02/52) |
630 | 630,320 | ||||||
| 5.75%, 03/15/40 |
120 | 121,870 | ||||||
| 5.75%, 03/02/63 (Call 09/02/62) |
460 | 460,187 | ||||||
| 6.38%, 06/01/37 |
160 | 171,757 | ||||||
| 6.40%, 02/01/39 |
125 | 135,198 | ||||||
| Baxalta Inc. |
||||||||
| 4.00%, 06/23/25 (Call 03/23/25) |
239 | 234,682 | ||||||
| 5.25%, 06/23/45 (Call 12/23/44) |
170 | 163,694 | ||||||
| Biogen Inc. |
||||||||
| 2.25%, 05/01/30 (Call 02/01/30) |
80 | 66,944 | ||||||
| 3.15%, 05/01/50 (Call 11/01/49) |
328 | 216,585 | ||||||
| 3.25%, 02/15/51 (Call 08/15/50)(a) |
110 | 75,027 | ||||||
| 4.05%, 09/15/25 (Call 06/15/25)(a) |
205 | 200,965 | ||||||
| 5.20%, 09/15/45 (Call 03/15/45)(a) |
560 | 527,016 | ||||||
| Gilead Sciences Inc. |
||||||||
| 1.20%, 10/01/27 (Call 08/01/27) |
365 | 321,076 | ||||||
| 1.65%, 10/01/30 (Call 07/01/30)(a) |
1,030 | 840,237 | ||||||
| 2.80%, 10/01/50 (Call 04/01/50)(a) |
90 | 57,935 | ||||||
| 2.95%, 03/01/27 (Call 12/01/26)(a) |
1,417 | 1,338,339 | ||||||
| Security | Par (000) |
Value | ||||||
| Biotechnology (continued) |
||||||||
| 3.65%, 03/01/26 (Call 12/01/25) |
$ | 1,426 | $ | 1,384,953 | ||||
| 4.00%, 09/01/36 (Call 03/01/36) |
205 | 181,372 | ||||||
| 4.15%, 03/01/47 (Call 09/01/46) |
485 | 400,197 | ||||||
| 4.50%, 02/01/45 (Call 08/01/44) |
371 | 326,220 | ||||||
| 4.60%, 09/01/35 (Call 03/01/35)(a) |
265 | 250,899 | ||||||
| 4.75%, 03/01/46 (Call 09/01/45) |
529 | 479,742 | ||||||
| 4.80%, 04/01/44 (Call 10/01/43) |
451 | 414,125 | ||||||
| 5.25%, 10/15/33 (Call 07/15/33)(a) |
670 | 677,759 | ||||||
| 5.65%, 12/01/41 (Call 06/01/41) |
317 | 322,578 | ||||||
| Illumina Inc., 2.55%, 03/23/31 (Call 12/23/30) |
165 | 135,371 | ||||||
| Regeneron Pharmaceuticals Inc., 2.80%, 09/15/50 (Call 03/15/50) |
220 | 137,066 | ||||||
| Royalty Pharma PLC |
||||||||
| 3.35%, 09/02/51 (Call 03/02/51) |
92 | 59,745 | ||||||
| 3.55%, 09/02/50 (Call 03/02/50)(a) |
144 | 98,017 | ||||||
|
|
|
|||||||
| 17,993,796 | ||||||||
| Building Materials — 1.8% | ||||||||
| Carrier Global Corp. |
||||||||
| 2.70%, 02/15/31 (Call 11/15/30) |
400 | 340,973 | ||||||
| 2.72%, 02/15/30 (Call 11/15/29) |
94 | 82,264 | ||||||
| 3.38%, 04/05/40 (Call 10/05/39) |
168 | 129,603 | ||||||
| 3.58%, 04/05/50 (Call 10/05/49) |
476 | 350,764 | ||||||
| 5.80%, 11/30/25 |
235 | 236,688 | ||||||
| 5.90%, 03/15/34 (Call 12/15/33) |
545 | 568,993 | ||||||
| 6.20%, 03/15/54 (Call 09/15/53) |
30 | 32,707 | ||||||
| Fortune Brands Innovations Inc. |
||||||||
| 3.25%, 09/15/29 (Call 06/15/29) |
468 | 422,801 | ||||||
| 4.00%, 06/15/25 (Call 03/15/25) |
2,096 | 2,056,667 | ||||||
| 4.00%, 03/25/32 (Call 12/25/31)(a) |
545 | 494,290 | ||||||
| 4.50%, 03/25/52 (Call 09/25/51) |
180 | 146,233 | ||||||
| 5.88%, 06/01/33 (Call 03/01/33) |
493 | 500,762 | ||||||
| Johnson Controls International PLC |
||||||||
| 3.90%, 02/14/26 (Call 11/14/25)(a) |
1,938 | 1,888,619 | ||||||
| 6.00%, 01/15/36 |
420 | 441,238 | ||||||
| Johnson Controls International PLC/Tyco Fire & Security Finance SCA |
||||||||
| 1.75%, 09/15/30 (Call 06/15/30) |
2,303 | 1,878,458 | ||||||
| 2.00%, 09/16/31 (Call 06/16/31) |
1,044 | 838,566 | ||||||
| Lafarge SA, 7.13%, 07/15/36 |
45 | 49,860 | ||||||
| Lennox International Inc. |
||||||||
| 1.35%, 08/01/25 (Call 07/01/25) |
165 | 155,551 | ||||||
| 1.70%, 08/01/27 (Call 06/01/27) |
1,050 | 941,096 | ||||||
| 5.50%, 09/15/28 (Call 08/15/28) |
385 | 388,582 | ||||||
| Martin Marietta Materials Inc. |
||||||||
| 3.20%, 07/15/51 (Call 01/15/51) |
187 | 129,436 | ||||||
| 3.45%, 06/01/27 (Call 03/01/27) |
41 | 39,100 | ||||||
| 3.50%, 12/15/27 (Call 09/15/27) |
35 | 33,206 | ||||||
| 4.25%, 12/15/47 (Call 06/15/47) |
81 | 67,314 | ||||||
| Series CB, 2.50%, 03/15/30 (Call 12/15/29) |
101 | 87,360 | ||||||
| Masco Corp. |
||||||||
| 3.13%, 02/15/51 (Call 08/15/50) |
40 | 26,639 | ||||||
| 3.50%, 11/15/27 (Call 08/15/27) |
178 | 167,315 | ||||||
| 4.50%, 05/15/47 (Call 11/15/46)(a) |
100 | 83,509 | ||||||
| Mohawk Industries Inc., 3.63%, 05/15/30 (Call 02/15/30) |
5 | 4,550 | ||||||
| Owens Corning |
||||||||
| 3.40%, 08/15/26 (Call 05/15/26) |
68 | 64,895 | ||||||
| 3.95%, 08/15/29 (Call 05/15/29)(a) |
414 | 390,540 | ||||||
| 4.30%, 07/15/47 (Call 01/15/47) |
137 | 112,262 | ||||||
| 4.40%, 01/30/48 (Call 07/30/47) |
92 | 75,661 | ||||||
| 7.00%, 12/01/36 |
177 | 196,603 | ||||||
| 92 | 2 0 2 4 I S H A R E S A N N U A L R E P O R T T O S H A R E H O L D E R S |
| Schedule of Investments (continued) February 29, 2024 |
iShares® ESG Aware USD Corporate Bond ETF (Percentages shown are based on Net Assets) |
| Security | Par (000) |
Value | ||||||
| Building Materials (continued) |
||||||||
| Trane Technologies Financing Ltd. |
||||||||
| 3.50%, 03/21/26 (Call 01/21/26)(a) |
$ | 1,620 | $ | 1,565,481 | ||||
| 3.80%, 03/21/29 (Call 12/21/28)(a) |
1,050 | 992,560 | ||||||
| 5.25%, 03/03/33 (Call 12/03/32) |
925 | 933,914 | ||||||
| Trane Technologies Global Holding Co. Ltd. |
||||||||
| 3.75%, 08/21/28 (Call 05/21/28)(a) |
1,306 | 1,245,391 | ||||||
| 4.30%, 02/21/48 (Call 08/21/47) |
96 | 82,574 | ||||||
| 5.75%, 06/15/43 |
196 | 202,561 | ||||||
| Vulcan Materials Co. |
||||||||
| 3.90%, 04/01/27 (Call 01/01/27) |
60 | 58,129 | ||||||
| 4.50%, 06/15/47 (Call 12/15/46) |
102 | 88,215 | ||||||
| 4.70%, 03/01/48 (Call 09/01/47) |
24 | 21,492 | ||||||
|
|
|
|||||||
| 18,613,422 | ||||||||
| Chemicals — 1.7% | ||||||||
| Albemarle Corp., 5.45%, 12/01/44 (Call 06/01/44) |
135 | 122,829 | ||||||
| Cabot Corp., 4.00%, 07/01/29 (Call 04/01/29)(a) |
65 | 60,644 | ||||||
| Celanese U.S. Holdings LLC |
||||||||
| 6.17%, 07/15/27 (Call 06/15/27) |
15 | 15,230 | ||||||
| 6.33%, 07/15/29 (Call 05/15/29) |
145 | 149,006 | ||||||
| 6.35%, 11/15/28 (Call 10/15/28) |
90 | 92,641 | ||||||
| 6.38%, 07/15/32 (Call 04/15/32) |
215 | 220,746 | ||||||
| 6.55%, 11/15/30 (Call 09/15/30) |
105 | 108,963 | ||||||
| CF Industries Inc. |
||||||||
| 4.95%, 06/01/43 |
107 | 94,655 | ||||||
| 5.38%, 03/15/44 |
151 | 140,611 | ||||||
| Dow Chemical Co. (The) |
||||||||
| 3.60%, 11/15/50 (Call 05/15/50) |
177 | 128,761 | ||||||
| 4.25%, 10/01/34 (Call 04/01/34)(a) |
151 | 138,917 | ||||||
| 4.38%, 11/15/42 (Call 05/15/42) |
148 | 124,934 | ||||||
| 4.63%, 10/01/44 (Call 04/01/44) |
93 | 80,634 | ||||||
| 4.80%, 11/30/28 (Call 08/30/28) |
42 | 41,677 | ||||||
| 4.80%, 05/15/49 (Call 11/15/48) |
157 | 136,304 | ||||||
| 5.15%, 02/15/34 (Call 11/15/33) |
100 | 98,489 | ||||||
| 5.25%, 11/15/41 (Call 05/15/41) |
168 | 157,335 | ||||||
| 5.55%, 11/30/48 (Call 05/30/48) |
223 | 216,823 | ||||||
| 5.60%, 02/15/54 (Call 08/15/53) |
100 | 98,035 | ||||||
| 6.30%, 03/15/33 (Call 12/15/32)(a) |
245 | 262,377 | ||||||
| 6.90%, 05/15/53 (Call 11/15/52) |
75 | 85,724 | ||||||
| 7.38%, 11/01/29 |
138 | 152,983 | ||||||
| 9.40%, 05/15/39 |
199 | 265,399 | ||||||
| DuPont de Nemours Inc. |
||||||||
| 4.49%, 11/15/25 (Call 09/15/25) |
138 | 136,394 | ||||||
| 4.73%, 11/15/28 (Call 08/15/28)(a) |
604 | 600,820 | ||||||
| 5.32%, 11/15/38 (Call 05/15/38) |
385 | 380,852 | ||||||
| 5.42%, 11/15/48 (Call 05/15/48) |
379 | 372,071 | ||||||
| Eastman Chemical Co. |
||||||||
| 4.65%, 10/15/44 (Call 04/15/44) |
160 | 135,231 | ||||||
| 4.80%, 09/01/42 (Call 03/01/42) |
179 | 156,936 | ||||||
| Ecolab Inc. |
||||||||
| 1.30%, 01/30/31 (Call 10/30/30)(a) |
632 | 500,040 | ||||||
| 2.13%, 02/01/32 (Call 11/01/31) |
30 | 24,574 | ||||||
| 2.13%, 08/15/50 (Call 02/15/50) |
70 | 40,430 | ||||||
| 2.70%, 11/01/26 (Call 08/01/26) |
4,414 | 4,183,763 | ||||||
| 2.70%, 12/15/51 (Call 06/15/51) |
108 | 68,216 | ||||||
| 3.25%, 12/01/27 (Call 09/01/27) |
2,012 | 1,905,221 | ||||||
| 4.80%, 03/24/30 (Call 12/24/29)(a) |
1,075 | 1,073,083 | ||||||
| FMC Corp. |
||||||||
| 3.45%, 10/01/29 (Call 07/01/29) |
53 | 47,094 | ||||||
| 4.50%, 10/01/49 (Call 04/01/49) |
76 | 56,487 | ||||||
| 5.65%, 05/18/33 (Call 02/18/33)(a) |
10 | 9,681 | ||||||
| Security | Par (000) |
Value | ||||||
| Chemicals (continued) |
||||||||
| International Flavors & Fragrances Inc. |
||||||||
| 4.38%, 06/01/47 (Call 12/01/46) |
$ | 216 | $ | 161,412 | ||||
| 4.45%, 09/26/28 (Call 06/26/28)(a) |
206 | 199,001 | ||||||
| 5.00%, 09/26/48 (Call 03/26/48) |
43 | 36,056 | ||||||
| LYB International Finance BV |
||||||||
| 4.88%, 03/15/44 (Call 09/15/43) |
200 | 175,406 | ||||||
| 5.25%, 07/15/43 |
226 | 207,296 | ||||||
| LYB International Finance III LLC |
||||||||
| 3.63%, 04/01/51 (Call 10/01/50) |
154 | 106,973 | ||||||
| 3.80%, 10/01/60 (Call 04/01/60)(a) |
341 | 230,672 | ||||||
| 4.20%, 10/15/49 (Call 04/15/49) |
222 | 171,345 | ||||||
| 4.20%, 05/01/50 (Call 11/01/49) |
220 | 169,978 | ||||||
| 5.50%, 03/01/34 (Call 12/01/33) |
200 | 198,481 | ||||||
| 5.63%, 05/15/33 (Call 02/15/33) |
275 | 278,658 | ||||||
| LyondellBasell Industries NV, 4.63%, 02/26/55 (Call 08/26/54) |
276 | 226,657 | ||||||
| Mosaic Co. (The) |
||||||||
| 4.05%, 11/15/27 (Call 08/15/27) |
60 | 57,653 | ||||||
| 4.88%, 11/15/41 (Call 05/15/41) |
15 | 13,093 | ||||||
| 5.45%, 11/15/33 (Call 05/15/33)(a) |
347 | 342,890 | ||||||
| 5.63%, 11/15/43 (Call 05/15/43) |
50 | 47,911 | ||||||
| Nutrien Ltd. |
||||||||
| 3.00%, 04/01/25 (Call 01/01/25) |
138 | 134,228 | ||||||
| 3.95%, 05/13/50 (Call 11/13/49) |
80 | 62,295 | ||||||
| 4.13%, 03/15/35 (Call 09/15/34) |
352 | 317,001 | ||||||
| 4.20%, 04/01/29 (Call 01/01/29) |
86 | 82,615 | ||||||
| 4.90%, 06/01/43 (Call 12/01/42) |
72 | 65,053 | ||||||
| 5.00%, 04/01/49 (Call 10/01/48) |
171 | 154,313 | ||||||
| 5.25%, 01/15/45 (Call 07/15/44) |
142 | 132,127 | ||||||
| 5.63%, 12/01/40 |
52 | 50,862 | ||||||
| 5.80%, 03/27/53 (Call 09/27/52) |
130 | 130,132 | ||||||
| 5.88%, 12/01/36 |
98 | 100,289 | ||||||
| 6.13%, 01/15/41 (Call 07/15/40) |
65 | 66,701 | ||||||
| PPG Industries Inc. |
||||||||
| 2.80%, 08/15/29 (Call 05/15/29) |
72 | 64,536 | ||||||
| 3.75%, 03/15/28 (Call 12/15/27) |
51 | 48,842 | ||||||
| RPM International Inc. |
||||||||
| 4.25%, 01/15/48 (Call 07/15/47)(a) |
19 | 15,273 | ||||||
| 4.55%, 03/01/29 (Call 12/01/28) |
26 | 25,015 | ||||||
| 5.25%, 06/01/45 (Call 12/01/44) |
62 | 56,892 | ||||||
| Sherwin-Williams Co. (The) |
||||||||
| 2.30%, 05/15/30 (Call 02/15/30) |
120 | 102,012 | ||||||
| 2.95%, 08/15/29 (Call 05/15/29) |
62 | 55,758 | ||||||
| 3.30%, 05/15/50 (Call 11/15/49) |
41 | 28,692 | ||||||
| 3.45%, 08/01/25 (Call 05/01/25) |
83 | 80,880 | ||||||
| 3.80%, 08/15/49 (Call 02/15/49) |
26 | 20,058 | ||||||
| 4.00%, 12/15/42 (Call 06/15/42) |
65 | 53,051 | ||||||
| 4.50%, 06/01/47 (Call 12/01/46) |
403 | 347,867 | ||||||
| 4.55%, 08/01/45 (Call 02/01/45) |
147 | 126,543 | ||||||
| Westlake Corp. |
||||||||
| 3.38%, 08/15/61 (Call 02/15/61)(a) |
130 | 80,503 | ||||||
| 5.00%, 08/15/46 (Call 02/15/46) |
28 | 24,911 | ||||||
|
|
|
|||||||
| 17,734,541 | ||||||||
| Commercial Services — 1.5% | ||||||||
| Automatic Data Processing Inc. |
||||||||
| 1.25%, 09/01/30 (Call 06/01/30)(a) |
3,491 | 2,827,623 | ||||||
| 1.70%, 05/15/28 (Call 03/15/28) |
3,853 | 3,430,281 | ||||||
| 3.38%, 09/15/25 (Call 06/15/25) |
1,271 | 1,241,729 | ||||||
| Block Financial LLC, 3.88%, 08/15/30 (Call 05/15/30) |
234 | 210,967 | ||||||
| Cintas Corp. No. 2, 3.70%, 04/01/27 (Call 01/01/27) |
79 | 76,515 | ||||||
| S C H E D U L E O F I N V E S T M E N T S |
93 |
| Schedule of Investments (continued) February 29, 2024 |
iShares® ESG Aware USD Corporate Bond ETF (Percentages shown are based on Net Assets) |
| Security | Par (000) |
Value | ||||||
| Commercial Services (continued) |
||||||||
| Global Payments Inc. |
||||||||
| 5.40%, 08/15/32 (Call 05/15/32)(a) |
$ | 40 | $ | 39,463 | ||||
| 5.95%, 08/15/52 (Call 02/15/52)(a) |
108 | 106,148 | ||||||
| GXO Logistics Inc. |
||||||||
| 1.65%, 07/15/26 (Call 06/15/26) |
975 | 894,025 | ||||||
| 2.65%, 07/15/31 (Call 04/15/31) |
525 | 426,417 | ||||||
| Moody’s Corp. |
||||||||
| 3.10%, 11/29/61 (Call 05/29/61) |
140 | 89,559 | ||||||
| 3.25%, 01/15/28 (Call 10/15/27) |
12 | 11,290 | ||||||
| 3.25%, 05/20/50 (Call 11/20/49) |
69 | 48,908 | ||||||
| 4.25%, 08/08/32 (Call 05/08/32) |
60 | 56,676 | ||||||
| 4.88%, 12/17/48 (Call 06/17/48) |
173 | 159,602 | ||||||
| PayPal Holdings Inc. |
||||||||
| 2.30%, 06/01/30 (Call 03/01/30) |
92 | 78,261 | ||||||
| 2.85%, 10/01/29 (Call 07/01/29) |
15 | 13,376 | ||||||
| 3.25%, 06/01/50 (Call 12/01/49)(a) |
245 | 170,435 | ||||||
| 5.05%, 06/01/52 (Call 12/01/51) |
60 | 56,300 | ||||||
| 5.25%, 06/01/62 (Call 12/01/61)(a) |
190 | 176,866 | ||||||
| Quanta Services Inc. |
||||||||
| 2.35%, 01/15/32 (Call 10/15/31) |
460 | 368,214 | ||||||
| 2.90%, 10/01/30 (Call 07/01/30) |
589 | 510,663 | ||||||
| 3.05%, 10/01/41 (Call 04/01/41) |
127 | 89,235 | ||||||
| RELX Capital Inc. |
||||||||
| 3.00%, 05/22/30 (Call 02/22/30) |
2,046 | 1,826,617 | ||||||
| 4.00%, 03/18/29 (Call 12/18/28) |
1,642 | 1,568,207 | ||||||
| S&P Global Inc. |
||||||||
| 2.30%, 08/15/60 (Call 02/15/60) |
365 | 197,211 | ||||||
| 3.25%, 12/01/49 (Call 06/01/49) |
265 | 188,793 | ||||||
| 3.90%, 03/01/62 (Call 09/01/61) |
35 | 27,239 | ||||||
| Triton Container International Ltd./TAL International Container Corp., 3.25%, 03/15/32 (Call 12/15/31). |
450 | 358,118 | ||||||
|
|
|
|||||||
| 15,248,738 | ||||||||
| Computers — 1.7% | ||||||||
| Apple Inc. |
||||||||
| 2.40%, 08/20/50 (Call 02/20/50)(a) |
325 | 202,265 | ||||||
| 2.55%, 08/20/60 (Call 02/20/60)(a) |
905 | 559,081 | ||||||
| 2.65%, 05/11/50 (Call 11/11/49) |
286 | 185,872 | ||||||
| 2.65%, 02/08/51 (Call 08/08/50) |
410 | 264,234 | ||||||
| 2.70%, 08/05/51 (Call 02/05/51) |
317 | 205,869 | ||||||
| 2.80%, 02/08/61 (Call 08/08/60) |
209 | 132,878 | ||||||
| 2.85%, 08/05/61 (Call 02/05/61) |
302 | 191,746 | ||||||
| 2.95%, 09/11/49 (Call 03/11/49) |
206 | 143,666 | ||||||
| 3.35%, 08/08/32 (Call 05/08/32)(a) |
195 | 177,034 | ||||||
| 3.45%, 02/09/45 |
193 | 153,299 | ||||||
| 3.75%, 09/12/47 (Call 03/12/47) |
114 | 92,596 | ||||||
| 3.75%, 11/13/47 (Call 05/13/47)(a) |
82 | 66,692 | ||||||
| 3.85%, 05/04/43 |
211 | 180,498 | ||||||
| 3.85%, 08/04/46 (Call 02/04/46) |
538 | 449,213 | ||||||
| 3.95%, 08/08/52 (Call 02/08/52) |
420 | 348,556 | ||||||
| 4.10%, 08/08/62 (Call 02/08/62) |
305 | 255,501 | ||||||
| 4.25%, 02/09/47 (Call 08/09/46) |
257 | 230,602 | ||||||
| 4.38%, 05/13/45 |
218 | 198,914 | ||||||
| 4.50%, 02/23/36 (Call 08/23/35)(a) |
25 | 24,571 | ||||||
| 4.65%, 02/23/46 (Call 08/23/45) |
960 | 907,226 | ||||||
| Dell Inc., 6.50%, 04/15/38 |
180 | 188,239 | ||||||
| Dell International LLC/EMC Corp. |
||||||||
| 8.10%, 07/15/36 (Call 01/15/36) |
197 | 236,072 | ||||||
| 8.35%, 07/15/46 (Call 01/15/46) |
154 | 195,063 | ||||||
| DXC Technology Co., 2.38%, 09/15/28 (Call 07/15/28)(a) |
55 | 47,418 | ||||||
| Security | Par (000) |
Value | ||||||
| Computers (continued) |
||||||||
| Hewlett Packard Enterprise Co. |
||||||||
| 1.75%, 04/01/26 (Call 03/01/26)(a) |
$ | 325 | $ | 302,065 | ||||
| 4.90%, 10/15/25 (Call 07/15/25) |
2,163 | 2,149,089 | ||||||
| 5.25%, 07/01/28 (Call 06/01/28)(a) |
410 | 410,656 | ||||||
| 6.10%, 04/01/26 (Call 04/01/24) |
115 | 115,040 | ||||||
| 6.20%, 10/15/35 (Call 04/15/35) |
451 | 470,872 | ||||||
| HP Inc. |
||||||||
| 4.20%, 04/15/32 (Call 01/15/32) |
220 | 202,838 | ||||||
| 5.50%, 01/15/33 (Call 10/15/32)(a) |
400 | 400,159 | ||||||
| 6.00%, 09/15/41(a) |
440 | 449,932 | ||||||
| International Business Machines Corp. |
||||||||
| 2.95%, 05/15/50 (Call 11/15/49) |
175 | 115,279 | ||||||
| 3.30%, 05/15/26(a) |
226 | 217,587 | ||||||
| 3.30%, 01/27/27 |
839 | 801,529 | ||||||
| 3.45%, 02/19/26 |
915 | 887,626 | ||||||
| 3.50%, 05/15/29 |
1,270 | 1,185,450 | ||||||
| 4.00%, 06/20/42(a) |
130 | 108,083 | ||||||
| 4.15%, 05/15/39 |
185 | 161,282 | ||||||
| 4.25%, 05/15/49 |
550 | 460,673 | ||||||
| 4.70%, 02/19/46 |
100 | 90,563 | ||||||
| 4.75%, 02/06/33 (Call 11/06/32)(a) |
270 | 263,474 | ||||||
| 4.90%, 07/27/52 (Call 01/27/52) |
40 | 36,972 | ||||||
| 5.10%, 02/06/53 (Call 08/06/52) |
85 | 81,014 | ||||||
| 5.60%, 11/30/39 |
121 | 124,409 | ||||||
| 5.88%, 11/29/32 |
172 | 182,097 | ||||||
| 6.22%, 08/01/27 |
405 | 422,517 | ||||||
| 6.50%, 01/15/28 |
102 | 107,909 | ||||||
| 7.00%, 10/30/25 |
523 | 539,827 | ||||||
| 7.13%, 12/01/96(a) |
55 | 69,066 | ||||||
| Kyndryl Holdings Inc., 3.15%, 10/15/31 (Call 07/15/31) |
55 | 45,355 | ||||||
| Leidos Inc. |
||||||||
| 2.30%, 02/15/31 (Call 11/15/30) |
180 | 147,465 | ||||||
| 4.38%, 05/15/30 (Call 02/15/30)(a) |
656 | 616,454 | ||||||
| Teledyne FLIR LLC, 2.50%, 08/01/30 (Call 05/01/30) |
75 | 63,355 | ||||||
| Western Digital Corp. |
||||||||
| 2.85%, 02/01/29 (Call 12/01/28) |
192 | 161,795 | ||||||
| 3.10%, 02/01/32 (Call 11/01/31) |
337 | 262,713 | ||||||
| 4.75%, 02/15/26 (Call 11/15/25) |
37 | 36,193 | ||||||
|
|
|
|||||||
| 17,326,443 | ||||||||
| Cosmetics & Personal Care — 0.6% | ||||||||
| Colgate-Palmolive Co. |
||||||||
| 3.70%, 08/01/47 (Call 02/01/47)(a) |
502 | 414,121 | ||||||
| 4.00%, 08/15/45 |
262 | 229,357 | ||||||
| Conopco Inc., Series E, 7.25%, 12/15/26(a) |
70 | 74,250 | ||||||
| Estee Lauder Companies Inc. (The) |
||||||||
| 2.38%, 12/01/29 (Call 09/01/29)(a) |
33 | 28,834 | ||||||
| 2.60%, 04/15/30 (Call 01/15/30) |
41 | 35,877 | ||||||
| 3.13%, 12/01/49 (Call 06/01/49)(a) |
168 | 114,537 | ||||||
| 4.15%, 03/15/47 (Call 09/15/46) |
128 | 105,624 | ||||||
| 4.38%, 06/15/45 (Call 12/15/44) |
99 | 85,086 | ||||||
| 6.00%, 05/15/37 |
54 | 57,547 | ||||||
| Procter & Gamble Co. (The) |
||||||||
| 2.45%, 11/03/26 |
311 | 293,796 | ||||||
| 2.80%, 03/25/27 |
409 | 387,175 | ||||||
| 2.85%, 08/11/27 |
1,001 | 944,571 | ||||||
| 3.00%, 03/25/30 |
26 | 23,791 | ||||||
| 3.50%, 10/25/47 |
10 | 8,038 | ||||||
| 3.60%, 03/25/50 |
45 | 36,914 | ||||||
| 5.55%, 03/05/37 |
415 | 445,198 | ||||||
| 94 | 2 0 2 4 I S H A R E S A N N U A L R E P O R T T O S H A R E H O L D E R S |
| Schedule of Investments (continued) February 29, 2024 |
iShares® ESG Aware USD Corporate Bond ETF (Percentages shown are based on Net Assets) |
| Security | Par (000) |
Value | ||||||
| Cosmetics & Personal Care (continued) |
||||||||
| 5.80%, 08/15/34 |
$ | 45 | $ | 50,035 | ||||
| Unilever Capital Corp. |
||||||||
| 1.38%, 09/14/30 (Call 06/14/30) |
210 | 169,694 | ||||||
| 1.75%, 08/12/31 (Call 05/12/31) |
780 | 627,283 | ||||||
| 2.00%, 07/28/26 |
162 | 151,726 | ||||||
| 2.13%, 09/06/29 (Call 06/06/29)(a) |
262 | 228,224 | ||||||
| 2.90%, 05/05/27 (Call 02/05/27) |
101 | 95,451 | ||||||
| 3.10%, 07/30/25 |
255 | 248,545 | ||||||
| 3.38%, 03/22/25 (Call 01/22/25) |
340 | 333,415 | ||||||
| 3.50%, 03/22/28 (Call 12/22/27) |
116 | 110,980 | ||||||
| 4.88%, 09/08/28 (Call 08/08/28) |
70 | 70,504 | ||||||
| 5.00%, 12/08/33 (Call 09/08/33)(a) |
415 | 415,697 | ||||||
| 5.90%, 11/15/32 |
402 | 427,750 | ||||||
| Series 30Y, 2.63%, 08/12/51 (Call 02/12/51) |
235 | 151,609 | ||||||
|
|
|
|||||||
| 6,365,629 | ||||||||
| Distribution & Wholesale — 0.2% | ||||||||
| LKQ Corp. |
||||||||
| 5.75%, 06/15/28 (Call 05/15/28) |
880 | 888,871 | ||||||
| 6.25%, 06/15/33 (Call 03/15/33) |
710 | 729,817 | ||||||
| WW Grainger Inc. |
||||||||
| 3.75%, 05/15/46 (Call 11/15/45) |
198 | 158,902 | ||||||
| 4.20%, 05/15/47 (Call 11/15/46) |
113 | 97,056 | ||||||
| 4.60%, 06/15/45 (Call 12/15/44) |
334 | 304,071 | ||||||
|
|
|
|||||||
| 2,178,717 | ||||||||
| Diversified Financial Services — 3.3% | ||||||||
| AerCap Ireland Capital DAC/AerCap Global Aviation Trust |
||||||||
| 2.45%, 10/29/26 (Call 09/29/26) |
35 | 32,295 | ||||||
| 3.00%, 10/29/28 (Call 08/29/28) |
485 | 435,773 | ||||||
| 3.30%, 01/30/32 (Call 10/30/31) |
830 | 702,407 | ||||||
| 3.40%, 10/29/33 (Call 07/29/33)(a) |
347 | 288,658 | ||||||
| 3.65%, 07/21/27 (Call 04/21/27) |
245 | 230,654 | ||||||
| 3.85%, 10/29/41 (Call 04/29/41) |
182 | 140,694 | ||||||
| 3.88%, 01/23/28 (Call 10/23/27) |
192 | 180,791 | ||||||
| 4.45%, 10/01/25 (Call 08/01/25)(a) |
355 | 348,193 | ||||||
| 4.45%, 04/03/26 (Call 02/03/26) |
354 | 346,748 | ||||||
| 4.63%, 10/15/27 (Call 08/15/27) |
156 | 151,027 | ||||||
| 5.10%, 01/19/29 (Call 12/19/28) |
150 | 147,458 | ||||||
| 5.30%, 01/19/34 (Call 10/19/33) |
150 | 144,922 | ||||||
| 5.75%, 06/06/28 (Call 05/06/28) |
150 | 151,196 | ||||||
| 6.10%, 01/15/27 (Call 12/15/26) |
150 | 151,939 | ||||||
| 6.15%, 09/30/30 (Call 07/30/30) |
150 | 154,910 | ||||||
| 6.50%, 07/15/25 (Call 06/15/25)(a) |
1,609 | 1,623,531 | ||||||
| Affiliated Managers Group Inc., 3.50%, 08/01/25 |
86 | 83,640 | ||||||
| Air Lease Corp. |
||||||||
| 2.88%, 01/15/32 (Call 10/15/31) |
215 | 178,400 | ||||||
| 3.00%, 02/01/30 (Call 11/01/29) |
184 | 159,944 | ||||||
| 3.13%, 12/01/30 (Call 09/01/30) |
40 | 34,440 | ||||||
| 3.25%, 03/01/25 (Call 01/01/25) |
124 | 121,069 | ||||||
| 3.25%, 10/01/29 (Call 07/01/29)(a) |
247 | 220,155 | ||||||
| 3.63%, 04/01/27 (Call 01/01/27) |
251 | 238,332 | ||||||
| 3.63%, 12/01/27 (Call 09/01/27)(a) |
218 | 204,096 | ||||||
| 3.75%, 06/01/26 (Call 04/01/26) |
209 | 201,412 | ||||||
| 4.63%, 10/01/28 (Call 07/01/28) |
243 | 234,714 | ||||||
| Aircastle Ltd., 4.25%, 06/15/26 (Call 04/15/26) |
819 | 793,723 | ||||||
| Ally Financial Inc. |
||||||||
| 4.63%, 03/30/25(a) |
95 | 93,791 | ||||||
| 6.85%, 01/03/30 (Call 01/03/29), |
15 | 15,331 | ||||||
| Security | Par (000) |
Value | ||||||
| Diversified Financial Services (continued) |
||||||||
| 6.99%, 06/13/29 (Call 06/13/28), |
$ | 10 | $ | 10,272 | ||||
| 8.00%, 11/01/31 |
727 | 796,302 | ||||||
| American Express Co. |
||||||||
| 3.13%, 05/20/26 (Call 04/20/26) |
972 | 932,817 | ||||||
| 4.05%, 12/03/42 |
225 | 193,543 | ||||||
| 4.20%, 11/06/25 (Call 10/06/25) |
1,372 | 1,353,360 | ||||||
| 4.42%, 08/03/33 (Call 08/03/32), |
167 | 158,211 | ||||||
| 4.99%, 05/01/26 (Call 05/01/25), |
110 | 109,367 | ||||||
| 4.99%, 05/26/33 (Call 02/26/32), |
135 | 131,313 | ||||||
| 5.04%, 05/01/34 (Call 05/01/33), |
190 | 186,355 | ||||||
| 5.10%, 02/16/28 (Call 02/16/27), |
75 | 74,701 | ||||||
| 5.28%, 07/27/29 (Call 07/27/28), |
325 | 326,857 | ||||||
| 5.39%, 07/28/27 (Call 07/28/26), |
85 | 85,234 | ||||||
| 5.63%, 07/28/34 (Call 07/28/33), |
55 | 55,337 | ||||||
| 6.34%, 10/30/26 (Call 10/30/25), |
30 | 30,456 | ||||||
| 6.49%, 10/30/31 (Call 10/30/30), |
125 | 133,126 | ||||||
| American Express Credit Corp., 3.30%, 05/03/27 (Call 04/03/27) |
495 | 469,130 | ||||||
| Ameriprise Financial Inc. |
||||||||
| 2.88%, 09/15/26 (Call 06/15/26)(a) |
23 | 21,820 | ||||||
| 3.00%, 04/02/25 (Call 03/02/25) |
15 | 14,606 | ||||||
| Brookfield Capital Finance LLC, 6.09%, 06/14/33 (Call 03/14/33) |
205 | 211,460 | ||||||
| Brookfield Finance I U.K. PLC/Brookfield Finance Inc., 2.34%, 01/30/32 (Call 10/30/31) |
205 | 164,265 | ||||||
| Brookfield Finance Inc. |
||||||||
| 3.50%, 03/30/51 (Call 09/30/50) |
208 | 147,713 | ||||||
| 3.63%, 02/15/52 (Call 08/15/51)(a) |
130 | 92,666 | ||||||
| 3.90%, 01/25/28 (Call 10/25/27) |
171 | 163,973 | ||||||
| 4.25%, 06/02/26 (Call 03/02/26) |
237 | 232,699 | ||||||
| 4.35%, 04/15/30 (Call 01/15/30) |
4 | 3,789 | ||||||
| 4.70%, 09/20/47 (Call 03/20/47) |
218 | 184,979 | ||||||
| 4.85%, 03/29/29 (Call 12/29/28)(a) |
112 | 110,395 | ||||||
| 5.97%, 03/04/54 (Call 09/04/53) |
50 | 50,466 | ||||||
| 6.35%, 01/05/34 (Call 10/05/33) |
200 | 210,184 | ||||||
| Brookfield Finance LLC/Brookfield Finance Inc., 3.45%, 04/15/50 (Call 10/15/49) |
201 | 139,510 | ||||||
| Capital One Financial Corp. |
||||||||
| 2.36%, 07/29/32 (Call 07/29/31), |
295 | 222,291 | ||||||
| 2.62%, 11/02/32 (Call 11/02/31), |
175 | 139,730 | ||||||
| 2.64%, 03/03/26 (Call 03/03/25), |
130 | 126,101 | ||||||
| 3.27%, 03/01/30 (Call 03/01/29), |
147 | 130,979 | ||||||
| 3.80%, 01/31/28 (Call 12/31/27) |
150 | 141,752 | ||||||
| 4.93%, 05/10/28 (Call 05/10/27), |
55 | 53,800 | ||||||
| S C H E D U L E O F I N V E S T M E N T S |
95 |
| Schedule of Investments (continued) February 29, 2024 |
iShares® ESG Aware USD Corporate Bond ETF (Percentages shown are based on Net Assets) |
| Security | Par (000) |
Value | ||||||
| Diversified Financial Services (continued) |
||||||||
| 4.99%, 07/24/26 (Call 07/24/25), |
$ | 110 | $ | 108,976 | ||||
| 5.25%, 07/26/30 (Call 07/26/29), |
125 | 121,879 | ||||||
| 5.27%, 05/10/33 (Call 05/10/32), |
415 | 402,495 | ||||||
| 5.82%, 02/01/34 (Call 02/01/33), |
110 | 108,707 | ||||||
| 6.31%, 06/08/29 (Call 06/08/28), |
145 | 148,501 | ||||||
| 6.38%, 06/08/34 (Call 06/08/33), |
295 | 303,864 | ||||||
| 7.62%, 10/30/31 (Call 10/30/30), |
35 | 38,303 | ||||||
| Cboe Global Markets Inc., 3.65%, 01/12/27 (Call 10/12/26) |
137 | 132,578 | ||||||
| Charles Schwab Corp. (The) |
||||||||
| 1.95%, 12/01/31 (Call 09/01/31) |
210 | 166,687 | ||||||
| 2.00%, 03/20/28 (Call 01/20/28)(a) |
75 | 66,490 | ||||||
| 2.30%, 05/13/31 (Call 02/13/31) |
115 | 95,190 | ||||||
| 2.90%, 03/03/32 (Call 12/03/31)(a) |
415 | 351,265 | ||||||
| 3.20%, 01/25/28 (Call 10/25/27) |
54 | 50,556 | ||||||
| 4.63%, 03/22/30 (Call 12/22/29)(a) |
60 | 59,227 | ||||||
| 5.85%, 05/19/34 (Call 05/19/33), |
15 | 15,225 | ||||||
| 6.14%, 08/24/34 (Call 08/24/33), |
220 | 228,195 | ||||||
| CI Financial Corp. |
||||||||
| 3.20%, 12/17/30 (Call 09/17/30) |
240 | 191,084 | ||||||
| 4.10%, 06/15/51 (Call 12/15/50) |
74 | 43,722 | ||||||
| CME Group Inc. |
||||||||
| 2.65%, 03/15/32 (Call 12/15/31) |
20 | 17,133 | ||||||
| 3.75%, 06/15/28 (Call 03/15/28) |
99 | 95,509 | ||||||
| 4.15%, 06/15/48 (Call 12/15/47) |
33 | 28,328 | ||||||
| 5.30%, 09/15/43 (Call 03/15/43) |
45 | 45,548 | ||||||
| Credit Suisse USA Inc., 7.13%, 07/15/32 |
220 | 245,505 | ||||||
| Discover Financial Services |
||||||||
| 4.10%, 02/09/27 (Call 11/09/26) |
594 | 570,883 | ||||||
| 6.70%, 11/29/32 (Call 08/29/32) |
250 | 261,610 | ||||||
| 7.96%, 11/02/34 (Call 11/02/33), |
220 | 246,551 | ||||||
| Eaton Vance Corp., 3.50%, 04/06/27 (Call 01/06/27) |
180 | 171,325 | ||||||
| Franklin Resources Inc. |
||||||||
| 2.85%, 03/30/25 |
51 | 49,686 | ||||||
| 2.95%, 08/12/51 (Call 02/12/51) |
30 | 18,433 | ||||||
| Intercontinental Exchange Inc. |
||||||||
| 1.85%, 09/15/32 (Call 06/15/32) |
135 | 104,187 | ||||||
| 2.65%, 09/15/40 (Call 03/15/40)(a) |
82 | 58,083 | ||||||
| 3.00%, 06/15/50 (Call 12/15/49) |
327 | 219,306 | ||||||
| 3.00%, 09/15/60 (Call 03/15/60) |
395 | 244,701 | ||||||
| 3.10%, 09/15/27 (Call 06/15/27) |
20 | 18,781 | ||||||
| 3.75%, 09/21/28 (Call 06/21/28)(a) |
5 | 4,772 | ||||||
| 4.25%, 09/21/48 (Call 03/21/48) |
265 | 224,284 | ||||||
| 4.60%, 03/15/33 (Call 12/15/32)(a) |
160 | 152,946 | ||||||
| 4.95%, 06/15/52 (Call 12/15/51) |
235 | 219,338 | ||||||
| 5.20%, 06/15/62 (Call 12/15/61) |
295 | 283,499 | ||||||
| Invesco Finance PLC |
||||||||
| 3.75%, 01/15/26(a) |
135 | 131,190 | ||||||
| 5.38%, 11/30/43 |
181 | 174,703 | ||||||
| Security | Par (000) |
Value | ||||||
| Diversified Financial Services (continued) |
| |||||||
| Janus Henderson U.S. Holdings Inc., 4.88%, 08/01/25 (Call 05/01/25) |
$ | 1,512 | $ | 1,494,166 | ||||
| Jefferies Financial Group Inc. |
||||||||
| 2.63%, 10/15/31 (Call 07/15/31) |
25 | 20,447 | ||||||
| 6.25%, 01/15/36 |
63 | 64,732 | ||||||
| 6.50%, 01/20/43 |
70 | 72,894 | ||||||
| Legg Mason Inc. |
||||||||
| 4.75%, 03/15/26(a) |
385 | 382,294 | ||||||
| 5.63%, 01/15/44 |
271 | 271,515 | ||||||
| Mastercard Inc. |
||||||||
| 2.95%, 06/01/29 (Call 03/01/29) |
40 | 36,722 | ||||||
| 2.95%, 03/15/51 (Call 09/15/50) |
110 | 76,193 | ||||||
| 3.35%, 03/26/30 (Call 12/26/29) |
115 | 106,186 | ||||||
| 3.65%, 06/01/49 (Call 12/01/48) |
275 | 218,652 | ||||||
| 3.80%, 11/21/46 (Call 05/21/46) |
111 | 91,651 | ||||||
| 3.85%, 03/26/50 (Call 09/26/49) |
261 | 215,489 | ||||||
| 3.95%, 02/26/48 (Call 08/26/47) |
123 | 103,951 | ||||||
| Nasdaq Inc. |
||||||||
| 1.65%, 01/15/31 (Call 10/15/30) |
205 | 163,257 | ||||||
| 3.25%, 04/28/50 (Call 10/28/49) |
103 | 70,037 | ||||||
| 3.85%, 06/30/26 (Call 03/30/26) |
165 | 160,131 | ||||||
| 3.95%, 03/07/52 (Call 09/07/51) |
229 | 173,978 | ||||||
| 5.35%, 06/28/28 (Call 05/28/28) |
390 | 393,905 | ||||||
| 5.55%, 02/15/34 (Call 11/15/33) |
375 | 377,444 | ||||||
| 5.65%, 06/28/25 |
50 | 50,162 | ||||||
| 6.10%, 06/28/63 (Call 12/28/62) |
65 | 67,458 | ||||||
| Nomura Holdings Inc. |
||||||||
| 2.17%, 07/14/28 |
735 | 640,676 | ||||||
| 2.33%, 01/22/27 |
135 | 123,711 | ||||||
| 2.61%, 07/14/31 |
222 | 182,393 | ||||||
| 2.68%, 07/16/30 |
388 | 327,953 | ||||||
| 2.71%, 01/22/29 |
241 | 212,372 | ||||||
| 3.00%, 01/22/32 |
231 | 192,423 | ||||||
| 3.10%, 01/16/30 |
506 | 444,220 | ||||||
| 5.39%, 07/06/27 |
215 | 214,506 | ||||||
| 6.07%, 07/12/28 |
200 | 204,752 | ||||||
| 6.09%, 07/12/33 |
200 | 208,452 | ||||||
| ORIX Corp. |
||||||||
| 3.70%, 07/18/27 |
56 | 53,543 | ||||||
| 4.00%, 04/13/32 |
125 | 116,176 | ||||||
| 5.20%, 09/13/32(a) |
145 | 146,530 | ||||||
| Radian Group Inc. |
||||||||
| 4.88%, 03/15/27 (Call 09/15/26)(a) |
70 | 67,979 | ||||||
| 6.63%, 03/15/25 (Call 09/15/24)(a) |
565 | 565,900 | ||||||
| Raymond James Financial Inc. |
||||||||
| 3.75%, 04/01/51 (Call 10/01/50) |
162 | 119,988 | ||||||
| 4.95%, 07/15/46 |
185 | 169,944 | ||||||
| Synchrony Financial |
||||||||
| 2.88%, 10/28/31 (Call 07/28/31) |
104 | 81,563 | ||||||
| 3.70%, 08/04/26 (Call 05/04/26) |
265 | 250,074 | ||||||
| 3.95%, 12/01/27 (Call 09/01/27) |
647 | 599,269 | ||||||
| 4.50%, 07/23/25 (Call 04/23/25) |
340 | 332,298 | ||||||
| 4.88%, 06/13/25 (Call 05/13/25)(a) |
20 | 19,680 | ||||||
| 5.15%, 03/19/29 (Call 12/19/28) |
456 | 435,000 | ||||||
| Visa Inc. |
||||||||
| 2.00%, 08/15/50 (Call 02/15/50) |
281 | 163,358 | ||||||
| 2.05%, 04/15/30 (Call 01/15/30) |
11 | 9,435 | ||||||
| 3.65%, 09/15/47 (Call 03/15/47) |
228 | 181,449 | ||||||
| 4.15%, 12/14/35 (Call 06/14/35) |
488 | 457,436 | ||||||
| 4.30%, 12/14/45 (Call 06/14/45) |
493 | 439,415 | ||||||
| 96 | 2 0 2 4 I S H A R E S A N N U A L R E P O R T T O S H A R E H O L D E R S |
| Schedule of Investments (continued) February 29, 2024 |
iShares® ESG Aware USD Corporate Bond ETF (Percentages shown are based on Net Assets) |
| Security | Par (000) |
Value | ||||||
| Diversified Financial Services (continued) |
||||||||
| Voya Financial Inc., 4.70%, 01/23/48 (Call 01/23/28), (3-mo. LIBOR US + |
$ | 250 | $ | 210,158 | ||||
| Western Union Co. (The), 6.20%, 11/17/36(a) |
293 | 295,122 | ||||||
|
|
|
|||||||
| 33,716,086 | ||||||||
| Electric — 7.9% | ||||||||
| AEP Texas Inc. |
||||||||
| 3.45%, 05/15/51 (Call 11/15/50) |
545 | 375,450 | ||||||
| 4.70%, 05/15/32 (Call 02/15/32) |
320 | 304,911 | ||||||
| 5.25%, 05/15/52 (Call 11/15/51) |
345 | 323,220 | ||||||
| 5.40%, 06/01/33 (Call 03/01/33)(a) |
555 | 553,888 | ||||||
| Series G, 4.15%, 05/01/49 (Call 11/01/48) |
90 | 70,578 | ||||||
| Series H, 3.45%, 01/15/50 (Call 07/15/49) |
170 | 118,566 | ||||||
| Avangrid Inc., 3.80%, 06/01/29 (Call 03/01/29) |
4,232 | 3,942,969 | ||||||
| Avista Corp. |
||||||||
| 4.00%, 04/01/52 (Call 10/01/51) |
298 | 227,493 | ||||||
| 4.35%, 06/01/48 (Call 12/01/47) |
532 | 438,185 | ||||||
| Baltimore Gas & Electric Co. |
||||||||
| 2.40%, 08/15/26 (Call 05/15/26) |
899 | 847,194 | ||||||
| 3.20%, 09/15/49 (Call 03/15/49) |
464 | 318,022 | ||||||
| 3.50%, 08/15/46 (Call 02/15/46) |
254 | 187,113 | ||||||
| 3.75%, 08/15/47 (Call 02/15/47)(a) |
94 | 71,517 | ||||||
| 4.25%, 09/15/48 (Call 03/15/48)(a) |
195 | 162,644 | ||||||
| 6.35%, 10/01/36 |
160 | 170,909 | ||||||
| CenterPoint Energy Houston Electric LLC |
||||||||
| 3.55%, 08/01/42 (Call 02/01/42) |
337 | 262,521 | ||||||
| 3.60%, 03/01/52 (Call 09/01/51) |
450 | 338,047 | ||||||
| 3.95%, 03/01/48 (Call 09/01/47) |
259 | 209,105 | ||||||
| 4.50%, 04/01/44 (Call 10/01/43) |
187 | 165,111 | ||||||
| 5.30%, 04/01/53 (Call 10/01/52) |
60 | 59,631 | ||||||
| Series AA, 3.00%, 02/01/27 (Call 11/01/26) |
144 | 136,593 | ||||||
| Series AC, 4.25%, 02/01/49 (Call 08/01/48) |
277 | 233,538 | ||||||
| Series AD, 2.90%, 07/01/50 (Call 01/01/50) |
83 | 54,558 | ||||||
| Series AF, 3.35%, 04/01/51 (Call 10/01/50) |
132 | 94,878 | ||||||
| Series K2, 6.95%, 03/15/33 |
50 | 56,399 | ||||||
| Series Z, 2.40%, 09/01/26 (Call 06/01/26) |
4 | 3,769 | ||||||
| Cleveland Electric Illuminating Co. (The), 5.95%, 12/15/36 |
330 | 329,186 | ||||||
| CMS Energy Corp. |
||||||||
| 3.75%, 12/01/50 (Call 09/01/30), |
500 | 400,708 | ||||||
| 4.75%, 06/01/50 (Call 03/01/30), |
55 | 50,185 | ||||||
| Commonwealth Edison Co. |
||||||||
| 2.20%, 03/01/30 (Call 12/01/29) |
1,012 | 860,559 | ||||||
| 2.55%, 06/15/26 (Call 03/15/26) |
854 | 807,975 | ||||||
| 3.00%, 03/01/50 (Call 09/01/49) |
310 | 204,251 | ||||||
| 3.65%, 06/15/46 (Call 12/15/45) |
219 | 166,890 | ||||||
| 3.70%, 08/15/28 (Call 05/15/28)(a) |
153 | 145,711 | ||||||
| 3.70%, 03/01/45 (Call 09/01/44) |
199 | 155,038 | ||||||
| 3.80%, 10/01/42 (Call 04/01/42) |
170 | 136,208 | ||||||
| 4.00%, 03/01/48 (Call 09/01/47) |
262 | 209,351 | ||||||
| 4.00%, 03/01/49 (Call 09/01/48) |
190 | 150,764 | ||||||
| 4.35%, 11/15/45 (Call 05/15/45) |
154 | 130,980 | ||||||
| 4.60%, 08/15/43 (Call 02/15/43) |
35 | 31,450 | ||||||
| 4.70%, 01/15/44 (Call 07/15/43) |
113 | 101,375 | ||||||
| 5.90%, 03/15/36 |
228 | 238,447 | ||||||
| 6.45%, 01/15/38(a) |
159 | 172,554 | ||||||
| Series 122, 2.95%, 08/15/27 (Call 05/15/27) |
51 | 47,764 | ||||||
| Series 123, 3.75%, 08/15/47 (Call 02/15/47) |
239 | 182,469 | ||||||
| Series 127, 3.20%, 11/15/49 (Call 05/15/49) |
292 | 200,073 | ||||||
| Security | Par (000) |
Value | ||||||
| Electric (continued) |
||||||||
| Connecticut Light & Power Co. (The) |
||||||||
| 4.00%, 04/01/48 (Call 10/01/47) |
$ | 598 | $ | 485,109 | ||||
| 4.30%, 04/15/44 (Call 10/15/43) |
295 | 251,237 | ||||||
| 4.90%, 07/01/33 (Call 04/01/33) |
40 | 39,068 | ||||||
| Series A, 2.05%, 07/01/31 (Call 04/01/31) |
385 | 312,843 | ||||||
| Series A, 3.20%, 03/15/27 (Call 12/15/26) |
272 | 258,428 | ||||||
| Series A, 4.15%, 06/01/45 (Call 12/01/44)(a) |
454 | 383,030 | ||||||
| Connecticut Light and Power Co. (The), 4.65%, 01/01/29 (Call 12/01/28) |
100 | 98,312 | ||||||
| Consolidated Edison Co. of New York Inc. |
||||||||
| 3.70%, 11/15/59 (Call 05/15/59) |
204 | 145,200 | ||||||
| 3.80%, 05/15/28 (Call 02/15/28)(a) |
96 | 91,678 | ||||||
| 3.85%, 06/15/46 (Call 12/15/45) |
185 | 145,227 | ||||||
| 3.95%, 03/01/43 (Call 09/01/42) |
80 | 65,493 | ||||||
| 4.45%, 03/15/44 (Call 09/15/43) |
216 | 187,115 | ||||||
| 4.50%, 12/01/45 (Call 06/01/45) |
218 | 188,561 | ||||||
| 4.50%, 05/15/58 (Call 11/15/57) |
114 | 95,683 | ||||||
| 4.63%, 12/01/54 (Call 06/01/54) |
191 | 164,026 | ||||||
| 5.70%, 06/15/40 |
120 | 120,699 | ||||||
| Series 05-A, 5.30%, 03/01/35 |
235 | 233,433 | ||||||
| Series 06-A, 5.85%, 03/15/36 |
199 | 204,647 | ||||||
| Series 06-B, 6.20%, 06/15/36 |
95 | 100,853 | ||||||
| Series 07-A, 6.30%, 08/15/37(a) |
98 | 104,529 | ||||||
| Series 08-B, 6.75%, 04/01/38 |
233 | 259,685 | ||||||
| Series 09-C, 5.50%, 12/01/39 |
147 | 146,438 | ||||||
| Series 12-A, 4.20%, 03/15/42 |
139 | 115,833 | ||||||
| Series 2017, 3.88%, 06/15/47 (Call 12/15/46) |
128 | 99,095 | ||||||
| Series 20A, 3.35%, 04/01/30 (Call 01/01/30) |
383 | 350,145 | ||||||
| Series 20B, 3.95%, 04/01/50 (Call 10/01/49) |
246 | 196,956 | ||||||
| Series A, 4.13%, 05/15/49 (Call 11/15/48) |
178 | 143,026 | ||||||
| Series B, 3.13%, 11/15/27 (Call 08/15/27) |
86 | 80,791 | ||||||
| Series C, 3.00%, 12/01/60 (Call 06/01/60) |
225 | 136,483 | ||||||
| Series C, 4.00%, 11/15/57 (Call 05/15/57) |
110 | 85,108 | ||||||
| Series C, 4.30%, 12/01/56 (Call 06/01/56) |
180 | 147,099 | ||||||
| Series D, 4.00%, 12/01/28 (Call 09/01/28)(a) |
251 | 242,061 | ||||||
| Series E, 4.65%, 12/01/48 (Call 06/01/48) |
113 | 98,606 | ||||||
| Constellation Energy Generation LLC |
||||||||
| 5.60%, 06/15/42 (Call 12/15/41)(a) |
101 | 98,432 | ||||||
| 5.75%, 10/01/41 (Call 04/01/41) |
77 | 75,449 | ||||||
| 5.80%, 03/01/33 (Call 12/01/32) |
525 | 536,493 | ||||||
| 6.25%, 10/01/39 |
145 | 149,586 | ||||||
| Consumers Energy Co. |
||||||||
| 2.50%, 05/01/60 (Call 11/01/59) |
1,385 | 768,507 | ||||||
| 2.65%, 08/15/52 (Call 02/15/52) |
500 | 310,195 | ||||||
| 4.20%, 09/01/52 (Call 03/01/52) |
225 | 186,656 | ||||||
| 4.63%, 05/15/33 (Call 11/15/32) |
280 | 270,703 | ||||||
| Delmarva Power & Light Co., 4.15%, 05/15/45 (Call 11/15/44) |
134 | 107,487 | ||||||
| Edison International |
||||||||
| 4.13%, 03/15/28 (Call 12/15/27) |
223 | 212,747 | ||||||
| 5.75%, 06/15/27 (Call 04/15/27) |
214 | 216,026 | ||||||
| El Paso Electric Co. |
||||||||
| 5.00%, 12/01/44 (Call 06/01/44)(a) |
115 | 97,622 | ||||||
| 6.00%, 05/15/35 |
75 | 75,212 | ||||||
| Enel Americas SA, 4.00%, 10/25/26 (Call 07/25/26) |
815 | 782,906 | ||||||
| Entergy Louisiana LLC |
||||||||
| 2.90%, 03/15/51 (Call 09/15/50) |
510 | 319,957 | ||||||
| 4.20%, 09/01/48 (Call 03/01/48) |
225 | 182,528 | ||||||
| 4.20%, 04/01/50 (Call 10/01/49) |
288 | 233,582 | ||||||
| 4.95%, 01/15/45 (Call 01/15/25) |
460 | 420,121 | ||||||
| S C H E D U L E O F I N V E S T M E N T S |
97 |
| Schedule of Investments (continued) February 29, 2024 |
iShares® ESG Aware USD Corporate Bond ETF (Percentages shown are based on Net Assets) |
| Security | Par (000) |
Value | ||||||
| Electric (continued) |
||||||||
| Entergy Texas Inc., 5.80%, 09/01/53 (Call 03/01/53)(a) |
$ | 100 | $ | 102,886 | ||||
| Eversource Energy |
||||||||
| 2.55%, 03/15/31 (Call 12/15/30)(a) |
180 | 148,573 | ||||||
| 3.45%, 01/15/50 (Call 07/15/49) |
501 | 341,177 | ||||||
| 5.00%, 01/01/27(a) |
75 | 74,487 | ||||||
| 5.13%, 05/15/33 (Call 02/15/33) |
10 | 9,660 | ||||||
| 5.45%, 03/01/28 (Call 02/01/28)(a) |
135 | 135,739 | ||||||
| 5.50%, 01/01/34 (Call 10/01/33)(a) |
200 | 197,933 | ||||||
| 5.95%, 02/01/29 (Call 01/01/29) |
195 | 199,712 | ||||||
| Series M, 3.30%, 01/15/28 (Call 10/15/27) |
238 | 221,664 | ||||||
| Series O, 4.25%, 04/01/29 (Call 01/01/29) |
187 | 178,142 | ||||||
| Series R, 1.65%, 08/15/30 (Call 05/15/30)(a) |
2,292 | 1,823,752 | ||||||
| Exelon Corp. |
||||||||
| 3.40%, 04/15/26 (Call 01/15/26) |
336 | 323,509 | ||||||
| 3.95%, 06/15/25 (Call 03/15/25) |
340 | 333,724 | ||||||
| 4.05%, 04/15/30 (Call 01/15/30) |
938 | 879,783 | ||||||
| 4.10%, 03/15/52 (Call 09/15/51)(a) |
135 | 104,713 | ||||||
| 4.45%, 04/15/46 (Call 10/15/45) |
291 | 243,576 | ||||||
| 4.70%, 04/15/50 (Call 10/15/49) |
354 | 305,718 | ||||||
| 4.95%, 06/15/35 (Call 12/15/34) |
208 | 194,326 | ||||||
| 5.10%, 06/15/45 (Call 12/15/44) |
240 | 218,362 | ||||||
| 5.15%, 03/15/29 (Call 02/15/29) |
25 | 24,881 | ||||||
| 5.45%, 03/15/34 (Call 12/15/33) |
50 | 49,781 | ||||||
| 5.60%, 03/15/53 (Call 09/15/52)(a) |
240 | 234,021 | ||||||
| 5.63%, 06/15/35 |
140 | 139,008 | ||||||
| Florida Power & Light Co. |
||||||||
| 2.85%, 04/01/25 (Call 03/01/25) |
5 | 4,875 | ||||||
| 2.88%, 12/04/51 (Call 06/04/51) |
25 | 16,235 | ||||||
| 3.15%, 10/01/49 (Call 04/01/49) |
99 | 68,259 | ||||||
| 3.70%, 12/01/47 (Call 06/01/47) |
174 | 135,255 | ||||||
| 3.95%, 03/01/48 (Call 09/01/47) |
246 | 199,108 | ||||||
| 3.99%, 03/01/49 (Call 09/01/48) |
233 | 188,507 | ||||||
| 4.05%, 06/01/42 (Call 12/01/41) |
191 | 161,833 | ||||||
| 4.05%, 10/01/44 (Call 04/01/44) |
120 | 101,020 | ||||||
| 4.13%, 02/01/42 (Call 08/01/41) |
264 | 226,343 | ||||||
| 4.13%, 06/01/48 (Call 12/01/47) |
169 | 140,358 | ||||||
| 4.95%, 06/01/35 |
171 | 168,223 | ||||||
| 5.25%, 02/01/41 (Call 08/01/40) |
115 | 113,442 | ||||||
| 5.63%, 04/01/34 |
346 | 361,679 | ||||||
| 5.65%, 02/01/37 |
112 | 115,624 | ||||||
| 5.69%, 03/01/40 |
90 | 92,213 | ||||||
| 5.95%, 02/01/38 |
146 | 155,260 | ||||||
| 5.96%, 04/01/39 |
104 | 111,516 | ||||||
| Iberdrola International BV |
||||||||
| 5.81%, 03/15/25 |
1,173 | 1,173,025 | ||||||
| 6.75%, 07/15/36 |
891 | 997,645 | ||||||
| ITC Holdings Corp. |
||||||||
| 3.35%, 11/15/27 (Call 08/15/27) |
204 | 191,351 | ||||||
| 5.30%, 07/01/43 (Call 01/01/43) |
428 | 400,597 | ||||||
| National Grid PLC |
||||||||
| 5.42%, 01/11/34 (Call 10/11/33) |
650 | 633,842 | ||||||
| 5.60%, 06/12/28 (Call 05/12/28) |
850 | 860,705 | ||||||
| 5.81%, 06/12/33 (Call 03/12/33) |
1,725 | 1,743,152 | ||||||
| National Grid USA, 5.80%, 04/01/35 |
930 | 916,993 | ||||||
| National Rural Utilities Cooperative Finance Corp. |
||||||||
| 3.90%, 11/01/28 (Call 08/01/28) |
45 | 43,131 | ||||||
| 4.02%, 11/01/32 (Call 05/01/32)(a) |
161 | 148,118 | ||||||
| 4.30%, 03/15/49 (Call 09/15/48) |
359 | 298,202 | ||||||
| 4.40%, 11/01/48 (Call 05/01/48) |
145 | 122,203 | ||||||
| 5.05%, 09/15/28 (Call 08/15/28) |
40 | 40,043 | ||||||
| Security | Par (000) |
Value | ||||||
| Electric (continued) |
||||||||
| 5.25%, 04/20/46 (Call 04/20/26), |
$ | 20 | $ | 19,401 | ||||
| Series C, 8.00%, 03/01/32 |
208 | 240,870 | ||||||
| Nevada Power Co. |
||||||||
| 5.90%, 05/01/53 (Call 11/01/52) |
510 | 524,551 | ||||||
| 6.00%, 03/15/54 (Call 09/15/53) |
15 | 15,670 | ||||||
| Series EE, 3.13%, 08/01/50 (Call 02/01/50) |
180 | 118,053 | ||||||
| NextEra Energy Capital Holdings Inc. |
||||||||
| 2.25%, 06/01/30 (Call 03/01/30) |
2,443 | 2,055,844 | ||||||
| 2.75%, 11/01/29 (Call 08/01/29) |
3,246 | 2,860,914 | ||||||
| 3.50%, 04/01/29 (Call 01/01/29) |
1,130 | 1,044,964 | ||||||
| 3.55%, 05/01/27 (Call 02/01/27) |
2,610 | 2,483,148 | ||||||
| 3.80%, 03/15/82 (Call 03/15/27), |
20 | 17,816 | ||||||
| 4.90%, 03/15/29 (Call 02/15/29) |
125 | 123,448 | ||||||
| 4.95%, 01/29/26 |
125 | 124,083 | ||||||
| 5.25%, 03/15/34 (Call 12/15/33) |
125 | 122,689 | ||||||
| 5.55%, 03/15/54 (Call 09/15/53) |
325 | 315,155 | ||||||
| NSTAR Electric Co. |
||||||||
| 1.95%, 08/15/31 (Call 05/15/31) |
322 | 257,488 | ||||||
| 3.10%, 06/01/51 (Call 12/01/50)(a) |
298 | 201,184 | ||||||
| 3.20%, 05/15/27 (Call 02/15/27) |
1,895 | 1,805,289 | ||||||
| 3.25%, 05/15/29 (Call 02/15/29) |
320 | 297,443 | ||||||
| 3.95%, 04/01/30 (Call 01/01/30) |
1,108 | 1,038,720 | ||||||
| 4.40%, 03/01/44 (Call 09/01/43) |
421 | 362,684 | ||||||
| 4.55%, 06/01/52 (Call 12/01/51) |
15 | 12,966 | ||||||
| 5.50%, 03/15/40 |
140 | 139,525 | ||||||
| Ohio Edison Co., 6.88%, 07/15/36 |
80 | 88,362 | ||||||
| Ohio Power Co. |
||||||||
| 4.00%, 06/01/49 (Call 12/01/48) |
268 | 209,149 | ||||||
| 4.15%, 04/01/48 (Call 10/01/47) |
170 | 136,112 | ||||||
| 5.00%, 06/01/33 (Call 03/01/33) |
130 | 127,504 | ||||||
| Series Q, 1.63%, 01/15/31 (Call 10/15/30) |
685 | 546,230 | ||||||
| Series R, 2.90%, 10/01/51 (Call 04/01/51)(a) |
445 | 283,334 | ||||||
| Oncor Electric Delivery Co. LLC |
||||||||
| 2.70%, 11/15/51 (Call 05/15/51)(a) |
475 | 294,983 | ||||||
| 3.10%, 09/15/49 (Call 03/15/49) |
463 | 317,419 | ||||||
| 3.75%, 04/01/45 (Call 10/01/44) |
328 | 260,129 | ||||||
| 3.80%, 09/30/47 (Call 03/30/47) |
162 | 124,975 | ||||||
| 3.80%, 06/01/49 (Call 12/01/48) |
286 | 224,360 | ||||||
| 4.10%, 11/15/48 (Call 05/15/48) |
230 | 188,478 | ||||||
| 4.55%, 12/01/41 (Call 06/01/41)(a) |
50 | 45,337 | ||||||
| 4.60%, 06/01/52 (Call 12/01/51) |
60 | 52,762 | ||||||
| 4.95%, 09/15/52 (Call 03/15/52) |
65 | 60,529 | ||||||
| 5.25%, 09/30/40 |
45 | 44,658 | ||||||
| 5.30%, 06/01/42 (Call 12/01/41) |
25 | 25,245 | ||||||
| 5.65%, 11/15/33 (Call 08/15/33) |
25 | 25,777 | ||||||
| 5.75%, 03/15/29 (Call 12/15/28) |
57 | 58,929 | ||||||
| 7.00%, 05/01/32 |
35 | 38,988 | ||||||
| 7.25%, 01/15/33 |
27 | 30,723 | ||||||
| Pacific Gas and Electric Co. |
||||||||
| 3.50%, 08/01/50 (Call 02/01/50) |
752 | 505,896 | ||||||
| 3.95%, 12/01/47 (Call 06/01/47) |
85 | 61,725 | ||||||
| 4.20%, 06/01/41 (Call 12/01/40) |
50 | 39,284 | ||||||
| 4.25%, 03/15/46 (Call 09/15/45) |
72 | 55,083 | ||||||
| 4.30%, 03/15/45 (Call 09/15/44) |
125 | 97,526 | ||||||
| 4.40%, 03/01/32 (Call 12/01/31) |
155 | 141,070 | ||||||
| 4.45%, 04/15/42 (Call 10/15/41) |
95 | 76,429 | ||||||
| 4.50%, 07/01/40 (Call 01/01/40) |
380 | 319,248 | ||||||
| 4.60%, 06/15/43 (Call 12/15/42) |
132 | 108,196 | ||||||
| 4.75%, 02/15/44 (Call 08/15/43) |
220 | 183,407 | ||||||
| 98 | 2 0 2 4 I S H A R E S A N N U A L R E P O R T T O S H A R E H O L D E R S |
| Schedule of Investments (continued) February 29, 2024 |
iShares® ESG Aware USD Corporate Bond ETF (Percentages shown are based on Net Assets) |
| Security | Par (000) |
Value | ||||||
| Electric (continued) |
||||||||
| 4.95%, 07/01/50 (Call 01/01/50)(a) |
$ | 645 | $ | 547,789 | ||||
| 5.25%, 03/01/52 (Call 09/01/51) |
490 | 433,819 | ||||||
| 5.90%, 06/15/32 (Call 03/15/32) |
579 | 581,913 | ||||||
| 6.15%, 01/15/33 (Call 10/15/32) |
320 | 327,418 | ||||||
| 6.75%, 01/15/53 (Call 07/15/52) |
470 | 503,748 | ||||||
| PECO Energy Co. |
||||||||
| 2.85%, 09/15/51 (Call 03/15/51) |
90 | 57,328 | ||||||
| 3.00%, 09/15/49 (Call 03/15/49) |
491 | 329,955 | ||||||
| 3.05%, 03/15/51 (Call 09/15/50) |
95 | 63,893 | ||||||
| 3.15%, 10/15/25 (Call 07/15/25) |
478 | 464,206 | ||||||
| 3.70%, 09/15/47 (Call 03/15/47)(a) |
365 | 283,633 | ||||||
| 3.90%, 03/01/48 (Call 09/01/47) |
344 | 276,734 | ||||||
| 4.15%, 10/01/44 (Call 04/01/44)(a) |
283 | 236,421 | ||||||
| 4.90%, 06/15/33 (Call 03/15/33)(a) |
98 | 97,018 | ||||||
| 5.95%, 10/01/36 |
81 | 85,686 | ||||||
| Potomac Electric Power Co. |
||||||||
| 4.15%, 03/15/43 (Call 09/15/42) |
565 | 474,814 | ||||||
| 5.20%, 03/15/34 (Call 12/15/33) |
50 | 49,710 | ||||||
| 5.50%, 03/15/54 (Call 09/15/53) |
75 | 74,656 | ||||||
| 6.50%, 11/15/37 |
147 | 162,251 | ||||||
| PPL Electric Utilities Corp. |
||||||||
| 3.00%, 10/01/49 (Call 04/01/49) |
190 | 129,613 | ||||||
| 3.95%, 06/01/47 (Call 12/01/46) |
65 | 52,465 | ||||||
| 4.15%, 10/01/45 (Call 04/01/45) |
35 | 29,098 | ||||||
| 4.15%, 06/15/48 (Call 12/15/47) |
169 | 141,625 | ||||||
| 5.00%, 05/15/33 (Call 02/15/33) |
485 | 482,232 | ||||||
| 5.25%, 05/15/53 (Call 11/15/52) |
535 | 519,356 | ||||||
| Public Service Co. of New Hampshire |
||||||||
| 3.60%, 07/01/49 (Call 01/01/49) |
780 | 589,781 | ||||||
| 5.15%, 01/15/53 (Call 07/15/52) |
40 | 38,368 | ||||||
| 5.35%, 10/01/33 (Call 07/01/33) |
175 | 176,826 | ||||||
| Series V, 2.20%, 06/15/31 (Call 03/15/31) |
457 | 376,382 | ||||||
| Public Service Electric & Gas Co. |
||||||||
| 2.45%, 01/15/30 (Call 10/15/29) |
82 | 71,304 | ||||||
| 3.00%, 05/15/27 (Call 02/15/27) |
100 | 94,516 | ||||||
| 3.15%, 01/01/50 (Call 07/01/49) |
360 | 250,172 | ||||||
| 3.20%, 08/01/49 (Call 02/01/49) |
282 | 198,959 | ||||||
| 3.60%, 12/01/47 (Call 06/01/47) |
121 | 92,227 | ||||||
| 3.65%, 09/01/28 (Call 06/01/28)(a) |
70 | 66,648 | ||||||
| 3.65%, 09/01/42 (Call 03/01/42) |
210 | 165,335 | ||||||
| 3.70%, 05/01/28 (Call 02/01/28) |
108 | 103,233 | ||||||
| 3.80%, 01/01/43 (Call 07/01/42) |
155 | 125,895 | ||||||
| 3.80%, 03/01/46 (Call 09/01/45) |
322 | 254,140 | ||||||
| 3.85%, 05/01/49 (Call 11/01/48) |
243 | 193,607 | ||||||
| 3.95%, 05/01/42 (Call 11/01/41) |
121 | 101,514 | ||||||
| 4.05%, 05/01/48 (Call 11/01/47) |
131 | 108,863 | ||||||
| 5.20%, 03/01/34 (Call 12/01/33) |
75 | 75,093 | ||||||
| 5.45%, 03/01/54 (Call 09/01/53) |
125 | 125,375 | ||||||
| 5.50%, 03/01/40 |
115 | 114,977 | ||||||
| 5.80%, 05/01/37 |
83 | 85,422 | ||||||
| Public Service Enterprise Group Inc. |
||||||||
| 1.60%, 08/15/30 (Call 05/15/30) |
1,872 | 1,503,728 | ||||||
| 2.45%, 11/15/31 (Call 08/15/31) |
1,470 | 1,195,520 | ||||||
| 6.13%, 10/15/33 (Call 07/15/33) |
60 | 62,616 | ||||||
| San Diego Gas & Electric Co. |
||||||||
| 2.50%, 05/15/26 (Call 02/15/26) |
1,326 | 1,258,013 | ||||||
| 4.15%, 05/15/48 (Call 11/15/47) |
174 | 143,212 | ||||||
| 4.50%, 08/15/40 |
222 | 197,008 | ||||||
| 4.95%, 08/15/28 (Call 07/15/28) |
160 | 159,956 | ||||||
| 6.00%, 06/01/39 |
107 | 110,733 | ||||||
| Series RRR, 3.75%, 06/01/47 (Call 12/01/46) |
168 | 129,183 | ||||||
| Security | Par (000) |
Value | ||||||
| Electric (continued) |
||||||||
| Series TTT, 4.10%, 06/15/49 (Call 12/15/48) |
$ | 187 | $ | 150,834 | ||||
| Series UUU, 3.32%, 04/15/50 (Call 10/15/49) |
349 | 242,251 | ||||||
| Series WWW, 2.95%, 08/15/51 (Call 02/15/51) |
65 | 43,110 | ||||||
| Sempra |
||||||||
| 3.40%, 02/01/28 (Call 11/01/27) |
165 | 155,270 | ||||||
| 3.80%, 02/01/38 (Call 08/01/37) |
331 | 271,507 | ||||||
| 4.00%, 02/01/48 (Call 08/01/47) |
402 | 312,111 | ||||||
| 4.13%, 04/01/52 (Call 01/01/27), |
377 | 346,161 | ||||||
| 5.50%, 08/01/33 (Call 05/01/33) |
100 | 99,418 | ||||||
| 6.00%, 10/15/39 |
205 | 206,918 | ||||||
| Southern California Edison Co. |
||||||||
| 2.25%, 06/01/30 (Call 03/01/30) |
17 | 14,348 | ||||||
| 3.45%, 02/01/52 (Call 08/01/51)(a) |
445 | 309,929 | ||||||
| 3.65%, 02/01/50 (Call 08/01/49) |
378 | 276,510 | ||||||
| 4.00%, 04/01/47 (Call 10/01/46) |
357 | 277,676 | ||||||
| 4.05%, 03/15/42 (Call 09/15/41) |
146 | 119,971 | ||||||
| 4.50%, 09/01/40 (Call 03/01/40) |
153 | 133,693 | ||||||
| 4.65%, 10/01/43 (Call 04/01/43) |
122 | 106,779 | ||||||
| 5.15%, 06/01/29 (Call 05/01/29) |
75 | 75,053 | ||||||
| 5.35%, 03/01/26 |
75 | 75,048 | ||||||
| 5.50%, 03/15/40 |
111 | 109,650 | ||||||
| 5.63%, 02/01/36 |
177 | 176,930 | ||||||
| 5.70%, 03/01/53 (Call 09/01/52) |
85 | 84,290 | ||||||
| 5.75%, 04/15/54 (Call 10/15/53) |
125 | 124,239 | ||||||
| 5.88%, 12/01/53 (Call 06/01/53) |
5 | 5,081 | ||||||
| 6.00%, 01/15/34 |
315 | 328,265 | ||||||
| 6.05%, 03/15/39 |
79 | 81,368 | ||||||
| 6.65%, 04/01/29 |
201 | 210,943 | ||||||
| Series 04-G, 5.75%, 04/01/35 |
112 | 113,288 | ||||||
| Series 05-E, 5.35%, 07/15/35 |
109 | 108,416 | ||||||
| Series 06-E, 5.55%, 01/15/37 |
50 | 49,757 | ||||||
| Series 08-A, 5.95%, 02/01/38 |
65 | 66,604 | ||||||
| Series 13-A, 3.90%, 03/15/43 (Call 09/15/42) |
123 | 97,233 | ||||||
| Series 20A, 2.95%, 02/01/51 (Call 08/01/50) |
20 | 12,797 | ||||||
| Series A, 4.20%, 03/01/29 (Call 12/01/28) |
5 | 4,810 | ||||||
| Series B, 3.65%, 03/01/28 (Call 12/01/27) |
72 | 68,189 | ||||||
| Series B, 4.88%, 03/01/49 (Call 09/01/48) |
41 | 36,389 | ||||||
| Series C, 3.60%, 02/01/45 (Call 08/01/44) |
193 | 142,868 | ||||||
| Series C, 4.13%, 03/01/48 (Call 09/01/47) |
229 | 182,701 | ||||||
| Series E, 5.45%, 06/01/52 (Call 12/01/51)(a) |
25 | 23,981 | ||||||
| Toledo Edison Co. (The), 6.15%, 05/15/37 |
215 | 226,338 | ||||||
|
|
|
|||||||
| 80,681,800 | ||||||||
| Electrical Components & Equipment — 0.1% | ||||||||
| Acuity Brands Lighting Inc., 2.15%, 12/15/30 (Call 09/15/30) |
924 | 757,268 | ||||||
| Emerson Electric Co. |
||||||||
| 2.80%, 12/21/51 (Call 06/21/51)(a) |
145 | 93,297 | ||||||
| 5.25%, 11/15/39 |
15 | 15,147 | ||||||
|
|
|
|||||||
| 865,712 | ||||||||
| Electronics — 0.7% | ||||||||
| Allegion PLC, 3.50%, 10/01/29 (Call 07/01/29) |
615 | 561,593 | ||||||
| Allegion U.S. Holding Co. Inc. |
||||||||
| 3.55%, 10/01/27 (Call 07/01/27)(a) |
437 | 413,368 | ||||||
| 5.41%, 07/01/32 (Call 04/01/32) |
358 | 357,652 | ||||||
| Amphenol Corp. |
||||||||
| 2.80%, 02/15/30 (Call 11/15/29) |
41 | 36,515 | ||||||
| 4.35%, 06/01/29 (Call 03/01/29) |
4 | 3,888 | ||||||
| S C H E D U L E O F I N V E S T M E N T S |
99 |
| Schedule of Investments (continued) February 29, 2024 |
iShares® ESG Aware USD Corporate Bond ETF (Percentages shown are based on Net Assets) |
| Security | Par (000) |
Value | ||||||
| Electronics (continued) |
||||||||
| Avnet Inc. |
||||||||
| 3.00%, 05/15/31 (Call 02/15/31) |
$ | 330 | $ | 272,385 | ||||
| 5.50%, 06/01/32 (Call 03/01/32) |
10 | 9,602 | ||||||
| Flex Ltd. |
||||||||
| 4.88%, 06/15/29 (Call 03/15/29) |
468 | 455,224 | ||||||
| 4.88%, 05/12/30 (Call 02/12/30) |
614 | 591,565 | ||||||
| Fortive Corp. |
||||||||
| 3.15%, 06/15/26 (Call 03/15/26) |
35 | 33,407 | ||||||
| 4.30%, 06/15/46 (Call 12/15/45) |
82 | 67,656 | ||||||
| Honeywell International Inc. |
||||||||
| 2.50%, 11/01/26 (Call 08/01/26) |
1,667 | 1,570,977 | ||||||
| 2.70%, 08/15/29 (Call 05/15/29) |
143 | 128,655 | ||||||
| 3.81%, 11/21/47 (Call 05/21/47) |
82 | 66,075 | ||||||
| 4.25%, 01/15/29 (Call 12/15/28) |
60 | 58,688 | ||||||
| 4.88%, 09/01/29 (Call 08/01/29) |
100 | 100,085 | ||||||
| 4.95%, 09/01/31 (Call 07/01/31) |
100 | 99,824 | ||||||
| 5.00%, 03/01/35 (Call 12/01/34) |
175 | 174,585 | ||||||
| 5.35%, 03/01/64 (Call 09/01/63) |
175 | 174,656 | ||||||
| 5.38%, 03/01/41(a) |
165 | 169,474 | ||||||
| 5.70%, 03/15/36 |
208 | 219,624 | ||||||
| 5.70%, 03/15/37 |
158 | 165,628 | ||||||
| Hubbell Inc. |
||||||||
| 3.15%, 08/15/27 (Call 05/15/27) |
28 | 26,272 | ||||||
| 3.35%, 03/01/26 (Call 12/01/25) |
85 | 82,005 | ||||||
| 3.50%, 02/15/28 (Call 11/15/27) |
42 | 39,674 | ||||||
| Keysight Technologies Inc. |
||||||||
| 3.00%, 10/30/29 (Call 07/30/29) |
152 | 135,175 | ||||||
| 4.60%, 04/06/27 (Call 01/06/27) |
647 | 636,647 | ||||||
| Trimble Inc., 4.90%, 06/15/28 (Call 03/15/28)(a) |
350 | 346,852 | ||||||
| Tyco Electronics Group SA, 7.13%, 10/01/37 |
129 | 148,080 | ||||||
| Vontier Corp. |
||||||||
| 2.40%, 04/01/28 (Call 02/01/28) |
182 | 159,329 | ||||||
| 2.95%, 04/01/31 (Call 01/01/31) |
189 | 155,583 | ||||||
|
|
|
|||||||
| 7,460,743 | ||||||||
| Entertainment — 0.2% | ||||||||
| Warnermedia Holdings Inc. |
||||||||
| 5.05%, 03/15/42 (Call 09/15/41) |
220 | 184,647 | ||||||
| 5.14%, 03/15/52 (Call 09/15/51) |
1,095 | 889,136 | ||||||
| 5.39%, 03/15/62 (Call 09/15/61) |
870 | 700,273 | ||||||
|
|
|
|||||||
| 1,774,056 | ||||||||
| Environmental Control — 0.2% | ||||||||
| Republic Services Inc. |
||||||||
| 2.38%, 03/15/33 (Call 12/15/32) |
25 | 20,035 | ||||||
| 3.05%, 03/01/50 (Call 09/01/49) |
150 | 103,860 | ||||||
| 5.70%, 05/15/41 (Call 11/15/40) |
50 | 51,870 | ||||||
| 6.20%, 03/01/40 |
50 | 54,475 | ||||||
| Veralto Corp. |
||||||||
| 5.35%, 09/18/28 (Call 08/18/28)(c) |
410 | 412,799 | ||||||
| 5.45%, 09/18/33 (Call 06/18/33)(c) |
700 | 703,160 | ||||||
| Waste Connections Inc. |
||||||||
| 2.95%, 01/15/52 (Call 07/15/51)(a) |
265 | 175,342 | ||||||
| 3.05%, 04/01/50 (Call 10/01/49) |
87 | 58,744 | ||||||
| 3.50%, 05/01/29 (Call 02/01/29) |
71 | 66,508 | ||||||
| 4.25%, 12/01/28 (Call 09/01/28) |
10 | 9,683 | ||||||
| Waste Management Inc. |
||||||||
| 2.50%, 11/15/50 (Call 05/15/50) |
310 | 191,506 | ||||||
| 3.15%, 11/15/27 (Call 08/15/27) |
25 | 23,527 | ||||||
| 4.10%, 03/01/45 (Call 09/01/44) |
37 | 31,757 | ||||||
| 4.15%, 07/15/49 (Call 01/15/49) |
226 | 190,969 | ||||||
|
|
|
|||||||
| 2,094,235 | ||||||||
| Security | Par (000) |
Value | ||||||
| Food — 2.3% |
||||||||
| Ahold Finance USA LLC, 6.88%, 05/01/29 |
$ | 141 | $ | 152,955 | ||||
| Campbell Soup Co. |
||||||||
| 2.38%, 04/24/30 (Call 01/24/30)(a) |
55 | 46,700 | ||||||
| 3.13%, 04/24/50 (Call 10/24/49)(a) |
169 | 110,196 | ||||||
| 3.30%, 03/19/25 (Call 12/19/24) |
1,330 | 1,296,713 | ||||||
| 3.95%, 03/15/25 (Call 01/15/25) |
393 | 386,700 | ||||||
| 4.15%, 03/15/28 (Call 12/15/27) |
744 | 717,645 | ||||||
| 4.80%, 03/15/48 (Call 09/15/47) |
194 | 170,153 | ||||||
| Conagra Brands Inc. |
||||||||
| 4.60%, 11/01/25 (Call 09/01/25) |
168 | 165,510 | ||||||
| 4.85%, 11/01/28 (Call 08/01/28) |
20 | 19,654 | ||||||
| 5.30%, 10/01/26 |
95 | 95,014 | ||||||
| 5.30%, 11/01/38 (Call 05/01/38) |
196 | 185,077 | ||||||
| 5.40%, 11/01/48 (Call 05/01/48) |
333 | 307,321 | ||||||
| 7.00%, 10/01/28 |
33 | 35,254 | ||||||
| 8.25%, 09/15/30 |
194 | 222,768 | ||||||
| General Mills Inc. |
||||||||
| 2.25%, 10/14/31 (Call 07/14/31)(a) |
808 | 662,200 | ||||||
| 2.88%, 04/15/30 (Call 01/15/30)(a) |
1,060 | 935,918 | ||||||
| 3.00%, 02/01/51 (Call 08/01/50)(a) |
208 | 134,069 | ||||||
| 3.20%, 02/10/27 (Call 11/10/26) |
1,179 | 1,120,655 | ||||||
| 4.00%, 04/17/25 (Call 02/17/25)(a) |
291 | 286,381 | ||||||
| 4.20%, 04/17/28 (Call 01/17/28) |
1,007 | 976,409 | ||||||
| 4.70%, 01/30/27 (Call 12/20/26)(a) |
125 | 123,742 | ||||||
| 4.95%, 03/29/33 (Call 12/29/32)(a) |
20 | 19,632 | ||||||
| 5.24%, 11/18/25 (Call 03/18/24)(a) |
40 | 39,951 | ||||||
| 5.40%, 06/15/40 |
92 | 90,431 | ||||||
| 5.50%, 10/17/28 (Call 09/17/28) |
260 | 264,236 | ||||||
| Hershey Co. (The) |
||||||||
| 2.45%, 11/15/29 (Call 08/15/29) |
48 | 42,547 | ||||||
| 3.13%, 11/15/49 (Call 05/15/49) |
17 | 12,178 | ||||||
| 3.38%, 08/15/46 (Call 02/15/46) |
35 | 26,326 | ||||||
| Hormel Foods Corp., 3.05%, 06/03/51 (Call 12/03/50) |
290 | 194,608 | ||||||
| Ingredion Inc. |
||||||||
| 2.90%, 06/01/30 (Call 03/01/30) |
954 | 838,299 | ||||||
| 3.20%, 10/01/26 (Call 07/01/26) |
75 | 71,520 | ||||||
| 3.90%, 06/01/50 (Call 12/01/49)(a) |
253 | 185,316 | ||||||
| J M Smucker Co. (The) |
||||||||
| 5.90%, 11/15/28 (Call 10/15/28) |
15 | 15,440 | ||||||
| 6.50%, 11/15/43 (Call 05/15/43) |
40 | 42,731 | ||||||
| 6.50%, 11/15/53 (Call 05/15/53) |
350 | 381,066 | ||||||
| JM Smucker Co. (The) |
||||||||
| 2.38%, 03/15/30 (Call 12/15/29) |
56 | 48,032 | ||||||
| 3.38%, 12/15/27 (Call 09/15/27)(a) |
59 | 55,634 | ||||||
| 3.50%, 03/15/25 |
390 | 382,165 | ||||||
| 3.55%, 03/15/50 (Call 09/15/49) |
71 | 49,727 | ||||||
| 4.25%, 03/15/35 |
151 | 135,218 | ||||||
| 4.38%, 03/15/45 |
87 | 72,701 | ||||||
| Kellanova |
||||||||
| 2.10%, 06/01/30 (Call 03/01/30)(a) |
1,397 | 1,175,601 | ||||||
| 3.25%, 04/01/26 |
1,786 | 1,716,744 | ||||||
| 3.40%, 11/15/27 (Call 08/15/27) |
1,174 | 1,105,330 | ||||||
| 4.30%, 05/15/28 (Call 02/15/28)(a) |
1,129 | 1,096,382 | ||||||
| Series B, 7.45%, 04/01/31 |
196 | 219,283 | ||||||
| Koninklijke Ahold Delhaize NV, 5.70%, 10/01/40 |
193 | 191,437 | ||||||
| Kraft Heinz Foods Co. |
||||||||
| 4.38%, 06/01/46 (Call 12/01/45) |
350 | 290,331 | ||||||
| 4.88%, 10/01/49 (Call 04/01/49) |
412 | 367,656 | ||||||
| 5.00%, 07/15/35 (Call 01/15/35) |
120 | 117,137 | ||||||
| 5.00%, 06/04/42 |
81 | 74,723 | ||||||
| 100 | 2 0 2 4 I S H A R E S A N N U A L R E P O R T T O S H A R E H O L D E R S |
| Schedule of Investments (continued) February 29, 2024 |
iShares® ESG Aware USD Corporate Bond ETF (Percentages shown are based on Net Assets) |
| Security | Par (000) |
Value | ||||||
| Food (continued) |
||||||||
| 5.20%, 07/15/45 (Call 01/15/45) |
$ | 408 | $ | 380,852 | ||||
| 5.50%, 06/01/50 (Call 12/01/49)(a) |
345 | 335,772 | ||||||
| 6.50%, 02/09/40 |
179 | 193,082 | ||||||
| 6.88%, 01/26/39 |
175 | 195,989 | ||||||
| Kroger Co. (The) |
||||||||
| 2.65%, 10/15/26 (Call 07/15/26)(a) |
103 | 96,780 | ||||||
| 3.50%, 02/01/26 (Call 11/01/25) |
39 | 37,800 | ||||||
| 3.70%, 08/01/27 (Call 05/01/27) |
59 | 56,593 | ||||||
| 3.88%, 10/15/46 (Call 04/15/46) |
102 | 77,404 | ||||||
| 3.95%, 01/15/50 (Call 07/15/49) |
193 | 151,178 | ||||||
| 4.45%, 02/01/47 (Call 08/01/46) |
293 | 247,124 | ||||||
| 4.50%, 01/15/29 (Call 10/15/28) |
55 | 53,758 | ||||||
| 4.65%, 01/15/48 (Call 07/15/47) |
118 | 102,801 | ||||||
| 5.00%, 04/15/42 (Call 10/15/41)(a) |
74 | 68,636 | ||||||
| 5.15%, 08/01/43 (Call 02/01/43) |
131 | 121,727 | ||||||
| 5.40%, 07/15/40 (Call 01/15/40) |
120 | 116,056 | ||||||
| 5.40%, 01/15/49 (Call 07/15/48) |
95 | 92,645 | ||||||
| 6.90%, 04/15/38 |
121 | 135,076 | ||||||
| 7.50%, 04/01/31 |
156 | 175,982 | ||||||
| McCormick & Co. Inc./MD |
||||||||
| 1.85%, 02/15/31 (Call 11/15/30) |
295 | 237,151 | ||||||
| 2.50%, 04/15/30 (Call 01/15/30) |
236 | 201,975 | ||||||
| 3.40%, 08/15/27 (Call 05/15/27) |
342 | 323,496 | ||||||
| 4.20%, 08/15/47 (Call 02/15/47)(a) |
228 | 188,663 | ||||||
| Mondelez International Inc. |
||||||||
| 2.63%, 09/04/50 (Call 03/04/50) |
143 | 89,328 | ||||||
| 2.75%, 04/13/30 (Call 01/13/30) |
58 | 51,220 | ||||||
| 4.13%, 05/07/28 (Call 02/07/28) |
25 | 24,483 | ||||||
| Sysco Corp. |
||||||||
| 2.40%, 02/15/30 (Call 11/15/29) |
114 | 98,137 | ||||||
| 3.25%, 07/15/27 (Call 04/15/27) |
75 | 70,681 | ||||||
| 3.30%, 07/15/26 (Call 04/15/26) |
115 | 110,410 | ||||||
| 3.30%, 02/15/50 (Call 08/15/49)(a) |
185 | 131,024 | ||||||
| 4.45%, 03/15/48 (Call 09/15/47) |
104 | 87,955 | ||||||
| 4.50%, 04/01/46 (Call 10/01/45) |
62 | 53,054 | ||||||
| 4.85%, 10/01/45 (Call 04/01/45) |
123 | 111,327 | ||||||
| 5.38%, 09/21/35 |
10 | 10,087 | ||||||
| 5.95%, 04/01/30 (Call 01/01/30) |
177 | 183,986 | ||||||
| 6.60%, 04/01/40 (Call 10/01/39) |
87 | 95,398 | ||||||
| 6.60%, 04/01/50 (Call 10/01/49) |
330 | 372,631 | ||||||
| Tyson Foods Inc. |
||||||||
| 3.55%, 06/02/27 (Call 03/02/27) |
5 | 4,740 | ||||||
| 4.35%, 03/01/29 (Call 12/01/28) |
54 | 51,960 | ||||||
| 4.55%, 06/02/47 (Call 12/02/46) |
143 | 115,785 | ||||||
| 5.10%, 09/28/48 (Call 03/28/48)(a) |
272 | 239,862 | ||||||
| 5.15%, 08/15/44 (Call 02/15/44) |
65 | 58,536 | ||||||
|
|
|
|||||||
| 23,024,560 | ||||||||
| Forest Products & Paper — 0.2% | ||||||||
| Celulosa Arauco y Constitucion SA, 5.50%, 11/02/47 (Call 05/02/47) |
200 | 168,889 | ||||||
| International Paper Co. |
||||||||
| 4.35%, 08/15/48 (Call 02/15/48)(a) |
123 | 104,171 | ||||||
| 4.40%, 08/15/47 (Call 02/15/47) |
239 | 198,629 | ||||||
| 4.80%, 06/15/44 (Call 12/15/43) |
80 | 71,231 | ||||||
| 5.00%, 09/15/35 (Call 03/15/35) |
135 | 130,869 | ||||||
| 5.15%, 05/15/46 (Call 11/15/45)(a) |
10 | 9,279 | ||||||
| 6.00%, 11/15/41 (Call 05/15/41) |
219 | 225,573 | ||||||
| 7.30%, 11/15/39(a) |
55 | 63,827 | ||||||
| Suzano Austria GmbH |
||||||||
| 3.13%, 01/15/32 (Call 10/15/31) |
182 | 149,447 | ||||||
| 3.75%, 01/15/31 (Call 10/15/30) |
215 | 187,850 | ||||||
| Security | Par (000) |
Value | ||||||
| Forest Products & Paper (continued) |
||||||||
| 5.00%, 01/15/30 (Call 10/15/29) |
$ | 402 | $ | 382,538 | ||||
| 6.00%, 01/15/29 (Call 10/15/28) |
322 | 322,055 | ||||||
|
|
|
|||||||
| 2,014,358 | ||||||||
| Gas — 0.5% | ||||||||
| Atmos Energy Corp. |
||||||||
| 2.85%, 02/15/52 (Call 08/15/51)(a) |
130 | 83,311 | ||||||
| 3.00%, 06/15/27 (Call 03/15/27) |
15 | 14,108 | ||||||
| 3.38%, 09/15/49 (Call 03/15/49) |
268 | 193,789 | ||||||
| 4.13%, 10/15/44 (Call 04/15/44) |
174 | 147,841 | ||||||
| 4.13%, 03/15/49 (Call 09/15/48) |
157 | 129,261 | ||||||
| 4.15%, 01/15/43 (Call 07/15/42) |
16 | 13,630 | ||||||
| 4.30%, 10/01/48 (Call 04/01/48) |
50 | 42,950 | ||||||
| 5.50%, 06/15/41 (Call 12/15/40)(a) |
43 | 43,395 | ||||||
| National Fuel Gas Co. |
||||||||
| 2.95%, 03/01/31 (Call 12/01/30) |
120 | 100,098 | ||||||
| 3.95%, 09/15/27 (Call 06/15/27) |
420 | 398,331 | ||||||
| 4.75%, 09/01/28 (Call 06/01/28) |
57 | 55,079 | ||||||
| 5.50%, 10/01/26 |
45 | 44,867 | ||||||
| ONE Gas Inc. |
||||||||
| 2.00%, 05/15/30 (Call 02/15/30) |
280 | 232,780 | ||||||
| 4.25%, 09/01/32 (Call 06/01/32)(a) |
60 | 56,811 | ||||||
| 4.50%, 11/01/48 (Call 05/01/48) |
200 | 171,752 | ||||||
| 4.66%, 02/01/44 (Call 08/01/43) |
124 | 110,428 | ||||||
| 5.10%, 04/01/29 (Call 03/01/29) |
30 | 30,074 | ||||||
| Piedmont Natural Gas Co. Inc. |
||||||||
| 2.50%, 03/15/31 (Call 12/15/30) |
570 | 476,735 | ||||||
| 3.35%, 06/01/50 (Call 12/01/49) |
165 | 109,648 | ||||||
| 5.05%, 05/15/52 (Call 11/15/51) |
202 | 182,020 | ||||||
| 5.40%, 06/15/33 (Call 03/15/33) |
100 | 100,296 | ||||||
| Southern California Gas Co. |
||||||||
| 3.20%, 06/15/25 (Call 03/15/25) |
259 | 253,080 | ||||||
| 5.13%, 11/15/40 |
70 | 66,891 | ||||||
| 5.20%, 06/01/33 (Call 03/01/33) |
140 | 139,035 | ||||||
| 5.75%, 06/01/53 (Call 12/01/52) |
25 | 25,238 | ||||||
| Series TT, 2.60%, 06/15/26 (Call 03/15/26) |
689 | 652,973 | ||||||
| Series UU, 4.13%, 06/01/48 (Call 12/01/47) |
183 | 148,035 | ||||||
| Series VV, 4.30%, 01/15/49 (Call 07/15/48) |
221 | 181,147 | ||||||
| Series WW, 3.95%, 02/15/50 (Call 08/15/49) |
220 | 169,528 | ||||||
| Series XX, 2.55%, 02/01/30 (Call 11/01/29) |
32 | 27,784 | ||||||
| Southwest Gas Corp. |
||||||||
| 3.18%, 08/15/51 (Call 02/15/51)(a) |
90 | 57,746 | ||||||
| 3.70%, 04/01/28 (Call 01/01/28) |
35 | 33,047 | ||||||
| 3.80%, 09/29/46 (Call 03/29/46)(a) |
159 | 116,250 | ||||||
| 4.15%, 06/01/49 (Call 12/01/48) |
131 | 100,151 | ||||||
| Washington Gas Light Co. |
||||||||
| 3.65%, 09/15/49 (Call 03/15/49)(a) |
315 | 232,147 | ||||||
| Series K, 3.80%, 09/15/46 (Call 03/15/46)(a) |
80 | 59,020 | ||||||
|
|
|
|||||||
| 4,999,276 | ||||||||
| Hand & Machine Tools — 0.1% | ||||||||
| Regal Rexnord Corp. |
||||||||
| 6.30%, 02/15/30 (Call 12/15/29)(c) |
95 | 96,662 | ||||||
| 6.40%, 04/15/33 (Call 01/15/33)(c) |
310 | 318,145 | ||||||
| Snap-on Inc. |
||||||||
| 3.10%, 05/01/50 (Call 11/01/49) |
15 | 10,529 | ||||||
| 3.25%, 03/01/27 (Call 12/01/26) |
35 | 33,510 | ||||||
| 4.10%, 03/01/48 (Call 09/01/47) |
15 | 12,519 | ||||||
| S C H E D U L E O F I N V E S T M E N T S |
101 |
| Schedule of Investments (continued) February 29, 2024 |
iShares® ESG Aware USD Corporate Bond ETF (Percentages shown are based on Net Assets) |
| Security | Par (000) |
Value | ||||||
| Hand & Machine Tools (continued) |
||||||||
| Stanley Black & Decker Inc. |
||||||||
| 4.00%, 03/15/60 (Call 03/15/25), |
$ | 432 | $ | 384,559 | ||||
| 4.25%, 11/15/28 (Call 08/15/28) |
55 | 53,068 | ||||||
|
|
|
|||||||
| 908,992 | ||||||||
| Health Care - Products — 1.1% | ||||||||
| Abbott Laboratories |
||||||||
| 4.75%, 11/30/36 (Call 05/30/36) |
380 | 372,060 | ||||||
| 4.75%, 04/15/43 (Call 10/15/42) |
115 | 110,091 | ||||||
| 4.90%, 11/30/46 (Call 05/30/46) |
731 | 704,657 | ||||||
| 5.30%, 05/27/40 |
63 | 64,310 | ||||||
| 6.00%, 04/01/39 |
128 | 142,027 | ||||||
| 6.15%, 11/30/37 |
151 | 167,330 | ||||||
| Agilent Technologies Inc. |
||||||||
| 2.30%, 03/12/31 (Call 12/12/30) |
75 | 62,575 | ||||||
| 2.75%, 09/15/29 (Call 06/15/29) |
713 | 637,931 | ||||||
| 3.05%, 09/22/26 (Call 06/22/26) |
481 | 457,387 | ||||||
| Baxter International Inc. |
||||||||
| 2.54%, 02/01/32 (Call 11/01/31)(a) |
255 | 208,965 | ||||||
| 2.60%, 08/15/26 (Call 05/15/26) |
90 | 84,387 | ||||||
| 3.13%, 12/01/51 (Call 06/01/51)(a) |
395 | 256,889 | ||||||
| 3.50%, 08/15/46 (Call 02/15/46)(a) |
218 | 154,258 | ||||||
| Boston Scientific Corp. |
||||||||
| 4.55%, 03/01/39 (Call 09/01/38) |
23 | 21,358 | ||||||
| 4.70%, 03/01/49 (Call 09/01/48)(a) |
291 | 266,429 | ||||||
| 6.50%, 11/15/35 |
110 | 121,404 | ||||||
| 7.38%, 01/15/40 |
113 | 132,724 | ||||||
| Danaher Corp. |
||||||||
| 2.60%, 10/01/50 (Call 04/01/50) |
265 | 166,844 | ||||||
| 2.80%, 12/10/51 (Call 06/10/51) |
453 | 293,544 | ||||||
| 4.38%, 09/15/45 (Call 03/15/45) |
122 | 108,097 | ||||||
| Dentsply Sirona Inc., 3.25%, 06/01/30 (Call 03/01/30) |
604 | 526,414 | ||||||
| DH Europe Finance II Sarl |
||||||||
| 2.60%, 11/15/29 (Call 08/15/29) |
26 | 23,090 | ||||||
| 3.25%, 11/15/39 (Call 05/15/39) |
288 | 228,808 | ||||||
| 3.40%, 11/15/49 (Call 05/15/49) |
393 | 292,790 | ||||||
| Edwards Lifesciences Corp., 4.30%, 06/15/28 (Call 03/15/28) |
1,769 | 1,716,795 | ||||||
| GE HealthCare Technologies Inc., 6.38%, 11/22/52 (Call 05/22/52) |
170 | 188,398 | ||||||
| HCA Inc., 3.63%, 03/15/32 (Call 12/15/31) |
184 | 160,759 | ||||||
| Medtronic Inc., 4.63%, 03/15/45 |
422 | 390,715 | ||||||
| Revvity Inc. |
||||||||
| 2.25%, 09/15/31 (Call 06/15/31) |
165 | 134,111 | ||||||
| 3.30%, 09/15/29 (Call 06/15/29) |
36 | 32,409 | ||||||
| 3.63%, 03/15/51 (Call 09/15/50) |
135 | 93,939 | ||||||
| Smith & Nephew PLC, 2.03%, 10/14/30 (Call 07/14/30) |
435 | 356,767 | ||||||
| STERIS Irish FinCo UnLtd Co. |
||||||||
| 2.70%, 03/15/31 (Call 12/15/30) |
841 | 715,199 | ||||||
| 3.75%, 03/15/51 (Call 09/15/50) |
360 | 265,968 | ||||||
| Stryker Corp. |
||||||||
| 2.90%, 06/15/50 (Call 12/15/49)(a) |
78 | 53,034 | ||||||
| 4.10%, 04/01/43 (Call 10/01/42) |
112 | 94,669 | ||||||
| 4.38%, 05/15/44 (Call 11/15/43) |
107 | 94,185 | ||||||
| 4.63%, 03/15/46 (Call 09/15/45)(a) |
251 | 227,386 | ||||||
| Thermo Fisher Scientific Inc. |
||||||||
| 2.60%, 10/01/29 (Call 07/01/29) |
55 | 49,044 | ||||||
| 4.10%, 08/15/47 (Call 02/15/47)(a) |
282 | 236,071 | ||||||
| 4.98%, 08/10/30 (Call 06/10/30) |
40 | 40,005 | ||||||
| Security | Par (000) |
Value | ||||||
| Health Care - Products (continued) |
||||||||
| 5.09%, 08/10/33 (Call 05/10/33) |
$ | 10 | $ | 10,046 | ||||
| 5.30%, 02/01/44 (Call 08/01/43) |
116 | 116,025 | ||||||
| 5.40%, 08/10/43 (Call 04/10/43) |
30 | 30,290 | ||||||
| Zimmer Biomet Holdings Inc. |
||||||||
| 2.60%, 11/24/31 (Call 08/24/31) |
570 | 476,785 | ||||||
| 4.45%, 08/15/45 (Call 02/15/45)(a) |
125 | 110,768 | ||||||
| 5.35%, 12/01/28 (Call 11/01/28)(a) |
65 | 65,671 | ||||||
| 5.75%, 11/30/39 |
180 | 178,967 | ||||||
|
|
|
|||||||
| 11,442,375 | ||||||||
| Health Care - Services — 2.6% | ||||||||
| Aetna Inc. |
||||||||
| 3.88%, 08/15/47 (Call 02/15/47) |
87 | 64,659 | ||||||
| 4.13%, 11/15/42 (Call 05/15/42) |
96 | 76,696 | ||||||
| 4.50%, 05/15/42 (Call 11/15/41)(a) |
189 | 160,589 | ||||||
| 4.75%, 03/15/44 (Call 09/15/43) |
119 | 102,721 | ||||||
| 6.63%, 06/15/36 |
186 | 202,535 | ||||||
| 6.75%, 12/15/37 |
147 | 160,619 | ||||||
| Centene Corp. |
||||||||
| 2.45%, 07/15/28 (Call 05/15/28) |
505 | 445,561 | ||||||
| 2.50%, 03/01/31 (Call 12/01/30) |
560 | 458,789 | ||||||
| 2.63%, 08/01/31 (Call 05/01/31) |
577 | 472,206 | ||||||
| 3.00%, 10/15/30 (Call 07/15/30) |
395 | 337,355 | ||||||
| 3.38%, 02/15/30 (Call 02/15/25) |
295 | 260,263 | ||||||
| 4.63%, 12/15/29 (Call 12/15/24) |
520 | 492,427 | ||||||
| Elevance Health Inc. |
||||||||
| 2.55%, 03/15/31 (Call 12/15/30) |
70 | 59,331 | ||||||
| 2.88%, 09/15/29 (Call 06/15/29) |
48 | 43,042 | ||||||
| 3.13%, 05/15/50 (Call 11/15/49) |
120 | 81,905 | ||||||
| 3.60%, 03/15/51 (Call 09/15/50) |
215 | 160,053 | ||||||
| 3.65%, 12/01/27 (Call 09/01/27) |
107 | 102,320 | ||||||
| 3.70%, 09/15/49 (Call 03/15/49) |
205 | 155,269 | ||||||
| 4.10%, 03/01/28 (Call 12/01/27) |
124 | 119,934 | ||||||
| 4.10%, 05/15/32 (Call 02/15/32) |
375 | 345,631 | ||||||
| 4.38%, 12/01/47 (Call 06/01/47) |
271 | 230,124 | ||||||
| 4.55%, 03/01/48 (Call 09/01/47) |
182 | 158,497 | ||||||
| 4.55%, 05/15/52 (Call 11/15/51) |
60 | 52,037 | ||||||
| 4.63%, 05/15/42 |
258 | 232,139 | ||||||
| 4.65%, 01/15/43 |
286 | 258,094 | ||||||
| 4.65%, 08/15/44 (Call 02/15/44) |
243 | 215,976 | ||||||
| 4.75%, 02/15/33 (Call 11/15/32) |
195 | 188,339 | ||||||
| 5.10%, 01/15/44 |
199 | 187,090 | ||||||
| 5.13%, 02/15/53 (Call 08/15/52) |
100 | 94,657 | ||||||
| 5.50%, 10/15/32 (Call 07/15/32) |
295 | 300,473 | ||||||
| 5.85%, 01/15/36 |
194 | 202,524 | ||||||
| 5.95%, 12/15/34 |
150 | 157,582 | ||||||
| 6.10%, 10/15/52 (Call 04/15/52) |
40 | 42,908 | ||||||
| 6.38%, 06/15/37 |
130 | 140,199 | ||||||
| HCA Inc. |
||||||||
| 2.38%, 07/15/31 (Call 04/15/31) |
90 | 73,183 | ||||||
| 3.50%, 09/01/30 (Call 03/01/30) |
267 | 238,679 | ||||||
| 3.50%, 07/15/51 (Call 01/15/51) |
379 | 255,829 | ||||||
| 4.13%, 06/15/29 (Call 03/15/29) |
736 | 692,152 | ||||||
| 4.50%, 02/15/27 (Call 08/15/26) |
652 | 638,459 | ||||||
| 4.63%, 03/15/52 (Call 09/15/51)(a) |
351 | 287,245 | ||||||
| 5.13%, 06/15/39 (Call 12/15/38) |
277 | 257,524 | ||||||
| 5.25%, 04/15/25 |
212 | 211,053 | ||||||
| 5.25%, 06/15/26 (Call 12/15/25) |
660 | 655,960 | ||||||
| 5.25%, 06/15/49 (Call 12/15/48) |
471 | 421,934 | ||||||
| 5.45%, 04/01/31 (Call 02/01/31)(a) |
30 | 29,860 | ||||||
| 5.50%, 06/01/33 (Call 03/01/33) |
235 | 233,382 | ||||||
| 5.50%, 06/15/47 (Call 12/15/46)(a) |
404 | 376,535 | ||||||
| 102 | 2 0 2 4 I S H A R E S A N N U A L R E P O R T T O S H A R E H O L D E R S |
| Schedule of Investments (continued) February 29, 2024 |
iShares® ESG Aware USD Corporate Bond ETF (Percentages shown are based on Net Assets) |
| Security | Par (000) |
Value | ||||||
| Health Care - Services (continued) |
||||||||
| 5.60%, 04/01/34 (Call 01/01/34) |
$ | 95 | $ | 94,566 | ||||
| 5.88%, 02/01/29 (Call 08/01/28)(a) |
205 | 208,646 | ||||||
| 5.90%, 06/01/53 (Call 12/01/52) |
105 | 103,141 | ||||||
| 6.00%, 04/01/54 (Call 10/01/53)(a) |
120 | 119,101 | ||||||
| 6.10%, 04/01/64 (Call 10/01/63) |
200 | 197,655 | ||||||
| Humana Inc. |
||||||||
| 3.95%, 03/15/27 (Call 12/15/26) |
177 | 170,703 | ||||||
| 3.95%, 08/15/49 (Call 02/15/49) |
166 | 129,747 | ||||||
| 4.50%, 04/01/25 (Call 03/01/25)(a) |
22 | 21,772 | ||||||
| 4.63%, 12/01/42 (Call 06/01/42) |
214 | 185,754 | ||||||
| 4.80%, 03/15/47 (Call 09/15/46) |
217 | 189,054 | ||||||
| 4.88%, 04/01/30 (Call 01/01/30) |
49 | 48,212 | ||||||
| 4.95%, 10/01/44 (Call 04/01/44) |
306 | 275,900 | ||||||
| 5.75%, 12/01/28 (Call 11/01/28) |
25 | 25,534 | ||||||
| 5.88%, 03/01/33 (Call 12/01/32) |
90 | 92,343 | ||||||
| IQVIA Inc. |
||||||||
| 5.70%, 05/15/28 (Call 04/15/28) |
390 | 393,029 | ||||||
| 6.25%, 02/01/29 (Call 01/01/29) |
65 | 66,875 | ||||||
| Laboratory Corp. of America Holdings |
||||||||
| 2.70%, 06/01/31 (Call 03/01/31)(a) |
485 | 414,175 | ||||||
| 2.95%, 12/01/29 (Call 09/01/29) |
185 | 164,646 | ||||||
| 3.60%, 09/01/27 (Call 06/01/27) |
103 | 97,820 | ||||||
| 4.70%, 02/01/45 (Call 08/01/44) |
426 | 380,142 | ||||||
| Providence St Joseph Health Obligated Group |
||||||||
| Series 21A, 2.70%, 10/01/51 (Call 04/01/51) |
200 | 119,797 | ||||||
| Series A, 3.93%, 10/01/48 (Call 04/01/48)(a) |
155 | 119,800 | ||||||
| Quest Diagnostics Inc. |
||||||||
| 2.80%, 06/30/31 (Call 03/30/31) |
688 | 587,203 | ||||||
| 2.95%, 06/30/30 (Call 03/30/30)(a) |
823 | 724,451 | ||||||
| 3.45%, 06/01/26 (Call 03/01/26) |
704 | 677,314 | ||||||
| 3.50%, 03/30/25 (Call 12/30/24) |
417 | 409,392 | ||||||
| 4.20%, 06/30/29 (Call 03/30/29)(a) |
534 | 513,299 | ||||||
| 4.70%, 03/30/45 (Call 09/30/44)(a) |
186 | 164,280 | ||||||
| UnitedHealth Group Inc. |
||||||||
| 2.00%, 05/15/30 |
10 | 8,404 | ||||||
| 2.30%, 05/15/31 (Call 02/15/31) |
60 | 50,252 | ||||||
| 2.88%, 08/15/29(a) |
216 | 195,786 | ||||||
| 2.90%, 05/15/50 (Call 11/15/49) |
163 | 108,181 | ||||||
| 3.13%, 05/15/60 (Call 11/15/59) |
235 | 153,731 | ||||||
| 3.25%, 05/15/51 (Call 11/15/50) |
310 | 218,283 | ||||||
| 3.50%, 08/15/39 (Call 02/15/39) |
49 | 39,600 | ||||||
| 3.70%, 08/15/49 (Call 02/15/49) |
259 | 199,310 | ||||||
| 3.75%, 10/15/47 (Call 04/15/47) |
175 | 135,668 | ||||||
| 3.85%, 06/15/28 |
20 | 19,254 | ||||||
| 3.88%, 12/15/28 |
130 | 124,746 | ||||||
| 3.88%, 08/15/59 (Call 02/15/59) |
303 | 230,599 | ||||||
| 3.95%, 10/15/42 (Call 04/15/42) |
120 | 100,867 | ||||||
| 4.00%, 05/15/29 (Call 03/15/29) |
260 | 249,854 | ||||||
| 4.20%, 05/15/32 (Call 02/15/32) |
540 | 509,508 | ||||||
| 4.20%, 01/15/47 (Call 07/15/46) |
141 | 119,200 | ||||||
| 4.25%, 01/15/29 (Call 12/15/28) |
410 | 399,761 | ||||||
| 4.25%, 03/15/43 (Call 09/15/42) |
182 | 158,658 | ||||||
| 4.25%, 04/15/47 (Call 10/15/46) |
219 | 186,548 | ||||||
| 4.25%, 06/15/48 (Call 12/15/47) |
305 | 256,718 | ||||||
| 4.38%, 03/15/42 (Call 09/15/41) |
150 | 133,715 | ||||||
| 4.45%, 12/15/48 (Call 06/15/48) |
264 | 230,887 | ||||||
| 4.50%, 04/15/33 (Call 01/15/33) |
380 | 364,935 | ||||||
| 4.63%, 07/15/35 |
248 | 239,308 | ||||||
| 4.63%, 11/15/41 (Call 05/15/41) |
195 | 177,998 | ||||||
| 4.75%, 07/15/45 |
515 | 476,151 | ||||||
| 4.75%, 05/15/52 (Call 11/15/51) |
245 | 223,240 | ||||||
| Security | Par (000) |
Value | ||||||
| Health Care - Services (continued) |
||||||||
| 4.95%, 05/15/62 (Call 11/15/61) |
$ | 280 | $ | 257,349 | ||||
| 5.05%, 04/15/53 (Call 10/15/52) |
40 | 38,059 | ||||||
| 5.20%, 04/15/63 (Call 10/15/62) |
120 | 114,395 | ||||||
| 5.30%, 02/15/30 (Call 12/15/29) |
85 | 86,605 | ||||||
| 5.35%, 02/15/33 (Call 11/15/32)(a) |
755 | 769,675 | ||||||
| 5.70%, 10/15/40 (Call 04/15/40) |
78 | 80,978 | ||||||
| 5.80%, 03/15/36 |
139 | 146,953 | ||||||
| 5.88%, 02/15/53 (Call 08/15/52) |
250 | 267,174 | ||||||
| 5.95%, 02/15/41 (Call 08/15/40) |
95 | 100,142 | ||||||
| 6.05%, 02/15/63 (Call 08/15/62) |
300 | 325,566 | ||||||
| 6.50%, 06/15/37 |
131 | 145,853 | ||||||
| 6.63%, 11/15/37 |
184 | 207,299 | ||||||
| 6.88%, 02/15/38 |
268 | 311,264 | ||||||
|
|
|
|||||||
| 25,991,164 | ||||||||
| Home Builders — 0.1% | ||||||||
| MDC Holdings Inc. |
||||||||
| 2.50%, 01/15/31 (Call 07/15/30) |
100 | 84,497 | ||||||
| 3.85%, 01/15/30 (Call 07/15/29) |
49 | 45,199 | ||||||
| 3.97%, 08/06/61 (Call 02/06/61) |
72 | 54,779 | ||||||
| 6.00%, 01/15/43 (Call 10/15/42) |
92 | 91,679 | ||||||
| PulteGroup Inc. |
||||||||
| 6.00%, 02/15/35(a) |
147 | 150,957 | ||||||
| 6.38%, 05/15/33 |
130 | 137,455 | ||||||
| 7.88%, 06/15/32(a) |
72 | 83,273 | ||||||
| Toll Brothers Finance Corp., 4.35%, 02/15/28 (Call 11/15/27) |
342 | 328,534 | ||||||
|
|
|
|||||||
| 976,373 | ||||||||
| Home Furnishings — 0.1% | ||||||||
| Leggett & Platt Inc. |
||||||||
| 3.50%, 11/15/27 (Call 08/15/27)(a) |
55 | 51,325 | ||||||
| 3.50%, 11/15/51 (Call 05/15/51)(a) |
172 | 118,586 | ||||||
| 4.40%, 03/15/29 (Call 12/15/28) |
150 | 142,112 | ||||||
| Whirlpool Corp. |
||||||||
| 4.50%, 06/01/46 (Call 12/01/45) |
102 | 82,007 | ||||||
| 4.60%, 05/15/50 (Call 11/15/49)(a) |
120 | 96,618 | ||||||
| 4.70%, 05/14/32 (Call 02/14/32) |
170 | 160,705 | ||||||
| 4.75%, 02/26/29 (Call 11/26/28)(a) |
326 | 318,336 | ||||||
| 5.50%, 03/01/33 (Call 12/01/32)(a) |
390 | 386,685 | ||||||
| 5.75%, 03/01/34 (Call 12/01/33)(a) |
75 | 74,592 | ||||||
|
|
|
|||||||
| 1,430,966 | ||||||||
| Household Products & Wares — 0.6% | ||||||||
| Avery Dennison Corp. |
||||||||
| 2.25%, 02/15/32 (Call 11/15/31) |
135 | 109,603 | ||||||
| 2.65%, 04/30/30 (Call 02/01/30) |
58 | 50,451 | ||||||
| 4.88%, 12/06/28 (Call 09/06/28) |
52 | 51,478 | ||||||
| 5.75%, 03/15/33 (Call 12/15/32) |
305 | 315,676 | ||||||
| Church & Dwight Co. Inc. |
||||||||
| 3.15%, 08/01/27 (Call 05/01/27) |
93 | 87,627 | ||||||
| 3.95%, 08/01/47 (Call 02/01/47) |
45 | 35,959 | ||||||
| 5.00%, 06/15/52 (Call 12/15/51) |
105 | 99,037 | ||||||
| 5.60%, 11/15/32 (Call 08/15/32)(a) |
60 | 62,217 | ||||||
| Clorox Co. (The) |
||||||||
| 1.80%, 05/15/30 (Call 02/15/30) |
888 | 733,562 | ||||||
| 3.10%, 10/01/27 (Call 07/01/27) |
221 | 207,310 | ||||||
| 3.90%, 05/15/28 (Call 02/15/28) |
937 | 900,508 | ||||||
| Kimberly-Clark Corp. |
||||||||
| 2.75%, 02/15/26(a) |
562 | 540,858 | ||||||
| 2.88%, 02/07/50 (Call 08/07/49)(a) |
154 | 105,191 | ||||||
| 3.05%, 08/15/25 |
1,175 | 1,142,524 | ||||||
| 3.10%, 03/26/30 (Call 12/26/29) |
271 | 246,518 | ||||||
| S C H E D U L E O F I N V E S T M E N T S |
103 |
| Schedule of Investments (continued) February 29, 2024 |
iShares® ESG Aware USD Corporate Bond ETF (Percentages shown are based on Net Assets) |
| Security | Par (000) |
Value | ||||||
| Household Products & Wares (continued) |
||||||||
| 3.20%, 04/25/29 (Call 01/25/29) |
$ | 909 | $ | 843,412 | ||||
| 3.90%, 05/04/47 (Call 11/04/46) |
135 | 109,361 | ||||||
| 3.95%, 11/01/28 (Call 08/01/28)(a) |
386 | 374,367 | ||||||
| 5.30%, 03/01/41 |
93 | 93,012 | ||||||
| 6.63%, 08/01/37(a) |
324 | 373,265 | ||||||
|
|
|
|||||||
| 6,481,936 | ||||||||
| Insurance — 2.3% | ||||||||
| ACE Capital Trust II, Series N, 9.70%, 04/01/30(a) |
15 | 17,620 | ||||||
| Aegon NV, 5.50%, 04/11/48 (Call 04/11/28), |
355 | 340,064 | ||||||
| Aflac Inc. |
||||||||
| 3.60%, 04/01/30 (Call 01/01/30)(a) |
51 | 47,275 | ||||||
| 4.00%, 10/15/46 (Call 04/15/46)(a) |
10 | 7,961 | ||||||
| 4.75%, 01/15/49 (Call 07/15/48) |
32 | 28,956 | ||||||
| Alleghany Corp., 4.90%, 09/15/44 (Call 03/15/44) |
9 | 8,428 | ||||||
| Allstate Corp. (The) |
||||||||
| 5.35%, 06/01/33(a) |
88 | 88,206 | ||||||
| 5.55%, 05/09/35(a) |
56 | 56,728 | ||||||
| 6.50%, 05/15/67 (Call 05/15/37), |
166 | 167,114 | ||||||
| American Financial Group Inc./OH |
||||||||
| 4.50%, 06/15/47 (Call 12/15/46) |
74 | 60,519 | ||||||
| 5.25%, 04/02/30 (Call 01/02/30) |
23 | 22,643 | ||||||
| American International Group Inc. |
||||||||
| 3.88%, 01/15/35 (Call 07/15/34) |
175 | 153,969 | ||||||
| 4.20%, 04/01/28 (Call 01/01/28) |
74 | 71,870 | ||||||
| 4.38%, 06/30/50 (Call 12/30/49) |
85 | 72,922 | ||||||
| 4.50%, 07/16/44 (Call 01/16/44) |
160 | 141,281 | ||||||
| 4.75%, 04/01/48 (Call 10/01/47) |
71 | 64,850 | ||||||
| 4.80%, 07/10/45 (Call 01/10/45) |
161 | 147,447 | ||||||
| 5.13%, 03/27/33 (Call 12/27/32) |
20 | 19,718 | ||||||
| 6.25%, 05/01/36 |
60 | 62,252 | ||||||
| Series A-9, 5.75%, 04/01/48 (Call 04/01/28), |
71 | 69,702 | ||||||
| Aon Corp. |
||||||||
| 2.80%, 05/15/30 (Call 02/15/30)(a) |
95 | 82,641 | ||||||
| 3.75%, 05/02/29 (Call 02/02/29) |
80 | 75,046 | ||||||
| 4.50%, 12/15/28 (Call 09/15/28)(a) |
54 | 52,723 | ||||||
| 6.25%, 09/30/40 |
38 | 40,256 | ||||||
| Aon Corp./Aon Global Holdings PLC |
||||||||
| 2.60%, 12/02/31 (Call 09/02/31) |
100 | 83,135 | ||||||
| 5.00%, 09/12/32 (Call 06/12/32) |
340 | 332,136 | ||||||
| 5.35%, 02/28/33 (Call 11/28/32)(a) |
70 | 69,875 | ||||||
| Aon Global Ltd., 4.75%, 05/15/45 (Call 11/15/44) |
12 | 10,578 | ||||||
| Arch Capital Finance LLC, 5.03%, 12/15/46 (Call 06/15/46) |
154 | 141,581 | ||||||
| Arch Capital Group Ltd. |
||||||||
| 3.64%, 06/30/50 (Call 12/30/49) |
132 | 97,240 | ||||||
| 7.35%, 05/01/34 |
34 | 38,144 | ||||||
| Arch Capital Group U.S. Inc., 5.14%, 11/01/43 |
27 | 25,126 | ||||||
| Arthur J Gallagher & Co. |
||||||||
| 2.40%, 11/09/31 (Call 08/09/31) |
5 | 4,049 | ||||||
| 3.05%, 03/09/52 (Call 09/09/51) |
60 | 38,054 | ||||||
| 3.50%, 05/20/51 (Call 11/20/50) |
92 | 63,870 | ||||||
| 5.50%, 03/02/33 (Call 12/02/32) |
100 | 99,735 | ||||||
| Assurant Inc. |
||||||||
| 2.65%, 01/15/32 (Call 10/15/31) |
190 | 154,629 | ||||||
| 3.70%, 02/22/30 (Call 11/22/29) |
104 | 92,810 | ||||||
| 4.90%, 03/27/28 (Call 12/27/27) |
35 | 34,283 | ||||||
| Athene Holding Ltd. |
||||||||
| 3.45%, 05/15/52 (Call 11/15/51) |
94 | 61,181 | ||||||
| Security | Par (000) |
Value | ||||||
| Insurance (continued) |
||||||||
| 3.95%, 05/25/51 (Call 11/25/50) |
$ | 21 | $ | 15,318 | ||||
| 4.13%, 01/12/28 (Call 10/12/27) |
76 | 72,781 | ||||||
| 6.15%, 04/03/30 (Call 01/03/30) |
132 | 135,842 | ||||||
| 6.65%, 02/01/33 (Call 11/01/32)(a) |
5 | 5,232 | ||||||
| AXA SA, 8.60%, 12/15/30 |
795 | 940,698 | ||||||
| AXIS Specialty Finance LLC |
||||||||
| 3.90%, 07/15/29 (Call 04/15/29)(a) |
27 | 25,382 | ||||||
| 4.90%, 01/15/40 (Call 01/15/30), |
85 | 75,015 | ||||||
| AXIS Specialty Finance PLC, 4.00%, 12/06/27 (Call 09/06/27)(a) |
82 | 78,402 | ||||||
| Berkshire Hathaway Finance Corp. |
||||||||
| 1.45%, 10/15/30 (Call 07/15/30) |
15 | 12,230 | ||||||
| 2.88%, 03/15/32 (Call 12/15/31) |
15 | 13,105 | ||||||
| 3.85%, 03/15/52 (Call 09/15/51) |
165 | 130,795 | ||||||
| 4.20%, 08/15/48 (Call 02/15/48) |
266 | 231,364 | ||||||
| 4.25%, 01/15/49 (Call 07/15/48) |
365 | 321,086 | ||||||
| 5.75%, 01/15/40 |
172 | 184,938 | ||||||
| Brighthouse Financial Inc., 4.70%, 06/22/47 (Call 12/22/46) |
163 | 126,309 | ||||||
| Brown & Brown Inc. |
||||||||
| 4.20%, 03/17/32 (Call 12/17/31)(a) |
180 | 163,485 | ||||||
| 4.50%, 03/15/29 (Call 12/15/28) |
15 | 14,515 | ||||||
| 4.95%, 03/17/52 (Call 09/17/51) |
20 | 17,232 | ||||||
| Chubb Corp. (The) |
||||||||
| 6.00%, 05/11/37 |
100 | 107,321 | ||||||
| Series 1, 6.50%, 05/15/38 |
120 | 134,830 | ||||||
| Chubb INA Holdings Inc. |
||||||||
| 2.85%, 12/15/51 (Call 06/15/51) |
65 | 43,992 | ||||||
| 3.05%, 12/15/61 (Call 06/15/61) |
85 | 56,430 | ||||||
| 3.35%, 05/03/26 (Call 02/03/26) |
60 | 57,843 | ||||||
| 4.15%, 03/13/43 |
45 | 39,337 | ||||||
| 4.35%, 11/03/45 (Call 05/03/45) |
225 | 198,650 | ||||||
| 6.70%, 05/15/36 |
20 | 22,743 | ||||||
| Cincinnati Financial Corp., 6.13%, 11/01/34 |
55 | 57,456 | ||||||
| CNO Financial Group Inc., 5.25%, 05/30/29 (Call 02/28/29) |
317 | 307,755 | ||||||
| Enstar Finance LLC, 5.50%, 01/15/42 (Call 01/15/27), |
210 | 191,011 | ||||||
| Enstar Group Ltd., 3.10%, 09/01/31 (Call 03/01/31) |
15 | 12,234 | ||||||
| Equitable Holdings Inc. |
||||||||
| 4.35%, 04/20/28 (Call 01/20/28) |
312 | 300,599 | ||||||
| 5.00%, 04/20/48 (Call 10/20/47) |
262 | 237,596 | ||||||
| 7.00%, 04/01/28(a) |
304 | 323,197 | ||||||
| Everest Reinsurance Holdings Inc. |
||||||||
| 3.13%, 10/15/52 (Call 04/15/52) |
202 | 126,584 | ||||||
| 3.50%, 10/15/50 (Call 04/15/50) |
25 | 17,556 | ||||||
| 4.87%, 06/01/44 |
25 | 22,505 | ||||||
| Fairfax Financial Holdings Ltd. |
||||||||
| 3.38%, 03/03/31 (Call 12/03/30) |
20 | 17,296 | ||||||
| 5.63%, 08/16/32 (Call 05/16/32) |
105 | 103,434 | ||||||
| Fidelity National Financial Inc., 2.45%, 03/15/31 (Call 12/15/30) |
5 | 4,064 | ||||||
| First American Financial Corp., 4.00%, 05/15/30 (Call 02/15/30) |
179 | 159,496 | ||||||
| Hanover Insurance Group Inc. (The), 4.50%, 04/15/26 (Call 01/15/26) |
37 | 36,292 | ||||||
| Hartford Financial Services Group Inc. (The) |
||||||||
| 2.90%, 09/15/51 (Call 03/15/51) |
30 | 19,227 | ||||||
| 3.60%, 08/19/49 (Call 02/19/49) |
78 | 58,699 | ||||||
| 4.30%, 04/15/43 |
32 | 27,324 | ||||||
| 104 | 2 0 2 4 I S H A R E S A N N U A L R E P O R T T O S H A R E H O L D E R S |
| Schedule of Investments (continued) February 29, 2024 |
iShares® ESG Aware USD Corporate Bond ETF (Percentages shown are based on Net Assets) |
| Security | Par (000) |
Value | ||||||
| Insurance (continued) | ||||||||
| 4.40%, 03/15/48 (Call 09/15/47) |
$ | 33 | $ | 28,499 | ||||
| 5.95%, 10/15/36 |
85 | 87,887 | ||||||
| 6.10%, 10/01/41 |
133 | 138,574 | ||||||
| Jackson Financial Inc. |
||||||||
| 3.13%, 11/23/31 (Call 08/23/31) |
100 | 82,801 | ||||||
| 4.00%, 11/23/51 (Call 05/23/51) |
80 | 57,130 | ||||||
| Kemper Corp., 3.80%, 02/23/32 (Call 11/23/31) |
15 | 12,589 | ||||||
| Lincoln National Corp. |
||||||||
| 3.40%, 01/15/31 (Call 10/15/30) |
25 | 21,885 | ||||||
| 3.63%, 12/12/26 (Call 09/15/26)(a) |
41 | 39,143 | ||||||
| 3.80%, 03/01/28 (Call 12/01/27) |
90 | 85,617 | ||||||
| 4.35%, 03/01/48 (Call 09/01/47) |
98 | 75,897 | ||||||
| 4.38%, 06/15/50 (Call 12/15/49)(a) |
88 | 67,930 | ||||||
| 6.30%, 10/09/37 |
55 | 56,421 | ||||||
| 7.00%, 06/15/40 |
48 | 52,339 | ||||||
| Loews Corp., 6.00%, 02/01/35 |
35 | 37,127 | ||||||
| Manulife Financial Corp. |
||||||||
| 4.06%, 02/24/32 (Call 02/24/27), |
353 | 336,441 | ||||||
| 4.15%, 03/04/26 |
30 | 29,404 | ||||||
| 5.38%, 03/04/46 |
222 | 217,283 | ||||||
| Markel Group Inc. |
||||||||
| 3.35%, 09/17/29 (Call 06/17/29) |
17 | 15,314 | ||||||
| 4.15%, 09/17/50 (Call 03/17/50) |
104 | 82,106 | ||||||
| 5.00%, 05/20/49 (Call 11/20/48) |
32 | 28,997 | ||||||
| Marsh & McLennan Companies Inc. |
||||||||
| 2.25%, 11/15/30 (Call 08/15/30) |
217 | 182,970 | ||||||
| 3.50%, 03/10/25 (Call 12/10/24) |
294 | 288,763 | ||||||
| 3.75%, 03/14/26 (Call 12/14/25) |
425 | 414,637 | ||||||
| 4.20%, 03/01/48 (Call 09/01/47) |
179 | 149,015 | ||||||
| 4.35%, 01/30/47 (Call 07/30/46) |
221 | 187,481 | ||||||
| 4.38%, 03/15/29 (Call 12/15/28) |
603 | 589,704 | ||||||
| 4.75%, 03/15/39 (Call 09/15/38) |
22 | 20,712 | ||||||
| 4.90%, 03/15/49 (Call 09/15/48) |
293 | 270,936 | ||||||
| 5.40%, 09/15/33 (Call 06/15/33) |
10 | 10,175 | ||||||
| 5.88%, 08/01/33 |
377 | 397,920 | ||||||
| MetLife Inc. |
||||||||
| 4.05%, 03/01/45 |
251 | 207,252 | ||||||
| 4.13%, 08/13/42 |
81 | 68,493 | ||||||
| 4.55%, 03/23/30 (Call 12/23/29)(a) |
59 | 57,739 | ||||||
| 4.60%, 05/13/46 (Call 11/13/45) |
144 | 128,674 | ||||||
| 4.72%, 12/15/44 |
155 | 137,937 | ||||||
| 4.88%, 11/13/43 |
250 | 229,702 | ||||||
| 5.38%, 07/15/33 (Call 04/15/33) |
15 | 15,082 | ||||||
| 5.70%, 06/15/35 |
97 | 100,404 | ||||||
| 5.88%, 02/06/41 |
127 | 132,556 | ||||||
| 6.38%, 06/15/34(a) |
70 | 75,406 | ||||||
| 6.40%, 12/15/66 (Call 12/15/31) |
354 | 359,845 | ||||||
| 10.75%, 08/01/69 (Call 08/01/34) |
225 | 306,260 | ||||||
| Munich Re America Corp., Series B, 7.45%, 12/15/26(a) |
1,296 | 1,373,193 | ||||||
| Nationwide Financial Services Inc., 6.75%, 05/15/87 |
38 | 37,795 | ||||||
| Principal Financial Group Inc. |
||||||||
| 3.70%, 05/15/29 (Call 02/15/29)(a) |
42 | 39,178 | ||||||
| 4.30%, 11/15/46 (Call 05/15/46) |
127 | 105,175 | ||||||
| 4.35%, 05/15/43 |
113 | 98,205 | ||||||
| 4.63%, 09/15/42 |
132 | 118,316 | ||||||
| 6.05%, 10/15/36 |
128 | 134,659 | ||||||
| Progressive Corp. (The) 2.45%, 01/15/27 |
59 | 55,052 | ||||||
| Security | Par (000) |
Value | ||||||
| Insurance (continued) |
||||||||
| 3.70%, 01/26/45(a) |
$ | 70 | $ | 56,625 | ||||
| 3.95%, 03/26/50 (Call 09/26/49) |
96 | 78,154 | ||||||
| 4.00%, 03/01/29 (Call 12/01/28) |
19 | 18,276 | ||||||
| 4.13%, 04/15/47 (Call 10/15/46) |
222 | 186,438 | ||||||
| 4.20%, 03/15/48 (Call 09/15/47) |
77 | 66,191 | ||||||
| 4.35%, 04/25/44 |
122 | 107,982 | ||||||
| 4.95%, 06/15/33 (Call 03/15/33) |
60 | 59,578 | ||||||
| 6.25%, 12/01/32 |
52 | 56,449 | ||||||
| 6.63%, 03/01/29 |
35 | 37,572 | ||||||
| Prudential Financial Inc. |
||||||||
| 1.50%, 03/10/26 (Call 02/10/26) |
110 | 102,484 | ||||||
| 2.10%, 03/10/30 (Call 12/10/29)(a) |
67 | 57,293 | ||||||
| 3.70%, 03/13/51 (Call 09/13/50)(a) |
356 | 270,282 | ||||||
| 3.88%, 03/27/28 (Call 12/27/27) |
100 | 96,077 | ||||||
| 3.91%, 12/07/47 (Call 06/07/47) |
100 | 78,938 | ||||||
| 3.94%, 12/07/49 (Call 06/07/49) |
220 | 172,426 | ||||||
| 4.35%, 02/25/50 (Call 08/25/49) |
236 | 199,549 | ||||||
| 4.42%, 03/27/48 (Call 09/27/47) |
27 | 23,047 | ||||||
| 4.50%, 09/15/47 (Call 09/15/27), |
162 | 151,671 | ||||||
| 4.60%, 05/15/44 |
136 | 121,069 | ||||||
| 5.13%, 03/01/52 (Call 11/28/31), |
210 | 196,218 | ||||||
| 5.38%, 05/15/45 (Call 05/15/25), |
278 | 273,753 | ||||||
| 5.70%, 12/14/36 |
200 | 206,366 | ||||||
| 5.70%, 09/15/48 (Call 09/15/28), |
78 | 76,192 | ||||||
| 5.75%, 07/15/33 |
121 | 126,959 | ||||||
| 6.00%, 09/01/52 (Call 06/01/32), |
280 | 279,102 | ||||||
| 6.63%, 12/01/37 |
208 | 231,318 | ||||||
| 6.63%, 06/21/40 |
131 | 144,540 | ||||||
| 6.75%, 03/01/53 (Call 12/01/32), |
85 | 88,314 | ||||||
| Prudential Funding Asia PLC |
||||||||
| 3.13%, 04/14/30 |
127 | 113,228 | ||||||
| 3.63%, 03/24/32 (Call 12/24/31) |
380 | 339,650 | ||||||
| Reinsurance Group of America Inc. |
||||||||
| 3.90%, 05/15/29 (Call 02/15/29) |
41 | 38,680 | ||||||
| 6.00%, 09/15/33 (Call 06/15/33) |
50 | 51,269 | ||||||
| RenaissanceRe Holdings Ltd. |
||||||||
| 3.60%, 04/15/29 (Call 01/15/29) |
7 | 6,451 | ||||||
| 5.75%, 06/05/33 (Call 03/05/33) |
5 | 5,038 | ||||||
| Selective Insurance Group Inc., 5.38%, 03/01/49 (Call 09/01/48) |
10 | 9,467 | ||||||
| Stewart Information Services Corp., 3.60%, 11/15/31 (Call 08/15/31) |
265 | 205,894 | ||||||
| Transatlantic Holdings Inc., 8.00%, 11/30/39 |
10 | 12,777 | ||||||
| Travelers Companies Inc. (The) |
||||||||
| 2.55%, 04/27/50 (Call 10/27/49) |
24 | 14,940 | ||||||
| 3.75%, 05/15/46 (Call 11/15/45) |
157 | 124,472 | ||||||
| 4.00%, 05/30/47 (Call 11/30/46) |
243 | 200,385 | ||||||
| 4.05%, 03/07/48 (Call 09/07/47) |
197 | 165,142 | ||||||
| 4.10%, 03/04/49 (Call 09/04/48) |
144 | 121,028 | ||||||
| 4.30%, 08/25/45 (Call 02/25/45) |
149 | 129,856 | ||||||
| 4.60%, 08/01/43 |
185 | 171,845 | ||||||
| 5.35%, 11/01/40 |
210 | 212,304 | ||||||
| 6.25%, 06/15/37 |
228 | 250,548 | ||||||
| 6.75%, 06/20/36 |
144 | 164,184 | ||||||
| S C H E D U L E O F I N V E S T M E N T S |
105 |
| Schedule of Investments (continued) February 29, 2024 |
iShares® ESG Aware USD Corporate Bond ETF (Percentages shown are based on Net Assets) |
| Security | Par (000) |
Value | ||||||
| Insurance (continued) | ||||||||
| Travelers Property Casualty Corp., 6.38%, 03/15/33(a) |
$ | 220 | $ | 244,143 | ||||
| Trinity Acquisition PLC, 4.40%, 03/15/26 (Call 12/15/25) |
46 | 45,076 | ||||||
| Unum Group |
||||||||
| 4.00%, 06/15/29 (Call 03/15/29) |
15 | 14,080 | ||||||
| 4.13%, 06/15/51 (Call 12/15/50) |
60 | 44,035 | ||||||
| 4.50%, 12/15/49 (Call 06/15/49) |
60 | 47,556 | ||||||
| 5.75%, 08/15/42(a) |
75 | 72,815 | ||||||
| Willis North America Inc. |
||||||||
| 2.95%, 09/15/29 (Call 06/15/29) |
151 | 134,178 | ||||||
| 3.88%, 09/15/49 (Call 03/15/49) |
119 | 88,222 | ||||||
| 4.50%, 09/15/28 (Call 06/15/28) |
73 | 70,441 | ||||||
| 5.05%, 09/15/48 (Call 03/15/48) |
131 | 117,284 | ||||||
| 5.35%, 05/15/33 (Call 02/15/33) |
20 | 19,687 | ||||||
| XL Group Ltd., 5.25%, 12/15/43 |
355 | 331,604 | ||||||
|
|
|
|||||||
| 23,469,579 | ||||||||
| Internet — 0.7% | ||||||||
| Alibaba Group Holding Ltd. |
||||||||
| 2.13%, 02/09/31 (Call 11/09/30) |
230 | 190,252 | ||||||
| 2.70%, 02/09/41 (Call 08/09/40) |
45 | 31,007 | ||||||
| 3.15%, 02/09/51 (Call 08/09/50) |
295 | 194,695 | ||||||
| 3.25%, 02/09/61 (Call 08/09/60) |
227 | 143,232 | ||||||
| 4.00%, 12/06/37 (Call 06/06/37) |
200 | 172,452 | ||||||
| 4.20%, 12/06/47 (Call 06/06/47) |
255 | 207,407 | ||||||
| 4.40%, 12/06/57 (Call 06/06/57) |
278 | 227,207 | ||||||
| 4.50%, 11/28/34 (Call 05/28/34) |
206 | 192,916 | ||||||
| Alphabet Inc. |
||||||||
| 2.05%, 08/15/50 (Call 02/15/50) |
102 | 60,249 | ||||||
| 2.25%, 08/15/60 (Call 02/15/60) |
302 | 173,378 | ||||||
| Amazon.com Inc. |
||||||||
| 2.50%, 06/03/50 (Call 12/03/49) |
591 | 370,731 | ||||||
| 2.70%, 06/03/60 (Call 12/03/59)(a) |
890 | 547,038 | ||||||
| 3.10%, 05/12/51 (Call 11/12/50) |
515 | 361,945 | ||||||
| 3.15%, 08/22/27 (Call 05/22/27) |
95 | 90,154 | ||||||
| 3.25%, 05/12/61 (Call 11/12/60) |
382 | 263,253 | ||||||
| 3.88%, 08/22/37 (Call 02/22/37) |
503 | 449,635 | ||||||
| 3.95%, 04/13/52 (Call 10/13/51)(a) |
480 | 396,671 | ||||||
| 4.05%, 08/22/47 (Call 02/22/47) |
506 | 432,748 | ||||||
| 4.10%, 04/13/62 (Call 10/13/61) |
230 | 190,099 | ||||||
| 4.25%, 08/22/57 (Call 02/22/57) |
628 | 538,782 | ||||||
| 4.70%, 12/01/32 (Call 09/01/32) |
200 | 199,054 | ||||||
| 4.80%, 12/05/34 (Call 06/05/34) |
290 | 289,918 | ||||||
| 4.95%, 12/05/44 (Call 06/05/44)(a) |
375 | 369,957 | ||||||
| Baidu Inc., 2.38%, 08/23/31 (Call 05/23/31) |
200 | 164,974 | ||||||
| Booking Holdings Inc. |
||||||||
| 3.55%, 03/15/28 (Call 12/15/27) |
118 | 112,290 | ||||||
| 4.63%, 04/13/30 (Call 01/13/30)(a) |
36 | 35,377 | ||||||
| eBay Inc. |
||||||||
| 1.90%, 03/11/25 (Call 02/11/25)(a) |
159 | 153,427 | ||||||
| 2.70%, 03/11/30 (Call 12/11/29) |
20 | 17,474 | ||||||
| 3.60%, 06/05/27 (Call 03/05/27) |
43 | 41,068 | ||||||
| 3.65%, 05/10/51 (Call 11/10/50) |
335 | 242,261 | ||||||
| 4.00%, 07/15/42 (Call 01/15/42) |
271 | 214,992 | ||||||
| Meta Platforms Inc. |
||||||||
| 4.45%, 08/15/52 (Call 02/15/52) |
250 | 218,498 | ||||||
| 4.65%, 08/15/62 (Call 02/15/62) |
165 | 145,532 | ||||||
| 5.75%, 05/15/63 (Call 11/15/62) |
20 | 20,939 | ||||||
|
|
|
|||||||
| 7,459,612 | ||||||||
| Security | Par (000) |
Value | ||||||
| Iron & Steel — 0.1% |
||||||||
| Nucor Corp. |
||||||||
| 2.98%, 12/15/55 (Call 06/15/55) |
$ | 420 | $ | 270,031 | ||||
| 4.40%, 05/01/48 (Call 11/01/47)(a) |
140 | 122,866 | ||||||
| 5.20%, 08/01/43 (Call 02/01/43) |
215 | 210,031 | ||||||
| 6.40%, 12/01/37(a) |
182 | 199,045 | ||||||
| Steel Dynamics Inc. |
||||||||
| 3.25%, 10/15/50 (Call 04/15/50) |
121 | 79,246 | ||||||
| 3.45%, 04/15/30 (Call 01/15/30) |
31 | 28,172 | ||||||
|
|
|
|||||||
| 909,391 | ||||||||
| Leisure Time — 0.2% | ||||||||
| Brunswick Corp. |
||||||||
| 4.40%, 09/15/32 (Call 06/15/32)(a) |
62 | 55,299 | ||||||
| 5.10%, 04/01/52 (Call 10/01/51) |
117 | 92,480 | ||||||
| Harley-Davidson Inc. |
||||||||
| 3.50%, 07/28/25 (Call 04/28/25)(a) |
1,932 | 1,875,476 | ||||||
| 4.63%, 07/28/45 (Call 01/28/45)(a) |
35 | 27,608 | ||||||
|
|
|
|||||||
| 2,050,863 | ||||||||
| Lodging — 0.2% | ||||||||
| Choice Hotels International Inc. |
||||||||
| 3.70%, 12/01/29 (Call 09/01/29) |
67 | 58,721 | ||||||
| 3.70%, 01/15/31 (Call 10/15/30) |
62 | 53,271 | ||||||
| Hyatt Hotels Corp., 5.75%, 04/23/30 (Call 01/23/30) |
81 | 82,539 | ||||||
| Marriott International Inc./MD |
||||||||
| 3.75%, 10/01/25 (Call 07/01/25) |
95 | 92,564 | ||||||
| 5.55%, 10/15/28 (Call 09/15/28) |
20 | 20,347 | ||||||
| Series AA, 4.65%, 12/01/28 (Call 09/01/28) |
75 | 73,449 | ||||||
| Series FF, 4.63%, 06/15/30 (Call 03/15/30)(a) |
262 | 253,527 | ||||||
| Series GG, 3.50%, 10/15/32 (Call 07/15/32) |
237 | 206,716 | ||||||
| Series R, 3.13%, 06/15/26 (Call 03/15/26) |
316 | 301,627 | ||||||
| Series X, 4.00%, 04/15/28 (Call 01/15/28) |
52 | 49,769 | ||||||
| Sands China Ltd. |
||||||||
| 3.10%, 03/08/29 (Call 01/08/29) |
400 | 344,561 | ||||||
| 3.25%, 08/08/31 (Call 05/08/31) |
315 | 261,306 | ||||||
| 4.63%, 06/18/30 (Call 03/18/30) |
15 | 13,644 | ||||||
| 5.40%, 08/08/28 (Call 05/08/28) |
420 | 408,242 | ||||||
|
|
|
|||||||
| 2,220,283 | ||||||||
| Machinery — 1.7% | ||||||||
| ABB Finance USA Inc. |
||||||||
| 3.80%, 04/03/28 (Call 01/03/28) |
1,065 | 1,035,463 | ||||||
| 4.38%, 05/08/42 |
185 | 166,042 | ||||||
| Caterpillar Financial Services Corp. |
||||||||
| 2.40%, 08/09/26(a) |
551 | 519,515 | ||||||
| 4.35%, 05/15/26(a) |
100 | 98,777 | ||||||
| 4.85%, 02/27/29 |
75 | 75,064 | ||||||
| 5.05%, 02/27/26 |
75 | 75,032 | ||||||
| 5.15%, 08/11/25(a) |
100 | 99,987 | ||||||
| Caterpillar Inc. |
||||||||
| 2.60%, 09/19/29 (Call 06/19/29) |
51 | 45,912 | ||||||
| 2.60%, 04/09/30 (Call 01/09/30) |
78 | 69,300 | ||||||
| 3.25%, 09/19/49 (Call 03/19/49) |
115 | 84,641 | ||||||
| 3.25%, 04/09/50 (Call 10/09/49)(a) |
90 | 66,531 | ||||||
| 3.80%, 08/15/42 |
286 | 238,647 | ||||||
| 4.30%, 05/15/44 (Call 11/15/43) |
116 | 104,772 | ||||||
| 4.75%, 05/15/64 (Call 11/15/63) |
137 | 123,883 | ||||||
| 5.20%, 05/27/41 |
116 | 117,200 | ||||||
| 5.30%, 09/15/35 |
119 | 124,571 | ||||||
| 6.05%, 08/15/36 |
130 | 142,409 | ||||||
| CNH Industrial Capital LLC |
||||||||
| 1.45%, 07/15/26 (Call 06/15/26) |
880 | 804,642 | ||||||
| 1.88%, 01/15/26 (Call 12/15/25) |
122 | 114,340 | ||||||
| 106 | 2 0 2 4 I S H A R E S A N N U A L R E P O R T T O S H A R E H O L D E R S |
| Schedule of Investments (continued) February 29, 2024 |
iShares® ESG Aware USD Corporate Bond ETF (Percentages shown are based on Net Assets) |
| Security | Par (000) |
Value | ||||||
| Machinery (continued) |
||||||||
| 3.95%, 05/23/25 |
$ | 1,187 | $ | 1,164,590 | ||||
| 4.55%, 04/10/28 (Call 03/10/28) |
100 | 97,837 | ||||||
| 5.45%, 10/14/25 |
1,929 | 1,929,184 | ||||||
| 5.50%, 01/12/29 (Call 12/12/28) |
100 | 101,328 | ||||||
| CNH Industrial NV, 3.85%, 11/15/27 (Call 08/15/27) |
1,804 | 1,730,939 | ||||||
| Deere & Co. |
||||||||
| 2.75%, 04/15/25 (Call 03/15/25) |
44 | 42,849 | ||||||
| 2.88%, 09/07/49 (Call 03/07/49) |
183 | 127,345 | ||||||
| 3.10%, 04/15/30 (Call 01/15/30) |
24 | 21,836 | ||||||
| 3.75%, 04/15/50 (Call 10/15/49) |
73 | 59,760 | ||||||
| 3.90%, 06/09/42 (Call 12/09/41) |
26 | 22,187 | ||||||
| 7.13%, 03/03/31 |
20 | 22,835 | ||||||
| Dover Corp. |
||||||||
| 2.95%, 11/04/29 (Call 08/04/29) |
10 | 8,920 | ||||||
| 3.15%, 11/15/25 (Call 08/15/25) |
105 | 101,249 | ||||||
| 5.38%, 10/15/35 |
125 | 127,118 | ||||||
| 5.38%, 03/01/41 (Call 12/01/40) |
15 | 14,754 | ||||||
| Flowserve Corp. |
||||||||
| 2.80%, 01/15/32 (Call 10/15/31) |
32 | 26,159 | ||||||
| 3.50%, 10/01/30 (Call 07/01/30) |
304 | 267,412 | ||||||
| IDEX Corp., 2.63%, 06/15/31 (Call 03/15/31) |
225 | 189,636 | ||||||
| John Deere Capital Corp. |
||||||||
| 2.25%, 09/14/26 |
27 | 25,275 | ||||||
| 2.45%, 01/09/30 |
52 | 45,694 | ||||||
| 2.65%, 06/10/26 |
30 | 28,593 | ||||||
| 2.80%, 09/08/27 |
41 | 38,366 | ||||||
| 2.80%, 07/18/29 |
46 | 41,813 | ||||||
| 3.40%, 09/11/25 |
40 | 39,057 | ||||||
| 3.45%, 03/13/25 |
41 | 40,267 | ||||||
| 3.90%, 06/07/32(a) |
135 | 125,808 | ||||||
| 4.35%, 09/15/32(a) |
130 | 125,736 | ||||||
| 4.75%, 06/08/26 |
35 | 34,895 | ||||||
| 4.95%, 06/06/25 |
10 | 9,985 | ||||||
| 4.95%, 07/14/28 |
20 | 20,115 | ||||||
| nVent Finance Sarl, 4.55%, 04/15/28 (Call 01/15/28) |
57 | 54,955 | ||||||
| Oshkosh Corp. |
||||||||
| 3.10%, 03/01/30 (Call 12/01/29) |
594 | 524,169 | ||||||
| 4.60%, 05/15/28 (Call 02/15/28) |
933 | 907,232 | ||||||
| Otis Worldwide Corp. |
||||||||
| 3.36%, 02/15/50 (Call 08/15/49) |
89 | 64,370 | ||||||
| 5.25%, 08/16/28 (Call 07/16/28)(a) |
60 | 60,514 | ||||||
| Rockwell Automation Inc. |
||||||||
| 2.80%, 08/15/61 (Call 02/15/61) |
50 | 29,877 | ||||||
| 2.88%, 03/01/25 (Call 12/01/24) |
94 | 91,848 | ||||||
| 3.50%, 03/01/29 (Call 12/01/28) |
73 | 69,559 | ||||||
| 4.20%, 03/01/49 (Call 09/01/48) |
76 | 64,757 | ||||||
| Westinghouse Air Brake Technologies Corp., 4.70%, 09/15/28 (Call 06/15/28) |
51 | 49,749 | ||||||
| Xylem Inc./NY |
||||||||
| 1.95%, 01/30/28 (Call 11/30/27) |
1,601 | 1,430,448 | ||||||
| 2.25%, 01/30/31 (Call 10/30/30) |
1,545 | 1,294,419 | ||||||
| 3.25%, 11/01/26 (Call 08/01/26)(a) |
1,880 | 1,794,813 | ||||||
|
|
|
|||||||
| 17,174,980 | ||||||||
| Machinery - Diversified — 0.0% | ||||||||
| John Deere Capital Corp. |
||||||||
| 5.15%, 09/08/26 |
25 | 25,155 | ||||||
| 5.15%, 09/08/33(a) |
185 | 188,190 | ||||||
| 5.30%, 09/08/25(a) |
45 | 45,198 | ||||||
|
|
|
|||||||
| 258,543 | ||||||||
| Security | Par (000) |
Value | ||||||
| Manufacturing — 1.3% |
||||||||
| 3M Co. |
||||||||
| 2.25%, 09/19/26 (Call 06/19/26)(a) |
$ | 1,670 | $ | 1,555,554 | ||||
| 2.38%, 08/26/29 (Call 05/26/29) |
113 | 98,024 | ||||||
| 2.65%, 04/15/25 (Call 03/15/25)(a) |
686 | 664,488 | ||||||
| 2.88%, 10/15/27 (Call 07/15/27)(a) |
2,505 | 2,319,546 | ||||||
| 3.00%, 08/07/25(a) |
1,799 | 1,742,935 | ||||||
| 3.05%, 04/15/30 (Call 01/15/30) |
600 | 532,245 | ||||||
| 3.63%, 09/14/28 (Call 06/14/28) |
1,060 | 1,000,188 | ||||||
| Carlisle Companies Inc. |
||||||||
| 2.75%, 03/01/30 (Call 12/01/29) |
262 | 227,872 | ||||||
| 3.75%, 12/01/27 (Call 09/01/27) |
16 | 15,205 | ||||||
| Eaton Corp. |
||||||||
| 3.10%, 09/15/27 (Call 06/15/27) |
56 | 52,925 | ||||||
| 4.00%, 11/02/32 |
129 | 120,864 | ||||||
| 4.15%, 11/02/42 |
131 | 113,723 | ||||||
| 4.70%, 08/23/52 (Call 02/23/52)(a) |
55 | 50,745 | ||||||
| GE Capital International Funding Co. Unlimited Co., 4.42%, 11/15/35 |
550 | 514,730 | ||||||
| General Electric Co. |
||||||||
| 4.35%, 05/01/50 (Call 11/01/49) |
35 | 30,806 | ||||||
| 5.88%, 01/14/38(a) |
90 | 95,534 | ||||||
| 6.75%, 03/15/32 |
600 | 666,296 | ||||||
| 6.88%, 01/10/39 |
82 | 96,912 | ||||||
| Illinois Tool Works Inc. |
||||||||
| 2.65%, 11/15/26 (Call 08/15/26) |
60 | 57,042 | ||||||
| 3.90%, 09/01/42 (Call 03/01/42) |
124 | 105,578 | ||||||
| 4.88%, 09/15/41 (Call 03/15/41) |
15 | 14,493 | ||||||
| Parker-Hannifin Corp. |
||||||||
| 3.25%, 06/14/29 (Call 03/14/29) |
33 | 30,365 | ||||||
| 4.00%, 06/14/49 (Call 12/14/48) |
177 | 144,420 | ||||||
| 4.10%, 03/01/47 (Call 09/01/46) |
53 | 43,521 | ||||||
| 4.20%, 11/21/34 (Call 05/21/34) |
56 | 51,564 | ||||||
| 4.45%, 11/21/44 (Call 05/21/44) |
71 | 62,282 | ||||||
| 6.25%, 05/15/38 |
47 | 50,537 | ||||||
| Pentair Finance Sarl |
||||||||
| 4.50%, 07/01/29 (Call 04/01/29)(a) |
626 | 603,749 | ||||||
| 5.90%, 07/15/32 (Call 04/15/32) |
235 | 241,130 | ||||||
| Teledyne Technologies Inc. |
||||||||
| 2.25%, 04/01/28 (Call 02/01/28) |
217 | 194,443 | ||||||
| 2.75%, 04/01/31 (Call 01/01/31) |
1,836 | 1,557,896 | ||||||
| Textron Inc. |
||||||||
| 3.00%, 06/01/30 (Call 03/01/30) |
27 | 23,694 | ||||||
| 3.65%, 03/15/27 (Call 12/15/26) |
10 | 9,568 | ||||||
| 4.00%, 03/15/26 (Call 12/15/25) |
38 | 36,969 | ||||||
|
|
|
|||||||
| 13,125,843 | ||||||||
| Media — 2.0% | ||||||||
| Charter Communications Operating LLC/Charter Communications Operating Capital |
||||||||
| 2.80%, 04/01/31 (Call 01/01/31) |
67 | 54,053 | ||||||
| 3.70%, 04/01/51 (Call 10/01/50) |
335 | 202,873 | ||||||
| 3.85%, 04/01/61 (Call 10/01/60)(a) |
335 | 194,129 | ||||||
| 3.90%, 06/01/52 (Call 12/01/51) |
419 | 262,931 | ||||||
| 3.95%, 06/30/62 (Call 12/30/61) |
259 | 152,271 | ||||||
| 4.40%, 04/01/33 (Call 01/01/33)(a) |
150 | 131,001 | ||||||
| 4.40%, 12/01/61 (Call 06/01/61) |
197 | 126,424 | ||||||
| 4.80%, 03/01/50 (Call 09/01/49) |
463 | 334,517 | ||||||
| 5.13%, 07/01/49 (Call 01/01/49) |
161 | 121,923 | ||||||
| 5.25%, 04/01/53 (Call 10/01/52) |
159 | 123,369 | ||||||
| 5.38%, 04/01/38 (Call 10/01/37) |
107 | 91,817 | ||||||
| 5.38%, 05/01/47 (Call 11/01/46) |
526 | 413,864 | ||||||
| 5.50%, 04/01/63 (Call 10/01/62) |
192 | 147,502 | ||||||
| S C H E D U L E O F I N V E S T M E N T S |
107 |
| Schedule of Investments (continued) February 29, 2024 |
iShares® ESG Aware USD Corporate Bond ETF (Percentages shown are based on Net Assets) |
| Security | Par (000) |
Value | ||||||
| Media (continued) |
||||||||
| 5.75%, 04/01/48 (Call 10/01/47) |
$ | 461 | $ | 383,102 | ||||
| 6.38%, 10/23/35 (Call 04/23/35) |
479 | 462,788 | ||||||
| 6.48%, 10/23/45 (Call 04/23/45) |
635 | 579,934 | ||||||
| 6.83%, 10/23/55 (Call 04/23/55) |
189 | 178,763 | ||||||
| Comcast Corp. |
||||||||
| 2.45%, 08/15/52 (Call 02/15/52) |
592 | 339,677 | ||||||
| 2.65%, 02/01/30 (Call 11/01/29) |
49 | 43,126 | ||||||
| 2.65%, 08/15/62 (Call 02/15/62) |
222 | 123,769 | ||||||
| 2.80%, 01/15/51 (Call 07/15/50) |
65 | 40,606 | ||||||
| 2.89%, 11/01/51 (Call 05/01/51) |
646 | 409,227 | ||||||
| 2.94%, 11/01/56 (Call 05/01/56) |
992 | 610,814 | ||||||
| 2.99%, 11/01/63 (Call 05/01/63)(a) |
830 | 496,657 | ||||||
| 3.20%, 07/15/36 (Call 01/15/36) |
84 | 67,825 | ||||||
| 3.25%, 11/01/39 (Call 05/01/39) |
76 | 58,365 | ||||||
| 3.40%, 04/01/30 (Call 01/01/30) |
4 | 3,661 | ||||||
| 3.40%, 07/15/46 (Call 01/15/46) |
61 | 44,747 | ||||||
| 3.45%, 02/01/50 (Call 08/01/49) |
286 | 205,387 | ||||||
| 3.75%, 04/01/40 (Call 10/01/39) |
81 | 66,198 | ||||||
| 3.90%, 03/01/38 (Call 09/01/37) |
83 | 71,223 | ||||||
| 3.97%, 11/01/47 (Call 05/01/47) |
315 | 249,851 | ||||||
| 4.00%, 08/15/47 (Call 02/15/47) |
211 | 168,796 | ||||||
| 4.00%, 03/01/48 (Call 09/01/47) |
226 | 179,179 | ||||||
| 4.00%, 11/01/49 (Call 05/01/49) |
412 | 325,840 | ||||||
| 4.05%, 11/01/52 (Call 05/01/52) |
414 | 326,532 | ||||||
| 4.15%, 10/15/28 (Call 07/15/28) |
55 | 53,390 | ||||||
| 4.20%, 08/15/34 (Call 02/15/34) |
100 | 91,870 | ||||||
| 4.25%, 10/15/30 (Call 07/15/30) |
37 | 35,361 | ||||||
| 4.25%, 01/15/33 |
105 | 98,350 | ||||||
| 4.40%, 08/15/35 (Call 02/15/35) |
58 | 53,733 | ||||||
| 4.60%, 10/15/38 (Call 04/15/38) |
130 | 119,615 | ||||||
| 4.60%, 08/15/45 (Call 02/15/45) |
171 | 151,166 | ||||||
| 4.65%, 07/15/42 |
362 | 326,072 | ||||||
| 4.70%, 10/15/48 (Call 04/15/48) |
511 | 461,304 | ||||||
| 4.75%, 03/01/44 |
215 | 195,010 | ||||||
| 4.95%, 10/15/58 (Call 04/15/58) |
373 | 344,446 | ||||||
| 5.50%, 05/15/64 (Call 11/15/63) |
150 | 147,318 | ||||||
| 5.65%, 06/15/35 |
122 | 125,328 | ||||||
| 6.45%, 03/15/37 |
408 | 446,882 | ||||||
| 6.50%, 11/15/35 |
135 | 147,239 | ||||||
| 6.55%, 07/01/39(a) |
70 | 76,940 | ||||||
| 6.95%, 08/15/37 |
135 | 153,897 | ||||||
| 7.05%, 03/15/33 |
58 | 65,192 | ||||||
| Discovery Communications LLC |
||||||||
| 3.95%, 03/20/28 (Call 12/20/27) |
188 | 175,761 | ||||||
| 4.00%, 09/15/55 (Call 03/15/55) |
385 | 254,853 | ||||||
| 4.13%, 05/15/29 (Call 02/15/29) |
39 | 36,040 | ||||||
| 4.65%, 05/15/50 (Call 11/15/49) |
122 | 92,625 | ||||||
| 5.00%, 09/20/37 (Call 03/20/37) |
142 | 121,509 | ||||||
| 5.20%, 09/20/47 (Call 03/20/47) |
283 | 230,193 | ||||||
| 5.30%, 05/15/49 (Call 11/15/48) |
154 | 125,600 | ||||||
| 6.35%, 06/01/40 |
205 | 197,069 | ||||||
| FactSet Research Systems Inc., 3.45%, 03/01/32 (Call 12/01/31) |
125 | 108,666 | ||||||
| Fox Corp. |
||||||||
| 3.50%, 04/08/30 (Call 01/08/30) |
19 | 17,094 | ||||||
| 4.71%, 01/25/29 (Call 10/25/28)(a) |
46 | 44,897 | ||||||
| 5.48%, 01/25/39 (Call 07/25/38) |
218 | 203,724 | ||||||
| 5.58%, 01/25/49 (Call 07/25/48) |
384 | 351,147 | ||||||
| 6.50%, 10/13/33 (Call 07/13/33) |
5 | 5,251 | ||||||
| Grupo Televisa SAB |
||||||||
| 5.25%, 05/24/49 (Call 11/24/48) |
157 | 137,324 | ||||||
| Security | Par (000) |
Value | ||||||
| Media (continued) |
||||||||
| 6.13%, 01/31/46 (Call 07/31/45) |
$ | 210 | $ | 204,909 | ||||
| 6.63%, 01/15/40 |
144 | 147,950 | ||||||
| NBCUniversal Media LLC |
||||||||
| 4.45%, 01/15/43 |
90 | 78,653 | ||||||
| 5.95%, 04/01/41 |
105 | 109,241 | ||||||
| 6.40%, 04/30/40(a) |
50 | 54,225 | ||||||
| Paramount Global |
||||||||
| 2.90%, 01/15/27 (Call 10/15/26) |
20 | 18,019 | ||||||
| 4.20%, 06/01/29 (Call 03/01/29)(a) |
47 | 41,387 | ||||||
| 4.20%, 05/19/32 (Call 02/19/32) |
82 | 66,827 | ||||||
| 4.38%, 03/15/43 |
216 | 144,689 | ||||||
| 4.60%, 01/15/45 (Call 07/15/44) |
158 | 108,191 | ||||||
| 4.85%, 07/01/42 (Call 01/01/42)(a) |
115 | 82,777 | ||||||
| 4.90%, 08/15/44 (Call 02/15/44) |
49 | 34,396 | ||||||
| 4.95%, 01/15/31 (Call 10/15/30)(a) |
274 | 239,930 | ||||||
| 4.95%, 05/19/50 (Call 11/19/49) |
205 | 146,846 | ||||||
| 5.25%, 04/01/44 (Call 10/01/43) |
99 | 72,979 | ||||||
| 5.50%, 05/15/33 |
98 | 84,844 | ||||||
| 5.85%, 09/01/43 (Call 03/01/43) |
286 | 231,366 | ||||||
| 5.90%, 10/15/40 (Call 04/15/40)(a) |
67 | 54,294 | ||||||
| 6.88%, 04/30/36 |
243 | 222,944 | ||||||
| 7.88%, 07/30/30 |
69 | 70,442 | ||||||
| Thomson Reuters Corp. |
||||||||
| 5.50%, 08/15/35 |
45 | 45,680 | ||||||
| 5.65%, 11/23/43 (Call 05/23/43) |
67 | 65,071 | ||||||
| 5.85%, 04/15/40(a) |
11 | 11,166 | ||||||
| Time Warner Cable Enterprises LLC, 8.38%, 07/15/33 |
213 | 236,215 | ||||||
| Time Warner Cable LLC |
||||||||
| 5.50%, 09/01/41 (Call 03/01/41) |
163 | 134,307 | ||||||
| 5.88%, 11/15/40 (Call 05/15/40) |
230 | 197,741 | ||||||
| 6.55%, 05/01/37 |
271 | 254,407 | ||||||
| 6.75%, 06/15/39 |
271 | 255,262 | ||||||
| 7.30%, 07/01/38 |
290 | 288,956 | ||||||
| TWDC Enterprises 18 Corp. |
||||||||
| 2.95%, 06/15/27(a) |
51 | 48,300 | ||||||
| 3.00%, 07/30/46 |
107 | 74,686 | ||||||
| 4.13%, 06/01/44 |
226 | 192,618 | ||||||
| 4.38%, 08/16/41 |
193 | 170,583 | ||||||
| Series E, 4.13%, 12/01/41 |
113 | 97,241 | ||||||
| Walt Disney Co. (The) |
||||||||
| 2.00%, 09/01/29 (Call 06/01/29) |
184 | 158,623 | ||||||
| 2.75%, 09/01/49 (Call 03/01/49) |
581 | 374,753 | ||||||
| 3.35%, 03/24/25(a) |
150 | 146,991 | ||||||
| 3.60%, 01/13/51 (Call 07/13/50) |
515 | 390,898 | ||||||
| 3.70%, 03/23/27 |
54 | 52,294 | ||||||
| 3.80%, 03/22/30(a) |
19 | 17,927 | ||||||
| 3.80%, 05/13/60 (Call 11/13/59) |
597 | 452,656 | ||||||
| 4.63%, 03/23/40 (Call 09/23/39) |
47 | 43,944 | ||||||
| 4.70%, 03/23/50 (Call 09/23/49)(a) |
420 | 384,238 | ||||||
| 4.75%, 09/15/44 (Call 03/15/44) |
115 | 105,680 | ||||||
| 4.75%, 11/15/46 (Call 05/15/46) |
198 | 179,496 | ||||||
| 4.95%, 10/15/45 (Call 04/15/45) |
187 | 175,043 | ||||||
| 5.40%, 10/01/43 |
244 | 245,267 | ||||||
| 6.15%, 03/01/37 |
55 | 59,409 | ||||||
| 6.15%, 02/15/41(a) |
125 | 134,928 | ||||||
| 6.40%, 12/15/35 |
15 | 16,488 | ||||||
| 6.55%, 03/15/33 |
36 | 40,145 | ||||||
| 6.65%, 11/15/37 |
173 | 195,641 | ||||||
| 7.75%, 12/01/45 |
80 | 102,372 | ||||||
|
|
|
|||||||
| 20,551,542 | ||||||||
| 108 | 2 0 2 4 I S H A R E S A N N U A L R E P O R T T O S H A R E H O L D E R S |
| Schedule of Investments (continued) February 29, 2024 |
iShares® ESG Aware USD Corporate Bond ETF (Percentages shown are based on Net Assets) |
| Security | Par (000) |
Value | ||||||
| Metal Fabricate & Hardware — 0.0% |
||||||||
| Timken Co. (The), 4.50%, 12/15/28 (Call 09/15/28) |
$ | 35 | $ | 33,972 | ||||
| Valmont Industries Inc. |
||||||||
| 5.00%, 10/01/44 (Call 04/01/44) |
35 | 30,489 | ||||||
| 5.25%, 10/01/54 (Call 04/01/54) |
100 | 86,073 | ||||||
|
|
|
|||||||
| 150,534 | ||||||||
| Mining — 0.3% | ||||||||
| AngloGold Ashanti Holdings PLC |
||||||||
| 3.38%, 11/01/28 (Call 09/01/28) |
245 | 219,466 | ||||||
| 3.75%, 10/01/30 (Call 07/01/30) |
160 | 138,480 | ||||||
| Freeport-McMoRan Inc. |
||||||||
| 5.40%, 11/14/34 (Call 05/14/34) |
205 | 199,069 | ||||||
| 5.45%, 03/15/43 (Call 09/15/42) |
290 | 270,156 | ||||||
| Kinross Gold Corp., 4.50%, 07/15/27 (Call 04/15/27) |
230 | 223,526 | ||||||
| Newmont Corp. |
||||||||
| 2.25%, 10/01/30 (Call 07/01/30) |
57 | 47,666 | ||||||
| 2.60%, 07/15/32 (Call 04/15/32)(a) |
120 | 98,704 | ||||||
| 2.80%, 10/01/29 (Call 07/01/29)(a) |
106 | 94,119 | ||||||
| 4.88%, 03/15/42 (Call 09/15/41) |
379 | 348,188 | ||||||
| 5.45%, 06/09/44 (Call 12/09/43) |
23 | 22,461 | ||||||
| 6.25%, 10/01/39 |
331 | 350,030 | ||||||
| Rio Tinto Alcan Inc. |
||||||||
| 5.75%, 06/01/35(a) |
61 | 63,111 | ||||||
| 6.13%, 12/15/33 |
185 | 196,611 | ||||||
| 7.25%, 03/15/31 |
102 | 114,030 | ||||||
| Rio Tinto Finance USA Ltd. |
||||||||
| 2.75%, 11/02/51 (Call 05/02/51) |
115 | 72,920 | ||||||
| 5.20%, 11/02/40 |
181 | 178,031 | ||||||
| Rio Tinto Finance USA PLC |
||||||||
| 4.13%, 08/21/42 (Call 02/21/42) |
75 | 64,145 | ||||||
| 4.75%, 03/22/42 (Call 09/22/41) |
172 | 161,224 | ||||||
| 5.13%, 03/09/53 (Call 09/09/52) |
75 | 72,070 | ||||||
| Southern Copper Corp. |
||||||||
| 5.88%, 04/23/45 |
225 | 223,810 | ||||||
| 6.75%, 04/16/40 |
150 | 165,382 | ||||||
| 7.50%, 07/27/35 |
150 | 172,598 | ||||||
|
|
|
|||||||
| 3,495,797 | ||||||||
| Office & Business Equipment — 0.1% | ||||||||
| CDW LLC/CDW Finance Corp. |
||||||||
| 3.28%, 12/01/28 (Call 10/01/28) |
207 | 186,369 | ||||||
| 3.57%, 12/01/31 (Call 09/01/31) |
353 | 306,113 | ||||||
| 4.25%, 04/01/28 (Call 04/01/24)(a) |
90 | 85,691 | ||||||
|
|
|
|||||||
| 578,173 | ||||||||
| Oil & Gas — 2.7% | ||||||||
| Apache Corp. |
||||||||
| 5.10%, 09/01/40 (Call 03/01/40) |
75 | 62,767 | ||||||
| 5.25%, 02/01/42 (Call 08/01/41) |
255 | 211,715 | ||||||
| 5.35%, 07/01/49 (Call 01/01/49) |
10 | 8,091 | ||||||
| 6.00%, 01/15/37(a) |
75 | 72,900 | ||||||
| BP Capital Markets America Inc. |
||||||||
| 2.77%, 11/10/50 (Call 05/10/50) |
301 | 191,177 | ||||||
| 2.94%, 06/04/51 (Call 12/04/50) |
343 | 225,443 | ||||||
| 3.00%, 02/24/50 (Call 08/24/49) |
522 | 349,252 | ||||||
| 3.00%, 03/17/52 (Call 09/17/51) |
165 | 109,501 | ||||||
| 3.07%, 03/30/50 (Call 09/30/49) |
20 | 18,340 | ||||||
| 3.12%, 05/04/26 (Call 02/04/26) |
93 | 89,363 | ||||||
| 3.38%, 02/08/61 (Call 08/08/60) |
594 | 399,785 | ||||||
| 3.41%, 02/11/26 (Call 12/11/25) |
50 | 48,490 | ||||||
| 3.59%, 04/14/27 (Call 01/14/27) |
10 | 9,612 | ||||||
| 3.63%, 04/06/30 (Call 01/06/30) |
221 | 205,946 | ||||||
| Security | Par (000) |
Value | ||||||
| Oil & Gas (continued) |
||||||||
| 3.94%, 09/21/28 (Call 06/21/28) |
$ | 93 | $ | 89,301 | ||||
| 4.23%, 11/06/28 (Call 08/06/28) |
125 | 121,642 | ||||||
| 4.89%, 09/11/33 (Call 06/11/33) |
15 | 14,713 | ||||||
| BP Capital Markets PLC, 3.28%, 09/19/27 (Call 06/19/27) |
68 | 64,382 | ||||||
| Burlington Resources LLC |
||||||||
| 5.95%, 10/15/36 |
45 | 47,341 | ||||||
| 7.20%, 08/15/31 |
235 | 265,164 | ||||||
| 7.40%, 12/01/31 |
142 | 162,320 | ||||||
| Chevron Corp., 3.08%, 05/11/50 (Call 11/11/49) |
221 | 155,904 | ||||||
| Chevron USA Inc. |
||||||||
| 2.34%, 08/12/50 (Call 02/12/50) |
134 | 80,356 | ||||||
| 5.25%, 11/15/43 (Call 05/15/43) |
85 | 85,691 | ||||||
| Conoco Funding Co., 7.25%, 10/15/31 |
325 | 368,192 | ||||||
| ConocoPhillips Co. |
||||||||
| 4.03%, 03/15/62 (Call 09/15/61) |
340 | 263,385 | ||||||
| 4.30%, 11/15/44 (Call 05/15/44) |
217 | 186,472 | ||||||
| 4.88%, 10/01/47 (Call 04/01/47) |
35 | 32,455 | ||||||
| 5.05%, 09/15/33 (Call 06/15/33)(a) |
55 | 54,816 | ||||||
| 5.30%, 05/15/53 (Call 11/15/52) |
50 | 48,928 | ||||||
| 5.55%, 03/15/54 (Call 09/15/53) |
180 | 182,006 | ||||||
| 5.70%, 09/15/63 (Call 03/15/63) |
150 | 153,238 | ||||||
| 5.90%, 10/15/32 |
226 | 241,789 | ||||||
| 5.90%, 05/15/38 |
365 | 382,630 | ||||||
| 5.95%, 03/15/46 (Call 09/15/45)(a) |
250 | 259,616 | ||||||
| 6.50%, 02/01/39 |
197 | 221,776 | ||||||
| 6.95%, 04/15/29 |
599 | 656,588 | ||||||
| Devon Energy Corp. |
||||||||
| 4.75%, 05/15/42 (Call 11/15/41) |
130 | 110,036 | ||||||
| 5.00%, 06/15/45 (Call 12/15/44) |
100 | 86,252 | ||||||
| 5.60%, 07/15/41 (Call 01/15/41) |
251 | 236,514 | ||||||
| 7.88%, 09/30/31 |
49 | 55,770 | ||||||
| 7.95%, 04/15/32 |
61 | 69,527 | ||||||
| Diamondback Energy Inc. |
||||||||
| 3.50%, 12/01/29 (Call 09/01/29) |
479 | 439,691 | ||||||
| 4.25%, 03/15/52 (Call 09/15/51) |
65 | 51,575 | ||||||
| 4.40%, 03/24/51 (Call 09/24/50)(a) |
93 | 75,068 | ||||||
| 6.25%, 03/15/53 (Call 09/15/52)(a) |
95 | 100,503 | ||||||
| Eni USA Inc., 7.30%, 11/15/27 |
230 | 244,074 | ||||||
| EOG Resources Inc. |
||||||||
| 3.90%, 04/01/35 (Call 10/01/34) |
102 | 91,428 | ||||||
| 4.38%, 04/15/30 (Call 01/15/30) |
77 | 74,671 | ||||||
| 4.95%, 04/15/50 (Call 10/15/49) |
203 | 189,246 | ||||||
| EQT Corp. |
||||||||
| 5.00%, 01/15/29 (Call 07/15/28) |
125 | 121,973 | ||||||
| 5.75%, 02/01/34 (Call 11/01/33)(a) |
125 | 122,950 | ||||||
| 7.00%, 02/01/30 (Call 11/01/29)(a) |
315 | 333,659 | ||||||
| Exxon Mobil Corp. |
||||||||
| 3.10%, 08/16/49 (Call 02/16/49)(a) |
271 | 189,409 | ||||||
| 3.45%, 04/15/51 (Call 10/15/50) |
628 | 465,564 | ||||||
| 3.48%, 03/19/30 (Call 12/19/29) |
144 | 134,347 | ||||||
| 3.57%, 03/06/45 (Call 09/06/44) |
103 | 80,255 | ||||||
| 4.11%, 03/01/46 (Call 09/01/45) |
313 | 265,286 | ||||||
| 4.23%, 03/19/40 (Call 09/19/39) |
337 | 302,210 | ||||||
| 4.33%, 03/19/50 (Call 09/19/49) |
540 | 470,569 | ||||||
| Hess Corp. |
||||||||
| 4.30%, 04/01/27 (Call 01/01/27) |
1,428 | 1,390,837 | ||||||
| 5.60%, 02/15/41 |
35 | 35,266 | ||||||
| 6.00%, 01/15/40 |
76 | 79,344 | ||||||
| 7.13%, 03/15/33 |
383 | 429,477 | ||||||
| 7.30%, 08/15/31 |
552 | 620,122 | ||||||
| S C H E D U L E O F I N V E S T M E N T S |
109 |
| Schedule of Investments (continued) February 29, 2024 |
iShares® ESG Aware USD Corporate Bond ETF (Percentages shown are based on Net Assets) |
| Security | Par (000) |
Value | ||||||
| Oil & Gas (continued) |
||||||||
| 7.88%, 10/01/29 |
$ | 526 | $ | 589,808 | ||||
| Marathon Oil Corp. |
||||||||
| 4.40%, 07/15/27 (Call 04/15/27) |
379 | 368,047 | ||||||
| 6.60%, 10/01/37 |
234 | 244,124 | ||||||
| 6.80%, 03/15/32(a) |
281 | 299,510 | ||||||
| Marathon Petroleum Corp. |
||||||||
| 3.80%, 04/01/28 (Call 01/01/28) |
205 | 195,170 | ||||||
| 4.50%, 04/01/48 (Call 10/01/47)(a) |
62 | 51,006 | ||||||
| 4.75%, 09/15/44 (Call 03/15/44) |
113 | 98,608 | ||||||
| 5.00%, 09/15/54 (Call 03/15/54) |
40 | 34,373 | ||||||
| 5.13%, 12/15/26 (Call 09/15/26) |
151 | 150,746 | ||||||
| 6.50%, 03/01/41 (Call 09/01/40)(a) |
286 | 303,558 | ||||||
| Occidental Petroleum Corp. |
||||||||
| 4.40%, 04/15/46 (Call 10/15/45)(a) |
75 | 60,176 | ||||||
| 6.13%, 01/01/31 (Call 07/01/30)(a) |
5 | 5,122 | ||||||
| 6.20%, 03/15/40 |
150 | 152,256 | ||||||
| 6.45%, 09/15/36 |
370 | 390,089 | ||||||
| 6.60%, 03/15/46 (Call 09/15/45)(a) |
195 | 207,167 | ||||||
| 6.63%, 09/01/30 (Call 03/01/30) |
20 | 21,046 | ||||||
| 7.50%, 05/01/31 |
360 | 397,679 | ||||||
| 7.88%, 09/15/31 |
20 | 22,518 | ||||||
| 7.95%, 06/15/39 |
55 | 64,090 | ||||||
| 8.88%, 07/15/30 (Call 01/15/30) |
40 | 46,238 | ||||||
| Ovintiv Inc. |
||||||||
| 5.38%, 01/01/26 (Call 10/01/25) |
1,195 | 1,188,154 | ||||||
| 5.65%, 05/15/25 |
175 | 175,023 | ||||||
| 5.65%, 05/15/28 (Call 04/15/28) |
150 | 151,319 | ||||||
| 6.25%, 07/15/33 (Call 04/15/33) |
140 | 143,946 | ||||||
| 6.50%, 08/15/34 |
228 | 238,832 | ||||||
| 6.50%, 02/01/38 |
155 | 158,698 | ||||||
| 6.63%, 08/15/37 |
105 | 108,357 | ||||||
| 7.10%, 07/15/53 (Call 01/15/53) |
5 | 5,450 | ||||||
| 7.20%, 11/01/31 |
346 | 373,418 | ||||||
| 7.38%, 11/01/31(a) |
270 | 294,277 | ||||||
| 8.13%, 09/15/30 |
175 | 196,361 | ||||||
| Phillips 66 |
||||||||
| 3.30%, 03/15/52 (Call 09/15/51) |
40 | 27,357 | ||||||
| 3.85%, 04/09/25 (Call 03/09/25) |
52 | 51,107 | ||||||
| 3.90%, 03/15/28 (Call 12/15/27) |
66 | 63,500 | ||||||
| 4.65%, 11/15/34 (Call 05/15/34) |
323 | 303,151 | ||||||
| 4.88%, 11/15/44 (Call 05/15/44) |
377 | 344,117 | ||||||
| 5.88%, 05/01/42 |
257 | 264,896 | ||||||
| Phillips 66 Co. |
||||||||
| 5.25%, 06/15/31 (Call 04/15/31) |
75 | 74,818 | ||||||
| 5.30%, 06/30/33 (Call 03/30/33) |
185 | 183,555 | ||||||
| 5.65%, 06/15/54 (Call 12/15/53) |
125 | 123,926 | ||||||
| Shell International Finance BV |
||||||||
| 3.00%, 11/26/51 (Call 05/26/51)(a) |
520 | 348,502 | ||||||
| 3.13%, 11/07/49 (Call 05/07/49) |
235 | 163,401 | ||||||
| 3.25%, 04/06/50 (Call 10/06/49) |
370 | 262,983 | ||||||
| 3.75%, 09/12/46 |
185 | 145,758 | ||||||
| 4.00%, 05/10/46 |
330 | 270,935 | ||||||
| 4.13%, 05/11/35 |
662 | 611,861 | ||||||
| 4.38%, 05/11/45 |
490 | 428,076 | ||||||
| 4.55%, 08/12/43 |
60 | 54,475 | ||||||
| 6.38%, 12/15/38 |
505 | 561,329 | ||||||
| Tosco Corp., 8.13%, 02/15/30 |
405 | 467,850 | ||||||
| TotalEnergies Capital International SA |
||||||||
| 2.83%, 01/10/30 (Call 10/10/29) |
230 | 206,605 | ||||||
| 2.99%, 06/29/41 (Call 12/29/40) |
47 | 34,889 | ||||||
| 3.13%, 05/29/50 (Call 11/29/49) |
495 | 344,271 | ||||||
| Security | Par (000) |
Value | ||||||
| Oil & Gas (continued) |
||||||||
| 3.39%, 06/29/60 (Call 12/29/59) |
$ | 552 | $ | 381,527 | ||||
| 3.46%, 02/19/29 (Call 11/19/28) |
114 | 107,081 | ||||||
| 3.46%, 07/12/49 (Call 01/12/49) |
236 | 176,248 | ||||||
| TotalEnergies Capital SA, 3.88%, 10/11/28 |
333 | 320,733 | ||||||
| Valero Energy Corp. |
||||||||
| 3.40%, 09/15/26 (Call 06/15/26) |
35 | 33,463 | ||||||
| 3.65%, 12/01/51 (Call 06/01/51) |
194 | 136,542 | ||||||
| 4.00%, 04/01/29 (Call 01/01/29) |
45 | 42,941 | ||||||
| 4.00%, 06/01/52 (Call 12/01/51)(a) |
29 | 21,805 | ||||||
| 4.35%, 06/01/28 (Call 03/01/28) |
36 | 35,050 | ||||||
| 4.90%, 03/15/45(a) |
78 | 70,477 | ||||||
| 6.63%, 06/15/37 |
461 | 493,706 | ||||||
| 7.50%, 04/15/32 |
295 | 335,578 | ||||||
|
|
|
|||||||
| 27,234,389 | ||||||||
| Oil & Gas Services — 0.5% | ||||||||
| Baker Hughes Holdings LLC, 5.13%, 09/15/40 |
441 | 427,697 | ||||||
| Baker Hughes Holdings LLC/Baker Hughes Co-Obligor Inc. |
||||||||
| 3.14%, 11/07/29 (Call 08/07/29) |
750 | 684,044 | ||||||
| 3.34%, 12/15/27 (Call 09/15/27) |
1,442 | 1,359,800 | ||||||
| 4.08%, 12/15/47 (Call 06/15/47) |
94 | 75,681 | ||||||
| Halliburton Co. |
||||||||
| 2.92%, 03/01/30 (Call 12/01/29) |
366 | 325,056 | ||||||
| 4.50%, 11/15/41 (Call 05/15/41) |
127 | 112,060 | ||||||
| 4.75%, 08/01/43 (Call 02/01/43) |
115 | 103,726 | ||||||
| 4.85%, 11/15/35 (Call 05/15/35) |
297 | 285,750 | ||||||
| 5.00%, 11/15/45 (Call 05/15/45)(a) |
295 | 274,429 | ||||||
| 6.70%, 09/15/38 |
103 | 115,332 | ||||||
| 7.45%, 09/15/39(a) |
219 | 263,025 | ||||||
| NOV Inc. |
||||||||
| 3.60%, 12/01/29 (Call 09/01/29)(a) |
312 | 284,601 | ||||||
| 3.95%, 12/01/42 (Call 06/01/42) |
132 | 98,368 | ||||||
| Schlumberger Investment SA |
||||||||
| 2.65%, 06/26/30 (Call 03/26/30) |
479 | 420,951 | ||||||
| 4.50%, 05/15/28 (Call 04/15/28) |
25 | 24,761 | ||||||
| 4.85%, 05/15/33 (Call 02/15/33)(a) |
45 | 44,532 | ||||||
|
|
|
|||||||
| 4,899,813 | ||||||||
| Packaging & Containers — 0.1% | ||||||||
| Amcor Finance USA Inc. |
||||||||
| 3.63%, 04/28/26 (Call 01/28/26) |
50 | 48,146 | ||||||
| 4.50%, 05/15/28 (Call 02/15/28) |
88 | 85,573 | ||||||
| 5.63%, 05/26/33 (Call 02/26/33) |
150 | 152,351 | ||||||
| Amcor Flexibles North America Inc. |
||||||||
| 2.63%, 06/19/30 (Call 03/19/30) |
147 | 125,410 | ||||||
| 2.69%, 05/25/31 (Call 02/25/31)(a) |
35 | 29,473 | ||||||
| Berry Global Inc.,
5.65%, 01/15/34 |
150 | 148,046 | ||||||
| Packaging Corp. of America, 4.05%, 12/15/49 (Call 06/15/49) |
14 | 11,055 | ||||||
| Sonoco Products Co. |
||||||||
| 3.13%, 05/01/30 (Call 02/01/30) |
14 | 12,424 | ||||||
| 5.75%, 11/01/40 (Call 05/01/40) |
110 | 110,654 | ||||||
| WestRock MWV LLC |
||||||||
| 7.95%, 02/15/31 |
18 | 20,509 | ||||||
| 8.20%, 01/15/30 |
68 | 77,316 | ||||||
| WRKCo Inc. |
||||||||
| 3.00%, 06/15/33 (Call 03/15/33) |
55 | 46,352 | ||||||
| 4.00%, 03/15/28 (Call 12/15/27) |
20 | 19,090 | ||||||
| 4.20%, 06/01/32 (Call 03/01/32)(a) |
60 | 56,377 | ||||||
| 4.90%, 03/15/29 (Call 12/15/28) |
29 | 28,712 | ||||||
|
|
|
|||||||
| 971,488 | ||||||||
| 110 | 2 0 2 4 I S H A R E S A N N U A L R E P O R T T O S H A R E H O L D E R S |
| Schedule of Investments (continued) February 29, 2024 |
iShares® ESG Aware USD Corporate Bond ETF (Percentages shown are based on Net Assets) |
| Security | Par (000) |
Value | ||||||
| Pharmaceuticals — 4.5% | ||||||||
| AbbVie Inc. |
||||||||
| 3.20%, 05/14/26 (Call 02/14/26) |
$ | 7 | $ | 6,737 | ||||
| 4.05%, 11/21/39 (Call 05/21/39) |
540 | 473,965 | ||||||
| 4.25%, 11/14/28 (Call 08/14/28) |
22 | 21,491 | ||||||
| 4.25%, 11/21/49 (Call 05/21/49) |
1,062 | 914,332 | ||||||
| 4.30%, 05/14/36 (Call 11/14/35) |
357 | 332,340 | ||||||
| 4.40%, 11/06/42 |
525 | 469,634 | ||||||
| 4.45%, 05/14/46 (Call 11/14/45) |
432 | 381,787 | ||||||
| 4.50%, 05/14/35 (Call 11/14/34) |
699 | 667,195 | ||||||
| 4.70%, 05/14/45 (Call 11/14/44) |
637 | 587,381 | ||||||
| 4.85%, 06/15/44 (Call 12/15/43) |
33 | 31,177 | ||||||
| 4.88%, 11/14/48 (Call 05/14/48) |
398 | 376,031 | ||||||
| Astrazeneca Finance LLC |
||||||||
| 4.88%, 03/03/33 (Call 12/03/32) |
355 | 353,427 | ||||||
| 5.00%, 02/26/34 (Call 11/26/33) |
125 | 125,463 | ||||||
| AstraZeneca PLC |
||||||||
| 3.13%, 06/12/27 (Call 03/12/27) |
672 | 638,395 | ||||||
| 3.38%, 11/16/25 |
525 | 510,620 | ||||||
| 4.00%, 01/17/29 (Call 10/17/28) |
521 | 502,973 | ||||||
| 4.00%, 09/18/42 |
180 | 153,856 | ||||||
| 4.38%, 11/16/45 |
364 | 321,771 | ||||||
| 4.38%, 08/17/48 (Call 02/17/48) |
106 | 94,118 | ||||||
| 6.45%, 09/15/37 |
708 | 797,285 | ||||||
| Becton Dickinson and Co. |
||||||||
| 3.70%, 06/06/27 (Call 03/06/27) |
937 | 898,455 | ||||||
| 4.67%, 06/06/47 (Call 12/06/46) |
458 | 405,624 | ||||||
| 4.69%, 12/15/44 (Call 06/15/44) |
292 | 262,008 | ||||||
| Bristol-Myers Squibb Co. |
||||||||
| 2.55%, 11/13/50 (Call 05/13/50) |
399 | 241,854 | ||||||
| 3.25%, 02/27/27 |
115 | 110,365 | ||||||
| 3.25%, 08/01/42 |
293 | 221,337 | ||||||
| 3.70%, 03/15/52 (Call 09/15/51) |
305 | 230,551 | ||||||
| 3.90%, 03/15/62 (Call 09/15/61) |
290 | 216,244 | ||||||
| 4.25%, 10/26/49 (Call 04/26/49) |
778 | 651,261 | ||||||
| 4.35%, 11/15/47 (Call 05/15/47) |
360 | 305,772 | ||||||
| 4.50%, 03/01/44 (Call 09/01/43) |
30 | 26,815 | ||||||
| 4.55%, 02/20/48 (Call 08/20/47) |
272 | 239,263 | ||||||
| 4.63%, 05/15/44 (Call 11/15/43) |
50 | 45,258 | ||||||
| 5.00%, 08/15/45 (Call 02/15/45) |
134 | 127,544 | ||||||
| 5.55%, 02/22/54 (Call 08/22/53) |
500 | 506,016 | ||||||
| 5.65%, 02/22/64 (Call 08/22/63) |
400 | 403,808 | ||||||
| 6.25%, 11/15/53 (Call 05/15/53)(a) |
15 | 16,644 | ||||||
| 6.40%, 11/15/63 (Call 05/15/63) |
205 | 228,652 | ||||||
| Cardinal Health Inc. |
||||||||
| 3.41%, 06/15/27 (Call 03/15/27) |
1,294 | 1,226,292 | ||||||
| 3.75%, 09/15/25 (Call 06/15/25) |
420 | 409,649 | ||||||
| 4.37%, 06/15/47 (Call 12/15/46) |
122 | 100,089 | ||||||
| 4.60%, 03/15/43 |
132 | 113,478 | ||||||
| 4.90%, 09/15/45 (Call 03/15/45) |
131 | 115,849 | ||||||
| 5.13%, 02/15/29 (Call 01/15/29) |
100 | 99,601 | ||||||
| 5.45%, 02/15/34 (Call 11/15/33) |
60 | 60,020 | ||||||
| Cencora Inc. |
||||||||
| 2.70%, 03/15/31 (Call 12/15/30) |
70 | 59,679 | ||||||
| 3.25%, 03/01/25 (Call 12/01/24) |
115 | 112,474 | ||||||
| 3.45%, 12/15/27 (Call 09/15/27) |
83 | 78,526 | ||||||
| 4.25%, 03/01/45 (Call 09/01/44)(a) |
242 | 210,335 | ||||||
| 4.30%, 12/15/47 (Call 06/15/47) |
161 | 136,830 | ||||||
| 5.13%, 02/15/34 (Call 11/15/33) |
500 | 490,716 | ||||||
| Cigna Group (The) |
||||||||
| 2.40%, 03/15/30 (Call 12/15/29)(a) |
346 | 296,623 | ||||||
| 3.40%, 03/15/50 (Call 09/15/49) |
242 | 168,410 | ||||||
| Security | Par (000) |
Value | ||||||
| Pharmaceuticals (continued) | ||||||||
| 3.40%, 03/15/51 (Call 09/15/50) |
$ | 280 | $ | 194,712 | ||||
| 3.88%, 10/15/47 (Call 04/15/47) |
316 | 242,815 | ||||||
| 4.38%, 10/15/28 (Call 07/15/28) |
946 | 918,715 | ||||||
| 4.80%, 08/15/38 (Call 02/15/38)(a) |
357 | 331,089 | ||||||
| 4.80%, 07/15/46 (Call 01/16/46) |
274 | 244,896 | ||||||
| 4.90%, 12/15/48 (Call 06/15/48) |
693 | 622,578 | ||||||
| 5.00%, 05/15/29 (Call 04/15/29)(a) |
150 | 148,923 | ||||||
| 5.13%, 05/15/31 (Call 03/15/31) |
150 | 148,298 | ||||||
| 5.25%, 02/15/34 (Call 11/15/33) |
550 | 543,275 | ||||||
| 5.40%, 03/15/33 (Call 12/15/32)(a) |
235 | 236,409 | ||||||
| 5.60%, 02/15/54 (Call 08/15/53) |
150 | 147,693 | ||||||
| 6.13%, 11/15/41 |
159 | 168,122 | ||||||
| CVS Health Corp. |
||||||||
| 2.88%, 06/01/26 (Call 03/01/26) |
63 | 59,876 | ||||||
| 3.25%, 08/15/29 (Call 05/15/29) |
49 | 44,581 | ||||||
| 3.63%, 04/01/27 (Call 02/01/27) |
80 | 76,694 | ||||||
| 3.75%, 04/01/30 (Call 01/01/30) |
18 | 16,609 | ||||||
| 3.88%, 07/20/25 (Call 04/20/25) |
72 | 70,538 | ||||||
| 4.25%, 04/01/50 (Call 10/01/49) |
41 | 32,748 | ||||||
| 4.30%, 03/25/28 (Call 12/25/27) |
854 | 829,126 | ||||||
| 4.78%, 03/25/38 (Call 09/25/37) |
981 | 892,480 | ||||||
| 4.88%, 07/20/35 (Call 01/20/35) |
190 | 181,222 | ||||||
| 5.05%, 03/25/48 (Call 09/25/47) |
1,527 | 1,364,296 | ||||||
| 5.13%, 07/20/45 (Call 01/20/45) |
773 | 703,763 | ||||||
| 5.25%, 02/21/33 (Call 11/21/32) |
315 | 311,889 | ||||||
| 5.30%, 06/01/33 (Call 03/01/33)(a) |
75 | 74,471 | ||||||
| 5.30%, 12/05/43 (Call 06/05/43) |
255 | 236,922 | ||||||
| 5.63%, 02/21/53 (Call 08/21/52) |
310 | 297,617 | ||||||
| 5.88%, 06/01/53 (Call 12/01/52)(a) |
165 | 164,416 | ||||||
| 6.00%, 06/01/63 (Call 12/01/62)(a) |
260 | 260,384 | ||||||
| 6.13%, 09/15/39 |
161 | 165,357 | ||||||
| 6.25%, 06/01/27 |
114 | 118,024 | ||||||
| Eli Lilly & Co. |
||||||||
| 2.50%, 09/15/60 (Call 03/15/60) |
100 | 58,179 | ||||||
| 3.10%, 05/15/27 (Call 02/15/27) |
103 | 97,997 | ||||||
| 3.38%, 03/15/29 (Call 12/15/28) |
57 | 53,704 | ||||||
| 3.70%, 03/01/45 (Call 09/01/44) |
91 | 75,182 | ||||||
| 3.95%, 05/15/47 (Call 11/15/46) |
50 | 43,004 | ||||||
| 3.95%, 03/15/49 (Call 09/15/48) |
600 | 503,111 | ||||||
| 4.15%, 03/15/59 (Call 09/15/58) |
355 | 298,499 | ||||||
| 5.50%, 03/15/27 |
40 | 40,931 | ||||||
| 5.55%, 03/15/37 |
130 | 137,081 | ||||||
| GlaxoSmithKline Capital Inc. |
||||||||
| 3.63%, 05/15/25 |
260 | 255,463 | ||||||
| 3.88%, 05/15/28 |
153 | 147,936 | ||||||
| 4.20%, 03/18/43 |
74 | 65,019 | ||||||
| 5.38%, 04/15/34(a) |
54 | 56,956 | ||||||
| 6.38%, 05/15/38 |
532 | 596,481 | ||||||
| GlaxoSmithKline Capital PLC, |
128 | 120,111 | ||||||
| Johnson & Johnson |
||||||||
| 2.45%, 09/01/60 (Call 03/01/60) |
391 | 230,249 | ||||||
| 3.50%, 01/15/48 (Call 07/15/47)(a) |
115 | 90,520 | ||||||
| 3.70%, 03/01/46 (Call 09/01/45) |
243 | 199,094 | ||||||
| 3.75%, 03/03/47 (Call 09/03/46) |
272 | 223,629 | ||||||
| 4.38%, 12/05/33 (Call 06/05/33) |
27 | 26,667 | ||||||
| 4.50%, 09/01/40 |
41 | 38,956 | ||||||
| 4.50%, 12/05/43 (Call 06/05/43)(a) |
157 | 147,724 | ||||||
| 4.85%, 05/15/41 |
173 | 171,302 | ||||||
| 5.85%, 07/15/38 |
207 | 227,458 | ||||||
| 5.95%, 08/15/37 |
188 | 207,251 | ||||||
| S C H E D U L E O F I N V E S T M E N T S |
111 |
| Schedule of Investments (continued) February 29, 2024 |
iShares® ESG Aware USD Corporate Bond ETF (Percentages shown are based on Net Assets) |
| Security | Par (000) |
Value | ||||||
| Pharmaceuticals (continued) | ||||||||
| McKesson Corp. |
||||||||
| 3.95%, 02/16/28 (Call 11/16/27) |
$ | 49 | $ | 47,547 | ||||
| 4.90%, 07/15/28 (Call 06/15/28) |
67 | 67,013 | ||||||
| 5.10%, 07/15/33 (Call 04/15/33) |
657 | 654,459 | ||||||
| Mead Johnson Nutrition Co. |
||||||||
| 4.13%, 11/15/25 (Call 08/15/25) |
250 | 245,281 | ||||||
| 4.60%, 06/01/44 (Call 12/01/43) |
220 | 199,058 | ||||||
| 5.90%, 11/01/39 |
226 | 235,754 | ||||||
| Merck & Co. Inc. |
||||||||
| 2.45%, 06/24/50 (Call 12/24/49) |
75 | 46,033 | ||||||
| 2.75%, 12/10/51 (Call 06/10/51) |
230 | 149,117 | ||||||
| 2.90%, 12/10/61 (Call 06/10/61) |
680 | 421,181 | ||||||
| 3.40%, 03/07/29 (Call 12/07/28) |
64 | 60,110 | ||||||
| 3.60%, 09/15/42 (Call 03/15/42) |
228 | 184,542 | ||||||
| 3.70%, 02/10/45 (Call 08/10/44) |
585 | 472,974 | ||||||
| 3.90%, 03/07/39 (Call 09/07/38) |
12 | 10,489 | ||||||
| 4.00%, 03/07/49 (Call 09/07/48) |
302 | 251,500 | ||||||
| 4.05%, 05/17/28 (Call 04/17/28)(a) |
40 | 39,182 | ||||||
| 4.15%, 05/18/43 |
427 | 372,712 | ||||||
| 4.30%, 05/17/30 (Call 03/17/30) |
25 | 24,328 | ||||||
| 4.50%, 05/17/33 (Call 02/17/33) |
250 | 243,176 | ||||||
| 5.15%, 05/17/63 (Call 11/17/62) |
290 | 283,533 | ||||||
| 6.50%, 12/01/33 |
302 | 340,428 | ||||||
| 6.55%, 09/15/37 |
137 | 153,735 | ||||||
| Merck Sharp & Dohme Corp. |
||||||||
| 5.75%, 11/15/36 |
205 | 219,080 | ||||||
| 5.95%, 12/01/28 |
78 | 81,827 | ||||||
| Mylan Inc., 5.20%, 04/15/48 (Call 10/15/47) |
94 | 76,974 | ||||||
| Novartis Capital Corp. |
||||||||
| 2.75%, 08/14/50 (Call 02/14/50)(a) |
140 | 93,285 | ||||||
| 4.00%, 11/20/45 (Call 05/20/45) |
150 | 127,533 | ||||||
| 4.40%, 05/06/44 |
51 | 46,416 | ||||||
| Pfizer Inc. |
||||||||
| 2.70%, 05/28/50 (Call 11/28/49) |
650 | 427,925 | ||||||
| 4.00%, 12/15/36 |
75 | 67,369 | ||||||
| 4.00%, 03/15/49 (Call 09/15/48) |
363 | 299,741 | ||||||
| 4.13%, 12/15/46 |
181 | 151,786 | ||||||
| 4.20%, 09/15/48 (Call 03/15/48) |
316 | 268,570 | ||||||
| 4.40%, 05/15/44(a) |
25 | 22,458 | ||||||
| 7.20%, 03/15/39 |
187 | 222,210 | ||||||
| Pfizer Investment Enterprises Pte Ltd. |
||||||||
| 4.75%, 05/19/33 (Call 02/19/33) |
626 | 610,010 | ||||||
| 5.30%, 05/19/53 (Call 11/19/52) |
845 | 827,604 | ||||||
| 5.34%, 05/19/63 (Call 11/19/62) |
1,100 | 1,059,785 | ||||||
| Shire Acquisitions Investments Ireland DAC, |
153 | 145,780 | ||||||
| Takeda Pharmaceutical Co. Ltd. |
||||||||
| 3.18%, 07/09/50 (Call 01/09/50) |
522 | 357,697 | ||||||
| 3.38%, 07/09/60 (Call 01/09/60) |
252 | 168,238 | ||||||
| 5.00%, 11/26/28 (Call 08/26/28) |
105 | 104,726 | ||||||
| Utah Acquisition Sub Inc., |
100 | 82,142 | ||||||
| Viatris Inc., 4.00%, 06/22/50 (Call 12/22/49) |
479 | 326,383 | ||||||
| Zoetis Inc. |
||||||||
| 2.00%, 05/15/30 (Call 02/15/30) |
70 | 58,709 | ||||||
| 3.00%, 09/12/27 (Call 06/12/27) |
1,092 | 1,022,152 | ||||||
| 3.00%, 05/15/50 (Call 11/15/49) |
10 | 6,845 | ||||||
| 3.90%, 08/20/28 (Call 05/20/28)(a) |
372 | 357,618 | ||||||
| 3.95%, 09/12/47 (Call 03/12/47) |
178 | 143,374 | ||||||
| 4.45%, 08/20/48 (Call 02/20/48) |
10 | 8,748 | ||||||
| 4.50%, 11/13/25 (Call 08/13/25) |
1,873 | 1,849,425 | ||||||
| Security | Par (000) |
Value | ||||||
| Pharmaceuticals (continued) | ||||||||
| 4.70%, 02/01/43 (Call 08/01/42) |
$ | 433 | $ | 395,540 | ||||
| 5.60%, 11/16/32 (Call 08/16/32) |
795 | 821,580 | ||||||
|
|
|
|||||||
| 45,490,744 | ||||||||
| Pipelines — 3.4% | ||||||||
| Boardwalk Pipelines LP |
||||||||
| 4.45%, 07/15/27 (Call 04/15/27) |
615 | 599,470 | ||||||
| 4.80%, 05/03/29 (Call 02/03/29) |
109 | 105,911 | ||||||
| Cheniere Corpus Christi Holdings LLC |
||||||||
| 2.74%, 12/31/39 (Call 07/04/39) |
110 | 86,317 | ||||||
| 3.70%, 11/15/29 (Call 05/18/29) |
684 | 631,522 | ||||||
| 5.13%, 06/30/27 (Call 01/01/27) |
128 | 127,385 | ||||||
| 5.88%, 03/31/25 (Call 10/02/24) |
252 | 251,919 | ||||||
| Cheniere Energy Inc., |
310 | 297,741 | ||||||
| Cheniere Energy Partners LP |
||||||||
| 3.25%, 01/31/32 (Call 01/31/27)(a) |
227 | 189,725 | ||||||
| 4.00%, 03/01/31 (Call 03/01/26) |
10 | 8,931 | ||||||
| 4.50%, 10/01/29 (Call 10/01/24) |
55 | 51,555 | ||||||
| 5.95%, 06/30/33 (Call 12/30/32) |
158 | 158,629 | ||||||
| Columbia Pipeline Group Inc., |
31 | 29,928 | ||||||
| DCP Midstream Operating LP |
||||||||
| 5.13%, 05/15/29 (Call 02/15/29) |
80 | 79,009 | ||||||
| 5.60%, 04/01/44 (Call 10/01/43) |
70 | 66,834 | ||||||
| 8.13%, 08/16/30(a) |
55 | 62,702 | ||||||
| Enbridge Energy Partners LP |
||||||||
| 7.38%, 10/15/45 (Call 04/15/45) |
144 | 166,226 | ||||||
| Series B, 7.50%, 04/15/38 |
127 | 146,787 | ||||||
| Enbridge Inc. |
||||||||
| 2.50%, 08/01/33 (Call 05/01/33) |
665 | 525,499 | ||||||
| 3.13%, 11/15/29 (Call 08/15/29) |
80 | 72,272 | ||||||
| 3.40%, 08/01/51 (Call 02/01/51) |
120 | 83,678 | ||||||
| 3.70%, 07/15/27 (Call 04/15/27) |
59 | 56,338 | ||||||
| 4.00%, 11/15/49 (Call 05/15/49) |
133 | 102,839 | ||||||
| 4.25%, 12/01/26 (Call 09/01/26) |
71 | 69,449 | ||||||
| 4.50%, 06/10/44 (Call 12/10/43) |
94 | 78,331 | ||||||
| 5.50%, 12/01/46 (Call 06/01/46)(a) |
162 | 156,415 | ||||||
| 5.70%, 03/08/33 (Call 12/08/32) |
425 | 430,188 | ||||||
| 5.90%, 11/15/26 (Call 10/15/26) |
245 | 249,602 | ||||||
| 6.00%, 11/15/28 (Call 10/15/28) |
20 | 20,710 | ||||||
| 6.20%, 11/15/30 (Call 09/15/30) |
105 | 110,093 | ||||||
| 6.70%, 11/15/53 (Call 05/15/53)(a) |
55 | 61,346 | ||||||
| Energy Transfer LP |
||||||||
| 4.15%, 09/15/29 (Call 06/15/29) |
125 | 117,856 | ||||||
| 4.40%, 03/15/27 (Call 12/15/26) |
279 | 271,732 | ||||||
| 4.90%, 03/15/35 (Call 09/15/34) |
5 | 4,663 | ||||||
| 4.95%, 05/15/28 (Call 02/15/28) |
216 | 213,129 | ||||||
| 5.00%, 05/15/44 (Call 11/15/43) |
970 | 839,669 | ||||||
| 5.00%, 05/15/50 (Call 11/15/49) |
365 | 314,721 | ||||||
| 5.40%, 10/01/47 (Call 04/01/47) |
40 | 36,175 | ||||||
| 5.75%, 02/15/33 (Call 11/15/32) |
85 | 85,524 | ||||||
| 5.95%, 05/15/54 (Call 11/15/53) |
15 | 14,668 | ||||||
| 6.00%, 06/15/48 (Call 12/15/47) |
105 | 102,787 | ||||||
| 6.25%, 04/15/49 (Call 10/15/48) |
250 | 252,242 | ||||||
| 6.63%, 10/15/36 |
80 | 84,067 | ||||||
| 7.50%, 07/01/38 |
120 | 136,309 | ||||||
| Enterprise Products Operating LLC |
||||||||
| 2.80%, 01/31/30 (Call 10/31/29) |
115 | 102,097 | ||||||
| 3.30%, 02/15/53 (Call 08/15/52) |
15 | 10,465 | ||||||
| 3.70%, 01/31/51 (Call 07/31/50) |
30 | 22,630 | ||||||
| 3.95%, 01/31/60 (Call 07/31/59) |
164 | 124,044 | ||||||
| 112 | 2 0 2 4 I S H A R E S A N N U A L R E P O R T T O S H A R E H O L D E R S |
| Schedule of Investments (continued) February 29, 2024 |
iShares® ESG Aware USD Corporate Bond ETF (Percentages shown are based on Net Assets) |
| Security | Par (000) |
Value | ||||||
| Pipelines (continued) | ||||||||
| 4.20%, 01/31/50 (Call 07/31/49) |
$ | 154 | $ | 127,142 | ||||
| 4.25%, 02/15/48 (Call 08/15/47) |
88 | 73,568 | ||||||
| 4.45%, 02/15/43 (Call 08/15/42) |
165 | 143,577 | ||||||
| 4.80%, 02/01/49 (Call 08/01/48) |
178 | 161,196 | ||||||
| 4.85%, 08/15/42 (Call 02/15/42) |
176 | 160,990 | ||||||
| 4.85%, 03/15/44 (Call 09/15/43) |
227 | 207,786 | ||||||
| 4.90%, 05/15/46 (Call 11/15/45) |
127 | 115,939 | ||||||
| 4.95%, 10/15/54 (Call 04/15/54) |
90 | 82,067 | ||||||
| 5.10%, 02/15/45 (Call 08/15/44) |
277 | 259,333 | ||||||
| 5.38%, 02/15/78 (Call 02/15/28), |
347 | 321,080 | ||||||
| 5.70%, 02/15/42(a) |
105 | 105,919 | ||||||
| 5.95%, 02/01/41 |
176 | 183,514 | ||||||
| 6.13%, 10/15/39 |
100 | 104,811 | ||||||
| 6.45%, 09/01/40 |
149 | 162,757 | ||||||
| 7.55%, 04/15/38 |
125 | 148,704 | ||||||
| Series D, 6.88%, 03/01/33 |
28 | 31,158 | ||||||
| Series E, 5.25%, 08/16/77 (Call 08/16/27), |
169 | 160,676 | ||||||
| Series H, 6.65%, 10/15/34 |
14 | 15,456 | ||||||
| Kinder Morgan Energy Partners LP |
||||||||
| 5.00%, 08/15/42 (Call 02/15/42) |
27 | 23,493 | ||||||
| 5.00%, 03/01/43 (Call 09/01/42) |
98 | 85,367 | ||||||
| 5.40%, 09/01/44 (Call 03/01/44) |
123 | 112,187 | ||||||
| 5.50%, 03/01/44 (Call 09/01/43) |
170 | 157,175 | ||||||
| 5.63%, 09/01/41 |
40 | 37,635 | ||||||
| 5.80%, 03/15/35 |
188 | 188,714 | ||||||
| 6.38%, 03/01/41 |
128 | 130,073 | ||||||
| 6.50%, 02/01/37 |
133 | 136,981 | ||||||
| 6.50%, 09/01/39 |
143 | 147,243 | ||||||
| 6.55%, 09/15/40 |
90 | 93,391 | ||||||
| 6.95%, 01/15/38 |
266 | 286,843 | ||||||
| 7.30%, 08/15/33 |
166 | 184,276 | ||||||
| 7.40%, 03/15/31 |
134 | 148,161 | ||||||
| 7.50%, 11/15/40 |
59 | 65,774 | ||||||
| 7.75%, 03/15/32 |
211 | 237,445 | ||||||
| Kinder Morgan Inc. |
||||||||
| 3.25%, 08/01/50 (Call 02/01/50) |
130 | 84,075 | ||||||
| 3.60%, 02/15/51 (Call 08/15/50) |
67 | 45,993 | ||||||
| 4.30%, 03/01/28 (Call 12/01/27) |
119 | 115,385 | ||||||
| 4.80%, 02/01/33 (Call 11/01/32) |
50 | 47,178 | ||||||
| 5.00%, 02/01/29 (Call 01/01/29) |
215 | 213,292 | ||||||
| 5.05%, 02/15/46 (Call 08/15/45) |
230 | 200,019 | ||||||
| 5.20%, 06/01/33 (Call 03/01/33) |
350 | 340,441 | ||||||
| 5.20%, 03/01/48 (Call 09/01/47) |
105 | 93,277 | ||||||
| 5.30%, 12/01/34 (Call 06/01/34)(a) |
276 | 268,984 | ||||||
| 5.40%, 02/01/34 (Call 11/01/33)(a) |
275 | 270,252 | ||||||
| 5.45%, 08/01/52 (Call 02/01/52)(a) |
95 | 87,500 | ||||||
| 5.55%, 06/01/45 (Call 12/01/44) |
402 | 377,160 | ||||||
| 7.75%, 01/15/32 |
288 | 324,326 | ||||||
| 7.80%, 08/01/31 |
258 | 288,532 | ||||||
| Magellan Midstream Partners LP, |
140 | 101,932 | ||||||
| MPLX LP |
||||||||
| 4.00%, 03/15/28 (Call 12/15/27) |
134 | 128,328 | ||||||
| 4.13%, 03/01/27 (Call 12/01/26) |
521 | 505,165 | ||||||
| 4.25%, 12/01/27 (Call 09/01/27) |
76 | 73,482 | ||||||
| 4.50%, 04/15/38 (Call 10/15/37) |
209 | 182,116 | ||||||
| 4.70%, 04/15/48 (Call 10/15/47) |
313 | 262,038 | ||||||
| 4.80%, 02/15/29 (Call 11/15/28) |
162 | 158,817 | ||||||
| 4.90%, 04/15/58 (Call 10/15/57) |
207 | 171,386 | ||||||
| Security | Par (000) |
Value | ||||||
| Pipelines (continued) | ||||||||
| 4.95%, 03/14/52 (Call 09/14/51) |
$ | 100 | $ | 86,120 | ||||
| 5.20%, 03/01/47 (Call 09/01/46) |
332 | 298,149 | ||||||
| 5.50%, 02/15/49 (Call 08/15/48) |
316 | 295,883 | ||||||
| Northwest Pipeline LLC, 4.00%, 04/01/27 (Call 01/01/27) |
43 | 41,731 | ||||||
| ONEOK Inc. |
||||||||
| 2.20%, 09/15/25 (Call 08/15/25) |
494 | 469,871 | ||||||
| 3.10%, 03/15/30 (Call 12/15/29) |
208 | 184,274 | ||||||
| 3.40%, 09/01/29 (Call 06/01/29) |
242 | 221,023 | ||||||
| 4.00%, 07/13/27 (Call 04/13/27) |
469 | 451,856 | ||||||
| 4.20%, 10/03/47 (Call 04/03/47) |
79 | 60,447 | ||||||
| 4.25%, 09/15/46 |
52 | 40,517 | ||||||
| 4.35%, 03/15/29 (Call 12/15/28)(a) |
340 | 327,323 | ||||||
| 4.45%, 09/01/49 (Call 03/01/49) |
43 | 34,293 | ||||||
| 4.50%, 03/15/50 (Call 09/15/49) |
27 | 21,600 | ||||||
| 4.55%, 07/15/28 (Call 04/15/28) |
438 | 427,926 | ||||||
| 4.85%, 02/01/49 |
88 | 75,091 | ||||||
| 4.95%, 07/13/47 (Call 01/06/47) |
80 | 68,866 | ||||||
| 5.15%, 10/15/43(a) |
43 | 38,837 | ||||||
| 5.55%, 11/01/26 (Call 10/01/26) |
300 | 302,157 | ||||||
| 5.65%, 11/01/28 (Call 10/01/28) |
250 | 254,424 | ||||||
| 5.80%, 11/01/30 (Call 09/01/30) |
55 | 56,301 | ||||||
| 5.85%, 01/15/26 (Call 12/15/25)(a) |
527 | 531,653 | ||||||
| 6.05%, 09/01/33 (Call 06/01/33)(a) |
400 | 412,153 | ||||||
| 6.10%, 11/15/32 (Call 08/15/32) |
285 | 295,189 | ||||||
| 6.35%, 01/15/31 (Call 10/15/30) |
150 | 157,296 | ||||||
| 6.63%, 09/01/53 (Call 03/01/53) |
100 | 107,623 | ||||||
| 7.15%, 01/15/51 (Call 07/15/50) |
24 | 26,617 | ||||||
| ONEOK Partners LP |
||||||||
| 4.90%, 03/15/25 (Call 12/15/24) |
2,272 | 2,254,951 | ||||||
| 6.20%, 09/15/43 (Call 03/15/43) |
141 | 143,912 | ||||||
| 6.65%, 10/01/36 |
237 | 250,665 | ||||||
| 6.85%, 10/15/37 |
223 | 239,102 | ||||||
| Plains All American Pipeline LP/PAA Finance Corp. |
||||||||
| 3.55%, 12/15/29 (Call 09/15/29) |
119 | 107,880 | ||||||
| 4.70%, 06/15/44 (Call 12/15/43) |
56 | 46,316 | ||||||
| 5.15%, 06/01/42 (Call 12/01/41) |
49 | 43,238 | ||||||
| 6.65%, 01/15/37(a) |
216 | 227,941 | ||||||
| Sabine Pass Liquefaction LLC |
||||||||
| 4.20%, 03/15/28 (Call 09/15/27) |
449 | 433,238 | ||||||
| 4.50%, 05/15/30 (Call 11/15/29) |
167 | 159,876 | ||||||
| 5.00%, 03/15/27 (Call 09/15/26) |
589 | 584,814 | ||||||
| 5.63%, 03/01/25 (Call 12/01/24) |
379 | 378,537 | ||||||
| 5.88%, 06/30/26 (Call 12/31/25) |
172 | 173,399 | ||||||
| Spectra Energy Partners LP |
||||||||
| 3.38%, 10/15/26 (Call 07/15/26) |
168 | 160,475 | ||||||
| 3.50%, 03/15/25 (Call 12/15/24) |
68 | 66,665 | ||||||
| 4.50%, 03/15/45 (Call 09/15/44) |
256 | 214,475 | ||||||
| 5.95%, 09/25/43 (Call 03/25/43) |
231 | 229,602 | ||||||
| Targa Resources Corp. |
||||||||
| 4.20%, 02/01/33 (Call 11/01/32) |
350 | 314,914 | ||||||
| 4.95%, 04/15/52 (Call 10/15/51) |
190 | 162,584 | ||||||
| 6.13%, 03/15/33 (Call 12/15/32) |
30 | 30,912 | ||||||
| 6.15%, 03/01/29 (Call 02/01/29) |
75 | 77,326 | ||||||
| 6.25%, 07/01/52 (Call 01/01/52) |
35 | 35,429 | ||||||
| 6.50%, 03/30/34 (Call 12/30/33) |
340 | 360,987 | ||||||
| 6.50%, 02/15/53 (Call 08/15/52) |
195 | 205,265 | ||||||
| Targa Resources Partners LP/Targa Resources Partners Finance Corp. |
||||||||
| 4.00%, 01/15/32 (Call 07/15/26) |
40 | 35,698 | ||||||
| 5.50%, 03/01/30 (Call 03/01/25)(a) |
60 | 59,310 | ||||||
| S C H E D U L E O F I N V E S T M E N T S |
113 |
| Schedule of Investments (continued) February 29, 2024 |
iShares® ESG Aware USD Corporate Bond ETF (Percentages shown are based on Net Assets) |
| Security | Par (000) |
Value | ||||||
| Pipelines (continued) | ||||||||
| TC PipeLines LP |
||||||||
| 3.90%, 05/25/27 (Call 02/25/27) |
$ | 266 | $ | 253,527 | ||||
| 4.38%, 03/13/25 (Call 12/13/24) |
39 | 38,403 | ||||||
| Tennessee Gas Pipeline Co. LLC |
||||||||
| 7.00%, 03/15/27(a) |
177 | 185,774 | ||||||
| 7.00%, 10/15/28 |
156 | 166,584 | ||||||
| 7.63%, 04/01/37 |
20 | 22,507 | ||||||
| Texas Eastern Transmission LP, 7.00%, 07/15/32(a) |
453 | 501,020 | ||||||
| TransCanada PipeLines Ltd. |
||||||||
| 4.10%, 04/15/30 (Call 01/15/30) |
88 | 82,425 | ||||||
| 4.25%, 05/15/28 (Call 02/15/28) |
112 | 107,867 | ||||||
| 4.63%, 03/01/34 (Call 12/01/33) |
315 | 291,975 | ||||||
| 4.75%, 05/15/38 (Call 11/15/37)(a) |
45 | 40,668 | ||||||
| 4.88%, 05/15/48 (Call 11/15/47) |
126 | 109,912 | ||||||
| 5.10%, 03/15/49 (Call 09/15/48)(a) |
158 | 144,723 | ||||||
| 5.60%, 03/31/34 |
167 | 166,769 | ||||||
| 5.85%, 03/15/36 |
163 | 162,882 | ||||||
| 6.10%, 06/01/40(a) |
76 | 77,635 | ||||||
| 6.20%, 10/15/37 |
240 | 246,919 | ||||||
| 7.25%, 08/15/38 |
138 | 155,568 | ||||||
| 7.63%, 01/15/39 |
221 | 257,493 | ||||||
| Transcontinental Gas Pipe Line Co. LLC |
||||||||
| 3.95%, 05/15/50 (Call 11/15/49) |
163 | 126,797 | ||||||
| 4.00%, 03/15/28 (Call 12/15/27) |
33 | 31,660 | ||||||
| 4.45%, 08/01/42 (Call 02/01/42)(a) |
95 | 82,443 | ||||||
| 4.60%, 03/15/48 (Call 09/15/47) |
143 | 125,040 | ||||||
| 5.40%, 08/15/41 (Call 02/15/41) |
83 | 80,949 | ||||||
| Valero Energy Partners LP, 4.50%, 03/15/28 (Call 12/15/27) |
197 | 191,576 | ||||||
| Western Midstream Operating LP |
||||||||
| 4.05%, 02/01/30 (Call 11/01/29) |
285 | 263,674 | ||||||
| 4.50%, 03/01/28 (Call 12/01/27) |
15 | 14,365 | ||||||
| 4.75%, 08/15/28 (Call 05/15/28) |
10 | 9,668 | ||||||
| 5.25%, 02/01/50 (Call 08/01/49) |
190 | 168,322 | ||||||
| 5.30%, 03/01/48 (Call 09/01/47) |
110 | 94,876 | ||||||
| 5.45%, 04/01/44 (Call 10/01/43) |
80 | 71,865 | ||||||
| 5.50%, 08/15/48 (Call 02/15/48) |
70 | 61,457 | ||||||
| 6.15%, 04/01/33 (Call 01/01/33) |
450 | 457,520 | ||||||
| 6.35%, 01/15/29 (Call 12/15/28) |
40 | 41,299 | ||||||
| Williams Companies Inc. (The) |
||||||||
| 3.75%, 06/15/27 (Call 03/15/27) |
28 | 26,782 | ||||||
| 4.85%, 03/01/48 (Call 09/01/47) |
188 | 164,994 | ||||||
| 4.90%, 01/15/45 (Call 07/15/44) |
117 | 103,051 | ||||||
| 5.10%, 09/15/45 (Call 03/15/45) |
240 | 219,139 | ||||||
| 5.40%, 03/04/44 (Call 09/04/43) |
137 | 128,338 | ||||||
| 5.75%, 06/24/44 (Call 12/24/43) |
22 | 21,530 | ||||||
| 5.80%, 11/15/43 (Call 05/15/43) |
107 | 104,741 | ||||||
| 6.30%, 04/15/40 |
313 | 324,125 | ||||||
| 8.75%, 03/15/32 |
86 | 102,349 | ||||||
| Series A, 7.50%, 01/15/31 |
50 | 55,546 | ||||||
|
|
|
|||||||
| 35,119,726 | ||||||||
| Real Estate — 0.3% | ||||||||
| CBRE Services Inc. |
||||||||
| 2.50%, 04/01/31 (Call 01/01/31)(a) |
488 | 400,746 | ||||||
| 4.88%, 03/01/26 (Call 12/01/25) |
2,592 | 2,560,832 | ||||||
| 5.95%, 08/15/34 (Call 05/15/34) |
65 | 65,660 | ||||||
| Realty Income Corp. |
||||||||
| 3.40%, 01/15/30 (Call 10/15/29) |
38 | 34,441 | ||||||
| 4.00%, 07/15/29 (Call 04/15/29)(a) |
59 | 55,629 | ||||||
|
|
|
|||||||
| 3,117,308 | ||||||||
| Security | Par (000) |
Value | ||||||
| Real Estate Investment Trusts — 3.9% | ||||||||
| Agree LP |
||||||||
| 2.60%, 06/15/33 (Call 03/15/33) |
$ | 25 | $ | 19,366 | ||||
| 4.80%, 10/01/32 (Call 07/01/32) |
15 | 14,019 | ||||||
| Alexandria Real Estate Equities Inc. |
||||||||
| 1.88%, 02/01/33 (Call 11/01/32) |
365 | 272,992 | ||||||
| 2.00%, 05/18/32 (Call 02/18/32) |
55 | 42,458 | ||||||
| 2.75%, 12/15/29 (Call 09/15/29) |
18 | 15,660 | ||||||
| 2.95%, 03/15/34 (Call 12/15/33) |
135 | 108,831 | ||||||
| 3.00%, 05/18/51 (Call 11/18/50)(a) |
165 | 103,532 | ||||||
| 3.38%, 08/15/31 (Call 05/15/31) |
10 | 8,781 | ||||||
| 3.55%, 03/15/52 (Call 09/15/51) |
200 | 138,773 | ||||||
| 3.95%, 01/15/27 (Call 10/15/26)(a) |
61 | 58,807 | ||||||
| 3.95%, 01/15/28 (Call 10/15/27) |
118 | 112,272 | ||||||
| 4.00%, 02/01/50 (Call 08/01/49) |
209 | 157,450 | ||||||
| 4.30%, 01/15/26 (Call 10/15/25) |
55 | 53,956 | ||||||
| 4.50%, 07/30/29 (Call 04/30/29) |
188 | 180,254 | ||||||
| 4.70%, 07/01/30 (Call 04/01/30) |
123 | 118,226 | ||||||
| 4.85%, 04/15/49 (Call 10/15/48)(a) |
120 | 104,866 | ||||||
| 4.90%, 12/15/30 (Call 09/15/30) |
14 | 13,626 | ||||||
| American Homes 4 Rent LP |
||||||||
| 3.38%, 07/15/51 (Call 01/15/51) |
35 | 23,126 | ||||||
| 3.63%, 04/15/32 (Call 01/15/32) |
155 | 135,051 | ||||||
| 4.25%, 02/15/28 (Call 11/15/27) |
35 | 33,619 | ||||||
| 4.30%, 04/15/52 (Call 10/15/51)(a) |
22 | 17,171 | ||||||
| 4.90%, 02/15/29 (Call 11/15/28)(a) |
41 | 39,957 | ||||||
| American Tower Corp. |
||||||||
| 1.88%, 10/15/30 (Call 07/15/30) |
105 | 84,327 | ||||||
| 2.10%, 06/15/30 (Call 03/15/30) |
235 | 193,425 | ||||||
| 2.30%, 09/15/31 (Call 06/15/31) |
190 | 153,350 | ||||||
| 2.40%, 03/15/25 (Call 02/15/25) |
86 | 83,187 | ||||||
| 2.70%, 04/15/31 (Call 01/15/31)(a) |
195 | 163,562 | ||||||
| 2.90%, 01/15/30 (Call 10/15/29) |
281 | 246,491 | ||||||
| 2.95%, 01/15/51 (Call 07/15/50)(a) |
235 | 148,868 | ||||||
| 3.10%, 06/15/50 (Call 12/15/49) |
265 | 173,150 | ||||||
| 3.13%, 01/15/27 (Call 10/15/26) |
303 | 285,746 | ||||||
| 3.38%, 10/15/26 (Call 07/15/26) |
399 | 380,487 | ||||||
| 3.55%, 07/15/27 (Call 04/15/27) |
325 | 308,077 | ||||||
| 3.60%, 01/15/28 (Call 10/15/27) |
300 | 282,310 | ||||||
| 3.70%, 10/15/49 (Call 04/15/49)(a) |
169 | 123,430 | ||||||
| 3.80%, 08/15/29 (Call 05/15/29) |
337 | 311,929 | ||||||
| 3.95%, 03/15/29 (Call 12/15/28) |
72 | 67,570 | ||||||
| 4.00%, 06/01/25 (Call 03/01/25) |
240 | 235,272 | ||||||
| 4.40%, 02/15/26 (Call 11/15/25) |
294 | 289,101 | ||||||
| 5.55%, 07/15/33 (Call 04/15/33) |
315 | 314,909 | ||||||
| 5.90%, 11/15/33 (Call 08/15/33) |
180 | 184,586 | ||||||
| AvalonBay Communities Inc. |
||||||||
| 2.05%, 01/15/32 (Call 10/15/31) |
100 | 81,587 | ||||||
| 2.30%, 03/01/30 (Call 12/01/29) |
67 | 57,560 | ||||||
| 3.20%, 01/15/28 (Call 10/15/27) |
18 | 16,866 | ||||||
| 3.30%, 06/01/29 (Call 03/01/29) |
37 | 34,112 | ||||||
| 3.90%, 10/15/46 (Call 04/15/46) |
71 | 55,453 | ||||||
| 4.15%, 07/01/47 (Call 01/01/47)(a) |
55 | 44,616 | ||||||
| 5.00%, 02/15/33 (Call 11/15/32) |
265 | 259,908 | ||||||
| Boston Properties LP |
||||||||
| 2.45%, 10/01/33 (Call 07/01/33)(a) |
245 | 180,808 | ||||||
| 2.55%, 04/01/32 (Call 01/01/32) |
230 | 178,721 | ||||||
| 2.75%, 10/01/26 (Call 07/01/26) |
642 | 594,358 | ||||||
| 2.90%, 03/15/30 (Call 12/15/29) |
101 | 85,368 | ||||||
| 3.25%, 01/30/31 (Call 10/30/30) |
301 | 253,415 | ||||||
| 3.40%, 06/21/29 (Call 03/21/29) |
144 | 127,075 | ||||||
| 3.65%, 02/01/26 (Call 11/03/25)(a) |
418 | 401,973 | ||||||
| 114 | 2 0 2 4 I S H A R E S A N N U A L R E P O R T T O S H A R E H O L D E R S |
| Schedule of Investments (continued) February 29, 2024 |
iShares® ESG Aware USD Corporate Bond ETF (Percentages shown are based on Net Assets) |
| Security | Par (000) |
Value | ||||||
| Real Estate Investment Trusts (continued) |
||||||||
| 4.50%, 12/01/28 (Call 09/01/28) |
$ | 143 | $ | 135,109 | ||||
| 6.50%, 01/15/34 (Call 10/15/33)(a) |
155 | 158,485 | ||||||
| Brixmor Operating Partnership LP |
||||||||
| 2.50%, 08/16/31 (Call 05/16/31)(a) |
90 | 73,087 | ||||||
| 3.90%, 03/15/27 (Call 12/15/26) |
86 | 81,931 | ||||||
| 4.05%, 07/01/30 (Call 04/01/30) |
80 | 73,464 | ||||||
| 4.13%, 06/15/26 (Call 03/15/26) |
134 | 129,716 | ||||||
| 4.13%, 05/15/29 (Call 02/15/29) |
98 | 91,559 | ||||||
| Camden Property Trust |
||||||||
| 2.80%, 05/15/30 (Call 02/15/30) |
19 | 16,696 | ||||||
| 3.15%, 07/01/29 (Call 04/01/29) |
52 | 47,305 | ||||||
| 3.35%, 11/01/49 (Call 05/01/49) |
19 | 13,546 | ||||||
| 4.10%, 10/15/28 (Call 07/15/28) |
31 | 29,854 | ||||||
| Corporate Office Properties LP |
||||||||
| 2.00%, 01/15/29 (Call 11/15/28)(a) |
325 | 269,071 | ||||||
| 2.25%, 03/15/26 (Call 02/15/26) |
995 | 930,477 | ||||||
| 2.75%, 04/15/31 (Call 01/15/31)(a) |
132 | 106,471 | ||||||
| 2.90%, 12/01/33 (Call 09/01/33) |
105 | 80,261 | ||||||
| Crown Castle Inc. |
||||||||
| 1.35%, 07/15/25 (Call 06/15/25) |
100 | 94,613 | ||||||
| 2.10%, 04/01/31 (Call 01/01/31) |
347 | 278,219 | ||||||
| 2.25%, 01/15/31 (Call 10/15/30) |
255 | 208,424 | ||||||
| 2.50%, 07/15/31 (Call 04/15/31) |
347 | 284,160 | ||||||
| 3.10%, 11/15/29 (Call 08/15/29) |
155 | 137,154 | ||||||
| 3.25%, 01/15/51 (Call 07/15/50) |
284 | 191,669 | ||||||
| 3.30%, 07/01/30 (Call 04/01/30) |
295 | 260,533 | ||||||
| 3.65%, 09/01/27 (Call 06/01/27) |
137 | 129,296 | ||||||
| 3.70%, 06/15/26 (Call 03/15/26) |
157 | 151,293 | ||||||
| 3.80%, 02/15/28 (Call 11/15/27) |
1,442 | 1,357,870 | ||||||
| 4.00%, 03/01/27 (Call 12/01/26) |
113 | 108,771 | ||||||
| 4.00%, 11/15/49 (Call 05/15/49) |
102 | 78,464 | ||||||
| 4.15%, 07/01/50 (Call 01/01/50) |
180 | 142,336 | ||||||
| 4.30%, 02/15/29 (Call 11/15/28)(a) |
929 | 882,954 | ||||||
| 4.45%, 02/15/26 (Call 11/15/25) |
947 | 929,257 | ||||||
| 4.75%, 05/15/47 (Call 11/15/46) |
193 | 163,107 | ||||||
| 4.80%, 09/01/28 (Call 08/01/28) |
40 | 39,003 | ||||||
| 5.10%, 05/01/33 (Call 02/01/33) |
635 | 613,015 | ||||||
| 5.20%, 02/15/49 (Call 08/15/48) |
114 | 103,114 | ||||||
| 5.60%, 06/01/29 (Call 05/01/29) |
115 | 115,763 | ||||||
| 5.80%, 03/01/34 (Call 12/01/33) |
130 | 131,884 | ||||||
| CubeSmart LP |
||||||||
| 2.50%, 02/15/32 (Call 11/15/31) |
140 | 113,047 | ||||||
| 3.00%, 02/15/30 (Call 11/15/29) |
40 | 34,916 | ||||||
| 4.38%, 02/15/29 (Call 11/15/28) |
15 | 14,265 | ||||||
| Digital Realty Trust LP |
||||||||
| 3.60%, 07/01/29 (Call 04/01/29)(a) |
580 | 534,745 | ||||||
| 3.70%, 08/15/27 (Call 05/15/27) |
127 | 121,039 | ||||||
| 4.45%, 07/15/28 (Call 04/15/28) |
90 | 87,079 | ||||||
| 5.55%, 01/15/28 (Call 12/15/27) |
500 | 505,062 | ||||||
| EPR Properties |
||||||||
| 3.60%, 11/15/31 (Call 08/15/31) |
50 | 40,883 | ||||||
| 4.95%, 04/15/28 (Call 01/15/28) |
10 | 9,478 | ||||||
| Equinix Inc. |
||||||||
| 1.80%, 07/15/27 (Call 05/15/27) |
26 | 23,370 | ||||||
| 2.15%, 07/15/30 (Call 04/15/30) |
482 | 399,656 | ||||||
| 2.50%, 05/15/31 (Call 02/15/31) |
295 | 246,340 | ||||||
| 2.95%, 09/15/51 (Call 03/15/51)(a) |
174 | 110,581 | ||||||
| 3.00%, 07/15/50 (Call 01/15/50) |
164 | 106,346 | ||||||
| 3.20%, 11/18/29 (Call 08/18/29) |
695 | 624,626 | ||||||
| 3.40%, 02/15/52 (Call 08/15/51)(a) |
120 | 83,161 | ||||||
| Security | Par (000) |
Value | ||||||
| Real Estate Investment Trusts (continued) |
||||||||
| ERP Operating LP |
||||||||
| 1.85%, 08/01/31 (Call 05/01/31) |
$ | 10 | $ | 8,022 | ||||
| 2.50%, 02/15/30 (Call 11/15/29) |
160 | 138,913 | ||||||
| 3.00%, 07/01/29 (Call 04/01/29) |
34 | 30,806 | ||||||
| 3.25%, 08/01/27 (Call 05/01/27) |
38 | 35,685 | ||||||
| 3.50%, 03/01/28 (Call 12/01/27) |
42 | 39,664 | ||||||
| 4.00%, 08/01/47 (Call 02/01/47)(a) |
27 | 20,774 | ||||||
| 4.15%, 12/01/28 (Call 09/01/28)(a) |
33 | 31,906 | ||||||
| 4.50%, 06/01/45 (Call 12/01/44) |
35 | 29,202 | ||||||
| Essex Portfolio LP |
||||||||
| 2.65%, 03/15/32 (Call 12/15/31) |
230 | 187,486 | ||||||
| 2.65%, 09/01/50 (Call 03/01/50)(a) |
30 | 17,408 | ||||||
| 3.00%, 01/15/30 (Call 10/15/29) |
10 | 8,773 | ||||||
| 4.00%, 03/01/29 (Call 12/01/28) |
30 | 28,411 | ||||||
| Extra Space Storage LP |
||||||||
| 2.35%, 03/15/32 (Call 12/15/31) |
130 | 103,067 | ||||||
| 2.40%, 10/15/31 (Call 07/15/31) |
100 | 80,778 | ||||||
| 3.88%, 12/15/27 (Call 09/15/27) |
9 | 8,546 | ||||||
| 4.00%, 06/15/29 (Call 03/15/29) |
9 | 8,446 | ||||||
| 5.50%, 07/01/30 (Call 05/01/30) |
25 | 25,110 | ||||||
| Federal Realty OP LP |
||||||||
| 3.20%, 06/15/29 (Call 03/15/29) |
611 | 545,948 | ||||||
| 3.25%, 07/15/27 (Call 04/15/27) |
360 | 336,297 | ||||||
| 3.50%, 06/01/30 (Call 03/01/30) |
475 | 426,020 | ||||||
| 4.50%, 12/01/44 (Call 06/01/44) |
188 | 152,994 | ||||||
| 5.38%, 05/01/28 (Call 04/01/28) |
615 | 612,915 | ||||||
| GLP Capital LP/GLP Financing II Inc. |
||||||||
| 3.25%, 01/15/32 (Call 10/15/31) |
80 | 66,374 | ||||||
| 4.00%, 01/15/30 (Call 10/15/29) |
138 | 124,183 | ||||||
| 4.00%, 01/15/31 (Call 10/15/30) |
107 | 94,337 | ||||||
| 5.30%, 01/15/29 (Call 10/15/28)(a) |
211 | 204,909 | ||||||
| 5.75%, 06/01/28 (Call 03/03/28)(a) |
158 | 156,873 | ||||||
| Healthcare Realty Holdings LP, |
10 | 8,617 | ||||||
| Healthpeak OP LLC |
||||||||
| 3.00%, 01/15/30 (Call 10/15/29)(a) |
308 | 270,234 | ||||||
| 3.25%, 07/15/26 (Call 05/15/26) |
15 | 14,329 | ||||||
| 3.50%, 07/15/29 (Call 04/15/29) |
239 | 218,367 | ||||||
| 4.00%, 06/01/25 (Call 03/01/25) |
438 | 429,709 | ||||||
| 6.75%, 02/01/41 (Call 08/01/40) |
151 | 165,389 | ||||||
| Highwoods Realty LP |
||||||||
| 3.05%, 02/15/30 (Call 11/15/29) |
87 | 72,833 | ||||||
| 4.20%, 04/15/29 (Call 01/15/29) |
72 | 64,898 | ||||||
| 7.65%, 02/01/34 (Call 11/01/33) |
100 | 107,223 | ||||||
| Host Hotels & Resorts LP |
||||||||
| Series E, 4.00%, 06/15/25 (Call 03/15/25) |
197 | 192,970 | ||||||
| Series F, 4.50%, 02/01/26 (Call 11/01/25) |
451 | 441,445 | ||||||
| Series H, 3.38%, 12/15/29 (Call 09/15/29) |
137 | 121,208 | ||||||
| Series I, 3.50%, 09/15/30 (Call 06/15/30) |
240 | 211,580 | ||||||
| Series J, 2.90%, 12/15/31 (Call 09/15/31) |
80 | 66,054 | ||||||
| Invitation Homes Operating Partnership LP |
||||||||
| 2.00%, 08/15/31 (Call 05/15/31) |
5 | 3,906 | ||||||
| 2.70%, 01/15/34 (Call 10/15/33) |
15 | 11,674 | ||||||
| 4.15%, 04/15/32 (Call 01/15/32) |
105 | 94,892 | ||||||
| Kilroy Realty LP |
||||||||
| 2.50%, 11/15/32 (Call 08/15/32) |
270 | 200,079 | ||||||
| 3.05%, 02/15/30 (Call 11/15/29) |
120 | 100,513 | ||||||
| 4.25%, 08/15/29 (Call 05/15/29)(a) |
252 | 229,930 | ||||||
| 4.38%, 10/01/25 (Call 07/01/25) |
208 | 202,737 | ||||||
| 4.75%, 12/15/28 (Call 09/15/28) |
7 | 6,593 | ||||||
| S C H E D U L E O F I N V E S T M E N T S |
115 |
| Schedule of Investments (continued) February 29, 2024 |
iShares® ESG Aware USD Corporate Bond ETF (Percentages shown are based on Net Assets) |
| Security | Par (000) |
Value | ||||||
| Real Estate Investment Trusts (continued) |
||||||||
| Kimco Realty OP LLC |
||||||||
| 2.80%, 10/01/26 (Call 07/01/26) |
$ | 36 | $ | 33,731 | ||||
| 3.70%, 10/01/49 (Call 04/01/49) |
88 | 63,268 | ||||||
| 3.80%, 04/01/27 (Call 01/01/27) |
71 | 68,034 | ||||||
| 4.13%, 12/01/46 (Call 06/01/46)(a) |
120 | 91,348 | ||||||
| 4.25%, 04/01/45 (Call 10/01/44)(a) |
120 | 93,904 | ||||||
| 4.45%, 09/01/47 (Call 03/01/47) |
48 | 38,219 | ||||||
| 4.60%, 02/01/33 (Call 11/01/32)(a) |
190 | 178,092 | ||||||
| Kite Realty Group LP, 4.00%, 10/01/26 (Call 07/01/26) |
35 | 33,172 | ||||||
| Kite Realty Group Trust, 4.75%, 09/15/30 (Call 06/15/30) |
25 | 23,589 | ||||||
| Mid-America Apartments LP |
||||||||
| 1.70%, 02/15/31 (Call 11/15/30) |
205 | 163,433 | ||||||
| 2.75%, 03/15/30 (Call 12/15/29)(a) |
35 | 30,760 | ||||||
| 3.95%, 03/15/29 (Call 12/15/28)(a) |
20 | 19,083 | ||||||
| NNN REIT Inc. |
||||||||
| 2.50%, 04/15/30 (Call 01/15/30) |
7 | 5,923 | ||||||
| 3.00%, 04/15/52 (Call 10/15/51)(a) |
35 | 22,303 | ||||||
| 3.10%, 04/15/50 (Call 10/15/49) |
88 | 56,973 | ||||||
| 3.50%, 04/15/51 (Call 10/15/50) |
75 | 53,458 | ||||||
| 4.30%, 10/15/28 (Call 07/15/28) |
7 | 6,720 | ||||||
| 4.80%, 10/15/48 (Call 04/15/48) |
31 | 26,608 | ||||||
| 5.60%, 10/15/33 (Call 07/15/33) |
25 | 24,913 | ||||||
| Omega Healthcare Investors Inc. |
||||||||
| 3.25%, 04/15/33 (Call 01/15/33)(a) |
160 | 127,188 | ||||||
| 3.38%, 02/01/31 (Call 11/01/30) |
132 | 111,120 | ||||||
| 3.63%, 10/01/29 (Call 07/01/29) |
225 | 197,593 | ||||||
| Physicians Realty LP |
||||||||
| 2.63%, 11/01/31 (Call 08/01/31) |
30 | 24,429 | ||||||
| 3.95%, 01/15/28 (Call 10/15/27) |
19 | 18,077 | ||||||
| 4.30%, 03/15/27 (Call 12/15/26) |
87 | 84,537 | ||||||
| Piedmont Operating Partnership LP |
||||||||
| 2.75%, 04/01/32 (Call 01/01/32) |
5 | 3,533 | ||||||
| 3.15%, 08/15/30 (Call 05/15/30)(a) |
57 | 43,732 | ||||||
| 9.25%, 07/20/28 (Call 06/20/28) |
310 | 326,752 | ||||||
| Prologis LP |
||||||||
| 2.13%, 04/15/27 (Call 02/15/27) |
93 | 85,342 | ||||||
| 2.13%, 10/15/50 (Call 04/15/50) |
110 | 60,061 | ||||||
| 2.25%, 04/15/30 (Call 01/15/30) |
83 | 71,173 | ||||||
| 3.00%, 04/15/50 (Call 10/15/49) |
268 | 181,232 | ||||||
| 3.25%, 10/01/26 (Call 07/01/26) |
32 | 30,558 | ||||||
| 3.88%, 09/15/28 (Call 06/15/28)(a) |
131 | 125,333 | ||||||
| 4.38%, 02/01/29 (Call 11/01/28)(a) |
81 | 79,087 | ||||||
| 4.38%, 09/15/48 (Call 03/15/48) |
55 | 46,735 | ||||||
| 4.63%, 01/15/33 (Call 10/15/32) |
90 | 86,599 | ||||||
| 4.75%, 06/15/33 (Call 03/15/33) |
280 | 271,208 | ||||||
| 4.88%, 06/15/28 (Call 05/15/28) |
100 | 99,856 | ||||||
| 5.13%, 01/15/34 (Call 10/15/33)(a) |
160 | 158,368 | ||||||
| Public Storage Operating Co. |
||||||||
| 2.25%, 11/09/31 (Call 08/09/31) |
215 | 177,273 | ||||||
| 2.30%, 05/01/31 (Call 02/01/31)(a) |
15 | 12,586 | ||||||
| 5.35%, 08/01/53 (Call 02/01/53) |
20 | 19,885 | ||||||
| Realty Income Corp. |
||||||||
| 1.80%, 03/15/33 (Call 12/15/32) |
140 | 105,130 | ||||||
| 2.85%, 12/15/32 (Call 09/15/32) |
300 | 246,982 | ||||||
| 3.25%, 06/15/29 (Call 03/15/29) |
11 | 10,064 | ||||||
| 3.25%, 01/15/31 (Call 10/15/30) |
105 | 92,877 | ||||||
| 3.65%, 01/15/28 (Call 10/15/27) |
92 | 87,208 | ||||||
| 4.90%, 07/15/33 (Call 04/15/33)(a) |
120 | 114,490 | ||||||
| 5.63%, 10/13/32 (Call 07/13/32) |
375 | 378,757 | ||||||
| Security | Par (000) |
Value | ||||||
| Real Estate Investment Trusts (continued) |
||||||||
| Regency Centers LP |
||||||||
| 2.95%, 09/15/29 (Call 06/15/29) |
$ | 99 | $ | 87,596 | ||||
| 3.60%, 02/01/27 (Call 11/01/26) |
48 | 45,900 | ||||||
| 4.13%, 03/15/28 (Call 12/15/27) |
40 | 38,201 | ||||||
| 4.40%, 02/01/47 (Call 08/01/46) |
147 | 117,614 | ||||||
| 4.65%, 03/15/49 (Call 09/15/48) |
111 | 93,962 | ||||||
| Sabra Health Care LP |
||||||||
| 3.20%, 12/01/31 (Call 09/01/31) |
101 | 82,034 | ||||||
| 3.90%, 10/15/29 (Call 07/15/29) |
67 | 59,678 | ||||||
| 5.13%, 08/15/26 (Call 05/15/26) |
394 | 386,671 | ||||||
| Simon Property Group LP |
||||||||
| 2.20%, 02/01/31 (Call 11/01/30)(a) |
120 | 98,372 | ||||||
| 2.25%, 01/15/32 (Call 10/15/31) |
290 | 233,204 | ||||||
| 2.45%, 09/13/29 (Call 06/13/29) |
235 | 204,733 | ||||||
| 2.65%, 02/01/32 (Call 12/01/31)(a) |
50 | 41,533 | ||||||
| 3.25%, 09/13/49 (Call 03/13/49) |
352 | 244,765 | ||||||
| 3.80%, 07/15/50 (Call 01/15/50) |
41 | 30,984 | ||||||
| 4.25%, 10/01/44 (Call 04/01/44)(a) |
80 | 65,377 | ||||||
| 4.25%, 11/30/46 (Call 05/30/46) |
106 | 86,021 | ||||||
| 4.75%, 03/15/42 (Call 09/15/41) |
135 | 120,454 | ||||||
| 5.50%, 03/08/33 (Call 12/08/32)(a) |
345 | 347,941 | ||||||
| 6.75%, 02/01/40 (Call 11/01/39) |
121 | 133,140 | ||||||
| SITE Centers Corp. |
||||||||
| 4.25%, 02/01/26 (Call 11/01/25) |
25 | 24,397 | ||||||
| 4.70%, 06/01/27 (Call 03/01/27) |
50 | 49,139 | ||||||
| Store Capital LLC |
||||||||
| 2.70%, 12/01/31 (Call 09/01/31) |
35 | 27,231 | ||||||
| 4.50%, 03/15/28 (Call 12/15/27) |
35 | 32,885 | ||||||
| 4.63%, 03/15/29 (Call 12/15/28) |
38 | 35,451 | ||||||
| Sun Communities Operating LP |
||||||||
| 4.20%, 04/15/32 (Call 01/15/32) |
50 | 44,373 | ||||||
| 5.70%, 01/15/33 (Call 10/15/32) |
105 | 103,358 | ||||||
| Tanger Properties LP, 3.88%, 07/15/27 (Call 04/15/27) |
15 | 13,737 | ||||||
| UDR Inc. |
||||||||
| 1.90%, 03/15/33 (Call 12/15/32) |
260 | 194,094 | ||||||
| 2.10%, 08/01/32 (Call 05/01/32) |
10 | 7,731 | ||||||
| 2.10%, 06/15/33 (Call 03/15/33)(a) |
60 | 45,227 | ||||||
| 3.00%, 08/15/31 (Call 05/15/31)(a) |
129 | 110,669 | ||||||
| 3.20%, 01/15/30 (Call 10/15/29)(a) |
41 | 36,678 | ||||||
| 4.40%, 01/26/29 (Call 10/26/28) |
26 | 24,886 | ||||||
| Ventas Realty LP |
||||||||
| 2.50%, 09/01/31 (Call 06/01/31) |
83 | 67,545 | ||||||
| 3.00%, 01/15/30 (Call 10/15/29)(a) |
152 | 132,670 | ||||||
| 3.85%, 04/01/27 (Call 01/01/27) |
58 | 55,289 | ||||||
| 4.00%, 03/01/28 (Call 12/01/27) |
41 | 39,016 | ||||||
| 4.38%, 02/01/45 (Call 08/01/44) |
71 | 56,216 | ||||||
| 4.40%, 01/15/29 (Call 10/15/28) |
181 | 173,295 | ||||||
| 4.75%, 11/15/30 (Call 08/15/30) |
255 | 243,930 | ||||||
| 4.88%, 04/15/49 (Call 10/15/48) |
115 | 97,298 | ||||||
| 5.70%, 09/30/43 (Call 03/30/43) |
76 | 71,792 | ||||||
| VICI Properties LP |
||||||||
| 4.75%, 02/15/28 (Call 01/15/28) |
307 | 297,426 | ||||||
| 4.95%, 02/15/30 (Call 12/15/29) |
259 | 247,202 | ||||||
| 5.13%, 05/15/32 (Call 02/15/32) |
334 | 313,686 | ||||||
| 5.63%, 05/15/52 (Call 11/15/51) |
137 | 123,508 | ||||||
| Welltower OP LLC |
||||||||
| 2.05%, 01/15/29 (Call 11/15/28) |
95 | 82,284 | ||||||
| 2.70%, 02/15/27 (Call 12/15/26) |
77 | 71,908 | ||||||
| 2.75%, 01/15/31 (Call 10/15/30) |
165 | 140,649 | ||||||
| 2.75%, 01/15/32 (Call 10/15/31) |
415 | 345,028 | ||||||
| 116 | 2 0 2 4 I S H A R E S A N N U A L R E P O R T T O S H A R E H O L D E R S |
| Schedule of Investments (continued) February 29, 2024 |
iShares® ESG Aware USD Corporate Bond ETF (Percentages shown are based on Net Assets) |
| Security | Par (000) |
Value | ||||||
| Real Estate Investment Trusts (continued) |
||||||||
| 2.80%, 06/01/31 (Call 03/01/31) |
$ | 250 | $ | 212,106 | ||||
| 3.10%, 01/15/30 (Call 10/15/29) |
190 | 169,428 | ||||||
| 4.00%, 06/01/25 (Call 03/01/25) |
213 | 209,085 | ||||||
| 4.13%, 03/15/29 (Call 12/15/28) |
190 | 180,633 | ||||||
| 4.25%, 04/01/26 (Call 01/01/26) |
49 | 48,043 | ||||||
| 4.25%, 04/15/28 (Call 01/15/28) |
114 | 110,265 | ||||||
| 4.95%, 09/01/48 (Call 03/01/48) |
130 | 116,895 | ||||||
| 6.50%, 03/15/41 (Call 09/15/40) |
202 | 218,274 | ||||||
| Weyerhaeuser Co. |
||||||||
| 4.00%, 11/15/29 (Call 08/15/29) |
201 | 188,761 | ||||||
| 4.00%, 04/15/30 (Call 01/15/30) |
255 | 238,310 | ||||||
| 6.95%, 10/01/27(a) |
224 | 237,514 | ||||||
| 7.38%, 03/15/32 |
640 | 722,597 | ||||||
| WP Carey Inc. |
||||||||
| 2.25%, 04/01/33 (Call 01/01/33) |
115 | 87,317 | ||||||
| 3.85%, 07/15/29 (Call 04/15/29) |
107 | 98,994 | ||||||
|
|
|
|||||||
| 39,802,238 | ||||||||
| Retail — 2.2% | ||||||||
| AutoNation Inc. |
||||||||
| 3.80%, 11/15/27 (Call 08/15/27) |
151 | 140,489 | ||||||
| 3.85%, 03/01/32 (Call 12/01/31)(a) |
70 | 61,091 | ||||||
| 4.50%, 10/01/25 (Call 07/01/25) |
97 | 95,222 | ||||||
| 4.75%, 06/01/30 (Call 03/01/30) |
221 | 210,111 | ||||||
| AutoZone Inc. |
||||||||
| 3.75%, 04/18/29 (Call 01/18/29) |
74 | 69,466 | ||||||
| 5.05%, 07/15/26(a) |
20 | 19,951 | ||||||
| 5.20%, 08/01/33 (Call 05/01/33)(a) |
45 | 44,596 | ||||||
| 6.55%, 11/01/33 (Call 08/01/33)(a) |
25 | 26,983 | ||||||
| Best Buy Co. Inc. |
||||||||
| 1.95%, 10/01/30 (Call 07/01/30)(a) |
2,290 | 1,880,819 | ||||||
| 4.45%, 10/01/28 (Call 07/01/28)(a) |
1,994 | 1,952,772 | ||||||
| Costco Wholesale Corp. |
||||||||
| 1.60%, 04/20/30 (Call 01/20/30) |
73 | 60,790 | ||||||
| 1.75%, 04/20/32 (Call 01/20/32) |
51 | 40,777 | ||||||
| Darden Restaurants Inc., 4.55%, 02/15/48 (Call 08/15/47) |
51 | 41,398 | ||||||
| Dollar General Corp. |
||||||||
| 4.13%, 04/03/50 (Call 10/03/49) |
72 | 55,008 | ||||||
| 5.50%, 11/01/52 (Call 05/01/52)(a) |
15 | 14,135 | ||||||
| Dollar Tree Inc. |
||||||||
| 3.38%, 12/01/51 (Call 06/01/51) |
100 | 66,079 | ||||||
| 4.20%, 05/15/28 (Call 02/15/28) |
63 | 60,697 | ||||||
| Home Depot Inc. (The) |
||||||||
| 2.13%, 09/15/26 (Call 06/15/26) |
49 | 45,790 | ||||||
| 2.38%, 03/15/51 (Call 09/15/50) |
140 | 82,239 | ||||||
| 2.50%, 04/15/27 (Call 02/15/27) |
240 | 223,541 | ||||||
| 2.70%, 04/15/30 (Call 01/15/30) |
177 | 156,579 | ||||||
| 2.75%, 09/15/51 (Call 03/15/51)(a) |
150 | 95,523 | ||||||
| 2.80%, 09/14/27 (Call 06/14/27) |
645 | 604,385 | ||||||
| 2.95%, 06/15/29 (Call 03/15/29) |
1,086 | 991,285 | ||||||
| 3.00%, 04/01/26 (Call 01/01/26) |
145 | 139,683 | ||||||
| 3.13%, 12/15/49 (Call 06/15/49) |
142 | 98,812 | ||||||
| 3.25%, 04/15/32 (Call 01/15/32) |
420 | 372,496 | ||||||
| 3.30%, 04/15/40 (Call 10/15/39) |
22 | 17,241 | ||||||
| 3.35%, 09/15/25 (Call 06/15/25) |
433 | 422,410 | ||||||
| 3.35%, 04/15/50 (Call 10/15/49) |
127 | 92,044 | ||||||
| 3.50%, 09/15/56 (Call 03/15/56) |
309 | 226,304 | ||||||
| 3.63%, 04/15/52 (Call 10/15/51) |
190 | 143,616 | ||||||
| 3.90%, 12/06/28 (Call 09/06/28) |
663 | 641,558 | ||||||
| 3.90%, 06/15/47 (Call 12/15/46) |
246 | 198,153 | ||||||
| 4.20%, 04/01/43 (Call 10/01/42) |
200 | 172,270 | ||||||
| Security | Par (000) |
Value | ||||||
| Retail (continued) |
||||||||
| 4.25%, 04/01/46 (Call 10/01/45) |
$ | 248 | $ | 211,704 | ||||
| 4.40%, 03/15/45 (Call 09/15/44) |
318 | 279,084 | ||||||
| 4.50%, 09/15/32 (Call 06/15/32)(a) |
300 | 293,191 | ||||||
| 4.50%, 12/06/48 (Call 06/06/48) |
281 | 247,948 | ||||||
| 4.88%, 02/15/44 (Call 08/15/43) |
317 | 297,381 | ||||||
| 4.90%, 04/15/29 (Call 03/15/29) |
140 | 140,501 | ||||||
| 4.95%, 09/30/26 (Call 08/30/26) |
105 | 105,049 | ||||||
| 4.95%, 09/15/52 (Call 03/15/52)(a) |
55 | 52,044 | ||||||
| 5.13%, 04/30/25 |
150 | 150,052 | ||||||
| 5.40%, 09/15/40 (Call 03/15/40)(a) |
167 | 167,976 | ||||||
| 5.88%, 12/16/36 |
806 | 858,578 | ||||||
| 5.95%, 04/01/41 (Call 10/01/40) |
225 | 240,054 | ||||||
| Lowe’s Companies Inc. |
||||||||
| 1.70%, 10/15/30 (Call 07/15/30) |
170 | 137,838 | ||||||
| 2.50%, 04/15/26 (Call 01/15/26) |
83 | 78,790 | ||||||
| 2.63%, 04/01/31 (Call 01/01/31) |
72 | 61,396 | ||||||
| 3.00%, 10/15/50 (Call 04/15/50) |
235 | 151,608 | ||||||
| 3.10%, 05/03/27 (Call 02/03/27) |
62 | 58,592 | ||||||
| 3.65%, 04/05/29 (Call 01/05/29)(a) |
70 | 65,999 | ||||||
| 3.70%, 04/15/46 (Call 10/15/45) |
247 | 185,928 | ||||||
| 3.75%, 04/01/32 (Call 01/01/32) |
460 | 417,456 | ||||||
| 4.00%, 04/15/25 (Call 03/15/25) |
65 | 64,061 | ||||||
| 4.05%, 05/03/47 (Call 11/03/46) |
357 | 282,819 | ||||||
| 4.25%, 04/01/52 (Call 10/01/51) |
225 | 180,926 | ||||||
| 4.38%, 09/15/45 (Call 03/15/45) |
200 | 169,520 | ||||||
| 4.45%, 04/01/62 (Call 10/01/61) |
395 | 315,786 | ||||||
| 4.50%, 04/15/30 (Call 01/15/30) |
172 | 167,098 | ||||||
| 4.55%, 04/05/49 (Call 10/05/48) |
107 | 90,471 | ||||||
| 4.65%, 04/15/42 (Call 10/15/41) |
271 | 242,377 | ||||||
| 5.00%, 04/15/33 (Call 01/15/33)(a) |
310 | 305,496 | ||||||
| 5.00%, 04/15/40 (Call 10/15/39) |
24 | 22,803 | ||||||
| 5.13%, 04/15/50 (Call 10/15/49) |
155 | 142,966 | ||||||
| 5.50%, 10/15/35 |
253 | 260,208 | ||||||
| 5.63%, 04/15/53 (Call 10/15/52) |
100 | 99,363 | ||||||
| 5.80%, 09/15/62 (Call 03/15/62) |
150 | 149,739 | ||||||
| 5.85%, 04/01/63 (Call 10/01/62) |
85 | 85,759 | ||||||
| 6.50%, 03/15/29(a) |
62 | 66,318 | ||||||
| McDonald’s Corp. |
||||||||
| 2.13%, 03/01/30 (Call 12/01/29) |
18 | 15,402 | ||||||
| 2.63%, 09/01/29 (Call 06/01/29)(a) |
11 | 9,840 | ||||||
| 3.50%, 07/01/27 (Call 05/01/27) |
133 | 127,270 | ||||||
| 3.60%, 07/01/30 (Call 04/01/30)(a) |
5 | 4,630 | ||||||
| 3.63%, 09/01/49 (Call 03/01/49) |
340 | 253,820 | ||||||
| 3.70%, 02/15/42 |
14 | 11,253 | ||||||
| 3.80%, 04/01/28 (Call 01/01/28) |
5 | 4,800 | ||||||
| 4.20%, 04/01/50 (Call 10/01/49) |
92 | 75,796 | ||||||
| 4.45%, 03/01/47 (Call 09/01/46) |
113 | 97,089 | ||||||
| 4.45%, 09/01/48 (Call 03/01/48)(a) |
100 | 86,397 | ||||||
| 4.60%, 05/26/45 (Call 11/26/44) |
154 | 137,027 | ||||||
| 4.70%, 12/09/35 (Call 06/09/35) |
82 | 78,757 | ||||||
| 4.88%, 07/15/40(a) |
118 | 112,535 | ||||||
| 4.88%, 12/09/45 (Call 06/09/45) |
434 | 398,823 | ||||||
| 5.15%, 09/09/52 (Call 03/09/52) |
50 | 47,484 | ||||||
| 5.70%, 02/01/39(a) |
117 | 120,445 | ||||||
| 6.30%, 10/15/37 |
207 | 225,430 | ||||||
| 6.30%, 03/01/38 |
197 | 214,348 | ||||||
| O’Reilly Automotive Inc., 4.20%, 04/01/30 (Call 01/01/30) |
49 | 46,512 | ||||||
| Starbucks Corp. |
||||||||
| 2.25%, 03/12/30 (Call 12/12/29)(a) |
26 | 22,234 | ||||||
| 3.35%, 03/12/50 (Call 09/12/49) |
137 | 96,693 | ||||||
| S C H E D U L E O F I N V E S T M E N T S |
117 |
| Schedule of Investments (continued) February 29, 2024 |
iShares® ESG Aware USD Corporate Bond ETF (Percentages shown are based on Net Assets) |
| Security | Par (000) |
Value | ||||||
| Retail (continued) |
||||||||
| 3.50%, 03/01/28 (Call 12/01/27) |
$ | 49 | $ | 46,453 | ||||
| 3.50%, 11/15/50 (Call 05/15/50) |
279 | 203,713 | ||||||
| 3.55%, 08/15/29 (Call 05/15/29) |
82 | 76,871 | ||||||
| 3.75%, 12/01/47 (Call 06/01/47) |
118 | 91,025 | ||||||
| 4.00%, 11/15/28 (Call 08/15/28)(a) |
40 | 38,636 | ||||||
| 4.30%, 06/15/45 (Call 12/15/44) |
107 | 91,326 | ||||||
| 4.45%, 08/15/49 (Call 02/15/49) |
208 | 177,960 | ||||||
| 4.50%, 11/15/48 (Call 05/15/48) |
217 | 187,539 | ||||||
| Target Corp. |
||||||||
| 2.25%, 04/15/25 (Call 03/15/25) |
488 | 472,804 | ||||||
| 2.35%, 02/15/30 (Call 11/15/29) |
121 | 105,547 | ||||||
| 2.65%, 09/15/30 (Call 06/15/30)(a) |
70 | 61,395 | ||||||
| 3.38%, 04/15/29 (Call 01/15/29) |
107 | 100,283 | ||||||
| 3.63%, 04/15/46 |
406 | 316,682 | ||||||
| 3.90%, 11/15/47 (Call 05/15/47) |
46 | 37,505 | ||||||
| 4.00%, 07/01/42 |
365 | 314,092 | ||||||
| 4.50%, 09/15/32 (Call 06/15/32)(a) |
85 | 82,261 | ||||||
| 6.35%, 11/01/32(a) |
320 | 349,937 | ||||||
| 6.50%, 10/15/37 |
295 | 329,565 | ||||||
| 7.00%, 01/15/38 |
145 | 169,335 | ||||||
| TJX Companies Inc. (The) |
||||||||
| 2.25%, 09/15/26 (Call 06/15/26) |
106 | 99,573 | ||||||
| 3.88%, 04/15/30 (Call 01/15/30) |
87 | 82,486 | ||||||
| 4.50%, 04/15/50 (Call 10/15/49)(a) |
214 | 194,964 | ||||||
| Tractor Supply Co. |
||||||||
| 1.75%, 11/01/30 (Call 08/01/30) |
581 | 467,817 | ||||||
| 5.25%, 05/15/33 (Call 02/15/33)(a) |
180 | 178,882 | ||||||
|
|
|
|||||||
| 22,874,428 | ||||||||
| Semiconductors — 3.5% | ||||||||
| Applied Materials Inc. |
||||||||
| 1.75%, 06/01/30 (Call 03/01/30) |
205 | 170,965 | ||||||
| 2.75%, 06/01/50 (Call 12/01/49) |
242 | 162,747 | ||||||
| 3.30%, 04/01/27 (Call 01/01/27)(a) |
497 | 475,726 | ||||||
| 3.90%, 10/01/25 (Call 07/01/25) |
188 | 184,702 | ||||||
| 4.35%, 04/01/47 (Call 10/01/46) |
301 | 266,886 | ||||||
| 5.10%, 10/01/35 (Call 04/01/35)(a) |
221 | 223,697 | ||||||
| 5.85%, 06/15/41 |
207 | 222,636 | ||||||
| Broadcom Inc. |
||||||||
| 2.60%, 02/15/33 (Call 11/15/32)(c) |
140 | 112,357 | ||||||
| 3.14%, 11/15/35 (Call 08/15/35)(c) |
327 | 259,174 | ||||||
| 3.19%, 11/15/36 (Call 08/15/36)(c) |
254 | 198,507 | ||||||
| 3.42%, 04/15/33 (Call 01/15/33)(c) |
431 | 368,049 | ||||||
| 3.47%, 04/15/34 (Call 01/15/34)(c) |
522 | 440,745 | ||||||
| 3.50%, 02/15/41 (Call 08/15/40)(c) |
430 | 328,539 | ||||||
| 3.75%, 02/15/51 (Call 08/15/50)(c) |
672 | 502,439 | ||||||
| 4.15%, 11/15/30 (Call 08/15/30) |
53 | 49,547 | ||||||
| 4.30%, 11/15/32 (Call 08/15/32)(a) |
165 | 152,793 | ||||||
| 4.93%, 05/15/37 (Call 02/15/37)(c) |
615 | 573,034 | ||||||
| 5.00%, 04/15/30 (Call 01/15/30) |
212 | 211,258 | ||||||
| Intel Corp. |
||||||||
| 1.60%, 08/12/28 (Call 06/12/28) |
899 | 781,951 | ||||||
| 2.45%, 11/15/29 (Call 08/15/29) |
174 | 152,378 | ||||||
| 2.60%, 05/19/26 (Call 02/19/26) |
761 | 723,818 | ||||||
| 3.05%, 08/12/51 (Call 02/12/51)(a) |
270 | 178,427 | ||||||
| 3.10%, 02/15/60 (Call 08/15/59) |
187 | 118,198 | ||||||
| 3.15%, 05/11/27 (Call 02/11/27) |
658 | 623,535 | ||||||
| 3.20%, 08/12/61 (Call 02/12/61) |
143 | 91,999 | ||||||
| 3.25%, 11/15/49 (Call 05/15/49) |
348 | 240,437 | ||||||
| 3.40%, 03/25/25 (Call 02/25/25) |
727 | 712,953 | ||||||
| 3.70%, 07/29/25 (Call 04/29/25) |
1,058 | 1,036,240 | ||||||
| 3.73%, 12/08/47 (Call 06/08/47) |
283 | 214,499 | ||||||
| Security | Par (000) |
Value | ||||||
| Semiconductors (continued) |
||||||||
| 3.75%, 03/25/27 (Call 01/25/27) |
$ | 582 | $ | 562,928 | ||||
| 3.75%, 08/05/27 (Call 07/05/27) |
538 | 518,522 | ||||||
| 3.90%, 03/25/30 (Call 12/25/29) |
115 | 108,129 | ||||||
| 4.00%, 08/05/29 (Call 06/05/29)(a) |
15 | 14,341 | ||||||
| 4.00%, 12/15/32(a) |
300 | 276,877 | ||||||
| 4.10%, 05/19/46 (Call 11/19/45) |
171 | 141,210 | ||||||
| 4.10%, 05/11/47 (Call 11/11/46) |
70 | 57,567 | ||||||
| 4.15%, 08/05/32 (Call 05/05/32) |
100 | 93,973 | ||||||
| 4.25%, 12/15/42 |
157 | 133,848 | ||||||
| 4.60%, 03/25/40 (Call 09/25/39)(a) |
10 | 9,277 | ||||||
| 4.75%, 03/25/50 (Call 09/25/49) |
494 | 438,712 | ||||||
| 4.80%, 10/01/41 |
295 | 275,399 | ||||||
| 4.88%, 02/10/26 |
125 | 124,598 | ||||||
| 4.88%, 02/10/28 (Call 01/10/28) |
75 | 74,791 | ||||||
| 4.90%, 07/29/45 (Call 01/29/45)(a) |
380 | 359,437 | ||||||
| 4.90%, 08/05/52 (Call 02/05/52) |
225 | 206,157 | ||||||
| 4.95%, 03/25/60 (Call 09/25/59)(a) |
254 | 231,701 | ||||||
| 5.00%, 02/21/31 (Call 12/21/30) |
105 | 104,342 | ||||||
| 5.05%, 08/05/62 (Call 02/05/62) |
147 | 135,668 | ||||||
| 5.15%, 02/21/34 (Call 11/21/33) |
135 | 133,675 | ||||||
| 5.20%, 02/10/33 (Call 11/10/32)(a) |
705 | 705,301 | ||||||
| 5.60%, 02/21/54 (Call 08/21/53) |
70 | 69,988 | ||||||
| 5.70%, 02/10/53 (Call 08/10/52) |
245 | 247,586 | ||||||
| 5.90%, 02/10/63 (Call 08/10/62) |
170 | 177,093 | ||||||
| KLA Corp. |
||||||||
| 3.30%, 03/01/50 (Call 08/28/49) |
30 | 21,534 | ||||||
| 4.95%, 07/15/52 (Call 01/15/52)(a) |
30 | 28,438 | ||||||
| 5.00%, 03/15/49 (Call 09/15/48) |
10 | 9,611 | ||||||
| 5.25%, 07/15/62 (Call 01/15/62) |
120 | 116,594 | ||||||
| Lam Research Corp. |
||||||||
| 1.90%, 06/15/30 (Call 03/15/30) |
785 | 658,779 | ||||||
| 2.88%, 06/15/50 (Call 12/15/49)(a) |
196 | 132,514 | ||||||
| 3.13%, 06/15/60 (Call 12/15/59) |
167 | 109,483 | ||||||
| 3.75%, 03/15/26 (Call 01/15/26) |
234 | 228,364 | ||||||
| 3.80%, 03/15/25 (Call 12/15/24) |
374 | 368,520 | ||||||
| 4.00%, 03/15/29 (Call 12/15/28) |
773 | 744,883 | ||||||
| 4.88%, 03/15/49 (Call 09/15/48) |
251 | 236,171 | ||||||
| Marvell Technology Inc. |
||||||||
| 2.95%, 04/15/31 (Call 01/15/31) |
85 | 72,791 | ||||||
| 5.75%, 02/15/29 (Call 01/15/29) |
15 | 15,285 | ||||||
| 5.95%, 09/15/33 (Call 06/15/33) |
75 | 77,343 | ||||||
| Micron Technology Inc. |
||||||||
| 2.70%, 04/15/32 (Call 01/15/32) |
160 | 131,258 | ||||||
| 3.48%, 11/01/51 (Call 05/01/51) |
250 | 173,661 | ||||||
| 4.66%, 02/15/30 (Call 11/15/29) |
15 | 14,486 | ||||||
| 5.33%, 02/06/29 (Call 11/06/28) |
56 | 56,055 | ||||||
| 5.88%, 02/09/33 (Call 11/09/32) |
120 | 122,466 | ||||||
| NVIDIA Corp. |
||||||||
| 2.00%, 06/15/31 (Call 03/15/31)(a) |
1,578 | 1,318,262 | ||||||
| 2.85%, 04/01/30 (Call 01/01/30) |
1,799 | 1,619,990 | ||||||
| 3.20%, 09/16/26 (Call 06/16/26)(a) |
5,130 | 4,944,977 | ||||||
| NXP BV/NXP Funding LLC |
||||||||
| 5.35%, 03/01/26 (Call 01/01/26)(a) |
130 | 129,792 | ||||||
| 5.55%, 12/01/28 (Call 09/01/28) |
460 | 465,067 | ||||||
| NXP BV/NXP Funding LLC/NXP USA Inc. |
||||||||
| 2.50%, 05/11/31 (Call 02/11/31) |
188 | 155,647 | ||||||
| 2.65%, 02/15/32 (Call 11/15/31) |
215 | 176,505 | ||||||
| 3.13%, 02/15/42 (Call 08/15/41) |
35 | 24,876 | ||||||
| 3.15%, 05/01/27 (Call 03/01/27) |
67 | 62,988 | ||||||
| 3.25%, 05/11/41 (Call 11/11/40) |
185 | 135,953 | ||||||
| 3.25%, 11/30/51 (Call 05/30/51) |
195 | 131,156 | ||||||
| 118 | 2 0 2 4 I S H A R E S A N N U A L R E P O R T T O S H A R E H O L D E R S |
| Schedule of Investments (continued) February 29, 2024 |
iShares® ESG Aware USD Corporate Bond ETF (Percentages shown are based on Net Assets) |
| Security | Par (000) |
Value | ||||||
| Semiconductors (continued) |
||||||||
| 3.40%, 05/01/30 (Call 02/01/30) |
$ | 125 | $ | 111,899 | ||||
| 4.30%, 06/18/29 (Call 03/18/29) |
267 | 254,891 | ||||||
| 4.40%, 06/01/27 (Call 05/01/27)(a) |
45 | 43,962 | ||||||
| 5.00%, 01/15/33 (Call 10/15/32) |
280 | 270,575 | ||||||
| Qorvo Inc., 4.38%, 10/15/29 (Call 10/15/24) |
55 | 51,148 | ||||||
| QUALCOMM Inc. |
||||||||
| 4.30%, 05/20/47 (Call 11/20/46) |
260 | 225,360 | ||||||
| 4.50%, 05/20/52 (Call 11/20/51) |
170 | 149,736 | ||||||
| 4.65%, 05/20/35 (Call 11/20/34) |
90 | 87,994 | ||||||
| 4.80%, 05/20/45 (Call 11/20/44)(a) |
182 | 170,812 | ||||||
| 6.00%, 05/20/53 (Call 11/20/52) |
145 | 158,959 | ||||||
| Texas Instruments Inc. |
||||||||
| 1.38%, 03/12/25 (Call 02/12/25) |
868 | 834,936 | ||||||
| 1.75%, 05/04/30 (Call 02/04/30) |
760 | 635,981 | ||||||
| 1.90%, 09/15/31 (Call 06/15/31)(a) |
310 | 255,837 | ||||||
| 2.25%, 09/04/29 (Call 06/04/29) |
953 | 841,054 | ||||||
| 2.70%, 09/15/51 (Call 03/15/51)(a) |
303 | 194,456 | ||||||
| 2.90%, 11/03/27 (Call 08/03/27)(a) |
513 | 481,531 | ||||||
| 3.65%, 08/16/32 (Call 05/16/32) |
390 | 358,164 | ||||||
| 3.88%, 03/15/39 (Call 09/15/38) |
92 | 80,872 | ||||||
| 4.15%, 05/15/48 (Call 11/15/47) |
444 | 377,043 | ||||||
| 4.60%, 02/08/27 (Call 01/08/27) |
75 | 74,741 | ||||||
| 4.60%, 02/15/28 (Call 01/15/28) |
575 | 573,959 | ||||||
| 4.60%, 02/08/29 (Call 01/08/29) |
75 | 74,595 | ||||||
| 4.85%, 02/08/34 (Call 11/08/33)(a) |
575 | 571,551 | ||||||
| 5.05%, 05/18/63 (Call 11/18/62) |
35 | 33,477 | ||||||
| 5.15%, 02/08/54 (Call 08/08/53)(a) |
75 | 74,314 | ||||||
| TSMC Arizona Corp. |
||||||||
| 2.50%, 10/25/31 (Call 07/25/31) |
230 | 194,700 | ||||||
| 3.25%, 10/25/51 (Call 04/25/51) |
355 | 269,107 | ||||||
| 3.88%, 04/22/27 (Call 03/22/27) |
35 | 33,930 | ||||||
| 4.13%, 04/22/29 (Call 02/22/29) |
100 | 96,681 | ||||||
| 4.25%, 04/22/32 (Call 01/22/32) |
310 | 299,369 | ||||||
| 4.50%, 04/22/52 (Call 10/22/51) |
290 | 278,813 | ||||||
|
|
|
|||||||
| 35,623,252 | ||||||||
| Shipbuilding — 0.1% | ||||||||
| Huntington Ingalls Industries Inc. |
||||||||
| 2.04%, 08/16/28 (Call 06/16/28) |
250 | 217,358 | ||||||
| 3.48%, 12/01/27 (Call 09/01/27) |
209 | 195,815 | ||||||
| 3.84%, 05/01/25 (Call 04/01/25) |
132 | 129,121 | ||||||
| 4.20%, 05/01/30 (Call 02/01/30) |
280 | 263,242 | ||||||
|
|
|
|||||||
| 805,536 | ||||||||
| Software — 3.3% | ||||||||
| Adobe Inc. |
||||||||
| 2.15%, 02/01/27 (Call 12/01/26) |
725 | 674,854 | ||||||
| 2.30%, 02/01/30 (Call 11/01/29) |
2,764 | 2,411,060 | ||||||
| Autodesk Inc. |
||||||||
| 2.40%, 12/15/31 (Call 09/15/31) |
1,155 | 958,115 | ||||||
| 2.85%, 01/15/30 (Call 10/15/29) |
177 | 156,903 | ||||||
| 3.50%, 06/15/27 (Call 03/15/27) |
1,033 | 987,700 | ||||||
| 4.38%, 06/15/25 (Call 03/15/25) |
368 | 363,802 | ||||||
| Broadridge Financial Solutions Inc. |
||||||||
| 2.60%, 05/01/31 (Call 02/01/31) |
20 | 16,757 | ||||||
| 3.40%, 06/27/26 (Call 03/27/26) |
2,000 | 1,911,611 | ||||||
| Electronic Arts Inc. |
||||||||
| 1.85%, 02/15/31 (Call 11/15/30) |
365 | 297,081 | ||||||
| 2.95%, 02/15/51 (Call 08/15/50) |
365 | 242,561 | ||||||
| Fidelity National Information Services Inc. |
||||||||
| 4.50%, 08/15/46 (Call 02/15/46) |
17 | 13,934 | ||||||
| 5.10%, 07/15/32 (Call 04/15/32)(a) |
530 | 529,678 | ||||||
| Security | Par (000) |
Value | ||||||
| Software (continued) |
||||||||
| 5.63%, 07/15/52 (Call 01/15/52)(a) |
$ | 125 | $ | 123,632 | ||||
| Fiserv Inc. |
||||||||
| 3.50%, 07/01/29 (Call 04/01/29) |
15 | 13,793 | ||||||
| 4.40%, 07/01/49 (Call 01/01/49) |
397 | 332,026 | ||||||
| 5.63%, 08/21/33 (Call 05/21/33) |
20 | 20,225 | ||||||
| Intuit Inc. |
||||||||
| 1.65%, 07/15/30 (Call 04/15/30) |
140 | 114,799 | ||||||
| 5.20%, 09/15/33 (Call 06/15/33) |
410 | 414,096 | ||||||
| 5.50%, 09/15/53 (Call 03/15/53) |
200 | 206,244 | ||||||
| Microsoft Corp. |
||||||||
| 2.40%, 08/08/26 (Call 05/08/26) |
1,846 | 1,747,479 | ||||||
| 2.50%, 09/15/50 (Call 03/15/50)(c) |
27 | 17,131 | ||||||
| 2.53%, 06/01/50 (Call 12/01/49) |
241 | 155,299 | ||||||
| 2.68%, 06/01/60 (Call 12/01/59) |
347 | 219,133 | ||||||
| 2.92%, 03/17/52 (Call 09/17/51) |
653 | 450,668 | ||||||
| 3.04%, 03/17/62 (Call 09/17/61) |
190 | 129,200 | ||||||
| 3.13%, 11/03/25 (Call 08/03/25) |
1,739 | 1,690,348 | ||||||
| 3.30%, 02/06/27 (Call 11/06/26) |
1,731 | 1,672,051 | ||||||
| 3.40%, 06/15/27 (Call 03/15/27)(a)(c) |
20 | 19,195 | ||||||
| 3.45%, 08/08/36 (Call 02/08/36) |
503 | 443,090 | ||||||
| 3.50%, 02/12/35 (Call 08/12/34) |
1,472 | 1,335,440 | ||||||
| 3.50%, 11/15/42 |
20 | 16,761 | ||||||
| 3.95%, 08/08/56 (Call 02/08/56) |
355 | 298,823 | ||||||
| 4.00%, 02/12/55 (Call 08/12/54)(a) |
505 | 438,076 | ||||||
| 4.10%, 02/06/37 (Call 08/06/36) |
420 | 395,692 | ||||||
| 4.20%, 11/03/35 (Call 05/03/35) |
110 | 106,303 | ||||||
| 4.25%, 02/06/47 (Call 08/06/46)(a) |
260 | 239,489 | ||||||
| 4.45%, 11/03/45 (Call 05/03/45) |
35 | 33,371 | ||||||
| 4.50%, 10/01/40 |
50 | 48,891 | ||||||
| 4.50%, 02/06/57 (Call 08/06/56) |
170 | 160,566 | ||||||
| 5.30%, 02/08/41(a) |
135 | 144,399 | ||||||
| Oracle Corp. |
||||||||
| 3.25%, 05/15/30 (Call 02/15/30)(a) |
97 | 86,940 | ||||||
| 3.60%, 04/01/40 (Call 10/01/39) |
185 | 142,835 | ||||||
| 3.60%, 04/01/50 (Call 10/01/49) |
694 | 488,444 | ||||||
| 3.80%, 11/15/37 (Call 05/15/37) |
97 | 79,782 | ||||||
| 3.85%, 07/15/36 (Call 01/15/36) |
309 | 259,754 | ||||||
| 3.85%, 04/01/60 (Call 10/01/59) |
612 | 425,144 | ||||||
| 3.90%, 05/15/35 (Call 11/15/34) |
354 | 303,862 | ||||||
| 3.95%, 03/25/51 (Call 09/25/50) |
554 | 412,914 | ||||||
| 4.00%, 07/15/46 (Call 01/15/46) |
646 | 496,904 | ||||||
| 4.00%, 11/15/47 (Call 05/15/47) |
468 | 357,813 | ||||||
| 4.10%, 03/25/61 (Call 09/25/60) |
312 | 228,362 | ||||||
| 4.13%, 05/15/45 (Call 11/15/44) |
341 | 269,405 | ||||||
| 4.30%, 07/08/34 (Call 01/08/34) |
490 | 444,276 | ||||||
| 4.38%, 05/15/55 (Call 11/15/54) |
412 | 322,834 | ||||||
| 4.50%, 07/08/44 (Call 01/08/44) |
217 | 182,130 | ||||||
| 4.90%, 02/06/33 (Call 11/06/32) |
95 | 91,729 | ||||||
| 5.38%, 07/15/40 |
501 | 479,173 | ||||||
| 5.55%, 02/06/53 (Call 08/06/52) |
350 | 335,003 | ||||||
| 6.13%, 07/08/39 |
276 | 284,024 | ||||||
| 6.25%, 11/09/32 (Call 08/09/32) |
630 | 665,230 | ||||||
| 6.50%, 04/15/38 |
329 | 351,384 | ||||||
| 6.90%, 11/09/52 (Call 05/09/52) |
385 | 434,389 | ||||||
| Roper Technologies Inc. |
||||||||
| 2.95%, 09/15/29 (Call 06/15/29) |
6 | 5,371 | ||||||
| 3.80%, 12/15/26 (Call 09/15/26) |
64 | 61,863 | ||||||
| Salesforce Inc. |
||||||||
| 2.90%, 07/15/51 (Call 01/15/51) |
348 | 231,472 | ||||||
| 3.70%, 04/11/28 (Call 01/11/28) |
4,439 | 4,283,295 | ||||||
| ServiceNow Inc., 1.40%, 09/01/30 (Call 06/01/30) |
250 | 200,541 | ||||||
| S C H E D U L E O F I N V E S T M E N T S |
119 |
| Schedule of Investments (continued) February 29, 2024 |
iShares® ESG Aware USD Corporate Bond ETF (Percentages shown are based on Net Assets) |
| Security | Par (000) |
Value | ||||||
| Software (continued) |
||||||||
| VMware LLC |
||||||||
| 3.90%, 08/21/27 (Call 05/21/27) |
$ | 517 | $ | 492,945 | ||||
| 4.65%, 05/15/27 (Call 03/15/27) |
82 | 80,268 | ||||||
| 4.70%, 05/15/30 (Call 02/15/30) |
587 | 564,481 | ||||||
| Workday Inc. |
||||||||
| 3.50%, 04/01/27 (Call 03/01/27) |
15 | 14,279 | ||||||
| 3.70%, 04/01/29 (Call 02/01/29) |
470 | 439,274 | ||||||
| 3.80%, 04/01/32 (Call 01/01/32) |
641 | 579,413 | ||||||
|
|
|
|||||||
| 33,645,809 | ||||||||
| Telecommunications — 3.9% | ||||||||
| America Movil SAB de CV |
||||||||
| 2.88%, 05/07/30 (Call 02/07/30) |
50 | 43,817 | ||||||
| 4.38%, 07/16/42 |
85 | 73,567 | ||||||
| 4.38%, 04/22/49 (Call 10/22/48) |
255 | 219,259 | ||||||
| 4.70%, 07/21/32 (Call 04/21/32) |
215 | 206,232 | ||||||
| 6.13%, 11/15/37 |
85 | 89,251 | ||||||
| 6.13%, 03/30/40 |
340 | 355,816 | ||||||
| 6.38%, 03/01/35(a) |
212 | 229,703 | ||||||
| AT&T Inc. |
||||||||
| 3.30%, 02/01/52 (Call 08/01/51)(a) |
340 | 230,579 | ||||||
| 3.50%, 09/15/53 (Call 03/15/53) |
1,085 | 746,441 | ||||||
| 3.50%, 02/01/61 (Call 08/01/60) |
205 | 136,826 | ||||||
| 3.55%, 09/15/55 (Call 03/15/55) |
1,190 | 810,750 | ||||||
| 3.65%, 06/01/51 (Call 12/01/50) |
465 | 332,568 | ||||||
| 3.65%, 09/15/59 (Call 03/15/59) |
988 | 669,516 | ||||||
| 3.80%, 12/01/57 (Call 06/01/57) |
1,008 | 711,259 | ||||||
| 3.85%, 06/01/60 (Call 12/01/59)(a) |
207 | 146,169 | ||||||
| 4.10%, 02/15/28 (Call 11/15/27) |
10 | 9,641 | ||||||
| 4.30%, 12/15/42 (Call 06/15/42) |
320 | 270,175 | ||||||
| 4.35%, 03/01/29 (Call 12/01/28) |
10 | 9,659 | ||||||
| 4.35%, 06/15/45 (Call 12/15/44) |
172 | 143,904 | ||||||
| 4.50%, 05/15/35 (Call 11/15/34) |
634 | 583,375 | ||||||
| 4.50%, 03/09/48 (Call 09/09/47) |
261 | 218,070 | ||||||
| 4.55%, 03/09/49 (Call 09/09/48) |
231 | 193,796 | ||||||
| 4.65%, 06/01/44 (Call 12/01/43) |
27 | 23,219 | ||||||
| 4.75%, 05/15/46 (Call 11/15/45) |
353 | 309,030 | ||||||
| 4.80%, 06/15/44 (Call 12/15/43) |
117 | 103,415 | ||||||
| 4.85%, 03/01/39 (Call 09/01/38) |
152 | 139,931 | ||||||
| 4.85%, 07/15/45 (Call 01/15/45)(a) |
25 | 22,126 | ||||||
| 4.90%, 08/15/37 (Call 02/14/37) |
78 | 72,928 | ||||||
| 5.15%, 03/15/42(a) |
102 | 97,140 | ||||||
| 5.15%, 11/15/46 (Call 05/15/46) |
215 | 199,028 | ||||||
| 5.15%, 02/15/50 (Call 08/14/49) |
181 | 165,519 | ||||||
| 5.25%, 03/01/37 (Call 09/01/36) |
408 | 396,086 | ||||||
| 5.35%, 09/01/40(a) |
202 | 194,665 | ||||||
| 5.45%, 03/01/47 (Call 09/01/46) |
160 | 155,463 | ||||||
| 5.55%, 08/15/41(a) |
132 | 131,475 | ||||||
| 5.65%, 02/15/47 (Call 08/15/46)(a) |
235 | 235,408 | ||||||
| 5.70%, 03/01/57 (Call 09/01/56)(a) |
159 | 155,792 | ||||||
| 6.00%, 08/15/40 (Call 05/15/40) |
88 | 90,211 | ||||||
| 6.30%, 01/15/38 |
125 | 132,133 | ||||||
| 6.38%, 03/01/41(a) |
50 | 52,609 | ||||||
| 6.55%, 02/15/39 |
5 | 5,374 | ||||||
| Bell Telephone Co. of Canada or Bell Canada |
||||||||
| 3.65%, 08/15/52 (Call 02/15/52) |
75 | 55,137 | ||||||
| 4.30%, 07/29/49 (Call 01/29/49) |
28 | 23,042 | ||||||
| 4.46%, 04/01/48 (Call 10/01/47) |
96 | 81,596 | ||||||
| Series US-6, 3.20%, 02/15/52 (Call 08/15/51) |
70 | 47,013 | ||||||
| British Telecommunications PLC |
||||||||
| 5.13%, 12/04/28 (Call 09/04/28)(a) |
397 | 399,035 | ||||||
| 9.63%, 12/15/30 |
1,301 | 1,591,061 | ||||||
| Security | Par (000) |
Value | ||||||
| Telecommunications (continued) |
||||||||
| Cisco Systems Inc. |
||||||||
| 2.50%, 09/20/26 (Call 06/20/26) |
$ | 469 | $ | 442,577 | ||||
| 2.95%, 02/28/26 |
283 | 272,781 | ||||||
| 4.80%, 02/26/27 (Call 01/26/27) |
200 | 200,046 | ||||||
| 4.85%, 02/26/29 (Call 01/26/29) |
200 | 200,320 | ||||||
| 4.90%, 02/26/26 |
130 | 130,057 | ||||||
| 4.95%, 02/26/31 (Call 12/26/30) |
150 | 150,127 | ||||||
| 5.05%, 02/26/34 (Call 11/26/33) |
145 | 145,750 | ||||||
| 5.30%, 02/26/54 (Call 08/26/53) |
195 | 197,327 | ||||||
| 5.35%, 02/26/64 (Call 08/26/63) |
210 | 211,543 | ||||||
| 5.50%, 01/15/40(a) |
619 | 639,040 | ||||||
| 5.90%, 02/15/39 |
612 | 656,760 | ||||||
| Corning Inc. |
||||||||
| 4.38%, 11/15/57 (Call 05/15/57)(a) |
220 | 180,972 | ||||||
| 5.45%, 11/15/79 (Call 05/19/79) |
182 | 168,088 | ||||||
| 5.75%, 08/15/40 |
10 | 9,995 | ||||||
| 5.85%, 11/15/68 (Call 05/15/68) |
23 | 22,628 | ||||||
| Deutsche Telekom International Finance BV |
||||||||
| 8.75%, 06/15/30 |
345 | 406,847 | ||||||
| 9.25%, 06/01/32 |
10 | 12,620 | ||||||
| Juniper Networks Inc. |
||||||||
| 3.75%, 08/15/29 (Call 05/15/29) |
17 | 15,757 | ||||||
| 5.95%, 03/15/41 |
110 | 108,821 | ||||||
| Koninklijke KPN NV, 8.38%, 10/01/30 |
969 | 1,129,480 | ||||||
| Motorola Solutions Inc. |
||||||||
| 2.30%, 11/15/30 (Call 08/15/30) |
55 | 45,294 | ||||||
| 4.60%, 02/23/28 (Call 11/23/27) |
231 | 226,597 | ||||||
| 4.60%, 05/23/29 (Call 02/23/29) |
127 | 123,462 | ||||||
| 5.50%, 09/01/44 |
30 | 28,511 | ||||||
| 5.60%, 06/01/32 (Call 03/01/32) |
95 | 95,291 | ||||||
| Nokia OYJ, 4.38%, 06/12/27(a) |
805 | 771,515 | ||||||
| Orange SA |
||||||||
| 5.38%, 01/13/42 |
215 | 211,457 | ||||||
| 5.50%, 02/06/44 (Call 08/06/43) |
165 | 164,630 | ||||||
| 9.00%, 03/01/31 |
852 | 1,029,578 | ||||||
| Rogers Communications Inc. |
||||||||
| 3.70%, 11/15/49 (Call 05/15/49)(a) |
245 | 176,024 | ||||||
| 4.30%, 02/15/48 (Call 08/15/47) |
158 | 126,231 | ||||||
| 4.35%, 05/01/49 (Call 11/01/48)(a) |
273 | 219,263 | ||||||
| 4.50%, 03/15/43 (Call 09/15/42) |
90 | 76,113 | ||||||
| 4.55%, 03/15/52 (Call 09/15/51) |
155 | 127,920 | ||||||
| 5.00%, 03/15/44 (Call 09/15/43) |
252 | 227,284 | ||||||
| 5.45%, 10/01/43 (Call 04/01/43) |
165 | 157,801 | ||||||
| 7.50%, 08/15/38 |
237 | 272,536 | ||||||
| Sprint Capital Corp., 8.75%, 03/15/32 |
200 | 241,683 | ||||||
| Telefonica Emisiones SA |
||||||||
| 4.10%, 03/08/27 |
297 | 287,632 | ||||||
| 4.67%, 03/06/38 |
10 | 8,918 | ||||||
| 4.90%, 03/06/48 |
200 | 171,390 | ||||||
| 5.21%, 03/08/47 |
428 | 384,588 | ||||||
| 5.52%, 03/01/49 (Call 09/01/48) |
150 | 139,929 | ||||||
| 7.05%, 06/20/36 |
526 | 579,555 | ||||||
| Telefonica Europe BV, 8.25%, 09/15/30 |
324 | 367,746 | ||||||
| TELUS Corp. |
||||||||
| 2.80%, 02/16/27 (Call 11/16/26) |
987 | 924,655 | ||||||
| 3.70%, 09/15/27 (Call 06/15/27) |
776 | 736,568 | ||||||
| 4.30%, 06/15/49 (Call 12/15/48) |
37 | 30,065 | ||||||
| 4.60%, 11/16/48 (Call 05/16/48)(a) |
229 | 195,690 | ||||||
| T-Mobile USA Inc. |
||||||||
| 2.63%, 02/15/29 (Call 03/11/24) |
5 | 4,441 | ||||||
| 2.88%, 02/15/31 (Call 02/15/26) |
425 | 365,596 | ||||||
| 120 | 2 0 2 4 I S H A R E S A N N U A L R E P O R T T O S H A R E H O L D E R S |
| Schedule of Investments (continued) February 29, 2024 |
iShares® ESG Aware USD Corporate Bond ETF (Percentages shown are based on Net Assets) |
| Security | Par (000) |
Value | ||||||
| Telecommunications (continued) |
||||||||
| 3.00%, 02/15/41 (Call 08/15/40) |
$ | 170 | $ | 122,684 | ||||
| 3.30%, 02/15/51 (Call 08/15/50) |
641 | 440,914 | ||||||
| 3.38%, 04/15/29 (Call 04/15/24) |
80 | 73,478 | ||||||
| 3.40%, 10/15/52 (Call 04/15/52) |
525 | 364,603 | ||||||
| 3.50%, 04/15/31 (Call 04/15/26) |
780 | 697,992 | ||||||
| 3.60%, 11/15/60 (Call 05/15/60) |
491 | 338,368 | ||||||
| 3.75%, 04/15/27 (Call 02/15/27) |
15 | 14,379 | ||||||
| 3.88%, 04/15/30 (Call 01/15/30) |
547 | 507,918 | ||||||
| 4.38%, 04/15/40 (Call 10/15/39) |
255 | 223,527 | ||||||
| 4.50%, 04/15/50 (Call 10/15/49) |
720 | 608,625 | ||||||
| 5.20%, 01/15/33 (Call 10/15/32) |
67 | 66,571 | ||||||
| 5.65%, 01/15/53 (Call 07/15/52) |
205 | 203,497 | ||||||
| 5.80%, 09/15/62 (Call 03/15/62) |
160 | 161,982 | ||||||
| Verizon Communications Inc. |
||||||||
| 2.36%, 03/15/32 (Call 12/15/31) |
250 | 202,486 | ||||||
| 2.55%, 03/21/31 (Call 12/21/30) |
360 | 303,288 | ||||||
| 2.88%, 11/20/50 (Call 05/20/50) |
446 | 284,169 | ||||||
| 2.99%, 10/30/56 (Call 04/30/56) |
733 | 455,667 | ||||||
| 3.00%, 11/20/60 (Call 05/20/60)(a) |
362 | 219,757 | ||||||
| 3.15%, 03/22/30 (Call 12/22/29) |
43 | 38,494 | ||||||
| 3.55%, 03/22/51 (Call 09/22/50) |
650 | 471,991 | ||||||
| 3.70%, 03/22/61 (Call 09/22/60) |
688 | 489,374 | ||||||
| 3.85%, 11/01/42 (Call 05/01/42) |
138 | 110,991 | ||||||
| 3.88%, 02/08/29 (Call 11/08/28)(a) |
22 | 20,902 | ||||||
| 4.00%, 03/22/50 (Call 09/22/49) |
66 | 52,051 | ||||||
| 4.02%, 12/03/29 (Call 09/03/29) |
74 | 70,239 | ||||||
| 4.13%, 03/16/27 |
104 | 101,145 | ||||||
| 4.13%, 08/15/46 |
255 | 208,696 | ||||||
| 4.27%, 01/15/36 |
770 | 698,969 | ||||||
| 4.33%, 09/21/28 |
11 | 10,679 | ||||||
| 4.40%, 11/01/34 (Call 05/01/34) |
478 | 444,291 | ||||||
| 4.50%, 08/10/33 |
518 | 488,124 | ||||||
| 4.52%, 09/15/48 |
340 | 297,490 | ||||||
| 4.67%, 03/15/55 |
265 | 233,714 | ||||||
| 4.75%, 11/01/41 |
146 | 134,358 | ||||||
| 4.81%, 03/15/39 |
338 | 315,236 | ||||||
| 4.86%, 08/21/46(a) |
612 | 561,829 | ||||||
| 5.01%, 04/15/49(a) |
95 | 92,350 | ||||||
| 5.01%, 08/21/54 |
255 | 236,367 | ||||||
| 5.05%, 05/09/33 (Call 02/09/33)(a) |
85 | 84,150 | ||||||
| 5.25%, 03/16/37 |
832 | 829,439 | ||||||
| 5.50%, 03/16/47(a) |
282 | 283,844 | ||||||
| 5.85%, 09/15/35 |
95 | 99,206 | ||||||
| 6.40%, 09/15/33 |
75 | 80,613 | ||||||
| 6.55%, 09/15/43 |
270 | 300,772 | ||||||
| 7.75%, 12/01/30 |
25 | 28,521 | ||||||
| Vodafone Group PLC |
||||||||
| 4.25%, 09/17/50 |
361 | 284,375 | ||||||
| 4.38%, 05/30/28(a) |
260 | 255,544 | ||||||
| 4.38%, 02/19/43 |
317 | 266,846 | ||||||
| 4.88%, 06/19/49 |
366 | 316,807 | ||||||
| 5.00%, 05/30/38(a) |
95 | 91,510 | ||||||
| 5.25%, 05/30/48(a) |
245 | 227,245 | ||||||
| 6.15%, 02/27/37 |
378 | 394,521 | ||||||
| 6.25%, 11/30/32 |
153 | 162,427 | ||||||
| 7.88%, 02/15/30 |
462 | 523,826 | ||||||
|
|
|
|||||||
| 39,725,149 | ||||||||
| Toys, Games & Hobbies — 0.2% | ||||||||
| Hasbro Inc. |
||||||||
| 3.50%, 09/15/27 (Call 06/15/27)(a) |
547 | 513,254 | ||||||
| 3.55%, 11/19/26 (Call 09/19/26) |
1,282 | 1,215,760 | ||||||
| Security | Par (000) |
Value | ||||||
| Toys, Games & Hobbies (continued) |
||||||||
| 3.90%, 11/19/29 (Call 08/19/29) |
$ | 775 | $ | 711,119 | ||||
| Mattel Inc., 5.45%, 11/01/41 (Call 05/01/41) |
30 | 27,221 | ||||||
|
|
|
|||||||
| 2,467,354 | ||||||||
| Transportation — 2.0% | ||||||||
| Burlington Northern Santa Fe LLC |
||||||||
| 3.05%, 02/15/51 (Call 08/15/50) |
229 | 155,118 | ||||||
| 3.55%, 02/15/50 (Call 08/15/49) |
298 | 224,449 | ||||||
| 3.90%, 08/01/46 (Call 02/01/46) |
145 | 116,699 | ||||||
| 4.05%, 06/15/48 (Call 12/15/47) |
190 | 156,708 | ||||||
| 4.13%, 06/15/47 (Call 12/15/46) |
185 | 154,711 | ||||||
| 4.15%, 12/15/48 (Call 06/15/48) |
189 | 157,430 | ||||||
| 4.40%, 03/15/42 (Call 09/15/41) |
10 | 8,888 | ||||||
| 4.70%, 09/01/45 (Call 03/01/45) |
63 | 57,571 | ||||||
| 4.90%, 04/01/44 (Call 10/01/43) |
15 | 14,153 | ||||||
| 4.95%, 09/15/41 (Call 03/15/41) |
58 | 55,276 | ||||||
| 5.05%, 03/01/41 (Call 09/01/40) |
40 | 38,783 | ||||||
| 5.20%, 04/15/54 (Call 10/15/53) |
15 | 14,658 | ||||||
| 5.40%, 06/01/41 (Call 12/01/40)(a) |
20 | 20,128 | ||||||
| 5.75%, 05/01/40 (Call 11/01/39) |
41 | 42,855 | ||||||
| 6.15%, 05/01/37 |
25 | 27,274 | ||||||
| 6.20%, 08/15/36 |
15 | 16,394 | ||||||
| Canadian National Railway Co. |
||||||||
| 2.45%, 05/01/50 (Call 11/01/49) |
330 | 205,768 | ||||||
| 3.20%, 08/02/46 (Call 02/02/46) |
365 | 270,571 | ||||||
| 3.65%, 02/03/48 (Call 08/03/47) |
406 | 321,577 | ||||||
| 4.45%, 01/20/49 (Call 07/20/48) |
255 | 227,752 | ||||||
| 5.85%, 11/01/33 (Call 08/01/33) |
55 | 58,373 | ||||||
| 6.20%, 06/01/36 |
208 | 226,649 | ||||||
| 6.25%, 08/01/34 |
187 | 204,197 | ||||||
| 6.38%, 11/15/37(a) |
162 | 177,375 | ||||||
| Canadian Pacific Railway Co. |
||||||||
| 2.05%, 03/05/30 (Call 12/05/29) |
152 | 128,095 | ||||||
| 3.10%, 12/02/51 (Call 06/02/51) |
495 | 336,707 | ||||||
| 4.20%, 11/15/69 (Call 05/15/69) |
170 | 133,001 | ||||||
| 4.80%, 09/15/35 (Call 03/15/35) |
53 | 50,704 | ||||||
| 4.80%, 08/01/45 (Call 02/01/45) |
175 | 158,366 | ||||||
| 5.95%, 05/15/37 |
31 | 32,040 | ||||||
| 6.13%, 09/15/2115 (Call 03/15/2115) |
149 | 156,607 | ||||||
| 7.13%, 10/15/31(a) |
32 | 35,750 | ||||||
| CH Robinson Worldwide Inc., 4.20%, 04/15/28 (Call 01/15/28) |
1,700 | 1,638,934 | ||||||
| CSX Corp. |
||||||||
| 2.40%, 02/15/30 (Call 11/15/29)(a) |
191 | 165,783 | ||||||
| 2.60%, 11/01/26 (Call 08/01/26) |
60 | 56,584 | ||||||
| 3.35%, 09/15/49 (Call 03/15/49) |
166 | 118,886 | ||||||
| 3.80%, 11/01/46 (Call 05/01/46) |
188 | 148,028 | ||||||
| 3.80%, 04/15/50 (Call 10/15/49) |
96 | 74,551 | ||||||
| 3.95%, 05/01/50 (Call 11/01/49) |
204 | 163,021 | ||||||
| 4.10%, 03/15/44 (Call 09/15/43) |
181 | 152,174 | ||||||
| 4.25%, 03/15/29 (Call 12/15/28) |
468 | 455,841 | ||||||
| 4.25%, 11/01/66 (Call 05/01/66) |
237 | 188,806 | ||||||
| 4.30%, 03/01/48 (Call 09/01/47) |
250 | 213,248 | ||||||
| 4.40%, 03/01/43 (Call 09/01/42) |
39 | 34,572 | ||||||
| 4.50%, 03/15/49 (Call 09/15/48) |
163 | 142,279 | ||||||
| 4.50%, 08/01/54 (Call 02/01/54) |
115 | 100,051 | ||||||
| 4.65%, 03/01/68 (Call 09/01/67) |
50 | 42,971 | ||||||
| 4.75%, 05/30/42 (Call 11/30/41) |
149 | 137,212 | ||||||
| 4.75%, 11/15/48 (Call 05/15/48) |
119 | 108,318 | ||||||
| 5.50%, 04/15/41 (Call 10/15/40) |
133 | 134,204 | ||||||
| 6.00%, 10/01/36 |
56 | 59,591 | ||||||
| 6.15%, 05/01/37 |
145 | 157,085 | ||||||
| S C H E D U L E O F I N V E S T M E N T S |
121 |
| Schedule of Investments (continued) February 29, 2024 |
iShares® ESG Aware USD Corporate Bond ETF (Percentages shown are based on Net Assets) |
| Security | Par (000) |
Value | ||||||
| Transportation (continued) |
||||||||
| 6.22%, 04/30/40 |
$ | 115 | $ | 124,600 | ||||
| FedEx Corp. |
||||||||
| 3.10%, 08/05/29 (Call 05/05/29) |
44 | 39,914 | ||||||
| 3.88%, 08/01/42 |
82 | 65,098 | ||||||
| 3.90%, 02/01/35 |
35 | 30,808 | ||||||
| 4.05%, 02/15/48 (Call 08/15/47) |
192 | 150,939 | ||||||
| 4.10%, 04/15/43 |
62 | 50,524 | ||||||
| 4.10%, 02/01/45 |
137 | 109,784 | ||||||
| 4.25%, 05/15/30 (Call 02/15/30)(a) |
59 | 56,304 | ||||||
| 4.40%, 01/15/47 (Call 07/15/46) |
143 | 118,612 | ||||||
| 4.55%, 04/01/46 (Call 10/01/45) |
299 | 254,657 | ||||||
| 4.75%, 11/15/45 (Call 05/15/45) |
303 | 265,195 | ||||||
| 4.90%, 01/15/34 |
39 | 37,876 | ||||||
| 4.95%, 10/17/48 (Call 04/17/48) |
87 | 78,328 | ||||||
| 5.10%, 01/15/44 |
168 | 155,335 | ||||||
| 5.25%, 05/15/50 (Call 11/15/49)(a) |
313 | 295,354 | ||||||
| Norfolk Southern Corp. |
||||||||
| 2.55%, 11/01/29 (Call 08/01/29)(a) |
173 | 152,032 | ||||||
| 2.90%, 08/25/51 (Call 02/25/51) |
190 | 122,172 | ||||||
| 3.16%, 05/15/55 (Call 11/15/54) |
120 | 78,610 | ||||||
| 3.40%, 11/01/49 (Call 05/01/49) |
159 | 115,426 | ||||||
| 3.65%, 08/01/25 (Call 06/01/25)(a) |
58 | 56,730 | ||||||
| 3.70%, 03/15/53 (Call 09/15/52) |
60 | 44,616 | ||||||
| 3.80%, 08/01/28 (Call 05/01/28) |
275 | 263,089 | ||||||
| 3.94%, 11/01/47 (Call 05/01/47) |
284 | 224,327 | ||||||
| 3.95%, 10/01/42 (Call 04/01/42) |
178 | 145,971 | ||||||
| 4.05%, 08/15/52 (Call 02/15/52) |
355 | 282,890 | ||||||
| 4.10%, 05/15/49 (Call 11/15/48) |
129 | 104,755 | ||||||
| 4.10%, 05/15/2121 (Call 11/15/2120) |
95 | 68,558 | ||||||
| 4.15%, 02/28/48 (Call 08/28/47) |
228 | 188,439 | ||||||
| 4.45%, 06/15/45 (Call 12/15/44) |
143 | 123,127 | ||||||
| 4.65%, 01/15/46 (Call 07/15/45) |
123 | 108,956 | ||||||
| 4.84%, 10/01/41 |
233 | 217,107 | ||||||
| 5.05%, 08/01/30 (Call 06/01/30) |
90 | 89,875 | ||||||
| 5.10%, 12/31/49 (Call 02/01/2118) |
10 | 8,688 | ||||||
| 7.80%, 05/15/27(a) |
30 | 32,513 | ||||||
| Ryder System Inc. |
||||||||
| 2.85%, 03/01/27 (Call 02/01/27) |
25 | 23,379 | ||||||
| 2.90%, 12/01/26 (Call 10/01/26) |
319 | 299,727 | ||||||
| 4.63%, 06/01/25 (Call 05/01/25) |
170 | 168,397 | ||||||
| 5.25%, 06/01/28 (Call 05/01/28)(a) |
345 | 345,521 | ||||||
| 5.30%, 03/15/27 (Call 02/15/27) |
75 | 75,098 | ||||||
| 5.38%, 03/15/29 (Call 02/15/29) |
100 | 99,890 | ||||||
| 5.65%, 03/01/28 (Call 02/01/28) |
530 | 538,806 | ||||||
| 6.30%, 12/01/28 (Call 11/01/28) |
500 | 521,011 | ||||||
| 6.60%, 12/01/33 (Call 09/01/33) |
455 | 487,166 | ||||||
| Union Pacific Corp. |
||||||||
| 2.95%, 03/10/52 (Call 09/10/51) |
130 | 86,912 | ||||||
| 2.97%, 09/16/62 (Call 03/16/62) |
210 | 129,900 | ||||||
| 3.25%, 02/05/50 (Call 08/05/49) |
392 | 282,754 | ||||||
| 3.35%, 08/15/46 (Call 02/15/46) |
88 | 63,543 | ||||||
| 3.38%, 02/01/35 (Call 08/01/34) |
85 | 72,548 | ||||||
| 3.50%, 02/14/53 (Call 08/14/52) |
230 | 171,049 | ||||||
| 3.55%, 05/20/61 (Call 11/20/60) |
80 | 57,040 | ||||||
| 3.75%, 02/05/70 (Call 08/05/69) |
158 | 115,477 | ||||||
| 3.80%, 10/01/51 (Call 04/01/51) |
311 | 245,234 | ||||||
| 3.80%, 04/06/71 (Call 10/06/70) |
203 | 148,592 | ||||||
| 3.84%, 03/20/60 (Call 09/20/59) |
280 | 212,302 | ||||||
| 3.85%, 02/14/72 (Call 08/14/71) |
107 | 79,270 | ||||||
| 3.88%, 02/01/55 (Call 08/01/54) |
203 | 157,552 | ||||||
| 3.95%, 08/15/59 (Call 02/15/59) |
193 | 149,699 | ||||||
| Security | Par (000) |
Value | ||||||
| Transportation (continued) |
||||||||
| 4.00%, 04/15/47 (Call 10/15/46) |
$ | 148 | $ | 120,303 | ||||
| 4.05%, 11/15/45 (Call 05/15/45) |
77 | 63,092 | ||||||
| 4.05%, 03/01/46 (Call 09/01/45) |
180 | 148,193 | ||||||
| 4.10%, 09/15/67 (Call 03/15/67)(a) |
176 | 138,267 | ||||||
| 4.30%, 03/01/49 (Call 09/01/48) |
233 | 197,488 | ||||||
| 4.50%, 09/10/48 (Call 03/10/48) |
248 | 217,451 | ||||||
| 6.63%, 02/01/29 |
28 | 30,260 | ||||||
| United Parcel Service Inc. |
||||||||
| 2.50%, 09/01/29 (Call 06/01/29) |
20 | 17,839 | ||||||
| 3.40%, 03/15/29 (Call 12/15/28) |
122 | 115,128 | ||||||
| 3.40%, 11/15/46 (Call 05/15/46) |
125 | 95,486 | ||||||
| 3.40%, 09/01/49 (Call 03/01/49)(a) |
287 | 214,369 | ||||||
| 3.63%, 10/01/42 |
86 | 69,582 | ||||||
| 3.75%, 11/15/47 (Call 05/15/47) |
376 | 297,409 | ||||||
| 4.25%, 03/15/49 (Call 09/15/48) |
281 | 241,508 | ||||||
| 4.45%, 04/01/30 (Call 01/01/30)(a) |
87 | 85,506 | ||||||
| 4.88%, 11/15/40 (Call 05/15/40) |
303 | 290,397 | ||||||
| 5.20%, 04/01/40 (Call 10/01/39) |
150 | 149,065 | ||||||
| 5.30%, 04/01/50 (Call 10/01/49) |
240 | 240,653 | ||||||
| 6.20%, 01/15/38 |
709 | 775,339 | ||||||
|
|
|
|||||||
| 20,576,177 | ||||||||
| Trucking & Leasing — 0.1% | ||||||||
| GATX Corp. |
||||||||
| 3.10%, 06/01/51 (Call 12/01/50)(a) |
100 | 64,268 | ||||||
| 3.25%, 03/30/25 (Call 12/30/24)(a) |
93 | 90,674 | ||||||
| 3.25%, 09/15/26 (Call 06/15/26) |
20 | 19,060 | ||||||
| 3.50%, 03/15/28 (Call 12/15/27)(a) |
29 | 27,197 | ||||||
| 3.50%, 06/01/32 (Call 03/01/32) |
55 | 47,558 | ||||||
| 3.85%, 03/30/27 (Call 12/30/26) |
48 | 46,046 | ||||||
| 4.55%, 11/07/28 (Call 08/07/28)(a) |
78 | 76,162 | ||||||
| 4.70%, 04/01/29 (Call 01/01/29)(a) |
53 | 51,814 | ||||||
| 4.90%, 03/15/33 (Call 12/15/32) |
180 | 171,904 | ||||||
| 5.20%, 03/15/44 (Call 09/15/43)(a) |
92 | 83,969 | ||||||
| 5.40%, 03/15/27 (Call 02/15/27) |
25 | 25,047 | ||||||
| 5.45%, 09/15/33 (Call 06/15/33) |
110 | 109,548 | ||||||
| 6.05%, 03/15/34 (Call 12/15/33) |
190 | 194,504 | ||||||
| 6.90%, 05/01/34 (Call 02/01/34) |
100 | 108,755 | ||||||
|
|
|
|||||||
| 1,116,506 | ||||||||
| Venture Capital — 0.0% | ||||||||
| Hercules Capital Inc., 3.38%, 01/20/27 (Call 12/20/26) |
120 | 108,820 | ||||||
|
|
|
|||||||
| Water — 0.2% | ||||||||
| American Water Capital Corp. |
||||||||
| 2.80%, 05/01/30 (Call 02/01/30) |
106 | 92,778 | ||||||
| 3.45%, 06/01/29 (Call 03/01/29) |
127 | 118,062 | ||||||
| 3.45%, 05/01/50 (Call 11/01/49) |
298 | 217,950 | ||||||
| 3.75%, 09/01/28 (Call 06/01/28) |
89 | 84,430 | ||||||
| 3.75%, 09/01/47 (Call 03/01/47) |
91 | 70,626 | ||||||
| 4.00%, 12/01/46 (Call 06/01/46) |
205 | 165,855 | ||||||
| 4.15%, 06/01/49 (Call 12/01/48) |
238 | 196,721 | ||||||
| 4.20%, 09/01/48 (Call 03/01/48) |
307 | 257,815 | ||||||
| 4.30%, 12/01/42 (Call 06/01/42) |
87 | 75,966 | ||||||
| 4.30%, 09/01/45 (Call 03/01/45) |
115 | 98,114 | ||||||
| 6.59%, 10/15/37 |
192 | 215,588 | ||||||
| Essential Utilities Inc. |
||||||||
| 2.70%, 04/15/30 (Call 01/15/30) |
89 | 76,594 | ||||||
| 3.35%, 04/15/50 (Call 10/15/49) |
209 | 144,491 | ||||||
| 3.57%, 05/01/29 (Call 02/01/29) |
89 | 82,507 | ||||||
| 4.28%, 05/01/49 (Call 11/01/48)(a) |
366 | 294,852 | ||||||
| 5.30%, 05/01/52 (Call 11/01/51) |
177 | 164,374 | ||||||
| 122 | 2 0 2 4 I S H A R E S A N N U A L R E P O R T T O S H A R E H O L D E R S |
| Schedule of Investments (continued) February 29, 2024 |
iShares® ESG Aware USD Corporate Bond ETF (Percentages shown are based on Net Assets) |
| Security | Par (000) |
Value | ||||||
|
|
||||||||
| Water (continued) |
||||||||
| 5.38%, 01/15/34 (Call 10/15/33) |
$ | 50 | $ | 49,123 | ||||
| United Utilities PLC, 6.88%, 08/15/28 |
55 | 58,262 | ||||||
|
|
|
|||||||
| 2,464,108 | ||||||||
|
|
|
|||||||
| Total Long-Term Investments — 98.5% |
|
1,005,099,502 | ||||||
|
|
|
|||||||
| Shares | ||||||||
|
|
||||||||
| Short-Term Securities |
||||||||
| Money Market Funds — 8.3% |
||||||||
| BlackRock Cash Funds: Institutional, SL Agency Shares, 5.50%(d)(e)(f) |
83,503,433 | 83,545,184 | ||||||
| BlackRock Cash Funds: Treasury, SL Agency Shares, 5.30%(d)(e) |
860,000 | 860,000 | ||||||
|
|
|
|||||||
| Total Short-Term Securities — 8.3% |
|
84,405,184 | ||||||
|
|
|
|||||||
| Total Investments — 106.8% |
|
1,089,504,686 | ||||||
| Liabilities in Excess of Other Assets — (6.8)% |
|
(69,071,521 | ) | |||||
|
|
|
|||||||
| Net Assets — 100.0% |
$ | 1,020,433,165 | ||||||
|
|
|
|||||||
| (a) | All or a portion of this security is on loan. |
| (b) | Variable rate security. Interest rate resets periodically. The rate shown is the effective interest rate as of period end. Security description also includes the reference rate and spread if published and available. |
| (c) | Security exempt from registration pursuant to Rule 144A under the Securities Act of 1933, as amended. These securities may be resold in transactions exempt from registration to qualified institutional investors. |
| (d) | Affiliate of the Fund. |
| (e) | Annualized 7-day yield as of period end. |
| (f) | All or a portion of this security was purchased with the cash collateral from loaned securities. |
Affiliates
Investments in issuers considered to be affiliate(s) of the Fund during the year ended February 29, 2024 for purposes of Section 2(a)(3) of the Investment Company Act of 1940, as amended, were as follows:
|
|
||||||||||||||||||||||||||||||||||||||||
| Affiliated Issuer | Value at 02/28/23 |
Purchases at Cost |
Proceeds from Sale |
Net Realized Gain (Loss) |
Change in Unrealized Appreciation (Depreciation) |
Value at 02/29/24 |
Shares Held at 02/29/24 |
Income | Capital Gain Distributions from Underlying Funds |
|||||||||||||||||||||||||||||||
|
|
||||||||||||||||||||||||||||||||||||||||
|
|
BlackRock Cash Funds: Institutional, SL Agency Shares |
$ | 85,290,166 | $ | — | $ | (1,733,262 | )(a) | $ | (6,148 | ) | $ | (5,572 | ) | $ | 83,545,184 | 83,503,433 | $ | 404,219 | (b) | $ | — | ||||||||||||||||||
| BlackRock Cash Funds: Treasury, SL Agency Shares |
13,040,000 | — | (12,180,000 | )(a) | — | — | 860,000 | 860,000 | 175,837 | — | ||||||||||||||||||||||||||||||
|
|
|
|
|
|
|
|
|
|
|
|||||||||||||||||||||||||||||||
| $ | (6,148 | ) | $ | (5,572 | ) | $ | 84,405,184 | $ | 580,056 | $ | — | |||||||||||||||||||||||||||||
|
|
|
|
|
|
|
|
|
|
|
|||||||||||||||||||||||||||||||
| (a) | Represents net amount purchased (sold). |
| (b) | All or a portion represents securities lending income earned from the reinvestment of cash collateral from loaned securities, net of fees and collateral investment expenses, and other payments to and from borrowers of securities. |
| S C H E D U L E O F I N V E S T M E N T S |
123 |
| Schedule of Investments (continued) February 29, 2024 |
iShares® ESG Aware USD Corporate Bond ETF |
Fair Value Hierarchy as of Period End
Various inputs are used in determining the fair value of financial instruments. For a description of the input levels and information about the Fund’s policy regarding valuation of financial instruments, refer to the Notes to Financial Statements.
The following table summarizes the Fund’s financial instruments categorized in the fair value hierarchy. The breakdown of the Fund’s financial instruments into major categories is disclosed in the Schedule of Investments above.
|
|
||||||||||||||||
| Level 1 | Level 2 | Level 3 | Total | |||||||||||||
|
|
||||||||||||||||
| Assets |
||||||||||||||||
| Investments |
||||||||||||||||
| Long-Term Investments |
||||||||||||||||
| Corporate Bonds & Notes |
$ | — | $ | 1,005,099,502 | $ | — | $ | 1,005,099,502 | ||||||||
| Short-Term Securities |
||||||||||||||||
| Money Market Funds |
84,405,184 | — | — | 84,405,184 | ||||||||||||
|
|
|
|
|
|
|
|
|
|||||||||
| $ | 84,405,184 | $ | 1,005,099,502 | $ | — | $ | 1,089,504,686 | |||||||||
|
|
|
|
|
|
|
|
|
|||||||||
See notes to financial statements.
| 124 | 2 0 2 4 I S H A R E S A N N U A L R E P O R T T O S H A R E H O L D E R S |
Statements of Assets and Liabilities
February 29, 2024
| iShares ESG Aware 1-5 Year USD Corporate Bond ETF |
iShares ESG Aware U.S. Aggregate Bond ETF |
iShares ESG Aware USD Corporate Bond ETF |
||||||||||
|
|
||||||||||||
| ASSETS |
||||||||||||
| Investments, at value — unaffiliated(a)(b) |
$ | 852,759,963 | $ | 3,526,877,168 | $ | 1,005,099,502 | ||||||
| Investments, at value — affiliated(c) |
41,084,469 | 248,990,586 | 84,405,184 | |||||||||
| Cash |
7,437 | — | 2,853 | |||||||||
| Receivables: |
||||||||||||
| Investments sold |
29,373,962 | 40,377,047 | 17,478,826 | |||||||||
| Securities lending income — affiliated |
10,313 | 11,657 | 28,654 | |||||||||
| TBA sales commitments |
— | 14,107,235 | — | |||||||||
| Capital shares sold |
— | 674,287 | 18,566 | |||||||||
| Dividends — affiliated |
3,993 | 912,491 | 6,057 | |||||||||
| Interest — unaffiliated |
7,944,307 | 24,096,784 | 12,212,174 | |||||||||
|
|
|
|
|
|
|
|||||||
| Total assets |
931,184,444 | 3,856,047,255 | 1,119,251,816 | |||||||||
|
|
|
|
|
|
|
|||||||
| LIABILITIES |
||||||||||||
| Bank overdraft |
— | 1,572 | — | |||||||||
| Collateral on securities loaned, at value |
39,742,708 | 42,373,063 | 83,560,913 | |||||||||
| TBA sales commitments, at value(d) |
— | 14,146,274 | — | |||||||||
| Payables: |
||||||||||||
| Investments purchased |
26,011,673 | 239,274,655 | 15,111,801 | |||||||||
| Capital shares redeemed |
— | 44,097 | — | |||||||||
| Investment advisory fees |
82,328 | 267,670 | 145,937 | |||||||||
|
|
|
|
|
|
|
|||||||
| Total liabilities |
65,836,709 | 296,107,331 | 98,818,651 | |||||||||
|
|
|
|
|
|
|
|||||||
| Commitments and contingent liabilities |
||||||||||||
| NET ASSETS |
$ | 865,347,735 | $ | 3,559,939,924 | $ | 1,020,433,165 | ||||||
|
|
|
|
|
|
|
|||||||
| NET ASSETS CONSIST OF |
||||||||||||
| Paid-in capital |
$ | 914,361,448 | $ | 3,883,865,089 | $ | 1,159,832,295 | ||||||
| Accumulated loss |
(49,013,713 | ) | (323,925,165 | ) | (139,399,130 | ) | ||||||
|
|
|
|
|
|
|
|||||||
| NET ASSETS |
$ | 865,347,735 | $ | 3,559,939,924 | $ | 1,020,433,165 | ||||||
|
|
|
|
|
|
|
|||||||
| NET ASSET VALUE |
||||||||||||
| Shares outstanding |
35,500,000 | 76,100,000 | 44,800,000 | |||||||||
|
|
|
|
|
|
|
|||||||
| Net asset value |
$ | 24.38 | $ | 46.78 | $ | 22.78 | ||||||
|
|
|
|
|
|
|
|||||||
| Shares authorized |
Unlimited | Unlimited | Unlimited | |||||||||
|
|
|
|
|
|
|
|||||||
| Par value |
None | None | None | |||||||||
|
|
|
|
|
|
|
|||||||
| (a) Investments, at cost — unaffiliated |
$ | 877,532,943 | $ | 3,799,652,715 | $ | 1,108,705,152 | ||||||
| (b) Securities loaned, at value |
$ | 37,434,866 | $ | 33,179,615 | $ | 80,785,652 | ||||||
| (c) Investments, at cost — affiliated |
$ | 41,070,813 | $ | 248,894,392 | $ | 84,376,156 | ||||||
| (d) Proceeds from TBA sales commitments |
$ | — | $ | 14,107,235 | $ | — | ||||||
See notes to financial statements.
| F I N A N C I A L S T A T E M E N T S |
125 |
Year Ended February 29, 2024
| iShares ESG Aware 1-5 Year USD Corporate Bond ETF |
iShares ESG Aware U.S. Aggregate Bond ETF |
iShares ESG Aware USD Corporate Bond ETF |
||||||||||
|
|
||||||||||||
| INVESTMENT INCOME |
||||||||||||
| Dividends — affiliated |
$ | 100,288 | $ | 11,990,975 | $ | 175,837 | ||||||
| Interest — unaffiliated |
26,671,866 | 100,273,311 | 44,632,834 | |||||||||
| Securities lending income — affiliated — net |
159,855 | 173,241 | 404,219 | |||||||||
| Other income — unaffiliated |
285 | 2,156 | 1,962 | |||||||||
|
|
|
|
|
|
|
|||||||
| Total investment income |
26,932,294 | 112,439,683 | 45,214,852 | |||||||||
|
|
|
|
|
|
|
|||||||
| EXPENSES |
||||||||||||
| Investment advisory |
1,047,722 | 3,082,497 | 1,914,859 | |||||||||
| Interest expense |
154 | 2,978 | 33 | |||||||||
|
|
|
|
|
|
|
|||||||
| Total expenses |
1,047,876 | 3,085,475 | 1,914,892 | |||||||||
| Less: |
||||||||||||
| Investment advisory fees waived |
— | (199,363 | ) | — | ||||||||
|
|
|
|
|
|
|
|||||||
| Total expenses after fees waived |
1,047,876 | 2,886,112 | 1,914,892 | |||||||||
|
|
|
|
|
|
|
|||||||
| Net investment income |
25,884,418 | 109,553,571 | 43,299,960 | |||||||||
|
|
|
|
|
|
|
|||||||
| REALIZED AND UNREALIZED GAIN (LOSS) |
||||||||||||
| Net realized gain (loss) from: |
||||||||||||
| Investments — unaffiliated |
(12,557,852 | ) | (25,261,259 | ) | (16,051,017 | ) | ||||||
| Investments — affiliated |
4,955 | 10,720 | (6,148 | ) | ||||||||
| Capital gain distributions from underlying funds — affiliated |
— | 189 | — | |||||||||
| In-kind redemptions — unaffiliated(a) |
(3,126,282 | ) | (106,505 | ) | (12,007,299 | ) | ||||||
|
|
|
|
|
|
|
|||||||
| (15,679,179 | ) | (25,356,855 | ) | (28,064,464 | ) | |||||||
|
|
|
|
|
|
|
|||||||
| Net change in unrealized appreciation (depreciation) on: |
||||||||||||
| Investments — unaffiliated |
37,057,070 | 15,135,257 | 50,856,271 | |||||||||
| Investments — affiliated |
(15,401 | ) | 2,139 | (5,572 | ) | |||||||
|
|
|
|
|
|
|
|||||||
| 37,041,669 | 15,137,396 | 50,850,699 | ||||||||||
|
|
|
|
|
|
|
|||||||
| Net realized and unrealized gain (loss) |
21,362,490 | (10,219,459 | ) | 22,786,235 | ||||||||
|
|
|
|
|
|
|
|||||||
| NET INCREASE IN NET ASSETS RESULTING FROM OPERATIONS |
$ | 47,246,908 | $ | 99,334,112 | $ | 66,086,195 | ||||||
|
|
|
|
|
|
|
|||||||
| (a) | See Note 2 of the Notes to Financial Statements. |
See notes to financial statements.
| 126 | 2 0 2 4 I S H A R E S A N N U A L R E P O R T T O S H A R E H O L D E R S |
Statements of Changes in Net Assets
| iShares ESG Aware 1-5 Year USD Corporate Bond ETF |
iShares ESG Aware U.S. Aggregate Bond ETF |
|||||||||||||||||||||||
| Year Ended 02/29/24 |
Year Ended 02/28/23 |
Year Ended 02/29/24 |
Year Ended 02/28/23 |
|||||||||||||||||||||
|
|
||||||||||||||||||||||||
| INCREASE (DECREASE) IN NET ASSETS |
||||||||||||||||||||||||
| OPERATIONS |
||||||||||||||||||||||||
| Net investment income |
$ | 25,884,418 | $ | 17,407,822 | $ | 109,553,571 | $ | 48,605,484 | ||||||||||||||||
| Net realized loss |
(15,679,179 | ) | (21,180,421 | ) | (25,356,855 | ) | (40,146,317 | ) | ||||||||||||||||
| Net change in unrealized appreciation (depreciation) |
37,041,669 | (31,818,122 | ) | 15,137,396 | (217,929,876 | ) | ||||||||||||||||||
|
|
|
|
|
|
|
|
|
|||||||||||||||||
| Net increase (decrease) in net assets resulting from operations |
47,246,908 | (35,590,721 | ) | 99,334,112 | (209,470,709 | ) | ||||||||||||||||||
|
|
|
|
|
|
|
|
|
|||||||||||||||||
| DISTRIBUTIONS TO SHAREHOLDERS(a) |
||||||||||||||||||||||||
| Decrease in net assets resulting from distributions to shareholders |
(25,633,094 | ) | (17,369,925 | ) | (104,458,748 | ) | (44,953,799 | ) | ||||||||||||||||
|
|
|
|
|
|
|
|
|
|||||||||||||||||
| CAPITAL SHARE TRANSACTIONS |
||||||||||||||||||||||||
| Net increase (decrease) in net assets derived from capital share transactions |
(59,757,531 | ) | (75,635,527 | ) | 1,164,614,155 | 669,010,992 | ||||||||||||||||||
|
|
|
|
|
|
|
|
|
|||||||||||||||||
| NET ASSETS |
||||||||||||||||||||||||
| Total increase (decrease) in net assets |
(38,143,717 | ) | (128,596,173 | ) | 1,159,489,519 | 414,586,484 | ||||||||||||||||||
| Beginning of year |
903,491,452 | 1,032,087,625 | 2,400,450,405 | 1,985,863,921 | ||||||||||||||||||||
|
|
|
|
|
|
|
|
|
|||||||||||||||||
| End of year |
$ | 865,347,735 | $ | 903,491,452 | $ | 3,559,939,924 | $ | 2,400,450,405 | ||||||||||||||||
|
|
|
|
|
|
|
|
|
|||||||||||||||||
| (a) | Distributions for annual periods determined in accordance with U.S. federal income tax regulations. |
See notes to financial statements.
| F I N A N C I A L S T A T E M E N T S |
127 |
Statements of Changes in Net Assets (continued)
| iShares ESG Aware USD Corporate Bond ETF |
||||||||||||||||
| Year Ended 02/29/24 |
Year Ended 02/28/23 |
|||||||||||||||
|
|
||||||||||||||||
| INCREASE (DECREASE) IN NET ASSETS |
||||||||||||||||
| OPERATIONS |
||||||||||||||||
| Net investment income |
$ | 43,299,960 | $ | 28,089,619 | ||||||||||||
| Net realized loss |
(28,064,464 | ) | (46,232,160 | ) | ||||||||||||
| Net change in unrealized appreciation (depreciation) |
50,850,699 | (98,756,993 | ) | |||||||||||||
|
|
|
|
|
|||||||||||||
| Net increase (decrease) in net assets resulting from operations |
66,086,195 | (116,899,534 | ) | |||||||||||||
|
|
|
|
|
|||||||||||||
| DISTRIBUTIONS TO SHAREHOLDERS(a) |
||||||||||||||||
| Decrease in net assets resulting from distributions to shareholders |
(43,445,842 | ) | (26,535,411 | ) | ||||||||||||
|
|
|
|
|
|||||||||||||
| CAPITAL SHARE TRANSACTIONS |
||||||||||||||||
| Net increase (decrease) in net assets derived from capital share transactions |
(142,110,104 | ) | 385,322,539 | |||||||||||||
|
|
|
|
|
|||||||||||||
| NET ASSETS |
||||||||||||||||
| Total increase (decrease) in net assets |
(119,469,751 | ) | 241,887,594 | |||||||||||||
| Beginning of year |
1,139,902,916 | 898,015,322 | ||||||||||||||
|
|
|
|
|
|||||||||||||
| End of year |
$ | 1,020,433,165 | $ | 1,139,902,916 | ||||||||||||
|
|
|
|
|
|||||||||||||
| (a) | Distributions for annual periods determined in accordance with U.S. federal income tax regulations. |
See notes to financial statements.
| 128 | 2 0 2 4 I S H A R E S A N N U A L R E P O R T T O S H A R E H O L D E R S |
(For a share outstanding throughout each period)
| iShares ESG Aware 1-5 Year USD Corporate Bond ETF | ||||||||||||||||||||
| Year Ended 02/29/24 |
Year Ended 02/28/23 |
Year Ended 02/28/22 |
Year Ended 02/28/21 |
Year Ended 02/29/20 |
||||||||||||||||
|
|
||||||||||||||||||||
| Net asset value, beginning of year |
$ | 23.78 | $ | 25.11 | $ | 26.05 | $ | 25.74 | $ | 24.72 | ||||||||||
|
|
|
|
|
|
|
|
|
|
|
|||||||||||
| Net investment income(a) |
0.71 | 0.44 | 0.27 | 0.44 | 0.70 | |||||||||||||||
| Net realized and unrealized gain (loss)(b) |
0.59 | (1.33 | ) | (0.88 | ) | 0.35 | 1.02 | |||||||||||||
|
|
|
|
|
|
|
|
|
|
|
|||||||||||
| Net increase (decrease) from investment operations |
1.30 | (0.89 | ) | (0.61 | ) | 0.79 | 1.72 | |||||||||||||
|
|
|
|
|
|
|
|
|
|
|
|||||||||||
| Distributions(c) |
||||||||||||||||||||
| From net investment income |
(0.70 | ) | (0.44 | ) | (0.29 | ) | (0.47 | ) | (0.70 | ) | ||||||||||
| From net realized gain |
— | — | (0.04 | ) | (0.01 | ) | — | |||||||||||||
|
|
|
|
|
|
|
|
|
|
|
|||||||||||
| Total distributions |
(0.70 | ) | (0.44 | ) | (0.33 | ) | (0.48 | ) | (0.70 | ) | ||||||||||
|
|
|
|
|
|
|
|
|
|
|
|||||||||||
| Net asset value, end of year |
$ | 24.38 | $ | 23.78 | $ | 25.11 | $ | 26.05 | $ | 25.74 | ||||||||||
|
|
|
|
|
|
|
|
|
|
|
|||||||||||
| Total Return(d) |
||||||||||||||||||||
| Based on net asset value |
5.58 | % | (3.58 | )% | (2.33 | )% | 3.07 | % | 7.07 | % | ||||||||||
|
|
|
|
|
|
|
|
|
|
|
|||||||||||
| Ratios to Average Net Assets(e) |
||||||||||||||||||||
| Total expenses |
0.12 | % | 0.12 | % | 0.12 | % | 0.12 | % | 0.12 | % | ||||||||||
|
|
|
|
|
|
|
|
|
|
|
|||||||||||
| Net investment income |
2.96 | % | 1.83 | % | 1.06 | % | 1.68 | % | 2.75 | % | ||||||||||
|
|
|
|
|
|
|
|
|
|
|
|||||||||||
| Supplemental Data |
||||||||||||||||||||
| Net assets, end of year (000) |
$ | 865,348 | $ | 903,491 | $ | 1,032,088 | $ | 652,486 | $ | 271,577 | ||||||||||
|
|
|
|
|
|
|
|
|
|
|
|||||||||||
| Portfolio turnover rate(f) |
31 | % | 30 | % | 37 | % | 38 | % | 24 | % | ||||||||||
|
|
|
|
|
|
|
|
|
|
|
|||||||||||
| (a) | Based on average shares outstanding. |
| (b) | The amounts reported for a share outstanding may not accord with the change in aggregate gains and losses in securities for the fiscal period due to the timing of capital share transactions in relation to the fluctuating market values of the Fund’s underlying securities. |
| (c) | Distributions for annual periods determined in accordance with U.S. federal income tax regulations. |
| (d) | Where applicable, assumes the reinvestment of distributions. |
| (e) | Excludes fees and expenses incurred indirectly as a result of investments in underlying funds. |
| (f) | Portfolio turnover rate excludes in-kind transactions, if any. |
See notes to financial statements.
| F I N A N C I A L H I G H L I G H T S |
129 |
Financial Highlights (continued)
(For a share outstanding throughout each period)
| iShares ESG Aware U.S. Aggregate Bond ETF | ||||||||||||||||||||
| Year Ended 02/29/24 |
Year Ended 02/28/23 |
Year Ended 02/28/22 |
Year Ended 02/28/21 |
Year Ended 02/29/20 |
||||||||||||||||
|
|
||||||||||||||||||||
| Net asset value, beginning of year |
$ | 46.88 | $ | 53.10 | $ | 55.22 | $ | 55.42 | $ | 51.25 | ||||||||||
|
|
|
|
|
|
|
|
|
|
|
|||||||||||
| Net investment income(a) |
1.66 | 1.12 | 0.62 | 0.74 | 1.44 | |||||||||||||||
| Net realized and unrealized gain (loss)(b) |
(0.17 | ) | (6.31 | ) | (2.15 | ) | 0.04 | 4.38 | ||||||||||||
|
|
|
|
|
|
|
|
|
|
|
|||||||||||
| Net increase (decrease) from investment operations |
1.49 | (5.19 | ) | (1.53 | ) | 0.78 | 5.82 | |||||||||||||
|
|
|
|
|
|
|
|
|
|
|
|||||||||||
| Distributions(c) |
||||||||||||||||||||
| From net investment income |
(1.59 | ) | (1.03 | ) | (0.59 | ) | (0.87 | ) | (1.48 | ) | ||||||||||
| From net realized gain |
— | — | — | (0.11 | ) | (0.17 | ) | |||||||||||||
|
|
|
|
|
|
|
|
|
|
|
|||||||||||
| Total distributions |
(1.59 | ) | (1.03 | ) | (0.59 | ) | (0.98 | ) | (1.65 | ) | ||||||||||
|
|
|
|
|
|
|
|
|
|
|
|||||||||||
| Net asset value, end of year |
$ | 46.78 | $ | 46.88 | $ | 53.10 | $ | 55.22 | $ | 55.42 | ||||||||||
|
|
|
|
|
|
|
|
|
|
|
|||||||||||
| Total Return(d) |
||||||||||||||||||||
| Based on net asset value |
3.22 | % | (9.81 | )% | (2.78 | )% | 1.39 | % | 11.52 | % | ||||||||||
|
|
|
|
|
|
|
|
|
|
|
|||||||||||
| Ratios to Average Net Assets(e) |
||||||||||||||||||||
| Total expenses |
0.10 | % | 0.10 | % | 0.10 | % | 0.10 | % | 0.10 | % | ||||||||||
|
|
|
|
|
|
|
|
|
|
|
|||||||||||
| Total expenses after fees waived |
0.09 | % | 0.09 | % | 0.09 | % | 0.08 | % | 0.09 | % | ||||||||||
|
|
|
|
|
|
|
|
|
|
|
|||||||||||
| Net investment income |
3.55 | % | 2.31 | % | 1.13 | % | 1.32 | % | 2.69 | % | ||||||||||
|
|
|
|
|
|
|
|
|
|
|
|||||||||||
| Supplemental Data |
||||||||||||||||||||
| Net assets, end of year (000) |
$ | 3,559,940 | $ | 2,400,450 | $ | 1,985,864 | $ | 1,121,045 | $ | 221,686 | ||||||||||
|
|
|
|
|
|
|
|
|
|
|
|||||||||||
| Portfolio turnover rate(f)(g) |
156 | % | 158 | % | 234 | % | 384 | % | 266 | % | ||||||||||
|
|
|
|
|
|
|
|
|
|
|
|||||||||||
| (a) | Based on average shares outstanding. |
| (b) | The amounts reported for a share outstanding may not accord with the change in aggregate gains and losses in securities for the fiscal period due to the timing of capital share transactions in relation to the fluctuating market values of the Fund’s underlying securities. |
| (c) | Distributions for annual periods determined in accordance with U.S. federal income tax regulations. |
| (d) | Where applicable, assumes the reinvestment of distributions. |
| (e) | Excludes fees and expenses incurred indirectly as a result of investments in underlying funds. |
| (f) | Portfolio turnover rate excludes in-kind transactions, if any. |
| (g) | Includes mortgage dollar roll transactions (“MDRs”). |
See notes to financial statements.
| 130 | 2 0 2 4 I S H A R E S A N N U A L R E P O R T T O S H A R E H O L D E R S |
Financial Highlights (continued)
(For a share outstanding throughout each period)
| iShares ESG Aware USD Corporate Bond ETF | ||||||||||||||||||||
| Year Ended 02/29/24 |
Year Ended 02/28/23 |
Year Ended 02/28/22 |
Year Ended 02/28/21 |
Year Ended 02/29/20 |
||||||||||||||||
|
|
||||||||||||||||||||
| Net asset value, beginning of year |
$ | 22.42 | $ | 25.84 | $ | 27.42 | $ | 27.30 | $ | 24.31 | ||||||||||
|
|
|
|
|
|
|
|
|
|
|
|||||||||||
| Net investment income(a) |
0.91 | 0.71 | 0.54 | 0.58 | 0.82 | |||||||||||||||
| Net realized and unrealized gain (loss)(b) |
0.37 | (3.46 | ) | (1.51 | ) | 0.14 | 2.97 | |||||||||||||
|
|
|
|
|
|
|
|
|
|
|
|||||||||||
| Net increase (decrease) from investment operations |
1.28 | (2.75 | ) | (0.97 | ) | 0.72 | 3.79 | |||||||||||||
|
|
|
|
|
|
|
|
|
|
|
|||||||||||
| Distributions(c) |
||||||||||||||||||||
| From net investment income |
(0.92 | ) | (0.67 | ) | (0.56 | ) | (0.60 | ) | (0.80 | ) | ||||||||||
| From net realized gain |
— | — | (0.05 | ) | — | — | ||||||||||||||
|
|
|
|
|
|
|
|
|
|
|
|||||||||||
| Total distributions |
(0.92 | ) | (0.67 | ) | (0.61 | ) | (0.60 | ) | (0.80 | ) | ||||||||||
|
|
|
|
|
|
|
|
|
|
|
|||||||||||
| Net asset value, end of year |
$ | 22.78 | $ | 22.42 | $ | 25.84 | $ | 27.42 | $ | 27.30 | ||||||||||
|
|
|
|
|
|
|
|
|
|
|
|||||||||||
| Total Return(d) |
||||||||||||||||||||
| Based on net asset value |
5.82 | % | (10.71 | )% | (3.60 | )% | 2.64 | % | 15.85 | % | ||||||||||
|
|
|
|
|
|
|
|
|
|
|
|||||||||||
| Ratios to Average Net Assets(e) |
||||||||||||||||||||
| Total expenses |
0.18 | % | 0.18 | % | 0.18 | % | 0.18 | % | 0.18 | % | ||||||||||
|
|
|
|
|
|
|
|
|
|
|
|||||||||||
| Net investment income |
4.07 | % | 3.05 | % | 2.00 | % | 2.08 | % | 3.14 | % | ||||||||||
|
|
|
|
|
|
|
|
|
|
|
|||||||||||
| Supplemental Data |
||||||||||||||||||||
| Net assets, end of year (000) |
$ | 1,020,433 | $ | 1,139,903 | $ | 898,015 | $ | 827,938 | $ | 126,955 | ||||||||||
|
|
|
|
|
|
|
|
|
|
|
|||||||||||
| Portfolio turnover rate(f) |
19 | % | 23 | % | 17 | % | 25 | % | 11 | % | ||||||||||
|
|
|
|
|
|
|
|
|
|
|
|||||||||||
| (a) | Based on average shares outstanding. |
| (b) | The amounts reported for a share outstanding may not accord with the change in aggregate gains and losses in securities for the fiscal period due to the timing of capital share transactions in relation to the fluctuating market values of the Fund’s underlying securities. |
| (c) | Distributions for annual periods determined in accordance with U.S. federal income tax regulations. |
| (d) | Where applicable, assumes the reinvestment of distributions. |
| (e) | Excludes fees and expenses incurred indirectly as a result of investments in underlying funds. |
| (f) | Portfolio turnover rate excludes in-kind transactions, if any. |
See notes to financial statements.
| F I N A N C I A L H I G H L I G H T S |
131 |
| 1. | ORGANIZATION |
iShares Trust (the “Trust”) is registered under the Investment Company Act of 1940, as amended (the “1940 Act”), as an open-end management investment company. The Trust is organized as a Delaware statutory trust and is authorized to have multiple series or portfolios.
These financial statements relate only to the following funds (each, a “Fund” and collectively, the “Funds”):
| iShares ETF | Diversification Classification |
|||
| ESG Aware 1-5 Year USD Corporate Bond |
Diversified | |||
| ESG Aware U.S. Aggregate Bond |
Diversified | |||
| ESG Aware USD Corporate Bond |
Diversified | |||
| 2. | SIGNIFICANT ACCOUNTING POLICIES |
The financial statements are prepared in conformity with accounting principles generally accepted in the United States of America (“U.S. GAAP”), which may require management to make estimates and assumptions that affect the reported amounts of assets and liabilities in the financial statements, disclosure of contingent assets and liabilities at the date of the financial statements and the reported amounts of increases and decreases in net assets from operations during the reporting period. Actual results could differ from those estimates. Each Fund is considered an investment company under U.S. GAAP and follows the accounting and reporting guidance applicable to investment companies. Below is a summary of significant accounting policies:
Investment Transactions and Income Recognition: For financial reporting purposes, investment transactions are recorded on the dates the transactions are executed (the “trade dates”). Realized gains and losses on investment transactions are determined using the specific identification method. Dividend income and capital gain distributions, if any, are recorded on the ex-dividend date. Non-cash dividends, if any, are recorded on the ex-dividend date at fair value. Interest income, including amortization and accretion of premiums and discounts on debt securities, is recognized daily on an accrual basis.
Bank Overdraft: Certain Funds had outstanding cash disbursements exceeding deposited cash amounts at the custodian during the reporting period. The Funds are obligated to repay the custodian for any overdraft, including any related costs or expenses, where applicable. For financial reporting purposes, overdraft fees, if any, are included in interest expense in the Statements of Operations.
Collateralization: If required by an exchange or counterparty agreement, the Funds may be required to deliver/deposit cash and/or securities to/with an exchange, or broker-dealer or custodian as collateral for certain investments.
In-kind Redemptions: For financial reporting purposes, in-kind redemptions are treated as sales of securities resulting in realized capital gains or losses to the Funds. Because such gains or losses are not taxable to the Funds and are not distributed to existing Fund shareholders, the gains or losses are reclassified from accumulated net realized gain (loss) to paid-in capital at the end of the Funds’ tax year. These reclassifications have no effect on net assets or net asset value (“NAV”) per share.
Distributions: Dividends and distributions paid by each Fund are recorded on the ex-dividend dates. Distributions are determined on a tax basis and may differ from net investment income and net realized capital gains for financial reporting purposes. Dividends and distributions are paid in U.S. dollars and cannot be automatically reinvested in additional shares of the Funds.
Indemnifications: In the normal course of business, each Fund enters into contracts that contain a variety of representations that provide general indemnification. The Funds’ maximum exposure under these arrangements is unknown because it involves future potential claims against the Funds, which cannot be predicted with any certainty.
| 3. | INVESTMENT VALUATION AND FAIR VALUE MEASUREMENTS |
Investment Valuation Policies: Each Fund’s investments are valued at fair value (also referred to as “market value” within the financial statements) each day that the Fund’s listing exchange is open and, for financial reporting purposes, as of the report date. U.S. GAAP defines fair value as the price a fund would receive to sell an asset or pay to transfer a liability in an orderly transaction between market participants at the measurement date. The Board of Trustees of the Trust (the “Board”) of each Fund has approved the designation of BlackRock Fund Advisors (“BFA”), the Funds’ investment adviser, as the valuation designee for each Fund. Each Fund determines the fair values of its financial instruments using various independent dealers or pricing services under BFA’s policies. If a security’s market price is not readily available or does not otherwise accurately represent the fair value of the security, the security will be valued in accordance with BFA’s policies and procedures as reflecting fair value. BFA has formed a committee (the “Valuation Committee”) to develop pricing policies and procedures and to oversee the pricing function for all financial instruments, with assistance from other BlackRock pricing committees.
Fair Value Inputs and Methodologies: The following methods and inputs are used to establish the fair value of each Fund’s assets and liabilities:
| • | Fixed-income investments for which market quotations are readily available are generally valued using the last available bid price or current market quotations provided by independent dealers or third-party pricing services. Pricing services generally value fixed income securities assuming orderly transactions of an institutional round lot size, but a fund may hold or transact in such securities in smaller, odd lot sizes. Odd lots may trade at lower prices than institutional round lots. The pricing services may use matrix pricing or valuation models that utilize certain inputs and assumptions to derive values, including transaction data (e.g., |
| 132 | 2 0 2 4 I S H A R E S A N N U A L R E P O R T T O S H A R E H O L D E R S |
Notes to Financial Statements (continued)
| recent representative bids and offers), market data, credit quality information, perceived market movements, news, and other relevant information. Certain fixed-income securities, including asset-backed and mortgage related securities may be valued based on valuation models that consider the estimated cash flows of each tranche of the entity, establish a benchmark yield and develop an estimated tranche specific spread to the benchmark yield based on the unique attributes of the tranche. The amortized cost method of valuation may be used with respect to debt obligations with sixty days or less remaining to maturity unless BFA determines such method does not represent fair value. |
| • | Investments in open-end U.S. mutual funds (including money market funds) are valued at that day’s published NAV. |
If events (e.g., market volatility, company announcement or a natural disaster) occur that are expected to materially affect the value of such investment, or in the event that application of these methods of valuation results in a price for an investment that is deemed not to be representative of the market value of such investment, or if a price is not available, the investment will be valued by the Valuation Committee, in accordance with BFA’s policies and procedures as reflecting fair value (“Fair Valued Investments”). The fair valuation approaches that may be used by the Valuation Committee include market approach, income approach and cost approach. Valuation techniques such as discounted cash flow, use of market comparables and matrix pricing are types of valuation approaches and are typically used in determining fair value. When determining the price for Fair Valued Investments, the Valuation Committee seeks to determine the price that each Fund might reasonably expect to receive or pay from the current sale or purchase of that asset or liability in an arm’s-length transaction. Fair value determinations shall be based upon all available factors that the Valuation Committee deems relevant and consistent with the principles of fair value measurement.
Fair value pricing could result in a difference between the prices used to calculate a fund’s NAV and the prices used by the fund’s underlying index, which in turn could result in a difference between the fund’s performance and the performance of the fund’s underlying index.
Fair Value Hierarchy: Various inputs are used in determining the fair value of financial instruments. These inputs to valuation techniques are categorized into a fair value hierarchy consisting of three broad levels for financial reporting purposes as follows:
| • | Level 1 – Unadjusted price quotations in active markets/exchanges for identical assets or liabilities that each Fund has the ability to access; |
| • | Level 2 – Other observable inputs (including, but not limited to, quoted prices for similar assets or liabilities in markets that are active, quoted prices for identical or similar assets or liabilities in markets that are not active, inputs other than quoted prices that are observable for the assets or liabilities (such as interest rates, yield curves, volatilities, prepayment speeds, loss severities, credit risks and default rates) or other market-corroborated inputs); and |
| • | Level 3 – Unobservable inputs based on the best information available in the circumstances, to the extent observable inputs are not available, (including the Valuation Committee’s assumptions used in determining the fair value of financial instruments). |
The hierarchy gives the highest priority to unadjusted quoted prices in active markets for identical assets or liabilities (Level 1 measurements) and the lowest priority to unobservable inputs (Level 3 measurements). Accordingly, the degree of judgment exercised in determining fair value is greatest for instruments categorized in Level 3. The inputs used to measure fair value may fall into different levels of the fair value hierarchy. In such cases, for disclosure purposes, the fair value hierarchy classification is determined based on the lowest level input that is significant to the fair value measurement in its entirety. Investments classified within Level 3 have significant unobservable inputs used by the Valuation Committee in determining the price for Fair Valued Investments. Level 3 investments include equity or debt issued by privately held companies or funds that may not have a secondary market and/or may have a limited number of investors. The categorization of a value determined for financial instruments is based on the pricing transparency of the financial instruments and is not necessarily an indication of the risks associated with investing in those securities.
| 4. | SECURITIES AND OTHER INVESTMENTS |
Asset-Backed and Mortgage-Backed Securities: Asset-backed securities are generally issued as pass-through certificates or as debt instruments. Asset-backed securities issued as pass-through certificates represent undivided fractional ownership interests in an underlying pool of assets. Asset-backed securities issued as debt instruments, which are also known as collateralized obligations, are typically issued as the debt of a special purpose entity organized solely for the purpose of owning such assets and issuing such debt. Asset-backed securities are often backed by a pool of assets representing the obligations of a number of different parties. The yield characteristics of certain asset-backed securities may differ from traditional debt securities. One such major difference is that all or a principal part of the obligations may be prepaid at any time because the underlying assets (i.e., loans) may be prepaid at any time. As a result, a decrease in interest rates in the market may result in increases in the level of prepayments as borrowers, particularly mortgagors, refinance and repay their loans. An increased prepayment rate with respect to an asset-backed security will have the effect of shortening the maturity of the security. In addition, a fund may subsequently have to reinvest the proceeds at lower interest rates. If a fund has purchased such an asset-backed security at a premium, a faster than anticipated prepayment rate could result in a loss of principal to the extent of the premium paid.
For mortgage pass-through securities (the “Mortgage Assets”) there are a number of important differences among the agencies and instrumentalities of the U.S. Government that issue mortgage-related securities and among the securities that they issue. For example, mortgage-related securities guaranteed by Ginnie Mae are guaranteed as to the timely payment of principal and interest by Ginnie Mae and such guarantee is backed by the full faith and credit of the United States. However, mortgage-related securities issued by Freddie Mac and Fannie Mae, including Freddie Mac and Fannie Mae guaranteed mortgage pass-through certificates, which are solely the obligations of Freddie Mac and Fannie Mae, are not backed by or entitled to the full faith and credit of the United States, but are supported by the right of the issuer to borrow from the U.S. Treasury.
Non-agency mortgage-backed securities are securities issued by non-governmental issuers and have no direct or indirect government guarantees of payment and are subject to various risks. Non-agency mortgage loans are obligations of the borrowers thereunder only and are not typically insured or guaranteed by any other person or entity. The ability of a borrower to repay a loan is dependent upon the income or assets of the borrower. A number of factors, including a general economic downturn, acts of God, terrorism, social unrest and civil disturbances, may impair a borrower’s ability to repay its loans.
| N O T E S T O F I N A N C I A L S T A T E M E N T S |
133 |
Notes to Financial Statements (continued)
Zero-Coupon Bonds: Zero-coupon bonds are normally issued at a significant discount from face value and do not provide for periodic interest payments. These bonds may experience greater volatility in market value than other debt obligations of similar maturity which provide for regular interest payments.
TBA Commitments: TBA commitments are forward agreements for the purchase or sale of securities, including mortgage-backed securities for a fixed price, with payment and delivery on an agreed upon future settlement date. The specific securities to be delivered are not identified at the trade date. However, delivered securities must meet specified terms, including issuer, rate and mortgage terms. When entering into TBA commitments, a fund may take possession of or deliver the underlying mortgage-backed securities but can extend the settlement or roll the transaction. TBA commitments involve a risk of loss if the value of the security to be purchased or sold declines or increases, respectively, prior to settlement date, if there are expenses or delays in connection with the TBA transactions, or if the counterparty fails to complete the transaction.
To mitigate counterparty risk, a fund enters into a two-way collateral agreement for TBA transactions with certain counterparties. Under such agreement, the “in-the-money” party of a TBA transaction may at any time require the other party to pledge collateral assets (in the form of cash or securities) to offset any loss the in-the-money party would incur upon cancellation of the TBA transaction. A party is in-the-money if they are the buyer and the market value of the TBA transaction increases or if they are the seller and the market value of the TBA transaction decreases. Cash collateral received from the counterparty may be reinvested in money market funds, including those managed by the Funds’ investment adviser, or its affiliates. Such collateral, if any, is noted in the Schedule of Investments and the obligation to return the collateral is presented as a liability in the Statements of Assets and Liabilities. Securities pledged as collateral by a fund, if any, are noted in the Schedule of Investments.
Mortgage Dollar Roll Transactions: Certain Funds may sell TBA mortgage-backed securities and simultaneously contract to repurchase substantially similar (i.e., same type, coupon and maturity) securities on a specific future date at an agreed upon price. During the period between the sale and repurchase, a fund is not entitled to receive interest and principal payments on the securities sold. Mortgage dollar roll transactions are treated as purchases and sales and a fund realizes gains and losses on these transactions. Mortgage dollar rolls involve the risk that the market value of the securities that a fund is required to purchase may decline below the agreed upon repurchase price of those securities.
Securities Lending: Each Fund may lend its securities to approved borrowers, such as brokers, dealers and other financial institutions. The borrower pledges and maintains with the Fund collateral consisting of cash, an irrevocable letter of credit issued by an approved bank, or securities issued or guaranteed by the U.S. government. The initial collateral received by each Fund is required to have a value of at least 102% of the current market value of the loaned securities for securities traded on U.S. exchanges and a value of at least 105% for all other securities. The collateral is maintained thereafter at a value equal to at least 100% of the current value of the securities on loan. The market value of the loaned securities is determined at the close of each business day of the Fund and any additional required collateral is delivered to the Fund or excess collateral is returned by the Fund, on the next business day. During the term of the loan, each Fund is entitled to all distributions made on or in respect of the loaned securities but does not receive interest income on securities received as collateral. Loans of securities are terminable at any time and the borrower, after notice, is required to return borrowed securities within the standard time period for settlement of securities transactions.
As of period end, any securities on loan were collateralized by cash and/or U.S. Government obligations. Cash collateral invested in money market funds managed by BFA, or its affiliates is disclosed in the Schedule of Investments. Any non-cash collateral received cannot be sold, re-invested or pledged by the Fund, except in the event of borrower default. The securities on loan, if any, are also disclosed in each Fund’s Schedule of Investments. The market value of any securities on loan and the value of any related cash collateral are disclosed in the Statements of Assets and Liabilities.
Securities lending transactions are entered into by the Funds under Master Securities Lending Agreements (each, an “MSLA”) which provide the right, in the event of default (including bankruptcy or insolvency) for the non-defaulting party to liquidate the collateral and calculate a net exposure to the defaulting party or request additional collateral. In the event that a borrower defaults, the Funds, as lender, would offset the market value of the collateral received against the market value of the securities loaned. When the value of the collateral is greater than that of the market value of the securities loaned, the lender is left with a net amount payable to the defaulting party. However, bankruptcy or insolvency laws of a particular jurisdiction may impose restrictions on or prohibitions against such a right of offset in the event of an MSLA counterparty’s bankruptcy or insolvency. Under the MSLA, absent an event of default, the borrower can resell or re-pledge the loaned securities, and the Funds can reinvest cash collateral received in connection with loaned securities. Upon an event of default, the parties’ obligations to return the securities or collateral to the other party are extinguished, and the parties can resell or re-pledge the loaned securities or the collateral received in connection with the loaned securities in order to satisfy the defaulting party’s net payment obligation for all transactions under the MSLA. The defaulting party remains liable for any deficiency.
| 134 | 2 0 2 4 I S H A R E S A N N U A L R E P O R T T O S H A R E H O L D E R S |
Notes to Financial Statements (continued)
As of period end, the following table is a summary of the securities on loan by counterparty which are subject to offset under an MSLA:
|
|
||||||||||||||||
| iShares ETF and Counterparty |
|
Securities Loaned at Value |
|
|
Cash Collateral Received |
(a) |
|
Non-Cash Collateral Received, at Fair Value |
(a) |
Net Amount | ||||||
|
|
||||||||||||||||
| ESG Aware 1-5 Year USD Corporate Bond |
||||||||||||||||
| Barclays Bank PLC |
$ | 13,407,575 | $ | (13,407,575 | ) | $ | — | $ | — | |||||||
| BMO Capital Markets Corp. |
1,235,264 | (1,235,264 | ) | — | — | |||||||||||
| BNP Paribas SA |
154,072 | (154,072 | ) | — | — | |||||||||||
| BofA Securities, Inc. |
1,609,958 | (1,609,958 | ) | — | — | |||||||||||
| Citigroup Global Markets, Inc. |
998,204 | (998,204 | ) | — | — | |||||||||||
| J.P. Morgan Securities LLC |
8,672,627 | (8,672,627 | ) | — | — | |||||||||||
| Jefferies LLC |
356,477 | (356,477 | ) | — | — | |||||||||||
| Mizuho Securities USA LLC |
3,059 | (3,059 | ) | — | — | |||||||||||
| Morgan Stanley |
6,050,776 | (6,050,776 | ) | — | — | |||||||||||
| RBC Capital Markets LLC |
2,668,557 | (2,668,557 | ) | — | — | |||||||||||
| Scotia Capital (USA), Inc. |
374,394 | (374,394 | ) | — | — | |||||||||||
| State Street Bank & Trust Co. |
1,089,469 | (1,089,469 | ) | — | — | |||||||||||
| Wells Fargo Securities LLC |
814,434 | (814,434 | ) | — | — | |||||||||||
|
|
|
|
|
|
|
|
|
|||||||||
| $ | 37,434,866 | $ | (37,434,866 | ) | $ | — | $ | — | ||||||||
|
|
|
|
|
|
|
|
|
|||||||||
| ESG Aware U.S. Aggregate Bond |
||||||||||||||||
| Barclays Capital, Inc. |
$ | 887,649 | $ | (887,649 | ) | $ | — | $ | — | |||||||
| BMO Capital Markets Corp. |
96,520 | (96,520 | ) | — | — | |||||||||||
| BNP Paribas SA |
1,342,448 | (1,342,448 | ) | — | — | |||||||||||
| BofA Securities, Inc. |
807,747 | (807,747 | ) | — | — | |||||||||||
| Citigroup Global Markets, Inc. |
10,371,783 | (10,371,783 | ) | — | — | |||||||||||
| Goldman Sachs & Co. LLC |
9,062,973 | (9,062,973 | ) | — | — | |||||||||||
| J.P. Morgan Securities LLC |
7,872,691 | (7,872,691 | ) | — | — | |||||||||||
| Jefferies LLC |
206,109 | (206,109 | ) | — | — | |||||||||||
| Mizuho Securities USA LLC |
264,082 | (264,082 | ) | — | — | |||||||||||
| Morgan Stanley |
1,347,389 | (1,347,389 | ) | — | — | |||||||||||
| Pershing LLC |
87,707 | (87,707 | ) | — | — | |||||||||||
| RBC Capital Markets LLC |
137,432 | (137,432 | ) | — | — | |||||||||||
| Scotia Capital (USA), Inc. |
354,404 | (354,404 | ) | — | — | |||||||||||
| TD Securities (USA) LLC |
88,527 | (88,527 | ) | — | — | |||||||||||
| Toronto-Dominion Bank (The) |
80,928 | (80,928 | ) | — | — | |||||||||||
| UBS Securities LLC |
86,169 | (86,169 | ) | — | — | |||||||||||
| Wells Fargo Bank N.A. |
36,452 | (36,452 | ) | — | — | |||||||||||
| Wells Fargo Securities LLC |
48,605 | (48,605 | ) | — | — | |||||||||||
|
|
|
|
|
|
|
|
|
|||||||||
| $ | 33,179,615 | $ | (33,179,615 | ) | $ | — | $ | — | ||||||||
|
|
|
|
|
|
|
|
|
|||||||||
| ESG Aware USD Corporate Bond |
||||||||||||||||
| Barclays Bank PLC |
$ | 18,873,976 | $ | (18,873,976 | ) | $ | — | $ | — | |||||||
| BMO Capital Markets Corp. |
2,023,236 | (2,023,236 | ) | — | — | |||||||||||
| BNP Paribas SA |
1,355,439 | (1,355,439 | ) | — | — | |||||||||||
| BofA Securities, Inc. |
7,405,499 | (7,405,499 | ) | — | — | |||||||||||
| Citigroup Global Markets, Inc. |
3,136,202 | (3,136,202 | ) | — | — | |||||||||||
| J.P. Morgan Securities LLC |
22,512,004 | (22,512,004 | ) | — | — | |||||||||||
| Jefferies LLC |
2,209,939 | (2,209,939 | ) | — | — | |||||||||||
| Mizuho Securities USA LLC |
130,830 | (130,830 | ) | — | — | |||||||||||
| Morgan Stanley |
9,177,511 | (9,177,511 | ) | — | — | |||||||||||
| Pershing LLC |
1,915,286 | (1,915,286 | ) | — | — | |||||||||||
| RBC Capital Markets LLC |
3,867,085 | (3,867,085 | ) | — | — | |||||||||||
| Scotia Capital (USA), Inc. |
1,885,143 | (1,885,143 | ) | — | — | |||||||||||
| State Street Bank & Trust Co. |
3,445,774 | (3,445,774 | ) | — | — | |||||||||||
| TD Securities (USA) LLC |
112,582 | (112,582 | ) | — | — | |||||||||||
| Toronto-Dominion Bank (The) |
228,964 | (228,964 | ) | — | — | |||||||||||
| UBS Securities LLC |
18,939 | (18,939 | ) | — | — | |||||||||||
| Wells Fargo Bank N.A. |
270,098 | (270,098 | ) | — | — | |||||||||||
| Wells Fargo Securities LLC |
2,217,145 | (2,217,145 | ) | — | — | |||||||||||
|
|
|
|
|
|
|
|
|
|||||||||
| $ | 80,785,652 | $ | (80,785,652 | ) | $ | — | $ | — | ||||||||
|
|
|
|
|
|
|
|
|
|||||||||
| (a) | Collateral received, if any, in excess of the market value of securities on loan is not presented in this table. The total cash collateral received by each Fund is disclosed in the Fund’s Statements of Assets and Liabilities. |
| N O T E S T O F I N A N C I A L S T A T E M E N T S |
135 |
Notes to Financial Statements (continued)
The risks of securities lending include the risk that the borrower may not provide additional collateral when required or may not return the securities when due. To mitigate these risks, each Fund benefits from a borrower default indemnity provided by BlackRock, Inc. (“BlackRock”). BlackRock’s indemnity allows for full replacement of the securities loaned to the extent the collateral received does not cover the value of the securities loaned in the event of borrower default. Each Fund could incur a loss if the value of an investment purchased with cash collateral falls below the market value of the loaned securities or if the value of an investment purchased with cash collateral falls below the value of the original cash collateral received. Such losses are borne entirely by each Fund.
| 5. | INVESTMENT ADVISORY AGREEMENT AND OTHER TRANSACTIONS WITH AFFILIATES |
Investment Advisory Fees: Pursuant to an Investment Advisory Agreement with the Trust, BFA manages the investment of each Fund’s assets. BFA is a California corporation indirectly owned by BlackRock. Under the Investment Advisory Agreement, BFA is responsible for substantially all expenses of the Funds, except (i) interest and taxes; (ii) brokerage commissions and other expenses connected with the execution of portfolio transactions; (iii) distribution fees; (iv) the advisory fee payable to BFA; and (v) litigation expenses and any extraordinary expenses (in each case as determined by a majority of the independent trustees).
For its investment advisory services to each of the following Funds, BFAis entitled to an annual investment advisory fee, accrued daily and paid monthly by the Funds, based on the average daily net assets of each Fund as follows:
| iShares ETF | Investment Advisory Fees | |||
| ESG Aware 1-5 Year USD Corporate Bond |
0.12 | % | ||
| ESG Aware U.S. Aggregate Bond |
0.10 | |||
| ESG Aware USD Corporate Bond |
0.18 | |||
Expense Waivers: A fund may incur its pro rata share of fees and expenses attributable to its investments in other investment companies (“acquired fund fees and expenses”). The total of the investment advisory fee and acquired fund fees and expenses, if any, is a fund’s total annual operating expenses. Total expenses as shown in the Statements of Operations does not include acquired fund fees and expenses.
For the iShares ESG Aware U.S. Aggregate Bond ETF, BFA has contractually agreed to waive a portion of its investment advisory fee for the Fund through June 30, 2024 in an amount equal to the acquired fund fees and expenses, if any, attributable to the Fund’s investments in other iShares funds.
This amount is included in investment advisory fees waived in the Statements of Operations. For the year ended February 29, 2024, the amounts waived in investment advisory fees pursuant to this arrangement were as follows:
| iShares ETF | Amounts Waived | |||
| ESG Aware U.S. Aggregate Bond |
$ | 199,363 | ||
Distributor: BlackRock Investments, LLC (“BRIL”), an affiliate of BFA, is the distributor for each Fund. Pursuant to the distribution agreement, BFA is responsible for any fees or expenses for distribution services provided to the Funds.
ETF Servicing Fees: Each Fund has entered into an ETF Services Agreement with BRIL to perform certain order processing, Authorized Participant communications, and related services in connection with the issuance and redemption of Creation Units (“ETF Services”). BRIL is entitled to a transaction fee from Authorized Participants on each creation or redemption order for the ETF Services provided. The Funds do not pay BRIL for ETF Services.
Prior to January 08, 2024 (date of conversion for iShares ESG Aware U.S. Aggregate Bond ETF and iShares ESG Aware USD Corporate Bond ETF), ETF Services were performed by State Street Bank and Trust Company.
Prior to January 26, 2024 (date of conversion for iShares ESG Aware 1-5 Year USD Corporate Bond ETF), ETF Services were performed by State Street Bank and Trust Company.
Securities Lending: The U.S. Securities and Exchange Commission (the “SEC”) has issued an exemptive order which permits BlackRock Institutional Trust Company, N.A. (“BTC”), an affiliate of BFA, to serve as securities lending agent for the Funds, subject to applicable conditions. As securities lending agent, BTC bears all operational costs directly related to securities lending, including any custodial costs. Each Fund is responsible for fees in connection with the investment of cash collateral received for securities on loan (the “collateral investment fees”). The cash collateral is invested in a money market fund, BlackRock Cash Funds: Institutional or BlackRock Cash Funds: Treasury, managed by BFA, or its affiliates. However, BTC has agreed to reduce the amount of securities lending income it receives in order to effectively limit the collateral investment fees each Fund bears to an annual rate of 0.04%. The SL Agency Shares of such money market fund will not be subject to a sales load, distribution fee or service fee. The money market fund in which the cash collateral has been invested may, under certain circumstances, impose a liquidity fee of up to 2% of the value redeemed or temporarily restrict redemptions for up to 10 business days during a 90 day period, in the event that the money market fund’s weekly liquid assets fall below certain thresholds.
Securities lending income is equal to the total of income earned from the reinvestment of cash collateral, net of fees and other payments to and from borrowers of securities, and less the collateral investment fees. Each Fund retains a portion of securities lending income and remits the remaining portion to BTC as compensation for its services as securities lending agent.
| 136 | 2 0 2 4 I S H A R E S A N N U A L R E P O R T T O S H A R E H O L D E R S |
Notes to Financial Statements (continued)
Pursuant to the current securities lending agreement, each Fund retains 82% of securities lending income (which excludes collateral investment fees), and the amount retained can never be less than 70% of the total of securities lending income plus the collateral investment fees.
In addition, commencing the business day following the date that the aggregate securities lending income plus the collateral investment fees generated across all 1940 Act iShares exchange-traded funds (the “iShares ETF Complex”) in that calendar year exceeds a specified threshold, each Fund, pursuant to the securities lending agreement, will retain for the remainder of that calendar year 85% of securities lending income (which excludes collateral investment fees) and the amount retained can never be less than 70% of the total of securities lending income plus the collateral investment fees.
The share of securities lending income earned by each Fund is shown as securities lending income – affiliated – net in its Statements of Operations. For the year ended February 29, 2024, the Funds paid BTC the following amounts for securities lending agent services:
| iShares ETF | Amounts | |||
| ESG Aware 1-5 Year USD Corporate Bond |
$ | 45,108 | ||
| ESG Aware U.S. Aggregate Bond |
40,815 | |||
| ESG Aware USD Corporate Bond |
110,922 | |||
Officers and Trustees: Certain officers and/or trustees of the Trust are officers and/or trustees of BlackRock or its affiliates.
| 6. | PURCHASES AND SALES |
For the year ended February 29, 2024, purchases and sales of investments, including mortgage dollar rolls and excluding short-term securities and in-kind transactions, were as follows:
| U.S. Government Securities | Other Securities | |||||||||||||||
|
|
|
|
|
|||||||||||||
| iShares ETF | Purchases | Sales | Purchases | Sales | ||||||||||||
| ESG Aware 1-5 Year USD Corporate Bond |
$ | — | $ | — | $ | 268,020,578 | $ | 270,481,268 | ||||||||
| ESG Aware U.S. Aggregate Bond |
4,922,482,614 | 4,626,516,111 | 160,889,012 | 146,500,348 | ||||||||||||
| ESG Aware USD Corporate Bond |
24,837 | — | 205,912,998 | 204,053,763 | ||||||||||||
For the year ended February 29, 2024, in-kind transactions were as follows:
| iShares ETF | In-kind Purchases |
In-kind Sales |
||||||
| ESG Aware 1-5 Year USD Corporate Bond |
$ | 44,925,069 | $ | 103,524,771 | ||||
| ESG Aware U.S. Aggregate Bond |
894,543,881 | 61,101,059 | ||||||
| ESG Aware USD Corporate Bond |
297,300,870 | 435,898,278 | ||||||
| 7. | INCOME TAX INFORMATION |
Each Fund is treated as an entity separate from the Trust’s other funds for federal income tax purposes. It is each Fund’s policy to comply with the requirements of the Internal Revenue Code of 1986, as amended, applicable to regulated investment companies, and to distribute substantially all of its taxable income to its shareholders. Therefore, no U.S. federal income tax provision is required.
Management has analyzed tax laws and regulations and their application to the Funds as of February 29, 2024, inclusive of the open tax return years, and does not believe that there are any uncertain tax positions that require recognition of a tax liability in the Funds’ financial statements.
U.S. GAAP requires that certain components of net assets be adjusted to reflect permanent differences between financial and tax reporting. These reclassifications have no effect on net assets or NAV per share. As of February 29, 2024, permanent differences attributable to realized gains (losses) from in-kind redemptions were reclassified to the following accounts:
| iShares ETF | Paid-in Capital | Accumulated Earnings (Loss) |
||||||
| ESG Aware 1-5 Year USD Corporate Bond |
$ | (3,126,282 | ) | $ | 3,126,282 | |||
| ESG Aware U.S. Aggregate Bond |
(106,505 | ) | 106,505 | |||||
| ESG Aware USD Corporate Bond |
(12,074,979 | ) | 12,074,979 | |||||
| N O T E S T O F I N A N C I A L S T A T E M E N T S |
137 |
Notes to Financial Statements (continued)
The tax character of distributions paid was as follows:
|
|
||||||||
| iShares ETF | Year Ended 02/29/24 |
Year Ended 02/28/23 |
||||||
|
|
||||||||
| ESG Aware 1-5 Year USD Corporate Bond |
||||||||
| Ordinary income |
$ | 25,633,094 | $ | 17,369,925 | ||||
|
|
|
|
|
|||||
| ESG Aware U.S. Aggregate Bond |
||||||||
| Ordinary income |
$ | 104,458,748 | $ | 44,953,799 | ||||
|
|
|
|
|
|||||
| ESG Aware USD Corporate Bond |
||||||||
| Ordinary income |
$ | 43,445,842 | $ | 26,535,411 | ||||
|
|
|
|
|
|||||
As of February 29, 2024, the tax components of accumulated net earnings (losses) were as follows:
| iShares ETF |
|
Undistributed Ordinary Income |
|
|
Non-expiring Capital Loss Carryforwards |
(a) |
|
Net Unrealized Gains (Losses) |
(b) |
Total | ||||||
| ESG Aware 1-5 Year USD Corporate Bond |
$ | 2,550,339 | $ | (26,221,063 | ) | $ | (25,342,989 | ) | $ | (49,013,713 | ) | |||||
| ESG Aware U.S. Aggregate Bond |
11,188,155 | (61,858,536 | ) | (273,254,784 | ) | (323,925,165 | ) | |||||||||
| ESG Aware USD Corporate Bond |
3,673,340 | (38,466,047 | ) | (104,606,423 | ) | (139,399,130 | ) | |||||||||
| (a) | Amounts available to offset future realized capital gains. |
| (b) | The difference between book-basis and tax-basis unrealized gains (losses) was attributable primarily to the tax deferral of losses on wash sales, amortization methods for premiums and discounts on fixed income securities and TBA transactions. |
As of February 29, 2024, gross unrealized appreciation and depreciation based on cost of investments (including short positions and derivatives, if any) for U.S. federal income tax purposes were as follows:
| iShares ETF | Tax Cost | Gross Unrealized Appreciation |
Gross Unrealized Depreciation |
Net Unrealized Appreciation |
||||||||||||
| ESG Aware 1-5 Year USD Corporate Bond |
$ | 919,187,421 | $ | 3,263,692 | $ | (28,606,681 | ) | $ | (25,342,989 | ) | ||||||
| ESG Aware U.S. Aggregate Bond |
4,049,083,499 | 10,013,435 | (283,268,219 | ) | (273,254,784 | ) | ||||||||||
| ESG Aware USD Corporate Bond |
1,194,111,109 | 3,085,031 | (107,691,454 | ) | (104,606,423 | ) | ||||||||||
| 8. | PRINCIPAL RISKS |
In the normal course of business, each Fund invests in securities or other instruments and may enter into certain transactions, and such activities subject the Fund to various risks, including, among others, fluctuations in the market (market risk) or failure of an issuer to meet all of its obligations. The value of securities or other instruments may also be affected by various factors, including, without limitation: (i) the general economy; (ii) the overall market as well as local, regional or global political and/or social instability; (iii) regulation, taxation or international tax treaties between various countries; or (iv) currency, interest rate or price fluctuations. Local, regional or global events such as war, acts of terrorism, the spread of infectious illness or other public health issues, recessions, or other events could have a significant impact on the Funds and their investments. Each Fund’s prospectus provides details of the risks to which the Fund is subject.
BFA uses an indexing approach to try to achieve each Fund’s investment objective. The Fund is not actively managed, and BFA generally does not attempt to take defensive positions under any market conditions, including declining markets.
The Funds may be exposed to additional risks when reinvesting cash collateral in money market funds that do not seek to maintain a stable NAV per share of $1.00, which may be subject to redemption gates or liquidity fees under certain circumstances.
Market Risk: Each Fund may be exposed to prepayment risk, which is the risk that borrowers may exercise their option to prepay principal earlier than scheduled during periods of declining interest rates, which would force each Fund to reinvest in lower yielding securities. Each Fund may also be exposed to reinvestment risk, which is the risk that income from each Fund’s portfolio will decline if each Fund invests the proceeds from matured, traded or called fixed-income securities at market interest rates that are below each Fund portfolio’s current earnings rate.
Municipal securities are subject to the risk that litigation, legislation or other political events, local business or economic conditions, credit rating downgrades, or the bankruptcy of the issuer could have a significant effect on an issuer’s ability to make payments of principal and/or interest or otherwise affect the value of such securities. Municipal securities can be significantly affected by political or economic changes, including changes made in the law after issuance of the securities, as well as uncertainties in the municipal market related to, taxation, legislative changes or the rights of municipal security holders, including in connection with an issuer insolvency. Municipal securities backed by current or anticipated revenues from a specific project or specific assets can be negatively affected by the discontinuance of the tax benefits supporting the project or assets or the inability to collect revenues for the project or from the assets. Municipal securities may be less liquid than taxable bonds, and there may be less publicly available information on the financial condition of municipal security issuers than for issuers of other securities.
| 138 | 2 0 2 4 I S H A R E S A N N U A L R E P O R T T O S H A R E H O L D E R S |
Notes to Financial Statements (continued)
Counterparty Credit Risk: The Funds may be exposed to counterparty credit risk, or the risk that an entity may fail to or be unable to perform on its commitments related to unsettled or open transactions, including making timely interest and/or principal payments or otherwise honoring its obligations. The Funds manage counterparty credit risk by entering into transactions only with counterparties that BFA believes have the financial resources to honor their obligations and by monitoring the financial stability of those counterparties. Financial assets, which potentially expose the Funds to market, issuer and counterparty credit risks, consist principally of financial instruments and receivables due from counterparties. The extent of the Funds’ exposure to market, issuer and counterparty credit risks with respect to these financial assets is approximately their value recorded in the Statements of Assets and Liabilities, less any collateral held by the Funds.
Geographic/Asset Class Risk: A diversified portfolio, where this is appropriate and consistent with a fund’s objectives, minimizes the risk that a price change of a particular investment will have a material impact on the NAV of a fund. The investment concentrations within each Fund’s portfolio are disclosed in its Schedule of Investments.
The Funds invest a significant portion of their assets in securities of issuers located in the United States. A decrease in imports or exports, changes in trade regulations, inflation and/or an economic recession in the United States may have a material adverse effect on the U.S. economy and the securities listed on U.S. exchanges. Proposed and adopted policy and legislative changes in the United States may also have a significant effect on U.S. markets generally, as well as on the value of certain securities. Governmental agencies project that the United States will continue to maintain elevated public debt levels for the foreseeable future which may constrain future economic growth. Circumstances could arise that could prevent the timely payment of interest or principal on U.S. government debt, such as reaching the legislative “debt ceiling.” Such non-payment would result in substantial negative consequences for the U.S. economy and the global financial system. If U.S. relations with certain countries deteriorate, it could adversely affect issuers that rely on the United States for trade. The United States has also experienced increased internal unrest and discord. If these trends were to continue, they may have an adverse impact on the U.S. economy and the issuers in which the the Funds invest.
Certain Funds invest a significant portion of their assets in securities within a single or limited number of market sectors. When a fund concentrates its investments in this manner, it assumes the risk that economic, regulatory, political and social conditions affecting such sectors may have a significant impact on the fund and could affect the income from, or the value or liquidity of, the fund’s portfolio. Investment percentages in specific sectors are presented in the Schedule of Investments.
The Funds invest a significant portion of their assets in fixed-income securities and/or use derivatives tied to the fixed-income markets. Changes in market interest rates or economic conditions may affect the value and/or liquidity of such investments. Interest rate risk is the risk that prices of bonds and other fixed-income securities will decrease as interest rates rise and increase as interest rates fall. The Funds may be subject to a greater risk of rising interest rates due to the period of historically low interest rates that ended in March 2022. The Federal Reserve has recently raised the federal funds rate as part of its efforts to address inflation. There is a risk that interest rates will continue to rise, which will likely drive down the prices of bonds and other fixed-income securities, and could negatively impact the Funds’ performance.
The Funds invest a significant portion of their assets in securities backed by commercial or residential mortgage loans or in issuers that hold mortgage and other asset-backed securities. When a fund concentrates its investments in this manner, it assumes a greater risk of prepayment or payment extension by securities issuers. Changes in economic conditions, including delinquencies and/or defaults on assets underlying these securities, can affect the value, income and/or liquidity of such positions. Investment percentages in these securities are presented in the Schedule of Investments.
Certain Funds invest a significant portion of their assets within the financials sector. Performance of companies in the financials sector may be adversely impacted by many factors, including, among others, changes in government regulations, economic conditions, and interest rates, credit rating downgrades, adverse public perception, exposure concentration and decreased liquidity in credit markets. The impact of changes in capital requirements and recent or future regulation on any individual financial company, or on the financials sector as a whole, cannot be predicted, but may negatively impact the Funds.
Significant Shareholder Redemption Risk: Certain shareholders may own or manage a substantial amount of fund shares and/or hold their fund investments for a limited period of time. Large redemptions of fund shares by these shareholders may force a fund to sell portfolio securities, which may negatively impact the fund’s NAV, increase the fund’s brokerage costs, and/or accelerate the realization of taxable income/gains and cause the fund to make additional taxable distributions to shareholders.
LIBOR Transition Risk: The Funds may be exposed to financial instruments that recently transitioned from, or continue to be tied to the London Interbank Offered Rate (“LIBOR”) to determine payment obligations, financing terms, hedging strategies or investment value. The United Kingdom’s Financial Conduct Authority, which regulates LIBOR, has ceased publishing all LIBOR settings, but some USD LIBOR settings will continue to be published under a synthetic methodology until September 30, 2024 for certain legacy contracts. The Secured Overnight Financing Rate (“SOFR”) has been used increasingly on a voluntary basis in new instruments and transactions. Under U.S. regulations that implement a statutory fallback mechanism to replace LIBOR, benchmark rates based on SOFR have replaced LIBOR in certain financial contracts. The ultimate effect of the LIBOR transition process on the Funds is uncertain.
| 9. | CAPITAL SHARE TRANSACTIONS |
Capital shares are issued and redeemed by each Fund only in aggregations of a specified number of shares or multiples thereof (“Creation Units”) at NAV. Except when aggregated in Creation Units, shares of each Fund are not redeemable.
| N O T E S T O F I N A N C I A L S T A T E M E N T S |
139 |
Notes to Financial Statements (continued)
Transactions in capital shares were as follows:
|
|
||||||||||||||||
| Year Ended 02/29/24 |
Year Ended 02/28/23 |
|||||||||||||||
|
|
|
|
|
|||||||||||||
| iShares ETF | Shares | Amount | Shares | Amount | ||||||||||||
|
|
||||||||||||||||
| ESG Aware 1-5 Year USD Corporate Bond | ||||||||||||||||
| Shares sold |
1,900,000 | $ | 45,696,459 | 6,700,000 | $ | 159,782,463 | ||||||||||
| Shares redeemed |
(4,400,000 | ) | (105,453,990 | ) | (9,800,000 | ) | (235,417,990 | ) | ||||||||
|
|
|
|
|
|
|
|
|
|||||||||
| (2,500,000 | ) | $ | (59,757,531 | ) | (3,100,000 | ) | $ | (75,635,527 | ) | |||||||
|
|
|
|
|
|
|
|
|
|||||||||
| ESG Aware U.S. Aggregate Bond | ||||||||||||||||
| Shares sold |
26,700,000 | $ | 1,247,309,890 | 17,500,000 | $ | 847,365,803 | ||||||||||
| Shares redeemed |
(1,800,000 | ) | (82,695,735 | ) | (3,700,000 | ) | (178,354,811 | ) | ||||||||
|
|
|
|
|
|
|
|
|
|||||||||
| 24,900,000 | $ | 1,164,614,155 | 13,800,000 | $ | 669,010,992 | |||||||||||
|
|
|
|
|
|
|
|
|
|||||||||
| ESG Aware USD Corporate Bond | ||||||||||||||||
| Shares sold |
13,550,000 | $ | 303,922,392 | 24,550,000 | $ | 572,972,570 | ||||||||||
| Shares redeemed |
(19,600,000 | ) | (446,032,496 | ) | (8,450,000 | ) | (187,650,031 | ) | ||||||||
|
|
|
|
|
|
|
|
|
|||||||||
| (6,050,000 | ) | $ | (142,110,104 | ) | 16,100,000 | $ | 385,322,539 | |||||||||
|
|
|
|
|
|
|
|
|
|||||||||
The consideration for the purchase of Creation Units of a fund in the Trust generally consists of the in-kind deposit of a designated portfolio of securities and a specified amount of cash. Certain funds in the Trust may be offered in Creation Units solely or partially for cash in U.S. dollars. Authorized Participants purchasing and redeeming Creation Units may pay a purchase transaction fee and a redemption transaction fee directly to BRIL, to offset transfer and other transaction costs associated with the issuance and redemption of Creation Units, including Creation Units for cash. Authorized Participants transacting in Creation Units for cash may also pay an additional variable charge to compensate the relevant fund for certain transaction costs (i.e., stamp taxes, taxes on currency or other financial transactions, and brokerage costs) and market impact expenses relating to investing in portfolio securities. Such variable charges, if any, are included in shares sold in the table above.
From time to time, settlement of securities related to in-kind contributions or in-kind redemptions may be delayed. In such cases, securities related to in-kind transactions are reflected as a receivable or a payable in the Statements of Assets and Liabilities.
| 10. | SUBSEQUENT EVENTS |
Management has evaluated the impact of all subsequent events on the Funds through the date the financial statements were available to be issued and has determined that there were no subsequent events requiring adjustment or additional disclosure in the financial statements.
| 140 | 2 0 2 4 I S H A R E S A N N U A L R E P O R T T O S H A R E H O L D E R S |
Report of Independent Registered Public Accounting Firm
To the Board of Trustees of
iShares Trust and Shareholders of each of the three funds listed in the table below
Opinions on the Financial Statements
We have audited the accompanying statements of assets and liabilities, including the schedules of investments, of each of the funds listed in the table below (three of the funds constituting iShares Trust, hereafter collectively referred to as the “Funds”) as of February 29, 2024, the related statements of operations for the year ended February 29, 2024, the statements of changes in net assets for each of the two years in the period ended February 29, 2024, including the related notes, and the financial highlights for each of the five years in the period ended February 29, 2024 (collectively referred to as the “financial statements”). In our opinion, the financial statements present fairly, in all material respects, the financial position of each of the Funds as of February 29, 2024, the results of each of their operations for the year then ended, the changes in each of their net assets for each of the two years in the period ended February 29, 2024 and each of the financial highlights for each of the five years in the period ended February 29, 2024 in conformity with accounting principles generally accepted in the United States of America.
iShares ESG Aware 1-5 Year USD Corporate Bond ETF
iShares ESG Aware U.S. Aggregate Bond ETF
iShares ESG Aware USD Corporate Bond ETF
Basis for Opinions
These financial statements are the responsibility of the Funds’ management. Our responsibility is to express an opinion on the Funds’ financial statements based on our audits. We are a public accounting firm registered with the Public Company Accounting Oversight Board (United States) (PCAOB) and are required to be independent with respect to the Funds in accordance with the U.S. federal securities laws and the applicable rules and regulations of the Securities and Exchange Commission and the PCAOB.
We conducted our audits of these financial statements in accordance with the standards of the PCAOB. Those standards require that we plan and perform the audit to obtain reasonable assurance about whether the financial statements are free of material misstatement, whether due to error or fraud.
Our audits included performing procedures to assess the risks of material misstatement of the financial statements, whether due to error or fraud, and performing procedures that respond to those risks. Such procedures included examining, on a test basis, evidence regarding the amounts and disclosures in the financial statements. Our audits also included evaluating the accounting principles used and significant estimates made by management, as well as evaluating the overall presentation of the financial statements. Our procedures included confirmation of securities owned as of February 29, 2024 by correspondence with the custodian, transfer agent and brokers; when replies were not received from brokers, we performed other auditing procedures. We believe that our audits provide a reasonable basis for our opinions.
/s/PricewaterhouseCoopers LLP
Philadelphia, Pennsylvania
April 19, 2024
We have served as the auditor of one or more BlackRock investment companies since 2000.
| R E P O R T O F I N D E P E N D E N T R E G I S T E R E D P U B L I C A C C O U N T I N G F I R M |
141 |
Important Tax Information (unaudited)
The Funds hereby designate the following amounts, or maximum amounts allowable by law, of distributions from direct federal obligation interest for the fiscal year ended February 29, 2024:
| iShares ETF | Federal Obligation Interest |
|||
| ESG Aware 1-5 Year USD Corporate Bond |
$ | 15,703 | ||
| ESG Aware U.S. Aggregate Bond |
36,941,805 | |||
| ESG Aware USD Corporate Bond |
27,483 | |||
The law varies in each state as to whether and what percent of ordinary income dividends attributable to federal obligations is exempt from state income tax. Shareholders are advised to check with their tax advisers to determine if any portion of the dividends received is exempt from state income tax.
The Funds hereby designate the following amounts, or maximum amounts allowable by law, as interest income eligible to be treated as a Section 163(j) interest dividend for the fiscal year ended February 29, 2024:
| iShares ETF | Interest Dividends | |||
| ESG Aware 1-5 Year USD Corporate Bond |
$ | 26,015,002 | ||
| ESG Aware U.S. Aggregate Bond |
109,538,785 | |||
| ESG Aware USD Corporate Bond |
43,087,912 | |||
The Funds hereby designate the following amount(s), or maximum amount(s) allowable by law, as interest-related dividends and qualified short-term capital gains eligible for exemption from U.S. withholding tax for nonresident aliens and foreign corporations for the fiscal year ended February 29, 2024:
| iShares ETF |
Interest-Related Dividends |
|||
| ESG Aware 1-5 Year USD Corporate Bond |
$ | 20,910,400 | ||
| ESG Aware U.S. Aggregate Bond |
101,341,139 | |||
| ESG Aware USD Corporate Bond |
36,044,115 | |||
| 142 | 2 0 2 4 I S H A R E S A N N U A L R E P O R T T O S H A R E H O L D E R S |
Statement Regarding Liquidity Risk Management Program (unaudited)
In compliance with Rule 22e-4 under the Investment Company Act of 1940, as amended (the “Liquidity Rule”), iShares Trust (the “Trust”) has adopted and implemented a liquidity risk management program (the “Program”) for iShares ESG Aware 1-5 Year USD Corporate Bond ETF, iShares ESG Aware U.S. Aggregate Bond ETF and iShares ESG Aware USD Corporate Bond ETF (the “Funds” or “ETFs”), each a series of the Trust, which is reasonably designed to assess and manage each Fund’s liquidity risk.
The Board of Trustees (the “Board”) of the Trust, on behalf of the Funds, met on December 8, 2023 (the “Meeting”) to review the Program. The Board previously appointed BlackRock Fund Advisors (“BlackRock”), the investment adviser to the Funds, as the program administrator for each Fund’s Program. BlackRock also previously delegated oversight of the Program to the 40Act Liquidity Risk Management Committee (the “Committee”). At the Meeting, the Committee, on behalf of BlackRock, provided the Board with a report that addressed the operation of the Program and assessed its adequacy and effectiveness of implementation, including the management of each Fund’s Highly Liquid Investment Minimum (“HLIM”) where applicable, and any material changes to the Program (the “Report”). The Report covered the period from October 1, 2022 through September 30, 2023 (the “Program Reporting Period”).
The Report described the Program’s liquidity classification methodology for categorizing each Fund’s investments (including derivative transactions) into one of four liquidity buckets. It also referenced the methodology used by BlackRock to establish each Fund’s HLIM and noted that the Committee reviews and ratifies the HLIM assigned to each Fund no less frequently than annually. The Report also discussed notable events affecting liquidity over the Program Reporting Period, including extended market holidays, delays in the repatriation of the local currency in certain non-U.S. countries, the continued illiquidity of Russian equity securities and the suspension of select sanctions in Venezuela.
The Report noted that the Program complied with the key factors for consideration under the Liquidity Rule for assessing, managing and periodically reviewing each Fund’s liquidity risk, as follows:
| a) | The Fund’s investment strategy and liquidity of portfolio investments during both normal and reasonably foreseeable stressed conditions. During the Program Reporting Period, the Committee reviewed whether each Fund’s strategy is appropriate for an open-end fund structure, with a focus on funds with more significant and consistent holdings of less liquid and illiquid assets. The Committee also factored a fund’s concentration in an issuer into the liquidity classification methodology by taking issuer position sizes into account. Derivative exposure was also considered in the calculation of a fund’s liquidity bucketing. Finally, a factor for consideration under the Liquidity Rule is a Fund’s use of borrowings for investment purposes. However, the Funds do not borrow for investment purposes. |
| b) | Short-term and long-term cash flow projections during both normal and reasonably foreseeable stressed conditions. During the Program Reporting Period, the Committee reviewed historical redemption activity and used this information as a component to establish each ETF’s reasonably anticipated trading size utilized for liquidity classifications. The Committee may also take into consideration a fund’s shareholder ownership concentration (which, depending on product type and distribution channel, may or may not be available), a fund’s distribution channels, and the degree of certainty associated with a fund’s short-term and long-term cash flow projections. |
| c) | Holdings of cash and cash equivalents, as well as borrowing arrangements. The Committee considered that ETFs generally do not hold more than de minimis amounts of cash. The Committee also considered that ETFs generally do not engage in borrowing. |
| d) | The relationship between an ETF’s portfolio liquidity and the way in which, and the prices and spreads at which, ETF shares trade, including the efficiency of the arbitrage function and the level of active participation by market participants, including authorized participants. The Committee monitored the prevailing bid/ask spread and the ETF price premium (or discount) to NAV for all ETFs. However, there were no ETFs with persistent deviations of fund premium/discount or bid/ask spreads from long-term averages over the Program Reporting Period. |
| e) | The effect of the composition of baskets on the overall liquidity of an ETF’s portfolio. In reviewing the linkage between the composition of custom baskets accepted by an ETF and any significant change in the liquidity profile of such ETF, the Committee reviewed changes in the proportion of each ETF’s portfolio comprised of less liquid and illiquid holdings to determine if applicable thresholds were met requiring enhanced review. There were no ETFs for which the custom baskets accepted by the ETF had a significant change in its liquidity profile. |
There were no material changes to the Program during the Program Reporting Period other than the enhancement of certain model components in the Program’s classification methodology. The Report provided to the Board stated that the Committee concluded that based on the operation of the functions, as described in the Report, the Program is operating as intended and is effective in implementing the requirements of the Liquidity Rule.
| S T A T E M E N T R E G A R D I N G L I Q U I D I T Y R I S K M A N A G E M E N T P R O G R A M |
143 |
Supplemental Information (unaudited)
Tailored Shareholder Reports for Open-End Mutual Funds and ETFs
Effective January 24, 2023, the SEC adopted rule and form amendments to require open-end mutual funds and ETFs to transmit concise and visually engaging streamlined annual and semiannual reports to shareholders that highlight key information. Other information, including financial statements, will no longer appear in a streamlined shareholder report but must be available online, delivered free of charge upon request, and filed on a semiannual basis on Form N-CSR. The rule and form amendments have a compliance date of July 24, 2024. At this time, management is evaluating the impact of these amendments on the shareholder reports for the Funds.
Premium/Discount Information
Information on the Fund’s net asset value, market price, premiums and discounts, and bid-ask spreads can be found at iShares.com.
| 144 | 2 0 2 4 I S H A R E S A N N U A L R E P O R T T O S H A R E H O L D E R S |
Trustee and Officer Information (unaudited)
The Board of Trustees has responsibility for the overall management and operations of the Funds, including general supervision of the duties performed by BFA and other service providers. Each Trustee serves until he or she resigns, is removed, dies, retires or becomes incapacitated. Each officer shall hold office until his or her successor is elected and qualifies or until his or her death, resignation or removal. Trustees who are not “interested persons” (as defined in the 1940 Act) of the Trust are referred to as independent trustees (“Independent Trustees”).
The registered investment companies advised by BFA or its affiliates (the “BlackRock-advised Funds”) are organized into one complex of open-end equity, multi-asset, index and money market funds and ETFs (the “BlackRock Multi-Asset Complex”), one complex of closed-end funds and open-end non-index fixed-income funds (including ETFs) (the “BlackRock Fixed-Income Complex”) and one complex of ETFs (“Exchange-Traded Fund Complex”) (each, a “BlackRock Fund Complex”). Each Fund is included in the Exchange-Traded Fund Complex. Each Trustee also serves as a Director of iShares, Inc. and a Trustee of iShares U.S. ETF Trust and, as a result, oversees all of the funds within the Exchange-Traded Fund Complex, which consists of 401 funds as of February 29, 2024. With the exception of Robert S. Kapito and Aaron Wasserman, the address of each Trustee and officer is c/o BlackRock, Inc., 400 Howard Street, San Francisco, CA 94105. The address of Mr. Kapito and Mr. Wasserman is c/o BlackRock, Inc., 50 Hudson Yards, New York, NY 10001. The Board has designated John E. Kerrigan as its Independent Board Chair. Additional information about the Funds’ Trustees and officers may be found in the Funds’ combined Statement of Additional Information, which is available without charge, upon request, by calling toll-free 1-800-iShares (1-800-474-2737).
| Interested Trustees | ||||||
| Name (Year of Birth) |
Position(s) | Principal Occupation(s) During Past 5 Years |
Other Directorships Held by Trustee | |||
| Robert S. Kapito(a) (1957) |
Trustee (since 2009). | President, of BlackRock, Inc. (since 2006); Vice Chairman of BlackRock, Inc. and Head of BlackRock’s Portfolio Management Group (since its formation in 1998) and BlackRock, Inc.’s predecessor entities (since 1988); Trustee, University of Pennsylvania (since 2009); President of Board of Directors, Hope & Heroes Children’s Cancer Fund (since 2002). | Director of BlackRock, Inc. (since 2006); Director of iShares, Inc. (since 2009); Trustee of iShares U.S. ETF Trust (since 2011). | |||
| (a) | Robert S. Kapito is deemed to be an “interested person” (as defined in the 1940 Act) of the Trust due to his affiliations with BlackRock, Inc. and its affiliates. |
| Independent Trustees | ||||||
| Name (Year of Birth) |
Position(s) | Principal Occupation(s) During Past 5 Years |
Other Directorships Held by Trustee | |||
| John E. Kerrigan (1955) |
Trustee (since 2005); Independent Board Chair (since 2022). | Chief Investment Officer, Santa Clara University (since 2002). | Director of iShares, Inc. (since 2005); Trustee of iShares U.S. ETF Trust (since 2011); Independent Board Chair of iShares, Inc. and iShares U.S. ETF Trust (since 2022). | |||
| Jane D. Carlin (1956) |
Trustee (since 2015); Risk Committee Chair (since 2016). | Consultant (since 2012); Member of the Audit Committee (2012-2018), Chair of the Nominating and Governance Committee (2017-2018) and Director of PHH Corporation (mortgage solutions) (2012-2018); Managing Director and Global Head of Financial Holding Company Governance & Assurance and the Global Head of Operational Risk Management of Morgan Stanley (2006-2012). | Director of iShares, Inc. (since 2015); Trustee of iShares U.S. ETF Trust (since 2015); Member of the Audit Committee (since 2016), Chair of the Audit Committee (since 2020) and Director of The Hanover Insurance Group, Inc. (since 2016). | |||
| Richard L. Fagnani (1954) |
Trustee (since 2017); Audit Committee Chair (since 2019). | Partner, KPMG LLP (2002-2016); Director of One Generation Away (since 2021). | Director of iShares, Inc. (since 2017); Trustee of iShares U.S. ETF Trust (since 2017). | |||
| Cecilia H. Herbert (1949) |
Trustee (since 2005); Nominating and Governance and Equity Plus Committee Chairs (since 2022). | Chair of the Finance Committee (since 2019) and Trustee and Member of the Finance, Audit and Quality Committees of Stanford Health Care (since 2016); Trustee of WNET, New York’s public media company (since 2011) and Member of the Audit Committee (since 2018), Investment Committee (since 2011) and Personnel Committee (since 2022); Member of the Wyoming State Investment Funds Committee (since 2022); Director of the Jackson Hole Center for the Arts (since 2021); Trustee of Forward Funds (14 portfolios) (2009-2018); Trustee of Salient MF Trust (4 portfolios) (2015-2018). | Director of iShares, Inc. (since 2005); Trustee of iShares U.S. ETF Trust (since 2011). | |||
| Drew E. Lawton (1959) |
Trustee (since 2017); 15(c) Committee Chair (since 2017). | Senior Managing Director of New York Life Insurance Company (2010-2015). | Director of iShares, Inc. (since 2017); Trustee of iShares U.S. ETF Trust (since 2017); Director of Jackson Financial Inc. (since 2021). | |||
| T R U S T E E A N D O F F I C E R I N F O R M A T I O N |
145 |
Trustee and Officer Information (unaudited) (continued)
| Independent Trustees (continued) | ||||||
| Name (Year of Birth) |
Position(s) | Principal Occupation(s) During Past 5 Years |
Other Directorships Held by Trustee | |||
| John E. Martinez (1961) |
Trustee (since 2003); Securities Lending Committee Chair (since 2019). | Director of Real Estate Equity Exchange, Inc. (since 2005); Director of Cloudera Foundation (2017-2020); and Director of Reading Partners (2012-2016). | Director of iShares, Inc. (since 2003); Trustee of iShares U.S. ETF Trust (since 2011). | |||
| Madhav V. Rajan (1964) |
Trustee (since 2011); Fixed-Income Plus Committee Chair (since 2019). | Dean, and George Pratt Shultz Professor of Accounting, University of Chicago Booth School of Business (since 2017); Advisory Board Member (since 2016) and Director (since 2020) of C.M. Capital Corporation; Chair of the Board for the Center for Research in Security Prices, LLC (since 2020); Robert K. Jaedicke Professor of Accounting, Stanford University Graduate School of Business (2001-2017); Professor of Law (by courtesy), Stanford Law School (2005-2017); Senior Associate Dean for Academic Affairs and Head of MBA Program, Stanford University Graduate School of Business (2010-2016). | Director of iShares, Inc. (since 2011); Trustee of iShares U.S. ETF Trust (since 2011). | |||
| Officers | ||||||
| Name (Year of Birth) |
Position(s) | Principal Occupation(s) During Past 5 Years | ||||
| Dominik Rohé (1973) |
President (since 2023). | Managing Director, BlackRock, Inc. (since 2005); Head of Americas ETF and Index Investments (since 2023); Head of Latin America (2019-2023). | ||||
| Trent Walker (1974) |
Treasurer and Chief Financial Officer (since 2020). | Managing Director, BlackRock, Inc. (since September 2019); Chief Financial Officer of iShares Delaware Trust Sponsor LLC, BlackRock Funds, BlackRock Funds II, BlackRock Funds IV, BlackRock Funds V and BlackRock Funds VI (since 2021); Executive Vice President of PIMCO (2016-2019); Senior Vice President of PIMCO (2008-2015); Treasurer (2013-2019) and Assistant Treasurer (2007-2017) of PIMCO Funds, PIMCO Variable Insurance Trust, PIMCO ETF Trust, PIMCO Equity Series, PIMCO Equity Series VIT, PIMCO Managed Accounts Trust, 2 PIMCO-sponsored interval funds and 21 PIMCO-sponsored closed-end funds. | ||||
| Aaron Wasserman (1974) | Chief Compliance Officer (iShares, Inc. and iShares Trust, since 2023; iShares U.S. ETF Trust, since 2023). | Managing Director of BlackRock, Inc. (since 2018); Chief Compliance Officer of the BlackRock Multi-Asset Complex, the BlackRock Fixed-Income Complex and the Exchange-Traded Fund Complex (since 2023); Deputy Chief Compliance Officer for the BlackRock Multi-Asset Complex, the BlackRock Fixed-Income Complex and the Exchange-Traded Fund Complex (2014-2023). | ||||
| Marisa Rolland (1980) |
Secretary (since 2022). | Managing Director, of BlackRock, Inc. (since 2023); Director, of BlackRock, Inc. (2018-2022); Vice President, BlackRock, Inc. (2010-2017). | ||||
| Rachel Aguirre (1982) |
Executive Vice President (since 2022). | Managing Director, of BlackRock, Inc. (since 2018); Director, BlackRock, Inc. (2009-2018); Head of U.S. iShares Product (since 2022); Head of EII U.S. Product Engineering of BlackRock, Inc. (since 2021); Co-Head of EII’s Americas Portfolio Engineering of BlackRock, Inc. (2020-2021); Head of Developed Markets Portfolio Engineering of BlackRock, Inc. (2016-2019). | ||||
| Jennifer Hsui (1976) |
Executive Vice President (since 2022). | Managing Director of BlackRock, Inc. (since 2009); Co-Head of Index Equity of BlackRock, Inc. (since 2022). | ||||
| James Mauro (1970) |
Executive Vice President (since 2022). | Managing Director, of BlackRock, Inc. (since 2010); Head of Fixed Income Index Investments in the Americas and Head of San Francisco Core Portfolio Management of BlackRock, Inc. (since 2020). | ||||
Effective July 1, 2023, Aaron Wasserman replaced Charles Park as Chief Compliance Officer.
Effective February 1, 2024, Salim Ramji resigned as Trustee of the Trust.
Effective March 5, 2024, Stephen Cohen replaced Salim Ramji as Trustee of the Trust.
Effective March 5, 2024, Dominik Rohé resigned as President of the Trust.
Effective March 5, 2024, Jessica Tan replaced Dominik Rohé as President of the Trust.
Effective April 8, 2024, Laura Fergerson was appointed as Trustee of the Trust.
Effective April 8, 2024, James Lam was appointed as Trustee of the Trust.
| 146 | 2 0 2 4 I S H A R E S A N N U A L R E P O R T T O S H A R E H O L D E R S |
Electronic Delivery
Shareholders can sign up for e-mail notifications announcing that the shareholder report or prospectus has been posted on the iShares website at iShares.com. Once you have enrolled, you will no longer receive prospectuses and shareholder reports in the mail.
To enroll in electronic delivery:
| • | Go to icsdelivery.com. |
| • | If your brokerage firm is not listed, electronic delivery may not be available. Please contact your broker-dealer or financial advisor. |
Householding
Householding is an option available to certain fund investors. Householding is a method of delivery, based on the preference of the individual investor, in which a single copy of certain shareholder documents and Rule 30e-3 notices can be delivered to investors who share the same address, even if their accounts are registered under different names. Please contact your broker-dealer if you are interested in enrolling in householding and receiving a single copy of prospectuses and other shareholder documents, or if you are currently enrolled in householding and wish to change your householding status.
Availability of Quarterly Schedule of Investments
The Funds file their complete schedule of portfolio holdings with the SEC for the first and third quarters of each fiscal year as an exhibit to their reports on Form N-PORT. The Funds’ Forms N-PORT are available on the SEC’s website at sec.gov. Additionally, each Fund makes its portfolio holdings for the first and third quarters of each fiscal year available at iShares.com/fundreports.
Availability of Proxy Voting Policies and Proxy Voting Records
A description of the policies and procedures that the iShares Funds use to determine how to vote proxies relating to portfolio securities and information about how the iShares Funds voted proxies relating to portfolio securities during the most recent twelve-month period ending June 30 is available without charge, upon request (1) by calling toll-free 1-800-474-2737; (2) on the iShares website at iShares.com; and (3) on the SEC website at sec.gov.
A description of the Trust’s policies and procedures with respect to the disclosure of the Fund’s portfolio securities is available in the Fund Prospectus. The Fund discloses its portfolio holdings daily and provides information regarding its top holdings in Fund fact sheets at iShares.com.
| G E N E R A L I N F O R M A T I O N |
147 |
Glossary of Terms Used in this Report
| Portfolio Abbreviation | ||
| BAB | Build America Bond | |
| CMT | Constant Maturity Treasury | |
| GO | General Obligation | |
| LIBOR | London Interbank Offered Rate | |
| REIT | Real Estate Investment Trust | |
| SCA | Svenska Celluosa Aktiebolaget | |
| SOFR | Secured Overnight Financing Rate | |
| TBA | To-Be-Announced | |
| 148 | 2 0 2 4 I S H A R E S A N N U A L R E P O R T T O S H A R E H O L D E R S |
Want to know more?
iShares.com | 1-800-474-2737
This report is intended for the Funds’ shareholders. It may not be distributed to prospective investors unless it is preceded or accompanied by the current prospectus.
Investing involves risk, including possible loss of principal.
The iShares Funds are distributed by BlackRock Investments, LLC (together with its affiliates, “BlackRock”).
The iShares Funds are not sponsored, endorsed, issued, sold or promoted by Bloomberg Index Services Limited, nor does this company make any representation regarding the advisability of investing in the iShares Funds. BlackRock is not affiliated with the company listed above.
©2024 BlackRock, Inc. All rights reserved. iSHARES and BLACKROCK are registered trademarks of BlackRock, Inc. or its subsidiaries. All other marks are the property of their respective owners.
iS-AR-209-0224
|
|

|
|
|
FEBRUARY 29, 2024 |

| 2024 Annual Report
| ||
iShares Trust
| · | iShares Core U.S. Aggregate Bond ETF | AGG | NYSE Arca |
Dear Shareholder,
The combination of continued economic growth and cooling inflation provided a supportive backdrop for investors during the 12-month reporting period ended February 29, 2024. Significantly tighter monetary policy helped to rein in inflation, and the Consumer Price Index decelerated substantially while remaining above pre-pandemic levels. A moderating labor market helped ease inflationary pressure, although wages continued to grow. Wage and job growth powered robust consumer spending, backstopping the economy. On October 7, 2023, Hamas launched a horrific attack on Israel. The ensuing war will have a significant humanitarian impact and could lead to heightened economic and market volatility. We see geopolitics as a structural market risk going forward. See our geopolitical risk dashboard at blackrock.com for more details.
Equity returns were robust during the period, as interest rates stabilized and the economy proved to be more resilient than many investors expected. The U.S. economy continued to show strength, and growth further accelerated in the second half of 2023. Large-capitalization U.S. stocks posted particularly substantial gains, supported by the performance of a few notable technology companies, while small-capitalization U.S. stocks advanced at a significantly slower pace. Meanwhile, international developed market equities also gained strongly, while emerging market stocks advanced at a more modest pace.
The 10-year U.S. Treasury yield rose during the reporting period, as investors reacted to elevated inflation and attempted to anticipate future interest rate changes. However, higher yields drove positive returns overall for 10-year U.S. Treasuries and solid gains in shorter-duration U.S. Treasuries. The corporate bond market benefited from improving economic sentiment, although high-yield corporate bond prices fared significantly better than investment-grade bonds as demand from yield-seeking investors remained strong.
The U.S. Federal Reserve (the “Fed”), attempting to manage persistent inflation, raised interest rates three times during the 12-month period, but paused its tightening after its July meeting. The Fed also continued to reduce its balance sheet by not replacing some of the securities that reach maturity.
Supply constraints appear to have become an embedded feature of the new macroeconomic environment, making it difficult for developed economies to increase production without sparking higher inflation. Geopolitical fragmentation and an aging population risk further exacerbating these constraints, keeping the labor market tight and wage growth high. Although the Fed has stopped tightening for now, we believe that the new economic regime means that the Fed will need to maintain high rates for an extended period despite the market’s hopes for rapid interest rate cuts, as reflected in the recent rally. In this new regime, we anticipate greater volatility and dispersion of returns, creating more opportunities for selective portfolio management.
Looking at developed market stocks, we have an overweight stance on U.S. stocks overall, particularly given the promise of emerging AI technologies. We are also overweight Japanese stocks as shareholder-friendly policies generate increased investor interest, although we maintain an underweight stance on European stocks. In credit, there are selective opportunities in the near term despite tighter credit and financial conditions. For fixed income investing with a six- to twelve-month horizon, we see the most attractive investments in short-term U.S. Treasuries and hard-currency emerging market bonds.
Overall, our view is that investors need to think globally, position themselves to be prepared for a decarbonizing economy, and be nimble as market conditions change. We encourage you to talk with your financial advisor and visit iShares.com for further insight about investing in today’s markets.

Rob Kapito
President, BlackRock Inc.

Rob Kapito
President, BlackRock Inc.
| Total Returns as of February 29, 2024
| ||||
|
6-Month
|
12-Month
| |||
|
U.S. large cap
equities
|
13.93% | 30.45% | ||
|
U.S. small cap
equities
|
8.97 | 10.05 | ||
|
International
equities
|
9.23 | 14.41 | ||
|
Emerging market
equities
|
4.93 | 8.73 | ||
|
3-month Treasury bills
|
2.69 | 5.22 | ||
|
U.S. Treasury
securities U.S. Treasury Index)
|
0.58 | 0.69 | ||
|
U.S. investment
grade bonds
|
2.35 | 3.33 | ||
|
Tax-exempt municipal bonds
|
4.33 | 5.42 | ||
|
U.S. high yield
bonds
|
6.18 | 11.01 | ||
|
Past performance is not an indication of future results. Index performance is shown for illustrative purposes only. You cannot invest directly in an index.
| ||||
| 2 | T H I S P A G E I S N O T P A R T O F Y O U R F U N D R E P O R T |
| Page
|
||||
| 2 | ||||
| Annual Report: |
||||
| 4 | ||||
| 5 | ||||
| 7 | ||||
| 7 | ||||
| 8 | ||||
| Financial Statements |
||||
| 116 | ||||
| 117 | ||||
| 118 | ||||
| 119 | ||||
| 120 | ||||
| 128 | ||||
| 129 | ||||
| 130 | ||||
| 131 | ||||
| 133 | ||||
| 135 | ||||
| 136 | ||||
iShares Trust
U.S. Bond Market Overview
U.S. investment-grade bonds produced a gain of 3.33% during the 12 months ended February 29, 2024 (the “reporting period”), as measured by the Bloomberg U.S. Aggregate Bond Index. Income made a sizable contribution to performance, and strength in credit-oriented market segments provided an additional boost to returns.
The 12-month gain for the index belies the challenging environment for the bond market through the first eight months of the period. During this time, yields drifted steadily higher (as prices fell) in response to better-than-expected economic growth and continued interest rate increases by the U.S. Federal Reserve (Fed). The Fed raised rates by a quarter-point at its meetings in March, May, and July 2023, moving its benchmark fed funds rate to a range of 5.25%—5.50%. Although the Fed’s aggressive actions contributed to a decline in inflation, U.S. economic growth remained robust behind persistent strength in the labor market. This trend gave rise to expectations that the central bank would need to keep rates “higher for longer,” fueling a sharp sell-off in the bond market in the span from August through October 2023.
The investment backdrop improved considerably in the final two months of 2023, touching off a rally that helped the fixed-income market quickly recover its earlier losses. The headline Consumer Price Index fell to its lowest levels since early 2021 in the November report, surprising the markets and causing the consensus to shift toward the view that the Fed was in fact finished raising rates. In December, Fed Chairman Jerome Powell provided another positive surprise with his suggestion that rate cuts could begin as early as the first half of 2024. Bond prices moved surged in response, with the credit sectors leading the way amid a pronounced improvement in investor sentiment. While yields crept higher in January and February, the Bloomberg U.S. Aggregate Bond Index finished in positive territory on the strength of its earlier advance.
These trends were reflected in the U.S. Treasury market, where the yield on the two-year note entered the annual period at 4.81%, reached a high of 5.19% in mid-October, and subsequently finished February 2024 at 4.64%. The 10-year issue followed a similar path, climbing from 3.92% at the start of the period to a high of 4.98% before sliding to 4.25% on February 29, 2024. One result of these moves was that the yield curve’s inversion—i.e., the extent to which short-term rates exceeded those of longer-term issues—gradually moderated from the unusually high level reached in early 2023. Short-term Treasuries were the strongest performers on a total return basis, followed by intermediate-term issues. However, longer-dated government bonds (those with maturities of 10 years and above) posted a loss.
Investment-grade corporate bonds were the best performing segment of the index during the 12-month period. The asset class was helped by a larger contribution from yield, together with a decline in yield spreads relative to U.S. Treasuries. Securitized assets—a category that encompasses mortgage-backed securities (MBS), asset backed securities (ABS) and commercial mortgage-backed securities (CMBS)—underperformed the index. While ABS and CMBS both held up well, agency MBS failed to keep pace with the broader fixed-income market due to the combination of the Fed’s ongoing balance sheet reduction and lower buying demand from banks.
| 4 | 2 0 2 4 I S H A R E S A N N U A L R E P O R T T O S H A R E H O L D E R S |
| Fund Summary as of February 29, 2024 | iShares® Core U.S. Aggregate Bond ETF |
Investment Objective
The iShares Core U.S. Aggregate Bond ETF (the “Fund”) seeks to track the investment results of an index composed of the total U.S. investment-grade bond market, as represented by the Bloomberg U.S. Aggregate Bond Index (the “Index”). The Fund invests in a representative sample of securities included in the Index that collectively has an investment profile similar to the Index. Due to the use of representative sampling, the Fund may or may not hold all of the securities that are included in the Index
Performance
| Average Annual Total Returns
|
Cumulative Total Returns
|
|||||||||||||||||||||||||||
|
1 Year
|
5 Years
|
10 Years
|
1 Year
|
5 Years
|
10 Years
|
|||||||||||||||||||||||
| Fund NAV |
3.32 | % | 0.53 | % | 1.40% | 3.32 | % | 2.69 | % | 14.92% | ||||||||||||||||||
| Fund Market |
3.34 | 0.53 | 1.39 | 3.34 | 2.68 | 14.82 | ||||||||||||||||||||||
| Index |
3.33 | 0.56 | 1.43 | 3.33 | 2.83 | 15.30 | ||||||||||||||||||||||
GROWTH OF $10,000 INVESTMENT
(AT NET ASSET VALUE)
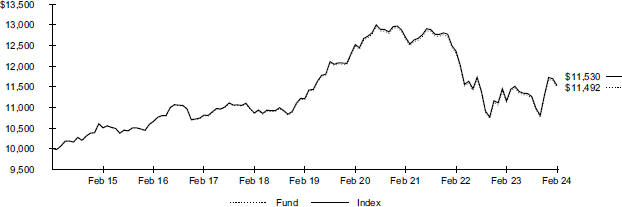
Past performance is not an indication of future results. Performance results do not reflect the deduction of taxes that a shareholder would pay on fund distributions or on the redemption or sale of fund shares. See “About Fund Performance” for more information.
Expense Example
| Actual | Hypothetical 5% Return | |||||||||||||||||||||||||||||
| |
Beginning Account Value (09/01/23) |
|
Ending Account Value (02/29/24) |
|
Expenses Paid During the Period |
(a) |
|
Beginning Account Value (09/01/23) |
|
Ending Account Value (02/29/24) |
|
Expenses Paid During the Period |
(a) |
|
Annualized Expense Ratio |
|||||||||||||||
| $ | 1,000.00 | $ | 1,023.50 | $ | 0.15 | $ | 1,000.00 | $ | 1,024.70 | $ | 0.15 | 0.03 | % | |||||||||||||||||
| (a) | Expenses are equal to the annualized expense ratio, multiplied by the average account value over the period, multiplied by 182/366 (to reflect the one-half year period shown). Other fees, such as brokerage commissions and other fees to financial intermediaries, may be paid which are not reflected in the tables and examples above. See “Disclosure of Expenses” for more information. |
| F U N D S U M M A R Y |
5 |
| Fund Summary as of February 29, 2024 (continued) | iShares® Core U.S. Aggregate Bond ETF |
Portfolio Information
CREDIT QUALITY ALLOCATION
| Moody’s Credit Rating* | |
Percent of Total Investments |
(a) | |
| Aaa |
72.3 | % | ||
| Aa |
2.2 | |||
| A |
12.1 | |||
| Baa |
11.9 | |||
| Ba |
0.5 | |||
| Not Rated |
1.0 |
PORTFOLIO COMPOSITION
| Investment Type | |
Percent of Total Investments |
(a) | |
| U.S. Government & Agency Obligations |
70.0 | % | ||
| Corporate Bonds & Notes |
26.0 | |||
| Foreign Government Obligations |
2.1 | |||
| Collaterized Mortgage Obligations |
1.0 | |||
| Municipal Debt Obligations |
0.6 | |||
| Asset-Backed Securities |
0.5 | |||
| TBA Sales Commitments |
(0.2 | ) |
| * | Credit quality ratings shown reflect the ratings assigned by Moody’s Investors Service (“Moody’s”), a widely used independent, nationally recognized statistical rating organization. Moody’s credit ratings are opinions of the credit quality of individual obligations or of an issuer’s general creditworthiness. Investment grade ratings are credit ratings of Baa or higher. Below investment grade ratings are credit ratings of Ba or lower. Unrated investments do not necessarily indicate low credit quality. Credit quality ratings are subject to change. |
| (a) | Excludes money market funds. |
| 6 | 2 0 2 4 I S H A R E S A N N U A L R E P O R T T O S H A R E H O L D E R S |
Past performance is not an indication of future results. Financial markets have experienced extreme volatility and trading in many instruments has been disrupted. These circumstances may continue for an extended period of time and may continue to affect adversely the value and liquidity of the Fund’s investments. As a result, current performance may be lower or higher than the performance data quoted. Performance data current to the most recent month-end is available at iShares.com. Performance results assume reinvestment of all dividends and capital gain distributions and do not reflect the deduction of taxes that a shareholder would pay on fund distributions or on the redemption or sale of fund shares. The investment return and principal value of shares will vary with changes in market conditions. Shares may be worth more or less than their original cost when they are redeemed or sold in the market. Performance for certain funds may reflect a waiver of a portion of investment advisory fees. Without such a waiver, performance would have been lower.
Net asset value or “NAV” is the value of one share of a fund as calculated in accordance with the standard formula for valuing mutual fund shares. Beginning August 10, 2020, the price used to calculate market return (“Market Price”) is the closing price. Prior to August 10, 2020, Market Price was determined using the midpoint between the highest bid and the lowest ask on the primary stock exchange on which shares of a fund are listed for trading, as of the time that such fund’s NAV is calculated. Market and NAV returns assume that dividends and capital gain distributions have been reinvested at Market Price and NAV, respectively.
An index is a statistical composite that tracks a specified financial market or sector. Unlike a fund, an index does not actually hold a portfolio of securities and therefore does not incur the expenses incurred by a fund. These expenses negatively impact fund performance. Also, index returns do not include brokerage commissions that may be payable on secondary market transactions. If brokerage commissions were included, index returns would be lower.
Shareholders of the Fund may incur the following charges: (1) transactional expenses, including brokerage commissions on purchases and sales of fund shares and (2) ongoing expenses, including management fees and other fund expenses. The expense example shown (which is based on a hypothetical investment of $1,000 invested at the beginning of the period and held through the end of the period) is intended to assist shareholders both in calculating expenses based on an investment in the Fund and in comparing these expenses with similar costs of investing in other funds.
The expense example provides information about actual account values and actual expenses. Annualized expense ratios reflect contractual and voluntary fee waivers, if any. In order to estimate the expenses a shareholder paid during the period covered by this report, shareholders can divide their account value by $1,000 and then multiply the result by the number under the heading entitled “Expenses Paid During the Period.”
The expense example also provides information about hypothetical account values and hypothetical expenses based on a fund’s actual expense ratio and an assumed rate of return of 5% per year before expenses. In order to assist shareholders in comparing the ongoing expenses of investing in the Fund and other funds, compare the 5% hypothetical example with the 5% hypothetical examples that appear in the shareholder reports of the other funds.
The expenses shown in the expense example are intended to highlight shareholders’ ongoing costs only and do not reflect any transactional expenses, such as brokerage commissions and other fees paid on purchases and sales of fund shares. Therefore, the hypothetical example is useful in comparing ongoing expenses only and will not help shareholders determine the relative total expenses of owning different funds. If these transactional expenses were included, shareholder expenses would have been higher.
| A B O U T F U N D P E R F O R M A N C E / D I S C L O S U R E O F E X P E N S E S |
7 |
|
February 29, 2024 |
iShares® Core U.S. Aggregate Bond ETF (Percentages shown are based on Net Assets) |
| Security | Par (000) |
Value | ||||||
| Asset-Backed Securities |
||||||||
| American Express Credit Account Master Trust |
||||||||
| 3.75%, 08/15/27 |
$ | 9,330 | $ | 9,145,398 | ||||
| 4.87%, 05/15/28 |
6,840 | 6,826,082 | ||||||
| 5.15%, 09/15/30 |
9,000 | 9,132,741 | ||||||
| Class A, 4.95%, 10/15/27 |
15,000 | 14,962,555 | ||||||
| AmeriCredit Automobile Receivables Trust, |
||||||||
| 5.62%, 11/18/27 (Call 06/18/27) |
8,210 | 8,220,144 | ||||||
| BA Credit Card Trust, 4.98%, 11/15/28 |
71,311 | 71,466,755 | ||||||
| BMW Vehicle Lease Trust |
||||||||
| 5.99%, 09/25/26 |
3,240 | 3,265,478 | ||||||
| 5.98%, 02/25/27 |
14,500 | 14,682,228 | ||||||
| Capital One Multi-Asset Execution Trust |
||||||||
| Class A2, 1.39%, 07/15/30 |
11,000 | 9,536,323 | ||||||
| CarMax Auto Owner Trust |
||||||||
| 4.65%, 01/16/29 (Call 11/15/26) |
8,300 | 8,210,236 | ||||||
| 6.00%, 07/17/28 |
8,137 | 8,276,534 | ||||||
| Chase Issuance Trust |
||||||||
| 4.60%, 01/16/29 |
47,830 | 47,519,332 | ||||||
| 4.63%, 01/15/31 |
3,210 | 3,193,009 | ||||||
| Citibank Credit Card Issuance Trust, 3.96%, 10/13/30 |
2,000 | 1,926,260 | ||||||
| Discover Card Execution Note Trust |
||||||||
| 3.56%, 07/15/27 |
18,000 | 17,607,841 | ||||||
| Series 2022-A1, Class A1, 1.96%, 02/15/27 |
6,900 | 6,685,036 | ||||||
| Exeter Automobile Receivables Trust |
||||||||
| 5.82%, 02/15/28 (Call 01/15/27) |
11,180 | 11,179,390 | ||||||
| Series 2021-2, Class D, 1.40%, 04/15/27 (Call 09/15/25) |
3,261 | 3,106,401 | ||||||
| Ford Credit Auto Lease Trust, 5.29%, 06/15/27 |
4,640 | 4,624,253 | ||||||
| GM Financial Automobile Leasing Trust, |
||||||||
| 5.16%, 01/20/27 (Call 08/20/25) |
21,771 | 21,717,400 | ||||||
| GM Financial Consumer Automobile Receivables Trust |
||||||||
| 1.51%, 04/17/28 (Call 03/16/26) |
2,940 | 2,751,903 | ||||||
| 4.66%, 02/16/28 (Call 12/16/26) |
18,560 | 18,407,575 | ||||||
| 4.59%, 07/17/28 (Call 12/16/26) |
3,500 | 3,459,812 | ||||||
| 4.47%, 02/16/28 (Call 12/16/26) |
6,667 | 6,588,670 | ||||||
| 4.43%, 10/16/28 (Call 12/16/26) |
13,000 | 12,807,485 | ||||||
| 5.78%, 08/16/28 |
6,090 | 6,176,719 | ||||||
| 5.71%, 02/16/29 |
9,710 | 9,906,796 | ||||||
| Hyundai Auto Receivables Trust |
||||||||
| 5.39%, 06/15/27 (Call 02/15/27) |
11,045 | 11,050,247 | ||||||
| 4.58%, 04/15/27 (Call 01/15/27) |
6,600 | 6,536,815 | ||||||
| 4.48%, 07/17/28 (Call 01/15/27) |
13,000 | 12,821,448 | ||||||
| 5.48%, 04/17/28 |
30,000 | 30,167,200 | ||||||
| Nissan Auto Lease Trust, 4.91%, 04/15/27 |
14,430 | 14,327,335 | ||||||
| Santander Drive Auto Receivables Trust |
||||||||
| 5.09%, 05/15/30 (Call 03/15/26) |
17,060 | 16,824,370 | ||||||
| 5.23%, 12/15/28 |
6,440 | 6,424,847 | ||||||
| 5.25%, 04/17/28 |
6,000 | 5,982,020 | ||||||
| 5.45%, 03/15/30 |
1,670 | 1,661,460 | ||||||
| Series 2021-3, Class C, 0.95%, 09/15/27 (Call 06/15/25) |
3,215 | 3,196,194 | ||||||
| Verizon Master Trust Series 2021-1, Class A, |
||||||||
| 0.50%, 05/20/27 (Call 05/20/24) |
28,690 | 28,380,569 | ||||||
| Volkswagen Auto Loan Enhanced Trust |
||||||||
| 5.02%, 06/20/28 |
10,780 | 10,760,729 | ||||||
| 5.01%, 01/22/30 |
6,000 | 5,996,377 | ||||||
| Security | Par (000) |
Value | ||||||
| World Omni Auto Receivables Trust, |
$ | 2,000 | $ | 1,984,518 | ||||
|
|
|
|||||||
| Total Asset-Backed Securities — 0.5% |
497,496,485 | |||||||
|
|
|
|||||||
| Collaterized Mortgage Obligations |
||||||||
| Mortgage-Backed Securities — 1.0% |
||||||||
| Bank |
||||||||
| 2.29%, 06/15/64 (Call 08/15/31) |
7,260 | 5,991,585 | ||||||
| Series 2018-BN15, Class A4, 4.41%, |
||||||||
| 11/15/61 (Call 11/15/28)(a) |
5,000 | 4,830,521 | ||||||
| Series 2019-BN21, Class A5, 2.85%, |
||||||||
| 10/17/52 (Call 10/15/29) |
15,310 | 13,494,409 | ||||||
| Series 2020, Class A5, 2.65%, 01/15/63 |
||||||||
| (Call 02/15/30) |
6,500 | 5,628,876 | ||||||
| Series 2020-BN27, Class A5, 2.14%, |
||||||||
| 04/15/63 (Call 04/15/30) |
23,610 | 19,609,260 | ||||||
| Series 2020-BN29, Class A4, 2.00%, |
||||||||
| 11/15/53 (Call 12/15/30) |
5,760 | 4,591,682 | ||||||
| Series 21-BN36, Class A5, 2.47%, 09/15/64 |
||||||||
| (Call 10/15/31) |
8,930 | 7,450,781 | ||||||
| Bank of America Merrill Lynch Commercial Mortgage Trust, Series 2017-BNK3, Class ASB, 3.37%, 02/15/50 (Call 02/15/27) |
1,338 | 1,301,493 | ||||||
| Barclays Commercial Mortgage Trust, Series 2019-C4, Class A5, 2.92%, 08/15/52 (Call 08/15/29) |
8,750 | 7,806,358 | ||||||
| BBCMS Mortgage Trust |
||||||||
| 5.45%, 04/15/56 (Call 04/15/33) |
7,710 | 7,869,523 | ||||||
| 5.71%, 12/15/55 (Call 12/15/32)(a) |
3,160 | 3,288,077 | ||||||
| 5.72%, 02/15/57 |
1,886 | 1,879,489 | ||||||
| 5.87%, 02/15/57 |
4,455 | 4,606,290 | ||||||
| 6.00%, 09/15/56 |
18,820 | 20,064,961 | ||||||
| 6.30%, 09/15/56 |
3,000 | 3,195,203 | ||||||
| 6.80%, 11/15/56 |
3,970 | 4,459,711 | ||||||
| Series 2017-C1, Class A4, 3.67%, 02/15/50 |
||||||||
| (Call 02/15/27) |
18,450 | 17,529,725 | ||||||
| Series 2020-C6, Class A4, 2.64%, 02/15/53 |
||||||||
| (Call 02/15/30) |
10,000 | 8,705,281 | ||||||
| Series 2020-C7, Class A5, 2.04%, 04/15/53 |
||||||||
| (Call 04/15/30) |
16,670 | 13,986,068 | ||||||
| Series 2021-C11, Class A5, 2.32%, 09/15/54 |
1,965 | 1,625,141 | ||||||
| Series 2022-C15, Class A5, 3.66%, 04/15/55 (Call 04/15/32)(a) |
3,745 | 3,358,578 | ||||||
| BBCMS Trust, Series 2021-C10, Class A5, |
||||||||
| 2.49%, 07/15/54 (Call 07/15/31) |
18,590 | 15,674,093 | ||||||
| Benchmark Mortgage Trust |
||||||||
| Series 2018-B2, Class A5, 3.88%, 02/15/51 |
||||||||
| (Call 02/15/28)(a) |
10,616 | 10,016,937 | ||||||
| Series 2018-B3, Class A5, 4.03%, 04/10/51 |
||||||||
| (Call 04/10/28) |
7,000 | 6,619,536 | ||||||
| Series 2018-B5, Class A4, 4.21%, 07/15/51 |
||||||||
| (Call 08/15/28) |
6,150 | 5,881,316 | ||||||
| Series 2018-B7, Class A4, 4.51%, 05/15/53 |
||||||||
| (Call 11/15/28)(a) |
10,093 | 9,668,935 | ||||||
| Series 2018-B8, Class A5, 4.23%, 01/15/52 |
||||||||
| (Call 12/15/28) |
17,000 | 15,986,161 | ||||||
| Series 2019-B11, Class A4, 3.28%, |
||||||||
| 05/15/52 (Call 06/15/29) |
20,650 | 18,661,538 | ||||||
| 8 | 2 0 2 4 I S H A R E S A N N U A L R E P O R T T O S H A R E H O L D E R S |
| Schedule of Investments (continued) February 29, 2024 |
iShares® Core U.S. Aggregate Bond ETF (Percentages shown are based on Net Assets) |
| Security | Par (000) |
Value | ||||||
| Mortgage-Backed Securities (continued) | ||||||||
| Series 2019-B11, Class A5, 3.54%, 05/15/52 (Call 06/15/29) |
$ | 20,000 | $ | 18,094,795 | ||||
| Series 2020-B19, Class B, 2.35%, 09/15/53 |
||||||||
| (Call 10/15/30) |
2,700 | 1,923,538 | ||||||
| Series 2020-B21, Class A4, 1.70%, 12/17/53 (Call 12/15/30) |
7,000 | 5,702,956 | ||||||
| Series 2020-B21, Class A5, 1.98%, 12/17/53 (Call 12/15/30) |
8,616 | 7,012,043 | ||||||
| Series 2020-B23, Class A5, 2.07%, 02/15/54 (Call 02/15/31) |
25,000 | 19,949,790 | ||||||
| Series 2023-B38, Class A2, 5.63%, 04/15/56 (Call 04/15/33) |
10,000 | 10,098,038 | ||||||
| BMO Mortgage Trust |
||||||||
| 5.96%, 09/15/56 |
30,000 | 31,721,947 | ||||||
| 7.24%, 11/15/56 |
11,200 | 11,942,582 | ||||||
| CD Mortgage Trust, Series 2017-CD3, Class A4, 3.63%, 02/10/50 (Call 08/10/27) |
5,500 | 5,101,887 | ||||||
| Citigroup Commercial Mortgage Trust |
||||||||
| Series 2014-GC25, Class AAB, 3.37%, 10/10/47 (Call 10/10/24) |
1,149 | 1,141,754 | ||||||
| Series 2014-GC25, Class AS, 4.02%, 10/10/47 (Call 10/10/24) |
5,209 | 5,082,300 | ||||||
| Series 2015-GC27, Class AAB, 2.94%, 02/10/48 (Call 01/10/25) |
1,209 | 1,201,325 | ||||||
| Series 2016-GC37, Class A4, 3.31%, 04/10/49 (Call 03/10/26) |
17,730 | 16,835,616 | ||||||
| Series 2016-P5, Class A4, 2.94%, 10/10/49 (Call 10/10/26) |
11,400 | 10,576,836 | ||||||
| Series 2017-P7, Class A4, 3.71%, 04/14/50 |
||||||||
| (Call 04/14/27) |
13,900 | 12,970,007 | ||||||
| Series 2018-B2, Class A4, 4.01%, 03/10/51 |
||||||||
| (Call 03/10/28) |
20,020 | 19,064,813 | ||||||
| Commission Mortgage Trust |
||||||||
| Series 2014-UBS3, Class A4, 3.82%, 06/10/47 (Call 06/10/24) |
12,887 | 12,826,943 | ||||||
| Series 2015-CR22, Class A5, 3.31%, 03/10/48 (Call 03/10/25) |
2,400 | 2,336,727 | ||||||
| Series 2015-CR24, Class A5, 3.70%, 08/10/48 (Call 06/10/26) |
16,990 | 16,490,192 | ||||||
| Series 2015-DC1, Class A5, 3.35%, 02/10/48 (Call 02/10/25) |
2,750 | 2,683,227 | ||||||
| Series 2015-LC21, Class A4, 3.71%, 07/10/48 (Call 01/10/26) |
15,500 | 15,068,713 | ||||||
| Series 2015-PC1, Class A5, 3.90%, 07/10/50 (Call 06/10/25) |
9,650 | 9,420,325 | ||||||
| Series 2016-CR28, Class A4, 3.76%, 02/10/49 (Call 01/10/26) |
8,000 | 7,714,453 | ||||||
| Series 2016-DC2, Class A5, 3.77%, 02/10/49 (Call 02/10/26) |
4,000 | 3,855,674 | ||||||
| CSAIL Commercial Mortgage Trust |
||||||||
| Series 2015-C2, Class A4, 3.50%, 06/15/57 |
||||||||
| (Call 05/15/25) |
10,000 | 9,691,921 | ||||||
| Series 2015-C4, Class A4, 3.81%, 11/15/48 |
||||||||
| (Call 11/15/25) |
17,519 | 16,956,539 | ||||||
| Series 2016-C7, Class A5, 3.50%, 11/15/49 |
||||||||
| (Call 11/15/26) |
5,200 | 4,920,003 | ||||||
| Series 2018-CX11, Class A5, 4.03%, 04/15/51 (Call 04/15/28)(a) |
27,000 | 25,641,182 | ||||||
| Series 2019-C18, Class A4, 2.97%, 12/15/52 (Call 12/15/29) |
10,000 | 8,766,065 | ||||||
| Security | Par (000) |
Value | ||||||
| Mortgage-Backed Securities (continued) | ||||||||
| DBJPM Mortgage Trust, Series 2016-C3, Class A5, 2.89%, 08/10/49 (Call 08/10/26) |
$ | 1,000 | $ | 934,800 | ||||
| Federal Home Loan Mortgage Corp. Multifamily Structured Pass-Through Certificates |
||||||||
| 3.78%, 01/25/32 |
10,911 | 10,344,347 | ||||||
| 3.78%, 11/25/32 (Call 11/25/32)(a) |
17,795 | 16,535,106 | ||||||
| 3.80%, 03/25/32 |
1,984 | 1,884,119 | ||||||
| 3.82%, 12/25/32 (Call 01/25/33)(a) |
21,500 | 20,028,770 | ||||||
| 4.05%, 07/25/33 |
35,000 | 33,075,657 | ||||||
| 4.20%, 05/25/33 |
48,000 | 45,913,424 | ||||||
| 4.25%, 04/25/33 (Call 04/25/33) |
40,000 | 38,416,745 | ||||||
| 4.28%, 07/25/30 |
10,500 | 10,225,072 | ||||||
| 4.35%, 01/25/33 (Call 02/25/33)(a) |
33,140 | 32,080,469 | ||||||
| 4.74%, 08/25/28 |
15,000 | 14,976,939 | ||||||
| Federal National Mortgage Association, |
||||||||
| 4.19%, 07/25/28 |
20,000 | 19,564,462 | ||||||
| GS Mortgage Securities Trust |
||||||||
| Series 2014-GC24, Class A4, 3.67%, 09/10/47 (Call 09/10/24) |
14,838 | 14,765,434 | ||||||
| Series 2014-GC24, Class A5, 3.93%, 09/10/47 (Call 09/10/24) |
6,000 | 5,910,650 | ||||||
| Series 2015-GS1, Class A3, 3.73%, 11/10/48 (Call 11/10/25) |
10,000 | 9,639,902 | ||||||
| Series 2017-GS7, Class A3, 3.17%, 08/10/50 (Call 08/10/27) |
13,000 | 12,012,101 | ||||||
| Series 2018-GS10, Class A5, 4.16%, 07/10/51 (Call 07/10/28)(a) |
3,000 | 2,798,767 | ||||||
| Series 2018-GS9, Class A4, 3.99%, 03/10/51 (Call 03/10/28)(a) |
3,000 | 2,774,406 | ||||||
| Series 2019-GC38, Class A4, 3.97%, 02/10/52 (Call 02/10/29) |
2,500 | 2,368,744 | ||||||
| Morgan Stanley Bank of America Merrill Lynch Trust |
||||||||
| Series 2015-C22, Class A4, 3.31%, 04/15/48 (Call 04/15/25) |
5,000 | 4,850,856 | ||||||
| Series 2015-C23, Class A4, 3.72%, 07/15/50 (Call 06/15/25) |
1,850 | 1,798,581 | ||||||
| Series 2015-C24, Class A4, 3.73%, 05/15/48 (Call 08/15/25) |
7,275 | 7,048,972 | ||||||
| Series 2015-C27, Class A4, 3.75%, 12/15/47 (Call 11/15/25) |
17,025 | 16,428,337 | ||||||
| Series 2016-C28, Class A4, 3.54%, 01/15/49 (Call 02/15/28) |
16,420 | 15,733,759 | ||||||
| Series 2016-C28, Class AS, 3.95%, 01/15/49 (Call 02/15/28) |
2,000 | 1,866,718 | ||||||
| Series 2016-C32, Class A3, 3.46%, 12/15/49 (Call 01/15/27) |
9,522 | 8,976,764 | ||||||
| Morgan Stanley Capital I Trust |
||||||||
| Series 2015-UBS8, Class A4, 3.81%, 12/15/48 (Call 12/15/25) |
3,500 | 3,370,303 | ||||||
| Series 2017-H1, Class A5, 3.53%, 06/15/50 |
||||||||
| (Call 06/15/27) |
12,000 | 11,264,024 | ||||||
| Series 2018, Class A3, 4.14%, 10/15/51 |
||||||||
| (Call 10/15/28) |
21,700 | 20,767,496 | ||||||
| Series 2018-H3, Class A4, 3.91%, 07/15/51 |
||||||||
| (Call 07/15/28) |
700 | 664,029 | ||||||
| Series 2019-H6, Class A4, 3.42%, 06/15/52 |
||||||||
| (Call 06/15/29) |
7,660 | 6,997,985 | ||||||
| Series 2019-L3, Class AS, 3.49%, 11/15/52 |
||||||||
| (Call 11/15/29) |
720 | 634,260 | ||||||
| S C H E D U L E O F I N V E S T M E N T S |
9 |
| Schedule of Investments (continued) February 29, 2024 |
iShares® Core U.S. Aggregate Bond ETF (Percentages shown are based on Net Assets) |
| Security | Par (000) |
Value | ||||||
| Mortgage-Backed Securities (continued) | ||||||||
| Series 2020-L4, Class A3, 2.70%, 02/15/53 |
||||||||
| (Call 02/15/30) |
$ | 20,000 | $ | 17,354,003 | ||||
| Series 2021-L7, Class A5, 2.57%, 10/15/54 |
||||||||
| (Call 10/15/31) |
10,430 | 8,692,583 | ||||||
| UBS Commercial Mortgage Trust, Series 2018-C08, Class A4, 3.98%, 02/15/51 (Call 02/15/28) |
18,150 | 17,057,072 | ||||||
| Wells Fargo Commercial Mortgage Trust Class A4, 2.34%, 08/15/54 (Call 07/15/31) |
4,600 | 3,805,354 | ||||||
| Series 2015-C27, Class A5, 3.45%, 02/15/48 (Call 03/15/25) |
8,500 | 8,267,063 | ||||||
| Series 2015-LC22, Class A4, 3.84%, 09/15/58 (Call 09/15/25) |
5,000 | 4,841,040 | ||||||
| Series 2015-SG1, Class A4, 3.79%, 09/15/48 (Call 08/15/25) |
10,856 | 10,526,729 | ||||||
| Series 2020-C56, Class A5, 2.45%, 06/15/53 (Call 04/15/30) |
6,480 | 5,533,577 | ||||||
| Series 2020-C58, Class A4, 2.09%, 07/15/53 (Call 12/15/30) |
17,680 | 14,527,813 | ||||||
| Series 2021-C59, Class A5, 2.63%, 04/15/54 (Call 04/15/31) |
5,200 | 4,393,920 | ||||||
|
|
|
|||||||
| 1,048,224,871 | ||||||||
|
|
|
|||||||
| Total Collaterized Mortgage Obligations — 1.0% |
|
1,048,224,871 | ||||||
|
|
|
|||||||
| Corporate Bonds & Notes |
||||||||
| Advertising — 0.0% |
||||||||
| Interpublic Group of Companies Inc. (The) |
||||||||
| 2.40%, 03/01/31 (Call 12/01/30)(b) |
2,598 | 2,163,914 | ||||||
| 3.38%, 03/01/41 (Call 09/01/40) |
1,922 | 1,412,656 | ||||||
| 4.65%, 10/01/28 (Call 07/01/28) |
2,281 | 2,233,683 | ||||||
| 4.75%, 03/30/30 (Call 12/30/29) |
2,833 | 2,755,211 | ||||||
| 5.38%, 06/15/33 (Call 03/15/33) |
1,558 | 1,541,445 | ||||||
| 5.40%, 10/01/48 (Call 04/01/48) |
1,825 | 1,686,462 | ||||||
| Omnicom Group Inc. |
||||||||
| 2.45%, 04/30/30 (Call 01/30/30) |
2,822 | 2,413,267 | ||||||
| 2.60%, 08/01/31 (Call 05/01/31) |
4,849 | 4,070,289 | ||||||
| 4.20%, 06/01/30 (Call 03/01/30) |
2,822 | 2,669,773 | ||||||
| Omnicom Group Inc./Omnicom Capital Inc., |
||||||||
| 3.60%, 04/15/26 (Call 01/15/26) |
7,840 | 7,594,723 | ||||||
|
|
|
|||||||
| 28,541,423 | ||||||||
| Aerospace & Defense — 0.5% | ||||||||
| Boeing Co. (The) |
||||||||
| 2.20%, 02/04/26 (Call 03/11/24) |
12,250 | 11,502,602 | ||||||
| 2.25%, 06/15/26 (Call 03/15/26) |
3,864 | 3,597,222 | ||||||
| 2.60%, 10/30/25 (Call 07/30/25) |
2,323 | 2,214,461 | ||||||
| 2.70%, 02/01/27 (Call 12/01/26) |
5,255 | 4,890,630 | ||||||
| 2.75%, 02/01/26 (Call 01/01/26) |
2,500 | 2,373,646 | ||||||
| 2.80%, 03/01/27 (Call 12/01/26) |
2,188 | 2,030,632 | ||||||
| 2.95%, 02/01/30 (Call 11/01/29) |
5,664 | 4,953,935 | ||||||
| 3.10%, 05/01/26 (Call 03/01/26) |
5,416 | 5,155,283 | ||||||
| 3.20%, 03/01/29 (Call 12/01/28) |
4,091 | 3,697,720 | ||||||
| 3.25%, 02/01/28 (Call 12/01/27) |
2,060 | 1,909,528 | ||||||
| 3.25%, 03/01/28 (Call 12/01/27) |
2,734 | 2,526,428 | ||||||
| 3.25%, 02/01/35 (Call 11/01/34) |
3,054 | 2,451,977 | ||||||
| 3.38%, 06/15/46 (Call 12/15/45)(b) |
1,638 | 1,121,421 | ||||||
| 3.45%, 11/01/28 (Call 08/01/28) |
2,453 | 2,259,363 | ||||||
| 3.50%, 03/01/39 (Call 09/01/38) |
2,169 | 1,643,259 | ||||||
| 3.55%, 03/01/38 (Call 09/01/37) |
1,393 | 1,076,518 | ||||||
| Security | Par (000) |
Value | ||||||
| Aerospace & Defense (continued) | ||||||||
| 3.60%, 05/01/34 (Call 02/01/34) |
$ | 3,151 | $ | 2,656,892 | ||||
| 3.63%, 02/01/31 (Call 11/01/30) |
1,957 | 1,751,968 | ||||||
| 3.63%, 03/01/48 (Call 09/01/47) |
2,083 | 1,447,177 | ||||||
| 3.65%, 03/01/47 (Call 09/01/46) |
1,701 | 1,199,156 | ||||||
| 3.75%, 02/01/50 (Call 08/01/49) |
5,253 | 3,720,972 | ||||||
| 3.83%, 03/01/59 (Call 09/01/58) |
1,702 | 1,177,142 | ||||||
| 3.85%, 11/01/48 (Call 05/01/48) |
1,749 | 1,268,252 | ||||||
| 3.90%, 05/01/49 (Call 11/01/48) |
3,751 | 2,750,864 | ||||||
| 3.95%, 08/01/59 (Call 02/01/59) |
4,383 | 3,096,774 | ||||||
| 4.88%, 05/01/25 (Call 04/01/25) |
11,962 | 11,857,544 | ||||||
| 5.04%, 05/01/27 (Call 03/01/27) |
7,684 | 7,612,947 | ||||||
| 5.15%, 05/01/30 (Call 02/01/30) |
13,388 | 13,162,114 | ||||||
| 5.71%, 05/01/40 (Call 11/01/39) |
8,927 | 8,691,048 | ||||||
| 5.81%, 05/01/50 (Call 11/01/49) |
20,696 | 19,890,110 | ||||||
| 5.88%, 02/15/40 |
2,008 | 1,978,684 | ||||||
| 5.93%, 05/01/60 (Call 11/01/59) |
12,875 | 12,304,086 | ||||||
| 6.13%, 02/15/33 |
1,818 | 1,885,845 | ||||||
| 6.63%, 02/15/38(b) |
1,244 | 1,313,228 | ||||||
| 6.88%, 03/15/39 |
2,351 | 2,554,716 | ||||||
| General Dynamics Corp. |
||||||||
| 1.15%, 06/01/26 (Call 05/01/26) |
3,230 | 2,973,579 | ||||||
| 2.13%, 08/15/26 (Call 05/15/26) |
3,698 | 3,460,215 | ||||||
| 2.25%, 06/01/31 (Call 03/01/31) |
1,975 | 1,656,502 | ||||||
| 2.63%, 11/15/27 (Call 08/15/27) |
2,539 | 2,348,203 | ||||||
| 2.85%, 06/01/41 (Call 12/01/40) |
2,834 | 2,052,113 | ||||||
| 3.25%, 04/01/25 (Call 03/01/25) |
3,829 | 3,748,802 | ||||||
| 3.50%, 05/15/25 (Call 03/15/25) |
2,902 | 2,846,308 | ||||||
| 3.50%, 04/01/27 (Call 02/01/27) |
2,717 | 2,614,291 | ||||||
| 3.60%, 11/15/42 (Call 05/15/42) |
1,093 | 879,844 | ||||||
| 3.63%, 04/01/30 (Call 01/01/30) |
4,987 | 4,653,448 | ||||||
| 3.75%, 05/15/28 (Call 02/15/28) |
4,713 | 4,535,245 | ||||||
| 4.25%, 04/01/40 (Call 10/01/39) |
3,814 | 3,400,269 | ||||||
| 4.25%, 04/01/50 (Call 10/01/49) |
3,765 | 3,240,751 | ||||||
| HEICO Corp. |
||||||||
| 5.25%, 08/01/28 (Call 07/01/28) |
1,160 | 1,167,376 | ||||||
| 5.35%, 08/01/33 (Call 05/01/33) |
1,130 | 1,123,157 | ||||||
| Hexcel Corp. |
||||||||
| 4.20%, 02/15/27 (Call 11/15/26) |
1,985 | 1,889,817 | ||||||
| 4.95%, 08/15/25 (Call 05/15/25) |
1,532 | 1,511,914 | ||||||
| Howmet Aerospace Inc. |
||||||||
| 3.00%, 01/15/29 (Call 11/15/28) |
340 | 304,742 | ||||||
| 5.95%, 02/01/37(b) |
235 | 239,961 | ||||||
| 6.75%, 01/15/28 |
20 | 20,854 | ||||||
| L3Harris Technologies Inc. |
||||||||
| 1.80%, 01/15/31 (Call 10/15/30) |
3,480 | 2,797,944 | ||||||
| 2.90%, 12/15/29 (Call 09/15/29) |
2,736 | 2,424,836 | ||||||
| 3.83%, 04/27/25 (Call 01/27/25) |
3,136 | 3,077,441 | ||||||
| 3.85%, 12/15/26 (Call 09/15/26) |
5,332 | 5,150,278 | ||||||
| 4.40%, 06/15/28 (Call 03/15/28) |
8,704 | 8,451,993 | ||||||
| 4.85%, 04/27/35 (Call 10/27/34) |
1,766 | 1,673,231 | ||||||
| 5.05%, 04/27/45 (Call 10/27/44) |
1,763 | 1,648,010 | ||||||
| 5.40%, 01/15/27 |
3,925 | 3,950,531 | ||||||
| 5.40%, 07/31/33 (Call 04/30/33) |
4,210 | 4,212,630 | ||||||
| 5.60%, 07/31/53 (Call 01/31/53) |
1,570 | 1,578,381 | ||||||
| 6.15%, 12/15/40 |
2,300 | 2,414,669 | ||||||
| Lockheed Martin Corp. |
||||||||
| 1.85%, 06/15/30 (Call 03/15/30) |
2,040 | 1,705,623 | ||||||
| 2.80%, 06/15/50 (Call 12/15/49)(b) |
4,128 | 2,725,283 | ||||||
| 3.55%, 01/15/26 (Call 10/15/25) |
5,568 | 5,424,839 | ||||||
| 3.60%, 03/01/35 (Call 09/01/34) |
2,143 | 1,871,278 | ||||||
| 3.80%, 03/01/45 (Call 09/01/44) |
4,780 | 3,871,670 | ||||||
| 10 | 2 0 2 4 I S H A R E S A N N U A L R E P O R T T O S H A R E H O L D E R S |
| Schedule of Investments (continued) February 29, 2024 |
iShares® Core U.S. Aggregate Bond ETF (Percentages shown are based on Net Assets) |
| Security | Par (000) |
Value | ||||||
| Aerospace & Defense (continued) |
||||||||
| 3.90%, 06/15/32 (Call 03/15/32) |
$ | 3,485 | $ | 3,230,516 | ||||
| 4.07%, 12/15/42 |
3,273 | 2,805,256 | ||||||
| 4.09%, 09/15/52 (Call 03/15/52) |
6,751 | 5,607,716 | ||||||
| 4.15%, 06/15/53 (Call 12/15/52) |
4,230 | 3,504,206 | ||||||
| 4.30%, 06/15/62 (Call 12/15/61) |
4,180 | 3,480,325 | ||||||
| 4.45%, 05/15/28 (Call 04/15/28) |
1,185 | 1,167,474 | ||||||
| 4.50%, 02/15/29 (Call 01/15/29) |
1,715 | 1,684,998 | ||||||
| 4.50%, 05/15/36 (Call 11/15/35) |
2,120 | 2,005,326 | ||||||
| 4.70%, 05/15/46 (Call 11/15/45) |
4,989 | 4,599,279 | ||||||
| 4.75%, 02/15/34 (Call 11/15/33) |
3,185 | 3,111,509 | ||||||
| 4.80%, 08/15/34 (Call 05/15/34) |
2,180 | 2,133,613 | ||||||
| 4.95%, 10/15/25 (Call 09/15/25) |
1,095 | 1,093,459 | ||||||
| 5.10%, 11/15/27 (Call 10/15/27) |
4,005 | 4,047,729 | ||||||
| 5.20%, 02/15/55 (Call 08/15/54) |
1,280 | 1,258,345 | ||||||
| 5.20%, 02/15/64 (Call 08/15/63) |
1,420 | 1,387,246 | ||||||
| 5.25%, 01/15/33 (Call 10/15/32) |
3,930 | 4,005,163 | ||||||
| 5.70%, 11/15/54 (Call 05/15/54) |
2,015 | 2,124,343 | ||||||
| 5.72%, 06/01/40(b) |
1,342 | 1,408,874 | ||||||
| 5.90%, 11/15/63 (Call 05/15/63) |
1,969 | 2,135,654 | ||||||
| Series B, 6.15%, 09/01/36 |
2,380 | 2,574,275 | ||||||
| Northrop Grumman Corp. |
||||||||
| 3.20%, 02/01/27 (Call 11/01/26) |
2,871 | 2,735,748 | ||||||
| 3.25%, 01/15/28 (Call 10/15/27) |
8,848 | 8,296,857 | ||||||
| 3.85%, 04/15/45 (Call 10/15/44) |
2,424 | 1,924,020 | ||||||
| 4.03%, 10/15/47 (Call 04/15/47) |
8,856 | 7,130,604 | ||||||
| 4.40%, 05/01/30 (Call 02/01/30) |
1,647 | 1,587,128 | ||||||
| 4.60%, 02/01/29 (Call 01/01/29) |
2,270 | 2,224,614 | ||||||
| 4.70%, 03/15/33 (Call 12/15/32) |
3,480 | 3,356,635 | ||||||
| 4.75%, 06/01/43 |
4,219 | 3,831,470 | ||||||
| 4.90%, 06/01/34 (Call 03/01/34) |
2,270 | 2,210,652 | ||||||
| 4.95%, 03/15/53 (Call 09/15/52) |
3,105 | 2,873,964 | ||||||
| 5.05%, 11/15/40 |
1,868 | 1,792,365 | ||||||
| 5.15%, 05/01/40 (Call 11/01/39) |
2,205 | 2,140,206 | ||||||
| 5.20%, 06/01/54 (Call 12/01/53) |
4,640 | 4,460,663 | ||||||
| 5.25%, 05/01/50 (Call 11/01/49) |
4,098 | 3,955,327 | ||||||
| RTX Corp. |
||||||||
| 1.90%, 09/01/31 (Call 06/01/31) |
3,691 | 2,938,712 | ||||||
| 2.25%, 07/01/30 (Call 04/01/30) |
4,460 | 3,774,538 | ||||||
| 2.38%, 03/15/32 (Call 12/15/31) |
3,957 | 3,206,941 | ||||||
| 2.65%, 11/01/26 (Call 08/01/26) |
2,155 | 2,027,924 | ||||||
| 2.82%, 09/01/51 (Call 03/01/51) |
4,264 | 2,658,156 | ||||||
| 3.03%, 03/15/52 (Call 09/15/51) |
5,287 | 3,438,634 | ||||||
| 3.13%, 05/04/27 (Call 02/04/27) |
5,166 | 4,875,427 | ||||||
| 3.13%, 07/01/50 (Call 01/01/50) |
5,085 | 3,417,852 | ||||||
| 3.50%, 03/15/27 (Call 12/15/26) |
5,450 | 5,208,641 | ||||||
| 3.75%, 11/01/46 (Call 05/01/46) |
4,809 | 3,651,169 | ||||||
| 3.95%, 08/16/25 (Call 06/16/25) |
6,589 | 6,463,178 | ||||||
| 4.05%, 05/04/47 (Call 11/04/46) |
3,423 | 2,742,107 | ||||||
| 4.13%, 11/16/28 (Call 08/16/28) |
9,374 | 9,002,974 | ||||||
| 4.15%, 05/15/45 (Call 11/16/44) |
4,555 | 3,721,448 | ||||||
| 4.35%, 04/15/47 (Call 10/15/46) |
5,096 | 4,257,703 | ||||||
| 4.45%, 11/16/38 (Call 05/16/38) |
3,265 | 2,899,517 | ||||||
| 4.50%, 06/01/42 |
14,487 | 12,670,875 | ||||||
| 4.63%, 11/16/48 (Call 05/16/48) |
6,503 | 5,646,800 | ||||||
| 4.70%, 12/15/41 |
2,300 | 2,055,080 | ||||||
| 4.80%, 12/15/43 (Call 06/15/43) |
2,709 | 2,432,853 | ||||||
| 4.88%, 10/15/40 |
1,039 | 961,275 | ||||||
| 5.00%, 02/27/26 (Call 01/27/26) |
2,260 | 2,254,227 | ||||||
| 5.15%, 02/27/33 (Call 11/27/32) |
4,880 | 4,830,037 | ||||||
| 5.38%, 02/27/53 (Call 08/27/52) |
3,840 | 3,706,214 | ||||||
| 5.40%, 05/01/35 |
582 | 587,078 | ||||||
| Security | Par (000) |
Value | ||||||
| Aerospace & Defense (continued) |
||||||||
| 5.70%, 04/15/40 |
$ | 580 | $ | 581,651 | ||||
| 5.75%, 11/08/26 (Call 10/08/26) |
5,200 | 5,275,691 | ||||||
| 5.75%, 01/15/29 (Call 12/15/28) |
3,045 | 3,134,704 | ||||||
| 6.00%, 03/15/31 (Call 01/15/31) |
7,470 | 7,781,198 | ||||||
| 6.05%, 06/01/36 |
220 | 230,362 | ||||||
| 6.10%, 03/15/34 (Call 12/15/33) |
5,860 | 6,195,992 | ||||||
| 6.13%, 07/15/38 |
1,070 | 1,130,141 | ||||||
| 6.40%, 03/15/54 (Call 09/15/53) |
2,890 | 3,199,124 | ||||||
| 7.20%, 08/15/27 |
2,228 | 2,380,540 | ||||||
| 7.50%, 09/15/29 |
1,858 | 2,062,422 | ||||||
|
|
|
|||||||
| 484,656,916 | ||||||||
| Agriculture — 0.3% | ||||||||
| Altria Group Inc. |
||||||||
| 2.35%, 05/06/25 (Call 04/06/25) |
4,200 | 4,053,700 | ||||||
| 2.45%, 02/04/32 (Call 11/04/31) |
7,535 | 6,031,547 | ||||||
| 2.63%, 09/16/26 (Call 06/16/26)(b) |
2,810 | 2,639,868 | ||||||
| 3.40%, 05/06/30 (Call 02/06/30) |
4,114 | 3,702,594 | ||||||
| 3.40%, 02/04/41 (Call 08/04/40) |
5,742 | 4,126,411 | ||||||
| 3.70%, 02/04/51 (Call 08/04/50) |
5,432 | 3,699,170 | ||||||
| 3.88%, 09/16/46 (Call 03/16/46) |
6,512 | 4,760,271 | ||||||
| 4.00%, 02/04/61 (Call 08/04/60) |
3,795 | 2,710,480 | ||||||
| 4.25%, 08/09/42 |
3,929 | 3,141,946 | ||||||
| 4.40%, 02/14/26 (Call 12/14/25) |
5,386 | 5,299,742 | ||||||
| 4.45%, 05/06/50 (Call 11/06/49) |
2,443 | 1,912,269 | ||||||
| 4.50%, 05/02/43 |
2,808 | 2,325,124 | ||||||
| 4.80%, 02/14/29 (Call 11/14/28) |
4,789 | 4,703,883 | ||||||
| 5.38%, 01/31/44(b) |
7,187 | 6,985,753 | ||||||
| 5.80%, 02/14/39 (Call 08/14/38) |
8,182 | 8,149,818 | ||||||
| 5.95%, 02/14/49 (Call 08/14/48) |
8,232 | 8,193,675 | ||||||
| 6.20%, 11/01/28 (Call 10/01/28) |
1,690 | 1,754,582 | ||||||
| 6.88%, 11/01/33 (Call 08/01/33) |
1,110 | 1,195,378 | ||||||
| Archer-Daniels-Midland Co. |
||||||||
| 2.50%, 08/11/26 (Call 05/11/26) |
5,960 | 5,611,637 | ||||||
| 2.70%, 09/15/51 (Call 03/15/51) |
1,460 | 924,861 | ||||||
| 2.90%, 03/01/32 (Call 12/01/31) |
2,505 | 2,134,715 | ||||||
| 3.25%, 03/27/30 (Call 12/27/29) |
4,256 | 3,850,442 | ||||||
| 3.75%, 09/15/47 (Call 03/15/47) |
2,819 | 2,140,140 | ||||||
| 4.02%, 04/16/43 |
1,747 | 1,433,833 | ||||||
| 4.50%, 08/15/33 (Call 05/15/33)(b) |
1,540 | 1,467,751 | ||||||
| 4.50%, 03/15/49 (Call 09/15/48) |
3,314 | 2,892,889 | ||||||
| 4.54%, 03/26/42 |
1,252 | 1,123,721 | ||||||
| 5.38%, 09/15/35 |
666 | 669,965 | ||||||
| 5.94%, 10/01/32(b) |
802 | 848,294 | ||||||
| BAT Capital Corp. |
||||||||
| 2.26%, 03/25/28 (Call 01/25/28) |
3,415 | 3,021,193 | ||||||
| 2.73%, 03/25/31 (Call 12/25/30) |
5,028 | 4,145,144 | ||||||
| 3.22%, 09/06/26 (Call 07/06/26) |
6,011 | 5,694,706 | ||||||
| 3.46%, 09/06/29 (Call 06/06/29) |
2,022 | 1,829,470 | ||||||
| 3.56%, 08/15/27 (Call 05/15/27) |
3,308 | 3,123,540 | ||||||
| 3.73%, 09/25/40 (Call 03/25/40) |
2,963 | 2,136,545 | ||||||
| 3.98%, 09/25/50 (Call 03/25/50) |
4,091 | 2,792,582 | ||||||
| 4.39%, 08/15/37 (Call 02/15/37) |
9,599 | 7,873,599 | ||||||
| 4.54%, 08/15/47 (Call 02/15/47) |
9,541 | 7,111,267 | ||||||
| 4.70%, 04/02/27 (Call 02/02/27) |
4,044 | 3,956,272 | ||||||
| 4.74%, 03/16/32 (Call 12/16/31) |
3,600 | 3,385,866 | ||||||
| 4.76%, 09/06/49 (Call 03/06/49) |
4,013 | 3,095,164 | ||||||
| 4.91%, 04/02/30 (Call 01/02/30) |
3,923 | 3,810,817 | ||||||
| 5.28%, 04/02/50 (Call 10/02/49) |
2,217 | 1,833,871 | ||||||
| 5.65%, 03/16/52 (Call 09/16/51) |
2,430 | 2,133,082 | ||||||
| 5.83%, 02/20/31 (Call 12/20/30) |
1,355 | 1,350,074 | ||||||
| 6.00%, 02/20/34 (Call 11/20/33) |
855 | 846,693 | ||||||
| S C H E D U L E O F I N V E S T M E N T S |
11 |
| Schedule of Investments (continued) February 29, 2024 |
iShares® Core U.S. Aggregate Bond ETF (Percentages shown are based on Net Assets) |
| Security | Par (000) |
Value | ||||||
| Agriculture (continued) |
||||||||
| 6.34%, 08/02/30 (Call 06/02/30) |
$ | 4,235 | $ | 4,370,837 | ||||
| 6.42%, 08/02/33 (Call 05/02/33)(b) |
4,930 | 5,060,090 | ||||||
| 7.08%, 08/02/43 (Call 02/02/43) |
3,135 | 3,263,787 | ||||||
| 7.08%, 08/02/53 (Call 02/02/53) |
4,040 | 4,187,886 | ||||||
| 7.75%, 10/19/32 (Call 07/19/32) |
2,485 | 2,770,922 | ||||||
| BAT International Finance PLC |
||||||||
| 1.67%, 03/25/26 (Call 02/25/26) |
4,119 | 3,816,566 | ||||||
| 4.45%, 03/16/28 (Call 02/16/28) |
4,530 | 4,369,161 | ||||||
| 5.93%, 02/02/29 (Call 01/02/29) |
4,085 | 4,169,955 | ||||||
| Bunge Ltd. Finance Corp. |
||||||||
| 1.63%, 08/17/25 (Call 07/17/25) |
4,480 | 4,240,952 | ||||||
| 2.75%, 05/14/31 (Call 02/14/31) |
5,250 | 4,466,682 | ||||||
| 3.25%, 08/15/26 (Call 05/15/26) |
3,928 | 3,744,862 | ||||||
| 3.75%, 09/25/27 (Call 06/25/27) |
3,021 | 2,890,213 | ||||||
| Philip Morris International Inc. |
||||||||
| 0.88%, 05/01/26 (Call 04/01/26) |
2,814 | 2,571,042 | ||||||
| 1.50%, 05/01/25 (Call 04/01/25) |
3,659 | 3,506,226 | ||||||
| 1.75%, 11/01/30 (Call 08/01/30) |
3,138 | 2,534,904 | ||||||
| 2.10%, 05/01/30 (Call 02/01/30) |
2,468 | 2,079,782 | ||||||
| 2.75%, 02/25/26 (Call 11/25/25) |
4,305 | 4,111,929 | ||||||
| 3.13%, 08/17/27 (Call 05/17/27) |
2,635 | 2,477,494 | ||||||
| 3.13%, 03/02/28 (Call 12/02/27) |
3,086 | 2,866,416 | ||||||
| 3.38%, 08/11/25 (Call 05/11/25) |
4,153 | 4,049,642 | ||||||
| 3.38%, 08/15/29 (Call 05/15/29) |
5,278 | 4,845,592 | ||||||
| 3.88%, 08/21/42 |
4,836 | 3,811,295 | ||||||
| 4.13%, 03/04/43 |
2,779 | 2,266,154 | ||||||
| 4.25%, 11/10/44 |
2,708 | 2,232,665 | ||||||
| 4.38%, 11/15/41 |
4,457 | 3,788,008 | ||||||
| 4.50%, 03/20/42 |
4,380 | 3,781,119 | ||||||
| 4.75%, 02/12/27 |
2,675 | 2,641,348 | ||||||
| 4.88%, 02/13/26 |
5,435 | 5,408,335 | ||||||
| 4.88%, 02/15/28 (Call 01/15/28) |
5,885 | 5,850,548 | ||||||
| 4.88%, 02/13/29 (Call 01/13/29) |
2,985 | 2,933,290 | ||||||
| 4.88%, 11/15/43 |
2,075 | 1,864,759 | ||||||
| 5.00%, 11/17/25 |
4,260 | 4,245,580 | ||||||
| 5.13%, 11/17/27 (Call 10/17/27) |
5,477 | 5,485,224 | ||||||
| 5.13%, 02/15/30 (Call 12/15/29) |
5,610 | 5,582,747 | ||||||
| 5.13%, 02/13/31 (Call 12/13/30) |
2,955 | 2,907,607 | ||||||
| 5.25%, 09/07/28 (Call 08/07/28) |
1,415 | 1,425,267 | ||||||
| 5.25%, 02/13/34 (Call 11/13/33) |
3,325 | 3,248,658 | ||||||
| 5.38%, 02/15/33 (Call 11/15/32) |
6,790 | 6,762,758 | ||||||
| 5.50%, 09/07/30 (Call 07/07/30) |
1,580 | 1,594,112 | ||||||
| 5.63%, 11/17/29 (Call 09/17/29) |
4,610 | 4,720,633 | ||||||
| 5.63%, 09/07/33 (Call 06/07/33) |
2,035 | 2,053,822 | ||||||
| 5.75%, 11/17/32 (Call 08/17/32) |
3,771 | 3,843,583 | ||||||
| 6.38%, 05/16/38 |
5,073 | 5,474,757 | ||||||
| Reynolds American Inc. |
||||||||
| 4.45%, 06/12/25 (Call 03/12/25) |
7,032 | 6,924,854 | ||||||
| 5.70%, 08/15/35 (Call 02/15/35) |
2,994 | 2,859,776 | ||||||
| 5.85%, 08/15/45 (Call 02/15/45) |
8,758 | 7,936,534 | ||||||
| 6.15%, 09/15/43 |
2,251 | 2,174,357 | ||||||
| 7.25%, 06/15/37 |
2,160 | 2,297,741 | ||||||
|
|
|
|||||||
| 337,134,815 | ||||||||
| Airlines — 0.1% | ||||||||
| American Airlines Pass Through Trust |
||||||||
| Series 2014-1, Class A, 3.70%, 04/01/28 |
578 | 547,825 | ||||||
| Series 2015-1, Class A, 3.38%, 11/01/28(b) |
1,030 | 963,890 | ||||||
| Series 2015-2, Class AA, 3.60%, 03/22/29(b) |
1,786 | 1,675,867 | ||||||
| Series 2016-1, Class AA, 3.58%, 07/15/29 |
1,373 | 1,280,551 | ||||||
| Series 2016-2, Class AA, 3.20%, 12/15/29 |
2,122 | 1,938,606 | ||||||
| Security | Par (000) |
Value | ||||||
| Airlines (continued) |
||||||||
| Series 2016-3, Class AA, 3.00%, 04/15/30(b) |
$ | 905 | $ | 819,376 | ||||
| Series 2017-1, Class AA, 3.65%, 02/15/29 |
2,433 | 2,250,846 | ||||||
| Series 2017-2, Class AA, 3.35%, 04/15/31(b) |
2,190 | 1,996,861 | ||||||
| Series 2019-1, Class AA, 3.15%, 08/15/33(b) |
2,535 | 2,223,372 | ||||||
| Series A, Class A, 2.88%, 01/11/36 |
4,805 | 4,045,083 | ||||||
| Delta Air Lines Pass Through Trust, Series 2020, Class AA, 2.00%, 12/10/29 |
4,665 | 4,161,538 | ||||||
| JetBlue Pass Through Trust |
||||||||
| Series 1A, Class A, 4.00%, 05/15/34(b) |
2,564 | 2,340,396 | ||||||
| Series 2019-1, Class AA, 2.75%, 11/15/33 |
1,915 | 1,619,057 | ||||||
| Southwest Airlines Co. |
||||||||
| 2.63%, 02/10/30 (Call 11/10/29) |
2,358 | 2,038,225 | ||||||
| 3.00%, 11/15/26 (Call 08/15/26) |
2,095 | 1,977,392 | ||||||
| 3.45%, 11/16/27 (Call 08/16/27) |
1,703 | 1,600,970 | ||||||
| 5.13%, 06/15/27 (Call 04/15/27) |
8,567 | 8,538,053 | ||||||
| 5.25%, 05/04/25 (Call 04/04/25) |
6,684 | 6,664,865 | ||||||
| United Airlines Pass Through Trust |
6,486 | 6,540,810 | ||||||
| Series 2013-1, Class A, 4.30%, 02/15/27 |
2,410 | 2,349,774 | ||||||
| Series 2014-1, Class A, 4.00%, 10/11/27(b) |
2,288 | 2,200,837 | ||||||
| Series 2014-2, Class A, 3.75%, 03/03/28(b) |
3,506 | 3,358,255 | ||||||
| Series 2016-1, Class AA, 3.10%, 01/07/30(b) |
2,710 | 2,459,652 | ||||||
| Series 2016-2, Class AA, 2.88%, 04/07/30 |
2,459 | 2,213,791 | ||||||
| Series 2018-1, Class AA, 3.50%, 09/01/31 |
3,262 | 2,976,156 | ||||||
| Series 2019, Class AA, 4.15%, 02/25/33 |
1,017 | 940,761 | ||||||
| Series 2019-2, Class AA, 2.70%, 11/01/33 |
3,102 | 2,638,194 | ||||||
| Series 2020-1, 5.88%, 04/15/29 |
4,575 | 4,602,324 | ||||||
| Series 2020-1, Class B, 4.88%, 07/15/27(b) |
2,415 | 2,376,283 | ||||||
|
|
|
|||||||
| 79,339,610 | ||||||||
| Alternate Investments — 0.0% | ||||||||
| New Mountain Finance Corp., 6.88%, 02/01/29 (Call 01/01/29) |
20 | 19,576 | ||||||
| Oaktree Strategic Credit Fund, 8.40%, 11/14/28 (Call 10/14/28)(b)(c) |
200 | 209,846 | ||||||
|
|
|
|||||||
| 229,422 | ||||||||
| Apparel — 0.1% | ||||||||
| NIKE Inc. |
||||||||
| 2.38%, 11/01/26 (Call 08/01/26) |
4,243 | 3,991,583 | ||||||
| 2.40%, 03/27/25 (Call 02/27/25) |
6,371 | 6,192,342 | ||||||
| 2.75%, 03/27/27 (Call 01/27/27) |
6,103 | 5,754,479 | ||||||
| 2.85%, 03/27/30 (Call 12/27/29) |
7,020 | 6,310,131 | ||||||
| 3.25%, 03/27/40 (Call 09/27/39) |
4,290 | 3,419,568 | ||||||
| 3.38%, 11/01/46 (Call 05/01/46) |
3,545 | 2,679,041 | ||||||
| 3.38%, 03/27/50 (Call 09/27/49)(b) |
4,607 | 3,492,969 | ||||||
| 3.63%, 05/01/43 (Call 11/01/42) |
2,539 | 2,069,431 | ||||||
| 3.88%, 11/01/45 (Call 05/01/45) |
5,583 | 4,614,585 | ||||||
| PVH Corp., 4.63%, 07/10/25 (Call 06/10/25) |
2,768 | 2,729,234 | ||||||
| Ralph Lauren Corp. |
||||||||
| 2.95%, 06/15/30 (Call 03/15/30) |
2,479 | 2,204,118 | ||||||
| 3.75%, 09/15/25 (Call 07/15/25)(b) |
2,919 | 2,852,803 | ||||||
| Tapestry Inc. |
||||||||
| 3.05%, 03/15/32 (Call 12/15/31) |
2,308 | 1,870,943 | ||||||
| 4.13%, 07/15/27 (Call 04/15/27) |
1,526 | 1,449,234 | ||||||
| 4.25%, 04/01/25 (Call 01/01/25)(b) |
330 | 324,926 | ||||||
| 7.00%, 11/27/26 |
4,860 | 4,991,258 | ||||||
| 7.05%, 11/27/25 |
1,875 | 1,910,051 | ||||||
| 12 | 2 0 2 4 I S H A R E S A N N U A L R E P O R T T O S H A R E H O L D E R S |
| Schedule of Investments (continued) February 29, 2024 |
iShares® Core U.S. Aggregate Bond ETF (Percentages shown are based on Net Assets) |
| Security | Par (000) |
Value | ||||||
| Apparel (continued) |
||||||||
| 7.35%, 11/27/28 (Call 10/27/28) |
$ | 4,195 | $ | 4,389,627 | ||||
| 7.70%, 11/27/30 (Call 09/27/30) |
2,319 | 2,463,538 | ||||||
| 7.85%, 11/27/33 (Call 08/27/33) |
2,040 | 2,207,195 | ||||||
| VF Corp. |
||||||||
| 2.40%, 04/23/25 (Call 03/23/25) |
3,864 | 3,706,997 | ||||||
| 2.80%, 04/23/27 (Call 02/23/27) |
3,219 | 2,918,662 | ||||||
| 2.95%, 04/23/30 (Call 01/23/30)(b) |
3,644 | 3,005,885 | ||||||
|
|
|
|||||||
| 75,548,600 | ||||||||
| Auto Manufacturers — 0.5% | ||||||||
| American Honda Finance Corp. |
||||||||
| 1.00%, 09/10/25 |
1,404 | 1,319,410 | ||||||
| 1.20%, 07/08/25 |
2,751 | 2,609,290 | ||||||
| 1.30%, 09/09/26 |
4,015 | 3,665,693 | ||||||
| 1.80%, 01/13/31 |
1,932 | 1,586,300 | ||||||
| 2.00%, 03/24/28 |
3,020 | 2,704,978 | ||||||
| 2.25%, 01/12/29 |
3,975 | 3,529,802 | ||||||
| 2.30%, 09/09/26 |
3,291 | 3,086,760 | ||||||
| 2.35%, 01/08/27 |
2,096 | 1,955,395 | ||||||
| 3.50%, 02/15/28 |
3,346 | 3,177,571 | ||||||
| 4.60%, 04/17/30 |
3,630 | 3,555,198 | ||||||
| 4.70%, 01/12/28 |
2,310 | 2,298,238 | ||||||
| 4.75%, 01/12/26 |
805 | 799,729 | ||||||
| 4.90%, 01/10/34 |
1,615 | 1,575,262 | ||||||
| 4.95%, 01/09/26 |
2,710 | 2,701,761 | ||||||
| 5.00%, 05/23/25 |
2,035 | 2,029,649 | ||||||
| 5.13%, 07/07/28 |
2,505 | 2,525,273 | ||||||
| 5.25%, 07/07/26 |
1,805 | 1,817,679 | ||||||
| 5.65%, 11/15/28 |
2,735 | 2,812,181 | ||||||
| 5.80%, 10/03/25 |
2,015 | 2,034,740 | ||||||
| 5.85%, 10/04/30 |
2,885 | 3,002,159 | ||||||
| Series A, 4.60%, 04/17/25 |
3,140 | 3,118,603 | ||||||
| Cummins Inc. |
||||||||
| 0.75%, 09/01/25 (Call 08/01/25)(b) |
2,095 | 1,965,176 | ||||||
| 1.50%, 09/01/30 (Call 06/01/30) |
2,409 | 1,945,884 | ||||||
| 2.60%, 09/01/50 (Call 03/01/50)(b) |
4,305 | 2,699,869 | ||||||
| 4.88%, 10/01/43 (Call 04/01/43) |
1,491 | 1,406,946 | ||||||
| 4.90%, 02/20/29 (Call 01/20/29) |
655 | 651,739 | ||||||
| 5.15%, 02/20/34 (Call 11/20/33) |
360 | 359,641 | ||||||
| 5.45%, 02/20/54 (Call 08/20/53) |
360 | 361,885 | ||||||
| Ford Motor Co. |
||||||||
| 3.25%, 02/12/32 (Call 11/12/31) |
8,375 | 6,874,960 | ||||||
| 4.35%, 12/08/26 (Call 09/08/26) |
380 | 369,083 | ||||||
| 4.75%, 01/15/43 |
9,020 | 7,311,791 | ||||||
| 5.29%, 12/08/46 (Call 06/08/46)(b) |
4,370 | 3,779,818 | ||||||
| 6.10%, 08/19/32 (Call 05/19/32) |
6,145 | 6,128,094 | ||||||
| 6.63%, 10/01/28(b) |
272 | 284,130 | ||||||
| 7.40%, 11/01/46 |
1,585 | 1,697,944 | ||||||
| 7.45%, 07/16/31 |
3,190 | 3,436,007 | ||||||
| 9.63%, 04/22/30 (Call 01/22/30) |
360 | 420,886 | ||||||
| Ford Motor Credit Co. LLC |
||||||||
| 2.70%, 08/10/26 (Call 07/10/26) |
3,365 | 3,123,932 | ||||||
| 2.90%, 02/16/28 (Call 12/16/27) |
1,160 | 1,039,891 | ||||||
| 2.90%, 02/10/29 (Call 12/10/28) |
1,330 | 1,158,996 | ||||||
| 3.38%, 11/13/25 (Call 10/13/25) |
8,110 | 7,782,624 | ||||||
| 3.63%, 06/17/31 (Call 03/17/31) |
2,910 | 2,480,246 | ||||||
| 3.82%, 11/02/27 (Call 08/02/27) |
601 | 560,627 | ||||||
| 4.00%, 11/13/30 (Call 08/13/30) |
7,130 | 6,302,650 | ||||||
| 4.13%, 08/04/25 |
4,800 | 4,684,094 | ||||||
| 4.13%, 08/17/27 (Call 06/17/27) |
2,480 | 2,343,988 | ||||||
| 4.27%, 01/09/27 (Call 11/09/26) |
1,130 | 1,082,391 | ||||||
| 4.39%, 01/08/26 |
7,810 | 7,598,365 | ||||||
| Security | Par (000) |
Value | ||||||
| Auto Manufacturers (continued) |
||||||||
| 4.54%, 08/01/26 (Call 06/01/26) |
$ | 4,406 | $ | 4,270,023 | ||||
| 4.69%, 06/09/25 (Call 04/09/25)(b) |
1,300 | 1,281,163 | ||||||
| 4.95%, 05/28/27 (Call 04/28/27) |
3,225 | 3,135,248 | ||||||
| 5.11%, 05/03/29 (Call 02/03/29) |
6,875 | 6,626,280 | ||||||
| 5.13%, 06/16/25 (Call 05/16/25) |
465 | 460,408 | ||||||
| 5.80%, 03/05/27 (Call 02/05/27) |
7,620 | 7,609,312 | ||||||
| 6.05%, 03/05/31 (Call 01/05/31)(b) |
3,850 | 3,832,641 | ||||||
| 6.80%, 05/12/28 (Call 04/12/28) |
5,865 | 6,053,357 | ||||||
| 6.80%, 11/07/28 (Call 10/07/28) |
7,580 | 7,849,242 | ||||||
| 6.95%, 03/06/26 (Call 02/06/26) |
5,365 | 5,461,862 | ||||||
| 6.95%, 06/10/26 (Call 05/10/26) |
6,260 | 6,382,284 | ||||||
| 7.12%, 11/07/33 (Call 08/07/33) |
5,570 | 5,942,369 | ||||||
| 7.20%, 06/10/30 (Call 04/10/30) |
2,470 | 2,605,353 | ||||||
| 7.35%, 11/04/27 (Call 10/04/27) |
6,260 | 6,541,184 | ||||||
| 7.35%, 03/06/30 (Call 01/06/30) |
4,630 | 4,902,657 | ||||||
| General Motors Co. |
||||||||
| 4.00%, 04/01/25 |
2,429 | 2,390,403 | ||||||
| 4.20%, 10/01/27 (Call 07/01/27) |
3,604 | 3,471,045 | ||||||
| 5.00%, 10/01/28 (Call 07/01/28)(b) |
3,595 | 3,570,710 | ||||||
| 5.00%, 04/01/35 |
3,353 | 3,134,836 | ||||||
| 5.15%, 04/01/38 (Call 10/01/37) |
4,050 | 3,749,216 | ||||||
| 5.20%, 04/01/45 |
5,157 | 4,551,922 | ||||||
| 5.40%, 10/15/29 (Call 08/15/29) |
2,440 | 2,431,981 | ||||||
| 5.40%, 04/01/48 (Call 10/01/47) |
3,426 | 3,072,870 | ||||||
| 5.60%, 10/15/32 (Call 07/15/32) |
5,235 | 5,219,839 | ||||||
| 5.95%, 04/01/49 (Call 10/01/48)(b) |
3,822 | 3,672,854 | ||||||
| 6.13%, 10/01/25 (Call 09/01/25) |
8,621 | 8,692,167 | ||||||
| 6.25%, 10/02/43 |
4,785 | 4,802,522 | ||||||
| 6.60%, 04/01/36 (Call 10/01/35) |
5,065 | 5,309,927 | ||||||
| 6.75%, 04/01/46 (Call 10/01/45)(b) |
3,442 | 3,638,022 | ||||||
| 6.80%, 10/01/27 (Call 08/01/27) |
4,451 | 4,647,738 | ||||||
| General Motors Financial Co. Inc. |
||||||||
| 1.25%, 01/08/26 (Call 12/08/25) |
2,353 | 2,180,464 | ||||||
| 1.50%, 06/10/26 (Call 05/10/26) |
6,625 | 6,068,909 | ||||||
| 2.35%, 02/26/27 (Call 01/26/27) |
4,230 | 3,878,162 | ||||||
| 2.35%, 01/08/31 (Call 10/08/30) |
2,450 | 1,996,616 | ||||||
| 2.40%, 04/10/28 (Call 02/10/28) |
3,560 | 3,173,314 | ||||||
| 2.40%, 10/15/28 (Call 08/15/28) |
5,082 | 4,465,091 | ||||||
| 2.70%, 08/20/27 (Call 06/20/27) |
2,924 | 2,682,457 | ||||||
| 2.70%, 06/10/31 (Call 03/10/31) |
5,000 | 4,114,063 | ||||||
| 2.75%, 06/20/25 (Call 05/20/25) |
5,954 | 5,746,422 | ||||||
| 3.10%, 01/12/32 (Call 10/12/31) |
3,582 | 2,991,663 | ||||||
| 3.60%, 06/21/30 (Call 03/21/30) |
3,471 | 3,112,884 | ||||||
| 3.80%, 04/07/25 |
800 | 784,195 | ||||||
| 3.85%, 01/05/28 (Call 10/05/27) |
2,239 | 2,125,226 | ||||||
| 4.00%, 10/06/26 (Call 07/06/26) |
3,870 | 3,741,326 | ||||||
| 4.30%, 07/13/25 (Call 04/13/25) |
3,153 | 3,100,901 | ||||||
| 4.30%, 04/06/29 (Call 02/06/29) |
1,520 | 1,441,577 | ||||||
| 4.35%, 04/09/25 (Call 02/09/25) |
3,362 | 3,318,540 | ||||||
| 4.35%, 01/17/27 (Call 10/17/26) |
5,444 | 5,298,376 | ||||||
| 5.00%, 04/09/27 (Call 03/09/27) |
4,830 | 4,778,877 | ||||||
| 5.25%, 03/01/26 (Call 12/01/25) |
5,630 | 5,612,076 | ||||||
| 5.40%, 04/06/26 |
2,460 | 2,461,198 | ||||||
| 5.40%, 05/08/27 |
830 | 830,933 | ||||||
| 5.65%, 01/17/29 (Call 10/17/28) |
2,589 | 2,609,039 | ||||||
| 5.75%, 02/08/31 (Call 12/08/30) |
1,225 | 1,221,481 | ||||||
| 5.80%, 06/23/28 (Call 05/23/28) |
2,905 | 2,946,704 | ||||||
| 5.80%, 01/07/29 (Call 12/07/28) |
4,190 | 4,245,304 | ||||||
| 5.85%, 04/06/30 (Call 02/06/30)(b) |
2,300 | 2,332,378 | ||||||
| 6.00%, 01/09/28 (Call 12/09/27) |
3,580 | 3,658,557 | ||||||
| 6.05%, 10/10/25 |
5,547 | 5,590,443 | ||||||
| S C H E D U L E O F I N V E S T M E N T S |
13 |
| Schedule of Investments (continued) February 29, 2024 |
iShares® Core U.S. Aggregate Bond ETF (Percentages shown are based on Net Assets) |
| Security | Par (000) |
Value | ||||||
| Auto Manufacturers (continued) |
||||||||
| 6.10%, 01/07/34 (Call 10/07/33) |
$ | 3,442 | $ | 3,476,857 | ||||
| 6.40%, 01/09/33 (Call 10/09/32) |
4,738 | 4,920,204 | ||||||
| Honda Motor Co. Ltd. |
||||||||
| 2.27%, 03/10/25 (Call 02/10/25)(b) |
1,480 | 1,436,543 | ||||||
| 2.53%, 03/10/27 (Call 02/10/27) |
1,340 | 1,252,036 | ||||||
| 2.97%, 03/10/32 (Call 12/10/31) |
3,740 | 3,283,902 | ||||||
| Mercedes-Benz Finance North America LLC, |
||||||||
| 8.50%, 01/18/31 |
6,149 | 7,461,111 | ||||||
| PACCAR Financial Corp. |
||||||||
| 1.10%, 05/11/26 |
2,584 | 2,381,983 | ||||||
| 2.00%, 02/04/27(b) |
1,655 | 1,526,853 | ||||||
| 2.85%, 04/07/25 |
115 | 112,302 | ||||||
| 3.55%, 08/11/25(b) |
1,853 | 1,814,716 | ||||||
| 4.45%, 03/30/26 |
1,255 | 1,243,959 | ||||||
| 4.60%, 01/10/28 |
1,415 | 1,407,546 | ||||||
| 4.60%, 01/31/29 |
1,525 | 1,510,138 | ||||||
| 4.95%, 10/03/25 |
2,479 | 2,474,513 | ||||||
| 4.95%, 08/10/28 |
90 | 90,610 | ||||||
| 5.05%, 08/10/26 |
550 | 552,101 | ||||||
| 5.20%, 11/09/26 |
1,485 | 1,497,871 | ||||||
| Toyota Motor Corp. |
||||||||
| 1.34%, 03/25/26 (Call 02/25/26) |
3,455 | 3,207,575 | ||||||
| 2.36%, 03/25/31 (Call 12/25/30)(b) |
1,975 | 1,701,650 | ||||||
| 2.76%, 07/02/29(b) |
1,208 | 1,112,528 | ||||||
| 3.67%, 07/20/28(b) |
1,930 | 1,871,486 | ||||||
| 5.12%, 07/13/28 (Call 06/13/28) |
1,718 | 1,750,622 | ||||||
| 5.12%, 07/13/33 (Call 04/13/33)(b) |
1,370 | 1,435,820 | ||||||
| 5.28%, 07/13/26 (Call 06/13/26) |
1,205 | 1,213,454 | ||||||
| Toyota Motor Credit Corp. |
||||||||
| 0.80%, 10/16/25 |
1,664 | 1,555,267 | ||||||
| 0.80%, 01/09/26 |
655 | 607,489 | ||||||
| 1.13%, 06/18/26 |
6,119 | 5,614,937 | ||||||
| 1.15%, 08/13/27 |
2,222 | 1,968,515 | ||||||
| 1.65%, 01/10/31 |
3,240 | 2,628,913 | ||||||
| 1.90%, 01/13/27 |
3,735 | 3,439,435 | ||||||
| 1.90%, 04/06/28 |
3,749 | 3,350,031 | ||||||
| 1.90%, 09/12/31 |
2,905 | 2,360,317 | ||||||
| 2.15%, 02/13/30 |
4,380 | 3,762,938 | ||||||
| 2.40%, 01/13/32 |
635 | 531,100 | ||||||
| 3.00%, 04/01/25 |
7,148 | 6,984,081 | ||||||
| 3.05%, 03/22/27 |
6,935 | 6,576,439 | ||||||
| 3.05%, 01/11/28 |
3,265 | 3,073,553 | ||||||
| 3.20%, 01/11/27 |
4,817 | 4,602,180 | ||||||
| 3.38%, 04/01/30 |
4,069 | 3,739,965 | ||||||
| 3.40%, 04/14/25 |
3,775 | 3,699,543 | ||||||
| 3.65%, 08/18/25 |
3,645 | 3,571,401 | ||||||
| 3.65%, 01/08/29 |
3,235 | 3,061,073 | ||||||
| 3.95%, 06/30/25 |
4,160 | 4,096,781 | ||||||
| 4.45%, 05/18/26 |
3,010 | 2,978,275 | ||||||
| 4.45%, 06/29/29 |
3,640 | 3,574,067 | ||||||
| 4.55%, 09/20/27 |
1,585 | 1,571,488 | ||||||
| 4.55%, 05/17/30 |
3,125 | 3,059,742 | ||||||
| 4.63%, 01/12/28 |
2,890 | 2,873,764 | ||||||
| 4.65%, 01/05/29 |
1,840 | 1,820,389 | ||||||
| 4.70%, 01/12/33(b) |
2,035 | 2,006,712 | ||||||
| 4.80%, 01/05/26 |
2,160 | 2,150,779 | ||||||
| 4.80%, 01/05/34 |
730 | 711,551 | ||||||
| 5.00%, 08/14/26 |
4,635 | 4,634,127 | ||||||
| 5.25%, 09/11/28 |
1,705 | 1,729,449 | ||||||
| 5.40%, 11/10/25 |
4,055 | 4,079,975 | ||||||
| 5.40%, 11/20/26 |
3,450 | 3,484,768 | ||||||
| Security | Par (000) |
Value | ||||||
| Auto Manufacturers (continued) |
||||||||
| 5.45%, 11/10/27 |
$ | 4,095 | $ | 4,176,151 | ||||
| 5.55%, 11/20/30 |
4,030 | 4,159,938 | ||||||
| 5.60%, 09/11/25 |
1,180 | 1,189,927 | ||||||
|
|
|
|||||||
| 519,735,379 | ||||||||
| Auto Parts & Equipment — 0.0% | ||||||||
| Aptiv PLC |
||||||||
| 3.10%, 12/01/51 (Call 06/01/51)(b) |
6,330 | 3,963,205 | ||||||
| 4.35%, 03/15/29 (Call 12/15/28) |
1,530 | 1,478,529 | ||||||
| 4.40%, 10/01/46 (Call 04/01/46) |
1,212 | 951,895 | ||||||
| 5.40%, 03/15/49 (Call 09/15/48)(b) |
1,602 | 1,452,557 | ||||||
| Aptiv PLC/Aptiv Corp. |
||||||||
| 3.25%, 03/01/32 (Call 12/01/31) |
3,875 | 3,341,393 | ||||||
| 4.15%, 05/01/52 (Call 11/01/51) |
4,570 | 3,488,285 | ||||||
| BorgWarner Inc. |
||||||||
| 2.65%, 07/01/27 (Call 05/01/27) |
4,753 | 4,387,054 | ||||||
| 4.38%, 03/15/45 (Call 09/15/44) |
2,230 | 1,815,093 | ||||||
| Lear Corp. |
||||||||
| 2.60%, 01/15/32 (Call 10/15/31) |
1,600 | 1,302,499 | ||||||
| 3.50%, 05/30/30 (Call 02/28/30)(b) |
1,840 | 1,644,300 | ||||||
| 3.55%, 01/15/52 (Call 07/15/51) |
1,230 | 833,808 | ||||||
| 3.80%, 09/15/27 (Call 06/15/27) |
1,959 | 1,874,907 | ||||||
| 4.25%, 05/15/29 (Call 02/15/29) |
2,385 | 2,269,449 | ||||||
| 5.25%, 05/15/49 (Call 11/15/48) |
1,910 | 1,715,170 | ||||||
| Magna International Inc. |
||||||||
| 2.45%, 06/15/30 (Call 03/15/30) |
1,243 | 1,069,107 | ||||||
| 4.15%, 10/01/25 (Call 07/01/25) |
3,564 | 3,498,353 | ||||||
| 5.50%, 03/21/33 (Call 12/21/32) |
1,430 | 1,464,860 | ||||||
| 5.98%, 03/21/26 (Call 03/21/24) |
165 | 165,040 | ||||||
|
|
|
|||||||
| 36,715,504 | ||||||||
| Banks — 5.5% | ||||||||
| Australia & New Zealand Banking Group Ltd. |
||||||||
| 3.70%, 11/16/25 |
3,719 | 3,637,135 | ||||||
| 4.75%, 01/18/27 |
5,230 | 5,211,699 | ||||||
| 5.09%, 12/08/25 |
1,760 | 1,760,803 | ||||||
| 5.38%, 07/03/25 |
4,340 | 4,353,253 | ||||||
| 5.67%, 10/03/25 |
5,440 | 5,489,143 | ||||||
| Banco Bilbao Vizcaya Argentaria SA |
||||||||
| 1.13%, 09/18/25 |
5,915 | 5,529,029 | ||||||
| 5.86%, 09/14/26 (Call 09/14/25), |
4,680 | 4,678,495 | ||||||
| 6.14%, 09/14/28 (Call 09/14/27), |
600 | 608,318 | ||||||
| 7.88%, 11/15/34 (Call 11/15/33), |
2,625 | 2,796,203 | ||||||
| Banco Santander SA |
||||||||
| 1.72%, 09/14/27 (Call 09/14/26), |
4,563 | 4,126,727 | ||||||
| 1.85%, 03/25/26 |
6,289 | 5,836,365 | ||||||
| 2.75%, 05/28/25 |
8,089 | 7,803,883 | ||||||
| 2.75%, 12/03/30 |
3,800 | 3,094,620 | ||||||
| 2.96%, 03/25/31 |
3,980 | 3,389,756 | ||||||
| 3.23%, 11/22/32 (Call 08/22/31), |
4,530 | 3,739,207 | ||||||
| 3.31%, 06/27/29 |
6,112 | 5,537,588 | ||||||
| 3.49%, 05/28/30 |
4,443 | 3,981,232 | ||||||
| 3.50%, 03/24/25 |
1,260 | 1,234,660 | ||||||
| 3.80%, 02/23/28 |
3,384 | 3,187,435 | ||||||
| 4.18%, 03/24/28 (Call 03/24/27), |
5,223 | 4,999,864 | ||||||
| 4.25%, 04/11/27 |
6,848 | 6,598,325 | ||||||
| 14 | 2 0 2 4 I S H A R E S A N N U A L R E P O R T T O S H A R E H O L D E R S |
| Schedule of Investments (continued) February 29, 2024 |
iShares® Core U.S. Aggregate Bond ETF (Percentages shown are based on Net Assets) |
| Security | Par (000) |
Value | ||||||
| Banks (continued) |
||||||||
| 4.38%, 04/12/28 |
$ | 4,494 | $ | 4,318,017 | ||||
| 5.15%, 08/18/25 |
3,435 | 3,408,692 | ||||||
| 5.18%, 11/19/25 |
6,886 | 6,789,857 | ||||||
| 5.29%, 08/18/27 |
4,823 | 4,785,932 | ||||||
| 5.59%, 08/08/28 |
5,900 | 5,945,715 | ||||||
| 6.53%, 11/07/27 (Call 11/07/26), |
||||||||
| (1-year CMT + 1.650%)(a) |
4,400 | 4,502,248 | ||||||
| 6.61%, 11/07/28 |
4,400 | 4,623,222 | ||||||
| 6.92%, 08/08/33 |
4,875 | 5,064,625 | ||||||
| 6.94%, 11/07/33 |
5,200 | 5,669,150 | ||||||
| Bank of America Corp. |
||||||||
| 1.20%, 10/24/26 (Call 10/24/25), |
||||||||
| (1-day SOFR + 1.010%)(a) |
10,653 | 9,924,759 | ||||||
| 1.32%, 06/19/26 (Call 06/19/25), |
||||||||
| (1-day SOFR + 1.150%)(a) |
12,108 | 11,463,612 | ||||||
| 1.73%, 07/22/27 (Call 07/22/26), |
||||||||
| (1-day SOFR + 0.960%)(a) |
20,233 | 18,547,884 | ||||||
| 1.90%, 07/23/31 (Call 07/23/30), |
||||||||
| (1-day SOFR + 1.530%)(a) |
6,265 | 5,082,652 | ||||||
| 1.92%, 10/24/31 (Call 10/24/30), |
||||||||
| (1-day SOFR + 1.370%)(a) |
12,056 | 9,728,534 | ||||||
| 2.09%, 06/14/29 (Call 06/14/28), |
||||||||
| (1-day SOFR + 1.060%)(a) |
9,640 | 8,459,485 | ||||||
| 2.30%, 07/21/32 (Call 07/21/31), |
||||||||
| (1-day SOFR + 1.220%)(a) |
16,385 | 13,255,184 | ||||||
| 2.48%, 09/21/36 (Call 09/21/31), |
||||||||
| (5-year CMT + 1.200%)(a) |
12,165 | 9,608,261 | ||||||
| 2.50%, 02/13/31 (Call 02/13/30), |
||||||||
| (3-mo. SOFR + 1.252%)(a) |
15,790 | 13,461,335 | ||||||
| 2.55%, 02/04/28 (Call 02/04/27), |
||||||||
| (1-day SOFR + 1.050%)(a) |
10,260 | 9,488,712 | ||||||
| 2.57%, 10/20/32 (Call 10/20/31), |
||||||||
| (1-day SOFR + 1.210%)(a) |
11,075 | 9,087,534 | ||||||
| 2.59%, 04/29/31 (Call 04/29/30), |
||||||||
| (1-day SOFR + 2.150%)(a) |
14,104 | 12,022,624 | ||||||
| 2.68%, 06/19/41 (Call 06/19/40), |
||||||||
| (1-day SOFR + 1.930%)(a) |
19,787 | 13,802,038 | ||||||
| 2.69%, 04/22/32 (Call 04/22/31), |
||||||||
| (1-day SOFR + 1.320%)(a) |
15,954 | 13,353,202 | ||||||
| 2.83%, 10/24/51 (Call 10/24/50), |
||||||||
| (1-day SOFR + 1.880%)(a) |
4,279 | 2,743,370 | ||||||
| 2.88%, 10/22/30 (Call 10/22/29), |
||||||||
| (3-mo. SOFR + 1.452%)(a) |
8,618 | 7,594,525 | ||||||
| 2.97%, 02/04/33 (Call 02/04/32), |
||||||||
| (1-day SOFR + 1.330%)(a) |
16,265 | 13,659,689 | ||||||
| 2.97%, 07/21/52 (Call 07/21/51), |
||||||||
| (1-day SOFR + 1.560%)(a) |
8,375 | 5,565,926 | ||||||
| 3.19%, 07/23/30 (Call 07/23/29), |
||||||||
| (3-mo. SOFR + 1.442%)(a) |
10,334 | 9,297,822 | ||||||
| 3.25%, 10/21/27 (Call 10/21/26) |
11,735 | 11,084,829 | ||||||
| 3.31%, 04/22/42 (Call 04/22/41), |
||||||||
| (1-day SOFR + 1.580%)(a) |
13,905 | 10,539,132 | ||||||
| 3.38%, 04/02/26 (Call 04/02/25), |
||||||||
| (1-day SOFR + 1.330%)(a) |
8,524 | 8,323,859 | ||||||
| 3.42%, 12/20/28 (Call 12/20/27), |
||||||||
| (3-mo. SOFR + 1.302%)(a) |
23,022 | 21,513,524 | ||||||
| 3.50%, 04/19/26 |
11,106 | 10,761,088 | ||||||
| 3.56%, 04/23/27 (Call 04/23/26), |
||||||||
| (3-mo. SOFR + 1.322%)(a) |
9,927 | 9,547,254 | ||||||
| 3.59%, 07/21/28 (Call 07/21/27), |
||||||||
| (3-mo. SOFR + 1.632%)(a) |
9,121 | 8,636,946 | ||||||
| Security | Par (000) |
Value | ||||||
| Banks (continued) |
||||||||
| 3.71%, 04/24/28 (Call 04/24/27), |
||||||||
| (3-mo. SOFR + 1.774%)(a) |
$ | 9,299 | $ | 8,856,245 | ||||
| 3.82%, 01/20/28 (Call 01/20/27), |
||||||||
| (3-mo. SOFR + 1.837%)(a) |
11,158 | 10,719,680 | ||||||
| 3.85%, 03/08/37 (Call 03/08/32), |
||||||||
| (5-year CMT + 2.000%)(a) |
3,620 | 3,160,407 | ||||||
| 3.88%, 08/01/25 |
3,158 | 3,107,535 | ||||||
| 3.95%, 01/23/49 (Call 01/23/48), |
||||||||
| (3-mo. SOFR + 1.452%)(a) |
4,790 | 3,846,993 | ||||||
| 3.97%, 03/05/29 (Call 03/05/28), |
||||||||
| (3-mo. SOFR + 1.332%)(a) |
10,375 | 9,869,203 | ||||||
| 3.97%, 02/07/30 (Call 02/07/29), |
||||||||
| (3-mo. SOFR + 1.472%)(a) |
11,898 | 11,182,091 | ||||||
| 4.08%, 04/23/40 (Call 04/23/39), |
||||||||
| (3-mo. SOFR + 1.582%)(a) |
6,289 | 5,380,653 | ||||||
| 4.08%, 03/20/51 (Call 03/20/50), |
||||||||
| (3-mo. SOFR + 3.412%)(a) |
19,638 | 15,859,179 | ||||||
| 4.24%, 04/24/38 (Call 04/24/37), |
||||||||
| (3-mo. SOFR + 2.076%)(a) |
8,598 | 7,637,556 | ||||||
| 4.25%, 10/22/26 |
9,523 | 9,313,019 | ||||||
| 4.27%, 07/23/29 (Call 07/23/28), |
||||||||
| (3-mo. SOFR + 1.572%)(a) |
12,784 | 12,282,196 | ||||||
| 4.33%, 03/15/50 (Call 03/15/49), |
||||||||
| (3-mo. SOFR + 1.782%)(a) |
10,721 | 9,029,117 | ||||||
| 4.38%, 04/27/28 (Call 04/27/27), |
||||||||
| (1-day SOFR + 1.580%)(a) |
6,246 | 6,079,279 | ||||||
| 4.44%, 01/20/48 (Call 01/20/47), |
||||||||
| (3-mo. SOFR + 2.252%)(a) |
8,116 | 6,981,970 | ||||||
| 4.45%, 03/03/26 |
8,476 | 8,335,921 | ||||||
| 4.57%, 04/27/33 (Call 04/27/32), |
||||||||
| (1-day SOFR + 1.830%)(a) |
13,720 | 12,912,396 | ||||||
| 4.83%, 07/22/26 (Call 07/22/25), |
||||||||
| (1-day SOFR + 1.750%)(a) |
9,335 | 9,255,069 | ||||||
| 4.88%, 04/01/44 |
2,008 | 1,895,435 | ||||||
| 4.95%, 07/22/28 (Call 07/22/27), |
||||||||
| (1-day SOFR + 2.040%)(a) |
10,730 | 10,622,052 | ||||||
| 5.00%, 01/21/44 |
8,340 | 7,976,303 | ||||||
| 5.02%, 07/22/33 (Call 07/22/32), |
||||||||
| (1-day SOFR + 2.160%)(a) |
17,380 | 16,931,312 | ||||||
| 5.08%, 01/20/27 (Call 01/20/26), |
||||||||
| (1-day SOFR + 1.290%)(a) |
12,080 | 12,002,683 | ||||||
| 5.20%, 04/25/29 (Call 04/25/28), |
||||||||
| (1-day SOFR + 1.630%)(a) |
12,090 | 12,021,570 | ||||||
| 5.29%, 04/25/34 (Call 04/25/33), |
||||||||
| (1-day SOFR + 1.910%)(a) |
18,595 | 18,326,866 | ||||||
| 5.47%, 01/23/35 (Call 01/23/34), |
||||||||
| (1-day SOFR + 1.650%)(a) |
9,100 | 9,075,788 | ||||||
| 5.82%, 09/15/29 (Call 09/15/28), |
||||||||
| (1-day SOFR + 1.570%)(a) |
10,660 | 10,867,003 | ||||||
| 5.87%, 09/15/34 (Call 09/15/33), |
||||||||
| (1-day SOFR + 1.840%)(a) |
12,580 | 12,900,686 | ||||||
| 5.88%, 02/07/42 |
6,202 | 6,596,398 | ||||||
| 5.93%, 09/15/27 (Call 09/15/26), |
||||||||
| (1-day SOFR + 1.340%)(a) |
7,495 | 7,600,404 | ||||||
| 6.11%, 01/29/37 |
9,332 | 9,780,556 | ||||||
| 6.20%, 11/10/28 (Call 11/10/27), |
||||||||
| (1-day SOFR + 1.990%)(a) |
7,859 | 8,102,569 | ||||||
| 6.22%, 09/15/26 |
3,479 | 3,553,777 | ||||||
| 7.75%, 05/14/38 |
7,159 | 8,590,315 | ||||||
| Series L, 3.95%, 04/21/25 |
12,001 | 11,802,643 | ||||||
| Series L, 4.18%, 11/25/27 (Call 11/25/26) |
9,183 | 8,867,585 | ||||||
| S C H E D U L E O F I N V E S T M E N T S |
15 |
| Schedule of Investments (continued) February 29, 2024 |
iShares® Core U.S. Aggregate Bond ETF (Percentages shown are based on Net Assets) |
| Security | Par (000) |
Value | ||||||
| Banks (continued) |
||||||||
| Series L, 4.75%, 04/21/45 |
$ | 2,337 | $ | 2,123,499 | ||||
| Series N, 1.66%, 03/11/27 (Call 03/11/26), |
||||||||
| (1-day SOFR + 0.910%)(a) |
11,840 | 10,992,478 | ||||||
| Series N, 2.65%, 03/11/32 (Call 03/11/31), |
||||||||
| (1-day SOFR + 1.220%)(a) |
11,265 | 9,422,973 | ||||||
| Series N, 3.48%, 03/13/52 (Call 03/13/51), |
||||||||
| (1-day SOFR + 1.650%)(a) |
4,375 | 3,208,262 | ||||||
| Bank of America NA |
||||||||
| 5.53%, 08/18/26 (Call 07/18/26) |
6,960 | 7,027,183 | ||||||
| 5.65%, 08/18/25 (Call 07/18/25) |
6,530 | 6,576,160 | ||||||
| 6.00%, 10/15/36 |
6,473 | 6,750,611 | ||||||
| Bank of Montreal |
||||||||
| 0.95%, 01/22/27 (Call 01/22/26), |
||||||||
| (1-day SOFR + 0.603%)(a) |
3,715 | 3,427,696 | ||||||
| 1.25%, 09/15/26 |
8,771 | 7,982,402 | ||||||
| 1.85%, 05/01/25 |
7,352 | 7,063,817 | ||||||
| 2.65%, 03/08/27 |
6,060 | 5,654,038 | ||||||
| 3.09%, 01/10/37 (Call 01/10/32), |
||||||||
| (5-year CMT + 1.400%)(a) |
3,265 | 2,644,314 | ||||||
| 3.70%, 06/07/25 |
2,915 | 2,855,985 | ||||||
| 3.80%, 12/15/32 (Call 12/15/27), |
||||||||
| (5-year USD Swap + 1.432%)(a) |
5,191 | 4,774,761 | ||||||
| 5.20%, 02/01/28 (Call 01/01/28) |
5,445 | 5,465,179 | ||||||
| 5.27%, 12/11/26 |
3,725 | 3,733,977 | ||||||
| 5.30%, 06/05/26 |
3,455 | 3,463,361 | ||||||
| 5.72%, 09/25/28 (Call 08/25/28) |
4,720 | 4,839,414 | ||||||
| 5.92%, 09/25/25 |
1,990 | 2,010,513 | ||||||
| Series H, 4.70%, 09/14/27 (Call 08/14/27) |
5,135 | 5,083,451 | ||||||
| Bank of New York Mellon Corp. (The) |
||||||||
| 0.75%, 01/28/26 (Call 12/28/25) |
1,691 | 1,559,700 | ||||||
| 1.05%, 10/15/26 (Call 09/15/26) |
2,856 | 2,579,782 | ||||||
| 1.60%, 04/24/25 (Call 03/24/25) |
2,601 | 2,498,689 | ||||||
| 1.65%, 07/14/28 (Call 05/14/28) |
2,160 | 1,892,115 | ||||||
| 1.65%, 01/28/31 (Call 10/28/30) |
1,242 | 999,699 | ||||||
| 1.80%, 07/28/31 (Call 04/28/31) |
1,975 | 1,592,672 | ||||||
| 2.05%, 01/26/27 (Call 12/26/26)(b) |
3,935 | 3,630,881 | ||||||
| 2.45%, 08/17/26 (Call 05/17/26) |
3,581 | 3,366,737 | ||||||
| 2.50%, 01/26/32 (Call 10/26/31) |
1,745 | 1,455,892 | ||||||
| 2.80%, 05/04/26 (Call 02/04/26) |
3,832 | 3,658,086 | ||||||
| 3.00%, 10/30/28 (Call 07/30/28) |
2,279 | 2,089,636 | ||||||
| 3.25%, 05/16/27 (Call 02/16/27) |
3,732 | 3,544,759 | ||||||
| 3.30%, 08/23/29 (Call 05/23/29) |
3,764 | 3,453,291 | ||||||
| 3.40%, 01/29/28 (Call 10/29/27) |
4,394 | 4,156,047 | ||||||
| 3.44%, 02/07/28 (Call 02/07/27), |
||||||||
| (3-mo. SOFR + 1.331%)(a) |
4,426 | 4,230,207 | ||||||
| 3.85%, 04/28/28 |
4,795 | 4,624,848 | ||||||
| 3.85%, 04/26/29 (Call 02/26/29) |
2,535 | 2,426,702 | ||||||
| 3.95%, 11/18/25 (Call 10/18/25) |
2,519 | 2,464,834 | ||||||
| 3.99%, 06/13/28 (Call 06/13/27), |
||||||||
| (1-day SOFR + 1.151%)(a) |
2,852 | 2,761,762 | ||||||
| 4.29%, 06/13/33 (Call 06/13/32), |
||||||||
| (1-day SOFR + 1.418%)(a) |
2,717 | 2,536,950 | ||||||
| 4.41%, 07/24/26 (Call 07/24/25), |
||||||||
| (1-day SOFR + 1.345%)(a) |
4,803 | 4,737,085 | ||||||
| 4.54%, 02/01/29 (Call 02/01/28), |
||||||||
| (1-day SOFR + 1.168%)(a) |
3,465 | 3,401,434 | ||||||
| 4.60%, 07/26/30 (Call 07/26/29), |
||||||||
| (1-day SOFR + 1.755%)(a) |
2,285 | 2,231,562 | ||||||
| 4.71%, 02/01/34 (Call 02/01/33), |
||||||||
| (1-day SOFR + 1.511%)(a) |
2,945 | 2,817,219 | ||||||
| Security | Par (000) |
Value | ||||||
| Banks (continued) |
||||||||
| 4.95%, 04/26/27 (Call 04/26/26), |
||||||||
| (1-day SOFR + 1.026%)(a) |
$ | 5,565 | $ | 5,535,970 | ||||
| 4.97%, 04/26/34 (Call 04/26/33), |
||||||||
| (1-day SOFR + 1.606%)(a) |
3,895 | 3,795,364 | ||||||
| 5.15%, 05/22/26 (Call 05/22/25), |
||||||||
| (1-day SOFR + 1.067%)(a) |
2,505 | 2,498,880 | ||||||
| 5.80%, 10/25/28 (Call 10/25/27), |
||||||||
| (1-day SOFR + 1.802%)(a) |
3,485 | 3,568,786 | ||||||
| 5.83%, 10/25/33 (Call 10/25/32), |
||||||||
| (1-day SOFR + 2.074%)(a) |
5,500 | 5,703,586 | ||||||
| 6.32%, 10/25/29 (Call 10/25/28), |
||||||||
| (1-day SOFR + 1.598%)(a) |
3,915 | 4,101,741 | ||||||
| 6.47%, 10/25/34 (Call 10/25/33), |
||||||||
| (1-day SOFR + 1.845%)(a) |
4,140 | 4,478,823 | ||||||
| Series J, 1.90%, 01/25/29 (Call 11/25/28) |
2,018 | 1,766,150 | ||||||
| Bank of Nova Scotia (The) |
||||||||
| 1.05%, 03/02/26 |
4,745 | 4,375,364 | ||||||
| 1.30%, 06/11/25 |
6,807 | 6,469,667 | ||||||
| 1.30%, 09/15/26 (Call 06/15/26) |
4,140 | 3,768,073 | ||||||
| 1.35%, 06/24/26 |
3,980 | 3,652,998 | ||||||
| 1.95%, 02/02/27 |
2,620 | 2,404,624 | ||||||
| 2.15%, 08/01/31 |
1,886 | 1,541,133 | ||||||
| 2.45%, 02/02/32 |
2,565 | 2,104,111 | ||||||
| 2.70%, 08/03/26 |
5,686 | 5,369,280 | ||||||
| 2.95%, 03/11/27 |
2,015 | 1,896,823 | ||||||
| 3.45%, 04/11/25 |
5,255 | 5,145,768 | ||||||
| 4.50%, 12/16/25 |
5,887 | 5,785,651 | ||||||
| 4.59%, 05/04/37 (Call 02/04/32), |
||||||||
| (5-year CMT + 2.050%)(a) |
4,492 | 4,020,660 | ||||||
| 4.75%, 02/02/26 |
1,510 | 1,498,480 | ||||||
| 4.85%, 02/01/30 |
4,840 | 4,774,161 | ||||||
| 5.25%, 06/12/28 |
2,195 | 2,205,942 | ||||||
| 5.35%, 12/07/26 |
3,575 | 3,589,140 | ||||||
| 5.45%, 06/12/25 |
2,820 | 2,821,968 | ||||||
| 5.65%, 02/01/34 |
2,665 | 2,707,014 | ||||||
| Bank OZK, 2.75%, 10/01/31 (Call 10/01/26), |
||||||||
| (3-mo. SOFR + 2.090%)(a) |
950 | 790,395 | ||||||
| BankUnited Inc. |
||||||||
| 4.88%, 11/17/25 (Call 08/17/25)(b) |
1,503 | 1,463,174 | ||||||
| 5.13%, 06/11/30 (Call 03/11/30) |
1,359 | 1,241,105 | ||||||
| Barclays PLC |
||||||||
| 2.28%, 11/24/27 (Call 11/24/26), |
||||||||
| (1-year CMT + 1.050%)(a) |
8,351 | 7,632,232 | ||||||
| 2.65%, 06/24/31 (Call 06/24/30), |
||||||||
| (1-year CMT + 1.900%)(a) |
3,789 | 3,150,601 | ||||||
| 2.67%, 03/10/32 (Call 03/10/31), |
||||||||
| (1-year CMT + 1.200%)(a) |
2,915 | 2,379,929 | ||||||
| 2.85%, 05/07/26 (Call 05/07/25), |
||||||||
| (1-day SOFR + 2.714%)(a) |
5,223 | 5,049,314 | ||||||
| 2.89%, 11/24/32 (Call 11/24/31), |
||||||||
| (1-year CMT + 1.300%)(a) |
5,733 | 4,668,433 | ||||||
| 3.33%, 11/24/42 (Call 11/24/41), |
||||||||
| (1-year CMT + 1.300%)(a) |
4,960 | 3,581,983 | ||||||
| 3.56%, 09/23/35 (Call 09/23/30), |
||||||||
| (5-year CMT + 2.900%)(a) |
3,885 | 3,259,889 | ||||||
| 3.65%, 03/16/25 |
8,723 | 8,541,001 | ||||||
| 3.81%, 03/10/42 (Call 03/10/41), |
||||||||
| (1-year CMT + 1.700%)(a) |
1,753 | 1,314,736 | ||||||
| 4.34%, 01/10/28 (Call 01/10/27) |
5,185 | 4,981,023 | ||||||
| 4.38%, 01/12/26 |
11,242 | 11,010,446 | ||||||
| 4.84%, 05/09/28 (Call 05/07/27) |
9,098 | 8,757,882 | ||||||
| 16 | 2 0 2 4 I S H A R E S A N N U A L R E P O R T T O S H A R E H O L D E R S |
| Schedule of Investments (continued) February 29, 2024 |
iShares® Core U.S. Aggregate Bond ETF (Percentages shown are based on Net Assets) |
| Security | Par (000) |
Value | ||||||
| Banks (continued) |
||||||||
| 4.95%, 01/10/47 |
$ | 6,585 | $ | 5,992,203 | ||||
| 4.97%, 05/16/29 (Call 05/16/28), |
||||||||
| (3-mo. LIBOR US + 1.902%)(a) |
7,375 | 7,170,394 | ||||||
| 5.09%, 06/20/30 (Call 06/20/29), |
||||||||
| (3-mo. LIBOR US + 3.054%)(a) |
5,973 | 5,653,703 | ||||||
| 5.20%, 05/12/26 |
7,668 | 7,575,099 | ||||||
| 5.25%, 08/17/45(b) |
6,328 | 6,034,505 | ||||||
| 5.30%, 08/09/26 (Call 08/09/25), |
||||||||
| (1-year CMT + 2.300%)(a) |
5,015 | 4,984,128 | ||||||
| 5.50%, 08/09/28 (Call 08/09/27), |
||||||||
| (1-year CMT + 2.650%)(a) |
6,760 | 6,722,764 | ||||||
| 5.75%, 08/09/33 (Call 08/09/32), |
||||||||
| (1-year CMT + 3.000%)(a) |
3,660 | 3,615,615 | ||||||
| 5.83%, 05/09/27 (Call 05/09/26), |
||||||||
| (1-day SOFR + 2.210%)(a) |
6,530 | 6,543,304 | ||||||
| 6.22%, 05/09/34 (Call 05/09/33), |
||||||||
| (1-day SOFR + 2.980%)(a) |
6,305 | 6,382,579 | ||||||
| 6.49%, 09/13/29 (Call 09/13/28), |
||||||||
| (1-day SOFR + 2.220%)(a) |
3,695 | 3,807,253 | ||||||
| 6.50%, 09/13/27 (Call 09/13/26), |
||||||||
| (1-day SOFR + 1.880%)(a) |
1,245 | 1,266,655 | ||||||
| 6.69%, 09/13/34 (Call 09/13/33), |
||||||||
| (1-day SOFR + 2.620%)(a)(b) |
3,350 | 3,503,153 | ||||||
| 7.12%, 06/27/34 (Call 06/27/33), |
||||||||
| (1-day SOFR + 3.570%)(a) |
9,920 | 10,286,800 | ||||||
| 7.33%, 11/02/26 (Call 11/02/25), |
||||||||
| (1-year CMT + 3.050%)(a) |
2,774 | 2,841,172 | ||||||
| 7.39%, 11/02/28 (Call 11/02/27), |
||||||||
| (1-year CMT + 3.300%)(a) |
3,296 | 3,483,341 | ||||||
| 7.44%, 11/02/33 (Call 11/02/32), |
||||||||
| (1-year CMT + 3.500%)(a) |
7,135 | 7,807,298 | ||||||
| BPCE SA, 3.38%, 12/02/26 |
1,973 | 1,891,461 | ||||||
| Canadian Imperial Bank of Commerce |
||||||||
| 0.95%, 10/23/25 |
4,483 | 4,190,400 | ||||||
| 1.25%, 06/22/26 (Call 05/22/26) |
4,610 | 4,226,100 | ||||||
| 3.30%, 04/07/25 |
2,365 | 2,310,326 | ||||||
| 3.45%, 04/07/27 (Call 03/07/27) |
3,395 | 3,235,725 | ||||||
| 3.60%, 04/07/32 (Call 03/07/32)(b) |
2,695 | 2,405,876 | ||||||
| 3.95%, 08/04/25 |
4,020 | 3,941,450 | ||||||
| 5.00%, 04/28/28 (Call 03/28/28) |
3,785 | 3,771,348 | ||||||
| 5.14%, 04/28/25 |
2,590 | 2,581,175 | ||||||
| 5.62%, 07/17/26(b) |
1,480 | 1,494,284 | ||||||
| 5.93%, 10/02/26 |
2,495 | 2,539,182 | ||||||
| 5.99%, 10/03/28 (Call 09/03/28)(b) |
1,995 | 2,066,542 | ||||||
| 6.09%, 10/03/33 (Call 07/03/33) |
4,585 | 4,761,193 | ||||||
| Citibank NA |
||||||||
| 5.49%, 12/04/26 (Call 11/04/26) |
8,280 | 8,349,655 | ||||||
| 5.80%, 09/29/28 (Call 08/29/28) |
6,000 | 6,180,406 | ||||||
| 5.86%, 09/29/25 (Call 08/29/25) |
6,295 | 6,369,869 | ||||||
| Citigroup Inc. |
||||||||
| 1.12%, 01/28/27 (Call 01/28/26), |
||||||||
| (1-day SOFR + 0.765%)(a) |
10,588 | 9,760,306 | ||||||
| 1.46%, 06/09/27 (Call 06/09/26), |
||||||||
| (1-day SOFR + 0.770%)(a) |
11,233 | 10,293,918 | ||||||
| 2.52%, 11/03/32 (Call 11/03/31), |
||||||||
| (1-day SOFR + 1.177%)(a) |
3,680 | 2,986,593 | ||||||
| 2.56%, 05/01/32 (Call 05/01/31), |
||||||||
| (1-day SOFR + 1.167%)(a) |
11,620 | 9,565,218 | ||||||
| 2.57%, 06/03/31 (Call 06/03/30), |
||||||||
| (1-day SOFR + 2.107%)(a) |
14,580 | 12,332,552 | ||||||
| Security | Par (000) |
Value | ||||||
| Banks (continued) |
||||||||
| 2.67%, 01/29/31 (Call 01/29/30), |
||||||||
| (1-day SOFR + 1.146%)(a) |
$ | 10,157 | $ | 8,708,762 | ||||
| 2.90%, 11/03/42 (Call 11/03/41), |
||||||||
| (1-day SOFR + 1.379%)(a) |
5,030 | 3,559,925 | ||||||
| 2.98%, 11/05/30 (Call 11/05/29), |
||||||||
| (1-day SOFR + 1.422%)(a) |
7,507 | 6,622,493 | ||||||
| 3.06%, 01/25/33 (Call 01/25/32), |
||||||||
| (1-day SOFR + 1.351%)(a) |
11,355 | 9,540,368 | ||||||
| 3.07%, 02/24/28 (Call 02/24/27), |
||||||||
| (1-day SOFR + 1.280%)(a) |
7,530 | 7,054,175 | ||||||
| 3.11%, 04/08/26 (Call 04/08/25), |
||||||||
| (1-day SOFR + 2.842%)(a) |
14,882 | 14,487,404 | ||||||
| 3.20%, 10/21/26 (Call 07/21/26) |
12,008 | 11,404,453 | ||||||
| 3.29%, 03/17/26 (Call 03/17/25), |
||||||||
| (1-day SOFR + 1.528%)(a) |
5,150 | 5,029,791 | ||||||
| 3.30%, 04/27/25 |
5,972 | 5,839,707 | ||||||
| 3.40%, 05/01/26 |
8,685 | 8,356,423 | ||||||
| 3.52%, 10/27/28 (Call 10/27/27), |
||||||||
| (3-mo. SOFR + 1.412%)(a) |
9,703 | 9,114,271 | ||||||
| 3.67%, 07/24/28 (Call 07/24/27), |
||||||||
| (3-mo. SOFR + 1.652%)(a) |
9,825 | 9,313,415 | ||||||
| 3.70%, 01/12/26 |
9,127 | 8,885,825 | ||||||
| 3.79%, 03/17/33 (Call 03/17/32), |
||||||||
| (1-day SOFR + 1.939%)(a) |
10,390 | 9,205,940 | ||||||
| 3.88%, 03/26/25 |
5,743 | 5,633,099 | ||||||
| 3.88%, 01/24/39 (Call 01/24/38), |
||||||||
| (3-mo. SOFR + 1.430%)(a) |
4,846 | 4,076,990 | ||||||
| 3.89%, 01/10/28 (Call 01/10/27), |
||||||||
| (3-mo. SOFR + 1.825%)(a) |
11,012 | 10,581,642 | ||||||
| 3.98%, 03/20/30 (Call 03/20/29), |
||||||||
| (3-mo. SOFR + 1.600%)(a) |
9,799 | 9,187,729 | ||||||
| 4.08%, 04/23/29 (Call 04/23/28), |
||||||||
| (3-mo. SOFR + 1.454%)(a) |
8,346 | 7,963,281 | ||||||
| 4.13%, 07/25/28(b) |
8,629 | 8,189,374 | ||||||
| 4.28%, 04/24/48 (Call 04/24/47), |
||||||||
| (3-mo. SOFR + 2.101%)(a) |
5,459 | 4,613,754 | ||||||
| 4.30%, 11/20/26 |
4,478 | 4,361,756 | ||||||
| 4.40%, 06/10/25 |
5,910 | 5,824,000 | ||||||
| 4.41%, 03/31/31 (Call 03/31/30), |
||||||||
| (1-day SOFR + 3.914%)(a) |
13,849 | 13,085,193 | ||||||
| 4.45%, 09/29/27 |
14,202 | 13,759,149 | ||||||
| 4.60%, 03/09/26 |
6,590 | 6,481,603 | ||||||
| 4.65%, 07/30/45 |
5,280 | 4,713,220 | ||||||
| 4.65%, 07/23/48 (Call 06/23/48) |
9,898 | 8,821,834 | ||||||
| 4.66%, 05/24/28 (Call 05/24/27), |
||||||||
| (1-day SOFR + 1.887%)(a) |
4,530 | 4,447,403 | ||||||
| 4.75%, 05/18/46 |
8,878 | 7,765,232 | ||||||
| 4.91%, 05/24/33 (Call 05/24/32), |
||||||||
| (1-day SOFR + 2.086%)(a) |
4,510 | 4,319,903 | ||||||
| 5.17%, 02/13/30 (Call 02/13/29), |
||||||||
| (1-day SOFR + 1.364%)(a) |
5,080 | 5,028,345 | ||||||
| 5.30%, 05/06/44 |
4,705 | 4,495,162 | ||||||
| 5.32%, 03/26/41 (Call 03/26/40), |
||||||||
| (1-day SOFR + 4.548%)(a) |
5,337 | 5,221,407 | ||||||
| 5.50%, 09/13/25 |
6,763 | 6,746,934 | ||||||
| 5.61%, 09/29/26 (Call 09/29/25), |
||||||||
| (1-day SOFR + 1.546%)(a) |
11,645 | 11,658,408 | ||||||
| 5.83%, 02/13/35 (Call 02/13/34), |
||||||||
| (1-day SOFR + 2.056%)(a) |
7,625 | 7,458,670 | ||||||
| 5.88%, 02/22/33 |
2,072 | 2,108,172 | ||||||
| 5.88%, 01/30/42 |
6,329 | 6,651,399 | ||||||
| S C H E D U L E O F I N V E S T M E N T S |
17 |
| Schedule of Investments (continued) February 29, 2024 |
iShares® Core U.S. Aggregate Bond ETF (Percentages shown are based on Net Assets) |
| Security | Par (000) |
Value | ||||||
| Banks (continued) |
||||||||
| 6.00%, 10/31/33 |
$ | 7,155 | $ | 7,396,062 | ||||
| 6.13%, 08/25/36 |
2,358 | 2,437,418 | ||||||
| 6.17%, 05/25/34 (Call 05/25/33), |
||||||||
| (1-day SOFR + 2.661%)(a) |
6,160 | 6,202,277 | ||||||
| 6.27%, 11/17/33 (Call 11/17/32), |
||||||||
| (1-day SOFR + 2.338%)(a)(b) |
10,970 | 11,513,719 | ||||||
| 6.63%, 01/15/28 |
1,447 | 1,533,778 | ||||||
| 6.63%, 06/15/32 |
5,155 | 5,490,008 | ||||||
| 6.68%, 09/13/43 |
5,459 | 5,986,320 | ||||||
| 8.13%, 07/15/39 |
9,463 | 11,981,878 | ||||||
| Citizens Bank NA |
||||||||
| 2.25%, 04/28/25 (Call 03/28/25) |
3,601 | 3,450,337 | ||||||
| 4.58%, 08/09/28 (Call 08/09/27), |
||||||||
| (1-day SOFR + 2.000%)(a) |
2,483 | 2,364,635 | ||||||
| Citizens Bank NA/Providence RI, 3.75%, 02/18/26 (Call 11/18/25) |
2,737 | 2,630,084 | ||||||
| Citizens Financial Group Inc. |
||||||||
| 2.50%, 02/06/30 (Call 11/06/29) |
946 | 784,160 | ||||||
| 2.64%, 09/30/32 (Call 07/02/32) |
2,087 | 1,580,125 | ||||||
| 2.85%, 07/27/26 (Call 04/27/26) |
2,430 | 2,270,624 | ||||||
| 3.25%, 04/30/30 (Call 01/30/30) |
2,973 | 2,572,034 | ||||||
| 4.30%, 12/03/25 (Call 11/03/25) |
979 | 953,756 | ||||||
| 5.64%, 05/21/37 (Call 05/21/32), |
||||||||
| (5-year CMT + 2.750%)(a) |
1,315 | 1,203,805 | ||||||
| 5.84%, 01/23/30 (Call 01/23/29), |
||||||||
| (1-day SOFR + 2.010%)(a) |
590 | 582,911 | ||||||
| Comerica Bank |
||||||||
| 4.00%, 07/27/25(b) |
1,180 | 1,143,744 | ||||||
| 5.33%, 08/25/33 (Call 08/25/32), |
||||||||
| (1-day SOFR + 2.610%)(a) |
830 | 743,402 | ||||||
| Comerica Inc. |
||||||||
| 4.00%, 02/01/29 (Call 11/03/28)(b) |
2,546 | 2,288,608 | ||||||
| 5.98%, 01/30/30 (Call 01/30/29), |
||||||||
| (1-day SOFR + 2.155%)(a) |
210 | 206,238 | ||||||
| Commonwealth Bank of Australia/New York |
||||||||
| 5.32%, 03/13/26 |
1,115 | 1,120,830 | ||||||
| 5.50%, 09/12/25 |
2,595 | 2,608,907 | ||||||
| Cooperatieve Rabobank UA |
||||||||
| 3.75%, 07/21/26 |
5,413 | 5,188,417 | ||||||
| 4.38%, 08/04/25 |
5,554 | 5,446,092 | ||||||
| 4.80%, 01/09/29(b) |
1,500 | 1,485,781 | ||||||
| 4.85%, 01/09/26 |
2,120 | 2,110,132 | ||||||
| 5.04%, 03/05/27 |
2,000 | 2,000,347 | ||||||
| 5.25%, 05/24/41 |
6,941 | 7,012,842 | ||||||
| 5.25%, 08/04/45 |
4,595 | 4,455,541 | ||||||
| 5.75%, 12/01/43 |
4,735 | 4,752,518 | ||||||
| Cooperatieve Rabobank UA/NY |
||||||||
| 3.38%, 05/21/25 |
3,947 | 3,865,159 | ||||||
| 5.50%, 07/18/25 |
3,370 | 3,385,286 | ||||||
| 5.50%, 10/05/26 |
3,650 | 3,690,954 | ||||||
| Credit Suisse AG/New York |
||||||||
| 1.25%, 08/07/26 |
4,963 | 4,507,325 | ||||||
| 2.95%, 04/09/25 |
4,844 | 4,704,641 | ||||||
| 5.00%, 07/09/27 |
7,130 | 7,062,507 | ||||||
| 7.50%, 02/15/28 |
4,335 | 4,669,248 | ||||||
| Deutsche Bank AG |
||||||||
| 4.10%, 01/13/26 |
2,529 | 2,465,503 | ||||||
| 4.50%, 04/01/25 |
2,558 | 2,508,926 | ||||||
| 5.71%, 02/08/28 (Call 02/08/27), |
||||||||
| (1-day SOFR + 1.594%)(a) |
1,645 | 1,633,451 | ||||||
| Security | Par (000) |
Value | ||||||
| Banks (continued) |
||||||||
| Deutsche Bank AG/New York |
||||||||
| 1.69%, 03/19/26 |
$ | 5,543 | $ | 5,164,925 | ||||
| 2.13%, 11/24/26 (Call 11/24/25), |
||||||||
| (1-day SOFR + 1.870%)(a) |
7,884 | 7,392,190 | ||||||
| 2.31%, 11/16/27 (Call 11/16/26), |
||||||||
| (1-day SOFR + 1.219%)(a) |
6,283 | 5,706,919 | ||||||
| 2.55%, 01/07/28 (Call 01/07/27), |
||||||||
| (1-day SOFR + 1.318%)(a) |
5,655 | 5,150,600 | ||||||
| 3.04%, 05/28/32 (Call 05/28/31), |
||||||||
| (1-day SOFR + 1.718%)(a) |
2,664 | 2,201,738 | ||||||
| 3.55%, 09/18/31 (Call 09/18/30), |
||||||||
| (1-day SOFR + 3.043%)(a) |
8,107 | 7,022,694 | ||||||
| 3.73%, 01/14/32 (Call 10/14/30), |
||||||||
| (1-day SOFR + 2.757%)(a) |
6,320 | 5,184,981 | ||||||
| 3.74%, 01/07/33 (Call 10/07/31), |
||||||||
| (1-day SOFR + 2.257%)(a) |
5,245 | 4,222,332 | ||||||
| 4.10%, 01/13/26 |
2,258 | 2,204,191 | ||||||
| 4.16%, 05/13/25 |
3,485 | 3,429,910 | ||||||
| 4.88%, 12/01/32 (Call 12/01/27), |
||||||||
| (5-year USD ICE Swap + 2.553%)(a) |
3,345 | 3,093,429 | ||||||
| 5.37%, 09/09/27 |
1,699 | 1,700,553 | ||||||
| 5.88%, 07/08/31 (Call 04/08/30), |
||||||||
| (1-day SOFR + 5.438%)(a) |
370 | 352,195 | ||||||
| 6.12%, 07/14/26 (Call 07/14/25), |
||||||||
| (1-day SOFR + 3.190%)(a) |
3,335 | 3,341,958 | ||||||
| 6.72%, 01/18/29 (Call 01/18/28), |
||||||||
| (1-day SOFR + 3.180%)(a) |
4,805 | 4,935,441 | ||||||
| 6.82%, 11/20/29 (Call 11/20/28), |
||||||||
| (1-day SOFR + 2.510%)(a) |
6,150 | 6,358,502 | ||||||
| 7.08%, 02/10/34 (Call 11/10/32), |
||||||||
| (1-day SOFR + 3.650%)(a) |
2,965 | 2,959,660 | ||||||
| 7.15%, 07/13/27 (Call 07/13/26), |
||||||||
| (1-day SOFR + 2.520%)(a) |
4,495 | 4,613,576 | ||||||
| Discover Bank |
||||||||
| 2.70%, 02/06/30 (Call 11/06/29) |
2,098 | 1,778,900 | ||||||
| 3.45%, 07/27/26 (Call 04/27/26) |
4,288 | 4,066,111 | ||||||
| 4.25%, 03/13/26 |
2,145 | 2,083,245 | ||||||
| 4.65%, 09/13/28 (Call 06/13/28) |
3,472 | 3,315,069 | ||||||
| Fifth Third Bancorp |
||||||||
| 1.71%, 11/01/27 (Call 11/01/26), |
||||||||
| (1-day SOFR + 0.685%)(a) |
2,829 | 2,537,743 | ||||||
| 2.55%, 05/05/27 (Call 04/05/27) |
3,399 | 3,120,894 | ||||||
| 3.95%, 03/14/28 (Call 02/14/28) |
290 | 275,490 | ||||||
| 4.06%, 04/25/28 (Call 04/25/27), |
||||||||
| (1-day SOFR + 1.355%)(a) |
1,958 | 1,851,922 | ||||||
| 4.34%, 04/25/33 (Call 04/25/32), |
||||||||
| (1-day SOFR + 1.660%)(a)(b) |
936 | 847,734 | ||||||
| 4.77%, 07/28/30 (Call 07/28/29), |
||||||||
| (1-day SOFR + 2.127%)(a) |
3,725 | 3,551,771 | ||||||
| 5.63%, 01/29/32 (Call 01/29/31), |
||||||||
| (1-day SOFR + 1.840%)(a) |
1,270 | 1,259,912 | ||||||
| 6.34%, 07/27/29 (Call 07/27/28), |
||||||||
| (1-day SOFR + 2.340%)(a) |
800 | 821,523 | ||||||
| 6.36%, 10/27/28 (Call 10/27/27), |
||||||||
| (1-day SOFR + 2.192%)(a) |
4,240 | 4,320,667 | ||||||
| 8.25%, 03/01/38 |
5,257 | 6,215,073 | ||||||
| Fifth Third Bank NA |
||||||||
| 2.25%, 02/01/27 (Call 01/01/27) |
2,801 | 2,568,200 | ||||||
| 3.85%, 03/15/26 (Call 02/15/26) |
3,474 | 3,340,809 | ||||||
| 3.95%, 07/28/25 (Call 06/28/25) |
2,937 | 2,871,668 | ||||||
| 18 | 2 0 2 4 I S H A R E S A N N U A L R E P O R T T O S H A R E H O L D E R S |
| Schedule of Investments (continued) February 29, 2024 |
iShares® Core U.S. Aggregate Bond ETF (Percentages shown are based on Net Assets) |
| Security | Par (000) |
Value | ||||||
| Banks (continued) |
||||||||
| First Citizens BancShares Inc./NC, 3.38%, |
||||||||
| 03/15/30 (Call 03/15/25), |
||||||||
| (3-mo. SOFR + 2.465%)(a)(b) |
$ | 1,165 | $ | 1,116,456 | ||||
| First Horizon Bank, 5.75%, 05/01/30 (Call 02/01/30)(b) |
1,596 | 1,491,932 | ||||||
| First Horizon Corp., 4.00%, 05/26/25 (Call 04/26/25) |
1,285 | 1,250,858 | ||||||
| First-Citizens Bank & Trust Co., 6.13%, 03/09/28 |
930 | 942,265 | ||||||
| FNB Corp., 5.15%, 08/25/25 (Call 07/25/25) |
535 | 525,344 | ||||||
| Goldman Sachs Capital I, 6.35%, 02/15/34(b) |
6,083 | 6,238,145 | ||||||
| Goldman Sachs Group Inc. (The) |
||||||||
| 1.09%, 12/09/26 (Call 12/09/25), |
||||||||
| (1-day SOFR + 0.789%)(a) |
4,432 | 4,106,579 | ||||||
| 1.43%, 03/09/27 (Call 03/09/26), |
||||||||
| (1-day SOFR + 0.798%)(a) |
12,340 | 11,406,386 | ||||||
| 1.54%, 09/10/27 (Call 09/10/26), |
||||||||
| (1-day SOFR + 0.818%)(a) |
13,303 | 12,091,954 | ||||||
| 1.95%, 10/21/27 (Call 10/21/26), |
||||||||
| (1-day SOFR + 0.913%)(a) |
17,610 | 16,125,870 | ||||||
| 1.99%, 01/27/32 (Call 01/27/31), |
||||||||
| (1-day SOFR + 1.090%)(a) |
10,195 | 8,173,692 | ||||||
| 2.38%, 07/21/32 (Call 07/21/31), |
||||||||
| (1-day SOFR + 1.248%)(a) |
9,817 | 7,988,424 | ||||||
| 2.60%, 02/07/30 (Call 11/07/29) |
8,746 | 7,587,731 | ||||||
| 2.62%, 04/22/32 (Call 04/22/31), |
||||||||
| (1-day SOFR + 1.281%)(a) |
14,550 | 12,093,222 | ||||||
| 2.64%, 02/24/28 (Call 02/24/27), |
||||||||
| (1-day SOFR + 1.114%)(a) |
12,850 | 11,905,126 | ||||||
| 2.65%, 10/21/32 (Call 10/21/31), |
||||||||
| (1-day SOFR + 1.264%)(a) |
12,105 | 9,982,763 | ||||||
| 2.91%, 07/21/42 (Call 07/21/41), |
||||||||
| (1-day SOFR + 1.472%)(a) |
8,135 | 5,765,861 | ||||||
| 3.10%, 02/24/33 (Call 02/24/32), |
||||||||
| (1-day SOFR + 1.410%)(a) |
15,340 | 13,000,186 | ||||||
| 3.21%, 04/22/42 (Call 04/22/41), |
||||||||
| (1-day SOFR + 1.513%)(a) |
10,583 | 7,873,340 | ||||||
| 3.44%, 02/24/43 (Call 02/24/42), |
||||||||
| (1-day SOFR + 1.632%)(a) |
6,785 | 5,162,983 | ||||||
| 3.50%, 04/01/25 (Call 03/01/25) |
13,250 | 12,976,235 | ||||||
| 3.50%, 11/16/26 (Call 11/16/25) |
12,696 | 12,177,859 | ||||||
| 3.62%, 03/15/28 (Call 03/15/27), |
||||||||
| (1-day SOFR + 1.846%)(a) |
6,615 | 6,307,725 | ||||||
| 3.69%, 06/05/28 (Call 06/05/27), |
||||||||
| (3-mo. SOFR + 1.772%)(a) |
9,972 | 9,511,994 | ||||||
| 3.75%, 05/22/25 (Call 02/22/25) |
9,315 | 9,135,433 | ||||||
| 3.75%, 02/25/26 (Call 11/25/25) |
7,863 | 7,666,531 | ||||||
| 3.80%, 03/15/30 (Call 12/15/29) |
9,937 | 9,239,335 | ||||||
| 3.81%, 04/23/29 (Call 04/23/28), |
||||||||
| (3-mo. SOFR + 1.420%)(a) |
10,139 | 9,577,768 | ||||||
| 3.85%, 01/26/27 (Call 01/26/26) |
13,274 | 12,825,570 | ||||||
| 4.02%, 10/31/38 (Call 10/31/37), |
||||||||
| (3-mo. SOFR + 1.635%)(a) |
8,851 | 7,580,142 | ||||||
| 4.22%, 05/01/29 (Call 05/01/28), |
||||||||
| (3-mo. SOFR + 1.563%)(a) |
12,036 | 11,540,765 | ||||||
| 4.25%, 10/21/25 |
9,399 | 9,230,139 | ||||||
| 4.39%, 06/15/27 (Call 06/15/26), |
||||||||
| (1-day SOFR + 1.510%)(a) |
3,416 | 3,352,885 | ||||||
| 4.41%, 04/23/39 (Call 04/23/38), |
||||||||
| (3-mo. SOFR + 1.692%)(a) |
5,733 | 5,077,336 | ||||||
| Security | Par (000) |
Value | ||||||
| Banks (continued) |
||||||||
| 4.48%, 08/23/28 (Call 08/23/27), |
||||||||
| (1-day SOFR + 1.725%)(a) |
$ | 10,770 | $ | 10,506,755 | ||||
| 4.75%, 10/21/45 (Call 04/21/45) |
7,099 | 6,478,758 | ||||||
| 4.80%, 07/08/44 (Call 01/08/44) |
8,459 | 7,703,461 | ||||||
| 5.15%, 05/22/45 |
8,957 | 8,559,707 | ||||||
| 5.80%, 08/10/26 (Call 08/10/25), |
||||||||
| (1-day SOFR + 1.075%)(a) |
8,880 | 8,928,431 | ||||||
| 5.95%, 01/15/27 |
4,463 | 4,554,725 | ||||||
| 6.13%, 02/15/33 |
5,383 | 5,772,704 | ||||||
| 6.25%, 02/01/41 |
10,226 | 11,036,860 | ||||||
| 6.45%, 05/01/36(b) |
4,479 | 4,784,515 | ||||||
| 6.48%, 10/24/29 (Call 10/24/28), |
||||||||
| (1-day SOFR + 1.770%)(a) |
10,800 | 11,319,829 | ||||||
| 6.56%, 10/24/34 (Call 10/24/33), |
||||||||
| (1-day SOFR + 1.950%)(a) |
1,725 | 1,863,611 | ||||||
| 6.75%, 10/01/37 |
22,771 | 24,763,506 | ||||||
| HSBC Bank USA NA, 7.00%, 01/15/39 |
3,005 | 3,423,345 | ||||||
| HSBC Bank USA NA/New York |
||||||||
| 5.63%, 08/15/35 |
1,115 | 1,092,687 | ||||||
| 5.88%, 11/01/34 |
1,240 | 1,281,311 | ||||||
| HSBC Holdings PLC |
||||||||
| 1.59%, 05/24/27 (Call 05/24/26), |
||||||||
| (1-day SOFR + 1.290%)(a) |
6,000 | 5,492,334 | ||||||
| 1.65%, 04/18/26 (Call 04/18/25), |
||||||||
| (1-day SOFR + 1.538%)(a) |
9,063 | 8,647,588 | ||||||
| 2.01%, 09/22/28 (Call 09/22/27), |
||||||||
| (1-day SOFR + 1.732%)(a) |
4,150 | 3,677,268 | ||||||
| 2.10%, 06/04/26 (Call 06/04/25), |
||||||||
| (1-day SOFR + 1.929%)(a) |
6,220 | 5,948,654 | ||||||
| 2.21%, 08/17/29 (Call 08/17/28), |
||||||||
| (1-day SOFR + 1.285%)(a) |
4,460 | 3,872,059 | ||||||
| 2.25%, 11/22/27 (Call 11/22/26), |
||||||||
| (1-day SOFR + 1.100%)(a) |
9,395 | 8,599,637 | ||||||
| 2.36%, 08/18/31 (Call 08/18/30), |
||||||||
| (1-day SOFR + 1.947%)(a) |
6,328 | 5,193,191 | ||||||
| 2.80%, 05/24/32 (Call 05/24/31), |
||||||||
| (1-day SOFR + 1.187%)(a) |
11,800 | 9,750,472 | ||||||
| 2.85%, 06/04/31 (Call 06/04/30), |
||||||||
| (1-day SOFR + 2.387%)(a) |
5,028 | 4,277,759 | ||||||
| 2.87%, 11/22/32 (Call 11/22/31), |
||||||||
| (1-day SOFR + 1.410%)(a) |
8,205 | 6,752,274 | ||||||
| 3.00%, 03/10/26 (Call 03/10/25), |
||||||||
| (1-day SOFR + 1.430%)(a) |
5,675 | 5,516,491 | ||||||
| 3.90%, 05/25/26 |
10,594 | 10,265,566 | ||||||
| 3.97%, 05/22/30 (Call 05/22/29), |
||||||||
| (3-mo. SOFR + 1.872%)(a) |
12,115 | 11,223,544 | ||||||
| 4.04%, 03/13/28 (Call 03/13/27), |
||||||||
| (3-mo. SOFR + 1.808%)(a) |
11,151 | 10,684,450 | ||||||
| 4.25%, 08/18/25 |
6,926 | 6,783,073 | ||||||
| 4.29%, 09/12/26 (Call 09/12/25), |
||||||||
| (3-mo. SOFR + 1.609%)(a) |
10,859 | 10,647,726 | ||||||
| 4.30%, 03/08/26 |
12,737 | 12,462,435 | ||||||
| 4.38%, 11/23/26 |
6,651 | 6,469,506 | ||||||
| 4.58%, 06/19/29 (Call 06/19/28), |
||||||||
| (3-mo. SOFR + 1.796%)(a) |
16,647 | 16,014,086 | ||||||
| 4.76%, 06/09/28 (Call 06/09/27), |
||||||||
| (1-day SOFR + 2.110%)(a) |
11,430 | 11,160,079 | ||||||
| 4.76%, 03/29/33 (Call 03/29/32), |
||||||||
| (1-day SOFR + 2.530%)(a) |
7,520 | 6,899,072 | ||||||
| 4.95%, 03/31/30 |
10,150 | 9,938,301 | ||||||
| S C H E D U L E O F I N V E S T M E N T S |
19 |
| Schedule of Investments (continued) February 29, 2024 |
iShares® Core U.S. Aggregate Bond ETF (Percentages shown are based on Net Assets) |
| Security | Par (000) |
Value | ||||||
| Banks (continued) |
||||||||
| 5.21%, 08/11/28 (Call 08/11/27), |
||||||||
| (1-day SOFR + 2.610%)(a) |
$ | 3,390 | $ | 3,357,512 | ||||
| 5.25%, 03/14/44 |
4,629 | 4,404,359 | ||||||
| 5.40%, 08/11/33 (Call 08/11/32), |
||||||||
| (1-day SOFR + 2.870%)(a) |
8,925 | 8,769,220 | ||||||
| 5.55%, 03/04/30 (Call 03/04/29), |
||||||||
| (1-day SOFR + 1.460%)(a) |
5,800 | 5,795,229 | ||||||
| 5.72%, 03/04/35 (Call 03/04/34), |
||||||||
| (1-day SOFR + 1.780%)(a) |
5,800 | 5,779,568 | ||||||
| 5.89%, 08/14/27 (Call 08/14/26), |
||||||||
| (1-day SOFR + 1.570%)(a) |
6,685 | 6,726,184 | ||||||
| 6.10%, 01/14/42 |
4,182 | 4,569,675 | ||||||
| 6.16%, 03/09/29 (Call 03/09/28), |
||||||||
| (1-day SOFR + 1.970%)(a) |
6,270 | 6,405,404 | ||||||
| 6.25%, 03/09/34 (Call 03/09/33), |
||||||||
| (1-day SOFR + 2.390%)(a)(b) |
9,800 | 10,169,639 | ||||||
| 6.33%, 03/09/44 (Call 03/09/43), |
||||||||
| (1-day SOFR + 2.650%)(a) |
9,715 | 10,205,502 | ||||||
| 6.50%, 05/02/36 |
8,392 | 8,628,705 | ||||||
| 6.50%, 09/15/37 |
9,597 | 9,887,977 | ||||||
| 6.55%, 06/20/34 (Call 06/20/33), |
||||||||
| (1-day SOFR + 2.980%)(a) |
4,880 | 4,966,922 | ||||||
| 6.80%, 06/01/38 |
6,415 | 6,744,678 | ||||||
| 7.34%, 11/03/26 (Call 11/03/25), |
||||||||
| (1-day SOFR + 3.030%)(a) |
7,950 | 8,181,275 | ||||||
| 7.39%, 11/03/28 (Call 11/03/27), |
||||||||
| (1-day SOFR + 3.350%)(a) |
9,000 | 9,528,181 | ||||||
| 7.40%, 11/13/34 (Call 11/13/33), |
||||||||
| (1-day SOFR + 3.020%)(a) |
6,590 | 7,060,594 | ||||||
| 8.11%, 11/03/33 (Call 11/03/32), |
||||||||
| (1-day SOFR + 4.250%)(a) |
8,980 | 10,111,658 | ||||||
| HSBC USA Inc. |
||||||||
| 5.29%, 03/04/27 |
2,155 | 2,156,727 | ||||||
| 5.63%, 03/17/25 |
1,335 | 1,336,463 | ||||||
| Huntington Bancshares Inc./OH |
||||||||
| 2.49%, 08/15/36 (Call 08/15/31), |
||||||||
| (5-year CMT + 1.170%)(a) |
1,800 | 1,358,534 | ||||||
| 2.55%, 02/04/30 (Call 11/04/29) |
2,747 | 2,312,100 | ||||||
| 4.00%, 05/15/25 (Call 04/15/25) |
1,866 | 1,832,247 | ||||||
| 4.44%, 08/04/28 (Call 08/04/27), |
||||||||
| (1-day SOFR + 1.970%)(a) |
2,460 | 2,362,339 | ||||||
| 5.02%, 05/17/33 (Call 05/17/32), |
||||||||
| (1-day SOFR + 2.050%)(a) |
1,204 | 1,137,865 | ||||||
| 5.71%, 02/02/35 (Call 02/02/34), |
||||||||
| (1-day SOFR + 1.870%)(a)(b) |
510 | 503,345 | ||||||
| 6.21%, 08/21/29 (Call 08/21/28), |
||||||||
| (1-day SOFR + 2.020%)(a) |
1,130 | 1,149,310 | ||||||
| Huntington National Bank (The) |
||||||||
| 4.55%, 05/17/28 (Call 05/17/27), |
||||||||
| (1-day SOFR + 1.650%)(a) |
3,000 | 2,891,998 | ||||||
| 5.65%, 01/10/30 (Call 11/10/29) |
2,200 | 2,190,386 | ||||||
| Industrial & Commercial Bank of China Ltd./New York, 3.54%, 11/08/27 |
2,340 | 2,231,973 | ||||||
| ING Groep NV |
||||||||
| 1.73%, 04/01/27 (Call 04/01/26), |
||||||||
| (1-day SOFR + 1.005%)(a) |
5,106 | 4,725,605 | ||||||
| 2.73%, 04/01/32 (Call 04/01/31), |
||||||||
| (1-day SOFR + 1.316%)(a) |
3,298 | 2,774,255 | ||||||
| 3.87%, 03/28/26 (Call 03/28/25), |
||||||||
| (1-day SOFR + 1.640%)(a) |
3,015 | 2,957,443 | ||||||
| 3.95%, 03/29/27 |
5,845 | 5,627,560 | ||||||
| Security | Par (000) |
Value | ||||||
| Banks (continued) |
||||||||
| 4.02%, 03/28/28 (Call 03/28/27), |
||||||||
| (1-day SOFR + 1.830%)(a) |
$ | 2,748 | $ | 2,637,586 | ||||
| 4.05%, 04/09/29 |
4,815 | 4,553,283 | ||||||
| 4.25%, 03/28/33 (Call 03/28/32), |
||||||||
| (1-day SOFR + 2.070%)(a)(b) |
2,805 | 2,578,906 | ||||||
| 4.55%, 10/02/28 |
5,171 | 5,041,009 | ||||||
| 6.08%, 09/11/27 (Call 09/11/26), |
||||||||
| (1-day SOFR + 1.560%)(a) |
2,200 | 2,224,986 | ||||||
| 6.11%, 09/11/34 (Call 09/11/33), |
||||||||
| (1-day SOFR + 2.090%)(a) |
1,750 | 1,805,586 | ||||||
| JPMorgan Chase & Co. |
||||||||
| 1.04%, 02/04/27 (Call 02/04/26), |
||||||||
| (3-mo. SOFR + 0.695%)(a) |
5,181 | 4,774,419 | ||||||
| 1.05%, 11/19/26 (Call 11/19/25), |
||||||||
| (1-day SOFR + 0.800%)(a) |
4,127 | 3,839,309 | ||||||
| 1.47%, 09/22/27 (Call 09/22/26), |
||||||||
| (1-day SOFR + 0.765%)(a) |
8,603 | 7,817,180 | ||||||
| 1.58%, 04/22/27 (Call 04/22/26), |
||||||||
| (1-day SOFR + 0.885%)(a) |
7,441 | 6,877,692 | ||||||
| 1.76%, 11/19/31 (Call 11/19/30), |
||||||||
| (3-mo. SOFR + 1.105%)(a) |
3,505 | 2,822,209 | ||||||
| 1.95%, 02/04/32 (Call 02/04/31), |
||||||||
| (1-day SOFR + 1.065%)(a) |
11,190 | 8,998,764 | ||||||
| 2.01%, 03/13/26 (Call 03/13/25), |
||||||||
| (3-mo. SOFR + 1.585%)(a) |
10,365 | 9,990,884 | ||||||
| 2.07%, 06/01/29 (Call 06/01/28), |
||||||||
| (1-day SOFR + 1.015%)(a) |
9,006 | 7,929,838 | ||||||
| 2.08%, 04/22/26 (Call 04/22/25), |
||||||||
| (1-day SOFR + 1.850%)(a) |
15,023 | 14,456,280 | ||||||
| 2.18%, 06/01/28 (Call 06/01/27), |
||||||||
| (1-day SOFR + 1.890%)(a) |
7,665 | 6,981,281 | ||||||
| 2.52%, 04/22/31 (Call 04/22/30), |
||||||||
| (1-day SOFR + 2.040%)(a) |
13,416 | 11,460,668 | ||||||
| 2.53%, 11/19/41 (Call 11/19/40), |
||||||||
| (3-mo. SOFR + 1.510%)(a) |
5,795 | 3,986,468 | ||||||
| 2.55%, 11/08/32 (Call 11/08/31), |
||||||||
| (1-day SOFR + 1.180%)(a) |
9,195 | 7,573,710 | ||||||
| 2.58%, 04/22/32 (Call 04/22/31), |
||||||||
| (3-mo. SOFR + 1.250%)(a) |
9,409 | 7,866,641 | ||||||
| 2.74%, 10/15/30 (Call 10/15/29), |
||||||||
| (3-mo. SOFR + 1.510%)(a) |
8,431 | 7,396,392 | ||||||
| 2.95%, 10/01/26 (Call 07/01/26) |
13,126 | 12,476,040 | ||||||
| 2.95%, 02/24/28 (Call 02/24/27), |
||||||||
| (1-day SOFR + 1.170%)(a) |
5,419 | 5,074,506 | ||||||
| 2.96%, 05/13/31 (Call 05/13/30), |
||||||||
| (3-mo. SOFR + 2.515%)(a) |
5,971 | 5,183,791 | ||||||
| 2.96%, 01/25/33 (Call 01/25/32), |
||||||||
| (1-day SOFR + 1.260%)(a) |
12,220 | 10,318,175 | ||||||
| 3.11%, 04/22/41 (Call 04/22/40), |
||||||||
| (3-mo. SOFR + 2.460%)(a) |
8,483 | 6,379,434 | ||||||
| 3.11%, 04/22/51 (Call 04/22/50), |
||||||||
| (1-day SOFR + 2.440%)(a) |
10,910 | 7,481,168 | ||||||
| 3.16%, 04/22/42 (Call 04/22/41), |
||||||||
| (1-day SOFR + 1.460%)(a) |
5,910 | 4,425,493 | ||||||
| 3.20%, 06/15/26 (Call 03/15/26) |
7,785 | 7,488,619 | ||||||
| 3.30%, 04/01/26 (Call 01/01/26) |
12,004 | 11,577,399 | ||||||
| 3.33%, 04/22/52 (Call 04/22/51), |
||||||||
| (1-day SOFR + 1.580%)(a) |
12,080 | 8,566,351 | ||||||
| 3.51%, 01/23/29 (Call 01/23/28), |
||||||||
| (3-mo. SOFR + 1.207%)(a) |
10,143 | 9,554,927 | ||||||
| 20 | 2 0 2 4 I S H A R E S A N N U A L R E P O R T T O S H A R E H O L D E R S |
| Schedule of Investments (continued) February 29, 2024 |
iShares® Core U.S. Aggregate Bond ETF (Percentages shown are based on Net Assets) |
| Security | Par (000) |
Value | ||||||
| Banks (continued) |
||||||||
| 3.54%, 05/01/28 (Call 05/01/27), |
||||||||
| (3-mo. SOFR + 1.642%)(a) |
$ | 9,210 | $ | 8,750,063 | ||||
| 3.63%, 12/01/27 (Call 12/01/26) |
6,311 | 5,997,619 | ||||||
| 3.70%, 05/06/30 (Call 05/06/29), |
||||||||
| (3-mo. SOFR + 1.422%)(a) |
12,751 | 11,869,080 | ||||||
| 3.78%, 02/01/28 (Call 02/01/27), |
||||||||
| (3-mo. SOFR + 1.599%)(a) |
12,291 | 11,799,476 | ||||||
| 3.88%, 07/24/38 (Call 07/24/37), |
||||||||
| (3-mo. SOFR + 1.622%)(a) |
12,021 | 10,271,693 | ||||||
| 3.90%, 07/15/25 (Call 04/15/25) |
11,140 | 10,950,173 | ||||||
| 3.90%, 01/23/49 (Call 01/23/48), |
||||||||
| (3-mo. SOFR + 1.482%)(a) |
9,133 | 7,303,749 | ||||||
| 3.96%, 01/29/27 (Call 01/29/26), |
||||||||
| (3-mo. SOFR + 1.507%)(a) |
9,803 | 9,566,628 | ||||||
| 3.96%, 11/15/48 (Call 11/15/47), |
||||||||
| (3-mo. SOFR + 1.642%)(a) |
12,570 | 10,096,721 | ||||||
| 4.01%, 04/23/29 (Call 04/23/28), |
||||||||
| (3-mo. SOFR + 1.382%)(a) |
7,254 | 6,925,719 | ||||||
| 4.03%, 07/24/48 (Call 07/24/47), |
||||||||
| (3-mo. SOFR + 1.722%)(a) |
7,501 | 6,084,032 | ||||||
| 4.08%, 04/26/26 (Call 04/26/25), |
||||||||
| (1-day SOFR + 1.320%)(a) |
13,005 | 12,810,491 | ||||||
| 4.13%, 12/15/26 |
10,781 | 10,523,913 | ||||||
| 4.20%, 07/23/29 (Call 07/23/28), |
||||||||
| (3-mo. SOFR + 1.522%)(a) |
10,897 | 10,468,349 | ||||||
| 4.25%, 10/01/27 |
5,583 | 5,460,946 | ||||||
| 4.26%, 02/22/48 (Call 02/22/47), |
||||||||
| (3-mo. SOFR + 1.842%)(a) |
9,634 | 8,123,571 | ||||||
| 4.32%, 04/26/28 (Call 04/26/27), |
||||||||
| (1-day SOFR + 1.560%)(a) |
12,248 | 11,954,029 | ||||||
| 4.45%, 12/05/29 (Call 12/05/28), |
||||||||
| (3-mo. SOFR + 1.592%)(a) |
10,886 | 10,527,930 | ||||||
| 4.49%, 03/24/31 (Call 03/24/30), |
||||||||
| (3-mo. SOFR + 3.790%)(a) |
12,750 | 12,242,323 | ||||||
| 4.57%, 06/14/30 (Call 06/14/29), |
||||||||
| (1-day SOFR + 1.750%)(a) |
8,796 | 8,519,885 | ||||||
| 4.59%, 04/26/33 (Call 04/26/32), |
||||||||
| (1-day SOFR + 1.800%)(a) |
8,180 | 7,767,299 | ||||||
| 4.85%, 07/25/28 (Call 07/25/27), |
||||||||
| (1-day SOFR + 1.990%)(a) |
8,290 | 8,197,911 | ||||||
| 4.85%, 02/01/44 |
6,261 | 5,874,586 | ||||||
| 4.91%, 07/25/33 (Call 07/25/32), |
||||||||
| (1-day SOFR + 2.080%)(a) |
17,550 | 17,026,812 | ||||||
| 4.95%, 06/01/45 |
5,661 | 5,279,818 | ||||||
| 5.01%, 01/23/30 (Call 01/23/29), |
||||||||
| (1-day SOFR + 1.310%)(a) |
10,405 | 10,295,588 | ||||||
| 5.04%, 01/23/28 (Call 01/23/27), |
||||||||
| (1-day SOFR + 1.190%)(a) |
6,845 | 6,808,465 | ||||||
| 5.30%, 07/24/29 (Call 07/24/28), |
||||||||
| (1-day SOFR + 1.450%)(a) |
10,800 | 10,829,248 | ||||||
| 5.34%, 01/23/35 (Call 01/23/34), |
||||||||
| (1-day SOFR + 1.620%)(a) |
4,715 | 4,691,143 | ||||||
| 5.35%, 06/01/34 (Call 06/01/33), |
||||||||
| (1-day SOFR + 1.845%)(a) |
14,210 | 14,136,197 | ||||||
| 5.40%, 01/06/42 |
7,559 | 7,650,401 | ||||||
| 5.50%, 10/15/40 |
7,049 | 7,206,541 | ||||||
| 5.60%, 07/15/41 |
9,240 | 9,525,135 | ||||||
| 5.63%, 08/16/43 |
7,148 | 7,331,558 | ||||||
| 5.72%, 09/14/33 (Call 09/14/32), |
||||||||
| (1-day SOFR + 2.580%)(a)(b) |
14,835 | 15,017,781 | ||||||
| Security | Par (000) |
Value | ||||||
| Banks (continued) |
||||||||
| 6.07%, 10/22/27 (Call 10/22/26), |
||||||||
| (1-day SOFR + 1.330%)(a) |
$ | 8,560 | $ | 8,723,154 | ||||
| 6.09%, 10/23/29 (Call 10/23/28), |
||||||||
| (1-day SOFR + 1.570%)(a) |
7,665 | 7,923,533 | ||||||
| 6.25%, 10/23/34 (Call 10/23/33), |
||||||||
| (1-day SOFR + 1.810%)(a) |
12,055 | 12,796,285 | ||||||
| 6.40%, 05/15/38 |
9,961 | 11,118,466 | ||||||
| 7.63%, 10/15/26 |
4,986 | 5,297,889 | ||||||
| 7.75%, 07/15/25 |
1,250 | 1,295,024 | ||||||
| 8.00%, 04/29/27 |
7,431 | 8,080,805 | ||||||
| 8.75%, 09/01/30 |
1,424 | 1,676,996 | ||||||
| JPMorgan Chase Bank NA, 5.11%, 12/08/26 (Call 11/08/26) |
8,465 | 8,474,362 | ||||||
| KeyBank NA |
||||||||
| 4.70%, 01/26/26 (Call 12/26/25) |
310 | 301,223 | ||||||
| 5.00%, 01/26/33 (Call 10/26/32) |
2,723 | 2,487,299 | ||||||
| KeyBank NA/Cleveland OH |
||||||||
| 3.30%, 06/01/25 |
930 | 894,198 | ||||||
| 3.40%, 05/20/26 |
2,975 | 2,796,172 | ||||||
| 3.90%, 04/13/29 (Call 03/13/29)(b) |
1,668 | 1,481,712 | ||||||
| 4.15%, 08/08/25 |
1,650 | 1,597,779 | ||||||
| 4.39%, 12/14/27 |
190 | 177,921 | ||||||
| 4.90%, 08/08/32(b) |
2,130 | 1,868,889 | ||||||
| 5.85%, 11/15/27 (Call 10/16/27) |
3,518 | 3,470,325 | ||||||
| 6.95%, 02/01/28 |
130 | 132,927 | ||||||
| KeyCorp |
||||||||
| 2.25%, 04/06/27 |
2,784 | 2,483,313 | ||||||
| 2.55%, 10/01/29 |
3,241 | 2,711,757 | ||||||
| 4.10%, 04/30/28 |
2,521 | 2,359,617 | ||||||
| 4.15%, 10/29/25 |
2,010 | 1,948,257 | ||||||
| 4.79%, 06/01/33 (Call 06/01/32), |
||||||||
| (1-day SOFR + 2.060%)(a) |
3,378 | 3,050,757 | ||||||
| Korea Development Bank (The) |
||||||||
| 0.80%, 07/19/26 |
970 | 878,874 | ||||||
| 1.00%, 09/09/26 |
800 | 724,424 | ||||||
| 1.63%, 01/19/31 |
2,765 | 2,242,846 | ||||||
| 2.00%, 09/12/26(b) |
775 | 719,767 | ||||||
| 2.00%, 10/25/31 |
3,730 | 3,048,690 | ||||||
| 2.25%, 02/24/27 |
670 | 621,639 | ||||||
| 3.00%, 01/13/26 |
3,753 | 3,621,290 | ||||||
| 3.38%, 09/16/25 |
3,765 | 3,664,901 | ||||||
| Kreditanstalt fuer Wiederaufbau |
||||||||
| 0.00%, 04/18/36(d) |
10,590 | 6,134,442 | ||||||
| 0.00%, 06/29/37(b)(d) |
14,383 | 7,869,966 | ||||||
| 0.38%, 07/18/25 |
11,175 | 10,504,037 | ||||||
| 0.63%, 01/22/26 |
8,946 | 8,291,905 | ||||||
| 0.75%, 09/30/30 |
4,519 | 3,599,088 | ||||||
| 1.00%, 10/01/26 |
5,374 | 4,917,304 | ||||||
| 1.75%, 09/14/29 |
9,117 | 7,957,029 | ||||||
| 2.00%, 05/02/25 |
8,248 | 7,967,196 | ||||||
| 2.88%, 04/03/28 |
10,322 | 9,723,047 | ||||||
| 3.00%, 05/20/27 |
1,655 | 1,581,142 | ||||||
| 3.13%, 06/10/25 |
1,385 | 1,353,652 | ||||||
| 3.63%, 04/01/26 |
3,300 | 3,232,050 | ||||||
| 3.75%, 02/15/28 |
3,355 | 3,270,673 | ||||||
| 3.88%, 06/15/28 |
4,020 | 3,933,196 | ||||||
| 4.00%, 03/15/29 |
300 | 294,869 | ||||||
| 4.13%, 07/15/33 |
10,475 | 10,238,876 | ||||||
| 4.38%, 02/28/34 |
10 | 9,996 | ||||||
| 4.63%, 08/07/26 |
8,357 | 8,361,402 | ||||||
| 4.75%, 10/29/30 |
1,535 | 1,567,771 | ||||||
| S C H E D U L E O F I N V E S T M E N T S |
21 |
| Schedule of Investments (continued) February 29, 2024 |
iShares® Core U.S. Aggregate Bond ETF (Percentages shown are based on Net Assets) |
| Security | Par (000) |
Value | ||||||
| Banks (continued) |
||||||||
| 5.13%, 09/29/25 |
$ | 5,035 | $ | 5,054,592 | ||||
| Landwirtschaftliche Rentenbank |
||||||||
| 0.88%, 03/30/26(b) |
5,385 | 4,982,105 | ||||||
| 0.88%, 09/03/30 |
4,105 | 3,285,838 | ||||||
| 1.75%, 07/27/26(b) |
3,925 | 3,670,849 | ||||||
| 2.38%, 06/10/25 |
3,610 | 3,493,067 | ||||||
| 3.88%, 09/28/27 |
1,380 | 1,352,225 | ||||||
| 3.88%, 06/14/28 |
1,578 | 1,544,046 | ||||||
| 5.00%, 10/24/33 |
1,425 | 1,489,130 | ||||||
| Series 37, 2.50%, 11/15/27 |
1,292 | 1,205,489 | ||||||
| Series 40, 0.50%, 05/27/25 |
5,760 | 5,449,507 | ||||||
| Lloyds Bank PLC, 3.50%, 05/14/25 |
220 | 214,806 | ||||||
| Lloyds Banking Group PLC |
||||||||
| 1.63%, 05/11/27 (Call 05/11/26), |
||||||||
| (1-year CMT + 0.850%)(a) |
3,020 | 2,770,105 | ||||||
| 3.37%, 12/14/46 (Call 09/14/41), |
||||||||
| (5-year CMT + 1.500%)(a) |
5,277 | 3,585,230 | ||||||
| 3.51%, 03/18/26 (Call 03/18/25), |
||||||||
| (1-year CMT + 1.600%)(a) |
6,040 | 5,895,857 | ||||||
| 3.57%, 11/07/28 (Call 11/07/27), |
||||||||
| (3-mo. LIBOR US + 1.205%)(a) |
6,147 | 5,732,884 | ||||||
| 3.75%, 01/11/27 |
5,489 | 5,266,074 | ||||||
| 3.75%, 03/18/28 (Call 03/18/27), |
||||||||
| (1-year CMT + 1.800%)(a) |
5,475 | 5,188,001 | ||||||
| 4.34%, 01/09/48 |
6,209 | 4,876,971 | ||||||
| 4.38%, 03/22/28 |
3,213 | 3,103,153 | ||||||
| 4.45%, 05/08/25 |
6,902 | 6,812,131 | ||||||
| 4.55%, 08/16/28 |
6,773 | 6,571,198 | ||||||
| 4.58%, 12/10/25 |
5,263 | 5,156,670 | ||||||
| 4.65%, 03/24/26 |
5,759 | 5,642,577 | ||||||
| 4.72%, 08/11/26 (Call 08/11/25), |
||||||||
| (1-year CMT + 1.750%)(a) |
3,688 | 3,638,548 | ||||||
| 4.98%, 08/11/33 (Call 08/11/32), |
||||||||
| (1-year CMT + 2.300%)(a) |
2,105 | 2,000,405 | ||||||
| 5.30%, 12/01/45(b) |
3,594 | 3,349,811 | ||||||
| 5.46%, 01/05/28 (Call 01/05/27), |
||||||||
| (1-year CMT + 1.375%)(a) |
5,360 | 5,338,823 | ||||||
| 5.68%, 01/05/35 (Call 01/05/34), |
||||||||
| (1-year CMT + 1.750%)(a) |
4,640 | 4,579,510 | ||||||
| 5.87%, 03/06/29 (Call 03/06/28), |
||||||||
| (1-year CMT + 1.700%)(a) |
2,555 | 2,579,854 | ||||||
| 5.99%, 08/07/27 (Call 08/07/26), |
||||||||
| (1-year CMT + 1.480%)(a) |
6,515 | 6,560,130 | ||||||
| 7.95%, 11/15/33 (Call 08/15/32), |
||||||||
| (1-year CMT + 3.750%)(a) |
4,365 | 4,866,095 | ||||||
| M&T Bank Corp. |
||||||||
| 4.55%, 08/16/28 (Call 08/16/27), |
||||||||
| (1-day SOFR + 1.780%)(a) |
2,165 | 2,063,559 | ||||||
| 5.05%, 01/27/34 (Call 01/27/33), |
||||||||
| (1-day SOFR + 1.850%)(a) |
2,750 | 2,527,617 | ||||||
| 7.41%, 10/30/29 (Call 10/30/28), |
||||||||
| (1-day SOFR + 2.800%)(a) |
1,515 | 1,589,222 | ||||||
| Manufacturers & Traders Trust Co. |
||||||||
| 3.40%, 08/17/27 |
2,020 | 1,842,060 | ||||||
| 4.65%, 01/27/26 (Call 12/27/25) |
2,625 | 2,555,804 | ||||||
| 4.70%, 01/27/28 (Call 12/27/27) |
2,945 | 2,832,749 | ||||||
| 5.40%, 11/21/25 (Call 10/21/25) |
2,155 | 2,133,751 | ||||||
| Mitsubishi UFJ Financial Group Inc. |
||||||||
| 1.41%, 07/17/25 |
4,224 | 4,002,046 | ||||||
| 1.54%, 07/20/27 (Call 07/20/26), |
||||||||
| (1-year CMT + 0.750%)(a) |
4,695 | 4,295,693 | ||||||
| Security | Par (000) |
Value | ||||||
| Banks (continued) |
||||||||
| 1.64%, 10/13/27 (Call 10/13/26), |
||||||||
| (1-year CMT + 0.670%)(a) |
$ | 3,805 | $ | 3,465,673 | ||||
| 2.05%, 07/17/30 |
2,985 | 2,476,366 | ||||||
| 2.31%, 07/20/32 (Call 07/20/31), |
||||||||
| (1-year CMT + 0.950%)(a) |
7,464 | 6,113,794 | ||||||
| 2.34%, 01/19/28 (Call 01/19/27), |
||||||||
| (1-year CMT + 0.830%)(a) |
6,270 | 5,788,692 | ||||||
| 2.49%, 10/13/32 (Call 10/13/31), |
||||||||
| (1-year CMT + 0.970%)(a) |
3,164 | 2,613,841 | ||||||
| 2.56%, 02/25/30 |
4,680 | 4,055,522 | ||||||
| 2.76%, 09/13/26 |
3,565 | 3,361,058 | ||||||
| 2.85%, 01/19/33 (Call 01/19/32), |
||||||||
| (1-year CMT + 1.100%)(a) |
4,200 | 3,541,178 | ||||||
| 3.20%, 07/18/29 |
7,974 | 7,243,336 | ||||||
| 3.29%, 07/25/27 |
3,857 | 3,647,344 | ||||||
| 3.68%, 02/22/27 |
4,119 | 3,970,004 | ||||||
| 3.74%, 03/07/29 |
5,824 | 5,498,784 | ||||||
| 3.75%, 07/18/39 |
5,875 | 5,009,641 | ||||||
| 3.78%, 03/02/25 |
5,321 | 5,234,914 | ||||||
| 3.84%, 04/17/26 (Call 04/17/25), |
||||||||
| (1-year CMT + 1.125%)(a)(b) |
3,405 | 3,339,554 | ||||||
| 3.85%, 03/01/26 |
3,364 | 3,279,433 | ||||||
| 3.96%, 03/02/28 |
5,468 | 5,266,819 | ||||||
| 4.05%, 09/11/28 |
4,216 | 4,080,358 | ||||||
| 4.08%, 04/19/28 (Call 04/19/27), |
||||||||
| (1-year CMT + 1.300%)(a) |
3,850 | 3,720,125 | ||||||
| 4.15%, 03/07/39(b) |
2,181 | 1,964,235 | ||||||
| 4.29%, 07/26/38(b) |
2,167 | 1,999,954 | ||||||
| 4.32%, 04/19/33 (Call 04/19/32), |
||||||||
| (1-year CMT + 1.550%)(a) |
2,755 | 2,576,955 | ||||||
| 5.02%, 07/20/28 (Call 07/20/27), |
||||||||
| (1-year CMT + 1.950%)(a) |
5,235 | 5,197,525 | ||||||
| 5.13%, 07/20/33 (Call 07/20/32), |
||||||||
| (1-year CMT + 2.125%)(a) |
5,905 | 5,835,697 | ||||||
| 5.24%, 04/19/29 (Call 04/19/28), |
||||||||
| (1-year CMT + 1.700%)(a) |
2,305 | 2,309,943 | ||||||
| 5.35%, 09/13/28 (Call 09/13/27), |
||||||||
| (1-year CMT + 1.900%)(a) |
4,200 | 4,210,628 | ||||||
| 5.41%, 04/19/34 (Call 04/19/33), |
||||||||
| (1-year CMT + 1.970%)(a)(b) |
3,005 | 3,036,627 | ||||||
| 5.42%, 02/22/29 (Call 02/22/28), |
||||||||
| (1-year CMT + 1.380%)(a) |
4,280 | 4,310,459 | ||||||
| 5.44%, 02/22/34 (Call 02/22/33), |
||||||||
| (1-year CMT + 1.630%)(a) |
2,780 | 2,811,589 | ||||||
| 5.47%, 09/13/33 (Call 09/13/32), |
||||||||
| (1-year CMT + 2.125%)(a) |
3,120 | 3,167,353 | ||||||
| 5.48%, 02/22/31 (Call 02/22/30), |
||||||||
| (1-year CMT + 1.530%)(a) |
3,085 | 3,114,666 | ||||||
| 5.54%, 04/17/26 (Call 04/17/25), |
||||||||
| (1-year CMT + 1.500%)(a) |
1,695 | 1,693,315 | ||||||
| Mizuho Financial Group Inc. |
||||||||
| 1.23%, 05/22/27 (Call 05/22/26), |
||||||||
| (1-year CMT + 0.670%)(a) |
3,788 | 3,460,797 | ||||||
| 1.55%, 07/09/27 (Call 07/09/26), |
||||||||
| (1-year CMT + 0.750%)(a) |
4,043 | 3,701,220 | ||||||
| 1.98%, 09/08/31 (Call 09/08/30), |
||||||||
| (3-mo. SOFR + 1.532%)(a) |
3,100 | 2,513,282 | ||||||
| 2.17%, 05/22/32 (Call 05/22/31), |
||||||||
| (1-year CMT + 0.870%)(a) |
1,758 | 1,418,095 | ||||||
| 2.20%, 07/10/31 (Call 07/10/30), |
||||||||
| (3-mo. SOFR + 1.772%)(a) |
4,005 | 3,312,505 | ||||||
| 22 | 2 0 2 4 I S H A R E S A N N U A L R E P O R T T O S H A R E H O L D E R S |
| Schedule of Investments (continued) February 29, 2024 |
iShares® Core U.S. Aggregate Bond ETF (Percentages shown are based on Net Assets) |
| Security | Par (000) |
Value | ||||||
| Banks (continued) |
||||||||
| 2.23%, 05/25/26 (Call 05/25/25), |
||||||||
| (3-mo. SOFR + 1.092%)(a) |
$ | 3,719 | $ | 3,567,452 | ||||
| 2.26%, 07/09/32 (Call 07/09/31), |
||||||||
| (1-year CMT + 0.900%)(a)(b) |
2,240 | 1,809,734 | ||||||
| 2.56%, 09/13/31 |
3,675 | 2,977,948 | ||||||
| 2.59%, 05/25/31 (Call 05/25/30), |
||||||||
| (3-mo. SOFR + 1.332%)(a) |
2,133 | 1,814,508 | ||||||
| 2.65%, 05/22/26 (Call 05/22/25), |
||||||||
| (1-year CMT + 0.900%)(a)(b) |
5,090 | 4,913,113 | ||||||
| 2.84%, 09/13/26 |
2,767 | 2,607,059 | ||||||
| 2.87%, 09/13/30 (Call 09/13/29), |
||||||||
| (3-mo. SOFR + 1.572%)(a) |
1,860 | 1,635,617 | ||||||
| 3.15%, 07/16/30 (Call 07/16/29), |
||||||||
| (3-mo. SOFR + 1.392%)(a) |
3,113 | 2,792,080 | ||||||
| 3.17%, 09/11/27 |
4,613 | 4,312,668 | ||||||
| 3.26%, 05/22/30 (Call 05/22/29), |
||||||||
| (1-year CMT + 1.250%)(a) |
2,020 | 1,827,222 | ||||||
| 3.66%, 02/28/27 |
2,462 | 2,356,477 | ||||||
| 4.02%, 03/05/28 |
5,415 | 5,205,845 | ||||||
| 4.25%, 09/11/29 (Call 09/11/28), |
||||||||
| (3-mo. SOFR + 1.532%)(a) |
3,980 | 3,813,798 | ||||||
| 5.38%, 05/26/30 (Call 05/26/29), |
||||||||
| (1-year CMT + 1.120%)(a) |
2,135 | 2,135,425 | ||||||
| 5.41%, 09/13/28 (Call 09/13/27), |
||||||||
| (1-year CMT + 2.050%)(a)(b) |
2,750 | 2,761,755 | ||||||
| 5.58%, 05/26/35 (Call 05/26/34), |
||||||||
| (1-year CMT + 1.300%)(a) |
2,950 | 2,957,383 | ||||||
| 5.67%, 05/27/29 (Call 05/27/28), |
||||||||
| (1-year CMT + 1.500%)(a) |
2,960 | 2,999,625 | ||||||
| 5.67%, 09/13/33 (Call 09/13/32), |
||||||||
| (1-year CMT + 2.400%)(a) |
2,720 | 2,760,395 | ||||||
| 5.74%, 05/27/31 (Call 05/27/30), |
||||||||
| (1-year CMT + 1.650%)(a) |
2,780 | 2,822,785 | ||||||
| 5.75%, 05/27/34 (Call 05/27/33), |
||||||||
| (1-year CMT + 1.800%)(a) |
3,280 | 3,348,381 | ||||||
| 5.75%, 07/06/34 (Call 07/06/33), |
||||||||
| (1-year CMT + 1.900%)(a) |
4,100 | 4,177,171 | ||||||
| 5.78%, 07/06/29 (Call 07/06/28), |
||||||||
| (1-year CMT + 1.650%)(a) |
5,890 | 5,997,084 | ||||||
| Morgan Stanley |
||||||||
| 0.99%, 12/10/26 (Call 12/10/25), |
||||||||
| (1-day SOFR + 0.720%)(a) |
10,589 | 9,770,460 | ||||||
| 1.51%, 07/20/27 (Call 07/20/26), |
||||||||
| (1-day SOFR + 0.858%)(a) |
11,584 | 10,594,704 | ||||||
| 1.59%, 05/04/27 (Call 05/04/26), |
||||||||
| (1-day SOFR + 0.879%)(a) |
7,158 | 6,599,268 | ||||||
| 1.79%, 02/13/32 (Call 02/13/31), |
||||||||
| (1-day SOFR + 1.034%)(a) |
8,160 | 6,461,264 | ||||||
| 1.93%, 04/28/32 (Call 04/28/31), |
||||||||
| (1-day SOFR + 1.020%)(a) |
14,170 | 11,248,098 | ||||||
| 2.19%, 04/28/26 (Call 04/28/25), |
||||||||
| (1-day SOFR + 1.990%)(a) |
13,169 | 12,673,606 | ||||||
| 2.24%, 07/21/32 (Call 07/21/31), |
||||||||
| (1-day SOFR + 1.178%)(a) |
10,967 | 8,841,847 | ||||||
| 2.48%, 01/21/28 (Call 01/21/27), |
||||||||
| (1-day SOFR + 1.000%)(a) |
9,575 | 8,857,004 | ||||||
| 2.48%, 09/16/36 (Call 09/16/31), |
||||||||
| (1-day SOFR + 1.360%)(a) |
14,483 | 11,381,327 | ||||||
| 2.51%, 10/20/32 (Call 10/20/31), |
||||||||
| (1-day SOFR + 1.200%)(a) |
10,028 | 8,213,092 | ||||||
| Security | Par (000) |
Value | ||||||
| Banks (continued) |
||||||||
| 2.70%, 01/22/31 (Call 01/22/30), |
||||||||
| (1-day SOFR + 1.143%)(a) |
$ | 15,487 | $ | 13,406,442 | ||||
| 2.80%, 01/25/52 (Call 01/25/51), |
||||||||
| (1-day SOFR + 1.430%)(a) |
8,884 | 5,711,013 | ||||||
| 2.94%, 01/21/33 (Call 01/21/32), |
||||||||
| (1-day SOFR + 1.290%)(a) |
7,603 | 6,377,976 | ||||||
| 3.13%, 07/27/26 |
12,782 | 12,187,132 | ||||||
| 3.22%, 04/22/42 (Call 04/22/41), |
||||||||
| (1-day SOFR + 1.485%)(a) |
5,881 | 4,418,604 | ||||||
| 3.59%, 07/22/28 (Call 07/22/27)(a) |
13,192 | 12,484,249 | ||||||
| 3.62%, 04/01/31 (Call 04/01/30), |
||||||||
| (1-day SOFR + 3.120%)(a)(b) |
6,284 | 5,706,223 | ||||||
| 3.63%, 01/20/27 |
11,435 | 11,024,900 | ||||||
| 3.77%, 01/24/29 (Call 01/24/28), |
||||||||
| (3-mo. SOFR + 1.402%)(a) |
11,604 | 10,967,258 | ||||||
| 3.88%, 01/27/26 |
13,572 | 13,242,102 | ||||||
| 3.95%, 04/23/27 |
8,830 | 8,498,707 | ||||||
| 3.97%, 07/22/38 (Call 07/22/37)(a) |
10,635 | 9,065,929 | ||||||
| 4.00%, 07/23/25 |
8,408 | 8,264,295 | ||||||
| 4.21%, 04/20/28 (Call 04/20/27), |
||||||||
| (1-day SOFR + 1.610%)(a) |
7,140 | 6,909,853 | ||||||
| 4.30%, 01/27/45 |
9,219 | 7,990,528 | ||||||
| 4.35%, 09/08/26 |
9,854 | 9,632,268 | ||||||
| 4.38%, 01/22/47 |
9,525 | 8,213,209 | ||||||
| 4.43%, 01/23/30 (Call 01/23/29), |
||||||||
| (3-mo. SOFR + 1.890%)(a) |
11,763 | 11,295,676 | ||||||
| 4.46%, 04/22/39 (Call 04/22/38), |
||||||||
| (3-mo. SOFR + 1.693%)(a) |
6,457 | 5,829,206 | ||||||
| 4.68%, 07/17/26 (Call 07/17/25), |
||||||||
| (1-day SOFR + 1.669%)(a) |
7,615 | 7,534,581 | ||||||
| 4.89%, 07/20/33 (Call 07/20/32), |
||||||||
| (1-day SOFR + 2.076%)(a) |
7,415 | 7,115,700 | ||||||
| 5.00%, 11/24/25 |
9,071 | 9,017,362 | ||||||
| 5.05%, 01/28/27 (Call 01/28/26), |
||||||||
| (1-day SOFR + 1.295%)(a) |
2,720 | 2,710,336 | ||||||
| 5.12%, 02/01/29 (Call 02/01/28), |
||||||||
| (1-day SOFR + 1.730%)(a) |
6,585 | 6,545,539 | ||||||
| 5.16%, 04/20/29 (Call 04/20/28), |
||||||||
| (1-day SOFR + 1.590%)(a) |
10,740 | 10,665,146 | ||||||
| 5.17%, 01/16/30 (Call 01/16/29), |
||||||||
| (1-day SOFR + 1.450%)(a) |
11,395 | 11,324,193 | ||||||
| 5.25%, 04/21/34 (Call 04/21/33), |
||||||||
| (1-day SOFR + 1.870%)(a) |
12,585 | 12,352,971 | ||||||
| 5.30%, 04/20/37 (Call 04/20/32), |
||||||||
| (1-day SOFR + 2.620%)(a) |
8,360 | 7,994,660 | ||||||
| 5.42%, 07/21/34 (Call 07/21/33), |
||||||||
| (1-day SOFR + 1.880%)(a) |
6,945 | 6,911,217 | ||||||
| 5.45%, 07/20/29 (Call 07/20/28), |
||||||||
| (1-day SOFR + 1.630%)(a) |
3,730 | 3,745,460 | ||||||
| 5.47%, 01/18/35 (Call 01/18/34), |
||||||||
| (1-day SOFR + 1.730%)(a) |
3,165 | 3,161,810 | ||||||
| 5.60%, 03/24/51 (Call 03/24/50), |
||||||||
| (1-day SOFR + 4.840%)(a) |
8,295 | 8,582,518 | ||||||
| 5.94%, 02/07/39 (Call 02/07/34), |
||||||||
| (5-year CMT + 1.800%)(a) |
4,400 | 4,333,972 | ||||||
| 5.95%, 01/19/38 (Call 01/19/33), |
||||||||
| (5-year CMT + 2.430%)(a) |
8,205 | 8,180,636 | ||||||
| 6.14%, 10/16/26 (Call 10/16/25), |
||||||||
| (1-day SOFR + 1.770%)(a) |
1,150 | 1,163,610 | ||||||
| 6.25%, 08/09/26 |
4,946 | 5,062,034 | ||||||
| S C H E D U L E O F I N V E S T M E N T S |
23 |
| Schedule of Investments (continued) February 29, 2024 |
iShares® Core U.S. Aggregate Bond ETF (Percentages shown are based on Net Assets) |
| Security | Par (000) |
Value | ||||||
| Banks (continued) |
||||||||
| 6.30%, 10/18/28 (Call 10/18/27), |
||||||||
| (1-day SOFR + 2.240%)(a) |
$ | 6,633 | $ | 6,856,143 | ||||
| 6.34%, 10/18/33 (Call 10/18/32), |
||||||||
| (1-day SOFR + 2.560%)(a) |
12,590 | 13,344,236 | ||||||
| 6.38%, 07/24/42 |
8,708 | 9,673,497 | ||||||
| 6.41%, 11/01/29 (Call 11/01/28), |
||||||||
| (1-day SOFR + 1.830%)(a) |
5,225 | 5,451,293 | ||||||
| 6.63%, 11/01/34 (Call 11/01/33), |
||||||||
| (1-day SOFR + 2.050%)(a) |
6,820 | 7,400,754 | ||||||
| 7.25%, 04/01/32 |
10,594 | 12,072,702 | ||||||
| Morgan Stanley Bank NA |
||||||||
| 4.75%, 04/21/26 (Call 03/21/26) |
7,403 | 7,357,004 | ||||||
| 4.95%, 01/14/28 (Call 01/14/27), |
||||||||
| (1-day SOFR + 1.080%)(a) |
5,130 | 5,101,147 | ||||||
| 5.48%, 07/16/25 (Call 06/16/25) |
5,135 | 5,155,550 | ||||||
| 5.88%, 10/30/26 (Call 09/30/26) |
8,445 | 8,599,543 | ||||||
| National Australia Bank Ltd. |
||||||||
| 4.75%, 12/10/25 |
2,635 | 2,622,515 | ||||||
| 4.79%, 01/10/29 |
2,750 | 2,731,804 | ||||||
| National Australia Bank Ltd./New York |
||||||||
| 2.50%, 07/12/26 |
5,496 | 5,185,185 | ||||||
| 3.38%, 01/14/26 |
4,524 | 4,388,438 | ||||||
| 3.50%, 06/09/25 |
315 | 308,671 | ||||||
| 3.91%, 06/09/27 |
365 | 353,858 | ||||||
| 4.90%, 06/13/28 |
3,020 | 3,012,989 | ||||||
| 4.94%, 01/12/28 |
3,715 | 3,713,426 | ||||||
| 4.97%, 01/12/26 |
3,019 | 3,013,395 | ||||||
| 5.20%, 05/13/25 |
3,185 | 3,186,646 | ||||||
| National Bank of Canada, 5.60%, 12/18/28 |
2,790 | 2,817,487 | ||||||
| NatWest Group PLC |
||||||||
| 1.64%, 06/14/27 (Call 06/14/26), |
||||||||
| (1-year CMT + 0.900%)(a) |
5,940 | 5,429,395 | ||||||
| 3.03%, 11/28/35 (Call 08/28/30), |
||||||||
| (5-year CMT + 2.350%)(a) |
4,598 | 3,786,064 | ||||||
| 3.07%, 05/22/28 (Call 05/22/27), |
||||||||
| (1-year CMT + 2.550%)(a) |
4,852 | 4,503,370 | ||||||
| 4.45%, 05/08/30 (Call 05/08/29), |
||||||||
| (3-mo. LIBOR US + 1.871%)(a) |
2,894 | 2,737,830 | ||||||
| 4.80%, 04/05/26 |
7,313 | 7,222,514 | ||||||
| 4.89%, 05/18/29 (Call 05/18/28), |
||||||||
| (3-mo. LIBOR US + 1.754%)(a) |
6,705 | 6,524,422 | ||||||
| 5.08%, 01/27/30 (Call 01/27/29), |
||||||||
| (3-mo. LIBOR US + 1.905%)(a) |
8,110 | 7,928,669 | ||||||
| 5.52%, 09/30/28 (Call 09/30/27), |
||||||||
| (1-year CMT + 2.270%)(a) |
3,080 | 3,077,442 | ||||||
| 5.58%, 03/01/28 (Call 03/01/27), |
||||||||
| (1-year CMT + 1.100%)(a)(b) |
2,000 | 2,001,565 | ||||||
| 5.78%, 03/01/35 (Call 03/01/34), |
||||||||
| (1-year CMT + 1.500%)(a) |
2,000 | 1,997,842 | ||||||
| 5.81%, 09/13/29 (Call 09/13/28), |
||||||||
| (1-year CMT + 1.950%)(a) |
3,630 | 3,666,595 | ||||||
| 5.85%, 03/02/27 (Call 03/02/26), |
||||||||
| (1-year CMT + 1.350%)(a) |
2,715 | 2,725,764 | ||||||
| 6.02%, 03/02/34 (Call 03/02/33), |
||||||||
| (1-year CMT + 2.100%)(a) |
1,670 | 1,702,681 | ||||||
| 7.47%, 11/10/26 (Call 11/10/25), |
||||||||
| (1-year CMT + 2.850%)(a) |
6,055 | 6,220,803 | ||||||
| Northern Trust Corp. |
||||||||
| 1.95%, 05/01/30 (Call 02/01/30) |
4,026 | 3,393,237 | ||||||
| 3.15%, 05/03/29 (Call 02/03/29)(b) |
2,887 | 2,671,996 | ||||||
| Security | Par (000) |
Value | ||||||
| Banks (continued) |
||||||||
| 3.38%, 05/08/32 (Call 05/08/27), |
||||||||
| (3-mo. LIBOR US + 1.131%)(a) |
$ | 3,916 | $ | 3,632,005 | ||||
| 3.65%, 08/03/28 (Call 05/03/28) |
1,070 | 1,023,088 | ||||||
| 3.95%, 10/30/25 |
4,051 | 3,973,502 | ||||||
| 4.00%, 05/10/27 (Call 04/10/27) |
8,560 | 8,313,373 | ||||||
| 6.13%, 11/02/32 (Call 08/02/32) |
2,686 | 2,821,219 | ||||||
| Oesterreichische Kontrollbank AG |
||||||||
| 0.38%, 09/17/25 |
3,020 | 2,818,987 | ||||||
| 0.50%, 02/02/26 |
3,545 | 3,270,676 | ||||||
| 2.88%, 05/23/25 |
915 | 891,336 | ||||||
| 3.63%, 09/09/27(b) |
1,745 | 1,694,996 | ||||||
| 4.13%, 01/20/26 |
1,875 | 1,852,732 | ||||||
| 4.13%, 01/18/29 |
600 | 592,946 | ||||||
| 4.25%, 03/01/28(b) |
2,185 | 2,166,059 | ||||||
| 4.63%, 11/03/25 |
1,405 | 1,398,820 | ||||||
| 5.00%, 10/23/26 |
1,720 | 1,737,113 | ||||||
| PNC Bank NA |
||||||||
| 2.70%, 10/22/29 |
3,772 | 3,249,969 | ||||||
| 3.10%, 10/25/27 (Call 09/25/27) |
4,848 | 4,503,751 | ||||||
| 3.25%, 06/01/25 (Call 05/02/25) |
4,057 | 3,948,670 | ||||||
| 3.25%, 01/22/28 (Call 12/23/27) |
3,874 | 3,597,423 | ||||||
| 3.88%, 04/10/25 (Call 03/10/25) |
2,846 | 2,791,828 | ||||||
| 4.05%, 07/26/28 |
5,689 | 5,380,576 | ||||||
| 4.20%, 11/01/25 (Call 10/02/25) |
2,288 | 2,234,232 | ||||||
| PNC Financial Services Group Inc. (The) |
||||||||
| 1.15%, 08/13/26 (Call 07/13/26) |
3,301 | 2,995,586 | ||||||
| 2.31%, 04/23/32 (Call 04/23/31), |
||||||||
| (1-day SOFR + 0.979%)(a) |
3,598 | 2,928,417 | ||||||
| 2.55%, 01/22/30 (Call 10/24/29) |
8,052 | 6,909,452 | ||||||
| 2.60%, 07/23/26 (Call 05/23/26) |
3,136 | 2,948,291 | ||||||
| 3.15%, 05/19/27 (Call 04/19/27) |
4,032 | 3,794,862 | ||||||
| 3.45%, 04/23/29 (Call 01/23/29) |
6,265 | 5,784,941 | ||||||
| 4.63%, 06/06/33 (Call 06/06/32), |
||||||||
| (1-day SOFR + 1.850%)(a) |
3,062 | 2,836,548 | ||||||
| 4.76%, 01/26/27 (Call 01/26/26), |
||||||||
| (1-day SOFR + 1.085%)(a) |
5,255 | 5,191,946 | ||||||
| 5.07%, 01/24/34 (Call 01/24/33), |
||||||||
| (1-day SOFR + 1.933%)(a) |
6,850 | 6,581,282 | ||||||
| 5.30%, 01/21/28 (Call 01/21/27), |
||||||||
| (1-day SOFR + 1.342%)(a) |
4,165 | 4,159,785 | ||||||
| 5.35%, 12/02/28 (Call 12/02/27), |
||||||||
| (1-day SOFR + 1.620%)(a) |
4,185 | 4,182,864 | ||||||
| 5.58%, 06/12/29 (Call 06/12/28), |
||||||||
| (1-day SOFR + 1.841%)(a) |
4,130 | 4,156,197 | ||||||
| 5.68%, 01/22/35 (Call 01/22/34), |
||||||||
| (1-day SOFR + 1.902%)(a) |
2,740 | 2,746,423 | ||||||
| 5.81%, 06/12/26 (Call 06/12/25), |
||||||||
| (1-day SOFR + 1.322%)(a) |
3,370 | 3,374,340 | ||||||
| 5.94%, 08/18/34 (Call 08/18/33), |
||||||||
| (1-day SOFR + 1.946%)(a) |
4,205 | 4,281,453 | ||||||
| 6.04%, 10/28/33 (Call 10/28/32), |
||||||||
| (1-day SOFR + 2.140%)(a) |
5,200 | 5,338,240 | ||||||
| 6.62%, 10/20/27 (Call 10/20/26), |
||||||||
| (1-day SOFR + 1.730%)(a) |
4,285 | 4,399,431 | ||||||
| 6.88%, 10/20/34 (Call 10/20/33), |
||||||||
| (1-day SOFR + 2.284%)(a) |
9,850 | 10,677,093 | ||||||
| Regions Bank/Birmingham AL, 6.45%, 06/26/37 |
2,495 | 2,536,562 | ||||||
| Regions Financial Corp. |
||||||||
| 1.80%, 08/12/28 (Call 06/12/28) |
920 | 783,534 | ||||||
| 2.25%, 05/18/25 (Call 04/18/25) |
2,705 | 2,590,105 | ||||||
| 24 | 2 0 2 4 I S H A R E S A N N U A L R E P O R T T O S H A R E H O L D E R S |
| Schedule of Investments (continued) February 29, 2024 |
iShares® Core U.S. Aggregate Bond ETF (Percentages shown are based on Net Assets) |
| Security | Par (000) |
Value | ||||||
| Banks (continued) |
||||||||
| 7.38%, 12/10/37 |
$ | 1,803 | $ | 2,027,248 | ||||
| Royal Bank of Canada |
||||||||
| 0.88%, 01/20/26 |
4,714 | 4,363,903 | ||||||
| 1.15%, 06/10/25 |
5,766 | 5,477,819 | ||||||
| 1.15%, 07/14/26 |
4,932 | 4,505,762 | ||||||
| 1.20%, 04/27/26 |
7,135 | 6,565,944 | ||||||
| 1.40%, 11/02/26 |
3,723 | 3,383,366 | ||||||
| 2.05%, 01/21/27 |
1,815 | 1,675,026 | ||||||
| 2.30%, 11/03/31 |
5,475 | 4,484,073 | ||||||
| 3.38%, 04/14/25 |
1,930 | 1,890,112 | ||||||
| 3.63%, 05/04/27 |
4,954 | 4,747,725 | ||||||
| 3.88%, 05/04/32 |
3,040 | 2,769,143 | ||||||
| 4.24%, 08/03/27 |
5,349 | 5,211,331 | ||||||
| 4.65%, 01/27/26 |
5,957 | 5,897,557 | ||||||
| 4.88%, 01/12/26 |
4,375 | 4,357,194 | ||||||
| 4.88%, 01/19/27 |
4,210 | 4,189,203 | ||||||
| 4.90%, 01/12/28 |
3,555 | 3,543,298 | ||||||
| 4.95%, 04/25/25 |
3,325 | 3,316,557 | ||||||
| 4.95%, 02/01/29 |
2,250 | 2,235,237 | ||||||
| 5.00%, 02/01/33 |
6,180 | 6,074,468 | ||||||
| 5.00%, 05/02/33(b) |
3,310 | 3,259,238 | ||||||
| 5.15%, 02/01/34 |
2,510 | 2,468,836 | ||||||
| 5.20%, 07/20/26 |
4,235 | 4,248,244 | ||||||
| 5.20%, 08/01/28 |
3,380 | 3,398,363 | ||||||
| 6.00%, 11/01/27 |
3,065 | 3,156,013 | ||||||
| Santander Holdings USA Inc. |
||||||||
| 2.49%, 01/06/28 (Call 01/06/27), |
||||||||
| (1-day SOFR + 1.249%)(a) |
3,790 | 3,427,567 | ||||||
| 3.24%, 10/05/26 (Call 08/05/26) |
3,904 | 3,658,008 | ||||||
| 3.45%, 06/02/25 (Call 05/02/25) |
4,029 | 3,907,020 | ||||||
| 4.40%, 07/13/27 (Call 04/14/27) |
3,403 | 3,261,305 | ||||||
| 4.50%, 07/17/25 (Call 04/17/25) |
4,616 | 4,525,218 | ||||||
| 5.81%, 09/09/26 (Call 09/09/25), |
||||||||
| (1-day SOFR + 2.328%)(a) |
1,940 | 1,935,365 | ||||||
| 6.17%, 01/09/30 (Call 01/09/29), |
||||||||
| (1-day SOFR + 2.500%)(a) |
2,065 | 2,058,225 | ||||||
| 6.50%, 03/09/29 (Call 03/09/28), |
||||||||
| (1-day SOFR + 2.356%)(a) |
3,525 | 3,579,799 | ||||||
| 6.57%, 06/12/29 (Call 06/12/28), |
||||||||
| (1-day SOFR + 2.700%)(a) |
1,665 | 1,695,771 | ||||||
| 7.66%, 11/09/31 (Call 11/09/30), |
||||||||
| (1-day SOFR + 3.280%)(a) |
2,395 | 2,558,378 | ||||||
| Santander U.K. Group Holdings PLC |
||||||||
| 1.53%, 08/21/26 (Call 08/21/25), |
||||||||
| (1-year CMT + 1.250%)(a) |
4,292 | 4,020,389 | ||||||
| 1.67%, 06/14/27 (Call 06/14/26), |
||||||||
| (1-day SOFR + 0.989%)(a) |
5,217 | 4,742,505 | ||||||
| 2.47%, 01/11/28 (Call 01/11/27), |
||||||||
| (1-day SOFR + 1.220%)(a) |
4,378 | 3,986,868 | ||||||
| 2.90%, 03/15/32 (Call 03/15/31), |
||||||||
| (1-day SOFR + 1.475%)(a) |
1,105 | 930,715 | ||||||
| 3.82%, 11/03/28 (Call 11/03/27), |
||||||||
| (3-mo. LIBOR US + 1.400%)(a) |
4,176 | 3,897,998 | ||||||
| 6.53%, 01/10/29 (Call 01/10/28), |
||||||||
| (1-day SOFR + 2.600%)(a) |
4,045 | 4,149,119 | ||||||
| 6.83%, 11/21/26 (Call 11/21/25), |
||||||||
| (1-day SOFR + 2.749%)(a) |
2,290 | 2,323,703 | ||||||
| State Street Corp. |
||||||||
| 1.68%, 11/18/27 (Call 11/18/26), |
||||||||
| (1-day SOFR + 0.560%)(a) |
1,495 | 1,368,436 | ||||||
| Security | Par (000) |
Value | ||||||
| Banks (continued) |
||||||||
| 2.20%, 02/07/28 (Call 02/07/27), |
||||||||
| (1-day SOFR + 0.730%)(a) |
$ | 2,145 | $ | 1,973,259 | ||||
| 2.20%, 03/03/31 |
3,520 | 2,910,016 | ||||||
| 2.40%, 01/24/30 |
3,468 | 3,031,149 | ||||||
| 2.62%, 02/07/33 (Call 02/07/32), |
||||||||
| (1-day SOFR + 1.002%)(a) |
2,945 | 2,444,419 | ||||||
| 2.65%, 05/19/26(b) |
3,631 | 3,452,939 | ||||||
| 2.90%, 03/30/26 (Call 03/30/25), |
||||||||
| (1-day SOFR + 2.600%)(a) |
1,964 | 1,912,526 | ||||||
| 3.03%, 11/01/34 (Call 11/01/29), |
||||||||
| (1-day SOFR + 1.490%)(a) |
2,505 | 2,209,656 | ||||||
| 3.15%, 03/30/31 (Call 03/30/30), |
||||||||
| (1-day SOFR + 2.650%)(a) |
1,981 | 1,761,577 | ||||||
| 3.55%, 08/18/25 |
5,427 | 5,316,752 | ||||||
| 4.14%, 12/03/29 (Call 12/03/28), |
||||||||
| (3-mo. SOFR + 1.292%)(a) |
1,918 | 1,838,124 | ||||||
| 4.16%, 08/04/33 (Call 08/04/32), |
||||||||
| (1-day SOFR + 1.726%)(a) |
2,810 | 2,594,832 | ||||||
| 4.42%, 05/13/33 (Call 05/13/32), |
||||||||
| (1-day SOFR + 1.605%)(a) |
2,105 | 1,985,136 | ||||||
| 4.82%, 01/26/34 (Call 01/26/33), |
||||||||
| (1-day SOFR + 1.567%)(a)(b) |
2,275 | 2,193,068 | ||||||
| 5.10%, 05/18/26 (Call 05/18/25), |
||||||||
| (1-day SOFR + 1.130%)(a) |
4,040 | 4,025,044 | ||||||
| 5.16%, 05/18/34 (Call 05/18/33), |
||||||||
| (1-day SOFR + 1.890%)(a)(b) |
3,395 | 3,351,207 | ||||||
| 5.27%, 08/03/26 (Call 07/03/26) |
4,865 | 4,880,884 | ||||||
| 5.68%, 11/21/29 (Call 11/21/28), |
||||||||
| (1-day SOFR + 1.484%)(a) |
4,155 | 4,247,980 | ||||||
| 5.75%, 11/04/26 (Call 11/04/25), |
||||||||
| (1-day SOFR + 1.353%)(a) |
1,960 | 1,968,525 | ||||||
| 5.82%, 11/04/28 (Call 11/04/27), |
||||||||
| (1-day SOFR + 1.715%)(a) |
2,010 | 2,056,278 | ||||||
| 6.12%, 11/21/34 (Call 11/21/33), |
||||||||
| (1-day SOFR + 1.958%)(a) |
3,185 | 3,292,850 | ||||||
| Sumitomo Mitsui Banking Corp., 3.65%, 07/23/25(b) |
3,800 | 3,715,174 | ||||||
| Sumitomo Mitsui Financial Group Inc. |
||||||||
| 0.95%, 01/12/26 |
1,970 | 1,821,562 | ||||||
| 1.40%, 09/17/26 |
8,550 | 7,788,760 | ||||||
| 1.47%, 07/08/25 |
4,034 | 3,834,579 | ||||||
| 1.71%, 01/12/31 |
2,625 | 2,089,689 | ||||||
| 1.90%, 09/17/28 |
8,580 | 7,464,827 | ||||||
| 2.13%, 07/08/30 |
5,735 | 4,767,134 | ||||||
| 2.14%, 09/23/30 |
3,016 | 2,476,994 | ||||||
| 2.17%, 01/14/27 |
1,749 | 1,614,846 | ||||||
| 2.22%, 09/17/31 |
2,895 | 2,348,168 | ||||||
| 2.30%, 01/12/41 |
840 | 565,724 | ||||||
| 2.47%, 01/14/29(b) |
1,615 | 1,436,573 | ||||||
| 2.63%, 07/14/26 |
8,863 | 8,366,989 | ||||||
| 2.72%, 09/27/29 |
1,826 | 1,607,926 | ||||||
| 2.75%, 01/15/30 |
5,565 | 4,865,514 | ||||||
| 2.93%, 09/17/41 |
3,730 | 2,773,983 | ||||||
| 3.01%, 10/19/26 |
6,088 | 5,763,661 | ||||||
| 3.04%, 07/16/29 |
9,445 | 8,490,192 | ||||||
| 3.05%, 01/14/42 |
2,185 | 1,647,115 | ||||||
| 3.20%, 09/17/29 |
1,716 | 1,543,040 | ||||||
| 3.35%, 10/18/27 |
3,779 | 3,564,335 | ||||||
| 3.36%, 07/12/27 |
2,986 | 2,829,900 | ||||||
| 3.45%, 01/11/27 |
4,062 | 3,890,148 | ||||||
| 3.54%, 01/17/28 |
3,726 | 3,529,057 | ||||||
| S C H E D U L E O F I N V E S T M E N T S |
25 |
| Schedule of Investments (continued) February 29, 2024 |
iShares® Core U.S. Aggregate Bond ETF (Percentages shown are based on Net Assets) |
| Security | Par (000) |
Value | ||||||
| Banks (continued) |
||||||||
| 3.78%, 03/09/26 |
$ | 6,916 | $ | 6,727,051 | ||||
| 3.94%, 07/19/28(b) |
3,574 | 3,420,575 | ||||||
| 4.31%, 10/16/28(b) |
3,902 | 3,817,609 | ||||||
| 5.46%, 01/13/26 |
4,925 | 4,940,281 | ||||||
| 5.52%, 01/13/28 |
8,160 | 8,288,819 | ||||||
| 5.71%, 01/13/30 |
5,030 | 5,153,819 | ||||||
| 5.72%, 09/14/28 |
5,050 | 5,162,718 | ||||||
| 5.77%, 01/13/33 |
6,130 | 6,324,415 | ||||||
| 5.78%, 07/13/33 |
2,425 | 2,507,739 | ||||||
| 5.80%, 07/13/28 |
2,770 | 2,845,043 | ||||||
| 5.81%, 09/14/33 |
5,710 | 5,914,585 | ||||||
| 5.85%, 07/13/30 |
2,780 | 2,862,486 | ||||||
| 5.88%, 07/13/26 |
2,420 | 2,455,616 | ||||||
| 6.18%, 07/13/43 |
480 | 525,676 | ||||||
| Synchrony Bank |
||||||||
| 5.40%, 08/22/25 (Call 07/22/25) |
3,880 | 3,834,820 | ||||||
| 5.63%, 08/23/27 (Call 07/23/27) |
3,357 | 3,266,323 | ||||||
| Synovus Bank, 5.63%, 02/15/28 (Call 01/15/28) |
915 | 881,397 | ||||||
| Synovus Financial Corp., 5.20%, 08/11/25 (Call 07/11/25)(b) |
405 | 397,843 | ||||||
| Toronto-Dominion Bank (The) |
||||||||
| 0.75%, 09/11/25 |
4,250 | 3,982,207 | ||||||
| 0.75%, 01/06/26 |
6,970 | 6,447,019 | ||||||
| 1.15%, 06/12/25 |
3,320 | 3,151,388 | ||||||
| 1.20%, 06/03/26 |
6,465 | 5,931,267 | ||||||
| 1.25%, 09/10/26 |
6,338 | 5,774,638 | ||||||
| 1.95%, 01/12/27(b) |
3,270 | 3,009,701 | ||||||
| 2.00%, 09/10/31 |
4,898 | 3,985,821 | ||||||
| 2.45%, 01/12/32 |
3,575 | 2,955,242 | ||||||
| 2.80%, 03/10/27 |
4,565 | 4,281,229 | ||||||
| 3.20%, 03/10/32 |
6,315 | 5,508,872 | ||||||
| 3.63%, 09/15/31 (Call 09/15/26), |
||||||||
| (5-year USD Swap + 2.205%)(a) |
6,381 | 6,089,707 | ||||||
| 3.77%, 06/06/25 |
6,065 | 5,956,873 | ||||||
| 4.11%, 06/08/27 |
5,685 | 5,517,213 | ||||||
| 4.46%, 06/08/32 |
4,890 | 4,661,058 | ||||||
| 4.69%, 09/15/27 |
6,055 | 5,985,913 | ||||||
| 5.10%, 01/09/26 |
1,130 | 1,131,458 | ||||||
| 5.16%, 01/10/28 |
4,190 | 4,202,546 | ||||||
| 5.26%, 12/11/26 |
2,710 | 2,726,508 | ||||||
| 5.52%, 07/17/28 |
4,905 | 4,983,478 | ||||||
| 5.53%, 07/17/26 |
4,475 | 4,514,722 | ||||||
| Truist Bank |
||||||||
| 1.50%, 03/10/25 (Call 02/10/25) |
3,738 | 3,591,733 | ||||||
| 2.25%, 03/11/30 (Call 12/11/29) |
5,255 | 4,316,269 | ||||||
| 3.30%, 05/15/26 (Call 04/15/26) |
5,119 | 4,875,155 | ||||||
| 3.63%, 09/16/25 (Call 08/16/25) |
6,004 | 5,824,761 | ||||||
| 3.80%, 10/30/26 (Call 09/30/26) |
4,221 | 4,031,135 | ||||||
| 4.05%, 11/03/25 (Call 09/03/25) |
3,210 | 3,141,322 | ||||||
| Truist Financial Corp. |
||||||||
| 1.13%, 08/03/27 (Call 06/03/27) |
3,742 | 3,256,902 | ||||||
| 1.20%, 08/05/25 (Call 07/03/25) |
3,094 | 2,910,295 | ||||||
| 1.27%, 03/02/27 (Call 03/02/26), |
||||||||
| (1-day SOFR + 0.609%)(a) |
3,756 | 3,447,622 | ||||||
| 1.89%, 06/07/29 (Call 06/07/28), |
||||||||
| (1-day SOFR + 0.862%)(a) |
4,370 | 3,753,167 | ||||||
| 1.95%, 06/05/30 (Call 03/05/30) |
2,870 | 2,344,129 | ||||||
| 3.70%, 06/05/25 (Call 05/05/25) |
3,834 | 3,749,602 | ||||||
| 3.88%, 03/19/29 (Call 02/16/29) |
3,096 | 2,851,120 | ||||||
| 4.00%, 05/01/25 (Call 03/01/25) |
3,112 | 3,055,673 | ||||||
| Security | Par (000) |
Value | ||||||
| Banks (continued) |
||||||||
| 4.12%, 06/06/28 (Call 06/06/27), |
||||||||
| (1-day SOFR + 1.368%)(a) |
$ | 3,315 | $ | 3,185,060 | ||||
| 4.26%, 07/28/26 (Call 07/28/25), |
||||||||
| (1-day SOFR + 1.456%)(a) |
4,316 | 4,227,714 | ||||||
| 4.87%, 01/26/29 (Call 01/26/28), |
||||||||
| (1-day SOFR + 1.435%)(a) |
3,960 | 3,853,948 | ||||||
| 4.92%, 07/28/33 (Call 07/28/32), |
||||||||
| (1-day SOFR + 2.240%)(a) |
6,400 | 5,881,159 | ||||||
| 5.12%, 01/26/34 (Call 01/26/33), |
||||||||
| (1-day SOFR + 1.852%)(a) |
2,625 | 2,489,211 | ||||||
| 5.44%, 01/24/30 (Call 01/24/29), |
||||||||
| (1-day SOFR + 1.620%)(a) |
3,135 | 3,103,782 | ||||||
| 5.71%, 01/24/35 (Call 01/24/34), |
||||||||
| (1-day SOFR + 1.922%)(a) |
3,385 | 3,356,466 | ||||||
| 5.87%, 06/08/34 (Call 06/08/33), |
||||||||
| (1-day SOFR + 2.361%)(a) |
3,695 | 3,694,493 | ||||||
| 5.90%, 10/28/26 (Call 10/28/25), |
||||||||
| (1-day SOFR + 1.626%)(a) |
3,920 | 3,928,682 | ||||||
| 6.05%, 06/08/27 (Call 06/08/26), |
||||||||
| (1-day SOFR + 2.050%)(a) |
2,690 | 2,716,084 | ||||||
| 6.12%, 10/28/33 (Call 10/28/32), |
||||||||
| (1-day SOFR + 2.300%)(a) |
4,818 | 4,898,068 | ||||||
| 7.16%, 10/30/29 (Call 10/30/28), |
||||||||
| (1-day SOFR + 2.446%)(a) |
3,415 | 3,615,173 | ||||||
| U.S. Bancorp. |
||||||||
| 1.38%, 07/22/30 (Call 04/22/30) |
3,228 | 2,558,520 | ||||||
| 1.45%, 05/12/25 (Call 04/11/25)(b) |
5,371 | 5,139,382 | ||||||
| 2.22%, 01/27/28 (Call 01/27/27), |
||||||||
| (1-day SOFR + 0.730%)(a) |
4,460 | 4,085,058 | ||||||
| 2.49%, 11/03/36 (Call 11/03/31), |
||||||||
| (5-year CMT + 0.950%)(a) |
7,520 | 5,812,570 | ||||||
| 2.68%, 01/27/33 (Call 01/27/32), |
||||||||
| (1-day SOFR + 1.020%)(a) |
6,083 | 4,965,060 | ||||||
| 3.00%, 07/30/29 (Call 04/30/29) |
3,349 | 2,965,790 | ||||||
| 3.10%, 04/27/26 (Call 03/27/26)(b) |
3,996 | 3,815,559 | ||||||
| 3.90%, 04/26/28 (Call 03/24/28) |
5,144 | 4,923,534 | ||||||
| 3.95%, 11/17/25 (Call 10/17/25) |
3,295 | 3,223,659 | ||||||
| 4.55%, 07/22/28 (Call 07/22/27), |
||||||||
| (1-day SOFR + 1.660%)(a) |
6,780 | 6,619,578 | ||||||
| 4.65%, 02/01/29 (Call 02/01/28), |
||||||||
| (1-day SOFR + 1.230%)(a)(b) |
4,665 | 4,533,490 | ||||||
| 4.84%, 02/01/34 (Call 02/01/33), |
||||||||
| (1-day SOFR + 1.600%)(a) |
5,145 | 4,842,485 | ||||||
| 4.97%, 07/22/33 (Call 07/22/32), |
||||||||
| (1-day SOFR + 2.110%)(a) |
7,930 | 7,420,448 | ||||||
| 5.38%, 01/23/30 (Call 01/23/29), |
||||||||
| (1-day SOFR + 1.560%)(a) |
3,160 | 3,142,182 | ||||||
| 5.68%, 01/23/35 (Call 01/23/34), |
||||||||
| (1-day SOFR + 1.860%)(a) |
7,420 | 7,403,372 | ||||||
| 5.73%, 10/21/26 (Call 10/21/25), |
||||||||
| (1-day SOFR + 1.430%)(a) |
5,630 | 5,653,749 | ||||||
| 5.78%, 06/12/29 (Call 06/12/28), |
||||||||
| (1-day SOFR + 2.020%)(a) |
2,295 | 2,318,470 | ||||||
| 5.84%, 06/12/34 (Call 06/10/33), |
||||||||
| (1-day SOFR + 2.260%)(a) |
2,750 | 2,771,311 | ||||||
| 5.85%, 10/21/33 (Call 10/21/32), |
||||||||
| (1-day SOFR + 2.090%)(a) |
9,430 | 9,522,011 | ||||||
| 6.79%, 10/26/27 (Call 10/26/26), |
||||||||
| (1-day SOFR + 1.880%)(a) |
2,615 | 2,701,105 | ||||||
| Series V, 2.38%, 07/22/26 (Call 06/22/26) |
5,737 | 5,376,265 | ||||||
| Series X, 3.15%, 04/27/27 (Call 03/27/27) |
5,007 | 4,727,458 | ||||||
| 26 | 2 0 2 4 I S H A R E S A N N U A L R E P O R T T O S H A R E H O L D E R S |
| Schedule of Investments (continued) February 29, 2024 |
iShares® Core U.S. Aggregate Bond ETF (Percentages shown are based on Net Assets) |
| Security | Par (000) |
Value | ||||||
| Banks (continued) |
||||||||
| UBS AG/London |
||||||||
| 1.25%, 06/01/26 |
$ | 400 | $ | 366,791 | ||||
| 4.50%, 06/26/48 |
575 | 526,340 | ||||||
| 5.65%, 09/11/28 |
3,880 | 3,957,339 | ||||||
| 5.80%, 09/11/25 |
4,345 | 4,375,713 | ||||||
| UBS Group AG |
||||||||
| 3.75%, 03/26/25 |
9,194 | 9,003,571 | ||||||
| 4.55%, 04/17/26 |
8,049 | 7,905,665 | ||||||
| 4.88%, 05/15/45 |
7,862 | 7,249,139 | ||||||
| Wachovia Corp. |
||||||||
| 5.50%, 08/01/35 |
8,145 | 8,011,347 | ||||||
| 7.57%, 08/01/26(e) |
475 | 498,157 | ||||||
| Webster Financial Corp., 4.10%, 03/25/29 |
||||||||
| (Call 12/25/28) |
1,705 | 1,549,031 | ||||||
| Wells Fargo & Co. |
||||||||
| 2.19%, 04/30/26 (Call 04/30/25), |
||||||||
| (1-day SOFR + 2.000%)(a) |
9,076 | 8,708,570 | ||||||
| 2.39%, 06/02/28 (Call 06/02/27), |
||||||||
| (1-day SOFR + 2.100%)(a) |
11,301 | 10,308,215 | ||||||
| 2.57%, 02/11/31 (Call 02/11/30), |
||||||||
| (3-mo. SOFR + 1.262%)(a) |
13,618 | 11,616,114 | ||||||
| 2.88%, 10/30/30 (Call 10/30/29), |
||||||||
| (3-mo. SOFR + 1.432%)(a) |
13,206 | 11,571,751 | ||||||
| 3.00%, 04/22/26 |
13,645 | 13,019,541 | ||||||
| 3.00%, 10/23/26 |
15,133 | 14,298,743 | ||||||
| 3.07%, 04/30/41 (Call 04/30/40), |
||||||||
| (1-day SOFR + 2.530%)(a) |
15,375 | 11,363,183 | ||||||
| 3.20%, 06/17/27 (Call 06/17/26), |
||||||||
| (3-mo. SOFR + 1.432%)(a) |
9,758 | 9,287,957 | ||||||
| 3.35%, 03/02/33 (Call 03/02/32), |
||||||||
| (1-day SOFR + 1.500%)(a) |
11,630 | 9,978,629 | ||||||
| 3.53%, 03/24/28 (Call 03/24/27), |
||||||||
| (1-day SOFR + 1.510%)(a) |
13,035 | 12,359,140 | ||||||
| 3.55%, 09/29/25 |
11,020 | 10,735,546 | ||||||
| 3.58%, 05/22/28 (Call 05/22/27), |
||||||||
| (3-mo. SOFR + 1.572%)(a) |
14,554 | 13,785,048 | ||||||
| 3.90%, 05/01/45 |
9,621 | 7,703,383 | ||||||
| 3.91%, 04/25/26 (Call 04/25/25), |
||||||||
| (1-day SOFR + 1.320%)(a) |
10,100 | 9,905,086 | ||||||
| 4.10%, 06/03/26 |
10,137 | 9,869,121 | ||||||
| 4.15%, 01/24/29 (Call 10/24/28) |
12,162 | 11,640,330 | ||||||
| 4.30%, 07/22/27 |
8,491 | 8,242,512 | ||||||
| 4.40%, 06/14/46 |
8,902 | 7,304,243 | ||||||
| 4.48%, 04/04/31 (Call 04/04/30), |
||||||||
| (3-mo. SOFR + 4.032%)(a) |
7,912 | 7,529,879 | ||||||
| 4.54%, 08/15/26 (Call 08/15/25), |
||||||||
| (1-day SOFR + 1.560%)(a) |
4,090 | 4,033,773 | ||||||
| 4.61%, 04/25/53 (Call 04/25/52), |
||||||||
| (1-day SOFR + 2.130%)(a) |
13,195 | 11,513,023 | ||||||
| 4.65%, 11/04/44 |
8,903 | 7,662,599 | ||||||
| 4.75%, 12/07/46 |
8,490 | 7,337,747 | ||||||
| 4.81%, 07/25/28 (Call 07/25/27), |
||||||||
| (1-day SOFR + 1.980%)(a) |
9,725 | 9,552,992 | ||||||
| 4.90%, 07/25/33 (Call 07/25/32), |
||||||||
| (1-day SOFR + 2.100%)(a) |
15,075 | 14,422,202 | ||||||
| 4.90%, 11/17/45 |
8,923 | 7,917,961 | ||||||
| 5.01%, 04/04/51 (Call 04/04/50), |
||||||||
| (3-mo. SOFR + 4.502%)(a) |
22,246 | 20,577,706 | ||||||
| 5.20%, 01/23/30 (Call 01/23/29), |
||||||||
| (1-day SOFR + 1.500%)(a) |
9,355 | 9,274,354 | ||||||
| 5.38%, 02/07/35 |
1,480 | 1,493,705 | ||||||
| Security | Par (000) |
Value | ||||||
| Banks (continued) |
||||||||
| 5.38%, 11/02/43 |
$ | 8,333 | $ | 7,951,478 | ||||
| 5.39%, 04/24/34 (Call 04/24/33), |
||||||||
| (1-day SOFR + 2.020%)(a) |
11,640 | 11,450,943 | ||||||
| 5.50%, 01/23/35 (Call 01/23/34), |
||||||||
| (1-day SOFR + 1.780%)(a) |
6,485 | 6,444,273 | ||||||
| 5.56%, 07/25/34 (Call 07/25/33), |
||||||||
| (1-day SOFR + 1.990%)(a) |
13,994 | 13,940,646 | ||||||
| 5.57%, 07/25/29 (Call 07/25/28), |
||||||||
| (1-day SOFR + 1.740%)(a) |
11,485 | 11,564,956 | ||||||
| 5.61%, 01/15/44 |
10,315 | 10,029,761 | ||||||
| 5.95%, 12/01/86 (Call 12/15/36) |
1,691 | 1,722,302 | ||||||
| 6.00%, 10/28/25 (Call 04/28/24)(b) |
430 | 428,487 | ||||||
| 6.30%, 10/23/29 (Call 10/23/28), |
||||||||
| (1-day SOFR + 1.790%)(a) |
8,405 | 8,710,863 | ||||||
| 6.49%, 10/23/34 (Call 10/23/33), |
||||||||
| (1-day SOFR + 2.060%)(a) |
12,200 | 12,975,395 | ||||||
| Series B, 7.95%, 11/15/29 |
1,104 | 1,229,561 | ||||||
| Wells Fargo Bank NA |
||||||||
| 4.81%, 01/15/26 (Call 12/15/25) |
4,590 | 4,565,761 | ||||||
| 5.25%, 12/11/26 (Call 11/09/26) |
8,855 | 8,886,612 | ||||||
| 5.45%, 08/07/26 (Call 07/07/26) |
8,250 | 8,322,684 | ||||||
| 5.55%, 08/01/25 (Call 07/01/25) |
8,250 | 8,283,965 | ||||||
| 5.85%, 02/01/37 |
3,689 | 3,774,999 | ||||||
| 5.95%, 08/26/36(b) |
3,262 | 3,332,789 | ||||||
| 6.60%, 01/15/38 |
5,151 | 5,551,363 | ||||||
| Westpac Banking Corp. |
||||||||
| 1.15%, 06/03/26 |
7,570 | 6,956,123 | ||||||
| 1.95%, 11/20/28 |
5,395 | 4,732,108 | ||||||
| 2.15%, 06/03/31 |
4,590 | 3,802,798 | ||||||
| 2.65%, 01/16/30 |
3,329 | 2,950,631 | ||||||
| 2.67%, 11/15/35 (Call 11/15/30), |
||||||||
| (5-year CMT + 1.750%)(a) |
3,984 | 3,246,210 | ||||||
| 2.70%, 08/19/26 |
4,621 | 4,381,996 | ||||||
| 2.85%, 05/13/26 |
7,695 | 7,352,921 | ||||||
| 2.96%, 11/16/40 |
4,008 | 2,736,757 | ||||||
| 3.02%, 11/18/36 (Call 11/18/31), |
||||||||
| (5-year CMT + 1.530%)(a) |
5,640 | 4,591,390 | ||||||
| 3.13%, 11/18/41 |
3,774 | 2,609,119 | ||||||
| 3.35%, 03/08/27 |
4,515 | 4,317,951 | ||||||
| 3.40%, 01/25/28 |
4,690 | 4,441,142 | ||||||
| 3.74%, 08/26/25 |
230 | 225,542 | ||||||
| 4.04%, 08/26/27(b) |
2,196 | 2,148,797 | ||||||
| 4.11%, 07/24/34 (Call 07/24/29), |
||||||||
| (5-year CMT + 2.000%)(a) |
5,048 | 4,611,067 | ||||||
| 4.32%, 11/23/31 (Call 11/23/26), |
||||||||
| (5-year USD ICE Swap + 2.236%)(a) |
6,008 | 5,768,981 | ||||||
| 4.42%, 07/24/39 |
4,141 | 3,584,626 | ||||||
| 5.41%, 08/10/33 (Call 08/10/32), |
||||||||
| (1-year CMT + 2.680%)(a) |
1,655 | 1,619,849 | ||||||
| 5.46%, 11/18/27 |
5,662 | 5,756,611 | ||||||
| 5.51%, 11/17/25 |
4,170 | 4,201,364 | ||||||
| 5.54%, 11/17/28 |
4,205 | 4,304,950 | ||||||
| 6.82%, 11/17/33 |
2,885 | 3,093,653 | ||||||
| Wintrust Financial Corp., 4.85%, 06/06/29 |
797 | 718,870 | ||||||
| Zions Bancorp. NA, 3.25%, 10/29/29 |
||||||||
| (Call 07/29/29) |
2,151 | 1,754,203 | ||||||
|
|
|
|||||||
| 5,606,717,398 | ||||||||
| S C H E D U L E O F I N V E S T M E N T S |
27 |
| Schedule of Investments (continued) February 29, 2024 |
iShares® Core U.S. Aggregate Bond ETF (Percentages shown are based on Net Assets) |
| Security | Par (000) | Value | ||||||
| Beverages — 0.5% |
||||||||
| Anheuser-Busch Companies LLC/Anheuser-Busch InBev Worldwide Inc. |
||||||||
| 3.65%, 02/01/26 (Call 11/01/25) |
$ | 4,490 | $ | 4,377,658 | ||||
| 4.70%, 02/01/36 (Call 08/01/35) |
21,403 | 20,483,595 | ||||||
| 4.90%, 02/01/46 (Call 08/01/45) |
36,986 | 34,523,850 | ||||||
| Anheuser-Busch InBev Finance Inc. |
||||||||
| 4.63%, 02/01/44 |
4,498 | 4,058,724 | ||||||
| 4.70%, 02/01/36 (Call 08/01/35) |
3,301 | 3,147,128 | ||||||
| 4.90%, 02/01/46 (Call 08/01/45) |
6,354 | 5,871,363 | ||||||
| Anheuser-Busch InBev Worldwide Inc. |
||||||||
| 3.50%, 06/01/30 (Call 03/01/30) |
4,611 | 4,261,029 | ||||||
| 3.75%, 07/15/42(b) |
370 | 302,406 | ||||||
| 4.00%, 04/13/28 (Call 01/13/28) |
10,445 | 10,125,440 | ||||||
| 4.35%, 06/01/40 (Call 12/01/39) |
5,374 | 4,805,868 | ||||||
| 4.38%, 04/15/38 (Call 10/15/37) |
4,923 | 4,502,744 | ||||||
| 4.44%, 10/06/48 (Call 04/06/48) |
7,960 | 6,967,326 | ||||||
| 4.60%, 04/15/48 (Call 10/15/47) |
1,534 | 1,377,943 | ||||||
| 4.75%, 01/23/29 (Call 10/23/28) |
16,038 | 15,929,517 | ||||||
| 4.75%, 04/15/58 (Call 10/15/57)(b) |
2,320 | 2,087,133 | ||||||
| 4.90%, 01/23/31 (Call 10/23/30) |
4,969 | 4,994,806 | ||||||
| 4.95%, 01/15/42 |
5,630 | 5,370,042 | ||||||
| 5.45%, 01/23/39 (Call 07/23/38) |
8,265 | 8,410,948 | ||||||
| 5.55%, 01/23/49 (Call 07/23/48) |
15,900 | 16,283,582 | ||||||
| 5.80%, 01/23/59 (Call 07/23/58) |
7,716 | 8,148,577 | ||||||
| 5.88%, 06/15/35 |
1,450 | 1,543,547 | ||||||
| 8.00%, 11/15/39 |
1,980 | 2,481,030 | ||||||
| 8.20%, 01/15/39 |
5,051 | 6,495,592 | ||||||
| Brown-Forman Corp. |
||||||||
| 3.50%, 04/15/25 (Call 02/15/25) |
570 | 558,410 | ||||||
| 4.00%, 04/15/38 (Call 10/15/37) |
1,016 | 891,661 | ||||||
| 4.50%, 07/15/45 (Call 01/15/45) |
1,570 | 1,393,224 | ||||||
| 4.75%, 04/15/33 (Call 01/15/33) |
2,250 | 2,218,141 | ||||||
| Coca-Cola Co. (The) |
||||||||
| 1.00%, 03/15/28 |
4,154 | 3,618,811 | ||||||
| 1.38%, 03/15/31 |
4,150 | 3,322,093 | ||||||
| 1.45%, 06/01/27 |
3,917 | 3,544,029 | ||||||
| 1.50%, 03/05/28 |
3,537 | 3,141,018 | ||||||
| 1.65%, 06/01/30 |
4,969 | 4,150,046 | ||||||
| 2.00%, 03/05/31 |
3,696 | 3,091,674 | ||||||
| 2.13%, 09/06/29 |
5,043 | 4,437,074 | ||||||
| 2.25%, 01/05/32 |
9,045 | 7,615,917 | ||||||
| 2.50%, 06/01/40 |
4,318 | 3,084,318 | ||||||
| 2.50%, 03/15/51 |
6,035 | 3,769,427 | ||||||
| 2.60%, 06/01/50 |
6,884 | 4,429,810 | ||||||
| 2.75%, 06/01/60(b) |
3,526 | 2,234,577 | ||||||
| 2.88%, 05/05/41 |
3,700 | 2,776,466 | ||||||
| 2.90%, 05/25/27 |
3,912 | 3,711,353 | ||||||
| 3.00%, 03/05/51 |
4,090 | 2,861,214 | ||||||
| 3.38%, 03/25/27 |
5,297 | 5,103,044 | ||||||
| 3.45%, 03/25/30 |
6,273 | 5,851,371 | ||||||
| 4.20%, 03/25/50 |
2,936 | 2,593,154 | ||||||
| Coca-Cola Consolidated Inc., 3.80%, 11/25/25 |
||||||||
| (Call 08/25/25) |
3,564 | 3,481,716 | ||||||
| Coca-Cola Femsa SAB de CV |
||||||||
| 1.85%, 09/01/32 (Call 06/01/32) |
4,208 | 3,275,371 | ||||||
| 2.75%, 01/22/30 (Call 10/22/29) |
3,518 | 3,110,864 | ||||||
| 5.25%, 11/26/43 |
2,442 | 2,370,557 | ||||||
| Constellation Brands Inc. |
||||||||
| 2.25%, 08/01/31 (Call 05/01/31) |
710 | 579,049 | ||||||
| 2.88%, 05/01/30 (Call 02/01/30) |
2,645 | 2,322,418 | ||||||
| Security | Par (000) |
Value | ||||||
| Beverages (continued) |
||||||||
| 3.15%, 08/01/29 (Call 05/01/29) |
$ | 3,712 | $ | 3,367,682 | ||||
| 3.50%, 05/09/27 (Call 02/09/27) |
2,570 | 2,442,480 | ||||||
| 3.60%, 02/15/28 (Call 11/15/27) |
2,335 | 2,206,256 | ||||||
| 3.70%, 12/06/26 (Call 09/06/26) |
3,955 | 3,806,039 | ||||||
| 3.75%, 05/01/50 (Call 11/01/49) |
2,390 | 1,788,014 | ||||||
| 4.10%, 02/15/48 (Call 08/15/47) |
2,431 | 1,945,981 | ||||||
| 4.35%, 05/09/27 (Call 04/09/27) |
2,675 | 2,615,623 | ||||||
| 4.40%, 11/15/25 (Call 09/15/25) |
2,869 | 2,825,988 | ||||||
| 4.50%, 05/09/47 (Call 11/09/46) |
2,175 | 1,832,166 | ||||||
| 4.65%, 11/15/28 (Call 08/15/28) |
2,942 | 2,883,309 | ||||||
| 4.75%, 12/01/25 |
2,437 | 2,410,189 | ||||||
| 4.75%, 05/09/32 (Call 02/09/32)(b) |
815 | 787,302 | ||||||
| 4.80%, 01/15/29 (Call 12/15/28) |
1,645 | 1,620,376 | ||||||
| 4.90%, 05/01/33 (Call 02/01/33) |
3,205 | 3,111,267 | ||||||
| 5.00%, 02/02/26 (Call 03/11/24) |
800 | 794,974 | ||||||
| 5.25%, 11/15/48 (Call 05/15/48) |
2,340 | 2,203,804 | ||||||
| Diageo Capital PLC |
||||||||
| 1.38%, 09/29/25 (Call 08/29/25) |
4,666 | 4,400,554 | ||||||
| 2.00%, 04/29/30 (Call 01/29/30) |
5,266 | 4,437,769 | ||||||
| 2.13%, 04/29/32 (Call 01/29/32) |
3,753 | 3,032,493 | ||||||
| 2.38%, 10/24/29 (Call 07/24/29) |
2,325 | 2,041,287 | ||||||
| 3.88%, 05/18/28 (Call 02/18/28) |
2,639 | 2,547,075 | ||||||
| 3.88%, 04/29/43 (Call 10/29/42) |
2,362 | 1,997,812 | ||||||
| 5.20%, 10/24/25 |
3,725 | 3,726,487 | ||||||
| 5.30%, 10/24/27 (Call 09/24/27) |
4,545 | 4,597,861 | ||||||
| 5.38%, 10/05/26 (Call 09/05/26) |
3,580 | 3,607,971 | ||||||
| 5.50%, 01/24/33 (Call 10/24/32) |
3,942 | 4,047,479 | ||||||
| 5.63%, 10/05/33 (Call 07/05/33) |
2,700 | 2,802,793 | ||||||
| 5.88%, 09/30/36 |
2,660 | 2,836,572 | ||||||
| Diageo Investment Corp. |
||||||||
| 4.25%, 05/11/42 |
1,012 | 897,712 | ||||||
| 7.45%, 04/15/35 |
1,980 | 2,341,383 | ||||||
| Fomento Economico Mexicano SAB de CV |
||||||||
| 3.50%, 01/16/50 (Call 07/16/49) |
1,070 | 790,920 | ||||||
| 4.38%, 05/10/43 |
340 | 298,014 | ||||||
| Keurig Dr Pepper Inc. |
||||||||
| 2.25%, 03/15/31 (Call 12/15/30) |
2,653 | 2,202,831 | ||||||
| 2.55%, 09/15/26 (Call 06/15/26) |
2,458 | 2,305,100 | ||||||
| 3.20%, 05/01/30 (Call 02/01/30) |
2,324 | 2,095,695 | ||||||
| 3.35%, 03/15/51 (Call 09/15/50) |
2,735 | 1,901,449 | ||||||
| 3.40%, 11/15/25 (Call 08/15/25) |
3,964 | 3,839,213 | ||||||
| 3.43%, 06/15/27 (Call 03/15/27) |
2,958 | 2,815,511 | ||||||
| 3.80%, 05/01/50 (Call 11/01/49) |
3,115 | 2,369,037 | ||||||
| 3.95%, 04/15/29 (Call 02/15/29) |
4,785 | 4,555,229 | ||||||
| 4.05%, 04/15/32 (Call 01/15/32) |
3,725 | 3,455,097 | ||||||
| 4.42%, 05/25/25 (Call 03/25/25) |
1,890 | 1,869,344 | ||||||
| 4.42%, 12/15/46 (Call 06/15/46) |
2,017 | 1,702,261 | ||||||
| 4.50%, 11/15/45 (Call 05/15/45) |
2,760 | 2,379,536 | ||||||
| 4.50%, 04/15/52 (Call 10/15/51) |
3,370 | 2,859,931 | ||||||
| 4.60%, 05/25/28 (Call 02/25/28) |
1,830 | 1,802,655 | ||||||
| 5.09%, 05/25/48 (Call 11/25/47) |
240 | 224,911 | ||||||
| Molson Coors Beverage Co. |
||||||||
| 3.00%, 07/15/26 (Call 04/15/26) |
6,521 | 6,210,736 | ||||||
| 4.20%, 07/15/46 (Call 01/15/46) |
7,262 | 5,916,364 | ||||||
| 5.00%, 05/01/42 |
4,587 | 4,262,431 | ||||||
| PepsiCo Inc. |
||||||||
| 1.40%, 02/25/31 (Call 11/25/30) |
3,740 | 2,990,014 | ||||||
| 1.63%, 05/01/30 (Call 02/01/30) |
4,608 | 3,830,486 | ||||||
| 1.95%, 10/21/31 (Call 07/21/31)(b) |
5,215 | 4,268,856 | ||||||
| 2.25%, 03/19/25 (Call 02/19/25) |
8,811 | 8,556,951 | ||||||
| 2.38%, 10/06/26 (Call 07/06/26) |
4,657 | 4,387,515 | ||||||
| 28 | 2 0 2 4 I S H A R E S A N N U A L R E P O R T T O S H A R E H O L D E R S |
| Schedule of Investments (continued) February 29, 2024 |
iShares® Core U.S. Aggregate Bond ETF (Percentages shown are based on Net Assets) |
| Security | Par (000) |
Value | ||||||
| Beverages (continued) |
||||||||
| 2.63%, 03/19/27 (Call 01/19/27) |
$ | 3,368 | $ | 3,166,831 | ||||
| 2.63%, 07/29/29 (Call 04/29/29) |
4,398 | 3,962,013 | ||||||
| 2.63%, 10/21/41 (Call 04/21/41) |
4,875 | 3,493,359 | ||||||
| 2.75%, 04/30/25 (Call 01/30/25) |
3,156 | 3,073,689 | ||||||
| 2.75%, 03/19/30 (Call 12/19/29) |
6,128 | 5,466,637 | ||||||
| 2.75%, 10/21/51 (Call 04/21/51) |
4,395 | 2,887,934 | ||||||
| 2.85%, 02/24/26 (Call 11/24/25) |
4,234 | 4,071,837 | ||||||
| 2.88%, 10/15/49 (Call 04/15/49) |
4,737 | 3,258,910 | ||||||
| 3.00%, 10/15/27 (Call 07/15/27) |
5,606 | 5,284,724 | ||||||
| 3.38%, 07/29/49 (Call 01/29/49) |
3,075 | 2,313,067 | ||||||
| 3.45%, 10/06/46 (Call 04/06/46) |
5,009 | 3,877,868 | ||||||
| 3.50%, 07/17/25 (Call 04/17/25) |
3,941 | 3,860,432 | ||||||
| 3.50%, 03/19/40 (Call 09/19/39) |
735 | 603,460 | ||||||
| 3.60%, 02/18/28 (Call 01/18/28) |
4,155 | 3,994,957 | ||||||
| 3.60%, 08/13/42 |
1,280 | 1,027,421 | ||||||
| 3.63%, 03/19/50 (Call 09/19/49) |
4,614 | 3,634,616 | ||||||
| 3.88%, 03/19/60 (Call 09/19/59) |
605 | 483,103 | ||||||
| 3.90%, 07/18/32 (Call 04/18/32) |
5,315 | 4,988,914 | ||||||
| 4.00%, 03/05/42 |
1,075 | 951,262 | ||||||
| 4.00%, 05/02/47 (Call 11/02/46) |
3,095 | 2,610,396 | ||||||
| 4.20%, 07/18/52 (Call 01/18/52) |
3,045 | 2,636,999 | ||||||
| 4.25%, 10/22/44 (Call 04/22/44) |
530 | 459,551 | ||||||
| 4.45%, 05/15/28 (Call 04/15/28)(b) |
3,205 | 3,198,566 | ||||||
| 4.45%, 02/15/33 (Call 11/15/32)(b) |
3,190 | 3,154,324 | ||||||
| 4.45%, 04/14/46 (Call 10/14/45) |
2,475 | 2,238,563 | ||||||
| 4.55%, 02/13/26 (Call 01/13/26) |
2,971 | 2,953,601 | ||||||
| 4.65%, 02/15/53 (Call 08/15/52) |
3,115 | 2,894,929 | ||||||
| 4.88%, 11/01/40 |
1,430 | 1,415,506 | ||||||
| 5.13%, 11/10/26 (Call 10/10/26) |
2,945 | 2,964,230 | ||||||
| 5.25%, 11/10/25 |
4,575 | 4,594,310 | ||||||
| 5.50%, 01/15/40 |
150 | 156,622 | ||||||
| 7.00%, 03/01/29 |
4,635 | 5,108,789 | ||||||
| Pepsico Singapore Financing I Pte Ltd. |
||||||||
| 4.55%, 02/16/29 (Call 01/16/29) |
1,580 | 1,565,818 | ||||||
| 4.65%, 02/16/27 (Call 01/16/27) |
1,520 | 1,508,847 | ||||||
| 4.70%, 02/16/34 (Call 11/16/33)(b) |
1,530 | 1,504,569 | ||||||
|
|
|
|||||||
| 523,300,094 | ||||||||
| Biotechnology — 0.3% |
||||||||
| Amgen Inc. |
||||||||
| 1.65%, 08/15/28 (Call 06/15/28) |
7,763 | 6,753,508 | ||||||
| 2.00%, 01/15/32 (Call 10/15/31) |
5,500 | 4,409,608 | ||||||
| 2.20%, 02/21/27 (Call 12/21/26) |
3,527 | 3,249,796 | ||||||
| 2.30%, 02/25/31 (Call 11/25/30) |
5,821 | 4,871,288 | ||||||
| 2.45%, 02/21/30 (Call 11/21/29) |
3,712 | 3,226,859 | ||||||
| 2.60%, 08/19/26 (Call 05/19/26) |
6,630 | 6,257,724 | ||||||
| 2.77%, 09/01/53 (Call 03/01/53) |
5,325 | 3,244,126 | ||||||
| 2.80%, 08/15/41 (Call 02/15/41) |
6,325 | 4,503,728 | ||||||
| 3.00%, 02/22/29 (Call 12/22/28) |
1,365 | 1,252,619 | ||||||
| 3.00%, 01/15/52 (Call 07/15/51)(b) |
6,497 | 4,342,692 | ||||||
| 3.13%, 05/01/25 (Call 02/01/25) |
5,689 | 5,547,147 | ||||||
| 3.15%, 02/21/40 (Call 08/21/39) |
7,822 | 5,867,190 | ||||||
| 3.20%, 11/02/27 (Call 08/02/27) |
4,052 | 3,808,309 | ||||||
| 3.35%, 02/22/32 (Call 11/22/31) |
2,866 | 2,534,479 | ||||||
| 3.38%, 02/21/50 (Call 08/21/49) |
7,675 | 5,474,654 | ||||||
| 4.05%, 08/18/29 (Call 06/18/29) |
6,545 | 6,256,637 | ||||||
| 4.20%, 03/01/33 (Call 12/01/32) |
3,790 | 3,509,038 | ||||||
| 4.20%, 02/22/52 (Call 08/22/51) |
3,339 | 2,704,534 | ||||||
| 4.40%, 05/01/45 (Call 11/01/44) |
8,799 | 7,510,367 | ||||||
| 4.40%, 02/22/62 (Call 08/22/61) |
4,081 | 3,279,012 | ||||||
| 4.56%, 06/15/48 (Call 12/15/47) |
6,769 | 5,861,183 | ||||||
| 4.66%, 06/15/51 (Call 12/15/50) |
11,570 | 10,035,269 | ||||||
| Security | Par (000) |
Value | ||||||
| Biotechnology (continued) |
||||||||
| 4.88%, 03/01/53 (Call 09/01/52) |
$ | 4,185 | $ | 3,755,044 | ||||
| 4.95%, 10/01/41 |
3,787 | 3,528,734 | ||||||
| 5.15%, 03/02/28 (Call 02/02/28) |
15,070 | 15,099,850 | ||||||
| 5.15%, 11/15/41 (Call 05/15/41) |
4,210 | 4,008,072 | ||||||
| 5.25%, 03/02/25 |
10,290 | 10,270,498 | ||||||
| 5.25%, 03/02/30 (Call 01/02/30) |
11,685 | 11,772,329 | ||||||
| 5.25%, 03/02/33 (Call 12/02/32) |
16,125 | 16,077,079 | ||||||
| 5.51%, 03/02/26 (Call 03/11/24) |
410 | 409,587 | ||||||
| 5.60%, 03/02/43 (Call 09/02/42) |
11,670 | 11,707,960 | ||||||
| 5.65%, 06/15/42 (Call 12/15/41) |
1,770 | 1,783,566 | ||||||
| 5.65%, 03/02/53 (Call 09/02/52) |
14,515 | 14,522,369 | ||||||
| 5.75%, 03/15/40 |
320 | 324,987 | ||||||
| 5.75%, 03/02/63 (Call 09/02/62) |
9,090 | 9,093,690 | ||||||
| 6.38%, 06/01/37 |
1,375 | 1,476,038 | ||||||
| 6.40%, 02/01/39 |
2,920 | 3,158,229 | ||||||
| Baxalta Inc. |
||||||||
| 4.00%, 06/23/25 (Call 03/23/25) |
4,175 | 4,099,581 | ||||||
| 5.25%, 06/23/45 (Call 12/23/44) |
2,048 | 1,972,032 | ||||||
| Biogen Inc. |
||||||||
| 2.25%, 05/01/30 (Call 02/01/30) |
7,250 | 6,066,811 | ||||||
| 3.15%, 05/01/50 (Call 11/01/49) |
8,146 | 5,378,967 | ||||||
| 3.25%, 02/15/51 (Call 08/15/50) |
4,851 | 3,308,678 | ||||||
| 4.05%, 09/15/25 (Call 06/15/25) |
8,254 | 8,091,526 | ||||||
| 5.20%, 09/15/45 (Call 03/15/45) |
1,172 | 1,102,969 | ||||||
| Bio-Rad Laboratories Inc. |
||||||||
| 3.30%, 03/15/27 (Call 02/15/27) |
2,226 | 2,099,414 | ||||||
| 3.70%, 03/15/32 (Call 12/15/31) |
3,545 | 3,157,500 | ||||||
| Gilead Sciences Inc. |
||||||||
| 1.20%, 10/01/27 (Call 08/01/27) |
4,417 | 3,885,461 | ||||||
| 1.65%, 10/01/30 (Call 07/01/30) |
3,748 | 3,057,483 | ||||||
| 2.60%, 10/01/40 (Call 04/01/40) |
4,606 | 3,210,360 | ||||||
| 2.80%, 10/01/50 (Call 04/01/50) |
6,605 | 4,251,766 | ||||||
| 2.95%, 03/01/27 (Call 12/01/26) |
6,439 | 6,081,556 | ||||||
| 3.65%, 03/01/26 (Call 12/01/25) |
9,168 | 8,904,103 | ||||||
| 4.00%, 09/01/36 (Call 03/01/36) |
3,763 | 3,329,282 | ||||||
| 4.15%, 03/01/47 (Call 09/01/46) |
7,610 | 6,279,377 | ||||||
| 4.50%, 02/01/45 (Call 08/01/44) |
5,495 | 4,831,752 | ||||||
| 4.60%, 09/01/35 (Call 03/01/35) |
4,843 | 4,585,291 | ||||||
| 4.75%, 03/01/46 (Call 09/01/45) |
9,113 | 8,264,448 | ||||||
| 4.80%, 04/01/44 (Call 10/01/43) |
5,031 | 4,619,648 | ||||||
| 5.25%, 10/15/33 (Call 07/15/33)(b) |
2,775 | 2,807,135 | ||||||
| 5.55%, 10/15/53 (Call 04/15/53) |
3,050 | 3,110,873 | ||||||
| 5.65%, 12/01/41 (Call 06/01/41) |
4,267 | 4,342,078 | ||||||
| Illumina Inc. |
||||||||
| 2.55%, 03/23/31 (Call 12/23/30) |
765 | 627,631 | ||||||
| 5.75%, 12/13/27 (Call 11/13/27) |
2,915 | 2,935,936 | ||||||
| 5.80%, 12/12/25 (Call 11/12/25) |
3,025 | 3,024,147 | ||||||
| Regeneron Pharmaceuticals Inc. |
||||||||
| 1.75%, 09/15/30 (Call 06/15/30) |
5,482 | 4,425,567 | ||||||
| 2.80%, 09/15/50 (Call 03/15/50) |
4,103 | 2,556,278 | ||||||
| Royalty Pharma PLC |
||||||||
| 1.20%, 09/02/25 (Call 08/02/25) |
3,074 | 2,878,358 | ||||||
| 1.75%, 09/02/27 (Call 07/02/27) |
4,356 | 3,872,537 | ||||||
| 2.15%, 09/02/31 (Call 06/02/31)(b) |
2,719 | 2,171,329 | ||||||
| 2.20%, 09/02/30 (Call 06/02/30) |
3,319 | 2,731,964 | ||||||
| 3.30%, 09/02/40 (Call 03/02/40) |
3,787 | 2,774,186 | ||||||
| 3.35%, 09/02/51 (Call 03/02/51) |
2,940 | 1,909,238 | ||||||
| 3.55%, 09/02/50 (Call 03/02/50) |
4,282 | 2,914,662 | ||||||
| 351,147,723 | ||||||||
| S C H E D U L E O F I N V E S T M E N T S |
29 |
| Schedule of Investments (continued) February 29, 2024 |
iShares® Core U.S. Aggregate Bond ETF (Percentages shown are based on Net Assets) |
| Security | Par (000) |
Value | ||||||
| Building Materials — 0.1% |
||||||||
| Carrier Global Corp. |
||||||||
| 2.49%, 02/15/27 (Call 12/15/26) |
$ | 2,678 | $ | 2,488,712 | ||||
| 2.70%, 02/15/31 (Call 11/15/30) |
3,440 | 2,932,369 | ||||||
| 2.72%, 02/15/30 (Call 11/15/29) |
9,138 | 7,997,079 | ||||||
| 3.38%, 04/05/40 (Call 10/05/39) |
6,955 | 5,365,393 | ||||||
| 3.58%, 04/05/50 (Call 10/05/49) |
7,431 | 5,475,891 | ||||||
| 5.80%, 11/30/25 |
5,570 | 5,610,004 | ||||||
| 5.90%, 03/15/34 (Call 12/15/33) |
1,990 | 2,077,607 | ||||||
| 6.20%, 03/15/54 (Call 09/15/53) |
970 | 1,057,513 | ||||||
| Eagle Materials Inc., 2.50%, 07/01/31 |
||||||||
| (Call 04/01/31) |
2,200 | 1,826,036 | ||||||
| Fortune Brands Innovations Inc. |
||||||||
| 3.25%, 09/15/29 (Call 06/15/29) |
3,467 | 3,132,162 | ||||||
| 4.00%, 06/15/25 (Call 03/15/25) |
2,285 | 2,242,121 | ||||||
| 4.00%, 03/25/32 (Call 12/25/31) |
1,965 | 1,782,165 | ||||||
| 4.50%, 03/25/52 (Call 09/25/51) |
2,392 | 1,943,278 | ||||||
| 5.88%, 06/01/33 (Call 03/01/33) |
2,074 | 2,106,654 | ||||||
| Johnson Controls International PLC |
||||||||
| 3.90%, 02/14/26 (Call 11/14/25) |
3,151 | 3,070,711 | ||||||
| 4.50%, 02/15/47 (Call 08/15/46) |
2,572 | 2,209,078 | ||||||
| 4.63%, 07/02/44 (Call 01/02/44) |
2,190 | 1,912,642 | ||||||
| 4.95%, 07/02/64 (Call 01/02/64)(e) |
1,812 | 1,610,181 | ||||||
| 5.13%, 09/14/45 (Call 03/14/45) |
617 | 574,134 | ||||||
| 6.00%, 01/15/36 |
829 | 870,920 | ||||||
| Johnson Controls International PLC/Tyco Fire & Security Finance SCA |
||||||||
| 1.75%, 09/15/30 (Call 06/15/30) |
2,755 | 2,247,135 | ||||||
| 2.00%, 09/16/31 (Call 06/16/31) |
2,005 | 1,610,465 | ||||||
| 4.90%, 12/01/32 (Call 09/01/32) |
1,620 | 1,590,465 | ||||||
| Lafarge SA, 7.13%, 07/15/36 |
910 | 1,008,280 | ||||||
| Lennox International Inc. |
||||||||
| 1.35%, 08/01/25 (Call 07/01/25) |
1,660 | 1,564,942 | ||||||
| 1.70%, 08/01/27 (Call 06/01/27) |
1,353 | 1,212,670 | ||||||
| 5.50%, 09/15/28 (Call 08/15/28) |
2,150 | 2,170,004 | ||||||
| Martin Marietta Materials Inc. |
||||||||
| 2.40%, 07/15/31 (Call 04/15/31) |
2,080 | 1,728,078 | ||||||
| 3.20%, 07/15/51 (Call 01/15/51) |
3,480 | 2,408,748 | ||||||
| 3.45%, 06/01/27 (Call 03/01/27) |
1,443 | 1,376,145 | ||||||
| 3.50%, 12/15/27 (Call 09/15/27) |
3,804 | 3,609,070 | ||||||
| 4.25%, 12/15/47 (Call 06/15/47) |
3,155 | 2,621,905 | ||||||
| Series CB, 2.50%, 03/15/30 (Call 12/15/29) |
2,826 | 2,444,350 | ||||||
| Masco Corp. |
||||||||
| 1.50%, 02/15/28 (Call 12/15/27) |
2,737 | 2,376,759 | ||||||
| 2.00%, 10/01/30 (Call 07/01/30) |
2,579 | 2,098,415 | ||||||
| 2.00%, 02/15/31 (Call 11/15/30) |
1,300 | 1,055,636 | ||||||
| 3.13%, 02/15/51 (Call 08/15/50) |
1,621 | 1,079,561 | ||||||
| 3.50%, 11/15/27 (Call 08/15/27) |
2,568 | 2,413,844 | ||||||
| 4.50%, 05/15/47 (Call 11/15/46)(b) |
2,070 | 1,728,634 | ||||||
| Mohawk Industries Inc. |
||||||||
| 3.63%, 05/15/30 (Call 02/15/30)(b) |
1,700 | 1,546,909 | ||||||
| 5.85%, 09/18/28 (Call 08/18/28)(b) |
1,825 | 1,861,961 | ||||||
| Owens Corning |
||||||||
| 3.40%, 08/15/26 (Call 05/15/26) |
2,868 | 2,737,040 | ||||||
| 3.88%, 06/01/30 (Call 03/01/30) |
1,725 | 1,590,040 | ||||||
| 3.95%, 08/15/29 (Call 05/15/29) |
3,653 | 3,445,993 | ||||||
| 4.30%, 07/15/47 (Call 01/15/47) |
3,126 | 2,561,551 | ||||||
| 4.40%, 01/30/48 (Call 07/30/47) |
1,949 | 1,602,856 | ||||||
| 7.00%, 12/01/36 |
1,465 | 1,627,249 | ||||||
| Trane Technologies Financing Ltd. |
||||||||
| 3.50%, 03/21/26 (Call 01/21/26) |
2,392 | 2,311,500 | ||||||
| 3.80%, 03/21/29 (Call 12/21/28) |
3,630 | 3,431,420 | ||||||
| Security | Par (000) |
Value | ||||||
| Building Materials (continued) |
||||||||
| 4.50%, 03/21/49 (Call 09/21/48) |
$ | 1,635 | $ | 1,447,297 | ||||
| 4.65%, 11/01/44 (Call 05/01/44) |
1,263 | 1,133,433 | ||||||
| 5.25%, 03/03/33 (Call 12/03/32) |
575 | 580,541 | ||||||
| Trane Technologies Global Holding Co. Ltd. |
||||||||
| 3.75%, 08/21/28 (Call 05/21/28) |
2,388 | 2,277,178 | ||||||
| 4.30%, 02/21/48 (Call 08/21/47) |
1,103 | 948,742 | ||||||
| 5.75%, 06/15/43 |
2,312 | 2,389,390 | ||||||
| Vulcan Materials Co. |
||||||||
| 3.50%, 06/01/30 (Call 03/01/30) |
3,835 | 3,495,087 | ||||||
| 3.90%, 04/01/27 (Call 01/01/27) |
1,480 | 1,433,858 | ||||||
| 4.50%, 04/01/25 (Call 01/01/25) |
1,687 | 1,669,055 | ||||||
| 4.50%, 06/15/47 (Call 12/15/46) |
3,224 | 2,788,296 | ||||||
| 4.70%, 03/01/48 (Call 09/01/47) |
1,878 | 1,681,788 | ||||||
| 5.80%, 03/01/26 (Call 03/01/24) |
620 | 620,000 | ||||||
|
|
|
|||||||
| 135,810,940 | ||||||||
| Chemicals — 0.4% |
||||||||
| Air Products and Chemicals Inc. |
||||||||
| 1.50%, 10/15/25 (Call 09/15/25) |
3,765 | 3,559,616 | ||||||
| 1.85%, 05/15/27 (Call 03/15/27) |
5,927 | 5,417,307 | ||||||
| 2.05%, 05/15/30 (Call 02/15/30) |
3,722 | 3,164,657 | ||||||
| 2.70%, 05/15/40 (Call 11/15/39) |
2,851 | 2,052,347 | ||||||
| 2.80%, 05/15/50 (Call 11/15/49) |
4,412 | 2,930,722 | ||||||
| 4.60%, 02/08/29 (Call 01/08/29) |
3,890 | 3,840,746 | ||||||
| 4.75%, 02/08/31 (Call 12/08/30) |
3,940 | 3,893,308 | ||||||
| 4.80%, 03/03/33 (Call 12/03/32) |
3,195 | 3,151,809 | ||||||
| 4.85%, 02/08/34 (Call 11/08/33) |
3,800 | 3,725,857 | ||||||
| Albemarle Corp. |
||||||||
| 4.65%, 06/01/27 (Call 05/01/27) |
2,360 | 2,318,438 | ||||||
| 5.05%, 06/01/32 (Call 03/01/32)(b) |
1,210 | 1,148,811 | ||||||
| 5.45%, 12/01/44 (Call 06/01/44) |
2,690 | 2,447,481 | ||||||
| 5.65%, 06/01/52 (Call 12/01/51) |
1,470 | 1,317,825 | ||||||
| Cabot Corp. |
||||||||
| 4.00%, 07/01/29 (Call 04/01/29) |
560 | 522,470 | ||||||
| 5.00%, 06/30/32 (Call 03/30/32) |
2,290 | 2,205,829 | ||||||
| Celanese U.S. Holdings LLC |
||||||||
| 1.40%, 08/05/26 (Call 07/05/26) |
2,454 | 2,222,240 | ||||||
| 6.05%, 03/15/25 |
4,045 | 4,054,370 | ||||||
| 6.17%, 07/15/27 (Call 06/15/27) |
9,075 | 9,214,099 | ||||||
| 6.33%, 07/15/29 (Call 05/15/29) |
1,945 | 1,998,737 | ||||||
| 6.35%, 11/15/28 (Call 10/15/28) |
3,915 | 4,029,877 | ||||||
| 6.38%, 07/15/32 (Call 04/15/32) |
3,410 | 3,501,131 | ||||||
| 6.55%, 11/15/30 (Call 09/15/30) |
4,095 | 4,249,549 | ||||||
| 6.70%, 11/15/33 (Call 08/15/33) |
3,690 | 3,873,958 | ||||||
| CF Industries Inc. |
||||||||
| 4.95%, 06/01/43 |
3,920 | 3,467,747 | ||||||
| 5.15%, 03/15/34 |
3,466 | 3,358,301 | ||||||
| 5.38%, 03/15/44 |
2,692 | 2,506,795 | ||||||
| Dow Chemical Co. (The) |
||||||||
| 2.10%, 11/15/30 (Call 08/15/30)(b) |
1,281 | 1,069,070 | ||||||
| 3.60%, 11/15/50 (Call 05/15/50) |
2,301 | 1,673,893 | ||||||
| 4.25%, 10/01/34 (Call 04/01/34) |
2,824 | 2,598,027 | ||||||
| 4.38%, 11/15/42 (Call 05/15/42) |
6,976 | 5,888,764 | ||||||
| 4.63%, 10/01/44 (Call 04/01/44) |
2,355 | 2,041,866 | ||||||
| 4.80%, 11/30/28 (Call 08/30/28) |
3,467 | 3,440,363 | ||||||
| 4.80%, 05/15/49 (Call 11/15/48) |
3,085 | 2,678,331 | ||||||
| 5.15%, 02/15/34 (Call 11/15/33) |
1,385 | 1,364,077 | ||||||
| 5.25%, 11/15/41 (Call 05/15/41) |
5,741 | 5,376,535 | ||||||
| 5.55%, 11/30/48 (Call 05/30/48) |
3,538 | 3,440,000 | ||||||
| 5.60%, 02/15/54 (Call 08/15/53) |
1,045 | 1,024,466 | ||||||
| 6.30%, 03/15/33 (Call 12/15/32)(b) |
875 | 937,062 | ||||||
| 6.90%, 05/15/53 (Call 11/15/52) |
1,795 | 2,051,659 | ||||||
| 30 | 2 0 2 4 I S H A R E S A N N U A L R E P O R T T O S H A R E H O L D E R S |
| Schedule of Investments (continued) February 29, 2024 |
iShares® Core U.S. Aggregate Bond ETF (Percentages shown are based on Net Assets) |
| Security | Par (000) | Value | ||||||
| Chemicals (continued) |
||||||||
| 7.38%, 11/01/29 |
$ | 4,069 | $ | 4,510,774 | ||||
| 9.40%, 05/15/39 |
2,012 | 2,683,333 | ||||||
| DuPont de Nemours Inc. |
||||||||
| 4.49%, 11/15/25 (Call 09/15/25) |
10,980 | 10,852,243 | ||||||
| 4.73%, 11/15/28 (Call 08/15/28) |
10,097 | 10,043,840 | ||||||
| 5.32%, 11/15/38 (Call 05/15/38) |
6,620 | 6,548,680 | ||||||
| 5.42%, 11/15/48 (Call 05/15/48) |
7,694 | 7,553,325 | ||||||
| Eastman Chemical Co. |
||||||||
| 3.80%, 03/15/25 (Call 12/15/24) |
5,084 | 4,992,620 | ||||||
| 4.50%, 12/01/28 (Call 09/01/28) |
1,326 | 1,286,994 | ||||||
| 4.65%, 10/15/44 (Call 04/15/44) |
3,943 | 3,332,601 | ||||||
| 4.80%, 09/01/42 (Call 03/01/42) |
2,782 | 2,439,088 | ||||||
| 5.63%, 02/20/34 (Call 11/20/33)(b) |
1,330 | 1,321,510 | ||||||
| 5.75%, 03/08/33 (Call 12/08/32) |
1,665 | 1,678,886 | ||||||
| Ecolab Inc. |
||||||||
| 1.30%, 01/30/31 (Call 10/30/30) |
3,180 | 2,516,026 | ||||||
| 1.65%, 02/01/27 (Call 01/01/27) |
1,667 | 1,523,694 | ||||||
| 2.13%, 02/01/32 (Call 11/01/31) |
2,930 | 2,400,065 | ||||||
| 2.13%, 08/15/50 (Call 02/15/50) |
1,138 | 657,274 | ||||||
| 2.70%, 11/01/26 (Call 08/01/26) |
4,749 | 4,501,289 | ||||||
| 2.70%, 12/15/51 (Call 06/15/51) |
2,685 | 1,695,925 | ||||||
| 2.75%, 08/18/55 (Call 02/18/55) |
5,679 | 3,529,839 | ||||||
| 3.25%, 12/01/27 (Call 09/01/27) |
2,665 | 2,523,565 | ||||||
| 3.95%, 12/01/47 (Call 06/01/47) |
610 | 506,604 | ||||||
| 4.80%, 03/24/30 (Call 12/24/29) |
3,128 | 3,122,423 | ||||||
| 5.25%, 01/15/28 (Call 12/15/27) |
3,290 | 3,337,578 | ||||||
| 5.50%, 12/08/41(b) |
105 | 106,791 | ||||||
| EIDP Inc. |
||||||||
| 1.70%, 07/15/25 (Call 06/15/25) |
4,930 | 4,686,658 | ||||||
| 2.30%, 07/15/30 (Call 04/15/30) |
3,342 | 2,860,440 | ||||||
| 4.50%, 05/15/26 (Call 04/15/26) |
1,490 | 1,467,237 | ||||||
| 4.80%, 05/15/33 (Call 02/15/33)(b) |
420 | 410,987 | ||||||
| FMC Corp. |
||||||||
| 3.20%, 10/01/26 (Call 08/01/26) |
2,098 | 1,966,220 | ||||||
| 3.45%, 10/01/29 (Call 07/01/29) |
2,161 | 1,920,200 | ||||||
| 4.50%, 10/01/49 (Call 04/01/49) |
2,335 | 1,735,503 | ||||||
| 5.15%, 05/18/26 (Call 04/18/26)(b) |
2,055 | 2,028,140 | ||||||
| 5.65%, 05/18/33 (Call 02/18/33)(b) |
2,175 | 2,105,724 | ||||||
| 6.38%, 05/18/53 (Call 11/18/52)(b) |
2,295 | 2,240,107 | ||||||
| Huntsman International LLC |
||||||||
| 2.95%, 06/15/31 (Call 03/15/31) |
2,310 | 1,903,587 | ||||||
| 4.50%, 05/01/29 (Call 02/01/29) |
3,650 | 3,467,632 | ||||||
| International Flavors & Fragrances Inc. |
||||||||
| 4.38%, 06/01/47 (Call 12/01/46) |
2,260 | 1,688,850 | ||||||
| 4.45%, 09/26/28 (Call 06/26/28) |
1,405 | 1,357,262 | ||||||
| 5.00%, 09/26/48 (Call 03/26/48) |
2,217 | 1,858,996 | ||||||
| Linde Inc./CT |
||||||||
| 1.10%, 08/10/30 (Call 05/10/30) |
4,832 | 3,866,068 | ||||||
| 2.00%, 08/10/50 (Call 02/10/50) |
2,015 | 1,130,894 | ||||||
| 3.20%, 01/30/26 (Call 10/30/25) |
4,979 | 4,825,866 | ||||||
| 3.55%, 11/07/42 (Call 05/07/42) |
2,192 | 1,750,529 | ||||||
| 4.70%, 12/05/25 (Call 11/05/25) |
5,460 | 5,435,013 | ||||||
| Lubrizol Corp. (The), 6.50%, 10/01/34 |
632 | 714,200 | ||||||
| LYB International Finance BV |
||||||||
| 4.88%, 03/15/44 (Call 09/15/43) |
4,060 | 3,560,741 | ||||||
| 5.25%, 07/15/43 |
884 | 810,838 | ||||||
| LYB International Finance II BV, 3.50%, |
||||||||
| 03/02/27 (Call 12/02/26) |
940 | 895,017 | ||||||
| LYB International Finance III LLC |
||||||||
| 1.25%, 10/01/25 (Call 09/01/25) |
3,337 | 3,119,429 | ||||||
| 2.25%, 10/01/30 (Call 07/01/30)(b) |
2,382 | 1,983,048 | ||||||
| Security | Par (000) |
Value | ||||||
| Chemicals (continued) |
||||||||
| 3.38%, 10/01/40 (Call 04/01/40) |
$ | 3,418 | $ | 2,531,604 | ||||
| 3.63%, 04/01/51 (Call 10/01/50) |
4,176 | 2,900,767 | ||||||
| 3.80%, 10/01/60 (Call 04/01/60)(b) |
3,436 | 2,324,311 | ||||||
| 4.20%, 10/15/49 (Call 04/15/49) |
3,958 | 3,054,876 | ||||||
| 4.20%, 05/01/50 (Call 11/01/49) |
4,212 | 3,254,299 | ||||||
| 5.50%, 03/01/34 (Call 12/01/33) |
3,295 | 3,269,968 | ||||||
| 5.63%, 05/15/33 (Call 02/15/33) |
2,685 | 2,720,711 | ||||||
| LyondellBasell Industries NV, 4.63%, 02/26/55 |
||||||||
| (Call 08/26/54) |
3,812 | 3,130,498 | ||||||
| Mosaic Co. (The) |
||||||||
| 4.05%, 11/15/27 (Call 08/15/27) |
1,160 | 1,114,616 | ||||||
| 4.88%, 11/15/41 (Call 05/15/41) |
1,090 | 951,406 | ||||||
| 5.38%, 11/15/28 (Call 10/15/28) |
1,500 | 1,508,733 | ||||||
| 5.45%, 11/15/33 (Call 05/15/33) |
1,517 | 1,499,031 | ||||||
| 5.63%, 11/15/43 (Call 05/15/43) |
923 | 884,446 | ||||||
| NewMarket Corp., 2.70%, 03/18/31 |
||||||||
| (Call 12/18/30) |
1,981 | 1,644,815 | ||||||
| Nutrien Ltd. |
||||||||
| 2.95%, 05/13/30 (Call 02/13/30) |
1,769 | 1,564,337 | ||||||
| 3.00%, 04/01/25 (Call 01/01/25) |
3,670 | 3,569,697 | ||||||
| 3.95%, 05/13/50 (Call 11/13/49) |
1,645 | 1,280,931 | ||||||
| 4.00%, 12/15/26 (Call 09/15/26) |
2,699 | 2,614,482 | ||||||
| 4.13%, 03/15/35 (Call 09/15/34) |
1,990 | 1,792,137 | ||||||
| 4.20%, 04/01/29 (Call 01/01/29) |
3,165 | 3,040,438 | ||||||
| 4.90%, 03/27/28 (Call 02/27/28) |
1,847 | 1,831,848 | ||||||
| 4.90%, 06/01/43 (Call 12/01/42) |
2,439 | 2,203,684 | ||||||
| 5.00%, 04/01/49 (Call 10/01/48) |
2,664 | 2,404,038 | ||||||
| 5.25%, 01/15/45 (Call 07/15/44) |
2,057 | 1,913,987 | ||||||
| 5.63%, 12/01/40 |
1,021 | 998,647 | ||||||
| 5.80%, 03/27/53 (Call 09/27/52) |
1,450 | 1,451,467 | ||||||
| 5.88%, 12/01/36 |
2,054 | 2,101,984 | ||||||
| 5.95%, 11/07/25 |
2,930 | 2,954,647 | ||||||
| 6.13%, 01/15/41 (Call 07/15/40) |
305 | 312,980 | ||||||
| PPG Industries Inc. |
||||||||
| 1.20%, 03/15/26 (Call 02/15/26) |
4,355 | 4,025,125 | ||||||
| 2.55%, 06/15/30 (Call 03/15/30) |
1,147 | 989,556 | ||||||
| 2.80%, 08/15/29 (Call 05/15/29) |
1,895 | 1,698,542 | ||||||
| 3.75%, 03/15/28 (Call 12/15/27) |
4,561 | 4,367,965 | ||||||
| Rohm & Haas Co., 7.85%, 07/15/29 |
2,484 | 2,757,998 | ||||||
| RPM International Inc. |
||||||||
| 2.95%, 01/15/32 (Call 10/15/31) |
1,845 | 1,556,840 | ||||||
| 3.75%, 03/15/27 (Call 12/15/26) |
2,915 | 2,781,378 | ||||||
| 4.25%, 01/15/48 (Call 07/15/47)(b) |
1,186 | 953,370 | ||||||
| 4.55%, 03/01/29 (Call 12/01/28) |
1,739 | 1,673,089 | ||||||
| 5.25%, 06/01/45 (Call 12/01/44) |
1,350 | 1,238,785 | ||||||
| Sherwin-Williams Co. (The) |
||||||||
| 2.20%, 03/15/32 (Call 12/15/31) |
2,962 | 2,396,659 | ||||||
| 2.30%, 05/15/30 (Call 02/15/30) |
2,153 | 1,830,268 | ||||||
| 2.90%, 03/15/52 (Call 09/15/51) |
2,720 | 1,754,668 | ||||||
| 2.95%, 08/15/29 (Call 05/15/29) |
3,777 | 3,396,716 | ||||||
| 3.30%, 05/15/50 (Call 11/15/49) |
2,290 | 1,602,557 | ||||||
| 3.45%, 08/01/25 (Call 05/01/25) |
2,834 | 2,761,614 | ||||||
| 3.45%, 06/01/27 (Call 03/01/27) |
7,555 | 7,194,791 | ||||||
| 3.80%, 08/15/49 (Call 02/15/49) |
2,700 | 2,082,898 | ||||||
| 3.95%, 01/15/26 (Call 10/15/25) |
2,611 | 2,555,060 | ||||||
| 4.00%, 12/15/42 (Call 06/15/42) |
1,210 | 987,570 | ||||||
| 4.25%, 08/08/25 |
2,650 | 2,608,976 | ||||||
| 4.50%, 06/01/47 (Call 12/01/46) |
5,193 | 4,482,560 | ||||||
| 4.55%, 08/01/45 (Call 02/01/45) |
1,132 | 974,468 | ||||||
| Westlake Corp. |
||||||||
| 2.88%, 08/15/41 (Call 02/15/41) |
1,398 | 951,983 | ||||||
| S C H E D U L E O F I N V E S T M E N T S |
31 |
| Schedule of Investments (continued) February 29, 2024 |
iShares® Core U.S. Aggregate Bond ETF (Percentages shown are based on Net Assets) |
| Security | Par (000) |
Value | ||||||
| Chemicals (continued) |
||||||||
| 3.13%, 08/15/51 (Call 02/15/51) |
$ | 3,080 | $ | 1,939,933 | ||||
| 3.38%, 06/15/30 (Call 03/15/30) |
1,865 | 1,665,867 | ||||||
| 3.38%, 08/15/61 (Call 02/15/61)(b) |
2,504 | 1,550,611 | ||||||
| 3.60%, 08/15/26 (Call 05/15/26) |
3,974 | 3,824,323 | ||||||
| 4.38%, 11/15/47 (Call 05/15/47) |
1,975 | 1,622,555 | ||||||
| 5.00%, 08/15/46 (Call 02/15/46) |
3,000 | 2,669,031 | ||||||
|
|
|
|||||||
| 392,933,434 | ||||||||
| Coal — 0.0% |
||||||||
| Teck Resources Ltd. |
||||||||
| 3.90%, 07/15/30 (Call 04/15/30) |
265 | 241,655 | ||||||
| 5.20%, 03/01/42 (Call 09/01/41) |
1,178 | 1,062,090 | ||||||
| 5.40%, 02/01/43 (Call 08/01/42) |
473 | 438,319 | ||||||
| 6.00%, 08/15/40 (Call 02/15/40) |
2,130 | 2,109,298 | ||||||
| 6.13%, 10/01/35 |
1,794 | 1,833,522 | ||||||
| 6.25%, 07/15/41 (Call 01/15/41) |
1,716 | 1,734,943 | ||||||
|
|
|
|||||||
| 7,419,827 | ||||||||
| Commercial Services — 0.3% |
||||||||
| American University (The), Series 2019, |
||||||||
| 3.67%, 04/01/49(b) |
2,410 | 1,943,861 | ||||||
| Automatic Data Processing Inc. |
||||||||
| 1.25%, 09/01/30 (Call 06/01/30) |
6,507 | 5,270,508 | ||||||
| 1.70%, 05/15/28 (Call 03/15/28) |
4,630 | 4,122,035 | ||||||
| 3.38%, 09/15/25 (Call 06/15/25) |
6,426 | 6,278,009 | ||||||
| Block Financial LLC |
||||||||
| 2.50%, 07/15/28 (Call 05/15/28) |
2,773 | 2,442,355 | ||||||
| 3.88%, 08/15/30 (Call 05/15/30) |
2,403 | 2,166,470 | ||||||
| 5.25%, 10/01/25 (Call 07/01/25) |
1,349 | 1,338,897 | ||||||
| Brown University, Series A, 2.92%, 09/01/50 |
||||||||
| (Call 03/01/50) |
1,975 | 1,387,629 | ||||||
| California Endowment (The), Series 2021, |
||||||||
| 2.50%, 04/01/51 (Call 10/01/50) |
3,233 | 2,001,290 | ||||||
| California Institute of Technology |
||||||||
| 3.65%, 09/01/2119 (Call 03/01/19) |
674 | 469,108 | ||||||
| 4.32%, 08/01/45 |
842 | 765,168 | ||||||
| 4.70%, 11/01/2111 |
1,709 | 1,521,456 | ||||||
| Case Western Reserve University, 5.41%, |
||||||||
| 06/01/2122 (Call 12/01/21) |
1,283 | 1,231,047 | ||||||
| Cintas Corp. No. 2 |
||||||||
| 3.45%, 05/01/25 (Call 04/01/25) |
1,915 | 1,874,689 | ||||||
| 3.70%, 04/01/27 (Call 01/01/27) |
6,147 | 5,953,611 | ||||||
| 4.00%, 05/01/32 (Call 02/01/32) |
2,465 | 2,308,615 | ||||||
| Claremont Mckenna College, 3.78%, |
||||||||
| 01/01/2122 (Call 07/01/21) |
510 | 341,467 | ||||||
| Duke University |
||||||||
| Series 2020, 2.68%, 10/01/44 |
1,516 | 1,107,171 | ||||||
| Series 2020, 2.76%, 10/01/50 |
1,583 | 1,090,052 | ||||||
| Series 2020, 2.83%, 10/01/55 |
2,560 | 1,738,525 | ||||||
| Emory University |
||||||||
| Series 2020, 2.14%, 09/01/30 |
||||||||
| (Call 06/01/30) |
358 | 305,268 | ||||||
| Series 2020, 2.97%, 09/01/50 |
||||||||
| (Call 03/01/50)(b) |
1,953 | 1,359,988 | ||||||
| Equifax Inc. |
||||||||
| 2.35%, 09/15/31 (Call 06/15/31) |
5,375 | 4,389,092 | ||||||
| 2.60%, 12/15/25 (Call 11/15/25) |
2,257 | 2,150,486 | ||||||
| 3.10%, 05/15/30 (Call 02/15/30) |
3,606 | 3,179,335 | ||||||
| 5.10%, 12/15/27 (Call 11/15/27) |
3,160 | 3,146,221 | ||||||
| 5.10%, 06/01/28 (Call 05/01/28) |
2,600 | 2,584,060 | ||||||
| Security | Par (000) |
Value | ||||||
| Commercial Services (continued) |
||||||||
| Ford Foundation (The) |
||||||||
| Series 2020, 2.42%, 06/01/50 |
||||||||
| (Call 12/01/49) |
$ | 2,670 | $ | 1,673,512 | ||||
| Series 2020, 2.82%, 06/01/70 |
||||||||
| (Call 12/01/69)(b) |
2,857 | 1,698,560 | ||||||
| George Washington University (The) |
||||||||
| 4.87%, 09/15/45 |
1,805 | 1,730,654 | ||||||
| Series 2014, 4.30%, 09/15/44 |
870 | 760,736 | ||||||
| Series 2018, 4.13%, 09/15/48 |
||||||||
| (Call 03/15/48) |
3,341 | 2,853,212 | ||||||
| Georgetown University (The) |
||||||||
| 5.12%, 04/01/53 (Call 10/01/52) |
20 | 20,033 | ||||||
| Series 20A, 2.94%, 04/01/50 |
||||||||
| (Call 10/01/49) |
1,514 | 1,030,658 | ||||||
| Series A, 5.22%, (Call 04/01/18) |
916 | 847,748 | ||||||
| Series B, 4.32%, 04/01/49 (Call 10/01/48) |
1,473 | 1,296,863 | ||||||
| Global Payments Inc. |
||||||||
| 1.20%, 03/01/26 (Call 02/01/26) |
3,152 | 2,901,672 | ||||||
| 2.15%, 01/15/27 (Call 12/15/26) |
3,607 | 3,310,323 | ||||||
| 2.90%, 05/15/30 (Call 02/15/30) |
3,569 | 3,074,367 | ||||||
| 2.90%, 11/15/31 (Call 08/15/31) |
3,379 | 2,819,550 | ||||||
| 3.20%, 08/15/29 (Call 05/15/29) |
5,962 | 5,313,753 | ||||||
| 4.15%, 08/15/49 (Call 02/15/49) |
2,854 | 2,176,500 | ||||||
| 4.45%, 06/01/28 (Call 03/01/28) |
2,440 | 2,351,873 | ||||||
| 4.80%, 04/01/26 (Call 01/01/26) |
4,327 | 4,269,692 | ||||||
| 4.95%, 08/15/27 (Call 07/15/27) |
1,669 | 1,652,675 | ||||||
| 5.30%, 08/15/29 (Call 06/15/29) |
2,220 | 2,190,240 | ||||||
| 5.40%, 08/15/32 (Call 05/15/32) |
3,285 | 3,240,880 | ||||||
| 5.95%, 08/15/52 (Call 02/15/52)(b) |
3,215 | 3,159,882 | ||||||
| GXO Logistics Inc. |
||||||||
| 1.65%, 07/15/26 (Call 06/15/26) |
3,184 | 2,919,566 | ||||||
| 2.65%, 07/15/31 (Call 04/15/31) |
3,222 | 2,616,985 | ||||||
| Howard University, 5.21%, 10/01/52 |
||||||||
| (Call 10/01/32) |
978 | 893,428 | ||||||
| Johns Hopkins University |
||||||||
| 4.71%, 07/01/32 (Call 04/01/32) |
1,430 | 1,438,064 | ||||||
| Series 2013, 4.08%, 07/01/53 |
2,373 | 2,082,025 | ||||||
| Series A, 2.81%, 01/01/60 |
||||||||
| (Call 07/01/59)(b) |
1,415 | 912,898 | ||||||
| Leland Stanford Junior University (The) |
||||||||
| 1.29%, 06/01/27 (Call 04/01/27) |
1,280 | 1,148,648 | ||||||
| 2.41%, 06/01/50 (Call 12/01/49) |
1,985 | 1,276,090 | ||||||
| 3.65%, 05/01/48 (Call 11/01/47) |
2,731 | 2,257,433 | ||||||
| Massachusetts Institute of Technology |
||||||||
| 3.07%, 04/01/52 (Call 10/01/51) |
1,498 | 1,092,030 | ||||||
| 3.89%, 07/01/2116 |
568 | 428,051 | ||||||
| 3.96%, 07/01/38 |
819 | 741,404 | ||||||
| 4.68%, |
2,428 | 2,214,372 | ||||||
| 5.60%, |
2,910 | 3,128,609 | ||||||
| Series F, 2.99%, 07/01/50 (Call 01/01/50) |
2,656 | 1,919,133 | ||||||
| Series G, 2.29%, 07/01/51 |
||||||||
| (Call 01/01/51)(b) |
1,584 | 979,263 | ||||||
| Moody’s Corp. |
||||||||
| 2.00%, 08/19/31 (Call 05/19/31)(b) |
3,822 | 3,089,956 | ||||||
| 2.75%, 08/19/41 (Call 02/19/41) |
3,325 | 2,335,074 | ||||||
| 3.10%, 11/29/61 (Call 05/29/61) |
2,645 | 1,692,026 | ||||||
| 3.25%, 01/15/28 (Call 10/15/27) |
2,954 | 2,779,320 | ||||||
| 3.25%, 05/20/50 (Call 11/20/49) |
1,903 | 1,348,867 | ||||||
| 3.75%, 03/24/25 (Call 02/24/25) |
1,070 | 1,052,059 | ||||||
| 3.75%, 02/25/52 (Call 08/25/51)(b) |
1,380 | 1,067,950 | ||||||
| 4.25%, 02/01/29 (Call 11/01/28) |
3,076 | 2,979,527 | ||||||
| 32 | 2 0 2 4 I S H A R E S A N N U A L R E P O R T T O S H A R E H O L D E R S |
| Schedule of Investments (continued) February 29, 2024 |
iShares® Core U.S. Aggregate Bond ETF (Percentages shown are based on Net Assets) |
| Security | Par (000) |
Value | ||||||
| Commercial Services (continued) |
||||||||
| 4.25%, 08/08/32 (Call 05/08/32) |
$ | 2,665 | $ | 2,517,349 | ||||
| 4.88%, 12/17/48 (Call 06/17/48) |
2,025 | 1,868,178 | ||||||
| 5.25%, 07/15/44 |
1,821 | 1,781,376 | ||||||
| Northeastern University, Series 2020, 2.89%, 10/01/50(b) |
1,541 | 1,065,025 | ||||||
| Northwestern University 4.64%, 12/01/44 |
1,490 | 1,416,373 | ||||||
| Series 2017, 3.66%, 12/01/57 (Call 06/01/57) |
1,499 | 1,181,680 | ||||||
| Series 2020, 2.64%, 12/01/50 (Call 06/01/50)(b) |
2,899 | 1,914,500 | ||||||
| PayPal Holdings Inc. |
||||||||
| 1.65%, 06/01/25 (Call 05/01/25) |
5,764 | 5,518,626 | ||||||
| 2.30%, 06/01/30 (Call 03/01/30) |
4,954 | 4,214,158 | ||||||
| 2.65%, 10/01/26 (Call 08/01/26) |
5,936 | 5,597,305 | ||||||
| 2.85%, 10/01/29 (Call 07/01/29) |
6,839 | 6,098,635 | ||||||
| 3.25%, 06/01/50 (Call 12/01/49)(b) |
2,647 | 1,841,395 | ||||||
| 3.90%, 06/01/27 (Call 05/01/27) |
950 | 918,403 | ||||||
| 4.40%, 06/01/32 (Call 03/01/32)(b) |
4,885 | 4,685,627 | ||||||
| 5.05%, 06/01/52 (Call 12/01/51)(b) |
4,630 | 4,344,443 | ||||||
| 5.25%, 06/01/62 (Call 12/01/61) |
1,735 | 1,615,065 | ||||||
| President and Fellows of Harvard College |
||||||||
| 2.52%, 10/15/50 (Call 04/15/50) |
2,404 | 1,572,823 | ||||||
| 3.15%, 07/15/46 (Call 01/15/46) |
1,570 | 1,174,140 | ||||||
| 3.30%, 07/15/56 (Call 01/15/56) |
1,846 | 1,367,284 | ||||||
| 3.75%, 11/15/52 (Call 05/15/52) |
230 | 191,355 | ||||||
| 4.88%, 10/15/40 |
745 | 734,915 | ||||||
| Quanta Services Inc. |
||||||||
| 2.35%, 01/15/32 (Call 10/15/31) |
2,126 | 1,701,789 | ||||||
| 2.90%, 10/01/30 (Call 07/01/30) |
3,485 | 3,021,493 | ||||||
| 3.05%, 10/01/41 (Call 04/01/41) |
2,465 | 1,732,010 | ||||||
| RELX Capital Inc. |
||||||||
| 3.00%, 05/22/30 (Call 02/22/30) |
2,589 | 2,311,394 | ||||||
| 4.00%, 03/18/29 (Call 12/18/28) |
6,897 | 6,587,040 | ||||||
| 4.75%, 05/20/32 (Call 02/20/32) |
760 | 746,337 | ||||||
| Rockefeller Foundation (The), Series 2020, |
||||||||
| 2.49%, 10/01/50 (Call 04/01/50) |
4,789 | 3,051,025 | ||||||
| S&P Global Inc. |
||||||||
| 1.25%, 08/15/30 (Call 05/15/30)(b) |
3,238 | 2,583,746 | ||||||
| 2.30%, 08/15/60 (Call 02/15/60) |
3,595 | 1,942,395 | ||||||
| 2.45%, 03/01/27 (Call 02/01/27) |
2,925 | 2,726,554 | ||||||
| 2.50%, 12/01/29 (Call 09/01/29) |
3,072 | 2,706,837 | ||||||
| 2.70%, 03/01/29 (Call 01/01/29) |
4,505 | 4,074,205 | ||||||
| 2.90%, 03/01/32 (Call 12/01/31) |
3,341 | 2,877,101 | ||||||
| 2.95%, 01/22/27 (Call 10/22/26) |
3,926 | 3,720,080 | ||||||
| 3.25%, 12/01/49 (Call 06/01/49) |
3,743 | 2,666,610 | ||||||
| 3.70%, 03/01/52 (Call 09/01/51) |
3,725 | 2,880,209 | ||||||
| 3.90%, 03/01/62 (Call 09/01/61) |
1,134 | 882,548 | ||||||
| 4.25%, 05/01/29 (Call 02/01/29) |
4,675 | 4,533,228 | ||||||
| 4.75%, 08/01/28 (Call 05/01/28) |
5,090 | 5,069,609 | ||||||
| 5.25%, 09/15/33 (Call 06/15/33)(c) |
1,427 | 1,441,849 | ||||||
| Thomas Jefferson University, 3.85%, 11/01/57 (Call 05/01/57) |
2,256 | 1,670,699 | ||||||
| Triton Container International Ltd./TAL International Container Corp., 3.25%, 03/15/32 (Call 12/15/31) |
2,464 | 1,960,895 | ||||||
| Trustees of Boston College, 3.13%, 07/01/52 |
1,723 | 1,249,747 | ||||||
| Trustees of Boston University, Series CC, 4.06%, 10/01/48 (Call 04/01/48) |
1,612 | 1,376,770 | ||||||
| Trustees of Princeton University (The) |
||||||||
| 4.20%, 03/01/52 (Call 09/01/51)(b) |
1,120 | 1,014,563 | ||||||
| Security | Par (000) |
Value | ||||||
| Commercial Services (continued) |
||||||||
| 5.70%, 03/01/39 |
$ | 2,490 | $ | 2,711,191 | ||||
| Series 2020, 2.52%, 07/01/50 (Call 01/01/50)(b) |
2,862 | 1,904,639 | ||||||
| Trustees of the University of Pennsylvania (The) |
||||||||
| 3.61%, 02/15/2119 (Call 08/15/18)(b) |
2,233 | 1,543,182 | ||||||
| 4.67%, 09/01/2112 |
100 | 89,747 | ||||||
| Series 2020, 2.40%, 10/01/50 (Call 04/01/50) |
1,223 | 761,588 | ||||||
| UL Solutions Inc., 6.50%, 10/20/28 |
1,050 | 1,084,545 | ||||||
| University of Chicago (The) |
||||||||
| 3.00%, 10/01/52 (Call 04/01/52) |
995 | 698,662 | ||||||
| 4.00%, 10/01/53 (Call 04/01/53) |
1,924 | 1,597,479 | ||||||
| Series 20B, 2.76%, 04/01/45 (Call 10/01/44) |
1,477 | 1,137,080 | ||||||
| Series C, 2.55%, 04/01/50 (Call 10/01/49) |
2,071 | 1,383,346 | ||||||
| University of Miami, 4.06%, 04/01/52 |
1,027 | 865,031 | ||||||
| University of Notre Dame du Lac |
||||||||
| Series 2015, 3.44%, 02/15/45 |
2,430 | 1,939,738 | ||||||
| Series 2017, 3.39%, 02/15/48 (Call 08/15/47) |
2,104 | 1,647,208 | ||||||
| University of Southern California |
||||||||
| 2.81%, 10/01/50 (Call 04/01/50) |
1,795 | 1,225,375 | ||||||
| 3.03%, 10/01/39 |
3,714 | 2,935,042 | ||||||
| 4.98%, 10/01/53 (Call 04/01/53) |
1,155 | 1,159,467 | ||||||
| 5.25%, 10/01/2111 |
893 | 881,675 | ||||||
| Series 2017, 3.84%, 10/01/47 (Call 04/01/47) |
2,113 | 1,761,985 | ||||||
| Series 21A, 2.95%, 10/01/51 (Call 04/01/51) |
2,225 | 1,550,145 | ||||||
| Series A, 3.23%, 10/01/2120 (Call 04/01/20) |
1,359 | 826,207 | ||||||
| Verisk Analytics Inc. |
||||||||
| 3.63%, 05/15/50 (Call 11/15/49) |
2,346 | 1,717,880 | ||||||
| 4.00%, 06/15/25 (Call 03/15/25) |
1,818 | 1,785,916 | ||||||
| 4.13%, 03/15/29 (Call 12/15/28) |
3,218 | 3,087,971 | ||||||
| 5.50%, 06/15/45 (Call 12/15/44) |
1,545 | 1,473,802 | ||||||
| 5.75%, 04/01/33 (Call 01/01/33) |
2,520 | 2,603,019 | ||||||
| Washington University (The) |
||||||||
| 3.52%, 04/15/54 (Call 10/15/53) |
3,206 | 2,485,881 | ||||||
| 4.35%, 04/15/2122 (Call 10/15/21) |
1,169 | 973,776 | ||||||
| William Marsh Rice University |
||||||||
| 3.57%, 05/15/45 |
985 | 803,145 | ||||||
| 3.77%, 05/15/55(b) |
1,465 | 1,180,705 | ||||||
| Yale University |
||||||||
| Series 2020, 0.87%, 04/15/25 (Call 03/15/25) |
2,967 | 2,830,009 | ||||||
| Series 2020, 1.48%, 04/15/30 (Call 01/15/30) |
1,479 | 1,234,763 | ||||||
| Series 2020, 2.40%, 04/15/50 (Call 10/15/49)(b) |
1,378 | 883,951 | ||||||
|
|
|
|||||||
| 318,144,112 | ||||||||
| Computers — 0.6% | ||||||||
| Amdocs Ltd., 2.54%, 06/15/30 (Call 03/15/30) |
2,901 | 2,461,839 | ||||||
| Apple Inc. |
||||||||
| 0.55%, 08/20/25 (Call 07/20/25) |
5,953 | 5,596,037 | ||||||
| 0.70%, 02/08/26 (Call 01/08/26) |
8,210 | 7,589,243 | ||||||
| 1.13%, 05/11/25 (Call 04/11/25) |
8,746 | 8,351,670 | ||||||
| 1.20%, 02/08/28 (Call 12/08/27) |
6,917 | 6,078,712 | ||||||
| 1.25%, 08/20/30 (Call 05/20/30) |
7,082 | 5,731,553 | ||||||
| S C H E D U L E O F I N V E S T M E N T S |
33 |
| Schedule of Investments (continued) February 29, 2024 |
iShares® Core U.S. Aggregate Bond ETF (Percentages shown are based on Net Assets) |
| Security | Par (000) |
Value | ||||||
| Computers (continued) |
||||||||
| 1.40%, 08/05/28 (Call 06/05/28) |
$ | 7,865 | $ | 6,874,013 | ||||
| 1.65%, 05/11/30 (Call 02/11/30) |
7,463 | 6,239,914 | ||||||
| 1.65%, 02/08/31 (Call 11/08/30) |
5,540 | 4,561,796 | ||||||
| 1.70%, 08/05/31 (Call 05/05/31) |
5,758 | 4,688,937 | ||||||
| 2.05%, 09/11/26 (Call 07/11/26) |
8,647 | 8,084,083 | ||||||
| 2.20%, 09/11/29 (Call 06/11/29) |
5,185 | 4,579,263 | ||||||
| 2.38%, 02/08/41 (Call 08/08/40) |
4,700 | 3,305,692 | ||||||
| 2.40%, 08/20/50 (Call 02/20/50)(b) |
3,541 | 2,203,755 | ||||||
| 2.45%, 08/04/26 (Call 05/04/26) |
9,941 | 9,409,915 | ||||||
| 2.55%, 08/20/60 (Call 02/20/60) |
11,242 | 6,944,954 | ||||||
| 2.65%, 05/11/50 (Call 11/11/49) |
8,861 | 5,758,783 | ||||||
| 2.65%, 02/08/51 (Call 08/08/50) |
8,210 | 5,291,124 | ||||||
| 2.70%, 08/05/51 (Call 02/05/51) |
8,494 | 5,516,236 | ||||||
| 2.80%, 02/08/61 (Call 08/08/60) |
4,343 | 2,761,201 | ||||||
| 2.85%, 08/05/61 (Call 02/05/61) |
3,745 | 2,377,771 | ||||||
| 2.90%, 09/12/27 (Call 06/12/27) |
7,616 | 7,183,340 | ||||||
| 2.95%, 09/11/49 (Call 03/11/49) |
7,723 | 5,386,073 | ||||||
| 3.00%, 06/20/27 (Call 03/20/27) |
5,990 | 5,681,394 | ||||||
| 3.00%, 11/13/27 (Call 08/13/27) |
7,517 | 7,109,939 | ||||||
| 3.20%, 05/13/25 |
9,010 | 8,818,417 | ||||||
| 3.20%, 05/11/27 (Call 02/11/27) |
7,702 | 7,348,928 | ||||||
| 3.25%, 02/23/26 (Call 11/23/25) |
13,368 | 12,968,500 | ||||||
| 3.25%, 08/08/29 (Call 06/08/29) |
5,530 | 5,170,457 | ||||||
| 3.35%, 02/09/27 (Call 11/09/26) |
10,070 | 9,687,712 | ||||||
| 3.35%, 08/08/32 (Call 05/08/32) |
7,545 | 6,849,859 | ||||||
| 3.45%, 02/09/45 |
9,571 | 7,602,191 | ||||||
| 3.75%, 09/12/47 (Call 03/12/47) |
4,989 | 4,052,284 | ||||||
| 3.75%, 11/13/47 (Call 05/13/47) |
6,252 | 5,084,862 | ||||||
| 3.85%, 05/04/43 |
12,058 | 10,314,906 | ||||||
| 3.85%, 08/04/46 (Call 02/04/46) |
8,749 | 7,305,146 | ||||||
| 3.95%, 08/08/52 (Call 02/08/52) |
7,520 | 6,240,805 | ||||||
| 4.00%, 05/10/28 (Call 04/10/28) |
2,870 | 2,810,149 | ||||||
| 4.10%, 08/08/62 (Call 02/08/62) |
5,025 | 4,209,484 | ||||||
| 4.15%, 05/10/30 (Call 03/10/30) |
3,000 | 2,945,337 | ||||||
| 4.25%, 02/09/47 (Call 08/09/46) |
3,706 | 3,325,331 | ||||||
| 4.30%, 05/10/33 (Call 02/10/33)(b) |
3,310 | 3,267,699 | ||||||
| 4.38%, 05/13/45 |
7,884 | 7,193,746 | ||||||
| 4.45%, 05/06/44(b) |
3,332 | 3,114,207 | ||||||
| 4.50%, 02/23/36 (Call 08/23/35) |
4,968 | 4,882,664 | ||||||
| 4.65%, 02/23/46 (Call 08/23/45) |
14,629 | 13,824,804 | ||||||
| 4.85%, 05/10/53 (Call 11/10/52)(b) |
3,420 | 3,341,328 | ||||||
| Booz Allen Hamilton Inc., 5.95%, 08/04/33 |
742 | 763,504 | ||||||
| CGI Inc. |
||||||||
| 1.45%, 09/14/26 (Call 08/14/26) |
2,681 | 2,431,181 | ||||||
| 2.30%, 09/14/31 (Call 06/14/31) |
2,743 | 2,194,202 | ||||||
| Dell Inc. |
||||||||
| 6.50%, 04/15/38 |
2,275 | 2,379,128 | ||||||
| 7.10%, 04/15/28(b) |
2,765 | 2,973,002 | ||||||
| Dell International LLC/EMC Corp. |
||||||||
| 3.38%, 12/15/41 (Call 06/15/41) |
5,845 | 4,258,621 | ||||||
| 3.45%, 12/15/51 (Call 06/15/51) |
3,454 | 2,364,615 | ||||||
| 4.90%, 10/01/26 (Call 08/01/26) |
8,864 | 8,783,055 | ||||||
| 5.25%, 02/01/28 (Call 01/01/28) |
1,490 | 1,500,479 | ||||||
| 5.30%, 10/01/29 (Call 07/01/29) |
6,635 | 6,647,580 | ||||||
| 5.75%, 02/01/33 (Call 11/01/32)(b) |
2,180 | 2,238,647 | ||||||
| 5.85%, 07/15/25 (Call 06/15/25) |
5,455 | 5,479,017 | ||||||
| 6.02%, 06/15/26 (Call 03/15/26) |
5,485 | 5,545,457 | ||||||
| 6.10%, 07/15/27 (Call 05/15/27)(b) |
3,190 | 3,272,789 | ||||||
| 6.20%, 07/15/30 (Call 04/15/30) |
2,853 | 2,985,122 | ||||||
| 8.10%, 07/15/36 (Call 01/15/36) |
3,572 | 4,280,443 | ||||||
| Security | Par (000) |
Value | ||||||
| Computers (continued) |
||||||||
| 8.35%, 07/15/46 (Call 01/15/46) |
$ | 1,415 | $ | 1,792,297 | ||||
| DXC Technology Co. |
||||||||
| 1.80%, 09/15/26 (Call 08/15/26) |
3,355 | 3,046,248 | ||||||
| 2.38%, 09/15/28 (Call 07/15/28) |
3,087 | 2,661,416 | ||||||
| Fortinet Inc. |
||||||||
| 1.00%, 03/15/26 (Call 02/15/26) |
3,500 | 3,211,558 | ||||||
| 2.20%, 03/15/31 (Call 12/15/30) |
3,369 | 2,786,034 | ||||||
| Genpact Luxembourg SARL/Genpact |
||||||||
| USA Inc., 1.75%, 04/10/26 (Call 03/10/26) |
775 | 714,409 | ||||||
| Hewlett Packard Enterprise Co. |
||||||||
| 1.75%, 04/01/26 (Call 03/01/26) |
1,456 | 1,353,252 | ||||||
| 4.90%, 10/15/25 (Call 07/15/25) |
10,086 | 10,021,135 | ||||||
| 5.25%, 07/01/28 (Call 06/01/28)(b) |
2,565 | 2,569,101 | ||||||
| 6.10%, 04/01/26 (Call 04/01/24) |
540 | 540,190 | ||||||
| 6.20%, 10/15/35 (Call 04/15/35) |
3,730 | 3,894,355 | ||||||
| 6.35%, 10/15/45 (Call 04/15/45) |
6,357 | 6,571,089 | ||||||
| HP Inc. |
||||||||
| 1.45%, 06/17/26 (Call 05/17/26)(b) |
311 | 285,738 | ||||||
| 2.20%, 06/17/25 (Call 05/17/25) |
6,176 | 5,928,641 | ||||||
| 2.65%, 06/17/31 (Call 03/17/31) |
4,685 | 3,909,417 | ||||||
| 3.00%, 06/17/27 (Call 04/17/27) |
4,144 | 3,871,240 | ||||||
| 3.40%, 06/17/30 (Call 03/17/30)(b) |
30 | 27,006 | ||||||
| 4.00%, 04/15/29 (Call 02/15/29) |
4,290 | 4,085,538 | ||||||
| 4.20%, 04/15/32 (Call 01/15/32) |
1,890 | 1,742,566 | ||||||
| 4.75%, 01/15/28 (Call 12/15/27) |
3,850 | 3,810,597 | ||||||
| 5.50%, 01/15/33 (Call 10/15/32)(b) |
5,235 | 5,237,076 | ||||||
| 6.00%, 09/15/41 |
5,452 | 5,575,066 | ||||||
| IBM International Capital Pte Ltd. |
||||||||
| 4.60%, 02/05/27 (Call 01/05/27) |
3,650 | 3,604,877 | ||||||
| 4.60%, 02/05/29 (Call 01/05/29) |
3,690 | 3,619,205 | ||||||
| 4.70%, 02/05/26 |
4,170 | 4,136,819 | ||||||
| 4.75%, 02/05/31 (Call 12/05/30) |
3,270 | 3,186,605 | ||||||
| 4.90%, 02/05/34 (Call 11/05/33) |
2,980 | 2,889,857 | ||||||
| 5.25%, 02/05/44 (Call 08/05/43) |
2,750 | 2,635,051 | ||||||
| 5.30%, 02/05/54 (Call 08/05/53) |
5,820 | 5,585,541 | ||||||
| International Business Machines Corp. |
||||||||
| 1.70%, 05/15/27 (Call 03/15/27) |
5,394 | 4,869,062 | ||||||
| 1.95%, 05/15/30 (Call 02/15/30) |
6,090 | 5,095,155 | ||||||
| 2.20%, 02/09/27 (Call 01/09/27) |
3,360 | 3,105,894 | ||||||
| 2.72%, 02/09/32 (Call 11/09/31) |
2,075 | 1,797,224 | ||||||
| 2.85%, 05/15/40 (Call 11/15/39) |
1,038 | 754,851 | ||||||
| 2.95%, 05/15/50 (Call 11/15/49) |
2,419 | 1,593,489 | ||||||
| 3.30%, 05/15/26 |
10,454 | 10,064,858 | ||||||
| 3.30%, 01/27/27 |
2,673 | 2,553,621 | ||||||
| 3.43%, 02/09/52 (Call 08/09/51) |
3,360 | 2,393,159 | ||||||
| 3.45%, 02/19/26 |
6,336 | 6,146,443 | ||||||
| 3.50%, 05/15/29 |
10,415 | 9,721,623 | ||||||
| 4.00%, 07/27/25 |
3,010 | 2,963,622 | ||||||
| 4.00%, 06/20/42 |
2,841 | 2,362,037 | ||||||
| 4.15%, 07/27/27 (Call 06/27/27) |
3,648 | 3,554,370 | ||||||
| 4.15%, 05/15/39 |
7,939 | 6,921,196 | ||||||
| 4.25%, 05/15/49 |
10,135 | 8,488,942 | ||||||
| 4.40%, 07/27/32 (Call 04/27/32) |
3,590 | 3,428,580 | ||||||
| 4.50%, 02/06/26(b) |
3,400 | 3,369,162 | ||||||
| 4.50%, 02/06/28 (Call 01/06/28) |
3,610 | 3,560,911 | ||||||
| 4.70%, 02/19/46 |
2,834 | 2,566,551 | ||||||
| 4.75%, 02/06/33 (Call 11/06/32)(b) |
3,617 | 3,529,570 | ||||||
| 4.90%, 07/27/52 (Call 01/27/52) |
2,320 | 2,144,382 | ||||||
| 5.10%, 02/06/53 (Call 08/06/52) |
2,595 | 2,473,324 | ||||||
| 5.60%, 11/30/39 |
1,420 | 1,460,009 | ||||||
| 5.88%, 11/29/32 |
2,719 | 2,878,618 | ||||||
| 34 | 2 0 2 4 I S H A R E S A N N U A L R E P O R T T O S H A R E H O L D E R S |
| Schedule of Investments (continued) February 29, 2024 |
iShares® Core U.S. Aggregate Bond ETF (Percentages shown are based on Net Assets) |
| Security | Par (000) |
Value | ||||||
| Computers (continued) |
||||||||
| 6.22%, 08/01/27 |
$ | 2,202 | $ | 2,297,241 | ||||
| 6.50%, 01/15/28 |
1,440 | 1,523,421 | ||||||
| 7.00%, 10/30/25 |
4,085 | 4,216,433 | ||||||
| 7.13%, 12/01/96(b) |
979 | 1,229,379 | ||||||
| Kyndryl Holdings Inc. |
||||||||
| 2.05%, 10/15/26 (Call 09/15/26)(b) |
3,120 | 2,849,909 | ||||||
| 2.70%, 10/15/28 (Call 08/15/28) |
2,372 | 2,079,684 | ||||||
| 3.15%, 10/15/31 (Call 07/15/31)(b) |
3,465 | 2,857,385 | ||||||
| 4.10%, 10/15/41 (Call 04/15/41) |
885 | 662,003 | ||||||
| 6.35%, 02/20/34 (Call 11/20/33) |
465 | 469,129 | ||||||
| Leidos Inc. |
||||||||
| 2.30%, 02/15/31 (Call 11/15/30) |
4,138 | 3,390,065 | ||||||
| 3.63%, 05/15/25 (Call 04/15/25) |
1,721 | 1,680,469 | ||||||
| 4.38%, 05/15/30 (Call 02/15/30) |
1,553 | 1,459,380 | ||||||
| NetApp Inc. |
||||||||
| 1.88%, 06/22/25 (Call 05/22/25) |
4,350 | 4,147,671 | ||||||
| 2.38%, 06/22/27 (Call 04/22/27) |
2,341 | 2,143,939 | ||||||
| 2.70%, 06/22/30 (Call 03/22/30) |
1,989 | 1,705,284 | ||||||
| Teledyne FLIR LLC, 2.50%, 08/01/30 |
1,911 | 1,614,290 | ||||||
| Western Digital Corp. |
||||||||
| 2.85%, 02/01/29 (Call 12/01/28) |
2,009 | 1,692,951 | ||||||
| 3.10%, 02/01/32 (Call 11/01/31) |
2,713 | 2,114,956 | ||||||
|
|
|
|||||||
| 573,445,061 | ||||||||
| Cosmetics & Personal Care — 0.2% | ||||||||
| Colgate-Palmolive Co. |
||||||||
| 3.10%, 08/15/25 |
1,455 | 1,418,589 | ||||||
| 3.10%, 08/15/27 (Call 07/15/27) |
860 | 820,465 | ||||||
| 3.25%, 08/15/32 (Call 05/15/32) |
2,740 | 2,455,648 | ||||||
| 3.70%, 08/01/47 (Call 02/01/47)(b) |
2,135 | 1,761,253 | ||||||
| 4.00%, 08/15/45(b) |
2,713 | 2,374,987 | ||||||
| 4.60%, 03/01/28 (Call 02/01/28)(b) |
829 | 834,795 | ||||||
| 4.60%, 03/01/33 (Call 12/01/32) |
1,244 | 1,234,716 | ||||||
| 4.80%, 03/02/26 |
1,774 | 1,778,267 | ||||||
| Conopco Inc., Series E, 7.25%, 12/15/26 |
1,517 | 1,609,107 | ||||||
| Estee Lauder Companies Inc. (The) |
||||||||
| 1.95%, 03/15/31 (Call 12/15/30) |
3,765 | 3,086,420 | ||||||
| 2.38%, 12/01/29 (Call 09/01/29) |
4,078 | 3,563,177 | ||||||
| 2.60%, 04/15/30 (Call 01/15/30) |
3,554 | 3,109,942 | ||||||
| 3.13%, 12/01/49 (Call 06/01/49) |
3,282 | 2,237,561 | ||||||
| 3.15%, 03/15/27 (Call 12/15/26) |
3,417 | 3,254,807 | ||||||
| 4.15%, 03/15/47 (Call 09/15/46) |
2,275 | 1,877,307 | ||||||
| 4.38%, 05/15/28 (Call 04/15/28) |
2,150 | 2,113,792 | ||||||
| 4.38%, 06/15/45 (Call 12/15/44) |
2,548 | 2,189,901 | ||||||
| 4.65%, 05/15/33 (Call 02/15/33)(b) |
120 | 116,404 | ||||||
| 5.00%, 02/14/34 (Call 11/14/33) |
1,325 | 1,301,807 | ||||||
| 5.15%, 05/15/53 (Call 11/15/52) |
1,185 | 1,135,110 | ||||||
| 6.00%, 05/15/37(b) |
2,572 | 2,740,917 | ||||||
| Haleon U.K. Capital PLC, 3.13%, 03/24/25 |
8,133 | 7,933,139 | ||||||
| Haleon U.S. Capital LLC |
||||||||
| 3.38%, 03/24/27 (Call 02/24/27) |
7,195 | 6,839,748 | ||||||
| 3.38%, 03/24/29 (Call 01/24/29) |
6,045 | 5,584,863 | ||||||
| 3.63%, 03/24/32 (Call 12/24/31) |
6,410 | 5,738,920 | ||||||
| 4.00%, 03/24/52 (Call 09/24/51) |
4,880 | 3,898,313 | ||||||
| Kenvue Inc. |
||||||||
| 4.90%, 03/22/33 (Call 12/22/32) |
5,880 | 5,813,644 | ||||||
| 5.00%, 03/22/30 (Call 01/22/30) |
3,710 | 3,717,600 | ||||||
| 5.05%, 03/22/28 (Call 02/22/28) |
6,185 | 6,223,759 | ||||||
| 5.05%, 03/22/53 (Call 09/22/52) |
6,220 | 5,986,017 | ||||||
| 5.10%, 03/22/43 (Call 09/22/42)(b) |
3,555 | 3,463,335 | ||||||
| 5.20%, 03/22/63 (Call 09/22/62) |
2,885 | 2,789,947 | ||||||
| Security | Par (000) |
Value | ||||||
| Cosmetics & Personal Care (continued) |
||||||||
| 5.35%, 03/22/26 (Call 02/22/26) |
$ | 2,045 | $ | 2,058,372 | ||||
| 5.50%, 03/22/25(b) |
825 | 827,043 | ||||||
| Procter & Gamble Co. (The) |
||||||||
| 0.55%, 10/29/25 |
5,344 | 4,982,142 | ||||||
| 1.00%, 04/23/26 |
1,590 | 1,471,000 | ||||||
| 1.20%, 10/29/30 |
7,105 | 5,713,794 | ||||||
| 1.90%, 02/01/27 |
1,780 | 1,649,145 | ||||||
| 1.95%, 04/23/31 |
1,912 | 1,608,301 | ||||||
| 2.30%, 02/01/32 |
4,980 | 4,247,177 | ||||||
| 2.45%, 11/03/26 |
3,955 | 3,736,217 | ||||||
| 2.70%, 02/02/26 |
3,334 | 3,206,588 | ||||||
| 2.80%, 03/25/27 |
3,942 | 3,731,644 | ||||||
| 2.85%, 08/11/27 |
4,611 | 4,351,066 | ||||||
| 3.00%, 03/25/30 |
7,900 | 7,228,814 | ||||||
| 3.50%, 10/25/47 |
1,835 | 1,475,039 | ||||||
| 3.55%, 03/25/40 |
1,745 | 1,493,792 | ||||||
| 3.60%, 03/25/50 |
1,102 | 903,985 | ||||||
| 3.95%, 01/26/28(b) |
3,055 | 3,001,877 | ||||||
| 4.05%, 01/26/33(b) |
1,715 | 1,651,946 | ||||||
| 4.10%, 01/26/26 |
5,027 | 4,970,715 | ||||||
| 4.35%, 01/29/29 |
2,870 | 2,845,386 | ||||||
| 4.55%, 01/29/34 |
2,960 | 2,920,959 | ||||||
| 5.55%, 03/05/37 |
1,120 | 1,201,497 | ||||||
| 5.80%, 08/15/34 |
615 | 683,805 | ||||||
| Unilever Capital Corp. |
||||||||
| 1.38%, 09/14/30 (Call 06/14/30)(b) |
2,736 | 2,210,870 | ||||||
| 1.75%, 08/12/31 (Call 05/12/31) |
3,645 | 2,931,341 | ||||||
| 2.00%, 07/28/26 |
3,612 | 3,382,923 | ||||||
| 2.13%, 09/06/29 (Call 06/06/29) |
4,250 | 3,702,109 | ||||||
| 2.90%, 05/05/27 (Call 02/05/27) |
6,485 | 6,128,691 | ||||||
| 3.10%, 07/30/25 |
2,205 | 2,149,179 | ||||||
| 3.38%, 03/22/25 (Call 01/22/25) |
1,664 | 1,631,774 | ||||||
| 3.50%, 03/22/28 (Call 12/22/27) |
5,014 | 4,797,001 | ||||||
| 4.88%, 09/08/28 (Call 08/08/28) |
2,050 | 2,064,767 | ||||||
| 5.00%, 12/08/33 (Call 09/08/33) |
2,481 | 2,485,165 | ||||||
| 5.90%, 11/15/32 |
4,885 | 5,197,911 | ||||||
| Series 30Y, 2.63%, 08/12/51 (Call 02/12/51) |
3,080 | 1,987,043 | ||||||
|
|
|
|||||||
| 203,633,335 | ||||||||
| Distribution & Wholesale — 0.0% | ||||||||
| LKQ Corp. |
||||||||
| 5.75%, 06/15/28 (Call 05/15/28) |
250 | 252,520 | ||||||
| 6.25%, 06/15/33 (Call 03/15/33) |
315 | 323,792 | ||||||
| WW Grainger Inc. |
||||||||
| 3.75%, 05/15/46 (Call 11/15/45) |
2,101 | 1,686,122 | ||||||
| 4.20%, 05/15/47 (Call 11/15/46) |
2,070 | 1,777,937 | ||||||
| 4.60%, 06/15/45 (Call 12/15/44) |
3,765 | 3,427,627 | ||||||
|
|
|
|||||||
| 7,467,998 | ||||||||
| Diversified Financial Services — 0.9% | ||||||||
| AerCap Ireland Capital DAC/AerCap Global Aviation Trust |
||||||||
| 1.75%, 01/30/26 (Call 12/30/25) |
3,273 | 3,040,666 | ||||||
| 2.45%, 10/29/26 (Call 09/29/26) |
10,258 | 9,465,072 | ||||||
| 3.00%, 10/29/28 (Call 08/29/28) |
14,475 | 13,005,801 | ||||||
| 3.30%, 01/30/32 (Call 10/30/31) |
16,145 | 13,663,093 | ||||||
| 3.40%, 10/29/33 (Call 07/29/33) |
7,442 | 6,190,766 | ||||||
| 3.65%, 07/21/27 (Call 04/21/27) |
5,425 | 5,107,328 | ||||||
| 3.85%, 10/29/41 (Call 04/29/41) |
4,088 | 3,160,200 | ||||||
| 3.88%, 01/23/28 (Call 10/23/27) |
4,402 | 4,145,012 | ||||||
| 4.45%, 10/01/25 (Call 08/01/25) |
3,560 | 3,491,742 | ||||||
| S C H E D U L E O F I N V E S T M E N T S |
35 |
| Schedule of Investments (continued) February 29, 2024 |
iShares® Core U.S. Aggregate Bond ETF (Percentages shown are based on Net Assets) |
| Security | Par (000) |
Value | ||||||
| Diversified Financial Services (continued) |
||||||||
| 4.45%, 04/03/26 (Call 02/03/26) |
$ | 3,938 | $ | 3,857,329 | ||||
| 4.63%, 10/15/27 (Call 08/15/27) |
3,116 | 3,016,669 | ||||||
| 5.10%, 01/19/29 (Call 12/19/28) |
2,820 | 2,772,209 | ||||||
| 5.30%, 01/19/34 (Call 10/19/33) |
3,255 | 3,144,803 | ||||||
| 5.75%, 06/06/28 (Call 05/06/28) |
2,695 | 2,716,480 | ||||||
| 6.10%, 01/15/27 (Call 12/15/26) |
1,870 | 1,894,174 | ||||||
| 6.15%, 09/30/30 (Call 07/30/30) |
3,125 | 3,227,287 | ||||||
| 6.45%, 04/15/27 (Call 03/15/27)(c) |
300 | 307,149 | ||||||
| 6.50%, 07/15/25 (Call 06/15/25) |
4,662 | 4,704,103 | ||||||
| Affiliated Managers Group Inc. |
||||||||
| 3.30%, 06/15/30 (Call 03/15/30) |
1,991 | 1,752,090 | ||||||
| 3.50%, 08/01/25 |
2,279 | 2,216,472 | ||||||
| Air Lease Corp. |
||||||||
| 1.88%, 08/15/26 (Call 07/15/26) |
2,388 | 2,193,067 | ||||||
| 2.10%, 09/01/28 (Call 07/01/28) |
2,540 | 2,205,797 | ||||||
| 2.20%, 01/15/27 (Call 12/15/26) |
1,335 | 1,222,799 | ||||||
| 2.88%, 01/15/26 (Call 12/15/25) |
4,651 | 4,436,871 | ||||||
| 2.88%, 01/15/32 (Call 10/15/31) |
3,993 | 3,313,256 | ||||||
| 3.00%, 02/01/30 (Call 11/01/29) |
2,886 | 2,508,689 | ||||||
| 3.13%, 12/01/30 (Call 09/01/30) |
2,088 | 1,797,786 | ||||||
| 3.25%, 03/01/25 (Call 01/01/25) |
4,168 | 4,069,469 | ||||||
| 3.25%, 10/01/29 (Call 07/01/29) |
2,341 | 2,086,573 | ||||||
| 3.38%, 07/01/25 (Call 06/01/25) |
2,877 | 2,795,387 | ||||||
| 3.63%, 04/01/27 (Call 01/01/27) |
2,958 | 2,808,714 | ||||||
| 3.63%, 12/01/27 (Call 09/01/27) |
2,504 | 2,344,300 | ||||||
| 3.75%, 06/01/26 (Call 04/01/26) |
5,043 | 4,859,917 | ||||||
| 4.63%, 10/01/28 (Call 07/01/28) |
2,594 | 2,505,544 | ||||||
| 5.10%, 03/01/29 (Call 02/01/29) |
1,900 | 1,867,248 | ||||||
| 5.30%, 02/01/28 (Call 01/01/28)(b) |
2,890 | 2,872,566 | ||||||
| 5.85%, 12/15/27 (Call 11/15/27) |
570 | 576,214 | ||||||
| Aircastle Ltd., 4.25%, 06/15/26 (Call 04/15/26) |
3,547 | 3,437,529 | ||||||
| Ally Financial Inc. |
||||||||
| 2.20%, 11/02/28 (Call 09/02/28) |
3,875 | 3,291,819 | ||||||
| 4.63%, 03/30/25 |
1,842 | 1,818,551 | ||||||
| 4.75%, 06/09/27 (Call 05/09/27)(b) |
3,380 | 3,281,936 | ||||||
| 5.80%, 05/01/25 (Call 04/01/25)(b) |
2,703 | 2,698,296 | ||||||
| 6.85%, 01/03/30 (Call 01/03/29), |
||||||||
| (1-day SOFR + 2.282%)(a) |
2,740 | 2,800,378 | ||||||
| 6.99%, 06/13/29 (Call 06/13/28), |
||||||||
| (1-day SOFR + 3.260%)(a)(b) |
1,750 | 1,797,617 | ||||||
| 7.10%, 11/15/27 (Call 10/15/27)(b) |
2,815 | 2,930,638 | ||||||
| 8.00%, 11/01/31 |
10,690 | 11,718,823 | ||||||
| American Express Co. |
||||||||
| 1.65%, 11/04/26 (Call 10/04/26) |
3,984 | 3,642,593 | ||||||
| 2.25%, 03/04/25 (Call 02/01/25) |
2,610 | 2,527,563 | ||||||
| 2.55%, 03/04/27 (Call 02/01/27) |
9,095 | 8,449,568 | ||||||
| 3.13%, 05/20/26 (Call 04/20/26) |
6,950 | 6,669,836 | ||||||
| 3.30%, 05/03/27 (Call 04/03/27) |
6,635 | 6,290,107 | ||||||
| 3.95%, 08/01/25 (Call 07/01/25) |
10,100 | 9,922,434 | ||||||
| 4.05%, 05/03/29 (Call 03/03/29) |
4,650 | 4,494,167 | ||||||
| 4.05%, 12/03/42 |
5,290 | 4,550,418 | ||||||
| 4.20%, 11/06/25 (Call 10/06/25) |
3,475 | 3,427,789 | ||||||
| 4.42%, 08/03/33 (Call 08/03/32), |
||||||||
| (1-day SOFR + 1.760%)(a) |
5,151 | 4,879,901 | ||||||
| 4.90%, 02/13/26 (Call 01/13/26) |
7,495 | 7,470,507 | ||||||
| 4.99%, 05/01/26 (Call 05/01/25), |
||||||||
| (1-day SOFR + 1.000%)(a) |
5,270 | 5,239,674 | ||||||
| 4.99%, 05/26/33 (Call 02/26/32), |
||||||||
| (1-day SOFR + 2.255%)(a) |
2,735 | 2,660,298 | ||||||
| 5.04%, 05/01/34 (Call 05/01/33), |
||||||||
| (1-day SOFR + 1.835%)(a) |
5,100 | 5,002,162 | ||||||
| Security | Par (000) |
Value | ||||||
| Diversified Financial Services (continued) |
||||||||
| 5.10%, 02/16/28 (Call 02/16/27), |
||||||||
| (1-day SOFR + 1.000%)(a) |
$ | 2,815 | $ | 2,803,769 | ||||
| 5.28%, 07/27/29 (Call 07/27/28), |
||||||||
| (1-day SOFR + 1.280%)(a) |
4,960 | 4,988,346 | ||||||
| 5.39%, 07/28/27 (Call 07/28/26), |
||||||||
| (1-day SOFR + 0.970%)(a) |
1,895 | 1,900,222 | ||||||
| 5.63%, 07/28/34 (Call 07/28/33), |
||||||||
| (1-day SOFR + 1.930%)(a) |
550 | 553,372 | ||||||
| 5.85%, 11/05/27 (Call 10/05/27) |
5,670 | 5,815,515 | ||||||
| 6.34%, 10/30/26 (Call 10/30/25), |
||||||||
| (1-day SOFR + 1.330%)(a) |
3,975 | 4,035,401 | ||||||
| 6.49%, 10/30/31 (Call 10/30/30), |
||||||||
| (1-day SOFR + 1.940%)(a) |
3,190 | 3,397,362 | ||||||
| American Express Credit Corp., 3.30%, 05/03/27 (Call 04/03/27) |
1,107 | 1,049,145 | ||||||
| Ameriprise Financial Inc. |
||||||||
| 2.88%, 09/15/26 (Call 06/15/26) |
3,093 | 2,934,338 | ||||||
| 3.00%, 04/02/25 (Call 03/02/25) |
2,112 | 2,056,580 | ||||||
| 4.50%, 05/13/32 (Call 02/13/32) |
2,500 | 2,398,529 | ||||||
| 5.15%, 05/15/33 (Call 02/15/33) |
2,605 | 2,608,389 | ||||||
| 5.70%, 12/15/28 (Call 11/15/28) |
2,240 | 2,303,354 | ||||||
| Andrew W Mellon Foundation (The), |
3,490 | 3,065,184 | ||||||
| Apollo Global Management Inc., 6.38%, 11/15/33 (Call 08/15/33) |
1,654 | 1,774,986 | ||||||
| Ares Management Corp., 6.38%, 11/10/28 |
150 | 155,673 | ||||||
| BGC Group Inc., 8.00%, 05/25/28 (Call 04/25/28) |
795 | 839,440 | ||||||
| Blue Owl Credit Income Corp., 7.95%, 06/13/28 |
230 | 237,012 | ||||||
| Brookfield Capital Finance LLC, 6.09%, 06/14/33 (Call 03/14/33) |
1,395 | 1,438,961 | ||||||
| Brookfield Finance I U.K. PLC/Brookfield |
||||||||
| Finance Inc., 2.34%, 01/30/32 (Call 10/30/31) |
4,580 | 3,669,926 | ||||||
| Brookfield Finance Inc. |
||||||||
| 2.72%, 04/15/31 (Call 01/15/31) |
2,750 | 2,310,584 | ||||||
| 3.50%, 03/30/51 (Call 09/30/50) |
2,487 | 1,766,169 | ||||||
| 3.63%, 02/15/52 (Call 08/15/51)(b) |
1,702 | 1,213,208 | ||||||
| 3.90%, 01/25/28 (Call 10/25/27) |
5,211 | 4,996,874 | ||||||
| 4.25%, 06/02/26 (Call 03/02/26) |
2,304 | 2,262,184 | ||||||
| 4.35%, 04/15/30 (Call 01/15/30) |
3,644 | 3,451,551 | ||||||
| 4.70%, 09/20/47 (Call 03/20/47) |
3,726 | 3,161,605 | ||||||
| 4.85%, 03/29/29 (Call 12/29/28) |
4,782 | 4,713,474 | ||||||
| 5.97%, 03/04/54 (Call 09/04/53) |
910 | 918,489 | ||||||
| 6.35%, 01/05/34 (Call 10/05/33) |
2,610 | 2,742,899 | ||||||
| Brookfield Finance LLC/Brookfield |
||||||||
| Finance Inc., 3.45%, 04/15/50 (Call 10/15/49) |
2,380 | 1,651,904 | ||||||
| Capital One Financial Corp. |
||||||||
| 1.88%, 11/02/27 (Call 11/02/26), |
||||||||
| (1-day SOFR + 0.855%)(a) |
5,375 | 4,877,068 | ||||||
| 2.36%, 07/29/32 (Call 07/29/31), |
||||||||
| (1-day SOFR + 1.337%)(a) |
4,328 | 3,261,270 | ||||||
| 2.62%, 11/02/32 (Call 11/02/31), |
||||||||
| (1-day SOFR + 1.265%)(a) |
2,095 | 1,672,763 | ||||||
| 2.64%, 03/03/26 (Call 03/03/25), |
||||||||
| (1-day SOFR + 1.290%)(a) |
5,465 | 5,301,104 | ||||||
| 3.27%, 03/01/30 (Call 03/01/29), |
||||||||
| (1-day SOFR + 1.790%)(a) |
3,745 | 3,336,857 | ||||||
| 36 | 2 0 2 4 I S H A R E S A N N U A L R E P O R T T O S H A R E H O L D E R S |
| Schedule of Investments (continued) February 29, 2024 |
iShares® Core U.S. Aggregate Bond ETF (Percentages shown are based on Net Assets) |
| Security | Par (000) |
Value | ||||||
| Diversified Financial Services (continued) |
||||||||
| 3.65%, 05/11/27 (Call 04/11/27) |
$ | 4,157 | $ | 3,957,087 | ||||
| 3.75%, 07/28/26 (Call 06/28/26) |
5,812 | 5,577,990 | ||||||
| 3.75%, 03/09/27 (Call 02/09/27) |
5,979 | 5,707,299 | ||||||
| 3.80%, 01/31/28 (Call 12/31/27) |
5,960 | 5,632,290 | ||||||
| 4.20%, 10/29/25 (Call 09/29/25) |
6,023 | 5,887,382 | ||||||
| 4.25%, 04/30/25 (Call 03/31/25) |
3,279 | 3,234,703 | ||||||
| 4.93%, 05/10/28 (Call 05/10/27), |
||||||||
| (1-day SOFR + 2.057%)(a) |
5,045 | 4,934,911 | ||||||
| 4.99%, 07/24/26 (Call 07/24/25), |
||||||||
| (1-day SOFR + 2.160%)(a) |
3,870 | 3,833,959 | ||||||
| 5.25%, 07/26/30 (Call 07/26/29), |
||||||||
| (1-day SOFR + 2.600%)(a) |
3,195 | 3,115,232 | ||||||
| 5.27%, 05/10/33 (Call 05/10/32), |
||||||||
| (1-day SOFR + 2.370%)(a) |
5,000 | 4,849,340 | ||||||
| 5.47%, 02/01/29 (Call 02/01/28), |
||||||||
| (1-day SOFR + 2.080%)(a) |
3,660 | 3,635,946 | ||||||
| 5.70%, 02/01/30 (Call 02/01/29), |
||||||||
| (1-day SOFR + 1.905%)(a)(b) |
1,475 | 1,477,781 | ||||||
| 5.82%, 02/01/34 (Call 02/01/33), |
||||||||
| (1-day SOFR + 2.600%)(a) |
4,125 | 4,076,510 | ||||||
| 6.05%, 02/01/35 (Call 02/01/34), |
||||||||
| (1-day SOFR + 2.260%)(a)(b) |
2,160 | 2,179,266 | ||||||
| 6.31%, 06/08/29 (Call 06/08/28), |
||||||||
| (1-day SOFR + 2.640%)(a) |
6,660 | 6,820,807 | ||||||
| 6.38%, 06/08/34 (Call 06/08/33), |
||||||||
| (1-day SOFR + 2.860%)(a) |
7,275 | 7,493,600 | ||||||
| 7.15%, 10/29/27 (Call 10/29/26), |
||||||||
| (1-day SOFR + 2.440%)(a) |
2,665 | 2,762,902 | ||||||
| 7.62%, 10/30/31 (Call 10/30/30), |
||||||||
| (1-day SOFR + 3.070%)(a) |
2,690 | 2,943,893 | ||||||
| Cboe Global Markets Inc. |
||||||||
| 1.63%, 12/15/30 (Call 09/15/30) |
3,375 | 2,737,896 | ||||||
| 3.00%, 03/16/32 (Call 12/16/31) |
2,130 | 1,842,127 | ||||||
| 3.65%, 01/12/27 (Call 10/12/26) |
3,044 | 2,945,752 | ||||||
| Charles Schwab Corp. (The) |
||||||||
| 0.90%, 03/11/26 (Call 02/11/26) |
6,814 | 6,248,218 | ||||||
| 1.15%, 05/13/26 (Call 04/13/26) |
5,743 | 5,269,035 | ||||||
| 1.65%, 03/11/31 (Call 12/11/30) |
3,399 | 2,690,094 | ||||||
| 1.95%, 12/01/31 (Call 09/01/31) |
4,141 | 3,286,915 | ||||||
| 2.00%, 03/20/28 (Call 01/20/28) |
3,402 | 3,015,990 | ||||||
| 2.30%, 05/13/31 (Call 02/13/31) |
4,348 | 3,599,019 | ||||||
| 2.45%, 03/03/27 (Call 02/03/27) |
3,060 | 2,835,392 | ||||||
| 2.75%, 10/01/29 (Call 07/01/29) |
2,179 | 1,933,077 | ||||||
| 2.90%, 03/03/32 (Call 12/03/31) |
4,848 | 4,103,452 | ||||||
| 3.00%, 03/10/25 (Call 12/10/24) |
245 | 239,203 | ||||||
| 3.20%, 03/02/27 (Call 12/02/26) |
3,487 | 3,309,061 | ||||||
| 3.20%, 01/25/28 (Call 10/25/27) |
4,168 | 3,902,175 | ||||||
| 3.25%, 05/22/29 (Call 02/22/29) |
2,545 | 2,346,033 | ||||||
| 3.30%, 04/01/27 (Call 01/01/27) |
4,390 | 4,170,320 | ||||||
| 3.45%, 02/13/26 (Call 11/13/25) |
1,858 | 1,798,443 | ||||||
| 3.63%, 04/01/25 (Call 01/01/25) |
2,249 | 2,205,924 | ||||||
| 3.85%, 05/21/25 (Call 03/21/25) |
3,676 | 3,607,282 | ||||||
| 4.00%, 02/01/29 (Call 11/01/28)(b) |
2,988 | 2,865,242 | ||||||
| 4.20%, 03/24/25 (Call 02/24/25) |
3,489 | 3,450,347 | ||||||
| 4.63%, 03/22/30 (Call 12/22/29)(b) |
2,598 | 2,564,523 | ||||||
| 5.64%, 05/19/29 (Call 05/19/28), |
||||||||
| (1-day SOFR + 2.210%)(a) |
1,590 | 1,610,052 | ||||||
| 5.85%, 05/19/34 (Call 05/19/33), |
||||||||
| (1-day SOFR + 2.500%)(a) |
3,840 | 3,897,497 | ||||||
| 5.88%, 08/24/26 (Call 07/24/26) |
1,735 | 1,762,215 | ||||||
| Security | Par (000) |
Value | ||||||
| Diversified Financial Services (continued) |
||||||||
| 6.14%, 08/24/34 (Call 08/24/33), |
||||||||
| (1-day SOFR + 2.010%)(a) |
$ | 2,875 | $ | 2,982,098 | ||||
| 6.20%, 11/17/29 (Call 11/17/28), |
||||||||
| (1-day SOFR + 1.878%)(a) |
4,070 | 4,203,139 | ||||||
| CI Financial Corp. |
||||||||
| 3.20%, 12/17/30 (Call 09/17/30) |
4,148 | 3,302,564 | ||||||
| 4.10%, 06/15/51 (Call 12/15/50)(b) |
3,835 | 2,265,847 | ||||||
| CME Group Inc. |
||||||||
| 2.65%, 03/15/32 (Call 12/15/31) |
3,711 | 3,178,925 | ||||||
| 3.00%, 03/15/25 (Call 12/15/24) |
8,281 | 8,090,927 | ||||||
| 3.75%, 06/15/28 (Call 03/15/28) |
5,313 | 5,125,656 | ||||||
| 4.15%, 06/15/48 (Call 12/15/47) |
2,908 | 2,496,309 | ||||||
| 5.30%, 09/15/43 (Call 03/15/43) |
3,974 | 4,022,375 | ||||||
| Credit Suisse USA Inc., 7.13%, 07/15/32 |
1,916 | 2,138,126 | ||||||
| Discover Financial Services |
||||||||
| 3.75%, 03/04/25 (Call 12/04/24) |
1,867 | 1,832,435 | ||||||
| 4.10%, 02/09/27 (Call 11/09/26) |
3,410 | 3,277,288 | ||||||
| 4.50%, 01/30/26 (Call 11/30/25) |
2,421 | 2,378,920 | ||||||
| 6.70%, 11/29/32 (Call 08/29/32) |
2,280 | 2,385,887 | ||||||
| 7.96%, 11/02/34 (Call 11/02/33), |
||||||||
| (1-day SOFR + 3.370%)(a) |
3,620 | 4,056,882 | ||||||
| Eaton Vance Corp., 3.50%, 04/06/27 |
2,969 | 2,825,910 | ||||||
| Franklin Resources Inc. |
||||||||
| 1.60%, 10/30/30 (Call 07/30/30) |
2,477 | 1,997,839 | ||||||
| 2.85%, 03/30/25 |
1,566 | 1,525,645 | ||||||
| 2.95%, 08/12/51 (Call 02/12/51) |
1,445 | 887,878 | ||||||
| HPS Corporate Lending Fund, 6.75%, 01/30/29 |
150 | 148,575 | ||||||
| Intercontinental Exchange Inc. |
||||||||
| 1.85%, 09/15/32 (Call 06/15/32) |
6,133 | 4,733,195 | ||||||
| 2.10%, 06/15/30 (Call 03/15/30) |
5,737 | 4,813,072 | ||||||
| 2.65%, 09/15/40 (Call 03/15/40) |
3,408 | 2,413,982 | ||||||
| 3.00%, 06/15/50 (Call 12/15/49) |
6,937 | 4,652,374 | ||||||
| 3.00%, 09/15/60 (Call 03/15/60) |
3,371 | 2,088,323 | ||||||
| 3.10%, 09/15/27 (Call 06/15/27) |
4,355 | 4,089,542 | ||||||
| 3.65%, 05/23/25 |
3,754 | 3,680,612 | ||||||
| 3.75%, 12/01/25 (Call 09/01/25) |
7,816 | 7,621,557 | ||||||
| 3.75%, 09/21/28 (Call 06/21/28)(b) |
3,035 | 2,896,678 | ||||||
| 4.00%, 09/15/27 (Call 08/15/27) |
4,455 | 4,302,119 | ||||||
| 4.25%, 09/21/48 (Call 03/21/48) |
6,445 | 5,454,747 | ||||||
| 4.35%, 06/15/29 (Call 04/15/29) |
6,249 | 6,065,455 | ||||||
| 4.60%, 03/15/33 (Call 12/15/32) |
6,010 | 5,745,018 | ||||||
| 4.95%, 06/15/52 (Call 12/15/51) |
4,422 | 4,127,295 | ||||||
| 5.20%, 06/15/62 (Call 12/15/61) |
4,455 | 4,281,320 | ||||||
| Invesco Finance PLC |
||||||||
| 3.75%, 01/15/26 |
2,223 | 2,160,253 | ||||||
| 5.38%, 11/30/43 |
1,379 | 1,331,027 | ||||||
| Janus Henderson U.S. Holdings Inc., 4.88%, |
||||||||
| 08/01/25 (Call 05/01/25) |
1,899 | 1,876,601 | ||||||
| Jefferies Financial Group Inc. |
||||||||
| 2.63%, 10/15/31 (Call 07/15/31) |
3,645 | 2,981,176 | ||||||
| 2.75%, 10/15/32 (Call 07/15/32) |
2,665 | 2,149,320 | ||||||
| 4.15%, 01/23/30 |
4,910 | 4,567,840 | ||||||
| 4.85%, 01/15/27 |
4,493 | 4,461,813 | ||||||
| 5.88%, 07/21/28 (Call 06/21/28) |
3,385 | 3,450,841 | ||||||
| 6.25%, 01/15/36 |
3,003 | 3,085,564 | ||||||
| 6.45%, 06/08/27 |
1,776 | 1,830,572 | ||||||
| 6.50%, 01/20/43 |
1,409 | 1,467,260 | ||||||
| Lazard Group LLC |
||||||||
| 3.63%, 03/01/27 (Call 12/01/26) |
1,756 | 1,661,103 | ||||||
| S C H E D U L E O F I N V E S T M E N T S |
37 |
| Schedule of Investments (continued) February 29, 2024 |
iShares® Core U.S. Aggregate Bond ETF (Percentages shown are based on Net Assets) |
| Security | Par (000) |
Value | ||||||
| Diversified Financial Services (continued) |
||||||||
| 4.38%, 03/11/29 (Call 12/11/28) |
$ | 3,527 | $ | 3,361,993 | ||||
| 4.50%, 09/19/28 (Call 06/19/28) |
1,398 | 1,340,759 | ||||||
| Legg Mason Inc. |
||||||||
| 4.75%, 03/15/26 |
1,723 | 1,710,891 | ||||||
| 5.63%, 01/15/44 |
2,133 | 2,137,052 | ||||||
| LPL Holdings Inc., 6.75%, 11/17/28 (Call 10/17/28) |
515 | 537,333 | ||||||
| Mastercard Inc. |
||||||||
| 1.90%, 03/15/31 (Call 12/15/30) |
4,140 | 3,434,483 | ||||||
| 2.00%, 03/03/25 (Call 02/03/25) |
3,863 | 3,743,942 | ||||||
| 2.00%, 11/18/31 (Call 08/18/31) |
4,100 | 3,363,487 | ||||||
| 2.95%, 11/21/26 (Call 08/21/26) |
3,261 | 3,110,447 | ||||||
| 2.95%, 06/01/29 (Call 03/01/29) |
6,064 | 5,567,107 | ||||||
| 2.95%, 03/15/51 (Call 09/15/50) |
4,025 | 2,787,974 | ||||||
| 3.30%, 03/26/27 (Call 01/26/27) |
4,485 | 4,297,774 | ||||||
| 3.35%, 03/26/30 (Call 12/26/29) |
7,220 | 6,666,621 | ||||||
| 3.50%, 02/26/28 (Call 11/26/27) |
3,170 | 3,043,174 | ||||||
| 3.65%, 06/01/49 (Call 12/01/48) |
3,726 | 2,962,535 | ||||||
| 3.80%, 11/21/46 (Call 05/21/46) |
2,487 | 2,053,484 | ||||||
| 3.85%, 03/26/50 (Call 09/26/49) |
5,074 | 4,189,242 | ||||||
| 3.95%, 02/26/48 (Call 08/26/47) |
2,956 | 2,498,204 | ||||||
| 4.85%, 03/09/33 (Call 12/09/32) |
2,631 | 2,627,512 | ||||||
| 4.88%, 03/09/28 (Call 02/09/28) |
3,595 | 3,635,282 | ||||||
| Nasdaq Inc. |
||||||||
| 1.65%, 01/15/31 (Call 10/15/30)(b) |
4,326 | 3,445,118 | ||||||
| 2.50%, 12/21/40 (Call 06/21/40) |
1,845 | 1,220,862 | ||||||
| 3.25%, 04/28/50 (Call 10/28/49) |
4,408 | 2,997,293 | ||||||
| 3.85%, 06/30/26 (Call 03/30/26) |
5,381 | 5,222,205 | ||||||
| 3.95%, 03/07/52 (Call 09/07/51) |
1,280 | 972,452 | ||||||
| 5.35%, 06/28/28 (Call 05/28/28) |
3,635 | 3,671,397 | ||||||
| 5.55%, 02/15/34 (Call 11/15/33) |
5,225 | 5,259,058 | ||||||
| 5.65%, 06/28/25 |
3,005 | 3,014,737 | ||||||
| 5.95%, 08/15/53 (Call 02/15/53) |
999 | 1,027,293 | ||||||
| 6.10%, 06/28/63 (Call 12/28/62) |
407 | 422,390 | ||||||
| Nomura Holdings Inc. |
||||||||
| 1.65%, 07/14/26 |
5,855 | 5,354,290 | ||||||
| 1.85%, 07/16/25 |
5,750 | 5,459,401 | ||||||
| 2.17%, 07/14/28 |
5,027 | 4,381,873 | ||||||
| 2.33%, 01/22/27 |
5,733 | 5,253,602 | ||||||
| 2.61%, 07/14/31 |
4,480 | 3,680,714 | ||||||
| 2.68%, 07/16/30 |
4,090 | 3,457,032 | ||||||
| 2.71%, 01/22/29 |
2,870 | 2,529,075 | ||||||
| 3.00%, 01/22/32 |
3,540 | 2,948,825 | ||||||
| 3.10%, 01/16/30 |
3,830 | 3,362,380 | ||||||
| 5.10%, 07/03/25 |
3,768 | 3,736,570 | ||||||
| 5.39%, 07/06/27 |
2,835 | 2,828,487 | ||||||
| 5.61%, 07/06/29 |
2,500 | 2,511,030 | ||||||
| 5.71%, 01/09/26 |
2,991 | 2,996,598 | ||||||
| 5.84%, 01/18/28 |
2,475 | 2,508,946 | ||||||
| 6.07%, 07/12/28 |
2,820 | 2,886,997 | ||||||
| 6.09%, 07/12/33(b) |
2,340 | 2,438,887 | ||||||
| 6.18%, 01/18/33(b) |
2,220 | 2,325,675 | ||||||
| ORIX Corp. |
||||||||
| 2.25%, 03/09/31(b) |
3,000 | 2,510,337 | ||||||
| 3.70%, 07/18/27 |
3,253 | 3,110,270 | ||||||
| 4.00%, 04/13/32 |
2,388 | 2,219,429 | ||||||
| 5.00%, 09/13/27 |
1,913 | 1,910,977 | ||||||
| 5.20%, 09/13/32(b) |
2,305 | 2,329,315 | ||||||
| Radian Group Inc. |
||||||||
| 4.88%, 03/15/27 (Call 09/15/26) |
3,110 | 3,020,218 | ||||||
| 6.20%, 05/15/29 (Call 02/15/29) |
1,900 | 1,904,708 | ||||||
| Security | Par (000) |
Value | ||||||
| Diversified Financial Services (continued) |
||||||||
| 6.63%, 03/15/25 (Call 09/15/24) |
$ | 2,315 | $ | 2,318,686 | ||||
| Raymond James Financial Inc. |
||||||||
| 3.75%, 04/01/51 (Call 10/01/50) |
3,005 | 2,225,701 | ||||||
| 4.65%, 04/01/30 (Call 01/01/30) |
2,052 | 2,027,655 | ||||||
| 4.95%, 07/15/46 |
3,009 | 2,764,118 | ||||||
| Stifel Financial Corp., 4.00%, 05/15/30 |
2,077 | 1,876,803 | ||||||
| Synchrony Financial |
||||||||
| 2.88%, 10/28/31 (Call 07/28/31) |
1,436 | 1,126,200 | ||||||
| 3.70%, 08/04/26 (Call 05/04/26) |
2,567 | 2,422,414 | ||||||
| 3.95%, 12/01/27 (Call 09/01/27) |
5,237 | 4,850,650 | ||||||
| 4.50%, 07/23/25 (Call 04/23/25) |
4,897 | 4,786,072 | ||||||
| 4.88%, 06/13/25 (Call 05/13/25) |
1,970 | 1,938,453 | ||||||
| 5.15%, 03/19/29 (Call 12/19/28) |
3,122 | 2,978,222 | ||||||
| Visa Inc. |
||||||||
| 0.75%, 08/15/27 (Call 06/15/27) |
3,094 | 2,716,749 | ||||||
| 1.10%, 02/15/31 (Call 11/15/30) |
6,057 | 4,786,165 | ||||||
| 1.90%, 04/15/27 (Call 02/15/27) |
6,591 | 6,068,593 | ||||||
| 2.00%, 08/15/50 (Call 02/15/50)(b) |
7,398 | 4,300,797 | ||||||
| 2.05%, 04/15/30 (Call 01/15/30) |
9,211 | 7,900,287 | ||||||
| 2.70%, 04/15/40 (Call 10/15/39) |
4,254 | 3,147,933 | ||||||
| 2.75%, 09/15/27 (Call 06/15/27) |
3,394 | 3,178,726 | ||||||
| 3.15%, 12/14/25 (Call 09/14/25) |
17,180 | 16,663,047 | ||||||
| 3.65%, 09/15/47 (Call 03/15/47) |
3,784 | 3,011,415 | ||||||
| 4.15%, 12/14/35 (Call 06/14/35) |
8,399 | 7,872,960 | ||||||
| 4.30%, 12/14/45 (Call 06/14/45) |
13,844 | 12,339,280 | ||||||
| Voya Financial Inc. |
||||||||
| 3.65%, 06/15/26 |
2,892 | 2,780,488 | ||||||
| 4.70%, 01/23/48 (Call 01/23/28), |
||||||||
| (3-mo. LIBOR US + 2.084%)(a) |
1,629 | 1,369,392 | ||||||
| 4.80%, 06/15/46 |
1,364 | 1,158,805 | ||||||
| 5.70%, 07/15/43 |
2,343 | 2,270,212 | ||||||
| Western Union Co. (The) |
||||||||
| 1.35%, 03/15/26 (Call 02/15/26) |
2,437 | 2,243,132 | ||||||
| 2.75%, 03/15/31 (Call 12/15/30) |
2,330 | 1,920,290 | ||||||
| 6.20%, 11/17/36 |
2,267 | 2,283,421 | ||||||
|
|
|
|||||||
| 934,791,222 | ||||||||
| Electric — 2.1% | ||||||||
| AEP Texas Inc. |
||||||||
| 3.45%, 05/15/51 (Call 11/15/50) |
1,225 | 843,902 | ||||||
| 3.80%, 10/01/47 (Call 04/01/47) |
1,756 | 1,301,643 | ||||||
| 3.95%, 06/01/28 (Call 03/01/28) |
2,032 | 1,942,398 | ||||||
| 4.70%, 05/15/32 (Call 02/15/32) |
1,590 | 1,515,025 | ||||||
| 5.25%, 05/15/52 (Call 11/15/51) |
2,480 | 2,323,437 | ||||||
| 5.40%, 06/01/33 (Call 03/01/33) |
1,110 | 1,107,776 | ||||||
| Series G, 4.15%, 05/01/49 (Call 11/01/48) |
1,681 | 1,318,235 | ||||||
| Series H, 3.45%, 01/15/50 (Call 07/15/49) |
2,407 | 1,678,749 | ||||||
| Series I, 2.10%, 07/01/30 (Call 04/01/30) |
2,905 | 2,404,492 | ||||||
| AEP Transmission Co. LLC |
||||||||
| 3.10%, 12/01/26 (Call 09/01/26) |
1,973 | 1,878,310 | ||||||
| 3.15%, 09/15/49 (Call 03/15/49) |
519 | 354,372 | ||||||
| 3.75%, 12/01/47 (Call 06/01/47) |
2,685 | 2,057,606 | ||||||
| 3.80%, 06/15/49 (Call 12/15/48) |
1,876 | 1,430,208 | ||||||
| 4.00%, 12/01/46 (Call 06/01/46) |
1,740 | 1,409,600 | ||||||
| 4.25%, 09/15/48 (Call 03/15/48) |
1,962 | 1,617,355 | ||||||
| 4.50%, 06/15/52 (Call 12/01/51) |
1,480 | 1,284,928 | ||||||
| 5.40%, 03/15/53 (Call 09/15/52) |
1,720 | 1,697,165 | ||||||
| Series M, 3.65%, 04/01/50 (Call 10/01/49) |
1,990 | 1,494,777 | ||||||
| Series N, 2.75%, 08/15/51 (Call 02/15/51) |
1,504 | 934,325 | ||||||
| AES Corp. (The) |
||||||||
| 1.38%, 01/15/26 (Call 12/15/25)(b) |
4,575 | 4,227,613 | ||||||
| 38 | 2 0 2 4 I S H A R E S A N N U A L R E P O R T T O S H A R E H O L D E R S |
| Schedule of Investments (continued) February 29, 2024 |
iShares® Core U.S. Aggregate Bond ETF (Percentages shown are based on Net Assets) |
| Security | Par (000) |
Value | ||||||
| Electric (continued) |
||||||||
| 2.45%, 01/15/31 (Call 10/15/30) |
$ | 4,875 | $ | 3,981,285 | ||||
| 5.45%, 06/01/28 (Call 05/01/28) |
3,190 | 3,179,247 | ||||||
| Alabama Power Co. |
||||||||
| 3.00%, 03/15/52 (Call 09/15/51) |
2,710 | 1,800,661 | ||||||
| 3.05%, 03/15/32 (Call 12/15/31) |
460 | 398,220 | ||||||
| 3.13%, 07/15/51 (Call 01/15/51) |
2,575 | 1,748,094 | ||||||
| 3.45%, 10/01/49 (Call 04/01/49) |
2,558 | 1,864,985 | ||||||
| 3.75%, 09/01/27 (Call 08/01/27) |
2,080 | 1,995,987 | ||||||
| 3.75%, 03/01/45 (Call 09/01/44) |
3,058 | 2,392,590 | ||||||
| 3.85%, 12/01/42 |
1,437 | 1,161,373 | ||||||
| 3.94%, 09/01/32 (Call 03/01/32) |
2,470 | 2,275,504 | ||||||
| 4.15%, 08/15/44 (Call 02/15/44) |
2,030 | 1,688,863 | ||||||
| 4.30%, 01/02/46 (Call 07/02/45) |
1,442 | 1,216,540 | ||||||
| 5.85%, 11/15/33 (Call 08/15/33) |
875 | 915,604 | ||||||
| 6.00%, 03/01/39(b) |
554 | 582,566 | ||||||
| 6.13%, 05/15/38 |
1,240 | 1,295,172 | ||||||
| Series 20-A, 1.45%, 09/15/30 (Call 06/15/30) |
2,994 | 2,404,585 | ||||||
| Series A, 4.30%, 07/15/48 (Call 01/15/48) |
2,351 | 1,963,306 | ||||||
| Series B, 3.70%, 12/01/47 (Call 06/01/47) |
1,316 | 1,000,517 | ||||||
| Ameren Corp. |
||||||||
| 1.75%, 03/15/28 (Call 01/15/28) |
1,421 | 1,248,741 | ||||||
| 1.95%, 03/15/27 (Call 02/15/27) |
2,895 | 2,643,565 | ||||||
| 3.50%, 01/15/31 (Call 10/15/30) |
2,995 | 2,698,090 | ||||||
| 3.65%, 02/15/26 (Call 11/15/25) |
2,403 | 2,324,393 | ||||||
| 5.00%, 01/15/29 (Call 12/15/28) |
2,589 | 2,567,223 | ||||||
| 5.70%, 12/01/26 (Call 11/01/26) |
2,530 | 2,559,463 | ||||||
| Ameren Illinois Co. |
||||||||
| 1.55%, 11/15/30 (Call 08/15/30) |
1,527 | 1,224,738 | ||||||
| 2.90%, 06/15/51 (Call 12/15/50) |
1,669 | 1,085,503 | ||||||
| 3.25%, 03/01/25 (Call 12/01/24) |
560 | 549,551 | ||||||
| 3.25%, 03/15/50 (Call 09/15/49) |
1,532 | 1,074,151 | ||||||
| 3.70%, 12/01/47 (Call 06/01/47) |
2,746 | 2,108,385 | ||||||
| 3.80%, 05/15/28 (Call 02/15/28) |
2,362 | 2,275,875 | ||||||
| 3.85%, 09/01/32 (Call 06/01/32) |
2,045 | 1,862,017 | ||||||
| 4.15%, 03/15/46 (Call 09/15/45) |
1,666 | 1,379,611 | ||||||
| 4.50%, 03/15/49 (Call 09/15/48) |
2,589 | 2,251,271 | ||||||
| 4.95%, 06/01/33 (Call 03/01/33) |
1,980 | 1,946,814 | ||||||
| 5.90%, 12/01/52 (Call 06/01/52) |
1,735 | 1,839,074 | ||||||
| American Electric Power Co. Inc. |
||||||||
| 2.30%, 03/01/30 (Call 12/01/29) |
1,431 | 1,209,768 | ||||||
| 3.20%, 11/13/27 (Call 08/13/27) |
2,408 | 2,252,992 | ||||||
| 3.25%, 03/01/50 (Call 09/01/49) |
1,097 | 747,973 | ||||||
| 3.88%, 02/15/62 (Call 11/15/26), |
||||||||
| (5-year CMT + 2.675%)(a) |
2,985 | 2,660,346 | ||||||
| 5.20%, 01/15/29 (Call 12/15/28) |
4,490 | 4,484,765 | ||||||
| 5.63%, 03/01/33 (Call 12/01/32)(b) |
2,091 | 2,105,973 | ||||||
| 5.70%, 08/15/25 |
915 | 916,652 | ||||||
| 5.75%, 11/01/27 (Call 10/01/27)(b) |
2,725 | 2,779,121 | ||||||
| 5.95%, 11/01/32 (Call 08/01/32)(b) |
1,534 | 1,586,698 | ||||||
| Series J, 4.30%, 12/01/28 (Call 09/01/28) |
2,795 | 2,690,182 | ||||||
| Series N, 1.00%, 11/01/25 (Call 10/01/25) |
957 | 888,807 | ||||||
| Appalachian Power Co. |
||||||||
| 3.40%, 06/01/25 (Call 03/01/25) |
1,311 | 1,279,226 | ||||||
| 4.40%, 05/15/44 (Call 11/15/43) |
1,244 | 1,019,464 | ||||||
| 4.45%, 06/01/45 (Call 12/01/44) |
1,778 | 1,465,068 | ||||||
| 4.50%, 08/01/32 (Call 05/01/32) |
2,630 | 2,458,928 | ||||||
| 7.00%, 04/01/38 |
2,010 | 2,245,493 | ||||||
| Series AA, 2.70%, 04/01/31 (Call 01/01/31) |
662 | 559,186 | ||||||
| Series X, 3.30%, 06/01/27 (Call 03/01/27) |
2,064 | 1,939,998 | ||||||
| Series Y, 4.50%, 03/01/49 (Call 09/01/48) |
2,085 | 1,685,249 | ||||||
| Security | Par (000) |
Value | ||||||
| Electric (continued) |
||||||||
| Series Z, 3.70%, 05/01/50 (Call 11/01/49) |
$ | 1,800 | $ | 1,287,065 | ||||
| Arizona Public Service Co. |
||||||||
| 2.20%, 12/15/31 (Call 09/15/31) |
1,930 | 1,551,131 | ||||||
| 2.60%, 08/15/29 (Call 05/15/29) |
2,235 | 1,968,267 | ||||||
| 2.65%, 09/15/50 (Call 03/15/50) |
1,291 | 765,254 | ||||||
| 2.95%, 09/15/27 (Call 06/15/27) |
1,044 | 978,094 | ||||||
| 3.15%, 05/15/25 (Call 02/15/25) |
2,091 | 2,031,202 | ||||||
| 3.35%, 05/15/50 (Call 11/15/49) |
2,262 | 1,544,936 | ||||||
| 3.50%, 12/01/49 (Call 06/01/49) |
1,558 | 1,074,308 | ||||||
| 3.75%, 05/15/46 (Call 11/15/45) |
1,526 | 1,130,708 | ||||||
| 4.20%, 08/15/48 (Call 02/15/48) |
1,453 | 1,147,502 | ||||||
| 4.25%, 03/01/49 (Call 09/01/48) |
1,685 | 1,342,094 | ||||||
| 4.35%, 11/15/45 (Call 05/15/45) |
1,582 | 1,299,688 | ||||||
| 4.50%, 04/01/42 (Call 10/01/41) |
1,985 | 1,686,067 | ||||||
| 5.05%, 09/01/41 (Call 03/01/41) |
1,355 | 1,238,665 | ||||||
| 5.55%, 08/01/33 (Call 05/01/33) |
1,915 | 1,923,369 | ||||||
| 6.35%, 12/15/32 (Call 09/15/32) |
1,585 | 1,678,430 | ||||||
| Atlantic City Electric Co. |
||||||||
| 2.30%, 03/15/31 (Call 12/15/30) |
1,589 | 1,311,024 | ||||||
| 4.00%, 10/15/28 (Call 07/15/28) |
1,457 | 1,402,098 | ||||||
| Avangrid Inc. |
||||||||
| 3.20%, 04/15/25 (Call 03/15/25) |
3,705 | 3,603,999 | ||||||
| 3.80%, 06/01/29 (Call 03/01/29)(b) |
4,068 | 3,790,169 | ||||||
| Avista Corp. |
||||||||
| 4.00%, 04/01/52 (Call 10/01/51)(b) |
1,855 | 1,416,106 | ||||||
| 4.35%, 06/01/48 (Call 12/01/47) |
1,920 | 1,581,421 | ||||||
| Baltimore Gas & Electric Co. |
||||||||
| 2.25%, 06/15/31 (Call 03/15/31) |
2,815 | 2,341,919 | ||||||
| 2.40%, 08/15/26 (Call 05/15/26) |
1,313 | 1,237,337 | ||||||
| 2.90%, 06/15/50 (Call 12/15/49) |
1,705 | 1,100,249 | ||||||
| 3.20%, 09/15/49 (Call 03/15/49) |
1,900 | 1,302,247 | ||||||
| 3.50%, 08/15/46 (Call 02/15/46) |
2,480 | 1,826,933 | ||||||
| 3.75%, 08/15/47 (Call 02/15/47) |
1,649 | 1,254,599 | ||||||
| 4.25%, 09/15/48 (Call 03/15/48) |
984 | 820,725 | ||||||
| 4.55%, 06/01/52 (Call 12/01/51) |
2,032 | 1,757,518 | ||||||
| 5.40%, 06/01/53 (Call 12/01/52) |
1,620 | 1,586,612 | ||||||
| 6.35%, 10/01/36 |
1,070 | 1,142,952 | ||||||
| Berkshire Hathaway Energy Co. |
||||||||
| 1.65%, 05/15/31 (Call 02/15/31) |
3,336 | 2,637,517 | ||||||
| 2.85%, 05/15/51 (Call 11/15/50) |
6,165 | 3,925,087 | ||||||
| 3.25%, 04/15/28 (Call 01/15/28) |
3,817 | 3,576,152 | ||||||
| 3.70%, 07/15/30 (Call 04/15/30) |
4,725 | 4,370,586 | ||||||
| 3.80%, 07/15/48 (Call 01/15/48) |
2,946 | 2,231,068 | ||||||
| 4.05%, 04/15/25 (Call 03/15/25) |
3,439 | 3,390,807 | ||||||
| 4.25%, 10/15/50 (Call 04/15/50) |
3,327 | 2,681,800 | ||||||
| 4.45%, 01/15/49 (Call 07/15/48) |
4,091 | 3,434,062 | ||||||
| 4.50%, 02/01/45 (Call 08/01/44) |
2,684 | 2,363,423 | ||||||
| 4.60%, 05/01/53 (Call 11/01/52) |
4,245 | 3,635,543 | ||||||
| 5.15%, 11/15/43 (Call 05/15/43) |
2,938 | 2,818,753 | ||||||
| 5.95%, 05/15/37 |
2,448 | 2,534,546 | ||||||
| 6.13%, 04/01/36 |
4,968 | 5,238,676 | ||||||
| Black Hills Corp. |
||||||||
| 2.50%, 06/15/30 (Call 03/15/30) |
1,457 | 1,209,992 | ||||||
| 3.05%, 10/15/29 (Call 07/15/29) |
2,692 | 2,387,076 | ||||||
| 3.15%, 01/15/27 (Call 07/15/26) |
2,794 | 2,635,058 | ||||||
| 3.88%, 10/15/49 (Call 04/15/49) |
1,874 | 1,352,285 | ||||||
| 3.95%, 01/15/26 (Call 07/15/25) |
2,184 | 2,121,891 | ||||||
| 4.20%, 09/15/46 (Call 03/15/46)(b) |
950 | 738,883 | ||||||
| 4.35%, 05/01/33 (Call 02/01/33) |
855 | 778,564 | ||||||
| 5.95%, 03/15/28 (Call 02/15/28)(b) |
2,710 | 2,785,812 | ||||||
| 6.15%, 05/15/34 (Call 02/15/34)(b) |
415 | 426,259 | ||||||
| S C H E D U L E O F I N V E S T M E N T S |
39 |
| Schedule of Investments (continued) February 29, 2024 |
iShares® Core U.S. Aggregate Bond ETF (Percentages shown are based on Net Assets) |
| Security | Par (000) |
Value | ||||||
| Electric (continued) |
||||||||
| CenterPoint Energy Houston Electric LLC |
||||||||
| 3.55%, 08/01/42 (Call 02/01/42) |
$ | 1,755 | $ | 1,367,133 | ||||
| 3.60%, 03/01/52 (Call 09/01/51) |
710 | 533,363 | ||||||
| 3.95%, 03/01/48 (Call 09/01/47) |
2,638 | 2,129,799 | ||||||
| 4.50%, 04/01/44 (Call 10/01/43) |
2,703 | 2,386,611 | ||||||
| 4.95%, 04/01/33 (Call 01/01/33) |
985 | 970,057 | ||||||
| 5.15%, 03/01/34 (Call 12/01/33) |
1,070 | 1,068,849 | ||||||
| 5.20%, 10/01/28 (Call 09/01/28) |
1,805 | 1,820,716 | ||||||
| 5.30%, 04/01/53 (Call 10/01/52) |
270 | 268,339 | ||||||
| Series AA, 3.00%, 02/01/27 (Call 11/01/26) |
1,240 | 1,176,216 | ||||||
| Series AC, 4.25%, 02/01/49 (Call 08/01/48) |
2,247 | 1,894,441 | ||||||
| Series AD, 2.90%, 07/01/50 (Call 01/01/50) |
2,350 | 1,544,701 | ||||||
| Series AE, 2.35%, 04/01/31 (Call 01/01/31) |
1,675 | 1,407,186 | ||||||
| Series AF, 3.35%, 04/01/51 (Call 10/01/50) |
810 | 582,207 | ||||||
| Series AG, 3.00%, 03/01/32 (Call 12/01/31) |
1,035 | 894,956 | ||||||
| Series ai., 4.45%, 10/01/32 (Call 07/01/32) |
2,435 | 2,318,338 | ||||||
| Series AJ, 4.85%, 10/01/52 (Call 04/01/52) |
1,010 | 931,346 | ||||||
| Series K2, 6.95%, 03/15/33(b) |
275 | 310,192 | ||||||
| Series Z, 2.40%, 09/01/26 (Call 06/01/26) |
1,968 | 1,854,556 | ||||||
| CenterPoint Energy Inc. |
||||||||
| 1.45%, 06/01/26 (Call 05/01/26) |
2,390 | 2,198,084 | ||||||
| 2.65%, 06/01/31 (Call 03/01/31) |
1,500 | 1,259,215 | ||||||
| 2.95%, 03/01/30 (Call 12/01/29) |
3,118 | 2,753,452 | ||||||
| 3.70%, 09/01/49 (Call 03/01/49) |
2,540 | 1,850,063 | ||||||
| 5.25%, 08/10/26 |
1,410 | 1,411,235 | ||||||
| Cleco Corporate Holdings LLC |
||||||||
| 3.74%, 05/01/26 (Call 02/01/26) |
3,289 | 3,162,452 | ||||||
| 4.97%, 05/01/46 (Call 11/01/45) |
1,609 | 1,328,309 | ||||||
| Cleveland Electric Illuminating Co. (The), |
||||||||
| 5.95%, 12/15/36 |
1,239 | 1,235,942 | ||||||
| CMS Energy Corp. |
||||||||
| 3.00%, 05/15/26 (Call 02/15/26) |
709 | 674,619 | ||||||
| 3.45%, 08/15/27 (Call 05/15/27) |
2,688 | 2,545,140 | ||||||
| 3.75%, 12/01/50 (Call 09/01/30), |
||||||||
| (5-year CMT + 2.900%)(a) |
1,160 | 929,642 | ||||||
| 4.75%, 06/01/50 (Call 03/01/30), |
||||||||
| (5-year CMT + 4.116%)(a) |
2,735 | 2,495,540 | ||||||
| 4.88%, 03/01/44 (Call 09/01/43) |
1,475 | 1,353,106 | ||||||
| Commonwealth Edison Co. |
||||||||
| 2.20%, 03/01/30 (Call 12/01/29) |
2,405 | 2,045,103 | ||||||
| 2.55%, 06/15/26 (Call 03/15/26) |
1,890 | 1,788,142 | ||||||
| 3.00%, 03/01/50 (Call 09/01/49) |
1,990 | 1,311,161 | ||||||
| 3.15%, 03/15/32 (Call 12/15/31) |
725 | 632,384 | ||||||
| 3.65%, 06/15/46 (Call 12/15/45) |
3,214 | 2,449,246 | ||||||
| 3.70%, 08/15/28 (Call 05/15/28) |
3,615 | 3,442,782 | ||||||
| 3.70%, 03/01/45 (Call 09/01/44) |
1,770 | 1,378,979 | ||||||
| 3.80%, 10/01/42 (Call 04/01/42) |
1,044 | 836,480 | ||||||
| 4.00%, 03/01/48 (Call 09/01/47) |
3,480 | 2,780,689 | ||||||
| 4.00%, 03/01/49 (Call 09/01/48) |
1,966 | 1,560,009 | ||||||
| 4.35%, 11/15/45 (Call 05/15/45) |
2,211 | 1,880,504 | ||||||
| 4.60%, 08/15/43 (Call 02/15/43) |
1,235 | 1,109,736 | ||||||
| 4.70%, 01/15/44 (Call 07/15/43) |
1,295 | 1,161,780 | ||||||
| 4.90%, 02/01/33 (Call 11/01/32) |
965 | 947,892 | ||||||
| 5.30%, 02/01/53 (Call 08/01/52) |
1,840 | 1,783,668 | ||||||
| 5.90%, 03/15/36 |
1,434 | 1,499,705 | ||||||
| 6.45%, 01/15/38 |
2,092 | 2,270,335 | ||||||
| Series 122, 2.95%, 08/15/27 (Call 05/15/27) |
2,697 | 2,525,876 | ||||||
| Series 123, 3.75%, 08/15/47 (Call 02/15/47) |
3,080 | 2,351,477 | ||||||
| Security | Par (000) |
Value | ||||||
| Electric (continued) |
||||||||
| Series 127, 3.20%, 11/15/49 (Call 05/15/49) |
$ | 1,748 | $ | 1,197,698 | ||||
| Series 130, 3.13%, 03/15/51 (Call 09/15/50) |
3,130 | 2,094,383 | ||||||
| Series 131, 2.75%, 09/01/51 (Call 03/01/51) |
1,070 | 657,250 | ||||||
| Series 133, 3.85%, 03/15/52 (Call 09/15/51) |
1,330 | 1,022,960 | ||||||
| Connecticut Light & Power Co. (The) |
||||||||
| 4.00%, 04/01/48 (Call 10/01/47) |
3,521 | 2,856,304 | ||||||
| 4.30%, 04/15/44 (Call 10/15/43) |
2,330 | 1,984,346 | ||||||
| 4.90%, 07/01/33 (Call 04/01/33) |
1,195 | 1,167,151 | ||||||
| 5.25%, 01/15/53 (Call 07/15/52) |
2,300 | 2,227,769 | ||||||
| Series A, 0.75%, 12/01/25 (Call 11/01/25) |
765 | 709,326 | ||||||
| Series A, 2.05%, 07/01/31 (Call 04/01/31) |
2,475 | 2,011,132 | ||||||
| Series A, 3.20%, 03/15/27 (Call 12/15/26) |
2,678 | 2,544,379 | ||||||
| Series A, 4.15%, 06/01/45 (Call 12/01/44) |
365 | 307,942 | ||||||
| Connecticut Light and Power Co. (The), |
||||||||
| 4.65%, 01/01/29 (Call 12/01/28) |
1,325 | 1,302,631 | ||||||
| Consolidated Edison Co. of New York Inc. |
||||||||
| 2.40%, 06/15/31 (Call 03/15/31) |
3,715 | 3,128,568 | ||||||
| 3.20%, 12/01/51 (Call 06/01/51) |
860 | 582,250 | ||||||
| 3.60%, 06/15/61 (Call 12/15/60) |
3,468 | 2,485,543 | ||||||
| 3.70%, 11/15/59 (Call 05/15/59) |
2,798 | 1,991,515 | ||||||
| 3.80%, 05/15/28 (Call 02/15/28) |
3,396 | 3,243,096 | ||||||
| 3.85%, 06/15/46 (Call 12/15/45) |
2,864 | 2,248,279 | ||||||
| 3.95%, 03/01/43 (Call 09/01/42) |
1,751 | 1,433,488 | ||||||
| 4.45%, 03/15/44 (Call 09/15/43) |
3,378 | 2,926,270 | ||||||
| 4.50%, 12/01/45 (Call 06/01/45) |
2,627 | 2,272,243 | ||||||
| 4.50%, 05/15/58 (Call 11/15/57) |
2,904 | 2,437,406 | ||||||
| 4.63%, 12/01/54 (Call 06/01/54) |
2,377 | 2,041,313 | ||||||
| 5.20%, 03/01/33 (Call 12/01/32)(b) |
2,000 | 2,017,552 | ||||||
| 5.50%, 03/15/34 (Call 12/15/33) |
2,531 | 2,586,557 | ||||||
| 5.70%, 06/15/40 |
1,987 | 1,998,572 | ||||||
| 5.90%, 11/15/53 (Call 05/15/53) |
2,410 | 2,529,089 | ||||||
| 6.15%, 11/15/52 (Call 05/15/52) |
3,100 | 3,359,066 | ||||||
| Series 05-A, 5.30%, 03/01/35 |
1,140 | 1,132,401 | ||||||
| Series 06-A, 5.85%, 03/15/36 |
2,467 | 2,537,004 | ||||||
| Series 06-B, 6.20%, 06/15/36 |
1,012 | 1,074,355 | ||||||
| Series 07-A, 6.30%, 08/15/37 |
893 | 952,490 | ||||||
| Series 08-B, 6.75%, 04/01/38 |
2,033 | 2,265,835 | ||||||
| Series 09-C, 5.50%, 12/01/39 |
2,491 | 2,481,474 | ||||||
| Series 12-A, 4.20%, 03/15/42 |
1,843 | 1,535,826 | ||||||
| Series 2017, 3.88%, 06/15/47 (Call 12/15/46) |
2,332 | 1,805,393 | ||||||
| Series 20A, 3.35%, 04/01/30 (Call 01/01/30) |
2,984 | 2,728,026 | ||||||
| Series 20B, 3.95%, 04/01/50 (Call 10/01/49) |
4,289 | 3,433,919 | ||||||
| Series A, 4.13%, 05/15/49 (Call 11/15/48) |
2,907 | 2,335,816 | ||||||
| Series B, 3.13%, 11/15/27 (Call 08/15/27) |
793 | 744,970 | ||||||
| Series C, 3.00%, 12/01/60 (Call 06/01/60) |
1,948 | 1,181,641 | ||||||
| Series C, 4.00%, 11/15/57 (Call 05/15/57)(b) |
1,395 | 1,079,318 | ||||||
| Series C, 4.30%, 12/01/56 (Call 06/01/56) |
2,169 | 1,772,547 | ||||||
| Series D, 4.00%, 12/01/28 (Call 09/01/28) |
2,077 | 2,003,033 | ||||||
| Series E, 4.65%, 12/01/48 (Call 06/01/48) |
2,874 | 2,507,903 | ||||||
| Constellation Energy Generation LLC |
||||||||
| 3.25%, 06/01/25 (Call 05/01/25) |
4,512 | 4,383,565 | ||||||
| 5.60%, 03/01/28 (Call 02/01/28) |
2,200 | 2,228,567 | ||||||
| 5.60%, 06/15/42 (Call 12/15/41) |
3,213 | 3,131,296 | ||||||
| 40 | 2 0 2 4 I S H A R E S A N N U A L R E P O R T T O S H A R E H O L D E R S |
| Schedule of Investments (continued) February 29, 2024 |
iShares® Core U.S. Aggregate Bond ETF (Percentages shown are based on Net Assets) |
| Security | Par (000) |
Value | ||||||
| Electric (continued) |
||||||||
| 5.75%, 10/01/41 (Call 04/01/41) |
$ | 3,876 | $ | 3,797,940 | ||||
| 5.80%, 03/01/33 (Call 12/01/32) |
2,550 | 2,605,824 | ||||||
| 6.13%, 01/15/34 (Call 10/15/33) |
2,035 | 2,124,870 | ||||||
| 6.25%, 10/01/39 |
1,162 | 1,198,752 | ||||||
| 6.50%, 10/01/53 (Call 04/01/53) |
1,790 | 1,965,840 | ||||||
| Consumers Energy Co. |
||||||||
| 2.50%, 05/01/60 (Call 11/01/59) |
2,405 | 1,334,483 | ||||||
| 2.65%, 08/15/52 (Call 02/15/52)(b) |
287 | 178,052 | ||||||
| 3.10%, 08/15/50 (Call 02/15/50) |
3,270 | 2,250,895 | ||||||
| 3.25%, 08/15/46 (Call 02/15/46) |
1,938 | 1,418,744 | ||||||
| 3.50%, 08/01/51 (Call 02/01/51) |
2,606 | 1,939,345 | ||||||
| 3.60%, 08/15/32 (Call 02/15/32) |
1,140 | 1,028,021 | ||||||
| 3.75%, 02/15/50 (Call 08/15/49) |
1,621 | 1,267,254 | ||||||
| 3.80%, 11/15/28 (Call 08/15/28) |
886 | 847,166 | ||||||
| 3.95%, 05/15/43 (Call 11/15/42) |
1,121 | 935,926 | ||||||
| 3.95%, 07/15/47 (Call 01/15/47) |
1,473 | 1,196,414 | ||||||
| 4.05%, 05/15/48 (Call 11/15/47) |
2,302 | 1,914,359 | ||||||
| 4.20%, 09/01/52 (Call 03/01/52) |
2,070 | 1,717,236 | ||||||
| 4.35%, 04/15/49 (Call 10/15/48) |
2,511 | 2,169,016 | ||||||
| 4.60%, 05/30/29 (Call 03/30/29) |
2,400 | 2,358,828 | ||||||
| 4.63%, 05/15/33 (Call 11/15/32) |
1,900 | 1,836,915 | ||||||
| 4.65%, 03/01/28 (Call 01/01/28) |
2,845 | 2,826,008 | ||||||
| 4.90%, 02/15/29 (Call 12/15/28) |
2,860 | 2,853,847 | ||||||
| Dayton Power & Light Co. (The), 3.95%, 06/15/49 (Call 12/15/48) |
2,390 | 1,762,727 | ||||||
| Delmarva Power & Light Co., 4.15%, 05/15/45 (Call 11/15/44) |
1,759 | 1,410,973 | ||||||
| Dominion Energy Inc. |
||||||||
| 3.90%, 10/01/25 (Call 07/01/25) |
2,163 | 2,112,507 | ||||||
| 4.25%, 06/01/28 (Call 03/01/28) |
2,952 | 2,848,477 | ||||||
| 4.35%, 08/15/32 (Call 05/15/32) |
1,520 | 1,414,910 | ||||||
| 4.70%, 12/01/44 (Call 06/01/44) |
1,840 | 1,582,767 | ||||||
| 4.85%, 08/15/52 (Call 02/15/52) |
2,015 | 1,761,284 | ||||||
| 5.38%, 11/15/32 (Call 08/15/32) |
2,700 | 2,684,577 | ||||||
| 7.00%, 06/15/38 |
915 | 995,754 | ||||||
| Series A, 1.45%, 04/15/26 (Call 03/15/26) |
2,845 | 2,626,388 | ||||||
| Series A, 3.30%, 03/15/25 (Call 02/15/25) |
1,670 | 1,631,999 | ||||||
| Series A, 4.60%, 03/15/49 (Call 09/15/48) |
1,325 | 1,117,000 | ||||||
| Series B, 3.30%, 04/15/41 (Call 10/15/40) |
2,225 | 1,634,095 | ||||||
| Series B, 3.60%, 03/15/27 (Call 01/15/27) |
1,775 | 1,695,337 | ||||||
| Series B, 5.95%, 06/15/35 |
2,167 | 2,205,773 | ||||||
| Series C, 2.25%, 08/15/31 (Call 05/15/31) |
2,433 | 1,967,740 | ||||||
| Series C, 3.38%, 04/01/30 (Call 01/01/30) |
5,839 | 5,257,853 | ||||||
| Series C, 4.05%, 09/15/42 (Call 03/15/42) |
1,675 | 1,325,870 | ||||||
| Series C, 4.90%, 08/01/41 (Call 02/01/41) |
2,320 | 2,077,273 | ||||||
| Series D, 2.85%, 08/15/26 (Call 05/15/26) |
2,038 | 1,921,865 | ||||||
| Series E, 6.30%, 03/15/33 |
1,425 | 1,488,852 | ||||||
| Series F, 5.25%, 08/01/33 |
2,520 | 2,473,624 | ||||||
| Dominion Energy South Carolina Inc. |
||||||||
| 4.60%, 06/15/43 (Call 12/15/42) |
1,655 | 1,461,111 | ||||||
| 5.10%, 06/01/65 (Call 12/01/64) |
1,930 | 1,776,959 | ||||||
| 5.30%, 05/15/33 |
1,670 | 1,678,813 | ||||||
| 5.45%, 02/01/41 (Call 08/01/40) |
965 | 951,622 | ||||||
| 6.05%, 01/15/38 |
1,855 | 1,960,359 | ||||||
| 6.25%, 10/15/53 (Call 04/15/53) |
2,020 | 2,229,567 | ||||||
| 6.63%, 02/01/32 |
375 | 416,769 | ||||||
| Series A, 2.30%, 12/01/31 (Call 09/01/31) |
2,570 | 2,108,222 | ||||||
| DTE Electric Co. |
||||||||
| 2.25%, 03/01/30 (Call 12/01/29) |
2,637 | 2,263,307 | ||||||
| 2.95%, 03/01/50 (Call 09/01/49) |
1,920 | 1,271,087 | ||||||
| 3.38%, 03/01/25 (Call 12/01/24) |
1,232 | 1,208,965 | ||||||
| Security | Par (000) |
Value | ||||||
| Electric (continued) |
||||||||
| 3.70%, 03/15/45 (Call 09/15/44)(b) |
$ | 2,710 | $ | 2,136,817 | ||||
| 3.70%, 06/01/46 (Call 12/01/45) |
1,590 | 1,226,090 | ||||||
| 3.75%, 08/15/47 (Call 02/15/47) |
2,017 | 1,555,851 | ||||||
| 3.95%, 03/01/49 (Call 09/01/48) |
2,484 | 2,001,713 | ||||||
| 4.30%, 07/01/44 (Call 01/01/44) |
1,646 | 1,413,003 | ||||||
| 4.85%, 12/01/26 |
590 | 588,911 | ||||||
| 5.20%, 04/01/33 (Call 01/01/33) |
2,685 | 2,702,104 | ||||||
| 5.20%, 03/01/34 (Call 12/01/33) |
1,935 | 1,927,837 | ||||||
| 5.40%, 04/01/53 (Call 10/01/52) |
2,185 | 2,166,809 | ||||||
| Series A, 1.90%, 04/01/28 (Call 02/01/28) |
2,865 | 2,550,728 | ||||||
| Series A, 3.00%, 03/01/32 (Call 12/01/31) |
2,205 | 1,902,219 | ||||||
| Series A, 4.00%, 04/01/43 (Call 10/01/42) |
937 | 777,859 | ||||||
| Series A, 4.05%, 05/15/48 (Call 11/15/47) |
2,166 | 1,757,628 | ||||||
| Series B, 3.25%, 04/01/51 (Call 10/01/50) |
2,176 | 1,507,364 | ||||||
| Series B, 3.65%, 03/01/52 (Call 09/01/51) |
1,085 | 810,390 | ||||||
| Series C, 2.63%, 03/01/31 (Call 12/01/30) |
2,500 | 2,147,153 | ||||||
| DTE Energy Co. |
||||||||
| 2.85%, 10/01/26 (Call 07/01/26) |
3,870 | 3,646,859 | ||||||
| 2.95%, 03/01/30 (Call 12/01/29) |
1,758 | 1,539,985 | ||||||
| 4.88%, 06/01/28 (Call 05/01/28) |
5,425 | 5,352,983 | ||||||
| 5.10%, 03/01/29 (Call 02/01/29) |
3,050 | 3,026,314 | ||||||
| Series C, 3.40%, 06/15/29 (Call 03/15/29) |
2,445 | 2,237,525 | ||||||
| Series F, 1.05%, 06/01/25 (Call 05/01/25) |
4,540 | 4,300,536 | ||||||
| Duke Energy Carolinas LLC |
||||||||
| 2.45%, 08/15/29 (Call 05/15/29) |
1,994 | 1,758,583 | ||||||
| 2.45%, 02/01/30 (Call 11/01/29) |
2,335 | 2,041,661 | ||||||
| 2.55%, 04/15/31 (Call 01/15/31) |
3,038 | 2,603,258 | ||||||
| 2.85%, 03/15/32 (Call 12/15/31) |
3,040 | 2,579,612 | ||||||
| 2.95%, 12/01/26 (Call 09/01/26) |
2,277 | 2,168,228 | ||||||
| 3.20%, 08/15/49 (Call 02/15/49) |
2,325 | 1,607,612 | ||||||
| 3.45%, 04/15/51 (Call 10/15/50) |
2,265 | 1,609,349 | ||||||
| 3.55%, 03/15/52 (Call 09/15/51) |
1,990 | 1,424,184 | ||||||
| 3.70%, 12/01/47 (Call 06/01/47) |
2,907 | 2,165,796 | ||||||
| 3.75%, 06/01/45 (Call 12/01/44) |
2,384 | 1,838,721 | ||||||
| 3.88%, 03/15/46 (Call 09/15/45) |
2,770 | 2,166,464 | ||||||
| 3.95%, 11/15/28 (Call 08/15/28) |
2,751 | 2,647,284 | ||||||
| 3.95%, 03/15/48 (Call 09/15/47) |
2,575 | 2,028,806 | ||||||
| 4.00%, 09/30/42 (Call 03/30/42) |
1,584 | 1,291,186 | ||||||
| 4.25%, 12/15/41 (Call 06/15/41) |
1,109 | 936,839 | ||||||
| 4.85%, 01/15/34 (Call 10/15/33) |
1,835 | 1,781,977 | ||||||
| 4.95%, 01/15/33 (Call 10/15/32) |
2,360 | 2,322,121 | ||||||
| 5.30%, 02/15/40 |
3,085 | 3,021,913 | ||||||
| 5.35%, 01/15/53 (Call 07/15/52) |
1,645 | 1,602,418 | ||||||
| 5.40%, 01/15/54 (Call 07/15/53) |
4,059 | 3,965,794 | ||||||
| 6.00%, 01/15/38 |
1,062 | 1,114,806 | ||||||
| 6.05%, 04/15/38 |
1,885 | 1,977,161 | ||||||
| 6.10%, 06/01/37 |
1,940 | 2,031,900 | ||||||
| 6.45%, 10/15/32 |
1,520 | 1,647,335 | ||||||
| Series A, 6.00%, 12/01/28 |
1,634 | 1,705,348 | ||||||
| Duke Energy Corp. |
||||||||
| 0.90%, 09/15/25 (Call 08/15/25) |
3,948 | 3,693,662 | ||||||
| 2.45%, 06/01/30 (Call 03/01/30) |
2,640 | 2,258,123 | ||||||
| 2.55%, 06/15/31 (Call 03/15/31) |
1,820 | 1,516,437 | ||||||
| 2.65%, 09/01/26 (Call 06/01/26) |
2,504 | 2,356,670 | ||||||
| 3.15%, 08/15/27 (Call 05/15/27) |
3,863 | 3,617,857 | ||||||
| 3.25%, 01/15/82 (Call 01/15/27), |
||||||||
| (5-year CMT + 2.321%)(a)(b) |
2,037 | 1,726,652 | ||||||
| 3.30%, 06/15/41 (Call 12/15/40) |
3,618 | 2,660,579 | ||||||
| 3.40%, 06/15/29 (Call 03/15/29) |
2,287 | 2,105,814 | ||||||
| 3.50%, 06/15/51 (Call 12/15/50) |
2,235 | 1,541,488 | ||||||
| 3.75%, 09/01/46 (Call 03/01/46) |
4,812 | 3,578,493 | ||||||
| S C H E D U L E O F I N V E S T M E N T S |
41 |
| Schedule of Investments (continued) February 29, 2024 |
iShares® Core U.S. Aggregate Bond ETF (Percentages shown are based on Net Assets) |
| Security | Par (000) |
Value | ||||||
| Electric (continued) |
||||||||
| 3.95%, 08/15/47 (Call 02/15/47) |
$ | 2,560 | $ | 1,943,076 | ||||
| 4.20%, 06/15/49 (Call 12/15/48) |
2,660 | 2,097,108 | ||||||
| 4.30%, 03/15/28 (Call 02/15/28) |
3,920 | 3,806,440 | ||||||
| 4.50%, 08/15/32 (Call 05/15/32) |
5,065 | 4,751,658 | ||||||
| 4.80%, 12/15/45 (Call 06/15/45) |
2,884 | 2,525,597 | ||||||
| 4.85%, 01/05/27 |
1,555 | 1,543,947 | ||||||
| 4.85%, 01/05/29 (Call 12/05/28) |
1,715 | 1,687,238 | ||||||
| 5.00%, 12/08/25 |
1,540 | 1,534,028 | ||||||
| 5.00%, 12/08/27 (Call 11/08/27) |
2,945 | 2,927,738 | ||||||
| 5.00%, 08/15/52 (Call 02/15/52) |
3,985 | 3,553,290 | ||||||
| 5.75%, 09/15/33 (Call 06/15/33) |
2,960 | 3,013,611 | ||||||
| 6.10%, 09/15/53 (Call 03/15/53) |
3,060 | 3,183,437 | ||||||
| Duke Energy Florida LLC |
||||||||
| 1.75%, 06/15/30 (Call 03/15/30) |
2,520 | 2,078,648 | ||||||
| 2.40%, 12/15/31 (Call 09/15/31) |
2,905 | 2,401,833 | ||||||
| 2.50%, 12/01/29 (Call 09/01/29) |
2,833 | 2,489,530 | ||||||
| 3.00%, 12/15/51 (Call 06/15/51) |
2,752 | 1,777,747 | ||||||
| 3.20%, 01/15/27 (Call 10/15/26) |
4,032 | 3,849,283 | ||||||
| 3.40%, 10/01/46 (Call 04/01/46) |
3,093 | 2,224,315 | ||||||
| 3.80%, 07/15/28 (Call 04/15/28) |
2,720 | 2,609,411 | ||||||
| 3.85%, 11/15/42 (Call 05/15/42) |
2,101 | 1,670,288 | ||||||
| 4.20%, 07/15/48 (Call 01/15/48) |
2,115 | 1,735,577 | ||||||
| 5.65%, 04/01/40 |
2,031 | 2,043,954 | ||||||
| 5.88%, 11/15/33 (Call 08/15/33) |
1,915 | 2,004,477 | ||||||
| 5.95%, 11/15/52 (Call 05/15/52) |
1,395 | 1,464,453 | ||||||
| 6.20%, 11/15/53 (Call 05/15/53) |
1,620 | 1,754,597 | ||||||
| 6.35%, 09/15/37 |
1,481 | 1,584,009 | ||||||
| 6.40%, 06/15/38 |
4,305 | 4,639,500 | ||||||
| Duke Energy Florida Project Finance LLC |
||||||||
| Series 2032, 2.86%, 03/01/33(b) |
705 | 606,584 | ||||||
| Series 2035, 3.11%, 09/01/38(b) |
1,015 | 836,106 | ||||||
| Duke Energy Indiana LLC |
||||||||
| 2.75%, 04/01/50 (Call 10/01/49) |
3,020 | 1,874,626 | ||||||
| 3.75%, 05/15/46 (Call 11/15/45) |
1,484 | 1,135,708 | ||||||
| 5.25%, 03/01/34 (Call 12/01/33) |
1,150 | 1,147,215 | ||||||
| 5.40%, 04/01/53 (Call 10/01/52) |
2,200 | 2,118,667 | ||||||
| 6.12%, 10/15/35 |
1,119 | 1,163,072 | ||||||
| 6.35%, 08/15/38 |
1,193 | 1,277,521 | ||||||
| 6.45%, 04/01/39 |
2,073 | 2,254,083 | ||||||
| Series WWW, 4.90%, 07/15/43 |
||||||||
| (Call 01/15/43) |
1,319 | 1,204,792 | ||||||
| Series YYY, 3.25%, 10/01/49 |
||||||||
| (Call 04/01/49) |
2,590 | 1,792,992 | ||||||
| Duke Energy Ohio Inc. |
||||||||
| 2.13%, 06/01/30 (Call 03/01/30)(b) |
1,978 | 1,661,169 | ||||||
| 3.65%, 02/01/29 (Call 11/01/28) |
2,071 | 1,955,801 | ||||||
| 3.70%, 06/15/46 (Call 12/15/45) |
1,767 | 1,328,173 | ||||||
| 4.30%, 02/01/49 (Call 08/01/48) |
1,977 | 1,615,858 | ||||||
| 5.25%, 04/01/33 (Call 01/01/33)(b) |
1,970 | 1,970,754 | ||||||
| 5.65%, 04/01/53 (Call 10/01/52) |
755 | 762,264 | ||||||
| Duke Energy Progress LLC |
||||||||
| 2.00%, 08/15/31 (Call 05/15/31) |
2,825 | 2,282,180 | ||||||
| 2.50%, 08/15/50 (Call 02/15/50) |
2,795 | 1,653,960 | ||||||
| 2.90%, 08/15/51 (Call 02/15/51) |
1,849 | 1,187,936 | ||||||
| 3.25%, 08/15/25 (Call 05/15/25) |
2,182 | 2,127,459 | ||||||
| 3.40%, 04/01/32 (Call 01/01/32) |
2,380 | 2,103,694 | ||||||
| 3.45%, 03/15/29 (Call 12/15/28) |
2,762 | 2,584,306 | ||||||
| 3.60%, 09/15/47 (Call 03/15/47) |
2,736 | 2,026,780 | ||||||
| 3.70%, 09/01/28 (Call 06/01/28) |
2,311 | 2,202,174 | ||||||
| 3.70%, 10/15/46 (Call 04/15/46) |
2,504 | 1,892,466 | ||||||
| 4.00%, 04/01/52 (Call 10/01/51) |
1,170 | 922,124 | ||||||
| Security | Par (000) |
Value | ||||||
| Electric (continued) |
||||||||
| 4.10%, 05/15/42 (Call 11/15/41) |
$ | 970 | $ | 804,059 | ||||
| 4.10%, 03/15/43 (Call 09/15/42) |
1,619 | 1,328,058 | ||||||
| 4.15%, 12/01/44 (Call 06/01/44) |
2,689 | 2,204,083 | ||||||
| 4.20%, 08/15/45 (Call 02/15/45) |
1,504 | 1,236,427 | ||||||
| 4.38%, 03/30/44 (Call 09/30/43) |
1,767 | 1,509,145 | ||||||
| 5.25%, 03/15/33 (Call 12/15/32) |
1,915 | 1,911,834 | ||||||
| 5.35%, 03/15/53 (Call 09/15/52) |
1,880 | 1,814,667 | ||||||
| 6.30%, 04/01/38 |
2,005 | 2,153,215 | ||||||
| Edison International |
||||||||
| 4.13%, 03/15/28 (Call 12/15/27) |
2,685 | 2,561,547 | ||||||
| 4.70%, 08/15/25 |
1,665 | 1,642,162 | ||||||
| 4.95%, 04/15/25 (Call 03/15/25) |
1,823 | 1,807,121 | ||||||
| 5.25%, 11/15/28 (Call 10/15/28) |
1,685 | 1,676,140 | ||||||
| 5.75%, 06/15/27 (Call 04/15/27) |
3,418 | 3,450,354 | ||||||
| 6.95%, 11/15/29 (Call 09/15/29) |
2,555 | 2,723,170 | ||||||
| El Paso Electric Co. |
||||||||
| 5.00%, 12/01/44 (Call 06/01/44)(b) |
1,291 | 1,095,914 | ||||||
| 6.00%, 05/15/35 |
619 | 620,754 | ||||||
| Emera U.S. Finance LP |
||||||||
| 2.64%, 06/15/31 (Call 03/15/31) |
2,010 | 1,618,015 | ||||||
| 3.55%, 06/15/26 (Call 03/15/26) |
3,995 | 3,828,329 | ||||||
| 4.75%, 06/15/46 (Call 12/15/45) |
4,801 | 3,904,219 | ||||||
| Enel Americas SA, 4.00%, 10/25/26 |
||||||||
| (Call 07/25/26) |
3,418 | 3,283,401 | ||||||
| Enel Chile SA, 4.88%, 06/12/28 |
||||||||
| (Call 03/12/28) |
3,842 | 3,737,447 | ||||||
| Entergy Arkansas LLC |
||||||||
| 2.65%, 06/15/51 (Call 12/15/50) |
1,953 | 1,170,581 | ||||||
| 3.35%, 06/15/52 (Call 12/15/51) |
1,740 | 1,194,773 | ||||||
| 3.50%, 04/01/26 (Call 01/01/26) |
3,263 | 3,164,403 | ||||||
| 4.00%, 06/01/28 (Call 03/01/28) |
1,310 | 1,258,544 | ||||||
| 4.20%, 04/01/49 (Call 10/01/48) |
2,694 | 2,198,000 | ||||||
| 5.15%, 01/15/33 (Call 10/15/32) |
1,865 | 1,862,238 | ||||||
| 5.30%, 09/15/33 (Call 06/15/33)(b) |
1,445 | 1,448,196 | ||||||
| Entergy Corp. |
||||||||
| 0.90%, 09/15/25 (Call 08/15/25) |
2,478 | 2,317,269 | ||||||
| 1.90%, 06/15/28 (Call 04/15/28) |
2,420 | 2,126,364 | ||||||
| 2.40%, 06/15/31 (Call 03/05/31) |
2,910 | 2,395,568 | ||||||
| 2.80%, 06/15/30 (Call 03/15/30) |
2,842 | 2,457,462 | ||||||
| 2.95%, 09/01/26 (Call 06/01/26) |
3,552 | 3,369,511 | ||||||
| 3.75%, 06/15/50 (Call 12/15/49) |
2,764 | 1,993,215 | ||||||
| Entergy Louisiana LLC |
||||||||
| 1.60%, 12/15/30 (Call 09/15/30) |
1,653 | 1,310,103 | ||||||
| 2.35%, 06/15/32 (Call 03/15/32) |
1,540 | 1,245,324 | ||||||
| 2.40%, 10/01/26 (Call 07/01/26) |
2,166 | 2,022,508 | ||||||
| 2.90%, 03/15/51 (Call 09/15/50) |
3,235 | 2,029,533 | ||||||
| 3.05%, 06/01/31 (Call 03/01/31) |
1,525 | 1,330,012 | ||||||
| 3.10%, 06/15/41 (Call 12/15/40) |
276 | 202,849 | ||||||
| 3.12%, 09/01/27 (Call 06/01/27) |
2,285 | 2,149,835 | ||||||
| 3.25%, 04/01/28 (Call 01/01/28) |
3,489 | 3,270,054 | ||||||
| 4.00%, 03/15/33 (Call 12/15/32) |
2,742 | 2,491,292 | ||||||
| 4.20%, 09/01/48 (Call 03/01/48) |
3,946 | 3,201,134 | ||||||
| 4.20%, 04/01/50 (Call 10/01/49) |
2,551 | 2,068,987 | ||||||
| 4.75%, 09/15/52 (Call 03/15/52) |
2,180 | 1,910,889 | ||||||
| 4.95%, 01/15/45 (Call 01/15/25) |
2,865 | 2,616,626 | ||||||
| Entergy Mississippi LLC |
||||||||
| 2.85%, 06/01/28 (Call 03/01/28) |
2,833 | 2,589,851 | ||||||
| 3.50%, 06/01/51 (Call 03/01/51) |
995 | 704,018 | ||||||
| 3.85%, 06/01/49 (Call 12/01/48) |
629 | 479,730 | ||||||
| 5.00%, 09/01/33 (Call 06/01/33) |
910 | 890,547 | ||||||
| 42 | 2 0 2 4 I S H A R E S A N N U A L R E P O R T T O S H A R E H O L D E R S |
| Schedule of Investments (continued) February 29, 2024 |
iShares® Core U.S. Aggregate Bond ETF (Percentages shown are based on Net Assets) |
| Security | Par (000) |
Value | ||||||
| Electric (continued) |
||||||||
| Entergy Texas Inc. |
||||||||
| 1.75%, 03/15/31 (Call 12/15/30) |
$ | 2,285 | $ | 1,829,005 | ||||
| 3.55%, 09/30/49 (Call 03/30/49) |
2,465 | 1,777,266 | ||||||
| 4.00%, 03/30/29 (Call 12/30/28) |
772 | 736,786 | ||||||
| 4.50%, 03/30/39 (Call 09/30/38) |
175 | 155,275 | ||||||
| 5.00%, 09/15/52 (Call 03/15/52)(b) |
1,710 | 1,557,217 | ||||||
| 5.80%, 09/01/53 (Call 03/01/53)(b) |
1,300 | 1,337,519 | ||||||
| Evergy Inc., 2.90%, 09/15/29 (Call 06/15/29) |
4,025 | 3,567,129 | ||||||
| Evergy Kansas Central Inc. |
||||||||
| 2.55%, 07/01/26 (Call 04/01/26) |
1,960 | 1,848,708 | ||||||
| 3.10%, 04/01/27 (Call 01/01/27) |
2,295 | 2,167,662 | ||||||
| 3.25%, 09/01/49 (Call 03/01/49) |
1,573 | 1,076,256 | ||||||
| 3.45%, 04/15/50 (Call 10/15/49) |
1,435 | 1,008,869 | ||||||
| 4.10%, 04/01/43 (Call 10/01/42) |
1,920 | 1,565,473 | ||||||
| 4.13%, 03/01/42 (Call 09/01/41) |
2,072 | 1,720,225 | ||||||
| 4.25%, 12/01/45 (Call 06/01/45) |
1,039 | 850,945 | ||||||
| 5.70%, 03/15/53 (Call 09/15/52) |
1,215 | 1,212,539 | ||||||
| 5.90%, 11/15/33 (Call 08/15/33) |
1,425 | 1,480,690 | ||||||
| Evergy Metro Inc. |
||||||||
| 3.65%, 08/15/25 (Call 05/15/25)(b) |
1,625 | 1,585,351 | ||||||
| 4.20%, 06/15/47 (Call 12/15/46) |
1,835 | 1,473,311 | ||||||
| 4.20%, 03/15/48 (Call 09/15/47) |
1,144 | 930,721 | ||||||
| 4.95%, 04/15/33 (Call 01/15/33) |
1,525 | 1,490,991 | ||||||
| 5.30%, 10/01/41 (Call 04/01/41) |
1,831 | 1,750,859 | ||||||
| Series 2019, 4.13%, 04/01/49 (Call 10/01/48) |
1,733 | 1,370,910 | ||||||
| Series 2020, 2.25%, 06/01/30 (Call 03/01/30) |
2,183 | 1,844,670 | ||||||
| Eversource Energy |
||||||||
| 2.55%, 03/15/31 (Call 12/15/30) |
1,870 | 1,543,507 | ||||||
| 2.90%, 03/01/27 (Call 02/01/27) |
2,990 | 2,797,618 | ||||||
| 3.38%, 03/01/32 (Call 12/01/31) |
2,306 | 1,979,491 | ||||||
| 3.45%, 01/15/50 (Call 07/15/49) |
3,045 | 2,073,621 | ||||||
| 4.60%, 07/01/27 (Call 06/01/27) |
3,598 | 3,518,416 | ||||||
| 4.75%, 05/15/26 |
1,575 | 1,554,992 | ||||||
| 5.00%, 01/01/27 |
2,130 | 2,115,419 | ||||||
| 5.13%, 05/15/33 (Call 02/15/33) |
2,460 | 2,376,444 | ||||||
| 5.45%, 03/01/28 (Call 02/01/28) |
4,950 | 4,977,081 | ||||||
| 5.50%, 01/01/34 (Call 10/01/33) |
3,925 | 3,884,439 | ||||||
| 5.95%, 02/01/29 (Call 01/01/29) |
4,040 | 4,137,631 | ||||||
| Series M, 3.30%, 01/15/28 (Call 10/15/27) |
1,146 | 1,067,339 | ||||||
| Series O, 4.25%, 04/01/29 (Call 01/01/29) |
2,741 | 2,611,166 | ||||||
| Series Q, 0.80%, 08/15/25 (Call 07/15/25) |
2,412 | 2,251,407 | ||||||
| Series R, 1.65%, 08/15/30 (Call 05/15/30) |
2,721 | 2,165,108 | ||||||
| Series U, 1.40%, 08/15/26 (Call 07/15/26)(b) |
1,795 | 1,629,948 | ||||||
| Exelon Corp. |
||||||||
| 2.75%, 03/15/27 (Call 02/15/27) |
2,405 | 2,237,912 | ||||||
| 3.35%, 03/15/32 (Call 12/15/31) |
785 | 684,455 | ||||||
| 3.40%, 04/15/26 (Call 01/15/26) |
4,607 | 4,435,737 | ||||||
| 3.95%, 06/15/25 (Call 03/15/25) |
3,998 | 3,924,204 | ||||||
| 4.05%, 04/15/30 (Call 01/15/30) |
5,715 | 5,360,300 | ||||||
| 4.10%, 03/15/52 (Call 09/15/51) |
2,445 | 1,896,461 | ||||||
| 4.45%, 04/15/46 (Call 10/15/45) |
2,803 | 2,346,198 | ||||||
| 4.70%, 04/15/50 (Call 10/15/49) |
3,422 | 2,955,276 | ||||||
| 4.95%, 06/15/35 (Call 12/15/34) |
944 | 881,941 | ||||||
| 5.10%, 06/15/45 (Call 12/15/44) |
2,505 | 2,279,152 | ||||||
| 5.15%, 03/15/28 (Call 02/15/28) |
1,780 | 1,776,184 | ||||||
| 5.15%, 03/15/29 (Call 02/15/29) |
785 | 781,249 | ||||||
| 5.30%, 03/15/33 (Call 12/15/32) |
3,045 | 3,015,604 | ||||||
| 5.45%, 03/15/34 (Call 12/15/33) |
1,610 | 1,602,953 | ||||||
| Security | Par (000) |
Value | ||||||
| Electric (continued) |
||||||||
| 5.60%, 03/15/53 (Call 09/15/52) |
$ | 3,835 | $ | 3,739,466 | ||||
| 5.63%, 06/15/35 |
3,019 | 2,997,598 | ||||||
| Florida Power & Light Co. |
||||||||
| 2.45%, 02/03/32 (Call 11/03/31) |
3,843 | 3,213,682 | ||||||
| 2.85%, 04/01/25 (Call 03/01/25) |
7,829 | 7,632,804 | ||||||
| 2.88%, 12/04/51 (Call 06/04/51) |
5,262 | 3,417,092 | ||||||
| 3.13%, 12/01/25 (Call 06/01/25) |
4,045 | 3,920,648 | ||||||
| 3.15%, 10/01/49 (Call 04/01/49) |
1,409 | 971,487 | ||||||
| 3.70%, 12/01/47 (Call 06/01/47) |
2,287 | 1,777,745 | ||||||
| 3.80%, 12/15/42 (Call 06/15/42) |
2,106 | 1,713,977 | ||||||
| 3.95%, 03/01/48 (Call 09/01/47) |
4,212 | 3,409,119 | ||||||
| 3.99%, 03/01/49 (Call 09/01/48) |
2,755 | 2,228,912 | ||||||
| 4.05%, 06/01/42 (Call 12/01/41) |
2,640 | 2,236,857 | ||||||
| 4.05%, 10/01/44 (Call 04/01/44) |
2,418 | 2,035,552 | ||||||
| 4.13%, 02/01/42 (Call 08/01/41) |
2,503 | 2,145,974 | ||||||
| 4.13%, 06/01/48 (Call 12/01/47) |
2,361 | 1,960,857 | ||||||
| 4.40%, 05/15/28 (Call 03/15/28) |
1,845 | 1,812,680 | ||||||
| 4.45%, 05/15/26 (Call 04/15/26) |
1,145 | 1,133,239 | ||||||
| 4.63%, 05/15/30 (Call 03/15/30) |
2,590 | 2,548,861 | ||||||
| 4.80%, 05/15/33 (Call 02/15/33) |
1,745 | 1,706,474 | ||||||
| 4.95%, 06/01/35 |
774 | 761,430 | ||||||
| 5.05%, 04/01/28 (Call 03/01/28) |
2,340 | 2,356,981 | ||||||
| 5.10%, 04/01/33 (Call 01/01/33) |
2,980 | 2,968,987 | ||||||
| 5.25%, 02/01/41 (Call 08/01/40) |
2,089 | 2,060,692 | ||||||
| 5.30%, 04/01/53 (Call 10/01/52) |
2,545 | 2,512,916 | ||||||
| 5.63%, 04/01/34 |
1,145 | 1,196,887 | ||||||
| 5.65%, 02/01/37 |
1,475 | 1,522,721 | ||||||
| 5.69%, 03/01/40 |
2,458 | 2,518,430 | ||||||
| 5.95%, 02/01/38 |
1,913 | 2,034,333 | ||||||
| 5.96%, 04/01/39 |
765 | 820,284 | ||||||
| Series A, 3.30%, 05/30/27 (Call 02/28/27) |
3,066 | 2,902,982 | ||||||
| Fortis Inc./Canada, 3.06%, 10/04/26 (Call 07/04/26) |
5,715 | 5,395,359 | ||||||
| Georgia Power Co. |
||||||||
| 3.25%, 04/01/26 (Call 01/01/26) |
894 | 858,534 | ||||||
| 3.25%, 03/30/27 (Call 12/30/26) |
2,440 | 2,310,934 | ||||||
| 4.30%, 03/15/42 |
4,953 | 4,227,592 | ||||||
| 4.30%, 03/15/43 |
2,087 | 1,752,748 | ||||||
| 4.65%, 05/16/28 (Call 03/16/28) |
4,480 | 4,413,102 | ||||||
| 4.70%, 05/15/32 (Call 02/15/32) |
1,520 | 1,469,179 | ||||||
| 4.95%, 05/17/33 (Call 11/17/32) |
4,620 | 4,513,867 | ||||||
| 5.00%, 02/23/27 (Call 01/23/27) |
735 | 733,541 | ||||||
| 5.13%, 05/15/52 (Call 11/15/51) |
3,320 | 3,151,090 | ||||||
| 5.25%, 03/15/34 (Call 09/15/33) |
1,925 | 1,918,697 | ||||||
| Series 10-C, 4.75%, 09/01/40 |
2,324 | 2,109,808 | ||||||
| Series A, 3.25%, 03/15/51 (Call 09/15/50) |
1,845 | 1,264,652 | ||||||
| Series B, 2.65%, 09/15/29 (Call 06/15/29) |
3,552 | 3,142,302 | ||||||
| Series B, 3.70%, 01/30/50 (Call 07/30/49) |
2,823 | 2,137,378 | ||||||
| Iberdrola International BV |
||||||||
| 5.81%, 03/15/25 |
3,705 | 3,705,079 | ||||||
| 6.75%, 07/15/36 |
1,502 | 1,681,776 | ||||||
| Idaho Power Co. |
||||||||
| 5.50%, 03/15/53 (Call 09/15/52) |
1,070 | 1,052,269 | ||||||
| 5.80%, 04/01/54 (Call 10/01/53)(b) |
740 | 753,407 | ||||||
| Series K, 4.20%, 03/01/48 (Call 09/01/47) |
1,281 | 1,031,539 | ||||||
| Indiana Michigan Power Co. |
||||||||
| 3.25%, 05/01/51 (Call 11/01/50) |
2,290 | 1,551,481 | ||||||
| 3.85%, 05/15/28 (Call 02/15/28) |
1,984 | 1,893,600 | ||||||
| 4.25%, 08/15/48 (Call 02/15/48) |
1,815 | 1,469,108 | ||||||
| 5.63%, 04/01/53 (Call 10/01/52) |
1,410 | 1,411,349 | ||||||
| 6.05%, 03/15/37 |
425 | 440,852 | ||||||
| S C H E D U L E O F I N V E S T M E N T S |
43 |
| Schedule of Investments (continued) February 29, 2024 |
iShares® Core U.S. Aggregate Bond ETF (Percentages shown are based on Net Assets) |
| Security | Par (000) |
Value | ||||||
| Electric (continued) |
||||||||
| Series K, 4.55%, 03/15/46 (Call 09/15/45) |
$ | 2,158 | $ | 1,840,536 | ||||
| Series L, 3.75%, 07/01/47 (Call 01/01/47) |
1,088 | 808,160 | ||||||
| Interstate Power & Light Co. |
||||||||
| 2.30%, 06/01/30 (Call 03/01/30) |
1,102 | 928,566 | ||||||
| 3.10%, 11/30/51 (Call 05/30/51) |
1,455 | 932,721 | ||||||
| 3.50%, 09/30/49 (Call 03/30/49) |
1,539 | 1,090,837 | ||||||
| 3.60%, 04/01/29 (Call 01/01/29) |
1,117 | 1,038,904 | ||||||
| 3.70%, 09/15/46 (Call 03/15/46) |
1,223 | 909,256 | ||||||
| 4.10%, 09/26/28 (Call 06/26/28) |
3,356 | 3,215,269 | ||||||
| 5.70%, 10/15/33 (Call 07/15/33) |
1,690 | 1,720,626 | ||||||
| 6.25%, 07/15/39 |
1,010 | 1,053,346 | ||||||
| IPALCO Enterprises Inc., 4.25%, 05/01/30 |
||||||||
| (Call 02/01/30) |
3,055 | 2,812,238 | ||||||
| ITC Holdings Corp. |
||||||||
| 3.25%, 06/30/26 (Call 03/30/26) |
2,410 | 2,301,738 | ||||||
| 3.35%, 11/15/27 (Call 08/15/27) |
1,635 | 1,533,624 | ||||||
| 5.30%, 07/01/43 (Call 01/01/43) |
1,636 | 1,531,255 | ||||||
| John Sevier Combined Cycle Generation LLC, |
||||||||
| 4.63%, 01/15/42 |
356 | 332,152 | ||||||
| Kentucky Utilities Co. |
||||||||
| 3.30%, 06/01/50 (Call 12/01/49) |
2,740 | 1,893,891 | ||||||
| 4.38%, 10/01/45 (Call 04/01/45) |
2,236 | 1,876,932 | ||||||
| 5.13%, 11/01/40 (Call 05/01/40) |
3,414 | 3,241,055 | ||||||
| 5.45%, 04/15/33 (Call 01/15/33) |
1,220 | 1,230,819 | ||||||
| Louisville Gas & Electric Co. |
||||||||
| 4.25%, 04/01/49 (Call 10/01/48) |
925 | 753,889 | ||||||
| 5.45%, 04/15/33 (Call 01/15/33) |
1,400 | 1,412,984 | ||||||
| Series 25, 3.30%, 10/01/25 (Call 07/01/25) |
1,257 | 1,220,877 | ||||||
| MidAmerican Energy Co. |
||||||||
| 2.70%, 08/01/52 (Call 02/01/52) |
3,020 | 1,849,833 | ||||||
| 3.10%, 05/01/27 (Call 02/01/27) |
3,480 | 3,292,264 | ||||||
| 3.15%, 04/15/50 (Call 10/15/49)(b) |
3,072 | 2,099,760 | ||||||
| 3.65%, 04/15/29 (Call 01/15/29) |
5,010 | 4,726,379 | ||||||
| 3.65%, 08/01/48 (Call 02/01/48) |
3,383 | 2,573,304 | ||||||
| 3.95%, 08/01/47 (Call 02/01/47) |
2,578 | 2,062,821 | ||||||
| 4.25%, 05/01/46 (Call 11/01/45) |
1,675 | 1,404,326 | ||||||
| 4.25%, 07/15/49 (Call 01/15/49) |
4,199 | 3,527,808 | ||||||
| 4.40%, 10/15/44 (Call 04/15/44) |
2,282 | 1,953,768 | ||||||
| 4.80%, 09/15/43 (Call 03/15/43) |
1,102 | 1,007,691 | ||||||
| 5.30%, 02/01/55 (Call 08/01/54) |
680 | 662,395 | ||||||
| 5.35%, 01/15/34 (Call 10/15/33) |
1,685 | 1,717,138 | ||||||
| 5.75%, 11/01/35 |
550 | 569,957 | ||||||
| 5.80%, 10/15/36 |
1,894 | 1,957,114 | ||||||
| 5.85%, 09/15/54 (Call 03/15/54) |
715 | 754,378 | ||||||
| 6.75%, 12/30/31 |
1,155 | 1,295,317 | ||||||
| Mississippi Power Co. |
||||||||
| 3.95%, 03/30/28 (Call 12/30/27) |
3,900 | 3,741,056 | ||||||
| Series 12-A, 4.25%, 03/15/42 |
2,356 | 1,963,910 | ||||||
| Series B, 3.10%, 07/30/51 |
||||||||
| (Call 01/30/51)(b) |
1,638 | 1,064,264 | ||||||
| National Grid PLC |
||||||||
| 5.42%, 01/11/34 (Call 10/11/33)(b) |
1,950 | 1,901,527 | ||||||
| 5.60%, 06/12/28 (Call 05/12/28) |
260 | 263,275 | ||||||
| 5.81%, 06/12/33 (Call 03/12/33) |
1,467 | 1,482,437 | ||||||
| National Grid USA, 5.80%, 04/01/35 |
1,672 | 1,648,615 | ||||||
| National Rural Utilities Cooperative Finance Corp. |
||||||||
| 1.00%, 06/15/26 (Call 05/15/26) |
2,632 | 2,402,025 | ||||||
| 1.35%, 03/15/31 (Call 12/15/30) |
2,169 | 1,683,767 | ||||||
| 1.65%, 06/15/31 (Call 03/15/31) |
1,635 | 1,293,239 | ||||||
| 2.40%, 03/15/30 (Call 12/15/29) |
2,705 | 2,328,578 | ||||||
| Security | Par (000) |
Value | ||||||
| Electric (continued) |
||||||||
| 2.75%, 04/15/32 (Call 01/15/32) |
$ | 2,200 | $ | 1,849,784 | ||||
| 3.05%, 04/25/27 (Call 01/25/27) |
2,321 | 2,199,324 | ||||||
| 3.25%, 11/01/25 (Call 08/01/25) |
2,135 | 2,069,200 | ||||||
| 3.40%, 02/07/28 (Call 11/07/27) |
2,800 | 2,644,869 | ||||||
| 3.45%, 06/15/25 |
1,575 | 1,539,014 | ||||||
| 3.70%, 03/15/29 (Call 12/15/28) |
1,630 | 1,530,501 | ||||||
| 3.90%, 11/01/28 (Call 08/01/28) |
1,603 | 1,536,413 | ||||||
| 4.02%, 11/01/32 (Call 05/01/32) |
1,619 | 1,489,457 | ||||||
| 4.15%, 12/15/32 (Call 09/15/32) |
2,050 | 1,887,274 | ||||||
| 4.30%, 03/15/49 (Call 09/15/48) |
1,969 | 1,635,545 | ||||||
| 4.40%, 11/01/48 (Call 05/01/48) |
1,560 | 1,314,736 | ||||||
| 4.45%, 03/13/26 (Call 02/13/26) |
1,665 | 1,644,492 | ||||||
| 4.80%, 02/05/27 (Call 01/05/27)(b) |
1,700 | 1,691,555 | ||||||
| 4.80%, 03/15/28 (Call 02/15/28) |
3,850 | 3,829,219 | ||||||
| 4.85%, 02/07/29 (Call 01/07/29) |
1,830 | 1,814,405 | ||||||
| 5.00%, 02/07/31 (Call 12/07/30) |
1,325 | 1,307,531 | ||||||
| 5.05%, 09/15/28 (Call 08/15/28) |
1,784 | 1,785,927 | ||||||
| 5.25%, 04/20/46 (Call 04/20/26), |
||||||||
| (3-mo. LIBOR US + 3.630%)(a) |
1,920 | 1,862,483 | ||||||
| 5.45%, 10/30/25(b) |
2,710 | 2,716,978 | ||||||
| 5.60%, 11/13/26 (Call 10/13/26) |
1,215 | 1,231,018 | ||||||
| 5.80%, 01/15/33 (Call 07/15/32) |
2,640 | 2,729,989 | ||||||
| 7.13%, 09/15/53 (Call 06/15/28), |
||||||||
| (5-year CMT + 3.533%)(a) |
510 | 527,520 | ||||||
| Series C, 8.00%, 03/01/32 |
1,458 | 1,688,408 | ||||||
| Nevada Power Co. |
||||||||
| 5.90%, 05/01/53 (Call 11/01/52) |
885 | 910,250 | ||||||
| 6.00%, 03/15/54 (Call 09/15/53) |
2,115 | 2,209,406 | ||||||
| Series CC, 3.70%, 05/01/29 (Call 02/01/29) |
2,759 | 2,603,206 | ||||||
| Series DD, 2.40%, 05/01/30 (Call 02/01/30) |
1,070 | 910,016 | ||||||
| Series EE, 3.13%, 08/01/50 (Call 02/01/50) |
1,675 | 1,098,548 | ||||||
| Series N, 6.65%, 04/01/36 |
1,900 | 2,033,280 | ||||||
| Series R, 6.75%, 07/01/37(b) |
1,575 | 1,743,162 | ||||||
| NextEra Energy Capital Holdings Inc. |
||||||||
| 1.88%, 01/15/27 (Call 12/15/26) |
5,440 | 4,964,296 | ||||||
| 1.90%, 06/15/28 (Call 04/15/28) |
4,390 | 3,844,979 | ||||||
| 2.25%, 06/01/30 (Call 03/01/30) |
5,167 | 4,348,155 | ||||||
| 2.44%, 01/15/32 (Call 10/15/31) |
4,808 | 3,904,232 | ||||||
| 2.75%, 11/01/29 (Call 08/01/29) |
5,345 | 4,710,901 | ||||||
| 3.00%, 01/15/52 (Call 07/15/51) |
2,290 | 1,451,638 | ||||||
| 3.50%, 04/01/29 (Call 01/01/29) |
3,892 | 3,599,114 | ||||||
| 3.55%, 05/01/27 (Call 02/01/27) |
7,417 | 7,056,516 | ||||||
| 3.80%, 03/15/82 (Call 03/15/27), |
||||||||
| (5-year CMT + 2.547%)(a) |
1,030 | 917,534 | ||||||
| 4.45%, 06/20/25 |
3,385 | 3,340,907 | ||||||
| 4.63%, 07/15/27 (Call 06/15/27) |
6,870 | 6,759,216 | ||||||
| 4.80%, 12/01/77 (Call 12/01/27), |
||||||||
| (3-mo. LIBOR US + 2.409%)(a) |
2,698 | 2,443,081 | ||||||
| 4.90%, 02/28/28 (Call 01/28/28) |
5,905 | 5,856,011 | ||||||
| 4.90%, 03/15/29 (Call 02/15/29) |
3,575 | 3,530,611 | ||||||
| 4.95%, 01/29/26 |
3,745 | 3,717,539 | ||||||
| 5.00%, 02/28/30 (Call 12/28/29) |
3,960 | 3,925,990 | ||||||
| 5.00%, 07/15/32 (Call 04/15/32) |
4,577 | 4,460,825 | ||||||
| 5.05%, 02/28/33 (Call 11/28/32) |
4,690 | 4,572,477 | ||||||
| 5.25%, 03/15/34 (Call 12/15/33) |
3,575 | 3,508,916 | ||||||
| 5.25%, 02/28/53 (Call 08/28/52) |
4,630 | 4,299,095 | ||||||
| 5.55%, 03/15/54 (Call 09/15/53) |
3,715 | 3,602,465 | ||||||
| 5.65%, 05/01/79 (Call 05/01/29), |
||||||||
| (3-mo. LIBOR US + 3.156%)(a) |
866 | 832,875 | ||||||
| 5.75%, 09/01/25 |
1,139 | 1,145,032 | ||||||
| 6.05%, 03/01/25 |
1,400 | 1,405,658 | ||||||
| 44 | 2 0 2 4 I S H A R E S A N N U A L R E P O R T T O S H A R E H O L D E R S |
| Schedule of Investments (continued) February 29, 2024 |
iShares® Core U.S. Aggregate Bond ETF (Percentages shown are based on Net Assets) |
| Security | Par (000) |
Value | ||||||
| Electric (continued) |
||||||||
| Northern States Power Co./MN |
||||||||
| 2.25%, 04/01/31 (Call 10/01/30) |
$ | 2,335 | $ | 1,955,860 | ||||
| 2.60%, 06/01/51 (Call 12/01/50) |
2,275 | 1,405,156 | ||||||
| 2.90%, 03/01/50 (Call 09/01/49) |
2,854 | 1,867,993 | ||||||
| 3.20%, 04/01/52 (Call 10/01/51) |
1,750 | 1,205,617 | ||||||
| 3.40%, 08/15/42 (Call 02/15/42) |
1,078 | 818,553 | ||||||
| 3.60%, 05/15/46 (Call 11/15/45) |
1,311 | 992,938 | ||||||
| 3.60%, 09/15/47 (Call 03/15/47) |
2,243 | 1,696,750 | ||||||
| 4.00%, 08/15/45 (Call 02/15/45) |
1,557 | 1,258,988 | ||||||
| 4.13%, 05/15/44 (Call 11/15/43) |
1,540 | 1,270,709 | ||||||
| 4.50%, 06/01/52 (Call 12/01/51) |
1,780 | 1,552,275 | ||||||
| 5.10%, 05/15/53 (Call 11/15/52) |
2,560 | 2,443,307 | ||||||
| 5.35%, 11/01/39 |
620 | 611,823 | ||||||
| 5.40%, 03/15/54 (Call 09/15/53) |
1,570 | 1,553,608 | ||||||
| 6.20%, 07/01/37 |
1,493 | 1,597,244 | ||||||
| 6.25%, 06/01/36 |
1,180 | 1,274,432 | ||||||
| NorthWestern Corp., 4.18%, 11/15/44 |
||||||||
| (Call 05/15/44) |
415 | 334,177 | ||||||
| NSTAR Electric Co. |
||||||||
| 1.95%, 08/15/31 (Call 05/15/31) |
876 | 700,495 | ||||||
| 3.10%, 06/01/51 (Call 12/01/50) |
1,295 | 874,274 | ||||||
| 3.20%, 05/15/27 (Call 02/15/27) |
2,551 | 2,430,233 | ||||||
| 3.25%, 05/15/29 (Call 02/15/29) |
2,662 | 2,474,358 | ||||||
| 3.95%, 04/01/30 (Call 01/01/30) |
2,477 | 2,322,120 | ||||||
| 4.40%, 03/01/44 (Call 09/01/43) |
1,885 | 1,623,895 | ||||||
| 4.55%, 06/01/52 (Call 12/01/51) |
2,255 | 1,949,286 | ||||||
| 4.95%, 09/15/52 (Call 03/15/52) |
20 | 18,503 | ||||||
| 5.50%, 03/15/40 |
405 | 403,627 | ||||||
| Oglethorpe Power Corp. |
||||||||
| 3.75%, 08/01/50 (Call 02/01/50) |
2,230 | 1,598,671 | ||||||
| 4.50%, 04/01/47 (Call 10/01/46) |
2,385 | 1,934,643 | ||||||
| 5.05%, 10/01/48 (Call 04/01/48) |
2,165 | 1,908,051 | ||||||
| 5.25%, 09/01/50 |
1,217 | 1,113,517 | ||||||
| 5.38%, 11/01/40 |
2,040 | 1,911,048 | ||||||
| 5.95%, 11/01/39 |
1,581 | 1,560,861 | ||||||
| 6.20%, 12/01/53 (Call 06/01/53)(c) |
2,085 | 2,145,105 | ||||||
| Ohio Edison Co., 6.88%, 07/15/36 |
1,390 | 1,535,287 | ||||||
| Ohio Power Co. |
||||||||
| 4.00%, 06/01/49 (Call 12/01/48) |
2,087 | 1,628,706 | ||||||
| 4.15%, 04/01/48 (Call 10/01/47) |
2,102 | 1,682,981 | ||||||
| 5.00%, 06/01/33 (Call 03/01/33) |
735 | 720,891 | ||||||
| Series P, 2.60%, 04/01/30 (Call 01/01/30) |
2,038 | 1,763,474 | ||||||
| Series Q, 1.63%, 01/15/31 (Call 10/15/30) |
2,481 | 1,978,387 | ||||||
| Series R, 2.90%, 10/01/51 (Call 04/01/51) |
1,350 | 859,552 | ||||||
| Oklahoma Gas & Electric Co. |
||||||||
| 3.25%, 04/01/30 (Call 10/01/29) |
2,411 | 2,163,465 | ||||||
| 3.30%, 03/15/30 (Call 09/15/29) |
1,756 | 1,581,040 | ||||||
| 3.80%, 08/15/28 (Call 02/15/28) |
1,377 | 1,318,927 | ||||||
| 3.85%, 08/15/47 (Call 02/15/47) |
1,829 | 1,389,077 | ||||||
| 4.15%, 04/01/47 (Call 10/01/46) |
2,960 | 2,358,491 | ||||||
| 5.40%, 01/15/33 (Call 07/15/32) |
1,780 | 1,809,042 | ||||||
| 5.60%, 04/01/53 (Call 10/01/52) |
895 | 899,951 | ||||||
| Oncor Electric Delivery Co. LLC |
||||||||
| 0.55%, 10/01/25 (Call 09/01/25) |
3,965 | 3,686,050 | ||||||
| 2.70%, 11/15/51 (Call 05/15/51) |
2,360 | 1,465,600 | ||||||
| 2.75%, 05/15/30 (Call 02/15/30) |
2,547 | 2,237,268 | ||||||
| 2.95%, 04/01/25 (Call 01/01/25) |
1,149 | 1,120,383 | ||||||
| 3.10%, 09/15/49 (Call 03/15/49) |
3,090 | 2,118,413 | ||||||
| 3.70%, 11/15/28 (Call 08/15/28) |
3,808 | 3,608,180 | ||||||
| 3.70%, 05/15/50 (Call 11/15/49) |
2,531 | 1,929,705 | ||||||
| 3.75%, 04/01/45 (Call 10/01/44) |
3,121 | 2,475,190 | ||||||
| Security | Par (000) |
Value | ||||||
| Electric (continued) |
||||||||
| 3.80%, 09/30/47 (Call 03/30/47) |
$ | 1,977 | $ | 1,525,160 | ||||
| 3.80%, 06/01/49 (Call 12/01/48) |
2,278 | 1,787,038 | ||||||
| 4.10%, 11/15/48 (Call 05/15/48) |
2,180 | 1,786,442 | ||||||
| 4.15%, 06/01/32 (Call 03/01/32) |
1,840 | 1,723,277 | ||||||
| 4.30%, 05/15/28 (Call 04/15/28) |
590 | 575,277 | ||||||
| 4.55%, 09/15/32 (Call 06/15/32) |
2,750 | 2,638,112 | ||||||
| 4.55%, 12/01/41 (Call 06/01/41) |
1,261 | 1,143,397 | ||||||
| 4.60%, 06/01/52 (Call 12/01/51) |
740 | 650,733 | ||||||
| 4.95%, 09/15/52 (Call 03/15/52) |
3,020 | 2,812,282 | ||||||
| 5.25%, 09/30/40 |
1,297 | 1,287,156 | ||||||
| 5.30%, 06/01/42 (Call 12/01/41) |
1,748 | 1,765,141 | ||||||
| 5.35%, 10/01/52 (Call 04/01/52) |
220 | 218,261 | ||||||
| 5.65%, 11/15/33 (Call 08/15/33) |
2,450 | 2,526,167 | ||||||
| 5.75%, 03/15/29 (Call 12/15/28) |
1,269 | 1,311,948 | ||||||
| 7.00%, 05/01/32 |
969 | 1,079,419 | ||||||
| 7.25%, 01/15/33 |
2,037 | 2,317,905 | ||||||
| 7.50%, 09/01/38 |
644 | 768,497 | ||||||
| Pacific Gas and Electric Co. |
||||||||
| 2.10%, 08/01/27 (Call 06/01/27) |
5,160 | 4,622,429 | ||||||
| 2.50%, 02/01/31 (Call 11/01/30) |
8,208 | 6,731,318 | ||||||
| 2.95%, 03/01/26 (Call 12/01/25) |
2,277 | 2,161,420 | ||||||
| 3.00%, 06/15/28 (Call 04/15/28) |
3,285 | 2,980,716 | ||||||
| 3.15%, 01/01/26 |
4,748 | 4,540,437 | ||||||
| 3.25%, 06/01/31 (Call 03/01/31) |
3,215 | 2,754,593 | ||||||
| 3.30%, 03/15/27 (Call 12/15/26) |
1,847 | 1,733,576 | ||||||
| 3.30%, 12/01/27 (Call 09/01/27) |
4,132 | 3,817,145 | ||||||
| 3.30%, 08/01/40 (Call 02/01/40) |
2,282 | 1,645,142 | ||||||
| 3.45%, 07/01/25 |
1,927 | 1,870,843 | ||||||
| 3.50%, 06/15/25 (Call 03/15/25) |
1,320 | 1,281,227 | ||||||
| 3.50%, 08/01/50 (Call 02/01/50) |
7,965 | 5,358,328 | ||||||
| 3.75%, 07/01/28 |
4,074 | 3,790,260 | ||||||
| 3.75%, 08/15/42 (Call 02/15/42) |
1,693 | 1,244,142 | ||||||
| 3.95%, 12/01/47 (Call 06/01/47) |
3,548 | 2,576,462 | ||||||
| 4.00%, 12/01/46 (Call 06/01/46) |
2,879 | 2,096,255 | ||||||
| 4.20%, 03/01/29 (Call 01/01/29) |
1,905 | 1,797,268 | ||||||
| 4.20%, 06/01/41 (Call 12/01/40) |
1,327 | 1,042,605 | ||||||
| 4.25%, 03/15/46 (Call 09/15/45) |
2,097 | 1,604,284 | ||||||
| 4.30%, 03/15/45 (Call 09/15/44) |
2,704 | 2,109,680 | ||||||
| 4.40%, 03/01/32 (Call 12/01/31) |
2,505 | 2,279,869 | ||||||
| 4.45%, 04/15/42 (Call 10/15/41) |
1,286 | 1,034,612 | ||||||
| 4.50%, 07/01/40 (Call 01/01/40) |
7,688 | 6,458,893 | ||||||
| 4.55%, 07/01/30 (Call 01/01/30) |
11,624 | 10,932,728 | ||||||
| 4.60%, 06/15/43 (Call 12/15/42) |
1,147 | 940,157 | ||||||
| 4.65%, 08/01/28 (Call 05/01/28) |
1,518 | 1,448,840 | ||||||
| 4.75%, 02/15/44 (Call 08/15/43) |
2,300 | 1,917,433 | ||||||
| 4.95%, 06/08/25 |
1,630 | 1,614,446 | ||||||
| 4.95%, 07/01/50 (Call 01/01/50) |
12,077 | 10,256,809 | ||||||
| 5.25%, 03/01/52 (Call 09/01/51) |
1,410 | 1,248,335 | ||||||
| 5.45%, 06/15/27 (Call 05/15/27) |
2,319 | 2,314,607 | ||||||
| 5.55%, 05/15/29 (Call 04/15/29) |
2,675 | 2,680,317 | ||||||
| 5.80%, 05/15/34 (Call 02/15/34) |
2,675 | 2,671,004 | ||||||
| 5.90%, 06/15/32 (Call 03/15/32) |
3,000 | 3,015,093 | ||||||
| 6.10%, 01/15/29 (Call 12/15/28) |
1,670 | 1,709,228 | ||||||
| 6.15%, 01/15/33 (Call 10/15/32) |
3,075 | 3,146,281 | ||||||
| 6.40%, 06/15/33 (Call 03/15/33) |
3,230 | 3,358,801 | ||||||
| 6.70%, 04/01/53 (Call 10/01/52) |
2,030 | 2,176,926 | ||||||
| 6.75%, 01/15/53 (Call 07/15/52) |
4,910 | 5,262,554 | ||||||
| 6.95%, 03/15/34 (Call 12/15/33) |
3,440 | 3,719,413 | ||||||
| PacifiCorp |
||||||||
| 2.90%, 06/15/52 (Call 12/15/51) |
3,935 | 2,398,428 | ||||||
| 3.30%, 03/15/51 (Call 09/15/50) |
2,629 | 1,724,048 | ||||||
| S C H E D U L E O F I N V E S T M E N T S |
45 |
| Schedule of Investments (continued) February 29, 2024 |
iShares® Core U.S. Aggregate Bond ETF (Percentages shown are based on Net Assets) |
| Security | Par (000) |
Value | ||||||
| Electric (continued) |
||||||||
| 4.10%, 02/01/42 (Call 08/01/41) |
$ | 1,291 | $ | 1,023,223 | ||||
| 4.13%, 01/15/49 (Call 07/15/48) |
2,710 | 2,113,354 | ||||||
| 4.15%, 02/15/50 (Call 08/15/49) |
2,802 | 2,174,857 | ||||||
| 5.10%, 02/15/29 (Call 01/15/29) |
2,190 | 2,183,565 | ||||||
| 5.25%, 06/15/35 |
904 | 878,131 | ||||||
| 5.35%, 12/01/53 (Call 06/01/53) |
3,820 | 3,508,334 | ||||||
| 5.50%, 05/15/54 (Call 11/15/53) |
2,725 | 2,543,225 | ||||||
| 5.75%, 04/01/37 |
1,092 | 1,085,498 | ||||||
| 6.00%, 01/15/39 |
2,708 | 2,780,574 | ||||||
| 6.10%, 08/01/36 |
1,165 | 1,206,487 | ||||||
| 6.25%, 10/15/37 |
3,051 | 3,189,173 | ||||||
| 6.35%, 07/15/38 |
820 | 861,370 | ||||||
| PacifiCorp. |
||||||||
| 2.70%, 09/15/30 (Call 06/15/30) |
2,130 | 1,827,632 | ||||||
| 3.50%, 06/15/29 (Call 03/15/29) |
1,785 | 1,645,733 | ||||||
| 5.30%, 02/15/31 (Call 12/15/30) |
2,210 | 2,190,879 | ||||||
| 5.45%, 02/15/34 (Call 11/15/33) |
2,310 | 2,278,519 | ||||||
| 5.80%, 01/15/55 (Call 07/15/54) |
4,260 | 4,117,671 | ||||||
| 7.70%, 11/15/31 |
785 | 899,129 | ||||||
| PECO Energy Co. |
||||||||
| 2.80%, 06/15/50 (Call 12/15/49)(b) |
380 | 244,820 | ||||||
| 2.85%, 09/15/51 (Call 03/15/51) |
1,185 | 754,821 | ||||||
| 3.00%, 09/15/49 (Call 03/15/49) |
1,845 | 1,239,852 | ||||||
| 3.05%, 03/15/51 (Call 09/15/50) |
1,070 | 719,635 | ||||||
| 3.15%, 10/15/25 (Call 07/15/25) |
1,185 | 1,150,804 | ||||||
| 3.70%, 09/15/47 (Call 03/15/47) |
1,841 | 1,430,599 | ||||||
| 3.90%, 03/01/48 (Call 09/01/47) |
2,587 | 2,081,134 | ||||||
| 4.15%, 10/01/44 (Call 04/01/44)(b) |
1,365 | 1,140,335 | ||||||
| 4.38%, 08/15/52 (Call 02/15/52) |
1,770 | 1,509,144 | ||||||
| 4.60%, 05/15/52 (Call 11/15/51) |
1,800 | 1,602,742 | ||||||
| 4.90%, 06/15/33 (Call 03/15/33) |
2,457 | 2,432,386 | ||||||
| 5.95%, 10/01/36 |
775 | 819,833 | ||||||
| PG&E Recovery Funding LLC, 5.05%, 07/15/34 |
91 | 90,342 | ||||||
| Pinnacle West Capital Corp., 1.30%, 06/15/25 |
||||||||
| (Call 05/15/25) |
2,538 | 2,408,523 | ||||||
| Potomac Electric Power Co. |
||||||||
| 4.15%, 03/15/43 (Call 09/15/42) |
2,709 | 2,276,586 | ||||||
| 5.20%, 03/15/34 (Call 12/15/33) |
1,300 | 1,292,454 | ||||||
| 5.50%, 03/15/54 (Call 09/15/53) |
1,300 | 1,294,033 | ||||||
| 6.50%, 11/15/37 |
260 | 286,975 | ||||||
| PPL Capital Funding Inc. |
||||||||
| 3.10%, 05/15/26 (Call 02/15/26) |
3,919 | 3,732,073 | ||||||
| 4.13%, 04/15/30 (Call 01/15/30) |
1,710 | 1,594,869 | ||||||
| PPL Electric Utilities Corp. |
||||||||
| 3.00%, 10/01/49 (Call 04/01/49) |
1,652 | 1,126,950 | ||||||
| 3.95%, 06/01/47 (Call 12/01/46) |
1,053 | 849,932 | ||||||
| 4.13%, 06/15/44 (Call 12/15/43) |
928 | 778,098 | ||||||
| 4.15%, 10/01/45 (Call 04/01/45) |
1,485 | 1,234,607 | ||||||
| 4.15%, 06/15/48 (Call 12/15/47) |
1,600 | 1,340,828 | ||||||
| 4.75%, 07/15/43 (Call 01/15/43) |
1,125 | 1,035,103 | ||||||
| 4.85%, 02/15/34 (Call 11/15/33) |
1,845 | 1,796,777 | ||||||
| 5.00%, 05/15/33 (Call 02/15/33) |
3,370 | 3,350,768 | ||||||
| 5.25%, 05/15/53 (Call 11/15/52) |
3,950 | 3,834,499 | ||||||
| 6.25%, 05/15/39 |
1,645 | 1,786,421 | ||||||
| Progress Energy Inc. |
||||||||
| 6.00%, 12/01/39 |
2,912 | 2,935,511 | ||||||
| 7.00%, 10/30/31 |
1,795 | 1,980,876 | ||||||
| 7.75%, 03/01/31 |
2,939 | 3,319,714 | ||||||
| Public Service Co. of Colorado |
||||||||
| 1.88%, 06/15/31 (Call 12/15/30) |
830 | 668,518 | ||||||
| Security | Par (000) |
Value | ||||||
| Electric (continued) |
||||||||
| 3.60%, 09/15/42 (Call 03/15/42) |
$ | 1,933 | $ | 1,483,697 | ||||
| 3.70%, 06/15/28 (Call 12/15/27) |
1,995 | 1,900,998 | ||||||
| 3.80%, 06/15/47 (Call 12/15/46) |
1,889 | 1,434,214 | ||||||
| 4.05%, 09/15/49 (Call 03/15/49) |
1,931 | 1,506,157 | ||||||
| 4.10%, 06/01/32 (Call 03/01/32)(b) |
1,235 | 1,146,789 | ||||||
| 4.10%, 06/15/48 (Call 12/15/47) |
1,620 | 1,292,437 | ||||||
| 4.30%, 03/15/44 (Call 09/15/43) |
1,566 | 1,303,226 | ||||||
| 4.50%, 06/01/52 (Call 12/01/51) |
2,025 | 1,695,721 | ||||||
| 5.25%, 04/01/53 (Call 10/01/52) |
3,055 | 2,892,269 | ||||||
| 6.50%, 08/01/38 |
110 | 119,709 | ||||||
| Series 17, 6.25%, 09/01/37 |
1,384 | 1,468,009 | ||||||
| Series 34, 3.20%, 03/01/50 (Call 09/01/49) |
1,599 | 1,083,077 | ||||||
| Series 35, 1.90%, 01/15/31 (Call 07/15/30) |
2,209 | 1,798,285 | ||||||
| Series 36, 2.70%, 01/15/51 (Call 07/15/50) |
1,620 | 979,514 | ||||||
| Public Service Co. of New Hampshire |
||||||||
| 3.60%, 07/01/49 (Call 01/01/49) |
1,550 | 1,172,000 | ||||||
| 5.15%, 01/15/53 (Call 07/15/52) |
1,670 | 1,601,880 | ||||||
| 5.35%, 10/01/33 (Call 07/01/33) |
1,475 | 1,490,390 | ||||||
| Series V, 2.20%, 06/15/31 (Call 03/15/31) |
280 | 230,606 | ||||||
| Public Service Co. of Oklahoma |
||||||||
| 5.25%, 01/15/33 (Call 10/15/32) |
2,810 | 2,782,387 | ||||||
| Series J, 2.20%, 08/15/31 (Call 05/15/31) |
1,095 | 890,518 | ||||||
| Series K, 3.15%, 08/15/51 (Call 02/15/51) |
520 | 347,850 | ||||||
| Public Service Electric & Gas Co. |
||||||||
| 0.95%, 03/15/26 (Call 02/15/26) |
1,865 | 1,725,894 | ||||||
| 1.90%, 08/15/31 (Call 05/15/31) |
2,685 | 2,162,746 | ||||||
| 2.05%, 08/01/50 (Call 02/01/50)(b) |
2,200 | 1,228,911 | ||||||
| 2.25%, 09/15/26 (Call 06/15/26) |
1,469 | 1,372,730 | ||||||
| 2.45%, 01/15/30 (Call 10/15/29) |
3,299 | 2,868,665 | ||||||
| 2.70%, 05/01/50 (Call 11/01/49) |
765 | 492,727 | ||||||
| 3.00%, 05/15/25 (Call 02/15/25) |
513 | 499,874 | ||||||
| 3.00%, 05/15/27 (Call 02/15/27) |
2,214 | 2,092,581 | ||||||
| 3.00%, 03/01/51 (Call 09/01/50) |
210 | 140,446 | ||||||
| 3.10%, 03/15/32 (Call 12/15/31)(b) |
504 | 438,701 | ||||||
| 3.15%, 01/01/50 (Call 07/01/49) |
1,785 | 1,240,439 | ||||||
| 3.20%, 05/15/29 (Call 02/15/29) |
1,559 | 1,437,774 | ||||||
| 3.20%, 08/01/49 (Call 02/01/49) |
2,055 | 1,449,862 | ||||||
| 3.60%, 12/01/47 (Call 06/01/47) |
1,879 | 1,432,184 | ||||||
| 3.65%, 09/01/28 (Call 06/01/28)(b) |
2,353 | 2,240,315 | ||||||
| 3.65%, 09/01/42 (Call 03/01/42) |
1,535 | 1,208,518 | ||||||
| 3.70%, 05/01/28 (Call 02/01/28) |
2,254 | 2,154,508 | ||||||
| 3.80%, 01/01/43 (Call 07/01/42) |
564 | 458,095 | ||||||
| 3.80%, 03/01/46 (Call 09/01/45) |
2,633 | 2,078,105 | ||||||
| 3.85%, 05/01/49 (Call 11/01/48) |
1,932 | 1,539,291 | ||||||
| 3.95%, 05/01/42 (Call 11/01/41) |
630 | 528,546 | ||||||
| 4.05%, 05/01/48 (Call 11/01/47) |
1,741 | 1,446,797 | ||||||
| 4.65%, 03/15/33 (Call 12/15/32) |
1,405 | 1,358,743 | ||||||
| 4.90%, 12/15/32 (Call 09/15/32)(b) |
2,078 | 2,049,612 | ||||||
| 5.13%, 03/15/53 (Call 09/15/52)(b) |
665 | 643,931 | ||||||
| 5.20%, 08/01/33 (Call 05/01/33) |
630 | 634,332 | ||||||
| 5.20%, 03/01/34 (Call 12/01/33) |
1,900 | 1,902,354 | ||||||
| 5.45%, 08/01/53 (Call 02/01/53) |
20 | 20,092 | ||||||
| 5.45%, 03/01/54 (Call 09/01/53) |
1,900 | 1,905,699 | ||||||
| 5.50%, 03/01/40 |
387 | 386,923 | ||||||
| 5.80%, 05/01/37 |
363 | 373,594 | ||||||
| Public Service Enterprise Group Inc. |
||||||||
| 0.80%, 08/15/25 (Call 07/15/25) |
2,522 | 2,361,599 | ||||||
| 1.60%, 08/15/30 (Call 05/15/30)(b) |
1,993 | 1,600,924 | ||||||
| 2.45%, 11/15/31 (Call 08/15/31) |
1,430 | 1,162,989 | ||||||
| 5.85%, 11/15/27 (Call 10/15/27) |
1,580 | 1,617,587 | ||||||
| 5.88%, 10/15/28 (Call 09/15/28) |
2,365 | 2,427,097 | ||||||
| 46 | 2 0 2 4 I S H A R E S A N N U A L R E P O R T T O S H A R E H O L D E R S |
| Schedule of Investments (continued) February 29, 2024 |
iShares® Core U.S. Aggregate Bond ETF (Percentages shown are based on Net Assets) |
| Security | Par (000) |
Value | ||||||
| Electric (continued) |
||||||||
| 6.13%, 10/15/33 (Call 07/15/33) |
$ | 2,125 | $ | 2,217,641 | ||||
| Puget Energy Inc. |
||||||||
| 2.38%, 06/15/28 (Call 04/15/28) |
3,680 | 3,262,867 | ||||||
| 3.65%, 05/15/25 (Call 02/15/25) |
2,753 | 2,682,274 | ||||||
| 4.10%, 06/15/30 (Call 03/15/30) |
1,634 | 1,479,394 | ||||||
| 4.22%, 03/15/32 (Call 12/15/31) |
2,244 | 2,003,662 | ||||||
| Puget Sound Energy Inc. |
||||||||
| 2.89%, 09/15/51 (Call 03/15/51) |
615 | 390,990 | ||||||
| 3.25%, 09/15/49 (Call 03/15/49) |
2,998 | 2,042,733 | ||||||
| 4.22%, 06/15/48 (Call 12/15/47) |
3,690 | 2,994,705 | ||||||
| 4.30%, 05/20/45 (Call 11/20/44) |
1,882 | 1,561,270 | ||||||
| 5.64%, 04/15/41 (Call 10/15/40) |
360 | 358,351 | ||||||
| 5.76%, 10/01/39 |
1,320 | 1,324,910 | ||||||
| 5.80%, 03/15/40 |
1,340 | 1,352,628 | ||||||
| 6.27%, 03/15/37 |
895 | 941,192 | ||||||
| San Diego Gas & Electric Co. |
||||||||
| 2.50%, 05/15/26 (Call 02/15/26) |
3,235 | 3,069,135 | ||||||
| 3.70%, 03/15/52 (Call 09/15/51) |
450 | 333,407 | ||||||
| 4.15%, 05/15/48 (Call 11/15/47) |
2,025 | 1,666,689 | ||||||
| 4.50%, 08/15/40 |
893 | 792,471 | ||||||
| 4.95%, 08/15/28 (Call 07/15/28) |
2,387 | 2,386,341 | ||||||
| 5.35%, 04/01/53 (Call 10/01/52) |
3,680 | 3,559,841 | ||||||
| 6.00%, 06/01/39 |
940 | 972,791 | ||||||
| Series RRR, 3.75%, 06/01/47 (Call 12/01/46) |
2,280 | 1,753,193 | ||||||
| Series TTT, 4.10%, 06/15/49 (Call 12/15/48) |
2,464 | 1,987,454 | ||||||
| Series UUU, 3.32%, 04/15/50 (Call 10/15/49) |
2,176 | 1,510,422 | ||||||
| Series VVV, 1.70%, 10/01/30 (Call 07/01/30) |
3,699 | 3,010,055 | ||||||
| Series WWW, 2.95%, 08/15/51 (Call 02/15/51) |
2,990 | 1,983,075 | ||||||
| Series XXX, 3.00%, 03/15/32 (Call 12/15/31) |
1,925 | 1,662,503 | ||||||
| Sempra |
||||||||
| 3.25%, 06/15/27 (Call 03/15/27) |
3,639 | 3,422,306 | ||||||
| 3.30%, 04/01/25 (Call 03/01/25) |
2,758 | 2,693,305 | ||||||
| 3.40%, 02/01/28 (Call 11/01/27) |
4,847 | 4,561,177 | ||||||
| 3.70%, 04/01/29 (Call 02/01/29) |
2,473 | 2,303,825 | ||||||
| 3.80%, 02/01/38 (Call 08/01/37) |
3,887 | 3,188,368 | ||||||
| 4.00%, 02/01/48 (Call 08/01/47) |
1,887 | 1,465,059 | ||||||
| 4.13%, 04/01/52 (Call 01/01/27), |
||||||||
| (5-year CMT + 2.868%)(a) |
4,100 | 3,764,611 | ||||||
| 5.40%, 08/01/26 (Call 07/01/26) |
2,195 | 2,200,393 | ||||||
| 5.50%, 08/01/33 (Call 05/01/33) |
2,100 | 2,087,769 | ||||||
| 6.00%, 10/15/39 |
3,275 | 3,305,636 | ||||||
| Sierra Pacific Power Co. |
||||||||
| 2.60%, 05/01/26 (Call 02/01/26) |
3,274 | 3,101,060 | ||||||
| 5.90%, 03/15/54 (Call 09/15/53)(c) |
1,740 | 1,777,898 | ||||||
| Southern California Edison Co. |
||||||||
| 2.25%, 06/01/30 (Call 03/01/30) |
2,422 | 2,044,175 | ||||||
| 2.75%, 02/01/32 (Call 11/01/31) |
3,045 | 2,556,900 | ||||||
| 2.85%, 08/01/29 (Call 05/01/29) |
2,348 | 2,102,519 | ||||||
| 3.45%, 02/01/52 (Call 08/01/51) |
2,600 | 1,810,822 | ||||||
| 3.65%, 02/01/50 (Call 08/01/49) |
5,359 | 3,920,151 | ||||||
| 4.00%, 04/01/47 (Call 10/01/46) |
5,379 | 4,183,811 | ||||||
| 4.05%, 03/15/42 (Call 09/15/41) |
2,152 | 1,768,333 | ||||||
| 4.50%, 09/01/40 (Call 03/01/40) |
1,670 | 1,459,260 | ||||||
| 4.65%, 10/01/43 (Call 04/01/43) |
2,948 | 2,580,192 | ||||||
| 4.88%, 02/01/27 (Call 01/01/27) |
2,180 | 2,168,745 | ||||||
| Security | Par (000) |
Value | ||||||
| Electric (continued) |
||||||||
| 4.90%, 06/01/26 (Call 05/01/26) |
$ | 1,365 | $ | 1,355,621 | ||||
| 5.15%, 06/01/29 (Call 05/01/29) |
1,900 | 1,901,335 | ||||||
| 5.20%, 06/01/34 (Call 03/01/34) |
2,060 | 2,015,156 | ||||||
| 5.30%, 03/01/28 (Call 02/01/28) |
695 | 701,678 | ||||||
| 5.35%, 03/01/26 |
1,900 | 1,901,217 | ||||||
| 5.50%, 03/15/40 |
2,668 | 2,635,563 | ||||||
| 5.63%, 02/01/36 |
1,459 | 1,458,422 | ||||||
| 5.65%, 10/01/28 (Call 09/01/28) |
620 | 634,817 | ||||||
| 5.70%, 03/01/53 (Call 09/01/52) |
485 | 480,951 | ||||||
| 5.75%, 04/15/54 (Call 10/15/53) |
1,900 | 1,888,438 | ||||||
| 5.85%, 11/01/27 (Call 10/01/27) |
2,180 | 2,232,549 | ||||||
| 5.88%, 12/01/53 (Call 06/01/53) |
1,920 | 1,951,001 | ||||||
| 5.95%, 11/01/32 (Call 08/01/32) |
1,560 | 1,625,760 | ||||||
| 6.00%, 01/15/34 |
1,734 | 1,807,021 | ||||||
| 6.05%, 03/15/39 |
2,655 | 2,734,587 | ||||||
| 6.65%, 04/01/29 |
1,395 | 1,464,009 | ||||||
| Series 04-G, 5.75%, 04/01/35 |
1,374 | 1,389,800 | ||||||
| Series 05-E, 5.35%, 07/15/35 |
1,261 | 1,254,241 | ||||||
| Series 06-E, 5.55%, 01/15/37 |
1,780 | 1,771,362 | ||||||
| Series 08-A, 5.95%, 02/01/38 |
2,187 | 2,240,985 | ||||||
| Series 13-A, 3.90%, 03/15/43 (Call 09/15/42) |
2,454 | 1,939,923 | ||||||
| Series 2020-C, 1.20%, 02/01/26 (Call 01/01/26) |
1,785 | 1,655,576 | ||||||
| Series 20A, 2.95%, 02/01/51 (Call 08/01/50) |
630 | 403,117 | ||||||
| Series A, 4.20%, 03/01/29 (Call 12/01/28) |
2,198 | 2,114,568 | ||||||
| Series B, 3.65%, 03/01/28 (Call 12/01/27) |
2,172 | 2,057,047 | ||||||
| Series B, 4.88%, 03/01/49 (Call 09/01/48) |
2,886 | 2,561,448 | ||||||
| Series C, 3.60%, 02/01/45 (Call 08/01/44) |
1,810 | 1,339,854 | ||||||
| Series C, 4.13%, 03/01/48 (Call 09/01/47) |
4,867 | 3,882,991 | ||||||
| Series C, 4.20%, 06/01/25 |
1,455 | 1,434,283 | ||||||
| Series D, 4.70%, 06/01/27 (Call 05/01/27) |
2,477 | 2,448,518 | ||||||
| Series E, 3.70%, 08/01/25 (Call 06/01/25) |
3,950 | 3,858,316 | ||||||
| Series E, 5.45%, 06/01/52 (Call 12/01/51) |
1,909 | 1,831,184 | ||||||
| Series G, 2.50%, 06/01/31 (Call 03/01/31) |
3,027 | 2,540,571 | ||||||
| Series H, 3.65%, 06/01/51 (Call 12/01/50) |
2,012 | 1,470,266 | ||||||
| Southern Co. (The) |
||||||||
| 3.25%, 07/01/26 (Call 04/01/26) |
6,545 | 6,260,771 | ||||||
| 4.25%, 07/01/36 (Call 01/01/36) |
975 | 861,004 | ||||||
| 4.40%, 07/01/46 (Call 01/01/46) |
7,721 | 6,511,544 | ||||||
| 4.85%, 06/15/28 (Call 04/15/28) |
2,470 | 2,446,339 | ||||||
| 5.11%, 08/01/27 |
2,500 | 2,493,714 | ||||||
| 5.15%, 10/06/25 |
2,505 | 2,501,068 | ||||||
| 5.20%, 06/15/33 (Call 12/15/32) |
2,875 | 2,830,385 | ||||||
| 5.50%, 03/15/29 (Call 01/15/29) |
3,430 | 3,474,884 | ||||||
| 5.70%, 10/15/32 (Call 04/15/32) |
1,735 | 1,777,016 | ||||||
| 5.70%, 03/15/34 (Call 09/15/33) |
3,000 | 3,058,756 | ||||||
| Series 21-A, 3.75%, 09/15/51 (Call 06/15/26), |
||||||||
| (5-year CMT + 2.915%)(a) |
4,125 | 3,870,832 | ||||||
| Series 21-B, 1.75%, 03/15/28 (Call 01/15/28) |
1,330 | 1,168,866 | ||||||
| Series A, 3.70%, 04/30/30 (Call 01/30/30) |
4,430 | 4,083,935 | ||||||
| Series B, 4.00%, 01/15/51 (Call 10/15/25), |
||||||||
| (5-year CMT + 3.733%)(a) |
1,865 | 1,792,977 | ||||||
| Southern Power Co. |
||||||||
| 0.90%, 01/15/26 (Call 12/15/25) |
1,713 | 1,579,146 | ||||||
| 4.15%, 12/01/25 (Call 09/01/25) |
4,411 | 4,334,866 | ||||||
| 5.15%, 09/15/41 |
2,528 | 2,332,011 | ||||||
| 5.25%, 07/15/43 |
1,880 | 1,742,202 | ||||||
| S C H E D U L E O F I N V E S T M E N T S |
47 |
| Schedule of Investments (continued) February 29, 2024 |
iShares® Core U.S. Aggregate Bond ETF (Percentages shown are based on Net Assets) |
| Security | Par (000) |
Value | ||||||
| Electric (continued) |
||||||||
| Series F, 4.95%, 12/15/46 (Call 06/15/46) |
$ | 1,905 | $ | 1,672,646 | ||||
| Southwestern Electric Power Co. |
||||||||
| 3.25%, 11/01/51 (Call 05/01/51) |
2,295 | 1,501,333 | ||||||
| 5.30%, 04/01/33 (Call 01/01/33) |
1,070 | 1,054,474 | ||||||
| 6.20%, 03/15/40 |
1,739 | 1,798,887 | ||||||
| Series J, 3.90%, 04/01/45 (Call 10/01/44) |
680 | 522,107 | ||||||
| Series K, 2.75%, 10/01/26 (Call 07/01/26) |
1,820 | 1,708,590 | ||||||
| Series L, 3.85%, 02/01/48 (Call 08/01/47) |
2,333 | 1,711,576 | ||||||
| Series M, 4.10%, 09/15/28 (Call 06/15/28) |
2,145 | 2,056,223 | ||||||
| Series N, 1.65%, 03/15/26 (Call 02/15/26) |
2,335 | 2,171,679 | ||||||
| Southwestern Public Service Co. |
||||||||
| 3.40%, 08/15/46 (Call 02/15/46) |
1,378 | 958,323 | ||||||
| 3.70%, 08/15/47 (Call 02/15/47) |
1,950 | 1,394,357 | ||||||
| 3.75%, 06/15/49 (Call 12/15/48) |
1,438 | 1,043,951 | ||||||
| 4.50%, 08/15/41 (Call 02/15/41) |
2,081 | 1,765,596 | ||||||
| Series 6, 4.40%, 11/15/48 (Call 05/15/48) |
718 | 585,089 | ||||||
| Series 8, 3.15%, 05/01/50 (Call 11/01/49) |
2,243 | 1,445,241 | ||||||
| System Energy Resources Inc., 6.00%, |
||||||||
| 04/15/28 (Call 03/15/28) |
1,155 | 1,166,263 | ||||||
| Tampa Electric Co. |
||||||||
| 2.40%, 03/15/31 (Call 12/15/30) |
2,024 | 1,676,563 | ||||||
| 3.45%, 03/15/51 (Call 09/15/50) |
935 | 648,286 | ||||||
| 3.63%, 06/15/50 (Call 12/15/49) |
1,756 | 1,275,049 | ||||||
| 4.10%, 06/15/42 (Call 12/15/41) |
2,308 | 1,893,855 | ||||||
| 4.30%, 06/15/48 (Call 12/15/47) |
1,714 | 1,408,676 | ||||||
| 4.35%, 05/15/44 (Call 11/15/43) |
1,295 | 1,072,532 | ||||||
| 4.45%, 06/15/49 (Call 12/15/48) |
2,019 | 1,698,606 | ||||||
| 4.90%, 03/01/29 (Call 02/01/29) |
1,300 | 1,292,434 | ||||||
| 5.00%, 07/15/52 (Call 01/15/52) |
1,255 | 1,143,862 | ||||||
| Toledo Edison Co. (The), 6.15%, 05/15/37 |
909 | 956,938 | ||||||
| Tucson Electric Power Co. |
||||||||
| 1.50%, 08/01/30 (Call 05/01/30) |
3,546 | 2,848,770 | ||||||
| 3.05%, 03/15/25 (Call 12/15/24) |
580 | 566,024 | ||||||
| 3.25%, 05/15/32 (Call 02/15/32) |
998 | 870,270 | ||||||
| 3.25%, 05/01/51 (Call 11/01/50) |
2,390 | 1,601,149 | ||||||
| 4.00%, 06/15/50 (Call 12/15/49) |
1,342 | 1,026,818 | ||||||
| 4.85%, 12/01/48 (Call 06/01/48) |
1,262 | 1,118,879 | ||||||
| 5.50%, 04/15/53 (Call 10/15/52) |
1,725 | 1,688,663 | ||||||
| Union Electric Co. |
||||||||
| 2.15%, 03/15/32 (Call 12/15/31) |
2,165 | 1,739,496 | ||||||
| 2.63%, 03/15/51 (Call 09/15/50) |
1,446 | 873,576 | ||||||
| 2.95%, 06/15/27 (Call 03/15/27) |
3,153 | 2,961,060 | ||||||
| 2.95%, 03/15/30 (Call 12/15/29)(b) |
2,134 | 1,891,973 | ||||||
| 3.25%, 10/01/49 (Call 04/01/49)(b) |
1,786 | 1,219,925 | ||||||
| 3.50%, 03/15/29 (Call 12/15/28) |
2,676 | 2,495,748 | ||||||
| 3.65%, 04/15/45 (Call 10/15/44) |
2,200 | 1,666,641 | ||||||
| 3.90%, 09/15/42 (Call 03/15/42) |
1,050 | 851,168 | ||||||
| 3.90%, 04/01/52 (Call 10/01/51) |
1,090 | 848,357 | ||||||
| 4.00%, 04/01/48 (Call 10/01/47) |
2,230 | 1,754,266 | ||||||
| 5.25%, 01/15/54 (Call 07/15/53) |
1,980 | 1,875,350 | ||||||
| 5.30%, 08/01/37 |
175 | 174,303 | ||||||
| 5.45%, 03/15/53 (Call 09/15/52) |
2,460 | 2,407,912 | ||||||
| 8.45%, 03/15/39 |
633 | 805,211 | ||||||
| Virginia Electric & Power Co. |
||||||||
| 2.30%, 11/15/31 (Call 08/15/31) |
2,509 | 2,066,589 | ||||||
| 2.40%, 03/30/32 (Call 12/30/31) |
1,155 | 949,689 | ||||||
| 2.45%, 12/15/50 (Call 06/15/50) |
3,702 | 2,146,949 | ||||||
| 2.95%, 11/15/51 (Call 05/15/51) |
3,580 | 2,299,843 | ||||||
| 3.30%, 12/01/49 (Call 06/01/49) |
2,285 | 1,604,208 | ||||||
| 4.00%, 01/15/43 (Call 07/15/42) |
2,120 | 1,736,850 | ||||||
| 4.45%, 02/15/44 (Call 08/15/43) |
2,290 | 1,967,504 | ||||||
| Security | Par (000) |
Value | ||||||
| Electric (continued) |
||||||||
| 4.60%, 12/01/48 (Call 06/01/48) |
$ | 2,200 | $ | 1,903,817 | ||||
| 5.00%, 04/01/33 (Call 01/01/33) |
3,180 | 3,114,329 | ||||||
| 5.00%, 01/15/34 (Call 10/15/33) |
2,555 | 2,483,534 | ||||||
| 5.30%, 08/15/33 (Call 05/15/33) |
2,185 | 2,179,170 | ||||||
| 5.35%, 01/15/54 (Call 07/15/53) |
1,865 | 1,792,530 | ||||||
| 5.45%, 04/01/53 (Call 10/01/52) |
2,880 | 2,817,708 | ||||||
| 5.70%, 08/15/53 (Call 02/15/53) |
2,195 | 2,217,594 | ||||||
| 6.35%, 11/30/37 |
1,737 | 1,852,964 | ||||||
| 8.88%, 11/15/38 |
2,288 | 3,041,080 | ||||||
| Series A, 2.88%, 07/15/29 (Call 04/15/29) |
2,202 | 1,991,822 | ||||||
| Series A, 3.10%, 05/15/25 (Call 02/15/25) |
2,267 | 2,207,710 | ||||||
| Series A, 3.15%, 01/15/26 (Call 10/15/25) |
4,122 | 3,976,608 | ||||||
| Series A, 3.50%, 03/15/27 (Call 12/15/26) |
4,172 | 3,993,168 | ||||||
| Series A, 3.80%, 04/01/28 (Call 01/01/28) |
3,645 | 3,491,421 | ||||||
| Series A, 6.00%, 05/15/37 |
2,132 | 2,209,900 | ||||||
| Series B, 2.95%, 11/15/26 (Call 08/15/26) |
2,125 | 2,012,555 | ||||||
| Series B, 3.75%, 05/15/27 (Call 04/15/27) |
1,689 | 1,625,151 | ||||||
| Series B, 3.80%, 09/15/47 (Call 03/15/47) |
2,187 | 1,668,055 | ||||||
| Series B, 4.20%, 05/15/45 (Call 11/15/44) |
1,312 | 1,083,540 | ||||||
| Series B, 6.00%, 01/15/36 |
1,684 | 1,753,602 | ||||||
| Series C, 4.00%, 11/15/46 (Call 05/15/46) |
2,275 | 1,803,736 | ||||||
| Series C, 4.63%, 05/15/52 (Call 11/15/51) |
2,515 | 2,164,325 | ||||||
| Series D, 4.65%, 08/15/43 (Call 02/15/43) |
2,325 | 2,057,120 | ||||||
| WEC Energy Group Inc. |
||||||||
| 1.38%, 10/15/27 (Call 08/15/27)(b) |
2,954 | 2,599,191 | ||||||
| 1.80%, 10/15/30 (Call 07/15/30) |
2,042 | 1,654,468 | ||||||
| 2.20%, 12/15/28 (Call 10/15/28) |
887 | 778,824 | ||||||
| 4.75%, 01/09/26 (Call 12/09/25) |
4,515 | 4,469,916 | ||||||
| 4.75%, 01/15/28 (Call 12/15/27) |
2,350 | 2,320,401 | ||||||
| 5.00%, 09/27/25 (Call 08/27/25)(b) |
2,495 | 2,483,156 | ||||||
| 5.15%, 10/01/27 (Call 09/01/27) |
2,440 | 2,436,266 | ||||||
| 5.60%, 09/12/26 (Call 08/12/26) |
1,475 | 1,490,081 | ||||||
| Wisconsin Electric Power Co. |
||||||||
| 1.70%, 06/15/28 (Call 04/15/28)(b) |
2,075 | 1,822,619 | ||||||
| 4.30%, 10/15/48 (Call 04/15/48) |
905 | 759,230 | ||||||
| 4.75%, 09/30/32 (Call 06/30/32) |
1,770 | 1,734,552 | ||||||
| 5.63%, 05/15/33 |
580 | 606,710 | ||||||
| 5.70%, 12/01/36 |
500 | 513,478 | ||||||
| Wisconsin Power and Light Co. |
||||||||
| 1.95%, 09/16/31 (Call 06/16/31) |
2,300 | 1,834,462 | ||||||
| 3.00%, 07/01/29 (Call 04/01/29)(b) |
2,123 | 1,940,028 | ||||||
| 3.05%, 10/15/27 (Call 07/15/27) |
1,360 | 1,269,180 | ||||||
| 3.65%, 04/01/50 (Call 10/01/49) |
1,305 | 952,479 | ||||||
| 3.95%, 09/01/32 (Call 06/01/32) |
2,415 | 2,222,253 | ||||||
| 4.95%, 04/01/33 (Call 01/01/33) |
1,140 | 1,111,092 | ||||||
| 6.38%, 08/15/37 |
390 | 417,566 | ||||||
| Wisconsin Public Service Corp. |
||||||||
| 2.85%, 12/01/51 (Call 06/01/51) |
1,925 | 1,215,520 | ||||||
| 3.30%, 09/01/49 (Call 03/01/49) |
2,210 | 1,547,122 | ||||||
| 3.67%, 12/01/42 |
1,520 | 1,185,022 | ||||||
| 4.75%, 11/01/44 (Call 05/01/44) |
2,073 | 1,888,618 | ||||||
| 5.35%, 11/10/25 (Call 10/10/25) |
1,630 | 1,632,641 | ||||||
| Xcel Energy Inc. |
||||||||
| 1.75%, 03/15/27 (Call 02/15/27) |
2,865 | 2,586,214 | ||||||
| 2.35%, 11/15/31 (Call 05/15/31) |
1,700 | 1,381,332 | ||||||
| 2.60%, 12/01/29 (Call 06/01/29) |
2,551 | 2,238,287 | ||||||
| 3.30%, 06/01/25 (Call 12/01/24) |
2,834 | 2,755,681 | ||||||
| 3.35%, 12/01/26 (Call 06/01/26) |
3,337 | 3,155,192 | ||||||
| 3.40%, 06/01/30 (Call 12/01/29) |
2,815 | 2,538,571 | ||||||
| 3.50%, 12/01/49 (Call 06/01/49) |
2,185 | 1,524,369 | ||||||
| 4.00%, 06/15/28 (Call 12/15/27) |
3,249 | 3,105,096 | ||||||
| 48 | 2 0 2 4 I S H A R E S A N N U A L R E P O R T T O S H A R E H O L D E R S |
| Schedule of Investments (continued) February 29, 2024 |
iShares® Core U.S. Aggregate Bond ETF (Percentages shown are based on Net Assets) |
| Security | Par (000) |
Value | ||||||
| Electric (continued) |
||||||||
| 4.60%, 06/01/32 (Call 12/01/31) |
$ | 2,905 | $ | 2,706,534 | ||||
| 5.45%, 08/15/33 (Call 02/15/33) |
2,615 | 2,600,787 | ||||||
| 5.50%, 03/15/34 (Call 09/15/33) |
2,875 | 2,826,221 | ||||||
| 6.50%, 07/01/36 |
1,049 | 1,128,855 | ||||||
|
|
|
|||||||
| 2,150,694,297 | ||||||||
| Electrical Components & Equipment — 0.0% | ||||||||
| Acuity Brands Lighting Inc., 2.15%, 12/15/30 |
||||||||
| (Call 09/15/30) |
1,711 | 1,402,257 | ||||||
| Emerson Electric Co. |
||||||||
| 0.88%, 10/15/26 (Call 09/15/26) |
2,084 | 1,883,612 | ||||||
| 1.80%, 10/15/27 (Call 08/15/27) |
3,196 | 2,877,242 | ||||||
| 1.95%, 10/15/30 (Call 07/15/30) |
1,476 | 1,238,239 | ||||||
| 2.00%, 12/21/28 (Call 10/21/28) |
3,362 | 2,965,453 | ||||||
| 2.20%, 12/21/31 (Call 09/21/31) |
3,326 | 2,755,702 | ||||||
| 2.75%, 10/15/50 (Call 04/15/50) |
3,318 | 2,117,707 | ||||||
| 2.80%, 12/21/51 (Call 06/21/51) |
2,745 | 1,766,212 | ||||||
| 3.15%, 06/01/25 (Call 03/01/25) |
3,125 | 3,051,852 | ||||||
| 5.25%, 11/15/39 |
1,645 | 1,661,087 | ||||||
|
|
|
|||||||
| 21,719,363 | ||||||||
| Electronics — 0.2% | ||||||||
| Allegion PLC, 3.50%, 10/01/29 (Call 07/01/29) |
3,011 | 2,749,521 | ||||||
| Allegion U.S. Holding Co. Inc. |
||||||||
| 3.55%, 10/01/27 (Call 07/01/27) |
1,827 | 1,728,198 | ||||||
| 5.41%, 07/01/32 (Call 04/01/32) |
1,680 | 1,678,367 | ||||||
| Amphenol Corp. |
||||||||
| 2.05%, 03/01/25 (Call 02/01/25) |
1,166 | 1,126,944 | ||||||
| 2.20%, 09/15/31 (Call 06/15/31) |
2,765 | 2,268,376 | ||||||
| 2.80%, 02/15/30 (Call 11/15/29) |
4,952 | 4,410,248 | ||||||
| 4.35%, 06/01/29 (Call 03/01/29) |
1,711 | 1,663,161 | ||||||
| 4.75%, 03/30/26 |
320 | 317,763 | ||||||
| Arrow Electronics Inc. |
||||||||
| 2.95%, 02/15/32 (Call 11/15/31)(b) |
3,053 | 2,548,127 | ||||||
| 3.88%, 01/12/28 (Call 10/12/27) |
1,790 | 1,690,588 | ||||||
| 4.00%, 04/01/25 (Call 01/01/25) |
1,651 | 1,622,079 | ||||||
| 6.13%, 03/01/26 (Call 03/11/24) |
2,030 | 2,029,740 | ||||||
| Avnet Inc. |
||||||||
| 3.00%, 05/15/31 (Call 02/15/31) |
1,746 | 1,441,164 | ||||||
| 4.63%, 04/15/26 (Call 01/15/26) |
3,211 | 3,142,515 | ||||||
| 5.50%, 06/01/32 (Call 03/01/32) |
1,475 | 1,416,360 | ||||||
| 6.25%, 03/15/28 (Call 02/15/28) |
2,110 | 2,146,128 | ||||||
| Flex Ltd. |
||||||||
| 3.75%, 02/01/26 (Call 01/01/26) |
2,955 | 2,857,407 | ||||||
| 4.75%, 06/15/25 (Call 03/15/25) |
3,087 | 3,051,673 | ||||||
| 4.88%, 06/15/29 (Call 03/15/29) |
3,681 | 3,580,509 | ||||||
| 4.88%, 05/12/30 (Call 02/12/30) |
2,549 | 2,455,862 | ||||||
| 6.00%, 01/15/28 (Call 12/15/27) |
1,740 | 1,768,646 | ||||||
| Fortive Corp. |
||||||||
| 3.15%, 06/15/26 (Call 03/15/26) |
5,156 | 4,921,402 | ||||||
| 4.30%, 06/15/46 (Call 12/15/45) |
1,460 | 1,204,611 | ||||||
| Honeywell International Inc. |
||||||||
| 1.10%, 03/01/27 (Call 02/01/27) |
3,294 | 2,959,708 | ||||||
| 1.35%, 06/01/25 (Call 05/01/25) |
5,614 | 5,363,622 | ||||||
| 1.75%, 09/01/31 (Call 06/01/31) |
6,155 | 4,945,732 | ||||||
| 1.95%, 06/01/30 (Call 03/01/30) |
3,591 | 3,034,543 | ||||||
| 2.50%, 11/01/26 (Call 08/01/26) |
7,262 | 6,843,692 | ||||||
| 2.70%, 08/15/29 (Call 05/15/29) |
5,340 | 4,804,308 | ||||||
| 2.80%, 06/01/50 (Call 12/01/49)(b) |
4,105 | 2,830,254 | ||||||
| 3.81%, 11/21/47 (Call 05/21/47) |
2,930 | 2,360,979 | ||||||
| 4.25%, 01/15/29 (Call 12/15/28) |
2,845 | 2,782,796 | ||||||
| 4.50%, 01/15/34 (Call 10/15/33) |
2,855 | 2,746,836 | ||||||
| Security | Par (000) |
Value | ||||||
| Electronics (continued) |
||||||||
| 4.88%, 09/01/29 (Call 08/01/29) |
$ | 2,675 | $ | 2,677,270 | ||||
| 4.95%, 02/15/28 (Call 01/15/28)(b) |
3,640 | 3,678,407 | ||||||
| 4.95%, 09/01/31 (Call 07/01/31) |
2,875 | 2,869,927 | ||||||
| 5.00%, 02/15/33 (Call 11/15/32) |
5,375 | 5,385,340 | ||||||
| 5.00%, 03/01/35 (Call 12/01/34) |
2,675 | 2,668,661 | ||||||
| 5.25%, 03/01/54 (Call 09/01/53) |
2,675 | 2,667,026 | ||||||
| 5.35%, 03/01/64 (Call 09/01/63) |
2,735 | 2,729,617 | ||||||
| 5.38%, 03/01/41 |
975 | 1,001,439 | ||||||
| 5.70%, 03/15/36 |
2,200 | 2,322,948 | ||||||
| 5.70%, 03/15/37 |
2,155 | 2,259,043 | ||||||
| Hubbell Inc. |
||||||||
| 2.30%, 03/15/31 (Call 12/15/30) |
795 | 656,987 | ||||||
| 3.15%, 08/15/27 (Call 05/15/27) |
2,432 | 2,281,920 | ||||||
| 3.35%, 03/01/26 (Call 12/01/25) |
1,975 | 1,905,403 | ||||||
| 3.50%, 02/15/28 (Call 11/15/27) |
2,674 | 2,525,942 | ||||||
| Jabil Inc. |
||||||||
| 1.70%, 04/15/26 (Call 03/15/26) |
3,095 | 2,862,855 | ||||||
| 3.00%, 01/15/31 (Call 10/15/30) |
3,026 | 2,581,864 | ||||||
| 3.60%, 01/15/30 (Call 10/15/29) |
2,111 | 1,901,696 | ||||||
| 3.95%, 01/12/28 (Call 10/12/27) |
2,850 | 2,695,280 | ||||||
| 4.25%, 05/15/27 (Call 04/15/27) |
1,235 | 1,192,590 | ||||||
| 5.45%, 02/01/29 (Call 01/01/29) |
895 | 893,990 | ||||||
| Keysight Technologies Inc. |
||||||||
| 3.00%, 10/30/29 (Call 07/30/29) |
3,829 | 3,405,170 | ||||||
| 4.60%, 04/06/27 (Call 01/06/27) |
4,678 | 4,603,145 | ||||||
| TD SYNNEX Corp. |
||||||||
| 1.75%, 08/09/26 (Call 07/09/26) |
3,381 | 3,079,619 | ||||||
| 2.38%, 08/09/28 (Call 06/09/28) |
2,510 | 2,189,309 | ||||||
| 2.65%, 08/09/31 (Call 05/09/31) |
2,971 | 2,362,042 | ||||||
| Trimble Inc. |
||||||||
| 4.90%, 06/15/28 (Call 03/15/28) |
3,089 | 3,061,213 | ||||||
| 6.10%, 03/15/33 (Call 12/15/32) |
690 | 719,994 | ||||||
| Tyco Electronics Group SA |
||||||||
| 2.50%, 02/04/32 (Call 12/04/31) |
625 | 528,547 | ||||||
| 3.13%, 08/15/27 (Call 05/15/27) |
3,430 | 3,242,144 | ||||||
| 3.70%, 02/15/26 (Call 11/15/25) |
2,159 | 2,101,627 | ||||||
| 4.50%, 02/13/26 |
2,365 | 2,336,775 | ||||||
| 7.13%, 10/01/37 |
1,266 | 1,453,251 | ||||||
| Vontier Corp. |
||||||||
| 1.80%, 04/01/26 (Call 03/01/26) |
3,767 | 3,475,091 | ||||||
| 2.40%, 04/01/28 (Call 02/01/28) |
2,906 | 2,544,008 | ||||||
| 2.95%, 04/01/31 (Call 01/01/31) |
2,679 | 2,205,334 | ||||||
|
|
|
|||||||
| 175,557,333 | ||||||||
| Engineering & Construction — 0.0% | ||||||||
| Jacobs Engineering Group Inc. |
||||||||
| 5.90%, 03/01/33 (Call 12/01/32) |
3,855 | 3,854,332 | ||||||
| 6.35%, 08/18/28 (Call 07/18/28) |
4,342 | 4,471,771 | ||||||
| Ste Transcore Holdings Inc., 4.13%, 05/23/26(f) |
600 | 587,139 | ||||||
|
|
|
|||||||
| 8,913,242 | ||||||||
| Entertainment — 0.1% | ||||||||
| Warnermedia Holdings Inc. |
||||||||
| 3.64%, 03/15/25 |
7,280 | 7,126,091 | ||||||
| 3.76%, 03/15/27 (Call 02/15/27) |
15,625 | 14,787,960 | ||||||
| 3.79%, 03/15/25 (Call 03/11/24) |
890 | 872,474 | ||||||
| 4.05%, 03/15/29 (Call 01/15/29) |
6,065 | 5,605,219 | ||||||
| 4.28%, 03/15/32 (Call 12/15/31) |
19,461 | 17,175,099 | ||||||
| 5.05%, 03/15/42 (Call 09/15/41) |
9,413 | 7,900,382 | ||||||
| 5.14%, 03/15/52 (Call 09/15/51) |
24,175 | 19,630,007 | ||||||
| 5.39%, 03/15/62 (Call 09/15/61) |
9,585 | 7,715,072 | ||||||
| S C H E D U L E O F I N V E S T M E N T S |
49 |
| Schedule of Investments (continued) February 29, 2024 |
iShares® Core U.S. Aggregate Bond ETF (Percentages shown are based on Net Assets) |
| Security | Par (000) |
Value | ||||||
| Entertainment (continued) |
||||||||
| 6.41%, 03/15/26 (Call 03/15/24) |
$ | 1,055 | $ | 1,054,590 | ||||
|
|
|
|||||||
| 81,866,894 | ||||||||
| Environmental Control — 0.1% | ||||||||
| Nature Conservancy (The), Series A, 3.96%, 03/01/52 (Call 09/01/51)(b) |
1,673 | 1,409,101 | ||||||
| Republic Services Inc. |
||||||||
| 0.88%, 11/15/25 (Call 10/15/25)(b) |
2,275 | 2,109,837 | ||||||
| 1.45%, 02/15/31 (Call 11/15/30) |
3,693 | 2,908,397 | ||||||
| 1.75%, 02/15/32 (Call 11/15/31) |
2,175 | 1,705,244 | ||||||
| 2.30%, 03/01/30 (Call 12/01/29) |
4,080 | 3,504,270 | ||||||
| 2.38%, 03/15/33 (Call 12/15/32) |
3,080 | 2,468,292 | ||||||
| 2.90%, 07/01/26 (Call 04/01/26) |
2,034 | 1,942,436 | ||||||
| 3.05%, 03/01/50 (Call 09/01/49) |
2,305 | 1,595,990 | ||||||
| 3.20%, 03/15/25 (Call 12/15/24) |
2,840 | 2,772,878 | ||||||
| 3.38%, 11/15/27 (Call 08/15/27) |
3,170 | 3,005,664 | ||||||
| 3.95%, 05/15/28 (Call 02/15/28) |
4,001 | 3,848,976 | ||||||
| 4.88%, 04/01/29 (Call 03/01/29) |
2,225 | 2,215,251 | ||||||
| 5.00%, 12/15/33 (Call 09/15/33) |
2,605 | 2,560,870 | ||||||
| 5.00%, 04/01/34 (Call 01/01/34) |
2,995 | 2,948,921 | ||||||
| 5.70%, 05/15/41 (Call 11/15/40) |
716 | 742,786 | ||||||
| 6.20%, 03/01/40 |
825 | 898,834 | ||||||
| Veralto Corp. |
||||||||
| 5.35%, 09/18/28 (Call 08/18/28)(c) |
2,910 | 2,929,865 | ||||||
| 5.45%, 09/18/33 (Call 06/18/33)(c) |
1,740 | 1,747,855 | ||||||
| 5.50%, 09/18/26 (Call 08/18/26)(c) |
3,250 | 3,264,164 | ||||||
| Waste Connections Inc. |
||||||||
| 2.20%, 01/15/32 (Call 10/15/31) |
2,583 | 2,090,661 | ||||||
| 2.60%, 02/01/30 (Call 11/01/29) |
2,912 | 2,565,784 | ||||||
| 2.95%, 01/15/52 (Call 07/15/51)(b) |
2,905 | 1,922,143 | ||||||
| 3.05%, 04/01/50 (Call 10/01/49) |
1,991 | 1,344,366 | ||||||
| 3.20%, 06/01/32 (Call 03/01/32) |
2,100 | 1,828,140 | ||||||
| 3.50%, 05/01/29 (Call 02/01/29) |
2,311 | 2,164,780 | ||||||
| 4.20%, 01/15/33 (Call 10/15/32) |
2,965 | 2,769,107 | ||||||
| 4.25%, 12/01/28 (Call 09/01/28) |
2,677 | 2,592,275 | ||||||
| 5.00%, 03/01/34 (Call 12/01/33) |
1,900 | 1,860,366 | ||||||
| Waste Management Inc. |
||||||||
| 0.75%, 11/15/25 (Call 10/15/25) |
2,021 | 1,877,304 | ||||||
| 1.15%, 03/15/28 (Call 01/15/28) |
1,700 | 1,472,634 | ||||||
| 1.50%, 03/15/31 (Call 12/15/30) |
1,648 | 1,307,864 | ||||||
| 2.00%, 06/01/29 (Call 04/01/29) |
3,405 | 2,947,278 | ||||||
| 2.50%, 11/15/50 (Call 05/15/50) |
1,157 | 714,748 | ||||||
| 2.95%, 06/01/41 (Call 12/01/40) |
3,290 | 2,429,921 | ||||||
| 3.13%, 03/01/25 (Call 12/01/24) |
726 | 710,528 | ||||||
| 3.15%, 11/15/27 (Call 08/15/27) |
4,283 | 4,030,616 | ||||||
| 4.10%, 03/01/45 (Call 09/01/44) |
370 | 317,568 | ||||||
| 4.15%, 04/15/32 (Call 01/15/32) |
1,610 | 1,516,601 | ||||||
| 4.15%, 07/15/49 (Call 01/15/49) |
3,902 | 3,297,176 | ||||||
| 4.63%, 02/15/30 (Call 12/15/29) |
2,960 | 2,911,055 | ||||||
| 4.63%, 02/15/33 (Call 11/15/32) |
5,870 | 5,662,928 | ||||||
| 4.88%, 02/15/29 (Call 01/15/29) |
3,340 | 3,345,143 | ||||||
| 4.88%, 02/15/34 (Call 11/15/33) |
3,970 | 3,885,050 | ||||||
|
|
|
|||||||
| 100,143,667 | ||||||||
| Food — 0.4% | ||||||||
| Ahold Finance USA LLC, 6.88%, 05/01/29 |
1,736 | 1,883,187 | ||||||
| Campbell Soup Co. |
||||||||
| 2.38%, 04/24/30 (Call 01/24/30) |
3,468 | 2,944,666 | ||||||
| 3.13%, 04/24/50 (Call 10/24/49) |
1,790 | 1,167,168 | ||||||
| 3.30%, 03/19/25 (Call 12/19/24) |
2,084 | 2,031,842 | ||||||
| 3.95%, 03/15/25 (Call 01/15/25) |
4,257 | 4,188,763 | ||||||
| 4.15%, 03/15/28 (Call 12/15/27) |
4,522 | 4,361,815 | ||||||
| Security | Par (000) |
Value | ||||||
| Food (continued) |
||||||||
| 4.80%, 03/15/48 (Call 09/15/47) |
$ | 3,195 | $ | 2,802,269 | ||||
| Conagra Brands Inc. |
||||||||
| 1.38%, 11/01/27 (Call 09/01/27) |
3,333 | 2,896,067 | ||||||
| 4.60%, 11/01/25 (Call 09/01/25) |
4,391 | 4,325,908 | ||||||
| 4.85%, 11/01/28 (Call 08/01/28) |
3,880 | 3,812,802 | ||||||
| 5.30%, 10/01/26 |
2,165 | 2,165,328 | ||||||
| 5.30%, 11/01/38 (Call 05/01/38) |
4,351 | 4,108,517 | ||||||
| 5.40%, 11/01/48 (Call 05/01/48) |
3,743 | 3,454,365 | ||||||
| 7.00%, 10/01/28 |
2,659 | 2,840,608 | ||||||
| 8.25%, 09/15/30 |
2,132 | 2,448,148 | ||||||
| Flowers Foods Inc. |
||||||||
| 2.40%, 03/15/31 (Call 12/15/30) |
1,870 | 1,562,050 | ||||||
| 3.50%, 10/01/26 (Call 07/01/26) |
1,737 | 1,665,591 | ||||||
| General Mills Inc. |
||||||||
| 2.25%, 10/14/31 (Call 07/14/31) |
2,582 | 2,116,090 | ||||||
| 2.88%, 04/15/30 (Call 01/15/30) |
3,284 | 2,899,579 | ||||||
| 3.00%, 02/01/51 (Call 08/01/50) |
4,044 | 2,606,607 | ||||||
| 3.20%, 02/10/27 (Call 11/10/26) |
3,747 | 3,561,574 | ||||||
| 4.00%, 04/17/25 (Call 02/17/25) |
5,537 | 5,449,114 | ||||||
| 4.20%, 04/17/28 (Call 01/17/28) |
6,643 | 6,441,200 | ||||||
| 4.70%, 01/30/27 (Call 12/20/26) |
2,410 | 2,385,740 | ||||||
| 4.70%, 04/17/48 (Call 10/17/47)(b) |
230 | 207,424 | ||||||
| 4.95%, 03/29/33 (Call 12/29/32)(b) |
4,306 | 4,226,721 | ||||||
| 5.24%, 11/18/25 (Call 03/18/24)(b) |
1,350 | 1,348,354 | ||||||
| 5.40%, 06/15/40(b) |
1,037 | 1,019,313 | ||||||
| 5.50%, 10/17/28 (Call 09/17/28) |
2,215 | 2,251,090 | ||||||
| Hershey Co. (The) |
||||||||
| 0.90%, 06/01/25 (Call 05/01/25) |
3,631 | 3,450,019 | ||||||
| 1.70%, 06/01/30 (Call 03/01/30) |
1,752 | 1,462,062 | ||||||
| 2.30%, 08/15/26 (Call 05/15/26) |
4,217 | 3,979,593 | ||||||
| 2.45%, 11/15/29 (Call 08/15/29) |
1,728 | 1,531,678 | ||||||
| 2.65%, 06/01/50 (Call 12/01/49) |
745 | 480,758 | ||||||
| 3.13%, 11/15/49 (Call 05/15/49) |
2,019 | 1,446,325 | ||||||
| 3.20%, 08/21/25 (Call 05/21/25) |
1,103 | 1,076,253 | ||||||
| 3.38%, 08/15/46 (Call 02/15/46) |
775 | 582,923 | ||||||
| 4.25%, 05/04/28 (Call 04/04/28) |
1,830 | 1,799,523 | ||||||
| 4.50%, 05/04/33 (Call 02/04/33)(b) |
790 | 772,919 | ||||||
| Hormel Foods Corp. |
||||||||
| 1.70%, 06/03/28 (Call 04/03/28) |
5,675 | 5,009,704 | ||||||
| 1.80%, 06/11/30 (Call 03/11/30)(b) |
1,557 | 1,292,085 | ||||||
| 3.05%, 06/03/51 (Call 12/03/50) |
3,570 | 2,395,686 | ||||||
| Ingredion Inc. |
||||||||
| 2.90%, 06/01/30 (Call 03/01/30) |
1,404 | 1,233,723 | ||||||
| 3.20%, 10/01/26 (Call 07/01/26) |
3,260 | 3,108,732 | ||||||
| 3.90%, 06/01/50 (Call 12/01/49) |
2,000 | 1,464,948 | ||||||
| J M Smucker Co. (The) |
||||||||
| 5.90%, 11/15/28 (Call 10/15/28) |
3,915 | 4,029,899 | ||||||
| 6.20%, 11/15/33 (Call 08/15/33)(b) |
4,375 | 4,628,176 | ||||||
| 6.50%, 11/15/43 (Call 05/15/43) |
2,250 | 2,403,642 | ||||||
| 6.50%, 11/15/53 (Call 05/15/53) |
1,440 | 1,567,813 | ||||||
| JBS USA LUX SA/JBS USA Food Co./JBS Luxembourg SARL |
||||||||
| 6.75%, 03/15/34 (Call 12/15/33)(c) |
7,325 | 7,542,598 | ||||||
| 7.25%, 11/15/53 (Call 05/15/53)(c) |
4,080 | 4,276,938 | ||||||
| JBS USA LUX SA/JBS USA Food Co./JBS USA Finance Inc. |
||||||||
| 2.50%, 01/15/27 (Call 12/15/26) |
495 | 454,602 | ||||||
| 3.00%, 02/02/29 (Call 12/02/28) |
475 | 416,336 | ||||||
| 3.00%, 05/15/32 (Call 02/15/32) |
3,021 | 2,418,050 | ||||||
| 3.63%, 01/15/32 (Call 01/15/27) |
995 | 836,665 | ||||||
| 3.75%, 12/01/31 (Call 12/01/26) |
1,335 | 1,134,487 | ||||||
| 50 | 2 0 2 4 I S H A R E S A N N U A L R E P O R T T O S H A R E H O L D E R S |
| Schedule of Investments (continued) February 29, 2024 |
iShares® Core U.S. Aggregate Bond ETF (Percentages shown are based on Net Assets) |
| Security | Par (000) |
Value | ||||||
| Food (continued) |
||||||||
| 4.38%, 02/02/52 (Call 08/02/51) |
$ | 2,400 | $ | 1,720,194 | ||||
| 5.13%, 02/01/28 (Call 01/01/28) |
4,648 | 4,552,042 | ||||||
| 5.50%, 01/15/30 (Call 01/15/25) |
3,255 | 3,170,637 | ||||||
| 5.75%, 04/01/33 (Call 01/01/33) |
7,000 | 6,786,791 | ||||||
| 6.50%, 12/01/52 (Call 06/01/52) |
6,679 | 6,435,320 | ||||||
| JM Smucker Co. (The) |
||||||||
| 2.13%, 03/15/32 (Call 12/15/31) |
2,580 | 2,058,827 | ||||||
| 2.38%, 03/15/30 (Call 12/15/29) |
2,500 | 2,144,292 | ||||||
| 2.75%, 09/15/41 (Call 03/15/41)(b) |
1,290 | 861,691 | ||||||
| 3.38%, 12/15/27 (Call 09/15/27) |
3,205 | 3,022,172 | ||||||
| 3.50%, 03/15/25 |
5,575 | 5,462,997 | ||||||
| 3.55%, 03/15/50 (Call 09/15/49) |
1,553 | 1,087,694 | ||||||
| 4.25%, 03/15/35 |
3,917 | 3,507,605 | ||||||
| 4.38%, 03/15/45 |
1,956 | 1,634,510 | ||||||
| Kellanova |
||||||||
| 2.10%, 06/01/30 (Call 03/01/30) |
1,780 | 1,497,902 | ||||||
| 3.25%, 04/01/26 |
4,766 | 4,581,189 | ||||||
| 3.40%, 11/15/27 (Call 08/15/27) |
2,867 | 2,699,302 | ||||||
| 4.30%, 05/15/28 (Call 02/15/28) |
3,379 | 3,281,377 | ||||||
| 4.50%, 04/01/46 |
2,074 | 1,782,567 | ||||||
| 5.25%, 03/01/33 (Call 12/01/32) |
1,165 | 1,156,402 | ||||||
| Series B, 7.45%, 04/01/31 |
3,672 | 4,108,196 | ||||||
| Koninklijke Ahold Delhaize NV, 5.70%, 10/01/40 |
1,575 | 1,562,245 | ||||||
| Kraft Heinz Foods Co. |
||||||||
| 3.00%, 06/01/26 (Call 03/01/26) |
7,620 | 7,270,586 | ||||||
| 3.75%, 04/01/30 (Call 01/01/30) |
3,655 | 3,407,498 | ||||||
| 3.88%, 05/15/27 (Call 02/15/27) |
6,695 | 6,461,877 | ||||||
| 4.25%, 03/01/31 (Call 12/01/30) |
1,927 | 1,829,944 | ||||||
| 4.38%, 06/01/46 (Call 12/01/45) |
9,945 | 8,249,560 | ||||||
| 4.63%, 01/30/29 (Call 10/30/28) |
2,800 | 2,746,062 | ||||||
| 4.63%, 10/01/39 (Call 04/01/39) |
1,710 | 1,544,343 | ||||||
| 4.88%, 10/01/49 (Call 04/01/49) |
4,535 | 4,046,898 | ||||||
| 5.00%, 07/15/35 (Call 01/15/35) |
3,460 | 3,377,455 | ||||||
| 5.00%, 06/04/42 |
5,646 | 5,208,453 | ||||||
| 5.20%, 07/15/45 (Call 01/15/45) |
6,390 | 5,964,816 | ||||||
| 5.50%, 06/01/50 (Call 12/01/49) |
3,640 | 3,542,640 | ||||||
| 6.50%, 02/09/40 |
2,880 | 3,106,566 | ||||||
| 6.75%, 03/15/32 |
1,935 | 2,128,473 | ||||||
| 6.88%, 01/26/39 |
3,350 | 3,751,781 | ||||||
| Kroger Co. (The) |
||||||||
| 1.70%, 01/15/31 (Call 10/15/30)(b) |
2,575 | 2,052,099 | ||||||
| 2.20%, 05/01/30 (Call 02/01/30) |
2,498 | 2,100,408 | ||||||
| 2.65%, 10/15/26 (Call 07/15/26) |
3,587 | 3,370,377 | ||||||
| 3.50%, 02/01/26 (Call 11/01/25) |
3,381 | 3,276,975 | ||||||
| 3.70%, 08/01/27 (Call 05/01/27) |
3,070 | 2,944,729 | ||||||
| 3.88%, 10/15/46 (Call 04/15/46) |
1,916 | 1,453,973 | ||||||
| 3.95%, 01/15/50 (Call 07/15/49) |
2,776 | 2,174,451 | ||||||
| 4.45%, 02/01/47 (Call 08/01/46) |
3,316 | 2,796,798 | ||||||
| 4.50%, 01/15/29 (Call 10/15/28) |
3,466 | 3,387,763 | ||||||
| 4.65%, 01/15/48 (Call 07/15/47) |
1,974 | 1,719,738 | ||||||
| 5.00%, 04/15/42 (Call 10/15/41) |
1,436 | 1,331,916 | ||||||
| 5.15%, 08/01/43 (Call 02/01/43) |
1,950 | 1,811,965 | ||||||
| 5.40%, 07/15/40 (Call 01/15/40) |
1,613 | 1,559,991 | ||||||
| 5.40%, 01/15/49 (Call 07/15/48) |
2,207 | 2,152,293 | ||||||
| 6.90%, 04/15/38 |
2,325 | 2,595,461 | ||||||
| 7.50%, 04/01/31 |
2,503 | 2,823,604 | ||||||
| McCormick & Co. Inc./MD |
||||||||
| 0.90%, 02/15/26 (Call 01/15/26) |
3,470 | 3,192,404 | ||||||
| 1.85%, 02/15/31 (Call 11/15/30) |
2,553 | 2,052,363 | ||||||
| 2.50%, 04/15/30 (Call 01/15/30) |
3,025 | 2,588,881 | ||||||
| Security | Par (000) |
Value | ||||||
| Food (continued) |
||||||||
| 3.40%, 08/15/27 (Call 05/15/27) |
$ | 5,110 | $ | 4,833,524 | ||||
| 4.20%, 08/15/47 (Call 02/15/47)(b) |
1,580 | 1,307,399 | ||||||
| 4.95%, 04/15/33 (Call 01/15/33)(b) |
2,280 | 2,225,280 | ||||||
| Mondelez International Inc. |
||||||||
| 1.50%, 05/04/25 (Call 04/04/25) |
5,128 | 4,902,413 | ||||||
| 1.50%, 02/04/31 (Call 11/04/30) |
3,006 | 2,389,195 | ||||||
| 1.88%, 10/15/32 (Call 07/15/32)(b) |
2,129 | 1,675,452 | ||||||
| 2.63%, 03/17/27 (Call 02/17/27) |
2,320 | 2,163,241 | ||||||
| 2.63%, 09/04/50 (Call 03/04/50) |
4,405 | 2,751,683 | ||||||
| 2.75%, 04/13/30 (Call 01/13/30) |
3,543 | 3,128,846 | ||||||
| 3.00%, 03/17/32 (Call 12/17/31) |
305 | 262,908 | ||||||
| 4.13%, 05/07/28 (Call 02/07/28) |
895 | 876,499 | ||||||
| 4.75%, 02/20/29 (Call 01/20/29) |
2,200 | 2,174,453 | ||||||
| Pilgrim’s Pride Corp. |
||||||||
| 3.50%, 03/01/32 (Call 09/01/26) |
4,410 | 3,685,482 | ||||||
| 4.25%, 04/15/31 (Call 04/15/26) |
5,045 | 4,507,397 | ||||||
| 6.25%, 07/01/33 (Call 04/01/33) |
4,360 | 4,413,485 | ||||||
| 6.88%, 05/15/34 (Call 02/15/34) |
1,300 | 1,368,750 | ||||||
| Sysco Corp. |
||||||||
| 2.40%, 02/15/30 (Call 11/15/29) |
3,204 | 2,758,173 | ||||||
| 2.45%, 12/14/31 (Call 09/14/31) |
2,610 | 2,162,344 | ||||||
| 3.15%, 12/14/51 (Call 06/14/51) |
3,615 | 2,446,165 | ||||||
| 3.25%, 07/15/27 (Call 04/15/27) |
3,971 | 3,742,338 | ||||||
| 3.30%, 07/15/26 (Call 04/15/26) |
4,300 | 4,128,390 | ||||||
| 3.30%, 02/15/50 (Call 08/15/49) |
2,419 | 1,713,231 | ||||||
| 3.75%, 10/01/25 (Call 07/01/25) |
4,280 | 4,170,930 | ||||||
| 4.45%, 03/15/48 (Call 09/15/47) |
1,943 | 1,643,227 | ||||||
| 4.50%, 04/01/46 (Call 10/01/45) |
975 | 834,310 | ||||||
| 4.85%, 10/01/45 (Call 04/01/45) |
1,975 | 1,787,569 | ||||||
| 5.38%, 09/21/35 |
1,924 | 1,940,695 | ||||||
| 5.75%, 01/17/29 (Call 12/17/28) |
2,210 | 2,262,992 | ||||||
| 5.95%, 04/01/30 (Call 01/01/30) |
3,153 | 3,277,442 | ||||||
| 6.00%, 01/17/34 (Call 10/17/33) |
3,186 | 3,350,057 | ||||||
| 6.60%, 04/01/40 (Call 10/01/39) |
1,185 | 1,299,385 | ||||||
| 6.60%, 04/01/50 (Call 10/01/49) |
4,617 | 5,213,442 | ||||||
| Tyson Foods Inc. |
||||||||
| 3.55%, 06/02/27 (Call 03/02/27) |
7,204 | 6,829,154 | ||||||
| 4.00%, 03/01/26 (Call 01/01/26) |
3,175 | 3,099,865 | ||||||
| 4.35%, 03/01/29 (Call 12/01/28) |
5,969 | 5,743,505 | ||||||
| 4.55%, 06/02/47 (Call 12/02/46) |
3,246 | 2,628,248 | ||||||
| 4.88%, 08/15/34 (Call 02/15/34) |
3,376 | 3,206,830 | ||||||
| 5.10%, 09/28/48 (Call 03/28/48) |
5,975 | 5,269,020 | ||||||
| 5.15%, 08/15/44 (Call 02/15/44) |
2,026 | 1,824,531 | ||||||
| 5.40%, 03/15/29 (Call 02/15/29) |
1,900 | 1,901,607 | ||||||
| 5.70%, 03/15/34 (Call 12/15/33) |
1,900 | 1,899,379 | ||||||
| Walmart Inc., 3.90%, 09/09/25 |
4,670 | 4,599,540 | ||||||
|
|
|
|||||||
| 437,503,506 | ||||||||
| Forest Products & Paper — 0.1% | ||||||||
| Celulosa Arauco y Constitucion SA |
||||||||
| 3.88%, 11/02/27 (Call 08/02/27) |
3,113 | 2,919,219 | ||||||
| 5.50%, 11/02/47 (Call 05/02/47) |
1,580 | 1,334,222 | ||||||
| Georgia-Pacific LLC |
||||||||
| 7.75%, 11/15/29 |
2,453 | 2,786,148 | ||||||
| 8.88%, 05/15/31 |
2,645 | 3,246,363 | ||||||
| International Paper Co. |
||||||||
| 4.35%, 08/15/48 (Call 02/15/48)(b) |
1,906 | 1,614,226 | ||||||
| 4.40%, 08/15/47 (Call 02/15/47) |
3,023 | 2,512,365 | ||||||
| 4.80%, 06/15/44 (Call 12/15/43) |
3,455 | 3,076,300 | ||||||
| 5.00%, 09/15/35 (Call 03/15/35) |
1,935 | 1,875,784 | ||||||
| 5.15%, 05/15/46 (Call 11/15/45) |
410 | 380,455 | ||||||
| 6.00%, 11/15/41 (Call 05/15/41) |
3,026 | 3,116,816 | ||||||
| S C H E D U L E O F I N V E S T M E N T S |
51 |
| Schedule of Investments (continued) February 29, 2024 |
iShares® Core U.S. Aggregate Bond ETF (Percentages shown are based on Net Assets) |
| Security | Par (000) |
Value | ||||||
| Forest Products & Paper (continued) |
||||||||
| 7.30%, 11/15/39(b) |
$ | 25 | $ | 29,012 | ||||
| Suzano Austria GmbH |
||||||||
| 2.50%, 09/15/28 (Call 07/15/28) |
2,129 | 1,859,682 | ||||||
| 3.13%, 01/15/32 (Call 10/15/31) |
3,892 | 3,195,856 | ||||||
| 3.75%, 01/15/31 (Call 10/15/30) |
3,126 | 2,731,255 | ||||||
| 5.00%, 01/15/30 (Call 10/15/29) |
4,856 | 4,620,907 | ||||||
| 6.00%, 01/15/29 (Call 10/15/28) |
7,402 | 7,403,269 | ||||||
| Suzano International Finance BV, 5.50%, |
||||||||
| 01/17/27 |
4,909 | 4,902,231 | ||||||
|
|
|
|||||||
| 47,604,110 | ||||||||
| Gas — 0.2% |
||||||||
| Atmos Energy Corp. |
||||||||
| 1.50%, 01/15/31 (Call 10/15/30) |
2,390 | 1,900,950 | ||||||
| 2.63%, 09/15/29 (Call 06/15/29) |
1,991 | 1,772,319 | ||||||
| 2.85%, 02/15/52 (Call 08/15/51) |
1,158 | 742,113 | ||||||
| 3.00%, 06/15/27 (Call 03/15/27) |
3,075 | 2,892,049 | ||||||
| 3.38%, 09/15/49 (Call 03/15/49) |
2,982 | 2,156,268 | ||||||
| 4.13%, 10/15/44 (Call 04/15/44) |
2,066 | 1,755,395 | ||||||
| 4.13%, 03/15/49 (Call 09/15/48) |
3,474 | 2,860,201 | ||||||
| 4.15%, 01/15/43 (Call 07/15/42) |
2,924 | 2,490,917 | ||||||
| 4.30%, 10/01/48 (Call 04/01/48) |
1,748 | 1,501,531 | ||||||
| 5.45%, 10/15/32 (Call 07/15/32) |
305 | 312,287 | ||||||
| 5.50%, 06/15/41 (Call 12/15/40) |
2,026 | 2,044,593 | ||||||
| 5.75%, 10/15/52 (Call 04/15/52) |
1,735 | 1,816,231 | ||||||
| 5.90%, 11/15/33 (Call 08/15/33)(b) |
1,885 | 1,981,041 | ||||||
| 6.20%, 11/15/53 (Call 05/15/53) |
1,135 | 1,252,505 | ||||||
| CenterPoint Energy Resources Corp. |
||||||||
| 1.75%, 10/01/30 (Call 07/01/30) |
3,305 | 2,685,832 | ||||||
| 4.00%, 04/01/28 (Call 01/01/28) |
2,204 | 2,116,378 | ||||||
| 4.10%, 09/01/47 (Call 03/01/47) |
1,098 | 878,853 | ||||||
| 4.40%, 07/01/32 (Call 04/01/32) |
2,170 | 2,054,429 | ||||||
| 5.25%, 03/01/28 (Call 02/01/28) |
4,792 | 4,826,481 | ||||||
| 5.40%, 03/01/33 (Call 12/01/32) |
2,798 | 2,816,313 | ||||||
| 5.85%, 01/15/41 (Call 07/15/40) |
1,338 | 1,365,184 | ||||||
| National Fuel Gas Co. |
||||||||
| 2.95%, 03/01/31 (Call 12/01/30) |
1,595 | 1,330,465 | ||||||
| 3.95%, 09/15/27 (Call 06/15/27) |
879 | 833,649 | ||||||
| 4.75%, 09/01/28 (Call 06/01/28) |
2,133 | 2,061,116 | ||||||
| 5.20%, 07/15/25 (Call 04/15/25) |
2,089 | 2,072,157 | ||||||
| 5.50%, 01/15/26 (Call 12/15/25) |
3,037 | 3,027,701 | ||||||
| 5.50%, 10/01/26 |
1,410 | 1,405,829 | ||||||
| NiSource Inc. |
||||||||
| 0.95%, 08/15/25 (Call 07/15/25) |
5,608 | 5,263,625 | ||||||
| 1.70%, 02/15/31 (Call 11/15/30) |
4,065 | 3,224,709 | ||||||
| 2.95%, 09/01/29 (Call 06/01/29) |
3,664 | 3,294,462 | ||||||
| 3.49%, 05/15/27 (Call 02/15/27) |
4,699 | 4,467,520 | ||||||
| 3.60%, 05/01/30 (Call 02/01/30) |
4,509 | 4,127,456 | ||||||
| 3.95%, 03/30/48 (Call 09/30/47) |
2,971 | 2,282,816 | ||||||
| 4.38%, 05/15/47 (Call 11/15/46) |
3,901 | 3,222,296 | ||||||
| 4.80%, 02/15/44 (Call 08/15/43) |
3,314 | 2,939,487 | ||||||
| 5.00%, 06/15/52 (Call 12/15/51) |
1,840 | 1,663,121 | ||||||
| 5.25%, 03/30/28 (Call 02/29/28) |
2,571 | 2,582,750 | ||||||
| 5.25%, 02/15/43 (Call 08/15/42) |
1,770 | 1,667,939 | ||||||
| 5.40%, 06/30/33 (Call 03/30/33) |
1,143 | 1,141,405 | ||||||
| 5.65%, 02/01/45 (Call 08/01/44) |
1,882 | 1,828,136 | ||||||
| 5.95%, 06/15/41 (Call 12/15/40) |
1,855 | 1,884,020 | ||||||
| ONE Gas Inc. |
||||||||
| 2.00%, 05/15/30 (Call 02/15/30)(b) |
827 | 687,532 | ||||||
| 4.25%, 09/01/32 (Call 06/01/32)(b) |
865 | 819,031 | ||||||
| 4.50%, 11/01/48 (Call 05/01/48) |
2,030 | 1,743,283 | ||||||
| 4.66%, 02/01/44 (Call 08/01/43) |
1,548 | 1,378,571 | ||||||
| Security | Par (000) |
Value | ||||||
| Gas (continued) |
||||||||
| 5.10%, 04/01/29 (Call 03/01/29) |
$ | 1,850 | $ | 1,854,534 | ||||
| Piedmont Natural Gas Co. Inc. |
||||||||
| 2.50%, 03/15/31 (Call 12/15/30) |
2,260 | 1,890,212 | ||||||
| 3.35%, 06/01/50 (Call 12/01/49) |
2,040 | 1,355,643 | ||||||
| 3.50%, 06/01/29 (Call 03/01/29) |
2,724 | 2,507,941 | ||||||
| 3.64%, 11/01/46 (Call 05/01/46) |
1,532 | 1,079,456 | ||||||
| 4.65%, 08/01/43 (Call 02/01/43) |
1,045 | 908,214 | ||||||
| 5.05%, 05/15/52 (Call 11/15/51) |
1,658 | 1,494,003 | ||||||
| 5.40%, 06/15/33 (Call 03/15/33) |
1,349 | 1,352,997 | ||||||
| Southern California Gas Co. |
||||||||
| 2.95%, 04/15/27 (Call 03/15/27) |
4,125 | 3,881,100 | ||||||
| 3.20%, 06/15/25 (Call 03/15/25) |
1,941 | 1,896,637 | ||||||
| 3.75%, 09/15/42 (Call 03/15/42) |
1,690 | 1,332,362 | ||||||
| 5.13%, 11/15/40(b) |
1,625 | 1,552,838 | ||||||
| 5.20%, 06/01/33 (Call 03/01/33) |
2,545 | 2,527,453 | ||||||
| 5.75%, 06/01/53 (Call 12/01/52) |
2,160 | 2,180,600 | ||||||
| 6.35%, 11/15/52 (Call 05/15/52) |
2,515 | 2,754,992 | ||||||
| Series TT, 2.60%, 06/15/26 (Call 03/15/26) |
3,637 | 3,446,826 | ||||||
| Series UU, 4.13%, 06/01/48 (Call 12/01/47) |
1,844 | 1,491,680 | ||||||
| Series VV, 4.30%, 01/15/49 (Call 07/15/48) |
2,345 | 1,922,125 | ||||||
| Series WW, 3.95%, 02/15/50 |
||||||||
| (Call 08/15/49) |
1,317 | 1,014,858 | ||||||
| Series XX, 2.55%, 02/01/30 (Call 11/01/29) |
2,933 | 2,546,587 | ||||||
| Southern Co. Gas Capital Corp. |
||||||||
| 3.25%, 06/15/26 (Call 03/15/26) |
1,854 | 1,772,287 | ||||||
| 3.95%, 10/01/46 (Call 04/01/46) |
2,642 | 2,007,161 | ||||||
| 4.40%, 06/01/43 (Call 12/01/42) |
2,430 | 2,017,888 | ||||||
| 4.40%, 05/30/47 (Call 11/30/46) |
2,188 | 1,775,584 | ||||||
| 5.15%, 09/15/32 (Call 03/15/32) |
1,475 | 1,461,874 | ||||||
| 5.75%, 09/15/33 (Call 03/15/33) |
1,850 | 1,894,603 | ||||||
| 5.88%, 03/15/41 (Call 09/15/40) |
2,310 | 2,309,623 | ||||||
| Series 2020-A, 1.75%, 01/15/31 |
||||||||
| (Call 10/15/30) |
2,899 | 2,322,968 | ||||||
| Series 21A, 3.15%, 09/30/51 |
||||||||
| (Call 03/30/51) |
1,800 | 1,157,349 | ||||||
| Southwest Gas Corp. |
||||||||
| 2.20%, 06/15/30 (Call 03/15/30) |
1,578 | 1,316,582 | ||||||
| 3.18%, 08/15/51 (Call 02/15/51) |
1,325 | 850,153 | ||||||
| 3.70%, 04/01/28 (Call 01/01/28) |
2,033 | 1,919,557 | ||||||
| 3.80%, 09/29/46 (Call 03/29/46)(b) |
1,381 | 1,009,690 | ||||||
| 4.05%, 03/15/32 (Call 12/15/31) |
2,792 | 2,554,184 | ||||||
| 4.15%, 06/01/49 (Call 12/01/48) |
1,439 | 1,100,129 | ||||||
| 5.45%, 03/23/28 (Call 02/23/28) |
1,550 | 1,562,913 | ||||||
| 5.80%, 12/01/27 (Call 11/01/27) |
2,000 | 2,035,641 | ||||||
| Spire Inc., 5.30%, 03/01/26 |
570 | 568,785 | ||||||
| Spire Missouri Inc. |
||||||||
| 3.30%, 06/01/51 (Call 12/01/50)(b) |
420 | 284,163 | ||||||
| 4.80%, 02/15/33 (Call 11/15/32)(b) |
1,070 | 1,039,578 | ||||||
| Washington Gas Light Co. |
||||||||
| 3.65%, 09/15/49 (Call 03/15/49) |
2,185 | 1,610,292 | ||||||
| Series K, 3.80%, 09/15/46 (Call 03/15/46) |
2,306 | 1,701,252 | ||||||
|
|
|
|||||||
| 170,434,260 | ||||||||
| Hand & Machine Tools — 0.0% |
||||||||
| Kennametal Inc. |
||||||||
| 2.80%, 03/01/31 (Call 12/01/30) |
1,515 | 1,268,957 | ||||||
| 4.63%, 06/15/28 (Call 03/15/28) |
930 | 904,345 | ||||||
| Regal Rexnord Corp. |
||||||||
| 6.05%, 02/15/26(c) |
5,235 | 5,259,380 | ||||||
| 6.05%, 04/15/28 (Call 03/15/28)(c) |
5,445 | 5,476,481 | ||||||
| 6.30%, 02/15/30 (Call 12/15/29)(c) |
2,460 | 2,503,051 | ||||||
| 6.40%, 04/15/33 (Call 01/15/33)(c) |
3,665 | 3,761,296 | ||||||
| 52 | 2 0 2 4 I S H A R E S A N N U A L R E P O R T T O S H A R E H O L D E R S |
| Schedule of Investments (continued) February 29, 2024 |
iShares® Core U.S. Aggregate Bond ETF (Percentages shown are based on Net Assets) |
| Security | Par (000) |
Value | ||||||
| Hand & Machine Tools (continued) |
||||||||
| Snap-on Inc. |
||||||||
| 3.10%, 05/01/50 (Call 11/01/49) |
$ | 2,034 | $ | 1,427,697 | ||||
| 3.25%, 03/01/27 (Call 12/01/26) |
1,925 | 1,843,033 | ||||||
| 4.10%, 03/01/48 (Call 09/01/47) |
1,045 | 872,145 | ||||||
| Stanley Black & Decker Inc. |
||||||||
| 2.30%, 03/15/30 (Call 12/15/29) |
3,765 | 3,160,710 | ||||||
| 2.75%, 11/15/50 (Call 05/15/50) |
3,655 | 2,129,831 | ||||||
| 3.00%, 05/15/32 (Call 02/15/32)(b) |
2,467 | 2,083,238 | ||||||
| 3.40%, 03/01/26 (Call 01/01/26) |
3,390 | 3,267,399 | ||||||
| 4.00%, 03/15/60 (Call 03/15/25), |
||||||||
| (5-year CMT + 2.657%)(a) |
2,940 | 2,617,141 | ||||||
| 4.25%, 11/15/28 (Call 08/15/28) |
2,141 | 2,065,789 | ||||||
| 4.85%, 11/15/48 (Call 05/15/48) |
2,127 | 1,840,485 | ||||||
| 5.20%, 09/01/40 |
1,598 | 1,499,577 | ||||||
| 6.00%, 03/06/28 (Call 02/06/28) |
3,710 | 3,828,919 | ||||||
|
|
|
|||||||
| 45,809,474 | ||||||||
| Health Care - Products — 0.3% |
||||||||
| Abbott Laboratories |
||||||||
| 1.15%, 01/30/28 (Call 11/30/27) |
4,544 | 3,984,657 | ||||||
| 1.40%, 06/30/30 (Call 03/30/30) |
4,048 | 3,337,992 | ||||||
| 2.95%, 03/15/25 (Call 12/15/24) |
4,775 | 4,672,063 | ||||||
| 3.75%, 11/30/26 (Call 08/30/26) |
9,482 | 9,238,439 | ||||||
| 3.88%, 09/15/25 (Call 06/15/25) |
3,594 | 3,540,360 | ||||||
| 4.75%, 11/30/36 (Call 05/30/36) |
6,483 | 6,347,539 | ||||||
| 4.75%, 04/15/43 (Call 10/15/42) |
5,000 | 4,786,580 | ||||||
| 4.90%, 11/30/46 (Call 05/30/46) |
9,637 | 9,289,711 | ||||||
| 5.30%, 05/27/40 |
3,955 | 4,037,212 | ||||||
| 6.00%, 04/01/39 |
1,250 | 1,386,986 | ||||||
| 6.15%, 11/30/37 |
3,570 | 3,956,080 | ||||||
| Agilent Technologies Inc. |
||||||||
| 2.10%, 06/04/30 (Call 03/04/30) |
1,211 | 1,014,499 | ||||||
| 2.30%, 03/12/31 (Call 12/12/30) |
4,404 | 3,674,382 | ||||||
| 2.75%, 09/15/29 (Call 06/15/29) |
2,624 | 2,347,730 | ||||||
| 3.05%, 09/22/26 (Call 06/22/26) |
2,931 | 2,787,111 | ||||||
| Baxter International Inc. |
||||||||
| 1.73%, 04/01/31 (Call 01/01/31) |
2,210 | 1,744,066 | ||||||
| 1.92%, 02/01/27 (Call 01/01/27) |
6,488 | 5,898,758 | ||||||
| 2.27%, 12/01/28 (Call 10/01/28) |
5,765 | 5,054,080 | ||||||
| 2.54%, 02/01/32 (Call 11/01/31)(b) |
3,385 | 2,773,911 | ||||||
| 2.60%, 08/15/26 (Call 05/15/26) |
4,007 | 3,757,080 | ||||||
| 3.13%, 12/01/51 (Call 06/01/51)(b) |
3,720 | 2,419,311 | ||||||
| 3.50%, 08/15/46 (Call 02/15/46) |
1,918 | 1,357,188 | ||||||
| 3.95%, 04/01/30 (Call 01/01/30) |
3,195 | 2,957,542 | ||||||
| Boston Scientific Corp. |
||||||||
| 1.90%, 06/01/25 (Call 05/01/25) |
4,362 | 4,182,514 | ||||||
| 2.65%, 06/01/30 (Call 03/01/30) |
3,116 | 2,725,700 | ||||||
| 4.00%, 03/01/28 (Call 12/01/27) |
3,230 | 3,124,155 | ||||||
| 4.55%, 03/01/39 (Call 09/01/38) |
2,218 | 2,059,618 | ||||||
| 4.70%, 03/01/49 (Call 09/01/48)(b) |
2,494 | 2,283,418 | ||||||
| 6.50%, 11/15/35 |
1,318 | 1,454,644 | ||||||
| 7.38%, 01/15/40 |
1,166 | 1,369,523 | ||||||
| Danaher Corp. |
||||||||
| 2.60%, 10/01/50 (Call 04/01/50) |
4,523 | 2,847,673 | ||||||
| 2.80%, 12/10/51 (Call 06/10/51)(b) |
3,955 | 2,562,843 | ||||||
| 3.35%, 09/15/25 (Call 06/15/25) |
2,516 | 2,454,023 | ||||||
| 4.38%, 09/15/45 (Call 03/15/45) |
2,158 | 1,912,073 | ||||||
| Dentsply Sirona Inc., 3.25%, 06/01/30 |
||||||||
| (Call 03/01/30) |
3,218 | 2,804,634 | ||||||
| DH Europe Finance II Sarl |
||||||||
| 2.60%, 11/15/29 (Call 08/15/29) |
3,396 | 3,015,956 | ||||||
| 3.25%, 11/15/39 (Call 05/15/39) |
3,637 | 2,889,501 | ||||||
| Security | Par (000) |
Value | ||||||
| Health Care - Products (continued) |
||||||||
| 3.40%, 11/15/49 (Call 05/15/49) |
$ | 2,929 | $ | 2,182,145 | ||||
| Edwards Lifesciences Corp., 4.30%, 06/15/28 |
||||||||
| (Call 03/15/28) |
2,866 | 2,781,421 | ||||||
| GE HealthCare Technologies Inc. |
||||||||
| 5.60%, 11/15/25 (Call 10/15/25) |
7,920 | 7,944,771 | ||||||
| 5.65%, 11/15/27 (Call 10/15/27) |
8,485 | 8,614,903 | ||||||
| 5.86%, 03/15/30 (Call 01/15/30) |
3,975 | 4,108,221 | ||||||
| 5.91%, 11/22/32 (Call 08/22/32) |
2,395 | 2,486,452 | ||||||
| 6.38%, 11/22/52 (Call 05/22/52) |
4,748 | 5,261,860 | ||||||
| HCA Inc. |
||||||||
| 3.13%, 03/15/27 (Call 02/15/27) |
3,690 | 3,467,839 | ||||||
| 3.63%, 03/15/32 (Call 12/15/31) |
5,867 | 5,125,942 | ||||||
| 4.38%, 03/15/42 (Call 09/15/41) |
2,191 | 1,815,865 | ||||||
| Koninklijke Philips NV |
||||||||
| 5.00%, 03/15/42 |
2,467 | 2,227,387 | ||||||
| 6.88%, 03/11/38 |
3,375 | 3,625,570 | ||||||
| Medtronic Global Holdings SCA |
||||||||
| 4.25%, 03/30/28 (Call 02/29/28) |
3,750 | 3,668,913 | ||||||
| 4.50%, 03/30/33 (Call 12/30/32) |
3,325 | 3,201,409 | ||||||
| Medtronic Inc. |
||||||||
| 4.00%, 04/01/43 (Call 10/01/42) |
30 | 25,752 | ||||||
| 4.38%, 03/15/35 |
9,470 | 8,928,621 | ||||||
| 4.63%, 03/15/45 |
7,962 | 7,371,731 | ||||||
| Revvity Inc. |
||||||||
| 1.90%, 09/15/28 (Call 07/15/28) |
2,848 | 2,460,345 | ||||||
| 2.25%, 09/15/31 (Call 06/15/31) |
2,475 | 2,011,660 | ||||||
| 2.55%, 03/15/31 (Call 12/15/30) |
1,100 | 921,308 | ||||||
| 3.30%, 09/15/29 (Call 06/15/29) |
3,076 | 2,769,144 | ||||||
| 3.63%, 03/15/51 (Call 09/15/50) |
1,180 | 821,094 | ||||||
| Smith & Nephew PLC, 2.03%, 10/14/30 |
||||||||
| (Call 07/14/30)(b) |
5,115 | 4,195,088 | ||||||
| Solventum Corp. |
||||||||
| 5.40%, 03/01/29 (Call 02/01/29)(c) |
3,590 | 3,584,871 | ||||||
| 5.45%, 02/25/27 (Call 01/25/27)(c) |
2,140 | 2,144,011 | ||||||
| 5.45%, 03/13/31 (Call 01/13/31)(c) |
4,450 | 4,415,392 | ||||||
| 5.60%, 03/23/34 (Call 12/23/33)(c) |
4,850 | 4,831,848 | ||||||
| 5.90%, 04/30/54 (Call 10/30/53)(c) |
4,450 | 4,357,317 | ||||||
| 6.00%, 05/15/64 (Call 11/15/63)(c) |
4,450 | 4,322,919 | ||||||
| STERIS Irish FinCo UnLtd Co. |
||||||||
| 2.70%, 03/15/31 (Call 12/15/30) |
3,306 | 2,811,473 | ||||||
| 3.75%, 03/15/51 (Call 09/15/50) |
3,500 | 2,585,798 | ||||||
| Stryker Corp. |
||||||||
| 1.15%, 06/15/25 (Call 05/15/25) |
3,143 | 2,981,467 | ||||||
| 1.95%, 06/15/30 (Call 03/15/30) |
4,608 | 3,857,376 | ||||||
| 2.90%, 06/15/50 (Call 12/15/49)(b) |
2,181 | 1,482,905 | ||||||
| 3.38%, 11/01/25 (Call 08/01/25) |
5,608 | 5,442,637 | ||||||
| 3.50%, 03/15/26 (Call 12/15/25) |
5,994 | 5,812,057 | ||||||
| 3.65%, 03/07/28 (Call 12/07/27) |
3,977 | 3,793,723 | ||||||
| 4.10%, 04/01/43 (Call 10/01/42) |
3,513 | 2,969,401 | ||||||
| 4.38%, 05/15/44 (Call 11/15/43) |
1,823 | 1,604,659 | ||||||
| 4.63%, 03/15/46 (Call 09/15/45) |
2,715 | 2,459,573 | ||||||
| 4.85%, 12/08/28 (Call 11/08/28) |
3,110 | 3,099,232 | ||||||
| Thermo Fisher Scientific Inc. |
||||||||
| 1.75%, 10/15/28 (Call 08/15/28) |
4,185 | 3,672,698 | ||||||
| 2.00%, 10/15/31 (Call 07/15/31) |
4,855 | 3,956,717 | ||||||
| 2.60%, 10/01/29 (Call 07/01/29) |
3,749 | 3,343,034 | ||||||
| 2.80%, 10/15/41 (Call 04/15/41) |
1,855 | 1,332,941 | ||||||
| 4.10%, 08/15/47 (Call 02/15/47) |
4,854 | 4,063,434 | ||||||
| 4.80%, 11/21/27 (Call 10/21/27) |
2,603 | 2,604,226 | ||||||
| 4.95%, 08/10/26 (Call 07/10/26) |
4,125 | 4,128,387 | ||||||
| 4.95%, 11/21/32 (Call 08/21/32) |
2,115 | 2,104,300 | ||||||
| S C H E D U L E O F I N V E S T M E N T S |
53 |
| Schedule of Investments (continued) February 29, 2024 |
iShares® Core U.S. Aggregate Bond ETF (Percentages shown are based on Net Assets) |
| Security | Par (000) |
Value | ||||||
| Health Care - Products (continued) |
||||||||
| 4.98%, 08/10/30 (Call 06/10/30) |
$ | 2,908 | $ | 2,908,398 | ||||
| 5.00%, 12/05/26 (Call 11/05/26) |
2,270 | 2,276,347 | ||||||
| 5.00%, 01/31/29 (Call 12/31/28) |
4,795 | 4,822,000 | ||||||
| 5.09%, 08/10/33 (Call 05/10/33) |
3,605 | 3,621,425 | ||||||
| 5.20%, 01/31/34 (Call 10/31/33)(b) |
2,390 | 2,416,849 | ||||||
| 5.30%, 02/01/44 (Call 08/01/43) |
2,239 | 2,239,491 | ||||||
| 5.40%, 08/10/43 (Call 04/10/43)(b) |
2,910 | 2,938,096 | ||||||
| Zimmer Biomet Holdings Inc. |
||||||||
| 2.60%, 11/24/31 (Call 08/24/31) |
4,005 | 3,350,043 | ||||||
| 3.05%, 01/15/26 (Call 12/15/25) |
3,103 | 2,980,760 | ||||||
| 3.55%, 04/01/25 (Call 01/01/25) |
1,875 | 1,834,059 | ||||||
| 4.45%, 08/15/45 (Call 02/15/45)(b) |
2,349 | 2,081,545 | ||||||
| 5.35%, 12/01/28 (Call 11/01/28) |
1,950 | 1,970,144 | ||||||
| 5.75%, 11/30/39 |
753 | 748,679 | ||||||
|
|
|
|||||||
| 334,017,225 | ||||||||
| Health Care - Services — 0.8% |
||||||||
| AdventHealth Obligated Group, Series E, |
||||||||
| 2.80%, 11/15/51 (Call 05/15/51) |
1,379 | 904,361 | ||||||
| Adventist Health System/West |
||||||||
| 2.95%, 03/01/29 (Call 12/01/28) |
1,138 | 1,010,185 | ||||||
| 3.63%, 03/01/49 (Call 09/01/48) |
1,901 | 1,399,433 | ||||||
| 5.43%, 03/01/32 (Call 12/01/31) |
415 | 415,108 | ||||||
| Advocate Health & Hospitals Corp. |
||||||||
| 3.39%, 10/15/49 (Call 04/15/49) |
1,787 | 1,336,991 | ||||||
| 3.83%, 08/15/28 (Call 05/15/28) |
1,186 | 1,138,658 | ||||||
| 4.27%, 08/15/48 (Call 02/15/48) |
1,586 | 1,374,165 | ||||||
| Series 2020, 2.21%, 06/15/30 |
||||||||
| (Call 03/15/30) |
455 | 383,919 | ||||||
| Series 2020, 3.01%, 06/15/50 |
||||||||
| (Call 12/15/49) |
1,622 | 1,123,436 | ||||||
| Aetna Inc. |
||||||||
| 3.88%, 08/15/47 (Call 02/15/47) |
2,775 | 2,062,408 | ||||||
| 4.13%, 11/15/42 (Call 05/15/42) |
3,036 | 2,425,499 | ||||||
| 4.50%, 05/15/42 (Call 11/15/41) |
2,461 | 2,091,053 | ||||||
| 4.75%, 03/15/44 (Call 09/15/43) |
2,159 | 1,863,654 | ||||||
| 6.63%, 06/15/36 |
3,031 | 3,300,441 | ||||||
| 6.75%, 12/15/37 |
2,968 | 3,242,972 | ||||||
| AHS Hospital Corp. |
||||||||
| 5.02%, 07/01/45 |
1,000 | 953,377 | ||||||
| Series 2021, 2.78%, 07/01/51 |
||||||||
| (Call 01/01/51) |
976 | 639,738 | ||||||
| Allina Health System |
||||||||
| 2.90%, 11/15/51 (Call 05/15/51) |
1,160 | 761,595 | ||||||
| Series 2019, 3.89%, 04/15/49 |
||||||||
| (Call 10/15/48) |
2,023 | 1,635,760 | ||||||
| Ascension Health |
||||||||
| 3.95%, 11/15/46 |
3,770 | 3,159,613 | ||||||
| 4.85%, 11/15/53 |
3,445 | 3,289,403 | ||||||
| Series B, 2.53%, 11/15/29 (Call 08/15/29) |
2,494 | 2,221,722 | ||||||
| Series B, 3.11%, 11/15/39 (Call 05/15/39) |
1,911 | 1,488,750 | ||||||
| Banner Health |
||||||||
| 1.90%, 01/01/31 (Call 07/01/30) |
1,543 | 1,255,968 | ||||||
| 2.34%, 01/01/30 (Call 10/01/29) |
2,412 | 2,081,461 | ||||||
| 2.91%, 01/01/42 (Call 07/01/41) |
560 | 408,004 | ||||||
| 2.91%, 01/01/51 (Call 07/01/50)(b) |
1,827 | 1,209,967 | ||||||
| Series 2020, 3.18%, 01/01/50 |
||||||||
| (Call 07/01/49)(b) |
1,653 | 1,179,696 | ||||||
| Baptist Health South Florida Obligated Group, |
||||||||
| Series 2021, 3.12%, 11/15/71 |
||||||||
| (Call 05/15/71)(b) |
510 | 301,230 | ||||||
| Security | Par (000) |
Value | ||||||
| Health Care - Services (continued) |
||||||||
| Baptist Healthcare System Obligated Group, |
||||||||
| Series 20B, 3.54%, 08/15/50 |
||||||||
| (Call 02/15/50) |
$ | 708 | $ | 524,793 | ||||
| BayCare Health System Inc., Series 2020, |
||||||||
| 3.83%, 11/15/50 (Call 05/15/50) |
2,669 | 2,173,776 | ||||||
| Baylor Scott & White Holdings |
||||||||
| 3.97%, 11/15/46 (Call 05/15/46) |
1,030 | 830,126 | ||||||
| 4.19%, 11/15/45 (Call 05/15/45) |
1,358 | 1,189,992 | ||||||
| Series 2021, 1.78%, 11/15/30 |
||||||||
| (Call 05/15/30) |
1,141 | 927,721 | ||||||
| Series 2021, 2.84%, 11/15/50 |
||||||||
| (Call 11/15/49) |
5,105 | 3,383,978 | ||||||
| Beth Israel Lahey Health Inc., Series L, 3.08%, |
||||||||
| 07/01/51 (Call 01/01/51) |
730 | 463,234 | ||||||
| Bon Secours Mercy Health Inc. |
||||||||
| 3.46%, 06/01/30 (Call 12/01/29) |
2,906 | 2,645,278 | ||||||
| Series 2018, 4.30%, 07/01/28 |
||||||||
| (Call 01/01/28) |
1,321 | 1,283,484 | ||||||
| Series 20-2, 2.10%, 06/01/31 |
||||||||
| (Call 12/01/30) |
1,725 | 1,392,917 | ||||||
| Series 20-2, 3.21%, 06/01/50 |
||||||||
| (Call 12/01/49) |
2,245 | 1,589,107 | ||||||
| Catholic Health Services of Long Island |
||||||||
| Obligated Group, Series 2020, 3.37%, 07/01/50 (Call 01/01/50) |
1,655 | 1,149,727 | ||||||
| Cedars-Sinai Health System, Series 2021, |
||||||||
| 2.29%, 08/15/31 (Call 02/15/31) |
1,260 | 1,047,758 | ||||||
| Centene Corp. |
||||||||
| 2.45%, 07/15/28 (Call 05/15/28) |
5,285 | 4,662,954 | ||||||
| 2.50%, 03/01/31 (Call 12/01/30) |
8,325 | 6,820,390 | ||||||
| 2.63%, 08/01/31 (Call 05/01/31) |
5,390 | 4,411,070 | ||||||
| 3.00%, 10/15/30 (Call 07/15/30) |
8,350 | 7,131,427 | ||||||
| 3.38%, 02/15/30 (Call 02/15/25)(b) |
8,030 | 7,084,453 | ||||||
| 4.25%, 12/15/27 (Call 03/18/24) |
5,485 | 5,228,360 | ||||||
| 4.63%, 12/15/29 (Call 12/15/24) |
9,180 | 8,693,227 | ||||||
| Children’s Health System of Texas, 2.51%, |
||||||||
| 08/15/50 (Call 02/15/50)(b) |
2,411 | 1,490,130 | ||||||
| Children’s Hospital Corp. (The) |
||||||||
| Series 2017, 4.12%, 01/01/47 |
||||||||
| (Call 07/01/46) |
1,773 | 1,508,210 | ||||||
| Series 2020, 2.59%, 02/01/50 |
||||||||
| (Call 08/01/49) |
675 | 425,018 | ||||||
| Children’s Hospital Medical Center/Cincinnati |
||||||||
| OH, 4.27%, 05/15/44 |
1,668 | 1,472,699 | ||||||
| Children’s Hospital of Philadelphia (The), |
||||||||
| Series 2020, 2.70%, 07/01/50 |
||||||||
| (Call 01/01/50) |
1,628 | 1,066,276 | ||||||
| Children’s Hospital/DC, Series 2020, 2.93%, |
||||||||
| 07/15/50 (Call 01/15/50) |
1,136 | 738,770 | ||||||
| CHRISTUS Health, Series C, 4.34%, 07/01/28 |
||||||||
| (Call 04/01/28) |
1,834 | 1,784,462 | ||||||
| City of Hope |
||||||||
| Series 2013, 5.62%, 11/15/43 |
1,090 | 1,070,476 | ||||||
| Series 2018, 4.38%, 08/15/48 |
||||||||
| (Call 02/15/48) |
2,077 | 1,709,162 | ||||||
| Cleveland Clinic Foundation (The), 4.86%, |
||||||||
| 01/01/2114 |
1,495 | 1,355,581 | ||||||
| CommonSpirit Health |
||||||||
| 1.55%, 10/01/25 (Call 07/01/25) |
1,828 | 1,717,052 | ||||||
| 2.78%, 10/01/30 (Call 04/01/30) |
1,872 | 1,602,636 | ||||||
| 3.35%, 10/01/29 (Call 04/01/29) |
3,045 | 2,764,889 | ||||||
| 54 | 2 0 2 4 I S H A R E S A N N U A L R E P O R T T O S H A R E H O L D E R S |
| Schedule of Investments (continued) February 29, 2024 |
iShares® Core U.S. Aggregate Bond ETF (Percentages shown are based on Net Assets) |
| Security | Par (000) |
Value | ||||||
| Health Care - Services (continued) |
||||||||
| 3.82%, 10/01/49 (Call 04/01/49) |
$ | 3,052 | $ | 2,347,829 | ||||
| 3.91%, 10/01/50 (Call 04/01/50) |
1,304 | 1,006,648 | ||||||
| 4.19%, 10/01/49 (Call 04/01/49) |
2,966 | 2,402,429 | ||||||
| 4.35%, 11/01/42 |
2,968 | 2,531,445 | ||||||
| 6.07%, 11/01/27 (Call 08/01/27) |
1,756 | 1,799,534 | ||||||
| 6.46%, 11/01/52 (Call 05/01/52)(b) |
915 | 1,024,318 | ||||||
| Community Health Network Inc., Series 20-A, |
||||||||
| 3.10%, 05/01/50 (Call 11/01/49) |
1,631 | 1,099,473 | ||||||
| Corewell Health Obligated Group, Series 19A, |
||||||||
| 3.49%, 07/15/49 (Call 01/15/49)(b) |
2,318 | 1,745,799 | ||||||
| Cottage Health Obligated Group, Series 2020, |
||||||||
| 3.30%, 11/01/49 (Call 05/01/49) |
2,955 | 2,130,074 | ||||||
| Dartmouth-Hitchcock Health, Series B, 4.18%, |
||||||||
| 08/01/48 (Call 02/01/48) |
1,692 | 1,283,930 | ||||||
| Dignity Health |
||||||||
| 4.50%, 11/01/42 |
1,030 | 882,205 | ||||||
| 5.27%, 11/01/64 |
1,100 | 1,022,597 | ||||||
| Duke University Health System Inc., Series |
||||||||
| 2017, 3.92%, 06/01/47 (Call 12/01/46) |
2,516 | 2,078,928 | ||||||
| Elevance Health Inc. |
||||||||
| 1.50%, 03/15/26 (Call 02/15/26) |
4,515 | 4,194,215 | ||||||
| 2.25%, 05/15/30 (Call 02/15/30) |
3,888 | 3,302,817 | ||||||
| 2.55%, 03/15/31 (Call 12/15/30) |
4,415 | 3,742,100 | ||||||
| 2.88%, 09/15/29 (Call 06/15/29) |
4,147 | 3,718,658 | ||||||
| 3.13%, 05/15/50 (Call 11/15/49) |
1,981 | 1,352,117 | ||||||
| 3.60%, 03/15/51 (Call 09/15/50) |
5,473 | 4,074,278 | ||||||
| 3.65%, 12/01/27 (Call 09/01/27) |
6,003 | 5,740,459 | ||||||
| 3.70%, 09/15/49 (Call 03/15/49) |
4,477 | 3,390,929 | ||||||
| 4.10%, 03/01/28 (Call 12/01/27) |
5,788 | 5,598,196 | ||||||
| 4.10%, 05/15/32 (Call 02/15/32) |
2,453 | 2,260,889 | ||||||
| 4.38%, 12/01/47 (Call 06/01/47) |
5,896 | 5,006,674 | ||||||
| 4.55%, 03/01/48 (Call 09/01/47) |
4,395 | 3,827,431 | ||||||
| 4.55%, 05/15/52 (Call 11/15/51) |
2,575 | 2,233,258 | ||||||
| 4.63%, 05/15/42 |
1,919 | 1,726,649 | ||||||
| 4.65%, 01/15/43 |
5,285 | 4,769,332 | ||||||
| 4.65%, 08/15/44 (Call 02/15/44) |
2,022 | 1,797,135 | ||||||
| 4.75%, 02/15/33 (Call 11/15/32) |
2,550 | 2,462,899 | ||||||
| 4.90%, 02/08/26 (Call 03/11/24) |
1,990 | 1,975,827 | ||||||
| 5.10%, 01/15/44 |
4,793 | 4,506,146 | ||||||
| 5.13%, 02/15/53 (Call 08/15/52) |
3,160 | 2,991,156 | ||||||
| 5.35%, 10/15/25 (Call 09/15/25) |
4,017 | 4,012,349 | ||||||
| 5.50%, 10/15/32 (Call 07/15/32) |
3,635 | 3,702,438 | ||||||
| 5.85%, 01/15/36 |
1,119 | 1,168,169 | ||||||
| 5.95%, 12/15/34 |
1,695 | 1,780,679 | ||||||
| 6.10%, 10/15/52 (Call 04/15/52) |
2,305 | 2,472,599 | ||||||
| 6.38%, 06/15/37 |
2,300 | 2,480,451 | ||||||
| Franciscan Missionaries of Our Lady Health |
||||||||
| System Inc., Series B, 3.91%, 07/01/49 |
||||||||
| (Call 01/01/49) |
205 | 159,921 | ||||||
| Fred Hutchinson Cancer Center, 4.97%, |
||||||||
| 01/01/52 (Call 07/01/51) |
667 | 628,021 | ||||||
| Hackensack Meridian Health Inc. |
||||||||
| 4.21%, 07/01/48 (Call 01/01/48) |
1,701 | 1,475,005 | ||||||
| 4.50%, 07/01/57 (Call 01/01/57) |
1,165 | 998,123 | ||||||
| Series 2020, 2.68%, 09/01/41 |
||||||||
| (Call 03/01/41) |
2,091 | 1,476,151 | ||||||
| Series 2020, 2.88%, 09/01/50 |
||||||||
| (Call 03/01/50) |
2,242 | 1,488,675 | ||||||
| Hartford HealthCare Corp., 3.45%, 07/01/54 |
2,080 | 1,452,905 | ||||||
| HCA Inc. |
||||||||
| 2.38%, 07/15/31 (Call 04/15/31) |
4,645 | 3,777,056 | ||||||
| Security | Par (000) |
Value | ||||||
| Health Care - Services (continued) |
||||||||
| 3.38%, 03/15/29 (Call 01/15/29) |
$ | 1,467 | $ | 1,337,765 | ||||
| 3.50%, 09/01/30 (Call 03/01/30) |
10,890 | 9,734,901 | ||||||
| 3.50%, 07/15/51 (Call 01/15/51) |
5,910 | 3,989,315 | ||||||
| 4.13%, 06/15/29 (Call 03/15/29) |
8,250 | 7,758,499 | ||||||
| 4.50%, 02/15/27 (Call 08/15/26) |
6,103 | 5,976,251 | ||||||
| 4.63%, 03/15/52 (Call 09/15/51) |
5,925 | 4,848,790 | ||||||
| 5.13%, 06/15/39 (Call 12/15/38) |
3,805 | 3,537,470 | ||||||
| 5.20%, 06/01/28 (Call 05/01/28) |
2,295 | 2,285,548 | ||||||
| 5.25%, 04/15/25 |
6,226 | 6,198,191 | ||||||
| 5.25%, 06/15/26 (Call 12/15/25) |
6,990 | 6,947,211 | ||||||
| 5.25%, 06/15/49 (Call 12/15/48) |
7,851 | 7,033,124 | ||||||
| 5.38%, 09/01/26 (Call 03/01/26) |
4,893 | 4,878,795 | ||||||
| 5.45%, 04/01/31 (Call 02/01/31)(b) |
775 | 771,380 | ||||||
| 5.50%, 06/01/33 (Call 03/01/33) |
4,196 | 4,167,114 | ||||||
| 5.50%, 06/15/47 (Call 12/15/46) |
7,462 | 6,954,709 | ||||||
| 5.60%, 04/01/34 (Call 01/01/34) |
2,450 | 2,438,818 | ||||||
| 5.63%, 09/01/28 (Call 03/01/28) |
6,657 | 6,706,363 | ||||||
| 5.88%, 02/15/26 (Call 08/15/25) |
7,125 | 7,156,440 | ||||||
| 5.88%, 02/01/29 (Call 08/01/28) |
4,610 | 4,691,992 | ||||||
| 5.90%, 06/01/53 (Call 12/01/52) |
3,850 | 3,781,837 | ||||||
| 6.00%, 04/01/54 (Call 10/01/53) |
2,015 | 1,999,909 | ||||||
| 6.10%, 04/01/64 (Call 10/01/63) |
3,350 | 3,310,724 | ||||||
| Hoag Memorial Hospital Presbyterian, 3.80%, |
||||||||
| 07/15/52 (Call 01/15/52)(b) |
1,977 | 1,612,981 | ||||||
| Humana Inc. |
||||||||
| 1.35%, 02/03/27 (Call 01/03/27) |
5,075 | 4,553,129 | ||||||
| 2.15%, 02/03/32 (Call 11/03/31) |
3,320 | 2,627,082 | ||||||
| 3.13%, 08/15/29 (Call 05/15/29) |
2,631 | 2,376,741 | ||||||
| 3.70%, 03/23/29 (Call 02/23/29) |
3,125 | 2,921,143 | ||||||
| 3.95%, 03/15/27 (Call 12/15/26) |
2,779 | 2,680,126 | ||||||
| 3.95%, 08/15/49 (Call 02/15/49) |
2,092 | 1,635,122 | ||||||
| 4.50%, 04/01/25 (Call 03/01/25) |
2,913 | 2,882,828 | ||||||
| 4.63%, 12/01/42 (Call 06/01/42) |
1,710 | 1,484,297 | ||||||
| 4.80%, 03/15/47 (Call 09/15/46) |
2,155 | 1,877,475 | ||||||
| 4.88%, 04/01/30 (Call 01/01/30) |
2,505 | 2,464,715 | ||||||
| 4.95%, 10/01/44 (Call 04/01/44) |
3,469 | 3,127,772 | ||||||
| 5.50%, 03/15/53 (Call 09/15/52) |
720 | 697,508 | ||||||
| 5.70%, 03/13/26 (Call 03/13/24) |
785 | 784,606 | ||||||
| 5.75%, 03/01/28 (Call 02/01/28) |
1,186 | 1,208,305 | ||||||
| 5.75%, 12/01/28 (Call 11/01/28) |
1,005 | 1,026,458 | ||||||
| 5.88%, 03/01/33 (Call 12/01/32) |
3,275 | 3,360,248 | ||||||
| 5.95%, 03/15/34 (Call 12/15/33) |
2,885 | 2,979,418 | ||||||
| IHC Health Services Inc., 4.13%, 05/15/48 |
||||||||
| (Call 11/15/47) |
565 | 481,647 | ||||||
| Indiana University Health Inc. Obligated Group |
||||||||
| 3.97%, 11/01/48 (Call 05/01/48) |
2,530 | 2,105,166 | ||||||
| Series 2021, 2.85%, 11/01/51 |
||||||||
| (Call 05/01/51) |
835 | 551,133 | ||||||
| Inova Health System Foundation, 4.07%, |
||||||||
| 05/15/52 (Call 11/15/51)(b) |
1,209 | 1,028,976 | ||||||
| Integris Baptist Medical Center Inc., Series A, |
||||||||
| 3.88%, 08/15/50 (Call 02/15/50) |
2,304 | 1,746,055 | ||||||
| Iowa Health System, Series 2020, 3.67%, |
||||||||
| 02/15/50 (Call 08/15/49) |
275 | 213,738 | ||||||
| IQVIA Inc. |
||||||||
| 5.70%, 05/15/28 (Call 04/15/28) |
935 | 942,261 | ||||||
| 6.25%, 02/01/29 (Call 01/01/29) |
980 | 1,008,263 | ||||||
| Johns Hopkins Health System Corp. (The), |
||||||||
| 3.84%, 05/15/46 |
2,956 | 2,427,470 | ||||||
| Kaiser Foundation Hospitals |
||||||||
| 3.15%, 05/01/27 (Call 02/01/27) |
4,268 | 4,055,508 | ||||||
| S C H E D U L E O F I N V E S T M E N T S |
55 |
| Schedule of Investments (continued) February 29, 2024 |
iShares® Core U.S. Aggregate Bond ETF (Percentages shown are based on Net Assets) |
| Security | Par (000) |
Value | ||||||
| Health Care - Services (continued) |
||||||||
| 4.15%, 05/01/47 (Call 11/01/46) |
$ | 6,942 | $ | 5,975,648 | ||||
| 4.88%, 04/01/42 |
2,482 | 2,356,289 | ||||||
| Series 2019, 3.27%, 11/01/49 |
||||||||
| (Call 05/01/49) |
5,288 | 3,876,520 | ||||||
| Series 2021, 2.81%, 06/01/41 |
||||||||
| (Call 12/01/40) |
3,552 | 2,599,247 | ||||||
| Series 2021, 3.00%, 06/01/51 |
||||||||
| (Call 12/01/50) |
3,127 | 2,142,991 | ||||||
| Laboratory Corp. of America Holdings |
||||||||
| 1.55%, 06/01/26 (Call 05/01/26) |
2,685 | 2,473,842 | ||||||
| 2.70%, 06/01/31 (Call 03/01/31) |
3,030 | 2,587,524 | ||||||
| 2.95%, 12/01/29 (Call 09/01/29) |
2,342 | 2,084,332 | ||||||
| 3.60%, 09/01/27 (Call 06/01/27) |
3,540 | 3,361,969 | ||||||
| 4.70%, 02/01/45 (Call 08/01/44) |
4,393 | 3,920,100 | ||||||
| Mass General Brigham Inc. |
||||||||
| Series 2015, 4.12%, 07/01/55 |
199 | 163,566 | ||||||
| Series 2017, 3.77%, 07/01/48 |
||||||||
| (Call 01/01/48) |
1,264 | 1,004,515 | ||||||
| Series 2020, 3.19%, 07/01/49 |
||||||||
| (Call 01/01/49) |
1,835 | 1,322,977 | ||||||
| Series 2020, 3.34%, 07/01/60 |
||||||||
| (Call 01/01/60) |
2,326 | 1,599,942 | ||||||
| Mayo Clinic |
||||||||
| 3.77%, 11/15/43 |
245 | 205,877 | ||||||
| Series 2016, 4.13%, 11/15/52(b) |
3,046 | 2,633,542 | ||||||
| Series 2021, 3.20%, 11/15/61 |
||||||||
| (Call 05/15/61) |
1,876 | 1,283,849 | ||||||
| McLaren Health Care Corp., Series A, 4.39%, 05/15/48 (Call 11/15/47) |
2,212 | 1,912,807 | ||||||
| MedStar Health Inc., Series 20A, 3.63%, 08/15/49(b) |
1,777 | 1,346,134 | ||||||
| Memorial Health Services, 3.45%, 11/01/49 |
2,223 | 1,653,685 | ||||||
| Memorial Sloan-Kettering Cancer Center |
||||||||
| 4.13%, 07/01/52 |
1,730 | 1,470,553 | ||||||
| 5.00%, 07/01/42 |
690 | 670,029 | ||||||
| Series 2015, 4.20%, 07/01/55 |
2,009 | 1,700,783 | ||||||
| Series 2020, 2.96%, 01/01/50 |
||||||||
| (Call 07/01/49) |
781 | 531,141 | ||||||
| Methodist Hospital (The), Series 20A, 2.71%, |
||||||||
| 12/01/50 (Call 06/01/50) |
2,736 | 1,755,777 | ||||||
| Montefiore Obligated Group |
||||||||
| 4.29%, 09/01/50 |
1,216 | 746,241 | ||||||
| Series 18-C, 5.25%, 11/01/48 |
||||||||
| (Call 05/01/48) |
1,802 | 1,351,767 | ||||||
| Mount Nittany Medical Center Obligated |
||||||||
| Group, 3.80%, 11/15/52 |
850 | 670,186 | ||||||
| Mount Sinai Hospital |
||||||||
| Series 2017, 3.98%, 07/01/48 |
1,637 | 1,303,880 | ||||||
| Series 2019, 3.74%, 07/01/49 |
||||||||
| (Call 01/01/49) |
2,230 | 1,661,205 | ||||||
| Series 2020, 3.39%, 07/01/50 |
||||||||
| (Call 07/01/49) |
1,706 | 1,140,268 | ||||||
| MultiCare Health System, 2.80%, 08/15/50 |
1,413 | 827,911 | ||||||
| MyMichigan Health, Series 2020, 3.41%, 06/01/50 |
1,943 | 1,406,781 | ||||||
| Nationwide Children’s Hospital Inc., 4.56%, 11/01/52 |
1,111 | 1,011,841 | ||||||
| New York and Presbyterian Hospital (The) |
1,079 | 728,038 | ||||||
| Security | Par (000) |
Value | ||||||
| Health Care - Services (continued) |
||||||||
| 2.61%, 08/01/60 (Call 02/01/60)(b) |
$ | 1,308 | $ | 744,103 | ||||
| 4.02%, 08/01/45 |
3,024 | 2,559,706 | ||||||
| 4.06%, 08/01/56 |
553 | 446,362 | ||||||
| Series 2019, 3.95%, (Call 02/01/19) |
1,835 | 1,331,586 | ||||||
| Northwell Healthcare Inc. |
||||||||
| 3.81%, 11/01/49 (Call 11/01/48) |
3,095 | 2,292,775 | ||||||
| 3.98%, 11/01/46 (Call 11/01/45) |
2,905 | 2,297,842 | ||||||
| 4.26%, 11/01/47 (Call 11/01/46) |
1,830 | 1,479,639 | ||||||
| Northwestern Memorial Healthcare Obligated Group, Series 2021, 2.63%, 07/15/51 (Call 01/15/51)(b) |
570 | 368,753 | ||||||
| Novant Health Inc. |
||||||||
| 2.64%, 11/01/36 (Call 08/01/36) |
986 | 740,731 | ||||||
| 3.17%, 11/01/51 (Call 05/01/51) |
3,579 | 2,439,612 | ||||||
| 3.32%, 11/01/61 (Call 05/01/61) |
1,536 | 1,010,860 | ||||||
| NY Society for Relief of Ruptured & Crippled Maintaining Hosp Special Surgery, Series 2020, 2.67%, 10/01/50 (Call 04/01/50) |
1,260 | 781,003 | ||||||
| OhioHealth Corp. |
||||||||
| 2.30%, 11/15/31 (Call 05/15/31) |
1,794 | 1,482,590 | ||||||
| 2.83%, 11/15/41 (Call 05/15/41) |
1,570 | 1,147,174 | ||||||
| Series 2020, 3.04%, 11/15/50 |
||||||||
| (Call 05/15/50) |
2,061 | 1,470,643 | ||||||
| Orlando Health Obligated Group |
||||||||
| 3.33%, 10/01/50 (Call 04/01/50) |
1,758 | 1,286,544 | ||||||
| 4.09%, 10/01/48 (Call 04/01/48) |
1,842 | 1,529,827 | ||||||
| PeaceHealth Obligated Group |
||||||||
| Series 2018, 4.79%, 11/15/48 |
||||||||
| (Call 05/15/48) |
1,717 | 1,513,647 | ||||||
| Series 2020, 1.38%, 11/15/25 |
||||||||
| (Call 08/15/25) |
2,242 | 2,083,458 | ||||||
| Series 2020, 3.22%, 11/15/50 |
||||||||
| (Call 05/15/50) |
2,077 | 1,383,693 | ||||||
| Piedmont Healthcare Inc. |
||||||||
| 2.04%, 01/01/32 (Call 07/01/31) |
1,007 | 811,669 | ||||||
| 2.86%, 01/01/52 (Call 07/01/51) |
2,006 | 1,310,077 | ||||||
| Series 2042, 2.72%, 01/01/42 |
||||||||
| (Call 07/01/41) |
1,551 | 1,091,085 | ||||||
| Presbyterian Healthcare Services, 4.88%, 08/01/52 |
1,205 | 1,147,348 | ||||||
| Providence St Joseph Health Obligated Group |
2,185 | 2,174,658 | ||||||
| Series 19A, 2.53%, 10/01/29 |
||||||||
| (Call 07/01/29) |
3,187 | 2,774,934 | ||||||
| Series 21A, 2.70%, 10/01/51 |
||||||||
| (Call 04/01/51)(b) |
2,730 | 1,635,232 | ||||||
| Series A, 3.93%, 10/01/48 (Call 04/01/48) |
2,030 | 1,568,991 | ||||||
| Series H, 2.75%, 10/01/26 (Call 07/01/26) |
1,147 | 1,075,303 | ||||||
| Series I, 3.74%, 10/01/47 |
2,538 | 1,939,489 | ||||||
| Queen’s Health Systems (The), 4.81%, |
||||||||
| 07/01/52 (Call 01/01/52)(b) |
1,031 | 961,948 | ||||||
| Quest Diagnostics Inc. |
||||||||
| 2.80%, 06/30/31 (Call 03/30/31) |
2,581 | 2,202,866 | ||||||
| 2.95%, 06/30/30 (Call 03/30/30) |
3,687 | 3,245,505 | ||||||
| 3.45%, 06/01/26 (Call 03/01/26) |
3,797 | 3,653,071 | ||||||
| 3.50%, 03/30/25 (Call 12/30/24) |
1,488 | 1,460,853 | ||||||
| 4.20%, 06/30/29 (Call 03/30/29) |
3,798 | 3,650,765 | ||||||
| 4.70%, 03/30/45 (Call 09/30/44) |
946 | 835,533 | ||||||
| 6.40%, 11/30/33 (Call 08/30/33) |
1,240 | 1,326,083 | ||||||
| Rady Children’s Hospital-San Diego, Series |
||||||||
| 21A, 3.15%, 08/15/51 (Call 08/15/50) |
980 | 682,677 | ||||||
| 56 | 2 0 2 4 I S H A R E S A N N U A L R E P O R T T O S H A R E H O L D E R S |
| Schedule of Investments (continued) February 29, 2024 |
iShares® Core U.S. Aggregate Bond ETF (Percentages shown are based on Net Assets) |
| Security | Par (000) |
Value | ||||||
| Health Care - Services (continued) |
||||||||
| Rush Obligated Group, Series 2020, 3.92%, 11/15/29 (Call 08/15/29) |
$ | 953 | $ | 893,401 | ||||
| RWJ Barnabas Health Inc. |
||||||||
| 3.48%, 07/01/49 (Call 01/01/49) |
1,119 | 833,290 | ||||||
| 3.95%, 07/01/46 (Call 07/01/45) |
2,423 | 1,966,261 | ||||||
| Seattle Children’s Hospital, Series 2021, 2.72%, 10/01/50 (Call 10/01/49) |
2,855 | 1,840,077 | ||||||
| Sentara Healthcare, 2.93%, 11/01/51 |
1,249 | 843,560 | ||||||
| Sharp HealthCare, Series 20B, 2.68%, 08/01/50 |
1,071 | 675,656 | ||||||
| SSM Health Care Corp. |
||||||||
| 4.89%, 06/01/28 (Call 03/01/28) |
2,235 | 2,224,500 | ||||||
| Series A, 3.82%, 06/01/27 (Call 03/01/27) |
745 | 714,758 | ||||||
| Stanford Health Care |
1,900 | 1,313,205 | ||||||
| Series 2018, 3.80%, 11/15/48 |
||||||||
| (Call 05/15/48) |
2,406 | 1,949,932 | ||||||
| Series 2020, 3.31%, 08/15/30 |
||||||||
| (Call 05/15/30) |
770 | 695,401 | ||||||
| Summa Health, 3.51%, 11/15/51 |
||||||||
| (Call 05/15/51)(b) |
1,755 | 1,306,384 | ||||||
| Sutter Health |
||||||||
| 5.55%, 08/15/53 (Call 02/15/53) |
248 | 258,544 | ||||||
| Series 2018, 3.70%, 08/15/28 |
||||||||
| (Call 05/15/28) |
2,054 | 1,954,178 | ||||||
| Series 2018, 4.09%, 08/15/48 |
||||||||
| (Call 02/15/48) |
2,161 | 1,807,644 | ||||||
| Series 20A, 1.32%, 08/15/25 |
||||||||
| (Call 05/15/25) |
1,109 | 1,043,054 | ||||||
| Series 20A, 2.29%, 08/15/30 |
||||||||
| (Call 02/15/30) |
1,489 | 1,266,354 | ||||||
| Series 20A, 3.16%, 08/15/40 |
||||||||
| (Call 02/15/40) |
857 | 656,137 | ||||||
| Series 20A, 3.36%, 08/15/50 |
||||||||
| (Call 02/15/50) |
2,014 | 1,472,684 | ||||||
| Texas Health Resources |
||||||||
| 2.33%, 11/15/50 (Call 05/15/50)(b) |
2,102 | 1,251,905 | ||||||
| 4.33%, 11/15/55(b) |
829 | 728,938 | ||||||
| Toledo Hospital (The), 5.75%, 11/15/38 |
||||||||
| (Call 11/15/28) |
1,960 | 1,964,690 | ||||||
| Trinity Health Corp. |
||||||||
| 4.13%, 12/01/45 |
1,441 | 1,228,996 | ||||||
| Series 2019, 3.43%, 12/01/48(b) |
1,885 | 1,431,768 | ||||||
| Series 2021, 2.63%, 12/01/40 |
||||||||
| (Call 06/01/40) |
1,186 | 833,529 | ||||||
| UMass Memorial Health Care Obligated Group, |
490 | 465,107 | ||||||
| UnitedHealth Group Inc. |
||||||||
| 3.70%, 05/15/27 (Call 04/15/27) |
2,825 | 2,734,067 | ||||||
| 1.15%, 05/15/26 (Call 04/15/26) |
4,220 | 3,889,135 | ||||||
| 1.25%, 01/15/26 |
2,208 | 2,062,844 | ||||||
| 2.00%, 05/15/30 |
5,175 | 4,349,270 | ||||||
| 2.30%, 05/15/31 (Call 02/15/31) |
5,770 | 4,832,563 | ||||||
| 2.75%, 05/15/40 (Call 11/15/39) |
4,456 | 3,209,244 | ||||||
| 2.88%, 08/15/29 |
4,139 | 3,751,651 | ||||||
| 2.90%, 05/15/50 (Call 11/15/49) |
5,218 | 3,463,113 | ||||||
| 2.95%, 10/15/27 |
3,864 | 3,627,689 | ||||||
| 3.05%, 05/15/41 (Call 11/15/40) |
4,252 | 3,159,533 | ||||||
| 3.10%, 03/15/26 |
4,002 | 3,865,494 | ||||||
| 3.13%, 05/15/60 (Call 11/15/59) |
2,529 | 1,654,410 | ||||||
| Security | Par (000) |
Value | ||||||
| Health Care - Services (continued) |
||||||||
| 3.25%, 05/15/51 (Call 11/15/50) |
$ | 6,015 | $ | 4,235,395 | ||||
| 3.38%, 04/15/27 |
2,878 | 2,757,603 | ||||||
| 3.45%, 01/15/27 |
3,723 | 3,593,113 | ||||||
| 3.50%, 08/15/39 (Call 02/15/39) |
5,279 | 4,266,344 | ||||||
| 3.70%, 12/15/25 |
2,259 | 2,209,637 | ||||||
| 3.70%, 08/15/49 (Call 02/15/49) |
4,927 | 3,791,506 | ||||||
| 3.75%, 07/15/25 |
9,784 | 9,602,362 | ||||||
| 3.75%, 10/15/47 (Call 04/15/47) |
4,426 | 3,431,248 | ||||||
| 3.85%, 06/15/28 |
4,816 | 4,636,334 | ||||||
| 3.88%, 12/15/28 |
3,522 | 3,379,663 | ||||||
| 3.88%, 08/15/59 (Call 02/15/59) |
4,040 | 3,074,657 | ||||||
| 3.95%, 10/15/42 (Call 04/15/42) |
3,000 | 2,521,668 | ||||||
| 4.00%, 05/15/29 (Call 03/15/29) |
3,740 | 3,594,053 | ||||||
| 4.20%, 05/15/32 (Call 02/15/32) |
5,565 | 5,250,765 | ||||||
| 4.20%, 01/15/47 (Call 07/15/46) |
3,394 | 2,869,243 | ||||||
| 4.25%, 01/15/29 (Call 12/15/28) |
5,255 | 5,123,769 | ||||||
| 4.25%, 03/15/43 (Call 09/15/42) |
2,116 | 1,844,620 | ||||||
| 4.25%, 04/15/47 (Call 10/15/46) |
3,384 | 2,882,544 | ||||||
| 4.25%, 06/15/48 (Call 12/15/47) |
5,648 | 4,753,914 | ||||||
| 4.38%, 03/15/42 (Call 09/15/41) |
2,259 | 2,013,746 | ||||||
| 4.45%, 12/15/48 (Call 06/15/48) |
4,891 | 4,277,531 | ||||||
| 4.50%, 04/15/33 (Call 01/15/33) |
5,785 | 5,555,650 | ||||||
| 4.63%, 07/15/35 |
2,836 | 2,736,601 | ||||||
| 4.63%, 11/15/41 (Call 05/15/41) |
3,006 | 2,743,901 | ||||||
| 4.75%, 07/15/45 |
7,855 | 7,262,455 | ||||||
| 4.75%, 05/15/52 (Call 11/15/51) |
7,450 | 6,788,320 | ||||||
| 4.95%, 05/15/62 (Call 11/15/61) |
4,730 | 4,347,357 | ||||||
| 5.05%, 04/15/53 (Call 10/15/52) |
6,530 | 6,213,103 | ||||||
| 5.15%, 10/15/25 |
3,750 | 3,758,255 | ||||||
| 5.20%, 04/15/63 (Call 10/15/62) |
5,555 | 5,295,531 | ||||||
| 5.25%, 02/15/28 (Call 01/15/28) |
3,755 | 3,815,678 | ||||||
| 5.30%, 02/15/30 (Call 12/15/29) |
4,691 | 4,779,581 | ||||||
| 5.35%, 02/15/33 (Call 11/15/32)(b) |
8,285 | 8,446,039 | ||||||
| 5.70%, 10/15/40 (Call 04/15/40) |
1,769 | 1,836,543 | ||||||
| 5.80%, 03/15/36 |
3,115 | 3,293,216 | ||||||
| 5.88%, 02/15/53 (Call 08/15/52) |
7,275 | 7,774,760 | ||||||
| 5.95%, 02/15/41 (Call 08/15/40) |
2,030 | 2,139,866 | ||||||
| 6.05%, 02/15/63 (Call 08/15/62) |
3,825 | 4,150,968 | ||||||
| 6.50%, 06/15/37 |
2,773 | 3,087,401 | ||||||
| 6.63%, 11/15/37 |
3,253 | 3,664,916 | ||||||
| 6.88%, 02/15/38 |
4,976 | 5,779,281 | ||||||
| Universal Health Services Inc. |
||||||||
| 1.65%, 09/01/26 (Call 08/01/26) |
3,570 | 3,245,196 | ||||||
| 2.65%, 10/15/30 (Call 07/15/30) |
3,613 | 3,015,853 | ||||||
| 2.65%, 01/15/32 (Call 10/15/31) |
2,350 | 1,908,304 | ||||||
| UPMC |
||||||||
| 5.04%, 05/15/33 (Call 02/15/33) |
145 | 143,137 | ||||||
| 5.38%, 05/15/43 (Call 11/15/42) |
280 | 282,014 | ||||||
| Series D-1, 3.60%, 04/03/25 |
1,005 | 986,871 | ||||||
| WakeMed, Series A, 3.29%, 10/01/52 |
||||||||
| (Call 04/01/52) |
885 | 624,885 | ||||||
| West Virginia United Health System Obligated Group, Series 2020, 3.13%, 06/01/50 |
833 | 527,248 | ||||||
| Willis-Knighton Medical Center |
||||||||
| Series 2018, 4.81%, 09/01/48 |
||||||||
| (Call 03/01/48) |
2,073 | 1,823,370 | ||||||
| Series 2021, 3.07%, 03/01/51 |
||||||||
| (Call 09/01/50) |
1,512 | 987,219 | ||||||
| S C H E D U L E O F I N V E S T M E N T S |
57 |
| Schedule of Investments (continued) February 29, 2024 |
iShares® Core U.S. Aggregate Bond ETF (Percentages shown are based on Net Assets) |
| Security | Par (000) |
Value | ||||||
| Health Care - Services (continued) |
||||||||
| Yale-New Haven Health Services Corp., |
$ | 2,526 | $ | 1,507,295 | ||||
|
|
|
|||||||
| 788,731,820 | ||||||||
| Holding Companies - Diversified — 0.1% |
||||||||
| Ares Capital Corp. |
||||||||
| 2.15%, 07/15/26 (Call 06/15/26) |
2,935 | 2,666,264 | ||||||
| 2.88%, 06/15/27 (Call 05/15/27) |
1,464 | 1,329,844 | ||||||
| 2.88%, 06/15/28 (Call 04/15/28) |
5,290 | 4,633,630 | ||||||
| 3.20%, 11/15/31 (Call 08/15/31) |
3,180 | 2,593,124 | ||||||
| 3.25%, 07/15/25 (Call 06/15/25) |
4,908 | 4,715,499 | ||||||
| 3.88%, 01/15/26 (Call 12/15/25) |
3,576 | 3,430,746 | ||||||
| 4.25%, 03/01/25 (Call 01/01/25) |
2,793 | 2,737,616 | ||||||
| 5.88%, 03/01/29 (Call 02/01/29) |
1,575 | 1,540,195 | ||||||
| 7.00%, 01/15/27 |
1,022 | 1,042,026 | ||||||
| Bain Capital Specialty Finance Inc. |
||||||||
| 2.55%, 10/13/26 (Call 09/13/26) |
1,860 | 1,692,061 | ||||||
| 2.95%, 03/10/26 (Call 02/10/26) |
2,090 | 1,955,566 | ||||||
| Barings BDC Inc., 3.30%, 11/23/26 |
875 | 798,657 | ||||||
| Blackstone Private Credit Fund |
||||||||
| 2.63%, 12/15/26 (Call 11/15/26) |
3,545 | 3,202,187 | ||||||
| 3.25%, 03/15/27 (Call 02/15/27) |
6,360 | 5,814,568 | ||||||
| 4.00%, 01/15/29 (Call 11/15/28)(b) |
2,795 | 2,541,353 | ||||||
| 4.70%, 03/24/25 |
3,329 | 3,276,377 | ||||||
| 6.25%, 01/25/31 (Call 11/25/30)(c) |
950 | 939,339 | ||||||
| 7.05%, 09/29/25 |
3,790 | 3,838,472 | ||||||
| 7.30%, 11/27/28 (Call 10/27/28)(c) |
1,135 | 1,170,847 | ||||||
| Blackstone Secured Lending Fund |
||||||||
| 2.13%, 02/15/27 (Call 01/15/27) |
1,659 | 1,484,109 | ||||||
| 2.75%, 09/16/26 (Call 08/19/26) |
2,008 | 1,841,450 | ||||||
| 2.85%, 09/30/28 (Call 07/30/28)(b) |
3,100 | 2,694,357 | ||||||
| 3.63%, 01/15/26 (Call 12/15/25) |
2,262 | 2,156,836 | ||||||
| Blue Owl Capital Corp. |
||||||||
| 2.63%, 01/15/27 (Call 12/15/26) |
2,972 | 2,691,400 | ||||||
| 2.88%, 06/11/28 (Call 04/11/28) |
3,900 | 3,410,167 | ||||||
| 3.40%, 07/15/26 (Call 06/15/26) |
1,825 | 1,699,278 | ||||||
| 3.75%, 07/22/25 (Call 06/22/25) |
2,374 | 2,287,641 | ||||||
| 4.00%, 03/30/25 (Call 02/28/25) |
1,501 | 1,465,577 | ||||||
| 4.25%, 01/15/26 (Call 12/15/25) |
2,330 | 2,243,130 | ||||||
| 5.95%, 03/15/29 (Call 02/15/29) |
90 | 87,927 | ||||||
| Blue Owl Capital Corp. II, 8.45%, 11/15/26 |
295 | 302,515 | ||||||
| Blue Owl Capital Corp. III, 3.13%, 04/13/27 |
2,685 | 2,424,064 | ||||||
| Blue Owl Credit Income Corp. |
||||||||
| 3.13%, 09/23/26 (Call 08/23/26) |
1,935 | 1,761,425 | ||||||
| 4.70%, 02/08/27 (Call 01/08/27) |
1,960 | 1,845,651 | ||||||
| 5.50%, 03/21/25 |
530 | 525,215 | ||||||
| 6.65%, 03/15/31 (Call 01/15/31)(c) |
1,595 | 1,542,678 | ||||||
| 7.75%, 09/16/27 (Call 08/16/27) |
735 | 751,585 | ||||||
| 7.75%, 01/15/29 (Call 12/15/28)(c) |
325 | 331,819 | ||||||
| Blue Owl Technology Finance Corp., 2.50%, |
1,792 | 1,578,244 | ||||||
| FS KKR Capital Corp. |
||||||||
| 2.63%, 01/15/27 (Call 12/15/26) |
2,714 | 2,456,609 | ||||||
| 3.13%, 10/12/28 (Call 08/12/28)(b) |
3,804 | 3,285,020 | ||||||
| 3.25%, 07/15/27 (Call 06/15/27) |
1,845 | 1,675,239 | ||||||
| 3.40%, 01/15/26 (Call 12/15/25) |
1,745 | 1,650,524 | ||||||
| 7.88%, 01/15/29 (Call 12/15/28) |
200 | 206,725 | ||||||
| Security | Par (000) |
Value | ||||||
| Holding Companies - Diversified (continued) |
||||||||
| Goldman Sachs BDC Inc., 2.88%, 01/15/26 |
$ | 1,105 | $ | 1,050,803 | ||||
| Golub Capital BDC Inc. |
||||||||
| 2.05%, 02/15/27 (Call 01/15/27)(b) |
3,028 | 2,664,183 | ||||||
| 2.50%, 08/24/26 (Call 07/24/26) |
1,785 | 1,625,582 | ||||||
| 6.00%, 07/15/29 (Call 06/15/29) |
140 | 135,919 | ||||||
| 7.05%, 12/05/28 (Call 11/05/28) |
40 | 40,753 | ||||||
| Main Street Capital Corp. |
||||||||
| 3.00%, 07/14/26 (Call 06/14/26) |
2,675 | 2,468,496 | ||||||
| 6.95%, 03/01/29 (Call 02/01/29) |
740 | 742,291 | ||||||
| Morgan Stanley Direct Lending Fund, 4.50%, |
590 | 563,959 | ||||||
| Oaktree Specialty Lending Corp. |
||||||||
| 2.70%, 01/15/27 (Call 12/15/26) |
2,773 | 2,475,155 | ||||||
| 7.10%, 02/15/29 (Call 01/15/29)(b) |
2,325 | 2,353,408 | ||||||
| Prospect Capital Corp. |
||||||||
| 3.36%, 11/15/26 (Call 10/15/26)(b) |
2,040 | 1,840,699 | ||||||
| 3.44%, 10/15/28 (Call 08/15/28) |
2,105 | 1,792,023 | ||||||
| 3.71%, 01/22/26 (Call 12/22/25) |
2,049 | 1,931,295 | ||||||
| Sixth Street Specialty Lending Inc. |
||||||||
| 2.50%, 08/01/26 (Call 07/01/26) |
670 | 615,395 | ||||||
| 6.13%, 03/01/29 (Call 02/01/29)(b) |
40 | 39,378 | ||||||
|
|
|
|||||||
| 112,656,895 | ||||||||
| Home Builders — 0.0% |
||||||||
| DR Horton Inc. |
||||||||
| 1.30%, 10/15/26 (Call 09/15/26) |
4,040 | 3,655,919 | ||||||
| 1.40%, 10/15/27 (Call 08/15/27)(b) |
1,399 | 1,234,036 | ||||||
| 2.60%, 10/15/25 (Call 09/15/25)(b) |
1,296 | 1,240,112 | ||||||
| Lennar Corp. |
||||||||
| 4.75%, 05/30/25 (Call 02/28/25) |
2,855 | 2,827,570 | ||||||
| 4.75%, 11/29/27 (Call 05/29/27) |
4,138 | 4,071,843 | ||||||
| 5.00%, 06/15/27 (Call 12/15/26) |
2,428 | 2,406,621 | ||||||
| 5.25%, 06/01/26 (Call 12/01/25) |
2,396 | 2,389,997 | ||||||
| MDC Holdings Inc. |
||||||||
| 2.50%, 01/15/31 (Call 07/15/30) |
1,907 | 1,611,359 | ||||||
| 3.85%, 01/15/30 (Call 07/15/29) |
1,906 | 1,758,131 | ||||||
| 3.97%, 08/06/61 (Call 02/06/61) |
1,525 | 1,160,259 | ||||||
| 6.00%, 01/15/43 (Call 10/15/42) |
3,217 | 3,205,774 | ||||||
| Meritage Homes Corp., 5.13%, 06/06/27 |
330 | 325,083 | ||||||
| NVR Inc., 3.00%, 05/15/30 (Call 11/15/29) |
1,308 | 1,152,775 | ||||||
| PulteGroup Inc. |
||||||||
| 5.00%, 01/15/27 (Call 10/15/26)(b) |
2,585 | 2,573,386 | ||||||
| 5.50%, 03/01/26 (Call 12/01/25) |
2,015 | 2,018,786 | ||||||
| 6.00%, 02/15/35 |
2,023 | 2,077,456 | ||||||
| 6.38%, 05/15/33 |
1,786 | 1,888,426 | ||||||
| 7.88%, 06/15/32(b) |
559 | 646,521 | ||||||
| Toll Brothers Finance Corp. |
||||||||
| 3.80%, 11/01/29 (Call 08/01/29) |
2,790 | 2,564,961 | ||||||
| 4.35%, 02/15/28 (Call 11/15/27) |
2,170 | 2,084,558 | ||||||
| 4.88%, 11/15/25 (Call 08/15/25) |
2,397 | 2,368,834 | ||||||
| 4.88%, 03/15/27 (Call 12/15/26)(b) |
2,320 | 2,280,925 | ||||||
|
|
|
|||||||
| 45,543,332 | ||||||||
| Home Furnishings — 0.0% |
||||||||
| Harman International Industries Inc., 4.15%, |
3,161 | 3,104,666 | ||||||
| Leggett & Platt Inc. |
||||||||
| 3.50%, 11/15/27 (Call 08/15/27) |
3,327 | 3,104,697 | ||||||
| 3.50%, 11/15/51 (Call 05/15/51)(b) |
2,680 | 1,847,733 | ||||||
| 4.40%, 03/15/29 (Call 12/15/28) |
2,712 | 2,569,383 | ||||||
| 58 | 2 0 2 4 I S H A R E S A N N U A L R E P O R T T O S H A R E H O L D E R S |
| Schedule of Investments (continued) February 29, 2024 |
iShares® Core U.S. Aggregate Bond ETF (Percentages shown are based on Net Assets) |
| Security | Par (000) |
Value | ||||||
| Home Furnishings (continued) |
||||||||
| Whirlpool Corp. |
||||||||
| 2.40%, 05/15/31 (Call 02/15/31) |
$ | 1,625 | $ | 1,332,649 | ||||
| 3.70%, 05/01/25 |
1,986 | 1,943,328 | ||||||
| 4.50%, 06/01/46 (Call 12/01/45)(b) |
2,068 | 1,662,645 | ||||||
| 4.60%, 05/15/50 (Call 11/15/49)(b) |
2,310 | 1,859,908 | ||||||
| 4.70%, 05/14/32 (Call 02/14/32)(b) |
1,209 | 1,142,894 | ||||||
| 4.75%, 02/26/29 (Call 11/26/28)(b) |
4,286 | 4,185,241 | ||||||
| 5.50%, 03/01/33 (Call 12/01/32)(b) |
1,465 | 1,452,547 | ||||||
| 5.75%, 03/01/34 (Call 12/01/33) |
1,410 | 1,402,324 | ||||||
|
|
|
|||||||
| 25,608,015 | ||||||||
| Household Products & Wares — 0.1% |
||||||||
| Avery Dennison Corp. |
||||||||
| 2.25%, 02/15/32 (Call 11/15/31) |
2,330 | 1,891,672 | ||||||
| 2.65%, 04/30/30 (Call 02/01/30) |
1,577 | 1,371,759 | ||||||
| 4.88%, 12/06/28 (Call 09/06/28) |
3,726 | 3,688,574 | ||||||
| 5.75%, 03/15/33 (Call 12/15/32) |
1,675 | 1,733,630 | ||||||
| Church & Dwight Co. Inc. |
||||||||
| 2.30%, 12/15/31 (Call 09/15/31) |
1,944 | 1,604,112 | ||||||
| 3.15%, 08/01/27 (Call 05/01/27) |
4,106 | 3,868,776 | ||||||
| 3.95%, 08/01/47 (Call 02/01/47) |
1,935 | 1,546,260 | ||||||
| 5.00%, 06/15/52 (Call 12/15/51) |
2,190 | 2,065,620 | ||||||
| 5.60%, 11/15/32 (Call 08/15/32) |
2,695 | 2,794,563 | ||||||
| Clorox Co. (The) |
||||||||
| 1.80%, 05/15/30 (Call 02/15/30) |
3,244 | 2,679,815 | ||||||
| 3.10%, 10/01/27 (Call 07/01/27) |
2,543 | 2,385,471 | ||||||
| 3.90%, 05/15/28 (Call 02/15/28) |
2,463 | 2,367,076 | ||||||
| 4.40%, 05/01/29 (Call 03/01/29) |
2,465 | 2,402,366 | ||||||
| 4.60%, 05/01/32 (Call 02/01/32)(b) |
3,314 | 3,215,459 | ||||||
| Kimberly-Clark Corp. |
||||||||
| 1.05%, 09/15/27 (Call 07/15/27) |
2,551 | 2,244,175 | ||||||
| 2.00%, 11/02/31 (Call 08/02/31) |
2,583 | 2,122,607 | ||||||
| 2.75%, 02/15/26 |
2,254 | 2,169,206 | ||||||
| 2.88%, 02/07/50 (Call 08/07/49) |
2,099 | 1,433,739 | ||||||
| 3.05%, 08/15/25 |
1,368 | 1,330,190 | ||||||
| 3.10%, 03/26/30 (Call 12/26/29) |
2,328 | 2,117,688 | ||||||
| 3.20%, 04/25/29 (Call 01/25/29)(b) |
1,635 | 1,517,028 | ||||||
| 3.20%, 07/30/46 (Call 01/30/46) |
2,095 | 1,529,693 | ||||||
| 3.90%, 05/04/47 (Call 11/04/46) |
1,852 | 1,500,273 | ||||||
| 3.95%, 11/01/28 (Call 08/01/28)(b) |
2,527 | 2,450,842 | ||||||
| 4.50%, 02/16/33 (Call 11/16/32)(b) |
2,270 | 2,219,103 | ||||||
| 5.30%, 03/01/41 |
1,950 | 1,950,263 | ||||||
| 6.63%, 08/01/37 |
4,153 | 4,784,478 | ||||||
|
|
|
|||||||
| 60,984,438 | ||||||||
| Insurance — 0.8% |
||||||||
| ACE Capital Trust II, Series N, 9.70%, 04/01/30(b) |
2,182 | 2,563,137 | ||||||
| Aegon NV, 5.50%, 04/11/48 (Call 04/11/28), |
||||||||
| (6-mo. LIBOR US + 3.540%)(a) |
2,940 | 2,816,301 | ||||||
| Aflac Inc. |
||||||||
| 1.13%, 03/15/26 (Call 02/15/26) |
2,535 | 2,341,557 | ||||||
| 2.88%, 10/15/26 (Call 07/15/26) |
2,437 | 2,301,055 | ||||||
| 3.60%, 04/01/30 (Call 01/01/30) |
5,373 | 4,980,568 | ||||||
| 4.00%, 10/15/46 (Call 04/15/46) |
1,631 | 1,298,426 | ||||||
| 4.75%, 01/15/49 (Call 07/15/48) |
3,158 | 2,857,554 | ||||||
| Alleghany Corp. |
||||||||
| 3.25%, 08/15/51 (Call 02/15/51) |
1,370 | 955,678 | ||||||
| 3.63%, 05/15/30 (Call 02/15/30) |
3,129 | 2,908,454 | ||||||
| 4.90%, 09/15/44 (Call 03/15/44) |
2,235 | 2,093,055 | ||||||
| Allied World Assurance Co. Holdings Ltd., |
||||||||
| 4.35%, 10/29/25 (Call 07/29/25) |
2,515 | 2,442,839 | ||||||
| Security | Par (000) |
Value | ||||||
| Insurance (continued) |
||||||||
| Allstate Corp. (The) |
||||||||
| 0.75%, 12/15/25 (Call 11/15/25) |
$ | 2,815 | $ | 2,597,492 | ||||
| 1.45%, 12/15/30 (Call 09/15/30) |
2,214 | 1,747,297 | ||||||
| 3.28%, 12/15/26 (Call 09/15/26) |
3,122 | 2,972,820 | ||||||
| 3.85%, 08/10/49 (Call 02/10/49) |
3,108 | 2,412,856 | ||||||
| 4.20%, 12/15/46 (Call 06/15/46) |
3,162 | 2,585,574 | ||||||
| 4.50%, 06/15/43 |
1,928 | 1,680,195 | ||||||
| 5.25%, 03/30/33 (Call 12/30/32) |
1,900 | 1,892,582 | ||||||
| 5.35%, 06/01/33(b) |
1,474 | 1,477,452 | ||||||
| 5.55%, 05/09/35 |
2,381 | 2,411,972 | ||||||
| 5.95%, 04/01/36 |
1,355 | 1,415,281 | ||||||
| 6.50%, 05/15/67 (Call 05/15/37), |
||||||||
| (3-mo. LIBOR US + 2.120%)(a) |
2,431 | 2,447,320 | ||||||
| American Equity Investment Life Holding Co., |
||||||||
| 5.00%, 06/15/27 (Call 03/15/27) |
2,416 | 2,327,433 | ||||||
| American Financial Group Inc./OH |
||||||||
| 4.50%, 06/15/47 (Call 12/15/46) |
965 | 789,201 | ||||||
| 5.25%, 04/02/30 (Call 01/02/30) |
592 | 582,801 | ||||||
| American International Group Inc. |
||||||||
| 3.40%, 06/30/30 (Call 03/30/30) |
1,725 | 1,557,014 | ||||||
| 3.88%, 01/15/35 (Call 07/15/34) |
500 | 439,910 | ||||||
| 4.20%, 04/01/28 (Call 01/01/28) |
2,030 | 1,971,579 | ||||||
| 4.38%, 06/30/50 (Call 12/30/49) |
4,559 | 3,911,219 | ||||||
| 4.50%, 07/16/44 (Call 01/16/44) |
1,760 | 1,554,096 | ||||||
| 4.75%, 04/01/48 (Call 10/01/47) |
5,323 | 4,861,916 | ||||||
| 4.80%, 07/10/45 (Call 01/10/45) |
4,070 | 3,727,374 | ||||||
| 5.13%, 03/27/33 (Call 12/27/32) |
3,235 | 3,189,437 | ||||||
| 6.25%, 05/01/36 |
943 | 978,398 | ||||||
| Series A-9, 5.75%, 04/01/48 (Call 04/01/28), |
||||||||
| (3-mo. LIBOR US + 2.868%)(a)(b) |
3,268 | 3,208,251 | ||||||
| Aon Corp. |
||||||||
| 2.80%, 05/15/30 (Call 02/15/30) |
3,611 | 3,141,214 | ||||||
| 3.75%, 05/02/29 (Call 02/02/29) |
2,822 | 2,647,263 | ||||||
| 4.50%, 12/15/28 (Call 09/15/28) |
2,437 | 2,379,381 | ||||||
| 6.25%, 09/30/40 |
1,424 | 1,508,536 | ||||||
| 8.21%, 01/01/27 |
371 | 399,237 | ||||||
| Aon Corp./Aon Global Holdings PLC |
||||||||
| 2.05%, 08/23/31 (Call 05/23/31) |
3,475 | 2,785,507 | ||||||
| 2.60%, 12/02/31 (Call 09/02/31) |
1,970 | 1,637,765 | ||||||
| 2.85%, 05/28/27 (Call 04/28/27) |
2,165 | 2,018,007 | ||||||
| 2.90%, 08/23/51 (Call 02/23/51) |
2,880 | 1,791,972 | ||||||
| 3.90%, 02/28/52 (Call 08/28/51) |
3,545 | 2,682,800 | ||||||
| 5.00%, 09/12/32 (Call 06/12/32) |
2,100 | 2,051,428 | ||||||
| 5.35%, 02/28/33 (Call 11/28/32) |
2,065 | 2,061,312 | ||||||
| Aon Global Ltd. |
||||||||
| 3.88%, 12/15/25 (Call 09/15/25) |
2,751 | 2,682,205 | ||||||
| 4.60%, 06/14/44 (Call 03/14/44) |
2,662 | 2,297,938 | ||||||
| 4.75%, 05/15/45 (Call 11/15/44) |
2,404 | 2,119,111 | ||||||
| Aon North America Inc. |
||||||||
| 5.13%, 03/01/27 (Call 02/01/27) |
2,690 | 2,688,912 | ||||||
| 5.15%, 03/01/29 (Call 02/01/29) |
3,675 | 3,675,542 | ||||||
| 5.30%, 03/01/31 (Call 01/01/31) |
3,800 | 3,795,249 | ||||||
| 5.45%, 03/01/34 (Call 12/01/33) |
3,800 | 3,802,066 | ||||||
| 5.75%, 03/01/54 (Call 09/01/53) |
2,530 | 2,541,827 | ||||||
| Arch Capital Finance LLC |
||||||||
| 4.01%, 12/15/26 (Call 09/15/26) |
2,207 | 2,131,103 | ||||||
| 5.03%, 12/15/46 (Call 06/15/46) |
1,704 | 1,566,589 | ||||||
| Arch Capital Group Ltd. |
||||||||
| 3.64%, 06/30/50 (Call 12/30/49) |
4,552 | 3,353,291 | ||||||
| 7.35%, 05/01/34 |
1,945 | 2,182,041 | ||||||
| Arch Capital Group U.S. Inc., 5.14%, 11/01/43 |
2,485 | 2,312,500 | ||||||
| S C H E D U L E O F I N V E S T M E N T S |
59 |
| Schedule of Investments (continued) February 29, 2024 |
iShares® Core U.S. Aggregate Bond ETF (Percentages shown are based on Net Assets) |
| Security | Par (000) |
Value | ||||||
| Insurance (continued) |
||||||||
| Arthur J Gallagher & Co. |
||||||||
| 2.40%, 11/09/31 (Call 08/09/31) |
$ | 1,980 | $ | 1,603,288 | ||||
| 3.05%, 03/09/52 (Call 09/09/51) |
2,500 | 1,585,567 | ||||||
| 3.50%, 05/20/51 (Call 11/20/50) |
3,097 | 2,150,053 | ||||||
| 5.45%, 07/15/34 (Call 04/15/34)(b) |
370 | 368,648 | ||||||
| 5.50%, 03/02/33 (Call 12/02/32) |
1,825 | 1,820,161 | ||||||
| 5.75%, 03/02/53 (Call 09/02/52) |
1,778 | 1,750,501 | ||||||
| 5.75%, 07/15/54 (Call 01/15/54) |
510 | 505,605 | ||||||
| 6.50%, 02/15/34 (Call 11/15/33) |
1,080 | 1,153,842 | ||||||
| 6.75%, 02/15/54 (Call 08/15/53) |
905 | 1,013,432 | ||||||
| Assurant Inc. |
||||||||
| 2.65%, 01/15/32 (Call 10/15/31)(b) |
1,535 | 1,249,239 | ||||||
| 3.70%, 02/22/30 (Call 11/22/29) |
2,247 | 2,005,230 | ||||||
| 4.90%, 03/27/28 (Call 12/27/27) |
2,495 | 2,443,854 | ||||||
| Assured Guaranty U.S. Holdings Inc. |
||||||||
| 3.15%, 06/15/31 (Call 03/15/31) |
2,681 | 2,345,362 | ||||||
| 3.60%, 09/15/51 (Call 03/15/51) |
750 | 527,442 | ||||||
| 6.13%, 09/15/28 (Call 08/15/28) |
240 | 247,633 | ||||||
| Athene Holding Ltd. |
||||||||
| 3.45%, 05/15/52 (Call 11/15/51) |
2,390 | 1,555,553 | ||||||
| 3.50%, 01/15/31 (Call 10/15/30) |
2,050 | 1,782,426 | ||||||
| 3.95%, 05/25/51 (Call 11/25/50) |
2,785 | 2,031,441 | ||||||
| 4.13%, 01/12/28 (Call 10/12/27) |
4,590 | 4,395,570 | ||||||
| 5.88%, 01/15/34 (Call 10/15/33) |
2,098 | 2,083,672 | ||||||
| 6.15%, 04/03/30 (Call 01/03/30) |
1,557 | 1,602,312 | ||||||
| 6.65%, 02/01/33 (Call 11/01/32) |
2,185 | 2,286,571 | ||||||
| AXA SA, 8.60%, 12/15/30 |
125 | 147,908 | ||||||
| AXIS Specialty Finance LLC |
||||||||
| 3.90%, 07/15/29 (Call 04/15/29)(b) |
1,694 | 1,592,512 | ||||||
| 4.90%, 01/15/40 (Call 01/15/30), |
||||||||
| (5-year CMT + 3.186%)(a) |
1,501 | 1,324,672 | ||||||
| AXIS Specialty Finance PLC, 4.00%, 12/06/27 |
||||||||
| (Call 09/06/27) |
2,904 | 2,776,577 | ||||||
| Berkshire Hathaway Finance Corp. |
||||||||
| 1.45%, 10/15/30 (Call 07/15/30) |
4,001 | 3,262,189 | ||||||
| 1.85%, 03/12/30 (Call 12/12/29) |
2,578 | 2,187,889 | ||||||
| 2.30%, 03/15/27 (Call 02/15/27) |
4,790 | 4,483,693 | ||||||
| 2.50%, 01/15/51 (Call 07/15/50) |
4,555 | 2,817,615 | ||||||
| 2.85%, 10/15/50 (Call 04/15/50) |
6,434 | 4,244,786 | ||||||
| 2.88%, 03/15/32 (Call 12/15/31) |
3,684 | 3,218,607 | ||||||
| 3.85%, 03/15/52 (Call 09/15/51) |
4,900 | 3,884,207 | ||||||
| 4.20%, 08/15/48 (Call 02/15/48) |
9,087 | 7,903,770 | ||||||
| 4.25%, 01/15/49 (Call 07/15/48) |
6,734 | 5,923,823 | ||||||
| 4.30%, 05/15/43 |
4,172 | 3,730,971 | ||||||
| 4.40%, 05/15/42 |
4,453 | 4,114,921 | ||||||
| 5.75%, 01/15/40 |
4,513 | 4,852,479 | ||||||
| Berkshire Hathaway Inc. |
||||||||
| 3.13%, 03/15/26 (Call 12/15/25) |
12,486 | 12,069,448 | ||||||
| 4.50%, 02/11/43(b) |
5,280 | 4,976,741 | ||||||
| Brighthouse Financial Inc. |
||||||||
| 3.70%, 06/22/27 (Call 03/22/27) |
145 | 136,727 | ||||||
| 3.85%, 12/22/51 (Call 06/22/51) |
1,290 | 835,569 | ||||||
| 4.70%, 06/22/47 (Call 12/22/46) |
3,577 | 2,771,834 | ||||||
| 5.63%, 05/15/30 (Call 02/15/30)(b) |
2,794 | 2,779,066 | ||||||
| Brown & Brown Inc. |
||||||||
| 2.38%, 03/15/31 (Call 12/15/30) |
4,678 | 3,822,416 | ||||||
| 4.20%, 03/17/32 (Call 12/17/31) |
1,550 | 1,407,792 | ||||||
| 4.50%, 03/15/29 (Call 12/15/28) |
2,025 | 1,959,517 | ||||||
| 4.95%, 03/17/52 (Call 09/17/51) |
3,235 | 2,787,269 | ||||||
| Security | Par (000) |
Value | ||||||
| Insurance (continued) |
||||||||
| Chubb Corp. (The) |
||||||||
| 6.00%, 05/11/37 |
$ | 4,104 | $ | 4,404,462 | ||||
| Series 1, 6.50%, 05/15/38 |
660 | 741,562 | ||||||
| Chubb INA Holdings Inc. |
||||||||
| 1.38%, 09/15/30 (Call 06/15/30) |
1,690 | 1,366,184 | ||||||
| 2.85%, 12/15/51 (Call 06/15/51) |
1,280 | 866,303 | ||||||
| 3.05%, 12/15/61 (Call 06/15/61) |
3,455 | 2,293,714 | ||||||
| 3.15%, 03/15/25 |
4,740 | 4,634,004 | ||||||
| 3.35%, 05/03/26 (Call 02/03/26) |
2,972 | 2,865,169 | ||||||
| 4.15%, 03/13/43 |
3,450 | 3,015,836 | ||||||
| 4.35%, 11/03/45 (Call 05/03/45) |
5,775 | 5,098,695 | ||||||
| 6.70%, 05/15/36 |
435 | 494,666 | ||||||
| Cincinnati Financial Corp. |
||||||||
| 6.13%, 11/01/34 |
2,349 | 2,453,911 | ||||||
| 6.92%, 05/15/28 |
1,039 | 1,106,662 | ||||||
| CNA Financial Corp. |
||||||||
| 2.05%, 08/15/30 (Call 05/15/30) |
1,060 | 875,780 | ||||||
| 3.45%, 08/15/27 (Call 05/15/27) |
2,302 | 2,178,828 | ||||||
| 3.90%, 05/01/29 (Call 02/01/29) |
3,166 | 2,971,625 | ||||||
| 4.50%, 03/01/26 (Call 12/01/25) |
2,704 | 2,660,721 | ||||||
| 5.13%, 02/15/34 (Call 11/15/33) |
555 | 536,234 | ||||||
| 5.50%, 06/15/33 (Call 03/15/33) |
755 | 759,942 | ||||||
| CNO Financial Group Inc. |
||||||||
| 5.25%, 05/30/25 (Call 02/28/25) |
2,201 | 2,187,690 | ||||||
| 5.25%, 05/30/29 (Call 02/28/29) |
2,435 | 2,363,989 | ||||||
| Corebridge Financial Inc. |
||||||||
| 3.50%, 04/04/25 (Call 03/04/25) |
3,650 | 3,564,347 | ||||||
| 3.65%, 04/05/27 (Call 03/05/27) |
4,391 | 4,156,229 | ||||||
| 3.85%, 04/05/29 (Call 02/05/29) |
2,608 | 2,418,970 | ||||||
| 3.90%, 04/05/32 (Call 01/05/32) |
4,470 | 3,929,771 | ||||||
| 4.35%, 04/05/42 (Call 10/05/41) |
2,290 | 1,894,174 | ||||||
| 4.40%, 04/05/52 (Call 10/05/51) |
2,215 | 1,780,478 | ||||||
| 5.75%, 01/15/34 (Call 10/15/33) |
2,490 | 2,484,642 | ||||||
| 6.05%, 09/15/33 (Call 06/15/33)(c) |
3,000 | 3,065,068 | ||||||
| 6.88%, 12/15/52 (Call 09/15/27), |
||||||||
| (5-year CMT + 3.846%)(a) |
1,445 | 1,443,405 | ||||||
| Enstar Finance LLC |
||||||||
| 5.50%, 01/15/42 (Call 01/15/27), |
||||||||
| (5-year CMT + 4.006%)(a) |
945 | 859,547 | ||||||
| 5.75%, 09/01/40 (Call 09/01/25), |
||||||||
| (5-year CMT + 5.468%)(a)(b) |
50 | 47,866 | ||||||
| Enstar Group Ltd. |
||||||||
| 3.10%, 09/01/31 (Call 03/01/31) |
1,516 | 1,236,439 | ||||||
| 4.95%, 06/01/29 (Call 03/01/29) |
2,721 | 2,647,786 | ||||||
| Equitable Holdings Inc. |
||||||||
| 4.35%, 04/20/28 (Call 01/20/28) |
5,898 | 5,682,486 | ||||||
| 5.00%, 04/20/48 (Call 10/20/47) |
5,792 | 5,252,494 | ||||||
| 5.59%, 01/11/33 (Call 10/11/32) |
2,620 | 2,638,286 | ||||||
| 7.00%, 04/01/28 |
1,049 | 1,115,244 | ||||||
| Everest Reinsurance Holdings Inc. |
||||||||
| 3.13%, 10/15/52 (Call 04/15/52) |
3,728 | 2,336,171 | ||||||
| 3.50%, 10/15/50 (Call 04/15/50) |
3,819 | 2,681,829 | ||||||
| 4.87%, 06/01/44 |
1,741 | 1,567,223 | ||||||
| F&G Annuities & Life Inc., 7.40%, 01/13/28 |
||||||||
| (Call 12/13/27) |
2,346 | 2,406,072 | ||||||
| Fairfax Financial Holdings Ltd. |
||||||||
| 3.38%, 03/03/31 (Call 12/03/30) |
1,837 | 1,588,668 | ||||||
| 4.63%, 04/29/30 (Call 01/29/30) |
2,047 | 1,928,919 | ||||||
| 4.85%, 04/17/28 (Call 01/17/28) |
2,919 | 2,856,712 | ||||||
| 5.63%, 08/16/32 (Call 05/16/32) |
1,710 | 1,684,499 | ||||||
| 6.00%, 12/07/33 (Call 09/07/33)(c) |
1,570 | 1,576,480 | ||||||
| 60 | 2 0 2 4 I S H A R E S A N N U A L R E P O R T T O S H A R E H O L D E R S |
| Schedule of Investments (continued) February 29, 2024 |
iShares® Core U.S. Aggregate Bond ETF (Percentages shown are based on Net Assets) |
| Security | Par (000) | Value | ||||||
| Insurance (continued) |
||||||||
| Fidelity National Financial Inc. |
||||||||
| 2.45%, 03/15/31 (Call 12/15/30) |
$ | 3,114 | $ | 2,531,003 | ||||
| 3.20%, 09/17/51 (Call 03/17/51)(b) |
2,615 | 1,641,238 | ||||||
| 3.40%, 06/15/30 (Call 03/15/30) |
3,070 | 2,708,109 | ||||||
| 4.50%, 08/15/28 (Call 05/15/28) |
2,572 | 2,472,297 | ||||||
| First American Financial Corp. |
||||||||
| 2.40%, 08/15/31 (Call 05/15/31) |
2,387 | 1,870,376 | ||||||
| 4.00%, 05/15/30 (Call 02/15/30) |
1,125 | 1,002,420 | ||||||
| Globe Life Inc. |
||||||||
| 2.15%, 08/15/30 (Call 05/15/30) |
2,872 | 2,378,767 | ||||||
| 4.55%, 09/15/28 (Call 06/15/28) |
3,555 | 3,464,833 | ||||||
| 4.80%, 06/15/32 (Call 03/15/32) |
460 | 442,710 | ||||||
| Hanover Insurance Group Inc. (The) |
||||||||
| 2.50%, 09/01/30 (Call 06/01/30) |
2,095 | 1,739,747 | ||||||
| 4.50%, 04/15/26 (Call 01/15/26) |
2,467 | 2,419,773 | ||||||
| Hartford Financial Services Group Inc. (The) |
||||||||
| 2.80%, 08/19/29 (Call 05/19/29) |
3,140 | 2,804,836 | ||||||
| 2.90%, 09/15/51 (Call 03/15/51) |
2,230 | 1,429,199 | ||||||
| 3.60%, 08/19/49 (Call 02/19/49) |
3,016 | 2,269,690 | ||||||
| 4.30%, 04/15/43 |
1,876 | 1,601,894 | ||||||
| 4.40%, 03/15/48 (Call 09/15/47) |
1,853 | 1,600,254 | ||||||
| 5.95%, 10/15/36 |
1,355 | 1,401,019 | ||||||
| 6.10%, 10/01/41 |
2,344 | 2,442,237 | ||||||
| Horace Mann Educators Corp., 7.25%, |
||||||||
| 09/15/28 (Call 08/15/28) |
70 | 74,945 | ||||||
| Jackson Financial Inc. |
||||||||
| 3.13%, 11/23/31 (Call 08/23/31) |
2,395 | 1,983,094 | ||||||
| 4.00%, 11/23/51 (Call 05/23/51) |
1,420 | 1,014,061 | ||||||
| 5.17%, 06/08/27 (Call 05/08/27)(b) |
2,290 | 2,279,235 | ||||||
| 5.67%, 06/08/32 (Call 03/08/32)(b) |
910 | 907,859 | ||||||
| Kemper Corp. |
||||||||
| 2.40%, 09/30/30 (Call 06/30/30) |
2,205 | 1,737,242 | ||||||
| 3.80%, 02/23/32 (Call 11/23/31) |
1,450 | 1,216,900 | ||||||
| Lincoln National Corp. |
||||||||
| 3.05%, 01/15/30 (Call 10/15/29)(b) |
2,036 | 1,782,181 | ||||||
| 3.35%, 03/09/25(b) |
1,478 | 1,442,222 | ||||||
| 3.40%, 01/15/31 (Call 10/15/30)(b) |
2,314 | 2,025,644 | ||||||
| 3.40%, 03/01/32 (Call 12/01/31) |
384 | 325,934 | ||||||
| 3.63%, 12/12/26 (Call 09/15/26)(b) |
1,763 | 1,683,151 | ||||||
| 3.80%, 03/01/28 (Call 12/01/27)(b) |
2,249 | 2,139,473 | ||||||
| 4.35%, 03/01/48 (Call 09/01/47) |
1,838 | 1,423,457 | ||||||
| 4.38%, 06/15/50 (Call 12/15/49) |
1,287 | 993,475 | ||||||
| 6.30%, 10/09/37 |
1,160 | 1,189,970 | ||||||
| 7.00%, 06/15/40(b) |
1,963 | 2,140,435 | ||||||
| Loews Corp. |
||||||||
| 3.20%, 05/15/30 (Call 02/15/30) |
2,950 | 2,661,294 | ||||||
| 3.75%, 04/01/26 (Call 01/01/26) |
4,002 | 3,891,021 | ||||||
| 4.13%, 05/15/43 (Call 11/15/42) |
3,517 | 2,978,522 | ||||||
| 6.00%, 02/01/35 |
347 | 368,088 | ||||||
| Manulife Financial Corp. |
||||||||
| 2.48%, 05/19/27 (Call 03/19/27) |
2,920 | 2,711,148 | ||||||
| 3.70%, 03/16/32 (Call 12/16/31)(b) |
2,590 | 2,359,987 | ||||||
| 4.06%, 02/24/32 (Call 02/24/27), |
||||||||
| (5-year USD ICE Swap + 1.647%)(a) |
3,463 | 3,300,557 | ||||||
| 4.15%, 03/04/26 |
5,766 | 5,651,362 | ||||||
| 5.38%, 03/04/46 |
2,018 | 1,975,118 | ||||||
| Markel Group Inc. |
||||||||
| 3.35%, 09/17/29 (Call 06/17/29) |
2,310 | 2,080,947 | ||||||
| 3.45%, 05/07/52 (Call 11/07/51) |
2,620 | 1,797,749 | ||||||
| 3.50%, 11/01/27 (Call 08/01/27) |
2,107 | 1,984,630 | ||||||
| 4.15%, 09/17/50 (Call 03/17/50) |
2,466 | 1,946,869 | ||||||
| Security | Par (000) | Value | ||||||
| Insurance (continued) |
||||||||
| 4.30%, 11/01/47 (Call 05/01/47) |
$ | 1,721 | $ | 1,369,117 | ||||
| 5.00%, 04/05/46 |
2,140 | 1,907,122 | ||||||
| 5.00%, 05/20/49 (Call 11/20/48) |
1,845 | 1,671,871 | ||||||
| Marsh & McLennan Companies Inc. |
||||||||
| 2.25%, 11/15/30 (Call 08/15/30) |
3,650 | 3,077,601 | ||||||
| 2.38%, 12/15/31 (Call 09/15/31) |
405 | 336,428 | ||||||
| 2.90%, 12/15/51 (Call 06/15/51) |
915 | 586,384 | ||||||
| 3.50%, 03/10/25 (Call 12/10/24) |
4,419 | 4,340,288 | ||||||
| 3.75%, 03/14/26 (Call 12/14/25) |
4,449 | 4,340,517 | ||||||
| 4.20%, 03/01/48 (Call 09/01/47) |
3,075 | 2,559,895 | ||||||
| 4.35%, 01/30/47 (Call 07/30/46) |
2,692 | 2,283,711 | ||||||
| 4.38%, 03/15/29 (Call 12/15/28) |
6,727 | 6,578,674 | ||||||
| 4.75%, 03/15/39 (Call 09/15/38) |
2,513 | 2,365,893 | ||||||
| 4.90%, 03/15/49 (Call 09/15/48) |
5,521 | 5,105,248 | ||||||
| 5.15%, 03/15/34 (Call 12/15/33) |
1,325 | 1,320,141 | ||||||
| 5.40%, 09/15/33 (Call 06/15/33) |
2,245 | 2,284,227 | ||||||
| 5.45%, 03/15/53 (Call 09/15/52) |
1,070 | 1,066,551 | ||||||
| 5.45%, 03/15/54 (Call 09/15/53) |
1,325 | 1,316,671 | ||||||
| 5.70%, 09/15/53 (Call 03/15/53) |
4,495 | 4,655,481 | ||||||
| 5.75%, 11/01/32 (Call 08/01/32) |
1,335 | 1,394,143 | ||||||
| 5.88%, 08/01/33 |
1,415 | 1,493,520 | ||||||
| 6.25%, 11/01/52 (Call 05/01/52) |
825 | 911,723 | ||||||
| Mercury General Corp., 4.40%, 03/15/27 |
||||||||
| (Call 12/15/26) |
2,520 | 2,406,491 | ||||||
| MetLife Inc. |
||||||||
| 3.00%, 03/01/25 |
3,873 | 3,786,026 | ||||||
| 3.60%, 11/13/25 (Call 08/13/25) |
3,083 | 3,007,659 | ||||||
| 4.05%, 03/01/45 |
5,346 | 4,414,222 | ||||||
| 4.13%, 08/13/42 |
4,403 | 3,723,124 | ||||||
| 4.55%, 03/23/30 (Call 12/23/29) |
5,382 | 5,266,993 | ||||||
| 4.60%, 05/13/46 (Call 11/13/45) |
2,509 | 2,241,958 | ||||||
| 4.72%, 12/15/44 |
3,106 | 2,764,072 | ||||||
| 4.88%, 11/13/43 |
3,535 | 3,247,990 | ||||||
| 5.00%, 07/15/52 (Call 01/15/52) |
2,650 | 2,472,355 | ||||||
| 5.25%, 01/15/54 (Call 07/15/53) |
3,700 | 3,577,522 | ||||||
| 5.38%, 07/15/33 (Call 04/15/33) |
2,895 | 2,910,734 | ||||||
| 5.70%, 06/15/35 |
5,668 | 5,866,920 | ||||||
| 5.88%, 02/06/41 |
4,057 | 4,234,495 | ||||||
| 6.38%, 06/15/34 |
1,986 | 2,139,380 | ||||||
| 6.40%, 12/15/66 (Call 12/15/31) |
4,747 | 4,825,382 | ||||||
| 6.50%, 12/15/32(b) |
2,215 | 2,419,029 | ||||||
| 10.75%, 08/01/69 (Call 08/01/34)(b) |
2,202 | 2,997,261 | ||||||
| MGIC Investment Corp., 5.25%, 08/15/28 |
90 | 86,968 | ||||||
| Munich Re America Corp., Series B, 7.45%, 12/15/26 |
235 | 248,997 | ||||||
| Nationwide Financial Services Inc., 6.75%, 05/15/87 |
514 | 511,234 | ||||||
| Old Republic International Corp. |
||||||||
| 3.85%, 06/11/51 (Call 12/11/50) |
2,164 | 1,566,558 | ||||||
| 3.88%, 08/26/26 (Call 07/26/26) |
3,151 | 3,048,633 | ||||||
| PartnerRe Finance B LLC |
||||||||
| 3.70%, 07/02/29 (Call 04/02/29)(b) |
3,261 | 3,059,060 | ||||||
| 4.50%, 10/01/50 (Call 04/01/30), |
||||||||
| (5-year CMT + 3.815%)(a) |
277 | 248,151 | ||||||
| Primerica Inc., 2.80%, 11/19/31 |
1,983 | 1,645,769 | ||||||
| Principal Financial Group Inc. |
||||||||
| 2.13%, 06/15/30 (Call 03/15/30) |
3,119 | 2,594,535 | ||||||
| 3.10%, 11/15/26 (Call 08/15/26) |
2,655 | 2,519,044 | ||||||
| 3.40%, 05/15/25 (Call 02/15/25) |
2,869 | 2,802,122 | ||||||
| S C H E D U L E O F I N V E S T M E N T S |
61 |
| Schedule of Investments (continued) February 29, 2024 |
iShares® Core U.S. Aggregate Bond ETF (Percentages shown are based on Net Assets) |
| Security | Par (000) |
Value | ||||||
| Insurance (continued) |
||||||||
| 3.70%, 05/15/29 (Call 02/15/29) |
$ | 1,710 | $ | 1,595,121 | ||||
| 4.30%, 11/15/46 (Call 05/15/46) |
1,709 | 1,415,306 | ||||||
| 4.35%, 05/15/43(b) |
1,788 | 1,553,899 | ||||||
| 4.63%, 09/15/42 |
1,056 | 946,528 | ||||||
| 5.38%, 03/15/33 (Call 12/15/32) |
905 | 911,951 | ||||||
| 5.50%, 03/15/53 (Call 09/15/52) |
1,525 | 1,490,950 | ||||||
| 6.05%, 10/15/36 |
1,990 | 2,093,525 | ||||||
| Progressive Corp. (The) |
||||||||
| 2.45%, 01/15/27 |
2,501 | 2,333,632 | ||||||
| 2.50%, 03/15/27 (Call 02/15/27) |
3,145 | 2,927,877 | ||||||
| 3.00%, 03/15/32 (Call 12/15/31) |
1,380 | 1,193,865 | ||||||
| 3.20%, 03/26/30 (Call 12/26/29) |
3,256 | 2,941,472 | ||||||
| 3.70%, 01/26/45 |
807 | 652,801 | ||||||
| 3.70%, 03/15/52 (Call 09/15/51) |
1,620 | 1,259,569 | ||||||
| 3.95%, 03/26/50 (Call 09/26/49) |
2,144 | 1,745,445 | ||||||
| 4.00%, 03/01/29 (Call 12/01/28) |
2,172 | 2,089,250 | ||||||
| 4.13%, 04/15/47 (Call 10/15/46) |
5,658 | 4,751,658 | ||||||
| 4.20%, 03/15/48 (Call 09/15/47) |
1,925 | 1,654,776 | ||||||
| 4.35%, 04/25/44 |
928 | 821,370 | ||||||
| 4.95%, 06/15/33 (Call 03/15/33) |
1,620 | 1,608,605 | ||||||
| 6.25%, 12/01/32 |
1,756 | 1,906,254 | ||||||
| 6.63%, 03/01/29 |
1,276 | 1,369,759 | ||||||
| Prudential Financial Inc. |
||||||||
| 1.50%, 03/10/26 (Call 02/10/26) |
2,706 | 2,521,114 | ||||||
| 2.10%, 03/10/30 (Call 12/10/29)(b) |
3,845 | 3,287,935 | ||||||
| 3.00%, 03/10/40 (Call 09/10/39) |
2,507 | 1,868,752 | ||||||
| 3.70%, 10/01/50 (Call 07/01/30), |
||||||||
| (5-year CMT + 3.035%)(a) |
955 | 832,731 | ||||||
| 3.70%, 03/13/51 (Call 09/13/50) |
6,409 | 4,865,839 | ||||||
| 3.88%, 03/27/28 (Call 12/27/27) |
2,592 | 2,490,316 | ||||||
| 3.91%, 12/07/47 (Call 06/07/47) |
4,166 | 3,288,539 | ||||||
| 3.94%, 12/07/49 (Call 06/07/49) |
4,311 | 3,378,766 | ||||||
| 4.35%, 02/25/50 (Call 08/25/49) |
4,227 | 3,574,119 | ||||||
| 4.42%, 03/27/48 (Call 09/27/47) |
2,003 | 1,709,779 | ||||||
| 4.50%, 09/15/47 (Call 09/15/27), |
||||||||
| (3-mo. LIBOR US + 2.380%)(a)(b) |
3,150 | 2,949,158 | ||||||
| 4.60%, 05/15/44 |
3,536 | 3,147,799 | ||||||
| 5.13%, 03/01/52 (Call 11/28/31), |
||||||||
| (5-year CMT + 3.162%)(a) |
1,500 | 1,401,555 | ||||||
| 5.38%, 05/15/45 (Call 05/15/25), |
||||||||
| (3-mo. LIBOR US + 3.031%)(a) |
4,102 | 4,039,340 | ||||||
| 5.70%, 12/14/36 |
4,184 | 4,317,185 | ||||||
| 5.70%, 09/15/48 (Call 09/15/28), |
||||||||
| (3-mo. LIBOR US + 2.665%)(a) |
3,898 | 3,807,636 | ||||||
| 5.75%, 07/15/33 |
1,107 | 1,161,518 | ||||||
| 6.00%, 09/01/52 (Call 06/01/32), |
||||||||
| (5-year CMT + 3.234%)(a) |
726 | 723,672 | ||||||
| 6.63%, 12/01/37 |
1,311 | 1,457,973 | ||||||
| 6.63%, 06/21/40 |
1,630 | 1,798,469 | ||||||
| 6.75%, 03/01/53 (Call 12/01/32), |
||||||||
| (5-year CMT + 2.848%)(a)(b) |
535 | 555,861 | ||||||
| Prudential Funding Asia PLC |
||||||||
| 3.13%, 04/14/30 |
2,836 | 2,528,473 | ||||||
| 3.63%, 03/24/32 (Call 12/24/31) |
2,230 | 1,993,207 | ||||||
| Reinsurance Group of America Inc. |
||||||||
| 3.15%, 06/15/30 (Call 03/15/30) |
2,611 | 2,307,841 | ||||||
| 3.90%, 05/15/29 (Call 02/15/29) |
3,263 | 3,078,388 | ||||||
| 3.95%, 09/15/26 (Call 06/15/26) |
2,532 | 2,476,111 | ||||||
| 6.00%, 09/15/33 (Call 06/15/33) |
1,346 | 1,380,155 | ||||||
| Security | Par (000) |
Value | ||||||
| Insurance (continued) |
||||||||
| RenaissanceRe Finance Inc. |
||||||||
| 3.45%, 07/01/27 (Call 04/01/27)(b) |
$ | 2,783 | $ | 2,617,809 | ||||
| 3.70%, 04/01/25 (Call 01/01/25) |
445 | 435,865 | ||||||
| RenaissanceRe Holdings Ltd. |
||||||||
| 3.60%, 04/15/29 (Call 01/15/29) |
2,445 | 2,253,327 | ||||||
| 5.75%, 06/05/33 (Call 03/05/33) |
3,490 | 3,516,416 | ||||||
| Selective Insurance Group Inc., 5.38%, 03/01/49 |
340 | 321,864 | ||||||
| Stewart Information Services Corp., 3.60%, |
2,880 | 2,237,639 | ||||||
| Transatlantic Holdings Inc., 8.00%, 11/30/39 |
1,983 | 2,533,694 | ||||||
| Travelers Companies Inc. (The) |
||||||||
| 2.55%, 04/27/50 (Call 10/27/49) |
2,956 | 1,840,065 | ||||||
| 3.05%, 06/08/51 (Call 12/08/50) |
3,544 | 2,423,181 | ||||||
| 3.75%, 05/15/46 (Call 11/15/45) |
1,925 | 1,526,167 | ||||||
| 4.00%, 05/30/47 (Call 11/30/46) |
3,594 | 2,963,718 | ||||||
| 4.05%, 03/07/48 (Call 09/07/47) |
2,576 | 2,159,422 | ||||||
| 4.10%, 03/04/49 (Call 09/04/48) |
2,396 | 2,013,773 | ||||||
| 4.30%, 08/25/45 (Call 02/25/45) |
2,491 | 2,170,941 | ||||||
| 4.60%, 08/01/43 |
1,340 | 1,244,714 | ||||||
| 5.35%, 11/01/40 |
3,607 | 3,646,571 | ||||||
| 5.45%, 05/25/53 (Call 11/25/52) |
1,465 | 1,494,409 | ||||||
| 6.25%, 06/15/37 |
3,478 | 3,821,954 | ||||||
| 6.75%, 06/20/36 |
1,802 | 2,054,576 | ||||||
| Travelers Property Casualty Corp., 6.38%, 03/15/33 |
2,183 | 2,422,562 | ||||||
| Trinity Acquisition PLC, 4.40%, 03/15/26 |
||||||||
| (Call 12/15/25) |
2,543 | 2,491,910 | ||||||
| Unum Group |
||||||||
| 4.00%, 06/15/29 (Call 03/15/29) |
2,031 | 1,906,376 | ||||||
| 4.13%, 06/15/51 (Call 12/15/50) |
2,000 | 1,467,833 | ||||||
| 4.50%, 12/15/49 (Call 06/15/49) |
745 | 590,483 | ||||||
| 5.75%, 08/15/42 |
2,380 | 2,310,667 | ||||||
| W R Berkley Corp. |
||||||||
| 3.15%, 09/30/61 (Call 03/30/61) |
810 | 485,633 | ||||||
| 3.55%, 03/30/52 (Call 09/30/51) |
963 | 664,836 | ||||||
| 4.00%, 05/12/50 (Call 11/12/49) |
2,526 | 1,944,625 | ||||||
| 4.75%, 08/01/44 |
2,168 | 1,880,557 | ||||||
| Willis North America Inc. |
||||||||
| 2.95%, 09/15/29 (Call 06/15/29) |
3,184 | 2,829,297 | ||||||
| 3.88%, 09/15/49 (Call 03/15/49) |
3,015 | 2,235,213 | ||||||
| 4.50%, 09/15/28 (Call 06/15/28) |
2,908 | 2,806,055 | ||||||
| 4.65%, 06/15/27 (Call 05/15/27) |
4,048 | 3,972,762 | ||||||
| 5.05%, 09/15/48 (Call 03/15/48) |
2,065 | 1,848,786 | ||||||
| 5.35%, 05/15/33 (Call 02/15/33) |
1,475 | 1,451,918 | ||||||
| 5.90%, 03/05/54 (Call 09/05/53) |
2,850 | 2,846,341 | ||||||
| XL Group Ltd., 5.25%, 12/15/43 |
2,010 | 1,877,531 | ||||||
|
|
|
|||||||
| 781,191,268 | ||||||||
| Internet — 0.4% |
||||||||
| Alibaba Group Holding Ltd. |
||||||||
| 2.13%, 02/09/31 (Call 11/09/30)(b) |
3,700 | 3,060,583 | ||||||
| 2.70%, 02/09/41 (Call 08/09/40) |
2,625 | 1,808,713 | ||||||
| 3.15%, 02/09/51 (Call 08/09/50) |
7,410 | 4,890,468 | ||||||
| 3.25%, 02/09/61 (Call 08/09/60)(b) |
3,873 | 2,443,770 | ||||||
| 3.40%, 12/06/27 (Call 09/06/27) |
11,444 | 10,802,737 | ||||||
| 4.00%, 12/06/37 (Call 06/06/37) |
4,415 | 3,806,868 | ||||||
| 4.20%, 12/06/47 (Call 06/06/47) |
7,945 | 6,462,162 | ||||||
| 4.40%, 12/06/57 (Call 06/06/57) |
3,960 | 3,236,476 | ||||||
| 4.50%, 11/28/34 (Call 05/28/34) |
3,382 | 3,167,189 | ||||||
| Alphabet Inc. |
||||||||
| 0.45%, 08/15/25 (Call 07/15/25) |
4,003 | 3,763,779 | ||||||
| 62 | 2 0 2 4 I S H A R E S A N N U A L R E P O R T T O S H A R E H O L D E R S |
| Schedule of Investments (continued) February 29, 2024 |
iShares® Core U.S. Aggregate Bond ETF (Percentages shown are based on Net Assets) |
| Security | Par (000) |
Value | ||||||
| Internet (continued) |
||||||||
| 0.80%, 08/15/27 (Call 06/15/27) |
$ | 5,495 | $ | 4,854,348 | ||||
| 1.10%, 08/15/30 (Call 05/15/30) |
9,274 | 7,502,702 | ||||||
| 1.90%, 08/15/40 (Call 02/15/40) |
5,643 | 3,731,644 | ||||||
| 2.00%, 08/15/26 (Call 05/15/26) |
9,801 | 9,204,625 | ||||||
| 2.05%, 08/15/50 (Call 02/15/50) |
10,808 | 6,383,996 | ||||||
| 2.25%, 08/15/60 (Call 02/15/60)(b) |
5,335 | 3,062,821 | ||||||
| Amazon.com Inc. |
||||||||
| 0.80%, 06/03/25 (Call 05/03/25) |
2,960 | 2,811,107 | ||||||
| 1.00%, 05/12/26 (Call 04/12/26) |
10,790 | 9,930,900 | ||||||
| 1.20%, 06/03/27 (Call 04/03/27) |
2,558 | 2,287,074 | ||||||
| 1.50%, 06/03/30 (Call 03/03/30) |
8,795 | 7,271,922 | ||||||
| 1.65%, 05/12/28 (Call 03/12/28) |
10,900 | 9,674,341 | ||||||
| 2.10%, 05/12/31 (Call 02/12/31) |
10,975 | 9,209,870 | ||||||
| 2.50%, 06/03/50 (Call 12/03/49) |
8,776 | 5,505,137 | ||||||
| 2.70%, 06/03/60 (Call 12/03/59) |
8,030 | 4,935,639 | ||||||
| 2.88%, 05/12/41 (Call 11/12/40) |
9,259 | 6,952,210 | ||||||
| 3.00%, 04/13/25 |
830 | 811,024 | ||||||
| 3.10%, 05/12/51 (Call 11/12/50) |
12,200 | 8,574,232 | ||||||
| 3.15%, 08/22/27 (Call 05/22/27) |
14,708 | 13,957,810 | ||||||
| 3.25%, 05/12/61 (Call 11/12/60) |
6,765 | 4,662,060 | ||||||
| 3.30%, 04/13/27 (Call 03/13/27) |
6,450 | 6,182,414 | ||||||
| 3.45%, 04/13/29 (Call 02/13/29) |
4,535 | 4,295,436 | ||||||
| 3.60%, 04/13/32 (Call 01/13/32)(b) |
7,770 | 7,162,705 | ||||||
| 3.88%, 08/22/37 (Call 02/22/37) |
12,107 | 10,822,538 | ||||||
| 3.95%, 04/13/52 (Call 10/13/51) |
9,720 | 8,032,596 | ||||||
| 4.05%, 08/22/47 (Call 02/22/47) |
12,892 | 11,025,674 | ||||||
| 4.10%, 04/13/62 (Call 10/13/61) |
4,818 | 3,982,155 | ||||||
| 4.25%, 08/22/57 (Call 02/22/57) |
8,201 | 7,035,903 | ||||||
| 4.55%, 12/01/27 (Call 11/01/27) |
2,625 | 2,616,196 | ||||||
| 4.60%, 12/01/25 |
5,285 | 5,260,619 | ||||||
| 4.65%, 12/01/29 (Call 10/01/29) |
4,490 | 4,492,376 | ||||||
| 4.70%, 12/01/32 (Call 09/01/32) |
7,215 | 7,180,867 | ||||||
| 4.80%, 12/05/34 (Call 06/05/34) |
5,547 | 5,545,435 | ||||||
| 4.95%, 12/05/44 (Call 06/05/44) |
5,448 | 5,374,737 | ||||||
| 5.20%, 12/03/25 (Call 09/03/25) |
4,205 | 4,223,662 | ||||||
| Baidu Inc. |
||||||||
| 1.63%, 02/23/27 (Call 01/23/27) |
1,524 | 1,376,362 | ||||||
| 1.72%, 04/09/26 (Call 03/09/26) |
520 | 482,807 | ||||||
| 2.38%, 08/23/31 (Call 05/23/31)(b) |
760 | 626,901 | ||||||
| 3.08%, 04/07/25 (Call 03/07/25)(b) |
545 | 530,221 | ||||||
| 3.43%, 04/07/30 (Call 01/07/30) |
1,425 | 1,290,574 | ||||||
| 3.63%, 07/06/27 |
1,964 | 1,870,159 | ||||||
| 4.13%, 06/30/25 |
2,421 | 2,375,045 | ||||||
| 4.38%, 03/29/28 (Call 12/29/27)(b) |
2,260 | 2,205,084 | ||||||
| 4.88%, 11/14/28 (Call 08/14/28) |
1,965 | 1,951,431 | ||||||
| Booking Holdings Inc. |
||||||||
| 3.55%, 03/15/28 (Call 12/15/27) |
3,874 | 3,686,541 | ||||||
| 3.60%, 06/01/26 (Call 03/01/26) |
4,756 | 4,609,162 | ||||||
| 3.65%, 03/15/25 (Call 12/15/24) |
3,126 | 3,073,951 | ||||||
| 4.63%, 04/13/30 (Call 01/13/30) |
7,514 | 7,383,907 | ||||||
| eBay Inc. |
||||||||
| 1.40%, 05/10/26 (Call 04/10/26) |
5,140 | 4,739,551 | ||||||
| 1.90%, 03/11/25 (Call 02/11/25) |
4,092 | 3,948,587 | ||||||
| 2.60%, 05/10/31 (Call 02/10/31) |
3,245 | 2,750,491 | ||||||
| 2.70%, 03/11/30 (Call 12/11/29) |
4,195 | 3,665,253 | ||||||
| 3.60%, 06/05/27 (Call 03/05/27) |
4,835 | 4,617,716 | ||||||
| 3.65%, 05/10/51 (Call 11/10/50) |
3,925 | 2,838,425 | ||||||
| 4.00%, 07/15/42 (Call 01/15/42) |
4,796 | 3,804,803 | ||||||
| 5.90%, 11/22/25 (Call 10/22/25) |
745 | 750,933 | ||||||
| 5.95%, 11/22/27 (Call 10/22/27)(b) |
1,535 | 1,577,360 | ||||||
| 6.30%, 11/22/32 (Call 08/22/32) |
1,780 | 1,887,698 | ||||||
| Security | Par (000) |
Value | ||||||
| Internet (continued) |
||||||||
| Expedia Group Inc. |
||||||||
| 2.95%, 03/15/31 (Call 12/15/30)(b) |
$ | 2,403 | $ | 2,057,172 | ||||
| 3.25%, 02/15/30 (Call 11/15/29) |
5,354 | 4,771,002 | ||||||
| 3.80%, 02/15/28 (Call 11/15/27) |
2,944 | 2,784,856 | ||||||
| 4.63%, 08/01/27 (Call 05/01/27) |
1,481 | 1,449,283 | ||||||
| 5.00%, 02/15/26 (Call 11/15/25) |
4,072 | 4,044,581 | ||||||
| JD.com Inc. |
||||||||
| 3.38%, 01/14/30 (Call 10/14/29)(b) |
2,265 | 2,043,548 | ||||||
| 3.88%, 04/29/26 |
885 | 858,292 | ||||||
| 4.13%, 01/14/50 (Call 07/14/49) |
1,900 | 1,480,777 | ||||||
| Meta Platforms Inc. |
||||||||
| 3.50%, 08/15/27 (Call 07/15/27) |
13,640 | 13,077,783 | ||||||
| 3.85%, 08/15/32 (Call 05/15/32) |
13,310 | 12,328,329 | ||||||
| 4.45%, 08/15/52 (Call 02/15/52) |
10,445 | 9,128,844 | ||||||
| 4.60%, 05/15/28 (Call 04/15/28) |
4,055 | 4,038,978 | ||||||
| 4.65%, 08/15/62 (Call 02/15/62) |
5,850 | 5,159,765 | ||||||
| 4.80%, 05/15/30 (Call 03/15/30) |
3,915 | 3,914,080 | ||||||
| 4.95%, 05/15/33 (Call 02/15/33) |
4,705 | 4,708,359 | ||||||
| 5.60%, 05/15/53 (Call 11/15/52) |
8,770 | 9,083,683 | ||||||
| 5.75%, 05/15/63 (Call 11/15/62) |
4,305 | 4,507,111 | ||||||
| Netflix Inc. |
||||||||
| 4.38%, 11/15/26 |
1,340 | 1,318,269 | ||||||
| 4.88%, 04/15/28 |
2,615 | 2,610,634 | ||||||
| 5.88%, 11/15/28 |
2,030 | 2,103,136 | ||||||
| 6.38%, 05/15/29 |
690 | 733,316 | ||||||
| Tencent Music Entertainment Group |
||||||||
| 1.38%, 09/03/25 (Call 08/03/25) |
2,034 | 1,912,959 | ||||||
| 2.00%, 09/03/30 (Call 06/03/30) |
3,361 | 2,735,907 | ||||||
| VeriSign Inc. |
||||||||
| 2.70%, 06/15/31 (Call 03/15/31) |
4,025 | 3,345,760 | ||||||
| 4.75%, 07/15/27 (Call 04/01/24) |
3,565 | 3,494,862 | ||||||
| 5.25%, 04/01/25 (Call 01/01/25) |
2,475 | 2,464,865 | ||||||
| Weibo Corp., 3.38%, 07/08/30 |
||||||||
| (Call 04/08/30)(b) |
3,919 | 3,363,092 | ||||||
|
|
|
|||||||
| 429,561,725 | ||||||||
| Iron & Steel — 0.1% |
||||||||
| ArcelorMittal SA |
||||||||
| 4.25%, 07/16/29 |
2,567 | 2,431,089 | ||||||
| 4.55%, 03/11/26 |
3,030 | 2,984,254 | ||||||
| 6.55%, 11/29/27 (Call 10/29/27) |
5,075 | 5,281,274 | ||||||
| 6.75%, 03/01/41 |
2,305 | 2,365,020 | ||||||
| 6.80%, 11/29/32 (Call 08/29/32) |
3,565 | 3,771,672 | ||||||
| 7.00%, 10/15/39 |
2,550 | 2,718,796 | ||||||
| Nucor Corp. |
||||||||
| 2.00%, 06/01/25 (Call 05/01/25) |
3,627 | 3,479,828 | ||||||
| 2.70%, 06/01/30 (Call 03/01/30)(b) |
3,074 | 2,709,130 | ||||||
| 2.98%, 12/15/55 (Call 06/15/55) |
5,652 | 3,633,848 | ||||||
| 3.13%, 04/01/32 (Call 01/01/32) |
545 | 475,825 | ||||||
| 3.85%, 04/01/52 (Call 09/01/51) |
2,690 | 2,114,843 | ||||||
| 3.95%, 05/23/25 |
3,165 | 3,115,802 | ||||||
| 3.95%, 05/01/28 (Call 02/01/28) |
1,583 | 1,529,543 | ||||||
| 4.30%, 05/23/27 (Call 04/23/27) |
3,885 | 3,796,151 | ||||||
| 4.40%, 05/01/48 (Call 11/01/47) |
444 | 389,660 | ||||||
| 5.20%, 08/01/43 (Call 02/01/43) |
1,080 | 1,055,039 | ||||||
| 6.40%, 12/01/37 |
718 | 785,245 | ||||||
| Reliance Inc. |
||||||||
| 1.30%, 08/15/25 (Call 07/15/25) |
3,588 | 3,367,748 | ||||||
| 2.15%, 08/15/30 (Call 05/15/30) |
545 | 452,180 | ||||||
| Steel Dynamics Inc. |
||||||||
| 1.65%, 10/15/27 (Call 08/15/27) |
1,030 | 915,526 | ||||||
| 2.40%, 06/15/25 (Call 05/15/25) |
3,595 | 3,453,425 | ||||||
| S C H E D U L E O F I N V E S T M E N T S |
63 |
| Schedule of Investments (continued) February 29, 2024 |
iShares® Core U.S. Aggregate Bond ETF (Percentages shown are based on Net Assets) |
| Security | Par (000) |
Value | ||||||
| Iron & Steel (continued) |
||||||||
| 3.25%, 01/15/31 (Call 10/15/30) |
$ | 2,521 | $ | 2,234,074 | ||||
| 3.25%, 10/15/50 (Call 04/15/50) |
2,179 | 1,427,080 | ||||||
| 3.45%, 04/15/30 (Call 01/15/30) |
2,234 | 2,030,183 | ||||||
| 5.00%, 12/15/26 (Call 04/01/24) |
3,518 | 3,489,267 | ||||||
| Vale Overseas Ltd. |
||||||||
| 3.75%, 07/08/30 (Call 04/08/30) |
4,764 | 4,286,559 | ||||||
| 6.13%, 06/12/33 (Call 03/12/33) |
1,440 | 1,453,743 | ||||||
| 6.25%, 08/10/26(b) |
660 | 670,308 | ||||||
| 6.88%, 11/21/36 |
5,572 | 5,962,846 | ||||||
| 6.88%, 11/10/39(b) |
3,620 | 3,870,851 | ||||||
| 8.25%, 01/17/34(b) |
580 | 680,651 | ||||||
| Vale SA, 5.63%, 09/11/42(b) |
1,176 | 1,149,467 | ||||||
|
|
|
|||||||
| 78,080,927 | ||||||||
| Leisure Time — 0.0% |
||||||||
| Brunswick Corp. |
||||||||
| 2.40%, 08/18/31 (Call 05/18/31)(b) |
1,994 | 1,569,006 | ||||||
| 4.40%, 09/15/32 (Call 06/15/32)(b) |
2,190 | 1,953,317 | ||||||
| 5.10%, 04/01/52 (Call 10/01/51)(b) |
1,580 | 1,248,873 | ||||||
| Harley-Davidson Inc. |
||||||||
| 3.50%, 07/28/25 (Call 04/28/25) |
2,605 | 2,528,786 | ||||||
| 4.63%, 07/28/45 (Call 01/28/45) |
1,524 | 1,202,113 | ||||||
| Polaris Inc., 6.95%, 03/15/29 (Call 02/15/29) |
370 | 390,113 | ||||||
|
|
|
|||||||
| 8,892,208 | ||||||||
| Lodging — 0.1% |
||||||||
| Choice Hotels International Inc. |
||||||||
| 3.70%, 12/01/29 (Call 09/01/29) |
2,171 | 1,902,731 | ||||||
| 3.70%, 01/15/31 (Call 10/15/30) |
1,930 | 1,658,281 | ||||||
| Hyatt Hotels Corp. |
||||||||
| 4.38%, 09/15/28 (Call 06/15/28) |
2,735 | 2,625,161 | ||||||
| 4.85%, 03/15/26 (Call 12/15/25) |
3,098 | 3,061,784 | ||||||
| 5.38%, 04/23/25 (Call 03/23/25) |
2,503 | 2,497,794 | ||||||
| 5.75%, 01/30/27 (Call 12/30/26) |
1,795 | 1,816,491 | ||||||
| 5.75%, 04/23/30 (Call 01/23/30) |
2,282 | 2,325,370 | ||||||
| Las Vegas Sands Corp., 3.90%, 08/08/29 |
||||||||
| (Call 05/08/29) |
60 | 54,296 | ||||||
| Marriott International Inc./MD |
||||||||
| 3.75%, 03/15/25 (Call 12/15/24) |
1,406 | 1,379,737 | ||||||
| 3.75%, 10/01/25 (Call 07/01/25) |
1,735 | 1,690,513 | ||||||
| 4.88%, 05/15/29 (Call 04/15/29) |
765 | 754,738 | ||||||
| 4.90%, 04/15/29 (Call 03/15/29) |
720 | 711,211 | ||||||
| 5.00%, 10/15/27 (Call 09/15/27) |
3,290 | 3,278,978 | ||||||
| 5.30%, 05/15/34 (Call 02/15/34) |
885 | 871,054 | ||||||
| 5.45%, 09/15/26 (Call 08/15/26) |
535 | 537,255 | ||||||
| 5.55%, 10/15/28 (Call 09/15/28) |
2,605 | 2,650,142 | ||||||
| Series AA, 4.65%, 12/01/28 |
||||||||
| (Call 09/01/28)(b) |
2,509 | 2,457,110 | ||||||
| Series EE, 5.75%, 05/01/25 (Call 04/01/25) |
3,836 | 3,849,716 | ||||||
| Series FF, 4.63%, 06/15/30 (Call 03/15/30) |
5,357 | 5,183,754 | ||||||
| Series GG, 3.50%, 10/15/32 |
||||||||
| (Call 07/15/32) |
2,549 | 2,223,288 | ||||||
| Series HH, 2.85%, 04/15/31 (Call 01/15/31) |
831 | 709,266 | ||||||
| Series II, 2.75%, 10/15/33 (Call 07/15/33)(b) |
3,905 | 3,143,416 | ||||||
| Series R, 3.13%, 06/15/26 (Call 03/15/26) |
4,438 | 4,236,140 | ||||||
| Series X, 4.00%, 04/15/28 (Call 01/15/28) |
1,744 | 1,669,157 | ||||||
| Sands China Ltd. |
||||||||
| 2.55%, 03/08/27 (Call 02/08/27) |
2,320 | 2,083,403 | ||||||
| 3.10%, 03/08/29 (Call 01/08/29) |
2,420 | 2,084,595 | ||||||
| 3.25%, 08/08/31 (Call 05/08/31) |
2,490 | 2,065,564 | ||||||
| 4.05%, 01/08/26 (Call 12/08/25) |
1,205 | 1,155,303 | ||||||
| 4.63%, 06/18/30 (Call 03/18/30) |
2,915 | 2,651,517 | ||||||
| Security | Par (000) |
Value | ||||||
| Lodging (continued) |
||||||||
| 5.13%, 08/08/25 (Call 06/08/25) |
$ | 395 | $ | 389,010 | ||||
| 5.40%, 08/08/28 (Call 05/08/28) |
3,160 | 3,071,533 | ||||||
|
|
|
|||||||
| 64,788,308 | ||||||||
| Machinery — 0.3% |
||||||||
| ABB Finance USA Inc. |
||||||||
| 3.80%, 04/03/28 (Call 01/03/28) |
800 | 777,813 | ||||||
| 4.38%, 05/08/42 |
280 | 251,307 | ||||||
| Caterpillar Financial Services Corp. |
||||||||
| 0.80%, 11/13/25 |
1,164 | 1,085,029 | ||||||
| 0.90%, 03/02/26 |
1,875 | 1,730,765 | ||||||
| 1.10%, 09/14/27 |
2,256 | 1,987,897 | ||||||
| 1.15%, 09/14/26 |
3,190 | 2,907,946 | ||||||
| 1.45%, 05/15/25 |
1,200 | 1,147,616 | ||||||
| 1.70%, 01/08/27 |
4,165 | 3,829,814 | ||||||
| 2.40%, 08/09/26(b) |
2,484 | 2,342,059 | ||||||
| 3.40%, 05/13/25 |
330 | 323,009 | ||||||
| 3.60%, 08/12/27 |
3,705 | 3,566,719 | ||||||
| 3.65%, 08/12/25 |
3,730 | 3,654,943 | ||||||
| 4.35%, 05/15/26 |
4,350 | 4,296,796 | ||||||
| 4.50%, 01/08/27 |
1,455 | 1,444,702 | ||||||
| 4.80%, 01/06/26 |
1,180 | 1,176,960 | ||||||
| 4.85%, 02/27/29 |
1,925 | 1,926,635 | ||||||
| 5.05%, 02/27/26 |
2,390 | 2,391,016 | ||||||
| 5.15%, 08/11/25(b) |
5,629 | 5,628,273 | ||||||
| 5.40%, 03/10/25 |
395 | 395,874 | ||||||
| Caterpillar Inc. |
||||||||
| 1.90%, 03/12/31 (Call 12/12/30) |
985 | 826,526 | ||||||
| 2.60%, 09/19/29 (Call 06/19/29) |
2,936 | 2,643,083 | ||||||
| 2.60%, 04/09/30 (Call 01/09/30) |
4,200 | 3,731,514 | ||||||
| 3.25%, 09/19/49 (Call 03/19/49) |
5,029 | 3,701,369 | ||||||
| 3.25%, 04/09/50 (Call 10/09/49) |
5,407 | 3,997,021 | ||||||
| 3.80%, 08/15/42 |
7,768 | 6,481,857 | ||||||
| 4.30%, 05/15/44 (Call 11/15/43) |
2,212 | 1,997,892 | ||||||
| 4.75%, 05/15/64 (Call 11/15/63) |
1,968 | 1,779,570 | ||||||
| 5.20%, 05/27/41 |
1,921 | 1,940,881 | ||||||
| 5.30%, 09/15/35(b) |
655 | 685,665 | ||||||
| 6.05%, 08/15/36 |
2,278 | 2,495,446 | ||||||
| CNH Industrial Capital LLC |
||||||||
| 1.45%, 07/15/26 (Call 06/15/26) |
1,900 | 1,737,296 | ||||||
| 1.88%, 01/15/26 (Call 12/15/25) |
1,940 | 1,818,190 | ||||||
| 3.95%, 05/23/25 |
2,115 | 2,075,070 | ||||||
| 4.55%, 04/10/28 (Call 03/10/28) |
2,945 | 2,881,303 | ||||||
| 5.45%, 10/14/25 |
1,920 | 1,920,183 | ||||||
| 5.50%, 01/12/29 (Call 12/12/28) |
1,850 | 1,874,564 | ||||||
| CNH Industrial NV, 3.85%, 11/15/27 |
||||||||
| (Call 08/15/27) |
3,220 | 3,089,591 | ||||||
| Deere & Co. |
||||||||
| 2.75%, 04/15/25 (Call 03/15/25) |
3,105 | 3,023,806 | ||||||
| 2.88%, 09/07/49 (Call 03/07/49) |
3,085 | 2,146,764 | ||||||
| 3.10%, 04/15/30 (Call 01/15/30) |
3,636 | 3,308,227 | ||||||
| 3.75%, 04/15/50 (Call 10/15/49) |
4,386 | 3,590,524 | ||||||
| 3.90%, 06/09/42 (Call 12/09/41) |
4,849 | 4,137,839 | ||||||
| 5.38%, 10/16/29 |
2,390 | 2,467,648 | ||||||
| 7.13%, 03/03/31(b) |
775 | 884,842 | ||||||
| Dover Corp. |
||||||||
| 2.95%, 11/04/29 (Call 08/04/29) |
2,280 | 2,033,826 | ||||||
| 3.15%, 11/15/25 (Call 08/15/25) |
2,246 | 2,165,771 | ||||||
| 5.38%, 10/15/35 |
192 | 195,253 | ||||||
| 5.38%, 03/01/41 (Call 12/01/40) |
1,950 | 1,917,963 | ||||||
| 64 | 2 0 2 4 I S H A R E S A N N U A L R E P O R T T O S H A R E H O L D E R S |
| Schedule of Investments (continued) February 29, 2024 |
iShares® Core U.S. Aggregate Bond ETF (Percentages shown are based on Net Assets) |
| Security | Par (000) |
Value | ||||||
| Machinery (continued) |
||||||||
| Flowserve Corp. |
||||||||
| 2.80%, 01/15/32 (Call 10/15/31) |
$ | 2,270 | $ | 1,855,622 | ||||
| 3.50%, 10/01/30 (Call 07/01/30) |
2,328 | 2,047,812 | ||||||
| IDEX Corp. |
||||||||
| 2.63%, 06/15/31 (Call 03/15/31) |
2,310 | 1,946,926 | ||||||
| 3.00%, 05/01/30 (Call 02/01/30) |
1,769 | 1,544,570 | ||||||
| John Deere Capital Corp. |
||||||||
| 0.70%, 01/15/26 |
3,870 | 3,582,443 | ||||||
| 1.05%, 06/17/26 |
2,220 | 2,035,119 | ||||||
| 1.30%, 10/13/26 |
2,210 | 2,019,138 | ||||||
| 1.45%, 01/15/31 |
3,205 | 2,587,024 | ||||||
| 1.50%, 03/06/28 |
2,177 | 1,917,375 | ||||||
| 1.70%, 01/11/27 |
2,470 | 2,263,052 | ||||||
| 1.75%, 03/09/27 |
2,486 | 2,273,018 | ||||||
| 2.00%, 06/17/31 |
2,514 | 2,078,065 | ||||||
| 2.13%, 03/07/25 |
685 | 664,554 | ||||||
| 2.25%, 09/14/26 |
2,386 | 2,233,572 | ||||||
| 2.35%, 03/08/27(b) |
1,208 | 1,125,579 | ||||||
| 2.45%, 01/09/30 |
2,951 | 2,593,135 | ||||||
| 2.65%, 06/10/26 |
1,409 | 1,342,913 | ||||||
| 2.80%, 09/08/27 |
2,722 | 2,547,120 | ||||||
| 2.80%, 07/18/29 |
3,421 | 3,109,614 | ||||||
| 3.05%, 01/06/28 |
1,160 | 1,094,392 | ||||||
| 3.35%, 04/18/29 |
2,660 | 2,496,199 | ||||||
| 3.40%, 06/06/25 |
2,600 | 2,547,460 | ||||||
| 3.40%, 09/11/25 |
1,805 | 1,762,455 | ||||||
| 3.45%, 03/13/25 |
4,298 | 4,221,119 | ||||||
| 3.45%, 03/07/29 |
3,134 | 2,955,304 | ||||||
| 3.90%, 06/07/32 |
740 | 689,612 | ||||||
| 4.05%, 09/08/25 |
2,675 | 2,637,423 | ||||||
| 4.15%, 09/15/27 |
3,205 | 3,140,979 | ||||||
| 4.35%, 09/15/32 |
2,730 | 2,640,463 | ||||||
| 4.50%, 01/08/27 |
2,150 | 2,132,550 | ||||||
| 4.50%, 01/16/29 |
2,110 | 2,079,339 | ||||||
| 4.70%, 06/10/30 |
2,300 | 2,281,608 | ||||||
| 4.75%, 06/08/26 |
2,390 | 2,382,841 | ||||||
| 4.75%, 01/20/28 |
1,295 | 1,293,774 | ||||||
| 4.80%, 01/09/26 |
1,905 | 1,900,127 | ||||||
| 4.85%, 10/11/29 |
1,940 | 1,950,175 | ||||||
| 4.90%, 03/03/28 |
160 | 160,777 | ||||||
| 4.95%, 06/06/25 |
2,145 | 2,141,777 | ||||||
| 4.95%, 07/14/28 |
1,595 | 1,604,134 | ||||||
| 5.05%, 03/03/26 |
555 | 556,342 | ||||||
| 5.15%, 03/03/25 |
305 | 305,194 | ||||||
| nVent Finance Sarl |
||||||||
| 2.75%, 11/15/31 (Call 08/15/31) |
1,653 | 1,347,593 | ||||||
| 4.55%, 04/15/28 (Call 01/15/28)(b) |
2,704 | 2,606,996 | ||||||
| 5.65%, 05/15/33 (Call 02/15/33) |
1,495 | 1,493,633 | ||||||
| Oshkosh Corp. |
||||||||
| 3.10%, 03/01/30 (Call 12/01/29) |
1,111 | 980,391 | ||||||
| 4.60%, 05/15/28 (Call 02/15/28) |
2,238 | 2,176,191 | ||||||
| Otis Worldwide Corp. |
||||||||
| 2.06%, 04/05/25 (Call 03/05/25) |
5,349 | 5,152,287 | ||||||
| 2.29%, 04/05/27 (Call 02/05/27) |
2,028 | 1,873,961 | ||||||
| 2.57%, 02/15/30 (Call 11/15/29) |
6,936 | 6,040,799 | ||||||
| 3.11%, 02/15/40 (Call 08/15/39) |
4,773 | 3,629,101 | ||||||
| 3.36%, 02/15/50 (Call 08/15/49) |
3,056 | 2,210,291 | ||||||
| 5.25%, 08/16/28 (Call 07/16/28) |
1,985 | 2,002,004 | ||||||
| Rockwell Automation Inc. |
||||||||
| 1.75%, 08/15/31 (Call 05/15/31) |
1,855 | 1,489,961 | ||||||
| 2.80%, 08/15/61 (Call 02/15/61) |
2,168 | 1,295,457 | ||||||
| Security | Par (000) |
Value | ||||||
| Machinery (continued) |
||||||||
| 2.88%, 03/01/25 (Call 12/01/24) |
$ | 1,417 | $ | 1,384,563 | ||||
| 3.50%, 03/01/29 (Call 12/01/28) |
2,038 | 1,941,947 | ||||||
| 4.20%, 03/01/49 (Call 09/01/48) |
2,973 | 2,533,183 | ||||||
| Westinghouse Air Brake Technologies Corp. |
||||||||
| 3.20%, 06/15/25 (Call 05/15/25) |
2,434 | 2,360,650 | ||||||
| 3.45%, 11/15/26 (Call 08/15/26) |
4,273 | 4,063,052 | ||||||
| 4.70%, 09/15/28 (Call 06/15/28) |
6,285 | 6,130,891 | ||||||
| Xylem Inc./NY |
||||||||
| 1.95%, 01/30/28 (Call 11/30/27) |
3,327 | 2,972,581 | ||||||
| 2.25%, 01/30/31 (Call 10/30/30) |
2,913 | 2,440,545 | ||||||
| 3.25%, 11/01/26 (Call 08/01/26) |
3,303 | 3,153,333 | ||||||
| 4.38%, 11/01/46 (Call 05/01/46) |
1,385 | 1,171,739 | ||||||
|
|
|
|||||||
| 255,606,501 | ||||||||
| Machinery - Diversified — 0.0% | ||||||||
| Ingersoll Rand Inc. |
||||||||
| 5.40%, 08/14/28 (Call 07/14/28) |
555 | 559,175 | ||||||
| 5.70%, 08/14/33 (Call 05/14/33) |
670 | 681,890 | ||||||
| John Deere Capital Corp. |
||||||||
| 5.15%, 09/08/26 |
885 | 890,469 | ||||||
| 5.15%, 09/08/33 |
935 | 951,125 | ||||||
| 5.30%, 09/08/25 |
1,935 | 1,943,529 | ||||||
| Nordson Corp. |
||||||||
| 5.60%, 09/15/28 (Call 08/15/28) |
750 | 762,033 | ||||||
| 5.80%, 09/15/33 (Call 06/15/33) |
1,165 | 1,203,094 | ||||||
| Westinghouse Air Brake Technologies Corp., |
||||||||
| 5.61%, 03/11/34 (Call 12/11/33) |
385 | 386,587 | ||||||
|
|
|
|||||||
| 7,377,902 | ||||||||
| Manufacturing — 0.1% | ||||||||
| 3M Co. |
||||||||
| 2.25%, 09/19/26 (Call 06/19/26)(b) |
3,320 | 3,092,478 | ||||||
| 2.38%, 08/26/29 (Call 05/26/29) |
4,590 | 3,981,703 | ||||||
| 2.65%, 04/15/25 (Call 03/15/25)(b) |
2,285 | 2,213,347 | ||||||
| 2.88%, 10/15/27 (Call 07/15/27)(b) |
4,178 | 3,868,687 | ||||||
| 3.00%, 08/07/25(b) |
2,008 | 1,945,421 | ||||||
| 3.05%, 04/15/30 (Call 01/15/30)(b) |
2,855 | 2,532,600 | ||||||
| 3.13%, 09/19/46 (Call 03/19/46)(b) |
2,107 | 1,454,978 | ||||||
| 3.25%, 08/26/49 (Call 02/26/49)(b) |
4,283 | 2,949,910 | ||||||
| 3.38%, 03/01/29 (Call 12/01/28) |
4,038 | 3,718,688 | ||||||
| 3.63%, 09/14/28 (Call 06/14/28)(b) |
3,280 | 3,094,922 | ||||||
| 3.63%, 10/15/47 (Call 04/15/47) |
2,241 | 1,622,019 | ||||||
| 3.70%, 04/15/50 (Call 10/15/49) |
2,777 | 2,053,022 | ||||||
| 3.88%, 06/15/44 |
1,620 | 1,271,495 | ||||||
| 4.00%, 09/14/48 (Call 03/14/48)(b) |
4,645 | 3,746,121 | ||||||
| 5.70%, 03/15/37(b) |
2,272 | 2,370,089 | ||||||
| Carlisle Companies Inc. |
||||||||
| 2.20%, 03/01/32 (Call 12/01/31) |
1,300 | 1,028,233 | ||||||
| 2.75%, 03/01/30 (Call 12/01/29) |
3,859 | 3,356,335 | ||||||
| 3.75%, 12/01/27 (Call 09/01/27) |
1,915 | 1,819,861 | ||||||
| Eaton Corp. |
||||||||
| 3.10%, 09/15/27 (Call 06/15/27) |
3,092 | 2,922,223 | ||||||
| 3.92%, 09/15/47 (Call 03/15/47)(b) |
2,509 | 2,052,709 | ||||||
| 4.00%, 11/02/32 |
3,669 | 3,437,602 | ||||||
| 4.15%, 03/15/33 (Call 12/15/32) |
3,295 | 3,103,839 | ||||||
| 4.15%, 11/02/42 |
3,229 | 2,803,133 | ||||||
| 4.35%, 05/18/28 (Call 04/18/28) |
785 | 773,079 | ||||||
| 4.70%, 08/23/52 (Call 02/23/52)(b) |
1,705 | 1,573,100 | ||||||
| GE Capital Funding LLC, 4.55%, 05/15/32 (Call 02/15/32) |
4,067 | 3,906,085 | ||||||
| S C H E D U L E O F I N V E S T M E N T S |
65 |
| Schedule of Investments (continued) February 29, 2024 |
iShares® Core U.S. Aggregate Bond ETF (Percentages shown are based on Net Assets) |
| Security | Par (000) |
Value | ||||||
| Manufacturing (continued) |
||||||||
| GE Capital International Funding Co. |
||||||||
| Unlimited Co. |
||||||||
| 3.37%, 11/15/25 |
$ | 430 | $ | 416,229 | ||||
| 4.42%, 11/15/35 |
3,949 | 3,695,758 | ||||||
| General Electric Co. |
||||||||
| 4.35%, 05/01/50 (Call 11/01/49) |
765 | 673,337 | ||||||
| 4.50%, 03/11/44(b) |
410 | 370,923 | ||||||
| 5.88%, 01/14/38 |
1,057 | 1,121,989 | ||||||
| 6.75%, 03/15/32 |
1,675 | 1,860,076 | ||||||
| 6.88%, 01/10/39 |
780 | 921,844 | ||||||
| Illinois Tool Works Inc. |
||||||||
| 2.65%, 11/15/26 (Call 08/15/26) |
6,179 | 5,874,399 | ||||||
| 3.90%, 09/01/42 (Call 03/01/42) |
2,162 | 1,840,798 | ||||||
| 4.88%, 09/15/41 (Call 03/15/41) |
2,465 | 2,381,733 | ||||||
| Parker-Hannifin Corp. |
||||||||
| 3.25%, 03/01/27 (Call 12/01/26) |
4,456 | 4,238,507 | ||||||
| 3.25%, 06/14/29 (Call 03/14/29) |
3,578 | 3,292,257 | ||||||
| 4.00%, 06/14/49 (Call 12/14/48) |
3,586 | 2,925,935 | ||||||
| 4.10%, 03/01/47 (Call 09/01/46) |
2,111 | 1,733,463 | ||||||
| 4.20%, 11/21/34 (Call 05/21/34) |
1,850 | 1,703,447 | ||||||
| 4.25%, 09/15/27 (Call 08/15/27) |
2,740 | 2,678,701 | ||||||
| 4.45%, 11/21/44 (Call 05/21/44) |
2,977 | 2,611,462 | ||||||
| 4.50%, 09/15/29 (Call 07/15/29) |
3,918 | 3,831,510 | ||||||
| 6.25%, 05/15/38 |
1,376 | 1,479,557 | ||||||
| Pentair Finance Sarl |
||||||||
| 4.50%, 07/01/29 (Call 04/01/29) |
2,403 | 2,317,586 | ||||||
| 5.90%, 07/15/32 (Call 04/15/32) |
1,150 | 1,179,999 | ||||||
| Teledyne Technologies Inc. |
||||||||
| 1.60%, 04/01/26 (Call 03/01/26) |
1,090 | 1,010,704 | ||||||
| 2.25%, 04/01/28 (Call 02/01/28) |
1,095 | 981,174 | ||||||
| 2.75%, 04/01/31 (Call 01/01/31) |
2,455 | 2,083,134 | ||||||
| Textron Inc. |
||||||||
| 2.45%, 03/15/31 (Call 12/15/30) |
2,398 | 2,001,942 | ||||||
| 3.00%, 06/01/30 (Call 03/01/30) |
1,590 | 1,395,316 | ||||||
| 3.38%, 03/01/28 (Call 12/01/27) |
1,843 | 1,727,473 | ||||||
| 3.65%, 03/15/27 (Call 12/15/26) |
2,905 | 2,779,401 | ||||||
| 3.88%, 03/01/25 (Call 12/01/24) |
1,230 | 1,210,670 | ||||||
| 3.90%, 09/17/29 (Call 06/17/29) |
2,519 | 2,351,654 | ||||||
| 4.00%, 03/15/26 (Call 12/15/25) |
2,514 | 2,445,814 | ||||||
| 6.10%, 11/15/33 (Call 08/15/33) |
1,380 | 1,438,120 | ||||||
|
|
|
|||||||
| 133,266,591 | ||||||||
| Media — 0.7% | ||||||||
| Charter Communications |
||||||||
| Operating LLC/Charter Communications |
||||||||
| Operating Capital |
||||||||
| 2.25%, 01/15/29 (Call 11/15/28) |
5,616 | 4,737,341 | ||||||
| 2.30%, 02/01/32 (Call 11/01/31) |
4,335 | 3,293,023 | ||||||
| 2.80%, 04/01/31 (Call 01/01/31) |
6,654 | 5,368,208 | ||||||
| 3.50%, 06/01/41 (Call 12/01/40) |
6,137 | 4,060,472 | ||||||
| 3.50%, 03/01/42 (Call 09/01/41) |
5,490 | 3,585,299 | ||||||
| 3.70%, 04/01/51 (Call 10/01/50) |
7,814 | 4,732,098 | ||||||
| 3.75%, 02/15/28 (Call 11/15/27) |
4,924 | 4,547,308 | ||||||
| 3.85%, 04/01/61 (Call 10/01/60) |
7,185 | 4,163,623 | ||||||
| 3.90%, 06/01/52 (Call 12/01/51) |
9,330 | 5,854,763 | ||||||
| 3.95%, 06/30/62 (Call 12/30/61) |
5,555 | 3,265,883 | ||||||
| 4.20%, 03/15/28 (Call 12/15/27) |
5,528 | 5,179,548 | ||||||
| 4.40%, 04/01/33 (Call 01/01/33)(b) |
4,130 | 3,606,886 | ||||||
| 4.40%, 12/01/61 (Call 06/01/61) |
5,493 | 3,525,107 | ||||||
| 4.80%, 03/01/50 (Call 09/01/49) |
10,901 | 7,875,961 | ||||||
| 4.91%, 07/23/25 (Call 04/23/25) |
19,097 | 18,830,562 | ||||||
| 5.05%, 03/30/29 (Call 12/30/28) |
5,728 | 5,479,604 | ||||||
| Security | Par (000) |
Value | ||||||
| Media (continued) |
||||||||
| 5.13%, 07/01/49 (Call 01/01/49) |
$ | 5,055 | $ | 3,828,073 | ||||
| 5.25%, 04/01/53 (Call 10/01/52)(b) |
5,705 | 4,426,551 | ||||||
| 5.38%, 04/01/38 (Call 10/01/37) |
4,643 | 3,984,184 | ||||||
| 5.38%, 05/01/47 (Call 11/01/46) |
9,353 | 7,359,075 | ||||||
| 5.50%, 04/01/63 (Call 10/01/62) |
3,905 | 2,999,973 | ||||||
| 5.75%, 04/01/48 (Call 10/01/47) |
9,411 | 7,820,774 | ||||||
| 6.15%, 11/10/26 (Call 10/10/26) |
4,940 | 4,988,996 | ||||||
| 6.38%, 10/23/35 (Call 04/23/35) |
8,160 | 7,883,823 | ||||||
| 6.48%, 10/23/45 (Call 04/23/45) |
13,264 | 12,113,776 | ||||||
| 6.65%, 02/01/34 (Call 11/01/33)(b) |
3,495 | 3,501,543 | ||||||
| 6.83%, 10/23/55 (Call 04/23/55) |
1,963 | 1,856,679 | ||||||
| Comcast Corp. |
||||||||
| 1.50%, 02/15/31 (Call 11/15/30) |
6,460 | 5,147,297 | ||||||
| 1.95%, 01/15/31 (Call 10/15/30) |
6,661 | 5,470,004 | ||||||
| 2.35%, 01/15/27 (Call 10/15/26) |
4,716 | 4,396,503 | ||||||
| 2.45%, 08/15/52 (Call 02/15/52) |
6,355 | 3,646,366 | ||||||
| 2.65%, 02/01/30 (Call 11/01/29) |
6,538 | 5,754,195 | ||||||
| 2.65%, 08/15/62 (Call 02/15/62)(b) |
5,009 | 2,792,609 | ||||||
| 2.80%, 01/15/51 (Call 07/15/50) |
7,724 | 4,825,181 | ||||||
| 2.89%, 11/01/51 (Call 05/01/51) |
15,930 | 10,091,312 | ||||||
| 2.94%, 11/01/56 (Call 05/01/56) |
17,821 | 10,973,108 | ||||||
| 2.99%, 11/01/63 (Call 05/01/63) |
15,333 | 9,174,987 | ||||||
| 3.15%, 03/01/26 (Call 12/01/25) |
10,349 | 9,988,230 | ||||||
| 3.15%, 02/15/28 (Call 11/15/27) |
7,405 | 6,944,538 | ||||||
| 3.20%, 07/15/36 (Call 01/15/36) |
4,320 | 3,488,127 | ||||||
| 3.25%, 11/01/39 (Call 05/01/39) |
3,752 | 2,881,385 | ||||||
| 3.30%, 02/01/27 (Call 11/01/26) |
5,201 | 4,986,083 | ||||||
| 3.30%, 04/01/27 (Call 02/01/27) |
3,089 | 2,946,843 | ||||||
| 3.38%, 08/15/25 (Call 05/15/25) |
5,692 | 5,556,425 | ||||||
| 3.40%, 04/01/30 (Call 01/01/30) |
6,590 | 6,030,974 | ||||||
| 3.40%, 07/15/46 (Call 01/15/46) |
3,572 | 2,620,293 | ||||||
| 3.45%, 02/01/50 (Call 08/01/49) |
6,905 | 4,958,722 | ||||||
| 3.55%, 05/01/28 (Call 02/01/28) |
4,016 | 3,811,113 | ||||||
| 3.75%, 04/01/40 (Call 10/01/39) |
7,404 | 6,050,990 | ||||||
| 3.90%, 03/01/38 (Call 09/01/37) |
5,369 | 4,607,156 | ||||||
| 3.95%, 10/15/25 (Call 08/15/25) |
7,539 | 7,408,339 | ||||||
| 3.97%, 11/01/47 (Call 05/01/47) |
5,562 | 4,411,658 | ||||||
| 4.00%, 08/15/47 (Call 02/15/47) |
4,557 | 3,645,503 | ||||||
| 4.00%, 03/01/48 (Call 09/01/47) |
4,771 | 3,782,589 | ||||||
| 4.00%, 11/01/49 (Call 05/01/49) |
7,818 | 6,183,045 | ||||||
| 4.05%, 11/01/52 (Call 05/01/52) |
4,429 | 3,493,265 | ||||||
| 4.15%, 10/15/28 (Call 07/15/28) |
10,474 | 10,167,379 | ||||||
| 4.20%, 08/15/34 (Call 02/15/34) |
5,235 | 4,809,370 | ||||||
| 4.25%, 10/15/30 (Call 07/15/30) |
5,604 | 5,355,704 | ||||||
| 4.25%, 01/15/33 |
8,496 | 7,957,926 | ||||||
| 4.40%, 08/15/35 (Call 02/15/35) |
4,309 | 3,992,003 | ||||||
| 4.55%, 01/15/29 (Call 12/15/28) |
5,110 | 5,027,700 | ||||||
| 4.60%, 10/15/38 (Call 04/15/38) |
4,305 | 3,961,112 | ||||||
| 4.60%, 08/15/45 (Call 02/15/45) |
4,236 | 3,744,661 | ||||||
| 4.65%, 02/15/33 (Call 11/15/32)(b) |
5,455 | 5,296,199 | ||||||
| 4.65%, 07/15/42 |
3,792 | 3,415,651 | ||||||
| 4.70%, 10/15/48 (Call 04/15/48) |
8,103 | 7,314,956 | ||||||
| 4.75%, 03/01/44 |
2,964 | 2,688,422 | ||||||
| 4.80%, 05/15/33 (Call 02/15/33) |
4,665 | 4,558,248 | ||||||
| 4.95%, 10/15/58 (Call 04/15/58)(b) |
4,304 | 3,974,513 | ||||||
| 5.25%, 11/07/25 |
2,305 | 2,315,059 | ||||||
| 5.35%, 11/15/27 (Call 10/15/27) |
3,434 | 3,487,581 | ||||||
| 5.35%, 05/15/53 (Call 11/15/52) |
4,310 | 4,203,501 | ||||||
| 5.50%, 11/15/32 (Call 08/15/32) |
4,675 | 4,791,943 | ||||||
| 5.50%, 05/15/64 (Call 11/15/63) |
4,980 | 4,890,967 | ||||||
| 5.65%, 06/15/35 |
4,656 | 4,782,993 | ||||||
| 66 | 2 0 2 4 I S H A R E S A N N U A L R E P O R T T O S H A R E H O L D E R S |
| Schedule of Investments (continued) February 29, 2024 |
iShares® Core U.S. Aggregate Bond ETF (Percentages shown are based on Net Assets) |
| Security | Par (000) |
Value | ||||||
| Media (continued) |
||||||||
| 6.45%, 03/15/37 |
$ | 325 | $ | 355,972 | ||||
| 6.50%, 11/15/35 |
3,757 | 4,097,594 | ||||||
| 6.55%, 07/01/39 |
1,875 | 2,060,887 | ||||||
| 6.95%, 08/15/37 |
2,030 | 2,314,153 | ||||||
| 7.05%, 03/15/33 |
4,537 | 5,099,583 | ||||||
| Discovery Communications LLC |
||||||||
| 3.45%, 03/15/25 (Call 12/15/24) |
1,456 | 1,421,778 | ||||||
| 3.63%, 05/15/30 (Call 02/15/30) |
4,237 | 3,723,557 | ||||||
| 3.95%, 06/15/25 (Call 03/15/25) |
2,018 | 1,970,220 | ||||||
| 3.95%, 03/20/28 (Call 12/20/27) |
7,385 | 6,904,242 | ||||||
| 4.00%, 09/15/55 (Call 03/15/55) |
8,133 | 5,383,681 | ||||||
| 4.13%, 05/15/29 (Call 02/15/29) |
3,343 | 3,089,237 | ||||||
| 4.65%, 05/15/50 (Call 11/15/49) |
4,688 | 3,559,234 | ||||||
| 4.88%, 04/01/43 |
1,121 | 897,437 | ||||||
| 4.90%, 03/11/26 (Call 12/11/25)(b) |
3,957 | 3,895,872 | ||||||
| 5.00%, 09/20/37 (Call 03/20/37) |
4,330 | 3,705,178 | ||||||
| 5.20%, 09/20/47 (Call 03/20/47) |
6,985 | 5,681,619 | ||||||
| 5.30%, 05/15/49 (Call 11/15/48) |
5,197 | 4,238,586 | ||||||
| 6.35%, 06/01/40 |
1,241 | 1,192,988 | ||||||
| FactSet Research Systems Inc. |
||||||||
| 2.90%, 03/01/27 (Call 02/01/27) |
1,620 | 1,512,937 | ||||||
| 3.45%, 03/01/32 (Call 12/01/31) |
1,925 | 1,673,452 | ||||||
| Fox Corp. |
||||||||
| 3.05%, 04/07/25 (Call 03/07/25) |
4,114 | 4,003,949 | ||||||
| 3.50%, 04/08/30 (Call 01/08/30) |
3,473 | 3,124,595 | ||||||
| 4.71%, 01/25/29 (Call 10/25/28) |
8,757 | 8,547,102 | ||||||
| 5.48%, 01/25/39 (Call 07/25/38) |
4,766 | 4,453,888 | ||||||
| 5.58%, 01/25/49 (Call 07/25/48) |
6,128 | 5,603,716 | ||||||
| 6.50%, 10/13/33 (Call 07/13/33) |
3,000 | 3,150,594 | ||||||
| Grupo Televisa SAB |
||||||||
| 5.00%, 05/13/45 (Call 11/13/44) |
505 | 422,726 | ||||||
| 5.25%, 05/24/49 (Call 11/24/48) |
135 | 118,081 | ||||||
| 6.13%, 01/31/46 (Call 07/31/45)(b) |
3,444 | 3,360,512 | ||||||
| 6.63%, 01/15/40 |
2,926 | 3,006,258 | ||||||
| 8.50%, 03/11/32 |
2,240 | 2,576,609 | ||||||
| NBCUniversal Media LLC |
||||||||
| 4.45%, 01/15/43 |
4,233 | 3,699,330 | ||||||
| 5.95%, 04/01/41 |
3,006 | 3,127,419 | ||||||
| 6.40%, 04/30/40 |
1,012 | 1,097,504 | ||||||
| Paramount Global |
||||||||
| 2.90%, 01/15/27 (Call 10/15/26) |
1,189 | 1,071,247 | ||||||
| 3.38%, 02/15/28 (Call 11/15/27) |
2,494 | 2,183,125 | ||||||
| 3.70%, 06/01/28 (Call 03/01/28) |
2,365 | 2,062,066 | ||||||
| 4.20%, 06/01/29 (Call 03/01/29) |
2,010 | 1,769,954 | ||||||
| 4.20%, 05/19/32 (Call 02/19/32)(b) |
4,275 | 3,483,968 | ||||||
| 4.38%, 03/15/43 |
3,646 | 2,442,300 | ||||||
| 4.60%, 01/15/45 (Call 07/15/44) |
2,607 | 1,785,151 | ||||||
| 4.85%, 07/01/42 (Call 01/01/42) |
2,177 | 1,567,011 | ||||||
| 4.90%, 08/15/44 (Call 02/15/44) |
2,396 | 1,681,876 | ||||||
| 4.95%, 01/15/31 (Call 10/15/30)(b) |
4,725 | 4,137,474 | ||||||
| 4.95%, 05/19/50 (Call 11/19/49) |
3,898 | 2,792,222 | ||||||
| 5.25%, 04/01/44 (Call 10/01/43)(b) |
1,495 | 1,102,063 | ||||||
| 5.50%, 05/15/33 |
1,722 | 1,490,828 | ||||||
| 5.85%, 09/01/43 (Call 03/01/43) |
3,224 | 2,608,129 | ||||||
| 5.90%, 10/15/40 (Call 04/15/40)(b) |
1,962 | 1,589,935 | ||||||
| 6.88%, 04/30/36 |
3,526 | 3,234,988 | ||||||
| 7.88%, 07/30/30 |
3,321 | 3,390,390 | ||||||
| TCI Communications Inc. |
||||||||
| 7.13%, 02/15/28 |
3,387 | 3,651,577 | ||||||
| 7.88%, 02/15/26 |
4,518 | 4,746,528 | ||||||
| Security | Par (000) | Value | ||||||
| Media (continued) |
||||||||
| Thomson Reuters Corp. |
||||||||
| 3.35%, 05/15/26 (Call 02/15/26) |
$ | 3,468 | $ | 3,326,355 | ||||
| 5.50%, 08/15/35(b) |
1,622 | 1,646,525 | ||||||
| 5.65%, 11/23/43 (Call 05/23/43)(b) |
1,276 | 1,239,260 | ||||||
| 5.85%, 04/15/40 |
2,329 | 2,364,229 | ||||||
| Time Warner Cable Enterprises LLC, 8.38%, 07/15/33 |
4,083 | 4,528,014 | ||||||
| Time Warner Cable LLC |
||||||||
| 4.50%, 09/15/42 (Call 03/15/42) |
6,496 | 4,748,603 | ||||||
| 5.50%, 09/01/41 (Call 03/01/41) |
6,114 | 5,037,733 | ||||||
| 5.88%, 11/15/40 (Call 05/15/40) |
6,118 | 5,259,918 | ||||||
| 6.55%, 05/01/37 |
6,837 | 6,418,371 | ||||||
| 6.75%, 06/15/39 |
6,911 | 6,509,647 | ||||||
| 7.30%, 07/01/38 |
6,611 | 6,587,204 | ||||||
| TWDC Enterprises 18 Corp. |
||||||||
| 1.85%, 07/30/26 |
5,643 | 5,245,016 | ||||||
| 2.95%, 06/15/27 |
4,104 | 3,886,716 | ||||||
| 3.00%, 02/13/26 |
5,565 | 5,357,905 | ||||||
| 3.00%, 07/30/46 |
2,439 | 1,702,415 | ||||||
| 3.15%, 09/17/25 |
4,372 | 4,241,366 | ||||||
| 3.70%, 12/01/42 |
2,456 | 1,993,304 | ||||||
| 4.13%, 06/01/44 |
3,782 | 3,223,376 | ||||||
| 4.38%, 08/16/41 |
1,755 | 1,551,152 | ||||||
| Series B, 7.00%, 03/01/32 |
3,782 | 4,278,670 | ||||||
| Series E, 4.13%, 12/01/41 |
2,733 | 2,351,848 | ||||||
| Walt Disney Co. (The) |
||||||||
| 1.75%, 01/13/26 |
6,292 | 5,931,951 | ||||||
| 2.00%, 09/01/29 (Call 06/01/29) |
9,032 | 7,786,309 | ||||||
| 2.20%, 01/13/28 |
3,802 | 3,468,355 | ||||||
| 2.65%, 01/13/31 |
8,983 | 7,803,577 | ||||||
| 2.75%, 09/01/49 (Call 03/01/49) |
8,042 | 5,187,200 | ||||||
| 3.35%, 03/24/25 |
4,813 | 4,716,455 | ||||||
| 3.38%, 11/15/26 (Call 08/15/26) |
2,584 | 2,485,537 | ||||||
| 3.50%, 05/13/40 (Call 11/13/39) |
6,882 | 5,524,662 | ||||||
| 3.60%, 01/13/51 (Call 07/13/50) |
10,577 | 8,028,208 | ||||||
| 3.70%, 10/15/25 (Call 07/15/25) |
4,215 | 4,119,259 | ||||||
| 3.70%, 03/23/27 |
3,732 | 3,614,110 | ||||||
| 3.80%, 03/22/30 |
4,409 | 4,160,075 | ||||||
| 3.80%, 05/13/60 (Call 11/13/59) |
4,527 | 3,432,448 | ||||||
| 4.63%, 03/23/40 (Call 09/23/39) |
2,761 | 2,581,502 | ||||||
| 4.70%, 03/23/50 (Call 09/23/49)(b) |
5,815 | 5,319,868 | ||||||
| 4.75%, 09/15/44 (Call 03/15/44) |
2,744 | 2,521,627 | ||||||
| 4.75%, 11/15/46 (Call 05/15/46) |
1,838 | 1,666,229 | ||||||
| 4.95%, 10/15/45 (Call 04/15/45) |
1,866 | 1,746,690 | ||||||
| 5.40%, 10/01/43 |
3,102 | 3,118,111 | ||||||
| 6.15%, 03/01/37 |
470 | 507,678 | ||||||
| 6.15%, 02/15/41 |
1,517 | 1,637,491 | ||||||
| 6.20%, 12/15/34 |
4,330 | 4,725,892 | ||||||
| 6.40%, 12/15/35 |
5,034 | 5,533,508 | ||||||
| 6.55%, 03/15/33 |
1,145 | 1,276,834 | ||||||
| 6.65%, 11/15/37 |
5,252 | 5,939,338 | ||||||
| 7.75%, 12/01/45 |
1,385 | 1,772,319 | ||||||
|
|
|
|||||||
| 743,636,043 | ||||||||
| Metal Fabricate & Hardware — 0.0% |
||||||||
| Precision Castparts Corp. |
||||||||
| 3.25%, 06/15/25 (Call 03/15/25) |
4,344 | 4,245,223 | ||||||
| 3.90%, 01/15/43 (Call 07/15/42) |
2,900 | 2,444,701 | ||||||
| 4.38%, 06/15/45 (Call 12/15/44) |
1,488 | 1,305,792 | ||||||
| Timken Co. (The) |
||||||||
| 4.13%, 04/01/32 (Call 01/01/32) |
1,760 | 1,602,940 | ||||||
| 4.50%, 12/15/28 (Call 09/15/28) |
2,370 | 2,300,398 | ||||||
| S C H E D U L E O F I N V E S T M E N T S |
67 |
| Schedule of Investments (continued) February 29, 2024 |
iShares® Core U.S. Aggregate Bond ETF (Percentages shown are based on Net Assets) |
| Security | Par (000) | Value | ||||||
| Metal Fabricate & Hardware (continued) |
||||||||
| Valmont Industries Inc. |
||||||||
| 5.00%, 10/01/44 (Call 04/01/44) |
$ | 1,724 | $ | 1,501,774 | ||||
| 5.25%, 10/01/54 (Call 04/01/54) |
1,384 | 1,191,249 | ||||||
|
|
|
|||||||
| 14,592,077 | ||||||||
| Mining — 0.2% |
||||||||
| AngloGold Ashanti Holdings PLC |
||||||||
| 3.38%, 11/01/28 (Call 09/01/28) |
2,820 | 2,526,099 | ||||||
| 3.75%, 10/01/30 (Call 07/01/30) |
1,603 | 1,387,392 | ||||||
| Barrick Gold Corp. |
||||||||
| 5.25%, 04/01/42 |
225 | 220,115 | ||||||
| 6.45%, 10/15/35 |
1,196 | 1,294,135 | ||||||
| Barrick North America Finance LLC |
||||||||
| 5.70%, 05/30/41 |
3,768 | 3,812,272 | ||||||
| 5.75%, 05/01/43 |
3,442 | 3,517,189 | ||||||
| Barrick PD Australia Finance Pty. Ltd., 5.95%, 10/15/39 |
3,603 | 3,682,645 | ||||||
| BHP Billiton Finance USA Ltd. |
||||||||
| 4.13%, 02/24/42 |
3,441 | 2,963,962 | ||||||
| 4.75%, 02/28/28 (Call 01/28/28) |
3,345 | 3,321,792 | ||||||
| 4.88%, 02/27/26 |
4,005 | 3,988,968 | ||||||
| 4.90%, 02/28/33 (Call 11/28/32) |
1,605 | 1,583,093 | ||||||
| 5.00%, 09/30/43 |
10,358 | 9,903,287 | ||||||
| 5.10%, 09/08/28 (Call 08/08/28) |
5,005 | 5,034,988 | ||||||
| 5.25%, 09/08/26 |
5,455 | 5,488,700 | ||||||
| 5.25%, 09/08/30 (Call 07/08/30) |
4,480 | 4,518,170 | ||||||
| 5.25%, 09/08/33 (Call 06/08/33) |
5,130 | 5,149,721 | ||||||
| 5.50%, 09/08/53 (Call 03/08/53) |
1,650 | 1,682,024 | ||||||
| 6.42%, 03/01/26 |
2,590 | 2,653,020 | ||||||
| Freeport-McMoRan Inc. |
||||||||
| 4.13%, 03/01/28 (Call 04/01/24) |
2,272 | 2,156,238 | ||||||
| 4.25%, 03/01/30 (Call 03/01/25) |
1,871 | 1,748,417 | ||||||
| 4.38%, 08/01/28 (Call 04/01/24) |
2,396 | 2,284,924 | ||||||
| 4.63%, 08/01/30 (Call 08/01/25) |
3,006 | 2,865,964 | ||||||
| 5.00%, 09/01/27 (Call 04/01/24) |
3,303 | 3,251,118 | ||||||
| 5.25%, 09/01/29 (Call 09/01/24) |
3,185 | 3,168,637 | ||||||
| 5.40%, 11/14/34 (Call 05/14/34) |
3,276 | 3,181,214 | ||||||
| 5.45%, 03/15/43 (Call 09/15/42) |
7,105 | 6,618,818 | ||||||
| Kinross Gold Corp. |
||||||||
| 4.50%, 07/15/27 (Call 04/15/27) |
2,955 | 2,871,817 | ||||||
| 6.25%, 07/15/33 (Call 04/15/33)(c) |
345 | 352,589 | ||||||
| Newmont Corp. |
||||||||
| 2.25%, 10/01/30 (Call 07/01/30) |
4,393 | 3,673,630 | ||||||
| 2.60%, 07/15/32 (Call 04/15/32) |
4,565 | 3,754,875 | ||||||
| 2.80%, 10/01/29 (Call 07/01/29) |
3,247 | 2,883,053 | ||||||
| 4.88%, 03/15/42 (Call 09/15/41) |
3,358 | 3,085,005 | ||||||
| 5.45%, 06/09/44 (Call 12/09/43) |
2,957 | 2,887,751 | ||||||
| 5.88%, 04/01/35 |
2,875 | 2,957,432 | ||||||
| 6.25%, 10/01/39 |
2,801 | 2,962,040 | ||||||
| Newmont Corp./Newcrest Finance Pty Ltd., |
||||||||
| 3.25%, 05/13/30 (Call 02/13/30)(c) |
90 | 80,614 | ||||||
| Rio Tinto Alcan Inc. |
||||||||
| 5.75%, 06/01/35 |
2,108 | 2,180,937 | ||||||
| 6.13%, 12/15/33 |
3,558 | 3,781,305 | ||||||
| 7.25%, 03/15/31 |
2,428 | 2,714,364 | ||||||
| Rio Tinto Finance USA Ltd. |
||||||||
| 2.75%, 11/02/51 (Call 05/02/51) |
4,865 | 3,084,848 | ||||||
| 5.20%, 11/02/40 |
3,914 | 3,849,787 | ||||||
| 7.13%, 07/15/28 |
3,306 | 3,601,124 | ||||||
| Rio Tinto Finance USA PLC |
||||||||
| 4.13%, 08/21/42 (Call 02/21/42) |
2,894 | 2,475,154 | ||||||
| 4.75%, 03/22/42 (Call 09/22/41) |
2,425 | 2,273,068 | ||||||
| Security | Par (000) |
Value | ||||||
| Mining (continued) |
||||||||
| 5.00%, 03/09/33 (Call 12/09/32) |
$ | 2,265 | $ | 2,262,042 | ||||
| 5.13%, 03/09/53 (Call 09/09/52) |
3,193 | 3,068,270 | ||||||
| Southern Copper Corp. |
||||||||
| 3.88%, 04/23/25 |
3,504 | 3,434,411 | ||||||
| 5.25%, 11/08/42 |
6,572 | 6,181,010 | ||||||
| 5.88%, 04/23/45 |
3,448 | 3,429,770 | ||||||
| 6.75%, 04/16/40 |
5,671 | 6,252,536 | ||||||
| 7.50%, 07/27/35 |
4,558 | 5,244,671 | ||||||
| Yamana Gold Inc., 2.63%, 08/15/31 |
1,185 | 977,377 | ||||||
|
|
|
|||||||
| 168,322,382 | ||||||||
| Office & Business Equipment — 0.0% |
||||||||
| CDW LLC/CDW Finance Corp. |
||||||||
| 2.67%, 12/01/26 (Call 11/01/26) |
4,074 | 3,781,222 | ||||||
| 3.25%, 02/15/29 (Call 04/01/24) |
4,214 | 3,756,275 | ||||||
| 3.28%, 12/01/28 (Call 10/01/28) |
3,530 | 3,178,183 | ||||||
| 3.57%, 12/01/31 (Call 09/01/31) |
5,590 | 4,847,520 | ||||||
| 4.13%, 05/01/25 (Call 04/01/24) |
3,730 | 3,656,372 | ||||||
| 4.25%, 04/01/28 (Call 04/01/24)(b) |
5,067 | 4,824,379 | ||||||
|
|
|
|||||||
| 24,043,951 | ||||||||
| Oil & Gas — 0.9% |
||||||||
| Apache Corp. |
||||||||
| 4.25%, 01/15/30 (Call 10/15/29)(b) |
1,315 | 1,208,294 | ||||||
| 4.38%, 10/15/28 (Call 07/15/28) |
695 | 651,159 | ||||||
| 4.75%, 04/15/43 (Call 10/15/42) |
1,920 | 1,476,556 | ||||||
| 5.10%, 09/01/40 (Call 03/01/40) |
2,365 | 1,979,262 | ||||||
| 5.25%, 02/01/42 (Call 08/01/41) |
1,560 | 1,295,200 | ||||||
| 5.35%, 07/01/49 (Call 01/01/49) |
1,720 | 1,391,687 | ||||||
| 6.00%, 01/15/37 |
1,955 | 1,900,271 | ||||||
| BP Capital Markets America Inc. |
||||||||
| 1.75%, 08/10/30 (Call 05/10/30) |
4,206 | 3,468,170 | ||||||
| 2.72%, 01/12/32 (Call 10/12/31) |
8,055 | 6,832,488 | ||||||
| 2.77%, 11/10/50 (Call 05/10/50) |
6,285 | 3,991,849 | ||||||
| 2.94%, 06/04/51 (Call 12/04/50) |
9,315 | 6,122,458 | ||||||
| 3.00%, 02/24/50 (Call 08/24/49) |
8,285 | 5,543,203 | ||||||
| 3.00%, 03/17/52 (Call 09/17/51) |
4,970 | 3,298,288 | ||||||
| 3.02%, 01/16/27 (Call 10/16/26) |
4,366 | 4,147,795 | ||||||
| 3.06%, 06/17/41 (Call 12/17/40) |
5,920 | 4,395,699 | ||||||
| 3.12%, 05/04/26 (Call 02/04/26) |
4,884 | 4,693,007 | ||||||
| 3.38%, 02/08/61 (Call 08/08/60) |
7,575 | 5,098,262 | ||||||
| 3.41%, 02/11/26 (Call 12/11/25) |
5,546 | 5,378,478 | ||||||
| 3.54%, 04/06/27 (Call 02/06/27) |
2,459 | 2,358,680 | ||||||
| 3.59%, 04/14/27 (Call 01/14/27) |
4,868 | 4,678,905 | ||||||
| 3.63%, 04/06/30 (Call 01/06/30) |
5,207 | 4,852,312 | ||||||
| 3.80%, 09/21/25 (Call 07/21/25) |
5,469 | 5,364,638 | ||||||
| 3.94%, 09/21/28 (Call 06/21/28) |
5,468 | 5,250,537 | ||||||
| 4.23%, 11/06/28 (Call 08/06/28) |
6,425 | 6,252,423 | ||||||
| 4.70%, 04/10/29 (Call 03/10/29) |
2,825 | 2,794,376 | ||||||
| 4.81%, 02/13/33 (Call 11/13/32) |
3,535 | 3,449,026 | ||||||
| 4.89%, 09/11/33 (Call 06/11/33) |
3,485 | 3,418,411 | ||||||
| 4.99%, 04/10/34 (Call 01/10/34) |
3,985 | 3,920,869 | ||||||
| BP Capital Markets PLC |
||||||||
| 3.28%, 09/19/27 (Call 06/19/27) |
6,340 | 6,002,635 | ||||||
| 3.72%, 11/28/28 (Call 08/28/28) |
5,092 | 4,834,500 | ||||||
| Burlington Resources LLC |
||||||||
| 5.95%, 10/15/36 |
290 | 305,088 | ||||||
| 7.20%, 08/15/31 |
950 | 1,071,938 | ||||||
| 7.40%, 12/01/31 |
275 | 314,352 | ||||||
| Canadian Natural Resources Ltd. |
||||||||
| 2.05%, 07/15/25 (Call 06/15/25) |
3,706 | 3,536,840 | ||||||
| 68 | 2 0 2 4 I S H A R E S A N N U A L R E P O R T T O S H A R E H O L D E R S |
| Schedule of Investments (continued) February 29, 2024 |
iShares® Core U.S. Aggregate Bond ETF (Percentages shown are based on Net Assets) |
| Security | Par (000) |
Value | ||||||
| Oil & Gas (continued) |
||||||||
| 2.95%, 07/15/30 (Call 04/15/30) |
$ | 2,720 | $ | 2,365,182 | ||||
| 3.85%, 06/01/27 (Call 03/01/27) |
5,176 | 4,956,030 | ||||||
| 4.95%, 06/01/47 (Call 12/01/46) |
3,738 | 3,257,290 | ||||||
| 5.85%, 02/01/35 |
1,805 | 1,801,042 | ||||||
| 6.25%, 03/15/38 |
4,053 | 4,155,936 | ||||||
| 6.45%, 06/30/33 |
1,455 | 1,529,756 | ||||||
| 6.50%, 02/15/37 |
2,244 | 2,336,696 | ||||||
| 6.75%, 02/01/39 |
1,885 | 2,007,588 | ||||||
| 7.20%, 01/15/32 |
1,450 | 1,579,134 | ||||||
| Cenovus Energy Inc. |
||||||||
| 2.65%, 01/15/32 (Call 10/15/31) |
1,366 | 1,117,648 | ||||||
| 3.75%, 02/15/52 (Call 08/15/51)(b) |
4,320 | 3,083,957 | ||||||
| 4.25%, 04/15/27 (Call 01/15/27) |
1,465 | 1,418,674 | ||||||
| 5.25%, 06/15/37 (Call 12/15/36) |
970 | 902,215 | ||||||
| 5.40%, 06/15/47 (Call 12/15/46) |
1,874 | 1,720,634 | ||||||
| 6.75%, 11/15/39 |
900 | 975,418 | ||||||
| Chevron Corp. |
||||||||
| 1.55%, 05/11/25 (Call 04/11/25) |
10,383 | 9,962,820 | ||||||
| 2.00%, 05/11/27 (Call 03/11/27) |
4,920 | 4,523,163 | ||||||
| 2.24%, 05/11/30 (Call 02/11/30) |
6,286 | 5,438,853 | ||||||
| 2.95%, 05/16/26 (Call 02/16/26) |
9,297 | 8,929,522 | ||||||
| 3.08%, 05/11/50 (Call 11/11/49) |
5,116 | 3,609,072 | ||||||
| 3.33%, 11/17/25 (Call 08/17/25) |
4,279 | 4,177,839 | ||||||
| Chevron USA Inc. |
||||||||
| 0.69%, 08/12/25 (Call 07/12/25) |
4,206 | 3,956,230 | ||||||
| 1.02%, 08/12/27 (Call 06/12/27) |
3,984 | 3,516,984 | ||||||
| 2.34%, 08/12/50 (Call 02/12/50) |
4,253 | 2,550,413 | ||||||
| 3.25%, 10/15/29 (Call 07/15/29) |
2,596 | 2,414,596 | ||||||
| 3.85%, 01/15/28 (Call 10/15/27) |
3,031 | 2,948,181 | ||||||
| 5.25%, 11/15/43 (Call 05/15/43) |
790 | 796,421 | ||||||
| 6.00%, 03/01/41 (Call 09/01/40) |
785 | 854,574 | ||||||
| CNOOC Finance 2013 Ltd. |
||||||||
| 2.88%, 09/30/29 (Call 06/30/29) |
1,249 | 1,132,985 | ||||||
| 3.30%, 09/30/49 (Call 03/30/49) |
1,315 | 972,686 | ||||||
| 4.25%, 05/09/43 |
3,599 | 3,202,350 | ||||||
| CNOOC Finance 2015 Australia Pty. Ltd., |
||||||||
| 4.20%, 05/05/45 |
500 | 439,435 | ||||||
| CNOOC Finance 2015 USA LLC |
||||||||
| 3.50%, 05/05/25 |
4,520 | 4,427,943 | ||||||
| 4.38%, 05/02/28 |
3,922 | 3,853,163 | ||||||
| CNOOC Petroleum North America ULC |
||||||||
| 5.88%, 03/10/35 |
1,913 | 2,025,110 | ||||||
| 6.40%, 05/15/37 |
3,637 | 4,045,422 | ||||||
| 7.50%, 07/30/39 |
1,006 | 1,232,865 | ||||||
| 7.88%, 03/15/32 |
2,046 | 2,427,274 | ||||||
| Conoco Funding Co., 7.25%, 10/15/31 |
1,719 | 1,947,451 | ||||||
| ConocoPhillips Co. |
||||||||
| 2.40%, 03/07/25 (Call 03/11/24) |
562 | 546,118 | ||||||
| 3.76%, 03/15/42 (Call 09/15/41) |
11,360 | 9,202,492 | ||||||
| 3.80%, 03/15/52 (Call 09/15/51) |
2,330 | 1,786,011 | ||||||
| 4.03%, 03/15/62 (Call 09/15/61) |
10,272 | 7,957,318 | ||||||
| 4.30%, 11/15/44 (Call 05/15/44) |
2,245 | 1,929,167 | ||||||
| 4.88%, 10/01/47 (Call 04/01/47) |
550 | 510,011 | ||||||
| 5.05%, 09/15/33 (Call 06/15/33) |
3,355 | 3,343,801 | ||||||
| 5.30%, 05/15/53 (Call 11/15/52) |
2,885 | 2,823,147 | ||||||
| 5.55%, 03/15/54 (Call 09/15/53) |
1,970 | 1,991,953 | ||||||
| 5.70%, 09/15/63 (Call 03/15/63) |
2,075 | 2,119,792 | ||||||
| 5.90%, 10/15/32 |
1,901 | 2,033,813 | ||||||
| 5.90%, 05/15/38 |
572 | 599,628 | ||||||
| 5.95%, 03/15/46 (Call 09/15/45) |
765 | 794,425 | ||||||
| 6.50%, 02/01/39 |
744 | 837,570 | ||||||
| Security | Par (000) |
Value | ||||||
| Oil & Gas (continued) |
||||||||
| 6.95%, 04/15/29 |
$ | 1,755 | $ | 1,923,726 | ||||
| Continental Resources Inc./OK |
||||||||
| 4.38%, 01/15/28 (Call 10/15/27) |
4,830 | 4,641,540 | ||||||
| 4.90%, 06/01/44 (Call 12/01/43)(b) |
3,655 | 2,962,922 | ||||||
| Coterra Energy Inc. |
||||||||
| 3.90%, 05/15/27 (Call 02/15/27) |
3,758 | 3,611,436 | ||||||
| 4.38%, 03/15/29 (Call 12/15/28) |
2,795 | 2,692,044 | ||||||
| 5.60%, 03/15/34 (Call 12/15/33) |
1,900 | 1,899,417 | ||||||
| Devon Energy Corp. |
||||||||
| 4.50%, 01/15/30 (Call 01/15/25) |
3,395 | 3,238,696 | ||||||
| 4.75%, 05/15/42 (Call 11/15/41) |
3,458 | 2,926,964 | ||||||
| 5.00%, 06/15/45 (Call 12/15/44) |
3,197 | 2,757,478 | ||||||
| 5.25%, 10/15/27 (Call 03/11/24) |
3,360 | 3,352,929 | ||||||
| 5.60%, 07/15/41 (Call 01/15/41) |
5,197 | 4,897,063 | ||||||
| 5.85%, 12/15/25 (Call 09/15/25) |
3,280 | 3,295,390 | ||||||
| 5.88%, 06/15/28 (Call 03/11/24) |
2,835 | 2,851,591 | ||||||
| 7.88%, 09/30/31 |
1,377 | 1,567,249 | ||||||
| 7.95%, 04/15/32 |
1,445 | 1,647,001 | ||||||
| Diamondback Energy Inc. |
||||||||
| 3.13%, 03/24/31 (Call 12/24/30) |
3,592 | 3,148,473 | ||||||
| 3.25%, 12/01/26 (Call 10/01/26) |
5,421 | 5,181,443 | ||||||
| 3.50%, 12/01/29 (Call 09/01/29) |
3,163 | 2,903,428 | ||||||
| 4.25%, 03/15/52 (Call 09/15/51) |
3,484 | 2,764,409 | ||||||
| 4.40%, 03/24/51 (Call 09/24/50) |
2,795 | 2,256,089 | ||||||
| 6.25%, 03/15/33 (Call 12/15/32) |
3,685 | 3,872,702 | ||||||
| 6.25%, 03/15/53 (Call 09/15/52) |
2,795 | 2,956,911 | ||||||
| Eni USA Inc., 7.30%, 11/15/27 |
1,130 | 1,199,148 | ||||||
| EOG Resources Inc. |
||||||||
| 3.15%, 04/01/25 (Call 01/01/25) |
1,429 | 1,396,840 | ||||||
| 3.90%, 04/01/35 (Call 10/01/34) |
3,283 | 2,942,738 | ||||||
| 4.15%, 01/15/26 (Call 10/15/25) |
6,032 | 5,941,164 | ||||||
| 4.38%, 04/15/30 (Call 01/15/30) |
3,599 | 3,490,154 | ||||||
| 4.95%, 04/15/50 (Call 10/15/49) |
3,869 | 3,606,865 | ||||||
| EQT Corp. |
||||||||
| 3.90%, 10/01/27 (Call 07/01/27) |
5,391 | 5,106,903 | ||||||
| 5.00%, 01/15/29 (Call 07/15/28) |
1,725 | 1,683,230 | ||||||
| 5.70%, 04/01/28 (Call 03/01/28) |
2,250 | 2,265,922 | ||||||
| 5.75%, 02/01/34 (Call 11/01/33)(b) |
2,090 | 2,055,729 | ||||||
| 7.00%, 02/01/30 (Call 11/01/29) |
2,855 | 3,024,116 | ||||||
| Equinor ASA |
||||||||
| 1.75%, 01/22/26 (Call 12/22/25) |
901 | 848,385 | ||||||
| 2.38%, 05/22/30 (Call 02/22/30) |
4,772 | 4,147,503 | ||||||
| 2.88%, 04/06/25 (Call 03/06/25) |
4,038 | 3,942,819 | ||||||
| 3.00%, 04/06/27 (Call 02/06/27) |
2,226 | 2,105,330 | ||||||
| 3.13%, 04/06/30 (Call 01/06/30)(b) |
5,646 | 5,147,693 | ||||||
| 3.25%, 11/18/49 (Call 05/18/49) |
3,909 | 2,804,902 | ||||||
| 3.63%, 09/10/28 (Call 06/10/28) |
4,221 | 4,036,844 | ||||||
| 3.63%, 04/06/40 (Call 10/06/39) |
2,099 | 1,731,527 | ||||||
| 3.70%, 04/06/50 (Call 10/06/49)(b) |
3,905 | 3,041,784 | ||||||
| 3.95%, 05/15/43 |
3,552 | 2,966,747 | ||||||
| 4.25%, 11/23/41 |
2,330 | 2,063,710 | ||||||
| 4.80%, 11/08/43 |
3,025 | 2,846,894 | ||||||
| 5.10%, 08/17/40 |
3,102 | 3,052,445 | ||||||
| 7.25%, 09/23/27 |
1,020 | 1,098,268 | ||||||
| Exxon Mobil Corp. |
||||||||
| 2.28%, 08/16/26 (Call 06/16/26) |
5,080 | 4,798,089 | ||||||
| 2.44%, 08/16/29 (Call 05/16/29) |
6,911 | 6,173,007 | ||||||
| 2.61%, 10/15/30 (Call 07/15/30) |
6,295 | 5,520,799 | ||||||
| 2.71%, 03/06/25 (Call 12/06/24) |
4,635 | 4,523,782 | ||||||
| 2.99%, 03/19/25 (Call 02/19/25) |
12,323 | 12,049,368 | ||||||
| 3.00%, 08/16/39 (Call 02/16/39) |
5,800 | 4,461,778 | ||||||
| S C H E D U L E O F I N V E S T M E N T S |
69 |
| Schedule of Investments (continued) February 29, 2024 |
iShares® Core U.S. Aggregate Bond ETF (Percentages shown are based on Net Assets) |
| Security | Par (000) | Value | ||||||
| Oil & Gas (continued) |
||||||||
| 3.04%, 03/01/26 (Call 12/01/25) |
$ | 10,191 | $ | 9,842,290 | ||||
| 3.10%, 08/16/49 (Call 02/16/49) |
7,681 | 5,368,464 | ||||||
| 3.29%, 03/19/27 (Call 01/19/27) |
3,550 | 3,418,510 | ||||||
| 3.45%, 04/15/51 (Call 10/15/50) |
7,043 | 5,221,291 | ||||||
| 3.48%, 03/19/30 (Call 12/19/29) |
4,804 | 4,481,950 | ||||||
| 3.57%, 03/06/45 (Call 09/06/44) |
3,417 | 2,662,453 | ||||||
| 4.11%, 03/01/46 (Call 09/01/45) |
11,371 | 9,637,578 | ||||||
| 4.23%, 03/19/40 (Call 09/19/39) |
6,471 | 5,802,962 | ||||||
| 4.33%, 03/19/50 (Call 09/19/49) |
9,970 | 8,688,091 | ||||||
| Helmerich & Payne Inc., 2.90%, 09/29/31 |
1,350 | 1,119,822 | ||||||
| Hess Corp. |
||||||||
| 4.30%, 04/01/27 (Call 01/01/27) |
6,817 | 6,639,590 | ||||||
| 5.60%, 02/15/41 |
5,333 | 5,373,562 | ||||||
| 5.80%, 04/01/47 (Call 10/01/46) |
2,509 | 2,544,636 | ||||||
| 6.00%, 01/15/40 |
3,103 | 3,239,549 | ||||||
| 7.13%, 03/15/33 |
2,327 | 2,609,379 | ||||||
| 7.30%, 08/15/31 |
2,519 | 2,829,870 | ||||||
| 7.88%, 10/01/29 |
1,302 | 1,459,943 | ||||||
| HF Sinclair Corp. |
||||||||
| 4.50%, 10/01/30 (Call 07/01/30)(b) |
1,407 | 1,315,927 | ||||||
| 5.00%, 02/01/28 (Call 03/11/24)(c) |
395 | 380,214 | ||||||
| 5.88%, 04/01/26 (Call 01/01/26) |
4,211 | 4,226,329 | ||||||
| 6.38%, 04/15/27 (Call 04/15/24)(c) |
565 | 565,773 | ||||||
| Marathon Oil Corp. |
||||||||
| 4.40%, 07/15/27 (Call 04/15/27) |
5,293 | 5,140,038 | ||||||
| 5.20%, 06/01/45 (Call 12/01/44)(b) |
2,906 | 2,523,164 | ||||||
| 6.60%, 10/01/37 |
3,738 | 3,899,724 | ||||||
| 6.80%, 03/15/32 |
2,119 | 2,258,580 | ||||||
| Marathon Petroleum Corp. |
||||||||
| 3.80%, 04/01/28 (Call 01/01/28) |
2,953 | 2,811,398 | ||||||
| 4.50%, 04/01/48 (Call 10/01/47) |
2,602 | 2,140,592 | ||||||
| 4.70%, 05/01/25 (Call 04/01/25) |
6,095 | 6,035,955 | ||||||
| 4.75%, 09/15/44 (Call 03/15/44) |
3,951 | 3,447,793 | ||||||
| 5.00%, 09/15/54 (Call 03/15/54) |
2,528 | 2,172,401 | ||||||
| 5.13%, 12/15/26 (Call 09/15/26) |
4,554 | 4,546,348 | ||||||
| 6.50%, 03/01/41 (Call 09/01/40)(b) |
2,396 | 2,543,092 | ||||||
| Occidental Petroleum Corp. |
||||||||
| 4.20%, 03/15/48 (Call 09/15/47)(b) |
2,060 | 1,585,554 | ||||||
| 4.40%, 04/15/46 (Call 10/15/45)(b) |
2,527 | 2,027,538 | ||||||
| 5.50%, 12/01/25 (Call 09/01/25) |
1,930 | 1,927,461 | ||||||
| 5.55%, 03/15/26 (Call 12/15/25) |
3,030 | 3,049,076 | ||||||
| 5.88%, 09/01/25 (Call 06/01/25) |
1,445 | 1,449,336 | ||||||
| 6.13%, 01/01/31 (Call 07/01/30) |
4,645 | 4,758,261 | ||||||
| 6.20%, 03/15/40 |
565 | 573,496 | ||||||
| 6.38%, 09/01/28 (Call 03/01/28)(b) |
395 | 409,728 | ||||||
| 6.45%, 09/15/36 |
7,730 | 8,149,688 | ||||||
| 6.60%, 03/15/46 (Call 09/15/45)(b) |
1,810 | 1,922,933 | ||||||
| 6.63%, 09/01/30 (Call 03/01/30) |
6,150 | 6,471,737 | ||||||
| 7.50%, 05/01/31 |
3,450 | 3,811,091 | ||||||
| 7.88%, 09/15/31 |
682 | 767,878 | ||||||
| 7.95%, 06/15/39 |
1,645 | 1,916,875 | ||||||
| 8.50%, 07/15/27 (Call 01/15/27)(b) |
1,965 | 2,131,477 | ||||||
| 8.88%, 07/15/30 (Call 01/15/30) |
3,730 | 4,311,733 | ||||||
| Ovintiv Inc. |
||||||||
| 5.38%, 01/01/26 (Call 10/01/25) |
3,189 | 3,170,731 | ||||||
| 5.65%, 05/15/25 |
2,805 | 2,805,360 | ||||||
| 5.65%, 05/15/28 (Call 04/15/28) |
2,505 | 2,527,028 | ||||||
| 6.25%, 07/15/33 (Call 04/15/33) |
2,020 | 2,076,932 | ||||||
| 6.50%, 08/15/34 |
2,539 | 2,659,630 | ||||||
| 6.50%, 02/01/38 |
1,955 | 2,001,640 | ||||||
| Security | Par (000) | Value | ||||||
| Oil & Gas (continued) |
||||||||
| 6.63%, 08/15/37 |
$ | 2,040 | $ | 2,105,218 | ||||
| 7.10%, 07/15/53 (Call 01/15/53) |
1,955 | 2,130,826 | ||||||
| 7.20%, 11/01/31 |
1,575 | 1,699,806 | ||||||
| 7.38%, 11/01/31 |
1,695 | 1,847,405 | ||||||
| 8.13%, 09/15/30 |
1,350 | 1,514,788 | ||||||
| Patterson-UTI Energy Inc. |
||||||||
| 3.95%, 02/01/28 (Call 11/01/27) |
370 | 345,926 | ||||||
| 5.15%, 11/15/29 (Call 08/15/29) |
290 | 278,781 | ||||||
| 7.15%, 10/01/33 (Call 07/01/33) |
565 | 598,851 | ||||||
| Phillips 66 |
||||||||
| 1.30%, 02/15/26 (Call 01/15/26) |
3,394 | 3,141,650 | ||||||
| 2.15%, 12/15/30 (Call 09/15/30) |
3,125 | 2,596,675 | ||||||
| 3.30%, 03/15/52 (Call 09/15/51) |
5,325 | 3,641,841 | ||||||
| 3.85%, 04/09/25 (Call 03/09/25) |
4,621 | 4,541,667 | ||||||
| 3.90%, 03/15/28 (Call 12/15/27) |
2,426 | 2,334,106 | ||||||
| 4.65%, 11/15/34 (Call 05/15/34) |
5,446 | 5,111,325 | ||||||
| 4.88%, 11/15/44 (Call 05/15/44) |
5,128 | 4,680,727 | ||||||
| 5.88%, 05/01/42 |
4,954 | 5,106,210 | ||||||
| Phillips 66 Co. |
||||||||
| 3.15%, 12/15/29 (Call 09/15/29) |
3,251 | 2,931,277 | ||||||
| 3.55%, 10/01/26 (Call 07/01/26) |
2,400 | 2,304,224 | ||||||
| 3.75%, 03/01/28 (Call 12/01/27) |
4,731 | 4,512,100 | ||||||
| 4.68%, 02/15/45 (Call 08/15/44) |
3,235 | 2,822,769 | ||||||
| 4.90%, 10/01/46 (Call 04/01/46) |
2,947 | 2,635,314 | ||||||
| 4.95%, 12/01/27 (Call 11/01/27) |
3,170 | 3,163,062 | ||||||
| 5.25%, 06/15/31 (Call 04/15/31) |
1,900 | 1,895,381 | ||||||
| 5.30%, 06/30/33 (Call 03/30/33) |
3,530 | 3,502,428 | ||||||
| 5.65%, 06/15/54 (Call 12/15/53) |
1,990 | 1,972,906 | ||||||
| Pioneer Natural Resources Co. |
||||||||
| 1.13%, 01/15/26 (Call 12/15/25) |
790 | 732,879 | ||||||
| 1.90%, 08/15/30 (Call 05/15/30) |
5,755 | 4,797,298 | ||||||
| 2.15%, 01/15/31 (Call 10/15/30) |
1,110 | 929,557 | ||||||
| 5.10%, 03/29/26 |
2,625 | 2,623,288 | ||||||
| Shell International Finance BV |
||||||||
| 2.38%, 11/07/29 (Call 08/07/29) |
6,566 | 5,784,493 | ||||||
| 2.50%, 09/12/26 |
6,290 | 5,940,419 | ||||||
| 2.75%, 04/06/30 (Call 01/06/30) |
3,103 | 2,762,163 | ||||||
| 2.88%, 05/10/26 |
8,162 | 7,810,060 | ||||||
| 2.88%, 11/26/41 (Call 05/26/41) |
2,760 | 2,014,652 | ||||||
| 3.00%, 11/26/51 (Call 05/26/51) |
4,555 | 3,052,742 | ||||||
| 3.13%, 11/07/49 (Call 05/07/49) |
5,383 | 3,742,922 | ||||||
| 3.25%, 05/11/25 |
11,876 | 11,614,561 | ||||||
| 3.25%, 04/06/50 (Call 10/06/49) |
8,188 | 5,819,733 | ||||||
| 3.63%, 08/21/42 |
2,583 | 2,082,030 | ||||||
| 3.75%, 09/12/46 |
5,146 | 4,054,430 | ||||||
| 3.88%, 11/13/28 (Call 08/13/28) |
4,515 | 4,356,483 | ||||||
| 4.00%, 05/10/46 |
8,489 | 6,969,605 | ||||||
| 4.13%, 05/11/35 |
7,483 | 6,916,242 | ||||||
| 4.38%, 05/11/45 |
10,828 | 9,459,615 | ||||||
| 4.55%, 08/12/43 |
3,933 | 3,570,834 | ||||||
| 5.50%, 03/25/40 |
4,223 | 4,344,836 | ||||||
| 6.38%, 12/15/38 |
9,796 | 10,888,663 | ||||||
| Suncor Energy Inc. |
||||||||
| 3.75%, 03/04/51 (Call 09/04/50) |
2,168 | 1,572,994 | ||||||
| 4.00%, 11/15/47 (Call 05/15/47) |
2,697 | 2,054,299 | ||||||
| 5.95%, 12/01/34 |
1,990 | 2,066,807 | ||||||
| 6.50%, 06/15/38 |
4,695 | 4,914,922 | ||||||
| 6.80%, 05/15/38 |
4,182 | 4,459,653 | ||||||
| 6.85%, 06/01/39 |
4,056 | 4,353,178 | ||||||
| 7.15%, 02/01/32 |
1,742 | 1,909,004 | ||||||
| Tosco Corp., 8.13%, 02/15/30 |
2,855 | 3,298,054 | ||||||
| 70 | 2 0 2 4 I S H A R E S A N N U A L R E P O R T T O S H A R E H O L D E R S |
| Schedule of Investments (continued) February 29, 2024 |
iShares® Core U.S. Aggregate Bond ETF (Percentages shown are based on Net Assets) |
| Security | Par (000) |
Value | ||||||
| Oil & Gas (continued) |
||||||||
| TotalEnergies Capital International SA |
||||||||
| 2.83%, 01/10/30 (Call 10/10/29) |
$ | 5,319 | $ | 4,777,963 | ||||
| 2.99%, 06/29/41 (Call 12/29/40)(b) |
2,998 | 2,225,499 | ||||||
| 3.13%, 05/29/50 (Call 11/29/49) |
9,221 | 6,413,178 | ||||||
| 3.39%, 06/29/60 (Call 12/29/59) |
1,385 | 957,272 | ||||||
| 3.46%, 02/19/29 (Call 11/19/28) |
5,674 | 5,329,613 | ||||||
| 3.46%, 07/12/49 (Call 01/12/49) |
5,625 | 4,200,816 | ||||||
| TotalEnergies Capital SA, 3.88%, 10/11/28 |
4,942 | 4,759,951 | ||||||
| Valero Energy Corp. |
||||||||
| 2.15%, 09/15/27 (Call 07/15/27) |
1,550 | 1,403,323 | ||||||
| 2.80%, 12/01/31 (Call 09/01/31) |
1,745 | 1,472,800 | ||||||
| 3.40%, 09/15/26 (Call 06/15/26) |
415 | 396,775 | ||||||
| 3.65%, 12/01/51 (Call 06/01/51) |
4,365 | 3,072,198 | ||||||
| 4.00%, 04/01/29 (Call 01/01/29) |
285 | 271,960 | ||||||
| 4.00%, 06/01/52 (Call 12/01/51) |
1,725 | 1,297,030 | ||||||
| 4.35%, 06/01/28 (Call 03/01/28) |
3,166 | 3,082,447 | ||||||
| 4.90%, 03/15/45(b) |
2,971 | 2,684,469 | ||||||
| 6.63%, 06/15/37 |
5,895 | 6,313,223 | ||||||
| 7.50%, 04/15/32 |
2,868 | 3,262,501 | ||||||
|
|
|
|||||||
| 887,453,986 | ||||||||
| Oil & Gas Services — 0.1% |
||||||||
| Baker Hughes Holdings LLC, 5.13%, 09/15/40 |
4,169 | 4,043,238 | ||||||
| Baker Hughes Holdings LLC/Baker Hughes |
||||||||
| Co-Obligor Inc. |
||||||||
| 2.06%, 12/15/26 (Call 11/15/26) |
4,055 | 3,741,428 | ||||||
| 3.14%, 11/07/29 (Call 08/07/29) |
2,081 | 1,897,994 | ||||||
| 3.34%, 12/15/27 (Call 09/15/27) |
6,901 | 6,507,615 | ||||||
| 4.08%, 12/15/47 (Call 06/15/47) |
5,993 | 4,825,055 | ||||||
| 4.49%, 05/01/30 (Call 02/01/30) |
2,219 | 2,156,835 | ||||||
| Halliburton Co. |
||||||||
| 2.92%, 03/01/30 (Call 12/01/29) |
2,043 | 1,814,454 | ||||||
| 3.80%, 11/15/25 (Call 08/15/25) |
2,671 | 2,609,522 | ||||||
| 4.50%, 11/15/41 (Call 05/15/41) |
2,840 | 2,505,919 | ||||||
| 4.75%, 08/01/43 (Call 02/01/43) |
4,385 | 3,955,115 | ||||||
| 4.85%, 11/15/35 (Call 05/15/35) |
5,162 | 4,966,464 | ||||||
| 5.00%, 11/15/45 (Call 05/15/45) |
6,211 | 5,777,898 | ||||||
| 6.70%, 09/15/38 |
3,346 | 3,746,616 | ||||||
| 7.45%, 09/15/39 |
4,726 | 5,676,045 | ||||||
| NOV Inc. |
||||||||
| 3.60%, 12/01/29 (Call 09/01/29) |
2,802 | 2,555,939 | ||||||
| 3.95%, 12/01/42 (Call 06/01/42) |
5,036 | 3,752,885 | ||||||
| Schlumberger Finance Canada Ltd., 1.40%, |
||||||||
| 09/17/25 (Call 08/17/25) |
3,755 | 3,548,229 | ||||||
| Schlumberger Investment SA |
||||||||
| 2.65%, 06/26/30 (Call 03/26/30)(b) |
3,408 | 2,994,990 | ||||||
| 4.50%, 05/15/28 (Call 04/15/28) |
1,675 | 1,659,013 | ||||||
| 4.85%, 05/15/33 (Call 02/15/33)(b) |
1,500 | 1,484,394 | ||||||
|
|
|
|||||||
| 70,219,648 | ||||||||
| Packaging & Containers — 0.1% |
||||||||
| Amcor Finance USA Inc. |
||||||||
| 3.63%, 04/28/26 (Call 01/28/26) |
2,439 | 2,348,584 | ||||||
| 4.50%, 05/15/28 (Call 02/15/28) |
1,440 | 1,400,293 | ||||||
| 5.63%, 05/26/33 (Call 02/26/33) |
2,115 | 2,148,142 | ||||||
| Amcor Flexibles North America Inc. |
||||||||
| 2.63%, 06/19/30 (Call 03/19/30) |
2,700 | 2,303,454 | ||||||
| 2.69%, 05/25/31 (Call 02/25/31) |
3,295 | 2,774,646 | ||||||
| 4.00%, 05/17/25 (Call 04/17/25) |
1,860 | 1,824,196 | ||||||
| AptarGroup Inc., 3.60%, 03/15/32 |
1,150 | 1,009,830 | ||||||
| Security | Par (000) |
Value | ||||||
| Packaging & Containers (continued) |
||||||||
| Berry Global Inc. |
||||||||
| 1.57%, 01/15/26 (Call 12/15/25) |
$ | 4,761 | $ | 4,435,312 | ||||
| 1.65%, 01/15/27 (Call 12/15/26) |
2,690 | 2,430,862 | ||||||
| 5.50%, 04/15/28 (Call 03/15/28)(c) |
701 | 697,069 | ||||||
| 5.65%, 01/15/34 (Call 10/15/33)(c) |
1,625 | 1,603,827 | ||||||
| Packaging Corp. of America |
||||||||
| 3.00%, 12/15/29 (Call 09/15/29) |
1,294 | 1,159,984 | ||||||
| 3.05%, 10/01/51 (Call 04/01/51) |
1,945 | 1,296,080 | ||||||
| 3.40%, 12/15/27 (Call 09/15/27) |
1,574 | 1,487,770 | ||||||
| 4.05%, 12/15/49 (Call 06/15/49) |
2,512 | 1,983,600 | ||||||
| 5.70%, 12/01/33 (Call 09/01/33) |
1,196 | 1,223,148 | ||||||
| Sonoco Products Co. |
||||||||
| 2.25%, 02/01/27 (Call 01/01/27)(b) |
2,520 | 2,312,686 | ||||||
| 2.85%, 02/01/32 (Call 11/01/31) |
2,478 | 2,091,345 | ||||||
| 3.13%, 05/01/30 (Call 02/01/30) |
2,600 | 2,307,249 | ||||||
| 5.75%, 11/01/40 (Call 05/01/40) |
135 | 135,802 | ||||||
| WestRock MWV LLC |
||||||||
| 7.95%, 02/15/31 |
1,683 | 1,917,554 | ||||||
| 8.20%, 01/15/30 |
1,126 | 1,280,270 | ||||||
| WRKCo Inc. |
||||||||
| 3.00%, 06/15/33 (Call 03/15/33)(b) |
2,475 | 2,085,822 | ||||||
| 3.38%, 09/15/27 (Call 06/15/27) |
1,691 | 1,591,251 | ||||||
| 3.75%, 03/15/25 (Call 01/15/25) |
2,669 | 2,614,000 | ||||||
| 3.90%, 06/01/28 (Call 03/01/28) |
2,676 | 2,536,491 | ||||||
| 4.00%, 03/15/28 (Call 12/15/27) |
3,221 | 3,074,502 | ||||||
| 4.20%, 06/01/32 (Call 03/01/32) |
1,966 | 1,847,296 | ||||||
| 4.65%, 03/15/26 (Call 01/15/26) |
4,332 | 4,275,003 | ||||||
| 4.90%, 03/15/29 (Call 12/15/28) |
3,844 | 3,805,802 | ||||||
|
|
|
|||||||
| 62,001,870 | ||||||||
| Pharmaceuticals — 1.4% |
||||||||
| AbbVie Inc. |
||||||||
| 2.95%, 11/21/26 (Call 09/21/26) |
9,112 | 8,640,838 | ||||||
| 3.20%, 05/14/26 (Call 02/14/26) |
8,663 | 8,337,368 | ||||||
| 3.20%, 11/21/29 (Call 08/21/29) |
19,689 | 18,013,823 | ||||||
| 3.60%, 05/14/25 (Call 02/14/25) |
14,599 | 14,305,988 | ||||||
| 3.80%, 03/15/25 (Call 12/15/24) |
11,856 | 11,615,680 | ||||||
| 4.05%, 11/21/39 (Call 05/21/39) |
14,206 | 12,468,797 | ||||||
| 4.25%, 11/14/28 (Call 08/14/28) |
6,371 | 6,223,480 | ||||||
| 4.25%, 11/21/49 (Call 05/21/49) |
20,693 | 17,815,707 | ||||||
| 4.30%, 05/14/36 (Call 11/14/35) |
5,080 | 4,729,103 | ||||||
| 4.40%, 11/06/42 |
10,257 | 9,175,314 | ||||||
| 4.45%, 05/14/46 (Call 11/14/45) |
8,508 | 7,519,075 | ||||||
| 4.50%, 05/14/35 (Call 11/14/34) |
9,606 | 9,168,914 | ||||||
| 4.55%, 03/15/35 (Call 09/15/34) |
7,757 | 7,436,541 | ||||||
| 4.63%, 10/01/42 (Call 04/01/42) |
1,973 | 1,805,291 | ||||||
| 4.70%, 05/14/45 (Call 11/14/44) |
10,613 | 9,786,298 | ||||||
| 4.75%, 03/15/45 (Call 09/15/44) |
4,034 | 3,736,872 | ||||||
| 4.80%, 03/15/27 (Call 02/15/27) |
8,980 | 8,954,713 | ||||||
| 4.80%, 03/15/29 (Call 02/15/29) |
8,600 | 8,561,028 | ||||||
| 4.85%, 06/15/44 (Call 12/15/43) |
4,303 | 4,065,246 | ||||||
| 4.88%, 11/14/48 (Call 05/14/48) |
7,435 | 7,024,597 | ||||||
| 4.95%, 03/15/31 (Call 01/15/31) |
4,510 | 4,509,741 | ||||||
| 5.05%, 03/15/34 (Call 12/15/33) |
3,705 | 3,722,470 | ||||||
| 5.35%, 03/15/44 (Call 09/15/43) |
2,495 | 2,515,785 | ||||||
| 5.40%, 03/15/54 (Call 09/15/53) |
1,805 | 1,832,741 | ||||||
| 5.50%, 03/15/64 (Call 09/15/63) |
2,145 | 2,168,573 | ||||||
| Astrazeneca Finance LLC |
||||||||
| 1.20%, 05/28/26 (Call 04/28/26) |
5,740 | 5,279,320 | ||||||
| 1.75%, 05/28/28 (Call 03/28/28) |
5,534 | 4,891,716 | ||||||
| 2.25%, 05/28/31 (Call 02/28/31) |
2,707 | 2,270,389 | ||||||
| 4.80%, 02/26/27 (Call 01/26/27) |
3,835 | 3,825,137 | ||||||
| S C H E D U L E O F I N V E S T M E N T S |
71 |
| Schedule of Investments (continued) February 29, 2024 |
iShares® Core U.S. Aggregate Bond ETF (Percentages shown are based on Net Assets) |
| Security | Par (000) |
Value | ||||||
| Pharmaceuticals (continued) |
||||||||
| 4.85%, 02/26/29 (Call 01/26/29) |
$ | 3,825 | $ | 3,823,521 | ||||
| 4.88%, 03/03/28 (Call 02/03/28) |
5,215 | 5,210,171 | ||||||
| 4.88%, 03/03/33 (Call 12/03/32) |
3,079 | 3,065,357 | ||||||
| 4.90%, 03/03/30 (Call 01/03/30) |
3,520 | 3,526,079 | ||||||
| 4.90%, 02/26/31 (Call 12/26/30) |
3,825 | 3,816,155 | ||||||
| 5.00%, 02/26/34 (Call 11/26/33) |
3,825 | 3,839,167 | ||||||
| AstraZeneca PLC |
||||||||
| 0.70%, 04/08/26 (Call 03/08/26) |
5,435 | 4,975,055 | ||||||
| 1.38%, 08/06/30 (Call 05/06/30) |
6,001 | 4,861,306 | ||||||
| 2.13%, 08/06/50 (Call 02/06/50) |
3,529 | 2,080,819 | ||||||
| 3.00%, 05/28/51 (Call 11/28/50) |
4,360 | 3,014,955 | ||||||
| 3.13%, 06/12/27 (Call 03/12/27) |
5,426 | 5,154,660 | ||||||
| 3.38%, 11/16/25 |
8,896 | 8,652,331 | ||||||
| 4.00%, 01/17/29 (Call 10/17/28) |
3,550 | 3,427,166 | ||||||
| 4.00%, 09/18/42 |
3,539 | 3,024,972 | ||||||
| 4.38%, 11/16/45 |
2,969 | 2,624,555 | ||||||
| 4.38%, 08/17/48 (Call 02/17/48) |
2,907 | 2,581,135 | ||||||
| 6.45%, 09/15/37 |
11,417 | 12,856,784 | ||||||
| Becton Dickinson and Co. |
||||||||
| 1.96%, 02/11/31 (Call 11/11/30) |
4,955 | 4,028,395 | ||||||
| 2.82%, 05/20/30 (Call 02/20/30) |
4,107 | 3,602,067 | ||||||
| 3.70%, 06/06/27 (Call 03/06/27) |
8,128 | 7,793,638 | ||||||
| 3.79%, 05/20/50 (Call 11/20/49) |
2,372 | 1,832,673 | ||||||
| 4.30%, 08/22/32 (Call 05/22/32) |
2,485 | 2,329,124 | ||||||
| 4.67%, 06/06/47 (Call 12/06/46) |
4,102 | 3,632,902 | ||||||
| 4.69%, 02/13/28 (Call 01/13/28) |
3,955 | 3,896,977 | ||||||
| 4.69%, 12/15/44 (Call 06/15/44) |
5,190 | 4,656,919 | ||||||
| 4.87%, 02/08/29 (Call 01/08/29) |
625 | 617,132 | ||||||
| 5.11%, 02/08/34 (Call 11/08/33) |
565 | 555,901 | ||||||
| Bristol-Myers Squibb Co. |
||||||||
| 0.75%, 11/13/25 (Call 10/13/25) |
3,336 | 3,103,706 | ||||||
| 1.13%, 11/13/27 (Call 09/13/27) |
3,361 | 2,945,701 | ||||||
| 1.45%, 11/13/30 (Call 08/13/30) |
4,195 | 3,364,576 | ||||||
| 2.35%, 11/13/40 (Call 05/13/40) |
1,959 | 1,314,235 | ||||||
| 2.55%, 11/13/50 (Call 05/13/50) |
7,827 | 4,744,330 | ||||||
| 2.95%, 03/15/32 (Call 12/15/31) |
4,585 | 3,961,361 | ||||||
| 3.20%, 06/15/26 (Call 04/15/26) |
8,806 | 8,471,253 | ||||||
| 3.25%, 02/27/27 |
795 | 762,956 | ||||||
| 3.25%, 08/01/42 |
3,363 | 2,540,461 | ||||||
| 3.40%, 07/26/29 (Call 04/26/29) |
8,177 | 7,621,550 | ||||||
| 3.45%, 11/15/27 (Call 08/15/27) |
2,505 | 2,388,719 | ||||||
| 3.55%, 03/15/42 (Call 09/15/41) |
3,485 | 2,747,579 | ||||||
| 3.70%, 03/15/52 (Call 09/15/51) |
7,530 | 5,691,967 | ||||||
| 3.90%, 02/20/28 (Call 11/20/27) |
9,188 | 8,873,037 | ||||||
| 3.90%, 03/15/62 (Call 09/15/61) |
3,742 | 2,790,288 | ||||||
| 4.13%, 06/15/39 (Call 12/15/38) |
9,931 | 8,654,754 | ||||||
| 4.25%, 10/26/49 (Call 04/26/49) |
14,282 | 11,955,418 | ||||||
| 4.35%, 11/15/47 (Call 05/15/47) |
5,529 | 4,696,151 | ||||||
| 4.50%, 03/01/44 (Call 09/01/43) |
125 | 111,728 | ||||||
| 4.55%, 02/20/48 (Call 08/20/47) |
6,151 | 5,410,689 | ||||||
| 4.63%, 05/15/44 (Call 11/15/43) |
1,025 | 927,786 | ||||||
| 4.90%, 02/22/27 (Call 01/22/27) |
1,795 | 1,792,729 | ||||||
| 4.90%, 02/22/29 (Call 01/22/29) |
2,595 | 2,588,350 | ||||||
| 4.95%, 02/20/26 |
3,040 | 3,035,530 | ||||||
| 5.00%, 08/15/45 (Call 02/15/45) |
1,350 | 1,284,960 | ||||||
| 5.10%, 02/22/31 (Call 12/22/30) |
1,385 | 1,389,253 | ||||||
| 5.20%, 02/22/34 (Call 11/22/33) |
8,210 | 8,272,588 | ||||||
| 5.50%, 02/22/44 (Call 08/22/43) |
1,025 | 1,036,937 | ||||||
| 5.55%, 02/22/54 (Call 08/22/53) |
5,180 | 5,242,330 | ||||||
| 5.65%, 02/22/64 (Call 08/22/63) |
5,785 | 5,840,070 | ||||||
| 5.75%, 02/01/31 (Call 12/01/30) |
3,945 | 4,109,524 | ||||||
| Security | Par (000) |
Value | ||||||
| Pharmaceuticals (continued) |
||||||||
| 5.90%, 11/15/33 (Call 08/15/33)(b) |
$ | 4,225 | $ | 4,473,609 | ||||
| 6.25%, 11/15/53 (Call 05/15/53) |
3,200 | 3,550,637 | ||||||
| 6.40%, 11/15/63 (Call 05/15/63) |
3,021 | 3,369,551 | ||||||
| Cardinal Health Inc. |
||||||||
| 3.41%, 06/15/27 (Call 03/15/27) |
2,885 | 2,734,045 | ||||||
| 3.75%, 09/15/25 (Call 06/15/25) |
3,117 | 3,040,178 | ||||||
| 4.37%, 06/15/47 (Call 12/15/46) |
2,249 | 1,845,088 | ||||||
| 4.50%, 11/15/44 (Call 05/15/44) |
1,445 | 1,218,617 | ||||||
| 4.60%, 03/15/43 |
1,725 | 1,482,951 | ||||||
| 4.90%, 09/15/45 (Call 03/15/45) |
1,957 | 1,730,655 | ||||||
| 5.13%, 02/15/29 (Call 01/15/29) |
1,655 | 1,648,398 | ||||||
| 5.45%, 02/15/34 (Call 11/15/33) |
1,235 | 1,235,412 | ||||||
| Cencora Inc. |
||||||||
| 2.70%, 03/15/31 (Call 12/15/30) |
4,800 | 4,092,282 | ||||||
| 2.80%, 05/15/30 (Call 02/15/30) |
1,717 | 1,508,347 | ||||||
| 3.25%, 03/01/25 (Call 12/01/24) |
2,167 | 2,119,397 | ||||||
| 3.45%, 12/15/27 (Call 09/15/27) |
5,791 | 5,478,858 | ||||||
| 4.25%, 03/01/45 (Call 09/01/44) |
2,210 | 1,920,832 | ||||||
| 4.30%, 12/15/47 (Call 06/15/47) |
2,310 | 1,963,214 | ||||||
| 5.13%, 02/15/34 (Call 11/15/33) |
625 | 613,395 | ||||||
| Cigna Group (The) |
||||||||
| 1.25%, 03/15/26 (Call 02/15/26)(b) |
1,731 | 1,599,213 | ||||||
| 2.38%, 03/15/31 (Call 12/15/30) |
3,496 | 2,915,283 | ||||||
| 2.40%, 03/15/30 (Call 12/15/29) |
6,487 | 5,561,243 | ||||||
| 3.05%, 10/15/27 (Call 07/15/27) |
2,959 | 2,763,020 | ||||||
| 3.20%, 03/15/40 (Call 09/15/39) |
3,105 | 2,318,918 | ||||||
| 3.25%, 04/15/25 (Call 01/15/25) |
4,664 | 4,552,484 | ||||||
| 3.40%, 03/01/27 (Call 12/01/26) |
6,501 | 6,190,682 | ||||||
| 3.40%, 03/15/50 (Call 09/15/49) |
6,352 | 4,420,411 | ||||||
| 3.40%, 03/15/51 (Call 09/15/50) |
4,160 | 2,892,865 | ||||||
| 3.88%, 10/15/47 (Call 04/15/47) |
5,566 | 4,276,921 | ||||||
| 4.38%, 10/15/28 (Call 07/15/28) |
13,493 | 13,103,834 | ||||||
| 4.50%, 02/25/26 (Call 11/27/25) |
3,913 | 3,860,676 | ||||||
| 4.80%, 08/15/38 (Call 02/15/38) |
9,649 | 8,948,678 | ||||||
| 4.80%, 07/15/46 (Call 01/16/46) |
3,894 | 3,480,384 | ||||||
| 4.90%, 12/15/48 (Call 06/15/48) |
11,073 | 9,947,765 | ||||||
| 5.00%, 05/15/29 (Call 04/15/29) |
2,010 | 1,995,573 | ||||||
| 5.13%, 05/15/31 (Call 03/15/31) |
2,000 | 1,977,301 | ||||||
| 5.25%, 02/15/34 (Call 11/15/33) |
2,000 | 1,975,544 | ||||||
| 5.40%, 03/15/33 (Call 12/15/32) |
3,455 | 3,475,719 | ||||||
| 5.60%, 02/15/54 (Call 08/15/53) |
2,330 | 2,294,167 | ||||||
| 5.69%, 03/15/26 (Call 03/15/24) |
2,215 | 2,214,814 | ||||||
| 6.13%, 11/15/41 |
2,453 | 2,593,726 | ||||||
| CVS Health Corp. |
||||||||
| 1.30%, 08/21/27 (Call 06/21/27) |
9,991 | 8,781,013 | ||||||
| 1.75%, 08/21/30 (Call 05/21/30) |
5,385 | 4,366,899 | ||||||
| 1.88%, 02/28/31 (Call 11/28/30) |
5,760 | 4,629,055 | ||||||
| 2.13%, 09/15/31 (Call 06/15/31) |
4,810 | 3,881,488 | ||||||
| 2.70%, 08/21/40 (Call 02/21/40) |
5,004 | 3,406,594 | ||||||
| 2.88%, 06/01/26 (Call 03/01/26) |
6,945 | 6,600,667 | ||||||
| 3.00%, 08/15/26 (Call 06/15/26) |
4,350 | 4,130,807 | ||||||
| 3.25%, 08/15/29 (Call 05/15/29) |
7,813 | 7,108,426 | ||||||
| 3.63%, 04/01/27 (Call 02/01/27) |
4,833 | 4,633,288 | ||||||
| 3.75%, 04/01/30 (Call 01/01/30) |
4,308 | 3,975,022 | ||||||
| 3.88%, 07/20/25 (Call 04/20/25) |
11,938 | 11,695,628 | ||||||
| 4.10%, 03/25/25 (Call 01/25/25) |
4,593 | 4,536,304 | ||||||
| 4.13%, 04/01/40 (Call 10/01/39) |
4,336 | 3,559,653 | ||||||
| 4.25%, 04/01/50 (Call 10/01/49) |
3,153 | 2,518,392 | ||||||
| 4.30%, 03/25/28 (Call 12/25/27) |
13,950 | 13,543,692 | ||||||
| 4.78%, 03/25/38 (Call 09/25/37) |
19,010 | 17,294,651 | ||||||
| 4.88%, 07/20/35 (Call 01/20/35) |
3,784 | 3,609,176 | ||||||
| 72 | 2 0 2 4 I S H A R E S A N N U A L R E P O R T T O S H A R E H O L D E R S |
| Schedule of Investments (continued) February 29, 2024 |
iShares® Core U.S. Aggregate Bond ETF (Percentages shown are based on Net Assets) |
| Security | Par (000) |
Value | ||||||
| Pharmaceuticals (continued) |
||||||||
| 5.00%, 02/20/26 (Call 01/20/26) |
$ | 5,216 | $ | 5,192,748 | ||||
| 5.00%, 01/30/29 (Call 12/30/28) |
4,210 | 4,192,718 | ||||||
| 5.05%, 03/25/48 (Call 09/25/47) |
31,009 | 27,704,948 | ||||||
| 5.13%, 02/21/30 (Call 12/21/29) |
4,225 | 4,199,712 | ||||||
| 5.13%, 07/20/45 (Call 01/20/45) |
12,939 | 11,780,072 | ||||||
| 5.25%, 01/30/31 (Call 11/30/30) |
3,240 | 3,234,656 | ||||||
| 5.25%, 02/21/33 (Call 11/21/32) |
5,766 | 5,709,060 | ||||||
| 5.30%, 06/01/33 (Call 03/01/33) |
5,111 | 5,074,956 | ||||||
| 5.30%, 12/05/43 (Call 06/05/43) |
3,222 | 2,993,577 | ||||||
| 5.63%, 02/21/53 (Call 08/21/52) |
4,960 | 4,761,870 | ||||||
| 5.88%, 06/01/53 (Call 12/01/52) |
5,110 | 5,091,924 | ||||||
| 6.00%, 06/01/63 (Call 12/01/62)(b) |
1,935 | 1,937,856 | ||||||
| 6.13%, 09/15/39 |
2,223 | 2,283,157 | ||||||
| 6.25%, 06/01/27 |
1,470 | 1,521,884 | ||||||
| Eli Lilly & Co. |
||||||||
| 2.25%, 05/15/50 (Call 11/15/49) |
6,552 | 3,971,098 | ||||||
| 2.50%, 09/15/60 (Call 03/15/60) |
3,015 | 1,754,103 | ||||||
| 2.75%, 06/01/25 (Call 03/01/25) |
4,025 | 3,912,742 | ||||||
| 3.10%, 05/15/27 (Call 02/15/27) |
5,559 | 5,289,006 | ||||||
| 3.38%, 03/15/29 (Call 12/15/28) |
5,725 | 5,393,999 | ||||||
| 3.70%, 03/01/45 (Call 09/01/44) |
475 | 392,433 | ||||||
| 3.95%, 05/15/47 (Call 11/15/46) |
1,608 | 1,383,018 | ||||||
| 3.95%, 03/15/49 (Call 09/15/48) |
610 | 511,496 | ||||||
| 4.15%, 03/15/59 (Call 09/15/58) |
1,371 | 1,152,793 | ||||||
| 4.50%, 02/09/27 (Call 01/09/27) |
3,835 | 3,818,915 | ||||||
| 4.50%, 02/09/29 (Call 01/09/29) |
3,885 | 3,863,896 | ||||||
| 4.70%, 02/27/33 (Call 11/27/32) |
3,310 | 3,282,147 | ||||||
| 4.70%, 02/09/34 (Call 11/09/33) |
4,415 | 4,359,463 | ||||||
| 4.88%, 02/27/53 (Call 08/27/52) |
3,419 | 3,314,128 | ||||||
| 4.95%, 02/27/63 (Call 08/27/62) |
2,025 | 1,948,974 | ||||||
| 5.00%, 02/27/26 (Call 03/11/24) |
125 | 124,978 | ||||||
| 5.00%, 02/09/54 (Call 08/09/53) |
2,640 | 2,602,081 | ||||||
| 5.10%, 02/09/64 (Call 08/09/63) |
3,825 | 3,760,476 | ||||||
| 5.50%, 03/15/27 |
500 | 511,644 | ||||||
| 5.55%, 03/15/37 |
2,060 | 2,172,204 | ||||||
| GlaxoSmithKline Capital Inc. |
||||||||
| 3.63%, 05/15/25 |
5,287 | 5,194,740 | ||||||
| 3.88%, 05/15/28 |
8,968 | 8,671,171 | ||||||
| 4.20%, 03/18/43 |
2,884 | 2,533,989 | ||||||
| 5.38%, 04/15/34(b) |
2,836 | 2,991,263 | ||||||
| 6.38%, 05/15/38 |
8,723 | 9,780,269 | ||||||
| GlaxoSmithKline Capital PLC, 3.38%, 06/01/29 (Call 03/01/29) |
4,438 | 4,164,473 | ||||||
| Johnson & Johnson |
||||||||
| 0.55%, 09/01/25 (Call 08/01/25) |
3,202 | 3,003,322 | ||||||
| 0.95%, 09/01/27 (Call 07/01/27) |
3,856 | 3,409,830 | ||||||
| 1.30%, 09/01/30 (Call 06/01/30) |
3,663 | 2,999,411 | ||||||
| 2.10%, 09/01/40 (Call 03/01/40) |
4,346 | 2,952,854 | ||||||
| 2.25%, 09/01/50 (Call 03/01/50)(b) |
3,971 | 2,453,926 | ||||||
| 2.45%, 03/01/26 (Call 12/01/25) |
4,930 | 4,717,449 | ||||||
| 2.45%, 09/01/60 (Call 03/01/60) |
4,533 | 2,669,360 | ||||||
| 2.90%, 01/15/28 (Call 10/15/27)(b) |
8,061 | 7,623,887 | ||||||
| 2.95%, 03/03/27 (Call 12/03/26) |
5,475 | 5,233,077 | ||||||
| 3.40%, 01/15/38 (Call 07/15/37) |
4,705 | 3,991,627 | ||||||
| 3.50%, 01/15/48 (Call 07/15/47) |
3,285 | 2,585,729 | ||||||
| 3.55%, 03/01/36 (Call 09/01/35) |
4,441 | 3,925,386 | ||||||
| 3.63%, 03/03/37 (Call 09/03/36) |
6,546 | 5,784,432 | ||||||
| 3.70%, 03/01/46 (Call 09/01/45) |
7,689 | 6,299,719 | ||||||
| 3.75%, 03/03/47 (Call 09/03/46) |
4,186 | 3,441,580 | ||||||
| 4.38%, 12/05/33 (Call 06/05/33) |
4,123 | 4,072,094 | ||||||
| 4.50%, 09/01/40 |
2,377 | 2,258,469 | ||||||
| Security | Par (000) |
Value | ||||||
| Pharmaceuticals (continued) |
||||||||
| 4.50%, 12/05/43 (Call 06/05/43) |
$ | 2,243 | $ | 2,110,478 | ||||
| 4.85%, 05/15/41 |
1,267 | 1,254,566 | ||||||
| 4.95%, 05/15/33 |
1,004 | 1,041,129 | ||||||
| 5.85%, 07/15/38 |
3,158 | 3,470,113 | ||||||
| 5.95%, 08/15/37 |
3,864 | 4,259,664 | ||||||
| 6.95%, 09/01/29(b) |
1,493 | 1,673,329 | ||||||
| McKesson Corp. |
||||||||
| 0.90%, 12/03/25 (Call 11/03/25) |
3,025 | 2,808,814 | ||||||
| 1.30%, 08/15/26 (Call 07/15/26) |
3,472 | 3,168,511 | ||||||
| 3.95%, 02/16/28 (Call 11/16/27) |
2,392 | 2,321,090 | ||||||
| 4.90%, 07/15/28 (Call 06/15/28) |
1,146 | 1,146,214 | ||||||
| 5.10%, 07/15/33 (Call 04/15/33) |
1,210 | 1,205,320 | ||||||
| 5.25%, 02/15/26 (Call 04/01/24) |
1,390 | 1,389,701 | ||||||
| Mead Johnson Nutrition Co. |
||||||||
| 4.13%, 11/15/25 (Call 08/15/25) |
5,276 | 5,176,408 | ||||||
| 4.60%, 06/01/44 (Call 12/01/43) |
2,798 | 2,531,659 | ||||||
| 5.90%, 11/01/39 |
865 | 902,333 | ||||||
| Merck & Co. Inc. |
||||||||
| 0.75%, 02/24/26 (Call 01/24/26) |
5,127 | 4,740,743 | ||||||
| 1.45%, 06/24/30 (Call 03/24/30) |
3,169 | 2,590,107 | ||||||
| 1.70%, 06/10/27 (Call 05/10/27) |
7,405 | 6,706,500 | ||||||
| 1.90%, 12/10/28 (Call 10/10/28) |
5,899 | 5,207,294 | ||||||
| 2.15%, 12/10/31 (Call 09/10/31) |
8,145 | 6,754,810 | ||||||
| 2.35%, 06/24/40 (Call 12/24/39) |
4,911 | 3,400,175 | ||||||
| 2.45%, 06/24/50 (Call 12/24/49) |
5,525 | 3,391,097 | ||||||
| 2.75%, 12/10/51 (Call 06/10/51) |
5,560 | 3,604,738 | ||||||
| 2.90%, 12/10/61 (Call 06/10/61) |
6,206 | 3,843,897 | ||||||
| 3.40%, 03/07/29 (Call 12/07/28) |
7,831 | 7,355,013 | ||||||
| 3.60%, 09/15/42 (Call 03/15/42) |
2,540 | 2,055,866 | ||||||
| 3.70%, 02/10/45 (Call 08/10/44) |
8,374 | 6,770,399 | ||||||
| 3.90%, 03/07/39 (Call 09/07/38) |
4,545 | 3,972,571 | ||||||
| 4.00%, 03/07/49 (Call 09/07/48) |
5,888 | 4,903,417 | ||||||
| 4.05%, 05/17/28 (Call 04/17/28)(b) |
2,405 | 2,355,839 | ||||||
| 4.15%, 05/18/43 |
4,892 | 4,270,042 | ||||||
| 4.30%, 05/17/30 (Call 03/17/30) |
3,964 | 3,857,525 | ||||||
| 4.50%, 05/17/33 (Call 02/17/33) |
2,530 | 2,460,937 | ||||||
| 4.90%, 05/17/44 (Call 11/17/43) |
2,600 | 2,495,993 | ||||||
| 5.00%, 05/17/53 (Call 11/17/52) |
6,395 | 6,198,679 | ||||||
| 5.15%, 05/17/63 (Call 11/17/62) |
1,825 | 1,784,304 | ||||||
| 6.50%, 12/01/33 |
2,468 | 2,782,042 | ||||||
| 6.55%, 09/15/37 |
1,360 | 1,526,133 | ||||||
| Merck Sharp & Dohme Corp. |
||||||||
| 5.75%, 11/15/36 |
1,255 | 1,341,197 | ||||||
| 5.95%, 12/01/28 |
3,988 | 4,183,665 | ||||||
| Mylan Inc. |
||||||||
| 4.55%, 04/15/28 (Call 01/15/28) |
3,455 | 3,331,881 | ||||||
| 5.20%, 04/15/48 (Call 10/15/47) |
2,945 | 2,411,577 | ||||||
| 5.40%, 11/29/43 (Call 05/29/43) |
2,189 | 1,889,746 | ||||||
| Novartis Capital Corp. |
||||||||
| 2.00%, 02/14/27 (Call 12/14/26) |
7,491 | 6,942,614 | ||||||
| 2.20%, 08/14/30 (Call 05/14/30) |
3,778 | 3,245,219 | ||||||
| 2.75%, 08/14/50 (Call 02/14/50) |
4,758 | 3,170,362 | ||||||
| 3.00%, 11/20/25 (Call 08/20/25) |
7,246 | 7,019,864 | ||||||
| 3.10%, 05/17/27 (Call 02/17/27) |
3,095 | 2,944,882 | ||||||
| 3.70%, 09/21/42 |
2,220 | 1,840,073 | ||||||
| 4.00%, 11/20/45 (Call 05/20/45) |
4,671 | 3,971,377 | ||||||
| 4.40%, 05/06/44 |
8,108 | 7,379,167 | ||||||
| Pfizer Inc. |
||||||||
| 0.80%, 05/28/25 (Call 04/28/25) |
4,777 | 4,534,729 | ||||||
| 1.70%, 05/28/30 (Call 02/28/30) |
4,436 | 3,695,860 | ||||||
| 1.75%, 08/18/31 (Call 05/18/31) |
4,510 | 3,633,951 | ||||||
| S C H E D U L E O F I N V E S T M E N T S |
73 |
| Schedule of Investments (continued) February 29, 2024 |
iShares® Core U.S. Aggregate Bond ETF (Percentages shown are based on Net Assets) |
| Security | Par (000) |
Value | ||||||
| Pharmaceuticals (continued) |
||||||||
| 2.55%, 05/28/40 (Call 11/28/39) |
$ | 5,230 | $ | 3,665,069 | ||||
| 2.63%, 04/01/30 (Call 01/01/30) |
6,243 | 5,519,566 | ||||||
| 2.70%, 05/28/50 (Call 11/28/49) |
3,750 | 2,468,796 | ||||||
| 2.75%, 06/03/26 |
5,588 | 5,345,267 | ||||||
| 3.00%, 12/15/26 |
8,040 | 7,666,303 | ||||||
| 3.45%, 03/15/29 (Call 12/15/28) |
7,853 | 7,381,918 | ||||||
| 3.60%, 09/15/28 (Call 06/15/28) |
3,333 | 3,183,711 | ||||||
| 3.90%, 03/15/39 (Call 09/15/38) |
4,078 | 3,476,804 | ||||||
| 4.00%, 12/15/36 |
3,842 | 3,451,067 | ||||||
| 4.00%, 03/15/49 (Call 09/15/48) |
6,217 | 5,133,584 | ||||||
| 4.10%, 09/15/38 (Call 03/15/38) |
4,357 | 3,871,582 | ||||||
| 4.13%, 12/15/46 |
3,272 | 2,743,897 | ||||||
| 4.20%, 09/15/48 (Call 03/15/48) |
3,170 | 2,694,198 | ||||||
| 4.30%, 06/15/43 |
3,038 | 2,657,528 | ||||||
| 4.40%, 05/15/44 |
4,194 | 3,767,625 | ||||||
| 5.60%, 09/15/40 |
3,009 | 3,086,735 | ||||||
| 7.20%, 03/15/39 |
9,813 | 11,660,673 | ||||||
| Pfizer Investment Enterprises Pte Ltd. |
||||||||
| 4.45%, 05/19/26 (Call 04/19/26) |
12,520 | 12,358,262 | ||||||
| 4.45%, 05/19/28 (Call 04/19/28) |
14,635 | 14,353,491 | ||||||
| 4.65%, 05/19/25 |
12,815 | 12,735,790 | ||||||
| 4.65%, 05/19/30 (Call 03/19/30) |
5,240 | 5,155,112 | ||||||
| 4.75%, 05/19/33 (Call 02/19/33) |
19,481 | 18,983,399 | ||||||
| 5.11%, 05/19/43 (Call 11/19/42) |
4,575 | 4,399,955 | ||||||
| 5.30%, 05/19/53 (Call 11/19/52) |
28,050 | 27,472,524 | ||||||
| 5.34%, 05/19/63 (Call 11/19/62) |
7,780 | 7,495,572 | ||||||
| Pharmacia LLC, 6.60%, 12/01/28 |
7,154 | 7,660,968 | ||||||
| Sanofi SA, 3.63%, 06/19/28 (Call 03/19/28) |
6,426 | 6,199,781 | ||||||
| Shire Acquisitions Investments Ireland DAC, |
||||||||
| 3.20%, 09/23/26 (Call 06/23/26) |
12,653 | 12,055,883 | ||||||
| Takeda Pharmaceutical Co. Ltd. |
||||||||
| 2.05%, 03/31/30 (Call 12/31/29) |
10,118 | 8,502,163 | ||||||
| 3.03%, 07/09/40 (Call 01/09/40) |
6,131 | 4,564,575 | ||||||
| 3.18%, 07/09/50 (Call 01/09/50) |
8,340 | 5,714,931 | ||||||
| 3.38%, 07/09/60 (Call 01/09/60) |
3,296 | 2,200,450 | ||||||
| 5.00%, 11/26/28 (Call 08/26/28) |
9,251 | 9,226,863 | ||||||
| Utah Acquisition Sub Inc. |
||||||||
| 3.95%, 06/15/26 (Call 03/15/26) |
7,702 | 7,431,946 | ||||||
| 5.25%, 06/15/46 (Call 12/15/45) |
3,682 | 3,024,482 | ||||||
| Viatris Inc. |
||||||||
| 1.65%, 06/22/25 (Call 05/22/25) |
4,017 | 3,811,245 | ||||||
| 2.30%, 06/22/27 (Call 04/22/27) |
3,753 | 3,393,956 | ||||||
| 2.70%, 06/22/30 (Call 03/22/30) |
5,595 | 4,706,413 | ||||||
| 3.85%, 06/22/40 (Call 12/22/39) |
6,091 | 4,471,111 | ||||||
| 4.00%, 06/22/50 (Call 12/22/49) |
7,821 | 5,329,110 | ||||||
| Wyeth LLC |
||||||||
| 5.95%, 04/01/37 |
10,216 | 10,900,056 | ||||||
| 6.00%, 02/15/36 |
3,239 | 3,463,788 | ||||||
| 6.50%, 02/01/34 |
4,024 | 4,429,287 | ||||||
| Zoetis Inc. |
||||||||
| 2.00%, 05/15/30 (Call 02/15/30) |
4,715 | 3,954,465 | ||||||
| 3.00%, 09/12/27 (Call 06/12/27) |
4,631 | 4,334,784 | ||||||
| 3.00%, 05/15/50 (Call 11/15/49) |
760 | 520,222 | ||||||
| 3.90%, 08/20/28 (Call 05/20/28) |
2,659 | 2,556,203 | ||||||
| 3.95%, 09/12/47 (Call 03/12/47) |
2,354 | 1,896,078 | ||||||
| 4.45%, 08/20/48 (Call 02/20/48) |
1,904 | 1,665,554 | ||||||
| 4.50%, 11/13/25 (Call 08/13/25) |
5,661 | 5,589,745 | ||||||
| 4.70%, 02/01/43 (Call 08/01/42) |
4,920 | 4,494,362 | ||||||
| 5.40%, 11/14/25 (Call 10/14/25) |
2,575 | 2,579,168 | ||||||
| 5.60%, 11/16/32 (Call 08/16/32) |
1,015 | 1,048,935 | ||||||
|
|
|
|||||||
| 1,438,641,774 | ||||||||
| Security | Par (000) |
Value | ||||||
| Pipelines — 0.9% |
||||||||
| Boardwalk Pipelines LP |
||||||||
| 3.40%, 02/15/31 (Call 11/15/30) |
$ | 1,882 | $ | 1,660,652 | ||||
| 3.60%, 09/01/32 (Call 06/01/32) |
1,080 | 937,947 | ||||||
| 4.45%, 07/15/27 (Call 04/15/27) |
1,297 | 1,264,249 | ||||||
| 4.80%, 05/03/29 (Call 02/03/29) |
2,461 | 2,391,246 | ||||||
| 5.63%, 08/01/34 (Call 05/01/34) |
1,525 | 1,511,308 | ||||||
| 5.95%, 06/01/26 (Call 03/01/26) |
2,969 | 2,990,480 | ||||||
| Cheniere Corpus Christi Holdings LLC |
||||||||
| 2.74%, 12/31/39 (Call 07/04/39) |
3,865 | 3,032,861 | ||||||
| 3.70%, 11/15/29 (Call 05/18/29) |
5,350 | 4,939,535 | ||||||
| 5.13%, 06/30/27 (Call 01/01/27) |
3,877 | 3,858,359 | ||||||
| 5.88%, 03/31/25 (Call 10/02/24) |
6,808 | 6,805,806 | ||||||
| Cheniere Energy Inc., 4.63%, 10/15/28 (Call 03/11/24) |
2,032 | 1,951,646 | ||||||
| Cheniere Energy Partners LP |
||||||||
| 3.25%, 01/31/32 (Call 01/31/27) |
3,727 | 3,114,997 | ||||||
| 4.00%, 03/01/31 (Call 03/01/26) |
3,099 | 2,767,788 | ||||||
| 4.50%, 10/01/29 (Call 10/01/24)(b) |
6,260 | 5,867,899 | ||||||
| 5.95%, 06/30/33 (Call 12/30/32) |
2,471 | 2,480,833 | ||||||
| Columbia Pipeline Group Inc. |
||||||||
| 4.50%, 06/01/25 (Call 03/01/25) |
6,210 | 6,119,310 | ||||||
| 5.80%, 06/01/45 (Call 12/01/44) |
2,742 | 2,647,181 | ||||||
| DCP Midstream Operating LP |
||||||||
| 3.25%, 02/15/32 (Call 08/15/31) |
1,225 | 1,043,955 | ||||||
| 5.13%, 05/15/29 (Call 02/15/29) |
1,815 | 1,792,509 | ||||||
| 5.38%, 07/15/25 (Call 04/15/25) |
1,719 | 1,715,942 | ||||||
| 5.60%, 04/01/44 (Call 10/01/43) |
825 | 787,690 | ||||||
| 5.63%, 07/15/27 (Call 04/15/27) |
1,040 | 1,045,368 | ||||||
| 8.13%, 08/16/30 |
680 | 775,225 | ||||||
| Eastern Gas Transmission & Storage Inc. |
||||||||
| 3.00%, 11/15/29 (Call 08/15/29) |
2,604 | 2,315,979 | ||||||
| 4.60%, 12/15/44 (Call 06/15/44) |
2,371 | 2,013,135 | ||||||
| 4.80%, 11/01/43 (Call 05/01/43) |
2,108 | 1,857,052 | ||||||
| Enbridge Energy Partners LP |
||||||||
| 5.50%, 09/15/40 (Call 03/15/40) |
2,300 | 2,228,862 | ||||||
| 5.88%, 10/15/25 (Call 07/15/25) |
2,757 | 2,773,091 | ||||||
| 7.38%, 10/15/45 (Call 04/15/45) |
3,074 | 3,548,456 | ||||||
| Series B, 7.50%, 04/15/38 |
1,935 | 2,236,473 | ||||||
| Enbridge Inc. |
||||||||
| 1.60%, 10/04/26 (Call 09/04/26) |
2,398 | 2,192,131 | ||||||
| 2.50%, 08/01/33 (Call 05/01/33) |
5,025 | 3,970,878 | ||||||
| 3.13%, 11/15/29 (Call 08/15/29) |
4,355 | 3,934,301 | ||||||
| 3.40%, 08/01/51 (Call 02/01/51) |
2,690 | 1,875,790 | ||||||
| 3.70%, 07/15/27 (Call 04/15/27) |
3,162 | 3,019,339 | ||||||
| 4.00%, 11/15/49 (Call 05/15/49) |
1,808 | 1,397,992 | ||||||
| 4.25%, 12/01/26 (Call 09/01/26) |
3,526 | 3,448,970 | ||||||
| 4.50%, 06/10/44 (Call 12/10/43) |
1,583 | 1,319,132 | ||||||
| 5.50%, 12/01/46 (Call 06/01/46) |
1,106 | 1,067,871 | ||||||
| 5.70%, 03/08/33 (Call 12/08/32) |
4,220 | 4,271,518 | ||||||
| 5.90%, 11/15/26 (Call 10/15/26) |
2,960 | 3,015,598 | ||||||
| 5.97%, 03/08/26 (Call 03/08/24) |
674 | 673,801 | ||||||
| 6.00%, 11/15/28 (Call 10/15/28) |
2,190 | 2,267,710 | ||||||
| 6.20%, 11/15/30 (Call 09/15/30) |
1,245 | 1,305,387 | ||||||
| 6.70%, 11/15/53 (Call 05/15/53)(b) |
3,065 | 3,418,641 | ||||||
| Energy Transfer LP |
||||||||
| 2.90%, 05/15/25 (Call 04/15/25) |
4,480 | 4,336,831 | ||||||
| 3.75%, 05/15/30 (Call 02/15/30) |
4,556 | 4,156,830 | ||||||
| 3.90%, 07/15/26 (Call 04/15/26) |
2,489 | 2,406,640 | ||||||
| 4.00%, 10/01/27 (Call 07/01/27) |
4,396 | 4,204,050 | ||||||
| 4.05%, 03/15/25 (Call 12/15/24) |
4,046 | 3,982,252 | ||||||
| 4.15%, 09/15/29 (Call 06/15/29) |
2,832 | 2,670,145 | ||||||
| 74 | 2 0 2 4 I S H A R E S A N N U A L R E P O R T T O S H A R E H O L D E R S |
| Schedule of Investments (continued) February 29, 2024 |
iShares® Core U.S. Aggregate Bond ETF (Percentages shown are based on Net Assets) |
| Security | Par (000) |
Value | ||||||
| Pipelines (continued) |
||||||||
| 4.20%, 04/15/27 (Call 01/15/27) |
$ | 2,467 | $ | 2,391,293 | ||||
| 4.40%, 03/15/27 (Call 12/15/26) |
3,609 | 3,514,983 | ||||||
| 4.75%, 01/15/26 (Call 10/15/25) |
5,017 | 4,960,064 | ||||||
| 4.90%, 03/15/35 (Call 09/15/34) |
1,525 | 1,422,303 | ||||||
| 4.95%, 05/15/28 (Call 02/15/28) |
2,473 | 2,440,127 | ||||||
| 4.95%, 06/15/28 (Call 03/15/28) |
4,304 | 4,237,739 | ||||||
| 4.95%, 01/15/43 (Call 07/15/42) |
1,975 | 1,701,766 | ||||||
| 5.00%, 05/15/44 (Call 11/15/43) |
1,895 | 1,640,384 | ||||||
| 5.00%, 05/15/50 (Call 11/15/49) |
7,999 | 6,897,136 | ||||||
| 5.15%, 02/01/43 (Call 08/01/42) |
2,471 | 2,174,917 | ||||||
| 5.15%, 03/15/45 (Call 09/15/44) |
1,648 | 1,470,526 | ||||||
| 5.25%, 04/15/29 (Call 01/15/29) |
5,627 | 5,605,006 | ||||||
| 5.30%, 04/01/44 (Call 10/01/43) |
3,389 | 3,068,861 | ||||||
| 5.30%, 04/15/47 (Call 10/15/46) |
3,825 | 3,416,780 | ||||||
| 5.35%, 05/15/45 (Call 11/15/44) |
3,718 | 3,363,701 | ||||||
| 5.40%, 10/01/47 (Call 04/01/47) |
5,983 | 5,410,808 | ||||||
| 5.50%, 06/01/27 (Call 03/01/27) |
3,448 | 3,461,211 | ||||||
| 5.55%, 02/15/28 (Call 01/15/28) |
3,090 | 3,115,854 | ||||||
| 5.55%, 05/15/34 (Call 02/15/34)(b) |
2,165 | 2,143,503 | ||||||
| 5.75%, 02/15/33 (Call 11/15/32) |
4,345 | 4,371,765 | ||||||
| 5.95%, 12/01/25 (Call 09/01/25) |
2,333 | 2,345,970 | ||||||
| 5.95%, 10/01/43 (Call 04/01/43) |
1,563 | 1,523,465 | ||||||
| 5.95%, 05/15/54 (Call 11/15/53) |
4,205 | 4,112,061 | ||||||
| 6.00%, 06/15/48 (Call 12/15/47) |
4,155 | 4,067,428 | ||||||
| 6.05%, 12/01/26 (Call 11/01/26) |
4,810 | 4,899,084 | ||||||
| 6.05%, 06/01/41 (Call 12/01/40) |
2,304 | 2,284,120 | ||||||
| 6.10%, 12/01/28 (Call 11/01/28) |
1,475 | 1,525,934 | ||||||
| 6.10%, 02/15/42(b) |
1,745 | 1,729,837 | ||||||
| 6.13%, 12/15/45 (Call 06/15/45) |
4,133 | 4,107,827 | ||||||
| 6.25%, 04/15/49 (Call 10/15/48) |
7,209 | 7,273,658 | ||||||
| 6.40%, 12/01/30 (Call 10/01/30) |
2,920 | 3,063,046 | ||||||
| 6.50%, 02/01/42 (Call 08/01/41) |
2,107 | 2,202,263 | ||||||
| 6.55%, 12/01/33 (Call 09/01/33) |
4,106 | 4,352,557 | ||||||
| 6.63%, 10/15/36 |
2,205 | 2,317,104 | ||||||
| 7.50%, 07/01/38 |
2,570 | 2,919,277 | ||||||
| Series 20Y, 5.80%, 06/15/38 (Call 12/15/37) |
1,714 | 1,691,597 | ||||||
| Enterprise Products Operating LLC |
||||||||
| 2.80%, 01/31/30 (Call 10/31/29) |
4,431 | 3,933,837 | ||||||
| 3.13%, 07/31/29 (Call 04/30/29) |
5,681 | 5,197,479 | ||||||
| 3.20%, 02/15/52 (Call 08/15/51) |
5,005 | 3,416,732 | ||||||
| 3.30%, 02/15/53 (Call 08/15/52) |
2,665 | 1,859,291 | ||||||
| 3.70%, 02/15/26 (Call 11/15/25) |
5,217 | 5,087,883 | ||||||
| 3.70%, 01/31/51 (Call 07/31/50) |
4,437 | 3,346,978 | ||||||
| 3.95%, 02/15/27 (Call 11/15/26) |
4,274 | 4,160,472 | ||||||
| 3.95%, 01/31/60 (Call 07/31/59) |
3,742 | 2,830,326 | ||||||
| 4.15%, 10/16/28 (Call 07/16/28) |
4,981 | 4,808,380 | ||||||
| 4.20%, 01/31/50 (Call 07/31/49) |
5,320 | 4,392,184 | ||||||
| 4.25%, 02/15/48 (Call 08/15/47) |
5,075 | 4,242,696 | ||||||
| 4.45%, 02/15/43 (Call 08/15/42) |
3,991 | 3,472,832 | ||||||
| 4.60%, 01/11/27 (Call 12/11/26) |
2,510 | 2,492,577 | ||||||
| 4.80%, 02/01/49 (Call 08/01/48) |
5,408 | 4,897,453 | ||||||
| 4.85%, 01/31/34 (Call 10/31/33) |
2,120 | 2,064,718 | ||||||
| 4.85%, 08/15/42 (Call 02/15/42) |
3,494 | 3,196,020 | ||||||
| 4.85%, 03/15/44 (Call 09/15/43) |
5,267 | 4,821,177 | ||||||
| 4.90%, 05/15/46 (Call 11/15/45) |
3,327 | 3,037,245 | ||||||
| 4.95%, 10/15/54 (Call 04/15/54) |
1,957 | 1,784,503 | ||||||
| 5.05%, 01/10/26 |
4,232 | 4,230,378 | ||||||
| 5.10%, 02/15/45 (Call 08/15/44) |
4,834 | 4,525,690 | ||||||
| 5.35%, 01/31/33 (Call 10/31/32) |
4,287 | 4,334,570 | ||||||
| Security | Par (000) |
Value | ||||||
| Pipelines (continued) |
||||||||
| 5.38%, 02/15/78 (Call 02/15/28), |
||||||||
| (3-mo. SOFR + 2.832%)(a) |
$ | 2,885 | $ | 2,669,501 | ||||
| 5.70%, 02/15/42 |
1,437 | 1,449,581 | ||||||
| 5.95%, 02/01/41 |
3,139 | 3,273,008 | ||||||
| 6.13%, 10/15/39 |
2,352 | 2,465,164 | ||||||
| 6.45%, 09/01/40 |
2,360 | 2,577,895 | ||||||
| 7.55%, 04/15/38 |
2,649 | 3,151,342 | ||||||
| Series D, 6.88%, 03/01/33 |
1,340 | 1,491,142 | ||||||
| Series E, 5.25%, 08/16/77 (Call 08/16/27), |
||||||||
| (3-mo. SOFR + 3.295%)(a) |
4,046 | 3,846,712 | ||||||
| Series H, 6.65%, 10/15/34 |
1,580 | 1,744,368 | ||||||
| Kinder Morgan Energy Partners LP |
||||||||
| 4.70%, 11/01/42 (Call 05/01/42) |
2,117 | 1,777,998 | ||||||
| 5.00%, 08/15/42 (Call 02/15/42) |
3,080 | 2,679,938 | ||||||
| 5.00%, 03/01/43 (Call 09/01/42) |
3,330 | 2,900,721 | ||||||
| 5.40%, 09/01/44 (Call 03/01/44) |
2,290 | 2,088,679 | ||||||
| 5.50%, 03/01/44 (Call 09/01/43) |
3,425 | 3,166,620 | ||||||
| 5.63%, 09/01/41 |
2,152 | 2,024,769 | ||||||
| 5.80%, 03/15/35 |
1,976 | 1,983,506 | ||||||
| 6.38%, 03/01/41 |
2,651 | 2,693,932 | ||||||
| 6.50%, 02/01/37 |
1,561 | 1,607,722 | ||||||
| 6.50%, 09/01/39 |
2,622 | 2,699,794 | ||||||
| 6.55%, 09/15/40 |
2,128 | 2,208,183 | ||||||
| 6.95%, 01/15/38 |
5,103 | 5,502,863 | ||||||
| 7.30%, 08/15/33 |
1,535 | 1,704,000 | ||||||
| 7.40%, 03/15/31(b) |
991 | 1,095,729 | ||||||
| 7.50%, 11/15/40 |
1,794 | 1,999,984 | ||||||
| 7.75%, 03/15/32 |
1,376 | 1,548,459 | ||||||
| Kinder Morgan Inc. |
||||||||
| 1.75%, 11/15/26 (Call 10/15/26) |
3,190 | 2,912,577 | ||||||
| 2.00%, 02/15/31 (Call 11/15/30) |
1,260 | 1,021,898 | ||||||
| 3.25%, 08/01/50 (Call 02/01/50) |
2,417 | 1,563,140 | ||||||
| 3.60%, 02/15/51 (Call 08/15/50) |
2,200 | 1,510,231 | ||||||
| 4.30%, 06/01/25 (Call 03/01/25) |
7,265 | 7,158,507 | ||||||
| 4.30%, 03/01/28 (Call 12/01/27) |
5,571 | 5,401,744 | ||||||
| 4.80%, 02/01/33 (Call 11/01/32) |
3,846 | 3,628,962 | ||||||
| 5.00%, 02/01/29 (Call 01/01/29) |
3,545 | 3,516,833 | ||||||
| 5.05%, 02/15/46 (Call 08/15/45) |
3,608 | 3,137,692 | ||||||
| 5.20%, 06/01/33 (Call 03/01/33)(b) |
3,400 | 3,307,139 | ||||||
| 5.20%, 03/01/48 (Call 09/01/47) |
3,243 | 2,880,913 | ||||||
| 5.30%, 12/01/34 (Call 06/01/34) |
3,798 | 3,701,447 | ||||||
| 5.40%, 02/01/34 (Call 11/01/33) |
3,850 | 3,783,524 | ||||||
| 5.45%, 08/01/52 (Call 02/01/52) |
3,440 | 3,168,420 | ||||||
| 5.55%, 06/01/45 (Call 12/01/44) |
6,890 | 6,464,264 | ||||||
| 7.75%, 01/15/32 |
4,944 | 5,567,600 | ||||||
| 7.80%, 08/01/31 |
2,377 | 2,658,297 | ||||||
| Magellan Midstream Partners LP |
||||||||
| 3.95%, 03/01/50 (Call 09/01/49) |
3,709 | 2,700,468 | ||||||
| 5.00%, 03/01/26 (Call 12/01/25) |
4,121 | 4,091,771 | ||||||
| MPLX LP |
||||||||
| 1.75%, 03/01/26 (Call 02/01/26) |
7,013 | 6,541,805 | ||||||
| 2.65%, 08/15/30 (Call 05/15/30) |
5,708 | 4,857,679 | ||||||
| 4.00%, 03/15/28 (Call 12/15/27) |
5,115 | 4,898,505 | ||||||
| 4.13%, 03/01/27 (Call 12/01/26) |
5,842 | 5,664,444 | ||||||
| 4.25%, 12/01/27 (Call 09/01/27) |
3,802 | 3,676,049 | ||||||
| 4.50%, 04/15/38 (Call 10/15/37) |
7,835 | 6,827,168 | ||||||
| 4.70%, 04/15/48 (Call 10/15/47) |
6,659 | 5,574,786 | ||||||
| 4.80%, 02/15/29 (Call 11/15/28) |
3,530 | 3,460,641 | ||||||
| 4.88%, 06/01/25 (Call 03/01/25) |
6,037 | 5,980,604 | ||||||
| 4.90%, 04/15/58 (Call 10/15/57) |
1,301 | 1,077,163 | ||||||
| 4.95%, 09/01/32 (Call 06/01/32) |
4,185 | 4,005,980 | ||||||
| S C H E D U L E O F I N V E S T M E N T S |
75 |
| Schedule of Investments (continued) February 29, 2024 |
iShares® Core U.S. Aggregate Bond ETF (Percentages shown are based on Net Assets) |
| Security | Par (000) |
Value | ||||||
| Pipelines (continued) |
||||||||
| 4.95%, 03/14/52 (Call 09/14/51) |
$ | 5,740 | $ | 4,943,302 | ||||
| 5.00%, 03/01/33 (Call 12/01/32) |
2,520 | 2,410,835 | ||||||
| 5.20%, 03/01/47 (Call 09/01/46) |
3,948 | 3,545,455 | ||||||
| 5.20%, 12/01/47 (Call 06/01/47) |
2,676 | 2,383,191 | ||||||
| 5.50%, 02/15/49 (Call 08/15/48) |
5,931 | 5,553,428 | ||||||
| 5.65%, 03/01/53 (Call 09/01/52) |
1,270 | 1,209,182 | ||||||
| Northwest Pipeline LLC, 4.00%, 04/01/27 |
2,304 | 2,236,028 | ||||||
| ONEOK Inc. |
||||||||
| 2.20%, 09/15/25 (Call 08/15/25) |
1,995 | 1,897,558 | ||||||
| 3.10%, 03/15/30 (Call 12/15/29) |
1,953 | 1,730,225 | ||||||
| 3.25%, 06/01/30 |
1,807 | 1,614,547 | ||||||
| 3.40%, 09/01/29 (Call 06/01/29) |
3,253 | 2,971,022 | ||||||
| 4.00%, 07/13/27 (Call 04/13/27) |
2,696 | 2,597,450 | ||||||
| 4.20%, 10/03/47 (Call 04/03/47) |
2,278 | 1,743,027 | ||||||
| 4.25%, 09/15/46 |
1,998 | 1,556,782 | ||||||
| 4.35%, 03/15/29 (Call 12/15/28) |
3,078 | 2,963,240 | ||||||
| 4.45%, 09/01/49 (Call 03/01/49) |
2,778 | 2,215,469 | ||||||
| 4.50%, 03/15/50 (Call 09/15/49) |
1,726 | 1,380,817 | ||||||
| 4.55%, 07/15/28 (Call 04/15/28) |
3,521 | 3,440,018 | ||||||
| 4.85%, 02/01/49 |
2,098 | 1,790,239 | ||||||
| 4.95%, 07/13/47 (Call 01/06/47) |
3,185 | 2,741,735 | ||||||
| 5.15%, 10/15/43(b) |
2,476 | 2,236,260 | ||||||
| 5.20%, 07/15/48 (Call 01/15/48) |
3,984 | 3,596,798 | ||||||
| 5.55%, 11/01/26 (Call 10/01/26) |
4,165 | 4,194,939 | ||||||
| 5.65%, 11/01/28 (Call 10/01/28) |
4,035 | 4,106,398 | ||||||
| 5.80%, 11/01/30 (Call 09/01/30) |
2,690 | 2,753,639 | ||||||
| 5.85%, 01/15/26 (Call 12/15/25) |
2,696 | 2,719,802 | ||||||
| 6.00%, 06/15/35(b) |
1,169 | 1,177,879 | ||||||
| 6.05%, 09/01/33 (Call 06/01/33) |
4,495 | 4,631,571 | ||||||
| 6.10%, 11/15/32 (Call 08/15/32) |
1,225 | 1,268,794 | ||||||
| 6.35%, 01/15/31 (Call 10/15/30) |
2,440 | 2,558,682 | ||||||
| 6.63%, 09/01/53 (Call 03/01/53) |
2,330 | 2,507,615 | ||||||
| 7.15%, 01/15/51 (Call 07/15/50) |
1,550 | 1,718,993 | ||||||
| ONEOK Partners LP |
||||||||
| 4.90%, 03/15/25 (Call 12/15/24) |
4,040 | 4,009,684 | ||||||
| 6.13%, 02/01/41 (Call 08/01/40) |
2,620 | 2,662,327 | ||||||
| 6.20%, 09/15/43 (Call 03/15/43) |
1,322 | 1,349,305 | ||||||
| 6.65%, 10/01/36 |
2,693 | 2,848,268 | ||||||
| 6.85%, 10/15/37 |
2,285 | 2,449,993 | ||||||
| Plains All American Pipeline LP/PAA Finance Corp. |
||||||||
| 3.55%, 12/15/29 (Call 09/15/29) |
3,773 | 3,420,436 | ||||||
| 3.80%, 09/15/30 (Call 06/15/30) |
2,764 | 2,518,101 | ||||||
| 4.30%, 01/31/43 (Call 07/31/42) |
1,722 | 1,361,509 | ||||||
| 4.50%, 12/15/26 (Call 09/15/26) |
4,450 | 4,365,114 | ||||||
| 4.65%, 10/15/25 (Call 07/15/25) |
5,708 | 5,630,359 | ||||||
| 4.70%, 06/15/44 (Call 12/15/43)(b) |
2,950 | 2,439,868 | ||||||
| 4.90%, 02/15/45 (Call 08/15/44) |
2,646 | 2,227,984 | ||||||
| 5.15%, 06/01/42 (Call 12/01/41) |
2,284 | 2,015,413 | ||||||
| 6.65%, 01/15/37 |
2,977 | 3,141,576 | ||||||
| Sabine Pass Liquefaction LLC |
||||||||
| 4.20%, 03/15/28 (Call 09/15/27) |
5,349 | 5,161,221 | ||||||
| 4.50%, 05/15/30 (Call 11/15/29) |
3,337 | 3,194,653 | ||||||
| 5.00%, 03/15/27 (Call 09/15/26) |
8,108 | 8,050,380 | ||||||
| 5.63%, 03/01/25 (Call 12/01/24) |
9,032 | 9,020,962 | ||||||
| 5.88%, 06/30/26 (Call 12/31/25) |
2,947 | 2,970,968 | ||||||
| 5.90%, 09/15/37 (Call 03/15/37) |
3,300 | 3,415,593 | ||||||
| Spectra Energy Partners LP |
||||||||
| 3.38%, 10/15/26 (Call 07/15/26) |
2,693 | 2,572,372 | ||||||
| 3.50%, 03/15/25 (Call 12/15/24) |
2,744 | 2,690,145 | ||||||
| Security | Par (000) |
Value | ||||||
| Pipelines (continued) |
||||||||
| 4.50%, 03/15/45 (Call 09/15/44) |
$ | 4,022 | $ | 3,369,608 | ||||
| 5.95%, 09/25/43 (Call 03/25/43) |
1,791 | 1,780,158 | ||||||
| Targa Resources Corp. |
||||||||
| 4.20%, 02/01/33 (Call 11/01/32) |
3,125 | 2,811,734 | ||||||
| 4.95%, 04/15/52 (Call 10/15/51) |
3,275 | 2,802,428 | ||||||
| 5.20%, 07/01/27 (Call 06/01/27) |
4,015 | 3,992,541 | ||||||
| 6.13%, 03/15/33 (Call 12/15/32) |
2,940 | 3,029,412 | ||||||
| 6.15%, 03/01/29 (Call 02/01/29) |
1,795 | 1,850,665 | ||||||
| 6.25%, 07/01/52 (Call 01/01/52) |
2,022 | 2,046,785 | ||||||
| 6.50%, 03/30/34 (Call 12/30/33) |
2,980 | 3,163,945 | ||||||
| 6.50%, 02/15/53 (Call 08/15/52) |
3,615 | 3,805,296 | ||||||
| Targa Resources Partners LP/Targa |
||||||||
| 4.00%, 01/15/32 (Call 07/15/26) |
3,805 | 3,395,764 | ||||||
| 4.88%, 02/01/31 (Call 02/01/26) |
4,190 | 3,976,094 | ||||||
| 5.00%, 01/15/28 (Call 04/01/24) |
2,970 | 2,908,414 | ||||||
| 5.50%, 03/01/30 (Call 03/01/25) |
3,935 | 3,889,768 | ||||||
| 6.50%, 07/15/27 (Call 04/01/24) |
4,920 | 4,974,949 | ||||||
| 6.88%, 01/15/29 (Call 04/01/24) |
2,730 | 2,814,825 | ||||||
| TC PipeLines LP |
||||||||
| 3.90%, 05/25/27 (Call 02/25/27) |
4,950 | 4,717,892 | ||||||
| 4.38%, 03/13/25 (Call 12/13/24) |
3,578 | 3,523,251 | ||||||
| Tennessee Gas Pipeline Co. LLC |
||||||||
| 7.00%, 03/15/27(b) |
2,183 | 2,291,209 | ||||||
| 7.00%, 10/15/28 |
1,400 | 1,494,988 | ||||||
| 7.63%, 04/01/37 |
560 | 630,203 | ||||||
| Texas Eastern Transmission LP, |
1,172 | 1,296,237 | ||||||
| TransCanada PipeLines Ltd. |
||||||||
| 2.50%, 10/12/31 (Call 07/12/31) |
3,584 | 2,937,013 | ||||||
| 4.10%, 04/15/30 (Call 01/15/30) |
1,925 | 1,803,053 | ||||||
| 4.25%, 05/15/28 (Call 02/15/28) |
6,789 | 6,538,469 | ||||||
| 4.63%, 03/01/34 (Call 12/01/33) |
5,859 | 5,430,742 | ||||||
| 4.75%, 05/15/38 (Call 11/15/37) |
2,105 | 1,902,359 | ||||||
| 4.88%, 01/15/26 (Call 10/15/25) |
4,590 | 4,549,986 | ||||||
| 4.88%, 05/15/48 (Call 11/15/47) |
4,425 | 3,860,004 | ||||||
| 5.00%, 10/16/43 (Call 04/16/43) |
3,086 | 2,755,946 | ||||||
| 5.10%, 03/15/49 (Call 09/15/48) |
4,636 | 4,246,416 | ||||||
| 5.60%, 03/31/34 |
1,291 | 1,289,215 | ||||||
| 5.85%, 03/15/36 |
2,393 | 2,391,266 | ||||||
| 6.10%, 06/01/40 |
3,211 | 3,280,071 | ||||||
| 6.20%, 03/09/26 (Call 03/18/24) |
1,025 | 1,025,041 | ||||||
| 6.20%, 10/15/37 |
4,918 | 5,059,774 | ||||||
| 7.25%, 08/15/38 |
2,961 | 3,337,940 | ||||||
| 7.63%, 01/15/39 |
3,519 | 4,100,077 | ||||||
| Transcontinental Gas Pipe Line Co. LLC |
||||||||
| 3.25%, 05/15/30 (Call 02/15/30) |
3,234 | 2,909,788 | ||||||
| 3.95%, 05/15/50 (Call 11/15/49) |
2,264 | 1,761,154 | ||||||
| 4.00%, 03/15/28 (Call 12/15/27) |
2,069 | 1,984,954 | ||||||
| 4.45%, 08/01/42 (Call 02/01/42) |
1,963 | 1,703,539 | ||||||
| 4.60%, 03/15/48 (Call 09/15/47) |
2,715 | 2,374,011 | ||||||
| 5.40%, 08/15/41 (Call 02/15/41) |
2,067 | 2,015,920 | ||||||
| 7.85%, 02/01/26 (Call 11/01/25) |
5,542 | 5,756,357 | ||||||
| Valero Energy Partners LP, 4.50%, 03/15/28 |
3,446 | 3,351,119 | ||||||
| Western Midstream Operating LP |
||||||||
| 3.95%, 06/01/25 (Call 03/01/25) |
705 | 688,928 | ||||||
| 4.05%, 02/01/30 (Call 11/01/29) |
3,640 | 3,367,620 | ||||||
| 4.50%, 03/01/28 (Call 12/01/27) |
1,044 | 999,824 | ||||||
| 4.65%, 07/01/26 (Call 04/01/26) |
820 | 801,625 | ||||||
| 4.75%, 08/15/28 (Call 05/15/28) |
565 | 546,242 | ||||||
| 76 | 2 0 2 4 I S H A R E S A N N U A L R E P O R T T O S H A R E H O L D E R S |
| Schedule of Investments (continued) February 29, 2024 |
iShares® Core U.S. Aggregate Bond ETF (Percentages shown are based on Net Assets) |
| Security | Par (000) |
Value | ||||||
| Pipelines (continued) |
||||||||
| 5.25%, 02/01/50 (Call 08/01/49) |
$ | 3,120 | $ | 2,764,019 | ||||
| 5.30%, 03/01/48 (Call 09/01/47) |
1,710 | 1,474,890 | ||||||
| 5.45%, 04/01/44 (Call 10/01/43) |
905 | 812,969 | ||||||
| 5.50%, 08/15/48 (Call 02/15/48) |
1,680 | 1,474,968 | ||||||
| 6.15%, 04/01/33 (Call 01/01/33) |
2,775 | 2,821,373 | ||||||
| 6.35%, 01/15/29 (Call 12/15/28) |
1,500 | 1,548,726 | ||||||
| Williams Companies Inc. (The) |
||||||||
| 2.60%, 03/15/31 (Call 12/15/30) |
2,517 | 2,120,378 | ||||||
| 3.50%, 11/15/30 (Call 08/15/30) |
2,994 | 2,699,928 | ||||||
| 3.50%, 10/15/51 (Call 04/15/51) |
2,625 | 1,828,739 | ||||||
| 3.75%, 06/15/27 (Call 03/15/27) |
6,169 | 5,900,699 | ||||||
| 4.00%, 09/15/25 (Call 06/15/25) |
5,146 | 5,045,762 | ||||||
| 4.65%, 08/15/32 (Call 05/15/32) |
4,235 | 4,027,163 | ||||||
| 4.85%, 03/01/48 (Call 09/01/47) |
3,836 | 3,366,578 | ||||||
| 4.90%, 03/15/29 (Call 02/15/29) |
2,840 | 2,804,778 | ||||||
| 4.90%, 01/15/45 (Call 07/15/44) |
2,086 | 1,837,303 | ||||||
| 5.10%, 09/15/45 (Call 03/15/45) |
3,043 | 2,778,505 | ||||||
| 5.15%, 03/15/34 (Call 12/15/33) |
2,100 | 2,052,449 | ||||||
| 5.30%, 08/15/28 (Call 07/15/28) |
4,615 | 4,644,198 | ||||||
| 5.30%, 08/15/52 (Call 02/15/52) |
2,585 | 2,418,410 | ||||||
| 5.40%, 03/02/26 |
2,110 | 2,114,912 | ||||||
| 5.40%, 03/04/44 (Call 09/04/43) |
2,666 | 2,497,434 | ||||||
| 5.65%, 03/15/33 (Call 12/15/32) |
4,235 | 4,304,295 | ||||||
| 5.75%, 06/24/44 (Call 12/24/43) |
2,251 | 2,202,942 | ||||||
| 5.80%, 11/15/43 (Call 05/15/43) |
2,060 | 2,016,510 | ||||||
| 6.30%, 04/15/40 |
5,184 | 5,368,263 | ||||||
| 8.75%, 03/15/32 |
735 | 874,728 | ||||||
| Series A, 7.50%, 01/15/31 |
1,250 | 1,388,659 | ||||||
|
|
|
|||||||
| 900,296,226 | ||||||||
| Real Estate — 0.0% | ||||||||
| American Homes 4 Rent LP, 5.50%, 02/01/34 |
1,525 | 1,497,052 | ||||||
| AvalonBay Communities Inc., 5.30%, 12/07/33 |
2,300 | 2,305,818 | ||||||
| Brixmor Operating Partnership LP, 5.50%, 02/15/34 |
1,010 | 983,200 | ||||||
| Camden Property Trust, 4.90%, 01/15/34 |
1,150 | 1,103,599 | ||||||
| CBRE Services Inc. |
||||||||
| 2.50%, 04/01/31 (Call 01/01/31)(b) |
2,613 | 2,145,797 | ||||||
| 4.88%, 03/01/26 (Call 12/01/25) |
3,454 | 3,412,467 | ||||||
| 5.50%, 04/01/29 (Call 03/01/29) |
180 | 180,059 | ||||||
| 5.95%, 08/15/34 (Call 05/15/34) |
2,155 | 2,176,891 | ||||||
| Essential Properties LP, 2.95%, 07/15/31 |
1,987 | 1,559,874 | ||||||
| Jones Lang LaSalle Inc., 6.88%, 12/01/28 |
610 | 641,299 | ||||||
| Kilroy Realty LP, 6.25%, 01/15/36 |
390 | 375,413 | ||||||
| Mid-America Apartments LP, 5.00%, 03/15/34 |
800 | 778,624 | ||||||
| Prologis LP |
||||||||
| 5.00%, 03/15/34 (Call 12/15/33) |
1,900 | 1,866,954 | ||||||
| 5.25%, 03/15/54 (Call 09/15/53) |
1,900 | 1,819,722 | ||||||
| Realty Income Corp. |
||||||||
| 2.10%, 03/15/28 (Call 01/15/28) |
1,496 | 1,326,282 | ||||||
| 2.70%, 02/15/32 (Call 11/15/31) |
835 | 684,450 | ||||||
| 3.20%, 02/15/31 (Call 11/15/30) |
840 | 733,886 | ||||||
| 3.40%, 01/15/30 (Call 10/15/29) |
2,050 | 1,858,026 | ||||||
| 4.00%, 07/15/29 (Call 04/15/29)(b) |
2,322 | 2,189,323 | ||||||
| 5.13%, 02/15/34 (Call 11/15/33) |
1,595 | 1,544,637 | ||||||
| Security | Par (000) |
Value | ||||||
| Real Estate (continued) |
||||||||
| Regency Centers LP, 5.25%, 01/15/34 |
$ | 310 | $ | 303,101 | ||||
| Sun Communities Operating LP, 5.50%, 01/15/29 |
1,425 | 1,411,439 | ||||||
|
|
|
|||||||
| 30,897,913 | ||||||||
| Real Estate Investment Trusts — 0.9% | ||||||||
| Agree LP |
||||||||
| 2.00%, 06/15/28 (Call 04/15/28) |
2,230 | 1,940,596 | ||||||
| 2.60%, 06/15/33 (Call 03/15/33) |
1,691 | 1,309,936 | ||||||
| 2.90%, 10/01/30 (Call 07/01/30)(b) |
1,304 | 1,110,958 | ||||||
| 4.80%, 10/01/32 (Call 07/01/32) |
575 | 537,406 | ||||||
| Alexandria Real Estate Equities Inc. |
||||||||
| 1.88%, 02/01/33 (Call 11/01/32) |
3,610 | 2,700,007 | ||||||
| 2.00%, 05/18/32 (Call 02/18/32) |
2,346 | 1,811,007 | ||||||
| 2.75%, 12/15/29 (Call 09/15/29) |
1,771 | 1,540,803 | ||||||
| 2.95%, 03/15/34 (Call 12/15/33) |
2,660 | 2,144,369 | ||||||
| 3.00%, 05/18/51 (Call 11/18/50) |
3,590 | 2,252,616 | ||||||
| 3.38%, 08/15/31 (Call 05/15/31) |
2,545 | 2,234,837 | ||||||
| 3.45%, 04/30/25 (Call 02/28/25) |
2,060 | 2,011,775 | ||||||
| 3.55%, 03/15/52 (Call 09/15/51) |
3,915 | 2,716,480 | ||||||
| 3.80%, 04/15/26 (Call 02/15/26) |
1,961 | 1,900,770 | ||||||
| 3.95%, 01/15/27 (Call 10/15/26) |
882 | 850,293 | ||||||
| 3.95%, 01/15/28 (Call 10/15/27) |
1,987 | 1,890,553 | ||||||
| 4.00%, 02/01/50 (Call 08/01/49) |
2,950 | 2,222,382 | ||||||
| 4.30%, 01/15/26 (Call 10/15/25) |
1,260 | 1,236,079 | ||||||
| 4.50%, 07/30/29 (Call 04/30/29) |
1,441 | 1,381,626 | ||||||
| 4.70%, 07/01/30 (Call 04/01/30) |
1,832 | 1,760,900 | ||||||
| 4.75%, 04/15/35 (Call 01/15/35) |
1,975 | 1,837,534 | ||||||
| 4.85%, 04/15/49 (Call 10/15/48) |
1,263 | 1,103,711 | ||||||
| 4.90%, 12/15/30 (Call 09/15/30) |
2,925 | 2,846,763 | ||||||
| 5.15%, 04/15/53 (Call 10/15/52) |
2,055 | 1,861,829 | ||||||
| 5.25%, 05/15/36 (Call 02/15/36) |
1,140 | 1,094,703 | ||||||
| 5.63%, 05/15/54 (Call 11/15/53) |
1,900 | 1,828,502 | ||||||
| American Assets Trust LP, 3.38%, 02/01/31 |
910 | 736,081 | ||||||
| American Homes 4 Rent LP |
||||||||
| 2.38%, 07/15/31 (Call 04/15/31) |
670 | 539,664 | ||||||
| 3.38%, 07/15/51 (Call 01/15/51) |
2,160 | 1,427,235 | ||||||
| 3.63%, 04/15/32 (Call 01/15/32) |
155 | 135,051 | ||||||
| 4.25%, 02/15/28 (Call 11/15/27) |
2,820 | 2,708,747 | ||||||
| 4.30%, 04/15/52 (Call 10/15/51) |
410 | 320,006 | ||||||
| 4.90%, 02/15/29 (Call 11/15/28) |
1,921 | 1,872,134 | ||||||
| American Tower Corp. |
||||||||
| 1.30%, 09/15/25 (Call 08/15/25) |
2,796 | 2,629,433 | ||||||
| 1.45%, 09/15/26 (Call 08/15/26) |
2,832 | 2,574,263 | ||||||
| 1.50%, 01/31/28 (Call 11/30/27) |
2,663 | 2,312,721 | ||||||
| 1.60%, 04/15/26 (Call 03/15/26) |
3,366 | 3,116,118 | ||||||
| 1.88%, 10/15/30 (Call 07/15/30) |
3,491 | 2,803,675 | ||||||
| 2.10%, 06/15/30 (Call 03/15/30) |
2,202 | 1,812,437 | ||||||
| 2.30%, 09/15/31 (Call 06/15/31) |
3,815 | 3,079,102 | ||||||
| 2.40%, 03/15/25 (Call 02/15/25) |
1,572 | 1,520,587 | ||||||
| 2.70%, 04/15/31 (Call 01/15/31) |
3,267 | 2,740,294 | ||||||
| 2.75%, 01/15/27 (Call 11/15/26)(b) |
3,143 | 2,927,128 | ||||||
| 2.90%, 01/15/30 (Call 10/15/29) |
3,090 | 2,710,520 | ||||||
| 2.95%, 01/15/51 (Call 07/15/50)(b) |
4,045 | 2,562,437 | ||||||
| 3.10%, 06/15/50 (Call 12/15/49) |
4,310 | 2,816,135 | ||||||
| 3.13%, 01/15/27 (Call 10/15/26)(b) |
1,703 | 1,606,023 | ||||||
| 3.38%, 10/15/26 (Call 07/15/26) |
4,372 | 4,169,150 | ||||||
| 3.55%, 07/15/27 (Call 04/15/27) |
2,661 | 2,522,441 | ||||||
| 3.60%, 01/15/28 (Call 10/15/27) |
3,171 | 2,984,012 | ||||||
| 3.65%, 03/15/27 (Call 02/15/27) |
2,750 | 2,628,112 | ||||||
| S C H E D U L E O F I N V E S T M E N T S |
77 |
| Schedule of Investments (continued) February 29, 2024 |
iShares® Core U.S. Aggregate Bond ETF (Percentages shown are based on Net Assets) |
| Security | Par (000) |
Value | ||||||
| Real Estate Investment Trusts (continued) |
||||||||
| 3.70%, 10/15/49 (Call 04/15/49) |
$ | 2,231 | $ | 1,629,423 | ||||
| 3.80%, 08/15/29 (Call 05/15/29) |
6,226 | 5,762,819 | ||||||
| 3.95%, 03/15/29 (Call 12/15/28)(b) |
3,263 | 3,062,232 | ||||||
| 4.00%, 06/01/25 (Call 03/01/25) |
4,026 | 3,946,682 | ||||||
| 4.05%, 03/15/32 (Call 12/15/31) |
2,490 | 2,264,352 | ||||||
| 4.40%, 02/15/26 (Call 11/15/25) |
2,094 | 2,059,107 | ||||||
| 5.25%, 07/15/28 (Call 06/15/28) |
2,170 | 2,163,268 | ||||||
| 5.50%, 03/15/28 (Call 02/15/28) |
2,610 | 2,620,781 | ||||||
| 5.55%, 07/15/33 (Call 04/15/33) |
2,591 | 2,590,254 | ||||||
| 5.65%, 03/15/33 (Call 12/15/32) |
3,665 | 3,685,485 | ||||||
| 5.80%, 11/15/28 (Call 10/15/28) |
4,170 | 4,251,803 | ||||||
| 5.90%, 11/15/33 (Call 08/15/33) |
3,375 | 3,460,979 | ||||||
| AvalonBay Communities Inc. |
||||||||
| 1.90%, 12/01/28 (Call 10/01/28) |
1,945 | 1,694,090 | ||||||
| 2.05%, 01/15/32 (Call 10/15/31)(b) |
2,965 | 2,419,041 | ||||||
| 2.30%, 03/01/30 (Call 12/01/29) |
3,098 | 2,661,495 | ||||||
| 2.45%, 01/15/31 (Call 10/17/30) |
2,444 | 2,084,130 | ||||||
| 2.90%, 10/15/26 (Call 07/15/26) |
1,692 | 1,598,900 | ||||||
| 2.95%, 05/11/26 (Call 02/11/26) |
2,919 | 2,788,313 | ||||||
| 3.20%, 01/15/28 (Call 10/15/27) |
2,223 | 2,083,012 | ||||||
| 3.30%, 06/01/29 (Call 03/01/29) |
1,848 | 1,703,750 | ||||||
| 3.35%, 05/15/27 (Call 02/15/27) |
1,427 | 1,353,483 | ||||||
| 3.45%, 06/01/25 (Call 03/03/25) |
2,692 | 2,631,674 | ||||||
| 3.50%, 11/15/25 (Call 08/15/25) |
1,730 | 1,681,250 | ||||||
| 3.90%, 10/15/46 (Call 04/15/46) |
1,065 | 831,799 | ||||||
| 4.15%, 07/01/47 (Call 01/01/47)(b) |
980 | 794,976 | ||||||
| 4.35%, 04/15/48 (Call 10/18/47) |
1,395 | 1,177,138 | ||||||
| 5.00%, 02/15/33 (Call 11/15/32) |
1,330 | 1,304,443 | ||||||
| Boston Properties LP |
||||||||
| 2.45%, 10/01/33 (Call 07/01/33) |
5,570 | 4,110,625 | ||||||
| 2.55%, 04/01/32 (Call 01/01/32) |
4,665 | 3,624,938 | ||||||
| 2.75%, 10/01/26 (Call 07/01/26) |
4,471 | 4,139,216 | ||||||
| 2.90%, 03/15/30 (Call 12/15/29) |
3,697 | 3,124,821 | ||||||
| 3.25%, 01/30/31 (Call 10/30/30) |
4,671 | 3,932,570 | ||||||
| 3.40%, 06/21/29 (Call 03/21/29) |
2,460 | 2,170,866 | ||||||
| 3.65%, 02/01/26 (Call 11/03/25) |
4,903 | 4,715,013 | ||||||
| 4.50%, 12/01/28 (Call 09/01/28) |
4,877 | 4,607,868 | ||||||
| 6.50%, 01/15/34 (Call 10/15/33)(b) |
1,165 | 1,191,194 | ||||||
| 6.75%, 12/01/27 (Call 11/01/27) |
1,415 | 1,461,682 | ||||||
| Brixmor Operating Partnership LP |
||||||||
| 2.25%, 04/01/28 (Call 02/01/28) |
858 | 758,912 | ||||||
| 2.50%, 08/16/31 (Call 05/16/31) |
2,505 | 2,034,244 | ||||||
| 3.90%, 03/15/27 (Call 12/15/26) |
956 | 910,763 | ||||||
| 4.05%, 07/01/30 (Call 04/01/30) |
3,572 | 3,280,166 | ||||||
| 4.13%, 06/15/26 (Call 03/15/26) |
2,453 | 2,374,569 | ||||||
| 4.13%, 05/15/29 (Call 02/15/29) |
2,164 | 2,021,771 | ||||||
| Broadstone Net Lease LLC, 2.60%, 09/15/31 |
2,432 | 1,886,729 | ||||||
| Camden Property Trust |
||||||||
| 2.80%, 05/15/30 (Call 02/15/30) |
3,320 | 2,917,424 | ||||||
| 3.15%, 07/01/29 (Call 04/01/29) |
2,632 | 2,394,363 | ||||||
| 3.35%, 11/01/49 (Call 05/01/49) |
1,960 | 1,397,378 | ||||||
| 4.10%, 10/15/28 (Call 07/15/28) |
1,717 | 1,653,521 | ||||||
| 5.85%, 11/03/26 (Call 10/03/26) |
1,160 | 1,183,407 | ||||||
| Corporate Office Properties LP |
||||||||
| 2.00%, 01/15/29 (Call 11/15/28)(b) |
2,029 | 1,679,831 | ||||||
| 2.25%, 03/15/26 (Call 02/15/26) |
1,290 | 1,206,347 | ||||||
| 2.75%, 04/15/31 (Call 01/15/31) |
1,925 | 1,552,696 | ||||||
| 2.90%, 12/01/33 (Call 09/01/33) |
1,870 | 1,429,415 | ||||||
| Crown Castle Inc. |
||||||||
| 1.05%, 07/15/26 (Call 06/15/26) |
4,640 | 4,194,241 | ||||||
| Security | Par (000) |
Value | ||||||
| Real Estate Investment Trusts (continued) |
||||||||
| 1.35%, 07/15/25 (Call 06/15/25) |
$ | 3,095 | $ | 2,928,280 | ||||
| 2.10%, 04/01/31 (Call 01/01/31) |
5,285 | 4,237,428 | ||||||
| 2.25%, 01/15/31 (Call 10/15/30) |
3,687 | 3,013,560 | ||||||
| 2.50%, 07/15/31 (Call 04/15/31) |
1,315 | 1,076,861 | ||||||
| 2.90%, 03/15/27 (Call 02/15/27) |
3,350 | 3,119,600 | ||||||
| 2.90%, 04/01/41 (Call 10/01/40) |
4,855 | 3,370,121 | ||||||
| 3.10%, 11/15/29 (Call 08/15/29) |
1,683 | 1,489,225 | ||||||
| 3.25%, 01/15/51 (Call 07/15/50)(b) |
3,285 | 2,217,017 | ||||||
| 3.30%, 07/01/30 (Call 04/01/30) |
3,765 | 3,325,104 | ||||||
| 3.65%, 09/01/27 (Call 06/01/27) |
4,990 | 4,709,407 | ||||||
| 3.70%, 06/15/26 (Call 03/15/26) |
3,519 | 3,391,083 | ||||||
| 3.80%, 02/15/28 (Call 11/15/27) |
4,521 | 4,257,232 | ||||||
| 4.00%, 03/01/27 (Call 12/01/26) |
2,860 | 2,752,956 | ||||||
| 4.00%, 11/15/49 (Call 05/15/49) |
1,513 | 1,163,889 | ||||||
| 4.15%, 07/01/50 (Call 01/01/50) |
2,073 | 1,639,236 | ||||||
| 4.30%, 02/15/29 (Call 11/15/28) |
3,180 | 3,022,385 | ||||||
| 4.45%, 02/15/26 (Call 11/15/25) |
4,456 | 4,372,515 | ||||||
| 4.75%, 05/15/47 (Call 11/15/46) |
1,443 | 1,219,499 | ||||||
| 4.80%, 09/01/28 (Call 08/01/28) |
2,875 | 2,803,315 | ||||||
| 5.00%, 01/11/28 (Call 12/11/27) |
4,100 | 4,039,893 | ||||||
| 5.10%, 05/01/33 (Call 02/01/33) |
2,785 | 2,688,577 | ||||||
| 5.20%, 02/15/49 (Call 08/15/48) |
1,628 | 1,472,535 | ||||||
| 5.60%, 06/01/29 (Call 05/01/29) |
4,015 | 4,041,636 | ||||||
| 5.80%, 03/01/34 (Call 12/01/33) |
4,480 | 4,544,911 | ||||||
| CubeSmart LP |
||||||||
| 2.00%, 02/15/31 (Call 11/15/30) |
1,825 | 1,465,945 | ||||||
| 2.25%, 12/15/28 (Call 10/15/28) |
2,372 | 2,063,241 | ||||||
| 2.50%, 02/15/32 (Call 11/15/31) |
2,655 | 2,143,861 | ||||||
| 3.00%, 02/15/30 (Call 11/15/29) |
1,010 | 881,623 | ||||||
| 3.13%, 09/01/26 (Call 06/01/26) |
2,922 | 2,763,471 | ||||||
| 4.00%, 11/15/25 (Call 08/15/25) |
1,781 | 1,734,260 | ||||||
| 4.38%, 02/15/29 (Call 11/15/28) |
1,786 | 1,698,464 | ||||||
| Digital Realty Trust LP |
||||||||
| 3.60%, 07/01/29 (Call 04/01/29) |
4,324 | 3,986,618 | ||||||
| 3.70%, 08/15/27 (Call 05/15/27) |
4,825 | 4,598,520 | ||||||
| 4.45%, 07/15/28 (Call 04/15/28) |
2,535 | 2,452,739 | ||||||
| 5.55%, 01/15/28 (Call 12/15/27) |
3,697 | 3,734,429 | ||||||
| EPR Properties |
||||||||
| 3.60%, 11/15/31 (Call 08/15/31) |
35 | 28,618 | ||||||
| 3.75%, 08/15/29 (Call 05/15/29) |
1,500 | 1,310,182 | ||||||
| 4.50%, 04/01/25 (Call 01/01/25) |
1,000 | 982,324 | ||||||
| 4.50%, 06/01/27 (Call 03/01/27) |
1,500 | 1,417,557 | ||||||
| 4.75%, 12/15/26 (Call 09/15/26) |
1,500 | 1,441,794 | ||||||
| 4.95%, 04/15/28 (Call 01/15/28) |
1,000 | 947,805 | ||||||
| Equinix Inc. |
||||||||
| 1.00%, 09/15/25 (Call 08/15/25) |
3,019 | 2,822,374 | ||||||
| 1.25%, 07/15/25 (Call 06/15/25) |
3,370 | 3,179,549 | ||||||
| 1.45%, 05/15/26 (Call 04/15/26) |
3,567 | 3,284,714 | ||||||
| 1.55%, 03/15/28 (Call 01/15/28) |
2,348 | 2,043,730 | ||||||
| 1.80%, 07/15/27 (Call 05/15/27) |
2,783 | 2,501,515 | ||||||
| 2.00%, 05/15/28 (Call 03/15/28) |
2,223 | 1,960,305 | ||||||
| 2.15%, 07/15/30 (Call 04/15/30) |
2,420 | 2,006,573 | ||||||
| 2.50%, 05/15/31 (Call 02/15/31) |
1,235 | 1,031,288 | ||||||
| 2.90%, 11/18/26 (Call 09/18/26) |
2,728 | 2,568,755 | ||||||
| 2.95%, 09/15/51 (Call 03/15/51) |
1,935 | 1,229,732 | ||||||
| 3.00%, 07/15/50 (Call 01/15/50) |
2,179 | 1,412,976 | ||||||
| 3.20%, 11/18/29 (Call 08/18/29) |
6,097 | 5,479,631 | ||||||
| 3.40%, 02/15/52 (Call 08/15/51) |
2,475 | 1,715,204 | ||||||
| 3.90%, 04/15/32 (Call 01/15/32)(b) |
2,360 | 2,141,620 | ||||||
| ERP Operating LP |
||||||||
| 1.85%, 08/01/31 (Call 05/01/31) |
865 | 693,921 | ||||||
| 78 | 2 0 2 4 I S H A R E S A N N U A L R E P O R T T O S H A R E H O L D E R S |
| Schedule of Investments (continued) February 29, 2024 |
iShares® Core U.S. Aggregate Bond ETF (Percentages shown are based on Net Assets) |
| Security | Par (000) |
Value | ||||||
| Real Estate Investment Trusts (continued) |
||||||||
| 2.50%, 02/15/30 (Call 11/15/29) |
$ | 2,508 | $ | 2,177,461 | ||||
| 2.85%, 11/01/26 (Call 08/01/26) |
1,416 | 1,336,103 | ||||||
| 3.00%, 07/01/29 (Call 04/01/29) |
2,623 | 2,376,606 | ||||||
| 3.25%, 08/01/27 (Call 05/01/27) |
1,649 | 1,548,525 | ||||||
| 3.38%, 06/01/25 (Call 03/01/25) |
1,318 | 1,285,267 | ||||||
| 3.50%, 03/01/28 (Call 12/01/27) |
2,898 | 2,736,795 | ||||||
| 4.00%, 08/01/47 (Call 02/01/47)(b) |
1,191 | 916,344 | ||||||
| 4.15%, 12/01/28 (Call 09/01/28) |
2,025 | 1,957,869 | ||||||
| 4.50%, 07/01/44 (Call 01/01/44) |
1,660 | 1,427,333 | ||||||
| 4.50%, 06/01/45 (Call 12/01/44) |
1,620 | 1,351,643 | ||||||
| Essex Portfolio LP |
||||||||
| 1.65%, 01/15/31 (Call 10/15/30) |
1,550 | 1,210,779 | ||||||
| 1.70%, 03/01/28 (Call 01/01/28) |
970 | 843,013 | ||||||
| 2.55%, 06/15/31 (Call 03/15/31) |
1,120 | 922,679 | ||||||
| 2.65%, 03/15/32 (Call 12/15/31) |
3,123 | 2,545,729 | ||||||
| 2.65%, 09/01/50 (Call 03/01/50)(b) |
780 | 452,601 | ||||||
| 3.00%, 01/15/30 (Call 10/15/29) |
2,840 | 2,491,639 | ||||||
| 3.38%, 04/15/26 (Call 01/15/26) |
1,934 | 1,860,994 | ||||||
| 3.50%, 04/01/25 (Call 01/01/25) |
2,151 | 2,104,929 | ||||||
| 3.63%, 05/01/27 (Call 02/01/27) |
2,010 | 1,909,363 | ||||||
| 4.00%, 03/01/29 (Call 12/01/28) |
1,696 | 1,606,194 | ||||||
| 4.50%, 03/15/48 (Call 09/15/47) |
1,865 | 1,559,891 | ||||||
| Extra Space Storage LP |
||||||||
| 2.20%, 10/15/30 (Call 07/15/30) |
1,781 | 1,455,624 | ||||||
| 2.35%, 03/15/32 (Call 12/15/31) |
1,940 | 1,538,078 | ||||||
| 2.40%, 10/15/31 (Call 07/15/31) |
2,610 | 2,108,296 | ||||||
| 2.55%, 06/01/31 (Call 03/01/31) |
1,815 | 1,494,678 | ||||||
| 3.50%, 07/01/26 (Call 04/01/26) |
1,819 | 1,741,619 | ||||||
| 3.88%, 12/15/27 (Call 09/15/27) |
1,151 | 1,092,976 | ||||||
| 3.90%, 04/01/29 (Call 02/01/29) |
450 | 420,046 | ||||||
| 4.00%, 06/15/29 (Call 03/15/29) |
1,863 | 1,748,312 | ||||||
| 5.40%, 02/01/34 (Call 11/01/33) |
1,500 | 1,470,231 | ||||||
| 5.50%, 07/01/30 (Call 05/01/30) |
935 | 939,103 | ||||||
| 5.70%, 04/01/28 (Call 03/01/28) |
1,645 | 1,667,663 | ||||||
| 5.90%, 01/15/31 (Call 11/15/30) |
1,370 | 1,401,297 | ||||||
| Federal Realty OP LP |
||||||||
| 1.25%, 02/15/26 (Call 01/15/26) |
1,479 | 1,363,558 | ||||||
| 3.20%, 06/15/29 (Call 03/15/29) |
1,783 | 1,593,167 | ||||||
| 3.25%, 07/15/27 (Call 04/15/27) |
2,789 | 2,605,368 | ||||||
| 3.50%, 06/01/30 (Call 03/01/30) |
521 | 467,276 | ||||||
| 4.50%, 12/01/44 (Call 06/01/44) |
1,406 | 1,144,204 | ||||||
| 5.38%, 05/01/28 (Call 04/01/28) |
1,645 | 1,639,424 | ||||||
| GLP Capital LP/GLP Financing II Inc. |
||||||||
| 3.25%, 01/15/32 (Call 10/15/31) |
3,475 | 2,883,109 | ||||||
| 4.00%, 01/15/30 (Call 10/15/29) |
3,293 | 2,963,294 | ||||||
| 4.00%, 01/15/31 (Call 10/15/30) |
2,882 | 2,540,929 | ||||||
| 5.25%, 06/01/25 (Call 03/01/25) |
4,515 | 4,478,021 | ||||||
| 5.30%, 01/15/29 (Call 10/15/28) |
3,400 | 3,301,857 | ||||||
| 5.38%, 04/15/26 (Call 01/15/26) |
5,128 | 5,074,908 | ||||||
| 5.75%, 06/01/28 (Call 03/03/28) |
2,199 | 2,183,312 | ||||||
| 6.75%, 12/01/33 (Call 09/01/33)(b) |
1,060 | 1,100,833 | ||||||
| Healthcare Realty Holdings LP |
||||||||
| 2.00%, 03/15/31 (Call 12/15/30) |
2,013 | 1,577,379 | ||||||
| 3.10%, 02/15/30 (Call 11/15/29) |
1,890 | 1,628,600 | ||||||
| 3.50%, 08/01/26 (Call 05/01/26) |
2,797 | 2,668,143 | ||||||
| 3.75%, 07/01/27 (Call 04/01/27) |
2,793 | 2,620,434 | ||||||
| Healthpeak OP LLC |
||||||||
| 1.35%, 02/01/27 (Call 01/01/27)(b) |
1,795 | 1,615,058 | ||||||
| 2.13%, 12/01/28 (Call 10/01/28) |
2,665 | 2,319,634 | ||||||
| 2.88%, 01/15/31 (Call 10/15/30) |
2,258 | 1,920,216 | ||||||
| 3.00%, 01/15/30 (Call 10/15/29) |
3,449 | 3,026,093 | ||||||
| Security | Par (000) |
Value | ||||||
| Real Estate Investment Trusts (continued) |
||||||||
| 3.25%, 07/15/26 (Call 05/15/26) |
$ | 2,712 | $ | 2,590,625 | ||||
| 3.50%, 07/15/29 (Call 04/15/29) |
2,106 | 1,924,185 | ||||||
| 4.00%, 06/01/25 (Call 03/01/25) |
2,611 | 2,561,577 | ||||||
| 5.25%, 12/15/32 (Call 09/15/32)(b) |
3,395 | 3,319,362 | ||||||
| 6.75%, 02/01/41 (Call 08/01/40) |
1,448 | 1,585,981 | ||||||
| Highwoods Realty LP |
||||||||
| 2.60%, 02/01/31 (Call 11/01/30) |
841 | 661,404 | ||||||
| 3.05%, 02/15/30 (Call 11/15/29) |
1,802 | 1,508,574 | ||||||
| 3.88%, 03/01/27 (Call 12/01/26) |
1,470 | 1,379,839 | ||||||
| 4.13%, 03/15/28 (Call 12/15/27) |
1,608 | 1,499,860 | ||||||
| 4.20%, 04/15/29 (Call 01/15/29) |
1,610 | 1,451,202 | ||||||
| 7.65%, 02/01/34 (Call 11/01/33) |
485 | 520,033 | ||||||
| Host Hotels & Resorts LP |
||||||||
| Series E, 4.00%, 06/15/25 (Call 03/15/25) |
3,084 | 3,020,912 | ||||||
| Series F, 4.50%, 02/01/26 (Call 11/01/25) |
626 | 612,737 | ||||||
| Series H, 3.38%, 12/15/29 (Call 09/15/29) |
3,169 | 2,803,706 | ||||||
| Series I, 3.50%, 09/15/30 (Call 06/15/30) |
650 | 573,029 | ||||||
| Series J, 2.90%, 12/15/31 (Call 09/15/31) |
1,735 | 1,432,554 | ||||||
| Invitation Homes Operating Partnership LP |
||||||||
| 2.00%, 08/15/31 (Call 05/15/31) |
1,173 | 916,238 | ||||||
| 2.30%, 11/15/28 (Call 09/15/28) |
2,920 | 2,554,513 | ||||||
| 2.70%, 01/15/34 (Call 10/15/33) |
2,335 | 1,817,199 | ||||||
| 4.15%, 04/15/32 (Call 01/15/32) |
2,010 | 1,816,496 | ||||||
| 5.45%, 08/15/30 (Call 06/15/30) |
1,895 | 1,886,941 | ||||||
| 5.50%, 08/15/33 (Call 05/15/33)(b) |
2,435 | 2,404,948 | ||||||
| Kilroy Realty LP |
||||||||
| 2.50%, 11/15/32 (Call 08/15/32) |
2,673 | 1,980,787 | ||||||
| 2.65%, 11/15/33 (Call 08/15/33) |
2,515 | 1,832,288 | ||||||
| 3.05%, 02/15/30 (Call 11/15/29) |
2,389 | 2,001,037 | ||||||
| 4.25%, 08/15/29 (Call 05/15/29) |
1,833 | 1,672,469 | ||||||
| 4.38%, 10/01/25 (Call 07/01/25) |
2,181 | 2,125,810 | ||||||
| 4.75%, 12/15/28 (Call 09/15/28) |
1,939 | 1,826,128 | ||||||
| Kimco Realty OP LLC |
||||||||
| 1.90%, 03/01/28 (Call 01/01/28) |
963 | 843,665 | ||||||
| 2.25%, 12/01/31 (Call 09/01/31) |
1,166 | 928,347 | ||||||
| 2.70%, 10/01/30 (Call 07/01/30) |
935 | 795,221 | ||||||
| 2.80%, 10/01/26 (Call 07/01/26) |
2,595 | 2,431,419 | ||||||
| 3.20%, 04/01/32 (Call 01/01/32) |
41 | 34,826 | ||||||
| 3.70%, 10/01/49 (Call 04/01/49) |
817 | 587,382 | ||||||
| 3.80%, 04/01/27 (Call 01/01/27) |
2,734 | 2,619,801 | ||||||
| 4.13%, 12/01/46 (Call 06/01/46) |
891 | 678,255 | ||||||
| 4.25%, 04/01/45 (Call 10/01/44)(b) |
1,777 | 1,390,558 | ||||||
| 4.45%, 09/01/47 (Call 03/01/47) |
2,185 | 1,739,760 | ||||||
| 4.60%, 02/01/33 (Call 11/01/32) |
1,905 | 1,785,604 | ||||||
| 6.40%, 03/01/34 (Call 12/01/33) |
1,912 | 2,012,733 | ||||||
| Kite Realty Group LP, 4.00%, 10/01/26 |
||||||||
| (Call 07/01/26)(b) |
2,067 | 1,959,018 | ||||||
| Kite Realty Group Trust |
||||||||
| 4.00%, 03/15/25 (Call 12/15/24) |
1,121 | 1,097,890 | ||||||
| 4.75%, 09/15/30 (Call 06/15/30) |
2,355 | 2,222,119 | ||||||
| LXP Industrial Trust |
||||||||
| 2.38%, 10/01/31 (Call 07/01/31) |
615 | 487,539 | ||||||
| 2.70%, 09/15/30 (Call 06/15/30) |
808 | 666,663 | ||||||
| 6.75%, 11/15/28 (Call 10/15/28) |
295 | 303,795 | ||||||
| Mid-America Apartments LP |
||||||||
| 1.10%, 09/15/26 (Call 08/15/26) |
2,205 | 1,992,939 | ||||||
| 1.70%, 02/15/31 (Call 11/15/30) |
2,681 | 2,137,386 | ||||||
| 2.75%, 03/15/30 (Call 12/15/29) |
1,155 | 1,015,084 | ||||||
| 2.88%, 09/15/51 (Call 03/15/51)(b) |
1,280 | 812,776 | ||||||
| 3.60%, 06/01/27 (Call 03/01/27) |
3,080 | 2,942,784 | ||||||
| 3.95%, 03/15/29 (Call 12/15/28)(b) |
2,220 | 2,118,252 | ||||||
| S C H E D U L E O F I N V E S T M E N T S |
79 |
| Schedule of Investments (continued) February 29, 2024 |
iShares® Core U.S. Aggregate Bond ETF (Percentages shown are based on Net Assets) |
| Security | Par (000) |
Value | ||||||
| Real Estate Investment Trusts (continued) |
||||||||
| 4.00%, 11/15/25 (Call 08/15/25) |
$ | 3,332 | $ | 3,260,538 | ||||
| 4.20%, 06/15/28 (Call 03/15/28) |
1,683 | 1,628,547 | ||||||
| National Health Investors Inc., 3.00%, 02/01/31 |
2,458 | 1,970,363 | ||||||
| NNN REIT Inc. |
||||||||
| 2.50%, 04/15/30 (Call 01/15/30) |
2,312 | 1,956,339 | ||||||
| 3.00%, 04/15/52 (Call 10/15/51)(b) |
1,098 | 699,679 | ||||||
| 3.10%, 04/15/50 (Call 10/15/49) |
2,117 | 1,370,597 | ||||||
| 3.50%, 10/15/27 (Call 07/15/27) |
920 | 865,159 | ||||||
| 3.50%, 04/15/51 (Call 10/15/50) |
2,447 | 1,744,167 | ||||||
| 3.60%, 12/15/26 (Call 09/15/26) |
2,107 | 2,008,875 | ||||||
| 4.00%, 11/15/25 (Call 08/15/25) |
2,443 | 2,382,373 | ||||||
| 4.30%, 10/15/28 (Call 07/15/28) |
1,130 | 1,084,876 | ||||||
| 4.80%, 10/15/48 (Call 04/15/48)(b) |
775 | 665,210 | ||||||
| 5.60%, 10/15/33 (Call 07/15/33) |
1,985 | 1,978,131 | ||||||
| Omega Healthcare Investors Inc. |
||||||||
| 3.25%, 04/15/33 (Call 01/15/33) |
3,513 | 2,792,563 | ||||||
| 3.38%, 02/01/31 (Call 11/01/30) |
2,659 | 2,238,392 | ||||||
| 3.63%, 10/01/29 (Call 07/01/29) |
2,507 | 2,201,623 | ||||||
| 4.50%, 04/01/27 (Call 01/01/27) |
2,210 | 2,125,669 | ||||||
| 4.75%, 01/15/28 (Call 10/15/27) |
2,472 | 2,371,883 | ||||||
| 5.25%, 01/15/26 (Call 10/15/25) |
3,700 | 3,665,641 | ||||||
| Phillips Edison Grocery Center Operating Partnership I LP, 2.63%, 11/15/31 |
2,555 | 2,054,808 | ||||||
| Physicians Realty LP |
||||||||
| 2.63%, 11/01/31 (Call 08/01/31) |
3,123 | 2,543,053 | ||||||
| 3.95%, 01/15/28 (Call 10/15/27) |
2,343 | 2,229,124 | ||||||
| 4.30%, 03/15/27 (Call 12/15/26) |
396 | 384,788 | ||||||
| Piedmont Operating Partnership LP |
||||||||
| 2.75%, 04/01/32 (Call 01/01/32) |
755 | 533,559 | ||||||
| 3.15%, 08/15/30 (Call 05/15/30) |
2,088 | 1,601,978 | ||||||
| 9.25%, 07/20/28 (Call 06/20/28) |
650 | 685,126 | ||||||
| Prologis LP |
||||||||
| 1.25%, 10/15/30 (Call 07/15/30) |
3,088 | 2,448,381 | ||||||
| 1.63%, 03/15/31 (Call 12/15/30) |
2,024 | 1,605,026 | ||||||
| 1.75%, 07/01/30 (Call 04/01/30) |
1,932 | 1,588,203 | ||||||
| 1.75%, 02/01/31 (Call 11/01/30)(b) |
2,110 | 1,708,999 | ||||||
| 2.13%, 04/15/27 (Call 02/15/27) |
2,396 | 2,198,706 | ||||||
| 2.13%, 10/15/50 (Call 04/15/50) |
2,487 | 1,357,936 | ||||||
| 2.25%, 04/15/30 (Call 01/15/30) |
3,502 | 3,002,969 | ||||||
| 2.25%, 01/15/32 (Call 10/15/31) |
2,577 | 2,104,972 | ||||||
| 2.88%, 11/15/29 (Call 08/15/29) |
1,830 | 1,643,237 | ||||||
| 3.00%, 04/15/50 (Call 10/15/49) |
3,988 | 2,696,839 | ||||||
| 3.05%, 03/01/50 (Call 09/01/49) |
2,111 | 1,432,509 | ||||||
| 3.25%, 06/30/26 (Call 03/30/26) |
1,084 | 1,041,208 | ||||||
| 3.25%, 10/01/26 (Call 07/01/26) |
1,780 | 1,699,793 | ||||||
| 3.38%, 12/15/27 (Call 09/15/27) |
2,260 | 2,133,474 | ||||||
| 3.88%, 09/15/28 (Call 06/15/28) |
2,232 | 2,135,437 | ||||||
| 4.00%, 09/15/28 (Call 06/15/28) |
1,741 | 1,675,982 | ||||||
| 4.38%, 02/01/29 (Call 11/01/28) |
1,546 | 1,509,493 | ||||||
| 4.38%, 09/15/48 (Call 03/15/48) |
864 | 734,158 | ||||||
| 4.63%, 01/15/33 (Call 10/15/32) |
2,880 | 2,771,161 | ||||||
| 4.75%, 06/15/33 (Call 03/15/33) |
1,700 | 1,646,620 | ||||||
| 4.88%, 06/15/28 (Call 05/15/28) |
2,435 | 2,431,495 | ||||||
| 5.13%, 01/15/34 (Call 10/15/33) |
2,250 | 2,227,056 | ||||||
| 5.25%, 06/15/53 (Call 12/15/52) |
2,620 | 2,538,847 | ||||||
| Public Storage Operating Co. |
||||||||
| 0.88%, 02/15/26 (Call 01/15/26) |
2,733 | 2,522,075 | ||||||
| 1.50%, 11/09/26 (Call 10/09/26) |
3,822 | 3,490,771 | ||||||
| 1.85%, 05/01/28 (Call 03/01/28) |
2,700 | 2,386,978 | ||||||
| Security | Par (000) |
Value | ||||||
| Real Estate Investment Trusts (continued) |
||||||||
| 1.95%, 11/09/28 (Call 09/09/28)(b) |
$ | 2,685 | $ | 2,358,564 | ||||
| 2.25%, 11/09/31 (Call 08/09/31) |
2,745 | 2,263,318 | ||||||
| 2.30%, 05/01/31 (Call 02/01/31) |
2,740 | 2,298,958 | ||||||
| 3.09%, 09/15/27 (Call 06/15/27) |
2,460 | 2,315,710 | ||||||
| 3.39%, 05/01/29 (Call 02/01/29) |
2,661 | 2,480,244 | ||||||
| 5.10%, 08/01/33 (Call 05/01/33) |
560 | 559,334 | ||||||
| 5.13%, 01/15/29 (Call 12/15/28)(b) |
1,791 | 1,809,413 | ||||||
| 5.35%, 08/01/53 (Call 02/01/53) |
1,379 | 1,371,079 | ||||||
| Rayonier LP, 2.75%, 05/17/31 (Call 02/17/31) |
2,532 | 2,063,718 | ||||||
| Realty Income Corp. |
||||||||
| 0.75%, 03/15/26 (Call 02/15/26) |
1,633 | 1,489,935 | ||||||
| 1.80%, 03/15/33 (Call 12/15/32) |
1,738 | 1,305,120 | ||||||
| 2.20%, 06/15/28 (Call 04/15/28) |
1,520 | 1,349,085 | ||||||
| 2.85%, 12/15/32 (Call 09/15/32) |
956 | 787,050 | ||||||
| 3.00%, 01/15/27 (Call 10/15/26) |
2,789 | 2,629,087 | ||||||
| 3.10%, 12/15/29 (Call 09/15/29) |
1,959 | 1,759,182 | ||||||
| 3.25%, 06/15/29 (Call 03/15/29) |
1,272 | 1,163,781 | ||||||
| 3.25%, 01/15/31 (Call 10/15/30) |
4,599 | 4,068,015 | ||||||
| 3.40%, 01/15/28 (Call 11/15/27) |
1,985 | 1,862,971 | ||||||
| 3.65%, 01/15/28 (Call 10/15/27) |
2,499 | 2,368,843 | ||||||
| 3.88%, 04/15/25 (Call 02/15/25) |
3,097 | 3,044,489 | ||||||
| 3.95%, 08/15/27 (Call 05/15/27) |
3,186 | 3,076,900 | ||||||
| 4.13%, 10/15/26 (Call 07/15/26) |
2,801 | 2,724,926 | ||||||
| 4.63%, 11/01/25 (Call 09/01/25) |
2,827 | 2,793,548 | ||||||
| 4.65%, 03/15/47 (Call 09/15/46) |
2,984 | 2,602,606 | ||||||
| 4.70%, 12/15/28 (Call 11/15/28) |
1,980 | 1,946,702 | ||||||
| 4.75%, 02/15/29 (Call 01/15/29) |
1,745 | 1,707,822 | ||||||
| 4.85%, 03/15/30 (Call 01/15/30) |
1,020 | 999,828 | ||||||
| 4.88%, 06/01/26 (Call 03/01/26) |
2,819 | 2,795,704 | ||||||
| 4.90%, 07/15/33 (Call 04/15/33) |
3,085 | 2,943,339 | ||||||
| 5.05%, 01/13/26 (Call 03/11/24) |
1,370 | 1,363,836 | ||||||
| 5.63%, 10/13/32 (Call 07/13/32) |
2,720 | 2,747,248 | ||||||
| Regency Centers LP |
||||||||
| 2.95%, 09/15/29 (Call 06/15/29) |
1,650 | 1,459,930 | ||||||
| 3.60%, 02/01/27 (Call 11/01/26) |
576 | 550,797 | ||||||
| 3.70%, 06/15/30 (Call 03/15/30) |
923 | 841,007 | ||||||
| 4.13%, 03/15/28 (Call 12/15/27) |
1,591 | 1,519,444 | ||||||
| 4.40%, 02/01/47 (Call 08/01/46) |
1,833 | 1,466,580 | ||||||
| 4.65%, 03/15/49 (Call 09/15/48) |
1,516 | 1,283,301 | ||||||
| Retail Opportunity Investments Partnership LP, |
||||||||
| 6.75%, 10/15/28 (Call 09/15/28) |
105 | 108,615 | ||||||
| Rexford Industrial Realty LP |
||||||||
| 2.13%, 12/01/30 (Call 09/01/30) |
2,128 | 1,723,024 | ||||||
| 2.15%, 09/01/31 (Call 06/01/31) |
2,095 | 1,654,516 | ||||||
| 5.00%, 06/15/28 (Call 05/15/28) |
1,370 | 1,354,940 | ||||||
| Sabra Health Care LP |
||||||||
| 3.20%, 12/01/31 (Call 09/01/31) |
3,847 | 3,124,610 | ||||||
| 3.90%, 10/15/29 (Call 07/15/29) |
2,143 | 1,908,792 | ||||||
| 5.13%, 08/15/26 (Call 05/15/26) |
3,156 | 3,097,297 | ||||||
| Safehold GL Holdings LLC |
||||||||
| 2.80%, 06/15/31 (Call 03/15/31) |
2,615 | 2,125,457 | ||||||
| 2.85%, 01/15/32 (Call 08/15/31)(b) |
855 | 687,794 | ||||||
| 6.10%, 04/01/34 (Call 01/01/34) |
575 | 569,445 | ||||||
| Simon Property Group LP |
||||||||
| 1.38%, 01/15/27 (Call 10/15/26) |
3,724 | 3,377,323 | ||||||
| 1.75%, 02/01/28 (Call 11/01/27) |
2,975 | 2,633,577 | ||||||
| 2.20%, 02/01/31 (Call 11/01/30) |
3,014 | 2,470,787 | ||||||
| 2.25%, 01/15/32 (Call 10/15/31) |
3,545 | 2,850,722 | ||||||
| 2.45%, 09/13/29 (Call 06/13/29) |
6,068 | 5,286,459 | ||||||
| 2.65%, 07/15/30 (Call 04/15/30) |
1,868 | 1,620,950 | ||||||
| 2.65%, 02/01/32 (Call 12/01/31) |
2,385 | 1,981,130 | ||||||
| 80 | 2 0 2 4 I S H A R E S A N N U A L R E P O R T T O S H A R E H O L D E R S |
| Schedule of Investments (continued) February 29, 2024 |
iShares® Core U.S. Aggregate Bond ETF (Percentages shown are based on Net Assets) |
| Security | Par (000) |
Value | ||||||
| Real Estate Investment Trusts (continued) |
||||||||
| 3.25%, 11/30/26 (Call 08/30/26) |
$ | 3,448 | $ | 3,286,696 | ||||
| 3.25%, 09/13/49 (Call 03/13/49) |
5,283 | 3,673,556 | ||||||
| 3.30%, 01/15/26 (Call 10/15/25) |
4,367 | 4,213,736 | ||||||
| 3.38%, 06/15/27 (Call 03/15/27) |
2,052 | 1,947,539 | ||||||
| 3.38%, 12/01/27 (Call 09/01/27) |
4,303 | 4,058,626 | ||||||
| 3.50%, 09/01/25 (Call 06/01/25) |
5,551 | 5,415,817 | ||||||
| 3.80%, 07/15/50 (Call 01/15/50) |
3,210 | 2,425,843 | ||||||
| 4.25%, 10/01/44 (Call 04/01/44) |
1,610 | 1,315,713 | ||||||
| 4.25%, 11/30/46 (Call 05/30/46) |
2,417 | 1,961,443 | ||||||
| 4.75%, 03/15/42 (Call 09/15/41) |
2,416 | 2,155,673 | ||||||
| 5.50%, 03/08/33 (Call 12/08/32)(b) |
3,255 | 3,282,744 | ||||||
| 5.85%, 03/08/53 (Call 09/03/52) |
2,695 | 2,736,735 | ||||||
| 6.25%, 01/15/34 (Call 10/15/33) |
865 | 910,698 | ||||||
| 6.65%, 01/15/54 (Call 07/15/53) |
1,185 | 1,332,324 | ||||||
| 6.75%, 02/01/40 (Call 11/01/39) |
2,298 | 2,528,554 | ||||||
| SITE Centers Corp. |
||||||||
| 4.25%, 02/01/26 (Call 11/01/25)(b) |
2,154 | 2,102,005 | ||||||
| 4.70%, 06/01/27 (Call 03/01/27) |
2,399 | 2,357,701 | ||||||
| Sixth Street Specialty Lending Inc., 6.95%, 08/14/28 |
305 | 310,540 | ||||||
| Store Capital LLC |
||||||||
| 2.70%, 12/01/31 (Call 09/01/31) |
2,430 | 1,890,643 | ||||||
| 2.75%, 11/18/30 (Call 08/18/30) |
1,154 | 913,502 | ||||||
| 4.50%, 03/15/28 (Call 12/15/27) |
1,852 | 1,740,069 | ||||||
| 4.63%, 03/15/29 (Call 12/15/28) |
2,191 | 2,044,034 | ||||||
| Sun Communities Operating LP |
||||||||
| 2.30%, 11/01/28 (Call 09/01/28) |
1,043 | 905,119 | ||||||
| 2.70%, 07/15/31 (Call 04/15/31) |
3,312 | 2,701,196 | ||||||
| 4.20%, 04/15/32 (Call 01/15/32) |
1,700 | 1,508,678 | ||||||
| 5.70%, 01/15/33 (Call 10/15/32) |
2,375 | 2,337,866 | ||||||
| Tanger Properties LP |
||||||||
| 2.75%, 09/01/31 (Call 06/01/31) |
1,635 | 1,318,716 | ||||||
| 3.13%, 09/01/26 (Call 06/01/26)(b) |
1,508 | 1,407,780 | ||||||
| 3.88%, 07/15/27 (Call 04/15/27)(b) |
1,661 | 1,521,185 | ||||||
| UDR Inc. |
||||||||
| 1.90%, 03/15/33 (Call 12/15/32) |
2,035 | 1,519,159 | ||||||
| 2.10%, 08/01/32 (Call 05/01/32) |
1,485 | 1,148,096 | ||||||
| 2.10%, 06/15/33 (Call 03/15/33)(b) |
980 | 738,705 | ||||||
| 2.95%, 09/01/26 (Call 06/01/26) |
1,495 | 1,409,594 | ||||||
| 3.00%, 08/15/31 (Call 05/15/31) |
2,408 | 2,065,827 | ||||||
| 3.10%, 11/01/34 (Call 08/01/34) |
1,208 | 971,667 | ||||||
| 3.20%, 01/15/30 (Call 10/15/29) |
2,493 | 2,230,214 | ||||||
| 3.50%, 07/01/27 (Call 04/01/27) |
1,368 | 1,285,883 | ||||||
| 3.50%, 01/15/28 (Call 10/15/27) |
1,050 | 979,135 | ||||||
| 4.40%, 01/26/29 (Call 10/26/28) |
1,860 | 1,780,297 | ||||||
| Ventas Realty LP |
||||||||
| 2.50%, 09/01/31 (Call 06/01/31) |
2,460 | 2,001,924 | ||||||
| 3.00%, 01/15/30 (Call 10/15/29) |
2,160 | 1,885,310 | ||||||
| 3.25%, 10/15/26 (Call 07/15/26) |
1,224 | 1,155,574 | ||||||
| 3.85%, 04/01/27 (Call 01/01/27) |
1,700 | 1,620,535 | ||||||
| 4.00%, 03/01/28 (Call 12/01/27) |
1,418 | 1,349,394 | ||||||
| 4.13%, 01/15/26 (Call 10/15/25) |
3,189 | 3,104,410 | ||||||
| 4.38%, 02/01/45 (Call 08/01/44) |
598 | 473,480 | ||||||
| 4.40%, 01/15/29 (Call 10/15/28) |
2,134 | 2,043,153 | ||||||
| 4.75%, 11/15/30 (Call 08/15/30) |
1,115 | 1,066,595 | ||||||
| 4.88%, 04/15/49 (Call 10/15/48) |
1,347 | 1,139,658 | ||||||
| 5.70%, 09/30/43 (Call 03/30/43) |
1,550 | 1,464,179 | ||||||
| VICI Properties LP |
||||||||
| 4.38%, 05/15/25 |
3,490 | 3,432,671 | ||||||
| 4.75%, 02/15/28 (Call 01/15/28) |
5,925 | 5,740,222 | ||||||
| 4.95%, 02/15/30 (Call 12/15/29) |
4,800 | 4,581,341 | ||||||
| Security | Par (000) |
Value | ||||||
| Real Estate Investment Trusts (continued) |
||||||||
| 5.13%, 05/15/32 (Call 02/15/32) |
$ | 6,210 | $ | 5,832,304 | ||||
| 5.63%, 05/15/52 (Call 11/15/51) |
3,748 | 3,378,896 | ||||||
| Welltower OP LLC |
||||||||
| 2.05%, 01/15/29 (Call 11/15/28) |
2,283 | 1,977,417 | ||||||
| 2.70%, 02/15/27 (Call 12/15/26) |
2,939 | 2,744,639 | ||||||
| 2.75%, 01/15/31 (Call 10/15/30) |
1,541 | 1,313,578 | ||||||
| 2.75%, 01/15/32 (Call 10/15/31) |
2,505 | 2,082,639 | ||||||
| 2.80%, 06/01/31 (Call 03/01/31) |
3,730 | 3,164,626 | ||||||
| 3.10%, 01/15/30 (Call 10/15/29) |
3,660 | 3,263,720 | ||||||
| 3.85%, 06/15/32 (Call 03/15/32)(b) |
1,770 | 1,586,802 | ||||||
| 4.00%, 06/01/25 (Call 03/01/25) |
5,963 | 5,853,391 | ||||||
| 4.13%, 03/15/29 (Call 12/15/28) |
2,611 | 2,482,273 | ||||||
| 4.25%, 04/01/26 (Call 01/01/26) |
4,347 | 4,262,098 | ||||||
| 4.25%, 04/15/28 (Call 01/15/28) |
3,573 | 3,455,924 | ||||||
| 4.95%, 09/01/48 (Call 03/01/48) |
745 | 669,898 | ||||||
| 6.50%, 03/15/41 (Call 09/15/40) |
2,417 | 2,611,726 | ||||||
| Weyerhaeuser Co. |
||||||||
| 3.38%, 03/09/33 (Call 12/09/32) |
790 | 682,496 | ||||||
| 4.00%, 11/15/29 (Call 08/15/29) |
3,124 | 2,933,783 | ||||||
| 4.00%, 04/15/30 (Call 01/15/30) |
3,470 | 3,242,889 | ||||||
| 4.00%, 03/09/52 (Call 09/09/51) |
664 | 520,497 | ||||||
| 4.75%, 05/15/26 |
2,997 | 2,961,249 | ||||||
| 6.95%, 10/01/27 |
2,179 | 2,310,465 | ||||||
| 7.38%, 03/15/32 |
3,058 | 3,452,657 | ||||||
| WP Carey Inc. |
||||||||
| 2.25%, 04/01/33 (Call 01/01/33) |
1,420 | 1,078,175 | ||||||
| 2.40%, 02/01/31 (Call 11/01/30) |
1,993 | 1,639,579 | ||||||
| 2.45%, 02/01/32 (Call 11/01/31) |
2,460 | 1,958,098 | ||||||
| 3.85%, 07/15/29 (Call 04/15/29) |
2,091 | 1,934,545 | ||||||
| 4.25%, 10/01/26 (Call 07/01/26) |
1,535 | 1,494,022 | ||||||
|
|
|
|||||||
| 941,459,918 | ||||||||
| Retail — 0.7% | ||||||||
| AutoNation Inc. |
||||||||
| 1.95%, 08/01/28 (Call 06/01/28) |
1,127 | 963,216 | ||||||
| 2.40%, 08/01/31 (Call 05/01/31) |
2,625 | 2,078,434 | ||||||
| 3.80%, 11/15/27 (Call 08/15/27) |
2,197 | 2,044,067 | ||||||
| 3.85%, 03/01/32 (Call 12/01/31) |
2,400 | 2,094,542 | ||||||
| 4.50%, 10/01/25 (Call 07/01/25) |
2,189 | 2,148,867 | ||||||
| 4.75%, 06/01/30 (Call 03/01/30) |
2,953 | 2,807,502 | ||||||
| AutoZone Inc. |
||||||||
| 1.65%, 01/15/31 (Call 10/15/30) |
806 | 641,171 | ||||||
| 3.13%, 04/21/26 (Call 01/21/26) |
3,393 | 3,250,144 | ||||||
| 3.25%, 04/15/25 (Call 01/15/25) |
3,493 | 3,408,990 | ||||||
| 3.63%, 04/15/25 (Call 03/15/25) |
965 | 947,383 | ||||||
| 3.75%, 06/01/27 (Call 03/01/27) |
2,529 | 2,428,846 | ||||||
| 3.75%, 04/18/29 (Call 01/18/29) |
2,940 | 2,759,846 | ||||||
| 4.00%, 04/15/30 (Call 01/15/30) |
3,125 | 2,937,389 | ||||||
| 4.50%, 02/01/28 (Call 01/01/28) |
2,960 | 2,899,532 | ||||||
| 4.75%, 08/01/32 (Call 05/01/32) |
3,280 | 3,151,715 | ||||||
| 4.75%, 02/01/33 (Call 11/01/32) |
2,705 | 2,591,066 | ||||||
| 5.05%, 07/15/26 |
1,340 | 1,336,728 | ||||||
| 5.20%, 08/01/33 (Call 05/01/33)(b) |
1,165 | 1,154,538 | ||||||
| 6.25%, 11/01/28 (Call 10/01/28)(b) |
2,225 | 2,314,804 | ||||||
| 6.55%, 11/01/33 (Call 08/01/33) |
1,625 | 1,753,924 | ||||||
| Best Buy Co. Inc. |
||||||||
| 1.95%, 10/01/30 (Call 07/01/30) |
3,694 | 3,033,950 | ||||||
| 4.45%, 10/01/28 (Call 07/01/28)(b) |
3,549 | 3,475,621 | ||||||
| Costco Wholesale Corp. |
||||||||
| 1.38%, 06/20/27 (Call 04/20/27) |
5,416 | 4,867,799 | ||||||
| 1.60%, 04/20/30 (Call 01/20/30) |
6,799 | 5,661,778 | ||||||
| 1.75%, 04/20/32 (Call 01/20/32) |
4,885 | 3,905,765 | ||||||
| S C H E D U L E O F I N V E S T M E N T S |
81 |
| Schedule of Investments (continued) February 29, 2024 |
iShares® Core U.S. Aggregate Bond ETF (Percentages shown are based on Net Assets) |
| Security | Par (000) |
Value | ||||||
| Retail (continued) |
||||||||
| 3.00%, 05/18/27 (Call 02/18/27) |
$ | 5,932 | $ | 5,658,678 | ||||
| Darden Restaurants Inc. |
||||||||
| 3.85%, 05/01/27 (Call 02/01/27) |
3,729 | 3,580,975 | ||||||
| 4.55%, 02/15/48 (Call 08/15/47) |
2,015 | 1,635,617 | ||||||
| 6.30%, 10/10/33 (Call 07/10/33) |
910 | 949,565 | ||||||
| Dick’s Sporting Goods Inc. |
||||||||
| 3.15%, 01/15/32 (Call 10/15/31)(b) |
3,080 | 2,580,369 | ||||||
| 4.10%, 01/15/52 (Call 07/15/51) |
4,030 | 2,831,129 | ||||||
| Dollar General Corp. |
||||||||
| 3.50%, 04/03/30 (Call 01/03/30) |
2,348 | 2,123,312 | ||||||
| 3.88%, 04/15/27 (Call 01/15/27) |
3,536 | 3,397,951 | ||||||
| 4.13%, 05/01/28 (Call 02/01/28) |
2,477 | 2,393,035 | ||||||
| 4.13%, 04/03/50 (Call 10/03/49) |
3,170 | 2,421,892 | ||||||
| 4.15%, 11/01/25 (Call 08/01/25) |
2,307 | 2,259,673 | ||||||
| 4.63%, 11/01/27 (Call 10/01/27) |
2,632 | 2,580,190 | ||||||
| 5.00%, 11/01/32 (Call 08/01/32)(b) |
4,055 | 3,937,342 | ||||||
| 5.20%, 07/05/28 (Call 06/05/28)(b) |
1,435 | 1,433,363 | ||||||
| 5.45%, 07/05/33 (Call 04/05/33)(b) |
2,145 | 2,128,548 | ||||||
| 5.50%, 11/01/52 (Call 05/01/52)(b) |
1,171 | 1,103,492 | ||||||
| Dollar Tree Inc. |
||||||||
| 2.65%, 12/01/31 (Call 09/01/31) |
3,815 | 3,175,908 | ||||||
| 3.38%, 12/01/51 (Call 06/01/51) |
2,845 | 1,879,946 | ||||||
| 4.00%, 05/15/25 (Call 03/15/25) |
4,760 | 4,676,562 | ||||||
| 4.20%, 05/15/28 (Call 02/15/28) |
5,918 | 5,701,630 | ||||||
| Genuine Parts Co. |
||||||||
| 1.88%, 11/01/30 (Call 08/01/30) |
3,190 | 2,560,036 | ||||||
| 2.75%, 02/01/32 (Call 11/01/31) |
800 | 657,462 | ||||||
| 6.50%, 11/01/28 (Call 10/01/28) |
1,705 | 1,787,761 | ||||||
| 6.88%, 11/01/33 (Call 08/01/33) |
1,875 | 2,048,028 | ||||||
| Home Depot Inc. (The) |
||||||||
| 0.90%, 03/15/28 (Call 01/15/28) |
3,592 | 3,097,721 | ||||||
| 1.38%, 03/15/31 (Call 12/15/30) |
7,340 | 5,806,807 | ||||||
| 1.50%, 09/15/28 (Call 07/15/28) |
2,070 | 1,803,319 | ||||||
| 1.88%, 09/15/31 (Call 06/15/31) |
2,760 | 2,236,179 | ||||||
| 2.13%, 09/15/26 (Call 06/15/26) |
4,435 | 4,144,466 | ||||||
| 2.38%, 03/15/51 (Call 09/15/50) |
5,525 | 3,245,497 | ||||||
| 2.50%, 04/15/27 (Call 02/15/27) |
4,874 | 4,539,742 | ||||||
| 2.70%, 04/15/25 (Call 03/15/25) |
1,955 | 1,904,743 | ||||||
| 2.70%, 04/15/30 (Call 01/15/30) |
6,921 | 6,122,492 | ||||||
| 2.75%, 09/15/51 (Call 03/15/51) |
2,810 | 1,789,460 | ||||||
| 2.80%, 09/14/27 (Call 06/14/27) |
4,374 | 4,098,572 | ||||||
| 2.88%, 04/15/27 (Call 03/15/27) |
2,880 | 2,717,487 | ||||||
| 2.95%, 06/15/29 (Call 03/15/29) |
3,956 | 3,610,979 | ||||||
| 3.00%, 04/01/26 (Call 01/01/26) |
5,802 | 5,589,252 | ||||||
| 3.13%, 12/15/49 (Call 06/15/49) |
5,754 | 4,003,979 | ||||||
| 3.25%, 04/15/32 (Call 01/15/32) |
6,175 | 5,476,585 | ||||||
| 3.30%, 04/15/40 (Call 10/15/39) |
3,957 | 3,101,085 | ||||||
| 3.35%, 09/15/25 (Call 06/15/25) |
2,965 | 2,892,482 | ||||||
| 3.35%, 04/15/50 (Call 10/15/49) |
5,846 | 4,236,940 | ||||||
| 3.50%, 09/15/56 (Call 03/15/56) |
3,535 | 2,588,948 | ||||||
| 3.63%, 04/15/52 (Call 10/15/51) |
6,275 | 4,743,111 | ||||||
| 3.90%, 12/06/28 (Call 09/06/28) |
5,418 | 5,242,776 | ||||||
| 3.90%, 06/15/47 (Call 12/15/46) |
5,161 | 4,157,177 | ||||||
| 4.00%, 09/15/25 (Call 08/15/25) |
1,865 | 1,835,655 | ||||||
| 4.20%, 04/01/43 (Call 10/01/42) |
4,694 | 4,043,168 | ||||||
| 4.25%, 04/01/46 (Call 10/01/45) |
6,620 | 5,651,119 | ||||||
| 4.40%, 03/15/45 (Call 09/15/44) |
3,447 | 3,025,169 | ||||||
| 4.50%, 09/15/32 (Call 06/15/32) |
2,360 | 2,306,433 | ||||||
| 4.50%, 12/06/48 (Call 06/06/48) |
6,463 | 5,702,816 | ||||||
| 4.88%, 02/15/44 (Call 08/15/43) |
4,425 | 4,151,136 | ||||||
| 4.90%, 04/15/29 (Call 03/15/29)(b) |
2,060 | 2,067,374 | ||||||
| Security | Par (000) | Value | ||||||
| Retail (continued) |
||||||||
| 4.95%, 09/30/26 (Call 08/30/26) |
$ | 2,360 | $ | 2,361,093 | ||||
| 4.95%, 09/15/52 (Call 03/15/52)(b) |
2,190 | 2,072,308 | ||||||
| 5.40%, 09/15/40 (Call 03/15/40) |
2,803 | 2,819,387 | ||||||
| 5.88%, 12/16/36 |
12,188 | 12,983,057 | ||||||
| 5.95%, 04/01/41 (Call 10/01/40) |
4,435 | 4,731,731 | ||||||
| Lowe’s Companies Inc. |
||||||||
| 1.30%, 04/15/28 (Call 02/15/28) |
5,592 | 4,845,928 | ||||||
| 1.70%, 09/15/28 (Call 07/15/28) |
4,578 | 3,977,829 | ||||||
| 1.70%, 10/15/30 (Call 07/15/30) |
4,788 | 3,882,162 | ||||||
| 2.50%, 04/15/26 (Call 01/15/26) |
4,067 | 3,860,721 | ||||||
| 2.63%, 04/01/31 (Call 01/01/31) |
6,397 | 5,454,868 | ||||||
| 2.80%, 09/15/41 (Call 03/15/41) |
4,451 | 3,106,795 | ||||||
| 3.00%, 10/15/50 (Call 04/15/50) |
5,463 | 3,524,397 | ||||||
| 3.10%, 05/03/27 (Call 02/03/27) |
5,601 | 5,293,106 | ||||||
| 3.35%, 04/01/27 (Call 03/01/27) |
2,763 | 2,632,536 | ||||||
| 3.38%, 09/15/25 (Call 06/15/25) |
4,982 | 4,846,504 | ||||||
| 3.50%, 04/01/51 (Call 10/01/50) |
3,892 | 2,745,209 | ||||||
| 3.65%, 04/05/29 (Call 01/05/29) |
5,283 | 4,981,035 | ||||||
| 3.70%, 04/15/46 (Call 10/15/45) |
7,346 | 5,529,663 | ||||||
| 3.75%, 04/01/32 (Call 01/01/32) |
5,890 | 5,345,247 | ||||||
| 4.00%, 04/15/25 (Call 03/15/25) |
3,817 | 3,761,873 | ||||||
| 4.05%, 05/03/47 (Call 11/03/46) |
6,274 | 4,970,327 | ||||||
| 4.25%, 04/01/52 (Call 10/01/51) |
4,950 | 3,980,373 | ||||||
| 4.38%, 09/15/45 (Call 03/15/45) |
2,315 | 1,962,190 | ||||||
| 4.40%, 09/08/25 |
2,745 | 2,711,582 | ||||||
| 4.45%, 04/01/62 (Call 10/01/61) |
3,240 | 2,590,241 | ||||||
| 4.50%, 04/15/30 (Call 01/15/30) |
5,139 | 4,992,542 | ||||||
| 4.55%, 04/05/49 (Call 10/05/48) |
1,918 | 1,621,719 | ||||||
| 4.65%, 04/15/42 (Call 10/15/41) |
2,380 | 2,128,624 | ||||||
| 4.80%, 04/01/26 (Call 03/01/26) |
2,865 | 2,846,115 | ||||||
| 5.00%, 04/15/33 (Call 01/15/33) |
3,840 | 3,784,203 | ||||||
| 5.00%, 04/15/40 (Call 10/15/39) |
2,471 | 2,347,801 | ||||||
| 5.13%, 04/15/50 (Call 10/15/49) |
1,180 | 1,088,390 | ||||||
| 5.15%, 07/01/33 (Call 04/01/33)(b) |
3,895 | 3,876,329 | ||||||
| 5.50%, 10/15/35 |
593 | 609,895 | ||||||
| 5.63%, 04/15/53 (Call 10/15/52) |
5,210 | 5,176,796 | ||||||
| 5.75%, 07/01/53 (Call 01/01/53) |
1,265 | 1,277,504 | ||||||
| 5.80%, 09/15/62 (Call 03/15/62) |
3,625 | 3,618,701 | ||||||
| 5.85%, 04/01/63 (Call 10/01/62) |
3,475 | 3,506,037 | ||||||
| 6.50%, 03/15/29 |
3,245 | 3,471,007 | ||||||
| McDonald’s Corp. |
||||||||
| 1.45%, 09/01/25 (Call 08/01/25) |
2,160 | 2,044,612 | ||||||
| 2.13%, 03/01/30 (Call 12/01/29) |
3,700 | 3,165,906 | ||||||
| 2.63%, 09/01/29 (Call 06/01/29) |
5,073 | 4,537,872 | ||||||
| 3.30%, 07/01/25 (Call 06/01/25) |
4,711 | 4,599,234 | ||||||
| 3.38%, 05/26/25 (Call 02/26/25) |
2,590 | 2,531,607 | ||||||
| 3.50%, 03/01/27 (Call 12/01/26)(b) |
4,299 | 4,139,087 | ||||||
| 3.50%, 07/01/27 (Call 05/01/27) |
4,748 | 4,543,434 | ||||||
| 3.60%, 07/01/30 (Call 04/01/30) |
4,080 | 3,778,309 | ||||||
| 3.63%, 05/01/43 |
1,981 | 1,560,126 | ||||||
| 3.63%, 09/01/49 (Call 03/01/49) |
7,197 | 5,372,783 | ||||||
| 3.70%, 01/30/26 (Call 10/30/25) |
5,835 | 5,702,465 | ||||||
| 3.70%, 02/15/42 |
2,596 | 2,086,627 | ||||||
| 3.80%, 04/01/28 (Call 01/01/28) |
5,761 | 5,530,317 | ||||||
| 4.20%, 04/01/50 (Call 10/01/49) |
3,431 | 2,826,698 | ||||||
| 4.45%, 03/01/47 (Call 09/01/46) |
4,435 | 3,810,527 | ||||||
| 4.45%, 09/01/48 (Call 03/01/48) |
3,200 | 2,764,709 | ||||||
| 4.60%, 09/09/32 (Call 06/09/32) |
425 | 414,923 | ||||||
| 4.60%, 05/26/45 (Call 11/26/44) |
2,704 | 2,405,988 | ||||||
| 4.70%, 12/09/35 (Call 06/09/35) |
3,776 | 3,626,682 | ||||||
| 4.80%, 08/14/28 (Call 07/14/28) |
1,970 | 1,964,184 | ||||||
| 82 | 2 0 2 4 I S H A R E S A N N U A L R E P O R T T O S H A R E H O L D E R S |
| Schedule of Investments (continued) February 29, 2024 |
iShares® Core U.S. Aggregate Bond ETF (Percentages shown are based on Net Assets) |
| Security | Par (000) |
Value | ||||||
| Retail (continued) |
||||||||
| 4.88%, 07/15/40 |
$ | 1,647 | $ | 1,570,724 | ||||
| 4.88%, 12/09/45 (Call 06/09/45) |
6,700 | 6,156,942 | ||||||
| 4.95%, 08/14/33 (Call 05/14/33) |
2,905 | 2,878,452 | ||||||
| 5.15%, 09/09/52 (Call 03/09/52) |
1,145 | 1,087,375 | ||||||
| 5.45%, 08/14/53 (Call 02/14/53)(b) |
3,435 | 3,410,879 | ||||||
| 5.70%, 02/01/39 |
2,044 | 2,104,183 | ||||||
| 6.30%, 10/15/37 |
4,008 | 4,364,840 | ||||||
| 6.30%, 03/01/38 |
3,143 | 3,419,772 | ||||||
| O’Reilly Automotive Inc. |
||||||||
| 1.75%, 03/15/31 (Call 12/15/30) |
1,285 | 1,030,120 | ||||||
| 3.55%, 03/15/26 (Call 12/15/25) |
3,108 | 3,007,322 | ||||||
| 3.60%, 09/01/27 (Call 06/01/27) |
3,501 | 3,335,183 | ||||||
| 3.90%, 06/01/29 (Call 03/01/29) |
2,597 | 2,463,237 | ||||||
| 4.20%, 04/01/30 (Call 01/01/30) |
3,131 | 2,971,999 | ||||||
| 4.35%, 06/01/28 (Call 03/01/28) |
1,950 | 1,899,977 | ||||||
| 4.70%, 06/15/32 (Call 03/15/32) |
4,350 | 4,206,654 | ||||||
| 5.75%, 11/20/26 (Call 10/20/26) |
1,740 | 1,764,828 | ||||||
| Ross Stores Inc. |
||||||||
| 0.88%, 04/15/26 (Call 03/15/26) |
3,765 | 3,443,418 | ||||||
| 1.88%, 04/15/31 (Call 01/15/31) |
1,785 | 1,449,846 | ||||||
| 4.60%, 04/15/25 (Call 03/15/25) |
3,019 | 2,989,903 | ||||||
| Starbucks Corp. |
||||||||
| 2.00%, 03/12/27 (Call 01/12/27) |
3,086 | 2,827,664 | ||||||
| 2.25%, 03/12/30 (Call 12/12/29) |
3,850 | 3,292,355 | ||||||
| 2.45%, 06/15/26 (Call 03/15/26) |
2,096 | 1,978,842 | ||||||
| 2.55%, 11/15/30 (Call 08/15/30) |
5,231 | 4,490,399 | ||||||
| 3.00%, 02/14/32 (Call 11/14/31) |
4,495 | 3,894,302 | ||||||
| 3.35%, 03/12/50 (Call 09/12/49) |
2,253 | 1,590,146 | ||||||
| 3.50%, 03/01/28 (Call 12/01/27) |
2,676 | 2,536,895 | ||||||
| 3.50%, 11/15/50 (Call 05/15/50) |
4,255 | 3,106,805 | ||||||
| 3.55%, 08/15/29 (Call 05/15/29) |
3,780 | 3,543,588 | ||||||
| 3.75%, 12/01/47 (Call 06/01/47) |
3,469 | 2,675,977 | ||||||
| 3.80%, 08/15/25 (Call 06/15/25) |
4,556 | 4,461,657 | ||||||
| 4.00%, 11/15/28 (Call 08/15/28) |
3,750 | 3,622,114 | ||||||
| 4.30%, 06/15/45 (Call 12/15/44) |
2,716 | 2,318,150 | ||||||
| 4.45%, 08/15/49 (Call 02/15/49) |
2,329 | 1,992,639 | ||||||
| 4.50%, 11/15/48 (Call 05/15/48) |
5,295 | 4,576,114 | ||||||
| 4.75%, 02/15/26 (Call 01/15/26) |
2,645 | 2,627,618 | ||||||
| 4.80%, 02/15/33 (Call 11/15/32)(b) |
2,205 | 2,174,093 | ||||||
| 4.85%, 02/08/27 (Call 01/08/27) |
1,605 | 1,596,539 | ||||||
| 4.90%, 02/15/31 (Call 12/15/30) |
1,325 | 1,309,135 | ||||||
| 5.00%, 02/15/34 (Call 11/15/33) |
1,325 | 1,303,940 | ||||||
| Target Corp. |
||||||||
| 1.95%, 01/15/27 (Call 12/15/26)(b) |
4,697 | 4,341,741 | ||||||
| 2.25%, 04/15/25 (Call 03/15/25) |
8,263 | 8,005,697 | ||||||
| 2.35%, 02/15/30 (Call 11/15/29) |
3,736 | 3,258,865 | ||||||
| 2.50%, 04/15/26 |
5,056 | 4,828,983 | ||||||
| 2.65%, 09/15/30 (Call 06/15/30) |
2,654 | 2,327,733 | ||||||
| 2.95%, 01/15/52 (Call 07/15/51) |
4,720 | 3,133,322 | ||||||
| 3.38%, 04/15/29 (Call 01/15/29) |
4,643 | 4,351,548 | ||||||
| 3.63%, 04/15/46 |
3,698 | 2,884,459 | ||||||
| 3.90%, 11/15/47 (Call 05/15/47) |
3,042 | 2,480,241 | ||||||
| 4.00%, 07/01/42 |
2,616 | 2,251,139 | ||||||
| 4.40%, 01/15/33 (Call 10/15/32) |
2,215 | 2,137,557 | ||||||
| 4.50%, 09/15/32 (Call 06/15/32) |
4,385 | 4,243,702 | ||||||
| 4.80%, 01/15/53 (Call 07/15/52)(b) |
5,166 | 4,767,417 | ||||||
| 6.35%, 11/01/32 |
581 | 635,355 | ||||||
| 6.50%, 10/15/37 |
1,498 | 1,673,521 | ||||||
| 7.00%, 01/15/38 |
1,279 | 1,493,656 | ||||||
| TJX Companies Inc. (The) 1.15%, 05/15/28 |
976 | 841,199 | ||||||
| Security | Par (000) |
Value | ||||||
| Retail (continued) |
||||||||
| 1.60%, 05/15/31 (Call 02/15/31) |
$ | 375 | $ | 302,226 | ||||
| 2.25%, 09/15/26 (Call 06/15/26) |
6,565 | 6,166,921 | ||||||
| 3.88%, 04/15/30 (Call 01/15/30) |
3,400 | 3,223,602 | ||||||
| 4.50%, 04/15/50 (Call 10/15/49) |
2,675 | 2,437,054 | ||||||
| Tractor Supply Co. |
||||||||
| 1.75%, 11/01/30 (Call 08/01/30) |
3,065 | 2,467,918 | ||||||
| 5.25%, 05/15/33 (Call 02/15/33) |
1,030 | 1,023,605 | ||||||
| Walmart Inc. |
||||||||
| 2.38%, 09/24/29 (Call 06/24/29) |
1,162 | 1,036,830 | ||||||
| 2.50%, 09/22/41 (Call 03/22/41) |
6,086 | 4,291,990 | ||||||
| 2.65%, 09/22/51 (Call 03/22/51) |
7,225 | 4,711,182 | ||||||
| 2.95%, 09/24/49 (Call 03/24/49) |
1,638 | 1,143,182 | ||||||
| 3.05%, 07/08/26 (Call 05/08/26) |
1,100 | 1,058,292 | ||||||
| 3.25%, 07/08/29 (Call 04/08/29)(b) |
2,623 | 2,467,632 | ||||||
| 3.55%, 06/26/25 (Call 04/26/25) |
1,260 | 1,239,774 | ||||||
| 3.63%, 12/15/47 (Call 06/15/47) |
905 | 712,834 | ||||||
| 3.70%, 06/26/28 (Call 03/26/28) |
4,497 | 4,350,532 | ||||||
| 3.90%, 04/15/28 (Call 03/15/28) |
3,200 | 3,122,152 | ||||||
| 3.95%, 06/28/38 (Call 12/28/37) |
1,850 | 1,669,862 | ||||||
| 4.00%, 04/15/26 (Call 03/15/26) |
2,315 | 2,279,334 | ||||||
| 4.00%, 04/15/30 (Call 02/15/30)(b) |
2,974 | 2,881,787 | ||||||
| 4.00%, 04/11/43 (Call 10/11/42) |
235 | 203,336 | ||||||
| 4.05%, 06/29/48 (Call 12/29/47) |
3,735 | 3,212,586 | ||||||
| 4.10%, 04/15/33 (Call 01/15/33) |
3,825 | 3,643,027 | ||||||
| 4.15%, 09/09/32 (Call 06/09/32) |
4,280 | 4,129,796 | ||||||
| 4.30%, 04/22/44 (Call 10/22/43) |
90 | 82,090 | ||||||
| 4.50%, 09/09/52 (Call 03/09/52) |
3,110 | 2,831,523 | ||||||
| 4.50%, 04/15/53 (Call 10/15/52) |
8,955 | 8,145,250 | ||||||
| 5.00%, 10/25/40 |
235 | 237,308 | ||||||
| 5.25%, 09/01/35 |
2,170 | 2,246,125 | ||||||
| 5.63%, 04/01/40 |
1,466 | 1,557,467 | ||||||
| 5.63%, 04/15/41 |
85 | 90,296 | ||||||
| 5.88%, 04/05/27 |
330 | 342,970 | ||||||
| 6.20%, 04/15/38 |
1,084 | 1,215,818 | ||||||
| 6.50%, 08/15/37 |
5,675 | 6,510,748 | ||||||
| 7.55%, 02/15/30 |
2,805 | 3,244,923 | ||||||
|
|
|
|||||||
| 704,225,398 | ||||||||
| Semiconductors — 0.7% | ||||||||
| Advanced Micro Devices Inc. |
||||||||
| 3.92%, 06/01/32 (Call 03/01/32) |
3,325 | 3,110,395 | ||||||
| 4.39%, 06/01/52 (Call 12/01/51) |
2,560 | 2,258,789 | ||||||
| Analog Devices Inc. |
||||||||
| 1.70%, 10/01/28 (Call 08/01/28) |
3,494 | 3,049,260 | ||||||
| 2.10%, 10/01/31 (Call 07/01/31) |
2,925 | 2,413,259 | ||||||
| 2.80%, 10/01/41 (Call 04/01/41) |
3,015 | 2,139,617 | ||||||
| 2.95%, 04/01/25 (Call 03/01/25) |
1,881 | 1,837,367 | ||||||
| 2.95%, 10/01/51 (Call 04/01/51) |
3,990 | 2,657,840 | ||||||
| 3.45%, 06/15/27 (Call 03/15/27) |
2,757 | 2,639,243 | ||||||
| 3.50%, 12/05/26 (Call 09/05/26) |
5,653 | 5,459,612 | ||||||
| 5.30%, 12/15/45 (Call 06/15/45) |
300 | 292,707 | ||||||
| Applied Materials Inc. |
||||||||
| 1.75%, 06/01/30 (Call 03/01/30) |
5,535 | 4,616,044 | ||||||
| 2.75%, 06/01/50 (Call 12/01/49) |
3,441 | 2,314,094 | ||||||
| 3.30%, 04/01/27 (Call 01/01/27) |
6,135 | 5,872,398 | ||||||
| 3.90%, 10/01/25 (Call 07/01/25) |
4,311 | 4,235,373 | ||||||
| 4.35%, 04/01/47 (Call 10/01/46) |
4,497 | 3,987,331 | ||||||
| 5.10%, 10/01/35 (Call 04/01/35) |
2,604 | 2,635,773 | ||||||
| 5.85%, 06/15/41 |
2,779 | 2,988,919 | ||||||
| S C H E D U L E O F I N V E S T M E N T S |
83 |
| Schedule of Investments (continued) February 29, 2024 |
iShares® Core U.S. Aggregate Bond ETF (Percentages shown are based on Net Assets) |
| Security | Par (000) | Value | ||||||
| Semiconductors (continued) |
||||||||
| Broadcom Corp./Broadcom Cayman Finance Ltd. |
||||||||
| 3.50%, 01/15/28 (Call 10/15/27) |
$ | 4,199 | $ | 3,955,287 | ||||
| 3.88%, 01/15/27 (Call 10/15/26) |
14,132 | 13,661,834 | ||||||
| Broadcom Inc. |
||||||||
| 1.95%, 02/15/28 (Call 12/15/27)(c) |
810 | 718,940 | ||||||
| 2.45%, 02/15/31 (Call 11/15/30)(c) |
10,800 | 8,989,467 | ||||||
| 2.60%, 02/15/33 (Call 11/15/32)(c) |
5,350 | 4,293,653 | ||||||
| 3.14%, 11/15/35 (Call 08/15/35)(c) |
5,885 | 4,664,342 | ||||||
| 3.15%, 11/15/25 (Call 10/15/25) |
4,367 | 4,215,301 | ||||||
| 3.19%, 11/15/36 (Call 08/15/36)(c) |
2,780 | 2,172,632 | ||||||
| 3.42%, 04/15/33 (Call 01/15/33)(c) |
13,881 | 11,853,583 | ||||||
| 3.46%, 09/15/26 (Call 07/15/26) |
1,575 | 1,510,797 | ||||||
| 3.47%, 04/15/34 (Call 01/15/34)(c) |
12,970 | 10,951,069 | ||||||
| 3.50%, 02/15/41 (Call 08/15/40)(c) |
10,608 | 8,104,979 | ||||||
| 3.75%, 02/15/51 (Call 08/15/50)(c) |
5,886 | 4,400,831 | ||||||
| 4.00%, 04/15/29 (Call 02/15/29)(c) |
4,190 | 3,964,811 | ||||||
| 4.11%, 09/15/28 (Call 06/15/28) |
690 | 661,293 | ||||||
| 4.15%, 11/15/30 (Call 08/15/30) |
4,915 | 4,594,752 | ||||||
| 4.15%, 04/15/32 (Call 01/15/32)(c) |
4,705 | 4,319,494 | ||||||
| 4.30%, 11/15/32 (Call 08/15/32) |
8,034 | 7,439,610 | ||||||
| 4.75%, 04/15/29 (Call 01/15/29) |
1,415 | 1,388,478 | ||||||
| 4.93%, 05/15/37 (Call 02/15/37)(c) |
19,710 | 18,365,051 | ||||||
| 5.00%, 04/15/30 (Call 01/15/30) |
940 | 936,710 | ||||||
| Intel Corp. |
||||||||
| 1.60%, 08/12/28 (Call 06/12/28) |
4,623 | 4,021,091 | ||||||
| 2.00%, 08/12/31 (Call 05/12/31) |
5,485 | 4,451,227 | ||||||
| 2.45%, 11/15/29 (Call 08/15/29) |
8,257 | 7,230,935 | ||||||
| 2.60%, 05/19/26 (Call 02/19/26) |
4,661 | 4,433,269 | ||||||
| 2.80%, 08/12/41 (Call 02/12/41) |
3,630 | 2,572,012 | ||||||
| 3.05%, 08/12/51 (Call 02/12/51) |
2,920 | 1,929,659 | ||||||
| 3.10%, 02/15/60 (Call 08/15/59) |
4,615 | 2,917,032 | ||||||
| 3.15%, 05/11/27 (Call 02/11/27) |
3,928 | 3,722,256 | ||||||
| 3.20%, 08/12/61 (Call 02/12/61) |
2,570 | 1,653,403 | ||||||
| 3.25%, 11/15/49 (Call 05/15/49) |
10,583 | 7,311,911 | ||||||
| 3.40%, 03/25/25 (Call 02/25/25) |
5,912 | 5,797,769 | ||||||
| 3.70%, 07/29/25 (Call 04/29/25) |
8,704 | 8,524,980 | ||||||
| 3.73%, 12/08/47 (Call 06/08/47) |
7,985 | 6,052,211 | ||||||
| 3.75%, 03/25/27 (Call 01/25/27) |
5,200 | 5,029,596 | ||||||
| 3.75%, 08/05/27 (Call 07/05/27) |
4,405 | 4,245,520 | ||||||
| 3.90%, 03/25/30 (Call 12/25/29) |
6,444 | 6,058,992 | ||||||
| 4.00%, 08/05/29 (Call 06/05/29) |
3,660 | 3,499,308 | ||||||
| 4.00%, 12/15/32 |
3,846 | 3,549,564 | ||||||
| 4.10%, 05/19/46 (Call 11/19/45) |
5,232 | 4,320,543 | ||||||
| 4.10%, 05/11/47 (Call 11/11/46) |
5,258 | 4,324,088 | ||||||
| 4.15%, 08/05/32 (Call 05/05/32) |
3,565 | 3,350,149 | ||||||
| 4.25%, 12/15/42(b) |
4,497 | 3,833,862 | ||||||
| 4.60%, 03/25/40 (Call 09/25/39) |
4,659 | 4,322,063 | ||||||
| 4.75%, 03/25/50 (Call 09/25/49) |
7,379 | 6,553,142 | ||||||
| 4.80%, 10/01/41 |
1,795 | 1,675,734 | ||||||
| 4.88%, 02/10/26 |
7,460 | 7,435,979 | ||||||
| 4.88%, 02/10/28 (Call 01/10/28) |
6,131 | 6,113,942 | ||||||
| 4.90%, 07/29/45 (Call 01/29/45) |
2,676 | 2,531,195 | ||||||
| 4.90%, 08/05/52 (Call 02/05/52) |
4,110 | 3,765,798 | ||||||
| 4.95%, 03/25/60 (Call 09/25/59) |
3,739 | 3,410,749 | ||||||
| 5.00%, 02/21/31 (Call 12/21/30) |
2,320 | 2,305,472 | ||||||
| 5.05%, 08/05/62 (Call 02/05/62) |
3,376 | 3,115,753 | ||||||
| 5.13%, 02/10/30 (Call 12/10/29) |
5,435 | 5,477,852 | ||||||
| 5.15%, 02/21/34 (Call 11/21/33) |
1,915 | 1,896,202 | ||||||
| 5.20%, 02/10/33 (Call 11/10/32) |
8,565 | 8,568,655 | ||||||
| 5.60%, 02/21/54 (Call 08/21/53) |
980 | 979,834 | ||||||
| Security | Par (000) |
Value | ||||||
| Semiconductors (continued) |
||||||||
| 5.63%, 02/10/43 (Call 08/10/42) |
$ | 4,220 | $ | 4,289,037 | ||||
| 5.70%, 02/10/53 (Call 08/10/52) |
6,940 | 7,013,266 | ||||||
| 5.90%, 02/10/63 (Call 08/10/62) |
5,185 | 5,401,321 | ||||||
| KLA Corp. |
||||||||
| 3.30%, 03/01/50 (Call 08/28/49) |
3,483 | 2,500,103 | ||||||
| 4.10%, 03/15/29 (Call 12/15/28) |
5,923 | 5,744,463 | ||||||
| 4.65%, 07/15/32 (Call 04/15/32) |
2,305 | 2,246,876 | ||||||
| 4.70%, 02/01/34 (Call 11/01/33) |
1,500 | 1,460,743 | ||||||
| 4.95%, 07/15/52 (Call 01/15/52) |
5,420 | 5,137,759 | ||||||
| 5.00%, 03/15/49 (Call 09/15/48) |
2,089 | 2,007,812 | ||||||
| 5.25%, 07/15/62 (Call 01/15/62) |
3,395 | 3,298,642 | ||||||
| Lam Research Corp. |
||||||||
| 1.90%, 06/15/30 (Call 03/15/30) |
3,975 | 3,335,856 | ||||||
| 2.88%, 06/15/50 (Call 12/15/49) |
3,479 | 2,352,119 | ||||||
| 3.13%, 06/15/60 (Call 12/15/59) |
2,916 | 1,911,686 | ||||||
| 3.75%, 03/15/26 (Call 01/15/26) |
4,990 | 4,869,818 | ||||||
| 3.80%, 03/15/25 (Call 12/15/24) |
2,832 | 2,790,505 | ||||||
| 4.00%, 03/15/29 (Call 12/15/28) |
4,456 | 4,293,920 | ||||||
| 4.88%, 03/15/49 (Call 09/15/48) |
3,545 | 3,335,559 | ||||||
| Marvell Technology Inc. |
||||||||
| 1.65%, 04/15/26 (Call 03/15/26) |
3,365 | 3,121,544 | ||||||
| 2.45%, 04/15/28 (Call 02/15/28) |
3,692 | 3,314,971 | ||||||
| 2.95%, 04/15/31 (Call 01/15/31) |
3,140 | 2,688,968 | ||||||
| 4.88%, 06/22/28 (Call 03/22/28) |
860 | 844,796 | ||||||
| 5.75%, 02/15/29 (Call 01/15/29) |
1,145 | 1,166,729 | ||||||
| 5.95%, 09/15/33 (Call 06/15/33) |
1,365 | 1,407,647 | ||||||
| Microchip Technology Inc., 4.25%, 09/01/25 |
||||||||
| (Call 04/01/24) |
5,995 | 5,885,332 | ||||||
| Micron Technology Inc. |
||||||||
| 2.70%, 04/15/32 (Call 01/15/32) |
4,477 | 3,672,754 | ||||||
| 3.37%, 11/01/41 (Call 05/01/41) |
2,340 | 1,702,080 | ||||||
| 3.48%, 11/01/51 (Call 05/01/51) |
2,490 | 1,729,668 | ||||||
| 4.19%, 02/15/27 (Call 12/15/26) |
3,939 | 3,827,568 | ||||||
| 4.66%, 02/15/30 (Call 11/15/29) |
3,812 | 3,681,485 | ||||||
| 4.98%, 02/06/26 (Call 12/06/25) |
2,966 | 2,948,623 | ||||||
| 5.30%, 01/15/31 (Call 11/15/30) |
2,025 | 2,004,436 | ||||||
| 5.33%, 02/06/29 (Call 11/06/28) |
3,099 | 3,102,019 | ||||||
| 5.38%, 04/15/28 (Call 03/15/28) |
2,710 | 2,717,376 | ||||||
| 5.88%, 02/09/33 (Call 11/09/32) |
2,740 | 2,796,303 | ||||||
| 5.88%, 09/15/33 (Call 06/15/33)(b) |
3,725 | 3,796,588 | ||||||
| 6.75%, 11/01/29 (Call 09/01/29) |
5,180 | 5,497,467 | ||||||
| NVIDIA Corp. |
||||||||
| 1.55%, 06/15/28 (Call 04/15/28) |
7,540 | 6,671,010 | ||||||
| 2.00%, 06/15/31 (Call 03/15/31) |
4,333 | 3,619,791 | ||||||
| 2.85%, 04/01/30 (Call 01/01/30) |
5,662 | 5,098,600 | ||||||
| 3.20%, 09/16/26 (Call 06/16/26) |
4,507 | 4,344,446 | ||||||
| 3.50%, 04/01/40 (Call 10/01/39) |
4,388 | 3,674,953 | ||||||
| 3.50%, 04/01/50 (Call 10/01/49) |
8,087 | 6,335,833 | ||||||
| 3.70%, 04/01/60 (Call 10/01/59)(b) |
2,850 | 2,241,571 | ||||||
| NXP BV/NXP Funding LLC |
||||||||
| 5.35%, 03/01/26 (Call 01/01/26) |
2,525 | 2,520,957 | ||||||
| 5.55%, 12/01/28 (Call 09/01/28) |
2,412 | 2,438,568 | ||||||
| NXP BV/NXP Funding LLC/NXP USA Inc. |
||||||||
| 2.50%, 05/11/31 (Call 02/11/31) |
4,274 | 3,538,481 | ||||||
| 2.65%, 02/15/32 (Call 11/15/31) |
4,111 | 3,374,938 | ||||||
| 2.70%, 05/01/25 (Call 04/01/25) |
2,514 | 2,431,285 | ||||||
| 3.13%, 02/15/42 (Call 08/15/41) |
2,395 | 1,702,231 | ||||||
| 3.15%, 05/01/27 (Call 03/01/27) |
2,855 | 2,684,040 | ||||||
| 3.25%, 05/11/41 (Call 11/11/40) |
3,975 | 2,921,156 | ||||||
| 3.25%, 11/30/51 (Call 05/30/51) |
2,220 | 1,493,157 | ||||||
| 3.40%, 05/01/30 (Call 02/01/30) |
4,323 | 3,869,909 | ||||||
| 84 | 2 0 2 4 I S H A R E S A N N U A L R E P O R T T O S H A R E H O L D E R S |
| Schedule of Investments (continued) February 29, 2024 |
iShares® Core U.S. Aggregate Bond ETF (Percentages shown are based on Net Assets) |
| Security | Par (000) |
Value | ||||||
| Semiconductors (continued) |
||||||||
| 3.88%, 06/18/26 (Call 04/18/26) |
$ | 3,730 | $ | 3,609,449 | ||||
| 4.30%, 06/18/29 (Call 03/18/29) |
5,104 | 4,872,531 | ||||||
| 4.40%, 06/01/27 (Call 05/01/27) |
1,180 | 1,152,794 | ||||||
| 5.00%, 01/15/33 (Call 10/15/32) |
4,360 | 4,213,238 | ||||||
| Qorvo Inc., 4.38%, 10/15/29 (Call 10/15/24) |
4,780 | 4,445,203 | ||||||
| QUALCOMM Inc. |
||||||||
| 1.30%, 05/20/28 (Call 02/20/28) |
4,425 | 3,847,192 | ||||||
| 1.65%, 05/20/32 (Call 02/20/32) |
5,608 | 4,377,137 | ||||||
| 2.15%, 05/20/30 (Call 02/20/30) |
6,475 | 5,538,307 | ||||||
| 3.25%, 05/20/27 (Call 02/20/27) |
9,262 | 8,830,652 | ||||||
| 3.25%, 05/20/50 (Call 11/20/49) |
3,819 | 2,781,276 | ||||||
| 3.45%, 05/20/25 (Call 02/20/25) |
966 | 946,030 | ||||||
| 4.25%, 05/20/32 (Call 02/20/32) |
2,311 | 2,204,307 | ||||||
| 4.30%, 05/20/47 (Call 11/20/46) |
6,455 | 5,594,988 | ||||||
| 4.50%, 05/20/52 (Call 11/20/51) |
4,285 | 3,774,237 | ||||||
| 4.65%, 05/20/35 (Call 11/20/34) |
5,482 | 5,359,841 | ||||||
| 4.80%, 05/20/45 (Call 11/20/44) |
5,871 | 5,510,090 | ||||||
| 5.40%, 05/20/33 (Call 02/20/33)(b) |
3,825 | 3,963,340 | ||||||
| 6.00%, 05/20/53 (Call 11/20/52) |
4,280 | 4,692,044 | ||||||
| Skyworks Solutions Inc. |
||||||||
| 1.80%, 06/01/26 (Call 05/01/26) |
3,410 | 3,154,086 | ||||||
| 3.00%, 06/01/31 (Call 03/01/31) |
2,970 | 2,487,319 | ||||||
| Texas Instruments Inc. |
||||||||
| 1.13%, 09/15/26 (Call 08/15/26) |
1,090 | 994,690 | ||||||
| 1.38%, 03/12/25 (Call 02/12/25) |
4,308 | 4,143,899 | ||||||
| 1.75%, 05/04/30 (Call 02/04/30) |
5,090 | 4,259,396 | ||||||
| 1.90%, 09/15/31 (Call 06/15/31) |
3,155 | 2,603,759 | ||||||
| 2.25%, 09/04/29 (Call 06/04/29) |
3,483 | 3,073,863 | ||||||
| 2.70%, 09/15/51 (Call 03/15/51) |
2,235 | 1,434,354 | ||||||
| 2.90%, 11/03/27 (Call 08/03/27) |
4,036 | 3,788,422 | ||||||
| 3.65%, 08/16/32 (Call 05/16/32) |
3,220 | 2,957,151 | ||||||
| 3.88%, 03/15/39 (Call 09/15/38) |
3,388 | 2,978,200 | ||||||
| 4.10%, 08/16/52 (Call 02/16/52) |
1,381 | 1,155,513 | ||||||
| 4.15%, 05/15/48 (Call 11/15/47) |
6,166 | 5,236,139 | ||||||
| 4.60%, 02/08/27 (Call 01/08/27) |
1,125 | 1,121,116 | ||||||
| 4.60%, 02/15/28 (Call 01/15/28) |
2,885 | 2,879,775 | ||||||
| 4.60%, 02/08/29 (Call 01/08/29) |
1,175 | 1,168,651 | ||||||
| 4.85%, 02/08/34 (Call 11/08/33) |
1,125 | 1,118,252 | ||||||
| 4.90%, 03/14/33 (Call 12/14/32) |
2,460 | 2,462,016 | ||||||
| 5.00%, 03/14/53 (Call 09/14/52) |
2,685 | 2,593,723 | ||||||
| 5.05%, 05/18/63 (Call 11/18/62) |
3,320 | 3,175,535 | ||||||
| 5.15%, 02/08/54 (Call 08/08/53)(b) |
1,125 | 1,114,714 | ||||||
| TSMC Arizona Corp. |
||||||||
| 1.75%, 10/25/26 (Call 09/25/26) |
6,420 | 5,896,062 | ||||||
| 2.50%, 10/25/31 (Call 07/25/31) |
5,805 | 4,914,072 | ||||||
| 3.13%, 10/25/41 (Call 04/25/41) |
5,260 | 4,170,052 | ||||||
| 3.25%, 10/25/51 (Call 04/25/51)(b) |
4,430 | 3,358,148 | ||||||
| 3.88%, 04/22/27 (Call 03/22/27) |
1,225 | 1,187,541 | ||||||
| 4.13%, 04/22/29 (Call 02/22/29)(b) |
855 | 826,619 | ||||||
| 4.25%, 04/22/32 (Call 01/22/32)(b) |
1,505 | 1,453,391 | ||||||
| 4.50%, 04/22/52 (Call 10/22/51)(b) |
1,445 | 1,389,258 | ||||||
| Xilinx Inc., 2.38%, 06/01/30 (Call 03/01/30) |
4,366 | 3,778,284 | ||||||
|
|
|
|||||||
| 664,096,103 | ||||||||
| Shipbuilding — 0.0% | ||||||||
| Huntington Ingalls Industries Inc. |
||||||||
| 2.04%, 08/16/28 (Call 06/16/28) |
2,814 | 2,446,587 | ||||||
| 3.48%, 12/01/27 (Call 09/01/27) |
3,151 | 2,952,208 | ||||||
| 3.84%, 05/01/25 (Call 04/01/25) |
2,500 | 2,445,476 | ||||||
| 4.20%, 05/01/30 (Call 02/01/30) |
1,735 | 1,631,157 | ||||||
| 9,475,428 | ||||||||
| Security | Par (000) | Value | ||||||
| Software — 0.7% |
||||||||
| Adobe Inc. |
||||||||
| 2.15%, 02/01/27 (Call 12/01/26) |
$ | 4,816 | $ | 4,482,890 | ||||
| 2.30%, 02/01/30 (Call 11/01/29) |
6,866 | 5,989,268 | ||||||
| Autodesk Inc. |
||||||||
| 2.40%, 12/15/31 (Call 09/15/31) |
4,678 | 3,880,573 | ||||||
| 2.85%, 01/15/30 (Call 10/15/29) |
2,662 | 2,359,755 | ||||||
| 3.50%, 06/15/27 (Call 03/15/27) |
3,905 | 3,733,754 | ||||||
| 4.38%, 06/15/25 (Call 03/15/25) |
3,357 | 3,318,707 | ||||||
| Broadridge Financial Solutions Inc. |
||||||||
| 2.60%, 05/01/31 (Call 02/01/31) |
5,486 | 4,596,414 | ||||||
| 2.90%, 12/01/29 (Call 09/01/29) |
4,403 | 3,876,027 | ||||||
| 3.40%, 06/27/26 (Call 03/27/26) |
3,317 | 3,170,408 | ||||||
| Concentrix Corp. |
||||||||
| 6.60%, 08/02/28 (Call 07/02/28)(b) |
3,300 | 3,315,197 | ||||||
| 6.65%, 08/02/26 (Call 07/02/26) |
3,090 | 3,119,014 | ||||||
| 6.85%, 08/02/33 (Call 05/02/33) |
2,620 | 2,562,043 | ||||||
| Electronic Arts Inc. |
||||||||
| 1.85%, 02/15/31 (Call 11/15/30) |
3,867 | 3,147,434 | ||||||
| 2.95%, 02/15/51 (Call 08/15/50) |
2,713 | 1,802,923 | ||||||
| 4.80%, 03/01/26 (Call 12/01/25)(b) |
3,642 | 3,622,576 | ||||||
| Fidelity National Information Services Inc. |
||||||||
| 1.15%, 03/01/26 (Call 02/01/26) |
6,458 | 5,973,053 | ||||||
| 1.65%, 03/01/28 (Call 01/01/28) |
3,729 | 3,286,323 | ||||||
| 2.25%, 03/01/31 (Call 12/01/30) |
6,755 | 5,645,135 | ||||||
| 3.10%, 03/01/41 (Call 09/01/40) |
3,530 | 2,541,576 | ||||||
| 3.75%, 05/21/29 (Call 02/21/29) |
60 | 57,111 | ||||||
| 4.50%, 07/15/25 |
2,575 | 2,550,436 | ||||||
| 4.50%, 08/15/46 (Call 02/15/46) |
1,262 | 1,034,369 | ||||||
| 4.70%, 07/15/27 (Call 06/15/27) |
2,760 | 2,739,159 | ||||||
| 5.10%, 07/15/32 (Call 04/15/32)(b) |
2,600 | 2,598,422 | ||||||
| 5.63%, 07/15/52 (Call 01/15/52) |
2,270 | 2,245,167 | ||||||
| Fiserv Inc. |
||||||||
| 2.25%, 06/01/27 (Call 04/01/27) |
2,765 | 2,530,023 | ||||||
| 2.65%, 06/01/30 (Call 03/01/30) |
5,589 | 4,805,872 | ||||||
| 3.20%, 07/01/26 (Call 05/01/26) |
8,434 | 8,054,800 | ||||||
| 3.50%, 07/01/29 (Call 04/01/29) |
10,355 | 9,521,779 | ||||||
| 3.85%, 06/01/25 (Call 03/01/25) |
4,945 | 4,846,171 | ||||||
| 4.20%, 10/01/28 (Call 07/01/28) |
4,912 | 4,711,758 | ||||||
| 4.40%, 07/01/49 (Call 01/01/49) |
8,430 | 7,050,332 | ||||||
| 5.15%, 03/15/27 (Call 02/15/27) |
2,180 | 2,179,233 | ||||||
| 5.35%, 03/15/31 (Call 01/15/31) |
2,260 | 2,261,320 | ||||||
| 5.38%, 08/21/28 (Call 07/21/28) |
2,800 | 2,817,285 | ||||||
| 5.45%, 03/02/28 (Call 02/02/28) |
3,550 | 3,578,981 | ||||||
| 5.45%, 03/15/34 (Call 12/15/33) |
2,030 | 2,027,276 | ||||||
| 5.60%, 03/02/33 (Call 12/02/32) |
1,630 | 1,643,365 | ||||||
| 5.63%, 08/21/33 (Call 05/21/33) |
2,750 | 2,780,895 | ||||||
| Intuit Inc. |
||||||||
| 0.95%, 07/15/25 (Call 06/15/25) |
4,225 | 3,986,196 | ||||||
| 1.35%, 07/15/27 (Call 05/15/27) |
3,529 | 3,148,370 | ||||||
| 1.65%, 07/15/30 (Call 04/15/30) |
4,342 | 3,560,412 | ||||||
| 5.13%, 09/15/28 (Call 08/15/28) |
4,155 | 4,205,051 | ||||||
| 5.20%, 09/15/33 (Call 06/15/33) |
3,935 | 3,974,309 | ||||||
| 5.25%, 09/15/26 (Call 08/15/26) |
2,825 | 2,849,637 | ||||||
| 5.50%, 09/15/53 (Call 03/15/53) |
1,435 | 1,479,803 | ||||||
| Microsoft Corp. |
||||||||
| 1.35%, 09/15/30 (Call 06/15/30)(c) |
3,255 | 2,663,933 | ||||||
| 2.40%, 08/08/26 (Call 05/08/26) |
15,800 | 14,956,756 | ||||||
| 2.50%, 09/15/50 (Call 03/15/50)(c) |
6,243 | 3,961,172 | ||||||
| 2.53%, 06/01/50 (Call 12/01/49) |
30,520 | 19,666,881 | ||||||
| 2.68%, 06/01/60 (Call 12/01/59) |
15,503 | 9,790,248 | ||||||
| 2.92%, 03/17/52 (Call 09/17/51) |
24,531 | 16,932,146 | ||||||
| S C H E D U L E O F I N V E S T M E N T S |
85 |
| Schedule of Investments (continued) February 29, 2024 |
iShares® Core U.S. Aggregate Bond ETF (Percentages shown are based on Net Assets) |
| Security | Par (000) | Value | ||||||
| Software (continued) |
||||||||
| 3.04%, 03/17/62 (Call 09/17/61) |
$ | 9,019 | $ | 6,132,905 | ||||
| 3.13%, 11/03/25 (Call 08/03/25) |
8,536 | 8,297,190 | ||||||
| 3.30%, 02/06/27 (Call 11/06/26) |
14,760 | 14,257,352 | ||||||
| 3.40%, 09/15/26 (Call 06/15/26)(c) |
5,015 | 4,850,905 | ||||||
| 3.40%, 06/15/27 (Call 03/15/27)(b)(c) |
2,535 | 2,432,936 | ||||||
| 3.45%, 08/08/36 (Call 02/08/36) |
7,521 | 6,625,208 | ||||||
| 3.50%, 02/12/35 (Call 08/12/34) |
11,241 | 10,198,156 | ||||||
| 3.50%, 11/15/42 |
2,930 | 2,455,491 | ||||||
| 3.70%, 08/08/46 (Call 02/08/46) |
3,840 | 3,194,304 | ||||||
| 3.75%, 02/12/45 (Call 08/12/44) |
1,295 | 1,106,337 | ||||||
| 3.95%, 08/08/56 (Call 02/08/56) |
870 | 732,327 | ||||||
| 4.00%, 02/12/55 (Call 08/12/54) |
1,980 | 1,717,604 | ||||||
| 4.10%, 02/06/37 (Call 08/06/36) |
3,375 | 3,179,665 | ||||||
| 4.20%, 11/03/35 (Call 05/03/35) |
1,210 | 1,169,335 | ||||||
| 4.25%, 02/06/47 (Call 08/06/46) |
1,827 | 1,682,869 | ||||||
| 4.45%, 11/03/45 (Call 05/03/45) |
2,946 | 2,808,875 | ||||||
| 4.50%, 10/01/40 |
2,770 | 2,704,255 | ||||||
| 4.50%, 06/15/47 (Call 12/15/46)(c) |
2,343 | 2,182,246 | ||||||
| 4.50%, 02/06/57 (Call 08/06/56) |
1,310 | 1,237,302 | ||||||
| 5.20%, 06/01/39(b) |
1,140 | 1,204,059 | ||||||
| 5.30%, 02/08/41(b) |
2,715 | 2,904,024 | ||||||
| Oracle Corp. |
||||||||
| 1.65%, 03/25/26 (Call 02/25/26) |
8,290 | 7,699,704 | ||||||
| 2.30%, 03/25/28 (Call 01/25/28) |
9,455 | 8,470,735 | ||||||
| 2.50%, 04/01/25 (Call 03/01/25)(b) |
10,119 | 9,800,604 | ||||||
| 2.65%, 07/15/26 (Call 04/15/26) |
13,940 | 13,129,904 | ||||||
| 2.80%, 04/01/27 (Call 02/01/27) |
9,532 | 8,890,783 | ||||||
| 2.88%, 03/25/31 (Call 12/25/30) |
11,486 | 9,908,619 | ||||||
| 2.95%, 05/15/25 (Call 02/15/25) |
8,324 | 8,078,472 | ||||||
| 2.95%, 04/01/30 (Call 01/01/30) |
13,075 | 11,531,452 | ||||||
| 3.25%, 11/15/27 (Call 08/15/27) |
9,362 | 8,778,608 | ||||||
| 3.25%, 05/15/30 (Call 02/15/30) |
1,504 | 1,348,016 | ||||||
| 3.60%, 04/01/40 (Call 10/01/39) |
13,530 | 10,446,274 | ||||||
| 3.60%, 04/01/50 (Call 10/01/49) |
17,548 | 12,350,446 | ||||||
| 3.65%, 03/25/41 (Call 09/25/40) |
7,833 | 6,024,045 | ||||||
| 3.80%, 11/15/37 (Call 05/15/37) |
7,448 | 6,125,960 | ||||||
| 3.85%, 07/15/36 (Call 01/15/36) |
5,407 | 4,545,277 | ||||||
| 3.85%, 04/01/60 (Call 10/01/59) |
13,483 | 9,366,372 | ||||||
| 3.90%, 05/15/35 (Call 11/15/34) |
5,250 | 4,506,424 | ||||||
| 3.95%, 03/25/51 (Call 09/25/50) |
12,185 | 9,081,867 | ||||||
| 4.00%, 07/15/46 (Call 01/15/46) |
10,899 | 8,383,518 | ||||||
| 4.00%, 11/15/47 (Call 05/15/47) |
8,673 | 6,631,006 | ||||||
| 4.10%, 03/25/61 (Call 09/25/60) |
5,515 | 4,036,589 | ||||||
| 4.13%, 05/15/45 (Call 11/15/44) |
8,294 | 6,552,623 | ||||||
| 4.30%, 07/08/34 (Call 01/08/34) |
7,287 | 6,607,023 | ||||||
| 4.38%, 05/15/55 (Call 11/15/54) |
5,059 | 3,964,114 | ||||||
| 4.50%, 05/06/28 (Call 04/06/28) |
2,270 | 2,226,647 | ||||||
| 4.50%, 07/08/44 (Call 01/08/44) |
3,438 | 2,885,539 | ||||||
| 4.65%, 05/06/30 (Call 03/06/30) |
2,255 | 2,193,703 | ||||||
| 4.90%, 02/06/33 (Call 11/06/32) |
4,765 | 4,600,939 | ||||||
| 5.38%, 07/15/40 |
8,379 | 8,013,959 | ||||||
| 5.55%, 02/06/53 (Call 08/06/52) |
7,145 | 6,838,853 | ||||||
| 5.80%, 11/10/25 |
2,115 | 2,132,000 | ||||||
| 6.13%, 07/08/39 |
4,778 | 4,916,914 | ||||||
| 6.15%, 11/09/29 (Call 09/09/29) |
5,330 | 5,572,977 | ||||||
| 6.25%, 11/09/32 (Call 08/09/32) |
7,452 | 7,868,721 | ||||||
| 6.50%, 04/15/38 |
6,250 | 6,675,236 | ||||||
| 6.90%, 11/09/52 (Call 05/09/52) |
8,845 | 9,979,658 | ||||||
| Roper Technologies Inc. |
||||||||
| 1.00%, 09/15/25 (Call 08/15/25) |
3,876 | 3,629,768 | ||||||
| 1.40%, 09/15/27 (Call 07/15/27) |
3,221 | 2,845,256 | ||||||
| Security | Par (000) | Value | ||||||
| Software (continued) |
||||||||
| 1.75%, 02/15/31 (Call 11/15/30) |
$ | 4,528 | $ | 3,617,449 | ||||
| 2.00%, 06/30/30 (Call 03/30/30) |
2,854 | 2,370,846 | ||||||
| 2.95%, 09/15/29 (Call 06/15/29) |
3,618 | 3,238,687 | ||||||
| 3.80%, 12/15/26 (Call 09/15/26) |
3,712 | 3,588,028 | ||||||
| 3.85%, 12/15/25 (Call 09/15/25) |
3,121 | 3,044,937 | ||||||
| 4.20%, 09/15/28 (Call 06/15/28) |
3,869 | 3,738,545 | ||||||
| Salesforce Inc. |
||||||||
| 1.50%, 07/15/28 (Call 05/15/28) |
3,105 | 2,716,128 | ||||||
| 1.95%, 07/15/31 (Call 04/15/31) |
5,252 | 4,300,956 | ||||||
| 2.70%, 07/15/41 (Call 01/15/41) |
3,400 | 2,425,266 | ||||||
| 2.90%, 07/15/51 (Call 01/15/51) |
5,840 | 3,884,467 | ||||||
| 3.05%, 07/15/61 (Call 01/15/61) |
4,350 | 2,797,337 | ||||||
| 3.70%, 04/11/28 (Call 01/11/28) |
9,011 | 8,694,926 | ||||||
| ServiceNow Inc., 1.40%, 09/01/30 |
||||||||
| (Call 06/01/30) |
7,809 | 6,264,089 | ||||||
| Take-Two Interactive Software Inc. |
||||||||
| 3.55%, 04/14/25 |
3,300 | 3,232,669 | ||||||
| 3.70%, 04/14/27 (Call 03/14/27) |
3,655 | 3,494,182 | ||||||
| 4.00%, 04/14/32 (Call 01/14/32) |
2,583 | 2,368,107 | ||||||
| 4.95%, 03/28/28 (Call 02/28/28) |
3,665 | 3,634,489 | ||||||
| 5.00%, 03/28/26 |
4,695 | 4,669,486 | ||||||
| VMware LLC |
||||||||
| 1.40%, 08/15/26 (Call 07/15/26) |
4,057 | 3,688,504 | ||||||
| 1.80%, 08/15/28 (Call 06/15/28) |
2,189 | 1,895,155 | ||||||
| 2.20%, 08/15/31 (Call 05/15/31) |
2,043 | 1,647,281 | ||||||
| 3.90%, 08/21/27 (Call 05/21/27) |
4,341 | 4,139,021 | ||||||
| 4.50%, 05/15/25 (Call 04/15/25) |
3,301 | 3,264,538 | ||||||
| 4.65%, 05/15/27 (Call 03/15/27) |
4,276 | 4,185,675 | ||||||
| 4.70%, 05/15/30 (Call 02/15/30) |
2,815 | 2,707,011 | ||||||
| Workday Inc. |
||||||||
| 3.50%, 04/01/27 (Call 03/01/27) |
3,480 | 3,312,744 | ||||||
| 3.70%, 04/01/29 (Call 02/01/29) |
2,963 | 2,769,295 | ||||||
| 3.80%, 04/01/32 (Call 01/01/32) |
4,560 | 4,121,877 | ||||||
|
|
|
|||||||
| 669,155,383 | ||||||||
| Telecommunications — 1.1% | ||||||||
| America Movil SAB de CV |
||||||||
| 2.88%, 05/07/30 (Call 02/07/30) |
4,305 | 3,772,610 | ||||||
| 3.63%, 04/22/29 (Call 01/22/29) |
4,641 | 4,311,091 | ||||||
| 4.38%, 07/16/42 |
5,150 | 4,457,280 | ||||||
| 4.38%, 04/22/49 (Call 10/22/48)(b) |
5,371 | 4,618,195 | ||||||
| 4.70%, 07/21/32 (Call 04/21/32) |
3,775 | 3,621,056 | ||||||
| 6.13%, 11/15/37 |
3,780 | 3,969,060 | ||||||
| 6.13%, 03/30/40 |
6,952 | 7,275,383 | ||||||
| 6.38%, 03/01/35 |
4,763 | 5,160,733 | ||||||
| AT&T Inc. |
||||||||
| 1.65%, 02/01/28 (Call 12/01/27) |
13,386 | 11,779,826 | ||||||
| 1.70%, 03/25/26 (Call 03/11/24) |
7,171 | 6,667,319 | ||||||
| 2.25%, 02/01/32 (Call 11/01/31) |
12,096 | 9,700,529 | ||||||
| 2.30%, 06/01/27 (Call 04/01/27) |
6,137 | 5,618,829 | ||||||
| 2.55%, 12/01/33 (Call 09/01/33) |
14,853 | 11,712,194 | ||||||
| 2.75%, 06/01/31 (Call 03/01/31) |
11,241 | 9,572,034 | ||||||
| 2.95%, 07/15/26 (Call 04/15/26) |
3,311 | 3,146,189 | ||||||
| 3.10%, 02/01/43 (Call 08/01/42)(b) |
1,680 | 1,207,561 | ||||||
| 3.30%, 02/01/52 (Call 08/01/51) |
2,680 | 1,817,503 | ||||||
| 3.50%, 06/01/41 (Call 12/01/40) |
11,945 | 9,168,855 | ||||||
| 3.50%, 09/15/53 (Call 03/15/53) |
31,876 | 21,929,540 | ||||||
| 3.50%, 02/01/61 (Call 08/01/60) |
1,560 | 1,041,212 | ||||||
| 3.55%, 09/15/55 (Call 03/15/55) |
30,738 | 20,941,873 | ||||||
| 3.65%, 06/01/51 (Call 12/01/50) |
10,381 | 7,424,488 | ||||||
| 3.65%, 09/15/59 (Call 03/15/59) |
26,337 | 17,847,200 | ||||||
| 3.80%, 02/15/27 (Call 11/15/26) |
2,644 | 2,547,586 | ||||||
| 86 | 2 0 2 4 I S H A R E S A N N U A L R E P O R T T O S H A R E H O L D E R S |
| Schedule of Investments (continued) February 29, 2024 |
iShares® Core U.S. Aggregate Bond ETF (Percentages shown are based on Net Assets) |
| Security | Par (000) | Value | ||||||
| Telecommunications (continued) |
||||||||
| 3.80%, 12/01/57 (Call 06/01/57) |
$ | 24,576 | $ | 17,341,176 | ||||
| 3.85%, 06/01/60 (Call 12/01/59) |
7,415 | 5,235,956 | ||||||
| 3.88%, 01/15/26 (Call 10/15/25) |
2,739 | 2,671,908 | ||||||
| 4.10%, 02/15/28 (Call 11/15/27) |
2,370 | 2,284,996 | ||||||
| 4.25%, 03/01/27 (Call 12/01/26) |
2,754 | 2,684,466 | ||||||
| 4.30%, 02/15/30 (Call 11/15/29) |
12,502 | 11,931,627 | ||||||
| 4.30%, 12/15/42 (Call 06/15/42) |
3,753 | 3,168,649 | ||||||
| 4.35%, 03/01/29 (Call 12/01/28) |
11,974 | 11,566,239 | ||||||
| 4.35%, 06/15/45 (Call 12/15/44) |
3,070 | 2,568,517 | ||||||
| 4.50%, 05/15/35 (Call 11/15/34) |
13,304 | 12,241,673 | ||||||
| 4.50%, 03/09/48 (Call 09/09/47) |
5,355 | 4,474,195 | ||||||
| 4.55%, 03/09/49 (Call 09/09/48) |
4,079 | 3,422,045 | ||||||
| 4.65%, 06/01/44 (Call 12/01/43) |
2,244 | 1,929,717 | ||||||
| 4.75%, 05/15/46 (Call 11/15/45) |
3,851 | 3,371,314 | ||||||
| 4.80%, 06/15/44 (Call 12/15/43) |
730 | 645,240 | ||||||
| 4.85%, 03/01/39 (Call 09/01/38) |
10,592 | 9,750,965 | ||||||
| 4.85%, 07/15/45 (Call 01/15/45) |
594 | 525,720 | ||||||
| 4.90%, 08/15/37 (Call 02/14/37) |
4,503 | 4,210,205 | ||||||
| 5.15%, 03/15/42(b) |
650 | 619,032 | ||||||
| 5.15%, 11/15/46 (Call 05/15/46) |
1,851 | 1,713,488 | ||||||
| 5.15%, 02/15/50 (Call 08/14/49) |
1,317 | 1,204,353 | ||||||
| 5.25%, 03/01/37 (Call 09/01/36) |
2,410 | 2,339,624 | ||||||
| 5.35%, 09/01/40 |
1,263 | 1,217,136 | ||||||
| 5.40%, 02/15/34 (Call 11/15/33) |
10,015 | 10,028,346 | ||||||
| 5.45%, 03/01/47 (Call 09/01/46) |
2,127 | 2,066,690 | ||||||
| 5.54%, 02/20/26 (Call 03/11/24) |
905 | 903,834 | ||||||
| 5.55%, 08/15/41 |
592 | 589,646 | ||||||
| 5.65%, 02/15/47 (Call 08/15/46)(b) |
702 | 703,219 | ||||||
| 5.70%, 03/01/57 (Call 09/01/56) |
1,066 | 1,044,491 | ||||||
| 6.00%, 08/15/40 (Call 05/15/40) |
1,724 | 1,767,320 | ||||||
| 6.30%, 01/15/38 |
895 | 946,069 | ||||||
| 6.38%, 03/01/41 |
1,119 | 1,177,383 | ||||||
| 6.55%, 02/15/39 |
660 | 709,313 | ||||||
| Bell Telephone Co. of Canada or Bell Canada |
||||||||
| 3.65%, 08/15/52 (Call 02/15/52) |
2,770 | 2,036,382 | ||||||
| 4.30%, 07/29/49 (Call 01/29/49) |
2,745 | 2,258,938 | ||||||
| 4.46%, 04/01/48 (Call 10/01/47) |
4,721 | 4,012,669 | ||||||
| 5.10%, 05/11/33 (Call 02/11/33) |
3,855 | 3,814,239 | ||||||
| 5.20%, 02/15/34 (Call 11/15/33) |
2,000 | 1,973,486 | ||||||
| 5.55%, 02/15/54 (Call 08/15/53) |
2,000 | 1,967,770 | ||||||
| Series US-4, 3.65%, 03/17/51 |
2,439 | 1,795,603 | ||||||
| Series US-5, 2.15%, 02/15/32 |
2,755 | 2,209,612 | ||||||
| Series US-6, 3.20%, 02/15/52 |
1,215 | 816,009 | ||||||
| British Telecommunications PLC |
||||||||
| 5.13%, 12/04/28 (Call 09/04/28) |
4,323 | 4,345,158 | ||||||
| 9.63%, 12/15/30 |
9,111 | 11,142,322 | ||||||
| Cisco Systems Inc. |
||||||||
| 2.50%, 09/20/26 (Call 06/20/26) |
4,732 | 4,465,406 | ||||||
| 2.95%, 02/28/26 |
2,995 | 2,886,850 | ||||||
| 3.50%, 06/15/25 |
2,898 | 2,843,814 | ||||||
| 4.80%, 02/26/27 (Call 01/26/27) |
5,475 | 5,476,269 | ||||||
| 4.85%, 02/26/29 (Call 01/26/29) |
5,475 | 5,483,762 | ||||||
| 4.90%, 02/26/26 |
3,505 | 3,506,536 | ||||||
| 4.95%, 02/26/31 (Call 12/26/30) |
4,065 | 4,068,442 | ||||||
| 5.05%, 02/26/34 (Call 11/26/33) |
4,205 | 4,226,762 | ||||||
| 5.30%, 02/26/54 (Call 08/26/53) |
3,015 | 3,050,977 | ||||||
| 5.35%, 02/26/64 (Call 08/26/63) |
3,255 | 3,278,920 | ||||||
| 5.50%, 01/15/40 |
8,326 | 8,595,550 | ||||||
| Security | Par (000) | Value | ||||||
| Telecommunications (continued) |
||||||||
| 5.90%, 02/15/39 |
$ | 9,380 | $ | 10,066,023 | ||||
| Corning Inc. |
||||||||
| 3.90%, 11/15/49 (Call 05/15/49) |
1,948 | 1,507,386 | ||||||
| 4.38%, 11/15/57 (Call 05/15/57) |
3,422 | 2,814,932 | ||||||
| 4.70%, 03/15/37 |
1,587 | 1,457,684 | ||||||
| 4.75%, 03/15/42 |
1,330 | 1,191,518 | ||||||
| 5.35%, 11/15/48 (Call 05/15/48) |
2,474 | 2,375,781 | ||||||
| 5.45%, 11/15/79 (Call 05/19/79) |
3,508 | 3,239,859 | ||||||
| 5.75%, 08/15/40 |
2,132 | 2,130,955 | ||||||
| 5.85%, 11/15/68 (Call 05/15/68) |
1,407 | 1,384,229 | ||||||
| Deutsche Telekom International Finance BV |
||||||||
| 8.75%, 06/15/30 |
12,935 | 15,253,803 | ||||||
| 9.25%, 06/01/32 |
3,407 | 4,299,530 | ||||||
| Juniper Networks Inc. |
||||||||
| 1.20%, 12/10/25 (Call 11/10/25) |
840 | 778,559 | ||||||
| 2.00%, 12/10/30 (Call 09/10/30) |
2,116 | 1,703,709 | ||||||
| 3.75%, 08/15/29 (Call 05/15/29) |
2,711 | 2,512,771 | ||||||
| 5.95%, 03/15/41 |
1,649 | 1,631,325 | ||||||
| Koninklijke KPN NV, 8.38%, 10/01/30 |
1,332 | 1,552,597 | ||||||
| KT Corp., 4.00%, 08/08/25(c) |
20 | 19,608 | ||||||
| Motorola Solutions Inc. |
||||||||
| 2.30%, 11/15/30 (Call 08/15/30) |
2,391 | 1,969,037 | ||||||
| 2.75%, 05/24/31 (Call 02/24/31) |
4,050 | 3,378,636 | ||||||
| 4.60%, 02/23/28 (Call 11/23/27) |
3,860 | 3,786,427 | ||||||
| 4.60%, 05/23/29 (Call 02/23/29) |
3,701 | 3,597,900 | ||||||
| 5.50%, 09/01/44 |
1,228 | 1,167,039 | ||||||
| 5.60%, 06/01/32 (Call 03/01/32) |
2,750 | 2,758,425 | ||||||
| Nokia OYJ |
||||||||
| 4.38%, 06/12/27 |
2,548 | 2,442,014 | ||||||
| 6.63%, 05/15/39 |
1,696 | 1,636,537 | ||||||
| Orange SA |
||||||||
| 5.38%, 01/13/42 |
4,079 | 4,011,779 | ||||||
| 5.50%, 02/06/44 (Call 08/06/43) |
2,674 | 2,668,010 | ||||||
| 9.00%, 03/01/31 |
9,825 | 11,872,769 | ||||||
| Rogers Communications Inc. |
||||||||
| 2.90%, 11/15/26 (Call 08/15/26) |
3,832 | 3,606,425 | ||||||
| 2.95%, 03/15/25 |
4,375 | 4,258,754 | ||||||
| 3.20%, 03/15/27 (Call 02/15/27) |
3,140 | 2,956,399 | ||||||
| 3.63%, 12/15/25 (Call 09/15/25) |
4,068 | 3,942,217 | ||||||
| 3.70%, 11/15/49 (Call 05/15/49) |
4,053 | 2,911,946 | ||||||
| 3.80%, 03/15/32 (Call 12/15/31) |
3,535 | 3,140,477 | ||||||
| 4.30%, 02/15/48 (Call 08/15/47) |
3,312 | 2,646,050 | ||||||
| 4.35%, 05/01/49 (Call 11/01/48) |
5,273 | 4,235,070 | ||||||
| 4.50%, 03/15/42 (Call 09/15/41) |
3,230 | 2,773,507 | ||||||
| 4.50%, 03/15/43 (Call 09/15/42) |
2,263 | 1,913,830 | ||||||
| 4.55%, 03/15/52 (Call 09/15/51) |
5,335 | 4,402,930 | ||||||
| 5.00%, 02/15/29 (Call 01/15/29) |
1,480 | 1,466,228 | ||||||
| 5.00%, 03/15/44 (Call 09/15/43) |
4,043 | 3,646,469 | ||||||
| 5.30%, 02/15/34 (Call 11/15/33) |
260 | 255,245 | ||||||
| 5.45%, 10/01/43 (Call 04/01/43) |
2,878 | 2,752,440 | ||||||
| 7.50%, 08/15/38 |
1,801 | 2,071,046 | ||||||
| Sprint Capital Corp. |
||||||||
| 6.88%, 11/15/28 |
1,730 | 1,843,896 | ||||||
| 8.75%, 03/15/32 |
6,855 | 8,283,672 | ||||||
| Sprint LLC, 7.63%, 03/01/26 (Call 11/01/25) |
1,710 | 1,767,103 | ||||||
| Telefonica Emisiones SA |
||||||||
| 4.10%, 03/08/27 |
2,994 | 2,899,563 | ||||||
| 4.67%, 03/06/38 |
2,436 | 2,172,348 | ||||||
| 4.90%, 03/06/48 |
4,708 | 4,034,520 | ||||||
| 5.21%, 03/08/47 |
9,535 | 8,567,867 | ||||||
| 5.52%, 03/01/49 (Call 09/01/48) |
4,857 | 4,530,905 | ||||||
| S C H E D U L E O F I N V E S T M E N T S |
87 |
| Schedule of Investments (continued) February 29, 2024 |
iShares® Core U.S. Aggregate Bond ETF (Percentages shown are based on Net Assets) |
| Security | Par (000) | Value | ||||||
| Telecommunications (continued) |
||||||||
| 7.05%, 06/20/36 |
$ | 7,689 | $ | 8,471,867 | ||||
| Telefonica Europe BV, 8.25%, 09/15/30 |
5,818 | 6,603,543 | ||||||
| TELUS Corp. |
||||||||
| 2.80%, 02/16/27 (Call 11/16/26) |
3,590 | 3,363,234 | ||||||
| 3.40%, 05/13/32 (Call 02/13/32) |
4,565 | 3,960,732 | ||||||
| 3.70%, 09/15/27 (Call 06/15/27) |
4,183 | 3,970,443 | ||||||
| 4.30%, 06/15/49 (Call 12/15/48) |
1,942 | 1,577,996 | ||||||
| 4.60%, 11/16/48 (Call 05/16/48) |
2,807 | 2,398,693 | ||||||
| T-Mobile USA Inc. |
||||||||
| 1.50%, 02/15/26 (Call 01/15/26) |
3,193 | 2,968,713 | ||||||
| 2.05%, 02/15/28 (Call 12/15/27) |
7,370 | 6,565,269 | ||||||
| 2.25%, 02/15/26 (Call 03/11/24) |
8,536 | 8,041,746 | ||||||
| 2.25%, 11/15/31 (Call 08/15/31) |
5,144 | 4,173,588 | ||||||
| 2.40%, 03/15/29 (Call 01/15/29) |
1,128 | 992,273 | ||||||
| 2.55%, 02/15/31 (Call 11/15/30) |
11,374 | 9,584,313 | ||||||
| 2.63%, 04/15/26 (Call 03/11/24) |
7,143 | 6,767,268 | ||||||
| 2.63%, 02/15/29 (Call 03/11/24) |
8,625 | 7,660,252 | ||||||
| 2.70%, 03/15/32 (Call 12/15/31) |
4,650 | 3,864,396 | ||||||
| 2.88%, 02/15/31 (Call 02/15/26) |
5,960 | 5,126,949 | ||||||
| 3.00%, 02/15/41 (Call 08/15/40) |
10,511 | 7,585,501 | ||||||
| 3.30%, 02/15/51 (Call 08/15/50) |
11,874 | 8,167,564 | ||||||
| 3.38%, 04/15/29 (Call 04/15/24) |
5,505 | 5,056,236 | ||||||
| 3.40%, 10/15/52 (Call 04/15/52) |
9,830 | 6,826,760 | ||||||
| 3.50%, 04/15/25 (Call 03/15/25) |
11,481 | 11,226,271 | ||||||
| 3.50%, 04/15/31 (Call 04/15/26) |
7,925 | 7,091,774 | ||||||
| 3.60%, 11/15/60 (Call 05/15/60) |
7,588 | 5,229,196 | ||||||
| 3.75%, 04/15/27 (Call 02/15/27) |
15,212 | 14,582,701 | ||||||
| 3.88%, 04/15/30 (Call 01/15/30) |
26,782 | 24,868,478 | ||||||
| 4.38%, 04/15/40 (Call 10/15/39) |
8,640 | 7,573,627 | ||||||
| 4.50%, 04/15/50 (Call 10/15/49) |
11,577 | 9,786,189 | ||||||
| 4.75%, 02/01/28 (Call 03/11/24) |
6,890 | 6,779,670 | ||||||
| 4.80%, 07/15/28 (Call 06/15/28) |
4,715 | 4,652,140 | ||||||
| 4.85%, 01/15/29 (Call 12/15/28) |
3,385 | 3,342,585 | ||||||
| 4.95%, 03/15/28 (Call 02/15/28) |
4,695 | 4,666,257 | ||||||
| 5.05%, 07/15/33 (Call 04/15/33) |
11,335 | 11,088,016 | ||||||
| 5.15%, 04/15/34 (Call 01/15/34) |
1,690 | 1,662,168 | ||||||
| 5.20%, 01/15/33 (Call 10/15/32) |
2,075 | 2,061,710 | ||||||
| 5.38%, 04/15/27 (Call 03/11/24) |
5,405 | 5,398,065 | ||||||
| 5.50%, 01/15/55 (Call 07/15/54) |
740 | 722,277 | ||||||
| 5.65%, 01/15/53 (Call 07/15/52) |
6,830 | 6,779,917 | ||||||
| 5.75%, 01/15/34 (Call 10/15/33) |
5,165 | 5,320,815 | ||||||
| 5.75%, 01/15/54 (Call 07/15/53) |
5,665 | 5,728,878 | ||||||
| 5.80%, 09/15/62 (Call 03/15/62) |
1,475 | 1,493,268 | ||||||
| 6.00%, 06/15/54 (Call 12/15/53) |
1,950 | 2,046,321 | ||||||
| Verizon Communications Inc. |
||||||||
| 0.85%, 11/20/25 (Call 10/20/25) |
7,986 | 7,411,291 | ||||||
| 1.45%, 03/20/26 (Call 02/20/26) |
6,955 | 6,449,032 | ||||||
| 1.50%, 09/18/30 (Call 06/18/30) |
3,627 | 2,909,938 | ||||||
| 1.68%, 10/30/30 (Call 07/30/30) |
3,418 | 2,750,427 | ||||||
| 1.75%, 01/20/31 (Call 10/20/30) |
9,650 | 7,738,647 | ||||||
| 2.10%, 03/22/28 (Call 01/22/28) |
13,210 | 11,761,746 | ||||||
| 2.36%, 03/15/32 (Call 12/15/31) |
19,552 | 15,836,056 | ||||||
| 2.55%, 03/21/31 (Call 12/21/30) |
12,661 | 10,666,482 | ||||||
| 2.63%, 08/15/26 |
9,504 | 8,962,390 | ||||||
| 2.65%, 11/20/40 (Call 05/20/40) |
13,393 | 9,233,185 | ||||||
| 2.85%, 09/03/41 (Call 03/03/41) |
5,422 | 3,819,053 | ||||||
| 2.88%, 11/20/50 (Call 05/20/50) |
12,559 | 8,001,958 | ||||||
| 2.99%, 10/30/56 (Call 04/30/56) |
15,759 | 9,796,532 | ||||||
| 3.00%, 03/22/27 (Call 01/22/27) |
4,430 | 4,168,148 | ||||||
| 3.00%, 11/20/60 (Call 05/20/60)(b) |
9,916 | 6,019,639 | ||||||
| 3.15%, 03/22/30 (Call 12/22/29) |
7,864 | 7,039,842 | ||||||
| Security | Par (000) | Value | ||||||
| Telecommunications (continued) |
||||||||
| 3.40%, 03/22/41 (Call 09/22/40) |
$ | 12,495 | $ | 9,568,180 | ||||
| 3.55%, 03/22/51 (Call 09/22/50) |
18,648 | 13,541,068 | ||||||
| 3.70%, 03/22/61 (Call 09/22/60) |
10,185 | 7,244,589 | ||||||
| 3.85%, 11/01/42 (Call 05/01/42) |
4,726 | 3,801,047 | ||||||
| 3.88%, 02/08/29 (Call 11/08/28) |
5,552 | 5,274,855 | ||||||
| 3.88%, 03/01/52 (Call 09/01/51) |
5,460 | 4,206,525 | ||||||
| 4.00%, 03/22/50 (Call 09/22/49) |
5,777 | 4,556,048 | ||||||
| 4.02%, 12/03/29 (Call 09/03/29) |
13,054 | 12,390,506 | ||||||
| 4.13%, 03/16/27 |
10,213 | 9,932,592 | ||||||
| 4.13%, 08/15/46 |
3,517 | 2,878,375 | ||||||
| 4.27%, 01/15/36 |
1,140 | 1,034,837 | ||||||
| 4.33%, 09/21/28 |
17,351 | 16,844,131 | ||||||
| 4.40%, 11/01/34 (Call 05/01/34) |
8,459 | 7,862,472 | ||||||
| 4.50%, 08/10/33 |
9,687 | 9,128,305 | ||||||
| 4.52%, 09/15/48 |
1,740 | 1,522,451 | ||||||
| 4.67%, 03/15/55 |
1,378 | 1,215,312 | ||||||
| 4.75%, 11/01/41 |
2,853 | 2,625,502 | ||||||
| 4.81%, 03/15/39 |
5,757 | 5,369,263 | ||||||
| 4.86%, 08/21/46 |
9,364 | 8,596,346 | ||||||
| 5.01%, 04/15/49(b) |
2,015 | 1,958,794 | ||||||
| 5.01%, 08/21/54 |
1,220 | 1,130,855 | ||||||
| 5.05%, 05/09/33 (Call 02/09/33) |
2,525 | 2,499,749 | ||||||
| 5.25%, 03/16/37 |
6,132 | 6,113,128 | ||||||
| 5.50%, 03/16/47 |
3,441 | 3,463,502 | ||||||
| 5.50%, 02/23/54 (Call 08/23/53) |
1,125 | 1,111,576 | ||||||
| 5.85%, 09/15/35 |
2,077 | 2,168,949 | ||||||
| 6.40%, 09/15/33 |
640 | 687,901 | ||||||
| 6.55%, 09/15/43 |
4,028 | 4,487,079 | ||||||
| 7.75%, 12/01/30 |
3,699 | 4,220,014 | ||||||
| Vodafone Group PLC |
||||||||
| 4.13%, 05/30/25 |
8,229 | 8,094,857 | ||||||
| 4.25%, 09/17/50 |
6,984 | 5,501,592 | ||||||
| 4.38%, 05/30/28 |
3,205 | 3,150,071 | ||||||
| 4.38%, 02/19/43 |
8,357 | 7,034,809 | ||||||
| 4.88%, 06/19/49 |
4,673 | 4,044,917 | ||||||
| 5.00%, 05/30/38 |
1,193 | 1,149,167 | ||||||
| 5.13%, 06/19/59 |
1,361 | 1,197,793 | ||||||
| 5.25%, 05/30/48 |
1,115 | 1,034,197 | ||||||
| 5.63%, 02/10/53 (Call 08/10/52) |
3,595 | 3,466,872 | ||||||
| 5.75%, 02/10/63 (Call 08/10/62) |
1,525 | 1,488,994 | ||||||
| 6.15%, 02/27/37 |
7,550 | 7,879,982 | ||||||
| 6.25%, 11/30/32 |
2,623 | 2,784,618 | ||||||
| 7.88%, 02/15/30 |
3,450 | 3,911,684 | ||||||
|
|
|
|||||||
| 1,149,471,452 | ||||||||
| Toys, Games & Hobbies — 0.0% | ||||||||
| Hasbro Inc. |
||||||||
| 3.50%, 09/15/27 (Call 06/15/27) |
2,614 | 2,452,735 | ||||||
| 3.55%, 11/19/26 (Call 09/19/26) |
3,424 | 3,247,085 | ||||||
| 3.90%, 11/19/29 (Call 08/19/29) |
3,829 | 3,513,384 | ||||||
| 5.10%, 05/15/44 (Call 11/15/43) |
1,601 | 1,344,657 | ||||||
| 6.35%, 03/15/40(b) |
2,084 | 2,112,125 | ||||||
| Mattel Inc., 5.45%, 11/01/41 (Call 05/01/41)(b) |
915 | 830,255 | ||||||
|
|
|
|||||||
| 13,500,241 | ||||||||
| Transportation — 0.6% | ||||||||
| BNSF Funding Trust I, 6.61%, 12/15/55 |
1,357 | 1,341,552 | ||||||
| Burlington Northern Santa Fe LLC |
||||||||
| 2.88%, 06/15/52 (Call 12/15/51) |
2,369 | 1,539,813 | ||||||
| 3.00%, 04/01/25 (Call 01/01/25) |
4,350 | 4,250,984 | ||||||
| 88 | 2 0 2 4 I S H A R E S A N N U A L R E P O R T T O S H A R E H O L D E R S |
| Schedule of Investments (continued) February 29, 2024 |
iShares® Core U.S. Aggregate Bond ETF (Percentages shown are based on Net Assets) |
| Security | Par (000) |
Value | ||||||
| Transportation (continued) |
||||||||
| 3.05%, 02/15/51 (Call 08/15/50) |
$ | 2,797 | $ | 1,894,603 | ||||
| 3.25%, 06/15/27 (Call 03/15/27) |
5,306 | 5,060,515 | ||||||
| 3.30%, 09/15/51 (Call 03/15/51) |
3,900 | 2,779,563 | ||||||
| 3.55%, 02/15/50 (Call 08/15/49) |
3,391 | 2,554,046 | ||||||
| 3.65%, 09/01/25 (Call 06/01/25) |
3,422 | 3,347,950 | ||||||
| 3.90%, 08/01/46 (Call 02/01/46) |
3,478 | 2,799,159 | ||||||
| 4.05%, 06/15/48 (Call 12/15/47) |
2,944 | 2,428,149 | ||||||
| 4.13%, 06/15/47 (Call 12/15/46) |
3,235 | 2,705,355 | ||||||
| 4.15%, 04/01/45 (Call 10/01/44) |
4,433 | 3,731,055 | ||||||
| 4.15%, 12/15/48 (Call 06/15/48) |
3,380 | 2,815,411 | ||||||
| 4.38%, 09/01/42 (Call 03/01/42) |
1,537 | 1,359,711 | ||||||
| 4.40%, 03/15/42 (Call 09/15/41) |
2,672 | 2,374,731 | ||||||
| 4.45%, 03/15/43 (Call 09/15/42) |
3,500 | 3,108,654 | ||||||
| 4.45%, 01/15/53 (Call 07/15/52) |
2,505 | 2,195,675 | ||||||
| 4.55%, 09/01/44 (Call 03/01/44) |
3,298 | 2,946,845 | ||||||
| 4.70%, 09/01/45 (Call 03/01/45) |
2,479 | 2,265,359 | ||||||
| 4.90%, 04/01/44 (Call 10/01/43) |
2,984 | 2,815,580 | ||||||
| 4.95%, 09/15/41 (Call 03/15/41) |
1,673 | 1,594,435 | ||||||
| 5.05%, 03/01/41 (Call 09/01/40) |
1,959 | 1,899,395 | ||||||
| 5.15%, 09/01/43 (Call 03/01/43) |
2,935 | 2,857,681 | ||||||
| 5.20%, 04/15/54 (Call 10/15/53) |
5,060 | 4,944,581 | ||||||
| 5.40%, 06/01/41 (Call 12/01/40) |
1,942 | 1,954,393 | ||||||
| 5.75%, 05/01/40 (Call 11/01/39) |
3,416 | 3,570,535 | ||||||
| 6.15%, 05/01/37 |
1,858 | 2,026,965 | ||||||
| 6.20%, 08/15/36 |
1,475 | 1,612,115 | ||||||
| 7.00%, 12/15/25 |
2,524 | 2,609,464 | ||||||
| Canadian National Railway Co. |
||||||||
| 2.45%, 05/01/50 (Call 11/01/49) |
3,277 | 2,043,334 | ||||||
| 2.75%, 03/01/26 (Call 12/01/25) |
5,088 | 4,880,001 | ||||||
| 3.20%, 08/02/46 (Call 02/02/46) |
2,554 | 1,893,252 | ||||||
| 3.65%, 02/03/48 (Call 08/03/47) |
2,559 | 2,026,888 | ||||||
| 3.85%, 08/05/32 (Call 05/05/32) |
3,500 | 3,220,475 | ||||||
| 4.40%, 08/05/52 (Call 02/05/52) |
2,310 | 2,034,356 | ||||||
| 4.45%, 01/20/49 (Call 07/20/48) |
3,007 | 2,685,686 | ||||||
| 5.85%, 11/01/33 (Call 08/01/33) |
1,215 | 1,289,502 | ||||||
| 6.13%, 11/01/53 (Call 05/01/53) |
230 | 261,389 | ||||||
| 6.20%, 06/01/36 |
1,283 | 1,398,034 | ||||||
| 6.25%, 08/01/34 |
1,875 | 2,047,430 | ||||||
| 6.38%, 11/15/37 |
1,992 | 2,181,053 | ||||||
| 6.90%, 07/15/28 |
1,765 | 1,902,309 | ||||||
| Canadian Pacific Railway Co. |
||||||||
| 1.75%, 12/02/26 (Call 11/02/26) |
2,710 | 2,484,561 | ||||||
| 2.05%, 03/05/30 (Call 12/05/29) |
2,771 | 2,335,202 | ||||||
| 2.45%, 12/02/31 (Call 09/02/31) |
3,035 | 2,695,649 | ||||||
| 2.88%, 11/15/29 (Call 08/15/29) |
2,663 | 2,368,404 | ||||||
| 3.00%, 12/02/41 (Call 06/02/41) |
4,182 | 3,524,467 | ||||||
| 3.10%, 12/02/51 (Call 06/02/51) |
6,292 | 4,279,921 | ||||||
| 3.50%, 05/01/50 (Call 11/01/49) |
2,805 | 2,048,357 | ||||||
| 4.00%, 06/01/28 (Call 03/01/28) |
3,255 | 3,130,443 | ||||||
| 4.20%, 11/15/69 (Call 05/15/69) |
1,561 | 1,221,263 | ||||||
| 4.30%, 05/15/43 (Call 11/15/42) |
2,156 | 1,844,101 | ||||||
| 4.70%, 05/01/48 (Call 11/01/47) |
2,245 | 1,974,171 | ||||||
| 4.80%, 09/15/35 (Call 03/15/35) |
2,718 | 2,600,276 | ||||||
| 4.80%, 08/01/45 (Call 02/01/45) |
2,652 | 2,399,918 | ||||||
| 4.95%, 08/15/45 (Call 02/15/45) |
2,382 | 2,183,471 | ||||||
| 5.95%, 05/15/37 |
1,223 | 1,264,033 | ||||||
| 6.13%, 09/15/2115 (Call 03/15/15) |
3,134 | 3,294,008 | ||||||
| 7.13%, 10/15/31(b) |
1,348 | 1,505,952 | ||||||
| CH Robinson Worldwide Inc., 4.20%, 04/15/28 |
4,180 | 4,029,850 | ||||||
| Security | Par (000) |
Value | ||||||
| Transportation (continued) |
||||||||
| CSX Corp. |
||||||||
| 2.40%, 02/15/30 (Call 11/15/29) |
$ | 2,798 | $ | 2,428,596 | ||||
| 2.50%, 05/15/51 (Call 11/15/50) |
1,016 | 618,005 | ||||||
| 2.60%, 11/01/26 (Call 08/01/26) |
5,433 | 5,123,683 | ||||||
| 3.25%, 06/01/27 (Call 03/01/27) |
6,591 | 6,254,755 | ||||||
| 3.35%, 11/01/25 (Call 08/01/25) |
6,259 | 6,075,957 | ||||||
| 3.35%, 09/15/49 (Call 03/15/49) |
2,579 | 1,847,032 | ||||||
| 3.80%, 03/01/28 (Call 12/01/27) |
3,471 | 3,338,356 | ||||||
| 3.80%, 11/01/46 (Call 05/01/46) |
2,094 | 1,648,774 | ||||||
| 3.80%, 04/15/50 (Call 10/15/49) |
2,211 | 1,717,008 | ||||||
| 3.95%, 05/01/50 (Call 11/01/49) |
2,561 | 2,046,553 | ||||||
| 4.10%, 11/15/32 (Call 08/15/32) |
2,956 | 2,758,112 | ||||||
| 4.10%, 03/15/44 (Call 09/15/43) |
3,758 | 3,159,508 | ||||||
| 4.25%, 03/15/29 (Call 12/15/28) |
4,860 | 4,733,737 | ||||||
| 4.25%, 11/01/66 (Call 05/01/66) |
2,253 | 1,794,850 | ||||||
| 4.30%, 03/01/48 (Call 09/01/47) |
3,200 | 2,729,569 | ||||||
| 4.40%, 03/01/43 (Call 09/01/42) |
1,785 | 1,582,319 | ||||||
| 4.50%, 03/15/49 (Call 09/15/48) |
1,711 | 1,493,494 | ||||||
| 4.50%, 11/15/52 (Call 05/15/52) |
3,126 | 2,734,733 | ||||||
| 4.50%, 08/01/54 (Call 02/01/54) |
1,274 | 1,108,395 | ||||||
| 4.65%, 03/01/68 (Call 09/01/67) |
1,790 | 1,538,361 | ||||||
| 4.75%, 05/30/42 (Call 11/30/41) |
3,050 | 2,808,699 | ||||||
| 4.75%, 11/15/48 (Call 05/15/48) |
2,746 | 2,499,515 | ||||||
| 5.20%, 11/15/33 (Call 08/15/33) |
3,170 | 3,191,245 | ||||||
| 5.50%, 04/15/41 (Call 10/15/40) |
1,564 | 1,578,152 | ||||||
| 6.00%, 10/01/36 |
1,637 | 1,741,981 | ||||||
| 6.15%, 05/01/37 |
2,400 | 2,600,034 | ||||||
| 6.22%, 04/30/40 |
3,108 | 3,367,457 | ||||||
| FedEx Corp. |
||||||||
| 2.40%, 05/15/31 (Call 02/15/31)(b) |
3,880 | 3,240,627 | ||||||
| 3.10%, 08/05/29 (Call 05/05/29) |
5,329 | 4,834,181 | ||||||
| 3.25%, 04/01/26 (Call 01/01/26) |
6,292 | 6,061,820 | ||||||
| 3.25%, 05/15/41 (Call 11/15/40) |
2,505 | 1,846,272 | ||||||
| 3.40%, 02/15/28 (Call 11/15/27) |
3,397 | 3,207,420 | ||||||
| 3.88%, 08/01/42 |
1,675 | 1,329,751 | ||||||
| 3.90%, 02/01/35 |
2,400 | 2,112,531 | ||||||
| 4.05%, 02/15/48 (Call 08/15/47) |
2,745 | 2,157,959 | ||||||
| 4.10%, 04/15/43 |
2,425 | 1,976,136 | ||||||
| 4.10%, 02/01/45 |
2,215 | 1,774,982 | ||||||
| 4.20%, 10/17/28 (Call 07/17/28) |
839 | 808,156 | ||||||
| 4.25%, 05/15/30 (Call 02/15/30) |
1,540 | 1,469,631 | ||||||
| 4.40%, 01/15/47 (Call 07/15/46) |
4,300 | 3,566,658 | ||||||
| 4.55%, 04/01/46 (Call 10/01/45) |
4,835 | 4,117,954 | ||||||
| 4.75%, 11/15/45 (Call 05/15/45) |
6,147 | 5,380,046 | ||||||
| 4.90%, 01/15/34 |
2,577 | 2,502,713 | ||||||
| 4.95%, 10/17/48 (Call 04/17/48) |
1,976 | 1,779,046 | ||||||
| 5.10%, 01/15/44 |
3,157 | 2,919,008 | ||||||
| 5.25%, 05/15/50 (Call 11/15/49)(b) |
4,876 | 4,601,109 | ||||||
| FedEx Corp. Pass Through Trust, Series 2020-1, Class AA, 1.88%, 08/20/35(b) |
4,364 | 3,581,599 | ||||||
| JB Hunt Transport Services Inc., 3.88%, 03/01/26 (Call 01/01/26) |
4,442 | 4,335,913 | ||||||
| Kirby Corp., 4.20%, 03/01/28 (Call 12/01/27) |
2,957 | 2,825,240 | ||||||
| Norfolk Southern Corp. |
||||||||
| 2.30%, 05/15/31 (Call 02/15/31) |
2,740 | 2,286,932 | ||||||
| 2.55%, 11/01/29 (Call 08/01/29) |
2,626 | 2,307,718 | ||||||
| 2.90%, 06/15/26 (Call 03/15/26) |
3,803 | 3,623,484 | ||||||
| 2.90%, 08/25/51 (Call 02/25/51) |
2,508 | 1,612,667 | ||||||
| 3.00%, 03/15/32 (Call 12/15/31) |
2,870 | 2,466,939 | ||||||
| 3.05%, 05/15/50 (Call 11/15/49) |
3,377 | 2,258,929 | ||||||
| 3.15%, 06/01/27 (Call 03/01/27) |
1,659 | 1,572,127 | ||||||
| S C H E D U L E O F I N V E S T M E N T S |
89 |
| Schedule of Investments (continued) February 29, 2024 |
iShares® Core U.S. Aggregate Bond ETF (Percentages shown are based on Net Assets) |
| Security | Par (000) |
Value | ||||||
| Transportation (continued) |
||||||||
| 3.16%, 05/15/55 (Call 11/15/54) |
$ | 3,116 | $ | 2,041,240 | ||||
| 3.40%, 11/01/49 (Call 05/01/49) |
1,874 | 1,360,431 | ||||||
| 3.65%, 08/01/25 (Call 06/01/25) |
3,023 | 2,956,804 | ||||||
| 3.70%, 03/15/53 (Call 09/15/52) |
1,711 | 1,272,298 | ||||||
| 3.80%, 08/01/28 (Call 05/01/28) |
2,766 | 2,646,194 | ||||||
| 3.94%, 11/01/47 (Call 05/01/47) |
3,139 | 2,479,449 | ||||||
| 3.95%, 10/01/42 (Call 04/01/42) |
1,372 | 1,125,126 | ||||||
| 4.05%, 08/15/52 (Call 02/15/52) |
3,224 | 2,569,115 | ||||||
| 4.10%, 05/15/49 (Call 11/15/48) |
1,690 | 1,372,375 | ||||||
| 4.10%, 05/15/2121 (Call 11/15/20) |
2,295 | 1,656,225 | ||||||
| 4.15%, 02/28/48 (Call 08/28/47) |
3,045 | 2,516,650 | ||||||
| 4.45%, 03/01/33 (Call 12/01/32)(b) |
2,304 | 2,192,239 | ||||||
| 4.45%, 06/15/45 (Call 12/15/44) |
2,292 | 1,973,480 | ||||||
| 4.55%, 06/01/53 (Call 12/01/52) |
3,125 | 2,704,534 | ||||||
| 4.65%, 01/15/46 (Call 07/15/45) |
2,209 | 1,956,774 | ||||||
| 4.84%, 10/01/41 |
2,437 | 2,270,769 | ||||||
| 5.05%, 08/01/30 (Call 06/01/30) |
3,160 | 3,155,625 | ||||||
| 5.10%, 12/31/49 (Call 02/01/18) |
715 | 621,174 | ||||||
| 5.35%, 08/01/54 (Call 02/01/54) |
2,655 | 2,604,883 | ||||||
| 5.55%, 03/15/34 (Call 12/15/33) |
2,277 | 2,335,770 | ||||||
| 5.95%, 03/15/64 (Call 09/15/63) |
2,887 | 3,041,036 | ||||||
| 7.80%, 05/15/27 |
842 | 912,534 | ||||||
| Ryder System Inc. |
||||||||
| 1.75%, 09/01/26 (Call 08/01/26) |
2,205 | 2,025,643 | ||||||
| 2.85%, 03/01/27 (Call 02/01/27) |
1,895 | 1,772,094 | ||||||
| 2.90%, 12/01/26 (Call 10/01/26) |
2,600 | 2,442,913 | ||||||
| 3.35%, 09/01/25 (Call 08/01/25) |
2,015 | 1,953,040 | ||||||
| 4.30%, 06/15/27 (Call 05/15/27) |
1,920 | 1,868,565 | ||||||
| 4.63%, 06/01/25 (Call 05/01/25) |
2,705 | 2,679,490 | ||||||
| 5.25%, 06/01/28 (Call 05/01/28) |
2,262 | 2,265,418 | ||||||
| 5.30%, 03/15/27 (Call 02/15/27) |
1,315 | 1,316,716 | ||||||
| 5.38%, 03/15/29 (Call 02/15/29) |
1,425 | 1,423,431 | ||||||
| 5.65%, 03/01/28 (Call 02/01/28) |
2,931 | 2,979,697 | ||||||
| 6.30%, 12/01/28 (Call 11/01/28) |
1,830 | 1,906,901 | ||||||
| 6.60%, 12/01/33 (Call 09/01/33)(b) |
2,145 | 2,296,639 | ||||||
| Union Pacific Corp. |
||||||||
| 2.15%, 02/05/27 (Call 12/05/26) |
3,233 | 2,996,995 | ||||||
| 2.38%, 05/20/31 (Call 02/20/31) |
3,560 | 3,009,061 | ||||||
| 2.40%, 02/05/30 (Call 11/05/29) |
4,210 | 3,663,114 | ||||||
| 2.75%, 03/01/26 (Call 12/01/25)(b) |
4,662 | 4,463,190 | ||||||
| 2.80%, 02/14/32 (Call 12/15/31) |
5,952 | 5,108,384 | ||||||
| 2.89%, 04/06/36 (Call 01/06/36) |
3,035 | 2,447,647 | ||||||
| 2.95%, 03/10/52 (Call 09/10/51) |
3,255 | 2,176,136 | ||||||
| 2.97%, 09/16/62 (Call 03/16/62) |
3,140 | 1,942,310 | ||||||
| 3.00%, 04/15/27 (Call 01/15/27) |
3,575 | 3,382,868 | ||||||
| 3.20%, 05/20/41 (Call 11/20/40) |
4,780 | 3,677,126 | ||||||
| 3.25%, 08/15/25 (Call 05/15/25) |
3,453 | 3,362,952 | ||||||
| 3.25%, 02/05/50 (Call 08/05/49) |
6,711 | 4,840,719 | ||||||
| 3.35%, 08/15/46 (Call 02/15/46) |
1,711 | 1,235,468 | ||||||
| 3.38%, 02/01/35 (Call 08/01/34) |
2,056 | 1,754,800 | ||||||
| 3.38%, 02/14/42 (Call 08/14/41) |
2,945 | 2,299,231 | ||||||
| 3.50%, 02/14/53 (Call 08/14/52) |
5,035 | 3,744,495 | ||||||
| 3.55%, 08/15/39 (Call 02/15/39) |
2,835 | 2,325,511 | ||||||
| 3.55%, 05/20/61 (Call 11/20/60) |
2,604 | 1,856,649 | ||||||
| 3.60%, 09/15/37 (Call 03/15/37) |
2,341 | 2,000,699 | ||||||
| 3.70%, 03/01/29 (Call 12/01/28) |
4,128 | 3,934,376 | ||||||
| 3.75%, 07/15/25 (Call 05/15/25) |
3,574 | 3,507,470 | ||||||
| 3.75%, 02/05/70 (Call 08/05/69) |
2,750 | 2,009,878 | ||||||
| 3.80%, 10/01/51 (Call 04/01/51) |
3,653 | 2,880,513 | ||||||
| 3.80%, 04/06/71 (Call 10/06/70) |
2,525 | 1,848,254 | ||||||
| 3.84%, 03/20/60 (Call 09/20/59) |
5,471 | 4,148,234 | ||||||
| Security | Par (000) |
Value | ||||||
| Transportation (continued) |
||||||||
| 3.85%, 02/14/72 (Call 08/14/71) |
$ | 1,965 | $ | 1,455,761 | ||||
| 3.88%, 02/01/55 (Call 08/01/54)(b) |
1,670 | 1,296,119 | ||||||
| 3.95%, 09/10/28 (Call 06/10/28) |
5,519 | 5,353,199 | ||||||
| 3.95%, 08/15/59 (Call 02/15/59) |
2,320 | 1,799,486 | ||||||
| 4.00%, 04/15/47 (Call 10/15/46) |
2,514 | 2,043,516 | ||||||
| 4.05%, 11/15/45 (Call 05/15/45) |
2,106 | 1,725,619 | ||||||
| 4.05%, 03/01/46 (Call 09/01/45) |
2,620 | 2,157,031 | ||||||
| 4.10%, 09/15/67 (Call 03/15/67) |
2,131 | 1,674,135 | ||||||
| 4.30%, 03/01/49 (Call 09/01/48) |
2,889 | 2,448,677 | ||||||
| 4.50%, 01/20/33 (Call 10/20/32)(b) |
5,500 | 5,319,133 | ||||||
| 4.50%, 09/10/48 (Call 03/10/48) |
1,978 | 1,734,348 | ||||||
| 4.75%, 02/21/26 (Call 01/21/26) |
6,450 | 6,434,978 | ||||||
| 4.95%, 09/09/52 (Call 03/09/52) |
175 | 167,499 | ||||||
| 4.95%, 05/15/53 (Call 11/15/52) |
2,575 | 2,463,052 | ||||||
| 5.15%, 01/20/63 (Call 07/20/62) |
1,313 | 1,256,613 | ||||||
| 6.63%, 02/01/29 |
2,025 | 2,188,466 | ||||||
| United Parcel Service Inc. |
||||||||
| 2.40%, 11/15/26 (Call 08/15/26) |
2,537 | 2,388,046 | ||||||
| 2.50%, 09/01/29 (Call 06/01/29) |
2,665 | 2,377,098 | ||||||
| 3.05%, 11/15/27 (Call 08/15/27) |
6,221 | 5,846,821 | ||||||
| 3.40%, 03/15/29 (Call 12/15/28) |
4,281 | 4,039,875 | ||||||
| 3.40%, 11/15/46 (Call 05/15/46) |
1,181 | 902,155 | ||||||
| 3.40%, 09/01/49 (Call 03/01/49)(b) |
3,016 | 2,252,737 | ||||||
| 3.63%, 10/01/42 |
1,840 | 1,488,730 | ||||||
| 3.75%, 11/15/47 (Call 05/15/47) |
3,687 | 2,916,347 | ||||||
| 3.90%, 04/01/25 (Call 03/01/25) |
6,218 | 6,133,746 | ||||||
| 4.25%, 03/15/49 (Call 09/15/48) |
3,768 | 3,238,445 | ||||||
| 4.45%, 04/01/30 (Call 01/01/30) |
1,882 | 1,849,687 | ||||||
| 4.88%, 03/03/33 (Call 12/03/32) |
3,145 | 3,121,479 | ||||||
| 4.88%, 11/15/40 (Call 05/15/40) |
2,783 | 2,667,247 | ||||||
| 5.05%, 03/03/53 (Call 09/03/52)(b) |
4,165 | 4,036,901 | ||||||
| 5.20%, 04/01/40 (Call 10/01/39) |
1,824 | 1,812,626 | ||||||
| 5.30%, 04/01/50 (Call 10/01/49) |
5,407 | 5,421,720 | ||||||
| 6.20%, 01/15/38 |
6,537 | 7,148,651 | ||||||
| Walmart Inc. |
||||||||
| 1.05%, 09/17/26 (Call 08/17/26) |
6,600 | 6,031,016 | ||||||
| 1.50%, 09/22/28 (Call 07/22/28) |
4,858 | 4,265,036 | ||||||
| 1.80%, 09/22/31 (Call 06/22/31) |
8,017 | 6,570,501 | ||||||
| 3.95%, 09/09/27 (Call 08/09/27) |
3,185 | 3,120,409 | ||||||
|
|
|
|||||||
| 567,966,715 | ||||||||
| Trucking & Leasing — 0.0% | ||||||||
| GATX Corp. |
||||||||
| 1.90%, 06/01/31 (Call 03/01/31) |
2,071 | 1,629,374 | ||||||
| 3.10%, 06/01/51 (Call 12/01/50) |
1,775 | 1,140,761 | ||||||
| 3.25%, 03/30/25 (Call 12/30/24) |
1,175 | 1,145,609 | ||||||
| 3.25%, 09/15/26 (Call 06/15/26) |
2,636 | 2,512,077 | ||||||
| 3.50%, 03/15/28 (Call 12/15/27) |
1,997 | 1,872,847 | ||||||
| 3.50%, 06/01/32 (Call 03/01/32) |
1,453 | 1,256,400 | ||||||
| 3.85%, 03/30/27 (Call 12/30/26) |
2,092 | 2,006,850 | ||||||
| 4.00%, 06/30/30 (Call 03/30/30) |
2,010 | 1,864,480 | ||||||
| 4.55%, 11/07/28 (Call 08/07/28)(b) |
2,133 | 2,082,742 | ||||||
| 4.70%, 04/01/29 (Call 01/01/29) |
1,747 | 1,707,904 | ||||||
| 4.90%, 03/15/33 (Call 12/15/32) |
1,795 | 1,714,268 | ||||||
| 5.20%, 03/15/44 (Call 09/15/43) |
1,647 | 1,503,221 | ||||||
| 5.40%, 03/15/27 (Call 02/15/27) |
345 | 345,646 | ||||||
| 5.45%, 09/15/33 (Call 06/15/33) |
2,450 | 2,439,931 | ||||||
| 6.05%, 03/15/34 (Call 12/15/33) |
1,977 | 2,023,867 | ||||||
| 6.90%, 05/01/34 (Call 02/01/34) |
1,485 | 1,615,012 | ||||||
|
|
|
|||||||
| 26,860,989 | ||||||||
| 90 | 2 0 2 4 I S H A R E S A N N U A L R E P O R T T O S H A R E H O L D E R S |
| Schedule of Investments (continued) February 29, 2024 |
iShares® Core U.S. Aggregate Bond ETF (Percentages shown are based on Net Assets) |
| Security | Par (000) |
Value | ||||||
| Venture Capital — 0.0% | ||||||||
| Hercules Capital Inc. |
||||||||
| 2.63%, 09/16/26 (Call 08/16/26) |
$ | 1,494 | $ | 1,345,563 | ||||
| 3.38%, 01/20/27 (Call 12/20/26) |
1,582 | 1,434,607 | ||||||
|
|
|
|||||||
| 2,780,170 | ||||||||
| Water — 0.1% | ||||||||
| American Water Capital Corp. |
||||||||
| 2.30%, 06/01/31 (Call 03/01/31) |
2,685 | 2,222,198 | ||||||
| 2.80%, 05/01/30 (Call 02/01/30) |
3,249 | 2,843,729 | ||||||
| 2.95%, 09/01/27 (Call 06/01/27) |
2,530 | 2,358,906 | ||||||
| 3.25%, 06/01/51 (Call 12/01/50) |
3,043 | 2,141,545 | ||||||
| 3.40%, 03/01/25 (Call 12/01/24) |
5,590 | 5,480,627 | ||||||
| 3.45%, 06/01/29 (Call 03/01/29) |
3,926 | 3,649,687 | ||||||
| 3.45%, 05/01/50 (Call 11/01/49) |
2,979 | 2,178,773 | ||||||
| 3.75%, 09/01/28 (Call 06/01/28) |
2,417 | 2,292,904 | ||||||
| 3.75%, 09/01/47 (Call 03/01/47) |
3,922 | 3,043,916 | ||||||
| 4.00%, 12/01/46 (Call 06/01/46) |
1,925 | 1,557,419 | ||||||
| 4.15%, 06/01/49 (Call 12/01/48) |
3,176 | 2,625,157 | ||||||
| 4.20%, 09/01/48 (Call 03/01/48) |
1,827 | 1,534,295 | ||||||
| 4.30%, 12/01/42 (Call 06/01/42) |
1,129 | 985,805 | ||||||
| 4.30%, 09/01/45 (Call 03/01/45) |
2,181 | 1,860,748 | ||||||
| 4.45%, 06/01/32 (Call 03/01/32)(b) |
3,015 | 2,882,804 | ||||||
| 5.15%, 03/01/34 (Call 12/01/33) |
1,925 | 1,909,005 | ||||||
| 5.45%, 03/01/54 (Call 09/01/53) |
1,925 | 1,895,370 | ||||||
| 6.59%, 10/15/37 |
1,180 | 1,324,966 | ||||||
| Essential Utilities Inc. |
||||||||
| 2.40%, 05/01/31 (Call 02/01/31) |
2,824 | 2,317,921 | ||||||
| 2.70%, 04/15/30 (Call 01/15/30) |
2,611 | 2,247,043 | ||||||
| 3.35%, 04/15/50 (Call 10/15/49) |
2,834 | 1,959,274 | ||||||
| 3.57%, 05/01/29 (Call 02/01/29) |
1,517 | 1,406,319 | ||||||
| 4.28%, 05/01/49 (Call 11/01/48) |
3,085 | 2,485,295 | ||||||
| 5.30%, 05/01/52 (Call 11/01/51) |
2,610 | 2,423,815 | ||||||
| 5.38%, 01/15/34 (Call 10/15/33) |
1,075 | 1,056,148 | ||||||
| United Utilities PLC, 6.88%, 08/15/28 |
1,071 | 1,134,523 | ||||||
|
|
|
|||||||
| 57,818,192 | ||||||||
|
|
|
|||||||
| Total Corporate Bonds & Notes — 25.7% |
|
26,130,181,973 | ||||||
|
|
|
|||||||
| Foreign Government Obligations(g) |
| |||||||
| Canada — 0.1% | ||||||||
| Canada Government International Bond |
||||||||
| 0.75%, 05/19/26 |
4,235 | 3,893,093 | ||||||
| 2.88%, 04/28/25 |
4,755 | 4,641,415 | ||||||
| 3.75%, 04/26/28 |
530 | 516,740 | ||||||
| Export Development Canada |
||||||||
| 3.00%, 05/25/27 |
755 | 721,078 | ||||||
| 3.38%, 08/26/25 |
255 | 249,544 | ||||||
| 3.88%, 02/14/28 |
655 | 641,335 | ||||||
| 4.38%, 06/29/26 |
120 | 119,284 | ||||||
| Hydro-Quebec |
||||||||
| Series HH, 8.50%, 12/01/29 |
1,000 | 1,166,846 | ||||||
| Series HK, 9.38%, 04/15/30 |
1,405 | 1,726,274 | ||||||
| Province of Alberta Canada |
||||||||
| 1.00%, 05/20/25 |
3,849 | 3,664,798 | ||||||
| 1.30%, 07/22/30 |
6,117 | 5,018,431 | ||||||
| 3.30%, 03/15/28 |
7,480 | 7,123,608 | ||||||
| 4.50%, 01/24/34 |
120 | 118,060 | ||||||
| Province of British Columbia Canada |
||||||||
| 0.90%, 07/20/26 |
1,585 | 1,450,272 | ||||||
| 1.30%, 01/29/31(b) |
4,155 | 3,368,525 | ||||||
| Security | Par (000) |
Value | ||||||
| Canada (continued) |
||||||||
| 2.25%, 06/02/26 |
$ | 7,305 | $ | 6,922,336 | ||||
| 4.20%, 07/06/33 |
375 | 362,378 | ||||||
| 4.80%, 11/15/28 |
140 | 141,627 | ||||||
| 6.50%, 01/15/26(b) |
358 | 367,763 | ||||||
| 7.25%, 09/01/36 |
388 | 473,777 | ||||||
| Province of Manitoba Canada |
||||||||
| 1.50%, 10/25/28 |
310 | 270,733 | ||||||
| 2.13%, 06/22/26 |
315 | 297,060 | ||||||
| 4.30%, 07/27/33 |
45 | 43,624 | ||||||
| Province of New Brunswick Canada, |
2,046 | 1,961,802 | ||||||
| Province of Ontario Canada |
||||||||
| 0.63%, 01/21/26 |
5,027 | 4,649,627 | ||||||
| 1.05%, 04/14/26 |
1,300 | 1,203,452 | ||||||
| 1.05%, 05/21/27 |
1,275 | 1,139,342 | ||||||
| 1.13%, 10/07/30 |
8,267 | 6,665,297 | ||||||
| 1.60%, 02/25/31 |
6,735 | 5,553,994 | ||||||
| 1.80%, 10/14/31 |
4,705 | 3,877,404 | ||||||
| 2.00%, 10/02/29 |
6,015 | 5,265,588 | ||||||
| 2.13%, 01/21/32(b) |
1,025 | 861,206 | ||||||
| 2.30%, 06/15/26(b) |
8,525 | 8,076,278 | ||||||
| 2.50%, 04/27/26 |
14,389 | 13,728,334 | ||||||
| 3.10%, 05/19/27 |
6,445 | 6,154,141 | ||||||
| 4.20%, 01/18/29 |
100 | 98,538 | ||||||
| Province of Quebec Canada |
||||||||
| 0.60%, 07/23/25 |
3,986 | 3,752,565 | ||||||
| 1.35%, 05/28/30 |
5,763 | 4,768,861 | ||||||
| 1.90%, 04/21/31 |
1,935 | 1,621,894 | ||||||
| 2.50%, 04/20/26 |
7,066 | 6,745,487 | ||||||
| 2.75%, 04/12/27(b) |
5,832 | 5,518,272 | ||||||
| 3.63%, 04/13/28 |
7,865 | 7,586,007 | ||||||
| 4.50%, 09/08/33 |
155 | 153,009 | ||||||
| Series PD, 7.50%, 09/15/29 |
5,122 | 5,846,204 | ||||||
| Province of Saskatchewan Canada, |
30 | 28,724 | ||||||
|
|
|
|||||||
| 138,554,627 | ||||||||
| Chile — 0.1% | ||||||||
| Chile Government International Bond |
||||||||
| 2.45%, 01/31/31 (Call 10/31/30) |
9,027 | 7,675,123 | ||||||
| 2.55%, 01/27/32 (Call 10/27/31)(b) |
8,526 | 7,171,256 | ||||||
| 2.55%, 07/27/33 (Call 04/27/33) |
10,288 | 8,318,520 | ||||||
| 2.75%, 01/31/27 (Call 12/31/26) |
3,309 | 3,095,841 | ||||||
| 3.10%, 05/07/41 (Call 11/07/40) |
10,001 | 7,334,880 | ||||||
| 3.10%, 01/22/61 (Call 07/22/60)(b) |
7,985 | 4,997,509 | ||||||
| 3.13%, 01/21/26 |
4,410 | 4,256,154 | ||||||
| 3.24%, 02/06/28 (Call 11/06/27) |
8,920 | 8,349,670 | ||||||
| 3.25%, 09/21/71 (Call 03/21/71) |
4,318 | 2,708,512 | ||||||
| 3.50%, 01/31/34 (Call 10/31/33)(b) |
6,578 | 5,721,765 | ||||||
| 3.50%, 01/25/50 (Call 07/25/49) |
10,475 | 7,590,576 | ||||||
| 3.63%, 10/30/42 |
430 | 334,087 | ||||||
| 3.86%, 06/21/47(b) |
4,158 | 3,259,722 | ||||||
| 4.00%, 01/31/52 (Call 07/31/51)(b) |
3,508 | 2,753,308 | ||||||
| 4.34%, 03/07/42 (Call 09/07/41) |
4,811 | 4,165,520 | ||||||
| 4.85%, 01/22/29 (Call 12/22/28) |
6,420 | 6,365,002 | ||||||
| 4.95%, 01/05/36 (Call 10/05/35) |
6,589 | 6,368,059 | ||||||
| 5.33%, 01/05/54 (Call 07/05/53) |
3,037 | 2,904,064 | ||||||
|
|
|
|||||||
| 93,369,568 | ||||||||
| Finland — 0.0% | ||||||||
| Finland Government International Bond, |
472 | 488,057 | ||||||
|
|
|
|||||||
| S C H E D U L E O F I N V E S T M E N T S |
91 |
| Schedule of Investments (continued) February 29, 2024 |
iShares® Core U.S. Aggregate Bond ETF (Percentages shown are based on Net Assets) |
| Security | Par (000) |
Value | ||||||
| Hong Kong — 0.0% |
||||||||
| Hong Kong Government International Bond, |
||||||||
| 1.75%, 11/24/31(f) |
$ | 4,500 | $ | 3,730,028 | ||||
|
|
|
|||||||
| Hungary — 0.0% | ||||||||
| Hungary Government International Bond, |
||||||||
| 7.63%, 03/29/41 |
5,102 | 5,844,821 | ||||||
|
|
|
|||||||
| Indonesia — 0.1% | ||||||||
| Indonesia Government International Bond |
||||||||
| 1.85%, 03/12/31 |
1,055 | 854,625 | ||||||
| 2.15%, 07/28/31 (Call 04/28/31) |
8,440 | 6,905,076 | ||||||
| 2.85%, 02/14/30 |
6,811 | 6,038,018 | ||||||
| 3.05%, 03/12/51 |
3,215 | 2,241,426 | ||||||
| 3.20%, 09/23/61 (Call 03/23/61) |
1,785 | 1,161,244 | ||||||
| 3.35%, 03/12/71 |
3,320 | 2,172,522 | ||||||
| 3.40%, 09/18/29 |
3,110 | 2,866,385 | ||||||
| 3.50%, 01/11/28 |
4,127 | 3,911,055 | ||||||
| 3.50%, 02/14/50(b) |
3,656 | 2,692,926 | ||||||
| 3.55%, 03/31/32 (Call 12/31/31) |
2,225 | 1,993,422 | ||||||
| 3.70%, 10/30/49(b) |
4,531 | 3,477,235 | ||||||
| 3.85%, 10/15/30 |
8,841 | 8,219,086 | ||||||
| 4.10%, 04/24/28 |
5,475 | 5,291,356 | ||||||
| 4.15%, 09/20/27 (Call 06/20/27) |
5,270 | 5,119,186 | ||||||
| 4.20%, 10/15/50(b) |
6,975 | 5,796,007 | ||||||
| 4.30%, 03/31/52 (Call 09/30/51) |
3,575 | 3,015,966 | ||||||
| 4.35%, 01/11/48 |
7,185 | 6,197,316 | ||||||
| 4.40%, 03/10/29 (Call 02/10/29) |
720 | 700,067 | ||||||
| 4.45%, 04/15/70 |
4,205 | 3,491,127 | ||||||
| 4.55%, 01/11/28 (Call 12/11/27) |
1,845 | 1,815,252 | ||||||
| 4.65%, 09/20/32 (Call 06/20/32) |
6,095 | 5,886,999 | ||||||
| 4.70%, 02/10/34 (Call 11/10/33)(b) |
1,000 | 974,569 | ||||||
| 4.75%, 02/11/29 |
4,493 | 4,443,165 | ||||||
| 4.85%, 01/11/33 (Call 10/11/32) |
3,505 | 3,439,090 | ||||||
| 5.10%, 02/10/54 (Call 08/10/53) |
240 | 230,575 | ||||||
| 5.35%, 02/11/49 |
4,430 | 4,416,354 | ||||||
| 5.45%, 09/20/52 (Call 03/20/52) |
2,615 | 2,600,421 | ||||||
| 5.65%, 01/11/53 (Call 07/11/52) |
3,375 | 3,484,889 | ||||||
|
|
|
|||||||
| 99,435,359 | ||||||||
| Israel — 0.1% | ||||||||
| Israel Government International Bond |
||||||||
| 2.75%, 07/03/30 |
11,865 | 10,158,162 | ||||||
| 2.88%, 03/16/26 |
3,905 | 3,705,243 | ||||||
| 3.25%, 01/17/28 |
4,025 | 3,721,263 | ||||||
| 3.88%, 07/03/50 |
8,660 | 6,370,098 | ||||||
| 4.13%, 01/17/48 |
2,630 | 2,051,818 | ||||||
| 4.50%, 01/17/33 |
7,440 | 6,916,990 | ||||||
| 4.50%, 01/30/43 |
5,963 | 5,137,691 | ||||||
| 4.50%, |
3,513 | 2,576,377 | ||||||
| State of Israel |
||||||||
| 2.50%, 01/15/30 |
3,175 | 2,711,599 | ||||||
| 3.38%, 01/15/50 |
6,573 | 4,408,455 | ||||||
|
|
|
|||||||
| 47,757,696 | ||||||||
| Italy — 0.0% | ||||||||
| Republic of Italy Government International Bond |
||||||||
| 1.25%, 02/17/26 |
12,760 | 11,791,663 | ||||||
| 2.88%, 10/17/29 |
8,230 | 7,250,550 | ||||||
| 3.88%, 05/06/51 |
9,395 | 6,502,111 | ||||||
| 4.00%, 10/17/49 |
7,975 | 5,690,218 | ||||||
| 5.38%, 06/15/33 |
7,637 | 7,495,094 | ||||||
|
|
|
|||||||
| 38,729,636 | ||||||||
| Security | Par (000) |
Value | ||||||
| Japan — 0.1% |
||||||||
| Japan Bank for International Cooperation |
||||||||
| 0.63%, 07/15/25 |
$ | 2,823 | $ | 2,654,813 | ||||
| 1.25%, 01/21/31 |
6,315 | 5,056,722 | ||||||
| 1.63%, 01/20/27 |
100 | 91,614 | ||||||
| 1.88%, 07/21/26 |
5,690 | 5,310,871 | ||||||
| 1.88%, 04/15/31 |
18,198 | 15,103,516 | ||||||
| 2.00%, 10/17/29 |
4,457 | 3,871,724 | ||||||
| 2.13%, 02/16/29(b) |
5,155 | 4,573,314 | ||||||
| 2.25%, 11/04/26 |
6,625 | 6,204,367 | ||||||
| 2.38%, 04/20/26 |
5,730 | 5,437,660 | ||||||
| 2.50%, 05/28/25 |
2,991 | 2,893,783 | ||||||
| 2.75%, 01/21/26(b) |
4,200 | 4,033,248 | ||||||
| 2.75%, 11/16/27 |
5,765 | 5,379,522 | ||||||
| 2.88%, 04/14/25 |
580 | 565,099 | ||||||
| 2.88%, 06/01/27 |
5,793 | 5,471,852 | ||||||
| 2.88%, 07/21/27 |
4,887 | 4,607,860 | ||||||
| 3.25%, 07/20/28 |
2,100 | 1,982,961 | ||||||
| 3.50%, 10/31/28(b) |
3,840 | 3,648,026 | ||||||
| 4.25%, 01/26/26 |
430 | 424,354 | ||||||
| 4.38%, 10/05/27 |
400 | 395,877 | ||||||
| 4.38%, 01/24/31 |
100 | 98,655 | ||||||
| 4.63%, 07/19/28 |
190 | 189,576 | ||||||
| 4.88%, 10/18/28 |
100 | 100,955 | ||||||
| Japan International Cooperation Agency |
||||||||
| 1.00%, 07/22/30(b) |
2,701 | 2,145,759 | ||||||
| 2.13%, 10/20/26 |
1,044 | 973,859 | ||||||
| 2.75%, 04/27/27(b) |
885 | 831,252 | ||||||
| 3.25%, 05/25/27 |
2,825 | 2,689,010 | ||||||
| 3.38%, 06/12/28 |
1,265 | 1,196,846 | ||||||
| 4.00%, 05/23/28 |
100 | 97,006 | ||||||
|
|
|
|||||||
| 86,030,101 | ||||||||
| Mexico — 0.3% | ||||||||
| Mexico Government International Bond |
||||||||
| 2.66%, 05/24/31 (Call 02/24/31) |
7,672 | 6,352,319 | ||||||
| 3.25%, 04/16/30 (Call 01/16/30) |
10,630 | 9,402,587 | ||||||
| 3.50%, 02/12/34 (Call 11/12/33) |
11,963 | 9,887,365 | ||||||
| 3.75%, 01/11/28 |
8,835 | 8,360,747 | ||||||
| 3.77%, 05/24/61 (Call 11/24/60) |
10,841 | 6,968,195 | ||||||
| 3.90%, 04/27/25 (Call 03/27/25) |
1,945 | 1,913,708 | ||||||
| 4.13%, 01/21/26 |
12,826 | 12,581,500 | ||||||
| 4.15%, 03/28/27 |
10,525 | 10,261,929 | ||||||
| 4.28%, 08/14/41 (Call 02/14/41) |
12,316 | 9,782,868 | ||||||
| 4.35%, 01/15/47(b) |
3,512 | 2,707,071 | ||||||
| 4.40%, 02/12/52 (Call 08/12/51) |
3,997 | 3,016,397 | ||||||
| 4.50%, 04/22/29 |
11,905 | 11,449,515 | ||||||
| 4.50%, 01/31/50 (Call 07/31/49)(b) |
8,061 | 6,271,269 | ||||||
| 4.60%, 01/23/46 |
11,404 | 9,098,506 | ||||||
| 4.60%, 02/10/48 |
7,646 | 6,043,452 | ||||||
| 4.75%, 04/27/32 (Call 01/27/32) |
14,332 | 13,490,180 | ||||||
| 4.75%, 03/08/44 |
15,947 | 13,166,773 | ||||||
| 4.88%, 05/19/33 (Call 02/19/33)(b) |
9,968 | 9,384,934 | ||||||
| 5.00%, 05/07/29 (Call 04/07/29) |
670 | 658,763 | ||||||
| 5.00%, 04/27/51 (Call 10/27/50)(b) |
13,199 | 10,984,566 | ||||||
| 5.40%, 02/09/28 (Call 01/09/28) |
3,337 | 3,348,891 | ||||||
| 5.55%, 01/21/45(b) |
11,435 | 10,529,874 | ||||||
| 5.75%, |
10,405 | 8,996,021 | ||||||
| 6.00%, 05/07/36 (Call 02/07/36) |
1,890 | 1,884,469 | ||||||
| 6.05%, 01/11/40 |
11,353 | 11,115,898 | ||||||
| 6.34%, 05/04/53 (Call 11/04/52) |
12,356 | 12,071,561 | ||||||
| 6.35%, 02/09/35 (Call 11/09/34) |
11,425 | 11,705,972 | ||||||
| 6.40%, 05/07/54 (Call 11/07/53) |
622 | 613,697 | ||||||
| 92 | 2 0 2 4 I S H A R E S A N N U A L R E P O R T T O S H A R E H O L D E R S |
| Schedule of Investments (continued) February 29, 2024 |
iShares® Core U.S. Aggregate Bond ETF (Percentages shown are based on Net Assets) |
| Security | Par (000) |
Value | ||||||
| Mexico (continued) |
||||||||
| 6.75%, 09/27/34 |
$ | 10,537 | $ | 11,111,632 | ||||
| 7.50%, 04/08/33 |
5,327 | 5,978,886 | ||||||
| 8.30%, 08/15/31(b) |
5,286 | 6,245,559 | ||||||
| 11.50%, 05/15/26(b) |
773 | 880,645 | ||||||
|
|
|
|||||||
| 246,265,749 | ||||||||
| Panama — 0.1% | ||||||||
| Panama Government International Bond |
||||||||
| 2.25%, 09/29/32 (Call 06/29/32) |
13,905 | 9,741,344 | ||||||
| 3.16%, 01/23/30 (Call 10/23/29) |
6,603 | 5,425,674 | ||||||
| 3.30%, 01/19/33 (Call 10/19/32) |
7,730 | 5,834,535 | ||||||
| 3.75%, 03/16/25 (Call 12/16/24) |
5,156 | 5,027,493 | ||||||
| 3.87%, 07/23/60 (Call 01/23/60)(b) |
11,298 | 6,313,863 | ||||||
| 3.88%, 03/17/28 (Call 12/17/27) |
5,152 | 4,664,739 | ||||||
| 4.30%, 04/29/53(b) |
6,749 | 4,237,425 | ||||||
| 4.50%, 05/15/47 (Call 11/15/46) |
3,826 | 2,554,402 | ||||||
| 4.50%, 04/16/50 (Call 10/16/49) |
9,479 | 6,169,479 | ||||||
| 4.50%, 04/01/56 (Call 10/01/55) |
9,450 | 5,957,836 | ||||||
| 4.50%, 01/19/63 (Call 07/19/62) |
5,810 | 3,603,680 | ||||||
| 6.40%, 02/14/35 (Call 11/14/34) |
8,310 | 7,673,488 | ||||||
| 6.70%, 01/26/36 |
10,226 | 9,669,428 | ||||||
| 6.85%, 03/28/54 (Call 09/28/53) |
3,905 | 3,438,983 | ||||||
| 6.88%, 01/31/36 (Call 10/31/35) |
2,237 | 2,115,303 | ||||||
| 7.13%, 01/29/26 |
4,827 | 4,900,497 | ||||||
| 8.88%, 09/30/27 |
5,521 | 5,950,482 | ||||||
| 9.38%, 04/01/29 |
4,482 | 4,951,729 | ||||||
|
|
|
|||||||
| 98,230,380 | ||||||||
| Peru — 0.1% | ||||||||
| Peruvian Government International Bond |
||||||||
| 1.86%, 12/01/32 (Call 09/01/32) |
4,785 | 3,621,930 | ||||||
| 2.39%, 01/23/26 (Call 12/23/25) |
3,841 | 3,635,831 | ||||||
| 2.78%, 01/23/31 (Call 10/23/30) |
14,039 | 11,941,955 | ||||||
| 2.78%, 12/01/60 (Call 06/01/60)(b) |
7,833 | 4,491,769 | ||||||
| 2.84%, 06/20/30(b) |
3,037 | 2,646,672 | ||||||
| 3.00%, 01/15/34 (Call 10/15/33) |
6,790 | 5,520,191 | ||||||
| 3.23%, (Call 01/28/21) |
4,108 | 2,348,237 | ||||||
| 3.30%, 03/11/41 (Call 09/11/40) |
4,586 | 3,402,363 | ||||||
| 3.55%, 03/10/51 (Call 09/10/50) |
6,158 | 4,419,243 | ||||||
| 3.60%, 01/15/72 (Call 07/15/71) |
3,365 | 2,209,674 | ||||||
| 4.13%, 08/25/27(b) |
3,623 | 3,503,133 | ||||||
| 5.63%, 11/18/50 |
7,800 | 7,719,647 | ||||||
| 6.55%, 03/14/37 |
4,991 | 5,383,206 | ||||||
| 7.35%, 07/21/25 |
5,514 | 5,650,780 | ||||||
| 8.75%, 11/21/33 |
9,480 | 11,637,392 | ||||||
|
|
|
|||||||
| 78,132,023 | ||||||||
| Philippines — 0.1% | ||||||||
| Bangko Sentral ng Pilipinas International Bond, 8.60%, 06/15/27 |
585 | 638,071 | ||||||
| Philippine Government International Bond |
||||||||
| 1.65%, 06/10/31 |
7,661 | 6,074,331 | ||||||
| 1.95%, 01/06/32 |
1,775 | 1,416,826 | ||||||
| 2.46%, 05/05/30 |
6,174 | 5,314,939 | ||||||
| 2.65%, 12/10/45 |
5,805 | 3,786,887 | ||||||
| 2.95%, 05/05/45 |
5,877 | 4,064,930 | ||||||
| 3.00%, 02/01/28 |
8,461 | 7,857,541 | ||||||
| 3.20%, 07/06/46 |
9,328 | 6,641,098 | ||||||
| 3.23%, 03/29/27 |
1,695 | 1,608,618 | ||||||
| 3.56%, 09/29/32 |
1,668 | 1,488,932 | ||||||
| 3.70%, 03/01/41 |
8,209 | 6,701,472 | ||||||
| 3.70%, 02/02/42 |
8,594 | 6,982,612 | ||||||
| 3.75%, 01/14/29 |
6,681 | 6,331,650 | ||||||
| Security | Par (000) |
Value | ||||||
| Philippines (continued) |
||||||||
| 3.95%, 01/20/40 |
$ | 8,000 | $ | 6,838,689 | ||||
| 4.20%, 03/29/47 |
4,205 | 3,507,600 | ||||||
| 4.63%, 07/17/28 |
1,645 | 1,626,667 | ||||||
| 5.00%, 07/17/33 |
6,795 | 6,802,935 | ||||||
| 5.00%, 01/13/37 |
5,780 | 5,689,060 | ||||||
| 5.17%, 10/13/27 |
3,034 | 3,055,502 | ||||||
| 5.50%, 03/30/26 |
5,681 | 5,746,858 | ||||||
| 5.50%, 01/17/48(b) |
5,375 | 5,465,900 | ||||||
| 5.61%, 04/13/33 |
1,785 | 1,849,398 | ||||||
| 5.95%, 10/13/47 |
1,820 | 1,933,596 | ||||||
| 6.38%, 01/15/32 |
4,972 | 5,373,484 | ||||||
| 6.38%, 10/23/34 |
8,031 | 8,817,943 | ||||||
| 7.75%, 01/14/31 |
6,843 | 7,884,946 | ||||||
| 9.50%, 02/02/30 |
4,024 | 4,938,185 | ||||||
| 10.63%, 03/16/25 |
6,366 | 6,722,325 | ||||||
|
|
|
|||||||
| 135,160,995 | ||||||||
| Poland — 0.0% | ||||||||
| Republic of Poland Government International Bond |
||||||||
| 3.25%, 04/06/26 |
8,670 | 8,433,076 | ||||||
| 4.88%, 10/04/33 (Call 07/04/33) |
9,660 | 9,458,042 | ||||||
| 5.50%, 11/16/27 (Call 08/16/27) |
3,636 | 3,722,031 | ||||||
| 5.50%, 04/04/53 (Call 10/04/52) |
8,295 | 8,284,887 | ||||||
| 5.75%, 11/16/32 (Call 08/16/32) |
5,940 | 6,193,151 | ||||||
|
|
|
|||||||
| 36,091,187 | ||||||||
| South Korea — 0.1% | ||||||||
| Export-Import Bank of Korea |
||||||||
| 0.63%, 02/09/26 |
260 | 239,248 | ||||||
| 0.75%, 09/21/25(b) |
1,245 | 1,164,790 | ||||||
| 1.13%, 12/29/26 |
1,695 | 1,527,257 | ||||||
| 1.25%, 09/21/30 |
3,085 | 2,466,706 | ||||||
| 1.38%, 02/09/31 |
1,490 | 1,184,687 | ||||||
| 1.63%, 01/18/27 |
2,165 | 1,976,784 | ||||||
| 2.13%, 01/18/32(b) |
2,025 | 1,663,200 | ||||||
| 2.38%, 04/21/27 |
1,950 | 1,808,710 | ||||||
| 2.50%, 06/29/41 |
4,288 | 3,051,499 | ||||||
| 2.63%, 05/26/26 |
3,927 | 3,730,628 | ||||||
| 3.25%, 11/10/25(b) |
3,290 | 3,191,626 | ||||||
| 3.25%, 08/12/26 |
1,930 | 1,853,943 | ||||||
| 4.25%, 09/15/27 |
820 | 802,606 | ||||||
| 4.50%, 01/11/29 |
410 | 405,806 | ||||||
| 4.50%, 09/15/32(b) |
2,300 | 2,236,264 | ||||||
| 4.63%, 01/11/27 |
140 | 139,153 | ||||||
| 4.63%, 01/11/34 |
1,000 | 977,067 | ||||||
| 4.88%, 01/11/26 |
400 | 398,848 | ||||||
| 5.00%, 01/11/28 |
1,850 | 1,865,265 | ||||||
| 5.13%, 09/18/28 |
680 | 690,393 | ||||||
| 5.13%, 01/11/33 |
3,710 | 3,766,728 | ||||||
| 5.13%, 09/18/33 |
1,330 | 1,351,172 | ||||||
| 5.38%, 09/18/25(b) |
742 | 745,238 | ||||||
| Korea Development Bank (The) |
||||||||
| 0.80%, 04/27/26 |
880 | 805,142 | ||||||
| 1.38%, 04/25/27 |
2,670 | 2,398,700 | ||||||
| 4.00%, 09/08/25 |
1,290 | 1,268,262 | ||||||
| 4.25%, 09/08/32 |
5,880 | 5,617,288 | ||||||
| 4.38%, 02/15/28 |
1,545 | 1,523,229 | ||||||
| 4.38%, 02/15/33 |
7,248 | 6,963,516 | ||||||
| 5.38%, 10/23/26(b) |
700 | 707,172 | ||||||
| 5.38%, 10/23/28 |
1,010 | 1,035,698 | ||||||
| 5.63%, 10/23/33 |
1,965 | 2,069,906 | ||||||
| S C H E D U L E O F I N V E S T M E N T S |
93 |
| Schedule of Investments (continued) February 29, 2024 |
iShares® Core U.S. Aggregate Bond ETF (Percentages shown are based on Net Assets) |
| Security | Par (000) |
Value | ||||||
| South Korea (continued) |
||||||||
| Korea International Bond |
||||||||
| 1.00%, 09/16/30 |
$ | 2,740 | $ | 2,198,620 | ||||
| 1.75%, 10/15/31 |
3,025 | 2,492,737 | ||||||
| 2.50%, 06/19/29 |
3,905 | 3,538,207 | ||||||
| 2.75%, 01/19/27 |
4,664 | 4,419,507 | ||||||
| 3.50%, 09/20/28 |
1,865 | 1,785,597 | ||||||
| 3.88%, 09/20/48 |
873 | 742,837 | ||||||
| 4.13%, 06/10/44 |
876 | 788,534 | ||||||
| 5.63%, 11/03/25(b) |
630 | 635,760 | ||||||
|
|
|
|||||||
| 76,228,330 | ||||||||
| Supranational — 0.8% | ||||||||
| African Development Bank |
||||||||
| 0.88%, 03/23/26 |
6,490 | 6,007,388 | ||||||
| 0.88%, 07/22/26 |
7,113 | 6,513,584 | ||||||
| 3.38%, 07/07/25 |
994 | 973,668 | ||||||
| 4.38%, 11/03/27 |
4,490 | 4,474,148 | ||||||
| 4.38%, 03/14/28 |
4,440 | 4,427,424 | ||||||
| 4.63%, 01/04/27 |
1,120 | 1,122,090 | ||||||
| Asian Development Bank |
||||||||
| 0.38%, 09/03/25 |
5,385 | 5,036,461 | ||||||
| 0.50%, 02/04/26 |
7,990 | 7,376,021 | ||||||
| 0.63%, 04/29/25 |
14,940 | 14,206,683 | ||||||
| 0.75%, 10/08/30 |
2,964 | 2,348,804 | ||||||
| 1.00%, 04/14/26 |
12,510 | 11,592,979 | ||||||
| 1.25%, 06/09/28 |
2,095 | 1,838,474 | ||||||
| 1.50%, 01/20/27 |
6,205 | 5,703,796 | ||||||
| 1.50%, 03/04/31 |
2,399 | 1,984,973 | ||||||
| 1.75%, 08/14/26 |
3,070 | 2,870,018 | ||||||
| 1.75%, 09/19/29 |
9,007 | 7,842,860 | ||||||
| 1.88%, 03/15/29 |
1,355 | 1,202,504 | ||||||
| 1.88%, 01/24/30 |
8,386 | 7,283,825 | ||||||
| 2.00%, 04/24/26(b) |
7,310 | 6,913,800 | ||||||
| 2.13%, 03/19/25(b) |
520 | 504,343 | ||||||
| 2.38%, 08/10/27 |
1,440 | 1,345,170 | ||||||
| 2.50%, 11/02/27 |
6,277 | 5,864,149 | ||||||
| 2.63%, 01/12/27 |
5,924 | 5,624,636 | ||||||
| 2.75%, 01/19/28 |
7,175 | 6,742,118 | ||||||
| 2.88%, 05/06/25 |
2,650 | 2,585,601 | ||||||
| 3.13%, 08/20/27 |
4,715 | 4,511,720 | ||||||
| 3.13%, 09/26/28 |
1,284 | 1,216,997 | ||||||
| 3.13%, 04/27/32 |
1,100 | 1,003,673 | ||||||
| 3.75%, 04/25/28 |
6,790 | 6,614,767 | ||||||
| 3.88%, 09/28/32(b) |
2,700 | 2,599,484 | ||||||
| 3.88%, 06/14/33 |
3,400 | 3,262,081 | ||||||
| 4.00%, 01/12/33 |
12,736 | 12,354,086 | ||||||
| 4.13%, 01/12/27 |
370 | 366,027 | ||||||
| 4.13%, 01/12/34 |
120 | 117,321 | ||||||
| 4.25%, 01/09/26 |
3,697 | 3,665,161 | ||||||
| 4.50%, 08/25/28(b) |
8,305 | 8,343,101 | ||||||
| 4.63%, 06/13/25 |
1,075 | 1,070,042 | ||||||
| 4.88%, 09/26/28 (Call 09/26/26) |
10 | 9,993 | ||||||
| 5.82%, 06/16/28 |
5,910 | 6,205,045 | ||||||
| 6.22%, 08/15/27 |
960 | 1,004,000 | ||||||
| 6.38%, 10/01/28 |
765 | 815,999 | ||||||
| Asian Infrastructure Investment Bank (The) |
||||||||
| 0.50%, 05/28/25 |
9,360 | 8,850,346 | ||||||
| 0.50%, 01/27/26 |
4,940 | 4,558,680 | ||||||
| 3.38%, 06/29/25 |
2,085 | 2,040,720 | ||||||
| 3.75%, 09/14/27 |
2,990 | 2,912,340 | ||||||
| 4.00%, 01/18/28 |
4,755 | 4,664,073 | ||||||
| 4.88%, 09/14/26(b) |
1,555 | 1,563,789 | ||||||
| Security | Par (000) |
Value | ||||||
| Supranational (continued) |
||||||||
| Corp. Andina de Fomento, 2.25%, 02/08/27 |
$ | 985 | $ | 905,958 | ||||
| Council of Europe Development Bank |
||||||||
| 0.88%, 09/22/26(b) |
190 | 173,065 | ||||||
| 3.00%, 06/16/25 |
755 | 735,843 | ||||||
| 3.63%, 01/26/28 |
940 | 912,385 | ||||||
| 3.75%, 05/25/26 |
4,415 | 4,329,605 | ||||||
| 4.13%, 01/24/29 |
120 | 118,649 | ||||||
| European Bank for Reconstruction & Development |
||||||||
| 0.50%, 05/19/25 |
8,800 | 8,335,279 | ||||||
| 0.50%, 11/25/25 |
4,510 | 4,190,135 | ||||||
| 0.50%, 01/28/26 |
1,173 | 1,083,529 | ||||||
| 4.13%, 01/25/29 |
430 | 425,124 | ||||||
| 4.38%, 03/09/28 |
715 | 713,116 | ||||||
| European Investment Bank |
||||||||
| 0.38%, 12/15/25 |
4,220 | 3,906,220 | ||||||
| 0.38%, 03/26/26 |
4,461 | 4,089,592 | ||||||
| 0.63%, 07/25/25 |
11,692 | 11,025,192 | ||||||
| 0.63%, 10/21/27 |
1,072 | 936,011 | ||||||
| 0.75%, 10/26/26 |
7,645 | 6,931,208 | ||||||
| 0.75%, 09/23/30 |
1,335 | 1,064,281 | ||||||
| 0.88%, 05/17/30 |
4,605 | 3,736,670 | ||||||
| 1.25%, 02/14/31 |
11,589 | 9,472,501 | ||||||
| 1.38%, 03/15/27(b) |
17,140 | 15,644,605 | ||||||
| 1.63%, 03/14/25 |
18,658 | 18,019,575 | ||||||
| 1.63%, 10/09/29 |
4,390 | 3,799,074 | ||||||
| 1.63%, 05/13/31 |
455 | 379,852 | ||||||
| 1.75%, 03/15/29 |
7,655 | 6,761,293 | ||||||
| 2.13%, 04/13/26 |
5,755 | 5,466,047 | ||||||
| 2.38%, 05/24/27 |
3,991 | 3,744,016 | ||||||
| 2.75%, 08/15/25 |
3,440 | 3,338,242 | ||||||
| 3.25%, 11/15/27 |
2,570 | 2,466,219 | ||||||
| 3.63%, 07/15/30 |
5,940 | 5,697,662 | ||||||
| 3.75%, 02/14/33 |
12,605 | 12,043,539 | ||||||
| 3.88%, 03/15/28 |
3,368 | 3,301,274 | ||||||
| 4.00%, 02/15/29 |
610 | 600,132 | ||||||
| 4.50%, 10/16/28 |
955 | 960,287 | ||||||
| 4.88%, 02/15/36 |
7,346 | 7,616,573 | ||||||
| Inter-American Development Bank |
||||||||
| 0.63%, 07/15/25 |
2,795 | 2,636,514 | ||||||
| 0.63%, 09/16/27 |
2,110 | 1,847,164 | ||||||
| 0.88%, 04/03/25 |
10,430 | 9,969,521 | ||||||
| 0.88%, 04/20/26 |
16,285 | 15,046,994 | ||||||
| 1.13%, 07/20/28(b) |
10,230 | 8,906,557 | ||||||
| 1.13%, 01/13/31 |
11,750 | 9,493,969 | ||||||
| 1.50%, 01/13/27 |
780 | 717,423 | ||||||
| 1.75%, 03/14/25 |
14,224 | 13,745,905 | ||||||
| 2.00%, 06/02/26 |
7,478 | 7,055,663 | ||||||
| 2.00%, 07/23/26 |
4,838 | 4,553,716 | ||||||
| 2.25%, 06/18/29 |
9,364 | 8,422,354 | ||||||
| 2.38%, 07/07/27 |
6,504 | 6,081,348 | ||||||
| 3.13%, 09/18/28 |
9,145 | 8,666,297 | ||||||
| 3.20%, 08/07/42 |
4,415 | 3,560,376 | ||||||
| 3.50%, 09/14/29 |
1,785 | 1,706,432 | ||||||
| 3.50%, 04/12/33 |
6,605 | 6,146,832 | ||||||
| 3.88%, 10/28/41 |
6,110 | 5,439,785 | ||||||
| 4.00%, 01/12/28 |
3,821 | 3,758,574 | ||||||
| 4.13%, 02/15/29 |
80 | 79,138 | ||||||
| 4.38%, 02/01/27(b) |
1,190 | 1,185,505 | ||||||
| 4.38%, 01/24/44 |
3,235 | 3,072,968 | ||||||
| 4.50%, 05/15/26(b) |
3,415 | 3,404,449 | ||||||
| 94 | 2 0 2 4 I S H A R E S A N N U A L R E P O R T T O S H A R E H O L D E R S |
| Schedule of Investments (continued) February 29, 2024 |
iShares® Core U.S. Aggregate Bond ETF (Percentages shown are based on Net Assets) |
| Security | Par (000) |
Value | ||||||
| Supranational (continued) |
||||||||
| 4.50%, 09/13/33 |
$ | 3,905 | $ | 3,927,464 | ||||
| 7.00%, 06/15/25 |
10 | 10,215 | ||||||
| Inter-American Investment Corp. |
||||||||
| 4.13%, 02/15/28 |
805 | 790,779 | ||||||
| 4.75%, 09/19/28 |
723 | 728,754 | ||||||
| International Bank for Reconstruction & Development |
||||||||
| 0.38%, 07/28/25 |
17,670 | 16,592,230 | ||||||
| 0.50%, 10/28/25 |
24,141 | 22,498,854 | ||||||
| 0.60%, 02/18/26 |
20 | 18,331 | ||||||
| 0.63%, 04/22/25 |
31,115 | 29,617,192 | ||||||
| 0.65%, 02/10/26 (Call 05/10/24) |
159 | 146,184 | ||||||
| 0.75%, 03/11/25 |
13,832 | 13,239,958 | ||||||
| 0.75%, 11/24/27 |
10,750 | 9,395,648 | ||||||
| 0.75%, 08/26/30 |
6,958 | 5,531,849 | ||||||
| 0.85%, 02/10/27 (Call 05/10/24) |
90 | 79,674 | ||||||
| 0.88%, 07/15/26 |
9,985 | 9,160,204 | ||||||
| 0.88%, 05/14/30 |
12,570 | 10,166,904 | ||||||
| 1.13%, 09/13/28 |
20,897 | 18,117,357 | ||||||
| 1.25%, 02/10/31(b) |
15,205 | 12,362,937 | ||||||
| 1.38%, 04/20/28 |
19,550 | 17,308,978 | ||||||
| 1.63%, 11/03/31(b) |
22,204 | 18,255,744 | ||||||
| 1.75%, 10/23/29 |
12,357 | 10,734,187 | ||||||
| 1.88%, 10/27/26 |
5,890 | 5,500,248 | ||||||
| 2.13%, 03/03/25 |
6,489 | 6,302,971 | ||||||
| 2.50%, 07/29/25 |
18,384 | 17,785,612 | ||||||
| 2.50%, 11/22/27 |
15,615 | 14,580,230 | ||||||
| 2.50%, 03/29/32 |
3,041 | 2,655,615 | ||||||
| 3.13%, 11/20/25 |
3,496 | 3,399,576 | ||||||
| 3.13%, 06/15/27 |
10,990 | 10,543,701 | ||||||
| 3.50%, 07/12/28 |
14,970 | 14,440,006 | ||||||
| 3.63%, 09/21/29 |
6,030 | 5,807,067 | ||||||
| 3.88%, 02/14/30(b) |
12,165 | 11,833,509 | ||||||
| 4.00%, 07/25/30 |
5,335 | 5,215,293 | ||||||
| 4.00%, 01/10/31 |
1,220 | 1,190,451 | ||||||
| 4.63%, 08/01/28 |
3,160 | 3,190,103 | ||||||
| 4.75%, 11/14/33(b) |
2,682 | 2,754,944 | ||||||
| 4.75%, 02/15/35(b) |
1,062 | 1,076,549 | ||||||
| 5.67%, 02/01/34 |
320 | 318,590 | ||||||
| International Finance Corp. |
||||||||
| 0.38%, 07/16/25 |
1,207 | 1,134,918 | ||||||
| 0.75%, 10/08/26(b) |
3,455 | 3,137,179 | ||||||
| 0.75%, 08/27/30 |
960 | 764,830 | ||||||
| 2.13%, 04/07/26 |
668 | 634,542 | ||||||
| 3.63%, 09/15/25 |
1,075 | 1,055,077 | ||||||
| 4.38%, 01/15/27(b) |
1,335 | 1,330,717 | ||||||
| 4.50%, 07/13/28 |
995 | 999,349 | ||||||
| Nordic Investment Bank |
||||||||
| 0.38%, 09/11/25 |
3,075 | 2,874,558 | ||||||
| 0.50%, 01/21/26 |
1,020 | 942,945 | ||||||
| 2.63%, 04/04/25 |
1,282 | 1,248,722 | ||||||
| 3.38%, 09/08/27 |
915 | 882,177 | ||||||
| 4.38%, 03/14/28 |
765 | 762,827 | ||||||
| 5.00%, 10/15/25 |
1,390 | 1,393,553 | ||||||
|
|
|
|||||||
| 800,994,501 | ||||||||
| Sweden — 0.0% | ||||||||
| Svensk Exportkredit AB |
||||||||
| 0.50%, 08/26/25 |
5,475 | 5,121,525 | ||||||
| 0.63%, 05/14/25 |
6,690 | 6,342,117 | ||||||
| 2.25%, 03/22/27 |
3,143 | 2,928,622 | ||||||
| 4.00%, 07/15/25 |
470 | 463,205 | ||||||
| Security | Par (000) |
Value | ||||||
| Sweden (continued) |
||||||||
| 4.13%, 06/14/28 |
$ | 2,125 | $ | 2,088,741 | ||||
| 4.25%, 02/01/29 |
450 | 445,525 | ||||||
| 4.38%, 02/13/26 |
610 | 604,361 | ||||||
| 4.63%, 11/28/25 |
3,710 | 3,688,664 | ||||||
| 4.88%, 09/14/26 |
405 | 406,587 | ||||||
| 4.88%, 10/04/30 |
2,865 | 2,908,009 | ||||||
|
|
|
|||||||
| 24,997,356 | ||||||||
| Uruguay — 0.1% | ||||||||
| Uruguay Government International Bond |
||||||||
| 4.13%, 11/20/45 |
3,477 | 3,028,395 | ||||||
| 4.38%, 10/27/27 |
13,885 | 13,724,737 | ||||||
| 4.38%, 01/23/31 (Call 10/23/30) |
14,386 | 14,007,312 | ||||||
| 4.98%, 04/20/55 |
9,826 | 9,149,642 | ||||||
| 5.10%, 06/18/50 |
13,127 | 12,604,487 | ||||||
| 5.75%, 10/28/34 (Call 07/28/34) |
5,005 | 5,262,133 | ||||||
| 7.63%, 03/21/36 |
5,531 | 6,643,549 | ||||||
|
|
|
|||||||
| 64,420,255 | ||||||||
|
|
|
|||||||
| Total Foreign Government Obligations — 2.1% |
|
2,074,460,669 | ||||||
|
|
|
|||||||
| Municipal Debt Obligations |
||||||||
| Alabama — 0.0% | ||||||||
| Alabama Federal Aid Highway Finance Authority RB, |
1,150 | 913,155 | ||||||
|
|
|
|||||||
| Arizona — 0.0% | ||||||||
| Salt River Project Agricultural Improvement & Power District RB BAB, 4.84%, 01/01/41 |
1,875 | 1,796,087 | ||||||
|
|
|
|||||||
| California — 0.2% | ||||||||
| Bay Area Toll Authority RB, 3.13%, 04/01/55 (Call 04/01/31) |
470 | 319,646 | ||||||
| Bay Area Toll Authority RB BAB |
||||||||
| Series F-2, 6.26%, 04/01/49 |
4,735 | 5,382,092 | ||||||
| Series S-1, 7.04%, 04/01/50 |
4,300 | 5,287,065 | ||||||
| Series S-3, 6.91%, 10/01/50 |
3,205 | 3,896,337 | ||||||
| California Earthquake Authority, 5.60%, 07/01/27 |
1,255 | 1,267,388 | ||||||
| California Health Facilities Financing Authority |
||||||||
| 4.19%, 06/01/37 (Call 06/01/32) |
325 | 300,637 | ||||||
| 4.35%, 06/01/41 (Call 06/01/32)(b) |
1,905 | 1,744,938 | ||||||
| California State University RB |
||||||||
| Class B, 2.72%, 11/01/52 |
910 | 608,596 | ||||||
| 2.94%, 11/01/52 (Call 11/01/31) |
1,000 | 682,053 | ||||||
| Class B, 2.98%, 11/01/51 (Call 05/01/51) |
3,315 | 2,331,137 | ||||||
| 5.18%, 11/01/53 (Call 11/01/33)(b) |
2,535 | 2,514,064 | ||||||
| Series E, 2.90%, 11/01/51 (Call 11/01/30) |
1,895 | 1,358,706 | ||||||
| City of Los Angeles Department of Airports Customer Facility Charge Revenue RB, 4.24%, 05/15/48 (Call 05/15/32) (AGM)(b) |
455 | 386,636 | ||||||
| City of San Francisco California Public Utilities Commission Water Revenue RB BAB, Series B, 6.00%, 11/01/40 |
2,500 | 2,659,240 | ||||||
| East Bay Municipal Utility District Water System Revenue RB BAB, Series B, 5.87%, 06/01/40 |
4,480 | 4,758,860 | ||||||
| S C H E D U L E O F I N V E S T M E N T S |
95 |
| Schedule of Investments (continued) February 29, 2024 |
iShares® Core U.S. Aggregate Bond ETF (Percentages shown are based on Net Assets) |
| Security | Par (000) |
Value | ||||||
| California (continued) |
||||||||
| Foothill-Eastern Transportation Corridor Agency RB |
||||||||
| 3.92%, 01/15/53 (Call 01/15/30) |
$ | 1,025 | $ | 824,434 | ||||
| Series A, 4.09%, 01/15/49 (Call 01/15/30) |
2,040 | 1,705,924 | ||||||
| Golden State Tobacco Securitization Corp. RB |
||||||||
| Class B, 2.75%, 06/01/34 (Call 06/01/31) |
1,270 | 1,053,578 | ||||||
| Class B, 3.00%, 06/01/46 |
680 | 625,052 | ||||||
| 3.12%, 06/01/38 (Call 06/01/31) (SAP) |
1,000 | 792,736 | ||||||
| Class B, 3.29%, 06/01/42 (Call 06/01/31) |
2,790 | 2,112,064 | ||||||
| 3.49%, 06/01/36 (Call 12/01/31) |
230 | 186,048 | ||||||
| 3.71%, 06/01/41 (Call 12/01/31) |
830 | 634,959 | ||||||
| 3.85%, 06/01/50 (Call 12/01/31) |
1,175 | 1,097,105 | ||||||
| 4.21%, 06/01/50 (Call 12/01/31) |
1,535 | 1,164,428 | ||||||
| Los Angeles Community College District/CA GO |
||||||||
| 1.81%, 08/01/30 |
5,000 | 4,270,526 | ||||||
| 2.11%, 08/01/32 (Call 08/01/30)(b) |
3,000 | 2,487,317 | ||||||
| Los Angeles Community College District/CA |
||||||||
| GO BAB, 6.75%, 08/01/49 |
1,100 | 1,327,725 | ||||||
| Los Angeles County Metropolitan Transportation Authority Sales Tax Revenue RB BAB, Series A, 5.74%, 06/01/39 |
2,315 | 2,400,386 | ||||||
| Los Angeles County Public Works Financing Authority RB BAB, 7.62%, 08/01/40 |
1,150 | 1,392,610 | ||||||
| Los Angeles Department of Water & Power |
||||||||
| RB BAB |
||||||||
| Series A, 5.72%, 07/01/39 |
2,100 | 2,177,539 | ||||||
| Series A, 6.60%, 07/01/50 |
385 | 446,701 | ||||||
| Series D, 6.57%, 07/01/45 |
2,970 | 3,401,407 | ||||||
| Los Angeles Unified School District/CA |
||||||||
| GO BAB |
||||||||
| 5.75%, 07/01/34(b) |
4,760 | 4,921,028 | ||||||
| 5.76%, 07/01/29 |
2,170 | 2,224,223 | ||||||
| Series RY, 6.76%, 07/01/34 |
5,025 | 5,508,649 | ||||||
| Regents of the University of California Medical Center Pooled Revenue RB |
||||||||
| 3.01%, 05/15/50 (Call 11/15/49) |
1,400 | 961,625 | ||||||
| Class A, 3.71%, 05/15/20 (Call 11/15/19) |
2,600 | 1,779,875 | ||||||
| 4.13%, 05/15/32 (Call 02/15/32) |
1,550 | 1,471,388 | ||||||
| 4.56%, 05/15/53 |
895 | 815,254 | ||||||
| Series N, Class A, 3.26%, 05/15/60 (Call 11/15/59)(b) |
1,835 | 1,248,639 | ||||||
| Regents of the University of California Medical Center Pooled Revenue RB BAB |
||||||||
| Series H, Class H, 6.55%, 05/15/48 |
2,575 | 2,963,889 | ||||||
| Series F, 6.58%, 05/15/49 |
3,015 | 3,433,908 | ||||||
| San Diego County Regional Transportation Commission RB BAB, 5.91%, 04/01/48 |
1,905 | 2,042,573 | ||||||
| San Diego County Water Authority RB BAB, |
2,350 | 2,587,129 | ||||||
| San Joaquin Hills Transportation Corridor Agency RB, 3.49%, 01/15/50 (Call 01/15/32) |
1,600 | 1,197,389 | ||||||
| State of California GO |
||||||||
| 1.70%, 02/01/28 |
140 | 125,374 | ||||||
| 2.50%, 10/01/29 |
6,000 | 5,365,187 | ||||||
| 3.38%, 04/01/25 |
3,000 | 2,946,423 | ||||||
| 3.50%, 04/01/28 |
910 | 871,557 | ||||||
| 4.50%, 04/01/33 (Call 04/01/28)(b) |
2,750 | 2,682,945 | ||||||
| 4.60%, 04/01/38 (Call 04/01/28) |
2,170 | 2,065,272 | ||||||
| 5.13%, 03/01/38 (Call 03/01/33)(b) |
1,000 | 976,524 | ||||||
| Security | Par (000) |
Value | ||||||
| California (continued) |
||||||||
| 5.20%, 03/01/43 (Call 03/01/33)(b) |
$ | 1,790 | $ | 1,741,330 | ||||
| 5.75%, 10/01/31 |
1,400 | 1,483,558 | ||||||
| Series A, 3.05%, 04/01/29 |
1,110 | 1,032,089 | ||||||
| State of California GO BAB |
||||||||
| 7.30%, 10/01/39 |
5,220 | 6,102,271 | ||||||
| 7.35%, 11/01/39 |
3,130 | 3,680,917 | ||||||
| 7.50%, 04/01/34(b) |
8,325 | 9,797,390 | ||||||
| 7.55%, 04/01/39(b) |
12,470 | 15,151,744 | ||||||
| 7.60%, 11/01/40 |
7,575 | 9,371,309 | ||||||
| 7.63%, 03/01/40 |
4,350 | 5,292,720 | ||||||
| University of California RB |
||||||||
| Series AD, 4.86%, 05/15/12 |
3,285 | 3,025,023 | ||||||
| Series AQ, 4.77%, 12/31/99(b) |
835 | 750,031 | ||||||
| Series AX, 3.06%, 07/01/25 (Call 04/01/25) |
2,925 | 2,849,464 | ||||||
| Series BD, 3.35%, 07/01/29(b) |
4,730 | 4,452,192 | ||||||
| Series BG, 0.88%, 05/15/25 (Call 04/15/25) |
950 | 904,191 | ||||||
| Series BG, 1.32%, 05/15/27 (Call 03/15/27) |
775 | 696,884 | ||||||
| Series BG, 1.61%, 05/15/30 (Call 02/15/30) |
2,990 | 2,497,545 | ||||||
| Series BG, 3.07%, 05/15/51 (Call 05/15/31) |
3,110 | 2,080,048 | ||||||
| University of California RB BAB, 5.95%, 05/15/45 |
3,255 | 3,423,449 | ||||||
|
|
|
|||||||
| 182,118,940 | ||||||||
| Colorado — 0.0% | ||||||||
| Regional Transportation District Sales Tax Revenue RB BAB, Series B, 5.84%, 11/01/50 |
700 | 764,459 | ||||||
|
|
|
|||||||
| Connecticut — 0.0% | ||||||||
| State of Connecticut GO, Series A, |
4,015 | 4,181,928 | ||||||
|
|
|
|||||||
| District of Columbia — 0.0% | ||||||||
| District of Columbia Income Tax Revenue RB BAB, Series E, 5.59%, 12/01/34 |
700 | 723,073 | ||||||
| District of Columbia Water & Sewer Authority RB |
||||||||
| 3.21%, 10/01/48 (Call 10/01/29) |
1,000 | 742,891 | ||||||
| 4.81%, 10/01/14 |
1,690 | 1,543,876 | ||||||
| Metropolitan Washington Airports Authority Dulles Toll Road Revenue RB BAB, 7.46%, 10/01/46 |
1,300 | 1,614,860 | ||||||
|
|
|
|||||||
| 4,624,700 | ||||||||
| Florida — 0.0% | ||||||||
| County of Broward FL Airport System Revenue RB, 3.48%, 10/01/43 (Call 10/01/29) |
250 | 203,432 | ||||||
| County of Miami-Dade FL Aviation Revenue RB, Series C, 4.28%, 10/01/41 (Call 10/01/28) |
985 | 886,815 | ||||||
| County of Miami-Dade FL Transit System RB, Series B, 2.60%, 07/01/42 (Call 07/01/30) |
1,300 | 951,093 | ||||||
| County of Miami-Dade FL Water & Sewer System Revenue RB, 3.49%, 10/01/42 (Call 10/01/29) |
1,265 | 1,022,920 | ||||||
| County of Miami-Dade Seaport Department RB, 6.22%, 11/01/55 (Call 11/01/33) |
245 | 260,357 | ||||||
| State Board of Administration Finance Corp. RB |
||||||||
| 1.26%, 07/01/25(b) |
4,385 | 4,164,347 | ||||||
| 1.71%, 07/01/27 |
3,250 | 2,925,066 | ||||||
| 2.15%, 07/01/30(b) |
4,902 | 4,130,859 | ||||||
|
|
|
|||||||
| 14,544,889 | ||||||||
| 96 | 2 0 2 4 I S H A R E S A N N U A L R E P O R T T O S H A R E H O L D E R S |
| Schedule of Investments (continued) February 29, 2024 |
iShares® Core U.S. Aggregate Bond ETF (Percentages shown are based on Net Assets) |
| Security | Par (000) |
Value | ||||||
| Georgia — 0.0% |
||||||||
| City of Atlanta GA Water & Wastewater Revenue RB, 2.26%, 11/01/35 (Call 11/01/30) |
$ | 1,330 | $ | 1,059,467 | ||||
| Municipal Electric Authority of Georgia RB BAB |
||||||||
| Project J, Series 2010-A, 6.64%, 04/01/57 |
3,789 | 4,252,761 | ||||||
| Project M, Series 2010-A, 6.66%, 04/01/57 |
3,316 | 3,684,902 | ||||||
| Project P, Series 2010-A, 7.06%, 04/01/57 |
313 | 339,500 | ||||||
|
|
|
|||||||
| 9,336,630 | ||||||||
| Idaho — 0.0% | ||||||||
| Idaho Energy Resources Authority RB, |
580 | 401,180 | ||||||
|
|
|
|||||||
| Illinois — 0.1% | ||||||||
| Chicago O’Hare International Airport RB |
||||||||
| Series C, 4.47%, 01/01/49 |
1,050 | 964,120 | ||||||
| Series C, 4.57%, 01/01/54(b) |
2,450 | 2,264,399 | ||||||
| Chicago O’Hare International Airport RB BAB, |
||||||||
| Series B, 6.40%, 01/01/40 |
500 | 550,034 | ||||||
| Chicago Transit Authority Sales & Transfer Tax |
||||||||
| Receipts Revenue RB |
||||||||
| Series A, 6.90%, 12/01/40 |
4,298 | 4,778,565 | ||||||
| Series B, 6.90%, 12/01/40(b) |
3,639 | 4,046,669 | ||||||
| Illinois State Toll Highway Authority RB BAB, |
||||||||
| Series A, 6.18%, 01/01/34 |
1,820 | 1,961,025 | ||||||
| Sales Tax Securitization Corp. RB |
||||||||
| 3.24%, 01/01/42 |
5,125 | 4,077,177 | ||||||
| 3.82%, 01/01/48 |
135 | 108,339 | ||||||
| State of Illinois GO, 5.10%, 06/01/33(b) |
30,923 | 30,461,514 | ||||||
| State of Illinois GO BAB, Series 5, 7.35%, 07/01/35 |
3,343 | 3,607,394 | ||||||
|
|
|
|||||||
| 52,819,236 | ||||||||
| Indiana — 0.0% | ||||||||
| Indiana Finance Authority RB, 3.05%, 01/01/51(b) |
645 | 474,376 | ||||||
|
|
|
|||||||
| Kansas — 0.0% | ||||||||
| Kansas Development Finance Authority RB, 2.77%, 05/01/51 |
605 | 419,726 | ||||||
| State of Kansas Department of Transportation RB BAB, 4.60%, 09/01/35 |
500 | 485,723 | ||||||
|
|
|
|||||||
| 905,449 | ||||||||
| Louisiana — 0.0% | ||||||||
| Louisiana Local Government Environmental Facilities & Community Development Auth |
||||||||
| 5.05%, 12/01/34 |
1,705 | 1,715,227 | ||||||
| 5.08%, 06/01/31 |
1,533 | 1,532,864 | ||||||
| 5.20%, 12/01/39 |
3,975 | 4,041,321 | ||||||
| Louisiana Local Government Environmental Facilities & Community Development Authority RB |
||||||||
| 3.62%, 02/01/29 |
1,192 | 1,161,047 | ||||||
| 4.15%, 02/01/33 |
2,280 | 2,203,783 | ||||||
| 4.28%, 02/01/36 |
1,560 | 1,479,972 | ||||||
| 4.48%, 08/01/39 |
1,710 | 1,616,566 | ||||||
| State of Louisiana Gasoline & Fuels Tax Revenue RB, 2.95%, 05/01/41 |
1,185 | 892,354 | ||||||
|
|
|
|||||||
| 14,643,134 | ||||||||
| Security | Par (000) |
Value | ||||||
| Maryland — 0.0% |
||||||||
| Maryland Health & Higher Educational Facilities Authority, Class D, 3.05%, 07/01/40 (Call 01/01/40) |
$ | 2,500 | $ | 1,864,564 | ||||
| Maryland State Transportation Authority RB BAB, 5.89%, 07/01/43 |
1,500 | 1,556,814 | ||||||
|
|
|
|||||||
| 3,421,378 | ||||||||
| Massachusetts — 0.0% | ||||||||
| Commonwealth of Massachusetts GOL, |
2,675 | 1,873,938 | ||||||
| Commonwealth of Massachusetts GOL BAB 4.91%, 05/01/29 |
1,950 | 1,963,318 | ||||||
| Series E, 5.46%, 12/01/39 |
3,700 | 3,836,769 | ||||||
| Commonwealth of Massachusetts RB, |
2,900 | 2,805,188 | ||||||
| Commonwealth of Massachusetts Transportation Fund Revenue RB BAB, Series A, |
1,435 | 1,489,625 | ||||||
| Massachusetts School Building Authority RB |
1,755 | 1,471,179 | ||||||
| Series B, 1.75%, 08/15/30 |
2,250 | 1,915,849 | ||||||
| Massachusetts School Building Authority RB BAB, Series B, 5.72%, 08/15/39 |
1,060 | 1,109,836 | ||||||
| Massachusetts Water Resources Authority RB, |
925 | 714,527 | ||||||
|
|
|
|||||||
| 17,180,229 | ||||||||
| Michigan — 0.0% | ||||||||
| Michigan Finance Authority RB |
||||||||
| 3.08%, 12/01/34 |
2,110 | 1,819,336 | ||||||
| 3.38%, 12/01/40 |
845 | 688,889 | ||||||
| Michigan State Building Authority RB, 2.71%, 10/15/40 (Call 10/15/30) |
1,250 | 932,735 | ||||||
| Michigan State University RB, 4.17%, 08/15/22 (Call 02/15/22) |
2,675 | 2,085,360 | ||||||
| Michigan Strategic Fund RB, 3.23%, 09/01/47 (Call 09/01/31) |
460 | 344,827 | ||||||
| University of Michigan RB |
||||||||
| 3.50%, 04/01/52 (Call 10/01/51) |
614 | 465,064 | ||||||
| 3.50%, 04/01/52 (Call 10/01/51)(b) |
475 | 359,129 | ||||||
| 3.60%, 04/01/47 |
1,800 | 1,519,417 | ||||||
| 4.45%, 12/31/99 (Call 10/01/21) |
4,080 | 3,481,776 | ||||||
| Series B, 2.44%, 04/01/40 (Call 10/01/39) |
2,862 | 2,064,170 | ||||||
|
|
|
|||||||
| 13,760,703 | ||||||||
| Minnesota — 0.0% | ||||||||
| University of Minnesota RB, 4.05%, 04/01/52 (Call 10/01/51) |
1,924 | 1,675,847 | ||||||
|
|
|
|||||||
| Mississippi — 0.0% | ||||||||
| State of Mississippi GO BAB, Series F, 5.25%, 11/01/34 |
1,000 | 1,026,739 | ||||||
|
|
|
|||||||
| Missouri — 0.0% | ||||||||
| Health & Educational Facilities Authority of the State of Missouri RB, Series A, 3.65%, 08/15/57 (Call 02/15/57) |
4,730 | 3,603,628 | ||||||
|
|
|
|||||||
| Nebraska — 0.0% | ||||||||
| University of Nebraska Facilities Corp. (The) RB, Series A, Class A, 3.04%, 10/01/49 |
2,000 | 1,464,863 | ||||||
|
|
|
|||||||
| Nevada — 0.0% | ||||||||
| County of Clark Department of Aviation RB BAB, Series C, 6.82%, 07/01/45 |
850 | 993,007 | ||||||
|
|
|
|||||||
| S C H E D U L E O F I N V E S T M E N T S |
97 |
| Schedule of Investments (continued) February 29, 2024 |
iShares® Core U.S. Aggregate Bond ETF (Percentages shown are based on Net Assets) |
| Security | Par (000) |
Value | ||||||
| New Jersey — 0.0% |
||||||||
| New Jersey Economic Development Authority RB, Series A, 7.43%, 02/15/29 (NPFGC) |
$ | 5,874 | $ | 6,288,860 | ||||
| New Jersey State Turnpike Authority RB BAB, Series F, 7.41%, 01/01/40(b) |
6,979 | 8,507,768 | ||||||
| New Jersey Transportation Trust Fund Authority RB BAB |
||||||||
| Series B, 6.56%, 12/15/40 |
2,650 | 2,891,781 | ||||||
| Series C, 5.75%, 12/15/28 |
3,100 | 3,132,302 | ||||||
| New Jersey Turnpike Authority RB BAB, |
||||||||
| Series A, 7.10%, 01/01/41 |
4,730 | 5,528,695 | ||||||
| Rutgers The State University of New Jersey RB |
||||||||
| 3.27%, 05/01/43 |
1,000 | 778,519 | ||||||
| Series P, 3.92%, 05/01/19 (Call 11/01/18)(b) |
1,475 | 1,046,425 | ||||||
| Rutgers The State University of New Jersey RB BAB, Class H, 5.67%, 05/01/40 |
900 | 929,748 | ||||||
|
|
|
|||||||
| 29,104,098 | ||||||||
| New York — 0.1% | ||||||||
| City of New York GO, 5.26%, 10/01/52 |
500 | 509,385 | ||||||
| City of New York GO BAB |
||||||||
| Series A-2, 5.21%, 10/01/31 |
2,000 | 2,005,030 | ||||||
| Series C-1, 5.52%, 10/01/37 |
3,000 | 3,059,323 | ||||||
| Series F1, 6.27%, 12/01/37 |
2,755 | 2,970,076 | ||||||
| Metropolitan Transportation Authority RB, |
||||||||
| Series C2, 5.18%, 11/15/49 |
3,880 | 3,625,473 | ||||||
| Metropolitan Transportation Authority RB BAB |
||||||||
| 7.34%, 11/15/39 |
3,265 | 3,933,397 | ||||||
| Series 2010-A, 6.67%, 11/15/39 |
50 | 54,544 | ||||||
| Series A, 5.87%, 11/15/39 |
160 | 163,285 | ||||||
| Series B, 6.65%, 11/15/39 |
220 | 238,968 | ||||||
| Series E, 6.81%, 11/15/40 |
1,830 | 2,024,515 | ||||||
| New York City Municipal Water Finance Authority RB, 5.88%, 06/15/44 |
3,200 | 3,413,919 | ||||||
| New York City Municipal Water Finance Authority RB BAB |
||||||||
| 5.44%, 06/15/43(b) |
1,385 | 1,408,863 | ||||||
| 5.72%, 06/15/42(b) |
3,145 | 3,252,301 | ||||||
| 6.01%, 06/15/42(b) |
1,860 | 2,000,621 | ||||||
| New York City Transitional Finance Authority Future Tax Secured Revenue RB BAB |
||||||||
| 5.51%, 08/01/37 |
2,235 | 2,281,148 | ||||||
| 5.57%, 11/01/38 |
2,100 | 2,155,069 | ||||||
| Series C-2, 5.77%, 08/01/36 |
1,815 | 1,874,343 | ||||||
| New York State Dormitory Authority RB BAB |
||||||||
| Series D, 5.60%, 03/15/40 |
2,325 | 2,449,967 | ||||||
| Series F, 5.63%, 03/15/39 |
2,725 | 2,824,617 | ||||||
| New York State Urban Development Corp. RB, |
||||||||
| Series B, 3.90%, 03/15/33 |
||||||||
| (Call 09/15/28)(b) |
290 | 273,202 | ||||||
| New York State Urban Development Corp. RB |
||||||||
| BAB, 5.77%, 03/15/39 |
6,015 | 6,084,528 | ||||||
| Port Authority of New York & New Jersey RB |
||||||||
| 3.14%, 02/15/51 (Call 08/15/31) |
1,145 | 823,707 | ||||||
| 3.29%, 08/01/69(b) |
1,300 | 871,484 | ||||||
| 4.03%, 09/01/48 |
1,440 | 1,182,422 | ||||||
| 5.07%, 07/15/53(b) |
2,820 | 2,828,757 | ||||||
| Series 164, 5.65%, 11/01/40(b) |
2,255 | 2,372,513 | ||||||
| Series 165, 5.65%, 11/01/40(b) |
1,795 | 1,900,895 | ||||||
| Series 168, 4.93%, 10/01/51 |
2,650 | 2,576,516 | ||||||
| Series 174, 4.46%, 10/01/62(b) |
6,585 | 5,870,201 | ||||||
| Series 181, 4.96%, 08/01/46(b) |
2,000 | 1,912,531 | ||||||
| Security | Par (000) |
Value | ||||||
| New York (continued) |
||||||||
| Series 182, 5.31%, 08/01/46 (Call 08/01/24) |
$ | 1,000 | $ | 988,008 | ||||
| Series 192, 4.81%, 10/15/65(b) |
4,235 | 3,995,543 | ||||||
| Series 225, 3.18%, 07/15/60 (Call 07/15/31) |
675 | 456,220 | ||||||
|
|
|
|||||||
| 72,381,371 | ||||||||
| North Carolina — 0.0% | ||||||||
| Charlotte-Mecklenburg Hospital Authority (The) RB, 3.20%, 01/15/51 (Call 01/15/50) |
1,100 | 755,418 | ||||||
|
|
|
|||||||
| Ohio — 0.0% | ||||||||
| American Municipal Power Inc. RB BAB, |
||||||||
| Series B, 8.08%, 02/15/50 |
4,075 | 5,441,457 | ||||||
| JobsOhio Beverage System RB |
||||||||
| 2.83%, 01/01/38 |
1,950 | 1,597,436 | ||||||
| 4.43%, 01/01/33 |
285 | 281,656 | ||||||
| Series B, 4.53%, 01/01/35 |
2,400 | 2,357,944 | ||||||
| Ohio State University (The) RB, Series A, |
||||||||
| 4.80%, 06/01/11(b) |
350 | 314,902 | ||||||
| Ohio State University (The) RB BAB, Series C, |
||||||||
| 4.91%, 06/01/40(b) |
1,905 | 1,846,939 | ||||||
| Ohio Turnpike & Infrastructure Commission |
||||||||
| RB, Series A, Class A, 3.22%, 02/15/48 |
||||||||
| (Call 02/15/30)(b) |
1,775 | 1,337,079 | ||||||
|
|
|
|||||||
| 13,177,413 | ||||||||
| Oklahoma — 0.0% | ||||||||
| Oklahoma Development Finance Authority RB |
||||||||
| 4.38%, 11/01/45 |
715 | 667,356 | ||||||
| 4.62%, 06/01/44 |
1,655 | 1,574,295 | ||||||
| 4.71%, 05/01/52 |
520 | 487,928 | ||||||
| 5.09%, 02/01/52 |
680 | 673,840 | ||||||
|
|
|
|||||||
| 3,403,419 | ||||||||
| Oregon — 0.0% | ||||||||
| Oregon School Boards Association GOL |
||||||||
| Series B, 5.55%, 06/30/28 (NPFGC) |
50 | 50,535 | ||||||
| Series B, 5.68%, 06/30/28 (NPFGC) |
1,000 | 1,016,551 | ||||||
| Oregon State University RB, 3.42%, 03/01/60 (Call 03/01/30) (BAM) |
1,100 | 807,300 | ||||||
| State of Oregon Department of Transportation |
||||||||
| RB BAB, Series 2010-A, 5.83%, 11/15/34 |
2,085 | 2,191,339 | ||||||
| State of Oregon GO, 5.89%, 06/01/27(b) |
8,020 | 8,146,857 | ||||||
|
|
|
|||||||
| 12,212,582 | ||||||||
| Pennsylvania — 0.0% | ||||||||
| City of Philadelphia PA Water & Wastewater Revenue RB, 2.93%, 07/01/45 (Call 07/01/31) |
1,030 | 764,917 | ||||||
| Commonwealth Financing Authority RB |
||||||||
| Class A, 2.99%, 06/01/42(b) |
1,130 | 855,397 | ||||||
| Series A, 4.14%, 06/01/38 |
50 | 46,294 | ||||||
| Pennsylvania State University (The) RB |
||||||||
| 2.79%, 09/01/43 |
1,750 | 1,307,604 | ||||||
| 2.84%, 09/01/50 |
975 | 677,374 | ||||||
| Pennsylvania Turnpike Commission RB BAB, |
||||||||
| Series B, 5.51%, 12/01/45 |
1,000 | 1,033,017 | ||||||
| University of Pittsburgh-of the Commonwealth System of Higher Education RB, 3.56%, 09/15/19 (Call 03/15/19) |
2,000 | 1,338,874 | ||||||
|
|
|
|||||||
| 6,023,477 | ||||||||
| 98 | 2 0 2 4 I S H A R E S A N N U A L R E P O R T T O S H A R E H O L D E R S |
| Schedule of Investments (continued) February 29, 2024 |
iShares® Core U.S. Aggregate Bond ETF (Percentages shown are based on Net Assets) |
| Security | Par (000) |
Value | ||||||
| South Carolina — 0.0% |
||||||||
| South Carolina Public Service Authority RB |
||||||||
| BAB, Series C, 6.45%, 01/01/50 |
$ | 1,000 | $ | 1,105,433 | ||||
|
|
|
|||||||
| Tennessee — 0.0% | ||||||||
| Metropolitan Government Nashville & Davidson County Health & Educational Facility Building RB, Series 2016B, 4.05%, 07/01/26 (Call 04/01/26) |
1,000 | 973,458 | ||||||
|
|
|
|||||||
| Texas — 0.1% | ||||||||
| Board of Regents of the University of Texas |
||||||||
| System RB, Series B, 2.44%, 08/15/49 (Call 02/15/49) |
765 | 464,164 | ||||||
| Board of Regents of the University of Texas |
||||||||
| System RB BAB, Series C, 4.79%, 08/15/46 |
2,400 | 2,308,640 | ||||||
| City of San Antonio Texas Electric & Gas |
||||||||
| Systems Revenue RB BAB |
||||||||
| 5.81%, 02/01/41 |
1,875 | 1,964,529 | ||||||
| Series C, 5.99%, 02/01/39(b) |
1,000 | 1,076,962 | ||||||
| Dallas Area Rapid Transit RB, 2.61%, 12/01/48 (Call 12/01/31) |
2,895 | 1,957,232 | ||||||
| Dallas Area Rapid Transit RB BAB |
||||||||
| 5.02%, 12/01/48(b) |
3,250 | 3,164,661 | ||||||
| Series B, 6.00%, 12/01/44 |
400 | 437,177 | ||||||
| Dallas Convention Center Hotel Development |
||||||||
| Corp. RB BAB, 7.09%, 01/01/42 |
700 | 785,715 | ||||||
| Dallas County Hospital District GOL BAB, |
||||||||
| Series C, 5.62%, 08/15/44 |
1,250 | 1,292,698 | ||||||
| Dallas Fort Worth International Airport RB |
||||||||
| 2.84%, 11/01/46 (Call 11/01/31)(b) |
220 | 159,855 | ||||||
| Class A, 2.99%, 11/01/38 |
1,200 | 988,291 | ||||||
| 4.09%, 11/01/51 |
1,245 | 1,036,798 | ||||||
| 4.51%, 11/01/51 (Call 11/01/32) |
3,305 | 2,997,673 | ||||||
| Series A, Class A, 3.14%, 11/01/45 |
1,405 | 1,059,133 | ||||||
| Series C, Class C, 2.92%, 11/01/50(b) |
2,670 | 1,874,862 | ||||||
| Series C, Class C, 3.09%, 11/01/40 (Call 11/01/30) |
340 | 267,593 | ||||||
| Dallas Independent School District GO BAB, |
||||||||
| Series C, 6.45%, 02/15/35 (Call 04/01/24) (PSF) |
400 | 402,116 | ||||||
| Grand Parkway Transportation Corp. RB, |
||||||||
| 3.24%, 10/01/52 (Call 04/01/30) |
4,805 | 3,482,131 | ||||||
| North Texas Tollway Authority RB BAB, |
||||||||
| Series B, 6.72%, 01/01/49 |
4,120 | 4,845,994 | ||||||
| Permanent University Fund - Texas A&M |
||||||||
| University System RB, Series B, 3.66%, 07/01/47 (Call 07/01/27) |
2,000 | 1,668,363 | ||||||
| Permanent University Fund - University of Texas System RB, Series A, 3.38%, 07/01/47 (Call 01/01/47) |
2,125 | 1,640,594 | ||||||
| State of Texas GO BAB |
||||||||
| 5.52%, 04/01/39(b) |
5,300 | 5,542,620 | ||||||
| Series A, 4.63%, 04/01/33 |
1,255 | 1,260,162 | ||||||
| Series A, 4.68%, 04/01/40 |
2,550 | 2,475,862 | ||||||
| Texas Natural Gas Securitization |
||||||||
| Finance Corp. |
||||||||
| 5.10%, 04/01/35 |
6,495 | 6,554,802 | ||||||
| 5.17%, 04/01/41 |
6,200 | 6,288,385 | ||||||
| Texas Private Activity Bond Surface |
||||||||
| Transportation Corp. RB, Series B, 3.92%, 12/31/49(b) |
3,350 | 2,721,076 | ||||||
| Security | Par (000) |
Value | ||||||
| Texas (continued) |
||||||||
| Texas Transportation Commission GO, 2.47%, 10/01/44 (Call 10/01/30) |
$ | 2,505 | $ | 1,726,824 | ||||
| Texas Transportation Commission State Highway Fund RB |
||||||||
| 4.00%, 10/01/33 |
2,775 | 2,637,644 | ||||||
| First Class, 5.18%, 04/01/30 |
5,115 | 5,129,527 | ||||||
|
|
|
|||||||
| 68,212,083 | ||||||||
| Virginia — 0.0% | ||||||||
| University of Virginia RB |
||||||||
| 2.26%, 09/01/50 (Call 03/01/50) |
2,790 | 1,692,209 | ||||||
| 2.58%, 11/01/51 (Call 05/01/51)(b) |
1,000 | 649,506 | ||||||
| Series A, 3.23%, 12/31/99 (Call 03/01/19) |
790 | 492,098 | ||||||
| Series C, 4.18%, 09/01/17 (Call 03/01/17) |
840 | 670,735 | ||||||
|
|
|
|||||||
| 3,504,548 | ||||||||
| Washington — 0.0% | ||||||||
| Central Puget Sound Regional Transit |
||||||||
| Authority Sales & Rental Car Taxes |
||||||||
| Revenue RB BAB, 5.49%, 11/01/39 |
1,200 | 1,237,912 | ||||||
| State of Washington GO BAB, Series F, |
||||||||
| 5.14%, 08/01/40 |
2,165 | 2,183,775 | ||||||
|
|
|
|||||||
| 3,421,687 | ||||||||
| Wisconsin — 0.0% | ||||||||
| State of Wisconsin RB |
||||||||
| Series A, 5.70%, 05/01/26 |
190 | 190,988 | ||||||
| Series C, 3.15%, 05/01/27 |
2,580 | 2,474,337 | ||||||
|
|
|
|||||||
| 2,665,325 | ||||||||
|
|
|
|||||||
| Total Municipal Debt Obligations — 0.5% |
|
547,590,869 | ||||||
|
|
|
|||||||
| U.S. Government & Agency Obligations |
|
|||||||
| Mortgage-Backed Securities — 26.8% | ||||||||
| Federal Home Loan Mortgage Corp. |
||||||||
| 2.50%, 10/01/27 |
68 | 66,157 | ||||||
| 2.50%, 02/01/28 |
889 | 858,180 | ||||||
| 2.50%, 01/01/30 |
7,954 | 7,548,583 | ||||||
| 2.50%, 03/01/31 |
77 | 72,278 | ||||||
| 2.50%, 08/01/31 |
2,526 | 2,367,548 | ||||||
| 2.50%, 10/01/31 |
5,786 | 5,400,299 | ||||||
| 2.50%, 11/01/31 |
34 | 31,717 | ||||||
| 2.50%, 12/01/31 |
8,683 | 8,092,572 | ||||||
| 2.50%, 02/01/32 |
10,737 | 10,018,133 | ||||||
| 2.50%, 08/01/32 |
126 | 116,820 | ||||||
| 2.50%, 01/01/33 |
9,317 | 8,681,557 | ||||||
| 2.50%, 02/01/33 |
24 | 22,659 | ||||||
| 2.50%, 04/01/33 |
1,115 | 1,032,709 | ||||||
| 3.00%, 11/01/26 |
138 | 133,068 | ||||||
| 3.00%, 01/01/27 |
64 | 61,922 | ||||||
| 3.00%, 02/01/27 |
157 | 152,229 | ||||||
| 3.00%, 04/01/27 |
112 | 109,354 | ||||||
| 3.00%, 05/01/27 |
941 | 914,312 | ||||||
| 3.00%, 06/01/27 |
855 | 831,121 | ||||||
| 3.00%, 07/01/27 |
42 | 41,051 | ||||||
| 3.00%, 08/01/27 |
127 | 123,465 | ||||||
| 3.00%, 09/01/27 |
547 | 531,085 | ||||||
| 3.00%, 11/01/27 |
233 | 226,231 | ||||||
| 3.00%, 12/01/27 |
103 | 99,630 | ||||||
| 3.00%, 01/01/28 |
26 | 25,506 | ||||||
| 3.00%, 11/01/28 |
105 | 102,110 | ||||||
| 3.00%, 01/01/29 |
154 | 148,557 | ||||||
| S C H E D U L E O F I N V E S T M E N T S |
99 |
| Schedule of Investments (continued) February 29, 2024 |
iShares® Core U.S. Aggregate Bond ETF (Percentages shown are based on Net Assets) |
| Security | Par (000) |
Value | ||||||
| Mortgage-Backed Securities (continued) |
||||||||
| 3.00%, 03/01/29 |
$ | 462 | $ | 445,386 | ||||
| 3.00%, 05/01/29 |
17,762 | 17,190,094 | ||||||
| 3.00%, 05/01/30 |
3,041 | 2,903,183 | ||||||
| 3.00%, 06/01/30 |
1,676 | 1,610,168 | ||||||
| 3.00%, 07/01/30 |
3,640 | 3,473,429 | ||||||
| 3.00%, 12/01/30 |
8,628 | 8,215,408 | ||||||
| 3.00%, 02/01/31 |
2,708 | 2,571,551 | ||||||
| 3.00%, 05/01/31 |
5,647 | 5,356,518 | ||||||
| 3.00%, 06/01/31 |
4,153 | 3,937,506 | ||||||
| 3.00%, 08/01/31 |
34 | 32,321 | ||||||
| 3.00%, 12/01/31 |
20 | 19,068 | ||||||
| 3.00%, 02/01/32 |
77 | 73,257 | ||||||
| 3.00%, 07/01/32 |
6,400 | 6,063,594 | ||||||
| 3.00%, 09/01/32 |
9 | 8,185 | ||||||
| 3.00%, 02/01/33 |
15 | 14,178 | ||||||
| 3.00%, 05/01/33 |
1,484 | 1,390,639 | ||||||
| 3.00%, 06/01/42 |
431 | 383,722 | ||||||
| 3.00%, 10/01/42 |
180 | 160,755 | ||||||
| 3.00%, 01/01/43 |
467 | 415,851 | ||||||
| 3.00%, 02/01/43 |
11,387 | 10,144,337 | ||||||
| 3.00%, 12/01/44 |
33 | 28,834 | ||||||
| 3.00%, 04/01/45 |
264 | 232,504 | ||||||
| 3.00%, 08/01/45 |
172 | 151,361 | ||||||
| 3.00%, 12/01/45 |
13 | 11,692 | ||||||
| 3.00%, 01/01/46 |
968 | 851,110 | ||||||
| 3.00%, 02/01/46 |
114 | 100,486 | ||||||
| 3.00%, 07/01/46 |
2,172 | 1,908,754 | ||||||
| 3.00%, 08/01/46 |
39,856 | 35,025,099 | ||||||
| 3.00%, 09/01/46 |
15,847 | 14,033,623 | ||||||
| 3.00%, 10/01/46 |
30,905 | 27,162,427 | ||||||
| 3.00%, 11/01/46 |
23,264 | 20,443,665 | ||||||
| 3.00%, 12/01/46 |
53,322 | 46,858,202 | ||||||
| 3.00%, 01/01/47 |
12,503 | 10,986,948 | ||||||
| 3.00%, 02/01/47 |
26,723 | 23,484,080 | ||||||
| 3.00%, 03/01/47 |
134 | 117,845 | ||||||
| 3.00%, 04/01/47 |
346 | 304,293 | ||||||
| 3.00%, 05/01/47 |
20,950 | 18,413,643 | ||||||
| 3.00%, 06/01/47 |
21,571 | 18,955,606 | ||||||
| 3.00%, 08/01/47 |
2,775 | 2,438,492 | ||||||
| 3.00%, 09/01/47 |
619 | 544,833 | ||||||
| 3.00%, 10/01/47 |
6,936 | 6,095,469 | ||||||
| 3.00%, 11/01/47 |
10 | 8,725 | ||||||
| 3.00%, 01/01/48 |
14 | 12,318 | ||||||
| 3.00%, 11/01/48 |
1,065 | 925,960 | ||||||
| 3.00%, 03/01/49 |
182 | 157,710 | ||||||
| 3.00%, 05/01/49 |
219 | 191,602 | ||||||
| 3.00%, 06/01/49 |
163 | 141,311 | ||||||
| 3.50%, 11/01/25 |
335 | 328,500 | ||||||
| 3.50%, 03/01/26 |
399 | 390,845 | ||||||
| 3.50%, 06/01/26 |
93 | 90,721 | ||||||
| 3.50%, 03/01/32 |
573 | 550,418 | ||||||
| 3.50%, 05/01/32 |
1,577 | 1,514,884 | ||||||
| 3.50%, 09/01/32 |
1,343 | 1,290,745 | ||||||
| 3.50%, 06/01/33 |
97 | 92,612 | ||||||
| 3.50%, 07/01/33 |
5,157 | 4,946,838 | ||||||
| 3.50%, 11/01/33 |
15 | 14,090 | ||||||
| 3.50%, 06/01/34 |
4,387 | 4,177,654 | ||||||
| 3.50%, 03/01/38 |
3,241 | 3,050,828 | ||||||
| 3.50%, 06/01/38 |
881 | 827,861 | ||||||
| 3.50%, 09/01/38 |
576 | 541,611 | ||||||
| 3.50%, 02/01/42 |
51 | 47,070 | ||||||
| Security | Par (000) |
Value | ||||||
| Mortgage-Backed Securities (continued) |
||||||||
| 3.50%, 05/01/42 |
$ | 5 | $ | 4,806 | ||||
| 3.50%, 09/01/42 |
8 | 7,404 | ||||||
| 3.50%, 10/01/42 |
6,745 | 6,209,317 | ||||||
| 3.50%, 11/01/42 |
518 | 476,671 | ||||||
| 3.50%, 01/01/43 |
10 | 8,928 | ||||||
| 3.50%, 04/01/43 |
3,693 | 3,397,030 | ||||||
| 3.50%, 06/01/43 |
715 | 658,579 | ||||||
| 3.50%, 07/01/43 |
1,226 | 1,125,144 | ||||||
| 3.50%, 08/01/43 |
4,391 | 4,030,326 | ||||||
| 3.50%, 10/01/43 |
992 | 913,774 | ||||||
| 3.50%, 01/01/44 |
11,353 | 10,453,910 | ||||||
| 3.50%, 02/01/44 |
5,885 | 5,422,041 | ||||||
| 3.50%, 09/01/44 |
4,557 | 4,181,020 | ||||||
| 3.50%, 10/01/44 |
6,635 | 6,068,110 | ||||||
| 3.50%, 11/01/44 |
84 | 76,139 | ||||||
| 3.50%, 12/01/45 |
8,617 | 7,787,830 | ||||||
| 3.50%, 01/01/46 |
216 | 197,080 | ||||||
| 3.50%, 03/01/46 |
24,048 | 21,905,968 | ||||||
| 3.50%, 05/01/46 |
3,125 | 2,847,679 | ||||||
| 3.50%, 06/01/46 |
92 | 83,661 | ||||||
| 3.50%, 07/01/46 |
4,172 | 3,798,533 | ||||||
| 3.50%, 08/01/46 |
2,935 | 2,672,917 | ||||||
| 3.50%, 09/01/46 |
4,644 | 4,228,247 | ||||||
| 3.50%, 10/01/46 |
864 | 785,285 | ||||||
| 3.50%, 11/01/46 |
628 | 570,891 | ||||||
| 3.50%, 12/01/46 |
3,514 | 3,190,650 | ||||||
| 3.50%, 01/01/47 |
1,852 | 1,682,750 | ||||||
| 3.50%, 02/01/47 |
4,761 | 4,328,799 | ||||||
| 3.50%, 03/01/47 |
3,084 | 2,803,888 | ||||||
| 3.50%, 04/01/47 |
6,919 | 6,279,629 | ||||||
| 3.50%, 05/01/47 |
1,399 | 1,272,067 | ||||||
| 3.50%, 07/01/47 |
5,826 | 5,287,217 | ||||||
| 3.50%, 08/01/47 |
17,027 | 15,540,359 | ||||||
| 3.50%, 09/01/47 |
22,436 | 20,312,602 | ||||||
| 3.50%, 12/01/47 |
3,856 | 3,499,496 | ||||||
| 3.50%, 01/01/48 |
17,676 | 16,158,646 | ||||||
| 3.50%, 02/01/48 |
18,582 | 16,816,887 | ||||||
| 3.50%, 03/01/48 |
7,768 | 7,043,458 | ||||||
| 3.50%, 04/01/48 |
1,770 | 1,619,322 | ||||||
| 3.50%, 05/01/48 |
8,634 | 7,825,252 | ||||||
| 3.50%, 04/01/49 |
1,185 | 1,074,612 | ||||||
| 3.50%, 05/01/49 |
3,486 | 3,149,418 | ||||||
| 3.50%, 06/01/49 |
1,621 | 1,469,433 | ||||||
| 4.00%, 05/01/25 |
30 | 29,376 | ||||||
| 4.00%, 10/01/25 |
222 | 218,481 | ||||||
| 4.00%, 02/01/26 |
134 | 131,460 | ||||||
| 4.00%, 05/01/26 |
265 | 260,587 | ||||||
| 4.00%, 12/01/32 |
1,113 | 1,082,872 | ||||||
| 4.00%, 05/01/33 |
1,750 | 1,707,145 | ||||||
| 4.00%, 09/01/41 |
2,550 | 2,420,582 | ||||||
| 4.00%, 02/01/42 |
2,114 | 2,006,858 | ||||||
| 4.00%, 03/01/42 |
470 | 445,829 | ||||||
| 4.00%, 06/01/42 |
3,112 | 2,953,086 | ||||||
| 4.00%, 08/01/42 |
1,312 | 1,244,943 | ||||||
| 4.00%, 07/01/44 |
3,447 | 3,258,594 | ||||||
| 4.00%, 01/01/45 |
849 | 800,660 | ||||||
| 4.00%, 02/01/45 |
1,246 | 1,179,058 | ||||||
| 4.00%, 06/01/45 |
1,984 | 1,868,397 | ||||||
| 4.00%, 08/01/45 |
3,293 | 3,101,303 | ||||||
| 4.00%, 09/01/45 |
5,432 | 5,115,802 | ||||||
| 4.00%, 01/01/46 |
1,436 | 1,352,547 | ||||||
| 100 | 2 0 2 4 I S H A R E S A N N U A L R E P O R T T O S H A R E H O L D E R S |
| Schedule of Investments (continued) February 29, 2024 |
iShares® Core U.S. Aggregate Bond ETF (Percentages shown are based on Net Assets) |
| Security | Par (000) |
Value | ||||||
| Mortgage-Backed Securities (continued) |
||||||||
| 4.00%, 02/01/46 |
$ | 146 | $ | 136,785 | ||||
| 4.00%, 03/01/46 |
322 | 302,222 | ||||||
| 4.00%, 05/01/46 |
3,226 | 3,031,503 | ||||||
| 4.00%, 06/01/46 |
71 | 66,078 | ||||||
| 4.00%, 07/01/46 |
2,729 | 2,573,711 | ||||||
| 4.00%, 08/01/46 |
86 | 81,196 | ||||||
| 4.00%, 10/01/46 |
2,584 | 2,433,307 | ||||||
| 4.00%, 11/01/46 |
7,407 | 6,960,259 | ||||||
| 4.00%, 02/01/47 |
3,085 | 2,898,869 | ||||||
| 4.00%, 08/01/47 |
227 | 213,015 | ||||||
| 4.00%, 10/01/47 |
691 | 648,059 | ||||||
| 4.00%, 11/01/47 |
1,292 | 1,211,129 | ||||||
| 4.00%, 01/01/48 |
5,078 | 4,760,972 | ||||||
| 4.00%, 02/01/48 |
7,433 | 6,979,733 | ||||||
| 4.00%, 04/01/48 |
158 | 146,959 | ||||||
| 4.00%, 06/01/48 |
13,717 | 12,902,494 | ||||||
| 4.00%, 07/01/48 |
12,746 | 11,923,594 | ||||||
| 4.00%, 08/01/48 |
1,655 | 1,547,961 | ||||||
| 4.00%, 09/01/48 |
3,267 | 3,055,684 | ||||||
| 4.00%, 10/01/48 |
1,766 | 1,655,626 | ||||||
| 4.00%, 12/01/48 |
8,646 | 8,110,932 | ||||||
| 4.00%, 01/01/49 |
1,340 | 1,253,117 | ||||||
| 4.50%, 07/01/24 |
8 | 7,905 | ||||||
| 4.50%, 08/01/24 |
2 | 2,397 | ||||||
| 4.50%, 09/01/24 |
10 | 10,199 | ||||||
| 4.50%, 10/01/24 |
11 | 10,785 | ||||||
| 4.50%, 08/01/30 |
903 | 890,862 | ||||||
| 4.50%, 03/01/39 |
878 | 859,455 | ||||||
| 4.50%, 05/01/39 |
1,050 | 1,027,459 | ||||||
| 4.50%, 10/01/39 |
630 | 616,624 | ||||||
| 4.50%, 01/01/40 |
186 | 182,116 | ||||||
| 4.50%, 02/01/41 |
1,299 | 1,269,136 | ||||||
| 4.50%, 04/01/41 |
38 | 37,475 | ||||||
| 4.50%, 05/01/41 |
3,295 | 3,219,195 | ||||||
| 4.50%, 05/01/42 |
3,376 | 3,298,172 | ||||||
| 4.50%, 01/01/45 |
2,463 | 2,396,794 | ||||||
| 4.50%, 11/01/45 |
167 | 162,266 | ||||||
| 4.50%, 12/01/45 |
127 | 124,317 | ||||||
| 4.50%, 01/01/46 |
3,764 | 3,661,336 | ||||||
| 4.50%, 03/01/46 |
183 | 177,400 | ||||||
| 4.50%, 04/01/46 |
546 | 527,455 | ||||||
| 4.50%, 05/01/46 |
347 | 335,468 | ||||||
| 4.50%, 07/01/46 |
106 | 102,106 | ||||||
| 4.50%, 08/01/46 |
285 | 275,378 | ||||||
| 4.50%, 09/01/46 |
2,305 | 2,237,125 | ||||||
| 4.50%, 05/01/47 |
2,037 | 1,965,680 | ||||||
| 4.50%, 06/01/47 |
1,154 | 1,113,553 | ||||||
| 4.50%, 11/01/47 |
126 | 121,761 | ||||||
| 4.50%, 05/01/48 |
6,516 | 6,272,389 | ||||||
| 4.50%, 06/01/48 |
5,145 | 4,954,152 | ||||||
| 4.50%, 07/01/48 |
3,652 | 3,516,357 | ||||||
| 4.50%, 09/01/48 |
174 | 167,500 | ||||||
| 4.50%, 10/01/48 |
6,862 | 6,616,234 | ||||||
| 4.50%, 11/01/48 |
32 | 30,764 | ||||||
| 4.50%, 12/01/48 |
6,429 | 6,187,664 | ||||||
| 4.50%, 01/01/49 |
1,462 | 1,407,241 | ||||||
| 4.50%, 05/01/49 |
13 | 12,362 | ||||||
| 5.00%, 08/01/25 |
164 | 162,172 | ||||||
| 5.00%, 04/01/33 |
2,320 | 2,321,513 | ||||||
| 5.00%, 06/01/33 |
288 | 287,992 | ||||||
| 5.00%, 12/01/33 |
599 | 599,394 | ||||||
| Security | Par (000) |
Value | ||||||
| Mortgage-Backed Securities (continued) |
||||||||
| 5.00%, 07/01/35 |
$ | 1,094 | $ | 1,093,737 | ||||
| 5.00%, 01/01/36 |
533 | 533,309 | ||||||
| 5.00%, 01/01/37 |
62 | 61,640 | ||||||
| 5.00%, 02/01/37 |
62 | 62,053 | ||||||
| 5.00%, 02/01/38 |
326 | 325,789 | ||||||
| 5.00%, 03/01/38 |
2,266 | 2,267,717 | ||||||
| 5.00%, 12/01/38 |
278 | 278,756 | ||||||
| 5.00%, 03/01/40 |
73 | 72,572 | ||||||
| 5.00%, 08/01/40 |
322 | 322,056 | ||||||
| 5.00%, 09/01/40 |
1,424 | 1,423,869 | ||||||
| 5.00%, 08/01/41 |
405 | 404,401 | ||||||
| 5.00%, 05/01/42(a) |
271 | 276,065 | ||||||
| 5.00%, 09/01/47 |
328 | 323,777 | ||||||
| 5.00%, 03/01/48 |
232 | 229,076 | ||||||
| 5.00%, 04/01/48 |
4,233 | 4,181,300 | ||||||
| 5.00%, 05/01/48 |
1,284 | 1,268,364 | ||||||
| 5.00%, 07/01/48 |
810 | 800,445 | ||||||
| 5.00%, 10/01/48 |
626 | 617,885 | ||||||
| 5.00%, 11/01/48 |
875 | 863,843 | ||||||
| 5.00%, 04/01/49 |
360 | 355,887 | ||||||
| 5.00%, 06/01/49 |
861 | 848,955 | ||||||
| 5.24%, 12/01/38(a) |
474 | 480,276 | ||||||
| 5.50%, 02/01/34 |
956 | 972,648 | ||||||
| 5.50%, 05/01/35 |
834 | 852,667 | ||||||
| 5.50%, 06/01/35 |
463 | 473,618 | ||||||
| 5.50%, 05/01/36 |
576 | 589,161 | ||||||
| 5.50%, 07/01/36 |
995 | 1,016,618 | ||||||
| 5.50%, 03/01/38 |
932 | 953,878 | ||||||
| 5.50%, 04/01/38 |
204 | 208,339 | ||||||
| 5.50%, 01/01/39 |
479 | 488,743 | ||||||
| 5.50%, 11/01/39 |
505 | 516,542 | ||||||
| 5.85%, 08/01/41(a) |
132 | 134,302 | ||||||
| 5.99%, 11/01/41(a) |
150 | 151,909 | ||||||
| 6.00%, 10/01/36 |
543 | 562,173 | ||||||
| 6.00%, 02/01/37 |
439 | 455,719 | ||||||
| 6.00%, 11/01/37 |
1,611 | 1,676,716 | ||||||
| 6.00%, 09/01/38 |
23 | 24,460 | ||||||
| 6.03%, 11/01/40(a) |
10 | 9,770 | ||||||
| 6.13%, 09/01/41(a) |
209 | 210,442 | ||||||
| 6.15%, 11/01/40(a) |
80 | 79,757 | ||||||
| 6.15%, 01/01/42(a) |
39 | 39,377 | ||||||
| 6.16%, 11/01/40(a) |
275 | 276,288 | ||||||
| Federal National Mortgage Association |
||||||||
| 3.00%, 02/01/47 |
8,536 | 7,554,637 | ||||||
| 3.00%, 03/01/47 |
6,733 | 5,819,845 | ||||||
| 3.50%, 11/01/51 |
5,584 | 5,015,761 | ||||||
| 4.00%, 02/01/47 |
9,351 | 8,782,565 | ||||||
| 4.00%, 01/01/57 |
6,300 | 5,846,664 | ||||||
| 4.00%, 02/01/57 |
7,068 | 6,559,396 | ||||||
| 4.43%, 04/01/44(a) |
201 | 203,122 | ||||||
| 6.00%, 08/01/41(a) |
199 | 203,223 | ||||||
| 6.07%, 10/01/41(a) |
304 | 309,156 | ||||||
| 6.26%, 02/01/42(a) |
67 | 67,268 | ||||||
| Series 2015-M10, Class A2, 3.09%, 04/25/27(a) |
2,992 | 2,859,259 | ||||||
| Series 2016-M6, Class A2, 2.49%, 05/25/26 |
7,981 | 7,590,272 | ||||||
| Series 2017, Class A2, 2.96%, 09/25/27(a) |
1,703 | 1,615,204 | ||||||
| Series 2017-M4, Class A2, 2.55%, 12/25/26(a) |
20,213 | 19,071,572 | ||||||
| S C H E D U L E O F I N V E S T M E N T S |
101 |
| Schedule of Investments (continued) February 29, 2024 |
iShares® Core U.S. Aggregate Bond ETF (Percentages shown are based on Net Assets) |
| Security | Par (000) |
Value | ||||||
| Mortgage-Backed Securities (continued) |
||||||||
| Series 2017-M7, Class A2, 2.96%, 02/25/27(a) |
$ | 14,238 | $ | 13,551,448 | ||||
| Series 2017-M8, Class A2, 3.06%, 05/25/27(a) |
8,093 | 7,708,033 | ||||||
| Series 2018-M10, Class A2, 3.36%, 07/25/28(a) |
2,999 | 2,853,127 | ||||||
| Series 2018-M12, Class A2, 3.63%, 08/25/30(a) |
12,300 | 11,499,738 | ||||||
| Series 2018-M13, Class A2, 3.74%, 09/25/30(a) |
7,734 | 7,290,751 | ||||||
| Series 2018-M2, Class A2, 2.91%, 01/25/28(a) |
8,372 | 7,880,218 | ||||||
| Series 2019-M2, Class A2, 3.62%, 11/25/28(a) |
5,154 | 4,935,618 | ||||||
| Series 2019-M22, Class A2, 2.52%, 08/25/29 |
22,289 | 20,048,960 | ||||||
| Series 2021-M13, Class A2, 1.60%, 04/25/31(a) |
17,050 | 13,786,578 | ||||||
| Series 2021-M17, Class A2, 1.71%, 07/25/31(a) |
20,500 | 16,660,145 | ||||||
| Series 2022-M1, Class A2, 1.67%, 10/25/31(a) |
29,670 | 23,858,254 | ||||||
| Freddie Mac Multifamily Structured Pass Through Certificates |
||||||||
| 2.92%, 06/25/32 (Call 07/25/32) |
25,000 | 21,849,877 | ||||||
| Series K046, Class A2, 3.21%, 03/25/25 |
5,000 | 4,895,218 | ||||||
| Series K048, Class A2, 3.28%, 06/25/25 |
21,168 | 20,693,595 | ||||||
| Series K052, Class A2, 3.15%, 11/25/25 |
19,250 | 18,685,075 | ||||||
| Series K053, Class A2, 3.00%, 12/25/25 |
15,000 | 14,507,739 | ||||||
| Series K059, Class A2, 3.12%, 09/25/26 |
14,300 | 13,725,821 | ||||||
| Series K063, Class A2, 3.43%, 01/25/27 |
20,000 | 19,288,534 | ||||||
| Series K066, Class A2, 3.12%, 06/25/27 |
18,250 | 17,372,253 | ||||||
| Series K067, Class A1, 2.90%, 03/25/27 |
7,206 | 6,966,760 | ||||||
| Series K069, Class A2, 3.19%, 09/25/27 |
3,150 | 2,993,470 | ||||||
| Series K072, Class A2, 3.44%, 12/25/27 |
10,000 | 9,551,763 | ||||||
| Series K074, Class A2, 3.60%, 01/25/28 |
10,000 | 9,595,644 | ||||||
| Series K076, Class A2, 3.90%, 04/25/28 |
8,000 | 7,745,061 | ||||||
| Series K081, Class A2, 3.90%, 08/25/28 |
19,091 | 18,440,916 | ||||||
| Series K085, Class A2, 4.06%, 10/25/28 |
20,000 | 19,415,929 | ||||||
| Series K089, Class A2, 3.56%, 01/25/29 |
10,000 | 9,500,910 | ||||||
| Series K100, Class A2, 2.67%, 09/25/29 |
10,000 | 8,989,743 | ||||||
| Series K101, Class A2, 2.52%, 10/25/29 |
31,000 | 27,658,476 | ||||||
| Series K105, Class A2, 1.87%, 01/25/30 |
4,775 | 4,076,621 | ||||||
| Security | Par (000) |
Value | ||||||
| Mortgage-Backed Securities (continued) |
||||||||
| Series K108, Class A2, 1.52%, 03/25/30 |
||||||||
| (Call 03/25/30) |
$ | 2,000 | $ | 1,668,745 | ||||
| Series K110, Class A2, 1.48%, 04/25/30 |
||||||||
| (Call 05/25/30) |
13,200 | 10,957,691 | ||||||
| Series K111, Class A2, 1.35%, 05/25/30 |
||||||||
| (Call 07/25/30) |
5,000 | 4,100,344 | ||||||
| Series K117, Class A2, 1.41%, 08/25/30 |
||||||||
| (Call 10/25/30) |
15,000 | 12,234,967 | ||||||
| Series K126, Class A2, 2.07%, 01/25/31 |
||||||||
| (Call 05/25/31) |
17,440 | 14,723,678 | ||||||
| Series K135, CLASS A2, 2.15%, 10/25/31 |
||||||||
| (Call 11/25/31)(a) |
4,670 | 3,896,205 | ||||||
| Series K1510, Class A3, 3.79%, 01/25/34 |
||||||||
| (Call 01/25/34) |
20,000 | 18,448,915 | ||||||
| Series K-1512, Class A2, 2.99%, 05/25/31 |
||||||||
| (Call 10/25/34) |
10,960 | 9,813,403 | ||||||
| Series K-1512, Class A3, 3.06%, 04/25/34 |
||||||||
| (Call 10/25/34) |
16,190 | 13,562,634 | ||||||
| Series K-1514, Class A2, 2.86%, 10/25/34 |
||||||||
| (Call 10/25/34) |
15,500 | 12,593,226 | ||||||
| Series K733, Class A2, 3.75%, 08/25/25 |
||||||||
| (Call 01/25/26) |
14,887 | 14,595,118 | ||||||
| Series K734, Class A2, 3.21%, 02/25/26 |
||||||||
| (Call 07/25/26) |
5,700 | 5,526,388 | ||||||
| Series K739, Class A2, 1.34%, 09/25/27 |
||||||||
| (Call 09/25/27) |
25,490 | 22,881,617 | ||||||
| Government National Mortgage Association |
||||||||
| 1.50%, 10/20/51 |
4,310 | 3,326,893 | ||||||
| 2.00%, 07/20/50 |
5,139 | 4,195,443 | ||||||
| 2.00%, 08/20/50 |
70,762 | 57,758,186 | ||||||
| 2.00%, 09/20/50 |
1,976 | 1,612,632 | ||||||
| 2.00%, 10/20/50 |
7,518 | 6,132,562 | ||||||
| 2.00%, 11/20/50 |
41,157 | 33,565,140 | ||||||
| 2.00%, 12/20/50 |
74,679 | 60,886,386 | ||||||
| 2.00%, 01/20/51 |
30,801 | 25,104,909 | ||||||
| 2.00%, 02/20/51 |
181,091 | 147,585,863 | ||||||
| 2.00%, 06/20/51 |
6,825 | 5,558,328 | ||||||
| 2.00%, 08/20/51 |
123,041 | 100,161,674 | ||||||
| 2.00%, 10/20/51 |
86,695 | 70,547,418 | ||||||
| 2.00%, 11/20/51 |
62,985 | 51,244,093 | ||||||
| 2.00%, 12/20/51 |
225,212 | 183,194,439 | ||||||
| 2.00%, 01/20/52 |
126,007 | 102,488,466 | ||||||
| 2.00%, 03/20/52 |
192,088 | 156,242,638 | ||||||
| 2.00%, 04/20/52 |
45,793 | 37,251,415 | ||||||
| 2.00%, 06/20/52 |
35,905 | 29,203,788 | ||||||
| 2.00%, 03/20/54(h) |
83,043 | 67,579,458 | ||||||
| 2.50%, 02/15/28 |
50 | 48,594 | ||||||
| 2.50%, 10/20/31 |
64 | 59,799 | ||||||
| 2.50%, 05/20/45 |
2,978 | 2,562,895 | ||||||
| 2.50%, 11/20/46 |
413 | 355,126 | ||||||
| 2.50%, 12/20/46 |
12,737 | 10,952,655 | ||||||
| 2.50%, 01/20/47 |
5,873 | 5,050,521 | ||||||
| 2.50%, 06/20/50 |
15,143 | 12,847,401 | ||||||
| 2.50%, 08/20/50 |
16,760 | 13,992,347 | ||||||
| 2.50%, 09/20/50 |
35,780 | 29,861,098 | ||||||
| 2.50%, 01/20/51 |
78,487 | 66,417,360 | ||||||
| 2.50%, 02/20/51 |
132,348 | 112,205,558 | ||||||
| 2.50%, 05/20/51 |
270,145 | 228,879,450 | ||||||
| 2.50%, 06/20/51 |
8,361 | 7,082,051 | ||||||
| 2.50%, 07/20/51 |
224,824 | 190,397,653 | ||||||
| 2.50%, 08/20/51 |
138,214 | 117,024,140 | ||||||
| 102 | 2 0 2 4 I S H A R E S A N N U A L R E P O R T T O S H A R E H O L D E R S |
| Schedule of Investments (continued) February 29, 2024 |
iShares® Core U.S. Aggregate Bond ETF (Percentages shown are based on Net Assets) |
| Security | Par (000) |
Value | ||||||
| Mortgage-Backed Securities (continued) |
||||||||
| 2.50%, 09/20/51 |
$ | 4,529 | $ | 3,833,520 | ||||
| 2.50%, 10/20/51 |
4,100 | 3,469,793 | ||||||
| 2.50%, 11/20/51 |
33,564 | 28,399,436 | ||||||
| 2.50%, 12/20/51 |
95,386 | 80,709,365 | ||||||
| 2.50%, 01/20/52 |
3,357 | 2,839,753 | ||||||
| 2.50%, 03/20/52 |
105,363 | 89,125,948 | ||||||
| 2.50%, 04/20/52 |
77,391 | 65,456,067 | ||||||
| 2.50%, 05/20/52 |
26,739 | 22,615,264 | ||||||
| 2.50%, 07/20/52 |
8,769 | 7,416,777 | ||||||
| 2.50%, 08/20/52 |
17,440 | 14,750,083 | ||||||
| 2.50%, 03/20/54(h) |
107,698 | 91,141,749 | ||||||
| 3.00%, 08/20/42 |
4,556 | 4,076,588 | ||||||
| 3.00%, 09/15/42 |
9 | 8,043 | ||||||
| 3.00%, 10/15/42 |
25 | 22,539 | ||||||
| 3.00%, 03/15/43 |
155 | 138,526 | ||||||
| 3.00%, 06/15/43 |
26 | 23,375 | ||||||
| 3.00%, 07/15/43 |
63 | 56,677 | ||||||
| 3.00%, 09/20/43 |
5,218 | 4,665,262 | ||||||
| 3.00%, 11/15/43 |
481 | 429,154 | ||||||
| 3.00%, 01/15/44 |
4,409 | 3,939,678 | ||||||
| 3.00%, 08/20/44 |
13,520 | 12,087,463 | ||||||
| 3.00%, 10/15/44 |
106 | 99,491 | ||||||
| 3.00%, 03/20/45 |
4,393 | 3,915,595 | ||||||
| 3.00%, 05/20/45 |
17,992 | 16,036,268 | ||||||
| 3.00%, 06/20/45 |
5,885 | 5,245,440 | ||||||
| 3.00%, 07/20/45 |
11,849 | 10,560,543 | ||||||
| 3.00%, 10/20/45 |
4,051 | 3,614,971 | ||||||
| 3.00%, 11/20/45 |
2,570 | 2,290,887 | ||||||
| 3.00%, 12/20/45 |
4,709 | 4,196,707 | ||||||
| 3.00%, 02/20/46 |
14,120 | 12,584,681 | ||||||
| 3.00%, 04/20/46 |
6,449 | 5,737,724 | ||||||
| 3.00%, 05/20/46 |
10,621 | 9,449,011 | ||||||
| 3.00%, 06/20/46 |
12,724 | 11,320,015 | ||||||
| 3.00%, 07/20/46 |
17,799 | 15,834,484 | ||||||
| 3.00%, 08/20/46 |
31,201 | 27,757,769 | ||||||
| 3.00%, 09/20/46 |
23,459 | 20,870,277 | ||||||
| 3.00%, 11/20/46 |
6,326 | 5,628,074 | ||||||
| 3.00%, 12/15/46 |
7,575 | 6,646,136 | ||||||
| 3.00%, 12/20/46 |
36,587 | 32,549,877 | ||||||
| 3.00%, 01/20/47 |
1,919 | 1,706,914 | ||||||
| 3.00%, 02/15/47 |
11,162 | 9,932,395 | ||||||
| 3.00%, 02/20/47 |
11,696 | 10,404,883 | ||||||
| 3.00%, 03/20/47 |
10,683 | 9,503,752 | ||||||
| 3.00%, 04/20/47 |
236 | 210,119 | ||||||
| 3.00%, 06/20/47 |
5,130 | 4,559,083 | ||||||
| 3.00%, 09/20/47 |
306 | 271,727 | ||||||
| 3.00%, 10/20/47 |
6,245 | 5,550,581 | ||||||
| 3.00%, 11/20/47 |
114 | 101,690 | ||||||
| 3.00%, 02/20/48 |
4,971 | 4,386,477 | ||||||
| 3.00%, 03/20/48 |
17 | 15,430 | ||||||
| 3.00%, 07/20/49 |
7,285 | 6,449,634 | ||||||
| 3.00%, 09/20/49 |
26,063 | 23,075,204 | ||||||
| 3.00%, 10/15/49 |
9,413 | 8,298,445 | ||||||
| 3.00%, 10/20/49 |
13,806 | 12,204,952 | ||||||
| 3.00%, 11/20/49 |
154 | 136,213 | ||||||
| 3.00%, 12/20/49 |
82,084 | 72,524,180 | ||||||
| 3.00%, 01/20/50 |
43,701 | 38,644,795 | ||||||
| 3.00%, 02/20/50 |
54,733 | 48,330,727 | ||||||
| 3.00%, 07/20/50 |
28,336 | 24,985,236 | ||||||
| 3.00%, 02/20/51 |
1,766 | 1,554,552 | ||||||
| 3.00%, 06/20/51 |
663 | 581,811 | ||||||
| Security | Par (000) |
Value | ||||||
| Mortgage-Backed Securities (continued) |
||||||||
| 3.00%, 08/20/51 |
$ | 72,623 | $ | 63,744,393 | ||||
| 3.00%, 09/20/51 |
23,930 | 20,998,967 | ||||||
| 3.00%, 10/20/51 |
27,659 | 24,264,244 | ||||||
| 3.00%, 11/20/51 |
47,208 | 41,403,895 | ||||||
| 3.00%, 12/20/51 |
42,308 | 37,096,579 | ||||||
| 3.00%, 02/20/52 |
21,808 | 19,111,108 | ||||||
| 3.00%, 03/20/52 |
34,592 | 30,006,605 | ||||||
| 3.00%, 05/20/52 |
9,077 | 7,953,935 | ||||||
| 3.00%, 06/20/52 |
28,754 | 25,196,129 | ||||||
| 3.00%, 07/20/52 |
26,729 | 23,421,785 | ||||||
| 3.00%, 08/20/52 |
13,242 | 11,603,808 | ||||||
| 3.00%, 09/20/52 |
18,080 | 15,843,294 | ||||||
| 3.00%, 11/20/52 |
2,498 | 2,192,346 | ||||||
| 3.00%, 03/20/54(h) |
94,707 | 83,022,353 | ||||||
| 3.50%, 11/20/40 |
56 | 52,137 | ||||||
| 3.50%, 12/20/40 |
41 | 38,436 | ||||||
| 3.50%, 05/20/41 |
78 | 72,457 | ||||||
| 3.50%, 09/15/41 |
143 | 132,780 | ||||||
| 3.50%, 10/15/41 |
199 | 184,138 | ||||||
| 3.50%, 12/15/41 |
1,453 | 1,344,600 | ||||||
| 3.50%, 04/15/42 |
95 | 88,186 | ||||||
| 3.50%, 08/20/42 |
8,068 | 7,468,162 | ||||||
| 3.50%, 09/15/42 |
338 | 312,142 | ||||||
| 3.50%, 09/20/42 |
9,654 | 8,935,469 | ||||||
| 3.50%, 10/15/42 |
266 | 246,100 | ||||||
| 3.50%, 10/20/42 |
25,871 | 23,946,594 | ||||||
| 3.50%, 11/15/42 |
354 | 327,601 | ||||||
| 3.50%, 11/20/42 |
22,527 | 20,851,402 | ||||||
| 3.50%, 12/15/42 |
604 | 558,934 | ||||||
| 3.50%, 12/20/42 |
7,966 | 7,373,365 | ||||||
| 3.50%, 02/15/43 |
336 | 311,159 | ||||||
| 3.50%, 02/20/43 |
155 | 142,867 | ||||||
| 3.50%, 03/15/43 |
404 | 372,692 | ||||||
| 3.50%, 03/20/43 |
690 | 637,122 | ||||||
| 3.50%, 04/15/43 |
23 | 21,563 | ||||||
| 3.50%, 04/20/43 |
175 | 161,408 | ||||||
| 3.50%, 05/15/43 |
672 | 620,074 | ||||||
| 3.50%, 06/15/43 |
9,569 | 8,798,595 | ||||||
| 3.50%, 08/20/43 |
125 | 115,328 | ||||||
| 3.50%, 09/20/43 |
61 | 56,601 | ||||||
| 3.50%, 10/20/43 |
168 | 155,532 | ||||||
| 3.50%, 01/15/44 |
146 | 134,359 | ||||||
| 3.50%, 01/20/44 |
5,159 | 4,764,695 | ||||||
| 3.50%, 02/20/44 |
1,670 | 1,542,175 | ||||||
| 3.50%, 03/20/44 |
159 | 146,819 | ||||||
| 3.50%, 07/20/44 |
28 | 26,096 | ||||||
| 3.50%, 08/15/44 |
26 | 24,053 | ||||||
| 3.50%, 08/20/44 |
5,479 | 5,055,792 | ||||||
| 3.50%, 09/15/44 |
62 | 57,429 | ||||||
| 3.50%, 09/20/44 |
9,791 | 9,034,552 | ||||||
| 3.50%, 10/15/44 |
144 | 132,169 | ||||||
| 3.50%, 10/20/44 |
1,492 | 1,376,078 | ||||||
| 3.50%, 11/20/44 |
13 | 12,245 | ||||||
| 3.50%, 12/20/44 |
923 | 851,591 | ||||||
| 3.50%, 01/15/45 |
56 | 51,270 | ||||||
| 3.50%, 01/20/45 |
136 | 125,655 | ||||||
| 3.50%, 03/15/45 |
112 | 102,665 | ||||||
| 3.50%, 04/20/45 |
9,459 | 8,694,875 | ||||||
| 3.50%, 05/20/45 |
3,556 | 3,245,988 | ||||||
| 3.50%, 06/15/45 |
41 | 37,446 | ||||||
| 3.50%, 06/20/45 |
5,332 | 4,901,673 | ||||||
| S C H E D U L E O F I N V E S T M E N T S |
103 |
| Schedule of Investments (continued) February 29, 2024 |
iShares® Core U.S. Aggregate Bond ETF (Percentages shown are based on Net Assets) |
| Security | Par (000) |
Value | ||||||
| Mortgage-Backed Securities (continued) |
||||||||
| 3.50%, 07/20/45 |
$ | 177 | $ | 163,080 | ||||
| 3.50%, 08/20/45 |
436 | 399,026 | ||||||
| 3.50%, 09/20/45 |
13,851 | 12,732,831 | ||||||
| 3.50%, 10/20/45 |
1,345 | 1,236,819 | ||||||
| 3.50%, 11/20/45 |
9,808 | 9,016,059 | ||||||
| 3.50%, 12/20/45 |
5,488 | 5,044,446 | ||||||
| 3.50%, 03/20/46 |
20,092 | 18,435,917 | ||||||
| 3.50%, 04/20/46 |
8,863 | 8,132,670 | ||||||
| 3.50%, 06/20/46 |
39,039 | 35,821,186 | ||||||
| 3.50%, 07/20/46 |
281 | 257,574 | ||||||
| 3.50%, 08/15/46 |
46 | 42,483 | ||||||
| 3.50%, 11/20/46 |
399 | 366,012 | ||||||
| 3.50%, 12/20/46 |
11,343 | 10,408,422 | ||||||
| 3.50%, 01/15/47 |
46 | 42,033 | ||||||
| 3.50%, 01/20/47 |
2,675 | 2,454,334 | ||||||
| 3.50%, 02/20/47 |
45,864 | 42,083,377 | ||||||
| 3.50%, 03/20/47 |
16,934 | 15,492,165 | ||||||
| 3.50%, 04/20/47 |
15,192 | 13,898,512 | ||||||
| 3.50%, 06/20/47 |
3,363 | 3,076,761 | ||||||
| 3.50%, 07/20/47 |
422 | 386,517 | ||||||
| 3.50%, 08/20/47 |
22,328 | 20,443,831 | ||||||
| 3.50%, 09/15/47 |
49 | 44,500 | ||||||
| 3.50%, 09/20/47 |
31,958 | 29,237,996 | ||||||
| 3.50%, 10/20/47 |
13,240 | 12,121,310 | ||||||
| 3.50%, 11/15/47 |
21 | 18,891 | ||||||
| 3.50%, 11/20/47 |
19,170 | 17,538,033 | ||||||
| 3.50%, 12/15/47 |
5 | 4,891 | ||||||
| 3.50%, 12/20/47 |
9,462 | 8,621,656 | ||||||
| 3.50%, 01/20/48 |
9,278 | 8,488,148 | ||||||
| 3.50%, 02/20/48 |
3,134 | 2,867,203 | ||||||
| 3.50%, 04/20/48 |
30,713 | 28,096,761 | ||||||
| 3.50%, 05/15/48 |
324 | 296,806 | ||||||
| 3.50%, 05/20/48 |
21,161 | 19,360,089 | ||||||
| 3.50%, 08/20/48 |
4,061 | 3,714,435 | ||||||
| 3.50%, 09/20/48 |
1,884 | 1,723,892 | ||||||
| 3.50%, 11/20/48 |
3,271 | 2,992,419 | ||||||
| 3.50%, 01/20/49 |
1,989 | 1,820,036 | ||||||
| 3.50%, 06/20/49 |
657 | 600,341 | ||||||
| 3.50%, 09/20/49 |
5,241 | 4,784,546 | ||||||
| 3.50%, 10/20/49 |
6,729 | 6,149,096 | ||||||
| 3.50%, 01/20/50 |
26,768 | 24,430,350 | ||||||
| 3.50%, 03/20/50 |
7,480 | 6,826,403 | ||||||
| 3.50%, 08/20/50 |
6,066 | 5,515,203 | ||||||
| 3.50%, 10/20/51 |
2,482 | 2,246,399 | ||||||
| 3.50%, 01/20/52 |
9,838 | 8,902,753 | ||||||
| 3.50%, 02/20/52 |
18,204 | 16,473,354 | ||||||
| 3.50%, 08/20/52 |
8,340 | 7,537,810 | ||||||
| 3.50%, 10/20/52 |
14,653 | 13,243,850 | ||||||
| 3.50%, 12/20/52 |
10,616 | 9,595,115 | ||||||
| 3.50%, 01/20/53 |
39,349 | 35,565,809 | ||||||
| 3.50%, 05/20/53 |
25,775 | 23,520,856 | ||||||
| 3.50%, 03/20/54(h) |
108,451 | 98,083,991 | ||||||
| 4.00%, 06/15/39 |
5 | 4,784 | ||||||
| 4.00%, 09/20/40 |
2,084 | 1,988,181 | ||||||
| 4.00%, 01/15/41 |
1 | 1,211 | ||||||
| 4.00%, 01/20/41 |
681 | 649,875 | ||||||
| 4.00%, 02/15/41 |
1,664 | 1,589,185 | ||||||
| 4.00%, 05/20/41 |
13 | 12,489 | ||||||
| 4.00%, 07/15/41 |
777 | 742,670 | ||||||
| 4.00%, 09/15/41 |
17 | 16,592 | ||||||
| 4.00%, 09/20/41 |
904 | 862,305 | ||||||
| Security | Par (000) |
Value | ||||||
| Mortgage-Backed Securities (continued) |
||||||||
| 4.00%, 10/15/41 |
$ | 307 | $ | 293,567 | ||||
| 4.00%, 11/15/41 |
196 | 187,450 | ||||||
| 4.00%, 12/15/41 |
692 | 660,668 | ||||||
| 4.00%, 12/20/41 |
3,033 | 2,893,954 | ||||||
| 4.00%, 01/15/42 |
65 | 61,682 | ||||||
| 4.00%, 01/20/42 |
1,320 | 1,259,830 | ||||||
| 4.00%, 02/15/42 |
312 | 297,497 | ||||||
| 4.00%, 03/15/42 |
1,660 | 1,583,503 | ||||||
| 4.00%, 04/15/42 |
482 | 459,658 | ||||||
| 4.00%, 09/20/42 |
649 | 619,303 | ||||||
| 4.00%, 08/15/43 |
12 | 11,489 | ||||||
| 4.00%, 10/20/43 |
3,260 | 3,106,835 | ||||||
| 4.00%, 03/15/44 |
73 | 68,887 | ||||||
| 4.00%, 04/15/44 |
30 | 28,056 | ||||||
| 4.00%, 06/15/44 |
105 | 99,780 | ||||||
| 4.00%, 08/15/44 |
9 | 8,628 | ||||||
| 4.00%, 08/20/44 |
232 | 220,481 | ||||||
| 4.00%, 09/15/44 |
2 | 1,895 | ||||||
| 4.00%, 10/15/44 |
10 | 9,234 | ||||||
| 4.00%, 10/20/44 |
4,340 | 4,123,098 | ||||||
| 4.00%, 12/20/44 |
289 | 274,113 | ||||||
| 4.00%, 01/20/45 |
6,854 | 6,511,310 | ||||||
| 4.00%, 08/20/45 |
3,822 | 3,626,044 | ||||||
| 4.00%, 09/20/45 |
4,479 | 4,249,360 | ||||||
| 4.00%, 10/20/45 |
532 | 504,309 | ||||||
| 4.00%, 01/20/46 |
2,031 | 1,926,901 | ||||||
| 4.00%, 03/20/46 |
9,984 | 9,472,577 | ||||||
| 4.00%, 07/20/46 |
2,142 | 2,022,759 | ||||||
| 4.00%, 08/20/46 |
28 | 26,018 | ||||||
| 4.00%, 09/20/46 |
487 | 460,230 | ||||||
| 4.00%, 11/20/46 |
2,601 | 2,455,771 | ||||||
| 4.00%, 12/15/46 |
3,876 | 3,666,421 | ||||||
| 4.00%, 04/20/47 |
16,127 | 15,209,397 | ||||||
| 4.00%, 06/20/47 |
6,520 | 6,148,835 | ||||||
| 4.00%, 07/20/47 |
28,352 | 26,737,919 | ||||||
| 4.00%, 08/20/47 |
1,374 | 1,295,845 | ||||||
| 4.00%, 11/20/47 |
17,364 | 16,375,229 | ||||||
| 4.00%, 12/20/47 |
41 | 38,087 | ||||||
| 4.00%, 01/20/48 |
138 | 129,881 | ||||||
| 4.00%, 03/15/48 |
39 | 36,467 | ||||||
| 4.00%, 03/20/48 |
19,964 | 18,827,612 | ||||||
| 4.00%, 04/20/48 |
10,797 | 10,173,020 | ||||||
| 4.00%, 05/15/48 |
1,734 | 1,633,876 | ||||||
| 4.00%, 05/20/48 |
11,481 | 10,815,419 | ||||||
| 4.00%, 08/20/48 |
17,762 | 16,737,293 | ||||||
| 4.00%, 09/20/48 |
6,425 | 6,053,956 | ||||||
| 4.00%, 10/20/48 |
544 | 512,186 | ||||||
| 4.00%, 11/20/48 |
15,139 | 14,259,988 | ||||||
| 4.00%, 02/20/49 |
6,626 | 6,243,702 | ||||||
| 4.00%, 03/20/49 |
270 | 254,016 | ||||||
| 4.00%, 05/20/49 |
645 | 607,770 | ||||||
| 4.00%, 06/15/49 |
655 | 616,813 | ||||||
| 4.00%, 06/20/49 |
1,685 | 1,587,100 | ||||||
| 4.00%, 09/15/49 |
1,765 | 1,663,220 | ||||||
| 4.00%, 01/20/50 |
67,948 | 63,981,426 | ||||||
| 4.00%, 02/20/50 |
27,616 | 26,004,057 | ||||||
| 4.00%, 07/20/50 |
4,930 | 4,645,463 | ||||||
| 4.00%, 07/20/52 |
8,878 | 8,259,190 | ||||||
| 4.00%, 09/20/52 |
81,836 | 76,132,888 | ||||||
| 4.00%, 12/20/52 |
16,804 | 15,632,556 | ||||||
| 4.00%, 03/20/53 |
9,821 | 9,136,313 | ||||||
| 104 | 2 0 2 4 I S H A R E S A N N U A L R E P O R T T O S H A R E H O L D E R S |
| Schedule of Investments (continued) February 29, 2024 |
iShares® Core U.S. Aggregate Bond ETF (Percentages shown are based on Net Assets) |
| Security | Par (000) |
Value | ||||||
| Mortgage-Backed Securities (continued) |
||||||||
| 4.00%, 10/20/53 |
$ | 7,022 | $ | 6,545,726 | ||||
| 4.00%, 03/20/54(h) |
70,231 | 65,356,978 | ||||||
| 4.50%, 04/15/39 |
278 | 272,881 | ||||||
| 4.50%, 08/15/39 |
1,390 | 1,366,713 | ||||||
| 4.50%, 11/20/39 |
707 | 694,685 | ||||||
| 4.50%, 01/20/40 |
192 | 188,536 | ||||||
| 4.50%, 06/15/40 |
1,312 | 1,289,766 | ||||||
| 4.50%, 07/15/40 |
633 | 622,182 | ||||||
| 4.50%, 08/15/40 |
1,000 | 983,098 | ||||||
| 4.50%, 08/20/40 |
1,185 | 1,165,003 | ||||||
| 4.50%, 09/15/40 |
1,156 | 1,136,094 | ||||||
| 4.50%, 10/20/40 |
2,888 | 2,838,040 | ||||||
| 4.50%, 06/20/41 |
2,530 | 2,488,992 | ||||||
| 4.50%, 07/20/41 |
13,172 | 12,958,991 | ||||||
| 4.50%, 09/20/41 |
1,745 | 1,717,252 | ||||||
| 4.50%, 12/20/41 |
360 | 354,446 | ||||||
| 4.50%, 11/20/45 |
2,991 | 2,918,345 | ||||||
| 4.50%, 02/15/46 |
4 | 3,866 | ||||||
| 4.50%, 08/20/46 |
3,695 | 3,609,957 | ||||||
| 4.50%, 09/20/46 |
592 | 579,978 | ||||||
| 4.50%, 10/20/46 |
2,656 | 2,594,740 | ||||||
| 4.50%, 11/20/46 |
1,017 | 993,890 | ||||||
| 4.50%, 12/20/46 |
434 | 424,469 | ||||||
| 4.50%, 02/20/47 |
436 | 424,893 | ||||||
| 4.50%, 04/20/47 |
521 | 505,350 | ||||||
| 4.50%, 05/20/47 |
494 | 479,620 | ||||||
| 4.50%, 06/20/47 |
1,145 | 1,112,847 | ||||||
| 4.50%, 07/20/47 |
2,545 | 2,470,297 | ||||||
| 4.50%, 10/20/47 |
810 | 785,880 | ||||||
| 4.50%, 04/20/48 |
1,940 | 1,878,669 | ||||||
| 4.50%, 05/20/48 |
4,866 | 4,710,765 | ||||||
| 4.50%, 06/20/48 |
5,317 | 5,147,303 | ||||||
| 4.50%, 07/20/48 |
6,904 | 6,683,143 | ||||||
| 4.50%, 08/20/48 |
11,204 | 10,845,969 | ||||||
| 4.50%, 09/20/48 |
560 | 542,208 | ||||||
| 4.50%, 10/20/48 |
581 | 562,887 | ||||||
| 4.50%, 11/20/48 |
161 | 155,380 | ||||||
| 4.50%, 12/20/48 |
5,716 | 5,533,103 | ||||||
| 4.50%, 01/20/49 |
141 | 136,926 | ||||||
| 4.50%, 02/20/49 |
1,281 | 1,238,196 | ||||||
| 4.50%, 03/20/49 |
2,405 | 2,327,738 | ||||||
| 4.50%, 05/20/49 |
523 | 506,304 | ||||||
| 4.50%, 06/20/49 |
7,684 | 7,438,842 | ||||||
| 4.50%, 07/20/49 |
5,724 | 5,541,183 | ||||||
| 4.50%, 08/20/49 |
2,275 | 2,202,479 | ||||||
| 4.50%, 07/20/52 |
4,643 | 4,443,858 | ||||||
| 4.50%, 08/20/52 |
103,221 | 98,684,805 | ||||||
| 4.50%, 04/20/53 |
75,566 | 72,144,653 | ||||||
| 4.50%, 05/20/53 |
38,283 | 36,549,633 | ||||||
| 4.50%, 06/20/53 |
54,147 | 51,696,084 | ||||||
| 4.50%, 03/20/54(h) |
74,836 | 71,463,374 | ||||||
| 5.00%, 12/15/36 |
383 | 384,313 | ||||||
| 5.00%, 01/15/39 |
1,185 | 1,191,945 | ||||||
| 5.00%, 07/15/39 |
2,130 | 2,141,718 | ||||||
| 5.00%, 05/15/40 |
761 | 762,868 | ||||||
| 5.00%, 07/20/40 |
3,955 | 3,966,726 | ||||||
| 5.00%, 08/20/40 |
1,476 | 1,480,024 | ||||||
| 5.00%, 05/15/47 |
1,030 | 1,021,952 | ||||||
| 5.00%, 06/15/47 |
157 | 155,208 | ||||||
| 5.00%, 11/15/47 |
353 | 350,105 | ||||||
| 5.00%, 12/15/47 |
256 | 253,849 | ||||||
| Security | Par (000) |
Value | ||||||
| Mortgage-Backed Securities (continued) |
||||||||
| 5.00%, 01/15/48 |
$ | 336 | $ | 333,130 | ||||
| 5.00%, 02/15/48 |
481 | 476,798 | ||||||
| 5.00%, 03/20/48 |
1,088 | 1,083,351 | ||||||
| 5.00%, 04/20/48 |
3,644 | 3,626,721 | ||||||
| 5.00%, 05/20/48 |
3,933 | 3,901,338 | ||||||
| 5.00%, 10/20/48 |
80 | 79,509 | ||||||
| 5.00%, 11/20/48 |
1,408 | 1,395,601 | ||||||
| 5.00%, 12/20/48 |
2,612 | 2,588,648 | ||||||
| 5.00%, 01/20/49 |
4,354 | 4,315,912 | ||||||
| 5.00%, 04/20/49 |
10,212 | 10,121,984 | ||||||
| 5.00%, 05/20/49 |
1,198 | 1,187,404 | ||||||
| 5.00%, 06/20/49 |
9,642 | 9,556,808 | ||||||
| 5.00%, 07/20/52 |
4,851 | 4,739,548 | ||||||
| 5.00%, 09/20/52 |
6,086 | 5,946,693 | ||||||
| 5.00%, 12/20/52 |
42,119 | 41,154,517 | ||||||
| 5.00%, 01/20/53 |
44,881 | 43,852,713 | ||||||
| 5.00%, 02/20/53 |
7,967 | 7,784,365 | ||||||
| 5.00%, 04/20/53 |
32,224 | 31,463,356 | ||||||
| 5.00%, 05/20/53 |
38,360 | 37,454,966 | ||||||
| 5.00%, 07/20/53 |
91,373 | 89,217,127 | ||||||
| 5.00%, 03/20/54(h) |
96,330 | 94,085,872 | ||||||
| 5.50%, 03/15/36 |
580 | 592,575 | ||||||
| 5.50%, 06/20/38 |
637 | 652,595 | ||||||
| 5.50%, 03/20/39 |
977 | 999,767 | ||||||
| 5.50%, 12/15/39 |
230 | 236,714 | ||||||
| 5.50%, 01/15/40 |
2,228 | 2,280,540 | ||||||
| 5.50%, 04/20/48 |
220 | 223,834 | ||||||
| 5.50%, 12/20/52 |
59,398 | 59,046,682 | ||||||
| 5.50%, 01/20/53 |
25,610 | 25,438,292 | ||||||
| 5.50%, 03/20/53 |
41,960 | 41,674,018 | ||||||
| 5.50%, 04/20/53 |
108,058 | 107,320,892 | ||||||
| 5.50%, 06/20/53 |
23,965 | 23,801,284 | ||||||
| 5.50%, 07/20/53 |
22,676 | 22,696,968 | ||||||
| 5.50%, 09/20/53 |
39,073 | 38,806,407 | ||||||
| 5.50%, 10/20/53 |
49,582 | 49,243,322 | ||||||
| 5.50%, 03/20/54(h) |
32,774 | 32,555,080 | ||||||
| 6.00%, 03/15/37 |
1,864 | 1,945,042 | ||||||
| 6.00%, 09/20/38 |
713 | 742,845 | ||||||
| 6.00%, 11/15/39 |
308 | 324,150 | ||||||
| 6.00%, 02/20/53 |
12,815 | 12,874,434 | ||||||
| 6.00%, 09/20/53 |
30,986 | 31,136,482 | ||||||
| 6.00%, 10/20/53 |
46,612 | 46,839,002 | ||||||
| 6.00%, 11/20/53 |
34,486 | 34,654,093 | ||||||
| 6.00%, 01/20/54 |
15,598 | 15,673,577 | ||||||
| 6.00%, 03/20/54(h) |
132,650 | 133,296,807 | ||||||
| 6.50%, 10/20/38 |
1,062 | 1,127,258 | ||||||
| 6.50%, 10/20/53 |
5,505 | 5,584,109 | ||||||
| 6.50%, 11/20/53 |
29,413 | 29,837,466 | ||||||
| 6.50%, 12/20/53 |
26,628 | 27,011,429 | ||||||
| 6.50%, 01/20/54 |
69,541 | 70,543,318 | ||||||
| 6.50%, 03/20/54(h) |
114,554 | 116,107,530 | ||||||
| Uniform Mortgage-Backed Securities |
||||||||
| 1.50%, 03/01/36 |
17,038 | 14,738,409 | ||||||
| 1.50%, 04/01/36 |
301 | 260,733 | ||||||
| 1.50%, 07/01/36 |
3,096 | 2,676,471 | ||||||
| 1.50%, 10/01/36 |
12,369 | 10,686,308 | ||||||
| 1.50%, 01/01/37 |
1,586 | 1,369,264 | ||||||
| 1.50%, 02/01/37 |
149,514 | 129,083,564 | ||||||
| 1.50%, 03/01/37 |
153,888 | 132,987,625 | ||||||
| 1.50%, 04/01/37 |
23,779 | 20,549,670 | ||||||
| 1.50%, 08/01/37 |
12,240 | 10,567,720 | ||||||
| S C H E D U L E O F I N V E S T M E N T S |
105 |
| Schedule of Investments (continued) February 29, 2024 |
iShares® Core U.S. Aggregate Bond ETF (Percentages shown are based on Net Assets) |
| Security | Par (000) |
Value | ||||||
| Mortgage-Backed Securities (continued) |
||||||||
| 1.50%, 03/18/39(h) |
$ | 176,063 | $ | 151,801,641 | ||||
| 1.50%, 11/01/50 |
87,595 | 65,597,898 | ||||||
| 1.50%, 01/01/51 |
24,441 | 18,293,806 | ||||||
| 1.50%, 04/01/51 |
8,883 | 6,639,918 | ||||||
| 1.50%, 05/01/51 |
99,300 | 74,213,037 | ||||||
| 1.50%, 06/01/51 |
46,860 | 35,016,248 | ||||||
| 1.50%, 07/01/51 |
135,668 | 101,386,372 | ||||||
| 1.50%, 11/01/51 |
88,335 | 65,960,202 | ||||||
| 1.50%, 04/01/52 |
9,140 | 6,827,969 | ||||||
| 1.50%, 03/13/54(h) |
19,975 | 14,900,875 | ||||||
| 2.00%, 10/01/35 |
28,971 | 25,816,246 | ||||||
| 2.00%, 11/01/35 |
13,755 | 12,302,924 | ||||||
| 2.00%, 12/01/35 |
65,111 | 57,720,742 | ||||||
| 2.00%, 02/01/36 |
330,515 | 293,698,621 | ||||||
| 2.00%, 03/01/36 |
66,347 | 58,870,043 | ||||||
| 2.00%, 04/01/36 |
494 | 439,979 | ||||||
| 2.00%, 05/01/36 |
52,626 | 46,726,507 | ||||||
| 2.00%, 06/01/36 |
30,516 | 27,050,812 | ||||||
| 2.00%, 08/01/36 |
24,567 | 21,753,548 | ||||||
| 2.00%, 09/01/36 |
20,301 | 17,932,895 | ||||||
| 2.00%, 10/01/36 |
6,457 | 5,715,637 | ||||||
| 2.00%, 11/01/36 |
43,979 | 38,883,684 | ||||||
| 2.00%, 12/01/36 |
83,307 | 73,656,855 | ||||||
| 2.00%, 01/01/37 |
122,368 | 108,239,982 | ||||||
| 2.00%, 02/01/37 |
68,675 | 60,674,647 | ||||||
| 2.00%, 03/01/37 |
33,407 | 29,470,001 | ||||||
| 2.00%, 04/01/37 |
135,637 | 119,588,580 | ||||||
| 2.00%, 05/01/37 |
60,985 | 53,751,342 | ||||||
| 2.00%, 06/01/37 |
90,119 | 79,445,485 | ||||||
| 2.00%, 08/01/37 |
5,043 | 4,444,443 | ||||||
| 2.00%, 10/01/37 |
9,490 | 8,364,311 | ||||||
| 2.00%, 03/18/39(h) |
132,889 | 117,213,938 | ||||||
| 2.00%, 07/01/50 |
57,842 | 45,851,936 | ||||||
| 2.00%, 09/01/50 |
64,207 | 50,997,960 | ||||||
| 2.00%, 10/01/50 |
155,914 | 123,658,092 | ||||||
| 2.00%, 11/01/50 |
2,470 | 1,953,786 | ||||||
| 2.00%, 12/01/50 |
228,315 | 182,125,154 | ||||||
| 2.00%, 01/01/51 |
98,000 | 78,489,021 | ||||||
| 2.00%, 02/01/51 |
439,422 | 347,575,143 | ||||||
| 2.00%, 03/01/51 |
462,054 | 365,863,016 | ||||||
| 2.00%, 04/01/51 |
476,909 | 377,743,469 | ||||||
| 2.00%, 05/01/51 |
107,595 | 85,364,617 | ||||||
| 2.00%, 06/01/51 |
251,732 | 199,588,811 | ||||||
| 2.00%, 07/01/51 |
254,650 | 201,583,976 | ||||||
| 2.00%, 08/01/51 |
153,235 | 120,713,626 | ||||||
| 2.00%, 09/01/51 |
35,604 | 28,060,708 | ||||||
| 2.00%, 10/01/51 |
676,147 | 533,982,687 | ||||||
| 2.00%, 11/01/51 |
378,647 | 299,225,247 | ||||||
| 2.00%, 12/01/51 |
394,856 | 311,471,501 | ||||||
| 2.00%, 01/01/52 |
228,122 | 179,866,419 | ||||||
| 2.00%, 02/01/52 |
535,743 | 421,522,050 | ||||||
| 2.00%, 03/01/52 |
382,583 | 300,881,731 | ||||||
| 2.00%, 04/01/52 |
25,337 | 19,922,327 | ||||||
| 2.00%, 05/01/52 |
53,652 | 42,266,287 | ||||||
| 2.00%, 06/01/52 |
61,917 | 48,691,778 | ||||||
| 2.00%, 03/13/54(h) |
178,581 | 140,304,542 | ||||||
| 2.00%, 04/11/54(h) |
76,781 | 60,407,953 | ||||||
| 2.50%, 05/01/27 |
694 | 672,515 | ||||||
| 2.50%, 10/01/27 |
768 | 742,354 | ||||||
| 2.50%, 01/01/28 |
95 | 91,431 | ||||||
| 2.50%, 03/01/28 |
147 | 141,059 | ||||||
| Security | Par (000) |
Value | ||||||
| Mortgage-Backed Securities (continued) |
||||||||
| 2.50%, 06/01/28 |
$ | 25 | $ | 23,860 | ||||
| 2.50%, 09/01/28 |
72 | 68,715 | ||||||
| 2.50%, 12/01/28 |
32 | 30,338 | ||||||
| 2.50%, 09/01/29 |
54 | 51,101 | ||||||
| 2.50%, 12/01/29 |
1,268 | 1,222,259 | ||||||
| 2.50%, 02/01/30 |
941 | 890,044 | ||||||
| 2.50%, 03/01/30 |
3,068 | 2,892,085 | ||||||
| 2.50%, 04/01/30 |
190 | 179,016 | ||||||
| 2.50%, 06/01/30 |
494 | 464,564 | ||||||
| 2.50%, 07/01/30 |
991 | 931,642 | ||||||
| 2.50%, 08/01/30 |
2,712 | 2,546,267 | ||||||
| 2.50%, 09/01/30 |
1,034 | 971,409 | ||||||
| 2.50%, 12/01/30 |
1,999 | 1,874,005 | ||||||
| 2.50%, 01/01/31 |
1,305 | 1,226,992 | ||||||
| 2.50%, 04/01/31 |
755 | 707,304 | ||||||
| 2.50%, 05/01/31 |
20 | 18,943 | ||||||
| 2.50%, 09/01/31 |
3,963 | 3,693,429 | ||||||
| 2.50%, 10/01/31 |
35,901 | 33,706,030 | ||||||
| 2.50%, 12/01/31 |
6,845 | 6,386,083 | ||||||
| 2.50%, 01/01/32 |
13,354 | 12,460,130 | ||||||
| 2.50%, 02/01/32 |
15,587 | 14,561,247 | ||||||
| 2.50%, 03/01/32 |
6,192 | 5,758,030 | ||||||
| 2.50%, 04/01/32 |
37,035 | 34,624,422 | ||||||
| 2.50%, 05/01/32 |
24,020 | 22,419,094 | ||||||
| 2.50%, 06/01/32 |
662 | 620,203 | ||||||
| 2.50%, 07/01/32 |
10,299 | 9,639,688 | ||||||
| 2.50%, 09/01/32 |
3,917 | 3,665,447 | ||||||
| 2.50%, 10/01/32 |
752 | 699,766 | ||||||
| 2.50%, 11/01/32 |
655 | 604,679 | ||||||
| 2.50%, 12/01/32 |
7,129 | 6,620,121 | ||||||
| 2.50%, 01/01/33 |
20,538 | 19,399,799 | ||||||
| 2.50%, 03/01/33 |
107 | 99,337 | ||||||
| 2.50%, 07/01/33 |
104 | 96,574 | ||||||
| 2.50%, 08/01/34 |
496 | 464,593 | ||||||
| 2.50%, 10/01/34 |
216 | 198,040 | ||||||
| 2.50%, 11/01/34 |
21,306 | 19,442,392 | ||||||
| 2.50%, 07/01/35 |
11,803 | 10,789,753 | ||||||
| 2.50%, 09/01/35 |
22,893 | 20,876,995 | ||||||
| 2.50%, 10/01/35 |
73,202 | 66,766,086 | ||||||
| 2.50%, 03/01/36 |
21,483 | 19,565,472 | ||||||
| 2.50%, 04/01/36 |
1,372 | 1,248,885 | ||||||
| 2.50%, 05/01/36 |
18,521 | 16,821,379 | ||||||
| 2.50%, 07/01/36 |
31,634 | 28,748,451 | ||||||
| 2.50%, 08/01/36 |
9,068 | 8,241,183 | ||||||
| 2.50%, 10/01/36 |
1,226 | 1,117,619 | ||||||
| 2.50%, 03/01/37 |
13,912 | 12,632,213 | ||||||
| 2.50%, 04/01/37 |
25,869 | 23,498,793 | ||||||
| 2.50%, 05/01/37 |
63,584 | 57,726,130 | ||||||
| 2.50%, 06/01/37 |
15,455 | 14,030,893 | ||||||
| 2.50%, 03/18/39(h) |
136,677 | 123,902,839 | ||||||
| 2.50%, 05/01/43 |
206 | 175,684 | ||||||
| 2.50%, 02/01/47 |
714 | 603,911 | ||||||
| 2.50%, 04/01/47 |
9,002 | 7,613,551 | ||||||
| 2.50%, 12/01/47 |
172 | 145,193 | ||||||
| 2.50%, 05/01/50 |
78,894 | 65,430,974 | ||||||
| 2.50%, 07/01/50 |
42,596 | 35,782,628 | ||||||
| 2.50%, 08/01/50 |
61,544 | 51,443,706 | ||||||
| 2.50%, 09/01/50 |
147,964 | 123,458,651 | ||||||
| 2.50%, 10/01/50 |
179,907 | 149,541,741 | ||||||
| 2.50%, 11/01/50 |
206,331 | 171,416,663 | ||||||
| 2.50%, 12/01/50 |
60,773 | 50,168,875 | ||||||
| 106 | 2 0 2 4 I S H A R E S A N N U A L R E P O R T T O S H A R E H O L D E R S |
| Schedule of Investments (continued) February 29, 2024 |
iShares® Core U.S. Aggregate Bond ETF (Percentages shown are based on Net Assets) |
| Security | Par (000) |
Value | ||||||
| Mortgage-Backed Securities (continued) |
||||||||
| 2.50%, 01/01/51 |
$ | 134,284 | $ | 110,782,628 | ||||
| 2.50%, 02/01/51 |
57,417 | 47,519,681 | ||||||
| 2.50%, 03/01/51 |
71,902 | 59,212,886 | ||||||
| 2.50%, 04/01/51 |
36,043 | 29,762,840 | ||||||
| 2.50%, 05/01/51 |
38,215 | 31,654,415 | ||||||
| 2.50%, 06/01/51 |
6,984 | 5,761,069 | ||||||
| 2.50%, 07/01/51 |
238,360 | 196,831,908 | ||||||
| 2.50%, 08/01/51 |
309,828 | 256,399,526 | ||||||
| 2.50%, 09/01/51 |
144,612 | 119,530,901 | ||||||
| 2.50%, 10/01/51 |
119,107 | 98,541,468 | ||||||
| 2.50%, 11/01/51 |
96,636 | 79,992,939 | ||||||
| 2.50%, 12/01/51 |
388,119 | 321,319,742 | ||||||
| 2.50%, 01/01/52 |
468,133 | 385,641,863 | ||||||
| 2.50%, 02/01/52 |
301,896 | 249,028,624 | ||||||
| 2.50%, 03/01/52 |
245,393 | 202,018,120 | ||||||
| 2.50%, 04/01/52 |
229,267 | 188,738,473 | ||||||
| 2.50%, 05/01/52 |
113,508 | 93,304,447 | ||||||
| 2.50%, 06/01/52 |
13,275 | 10,911,251 | ||||||
| 2.50%, 07/01/52 |
101,928 | 83,812,140 | ||||||
| 2.50%, 08/01/52 |
11,087 | 9,113,193 | ||||||
| 2.50%, 04/01/53 |
140,343 | 115,353,973 | ||||||
| 2.50%, 03/13/54(h) |
190,002 | 156,088,096 | ||||||
| 3.00%, 11/01/25 |
42 | 41,360 | ||||||
| 3.00%, 10/01/26 |
38 | 37,013 | ||||||
| 3.00%, 01/01/27 |
983 | 950,348 | ||||||
| 3.00%, 02/01/27 |
12 | 11,311 | ||||||
| 3.00%, 10/01/27 |
1,485 | 1,439,440 | ||||||
| 3.00%, 11/01/27 |
922 | 893,913 | ||||||
| 3.00%, 12/01/27 |
62 | 59,688 | ||||||
| 3.00%, 03/01/29 |
112 | 107,677 | ||||||
| 3.00%, 07/01/29 |
167 | 160,529 | ||||||
| 3.00%, 09/01/29 |
86 | 82,735 | ||||||
| 3.00%, 10/01/29 |
25 | 23,489 | ||||||
| 3.00%, 01/01/30 |
63 | 60,553 | ||||||
| 3.00%, 03/01/30 |
29,550 | 28,485,068 | ||||||
| 3.00%, 04/01/30 |
2,821 | 2,691,225 | ||||||
| 3.00%, 06/01/30 |
530 | 511,886 | ||||||
| 3.00%, 07/01/30 |
2,242 | 2,135,225 | ||||||
| 3.00%, 08/01/30 |
8,387 | 7,980,956 | ||||||
| 3.00%, 09/01/30 |
11,004 | 10,481,594 | ||||||
| 3.00%, 10/01/30 |
5,077 | 4,828,253 | ||||||
| 3.00%, 11/01/30 |
1,202 | 1,143,588 | ||||||
| 3.00%, 12/01/30 |
3,347 | 3,181,202 | ||||||
| 3.00%, 01/01/31 |
11,412 | 10,899,234 | ||||||
| 3.00%, 02/01/31 |
8,098 | 7,715,739 | ||||||
| 3.00%, 03/01/31 |
5,469 | 5,190,875 | ||||||
| 3.00%, 04/01/31 |
817 | 776,276 | ||||||
| 3.00%, 05/01/31 |
265 | 251,913 | ||||||
| 3.00%, 06/01/31 |
4,840 | 4,589,458 | ||||||
| 3.00%, 07/01/31 |
1,260 | 1,190,286 | ||||||
| 3.00%, 09/01/31 |
4,516 | 4,284,961 | ||||||
| 3.00%, 10/01/31 |
952 | 901,702 | ||||||
| 3.00%, 12/01/31 |
8,083 | 7,804,219 | ||||||
| 3.00%, 01/01/32 |
8,125 | 7,690,589 | ||||||
| 3.00%, 02/01/32 |
14,997 | 14,218,608 | ||||||
| 3.00%, 03/01/32 |
2,118 | 2,006,801 | ||||||
| 3.00%, 04/01/32 |
155 | 147,367 | ||||||
| 3.00%, 05/01/32 |
3,089 | 2,910,393 | ||||||
| 3.00%, 06/01/32 |
4,904 | 4,660,957 | ||||||
| 3.00%, 08/01/32 |
3,066 | 2,905,564 | ||||||
| 3.00%, 09/01/32 |
833 | 790,600 | ||||||
| Security | Par (000) |
Value | ||||||
| Mortgage-Backed Securities (continued) |
||||||||
| 3.00%, 11/01/32 |
$ | 4,936 | $ | 4,675,250 | ||||
| 3.00%, 12/01/32 |
9,819 | 9,274,270 | ||||||
| 3.00%, 02/01/33 |
5,392 | 5,102,163 | ||||||
| 3.00%, 05/01/33 |
449 | 419,973 | ||||||
| 3.00%, 09/01/33 |
375 | 354,241 | ||||||
| 3.00%, 10/01/33 |
4,585 | 4,322,295 | ||||||
| 3.00%, 07/01/34 |
3,593 | 3,356,813 | ||||||
| 3.00%, 08/01/34 |
365 | 341,262 | ||||||
| 3.00%, 09/01/34 |
5,358 | 5,005,724 | ||||||
| 3.00%, 11/01/34 |
3,579 | 3,343,852 | ||||||
| 3.00%, 12/01/34 |
12,647 | 11,815,496 | ||||||
| 3.00%, 03/01/35 |
3,464 | 3,236,243 | ||||||
| 3.00%, 04/01/35 |
20,835 | 19,459,317 | ||||||
| 3.00%, 06/01/35 |
493 | 460,260 | ||||||
| 3.00%, 07/01/35 |
2,825 | 2,639,336 | ||||||
| 3.00%, 09/01/35 |
15,970 | 15,194,892 | ||||||
| 3.00%, 10/01/35 |
8,491 | 7,929,185 | ||||||
| 3.00%, 12/01/35 |
5,617 | 5,290,370 | ||||||
| 3.00%, 07/01/37 |
14,522 | 13,493,738 | ||||||
| 3.00%, 03/18/39(h) |
130,245 | 120,669,100 | ||||||
| 3.00%, 08/01/42 |
216 | 191,557 | ||||||
| 3.00%, 09/01/42 |
77 | 68,219 | ||||||
| 3.00%, 10/01/42 |
3,256 | 2,896,060 | ||||||
| 3.00%, 11/01/42 |
2,439 | 2,169,564 | ||||||
| 3.00%, 12/01/42 |
13,108 | 11,660,918 | ||||||
| 3.00%, 01/01/43 |
6,616 | 5,886,327 | ||||||
| 3.00%, 02/01/43 |
222 | 197,603 | ||||||
| 3.00%, 03/01/43 |
9,512 | 8,459,018 | ||||||
| 3.00%, 04/01/43 |
10,270 | 9,132,308 | ||||||
| 3.00%, 05/01/43 |
4,341 | 3,860,415 | ||||||
| 3.00%, 06/01/43 |
2,140 | 1,902,448 | ||||||
| 3.00%, 07/01/43 |
1,507 | 1,340,208 | ||||||
| 3.00%, 08/01/43 |
2,560 | 2,276,363 | ||||||
| 3.00%, 09/01/43 |
6,078 | 5,404,510 | ||||||
| 3.00%, 01/01/44 |
8,482 | 7,541,528 | ||||||
| 3.00%, 10/01/44 |
26,678 | 23,721,273 | ||||||
| 3.00%, 12/01/44 |
6 | 5,449 | ||||||
| 3.00%, 01/01/45 |
2,713 | 2,413,105 | ||||||
| 3.00%, 02/01/45 |
246 | 217,519 | ||||||
| 3.00%, 03/01/45 |
11,583 | 10,298,932 | ||||||
| 3.00%, 04/01/45 |
93 | 82,111 | ||||||
| 3.00%, 05/01/45 |
11,229 | 9,955,610 | ||||||
| 3.00%, 06/01/45 |
55 | 48,526 | ||||||
| 3.00%, 08/01/45 |
129 | 112,954 | ||||||
| 3.00%, 09/01/45 |
846 | 743,203 | ||||||
| 3.00%, 11/01/45 |
1,921 | 1,687,436 | ||||||
| 3.00%, 12/01/45 |
204 | 179,308 | ||||||
| 3.00%, 01/01/46 |
500 | 439,537 | ||||||
| 3.00%, 04/01/46 |
2,892 | 2,540,732 | ||||||
| 3.00%, 06/01/46 |
57 | 49,963 | ||||||
| 3.00%, 07/01/46 |
70,677 | 62,088,985 | ||||||
| 3.00%, 08/01/46 |
12,410 | 10,891,949 | ||||||
| 3.00%, 10/01/46 |
3,889 | 3,410,204 | ||||||
| 3.00%, 11/01/46 |
47,689 | 41,867,893 | ||||||
| 3.00%, 12/01/46 |
106,133 | 93,151,921 | ||||||
| 3.00%, 01/01/47 |
39,435 | 34,613,517 | ||||||
| 3.00%, 02/01/47 |
64,788 | 56,860,090 | ||||||
| 3.00%, 03/01/47 |
35,188 | 30,883,091 | ||||||
| 3.00%, 05/01/47 |
1,327 | 1,162,852 | ||||||
| 3.00%, 07/01/47 |
16,095 | 14,125,205 | ||||||
| 3.00%, 08/01/47 |
4,950 | 4,344,456 | ||||||
| S C H E D U L E O F I N V E S T M E N T S |
107 |
| Schedule of Investments (continued) February 29, 2024 |
iShares® Core U.S. Aggregate Bond ETF (Percentages shown are based on Net Assets) |
| Security | Par (000) |
Value | ||||||
| Mortgage-Backed Securities (continued) |
||||||||
| 3.00%, 12/01/47 |
$ | 25,750 | $ | 22,578,788 | ||||
| 3.00%, 03/01/48 |
3,945 | 3,457,595 | ||||||
| 3.00%, 04/01/48 |
166 | 142,390 | ||||||
| 3.00%, 09/01/48 |
397 | 348,798 | ||||||
| 3.00%, 11/01/48 |
45,115 | 39,563,921 | ||||||
| 3.00%, 02/01/49 |
20,843 | 18,309,828 | ||||||
| 3.00%, 09/01/49 |
9,593 | 8,359,222 | ||||||
| 3.00%, 11/01/49 |
15,127 | 13,141,762 | ||||||
| 3.00%, 12/01/49 |
29,313 | 25,442,533 | ||||||
| 3.00%, 02/01/50 |
7,939 | 6,813,140 | ||||||
| 3.00%, 03/01/50 |
19,177 | 16,640,662 | ||||||
| 3.00%, 04/01/50 |
11,574 | 10,030,785 | ||||||
| 3.00%, 05/01/50 |
8,914 | 7,646,693 | ||||||
| 3.00%, 06/01/50 |
52,734 | 45,652,310 | ||||||
| 3.00%, 07/01/50 |
75,220 | 65,082,347 | ||||||
| 3.00%, 08/01/50 |
65,587 | 56,831,647 | ||||||
| 3.00%, 09/01/50 |
9,775 | 8,451,818 | ||||||
| 3.00%, 10/01/50 |
138,419 | 118,866,683 | ||||||
| 3.00%, 11/01/50 |
18,796 | 16,252,647 | ||||||
| 3.00%, 12/01/50 |
8,670 | 7,493,438 | ||||||
| 3.00%, 01/01/51 |
27,591 | 23,889,347 | ||||||
| 3.00%, 05/01/51 |
68,043 | 59,311,129 | ||||||
| 3.00%, 06/01/51 |
63,867 | 55,045,223 | ||||||
| 3.00%, 07/01/51 |
43,521 | 37,613,346 | ||||||
| 3.00%, 08/01/51 |
61,047 | 52,476,673 | ||||||
| 3.00%, 11/01/51 |
18,441 | 15,819,651 | ||||||
| 3.00%, 01/01/52 |
78,992 | 67,853,406 | ||||||
| 3.00%, 02/01/52 |
94,828 | 82,037,143 | ||||||
| 3.00%, 03/01/52 |
137,922 | 118,510,681 | ||||||
| 3.00%, 04/01/52 |
181,084 | 155,972,072 | ||||||
| 3.00%, 05/01/52 |
61,505 | 52,870,613 | ||||||
| 3.00%, 03/13/54(h) |
178,877 | 152,978,892 | ||||||
| 3.50%, 10/01/25 |
76 | 74,576 | ||||||
| 3.50%, 01/01/27 |
141 | 136,688 | ||||||
| 3.50%, 11/01/28 |
83 | 80,772 | ||||||
| 3.50%, 01/01/29 |
172 | 167,529 | ||||||
| 3.50%, 11/01/29 |
77 | 75,116 | ||||||
| 3.50%, 12/01/29 |
683 | 661,329 | ||||||
| 3.50%, 07/01/30 |
4,298 | 4,162,471 | ||||||
| 3.50%, 10/01/30 |
1,114 | 1,077,250 | ||||||
| 3.50%, 11/01/30 |
282 | 271,284 | ||||||
| 3.50%, 03/01/31 |
1,790 | 1,719,108 | ||||||
| 3.50%, 06/01/31 |
5,480 | 5,287,682 | ||||||
| 3.50%, 01/01/32 |
6,898 | 6,619,837 | ||||||
| 3.50%, 02/01/32 |
870 | 836,098 | ||||||
| 3.50%, 05/01/32 |
3,420 | 3,282,541 | ||||||
| 3.50%, 06/01/32 |
3,171 | 3,044,670 | ||||||
| 3.50%, 07/01/32 |
1,170 | 1,118,688 | ||||||
| 3.50%, 08/01/32 |
809 | 776,609 | ||||||
| 3.50%, 09/01/32 |
1,845 | 1,772,374 | ||||||
| 3.50%, 10/01/32 |
808 | 775,598 | ||||||
| 3.50%, 11/01/32 |
935 | 897,952 | ||||||
| 3.50%, 12/01/32 |
110 | 105,203 | ||||||
| 3.50%, 02/01/33 |
486 | 465,671 | ||||||
| 3.50%, 03/01/33 |
4,069 | 3,904,165 | ||||||
| 3.50%, 04/01/33 |
4,933 | 4,735,232 | ||||||
| 3.50%, 05/01/33 |
3,585 | 3,442,234 | ||||||
| 3.50%, 06/01/33 |
4,171 | 3,997,748 | ||||||
| 3.50%, 10/01/33 |
567 | 543,098 | ||||||
| 3.50%, 01/01/34 |
1,378 | 1,321,206 | ||||||
| 3.50%, 02/01/34 |
20,535 | 19,713,236 | ||||||
| Security | Par (000) |
Value | ||||||
| Mortgage-Backed Securities (continued) |
||||||||
| 3.50%, 03/01/34 |
$ | 512 | $ | 487,114 | ||||
| 3.50%, 04/01/34 |
1,120 | 1,076,481 | ||||||
| 3.50%, 05/01/34 |
1,755 | 1,670,331 | ||||||
| 3.50%, 07/01/34 |
4,533 | 4,422,338 | ||||||
| 3.50%, 08/01/34 |
5,021 | 4,775,630 | ||||||
| 3.50%, 01/01/35 |
3,476 | 3,306,004 | ||||||
| 3.50%, 05/01/35 |
287 | 274,696 | ||||||
| 3.50%, 07/01/38 |
36,907 | 34,899,037 | ||||||
| 3.50%, 08/01/38 |
856 | 803,734 | ||||||
| 3.50%, 09/01/38 |
1,489 | 1,397,876 | ||||||
| 3.50%, 03/18/39(h) |
52,091 | 49,278,692 | ||||||
| 3.50%, 11/01/40 |
235 | 216,457 | ||||||
| 3.50%, 02/01/41 |
255 | 234,928 | ||||||
| 3.50%, 02/01/42 |
7,206 | 6,625,855 | ||||||
| 3.50%, 03/01/42 |
53 | 49,155 | ||||||
| 3.50%, 04/01/42 |
24 | 22,351 | ||||||
| 3.50%, 05/01/42 |
2,545 | 2,340,072 | ||||||
| 3.50%, 08/01/42 |
431 | 395,971 | ||||||
| 3.50%, 09/01/42 |
14,808 | 13,615,059 | ||||||
| 3.50%, 11/01/42 |
9,114 | 8,379,671 | ||||||
| 3.50%, 12/01/42 |
3,174 | 2,917,818 | ||||||
| 3.50%, 01/01/43 |
83 | 76,588 | ||||||
| 3.50%, 02/01/43 |
491 | 456,407 | ||||||
| 3.50%, 04/01/43 |
84 | 77,555 | ||||||
| 3.50%, 05/01/43 |
120 | 110,569 | ||||||
| 3.50%, 06/01/43 |
3,224 | 2,955,124 | ||||||
| 3.50%, 08/01/43 |
96 | 88,469 | ||||||
| 3.50%, 10/01/43 |
3,569 | 3,281,218 | ||||||
| 3.50%, 09/01/44 |
208 | 190,422 | ||||||
| 3.50%, 10/01/44 |
4,296 | 3,937,695 | ||||||
| 3.50%, 01/01/45 |
100 | 91,458 | ||||||
| 3.50%, 02/01/45 |
5,137 | 4,709,915 | ||||||
| 3.50%, 03/01/45 |
19,902 | 18,122,759 | ||||||
| 3.50%, 05/01/45 |
22,174 | 20,229,472 | ||||||
| 3.50%, 06/01/45 |
79 | 71,499 | ||||||
| 3.50%, 07/01/45 |
9,109 | 8,309,184 | ||||||
| 3.50%, 08/01/45 |
3,554 | 3,241,980 | ||||||
| 3.50%, 10/01/45 |
1,808 | 1,661,539 | ||||||
| 3.50%, 11/01/45 |
259 | 235,659 | ||||||
| 3.50%, 12/01/45 |
34,095 | 31,055,288 | ||||||
| 3.50%, 01/01/46 |
15,155 | 13,914,490 | ||||||
| 3.50%, 02/01/46 |
15,457 | 14,067,949 | ||||||
| 3.50%, 03/01/46 |
19,128 | 17,453,564 | ||||||
| 3.50%, 04/01/46 |
2,581 | 2,332,695 | ||||||
| 3.50%, 05/01/46 |
15,742 | 14,329,314 | ||||||
| 3.50%, 06/01/46 |
2,985 | 2,703,356 | ||||||
| 3.50%, 07/01/46 |
25,330 | 23,065,593 | ||||||
| 3.50%, 08/01/46 |
8,147 | 7,392,666 | ||||||
| 3.50%, 09/01/46 |
6,385 | 5,758,879 | ||||||
| 3.50%, 10/01/46 |
9,209 | 8,374,479 | ||||||
| 3.50%, 11/01/46 |
13,069 | 11,888,955 | ||||||
| 3.50%, 12/01/46 |
56,289 | 51,338,007 | ||||||
| 3.50%, 01/01/47 |
29,297 | 26,755,706 | ||||||
| 3.50%, 02/01/47 |
12,547 | 11,414,035 | ||||||
| 3.50%, 04/01/47 |
11,589 | 10,535,437 | ||||||
| 3.50%, 05/01/47 |
13,114 | 11,923,530 | ||||||
| 3.50%, 06/01/47 |
8,876 | 8,072,132 | ||||||
| 3.50%, 07/01/47 |
58,560 | 53,148,422 | ||||||
| 3.50%, 08/01/47 |
14,026 | 12,724,641 | ||||||
| 3.50%, 09/01/47 |
15,141 | 13,721,742 | ||||||
| 3.50%, 10/01/47 |
11,481 | 10,458,540 | ||||||
| 108 | 2 0 2 4 I S H A R E S A N N U A L R E P O R T T O S H A R E H O L D E R S |
| Schedule of Investments (continued) February 29, 2024 |
iShares® Core U.S. Aggregate Bond ETF (Percentages shown are based on Net Assets) |
| Security | Par (000) |
Value | ||||||
| Mortgage-Backed Securities (continued) |
||||||||
| 3.50%, 11/01/47 |
$ | 16,280 | $ | 14,825,544 | ||||
| 3.50%, 12/01/47 |
15,733 | 14,262,411 | ||||||
| 3.50%, 01/01/48 |
34,629 | 31,437,548 | ||||||
| 3.50%, 02/01/48 |
73,547 | 66,756,055 | ||||||
| 3.50%, 03/01/48 |
2,344 | 2,121,411 | ||||||
| 3.50%, 04/01/48 |
10,730 | 9,745,821 | ||||||
| 3.50%, 05/01/48 |
29,073 | 26,334,351 | ||||||
| 3.50%, 06/01/48 |
3,184 | 2,881,395 | ||||||
| 3.50%, 07/01/48 |
2,466 | 2,238,069 | ||||||
| 3.50%, 11/01/48 |
37,087 | 33,561,614 | ||||||
| 3.50%, 02/01/49 |
101 | 90,727 | ||||||
| 3.50%, 03/01/49 |
1,379 | 1,244,358 | ||||||
| 3.50%, 04/01/49 |
2,364 | 2,136,328 | ||||||
| 3.50%, 05/01/49 |
1,519 | 1,357,209 | ||||||
| 3.50%, 06/01/49 |
79,761 | 72,290,990 | ||||||
| 3.50%, 07/01/49 |
12,666 | 11,406,430 | ||||||
| 3.50%, 09/01/49 |
17,473 | 15,735,140 | ||||||
| 3.50%, 04/01/50 |
44,508 | 40,192,952 | ||||||
| 3.50%, 05/01/50 |
9,913 | 8,916,642 | ||||||
| 3.50%, 06/01/50 |
5,094 | 4,580,330 | ||||||
| 3.50%, 07/01/50 |
22,200 | 19,860,663 | ||||||
| 3.50%, 02/01/51 |
28,031 | 25,245,132 | ||||||
| 3.50%, 05/01/51 |
7,015 | 6,321,408 | ||||||
| 3.50%, 07/01/51 |
3,958 | 3,541,944 | ||||||
| 3.50%, 04/01/52 |
154,804 | 139,146,061 | ||||||
| 3.50%, 05/01/52 |
153,936 | 137,312,872 | ||||||
| 3.50%, 06/01/52 |
65,461 | 58,584,371 | ||||||
| 3.50%, 07/01/52 |
26,255 | 23,552,375 | ||||||
| 3.50%, 03/13/54(h) |
85,811 | 76,334,180 | ||||||
| 4.00%, 10/01/25 |
295 | 290,000 | ||||||
| 4.00%, 11/01/25 |
10 | 9,571 | ||||||
| 4.00%, 03/01/26 |
140 | 137,849 | ||||||
| 4.00%, 06/01/26 |
210 | 206,213 | ||||||
| 4.00%, 09/01/26 |
79 | 77,525 | ||||||
| 4.00%, 12/01/30 |
919 | 895,605 | ||||||
| 4.00%, 01/01/31 |
337 | 328,142 | ||||||
| 4.00%, 02/01/31 |
240 | 234,199 | ||||||
| 4.00%, 10/01/31 |
1,048 | 1,020,911 | ||||||
| 4.00%, 02/01/32 |
1,392 | 1,354,807 | ||||||
| 4.00%, 07/01/32 |
2,349 | 2,302,753 | ||||||
| 4.00%, 05/01/33 |
4,180 | 4,074,034 | ||||||
| 4.00%, 06/01/33 |
710 | 691,345 | ||||||
| 4.00%, 07/01/33 |
1,234 | 1,202,299 | ||||||
| 4.00%, 12/01/33 |
4,506 | 4,428,779 | ||||||
| 4.00%, 07/01/37 |
4,853 | 4,677,554 | ||||||
| 4.00%, 08/01/37 |
4,854 | 4,683,827 | ||||||
| 4.00%, 09/01/37 |
6,754 | 6,509,691 | ||||||
| 4.00%, 11/01/37 |
9,584 | 9,237,605 | ||||||
| 4.00%, 02/01/38 |
5,104 | 4,919,492 | ||||||
| 4.00%, 05/01/38 |
7,926 | 7,636,011 | ||||||
| 4.00%, 06/01/38 |
6,556 | 6,298,865 | ||||||
| 4.00%, 07/01/38 |
15,943 | 15,360,837 | ||||||
| 4.00%, 11/01/38 |
2,757 | 2,656,526 | ||||||
| 4.00%, 03/18/39(h) |
55,015 | 52,983,829 | ||||||
| 4.00%, 12/01/40 |
20 | 19,309 | ||||||
| 4.00%, 12/01/41 |
1,032 | 978,740 | ||||||
| 4.00%, 03/01/42 |
2,273 | 2,153,582 | ||||||
| 4.00%, 06/01/42 |
1,706 | 1,616,800 | ||||||
| 4.00%, 07/01/42 |
62 | 58,800 | ||||||
| 4.00%, 09/01/43 |
108 | 102,244 | ||||||
| 4.00%, 10/01/43 |
78 | 73,727 | ||||||
| Security | Par (000) |
Value | ||||||
| Mortgage-Backed Securities (continued) |
||||||||
| 4.00%, 04/01/44 |
$ | 39 | $ | 36,423 | ||||
| 4.00%, 05/01/44 |
2,470 | 2,334,392 | ||||||
| 4.00%, 06/01/44 |
4,057 | 3,845,736 | ||||||
| 4.00%, 10/01/44 |
1,212 | 1,144,535 | ||||||
| 4.00%, 12/01/44 |
8,435 | 7,960,854 | ||||||
| 4.00%, 01/01/45 |
11,580 | 10,952,740 | ||||||
| 4.00%, 02/01/45 |
35,683 | 33,748,960 | ||||||
| 4.00%, 03/01/45 |
5,586 | 5,267,338 | ||||||
| 4.00%, 05/01/45 |
10,132 | 9,566,798 | ||||||
| 4.00%, 06/01/45 |
5,532 | 5,222,896 | ||||||
| 4.00%, 07/01/45 |
412 | 387,925 | ||||||
| 4.00%, 08/01/45 |
344 | 323,808 | ||||||
| 4.00%, 09/01/45 |
736 | 694,038 | ||||||
| 4.00%, 11/01/45 |
132 | 124,292 | ||||||
| 4.00%, 12/01/45 |
849 | 800,755 | ||||||
| 4.00%, 01/01/46 |
727 | 683,610 | ||||||
| 4.00%, 02/01/46 |
1,200 | 1,128,355 | ||||||
| 4.00%, 03/01/46 |
1,550 | 1,455,853 | ||||||
| 4.00%, 04/01/46 |
2,264 | 2,124,421 | ||||||
| 4.00%, 05/01/46 |
6,829 | 6,432,256 | ||||||
| 4.00%, 06/01/46 |
17,943 | 16,957,700 | ||||||
| 4.00%, 07/01/46 |
21,246 | 19,989,530 | ||||||
| 4.00%, 08/01/46 |
3,625 | 3,403,351 | ||||||
| 4.00%, 09/01/46 |
138 | 129,523 | ||||||
| 4.00%, 10/01/46 |
3,775 | 3,565,375 | ||||||
| 4.00%, 11/01/46 |
1,337 | 1,263,744 | ||||||
| 4.00%, 02/01/47 |
2,817 | 2,648,474 | ||||||
| 4.00%, 03/01/47 |
2,112 | 1,973,966 | ||||||
| 4.00%, 04/01/47 |
6,082 | 5,705,958 | ||||||
| 4.00%, 05/01/47 |
5,473 | 5,138,527 | ||||||
| 4.00%, 06/01/47 |
10,840 | 10,186,520 | ||||||
| 4.00%, 07/01/47 |
16,910 | 15,858,174 | ||||||
| 4.00%, 08/01/47 |
14,284 | 13,403,632 | ||||||
| 4.00%, 09/01/47 |
14,922 | 13,993,343 | ||||||
| 4.00%, 10/01/47 |
13,190 | 12,413,755 | ||||||
| 4.00%, 11/01/47 |
6,349 | 5,945,941 | ||||||
| 4.00%, 12/01/47 |
9,873 | 9,248,288 | ||||||
| 4.00%, 01/01/48 |
1,968 | 1,843,639 | ||||||
| 4.00%, 02/01/48 |
20,759 | 19,439,300 | ||||||
| 4.00%, 04/01/48 |
21,927 | 20,488,095 | ||||||
| 4.00%, 05/01/48 |
1,797 | 1,679,370 | ||||||
| 4.00%, 07/01/48 |
2,828 | 2,642,184 | ||||||
| 4.00%, 09/01/48 |
10,933 | 10,214,622 | ||||||
| 4.00%, 10/01/48 |
7,768 | 7,272,082 | ||||||
| 4.00%, 11/01/48 |
23,194 | 21,668,378 | ||||||
| 4.00%, 01/01/49 |
2,934 | 2,748,777 | ||||||
| 4.00%, 02/01/49 |
3,170 | 2,961,549 | ||||||
| 4.00%, 03/01/49 |
37,015 | 34,581,134 | ||||||
| 4.00%, 04/01/49 |
11,235 | 10,531,596 | ||||||
| 4.00%, 05/01/49 |
8,314 | 7,794,119 | ||||||
| 4.00%, 06/01/49 |
31,796 | 29,775,678 | ||||||
| 4.00%, 07/01/49 |
56,573 | 52,897,508 | ||||||
| 4.00%, 08/01/49 |
957 | 898,425 | ||||||
| 4.00%, 10/01/49 |
1,704 | 1,592,127 | ||||||
| 4.00%, 11/01/49 |
41,763 | 38,885,781 | ||||||
| 4.00%, 12/01/49 |
3,524 | 3,289,641 | ||||||
| 4.00%, 01/01/50 |
19,593 | 18,304,156 | ||||||
| 4.00%, 02/01/50 |
574 | 535,874 | ||||||
| 4.00%, 05/01/50 |
10,212 | 9,533,448 | ||||||
| 4.00%, 03/01/51 |
7,835 | 7,313,861 | ||||||
| 4.00%, 05/01/51 |
20,082 | 18,761,051 | ||||||
| S C H E D U L E O F I N V E S T M E N T S |
109 |
| Schedule of Investments (continued) February 29, 2024 |
iShares® Core U.S. Aggregate Bond ETF (Percentages shown are based on Net Assets) |
| Security | Par (000) |
Value | ||||||
| Mortgage-Backed Securities (continued) |
||||||||
| 4.00%, 04/01/52 |
$ | 16,325 | $ | 15,041,040 | ||||
| 4.00%, 05/01/52 |
34,746 | 32,011,312 | ||||||
| 4.00%, 06/01/52 |
49,038 | 45,153,629 | ||||||
| 4.00%, 07/01/52 |
81,411 | 75,048,608 | ||||||
| 4.00%, 08/01/52 |
181,629 | 167,187,313 | ||||||
| 4.00%, 09/01/52 |
21,372 | 19,674,540 | ||||||
| 4.00%, 10/01/52 |
27,244 | 25,293,568 | ||||||
| 4.00%, 11/01/52 |
4,382 | 4,036,773 | ||||||
| 4.00%, 12/01/52 |
59,061 | 54,342,416 | ||||||
| 4.00%, 02/01/53 |
30,964 | 28,838,878 | ||||||
| 4.00%, 03/13/54(h) |
124,565 | 114,596,702 | ||||||
| 4.50%, 10/01/24 |
27 | 26,964 | ||||||
| 4.50%, 02/01/25 |
19 | 18,364 | ||||||
| 4.50%, 04/01/25 |
33 | 32,722 | ||||||
| 4.50%, 06/01/25 |
164 | 161,971 | ||||||
| 4.50%, 08/01/31 |
922 | 910,185 | ||||||
| 4.50%, 08/01/34 |
259 | 253,265 | ||||||
| 4.50%, 03/18/39(h) |
4,200 | 4,108,454 | ||||||
| 4.50%, 09/01/40 |
2,521 | 2,459,388 | ||||||
| 4.50%, 12/01/40 |
1,453 | 1,417,810 | ||||||
| 4.50%, 01/01/41 |
3,018 | 2,944,417 | ||||||
| 4.50%, 05/01/41 |
1,981 | 1,932,818 | ||||||
| 4.50%, 06/01/41 |
11,116 | 10,916,828 | ||||||
| 4.50%, 08/01/41 |
4,028 | 3,928,770 | ||||||
| 4.50%, 09/01/41 |
1,292 | 1,259,646 | ||||||
| 4.50%, 01/01/42 |
1,354 | 1,321,064 | ||||||
| 4.50%, 09/01/42 |
1,252 | 1,219,235 | ||||||
| 4.50%, 08/01/43 |
2,159 | 2,096,366 | ||||||
| 4.50%, 12/01/43 |
71 | 69,113 | ||||||
| 4.50%, 03/01/44 |
13 | 12,401 | ||||||
| 4.50%, 04/01/44 |
3,516 | 3,416,861 | ||||||
| 4.50%, 06/01/44 |
711 | 693,799 | ||||||
| 4.50%, 12/01/44 |
263 | 256,220 | ||||||
| 4.50%, 02/01/45 |
1,441 | 1,400,067 | ||||||
| 4.50%, 08/01/45 |
1,987 | 1,931,007 | ||||||
| 4.50%, 10/01/45 |
363 | 352,736 | ||||||
| 4.50%, 11/01/45 |
184 | 178,219 | ||||||
| 4.50%, 12/01/45 |
590 | 571,808 | ||||||
| 4.50%, 01/01/46 |
72 | 70,135 | ||||||
| 4.50%, 02/01/46 |
7,416 | 7,235,073 | ||||||
| 4.50%, 03/01/46 |
1,274 | 1,242,885 | ||||||
| 4.50%, 04/01/46 |
249 | 240,669 | ||||||
| 4.50%, 05/01/46 |
111 | 107,553 | ||||||
| 4.50%, 06/01/46 |
4 | 3,951 | ||||||
| 4.50%, 07/01/46 |
27 | 25,888 | ||||||
| 4.50%, 08/01/46 |
1,838 | 1,778,792 | ||||||
| 4.50%, 09/01/46 |
691 | 669,047 | ||||||
| 4.50%, 10/01/46 |
889 | 858,019 | ||||||
| 4.50%, 01/01/47 |
400 | 386,318 | ||||||
| 4.50%, 02/01/47 |
146 | 141,286 | ||||||
| 4.50%, 03/01/47 |
1,663 | 1,603,341 | ||||||
| 4.50%, 04/01/47 |
4,927 | 4,749,864 | ||||||
| 4.50%, 06/01/47 |
2,729 | 2,630,063 | ||||||
| 4.50%, 07/01/47 |
18 | 17,424 | ||||||
| 4.50%, 08/01/47 |
219 | 210,699 | ||||||
| 4.50%, 10/01/47 |
6,437 | 6,208,134 | ||||||
| 4.50%, 01/01/48 |
9,350 | 9,011,952 | ||||||
| 4.50%, 02/01/48 |
942 | 908,068 | ||||||
| 4.50%, 03/01/48 |
5,276 | 5,083,270 | ||||||
| 4.50%, 04/01/48 |
2,481 | 2,385,704 | ||||||
| 4.50%, 05/01/48 |
5,205 | 5,014,400 | ||||||
| Security | Par (000) |
Value | ||||||
| Mortgage-Backed Securities (continued) |
||||||||
| 4.50%, 06/01/48 |
$ | 3,351 | $ | 3,227,599 | ||||
| 4.50%, 07/01/48 |
1,963 | 1,887,364 | ||||||
| 4.50%, 08/01/48 |
9,356 | 9,003,725 | ||||||
| 4.50%, 09/01/48 |
269 | 257,786 | ||||||
| 4.50%, 10/01/48 |
12,258 | 11,785,706 | ||||||
| 4.50%, 11/01/48 |
4,564 | 4,387,784 | ||||||
| 4.50%, 12/01/48 |
16,953 | 16,307,566 | ||||||
| 4.50%, 01/01/49 |
5,339 | 5,132,915 | ||||||
| 4.50%, 02/01/49 |
6,627 | 6,371,766 | ||||||
| 4.50%, 03/01/49 |
698 | 673,411 | ||||||
| 4.50%, 04/01/49 |
12,095 | 11,639,004 | ||||||
| 4.50%, 05/01/49 |
10,080 | 9,684,242 | ||||||
| 4.50%, 07/01/49 |
794 | 758,813 | ||||||
| 4.50%, 08/01/49 |
173 | 165,250 | ||||||
| 4.50%, 09/01/50 |
36,091 | 34,697,929 | ||||||
| 4.50%, 05/01/52 |
10,130 | 9,738,966 | ||||||
| 4.50%, 06/01/52 |
80,089 | 75,810,443 | ||||||
| 4.50%, 07/01/52 |
2,311 | 2,188,421 | ||||||
| 4.50%, 08/01/52 |
28,856 | 27,328,907 | ||||||
| 4.50%, 09/01/52 |
72,048 | 68,439,011 | ||||||
| 4.50%, 10/01/52 |
100,748 | 95,951,984 | ||||||
| 4.50%, 11/01/52 |
28,109 | 26,597,523 | ||||||
| 4.50%, 12/01/52 |
166,475 | 158,354,477 | ||||||
| 4.50%, 04/01/53 |
17,354 | 16,433,583 | ||||||
| 4.50%, 07/01/53 |
2,320 | 2,197,052 | ||||||
| 4.50%, 08/01/53 |
23,363 | 22,163,742 | ||||||
| 4.50%, 03/13/54(h) |
147,595 | 139,702,735 | ||||||
| 5.00%, 09/01/33 |
80 | 79,637 | ||||||
| 5.00%, 11/01/33 |
2,335 | 2,333,893 | ||||||
| 5.00%, 06/01/35 |
116 | 115,445 | ||||||
| 5.00%, 10/01/35 |
43 | 43,079 | ||||||
| 5.00%, 12/01/36 |
34 | 33,969 | ||||||
| 5.00%, 03/18/39(h) |
975 | 966,377 | ||||||
| 5.00%, 05/01/39 |
26 | 26,422 | ||||||
| 5.00%, 06/01/39 |
472 | 472,047 | ||||||
| 5.00%, 12/01/39 |
75 | 74,639 | ||||||
| 5.00%, 01/01/40 |
2 | 1,707 | ||||||
| 5.00%, 03/01/40 |
1,289 | 1,286,668 | ||||||
| 5.00%, 04/01/40 |
204 | 203,992 | ||||||
| 5.00%, 05/01/40 |
13 | 12,787 | ||||||
| 5.00%, 06/01/40 |
121 | 119,448 | ||||||
| 5.00%, 07/01/40 |
765 | 764,141 | ||||||
| 5.00%, 08/01/40 |
1,089 | 1,088,168 | ||||||
| 5.00%, 09/01/40 |
8 | 8,278 | ||||||
| 5.00%, 10/01/40 |
33 | 33,057 | ||||||
| 5.00%, 04/01/41 |
520 | 519,471 | ||||||
| 5.00%, 05/01/41 |
2,114 | 2,110,537 | ||||||
| 5.00%, 06/01/41 |
547 | 546,556 | ||||||
| 5.00%, 08/01/41 |
994 | 992,171 | ||||||
| 5.00%, 10/01/41 |
2,578 | 2,573,282 | ||||||
| 5.00%, 01/01/42 |
13,510 | 13,487,568 | ||||||
| 5.00%, 05/01/42 |
4,832 | 4,823,760 | ||||||
| 5.00%, 09/01/47 |
432 | 425,623 | ||||||
| 5.00%, 02/01/48 |
1,539 | 1,517,880 | ||||||
| 5.00%, 03/01/48 |
1,314 | 1,295,657 | ||||||
| 5.00%, 04/01/48 |
2,064 | 2,035,752 | ||||||
| 5.00%, 05/01/48 |
1,780 | 1,756,180 | ||||||
| 5.00%, 07/01/48 |
2,232 | 2,201,927 | ||||||
| 5.00%, 09/01/48 |
1,563 | 1,541,040 | ||||||
| 5.00%, 01/01/49 |
124 | 122,105 | ||||||
| 5.00%, 04/01/49 |
6,376 | 6,288,723 | ||||||
| 110 | 2 0 2 4 I S H A R E S A N N U A L R E P O R T T O S H A R E H O L D E R S |
| Schedule of Investments (continued) February 29, 2024 |
iShares® Core U.S. Aggregate Bond ETF (Percentages shown are based on Net Assets) |
| Security | Par (000) |
Value | ||||||
| Mortgage-Backed Securities (continued) |
||||||||
| 5.00%, 05/01/49 |
$ | 26 | $ | 26,095 | ||||
| 5.00%, 06/01/49 |
240 | 236,471 | ||||||
| 5.00%, 09/01/49 |
65 | 63,724 | ||||||
| 5.00%, 10/01/49 |
178 | 175,133 | ||||||
| 5.00%, 08/01/52 |
14,801 | 14,446,130 | ||||||
| 5.00%, 09/01/52 |
25,371 | 24,833,199 | ||||||
| 5.00%, 10/01/52 |
31,680 | 30,907,509 | ||||||
| 5.00%, 11/01/52 |
36,604 | 35,724,042 | ||||||
| 5.00%, 12/01/52 |
24,302 | 23,783,130 | ||||||
| 5.00%, 01/01/53 |
44,071 | 42,917,142 | ||||||
| 5.00%, 02/01/53 |
51,342 | 49,812,969 | ||||||
| 5.00%, 03/01/53 |
54,532 | 53,154,131 | ||||||
| 5.00%, 04/01/53 |
100,585 | 97,556,756 | ||||||
| 5.00%, 05/01/53 |
77,838 | 75,529,643 | ||||||
| 5.00%, 06/01/53 |
151,701 | 147,595,311 | ||||||
| 5.00%, 07/01/53 |
45,761 | 44,604,806 | ||||||
| 5.00%, 08/01/53 |
37,015 | 35,901,241 | ||||||
| 5.00%, 09/01/53 |
25,151 | 24,394,301 | ||||||
| 5.00%, 03/01/54(h) |
102,445 | 99,339,808 | ||||||
| 5.50%, 05/01/33 |
862 | 875,670 | ||||||
| 5.50%, 11/01/33 |
1,774 | 1,801,906 | ||||||
| 5.50%, 09/01/34 |
2,644 | 2,692,607 | ||||||
| 5.50%, 09/01/36 |
192 | 195,422 | ||||||
| 5.50%, 03/01/38 |
167 | 170,395 | ||||||
| 5.50%, 06/01/38 |
4,456 | 4,549,525 | ||||||
| 5.50%, 11/01/38 |
346 | 353,601 | ||||||
| 5.50%, 07/01/40 |
1,109 | 1,131,791 | ||||||
| 5.50%, 09/01/41 |
27,800 | 28,246,658 | ||||||
| 5.50%, 01/01/47 |
2,220 | 2,265,223 | ||||||
| 5.50%, 12/01/48 |
210 | 213,054 | ||||||
| 5.50%, 09/01/52 |
12,966 | 13,052,314 | ||||||
| 5.50%, 11/01/52 |
14,383 | 14,347,487 | ||||||
| 5.50%, 12/01/52 |
60,805 | 60,764,143 | ||||||
| 5.50%, 01/01/53 |
81,459 | 81,540,803 | ||||||
| 5.50%, 02/01/53 |
73,820 | 73,388,513 | ||||||
| 5.50%, 03/01/53 |
67,066 | 67,003,406 | ||||||
| 5.50%, 04/01/53 |
63,418 | 62,963,057 | ||||||
| 5.50%, 05/01/53 |
85,927 | 85,159,873 | ||||||
| 5.50%, 06/01/53 |
37,986 | 37,796,967 | ||||||
| 5.50%, 07/01/53 |
46,599 | 46,413,169 | ||||||
| 5.50%, 08/01/53 |
3,171 | 3,138,912 | ||||||
| 5.50%, 10/01/53 |
44,899 | 44,394,113 | ||||||
| 5.50%, 11/01/53 |
31,243 | 31,118,063 | ||||||
| 5.50%, 03/13/54(h) |
130,080 | 128,671,597 | ||||||
| 6.00%, 03/01/34 |
1,450 | 1,498,598 | ||||||
| 6.00%, 05/01/34 |
127 | 131,060 | ||||||
| 6.00%, 08/01/34 |
244 | 251,974 | ||||||
| 6.00%, 11/01/34 |
79 | 81,397 | ||||||
| 6.00%, 09/01/36 |
340 | 352,560 | ||||||
| 6.00%, 08/01/37 |
816 | 848,351 | ||||||
| 6.00%, 03/01/38 |
281 | 291,850 | ||||||
| 6.00%, 05/01/38 |
134 | 139,122 | ||||||
| 6.00%, 09/01/38 |
109 | 113,365 | ||||||
| 6.00%, 06/01/39 |
2,072 | 2,141,702 | ||||||
| 6.00%, 10/01/39 |
140 | 145,014 | ||||||
| 6.00%, 07/01/41 |
1,176 | 1,220,098 | ||||||
| 6.00%, 02/01/49 |
5,675 | 5,888,851 | ||||||
| 6.00%, 01/01/53 |
12,561 | 12,791,205 | ||||||
| 6.00%, 04/01/53 |
2,481 | 2,525,302 | ||||||
| 6.00%, 05/01/53 |
3,325 | 3,377,815 | ||||||
| 6.00%, 06/01/53 |
17,118 | 17,311,950 | ||||||
| Security | Par (000) |
Value | ||||||
| Mortgage-Backed Securities (continued) |
| |||||||
| 6.00%, 07/01/53 |
$ | 105,800 | $ | 106,996,103 | ||||
| 6.00%, 08/01/53 |
213,185 | 216,340,982 | ||||||
| 6.00%, 09/01/53 |
86,600 | 87,535,112 | ||||||
| 6.00%, 10/01/53 |
22,171 | 22,283,861 | ||||||
| 6.00%, 11/01/53 |
85,170 | 85,763,996 | ||||||
| 6.00%, 02/01/54 |
5,486 | 5,542,541 | ||||||
| 6.00%, 03/13/54(h) |
95,625 | 96,023,831 | ||||||
| 6.00%, 04/11/54(h) |
35,300 | 35,441,713 | ||||||
| 6.50%, 08/01/36 |
20 | 21,368 | ||||||
| 6.50%, 09/01/36 |
157 | 165,692 | ||||||
| 6.50%, 10/01/36 |
22 | 23,141 | ||||||
| 6.50%, 12/01/36 |
33 | 34,597 | ||||||
| 6.50%, 07/01/37 |
38 | 40,273 | ||||||
| 6.50%, 08/01/37 |
1,712 | 1,812,471 | ||||||
| 6.50%, 10/01/37 |
67 | 70,649 | ||||||
| 6.50%, 11/01/37 |
18 | 18,765 | ||||||
| 6.50%, 12/01/37 |
543 | 572,630 | ||||||
| 6.50%, 06/01/38 |
15 | 16,031 | ||||||
| 6.50%, 10/01/39 |
479 | 507,270 | ||||||
| 6.50%, 05/01/40 |
15 | 15,726 | ||||||
| 6.50%, 07/01/53 |
7,814 | 8,048,057 | ||||||
| 6.50%, 09/01/53 |
65,341 | 66,757,222 | ||||||
| 6.50%, 10/01/53 |
56,254 | 57,829,631 | ||||||
| 6.50%, 11/01/53 |
88,018 | 90,018,621 | ||||||
| 6.50%, 12/01/53 |
139,061 | 142,873,977 | ||||||
| 6.50%, 01/01/54 |
24,396 | 24,957,929 | ||||||
| 6.50%, 02/01/54 |
30,441 | 31,411,474 | ||||||
| 6.50%, 03/13/54(h) |
197,675 | 201,131,322 | ||||||
| 7.00%, 04/01/37 |
598 | 645,578 | ||||||
|
|
|
|||||||
| 27,236,789,363 | ||||||||
| U.S. Government Agency Obligations — 0.3% |
| |||||||
| Federal Home Loan Banks |
||||||||
| 0.50%, 04/14/25 |
7,000 | 6,664,126 | ||||||
| 1.25%, 12/21/26 |
180 | 164,812 | ||||||
| 1.50%, 08/15/24 |
1,000 | 982,649 | ||||||
| 2.13%, 12/14/29 |
70 | 61,980 | ||||||
| 2.75%, 12/13/24 |
250 | 245,405 | ||||||
| 2.88%, 09/13/24 |
1,000 | 987,531 | ||||||
| 3.13%, 06/13/25 |
980 | 957,343 | ||||||
| 3.25%, 11/16/28 |
25,470 | 24,384,401 | ||||||
| 4.25%, 12/10/27 |
75 | 74,381 | ||||||
| 5.50%, 07/15/36 |
7,900 | 8,632,500 | ||||||
| Federal Home Loan Mortgage Corp. |
||||||||
| 6.25%, 07/15/32(b) |
73,453 | 83,253,934 | ||||||
| 6.75%, 03/15/31 |
21,820 | 24,915,046 | ||||||
| Federal National Mortgage Association |
||||||||
| 0.38%, 08/25/25 |
24,991 | 23,413,317 | ||||||
| 0.63%, 04/22/25 |
5,000 | 4,762,029 | ||||||
| 0.88%, 08/05/30 |
17,530 | 14,130,670 | ||||||
| 1.63%, 01/07/25(b) |
13,020 | 12,646,297 | ||||||
| 1.75%, 07/02/24 |
1,550 | 1,531,561 | ||||||
| 1.88%, 09/24/26 |
1,285 | 1,204,207 | ||||||
| 2.63%, 09/06/24 |
39,730 | 39,205,322 | ||||||
| 5.63%, 07/15/37 |
795 | 876,940 | ||||||
| 6.25%, 05/15/29 |
580 | 631,640 | ||||||
| 6.63%, 11/15/30 |
8,180 | 9,233,901 | ||||||
| 7.13%, 01/15/30 |
10,000 | 11,428,586 | ||||||
| 7.25%, 05/15/30 |
17,396 | 20,124,907 | ||||||
| Tennessee Valley Authority |
||||||||
| 1.50%, 09/15/31 |
1,000 | 802,231 | ||||||
| 3.50%, 12/15/42 |
525 | 426,596 | ||||||
| S C H E D U L E O F I N V E S T M E N T S |
111 |
| Schedule of Investments (continued) February 29, 2024 |
iShares® Core U.S. Aggregate Bond ETF (Percentages shown are based on Net Assets) |
| Security | Par (000) |
Value | ||||||
| U.S. Government Agency Obligations (continued) |
| |||||||
| 4.63%, 09/15/60 |
$ | 1,000 | $ | 931,821 | ||||
| 4.88%, 01/15/48 |
8,035 | 7,856,119 | ||||||
| 5.25%, 09/15/39 |
458 | 474,423 | ||||||
| 5.50%, 06/15/38 |
10,000 | 10,656,860 | ||||||
| 5.88%, 04/01/36 |
95 | 105,731 | ||||||
| 6.15%, 01/15/38 |
3,553 | 3,997,034 | ||||||
| 7.13%, 05/01/30 |
3,556 | 4,051,322 | ||||||
| Series B, 4.70%, 07/15/33 |
1,500 | 1,512,977 | ||||||
| Series E, 6.75%, 11/01/25 |
7,000 | 7,207,048 | ||||||
|
|
|
|||||||
| 328,535,647 | ||||||||
| U.S. Government Obligations — 42.0% |
| |||||||
| U.S. Treasury Note/Bond |
||||||||
| 0.25%, 05/31/25 |
106,410 | 100,432,751 | ||||||
| 0.25%, 06/30/25 |
4,100 | 3,858,164 | ||||||
| 0.25%, 07/31/25 |
184,800 | 173,286,093 | ||||||
| 0.25%, 08/31/25 |
210,050 | 196,322,905 | ||||||
| 0.25%, 09/30/25 |
116,300 | 108,345,261 | ||||||
| 0.25%, 10/31/25 |
194,300 | 180,425,766 | ||||||
| 0.38%, 04/30/25 |
44,000 | 41,739,844 | ||||||
| 0.38%, 11/30/25 |
291,800 | 270,712,892 | ||||||
| 0.38%, 12/31/25(b) |
210,900 | 195,107,215 | ||||||
| 0.38%, 01/31/26 |
648,200 | 597,645,798 | ||||||
| 0.38%, 07/31/27 |
119,700 | 104,625,281 | ||||||
| 0.38%, 09/30/27 |
5,000 | 4,345,313 | ||||||
| 0.50%, 03/31/25 |
20,000 | 19,059,375 | ||||||
| 0.50%, 02/28/26 |
204,700 | 188,707,812 | ||||||
| 0.50%, 04/30/27 |
93,800 | 83,093,610 | ||||||
| 0.50%, 05/31/27 |
108,400 | 95,739,219 | ||||||
| 0.50%, 06/30/27 |
136,900 | 120,568,259 | ||||||
| 0.50%, 08/31/27 |
155,022 | 135,741,577 | ||||||
| 0.50%, 10/31/27 |
202,200 | 176,024,579 | ||||||
| 0.63%, 07/31/26 |
76,400 | 69,655,313 | ||||||
| 0.63%, 03/31/27 |
75,600 | 67,461,188 | ||||||
| 0.63%, 11/30/27 |
197,000 | 171,867,110 | ||||||
| 0.63%, 12/31/27 |
187,400 | 163,008,719 | ||||||
| 0.63%, 05/15/30 |
270,400 | 217,101,626 | ||||||
| 0.63%, 08/15/30 |
396,000 | 315,284,064 | ||||||
| 0.75%, 03/31/26 |
20,500 | 18,954,492 | ||||||
| 0.75%, 04/30/26 |
94,000 | 86,641,563 | ||||||
| 0.75%, 05/31/26 |
71,500 | 65,729,727 | ||||||
| 0.75%, 08/31/26 |
244,200 | 222,756,187 | ||||||
| 0.75%, 01/31/28 |
496,300 | 432,789,109 | ||||||
| 0.88%, 06/30/26 |
170,000 | 156,426,562 | ||||||
| 0.88%, 09/30/26 |
190,610 | 174,080,539 | ||||||
| 0.88%, 11/15/30 |
163,800 | 131,859,000 | ||||||
| 1.00%, 07/31/28 |
200,000 | 173,703,126 | ||||||
| 1.13%, 01/15/25(b) |
157,460 | 152,164,178 | ||||||
| 1.13%, 02/28/25 |
83,700 | 80,528,555 | ||||||
| 1.13%, 10/31/26 |
171,100 | 156,823,844 | ||||||
| 1.13%, 02/28/27 |
40,300 | 36,613,180 | ||||||
| 1.13%, 02/29/28 |
132,340 | 116,914,119 | ||||||
| 1.13%, 08/31/28 |
273,600 | 238,395,376 | ||||||
| 1.13%, 02/15/31 |
257,200 | 209,738,562 | ||||||
| 1.13%, 05/15/40 |
156,500 | 96,565,391 | ||||||
| 1.13%, 08/15/40 |
58,000 | 35,434,375 | ||||||
| 1.25%, 11/30/26 |
214,900 | 197,237,906 | ||||||
| 1.25%, 12/31/26 |
191,230 | 175,214,487 | ||||||
| 1.25%, 03/31/28 |
216,000 | 191,396,250 | ||||||
| 1.25%, 04/30/28 |
169,100 | 149,494,969 | ||||||
| 1.25%, 05/31/28 |
229,110 | 202,100,080 | ||||||
| 1.25%, 06/30/28 |
212,175 | 186,763,730 | ||||||
| Security | Par (000) |
Value | ||||||
| U.S. Government Obligations (continued) |
||||||||
| 1.25%, 09/30/28 |
$ | 317,000 | $ | 277,201,642 | ||||
| 1.25%, 08/15/31 |
318,900 | 258,209,344 | ||||||
| 1.25%, 05/15/50 |
205,900 | 104,590,766 | ||||||
| 1.38%, 08/31/26 |
42,500 | 39,382,227 | ||||||
| 1.38%, 10/31/28 |
185,000 | 162,438,673 | ||||||
| 1.38%, 12/31/28 |
196,730 | 172,015,794 | ||||||
| 1.38%, 11/15/31 |
400,250 | 324,952,969 | ||||||
| 1.38%, 11/15/40 |
284,800 | 180,803,500 | ||||||
| 1.38%, 08/15/50 |
18,100 | 9,502,500 | ||||||
| 1.50%, 02/15/25 |
152,720 | 147,583,597 | ||||||
| 1.50%, 08/15/26 |
382,000 | 355,409,221 | ||||||
| 1.50%, 01/31/27 |
325,280 | 299,460,900 | ||||||
| 1.50%, 11/30/28 |
284,200 | 250,562,267 | ||||||
| 1.50%, 02/15/30 |
83,185 | 71,175,166 | ||||||
| 1.63%, 02/15/26 |
207,890 | 196,261,153 | ||||||
| 1.63%, 05/15/26 |
270,000 | 253,420,312 | ||||||
| 1.63%, 09/30/26 |
44,500 | 41,444,102 | ||||||
| 1.63%, 10/31/26 |
76,300 | 70,875,547 | ||||||
| 1.63%, 11/30/26 |
81,200 | 75,319,344 | ||||||
| 1.63%, 08/15/29 |
54,000 | 47,245,782 | ||||||
| 1.63%, 05/15/31 |
390,910 | 327,692,523 | ||||||
| 1.63%, 11/15/50 |
229,500 | 128,914,453 | ||||||
| 1.75%, 03/15/25 |
101,700 | 98,327,215 | ||||||
| 1.75%, 12/31/26 |
91,870 | 85,367,327 | ||||||
| 1.75%, 01/31/29 |
170,700 | 151,749,634 | ||||||
| 1.75%, 08/15/41 |
271,420 | 180,791,166 | ||||||
| 1.88%, 06/30/26 |
80,000 | 75,375,000 | ||||||
| 1.88%, 07/31/26 |
49,900 | 46,906,000 | ||||||
| 1.88%, 02/28/27 |
178,100 | 165,479,946 | ||||||
| 1.88%, 02/28/29 |
159,200 | 142,173,063 | ||||||
| 1.88%, 02/15/32 |
422,760 | 355,052,344 | ||||||
| 1.88%, 02/15/41 |
130,200 | 89,715,938 | ||||||
| 1.88%, 02/15/51 |
575,700 | 344,790,328 | ||||||
| 1.88%, 11/15/51 |
233,450 | 139,194,562 | ||||||
| 2.00%, 02/15/25 |
180,068 | 174,855,876 | ||||||
| 2.00%, 08/15/25 |
184,515 | 177,228,099 | ||||||
| 2.00%, 11/15/26 |
181,000 | 169,701,642 | ||||||
| 2.00%, 11/15/41 |
103,260 | 71,475,281 | ||||||
| 2.00%, 02/15/50 |
102,000 | 63,526,875 | ||||||
| 2.00%, 08/15/51 |
466,600 | 287,542,250 | ||||||
| 2.13%, 05/15/25 |
206,000 | 199,272,812 | ||||||
| 2.13%, 05/31/26 |
105,300 | 99,870,469 | ||||||
| 2.25%, 11/15/25 |
167,829 | 161,037,170 | ||||||
| 2.25%, 03/31/26 |
88,500 | 84,406,875 | ||||||
| 2.25%, 02/15/27 |
161,206 | 151,571,329 | ||||||
| 2.25%, 08/15/27 |
146,750 | 136,809,981 | ||||||
| 2.25%, 11/15/27 |
153,750 | 142,759,278 | ||||||
| 2.25%, 05/15/41 |
276,900 | 202,180,266 | ||||||
| 2.25%, 08/15/46 |
118,960 | 80,799,863 | ||||||
| 2.25%, 08/15/49 |
106,500 | 70,556,250 | ||||||
| 2.25%, 02/15/52 |
252,900 | 165,530,953 | ||||||
| 2.38%, 04/30/26 |
124,400 | 118,782,563 | ||||||
| 2.38%, 05/15/27 |
190,870 | 179,432,713 | ||||||
| 2.38%, 03/31/29 |
244,200 | 223,175,906 | ||||||
| 2.38%, 05/15/29 |
191,600 | 174,805,062 | ||||||
| 2.38%, 02/15/42 |
141,000 | 103,657,031 | ||||||
| 2.38%, 11/15/49 |
229,400 | 156,063,687 | ||||||
| 2.38%, 05/15/51 |
186,000 | 125,579,062 | ||||||
| 2.50%, 02/28/26 |
92,350 | 88,637,963 | ||||||
| 2.50%, 03/31/27 |
116,200 | 109,881,625 | ||||||
| 2.50%, 02/15/45 |
50,824 | 36,839,459 | ||||||
| 112 | 2 0 2 4 I S H A R E S A N N U A L R E P O R T T O S H A R E H O L D E R S |
| Schedule of Investments (continued) February 29, 2024 |
iShares® Core U.S. Aggregate Bond ETF (Percentages shown are based on Net Assets) |
| Security | Par (000) |
Value | ||||||
| U.S. Government Obligations (continued) |
| |||||||
| 2.50%, 02/15/46 |
$ | 152,800 | $ | 109,657,875 | ||||
| 2.50%, 05/15/46 |
123,517 | 88,411,153 | ||||||
| 2.63%, 03/31/25 |
5,000 | 4,875,391 | ||||||
| 2.63%, 04/15/25 |
97,100 | 94,608,020 | ||||||
| 2.63%, 12/31/25 |
86,500 | 83,401,543 | ||||||
| 2.63%, 01/31/26 |
86,000 | 82,828,750 | ||||||
| 2.63%, 05/31/27 |
132,700 | 125,629,578 | ||||||
| 2.63%, 02/15/29 |
211,491 | 195,959,630 | ||||||
| 2.63%, 07/31/29 |
145,500 | 134,041,875 | ||||||
| 2.75%, 02/28/25 |
90,500 | 88,492,031 | ||||||
| 2.75%, 05/15/25 |
158,200 | 154,177,023 | ||||||
| 2.75%, 06/30/25 |
16,900 | 16,445,152 | ||||||
| 2.75%, 08/31/25 |
140,808 | 136,605,761 | ||||||
| 2.75%, 04/30/27 |
169,300 | 161,086,306 | ||||||
| 2.75%, 07/31/27 |
119,500 | 113,356,953 | ||||||
| 2.75%, 02/15/28 |
222,702 | 209,948,832 | ||||||
| 2.75%, 05/31/29 |
285,900 | 265,596,634 | ||||||
| 2.75%, 08/15/32 |
404,850 | 361,455,141 | ||||||
| 2.75%, 08/15/42 |
106,523 | 82,854,921 | ||||||
| 2.75%, 11/15/42 |
128,580 | 99,649,500 | ||||||
| 2.75%, 08/15/47 |
219,000 | 162,812,812 | ||||||
| 2.75%, 11/15/47 |
158,550 | 117,649,055 | ||||||
| 2.88%, 04/30/25 |
48,000 | 46,869,375 | ||||||
| 2.88%, 05/31/25 |
116,800 | 113,930,188 | ||||||
| 2.88%, 06/15/25 |
277,400 | 270,399,986 | ||||||
| 2.88%, 07/31/25 |
183,900 | 178,964,871 | ||||||
| 2.88%, 11/30/25 |
110,400 | 107,010,376 | ||||||
| 2.88%, 05/15/28 |
252,994 | 239,059,566 | ||||||
| 2.88%, 08/15/28 |
219,930 | 207,284,025 | ||||||
| 2.88%, 04/30/29 |
176,320 | 164,996,950 | ||||||
| 2.88%, 05/15/32 |
489,500 | 442,538,594 | ||||||
| 2.88%, 05/15/43 |
121,184 | 95,375,595 | ||||||
| 2.88%, 08/15/45 |
153,125 | 118,241,211 | ||||||
| 2.88%, 11/15/46 |
54,000 | 41,318,438 | ||||||
| 2.88%, 05/15/49 |
42,000 | 31,755,938 | ||||||
| 2.88%, 05/15/52 |
205,000 | 154,454,687 | ||||||
| 3.00%, 07/15/25 |
161,030 | 157,086,023 | ||||||
| 3.00%, 09/30/25 |
101,200 | 98,464,438 | ||||||
| 3.00%, 10/31/25 |
106,600 | 103,618,531 | ||||||
| 3.00%, 05/15/42 |
43,150 | 34,964,984 | ||||||
| 3.00%, 11/15/44 |
99,727 | 79,111,559 | ||||||
| 3.00%, 05/15/45 |
121,400 | 96,019,813 | ||||||
| 3.00%, 11/15/45 |
65,100 | 51,296,766 | ||||||
| 3.00%, 02/15/47 |
116,190 | 90,791,592 | ||||||
| 3.00%, 05/15/47 |
152,118 | 118,699,577 | ||||||
| 3.00%, 02/15/48 |
154,550 | 120,114,328 | ||||||
| 3.00%, 08/15/48 |
160,190 | 124,297,428 | ||||||
| 3.00%, 02/15/49 |
32,400 | 25,110,000 | ||||||
| 3.00%, 08/15/52 |
204,180 | 157,952,372 | ||||||
| 3.13%, 08/15/25 |
142,420 | 139,043,088 | ||||||
| 3.13%, 08/31/27 |
39,200 | 37,619,750 | ||||||
| 3.13%, 11/15/28 |
207,515 | 197,301,371 | ||||||
| 3.13%, 08/31/29 |
208,900 | 197,165,696 | ||||||
| 3.13%, 11/15/41 |
53,900 | 44,863,328 | ||||||
| 3.13%, 02/15/42 |
71,800 | 59,537,906 | ||||||
| 3.13%, 02/15/43 |
76,200 | 62,543,531 | ||||||
| 3.13%, 08/15/44 |
60,519 | 49,105,495 | ||||||
| 3.13%, 05/15/48 |
149,460 | 118,773,994 | ||||||
| 3.25%, 06/30/27 |
100,000 | 96,523,438 | ||||||
| 3.25%, 06/30/29 |
175,480 | 166,939,060 | ||||||
| 3.25%, 05/15/42 |
155,200 | 130,562,000 | ||||||
| Security | Par (000) |
Value | ||||||
| U.S. Government Obligations (continued) |
||||||||
| 3.38%, 05/15/33 |
$ | 369,303 | $ | 344,605,862 | ||||
| 3.38%, 08/15/42 |
46,000 | 39,337,188 | ||||||
| 3.38%, 05/15/44 |
84,200 | 71,188,469 | ||||||
| 3.38%, 11/15/48 |
248,350 | 206,285,719 | ||||||
| 3.50%, 09/15/25 |
136,970 | 134,337,608 | ||||||
| 3.50%, 01/31/28 |
134,655 | 130,615,350 | ||||||
| 3.50%, 04/30/28 |
153,594 | 148,842,186 | ||||||
| 3.50%, 01/31/30 |
176,500 | 169,371,056 | ||||||
| 3.50%, 04/30/30 |
195,601 | 187,410,208 | ||||||
| 3.50%, 02/15/33 |
373,240 | 352,128,612 | ||||||
| 3.50%, 02/15/39 |
24,000 | 21,821,250 | ||||||
| 3.63%, 05/15/26 |
331,123 | 324,604,016 | ||||||
| 3.63%, 03/31/28 |
128,431 | 125,079,754 | ||||||
| 3.63%, 05/31/28 |
148,400 | 144,469,719 | ||||||
| 3.63%, 03/31/30 |
198,200 | 191,309,454 | ||||||
| 3.63%, 08/15/43 |
73,600 | 64,883,000 | ||||||
| 3.63%, 02/15/44 |
83,950 | 73,797,297 | ||||||
| 3.63%, 02/15/53 |
250,675 | 219,262,289 | ||||||
| 3.63%, 05/15/53 |
249,032 | 218,019,734 | ||||||
| 3.75%, 04/15/26 |
238,673 | 234,626,748 | ||||||
| 3.75%, 12/31/28 |
215,114 | 210,240,323 | ||||||
| 3.75%, 05/31/30 |
179,486 | 174,283,711 | ||||||
| 3.75%, 06/30/30 |
196,443 | 190,703,181 | ||||||
| 3.75%, 12/31/30 |
200,554 | 194,380,697 | ||||||
| 3.75%, 08/15/41 |
52,000 | 47,425,625 | ||||||
| 3.75%, 11/15/43 |
36,600 | 32,819,906 | ||||||
| 3.88%, 03/31/25 |
119,300 | 117,873,993 | ||||||
| 3.88%, 04/30/25 |
153,247 | 151,379,302 | ||||||
| 3.88%, 01/15/26 |
273,074 | 269,191,229 | ||||||
| 3.88%, 11/30/27 |
162,801 | 160,104,608 | ||||||
| 3.88%, 12/31/27 |
162,637 | 159,930,619 | ||||||
| 3.88%, 09/30/29 |
233,630 | 228,993,905 | ||||||
| 3.88%, 11/30/29 |
192,418 | 188,524,543 | ||||||
| 3.88%, 12/31/29 |
174,278 | 170,697,133 | ||||||
| 3.88%, 08/15/33 |
401,438 | 389,457,585 | ||||||
| 3.88%, 08/15/40 |
80,516 | 75,269,879 | ||||||
| 3.88%, 02/15/43 |
184,664 | 169,140,682 | ||||||
| 3.88%, 05/15/43 |
195,987 | 179,236,236 | ||||||
| 4.00%, 12/15/25 |
151,837 | 149,986,487 | ||||||
| 4.00%, 02/15/26(b) |
267,611 | 264,433,119 | ||||||
| 4.00%, 01/15/27 |
192,225 | 189,972,363 | ||||||
| 4.00%, 02/29/28 |
113,505 | 112,112,791 | ||||||
| 4.00%, 06/30/28 |
145,756 | 144,002,373 | ||||||
| 4.00%, 01/31/29(b) |
213,069 | 210,605,390 | ||||||
| 4.00%, 10/31/29 |
165,150 | 162,827,578 | ||||||
| 4.00%, 02/28/30 |
202,432 | 199,442,966 | ||||||
| 4.00%, 07/31/30 |
192,635 | 189,655,177 | ||||||
| 4.00%, 01/31/31 |
197,686 | 194,504,491 | ||||||
| 4.00%, 02/15/34 |
213,715 | 209,540,879 | ||||||
| 4.00%, 11/15/42 |
166,665 | 155,623,444 | ||||||
| 4.00%, 11/15/52 |
234,889 | 220,024,930 | ||||||
| 4.13%, 01/31/25 |
117,443 | 116,419,961 | ||||||
| 4.13%, 06/15/26 |
331,572 | 328,489,418 | ||||||
| 4.13%, 02/15/27 |
37,774 | 37,461,184 | ||||||
| 4.13%, 09/30/27 |
267,000 | 264,851,486 | ||||||
| 4.13%, 10/31/27 |
154,214 | 152,961,011 | ||||||
| 4.13%, 07/31/28 |
143,800 | 142,788,906 | ||||||
| 4.13%, 08/31/30 |
179,457 | 177,858,711 | ||||||
| 4.13%, 11/15/32 |
367,597 | 363,748,719 | ||||||
| 4.13%, 08/15/53 |
251,686 | 241,146,649 | ||||||
| 4.25%, 05/31/25 |
139,146 | 137,999,132 | ||||||
| S C H E D U L E O F I N V E S T M E N T S |
113 |
| Schedule of Investments (continued) February 29, 2024 |
iShares® Core U.S. Aggregate Bond ETF (Percentages shown are based on Net Assets) |
| Security | Par (000) |
Value | ||||||
| U.S. Government Obligations (continued) |
| |||||||
| 4.25%, 10/15/25 |
$ | 145,620 | $ | 144,442,525 | ||||
| 4.25%, 12/31/25 |
271,675 | 269,573,765 | ||||||
| 4.25%, 01/31/26(b) |
314,471 | 312,137,037 | ||||||
| 4.25%, 02/28/29(b) |
120,671 | 120,680,428 | ||||||
| 4.25%, 02/28/31 |
116,399 | 116,271,689 | ||||||
| 4.25%, 05/15/39 |
37,340 | 36,925,759 | ||||||
| 4.25%, 11/15/40 |
28,889 | 28,229,970 | ||||||
| 4.25%, 02/15/54 |
111,402 | 109,348,026 | ||||||
| 4.38%, 08/15/26 |
209,332 | 208,645,129 | ||||||
| 4.38%, 12/15/26 |
251,049 | 250,558,671 | ||||||
| 4.38%, 08/31/28 |
160,616 | 161,130,474 | ||||||
| 4.38%, 11/30/28 |
199,552 | 200,409,451 | ||||||
| 4.38%, 11/30/30 |
186,847 | 187,898,014 | ||||||
| 4.38%, 02/15/38 |
32,000 | 32,360,000 | ||||||
| 4.38%, 11/15/39 |
50,933 | 50,909,125 | ||||||
| 4.38%, 05/15/40 |
32,403 | 32,271,363 | ||||||
| 4.38%, 05/15/41 |
15,949 | 15,772,066 | ||||||
| 4.38%, 08/15/43 |
205,898 | 201,651,354 | ||||||
| 4.50%, 11/15/25 |
151,817 | 151,223,965 | ||||||
| 4.50%, 07/15/26 |
335,370 | 335,107,992 | ||||||
| 4.50%, 11/15/33 |
411,677 | 419,524,593 | ||||||
| 4.50%, 02/15/36 |
27,685 | 28,636,672 | ||||||
| 4.50%, 05/15/38(b) |
47,000 | 48,042,813 | ||||||
| 4.50%, 08/15/39 |
50,707 | 51,499,297 | ||||||
| 4.50%, 02/15/44(b) |
33,953 | 33,953,000 | ||||||
| 4.63%, 02/28/25(b) |
126,434 | 125,900,607 | ||||||
| 4.63%, 06/30/25 |
116,370 | 115,997,253 | ||||||
| 4.63%, 02/28/26 |
25,448 | 25,446,012 | ||||||
| 4.63%, 03/15/26 |
260,697 | 260,697,000 | ||||||
| 4.63%, 09/15/26 |
288,053 | 288,885,655 | ||||||
| 4.63%, 10/15/26 |
264,788 | 265,677,524 | ||||||
| 4.63%, 11/15/26 |
285,351 | 286,421,066 | ||||||
| 4.63%, 09/30/28 |
170,942 | 173,252,389 | ||||||
| 4.63%, 09/30/30 |
186,122 | 189,786,277 | ||||||
| 4.63%, 02/15/40 |
45,950 | 47,184,906 | ||||||
| 4.75%, 07/31/25 |
7,400 | 7,390,750 | ||||||
| 4.75%, 02/15/37 |
21,977 | 23,196,037 | ||||||
| 4.75%, 02/15/41 |
91,158 | 94,519,451 | ||||||
| 4.75%, 11/15/43 |
161,497 | 166,240,974 | ||||||
| 4.75%, 11/15/53 |
257,241 | 273,881,277 | ||||||
| 4.88%, 11/30/25 |
233,193 | 233,766,874 | ||||||
| 4.88%, 10/31/28 |
187,904 | 192,498,841 | ||||||
| 4.88%, 10/31/30(b) |
216,343 | 223,712,183 | ||||||
| 5.00%, 09/30/25 |
122,628 | 123,020,793 | ||||||
| 5.00%, 10/31/25 |
232,870 | 233,779,648 | ||||||
| 5.00%, 05/15/37 |
53,658 | 57,883,568 | ||||||
| 5.25%, 11/15/28 |
29,377 | 30,531,424 | ||||||
| 5.25%, 02/15/29 |
60,090 | 62,460,739 | ||||||
| 5.50%, 08/15/28 |
77,000 | 80,717,656 | ||||||
| 6.00%, 02/15/26 |
9,468 | 9,695,824 | ||||||
| 6.13%, 08/15/29(b) |
14,600 | 15,860,391 | ||||||
| 6.25%, 05/15/30 |
5,000 | 5,522,656 | ||||||
| 6.50%, 11/15/26 |
26,950 | 28,284,867 | ||||||
| 6.63%, 02/15/27 |
28,800 | 30,507,750 | ||||||
| 6.75%, 08/15/26 |
14,400 | 15,105,375 | ||||||
| Security | Par (000) |
Value | ||||||
| U.S. Government Obligations (continued) |
| |||||||
| 6.88%, 08/15/25 |
$ | 6,265 | $ | 6,446,587 | ||||
|
|
|
|||||||
| 42,692,680,863 | ||||||||
|
|
|
|||||||
| Total U.S. Government & Agency |
|
70,258,005,873 | ||||||
|
|
|
|||||||
| Total Long-Term Investments — 98.9% |
|
100,555,960,740 | ||||||
|
|
|
|||||||
| Shares | ||||||||
| Short-Term Securities | ||||||||
| Money Market Funds — 5.0% | ||||||||
| BlackRock Cash Funds: Institutional, SL Agency Shares, 5.50%(i)(j) |
3,258,812,006 | 3,260,441,412 | ||||||
| BlackRock Cash Funds: Treasury, SL Agency Shares, 5.30%(i)(j)(k) |
1,794,286,638 | 1,794,286,638 | ||||||
|
|
|
|||||||
| Total Short-Term Securities — 5.0% |
|
5,054,728,050 | ||||||
|
|
|
|||||||
| Total Investments Before TBA Sales |
|
105,610,688,790 | ||||||
|
|
|
|||||||
| Par (000) |
||||||||
| TBA Sales Commitments | ||||||||
| Mortgage-Backed Securities — (0.2)% | ||||||||
| Government National Mortgage Association, |
||||||||
| 2.00%, 03/20/54(h) |
$ | (30,800 | ) | (25,064,693 | ) | |||
| Uniform Mortgage-Backed Securities |
||||||||
| 2.00%, 03/13/54(h) |
(76,781 | ) | (60,323,974 | ) | ||||
| 6.00%, 03/13/54(h) |
(35,300 | ) | (35,447,228 | ) | ||||
| 6.50%, 03/13/54(h) |
(53,775 | ) | (54,715,249 | ) | ||||
|
|
|
|||||||
| Total TBA Sales Commitments — (0.2)% |
|
(175,551,144 | ) | |||||
|
|
|
|||||||
| Total Investments, Net of TBA Sales |
|
105,435,137,646 | ||||||
| Liabilities in Excess of Other Assets — (3.7)% |
|
(3,794,229,567 | ) | |||||
|
|
|
|||||||
| Net Assets — 100.0% |
|
$ | 101,640,908,079 | |||||
|
|
|
|||||||
| (a) | Variable rate security. Interest rate resets periodically. The rate shown is the effective interest rate as of period end. Security description also includes the reference rate and spread if published and available. |
| (b) | All or a portion of this security is on loan. |
| (c) | Security exempt from registration pursuant to Rule 144A under the Securities Act of 1933, as amended. These securities may be resold in transactions exempt from registration to qualified institutional investors. |
| (d) | Zero-coupon bond. |
| (e) | Step coupon security. Coupon rate will either increase (step-up bond) or decrease (step-down bond) at regular intervals until maturity. Interest rate shown reflects the rate currently in effect. |
| (f) | This security may be resold to qualified foreign investors and foreign institutional buyers under Regulation S of the Securities Act of 1933. |
| (g) | U.S. dollar denominated security issued by foreign domiciled entity. |
| (h) | Represents or includes a TBA transaction. |
| (i) | Affiliate of the Fund. |
| (j) | Annualized 7-day yield as of period end. |
| (k) | All or a portion of this security was purchased with the cash collateral from loaned securities. |
| 114 | 2 0 2 4 I S H A R E S A N N U A L R E P O R T T O S H A R E H O L D E R S |
| Schedule of Investments (continued) February 29, 2024 |
iShares® Core U.S. Aggregate Bond ETF |
Affiliates
Investments in issuers considered to be affiliate(s) of the Fund during the year ended February 29, 2024 for purposes of Section 2(a)(3) of the Investment Company Act of 1940, as amended, were as follows:
| Affiliated Issuer | Value at 02/28/23 |
Purchases at Cost |
Proceeds from Sale |
Net Realized Gain (Loss) |
Change in Unrealized Appreciation (Depreciation) |
Value at 02/29/24 |
Shares Held at |
Income | Capital Gain from Funds |
|||||||||||||||||||||||||||
| BlackRock Cash Funds: Institutional, SL Agency Shares |
$ | 3,824,049,590 | $ | — | $ | (563,123,475 | )(a) | $ | 412,434 | $ | (897,137 | ) | $ | 3,260,441,412 | 3,258,812,006 | $ | 192,169,846 | $ | 2,552 | |||||||||||||||||
| BlackRock Cash Funds: Treasury, SL Agency Shares |
642,810,889 | 1,151,475,749 | (a) | — | — | — | 1,794,286,638 | 1,794,286,638 | 5,255,073 | (b) | — | |||||||||||||||||||||||||
|
|
|
|
|
|
|
|
|
|
|
|||||||||||||||||||||||||||
| $ | 412,434 | $ | (897,137 | ) | $ | 5,054,728,050 | $ | 197,424,919 | $ | 2,552 | ||||||||||||||||||||||||||
|
|
|
|
|
|
|
|
|
|
|
|||||||||||||||||||||||||||
| (a) | Represents net amount purchased (sold). |
| (b) | All or a portion represents securities lending income earned from the reinvestment of cash collateral from loaned securities, net of fees and collateral investment expenses, and other payments to and from borrowers of securities. |
Fair Value Hierarchy as of Period End
Various inputs are used in determining the fair value of financial instruments. For a description of the input levels and information about the Fund’s policy regarding valuation of financial instruments, refer to the Notes to Financial Statements.
The following table summarizes the Fund’s financial instruments categorized in the fair value hierarchy. The breakdown of the Fund’s financial instruments into major categories is disclosed in the Schedule of Investments above.
| Level 1 | Level 2 | Level 3 | Total | |||||||||||||
| Assets |
||||||||||||||||
| Investments |
||||||||||||||||
| Long-Term Investments |
||||||||||||||||
| Asset-Backed Securities |
$ | — | $ | 497,496,485 | $ | — | $ | 497,496,485 | ||||||||
| Collaterized Mortgage Obligations |
— | 1,048,224,871 | — | 1,048,224,871 | ||||||||||||
| Corporate Bonds & Notes |
— | 26,130,181,973 | — | 26,130,181,973 | ||||||||||||
| Foreign Government Obligations |
— | 2,074,460,669 | — | 2,074,460,669 | ||||||||||||
| Municipal Debt Obligations |
— | 547,590,869 | — | 547,590,869 | ||||||||||||
| U.S. Government & Agency Obligations |
— | 70,258,005,873 | — | 70,258,005,873 | ||||||||||||
| Short-Term Securities |
||||||||||||||||
| Money Market Funds |
5,054,728,050 | — | — | 5,054,728,050 | ||||||||||||
| Liabilities |
||||||||||||||||
| Investments |
||||||||||||||||
| TBA Sales Commitments |
— | (175,551,144 | ) | — | (175,551,144 | ) | ||||||||||
|
|
|
|
|
|
|
|
|
|||||||||
| $ | 5,054,728,050 | $ | 100,380,409,596 | $ | — | $ | 105,435,137,646 | |||||||||
|
|
|
|
|
|
|
|
|
|||||||||
See notes to financial statements.
| S C H E D U L E O F I N V E S T M E N T S |
115 |
Statement of Assets and Liabilities
February 29, 2024
| iShares Core U.S. Aggregate Bond ETF |
||||
|
|
||||
| ASSETS |
||||
| Investments, at value — unaffiliated(a)(b) |
$ | 100,555,960,740 | ||
| Investments, at value — affiliated(c) |
5,054,728,050 | |||
| Cash pledged as collateral for TBA commitments |
17,723,000 | |||
| Foreign currency, at value(d) |
78 | |||
| Receivables: |
||||
| Investments sold |
864,878,618 | |||
| Securities lending income — affiliated |
480,931 | |||
| TBA sales commitments |
175,162,522 | |||
| Capital shares sold |
26,844,678 | |||
| Dividends — affiliated |
13,286,009 | |||
| Interest — unaffiliated |
680,336,031 | |||
|
|
|
|||
| Total assets |
107,389,400,657 | |||
|
|
|
|||
| LIABILITIES |
||||
| Bank overdraft |
184,247 | |||
| Collateral on securities loaned, at value |
1,794,186,638 | |||
| TBA sales commitments, at value(e) |
175,551,144 | |||
| Payables: |
||||
| Investments purchased |
3,606,430,958 | |||
| Capital shares redeemed |
169,946,893 | |||
| Investment advisory fees |
2,192,698 | |||
|
|
|
|||
| Total liabilities |
5,748,492,578 | |||
|
|
|
|||
| Commitments and contingent liabilities |
||||
| NET ASSETS |
$ | 101,640,908,079 | ||
|
|
|
|||
| NET ASSETS CONSIST OF |
||||
| Paid-in capital |
$ | 113,176,699,344 | ||
| Accumulated loss |
(11,535,791,265 | ) | ||
|
|
|
|||
| NET ASSETS |
$ | 101,640,908,079 | ||
|
|
|
|||
| NET ASSET VALUE |
||||
| Shares outstanding |
1,044,100,000 | |||
|
|
|
|||
| Net asset value |
$ | 97.35 | ||
|
|
|
|||
| Shares authorized |
Unlimited | |||
|
|
|
|||
| Par value |
None | |||
|
|
|
|||
| (a) Investments, at cost — unaffiliated |
$ | 110,789,143,569 | ||
| (b) Securities loaned, at value |
$ | 1,461,930,981 | ||
| (c) Investments, at cost — affiliated |
$ | 5,053,171,063 | ||
| (d) Foreign currency, at cost |
$ | 78 | ||
| (e) Proceeds from TBA sales commitments |
$ | 175,162,522 | ||
See notes to financial statements.
| 116 | 2 0 2 4 I S H A R E S A N N U A L R E P O R T T O S H A R E H O L D E R S |
Year Ended February 29, 2024
| iShares Core U.S. Aggregate Bond ETF |
||||
|
|
||||
| INVESTMENT INCOME |
||||
| Dividends — affiliated |
$ | 192,176,214 | ||
| Interest — unaffiliated |
2,922,537,659 | |||
| Securities lending income — affiliated — net |
5,248,705 | |||
| Other income — unaffiliated |
88,122 | |||
|
|
|
|||
| Total investment income |
3,120,050,700 | |||
|
|
|
|||
| EXPENSES |
||||
| Investment advisory |
27,909,044 | |||
| Interest expense |
9,636 | |||
|
|
|
|||
| Total expenses |
27,918,680 | |||
| Less: |
||||
| Investment advisory fees waived |
(3,227,736 | ) | ||
|
|
|
|||
| Total expenses after fees waived |
24,690,944 | |||
|
|
|
|||
| Net investment income |
3,095,359,756 | |||
|
|
|
|||
| REALIZED AND UNREALIZED GAIN (LOSS) |
||||
| Net realized gain (loss) from: |
||||
| Investments — unaffiliated |
(539,751,388 | ) | ||
| Investments — affiliated |
412,434 | |||
| Capital gain distributions from underlying funds — affiliated |
2,552 | |||
| In-kind redemptions — unaffiliated(a) |
(70,940,555 | ) | ||
|
|
|
|||
| (610,276,957 | ) | |||
|
|
|
|||
| Net change in unrealized appreciation (depreciation) on: |
||||
| Investments — unaffiliated |
507,247,310 | |||
| Investments — affiliated |
(897,137 | ) | ||
|
|
|
|||
| 506,350,173 | ||||
|
|
|
|||
| Net realized and unrealized loss |
(103,926,784 | ) | ||
|
|
|
|||
| NET INCREASE IN NET ASSETS RESULTING FROM OPERATIONS |
$ | 2,991,432,972 | ||
|
|
|
|||
| (a) | See Note 2 of the Notes to Financial Statements. |
See notes to financial statements.
| F I N A N C I A L S T A T E M E N T S |
117 |
Statements of Changes in Net Assets
| iShares Core U.S. Aggregate Bond ETF |
||||||||
|
Year Ended |
Year Ended |
|||||||
|
|
||||||||
| INCREASE (DECREASE) IN NET ASSETS |
||||||||
| OPERATIONS |
||||||||
| Net investment income |
$ | 3,095,359,756 | $ | 2,042,450,505 | ||||
| Net realized loss |
(610,276,957 | ) | (1,219,119,565 | ) | ||||
| Net change in unrealized appreciation (depreciation) |
506,350,173 | (9,419,957,653 | ) | |||||
|
|
|
|
|
|||||
| Net increase (decrease) in net assets resulting from operations |
2,991,432,972 | (8,596,626,713 | ) | |||||
|
|
|
|
|
|||||
| DISTRIBUTIONS TO SHAREHOLDERS(a) |
||||||||
| Decrease in net assets resulting from distributions to shareholders |
(3,006,081,368 | ) | (1,958,102,477 | ) | ||||
|
|
|
|
|
|||||
| CAPITAL SHARE TRANSACTIONS |
||||||||
| Net increase in net assets derived from capital share transactions |
15,936,200,479 | 8,351,623,889 | ||||||
|
|
|
|
|
|||||
| NET ASSETS |
||||||||
| Total increase (decrease) in net assets |
15,921,552,083 | (2,203,105,301 | ) | |||||
| Beginning of year |
85,719,355,996 | 87,922,461,297 | ||||||
|
|
|
|
|
|||||
| End of year |
$ | 101,640,908,079 | $ | 85,719,355,996 | ||||
|
|
|
|
|
|||||
| (a) | Distributions for annual periods determined in accordance with U.S. federal income tax regulations. |
See notes to financial statements.
| 118 | 2 0 2 4 I S H A R E S A N N U A L R E P O R T T O S H A R E H O L D E R S |
(For a share outstanding throughout each period)
| iShares Core U.S. Aggregate Bond ETF | ||||||||||||||||||||
| Year Ended 02/29/24 |
Year Ended 02/28/23 |
Year Ended 02/28/22 |
Year Ended 02/28/21 |
Year Ended 02/29/20 |
||||||||||||||||
| Net asset value, beginning of year |
$ | 97.33 | $ | 110.34 | $ | 115.40 | $ | 116.32 | $ | 107.07 | ||||||||||
|
|
|
|
|
|
|
|
|
|
|
|||||||||||
| Net investment income(a) |
3.23 | 2.50 | 1.99 | 2.38 | 3.02 | |||||||||||||||
| Net realized and unrealized gain (loss)(b) |
(0.05 | ) | (13.11 | ) | (5.06 | ) | (0.82 | ) | 9.24 | |||||||||||
|
|
|
|
|
|
|
|
|
|
|
|||||||||||
| Net increase (decrease) from investment operations |
3.18 | (10.61 | ) | (3.07 | ) | 1.56 | 12.26 | |||||||||||||
|
|
|
|
|
|
|
|
|
|
|
|||||||||||
| Distributions from net investment income(c) |
(3.16 | ) | (2.40 | ) | (1.99 | ) | (2.48 | ) | (3.01 | ) | ||||||||||
|
|
|
|
|
|
|
|
|
|
|
|||||||||||
| Net asset value, end of year |
$ | 97.35 | $ | 97.33 | $ | 110.34 | $ | 115.40 | $ | 116.32 | ||||||||||
|
|
|
|
|
|
|
|
|
|
|
|||||||||||
| Total Return(d) |
||||||||||||||||||||
| Based on net asset value |
3.32 | % | (9.67 | )%(e) | (2.68 | )% | 1.31 | % | 11.61 | % | ||||||||||
|
|
|
|
|
|
|
|
|
|
|
|||||||||||
| Ratios to Average Net Assets(f) |
||||||||||||||||||||
| Total expenses |
0.03 | % | 0.03 | % | 0.04 | % | 0.04 | % | 0.05 | % | ||||||||||
|
|
|
|
|
|
|
|
|
|
|
|||||||||||
| Total expenses after fees waived |
0.03 | % | 0.03 | % | 0.03 | % | 0.03 | % | 0.05 | % | ||||||||||
|
|
|
|
|
|
|
|
|
|
|
|||||||||||
| Net investment income |
3.33 | % | 2.48 | % | 1.74 | % | 2.03 | % | 2.70 | % | ||||||||||
|
|
|
|
|
|
|
|
|
|
|
|||||||||||
| Supplemental Data |
||||||||||||||||||||
| Net assets, end of year (000) |
$ | 101,640,908 | $ | 85,719,356 | $ | 87,922,461 | $ | 85,958,288 | $ | 76,413,081 | ||||||||||
|
|
|
|
|
|
|
|
|
|
|
|||||||||||
| Portfolio turnover rate(g)(h) |
89 | % | 104 | % | 163 | % | 179 | % | 108 | % | ||||||||||
|
|
|
|
|
|
|
|
|
|
|
|||||||||||
| (a) | Based on average shares outstanding. |
| (b) | The amounts reported for a share outstanding may not accord with the change in aggregate gains and losses in securities for the fiscal period due to the timing of capital share transactions in relation to the fluctuating market values of the Fund’s underlying securities. |
| (c) | Distributions for annual periods determined in accordance with U.S. federal income tax regulations. |
| (d) | Where applicable, assumes the reinvestment of distributions. |
| (e) | Includes payment received from an affiliate, which had no impact on the Fund’s total return. |
| (f) | Excludes fees and expenses incurred indirectly as a result of investments in underlying funds. |
| (g) | Portfolio turnover rate excludes in-kind transactions, if any. |
| (h) | Includes mortgage dollar roll transactions (“MDRs”). |
See notes to financial statements.
| F I N A N C I A L H I G H L I G H T S |
119 |
| 1. | ORGANIZATION |
iShares Trust (the “Trust”) is registered under the Investment Company Act of 1940, as amended (the “1940 Act”), as an open-end management investment company. The Trust is organized as a Delaware statutory trust and is authorized to have multiple series or portfolios.
These financial statements relate only to the following fund (the “Fund”):
| iShares ETF | Diversification Classification | |
| Core U.S. Aggregate Bond |
Diversified |
| 2. | SIGNIFICANT ACCOUNTING POLICIES |
The financial statements are prepared in conformity with accounting principles generally accepted in the United States of America (“U.S. GAAP”), which may require management to make estimates and assumptions that affect the reported amounts of assets and liabilities in the financial statements, disclosure of contingent assets and liabilities at the date of the financial statements and the reported amounts of increases and decreases in net assets from operations during the reporting period. Actual results could differ from those estimates. The Fund is considered an investment company under U.S. GAAP and follows the accounting and reporting guidance applicable to investment companies. Below is a summary of significant accounting policies:
Investment Transactions and Income Recognition: For financial reporting purposes, investment transactions are recorded on the dates the transactions are executed (the “trade dates”). Realized gains and losses on investment transactions are determined using the specific identification method. Dividend income and capital gain distributions, if any, are recorded on the ex-dividend date. Non-cash dividends, if any, are recorded on the ex-dividend date at fair value. Interest income, including amortization and accretion of premiums and discounts on debt securities, is recognized daily on an accrual basis.
Bank Overdraft: The Fund had outstanding cash disbursements exceeding deposited cash amounts at the custodian during the reporting period. The Fund is obligated to repay the custodian for any overdraft, including any related costs or expenses, where applicable. For financial reporting purposes, overdraft fees, if any, are included in interest expense in the Statement of Operations.
In-kind Redemptions: For financial reporting purposes, in-kind redemptions are treated as sales of securities resulting in realized capital gains or losses to the Fund. Because such gains or losses are not taxable to the Fund and are not distributed to existing Fund shareholders, the gains or losses are reclassified from accumulated net realized gain (loss) to paid-in capital at the end of the Fund’s tax year. These reclassifications have no effect on net assets or net asset value (“NAV”) per share.
Distributions: Dividends and distributions paid by the Fund are recorded on the ex-dividend dates. Distributions are determined on a tax basis and may differ from net investment income and net realized capital gains for financial reporting purposes. Dividends and distributions are paid in U.S. dollars and cannot be automatically reinvested in additional shares of the Fund.
Indemnifications: In the normal course of business, the Fund enters into contracts that contain a variety of representations that provide general indemnification. The Fund’s maximum exposure under these arrangements is unknown because it involves future potential claims against the Fund, which cannot be predicted with any certainty.
| 3. | INVESTMENT VALUATION AND FAIR VALUE MEASUREMENTS |
Investment Valuation Policies: The Fund’s investments are valued at fair value (also referred to as “market value” within the financial statements) each day that the Fund’s listing exchange is open and, for financial reporting purposes, as of the report date. U.S. GAAP defines fair value as the price a fund would receive to sell an asset or pay to transfer a liability in an orderly transaction between market participants at the measurement date. The Board of Trustees of the Trust (the “Board”) of the Fund has approved the designation of BlackRock Fund Advisors (“BFA”), the Fund’s investment adviser, as the valuation designee for the Fund. The Fund determines the fair values of its financial instruments using various independent dealers or pricing services under BFA’s policies. If a security’s market price is not readily available or does not otherwise accurately represent the fair value of the security, the security will be valued in accordance with BFA’s policies and procedures as reflecting fair value. BFA has formed a committee (the “Valuation Committee”) to develop pricing policies and procedures and to oversee the pricing function for all financial instruments, with assistance from other BlackRock pricing committees.
Fair Value Inputs and Methodologies: The following methods and inputs are used to establish the fair value of the Fund’s assets and liabilities:
| • | Fixed-income investments for which market quotations are readily available are generally valued using the last available bid price or current market quotations provided by independent dealers or third-party pricing services. Pricing services generally value fixed income securities assuming orderly transactions of an institutional round lot size, but a fund may hold or transact in such securities in smaller, odd lot sizes. Odd lots may trade at lower prices than institutional round lots. The pricing services may use matrix pricing or valuation models that utilize certain inputs and assumptions to derive values, including transaction data (e.g., recent representative bids and offers), market data, credit quality information, perceived market movements, news, and other relevant information. Certain fixed-income securities, including asset-backed and mortgage related securities may be valued based on valuation models that consider the estimated cash flows of each tranche of the entity, establish a benchmark yield and develop an estimated tranche specific spread to the benchmark yield based on the unique attributes of the tranche. The amortized cost method of valuation may be used with respect to debt obligations with sixty days or less remaining to maturity unless BFA determines such method does not represent fair value. |
| 120 | 2 0 2 4 I S H A R E S A N N U A L R E P O R T T O S H A R E H O L D E R S |
Notes to Financial Statements (continued)
| • | Investments in open-end U.S. mutual funds (including money market funds) are valued at that day’s published NAV. |
If events (e.g., market volatility, company announcement or a natural disaster) occur that are expected to materially affect the value of such investment, or in the event that application of these methods of valuation results in a price for an investment that is deemed not to be representative of the market value of such investment, or if a price is not available, the investment will be valued by the Valuation Committee, in accordance with BFA’s policies and procedures as reflecting fair value (“Fair Valued Investments”). The fair valuation approaches that may be used by the Valuation Committee include market approach, income approach and cost approach. Valuation techniques such as discounted cash flow, use of market comparables and matrix pricing are types of valuation approaches and are typically used in determining fair value. When determining the price for Fair Valued Investments, the Valuation Committee seeks to determine the price that the Fund might reasonably expect to receive or pay from the current sale or purchase of that asset or liability in an arm’s-length transaction. Fair value determinations shall be based upon all available factors that the Valuation Committee deems relevant and consistent with the principles of fair value measurement.
Fair value pricing could result in a difference between the prices used to calculate a fund’s NAV and the prices used by the fund’s underlying index, which in turn could result in a difference between the fund’s performance and the performance of the fund’s underlying index.
Fair Value Hierarchy: Various inputs are used in determining the fair value of financial instruments. These inputs to valuation techniques are categorized into a fair value hierarchy consisting of three broad levels for financial reporting purposes as follows:
| • | Level 1 – Unadjusted price quotations in active markets/exchanges for identical assets or liabilities that the Fund has the ability to access; |
| • | Level 2 – Other observable inputs (including, but not limited to, quoted prices for similar assets or liabilities in markets that are active, quoted prices for identical or similar assets or liabilities in markets that are not active, inputs other than quoted prices that are observable for the assets or liabilities (such as interest rates, yield curves, volatilities, prepayment speeds, loss severities, credit risks and default rates) or other market-corroborated inputs); and |
| • | Level 3 – Unobservable inputs based on the best information available in the circumstances, to the extent observable inputs are not available, (including the Valuation Committee’s assumptions used in determining the fair value of financial instruments). |
The hierarchy gives the highest priority to unadjusted quoted prices in active markets for identical assets or liabilities (Level 1 measurements) and the lowest priority to unobservable inputs (Level 3 measurements). Accordingly, the degree of judgment exercised in determining fair value is greatest for instruments categorized in Level 3. The inputs used to measure fair value may fall into different levels of the fair value hierarchy. In such cases, for disclosure purposes, the fair value hierarchy classification is determined based on the lowest level input that is significant to the fair value measurement in its entirety. Investments classified within Level 3 have significant unobservable inputs used by the Valuation Committee in determining the price for Fair Valued Investments. Level 3 investments include equity or debt issued by privately held companies or funds that may not have a secondary market and/or may have a limited number of investors. The categorization of a value determined for financial instruments is based on the pricing transparency of the financial instruments and is not necessarily an indication of the risks associated with investing in those securities.
| 4. | SECURITIES AND OTHER INVESTMENTS |
Asset-Backed and Mortgage-Backed Securities: Asset-backed securities are generally issued as pass-through certificates or as debt instruments. Asset-backed securities issued as pass-through certificates represent undivided fractional ownership interests in an underlying pool of assets. Asset-backed securities issued as debt instruments, which are also known as collateralized obligations, are typically issued as the debt of a special purpose entity organized solely for the purpose of owning such assets and issuing such debt. Asset-backed securities are often backed by a pool of assets representing the obligations of a number of different parties. The yield characteristics of certain asset-backed securities may differ from traditional debt securities. One such major difference is that all or a principal part of the obligations may be prepaid at any time because the underlying assets (i.e., loans) may be prepaid at any time. As a result, a decrease in interest rates in the market may result in increases in the level of prepayments as borrowers, particularly mortgagors, refinance and repay their loans. An increased prepayment rate with respect to an asset-backed security will have the effect of shortening the maturity of the security. In addition, a fund may subsequently have to reinvest the proceeds at lower interest rates. If a fund has purchased such an asset-backed security at a premium, a faster than anticipated prepayment rate could result in a loss of principal to the extent of the premium paid.
For mortgage pass-through securities (the “Mortgage Assets”) there are a number of important differences among the agencies and instrumentalities of the U.S. Government that issue mortgage-related securities and among the securities that they issue. For example, mortgage-related securities guaranteed by Ginnie Mae are guaranteed as to the timely payment of principal and interest by Ginnie Mae and such guarantee is backed by the full faith and credit of the United States. However, mortgage-related securities issued by Freddie Mac and Fannie Mae, including Freddie Mac and Fannie Mae guaranteed mortgage pass-through certificates, which are solely the obligations of Freddie Mac and Fannie Mae, are not backed by or entitled to the full faith and credit of the United States, but are supported by the right of the issuer to borrow from the U.S. Treasury.
Non-agency mortgage-backed securities are securities issued by non-governmental issuers and have no direct or indirect government guarantees of payment and are subject to various risks. Non-agency mortgage loans are obligations of the borrowers thereunder only and are not typically insured or guaranteed by any other person or entity. The ability of a borrower to repay a loan is dependent upon the income or assets of the borrower. A number of factors, including a general economic downturn, acts of God, terrorism, social unrest and civil disturbances, may impair a borrower’s ability to repay its loans.
Zero-Coupon Bonds: Zero-coupon bonds are normally issued at a significant discount from face value and do not provide for periodic interest payments. These bonds may experience greater volatility in market value than other debt obligations of similar maturity which provide for regular interest payments.
TBA Commitments: TBA commitments are forward agreements for the purchase or sale of securities, including mortgage-backed securities for a fixed price, with payment and delivery on an agreed upon future settlement date. The specific securities to be delivered are not identified at the trade date. However, delivered securities must meet
| N O T E S T O F I N A N C I A L S T A T E M E N T S |
121 |
Notes to Financial Statements (continued)
specified terms, including issuer, rate and mortgage terms. When entering into TBA commitments, a fund may take possession of or deliver the underlying mortgage-backed securities but can extend the settlement or roll the transaction. TBA commitments involve a risk of loss if the value of the security to be purchased or sold declines or increases, respectively, prior to settlement date, if there are expenses or delays in connection with the TBA transactions, or if the counterparty fails to complete the transaction.
To mitigate counterparty risk, a fund enters into a two-way collateral agreement for TBA transactions with certain counterparties. Under such agreement, the “in-the-money” party of a TBA transaction may at any time require the other party to pledge collateral assets (in the form of cash or securities) to offset any loss the in-the-money party would incur upon cancellation of the TBA transaction. A party is in-the-money if they are the buyer and the market value of the TBA transaction increases or if they are the seller and the market value of the TBA transaction decreases. Cash collateral received from the counterparty may be reinvested in money market funds, including those managed by the Fund’s investment adviser, or its affiliates. Such collateral, if any, is noted in the Schedule of Investments and the obligation to return the collateral is presented as a liability in the Statement of Assets and Liabilities. Securities pledged as collateral by a fund, if any, are noted in the Schedule of Investments.
Mortgage Dollar RollTransactions: The Fund may sell TBA mortgage-backed securities and simultaneously contract to repurchase substantially similar (i.e., same type, coupon and maturity) securities on a specific future date at an agreed upon price. During the period between the sale and repurchase, a fund is not entitled to receive interest and principal payments on the securities sold. Mortgage dollar roll transactions are treated as purchases and sales and a fund realizes gains and losses on these transactions. Mortgage dollar rolls involve the risk that the market value of the securities that a fund is required to purchase may decline below the agreed upon repurchase price of those securities.
Securities Lending: The Fund may lend its securities to approved borrowers, such as brokers, dealers and other financial institutions. The borrower pledges and maintains with the Fund collateral consisting of cash, an irrevocable letter of credit issued by an approved bank, or securities issued or guaranteed by the U.S. government. The initial collateral received by the Fund is required to have a value of at least 102% of the current market value of the loaned securities for securities traded on U.S. exchanges and a value of at least 105% for all other securities. The collateral is maintained thereafter at a value equal to at least 100% of the current value of the securities on loan. The market value of the loaned securities is determined at the close of each business day of the Fund and any additional required collateral is delivered to the Fund or excess collateral is returned by the Fund, on the next business day. During the term of the loan, the Fund is entitled to all distributions made on or in respect of the loaned securities but does not receive interest income on securities received as collateral. Loans of securities are terminable at any time and the borrower, after notice, is required to return borrowed securities within the standard time period for settlement of securities transactions.
As of period end, any securities on loan were collateralized by cash and/or U.S. Government obligations. Cash collateral invested in money market funds managed by BFA, or its affiliates is disclosed in the Schedule of Investments. Any non-cash collateral received cannot be sold, re-invested or pledged by the Fund, except in the event of borrower default. The securities on loan, if any, are also disclosed in the Fund’s Schedule of Investments. The market value of any securities on loan and the value of any related cash collateral are disclosed in the Statement of Assets and Liabilities.
Securities lending transactions are entered into by the Fund under Master Securities Lending Agreements (each, an “MSLA”) which provide the right, in the event of default (including bankruptcy or insolvency) for the non-defaulting party to liquidate the collateral and calculate a net exposure to the defaulting party or request additional collateral. In the event that a borrower defaults, the Fund, as lender, would offset the market value of the collateral received against the market value of the securities loaned. When the value of the collateral is greater than that of the market value of the securities loaned, the lender is left with a net amount payable to the defaulting party. However, bankruptcy or insolvency laws of a particular jurisdiction may impose restrictions on or prohibitions against such a right of offset in the event of an MSLA counterparty’s bankruptcy or insolvency. Under the MSLA, absent an event of default, the borrower can resell or re-pledge the loaned securities, and the Fund can reinvest cash collateral received in connection with loaned securities. Upon an event of default, the parties’ obligations to return the securities or collateral to the other party are extinguished, and the parties can resell or re-pledge the loaned securities or the collateral received in connection with the loaned securities in order to satisfy the defaulting party’s net payment obligation for all transactions under the MSLA. The defaulting party remains liable for any deficiency.
| 122 | 2 0 2 4 I S H A R E S A N N U A L R E P O R T T O S H A R E H O L D E R S |
Notes to Financial Statements (continued)
As of period end, the following table is a summary of the securities on loan by counterparty which are subject to offset under an MSLA:
| iShares ETF and Counterparty | |
Securities Loaned at Value |
|
|
Cash Collateral Received |
(a) |
|
Non-Cash Collateral Received, at Fair Value |
(a) |
Net Amount | ||||||
| Core U.S. Aggregate Bond |
||||||||||||||||
| Barclays Bank PLC |
$ | 97,083,872 | $ | (97,083,872 | ) | $ | — | $ | — | |||||||
| Barclays Capital, Inc. |
110,935,030 | (110,935,030 | ) | — | — | |||||||||||
| BMO Capital Markets Corp. |
17,765,884 | (17,765,884 | ) | — | — | |||||||||||
| BNP Paribas SA |
47,012,659 | (47,012,659 | ) | — | — | |||||||||||
| BofA Securities, Inc. |
144,370,509 | (144,370,509 | ) | — | — | |||||||||||
| Citigroup Global Markets, Inc. |
168,048,384 | (168,048,384 | ) | — | — | |||||||||||
| Credit Agricole Corporate & Investment Bank SA |
36,932,244 | (36,932,244 | ) | — | — | |||||||||||
| Deutsche Bank Securities, Inc. |
44,506,768 | (44,506,768 | ) | — | — | |||||||||||
| Goldman Sachs & Co. LLC |
291,970,171 | (291,970,171 | ) | — | — | |||||||||||
| HSBC Securities (USA), Inc. |
4,302,376 | (4,302,376 | ) | — | — | |||||||||||
| J.P. Morgan Securities LLC |
291,846,973 | (291,846,973 | ) | — | — | |||||||||||
| Jefferies LLC |
855,172 | (855,172 | ) | — | — | |||||||||||
| Mitsubishi UFJ Securities Holdings Co., Ltd. |
3,468,516 | (3,468,516 | ) | — | — | |||||||||||
| Mizuho Securities USA LLC |
163,491 | (163,491 | ) | — | — | |||||||||||
| Morgan Stanley |
65,357,430 | (65,357,430 | ) | — | — | |||||||||||
| Nomura Securities International, Inc. |
20,460,296 | (20,460,296 | ) | — | — | |||||||||||
| Pershing LLC |
6,480,869 | (6,480,869 | ) | — | — | |||||||||||
| RBC Capital Markets LLC |
17,916,455 | (17,916,455 | ) | — | — | |||||||||||
| Scotia Capital (USA), Inc. |
2,398,182 | (2,263,679 | ) | — | 134,503 | (b) | ||||||||||
| State Street Bank & Trust Co. |
897,746 | (897,746 | ) | — | — | |||||||||||
| TD Securities (USA) LLC |
13,737,188 | (13,737,188 | ) | — | — | |||||||||||
| Toronto-Dominion Bank (The) |
27,465,799 | (27,465,799 | ) | — | — | |||||||||||
| UBS AG |
1,181,673 | (1,181,673 | ) | — | — | |||||||||||
| UBS Securities LLC |
2,892,369 | (2,892,369 | ) | — | — | |||||||||||
| Wells Fargo Bank N.A. |
11,749,297 | (11,749,297 | ) | — | — | |||||||||||
| Wells Fargo Securities LLC |
32,131,628 | (32,131,628 | ) | — | — | |||||||||||
|
|
|
|
|
|
|
|
|
|||||||||
| $ | 1,461,930,981 | $ | (1,461,796,478 | ) | $ | — | $ | 134,503 | ||||||||
|
|
|
|
|
|
|
|
|
| (a) | Collateral received, if any, in excess of the market value of securities on loan is not presented in this table. The total cash collateral received by the Fund is disclosed in the Fund’s Statements of Assets and Liabilities. |
| (b) | The market value of the loaned securities is determined as of February 29, 2024. Additional collateral is delivered to the Fund on the next business day in accordance with the MSLA. The net amount would be subject to the borrower default indemnity in the event of default by a counterparty. |
The risks of securities lending include the risk that the borrower may not provide additional collateral when required or may not return the securities when due. To mitigate these risks, the Fund benefits from a borrower default indemnity provided by BlackRock, Inc. (“BlackRock”). BlackRock’s indemnity allows for full replacement of the securities loaned to the extent the collateral received does not cover the value of the securities loaned in the event of borrower default. The Fund could incur a loss if the value of an investment purchased with cash collateral falls below the market value of the loaned securities or if the value of an investment purchased with cash collateral falls below the value of the original cash collateral received. Such losses are borne entirely by the Fund.
| 5. | INVESTMENT ADVISORY AGREEMENT AND OTHER TRANSACTIONS WITH AFFILIATES |
Investment Advisory Fees: Pursuant to an Investment Advisory Agreement with the Trust, BFA manages the investment of the Fund’s assets. BFA is a California corporation indirectly owned by BlackRock. Under the Investment Advisory Agreement, BFA is responsible for substantially all expenses of the Fund, except (i) interest and taxes; (ii) brokerage commissions and other expenses connected with the execution of portfolio transactions; (iii) distribution fees; (iv) the advisory fee payable to BFA; and (v) litigation expenses and any extraordinary expenses (in each case as determined by a majority of the independent trustees).
For its investment advisory services to the Fund, BFA is entitled to an annual investment advisory fee of 0.03%, accrued daily and paid monthly by the Fund, based on the average daily net assets of the Fund.
Expense Waivers: A fund may incur its pro rata share of fees and expenses attributable to its investments in other investment companies (“acquired fund fees and expenses”). The total of the investment advisory fee and acquired fund fees and expenses, if any, is a fund’s total annual operating expenses. Total expenses as shown in the Statement of Operations does not include acquired fund fees and expenses.
BFA has contractually agreed to waive a portion of its investment advisory fee for the Fund through June 30, 2026 in an amount equal to the acquired fund fees and expenses, if any, attributable to investments by the Fund in other registered investment companies advised by BFA or its affiliates.
| N O T E S T O F I N A N C I A L S T A T E M E N T S |
123 |
Notes to Financial Statements (continued)
This amount is included in investment advisory fees waived in the Statement of Operations. For the year ended February 29, 2024, the amounts waived in investment advisory fees pursuant to this arrangement were as follows:
| iShares ETF | Amounts Waived | |||
| Core U.S. Aggregate Bond |
$ | 3,227,736 | ||
Distributor: BlackRock Investments, LLC (“BRIL”), an affiliate of BFA, is the distributor for the Fund. Pursuant to the distribution agreement, BFA is responsible for any fees or expenses for distribution services provided to the Fund.
ETF Servicing Fees: Each Fund has entered into an ETF Services Agreement with BRIL to perform certain order processing, Authorized Participant communications, and related services in connection with the issuance and redemption of Creation Units (“ETF Services”). BRIL is entitled to a transaction fee fromAuthorized Participants on each creation or redemption order for the ETF Services provided. The Funds do not pay BRIL for ETF Services.
Prior to January 26, 2024 (date of conversion for the fund), ETF Services were performed by State Street Bank and Trust Company.
Securities Lending: The U.S. Securities and Exchange Commission (the “SEC”) has issued an exemptive order which permits BlackRock Institutional Trust Company, N.A. (“BTC”), an affiliate of BFA, to serve as securities lending agent for the Fund, subject to applicable conditions. As securities lending agent, BTC bears all operational costs directly related to securities lending, including any custodial costs. The Fund is responsible for fees in connection with the investment of cash collateral received for securities on loan (the “collateral investment fees”). The cash collateral is invested in a money market fund, BlackRock Cash Funds: Institutional or BlackRock Cash Funds: Treasury, managed by BFA, or its affiliates. However, BTC has agreed to reduce the amount of securities lending income it receives in order to effectively limit the collateral investment fees the Fund bears to an annual rate of 0.04%. The SL Agency Shares of such money market fund will not be subject to a sales load, distribution fee or service fee. The money market fund in which the cash collateral has been invested may, under certain circumstances, impose a liquidity fee of up to 2% of the value redeemed or temporarily restrict redemptions for up to 10 business days during a 90 day period, in the event that the money market fund’s weekly liquid assets fall below certain thresholds.
Securities lending income is equal to the total of income earned from the reinvestment of cash collateral, net of fees and other payments to and from borrowers of securities, and less the collateral investment fees. The Fund retains a portion of securities lending income and remits the remaining portion to BTC as compensation for its services as securities lending agent.
Pursuant to the current securities lending agreement, the Fund retains 82% of securities lending income (which excludes collateral investment fees), and the amount retained can never be less than 70% of the total of securities lending income plus the collateral investment fees.
In addition, commencing the business day following the date that the aggregate securities lending income plus the collateral investment fees generated across all 1940 Act iShares exchange-traded funds (the “iShares ETF Complex”) in that calendar year exceeds a specified threshold, the Fund, pursuant to the securities lending agreement, will retain for the remainder of that calendar year 85% of securities lending income (which excludes collateral investment fees) and the amount retained can never be less than 70% of the total of securities lending income plus the collateral investment fees.
The share of securities lending income earned by the Fund is shown as securities lending income – affiliated – net in its Statement of Operations. For the year ended February 29, 2024, the Fund paid BTC $1,298,661 for securities lending agent services.
Officers and Trustees: Certain officers and/or trustees of the Trust are officers and/or trustees of BlackRock or its affiliates.
OtherTransactions: The Fund may invest its positive cash balances in certain money market funds managed by BFA or an affiliate. The income earned on these temporary cash investments is shown as dividends – affiliated in the Statement of Operations.
A fund, in order to improve its portfolio liquidity and its ability to track its underlying index, may invest in shares of other iShares funds that invest in securities in the fund’s underlying index.
| 6. | PURCHASES AND SALES |
For the year ended February 29, 2024, purchases and sales of investments, including mortgage dollar rolls and excluding short-term securities and in-kind transactions, were as follows:
| U.S. Government Securities | Other Securities | |||||||||||||||||||
| iShares ETF | Purchases | Sales | Purchases | Sales | ||||||||||||||||
| Core U.S. Aggregate Bond |
$ | 82,525,708,432 | $ | 78,507,490,714 | $ | 3,258,479,467 | $ | 3,190,627,202 | ||||||||||||
For the year ended February 29, 2024, in-kind transactions were as follows:
| iShares ETF | In-kind Purchases |
In-kind Sales |
||||||
| Core U.S. Aggregate Bond |
$ | 17,762,496,921 | $ | 6,094,795,802 | ||||
| 124 | 2 0 2 4 I S H A R E S A N N U A L R E P O R T T O S H A R E H O L D E R S |
Notes to Financial Statements (continued)
| 7. | INCOME TAX INFORMATION |
The Fund is treated as an entity separate from the Trust’s other funds for federal income tax purposes. It is the Fund’s policy to comply with the requirements of the Internal Revenue Code of 1986, as amended, applicable to regulated investment companies, and to distribute substantially all of its taxable income to its shareholders. Therefore, no U.S. federal income tax provision is required.
Management has analyzed tax laws and regulations and their application to the Fund as of February 29, 2024, inclusive of the open tax return years, and does not believe that there are any uncertain tax positions that require recognition of a tax liability in the Fund’s financial statements.
U.S. GAAP requires that certain components of net assets be adjusted to reflect permanent differences between financial and tax reporting. These reclassifications have no effect on net assets or NAV per share. As of February 29, 2024, permanent differences attributable to realized gains (losses) from in-kind redemptions were reclassified to the following accounts:
| iShares ETF | Paid-in Capital | Accumulated Earnings (Loss) |
||||||
| Core U.S. Aggregate Bond |
$ | (70,940,572 | ) | $ | 70,940,572 | |||
The tax character of distributions paid was as follows:
| iShares ETF | Year Ended 02/29/24 |
Year Ended 02/28/23 |
||||||
| Core U.S. Aggregate Bond |
||||||||
| Ordinary income |
$ | 3,006,081,368 | $ | 1,958,102,477 | ||||
|
|
|
|
|
|||||
As of February 29, 2024, the tax components of accumulated net earnings (losses) were as follows:
| iShares ETF | |
Undistributed Ordinary Income |
|
|
Non-expiring Capital Loss Carryforwards |
(a) |
|
Net Unrealized Gains (Losses) |
(b) |
Total | ||||||
| Core U.S. Aggregate Bond |
$ | 301,320,365 | $ | (1,591,095,355) | $ | (10,246,016,275 | ) | $ | (11,535,791,265 | ) |
| (a) | Amounts available to offset future realized capital gains. |
| (b) | The difference between book-basis and tax-basis unrealized gains (losses) was attributable primarily to the tax deferral of losses on wash sales, amortization methods for premiums and discounts on fixed income securities and TBA transactions. |
As of February 29, 2024, gross unrealized appreciation and depreciation based on cost of investments (including short positions and derivatives, if any) for U.S. federal income tax purposes were as follows:
| iShares ETF | Tax Cost | Gross Unrealized Appreciation |
Gross Unrealized Depreciation |
Net Unrealized Appreciation (Depreciation) |
||||||||||||
| Core U.S. Aggregate Bond |
$ | 115,856,316,443 | $ | 149,541,456 | $ | (10,395,557,731 | ) | $ | (10,246,016,275 | ) | ||||||
| 8. | PRINCIPAL RISKS |
In the normal course of business, the Fund invests in securities or other instruments and may enter into certain transactions, and such activities subject the Fund to various risks, including, among others, fluctuations in the market (market risk) or failure of an issuer to meet all of its obligations. The value of securities or other instruments may also be affected by various factors, including, without limitation: (i) the general economy; (ii) the overall market as well as local, regional or global political and/or social instability; (iii) regulation, taxation or international tax treaties between various countries; or (iv) currency, interest rate or price fluctuations. Local, regional or global events such as war, acts of terrorism, the spread of infectious illness or other public health issues, recessions, or other events could have a significant impact on the Fund and its investments. The Fund’s prospectus provides details of the risks to which the Fund is subject.
BFA uses an indexing approach to try to achieve the Fund’s investment objective. The Fund is not actively managed, and BFA generally does not attempt to take defensive positions under any market conditions, including declining markets.
The Fund may be exposed to additional risks when reinvesting cash collateral in money market funds that do not seek to maintain a stable NAV per share of $1.00, which may be subject to redemption gates or liquidity fees under certain circumstances.
Market Risk: The Fund may be exposed to prepayment risk, which is the risk that borrowers may exercise their option to prepay principal earlier than scheduled during periods of declining interest rates, which would force the Fund to reinvest in lower yielding securities. The Fund may also be exposed to reinvestment risk, which is the risk that income from the Fund’s portfolio will decline if the Fund invests the proceeds from matured, traded or called fixed-income securities at market interest rates that are below the Fund portfolio’s current earnings rate.
| N O T E S T O F I N A N C I A L S T A T E M E N T S |
125 |
Notes to Financial Statements (continued)
Municipal securities are subject to the risk that litigation, legislation or other political events, local business or economic conditions, credit rating downgrades, or the bankruptcy of the issuer could have a significant effect on an issuer’s ability to make payments of principal and/or interest or otherwise affect the value of such securities. Municipal securities can be significantly affected by political or economic changes, including changes made in the law after issuance of the securities, as well as uncertainties in the municipal market related to, taxation, legislative changes or the rights of municipal security holders, including in connection with an issuer insolvency. Municipal securities backed by current or anticipated revenues from a specific project or specific assets can be negatively affected by the discontinuance of the tax benefits supporting the project or assets or the inability to collect revenues for the project or from the assets. Municipal securities may be less liquid than taxable bonds, and there may be less publicly available information on the financial condition of municipal security issuers than for issuers of other securities.
Counterparty Credit Risk: The Fund may be exposed to counterparty credit risk, or the risk that an entity may fail to or be unable to perform on its commitments related to unsettled or open transactions, including making timely interest and/or principal payments or otherwise honoring its obligations. The Fund manages counterparty credit risk by entering into transactions only with counterparties that BFA believes have the financial resources to honor their obligations and by monitoring the financial stability of those counterparties. Financial assets, which potentially expose the Fund to market, issuer and counterparty credit risks, consist principally of financial instruments and receivables due from counterparties. The extent of the Fund’s exposure to market, issuer and counterparty credit risks with respect to these financial assets is approximately their value recorded in the Statement of Assets and Liabilities, less any collateral held by the Fund.
Geographic/Asset Class Risk: A diversified portfolio, where this is appropriate and consistent with a fund’s objectives, minimizes the risk that a price change of a particular investment will have a material impact on the NAV of a fund. The investment concentrations within the Fund’s portfolio are disclosed in its Schedule of Investments.
The Fund invests a significant portion of its assets in fixed-income securities and/or uses derivatives tied to the fixed-income markets. Changes in market interest rates or economic conditions may affect the value and/or liquidity of such investments. Interest rate risk is the risk that prices of bonds and other fixed-income securities will decrease as interest rates rise and increase as interest rates fall. The Fund may be subject to a greater risk of rising interest rates due to the period of historically low interest rates that ended in March 2022. The Federal Reserve has recently raised the federal funds rate as part of its efforts to address inflation. There is a risk that interest rates will continue to rise, which will likely drive down the prices of bonds and other fixed-income securities, and could negatively impact the Fund’s performance.
The Fund invests a significant portion of its assets in securities backed by commercial or residential mortgage loans or in issuers that hold mortgage and other asset-backed securities. When a fund concentrates its investments in this manner, it assumes a greater risk of prepayment or payment extension by securities issuers. Changes in economic conditions, including delinquencies and/or defaults on assets underlying these securities, can affect the value, income and/or liquidity of such positions. Investment percentages in these securities are presented in the Schedule of Investments.
Significant Shareholder Redemption Risk: Certain shareholders may own or manage a substantial amount of fund shares and/or hold their fund investments for a limited period of time. Large redemptions of fund shares by these shareholders may force a fund to sell portfolio securities, which may negatively impact the fund’s NAV, increase the fund’s brokerage costs, and/or accelerate the realization of taxable income/gains and cause the fund to make additional taxable distributions to shareholders.
LIBOR Transition Risk: The Fund may be exposed to financial instruments that recently transitioned from, or continue to be tied to the London Interbank Offered Rate (“LIBOR”) to determine payment obligations, financing terms, hedging strategies or investment value. The United Kingdom’s Financial Conduct Authority, which regulates LIBOR, has ceased publishing all LIBOR settings, but some USD LIBOR settings will continue to be published under a synthetic methodology until September 30, 2024 for certain legacy contracts. The Secured Overnight Financing Rate (“SOFR”) has been used increasingly on a voluntary basis in new instruments and transactions. Under U.S. regulations that implement a statutory fallback mechanism to replace LIBOR, benchmark rates based on SOFR have replaced LIBOR in certain financial contracts. The ultimate effect of the LIBOR transition process on the Fund is uncertain.
| 9. | CAPITAL SHARE TRANSACTIONS |
Capital shares are issued and redeemed by the Fund only in aggregations of a specified number of shares or multiples thereof (“Creation Units”) at NAV. Except when aggregated in Creation Units, shares of the Fund are not redeemable.
Transactions in capital shares were as follows:
| Year Ended 02/29/24 |
Year Ended 02/28/23 |
|||||||||||||||||||
| iShares ETF | Shares | Amount | Shares | Amount | ||||||||||||||||
| Core U.S. Aggregate Bond |
||||||||||||||||||||
| Shares sold |
250,400,000 | $ | 24,342,335,867 | 172,600,000 | $ | 17,350,936,843 | ||||||||||||||
| Shares redeemed |
(87,000,000 | ) | (8,406,135,388 | ) | (88,700,000 | ) | (8,999,312,954 | ) | ||||||||||||
|
|
|
|
|
|
|
|
|
|||||||||||||
| 163,400,000 | $ | 15,936,200,479 | 83,900,000 | $ | 8,351,623,889 | |||||||||||||||
|
|
|
|
|
|
|
|
|
|||||||||||||
The consideration for the purchase of Creation Units of a fund in the Trust generally consists of the in-kind deposit of a designated portfolio of securities and a specified amount of cash. Certain funds in the Trust may be offered in Creation Units solely or partially for cash in U.S. dollars. Authorized Participants purchasing and redeeming Creation Units may pay a purchase transaction fee and a redemption transaction fee directly to BRIL, to offset transfer and other transaction costs associated with the issuance and redemption of Creation Units, including Creation Units for cash. Authorized Participants transacting in Creation Units for cash may also pay an additional
| 126 | 2 0 2 4 I S H A R E S A N N U A L R E P O R T T O S H A R E H O L D E R S |
Notes to Financial Statements (continued)
variable charge to compensate the relevant fund for certain transaction costs (i.e., stamp taxes, taxes on currency or other financial transactions, and brokerage costs) and market impact expenses relating to investing in portfolio securities. Such variable charges, if any, are included in shares sold in the table above.
From time to time, settlement of securities related to in-kind contributions or in-kind redemptions may be delayed. In such cases, securities related to in-kind transactions are reflected as a receivable or a payable in the Statement of Assets and Liabilities.
| 10. | SUBSEQUENT EVENTS |
Management has evaluated the impact of all subsequent events on the Fund through the date the financial statements were available to be issued and has determined that there were no subsequent events requiring adjustment or additional disclosure in the financial statements.
| N O T E S T O F I N A N C I A L S T A T E M E N T S |
127 |
Report of Independent Registered Public Accounting Firm
To the Board of Trustees of
iShares Trust and Shareholders of iShares Core U.S. Aggregate Bond ETF
Opinion on the Financial Statements
We have audited the accompanying statement of assets and liabilities, including the schedule of investments, of iShares Core U.S. Aggregate Bond ETF (one of the funds constituting iShares Trust, referred to hereafter as the “Fund”) as of February 29, 2024, the related statement of operations for the year ended February 29, 2024, the statement of changes in net assets for each of the two years in the period ended February 29, 2024, including the related notes, and the financial highlights for each of the five years in the period ended February 29, 2024 (collectively referred to as the “financial statements”). In our opinion, the financial statements present fairly, in all material respects, the financial position of the Fund as of February 29, 2024, the results of its operations for the year then ended, the changes in its net assets for each of the two years in the period ended February 29, 2024 and the financial highlights for each of the five years in the period ended February 29, 2024 in conformity with accounting principles generally accepted in the United States of America.
Basis for Opinion
These financial statements are the responsibility of the Fund’s management. Our responsibility is to express an opinion on the Fund’s financial statements based on our audits. We are a public accounting firm registered with the Public Company Accounting Oversight Board (United States) (PCAOB) and are required to be independent with respect to the Fund in accordance with the U.S. federal securities laws and the applicable rules and regulations of the Securities and Exchange Commission and the PCAOB.
We conducted our audits of these financial statements in accordance with the standards of the PCAOB. Those standards require that we plan and perform the audit to obtain reasonable assurance about whether the financial statements are free of material misstatement, whether due to error or fraud.
Our audits included performing procedures to assess the risks of material misstatement of the financial statements, whether due to error or fraud, and performing procedures that respond to those risks. Such procedures included examining, on a test basis, evidence regarding the amounts and disclosures in the financial statements. Our audits also included evaluating the accounting principles used and significant estimates made by management, as well as evaluating the overall presentation of the financial statements. Our procedures included confirmation of securities owned as of February 29, 2024 by correspondence with the custodian, transfer agent and brokers; when replies were not received from brokers, we performed other auditing procedures. We believe that our audits provide a reasonable basis for our opinion.
/s/PricewaterhouseCoopers LLP
Philadelphia, Pennsylvania
April 19, 2024
We have served as the auditor of one or more BlackRock investment companies since 2000.
| 128 | 2 0 2 4 I S H A R E S A N N U A L R E P O R T T O S H A R E H O L D E R S |
| Important Tax Information (unaudited) |
The Fund hereby designates the following amount, or maximum amount allowable by law, of distributions from direct federal obligation interest for the fiscal year ended February 29, 2024:
| iShares ETF | Federal Obligation Interest |
|||
| Core U.S. Aggregate Bond |
$ | 1,062,944,790 | ||
The law varies in each state as to whether and what percent of ordinary income dividends attributable to federal obligations is exempt from state income tax. Shareholders are advised to check with their tax advisers to determine if any portion of the dividends received is exempt from state income tax.
The Fund hereby designates the following amount, or maximum amount allowable by law, as interest income eligible to be treated as a Section 163(j) interest dividend for the fiscal year ended February 29, 2024:
| iShares ETF | Interest Dividends | |||
| Core U.S. Aggregate Bond |
$ | 3,093,923,648 | ||
The Fund hereby designates the following amount, or maximum amount allowable by law, as interest-related dividends eligible for exemption from U.S. withholding tax for nonresident aliens and foreign corporations for the fiscal year ended February 29, 2024:
| iShares ETF | Interest-Related Dividends |
|||
| Core U.S. Aggregate Bond |
$ | 2,904,066,212 | ||
| I M P O R T A N T T A X I N F O R M A T I O N |
129 |
Statement Regarding Liquidity Risk Management Program (unaudited)
In compliance with Rule 22e-4 under the Investment Company Act of 1940, as amended (the “Liquidity Rule”), iShares Trust (the “Trust”) has adopted and implemented a liquidity risk management program (the “Program”) for iShares Core U.S. Aggregate Bond ETF (the “Fund” or “ETF”), a series of the Trust, which is reasonably designed to assess and manage the Fund’s liquidity risk.
The Board of Trustees (the “Board”) of the Trust, on behalf of the Fund, met on December 8, 2023 (the “Meeting”) to review the Program. The Board previously appointed BlackRock Fund Advisors (“BlackRock”), the investment adviser to the Fund, as the program administrator for the Fund’s Program. BlackRock also previously delegated oversight of the Program to the 40Act Liquidity Risk Management Committee (the “Committee”).At the Meeting, the Committee, on behalf of BlackRock, provided the Board with a report that addressed the operation of the Program and assessed its adequacy and effectiveness of implementation, including the management of the Fund’s Highly Liquid Investment Minimum (“HLIM”) where applicable, and any material changes to the Program (the “Report”). The Report covered the period from October 1, 2022 through September 30, 2023 (the “Program Reporting Period”).
The Report described the Program’s liquidity classification methodology for categorizing the Fund’s investments (including derivative transactions) into one of four liquidity buckets. It also referenced the methodology used by BlackRock to establish the Fund’s HLIM and noted that the Committee reviews and ratifies the HLIM assigned to the Fund no less frequently than annually. The Report also discussed notable events affecting liquidity over the Program Reporting Period, including extended market holidays, delays in the repatriation of the local currency in certain non-U.S. countries, the continued illiquidity of Russian equity securities and the suspension of select sanctions in Venezuela.
The Report noted that the Program complied with the key factors for consideration under the Liquidity Rule for assessing, managing and periodically reviewing the Fund’s liquidity risk, as follows:
| a) | The Fund’s investment strategy and liquidity of portfolio investments during both normal and reasonably foreseeable stressed conditions. During the Program Reporting Period, the Committee reviewed whether the Fund’s strategy is appropriate for an open-end fund structure, with a focus on funds with more significant and consistent holdings of less liquid and illiquid assets. The Committee also factored a fund’s concentration in an issuer into the liquidity classification methodology by taking issuer position sizes into account. Derivative exposure was also considered in the calculation of a fund’s liquidity bucketing. Finally, a factor for consideration under the Liquidity Rule is a Fund’s use of borrowings for investment purposes. However, the Funds do not borrow for investment purposes. |
| b) | Short-term and long-term cash flow projections during both normal and reasonably foreseeable stressed conditions. During the Program Reporting Period, the Committee reviewed historical redemption activity and used this information as a component to establish each ETF’s reasonably anticipated trading size utilized for liquidity classifications. The Committee may also take into consideration a fund’s shareholder ownership concentration (which, depending on product type and distribution channel, may or may not be available), a fund’s distribution channels, and the degree of certainty associated with a fund’s short-term and long-term cash flow projections. |
| c) | Holdings of cash and cash equivalents, as well as borrowing arrangements. The Committee considered that ETFs generally do not hold more than de minimis amounts of cash. The Committee also considered that ETFs generally do not engage in borrowing. |
| d) | The relationship between an ETF’s portfolio liquidity and the way in which, and the prices and spreads at which, ETF shares trade, including the efficiency of the arbitrage function and the level of active participation by market participants, including authorized participants. The Committee monitored the prevailing bid/ask spread and the ETF price premium (or discount) to NAV for all ETFs. However, there were no ETFs with persistent deviations of fund premium/discount or bid/ask spreads from long-term averages over the Program Reporting Period. |
| e) | The effect of the composition of baskets on the overall liquidity of an ETF’s portfolio. In reviewing the linkage between the composition of custom baskets accepted by an ETF and any significant change in the liquidity profile of such ETF, the Committee reviewed changes in the proportion of each ETF’s portfolio comprised of less liquid and illiquid holdings to determine if applicable thresholds were met requiring enhanced review. There were no ETFs for which the custom baskets accepted by the ETF had a significant change in its liquidity profile. |
There were no material changes to the Program during the Program Reporting Period other than the enhancement of certain model components in the Program’s classification methodology. The Report provided to the Board stated that the Committee concluded that based on the operation of the functions, as described in the Report, the Program is operating as intended and is effective in implementing the requirements of the Liquidity Rule.
| 130 | 2 0 2 4 I S H A R E S A N N U A L R E P O R T T O S H A R E H O L D E R S |
Supplemental Information (unaudited)
Tailored Shareholder Reports for Open-End Mutual Funds and ETFs
Effective January 24, 2023, the SEC adopted rule and form amendments to require open-end mutual funds and ETFs to transmit concise and visually engaging streamlined annual and semiannual reports to shareholders that highlight key information. Other information, including financial statements, will no longer appear in a streamlined shareholder report but must be available online, delivered free of charge upon request, and filed on a semiannual basis on Form N-CSR. The rule and form amendments have a compliance date of July 24, 2024. At this time, management is evaluating the impact of these amendments on the shareholder reports for the Funds.
Premium/Discount Information
Information on the Fund’s net asset value, market price, premiums and discounts, and bid-ask spreads can be found at iShares.com.
Regulation under the Alternative Investment Fund Managers Directive
The Alternative Investment Fund Managers Directive, and its United Kingdom (“UK”) equivalent, (the “AIFMD”) impose detailed and prescriptive obligations on fund managers established in the European Union (the “EU”) and the UK. These do not currently apply to managers established outside of the EU or UK, such as BFA (the “Company”). However, the Company is required to comply with certain disclosure, reporting and transparency obligations of the AIFMD because it has registered the iShares Core U.S. Aggregate Bond ETF (the “Fund”) to be marketed to investors in the EU and/or UK.
Report on Remuneration
BlackRock has a clear and well-defined pay-for-performance philosophy, and compensation programs which support that philosophy.
BlackRock operates a total compensation model for remuneration which includes a base salary, which is contractual, and a discretionary bonus scheme. Although all employees are eligible to receive a discretionary bonus, there is no contractual obligation to make a discretionary bonus award to any employees. For senior management and staff who have the ability to materially affect the risk profile of the Fund, a significant percentage of variable remuneration is deferred over time.All employees are subject to a clawback policy.
Remuneration decisions for employees are made once annually in January following the end of the performance year, based on BlackRock’s full-year financial results and other non-financial goals and objectives. Alongside financial performance, individual total compensation is also based on strategic and operating results and other considerations such as management and leadership capabilities. No set formulas are established and no fixed benchmarks are used in determining annual incentive awards.
Annual incentive awards are paid from a bonus pool which is reviewed throughout the year by BlackRock’s independent compensation committee, taking into account both actual and projected financial information together with information provided by the Enterprise Risk and Regulatory Compliance departments in relation to any activities, incidents or events that warrant consideration in making compensation decisions. Individuals are not involved in setting their own remuneration.
Each of the control functions (Enterprise Risk, Legal & Compliance, Finance, Human Resources and Internal Audit) each have their own organizational structures which are independent of the business units and therefore staff members in control functions are remunerated independently of the businesses they oversee. Functional bonus pools for those control functions are determined with reference to the performance of each individual function and the remuneration of the senior members of control functions is directly overseen by BlackRock’s independent remuneration committee.
The Company is required under the AIFMD to make quantitative disclosures of remuneration. These disclosures are made in line with BlackRock’s interpretation of currently available regulatory guidance on quantitative remuneration disclosures. As market or regulatory practice develops BlackRock may consider it appropriate to make changes to the way in which quantitative remuneration disclosures are calculated. Where such changes are made, this may result in disclosures in relation to a fund not being comparable to the disclosures made in the prior year, or in relation to other BlackRock fund disclosures in that same year. BlackRock bases its proportionality approach on a combination of factors that it is entitled to take into account based on relevant guidelines.
Remuneration information at an individual AIF level is not readily available. Disclosures are provided in relation to (a) the staff of the Company; (b) staff who are senior management; (c) staff who have the ability to materially affect the risk profile of the Fund; and (d) staff of companies to which portfolio management and risk management has been formally delegated.
All individuals included in the aggregated figures disclosed are rewarded in line with BlackRock’s remuneration policy for their responsibilities across the relevant BlackRock business area.As all individuals have a number of areas of responsibilities, only the portion of remuneration for those individuals’ services attributable to the Fund is included in the aggregate figures disclosed.
Members of staff and senior management of the Company typically provide both AIFMD and non-AIFMD related services in respect of multiple funds, clients and functions of the Company and across the broader BlackRock group. Conversely, members of staff and senior management of the broader BlackRock group may provide both AIFMD and non-AIFMD related services in respect of multiple funds, clients and functions of the broader BlackRock group and of the Company. Therefore, the figures disclosed are a sum of individuals’ portion of remuneration attributable to the Company according to an objective apportionment methodology which acknowledges the multiple-service nature of the Company and the broader BlackRock group. Accordingly, the figures are not representative of any individual’s actual remuneration or their remuneration structure.
| S U P P L E M E N T A L I N F O R M A T I O N |
131 |
Supplemental Information (unaudited) (continued)
The amount of the total remuneration awarded to the Company’s staff in respect of the Company’s financial year ending December 31, 2023 was USD 5.43m. This figure is comprised of fixed remuneration of USD 0.74m and variable remuneration of USD 4.68m. There was a total of 8 beneficiaries of the remuneration described above.
The amount of the aggregate remuneration awarded by the Company in respect of the Company’s financial year ending December 31, 2023, to its senior management was USD 3.66m, and to other members of its staff whose actions potentially have a material impact on the risk profile of the Company or its funds was USD 1.77m.
Disclosures Under the EU Sustainable Finance Disclosure Regulation
The Fund is registered under the Alternative Investment Fund Managers Directive to be marketed to European Union (“EU”) investors, as noted above. As a result, certain disclosures are required under the EU Sustainable Finance Disclosure Regulation (“SFDR”).
The Fund has not been categorized under the SFDR as an “Article 8” or “Article 9” product. In addition, the Fund’s investment strategy does not take into account the criteria for environmentally sustainable economic activities under the EU sustainable investment taxonomy regulation or principal adverse impacts (“PAIs”) on sustainability factors under the SFDR. PAIs are identified under the SFDR as the material impacts of investment decisions on sustainability factors relating to environmental, social and employee matters, respect for human rights, and anti-corruption and anti-bribery matters.
| 132 | 2 0 2 4 I S H A R E S A N N U A L R E P O R T T O S H A R E H O L D E R S |
Trustee and Officer Information (unaudited)
The Board of Trustees has responsibility for the overall management and operations of the Funds, including general supervision of the duties performed by BFA and other service providers. Each Trustee serves until he or she resigns, is removed, dies, retires or becomes incapacitated. Each officer shall hold office until his or her successor is elected and qualifies or until his or her death, resignation or removal. Trustees who are not “interested persons” (as defined in the 1940 Act) of the Trust are referred to as independent trustees (“Independent Trustees”).
The registered investment companies advised by BFA or its affiliates (the “BlackRock-advised Funds”) are organized into one complex of open-end equity, multi-asset, index and money market funds and ETFs (the “BlackRock Multi-Asset Complex”), one complex of closed-end funds and open-end non-index fixed-income funds (including ETFs) (the “BlackRock Fixed-Income Complex”) and one complex of ETFs (“Exchange-Traded Fund Complex”) (each, a “BlackRock Fund Complex”). Each Fundis included in the Exchange-Traded Fund Complex. Each Trustee also serves as a Director of iShares, Inc. and a Trustee of iShares U.S. ETF Trust and, as a result, oversees all of the funds within the Exchange-Traded Fund Complex, which consists of 401 funds as of February 29, 2024. With the exception of Robert S. Kapito and Aaron Wasserman, the address of each Trustee and officer is c/o BlackRock, Inc., 400 Howard Street, San Francisco, CA 94105. The address of Mr. Kapito and Mr. Wasserman is c/o BlackRock, Inc., 50 Hudson Yards, New York, NY 10001. The Board has designated John E. Kerrigan as its Independent Board Chair. Additional information about the Funds’ Trustees and officers may be found in the Funds’ combined Statement of Additional Information, which is available without charge, upon request, by calling toll-free 1-800-iShares (1-800-474-2737).
| Interested Trustees | ||||||
| Name (Year of Birth) |
Position(s) | Principal Occupation(s) During Past 5 Years |
Other Directorships Held by Trustee | |||
| Robert S Kapito(a) (1957) | Trustee (since 2009) | President, of BlackRock, Inc. (since 2006); Vice Chairman of BlackRock, Inc. and Head of BlackRock’s Portfolio Management Group (since its formation in 1998) and BlackRock, Inc.’s predecessor entities (since 1988); Trustee, University of Pennsylvania (since 2009); President of Board of Directors, Hope & Heroes Children’s Cancer Fund (since 2002) | Director of BlackRock, Inc. (since 2006); Director of iShares, Inc. (since 2009); Trustee of iShares U.S. ETF Trust (since 2011) | |||
| (a) | Robert S. Kapito is deemed to be an “interested person” (as defined in the 1940 Act) of the Trust due to his affiliations with BlackRock, Inc. and its affiliates. |
| Independent Trustees | ||||||
| Name (Year of Birth) |
Position(s) | Principal Occupation(s) During Past 5 Years | Other Directorships Held by Trustee | |||
| John E Kerrigan (1955) |
Trustee (since 2005); Independent Board Chair (since 2022) | Chief Investment Officer, Santa Clara University (since 2002) | Director of iShares, Inc. (since 2005); Trustee of iShares U.S. ETF Trust (since 2011); Independent Board Chair of iShares, Inc. and iShares U.S. ETF Trust (since 2022) | |||
| Jane D. Carlin (1956) |
Trustee (since 2015); Risk Committee Chair (since 2016) | Consultant (since 2012); Member of the Audit Committee (2012-2018), Chair of the Nominating and Governance Committee (2017-2018) and Director of PHH Corporation (mortgage solutions) (2012-2018); Managing Director and Global Head of Financial Holding Company Governance & Assurance and the Global Head of Operational Risk Management of Morgan Stanley (2006-2012) | Director of iShares, Inc. (since 2015); Trustee of iShares U.S. ETF Trust (since 2015); Member of the Audit Committee (since 2016), Chair of the Audit Committee (since 2020) and Director of The Hanover Insurance Group, Inc. (since 2016) | |||
| Richard L Fagnani (1954) | Trustee (since 2017); Audit Committee Chair (since 2019) | Partner, KPMG LLP (2002-2016); Director of One Generation Away (since 2021) | Director of iShares, Inc. (since 2017); Trustee of iShares U.S. ETF Trust (since 2017) | |||
| Cecilia H Herbert (1949) | Trustee (since 2005); Nominating and Governance and Equity Plus Committee Chairs (since 2022) | Chair of the Finance Committee (since 2019) and Trustee and Member of the Finance, Audit and Quality Committees of Stanford Health Care (since 2016); Trustee of WNET, New York’s public media company (since 2011) and Member of the Audit Committee (since 2018), Investment Committee (since 2011) and Personnel Committee (since 2022); Member of the Wyoming State Investment Funds Committee (since 2022); Director of the Jackson Hole Center for the Arts (since 2021); Trustee of Forward Funds (14 portfolios) (2009-2018); Trustee of Salient MF Trust (4 portfolios) (2015-2018) | Director of iShares, Inc. (since 2005); Trustee of iShares U.S. ETF Trust (since 2011) | |||
| Drew E Lawton (1959) |
Trustee (since 2017); 15(c) Committee Chair (since 2017) | Senior Managing Director of New York Life Insurance Company (2010-2015) | Director of iShares, Inc. (since 2017); Trustee of iShares U.S. ETF Trust (since 2017); Director of Jackson Financial Inc. (since 2021) | |||
| T R U S T E E A N D O F F I C E R I N F O R M A T I O N |
133 |
Trustee and Officer Information (unaudited) (continued)
| Independent Trustees (continued) | ||||||
| Name (Year of Birth) |
Position(s) | Principal Occupation(s) During Past 5 Years |
Other Directorships Held by Trustee | |||
| John E Martinez (1961) |
Trustee (since 2003); Securities Lending Committee Chair (since 2019) | Director of Real Estate Equity Exchange, Inc. (since 2005); Director of Cloudera Foundation (2017-2020); and Director of Reading Partners (2012-2016) | Director of iShares, Inc. (since 2003); Trustee of iShares U.S. ETF Trust (since 2011) | |||
| Madhav V Rajan (1964) |
Trustee (since 2011); Fixed-Income Plus Committee Chair (since 2019) | Dean, and George Pratt Shultz Professor of Accounting, University of Chicago Booth School of Business (since 2017); Advisory Board Member (since 2016) and Director (since 2020) of C.M. Capital Corporation; Chair of the Board for the Center for Research in Security Prices, LLC (since 2020); Robert K. Jaedicke Professor of Accounting, Stanford University Graduate School of Business (2001-2017); Professor of Law (by courtesy), Stanford Law School (2005-2017); Senior Associate Dean for Academic Affairs and Head of MBA Program, Stanford University Graduate School of Business (2010-2016) | Director of iShares, Inc. (since 2011); Trustee of iShares U.S. ETF Trust (since 2011) | |||
| Officers | ||||||
| Name (Year of Birth) |
Position(s) | Principal Occupation(s) During Past 5 Years | ||||
| Dominik Rohé (1973) |
President (since 2023) | Managing Director, BlackRock, Inc. (since 2005); Head of Americas ETF and Index Investments (since 2023); Head of Latin America (2019-2023) | ||||
| Trent Walker (1974) |
Treasurer and Chief Financial Officer (since 2020) | Managing Director, BlackRock, Inc. (since September 2019); Chief Financial Officer of iShares Delaware Trust Sponsor LLC, BlackRock Funds, BlackRock Funds II, BlackRock Funds IV, BlackRock Funds V and BlackRock Funds VI (since 2021); Executive Vice President of PIMCO (2016-2019); Senior Vice President of PIMCO (2008-2015); Treasurer (2013-2019) and Assistant Treasurer (2007-2017) of PIMCO Funds, PIMCO Variable Insurance Trust, PIMCO ETF Trust, PIMCO Equity Series, PIMCO Equity Series VIT, PIMCO Managed Accounts Trust, 2 PIMCO-sponsored interval funds and 21 PIMCO-sponsored closed-end funds | ||||
| Aaron Wasserman (1974) |
Chief Compliance Officer (iShares, Inc. and iShares Trust, since 2023; iShares U.S. ETF Trust, since 2023) | Managing Director of BlackRock, Inc. (since 2018); Chief Compliance Officer of the BlackRock Multi-Asset Complex, the BlackRock Fixed-Income Complex and the Exchange-Traded Fund Complex (since 2023); Deputy Chief Compliance Officer for the BlackRock Multi-Asset Complex, the BlackRock Fixed-Income Complex and the Exchange-Traded Fund Complex (2014-2023) | ||||
| Marisa Rolland (1980) |
Secretary (since 2022) | Managing Director, of BlackRock, Inc. (since 2023); Director, of BlackRock, Inc. (2018-2022); Vice President, BlackRock, Inc. (2010-2017) | ||||
| Rachel Aguirre (1982) |
Executive Vice President (since 2022) | Managing Director, of BlackRock, Inc. (since 2018); Director, BlackRock, Inc. (2009-2018); Head of U.S. iShares Product (since 2022); Head of EII U.S. Product Engineering of BlackRock, Inc. (since 2021); Co-Head of EII’s Americas Portfolio Engineering of BlackRock, Inc. (2020-2021); Head of Developed Markets Portfolio Engineering of BlackRock, Inc. (2016-2019) | ||||
| Jennifer Hsui (1976) |
Executive Vice President (since 2022) | Managing Director of BlackRock, Inc. (since 2009); Co-Head of Index Equity of BlackRock, Inc. (since 2022) | ||||
| James Mauro (1970) |
Executive Vice President (since 2022) | Managing Director, of BlackRock, Inc. (since 2010); Head of Fixed Income Index Investments in the Americas and Head of San Francisco Core Portfolio Management of BlackRock, Inc. (since 2020) | ||||
| Effective July 1, 2023, Aaron Wasserman replaced Charles Park as Chief Compliance Officer Effective February 1, 2024, Salim Ramji resigned as Trustee of the Trust Effective March 5, 2024, Stephen Cohen replaced Salim Ramji as Trustee of the Trust Effective March 5, 2024, Dominik Rohé resigned as President of the Trust Effective March 5, 2024, Jessica Tan replaced Dominik Rohé as President of the Trust Effective April 8, 2024, Laura Fergerson was appointed as Trustee of the Trust Effective April 8, 2024, James Lam was appointed as Trustee of the Trust
|
| 134 | 2 0 2 4 I S H A R E S A N N U A L R E P O R T T O S H A R E H O L D E R S |
Electronic Delivery
Shareholders can sign up for e-mail notifications announcing that the shareholder report or prospectus has been posted on the iShares website at iShares.com. Once you have enrolled, you will no longer receive prospectuses and shareholder reports in the mail.
To enroll in electronic delivery:
| • | Go to icsdelivery.com. |
| • | If your brokerage firm is not listed, electronic delivery may not be available. Please contact your broker-dealer or financial advisor. |
Householding
Householding is an option available to certain fund investors. Householding is a method of delivery, based on the preference of the individual investor, in which a single copy of certain shareholder documents and Rule 30e-3 notices can be delivered to investors who share the same address, even if their accounts are registered under different names. Please contact your broker-dealer if you are interested in enrolling in householding and receiving a single copy of prospectuses and other shareholder documents, or if you are currently enrolled in householding and wish to change your householding status.
Availability of Quarterly Schedule of Investments
The Fund files its complete schedule of portfolio holdings with the SEC for the first and third quarters of each fiscal year as an exhibit to its reports on Form N-PORT. The Fund’s Forms N-PORT are available on the SEC’s website at sec.gov. Additionally, the Fund makes its portfolio holdings for the first and third quarters of each fiscal year available at iShares.com/fundreports.
Availability of Proxy Voting Policies and Proxy Voting Records
A description of the policies and procedures that the iShares Funds use to determine how to vote proxies relating to portfolio securities and information about how the iShares Funds voted proxies relating to portfolio securities during the most recent twelve-month period ending June 30 is available without charge, upon request (1) by calling toll-free 1-800-474-2737; (2) on the iShares website at iShares.com; and (3) on the SEC website at sec.gov.
A description of the Trust’s policies and procedures with respect to the disclosure of the Fund’s portfolio securities is available in the Fund Prospectus. The Fund discloses its portfolio holdings daily and provides information regarding its top holdings in Fund fact sheets at iShares.com.
| G E N E R A L I N F O R M A T I O N |
135 |
Glossary of Terms Used in this Report
| Portfolio Abbreviation | ||
| AGM | Assured Guaranty Municipal Corp. | |
| BAB | Build America Bond | |
| BAM | Build America Mutual Assurance Co. | |
| CMT | Constant Maturity Treasury | |
| GO | General Obligation | |
| GOL | General Obligation Limited | |
| LIBOR | London Interbank Offered Rate | |
| NPFGC | National Public Finance Guarantee Corp. | |
| PSF | Permanent School Fund | |
| RB | Revenue Bond | |
| REIT | Real Estate Investment Trust | |
| SAP | Subject to Appropriations | |
| SCA | Svenska Celluosa Aktiebolaget | |
| SOFR | Secured Overnight Financing Rate | |
| TBA | To-Be-Announced | |
| 136 | 2 0 2 4 I S H A R E S A N N U A L R E P O R T T O S H A R E H O L D E R S |
Want to know more?
iShares.com | 1-800-474-2737
This report is intended for the Fund’s shareholders. It may not be distributed to prospective investors unless it is preceded or accompanied by the current prospectus.
Investing involves risk, including possible loss of principal.
The iShares Funds are distributed by BlackRock Investments, LLC (together with its affiliates, “BlackRock”).
The iShares Funds are not sponsored, endorsed, issued, sold or promoted by Bloomberg Index Services Limited, nor does this company make any representation regarding the advisability of investing in the iShares Funds. BlackRock is not affiliated with the company listed above.
©2024 BlackRock, Inc. All rights reserved. iSHARES and BLACKROCK are registered trademarks of BlackRock, Inc. or its subsidiaries. All other marks are the property of their respective owners.
iS-AR-211-0224
|
|

|
|
|
FEBRUARY 29, 2024 |

| 2024 Annual Report | ||
iShares Trust
| · | iShares BBB Rated Corporate Bond ETF | LQDB | NYSE Arca |
| · | iShares Broad USD Investment Grade Corporate Bond ETF | USIG | NASDAQ |
| · | iShares 1-5 Year Investment Grade Corporate Bond ETF | IGSB | NASDAQ |
| · | iShares 5-10 Year Investment Grade Corporate Bond ETF | IGIB | NASDAQ |
| · | iShares 10+ Year Investment Grade Corporate Bond ETF | IGLB | NYSE Arca |
Dear Shareholder,
The combination of continued economic growth and cooling inflation provided a supportive backdrop for investors during the 12-month reporting period ended February 29, 2024. Significantly tighter monetary policy helped to rein in inflation, and the Consumer Price Index decelerated substantially while remaining above pre-pandemic levels. A moderating labor market helped ease inflationary pressure, although wages continued to grow. Wage and job growth powered robust consumer spending, backstopping the economy. On October 7, 2023, Hamas launched a horrific attack on Israel. The ensuing war will have a significant humanitarian impact and could lead to heightened economic and market volatility. We see geopolitics as a structural market risk going forward. See our geopolitical risk dashboard at blackrock.com for more details.
Equity returns were robust during the period, as interest rates stabilized and the economy proved to be more resilient than many investors expected. The U.S. economy continued to show strength, and growth further accelerated in the second half of 2023. Large-capitalization U.S. stocks posted particularly substantial gains, supported by the performance of a few notable technology companies, while small-capitalization U.S. stocks advanced at a significantly slower pace. Meanwhile, international developed market equities also gained strongly, while emerging market stocks advanced at a more modest pace.
The 10-year U.S. Treasury yield rose during the reporting period, as investors reacted to elevated inflation and attempted to anticipate future interest rate changes. However, higher yields drove positive returns overall for 10-year U.S. Treasuries and solid gains in shorter-duration U.S. Treasuries. The corporate bond market benefited from improving economic sentiment, although high-yield corporate bond prices fared significantly better than investment-grade bonds as demand from yield-seeking investors remained strong.
The U.S. Federal Reserve (the “Fed”), attempting to manage persistent inflation, raised interest rates three times during the 12-month period, but paused its tightening after its July meeting. The Fed also continued to reduce its balance sheet by not replacing some of the securities that reach maturity.
Supply constraints appear to have become an embedded feature of the new macroeconomic environment, making it difficult for developed economies to increase production without sparking higher inflation. Geopolitical fragmentation and an aging population risk further exacerbating these constraints, keeping the labor market tight and wage growth high. Although the Fed has stopped tightening for now, we believe that the new economic regime means that the Fed will need to maintain high rates for an extended period despite the market’s hopes for rapid interest rate cuts, as reflected in the recent rally. In this new regime, we anticipate greater volatility and dispersion of returns, creating more opportunities for selective portfolio management.
Looking at developed market stocks, we have an overweight stance on U.S. stocks overall, particularly given the promise of emerging AI technologies. We are also overweight Japanese stocks as shareholder-friendly policies generate increased investor interest, although we maintain an underweight stance on European stocks. In credit, there are selective opportunities in the near term despite tighter credit and financial conditions. For fixed income investing with a six- to twelve-month horizon, we see the most attractive investments in short-term U.S. Treasuries and hard-currency emerging market bonds.
Overall, our view is that investors need to think globally, position themselves to be prepared for a decarbonizing economy, and be nimble as market conditions change. We encourage you to talk with your financial advisor and visit iShares.com for further insight about investing in today’s markets.

Rob Kapito
President, BlackRock Inc.

Rob Kapitos
President, BlackRock Inc.
| Total Returns as of February 29, 2024 | ||||||||
| 6-Month | 12-Month | |||||||
| U.S. large cap equities |
13.93 | % | 30.45 | % | ||||
| U.S. small cap equities |
8.97 | 10.05 | ||||||
| International equities |
9.23 | 14.41 | ||||||
| Emerging market equities |
4.93 | 8.73 | ||||||
| 3-month Treasury bills |
2.69 | 5.22 | ||||||
| U.S. Treasury securities |
0.58 | 0.69 | ||||||
| U.S. investment grade bonds |
2.35 | 3.33 | ||||||
| Tax-exempt municipal bonds |
4.33 | 5.42 | ||||||
| U.S. high yield bonds |
6.18 | 11.01 | ||||||
|
Past performance is not an indication of future results. Index performance is shown for illustrative purposes only. You cannot invest directly in an index.
|
| |||||||
| 2 | T H I S P A G E I S N O T P A R T O F Y O U R F U N D R E P O R T |
Table of Contents
| Page | ||||
| 2 | ||||
| Annual Report: |
||||
| 4 | ||||
| 5 | ||||
| 15 | ||||
| 15 | ||||
| 16 | ||||
| Financial Statements |
||||
| 258 | ||||
| 260 | ||||
| 262 | ||||
| 265 | ||||
| 270 | ||||
| 280 | ||||
| 281 | ||||
| 282 | ||||
| 283 | ||||
| 285 | ||||
| 287 | ||||
| 288 | ||||
iShares Trust
U.S. Corporate Bond Market Overview
Investment-grade corporate bonds produced a solid gain during the 12 months ended February 29, 2024 (the “reporting period”). The Markit iBoxx USD Liquid Investment Grade Index returned 6.27% for the reporting period and strongly outperformed the 3.33% of the Bloomberg U.S. Aggregate Bond Index, a broad measure of the overall bond market.
The 12-month gain for the index belies the challenging environment for the bond market through the first eight months of the period. During this time, yields drifted steadily higher (as prices fell) in response to better-than-expected economic growth and continued interest rate increases by the U.S. Federal Reserve (Fed). The Fed raised rates by a quarter-point at its meetings in March, May, and July 2023, moving its benchmark fed funds rate to a range of 5.25% - 5.50%. Although the Fed’s aggressive actions contributed to a decline in inflation, U.S. economic growth remained robust behind persistent strength in the labor market. This trend gave rise to expectations that the central bank would need to keep rates “higher for longer,” fueling a sharp sell-off in the bond market in the span from August through October 2023.
The investment backdrop improved considerably in the final two months of 2023, touching off a rally that helped the fixed-income market quickly recover its earlier losses. The headline Consumer Price Index fell to its lowest levels since early 2021 in the November report, surprising the markets and causing the consensus to shift toward the view that the Fed was in fact finished raising rates. In December, Fed Chairman Jerome Powell provided another positive surprise with this suggestion that rate cuts could begin as early as the first half of 2024. Bond prices moved surged in response, with the credit sectors leading the way amid a pronounced improvement in investor sentiment. While yields crept higher in January and February, broad-based indexes such as the Bloomberg U.S. Aggregate Bond Index finished in positive territory on the strength of their earlier advance.
Corporate bonds were the top-performing segment of the investment-grade market in the 12-month period. According to the Federal Reserve Bank of St. Louis Economic Database, the ICE BofA US Corporate Index Option-Adjusted Spread fell from 130 basis points (1.30 percentage points) to 100 basis points over the course of the period. The compression in yield spreads, which indicates outperformance relative to Treasuries, reflected the backdrop of better-than-expected corporate earnings and investors’ hearty appetite for risk in the latter part of the period. The gains were broad-based across the category, with participation from each of the three major sectors: financials, industrials, and utilities. At a time of better-than-expected economic growth, the strongest performance at the industry level generally came from industrial, consumer, and technology-related companies. Lower-quality investment-grade corporate bonds outpaced their higher-quality counterparts, which was in part a function of investors’ willingness to take on greater risk in search of higher yields.
| 4 | 2 0 2 4 I S H A R E S A N N U A L R E P O R T T O S H A R E H O L D E R S |
| Fund Summary as of February 29, 2024 | iShares® BBB Rated Corporate Bond ETF |
Investment Objective
The iShares BBB Rated Corporate Bond ETF (the “Fund”) seeks to track the investment results of an index composed of BBB (or its equivalent) fixed rate U.S. dollar-denominated bonds issued by U.S. and non-U.S. corporate issuers, as represented by the iBoxx USD Liquid Investment Grade BBB 0+ Index (the“Index”). The Fund invests in a representative sample of securities included in the Index that collectively has an investment profile similar to the Index. Due to the use of representative sampling, the Fund may or may not hold all of the securities that are included in the Index.
Performance
| Average Annual Total Returns | Cumulative Total Returns | |||||||||||||||
| 1 Year | Since Inception |
1 Year | Since Inception |
|||||||||||||
| Fund NAV |
6.81 | % | (2.41 | )% | 6.81 | % | (6.57 | )% | ||||||||
| Fund Market |
6.86 | (2.36 | ) | 6.86 | (6.45 | ) | ||||||||||
| Index |
7.02 | (2.27 | ) | 7.02 | (6.21 | ) | ||||||||||
GROWTH OF $10,000 INVESTMENT
(SINCE INCEPTION AT NET ASSET VALUE)
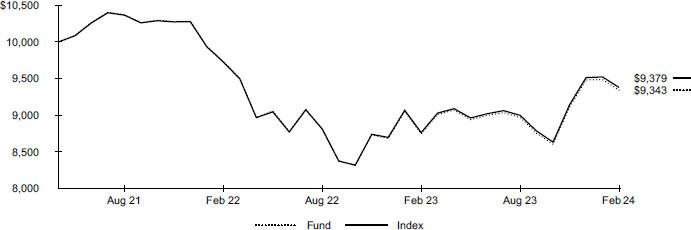
The inception date of the Fund was 5/18/21. The first day of secondary market trading was 5/20/21.
Past performance is not an indication of future results. Performance results do not reflect the deduction of taxes that a shareholder would pay on fund distributions or on the redemption or sale of fund shares. See “About Fund Performance” for more information.
Expense Example
| Actual | Hypothetical 5% Return | |||||||||||||||||||||||||
|
|
|
|
|
|||||||||||||||||||||||
| |
Beginning Account Value |
|
|
Ending Account Value (02/29/24 |
) |
|
Expenses Paid During the Period |
(a) |
|
Beginning Account Value (09/01/23 |
) |
|
Ending Account Value (02/29/24 |
) |
|
Expenses Paid During the Period |
(a) |
|
Annualized Expense Ratio |
| ||||||
| $ | 1,000.00 | $ | 1,041.60 | $ | 0.76 | $ | 1,000.00 | $ | 1,024.10 | $ | 0.75 | 0.15 | % | |||||||||||||
| (a) | Expenses are equal to the annualized expense ratio, multiplied by the average account value over the period, multiplied by 182/366 (to reflect the one-half year period shown). Other fees, such as brokerage commissions and other fees to financial intermediaries, may be paid which are not reflected in the tables and examples above. See “Disclosure of Expenses” for more information. |
| F U N D S U M M A R Y |
5 |
| Fund Summary as of February 29, 2024 (continued) | iShares® BBB Rated Corporate Bond ETF |
Portfolio Information
| CREDIT QUALITY ALLOCATION
|
| |||
| S&P Credit Rating* |
|
Percent of Total Investments |
(a) | |
| A |
0.8 | % | ||
| A- |
2.2 | |||
| BBB+ |
28.3 | |||
| BBB |
49.0 | |||
| BBB- |
18.2 | |||
| BB+ |
1.0 | |||
| Not Rated |
0.5 | |||
| MATURITY ALLOCATION
|
| |||
| Maturity |
|
Percent of Total Investments |
(a) | |
| 0-1 Year |
2.1 | % | ||
| 1-5 Years |
37.5 | |||
| 5-10 Years |
30.1 | |||
| 10-15 Years |
4.3 | |||
| 15-20 Years |
4.6 | |||
| More than 20 Years |
21.4 | |||
| * | Credit quality ratings shown reflect the ratings assigned by S&P Global Ratings, a widely used independent, nationally recognized statistical rating organization. S&P credit ratings are opinions of the credit quality of individual obligations or of an issuer’s general creditworthiness. Investment grade ratings are credit ratings of BBB or higher. Below investment grade ratings are credit ratings of BB or lower. Unrated investments do not necessarily indicate low credit quality. Credit quality ratings are subject to change. |
| (a) | Excludes money market funds. |
| 6 | 2 0 2 4 I S H A R E S A N N U A L R E P O R T T O S H A R E H O L D E R S |
| Fund Summary as of February 29, 2024 | iShares® Broad USD Investment Grade Corporate Bond ETF |
Investment Objective
The iShares Broad USD Investment Grade Corporate Bond ETF (the “Fund”) seeks to track the investment results of an index composed of U.S. dollar-denominated investment-grade corporate bonds, as represented by the ICE BofA US Corporate Index (the “Index”). The Fund invests in a representative sample of securities included in the Index that collectively has an investment profile similar to the Index. Due to the use of representative sampling, the Fund may or may not hold all of the securities that are included in the Index.
Performance
| Average Annual Total Returns | Cumulative Total Returns | |||||||||||||||||||||||
| 1 Year | 5 Years | 10 Years | 1 Year | 5 Years | 10 Years | |||||||||||||||||||
| Fund NAV |
6.14 | % | 1.79 | % | 2.37 | % | 6.14 | % | 9.27 | % | 26.38 | % | ||||||||||||
| Fund Market |
6.07 | 1.73 | 2.35 | 6.07 | 8.98 | 26.11 | ||||||||||||||||||
| Index |
6.13 | 1.88 | 2.51 | 6.13 | 9.76 | 28.12 | ||||||||||||||||||
GROWTH OF $10,000 INVESTMENT
(AT NET ASSET VALUE)
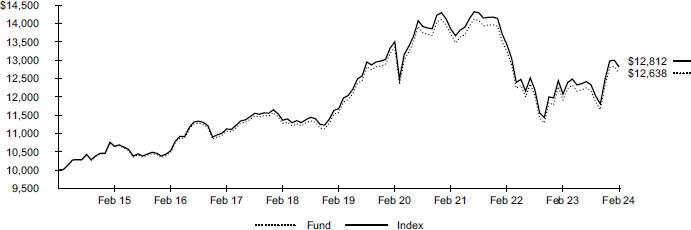
On December 1, 2023, the Fund began to compare its performance to the standard pricing time of the ICE BofA US Corporate Index (the “Index”). Index data prior to March 1, 2021 is for the Index’s standard pricing time of 3 pm. Index data from March 1, 2021 through November 30, 2023 is for a custom 4pm pricing variant of the Index. Index returns beginning on December 1, 2023 reflect the Index’s new standard pricing time of 4 pm. The change of the Index’s standard pricing time from 3 pm to 4 pm resulted in the discontinuation of the custom 4pm pricing variant used from March 1, 2021 through November 30, 2023. Index data prior to August 1, 2018 is for the Bloomberg U.S. Credit Bond Index.
Past performance is not an indication of future results. Performance results do not reflect the deduction of taxes that a shareholder would pay on fund distributions or on the redemption or sale of fund shares. See “About Fund Performance” for more information.
Expense Example
| Actual | Hypothetical 5% Return | |||||||||||||||||||||||||
|
|
|
|
|
|||||||||||||||||||||||
|
|
Beginning Account Value (09/01/23 |
) |
|
Ending Account Value (02/29/24 |
) |
|
Expenses Paid During the Period |
(a) |
|
Beginning Account Value (09/01/23 |
) |
|
Ending Account Value (02/29/24 |
) |
|
Expenses Paid During the Period |
(a) |
|
Annualized Expense Ratio |
| ||||||
| $ | 1,000.00 | $ | 1,039.30 | $ | 0.20 | $ | 1,000.00 | $ | 1,024.70 | $ | 0.20 | 0.04 | % | |||||||||||||
| (a) | Expenses are equal to the annualized expense ratio, multiplied by the average account value over the period, multiplied by 182/366 (to reflect the one-half year period shown). Other fees, such as brokerage commissions and other fees to financial intermediaries, may be paid which are not reflected in the tables and examples above. See “Disclosure of Expenses” for more information. |
| F U N D S U M M A R Y |
7 |
| Fund Summary as of February 29, 2024 (continued) | iShares® Broad USD Investment Grade Corporate Bond ETF |
Portfolio Information
CREDIT QUALITY ALLOCATION
| Moody’s Credit Rating* |
|
Percent of Total Investments |
(a) | |
| Aaa |
2.0 | % | ||
| Aa |
7.3 | |||
| A |
43.3 | |||
| Baa |
43.7 | |||
| Ba |
1.9 | |||
| Not Rated |
1.8 | |||
MATURITY ALLOCATION
| Maturity |
|
Percent of Total Investments |
(a) | |
| 1-5 Years |
39.3 | % | ||
| 5-10 Years |
27.4 | |||
| 10-15 Years |
6.8 | |||
| 15-20 Years |
6.9 | |||
| More than 20 Years |
19.6 | |||
| * | Credit quality ratings shown reflect the ratings assigned by Moody’s Investors Service (“Moody’s”), a widely used independent, nationally recognized statistical rating organization. Moody’s credit ratings are opinions of the credit quality of individual obligations or of an issuer’s general creditworthiness. Investment grade ratings are credit ratings of Baa or higher. Below investment grade ratings are credit ratings of Ba or lower. Unrated investments do not necessarily indicate low credit quality. Credit quality ratings are subject to change. |
| (a) | Excludes money market funds. |
| 8 | 2 0 2 4 I S H A R E S A N N U A L R E P O R T T O S H A R E H O L D E R S |
| Fund Summary as of February 29, 2024 | iShares® 1-5 Year Investment Grade Corporate Bond ETF |
Investment Objective
The iShares 1-5 Year Investment Grade Corporate Bond ETF (the “Fund”) seeks to track the investment results of an index composed of U.S. dollar-denominated investment-grade corporate bonds with remaining maturities between one and five years, as represented by the ICE BofA 1-5 Year US Corporate Index (the “Index”). The Fund invests in a representative sample of securities included in the Index that collectively has an investment profile similar to the Index. Due to the use of representative sampling, the Fund may or may not hold all of the securities that are included in the Index.
Performance
| Average Annual Total Returns | Cumulative Total Returns | |||||||||||||||||||||||
| 1 Year | 5 Years | 10 Years | 1 Year | 5 Years | 10 Years | |||||||||||||||||||
| Fund NAV |
5.91 | % | 2.10 | % | 1.74 | % | 5.91 | % | 10.92 | % | 18.84 | % | ||||||||||||
| Fund Market |
5.83 | 2.06 | 1.73 | 5.83 | 10.71 | 18.68 | ||||||||||||||||||
| Index |
5.87 | 2.12 | 1.89 | 5.87 | 11.07 | 20.57 | ||||||||||||||||||
GROWTH OF $10,000 INVESTMENT
(AT NET ASSET VALUE)
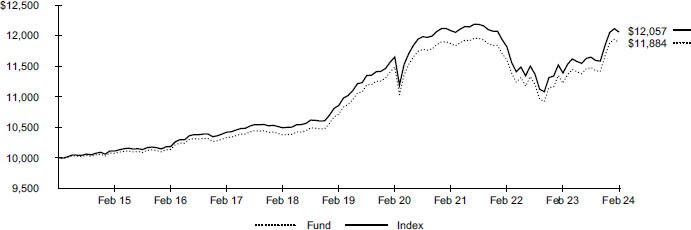
On December 1, 2023, the Fund began to compare its performance to the standard pricing time of the ICE BofA 1-5 Year US Corporate Index (the “Index”). Index data prior to March 1, 2021 is for the Index’s standard pricing time of 3 pm. Index data from March 1, 2021 through November 30, 2023 is for a custom 4 pm pricing variant of the Index. Index returns beginning on December 1, 2023 reflect the Index’s new standard pricing time of 4 pm. The change of the Index’s standard pricing time from 3 pm to 4 pm resulted in the discontinuation of the custom 4pm pricing variant used from March 1, 2021 through November 30, 2023. Index data prior to August 1, 2018 is for the Bloomberg U.S. 1-3 Year Credit Bond Index.
Past performance is not an indication of future results. Performance results do not reflect the deduction of taxes that a shareholder would pay on fund distributions or on the redemption or sale of fund shares. See “About Fund Performance” for more information.
Expense Example
| Actual | Hypothetical 5% Return | |||||||||||||||||||||||||
|
|
|
|
|
|||||||||||||||||||||||
|
|
Beginning Account Value (09/01/23 |
) |
|
Ending Account Value |
|
|
Expenses Paid During the |
|
|
Beginning Account Value (09/01/23 |
) |
|
Ending Account Value (02/29/24 |
) |
|
Expenses Paid During the Period |
(a) |
|
Annualized Expense Ratio |
| ||||||
| $ 1,000.00 | $ 1,035.40 | $ 0.20 | $ 1,000.00 | $ 1,024.70 | $ 0.20 | 0.04% | ||||||||||||||||||||
| (a) | Expenses are equal to the annualized expense ratio, multiplied by the average account value over the period, multiplied by 182/366 (to reflect the one-half year period shown). Other fees, such as brokerage commissions and other fees to financial intermediaries, may be paid which are not reflected in the tables and examples above. See “Disclosure of Expenses” for more information. |
| F U N D S U M M A R Y |
9 |
| Fund Summary as of February 29, 2024 (continued) | iShares® 1-5 Year Investment Grade Corporate Bond ETF |
Portfolio Information
CREDIT QUALITY ALLOCATION
| Moody’s Credit Rating* |
|
Percent of Total Investments |
(a) | |
| Aaa |
2.0 | % | ||
| Aa |
8.0 | |||
| A |
45.2 | |||
| Baa |
41.4 | |||
| Ba |
1.8 | |||
| Not Rated |
1.6 | |||
MATURITY ALLOCATION
| Percent of | ||||
| Maturity |
Total Investments | (a) | ||
| 1-2 Years |
25.1 | % | ||
| 2-3 Years |
26.4 | |||
| 3-4 Years |
23.1 | |||
| 4-5 Years |
20.8 | |||
| 5-6 Years |
4.1 | |||
| 6-7 Years |
0.1 | |||
| 7-8 Years |
0.1 | |||
| 8-9 Years |
0.2 | |||
| 21-22 Years |
0.1 | |||
| * | Credit quality ratings shown reflect the ratings assigned by Moody’s Investors Service (“Moody’s”), a widely used independent, nationally recognized statistical rating organization. Moody’s credit ratings are opinions of the credit quality of individual obligations or of an issuer’s general creditworthiness. Investment grade ratings are credit ratings of Baa or higher. Below investment grade ratings are credit ratings of Ba or lower. Unrated investments do not necessarily indicate low credit quality. Credit quality ratings are subject to change. |
| (a) | Excludes money market funds. |
| 10 | 2 0 2 4 I S H A R E S A N N U A L R E P O R T T O S H A R E H O L D E R S |
| Fund Summary as of February 29, 2024 | iShares® 5-10 Year Investment Grade Corporate Bond ETF |
Investment Objective
The iShares 5-10 Year Investment Grade Corporate Bond ETF (the “Fund”) seeks to track the investment results of an index composed of U.S. dollar-denominated investment-grade corporate bonds with remaining maturities between five and ten years, as represented by the ICE BofA 5-10 Year US Corporate Index (the “Index”). The Fund invests in a representative sample of securities included in the Index that collectively has an investment profile similar to the Index. Due to the use of representative sampling, the Fund may or may not hold all of the securities that are included in the Index.
Performance
| Average Annual Total Returns | Cumulative Total Returns | |||||||||||||||||||||||||||
| 1 Year | 5 Years | 10 Years | 1 Year | 5 Years | 10 Years | |||||||||||||||||||||||
| Fund NAV |
6.71 | % | 2.10 | % | 2.26 | % | 6.71 | % | 10.97 | % | 25.06 | % | ||||||||||||||||
| Fund Market |
6.68 | 2.09 | 2.25 | 6.68 | 10.87 | 24.91 | ||||||||||||||||||||||
| Index |
6.66 | 2.15 | 2.38 | 6.66 | 11.21 | 26.52 | ||||||||||||||||||||||
GROWTH OF $10,000 INVESTMENT
(AT NET ASSET VALUE)
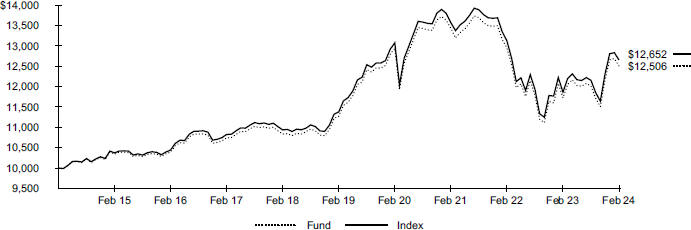
On December 1, 2023, the Fund began to compare its performance to the standard pricing time of the ICE BofA 5-10 Year US Corporate Index (the “Index”). Index data prior to March 1, 2021 is for the Index’s standard pricing time of 3 pm. Index data from March 1, 2021 through November 30, 2023 is for a custom 4pm pricing variant of the Index. Index returns beginning on December 1, 2023 reflect the Index’s new standard pricing time of 4 pm. The change of the Index’s standard pricing time from 3 pm to 4 pm resulted in the discontinuation of the custom 4pm pricing variant used from March 1, 2021 through November 30, 2023. Index data prior to August 1, 2018 is for Bloomberg U.S. Intermediate Credit Bond Index.
Past performance is not an indication of future results. Performance results do not reflect the deduction of taxes that a shareholder would pay on fund distributions or on the redemption or sale of fund shares. See “About Fund Performance” for more information.
Expense Example
| Actual | Hypothetical 5% Return | |||||||||||||||||||||||||||||||
|
|
|
|
|
|||||||||||||||||||||||||||||
| |
Beginning Account Value (09/01/23) |
|
Ending Account Value (02/29/24) |
|
Expenses Paid During the Period |
(a) |
|
Beginning Account Value (09/01/23) |
|
|
Ending Account Value (02/29/24) |
|
|
Expenses Paid During the Period |
(a) |
|
Annualized Expense Ratio |
| ||||||||||||||
|
|
$ 1,000.00 | $ 1,041.10 | $ 0.20 | $ 1,000.00 | $ 1,024.70 | $ 0.20 | 0.04% | |||||||||||||||||||||||||
| (a) | Expenses are equal to the annualized expense ratio, multiplied by the average account value over the period, multiplied by 182/366 (to reflect the one-half year period shown). Other fees, such as brokerage commissions and other fees to financial intermediaries, may be paid which are not reflected in the tables and examples above. See “Disclosure of Expenses” for more information. |
| F U N D S U M M A R Y |
11 |
| Fund Summary as of February 29, 2024 (continued) | iShares® 5-10 Year Investment Grade Corporate Bond ETF |
Portfolio Information
CREDIT QUALITY ALLOCATION
| Moody’s Credit Rating* |
|
Percent of Total Investments |
(a) | |
| Aaa |
0.8 | % | ||
| Aa |
4.5 | |||
| A |
42.0 | |||
| Baa |
48.4 | |||
| Ba |
2.5 | |||
| Not Rated |
1.8 | |||
MATURITY ALLOCATION
| Maturity |
|
Percent of Total Investments |
(a) | |
| 5-10 Years |
91.4 | % | ||
| 10-15 Years |
7.7 | |||
| 15-20 Years |
0.1 | |||
| More than 20 Years |
0.8 | |||
| * | Credit quality ratings shown reflect the ratings assigned by Moody’s Investors Service (“Moody’s”), a widely used independent, nationally recognized statistical rating organization. Moody’s credit ratings are opinions of the credit quality of individual obligations or of an issuer’s general creditworthiness. Investment grade ratings are credit ratings of Baa or higher. Below investment grade ratings are credit ratings of Ba or lower. Unrated investments do not necessarily indicate low credit quality. Credit quality ratings are subject to change. |
| (a) | Excludes money market funds. |
| 12 | 2 0 2 4 I S H A R E S A N N U A L R E P O R T T O S H A R E H O L D E R S |
| Fund Summary as of February 29, 2024 | iShares® 10+ Year Investment Grade Corporate Bond ETF |
Investment Objective
The iShares 10+ Year Investment Grade Corporate Bond ETF (the “Fund”) seeks to track the investment results of an index composed of U.S. dollar-denominated investment-grade corporate bonds with remaining maturities greater than ten years, as represented by the ICE BofA 10+ Year US Corporate Index (the “Index”). The Fund invests in a representative sample of securities included in the Index that collectively has an investment profile similar to the Index. Due to the use of representative sampling, the Fund may or may not hold all of the securities that are included in the Index.
Performance
| Average Annual Total Returns | Cumulative Total Returns | |||||||||||||||||||||||||||
| 1 Year | 5 Years | 10 Years | 1 Year | 5 Years | 10 Years | |||||||||||||||||||||||
| Fund NAV |
5.87 | % | 1.34 | % | 2.81 | % | 5.87 | % | 6.90 | % | 31.89 | % | ||||||||||||||||
| Fund Market |
5.72 | 1.29 | 2.76 | 5.72 | 6.61 | 31.23 | ||||||||||||||||||||||
| Index |
5.91 | 1.49 | 3.07 | 5.91 | 7.65 | 35.31 | ||||||||||||||||||||||
GROWTH OF $10,000 INVESTMENT
(AT NET ASSET VALUE)
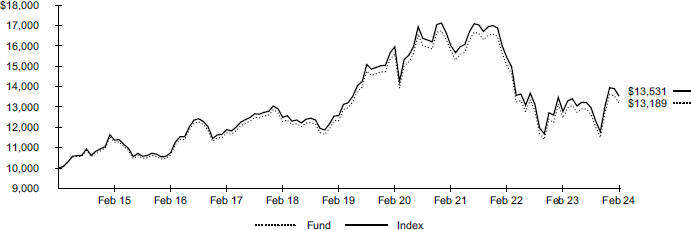
On December 1, 2023, the Fund began to compare its performance to the standard pricing time of the ICE BofA 10+ Year US Corporate Index (the “Index”). Index data prior to March 1, 2021 is for the Index’s standard pricing time of 3 pm. Index data from March 1, 2021 through November 30, 2023 is for a custom 4 pm pricing variant of the Index. Index returns beginning on December 1, 2023 reflect the Index’s new standard pricing time of 4 pm. The change of the Index’s standard pricing time from 3 pm to 4 pm resulted in the discontinuation of the custom 4pm pricing variant used from March 1, 2021 through November 30, 2023. Index data prior to August 1, 2018 is for the Bloomberg U.S. Long Credit Index.
Past performance is not an indication of future results. Performance results do not reflect the deduction of taxes that a shareholder would pay on fund distributions or on the redemption or sale of fund shares. See “About Fund Performance” for more information.
Expense Example
| Actual | Hypothetical 5% Return | |||||||||||||||||||||||||||||||
|
|
|
|
|
|||||||||||||||||||||||||||||
| |
Beginning Account Value (09/01/23) |
|
|
Ending Account Value (02/29/24) |
|
|
Expenses Paid During the Period |
(a) |
|
Beginning Account Value (09/01/23) |
|
|
Ending Account Value (02/29/24) |
|
|
Expenses Paid During the Period |
(a) |
|
Annualized Expense Ratio |
| ||||||||||||
| $ 1,000.00 | $ 1,042.80 | $ 0.20 | $ 1,000.00 | $ 1,024.70 | $ 0.20 | 0.04% | ||||||||||||||||||||||||||
| (a) | Expenses are equal to the annualized expense ratio, multiplied by the average account value over the period, multiplied by 182/366 (to reflect the one-half year period shown). Other fees, such as brokerage commissions and other fees to financial intermediaries, may be paid which are not reflected in the tables and examples above. See “Disclosure of Expenses” for more information. |
| F U N D S U M M A R Y |
13 |
| Fund Summary as of February 29, 2024 (continued) | iShares® 10+ Year Investment Grade Corporate Bond ETF |
Portfolio Information
CREDIT QUALITY ALLOCATION
| Moody’s Credit Rating* |
|
Percent of Total Investments |
(a) | |
| Aaa |
3.2 | % | ||
| Aa |
8.9 | |||
| A |
43.0 | |||
| Baa |
42.0 | |||
| Ba |
1.5 | |||
| Not Rated |
1.4 | |||
MATURITY ALLOCATION
| Maturity |
|
Percent of Total Investments |
(a) | |
| 10-15 Years |
15.5 | % | ||
| 15-20 Years |
22.1 | |||
| More than 20 Years |
62.4 | |||
| * | Credit quality ratings shown reflect the ratings assigned by Moody’s Investors Service (“Moody’s”), a widely used independent, nationally recognized statistical rating organization. Moody’s credit ratings are opinions of the credit quality of individual obligations or of an issuer’s general creditworthiness. Investment grade ratings are credit ratings of Baa or higher. Below investment grade ratings are credit ratings of Ba or lower. Unrated investments do not necessarily indicate low credit quality. Credit quality ratings are subject to change. |
| (a) | Excludes money market funds. |
| 14 | 2 0 2 4 I S H A R E S A N N U A L R E P O R T T O S H A R E H O L D E R S |
Past performance is not an indication of future results. Financial markets have experienced extreme volatility and trading in many instruments has been disrupted. These circumstances may continue for an extended period of time and may continue to affect adversely the value and liquidity of each Fund’s investments. As a result, current performance may be lower or higher than the performance data quoted. Performance data current to the most recent month-end is available at iShares.com. Performance results assume reinvestment of all dividends and capital gain distributions and do not reflect the deduction of taxes that a shareholder would pay on fund distributions or on the redemption or sale of fund shares. The investment return and principal value of shares will vary with changes in market conditions. Shares may be worth more or less than their original cost when they are redeemed or sold in the market. Performance for certain funds may reflect a waiver of a portion of investment advisory fees. Without such a waiver, performance would have been lower.
Net asset value or “NAV” is the value of one share of a fund as calculated in accordance with the standard formula for valuing mutual fund shares. Beginning August 10, 2020, the price used to calculate market return (“Market Price”) is the closing price. Prior to August 10, 2020, Market Price was determined using the midpoint between the highest bid and the lowest ask on the primary stock exchange on which shares of a fund are listed for trading, as of the time that such fund’s NAV is calculated. Since shares of a fund may not trade in the secondary market until after the fund’s inception, for the period from inception to the first day of secondary market trading in shares of the fund, the NAV of the fund is used as a proxy for the Market Price to calculate market returns. Market and NAV returns assume that dividends and capital gain distributions have been reinvested at Market Price and NAV, respectively.
An index is a statistical composite that tracks a specified financial market or sector. Unlike a fund, an index does not actually hold a portfolio of securities and therefore does not incur the expenses incurred by a fund. These expenses negatively impact fund performance. Also, index returns do not include brokerage commissions that may be payable on secondary market transactions. If brokerage commissions were included, index returns would be lower.
Shareholders of each Fund may incur the following charges: (1) transactional expenses, including brokerage commissions on purchases and sales of fund shares and (2) ongoing expenses, including management fees and other fund expenses. The expense examples shown (which are based on a hypothetical investment of $1,000 invested at the beginning of the period and held through the end of the period) are intended to assist shareholders both in calculating expenses based on an investment in each Fund and in comparing these expenses with similar costs of investing in other funds.
The expense examples provide information about actual account values and actual expenses. Annualized expense ratios reflect contractual and voluntary fee waivers, if any. In order to estimate the expenses a shareholder paid during the period covered by this report, shareholders can divide their account value by $1,000 and then multiply the result by the number under the heading entitled “Expenses Paid During the Period.”
The expense examples also provide information about hypothetical account values and hypothetical expenses based on a fund’s actual expense ratio and an assumed rate of return of 5% per year before expenses. In order to assist shareholders in comparing the ongoing expenses of investing in the Funds and other funds, compare the 5% hypothetical examples with the 5% hypothetical examples that appear in the shareholder reports of the other funds.
The expenses shown in the expense examples are intended to highlight shareholders’ ongoing costs only and do not reflect any transactional expenses, such as brokerage commissions and other fees paid on purchases and sales of fund shares. Therefore, the hypothetical examples are useful in comparing ongoing expenses only and will not help shareholders determine the relative total expenses of owning different funds. If these transactional expenses were included, shareholder expenses would have been higher.
| A B O U T F U N D P E R F O R M A N C E / D I S C L O S U R E O F E X P E N S E S |
15 |
|
February 29, 2024 |
iShares® BBB Rated Corporate Bond ETF (Percentages shown are based on Net Assets) |
| Security | Par (000) |
Value | ||||||
| Corporate Bonds & Notes |
||||||||
| Advertising — 0.2% | ||||||||
| Interpublic Group of Companies Inc. (The) |
||||||||
| 2.40%, 03/01/31 (Call 12/01/30)(a) |
$ | 18 | $ | 14,961 | ||||
| 5.40%, 10/01/48 (Call 04/01/48) |
10 | 9,251 | ||||||
| Omnicom Group Inc., 2.60%, 08/01/31 |
32 | 26,870 | ||||||
| Omnicom Group Inc./Omnicom Capital Inc., 3.60%, 04/15/26 (Call 01/15/26)(a) |
25 | 24,242 | ||||||
|
|
|
|||||||
| 75,324 | ||||||||
| Aerospace & Defense — 3.3% | ||||||||
| Boeing Co. (The) |
||||||||
| 2.20%, 02/04/26 (Call 03/11/24) |
75 | 70,370 | ||||||
| 2.75%, 02/01/26 (Call 01/01/26) |
25 | 23,737 | ||||||
| 4.88%, 05/01/25 (Call 04/01/25) |
25 | 24,786 | ||||||
| 5.04%, 05/01/27 (Call 03/01/27) |
105 | 103,930 | ||||||
| 5.15%, 05/01/30 (Call 02/01/30) |
100 | 98,279 | ||||||
| 5.71%, 05/01/40 (Call 11/01/39) |
62 | 60,304 | ||||||
| 5.81%, 05/01/50 (Call 11/01/49) |
70 | 67,215 | ||||||
| 5.93%, 05/01/60 (Call 11/01/59) |
50 | 47,754 | ||||||
| Howmet Aerospace Inc., 3.00%, 01/15/29 |
35 | 31,361 | ||||||
| L3Harris Technologies Inc. |
||||||||
| 4.40%, 06/15/28 (Call 03/15/28) |
64 | 62,249 | ||||||
| 5.05%, 04/27/45 (Call 10/27/44) |
15 | 13,999 | ||||||
| Northrop Grumman Corp. |
||||||||
| 3.25%, 01/15/28 (Call 10/15/27)(a) |
75 | 70,315 | ||||||
| 4.03%, 10/15/47 (Call 04/15/47) |
53 | 42,730 | ||||||
| 5.25%, 05/01/50 (Call 11/01/49) |
25 | 24,172 | ||||||
| RTX Corp. |
||||||||
| 2.82%, 09/01/51 (Call 03/01/51) |
45 | 28,113 | ||||||
| 4.13%, 11/16/28 (Call 08/16/28) |
115 | 110,331 | ||||||
| 4.15%, 05/15/45 (Call 11/16/44) |
35 | 28,672 | ||||||
| 4.50%, 06/01/42 |
70 | 61,082 | ||||||
| 4.63%, 11/16/48 (Call 05/16/48) |
35 | 30,494 | ||||||
| 5.15%, 02/27/33 (Call 11/27/32) |
30 | 29,695 | ||||||
| 6.10%, 03/15/34 (Call 12/15/33)(a) |
50 | 52,767 | ||||||
| 6.40%, 03/15/54 (Call 09/15/53) |
30 | 33,163 | ||||||
|
|
|
|||||||
| 1,115,518 | ||||||||
| Agriculture — 2.1% | ||||||||
| Altria Group Inc. |
||||||||
| 3.70%, 02/04/51 (Call 08/04/50) |
35 | 23,800 | ||||||
| 4.40%, 02/14/26 (Call 12/14/25) |
41 | 40,387 | ||||||
| 4.50%, 05/02/43 |
35 | 29,021 | ||||||
| 4.80%, 02/14/29 (Call 11/14/28) |
84 | 82,380 | ||||||
| 5.80%, 02/14/39 (Call 08/14/38) |
40 | 39,847 | ||||||
| 5.95%, 02/14/49 (Call 08/14/48)(a) |
60 | 59,706 | ||||||
| BAT Capital Corp. |
||||||||
| 2.73%, 03/25/31 (Call 12/25/30) |
40 | 32,960 | ||||||
| 3.22%, 08/15/24 (Call 06/15/24) |
33 | 32,618 | ||||||
| 3.56%, 08/15/27 (Call 05/15/27) |
44 | 41,545 | ||||||
| 4.39%, 08/15/37 (Call 02/15/37) |
50 | 40,960 | ||||||
| 4.54%, 08/15/47 (Call 02/15/47) |
50 | 37,279 | ||||||
| 4.74%, 03/16/32 (Call 12/16/31) |
25 | 23,510 | ||||||
| 5.65%, 03/16/52 (Call 09/16/51) |
30 | 26,258 | ||||||
| 6.34%, 08/02/30 (Call 06/02/30) |
70 | 72,312 | ||||||
| Bunge Ltd. Finance Corp. |
||||||||
| 2.75%, 05/14/31 (Call 02/14/31) |
18 | 15,299 | ||||||
| 3.75%, 09/25/27 (Call 06/25/27) |
35 | 33,412 | ||||||
| Security | Par (000) |
Value | ||||||
| Agriculture (continued) | ||||||||
| Reynolds American Inc. |
||||||||
| 4.45%, 06/12/25 (Call 03/12/25) |
$ | 51 | $ | 50,238 | ||||
| 5.85%, 08/15/45 (Call 02/15/45) |
30 | 27,147 | ||||||
|
|
|
|||||||
| 708,679 | ||||||||
| Airlines — 0.2% | ||||||||
| Southwest Airlines Co., 5.25%, 05/04/25 (Call 04/04/25) |
68 | 67,788 | ||||||
|
|
|
|||||||
| Apparel — 0.2% | ||||||||
| Tapestry Inc. |
||||||||
| 7.00%, 11/27/26 |
25 | 25,675 | ||||||
| 7.85%, 11/27/33 (Call 08/27/33) |
25 | 27,021 | ||||||
| VF Corp. |
||||||||
| 2.40%, 04/23/25 (Call 03/23/25) |
10 | 9,584 | ||||||
| 2.95%, 04/23/30 (Call 01/23/30)(a) |
20 | 16,504 | ||||||
|
|
|
|||||||
| 78,784 | ||||||||
| Auto Manufacturers — 2.5% | ||||||||
| Ford Motor Co., 4.75%, 01/15/43 |
25 | 20,247 | ||||||
| Ford Motor Credit Co. LLC, 7.12%, 11/07/33 |
210 | 223,893 | ||||||
| General Motors Co. |
||||||||
| 6.13%, 10/01/25 (Call 09/01/25) |
25 | 25,227 | ||||||
| 6.25%, 10/02/43 |
35 | 35,159 | ||||||
| 6.60%, 04/01/36 (Call 10/01/35) |
60 | 62,716 | ||||||
| 6.75%, 04/01/46 (Call 10/01/45) |
30 | 31,711 | ||||||
| General Motors Financial Co. Inc. |
||||||||
| 1.25%, 01/08/26 (Call 12/08/25) |
135 | 125,087 | ||||||
| 2.35%, 02/26/27 (Call 01/26/27) |
90 | 82,523 | ||||||
| 2.35%, 01/08/31 (Call 10/08/30) |
60 | 48,939 | ||||||
| 3.80%, 04/07/25 |
42 | 41,160 | ||||||
| 5.00%, 04/09/27 (Call 03/09/27) |
47 | 46,526 | ||||||
| 5.85%, 04/06/30 (Call 02/06/30)(a) |
30 | 30,428 | ||||||
| 6.05%, 10/10/25 |
60 | 60,437 | ||||||
|
|
|
|||||||
| 834,053 | ||||||||
| Auto Parts & Equipment — 0.3% | ||||||||
| Aptiv PLC, 3.10%, 12/01/51 (Call 06/01/51) |
30 | 18,836 | ||||||
| Aptiv PLC/Aptiv Corp. |
||||||||
| 3.25%, 03/01/32 (Call 12/01/31)(a) |
20 | 17,220 | ||||||
| 4.15%, 05/01/52 (Call 11/01/51) |
16 | 12,236 | ||||||
| BorgWarner Inc. |
||||||||
| 2.65%, 07/01/27 (Call 05/01/27) |
36 | 33,218 | ||||||
| 4.38%, 03/15/45 (Call 09/15/44) |
15 | 12,179 | ||||||
| Lear Corp., 5.25%, 05/15/49 (Call 11/15/48) |
7 | 6,300 | ||||||
|
|
|
|||||||
| 99,989 | ||||||||
| Banks — 5.8% | ||||||||
| Citigroup Inc. |
||||||||
| 3.88%, 03/26/25 |
36 | 35,344 | ||||||
| 4.13%, 07/25/28 |
25 | 23,767 | ||||||
| 4.45%, 09/29/27 |
75 | 72,608 | ||||||
| 4.60%, 03/09/26 |
34 | 33,444 | ||||||
| 4.75%, 05/18/46 |
45 | 39,349 | ||||||
| 6.63%, 06/15/32 |
35 | 37,264 | ||||||
| 6.68%, 09/13/43 |
24 | 26,410 | ||||||
| Citizens Financial Group Inc. |
||||||||
| 2.64%, 09/30/32 (Call 07/02/32) |
25 | 18,978 | ||||||
| 3.25%, 04/30/30 (Call 01/30/30)(a) |
25 | 21,622 | ||||||
| Comerica Inc., 4.00%, 02/01/29 |
25 | 22,554 | ||||||
| 16 | 2 0 2 4 I S H A R E S A N N U A L R E P O R T T O S H A R E H O L D E R S |
| Schedule of Investments (continued) February 29, 2024 |
iShares® BBB Rated Corporate Bond ETF (Percentages shown are based on Net Assets) |
| Security | Par (000) |
Value | ||||||
| Banks (continued) | ||||||||
| Deutsche Bank AG/New York |
||||||||
| 6.12%, 07/14/26 (Call 07/14/25), |
$ | 150 | $ | 150,321 | ||||
| 7.15%, 07/13/27 (Call 07/13/26), |
155 | 159,174 | ||||||
| Fifth Third Bancorp. |
||||||||
| 4.77%, 07/28/30 (Call 07/28/29), |
25 | 23,857 | ||||||
| 6.36%, 10/27/28 (Call 10/27/27), |
45 | 45,917 | ||||||
| 8.25%, 03/01/38 |
10 | 11,821 | ||||||
| Goldman Sachs Group Inc. (The) |
||||||||
| 4.25%, 10/21/25 |
37 | 36,347 | ||||||
| 5.15%, 05/22/45(a) |
50 | 47,565 | ||||||
| 6.75%, 10/01/37 |
75 | 81,468 | ||||||
| HSBC Holdings PLC, 6.50%, 05/02/36 |
110 | 115,147 | ||||||
| Huntington Bancshares Inc./OH, 6.21%, 08/21/29 |
||||||||
| (Call 08/21/28), (1-day SOFR + 2.020%)(b) |
20 | 20,332 | ||||||
| KeyCorp |
||||||||
| 2.55%, 10/01/29 |
25 | 20,896 | ||||||
| 4.79%, 06/01/33 (Call 06/01/32), |
53 | 47,914 | ||||||
| Morgan Stanley |
||||||||
| 3.95%, 04/23/27 |
68 | 65,420 | ||||||
| 4.35%, 09/08/26 |
20 | 19,532 | ||||||
| 5.00%, 11/24/25 |
65 | 64,621 | ||||||
| Regions Financial Corp., 2.25%, 05/18/25 |
||||||||
| (Call 04/18/25) |
50 | 47,884 | ||||||
| Santander Holdings USA Inc. |
||||||||
| 3.45%, 06/02/25 (Call 05/02/25) |
75 | 72,705 | ||||||
| 5.81%, 09/09/26 (Call 09/09/25), |
||||||||
| (1-day SOFR + 2.328%)(b) |
39 | 38,962 | ||||||
| 6.17%, 01/09/30 (Call 01/09/29), |
||||||||
| (1-day SOFR + 2.500%)(b) |
60 | 59,847 | ||||||
| Santander U.K. Group Holdings PLC, 1.09%, 03/15/25 (Call 03/15/24), (1-day SOFR + 0.787%)(b) |
200 | 199,696 | ||||||
| Wells Fargo & Co. |
||||||||
| 4.10%, 06/03/26 |
15 | 14,588 | ||||||
| 4.30%, 07/22/27 |
95 | 92,143 | ||||||
| 4.75%, 12/07/46 |
60 | 51,932 | ||||||
| 4.90%, 11/17/45 |
65 | 57,232 | ||||||
| 5.61%, 01/15/44 |
48 | 46,535 | ||||||
| Westpac Banking Corp. |
||||||||
| 2.96%, 11/16/40 |
25 | 17,068 | ||||||
| 3.13%, 11/18/41 |
25 | 17,280 | ||||||
|
|
|
|||||||
| 1,957,544 | ||||||||
| Beverages — 0.8% | ||||||||
| Constellation Brands Inc. |
||||||||
| 3.15%, 08/01/29 (Call 05/01/29) |
25 | 22,712 | ||||||
| 3.70%, 12/06/26 (Call 09/06/26) |
38 | 36,575 | ||||||
| 3.75%, 05/01/50 (Call 11/01/49) |
27 | 20,198 | ||||||
| 4.75%, 05/09/32 (Call 02/09/32) |
33 | 31,852 | ||||||
| Keurig Dr Pepper Inc. |
||||||||
| 2.25%, 03/15/31 (Call 12/15/30) |
58 | 48,203 | ||||||
| 3.35%, 03/15/51 (Call 09/15/50) |
45 | 31,326 | ||||||
| 4.60%, 05/25/28 (Call 02/25/28) |
30 | 29,590 | ||||||
| Molson Coors Beverage Co. |
||||||||
| 4.20%, 07/15/46 (Call 01/15/46) |
35 | 28,561 | ||||||
| 5.00%, 05/01/42 |
15 | 13,984 | ||||||
|
|
|
|||||||
| 263,001 | ||||||||
| Security | Par (000) |
Value | ||||||
| Biotechnology — 3.4% | ||||||||
| Amgen Inc. |
||||||||
| 2.20%, 02/21/27 (Call 12/21/26) |
$ | 135 | $ | 124,433 | ||||
| 2.30%, 02/25/31 (Call 11/25/30) |
155 | 129,373 | ||||||
| 2.45%, 02/21/30 (Call 11/21/29) |
25 | 21,725 | ||||||
| 2.60%, 08/19/26 (Call 05/19/26) |
25 | 23,601 | ||||||
| 2.77%, 09/01/53 (Call 03/01/53) |
94 | 57,296 | ||||||
| 2.80%, 08/15/41 (Call 02/15/41) |
80 | 57,022 | ||||||
| 3.63%, 05/22/24 (Call 03/18/24) |
19 | 18,918 | ||||||
| 4.40%, 05/01/45 (Call 11/01/44) |
60 | 51,029 | ||||||
| 4.66%, 06/15/51 (Call 12/15/50) |
85 | 73,676 | ||||||
| 5.25%, 03/02/33 (Call 12/02/32) |
35 | 34,850 | ||||||
| 5.75%, 03/02/63 (Call 09/02/62) |
45 | 44,960 | ||||||
| Baxalta Inc., 5.25%, 06/23/45 (Call 12/23/44) |
37 | 35,330 | ||||||
| Biogen Inc. |
||||||||
| 2.25%, 05/01/30 (Call 02/01/30) |
40 | 33,449 | ||||||
| 3.15%, 05/01/50 (Call 11/01/49) |
16 | 10,552 | ||||||
| 3.25%, 02/15/51 (Call 08/15/50) |
33 | 22,421 | ||||||
| 4.05%, 09/15/25 (Call 06/15/25) |
37 | 36,254 | ||||||
| Gilead Sciences Inc. |
||||||||
| 1.65%, 10/01/30 (Call 07/01/30) |
70 | 57,094 | ||||||
| 3.50%, 02/01/25 (Call 11/01/24) |
36 | 35,368 | ||||||
| 3.65%, 03/01/26 (Call 12/01/25) |
25 | 24,270 | ||||||
| 4.75%, 03/01/46 (Call 09/01/45) |
65 | 59,078 | ||||||
| 4.80%, 04/01/44 (Call 10/01/43) |
65 | 59,580 | ||||||
| Regeneron Pharmaceuticals Inc. |
||||||||
| 1.75%, 09/15/30 (Call 06/15/30) |
22 | 17,784 | ||||||
| 2.80%, 09/15/50 (Call 03/15/50) |
25 | 15,559 | ||||||
| Royalty Pharma PLC |
||||||||
| 1.20%, 09/02/25 (Call 08/02/25) |
37 | 34,679 | ||||||
| 1.75%, 09/02/27 (Call 07/02/27) |
53 | 47,186 | ||||||
| 3.30%, 09/02/40 (Call 03/02/40)(a) |
25 | 18,193 | ||||||
| 3.55%, 09/02/50 (Call 03/02/50)(a) |
20 | 13,607 | ||||||
|
|
|
|||||||
| 1,157,287 | ||||||||
| Building Materials — 0.9% | ||||||||
| Carrier Global Corp. |
||||||||
| 2.49%, 02/15/27 (Call 12/15/26) |
61 | 56,617 | ||||||
| 3.58%, 04/05/50 (Call 10/05/49)(a) |
48 | 35,279 | ||||||
| 5.90%, 03/15/34 (Call 12/15/33) |
25 | 25,929 | ||||||
| Johnson Controls International PLC, 4.50%, 02/15/47 (Call 08/15/46)(a) |
15 | 12,854 | ||||||
| Johnson Controls International PLC/Tyco Fire & Security Finance SCA, 2.00%, 09/16/31 (Call 06/16/31) |
29 | 23,277 | ||||||
| Martin Marietta Materials Inc. |
||||||||
| 3.20%, 07/15/51 (Call 01/15/51) |
25 | 17,253 | ||||||
| 3.50%, 12/15/27 (Call 09/15/27) |
65 | 61,598 | ||||||
| Trane Technologies Financing Ltd., 3.80%, 03/21/29 |
35 | 33,072 | ||||||
| Trane Technologies Global Holding Co. Ltd., 5.75%, 06/15/43 |
15 | 15,437 | ||||||
| Vulcan Materials Co. |
||||||||
| 3.50%, 06/01/30 (Call 03/01/30) |
29 | 26,430 | ||||||
| 4.50%, 06/15/47 (Call 12/15/46) |
12 | 10,389 | ||||||
|
|
|
|||||||
| 318,135 | ||||||||
| Chemicals — 2.2% | ||||||||
| Albemarle Corp., 4.65%, 06/01/27 (Call 05/01/27) |
41 | 40,243 | ||||||
| Celanese U.S. Holdings LLC |
||||||||
| 6.17%, 07/15/27 (Call 06/15/27)(a) |
25 | 25,377 | ||||||
| 6.33%, 07/15/29 (Call 05/15/29) |
37 | 37,989 | ||||||
| 6.70%, 11/15/33 (Call 08/15/33) |
30 | 31,462 | ||||||
| CF Industries Inc., 5.38%, 03/15/44 |
25 | 23,316 | ||||||
| S C H E D U L E O F I N V E S T M E N T S |
17 |
| Schedule of Investments (continued) February 29, 2024 |
iShares® BBB Rated Corporate Bond ETF (Percentages shown are based on Net Assets) |
| Security | Par (000) |
Value | ||||||
| Chemicals (continued) | ||||||||
| Dow Chemical Co. (The) |
||||||||
| 2.10%, 11/15/30 (Call 08/15/30)(a) |
$ | 78 | $ | 65,143 | ||||
| 3.60%, 11/15/50 (Call 05/15/50) |
45 | 32,710 | ||||||
| 4.38%, 11/15/42 (Call 05/15/42) |
45 | 37,854 | ||||||
| DuPont de Nemours Inc. |
||||||||
| 4.73%, 11/15/28 (Call 08/15/28) |
50 | 49,738 | ||||||
| 5.32%, 11/15/38 (Call 05/15/38) |
30 | 29,523 | ||||||
| 5.42%, 11/15/48 (Call 05/15/48) |
35 | 34,326 | ||||||
| Eastman Chemical Co. |
||||||||
| 4.50%, 12/01/28 (Call 09/01/28) |
34 | 32,960 | ||||||
| 4.65%, 10/15/44 (Call 04/15/44) |
25 | 21,164 | ||||||
| FMC Corp. |
||||||||
| 3.45%, 10/01/29 (Call 07/01/29) |
16 | 14,232 | ||||||
| 4.50%, 10/01/49 (Call 04/01/49) |
15 | 11,143 | ||||||
| International Flavors & Fragrances Inc. |
||||||||
| 4.38%, 06/01/47 (Call 12/01/46) |
10 | 7,480 | ||||||
| 5.00%, 09/26/48 (Call 03/26/48) |
5 | 4,204 | ||||||
| LYB International Finance III LLC |
||||||||
| 2.25%, 10/01/30 (Call 07/01/30) |
25 | 20,829 | ||||||
| 3.38%, 10/01/40 (Call 04/01/40) |
15 | 11,116 | ||||||
| 3.80%, 10/01/60 (Call 04/01/60)(a) |
30 | 20,297 | ||||||
| 4.20%, 05/01/50 (Call 11/01/49) |
40 | 30,880 | ||||||
| Mosaic Co. (The), 4.05%, 11/15/27 (Call 08/15/27) |
30 | 28,827 | ||||||
| Nutrien Ltd. |
||||||||
| 2.95%, 05/13/30 (Call 02/13/30) |
22 | 19,446 | ||||||
| 3.95%, 05/13/50 (Call 11/13/49) |
20 | 15,532 | ||||||
| Sherwin-Williams Co. (The) |
||||||||
| 3.45%, 06/01/27 (Call 03/01/27) |
63 | 60,034 | ||||||
| 4.50%, 06/01/47 (Call 12/01/46) |
35 | 30,046 | ||||||
| Westlake Corp. |
||||||||
| 3.13%, 08/15/51 (Call 02/15/51) |
15 | 9,418 | ||||||
| 5.00%, 08/15/46 (Call 02/15/46) |
15 | 13,087 | ||||||
|
|
|
|||||||
| 758,376 | ||||||||
| Commercial Services — 1.0% | ||||||||
| Block Financial LLC, 2.50%, 07/15/28 (Call 05/15/28) |
37 | 32,587 | ||||||
| Equifax Inc. |
||||||||
| 2.35%, 09/15/31 (Call 06/15/31)(a) |
43 | 35,116 | ||||||
| 3.10%, 05/15/30 (Call 02/15/30) |
25 | 22,037 | ||||||
| Global Payments Inc. |
||||||||
| 1.20%, 03/01/26 (Call 02/01/26) |
95 | 87,448 | ||||||
| 3.20%, 08/15/29 (Call 05/15/29) |
25 | 22,258 | ||||||
| 4.15%, 08/15/49 (Call 02/15/49) |
25 | 19,041 | ||||||
| Moody’s Corp. |
||||||||
| 3.75%, 02/25/52 (Call 08/25/51) |
15 | 11,649 | ||||||
| 4.25%, 08/08/32 (Call 05/08/32)(a) |
20 | 18,873 | ||||||
| Quanta Services Inc. |
||||||||
| 2.35%, 01/15/32 (Call 10/15/31)(a) |
25 | 20,020 | ||||||
| 3.05%, 10/01/41 (Call 04/01/41) |
15 | 10,521 | ||||||
| RELX Capital Inc., 4.00%, 03/18/29 (Call 12/18/28) |
52 | 49,645 | ||||||
| Verisk Analytics Inc., 3.63%, 05/15/50 (Call 11/15/49) |
20 | 14,626 | ||||||
|
|
|
|||||||
| 343,821 | ||||||||
| Computers — 1.6% | ||||||||
| Dell International LLC/EMC Corp. |
||||||||
| 3.45%, 12/15/51 (Call 06/15/51) |
16 | 10,973 | ||||||
| 5.25%, 02/01/28 (Call 01/01/28) |
70 | 70,556 | ||||||
| 6.02%, 06/15/26 (Call 03/15/26) |
47 | 47,517 | ||||||
| 8.10%, 07/15/36 (Call 01/15/36) |
25 | 30,040 | ||||||
| Hewlett Packard Enterprise Co. |
||||||||
| 1.45%, 04/01/24 (Call 03/01/24) |
15 | 14,950 | ||||||
| 4.90%, 10/15/25 (Call 07/15/25) |
58 | 57,606 | ||||||
| Security | Par (000) |
Value | ||||||
| Computers (continued) | ||||||||
| 6.35%, 10/15/45 (Call 04/15/45) |
$ | 20 | $ | 20,653 | ||||
| HP Inc. |
||||||||
| 2.20%, 06/17/25 (Call 05/17/25) |
30 | 28,798 | ||||||
| 2.65%, 06/17/31 (Call 03/17/31) |
35 | 29,224 | ||||||
| 4.75%, 01/15/28 (Call 12/15/27) |
70 | 69,342 | ||||||
| 6.00%, 09/15/41(a) |
20 | 20,432 | ||||||
| Kyndryl Holdings Inc. |
||||||||
| 2.05%, 10/15/26 (Call 09/15/26)(a) |
18 | 16,427 | ||||||
| 2.70%, 10/15/28 (Call 08/15/28) |
25 | 21,912 | ||||||
| 4.10%, 10/15/41 (Call 04/15/41) |
15 | 11,220 | ||||||
| Leidos Inc., 4.38%, 05/15/30 (Call 02/15/30) |
26 | 24,478 | ||||||
| NetApp Inc., 1.88%, 06/22/25 (Call 05/22/25) |
55 | 52,516 | ||||||
| Western Digital Corp., 3.10%, 02/01/32 (Call 11/01/31) |
15 | 11,655 | ||||||
|
|
|
|||||||
| 538,299 | ||||||||
| Distribution & Wholesale — 0.0% | ||||||||
| LKQ Corp., 6.25%, 06/15/33 (Call 03/15/33) |
15 | 15,414 | ||||||
|
|
|
|||||||
| Diversified Financial Services — 3.8% | ||||||||
| AerCap Ireland Capital DAC/AerCap Global |
||||||||
| Aviation Trust |
||||||||
| 1.65%, 10/29/24 (Call 09/29/24) |
150 | 146,016 | ||||||
| 6.15%, 09/30/30 (Call 07/30/30) |
180 | 185,945 | ||||||
| Air Lease Corp. |
||||||||
| 2.10%, 09/01/28 (Call 07/01/28) |
85 | 73,838 | ||||||
| 2.20%, 01/15/27 (Call 12/15/26) |
30 | 27,463 | ||||||
| 2.88%, 01/15/26 (Call 12/15/25)(a) |
37 | 35,274 | ||||||
| Aircastle Ltd., 4.25%, 06/15/26 (Call 04/15/26) |
25 | 24,199 | ||||||
| Ally Financial Inc. |
||||||||
| 2.20%, 11/02/28 (Call 09/02/28) |
25 | 21,260 | ||||||
| 4.75%, 06/09/27 (Call 05/09/27)(a) |
36 | 34,965 | ||||||
| 8.00%, 11/01/31 |
20 | 21,939 | ||||||
| American Express Co., 3.63%, 12/05/24 (Call 11/04/24) |
15 | 14,814 | ||||||
| Capital One Financial Corp. |
||||||||
| 3.65%, 05/11/27 (Call 04/11/27) |
80 | 75,968 | ||||||
| 3.75%, 03/09/27 (Call 02/09/27) |
100 | 95,315 | ||||||
| CI Financial Corp. |
||||||||
| 3.20%, 12/17/30 (Call 09/17/30) |
20 | 15,781 | ||||||
| 4.10%, 06/15/51 (Call 12/15/50) |
15 | 8,886 | ||||||
| Discover Financial Services, 4.10%, 02/09/27 |
||||||||
| (Call 11/09/26) |
90 | 86,304 | ||||||
| Jefferies Financial Group Inc. |
||||||||
| 2.63%, 10/15/31 (Call 07/15/31) |
35 | 28,619 | ||||||
| 5.88%, 07/21/28 (Call 06/21/28) |
30 | 30,593 | ||||||
| 6.25%, 01/15/36 |
10 | 10,264 | ||||||
| Nasdaq Inc. |
||||||||
| 1.65%, 01/15/31 (Call 10/15/30) |
35 | 27,809 | ||||||
| 3.25%, 04/28/50 (Call 10/28/49) |
25 | 16,902 | ||||||
| 5.95%, 08/15/53 (Call 02/15/53)(a) |
20 | 20,539 | ||||||
| Nomura Holdings Inc., 1.85%, 07/16/25 |
200 | 189,902 | ||||||
| Synchrony Financial |
||||||||
| 2.88%, 10/28/31 (Call 07/28/31) |
17 | 13,289 | ||||||
| 4.50%, 07/23/25 (Call 04/23/25) |
36 | 35,189 | ||||||
| 5.15%, 03/19/29 (Call 12/19/28) |
25 | 23,846 | ||||||
| Western Union Co. (The), 1.35%, 03/15/26 |
||||||||
| (Call 02/15/26) |
37 | 34,069 | ||||||
|
|
|
|||||||
| 1,298,988 | ||||||||
| Electric — 6.1% | ||||||||
| AEP Texas Inc. |
||||||||
| 5.25%, 05/15/52 (Call 11/15/51) |
20 | 18,675 | ||||||
| Series I, 2.10%, 07/01/30 (Call 04/01/30) |
25 | 20,709 | ||||||
| AES Corp. (The), 2.45%, 01/15/31 (Call 10/15/30) |
25 | 20,397 | ||||||
| 18 | 2 0 2 4 I S H A R E S A N N U A L R E P O R T T O S H A R E H O L D E R S |
| Schedule of Investments (continued) February 29, 2024 |
iShares® BBB Rated Corporate Bond ETF (Percentages shown are based on Net Assets) |
| Security | Par (000) |
Value | ||||||
| Electric (continued) | ||||||||
| American Electric Power Co. Inc., 5.95%, 11/01/32 |
||||||||
| (Call 08/01/32) |
$ | 20 | $ | 20,684 | ||||
| Avangrid Inc., 3.20%, 04/15/25 (Call 03/15/25) |
12 | 11,674 | ||||||
| Constellation Energy Generation LLC |
||||||||
| 5.60%, 03/01/28 (Call 02/01/28) |
35 | 35,460 | ||||||
| 5.60%, 06/15/42 (Call 12/15/41) |
20 | 19,395 | ||||||
| 5.80%, 03/01/33 (Call 12/01/32) |
15 | 15,321 | ||||||
| 6.25%, 10/01/39 |
20 | 20,659 | ||||||
| Dominion Energy Inc. |
||||||||
| Series B, 3.30%, 04/15/41 (Call 10/15/40) |
24 | 17,658 | ||||||
| Series C, 3.38%, 04/01/30 (Call 01/01/30) |
80 | 71,919 | ||||||
| DTE Energy Co. |
||||||||
| 2.85%, 10/01/26 (Call 07/01/26) |
35 | 32,966 | ||||||
| Series C, 2.53%, 10/01/24(c) |
27 | 26,485 | ||||||
| Duke Energy Corp. |
||||||||
| 2.45%, 06/01/30 (Call 03/01/30) |
90 | 77,023 | ||||||
| 3.50%, 06/15/51 (Call 12/15/50) |
35 | 24,037 | ||||||
| 3.75%, 04/15/24 (Call 04/01/24) |
39 | 38,916 | ||||||
| 3.75%, 09/01/46 (Call 03/01/46) |
43 | 32,018 | ||||||
| 5.75%, 09/15/33 (Call 06/15/33)(a) |
50 | 50,899 | ||||||
| Edison International, 6.95%, 11/15/29 (Call 09/15/29) |
35 | 37,339 | ||||||
| Emera U.S. Finance LP, 4.75%, 06/15/46 |
||||||||
| (Call 12/15/45) |
19 | 15,435 | ||||||
| Entergy Corp. |
||||||||
| 1.90%, 06/15/28 (Call 04/15/28) |
25 | 21,976 | ||||||
| 2.40%, 06/15/31 (Call 03/05/31) |
40 | 32,863 | ||||||
| Evergy Inc., 2.90%, 09/15/29 (Call 06/15/29) |
25 | 22,140 | ||||||
| Eversource Energy, 2.90%, 03/01/27 (Call 02/01/27) |
80 | 74,829 | ||||||
| Exelon Corp. |
||||||||
| 3.95%, 06/15/25 (Call 03/15/25) |
54 | 52,990 | ||||||
| 4.05%, 04/15/30 (Call 01/15/30) |
36 | 33,761 | ||||||
| 4.70%, 04/15/50 (Call 10/15/49) |
25 | 21,645 | ||||||
| 5.15%, 03/15/28 (Call 02/15/28) |
88 | 87,714 | ||||||
| 5.60%, 03/15/53 (Call 09/15/52)(a) |
15 | 14,510 | ||||||
| Georgia Power Co. |
||||||||
| 4.95%, 05/17/33 (Call 11/17/32) |
40 | 39,170 | ||||||
| 5.13%, 05/15/52 (Call 11/15/51) |
30 | 28,358 | ||||||
| Series A, 3.25%, 03/15/51 (Call 09/15/50)(a) |
35 | 23,989 | ||||||
| NextEra Energy Capital Holdings Inc. |
||||||||
| 2.25%, 06/01/30 (Call 03/01/30) |
125 | 105,180 | ||||||
| 4.20%, 06/20/24 |
39 | 38,814 | ||||||
| 4.45%, 06/20/25 |
27 | 26,633 | ||||||
| 5.25%, 02/28/53 (Call 08/28/52) |
20 | 18,535 | ||||||
| 5.75%, 09/01/25 |
25 | 25,123 | ||||||
| Pacific Gas and Electric Co. |
||||||||
| 3.15%, 01/01/26 |
25 | 23,887 | ||||||
| 3.25%, 06/01/31 (Call 03/01/31)(a) |
55 | 47,101 | ||||||
| 3.45%, 07/01/25 |
25 | 24,244 | ||||||
| 3.50%, 06/15/25 (Call 03/15/25) |
25 | 24,241 | ||||||
| 3.50%, 08/01/50 (Call 02/01/50) |
30 | 20,126 | ||||||
| 4.00%, 12/01/46 (Call 06/01/46) |
40 | 29,181 | ||||||
| 4.55%, 07/01/30 (Call 01/01/30) |
60 | 56,377 | ||||||
| 4.95%, 07/01/50 (Call 01/01/50) |
60 | 50,882 | ||||||
| 6.40%, 06/15/33 (Call 03/15/33) |
30 | 31,114 | ||||||
| 6.75%, 01/15/53 (Call 07/15/52) |
28 | 29,925 | ||||||
| Public Service Enterprise Group Inc. |
||||||||
| 2.45%, 11/15/31 (Call 08/15/31) |
17 | 13,843 | ||||||
| 5.85%, 11/15/27 (Call 10/15/27) |
41 | 42,009 | ||||||
| Sempra |
||||||||
| 3.40%, 02/01/28 (Call 11/01/27) |
52 | 48,875 | ||||||
| 4.00%, 02/01/48 (Call 08/01/47) |
40 | 31,045 | ||||||
| Security | Par (000) |
Value | ||||||
| Electric (continued) | ||||||||
| Southern Co. (The) |
||||||||
| 3.25%, 07/01/26 (Call 04/01/26) |
$ | 73 | $ | 69,810 | ||||
| 4.40%, 07/01/46 (Call 01/01/46) |
45 | 37,808 | ||||||
| 5.50%, 03/15/29 (Call 01/15/29)(a) |
75 | 76,009 | ||||||
| 5.70%, 10/15/32 (Call 04/15/32) |
25 | 25,506 | ||||||
| Southwestern Electric Power Co., Series N, 1.65%, 03/15/26 (Call 02/15/26) |
35 | 32,545 | ||||||
| WEC Energy Group Inc., 2.20%, 12/15/28 |
||||||||
| (Call 10/15/28) |
43 | 37,717 | ||||||
| Xcel Energy Inc., 2.60%, 12/01/29 (Call 06/01/29) |
45 | 39,453 | ||||||
|
|
|
|||||||
| 2,067,597 | ||||||||
| Electronics — 0.6% | ||||||||
| Amphenol Corp., 2.20%, 09/15/31 (Call 06/15/31) |
34 | 27,881 | ||||||
| Arrow Electronics Inc., 2.95%, 02/15/32 |
||||||||
| (Call 11/15/31)(a) |
19 | 15,831 | ||||||
| Flex Ltd., 4.88%, 06/15/29 (Call 03/15/29) |
23 | 22,364 | ||||||
| Fortive Corp., 4.30%, 06/15/46 (Call 12/15/45) |
10 | 8,195 | ||||||
| Jabil Inc., 3.95%, 01/12/28 (Call 10/12/27) |
38 | 35,942 | ||||||
| Keysight Technologies Inc., 3.00%, 10/30/29 |
||||||||
| (Call 07/30/29) |
11 | 9,777 | ||||||
| TD SYNNEX Corp. |
||||||||
| 2.38%, 08/09/28 (Call 06/09/28) |
25 | 21,831 | ||||||
| 2.65%, 08/09/31 (Call 05/09/31)(a) |
20 | 15,936 | ||||||
| Trimble Inc., 6.10%, 03/15/33 (Call 12/15/32)(a) |
20 | 20,881 | ||||||
| Vontier Corp., 2.95%, 04/01/31 (Call 01/01/31) |
10 | 8,213 | ||||||
|
|
|
|||||||
| 186,851 | ||||||||
| Entertainment — 0.7% | ||||||||
| Warnermedia Holdings Inc. |
||||||||
| 3.64%, 03/15/25 |
50 | 48,944 | ||||||
| 4.28%, 03/15/32 (Call 12/15/31) |
80 | 70,451 | ||||||
| 5.05%, 03/15/42 (Call 09/15/41) |
20 | 16,774 | ||||||
| 5.14%, 03/15/52 (Call 09/15/51) |
125 | 101,336 | ||||||
| 5.39%, 03/15/62 (Call 09/15/61) |
15 | 12,118 | ||||||
|
|
|
|||||||
| 249,623 | ||||||||
| Environmental Control — 0.5% | ||||||||
| Republic Services Inc. |
||||||||
| 2.38%, 03/15/33 (Call 12/15/32)(a) |
46 | 36,845 | ||||||
| 3.38%, 11/15/27 (Call 08/15/27)(a) |
66 | 62,589 | ||||||
| Veralto Corp., 5.45%, 09/18/33 (Call 06/18/33)(d) |
25 | 25,111 | ||||||
| Waste Connections Inc. |
||||||||
| 2.20%, 01/15/32 (Call 10/15/31) |
18 | 14,599 | ||||||
| 2.95%, 01/15/52 (Call 07/15/51) |
25 | 16,504 | ||||||
| 3.20%, 06/01/32 (Call 03/01/32)(a) |
19 | 16,539 | ||||||
|
|
|
|||||||
| 172,187 | ||||||||
| Food — 3.0% | ||||||||
| Campbell Soup Co. |
||||||||
| 3.13%, 04/24/50 (Call 10/24/49) |
15 | 9,772 | ||||||
| 4.15%, 03/15/28 (Call 12/15/27) |
28 | 27,030 | ||||||
| Conagra Brands Inc. |
||||||||
| 1.38%, 11/01/27 (Call 09/01/27) |
67 | 58,270 | ||||||
| 5.40%, 11/01/48 (Call 05/01/48) |
25 | 23,069 | ||||||
| General Mills Inc. |
||||||||
| 3.00%, 02/01/51 (Call 08/01/50) |
17 | 11,059 | ||||||
| 3.20%, 02/10/27 (Call 11/10/26) |
55 | 52,290 | ||||||
| 4.00%, 04/17/25 (Call 02/17/25) |
37 | 36,426 | ||||||
| JBS USA LUX SA/JBS USA Food Co./JBS USA |
||||||||
| Finance Inc. |
||||||||
| 3.00%, 05/15/32 (Call 02/15/32) |
100 | 80,147 | ||||||
| 6.50%, 12/01/52 (Call 06/01/52) |
35 | 33,789 | ||||||
| S C H E D U L E O F I N V E S T M E N T S |
19 |
| Schedule of Investments (continued) February 29, 2024 |
iShares® BBB Rated Corporate Bond ETF (Percentages shown are based on Net Assets) |
| Security | Par (000) |
Value | ||||||
| Food (continued) | ||||||||
| JM Smucker Co. (The) |
||||||||
| 2.13%, 03/15/32 (Call 12/15/31)(a) |
$ | 19 | $ | 15,157 | ||||
| 3.50%, 03/15/25 |
25 | 24,493 | ||||||
| 4.38%, 03/15/45 |
20 | 16,701 | ||||||
| Kellanova |
||||||||
| 3.40%, 11/15/27 (Call 08/15/27) |
38 | 35,844 | ||||||
| 4.50%, 04/01/46 |
12 | 10,281 | ||||||
| Kraft Heinz Foods Co. |
||||||||
| 3.00%, 06/01/26 (Call 03/01/26) |
25 | 23,840 | ||||||
| 4.38%, 06/01/46 (Call 12/01/45) |
110 | 90,870 | ||||||
| 5.00%, 07/15/35 (Call 01/15/35) |
15 | 14,664 | ||||||
| 6.50%, 02/09/40 |
23 | 24,839 | ||||||
| Kroger Co. (The) |
||||||||
| 2.20%, 05/01/30 (Call 02/01/30) |
25 | 21,014 | ||||||
| 2.65%, 10/15/26 (Call 07/15/26) |
35 | 32,871 | ||||||
| 3.95%, 01/15/50 (Call 07/15/49) |
29 | 22,667 | ||||||
| 4.45%, 02/01/47 (Call 08/01/46) |
18 | 15,244 | ||||||
| McCormick & Co. Inc./MD |
||||||||
| 0.90%, 02/15/26 (Call 01/15/26) |
41 | 37,711 | ||||||
| 1.85%, 02/15/31 (Call 11/15/30) |
16 | 12,824 | ||||||
| Mondelez International Inc. |
||||||||
| 1.50%, 05/04/25 (Call 04/04/25) |
26 | 24,851 | ||||||
| 2.63%, 09/04/50 (Call 03/04/50) |
30 | 18,803 | ||||||
| 3.00%, 03/17/32 (Call 12/17/31) |
35 | 30,064 | ||||||
| Sysco Corp. |
||||||||
| 3.15%, 12/14/51 (Call 06/14/51) |
20 | 13,543 | ||||||
| 3.30%, 07/15/26 (Call 04/15/26) |
30 | 28,817 | ||||||
| 5.95%, 04/01/30 (Call 01/01/30) |
30 | 31,269 | ||||||
| 6.60%, 04/01/50 (Call 10/01/49) |
30 | 33,844 | ||||||
| Tyson Foods Inc. |
||||||||
| 3.95%, 08/15/24 (Call 05/15/24) |
30 | 29,756 | ||||||
| 4.35%, 03/01/29 (Call 12/01/28) |
50 | 48,049 | ||||||
| 5.10%, 09/28/48 (Call 03/28/48) |
30 | 26,461 | ||||||
|
|
|
|||||||
| 1,016,329 | ||||||||
| Forest Products & Paper — 0.1% | ||||||||
| International Paper Co., 4.40%, 08/15/47 (Call 02/15/47) |
40 | 33,268 | ||||||
|
|
|
|||||||
| Gas — 0.4% | ||||||||
| National Fuel Gas Co., 2.95%, 03/01/31 |
||||||||
| (Call 12/01/30)(a) |
15 | 12,504 | ||||||
| NiSource Inc. |
||||||||
| 3.49%, 05/15/27 (Call 02/15/27) |
35 | 33,279 | ||||||
| 3.60%, 05/01/30 (Call 02/01/30) |
45 | 41,180 | ||||||
| 4.38%, 05/15/47 (Call 11/15/46) |
50 | 41,165 | ||||||
|
|
|
|||||||
| 128,128 | ||||||||
| Hand & Machine Tools — 0.4% | ||||||||
| Regal Rexnord Corp. |
||||||||
| 6.05%, 04/15/28 (Call 03/15/28)(d) |
35 | 35,204 | ||||||
| 6.40%, 04/15/33 (Call 01/15/33)(d) |
25 | 25,665 | ||||||
| Stanley Black & Decker Inc. |
||||||||
| 2.30%, 02/24/25 (Call 03/11/24) |
30 | 29,069 | ||||||
| 4.25%, 11/15/28 (Call 08/15/28) |
35 | 33,819 | ||||||
| 4.85%, 11/15/48 (Call 05/15/48) |
15 | 12,943 | ||||||
|
|
|
|||||||
| 136,700 | ||||||||
| Health Care - Products — 1.8% | ||||||||
| Agilent Technologies Inc., 2.30%, 03/12/31 |
||||||||
| (Call 12/12/30) |
24 | 20,054 | ||||||
| Baxter International Inc. |
||||||||
| 1.92%, 02/01/27 (Call 01/01/27) |
46 | 41,828 | ||||||
| 2.54%, 02/01/32 (Call 11/01/31)(a) |
40 | 32,759 | ||||||
| Security | Par (000) |
Value | ||||||
| Health Care - Products (continued) | ||||||||
| 3.13%, 12/01/51 (Call 06/01/51)(a) |
$ | 20 | $ | 13,026 | ||||
| 3.95%, 04/01/30 (Call 01/01/30) |
25 | 23,113 | ||||||
| Boston Scientific Corp. |
||||||||
| 1.90%, 06/01/25 (Call 05/01/25) |
10 | 9,587 | ||||||
| 2.65%, 06/01/30 (Call 03/01/30) |
22 | 19,232 | ||||||
| 4.70%, 03/01/49 (Call 09/01/48) |
20 | 18,338 | ||||||
| GE HealthCare Technologies Inc., 5.65%, 11/15/27 |
||||||||
| (Call 10/15/27) |
115 | 116,731 | ||||||
| HCA Inc., 3.13%, 03/15/27 (Call 02/15/27) |
80 | 75,112 | ||||||
| Koninklijke Philips NV |
||||||||
| 5.00%, 03/15/42(a) |
15 | 13,467 | ||||||
| 6.88%, 03/11/38 |
20 | 21,472 | ||||||
| Revvity Inc., 1.90%, 09/15/28 (Call 07/15/28) |
37 | 31,985 | ||||||
| Smith & Nephew PLC, 2.03%, 10/14/30 (Call 07/14/30) |
26 | 21,282 | ||||||
| Stryker Corp. |
||||||||
| 1.15%, 06/15/25 (Call 05/15/25) |
15 | 14,231 | ||||||
| 3.50%, 03/15/26 (Call 12/15/25) |
55 | 53,364 | ||||||
| 4.63%, 03/15/46 (Call 09/15/45) |
30 | 27,222 | ||||||
| Zimmer Biomet Holdings Inc. |
||||||||
| 2.60%, 11/24/31 (Call 08/24/31) |
13 | 10,857 | ||||||
| 3.05%, 01/15/26 (Call 12/15/25) |
35 | 33,645 | ||||||
|
|
|
|||||||
| 597,305 | ||||||||
| Health Care - Services — 3.1% | ||||||||
| Aetna Inc. |
||||||||
| 3.50%, 11/15/24 (Call 08/15/24) |
36 | 35,531 | ||||||
| 3.88%, 08/15/47 (Call 02/15/47)(a) |
20 | 14,876 | ||||||
| 4.13%, 11/15/42 (Call 05/15/42) |
15 | 11,966 | ||||||
| 6.63%, 06/15/36 |
14 | 15,147 | ||||||
| Centene Corp. |
||||||||
| 2.63%, 08/01/31 (Call 05/01/31) |
60 | 49,096 | ||||||
| 4.63%, 12/15/29 (Call 12/15/24) |
100 | 94,655 | ||||||
| Elevance Health Inc. |
||||||||
| 1.50%, 03/15/26 (Call 02/15/26) |
75 | 69,647 | ||||||
| 2.38%, 01/15/25 (Call 12/15/24) |
36 | 35,024 | ||||||
| 2.55%, 03/15/31 (Call 12/15/30) |
47 | 39,849 | ||||||
| 3.35%, 12/01/24 (Call 10/01/24) |
10 | 9,848 | ||||||
| 3.60%, 03/15/51 (Call 09/15/50) |
85 | 63,165 | ||||||
| 4.38%, 12/01/47 (Call 06/01/47) |
35 | 29,642 | ||||||
| HCA Inc. |
||||||||
| 3.50%, 09/01/30 (Call 03/01/30) |
65 | 57,966 | ||||||
| 3.50%, 07/15/51 (Call 01/15/51) |
54 | 36,505 | ||||||
| 4.13%, 06/15/29 (Call 03/15/29) |
60 | 56,387 | ||||||
| 5.25%, 06/15/26 (Call 12/15/25) |
35 | 34,789 | ||||||
| 5.25%, 06/15/49 (Call 12/15/48) |
40 | 35,905 | ||||||
| 5.38%, 02/01/25 |
65 | 64,755 | ||||||
| 5.50%, 06/15/47 (Call 12/15/46) |
30 | 27,947 | ||||||
| Humana Inc. |
||||||||
| 3.70%, 03/23/29 (Call 02/23/29) |
60 | 56,067 | ||||||
| 3.85%, 10/01/24 (Call 07/01/24) |
37 | 36,596 | ||||||
| 3.95%, 08/15/49 (Call 02/15/49) |
40 | 31,112 | ||||||
| 5.95%, 03/15/34 (Call 12/15/33) |
35 | 36,114 | ||||||
| Laboratory Corp. of America Holdings |
||||||||
| 1.55%, 06/01/26 (Call 05/01/26) |
36 | 33,189 | ||||||
| 4.70%, 02/01/45 (Call 08/01/44) |
20 | 17,838 | ||||||
| Quest Diagnostics Inc., 4.20%, 06/30/29 (Call 03/30/29) |
41 | 39,404 | ||||||
| Universal Health Services Inc. |
||||||||
| 2.65%, 10/15/30 (Call 07/15/30) |
30 | 25,008 | ||||||
| 2.65%, 01/15/32 (Call 10/15/31) |
5 | 4,035 | ||||||
|
|
|
|||||||
| 1,062,063 | ||||||||
| 20 | 2 0 2 4 I S H A R E S A N N U A L R E P O R T T O S H A R E H O L D E R S |
| Schedule of Investments (continued) February 29, 2024 |
iShares® BBB Rated Corporate Bond ETF (Percentages shown are based on Net Assets) |
| Security | Par (000) |
Value | ||||||
| Holding Companies - Diversified — 0.9% | ||||||||
| Ares Capital Corp. |
||||||||
| 2.15%, 07/15/26 (Call 06/15/26) |
$ | 70 | $ | 63,630 | ||||
| 2.88%, 06/15/28 (Call 04/15/28) |
40 | 35,012 | ||||||
| Blackstone Private Credit Fund |
||||||||
| 3.25%, 03/15/27 (Call 02/15/27) |
50 | 45,697 | ||||||
| 4.70%, 03/24/25(a) |
37 | 36,431 | ||||||
| Blackstone Secured Lending Fund, 2.85%, 09/30/28 (Call 07/30/28) |
33 | 28,728 | ||||||
| Blue Owl Capital Corp., 3.40%, 07/15/26 (Call 06/15/26) |
43 | 40,036 | ||||||
| FS KKR Capital Corp., 3.13%, 10/12/28 (Call 08/12/28) |
35 | 30,008 | ||||||
| Golub Capital BDC Inc., 2.50%, 08/24/26 |
||||||||
| (Call 07/24/26) |
25 | 22,820 | ||||||
|
|
|
|||||||
| 302,362 | ||||||||
| Home Builders — 0.2% | ||||||||
| DR Horton Inc., 1.40%, 10/15/27 (Call 08/15/27)(a) |
35 | 30,854 | ||||||
| Lennar Corp., 4.75%, 11/29/27 (Call 05/29/27) |
28 | 27,552 | ||||||
|
|
|
|||||||
| 58,406 | ||||||||
| Home Furnishings — 0.1% | ||||||||
| Whirlpool Corp., 4.60%, 05/15/50 (Call 11/15/49)(a) |
20 | 15,971 | ||||||
|
|
|
|||||||
| Household Products & Wares — 0.1% | ||||||||
| Avery Dennison Corp., 2.25%, 02/15/32 (Call 11/15/31) |
15 | 12,151 | ||||||
| Church & Dwight Co. Inc., 5.00%, 06/15/52 |
||||||||
| (Call 12/15/51) |
15 | 14,175 | ||||||
| Clorox Co. (The), 1.80%, 05/15/30 (Call 02/15/30) |
23 | 19,009 | ||||||
|
|
|
|||||||
| 45,335 | ||||||||
| Insurance — 2.5% | ||||||||
| Allstate Corp. (The) |
||||||||
| 1.45%, 12/15/30 (Call 09/15/30) |
25 | 19,752 | ||||||
| 5.25%, 03/30/33 (Call 12/30/32) |
55 | 54,755 | ||||||
| American International Group Inc. |
||||||||
| 4.38%, 06/30/50 (Call 12/30/49) |
30 | 25,754 | ||||||
| 4.80%, 07/10/45 (Call 01/10/45) |
20 | 18,301 | ||||||
| 5.13%, 03/27/33 (Call 12/27/32) |
35 | 34,455 | ||||||
| Aon Corp., 2.80%, 05/15/30 (Call 02/15/30) |
47 | 40,850 | ||||||
| Aon Corp./Aon Global Holdings PLC, 3.90%, 02/28/52 (Call 08/28/51) |
28 | 21,239 | ||||||
| Aon Global Ltd. |
||||||||
| 3.88%, 12/15/25 (Call 09/15/25) |
70 | 68,238 | ||||||
| 4.75%, 05/15/45 (Call 11/15/44) |
21 | 18,544 | ||||||
| Arch Capital Group Ltd., 3.64%, 06/30/50 |
||||||||
| (Call 12/30/49) |
25 | 18,422 | ||||||
| Athene Holding Ltd. |
||||||||
| 3.50%, 01/15/31 (Call 10/15/30) |
18 | 15,613 | ||||||
| 6.15%, 04/03/30 (Call 01/03/30) |
10 | 10,295 | ||||||
| Brighthouse Financial Inc., 4.70%, 06/22/47 |
||||||||
| (Call 12/22/46) |
15 | 11,591 | ||||||
| Brown & Brown Inc. |
||||||||
| 2.38%, 03/15/31 (Call 12/15/30) |
20 | 16,409 | ||||||
| 4.95%, 03/17/52 (Call 09/17/51) |
20 | 17,284 | ||||||
| CNA Financial Corp., 3.45%, 08/15/27 (Call 05/15/27) |
60 | 56,819 | ||||||
| Corebridge Financial Inc. |
||||||||
| 3.65%, 04/05/27 (Call 03/05/27) |
46 | 43,615 | ||||||
| 3.85%, 04/05/29 (Call 02/05/29) |
40 | 37,089 | ||||||
| 4.40%, 04/05/52 (Call 10/05/51) |
20 | 15,958 | ||||||
| Enstar Group Ltd., 3.10%, 09/01/31 (Call 03/01/31) |
25 | 20,404 | ||||||
| Equitable Holdings Inc. |
||||||||
| 4.35%, 04/20/28 (Call 01/20/28) |
31 | 29,847 | ||||||
| 5.00%, 04/20/48 (Call 10/20/47) |
25 | 22,683 | ||||||
| 5.59%, 01/11/33 (Call 10/11/32) |
10 | 10,066 | ||||||
| Security | Par (000) |
Value | ||||||
| Insurance (continued) | ||||||||
| Everest Reinsurance Holdings Inc., 3.13%, 10/15/52 |
||||||||
| (Call 04/15/52) |
$ | 30 | $ | 19,135 | ||||
| Fairfax Financial Holdings Ltd., 3.38%, 03/03/31 |
||||||||
| (Call 12/03/30) |
25 | 21,675 | ||||||
| Fidelity National Financial Inc., 3.40%, 06/15/30 |
||||||||
| (Call 03/15/30)(a) |
15 | 13,257 | ||||||
| Hartford Financial Services Group Inc. (The) |
||||||||
| 2.80%, 08/19/29 (Call 05/19/29) |
28 | 25,009 | ||||||
| 2.90%, 09/15/51 (Call 03/15/51) |
10 | 6,399 | ||||||
| 3.60%, 08/19/49 (Call 02/19/49) |
20 | 14,998 | ||||||
| Jackson Financial Inc., 4.00%, 11/23/51 (Call 05/23/51) |
10 | 7,108 | ||||||
| Lincoln National Corp. |
||||||||
| 3.05%, 01/15/30 (Call 10/15/29) |
22 | 19,228 | ||||||
| 7.00%, 06/15/40 |
7 | 7,627 | ||||||
| Markel Group Inc. |
||||||||
| 3.45%, 05/07/52 (Call 11/07/51) |
30 | 20,591 | ||||||
| 5.00%, 04/05/46 |
15 | 13,370 | ||||||
| Old Republic International Corp., 3.85%, 06/11/51 |
||||||||
| (Call 12/11/50) |
15 | 10,841 | ||||||
| Willis North America Inc. |
||||||||
| 3.88%, 09/15/49 (Call 03/15/49) |
17 | 12,669 | ||||||
| 4.50%, 09/15/28 (Call 06/15/28) |
32 | 30,987 | ||||||
|
|
|
|||||||
| 850,877 | ||||||||
| Internet — 0.8% | ||||||||
| eBay Inc. |
||||||||
| 2.70%, 03/11/30 (Call 12/11/29)(a) |
25 | 21,853 | ||||||
| 3.60%, 06/05/27 (Call 03/05/27) |
49 | 46,811 | ||||||
| 3.65%, 05/10/51 (Call 11/10/50) |
20 | 14,467 | ||||||
| Expedia Group Inc. |
||||||||
| 2.95%, 03/15/31 (Call 12/15/30) |
35 | 29,966 | ||||||
| 3.25%, 02/15/30 (Call 11/15/29) |
10 | 8,909 | ||||||
| 5.00%, 02/15/26 (Call 11/15/25) |
20 | 19,860 | ||||||
| Netflix Inc., 5.88%, 11/15/28 |
90 | 93,169 | ||||||
| VeriSign Inc., 2.70%, 06/15/31 (Call 03/15/31) |
42 | 34,874 | ||||||
|
|
|
|||||||
| 269,909 | ||||||||
| Iron & Steel — 0.2% | ||||||||
| ArcelorMittal SA |
||||||||
| 4.25%, 07/16/29 |
63 | 59,763 | ||||||
| 7.00%, 10/15/39 |
5 | 5,318 | ||||||
|
|
|
|||||||
| 65,081 | ||||||||
| Lodging — 0.4% | ||||||||
| Marriott International Inc./MD |
||||||||
| 5.00%, 10/15/27 (Call 09/15/27) |
93 | 92,613 | ||||||
| Series EE, 5.75%, 05/01/25 (Call 04/01/25) |
23 | 23,083 | ||||||
| Series GG, 3.50%, 10/15/32 (Call 07/15/32) |
35 | 30,552 | ||||||
|
|
|
|||||||
| 146,248 | ||||||||
| Machinery — 0.5% | ||||||||
| CNH Industrial Capital LLC |
||||||||
| 1.88%, 01/15/26 (Call 12/15/25) |
15 | 14,060 | ||||||
| 3.95%, 05/23/25 |
31 | 30,438 | ||||||
| Flowserve Corp., 2.80%, 01/15/32 (Call 10/15/31) |
15 | 12,244 | ||||||
| IDEX Corp., 2.63%, 06/15/31 (Call 03/15/31) |
20 | 16,847 | ||||||
| Otis Worldwide Corp. |
||||||||
| 2.57%, 02/15/30 (Call 11/15/29) |
39 | 34,044 | ||||||
| 3.11%, 02/15/40 (Call 08/15/39)(a) |
25 | 19,046 | ||||||
| Westinghouse Air Brake Technologies Corp., 4.70%, 09/15/28 (Call 06/15/28) |
33 | 32,203 | ||||||
|
|
|
|||||||
| 158,882 | ||||||||
| Machinery - Diversified — 0.1% | ||||||||
| Ingersoll Rand Inc., 5.70%, 08/14/33 (Call 05/14/33) |
35 | 35,632 | ||||||
|
|
|
|||||||
|
S C H E D U L E O F I N V E S T M E N T S |
21 |
| Schedule of Investments (continued) February 29, 2024 |
iShares® BBB Rated Corporate Bond ETF (Percentages shown are based on Net Assets) |
| Security | Par (000) |
Value | ||||||
| Manufacturing — 0.9% | ||||||||
| 3M Co. |
||||||||
| 2.88%, 10/15/27 (Call 07/15/27) |
$ | 35 | $ | 32,378 | ||||
| 3.70%, 04/15/50 (Call 10/15/49) |
55 | 40,606 | ||||||
| Carlisle Companies Inc., 3.75%, 12/01/27 |
||||||||
| (Call 09/01/27) |
49 | 46,578 | ||||||
| General Electric Co., 6.75%, 03/15/32 |
45 | 49,954 | ||||||
| Parker-Hannifin Corp. |
||||||||
| 3.25%, 03/01/27 (Call 12/01/26) |
41 | 38,970 | ||||||
| 3.25%, 06/14/29 (Call 03/14/29) |
50 | 46,044 | ||||||
| 4.00%, 06/14/49 (Call 12/14/48) |
30 | 24,484 | ||||||
| Teledyne Technologies Inc., 2.75%, 04/01/31 |
||||||||
| (Call 01/01/31) |
30 | 25,471 | ||||||
|
|
|
|||||||
| 304,485 | ||||||||
| Media — 2.6% | ||||||||
| Charter Communications Operating LLC/Charter |
||||||||
| Communications Operating Capital |
||||||||
| 2.80%, 04/01/31 (Call 01/01/31) |
65 | 52,513 | ||||||
| 3.70%, 04/01/51 (Call 10/01/50) |
35 | 21,254 | ||||||
| 3.85%, 04/01/61 (Call 10/01/60) |
50 | 28,995 | ||||||
| 3.90%, 06/01/52 (Call 12/01/51) |
45 | 28,123 | ||||||
| 3.95%, 06/30/62 (Call 12/30/61) |
35 | 20,644 | ||||||
| 4.40%, 04/01/33 (Call 01/01/33)(a) |
60 | 52,399 | ||||||
| 4.91%, 07/23/25 (Call 04/23/25) |
125 | 123,273 | ||||||
| 5.38%, 05/01/47 (Call 11/01/46) |
35 | 27,639 | ||||||
| 5.75%, 04/01/48 (Call 10/01/47) |
67 | 55,684 | ||||||
| 6.48%, 10/23/45 (Call 04/23/45) |
60 | 54,662 | ||||||
| Discovery Communications LLC |
||||||||
| 3.95%, 03/20/28 (Call 12/20/27) |
85 | 79,415 | ||||||
| 4.00%, 09/15/55 (Call 03/15/55)(a) |
35 | 23,034 | ||||||
| 5.20%, 09/20/47 (Call 03/20/47) |
45 | 36,597 | ||||||
| Fox Corp. |
||||||||
| 4.71%, 01/25/29 (Call 10/25/28)(a) |
50 | 48,809 | ||||||
| 5.48%, 01/25/39 (Call 07/25/38) |
25 | 23,194 | ||||||
| 5.58%, 01/25/49 (Call 07/25/48) |
10 | 9,130 | ||||||
| 6.50%, 10/13/33 (Call 07/13/33) |
10 | 10,495 | ||||||
| Paramount Global |
||||||||
| 4.38%, 03/15/43 |
25 | 16,715 | ||||||
| 4.95%, 01/15/31 (Call 10/15/30) |
45 | 39,443 | ||||||
| 4.95%, 05/19/50 (Call 11/19/49) |
25 | 17,779 | ||||||
| 5.85%, 09/01/43 (Call 03/01/43) |
10 | 8,077 | ||||||
| 6.88%, 04/30/36 |
10 | 9,174 | ||||||
| Thomson Reuters Corp., 5.85%, 04/15/40 |
5 | 5,079 | ||||||
| Time Warner Cable LLC |
||||||||
| 5.50%, 09/01/41 (Call 03/01/41) |
35 | 28,783 | ||||||
| 6.55%, 05/01/37 |
20 | 18,726 | ||||||
| 6.75%, 06/15/39 |
35 | 32,929 | ||||||
| 7.30%, 07/01/38 |
25 | 24,947 | ||||||
|
|
|
|||||||
| 897,512 | ||||||||
| Mining — 0.6% | ||||||||
| Barrick North America Finance LLC, 5.70%, 05/30/41 |
35 | 35,447 | ||||||
| Freeport-McMoRan Inc. |
||||||||
| 4.13%, 03/01/28 (Call 04/01/24) |
38 | 36,094 | ||||||
| 5.40%, 11/14/34 (Call 05/14/34)(a) |
20 | 19,422 | ||||||
| 5.45%, 03/15/43 (Call 09/15/42) |
25 | 23,247 | ||||||
| Newmont Corp. |
||||||||
| 2.25%, 10/01/30 (Call 07/01/30) |
25 | 20,963 | ||||||
| 2.60%, 07/15/32 (Call 04/15/32) |
46 | 37,847 | ||||||
| 4.88%, 03/15/42 (Call 09/15/41) |
35 | 32,192 | ||||||
|
|
|
|||||||
| 205,212 | ||||||||
| Security | Par (000) |
Value | ||||||
| Office & Business Equipment — 0.1% | ||||||||
| CDW LLC/CDW Finance Corp., 3.28%, 12/01/28 |
||||||||
| (Call 10/01/28) |
$ | 54 | $ | 48,588 | ||||
|
|
|
|||||||
| Oil & Gas — 3.2% | ||||||||
| Apache Corp., 4.25%, 01/15/30 (Call 10/15/29)(a) |
20 | 18,343 | ||||||
| Canadian Natural Resources Ltd. |
||||||||
| 3.85%, 06/01/27 (Call 03/01/27) |
35 | 33,517 | ||||||
| 4.95%, 06/01/47 (Call 12/01/46) |
15 | 12,992 | ||||||
| 6.25%, 03/15/38 |
25 | 25,679 | ||||||
| Cenovus Energy Inc. |
||||||||
| 3.75%, 02/15/52 (Call 08/15/51)(a) |
25 | 17,803 | ||||||
| 6.75%, 11/15/39 |
8 | 8,634 | ||||||
| Continental Resources Inc./OK, 4.90%, 06/01/44 |
||||||||
| (Call 12/01/43)(a) |
25 | 20,280 | ||||||
| Devon Energy Corp. |
||||||||
| 4.50%, 01/15/30 (Call 01/15/25)(a) |
24 | 22,899 | ||||||
| 5.00%, 06/15/45 (Call 12/15/44) |
20 | 17,278 | ||||||
| 5.60%, 07/15/41 (Call 01/15/41) |
20 | 18,767 | ||||||
| Diamondback Energy Inc. |
||||||||
| 3.50%, 12/01/29 (Call 09/01/29) |
70 | 64,316 | ||||||
| 4.25%, 03/15/52 (Call 09/15/51) |
20 | 15,785 | ||||||
| EQT Corp., 5.70%, 04/01/28 (Call 03/01/28) |
43 | 43,363 | ||||||
| Hess Corp. |
||||||||
| 5.60%, 02/15/41(a) |
35 | 35,237 | ||||||
| 7.30%, 08/15/31 |
32 | 35,960 | ||||||
| Marathon Oil Corp. |
||||||||
| 4.40%, 07/15/27 (Call 04/15/27) |
28 | 27,188 | ||||||
| 5.20%, 06/01/45 (Call 12/01/44) |
15 | 12,975 | ||||||
| 6.60%, 10/01/37 |
10 | 10,362 | ||||||
| Marathon Petroleum Corp. |
||||||||
| 4.70%, 05/01/25 (Call 04/01/25) |
75 | 74,283 | ||||||
| 6.50%, 03/01/41 (Call 09/01/40) |
30 | 31,814 | ||||||
| Occidental Petroleum Corp. |
||||||||
| 5.55%, 03/15/26 (Call 12/15/25) |
35 | 35,176 | ||||||
| 6.60%, 03/15/46 (Call 09/15/45)(a) |
35 | 37,131 | ||||||
| 7.50%, 05/01/31 |
60 | 66,218 | ||||||
| 8.88%, 07/15/30 (Call 01/15/30) |
30 | 34,770 | ||||||
| Ovintiv Inc., 6.50%, 08/15/34 |
20 | 20,941 | ||||||
| Phillips 66, 4.88%, 11/15/44 (Call 05/15/44) |
35 | 31,937 | ||||||
| Phillips 66 Co. |
||||||||
| 3.15%, 12/15/29 (Call 09/15/29) |
30 | 27,076 | ||||||
| 4.95%, 12/01/27 (Call 11/01/27)(a) |
30 | 29,901 | ||||||
| Pioneer Natural Resources Co., 1.13%, 01/15/26 |
||||||||
| (Call 12/15/25) |
112 | 104,041 | ||||||
| Suncor Energy Inc. |
||||||||
| 3.75%, 03/04/51 (Call 09/04/50) |
35 | 25,456 | ||||||
| 6.80%, 05/15/38 |
35 | 37,280 | ||||||
| Valero Energy Corp. |
||||||||
| 2.80%, 12/01/31 (Call 09/01/31)(a) |
30 | 25,265 | ||||||
| 3.65%, 12/01/51 (Call 06/01/51) |
20 | 14,096 | ||||||
| 4.35%, 06/01/28 (Call 03/01/28) |
35 | 34,056 | ||||||
| 6.63%, 06/15/37 |
25 | 26,757 | ||||||
|
|
|
|||||||
| 1,097,576 | ||||||||
| Oil & Gas Services — 0.4% | ||||||||
| Halliburton Co. |
||||||||
| 4.50%, 11/15/41 (Call 05/15/41) |
25 | 22,022 | ||||||
| 4.85%, 11/15/35 (Call 05/15/35) |
25 | 23,945 | ||||||
| 5.00%, 11/15/45 (Call 05/15/45)(a) |
40 | 37,168 | ||||||
| 7.45%, 09/15/39 |
15 | 18,002 | ||||||
| 22 | 2 0 2 4 I S H A R E S A N N U A L R E P O R T T O S H A R E H O L D E R S |
| Schedule of Investments (continued) February 29, 2024 |
iShares® BBB Rated Corporate Bond ETF (Percentages shown are based on Net Assets) |
| Security | Par (000) |
Value | ||||||
| Oil & Gas Services (continued) | ||||||||
| NOV Inc. |
||||||||
| 3.60%, 12/01/29 (Call 09/01/29) |
$ | 20 | $ | 18,273 | ||||
| 3.95%, 12/01/42 (Call 06/01/42) |
20 | 14,876 | ||||||
|
|
|
|||||||
| 134,286 | ||||||||
| Packaging & Containers — 0.5% | ||||||||
| Amcor Flexibles North America Inc., 2.69%, 05/25/31 |
||||||||
| (Call 02/25/31) |
40 | 33,765 | ||||||
| Packaging Corp. of America, 3.05%, 10/01/51 |
||||||||
| (Call 04/01/51)(a) |
20 | 13,325 | ||||||
| Sonoco Products Co. |
||||||||
| 2.85%, 02/01/32 (Call 11/01/31) |
28 | 23,621 | ||||||
| 5.75%, 11/01/40 (Call 05/01/40) |
15 | 15,071 | ||||||
| WRKCo Inc. |
||||||||
| 3.00%, 06/15/33 (Call 03/15/33)(a) |
15 | 12,635 | ||||||
| 3.75%, 03/15/25 (Call 01/15/25) |
31 | 30,485 | ||||||
| 4.90%, 03/15/29 (Call 12/15/28)(a) |
25 | 24,802 | ||||||
|
|
|
|||||||
| 153,704 | ||||||||
| Pharmaceuticals — 4.1% | ||||||||
| Becton Dickinson and Co. |
||||||||
| 1.96%, 02/11/31 (Call 11/11/30) |
44 | 35,800 | ||||||
| 3.36%, 06/06/24 (Call 04/06/24) |
37 | 36,782 | ||||||
| 3.79%, 05/20/50 (Call 11/20/49) |
15 | 11,581 | ||||||
| 4.67%, 06/06/47 (Call 12/06/46) |
35 | 30,916 | ||||||
| 4.69%, 02/13/28 (Call 01/13/28) |
46 | 45,303 | ||||||
| Cardinal Health Inc. |
||||||||
| 3.41%, 06/15/27 (Call 03/15/27) |
30 | 28,422 | ||||||
| 4.37%, 06/15/47 (Call 12/15/46) |
15 | 12,293 | ||||||
| Cencora Inc. |
||||||||
| 2.80%, 05/15/30 (Call 02/15/30) |
30 | 26,379 | ||||||
| 4.30%, 12/15/47 (Call 06/15/47) |
20 | 16,961 | ||||||
| Cigna Group (The) |
||||||||
| 3.40%, 03/15/50 (Call 09/15/49) |
25 | 17,443 | ||||||
| 3.40%, 03/15/51 (Call 09/15/50) |
43 | 29,902 | ||||||
| 4.38%, 10/15/28 (Call 07/15/28) |
113 | 109,584 | ||||||
| 4.80%, 07/15/46 (Call 01/16/46) |
50 | 44,752 | ||||||
| 5.40%, 03/15/33 (Call 12/15/32)(a) |
55 | 55,151 | ||||||
| CVS Health Corp. |
||||||||
| 1.30%, 08/21/27 (Call 06/21/27)(a) |
30 | 26,372 | ||||||
| 2.13%, 09/15/31 (Call 06/15/31) |
35 | 28,218 | ||||||
| 3.88%, 07/20/25 (Call 04/20/25) |
65 | 63,671 | ||||||
| 4.30%, 03/25/28 (Call 12/25/27) |
60 | 58,223 | ||||||
| 4.78%, 03/25/38 (Call 09/25/37) |
85 | 77,043 | ||||||
| 5.00%, 02/20/26 (Call 01/20/26) |
36 | 35,834 | ||||||
| 5.05%, 03/25/48 (Call 09/25/47) |
110 | 98,044 | ||||||
| 5.13%, 02/21/30 (Call 12/21/29) |
65 | 64,604 | ||||||
| 5.25%, 02/21/33 (Call 11/21/32) |
48 | 47,401 | ||||||
| 5.63%, 02/21/53 (Call 08/21/52) |
74 | 70,937 | ||||||
| McKesson Corp., 0.90%, 12/03/25 (Call 11/03/25)(a) |
75 | 69,648 | ||||||
| Mylan Inc., 5.20%, 04/15/48 (Call 10/15/47) |
35 | 28,722 | ||||||
| Shire Acquisitions Investments Ireland DAC, 3.20%, 09/23/26 (Call 06/23/26) |
25 | 23,805 | ||||||
| Utah Acquisition Sub Inc., 3.95%, 06/15/26 |
||||||||
| (Call 03/15/26) |
25 | 24,139 | ||||||
| Viatris Inc. |
||||||||
| 2.70%, 06/22/30 (Call 03/22/30) |
45 | 37,901 | ||||||
| 4.00%, 06/22/50 (Call 12/22/49) |
30 | 20,488 | ||||||
| Zoetis Inc. |
||||||||
| 2.00%, 05/15/30 (Call 02/15/30) |
52 | 43,558 | ||||||
| 4.70%, 02/01/43 (Call 08/01/42) |
30 | 27,408 | ||||||
| Security | Par (000) |
Value | ||||||
| Pharmaceuticals (continued) | ||||||||
| 5.40%, 11/14/25 (Call 10/14/25) |
$ | 30 | $ | 30,055 | ||||
|
|
|
|||||||
| 1,377,340 | ||||||||
| Pipelines — 6.7% | ||||||||
| Boardwalk Pipelines LP |
||||||||
| 3.40%, 02/15/31 (Call 11/15/30) |
25 | 21,967 | ||||||
| 5.95%, 06/01/26 (Call 03/01/26) |
18 | 18,126 | ||||||
| Cheniere Corpus Christi Holdings LLC |
||||||||
| 2.74%, 12/31/39 (Call 07/04/39) |
19 | 14,807 | ||||||
| 5.13%, 06/30/27 (Call 01/01/27) |
45 | 44,782 | ||||||
| 5.88%, 03/31/25 (Call 10/02/24) |
25 | 25,001 | ||||||
| Cheniere Energy Partners LP |
||||||||
| 3.25%, 01/31/32 (Call 01/31/27) |
45 | 37,572 | ||||||
| 5.95%, 06/30/33 (Call 12/30/32) |
25 | 25,023 | ||||||
| Columbia Pipeline Group Inc., 5.80%, 06/01/45 |
||||||||
| (Call 12/01/44) |
15 | 14,502 | ||||||
| Enbridge Inc. |
||||||||
| 2.50%, 08/01/33 (Call 05/01/33)(a) |
25 | 19,706 | ||||||
| 3.50%, 06/10/24 (Call 04/01/24) |
25 | 24,833 | ||||||
| 4.00%, 11/15/49 (Call 05/15/49) |
25 | 19,278 | ||||||
| 5.70%, 03/08/33 (Call 12/08/32) |
50 | 50,534 | ||||||
| Energy Transfer LP |
||||||||
| 3.75%, 05/15/30 (Call 02/15/30) |
53 | 48,337 | ||||||
| 4.15%, 09/15/29 (Call 06/15/29) |
36 | 33,990 | ||||||
| 4.75%, 01/15/26 (Call 10/15/25) |
50 | 49,398 | ||||||
| 5.00%, 05/15/44 (Call 11/15/43) |
42 | 36,335 | ||||||
| 5.00%, 05/15/50 (Call 11/15/49)(a) |
70 | 60,425 | ||||||
| 5.15%, 03/15/45 (Call 09/15/44) |
35 | 31,240 | ||||||
| 5.50%, 06/01/27 (Call 03/01/27) |
71 | 71,233 | ||||||
| 5.75%, 02/15/33 (Call 11/15/32) |
35 | 35,171 | ||||||
| 6.25%, 04/15/49 (Call 10/15/48) |
34 | 34,307 | ||||||
| 6.55%, 12/01/33 (Call 09/01/33) |
30 | 31,757 | ||||||
| Kinder Morgan Energy Partners LP |
||||||||
| 5.50%, 03/01/44 (Call 09/01/43) |
39 | 36,074 | ||||||
| 6.95%, 01/15/38 |
45 | 48,551 | ||||||
| Kinder Morgan Inc. |
||||||||
| 1.75%, 11/15/26 (Call 10/15/26) |
36 | 32,868 | ||||||
| 3.60%, 02/15/51 (Call 08/15/50) |
45 | 30,882 | ||||||
| 4.30%, 06/01/25 (Call 03/01/25) |
87 | 85,739 | ||||||
| 5.20%, 06/01/33 (Call 03/01/33) |
25 | 24,278 | ||||||
| 5.55%, 06/01/45 (Call 12/01/44) |
40 | 37,540 | ||||||
| 7.75%, 01/15/32 |
25 | 28,151 | ||||||
| Magellan Midstream Partners LP, 3.95%, 03/01/50 |
||||||||
| (Call 09/01/49) |
30 | 21,966 | ||||||
| MPLX LP |
||||||||
| 1.75%, 03/01/26 (Call 02/01/26)(a) |
57 | 53,170 | ||||||
| 2.65%, 08/15/30 (Call 05/15/30) |
60 | 50,995 | ||||||
| 4.50%, 04/15/38 (Call 10/15/37) |
40 | 34,798 | ||||||
| 5.50%, 02/15/49 (Call 08/15/48) |
45 | 42,011 | ||||||
| 5.65%, 03/01/53 (Call 09/01/52) |
35 | 33,246 | ||||||
| ONEOK Inc. |
||||||||
| 4.00%, 07/13/27 (Call 04/13/27) |
39 | 37,593 | ||||||
| 4.25%, 09/15/46 |
25 | 19,348 | ||||||
| 5.20%, 07/15/48 (Call 01/15/48) |
40 | 36,003 | ||||||
| 5.85%, 01/15/26 (Call 12/15/25) |
20 | 20,178 | ||||||
| 6.10%, 11/15/32 (Call 08/15/32) |
35 | 36,166 | ||||||
| 6.35%, 01/15/31 (Call 10/15/30) |
10 | 10,480 | ||||||
| 6.63%, 09/01/53 (Call 03/01/53)(a) |
25 | 26,799 | ||||||
| Plains All American Pipeline LP/PAA Finance Corp. |
||||||||
| 3.55%, 12/15/29 (Call 09/15/29) |
45 | 40,804 | ||||||
| 5.15%, 06/01/42 (Call 12/01/41) |
21 | 18,546 | ||||||
| S C H E D U L E O F I N V E S T M E N T S |
23 |
| Schedule of Investments (continued) February 29, 2024 |
iShares® BBB Rated Corporate Bond ETF (Percentages shown are based on Net Assets) |
| Security | Par (000) |
Value | ||||||
| Pipelines (continued) | ||||||||
| Sabine Pass Liquefaction LLC |
||||||||
| 4.50%, 05/15/30 (Call 11/15/29) |
$ | 60 | $ | 57,404 | ||||
| 5.63%, 03/01/25 (Call 12/01/24) |
52 | 51,951 | ||||||
| Spectra Energy Partners LP, 4.50%, 03/15/45 |
||||||||
| (Call 09/15/44) |
25 | 20,977 | ||||||
| Targa Resources Corp. |
||||||||
| 4.20%, 02/01/33 (Call 11/01/32) |
40 | 35,891 | ||||||
| 6.13%, 03/15/33 (Call 12/15/32) |
25 | 25,712 | ||||||
| 6.25%, 07/01/52 (Call 01/01/52)(a) |
25 | 25,360 | ||||||
| Targa Resources Partners LP/Targa Resources Partners Finance Corp., 6.88%, 01/15/29 (Call 04/01/24)(a) |
60 | 61,816 | ||||||
| TransCanada PipeLines Ltd. |
||||||||
| 2.50%, 10/12/31 (Call 07/12/31) |
42 | 34,431 | ||||||
| 4.25%, 05/15/28 (Call 02/15/28) |
25 | 24,051 | ||||||
| 5.10%, 03/15/49 (Call 09/15/48)(a) |
35 | 32,142 | ||||||
| 6.20%, 10/15/37 |
35 | 36,023 | ||||||
| 7.63%, 01/15/39 |
26 | 30,336 | ||||||
| Transcontinental Gas Pipe Line Co. LLC, 7.85%, 02/01/26 (Call 11/01/25) |
24 | 24,934 | ||||||
| Western Midstream Operating LP |
||||||||
| 4.05%, 02/01/30 (Call 11/01/29) |
40 | 37,031 | ||||||
| 5.25%, 02/01/50 (Call 08/01/49) |
35 | 31,067 | ||||||
| Williams Companies Inc. (The) |
||||||||
| 2.60%, 03/15/31 (Call 12/15/30) |
65 | 54,689 | ||||||
| 3.50%, 10/15/51 (Call 04/15/51) |
25 | 17,330 | ||||||
| 3.75%, 06/15/27 (Call 03/15/27) |
30 | 28,688 | ||||||
| 5.10%, 09/15/45 (Call 03/15/45) |
35 | 31,963 | ||||||
| 5.40%, 03/02/26 |
25 | 25,052 | ||||||
| 6.30%, 04/15/40 |
30 | 31,066 | ||||||
|
|
|
|||||||
| 2,272,424 | ||||||||
| Real Estate — 0.0% | ||||||||
| CBRE Services Inc., 2.50%, 04/01/31 (Call 01/01/31) |
15 | 12,325 | ||||||
|
|
|
|||||||
| Real Estate Investment Trusts — 4.6% | ||||||||
| Alexandria Real Estate Equities Inc. |
||||||||
| 2.00%, 05/18/32 (Call 02/18/32) |
68 | 52,580 | ||||||
| 4.00%, 02/01/50 (Call 08/01/49) |
15 | 11,336 | ||||||
| 5.15%, 04/15/53 (Call 10/15/52)(a) |
25 | 22,638 | ||||||
| American Homes 4 Rent LP, 3.63%, 04/15/32 |
||||||||
| (Call 01/15/32) |
10 | 8,720 | ||||||
| American Tower Corp. |
||||||||
| 2.40%, 03/15/25 (Call 02/15/25) |
25 | 24,181 | ||||||
| 3.10%, 06/15/50 (Call 12/15/49) |
70 | 45,666 | ||||||
| 3.38%, 10/15/26 (Call 07/15/26) |
72 | 68,669 | ||||||
| 3.80%, 08/15/29 (Call 05/15/29) |
120 | 111,086 | ||||||
| Boston Properties LP |
||||||||
| 2.75%, 10/01/26 (Call 07/01/26) |
20 | 18,501 | ||||||
| 2.90%, 03/15/30 (Call 12/15/29) |
45 | 37,958 | ||||||
| 3.25%, 01/30/31 (Call 10/30/30) |
40 | 33,710 | ||||||
| 3.65%, 02/01/26 (Call 11/03/25) |
25 | 24,038 | ||||||
| Brixmor Operating Partnership LP |
||||||||
| 2.50%, 08/16/31 (Call 05/16/31) |
30 | 24,365 | ||||||
| 4.13%, 06/15/26 (Call 03/15/26) |
26 | 25,200 | ||||||
| Crown Castle Inc. |
||||||||
| 2.90%, 04/01/41 (Call 10/01/40) |
34 | 23,560 | ||||||
| 3.25%, 01/15/51 (Call 07/15/50)(a) |
15 | 10,138 | ||||||
| 3.80%, 02/15/28 (Call 11/15/27) |
150 | 141,173 | ||||||
| CubeSmart LP, 2.25%, 12/15/28 (Call 10/15/28) |
20 | 17,460 | ||||||
| Digital Realty Trust LP, 3.70%, 08/15/27 (Call 05/15/27) |
65 | 61,980 | ||||||
| Equinix Inc. |
||||||||
| 1.45%, 05/15/26 (Call 04/15/26) |
31 | 28,523 | ||||||
| Security | Par (000) |
Value | ||||||
| Real Estate Investment Trusts (continued) | ||||||||
| 2.15%, 07/15/30 (Call 04/15/30) |
$ | 70 | $ | 57,949 | ||||
| 2.95%, 09/15/51 (Call 03/15/51) |
17 | 10,806 | ||||||
| Essex Portfolio LP, 2.65%, 03/15/32 (Call 12/15/31)(a) |
30 | 24,383 | ||||||
| Extra Space Storage LP, 2.40%, 10/15/31 |
||||||||
| (Call 07/15/31) |
25 | 20,160 | ||||||
| GLP Capital LP/GLP Financing II Inc. |
||||||||
| 5.30%, 01/15/29 (Call 10/15/28) |
25 | 24,312 | ||||||
| 5.75%, 06/01/28 (Call 03/03/28) |
31 | 30,812 | ||||||
| Healthcare Realty Holdings LP, 3.75%, 07/01/27 |
||||||||
| (Call 04/01/27)(a) |
59 | 55,269 | ||||||
| Healthpeak OP LLC |
||||||||
| 2.13%, 12/01/28 (Call 10/01/28) |
45 | 39,126 | ||||||
| 3.00%, 01/15/30 (Call 10/15/29) |
37 | 32,495 | ||||||
| Host Hotels & Resorts LP, Series H, 3.38%, 12/15/29 |
||||||||
| (Call 09/15/29) |
25 | 22,121 | ||||||
| Invitation Homes Operating Partnership LP, 2.30%, 11/15/28 (Call 09/15/28) |
46 | 40,245 | ||||||
| Kimco Realty OP LLC |
||||||||
| 2.70%, 10/01/30 (Call 07/01/30) |
30 | 25,545 | ||||||
| 3.30%, 02/01/25 (Call 12/01/24) |
10 | 9,784 | ||||||
| 6.40%, 03/01/34 (Call 12/01/33) |
20 | 21,044 | ||||||
| Omega Healthcare Investors Inc., 3.25%, 04/15/33 |
||||||||
| (Call 01/15/33) |
25 | 19,916 | ||||||
| Sabra Health Care LP, 3.20%, 12/01/31 (Call 09/01/31) |
35 | 28,393 | ||||||
| Ventas Realty LP, 4.75%, 11/15/30 (Call 08/15/30) |
39 | 37,350 | ||||||
| VICI Properties LP |
||||||||
| 4.38%, 05/15/25 |
56 | 55,062 | ||||||
| 4.75%, 02/15/28 (Call 01/15/28) |
50 | 48,464 | ||||||
| 5.63%, 05/15/52 (Call 11/15/51) |
17 | 15,336 | ||||||
| Welltower OP LLC |
||||||||
| 2.05%, 01/15/29 (Call 11/15/28) |
35 | 30,324 | ||||||
| 2.75%, 01/15/32 (Call 10/15/31) |
25 | 20,784 | ||||||
| 2.80%, 06/01/31 (Call 03/01/31) |
30 | 25,484 | ||||||
| 4.00%, 06/01/25 (Call 03/01/25) |
10 | 9,815 | ||||||
| 4.95%, 09/01/48 (Call 03/01/48) |
16 | 14,424 | ||||||
| Weyerhaeuser Co. |
||||||||
| 4.00%, 11/15/29 (Call 08/15/29) |
25 | 23,491 | ||||||
| 7.38%, 03/15/32 |
30 | 33,834 | ||||||
|
|
|
|||||||
| 1,568,210 | ||||||||
| Retail — 3.4% | ||||||||
| AutoNation Inc., 3.85%, 03/01/32 (Call 12/01/31)(a) |
10 | 8,722 | ||||||
| AutoZone Inc. |
||||||||
| 1.65%, 01/15/31 (Call 10/15/30) |
25 | 19,868 | ||||||
| 4.75%, 08/01/32 (Call 05/01/32) |
33 | 31,684 | ||||||
| 4.75%, 02/01/33 (Call 11/01/32) |
25 | 23,946 | ||||||
| Best Buy Co. Inc., 1.95%, 10/01/30 (Call 07/01/30)(a) |
24 | 19,637 | ||||||
| Dick’s Sporting Goods Inc., 4.10%, 01/15/52 |
||||||||
| (Call 07/15/51)(a) |
10 | 7,052 | ||||||
| Dollar General Corp. |
||||||||
| 3.50%, 04/03/30 (Call 01/03/30) |
32 | 28,936 | ||||||
| 3.88%, 04/15/27 (Call 01/15/27) |
35 | 33,674 | ||||||
| 4.13%, 04/03/50 (Call 10/03/49) |
15 | 11,442 | ||||||
| 5.45%, 07/05/33 (Call 04/05/33)(a) |
10 | 9,931 | ||||||
| Dollar Tree Inc. |
||||||||
| 4.00%, 05/15/25 (Call 03/15/25) |
46 | 45,179 | ||||||
| 4.20%, 05/15/28 (Call 02/15/28) |
25 | 24,108 | ||||||
| Genuine Parts Co., 2.75%, 02/01/32 (Call 11/01/31) |
20 | 16,477 | ||||||
| Lowe’s Companies Inc. |
||||||||
| 1.70%, 10/15/30 (Call 07/15/30) |
61 | 49,544 | ||||||
| 2.50%, 04/15/26 (Call 01/15/26) |
65 | 61,674 | ||||||
| 3.70%, 04/15/46 (Call 10/15/45) |
45 | 33,913 | ||||||
| 24 | 2 0 2 4 I S H A R E S A N N U A L R E P O R T T O S H A R E H O L D E R S |
| Schedule of Investments (continued) February 29, 2024 |
iShares® BBB Rated Corporate Bond ETF (Percentages shown are based on Net Assets) |
| Security | Par (000) |
Value | ||||||
| Retail (continued) | ||||||||
| 4.25%, 04/01/52 (Call 10/01/51) |
$ | 40 | $ | 32,065 | ||||
| 4.80%, 04/01/26 (Call 03/01/26) |
50 | 49,667 | ||||||
| 5.00%, 04/15/33 (Call 01/15/33) |
40 | 39,445 | ||||||
| 5.80%, 09/15/62 (Call 03/15/62) |
30 | 29,872 | ||||||
| 5.85%, 04/01/63 (Call 10/01/62) |
30 | 30,206 | ||||||
| McDonald’s Corp. |
||||||||
| 3.30%, 07/01/25 (Call 06/01/25) |
36 | 35,144 | ||||||
| 3.38%, 05/26/25 (Call 02/26/25) |
25 | 24,429 | ||||||
| 3.60%, 07/01/30 (Call 04/01/30) |
70 | 64,952 | ||||||
| 3.63%, 09/01/49 (Call 03/01/49) |
45 | 33,552 | ||||||
| 3.70%, 01/30/26 (Call 10/30/25)(a) |
25 | 24,411 | ||||||
| 4.88%, 12/09/45 (Call 06/09/45) |
32 | 29,481 | ||||||
| 4.95%, 08/14/33 (Call 05/14/33)(a) |
35 | 34,633 | ||||||
| 5.45%, 08/14/53 (Call 02/14/53) |
30 | 29,852 | ||||||
| 6.30%, 03/01/38 |
20 | 21,778 | ||||||
| O’Reilly Automotive Inc., 3.90%, 06/01/29 (Call 03/01/29) |
60 | 56,866 | ||||||
| Starbucks Corp. |
||||||||
| 2.55%, 11/15/30 (Call 08/15/30) |
45 | 38,588 | ||||||
| 3.00%, 02/14/32 (Call 11/14/31) |
15 | 12,998 | ||||||
| 3.50%, 11/15/50 (Call 05/15/50) |
36 | 26,276 | ||||||
| 4.45%, 08/15/49 (Call 02/15/49) |
21 | 17,972 | ||||||
| 4.75%, 02/15/26 (Call 01/15/26) |
68 | 67,554 | ||||||
| Tractor Supply Co., 5.25%, 05/15/33 |
35 | 34,767 | ||||||
|
|
|
|||||||
| 1,160,295 | ||||||||
| Semiconductors — 2.3% | ||||||||
| Broadcom Corp./Broadcom Cayman Finance Ltd., |
||||||||
| 3.88%, 01/15/27 (Call 10/15/26) |
75 | 72,442 | ||||||
| Broadcom Inc. |
||||||||
| 2.45%, 02/15/31 (Call 11/15/30)(d) |
105 | 87,417 | ||||||
| 3.14%, 11/15/35 (Call 08/15/35)(d) |
60 | 47,578 | ||||||
| 3.42%, 04/15/33 (Call 01/15/33)(d) |
105 | 89,565 | ||||||
| 3.47%, 04/15/34 (Call 01/15/34)(d) |
20 | 16,856 | ||||||
| 3.50%, 02/15/41 (Call 08/15/40)(d) |
50 | 38,241 | ||||||
| 3.75%, 02/15/51 (Call 08/15/50)(d) |
15 | 11,221 | ||||||
| 4.00%, 04/15/29 (Call 02/15/29)(d) |
60 | 56,847 | ||||||
| 4.93%, 05/15/37 (Call 02/15/37)(d) |
20 | 18,630 | ||||||
| Marvell Technology Inc. |
||||||||
| 2.45%, 04/15/28 (Call 02/15/28) |
35 | 31,450 | ||||||
| 2.95%, 04/15/31 (Call 01/15/31) |
32 | 27,355 | ||||||
| Microchip Technology Inc., 4.25%, 09/01/25 |
||||||||
| (Call 04/01/24) |
31 | 30,857 | ||||||
| Micron Technology Inc. |
||||||||
| 3.48%, 11/01/51 (Call 05/01/51) |
15 | 10,383 | ||||||
| 4.19%, 02/15/27 (Call 12/15/26) |
35 | 33,987 | ||||||
| 4.66%, 02/15/30 (Call 11/15/29) |
64 | 61,919 | ||||||
| 6.75%, 11/01/29 (Call 09/01/29) |
41 | 43,524 | ||||||
| NXP BV/NXP Funding LLC/NXP USA Inc. |
||||||||
| 2.65%, 02/15/32 (Call 11/15/31) |
10 | 8,199 | ||||||
| 3.13%, 02/15/42 (Call 08/15/41) |
15 | 10,652 | ||||||
| 3.25%, 05/11/41 (Call 11/11/40) |
15 | 10,980 | ||||||
| 3.25%, 11/30/51 (Call 05/30/51) |
5 | 3,362 | ||||||
| 3.88%, 06/18/26 (Call 04/18/26) |
21 | 20,338 | ||||||
| 4.30%, 06/18/29 (Call 03/18/29) |
41 | 39,190 | ||||||
| 5.00%, 01/15/33 (Call 10/15/32) |
25 | 24,135 | ||||||
|
|
|
|||||||
| 795,128 | ||||||||
| Shipbuilding — 0.1% | ||||||||
| Huntington Ingalls Industries Inc., 3.84%, 05/01/25 (Call 04/01/25) |
25 | 24,497 | ||||||
|
|
|
|||||||
| Security | Par (000) |
Value | ||||||
| Software — 4.3% | ||||||||
| Autodesk Inc., 2.40%, 12/15/31 (Call 09/15/31) |
$ | 26 | $ | 21,528 | ||||
| Broadridge Financial Solutions Inc., 2.60%, 05/01/31 (Call 02/01/31) |
29 | 24,244 | ||||||
| Electronic Arts Inc., 2.95%, 02/15/51 |
25 | 16,619 | ||||||
| Fidelity National Information Services Inc. |
||||||||
| 1.15%, 03/01/26 (Call 02/01/26)(a) |
62 | 57,428 | ||||||
| 3.10%, 03/01/41 (Call 09/01/40) |
20 | 14,383 | ||||||
| 5.10%, 07/15/32 (Call 04/15/32)(a) |
20 | 19,974 | ||||||
| Fiserv Inc. |
||||||||
| 3.20%, 07/01/26 (Call 05/01/26) |
49 | 46,832 | ||||||
| 3.50%, 07/01/29 (Call 04/01/29) |
75 | 68,876 | ||||||
| 4.40%, 07/01/49 (Call 01/01/49) |
30 | 24,890 | ||||||
| 5.63%, 08/21/33 (Call 05/21/33) |
40 | 40,365 | ||||||
| Oracle Corp. |
||||||||
| 1.65%, 03/25/26 (Call 02/25/26) |
41 | 38,077 | ||||||
| 2.50%, 04/01/25 (Call 03/01/25) |
79 | 76,484 | ||||||
| 2.65%, 07/15/26 (Call 04/15/26) |
25 | 23,565 | ||||||
| 2.88%, 03/25/31 (Call 12/25/30) |
155 | 133,621 | ||||||
| 2.95%, 05/15/25 (Call 02/15/25) |
50 | 48,494 | ||||||
| 2.95%, 04/01/30 (Call 01/01/30) |
35 | 30,882 | ||||||
| 3.60%, 04/01/40 (Call 10/01/39) |
95 | 73,323 | ||||||
| 3.60%, 04/01/50 (Call 10/01/49) |
15 | 10,574 | ||||||
| 3.65%, 03/25/41 (Call 09/25/40) |
80 | 61,367 | ||||||
| 3.85%, 04/01/60 (Call 10/01/59) |
110 | 76,270 | ||||||
| 3.95%, 03/25/51 (Call 09/25/50) |
65 | 48,514 | ||||||
| 4.00%, 07/15/46 (Call 01/15/46) |
10 | 7,685 | ||||||
| 4.10%, 03/25/61 (Call 09/25/60) |
35 | 25,563 | ||||||
| 4.30%, 07/08/34 (Call 01/08/34) |
35 | 31,700 | ||||||
| 4.50%, 05/06/28 (Call 04/06/28) |
75 | 73,475 | ||||||
| 5.55%, 02/06/53 (Call 08/06/52) |
15 | 14,319 | ||||||
| 6.50%, 04/15/38 |
65 | 69,324 | ||||||
| Roper Technologies Inc. |
||||||||
| 1.00%, 09/15/25 (Call 08/15/25) |
56 | 52,473 | ||||||
| 1.40%, 09/15/27 (Call 07/15/27) |
41 | 36,234 | ||||||
| 1.75%, 02/15/31 (Call 11/15/30) |
23 | 18,409 | ||||||
| Take-Two Interactive Software Inc., 3.55%, 04/14/25 |
18 | 17,629 | ||||||
| VMware LLC, 3.90%, 08/21/27 (Call 05/21/27) |
110 | 104,876 | ||||||
| Workday Inc., 3.50%, 04/01/27 (Call 03/01/27) |
37 | 35,213 | ||||||
|
|
|
|||||||
| 1,443,210 | ||||||||
| Telecommunications — 9.7% | ||||||||
| AT&T Inc. |
||||||||
| 1.70%, 03/25/26 (Call 03/11/24) |
30 | 27,903 | ||||||
| 2.30%, 06/01/27 (Call 04/01/27) |
150 | 137,402 | ||||||
| 2.55%, 12/01/33 (Call 09/01/33) |
35 | 27,553 | ||||||
| 2.75%, 06/01/31 (Call 03/01/31) |
125 | 106,481 | ||||||
| 3.50%, 06/01/41 (Call 12/01/40) |
35 | 26,771 | ||||||
| 3.50%, 09/15/53 (Call 03/15/53) |
174 | 119,534 | ||||||
| 3.55%, 09/15/55 (Call 03/15/55) |
30 | 20,387 | ||||||
| 3.65%, 06/01/51 (Call 12/01/50) |
30 | 21,581 | ||||||
| 3.65%, 09/15/59 (Call 03/15/59) |
145 | 97,724 | ||||||
| 3.80%, 12/01/57 (Call 06/01/57) |
85 | 59,728 | ||||||
| 4.25%, 03/01/27 (Call 12/01/26)(a) |
25 | 24,367 | ||||||
| 4.50%, 05/15/35 (Call 11/15/34) |
95 | 87,359 | ||||||
| 4.50%, 03/09/48 (Call 09/09/47) |
45 | 37,635 | ||||||
| 5.40%, 02/15/34 (Call 11/15/33) |
25 | 25,042 | ||||||
| Bell Telephone Co. of Canada or Bell Canada |
||||||||
| 4.46%, 04/01/48 (Call 10/01/47) |
35 | 29,647 | ||||||
| Series US-4, 3.65%, 03/17/51 (Call 09/17/50) |
30 | 22,052 | ||||||
| British Telecommunications PLC, 9.63%, 12/15/30 |
50 | 61,197 | ||||||
| Corning Inc. |
||||||||
| 4.38%, 11/15/57 (Call 05/15/57) |
25 | 20,616 | ||||||
| S C H E D U L E O F I N V E S T M E N T S |
25 |
| Schedule of Investments (continued) February 29, 2024 |
iShares® BBB Rated Corporate Bond ETF (Percentages shown are based on Net Assets) |
| Security | Par (000) |
Value | ||||||
| Telecommunications (continued) | ||||||||
| 5.45%, 11/15/79 (Call 05/19/79) |
$ | 12 | $ | 11,099 | ||||
| Deutsche Telekom International Finance BV, 8.75%, 06/15/30 |
67 | 78,937 | ||||||
| Motorola Solutions Inc. |
||||||||
| 2.75%, 05/24/31 (Call 02/24/31) |
25 | 20,849 | ||||||
| 4.60%, 02/23/28 (Call 11/23/27) |
22 | 21,499 | ||||||
| 5.60%, 06/01/32 (Call 03/01/32) |
21 | 21,050 | ||||||
| Orange SA |
||||||||
| 5.38%, 01/13/42 |
25 | 24,618 | ||||||
| 9.00%, 03/01/31 |
45 | 54,372 | ||||||
| Rogers Communications Inc. |
||||||||
| 3.20%, 03/15/27 (Call 02/15/27) |
71 | 66,824 | ||||||
| 3.63%, 12/15/25 (Call 09/15/25) |
30 | 29,095 | ||||||
| 3.70%, 11/15/49 (Call 05/15/49) |
60 | 43,376 | ||||||
| 5.00%, 03/15/44 (Call 09/15/43) |
50 | 45,064 | ||||||
| Sprint Capital Corp., 6.88%, 11/15/28 |
102 | 108,542 | ||||||
| Telefonica Emisiones SA, 7.05%, 06/20/36(a) |
25 | 27,487 | ||||||
| Telefonica Europe BV, 8.25%, 09/15/30 |
60 | 68,135 | ||||||
| TELUS Corp., 4.60%, 11/16/48 (Call 05/16/48) |
25 | 21,343 | ||||||
| T-Mobile USA Inc. |
||||||||
| 1.50%, 02/15/26 (Call 01/15/26) |
57 | 53,017 | ||||||
| 2.55%, 02/15/31 (Call 11/15/30) |
85 | 71,627 | ||||||
| 3.00%, 02/15/41 (Call 08/15/40) |
55 | 39,745 | ||||||
| 3.30%, 02/15/51 (Call 08/15/50) |
60 | 41,129 | ||||||
| 3.40%, 10/15/52 (Call 04/15/52) |
15 | 10,411 | ||||||
| 3.50%, 04/15/25 (Call 03/15/25) |
25 | 24,439 | ||||||
| 3.50%, 04/15/31 (Call 04/15/26) |
35 | 31,250 | ||||||
| 3.60%, 11/15/60 (Call 05/15/60) |
45 | 31,063 | ||||||
| 3.75%, 04/15/27 (Call 02/15/27) |
85 | 81,429 | ||||||
| 3.88%, 04/15/30 (Call 01/15/30) |
145 | 134,485 | ||||||
| 4.50%, 04/15/50 (Call 10/15/49) |
65 | 54,959 | ||||||
| 4.95%, 03/15/28 (Call 02/15/28) |
35 | 34,779 | ||||||
| 5.05%, 07/15/33 (Call 04/15/33) |
40 | 39,058 | ||||||
| 5.65%, 01/15/53 (Call 07/15/52) |
30 | 29,850 | ||||||
| Verizon Communications Inc. |
||||||||
| 1.45%, 03/20/26 (Call 02/20/26) |
148 | 137,209 | ||||||
| 1.68%, 10/30/30 (Call 07/30/30) |
90 | 72,486 | ||||||
| 2.36%, 03/15/32 (Call 12/15/31) |
35 | 28,375 | ||||||
| 2.55%, 03/21/31 (Call 12/21/30) |
131 | 110,479 | ||||||
| 2.88%, 11/20/50 (Call 05/20/50)(a) |
30 | 19,177 | ||||||
| 2.99%, 10/30/56 (Call 04/30/56) |
85 | 52,576 | ||||||
| 3.40%, 03/22/41 (Call 09/22/40) |
75 | 57,505 | ||||||
| 3.55%, 03/22/51 (Call 09/22/50)(a) |
115 | 83,442 | ||||||
| 3.70%, 03/22/61 (Call 09/22/60)(a) |
50 | 35,553 | ||||||
| 4.33%, 09/21/28(a) |
116 | 112,502 | ||||||
| 4.86%, 08/21/46 |
70 | 64,130 | ||||||
| 5.05%, 05/09/33 (Call 02/09/33) |
65 | 64,317 | ||||||
| Vodafone Group PLC |
||||||||
| 4.25%, 09/17/50 |
15 | 11,775 | ||||||
| 4.38%, 05/30/28(a) |
60 | 58,970 | ||||||
| 5.25%, 05/30/48(a) |
45 | 41,780 | ||||||
| 5.75%, 02/10/63 (Call 08/10/62) |
33 | 32,156 | ||||||
| 6.15%, 02/27/37 |
20 | 20,860 | ||||||
|
|
|
|||||||
| 3,275,802 | ||||||||
| Toys, Games & Hobbies — 0.1% | ||||||||
| Hasbro Inc., 3.55%, 11/19/26 (Call 09/19/26) |
35 | 33,228 | ||||||
|
|
|
|||||||
| Transportation — 1.7% | ||||||||
| Canadian Pacific Railway Co. |
||||||||
| 1.75%, 12/02/26 (Call 11/02/26) |
35 | 32,122 | ||||||
| 2.05%, 03/05/30 (Call 12/05/29) |
25 | 21,062 | ||||||
| Security | Par (000) |
Value | ||||||
| Transportation (continued) | ||||||||
| 3.10%, 12/02/51 (Call 06/02/51)(a) |
$ | 15 | $ | 10,191 | ||||
| 3.50%, 05/01/50 (Call 11/01/49) |
15 | 10,964 | ||||||
| 6.13%, 09/15/2115 (Call 03/15/2115) |
10 | 10,447 | ||||||
| CSX Corp. |
||||||||
| 2.50%, 05/15/51 (Call 11/15/50) |
40 | 24,384 | ||||||
| 2.60%, 11/01/26 (Call 08/01/26) |
35 | 33,009 | ||||||
| 4.25%, 03/15/29 (Call 12/15/28) |
95 | 92,445 | ||||||
| 4.25%, 11/01/66 (Call 05/01/66) |
30 | 24,072 | ||||||
| 4.30%, 03/01/48 (Call 09/01/47) |
35 | 29,923 | ||||||
| 4.50%, 11/15/52 (Call 05/15/52)(a) |
5 | 4,373 | ||||||
| FedEx Corp. |
||||||||
| 3.10%, 08/05/29 (Call 05/05/29) |
75 | 68,133 | ||||||
| 3.25%, 05/15/41 (Call 11/15/40) |
35 | 25,785 | ||||||
| 4.75%, 11/15/45 (Call 05/15/45) |
30 | 26,259 | ||||||
| 5.25%, 05/15/50 (Call 11/15/49)(a) |
35 | 32,919 | ||||||
| Norfolk Southern Corp. |
||||||||
| 3.05%, 05/15/50 (Call 11/15/49) |
65 | 43,536 | ||||||
| 3.16%, 05/15/55 (Call 11/15/54) |
30 | 19,645 | ||||||
| 4.45%, 03/01/33 (Call 12/01/32) |
30 | 28,549 | ||||||
| 5.35%, 08/01/54 (Call 02/01/54) |
10 | 9,785 | ||||||
| Ryder System Inc., 5.25%, 06/01/28 (Call 05/01/28)(a) |
30 | 30,055 | ||||||
|
|
|
|||||||
| 577,658 | ||||||||
| Trucking & Leasing — 0.1% | ||||||||
| GATX Corp. |
||||||||
| 3.10%, 06/01/51 (Call 12/01/50) |
10 | 6,411 | ||||||
| 4.00%, 06/30/30 (Call 03/30/30) |
35 | 32,325 | ||||||
|
|
|
|||||||
| 38,736 | ||||||||
| Water — 0.1% | ||||||||
| Essential Utilities Inc. |
||||||||
| 3.35%, 04/15/50 (Call 10/15/49) |
10 | 6,838 | ||||||
| 5.30%, 05/01/52 (Call 11/01/51) |
15 | 13,889 | ||||||
|
|
|
|||||||
| 20,727 | ||||||||
|
|
|
|||||||
| Total Long-Term Investments — 96.3% |
32,670,697 | |||||||
|
|
|
|||||||
| Shares | ||||||||
| Short-Term Securities | ||||||||
| Money Market Funds — 10.0% | ||||||||
| BlackRock Cash Funds: Institutional, SL Agency Shares, 5.50%(e)(f)(g) |
2,750,612 | 2,751,987 | ||||||
| BlackRock Cash Funds: Treasury, SL Agency Shares, 5.30%(e)(f) |
630,000 | 630,000 | ||||||
|
|
|
|||||||
| Total Short-Term Securities — 10.0% |
|
3,381,987 | ||||||
|
|
|
|||||||
| Total Investments — 106.3% |
|
36,052,684 | ||||||
| Liabilities in Excess of Other Assets — (6.3)% |
|
(2,121,082 | ) | |||||
|
|
|
|||||||
| Net Assets — 100.0% |
|
$ | 33,931,602 | |||||
|
|
|
|||||||
| (a) | All or a portion of this security is on loan. |
| (b) | Variable rate security. Interest rate resets periodically. The rate shown is the effective interest rate as of period end. Security description also includes the reference rate and spread if published and available. |
| (c) | Step coupon security. Coupon rate will either increase (step-up bond) or decrease (step-down bond) at regular intervals until maturity. Interest rate shown reflects the rate currently in effect. |
| 26 | 2 0 2 4 I S H A R E S A N N U A L R E P O R T T O S H A R E H O L D E R S |
| Schedule of Investments (continued) February 29, 2024 |
iShares® BBB Rated Corporate Bond ETF |
| (d) | Security exempt from registration pursuant to Rule 144A under the Securities Act of 1933, as amended. These securities may be resold in transactions exempt from registration to qualified institutional investors. |
| (e) | Affiliate of the Fund. |
| (f) | Annualized 7-day yield as of period end. |
| (g) | All or a portion of this security was purchased with the cash collateral from loaned securities. |
Affiliates
Investments in issuers considered to be affiliate(s) of the Fund during the year ended February 29, 2024 for purposes of Section 2(a)(3) of the Investment Company Act of 1940, as amended, were as follows:
| Affiliated Issuer | Value at 02/28/23 |
Purchases at Cost |
Proceeds from Sale |
Net Realized Gain (Loss) |
Change in Unrealized Appreciation (Depreciation) |
Value at 02/29/24 |
Shares Held at 02/29/24 |
Income | Capital Gain |
|||||||||||||||||||||||||||||||||||||
| BlackRock Cash Funds: Institutional, SL Agency |
$ | 1,369,056 | $ | 1,383,174 | (a) | $ | — | $ | 224 | $ | (467 | ) | $ | 2,751,987 | 2,750,612 | $ | 7,061 | (b) | $ | — | ||||||||||||||||||||||||||
| BlackRock Cash Funds: Treasury, SL Agency |
690,000 | — | (60,000 | )(a) | — | — | 630,000 | 630,000 | 39,761 | — | ||||||||||||||||||||||||||||||||||||
|
|
|
|
|
|
|
|
|
|
|
|||||||||||||||||||||||||||||||||||||
| $ | 224 | $ | (467 | ) | $ | 3,381,987 | $ | 46,822 | $ | — | ||||||||||||||||||||||||||||||||||||
|
|
|
|
|
|
|
|
|
|
|
|||||||||||||||||||||||||||||||||||||
| (a) | Represents net amount purchased (sold). |
| (b) | All or a portion represents securities lending income earned from the reinvestment of cash collateral from loaned securities, net of fees and collateral investment expenses, and other payments to and from borrowers of securities. |
Fair Value Hierarchy as of Period End
Various inputs are used in determining the fair value of financial instruments. For a description of the input levels and information about the Fund’s policy regarding valuation of financial instruments, refer to the Notes to Financial Statements.
The following table summarizes the Fund’s financial instruments categorized in the fair value hierarchy. The breakdown of the Fund’s financial instruments into major categories is disclosed in the Schedule of Investments above.
|
|
||||||||||||||||||||||||||||||||||
| Level 1 | Level 2 | Level 3 | Total | |||||||||||||||||||||||||||||||
|
|
||||||||||||||||||||||||||||||||||
| Assets |
||||||||||||||||||||||||||||||||||
| Investments |
||||||||||||||||||||||||||||||||||
| Long-Term Investments |
||||||||||||||||||||||||||||||||||
| Corporate Bonds & Notes |
$ | — | $ | 32,670,697 | $ | — | $ | 32,670,697 | ||||||||||||||||||||||||||
| Short-Term Securities |
||||||||||||||||||||||||||||||||||
| Money Market Funds |
3,381,987 | — | — | 3,381,987 | ||||||||||||||||||||||||||||||
|
|
|
|
|
|
|
|
|
|||||||||||||||||||||||||||
| $ | 3,381,987 | $ | 32,670,697 | $ | — | $ | 36,052,684 | |||||||||||||||||||||||||||
|
|
|
|
|
|
|
|
|
|||||||||||||||||||||||||||
See notes to financial statements.
| S C H E D U L E O F I N V E S T M E N T S |
27 |
| Schedule of Investments February 29, 2024 |
iShares® Broad USD Investment Grade Corporate Bond ETF (Percentages shown are based on Net Assets) |
| Security | Par (000) |
Value | ||||||
| Corporate Bonds & Notes |
||||||||
| Advertising — 0.1% | ||||||||
| Interpublic Group of Companies Inc. (The) |
||||||||
| 2.40%, 03/01/31 (Call 12/01/30)(a) |
$ | 632 | $ | 526,774 | ||||
| 3.38%, 03/01/41 (Call 09/01/40)(a) |
449 | 329,517 | ||||||
| 4.65%, 10/01/28 (Call 07/01/28) |
1,208 | 1,184,288 | ||||||
| 4.75%, 03/30/30 (Call 12/30/29) |
940 | 914,507 | ||||||
| 5.38%, 06/15/33 (Call 03/15/33) |
553 | 546,989 | ||||||
| 5.40%, 10/01/48 (Call 04/01/48) |
841 | 778,241 | ||||||
| Omnicom Group Inc. |
||||||||
| 2.45%, 04/30/30 (Call 01/30/30) |
1,023 | 873,827 | ||||||
| 2.60%, 08/01/31 (Call 05/01/31) |
1,285 | 1,078,120 | ||||||
| 4.20%, 06/01/30 (Call 03/01/30) |
1,107 | 1,048,464 | ||||||
| Omnicom Group Inc./Omnicom Capital Inc., |
2,365 | 2,291,598 | ||||||
|
|
|
|||||||
| 9,572,325 | ||||||||
| Aerospace & Defense — 1.6% | ||||||||
| Airbus SE |
||||||||
| 3.15%, 04/10/27 (Call 01/10/27)(a)(b) |
1,380 | 1,316,962 | ||||||
| 3.95%, 04/10/47 (Call 10/10/46)(a)(b) |
955 | 783,858 | ||||||
| BAE Systems Finance Inc., 7.50%, 07/01/27(b) |
825 | 881,572 | ||||||
| BAE Systems Holdings Inc. |
||||||||
| 3.85%, 12/15/25 (Call 09/15/25)(b) |
1,054 | 1,028,005 | ||||||
| 4.75%, 10/07/44(a)(b) |
508 | 452,260 | ||||||
| BAE Systems PLC |
||||||||
| 1.90%, 02/15/31 (Call 11/15/30)(b) |
1,375 | 1,113,098 | ||||||
| 3.00%, 09/15/50 (Call 03/15/50)(b) |
485 | 325,106 | ||||||
| 3.40%, 04/15/30 (Call 01/15/30)(b) |
1,700 | 1,539,740 | ||||||
| 5.80%, 10/11/41(b) |
567 | 571,821 | ||||||
| Boeing Co. (The) |
||||||||
| 2.20%, 02/04/26 (Call 03/11/24) |
6,755 | 6,337,032 | ||||||
| 2.25%, 06/15/26 (Call 03/15/26) |
836 | 778,116 | ||||||
| 2.50%, 03/01/25 (Call 12/01/24) |
397 | 384,069 | ||||||
| 2.60%, 10/30/25 (Call 07/30/25)(a) |
855 | 815,355 | ||||||
| 2.70%, 02/01/27 (Call 12/01/26) |
1,435 | 1,336,389 | ||||||
| 2.75%, 02/01/26 (Call 01/01/26) |
1,530 | 1,452,939 | ||||||
| 2.80%, 03/01/27 (Call 12/01/26) |
782 | 725,778 | ||||||
| 2.95%, 02/01/30 (Call 11/01/29) |
1,495 | 1,310,288 | ||||||
| 3.10%, 05/01/26 (Call 03/01/26) |
934 | 889,809 | ||||||
| 3.20%, 03/01/29 (Call 12/01/28) |
1,320 | 1,194,206 | ||||||
| 3.25%, 02/01/28 (Call 12/01/27) |
762 | 706,971 | ||||||
| 3.25%, 03/01/28 (Call 12/01/27) |
747 | 691,061 | ||||||
| 3.25%, 02/01/35 (Call 11/01/34) |
896 | 720,357 | ||||||
| 3.30%, 03/01/35 (Call 09/01/34) |
198 | 154,882 | ||||||
| 3.38%, 06/15/46 (Call 12/15/45)(a) |
580 | 393,729 | ||||||
| 3.45%, 11/01/28 (Call 08/01/28)(a) |
717 | 662,231 | ||||||
| 3.50%, 03/01/39 (Call 09/01/38) |
607 | 460,435 | ||||||
| 3.50%, 03/01/45 (Call 09/01/44) |
567 | 390,070 | ||||||
| 3.55%, 03/01/38 (Call 09/01/37) |
515 | 398,509 | ||||||
| 3.60%, 05/01/34 (Call 02/01/34) |
1,123 | 943,922 | ||||||
| 3.63%, 02/01/31 (Call 11/01/30) |
1,445 | 1,294,141 | ||||||
| 3.63%, 03/01/48 (Call 09/01/47) |
693 | 480,086 | ||||||
| 3.65%, 03/01/47 (Call 09/01/46)(a) |
470 | 330,525 | ||||||
| 3.75%, 02/01/50 (Call 08/01/49)(a) |
1,688 | 1,198,410 | ||||||
| 3.83%, 03/01/59 (Call 09/01/58)(a) |
799 | 554,624 | ||||||
| 3.85%, 11/01/48 (Call 05/01/48) |
646 | 468,434 | ||||||
| 3.90%, 05/01/49 (Call 11/01/48) |
1,287 | 949,936 | ||||||
| 3.95%, 08/01/59 (Call 02/01/59) |
1,357 | 967,233 | ||||||
| 4.88%, 05/01/25 (Call 04/01/25) |
3,083 | 3,054,456 | ||||||
| 5.04%, 05/01/27 (Call 03/01/27) |
2,755 | 2,729,030 | ||||||
| 5.15%, 05/01/30 (Call 02/01/30) |
5,005 | 4,921,246 | ||||||
| Security | Par (000) |
Value | ||||||
| Aerospace & Defense (continued) | ||||||||
| 5.71%, 05/01/40 (Call 11/01/39) |
$ | 3,820 | $ | 3,721,088 | ||||
| 5.81%, 05/01/50 (Call 11/01/49) |
6,549 | 6,312,452 | ||||||
| 5.88%, 02/15/40 |
670 | 660,042 | ||||||
| 5.93%, 05/01/60 (Call 11/01/59) |
4,387 | 4,200,062 | ||||||
| 6.13%, 02/15/33(a) |
634 | 657,515 | ||||||
| 6.63%, 02/15/38(a) |
487 | 517,112 | ||||||
| 6.88%, 03/15/39 |
688 | 746,909 | ||||||
| General Dynamics Corp. |
||||||||
| 1.15%, 06/01/26 (Call 05/01/26)(a) |
1,172 | 1,079,646 | ||||||
| 2.13%, 08/15/26 (Call 05/15/26) |
121 | 113,240 | ||||||
| 2.25%, 06/01/31 (Call 03/01/31) |
845 | 710,018 | ||||||
| 2.63%, 11/15/27 (Call 08/15/27)(a) |
695 | 642,867 | ||||||
| 2.85%, 06/01/41 (Call 12/01/40) |
860 | 623,129 | ||||||
| 3.25%, 04/01/25 (Call 03/01/25) |
926 | 906,629 | ||||||
| 3.50%, 05/15/25 (Call 03/15/25)(a) |
881 | 864,213 | ||||||
| 3.50%, 04/01/27 (Call 02/01/27) |
1,248 | 1,200,897 | ||||||
| 3.60%, 11/15/42 (Call 05/15/42)(a) |
424 | 338,605 | ||||||
| 3.63%, 04/01/30 (Call 01/01/30) |
1,347 | 1,258,228 | ||||||
| 3.75%, 05/15/28 (Call 02/15/28)(a) |
1,361 | 1,311,181 | ||||||
| 4.25%, 04/01/40 (Call 10/01/39) |
1,032 | 917,556 | ||||||
| 4.25%, 04/01/50 (Call 10/01/49) |
1,135 | 978,837 | ||||||
| HEICO Corp. |
||||||||
| 5.25%, 08/01/28 (Call 07/01/28)(a) |
575 | 579,576 | ||||||
| 5.35%, 08/01/33 (Call 05/01/33) |
715 | 711,350 | ||||||
| Hexcel Corp. |
||||||||
| 4.20%, 02/15/27 (Call 11/15/26) |
405 | 385,968 | ||||||
| 4.95%, 08/15/25 (Call 05/15/25) |
355 | 349,387 | ||||||
| Howmet Aerospace Inc. |
||||||||
| 3.00%, 01/15/29 (Call 11/15/28) |
645 | 578,484 | ||||||
| 5.90%, 02/01/27 |
340 | 343,250 | ||||||
| 5.95%, 02/01/37(a) |
720 | 731,089 | ||||||
| 6.75%, 01/15/28 |
290 | 302,362 | ||||||
| L3Harris Technologies Inc. |
||||||||
| 1.80%, 01/15/31 (Call 10/15/30) |
1,078 | 867,408 | ||||||
| 2.90%, 12/15/29 (Call 09/15/29) |
1,031 | 914,171 | ||||||
| 3.83%, 04/27/25 (Call 01/27/25) |
941 | 923,737 | ||||||
| 3.85%, 12/15/26 (Call 09/15/26) |
977 | 943,685 | ||||||
| 4.40%, 06/15/28 (Call 03/15/28) |
2,457 | 2,388,538 | ||||||
| 4.85%, 04/27/35 (Call 10/27/34) |
632 | 600,782 | ||||||
| 5.05%, 04/27/45 (Call 10/27/44) |
889 | 832,920 | ||||||
| 5.40%, 01/15/27 |
1,300 | 1,308,089 | ||||||
| 5.40%, 07/31/33 (Call 04/30/33) |
1,425 | 1,426,008 | ||||||
| 5.60%, 07/31/53 (Call 01/31/53) |
315 | 317,552 | ||||||
| 6.15%, 12/15/40(a) |
431 | 452,738 | ||||||
| Lockheed Martin Corp. |
||||||||
| 1.85%, 06/15/30 (Call 03/15/30) |
835 | 698,408 | ||||||
| 2.80%, 06/15/50 (Call 12/15/49) |
1,236 | 817,249 | ||||||
| 3.55%, 01/15/26 (Call 10/15/25)(a) |
1,376 | 1,340,943 | ||||||
| 3.60%, 03/01/35 (Call 09/01/34) |
949 | 830,577 | ||||||
| 3.80%, 03/01/45 (Call 09/01/44) |
1,444 | 1,169,924 | ||||||
| 3.90%, 06/15/32 (Call 03/15/32) |
1,140 | 1,058,241 | ||||||
| 4.07%, 12/15/42 |
1,605 | 1,374,571 | ||||||
| 4.09%, 09/15/52 (Call 03/15/52) |
1,611 | 1,339,373 | ||||||
| 4.15%, 06/15/53 (Call 12/15/52) |
1,215 | 1,008,100 | ||||||
| 4.30%, 06/15/62 (Call 12/15/61) |
989 | 828,072 | ||||||
| 4.45%, 05/15/28 (Call 04/15/28) |
688 | 678,212 | ||||||
| 4.50%, 02/15/29 (Call 01/15/29) |
545 | 535,533 | ||||||
| 4.50%, 05/15/36 (Call 11/15/35) |
787 | 743,965 | ||||||
| 4.70%, 05/15/46 (Call 11/15/45) |
1,267 | 1,167,707 | ||||||
| 4.75%, 02/15/34 (Call 11/15/33)(a) |
995 | 972,199 | ||||||
| 4.80%, 08/15/34 (Call 05/15/34) |
625 | 611,148 | ||||||
| 28 | 2 0 2 4 I S H A R E S A N N U A L R E P O R T T O S H A R E H O L D E R S |
| Schedule of Investments (continued) February 29, 2024 |
iShares® Broad USD Investment Grade Corporate Bond ETF (Percentages shown are based on Net Assets) |
| Security | Par (000) |
Value | ||||||
| Aerospace & Defense (continued) | ||||||||
| 4.95%, 10/15/25 (Call 09/15/25) |
$ | 604 | $ | 602,992 | ||||
| 5.10%, 11/15/27 (Call 10/15/27)(a) |
1,432 | 1,447,840 | ||||||
| 5.20%, 02/15/55 (Call 08/15/54) |
360 | 353,620 | ||||||
| 5.20%, 02/15/64 (Call 08/15/63) |
450 | 439,467 | ||||||
| 5.25%, 01/15/33 (Call 10/15/32)(a) |
1,395 | 1,423,838 | ||||||
| 5.70%, 11/15/54 (Call 05/15/54)(a) |
1,360 | 1,435,540 | ||||||
| 5.72%, 06/01/40 |
275 | 288,087 | ||||||
| 5.90%, 11/15/63 (Call 05/15/63) |
1,035 | 1,126,803 | ||||||
| Series B, 6.15%, 09/01/36 |
840 | 909,093 | ||||||
| Northrop Grumman Corp. |
||||||||
| 3.20%, 02/01/27 (Call 11/01/26) |
996 | 948,949 | ||||||
| 3.25%, 01/15/28 (Call 10/15/27) |
2,299 | 2,156,011 | ||||||
| 3.85%, 04/15/45 (Call 10/15/44) |
838 | 666,246 | ||||||
| 4.03%, 10/15/47 (Call 04/15/47) |
2,684 | 2,166,280 | ||||||
| 4.40%, 05/01/30 (Call 02/01/30) |
1,461 | 1,407,478 | ||||||
| 4.60%, 02/01/29 (Call 01/01/29) |
750 | 734,459 | ||||||
| 4.70%, 03/15/33 (Call 12/15/32) |
1,345 | 1,298,340 | ||||||
| 4.75%, 06/01/43 |
1,604 | 1,456,725 | ||||||
| 4.90%, 06/01/34 (Call 03/01/34) |
820 | 798,205 | ||||||
| 4.95%, 03/15/53 (Call 09/15/52)(a) |
740 | 683,903 | ||||||
| 5.05%, 11/15/40 |
774 | 741,843 | ||||||
| 5.15%, 05/01/40 (Call 11/01/39) |
661 | 641,668 | ||||||
| 5.20%, 06/01/54 (Call 12/01/53) |
1,500 | 1,438,796 | ||||||
| 5.25%, 05/01/50 (Call 11/01/49) |
1,105 | 1,065,364 | ||||||
| Northrop Grumman Systems Corp., 7.75%, 02/15/31 |
180 | 204,585 | ||||||
| RTX Corp. |
||||||||
| 1.90%, 09/01/31 (Call 06/01/31) |
1,390 | 1,108,404 | ||||||
| 2.25%, 07/01/30 (Call 04/01/30)(a) |
1,071 | 906,434 | ||||||
| 2.38%, 03/15/32 (Call 12/15/31) |
1,797 | 1,463,346 | ||||||
| 2.65%, 11/01/26 (Call 08/01/26)(a) |
1,032 | 971,573 | ||||||
| 2.82%, 09/01/51 (Call 03/01/51) |
1,585 | 991,107 | ||||||
| 3.03%, 03/15/52 (Call 09/15/51) |
1,275 | 833,478 | ||||||
| 3.13%, 05/04/27 (Call 02/04/27) |
1,005 | 948,382 | ||||||
| 3.13%, 07/01/50 (Call 01/01/50) |
1,315 | 884,497 | ||||||
| 3.50%, 03/15/27 (Call 12/15/26) |
1,880 | 1,796,800 | ||||||
| 3.75%, 11/01/46 (Call 05/01/46) |
1,827 | 1,394,557 | ||||||
| 3.95%, 08/16/25 (Call 06/16/25) |
1,510 | 1,481,126 | ||||||
| 4.05%, 05/04/47 (Call 11/04/46) |
1,017 | 814,907 | ||||||
| 4.13%, 11/16/28 (Call 08/16/28) |
3,299 | 3,165,710 | ||||||
| 4.15%, 05/15/45 (Call 11/16/44) |
1,252 | 1,027,376 | ||||||
| 4.20%, 12/15/44 (Call 06/15/44)(a) |
330 | 261,269 | ||||||
| 4.35%, 04/15/47 (Call 10/15/46) |
1,528 | 1,279,091 | ||||||
| 4.45%, 11/16/38 (Call 05/16/38) |
1,194 | 1,064,318 | ||||||
| 4.50%, 06/01/42 |
4,284 | 3,745,542 | ||||||
| 4.63%, 11/16/48 (Call 05/16/48) |
2,120 | 1,852,446 | ||||||
| 4.70%, 12/15/41 |
590 | 527,285 | ||||||
| 4.80%, 12/15/43 (Call 06/15/43) |
789 | 710,152 | ||||||
| 4.88%, 10/15/40 |
456 | 420,710 | ||||||
| 5.00%, 02/27/26 (Call 01/27/26) |
470 | 468,861 | ||||||
| 5.15%, 02/27/33 (Call 11/27/32) |
1,425 | 1,411,012 | ||||||
| 5.38%, 02/27/53 (Call 08/27/52)(a) |
1,610 | 1,561,739 | ||||||
| 5.40%, 05/01/35(a) |
675 | 680,042 | ||||||
| 5.70%, 04/15/40(a) |
475 | 476,569 | ||||||
| 5.75%, 11/08/26 (Call 10/08/26) |
1,495 | 1,516,380 | ||||||
| 5.75%, 01/15/29 (Call 12/15/28) |
1,050 | 1,081,134 | ||||||
| 6.00%, 03/15/31 (Call 01/15/31) |
2,025 | 2,108,978 | ||||||
| 6.05%, 06/01/36(a) |
555 | 577,913 | ||||||
| 6.10%, 03/15/34 (Call 12/15/33)(a) |
1,720 | 1,816,027 | ||||||
| 6.13%, 07/15/38 |
805 | 848,598 | ||||||
| 6.40%, 03/15/54 (Call 09/15/53)(a) |
1,460 | 1,616,221 | ||||||
| Security | Par (000) |
Value | ||||||
| Aerospace & Defense (continued) | ||||||||
| 6.70%, 08/01/28(a) |
$ | 615 | $ | 653,491 | ||||
| 7.20%, 08/15/27 |
150 | 158,258 | ||||||
| 7.50%, 09/15/29 |
1,235 | 1,369,982 | ||||||
|
|
|
|||||||
| 172,028,080 | ||||||||
| Agriculture — 1.3% | ||||||||
| Altria Group Inc. |
||||||||
| 2.35%, 05/06/25 (Call 04/06/25) |
1,141 | 1,101,796 | ||||||
| 2.45%, 02/04/32 (Call 11/04/31) |
2,620 | 2,098,331 | ||||||
| 2.63%, 09/16/26 (Call 06/16/26) |
930 | 873,492 | ||||||
| 3.40%, 05/06/30 (Call 02/06/30) |
1,088 | 979,235 | ||||||
| 3.40%, 02/04/41 (Call 08/04/40) |
2,146 | 1,543,275 | ||||||
| 3.70%, 02/04/51 (Call 08/04/50) |
1,791 | 1,219,400 | ||||||
| 3.88%, 09/16/46 (Call 03/16/46) |
2,089 | 1,536,945 | ||||||
| 4.00%, 02/04/61 (Call 08/04/60)(a) |
1,135 | 816,634 | ||||||
| 4.25%, 08/09/42 |
995 | 797,654 | ||||||
| 4.40%, 02/14/26 (Call 12/14/25) |
1,619 | 1,593,875 | ||||||
| 4.45%, 05/06/50 (Call 11/06/49) |
557 | 439,256 | ||||||
| 4.50%, 05/02/43 |
872 | 723,930 | ||||||
| 4.80%, 02/14/29 (Call 11/14/28)(a) |
2,834 | 2,782,624 | ||||||
| 5.38%, 01/31/44 |
1,855 | 1,802,821 | ||||||
| 5.80%, 02/14/39 (Call 08/14/38) |
2,544 | 2,536,881 | ||||||
| 5.95%, 02/14/49 (Call 08/14/48) |
3,146 | 3,133,995 | ||||||
| 6.20%, 11/01/28 (Call 10/01/28)(a) |
450 | 467,689 | ||||||
| 6.20%, 02/14/59 (Call 08/14/58) |
488 | 495,890 | ||||||
| 6.88%, 11/01/33 (Call 08/01/33) |
580 | 626,617 | ||||||
| Archer-Daniels-Midland Co. |
||||||||
| 2.50%, 08/11/26 (Call 05/11/26)(a) |
1,500 | 1,411,664 | ||||||
| 2.70%, 09/15/51 (Call 03/15/51)(a) |
1,190 | 752,616 | ||||||
| 2.90%, 03/01/32 (Call 12/01/31) |
955 | 814,258 | ||||||
| 3.25%, 03/27/30 (Call 12/27/29)(a) |
1,117 | 1,009,961 | ||||||
| 3.75%, 09/15/47 (Call 03/15/47) |
780 | 591,140 | ||||||
| 4.02%, 04/16/43 |
663 | 543,611 | ||||||
| 4.50%, 08/15/33 (Call 05/15/33)(a) |
185 | 176,991 | ||||||
| 4.50%, 03/15/49 (Call 09/15/48)(a) |
660 | 573,557 | ||||||
| 4.54%, 03/26/42(a) |
430 | 384,000 | ||||||
| 5.38%, 09/15/35 |
575 | 574,180 | ||||||
| 5.77%, 03/01/41(c) |
255 | 257,974 | ||||||
| 5.94%, 10/01/32(a) |
511 | 538,971 | ||||||
| BAT Capital Corp. |
||||||||
| 2.26%, 03/25/28 (Call 01/25/28) |
2,048 | 1,812,319 | ||||||
| 2.73%, 03/25/31 (Call 12/25/30) |
1,424 | 1,173,946 | ||||||
| 3.22%, 09/06/26 (Call 07/06/26) |
1,210 | 1,147,396 | ||||||
| 3.46%, 09/06/29 (Call 06/06/29) |
1,122 | 1,015,226 | ||||||
| 3.56%, 08/15/27 (Call 05/15/27) |
2,108 | 1,992,804 | ||||||
| 3.73%, 09/25/40 (Call 03/25/40)(a) |
1,140 | 829,115 | ||||||
| 3.98%, 09/25/50 (Call 03/25/50) |
1,411 | 963,061 | ||||||
| 4.39%, 08/15/37 (Call 02/15/37)(a) |
3,138 | 2,573,480 | ||||||
| 4.54%, 08/15/47 (Call 02/15/47) |
3,199 | 2,399,326 | ||||||
| 4.70%, 04/02/27 (Call 02/02/27) |
1,669 | 1,633,425 | ||||||
| 4.74%, 03/16/32 (Call 12/16/31)(a) |
1,337 | 1,257,747 | ||||||
| 4.76%, 09/06/49 (Call 03/06/49) |
1,441 | 1,114,815 | ||||||
| 4.91%, 04/02/30 (Call 01/02/30) |
1,596 | 1,551,069 | ||||||
| 5.28%, 04/02/50 (Call 10/02/49) |
648 | 537,279 | ||||||
| 5.65%, 03/16/52 (Call 09/16/51)(a) |
869 | 763,316 | ||||||
| 5.83%, 02/20/31 (Call 12/20/30) |
340 | 338,824 | ||||||
| 6.00%, 02/20/34 (Call 11/20/33) |
240 | 237,426 | ||||||
| 6.34%, 08/02/30 (Call 06/02/30) |
975 | 1,006,880 | ||||||
| 6.42%, 08/02/33 (Call 05/02/33)(a) |
1,625 | 1,671,640 | ||||||
| 7.08%, 08/02/43 (Call 02/02/43) |
890 | 927,464 | ||||||
| 7.08%, 08/02/53 (Call 02/02/53) |
1,390 | 1,438,955 | ||||||
| 7.75%, 10/19/32 (Call 07/19/32) |
700 | 782,313 | ||||||
| S C H E D U L E O F I N V E S T M E N T S |
29 |
| Schedule of Investments (continued) February 29, 2024 |
iShares® Broad USD Investment Grade Corporate Bond ETF (Percentages shown are based on Net Assets) |
| Security | Par (000) | Value | ||||||
| Agriculture (continued) | ||||||||
| BAT International Finance PLC |
||||||||
| 1.67%, 03/25/26 (Call 02/25/26)(a) |
$ | 1,428 | $ | 1,323,005 | ||||
| 3.95%, 06/15/25(b) |
200 | 195,477 | ||||||
| 4.45%, 03/16/28 (Call 02/16/28) |
1,475 | 1,422,471 | ||||||
| 5.93%, 02/02/29 (Call 01/02/29) |
905 | 924,214 | ||||||
| Bunge Ltd. Finance Corp. |
||||||||
| 1.63%, 08/17/25 (Call 07/17/25) |
1,037 | 981,912 | ||||||
| 2.75%, 05/14/31 (Call 02/14/31)(a) |
1,393 | 1,184,566 | ||||||
| 3.25%, 08/15/26 (Call 05/15/26) |
1,104 | 1,053,140 | ||||||
| 3.75%, 09/25/27 (Call 06/25/27) |
819 | 783,826 | ||||||
| Cargill Inc. |
||||||||
| 0.75%, 02/02/26 (Call 01/02/26)(b) |
972 | 896,857 | ||||||
| 1.70%, 02/02/31 (Call 11/02/30)(a)(b) |
810 | 651,783 | ||||||
| 2.13%, 04/23/30 (Call 01/23/30)(a)(b) |
1,213 | 1,031,214 | ||||||
| 2.13%, 11/10/31 (Call 08/10/31)(b) |
499 | 405,786 | ||||||
| 3.13%, 05/25/51 (Call 11/25/50)(b) |
1,045 | 717,689 | ||||||
| 3.25%, 05/23/29 (Call 02/23/29)(b) |
1,035 | 964,132 | ||||||
| 3.50%, 04/22/25 (Call 04/01/24)(a)(b) |
946 | 927,913 | ||||||
| 3.63%, 04/22/27 (Call 03/22/27)(a)(b) |
960 | 923,834 | ||||||
| 3.88%, 05/23/49 (Call 11/23/48)(a)(b) |
475 | 373,939 | ||||||
| 4.00%, 06/22/32 (Call 03/22/32)(a)(b) |
1,030 | 950,678 | ||||||
| 4.38%, 04/22/52 (Call 10/22/51)(a)(b) |
529 | 457,505 | ||||||
| 4.50%, 06/24/26(b) |
430 | 424,645 | ||||||
| 4.75%, 04/24/33 (Call 01/24/33)(b) |
705 | 683,855 | ||||||
| 4.76%, 11/23/45(a)(b) |
1,152 | 1,055,197 | ||||||
| 4.88%, 10/10/25 (Call 09/10/25)(b) |
565 | 562,752 | ||||||
| 5.13%, 10/11/32 (Call 07/11/32)(a)(b) |
752 | 748,879 | ||||||
| Imperial Brands Finance PLC |
||||||||
| 3.50%, 07/26/26 (Call 05/26/26)(b) |
1,278 | 1,215,719 | ||||||
| 3.88%, 07/26/29 (Call 04/26/29)(b) |
1,549 | 1,431,781 | ||||||
| 4.25%, 07/21/25 (Call 04/21/25)(b) |
2,050 | 2,009,123 | ||||||
| 6.13%, 07/27/27 (Call 06/27/27)(b) |
1,480 | 1,506,623 | ||||||
| JT International Financial Services BV, |
555 | 613,906 | ||||||
| Philip Morris International Inc. |
||||||||
| 0.88%, 05/01/26 (Call 04/01/26) |
1,438 | 1,314,046 | ||||||
| 1.50%, 05/01/25 (Call 04/01/25) |
1,095 | 1,049,528 | ||||||
| 1.75%, 11/01/30 (Call 08/01/30) |
1,463 | 1,182,198 | ||||||
| 2.10%, 05/01/30 (Call 02/01/30) |
1,140 | 961,733 | ||||||
| 2.75%, 02/25/26 (Call 11/25/25)(a) |
1,408 | 1,344,380 | ||||||
| 3.13%, 08/17/27 (Call 05/17/27)(a) |
668 | 629,239 | ||||||
| 3.13%, 03/02/28 (Call 12/02/27) |
701 | 652,303 | ||||||
| 3.38%, 08/11/25 (Call 05/11/25) |
1,007 | 981,958 | ||||||
| 3.38%, 08/15/29 (Call 05/15/29)(a) |
1,040 | 955,165 | ||||||
| 3.88%, 08/21/42 |
1,134 | 894,419 | ||||||
| 4.13%, 03/04/43 |
1,093 | 894,435 | ||||||
| 4.25%, 11/10/44 |
1,720 | 1,418,221 | ||||||
| 4.38%, 11/15/41 |
1,065 | 905,282 | ||||||
| 4.50%, 03/20/42(a) |
1,017 | 878,880 | ||||||
| 4.75%, 02/12/27 |
900 | 888,823 | ||||||
| 4.88%, 02/13/26 |
1,668 | 1,659,935 | ||||||
| 4.88%, 02/15/28 (Call 01/15/28) |
1,615 | 1,606,107 | ||||||
| 4.88%, 02/13/29 (Call 01/13/29) |
927 | 911,146 | ||||||
| 4.88%, 11/15/43 |
435 | 391,546 | ||||||
| 5.00%, 11/17/25 |
1,002 | 998,501 | ||||||
| 5.13%, 11/17/27 (Call 10/17/27) |
1,555 | 1,557,630 | ||||||
| 5.13%, 02/15/30 (Call 12/15/29) |
2,178 | 2,167,458 | ||||||
| 5.13%, 02/13/31 (Call 12/13/30) |
945 | 930,733 | ||||||
| 5.25%, 09/07/28 (Call 08/07/28) |
535 | 539,050 | ||||||
| 5.25%, 02/13/34 (Call 11/13/33)(a) |
1,020 | 996,539 | ||||||
| 5.38%, 02/15/33 (Call 11/15/32) |
2,740 | 2,726,878 | ||||||
| Security | Par (000) | Value | ||||||
| Agriculture (continued) | ||||||||
| 5.50%, 09/07/30 (Call 07/07/30) |
$ | 470 | $ | 474,385 | ||||
| 5.63%, 11/17/29 (Call 09/17/29) |
1,505 | 1,541,011 | ||||||
| 5.63%, 09/07/33 (Call 06/07/33) |
1,350 | 1,364,416 | ||||||
| 5.75%, 11/17/32 (Call 08/17/32) |
1,760 | 1,795,302 | ||||||
| 6.38%, 05/16/38 |
1,845 | 1,990,664 | ||||||
| Reynolds American Inc. |
||||||||
| 4.45%, 06/12/25 (Call 03/12/25) |
1,665 | 1,639,455 | ||||||
| 5.70%, 08/15/35 (Call 02/15/35) |
973 | 929,406 | ||||||
| 5.85%, 08/15/45 (Call 02/15/45)(a) |
2,906 | 2,640,112 | ||||||
| 6.15%, 09/15/43(a) |
782 | 756,229 | ||||||
| 7.25%, 06/15/37(a) |
830 | 887,950 | ||||||
| Viterra Finance BV |
||||||||
| 2.00%, 04/21/26 (Call 03/21/26)(b) |
1,201 | 1,111,706 | ||||||
| 3.20%, 04/21/31 (Call 01/21/31)(b) |
1,065 | 914,027 | ||||||
| 4.90%, 04/21/27 (Call 03/21/27)(b) |
550 | 538,396 | ||||||
| 5.25%, 04/21/32 (Call 01/21/32)(b) |
365 | 355,268 | ||||||
|
|
|
|||||||
| 133,163,970 | ||||||||
| Airlines — 0.2% | ||||||||
| Delta Air Lines Inc., 7.00%, 05/01/25(b) |
1,430 | 1,453,440 | ||||||
| Delta Air Lines Inc./SkyMiles IP Ltd. |
||||||||
| 4.50%, 10/20/25(b) |
1,932 | 1,908,552 | ||||||
| 4.75%, 10/20/28(a)(b) |
4,575 | 4,472,113 | ||||||
| Mileage Plus Holdings LLC/Mileage Plus |
3,447 | 3,447,641 | ||||||
| Southwest Airlines Co. |
||||||||
| 2.63%, 02/10/30 (Call 11/10/29)(a) |
1,136 | 982,462 | ||||||
| 3.00%, 11/15/26 (Call 08/15/26)(a) |
359 | 338,878 | ||||||
| 3.45%, 11/16/27 (Call 08/16/27)(a) |
59 | 55,503 | ||||||
| 5.13%, 06/15/27 (Call 04/15/27) |
2,493 | 2,482,930 | ||||||
| 5.25%, 05/04/25 (Call 04/04/25) |
2,047 | 2,041,371 | ||||||
|
|
|
|||||||
| 17,182,890 | ||||||||
| Alternate Investments — 0.0% | ||||||||
| New Mountain Finance Corp., 6.88%, 02/01/29 |
10 | 9,788 | ||||||
|
|
|
|||||||
| Apparel — 0.2% | ||||||||
| NIKE Inc. |
||||||||
| 2.38%, 11/01/26 (Call 08/01/26) |
1,503 | 1,414,286 | ||||||
| 2.40%, 03/27/25 (Call 02/27/25) |
1,357 | 1,319,337 | ||||||
| 2.75%, 03/27/27 (Call 01/27/27)(a) |
1,785 | 1,683,290 | ||||||
| 2.85%, 03/27/30 (Call 12/27/29) |
2,435 | 2,192,314 | ||||||
| 3.25%, 03/27/40 (Call 09/27/39) |
1,539 | 1,222,798 | ||||||
| 3.38%, 11/01/46 (Call 05/01/46) |
931 | 707,239 | ||||||
| 3.38%, 03/27/50 (Call 09/27/49) |
1,625 | 1,233,156 | ||||||
| 3.63%, 05/01/43 (Call 11/01/42) |
670 | 547,905 | ||||||
| 3.88%, 11/01/45 (Call 05/01/45)(a) |
1,488 | 1,231,808 | ||||||
| PVH Corp., 4.63%, 07/10/25 (Call 06/10/25) |
799 | 787,656 | ||||||
| Ralph Lauren Corp. |
||||||||
| 2.95%, 06/15/30 (Call 03/15/30) |
1,291 | 1,148,401 | ||||||
| 3.75%, 09/15/25 (Call 07/15/25)(a) |
614 | 599,966 | ||||||
| Tapestry Inc. |
||||||||
| 3.05%, 03/15/32 (Call 12/15/31)(a) |
1,135 | 919,685 | ||||||
| 4.13%, 07/15/27 (Call 04/15/27) |
772 | 733,781 | ||||||
| 4.25%, 04/01/25 (Call 01/01/25)(a) |
220 | 216,853 | ||||||
| 7.00%, 11/27/26(a) |
1,425 | 1,463,550 | ||||||
| 7.05%, 11/27/25 |
470 | 478,775 | ||||||
| 7.35%, 11/27/28 (Call 10/27/28) |
1,300 | 1,359,803 | ||||||
| 7.70%, 11/27/30 (Call 09/27/30) |
815 | 864,184 | ||||||
| 7.85%, 11/27/33 (Call 08/27/33) |
780 | 843,762 | ||||||
| 30 | 2 0 2 4 I S H A R E S A N N U A L R E P O R T T O S H A R E H O L D E R S |
| Schedule of Investments (continued) February 29, 2024 |
iShares® Broad USD Investment Grade Corporate Bond ETF (Percentages shown are based on Net Assets) |
| Security | Par (000) | Value | ||||||
| Apparel (continued) | ||||||||
| VF Corp. | ||||||||
| 2.40%, 04/23/25 (Call 03/23/25) |
$ | 1,195 | $ | 1,145,455 | ||||
| 2.80%, 04/23/27 (Call 02/23/27) |
981 | 890,685 | ||||||
| 2.95%, 04/23/30 (Call 01/23/30)(a) |
1,250 | 1,030,330 | ||||||
| 6.00%, 10/15/33(a) |
410 | 398,283 | ||||||
| 6.45%, 11/01/37 |
405 | 392,639 | ||||||
|
|
|
|||||||
| 24,825,941 | ||||||||
| Auto Manufacturers — 2.6% | ||||||||
| American Honda Finance Corp. |
||||||||
| 1.00%, 09/10/25 |
1,135 | 1,066,580 | ||||||
| 1.20%, 07/08/25 |
953 | 903,865 | ||||||
| 1.30%, 09/09/26 |
1,305 | 1,190,613 | ||||||
| 1.80%, 01/13/31(a) |
585 | 480,282 | ||||||
| 2.00%, 03/24/28(a) |
1,299 | 1,164,397 | ||||||
| 2.25%, 01/12/29 |
1,395 | 1,237,789 | ||||||
| 2.30%, 09/09/26(a) |
942 | 884,240 | ||||||
| 2.35%, 01/08/27 |
840 | 783,695 | ||||||
| 3.50%, 02/15/28 |
482 | 458,032 | ||||||
| 4.60%, 04/17/30 |
935 | 915,979 | ||||||
| 4.70%, 01/12/28 |
1,035 | 1,030,583 | ||||||
| 4.75%, 01/12/26 |
435 | 432,223 | ||||||
| 4.90%, 01/10/34 |
490 | 477,540 | ||||||
| 4.95%, 01/09/26(a) |
750 | 747,405 | ||||||
| 5.00%, 05/23/25 |
750 | 747,897 | ||||||
| 5.13%, 07/07/28 |
885 | 892,403 | ||||||
| 5.25%, 07/07/26(a) |
870 | 876,685 | ||||||
| 5.65%, 11/15/28 |
765 | 786,996 | ||||||
| 5.80%, 10/03/25 |
600 | 605,688 | ||||||
| 5.85%, 10/04/30 |
890 | 925,586 | ||||||
| Series A, 4.60%, 04/17/25 |
840 | 834,194 | ||||||
| BMW Finance NV, 2.85%,
08/14/29 |
845 | 771,293 | ||||||
| BMW U.S. Capital LLC |
||||||||
| 1.25%, 08/12/26 (Call 07/12/26)(b) |
712 | 650,549 | ||||||
| 1.95%, 08/12/31 (Call 05/12/31)(b) |
435 | 353,284 | ||||||
| 2.55%, 04/01/31 (Call 01/01/31)(a)(b) |
1,222 | 1,045,993 | ||||||
| 2.80%, 04/11/26 (Call 01/11/26)(b) |
1,895 | 1,812,717 | ||||||
| 3.25%, 04/01/25(a)(b) |
487 | 476,685 | ||||||
| 3.30%, 04/06/27 (Call 01/06/27)(b) |
1,057 | 1,005,761 | ||||||
| 3.45%, 04/01/27 (Call 03/01/27)(a)(b) |
1,091 | 1,046,524 | ||||||
| 3.63%, 04/18/29 (Call 01/18/29)(a)(b) |
875 | 828,594 | ||||||
| 3.70%, 04/01/32 (Call 01/01/32)(b) |
560 | 507,351 | ||||||
| 3.75%, 04/12/28 (Call 01/12/28)(a)(b) |
871 | 835,609 | ||||||
| 3.90%, 04/09/25 (Call 03/09/25)(b) |
1,278 | 1,260,090 | ||||||
| 3.95%, 08/14/28 (Call 05/14/28)(a)(b) |
873 | 839,306 | ||||||
| 4.15%, 04/09/30 (Call 01/09/30)(b) |
1,455 | 1,398,242 | ||||||
| 5.05%, 08/11/28 (Call 07/11/28)(b) |
615 | 618,718 | ||||||
| 5.15%, 08/11/33 (Call 05/11/33)(a)(b) |
525 | 525,080 | ||||||
| 5.30%, 08/11/25(b) |
500 | 501,403 | ||||||
| Cummins Inc. |
||||||||
| 0.75%, 09/01/25 (Call 08/01/25) |
811 | 760,717 | ||||||
| 1.50%, 09/01/30 (Call 06/01/30) |
1,070 | 864,847 | ||||||
| 2.60%, 09/01/50 (Call 03/01/50)(a) |
1,333 | 839,359 | ||||||
| 4.88%, 10/01/43 (Call 04/01/43) |
500 | 473,200 | ||||||
| 4.90%, 02/20/29 (Call 01/20/29) |
225 | 224,038 | ||||||
| 5.15%, 02/20/34 (Call 11/20/33) |
125 | 124,823 | ||||||
| 5.45%, 02/20/54 (Call 08/20/53) |
125 | 125,686 | ||||||
| 7.13%, 03/01/28 |
335 | 359,807 | ||||||
| Daimler Trucks Finance North America LLC |
||||||||
| 2.00%, 12/14/26(b) |
1,090 | 999,871 | ||||||
| 2.38%, 12/14/28(b) |
470 | 416,022 | ||||||
| Security | Par (000) | Value | ||||||
| Auto Manufacturers (continued) | ||||||||
| 2.50%, 12/14/31(a)(b) |
$ | 1,180 | $ | 967,596 | ||||
| 3.50%, 04/07/25(b) |
1,220 | 1,193,770 | ||||||
| 3.65%, 04/07/27(a)(b) |
1,227 | 1,177,150 | ||||||
| 5.00%, 01/15/27(b) |
590 | 587,746 | ||||||
| 5.13%, 01/19/28(a)(b) |
845 | 844,114 | ||||||
| 5.15%, 01/16/26(a)(b) |
652 | 650,001 | ||||||
| 5.38%, 01/18/34 (Call 10/18/33)(b) |
535 | 533,179 | ||||||
| 5.40%, 09/20/28(b) |
940 | 950,694 | ||||||
| 5.50%, 09/20/33(b) |
780 | 784,673 | ||||||
| 5.60%, 08/08/25(b) |
505 | 506,163 | ||||||
| Ford Holdings LLC, 9.30%, 03/01/30 |
165 | 190,023 | ||||||
| Ford Motor Co. |
||||||||
| 3.25%, 02/12/32 (Call 11/12/31)(a) |
4,100 | 3,362,233 | ||||||
| 4.35%, 12/08/26 (Call 09/08/26)(a) |
2,085 | 2,025,441 | ||||||
| 4.75%, 01/15/43(a) |
2,735 | 2,212,661 | ||||||
| 5.29%, 12/08/46 (Call 06/08/46)(a) |
1,045 | 903,686 | ||||||
| 6.10%, 08/19/32 (Call 05/19/32)(a) |
2,265 | 2,261,030 | ||||||
| 7.40%, 11/01/46 |
130 | 139,461 | ||||||
| 7.45%, 07/16/31 |
195 | 210,231 | ||||||
| 9.63%, 04/22/30 (Call 01/22/30) |
150 | 175,233 | ||||||
| Ford Motor Credit Co. LLC |
||||||||
| 2.70%, 08/10/26 (Call 07/10/26)(a) |
550 | 510,596 | ||||||
| 2.90%, 02/16/28 (Call 12/16/27) |
515 | 461,437 | ||||||
| 2.90%, 02/10/29 (Call 12/10/28) |
1,540 | 1,341,688 | ||||||
| 3.38%, 11/13/25 (Call 10/13/25) |
2,000 | 1,918,847 | ||||||
| 3.63%, 06/17/31 (Call 03/17/31) |
805 | 686,256 | ||||||
| 3.82%, 11/02/27 (Call 08/02/27) |
155 | 144,545 | ||||||
| 4.00%, 11/13/30 (Call 08/13/30) |
4,085 | 3,611,764 | ||||||
| 4.13%, 08/17/27 (Call 06/17/27) |
1,705 | 1,613,652 | ||||||
| 4.27%, 01/09/27 (Call 11/09/26)(a) |
1,025 | 981,916 | ||||||
| 4.39%, 01/08/26 |
1,100 | 1,069,617 | ||||||
| 4.54%, 08/01/26 (Call 06/01/26) |
1,000 | 969,490 | ||||||
| 4.95%, 05/28/27 (Call 04/28/27)(a) |
2,070 | 2,012,484 | ||||||
| 5.11%, 05/03/29 (Call 02/03/29) |
3,125 | 3,011,456 | ||||||
| 5.13%, 06/16/25 (Call 05/16/25) |
1,200 | 1,187,846 | ||||||
| 5.80%, 03/05/27 (Call 02/05/27) |
1,515 | 1,512,066 | ||||||
| 6.05%, 03/05/31 (Call 01/05/31)(a) |
1,050 | 1,045,244 | ||||||
| 6.80%, 05/12/28 (Call 04/12/28) |
1,930 | 1,991,679 | ||||||
| 6.80%, 11/07/28 (Call 10/07/28) |
1,470 | 1,523,537 | ||||||
| 6.95%, 03/06/26 (Call 02/06/26) |
330 | 335,941 | ||||||
| 6.95%, 06/10/26 (Call 05/10/26) |
55 | 56,094 | ||||||
| 7.12%, 11/07/33 (Call 08/07/33) |
1,765 | 1,881,304 | ||||||
| 7.20%, 06/10/30 (Call 04/10/30)(a) |
460 | 484,431 | ||||||
| 7.35%, 11/04/27 (Call 10/04/27) |
3,400 | 3,553,592 | ||||||
| 7.35%, 03/06/30 (Call 01/06/30) |
2,830 | 2,999,807 | ||||||
| General Motors Co. |
||||||||
| 4.00%, 04/01/25 |
413 | 406,531 | ||||||
| 4.20%, 10/01/27 (Call 07/01/27) |
1,184 | 1,142,305 | ||||||
| 5.00%, 10/01/28 (Call 07/01/28)(a) |
1,252 | 1,244,256 | ||||||
| 5.00%, 04/01/35 |
1,250 | 1,167,951 | ||||||
| 5.15%, 04/01/38 (Call 10/01/37) |
1,498 | 1,387,675 | ||||||
| 5.20%, 04/01/45 |
1,788 | 1,578,109 | ||||||
| 5.40%, 10/15/29 (Call 08/15/29)(a) |
510 | 508,757 | ||||||
| 5.40%, 04/01/48 (Call 10/01/47)(a) |
1,065 | 953,600 | ||||||
| 5.60%, 10/15/32 (Call 07/15/32)(a) |
1,385 | 1,382,156 | ||||||
| 5.95%, 04/01/49 (Call 10/01/48)(a) |
1,335 | 1,285,955 | ||||||
| 6.13%, 10/01/25 (Call 09/01/25) |
2,398 | 2,417,459 | ||||||
| 6.25%, 10/02/43 |
2,085 | 2,093,995 | ||||||
| 6.60%, 04/01/36 (Call 10/01/35) |
1,728 | 1,818,092 | ||||||
| 6.75%, 04/01/46 (Call 10/01/45)(a) |
764 | 808,020 | ||||||
| 6.80%, 10/01/27 (Call 08/01/27) |
1,488 | 1,553,767 | ||||||
| S C H E D U L E O F I N V E S T M E N T S |
31 |
| Schedule of Investments (continued) February 29, 2024 |
iShares® Broad USD Investment Grade Corporate Bond ETF (Percentages shown are based on Net Assets) |
| Security | Par (000) | Value | ||||||
| Auto Manufacturers (continued) | ||||||||
| General Motors Financial Co. Inc. |
||||||||
| 1.25%, 01/08/26 (Call 12/08/25) |
$ | 2,075 | $ | 1,922,798 | ||||
| 1.50%, 06/10/26 (Call 05/10/26) |
1,755 | 1,607,702 | ||||||
| 2.35%, 02/26/27 (Call 01/26/27) |
1,295 | 1,187,118 | ||||||
| 2.35%, 01/08/31 (Call 10/08/30) |
1,504 | 1,226,526 | ||||||
| 2.40%, 04/10/28 (Call 02/10/28) |
1,506 | 1,342,428 | ||||||
| 2.40%, 10/15/28 (Call 08/15/28) |
1,495 | 1,314,411 | ||||||
| 2.70%, 08/20/27 (Call 06/20/27)(a) |
1,434 | 1,315,542 | ||||||
| 2.70%, 06/10/31 (Call 03/10/31) |
1,547 | 1,275,263 | ||||||
| 2.75%, 06/20/25 (Call 05/20/25)(a) |
1,466 | 1,414,648 | ||||||
| 3.10%, 01/12/32 (Call 10/12/31)(a) |
1,835 | 1,532,869 | ||||||
| 3.60%, 06/21/30 (Call 03/21/30)(a) |
1,517 | 1,357,318 | ||||||
| 3.80%, 04/07/25 |
165 | 161,915 | ||||||
| 3.85%, 01/05/28 (Call 10/05/27)(a) |
754 | 715,766 | ||||||
| 4.00%, 10/06/26 (Call 07/06/26) |
1,208 | 1,167,920 | ||||||
| 4.30%, 07/13/25 (Call 04/13/25) |
1,070 | 1,052,253 | ||||||
| 4.30%, 04/06/29 (Call 02/06/29) |
505 | 479,150 | ||||||
| 4.35%, 04/09/25 (Call 02/09/25) |
1,062 | 1,048,191 | ||||||
| 4.35%, 01/17/27 (Call 10/17/26) |
1,835 | 1,785,969 | ||||||
| 5.00%, 04/09/27 (Call 03/09/27) |
1,635 | 1,619,263 | ||||||
| 5.25%, 03/01/26 (Call 12/01/25) |
1,722 | 1,716,466 | ||||||
| 5.40%, 04/06/26 |
1,821 | 1,821,825 | ||||||
| 5.40%, 05/08/27 |
387 | 387,174 | ||||||
| 5.65%, 01/17/29 (Call 10/17/28) |
813 | 820,213 | ||||||
| 5.75%, 02/08/31 (Call 12/08/30)(a) |
222 | 221,355 | ||||||
| 5.80%, 06/23/28 (Call 05/23/28) |
1,175 | 1,193,323 | ||||||
| 5.80%, 01/07/29 (Call 12/07/28) |
1,845 | 1,867,445 | ||||||
| 5.85%, 04/06/30 (Call 02/06/30)(a) |
900 | 911,885 | ||||||
| 6.00%, 01/09/28 (Call 12/09/27) |
1,460 | 1,490,562 | ||||||
| 6.05%, 10/10/25 |
1,190 | 1,198,878 | ||||||
| 6.10%, 01/07/34 (Call 10/07/33) |
1,295 | 1,309,167 | ||||||
| 6.40%, 01/09/33 (Call 10/09/32)(a) |
1,158 | 1,203,833 | ||||||
| Honda Motor Co. Ltd. |
||||||||
| 2.27%, 03/10/25 (Call 02/10/25) |
836 | 812,165 | ||||||
| 2.53%, 03/10/27 (Call 02/10/27) |
885 | 826,544 | ||||||
| 2.97%, 03/10/32 (Call 12/10/31) |
1,215 | 1,067,513 | ||||||
| Hyundai Capital America |
||||||||
| 1.30%, 01/08/26 (Call 12/08/25)(a)(b) |
1,165 | 1,079,743 | ||||||
| 1.50%, 06/15/26 (Call 05/15/26)(b) |
1,380 | 1,262,892 | ||||||
| 1.65%, 09/17/26 (Call 08/17/26)(a)(b) |
1,515 | 1,380,831 | ||||||
| 1.80%, 10/15/25 (Call 09/15/25)(b) |
1,096 | 1,033,049 | ||||||
| 1.80%, 01/10/28 (Call 11/08/27)(b) |
1,240 | 1,089,822 | ||||||
| 2.00%, 06/15/28 (Call 04/15/28)(a)(b) |
1,196 | 1,047,669 | ||||||
| 2.10%, 09/15/28 (Call 07/17/28)(a)(b) |
1,175 | 1,025,244 | ||||||
| 2.38%, 10/15/27 (Call 08/15/27)(b) |
880 | 796,468 | ||||||
| 2.75%, 09/27/26(a)(b) |
883 | 826,011 | ||||||
| 3.00%, 02/10/27 (Call 12/10/26)(b) |
586 | 549,851 | ||||||
| 3.50%, 11/02/26 (Call 09/02/26)(a)(b) |
1,139 | 1,086,131 | ||||||
| 5.25%, 01/08/27(b) |
740 | 737,357 | ||||||
| 5.30%, 01/08/29 (Call 12/08/28)(b) |
985 | 982,678 | ||||||
| 5.40%, 01/08/31 (Call 11/08/30)(a)(b) |
695 | 695,732 | ||||||
| 5.50%, 03/30/26(b) |
545 | 545,426 | ||||||
| 5.60%, 03/30/28 (Call 02/29/28)(b) |
710 | 716,547 | ||||||
| 5.65%, 06/26/26(a)(b) |
1,205 | 1,208,729 | ||||||
| 5.68%, 06/26/28 (Call 05/26/28)(a)(b) |
1,265 | 1,282,420 | ||||||
| 5.70%, 06/26/30 (Call 04/26/30)(b) |
810 | 823,250 | ||||||
| 5.80%, 06/26/25(b) |
420 | 421,577 | ||||||
| 5.80%, 04/01/30 (Call 02/01/30)(a)(b) |
544 | 555,393 | ||||||
| 5.88%, 04/07/25 (Call 03/07/25)(a)(b) |
645 | 646,878 | ||||||
| 5.95%, 09/21/26(a)(b) |
940 | 950,605 | ||||||
| 6.10%, 09/21/28 (Call 08/21/28)(a)(b) |
1,225 | 1,261,496 | ||||||
| Security | Par (000) | Value | ||||||
| Auto Manufacturers (continued) | ||||||||
| 6.20%, 09/21/30 (Call 07/21/30)(b) |
$ | 800 | $ | 835,332 | ||||
| 6.25%, 11/03/25(a)(b) |
600 | 606,868 | ||||||
| 6.38%, 04/08/30 (Call 01/08/30)(a)(b) |
990 | 1,041,320 | ||||||
| 6.50%, 01/16/29 (Call 12/16/28)(b) |
690 | 722,110 | ||||||
| Hyundai Capital Services Inc. |
||||||||
| 1.25%, 02/08/26(a)(b) |
725 | 667,919 | ||||||
| 2.13%, 04/24/25(b) |
200 | 192,137 | ||||||
| 2.50%, 01/24/27(b) |
540 | 497,267 | ||||||
| 3.63%, 08/29/27(b) |
220 | 207,326 | ||||||
| Kia Corp. |
||||||||
| 2.75%, 02/14/27(b) |
255 | 237,337 | ||||||
| 3.25%, 04/21/26(b) |
805 | 769,053 | ||||||
| 3.50%, 10/25/27(a)(b) |
645 | 604,178 | ||||||
| Mercedes-Benz Finance North America LLC |
||||||||
| 1.45%, 03/02/26(b) |
1,598 | 1,485,159 | ||||||
| 2.13%, 03/10/25(b) |
550 | 532,928 | ||||||
| 2.45%, 03/02/31(a)(b) |
1,085 | 928,256 | ||||||
| 2.63%, 03/10/30(b) |
1,035 | 904,737 | ||||||
| 3.10%, 08/15/29(b) |
793 | 722,801 | ||||||
| 3.30%, 05/19/25(b) |
797 | 778,545 | ||||||
| 3.45%, 01/06/27(a)(b) |
1,063 | 1,020,509 | ||||||
| 3.50%, 08/03/25(b) |
517 | 505,016 | ||||||
| 3.75%, 02/22/28(a)(b) |
1,376 | 1,316,760 | ||||||
| 4.30%, 02/22/29(b) |
695 | 675,777 | ||||||
| 4.80%, 03/30/26(b) |
1,455 | 1,444,702 | ||||||
| 4.80%, 01/11/27(a)(b) |
920 | 915,438 | ||||||
| 4.80%, 03/30/28(a)(b) |
1,675 | 1,662,471 | ||||||
| 4.85%, 01/11/29(b) |
785 | 777,775 | ||||||
| 4.90%, 01/09/26(a)(b) |
750 | 747,274 | ||||||
| 4.95%, 03/30/25(b) |
895 | 892,522 | ||||||
| 5.00%, 01/11/34(b) |
485 | 476,104 | ||||||
| 5.05%, 08/03/33(b) |
720 | 714,250 | ||||||
| 5.10%, 08/03/28(b) |
1,380 | 1,384,794 | ||||||
| 5.20%, 08/03/26(b) |
777 | 778,569 | ||||||
| 5.25%, 11/29/27(a)(b) |
910 | 915,878 | ||||||
| 5.38%, 08/01/25(b) |
1,035 | 1,037,391 | ||||||
| 5.38%, 11/26/25(b) |
915 | 917,145 | ||||||
| 8.50%, 01/18/31 |
1,617 | 1,965,239 | ||||||
| Nissan Motor Acceptance Co. LLC |
||||||||
| 1.85%, 09/16/26 (Call 08/16/26)(a)(b) |
1,424 | 1,281,848 | ||||||
| 2.00%, 03/09/26 (Call 02/09/26)(b) |
1,175 | 1,083,143 | ||||||
| 2.45%, 09/15/28 (Call 07/15/28)(a)(b) |
475 | 406,353 | ||||||
| 2.75%, 03/09/28 (Call 01/09/28)(a)(b) |
785 | 691,040 | ||||||
| 6.95%, 09/15/26(a)(b) |
380 | 390,119 | ||||||
| 7.05%, 09/15/28 (Call 08/15/28)(a)(b) |
875 | 911,493 | ||||||
| Nissan Motor Co. Ltd. |
||||||||
| 3.52%, 09/17/25 (Call 08/17/25)(b) |
810 | 779,080 | ||||||
| 4.35%, 09/17/27 (Call 07/17/27)(b) |
2,785 | 2,645,210 | ||||||
| 4.81%, 09/17/30 (Call 06/17/30)(a)(b) |
2,121 | 1,952,880 | ||||||
| PACCAR Financial Corp. |
||||||||
| 1.10%, 05/11/26 |
650 | 599,218 | ||||||
| 2.00%, 02/04/27(a) |
510 | 469,436 | ||||||
| 2.85%, 04/07/25(a) |
235 | 229,398 | ||||||
| 3.55%, 08/11/25 |
440 | 430,889 | ||||||
| 4.45%, 03/30/26 |
355 | 351,861 | ||||||
| 4.60%, 01/10/28(a) |
700 | 696,965 | ||||||
| 4.60%, 01/31/29(a) |
525 | 519,426 | ||||||
| 4.95%, 10/03/25 |
560 | 559,387 | ||||||
| 4.95%, 08/10/28 |
30 | 30,219 | ||||||
| 5.05%, 08/10/26(a) |
225 | 225,781 | ||||||
| 5.20%, 11/09/26 |
495 | 499,225 | ||||||
| 32 | 2 0 2 4 I S H A R E S A N N U A L R E P O R T T O S H A R E H O L D E R S |
| Schedule of Investments (continued) February 29, 2024 |
iShares® Broad USD Investment Grade Corporate Bond ETF (Percentages shown are based on Net Assets) |
| Security | Par (000) | Value | ||||||
| Auto Manufacturers (continued) | ||||||||
| Stellantis Finance U.S. Inc. |
||||||||
| 1.71%, 01/29/27 (Call 12/29/26)(b) |
$ | 1,183 | $ | 1,075,349 | ||||
| 2.69%, 09/15/31 (Call 06/15/31)(a)(b) |
1,795 | 1,485,516 | ||||||
| 5.63%, 01/12/28 (Call 12/12/27)(a)(b) |
860 | 881,801 | ||||||
| 6.38%, 09/12/32 (Call 06/12/32)(a)(b) |
821 | 873,573 | ||||||
| Toyota Motor Corp. |
||||||||
| 1.34%, 03/25/26 (Call 02/25/26)(a) |
1,550 | 1,438,803 | ||||||
| 2.36%, 03/25/31 (Call 12/25/30)(a) |
681 | 587,661 | ||||||
| 2.76%, 07/02/29(a) |
570 | 525,166 | ||||||
| 3.67%, 07/20/28(a) |
300 | 291,031 | ||||||
| 5.12%, 07/13/28 (Call 06/13/28) |
655 | 667,864 | ||||||
| 5.12%, 07/13/33 (Call 04/13/33)(a) |
455 | 477,872 | ||||||
| 5.28%, 07/13/26 (Call 06/13/26) |
450 | 453,411 | ||||||
| Toyota Motor Credit Corp. |
||||||||
| 0.80%, 10/16/25 |
1,261 | 1,178,926 | ||||||
| 0.80%, 01/09/26(a) |
1,210 | 1,122,415 | ||||||
| 1.13%, 06/18/26 |
1,227 | 1,126,026 | ||||||
| 1.15%, 08/13/27(a) |
847 | 750,625 | ||||||
| 1.65%, 01/10/31 |
1,110 | 900,565 | ||||||
| 1.90%, 01/13/27 |
1,220 | 1,124,758 | ||||||
| 1.90%, 04/06/28 |
941 | 840,612 | ||||||
| 1.90%, 09/12/31 |
1,173 | 953,199 | ||||||
| 2.15%, 02/13/30(a) |
1,417 | 1,217,055 | ||||||
| 2.40%, 01/13/32(a) |
235 | 196,664 | ||||||
| 3.00%, 04/01/25 |
1,516 | 1,481,247 | ||||||
| 3.05%, 03/22/27(a) |
1,920 | 1,821,484 | ||||||
| 3.05%, 01/11/28 |
581 | 547,026 | ||||||
| 3.20%, 01/11/27(a) |
1,494 | 1,427,465 | ||||||
| 3.38%, 04/01/30 |
2,037 | 1,873,737 | ||||||
| 3.40%, 04/14/25 |
443 | 434,209 | ||||||
| 3.65%, 08/18/25 |
1,222 | 1,197,521 | ||||||
| 3.65%, 01/08/29 |
1,280 | 1,212,220 | ||||||
| 3.95%, 06/30/25 |
1,176 | 1,157,921 | ||||||
| 4.45%, 05/18/26 |
1,435 | 1,420,000 | ||||||
| 4.45%, 06/29/29(a) |
1,140 | 1,120,303 | ||||||
| 4.55%, 09/20/27 |
1,338 | 1,326,377 | ||||||
| 4.55%, 05/17/30(a) |
960 | 941,736 | ||||||
| 4.63%, 01/12/28 |
1,280 | 1,272,122 | ||||||
| 4.65%, 01/05/29 |
800 | 791,480 | ||||||
| 4.70%, 01/12/33(a) |
615 | 606,768 | ||||||
| 4.80%, 01/05/26 |
500 | 497,949 | ||||||
| 4.80%, 01/05/34 |
255 | 248,697 | ||||||
| 5.00%, 08/14/26 |
1,035 | 1,034,866 | ||||||
| 5.25%, 09/11/28 |
530 | 537,995 | ||||||
| 5.40%, 11/10/25 |
790 | 794,584 | ||||||
| 5.40%, 11/20/26 |
920 | 929,351 | ||||||
| 5.45%, 11/10/27 |
1,050 | 1,070,900 | ||||||
| 5.55%, 11/20/30 |
615 | 635,111 | ||||||
| 5.60%, 09/11/25 |
350 | 353,012 | ||||||
| Volkswagen Group of America Finance LLC |
||||||||
| 1.25%, 11/24/25 (Call 10/24/25)(b) |
1,951 | 1,816,740 | ||||||
| 1.63%, 11/24/27 (Call 09/24/27)(b) |
1,121 | 990,440 | ||||||
| 3.20%, 09/26/26 (Call 07/26/26)(b) |
530 | 503,422 | ||||||
| 3.35%, 05/13/25(b) |
1,365 | 1,329,673 | ||||||
| 3.75%, 05/13/30(a)(b) |
1,005 | 931,686 | ||||||
| 3.95%, 06/06/25(b) |
1,085 | 1,062,572 | ||||||
| 4.35%, 06/08/27 (Call 05/08/27)(a)(b) |
1,785 | 1,740,677 | ||||||
| 4.60%, 06/08/29 (Call 04/08/29)(b) |
805 | 783,846 | ||||||
| 4.63%, 11/13/25(b) |
1,214 | 1,197,894 | ||||||
| 4.75%, 11/13/28(a)(b) |
1,654 | 1,634,043 | ||||||
| 5.65%, 09/12/28 (Call 08/12/28)(a)(b) |
705 | 717,531 | ||||||
| Security | Par (000) | Value | ||||||
| Auto Manufacturers (continued) | ||||||||
| 5.70%, 09/12/26(b) |
$ | 410 | $ | 413,803 | ||||
| 5.80%, 09/12/25(b) |
400 | 401,702 | ||||||
| 5.90%, 09/12/33 (Call 06/12/33)(a)(b) |
640 | 650,551 | ||||||
| 6.00%, 11/16/26(a)(b) |
500 | 509,454 | ||||||
| 6.20%, 11/16/28 (Call 10/16/28)(a)(b) |
435 | 452,931 | ||||||
| 6.45%, 11/16/30 (Call 09/16/30)(a)(b) |
600 | 633,808 | ||||||
|
|
|
|||||||
| 277,126,044 | ||||||||
| Auto Parts & Equipment — 0.1% | ||||||||
| Aptiv PLC |
||||||||
| 3.10%, 12/01/51 (Call 06/01/51) |
2,151 | 1,349,872 | ||||||
| 4.35%, 03/15/29 (Call 12/15/28) |
669 | 647,046 | ||||||
| 4.40%, 10/01/46 (Call 04/01/46)(a) |
436 | 338,727 | ||||||
| 5.40%, 03/15/49 (Call 09/15/48)(a) |
298 | 267,605 | ||||||
| Aptiv PLC/Aptiv Corp. |
||||||||
| 3.25%, 03/01/32 (Call 12/01/31)(a) |
815 | 702,766 | ||||||
| 4.15%, 05/01/52 (Call 11/01/51) |
1,510 | 1,155,321 | ||||||
| BorgWarner Inc. |
||||||||
| 2.65%, 07/01/27 (Call 05/01/27)(a) |
1,479 | 1,365,671 | ||||||
| 4.38%, 03/15/45 (Call 09/15/44)(a) |
719 | 585,608 | ||||||
| Denso Corp., 1.24%, 09/16/26 |
810 | 732,553 | ||||||
| Lear Corp. |
||||||||
| 2.60%, 01/15/32 (Call 10/15/31) |
640 | 517,970 | ||||||
| 3.50%, 05/30/30 (Call 02/28/30)(a) |
730 | 652,099 | ||||||
| 3.55%, 01/15/52 (Call 07/15/51) |
755 | 512,967 | ||||||
| 3.80%, 09/15/27 (Call 06/15/27)(a) |
962 | 920,938 | ||||||
| 4.25%, 05/15/29 (Call 02/15/29) |
632 | 601,188 | ||||||
| 5.25%, 05/15/49 (Call 11/15/48)(a) |
804 | 723,959 | ||||||
| LG Energy Solution
Ltd., |
75 | 75,206 | ||||||
| Magna International Inc. |
||||||||
| 2.45%, 06/15/30 (Call 03/15/30) |
1,217 | 1,047,225 | ||||||
| 4.15%, 10/01/25 (Call 07/01/25) |
980 | 962,008 | ||||||
| 5.50%, 03/21/33 (Call 12/21/32)(a) |
640 | 656,255 | ||||||
| 5.98%, 03/21/26 (Call 03/21/24) |
50 | 50,008 | ||||||
| Toyota Industries Corp., |
220 | 207,410 | ||||||
|
|
|
|||||||
| 14,072,402 | ||||||||
| Banks — 21.4% | ||||||||
| ABN AMRO Bank NV |
||||||||
| 1.54%, 06/16/27 (Call 06/16/26), |
830 | 752,228 | ||||||
| 2.47%, 12/13/29 (Call 12/13/28), |
1,300 | 1,130,677 | ||||||
| 3.32%, 03/13/37 (Call 12/13/31), |
1,672 | 1,329,533 | ||||||
| 4.75%, 07/28/25(b) |
1,690 | 1,657,958 | ||||||
| 4.80%, 04/18/26(b) |
1,278 | 1,246,853 | ||||||
| 6.34%, 09/18/27 (Call 09/18/26), |
1,500 | 1,525,470 | ||||||
| 6.58%, 10/13/26 (Call 10/13/25), |
600 | 605,709 | ||||||
| AIB Group PLC |
||||||||
| 6.61%, 09/13/29 (Call 09/13/28), |
375 | 389,112 | ||||||
| 7.58%, 10/14/26 (Call 10/14/25), |
585 | 599,951 | ||||||
| ANZ Bank New Zealand Ltd., |
||||||||
| (5-year CMT + 2.700%)(a)(b)(d) |
755 | 758,934 | ||||||
| S C H E D U L E O F I N V E S T M E N T S |
33 |
| Schedule of Investments (continued) February 29, 2024 |
iShares® Broad USD Investment Grade Corporate Bond ETF (Percentages shown are based on Net Assets) |
| Security | Par (000) |
Value | ||||||
| Banks (continued) | ||||||||
| ANZ New Zealand Int’l Ltd./London |
||||||||
| 1.25%, 06/22/26(b) |
$ | 1,408 | $ | 1,286,076 | ||||
| 2.55%, 02/13/30(a)(b) |
1,360 | 1,176,773 | ||||||
| 3.45%, 07/17/27(a)(b) |
822 | 776,159 | ||||||
| 3.45%, 01/21/28(b) |
652 | 611,318 | ||||||
| 5.36%, 08/14/28(b) |
920 | 927,512 | ||||||
| ASB Bank Ltd. |
||||||||
| 1.63%, 10/22/26(a)(b) |
1,035 | 942,196 | ||||||
| 2.38%, 10/22/31(a)(b) |
640 | 517,910 | ||||||
| 5.28%, 06/17/32 (Call 06/17/27), |
805 | 790,783 | ||||||
| 5.35%, 06/15/26(a)(b) |
655 | 654,743 | ||||||
| 5.40%, 11/29/27(a)(b) |
910 | 915,900 | ||||||
| Australia & New Zealand Banking Group Ltd. |
||||||||
| 2.57%, 11/25/35 (Call 11/25/30), |
2,483 | 2,008,830 | ||||||
| 2.95%, 07/22/30 (Call 07/22/25), |
700 | 669,165 | ||||||
| 3.70%, 11/16/25 |
1,052 | 1,029,106 | ||||||
| 4.40%, 05/19/26(b) |
2,337 | 2,269,649 | ||||||
| 4.75%, 01/18/27 |
1,580 | 1,573,826 | ||||||
| 5.09%, 12/08/25 |
795 | 795,652 | ||||||
| 5.38%, 07/03/25(a) |
1,220 | 1,223,749 | ||||||
| 5.67%, 10/03/25(a) |
1,000 | 1,009,239 | ||||||
| 6.74%, 12/08/32(a)(b) |
1,025 | 1,088,657 | ||||||
| Banco Bilbao Vizcaya Argentaria SA |
||||||||
| 1.13%, 09/18/25 |
1,166 | 1,090,304 | ||||||
| 5.86%, 09/14/26 (Call 09/14/25), |
750 | 749,612 | ||||||
| 6.14%, 09/14/28 (Call 09/14/27), |
465 | 471,941 | ||||||
| 7.88%, 11/15/34 (Call 11/15/33), |
885 | 943,458 | ||||||
| Banco de Bogota SA, 4.38%, 08/03/27 |
200 | 189,551 | ||||||
| Banco de Chile, 2.99%, 12/09/31 |
50 | 42,784 | ||||||
| Banco de Credito del Peru SA |
||||||||
| 3.13%, 07/01/30 (Call 07/01/25), |
750 | 712,004 | ||||||
| 3.25%, 09/30/31 (Call 09/30/26), |
734 | 676,875 | ||||||
| 5.85%, 01/11/29 (Call 12/11/28)(b) |
100 | 101,075 | ||||||
| Banco de Credito e Inversiones SA |
||||||||
| 2.88%, 10/14/31 (Call 07/14/31)(b) |
520 | 439,868 | ||||||
| 3.50%, 10/12/27(b) |
692 | 651,655 | ||||||
| Banco General SA, 4.13%, 08/07/27 |
||||||||
| (Call 05/07/27)(b) |
360 | 340,920 | ||||||
| Banco Inbursa SA Institucion De Banca Multiple |
||||||||
| Grupo Financiero Inbursa, 4.38%, 04/11/27 (Call 01/11/27)(b) |
512 | 494,022 | ||||||
| Banco Internacional del Peru SAA Interbank, |
||||||||
| 3.25%, 10/04/26 (Call 08/04/26)(b) |
453 | 426,617 | ||||||
| Banco Nacional de Panama, 2.50%, 08/11/30 |
||||||||
| (Call 05/11/30)(b) |
1,201 | 906,755 | ||||||
| Banco Santander Mexico SA Institucion de |
||||||||
| 5.38%, 04/17/25(b) |
1,474 | 1,464,685 | ||||||
| Banco Santander SA |
||||||||
| 1.72%, 09/14/27 (Call 09/14/26), |
1,970 | 1,782,400 | ||||||
| Security | Par (000) | Value | ||||||
| Banks (continued) | ||||||||
| 1.85%, 03/25/26 |
$ | 1,995 | $ | 1,851,621 | ||||
| 2.75%, 05/28/25 |
1,900 | 1,833,397 | ||||||
| 2.75%, 12/03/30 |
1,860 | 1,512,880 | ||||||
| 2.96%, 03/25/31(a) |
1,235 | 1,053,346 | ||||||
| 3.23%, 11/22/32 (Call 08/22/31), |
1,210 | 1,000,920 | ||||||
| 3.31%, 06/27/29 |
1,385 | 1,256,272 | ||||||
| 3.49%, 05/28/30 |
1,542 | 1,383,171 | ||||||
| 3.50%, 03/24/25 |
1,220 | 1,195,125 | ||||||
| 3.80%, 02/23/28(a) |
1,017 | 958,219 | ||||||
| 4.18%, 03/24/28 (Call 03/24/27), |
2,220 | 2,125,584 | ||||||
| 4.25%, 04/11/27 |
1,910 | 1,841,727 | ||||||
| 4.38%, 04/12/28 |
1,390 | 1,336,066 | ||||||
| 5.15%, 08/18/25(a) |
695 | 689,845 | ||||||
| 5.18%, 11/19/25 |
1,992 | 1,965,326 | ||||||
| 5.29%, 08/18/27 |
1,825 | 1,812,965 | ||||||
| 5.59%, 08/08/28 |
1,510 | 1,523,384 | ||||||
| 6.53%, 11/07/27 (Call 11/07/26), |
1,000 | 1,023,088 | ||||||
| 6.61%, 11/07/28 |
1,225 | 1,287,091 | ||||||
| 6.92%, 08/08/33 |
1,410 | 1,464,161 | ||||||
| 6.94%, 11/07/33 |
1,820 | 1,984,085 | ||||||
| Bangkok Bank PCL/Hong Kong |
||||||||
| 3.47%, 09/23/36 (Call 09/23/31), |
1,080 | 907,039 | ||||||
| 4.30%, 06/15/27 (Call 05/15/27)(b) |
330 | 319,989 | ||||||
| 4.45%, 09/19/28(b) |
515 | 498,240 | ||||||
| 5.30%, 09/21/28 (Call 08/21/28)(b) |
80 | 80,196 | ||||||
| Bank of America Corp. |
||||||||
| 1.20%, 10/24/26 (Call 10/24/25), |
2,961 | 2,758,677 | ||||||
| 1.32%, 06/19/26 (Call 06/19/25), |
3,365 | 3,185,010 | ||||||
| 1.73%, 07/22/27 (Call 07/22/26), |
7,255 | 6,652,700 | ||||||
| 1.90%, 07/23/31 (Call 07/23/30), |
3,662 | 2,972,123 | ||||||
| 1.92%, 10/24/31 (Call 10/24/30), |
3,268 | 2,637,040 | ||||||
| 2.09%, 06/14/29 (Call 06/14/28), |
3,735 | 3,282,244 | ||||||
| 2.30%, 07/21/32 (Call 07/21/31), |
4,807 | 3,890,879 | ||||||
| 2.48%, 09/21/36 (Call 09/21/31), |
2,774 | 2,186,908 | ||||||
| 2.50%, 02/13/31 (Call 02/13/30), |
4,394 | 3,745,887 | ||||||
| 2.55%, 02/04/28 (Call 02/04/27), |
2,980 | 2,757,815 | ||||||
| 2.57%, 10/20/32 (Call 10/20/31), |
4,238 | 3,473,467 | ||||||
| 2.59%, 04/29/31 (Call 04/29/30), |
3,937 | 3,364,904 | ||||||
| 2.68%, 06/19/41 (Call 06/19/40), |
6,596 | 4,592,745 | ||||||
| 2.69%, 04/22/32 (Call 04/22/31), |
5,937 | 4,971,805 | ||||||
| 2.83%, 10/24/51 (Call 10/24/50), |
1,547 | 991,844 | ||||||
| 34 | 2 0 2 4 I S H A R E S A N N U A L R E P O R T T O S H A R E H O L D E R S |
| Schedule of Investments (continued) February 29, 2024 |
iShares® Broad USD Investment Grade Corporate Bond ETF (Percentages shown are based on Net Assets) |
| Security | Par (000) |
Value | ||||||
| Banks (continued) | ||||||||
| 2.88%, 10/22/30 (Call 10/22/29), |
||||||||
| (3-mo. SOFR + 1.452%)(d) |
$ | 2,418 | $ | 2,129,435 | ||||
| 2.97%, 02/04/33 (Call 02/04/32), |
||||||||
| (1-day SOFR + 1.330%)(a)(d) |
4,925 | 4,136,537 | ||||||
| 2.97%, 07/21/52 (Call 07/21/51), |
||||||||
| (1-day SOFR + 1.560%)(a)(d) |
2,910 | 1,936,200 | ||||||
| 3.19%, 07/23/30 (Call 07/23/29), |
||||||||
| (3-mo. SOFR + 1.442%)(d) |
3,207 | 2,887,025 | ||||||
| 3.25%, 10/21/27 (Call 10/21/26)(a) |
3,293 | 3,112,387 | ||||||
| 3.31%, 04/22/42 (Call 04/22/41), |
||||||||
| (1-day SOFR + 1.580%)(d) |
4,263 | 3,228,256 | ||||||
| 3.38%, 04/02/26 (Call 04/02/25), |
||||||||
| (1-day SOFR + 1.330%)(d) |
3,985 | 3,889,707 | ||||||
| 3.42%, 12/20/28 (Call 12/20/27), |
||||||||
| (3-mo. SOFR + 1.302%)(d) |
7,692 | 7,186,125 | ||||||
| 3.50%, 04/19/26 |
3,323 | 3,221,493 | ||||||
| 3.56%, 04/23/27 (Call 04/23/26), |
||||||||
| (3-mo. SOFR + 1.322%)(d) |
3,804 | 3,658,766 | ||||||
| 3.59%, 07/21/28 (Call 07/21/27), |
||||||||
| (3-mo. SOFR + 1.632%)(a)(d) |
3,019 | 2,862,193 | ||||||
| 3.71%, 04/24/28 (Call 04/24/27), |
||||||||
| (3-mo. SOFR + 1.774%)(d) |
2,865 | 2,731,504 | ||||||
| 3.82%, 01/20/28 (Call 01/20/27), |
||||||||
| (3-mo. SOFR + 1.837%)(d) |
3,376 | 3,242,811 | ||||||
| 3.85%, 03/08/37 (Call 03/08/32), |
||||||||
| (5-year CMT + 2.000%)(a)(d) |
3,167 | 2,764,833 | ||||||
| 3.88%, 08/01/25(a) |
1,987 | 1,956,027 | ||||||
| 3.95%, 01/23/49 (Call 01/23/48), |
||||||||
| (3-mo. SOFR + 1.452%)(d) |
1,738 | 1,407,950 | ||||||
| 3.97%, 03/05/29 (Call 03/05/28), |
||||||||
| (3-mo. SOFR + 1.332%)(d) |
3,376 | 3,210,957 | ||||||
| 3.97%, 02/07/30 (Call 02/07/29), |
||||||||
| (3-mo. SOFR + 1.472%)(d) |
4,018 | 3,776,866 | ||||||
| 4.08%, 04/23/40 (Call 04/23/39), |
||||||||
| (3-mo. SOFR + 1.582%)(d) |
2,210 | 1,888,411 | ||||||
| 4.08%, 03/20/51 (Call 03/20/50), |
||||||||
| (3-mo. SOFR + 3.412%)(d) |
7,161 | 5,780,352 | ||||||
| 4.24%, 04/24/38 (Call 04/24/37), |
||||||||
| (3-mo. SOFR + 2.076%)(d) |
2,807 | 2,490,074 | ||||||
| 4.25%, 10/22/26 |
2,647 | 2,589,923 | ||||||
| 4.27%, 07/23/29 (Call 07/23/28), |
||||||||
| (3-mo. SOFR + 1.572%)(d) |
4,016 | 3,858,568 | ||||||
| 4.33%, 03/15/50 (Call 03/15/49), |
||||||||
| (3-mo. SOFR + 1.782%)(d) |
2,868 | 2,440,015 | ||||||
| 4.38%, 04/27/28 (Call 04/27/27), |
||||||||
| (1-day SOFR + 1.580%)(d) |
3,075 | 2,989,418 | ||||||
| 4.44%, 01/20/48 (Call 01/20/47), |
||||||||
| (3-mo. SOFR + 2.252%)(d) |
2,682 | 2,323,453 | ||||||
| 4.45%, 03/03/26 |
2,636 | 2,594,174 | ||||||
| 4.57%, 04/27/33 (Call 04/27/32), |
||||||||
| (1-day SOFR + 1.830%)(d) |
5,085 | 4,780,571 | ||||||
| 4.83%, 07/22/26 (Call 07/22/25), |
||||||||
| (1-day SOFR + 1.750%)(d) |
3,105 | 3,078,899 | ||||||
| 4.88%, 04/01/44 |
642 | 607,024 | ||||||
| 4.95%, 07/22/28 (Call 07/22/27), |
||||||||
| (1-day SOFR + 2.040%)(d) |
4,270 | 4,227,595 | ||||||
| 5.00%, 01/21/44 |
2,628 | 2,515,010 | ||||||
| 5.02%, 07/22/33 (Call 07/22/32), |
||||||||
| (1-day SOFR + 2.160%)(d) |
6,555 | 6,389,299 | ||||||
| 5.08%, 01/20/27 (Call 01/20/26), |
||||||||
| (1-day SOFR + 1.290%)(d) |
3,750 | 3,726,266 | ||||||
| Security | Par (000) |
Value | ||||||
| Banks (continued) | ||||||||
| 5.20%, 04/25/29 (Call 04/25/28), |
||||||||
| (1-day SOFR + 1.630%)(d) |
$ | 4,580 | $ | 4,555,192 | ||||
| 5.29%, 04/25/34 (Call 04/25/33), |
||||||||
| (1-day SOFR + 1.910%)(d) |
6,470 | 6,378,392 | ||||||
| 5.47%, 01/23/35 (Call 01/23/34), |
||||||||
| (1-day SOFR + 1.650%)(a)(d) |
3,190 | 3,180,772 | ||||||
| 5.82%, 09/15/29 (Call 09/15/28), |
||||||||
| (1-day SOFR + 1.570%)(d) |
3,555 | 3,622,822 | ||||||
| 5.87%, 09/15/34 (Call 09/15/33), |
||||||||
| (1-day SOFR + 1.840%)(d) |
4,000 | 4,101,647 | ||||||
| 5.88%, 02/07/42 |
2,108 | 2,221,406 | ||||||
| 5.93%, 09/15/27 (Call 09/15/26), |
||||||||
| (1-day SOFR + 1.340%)(d) |
1,995 | 2,021,688 | ||||||
| 6.11%, 01/29/37 |
2,629 | 2,756,595 | ||||||
| 6.20%, 11/10/28 (Call 11/10/27), |
||||||||
| (1-day SOFR + 1.990%)(a)(d) |
2,890 | 2,981,635 | ||||||
| 6.22%, 09/15/26 |
640 | 654,404 | ||||||
| 7.75%, 05/14/38 |
2,183 | 2,620,843 | ||||||
| Series L, 3.95%, 04/21/25 |
2,817 | 2,770,567 | ||||||
| Series L, 4.18%, 11/25/27 (Call 11/25/26) |
2,807 | 2,714,026 | ||||||
| Series L, 4.75%, 04/21/45(a) |
674 | 612,007 | ||||||
| Series N, 1.66%, 03/11/27 (Call 03/11/26), |
||||||||
| (1-day SOFR + 0.910%)(d) |
3,425 | 3,178,037 | ||||||
| Series N, 2.65%, 03/11/32 (Call 03/11/31), |
||||||||
| (1-day SOFR + 1.220%)(d) |
2,624 | 2,195,992 | ||||||
| Series N, 3.48%, 03/13/52 (Call 03/13/51), |
||||||||
| (1-day SOFR + 1.650%)(d) |
1,440 | 1,057,216 | ||||||
| Bank of America NA |
||||||||
| 5.53%, 08/18/26 (Call 07/18/26) |
2,435 | 2,459,081 | ||||||
| 5.65%, 08/18/25 (Call 07/18/25) |
2,050 | 2,064,804 | ||||||
| 6.00%, 10/15/36 |
1,848 | 1,928,313 | ||||||
| Bank of Ireland Group PLC |
||||||||
| 2.03%, 09/30/27 (Call 09/30/26), |
||||||||
| (1-year CMT + 1.100%)(b)(d) |
260 | 236,499 | ||||||
| 6.25%, 09/16/26 (Call 09/16/25), |
||||||||
| (1-year CMT + 2.650%)(b)(d) |
1,510 | 1,517,979 | ||||||
| Bank of Montreal |
||||||||
| 0.95%, 01/22/27 (Call 01/22/26), |
||||||||
| (1-day SOFR + 0.603%)(d) |
1,680 | 1,550,000 | ||||||
| 1.25%, 09/15/26 |
2,255 | 2,051,268 | ||||||
| 1.85%, 05/01/25 |
1,605 | 1,542,392 | ||||||
| 2.65%, 03/08/27 |
1,805 | 1,685,407 | ||||||
| 3.09%, 01/10/37 (Call 01/10/32), |
||||||||
| (5-year CMT + 1.400%)(d) |
1,572 | 1,272,578 | ||||||
| 3.70%, 06/07/25 |
1,305 | 1,278,644 | ||||||
| 3.80%, 12/15/32 (Call 12/15/27), |
||||||||
| (5-year USD Swap + 1.432%)(d) |
1,098 | 1,010,917 | ||||||
| 5.20%, 02/01/28 (Call 01/01/28) |
2,045 | 2,052,971 | ||||||
| 5.27%, 12/11/26 |
1,505 | 1,508,806 | ||||||
| 5.30%, 06/05/26 |
1,270 | 1,273,244 | ||||||
| 5.72%, 09/25/28 (Call 08/25/28) |
1,600 | 1,640,209 | ||||||
| 5.92%, 09/25/25 |
600 | 606,206 | ||||||
| Series H, 4.70%, 09/14/27 (Call 08/14/27) |
1,380 | 1,366,395 | ||||||
| Bank of New York Mellon Corp. (The) |
||||||||
| 0.75%, 01/28/26 (Call 12/28/25) |
915 | 844,254 | ||||||
| 1.05%, 10/15/26 (Call 09/15/26) |
733 | 662,779 | ||||||
| 1.60%, 04/24/25 (Call 03/24/25) |
1,812 | 1,740,875 | ||||||
| 1.65%, 07/14/28 (Call 05/14/28)(a) |
500 | 437,538 | ||||||
| 1.65%, 01/28/31 (Call 10/28/30)(a) |
387 | 311,587 | ||||||
| 1.80%, 07/28/31 (Call 04/28/31)(a) |
650 | 523,951 | ||||||
| 2.05%, 01/26/27 (Call 12/26/26)(a) |
795 | 734,605 | ||||||
| S C H E D U L E O F I N V E S T M E N T S |
35 |
| Schedule of Investments (continued) February 29, 2024 |
iShares® Broad USD Investment Grade Corporate Bond ETF (Percentages shown are based on Net Assets) |
| Security | Par (000) |
Value | ||||||
| Banks (continued) | ||||||||
| 2.45%, 08/17/26 (Call 05/17/26) |
$ | 1,145 | $ | 1,078,141 | ||||
| 2.50%, 01/26/32 (Call 10/26/31)(a) |
560 | 468,085 | ||||||
| 2.80%, 05/04/26 (Call 02/04/26)(a) |
1,219 | 1,165,061 | ||||||
| 3.00%, 10/30/28 (Call 07/30/28)(a) |
801 | 734,656 | ||||||
| 3.25%, 05/16/27 (Call 02/16/27) |
918 | 872,897 | ||||||
| 3.30%, 08/23/29 (Call 05/23/29) |
1,274 | 1,169,023 | ||||||
| 3.40%, 01/29/28 (Call 10/29/27) |
1,335 | 1,265,226 | ||||||
| 3.44%, 02/07/28 (Call 02/07/27), |
1,380 | 1,319,252 | ||||||
| 3.85%, 04/28/28 |
1,476 | 1,425,392 | ||||||
| 3.85%, 04/26/29 (Call 02/26/29) |
435 | 416,640 | ||||||
| 3.95%, 11/18/25 (Call 10/18/25) |
471 | 461,156 | ||||||
| 3.99%, 06/13/28 (Call 06/13/27), |
805 | 780,232 | ||||||
| 4.29%, 06/13/33 (Call 06/13/32), |
1,082 | 1,012,197 | ||||||
| 4.41%, 07/24/26 (Call 07/24/25), |
1,460 | 1,439,932 | ||||||
| 4.54%, 02/01/29 (Call 02/01/28), |
700 | 687,853 | ||||||
| 4.60%, 07/26/30 (Call 07/26/29), |
700 | 683,628 | ||||||
| 4.71%, 02/01/34 (Call 02/01/33), |
1,030 | 987,222 | ||||||
| 4.95%, 04/26/27 (Call 04/26/26), |
1,295 | 1,287,962 | ||||||
| 4.97%, 04/26/34 (Call 04/26/33), |
1,250 | 1,218,144 | ||||||
| 5.15%, 05/22/26 (Call 05/22/25), |
710 | 708,330 | ||||||
| 5.80%, 10/25/28 (Call 10/25/27), |
1,525 | 1,562,323 | ||||||
| 5.83%, 10/25/33 (Call 10/25/32), |
1,839 | 1,909,712 | ||||||
| 6.32%, 10/25/29 (Call 10/25/28), |
930 | 975,087 | ||||||
| 6.47%, 10/25/34 (Call 10/25/33), |
1,370 | 1,486,109 | ||||||
| Series J, 1.90%, 01/25/29 (Call 11/25/28)(a) |
862 | 754,601 | ||||||
| Bank of New Zealand |
||||||||
| 1.00%, 03/03/26(b) |
965 | 887,458 | ||||||
| 2.29%, 01/27/27(a)(b) |
730 | 672,035 | ||||||
| 2.87%, 01/27/32(b) |
495 | 413,263 | ||||||
| 4.85%, 02/07/28(b) |
1,050 | 1,038,891 | ||||||
| 5.08%, 01/30/29(b) |
1,110 | 1,104,578 | ||||||
| Bank of Nova Scotia (The) |
||||||||
| 1.05%, 03/02/26(a) |
1,396 | 1,287,308 | ||||||
| 1.30%, 06/11/25 |
1,762 | 1,674,535 | ||||||
| 1.30%, 09/15/26 (Call 06/15/26) |
1,252 | 1,140,471 | ||||||
| 1.35%, 06/24/26 |
1,065 | 977,525 | ||||||
| 1.95%, 02/02/27 |
1,125 | 1,032,913 | ||||||
| 2.15%, 08/01/31 |
1,100 | 898,657 | ||||||
| 2.45%, 02/02/32(a) |
1,310 | 1,075,147 | ||||||
| 2.70%, 08/03/26 |
1,553 | 1,468,254 | ||||||
| 2.95%, 03/11/27 |
900 | 847,020 | ||||||
| 3.45%, 04/11/25 |
2,502 | 2,449,067 | ||||||
| 4.50%, 12/16/25 |
1,949 | 1,915,737 | ||||||
| 4.59%, 05/04/37 (Call 02/04/32), |
1,614 | 1,443,595 | ||||||
| 4.75%, 02/02/26 |
1,760 | 1,746,076 | ||||||
| 4.85%, 02/01/30 |
1,760 | 1,736,582 | ||||||
| Security | Par (000) |
Value | ||||||
| Banks (continued) | ||||||||
| 4.90%, (Call 06/04/25), |
$ | 1,122 | $ | 1,075,231 | ||||
| 5.25%, 06/12/28 |
1,005 | 1,009,787 | ||||||
| 5.35%, 12/07/26 |
1,125 | 1,129,090 | ||||||
| 5.45%, 06/12/25 |
640 | 640,284 | ||||||
| 5.65%, 02/01/34 |
755 | 766,388 | ||||||
| 8.63%, 10/27/82 (Call 10/27/27), |
280 | 288,068 | ||||||
| Series 2, 3.63%, 10/27/81 (Call 10/27/26), |
952 | 747,425 | ||||||
| Bank OZK, 2.75%, 10/01/31 (Call 10/01/26), |
595 | 495,076 | ||||||
| BankUnited Inc. |
547 | 531,750 | ||||||
| 5.13%, 06/11/30 (Call 03/11/30)(a) |
560 | 506,920 | ||||||
| Banque Federative du Credit Mutuel SA |
||||||||
| 1.60%, 10/04/26(b) |
1,660 | 1,514,049 | ||||||
| 4.52%, 07/13/25(b) |
385 | 380,519 | ||||||
| 4.75%, 07/13/27(b) |
1,025 | 1,011,687 | ||||||
| 4.94%, 01/26/26(b) |
1,510 | 1,499,079 | ||||||
| 5.09%, 01/23/27(a)(b) |
1,420 | 1,417,348 | ||||||
| 5.79%, 07/13/28(b) |
910 | 930,567 | ||||||
| 5.90%, 07/13/26(b) |
1,340 | 1,357,455 | ||||||
| Barclays PLC |
||||||||
| 2.28%, 11/24/27 (Call 11/24/26), |
2,075 | 1,896,453 | ||||||
| 2.65%, 06/24/31 (Call 06/24/30), |
1,127 | 938,247 | ||||||
| 2.67%, 03/10/32 (Call 03/10/31), |
1,762 | 1,436,281 | ||||||
| 2.85%, 05/07/26 (Call 05/07/25), |
2,200 | 2,126,890 | ||||||
| 2.89%, 11/24/32 (Call 11/24/31), |
2,075 | 1,689,734 | ||||||
| 3.33%, 11/24/42 (Call 11/24/41), |
1,515 | 1,096,781 | ||||||
| 3.56%, 09/23/35 (Call 09/23/30), |
1,293 | 1,083,768 | ||||||
| 3.65%, 03/16/25 |
1,655 | 1,620,851 | ||||||
| 3.81%, 03/10/42 (Call 03/10/41), |
1,010 | 757,397 | ||||||
| 4.34%, 01/10/28 (Call 01/10/27) |
1,745 | 1,679,766 | ||||||
| 4.38%, 01/12/26 |
3,037 | 2,975,175 | ||||||
| 4.84%, 05/09/28 (Call 05/07/27) |
2,689 | 2,591,250 | ||||||
| 4.95%, 01/10/47 |
2,060 | 1,872,658 | ||||||
| 4.97%, 05/16/29 (Call 05/16/28), |
2,368 | 2,302,382 | ||||||
| 5.09%, 06/20/30 (Call 06/20/29), |
2,160 | 2,046,264 | ||||||
| 5.20%, 05/12/26(a) |
2,632 | 2,602,473 | ||||||
| 5.25%, 08/17/45(a) |
2,110 | 2,016,809 | ||||||
| 5.30%, 08/09/26 (Call 08/09/25), |
1,910 | 1,897,803 | ||||||
| 5.50%, 08/09/28 (Call 08/09/27), |
1,945 | 1,936,516 | ||||||
| 5.75%, 08/09/33 (Call 08/09/32), |
1,360 | 1,348,051 | ||||||
| 5.83%, 05/09/27 (Call 05/09/26), |
3,035 | 3,042,681 | ||||||
| 6.22%, 05/09/34 (Call 05/09/33), |
1,985 | 2,009,775 | ||||||
| 36 | 2 0 2 4 I S H A R E S A N N U A L R E P O R T T O S H A R E H O L D E R S |
| Schedule of Investments (continued) February 29, 2024 |
iShares® Broad USD Investment Grade Corporate Bond ETF (Percentages shown are based on Net Assets) |
| Security | Par (000) |
Value | ||||||
| Banks (continued) | ||||||||
| 6.49%, 09/13/29 (Call 09/13/28), |
$ | 1,545 | $ | 1,592,566 | ||||
| 6.50%, 09/13/27 (Call 09/13/26), |
895 | 910,733 | ||||||
| 6.69%, 09/13/34 (Call 09/13/33), |
1,085 | 1,134,883 | ||||||
| 7.12%, 06/27/34 (Call 06/27/33), |
2,250 | 2,335,537 | ||||||
| 7.33%, 11/02/26 (Call 11/02/25), |
1,790 | 1,834,508 | ||||||
| 7.39%, 11/02/28 (Call 11/02/27), |
1,895 | 2,003,338 | ||||||
| 7.44%, 11/02/33 (Call 11/02/32), |
2,842 | 3,109,149 | ||||||
| BBVA Bancomer SA/Texas, 1.88%, 09/18/25(b) |
720 | 680,677 | ||||||
| BNP Paribas SA |
||||||||
| 1.32%, 01/13/27 (Call 01/13/26), |
||||||||
| (1-day SOFR + 1.004%)(b)(d) |
3,370 | 3,116,800 | ||||||
| 1.68%, 06/30/27 (Call 06/30/26), |
||||||||
| (1-day SOFR + 0.912%)(a)(b)(d) |
1,452 | 1,328,610 | ||||||
| 1.90%, 09/30/28 (Call 09/30/27), |
||||||||
| (1-day SOFR + 1.609%)(b)(d) |
1,867 | 1,652,158 | ||||||
| 2.16%, 09/15/29 (Call 09/15/28), |
||||||||
| (1-day SOFR + 1.218%)(b)(d) |
2,265 | 1,959,835 | ||||||
| 2.22%, 06/09/26 (Call 06/09/25), |
||||||||
| (1-day SOFR + 2.074%)(b)(d) |
2,032 | 1,945,222 | ||||||
| 2.59%, 01/20/28 (Call 01/20/27), |
||||||||
| (1-day SOFR + 1.228%)(b)(d) |
2,373 | 2,189,049 | ||||||
| 2.59%, 08/12/35 (Call 08/12/30), |
||||||||
| (5-year CMT + 2.050%)(a)(b)(d) |
2,479 | 1,981,124 | ||||||
| 2.82%, 01/26/41(a)(b) |
895 | 603,959 | ||||||
| 2.87%, 04/19/32 (Call 04/19/31), |
||||||||
| (1-day SOFR + 1.387%)(b)(d) |
3,112 | 2,602,179 | ||||||
| 3.05%, 01/13/31 (Call 01/13/30), |
||||||||
| (1-day SOFR + 1.507%)(b)(d) |
995 | 867,588 | ||||||
| 3.13%, 01/20/33 (Call 01/20/32), |
||||||||
| (1-day SOFR + 1.561%)(b)(d) |
1,945 | 1,636,204 | ||||||
| 3.50%, 11/16/27(b) |
1,810 | 1,703,649 | ||||||
| 4.38%, 05/12/26(b) |
1,540 | 1,494,749 | ||||||
| 4.38%, 03/01/33 (Call 03/01/28), |
||||||||
| (5-year USD Swap + 1.483%)(b)(d) |
1,455 | 1,366,754 | ||||||
| 4.40%, 08/14/28(a)(b) |
2,887 | 2,784,458 | ||||||
| 4.63%, 03/13/27(a)(b) |
2,698 | 2,618,351 | ||||||
| 5.13%, 01/13/29 (Call 01/13/28), |
||||||||
| (1-year CMT + 1.450%)(b)(d) |
2,805 | 2,785,125 | ||||||
| 5.18%, 01/09/30 (Call 01/09/29), |
||||||||
| (1-day SOFR + 1.520%)(a)(b)(d) |
1,710 | 1,693,996 | ||||||
| 5.34%, 06/12/29 (Call 06/12/28), |
||||||||
| (1-year CMT + 1.500%)(b)(d) |
5 | 4,998 | ||||||
| 5.50%, 05/20/30 (Call 05/20/29), |
||||||||
| (1-day SOFR + 1.590%)(b)(d) |
1,200 | 1,194,621 | ||||||
| 5.74%, 02/20/35 (Call 02/20/34), |
||||||||
| (1-day SOFR + 1.880%)(b)(d) |
1,200 | 1,188,235 | ||||||
| 5.89%, 12/05/34 (Call 12/05/33), |
||||||||
| (1-day SOFR + 1.866%)(b)(d) |
2,155 | 2,202,519 | ||||||
| BPCE SA |
||||||||
| 1.00%, 01/20/26(b) |
1,873 | 1,728,899 | ||||||
| 1.65%, 10/06/26 (Call 10/06/25), |
||||||||
| (1-day SOFR + 1.520%)(b)(d) |
1,980 | 1,850,998 | ||||||
| 2.05%, 10/19/27 (Call 10/19/26), |
||||||||
| (1-day SOFR + 1.087%)(b)(d) |
1,777 | 1,612,693 | ||||||
| Security | Par (000) |
Value | ||||||
| Banks (continued) | ||||||||
| 2.28%, 01/20/32 (Call 01/20/31), |
||||||||
| (1-day SOFR + 1.312%)(a)(b)(d) |
$ | 1,808 | $ | 1,447,173 | ||||
| 2.70%, 10/01/29(a)(b) |
1,296 | 1,135,709 | ||||||
| 3.12%, 10/19/32 (Call 10/19/31), |
||||||||
| (1-day SOFR + 1.730%)(a)(b)(d) |
1,432 | 1,154,845 | ||||||
| 3.25%, 01/11/28(b) |
1,525 | 1,415,928 | ||||||
| 3.38%, 12/02/26 |
641 | 613,016 | ||||||
| 3.50%, 10/23/27(a)(b) |
1,270 | 1,183,323 | ||||||
| 3.58%, 10/19/42 (Call 10/19/41), |
||||||||
| (1-day SOFR + 1.952%)(a)(b)(d) |
390 | 275,408 | ||||||
| 3.65%, 01/14/37 (Call 01/14/32), |
||||||||
| (5-year CMT + 1.900%)(b)(d) |
1,525 | 1,235,639 | ||||||
| 4.50%, 03/15/25(b) |
990 | 972,020 | ||||||
| 4.63%, 09/12/28(b) |
765 | 739,307 | ||||||
| 4.75%, 07/19/27(a)(b) |
1,212 | 1,188,042 | ||||||
| 4.88%, 04/01/26(a)(b) |
1,473 | 1,440,459 | ||||||
| 5.13%, 01/18/28(b) |
1,225 | 1,215,243 | ||||||
| 5.20%, 01/18/27(a)(b) |
520 | 519,746 | ||||||
| 5.72%, 01/18/30 (Call 01/18/29), |
||||||||
| (1-year CMT + 1.959%)(a)(b)(d) |
1,105 | 1,100,310 | ||||||
| 5.75%, 07/19/33 (Call 07/19/32), |
||||||||
| (1-day SOFR + 2.865%)(a)(b)(d) |
1,358 | 1,343,271 | ||||||
| 5.98%, 01/18/27 (Call 01/18/26), |
||||||||
| (1-day SOFR + 2.10%)(b)(d) |
1,975 | 1,976,638 | ||||||
| 6.51%, 01/18/35 (Call 01/18/34), |
||||||||
| (1-year CMT + 2.791%)(b)(d) |
840 | 832,308 | ||||||
| 6.61%, 10/19/27 (Call 10/19/26), |
||||||||
| (1-day SOFR + 1.980%)(a)(b)(d) |
750 | 765,024 | ||||||
| 6.71%, 10/19/29 (Call 10/19/28), |
||||||||
| (1-day SOFR + 2.270%)(a) |
1,025 | 1,064,098 | ||||||
| 7.00%, 10/19/34 (Call 10/19/33), |
||||||||
| (1-day SOFR + 2.590%)(b)(d) |
1,325 | 1,413,831 | ||||||
| CaixaBank SA |
||||||||
| 6.21%, 01/18/29 (Call 01/18/28), |
||||||||
| (1-day SOFR + 2.700%)(b)(d) |
1,380 | 1,399,237 | ||||||
| 6.68%, 09/13/27 (Call 09/13/26), |
||||||||
| (1-day SOFR + 2.080%)(a)(b)(d) |
910 | 927,608 | ||||||
| 6.84%, 09/13/34 (Call 09/13/33), |
||||||||
| (1-day SOFR + 2.770%)(a)(b)(d) |
540 | 567,773 | ||||||
| Canadian Imperial Bank of Commerce |
||||||||
| 0.95%, 10/23/25(a) |
1,655 | 1,547,307 | ||||||
| 1.25%, 06/22/26 (Call 05/22/26) |
1,069 | 979,786 | ||||||
| 3.30%, 04/07/25 |
1,190 | 1,162,525 | ||||||
| 3.45%, 04/07/27 (Call 03/07/27) |
1,390 | 1,325,421 | ||||||
| 3.60%, 04/07/32 (Call 03/07/32)(a) |
1,400 | 1,251,283 | ||||||
| 3.95%, 08/04/25 |
1,090 | 1,068,623 | ||||||
| 5.00%, 04/28/28 (Call 03/28/28) |
1,325 | 1,320,244 | ||||||
| 5.14%, 04/28/25 |
720 | 717,487 | ||||||
| 5.62%, 07/17/26 |
400 | 403,940 | ||||||
| 5.93%, 10/02/26 |
625 | 636,609 | ||||||
| 5.99%, 10/03/28 (Call 09/03/28)(a) |
805 | 833,017 | ||||||
| 6.09%, 10/03/33 (Call 07/03/33) |
1,485 | 1,541,453 | ||||||
| CIMB Bank Bhd, 2.13%, 07/20/27(b) |
720 | 652,082 | ||||||
| Citibank NA |
||||||||
| 5.49%, 12/04/26 (Call 11/04/26)(a) |
2,435 | 2,455,303 | ||||||
| 5.80%, 09/29/28 (Call 08/29/28) |
2,405 | 2,477,797 | ||||||
| 5.86%, 09/29/25 (Call 08/29/25) |
1,750 | 1,770,561 | ||||||
| Citigroup Inc. |
||||||||
| 1.12%, 01/28/27 (Call 01/28/26), |
||||||||
| (1-day SOFR + 0.765%)(d) |
2,835 | 2,612,712 | ||||||
| S C H E D U L E O F I N V E S T M E N T S |
37 |
| Schedule of Investments (continued) February 29, 2024 |
iShares® Broad USD Investment Grade Corporate Bond ETF (Percentages shown are based on Net Assets) |
| Security | Par (000) |
Value | ||||||
| Banks (continued) | ||||||||
| 1.46%, 06/09/27 (Call 06/09/26), |
||||||||
| (1-day SOFR + 0.770%)(d) |
$ | 3,365 | $ | 3,082,028 | ||||
| 2.52%, 11/03/32 (Call 11/03/31), |
||||||||
| (1-day SOFR + 1.177%)(d) |
2,504 | 2,032,469 | ||||||
| 2.56%, 05/01/32 (Call 05/01/31), |
||||||||
| (1-day SOFR + 1.167%)(d) |
4,040 | 3,326,239 | ||||||
| 2.57%, 06/03/31 (Call 06/03/30), |
||||||||
| (1-day SOFR + 2.107%)(d) |
4,655 | 3,936,331 | ||||||
| 2.67%, 01/29/31 (Call 01/29/30), |
||||||||
| (1-day SOFR + 1.146%)(d) |
3,149 | 2,701,639 | ||||||
| 2.90%, 11/03/42 (Call 11/03/41), |
||||||||
| (1-day SOFR + 1.379%)(d) |
1,830 | 1,297,772 | ||||||
| 2.98%, 11/05/30 (Call 11/05/29), |
||||||||
| (1-day SOFR + 1.422%)(a)(d) |
2,862 | 2,522,282 | ||||||
| 3.06%, 01/25/33 (Call 01/25/32), |
||||||||
| (1-day SOFR + 1.351%)(a)(d) |
4,046 | 3,397,187 | ||||||
| 3.07%, 02/24/28 (Call 02/24/27), |
||||||||
| (1-day SOFR + 1.280%)(d) |
3,313 | 3,103,248 | ||||||
| 3.11%, 04/08/26 (Call 04/08/25), |
||||||||
| (1-day SOFR + 2.842%)(d) |
4,323 | 4,207,625 | ||||||
| 3.20%, 10/21/26 (Call 07/21/26)(a) |
3,693 | 3,506,803 | ||||||
| 3.29%, 03/17/26 (Call 03/17/25), |
||||||||
| (1-day SOFR + 1.528%)(d) |
1,875 | 1,830,369 | ||||||
| 3.30%, 04/27/25 |
1,471 | 1,438,229 | ||||||
| 3.40%, 05/01/26 |
3,067 | 2,950,773 | ||||||
| 3.52%, 10/27/28 (Call 10/27/27), |
||||||||
| (3-mo. SOFR + 1.412%)(d) |
3,828 | 3,597,323 | ||||||
| 3.67%, 07/24/28 (Call 07/24/27), |
||||||||
| (3-mo. SOFR + 1.652%)(d) |
3,397 | 3,221,012 | ||||||
| 3.70%, 01/12/26 |
2,558 | 2,490,174 | ||||||
| 3.79%, 03/17/33 (Call 03/17/32), |
||||||||
| (1-day SOFR + 1.939%)(d) |
4,187 | 3,704,800 | ||||||
| 3.88%, 03/26/25 |
1,274 | 1,250,578 | ||||||
| 3.88%, 01/24/39 (Call 01/24/38), |
||||||||
| (3-mo. SOFR + 1.430%)(d) |
1,421 | 1,195,824 | ||||||
| 3.89%, 01/10/28 (Call 01/10/27), |
||||||||
| (3-mo. SOFR + 1.825%)(d) |
3,671 | 3,528,281 | ||||||
| 3.98%, 03/20/30 (Call 03/20/29), |
||||||||
| (3-mo. SOFR + 1.600%)(d) |
3,310 | 3,102,664 | ||||||
| 4.08%, 04/23/29 (Call 04/23/28), |
||||||||
| (3-mo. SOFR + 1.454%)(d) |
2,853 | 2,722,907 | ||||||
| 4.13%, 07/25/28 |
3,190 | 3,034,475 | ||||||
| 4.28%, 04/24/48 (Call 04/24/47), |
||||||||
| (3-mo. SOFR + 2.101%)(d) |
1,472 | 1,249,073 | ||||||
| 4.30%, 11/20/26 |
1,504 | 1,464,963 | ||||||
| 4.40%, 06/10/25 |
3,071 | 3,025,344 | ||||||
| 4.41%, 03/31/31 (Call 03/31/30), |
||||||||
| (1-day SOFR + 3.914%)(d) |
4,919 | 4,646,703 | ||||||
| 4.45%, 09/29/27 |
4,410 | 4,271,764 | ||||||
| 4.60%, 03/09/26 |
1,615 | 1,588,539 | ||||||
| 4.65%, 07/30/45 |
1,379 | 1,240,249 | ||||||
| 4.65%, 07/23/48 (Call 06/23/48)(a) |
3,408 | 3,032,882 | ||||||
| 4.66%, 05/24/28 (Call 05/24/27), |
||||||||
| (1-day SOFR + 1.887%)(d) |
960 | 943,057 | ||||||
| 4.75%, 05/18/46 |
2,766 | 2,434,581 | ||||||
| 4.91%, 05/24/33 (Call 05/24/32), |
||||||||
| (1-day SOFR + 2.086%)(d) |
3,337 | 3,195,144 | ||||||
| 5.17%, 02/13/30 (Call 02/13/29), |
||||||||
| (1-day SOFR + 1.364%)(d) |
1,590 | 1,573,760 | ||||||
| 5.30%, 05/06/44 |
1,343 | 1,282,500 | ||||||
| Security | Par (000) |
Value | ||||||
| Banks (continued) | ||||||||
| 5.32%, 03/26/41 (Call 03/26/40), |
||||||||
| (1-day SOFR + 4.548%)(d) |
$ | 1,261 | $ | 1,233,149 | ||||
| 5.50%, 09/13/25 |
1,873 | 1,869,436 | ||||||
| 5.61%, 09/29/26 (Call 09/29/25), |
||||||||
| (1-day SOFR + 1.546%)(d) |
3,567 | 3,571,526 | ||||||
| 5.83%, 02/13/35 (Call 02/13/34), |
||||||||
| (1-day SOFR + 2.056%)(d) |
2,630 | 2,573,115 | ||||||
| 5.88%, 02/22/33 |
808 | 824,171 | ||||||
| 5.88%, 01/30/42(a) |
1,449 | 1,521,743 | ||||||
| 6.00%, 10/31/33(a) |
1,087 | 1,123,467 | ||||||
| 6.13%, 08/25/36 |
1,057 | 1,085,202 | ||||||
| 6.17%, 05/25/34 (Call 05/25/33), |
||||||||
| (1-day SOFR + 2.661%)(d) |
3,495 | 3,521,195 | ||||||
| 6.27%, 11/17/33 (Call 11/17/32), |
||||||||
| (1-day SOFR + 2.338%)(a)(d) |
3,364 | 3,528,993 | ||||||
| 6.63%, 01/15/28(a) |
413 | 436,441 | ||||||
| 6.63%, 06/15/32 |
1,427 | 1,519,451 | ||||||
| 6.68%, 09/13/43 |
1,352 | 1,491,616 | ||||||
| 6.88%, 03/05/38(a) |
545 | 589,881 | ||||||
| 6.88%, 02/15/98 |
216 | 246,989 | ||||||
| 8.13%, 07/15/39 |
2,605 | 3,308,057 | ||||||
| Citizens Bank NA |
||||||||
| 2.25%, 04/28/25 (Call 03/28/25)(a) |
810 | 777,189 | ||||||
| 4.58%, 08/09/28 (Call 08/09/27), |
||||||||
| (1-day SOFR + 2.000%)(a)(d) |
1,035 | 986,185 | ||||||
| Citizens Bank NA/Providence RI, |
668 | 639,919 | ||||||
| Citizens Financial Group Inc. |
||||||||
| 2.50%, 02/06/30 (Call 11/06/29) |
585 | 485,295 | ||||||
| 2.64%, 09/30/32 (Call 07/02/32) |
748 | 567,955 | ||||||
| 2.85%, 07/27/26 (Call 04/27/26)(a) |
830 | 773,688 | ||||||
| 3.25%, 04/30/30 (Call 01/30/30)(a) |
1,050 | 908,460 | ||||||
| 4.30%, 12/03/25 (Call 11/03/25) |
388 | 377,782 | ||||||
| 5.64%, 05/21/37 (Call 05/21/32), |
||||||||
| (5-year CMT + 2.750%)(a)(d) |
585 | 536,990 | ||||||
| 5.84%, 01/23/30 (Call 01/23/29), |
||||||||
| (1-day SOFR + 2.010%)(d) |
185 | 182,785 | ||||||
| Comerica Bank |
||||||||
| 4.00%, 07/27/25 |
345 | 334,652 | ||||||
| 5.33%, 08/25/33 (Call 08/25/32), |
||||||||
| (1-day SOFR + 2.610%)(d) |
225 | 200,910 | ||||||
| Comerica Inc. |
||||||||
| 3.80%, 07/22/26 |
457 | 436,826 | ||||||
| 4.00%, 02/01/29 (Call 11/03/28)(a) |
954 | 857,675 | ||||||
| Commonwealth Bank of Australia |
||||||||
| 1.13%, 06/15/26(b) |
2,657 | 2,432,782 | ||||||
| 1.88%, 09/15/31(a)(b) |
1,354 | 1,087,702 | ||||||
| 2.30%, 03/14/25(a)(b) |
1,505 | 1,461,452 | ||||||
| 2.55%, 03/14/27(a)(b) |
1,701 | 1,585,507 | ||||||
| 2.63%, 09/06/26(a)(b) |
1,075 | 1,015,257 | ||||||
| 2.69%, 03/11/31(b) |
2,410 | 1,981,342 | ||||||
| 2.85%, 05/18/26(b) |
925 | 882,598 | ||||||
| 3.15%, 09/19/27(b) |
632 | 593,160 | ||||||
| 3.31%, 03/11/41(a)(b) |
1,482 | 1,062,282 | ||||||
| 3.61%, 09/12/34 (Call 09/12/29), |
||||||||
| (5-year CMT + 2.050%)(a)(b)(d) |
1,896 | 1,686,686 | ||||||
| 3.74%, 09/12/39(a)(b) |
2,021 | 1,586,921 | ||||||
| 3.78%, 03/14/32(b) |
990 | 866,007 | ||||||
| 3.90%, 03/16/28(a)(b) |
1,157 | 1,114,121 | ||||||
| 3.90%, 07/12/47(a)(b) |
1,693 | 1,389,703 | ||||||
| 4.32%, 01/10/48(b) |
1,176 | 944,095 | ||||||
| 38 | 2 0 2 4 I S H A R E S A N N U A L R E P O R T T O S H A R E H O L D E R S |
| Schedule of Investments (continued) February 29, 2024 |
iShares® Broad USD Investment Grade Corporate Bond ETF (Percentages shown are based on Net Assets) |
| Security | Par (000) |
Value | ||||||
| Banks (continued) | ||||||||
| 4.50%, 12/09/25(b) |
$ | 538 | $ | 527,848 | ||||
| Commonwealth Bank of Australia/New York |
||||||||
| 5.32%, 03/13/26 |
1,370 | 1,376,454 | ||||||
| 5.50%, 09/12/25 |
500 | 502,857 | ||||||
| Cooperatieve Rabobank UA |
||||||||
| 1.00%, 09/24/26 (Call 09/24/25), |
||||||||
| (1-year CMT + 0.730%)(b)(d) |
1,649 | 1,536,581 | ||||||
| 1.11%, 02/24/27 (Call 02/24/26), |
||||||||
| (1-year CMT + 0.550%)(b)(d) |
2,620 | 2,402,042 | ||||||
| 1.34%, 06/24/26 (Call 06/24/25), |
||||||||
| (1-year CMT + 1.000%)(b)(d) |
1,300 | 1,228,420 | ||||||
| 1.98%, 12/15/27 (Call 12/15/26), |
||||||||
| (1-year CMT + 0.730%)(b)(d) |
2,165 | 1,964,048 | ||||||
| 3.65%, 04/06/28 (Call 04/06/27), |
||||||||
| (1-year CMT + 1.220%)(b)(d) |
1,696 | 1,606,861 | ||||||
| 3.75%, 07/21/26 |
2,273 | 2,178,687 | ||||||
| 3.76%, 04/06/33 (Call 04/06/32), |
||||||||
| (1-year CMT + 1.420%)(b)(d) |
1,230 | 1,091,700 | ||||||
| 4.38%, 08/04/25 |
1,170 | 1,147,515 | ||||||
| 4.66%, 08/22/28 (Call 08/22/27), |
||||||||
| (1-year CMT + 1.750%)(b)(d) |
2,065 | 2,011,965 | ||||||
| 4.80%, 01/09/29(a) |
600 | 594,345 | ||||||
| 4.85%, 01/09/26 |
500 | 497,886 | ||||||
| 5.04%, 03/05/27 |
750 | 750,192 | ||||||
| 5.25%, 05/24/41(a) |
1,987 | 2,008,075 | ||||||
| 5.25%, 08/04/45(a) |
1,232 | 1,195,671 | ||||||
| 5.45%, 03/05/30 (Call 03/05/29), |
||||||||
| (1-year CMT + 1.120%)(b)(d) |
1,250 | 1,250,012 | ||||||
| 5.56%, 02/28/29 (Call 02/28/28), |
||||||||
| (1-year CMT + 1.400%)(b)(d) |
40 | 40,139 | ||||||
| 5.75%, 12/01/43 |
1,890 | 1,901,576 | ||||||
| Cooperatieve Rabobank UA/NY |
||||||||
| 3.38%, 05/21/25 |
1,982 | 1,940,515 | ||||||
| 5.50%, 07/18/25 |
750 | 753,527 | ||||||
| 5.50%, 10/05/26 |
710 | 718,370 | ||||||
| Credicorp Ltd., 2.75%, 06/17/25 |
||||||||
| (Call 05/17/25)(a)(b) |
605 | 579,380 | ||||||
| Credit Agricole SA |
||||||||
| 1.25%, 01/26/27 (Call 01/26/26), |
||||||||
| (1-day SOFR + 0.891%)(b)(d) |
1,212 | 1,118,770 | ||||||
| 2.02%, 01/11/27(a)(b) |
1,000 | 919,317 | ||||||
| 2.81%, 01/11/41(b) |
1,287 | 864,213 | ||||||
| 3.25%, 01/14/30(a)(b) |
1,919 | 1,683,316 | ||||||
| 4.00%, 01/10/33 (Call 01/10/28), |
||||||||
| (5-year USD Swap + 1.644%)(b)(d) |
1,555 | 1,437,008 | ||||||
| 4.38%, 03/17/25(b) |
325 | 319,427 | ||||||
| 5.30%, 07/12/28(a)(b) |
1,795 | 1,808,358 | ||||||
| 5.34%, 01/10/30 (Call 01/10/29), |
||||||||
| (1-day SOFR + 1.690%)(a)(b)(d) |
1,020 | 1,011,838 | ||||||
| 5.51%, 07/05/33(b) |
715 | 728,127 | ||||||
| 5.59%, 07/05/26(b) |
1,095 | 1,104,096 | ||||||
| 6.25%, 01/10/35 (Call 01/10/34), |
||||||||
| (1-day SOFR + 2.670%)(b)(d) |
1,720 | 1,718,655 | ||||||
| 6.32%, 10/03/29 (Call 10/03/28), |
||||||||
| (1-day SOFR + 1.860%)(b)(d) |
2,445 | 2,519,875 | ||||||
| Credit Agricole SA/London |
||||||||
| 1.91%, 06/16/26 (Call 06/16/25), |
||||||||
| (1-day SOFR + 1.676%)(b)(d) |
2,462 | 2,345,759 | ||||||
| 4.13%, 01/10/27(a)(b) |
1,941 | 1,880,279 | ||||||
| Credit Suisse AG/New York |
||||||||
| 1.25%, 08/07/26 |
2,090 | 1,894,918 | ||||||
| Security | Par (000) |
Value | ||||||
| Banks (continued) | ||||||||
| 2.95%, 04/09/25 |
$ | 1,319 | $ | 1,280,766 | ||||
| 5.00%, 07/09/27 |
1,815 | 1,798,246 | ||||||
| 7.50%, 02/15/28 |
3,075 | 3,309,746 | ||||||
| Danske Bank A/S |
||||||||
| 1.55%, 09/10/27 (Call 09/10/26), |
||||||||
| (1-year CMT + 0.730%)(a)(b)(d) |
835 | 758,293 | ||||||
| 1.62%, 09/11/26 (Call 09/11/25), |
||||||||
| (1-year CMT + 1.350%)(b)(d) |
892 | 836,221 | ||||||
| 4.30%, 04/01/28 (Call 04/01/27), |
||||||||
| (1-year CMT + 1.750%)(a)(b)(d) |
1,615 | 1,555,385 | ||||||
| 4.38%, 06/12/28(b) |
654 | 632,006 | ||||||
| 5.43%, 03/01/28 (Call 03/01/27), |
||||||||
| (1-year CMT + 0.950%)(b)(d) |
1,000 | 1,001,469 | ||||||
| 5.71%, 03/01/30 (Call 03/01/29), |
||||||||
| (1-year CMT + 1.400%)(b)(d) |
1,000 | 1,002,123 | ||||||
| 6.26%, 09/22/26 (Call 09/22/25), |
||||||||
| (1-year CMT + 1.180%)(b)(d) |
1,545 | 1,560,928 | ||||||
| Deutsche Bank AG |
||||||||
| 4.10%, 01/13/26 |
684 | 665,810 | ||||||
| 4.50%, 04/01/25(a) |
1,525 | 1,495,765 | ||||||
| 5.71%, 02/08/28 (Call 02/08/27), |
||||||||
| (1-day SOFR + 1.594%)(d) |
670 | 665,362 | ||||||
| Deutsche Bank AG/New York |
||||||||
| 1.69%, 03/19/26 |
1,090 | 1,015,654 | ||||||
| 2.13%, 11/24/26 (Call 11/24/25), |
||||||||
| (1-day SOFR + 1.870%)(d) |
2,675 | 2,506,977 | ||||||
| 2.31%, 11/16/27 (Call 11/16/26), |
||||||||
| (1-day SOFR + 1.219%)(d) |
1,640 | 1,489,849 | ||||||
| 2.55%, 01/07/28 (Call 01/07/27), |
||||||||
| (1-day SOFR + 1.318%)(d) |
2,770 | 2,525,749 | ||||||
| 3.04%, 05/28/32 (Call 05/28/31), |
||||||||
| (1-day SOFR + 1.718%)(d) |
1,528 | 1,263,487 | ||||||
| 3.55%, 09/18/31 (Call 09/18/30), |
||||||||
| (1-day SOFR + 3.043%)(d) |
2,672 | 2,318,358 | ||||||
| 3.73%, 01/14/32 (Call 10/14/30), |
||||||||
| (1-day SOFR + 2.757%)(d) |
1,200 | 982,922 | ||||||
| 3.74%, 01/07/33 (Call 10/07/31), |
||||||||
| (1-day SOFR + 2.257%)(d) |
1,365 | 1,097,004 | ||||||
| 4.10%, 01/13/26 |
660 | 643,788 | ||||||
| 4.16%, 05/13/25 |
295 | 290,410 | ||||||
| 4.88%, 12/01/32 (Call 12/01/27), |
||||||||
| (5-year USD ICE Swap + 2.553%)(d) |
1,520 | 1,406,956 | ||||||
| 5.37%, 09/09/27 |
570 | 571,044 | ||||||
| 5.88%, 07/08/31 (Call 04/08/30), |
||||||||
| (1-day SOFR + 5.438%)(d) |
380 | 363,750 | ||||||
| 6.12%, 07/14/26 (Call 07/14/25), |
||||||||
| (1-day SOFR + 3.190%)(d) |
1,210 | 1,212,614 | ||||||
| 6.72%, 01/18/29 (Call 01/18/28), |
||||||||
| (1-day SOFR + 3.180%)(d) |
1,410 | 1,448,614 | ||||||
| 6.82%, 11/20/29 (Call 11/20/28), |
||||||||
| (1-day SOFR + 2.510%)(d) |
1,050 | 1,085,846 | ||||||
| 7.08%, 02/10/34 (Call 11/10/32), |
||||||||
| (1-day SOFR + 3.650%)(d) |
1,645 | 1,639,631 | ||||||
| 7.15%, 07/13/27 (Call 07/13/26), |
||||||||
| (1-day SOFR + 2.520%)(d) |
1,430 | 1,468,813 | ||||||
| Discover Bank |
||||||||
| 2.70%, 02/06/30 (Call 11/06/29) |
750 | 637,636 | ||||||
| 3.45%, 07/27/26 (Call 04/27/26) |
1,360 | 1,289,799 | ||||||
| 4.25%, 03/13/26 |
507 | 492,417 | ||||||
| 4.65%, 09/13/28 (Call 06/13/28) |
980 | 935,791 | ||||||
| S C H E D U L E O F I N V E S T M E N T S |
39 |
| Schedule of Investments (continued) February 29, 2024 |
iShares® Broad USD Investment Grade Corporate Bond ETF (Percentages shown are based on Net Assets) |
| Security | Par (000) |
Value | ||||||
| Banks (continued) | ||||||||
| DNB Bank ASA |
||||||||
| 1.13%, 09/16/26 (Call 09/16/25), |
||||||||
| (1-year CMT + 0.850%)(a)(b)(d) |
$ | 845 | $ | 788,212 | ||||
| 1.54%, 05/25/27 (Call 05/25/26), |
||||||||
| (1-year CMT + 0.720%)(a)(b)(d) |
1,300 | 1,192,615 | ||||||
| 1.61%, 03/30/28 (Call 03/30/27), |
||||||||
| (1-year CMT + 0.680%)(a)(b)(d) |
890 | 792,284 | ||||||
| 5.90%, 10/09/26 (Call 10/09/25), |
||||||||
| (1-day SOFR + 1.950%)(a)(b)(d) |
1,305 | 1,311,833 | ||||||
| Federation des Caisses Desjardins du Quebec |
||||||||
| 4.40%, 08/23/25(a)(b) |
647 | 637,894 | ||||||
| 4.55%, 08/23/27(a)(b) |
646 | 633,973 | ||||||
| 5.25%, 04/26/29(b) |
1,080 | 1,070,240 | ||||||
| 5.70%, 03/14/28(a)(b) |
935 | 945,291 | ||||||
| Fifth Third Bancorp. |
||||||||
| 1.71%, 11/01/27 (Call 11/01/26), |
||||||||
| (1-day SOFR + 0.685%)(d) |
725 | 651,019 | ||||||
| 2.55%, 05/05/27 (Call 04/05/27) |
922 | 846,660 | ||||||
| 3.95%, 03/14/28 (Call 02/14/28)(a) |
773 | 735,292 | ||||||
| 4.06%, 04/25/28 (Call 04/25/27), |
||||||||
| (1-day SOFR + 1.355%)(d) |
745 | 706,308 | ||||||
| 4.34%, 04/25/33 (Call 04/25/32), |
||||||||
| (1-day SOFR + 1.660%)(a)(d) |
805 | 729,803 | ||||||
| 4.77%, 07/28/30 (Call 07/28/29), |
||||||||
| (1-day SOFR + 2.127%)(d) |
1,396 | 1,332,082 | ||||||
| 5.63%, 01/29/32 (Call 01/29/31), |
||||||||
| (1-day SOFR + 1.840%)(a)(d) |
345 | 341,912 | ||||||
| 6.34%, 07/27/29 (Call 07/27/28), |
||||||||
| (1-day SOFR + 2.340%)(d) |
1,385 | 1,421,233 | ||||||
| 6.36%, 10/27/28 (Call 10/27/27), |
||||||||
| (1-day SOFR + 2.192%)(d) |
1,494 | 1,523,066 | ||||||
| 8.25%, 03/01/38 |
1,490 | 1,761,749 | ||||||
| Fifth Third Bank NA |
||||||||
| 2.25%, 02/01/27 (Call 01/01/27) |
937 | 859,700 | ||||||
| 3.85%, 03/15/26 (Call 02/15/26) |
1,176 | 1,132,904 | ||||||
| 3.95%, 07/28/25 (Call 06/28/25) |
770 | 753,624 | ||||||
| First Citizens BancShares Inc./NC, |
772 | 738,209 | ||||||
| First Horizon Bank, 5.75%, 05/01/30 |
||||||||
| (Call 02/01/30) |
645 | 602,636 | ||||||
| First Horizon Corp., 4.00%, 05/26/25 |
||||||||
| (Call 04/26/25)(a) |
380 | 371,494 | ||||||
| First-Citizens Bank & Trust Co., |
525 | 533,159 | ||||||
| FNB Corp., 5.15%, 08/25/25 |
473 | 464,409 | ||||||
| Goldman Sachs Capital I, |
820 | 840,106 | ||||||
| Goldman Sachs Group Inc. (The) |
||||||||
| 1.09%, 12/09/26 (Call 12/09/25), |
||||||||
| (1-day SOFR + 0.789%)(d) |
2,549 | 2,361,247 | ||||||
| 1.43%, 03/09/27 (Call 03/09/26), |
||||||||
| (1-day SOFR + 0.798%)(d) |
3,762 | 3,477,017 | ||||||
| 1.54%, 09/10/27 (Call 09/10/26), |
||||||||
| (1-day SOFR + 0.818%)(d) |
3,595 | 3,272,483 | ||||||
| 1.95%, 10/21/27 (Call 10/21/26), |
||||||||
| (1-day SOFR + 0.913%)(d) |
5,378 | 4,923,284 | ||||||
| 1.99%, 01/27/32 (Call 01/27/31), |
||||||||
| (1-day SOFR + 1.090%)(d) |
3,481 | 2,791,194 | ||||||
| 2.38%, 07/21/32 (Call 07/21/31), |
||||||||
| (1-day SOFR + 1.248%)(d) |
4,631 | 3,768,634 | ||||||
| 2.60%, 02/07/30 (Call 11/07/29) |
2,878 | 2,499,360 | ||||||
| Security | Par (000) |
Value | ||||||
| Banks (continued) | ||||||||
| 2.62%, 04/22/32 (Call 04/22/31), |
||||||||
| (1-day SOFR + 1.281%)(d) |
$ | 4,848 | $ | 4,031,018 | ||||
| 2.64%, 02/24/28 (Call 02/24/27), |
||||||||
| (1-day SOFR + 1.114%)(d) |
3,988 | 3,693,424 | ||||||
| 2.65%, 10/21/32 (Call 10/21/31), |
||||||||
| (1-day SOFR + 1.264%)(d) |
3,937 | 3,247,136 | ||||||
| 2.91%, 07/21/42 (Call 07/21/41), |
||||||||
| (1-day SOFR + 1.472%)(d) |
1,994 | 1,413,346 | ||||||
| 3.10%, 02/24/33 (Call 02/24/32), |
||||||||
| (1-day SOFR + 1.410%)(d) |
5,275 | 4,473,308 | ||||||
| 3.21%, 04/22/42 (Call 04/22/41), |
||||||||
| (1-day SOFR + 1.513%)(d) |
3,061 | 2,277,722 | ||||||
| 3.44%, 02/24/43 (Call 02/24/42), |
||||||||
| (1-day SOFR + 1.632%)(d) |
2,576 | 1,959,590 | ||||||
| 3.50%, 04/01/25 (Call 03/01/25) |
3,878 | 3,797,833 | ||||||
| 3.50%, 11/16/26 (Call 11/16/25) |
3,124 | 2,996,463 | ||||||
| 3.62%, 03/15/28 (Call 03/15/27), |
||||||||
| (1-day SOFR + 1.846%)(d) |
3,835 | 3,656,411 | ||||||
| 3.69%, 06/05/28 (Call 06/05/27), |
||||||||
| (3-mo. SOFR + 1.772%)(a)(d) |
3,043 | 2,901,959 | ||||||
| 3.75%, 05/22/25 (Call 02/22/25) |
2,494 | 2,444,377 | ||||||
| 3.75%, 02/25/26 (Call 11/25/25) |
2,227 | 2,170,421 | ||||||
| 3.80%, 03/15/30 (Call 12/15/29) |
2,750 | 2,556,920 | ||||||
| 3.81%, 04/23/29 (Call 04/23/28), |
||||||||
| (3-mo. SOFR + 1.420%)(d) |
3,316 | 3,130,747 | ||||||
| 3.85%, 01/26/27 (Call 01/26/26) |
3,995 | 3,858,084 | ||||||
| 4.02%, 10/31/38 (Call 10/31/37), |
||||||||
| (3-mo. SOFR + 1.635%)(d) |
3,484 | 2,976,617 | ||||||
| 4.22%, 05/01/29 (Call 05/01/28), |
||||||||
| (3-mo. SOFR + 1.563%)(d) |
4,561 | 4,373,269 | ||||||
| 4.25%, 10/21/25(a) |
2,511 | 2,466,520 | ||||||
| 4.39%, 06/15/27 (Call 06/15/26), |
||||||||
| (1-day SOFR + 1.510%)(a)(d) |
1,100 | 1,079,674 | ||||||
| 4.41%, 04/23/39 (Call 04/23/38), |
||||||||
| (3-mo. SOFR + 1.692%)(d) |
2,195 | 1,942,390 | ||||||
| 4.48%, 08/23/28 (Call 08/23/27), |
||||||||
| (1-day SOFR + 1.725%)(d) |
3,430 | 3,344,330 | ||||||
| 4.75%, 10/21/45 (Call 04/21/45) |
2,467 | 2,254,140 | ||||||
| 4.80%, 07/08/44 (Call 01/08/44) |
2,499 | 2,282,478 | ||||||
| 5.15%, 05/22/45 |
2,380 | 2,271,373 | ||||||
| 5.80%, 08/10/26 (Call 08/10/25), |
||||||||
| (1-day SOFR + 1.075%)(d) |
2,475 | 2,488,648 | ||||||
| 5.95%, 01/15/27 |
1,155 | 1,179,201 | ||||||
| 6.13%, 02/15/33(a) |
825 | 884,989 | ||||||
| 6.25%, 02/01/41 |
3,207 | 3,452,231 | ||||||
| 6.45%, 05/01/36(a) |
1,208 | 1,286,976 | ||||||
| 6.48%, 10/24/29 (Call 10/24/28), |
||||||||
| (1-day SOFR + 1.770%)(d) |
3,660 | 3,834,774 | ||||||
| 6.56%, 10/24/34 (Call 10/24/33), |
||||||||
| (1-day SOFR + 1.950%)(a)(d) |
1,315 | 1,416,526 | ||||||
| 6.75%, 10/01/37 |
7,250 | 7,880,397 | ||||||
| Hana Bank |
||||||||
| 1.25%, 12/16/26(a)(b) |
95 | 85,038 | ||||||
| 3.25%, 03/30/27(b) |
280 | 265,003 | ||||||
| 3.50%, (Call 10/19/26), |
||||||||
| (5-year CMT + 2.409%)(b)(d)(e) |
390 | 365,804 | ||||||
| 5.75%, 10/24/28(b) |
185 | 190,287 | ||||||
| HBOS PLC, 6.00%, 11/01/33(b) |
476 | 449,664 | ||||||
| HSBC Bank USA NA, 7.00%, 01/15/39 |
935 | 1,069,556 | ||||||
| HSBC Bank USA NA/New York |
510 | 499,907 | ||||||
| 40 | 2 0 2 4 I S H A R E S A N N U A L R E P O R T T O S H A R E H O L D E R S |
| Schedule of Investments (continued) February 29, 2024 |
iShares® Broad USD Investment Grade Corporate Bond ETF (Percentages shown are based on Net Assets) |
| Security | Par (000) | Value | ||||||
| Banks (continued) | ||||||||
| 5.88%, 11/01/34 |
$ | 505 | $ | 520,768 | ||||
| HSBC Capital Funding Dollar 1 LP, |
||||||||
| (3-mo. LIBOR US + 4.980%)(b)(d)(e) |
1,067 | 1,337,216 | ||||||
| HSBC Holdings PLC |
||||||||
| 1.59%, 05/24/27 (Call 05/24/26), |
2,830 | 2,590,973 | ||||||
| 1.65%, 04/18/26 (Call 04/18/25), |
2,402 | 2,292,498 | ||||||
| 2.01%, 09/22/28 (Call 09/22/27), |
2,755 | 2,440,819 | ||||||
| 2.10%, 06/04/26 (Call 06/04/25), |
2,575 | 2,463,511 | ||||||
| 2.21%, 08/17/29 (Call 08/17/28), |
2,745 | 2,383,188 | ||||||
| 2.25%, 11/22/27 (Call 11/22/26), |
3,260 | 2,986,306 | ||||||
| 2.36%, 08/18/31 (Call 08/18/30), |
1,800 | 1,481,045 | ||||||
| 2.80%, 05/24/32 (Call 05/24/31), |
4,292 | 3,548,554 | ||||||
| 2.85%, 06/04/31 (Call 06/04/30), |
1,922 | 1,635,886 | ||||||
| 2.87%, 11/22/32 (Call 11/22/31), |
2,310 | 1,905,503 | ||||||
| 3.00%, 03/10/26 (Call 03/10/25), |
2,750 | 2,672,924 | ||||||
| 3.90%, 05/25/26 |
3,305 | 3,202,436 | ||||||
| 3.97%, 05/22/30 (Call 05/22/29), |
3,842 | 3,562,401 | ||||||
| 4.04%, 03/13/28 (Call 03/13/27), |
3,293 | 3,156,874 | ||||||
| 4.25%, 08/18/25 |
660 | 645,835 | ||||||
| 4.29%, 09/12/26 (Call 09/12/25), |
2,991 | 2,931,628 | ||||||
| 4.30%, 03/08/26(a) |
3,487 | 3,417,732 | ||||||
| 4.38%, 11/23/26 |
1,979 | 1,925,778 | ||||||
| 4.58%, 06/19/29 (Call 06/19/28), |
3,741 | 3,599,057 | ||||||
| 4.76%, 06/09/28 (Call 06/09/27), |
3,175 | 3,100,141 | ||||||
| 4.76%, 03/29/33 (Call 03/29/32), |
3,120 | 2,867,372 | ||||||
| 4.95%, 03/31/30 |
3,022 | 2,959,472 | ||||||
| 5.21%, 08/11/28 (Call 08/11/27), |
2,610 | 2,584,689 | ||||||
| 5.25%, 03/14/44(a) |
1,660 | 1,580,566 | ||||||
| 5.40%, 08/11/33 (Call 08/11/32), |
3,200 | 3,144,534 | ||||||
| 5.55%, 03/04/30 (Call 03/04/29), |
2,000 | 1,998,172 | ||||||
| 5.72%, 03/04/35 (Call 03/04/34), |
2,000 | 1,993,023 | ||||||
| 5.89%, 08/14/27 (Call 08/14/26), |
2,715 | 2,733,010 | ||||||
| 6.10%, 01/14/42(a) |
920 | 1,008,449 | ||||||
| 6.16%, 03/09/29 (Call 03/09/28), |
2,710 | 2,768,847 | ||||||
| 6.25%, 03/09/34 (Call 03/09/33), |
2,970 | 3,081,830 | ||||||
| Security | Par (000) | Value | ||||||
| Banks (continued) | ||||||||
| 6.33%, 03/09/44 (Call 03/09/43), |
$ | 3,790 | $ | 3,984,679 | ||||
| 6.50%, 05/02/36 |
2,610 | 2,721,913 | ||||||
| 6.50%, 09/15/37 |
2,033 | 2,100,204 | ||||||
| 6.55%, 06/20/34 (Call 06/20/33), |
1,850 | 1,893,482 | ||||||
| 6.80%, 06/01/38(a) |
809 | 849,184 | ||||||
| 7.34%, 11/03/26 (Call 11/03/25), |
2,305 | 2,373,284 | ||||||
| 7.39%, 11/03/28 (Call 11/03/27), |
3,195 | 3,384,694 | ||||||
| 7.40%, 11/13/34 (Call 11/13/33), |
2,250 | 2,412,270 | ||||||
| 7.63%, 05/17/32(a) |
110 | 121,959 | ||||||
| 8.11%, 11/03/33 (Call 11/03/32), |
2,715 | 3,065,840 | ||||||
| HSBC USA Inc. |
||||||||
| 5.29%, 03/04/27 |
665 | 665,632 | ||||||
| 5.63%, 03/17/25 |
1,200 | 1,201,458 | ||||||
| 7.20%, 07/15/97(a) |
170 | 203,112 | ||||||
| Huntington Bancshares Inc./OH |
||||||||
| 2.49%, 08/15/36 (Call 08/15/31), |
770 | 582,478 | ||||||
| 2.55%, 02/04/30 (Call 11/04/29) |
1,010 | 852,122 | ||||||
| 4.00%, 05/15/25 (Call 04/15/25)(a) |
350 | 343,711 | ||||||
| 4.44%, 08/04/28 (Call 08/04/27), |
1,327 | 1,274,459 | ||||||
| 5.02%, 05/17/33 (Call 05/17/32), |
693 | 655,126 | ||||||
| 6.21%, 08/21/29 (Call 08/21/28), |
1,010 | 1,027,029 | ||||||
| Huntington National Bank (The) |
||||||||
| 4.55%, 05/17/28 (Call 05/17/27), |
965 | 931,064 | ||||||
| 5.65%, 01/10/30 (Call 11/10/29) |
825 | 822,317 | ||||||
| ICICI Bank Ltd./Dubai |
||||||||
| 3.80%, 12/14/27(b) |
450 | 424,558 | ||||||
| 4.00%, 03/18/26(b) |
935 | 907,826 | ||||||
| Industrial & Commercial Bank of China Ltd., |
||||||||
| 4.88%, 09/21/25(a)(b) |
1,975 | 1,952,979 | ||||||
| Industrial & Commercial Bank of China Ltd./ |
1,543 | 1,466,329 | ||||||
| ING Groep NV |
||||||||
| 1.40%, 07/01/26 (Call 07/01/25), |
1,403 | 1,328,573 | ||||||
| 1.73%, 04/01/27 (Call 04/01/26), |
1,524 | 1,410,780 | ||||||
| 2.73%, 04/01/32 (Call 04/01/31), |
1,082 | 910,845 | ||||||
| 3.87%, 03/28/26 (Call 03/28/25), |
1,345 | 1,320,057 | ||||||
| 3.95%, 03/29/27 |
2,074 | 1,997,288 | ||||||
| 4.02%, 03/28/28 (Call 03/28/27), |
1,295 | 1,243,463 | ||||||
| 4.05%, 04/09/29 |
1,074 | 1,015,686 | ||||||
| 4.25%, 03/28/33 (Call 03/28/32), |
1,510 | 1,390,036 | ||||||
| 4.55%, 10/02/28 |
1,607 | 1,568,191 | ||||||
| 4.63%, 01/06/26(b) |
2,476 | 2,445,111 | ||||||
| 6.08%, 09/11/27 (Call 09/11/26), |
585 | 592,733 | ||||||
| S C H E D U L E O F I N V E S T M E N T S |
41 |
| Schedule of Investments (continued) February 29, 2024 |
iShares® Broad USD Investment Grade Corporate Bond ETF (Percentages shown are based on Net Assets) |
| Security | Par (000) | Value | ||||||
| Banks (continued) | ||||||||
| 6.11%, 09/11/34 (Call 09/11/33), |
$ | 975 | $ | 1,005,592 | ||||
| Intesa Sanpaolo SpA |
||||||||
| 3.88%, 07/14/27(a)(b) |
1,500 | 1,398,588 | ||||||
| 3.88%, 01/12/28(b) |
645 | 593,440 | ||||||
| 6.63%, 06/20/33(a)(b) |
1,370 | 1,385,029 | ||||||
| 7.00%, 11/21/25(a)(b) |
710 | 722,709 | ||||||
| 7.20%, 11/28/33(b) |
1,845 | 1,931,450 | ||||||
| 7.78%, 06/20/54 (Call 06/20/53), |
2,005 | 2,025,834 | ||||||
| 7.80%, 11/28/53(b) |
1,370 | 1,480,058 | ||||||
| 8.25%, 11/21/33 (Call 11/21/32), |
1,820 | 1,975,073 | ||||||
| JPMorgan Chase & Co. |
||||||||
| 1.04%, 02/04/27 (Call 02/04/26), |
2,707 | 2,494,632 | ||||||
| 1.05%, 11/19/26 (Call 11/19/25), |
3,392 | 3,153,828 | ||||||
| 1.47%, 09/22/27 (Call 09/22/26), |
3,464 | 3,147,505 | ||||||
| 1.58%, 04/22/27 (Call 04/22/26), |
4,310 | 3,985,633 | ||||||
| 1.76%, 11/19/31 (Call 11/19/30), |
1,906 | 1,534,968 | ||||||
| 1.95%, 02/04/32 (Call 02/04/31), |
3,908 | 3,142,899 | ||||||
| 2.01%, 03/13/26 (Call 03/13/25), |
2,948 | 2,842,278 | ||||||
| 2.07%, 06/01/29 (Call 06/01/28), |
2,880 | 2,537,260 | ||||||
| 2.08%, 04/22/26 (Call 04/22/25), |
5,001 | 4,811,544 | ||||||
| 2.18%, 06/01/28 (Call 06/01/27), |
2,240 | 2,040,756 | ||||||
| 2.52%, 04/22/31 (Call 04/22/30), |
3,575 | 3,058,818 | ||||||
| 2.53%, 11/19/41 (Call 11/19/40), |
2,235 | 1,535,792 | ||||||
| 2.55%, 11/08/32 (Call 11/08/31), |
4,068 | 3,349,742 | ||||||
| 2.58%, 04/22/32 (Call 04/22/31), |
4,518 | 3,780,237 | ||||||
| 2.74%, 10/15/30 (Call 10/15/29), |
4,843 | 4,248,725 | ||||||
| 2.95%, 10/01/26 (Call 07/01/26) |
2,757 | 2,620,882 | ||||||
| 2.95%, 02/24/28 (Call 02/24/27), |
2,300 | 2,154,543 | ||||||
| 2.96%, 05/13/31 (Call 05/13/30), |
3,678 | 3,194,612 | ||||||
| 2.96%, 01/25/33 (Call 01/25/32), |
4,627 | 3,907,927 | ||||||
| 3.11%, 04/22/41 (Call 04/22/40), |
2,112 | 1,588,993 | ||||||
| 3.11%, 04/22/51 (Call 04/22/50), |
3,090 | 2,120,473 | ||||||
| 3.16%, 04/22/42 (Call 04/22/41), |
2,803 | 2,101,716 | ||||||
| 3.20%, 06/15/26 (Call 03/15/26)(a) |
2,598 | 2,500,273 | ||||||
| 3.30%, 04/01/26 (Call 01/01/26) |
3,285 | 3,168,117 | ||||||
| 3.33%, 04/22/52 (Call 04/22/51), |
4,676 | 3,319,517 | ||||||
| Security | Par (000) | Value | ||||||
| Banks (continued) | ||||||||
| 3.51%, 01/23/29 (Call 01/23/28), |
$ | 3,179 | $ | 2,994,252 | ||||
| 3.54%, 05/01/28 (Call 05/01/27), |
3,393 | 3,225,190 | ||||||
| 3.63%, 12/01/27 (Call 12/01/26) |
1,691 | 1,610,457 | ||||||
| 3.70%, 05/06/30 (Call 05/06/29), |
3,416 | 3,182,655 | ||||||
| 3.78%, 02/01/28 (Call 02/01/27), |
2,916 | 2,800,012 | ||||||
| 3.88%, 07/24/38 (Call 07/24/37), |
3,450 | 2,942,812 | ||||||
| 3.90%, 07/15/25 (Call 04/15/25) |
2,479 | 2,436,917 | ||||||
| 3.90%, 01/23/49 (Call 01/23/48), |
2,398 | 1,914,828 | ||||||
| 3.96%, 01/29/27 (Call 01/29/26), |
2,560 | 2,499,309 | ||||||
| 3.96%, 11/15/48 (Call 11/15/47), |
4,148 | 3,329,726 | ||||||
| 4.01%, 04/23/29 (Call 04/23/28), |
2,949 | 2,817,461 | ||||||
| 4.03%, 07/24/48 (Call 07/24/47), |
2,118 | 1,721,762 | ||||||
| 4.08%, 04/26/26 (Call 04/26/25), |
3,480 | 3,423,716 | ||||||
| 4.13%, 12/15/26(a) |
2,885 | 2,816,496 | ||||||
| 4.20%, 07/23/29 (Call 07/23/28), |
3,509 | 3,369,197 | ||||||
| 4.25%, 10/01/27 |
2,252 | 2,206,530 | ||||||
| 4.26%, 02/22/48 (Call 02/22/47), |
2,532 | 2,151,582 | ||||||
| 4.32%, 04/26/28 (Call 04/26/27), |
4,140 | 4,040,013 | ||||||
| 4.45%, 12/05/29 (Call 12/05/28), |
3,046 | 2,946,386 | ||||||
| 4.49%, 03/24/31 (Call 03/24/30), |
3,649 | 3,504,667 | ||||||
| 4.57%, 06/14/30 (Call 06/14/29), |
2,795 | 2,707,898 | ||||||
| 4.59%, 04/26/33 (Call 04/26/32), |
3,250 | 3,083,709 | ||||||
| 4.85%, 07/25/28 (Call 07/25/27), |
4,500 | 4,450,132 | ||||||
| 4.85%, 02/01/44 |
1,370 | 1,286,446 | ||||||
| 4.91%, 07/25/33 (Call 07/25/32), |
5,828 | 5,653,558 | ||||||
| 4.95%, 06/01/45 |
2,384 | 2,238,292 | ||||||
| 5.01%, 01/23/30 (Call 01/23/29), |
3,305 | 3,269,797 | ||||||
| 5.04%, 01/23/28 (Call 01/23/27), |
1,895 | 1,884,926 | ||||||
| 5.30%, 07/24/29 (Call 07/24/28), |
3,515 | 3,523,964 | ||||||
| 5.34%, 01/23/35 (Call 01/23/34), |
1,685 | 1,675,949 | ||||||
| 5.35%, 06/01/34 (Call 06/01/33), |
5,495 | 5,470,656 | ||||||
| 5.40%, 01/06/42(a) |
1,715 | 1,736,321 | ||||||
| 5.50%, 10/15/40 |
1,790 | 1,830,268 | ||||||
| 5.60%, 07/15/41 |
2,436 | 2,513,324 | ||||||
| 5.63%, 08/16/43(a) |
1,771 | 1,817,585 | ||||||
| 42 | 2 0 2 4 I S H A R E S A N N U A L R E P O R T T O S H A R E H O L D E R S |
| Schedule of Investments (continued) February 29, 2024 |
iShares® Broad USD Investment Grade Corporate Bond ETF (Percentages shown are based on Net Assets) |
| Security | Par (000) |
Value | ||||||
| Banks (continued) | ||||||||
| 5.72%, 09/14/33 (Call 09/14/32), |
$ | 4,555 | $ | 4,612,075 | ||||
| 6.07%, 10/22/27 (Call 10/22/26), |
2,980 | 3,037,276 | ||||||
| 6.09%, 10/23/29 (Call 10/23/28), |
3,065 | 3,168,131 | ||||||
| 6.25%, 10/23/34 (Call 10/23/33), |
3,615 | 3,834,853 | ||||||
| 6.40%, 05/15/38 |
3,427 | 3,823,401 | ||||||
| 7.63%, 10/15/26 |
1,297 | 1,377,978 | ||||||
| 7.75%, 07/15/25 |
165 | 170,711 | ||||||
| 8.00%, 04/29/27 |
1,254 | 1,362,536 | ||||||
| 8.75%, 09/01/30 |
347 | 408,600 | ||||||
| JPMorgan Chase Bank NA, 5.11%, 12/08/26 |
3,515 | 3,519,582 | ||||||
| KBC Group NV |
||||||||
| 5.80%, 01/19/29 (Call 01/19/28), |
1,200 | 1,207,286 | ||||||
| 6.32%, 09/21/34 (Call 09/21/33), |
1,245 | 1,290,138 | ||||||
| KeyBank NA |
||||||||
| 4.70%, 01/26/26 (Call 12/26/25) |
350 | 340,170 | ||||||
| 5.00%, 01/26/33 (Call 10/26/32) |
880 | 803,332 | ||||||
| KeyBank NA/Cleveland OH |
||||||||
| 3.30%, 06/01/25 |
908 | 873,993 | ||||||
| 3.40%, 05/20/26 |
737 | 695,063 | ||||||
| 3.90%, 04/13/29 (Call 03/13/29)(a) |
900 | 799,890 | ||||||
| 4.15%, 08/08/25(a) |
1,439 | 1,393,564 | ||||||
| 4.90%, 08/08/32(a) |
1,110 | 973,858 | ||||||
| 5.85%, 11/15/27 (Call 10/16/27) |
1,049 | 1,036,021 | ||||||
| 6.95%, 02/01/28 |
330 | 336,752 | ||||||
| KeyCorp |
||||||||
| 2.25%, 04/06/27 |
1,093 | 976,298 | ||||||
| 2.55%, 10/01/29 |
680 | 568,729 | ||||||
| 4.10%, 04/30/28 |
647 | 605,928 | ||||||
| 4.15%, 10/29/25(a) |
533 | 516,559 | ||||||
| 4.79%, 06/01/33 (Call 06/01/32), |
1,045 | 945,289 | ||||||
| KKR Group Finance Co. XII LLC, |
||||||||
| 4.85%, 05/17/32 (Call 02/17/32)(b) |
1,108 | 1,057,563 | ||||||
| Kookmin Bank |
||||||||
| 1.75%, 05/04/25(b) |
550 | 526,831 | ||||||
| 2.50%, 11/04/30(b) |
60 | 49,390 | ||||||
| 4.63%, 04/21/28(b) |
74 | 72,766 | ||||||
| Lloyds Bank PLC, 3.50%, 05/14/25 |
350 | 341,829 | ||||||
| Lloyds Banking Group PLC |
||||||||
| 1.63%, 05/11/27 (Call 05/11/26), |
890 | 816,292 | ||||||
| 3.37%, 12/14/46 (Call 09/14/41), |
2,056 | 1,398,061 | ||||||
| 3.51%, 03/18/26 (Call 03/18/25), |
1,505 | 1,469,145 | ||||||
| 3.57%, 11/07/28 (Call 11/07/27), |
2,435 | 2,274,036 | ||||||
| 3.75%, 01/11/27 |
1,765 | 1,693,684 | ||||||
| 3.75%, 03/18/28 (Call 03/18/27), |
1,332 | 1,263,405 | ||||||
| 4.34%, 01/09/48 |
1,669 | 1,314,402 | ||||||
| 4.38%, 03/22/28 |
1,721 | 1,661,320 | ||||||
| 4.45%, 05/08/25 |
1,602 | 1,581,466 | ||||||
| 4.55%, 08/16/28 |
1,635 | 1,587,853 | ||||||
| Security | Par (000) |
Value | ||||||
| Banks (continued) | ||||||||
| 4.58%, 12/10/25 |
$ | 1,578 | $ | 1,546,350 | ||||
| 4.65%, 03/24/26 |
2,200 | 2,158,210 | ||||||
| 4.72%, 08/11/26 (Call 08/11/25), |
1,405 | 1,386,121 | ||||||
| 4.98%, 08/11/33 (Call 08/11/32), |
1,195 | 1,137,297 | ||||||
| 5.30%, 12/01/45(a) |
710 | 661,732 | ||||||
| 5.46%, 01/05/28 (Call 01/05/27), |
1,725 | 1,717,618 | ||||||
| 5.68%, 01/05/35 (Call 01/05/34), |
1,460 | 1,443,456 | ||||||
| 5.87%, 03/06/29 (Call 03/06/28), |
1,350 | 1,362,829 | ||||||
| 5.99%, 08/07/27 (Call 08/07/26), |
1,730 | 1,742,125 | ||||||
| 7.95%, 11/15/33 (Call 08/15/32), |
1,755 | 1,952,160 | ||||||
| M&T Bank Corp. |
||||||||
| 4.55%, 08/16/28 (Call 08/16/27), |
698 | 665,701 | ||||||
| 5.05%, 01/27/34 (Call 01/27/33), |
1,570 | 1,441,358 | ||||||
| Macquarie Bank Ltd. |
||||||||
| 3.05%, 03/03/36 (Call 03/03/31), |
1,475 | 1,200,894 | ||||||
| 3.23%, 03/21/25(b) |
1,167 | 1,141,428 | ||||||
| 3.62%, 06/03/30(a)(b) |
1,130 | 991,140 | ||||||
| 3.90%, 01/15/26(b) |
1,150 | 1,120,156 | ||||||
| 4.00%, 07/29/25(a)(b) |
520 | 510,826 | ||||||
| 4.88%, 06/10/25(a)(b) |
750 | 740,405 | ||||||
| 5.21%, 06/15/26(a)(b) |
980 | 978,385 | ||||||
| 5.39%, 12/07/26(b) |
1,075 | 1,077,033 | ||||||
| 6.80%, 01/18/33(a)(b) |
1,295 | 1,364,473 | ||||||
| Macquarie Group Ltd. |
||||||||
| 1.34%, 01/12/27 (Call 01/12/26), |
1,697 | 1,565,962 | ||||||
| 1.63%, 09/23/27 (Call 09/23/26), |
1,245 | 1,124,574 | ||||||
| 1.94%, 04/14/28 (Call 04/14/27), |
825 | 735,141 | ||||||
| 2.69%, 06/23/32 (Call 06/23/31), |
1,285 | 1,056,719 | ||||||
| 2.87%, 01/14/33 (Call 01/14/32), |
1,809 | 1,488,519 | ||||||
| 3.76%, 11/28/28 (Call 11/28/27), |
1,106 | 1,033,187 | ||||||
| 4.10%, 06/21/28 (Call 06/21/27), |
905 | 862,734 | ||||||
| 4.44%, 06/21/33 (Call 06/21/32), |
940 | 866,845 | ||||||
| 4.65%, 03/27/29 (Call 03/27/28), |
735 | 710,294 | ||||||
| 5.03%, 01/15/30 (Call 01/15/29), |
1,153 | 1,138,052 | ||||||
| 5.11%, 08/09/26 (Call 08/09/25), |
765 | 760,093 | ||||||
| 5.49%, 11/09/33 (Call 11/09/32), |
430 | 426,296 | ||||||
| 5.89%, 06/15/34 (Call 06/15/33), |
980 | 989,911 | ||||||
| S C H E D U L E O F I N V E S T M E N T S |
43 |
| Schedule of Investments (continued) February 29, 2024 |
iShares® Broad USD Investment Grade Corporate Bond ETF (Percentages shown are based on Net Assets) |
| Security | Par (000) |
Value | ||||||
| Banks (continued) | ||||||||
| 6.26%, 12/07/34 (Call 12/07/33), |
$ | 1,200 | $ | 1,241,629 | ||||
| Manufacturers & Traders Trust Co. |
||||||||
| 3.40%, 08/17/27(a) |
651 | 594,621 | ||||||
| 4.65%, 01/27/26 (Call 12/27/25) |
575 | 559,996 | ||||||
| 4.70%, 01/27/28 (Call 12/27/27) |
1,555 | 1,495,981 | ||||||
| 5.40%, 11/21/25 (Call 10/21/25) |
1,292 | 1,279,679 | ||||||
| Mitsubishi UFJ Financial Group Inc. |
||||||||
| 1.41%, 07/17/25 |
2,015 | 1,908,464 | ||||||
| 1.54%, 07/20/27 (Call 07/20/26), |
2,330 | 2,131,711 | ||||||
| 1.64%, 10/13/27 (Call 10/13/26), |
1,535 | 1,399,456 | ||||||
| 2.05%, 07/17/30 |
1,645 | 1,365,465 | ||||||
| 2.31%, 07/20/32 (Call 07/20/31), |
1,595 | 1,306,557 | ||||||
| 2.34%, 01/19/28 (Call 01/19/27), |
2,030 | 1,873,875 | ||||||
| 2.49%, 10/13/32 (Call 10/13/31), |
1,071 | 886,139 | ||||||
| 2.56%, 02/25/30 |
1,404 | 1,215,908 | ||||||
| 2.76%, 09/13/26 |
1,505 | 1,419,498 | ||||||
| 2.85%, 01/19/33 (Call 01/19/32), |
1,509 | 1,271,550 | ||||||
| 3.20%, 07/18/29 |
1,791 | 1,628,714 | ||||||
| 3.29%, 07/25/27 |
616 | 582,599 | ||||||
| 3.68%, 02/22/27(a) |
1,379 | 1,328,680 | ||||||
| 3.74%, 03/07/29(a) |
2,221 | 2,097,783 | ||||||
| 3.75%, 07/18/39(a) |
1,738 | 1,481,910 | ||||||
| 3.78%, 03/02/25 |
537 | 528,147 | ||||||
| 3.84%, 04/17/26 (Call 04/17/25), |
695 | 681,603 | ||||||
| 3.85%, 03/01/26 |
3,295 | 3,212,775 | ||||||
| 3.96%, 03/02/28 |
1,503 | 1,447,458 | ||||||
| 4.05%, 09/11/28 |
1,347 | 1,305,514 | ||||||
| 4.08%, 04/19/28 (Call 04/19/27), |
1,300 | 1,256,518 | ||||||
| 4.15%, 03/07/39 |
838 | 754,493 | ||||||
| 4.29%, 07/26/38(a) |
631 | 584,228 | ||||||
| 4.32%, 04/19/33 (Call 04/19/32), |
670 | 626,976 | ||||||
| 5.02%, 07/20/28 (Call 07/20/27), |
1,910 | 1,897,547 | ||||||
| 5.13%, 07/20/33 (Call 07/20/32), |
2,050 | 2,028,225 | ||||||
| 5.24%, 04/19/29 (Call 04/19/28), |
1,110 | 1,113,373 | ||||||
| 5.35%, 09/13/28 (Call 09/13/27), |
1,465 | 1,469,945 | ||||||
| 5.41%, 04/19/34 (Call 04/19/33), |
1,490 | 1,506,179 | ||||||
| 5.42%, 02/22/29 (Call 02/22/28), |
1,615 | 1,626,457 | ||||||
| 5.44%, 02/22/34 (Call 02/22/33), |
1,570 | 1,588,290 | ||||||
| 5.47%, 09/13/33 (Call 09/13/32), |
981 | 997,285 | ||||||
| 5.48%, 02/22/31 (Call 02/22/30), |
705 | 710,258 | ||||||
| 5.54%, 04/17/26 (Call 04/17/25), |
470 | 469,689 | ||||||
| Security | Par (000) |
Value | ||||||
| Banks (continued) | ||||||||
| Mizuho Financial Group Inc. |
||||||||
| 1.23%, 05/22/27 (Call 05/22/26), |
$ | 2,019 | $ | 1,845,034 | ||||
| 1.55%, 07/09/27 (Call 07/09/26), |
1,603 | 1,470,519 | ||||||
| 1.98%, 09/08/31 (Call 09/08/30), |
1,110 | 898,989 | ||||||
| 2.17%, 05/22/32 (Call 05/22/31), |
828 | 669,155 | ||||||
| 2.20%, 07/10/31 (Call 07/10/30), |
1,412 | 1,167,816 | ||||||
| 2.23%, 05/25/26 (Call 05/25/25), |
945 | 906,367 | ||||||
| 2.26%, 07/09/32 (Call 07/09/31), |
631 | 509,995 | ||||||
| 2.56%, 09/13/31 |
975 | 791,800 | ||||||
| 2.59%, 05/25/31 (Call 05/25/30), |
715 | 608,856 | ||||||
| 2.65%, 05/22/26 (Call 05/22/25), |
855 | 825,342 | ||||||
| 2.84%, 09/13/26 |
1,384 | 1,303,092 | ||||||
| 2.87%, 09/13/30 (Call 09/13/29), |
730 | 642,520 | ||||||
| 3.15%, 07/16/30 (Call 07/16/29), |
984 | 885,183 | ||||||
| 3.17%, 09/11/27 |
1,065 | 997,341 | ||||||
| 3.26%, 05/22/30 (Call 05/22/29), |
1,055 | 955,033 | ||||||
| 3.48%, 04/12/26(a)(b) |
2,195 | 2,113,256 | ||||||
| 3.66%, 02/28/27 |
906 | 866,527 | ||||||
| 4.02%, 03/05/28 |
1,415 | 1,361,363 | ||||||
| 4.25%, 09/11/29 (Call 09/11/28), |
1,390 | 1,331,663 | ||||||
| 4.35%, 10/20/25(b) |
790 | 771,087 | ||||||
| 5.38%, 05/26/30 (Call 05/26/29), |
590 | 590,232 | ||||||
| 5.41%, 09/13/28 (Call 09/13/27), |
1,290 | 1,296,407 | ||||||
| 5.58%, 05/26/35 (Call 05/26/34), |
1,020 | 1,022,238 | ||||||
| 5.67%, 05/27/29 (Call 05/27/28), |
1,245 | 1,261,248 | ||||||
| 5.67%, 09/13/33 (Call 09/13/32), |
1,082 | 1,097,582 | ||||||
| 5.74%, 05/27/31 (Call 05/27/30), |
910 | 928,055 | ||||||
| 5.75%, 05/27/34 (Call 05/27/33), |
1,145 | 1,169,116 | ||||||
| 5.75%, 07/06/34 (Call 07/06/33), |
1,570 | 1,601,357 | ||||||
| 5.78%, 07/06/29 (Call 07/06/28), |
1,910 | 1,945,995 | ||||||
| Morgan Stanley |
||||||||
| 0.99%, 12/10/26 (Call 12/10/25), |
3,325 | 3,067,776 | ||||||
| 1.51%, 07/20/27 (Call 07/20/26), |
3,800 | 3,476,378 | ||||||
| 1.59%, 05/04/27 (Call 05/04/26), |
4,440 | 4,093,281 | ||||||
| 1.79%, 02/13/32 (Call 02/13/31), |
3,749 | 2,968,345 | ||||||
| 44 | 2 0 2 4 I S H A R E S A N N U A L R E P O R T T O S H A R E H O L D E R S |
| Schedule of Investments (continued) February 29, 2024 |
iShares® Broad USD Investment Grade Corporate Bond ETF (Percentages shown are based on Net Assets) |
| Security | Par (000) |
Value | ||||||
| Banks (continued) | ||||||||
| 1.93%, 04/28/32 (Call 04/28/31), |
$ | 3,054 | $ | 2,421,246 | ||||
| 2.19%, 04/28/26 (Call 04/28/25), |
3,404 | 3,275,863 | ||||||
| 2.24%, 07/21/32 (Call 07/21/31), |
4,469 | 3,600,295 | ||||||
| 2.48%, 01/21/28 (Call 01/21/27), |
2,990 | 2,766,035 | ||||||
| 2.48%, 09/16/36 (Call 09/16/31), |
3,190 | 2,500,341 | ||||||
| 2.51%, 10/20/32 (Call 10/20/31), |
3,495 | 2,861,815 | ||||||
| 2.70%, 01/22/31 (Call 01/22/30), |
4,851 | 4,202,167 | ||||||
| 2.80%, 01/25/52 (Call 01/25/51), |
2,783 | 1,789,382 | ||||||
| 2.94%, 01/21/33 (Call 01/21/32), |
3,430 | 2,876,707 | ||||||
| 3.13%, 07/27/26 |
3,784 | 3,609,437 | ||||||
| 3.22%, 04/22/42 (Call 04/22/41), |
2,924 | 2,198,293 | ||||||
| 3.59%, 07/22/28 (Call 07/22/27)(d) |
4,417 | 4,181,154 | ||||||
| 3.62%, 04/01/31 (Call 04/01/30), |
3,700 | 3,361,348 | ||||||
| 3.63%, 01/20/27 |
3,771 | 3,635,828 | ||||||
| 3.77%, 01/24/29 (Call 01/24/28), |
4,117 | 3,892,663 | ||||||
| 3.88%, 01/27/26 |
4,022 | 3,922,894 | ||||||
| 3.95%, 04/23/27 |
2,635 | 2,536,401 | ||||||
| 3.97%, 07/22/38 (Call 07/22/37)(d) |
2,886 | 2,462,187 | ||||||
| 4.00%, 07/23/25 |
2,678 | 2,631,747 | ||||||
| 4.21%, 04/20/28 (Call 04/20/27), |
3,168 | 3,066,226 | ||||||
| 4.30%, 01/27/45 |
3,088 | 2,676,206 | ||||||
| 4.35%, 09/08/26 |
2,963 | 2,896,208 | ||||||
| 4.38%, 01/22/47 |
3,137 | 2,706,994 | ||||||
| 4.43%, 01/23/30 (Call 01/23/29), |
4,045 | 3,882,720 | ||||||
| 4.46%, 04/22/39 (Call 04/22/38), |
1,567 | 1,407,542 | ||||||
| 4.68%, 07/17/26 (Call 07/17/25), |
2,835 | 2,804,589 | ||||||
| 4.89%, 07/20/33 (Call 07/20/32), |
2,655 | 2,550,254 | ||||||
| 5.00%, 11/24/25 |
2,090 | 2,077,927 | ||||||
| 5.05%, 01/28/27 (Call 01/28/26), |
1,910 | 1,903,340 | ||||||
| 5.12%, 02/01/29 (Call 02/01/28), |
3,310 | 3,288,312 | ||||||
| 5.16%, 04/20/29 (Call 04/20/28), |
3,250 | 3,231,412 | ||||||
| 5.17%, 01/16/30 (Call 01/16/29), |
3,500 | 3,478,026 | ||||||
| 5.25%, 04/21/34 (Call 04/21/33), |
4,345 | 4,264,763 | ||||||
| 5.30%, 04/20/37 (Call 04/20/32), |
2,805 | 2,687,093 | ||||||
| 5.42%, 07/21/34 (Call 07/21/33), |
2,890 | 2,872,839 | ||||||
| 5.45%, 07/20/29 (Call 07/20/28), |
1,885 | 1,892,176 | ||||||
| Security | Par (000) |
Value | ||||||
| Banks (continued) | ||||||||
| 5.47%, 01/18/35 (Call 01/18/34), |
$ | 1,605 | $ | 1,603,111 | ||||
| 5.60%, 03/24/51 (Call 03/24/50), |
2,775 | 2,881,259 | ||||||
| 5.94%, 02/07/39 (Call 02/07/34), |
1,485 | 1,462,281 | ||||||
| 5.95%, 01/19/38 (Call 01/19/33), |
2,670 | 2,662,960 | ||||||
| 6.14%, 10/16/26 (Call 10/16/25), |
1,930 | 1,952,788 | ||||||
| 6.25%, 08/09/26 |
1,195 | 1,223,290 | ||||||
| 6.30%, 10/18/28 (Call 10/18/27), |
3,190 | 3,297,473 | ||||||
| 6.34%, 10/18/33 (Call 10/18/32), |
4,030 | 4,271,250 | ||||||
| 6.38%, 07/24/42(a) |
2,603 | 2,895,144 | ||||||
| 6.41%, 11/01/29 (Call 11/01/28), |
2,295 | 2,395,636 | ||||||
| 6.63%, 11/01/34 (Call 11/01/33), |
2,270 | 2,459,740 | ||||||
| 7.25%, 04/01/32(a) |
1,388 | 1,582,713 | ||||||
| Morgan Stanley Bank NA |
||||||||
| 4.75%, 04/21/26 (Call 03/21/26)(a) |
2,005 | 1,992,276 | ||||||
| 4.95%, 01/14/28 (Call 01/14/27), |
2,115 | 2,104,305 | ||||||
| 5.48%, 07/16/25 (Call 06/16/25) |
1,150 | 1,154,778 | ||||||
| 5.88%, 10/30/26 (Call 09/30/26) |
2,350 | 2,393,199 | ||||||
| MUFG Bank Ltd., 4.70%, 03/10/44(a)(b) |
300 | 268,735 | ||||||
| National Australia Bank Ltd. |
||||||||
| 1.89%, 01/12/27(a)(b) |
1,710 | 1,569,808 | ||||||
| 2.33%, 08/21/30(b) |
2,300 | 1,881,642 | ||||||
| 2.65%, 01/14/41(a)(b) |
1,040 | 672,103 | ||||||
| 2.99%, 05/21/31(a)(b) |
1,207 | 1,006,224 | ||||||
| 3.35%, 01/12/37 (Call 01/12/32), |
1,997 | 1,666,121 | ||||||
| 3.50%, 01/10/27(b) |
1,110 | 1,066,082 | ||||||
| 3.93%, 08/02/34 (Call 08/02/29), |
1,841 | 1,671,239 | ||||||
| 4.75%, 12/10/25 |
525 | 522,500 | ||||||
| 4.79%, 01/10/29 |
810 | 804,799 | ||||||
| 4.95%, 01/10/34(a)(b) |
855 | 844,015 | ||||||
| 6.43%, 01/12/33(a)(b) |
1,705 | 1,771,343 | ||||||
| National Australia Bank Ltd./New York |
||||||||
| 2.50%, 07/12/26 |
1,668 | 1,573,316 | ||||||
| 3.38%, 01/14/26 |
1,002 | 971,901 | ||||||
| 3.50%, 06/09/25 |
560 | 549,043 | ||||||
| 3.91%, 06/09/27 |
950 | 920,806 | ||||||
| 4.90%, 06/13/28(a) |
1,500 | 1,496,053 | ||||||
| 4.94%, 01/12/28 |
1,535 | 1,534,248 | ||||||
| 4.97%, 01/12/26 |
1,493 | 1,490,351 | ||||||
| 5.20%, 05/13/25 |
640 | 640,674 | ||||||
| National Bank of Canada, 5.60%, 12/18/28 |
690 | 696,989 | ||||||
| National Securities Clearing Corp. |
||||||||
| 0.75%, 12/07/25 (Call 11/07/25)(a)(b) |
755 | 700,591 | ||||||
| 1.50%, 04/23/25 (Call 03/23/25)(b) |
1,987 | 1,907,934 | ||||||
| 5.00%, 05/30/28 (Call 04/30/28)(b) |
785 | 790,643 | ||||||
| 5.10%, 11/21/27 (Call 10/21/27)(b) |
940 | 946,407 | ||||||
| NatWest Group PLC |
||||||||
| 1.64%, 06/14/27 (Call 06/14/26), |
1,860 | 1,699,711 | ||||||
| S C H E D U L E O F I N V E S T M E N T S |
45 |
| Schedule of Investments (continued) February 29, 2024 |
iShares® Broad USD Investment Grade Corporate Bond ETF (Percentages shown are based on Net Assets) |
| Security | Par (000) |
Value | ||||||
| Banks (continued) | ||||||||
| 3.03%, 11/28/35 (Call 08/28/30), |
$ | 1,300 | $ | 1,071,056 | ||||
| 3.07%, 05/22/28 (Call 05/22/27), |
1,222 | 1,133,880 | ||||||
| 4.45%, 05/08/30 (Call 05/08/29), |
1,865 | 1,765,650 | ||||||
| 4.80%, 04/05/26(a) |
1,703 | 1,681,950 | ||||||
| 4.89%, 05/18/29 (Call 05/18/28), |
2,303 | 2,243,751 | ||||||
| 5.08%, 01/27/30 (Call 01/27/29), |
2,441 | 2,384,486 | ||||||
| 5.52%, 09/30/28 (Call 09/30/27), |
570 | 570,119 | ||||||
| 5.58%, 03/01/28 (Call 03/01/27), |
600 | 600,519 | ||||||
| 5.78%, 03/01/35 (Call 03/01/34), |
600 | 598,807 | ||||||
| 5.81%, 09/13/29 (Call 09/13/28), |
1,455 | 1,469,795 | ||||||
| 5.85%, 03/02/27 (Call 03/02/26), |
1,435 | 1,440,894 | ||||||
| 6.02%, 03/02/34 (Call 03/02/33), |
1,045 | 1,065,476 | ||||||
| 7.47%, 11/10/26 (Call 11/10/25), |
1,896 | 1,947,969 | ||||||
| NatWest Markets PLC |
||||||||
| 1.60%, 09/29/26(b) |
1,480 | 1,347,954 | ||||||
| 3.48%, 03/22/25(b) |
960 | 939,703 | ||||||
| NBK SPC Ltd., 1.63%, 09/15/27 (Call 09/15/26), |
215 | 195,338 | ||||||
| NBK Tier 1 Financing 2 Ltd., 4.50%, |
554 | 529,689 | ||||||
| NBK Tier 1 Ltd., 3.63%, (Call 08/24/26)(b)(d)(e) |
185 | 168,174 | ||||||
| NongHyup Bank |
||||||||
| 1.25%, 07/28/26(b) |
75 | 68,102 | ||||||
| 4.25%, 07/06/27(b) |
50 | 48,417 | ||||||
| Nordea Bank Abp |
||||||||
| 0.75%, 08/28/25(a)(b) |
1,312 | 1,227,142 | ||||||
| 1.50%, 09/30/26(b) |
2,290 | 2,076,607 | ||||||
| 3.60%, 06/06/25(b) |
888 | 869,774 | ||||||
| 4.63%, 09/13/33 (Call 09/13/28), |
792 | 743,933 | ||||||
| 4.75%, 09/22/25(b) |
690 | 685,179 | ||||||
| 5.38%, 09/22/27(b) |
1,280 | 1,284,479 | ||||||
| Norinchukin Bank (The) |
||||||||
| 1.28%, 09/22/26(a)(b) |
1,730 | 1,564,854 | ||||||
| 2.08%, 09/22/31(a)(b) |
1,155 | 934,296 | ||||||
| 4.87%, 09/14/27(a)(b) |
1,275 | 1,258,557 | ||||||
| 5.07%, 09/14/32(a)(b) |
417 | 412,340 | ||||||
| 5.43%, 03/09/28(a)(b) |
1,106 | 1,117,847 | ||||||
| Northern Trust Corp. |
||||||||
| 1.95%, 05/01/30 (Call 02/01/30) |
1,396 | 1,179,320 | ||||||
| 3.15%, 05/03/29 (Call 02/03/29) |
854 | 791,017 | ||||||
| 3.38%, 05/08/32 (Call 05/08/27), |
598 | 554,924 | ||||||
| 3.65%, 08/03/28 (Call 05/03/28)(a) |
449 | 429,633 | ||||||
| 3.95%, 10/30/25 |
1,015 | 995,163 | ||||||
| 4.00%, 05/10/27 (Call 04/10/27) |
1,624 | 1,577,856 | ||||||
| 6.13%, 11/02/32 (Call 08/02/32)(a) |
1,345 | 1,416,076 | ||||||
| Security | Par (000) |
Value | ||||||
| Banks (continued) | ||||||||
| Oversea-Chinese Banking Corp. Ltd., |
||||||||
| 1.83%, 09/10/30 (Call 09/10/25), |
||||||||
| (5-year CMT + 1.580%)(b)(d) |
$ | 1,225 | $ | 1,154,159 | ||||
| PNC Bank NA |
||||||||
| 2.70%, 10/22/29 |
1,175 | 1,013,391 | ||||||
| 3.10%, 10/25/27 (Call 09/25/27) |
1,611 | 1,497,659 | ||||||
| 3.25%, 06/01/25 (Call 05/02/25) |
1,195 | 1,163,064 | ||||||
| 3.25%, 01/22/28 (Call 12/23/27) |
985 | 915,763 | ||||||
| 3.88%, 04/10/25 (Call 03/10/25) |
840 | 824,044 | ||||||
| 4.05%, 07/26/28 |
1,930 | 1,825,519 | ||||||
| 4.20%, 11/01/25 (Call 10/02/25) |
625 | 610,841 | ||||||
| PNC Financial Services Group Inc. (The) |
||||||||
| 1.15%, 08/13/26 (Call 07/13/26) |
892 | 810,153 | ||||||
| 2.31%, 04/23/32 (Call 04/23/31), |
1,300 | 1,060,654 | ||||||
| 2.55%, 01/22/30 (Call 10/24/29)(a) |
2,604 | 2,236,921 | ||||||
| 2.60%, 07/23/26 (Call 05/23/26) |
1,288 | 1,211,130 | ||||||
| 3.15%, 05/19/27 (Call 04/19/27) |
1,169 | 1,101,115 | ||||||
| 3.45%, 04/23/29 (Call 01/23/29) |
1,935 | 1,786,925 | ||||||
| 4.63%, 06/06/33 (Call 06/06/32), |
1,054 | 976,733 | ||||||
| 4.76%, 01/26/27 (Call 01/26/26), |
1,685 | 1,664,731 | ||||||
| 5.07%, 01/24/34 (Call 01/24/33), |
2,170 | 2,086,664 | ||||||
| 5.30%, 01/21/28 (Call 01/21/27), |
740 | 739,077 | ||||||
| 5.35%, 12/02/28 (Call 12/02/27), |
1,550 | 1,550,661 | ||||||
| 5.58%, 06/12/29 (Call 06/12/28), |
2,051 | 2,062,310 | ||||||
| 5.68%, 01/22/35 (Call 01/22/34), |
640 | 641,845 | ||||||
| 5.81%, 06/12/26 (Call 06/12/25), |
1,061 | 1,062,541 | ||||||
| 5.94%, 08/18/34 (Call 08/18/33), |
1,055 | 1,074,809 | ||||||
| 6.04%, 10/28/33 (Call 10/28/32), |
2,290 | 2,350,061 | ||||||
| 6.62%, 10/20/27 (Call 10/20/26), |
1,425 | 1,463,813 | ||||||
| 6.88%, 10/20/34 (Call 10/20/33), |
1,735 | 1,879,505 | ||||||
| Regions Bank/Birmingham AL, |
895 | 908,281 | ||||||
| Regions Financial Corp. |
||||||||
| 1.80%, 08/12/28 (Call 06/12/28) |
853 | 725,733 | ||||||
| 2.25%, 05/18/25 (Call 04/18/25) |
805 | 770,836 | ||||||
| 7.38%, 12/10/37(a) |
364 | 408,020 | ||||||
| Rheinland-Pfalz Bank, 6.88%, 02/23/28(b)(c) |
50 | 53,035 | ||||||
| Royal Bank of Canada |
||||||||
| 0.88%, 01/20/26 |
936 | 866,555 | ||||||
| 1.15%, 06/10/25 |
2,172 | 2,062,603 | ||||||
| 1.15%, 07/14/26 |
1,812 | 1,656,419 | ||||||
| 1.20%, 04/27/26(a) |
2,227 | 2,049,819 | ||||||
| 1.40%, 11/02/26 |
1,075 | 977,537 | ||||||
| 2.05%, 01/21/27 |
730 | 674,127 | ||||||
| 2.30%, 11/03/31 |
1,960 | 1,604,657 | ||||||
| 3.38%, 04/14/25 |
1,235 | 1,209,724 | ||||||
| 3.63%, 05/04/27 |
1,746 | 1,674,121 | ||||||
| 3.88%, 05/04/32 |
1,398 | 1,276,282 | ||||||
| 46 | 2 0 2 4 I S H A R E S A N N U A L R E P O R T T O S H A R E H O L D E R S |
| Schedule of Investments (continued) February 29, 2024 |
iShares® Broad USD Investment Grade Corporate Bond ETF (Percentages shown are based on Net Assets) |
| Security | Par (000) | Value | ||||||
| Banks (continued) | ||||||||
| 4.24%, 08/03/27 |
$ | 1,142 | $ | 1,113,031 | ||||
| 4.65%, 01/27/26 |
1,927 | 1,909,354 | ||||||
| 4.88%, 01/12/26 |
1,285 | 1,280,890 | ||||||
| 4.88%, 01/19/27 |
725 | 721,664 | ||||||
| 4.90%, 01/12/28 |
1,244 | 1,241,176 | ||||||
| 4.95%, 04/25/25 |
910 | 907,309 | ||||||
| 4.95%, 02/01/29(a) |
885 | 878,595 | ||||||
| 5.00%, 02/01/33 |
2,190 | 2,153,655 | ||||||
| 5.00%, 05/02/33(a) |
1,045 | 1,028,481 | ||||||
| 5.15%, 02/01/34 |
950 | 935,481 | ||||||
| 5.20%, 07/20/26 |
1,390 | 1,394,869 | ||||||
| 5.20%, 08/01/28 |
1,300 | 1,308,310 | ||||||
| 6.00%, 11/01/27 |
1,620 | 1,668,060 | ||||||
| Santander Holdings USA Inc. |
||||||||
| 2.49%, 01/06/28 (Call 01/06/27), |
1,550 | 1,401,678 | ||||||
| 3.24%, 10/05/26 (Call 08/05/26) |
1,285 | 1,203,537 | ||||||
| 3.45%, 06/02/25 (Call 05/02/25) |
1,068 | 1,035,493 | ||||||
| 4.40%, 07/13/27 (Call 04/14/27) |
1,412 | 1,353,688 | ||||||
| 4.50%, 07/17/25 (Call 04/17/25) |
1,238 | 1,213,911 | ||||||
| 5.81%, 09/09/26 (Call 09/09/25), |
1,090 | 1,088,572 | ||||||
| 6.17%, 01/09/30 (Call 01/09/29), |
750 | 748,045 | ||||||
| 6.50%, 03/09/29 (Call 03/09/28), |
1,210 | 1,228,492 | ||||||
| 6.57%, 06/12/29 (Call 06/12/28), |
764 | 777,356 | ||||||
| 7.66%, 11/09/31 (Call 11/09/30), |
845 | 902,887 | ||||||
| Santander U.K. Group Holdings PLC |
||||||||
| 1.53%, 08/21/26 (Call 08/21/25), |
1,252 | 1,173,574 | ||||||
| 1.67%, 06/14/27 (Call 06/14/26), |
1,265 | 1,149,913 | ||||||
| 2.47%, 01/11/28 (Call 01/11/27), |
1,295 | 1,178,956 | ||||||
| 2.90%, 03/15/32 (Call 03/15/31), |
775 | 652,976 | ||||||
| 3.82%, 11/03/28 (Call 11/03/27), |
1,385 | 1,292,772 | ||||||
| 6.53%, 01/10/29 (Call 01/10/28), |
1,394 | 1,429,427 | ||||||
| 6.83%, 11/21/26 (Call 11/21/25), |
1,610 | 1,634,550 | ||||||
| Shinhan Bank Co. Ltd. |
||||||||
| 1.38%, 10/21/26(b) |
50 | 45,230 | ||||||
| 3.75%, 09/20/27(b) |
200 | 187,894 | ||||||
| 4.00%, 04/23/29(b) |
577 | 533,103 | ||||||
| 4.38%, 04/13/32(b) |
590 | 538,062 | ||||||
| Shinhan Financial Group Co. Ltd. |
||||||||
| 1.35%, 01/10/26(b) |
200 | 185,551 | ||||||
| 2.88%, (Call 05/12/26), |
366 | 341,383 | ||||||
| 5.00%, 07/24/28 |
70 | 69,275 | ||||||
| Skandinaviska Enskilda Banken AB |
||||||||
| 0.85%, 09/02/25(b) |
540 | 505,365 | ||||||
| 1.20%, 09/09/26(b) |
285 | 257,740 | ||||||
| 1.40%, 11/19/25(b) |
195 | 182,892 | ||||||
| 5.13%, 03/05/27(b) |
800 | 799,244 | ||||||
| 5.38%, 03/05/29(b) |
800 | 797,150 | ||||||
| Security | Par (000) | Value | ||||||
| Banks (continued) | ||||||||
| Societe Generale SA |
||||||||
| 1.38%, 07/08/25(b) |
$ | 200 | $ | 189,472 | ||||
| 1.49%, 12/14/26 (Call 12/14/25), |
2,755 | 2,540,890 | ||||||
| 1.79%, 06/09/27 (Call 06/09/26), |
1,594 | 1,451,869 | ||||||
| 2.80%, 01/19/28 (Call 01/19/27), |
2,460 | 2,257,296 | ||||||
| 2.89%, 06/09/32 (Call 06/09/31), |
1,950 | 1,580,755 | ||||||
| 3.00%, 01/22/30(b) |
1,323 | 1,142,307 | ||||||
| 3.34%, 01/21/33 (Call 01/21/32), |
890 | 734,917 | ||||||
| 3.63%, 03/01/41(a)(b) |
1,485 | 994,366 | ||||||
| 3.65%, 07/08/35 (Call 07/08/30), |
846 | 710,236 | ||||||
| 4.00%, 01/12/27(b) |
1,395 | 1,335,238 | ||||||
| 4.03%, 01/21/43 (Call 01/21/42), |
1,180 | 821,459 | ||||||
| 4.25%, 04/14/25(b) |
1,675 | 1,638,726 | ||||||
| 4.25%, 08/19/26(b) |
1,152 | 1,100,128 | ||||||
| 4.35%, 06/13/25(b) |
315 | 310,915 | ||||||
| 4.68%, 06/15/27(b) |
510 | 501,941 | ||||||
| 4.75%, 11/24/25(b) |
720 | 705,041 | ||||||
| 4.75%, 09/14/28(a)(b) |
731 | 709,804 | ||||||
| 5.52%, 01/19/28 (Call 01/19/27), |
1,065 | 1,053,185 | ||||||
| 5.63%, 01/19/30 (Call 01/19/29), |
1,025 | 1,010,079 | ||||||
| 5.63%, 11/24/45(a)(b) |
380 | 326,601 | ||||||
| 6.07%, 01/19/35 (Call 01/19/34), |
1,065 | 1,049,378 | ||||||
| 6.22%, 06/15/33 (Call 06/15/32), |
1,497 | 1,467,611 | ||||||
| 6.45%, 01/12/27 (Call 01/12/26), |
1,525 | 1,537,720 | ||||||
| 6.45%, 01/10/29 (Call 01/10/28), |
1,450 | 1,481,136 | ||||||
| 6.69%, 01/10/34 (Call 01/10/33), |
1,975 | 2,040,258 | ||||||
| 7.13%, 01/19/55 (Call 01/19/54), |
520 | 504,688 | ||||||
| 7.37%, 01/10/53(a)(b) |
1,295 | 1,325,425 | ||||||
| Standard Chartered Bank, 8.00%, 05/30/31(a)(b) |
1,550 | 1,673,170 | ||||||
| Standard Chartered PLC |
||||||||
| 1.46%, 01/14/27 (Call 01/14/26), |
1,310 | 1,204,058 | ||||||
| 2.61%, 01/12/28 (Call 01/12/27), |
2,015 | 1,844,835 | ||||||
| 2.68%, 06/29/32 (Call 06/29/31), |
1,030 | 834,856 | ||||||
| 3.20%, 04/17/25(a)(b) |
940 | 914,282 | ||||||
| 3.27%, 02/18/36 (Call 11/18/30), |
1,981 | 1,641,235 | ||||||
| 3.60%, 01/12/33 (Call 01/12/32), |
965 | 810,836 | ||||||
| 3.97%, 03/30/26 (Call 03/30/25), |
1,455 | 1,421,632 | ||||||
| 4.05%, 04/12/26(b) |
1,262 | 1,223,698 | ||||||
| 4.30%, 02/19/27(a)(b) |
1,255 | 1,204,459 | ||||||
| S C H E D U L E O F I N V E S T M E N T S |
47 |
| Schedule of Investments (continued) February 29, 2024 |
iShares® Broad USD Investment Grade Corporate Bond ETF (Percentages shown are based on Net Assets) |
| Security | Par (000) | Value | ||||||
| Banks (continued) | ||||||||
| 4.31%, 05/21/30 (Call 05/21/29), |
$ | 760 | $ | 707,555 | ||||
| 4.64%, 04/01/31 (Call 04/01/30), |
2,065 | 1,957,497 | ||||||
| 4.87%, 03/15/33 (Call 03/15/28), |
985 | 928,510 | ||||||
| 5.30%, 01/09/43(a)(b) |
765 | 689,691 | ||||||
| 5.70%, 03/26/44(a)(b) |
1,526 | 1,491,702 | ||||||
| 6.10%, 01/11/35 (Call 01/11/34), |
1,245 | 1,254,661 | ||||||
| 6.17%, 01/09/27 (Call 01/09/26), |
1,230 | 1,240,799 | ||||||
| 6.19%, 07/06/27 (Call 07/06/26), |
1,665 | 1,681,456 | ||||||
| 6.30%, 01/09/29 (Call 01/09/28), |
1,815 | 1,854,989 | ||||||
| 6.30%, 07/06/34 (Call 07/06/33), |
1,325 | 1,364,989 | ||||||
| 7.02%, 02/08/30 (Call 02/08/29), |
400 | 420,527 | ||||||
| 7.77%, 11/16/28 (Call 11/16/27), |
1,390 | 1,480,282 | ||||||
| State Street Corp. |
||||||||
| 1.68%, 11/18/27 (Call 11/18/26), |
638 | 584,166 | ||||||
| 2.20%, 02/07/28 (Call 02/07/27), |
1,070 | 986,367 | ||||||
| 2.20%, 03/03/31 |
1,507 | 1,247,561 | ||||||
| 2.40%, 01/24/30(a) |
1,227 | 1,072,623 | ||||||
| 2.62%, 02/07/33 (Call 02/07/32), |
438 | 363,623 | ||||||
| 2.65%, 05/19/26(a) |
1,020 | 969,585 | ||||||
| 2.90%, 03/30/26 (Call 03/30/25), |
506 | 492,527 | ||||||
| 3.03%, 11/01/34 (Call 11/01/29), |
820 | 723,456 | ||||||
| 3.15%, 03/30/31 (Call 03/30/30), |
485 | 431,339 | ||||||
| 3.55%, 08/18/25 |
912 | 893,643 | ||||||
| 4.14%, 12/03/29 (Call 12/03/28), |
721 | 691,368 | ||||||
| 4.16%, 08/04/33 (Call 08/04/32), |
915 | 845,640 | ||||||
| 4.42%, 05/13/33 (Call 05/13/32), |
700 | 660,917 | ||||||
| 4.82%, 01/26/34 (Call 01/26/33), |
1,215 | 1,171,812 | ||||||
| 5.10%, 05/18/26 (Call 05/18/25), |
1,160 | 1,155,543 | ||||||
| 5.16%, 05/18/34 (Call 05/18/33), |
760 | 750,912 | ||||||
| 5.27%, 08/03/26 (Call 07/03/26)(a) |
1,560 | 1,565,689 | ||||||
| 5.68%, 11/21/29 (Call 11/21/28), |
1,200 | 1,226,001 | ||||||
| 5.75%, 11/04/26 (Call 11/04/25), |
729 | 732,471 | ||||||
| 5.82%, 11/04/28 (Call 11/04/27), |
650 | 665,583 | ||||||
| 6.12%, 11/21/34 (Call 11/21/33), |
950 | 981,963 | ||||||
| Security | Par (000) | Value | ||||||
| Banks (continued) | ||||||||
| Sumitomo Mitsui Financial Group Inc. |
||||||||
| 0.95%, 01/12/26 |
$ | 1,773 | $ | 1,638,562 | ||||
| 1.40%, 09/17/26 |
2,705 | 2,464,633 | ||||||
| 1.47%, 07/08/25 |
2,350 | 2,233,334 | ||||||
| 1.71%, 01/12/31 |
885 | 702,762 | ||||||
| 1.90%, 09/17/28 |
3,080 | 2,680,269 | ||||||
| 2.13%, 07/08/30 |
1,925 | 1,602,599 | ||||||
| 2.14%, 09/23/30 |
1,239 | 1,018,237 | ||||||
| 2.17%, 01/14/27 |
905 | 835,940 | ||||||
| 2.22%, 09/17/31 |
1,113 | 903,229 | ||||||
| 2.30%, 01/12/41(a) |
560 | 377,062 | ||||||
| 2.47%, 01/14/29 |
997 | 885,643 | ||||||
| 2.63%, 07/14/26(a) |
1,771 | 1,673,238 | ||||||
| 2.72%, 09/27/29 |
875 | 769,093 | ||||||
| 2.75%, 01/15/30(a) |
1,950 | 1,705,187 | ||||||
| 2.93%, 09/17/41(a) |
475 | 353,132 | ||||||
| 3.01%, 10/19/26 |
1,052 | 996,414 | ||||||
| 3.04%, 07/16/29 |
3,055 | 2,748,104 | ||||||
| 3.05%, 01/14/42 |
405 | 306,788 | ||||||
| 3.20%, 09/17/29(a) |
676 | 608,759 | ||||||
| 3.35%, 10/18/27 |
1,055 | 996,031 | ||||||
| 3.36%, 07/12/27(a) |
1,628 | 1,545,638 | ||||||
| 3.45%, 01/11/27(a) |
1,789 | 1,713,122 | ||||||
| 3.54%, 01/17/28 |
1,391 | 1,317,253 | ||||||
| 3.78%, 03/09/26 |
2,770 | 2,695,345 | ||||||
| 3.94%, 07/19/28(a) |
939 | 899,784 | ||||||
| 4.31%, 10/16/28(a) |
854 | 836,663 | ||||||
| 5.46%, 01/13/26 |
1,525 | 1,530,572 | ||||||
| 5.52%, 01/13/28 |
2,350 | 2,387,661 | ||||||
| 5.71%, 01/13/30(a) |
1,570 | 1,610,056 | ||||||
| 5.72%, 09/14/28(a) |
1,275 | 1,303,183 | ||||||
| 5.77%, 01/13/33 |
2,310 | 2,385,424 | ||||||
| 5.78%, 07/13/33 |
840 | 869,822 | ||||||
| 5.80%, 07/13/28 |
905 | 930,260 | ||||||
| 5.81%, 09/14/33(a) |
1,235 | 1,279,630 | ||||||
| 5.85%, 07/13/30 |
780 | 803,309 | ||||||
| 5.88%, 07/13/26 |
745 | 755,862 | ||||||
| 6.18%, 07/13/43(a) |
1,355 | 1,484,840 | ||||||
| Sumitomo Mitsui Trust Bank Ltd. |
||||||||
| 1.05%, 09/12/25(a)(b) |
539 | 505,414 | ||||||
| 1.35%, 09/16/26(b) |
1,083 | 981,453 | ||||||
| 1.55%, 03/25/26(b) |
1,425 | 1,321,922 | ||||||
| 2.55%, 03/10/25(a)(b) |
425 | 412,831 | ||||||
| 2.80%, 03/10/27(a)(b) |
940 | 878,340 | ||||||
| 4.80%, 09/15/25(a)(b) |
400 | 396,628 | ||||||
| 4.95%, 09/15/27(b) |
475 | 471,244 | ||||||
| 5.20%, 03/07/27(b) |
600 | 599,167 | ||||||
| 5.20%, 03/07/29 |
515 | 516,152 | ||||||
| 5.35%, 03/07/34 |
600 | 604,082 | ||||||
| 5.50%, 03/09/28(a)(b) |
865 | 875,218 | ||||||
| 5.55%, 09/14/28(b) |
890 | 906,158 | ||||||
| 5.65%, 03/09/26(a)(b) |
1,255 | 1,263,426 | ||||||
| 5.65%, 09/14/26(b) |
820 | 826,739 | ||||||
| Svenska Handelsbanken AB |
||||||||
| 1.42%, 06/11/27 (Call 06/11/26), |
1,575 | 1,429,878 | ||||||
| 3.65%, 06/10/25(b) |
725 | 710,701 | ||||||
| 3.95%, 06/10/27(b) |
1,340 | 1,294,579 | ||||||
| 5.25%, 06/15/26(b) |
60 | 59,913 | ||||||
| 5.50%, 06/15/28(a)(b) |
895 | 899,770 | ||||||
| 48 | 2 0 2 4 I S H A R E S A N N U A L R E P O R T T O S H A R E H O L D E R S |
| Schedule of Investments (continued) February 29, 2024 |
iShares® Broad USD Investment Grade Corporate Bond ETF (Percentages shown are based on Net Assets) |
| Security | Par (000) | Value | ||||||
| Banks (continued) | ||||||||
| Swedbank AB |
||||||||
| 1.54%, 11/16/26(a)(b) |
$ | 1,400 | $ | 1,272,392 | ||||
| 3.36%, 04/04/25(a)(b) |
895 | 875,910 | ||||||
| 5.34%, 09/20/27(b) |
1,225 | 1,222,046 | ||||||
| 5.47%, 06/15/26(a)(b) |
925 | 929,468 | ||||||
| 6.14%, 09/12/26(b) |
700 | 708,615 | ||||||
| Synchrony Bank |
||||||||
| 5.40%, 08/22/25 (Call 07/22/25) |
1,110 | 1,096,955 | ||||||
| 5.63%, 08/23/27 (Call 07/23/27) |
979 | 952,497 | ||||||
| Synovus Bank, 5.63%, 02/15/28 (Call 01/15/28) |
645 | 623,040 | ||||||
| Synovus Financial Corp., 5.20%, 08/11/25 |
375 | 368,702 | ||||||
| Toronto-Dominion Bank (The) |
||||||||
| 0.75%, 09/11/25 |
1,036 | 970,509 | ||||||
| 0.75%, 01/06/26 |
1,600 | 1,479,551 | ||||||
| 1.15%, 06/12/25 |
930 | 882,728 | ||||||
| 1.20%, 06/03/26 |
1,960 | 1,798,296 | ||||||
| 1.25%, 09/10/26 |
2,185 | 1,989,829 | ||||||
| 1.95%, 01/12/27 |
1,300 | 1,196,440 | ||||||
| 2.00%, 09/10/31(a) |
1,090 | 888,701 | ||||||
| 2.45%, 01/12/32 |
775 | 642,962 | ||||||
| 2.80%, 03/10/27 |
1,805 | 1,692,986 | ||||||
| 3.20%, 03/10/32 |
2,021 | 1,762,385 | ||||||
| 3.63%, 09/15/31 (Call 09/15/26), |
2,012 | 1,923,250 | ||||||
| 3.77%, 06/06/25 |
1,955 | 1,919,962 | ||||||
| 4.11%, 06/08/27 |
2,390 | 2,322,339 | ||||||
| 4.46%, 06/08/32(a) |
2,590 | 2,469,559 | ||||||
| 4.69%, 09/15/27 |
2,385 | 2,357,943 | ||||||
| 5.10%, 01/09/26 |
823 | 824,151 | ||||||
| 5.16%, 01/10/28(a) |
1,850 | 1,856,335 | ||||||
| 5.26%, 12/11/26 |
1,175 | 1,182,486 | ||||||
| 5.52%, 07/17/28(a) |
1,925 | 1,957,314 | ||||||
| 5.53%, 07/17/26 |
2,380 | 2,400,746 | ||||||
| 8.13%, 10/31/82 (Call 10/31/27), |
108 | 112,402 | ||||||
| Truist Bank |
||||||||
| 1.50%, 03/10/25 (Call 02/10/25) |
1,815 | 1,743,834 | ||||||
| 2.25%, 03/11/30 (Call 12/11/29) |
1,648 | 1,354,471 | ||||||
| 3.30%, 05/15/26 (Call 04/15/26)(a) |
1,429 | 1,363,153 | ||||||
| 3.63%, 09/16/25 (Call 08/16/25) |
1,644 | 1,595,555 | ||||||
| 3.80%, 10/30/26 (Call 09/30/26) |
1,480 | 1,418,653 | ||||||
| 4.05%, 11/03/25 (Call 09/03/25) |
850 | 831,241 | ||||||
| Truist Financial Corp. |
||||||||
| 1.13%, 08/03/27 (Call 06/03/27) |
1,040 | 905,821 | ||||||
| 1.20%, 08/05/25 (Call 07/03/25) |
647 | 608,496 | ||||||
| 1.27%, 03/02/27 (Call 03/02/26), |
2,023 | 1,856,985 | ||||||
| 1.89%, 06/07/29 (Call 06/07/28), |
1,486 | 1,278,114 | ||||||
| 1.95%, 06/05/30 (Call 03/05/30) |
1,140 | 933,239 | ||||||
| 3.70%, 06/05/25 (Call 05/05/25)(a) |
820 | 802,482 | ||||||
| 3.88%, 03/19/29 (Call 02/16/29)(a) |
71 | 65,317 | ||||||
| 4.00%, 05/01/25 (Call 03/01/25) |
1,172 | 1,150,961 | ||||||
| 4.12%, 06/06/28 (Call 06/06/27), |
1,285 | 1,237,201 | ||||||
| 4.26%, 07/28/26 (Call 07/28/25), |
1,347 | 1,319,568 | ||||||
| 4.87%, 01/26/29 (Call 01/26/28), |
1,875 | 1,828,709 | ||||||
| Security | Par (000) | Value | ||||||
| Banks (continued) | ||||||||
| 4.92%, 07/28/33 (Call 07/28/32), |
$ | 1,580 | $ | 1,453,137 | ||||
| 5.12%, 01/26/34 (Call 01/26/33), |
2,065 | 1,958,793 | ||||||
| 5.44%, 01/24/30 (Call 01/24/29), |
910 | 900,048 | ||||||
| 5.71%, 01/24/35 (Call 01/24/34), |
1,305 | 1,291,987 | ||||||
| 5.87%, 06/08/34 (Call 06/08/33), |
1,600 | 1,599,837 | ||||||
| 5.90%, 10/28/26 (Call 10/28/25), |
1,160 | 1,164,966 | ||||||
| 6.05%, 06/08/27 (Call 06/08/26), |
1,225 | 1,237,374 | ||||||
| 6.12%, 10/28/33 (Call 10/28/32), |
1,010 | 1,027,783 | ||||||
| 7.16%, 10/30/29 (Call 10/30/28), |
1,840 | 1,947,407 | ||||||
| U.S. Bancorp. |
||||||||
| 1.38%, 07/22/30 (Call 04/22/30) |
1,984 | 1,571,191 | ||||||
| 1.45%, 05/12/25 (Call 04/11/25) |
1,754 | 1,678,324 | ||||||
| 2.22%, 01/27/28 (Call 01/27/27), |
1,835 | 1,681,248 | ||||||
| 2.49%, 11/03/36 (Call 11/03/31), |
2,040 | 1,576,403 | ||||||
| 2.68%, 01/27/33 (Call 01/27/32), |
1,587 | 1,297,811 | ||||||
| 3.00%, 07/30/29 (Call 04/30/29) |
1,602 | 1,420,676 | ||||||
| 3.10%, 04/27/26 (Call 03/27/26)(a) |
1,616 | 1,543,542 | ||||||
| 3.90%, 04/26/28 (Call 03/24/28) |
1,298 | 1,243,241 | ||||||
| 3.95%, 11/17/25 (Call 10/17/25)(a) |
1,227 | 1,200,759 | ||||||
| 4.55%, 07/22/28 (Call 07/22/27), |
2,004 | 1,956,558 | ||||||
| 4.65%, 02/01/29 (Call 02/01/28), |
2,090 | 2,032,978 | ||||||
| 4.84%, 02/01/34 (Call 02/01/33), |
2,915 | 2,743,321 | ||||||
| 4.97%, 07/22/33 (Call 07/22/32), |
2,000 | 1,869,202 | ||||||
| 5.38%, 01/23/30 (Call 01/23/29), |
1,125 | 1,118,682 | ||||||
| 5.68%, 01/23/35 (Call 01/23/34), |
750 | 748,256 | ||||||
| 5.73%, 10/21/26 (Call 10/21/25), |
1,632 | 1,639,211 | ||||||
| 5.78%, 06/12/29 (Call 06/12/28), |
1,195 | 1,207,471 | ||||||
| 5.84%, 06/12/34 (Call 06/10/33), |
1,460 | 1,474,248 | ||||||
| 5.85%, 10/21/33 (Call 10/21/32), |
2,260 | 2,287,797 | ||||||
| 6.79%, 10/26/27 (Call 10/26/26), |
675 | 697,409 | ||||||
| Series V, 2.38%, 07/22/26 (Call 06/22/26)(a) |
1,709 | 1,601,841 | ||||||
| Series X, 3.15%, 04/27/27 (Call 03/27/27)(a) |
1,868 | 1,763,639 | ||||||
| UBS AG/London |
||||||||
| 1.25%, 06/01/26 |
1,520 | 1,393,629 | ||||||
| 4.50%, 06/26/48(a) |
1,335 | 1,222,740 | ||||||
| 5.65%, 09/11/28 |
1,710 | 1,742,484 | ||||||
| 5.80%, 09/11/25 |
800 | 805,733 | ||||||
| UBS AG/Stamford CT, 7.50%, 07/15/25 |
555 | 566,513 | ||||||
| S C H E D U L E O F I N V E S T M E N T S |
49 |
| Schedule of Investments (continued) February 29, 2024 |
iShares® Broad USD Investment Grade Corporate Bond ETF (Percentages shown are based on Net Assets) |
| Security | Par (000) |
Value | ||||||
| Banks (continued) | ||||||||
| UBS Group AG |
||||||||
| 1.31%, 02/02/27 (Call 02/02/26), |
$ | 2,535 | $ | 2,330,636 | ||||
| 1.36%, 01/30/27 (Call 01/30/26), |
1,780 | 1,639,869 | ||||||
| 1.49%, 08/10/27 (Call 08/10/26), |
2,655 | 2,405,330 | ||||||
| 2.10%, 02/11/32 (Call 02/11/31), |
2,722 | 2,149,153 | ||||||
| 2.19%, 06/05/26 (Call 06/05/25), |
2,297 | 2,197,822 | ||||||
| 2.75%, 02/11/33 (Call 02/11/32), |
2,120 | 1,707,658 | ||||||
| 3.09%, 05/14/32 (Call 05/14/31), |
4,183 | 3,515,134 | ||||||
| 3.13%, 08/13/30 (Call 08/13/29), |
2,095 | 1,851,900 | ||||||
| 3.18%, 02/11/43 (Call 02/11/42), |
1,900 | 1,367,946 | ||||||
| 3.75%, 03/26/25 |
1,635 | 1,601,297 | ||||||
| 3.87%, 01/12/29 (Call 01/12/28), |
2,872 | 2,701,110 | ||||||
| 4.13%, 09/24/25(b) |
2,534 | 2,478,647 | ||||||
| 4.13%, 04/15/26(b) |
2,855 | 2,772,031 | ||||||
| 4.19%, 04/01/31 (Call 04/01/30), |
3,876 | 3,564,760 | ||||||
| 4.25%, 03/23/28 (Call 03/23/27)(b) |
2,580 | 2,469,532 | ||||||
| 4.28%, 01/09/28 (Call 01/09/27)(b) |
2,712 | 2,602,613 | ||||||
| 4.49%, 05/12/26 (Call 05/12/25), |
1,730 | 1,701,839 | ||||||
| 4.55%, 04/17/26 |
2,465 | 2,421,954 | ||||||
| 4.70%, 08/05/27 (Call 08/05/26), |
1,880 | 1,842,756 | ||||||
| 4.75%, 05/12/28 (Call 05/12/27), |
1,815 | 1,770,223 | ||||||
| 4.88%, 05/15/45 |
2,433 | 2,235,669 | ||||||
| 4.99%, 08/05/33 (Call 08/05/32), |
1,935 | 1,844,553 | ||||||
| 5.43%, 02/08/30 (Call 02/08/29), |
2,020 | 2,006,494 | ||||||
| 5.70%, 02/08/35 (Call 02/08/34), |
2,000 | 1,978,166 | ||||||
| 5.71%, 01/12/27 (Call 01/12/26), |
2,380 | 2,379,243 | ||||||
| 5.96%, 01/12/34 (Call 01/12/33), |
2,910 | 2,949,443 | ||||||
| 6.25%, 09/22/29 (Call 09/22/28), |
1,795 | 1,843,761 | ||||||
| 6.30%, 09/22/34 (Call 09/22/33), |
2,390 | 2,470,745 | ||||||
| 6.33%, 12/22/27 (Call 12/22/26), |
1,740 | 1,775,000 | ||||||
| 6.37%, 07/15/26 (Call 07/15/25), |
2,095 | 2,109,374 | ||||||
| 6.44%, 08/11/28 (Call 08/11/27), |
2,445 | 2,512,879 | ||||||
| 6.54%, 08/12/33 (Call 08/12/32), |
3,845 | 4,009,782 | ||||||
| 9.02%, 11/15/33 (Call 11/15/32), |
2,510 | 3,020,070 | ||||||
| Security | Par (000) |
Value | ||||||
| Banks (continued) | ||||||||
| UniCredit SpA |
||||||||
| 1.98%, 06/03/27 (Call 06/03/26), |
$ | 1,465 | $ | 1,344,461 | ||||
| 2.57%, 09/22/26 (Call 09/22/25), |
954 | 903,590 | ||||||
| 3.13%, 06/03/32 (Call 06/03/31), |
1,382 | 1,155,608 | ||||||
| United Overseas Bank Ltd. |
||||||||
| 1.25%, 04/14/26(b) |
70 | 64,629 | ||||||
| 3.86%, 10/07/32 (Call 10/07/27), |
1,462 | 1,387,313 | ||||||
| Wachovia Corp. |
||||||||
| 5.50%, 08/01/35 |
1,365 | 1,338,528 | ||||||
| 6.61%, 10/01/25(a) |
185 | 187,868 | ||||||
| 7.50%, 04/15/35 |
701 | 801,402 | ||||||
| 7.57%, 08/01/26(a)(c) |
715 | 750,118 | ||||||
| Webster Financial Corp., 4.10%, 03/25/29 |
453 | 412,455 | ||||||
| Wells Fargo & Co. |
||||||||
| 2.19%, 04/30/26 (Call 04/30/25), |
3,538 | 3,394,823 | ||||||
| 2.39%, 06/02/28 (Call 06/02/27), |
4,040 | 3,684,808 | ||||||
| 2.57%, 02/11/31 (Call 02/11/30), |
4,466 | 3,807,605 | ||||||
| 2.88%, 10/30/30 (Call 10/30/29), |
5,415 | 4,748,829 | ||||||
| 3.00%, 04/22/26 |
4,220 | 4,025,913 | ||||||
| 3.00%, 10/23/26 |
4,582 | 4,331,824 | ||||||
| 3.07%, 04/30/41 (Call 04/30/40), |
4,679 | 3,455,332 | ||||||
| 3.20%, 06/17/27 (Call 06/17/26), |
3,045 | 2,899,146 | ||||||
| 3.35%, 03/02/33 (Call 03/02/32), |
5,081 | 4,361,103 | ||||||
| 3.53%, 03/24/28 (Call 03/24/27), |
5,465 | 5,181,485 | ||||||
| 3.55%, 09/29/25(a) |
3,239 | 3,155,346 | ||||||
| 3.58%, 05/22/28 (Call 05/22/27), |
3,710 | 3,516,939 | ||||||
| 3.90%, 05/01/45 |
2,820 | 2,256,946 | ||||||
| 3.91%, 04/25/26 (Call 04/25/25), |
3,760 | 3,686,762 | ||||||
| 4.10%, 06/03/26 |
3,091 | 3,010,509 | ||||||
| 4.15%, 01/24/29 (Call 10/24/28) |
3,547 | 3,395,248 | ||||||
| 4.30%, 07/22/27 |
3,468 | 3,366,544 | ||||||
| 4.40%, 06/14/46 |
2,706 | 2,228,741 | ||||||
| 4.48%, 04/04/31 (Call 04/04/30), |
2,745 | 2,610,188 | ||||||
| 4.54%, 08/15/26 (Call 08/15/25), |
2,307 | 2,275,124 | ||||||
| 4.61%, 04/25/53 (Call 04/25/52), |
4,360 | 3,801,061 | ||||||
| 4.65%, 11/04/44 |
2,298 | 1,984,347 | ||||||
| 4.75%, 12/07/46(a) |
2,565 | 2,217,434 | ||||||
| 4.81%, 07/25/28 (Call 07/25/27), |
4,345 | 4,267,103 | ||||||
| 4.90%, 07/25/33 (Call 07/25/32), |
5,451 | 5,211,967 | ||||||
| 4.90%, 11/17/45 |
2,585 | 2,291,526 | ||||||
| 50 | 2 0 2 4 I S H A R E S A N N U A L R E P O R T T O S H A R E H O L D E R S |
| Schedule of Investments (continued) February 29, 2024 |
iShares® Broad USD Investment Grade Corporate Bond ETF (Percentages shown are based on Net Assets) |
| Security | Par (000) | Value | ||||||
| Banks (continued) | ||||||||
| 5.01%, 04/04/51 (Call 04/04/50), |
$ | 7,059 | $ | 6,527,415 | ||||
| 5.20%, 01/23/30 (Call 01/23/29), |
2,815 | 2,790,821 | ||||||
| 5.38%, 02/07/35(a) |
770 | 777,651 | ||||||
| 5.38%, 11/02/43 |
2,529 | 2,417,950 | ||||||
| 5.39%, 04/24/34 (Call 04/24/33), |
4,480 | 4,406,256 | ||||||
| 5.50%, 01/23/35 (Call 01/23/34), |
2,195 | 2,180,502 | ||||||
| 5.56%, 07/25/34 (Call 07/25/33), |
5,425 | 5,404,039 | ||||||
| 5.57%, 07/25/29 (Call 07/25/28), |
5,025 | 5,057,907 | ||||||
| 5.61%, 01/15/44 |
3,341 | 3,241,339 | ||||||
| 5.95%, 12/01/86 (Call 12/15/36) |
376 | 383,047 | ||||||
| 6.30%, 10/23/29 (Call 10/23/28), |
3,140 | 3,254,555 | ||||||
| 6.49%, 10/23/34 (Call 10/23/33), |
4,050 | 4,307,213 | ||||||
| Series B, 7.95%, 11/15/29 |
320 | 356,833 | ||||||
| Wells Fargo Bank NA |
||||||||
| 4.81%, 01/15/26 (Call 12/15/25) |
1,500 | 1,492,437 | ||||||
| 5.25%, 12/11/26 (Call 11/09/26) |
3,650 | 3,663,353 | ||||||
| 5.45%, 08/07/26 (Call 07/07/26) |
2,920 | 2,945,013 | ||||||
| 5.55%, 08/01/25 (Call 07/01/25) |
2,000 | 2,008,182 | ||||||
| 5.85%, 02/01/37 |
1,520 | 1,554,525 | ||||||
| 5.95%, 08/26/36(a) |
895 | 915,826 | ||||||
| 6.60%, 01/15/38 |
1,760 | 1,896,541 | ||||||
| Westpac Banking Corp. |
||||||||
| 1.15%, 06/03/26 |
1,707 | 1,568,856 | ||||||
| 1.95%, 11/20/28 |
2,162 | 1,897,440 | ||||||
| 2.15%, 06/03/31 |
1,478 | 1,225,241 | ||||||
| 2.65%, 01/16/30(a) |
1,040 | 922,505 | ||||||
| 2.67%, 11/15/35 (Call 11/15/30), |
1,629 | 1,328,414 | ||||||
| 2.70%, 08/19/26(a) |
1,591 | 1,510,935 | ||||||
| 2.85%, 05/13/26 |
2,193 | 2,094,793 | ||||||
| 2.96%, 11/16/40(a) |
1,366 | 933,302 | ||||||
| 3.02%, 11/18/36 (Call 11/18/31), |
1,462 | 1,189,351 | ||||||
| 3.13%, 11/18/41(a) |
1,410 | 976,083 | ||||||
| 3.35%, 03/08/27 |
1,599 | 1,529,979 | ||||||
| 3.40%, 01/25/28(a) |
1,264 | 1,198,290 | ||||||
| 3.74%, 08/26/25(a) |
152 | 149,155 | ||||||
| 4.04%, 08/26/27 |
265 | 259,347 | ||||||
| 4.11%, 07/24/34 (Call 07/24/29), |
1,682 | 1,536,417 | ||||||
| 4.32%, 11/23/31 (Call 11/23/26), |
2,013 | 1,933,238 | ||||||
| 4.42%, 07/24/39 |
1,123 | 974,659 | ||||||
| 5.41%, 08/10/33 (Call 08/10/32), |
1,294 | 1,268,551 | ||||||
| 5.46%, 11/18/27 |
1,415 | 1,438,835 | ||||||
| 5.51%, 11/17/25 |
1,225 | 1,234,459 | ||||||
| 5.54%, 11/17/28 |
1,680 | 1,719,398 | ||||||
| 6.82%, 11/17/33(a) |
1,125 | 1,207,241 | ||||||
| Westpac New Zealand Ltd. |
||||||||
| 4.90%, 02/15/28(b) |
755 | 746,656 | ||||||
| 5.13%, 02/26/27(a)(b) |
800 | 799,129 | ||||||
| 5.20%, 02/28/29(b) |
800 | 799,448 | ||||||
| Security | Par (000) |
Value | ||||||
| Banks (continued) | ||||||||
| Wintrust Financial Corp., 4.85%, 06/06/29 |
$ | 467 | $ | 423,752 | ||||
| Woori Bank, 5.13%, 08/06/28(a)(b) |
460 | 450,156 | ||||||
| Zions Bancorp. NA, 3.25%, 10/29/29 |
785 | 640,268 | ||||||
|
|
|
|||||||
| 2,245,823,766 | ||||||||
| Beverages — 1.8% | ||||||||
| Anheuser-Busch |
||||||||
| Companies LLC/Anheuser-Busch InBev |
||||||||
| Worldwide Inc. |
||||||||
| 3.65%, 02/01/26 (Call 11/01/25) |
1,848 | 1,800,880 | ||||||
| 4.70%, 02/01/36 (Call 08/01/35) |
6,389 | 6,114,979 | ||||||
| 4.90%, 02/01/46 (Call 08/01/45) |
12,165 | 11,246,492 | ||||||
| Anheuser-Busch InBev Finance Inc. |
||||||||
| 4.63%, 02/01/44 |
1,270 | 1,145,808 | ||||||
| 4.70%, 02/01/36 (Call 08/01/35) |
1,060 | 1,014,537 | ||||||
| 4.90%, 02/01/46 (Call 08/01/45) |
2,098 | 1,939,592 | ||||||
| Anheuser-Busch InBev Worldwide Inc. |
||||||||
| 3.50%, 06/01/30 (Call 03/01/30) |
2,357 | 2,180,542 | ||||||
| 4.00%, 04/13/28 (Call 01/13/28) |
3,386 | 3,283,615 | ||||||
| 4.35%, 06/01/40 (Call 12/01/39) |
1,349 | 1,207,936 | ||||||
| 4.38%, 04/15/38 (Call 10/15/37) |
2,290 | 2,094,123 | ||||||
| 4.44%, 10/06/48 (Call 04/06/48) |
2,378 | 2,081,450 | ||||||
| 4.50%, 06/01/50 (Call 12/01/49) |
245 | 220,865 | ||||||
| 4.60%, 04/15/48 (Call 10/15/47) |
958 | 860,840 | ||||||
| 4.75%, 01/23/29 (Call 10/23/28) |
5,711 | 5,663,445 | ||||||
| 4.75%, 04/15/58 (Call 10/15/57)(a) |
1,200 | 1,089,436 | ||||||
| 4.90%, 01/23/31 (Call 10/23/30)(a) |
1,104 | 1,110,203 | ||||||
| 4.95%, 01/15/42 |
2,171 | 2,070,841 | ||||||
| 5.45%, 01/23/39 (Call 07/23/38) |
2,984 | 3,034,503 | ||||||
| 5.55%, 01/23/49 (Call 07/23/48) |
5,110 | 5,238,570 | ||||||
| 5.80%, 01/23/59 (Call 07/23/58) |
2,527 | 2,682,581 | ||||||
| 5.88%, 06/15/35(a) |
245 | 259,543 | ||||||
| 6.63%, 08/15/33 |
582 | 644,204 | ||||||
| 8.00%, 11/15/39 |
681 | 856,089 | ||||||
| 8.20%, 01/15/39 |
1,554 | 2,002,199 | ||||||
| Bacardi Ltd. |
||||||||
| 2.75%, 07/15/26 (Call 04/15/26)(b) |
450 | 423,997 | ||||||
| 4.45%, 05/15/25 (Call 03/15/25)(a)(b) |
1,180 | 1,162,575 | ||||||
| 4.70%, 05/15/28 (Call 02/15/28)(b) |
1,100 | 1,068,318 | ||||||
| 5.15%, 05/15/38 (Call 11/15/37)(a)(b) |
820 | 774,261 | ||||||
| 5.30%, 05/15/48 (Call 11/15/47)(b) |
1,215 | 1,131,427 | ||||||
| Bacardi Ltd./Bacardi-Martini BV |
||||||||
| 5.25%, 01/15/29 (Call 12/15/28)(a)(b) |
640 | 630,030 | ||||||
| 5.40%, 06/15/33 (Call 03/15/33)(b) |
417 | 410,173 | ||||||
| 5.90%, 06/15/43 (Call 12/15/42)(b) |
165 | 163,512 | ||||||
| Becle SAB de CV, 2.50%, 10/14/31 |
||||||||
| (Call 07/14/31)(b) |
565 | 442,242 | ||||||
| Brown-Forman Corp. |
||||||||
| 3.50%, 04/15/25 (Call 02/15/25) |
621 | 608,106 | ||||||
| 3.75%, 01/15/43 (Call 07/15/42) |
470 | 371,273 | ||||||
| 4.00%, 04/15/38 (Call 10/15/37) |
585 | 510,951 | ||||||
| 4.50%, 07/15/45 (Call 01/15/45)(a) |
714 | 632,936 | ||||||
| 4.75%, 04/15/33 (Call 01/15/33)(a) |
815 | 803,921 | ||||||
| Cia. Cervecerias Unidas SA, 3.35%, 01/19/32 |
||||||||
| (Call 10/19/31)(b) |
10 | 8,560 | ||||||
| Coca-Cola Co. (The) |
||||||||
| 1.00%, 03/15/28 |
1,670 | 1,456,240 | ||||||
| 1.38%, 03/15/31 |
2,616 | 2,094,459 | ||||||
| 1.45%, 06/01/27 |
1,778 | 1,609,213 | ||||||
| 1.50%, 03/05/28 |
805 | 715,992 | ||||||
| 1.65%, 06/01/30 |
1,910 | 1,597,285 | ||||||
| S C H E D U L E O F I N V E S T M E N T S |
51 |
| Schedule of Investments (continued) February 29, 2024 |
iShares® Broad USD Investment Grade Corporate Bond ETF (Percentages shown are based on Net Assets) |
| Security | Par (000) | Value | ||||||
| Beverages (continued) | ||||||||
| 2.00%, 03/05/31 |
$ | 974 | $ | 814,699 | ||||
| 2.13%, 09/06/29(a) |
1,459 | 1,283,748 | ||||||
| 2.25%, 01/05/32(a) |
1,255 | 1,057,203 | ||||||
| 2.50%, 06/01/40 |
1,671 | 1,193,705 | ||||||
| 2.50%, 03/15/51 |
1,595 | 998,263 | ||||||
| 2.60%, 06/01/50 |
2,021 | 1,307,547 | ||||||
| 2.75%, 06/01/60(a) |
1,322 | 838,692 | ||||||
| 2.88%, 05/05/41(a) |
877 | 657,864 | ||||||
| 2.90%, 05/25/27 |
937 | 889,672 | ||||||
| 3.00%, 03/05/51(a) |
1,810 | 1,275,375 | ||||||
| 3.38%, 03/25/27(a) |
1,590 | 1,533,569 | ||||||
| 3.45%, 03/25/30 |
1,838 | 1,714,664 | ||||||
| 4.20%, 03/25/50 |
1,025 | 905,533 | ||||||
| Coca-Cola Consolidated Inc., 3.80%, 11/25/25 |
||||||||
| (Call 08/25/25) |
430 | 420,560 | ||||||
| Coca-Cola Europacific Partners PLC, |
||||||||
| 1.50%, 01/15/27 (Call 12/15/26)(b) |
962 | 869,259 | ||||||
| Coca-Cola Femsa SAB de CV |
||||||||
| 1.85%, 09/01/32 (Call 06/01/32) |
1,065 | 832,074 | ||||||
| 2.75%, 01/22/30 (Call 10/22/29) |
1,300 | 1,143,350 | ||||||
| 5.25%, 11/26/43 |
455 | 438,615 | ||||||
| Constellation Brands Inc. |
||||||||
| 2.25%, 08/01/31 (Call 05/01/31) |
1,517 | 1,237,802 | ||||||
| 2.88%, 05/01/30 (Call 02/01/30)(a) |
1,208 | 1,060,909 | ||||||
| 3.15%, 08/01/29 (Call 05/01/29) |
1,048 | 950,909 | ||||||
| 3.50%, 05/09/27 (Call 02/09/27) |
808 | 768,204 | ||||||
| 3.60%, 02/15/28 (Call 11/15/27) |
1,110 | 1,049,390 | ||||||
| 3.70%, 12/06/26 (Call 09/06/26) |
1,000 | 963,189 | ||||||
| 3.75%, 05/01/50 (Call 11/01/49) |
850 | 636,046 | ||||||
| 4.10%, 02/15/48 (Call 08/15/47) |
936 | 752,305 | ||||||
| 4.35%, 05/09/27 (Call 04/09/27)(a) |
535 | 523,226 | ||||||
| 4.40%, 11/15/25 (Call 09/15/25) |
860 | 847,161 | ||||||
| 4.50%, 05/09/47 (Call 11/09/46) |
852 | 718,790 | ||||||
| 4.65%, 11/15/28 (Call 08/15/28) |
805 | 790,204 | ||||||
| 4.75%, 12/01/25 |
680 | 672,772 | ||||||
| 4.75%, 05/09/32 (Call 02/09/32)(a) |
865 | 836,569 | ||||||
| 4.80%, 01/15/29 (Call 12/15/28) |
595 | 586,419 | ||||||
| 4.90%, 05/01/33 (Call 02/01/33) |
1,065 | 1,032,855 | ||||||
| 5.00%, 02/02/26 (Call 03/11/24)(a) |
295 | 293,119 | ||||||
| 5.25%, 11/15/48 (Call 05/15/48)(a) |
817 | 773,036 | ||||||
| Diageo Capital PLC |
||||||||
| 1.38%, 09/29/25 (Call 08/29/25) |
1,045 | 985,852 | ||||||
| 2.00%, 04/29/30 (Call 01/29/30) |
800 | 674,736 | ||||||
| 2.13%, 04/29/32 (Call 01/29/32) |
1,095 | 886,230 | ||||||
| 2.38%, 10/24/29 (Call 07/24/29)(a) |
1,293 | 1,135,914 | ||||||
| 3.88%, 05/18/28 (Call 02/18/28) |
875 | 847,351 | ||||||
| 3.88%, 04/29/43 (Call 10/29/42)(a) |
590 | 499,928 | ||||||
| 5.20%, 10/24/25 |
783 | 783,558 | ||||||
| 5.30%, 10/24/27 (Call 09/24/27) |
1,160 | 1,174,077 | ||||||
| 5.38%, 10/05/26 (Call 09/05/26) |
1,115 | 1,124,162 | ||||||
| 5.50%, 01/24/33 (Call 10/24/32) |
1,400 | 1,438,748 | ||||||
| 5.63%, 10/05/33 (Call 07/05/33) |
765 | 795,533 | ||||||
| 5.88%, 09/30/36 |
538 | 573,646 | ||||||
| Diageo Investment Corp. |
||||||||
| 4.25%, 05/11/42(a) |
613 | 544,980 | ||||||
| 7.45%, 04/15/35 |
190 | 223,593 | ||||||
| Fomento Economico Mexicano SAB de CV, |
||||||||
| 3.50%, 01/16/50 (Call 07/16/49) |
145 | 107,968 | ||||||
| Heineken NV |
||||||||
| 3.50%, 01/29/28 (Call 10/29/27)(b) |
1,657 | 1,581,277 | ||||||
| 4.00%, 10/01/42(a)(b) |
706 | 581,711 | ||||||
| Security | Par (000) | Value | ||||||
| Beverages (continued) | ||||||||
| 4.35%, 03/29/47 (Call 09/29/46)(a)(b) |
$ | 575 | $ | 502,911 | ||||
| JDE Peet’s NV |
||||||||
| 1.38%, 01/15/27 (Call 12/15/26)(b) |
1,383 | 1,236,722 | ||||||
| 2.25%, 09/24/31 (Call 06/24/31)(b) |
916 | 716,608 | ||||||
| Keurig Dr Pepper Inc. |
||||||||
| 2.25%, 03/15/31 (Call 12/15/30) |
949 | 788,618 | ||||||
| 2.55%, 09/15/26 (Call 06/15/26) |
487 | 456,648 | ||||||
| 3.20%, 05/01/30 (Call 02/01/30) |
926 | 836,620 | ||||||
| 3.35%, 03/15/51 (Call 09/15/50) |
849 | 592,886 | ||||||
| 3.40%, 11/15/25 (Call 08/15/25) |
846 | 819,637 | ||||||
| 3.43%, 06/15/27 (Call 03/15/27)(a) |
672 | 639,776 | ||||||
| 3.80%, 05/01/50 (Call 11/01/49) |
1,485 | 1,129,673 | ||||||
| 3.95%, 04/15/29 (Call 02/15/29) |
1,325 | 1,262,408 | ||||||
| 4.05%, 04/15/32 (Call 01/15/32)(a) |
1,015 | 942,745 | ||||||
| 4.42%, 05/25/25 (Call 03/25/25) |
631 | 624,066 | ||||||
| 4.42%, 12/15/46 (Call 06/15/46) |
808 | 677,192 | ||||||
| 4.50%, 11/15/45 (Call 05/15/45) |
656 | 565,915 | ||||||
| 4.50%, 04/15/52 (Call 10/15/51)(a) |
1,042 | 884,750 | ||||||
| 4.60%, 05/25/28 (Call 02/25/28) |
1,720 | 1,696,608 | ||||||
| 5.09%, 05/25/48 (Call 11/25/47) |
405 | 379,339 | ||||||
| Molson Coors Beverage Co. |
||||||||
| 3.00%, 07/15/26 (Call 04/15/26) |
2,694 | 2,565,848 | ||||||
| 4.20%, 07/15/46 (Call 01/15/46) |
2,120 | 1,731,825 | ||||||
| 5.00%, 05/01/42(a) |
1,777 | 1,654,245 | ||||||
| PepsiCo Inc. |
||||||||
| 1.40%, 02/25/31 (Call 11/25/30) |
1,057 | 844,910 | ||||||
| 1.63%, 05/01/30 (Call 02/01/30) |
1,799 | 1,496,620 | ||||||
| 1.95%, 10/21/31 (Call 07/21/31)(a) |
1,480 | 1,213,463 | ||||||
| 2.25%, 03/19/25 (Call 02/19/25) |
1,721 | 1,670,594 | ||||||
| 2.38%, 10/06/26 (Call 07/06/26) |
1,451 | 1,367,140 | ||||||
| 2.63%, 03/19/27 (Call 01/19/27) |
630 | 592,327 | ||||||
| 2.63%, 07/29/29 (Call 04/29/29) |
1,369 | 1,233,465 | ||||||
| 2.63%, 10/21/41 (Call 04/21/41) |
1,370 | 983,433 | ||||||
| 2.75%, 04/30/25 (Call 01/30/25) |
1,291 | 1,257,144 | ||||||
| 2.75%, 03/19/30 (Call 12/19/29) |
1,744 | 1,557,448 | ||||||
| 2.75%, 10/21/51 (Call 04/21/51)(a) |
1,522 | 1,001,710 | ||||||
| 2.85%, 02/24/26 (Call 11/24/25) |
1,223 | 1,175,703 | ||||||
| 2.88%, 10/15/49 (Call 04/15/49) |
910 | 628,939 | ||||||
| 3.00%, 10/15/27 (Call 07/15/27) |
2,007 | 1,892,181 | ||||||
| 3.38%, 07/29/49 (Call 01/29/49)(a) |
1,006 | 758,251 | ||||||
| 3.45%, 10/06/46 (Call 04/06/46)(a) |
1,522 | 1,181,822 | ||||||
| 3.50%, 07/17/25 (Call 04/17/25)(a) |
960 | 940,627 | ||||||
| 3.50%, 03/19/40 (Call 09/19/39) |
365 | 298,681 | ||||||
| 3.60%, 02/18/28 (Call 01/18/28) |
1,095 | 1,053,405 | ||||||
| 3.60%, 08/13/42 |
110 | 88,945 | ||||||
| 3.63%, 03/19/50 (Call 09/19/49) |
1,452 | 1,146,026 | ||||||
| 3.88%, 03/19/60 (Call 09/19/59) |
610 | 488,304 | ||||||
| 3.90%, 07/18/32 (Call 04/18/32) |
1,638 | 1,537,063 | ||||||
| 4.00%, 03/05/42(a) |
980 | 870,903 | ||||||
| 4.00%, 05/02/47 (Call 11/02/46)(a) |
480 | 401,189 | ||||||
| 4.20%, 07/18/52 (Call 01/18/52) |
957 | 833,356 | ||||||
| 4.25%, 10/22/44 (Call 04/22/44)(a) |
145 | 125,720 | ||||||
| 4.45%, 05/15/28 (Call 04/15/28)(a) |
933 | 931,173 | ||||||
| 4.45%, 02/15/33 (Call 11/15/32)(a) |
930 | 922,006 | ||||||
| 4.45%, 04/14/46 (Call 10/14/45) |
880 | 796,499 | ||||||
| 4.55%, 02/13/26 (Call 01/13/26) |
500 | 497,036 | ||||||
| 4.60%, 07/17/45 (Call 01/17/45) |
537 | 484,606 | ||||||
| 4.65%, 02/15/53 (Call 08/15/52) |
850 | 791,973 | ||||||
| 4.88%, 11/01/40(a) |
675 | 662,702 | ||||||
| 5.13%, 11/10/26 (Call 10/10/26)(a) |
985 | 991,249 | ||||||
| 5.25%, 11/10/25(a) |
875 | 878,590 | ||||||
| 52 | 2 0 2 4 I S H A R E S A N N U A L R E P O R T T O S H A R E H O L D E R S |
| Schedule of Investments (continued) February 29, 2024 |
iShares® Broad USD Investment Grade Corporate Bond ETF (Percentages shown are based on Net Assets) |
| Security | Par (000) |
Value | ||||||
| Beverages (continued) | ||||||||
| 7.00%, 03/01/29(a) |
$ | 1,392 | $ | 1,536,996 | ||||
| Pepsico Singapore Financing I Pte Ltd. |
||||||||
| 4.55%, 02/16/29 (Call 01/16/29) |
610 | 604,488 | ||||||
| 4.65%, 02/16/27 (Call 01/16/27) |
500 | 496,460 | ||||||
| 4.70%, 02/16/34 (Call 11/16/33)(a) |
500 | 491,831 | ||||||
| Pernod Ricard International Finance LLC |
||||||||
| 1.25%, 04/01/28 (Call 02/01/28)(a)(b) |
1,120 | 965,189 | ||||||
| 1.63%, 04/01/31 (Call 01/01/30)(b) |
1,524 | 1,208,558 | ||||||
| 2.75%, 10/01/50 (Call 04/01/50)(b) |
465 | 291,658 | ||||||
| Pernod Ricard SA |
||||||||
| 3.25%, 06/08/26 (Call 03/08/26)(b) |
1,110 | 1,066,108 | ||||||
| 5.50%, 01/15/42(a)(b) |
1,045 | 1,056,114 | ||||||
|
|
|
|||||||
| 185,102,950 | ||||||||
| Biotechnology — 1.1% | ||||||||
| Amgen Inc. |
||||||||
| 1.65%, 08/15/28 (Call 06/15/28) |
1,761 | 1,534,114 | ||||||
| 2.00%, 01/15/32 (Call 10/15/31) |
1,715 | 1,374,276 | ||||||
| 2.20%, 02/21/27 (Call 12/21/26) |
2,298 | 2,119,146 | ||||||
| 2.30%, 02/25/31 (Call 11/25/30) |
1,674 | 1,400,738 | ||||||
| 2.45%, 02/21/30 (Call 11/21/29) |
1,703 | 1,480,294 | ||||||
| 2.60%, 08/19/26 (Call 05/19/26) |
1,527 | 1,441,232 | ||||||
| 2.77%, 09/01/53 (Call 03/01/53) |
1,226 | 748,325 | ||||||
| 2.80%, 08/15/41 (Call 02/15/41) |
1,525 | 1,087,517 | ||||||
| 3.00%, 02/22/29 (Call 12/22/28)(a) |
1,070 | 981,364 | ||||||
| 3.00%, 01/15/52 (Call 07/15/51)(a) |
1,400 | 935,219 | ||||||
| 3.13%, 05/01/25 (Call 02/01/25) |
1,298 | 1,264,854 | ||||||
| 3.15%, 02/21/40 (Call 08/21/39) |
2,470 | 1,853,055 | ||||||
| 3.20%, 11/02/27 (Call 08/02/27) |
1,610 | 1,513,948 | ||||||
| 3.35%, 02/22/32 (Call 11/22/31) |
1,335 | 1,181,390 | ||||||
| 3.38%, 02/21/50 (Call 08/21/49)(a) |
2,774 | 1,991,139 | ||||||
| 4.05%, 08/18/29 (Call 06/18/29)(a) |
1,715 | 1,639,785 | ||||||
| 4.20%, 03/01/33 (Call 12/01/32) |
965 | 892,651 | ||||||
| 4.20%, 02/22/52 (Call 08/22/51) |
1,248 | 1,009,203 | ||||||
| 4.40%, 05/01/45 (Call 11/01/44) |
2,737 | 2,336,674 | ||||||
| 4.40%, 02/22/62 (Call 08/22/61) |
1,585 | 1,274,687 | ||||||
| 4.56%, 06/15/48 (Call 12/15/47) |
1,920 | 1,664,183 | ||||||
| 4.66%, 06/15/51 (Call 12/15/50) |
4,564 | 3,971,997 | ||||||
| 4.88%, 03/01/53 (Call 09/01/52) |
1,415 | 1,269,628 | ||||||
| 4.95%, 10/01/41 |
561 | 522,411 | ||||||
| 5.15%, 03/02/28 (Call 02/02/28) |
4,690 | 4,699,053 | ||||||
| 5.15%, 11/15/41 (Call 05/15/41) |
960 | 913,128 | ||||||
| 5.25%, 03/02/25 |
2,590 | 2,583,577 | ||||||
| 5.25%, 03/02/30 (Call 01/02/30) |
3,265 | 3,289,264 | ||||||
| 5.25%, 03/02/33 (Call 12/02/32) |
5,335 | 5,320,371 | ||||||
| 5.51%, 03/02/26 (Call 03/11/24) |
440 | 439,427 | ||||||
| 5.60%, 03/02/43 (Call 09/02/42) |
3,705 | 3,709,040 | ||||||
| 5.65%, 06/15/42 (Call 12/15/41)(a) |
480 | 481,630 | ||||||
| 5.65%, 03/02/53 (Call 09/02/52)(a) |
5,170 | 5,167,849 | ||||||
| 5.75%, 03/15/40 |
485 | 491,039 | ||||||
| 5.75%, 03/02/63 (Call 09/02/62) |
3,549 | 3,549,329 | ||||||
| 6.38%, 06/01/37(a) |
734 | 785,917 | ||||||
| 6.40%, 02/01/39 |
635 | 686,564 | ||||||
| 6.90%, 06/01/38(a) |
360 | 402,870 | ||||||
| Baxalta Inc. |
||||||||
| 4.00%, 06/23/25 (Call 03/23/25) |
1,200 | 1,178,719 | ||||||
| 5.25%, 06/23/45 (Call 12/23/44)(a) |
526 | 507,273 | ||||||
| Biogen Inc. |
||||||||
| 2.25%, 05/01/30 (Call 02/01/30) |
2,176 | 1,821,318 | ||||||
| 3.15%, 05/01/50 (Call 11/01/49) |
2,301 | 1,519,985 | ||||||
| 3.25%, 02/15/51 (Call 08/15/50)(a) |
1,241 | 849,594 | ||||||
| 4.05%, 09/15/25 (Call 06/15/25)(a) |
2,373 | 2,325,849 | ||||||
| Security | Par (000) |
Value | ||||||
| Biotechnology (continued) | ||||||||
| 5.20%, 09/15/45 (Call 03/15/45) |
$ | 1,244 | $ | 1,172,481 | ||||
| Bio-Rad Laboratories Inc. |
||||||||
| 3.30%, 03/15/27 (Call 02/15/27) |
623 | 587,481 | ||||||
| 3.70%, 03/15/32 (Call 12/15/31)(a) |
1,345 | 1,197,942 | ||||||
| CSL Finance PLC |
||||||||
| 3.85%, 04/27/27 (Call 03/27/27)(a)(b) |
542 | 521,956 | ||||||
| 4.05%, 04/27/29 (Call 02/27/29)(a)(b) |
1,285 | 1,226,434 | ||||||
| 4.25%, 04/27/32 (Call 01/27/32)(b) |
1,060 | 1,000,944 | ||||||
| 4.63%, 04/27/42 (Call 10/27/41)(b) |
245 | 223,601 | ||||||
| 4.75%, 04/27/52 (Call 10/27/51)(b) |
1,310 | 1,184,389 | ||||||
| 4.95%, 04/27/62 (Call 10/27/61)(a)(b) |
680 | 616,026 | ||||||
| Gilead Sciences Inc. |
||||||||
| 1.20%, 10/01/27 (Call 08/01/27) |
1,177 | 1,035,696 | ||||||
| 1.65%, 10/01/30 (Call 07/01/30) |
1,633 | 1,333,358 | ||||||
| 2.60%, 10/01/40 (Call 04/01/40) |
1,426 | 995,558 | ||||||
| 2.80%, 10/01/50 (Call 04/01/50) |
2,177 | 1,402,987 | ||||||
| 2.95%, 03/01/27 (Call 12/01/26) |
1,720 | 1,625,020 | ||||||
| 3.65%, 03/01/26 (Call 12/01/25) |
3,798 | 3,687,810 | ||||||
| 4.00%, 09/01/36 (Call 03/01/36) |
1,286 | 1,137,864 | ||||||
| 4.15%, 03/01/47 (Call 09/01/46) |
2,691 | 2,224,226 | ||||||
| 4.50%, 02/01/45 (Call 08/01/44) |
2,258 | 1,987,035 | ||||||
| 4.60%, 09/01/35 (Call 03/01/35)(a) |
1,029 | 976,609 | ||||||
| 4.75%, 03/01/46 (Call 09/01/45) |
2,858 | 2,597,944 | ||||||
| 4.80%, 04/01/44 (Call 10/01/43) |
2,174 | 1,996,780 | ||||||
| 5.25%, 10/15/33 (Call 07/15/33)(a) |
865 | 875,080 | ||||||
| 5.55%, 10/15/53 (Call 04/15/53)(a) |
920 | 937,777 | ||||||
| 5.65%, 12/01/41 (Call 06/01/41)(a) |
1,213 | 1,236,133 | ||||||
| Illumina Inc. |
||||||||
| 2.55%, 03/23/31 (Call 12/23/30)(a) |
1,024 | 841,252 | ||||||
| 5.75%, 12/13/27 (Call 11/13/27) |
1,005 | 1,013,630 | ||||||
| 5.80%, 12/12/25 (Call 11/12/25) |
760 | 760,080 | ||||||
| Regeneron Pharmaceuticals Inc. |
||||||||
| 1.75%, 09/15/30 (Call 06/15/30) |
1,824 | 1,475,489 | ||||||
| 2.80%, 09/15/50 (Call 03/15/50)(a) |
1,307 | 813,471 | ||||||
| Royalty Pharma PLC |
||||||||
| 1.20%, 09/02/25 (Call 08/02/25) |
1,276 | 1,194,650 | ||||||
| 1.75%, 09/02/27 (Call 07/02/27) |
1,549 | 1,379,332 | ||||||
| 2.15%, 09/02/31 (Call 06/02/31)(a) |
889 | 709,525 | ||||||
| 2.20%, 09/02/30 (Call 06/02/30) |
1,623 | 1,336,050 | ||||||
| 3.30%, 09/02/40 (Call 03/02/40)(a) |
1,527 | 1,120,700 | ||||||
| 3.35%, 09/02/51 (Call 03/02/51) |
1,060 | 693,787 | ||||||
| 3.55%, 09/02/50 (Call 03/02/50)(a) |
1,326 | 902,628 | ||||||
|
|
|
|||||||
| 120,231,351 | ||||||||
| Building Materials — 0.5% | ||||||||
| Carrier Global Corp. |
||||||||
| 2.49%, 02/15/27 (Call 12/15/26) |
399 | 370,556 | ||||||
| 2.70%, 02/15/31 (Call 11/15/30) |
955 | 815,081 | ||||||
| 2.72%, 02/15/30 (Call 11/15/29)(a) |
3,009 | 2,634,411 | ||||||
| 3.38%, 04/05/40 (Call 10/05/39)(a) |
2,308 | 1,781,152 | ||||||
| 3.58%, 04/05/50 (Call 10/05/49)(a) |
2,321 | 1,712,381 | ||||||
| 5.90%, 03/15/34 (Call 12/15/33)(a) |
555 | 575,734 | ||||||
| 6.20%, 03/15/54 (Call 09/15/53) |
890 | 971,425 | ||||||
| CRH America Finance Inc. |
||||||||
| 3.40%, 05/09/27 (Call 02/09/27)(a)(b) |
728 | 690,710 | ||||||
| 3.95%, 04/04/28 (Call 01/04/28)(b) |
1,607 | 1,548,244 | ||||||
| 4.50%, 04/04/48 (Call 10/04/47)(a)(b) |
905 | 797,310 | ||||||
| CRH America Inc. |
||||||||
| 3.88%, 05/18/25 (Call 02/15/25)(b) |
1,715 | 1,677,298 | ||||||
| 5.13%, 05/18/45 (Call 11/18/44)(b) |
835 | 789,136 | ||||||
| Eagle Materials Inc., 2.50%, 07/01/31 |
||||||||
| (Call 04/01/31)(a) |
955 | 793,923 | ||||||
| S C H E D U L E O F I N V E S T M E N T S |
53 |
| Schedule of Investments (continued) February 29, 2024 |
iShares® Broad USD Investment Grade Corporate Bond ETF (Percentages shown are based on Net Assets) |
| Security | Par (000) |
Value | ||||||
| Building Materials (continued) | ||||||||
| Fortune Brands Innovations Inc. |
||||||||
| 3.25%, 09/15/29 (Call 06/15/29) |
$ | 1,291 | $ | 1,167,977 | ||||
| 4.00%, 06/15/25 (Call 03/15/25) |
680 | 667,026 | ||||||
| 4.00%, 03/25/32 (Call 12/25/31)(a) |
600 | 544,709 | ||||||
| 4.50%, 03/25/52 (Call 09/25/51)(a) |
810 | 656,420 | ||||||
| 5.88%, 06/01/33 (Call 03/01/33) |
887 | 900,575 | ||||||
| GCC SAB de CV, 3.61%, 04/20/32 |
||||||||
| (Call 01/20/32)(b) |
200 | 169,564 | ||||||
| Holcim Capital Corp. Ltd., 6.50%, 09/12/43(b) |
300 | 300,231 | ||||||
| Holcim Finance U.S. LLC |
||||||||
| 3.50%, 09/22/26 (Call 06/22/26)(b) |
1,145 | 1,096,682 | ||||||
| 4.75%, 09/22/46 (Call 03/22/46)(a)(b) |
435 | 382,503 | ||||||
| Holcim U.S. Finance Luxembourg SA, 6.88%, |
||||||||
| 09/29/39(b) |
320 | 339,253 | ||||||
| Johnson Controls International PLC |
||||||||
| 3.90%, 02/14/26 (Call 11/14/25)(a) |
895 | 872,128 | ||||||
| 4.50%, 02/15/47 (Call 08/15/46) |
828 | 711,560 | ||||||
| 4.63%, 07/02/44 (Call 01/02/44)(a) |
634 | 552,667 | ||||||
| 4.95%, 07/02/64 (Call 01/02/64)(c) |
441 | 390,854 | ||||||
| 5.13%, 09/14/45 (Call 03/14/45) |
112 | 104,062 | ||||||
| 6.00%, 01/15/36 |
729 | 766,058 | ||||||
| Johnson Controls International PLC/Tyco Fire & |
||||||||
| 1.75%, 09/15/30 (Call 06/15/30) |
786 | 642,193 | ||||||
| 2.00%, 09/16/31 (Call 06/16/31)(a) |
790 | 633,935 | ||||||
| 4.90%, 12/01/32 (Call 09/01/32)(a) |
180 | 176,384 | ||||||
| Lafarge SA, 7.13%, 07/15/36 |
453 | 500,943 | ||||||
| Lennox International Inc. |
||||||||
| 1.35%, 08/01/25 (Call 07/01/25) |
476 | 448,880 | ||||||
| 1.70%, 08/01/27 (Call 06/01/27) |
745 | 667,011 | ||||||
| 5.50%, 09/15/28 (Call 08/15/28) |
765 | 772,016 | ||||||
| Martin Marietta Materials Inc. |
||||||||
| 2.40%, 07/15/31 (Call 04/15/31) |
1,381 | 1,149,149 | ||||||
| 3.20%, 07/15/51 (Call 01/15/51) |
1,475 | 1,019,763 | ||||||
| 3.45%, 06/01/27 (Call 03/01/27)(a) |
335 | 319,918 | ||||||
| 3.50%, 12/15/27 (Call 09/15/27) |
521 | 493,850 | ||||||
| 4.25%, 12/15/47 (Call 06/15/47) |
440 | 365,353 | ||||||
| Series CB, 2.50%, 03/15/30 (Call 12/15/29) |
888 | 769,587 | ||||||
| Masco Corp. |
||||||||
| 1.50%, 02/15/28 (Call 12/15/27) |
1,024 | 889,823 | ||||||
| 2.00%, 10/01/30 (Call 07/01/30)(a) |
756 | 615,351 | ||||||
| 2.00%, 02/15/31 (Call 11/15/30)(a) |
1,080 | 876,980 | ||||||
| 3.13%, 02/15/51 (Call 08/15/50)(a) |
422 | 281,332 | ||||||
| 3.50%, 11/15/27 (Call 08/15/27) |
567 | 532,815 | ||||||
| 4.50%, 05/15/47 (Call 11/15/46)(a) |
629 | 524,855 | ||||||
| Mohawk Industries Inc., 5.85%, 09/18/28 |
||||||||
| (Call 08/18/28) |
600 | 612,969 | ||||||
| Owens Corning |
||||||||
| 3.40%, 08/15/26 (Call 05/15/26) |
990 | 945,691 | ||||||
| 3.88%, 06/01/30 (Call 03/01/30) |
765 | 704,731 | ||||||
| 3.95%, 08/15/29 (Call 05/15/29)(a) |
793 | 747,798 | ||||||
| 4.30%, 07/15/47 (Call 01/15/47)(a) |
706 | 579,098 | ||||||
| 4.40%, 01/30/48 (Call 07/30/47) |
776 | 641,012 | ||||||
| 7.00%, 12/01/36 |
334 | 371,421 | ||||||
| St Marys Cement Inc. Canada, 5.75%, 01/28/27 |
||||||||
| (Call 10/28/26)(b) |
220 | 219,064 | ||||||
| Trane Technologies Financing Ltd. |
||||||||
| 3.50%, 03/21/26 (Call 01/21/26) |
774 | 748,194 | ||||||
| 3.80%, 03/21/29 (Call 12/21/28)(a) |
999 | 944,535 | ||||||
| 4.50%, 03/21/49 (Call 09/21/48) |
359 | 318,365 | ||||||
| 4.65%, 11/01/44 (Call 05/01/44) |
761 | 684,313 | ||||||
| Security | Par (000) |
Value | ||||||
| Building Materials (continued) | ||||||||
| 5.25%, 03/03/33 (Call 12/03/32) |
$ | 890 | $ | 897,552 | ||||
| Trane Technologies Global Holding Co. Ltd. |
||||||||
| 3.75%, 08/21/28 (Call 05/21/28) |
754 | 719,234 | ||||||
| 4.30%, 02/21/48 (Call 08/21/47) |
220 | 188,172 | ||||||
| 5.75%, 06/15/43(a) |
544 | 559,466 | ||||||
| UltraTech Cement Ltd., 2.80%, 02/16/31 |
||||||||
| (Call 08/16/30)(a)(b) |
550 | 461,548 | ||||||
| Votorantim Cimentos International SA, |
||||||||
| 7.25%, 04/05/41(b) |
285 | 311,044 | ||||||
| Vulcan Materials Co. |
||||||||
| 3.50%, 06/01/30 (Call 03/01/30) |
1,475 | 1,343,438 | ||||||
| 3.90%, 04/01/27 (Call 01/01/27) |
593 | 574,248 | ||||||
| 4.50%, 04/01/25 (Call 01/01/25) |
712 | 704,196 | ||||||
| 4.50%, 06/15/47 (Call 12/15/46) |
586 | 506,182 | ||||||
| 4.70%, 03/01/48 (Call 09/01/47) |
762 | 680,569 | ||||||
| 5.80%, 03/01/26 (Call 03/01/24) |
95 | 95,000 | ||||||
|
|
|
|||||||
| 51,017,608 | ||||||||
| Chemicals — 1.5% | ||||||||
| Air Liquide Finance SA |
||||||||
| 2.25%, 09/10/29 (Call 06/10/29)(a)(b) |
1,073 | 945,837 | ||||||
| 2.50%, 09/27/26 (Call 06/27/26)(b) |
1,575 | 1,481,482 | ||||||
| 3.50%, 09/27/46 (Call 03/27/46)(a)(b) |
912 | 717,307 | ||||||
| Air Products and Chemicals Inc. |
||||||||
| 1.50%, 10/15/25 (Call 09/15/25) |
817 | 772,319 | ||||||
| 1.85%, 05/15/27 (Call 03/15/27)(a) |
1,218 | 1,113,498 | ||||||
| 2.05%, 05/15/30 (Call 02/15/30) |
1,201 | 1,021,664 | ||||||
| 2.70%, 05/15/40 (Call 11/15/39) |
971 | 699,182 | ||||||
| 2.80%, 05/15/50 (Call 11/15/49)(a) |
1,424 | 948,202 | ||||||
| 4.60%, 02/08/29 (Call 01/08/29) |
1,375 | 1,358,609 | ||||||
| 4.75%, 02/08/31 (Call 12/08/30) |
1,275 | 1,258,852 | ||||||
| 4.80%, 03/03/33 (Call 12/03/32) |
1,075 | 1,059,879 | ||||||
| 4.85%, 02/08/34 (Call 11/08/33) |
1,275 | 1,250,095 | ||||||
| Albemarle Corp. |
||||||||
| 4.65%, 06/01/27 (Call 05/01/27)(a) |
515 | 505,772 | ||||||
| 5.05%, 06/01/32 (Call 03/01/32)(a) |
1,090 | 1,035,086 | ||||||
| 5.45%, 12/01/44 (Call 06/01/44) |
180 | 163,753 | ||||||
| 5.65%, 06/01/52 (Call 12/01/51)(a) |
745 | 672,075 | ||||||
| Alpek SAB de CV, 3.25%, 02/25/31 |
||||||||
| (Call 11/25/30)(a)(b) |
567 | 475,203 | ||||||
| Bayport Polymers LLC |
||||||||
| 4.74%, 04/14/27 (Call 03/14/27)(a)(b) |
20 | 18,957 | ||||||
| 5.14%, 04/14/32 (Call 01/14/32)(a)(b) |
675 | 601,790 | ||||||
| Cabot Corp. |
||||||||
| 3.40%, 09/15/26 (Call 06/15/26) |
723 | 680,091 | ||||||
| 4.00%, 07/01/29 (Call 04/01/29)(a) |
606 | 563,981 | ||||||
| 5.00%, 06/30/32 (Call 03/30/32) |
715 | 689,422 | ||||||
| Celanese U.S. Holdings LLC |
||||||||
| 1.40%, 08/05/26 (Call 07/05/26) |
835 | 757,317 | ||||||
| 6.05%, 03/15/25 |
1,121 | 1,123,774 | ||||||
| 6.17%, 07/15/27 (Call 06/15/27) |
2,806 | 2,848,696 | ||||||
| 6.33%, 07/15/29 (Call 05/15/29) |
1,005 | 1,032,086 | ||||||
| 6.35%, 11/15/28 (Call 10/15/28) |
1,405 | 1,444,979 | ||||||
| 6.38%, 07/15/32 (Call 04/15/32) |
796 | 815,562 | ||||||
| 6.55%, 11/15/30 (Call 09/15/30) |
1,573 | 1,635,419 | ||||||
| 6.70%, 11/15/33 (Call 08/15/33) |
1,465 | 1,538,961 | ||||||
| CF Industries Inc. |
||||||||
| 4.50%, 12/01/26(b) |
1,408 | 1,372,147 | ||||||
| 4.95%, 06/01/43 |
1,170 | 1,040,351 | ||||||
| 5.15%, 03/15/34 |
1,075 | 1,040,254 | ||||||
| 5.38%, 03/15/44 |
985 | 920,937 | ||||||
| 54 | 2 0 2 4 I S H A R E S A N N U A L R E P O R T T O S H A R E H O L D E R S |
| Schedule of Investments (continued) February 29, 2024 |
iShares® Broad USD Investment Grade Corporate Bond ETF (Percentages shown are based on Net Assets) |
| Security | Par (000) |
Value | ||||||
| Chemicals (continued) | ||||||||
| Chevron Phillips Chemical Co. LLC/Chevron |
||||||||
| 3.40%, 12/01/26 (Call 09/01/26)(a)(b) |
$ | 1,339 | $ | 1,275,813 | ||||
| 3.70%, 06/01/28 (Call 03/01/28)(a)(b) |
1,085 | 1,028,881 | ||||||
| 5.13%, 04/01/25 (Call 03/01/25)(b) |
1,037 | 1,032,931 | ||||||
| Dow Chemical Co. (The) |
||||||||
| 2.10%, 11/15/30 (Call 08/15/30)(a) |
1,239 | 1,034,376 | ||||||
| 3.60%, 11/15/50 (Call 05/15/50) |
1,685 | 1,226,928 | ||||||
| 4.25%, 10/01/34 (Call 04/01/34)(a) |
697 | 641,544 | ||||||
| 4.38%, 11/15/42 (Call 05/15/42) |
1,554 | 1,307,092 | ||||||
| 4.63%, 10/01/44 (Call 04/01/44) |
745 | 643,802 | ||||||
| 4.80%, 11/30/28 (Call 08/30/28)(a) |
934 | 927,174 | ||||||
| 4.80%, 05/15/49 (Call 11/15/48) |
1,115 | 973,066 | ||||||
| 5.15%, 02/15/34 (Call 11/15/33)(a) |
450 | 443,445 | ||||||
| 5.25%, 11/15/41 (Call 05/15/41) |
1,188 | 1,118,413 | ||||||
| 5.55%, 11/30/48 (Call 05/30/48) |
606 | 589,984 | ||||||
| 5.60%, 02/15/54 (Call 08/15/53) |
450 | 439,715 | ||||||
| 6.30%, 03/15/33 (Call 12/15/32)(a) |
740 | 792,748 | ||||||
| 6.90%, 05/15/53 (Call 11/15/52) |
1,155 | 1,322,430 | ||||||
| 7.38%, 11/01/29 |
1,181 | 1,309,961 | ||||||
| 9.40%, 05/15/39 |
723 | 962,370 | ||||||
| DuPont de Nemours Inc. |
||||||||
| 4.49%, 11/15/25 (Call 09/15/25)(a) |
2,543 | 2,513,028 | ||||||
| 4.73%, 11/15/28 (Call 08/15/28) |
3,146 | 3,128,543 | ||||||
| 5.32%, 11/15/38 (Call 05/15/38) |
2,231 | 2,205,351 | ||||||
| 5.42%, 11/15/48 (Call 05/15/48)(a) |
2,861 | 2,815,046 | ||||||
| Eastman Chemical Co. |
||||||||
| 3.80%, 03/15/25 (Call 12/15/24) |
1,151 | 1,132,195 | ||||||
| 4.50%, 12/01/28 (Call 09/01/28) |
1,100 | 1,067,443 | ||||||
| 4.65%, 10/15/44 (Call 04/15/44)(a) |
1,220 | 1,035,383 | ||||||
| 4.80%, 09/01/42 (Call 03/01/42) |
729 | 637,045 | ||||||
| 5.63%, 02/20/34 (Call 11/20/33)(a) |
495 | 491,366 | ||||||
| 5.75%, 03/08/33 (Call 12/08/32) |
695 | 699,624 | ||||||
| Ecolab Inc. |
||||||||
| 1.30%, 01/30/31 (Call 10/30/30)(a) |
830 | 658,192 | ||||||
| 1.65%, 02/01/27 (Call 01/01/27) |
660 | 603,122 | ||||||
| 2.13%, 02/01/32 (Call 11/01/31) |
1,245 | 1,023,130 | ||||||
| 2.13%, 08/15/50 (Call 02/15/50)(a) |
682 | 394,370 | ||||||
| 2.70%, 11/01/26 (Call 08/01/26)(a) |
996 | 945,354 | ||||||
| 2.70%, 12/15/51 (Call 06/15/51) |
1,370 | 868,823 | ||||||
| 2.75%, 08/18/55 (Call 02/18/55)(a) |
693 | 431,173 | ||||||
| 3.25%, 12/01/27 (Call 09/01/27) |
799 | 756,840 | ||||||
| 3.95%, 12/01/47 (Call 06/01/47)(a) |
445 | 367,743 | ||||||
| 4.80%, 03/24/30 (Call 12/24/29)(a) |
966 | 965,206 | ||||||
| 5.25%, 01/15/28 (Call 12/15/27) |
949 | 963,196 | ||||||
| 5.50%, 12/08/41 |
600 | 607,825 | ||||||
| EIDP Inc. |
||||||||
| 1.70%, 07/15/25 (Call 06/15/25) |
470 | 446,567 | ||||||
| 2.30%, 07/15/30 (Call 04/15/30)(a) |
968 | 827,934 | ||||||
| 4.50%, 05/15/26 (Call 04/15/26) |
725 | 713,810 | ||||||
| 4.80%, 05/15/33 (Call 02/15/33)(a) |
380 | 371,808 | ||||||
| FMC Corp. |
||||||||
| 3.20%, 10/01/26 (Call 08/01/26)(a) |
925 | 866,642 | ||||||
| 3.45%, 10/01/29 (Call 07/01/29) |
931 | 827,560 | ||||||
| 4.50%, 10/01/49 (Call 04/01/49)(a) |
775 | 576,478 | ||||||
| 5.15%, 05/18/26 (Call 04/18/26) |
795 | 784,042 | ||||||
| 5.65%, 05/18/33 (Call 02/18/33)(a) |
925 | 895,805 | ||||||
| 6.38%, 05/18/53 (Call 11/18/52)(a) |
785 | 765,727 | ||||||
| GC Treasury Center Co. Ltd. |
||||||||
| 2.98%, 03/18/31 (Call 12/18/30)(b) |
277 | 230,531 | ||||||
| 4.30%, 03/18/51 (Call 09/18/50)(b) |
385 | 290,743 | ||||||
| Security | Par (000) |
Value | ||||||
| Chemicals (continued) | ||||||||
| 4.40%, 03/30/32 (Call 09/30/31)(a)(b) |
$ | 1,165 | $ | 1,055,664 | ||||
| Huntsman International LLC |
||||||||
| 2.95%, 06/15/31 (Call 03/15/31) |
825 | 679,353 | ||||||
| 4.50%, 05/01/29 (Call 02/01/29)(a) |
1,230 | 1,168,261 | ||||||
| International Flavors & Fragrances Inc. |
||||||||
| 1.23%, 10/01/25 (Call 09/01/25)(b) |
100 | 93,193 | ||||||
| 1.83%, 10/15/27 (Call 08/15/27)(b) |
260 | 228,502 | ||||||
| 2.30%, 11/01/30 (Call 08/01/30)(a)(b) |
425 | 348,772 | ||||||
| 3.27%, 11/15/40 (Call 05/15/40)(b) |
697 | 488,553 | ||||||
| 3.47%, 12/01/50 (Call 06/01/50)(a)(b) |
1,710 | 1,125,360 | ||||||
| 4.38%, 06/01/47 (Call 12/01/46) |
495 | 369,275 | ||||||
| 4.45%, 09/26/28 (Call 06/26/28)(a) |
570 | 549,730 | ||||||
| 5.00%, 09/26/48 (Call 03/26/48) |
716 | 602,409 | ||||||
| LG Chem Ltd. |
||||||||
| 1.38%, 07/07/26(b) |
1,265 | 1,153,124 | ||||||
| 2.38%, 07/07/31(b) |
655 | 538,685 | ||||||
| Linde Inc./CT |
||||||||
| 1.10%, 08/10/30 (Call 05/10/30) |
1,398 | 1,119,425 | ||||||
| 2.00%, 08/10/50 (Call 02/10/50) |
288 | 161,359 | ||||||
| 3.20%, 01/30/26 (Call 10/30/25) |
1,091 | 1,057,463 | ||||||
| 3.55%, 11/07/42 (Call 05/07/42) |
910 | 726,779 | ||||||
| 4.70%, 12/05/25 (Call 11/05/25) |
925 | 920,672 | ||||||
| Lubrizol Corp. (The), 6.50%, 10/01/34 |
565 | 637,227 | ||||||
| LYB Finance Co. BV, 8.10%, 03/15/27(b) |
505 | 537,218 | ||||||
| LYB International Finance BV |
||||||||
| 4.88%, 03/15/44 (Call 09/15/43) |
1,267 | 1,114,200 | ||||||
| 5.25%, 07/15/43 |
1,013 | 929,540 | ||||||
| LYB International Finance II BV, |
||||||||
| 3.50%, 03/02/27 (Call 12/02/26) |
935 | 890,968 | ||||||
| LYB International Finance III LLC |
||||||||
| 1.25%, 10/01/25 (Call 09/01/25) |
945 | 883,036 | ||||||
| 2.25%, 10/01/30 (Call 07/01/30)(a) |
860 | 716,255 | ||||||
| 3.38%, 10/01/40 (Call 04/01/40) |
1,052 | 780,425 | ||||||
| 3.63%, 04/01/51 (Call 10/01/50)(a) |
1,357 | 943,871 | ||||||
| 3.80%, 10/01/60 (Call 04/01/60)(a) |
664 | 449,376 | ||||||
| 4.20%, 10/15/49 (Call 04/15/49) |
1,358 | 1,048,915 | ||||||
| 4.20%, 05/01/50 (Call 11/01/49) |
1,271 | 981,665 | ||||||
| 5.50%, 03/01/34 (Call 12/01/33) |
950 | 942,563 | ||||||
| 5.63%, 05/15/33 (Call 02/15/33)(a) |
890 | 903,724 | ||||||
| LyondellBasell Industries NV, 4.63%, 02/26/55 |
||||||||
| (Call 08/26/54) |
915 | 750,840 | ||||||
| MEGlobal BV |
||||||||
| 2.63%, 04/28/28 (Call 01/28/28)(b) |
185 | 164,195 | ||||||
| 4.25%, 11/03/26(b) |
1,507 | 1,446,720 | ||||||
| MEGlobal Canada ULC |
||||||||
| 5.00%, 05/18/25(a)(b) |
1,100 | 1,084,941 | ||||||
| 5.88%, 05/18/30(b) |
750 | 755,160 | ||||||
| Mosaic Co. (The) |
||||||||
| 4.05%, 11/15/27 (Call 08/15/27) |
209 | 200,767 | ||||||
| 4.88%, 11/15/41 (Call 05/15/41) |
150 | 131,124 | ||||||
| 5.38%, 11/15/28 (Call 10/15/28)(a) |
475 | 478,520 | ||||||
| 5.45%, 11/15/33 (Call 05/15/33) |
282 | 278,835 | ||||||
| 5.63%, 11/15/43 (Call 05/15/43) |
525 | 501,479 | ||||||
| NewMarket Corp., 2.70%, 03/18/31 |
||||||||
| (Call 12/18/30) |
860 | 713,953 | ||||||
| Nutrien Ltd. |
||||||||
| 2.95%, 05/13/30 (Call 02/13/30) |
925 | 819,006 | ||||||
| 3.00%, 04/01/25 (Call 01/01/25) |
514 | 499,854 | ||||||
| 3.95%, 05/13/50 (Call 11/13/49) |
770 | 601,337 | ||||||
| 4.00%, 12/15/26 (Call 09/15/26) |
926 | 896,688 | ||||||
| 4.13%, 03/15/35 (Call 09/15/34) |
699 | 628,727 | ||||||
| S C H E D U L E O F I N V E S T M E N T S |
55 |
| Schedule of Investments (continued) February 29, 2024 |
iShares® Broad USD Investment Grade Corporate Bond ETF (Percentages shown are based on Net Assets) |
| Security | Par (000) |
Value | ||||||
| Chemicals (continued) | ||||||||
| 4.20%, 04/01/29 (Call 01/01/29) |
$ | 1,275 | $ | 1,225,569 | ||||
| 4.90%, 03/27/28 (Call 02/27/28) |
890 | 882,700 | ||||||
| 4.90%, 06/01/43 (Call 12/01/42)(a) |
697 | 630,006 | ||||||
| 5.00%, 04/01/49 (Call 10/01/48)(a) |
725 | 655,451 | ||||||
| 5.25%, 01/15/45 (Call 07/15/44) |
748 | 695,463 | ||||||
| 5.63%, 12/01/40 |
681 | 667,085 | ||||||
| 5.80%, 03/27/53 (Call 09/27/52)(a) |
870 | 873,104 | ||||||
| 5.88%, 12/01/36 |
722 | 740,433 | ||||||
| 5.95%, 11/07/25 |
895 | 902,225 | ||||||
| 6.13%, 01/15/41 (Call 07/15/40)(a) |
440 | 450,460 | ||||||
| OCI NV |
||||||||
| 4.63%, 10/15/25 (Call 04/02/24)(b) |
240 | 235,315 | ||||||
| 6.70%, 03/16/33 (Call 12/16/32)(b) |
810 | 802,843 | ||||||
| Orbia Advance Corp. SAB de CV |
||||||||
| 1.88%, 05/11/26 (Call 04/11/26)(b) |
1,145 | 1,044,413 | ||||||
| 2.88%, 05/11/31 (Call 02/11/31)(b) |
610 | 494,260 | ||||||
| 4.00%, 10/04/27 (Call 07/04/27)(b) |
280 | 263,615 | ||||||
| 5.50%, 01/15/48 (Call 07/15/47)(b) |
602 | 507,185 | ||||||
| 5.88%, 09/17/44(b) |
990 | 883,315 | ||||||
| PPG Industries Inc. |
||||||||
| 1.20%, 03/15/26 (Call 02/15/26) |
1,142 | 1,055,369 | ||||||
| 2.55%, 06/15/30 (Call 03/15/30)(a) |
630 | 542,813 | ||||||
| 2.80%, 08/15/29 (Call 05/15/29) |
612 | 547,212 | ||||||
| 3.75%, 03/15/28 (Call 12/15/27) |
1,418 | 1,358,764 | ||||||
| Rohm & Haas Co., 7.85%, 07/15/29 |
946 | 1,049,727 | ||||||
| RPM International Inc. |
||||||||
| 2.95%, 01/15/32 (Call 10/15/31)(a) |
632 | 533,769 | ||||||
| 3.75%, 03/15/27 (Call 12/15/26) |
955 | 911,137 | ||||||
| 4.25%, 01/15/48 (Call 07/15/47)(a) |
425 | 341,372 | ||||||
| 4.55%, 03/01/29 (Call 12/01/28) |
685 | 658,880 | ||||||
| 5.25%, 06/01/45 (Call 12/01/44)(a) |
412 | 380,892 | ||||||
| SABIC Capital II BV, 4.50%, 10/10/28(b) |
1,145 | 1,116,393 | ||||||
| Sherwin-Williams Co. (The) |
||||||||
| 2.20%, 03/15/32 (Call 12/15/31)(a) |
825 | 668,631 | ||||||
| 2.30%, 05/15/30 (Call 02/15/30) |
936 | 794,551 | ||||||
| 2.90%, 03/15/52 (Call 09/15/51) |
735 | 475,511 | ||||||
| 2.95%, 08/15/29 (Call 05/15/29) |
1,093 | 981,992 | ||||||
| 3.30%, 05/15/50 (Call 11/15/49) |
790 | 555,151 | ||||||
| 3.45%, 08/01/25 (Call 05/01/25)(a) |
729 | 710,578 | ||||||
| 3.45%, 06/01/27 (Call 03/01/27) |
2,305 | 2,195,247 | ||||||
| 3.80%, 08/15/49 (Call 02/15/49) |
790 | 609,369 | ||||||
| 3.95%, 01/15/26 (Call 10/15/25) |
670 | 655,490 | ||||||
| 4.00%, 12/15/42 (Call 06/15/42)(a) |
205 | 167,624 | ||||||
| 4.25%, 08/08/25 |
412 | 406,118 | ||||||
| 4.50%, 06/01/47 (Call 12/01/46) |
1,586 | 1,374,548 | ||||||
| 4.55%, 08/01/45 (Call 02/01/45) |
507 | 435,523 | ||||||
| Sociedad Quimica y Minera de Chile SA |
||||||||
| 3.50%, 09/10/51 (Call 03/10/51)(a)(b) |
845 | 553,163 | ||||||
| 4.25%, 05/07/29 (Call 02/07/29)(b) |
565 | 534,236 | ||||||
| 4.25%, 01/22/50 (Call 07/22/49)(b) |
420 | 317,803 | ||||||
| 6.50%, 11/07/33 (Call 08/07/33)(b) |
275 | 283,525 | ||||||
| Syngenta Finance NV, 4.89%, 04/24/25 |
||||||||
| (Call 02/24/25)(a)(b) |
563 | 555,265 | ||||||
| Westlake Corp. |
||||||||
| 2.88%, 08/15/41 (Call 02/15/41) |
420 | 286,126 | ||||||
| 3.13%, 08/15/51 (Call 02/15/51) |
1,065 | 669,258 | ||||||
| 3.38%, 06/15/30 (Call 03/15/30)(a) |
770 | 687,817 | ||||||
| 3.38%, 08/15/61 (Call 02/15/61)(a) |
495 | 306,949 | ||||||
| 3.60%, 08/15/26 (Call 05/15/26)(a) |
1,160 | 1,116,068 | ||||||
| 4.38%, 11/15/47 (Call 05/15/47) |
649 | 527,024 | ||||||
| 5.00%, 08/15/46 (Call 02/15/46)(a) |
805 | 716,416 | ||||||
| Security | Par (000) |
Value | ||||||
| Chemicals (continued) | ||||||||
| Yara International ASA |
||||||||
| 3.15%, 06/04/30 (Call 03/04/30)(a)(b) |
$ | 1,350 | $ | 1,170,429 | ||||
| 3.80%, 06/06/26 (Call 03/06/26)(a)(b) |
990 | 949,557 | ||||||
| 4.75%, 06/01/28 (Call 03/01/28)(b) |
1,696 | 1,639,460 | ||||||
| 7.38%, 11/14/32 (Call 08/14/32)(a)(b) |
1,000 | 1,098,961 | ||||||
|
|
|
|||||||
| 158,571,725 | ||||||||
| Coal — 0.0% | ||||||||
| Teck Resources Ltd. |
||||||||
| 3.90%, 07/15/30 (Call 04/15/30)(a) |
25 | 22,794 | ||||||
| 5.20%, 03/01/42 (Call 09/01/41)(a) |
144 | 130,475 | ||||||
| 5.40%, 02/01/43 (Call 08/01/42) |
359 | 332,234 | ||||||
| 6.00%, 08/15/40 (Call 02/15/40) |
427 | 421,242 | ||||||
| 6.13%, 10/01/35 |
495 | 505,104 | ||||||
| 6.25%, 07/15/41 (Call 01/15/41) |
647 | 655,001 | ||||||
|
|
|
|||||||
| 2,066,850 | ||||||||
| Commercial Services — 1.4% | ||||||||
| Adani Ports & Special Economic Zone Ltd. |
||||||||
| 4.20%, 08/04/27 (Call 02/04/27)(b) |
1,146 | 1,054,318 | ||||||
| 4.38%, 07/03/29(b) |
810 | 721,461 | ||||||
| 5.00%, 08/02/41 (Call 02/02/41)(b) |
150 | 121,490 | ||||||
| American University (The), Series 2019, |
||||||||
| 3.67%, 04/01/49(a) |
660 | 533,078 | ||||||
| Ashtead Capital Inc. |
||||||||
| 1.50%, 08/12/26 (Call 07/12/26)(b) |
1,030 | 932,497 | ||||||
| 2.45%, 08/12/31 (Call 05/12/31)(a)(b) |
1,088 | 875,752 | ||||||
| 4.00%, 05/01/28 (Call 03/11/24)(b) |
862 | 806,240 | ||||||
| 4.25%, 11/01/29 (Call 11/01/24)(a)(b) |
705 | 650,421 | ||||||
| 4.38%, 08/15/27 (Call 03/18/24)(b) |
1,040 | 993,344 | ||||||
| 5.50%, 08/11/32 (Call 05/11/32)(b) |
480 | 469,245 | ||||||
| 5.55%, 05/30/33 (Call 02/28/33)(a)(b) |
1,095 | 1,071,041 | ||||||
| 5.80%, 04/15/34 (Call 01/15/34)(b) |
50 | 49,522 | ||||||
| 5.95%, 10/15/33 (Call 07/15/33)(b) |
845 | 849,383 | ||||||
| Automatic Data Processing Inc. |
||||||||
| 1.25%, 09/01/30 (Call 06/01/30) |
1,804 | 1,462,842 | ||||||
| 1.70%, 05/15/28 (Call 03/15/28) |
1,470 | 1,310,725 | ||||||
| 3.38%, 09/15/25 (Call 06/15/25) |
1,162 | 1,135,509 | ||||||
| Autopistas Metropolitanas de Puerto Rico LLC, |
||||||||
| 6.75%, 06/30/35(b) |
72 | 70,852 | ||||||
| Block Financial LLC |
||||||||
| 2.50%, 07/15/28 (Call 05/15/28) |
940 | 827,775 | ||||||
| 3.88%, 08/15/30 (Call 05/15/30) |
951 | 857,417 | ||||||
| 5.25%, 10/01/25 (Call 07/01/25)(a) |
460 | 457,221 | ||||||
| Brown University, Series A, 2.92%, 09/01/50 |
||||||||
| (Call 03/01/50)(a) |
255 | 178,936 | ||||||
| California Endowment (The), Series 2021, |
||||||||
| 2.50%, 04/01/51 (Call 10/01/50) |
637 | 392,048 | ||||||
| California Institute of Technology |
||||||||
| 3.65%, 09/01/2119 (Call 03/01/2119)(a) |
588 | 407,839 | ||||||
| 4.32%, 08/01/45(a) |
485 | 435,806 | ||||||
| 4.70%, 11/01/2111 |
332 | 294,641 | ||||||
| Case Western Reserve University, 5.41%, |
||||||||
| 06/01/2122 (Call 12/01/2121) |
50 | 47,914 | ||||||
| Cintas Corp. No. 2 |
||||||||
| 3.45%, 05/01/25 (Call 04/01/25) |
445 | 435,677 | ||||||
| 3.70%, 04/01/27 (Call 01/01/27) |
1,771 | 1,717,160 | ||||||
| 4.00%, 05/01/32 (Call 02/01/32) |
835 | 783,638 | ||||||
| CK Hutchison International 23 Ltd. |
||||||||
| 4.75%, 04/21/28 (Call 03/21/28)(b) |
1,420 | 1,406,887 | ||||||
| 4.88%, 04/21/33 (Call 01/21/33)(a)(b) |
685 | 675,923 | ||||||
| 56 | 2 0 2 4 I S H A R E S A N N U A L R E P O R T T O S H A R E H O L D E R S |
| Schedule of Investments (continued) February 29, 2024 |
iShares® Broad USD Investment Grade Corporate Bond ETF (Percentages shown are based on Net Assets) |
| Security | Par (000) |
Value | ||||||
| Commercial Services (continued) | ||||||||
| Claremont Mckenna College, |
||||||||
| 3.78%, 01/01/2122 (Call 07/01/2121) |
$ | 200 | $ | 133,888 | ||||
| CoStar Group Inc., 2.80%, 07/15/30 |
||||||||
| (Call 04/15/30)(b) |
1,610 | 1,361,276 | ||||||
| DP World Crescent Ltd. |
||||||||
| 3.75%, 01/30/30 (Call 10/30/29)(a)(b) |
855 | 788,155 | ||||||
| 4.85%, 09/26/28(b) |
1,810 | 1,776,823 | ||||||
| DP World Ltd./United Arab Emirates |
||||||||
| 4.70%, 09/30/49 (Call 03/30/49)(b) |
680 | 551,684 | ||||||
| 5.63%, 09/25/48(b) |
1,603 | 1,496,400 | ||||||
| 6.85%, 07/02/37(a)(b) |
2,280 | 2,459,071 | ||||||
| Duke University |
||||||||
| 3.20%, 10/01/38(a) |
285 | 233,255 | ||||||
| 3.30%, 10/01/46(a) |
730 | 554,721 | ||||||
| Series 2020, 2.68%, 10/01/44 |
815 | 601,559 | ||||||
| Series 2020, 2.76%, 10/01/50(a) |
133 | 91,634 | ||||||
| Series 2020, 2.83%, 10/01/55(a) |
603 | 415,609 | ||||||
| Element Fleet Management Corp. |
||||||||
| 3.85%, 06/15/25 (Call 05/15/25)(b) |
672 | 653,658 | ||||||
| 6.27%, 06/26/26 (Call 05/26/26)(a)(b) |
585 | 590,225 | ||||||
| 6.32%, 12/04/28 (Call 11/04/28)(a)(b) |
1,185 | 1,215,391 | ||||||
| Emory University |
||||||||
| Series 2020, 2.14%, 09/01/30 |
||||||||
| (Call 06/01/30) |
215 | 183,604 | ||||||
| Series 2020, 2.97%, 09/01/50 |
||||||||
| (Call 03/01/50)(a) |
720 | 500,397 | ||||||
| Equifax Inc. |
||||||||
| 2.35%, 09/15/31 (Call 06/15/31) |
1,700 | 1,387,469 | ||||||
| 2.60%, 12/15/25 (Call 11/15/25) |
705 | 671,889 | ||||||
| 3.10%, 05/15/30 (Call 02/15/30) |
1,160 | 1,023,261 | ||||||
| 3.25%, 06/01/26 (Call 03/01/26) |
755 | 721,234 | ||||||
| 5.10%, 12/15/27 (Call 11/15/27) |
1,135 | 1,131,238 | ||||||
| 5.10%, 06/01/28 (Call 05/01/28) |
965 | 959,210 | ||||||
| 7.00%, 07/01/37(a) |
298 | 328,288 | ||||||
| ERAC USA Finance LLC |
||||||||
| 3.30%, 12/01/26 (Call 09/01/26)(a)(b) |
958 | 911,941 | ||||||
| 3.80%, 11/01/25 (Call 08/01/25)(b) |
1,399 | 1,362,364 | ||||||
| 4.20%, 11/01/46 (Call 05/01/46)(b) |
631 | 528,539 | ||||||
| 4.50%, 02/15/45 (Call 08/15/44)(b) |
704 | 617,481 | ||||||
| 4.60%, 05/01/28 (Call 04/01/28)(a)(b) |
805 | 791,161 | ||||||
| 4.90%, 05/01/33 (Call 02/01/33)(b) |
1,065 | 1,038,943 | ||||||
| 5.00%, 02/15/29 (Call 01/15/29)(a)(b) |
255 | 253,399 | ||||||
| 5.20%, 10/30/34 (Call 07/30/34)(a)(b) |
235 | 233,093 | ||||||
| 5.40%, 05/01/53 (Call 11/01/52)(a)(b) |
1,350 | 1,353,211 | ||||||
| 5.63%, 03/15/42(a)(b) |
970 | 982,002 | ||||||
| 6.70%, 06/01/34(b) |
1,033 | 1,138,024 | ||||||
| 7.00%, 10/15/37(b) |
1,181 | 1,342,247 | ||||||
| Experian Finance PLC |
||||||||
| 2.75%, 03/08/30 (Call 12/08/29)(b) |
900 | 778,805 | ||||||
| 4.25%, 02/01/29 (Call 11/01/28)(a)(b) |
1,181 | 1,141,423 | ||||||
| Ford Foundation (The) |
||||||||
| Series 2017, 3.86%, 06/01/47 |
||||||||
| (Call 12/01/46)(a) |
652 | 533,705 | ||||||
| Series 2020, 2.42%, 06/01/50 |
||||||||
| (Call 12/01/49)(a) |
745 | 468,622 | ||||||
| Series 2020, 2.82%, 06/01/70 |
||||||||
| (Call 12/01/69) |
424 | 251,809 | ||||||
| Gartner Inc. |
||||||||
| 3.63%, 06/15/29 (Call 06/15/24)(b) |
490 | 439,038 | ||||||
| 3.75%, 10/01/30 (Call 10/01/25)(b) |
110 | 97,358 | ||||||
| 4.50%, 07/01/28 (Call 04/01/24)(a)(b) |
495 | 468,559 | ||||||
| Security | Par (000) |
Value | ||||||
| Commercial Services (continued) | ||||||||
| George Washington University (The) |
||||||||
| 4.87%, 09/15/45(a) |
$ | 610 | $ | 587,469 | ||||
| Series 2014, 4.30%, 09/15/44(a) |
410 | 356,177 | ||||||
| Series 2016, 3.55%, 09/15/46 |
508 | 395,669 | ||||||
| Series 2018, 4.13%, 09/15/48 |
||||||||
| (Call 03/15/48)(a) |
1,089 | 930,416 | ||||||
| Georgetown University (The) |
||||||||
| 5.12%, 04/01/53 (Call 10/01/52)(a) |
20 | 20,154 | ||||||
| Series 20A, 2.94%, 04/01/50 (Call 10/01/49) |
440 | 300,376 | ||||||
| Series A, 5.22%, (Call 04/01/2118)(a) |
145 | 134,469 | ||||||
| Series B, 4.32%, 04/01/49 (Call 10/01/48) |
941 | 838,562 | ||||||
| Global Payments Inc. |
||||||||
| 1.20%, 03/01/26 (Call 02/01/26) |
1,417 | 1,304,367 | ||||||
| 2.15%, 01/15/27 (Call 12/15/26) |
1,151 | 1,056,341 | ||||||
| 2.90%, 05/15/30 (Call 02/15/30) |
1,388 | 1,196,340 | ||||||
| 2.90%, 11/15/31 (Call 08/15/31)(a) |
966 | 806,238 | ||||||
| 3.20%, 08/15/29 (Call 05/15/29) |
1,649 | 1,468,625 | ||||||
| 4.15%, 08/15/49 (Call 02/15/49) |
1,033 | 788,004 | ||||||
| 4.45%, 06/01/28 (Call 03/01/28) |
740 | 713,733 | ||||||
| 4.80%, 04/01/26 (Call 01/01/26) |
1,175 | 1,160,317 | ||||||
| 4.95%, 08/15/27 (Call 07/15/27) |
690 | 683,669 | ||||||
| 5.30%, 08/15/29 (Call 06/15/29) |
695 | 685,662 | ||||||
| 5.40%, 08/15/32 (Call 05/15/32)(a) |
1,010 | 996,528 | ||||||
| 5.95%, 08/15/52 (Call 02/15/52)(a) |
998 | 980,516 | ||||||
| GXO Logistics Inc. |
||||||||
| 1.65%, 07/15/26 (Call 06/15/26) |
1,050 | 958,107 | ||||||
| 2.65%, 07/15/31 (Call 04/15/31)(a) |
775 | 630,002 | ||||||
| Howard University, 5.21%, 10/01/52 |
||||||||
| (Call 10/01/32)(a) |
200 | 178,534 | ||||||
| ITR Concession Co. LLC, 5.18%, 07/15/35 |
||||||||
| (Call 01/15/35)(a)(b) |
780 | 673,529 | ||||||
| Johns Hopkins University |
||||||||
| 4.71%, 07/01/32 (Call 04/01/32)(a) |
410 | 411,570 | ||||||
| Series 2013, 4.08%, 07/01/53 |
540 | 474,401 | ||||||
| Series A, 2.81%, 01/01/60 (Call 07/01/59)(a) |
374 | 241,671 | ||||||
| Leland Stanford Junior University (The) |
||||||||
| 1.29%, 06/01/27 (Call 04/01/27) |
345 | 309,641 | ||||||
| 2.41%, 06/01/50 (Call 12/01/49)(a) |
950 | 612,362 | ||||||
| 3.46%, 05/01/47 |
605 | 471,822 | ||||||
| 3.65%, 05/01/48 (Call 11/01/47) |
770 | 638,733 | ||||||
| Massachusetts Institute of Technology |
||||||||
| 3.07%, 04/01/52 (Call 10/01/51) |
380 | 277,626 | ||||||
| 3.89%, 07/01/2116(a) |
620 | 469,010 | ||||||
| 3.96%, 07/01/38(a) |
360 | 329,238 | ||||||
| 4.68%, (a) |
341 | 311,860 | ||||||
| 5.60%, (a) |
830 | 894,185 | ||||||
| Series F, 2.99%, 07/01/50 (Call 01/01/50) |
841 | 607,040 | ||||||
| Series G, 2.29%, 07/01/51 (Call 01/01/51)(a) |
730 | 453,412 | ||||||
| Metropolitan Museum of Art (The), Series 2015, |
||||||||
| 3.40%, 07/01/45 |
390 | 298,723 | ||||||
| Moody’s Corp. |
||||||||
| 2.00%, 08/19/31 (Call 05/19/31)(a) |
565 | 456,350 | ||||||
| 2.55%, 08/18/60 (Call 02/18/60)(a) |
430 | 241,254 | ||||||
| 2.75%, 08/19/41 (Call 02/19/41)(a) |
990 | 694,181 | ||||||
| 3.10%, 11/29/61 (Call 05/29/61)(a) |
750 | 479,309 | ||||||
| 3.25%, 01/15/28 (Call 10/15/27)(a) |
860 | 809,438 | ||||||
| 3.25%, 05/20/50 (Call 11/20/49)(a) |
296 | 209,587 | ||||||
| 3.75%, 03/24/25 (Call 02/24/25) |
603 | 592,771 | ||||||
| 3.75%, 02/25/52 (Call 08/25/51)(a) |
760 | 590,454 | ||||||
| 4.25%, 02/01/29 (Call 11/01/28)(a) |
578 | 559,161 | ||||||
| 4.25%, 08/08/32 (Call 05/08/32) |
1,085 | 1,025,216 | ||||||
| S C H E D U L E O F I N V E S T M E N T S |
57 |
| Schedule of Investments (continued) February 29, 2024 |
iShares® Broad USD Investment Grade Corporate Bond ETF (Percentages shown are based on Net Assets) |
| Security | Par (000) |
Value | ||||||
| Commercial Services (continued) | ||||||||
| 4.88%, 12/17/48 (Call 06/17/48) |
$ | 530 | $ | 489,947 | ||||
| 5.25%, 07/15/44 |
634 | 619,250 | ||||||
| Northeastern University, Series 2020, |
||||||||
| 2.89%, 10/01/50(a) |
55 | 38,124 | ||||||
| Northwestern University |
||||||||
| 3.69%, 12/01/38(a) |
565 | 488,773 | ||||||
| 3.87%, 12/01/48(a) |
565 | 473,663 | ||||||
| 4.64%, 12/01/44(a) |
555 | 529,056 | ||||||
| Series 2017, 3.66%, 12/01/57 |
||||||||
| (Call 06/01/57) |
495 | 392,660 | ||||||
| Series 2020, 2.64%, 12/01/50 |
||||||||
| (Call 06/01/50)(a) |
620 | 414,046 | ||||||
| PayPal Holdings Inc. |
||||||||
| 1.65%, 06/01/25 (Call 05/01/25) |
1,285 | 1,229,855 | ||||||
| 2.30%, 06/01/30 (Call 03/01/30) |
1,573 | 1,338,745 | ||||||
| 2.65%, 10/01/26 (Call 08/01/26)(a) |
1,934 | 1,822,685 | ||||||
| 2.85%, 10/01/29 (Call 07/01/29) |
2,028 | 1,807,328 | ||||||
| 3.25%, 06/01/50 (Call 12/01/49)(a) |
1,501 | 1,044,697 | ||||||
| 3.90%, 06/01/27 (Call 05/01/27) |
625 | 604,214 | ||||||
| 4.40%, 06/01/32 (Call 03/01/32)(a) |
1,230 | 1,180,044 | ||||||
| 5.05%, 06/01/52 (Call 12/01/51)(a) |
1,445 | 1,355,745 | ||||||
| 5.25%, 06/01/62 (Call 12/01/61)(a) |
730 | 680,002 | ||||||
| Pelabuhan Indonesia Persero PT |
||||||||
| 4.25%, 05/05/25(b) |
1,458 | 1,433,148 | ||||||
| 5.38%, 05/05/45(b) |
522 | 494,047 | ||||||
| President and Fellows of Harvard College |
||||||||
| 2.52%, 10/15/50 (Call 04/15/50) |
315 | 205,526 | ||||||
| 3.15%, 07/15/46 (Call 01/15/46) |
1,036 | 775,214 | ||||||
| 3.30%, 07/15/56 (Call 01/15/56) |
380 | 281,541 | ||||||
| 3.62%, 10/01/37 |
513 | 453,724 | ||||||
| 3.75%, 11/15/52 (Call 05/15/52)(a) |
440 | 366,903 | ||||||
| 4.88%, 10/15/40(a) |
652 | 644,007 | ||||||
| 6.50%, 01/15/39(a)(b) |
606 | 705,177 | ||||||
| Quanta Services Inc. |
||||||||
| 2.35%, 01/15/32 (Call 10/15/31) |
1,366 | 1,094,100 | ||||||
| 2.90%, 10/01/30 (Call 07/01/30) |
1,288 | 1,116,292 | ||||||
| 3.05%, 10/01/41 (Call 04/01/41)(a) |
1,110 | 782,162 | ||||||
| RELX Capital Inc. |
||||||||
| 3.00%, 05/22/30 (Call 02/22/30) |
1,701 | 1,518,979 | ||||||
| 4.00%, 03/18/29 (Call 12/18/28) |
985 | 940,790 | ||||||
| 4.75%, 05/20/32 (Call 02/20/32)(a) |
750 | 736,414 | ||||||
| Rockefeller Foundation (The), Series 2020, |
||||||||
| 2.49%, 10/01/50 (Call 04/01/50)(a) |
1,151 | 730,214 | ||||||
| S&P Global Inc. |
||||||||
| 1.25%, 08/15/30 (Call 05/15/30)(a) |
903 | 720,972 | ||||||
| 2.30%, 08/15/60 (Call 02/15/60)(a) |
821 | 443,457 | ||||||
| 2.45%, 03/01/27 (Call 02/01/27) |
1,085 | 1,011,494 | ||||||
| 2.50%, 12/01/29 (Call 09/01/29)(a) |
737 | 649,441 | ||||||
| 2.70%, 03/01/29 (Call 01/01/29) |
1,657 | 1,500,090 | ||||||
| 2.90%, 03/01/32 (Call 12/01/31) |
1,810 | 1,560,414 | ||||||
| 2.95%, 01/22/27 (Call 10/22/26) |
865 | 820,838 | ||||||
| 3.25%, 12/01/49 (Call 06/01/49)(a) |
809 | 578,505 | ||||||
| 3.70%, 03/01/52 (Call 09/01/51)(a) |
1,465 | 1,134,654 | ||||||
| 3.90%, 03/01/62 (Call 09/01/61) |
675 | 525,174 | ||||||
| 4.25%, 05/01/29 (Call 02/01/29)(a) |
1,334 | 1,293,401 | ||||||
| 4.50%, 05/15/48 (Call 11/15/47)(a) |
295 | 246,624 | ||||||
| 4.75%, 08/01/28 (Call 05/01/28)(a) |
1,709 | 1,703,631 | ||||||
| 5.25%, 09/15/33 (Call 06/15/33)(b) |
285 | 288,297 | ||||||
| 6.55%, 11/15/37(a) |
75 | 81,609 | ||||||
| Sodexo Inc. |
||||||||
| 1.63%, 04/16/26 (Call 03/16/26)(b) |
1,009 | 932,221 | ||||||
| Security | Par (000) |
Value | ||||||
| Commercial Services (continued) | ||||||||
| 2.72%, 04/16/31 (Call 01/16/31)(b) |
$ | 1,098 | $ | 925,089 | ||||
| Thomas Jefferson University, 3.85%, 11/01/57 |
||||||||
| (Call 05/01/57) |
170 | 127,299 | ||||||
| Transurban Finance Co. Pty. Ltd. |
||||||||
| 2.45%, 03/16/31 (Call 12/16/30)(b) |
1,284 | 1,065,057 | ||||||
| 3.38%, 03/22/27 (Call 12/22/26)(a)(b) |
546 | 514,377 | ||||||
| 4.13%, 02/02/26 (Call 11/02/25)(b) |
1,210 | 1,179,727 | ||||||
| Triton Container International Ltd. |
||||||||
| 2.05%, 04/15/26 (Call 03/15/26)(b) |
1,115 | 1,021,998 | ||||||
| 3.15%, 06/15/31 (Call 03/15/31)(a)(b) |
1,020 | 802,915 | ||||||
| Triton Container International Ltd./TAL |
||||||||
| International Container Corp., |
||||||||
| 3.25%, 03/15/32 (Call 12/15/31) |
930 | 738,321 | ||||||
| Trustees of Boston College |
||||||||
| 3.13%, 07/01/52(a) |
451 | 327,372 | ||||||
| 3.99%, 07/01/47 |
280 | 227,141 | ||||||
| Trustees of Boston University, Series CC, |
||||||||
| 4.06%, 10/01/48 (Call 04/01/48)(a) |
755 | 643,117 | ||||||
| Trustees of Dartmouth College, |
||||||||
| 3.47%, 06/01/46(a) |
895 | 698,611 | ||||||
| Trustees of Princeton University (The) |
||||||||
| 4.20%, 03/01/52 (Call 09/01/51) |
60 | 54,349 | ||||||
| 5.70%, 03/01/39(a) |
1,004 | 1,098,193 | ||||||
| Series 2020, 2.52%, 07/01/50 |
||||||||
| (Call 01/01/50)(a) |
310 | 208,476 | ||||||
| Trustees of the University of Pennsylvania (The) |
||||||||
| 3.61%, 02/15/2119 (Call 08/15/2118)(a) |
382 | 265,722 | ||||||
| 4.67%, 09/01/2112 |
265 | 234,533 | ||||||
| Series 2020, 2.40%, 10/01/50 |
||||||||
| (Call 04/01/50) |
345 | 214,312 | ||||||
| Trustees of Tufts College |
||||||||
| 3.10%, 08/15/51 (Call 02/15/51) |
50 | 36,491 | ||||||
| Series 2012, 5.02%, 04/15/2112 |
135 | 116,972 | ||||||
| UL Solutions Inc., 6.50%, 10/20/28 |
||||||||
| (Call 09/20/28)(a)(b) |
350 | 361,561 | ||||||
| United Rentals North America Inc., |
||||||||
| 6.00%, 12/15/29 (Call 12/15/25)(b) |
585 | 585,536 | ||||||
| University of Chicago (The) |
||||||||
| 3.00%, 10/01/52 (Call 04/01/52)(a) |
231 | 164,273 | ||||||
| 4.00%, 10/01/53 (Call 04/01/53) |
480 | 397,985 | ||||||
| Series 20B, 2.76%, 04/01/45 (Call 10/01/44) |
599 | 466,622 | ||||||
| Series C, 2.55%, 04/01/50 (Call 10/01/49)(a) |
415 | 280,758 | ||||||
| University of Miami, 4.06%, 04/01/52 |
505 | 425,167 | ||||||
| University of Notre Dame du Lac |
||||||||
| Series 2015, 3.44%, 02/15/45 |
818 | 656,835 | ||||||
| Series 2017, 3.39%, 02/15/48 |
||||||||
| (Call 08/15/47) |
763 | 594,843 | ||||||
| University of Southern California |
||||||||
| 2.81%, 10/01/50 (Call 04/01/50) |
550 | 377,596 | ||||||
| 3.03%, 10/01/39(a) |
1,226 | 990,753 | ||||||
| 4.98%, 10/01/53 (Call 04/01/53)(a) |
80 | 80,168 | ||||||
| 5.25%, 10/01/2111(a) |
235 | 231,784 | ||||||
| Series 2017, 3.84%, 10/01/47 |
||||||||
| (Call 04/01/47)(a) |
720 | 601,983 | ||||||
| Series 21A, 2.95%, 10/01/51 |
||||||||
| (Call 04/01/51)(a) |
790 | 550,505 | ||||||
| Series A, 3.23%, 10/01/2120 |
||||||||
| (Call 04/01/2120) |
25 | 15,241 | ||||||
| Verisk Analytics Inc. |
||||||||
| 3.63%, 05/15/50 (Call 11/15/49) |
899 | 659,932 | ||||||
| 4.00%, 06/15/25 (Call 03/15/25) |
1,167 | 1,146,346 | ||||||
| 58 | 2 0 2 4 I S H A R E S A N N U A L R E P O R T T O S H A R E H O L D E R S |
| Schedule of Investments (continued) February 29, 2024 |
iShares® Broad USD Investment Grade Corporate Bond ETF (Percentages shown are based on Net Assets) |
| Security | Par (000) |
Value | ||||||
| Commercial Services (continued) | ||||||||
| 4.13%, 03/15/29 (Call 12/15/28) |
$ | 1,259 | $ | 1,208,646 | ||||
| 5.50%, 06/15/45 (Call 12/15/44)(a) |
264 | 251,975 | ||||||
| 5.75%, 04/01/33 (Call 01/01/33) |
590 | 609,225 | ||||||
| Washington University (The) |
||||||||
| 3.52%, 04/15/54 (Call 10/15/53)(a) |
405 | 317,274 | ||||||
| 4.35%, 04/15/2122 (Call 10/15/2121)(a) |
265 | 222,417 | ||||||
| Wesleyan University, 4.78%, 07/01/2116(a) |
360 | 303,284 | ||||||
| William Marsh Rice University |
||||||||
| 3.57%, 05/15/45 |
185 | 149,178 | ||||||
| 3.77%, 05/15/55(a) |
490 | 391,058 | ||||||
| WK Kellogg Foundation Trust, 2.44%, 10/01/50 |
||||||||
| (Call 04/01/50)(b) |
205 | 125,932 | ||||||
| Yale University |
||||||||
| Series 2020, 0.87%, 04/15/25 |
||||||||
| (Call 03/15/25) |
405 | 386,356 | ||||||
| Series 2020, 1.48%, 04/15/30 |
||||||||
| (Call 01/15/30) |
810 | 678,638 | ||||||
| Series 2020, 2.40%, 04/15/50 |
||||||||
| (Call 10/15/49)(a) |
497 | 320,886 | ||||||
|
|
|
|||||||
| 151,221,807 | ||||||||
| Computers — 1.9% | ||||||||
| Amdocs Ltd., 2.54%, 06/15/30 (Call 03/15/30) |
1,275 | 1,082,230 | ||||||
| Apple Inc. |
||||||||
| 0.55%, 08/20/25 (Call 07/20/25) |
1,490 | 1,400,823 | ||||||
| 0.70%, 02/08/26 (Call 01/08/26)(a) |
3,315 | 3,064,438 | ||||||
| 1.13%, 05/11/25 (Call 04/11/25) |
2,556 | 2,440,458 | ||||||
| 1.20%, 02/08/28 (Call 12/08/27) |
3,150 | 2,767,810 | ||||||
| 1.25%, 08/20/30 (Call 05/20/30)(a) |
2,667 | 2,160,137 | ||||||
| 1.40%, 08/05/28 (Call 06/05/28) |
3,050 | 2,666,153 | ||||||
| 1.65%, 05/11/30 (Call 02/11/30) |
2,315 | 1,937,099 | ||||||
| 1.65%, 02/08/31 (Call 11/08/30) |
3,430 | 2,822,836 | ||||||
| 1.70%, 08/05/31 (Call 05/05/31) |
1,365 | 1,111,845 | ||||||
| 2.05%, 09/11/26 (Call 07/11/26) |
2,644 | 2,473,139 | ||||||
| 2.20%, 09/11/29 (Call 06/11/29) |
1,296 | 1,145,737 | ||||||
| 2.38%, 02/08/41 (Call 08/08/40)(a) |
2,078 | 1,461,690 | ||||||
| 2.40%, 08/20/50 (Call 02/20/50)(a) |
1,626 | 1,013,783 | ||||||
| 2.45%, 08/04/26 (Call 05/04/26) |
3,245 | 3,071,165 | ||||||
| 2.55%, 08/20/60 (Call 02/20/60)(a) |
1,906 | 1,171,576 | ||||||
| 2.65%, 05/11/50 (Call 11/11/49) |
3,313 | 2,157,233 | ||||||
| 2.65%, 02/08/51 (Call 08/08/50) |
3,879 | 2,501,818 | ||||||
| 2.70%, 08/05/51 (Call 02/05/51) |
2,510 | 1,633,979 | ||||||
| 2.80%, 02/08/61 (Call 08/08/60) |
2,269 | 1,441,919 | ||||||
| 2.85%, 08/05/61 (Call 02/05/61) |
1,990 | 1,266,949 | ||||||
| 2.90%, 09/12/27 (Call 06/12/27) |
2,686 | 2,534,468 | ||||||
| 2.95%, 09/11/49 (Call 03/11/49) |
1,982 | 1,385,830 | ||||||
| 3.00%, 06/20/27 (Call 03/20/27) |
2,000 | 1,897,577 | ||||||
| 3.00%, 11/13/27 (Call 08/13/27)(a) |
2,005 | 1,896,662 | ||||||
| 3.20%, 05/13/25 |
2,292 | 2,244,219 | ||||||
| 3.20%, 05/11/27 (Call 02/11/27) |
2,556 | 2,440,101 | ||||||
| 3.25%, 02/23/26 (Call 11/23/25) |
4,186 | 4,061,209 | ||||||
| 3.25%, 08/08/29 (Call 06/08/29) |
1,505 | 1,407,125 | ||||||
| 3.35%, 02/09/27 (Call 11/09/26) |
2,680 | 2,578,289 | ||||||
| 3.35%, 08/08/32 (Call 05/08/32) |
1,700 | 1,543,654 | ||||||
| 3.45%, 02/09/45 |
2,953 | 2,343,038 | ||||||
| 3.75%, 09/12/47 (Call 03/12/47) |
1,350 | 1,100,795 | ||||||
| 3.75%, 11/13/47 (Call 05/13/47) |
1,703 | 1,385,213 | ||||||
| 3.85%, 05/04/43 |
3,729 | 3,191,804 | ||||||
| 3.85%, 08/04/46 (Call 02/04/46) |
2,713 | 2,261,448 | ||||||
| 3.95%, 08/08/52 (Call 02/08/52) |
2,385 | 1,985,816 | ||||||
| 4.00%, 05/10/28 (Call 04/10/28) |
1,755 | 1,717,040 | ||||||
| 4.10%, 08/08/62 (Call 02/08/62) |
1,700 | 1,423,550 | ||||||
| Security | Par (000) |
Value | ||||||
| Computers (continued) |
||||||||
| 4.15%, 05/10/30 (Call 03/10/30)(a) |
$ | 855 | $ | 839,499 | ||||
| 4.25%, 02/09/47 (Call 08/09/46) |
1,079 | 970,862 | ||||||
| 4.30%, 05/10/33 (Call 02/10/33)(a) |
1,225 | 1,211,929 | ||||||
| 4.38%, 05/13/45 |
2,596 | 2,369,913 | ||||||
| 4.45%, 05/06/44(a) |
1,029 | 962,557 | ||||||
| 4.50%, 02/23/36 (Call 08/23/35)(a) |
1,560 | 1,533,599 | ||||||
| 4.65%, 02/23/46 (Call 08/23/45) |
4,994 | 4,720,325 | ||||||
| 4.85%, 05/10/53 (Call 11/10/52)(a) |
1,540 | 1,505,377 | ||||||
| Booz Allen Hamilton Inc. |
||||||||
| 3.88%, 09/01/28 (Call 04/01/24)(b) |
95 | 88,148 | ||||||
| 4.00%, 07/01/29 (Call 07/01/24)(a)(b) |
590 | 544,653 | ||||||
| 5.95%, 08/04/33 (Call 05/04/33) |
447 | 458,518 | ||||||
| CGI Inc. |
||||||||
| 1.45%, 09/14/26 (Call 08/14/26)(a) |
1,155 | 1,046,670 | ||||||
| 2.30%, 09/14/31 (Call 06/14/31) |
770 | 615,227 | ||||||
| Dell Inc. |
||||||||
| 5.40%, 09/10/40 |
657 | 632,161 | ||||||
| 6.50%, 04/15/38(a) |
829 | 865,305 | ||||||
| 7.10%, 04/15/28 |
710 | 761,574 | ||||||
| Dell International LLC/EMC Corp. |
||||||||
| 3.38%, 12/15/41 (Call 06/15/41) |
1,631 | 1,192,198 | ||||||
| 3.45%, 12/15/51 (Call 06/15/51) |
1,256 | 862,469 | ||||||
| 4.90%, 10/01/26 (Call 08/01/26) |
2,326 | 2,304,677 | ||||||
| 5.25%, 02/01/28 (Call 01/01/28) |
1,470 | 1,481,006 | ||||||
| 5.30%, 10/01/29 (Call 07/01/29) |
1,418 | 1,421,325 | ||||||
| 5.75%, 02/01/33 (Call 11/01/32)(a) |
1,140 | 1,173,521 | ||||||
| 5.85%, 07/15/25 (Call 06/15/25) |
1,310 | 1,315,785 | ||||||
| 6.02%, 06/15/26 (Call 03/15/26) |
2,424 | 2,450,589 | ||||||
| 6.10%, 07/15/27 (Call 05/15/27)(a) |
1,006 | 1,033,062 | ||||||
| 6.20%, 07/15/30 (Call 04/15/30) |
1,512 | 1,582,325 | ||||||
| 8.10%, 07/15/36 (Call 01/15/36)(a) |
1,103 | 1,323,158 | ||||||
| 8.35%, 07/15/46 (Call 01/15/46) |
539 | 681,929 | ||||||
| DXC Technology Co. |
||||||||
| 1.80%, 09/15/26 (Call 08/15/26) |
1,130 | 1,025,940 | ||||||
| 2.38%, 09/15/28 (Call 07/15/28)(a) |
1,040 | 897,012 | ||||||
| Fortinet Inc. |
||||||||
| 1.00%, 03/15/26 (Call 02/15/26) |
919 | 843,230 | ||||||
| 2.20%, 03/15/31 (Call 12/15/30) |
987 | 816,955 | ||||||
| Genpact Luxembourg SARL/Genpact USA Inc., |
||||||||
| 1.75%, 04/10/26 (Call 03/10/26) |
824 | 746,394 | ||||||
| Hewlett Packard Enterprise Co. |
||||||||
| 1.75%, 04/01/26 (Call 03/01/26)(a) |
1,386 | 1,287,772 | ||||||
| 4.90%, 10/15/25 (Call 07/15/25)(a) |
2,825 | 2,805,706 | ||||||
| 5.25%, 07/01/28 (Call 06/01/28)(a) |
1,050 | 1,051,321 | ||||||
| 6.10%, 04/01/26 (Call 04/01/24) |
300 | 300,140 | ||||||
| 6.20%, 10/15/35 (Call 04/15/35) |
1,205 | 1,258,854 | ||||||
| 6.35%, 10/15/45 (Call 04/15/45) |
2,004 | 2,070,977 | ||||||
| HP Inc. |
||||||||
| 1.45%, 06/17/26 (Call 05/17/26) |
721 | 662,485 | ||||||
| 2.20%, 06/17/25 (Call 05/17/25)(a) |
1,581 | 1,517,818 | ||||||
| 2.65%, 06/17/31 (Call 03/17/31)(a) |
1,475 | 1,233,619 | ||||||
| 3.00%, 06/17/27 (Call 04/17/27) |
1,587 | 1,482,124 | ||||||
| 3.40%, 06/17/30 (Call 03/17/30)(a) |
333 | 300,088 | ||||||
| 4.00%, 04/15/29 (Call 02/15/29)(a) |
1,315 | 1,252,854 | ||||||
| 4.20%, 04/15/32 (Call 01/15/32) |
840 | 775,319 | ||||||
| 4.75%, 01/15/28 (Call 12/15/27) |
1,450 | 1,435,649 | ||||||
| 5.50%, 01/15/33 (Call 10/15/32)(a) |
1,655 | 1,660,077 | ||||||
| 6.00%, 09/15/41(a) |
1,710 | 1,753,138 | ||||||
| IBM International Capital Pte Ltd. |
||||||||
| 4.60%, 02/05/27 (Call 01/05/27) |
900 | 888,763 | ||||||
| 4.60%, 02/05/29 (Call 01/05/29) |
925 | 906,951 | ||||||
| S C H E D U L E O F I N V E S T M E N T S |
59 |
| Schedule of Investments (continued) February 29, 2024 |
iShares® Broad USD Investment Grade Corporate Bond ETF (Percentages shown are based on Net Assets) |
| Security | Par (000) |
Value | ||||||
| Computers (continued) | ||||||||
| 4.70%, 02/05/26 |
$ | 900 | $ | 892,659 | ||||
| 4.75%, 02/05/31 (Call 12/05/30) |
975 | 949,428 | ||||||
| 4.90%, 02/05/34 (Call 11/05/33) |
900 | 875,323 | ||||||
| 5.25%, 02/05/44 (Call 08/05/43) |
900 | 861,946 | ||||||
| 5.30%, 02/05/54 (Call 08/05/53) |
1,800 | 1,727,421 | ||||||
| International Business Machines Corp. |
||||||||
| 1.70%, 05/15/27 (Call 03/15/27) |
2,152 | 1,942,969 | ||||||
| 1.95%, 05/15/30 (Call 02/15/30) |
2,020 | 1,690,808 | ||||||
| 2.20%, 02/09/27 (Call 01/09/27) |
968 | 895,257 | ||||||
| 2.72%, 02/09/32 (Call 11/09/31)(a) |
565 | 489,512 | ||||||
| 2.85%, 05/15/40 (Call 11/15/39)(a) |
1,014 | 739,118 | ||||||
| 2.95%, 05/15/50 (Call 11/15/49)(a) |
1,162 | 768,610 | ||||||
| 3.30%, 05/15/26(a) |
3,304 | 3,180,349 | ||||||
| 3.30%, 01/27/27 |
99 | 94,635 | ||||||
| 3.43%, 02/09/52 (Call 08/09/51) |
535 | 382,107 | ||||||
| 3.45%, 02/19/26(a) |
1,936 | 1,878,137 | ||||||
| 3.50%, 05/15/29(a) |
3,406 | 3,182,818 | ||||||
| 4.00%, 07/27/25 |
635 | 625,080 | ||||||
| 4.00%, 06/20/42(a) |
1,583 | 1,316,912 | ||||||
| 4.15%, 07/27/27 (Call 06/27/27) |
1,125 | 1,096,946 | ||||||
| 4.15%, 05/15/39 |
2,729 | 2,380,042 | ||||||
| 4.25%, 05/15/49 |
3,343 | 2,805,461 | ||||||
| 4.40%, 07/27/32 (Call 04/27/32)(a) |
1,085 | 1,036,207 | ||||||
| 4.50%, 02/06/26(a) |
975 | 966,357 | ||||||
| 4.50%, 02/06/28 (Call 01/06/28)(a) |
1,175 | 1,158,567 | ||||||
| 4.70%, 02/19/46(a) |
935 | 840,716 | ||||||
| 4.75%, 02/06/33 (Call 11/06/32)(a) |
1,145 | 1,117,919 | ||||||
| 4.90%, 07/27/52 (Call 01/27/52) |
1,105 | 1,027,963 | ||||||
| 5.10%, 02/06/53 (Call 08/06/52) |
910 | 868,051 | ||||||
| 5.60%, 11/30/39(a) |
1,025 | 1,055,324 | ||||||
| 5.88%, 11/29/32(a) |
863 | 914,707 | ||||||
| 6.22%, 08/01/27 |
1,027 | 1,072,580 | ||||||
| 6.50%, 01/15/28(a) |
663 | 700,810 | ||||||
| 7.00%, 10/30/25(a) |
1,581 | 1,631,454 | ||||||
| 7.13%, 12/01/96(a) |
350 | 438,746 | ||||||
| Kyndryl Holdings Inc. |
||||||||
| 2.05%, 10/15/26 (Call 09/15/26)(a) |
570 | 520,457 | ||||||
| 2.70%, 10/15/28 (Call 08/15/28)(a) |
877 | 768,374 | ||||||
| 3.15%, 10/15/31 (Call 07/15/31)(a) |
1,130 | 931,883 | ||||||
| 4.10%, 10/15/41 (Call 04/15/41) |
792 | 592,407 | ||||||
| 6.35%, 02/20/34 (Call 11/20/33) |
200 | 201,871 | ||||||
| Leidos Inc. |
||||||||
| 2.30%, 02/15/31 (Call 11/15/30) |
1,042 | 854,047 | ||||||
| 3.63%, 05/15/25 (Call 04/15/25) |
652 | 636,960 | ||||||
| 4.38%, 05/15/30 (Call 02/15/30) |
765 | 719,846 | ||||||
| 5.75%, 03/15/33 (Call 12/15/32) |
35 | 35,571 | ||||||
| Lenovo Group Ltd. |
||||||||
| 3.42%, 11/02/30 (Call 08/02/30)(b) |
385 | 334,924 | ||||||
| 5.83%, 01/27/28 (Call 12/27/27)(b) |
250 | 252,158 | ||||||
| 6.54%, 07/27/32 (Call 04/27/32)(b) |
15 | 15,730 | ||||||
| NetApp Inc. |
||||||||
| 1.88%, 06/22/25 (Call 05/22/25) |
1,082 | 1,033,015 | ||||||
| 2.38%, 06/22/27 (Call 04/22/27)(a) |
945 | 866,115 | ||||||
| 2.70%, 06/22/30 (Call 03/22/30) |
1,340 | 1,150,293 | ||||||
| Teledyne FLIR LLC, 2.50%, 08/01/30 |
||||||||
| (Call 05/01/30) |
1,048 | 884,503 | ||||||
| Western Digital Corp. |
||||||||
| 2.85%, 02/01/29 (Call 12/01/28) |
325 | 273,714 | ||||||
| 3.10%, 02/01/32 (Call 11/01/31) |
270 | 211,329 | ||||||
| Security | Par (000) |
Value | ||||||
| Computers (continued) | ||||||||
| Wipro IT Services LLC, 1.50%, 06/23/26 |
||||||||
| (Call 05/23/26)(b) |
$ | 1,100 | $ | 1,009,861 | ||||
|
|
|
|||||||
| 194,010,199 | ||||||||
| Cosmetics & Personal Care — 0.6% | ||||||||
| Colgate-Palmolive Co. |
||||||||
| 3.10%, 08/15/25 |
445 | 433,851 | ||||||
| 3.10%, 08/15/27 (Call 07/15/27) |
450 | 429,776 | ||||||
| 3.25%, 08/15/32 (Call 05/15/32) |
1,152 | 1,034,032 | ||||||
| 3.70%, 08/01/47 (Call 02/01/47)(a) |
857 | 708,374 | ||||||
| 4.00%, 08/15/45 |
876 | 767,724 | ||||||
| 4.60%, 03/01/28 (Call 02/01/28)(a) |
356 | 358,701 | ||||||
| 4.60%, 03/01/33 (Call 12/01/32) |
461 | 457,269 | ||||||
| 4.80%, 03/02/26 |
641 | 642,538 | ||||||
| Conopco Inc. |
||||||||
| Series E, 7.25%, 12/15/26 |
585 | 618,997 | ||||||
| Series F, 6.63%, 04/15/28 |
150 | 160,401 | ||||||
| Estee Lauder Companies Inc. (The) |
||||||||
| 1.95%, 03/15/31 (Call 12/15/30) |
950 | 779,443 | ||||||
| 2.38%, 12/01/29 (Call 09/01/29) |
1,077 | 941,394 | ||||||
| 2.60%, 04/15/30 (Call 01/15/30)(a) |
1,005 | 878,901 | ||||||
| 3.13%, 12/01/49 (Call 06/01/49) |
1,159 | 792,258 | ||||||
| 3.15%, 03/15/27 (Call 12/15/26) |
895 | 853,213 | ||||||
| 3.70%, 08/15/42 |
542 | 409,784 | ||||||
| 4.15%, 03/15/47 (Call 09/15/46) |
762 | 625,691 | ||||||
| 4.38%, 05/15/28 (Call 04/15/28) |
435 | 427,748 | ||||||
| 4.38%, 06/15/45 (Call 12/15/44) |
709 | 607,562 | ||||||
| 4.65%, 05/15/33 (Call 02/15/33)(a) |
125 | 121,245 | ||||||
| 5.00%, 02/14/34 (Call 11/14/33) |
450 | 442,122 | ||||||
| 5.15%, 05/15/53 (Call 11/15/52) |
329 | 316,065 | ||||||
| 6.00%, 05/15/37 |
666 | 710,752 | ||||||
| Haleon U.K. Capital PLC, 3.13%, 03/24/25 |
2,080 | 2,028,401 | ||||||
| Haleon U.S. Capital LLC |
||||||||
| 3.38%, 03/24/27 (Call 02/24/27) |
2,920 | 2,773,573 | ||||||
| 3.38%, 03/24/29 (Call 01/24/29) |
498 | 460,210 | ||||||
| 3.63%, 03/24/32 (Call 12/24/31) |
2,795 | 2,503,775 | ||||||
| 4.00%, 03/24/52 (Call 09/24/51) |
1,520 | 1,213,941 | ||||||
| Kenvue Inc. |
||||||||
| 4.90%, 03/22/33 (Call 12/22/32)(a) |
1,730 | 1,710,297 | ||||||
| 5.00%, 03/22/30 (Call 01/22/30) |
1,555 | 1,559,522 | ||||||
| 5.05%, 03/22/28 (Call 02/22/28) |
1,565 | 1,574,968 | ||||||
| 5.05%, 03/22/53 (Call 09/22/52)(a) |
2,139 | 2,059,954 | ||||||
| 5.10%, 03/22/43 (Call 09/22/42)(a) |
1,110 | 1,084,778 | ||||||
| 5.20%, 03/22/63 (Call 09/22/62) |
1,044 | 1,011,472 | ||||||
| 5.35%, 03/22/26 (Call 02/22/26) |
1,680 | 1,690,912 | ||||||
| Procter & Gamble Co. (The) |
||||||||
| 0.55%, 10/29/25 |
1,363 | 1,270,896 | ||||||
| 1.00%, 04/23/26 |
1,435 | 1,328,297 | ||||||
| 1.20%, 10/29/30 |
1,392 | 1,120,710 | ||||||
| 1.90%, 02/01/27 |
330 | 305,714 | ||||||
| 1.95%, 04/23/31 |
1,720 | 1,447,596 | ||||||
| 2.30%, 02/01/32(a) |
1,230 | 1,050,746 | ||||||
| 2.45%, 11/03/26 |
1,311 | 1,239,404 | ||||||
| 2.70%, 02/02/26 |
901 | 867,645 | ||||||
| 2.80%, 03/25/27 |
914 | 865,367 | ||||||
| 2.85%, 08/11/27 |
1,117 | 1,055,140 | ||||||
| 3.00%, 03/25/30 |
2,095 | 1,917,226 | ||||||
| 3.50%, 10/25/47 |
600 | 479,254 | ||||||
| 3.55%, 03/25/40 |
873 | 748,088 | ||||||
| 3.60%, 03/25/50 |
770 | 632,223 | ||||||
| 3.95%, 01/26/28(a) |
1,025 | 1,007,436 | ||||||
| 4.05%, 01/26/33(a) |
905 | 871,529 | ||||||
| 60 | 2 0 2 4 I S H A R E S A N N U A L R E P O R T T O S H A R E H O L D E R S |
| Schedule of Investments (continued) February 29, 2024 |
iShares® Broad USD Investment Grade Corporate Bond ETF (Percentages shown are based on Net Assets) |
| Security | Par (000) |
Value | ||||||
| Cosmetics & Personal Care (continued) | ||||||||
| 4.10%, 01/26/26(a) |
$ | 905 | $ | 894,638 | ||||
| 4.35%, 01/29/29 |
660 | 654,127 | ||||||
| 4.55%, 01/29/34 |
685 | 675,369 | ||||||
| 5.50%, 02/01/34(a) |
297 | 315,511 | ||||||
| 5.55%, 03/05/37 |
557 | 597,948 | ||||||
| 5.80%, 08/15/34 |
375 | 412,214 | ||||||
| Unilever Capital Corp. |
||||||||
| 1.38%, 09/14/30 (Call 06/14/30) |
860 | 694,903 | ||||||
| 1.75%, 08/12/31 (Call 05/12/31) |
1,685 | 1,357,124 | ||||||
| 2.00%, 07/28/26(a) |
995 | 931,666 | ||||||
| 2.13%, 09/06/29 (Call 06/06/29) |
1,350 | 1,175,869 | ||||||
| 2.90%, 05/05/27 (Call 02/05/27) |
1,530 | 1,447,075 | ||||||
| 3.10%, 07/30/25 |
815 | 794,972 | ||||||
| 3.38%, 03/22/25 (Call 01/22/25) |
505 | 494,827 | ||||||
| 3.50%, 03/22/28 (Call 12/22/27) |
1,980 | 1,893,978 | ||||||
| 4.88%, 09/08/28 (Call 08/08/28) |
680 | 685,060 | ||||||
| 5.00%, 12/08/33 (Call 09/08/33)(a) |
730 | 731,138 | ||||||
| 5.90%, 11/15/32 |
1,239 | 1,320,551 | ||||||
| Series 30Y, 2.63%, 08/12/51 |
1,245 | 802,933 | ||||||
|
|
|
|||||||
| 65,276,818 | ||||||||
| Distribution & Wholesale — 0.1% | ||||||||
| Ferguson Finance PLC |
||||||||
| 3.25%, 06/02/30 (Call 03/02/30)(a)(b) |
983 | 877,358 | ||||||
| 4.25%, 04/20/27 (Call 03/20/27)(b) |
280 | 272,149 | ||||||
| 4.50%, 10/24/28 (Call 07/24/28)(a)(b) |
1,410 | 1,374,731 | ||||||
| 4.65%, 04/20/32 (Call 01/20/32)(b) |
515 | 491,149 | ||||||
| LKQ Corp. |
||||||||
| 5.75%, 06/15/28 (Call 05/15/28) |
780 | 788,226 | ||||||
| 6.25%, 06/15/33 (Call 03/15/33) |
825 | 847,826 | ||||||
| Mitsubishi Corp. |
||||||||
| 1.13%, 07/15/26 (Call 06/15/26)(b) |
840 | 763,988 | ||||||
| 5.00%, 07/05/28 (Call 06/05/28)(b) |
750 | 750,637 | ||||||
| WW Grainger Inc. |
||||||||
| 3.75%, 05/15/46 (Call 11/15/45) |
460 | 369,682 | ||||||
| 4.20%, 05/15/47 (Call 11/15/46)(a) |
401 | 344,582 | ||||||
| 4.60%, 06/15/45 (Call 12/15/44)(a) |
963 | 881,126 | ||||||
|
|
|
|||||||
| 7,761,454 | ||||||||
| Diversified Financial Services — 3.2% | ||||||||
| AerCap Ireland Capital DAC/AerCap Global Aviation Trust |
||||||||
| 1.75%, 01/30/26 (Call 12/30/25) |
1,340 | 1,244,923 | ||||||
| 2.45%, 10/29/26 (Call 09/29/26) |
3,380 | 3,117,681 | ||||||
| 3.00%, 10/29/28 (Call 08/29/28) |
4,730 | 4,250,218 | ||||||
| 3.30%, 01/30/32 (Call 10/30/31) |
5,095 | 4,308,755 | ||||||
| 3.40%, 10/29/33 (Call 07/29/33) |
1,955 | 1,624,170 | ||||||
| 3.65%, 07/21/27 (Call 04/21/27) |
1,417 | 1,333,347 | ||||||
| 3.85%, 10/29/41 (Call 04/29/41) |
1,710 | 1,327,539 | ||||||
| 3.88%, 01/23/28 (Call 10/23/27) |
1,048 | 987,084 | ||||||
| 4.45%, 10/01/25 (Call 08/01/25) |
535 | 524,682 | ||||||
| 4.45%, 04/03/26 (Call 02/03/26) |
1,040 | 1,019,006 | ||||||
| 4.63%, 10/15/27 (Call 08/15/27) |
878 | 850,663 | ||||||
| 5.10%, 01/19/29 (Call 12/19/28)(a) |
1,015 | 997,696 | ||||||
| 5.30%, 01/19/34 (Call 10/19/33)(a) |
1,030 | 993,580 | ||||||
| 5.75%, 06/06/28 (Call 05/06/28)(a) |
1,125 | 1,133,142 | ||||||
| 6.10%, 01/15/27 (Call 12/15/26) |
525 | 531,560 | ||||||
| 6.15%, 09/30/30 (Call 07/30/30)(a) |
850 | 877,996 | ||||||
| 6.45%, 04/15/27 (Call 03/15/27)(a)(b) |
645 | 660,196 | ||||||
| 6.50%, 07/15/25 (Call 06/15/25)(a) |
1,590 | 1,604,906 | ||||||
| Security | Par (000) |
Value | ||||||
| Diversified Financial Services (continued) | ||||||||
| Affiliated Managers Group Inc. |
||||||||
| 3.30%, 06/15/30 (Call 03/15/30)(a) |
$ | 722 | $ | 635,074 | ||||
| 3.50%, 08/01/25 |
345 | 335,319 | ||||||
| Air Lease Corp. |
||||||||
| 1.88%, 08/15/26 (Call 07/15/26)(a) |
1,440 | 1,322,296 | ||||||
| 2.10%, 09/01/28 (Call 07/01/28) |
767 | 665,426 | ||||||
| 2.20%, 01/15/27 (Call 12/15/26) |
1,272 | 1,166,152 | ||||||
| 2.88%, 01/15/26 (Call 12/15/25) |
334 | 318,514 | ||||||
| 2.88%, 01/15/32 (Call 10/15/31)(a) |
1,000 | 830,158 | ||||||
| 3.00%, 02/01/30 (Call 11/01/29) |
1,085 | 944,679 | ||||||
| 3.13%, 12/01/30 (Call 09/01/30) |
1,159 | 998,999 | ||||||
| 3.25%, 03/01/25 (Call 01/01/25) |
763 | 744,907 | ||||||
| 3.25%, 10/01/29 (Call 07/01/29)(a) |
790 | 702,642 | ||||||
| 3.38%, 07/01/25 (Call 06/01/25)(a) |
1,226 | 1,190,870 | ||||||
| 3.63%, 04/01/27 (Call 01/01/27)(a) |
923 | 867,258 | ||||||
| 3.63%, 12/01/27 (Call 09/01/27) |
605 | 568,463 | ||||||
| 3.75%, 06/01/26 (Call 04/01/26) |
218 | 210,023 | ||||||
| 4.63%, 10/01/28 (Call 07/01/28) |
760 | 734,219 | ||||||
| 5.10%, 03/01/29 (Call 02/01/29)(a) |
625 | 615,214 | ||||||
| 5.30%, 02/01/28 (Call 01/01/28)(a) |
800 | 796,167 | ||||||
| 5.85%, 12/15/27 (Call 11/15/27)(a) |
240 | 242,974 | ||||||
| AIR Lease Corp. Sukuk Ltd., 5.85%, 04/01/28 (Call 03/01/28)(b) |
285 | 284,319 | ||||||
| Aircastle Ltd. |
||||||||
| 2.85%, 01/26/28 (Call 11/26/27)(a)(b) |
587 | 522,133 | ||||||
| 4.25%, 06/15/26 (Call 04/15/26) |
1,310 | 1,269,980 | ||||||
| 5.25%, 08/11/25 (Call 07/11/25)(b) |
917 | 906,410 | ||||||
| 5.95%, 02/15/29 (Call 01/15/29)(a)(b) |
625 | 617,416 | ||||||
| 6.50%, 07/18/28 (Call 06/18/28)(b) |
695 | 702,142 | ||||||
| Ally Financial Inc. |
||||||||
| 2.20%, 11/02/28 (Call 09/02/28) |
1,320 | 1,122,504 | ||||||
| 4.63%, 03/30/25(a) |
524 | 518,238 | ||||||
| 4.75%, 06/09/27 (Call 05/09/27)(a) |
1,030 | 1,000,453 | ||||||
| 5.80%, 05/01/25 (Call 04/01/25)(a) |
887 | 885,601 | ||||||
| 6.85%, 01/03/30 (Call 01/03/29), |
1,070 | 1,093,568 | ||||||
| 6.99%, 06/13/29 (Call 06/13/28), |
664 | 682,197 | ||||||
| 7.10%, 11/15/27 (Call 10/15/27)(a) |
1,009 | 1,050,598 | ||||||
| 8.00%, 11/01/31 |
3,270 | 3,582,929 | ||||||
| American Express Co. |
||||||||
| 1.65%, 11/04/26 (Call 10/04/26)(a) |
1,550 | 1,417,855 | ||||||
| 2.25%, 03/04/25 (Call 02/01/25) |
1,065 | 1,031,362 | ||||||
| 2.55%, 03/04/27 (Call 02/01/27) |
2,883 | 2,675,719 | ||||||
| 3.13%, 05/20/26 (Call 04/20/26) |
1,533 | 1,472,580 | ||||||
| 3.30%, 05/03/27 (Call 04/03/27) |
2,614 | 2,477,834 | ||||||
| 3.95%, 08/01/25 (Call 07/01/25) |
3,120 | 3,065,255 | ||||||
| 4.05%, 05/03/29 (Call 03/03/29) |
1,210 | 1,170,892 | ||||||
| 4.05%, 12/03/42 |
1,350 | 1,162,874 | ||||||
| 4.20%, 11/06/25 (Call 10/06/25)(a) |
968 | 955,288 | ||||||
| 4.42%, 08/03/33 (Call 08/03/32), |
2,105 | 1,994,670 | ||||||
| 4.90%, 02/13/26 (Call 01/13/26) |
1,757 | 1,751,384 | ||||||
| 4.99%, 05/01/26 (Call 05/01/25), |
1,645 | 1,635,348 | ||||||
| 4.99%, 05/26/33 (Call 02/26/32), |
1,036 | 1,006,765 | ||||||
| 5.04%, 05/01/34 (Call 05/01/33), |
1,995 | 1,958,026 | ||||||
| 5.10%, 02/16/28 (Call 02/16/27), |
880 | 876,682 | ||||||
| S C H E D U L E O F I N V E S T M E N T S |
61 |
| Schedule of Investments (continued) February 29, 2024 |
iShares® Broad USD Investment Grade Corporate Bond ETF (Percentages shown are based on Net Assets) |
| Security | Par (000) |
Value | ||||||
| Diversified Financial Services (continued) | ||||||||
| 5.28%, 07/27/29 (Call 07/27/28), |
$ | 1,410 | $ | 1,417,205 | ||||
| 5.39%, 07/28/27 (Call 07/28/26), |
760 | 762,096 | ||||||
| 5.63%, 07/28/34 (Call 07/28/33), |
215 | 216,674 | ||||||
| 5.85%, 11/05/27 (Call 10/05/27) |
1,935 | 1,986,671 | ||||||
| 6.34%, 10/30/26 (Call 10/30/25), |
1,830 | 1,857,846 | ||||||
| 6.49%, 10/30/31 (Call 10/30/30), |
1,040 | 1,107,926 | ||||||
| American Express Credit Corp., 3.30%, 05/03/27 (Call 04/03/27) |
460 | 436,727 | ||||||
| Ameriprise Financial Inc. |
||||||||
| 2.88%, 09/15/26 (Call 06/15/26) |
761 | 722,244 | ||||||
| 3.00%, 04/02/25 (Call 03/02/25) |
579 | 564,261 | ||||||
| 4.50%, 05/13/32 (Call 02/13/32) |
655 | 629,465 | ||||||
| 5.15%, 05/15/33 (Call 02/15/33) |
1,105 | 1,104,936 | ||||||
| 5.70%, 12/15/28 (Call 11/15/28) |
695 | 714,736 | ||||||
| Andrew W Mellon Foundation (The), Series 2020, 0.95%, 08/01/27 (Call 06/01/27) |
1,035 | 906,291 | ||||||
| Antares Holdings LP |
||||||||
| 2.75%, 01/15/27 (Call 12/15/26)(a)(b) |
605 | 539,022 | ||||||
| 3.75%, 07/15/27 (Call 06/15/27)(a)(b) |
510 | 460,360 | ||||||
| 3.95%, 07/15/26 (Call 06/15/26)(b) |
570 | 530,529 | ||||||
| Apollo Global Management Inc., 6.38%, 11/15/33 (Call 08/15/33) |
445 | 477,751 | ||||||
| Ares Finance Co. II LLC, 3.25%, 06/15/30 (Call 03/15/30)(a)(b) |
835 | 729,141 | ||||||
| Ares Finance Co. III LLC, 4.13%, 06/30/51 (Call 06/30/26), |
975 | 880,815 | ||||||
| Ares Finance Co. IV LLC, 3.65%, 02/01/52 (Call 08/01/51)(a)(b) |
160 | 110,607 | ||||||
| Ares Management Corp., 6.38%, 11/10/28 (Call 10/10/28)(a) |
90 | 93,790 | ||||||
| Aviation Capital Group LLC |
||||||||
| 1.95%, 01/30/26 (Call 12/30/25)(b) |
965 | 896,922 | ||||||
| 1.95%, 09/20/26 (Call 08/20/26)(a)(b) |
1,357 | 1,234,767 | ||||||
| 3.50%, 11/01/27 (Call 07/01/27)(b) |
925 | 853,126 | ||||||
| 4.13%, 08/01/25 (Call 06/01/25)(b) |
640 | 621,780 | ||||||
| 4.88%, 10/01/25 (Call 07/01/25)(b) |
434 | 425,275 | ||||||
| 6.25%, 04/15/28 (Call 03/15/28)(b) |
835 | 847,308 | ||||||
| 6.38%, 07/15/30 (Call 05/15/30)(a)(b) |
1,074 | 1,095,074 | ||||||
| 6.75%, 10/25/28 (Call 09/25/28)(b) |
710 | 735,726 | ||||||
| Avolon Holdings Funding Ltd. |
||||||||
| 2.13%, 02/21/26 (Call 01/21/26)(a)(b) |
1,052 | 976,125 | ||||||
| 2.53%, 11/18/27 (Call 10/18/27)(a)(b) |
3,058 | 2,707,035 | ||||||
| 2.75%, 02/21/28 (Call 12/21/27)(b) |
1,250 | 1,111,755 | ||||||
| 3.25%, 02/15/27 (Call 12/15/26)(b) |
1,200 | 1,108,767 | ||||||
| 4.25%, 04/15/26 (Call 03/15/26)(b) |
1,475 | 1,422,237 | ||||||
| 4.38%, 05/01/26 (Call 03/01/26)(b) |
1,185 | 1,143,398 | ||||||
| 5.50%, 01/15/26 (Call 12/15/25)(b) |
849 | 840,219 | ||||||
| 5.75%, 03/01/29 (Call 02/01/29)(b) |
1,103 | 1,087,087 | ||||||
| 6.38%, 05/04/28 (Call 04/04/28)(a)(b) |
400 | 405,901 | ||||||
| BGC Group Inc. |
650 | 627,492 | ||||||
| 8.00%, 05/25/28 (Call 04/25/28)(a) |
435 | 459,998 | ||||||
| Blackstone Holdings Finance Co. LLC |
||||||||
| 1.60%, 03/30/31 (Call 12/30/30)(b) |
658 | 509,521 | ||||||
| 1.63%, 08/05/28 (Call 06/05/28)(a)(b) |
518 | 448,605 | ||||||
| 2.00%, 01/30/32 (Call 10/30/31)(b) |
1,093 | 847,987 | ||||||
| Security | Par (000) |
Value | ||||||
| Diversified Financial Services (continued) | ||||||||
| 2.50%, 01/10/30 (Call 10/10/29)(b) |
$ | 763 | $ | 654,121 | ||||
| 2.55%, 03/30/32 (Call 12/30/31)(a)(b) |
645 | 525,589 | ||||||
| 2.80%, 09/30/50 (Call 03/30/50)(b) |
217 | 131,836 | ||||||
| 2.85%, 08/05/51 (Call 02/05/51)(a)(b) |
620 | 384,811 | ||||||
| 3.15%, 10/02/27 (Call 07/02/27)(a)(b) |
487 | 455,129 | ||||||
| 3.20%, 01/30/52 (Call 07/30/51)(a)(b) |
1,170 | 787,954 | ||||||
| 3.50%, 09/10/49 (Call 03/10/49)(a)(b) |
755 | 533,357 | ||||||
| 4.00%, 10/02/47 (Call 04/02/47)(a)(b) |
629 | 476,412 | ||||||
| 4.45%, 07/15/45(b) |
350 | 288,723 | ||||||
| 5.00%, 06/15/44(b) |
341 | 307,962 | ||||||
| 5.90%, 11/03/27 (Call 10/03/27)(a)(b) |
790 | 807,339 | ||||||
| 6.20%, 04/22/33 (Call 01/22/33)(b) |
1,270 | 1,326,800 | ||||||
| 6.25%, 08/15/42(a)(b) |
546 | 561,391 | ||||||
| Blue Owl Credit Income Corp., 7.95%, 06/13/28 (Call 05/13/28)(b) |
225 | 232,150 | ||||||
| Blue Owl Finance LLC |
||||||||
| 3.13%, 06/10/31 (Call 03/10/31)(b) |
753 | 623,505 | ||||||
| 4.13%, 10/07/51 (Call 04/07/51)(a)(b) |
520 | 349,661 | ||||||
| 4.38%, 02/15/32 (Call 11/15/31)(a)(b) |
635 | 557,016 | ||||||
| BOC Aviation Ltd. |
||||||||
| 2.63%, 09/17/30 (Call 06/17/30)(a)(b) |
680 | 578,632 | ||||||
| 3.00%, 09/11/29 (Call 06/11/29)(a)(b) |
901 | 805,818 | ||||||
| 3.25%, 04/29/25 (Call 03/29/25)(b) |
522 | 507,024 | ||||||
| 3.50%, 09/18/27 (Call 06/18/27)(a)(b) |
1,090 | 1,023,870 | ||||||
| 3.88%, 04/27/26 (Call 01/27/26)(b) |
1,300 | 1,257,568 | ||||||
| BOC Aviation USA Corp. |
||||||||
| 4.88%, 05/03/33 (Call 02/03/33)(a)(b) |
855 | 833,646 | ||||||
| 5.75%, 11/09/28 (Call 10/09/28)(b) |
1,465 | 1,497,983 | ||||||
| Brookfield Capital Finance LLC, 6.09%, 06/14/33 (Call 03/14/33) |
194 | 200,675 | ||||||
| Brookfield Finance I U.K. PLC/Brookfield |
1,495 | 1,199,610 | ||||||
| Brookfield Finance Inc. |
||||||||
| 2.72%, 04/15/31 (Call 01/15/31) |
880 | 739,479 | ||||||
| 3.50%, 03/30/51 (Call 09/30/50) |
610 | 432,768 | ||||||
| 3.63%, 02/15/52 (Call 08/15/51)(a) |
430 | 305,951 | ||||||
| 3.90%, 01/25/28 (Call 10/25/27) |
1,419 | 1,361,279 | ||||||
| 4.25%, 06/02/26 (Call 03/02/26)(a) |
907 | 890,628 | ||||||
| 4.35%, 04/15/30 (Call 01/15/30) |
1,189 | 1,127,109 | ||||||
| 4.70%, 09/20/47 (Call 03/20/47)(a) |
1,213 | 1,032,279 | ||||||
| 4.85%, 03/29/29 (Call 12/29/28) |
1,641 | 1,618,202 | ||||||
| 5.97%, 03/04/54 (Call 09/04/53) |
315 | 317,474 | ||||||
| 6.35%, 01/05/34 (Call 10/05/33)(a) |
650 | 683,008 | ||||||
| Brookfield Finance LLC/Brookfield Finance Inc., |
||||||||
| 3.45%, 04/15/50 (Call 10/15/49)(a) |
1,244 | 860,700 | ||||||
| Cantor Fitzgerald LP |
||||||||
| 4.50%, 04/14/27 (Call 01/14/27)(a)(b) |
745 | 705,802 | ||||||
| 7.20%, 12/12/28 (Call 11/12/28)(b) |
850 | 872,449 | ||||||
| Capital One Financial Corp. |
||||||||
| 1.88%, 11/02/27 (Call 11/02/26), |
1,841 | 1,670,968 | ||||||
| 2.36%, 07/29/32 (Call 07/29/31), |
1,659 | 1,254,173 | ||||||
| 2.62%, 11/02/32 (Call 11/02/31), |
930 | 744,158 | ||||||
| 2.64%, 03/03/26 (Call 03/03/25), |
1,645 | 1,595,317 | ||||||
| 3.27%, 03/01/30 (Call 03/01/29), |
1,850 | 1,648,971 | ||||||
| 3.65%, 05/11/27 (Call 04/11/27) |
1,757 | 1,673,444 | ||||||
| 62 | 2 0 2 4 I S H A R E S A N N U A L R E P O R T T O S H A R E H O L D E R S |
| Schedule of Investments (continued) February 29, 2024 |
iShares® Broad USD Investment Grade Corporate Bond ETF (Percentages shown are based on Net Assets) |
| Security | Par (000) | Value | ||||||
| Diversified Financial Services (continued) | ||||||||
| 3.75%, 07/28/26 (Call 06/28/26) |
$ | 1,910 | $ | 1,834,591 | ||||
| 3.75%, 03/09/27 (Call 02/09/27) |
2,592 | 2,474,574 | ||||||
| 3.80%, 01/31/28 (Call 12/31/27) |
2,124 | 2,008,835 | ||||||
| 4.20%, 10/29/25 (Call 09/29/25) |
1,567 | 1,531,903 | ||||||
| 4.25%, 04/30/25 (Call 03/31/25) |
888 | 876,004 | ||||||
|
4.93%, 05/10/28 (Call 05/10/27), |
1,240 | 1,213,232 | ||||||
|
4.99%, 07/24/26 (Call 07/24/25), |
1,740 | 1,724,110 | ||||||
|
5.25%, 07/26/30 (Call 07/26/29), |
860 | 838,598 | ||||||
| 5.27%, 05/10/33 (Call 05/10/32), |
1,898 | 1,843,741 | ||||||
|
5.47%, 02/01/29 (Call 02/01/28), |
1,205 | 1,198,337 | ||||||
|
5.70%, 02/01/30 (Call 02/01/29), |
375 | 375,843 | ||||||
|
5.82%, 02/01/34 (Call 02/01/33), |
1,970 | 1,947,867 | ||||||
|
6.05%, 02/01/35 (Call 02/01/34), |
425 | 429,259 | ||||||
|
6.31%, 06/08/29 (Call 06/08/28), |
1,375 | 1,407,495 | ||||||
|
6.38%, 06/08/34 (Call 06/08/33), |
1,495 | 1,540,444 | ||||||
|
7.15%, 10/29/27 (Call 10/29/26), |
600 | 621,932 | ||||||
|
7.62%, 10/30/31 (Call 10/30/30), |
620 | 678,492 | ||||||
| Cboe Global Markets Inc. |
||||||||
| 1.63%, 12/15/30 (Call 09/15/30)(a) |
663 | 537,911 | ||||||
| 3.00%, 03/16/32 (Call 12/16/31)(a) |
600 | 517,392 | ||||||
| 3.65%, 01/12/27 (Call 10/12/26)(a) |
1,340 | 1,297,613 | ||||||
| Charles Schwab Corp. (The) |
||||||||
| 0.90%, 03/11/26 (Call 02/11/26)(a) |
1,847 | 1,694,057 | ||||||
| 1.15%, 05/13/26 (Call 04/13/26) |
1,540 | 1,412,727 | ||||||
| 1.65%, 03/11/31 (Call 12/11/30) |
1,024 | 812,207 | ||||||
| 1.95%, 12/01/31 (Call 09/01/31)(a) |
1,637 | 1,299,962 | ||||||
| 2.00%, 03/20/28 (Call 01/20/28)(a) |
1,900 | 1,685,379 | ||||||
| 2.30%, 05/13/31 (Call 02/13/31) |
1,350 | 1,118,309 | ||||||
| 2.45%, 03/03/27 (Call 02/03/27)(a) |
1,265 | 1,172,569 | ||||||
| 2.75%, 10/01/29 (Call 07/01/29) |
497 | 441,044 | ||||||
| 2.90%, 03/03/32 (Call 12/03/31) |
1,530 | 1,297,542 | ||||||
| 3.00%, 03/10/25 (Call 12/10/24) |
717 | 700,047 | ||||||
| 3.20%, 03/02/27 (Call 12/02/26) |
1,265 | 1,200,574 | ||||||
| 3.20%, 01/25/28 (Call 10/25/27) |
820 | 767,978 | ||||||
| 3.25%, 05/22/29 (Call 02/22/29) |
1,095 | 1,009,764 | ||||||
| 3.30%, 04/01/27 (Call 01/01/27)(a) |
1,184 | 1,124,705 | ||||||
| 3.45%, 02/13/26 (Call 11/13/25) |
775 | 749,986 | ||||||
| 3.63%, 04/01/25 (Call 01/01/25) |
576 | 565,046 | ||||||
| 3.85%, 05/21/25 (Call 03/21/25) |
674 | 661,369 | ||||||
| 4.00%, 02/01/29 (Call 11/01/28)(a) |
1,204 | 1,156,385 | ||||||
| 4.20%, 03/24/25 (Call 02/24/25) |
936 | 924,624 | ||||||
| 4.63%, 03/22/30 (Call 12/22/29)(a) |
560 | 553,027 | ||||||
|
5.64%, 05/19/29 (Call 05/19/28), |
812 | 822,258 | ||||||
|
5.85%, 05/19/34 (Call 05/19/33), |
960 | 974,886 | ||||||
| 5.88%, 08/24/26 (Call 07/24/26) |
1,231 | 1,250,006 | ||||||
|
6.14%, 08/24/34 (Call 08/24/33), |
1,260 | 1,305,373 | ||||||
| Security | Par (000) | Value | ||||||
| Diversified Financial Services (continued) | ||||||||
| 6.20%, 11/17/29 (Call 11/17/28), |
$ | 1,414 | $ | 1,459,933 | ||||
| China Cinda Finance 2015 I Ltd., 4.25%, 04/23/25(b) |
1,695 | 1,663,592 | ||||||
| CI Financial Corp. |
||||||||
| 3.20%, 12/17/30 (Call 09/17/30) |
1,315 | 1,048,236 | ||||||
| 4.10%, 06/15/51 (Call 12/15/50)(a) |
1,560 | 921,301 | ||||||
| Citadel Finance LLC, 3.38%, 03/09/26 |
1,315 | 1,230,356 | ||||||
| Citadel LP, 4.88%, 01/15/27 |
733 | 711,690 | ||||||
| CME Group Inc. |
||||||||
| 2.65%, 03/15/32 (Call 12/15/31) |
1,275 | 1,093,595 | ||||||
| 3.00%, 03/15/25 (Call 12/15/24) |
1,133 | 1,107,067 | ||||||
| 3.75%, 06/15/28 (Call 03/15/28)(a) |
942 | 909,680 | ||||||
| 4.15%, 06/15/48 (Call 12/15/47)(a) |
821 | 706,709 | ||||||
| 5.30%, 09/15/43 (Call 03/15/43) |
1,301 | 1,314,382 | ||||||
| Credit Suisse USA Inc., 7.13%, 07/15/32(a) |
1,073 | 1,197,515 | ||||||
| DAE Sukuk Difc Ltd., 3.75%, 02/15/26(b) |
595 | 571,755 | ||||||
| Discover Financial Services |
||||||||
| 3.75%, 03/04/25 (Call 12/04/24)(a) |
517 | 507,182 | ||||||
| 4.10%, 02/09/27 (Call 11/09/26) |
1,393 | 1,336,015 | ||||||
| 4.50%, 01/30/26 (Call 11/30/25) |
716 | 704,566 | ||||||
| 6.70%, 11/29/32 (Call 08/29/32) |
1,160 | 1,214,074 | ||||||
|
7.96%, 11/02/34 (Call 11/02/33), |
1,155 | 1,293,687 | ||||||
| Drawbridge Special Opportunities |
928 | 860,652 | ||||||
| Eaton Vance Corp., 3.50%, 04/06/27 |
581 | 553,402 | ||||||
| Enact Holdings Inc., 6.50%, 08/15/25 |
170 | 170,007 | ||||||
| FMR LLC |
||||||||
| 5.15%, 02/01/43(b) |
187 | 173,028 | ||||||
| 6.45%, 11/15/39(a)(b) |
830 | 879,598 | ||||||
| 6.50%, 12/14/40(b) |
250 | 264,502 | ||||||
| 7.57%, 06/15/29(b) |
900 | 996,640 | ||||||
| Franklin Resources Inc. |
||||||||
| 1.60%, 10/30/30 (Call 07/30/30)(a) |
1,107 | 893,795 | ||||||
| 2.85%, 03/30/25 |
719 | 700,516 | ||||||
| 2.95%, 08/12/51 (Call 02/12/51)(a) |
525 | 320,931 | ||||||
| HPS Corporate Lending Fund, 6.75%, 01/30/29 (Call 12/30/28)(b) |
75 | 74,247 | ||||||
| ICBCIL Finance Co. Ltd., 3.63%, 05/19/26(b) |
270 | 260,264 | ||||||
| Invesco Finance PLC |
||||||||
| 3.75%, 01/15/26(a) |
917 | 891,201 | ||||||
| 5.38%, 11/30/43 |
395 | 380,544 | ||||||
| Janus Henderson U.S. Holdings Inc., 4.88%, |
650 | 642,644 | ||||||
| Jefferies Financial Group Inc. |
||||||||
| 2.63%, 10/15/31 (Call 07/15/31) |
1,127 | 921,883 | ||||||
| 2.75%, 10/15/32 (Call 07/15/32) |
640 | 516,505 | ||||||
| 4.15%, 01/23/30 |
1,196 | 1,112,759 | ||||||
| 4.85%, 01/15/27 |
1,228 | 1,219,553 | ||||||
| 5.88%, 07/21/28 (Call 06/21/28) |
1,240 | 1,264,337 | ||||||
| 6.25%, 01/15/36(a) |
745 | 764,159 | ||||||
| 6.45%, 06/08/27 |
592 | 610,105 | ||||||
| 6.50%, 01/20/43 |
559 | 580,615 | ||||||
| 6.63%, 10/23/43 (Call 07/23/43)(a) |
360 | 368,175 | ||||||
| KKR Group Finance Co. II LLC, 5.50%, 02/01/43 (Call 08/01/42)(a)(b) |
1,078 | 1,025,078 | ||||||
| S C H E D U L E O F I N V E S T M E N T S |
63 |
| Schedule of Investments (continued) February 29, 2024 |
iShares® Broad USD Investment Grade Corporate Bond ETF (Percentages shown are based on Net Assets) |
| Security | Par (000) |
Value | ||||||
| Diversified Financial Services (continued) | ||||||||
| Lazard Group LLC |
||||||||
| 3.63%, 03/01/27 (Call 12/01/26) |
$ | 386 | $ | 365,652 | ||||
| 4.38%, 03/11/29 (Call 12/11/28) |
982 | 935,026 | ||||||
| 4.50%, 09/19/28 (Call 06/19/28) |
886 | 849,061 | ||||||
| Legg Mason Inc. |
||||||||
| 4.75%, 03/15/26 |
1,050 | 1,043,557 | ||||||
| 5.63%, 01/15/44(a) |
651 | 653,234 | ||||||
| LPL Holdings Inc. |
||||||||
| 4.00%, 03/15/29 (Call 04/01/24)(a)(b) |
340 | 311,939 | ||||||
| 4.38%, 05/15/31 (Call 05/15/26)(a)(b) |
450 | 407,050 | ||||||
| 4.63%, 11/15/27 (Call 03/05/24)(a)(b) |
680 | 652,067 | ||||||
| 6.75%, 11/17/28 (Call 10/17/28)(a) |
240 | 250,515 | ||||||
| LSEGA Financing PLC |
||||||||
| 1.38%, 04/06/26 (Call 03/06/26)(b) |
1,752 | 1,616,552 | ||||||
| 2.00%, 04/06/28 (Call 02/06/28)(b) |
1,518 | 1,350,330 | ||||||
| 2.50%, 04/06/31 (Call 01/06/31)(a)(b) |
1,473 | 1,237,962 | ||||||
| 3.20%, 04/06/41 (Call 10/06/40)(b) |
801 | 599,119 | ||||||
| Mastercard Inc. |
||||||||
| 1.90%, 03/15/31 (Call 12/15/30) |
940 | 780,550 | ||||||
| 2.00%, 03/03/25 (Call 02/03/25) |
986 | 954,949 | ||||||
| 2.00%, 11/18/31 (Call 08/18/31) |
1,105 | 907,863 | ||||||
| 2.95%, 11/21/26 (Call 08/21/26)(a) |
780 | 744,181 | ||||||
| 2.95%, 06/01/29 (Call 03/01/29) |
1,400 | 1,285,032 | ||||||
| 2.95%, 03/15/51 (Call 09/15/50) |
841 | 585,699 | ||||||
| 3.30%, 03/26/27 (Call 01/26/27) |
1,673 | 1,604,898 | ||||||
| 3.35%, 03/26/30 (Call 12/26/29)(a) |
1,905 | 1,759,830 | ||||||
| 3.50%, 02/26/28 (Call 11/26/27) |
966 | 929,185 | ||||||
| 3.65%, 06/01/49 (Call 12/01/48) |
1,247 | 995,115 | ||||||
| 3.80%, 11/21/46 (Call 05/21/46) |
755 | 621,279 | ||||||
| 3.85%, 03/26/50 (Call 09/26/49) |
2,229 | 1,841,322 | ||||||
| 3.95%, 02/26/48 (Call 08/26/47)(a) |
580 | 491,984 | ||||||
| 4.85%, 03/09/33 (Call 12/09/32) |
1,135 | 1,133,587 | ||||||
| 4.88%, 03/09/28 (Call 02/09/28) |
940 | 950,505 | ||||||
| Mitsubishi HC Capital Inc. |
||||||||
| 3.64%, 04/13/25 (Call 03/13/25)(a)(b) |
943 | 922,601 | ||||||
| 5.08%, 09/15/27 (Call 08/15/27)(a)(b) |
925 | 915,671 | ||||||
| Mitsubishi HC Finance America LLC |
||||||||
| 5.66%, 02/28/33 (Call 11/28/32)(a)(b) |
730 | 735,927 | ||||||
| 5.81%, 09/12/28 (Call 08/12/28)(b) |
445 | 452,507 | ||||||
| Nasdaq Inc. |
||||||||
| 1.65%, 01/15/31 (Call 10/15/30)(a) |
1,071 | 852,677 | ||||||
| 2.50%, 12/21/40 (Call 06/21/40) |
834 | 552,970 | ||||||
| 3.25%, 04/28/50 (Call 10/28/49) |
775 | 528,191 | ||||||
| 3.85%, 06/30/26 (Call 03/30/26) |
1,068 | 1,037,138 | ||||||
| 3.95%, 03/07/52 (Call 09/07/51) |
815 | 620,352 | ||||||
| 5.35%, 06/28/28 (Call 05/28/28) |
1,355 | 1,368,588 | ||||||
| 5.55%, 02/15/34 (Call 11/15/33) |
1,775 | 1,787,007 | ||||||
| 5.65%, 06/28/25 |
250 | 250,829 | ||||||
| 5.95%, 08/15/53 (Call 02/15/53)(a) |
1,010 | 1,038,542 | ||||||
| 6.10%, 06/28/63 (Call 12/28/62)(a) |
645 | 672,541 | ||||||
| Neuberger Berman Group LLC/Neuberger |
||||||||
| Berman Finance Corp. |
||||||||
| 4.50%, 03/15/27 (Call 12/15/26)(b) |
653 | 626,417 | ||||||
| 4.88%, 04/15/45 (Call 10/15/44)(b) |
435 | 348,753 | ||||||
| Nomura Holdings Inc. |
||||||||
| 1.65%, 07/14/26 |
1,815 | 1,661,273 | ||||||
| 1.85%, 07/16/25 |
1,942 | 1,844,336 | ||||||
| 2.17%, 07/14/28 |
1,229 | 1,070,520 | ||||||
| 2.33%, 01/22/27 |
1,680 | 1,541,149 | ||||||
| 2.61%, 07/14/31 |
1,580 | 1,298,939 | ||||||
| 2.68%, 07/16/30 |
1,154 | 975,705 | ||||||
| Security | Par (000) |
Value | ||||||
| Diversified Financial Services (continued) | ||||||||
| 2.71%, 01/22/29(a) |
$ | 470 | $ | 414,402 | ||||
| 3.00%, 01/22/32 |
1,225 | 1,018,828 | ||||||
| 3.10%, 01/16/30 |
1,755 | 1,540,240 | ||||||
| 5.10%, 07/03/25 |
1,090 | 1,079,414 | ||||||
| 5.39%, 07/06/27 |
715 | 713,611 | ||||||
| 5.61%, 07/06/29 |
675 | 678,586 | ||||||
| 5.71%, 01/09/26 |
395 | 395,818 | ||||||
| 5.84%, 01/18/28 |
730 | 739,115 | ||||||
| 6.07%, 07/12/28 |
1,300 | 1,331,553 | ||||||
| 6.09%, 07/12/33(a) |
775 | 808,811 | ||||||
| 6.18%, 01/18/33 |
700 | 733,698 | ||||||
| Nuveen LLC, 4.00%, 11/01/28 |
1,545 | 1,493,223 | ||||||
| ORIX Corp. |
||||||||
| 2.25%, 03/09/31(a) |
885 | 741,691 | ||||||
| 3.70%, 07/18/27 |
520 | 497,192 | ||||||
| 4.00%, 04/13/32 |
665 | 618,453 | ||||||
| 5.00%, 09/13/27 |
425 | 424,560 | ||||||
| 5.20%, 09/13/32(a) |
660 | 666,511 | ||||||
| Power Finance Corp. Ltd. |
||||||||
| 3.95%, 04/23/30(a)(b) |
971 | 883,237 | ||||||
| 6.15%, 12/06/28(a)(b) |
980 | 1,004,201 | ||||||
| Radian Group Inc. |
||||||||
| 4.88%, 03/15/27 (Call 09/15/26)(a) |
955 | 926,433 | ||||||
| 6.20%, 05/15/29 (Call 02/15/29) |
625 | 626,794 | ||||||
| 6.63%, 03/15/25 (Call 09/15/24) |
900 | 901,748 | ||||||
| Raymond James Financial Inc. |
||||||||
| 3.75%, 04/01/51 (Call 10/01/50) |
1,200 | 891,143 | ||||||
| 4.65%, 04/01/30 (Call 01/01/30) |
967 | 956,184 | ||||||
| 4.95%, 07/15/46 |
894 | 820,782 | ||||||
| REC Ltd., 5.63%, 04/11/28(b) |
40 | 40,082 | ||||||
| Stifel Financial Corp., 4.00%, 05/15/30 |
765 | 691,277 | ||||||
| SURA Asset Management SA, 4.38%, 04/11/27(b) |
85 | 81,498 | ||||||
| Synchrony Financial |
||||||||
| 2.88%, 10/28/31 (Call 07/28/31) |
1,205 | 945,929 | ||||||
| 3.70%, 08/04/26 (Call 05/04/26)(a) |
734 | 692,788 | ||||||
| 3.95%, 12/01/27 (Call 09/01/27) |
1,161 | 1,075,444 | ||||||
| 4.50%, 07/23/25 (Call 04/23/25) |
1,252 | 1,223,758 | ||||||
| 4.88%, 06/13/25 (Call 05/13/25)(a) |
795 | 782,343 | ||||||
| 5.15%, 03/19/29 (Call 12/19/28) |
1,138 | 1,085,526 | ||||||
| USAA Capital Corp. |
||||||||
| 2.13%, 05/01/30 (Call 02/01/30)(b) |
632 | 522,615 | ||||||
| 3.38%, 05/01/25(a)(b) |
734 | 716,782 | ||||||
| Visa Inc. |
||||||||
| 0.75%, 08/15/27 (Call 06/15/27)(a) |
894 | 785,237 | ||||||
| 1.10%, 02/15/31 (Call 11/15/30) |
1,614 | 1,274,977 | ||||||
| 1.90%, 04/15/27 (Call 02/15/27)(a) |
2,093 | 1,928,414 | ||||||
| 2.00%, 08/15/50 (Call 02/15/50)(a) |
2,402 | 1,401,384 | ||||||
| 2.05%, 04/15/30 (Call 01/15/30) |
2,208 | 1,894,272 | ||||||
| 2.70%, 04/15/40 (Call 10/15/39) |
1,443 | 1,065,518 | ||||||
| 2.75%, 09/15/27 (Call 06/15/27) |
1,170 | 1,096,249 | ||||||
| 3.15%, 12/14/25 (Call 09/14/25) |
1,904 | 1,845,958 | ||||||
| 3.65%, 09/15/47 (Call 03/15/47) |
1,477 | 1,178,410 | ||||||
| 4.15%, 12/14/35 (Call 06/14/35)(a) |
1,649 | 1,550,089 | ||||||
| 4.30%, 12/14/45 (Call 06/14/45) |
3,657 | 3,269,456 | ||||||
| Voya Financial Inc. |
||||||||
| 3.65%, 06/15/26 |
980 | 940,462 | ||||||
|
4.70%, 01/23/48 (Call 01/23/28), |
554 | 464,929 | ||||||
| 64 | 2 0 2 4 I S H A R E S A N N U A L R E P O R T T O S H A R E H O L D E R S |
| Schedule of Investments (continued) February 29, 2024 |
iShares® Broad USD Investment Grade Corporate Bond ETF (Percentages shown are based on Net Assets) |
| Security | Par (000) |
Value | ||||||
| Diversified Financial Services (continued) | ||||||||
| 4.80%, 06/15/46 |
$ | 683 | $ | 579,029 | ||||
| 5.70%, 07/15/43 |
361 | 350,052 | ||||||
| Western Union Co. (The) |
||||||||
| 1.35%, 03/15/26 (Call 02/15/26)(a) |
1,121 | 1,032,564 | ||||||
| 2.75%, 03/15/31 (Call 12/15/30) |
651 | 534,646 | ||||||
| 6.20%, 11/17/36(a) |
673 | 679,410 | ||||||
| 6.20%, 06/21/40(a) |
525 | 524,217 | ||||||
|
|
|
|||||||
| 336,420,150 | ||||||||
| Electric — 8.3% | ||||||||
| Abu Dhabi National Energy Co. PJSC |
||||||||
| 2.00%, 04/29/28 (Call 01/29/28)(b) |
1,115 | 989,489 | ||||||
| 3.40%, 04/29/51 (Call 10/29/50)(a)(b) |
1,330 | 941,108 | ||||||
| 4.00%, 10/03/49(b) |
1,035 | 825,713 | ||||||
| 4.38%, 04/23/25(b) |
1,408 | 1,390,400 | ||||||
| 4.38%, 06/22/26(b) |
640 | 628,372 | ||||||
| 4.38%, 01/24/29(b) |
65 | 63,208 | ||||||
| 4.70%, 04/24/33(a)(b) |
1,775 | 1,727,895 | ||||||
| 4.88%, 04/23/30(b) |
467 | 465,677 | ||||||
| 6.50%, 10/27/36(a)(b) |
1,094 | 1,225,114 | ||||||
| Adani Electricity Mumbai Ltd. |
||||||||
| 3.87%, 07/22/31 (Call 01/22/31)(b) |
300 | 248,787 | ||||||
| 3.95%, 02/12/30(b) |
362 | 310,352 | ||||||
| Adani Transmission Step-One Ltd. |
||||||||
| 4.00%, 08/03/26(b) |
550 | 515,735 | ||||||
| 4.25%, 05/21/36 (Call 11/21/35)(b) |
393 | 334,522 | ||||||
| AEP Texas Inc. |
||||||||
| 3.45%, 05/15/51 (Call 11/15/50) |
567 | 390,973 | ||||||
| 3.80%, 10/01/47 (Call 04/01/47) |
502 | 373,527 | ||||||
| 3.85%, 10/01/25 (Call 07/01/25)(b) |
416 | 402,648 | ||||||
| 3.95%, 06/01/28 (Call 03/01/28) |
629 | 601,749 | ||||||
| 4.70%, 05/15/32 (Call 02/15/32) |
880 | 841,165 | ||||||
| 5.25%, 05/15/52 (Call 11/15/51) |
685 | 643,867 | ||||||
| 5.40%, 06/01/33 (Call 03/01/33)(a) |
325 | 324,963 | ||||||
| Series E, 6.65%, 02/15/33(a) |
489 | 520,555 | ||||||
| Series G, 4.15%, 05/01/49 (Call 11/01/48) |
520 | 407,880 | ||||||
| Series H, 3.45%, 01/15/50 (Call 07/15/49) |
613 | 427,452 | ||||||
| Series I, 2.10%, 07/01/30 (Call 04/01/30) |
1,037 | 858,400 | ||||||
| AEP Transmission Co. LLC |
||||||||
| 3.10%, 12/01/26 (Call 09/01/26) |
632 | 601,920 | ||||||
| 3.15%, 09/15/49 (Call 03/15/49) |
255 | 174,109 | ||||||
| 3.75%, 12/01/47 (Call 06/01/47) |
664 | 509,958 | ||||||
| 3.80%, 06/15/49 (Call 12/15/48) |
525 | 404,030 | ||||||
| 4.00%, 12/01/46 (Call 06/01/46) |
495 | 399,561 | ||||||
| 4.25%, 09/15/48 (Call 03/15/48) |
545 | 447,900 | ||||||
| 4.50%, 06/15/52 (Call 12/01/51) |
630 | 545,902 | ||||||
| 5.40%, 03/15/53 (Call 09/15/52) |
810 | 802,069 | ||||||
| Series M, 3.65%, 04/01/50 (Call 10/01/49) |
690 | 518,488 | ||||||
| Series N, 2.75%, 08/15/51 (Call 02/15/51) |
352 | 219,327 | ||||||
| AES Corp. (The) |
||||||||
| 1.38%, 01/15/26 (Call 12/15/25) |
1,283 | 1,185,201 | ||||||
| 2.45%, 01/15/31 (Call 10/15/30) |
1,300 | 1,060,451 | ||||||
| 3.30%, 07/15/25 (Call 06/15/25)(b) |
875 | 843,685 | ||||||
| 3.95%, 07/15/30 (Call 04/15/30)(a)(b) |
859 | 780,434 | ||||||
| 5.45%, 06/01/28 (Call 05/01/28) |
1,375 | 1,370,784 | ||||||
| AES Panama Generation Holdings SRL, |
687 | 577,004 | ||||||
| Alabama Power Co. |
||||||||
| 2.80%, 04/01/25 (Call 01/01/25) |
245 | 238,228 | ||||||
| 3.00%, 03/15/52 (Call 09/15/51)(a) |
760 | 506,371 | ||||||
| 3.05%, 03/15/32 (Call 12/15/31)(a) |
350 | 303,039 | ||||||
| 3.13%, 07/15/51 (Call 01/15/51) |
810 | 550,797 | ||||||
| Security | Par (000) |
Value | ||||||
| Electric (continued) | ||||||||
| 3.45%, 10/01/49 (Call 04/01/49) |
$ | 644 | $ | 468,461 | ||||
| 3.75%, 09/01/27 (Call 08/01/27) |
705 | 677,613 | ||||||
| 3.75%, 03/01/45 (Call 09/01/44) |
961 | 754,229 | ||||||
| 3.85%, 12/01/42 |
500 | 402,629 | ||||||
| 3.94%, 09/01/32 (Call 03/01/32) |
617 | 567,213 | ||||||
| 4.10%, 01/15/42 |
330 | 267,569 | ||||||
| 4.15%, 08/15/44 (Call 02/15/44) |
421 | 350,788 | ||||||
| 4.30%, 01/02/46 (Call 07/02/45) |
545 | 458,967 | ||||||
| 5.50%, 03/15/41(a) |
240 | 235,714 | ||||||
| 5.70%, 02/15/33(a) |
299 | 302,056 | ||||||
| 5.85%, 11/15/33 (Call 08/15/33) |
300 | 313,887 | ||||||
| 6.00%, 03/01/39(a) |
761 | 802,123 | ||||||
| 6.13%, 05/15/38 |
385 | 402,893 | ||||||
| Series 11-C, 5.20%, 06/01/41(a) |
346 | 339,165 | ||||||
| Series 20-A, 1.45%, 09/15/30 (Call 06/15/30) |
820 | 659,363 | ||||||
| Series A, 4.30%, 07/15/48 (Call 01/15/48) |
711 | 596,047 | ||||||
| Series B, 3.70%, 12/01/47 (Call 06/01/47) |
806 | 610,963 | ||||||
| Alexander Funding Trust II, 7.47%, 07/31/28 (Call 06/30/28)(a)(b) |
835 | 873,927 | ||||||
| Alfa Desarrollo SpA, 4.55%, 09/27/51 (Call 03/27/51)(a)(b) |
929 | 690,663 | ||||||
| Alliant Energy Finance LLC |
||||||||
| 3.60%, 03/01/32 (Call 12/01/31)(a)(b) |
649 | 560,161 | ||||||
| 4.25%, 06/15/28 (Call 03/15/28)(b) |
790 | 759,863 | ||||||
| 5.95%, 03/30/29 (Call 02/28/29)(a)(b) |
230 | 235,422 | ||||||
| Ameren Corp. |
||||||||
| 1.75%, 03/15/28 (Call 01/15/28) |
880 | 773,814 | ||||||
| 1.95%, 03/15/27 (Call 02/15/27) |
895 | 817,854 | ||||||
| 3.50%, 01/15/31 (Call 10/15/30)(a) |
1,134 | 1,021,016 | ||||||
| 3.65%, 02/15/26 (Call 11/15/25)(a) |
777 | 751,264 | ||||||
| 5.00%, 01/15/29 (Call 12/15/28) |
955 | 946,886 | ||||||
| 5.70%, 12/01/26 (Call 11/01/26)(a) |
945 | 955,765 | ||||||
| Ameren Illinois Co. |
||||||||
| 1.55%, 11/15/30 (Call 08/15/30)(a) |
545 | 436,350 | ||||||
| 2.90%, 06/15/51 (Call 12/15/50)(a) |
365 | 237,170 | ||||||
| 3.25%, 03/01/25 (Call 12/01/24)(a) |
410 | 402,279 | ||||||
| 3.25%, 03/15/50 (Call 09/15/49)(a) |
390 | 273,330 | ||||||
| 3.70%, 12/01/47 (Call 06/01/47) |
847 | 654,393 | ||||||
| 3.80%, 05/15/28 (Call 02/15/28) |
665 | 641,429 | ||||||
| 3.85%, 09/01/32 (Call 06/01/32) |
695 | 633,567 | ||||||
| 4.15%, 03/15/46 (Call 09/15/45) |
695 | 575,412 | ||||||
| 4.30%, 07/01/44 (Call 01/01/44) |
218 | 180,264 | ||||||
| 4.50%, 03/15/49 (Call 09/15/48)(a) |
524 | 454,599 | ||||||
| 4.80%, 12/15/43 (Call 06/15/43) |
415 | 368,293 | ||||||
| 4.95%, 06/01/33 (Call 03/01/33)(a) |
535 | 526,647 | ||||||
| 5.90%, 12/01/52 (Call 06/01/52) |
485 | 514,942 | ||||||
| American Electric Power Co. Inc. |
||||||||
| 2.30%, 03/01/30 (Call 12/01/29) |
580 | 489,822 | ||||||
| 3.20%, 11/13/27 (Call 08/13/27) |
648 | 606,260 | ||||||
| 3.25%, 03/01/50 (Call 09/01/49)(a) |
608 | 416,228 | ||||||
| 3.88%, 02/15/62 (Call 11/15/26), |
465 | 413,634 | ||||||
| 5.20%, 01/15/29 (Call 12/15/28) |
1,535 | 1,532,893 | ||||||
| 5.63%, 03/01/33 (Call 12/01/32) |
584 | 588,211 | ||||||
| 5.70%, 08/15/25 |
125 | 125,161 | ||||||
| 5.75%, 11/01/27 (Call 10/01/27) |
431 | 439,847 | ||||||
| 5.95%, 11/01/32 (Call 08/01/32)(a) |
935 | 967,476 | ||||||
| Series J, 4.30%, 12/01/28 (Call 09/01/28)(a) |
807 | 777,234 | ||||||
| Series N, 1.00%, 11/01/25 (Call 10/01/25) |
665 | 618,059 | ||||||
| S C H E D U L E O F I N V E S T M E N T S |
65 |
| Schedule of Investments (continued) February 29, 2024 |
iShares® Broad USD Investment Grade Corporate Bond ETF (Percentages shown are based on Net Assets) |
| Security | Par (000) | Value | ||||||
| Electric (continued) | ||||||||
| American Transmission Systems Inc. |
||||||||
| 2.65%, 01/15/32 (Call 10/15/31)(b) |
$ | 717 | $ | 588,790 | ||||
| 5.00%, 09/01/44 (Call 03/01/44)(a)(b) |
493 | 442,512 | ||||||
| Appalachian Power Co. |
||||||||
| 3.40%, 06/01/25 (Call 03/01/25) |
505 | 492,722 | ||||||
| 4.40%, 05/15/44 (Call 11/15/43) |
457 | 373,879 | ||||||
| 4.45%, 06/01/45 (Call 12/01/44) |
588 | 484,213 | ||||||
| 4.50%, 08/01/32 (Call 05/01/32) |
680 | 636,266 | ||||||
| 7.00%, 04/01/38 |
423 | 473,960 | ||||||
| Series AA, 2.70%, 04/01/31 (Call 01/01/31) |
615 | 519,820 | ||||||
| Series L, 5.80%, 10/01/35 |
85 | 87,201 | ||||||
| Series P, 6.70%, 08/15/37(a) |
635 | 688,307 | ||||||
| Series X, 3.30%, 06/01/27 (Call 03/01/27) |
485 | 455,880 | ||||||
| Series Y, 4.50%, 03/01/49 (Call 09/01/48)(a) |
527 | 425,327 | ||||||
| Series Z, 3.70%, 05/01/50 (Call 11/01/49) |
675 | 483,514 | ||||||
| Arizona Public Service Co. |
||||||||
| 2.20%, 12/15/31 (Call 09/15/31)(a) |
817 | 656,548 | ||||||
| 2.55%, 09/15/26 (Call 06/15/26) |
405 | 378,157 | ||||||
| 2.60%, 08/15/29 (Call 05/15/29) |
625 | 550,985 | ||||||
| 2.65%, 09/15/50 (Call 03/15/50)(a) |
575 | 341,504 | ||||||
| 2.95%, 09/15/27 (Call 06/15/27)(a) |
590 | 552,073 | ||||||
| 3.15%, 05/15/25 (Call 02/15/25) |
447 | 434,666 | ||||||
| 3.35%, 05/15/50 (Call 11/15/49)(a) |
655 | 446,632 | ||||||
| 3.50%, 12/01/49 (Call 06/01/49)(a) |
585 | 403,223 | ||||||
| 3.75%, 05/15/46 (Call 11/15/45) |
580 | 427,493 | ||||||
| 4.20%, 08/15/48 (Call 02/15/48) |
440 | 348,401 | ||||||
| 4.25%, 03/01/49 (Call 09/01/48) |
656 | 525,085 | ||||||
| 4.35%, 11/15/45 (Call 05/15/45) |
385 | 312,761 | ||||||
| 4.50%, 04/01/42 (Call 10/01/41) |
635 | 540,397 | ||||||
| 4.70%, 01/15/44 (Call 07/15/43) |
95 | 78,966 | ||||||
| 5.05%, 09/01/41 (Call 03/01/41) |
340 | 309,746 | ||||||
| 5.50%, 09/01/35 |
395 | 387,789 | ||||||
| 5.55%, 08/01/33 (Call 05/01/33) |
510 | 511,677 | ||||||
| 6.35%, 12/15/32 (Call 09/15/32) |
485 | 512,834 | ||||||
| Atlantic City Electric Co. |
||||||||
| 2.30%, 03/15/31 (Call 12/15/30) |
545 | 449,819 | ||||||
| 4.00%, 10/15/28 (Call 07/15/28) |
797 | 767,786 | ||||||
| Ausgrid Finance Pty Ltd., |
290 | 277,107 | ||||||
| Avangrid Inc. |
||||||||
| 3.20%, 04/15/25 (Call 03/15/25) |
1,093 | 1,063,194 | ||||||
| 3.80%, 06/01/29 (Call 03/01/29)(a) |
1,504 | 1,403,161 | ||||||
| Avista Corp. |
||||||||
| 4.00%, 04/01/52 (Call 10/01/51)(a) |
590 | 447,728 | ||||||
| 4.35%, 06/01/48 (Call 12/01/47) |
640 | 525,570 | ||||||
| Baltimore Gas & Electric Co. |
||||||||
| 2.25%, 06/15/31 (Call 03/15/31) |
500 | 416,554 | ||||||
| 2.40%, 08/15/26 (Call 05/15/26) |
667 | 628,436 | ||||||
| 2.90%, 06/15/50 (Call 12/15/49) |
430 | 278,811 | ||||||
| 3.20%, 09/15/49 (Call 03/15/49)(a) |
474 | 324,882 | ||||||
| 3.50%, 08/15/46 (Call 02/15/46) |
726 | 535,702 | ||||||
| 3.75%, 08/15/47 (Call 02/15/47)(a) |
329 | 247,940 | ||||||
| 4.25%, 09/15/48 (Call 03/15/48) |
735 | 608,322 | ||||||
| 4.55%, 06/01/52 (Call 12/01/51) |
560 | 487,815 | ||||||
| 5.40%, 06/01/53 (Call 12/01/52)(a) |
645 | 632,659 | ||||||
| 6.35%, 10/01/36 |
362 | 386,891 | ||||||
| Basin Electric Power Cooperative, |
375 | 320,664 | ||||||
| Berkshire Hathaway Energy Co. |
||||||||
| 1.65%, 05/15/31 (Call 02/15/31) |
950 | 752,204 | ||||||
| 2.85%, 05/15/51 (Call 11/15/50) |
1,835 | 1,178,471 | ||||||
| Security | Par (000) | Value | ||||||
| Electric (continued) | ||||||||
| 3.25%, 04/15/28 (Call 01/15/28) |
$ | 1,054 | $ | 987,220 | ||||
| 3.70%, 07/15/30 (Call 04/15/30) |
1,376 | 1,270,958 | ||||||
| 3.80%, 07/15/48 (Call 01/15/48) |
1,038 | 788,921 | ||||||
| 4.05%, 04/15/25 (Call 03/15/25) |
1,235 | 1,217,401 | ||||||
| 4.25%, 10/15/50 (Call 04/15/50) |
1,138 | 916,799 | ||||||
| 4.45%, 01/15/49 (Call 07/15/48) |
1,267 | 1,068,636 | ||||||
| 4.50%, 02/01/45 (Call 08/01/44) |
1,019 | 904,153 | ||||||
| 4.60%, 05/01/53 (Call 11/01/52)(a) |
1,065 | 909,306 | ||||||
| 5.15%, 11/15/43 (Call 05/15/43) |
908 | 871,780 | ||||||
| 5.95%, 05/15/37 |
529 | 548,078 | ||||||
| 6.13%, 04/01/36 |
1,951 | 2,060,038 | ||||||
| 8.48%, 09/15/28 |
205 | 234,426 | ||||||
| Black Hills Corp. |
||||||||
| 2.50%, 06/15/30 (Call 03/15/30) |
720 | 598,146 | ||||||
| 3.05%, 10/15/29 (Call 07/15/29)(a) |
662 | 586,585 | ||||||
| 3.15%, 01/15/27 (Call 07/15/26) |
852 | 806,246 | ||||||
| 3.88%, 10/15/49 (Call 04/15/49)(a) |
515 | 366,557 | ||||||
| 3.95%, 01/15/26 (Call 07/15/25) |
655 | 635,587 | ||||||
| 4.20%, 09/15/46 (Call 03/15/46)(a) |
385 | 299,472 | ||||||
| 4.35%, 05/01/33 (Call 02/01/33)(a) |
544 | 495,965 | ||||||
| 5.95%, 03/15/28 (Call 02/15/28)(a) |
610 | 627,397 | ||||||
| 6.15%, 05/15/34 (Call 02/15/34)(a) |
175 | 179,844 | ||||||
| CenterPoint Energy Houston Electric LLC |
||||||||
| 3.55%, 08/01/42 (Call 02/01/42) |
658 | 512,945 | ||||||
| 3.60%, 03/01/52 (Call 09/01/51) |
455 | 341,962 | ||||||
| 3.95%, 03/01/48 (Call 09/01/47) |
624 | 504,722 | ||||||
| 4.50%, 04/01/44 (Call 10/01/43) |
997 | 882,395 | ||||||
| 4.95%, 04/01/33 (Call 01/01/33)(a) |
290 | 285,736 | ||||||
| 5.15%, 03/01/34 (Call 12/01/33) |
355 | 354,343 | ||||||
| 5.20%, 10/01/28 (Call 09/01/28) |
460 | 464,008 | ||||||
| 5.30%, 04/01/53 (Call 10/01/52) |
510 | 507,629 | ||||||
| Series AA, 3.00%, 02/01/27 (Call 11/01/26) |
355 | 336,684 | ||||||
| Series AC, 4.25%, 02/01/49 (Call 08/01/48) |
1,161 | 984,071 | ||||||
| Series AD, 2.90%, 07/01/50 (Call 01/01/50)(a) |
846 | 556,555 | ||||||
| Series AE, 2.35%, 04/01/31 (Call 01/01/31)(a) |
495 | 415,792 | ||||||
| Series AF, 3.35%, 04/01/51 (Call 10/01/50) |
440 | 316,340 | ||||||
| Series AG, 3.00%, 03/01/32 (Call 12/01/31) |
325 | 281,161 | ||||||
| Series ai., 4.45%, 10/01/32 (Call 07/01/32) |
600 | 571,528 | ||||||
| Series AJ, 4.85%, 10/01/52 (Call 04/01/52) |
280 | 258,359 | ||||||
| Series K2, 6.95%, 03/15/33(a) |
695 | 786,265 | ||||||
| Series Z, 2.40%, 09/01/26 (Call 06/01/26) |
641 | 603,939 | ||||||
| CenterPoint Energy Inc. |
||||||||
| 1.45%, 06/01/26 (Call 05/01/26) |
882 | 812,422 | ||||||
| 2.65%, 06/01/31 (Call 03/01/31)(a) |
560 | 469,527 | ||||||
| 2.95%, 03/01/30 (Call 12/01/29)(a) |
782 | 691,528 | ||||||
| 3.70%, 09/01/49 (Call 03/01/49)(a) |
795 | 579,565 | ||||||
| 5.25%, 08/10/26(a) |
490 | 490,142 | ||||||
| Cleco Corporate Holdings LLC |
||||||||
| 3.38%, 09/15/29 (Call 06/15/29) |
629 | 546,932 | ||||||
| 3.74%, 05/01/26 (Call 02/01/26)(a) |
932 | 895,377 | ||||||
| 4.97%, 05/01/46 (Call 11/01/45) |
457 | 376,083 | ||||||
| Cleco Power LLC |
||||||||
| 6.00%, 12/01/40 |
385 | 390,245 | ||||||
| 6.50%, 12/01/35(a) |
377 | 388,985 | ||||||
| Cleveland Electric Illuminating Co. (The) |
||||||||
| 3.50%, 04/01/28 (Call 01/01/28)(a)(b) |
345 | 321,286 | ||||||
| 4.55%, 11/15/30 (Call 08/15/30)(a)(b) |
615 | 572,936 | ||||||
| 5.95%, 12/15/36 |
642 | 639,767 | ||||||
| 66 | 2 0 2 4 I S H A R E S A N N U A L R E P O R T T O S H A R E H O L D E R S |
| Schedule of Investments (continued) February 29, 2024 |
iShares® Broad USD Investment Grade Corporate Bond ETF (Percentages shown are based on Net Assets) |
| Security | Par (000) | Value | ||||||
| Electric (continued) | ||||||||
| CMS Energy Corp. |
||||||||
| 2.95%, 02/15/27 (Call 11/15/26)(a) |
$ | 447 | $ | 415,006 | ||||
| 3.00%, 05/15/26 (Call 02/15/26) |
532 | 505,420 | ||||||
| 3.45%, 08/15/27 (Call 05/15/27)(a) |
505 | 478,411 | ||||||
| 3.60%, 11/15/25 (Call 08/15/25)(a) |
650 | 628,303 | ||||||
| 3.75%, 12/01/50 (Call 09/01/30), |
556 | 444,707 | ||||||
| 4.70%, 03/31/43 (Call 09/30/42)(a) |
472 | 410,107 | ||||||
| 4.75%, 06/01/50 (Call 03/01/30), |
564 | 516,799 | ||||||
| 4.88%, 03/01/44 (Call 09/01/43)(a) |
508 | 466,507 | ||||||
| Colbun SA |
||||||||
| 3.15%, 03/06/30 (Call 12/06/29)(b) |
280 | 245,449 | ||||||
| 3.15%, 01/19/32 (Call 10/19/31)(b) |
315 | 265,957 | ||||||
| 3.95%, 10/11/27 (Call 07/11/27)(b) |
572 | 545,029 | ||||||
| Cometa Energia SA de CV, |
437 | 432,173 | ||||||
| Comision Federal de Electricidad |
||||||||
| 3.35%, 02/09/31 (Call 11/09/30)(b) |
1,410 | 1,188,817 | ||||||
| 3.88%, 07/26/33 (Call 04/26/33)(b) |
1,101 | 902,262 | ||||||
| 4.68%, 02/09/51 (Call 08/09/50)(b) |
537 | 376,643 | ||||||
| 4.69%, 05/15/29 (Call 03/15/29)(b) |
1,172 | 1,110,268 | ||||||
| 4.75%, 02/23/27(a)(b) |
640 | 625,335 | ||||||
| 5.75%, 02/14/42(a)(b) |
512 | 441,703 | ||||||
| 6.26%, 02/15/52 (Call 08/15/51)(a)(b) |
1,080 | 938,118 | ||||||
| Commonwealth Edison Co. |
||||||||
| 2.20%, 03/01/30 (Call 12/01/29) |
787 | 669,476 | ||||||
| 2.55%, 06/15/26 (Call 03/15/26) |
1,131 | 1,070,166 | ||||||
| 3.00%, 03/01/50 (Call 09/01/49) |
746 | 492,911 | ||||||
| 3.15%, 03/15/32 (Call 12/15/31) |
385 | 334,979 | ||||||
| 3.65%, 06/15/46 (Call 12/15/45)(a) |
434 | 330,247 | ||||||
| 3.70%, 08/15/28 (Call 05/15/28) |
879 | 837,444 | ||||||
| 3.70%, 03/01/45 (Call 09/01/44)(a) |
807 | 629,214 | ||||||
| 3.80%, 10/01/42 (Call 04/01/42) |
389 | 312,575 | ||||||
| 4.00%, 03/01/48 (Call 09/01/47) |
900 | 725,176 | ||||||
| 4.00%, 03/01/49 (Call 09/01/48) |
895 | 715,266 | ||||||
| 4.35%, 11/15/45 (Call 05/15/45) |
555 | 472,108 | ||||||
| 4.60%, 08/15/43 (Call 02/15/43) |
422 | 374,261 | ||||||
| 4.70%, 01/15/44 (Call 07/15/43) |
410 | 365,290 | ||||||
| 4.90%, 02/01/33 (Call 11/01/32) |
245 | 241,046 | ||||||
| 5.30%, 02/01/53 (Call 08/01/52)(a) |
665 | 643,674 | ||||||
| 6.45%, 01/15/38 |
739 | 801,888 | ||||||
| Series 122, 2.95%, 08/15/27 (Call 05/15/27) |
780 | 730,954 | ||||||
| Series 123, 3.75%, 08/15/47 (Call 02/15/47) |
806 | 618,424 | ||||||
| Series 127, 3.20%, 11/15/49 (Call 05/15/49)(a) |
411 | 283,148 | ||||||
| Series 130, 3.13%, 03/15/51 (Call 09/15/50) |
775 | 520,104 | ||||||
| Series 131, 2.75%, 09/01/51 (Call 03/01/51) |
520 | 320,943 | ||||||
| Series 133, 3.85%, 03/15/52 (Call 09/15/51)(a) |
545 | 419,501 | ||||||
| Connecticut Light & Power Co. (The) |
||||||||
| 4.00%, 04/01/48 (Call 10/01/47) |
1,055 | 859,114 | ||||||
| 4.30%, 04/15/44 (Call 10/15/43) |
650 | 553,014 | ||||||
| 4.90%, 07/01/33 (Call 04/01/33) |
485 | 474,526 | ||||||
| 5.25%, 01/15/53 (Call 07/15/52)(a) |
740 | 721,325 | ||||||
| Series A, 0.75%, 12/01/25 (Call 11/01/25) |
374 | 346,478 | ||||||
| Series A, 2.05%, 07/01/31 (Call 04/01/31) |
66 | 53,510 | ||||||
| Series A, 3.20%, 03/15/27 (Call 12/15/26)(a) |
937 | 891,556 | ||||||
| Series A, 4.15%, 06/01/45 (Call 12/01/44)(a) |
315 | 265,240 | ||||||
| Connecticut Light and Power Co. (The), |
580 | 570,088 | ||||||
| Security | Par (000) | Value | ||||||
| Electric (continued) | ||||||||
| Consolidated Edison Co. of New York Inc. |
||||||||
| 2.40%, 06/15/31 (Call 03/15/31) |
$ | 1,302 | $ | 1,096,249 | ||||
| 3.20%, 12/01/51 (Call 06/01/51) |
815 | 553,480 | ||||||
| 3.60%, 06/15/61 (Call 12/15/60)(a) |
800 | 577,626 | ||||||
| 3.70%, 11/15/59 (Call 05/15/59) |
960 | 684,982 | ||||||
| 3.80%, 05/15/28 (Call 02/15/28)(a) |
905 | 859,923 | ||||||
| 3.85%, 06/15/46 (Call 12/15/45)(a) |
864 | 678,884 | ||||||
| 3.95%, 03/01/43 (Call 09/01/42) |
935 | 767,028 | ||||||
| 4.45%, 03/15/44 (Call 09/15/43)(a) |
1,149 | 999,351 | ||||||
| 4.50%, 12/01/45 (Call 06/01/45) |
1,070 | 926,281 | ||||||
| 4.50%, 05/15/58 (Call 11/15/57)(a) |
739 | 621,668 | ||||||
| 4.63%, 12/01/54 (Call 06/01/54) |
805 | 691,232 | ||||||
| 5.20%, 03/01/33 (Call 12/01/32)(a) |
645 | 649,857 | ||||||
| 5.50%, 03/15/34 (Call 12/15/33 |
775 | 791,485 | ||||||
| 5.70%, 06/15/40 |
460 | 462,893 | ||||||
| 5.90%, 11/15/53 (Call 05/15/53)(a) |
870 | 917,499 | ||||||
| 6.15%, 11/15/52 (Call 05/15/52)(a) |
310 | 335,945 | ||||||
| Series 05-A, 5.30%, 03/01/35 |
634 | 629,709 | ||||||
| Series 06-A, 5.85%, 03/15/36 |
630 | 646,343 | ||||||
| Series 06-B, 6.20%, 06/15/36 |
545 | 579,295 | ||||||
| Series 06-E, 5.70%, 12/01/36 |
535 | 536,012 | ||||||
| Series 07-A, 6.30%, 08/15/37 |
833 | 890,752 | ||||||
| Series 08-B, 6.75%, 04/01/38 |
874 | 973,659 | ||||||
| Series 09-C, 5.50%, 12/01/39 |
638 | 637,568 | ||||||
| Series 12-A, 4.20%, 03/15/42 |
744 | 621,864 | ||||||
| Series 2017, 3.88%, 06/15/47 (Call 12/15/46) |
939 | 729,636 | ||||||
| Series 20A, 3.35%, 04/01/30 (Call 01/01/30) |
1,136 | 1,038,548 | ||||||
| Series 20B, 3.95%, 04/01/50 (Call 10/01/49) |
1,195 | 957,218 | ||||||
| Series A, 4.13%, 05/15/49 (Call 11/15/48)(a) |
750 | 602,454 | ||||||
| Series B, 2.90%, 12/01/26 (Call 09/01/26) |
455 | 426,795 | ||||||
| Series B, 3.13%, 11/15/27 (Call 08/15/27) |
462 | 434,638 | ||||||
| Series C, 3.00%, 12/01/60 (Call 06/01/60) |
570 | 348,004 | ||||||
| Series C, 4.00%, 11/15/57 (Call 05/15/57)(a) |
300 | 233,604 | ||||||
| Series C, 4.30%, 12/01/56 (Call 06/01/56)(a) |
641 | 524,846 | ||||||
| Series D, 4.00%, 12/01/28 (Call 09/01/28)(a) |
275 | 265,387 | ||||||
| Series E, 4.65%, 12/01/48 (Call 06/01/48) |
918 | 802,412 | ||||||
| Consorcio Transmantaro SA |
||||||||
| 4.70%, 04/16/34(a)(b) |
1,200 | 1,125,875 | ||||||
| 5.20%, 04/11/38 (Call 01/11/38)(b) |
405 | 377,464 | ||||||
| Constellation Energy Generation LLC |
||||||||
| 3.25%, 06/01/25 (Call 05/01/25) |
1,371 | 1,331,626 | ||||||
| 5.60%, 03/01/28 (Call 02/01/28)(a) |
755 | 765,021 | ||||||
| 5.60%, 06/15/42 (Call 12/15/41) |
850 | 828,042 | ||||||
| 5.75%, 10/01/41 (Call 04/01/41) |
646 | 632,117 | ||||||
| 5.80%, 03/01/33 (Call 12/01/32) |
660 | 674,580 | ||||||
| 6.13%, 01/15/34 (Call 10/15/33) |
850 | 886,798 | ||||||
| 6.25%, 10/01/39 |
910 | 938,110 | ||||||
| 6.50%, 10/01/53 (Call 04/01/53)(a) |
735 | 806,663 | ||||||
| Consumers Energy Co. |
||||||||
| 2.50%, 05/01/60 (Call 11/01/59) |
345 | 190,568 | ||||||
| 3.10%, 08/15/50 (Call 02/15/50) |
750 | 520,135 | ||||||
| 3.25%, 08/15/46 (Call 02/15/46) |
440 | 321,819 | ||||||
| 3.50%, 08/01/51 (Call 02/01/51) |
835 | 624,506 | ||||||
| 3.60%, 08/15/32 (Call 02/15/32) |
350 | 315,431 | ||||||
| 3.75%, 02/15/50 (Call 08/15/49) |
523 | 408,965 | ||||||
| 3.80%, 11/15/28 (Call 08/15/28)(a) |
596 | 570,671 | ||||||
| 3.95%, 05/15/43 (Call 11/15/42) |
545 | 447,968 | ||||||
| 3.95%, 07/15/47 (Call 01/15/47)(a) |
525 | 426,330 | ||||||
| 4.05%, 05/15/48 (Call 11/15/47) |
705 | 584,303 | ||||||
| 4.10%, 11/15/45 (Call 05/15/45) |
60 | 48,109 | ||||||
| S C H E D U L E O F I N V E S T M E N T S |
67 |
| Schedule of Investments (continued) February 29, 2024 |
iShares® Broad USD Investment Grade Corporate Bond ETF (Percentages shown are based on Net Assets) |
| Security | Par (000) |
Value | ||||||
| Electric (continued) | ||||||||
| 4.20%, 09/01/52 (Call 03/01/52) |
$ | 305 | $ | 253,520 | ||||
| 4.35%, 04/15/49 (Call 10/15/48) |
681 | 589,272 | ||||||
| 4.35%, 08/31/64 (Call 02/28/64) |
295 | 224,377 | ||||||
| 4.60%, 05/30/29 (Call 03/30/29)(a) |
310 | 304,710 | ||||||
| 4.63%, 05/15/33 (Call 11/15/32) |
1,005 | 970,959 | ||||||
| 4.65%, 03/01/28 (Call 01/01/28)(a) |
705 | 700,905 | ||||||
| 4.90%, 02/15/29 (Call 12/15/28)(a) |
755 | 753,057 | ||||||
| Dayton Power & Light Co. (The), |
720 | 529,459 | ||||||
| Delmarva Power & Light Co. |
||||||||
| 4.00%, 06/01/42 (Call 12/01/41) |
175 | 140,236 | ||||||
| 4.15%, 05/15/45 (Call 11/15/44) |
486 | 388,912 | ||||||
| Dominion Energy Inc. |
||||||||
| 3.90%, 10/01/25 (Call 07/01/25) |
349 | 340,831 | ||||||
| 4.25%, 06/01/28 (Call 03/01/28)(a) |
788 | 760,391 | ||||||
| 4.35%, 08/15/32 (Call 05/15/32)(a) |
5 | 4,660 | ||||||
| 4.70%, 12/01/44 (Call 06/01/44) |
685 | 589,337 | ||||||
| 4.85%, 08/15/52 (Call 02/15/52)(a) |
940 | 823,373 | ||||||
| 5.38%, 11/15/32 (Call 08/15/32)(a) |
955 | 949,488 | ||||||
| 7.00%, 06/15/38 |
691 | 752,045 | ||||||
| Series A, 1.45%, 04/15/26 (Call 03/15/26) |
953 | 880,355 | ||||||
| Series A, 3.30%, 03/15/25 (Call 02/15/25) |
783 | 765,201 | ||||||
| Series A, 4.60%, 03/15/49 (Call 09/15/48) |
449 | 380,367 | ||||||
| Series B, 3.30%, 04/15/41 (Call 10/15/40)(a) |
985 | 725,070 | ||||||
| Series B, 3.60%, 03/15/27 (Call 01/15/27) |
505 | 483,091 | ||||||
| Series B, 5.95%, 06/15/35 |
980 | 1,002,182 | ||||||
| Series C, 2.25%, 08/15/31 (Call 05/15/31) |
1,235 | 999,826 | ||||||
| Series C, 3.38%, 04/01/30 (Call 01/01/30) |
1,661 | 1,493,467 | ||||||
| Series C, 4.05%, 09/15/42 (Call 03/15/42) |
669 | 529,302 | ||||||
| Series C, 4.90%, 08/01/41 (Call 02/01/41) |
776 | 695,567 | ||||||
| Series D, 2.85%, 08/15/26 (Call 05/15/26) |
749 | 707,528 | ||||||
| Series E, 6.30%, 03/15/33 |
460 | 480,107 | ||||||
| Series F, 5.25%, 08/01/33 |
719 | 706,827 | ||||||
| Dominion Energy South Carolina Inc. |
||||||||
| 4.60%, 06/15/43 (Call 12/15/42) |
807 | 711,244 | ||||||
| 5.10%, 06/01/65 (Call 12/01/64) |
325 | 300,730 | ||||||
| 5.30%, 05/15/33 |
635 | 640,264 | ||||||
| 5.45%, 02/01/41 (Call 08/01/40) |
485 | 474,722 | ||||||
| 6.05%, 01/15/38(a) |
681 | 719,712 | ||||||
| 6.25%, 10/15/53 (Call 04/15/53) |
255 | 281,898 | ||||||
| 6.63%, 02/01/32(a) |
542 | 601,117 | ||||||
| Series A, 2.30%, 12/01/31 (Call 09/01/31) |
455 | 373,064 | ||||||
| DTE Electric Co. |
||||||||
| 2.25%, 03/01/30 (Call 12/01/29)(a) |
524 | 449,877 | ||||||
| 2.95%, 03/01/50 (Call 09/01/49) |
600 | 398,921 | ||||||
| 3.38%, 03/01/25 (Call 12/01/24) |
372 | 365,118 | ||||||
| 3.70%, 03/15/45 (Call 09/15/44) |
548 | 430,192 | ||||||
| 3.70%, 06/01/46 (Call 12/01/45) |
639 | 489,791 | ||||||
| 3.75%, 08/15/47 (Call 02/15/47)(a) |
927 | 710,432 | ||||||
| 3.95%, 06/15/42 (Call 12/15/41)(a) |
364 | 290,177 | ||||||
| 3.95%, 03/01/49 (Call 09/01/48)(a) |
804 | 649,882 | ||||||
| 4.30%, 07/01/44 (Call 01/01/44)(a) |
430 | 367,985 | ||||||
| 4.85%, 12/01/26 |
195 | 194,647 | ||||||
| 5.20%, 04/01/33 (Call 01/01/33) |
815 | 820,112 | ||||||
| 5.20%, 03/01/34 (Call 12/01/33) |
625 | 621,882 | ||||||
| 5.40%, 04/01/53 (Call 10/01/52)(a) |
810 | 802,532 | ||||||
| 5.70%, 10/01/37(a) |
176 | 177,528 | ||||||
| Series A, 1.90%, 04/01/28 (Call 02/01/28) |
640 | 570,183 | ||||||
| Series A, 3.00%, 03/01/32 (Call 12/01/31) |
820 | 707,974 | ||||||
| Series A, 4.00%, 04/01/43 (Call 10/01/42)(a) |
448 | 371,021 | ||||||
| Series A, 4.05%, 05/15/48 (Call 11/15/47) |
670 | 547,651 | ||||||
| Security | Par (000) |
Value | ||||||
| Electric (continued) | ||||||||
| Series A, 6.63%, 06/01/36 |
$ | 130 | $ | 142,361 | ||||
| Series B, 3.25%, 04/01/51 (Call 10/01/50) |
667 | 464,197 | ||||||
| Series B, 3.65%, 03/01/52 (Call 09/01/51) |
377 | 283,166 | ||||||
| Series C, 2.63%, 03/01/31 (Call 12/01/30)(a) |
773 | 664,124 | ||||||
| DTE Energy Co. |
||||||||
| 2.85%, 10/01/26 (Call 07/01/26) |
1,145 | 1,078,365 | ||||||
| 2.95%, 03/01/30 (Call 12/01/29) |
639 | 559,107 | ||||||
| 4.88%, 06/01/28 (Call 05/01/28) |
890 | 877,335 | ||||||
| 5.10%, 03/01/29 (Call 02/01/29)(a) |
1,025 | 1,016,354 | ||||||
| Series C, 3.40%, 06/15/29 (Call 03/15/29) |
943 | 862,729 | ||||||
| Series F, 1.05%, 06/01/25 (Call 05/01/25) |
968 | 916,577 | ||||||
| Duke Energy Carolinas LLC |
||||||||
| 2.45%, 08/15/29 (Call 05/15/29)(a) |
776 | 684,395 | ||||||
| 2.45%, 02/01/30 (Call 11/01/29) |
523 | 457,241 | ||||||
| 2.55%, 04/15/31 (Call 01/15/31) |
537 | 460,117 | ||||||
| 2.85%, 03/15/32 (Call 12/15/31)(a) |
520 | 441,836 | ||||||
| 2.95%, 12/01/26 (Call 09/01/26) |
921 | 877,847 | ||||||
| 3.20%, 08/15/49 (Call 02/15/49) |
974 | 672,770 | ||||||
| 3.45%, 04/15/51 (Call 10/15/50) |
400 | 284,422 | ||||||
| 3.55%, 03/15/52 (Call 09/15/51) |
797 | 573,675 | ||||||
| 3.70%, 12/01/47 (Call 06/01/47) |
827 | 616,076 | ||||||
| 3.75%, 06/01/45 (Call 12/01/44) |
729 | 564,026 | ||||||
| 3.88%, 03/15/46 (Call 09/15/45) |
658 | 512,696 | ||||||
| 3.95%, 11/15/28 (Call 08/15/28) |
962 | 926,721 | ||||||
| 3.95%, 03/15/48 (Call 09/15/47)(a) |
659 | 521,379 | ||||||
| 4.00%, 09/30/42 (Call 03/30/42) |
857 | 701,384 | ||||||
| 4.25%, 12/15/41 (Call 06/15/41) |
880 | 745,450 | ||||||
| 4.85%, 01/15/34 (Call 10/15/33) |
470 | 455,948 | ||||||
| 4.95%, 01/15/33 (Call 10/15/32) |
1,440 | 1,419,429 | ||||||
| 5.30%, 02/15/40 |
762 | 747,530 | ||||||
| 5.35%, 01/15/53 (Call 07/15/52) |
1,090 | 1,066,862 | ||||||
| 5.40%, 01/15/54 (Call 07/15/53) |
1,291 | 1,257,831 | ||||||
| 6.00%, 01/15/38 |
712 | 747,348 | ||||||
| 6.05%, 04/15/38 |
527 | 553,613 | ||||||
| 6.10%, 06/01/37 |
596 | 622,446 | ||||||
| 6.45%, 10/15/32 |
700 | 758,370 | ||||||
| Series A, 6.00%, 12/01/28(a) |
802 | 836,959 | ||||||
| Duke Energy Corp. |
||||||||
| 0.90%, 09/15/25 (Call 08/15/25) |
1,114 | 1,042,119 | ||||||
| 2.45%, 06/01/30 (Call 03/01/30)(a) |
973 | 832,005 | ||||||
| 2.55%, 06/15/31 (Call 03/15/31) |
1,204 | 1,003,804 | ||||||
| 2.65%, 09/01/26 (Call 06/01/26) |
1,722 | 1,619,978 | ||||||
| 3.15%, 08/15/27 (Call 05/15/27) |
1,107 | 1,037,791 | ||||||
| 3.25%, 01/15/82 (Call 01/15/27), |
459 | 387,105 | ||||||
| 3.30%, 06/15/41 (Call 12/15/40) |
1,024 | 753,291 | ||||||
| 3.40%, 06/15/29 (Call 03/15/29) |
670 | 616,951 | ||||||
| 3.50%, 06/15/51 (Call 12/15/50) |
1,173 | 812,068 | ||||||
| 3.75%, 09/01/46 (Call 03/01/46) |
1,305 | 973,787 | ||||||
| 3.95%, 08/15/47 (Call 02/15/47) |
791 | 603,499 | ||||||
| 4.20%, 06/15/49 (Call 12/15/48) |
830 | 653,202 | ||||||
| 4.30%, 03/15/28 (Call 02/15/28) |
1,375 | 1,335,863 | ||||||
| 4.50%, 08/15/32 (Call 05/15/32) |
705 | 661,832 | ||||||
| 4.80%, 12/15/45 (Call 06/15/45) |
657 | 576,963 | ||||||
| 4.85%, 01/05/27 |
545 | 540,914 | ||||||
| 4.85%, 01/05/29 (Call 12/05/28) |
700 | 688,105 | ||||||
| 5.00%, 12/08/25 |
508 | 506,275 | ||||||
| 5.00%, 12/08/27 (Call 11/08/27)(a) |
780 | 774,687 | ||||||
| 5.00%, 08/15/52 (Call 02/15/52) |
1,570 | 1,398,724 | ||||||
| 5.75%, 09/15/33 (Call 06/15/33)(a) |
890 | 906,692 | ||||||
| 6.10%, 09/15/53 (Call 03/15/53)(a) |
1,045 | 1,084,291 | ||||||
| 68 | 2 0 2 4 I S H A R E S A N N U A L R E P O R T T O S H A R E H O L D E R S |
| Schedule of Investments (continued) February 29, 2024 |
iShares® Broad USD Investment Grade Corporate Bond ETF (Percentages shown are based on Net Assets) |
| Security | Par (000) | Value | ||||||
| Electric (continued) | ||||||||
| Duke Energy Florida LLC |
||||||||
| 1.75%, 06/15/30 (Call 03/15/30) |
$ | 630 | $ | 519,852 | ||||
| 2.40%, 12/15/31 (Call 09/15/31) |
772 | 637,817 | ||||||
| 2.50%, 12/01/29 (Call 09/01/29) |
701 | 616,182 | ||||||
| 3.00%, 12/15/51 (Call 06/15/51) |
615 | 397,130 | ||||||
| 3.20%, 01/15/27 (Call 10/15/26) |
1,007 | 961,481 | ||||||
| 3.40%, 10/01/46 (Call 04/01/46) |
714 | 513,948 | ||||||
| 3.80%, 07/15/28 (Call 04/15/28) |
703 | 674,949 | ||||||
| 3.85%, 11/15/42 (Call 05/15/42) |
587 | 466,898 | ||||||
| 4.20%, 07/15/48 (Call 01/15/48) |
627 | 512,305 | ||||||
| 5.65%, 04/01/40 |
650 | 653,297 | ||||||
| 5.88%, 11/15/33 (Call 08/15/33) |
850 | 889,815 | ||||||
| 5.95%, 11/15/52 (Call 05/15/52) |
689 | 725,589 | ||||||
| 6.20%, 11/15/53 (Call 05/15/53)(a) |
825 | 893,429 | ||||||
| 6.35%, 09/15/37 |
879 | 941,204 | ||||||
| 6.40%, 06/15/38 |
973 | 1,052,534 | ||||||
| Duke Energy Indiana LLC |
||||||||
| 2.75%, 04/01/50 (Call 10/01/49) |
890 | 554,035 | ||||||
| 3.75%, 05/15/46 (Call 11/15/45) |
529 | 404,165 | ||||||
| 5.25%, 03/01/34 (Call 12/01/33) |
375 | 374,025 | ||||||
| 5.40%, 04/01/53 (Call 10/01/52) |
645 | 622,079 | ||||||
| 6.12%, 10/15/35(a) |
499 | 516,568 | ||||||
| 6.35%, 08/15/38 |
667 | 713,416 | ||||||
| 6.45%, 04/01/39 |
444 | 484,540 | ||||||
| Series UUU, 4.20%, 03/15/42 (Call 09/15/41) |
200 | 166,887 | ||||||
| Series WWW, 4.90%, 07/15/43 (Call 01/15/43) |
405 | 373,079 | ||||||
| Series YYY, 3.25%, 10/01/49 (Call 04/01/49)(a) |
602 | 415,677 | ||||||
| Duke Energy Ohio Inc. |
||||||||
| 2.13%, 06/01/30 (Call 03/01/30) |
829 | 696,556 | ||||||
| 3.65%, 02/01/29 (Call 11/01/28)(a) |
739 | 698,056 | ||||||
| 3.70%, 06/15/46 (Call 12/15/45) |
350 | 262,803 | ||||||
| 4.30%, 02/01/49 (Call 08/01/48) |
564 | 458,949 | ||||||
| 5.25%, 04/01/33 (Call 01/01/33) |
450 | 450,353 | ||||||
| 5.65%, 04/01/53 (Call 10/01/52)(a) |
485 | 489,434 | ||||||
| Duke Energy Progress LLC |
||||||||
| 2.00%, 08/15/31 (Call 05/15/31) |
1,005 | 812,443 | ||||||
| 2.50%, 08/15/50 (Call 02/15/50) |
677 | 404,051 | ||||||
| 2.90%, 08/15/51 (Call 02/15/51) |
487 | 312,359 | ||||||
| 3.25%, 08/15/25 (Call 05/15/25)(a) |
604 | 589,033 | ||||||
| 3.40%, 04/01/32 (Call 01/01/32) |
280 | 247,677 | ||||||
| 3.45%, 03/15/29 (Call 12/15/28) |
584 | 546,216 | ||||||
| 3.60%, 09/15/47 (Call 03/15/47)(a) |
866 | 641,837 | ||||||
| 3.70%, 09/01/28 (Call 06/01/28)(a) |
626 | 597,021 | ||||||
| 3.70%, 10/15/46 (Call 04/15/46) |
646 | 489,148 | ||||||
| 4.00%, 04/01/52 (Call 10/01/51) |
505 | 398,301 | ||||||
| 4.10%, 05/15/42 (Call 11/15/41) |
744 | 615,933 | ||||||
| 4.10%, 03/15/43 (Call 09/15/42) |
574 | 470,652 | ||||||
| 4.15%, 12/01/44 (Call 06/01/44) |
867 | 709,249 | ||||||
| 4.20%, 08/15/45 (Call 02/15/45) |
929 | 766,286 | ||||||
| 4.38%, 03/30/44 (Call 09/30/43) |
493 | 421,431 | ||||||
| 5.25%, 03/15/33 (Call 12/15/32)(a) |
575 | 574,001 | ||||||
| 5.35%, 03/15/53 (Call 09/15/52) |
685 | 663,589 | ||||||
| 6.30%, 04/01/38(a) |
675 | 724,558 | ||||||
| Duquesne Light Holdings Inc. |
||||||||
| 2.53%, 10/01/30 (Call 07/01/30)(b) |
577 | 476,396 | ||||||
| 2.78%, 01/07/32 (Call 10/07/31)(a)(b) |
690 | 559,445 | ||||||
| 3.62%, 08/01/27 (Call 05/01/27)(b) |
564 | 525,030 | ||||||
| Security | Par (000) | Value | ||||||
| Electric (continued) | ||||||||
| E.ON International Finance BV, |
$ | 1,580 | $ | 1,691,154 | ||||
| Edison International |
||||||||
| 4.13%, 03/15/28 (Call 12/15/27) |
830 | 793,164 | ||||||
| 4.70%, 08/15/25 |
555 | 547,210 | ||||||
| 4.95%, 04/15/25 (Call 03/15/25)(a) |
579 | 573,941 | ||||||
| 5.25%, 11/15/28 (Call 10/15/28) |
365 | 362,919 | ||||||
| 5.75%, 06/15/27 (Call 04/15/27) |
781 | 788,280 | ||||||
| 6.95%, 11/15/29 (Call 09/15/29) |
855 | 911,293 | ||||||
| EDP Finance BV, 1.71%, 01/24/28(b) |
1,432 | 1,259,266 | ||||||
| El Paso Electric Co. |
||||||||
| 5.00%, 12/01/44 (Call 06/01/44)(a) |
489 | 417,686 | ||||||
| 6.00%, 05/15/35(a) |
724 | 727,853 | ||||||
| Electricite de France SA |
||||||||
| 3.63%, 10/13/25 (Call 07/13/25)(b) |
1,242 | 1,210,356 | ||||||
| 4.50%, 09/21/28 (Call 06/21/28)(a)(b) |
1,453 | 1,408,014 | ||||||
| 4.75%, 10/13/35 (Call 04/13/35)(b) |
392 | 360,274 | ||||||
| 4.88%, 09/21/38 (Call 03/21/38)(b) |
585 | 519,205 | ||||||
| 4.88%, 01/22/44(b) |
811 | 707,593 | ||||||
| 4.95%, 10/13/45 (Call 04/13/45)(a)(b) |
994 | 874,022 | ||||||
| 5.00%, 09/21/48 (Call 03/21/48)(b) |
2,019 | 1,775,135 | ||||||
| 5.25%, 10/13/55 (Call 04/13/55)(a)(b) |
260 | 222,642 | ||||||
| 5.60%, 01/27/40(a)(b) |
863 | 835,273 | ||||||
| 5.70%, 05/23/28 (Call 04/23/28)(a)(b) |
580 | 590,457 | ||||||
| 6.00%, 01/22/2114(a)(b) |
687 | 644,221 | ||||||
| 6.25%, 05/23/33 (Call 02/23/33)(b) |
1,095 | 1,143,911 | ||||||
| 6.90%, 05/23/53 (Call 11/23/52)(b) |
1,580 | 1,721,568 | ||||||
| 6.95%, 01/26/39(a)(b) |
1,764 | 1,933,155 | ||||||
| Elm Road Generating Station Supercritical LLC, |
||||||||
| 6.09%, 02/11/40(a)(b) |
235 | 229,290 | ||||||
| Emera U.S. Finance LP |
||||||||
| 2.64%, 06/15/31 (Call 03/15/31)(a) |
665 | 539,231 | ||||||
| 3.55%, 06/15/26 (Call 03/15/26) |
1,345 | 1,289,858 | ||||||
| 4.75%, 06/15/46 (Call 12/15/45) |
1,716 | 1,404,704 | ||||||
| Empresa de Transmision Electrica SA, 5.13%, 05/02/49(b) |
470 | 336,050 | ||||||
| Enel Americas SA, 4.00%, 10/25/26 (Call 07/25/26) |
934 | 898,050 | ||||||
| Enel Chile SA, 4.88%, 06/12/28 (Call 03/12/28) |
1,406 | 1,367,808 | ||||||
| Enel Finance America LLC |
||||||||
| 2.88%, 07/12/41 (Call 01/12/41)(a)(b) |
1,005 | 669,494 | ||||||
| 7.10%, 10/14/27 (Call 09/14/27)(b) |
1,275 | 1,341,601 | ||||||
| Enel Finance International NV |
||||||||
| 1.38%, 07/12/26 (Call 06/12/26)(b) |
1,920 | 1,749,361 | ||||||
| 1.88%, 07/12/28 (Call 05/12/28)(a)(b) |
1,475 | 1,278,527 | ||||||
| 2.25%, 07/12/31 (Call 04/12/31)(b) |
1,781 | 1,423,221 | ||||||
| 3.50%, 04/06/28(a)(b) |
1,775 | 1,654,668 | ||||||
| 3.63%, 05/25/27(a)(b) |
1,370 | 1,302,152 | ||||||
| 4.25%, 06/15/25(b) |
330 | 324,302 | ||||||
| 4.63%, 06/15/27 (Call 05/15/27)(b) |
1,105 | 1,083,333 | ||||||
| 4.75%, 05/25/47(a)(b) |
1,375 | 1,155,650 | ||||||
| 4.88%, 06/14/29(a)(b) |
1,140 | 1,117,929 | ||||||
| 5.00%, 06/15/32 (Call 03/15/32)(b) |
1,495 | 1,426,496 | ||||||
| 5.50%, 06/15/52 (Call 12/15/51)(a)(b) |
1,568 | 1,428,002 | ||||||
| 6.00%, 10/07/39(b) |
2,102 | 2,103,456 | ||||||
| 6.80%, 10/14/25(b) |
365 | 372,098 | ||||||
| 6.80%, 09/15/37(b) |
1,035 | 1,110,076 | ||||||
| 7.50%, 10/14/32 (Call 07/14/32)(b) |
1,145 | 1,274,040 | ||||||
| 7.75%, 10/14/52 (Call 04/14/52)(b) |
1,415 | 1,693,060 | ||||||
| Engie Energia Chile SA, 3.40%, 01/28/30 (Call 10/28/29)(b) |
140 | 121,861 | ||||||
| S C H E D U L E O F I N V E S T M E N T S |
69 |
| Schedule of Investments (continued) February 29, 2024 |
iShares® Broad USD Investment Grade Corporate Bond ETF (Percentages shown are based on Net Assets) |
| Security | Par (000) | Value | ||||||
| Electric (continued) | ||||||||
| Entergy Arkansas LLC |
||||||||
| 2.65%, 06/15/51 (Call 12/15/50)(a) |
$ | 995 | $ | 597,846 | ||||
| 3.35%, 06/15/52 (Call 12/15/51)(a) |
637 | 435,695 | ||||||
| 3.50%, 04/01/26 (Call 01/01/26) |
878 | 851,668 | ||||||
| 4.00%, 06/01/28 (Call 03/01/28)(a) |
740 | 711,896 | ||||||
| 4.20%, 04/01/49 (Call 10/01/48) |
815 | 668,990 | ||||||
| 4.95%, 12/15/44 (Call 12/15/24) |
481 | 421,737 | ||||||
| 5.15%, 01/15/33 (Call 10/15/32) |
630 | 630,888 | ||||||
| 5.30%, 09/15/33 (Call 06/15/33)(a) |
150 | 150,413 | ||||||
| Entergy Corp. |
||||||||
| 0.90%, 09/15/25 (Call 08/15/25) |
1,192 | 1,114,139 | ||||||
| 1.90%, 06/15/28 (Call 04/15/28)(a) |
1,035 | 909,490 | ||||||
| 2.40%, 06/15/31 (Call 03/05/31)(a) |
1,009 | 831,098 | ||||||
| 2.80%, 06/15/30 (Call 03/15/30) |
711 | 614,858 | ||||||
| 2.95%, 09/01/26 (Call 06/01/26) |
1,251 | 1,187,204 | ||||||
| 3.75%, 06/15/50 (Call 12/15/49) |
888 | 642,526 | ||||||
| Entergy Louisiana LLC |
||||||||
| 1.60%, 12/15/30 (Call 09/15/30)(a) |
696 | 551,491 | ||||||
| 2.35%, 06/15/32 (Call 03/15/32) |
669 | 541,983 | ||||||
| 2.40%, 10/01/26 (Call 07/01/26) |
774 | 722,922 | ||||||
| 2.90%, 03/15/51 (Call 09/15/50) |
998 | 626,720 | ||||||
| 3.05%, 06/01/31 (Call 03/01/31)(a) |
638 | 552,161 | ||||||
| 3.10%, 06/15/41 (Call 12/15/40) |
155 | 113,694 | ||||||
| 3.12%, 09/01/27 (Call 06/01/27) |
846 | 796,526 | ||||||
| 3.25%, 04/01/28 (Call 01/01/28)(a) |
729 | 683,321 | ||||||
| 4.00%, 03/15/33 (Call 12/15/32) |
664 | 604,590 | ||||||
| 4.20%, 09/01/48 (Call 03/01/48) |
1,246 | 1,007,856 | ||||||
| 4.20%, 04/01/50 (Call 10/01/49) |
765 | 618,630 | ||||||
| 4.44%, 01/15/26 (Call 10/15/25) |
5 | 4,937 | ||||||
| 4.75%, 09/15/52 (Call 03/15/52) |
675 | 589,439 | ||||||
| 4.95%, 01/15/45 (Call 01/15/25) |
644 | 586,040 | ||||||
| Entergy Mississippi LLC |
||||||||
| 2.85%, 06/01/28 (Call 03/01/28) |
685 | 627,059 | ||||||
| 3.50%, 06/01/51 (Call 03/01/51)(a) |
340 | 240,395 | ||||||
| 3.85%, 06/01/49 (Call 12/01/48) |
512 | 389,435 | ||||||
| 5.00%, 09/01/33 (Call 06/01/33) |
235 | 230,480 | ||||||
| Entergy Texas Inc. |
||||||||
| 1.75%, 03/15/31 (Call 12/15/30) |
818 | 655,394 | ||||||
| 3.55%, 09/30/49 (Call 03/30/49) |
637 | 460,064 | ||||||
| 4.00%, 03/30/29 (Call 12/30/28) |
410 | 391,728 | ||||||
| 4.50%, 03/30/39 (Call 09/30/38) |
366 | 325,622 | ||||||
| 5.00%, 09/15/52 (Call 03/15/52) |
345 | 313,288 | ||||||
| 5.15%, 06/01/45 (Call 06/01/25)(a) |
298 | 274,792 | ||||||
| 5.80%, 09/01/53 (Call 03/01/53)(a) |
480 | 494,736 | ||||||
| Evergy Inc., 2.90%, 09/15/29 (Call 06/15/29) |
269 | 238,324 | ||||||
| Evergy Kansas Central Inc. |
||||||||
| 2.55%, 07/01/26 (Call 04/01/26)(a) |
145 | 136,590 | ||||||
| 3.10%, 04/01/27 (Call 01/01/27) |
555 | 523,110 | ||||||
| 3.25%, 12/01/25 (Call 09/01/25) |
674 | 650,420 | ||||||
| 3.25%, 09/01/49 (Call 03/01/49) |
730 | 501,609 | ||||||
| 3.45%, 04/15/50 (Call 10/15/49) |
445 | 312,389 | ||||||
| 4.10%, 04/01/43 (Call 10/01/42)(a) |
442 | 359,849 | ||||||
| 4.13%, 03/01/42 (Call 09/01/41)(a) |
660 | 546,370 | ||||||
| 4.25%, 12/01/45 (Call 06/01/45) |
741 | 605,478 | ||||||
| 4.63%, 09/01/43 (Call 03/01/43)(a) |
301 | 257,446 | ||||||
| 5.70%, 03/15/53 (Call 09/15/52)(a) |
415 | 414,750 | ||||||
| 5.90%, 11/15/33 (Call 08/15/33) |
650 | 676,029 | ||||||
| Evergy Kansas South Inc., |
35 | 28,244 | ||||||
| Evergy Metro Inc. |
||||||||
| 3.65%, 08/15/25 (Call 05/15/25) |
165 | 160,981 | ||||||
| Security | Par (000) | Value | ||||||
| Electric (continued) | ||||||||
| 4.20%, 06/15/47 (Call 12/15/46) |
$ | 415 | $ | 333,874 | ||||
| 4.20%, 03/15/48 (Call 09/15/47) |
497 | 405,463 | ||||||
| 4.95%, 04/15/33 (Call 01/15/33)(a) |
550 | 537,758 | ||||||
| 5.30%, 10/01/41 (Call 04/01/41)(a) |
659 | 619,455 | ||||||
| Series 2019, 4.13%, 04/01/49 (Call 10/01/48) |
532 | 423,697 | ||||||
| Series 2020, 2.25%, 06/01/30 (Call 03/01/30)(a) |
554 | 467,849 | ||||||
| Series B, 6.05%, 11/15/35(a) |
74 | 76,548 | ||||||
| Evergy Missouri West Inc. |
||||||||
| 3.75%, 03/15/32 (Call 12/15/31)(b) |
542 | 476,814 | ||||||
| 5.15%, 12/15/27 (Call 11/15/27)(a)(b) |
650 | 647,475 | ||||||
| Eversource Energy |
||||||||
| 2.55%, 03/15/31 (Call 12/15/30) |
100 | 82,488 | ||||||
| 2.90%, 03/01/27 (Call 02/01/27) |
1,172 | 1,095,985 | ||||||
| 3.35%, 03/15/26 (Call 12/15/25) |
530 | 509,037 | ||||||
| 3.38%, 03/01/32 (Call 12/01/31) |
835 | 717,388 | ||||||
| 3.45%, 01/15/50 (Call 07/15/49)(a) |
995 | 680,492 | ||||||
| 4.60%, 07/01/27 (Call 06/01/27) |
825 | 806,006 | ||||||
| 4.75%, 05/15/26 |
475 | 468,988 | ||||||
| 5.00%, 01/01/27(a) |
605 | 601,046 | ||||||
| 5.13%, 05/15/33 (Call 02/15/33) |
630 | 608,532 | ||||||
| 5.45%, 03/01/28 (Call 02/01/28) |
1,625 | 1,633,434 | ||||||
| 5.50%, 01/01/34 (Call 10/01/33) |
1,250 | 1,237,212 | ||||||
| 5.95%, 02/01/29 (Call 01/01/29) |
1,040 | 1,065,037 | ||||||
| Series M, 3.30%, 01/15/28 (Call 10/15/27) |
485 | 451,710 | ||||||
| Series O, 4.25%, 04/01/29 (Call 01/01/29) |
784 | 747,503 | ||||||
| Series Q, 0.80%, 08/15/25 (Call 07/15/25) |
621 | 579,966 | ||||||
| Series R, 1.65%, 08/15/30 (Call 05/15/30) |
777 | 618,630 | ||||||
| Series U, 1.40%, 08/15/26 (Call 07/15/26) |
570 | 518,319 | ||||||
| Exelon Corp. |
||||||||
| 2.75%, 03/15/27 (Call 02/15/27) |
605 | 562,788 | ||||||
| 3.35%, 03/15/32 (Call 12/15/31)(a) |
993 | 865,674 | ||||||
| 3.40%, 04/15/26 (Call 01/15/26) |
796 | 766,396 | ||||||
| 3.95%, 06/15/25 (Call 03/15/25) |
883 | 866,500 | ||||||
| 4.05%, 04/15/30 (Call 01/15/30) |
1,367 | 1,282,066 | ||||||
| 4.10%, 03/15/52 (Call 09/15/51) |
1,230 | 953,722 | ||||||
| 4.45%, 04/15/46 (Call 10/15/45) |
1,207 | 1,011,932 | ||||||
| 4.70%, 04/15/50 (Call 10/15/49) |
1,128 | 978,984 | ||||||
| 4.95%, 06/15/35 (Call 12/15/34) |
352 | 329,898 | ||||||
| 5.10%, 06/15/45 (Call 12/15/44) |
1,002 | 915,068 | ||||||
| 5.15%, 03/15/28 (Call 02/15/28) |
875 | 872,619 | ||||||
| 5.15%, 03/15/29 (Call 02/15/29) |
190 | 189,187 | ||||||
| 5.30%, 03/15/33 (Call 12/15/32)(a) |
890 | 881,171 | ||||||
| 5.45%, 03/15/34 (Call 12/15/33) |
450 | 447,811 | ||||||
| 5.60%, 03/15/53 (Call 09/15/52) |
1,310 | 1,275,768 | ||||||
| 5.63%, 06/15/35 |
890 | 884,886 | ||||||
| 7.60%, 04/01/32 |
870 | 984,537 | ||||||
| Fells Point Funding Trust, |
1,565 | 1,464,368 | ||||||
| FirstEnergy Transmission LLC |
||||||||
| 2.87%, 09/15/28 (Call 07/15/28)(a)(b) |
879 | 794,061 | ||||||
| 4.55%, 04/01/49 (Call 10/01/48)(a)(b) |
725 | 599,763 | ||||||
| 5.45%, 07/15/44 (Call 01/15/44)(a)(b) |
565 | 531,986 | ||||||
| Florida Power & Light Co. |
||||||||
| 2.45%, 02/03/32 (Call 11/03/31) |
2,057 | 1,716,103 | ||||||
| 2.85%, 04/01/25 (Call 03/01/25) |
1,852 | 1,805,874 | ||||||
| 2.88%, 12/04/51 (Call 06/04/51)(a) |
1,579 | 1,026,404 | ||||||
| 3.13%, 12/01/25 (Call 06/01/25) |
1,012 | 982,185 | ||||||
| 3.15%, 10/01/49 (Call 04/01/49) |
1,108 | 763,873 | ||||||
| 3.70%, 12/01/47 (Call 06/01/47) |
1,009 | 785,278 | ||||||
| 70 | 2 0 2 4 I S H A R E S A N N U A L R E P O R T T O S H A R E H O L D E R S |
| Schedule of Investments (continued) February 29, 2024 |
iShares® Broad USD Investment Grade Corporate Bond ETF (Percentages shown are based on Net Assets) |
| Security | Par (000) |
Value | ||||||
| Electric (continued) | ||||||||
| 3.80%, 12/15/42 (Call 06/15/42) |
$ | 457 | $ | 373,614 | ||||
| 3.95%, 03/01/48 (Call 09/01/47) |
1,395 | 1,131,068 | ||||||
| 3.99%, 03/01/49 (Call 09/01/48) |
800 | 646,496 | ||||||
| 4.05%, 06/01/42 (Call 12/01/41) |
645 | 546,644 | ||||||
| 4.05%, 10/01/44 (Call 04/01/44) |
815 | 687,067 | ||||||
| 4.13%, 02/01/42 (Call 08/01/41) |
1,010 | 868,439 | ||||||
| 4.13%, 06/01/48 (Call 12/01/47) |
547 | 452,657 | ||||||
| 4.40%, 05/15/28 (Call 03/15/28) |
645 | 633,293 | ||||||
| 4.45%, 05/15/26 (Call 04/15/26) |
550 | 545,114 | ||||||
| 4.63%, 05/15/30 (Call 03/15/30) |
645 | 635,060 | ||||||
| 4.80%, 05/15/33 (Call 02/15/33)(a) |
890 | 869,690 | ||||||
| 4.95%, 06/01/35 |
520 | 511,136 | ||||||
| 5.05%, 04/01/28 (Call 03/01/28) |
840 | 846,294 | ||||||
| 5.10%, 04/01/33 (Call 01/01/33) |
1,180 | 1,174,970 | ||||||
| 5.13%, 06/01/41 (Call 12/01/40)(a) |
260 | 247,241 | ||||||
| 5.25%, 02/01/41 (Call 08/01/40)(a) |
650 | 641,446 | ||||||
| 5.30%, 04/01/53 (Call 10/01/52)(a) |
990 | 978,579 | ||||||
| 5.63%, 04/01/34(a) |
87 | 90,944 | ||||||
| 5.65%, 02/01/37 |
745 | 766,423 | ||||||
| 5.69%, 03/01/40(a) |
530 | 542,544 | ||||||
| 5.95%, 10/01/33(a) |
495 | 515,174 | ||||||
| 5.95%, 02/01/38 |
950 | 1,010,945 | ||||||
| 5.96%, 04/01/39 |
585 | 628,738 | ||||||
| Series A, 3.30%, 05/30/27 (Call 02/28/27) |
370 | 351,026 | ||||||
| Fortis Inc./Canada, 3.06%, 10/04/26 |
1,560 | 1,473,606 | ||||||
| Georgia Power Co. |
||||||||
| 3.25%, 04/01/26 (Call 01/01/26) |
762 | 732,135 | ||||||
| 3.25%, 03/30/27 (Call 12/30/26) |
530 | 500,760 | ||||||
| 4.30%, 03/15/42(a) |
1,268 | 1,084,738 | ||||||
| 4.30%, 03/15/43 |
757 | 637,864 | ||||||
| 4.65%, 05/16/28 (Call 03/16/28) |
745 | 734,225 | ||||||
| 4.70%, 05/15/32 (Call 02/15/32) |
1,075 | 1,038,947 | ||||||
| 4.95%, 05/17/33 (Call 11/17/32)(a) |
1,015 | 993,765 | ||||||
| 5.00%, 02/23/27 (Call 01/23/27) |
195 | 194,633 | ||||||
| 5.13%, 05/15/52 (Call 11/15/51)(a) |
1,105 | 1,047,462 | ||||||
| 5.25%, 03/15/34 (Call 09/15/33) |
625 | 622,177 | ||||||
| 5.40%, 06/01/40(a) |
244 | 234,534 | ||||||
| Series 10-C, 4.75%, 09/01/40 |
734 | 664,882 | ||||||
| Series A, 3.25%, 03/15/51 (Call 09/15/50) |
1,085 | 744,586 | ||||||
| Series B, 2.65%, 09/15/29 (Call 06/15/29) |
1,168 | 1,032,984 | ||||||
| Series B, 3.70%, 01/30/50 (Call 07/30/49)(a) |
627 | 473,698 | ||||||
| Great River Energy, 6.25%, 07/01/38(b) |
363 | 374,591 | ||||||
| Iberdrola International BV |
||||||||
| 5.81%, 03/15/25 |
545 | 546,779 | ||||||
| 6.75%, 07/15/36(a) |
980 | 1,096,217 | ||||||
| Idaho Power Co. |
||||||||
| 3.65%, 03/01/45 (Call 09/01/44) |
150 | 109,616 | ||||||
| 5.50%, 03/15/53 (Call 09/15/52)(a) |
485 | 476,081 | ||||||
| 5.80%, 04/01/54 (Call 10/01/53)(a) |
280 | 285,210 | ||||||
| Series K, 4.20%, 03/01/48 (Call 09/01/47) |
725 | 585,514 | ||||||
| Indiana Michigan Power Co. |
||||||||
| 3.25%, 05/01/51 (Call 11/01/50)(a) |
410 | 276,973 | ||||||
| 3.85%, 05/15/28 (Call 02/15/28) |
255 | 243,119 | ||||||
| 4.25%, 08/15/48 (Call 02/15/48) |
570 | 462,593 | ||||||
| 5.63%, 04/01/53 (Call 10/01/52) |
755 | 755,581 | ||||||
| 6.05%, 03/15/37(a) |
425 | 441,717 | ||||||
| Series K, 4.55%, 03/15/46 (Call 09/15/45) |
605 | 517,621 | ||||||
| Series L, 3.75%, 07/01/47 (Call 01/01/47) |
532 | 396,308 | ||||||
| Indianapolis Power & Light Co. |
||||||||
| 4.05%, 05/01/46 (Call 11/01/45)(b) |
825 | 650,046 | ||||||
| Security | Par (000) |
Value | ||||||
| Electric (continued) | ||||||||
| 4.70%, 09/01/45 (Call 03/01/45)(a)(b) |
$ | 390 | $ | 325,610 | ||||
| 5.65%, 12/01/32 (Call 09/01/32)(a)(b) |
540 | 549,243 | ||||||
| Infraestructura Energetica Nova SAPI de CV |
||||||||
| 3.75%, 01/14/28(b) |
125 | 117,162 | ||||||
| 4.75%, 01/15/51 (Call 07/15/50)(b) |
655 | 495,332 | ||||||
| 4.88%, 01/14/48(b) |
487 | 372,190 | ||||||
| Interchile SA, 4.50%, 06/30/56 (Call 12/30/55)(a)(b) |
1,295 | 1,025,219 | ||||||
| Interconexion Electrica SA ESP, |
184 | 155,940 | ||||||
| International Transmission Co., 4.63%, 08/15/43 (Call 02/15/43) |
25 | 21,378 | ||||||
| Interstate Power & Light Co. |
||||||||
| 2.30%, 06/01/30 (Call 03/01/30)(a) |
649 | 547,004 | ||||||
| 3.10%, 11/30/51 (Call 05/30/51) |
165 | 105,529 | ||||||
| 3.40%, 08/15/25 (Call 05/15/25)(a) |
320 | 310,349 | ||||||
| 3.50%, 09/30/49 (Call 03/30/49)(a) |
735 | 523,376 | ||||||
| 3.60%, 04/01/29 (Call 01/01/29) |
289 | 268,500 | ||||||
| 3.70%, 09/15/46 (Call 03/15/46)(a) |
390 | 289,430 | ||||||
| 4.10%, 09/26/28 (Call 06/26/28) |
850 | 814,176 | ||||||
| 4.70%, 10/15/43 (Call 04/15/43)(a) |
372 | 312,937 | ||||||
| 5.70%, 10/15/33 (Call 07/15/33) |
510 | 518,778 | ||||||
| 6.25%, 07/15/39 |
516 | 537,649 | ||||||
| IPALCO Enterprises Inc., 4.25%, 05/01/30 |
825 | 759,567 | ||||||
| Israel Electric Corp. Ltd. |
||||||||
| 4.25%, 08/14/28(b) |
1,470 | 1,349,660 | ||||||
| 7.75%, 12/15/27(b) |
100 | 105,041 | ||||||
| ITC Holdings Corp. |
||||||||
| 2.95%, 05/14/30 (Call 02/14/30)(b) |
992 | 865,802 | ||||||
| 3.25%, 06/30/26 (Call 03/30/26) |
925 | 883,345 | ||||||
| 3.35%, 11/15/27 (Call 08/15/27)(a) |
952 | 892,737 | ||||||
| 4.95%, 09/22/27 (Call 08/22/27)(b) |
1,285 | 1,276,604 | ||||||
| 5.30%, 07/01/43 (Call 01/01/43)(a) |
825 | 773,608 | ||||||
| 5.40%, 06/01/33 (Call 03/01/33)(b) |
465 | 459,286 | ||||||
| Jersey Central Power & Light Co. |
||||||||
| 2.75%, 03/01/32 (Call 12/01/31)(a)(b) |
485 | 400,928 | ||||||
| 4.30%, 01/15/26 (Call 10/15/25)(b) |
1,095 | 1,068,785 | ||||||
| 6.15%, 06/01/37(a) |
188 | 194,099 | ||||||
| Kallpa Generacion SA, 4.13%, 08/16/27 |
660 | 622,863 | ||||||
| Kentucky Power Co., 7.00%, 11/15/33 |
480 | 506,461 | ||||||
| Kentucky Utilities Co. |
||||||||
| 3.30%, 10/01/25 (Call 07/01/25)(a) |
690 | 666,374 | ||||||
| 3.30%, 06/01/50 (Call 12/01/49) |
950 | 658,203 | ||||||
| 4.38%, 10/01/45 (Call 04/01/45) |
747 | 627,728 | ||||||
| 5.13%, 11/01/40 (Call 05/01/40) |
1,100 | 1,043,549 | ||||||
| 5.45%, 04/15/33 (Call 01/15/33) |
535 | 540,134 | ||||||
| Series 1, 4.65%, 11/15/43 (Call 05/15/43) |
269 | 231,095 | ||||||
| Korea East-West Power Co. Ltd. |
||||||||
| 1.75%, 05/06/25(b) |
1,360 | 1,303,113 | ||||||
| 3.60%, 05/06/25(a)(b) |
135 | 132,135 | ||||||
| Korea Southern Power Co. Ltd., 0.75%, 01/27/26(b) |
520 | 477,112 | ||||||
| Liberty Utilities Co. |
||||||||
| 5.58%, 01/31/29 (Call 12/31/28)(b) |
10 | 10,023 | ||||||
| 5.87%, 01/31/34 (Call 10/31/33)(b) |
460 | 462,109 | ||||||
| Liberty Utilities Finance GP 1, 2.05%, 09/15/30 (Call 06/15/30)(a)(b) |
1,313 | 1,041,933 | ||||||
| LLPL Capital Pte Ltd., 6.88%, 02/04/39(a)(b) |
468 | 452,583 | ||||||
| S C H E D U L E O F I N V E S T M E N T S |
71 |
| Schedule of Investments (continued) February 29, 2024 |
iShares® Broad USD Investment Grade Corporate Bond ETF (Percentages shown are based on Net Assets) |
| Security | Par (000) |
Value | ||||||
| Electric (continued) | ||||||||
| Louisville Gas & Electric Co. |
||||||||
| 4.25%, 04/01/49 (Call 10/01/48)(a) |
$ | 517 | $ | 421,681 | ||||
| 4.38%, 10/01/45 (Call 04/01/45) |
513 | 429,884 | ||||||
| 4.65%, 11/15/43 (Call 05/15/43)(a) |
435 | 376,714 | ||||||
| 5.13%, 11/15/40 (Call 05/15/40)(a) |
355 | 326,523 | ||||||
| 5.45%, 04/15/33 (Call 01/15/33) |
380 | 383,693 | ||||||
| Series 25, 3.30%, 10/01/25 (Call 07/01/25) |
161 | 156,254 | ||||||
| Majapahit Holding BV, 7.88%, 06/29/37(b) |
145 | 169,067 | ||||||
| Massachusetts Electric Co. |
||||||||
| 1.73%, 11/24/30 (Call 08/24/30)(a)(b) |
549 | 431,536 | ||||||
| 4.00%, 08/15/46 (Call 02/15/46)(b) |
550 | 421,170 | ||||||
| 5.87%, 02/26/54 (Call 08/26/53)(b) |
500 | 502,087 | ||||||
| 5.90%, 11/15/39(a)(b) |
705 | 701,147 | ||||||
| Metropolitan Edison Co. |
||||||||
| 4.00%, 04/15/25(a)(b) |
185 | 181,080 | ||||||
| 4.30%, 01/15/29 (Call 10/15/28)(a)(b) |
776 | 745,727 | ||||||
| 5.20%, 04/01/28 (Call 03/01/28)(a)(b) |
355 | 354,278 | ||||||
| Mexico Generadora de Energia S de rl, |
186 | 181,688 | ||||||
| MidAmerican Energy Co. |
||||||||
| 2.70%, 08/01/52 (Call 02/01/52) |
830 | 510,519 | ||||||
| 3.10%, 05/01/27 (Call 02/01/27) |
623 | 589,193 | ||||||
| 3.15%, 04/15/50 (Call 10/15/49) |
1,045 | 714,685 | ||||||
| 3.65%, 04/15/29 (Call 01/15/29) |
1,122 | 1,058,582 | ||||||
| 3.65%, 08/01/48 (Call 02/01/48) |
787 | 600,887 | ||||||
| 3.95%, 08/01/47 (Call 02/01/47) |
835 | 669,404 | ||||||
| 4.25%, 05/01/46 (Call 11/01/45) |
536 | 449,082 | ||||||
| 4.25%, 07/15/49 (Call 01/15/49) |
1,277 | 1,075,220 | ||||||
| 4.40%, 10/15/44 (Call 04/15/44)(a) |
158 | 135,660 | ||||||
| 4.80%, 09/15/43 (Call 03/15/43) |
573 | 523,833 | ||||||
| 5.30%, 02/01/55 (Call 08/01/54) |
205 | 199,294 | ||||||
| 5.35%, 01/15/34 (Call 10/15/33) |
450 | 458,735 | ||||||
| 5.75%, 11/01/35 |
305 | 317,301 | ||||||
| 5.80%, 10/15/36 |
650 | 669,850 | ||||||
| 5.85%, 09/15/54 (Call 03/15/54) |
570 | 600,163 | ||||||
| 6.75%, 12/30/31(a) |
730 | 819,431 | ||||||
| Mid-Atlantic Interstate Transmission LLC, |
||||||||
| 4.10%, 05/15/28 (Call 02/15/28)(a)(b) |
278 | 266,241 | ||||||
| Minejesa Capital BV |
||||||||
| 4.63%, 08/10/30(b) |
873 | 824,482 | ||||||
| 5.63%, 08/10/37(a)(b) |
400 | 349,000 | ||||||
| Mississippi Power Co. |
||||||||
| 3.95%, 03/30/28 (Call 12/30/27) |
949 | 908,859 | ||||||
| Series 12-A, 4.25%, 03/15/42 |
688 | 572,714 | ||||||
| Series B, 3.10%, 07/30/51 (Call 01/30/51)(a) |
451 | 293,374 | ||||||
| Monongahela Power Co. |
||||||||
| 3.55%, 05/15/27 (Call 02/15/27)(a)(b) |
850 | 806,093 | ||||||
| 5.40%, 12/15/43 (Call 06/15/43)(b) |
940 | 888,116 | ||||||
| 5.85%, 02/15/34 (Call 11/15/33)(b) |
420 | 427,801 | ||||||
| Narragansett Electric Co. (The) |
||||||||
| 3.40%, 04/09/30 (Call 01/09/30)(b) |
977 | 886,297 | ||||||
| 3.92%, 08/01/28 (Call 05/01/28)(a)(b) |
270 | 259,277 | ||||||
| 4.17%, 12/10/42(b) |
410 | 324,136 | ||||||
| 5.64%, 03/15/40(a)(b) |
261 | 255,684 | ||||||
| National Grid PLC |
||||||||
| 5.42%, 01/11/34 (Call 10/11/33) |
675 | 658,491 | ||||||
| 5.60%, 06/12/28 (Call 05/12/28) |
370 | 374,604 | ||||||
| 5.81%, 06/12/33 (Call 03/12/33) |
610 | 616,349 | ||||||
| National Grid USA |
||||||||
| 5.80%, 04/01/35 |
425 | 420,416 | ||||||
| 8.00%, 11/15/30 |
160 | 178,776 | ||||||
| Security | Par (000) | Value | ||||||
| Electric (continued) | ||||||||
| National Rural Utilities Cooperative Finance Corp. |
||||||||
| 1.00%, 06/15/26 (Call 05/15/26) |
$ | 1,125 | $ | 1,026,763 | ||||
| 1.35%, 03/15/31 (Call 12/15/30) |
529 | 411,130 | ||||||
| 1.65%, 06/15/31 (Call 03/15/31)(a) |
658 | 521,651 | ||||||
| 2.40%, 03/15/30 (Call 12/15/29) |
510 | 439,904 | ||||||
| 2.75%, 04/15/32 (Call 01/15/32)(a) |
335 | 281,408 | ||||||
| 3.05%, 04/25/27 (Call 01/25/27) |
720 | 684,299 | ||||||
| 3.25%, 11/01/25 (Call 08/01/25) |
388 | 376,161 | ||||||
| 3.40%, 02/07/28 (Call 11/07/27) |
651 | 615,822 | ||||||
| 3.45%, 06/15/25 |
640 | 625,414 | ||||||
| 3.70%, 03/15/29 (Call 12/15/28) |
592 | 556,422 | ||||||
| 3.90%, 11/01/28 (Call 08/01/28) |
759 | 728,919 | ||||||
| 4.02%, 11/01/32 (Call 05/01/32)(a) |
326 | 299,258 | ||||||
| 4.15%, 12/15/32 (Call 09/15/32)(a) |
637 | 586,936 | ||||||
| 4.30%, 03/15/49 (Call 09/15/48) |
508 | 423,127 | ||||||
| 4.40%, 11/01/48 (Call 05/01/48) |
625 | 527,203 | ||||||
| 4.45%, 03/13/26 (Call 02/13/26) |
345 | 340,708 | ||||||
| 4.80%, 02/05/27 (Call 01/05/27)(a) |
575 | 572,134 | ||||||
| 4.80%, 03/15/28 (Call 02/15/28)(a) |
1,005 | 1,000,366 | ||||||
| 4.85%, 02/07/29 (Call 01/07/29) |
575 | 569,730 | ||||||
| 5.00%, 02/07/31 (Call 12/07/30) |
450 | 443,602 | ||||||
| 5.05%, 09/15/28 (Call 08/15/28) |
820 | 822,478 | ||||||
| 5.25%, 04/20/46 (Call 04/20/26), |
533 | 516,193 | ||||||
| 5.45%, 10/30/25 |
380 | 381,240 | ||||||
| 5.60%, 11/13/26 (Call 10/13/26) |
350 | 354,667 | ||||||
| 5.80%, 01/15/33 (Call 07/15/32) |
930 | 961,857 | ||||||
| 7.13%, 09/15/53 (Call 06/15/28), |
25 | 25,847 | ||||||
| Series C, 8.00%, 03/01/32 |
740 | 855,240 | ||||||
| Nevada Power Co. |
||||||||
| 5.38%, 09/15/40 (Call 03/15/40) |
542 | 523,676 | ||||||
| 5.45%, 05/15/41 (Call 11/15/40) |
230 | 222,332 | ||||||
| 5.90%, 05/01/53 (Call 11/01/52) |
325 | 333,222 | ||||||
| 6.00%, 03/15/54 (Call 09/15/53)(a) |
665 | 698,385 | ||||||
| Series CC, 3.70%, 05/01/29 (Call 02/01/29) |
714 | 674,347 | ||||||
| Series DD, 2.40%, 05/01/30 (Call 02/01/30) |
576 | 489,948 | ||||||
| Series EE, 3.13%, 08/01/50 (Call 02/01/50)(a) |
440 | 287,488 | ||||||
| Series N, 6.65%, 04/01/36 |
765 | 820,619 | ||||||
| Series R, 6.75%, 07/01/37(a) |
200 | 221,319 | ||||||
| New England Power Co. |
||||||||
| 2.81%, 10/06/50 (Call 04/06/50)(a)(b) |
515 | 317,822 | ||||||
| 3.80%, 12/05/47 (Call 06/05/47)(a)(b) |
500 | 376,865 | ||||||
| 5.94%, 11/25/52 (Call 05/25/52)(a)(b) |
430 | 436,919 | ||||||
| New York State Electric & Gas Corp. |
||||||||
| 2.15%, 10/01/31 (Call 07/01/31)(b) |
1,070 | 848,022 | ||||||
| 3.25%, 12/01/26 (Call 09/01/26)(b) |
307 | 289,204 | ||||||
| 3.30%, 09/15/49 (Call 03/15/49)(a)(b) |
586 | 383,438 | ||||||
| 5.65%, 08/15/28 (Call 07/15/28)(a)(b) |
245 | 250,417 | ||||||
| 5.85%, 08/15/33 (Call 05/15/33)(b) |
245 | 251,441 | ||||||
| NextEra Energy Capital Holdings Inc. |
||||||||
| 1.88%, 01/15/27 (Call 12/15/26) |
1,500 | 1,368,660 | ||||||
| 1.90%, 06/15/28 (Call 04/15/28) |
1,062 | 929,518 | ||||||
| 2.25%, 06/01/30 (Call 03/01/30) |
2,302 | 1,935,849 | ||||||
| 2.44%, 01/15/32 (Call 10/15/31)(a) |
1,419 | 1,152,456 | ||||||
| 2.75%, 11/01/29 (Call 08/01/29) |
1,400 | 1,233,447 | ||||||
| 3.00%, 01/15/52 (Call 07/15/51) |
805 | 510,711 | ||||||
| 3.50%, 04/01/29 (Call 01/01/29) |
710 | 657,060 | ||||||
| 3.55%, 05/01/27 (Call 02/01/27) |
1,705 | 1,622,547 | ||||||
| 72 | 2 0 2 4 I S H A R E S A N N U A L R E P O R T T O S H A R E H O L D E R S |
| Schedule of Investments (continued) February 29, 2024 |
iShares® Broad USD Investment Grade Corporate Bond ETF (Percentages shown are based on Net Assets) |
| Security | Par (000) |
Value | ||||||
| Electric (continued) | ||||||||
| 3.80%, 03/15/82 (Call 03/15/27), |
$ | 477 | $ | 422,674 | ||||
| 4.45%, 06/20/25 |
1,300 | 1,282,480 | ||||||
| 4.63%, 07/15/27 (Call 06/15/27) |
1,610 | 1,584,164 | ||||||
| 4.80%, 12/01/77 (Call 12/01/27), |
536 | 485,767 | ||||||
| 4.90%, 02/28/28 (Call 01/28/28) |
1,855 | 1,839,365 | ||||||
| 4.90%, 03/15/29 (Call 02/15/29) |
1,175 | 1,160,380 | ||||||
| 4.95%, 01/29/26 |
1,175 | 1,165,827 | ||||||
| 5.00%, 02/28/30 (Call 12/28/29)(a) |
875 | 867,917 | ||||||
| 5.00%, 07/15/32 (Call 04/15/32) |
1,405 | 1,368,418 | ||||||
| 5.05%, 02/28/33 (Call 11/28/32)(a) |
1,055 | 1,029,344 | ||||||
| 5.25%, 03/15/34 (Call 12/15/33) |
1,175 | 1,152,492 | ||||||
| 5.25%, 02/28/53 (Call 08/28/52) |
1,320 | 1,230,298 | ||||||
| 5.55%, 03/15/54 (Call 09/15/53) |
1,765 | 1,710,322 | ||||||
| 5.65%, 05/01/79 (Call 05/01/29), |
766 | 734,751 | ||||||
| 5.75%, 09/01/25 |
750 | 754,006 | ||||||
| 6.05%, 03/01/25 |
100 | 100,360 | ||||||
| Niagara Mohawk Power Corp. |
||||||||
| 1.96%, 06/27/30 (Call 03/27/30)(a)(b) |
926 | 756,766 | ||||||
| 2.76%, 01/10/32 (Call 10/10/31)(b) |
675 | 554,749 | ||||||
| 3.03%, 06/27/50 (Call 12/27/49)(b) |
445 | 276,737 | ||||||
| 4.12%, 11/28/42(b) |
365 | 290,043 | ||||||
| 4.28%, 12/15/28 (Call 09/15/28)(a)(b) |
548 | 520,648 | ||||||
| 4.28%, 10/01/34 (Call 04/01/34)(b) |
381 | 338,928 | ||||||
| 5.29%, 01/17/34 (Call 10/17/33)(b) |
825 | 804,905 | ||||||
| 5.66%, 01/17/54 (Call 07/17/53)(b) |
960 | 932,093 | ||||||
| 5.78%, 09/16/52 (Call 03/16/52)(a)(b) |
815 | 812,741 | ||||||
| Northern States Power Co./MN |
||||||||
| 2.25%, 04/01/31 (Call 10/01/30) |
410 | 343,485 | ||||||
| 2.60%, 06/01/51 (Call 12/01/50) |
522 | 322,366 | ||||||
| 2.90%, 03/01/50 (Call 09/01/49) |
801 | 522,880 | ||||||
| 3.20%, 04/01/52 (Call 10/01/51) |
412 | 283,329 | ||||||
| 3.40%, 08/15/42 (Call 02/15/42)(a) |
436 | 330,846 | ||||||
| 3.60%, 05/15/46 (Call 11/15/45) |
399 | 304,177 | ||||||
| 3.60%, 09/15/47 (Call 03/15/47) |
691 | 523,405 | ||||||
| 4.00%, 08/15/45 (Call 02/15/45)(a) |
516 | 416,032 | ||||||
| 4.13%, 05/15/44 (Call 11/15/43)(a) |
432 | 356,254 | ||||||
| 4.50%, 06/01/52 (Call 12/01/51) |
665 | 580,443 | ||||||
| 4.85%, 08/15/40 (Call 02/15/40)(a) |
396 | 359,369 | ||||||
| 5.10%, 05/15/53 (Call 11/15/52)(a) |
580 | 554,541 | ||||||
| 5.25%, 07/15/35(a) |
235 | 234,342 | ||||||
| 5.35%, 11/01/39 |
410 | 404,400 | ||||||
| 5.40%, 03/15/54 (Call 09/15/53) |
505 | 499,636 | ||||||
| 6.20%, 07/01/37(a) |
539 | 578,369 | ||||||
| 6.25%, 06/01/36(a) |
710 | 769,193 | ||||||
| NorthWestern Corp., 4.18%, 11/15/44 |
400 | 321,701 | ||||||
| NRG Energy Inc. |
||||||||
| 2.00%, 12/02/25 (Call 11/02/25)(b) |
841 | 787,954 | ||||||
| 2.45%, 12/02/27 (Call 10/02/27)(a)(b) |
1,283 | 1,145,908 | ||||||
| 4.45%, 06/15/29 (Call 03/15/29)(a)(b) |
643 | 597,607 | ||||||
| 7.00%, 03/15/33 (Call 12/15/32)(b) |
1,135 | 1,181,699 | ||||||
| NSTAR Electric Co. |
||||||||
| 1.95%, 08/15/31 (Call 05/15/31) |
382 | 304,978 | ||||||
| 2.70%, 06/01/26 (Call 03/01/26) |
285 | 269,260 | ||||||
| 3.10%, 06/01/51 (Call 12/01/50)(a) |
710 | 474,213 | ||||||
| 3.20%, 05/15/27 (Call 02/15/27) |
954 | 909,347 | ||||||
| 3.25%, 11/15/25 (Call 08/15/25)(a) |
327 | 315,734 | ||||||
| 3.25%, 05/15/29 (Call 02/15/29) |
695 | 647,077 | ||||||
| Security | Par (000) |
Value | ||||||
| Electric (continued) | ||||||||
| 3.95%, 04/01/30 (Call 01/01/30) |
$ | 625 | $ | 585,800 | ||||
| 4.40%, 03/01/44 (Call 09/01/43)(a) |
310 | 266,964 | ||||||
| 4.55%, 06/01/52 (Call 12/01/51) |
659 | 573,312 | ||||||
| 4.95%, 09/15/52 (Call 03/15/52) |
230 | 213,112 | ||||||
| 5.50%, 03/15/40 |
465 | 462,580 | ||||||
| Oglethorpe Power Corp. |
||||||||
| 3.75%, 08/01/50 (Call 02/01/50) |
740 | 532,695 | ||||||
| 4.20%, 12/01/42(a) |
460 | 360,523 | ||||||
| 4.25%, 04/01/46 (Call 10/01/45) |
538 | 415,149 | ||||||
| 4.50%, 04/01/47 (Call 10/01/46) |
540 | 439,335 | ||||||
| 4.55%, 06/01/44 |
80 | 65,965 | ||||||
| 5.05%, 10/01/48 (Call 04/01/48) |
734 | 647,933 | ||||||
| 5.25%, 09/01/50 |
470 | 435,333 | ||||||
| 5.38%, 11/01/40(a) |
525 | 492,161 | ||||||
| 5.95%, 11/01/39 |
586 | 584,441 | ||||||
| 6.19%, 01/01/31(b) |
162 | 160,947 | ||||||
| 6.20%, 12/01/53 (Call 06/01/53)(a)(b) |
575 | 591,418 | ||||||
| Ohio Edison Co. |
||||||||
| 6.88%, 07/15/36 |
700 | 772,136 | ||||||
| 8.25%, 10/15/38 |
300 | 368,632 | ||||||
| Ohio Power Co. |
||||||||
| 4.00%, 06/01/49 (Call 12/01/48)(a) |
375 | 290,834 | ||||||
| 4.15%, 04/01/48 (Call 10/01/47) |
575 | 457,909 | ||||||
| 5.00%, 06/01/33 (Call 03/01/33) |
290 | 284,710 | ||||||
| Series D, 6.60%, 03/01/33 |
565 | 604,915 | ||||||
| Series F, 5.85%, 10/01/35 |
390 | 394,809 | ||||||
| Series G, 6.60%, 02/15/33(a) |
435 | 470,842 | ||||||
| Series P, 2.60%, 04/01/30 (Call 01/01/30) |
370 | 320,387 | ||||||
| Series Q, 1.63%, 01/15/31 (Call 10/15/30) |
317 | 252,885 | ||||||
| Series R, 2.90%, 10/01/51 (Call 04/01/51)(a) |
635 | 407,054 | ||||||
| Oklahoma Gas & Electric Co. |
||||||||
| 3.25%, 04/01/30 (Call 10/01/29) |
596 | 534,553 | ||||||
| 3.30%, 03/15/30 (Call 09/15/29) |
449 | 404,152 | ||||||
| 3.80%, 08/15/28 (Call 02/15/28) |
626 | 599,781 | ||||||
| 3.85%, 08/15/47 (Call 02/15/47) |
605 | 458,718 | ||||||
| 3.90%, 05/01/43 (Call 11/01/42)(a) |
190 | 150,955 | ||||||
| 4.00%, 12/15/44 (Call 06/15/44) |
260 | 203,578 | ||||||
| 4.15%, 04/01/47 (Call 10/01/46) |
755 | 601,416 | ||||||
| 4.55%, 03/15/44 (Call 09/15/43) |
250 | 211,900 | ||||||
| 5.25%, 05/15/41 (Call 11/15/40) |
65 | 61,193 | ||||||
| 5.40%, 01/15/33 (Call 07/15/32) |
315 | 320,580 | ||||||
| 5.60%, 04/01/53 (Call 10/01/52) |
380 | 382,746 | ||||||
| 5.85%, 06/01/40(a) |
170 | 171,175 | ||||||
| Oncor Electric Delivery Co. LLC |
||||||||
| 0.55%, 10/01/25 (Call 09/01/25) |
744 | 691,767 | ||||||
| 2.70%, 11/15/51 (Call 05/15/51)(a) |
925 | 571,758 | ||||||
| 2.75%, 05/15/30 (Call 02/15/30) |
745 | 655,125 | ||||||
| 2.95%, 04/01/25 (Call 01/01/25)(a) |
538 | 524,706 | ||||||
| 3.10%, 09/15/49 (Call 03/15/49) |
1,174 | 805,891 | ||||||
| 3.70%, 11/15/28 (Call 08/15/28) |
575 | 544,808 | ||||||
| 3.70%, 05/15/50 (Call 11/15/49) |
654 | 497,161 | ||||||
| 3.75%, 04/01/45 (Call 10/01/44)(a) |
825 | 655,367 | ||||||
| 3.80%, 09/30/47 (Call 03/30/47) |
625 | 480,195 | ||||||
| 3.80%, 06/01/49 (Call 12/01/48) |
565 | 443,782 | ||||||
| 4.10%, 11/15/48 (Call 05/15/48) |
713 | 586,541 | ||||||
| 4.15%, 06/01/32 (Call 03/01/32)(a) |
390 | 364,953 | ||||||
| 4.30%, 05/15/28 (Call 04/15/28)(a) |
25 | 24,342 | ||||||
| 4.55%, 09/15/32 (Call 06/15/32) |
760 | 730,089 | ||||||
| 4.55%, 12/01/41 (Call 06/01/41) |
525 | 475,208 | ||||||
| 4.60%, 06/01/52 (Call 12/01/51) |
700 | 618,995 | ||||||
| 4.95%, 09/15/52 (Call 03/15/52) |
570 | 530,470 | ||||||
| S C H E D U L E O F I N V E S T M E N T S |
73 |
| Schedule of Investments (continued) February 29, 2024 |
iShares® Broad USD Investment Grade Corporate Bond ETF (Percentages shown are based on Net Assets) |
| Security | Par (000) |
Value | ||||||
| Electric (continued) | ||||||||
| 5.25%, 09/30/40 |
$ | 285 | $ | 282,882 | ||||
| 5.30%, 06/01/42 (Call 12/01/41)(a) |
585 | 590,816 | ||||||
| 5.35%, 10/01/52 (Call 04/01/52) |
497 | 493,341 | ||||||
| 5.65%, 11/15/33 (Call 08/15/33) |
695 | 717,957 | ||||||
| 7.00%, 05/01/32 |
520 | 578,841 | ||||||
| 7.25%, 01/15/33 |
750 | 852,446 | ||||||
| 7.50%, 09/01/38(a) |
500 | 596,655 | ||||||
| Pacific Gas and Electric Co. |
||||||||
| 2.10%, 08/01/27 (Call 06/01/27) |
835 | 747,793 | ||||||
| 2.50%, 02/01/31 (Call 11/01/30) |
2,217 | 1,816,774 | ||||||
| 2.95%, 03/01/26 (Call 12/01/25) |
1,117 | 1,060,038 | ||||||
| 3.00%, 06/15/28 (Call 04/15/28) |
765 | 694,597 | ||||||
| 3.15%, 01/01/26 |
1,345 | 1,285,715 | ||||||
| 3.25%, 06/01/31 (Call 03/01/31)(a) |
1,015 | 870,863 | ||||||
| 3.30%, 03/15/27 (Call 12/15/26) |
760 | 712,297 | ||||||
| 3.30%, 12/01/27 (Call 09/01/27) |
1,855 | 1,716,432 | ||||||
| 3.30%, 08/01/40 (Call 02/01/40) |
1,271 | 915,274 | ||||||
| 3.45%, 07/01/25 |
807 | 783,796 | ||||||
| 3.50%, 06/15/25 (Call 03/15/25) |
884 | 857,644 | ||||||
| 3.50%, 08/01/50 (Call 02/01/50) |
2,297 | 1,546,340 | ||||||
| 3.75%, 07/01/28 |
1,468 | 1,366,596 | ||||||
| 3.75%, 08/15/42 (Call 02/15/42)(a) |
639 | 466,148 | ||||||
| 3.95%, 12/01/47 (Call 06/01/47) |
1,271 | 924,971 | ||||||
| 4.00%, 12/01/46 (Call 06/01/46) |
978 | 713,124 | ||||||
| 4.20%, 03/01/29 (Call 01/01/29) |
1,095 | 1,032,339 | ||||||
| 4.20%, 06/01/41 (Call 12/01/40) |
705 | 554,190 | ||||||
| 4.25%, 03/15/46 (Call 09/15/45)(a) |
725 | 552,423 | ||||||
| 4.30%, 03/15/45 (Call 09/15/44)(a) |
875 | 683,150 | ||||||
| 4.40%, 03/01/32 (Call 12/01/31) |
1,135 | 1,031,710 | ||||||
| 4.45%, 04/15/42 (Call 10/15/41)(a) |
826 | 665,893 | ||||||
| 4.50%, 07/01/40 (Call 01/01/40)(a) |
2,423 | 2,030,224 | ||||||
| 4.50%, 12/15/41 (Call 06/15/41) |
553 | 427,363 | ||||||
| 4.55%, 07/01/30 (Call 01/01/30) |
3,372 | 3,164,738 | ||||||
| 4.60%, 06/15/43 (Call 12/15/42) |
805 | 661,876 | ||||||
| 4.65%, 08/01/28 (Call 05/01/28)(a) |
560 | 535,443 | ||||||
| 4.75%, 02/15/44 (Call 08/15/43) |
917 | 765,597 | ||||||
| 4.95%, 06/08/25 |
740 | 732,926 | ||||||
| 4.95%, 07/01/50 (Call 01/01/50) |
3,886 | 3,298,551 | ||||||
| 5.25%, 03/01/52 (Call 09/01/51) |
865 | 766,955 | ||||||
| 5.45%, 06/15/27 (Call 05/15/27)(a) |
900 | 898,573 | ||||||
| 5.55%, 05/15/29 (Call 04/15/29) |
875 | 876,806 | ||||||
| 5.80%, 05/15/34 (Call 02/15/34) |
875 | 874,080 | ||||||
| 5.90%, 06/15/32 (Call 03/15/32) |
1,171 | 1,177,480 | ||||||
| 6.10%, 01/15/29 (Call 12/15/28) |
725 | 742,156 | ||||||
| 6.15%, 01/15/33 (Call 10/15/32) |
1,090 | 1,115,004 | ||||||
| 6.40%, 06/15/33 (Call 03/15/33)(a) |
1,175 | 1,221,660 | ||||||
| 6.70%, 04/01/53 (Call 10/01/52)(a) |
780 | 834,397 | ||||||
| 6.75%, 01/15/53 (Call 07/15/52) |
950 | 1,016,621 | ||||||
| 6.95%, 03/15/34 (Call 12/15/33)(a) |
1,090 | 1,178,009 | ||||||
| PacifiCorp |
||||||||
| 2.90%, 06/15/52 (Call 12/15/51) |
1,340 | 816,384 | ||||||
| 3.30%, 03/15/51 (Call 09/15/50) |
647 | 424,731 | ||||||
| 3.35%, 07/01/25 (Call 04/01/25)(a) |
295 | 287,235 | ||||||
| 4.10%, 02/01/42 (Call 08/01/41) |
585 | 462,100 | ||||||
| 4.13%, 01/15/49 (Call 07/15/48) |
852 | 665,323 | ||||||
| 4.15%, 02/15/50 (Call 08/15/49) |
882 | 686,379 | ||||||
| 5.10%, 02/15/29 (Call 01/15/29)(a) |
760 | 757,462 | ||||||
| 5.25%, 06/15/35(a) |
210 | 204,529 | ||||||
| 5.35%, 12/01/53 (Call 06/01/53) |
1,220 | 1,126,875 | ||||||
| 5.50%, 05/15/54 (Call 11/15/53) |
1,150 | 1,073,999 | ||||||
| 5.75%, 04/01/37 |
1,012 | 1,005,734 | ||||||
| Security | Par (000) | Value | ||||||
| Electric (continued) | ||||||||
| 6.00%, 01/15/39(a) |
$ | 881 | $ | 906,254 | ||||
| 6.10%, 08/01/36 |
524 | 543,756 | ||||||
| 6.25%, 10/15/37(a) |
846 | 871,724 | ||||||
| 6.35%, 07/15/38(a) |
389 | 408,533 | ||||||
| PacifiCorp. |
||||||||
| 2.70%, 09/15/30 (Call 06/15/30)(a) |
972 | 834,386 | ||||||
| 3.50%, 06/15/29 (Call 03/15/29)(a) |
445 | 409,867 | ||||||
| 5.30%, 02/15/31 (Call 12/15/30) |
760 | 751,845 | ||||||
| 5.45%, 02/15/34 (Call 11/15/33) |
1,065 | 1,049,572 | ||||||
| 5.80%, 01/15/55 (Call 07/15/54)(a) |
1,445 | 1,395,419 | ||||||
| 7.70%, 11/15/31 |
242 | 277,329 | ||||||
| Palomino Funding Trust I, 7.23%, 05/17/28 (Call 04/17/28)(b) |
700 | 729,471 | ||||||
| PECO Energy Co. |
||||||||
| 2.80%, 06/15/50 (Call 12/15/49)(a) |
533 | 344,800 | ||||||
| 2.85%, 09/15/51 (Call 03/15/51) |
550 | 353,099 | ||||||
| 3.00%, 09/15/49 (Call 03/15/49) |
644 | 430,879 | ||||||
| 3.05%, 03/15/51 (Call 09/15/50)(a) |
375 | 251,255 | ||||||
| 3.15%, 10/15/25 (Call 07/15/25) |
332 | 322,613 | ||||||
| 3.70%, 09/15/47 (Call 03/15/47)(a) |
450 | 349,275 | ||||||
| 3.90%, 03/01/48 (Call 09/01/47) |
665 | 534,310 | ||||||
| 4.15%, 10/01/44 (Call 04/01/44)(a) |
480 | 401,242 | ||||||
| 4.38%, 08/15/52 (Call 02/15/52) |
280 | 239,426 | ||||||
| 4.60%, 05/15/52 (Call 11/15/51) |
505 | 447,952 | ||||||
| 4.80%, 10/15/43 (Call 04/15/43) |
615 | 547,642 | ||||||
| 4.90%, 06/15/33 (Call 03/15/33)(a) |
465 | 461,050 | ||||||
| 5.95%, 10/01/36 |
250 | 264,916 | ||||||
| Pennsylvania Electric Co. |
||||||||
| 3.25%, 03/15/28 (Call 12/15/27)(a)(b) |
575 | 530,723 | ||||||
| 3.60%, 06/01/29 (Call 03/01/29)(b) |
339 | 313,010 | ||||||
| 6.15%, 10/01/38(a) |
460 | 467,413 | ||||||
| Pertamina Geothermal Energy PT, 5.15%, 04/27/28 (Call 03/27/28)(b) |
206 | 204,712 | ||||||
| Perusahaan Perseroan Persero PT Perusahaan Listrik Negara |
||||||||
| 3.00%, 06/30/30 (Call 03/30/30)(b) |
907 | 780,207 | ||||||
| 3.38%, 02/05/30(b) |
260 | 230,750 | ||||||
| 3.88%, 07/17/29(a)(b) |
575 | 529,417 | ||||||
| 4.00%, 06/30/50 (Call 12/30/49)(b) |
1,235 | 876,946 | ||||||
| 4.13%, 05/15/27(b) |
2,357 | 2,253,881 | ||||||
| 4.38%, 02/05/50(b) |
795 | 603,890 | ||||||
| 4.88%, 07/17/49(a)(b) |
1,133 | 924,410 | ||||||
| 5.25%, 10/24/42(a)(b) |
1,443 | 1,292,488 | ||||||
| 5.25%, 05/15/47(a)(b) |
545 | 477,041 | ||||||
| 5.38%, 01/25/29(b) |
1,000 | 991,492 | ||||||
| 5.45%, 05/21/28(b) |
1,530 | 1,520,616 | ||||||
| 6.15%, 05/21/48(b) |
1,460 | 1,414,375 | ||||||
| 6.25%, 01/25/49(a)(b) |
824 | 807,520 | ||||||
| Pinnacle West Capital Corp., 1.30%, 06/15/25 (Call 05/15/25) |
807 | 765,975 | ||||||
| Potomac Electric Power Co. |
||||||||
| 4.15%, 03/15/43 (Call 09/15/42) |
793 | 667,215 | ||||||
| 5.20%, 03/15/34 (Call 12/15/33) |
425 | 422,809 | ||||||
| 5.50%, 03/15/54 (Call 09/15/53) |
425 | 421,644 | ||||||
| 6.50%, 11/15/37 |
403 | 443,878 | ||||||
| 7.90%, 12/15/38(a) |
285 | 359,350 | ||||||
| PPL Capital Funding Inc. |
||||||||
| 3.10%, 05/15/26 (Call 02/15/26) |
1,023 | 975,231 | ||||||
| 4.13%, 04/15/30 (Call 01/15/30)(a) |
239 | 222,665 | ||||||
| PPL Electric Utilities Corp. |
||||||||
| 3.00%, 10/01/49 (Call 04/01/49) |
399 | 271,857 | ||||||
| 74 | 2 0 2 4 I S H A R E S A N N U A L R E P O R T T O S H A R E H O L D E R S |
| Schedule of Investments (continued) February 29, 2024 |
iShares® Broad USD Investment Grade Corporate Bond ETF (Percentages shown are based on Net Assets) |
| Security | Par (000) |
Value | ||||||
| Electric (continued) | ||||||||
| 3.95%, 06/01/47 (Call 12/01/46) |
$ | 542 | $ | 436,629 | ||||
| 4.13%, 06/15/44 (Call 12/15/43) |
380 | 318,263 | ||||||
| 4.15%, 10/01/45 (Call 04/01/45) |
411 | 339,078 | ||||||
| 4.15%, 06/15/48 (Call 12/15/47) |
619 | 517,320 | ||||||
| 4.75%, 07/15/43 (Call 01/15/43) |
170 | 155,626 | ||||||
| 4.85%, 02/15/34 (Call 11/15/33) |
630 | 613,473 | ||||||
| 5.00%, 05/15/33 (Call 02/15/33) |
730 | 725,444 | ||||||
| 5.25%, 05/15/53 (Call 11/15/52) |
840 | 816,131 | ||||||
| 6.25%, 05/15/39(a) |
355 | 383,933 | ||||||
| Progress Energy Inc. |
||||||||
| 6.00%, 12/01/39 |
844 | 851,945 | ||||||
| 7.00%, 10/30/31 |
610 | 672,742 | ||||||
| 7.75%, 03/01/31 |
969 | 1,095,887 | ||||||
| Public Service Co. of Colorado |
||||||||
| 1.88%, 06/15/31 (Call 12/15/30) |
755 | 607,660 | ||||||
| 2.90%, 05/15/25 (Call 11/15/24) |
648 | 628,191 | ||||||
| 3.55%, 06/15/46 (Call 12/15/45) |
410 | 288,113 | ||||||
| 3.60%, 09/15/42 (Call 03/15/42) |
678 | 521,457 | ||||||
| 3.70%, 06/15/28 (Call 12/15/27) |
203 | 193,549 | ||||||
| 3.80%, 06/15/47 (Call 12/15/46) |
518 | 390,763 | ||||||
| 3.95%, 03/15/43 (Call 09/15/42)(a) |
355 | 275,712 | ||||||
| 4.05%, 09/15/49 (Call 03/15/49) |
510 | 397,756 | ||||||
| 4.10%, 06/01/32 (Call 03/01/32)(a) |
400 | 370,937 | ||||||
| 4.10%, 06/15/48 (Call 12/15/47) |
645 | 512,812 | ||||||
| 4.30%, 03/15/44 (Call 09/15/43) |
546 | 453,690 | ||||||
| 4.50%, 06/01/52 (Call 12/01/51)(a) |
530 | 445,839 | ||||||
| 4.75%, 08/15/41 (Call 02/15/41) |
185 | 165,742 | ||||||
| 5.25%, 04/01/53 (Call 10/01/52) |
1,105 | 1,044,912 | ||||||
| 6.50%, 08/01/38(a) |
115 | 125,925 | ||||||
| Series 17, 6.25%, 09/01/37 |
606 | 641,352 | ||||||
| Series 34, 3.20%, 03/01/50 (Call 09/01/49)(a) |
797 | 540,457 | ||||||
| Series 35, 1.90%, 01/15/31 (Call 07/15/30) |
987 | 802,735 | ||||||
| Series 36, 2.70%, 01/15/51 (Call 07/15/50) |
695 | 420,293 | ||||||
| Public Service Co. of New Hampshire |
||||||||
| 3.60%, 07/01/49 (Call 01/01/49) |
390 | 295,845 | ||||||
| 5.15%, 01/15/53 (Call 07/15/52) |
505 | 482,977 | ||||||
| 5.35%, 10/01/33 (Call 07/01/33) |
605 | 612,048 | ||||||
| Series V, 2.20%, 06/15/31 (Call 03/15/31) |
548 | 452,508 | ||||||
| Public Service Co. of New Mexico, 3.85%, 08/01/25 |
675 | 655,901 | ||||||
| Public Service Co. of Oklahoma |
||||||||
| 5.25%, 01/15/33 (Call 10/15/32) |
920 | 912,405 | ||||||
| Series G, 6.63%, 11/15/37 |
410 | 443,796 | ||||||
| Series J, 2.20%, 08/15/31 (Call 05/15/31) |
360 | 292,995 | ||||||
| Series K, 3.15%, 08/15/51 (Call 02/15/51)(a) |
305 | 204,243 | ||||||
| Public Service Electric & Gas Co. |
||||||||
| 0.95%, 03/15/26 (Call 02/15/26) |
951 | 879,793 | ||||||
| 1.90%, 08/15/31 (Call 05/15/31) |
635 | 511,210 | ||||||
| 2.05%, 08/01/50 (Call 02/01/50) |
566 | 315,107 | ||||||
| 2.25%, 09/15/26 (Call 06/15/26) |
595 | 557,720 | ||||||
| 2.45%, 01/15/30 (Call 10/15/29) |
595 | 517,450 | ||||||
| 2.70%, 05/01/50 (Call 11/01/49) |
515 | 330,732 | ||||||
| 3.00%, 05/15/25 (Call 02/15/25)(a) |
347 | 338,173 | ||||||
| 3.00%, 05/15/27 (Call 02/15/27) |
735 | 694,539 | ||||||
| 3.00%, 03/01/51 (Call 09/01/50) |
449 | 296,254 | ||||||
| 3.10%, 03/15/32 (Call 12/15/31)(a) |
910 | 793,941 | ||||||
| 3.15%, 01/01/50 (Call 07/01/49) |
325 | 226,321 | ||||||
| 3.20%, 05/15/29 (Call 02/15/29) |
135 | 124,471 | ||||||
| 3.20%, 08/01/49 (Call 02/01/49) |
546 | 385,923 | ||||||
| 3.60%, 12/01/47 (Call 06/01/47) |
534 | 407,665 | ||||||
| 3.65%, 09/01/28 (Call 06/01/28)(a) |
667 | 635,462 | ||||||
| Security | Par (000) |
Value | ||||||
| Electric (continued) | ||||||||
| 3.65%, 09/01/42 (Call 03/01/42) |
$ | 570 | $ | 449,938 | ||||
| 3.70%, 05/01/28 (Call 02/01/28) |
165 | 157,824 | ||||||
| 3.80%, 01/01/43 (Call 07/01/42) |
640 | 521,180 | ||||||
| 3.80%, 03/01/46 (Call 09/01/45) |
780 | 613,434 | ||||||
| 3.85%, 05/01/49 (Call 11/01/48)(a) |
489 | 390,787 | ||||||
| 3.95%, 05/01/42 (Call 11/01/41) |
385 | 322,040 | ||||||
| 4.05%, 05/01/48 (Call 11/01/47)(a) |
415 | 345,309 | ||||||
| 4.15%, 11/01/45 (Call 05/01/45) |
425 | 342,365 | ||||||
| 4.65%, 03/15/33 (Call 12/15/32)(a) |
535 | 517,821 | ||||||
| 4.90%, 12/15/32 (Call 09/15/32) |
621 | 613,473 | ||||||
| 5.13%, 03/15/53 (Call 09/15/52)(a) |
485 | 468,881 | ||||||
| 5.20%, 08/01/33 (Call 05/01/33) |
145 | 146,507 | ||||||
| 5.20%, 03/01/34 (Call 12/01/33) |
625 | 625,143 | ||||||
| 5.38%, 11/01/39 |
360 | 348,236 | ||||||
| 5.45%, 08/01/53 (Call 02/01/53)(a) |
300 | 301,479 | ||||||
| 5.45%, 03/01/54 (Call 09/01/53) |
625 | 625,402 | ||||||
| 5.50%, 03/01/40(a) |
395 | 395,717 | ||||||
| 5.80%, 05/01/37 |
360 | 371,381 | ||||||
| Series I, 4.00%, 06/01/44 (Call 12/01/43) |
370 | 294,269 | ||||||
| Series K, 4.05%, 05/01/45 (Call 11/01/44)(a) |
260 | 206,528 | ||||||
| Public Service Enterprise Group Inc. |
||||||||
| 0.80%, 08/15/25 (Call 07/15/25) |
663 | 620,714 | ||||||
| 1.60%, 08/15/30 (Call 05/15/30) |
632 | 507,950 | ||||||
| 2.45%, 11/15/31 (Call 08/15/31) |
1,165 | 948,415 | ||||||
| 5.85%, 11/15/27 (Call 10/15/27) |
1,140 | 1,168,116 | ||||||
| 5.88%, 10/15/28 (Call 09/15/28) |
975 | 1,000,801 | ||||||
| 6.13%, 10/15/33 (Call 07/15/33) |
580 | 604,463 | ||||||
| Puget Energy Inc. |
||||||||
| 2.38%, 06/15/28 (Call 04/15/28) |
790 | 701,837 | ||||||
| 3.65%, 05/15/25 (Call 02/15/25) |
732 | 713,098 | ||||||
| 4.10%, 06/15/30 (Call 03/15/30)(a) |
595 | 538,666 | ||||||
| 4.22%, 03/15/32 (Call 12/15/31) |
570 | 509,937 | ||||||
| Puget Sound Energy Inc. |
||||||||
| 2.89%, 09/15/51 (Call 03/15/51)(a) |
340 | 215,578 | ||||||
| 3.25%, 09/15/49 (Call 03/15/49) |
780 | 527,776 | ||||||
| 4.22%, 06/15/48 (Call 12/15/47) |
425 | 342,088 | ||||||
| 4.30%, 05/20/45 (Call 11/20/44)(a) |
762 | 626,883 | ||||||
| 4.43%, 11/15/41 (Call 05/15/41) |
409 | 343,432 | ||||||
| 5.45%, 06/01/53 (Call 12/01/52) |
285 | 281,888 | ||||||
| 5.48%, 06/01/35(a) |
270 | 269,676 | ||||||
| 5.64%, 04/15/41 (Call 10/15/40) |
205 | 203,663 | ||||||
| 5.76%, 10/01/39 |
590 | 594,533 | ||||||
| 5.76%, 07/15/40(a) |
370 | 368,652 | ||||||
| 5.80%, 03/15/40 |
525 | 527,657 | ||||||
| 6.27%, 03/15/37 |
275 | 287,938 | ||||||
| 6.72%, 06/15/36(a) |
230 | 250,418 | ||||||
| 7.02%, 12/01/27(a) |
380 | 398,841 | ||||||
| Rochester Gas and Electric Corp., 3.10%, 06/01/27 (Call 03/01/27)(a)(b) |
689 | 645,904 | ||||||
| Ruwais Power Co. PJSC, 6.00%, 08/31/36(b) |
205 | 202,765 | ||||||
| San Diego Gas & Electric Co. |
||||||||
| 2.50%, 05/15/26 (Call 02/15/26) |
1,170 | 1,109,534 | ||||||
| 3.70%, 03/15/52 (Call 09/15/51) |
230 | 170,842 | ||||||
| 3.95%, 11/15/41(a) |
297 | 239,486 | ||||||
| 4.15%, 05/15/48 (Call 11/15/47) |
604 | 497,435 | ||||||
| 4.30%, 04/01/42 (Call 10/01/41) |
571 | 480,562 | ||||||
| 4.50%, 08/15/40 |
829 | 736,833 | ||||||
| 4.95%, 08/15/28 (Call 07/15/28) |
1,175 | 1,174,724 | ||||||
| 5.35%, 05/15/35 |
395 | 391,985 | ||||||
| 5.35%, 05/15/40(a) |
250 | 240,353 | ||||||
| 5.35%, 04/01/53 (Call 10/01/52) |
780 | 756,651 | ||||||
| S C H E D U L E O F I N V E S T M E N T S |
75 |
| Schedule of Investments (continued) February 29, 2024 |
iShares® Broad USD Investment Grade Corporate Bond ETF (Percentages shown are based on Net Assets) |
| Security | Par (000) | Value | ||||||
| Electric (continued) | ||||||||
| 6.00%, 06/01/26(a) |
$ | 232 | $ | 236,212 | ||||
| 6.00%, 06/01/39 |
370 | 386,419 | ||||||
| Series FFF, 6.13%, 09/15/37 |
10 | 10,106 | ||||||
| Series RRR, 3.75%, 06/01/47 |
512 | 395,649 | ||||||
| Series TTT, 4.10%, 06/15/49 |
605 | 488,944 | ||||||
| Series UUU, 3.32%, 04/15/50 |
632 | 439,085 | ||||||
| Series VVV, 1.70%, 10/01/30 (Call 07/01/30) |
1,033 | 840,957 | ||||||
| Series WWW, 2.95%, 08/15/51 |
1,065 | 708,875 | ||||||
| Series XXX, 3.00%, 03/15/32 (Call 12/15/31) |
860 | 743,841 | ||||||
| Saudi Electricity Global Sukuk Co. 2, |
825 | 771,410 | ||||||
| Saudi Electricity Global Sukuk Co. 3, |
1,096 | 1,065,860 | ||||||
| Sempra |
||||||||
| 3.25%, 06/15/27 (Call 03/15/27) |
1,044 | 982,318 | ||||||
| 3.30%, 04/01/25 (Call 03/01/25) |
300 | 292,889 | ||||||
| 3.40%, 02/01/28 (Call 11/01/27) |
272 | 255,787 | ||||||
| 3.70%, 04/01/29 (Call 02/01/29) |
785 | 730,473 | ||||||
| 3.80%, 02/01/38 (Call 08/01/37) |
1,158 | 950,183 | ||||||
| 4.00%, 02/01/48 (Call 08/01/47) |
930 | 723,178 | ||||||
| 4.13%, 04/01/52 (Call 01/01/27), |
1,235 | 1,133,075 | ||||||
| 5.40%, 08/01/26 (Call 07/01/26) |
625 | 626,563 | ||||||
| 5.50%, 08/01/33 (Call 05/01/33)(a) |
840 | 834,816 | ||||||
| 6.00%, 10/15/39 |
1,244 | 1,257,869 | ||||||
| Sierra Pacific Power Co. |
||||||||
| 2.60%, 05/01/26 (Call 02/01/26) |
957 | 906,624 | ||||||
| 5.90%, 03/15/54 (Call 09/15/53)(b) |
725 | 741,588 | ||||||
| Series P, 6.75%, 07/01/37(a) |
185 | 196,481 | ||||||
| Solar Star Funding LLC, 5.38%, 06/30/35(b) |
89 | 87,776 | ||||||
| Southern California Edison Co. |
||||||||
| 2.25%, 06/01/30 (Call 03/01/30) |
898 | 758,158 | ||||||
| 2.75%, 02/01/32 (Call 11/01/31) |
717 | 602,908 | ||||||
| 2.85%, 08/01/29 (Call 05/01/29) |
866 | 774,793 | ||||||
| 3.45%, 02/01/52 (Call 08/01/51) |
955 | 666,283 | ||||||
| 3.65%, 02/01/50 (Call 08/01/49) |
1,272 | 931,011 | ||||||
| 3.90%, 12/01/41 (Call 06/01/41)(a) |
380 | 301,550 | ||||||
| 4.00%, 04/01/47 (Call 10/01/46) |
2,413 | 1,883,074 | ||||||
| 4.05%, 03/15/42 (Call 09/15/41) |
570 | 467,916 | ||||||
| 4.50%, 09/01/40 (Call 03/01/40) |
902 | 786,551 | ||||||
| 4.65%, 10/01/43 (Call 04/01/43) |
961 | 841,591 | ||||||
| 4.88%, 02/01/27 (Call 01/01/27) |
725 | 720,988 | ||||||
| 4.90%, 06/01/26 (Call 05/01/26) |
505 | 501,490 | ||||||
| 5.15%, 06/01/29 (Call 05/01/29) |
625 | 625,144 | ||||||
| 5.20%, 06/01/34 (Call 03/01/34) |
750 | 733,603 | ||||||
| 5.30%, 03/01/28 (Call 02/01/28) |
840 | 847,990 | ||||||
| 5.35%, 03/01/26 |
625 | 625,503 | ||||||
| 5.50%, 03/15/40 |
489 | 483,672 | ||||||
| 5.63%, 02/01/36(a) |
303 | 302,107 | ||||||
| 5.65%, 10/01/28 (Call 09/01/28) |
270 | 276,484 | ||||||
| 5.70%, 03/01/53 (Call 09/01/52) |
45 | 44,740 | ||||||
| 5.75%, 04/15/54 (Call 10/15/53) |
625 | 622,481 | ||||||
| 5.85%, 11/01/27 (Call 10/01/27) |
1,250 | 1,279,905 | ||||||
| 5.88%, 12/01/53 (Call 06/01/53) |
760 | 770,831 | ||||||
| 5.95%, 11/01/32 (Call 08/01/32)(a) |
1,015 | 1,058,348 | ||||||
| 6.00%, 01/15/34 |
892 | 931,144 | ||||||
| 6.05%, 03/15/39(a) |
835 | 860,742 | ||||||
| Security | Par (000) | Value | ||||||
| Electric (continued) | ||||||||
| 6.65%, 04/01/29 |
$ | 545 | $ | 572,241 | ||||
| Series 04-G, 5.75%, 04/01/35 |
425 | 427,734 | ||||||
| Series 05-B, 5.55%, 01/15/36(a) |
235 | 232,493 | ||||||
| Series 05-E, 5.35%, 07/15/35(a) |
472 | 470,520 | ||||||
| Series 06-E, 5.55%, 01/15/37 |
875 | 868,469 | ||||||
| Series 08-A, 5.95%, 02/01/38 |
935 | 958,861 | ||||||
| Series 13-A, 3.90%, 03/15/43 |
700 | 553,659 | ||||||
| Series 2020-C, 1.20%, 02/01/26 |
736 | 682,516 | ||||||
| Series 20A, 2.95%, 02/01/51 |
820 | 526,867 | ||||||
| Series A, 4.20%, 03/01/29 (Call 12/01/28) |
853 | 821,484 | ||||||
| Series B, 3.65%, 03/01/28 (Call 12/01/27) |
475 | 450,005 | ||||||
| Series B, 4.88%, 03/01/49 (Call 09/01/48) |
807 | 717,820 | ||||||
| Series C, 3.60%, 02/01/45 (Call 08/01/44) |
679 | 502,377 | ||||||
| Series C, 4.13%, 03/01/48 (Call 09/01/47) |
1,770 | 1,415,590 | ||||||
| Series C, 4.20%, 06/01/25 |
380 | 374,480 | ||||||
| Series D, 4.70%, 06/01/27 (Call 05/01/27) |
905 | 895,107 | ||||||
| Series E, 3.70%, 08/01/25 (Call 06/01/25) |
1,171 | 1,143,854 | ||||||
| Series E, 5.45%, 06/01/52 (Call 12/01/51)(a) |
470 | 450,639 | ||||||
| Series G, 2.50%, 06/01/31 (Call 03/01/31) |
356 | 298,899 | ||||||
| Series H, 3.65%, 06/01/51 (Call 12/01/50)(a) |
640 | 470,019 | ||||||
| Southern Co. (The) |
||||||||
| 3.25%, 07/01/26 (Call 04/01/26) |
2,267 | 2,167,909 | ||||||
| 4.25%, 07/01/36 (Call 01/01/36) |
289 | 255,655 | ||||||
| 4.40%, 07/01/46 (Call 01/01/46) |
2,535 | 2,136,639 | ||||||
| 4.85%, 06/15/28 (Call 04/15/28) |
960 | 951,250 | ||||||
| 5.11%, 08/01/27 |
1,025 | 1,022,425 | ||||||
| 5.15%, 10/06/25 |
751 | 749,971 | ||||||
| 5.20%, 06/15/33 (Call 12/15/32) |
880 | 866,249 | ||||||
| 5.50%, 03/15/29 (Call 01/15/29)(a) |
1,275 | 1,293,133 | ||||||
| 5.70%, 10/15/32 (Call 04/15/32) |
820 | 839,540 | ||||||
| 5.70%, 03/15/34 (Call 09/15/33) |
1,025 | 1,044,152 | ||||||
| Series 21-A, 3.75%, 09/15/51 |
970 | 909,722 | ||||||
| Series 21-B, 1.75%, 03/15/28 |
647 | 569,041 | ||||||
| Series A, 3.70%, 04/30/30 (Call 01/30/30) |
910 | 838,941 | ||||||
| Series B, 4.00%, 01/15/51 (Call 10/15/25), |
1,280 | 1,229,198 | ||||||
| Southern Power Co. |
||||||||
| 0.90%, 01/15/26 (Call 12/15/25) |
832 | 766,038 | ||||||
| 4.15%, 12/01/25 (Call 09/01/25) |
759 | 746,070 | ||||||
| 5.15%, 09/15/41 |
583 | 537,110 | ||||||
| 5.25%, 07/15/43 |
576 | 531,524 | ||||||
| Series F, 4.95%, 12/15/46 (Call 06/15/46) |
563 | 493,299 | ||||||
| Southwestern Electric Power Co. |
||||||||
| 3.25%, 11/01/51 (Call 05/01/51)(a) |
500 | 328,269 | ||||||
| 5.30%, 04/01/33 (Call 01/01/33)(a) |
695 | 685,662 | ||||||
| 6.20%, 03/15/40(a) |
490 | 505,198 | ||||||
| Series J, 3.90%, 04/01/45 (Call 10/01/44) |
524 | 400,442 | ||||||
| Series K, 2.75%, 10/01/26 (Call 07/01/26) |
971 | 911,568 | ||||||
| Series L, 3.85%, 02/01/48 (Call 08/01/47) |
564 | 412,050 | ||||||
| Series M, 4.10%, 09/15/28 (Call 06/15/28) |
1,203 | 1,152,969 | ||||||
| Series N, 1.65%, 03/15/26 (Call 02/15/26) |
825 | 767,562 | ||||||
| Southwestern Public Service Co. |
||||||||
| 3.40%, 08/15/46 (Call 02/15/46) |
545 | 379,018 | ||||||
| 3.70%, 08/15/47 (Call 02/15/47) |
677 | 481,013 | ||||||
| 3.75%, 06/15/49 (Call 12/15/48) |
537 | 388,978 | ||||||
| 4.50%, 08/15/41 (Call 02/15/41) |
490 | 405,507 | ||||||
| 76 | 2 0 2 4 I S H A R E S A N N U A L R E P O R T T O S H A R E H O L D E R S |
| Schedule of Investments (continued) February 29, 2024 |
iShares® Broad USD Investment Grade Corporate Bond ETF (Percentages shown are based on Net Assets) |
| Security | Par (000) | Value | ||||||
| Electric (continued) | ||||||||
| 6.00%, 10/01/36 |
$ | 411 | $ | 411,570 | ||||
| Series 6, 4.40%, 11/15/48 (Call 05/15/48)(a) |
398 | 317,055 | ||||||
| Series 8, 3.15%, 05/01/50 (Call 11/01/49) |
835 | 537,583 | ||||||
| SP Group Treasury Pte. Ltd., 3.38%, 02/27/29 |
906 | 843,736 | ||||||
| SP PowerAssets Ltd. |
||||||||
| 3.00%, 09/26/27(a)(b) |
200 | 187,683 | ||||||
| 3.25%, 11/24/25(a)(b) |
921 | 892,078 | ||||||
| Star Energy Geothermal Darajat II/Star Energy |
||||||||
| 3.25%, 04/14/29 (Call 04/14/24)(b) |
80 | 74,109 | ||||||
| 4.85%, 10/14/38 (Call 10/14/29)(a)(b) |
745 | 679,946 | ||||||
| State Grid Overseas Investment 2014 Ltd., |
||||||||
| 4.85%, 05/07/44(a)(b) |
855 | 826,445 | ||||||
| State Grid Overseas Investment BVI Ltd. |
||||||||
| 2.88%, 05/18/26(b) |
85 | 81,146 | ||||||
| 3.50%, 05/04/27(b) |
3,940 | 3,782,809 | ||||||
| 4.00%, 05/04/47(a)(b) |
677 | 575,290 | ||||||
| 4.25%, 05/02/28(a)(b) |
905 | 890,443 | ||||||
| System Energy Resources Inc., |
330 | 333,844 | ||||||
| Tampa Electric Co. |
||||||||
| 2.40%, 03/15/31 (Call 12/15/30)(a) |
571 | 473,467 | ||||||
| 3.45%, 03/15/51 (Call 09/15/50)(a) |
629 | 437,221 | ||||||
| 3.63%, 06/15/50 (Call 12/15/49)(a) |
465 | 338,407 | ||||||
| 4.10%, 06/15/42 (Call 12/15/41) |
370 | 301,752 | ||||||
| 4.20%, 05/15/45 (Call 11/15/44) |
435 | 341,705 | ||||||
| 4.30%, 06/15/48 (Call 12/15/47) |
272 | 223,337 | ||||||
| 4.35%, 05/15/44 (Call 11/15/43) |
437 | 363,387 | ||||||
| 4.45%, 06/15/49 (Call 12/15/48) |
533 | 452,382 | ||||||
| 4.90%, 03/01/29 (Call 02/01/29) |
430 | 427,718 | ||||||
| 5.00%, 07/15/52 (Call 01/15/52)(a) |
421 | 383,257 | ||||||
| 6.15%, 05/15/37(a) |
220 | 226,811 | ||||||
| 6.55%, 05/15/36 |
585 | 620,813 | ||||||
| Three Gorges Finance I Cayman Islands Ltd. |
||||||||
| 1.30%, 09/22/25 (Call 08/22/25)(b) |
700 | 658,891 | ||||||
| 3.15%, 06/02/26(a)(b) |
730 | 699,675 | ||||||
| Tierra Mojada Luxembourg II Sarl, |
737 | 658,470 | ||||||
| Toledo Edison Co. (The), 6.15%, 05/15/37 |
272 | 286,619 | ||||||
| Trans-Allegheny Interstate Line Co., |
359 | 351,367 | ||||||
| Tri-State Generation & Transmission |
||||||||
| 4.70%, 11/01/44 (Call 05/01/44) |
385 | 293,528 | ||||||
| 6.00%, 06/15/40(b) |
747 | 699,808 | ||||||
| Tucson Electric Power Co. |
||||||||
| 1.50%, 08/01/30 (Call 05/01/30)(a) |
787 | 631,788 | ||||||
| 3.05%, 03/15/25 (Call 12/15/24) |
597 | 582,580 | ||||||
| 3.25%, 05/15/32 (Call 02/15/32)(a) |
395 | 341,970 | ||||||
| 3.25%, 05/01/51 (Call 11/01/50)(a) |
441 | 296,120 | ||||||
| 4.00%, 06/15/50 (Call 12/15/49)(a) |
622 | 478,023 | ||||||
| 4.85%, 12/01/48 (Call 06/01/48)(a) |
381 | 336,926 | ||||||
| 5.50%, 04/15/53 (Call 10/15/52) |
505 | 493,350 | ||||||
| Union Electric Co. |
||||||||
| 2.15%, 03/15/32 (Call 12/15/31) |
795 | 639,608 | ||||||
| 2.63%, 03/15/51 (Call 09/15/50) |
775 | 468,052 | ||||||
| 2.95%, 06/15/27 (Call 03/15/27) |
526 | 493,386 | ||||||
| 2.95%, 03/15/30 (Call 12/15/29) |
140 | 124,073 | ||||||
| 3.25%, 10/01/49 (Call 04/01/49)(a) |
660 | 449,811 | ||||||
| 3.50%, 03/15/29 (Call 12/15/28) |
491 | 457,880 | ||||||
| Security | Par (000) | Value | ||||||
| Electric (continued) | ||||||||
| 3.65%, 04/15/45 (Call 10/15/44) |
$ | 732 | $ | 550,798 | ||||
| 3.90%, 09/15/42 (Call 03/15/42) |
420 | 339,893 | ||||||
| 3.90%, 04/01/52 (Call 10/01/51)(a) |
685 | 533,221 | ||||||
| 4.00%, 04/01/48 (Call 10/01/47) |
652 | 513,431 | ||||||
| 5.25%, 01/15/54 (Call 07/15/53) |
475 | 449,738 | ||||||
| 5.30%, 08/01/37(a) |
385 | 382,901 | ||||||
| 5.45%, 03/15/53 (Call 09/15/52) |
675 | 662,281 | ||||||
| 8.45%, 03/15/39 |
390 | 496,149 | ||||||
| Virginia Electric & Power Co. |
||||||||
| 2.30%, 11/15/31 (Call 08/15/31) |
675 | 556,372 | ||||||
| 2.40%, 03/30/32 (Call 12/30/31)(a) |
585 | 482,853 | ||||||
| 2.45%, 12/15/50 (Call 06/15/50) |
1,509 | 875,294 | ||||||
| 2.95%, 11/15/51 (Call 05/15/51) |
505 | 323,903 | ||||||
| 3.30%, 12/01/49 (Call 06/01/49) |
552 | 388,743 | ||||||
| 4.00%, 01/15/43 (Call 07/15/42)(a) |
620 | 506,343 | ||||||
| 4.45%, 02/15/44 (Call 08/15/43) |
685 | 589,170 | ||||||
| 4.60%, 12/01/48 (Call 06/01/48) |
790 | 686,507 | ||||||
| 5.00%, 04/01/33 (Call 01/01/33) |
930 | 911,299 | ||||||
| 5.00%, 01/15/34 (Call 10/15/33) |
905 | 879,728 | ||||||
| 5.30%, 08/15/33 (Call 05/15/33) |
120 | 119,915 | ||||||
| 5.35%, 01/15/54 (Call 07/15/53) |
425 | 409,029 | ||||||
| 5.45%, 04/01/53 (Call 10/01/52) |
1,045 | 1,023,375 | ||||||
| 5.70%, 08/15/53 (Call 02/15/53)(a) |
760 | 769,131 | ||||||
| 6.35%, 11/30/37 |
812 | 868,111 | ||||||
| 8.88%, 11/15/38 |
813 | 1,081,053 | ||||||
| Series A, 2.88%, 07/15/29 (Call 04/15/29)(a) |
780 | 705,801 | ||||||
| Series A, 3.10%, 05/15/25 (Call 02/15/25) |
344 | 334,509 | ||||||
| Series A, 3.15%, 01/15/26 (Call 10/15/25) |
1,177 | 1,136,621 | ||||||
| Series A, 3.50%, 03/15/27 (Call 12/15/26) |
880 | 842,685 | ||||||
| Series A, 3.80%, 04/01/28 (Call 01/01/28) |
1,148 | 1,100,966 | ||||||
| Series A, 6.00%, 05/15/37 |
960 | 996,702 | ||||||
| Series B, 2.95%, 11/15/26 (Call 08/15/26) |
567 | 537,339 | ||||||
| Series B, 3.75%, 05/15/27 (Call 04/15/27) |
478 | 459,737 | ||||||
| Series B, 3.80%, 09/15/47 (Call 03/15/47)(a) |
612 | 466,286 | ||||||
| Series B, 4.20%, 05/15/45 (Call 11/15/44) |
500 | 411,996 | ||||||
| Series B, 6.00%, 01/15/36 |
689 | 720,270 | ||||||
| Series C, 4.00%, 11/15/46 (Call 05/15/46) |
618 | 491,425 | ||||||
| Series C, 4.63%, 05/15/52 (Call 11/15/51) |
600 | 518,028 | ||||||
| Series D, 4.65%, 08/15/43 (Call 02/15/43) |
925 | 818,093 | ||||||
| Vistra Operations Co. LLC |
||||||||
| 3.70%, 01/30/27 (Call 11/30/26)(a)(b) |
1,256 | 1,187,997 | ||||||
| 4.30%, 07/15/29 (Call 04/15/29)(b) |
1,349 | 1,257,311 | ||||||
| 5.13%, 05/13/25(a)(b) |
1,155 | 1,145,480 | ||||||
| 6.95%, 10/15/33 (Call 07/15/33)(b) |
965 | 1,005,429 | ||||||
| WEC Energy Group Inc. |
||||||||
| 1.38%, 10/15/27 (Call 08/15/27) |
829 | 729,239 | ||||||
| 1.80%, 10/15/30 (Call 07/15/30) |
643 | 520,274 | ||||||
| 2.20%, 12/15/28 (Call 10/15/28)(a) |
630 | 553,485 | ||||||
| 4.75%, 01/09/26 (Call 12/09/25) |
1,270 | 1,257,628 | ||||||
| 4.75%, 01/15/28 (Call 12/15/27)(a) |
830 | 820,369 | ||||||
| 5.00%, 09/27/25 (Call 08/27/25) |
720 | 716,010 | ||||||
| 5.15%, 10/01/27 (Call 09/01/27) |
870 | 869,127 | ||||||
| 5.60%, 09/12/26 (Call 08/12/26) |
480 | 484,683 | ||||||
| Wisconsin Electric Power Co. |
||||||||
| 1.70%, 06/15/28 (Call 04/15/28)(a) |
345 | 303,938 | ||||||
| 3.10%, 06/01/25 (Call 03/01/25) |
190 | 184,831 | ||||||
| 3.65%, 12/15/42 (Call 06/15/42)(a) |
220 | 167,601 | ||||||
| 4.25%, 06/01/44 (Call 12/01/43)(a) |
455 | 373,229 | ||||||
| 4.30%, 12/15/45 (Call 06/15/45)(a) |
155 | 126,629 | ||||||
| 4.30%, 10/15/48 (Call 04/15/48)(a) |
375 | 313,578 | ||||||
| 4.75%, 09/30/32 (Call 06/30/32)(a) |
795 | 779,572 | ||||||
| S C H E D U L E O F I N V E S T M E N T S |
77 |
| Schedule of Investments (continued) February 29, 2024 |
iShares® Broad USD Investment Grade Corporate Bond ETF (Percentages shown are based on Net Assets) |
| Security | Par (000) | Value | ||||||
| Electric (continued) | ||||||||
| 5.63%, 05/15/33(a) |
$ | 242 | $ | 253,558 | ||||
| 5.70%, 12/01/36(a) |
105 | 107,986 | ||||||
| Wisconsin Power and Light Co. |
||||||||
| 1.95%, 09/16/31 (Call 06/16/31)(a) |
360 | 285,987 | ||||||
| 3.00%, 07/01/29 (Call 04/01/29)(a) |
362 | 330,284 | ||||||
| 3.05%, 10/15/27 (Call 07/15/27) |
515 | 480,633 | ||||||
| 3.65%, 04/01/50 (Call 10/01/49) |
370 | 269,794 | ||||||
| 3.95%, 09/01/32 (Call 06/01/32)(a) |
855 | 788,822 | ||||||
| 4.10%, 10/15/44 (Call 04/15/44)(a) |
170 | 132,898 | ||||||
| 4.95%, 04/01/33 (Call 01/01/33) |
375 | 364,482 | ||||||
| 6.38%, 08/15/37(a) |
435 | 462,486 | ||||||
| 7.60%, 10/01/38 |
375 | 437,874 | ||||||
| Wisconsin Public Service Corp. |
||||||||
| 2.85%, 12/01/51 (Call 06/01/51) |
710 | 447,526 | ||||||
| 3.30%, 09/01/49 (Call 03/01/49)(a) |
525 | 368,480 | ||||||
| 3.67%, 12/01/42 |
632 | 494,153 | ||||||
| 4.75%, 11/01/44 (Call 05/01/44)(a) |
599 | 533,622 | ||||||
| 5.35%, 11/10/25 (Call 10/10/25)(a) |
478 | 478,860 | ||||||
| Xcel Energy Inc. |
||||||||
| 1.75%, 03/15/27 (Call 02/15/27) |
1,025 | 921,608 | ||||||
| 2.35%, 11/15/31 (Call 05/15/31) |
415 | 332,881 | ||||||
| 2.60%, 12/01/29 (Call 06/01/29)(a) |
520 | 452,564 | ||||||
| 3.30%, 06/01/25 (Call 12/01/24) |
658 | 640,248 | ||||||
| 3.35%, 12/01/26 (Call 06/01/26) |
1,087 | 1,027,046 | ||||||
| 3.40%, 06/01/30 (Call 12/01/29) |
670 | 597,686 | ||||||
| 3.50%, 12/01/49 (Call 06/01/49) |
560 | 385,394 | ||||||
| 4.00%, 06/15/28 (Call 12/15/27)(a) |
694 | 662,378 | ||||||
| 4.60%, 06/01/32 (Call 12/01/31) |
875 | 815,892 | ||||||
| 4.80%, 09/15/41 (Call 03/15/41) |
573 | 493,499 | ||||||
| 5.45%, 08/15/33 (Call 02/15/33) |
840 | 831,690 | ||||||
| 5.50%, 03/15/34 (Call 09/15/33) |
950 | 933,755 | ||||||
| 6.50%, 07/01/36 |
540 | 567,830 | ||||||
|
|
|
|||||||
| 870,267,194 | ||||||||
| Electrical Components & Equipment — 0.1% | ||||||||
| Acuity Brands Lighting Inc., 2.15%, 12/15/30 |
674 | 552,367 | ||||||
| Emerson Electric Co. |
||||||||
| 0.88%, 10/15/26 (Call 09/15/26)(a) |
1,396 | 1,262,689 | ||||||
| 1.80%, 10/15/27 (Call 08/15/27)(a) |
839 | 755,745 | ||||||
| 1.95%, 10/15/30 (Call 07/15/30) |
1,105 | 927,167 | ||||||
| 2.00%, 12/21/28 (Call 10/21/28) |
1,000 | 881,876 | ||||||
| 2.20%, 12/21/31 (Call 09/21/31) |
990 | 821,369 | ||||||
| 2.75%, 10/15/50 (Call 04/15/50) |
856 | 547,444 | ||||||
| 2.80%, 12/21/51 (Call 06/21/51)(a) |
1,490 | 961,828 | ||||||
| 3.15%, 06/01/25 (Call 03/01/25) |
295 | 288,257 | ||||||
| 5.25%, 11/15/39(a) |
45 | 45,508 | ||||||
| 6.00%, 08/15/32(a) |
650 | 683,211 | ||||||
| 6.13%, 04/15/39 |
110 | 117,335 | ||||||
| Molex Electronic Technologies LLC, |
695 | 673,749 | ||||||
|
|
|
|||||||
| 8,518,545 | ||||||||
| Electronics — 0.6% | ||||||||
| Allegion PLC, 3.50%, 10/01/29 (Call 07/01/29) |
943 | 860,842 | ||||||
| Allegion U.S. Holding Co. Inc. |
||||||||
| 3.55%, 10/01/27 (Call 07/01/27) |
730 | 690,178 | ||||||
| 5.41%, 07/01/32 (Call 04/01/32) |
599 | 598,514 | ||||||
| Amphenol Corp. |
||||||||
| 2.05%, 03/01/25 (Call 02/01/25) |
678 | 655,476 | ||||||
| 2.20%, 09/15/31 (Call 06/15/31) |
800 | 656,417 | ||||||
| 2.80%, 02/15/30 (Call 11/15/29)(a) |
1,682 | 1,498,436 | ||||||
| Security | Par (000) |
Value | ||||||
| Electronics (continued) | ||||||||
| 4.35%, 06/01/29 (Call 03/01/29) |
$ | 715 | $ | 695,066 | ||||
| 4.75%, 03/30/26 |
240 | 238,346 | ||||||
| Arrow Electronics Inc. |
||||||||
| 2.95%, 02/15/32 (Call 11/15/31)(a) |
881 | 736,228 | ||||||
| 3.88%, 01/12/28 (Call 10/12/27)(a) |
915 | 864,396 | ||||||
| 4.00%, 04/01/25 (Call 01/01/25) |
515 | 505,943 | ||||||
| 6.13%, 03/01/26 (Call 03/11/24)(a) |
920 | 919,149 | ||||||
| Avnet Inc. |
||||||||
| 3.00%, 05/15/31 (Call 02/15/31) |
595 | 491,608 | ||||||
| 4.63%, 04/15/26 (Call 01/15/26) |
1,007 | 985,330 | ||||||
| 5.50%, 06/01/32 (Call 03/01/32) |
565 | 542,012 | ||||||
| 6.25%, 03/15/28 (Call 02/15/28) |
870 | 884,819 | ||||||
| Flex Ltd. |
||||||||
| 3.75%, 02/01/26 (Call 01/01/26) |
1,063 | 1,027,578 | ||||||
| 4.75%, 06/15/25 (Call 03/15/25) |
870 | 859,734 | ||||||
| 4.88%, 06/15/29 (Call 03/15/29) |
933 | 907,410 | ||||||
| 4.88%, 05/12/30 (Call 02/12/30) |
1,054 | 1,016,125 | ||||||
| 6.00%, 01/15/28 (Call 12/15/27) |
1,020 | 1,036,769 | ||||||
| Fortive Corp. |
||||||||
| 3.15%, 06/15/26 (Call 03/15/26) |
1,552 | 1,481,738 | ||||||
| 4.30%, 06/15/46 (Call 12/15/45)(a) |
656 | 535,797 | ||||||
| Honeywell International Inc. |
||||||||
| 1.10%, 03/01/27 (Call 02/01/27) |
1,470 | 1,320,404 | ||||||
| 1.35%, 06/01/25 (Call 05/01/25)(a) |
1,568 | 1,498,595 | ||||||
| 1.75%, 09/01/31 (Call 06/01/31) |
2,395 | 1,925,916 | ||||||
| 1.95%, 06/01/30 (Call 03/01/30) |
1,690 | 1,428,788 | ||||||
| 2.50%, 11/01/26 (Call 08/01/26) |
1,976 | 1,862,379 | ||||||
| 2.70%, 08/15/29 (Call 05/15/29) |
1,305 | 1,173,930 | ||||||
| 2.80%, 06/01/50 (Call 12/01/49)(a) |
899 | 624,669 | ||||||
| 3.81%, 11/21/47 (Call 05/21/47) |
665 | 533,984 | ||||||
| 4.25%, 01/15/29 (Call 12/15/28)(a) |
580 | 567,187 | ||||||
| 4.50%, 01/15/34 (Call 10/15/33) |
480 | 461,651 | ||||||
| 4.88%, 09/01/29 (Call 08/01/29) |
875 | 875,498 | ||||||
| 4.95%, 02/15/28 (Call 01/15/28) |
970 | 979,835 | ||||||
| 4.95%, 09/01/31 (Call 07/01/31) |
875 | 873,299 | ||||||
| 5.00%, 02/15/33 (Call 11/15/32) |
1,725 | 1,728,072 | ||||||
| 5.00%, 03/01/35 (Call 12/01/34) |
875 | 872,394 | ||||||
| 5.25%, 03/01/54 (Call 09/01/53) |
875 | 873,221 | ||||||
| 5.35%, 03/01/64 (Call 09/01/63) |
875 | 873,908 | ||||||
| 5.38%, 03/01/41 |
527 | 537,972 | ||||||
| 5.70%, 03/15/36(a) |
805 | 850,022 | ||||||
| 5.70%, 03/15/37 |
800 | 836,471 | ||||||
| Hubbell Inc. |
||||||||
| 2.30%, 03/15/31 (Call 12/15/30)(a) |
367 | 302,910 | ||||||
| 3.15%, 08/15/27 (Call 05/15/27) |
765 | 717,741 | ||||||
| 3.35%, 03/01/26 (Call 12/01/25) |
390 | 376,576 | ||||||
| 3.50%, 02/15/28 (Call 11/15/27) |
703 | 663,953 | ||||||
| Jabil Inc. |
||||||||
| 1.70%, 04/15/26 (Call 03/15/26) |
1,030 | 953,392 | ||||||
| 3.00%, 01/15/31 (Call 10/15/30) |
647 | 552,649 | ||||||
| 3.60%, 01/15/30 (Call 10/15/29) |
1,177 | 1,060,205 | ||||||
| 3.95%, 01/12/28 (Call 10/12/27) |
895 | 845,443 | ||||||
| 4.25%, 05/15/27 (Call 04/15/27) |
940 | 907,228 | ||||||
| 5.45%, 02/01/29 (Call 01/01/29) |
575 | 573,952 | ||||||
| Keysight Technologies Inc. |
||||||||
| 3.00%, 10/30/29 (Call 07/30/29) |
1,240 | 1,102,893 | ||||||
| 4.60%, 04/06/27 (Call 01/06/27) |
1,582 | 1,557,192 | ||||||
| TD SYNNEX Corp. |
||||||||
| 1.75%, 08/09/26 (Call 07/09/26) |
1,145 | 1,042,787 | ||||||
| 2.38%, 08/09/28 (Call 06/09/28)(a) |
1,133 | 985,645 | ||||||
| 2.65%, 08/09/31 (Call 05/09/31) |
689 | 546,621 | ||||||
| 78 | 2 0 2 4 I S H A R E S A N N U A L R E P O R T T O S H A R E H O L D E R S |
| Schedule of Investments (continued) February 29, 2024 |
iShares® Broad USD Investment Grade Corporate Bond ETF (Percentages shown are based on Net Assets) |
| Security | Par (000) | Value | ||||||
| Electronics (continued) | ||||||||
| Trimble Inc. |
||||||||
| 4.90%, 06/15/28 (Call 03/15/28)(a) |
$ | 1,346 | $ | 1,335,438 | ||||
| 6.10%, 03/15/33 (Call 12/15/32)(a) |
495 | 517,276 | ||||||
| Tyco Electronics Group SA |
||||||||
| 2.50%, 02/04/32 (Call 12/04/31)(a) |
850 | 719,153 | ||||||
| 3.13%, 08/15/27 (Call 05/15/27)(a) |
716 | 676,050 | ||||||
| 3.70%, 02/15/26 (Call 11/15/25) |
660 | 642,888 | ||||||
| 4.50%, 02/13/26 |
700 | 692,218 | ||||||
| 7.13%, 10/01/37(a) |
770 | 876,735 | ||||||
| Vontier Corp. |
||||||||
| 1.80%, 04/01/26 (Call 03/01/26) |
851 | 784,323 | ||||||
| 2.40%, 04/01/28 (Call 02/01/28) |
811 | 708,696 | ||||||
| 2.95%, 04/01/31 (Call 01/01/31) |
842 | 692,745 | ||||||
|
|
|
|||||||
| 59,220,815 | ||||||||
| Energy - Alternate Sources — 0.0% | ||||||||
| Sweihan PV Power Co. PJSC, |
123 | 97,603 | ||||||
|
|
|
|||||||
| Engineering & Construction — 0.1% | ||||||||
| Aeropuerto Internacional de Tocumen SA |
||||||||
| 4.00%, 08/11/41 (Call 08/11/40)(b) |
445 | 314,837 | ||||||
| 5.13%, 08/11/61 (Call 08/11/60)(a)(b) |
1,387 | 969,374 | ||||||
| Jacobs Engineering Group Inc. |
||||||||
| 5.90%, 03/01/33 (Call 12/01/32)(a) |
1,090 | 1,089,571 | ||||||
| 6.35%, 08/18/28 (Call 07/18/28) |
1,050 | 1,083,737 | ||||||
| LBJ Infrastructure Group LLC, 3.80%, 12/31/57 |
585 | 394,817 | ||||||
| MasTec Inc., 4.50%, 08/15/28 |
795 | 745,502 | ||||||
| Mexico City Airport Trust |
||||||||
| 3.88%, 04/30/28 (Call 01/30/28)(b) |
424 | 392,927 | ||||||
| 4.25%, 10/31/26 (Call 07/31/26)(b) |
1,065 | 1,020,061 | ||||||
| 5.50%, 10/31/46 (Call 04/30/46)(a)(b) |
727 | 601,915 | ||||||
| 5.50%, 07/31/47 (Call 01/31/47)(b) |
2,121 | 1,763,081 | ||||||
| Sitios Latinoamerica SAB de CV, |
1,235 | 1,138,700 | ||||||
| Ste Transcore Holdings Inc., 3.75%, 05/05/32 |
50 | 45,444 | ||||||
| Sydney Airport Finance Co. Pty. Ltd. |
||||||||
| 3.38%, 04/30/25 (Call 01/30/25)(b) |
331 | 322,598 | ||||||
| 3.63%, 04/28/26 (Call 01/28/26)(b) |
1,919 | 1,846,247 | ||||||
| Vinci SA, 3.75%, 04/10/29 (Call 01/10/29)(b) |
1,580 | 1,503,396 | ||||||
|
|
|
|||||||
| 13,232,207 | ||||||||
| Entertainment — 0.3% | ||||||||
| Warnermedia Holdings Inc. |
||||||||
| 3.64%, 03/15/25 |
2,010 | 1,967,585 | ||||||
| 3.76%, 03/15/27 (Call 02/15/27) |
5,300 | 5,015,065 | ||||||
| 3.79%, 03/15/25 (Call 03/11/24) |
570 | 558,761 | ||||||
| 4.05%, 03/15/29 (Call 01/15/29) |
2,050 | 1,898,850 | ||||||
| 4.28%, 03/15/32 (Call 12/15/31)(a) |
5,570 | 4,913,782 | ||||||
| 5.05%, 03/15/42 (Call 09/15/41)(a) |
5,718 | 4,808,368 | ||||||
| 5.14%, 03/15/52 (Call 09/15/51)(a) |
8,940 | 7,264,605 | ||||||
| 5.39%, 03/15/62 (Call 09/15/61) |
3,650 | 2,944,548 | ||||||
| 6.41%, 03/15/26 (Call 03/15/24) |
900 | 899,764 | ||||||
|
|
|
|||||||
| 30,271,328 | ||||||||
| Environmental Control — 0.3% | ||||||||
| Nature Conservancy (The), Series A, |
110 | 93,292 | ||||||
| Republic Services Inc. |
||||||||
| 0.88%, 11/15/25 (Call 10/15/25) |
491 | 455,611 | ||||||
| Security | Par (000) | Value | ||||||
| Environmental Control (continued) | ||||||||
| 1.45%, 02/15/31 (Call 11/15/30) |
$ | 1,050 | $ | 828,685 | ||||
| 1.75%, 02/15/32 (Call 11/15/31) |
789 | 619,126 | ||||||
| 2.30%, 03/01/30 (Call 12/01/29) |
1,476 | 1,267,272 | ||||||
| 2.38%, 03/15/33 (Call 12/15/32)(a) |
1,110 | 889,268 | ||||||
| 2.90%, 07/01/26 (Call 04/01/26)(a) |
664 | 634,316 | ||||||
| 3.05%, 03/01/50 (Call 09/01/49)(a) |
828 | 574,293 | ||||||
| 3.20%, 03/15/25 (Call 12/15/24) |
710 | 694,451 | ||||||
| 3.38%, 11/15/27 (Call 08/15/27) |
1,023 | 970,953 | ||||||
| 3.95%, 05/15/28 (Call 02/15/28) |
1,228 | 1,182,590 | ||||||
| 4.88%, 04/01/29 (Call 03/01/29) |
785 | 781,998 | ||||||
| 5.00%, 12/15/33 (Call 09/15/33) |
905 | 890,403 | ||||||
| 5.00%, 04/01/34 (Call 01/01/34) |
770 | 758,109 | ||||||
| 5.70%, 05/15/41 (Call 11/15/40) |
155 | 160,787 | ||||||
| 6.20%, 03/01/40(a) |
392 | 425,659 | ||||||
| Veralto Corp. |
||||||||
| 5.35%, 09/18/28 (Call 08/18/28)(b) |
1,285 | 1,293,716 | ||||||
| 5.45%, 09/18/33 (Call 06/18/33)(b) |
820 | 823,604 | ||||||
| 5.50%, 09/18/26 (Call 08/18/26)(b) |
995 | 999,276 | ||||||
| Waste Connections Inc. |
||||||||
| 2.20%, 01/15/32 (Call 10/15/31) |
750 | 608,235 | ||||||
| 2.60%, 02/01/30 (Call 11/01/29) |
982 | 864,206 | ||||||
| 2.95%, 01/15/52 (Call 07/15/51) |
1,105 | 731,503 | ||||||
| 3.05%, 04/01/50 (Call 10/01/49) |
1,095 | 745,673 | ||||||
| 3.20%, 06/01/32 (Call 03/01/32)(a) |
684 | 595,624 | ||||||
| 3.50%, 05/01/29 (Call 02/01/29) |
888 | 832,006 | ||||||
| 4.20%, 01/15/33 (Call 10/15/32) |
1,137 | 1,062,925 | ||||||
| 4.25%, 12/01/28 (Call 09/01/28)(a) |
741 | 717,933 | ||||||
| 5.00%, 03/01/34 (Call 12/01/33) |
675 | 660,907 | ||||||
| Waste Management Inc. |
||||||||
| 0.75%, 11/15/25 (Call 10/15/25)(a) |
770 | 714,945 | ||||||
| 1.15%, 03/15/28 (Call 01/15/28)(a) |
730 | 633,056 | ||||||
| 1.50%, 03/15/31 (Call 12/15/30) |
837 | 665,688 | ||||||
| 2.00%, 06/01/29 (Call 04/01/29) |
1,275 | 1,103,254 | ||||||
| 2.50%, 11/15/50 (Call 05/15/50) |
600 | 370,584 | ||||||
| 2.95%, 06/01/41 (Call 12/01/40) |
750 | 555,131 | ||||||
| 3.13%, 03/01/25 (Call 12/01/24)(a) |
350 | 342,406 | ||||||
| 3.15%, 11/15/27 (Call 08/15/27) |
1,138 | 1,070,936 | ||||||
| 3.90%, 03/01/35 (Call 09/01/34) |
678 | 597,107 | ||||||
| 4.10%, 03/01/45 (Call 09/01/44) |
175 | 150,153 | ||||||
| 4.15%, 04/15/32 (Call 01/15/32)(a) |
955 | 899,825 | ||||||
| 4.15%, 07/15/49 (Call 01/15/49) |
1,066 | 904,818 | ||||||
| 4.63%, 02/15/30 (Call 12/15/29) |
755 | 742,643 | ||||||
| 4.63%, 02/15/33 (Call 11/15/32) |
655 | 632,662 | ||||||
| 4.88%, 02/15/29 (Call 01/15/29) |
1,065 | 1,065,978 | ||||||
| 4.88%, 02/15/34 (Call 11/15/33) |
995 | 974,884 | ||||||
| 7.00%, 07/15/28 |
400 | 434,472 | ||||||
|
|
|
|||||||
| 33,020,963 | ||||||||
| Food — 1.8% | ||||||||
| Ahold Finance USA LLC, 6.88%, 05/01/29 |
1,070 | 1,161,462 | ||||||
| Bimbo Bakeries USA Inc. |
||||||||
| 4.00%, 05/17/51 (Call 11/17/50)(b) |
817 | 628,739 | ||||||
| 5.38%, 01/09/36 (Call 10/09/35)(b) |
180 | 178,691 | ||||||
| 6.05%, 01/15/29 (Call 12/15/28)(b) |
615 | 633,149 | ||||||
| 6.40%, 01/15/34 (Call 10/15/33)(b) |
340 | 363,494 | ||||||
| Campbell Soup Co. |
||||||||
| 2.38%, 04/24/30 (Call 01/24/30)(a) |
860 | 729,797 | ||||||
| 3.13%, 04/24/50 (Call 10/24/49) |
543 | 352,898 | ||||||
| 3.30%, 03/19/25 (Call 12/19/24) |
575 | 561,269 | ||||||
| 3.95%, 03/15/25 (Call 01/15/25) |
940 | 924,935 | ||||||
| 4.15%, 03/15/28 (Call 12/15/27) |
1,710 | 1,649,892 | ||||||
| 4.80%, 03/15/48 (Call 09/15/47) |
895 | 785,584 | ||||||
| S C H E D U L E O F I N V E S T M E N T S |
79 |
| Schedule of Investments (continued) February 29, 2024 |
iShares® Broad USD Investment Grade Corporate Bond ETF (Percentages shown are based on Net Assets) |
| Security | Par (000) | Value | ||||||
| Food (continued) | ||||||||
| Cencosud SA |
||||||||
| 4.38%, 07/17/27 (Call 04/17/27)(a)(b) |
$ | 1,075 | $ | 1,034,455 | ||||
| 6.63%, 02/12/45 (Call 08/12/44)(b) |
330 | 335,775 | ||||||
| CK Hutchison International 20 Ltd., |
755 | 652,224 | ||||||
| CK Hutchison International 21 Ltd., |
1,715 | 1,455,201 | ||||||
| Conagra Brands Inc. |
||||||||
| 1.38%, 11/01/27 (Call 09/01/27) |
1,245 | 1,082,444 | ||||||
| 4.60%, 11/01/25 (Call 09/01/25) |
1,492 | 1,470,055 | ||||||
| 4.85%, 11/01/28 (Call 08/01/28) |
1,728 | 1,697,509 | ||||||
| 5.30%, 10/01/26 |
630 | 630,149 | ||||||
| 5.30%, 11/01/38 (Call 05/01/38) |
1,484 | 1,404,877 | ||||||
| 5.40%, 11/01/48 (Call 05/01/48)(a) |
1,435 | 1,324,994 | ||||||
| 7.00%, 10/01/28 |
885 | 945,428 | ||||||
| 7.13%, 10/01/26 |
530 | 551,856 | ||||||
| 8.25%, 09/15/30(a) |
542 | 622,465 | ||||||
| Danone SA, 2.95%, 11/02/26 (Call 08/02/26)(b) |
2,695 | 2,551,300 | ||||||
| Flowers Foods Inc. |
||||||||
| 2.40%, 03/15/31 (Call 12/15/30)(a) |
813 | 679,708 | ||||||
| 3.50%, 10/01/26 (Call 07/01/26)(a) |
345 | 330,485 | ||||||
| General Mills Inc. |
||||||||
| 2.25%, 10/14/31 (Call 07/14/31)(a) |
725 | 594,699 | ||||||
| 2.88%, 04/15/30 (Call 01/15/30) |
1,393 | 1,231,069 | ||||||
| 3.00%, 02/01/51 (Call 08/01/50)(a) |
1,015 | 653,943 | ||||||
| 3.20%, 02/10/27 (Call 11/10/26) |
1,135 | 1,078,799 | ||||||
| 4.00%, 04/17/25 (Call 02/17/25)(a) |
1,284 | 1,263,491 | ||||||
| 4.15%, 02/15/43 (Call 08/15/42)(a) |
50 | 41,733 | ||||||
| 4.20%, 04/17/28 (Call 01/17/28) |
2,015 | 1,956,518 | ||||||
| 4.55%, 04/17/38 (Call 10/17/37) |
686 | 608,799 | ||||||
| 4.70%, 01/30/27 (Call 12/20/26) |
760 | 752,693 | ||||||
| 4.70%, 04/17/48 (Call 10/17/47)(a) |
355 | 316,129 | ||||||
| 4.95%, 03/29/33 (Call 12/29/32)(a) |
1,125 | 1,104,432 | ||||||
| 5.24%, 11/18/25 (Call 03/18/24)(a) |
100 | 99,888 | ||||||
| 5.40%, 06/15/40 |
710 | 693,460 | ||||||
| 5.50%, 10/17/28 (Call 09/17/28) |
390 | 396,360 | ||||||
| Grupo Bimbo SAB de CV |
||||||||
| 4.00%, 09/06/49 (Call 03/06/49)(a)(b) |
665 | 519,432 | ||||||
| 4.70%, 11/10/47 (Call 05/10/47)(b) |
568 | 490,108 | ||||||
| 4.88%, 06/27/44(b) |
330 | 292,373 | ||||||
| Hershey Co. (The) |
||||||||
| 0.90%, 06/01/25 (Call 05/01/25) |
469 | 445,657 | ||||||
| 1.70%, 06/01/30 (Call 03/01/30) |
645 | 538,627 | ||||||
| 2.30%, 08/15/26 (Call 05/15/26) |
1,021 | 963,518 | ||||||
| 2.45%, 11/15/29 (Call 08/15/29) |
500 | 442,845 | ||||||
| 2.65%, 06/01/50 (Call 12/01/49) |
482 | 312,935 | ||||||
| 3.13%, 11/15/49 (Call 05/15/49)(a) |
589 | 422,768 | ||||||
| 3.20%, 08/21/25 (Call 05/21/25) |
355 | 346,552 | ||||||
| 3.38%, 08/15/46 (Call 02/15/46)(a) |
690 | 521,059 | ||||||
| 4.25%, 05/04/28 (Call 04/04/28) |
730 | 717,947 | ||||||
| 4.50%, 05/04/33 (Call 02/04/33)(a) |
280 | 273,841 | ||||||
| Hormel Foods Corp. |
||||||||
| 1.70%, 06/03/28 (Call 04/03/28) |
1,435 | 1,266,709 | ||||||
| 1.80%, 06/11/30 (Call 03/11/30) |
1,076 | 892,366 | ||||||
| 3.05%, 06/03/51 (Call 12/03/50)(a) |
920 | 618,591 | ||||||
| Ingredion Inc. |
||||||||
| 2.90%, 06/01/30 (Call 03/01/30) |
805 | 706,318 | ||||||
| 3.20%, 10/01/26 (Call 07/01/26)(a) |
928 | 885,267 | ||||||
| 3.90%, 06/01/50 (Call 12/01/49)(a) |
494 | 360,768 | ||||||
| 6.63%, 04/15/37 |
384 | 414,284 | ||||||
| Security | Par (000) | Value | ||||||
| Food (continued) | ||||||||
| J M Smucker Co. (The) |
||||||||
| 5.90%, 11/15/28 (Call 10/15/28) |
$ | 1,090 | $ | 1,121,652 | ||||
| 6.20%, 11/15/33 (Call 08/15/33)(a) |
1,135 | 1,199,656 | ||||||
| 6.50%, 11/15/43 (Call 05/15/43) |
695 | 744,363 | ||||||
| 6.50%, 11/15/53 (Call 05/15/53)(a) |
1,195 | 1,298,463 | ||||||
| JBS USA LUX SA/JBS USA Food Co./JBS |
||||||||
| 6.75%, 03/15/34 (Call 12/15/33)(b) |
1,180 | 1,215,397 | ||||||
| 7.25%, 11/15/53 (Call 05/15/53)(a)(b) |
1,255 | 1,314,897 | ||||||
| JBS USA LUX SA/JBS USA Food Co./JBS USA |
||||||||
| 2.50%, 01/15/27 (Call 12/15/26) |
1,530 | 1,403,687 | ||||||
| 3.00%, 02/02/29 (Call 12/02/28) |
915 | 802,090 | ||||||
| 3.00%, 05/15/32 (Call 02/15/32) |
1,597 | 1,278,648 | ||||||
| 3.63%, 01/15/32 (Call 01/15/27) |
455 | 382,580 | ||||||
| 3.75%, 12/01/31 (Call 12/01/26) |
1,275 | 1,084,178 | ||||||
| 4.38%, 02/02/52 (Call 08/02/51) |
1,195 | 859,716 | ||||||
| 5.13%, 02/01/28 (Call 01/01/28) |
1,375 | 1,347,242 | ||||||
| 5.50%, 01/15/30 (Call 01/15/25) |
1,924 | 1,875,211 | ||||||
| 5.75%, 04/01/33 (Call 01/01/33) |
2,025 | 1,963,882 | ||||||
| 6.50%, 12/01/52 (Call 06/01/52) |
2,060 | 1,980,707 | ||||||
| JM Smucker Co. (The) |
||||||||
| 2.13%, 03/15/32 (Call 12/15/31)(a) |
430 | 342,500 | ||||||
| 2.38%, 03/15/30 (Call 12/15/29)(a) |
804 | 690,008 | ||||||
| 2.75%, 09/15/41 (Call 03/15/41) |
524 | 349,720 | ||||||
| 3.38%, 12/15/27 (Call 09/15/27)(a) |
877 | 826,956 | ||||||
| 3.50%, 03/15/25 |
1,470 | 1,439,949 | ||||||
| 3.55%, 03/15/50 (Call 09/15/49)(a) |
610 | 425,897 | ||||||
| 4.25%, 03/15/35 |
1,290 | 1,157,309 | ||||||
| 4.38%, 03/15/45 |
700 | 585,731 | ||||||
| Kellanova |
||||||||
| 2.10%, 06/01/30 (Call 03/01/30)(a) |
807 | 680,093 | ||||||
| 3.25%, 04/01/26 |
1,330 | 1,278,558 | ||||||
| 3.40%, 11/15/27 (Call 08/15/27) |
834 | 786,392 | ||||||
| 4.30%, 05/15/28 (Call 02/15/28) |
1,025 | 996,229 | ||||||
| 4.50%, 04/01/46(a) |
908 | 782,744 | ||||||
| 5.25%, 03/01/33 (Call 12/01/32)(a) |
430 | 427,167 | ||||||
| Series B, 7.45%, 04/01/31(a) |
1,010 | 1,130,674 | ||||||
| Koninklijke Ahold Delhaize NV, |
465 | 461,461 | ||||||
| Kraft Heinz Foods Co. |
||||||||
| 3.00%, 06/01/26 (Call 03/01/26) |
1,775 | 1,692,989 | ||||||
| 3.75%, 04/01/30 (Call 01/01/30)(a) |
1,145 | 1,068,557 | ||||||
| 3.88%, 05/15/27 (Call 02/15/27) |
1,490 | 1,439,104 | ||||||
| 4.25%, 03/01/31 (Call 12/01/30) |
750 | 712,630 | ||||||
| 4.38%, 06/01/46 (Call 12/01/45) |
3,630 | 3,007,382 | ||||||
| 4.63%, 01/30/29 (Call 10/30/28)(a) |
840 | 824,769 | ||||||
| 4.63%, 10/01/39 (Call 04/01/39) |
295 | 266,413 | ||||||
| 4.88%, 10/01/49 (Call 04/01/49)(a) |
1,765 | 1,574,631 | ||||||
| 5.00%, 07/15/35 (Call 01/15/35) |
980 | 957,087 | ||||||
| 5.00%, 06/04/42 |
1,915 | 1,770,371 | ||||||
| 5.20%, 07/15/45 (Call 01/15/45)(a) |
2,425 | 2,264,153 | ||||||
| 5.50%, 06/01/50 (Call 12/01/49)(a) |
310 | 301,522 | ||||||
| 6.50%, 02/09/40 |
775 | 841,003 | ||||||
| 6.75%, 03/15/32 |
645 | 705,431 | ||||||
| 6.88%, 01/26/39 |
1,240 | 1,394,935 | ||||||
| 7.13%, 08/01/39(b) |
1,095 | 1,246,321 | ||||||
| Kroger Co. (The) |
||||||||
| 1.70%, 01/15/31 (Call 10/15/30)(a) |
520 | 414,726 | ||||||
| 2.20%, 05/01/30 (Call 02/01/30) |
590 | 497,034 | ||||||
| 2.65%, 10/15/26 (Call 07/15/26)(a) |
1,017 | 955,865 | ||||||
| 80 | 2 0 2 4 I S H A R E S A N N U A L R E P O R T T O S H A R E H O L D E R S |
| Schedule of Investments (continued) February 29, 2024 |
iShares® Broad USD Investment Grade Corporate Bond ETF (Percentages shown are based on Net Assets) |
| Security | Par (000) |
Value | ||||||
| Food (continued) |
||||||||
| 3.50%, 02/01/26 (Call 11/01/25) |
$ | 810 | $ | 785,484 | ||||
| 3.70%, 08/01/27 (Call 05/01/27) |
942 | 904,530 | ||||||
| 3.88%, 10/15/46 (Call 04/15/46) |
715 | 543,711 | ||||||
| 3.95%, 01/15/50 (Call 07/15/49) |
1,072 | 842,001 | ||||||
| 4.45%, 02/01/47 (Call 08/01/46) |
1,120 | 947,186 | ||||||
| 4.50%, 01/15/29 (Call 10/15/28)(a) |
864 | 844,906 | ||||||
| 4.65%, 01/15/48 (Call 07/15/47) |
760 | 662,319 | ||||||
| 5.00%, 04/15/42 (Call 10/15/41) |
552 | 506,460 | ||||||
| 5.15%, 08/01/43 (Call 02/01/43) |
171 | 159,265 | ||||||
| 5.40%, 07/15/40 (Call 01/15/40)(a) |
583 | 559,236 | ||||||
| 5.40%, 01/15/49 (Call 07/15/48)(a) |
751 | 733,972 | ||||||
| 6.90%, 04/15/38 |
677 | 756,346 | ||||||
| 7.50%, 04/01/31(a) |
775 | 874,620 | ||||||
| 8.00%, 09/15/29(a) |
669 | 759,649 | ||||||
| Series B, 7.70%, 06/01/29 |
660 | 732,525 | ||||||
| Mars Inc. |
||||||||
| 0.88%, 07/16/26 (Call 06/16/26)(b) |
1,067 | 967,624 | ||||||
| 1.63%, 07/16/32 (Call 04/16/32)(a)(b) |
745 | 572,800 | ||||||
| 2.38%, 07/16/40 (Call 01/16/40)(a)(b) |
1,456 | 1,002,114 | ||||||
| 2.45%, 07/16/50 (Call 01/16/50)(a)(b) |
570 | 341,861 | ||||||
| 2.70%, 04/01/25 (Call 03/01/25)(b) |
609 | 592,655 | ||||||
| 3.20%, 04/01/30 (Call 01/01/30)(a)(b) |
920 | 833,948 | ||||||
| 3.60%, 04/01/34 (Call 01/01/34)(a)(b) |
1,201 | 1,058,143 | ||||||
| 3.88%, 04/01/39 (Call 10/01/38)(a)(b) |
895 | 767,221 | ||||||
| 3.95%, 04/01/44 (Call 10/01/43)(a)(b) |
635 | 519,024 | ||||||
| 3.95%, 04/01/49 (Call 10/01/48)(a)(b) |
987 | 797,809 | ||||||
| 4.13%, 04/01/54 (Call 10/01/53)(a)(b) |
608 | 495,696 | ||||||
| 4.20%, 04/01/59 (Call 10/01/58)(b) |
721 | 592,777 | ||||||
| 4.55%, 04/20/28 (Call 03/20/28)(b) |
1,655 | 1,632,071 | ||||||
| 4.65%, 04/20/31 (Call 02/20/31)(b) |
700 | 685,396 | ||||||
| 4.75%, 04/20/33 (Call 01/20/33)(b) |
1,165 | 1,134,541 | ||||||
| McCormick & Co. Inc./MD |
||||||||
| 0.90%, 02/15/26 (Call 01/15/26) |
837 | 769,636 | ||||||
| 1.85%, 02/15/31 (Call 11/15/30) |
927 | 744,938 | ||||||
| 2.50%, 04/15/30 (Call 01/15/30)(a) |
667 | 571,519 | ||||||
| 3.25%, 11/15/25 (Call 08/15/25) |
461 | 444,567 | ||||||
| 3.40%, 08/15/27 (Call 05/15/27) |
1,341 | 1,270,319 | ||||||
| 4.20%, 08/15/47 (Call 02/15/47)(a) |
470 | 388,038 | ||||||
| 4.95%, 04/15/33 (Call 01/15/33)(a) |
750 | 731,984 | ||||||
| Mondelez International Holdings Netherlands BV |
||||||||
| 1.25%, 09/24/26 (Call 08/24/26)(b) |
1,010 | 915,290 | ||||||
| 4.25%, 09/15/25(a)(b) |
469 | 461,712 | ||||||
| Mondelez International Inc. |
||||||||
| 1.50%, 05/04/25 (Call 04/04/25) |
1,165 | 1,113,656 | ||||||
| 1.50%, 02/04/31 (Call 11/04/30) |
445 | 354,089 | ||||||
| 1.88%, 10/15/32 (Call 07/15/32)(a) |
1,007 | 792,419 | ||||||
| 2.63%, 03/17/27 (Call 02/17/27) |
1,110 | 1,035,473 | ||||||
| 2.63%, 09/04/50 (Call 03/04/50) |
1,817 | 1,140,165 | ||||||
| 2.75%, 04/13/30 (Call 01/13/30) |
1,012 | 894,489 | ||||||
| 3.00%, 03/17/32 (Call 12/17/31) |
485 | 418,004 | ||||||
| 4.13%, 05/07/28 (Call 02/07/28) |
30 | 29,386 | ||||||
| 4.75%, 02/20/29 (Call 01/20/29) |
650 | 642,526 | ||||||
| 6.50%, 11/01/31(a) |
35 | 37,360 | ||||||
| Nestle Holdings Inc. |
||||||||
| 0.63%, 01/15/26 (Call 12/15/25)(b) |
1,275 | 1,175,943 | ||||||
| 1.00%, 09/15/27 (Call 07/15/27)(a)(b) |
1,655 | 1,455,012 | ||||||
| 1.15%, 01/14/27 (Call 12/14/26)(a)(b) |
1,388 | 1,251,977 | ||||||
| 1.25%, 09/15/30 (Call 06/15/30)(a)(b) |
730 | 587,314 | ||||||
| 1.50%, 09/14/28 (Call 07/14/28)(b) |
975 | 847,284 | ||||||
| 1.88%, 09/14/31 (Call 06/14/31)(a)(b) |
1,108 | 914,283 | ||||||
| Security | Par (000) |
Value | ||||||
| Food (continued) |
||||||||
| 2.50%, 09/14/41 |
$ | 722 | $ | 508,790 | ||||
| 2.63%, 09/14/51 |
725 | 466,375 | ||||||
| 3.50%, 09/24/25 (Call 07/24/25)(b) |
1,475 | 1,442,462 | ||||||
| 3.63%, 09/24/28 (Call 06/24/28)(b) |
1,639 | 1,567,932 | ||||||
| 3.90%, 09/24/38 (Call 03/24/38)(b) |
1,764 | 1,549,208 | ||||||
| 4.00%, 09/12/25 (Call 08/12/25)(b) |
530 | 522,473 | ||||||
| 4.00%, 09/24/48 (Call 03/24/48)(b) |
2,914 | 2,459,810 | ||||||
| 4.13%, 10/01/27 (Call 09/01/27)(b) |
905 | 885,013 | ||||||
| 4.25%, 10/01/29 |
705 | 688,035 | ||||||
| 4.30%, 10/01/32 |
760 | 744,805 | ||||||
| 4.70%, 01/15/53 |
1,250 | 1,176,684 | ||||||
| 4.85%, 03/14/33 |
1,660 | 1,664,234 | ||||||
| 4.95%, 03/14/30 |
1,070 | 1,079,574 | ||||||
| 5.00%, 03/14/28 |
1,165 | 1,175,801 | ||||||
| 5.00%, 09/12/28 (Call 08/12/28)(b) |
750 | 757,289 | ||||||
| 5.00%, 09/12/30 (Call 07/12/30)(b) |
705 | 716,937 | ||||||
| 5.00%, 09/12/33 (Call 06/12/33)(b) |
300 | 305,924 | ||||||
| 5.25%, 03/13/26(a)(b) |
720 | 723,805 | ||||||
| Sigma Alimentos SA de CV, 4.13%, 05/02/26 (Call 02/02/26)(b) |
1,751 | 1,695,935 | ||||||
| Sigma Finance Netherlands BV, 4.88%, 03/27/28 (Call 12/27/27)(b) |
170 | 165,435 | ||||||
| Smithfield Foods Inc. |
||||||||
| 2.63%, 09/13/31 |
807 | 617,000 | ||||||
| 3.00%, 10/15/30 (Call 07/15/30)(b) |
375 | 308,742 | ||||||
| 4.25%, 02/01/27 (Call 11/01/26)(b) |
1,127 | 1,078,354 | ||||||
| 5.20%, 04/01/29 |
711 | 682,196 | ||||||
| Sysco Corp. |
||||||||
| 2.40%, 02/15/30 (Call 11/15/29) |
980 | 842,939 | ||||||
| 2.45%, 12/14/31 (Call 09/14/31) |
775 | 640,568 | ||||||
| 3.15%, 12/14/51 (Call 06/14/51) |
1,220 | 827,455 | ||||||
| 3.25%, 07/15/27 (Call 04/15/27) |
1,251 | 1,180,465 | ||||||
| 3.30%, 07/15/26 (Call 04/15/26) |
1,403 | 1,346,329 | ||||||
| 3.30%, 02/15/50 (Call 08/15/49)(a) |
710 | 501,475 | ||||||
| 3.75%, 10/01/25 (Call 07/01/25) |
955 | 931,167 | ||||||
| 4.45%, 03/15/48 (Call 09/15/47) |
450 | 378,901 | ||||||
| 4.50%, 04/01/46 (Call 10/01/45) |
567 | 485,536 | ||||||
| 4.85%, 10/01/45 (Call 04/01/45) |
580 | 527,374 | ||||||
| 5.38%, 09/21/35 |
520 | 524,391 | ||||||
| 5.75%, 01/17/29 (Call 12/17/28) |
535 | 547,348 | ||||||
| 5.95%, 04/01/30 (Call 01/01/30) |
1,362 | 1,417,252 | ||||||
| 6.00%, 01/17/34 (Call 10/17/33) |
600 | 632,316 | ||||||
| 6.60%, 04/01/40 (Call 10/01/39)(a) |
795 | 869,069 | ||||||
| 6.60%, 04/01/50 (Call 10/01/49) |
1,346 | 1,521,042 | ||||||
| Tesco PLC, 6.15%, 11/15/37(a)(b) |
730 | 731,789 | ||||||
| Tyson Foods Inc. |
||||||||
| 3.55%, 06/02/27 (Call 03/02/27) |
1,817 | 1,722,122 | ||||||
| 4.00%, 03/01/26 (Call 01/01/26) |
1,436 | 1,401,982 | ||||||
| 4.35%, 03/01/29 (Call 12/01/28)(a) |
1,671 | 1,607,961 | ||||||
| 4.55%, 06/02/47 (Call 12/02/46) |
931 | 753,880 | ||||||
| 4.88%, 08/15/34 (Call 02/15/34)(a) |
591 | 561,252 | ||||||
| 5.10%, 09/28/48 (Call 03/28/48) |
1,485 | 1,310,194 | ||||||
| 5.15%, 08/15/44 (Call 02/15/44) |
889 | 800,079 | ||||||
| 5.40%, 03/15/29 (Call 02/15/29) |
625 | 624,930 | ||||||
| 5.70%, 03/15/34 (Call 12/15/33) |
625 | 624,192 | ||||||
| Walmart Inc., 3.90%, 09/09/25 |
2,190 | 2,156,470 | ||||||
|
|
|
|||||||
| 191,176,057 | ||||||||
| Forest Products & Paper — 0.3% | ||||||||
| Celulosa Arauco y Constitucion SA |
||||||||
| 3.88%, 11/02/27 (Call 08/02/27) |
1,115 | 1,046,890 | ||||||
| 4.20%, 01/29/30 |
520 | 475,596 | ||||||
| S C H E D U L E O F I N V E S T M E N T S |
81 |
| Schedule of Investments (continued) February 29, 2024 |
iShares® Broad USD Investment Grade Corporate Bond ETF (Percentages shown are based on Net Assets) |
| Security | Par (000) | Value | ||||||
| Forest Products & Paper (continued) |
| |||||||
| 4.25%, 04/30/29 (Call 01/30/29)(b) |
$ | 387 | $ | 350,818 | ||||
| 5.15%, 01/29/50 (Call 07/29/49)(b) |
320 | 258,678 | ||||||
| 5.50%, 11/02/47 (Call 05/02/47)(a) |
701 | 590,951 | ||||||
| 5.50%, 04/30/49 |
530 | 447,579 | ||||||
| Georgia-Pacific LLC |
||||||||
| 0.95%, 05/15/26 |
1,541 | 1,408,866 | ||||||
| 1.75%, 09/30/25 (Call 08/30/25)(b) |
957 | 905,993 | ||||||
| 2.10%, 04/30/27 |
489 | 447,226 | ||||||
| 2.30%, 04/30/30 (Call 01/30/30)(b) |
134 | 114,240 | ||||||
| 3.60%, 03/01/25 (Call 12/01/24)(b) |
1,350 | 1,328,066 | ||||||
| 7.25%, 06/01/28(a) |
948 | 1,011,178 | ||||||
| 7.75%, 11/15/29(a) |
1,135 | 1,289,479 | ||||||
| 8.88%, 05/15/31 |
302 | 370,483 | ||||||
| International Paper Co. |
||||||||
| 4.35%, 08/15/48 (Call 02/15/48)(a) |
1,160 | 983,573 | ||||||
| 4.40%, 08/15/47 (Call 02/15/47) |
582 | 483,509 | ||||||
| 4.80%, 06/15/44 (Call 12/15/43)(a) |
1,110 | 984,313 | ||||||
| 5.00%, 09/15/35 (Call 03/15/35) |
805 | 778,118 | ||||||
| 5.15%, 05/15/46 (Call 11/15/45)(a) |
260 | 238,643 | ||||||
| 6.00%, 11/15/41 (Call 05/15/41)(a) |
871 | 899,255 | ||||||
| 7.30%, 11/15/39(a) |
165 | 190,986 | ||||||
| Inversiones CMPC SA |
||||||||
| 3.00%, 04/06/31 |
857 | 724,268 | ||||||
| 3.85%, 01/13/30 |
525 | 476,632 | ||||||
| 4.38%, 04/04/27(b) |
280 | 269,905 | ||||||
| 6.13%, 06/23/33 (Call 03/23/33)(b) |
480 | 484,637 | ||||||
| Smurfit Kappa Treasury Funding DAC, 7.50%, 11/20/25(a) |
811 | 836,695 | ||||||
| Suzano Austria GmbH |
||||||||
| 2.50%, 09/15/28 (Call 07/15/28) |
880 | 767,214 | ||||||
| 3.13%, 01/15/32 (Call 10/15/31) |
1,590 | 1,305,728 | ||||||
| 3.75%, 01/15/31 (Call 10/15/30)(a) |
1,715 | 1,500,508 | ||||||
| 5.00%, 01/15/30 (Call 10/15/29)(a) |
1,499 | 1,427,629 | ||||||
| 5.75%, 07/14/26(b) |
130 | 129,791 | ||||||
| 6.00%, 01/15/29 (Call 10/15/28) |
2,847 | 2,845,266 | ||||||
| 7.00%, 03/16/47 |
1,632 | 1,693,327 | ||||||
| Suzano International Finance BV, 5.50%, 01/17/27(a) |
1,312 | 1,308,361 | ||||||
| UPM-Kymmene OYJ, 7.45%, 11/26/27(b) |
10 | 10,494 | ||||||
|
|
|
|||||||
| 28,384,895 | ||||||||
| Gas — 0.7% | ||||||||
| APA Infrastructure Ltd. |
||||||||
| 4.20%, 03/23/25 (Call 12/23/24)(b) |
1,741 | 1,714,061 | ||||||
| 4.25%, 07/15/27 |
1,036 | 1,011,006 | ||||||
| 5.00%, 03/23/35 (Call 12/23/34)(b) |
575 | 533,443 | ||||||
| Atmos Energy Corp. |
||||||||
| 1.50%, 01/15/31 (Call 10/15/30)(a) |
995 | 792,352 | ||||||
| 2.63%, 09/15/29 (Call 06/15/29) |
920 | 818,877 | ||||||
| 2.85%, 02/15/52 (Call 08/15/51)(a) |
610 | 390,291 | ||||||
| 3.00%, 06/15/27 (Call 03/15/27) |
700 | 658,231 | ||||||
| 3.38%, 09/15/49 (Call 03/15/49) |
612 | 440,757 | ||||||
| 4.13%, 10/15/44 (Call 04/15/44) |
919 | 783,848 | ||||||
| 4.13%, 03/15/49 (Call 09/15/48) |
888 | 732,300 | ||||||
| 4.15%, 01/15/43 (Call 07/15/42) |
680 | 582,114 | ||||||
| 4.30%, 10/01/48 (Call 04/01/48)(a) |
597 | 511,326 | ||||||
| 5.45%, 10/15/32 (Call 07/15/32) |
200 | 205,081 | ||||||
| 5.50%, 06/15/41 (Call 12/15/40)(a) |
324 | 325,665 | ||||||
| 5.75%, 10/15/52 (Call 04/15/52) |
630 | 662,273 | ||||||
| 5.90%, 11/15/33 (Call 08/15/33) |
740 | 778,157 | ||||||
| 6.20%, 11/15/53 (Call 05/15/53) |
445 | 492,181 | ||||||
| Security | Par (000) |
Value | ||||||
| Gas (continued) |
||||||||
| Boston Gas Co. |
||||||||
| 3.00%, 08/01/29 (Call 05/01/29)(a)(b) |
$ | 787 | $ | 690,190 | ||||
| 3.15%, 08/01/27 (Call 05/01/27)(b) |
744 | 690,728 | ||||||
| 3.76%, 03/16/32 (Call 12/16/31)(b) |
1,085 | 948,605 | ||||||
| 4.49%, 02/15/42(b) |
730 | 595,632 | ||||||
| 6.12%, 07/20/53 (Call 01/20/53)(a)(b) |
760 | 764,952 | ||||||
| Brooklyn Union Gas Co. (The) |
||||||||
| 3.41%, 03/10/26 (Call 12/10/25)(b) |
990 | 946,518 | ||||||
| 3.87%, 03/04/29 (Call 12/04/28)(a)(b) |
805 | 740,833 | ||||||
| 4.27%, 03/15/48 (Call 09/15/47)(b) |
881 | 668,217 | ||||||
| 4.49%, 03/04/49 (Call 09/04/48)(b) |
417 | 321,775 | ||||||
| 4.50%, 03/10/46 (Call 09/10/45)(b) |
475 | 369,542 | ||||||
| 4.63%, 08/05/27 (Call 07/05/27)(a)(b) |
590 | 570,617 | ||||||
| 4.87%, 08/05/32 (Call 05/05/32)(b) |
520 | 477,397 | ||||||
| 6.39%, 09/15/33 (Call 06/15/33)(a)(b) |
480 | 489,815 | ||||||
| CenterPoint Energy Resources Corp. |
||||||||
| 1.75%, 10/01/30 (Call 07/01/30)(a) |
993 | 806,699 | ||||||
| 4.00%, 04/01/28 (Call 01/01/28) |
409 | 392,758 | ||||||
| 4.10%, 09/01/47 (Call 03/01/47) |
390 | 310,599 | ||||||
| 4.40%, 07/01/32 (Call 04/01/32)(a) |
775 | 733,437 | ||||||
| 5.25%, 03/01/28 (Call 02/01/28) |
1,159 | 1,166,804 | ||||||
| 5.40%, 03/01/33 (Call 12/01/32) |
770 | 776,609 | ||||||
| 5.85%, 01/15/41 (Call 07/15/40) |
237 | 242,167 | ||||||
| 6.63%, 11/01/37(a) |
226 | 244,940 | ||||||
| Centrica PLC, 5.38%, 10/16/43 |
770 | 674,489 | ||||||
| East Ohio Gas Co. (The) |
||||||||
| 1.30%, 06/15/25 (Call 05/15/25)(b) |
808 | 766,162 | ||||||
| 2.00%, 06/15/30 (Call 03/15/30)(b) |
1,157 | 948,528 | ||||||
| 3.00%, 06/15/50 (Call 12/15/49)(b) |
1,127 | 703,117 | ||||||
| ENN Energy Holdings Ltd., 4.63%, 05/17/27 (Call 04/17/27)(b) |
20 | 19,522 | ||||||
| Grupo Energia Bogota SA ESP |
||||||||
| 4.88%, 05/15/30 (Call 02/15/30)(a)(b) |
535 | 507,241 | ||||||
| 7.85%, 11/09/33 (Call 07/09/33)(b) |
390 | 426,547 | ||||||
| KeySpan Gas East Corp. |
||||||||
| 2.74%, 08/15/26 (Call 05/15/26)(b) |
880 | 821,396 | ||||||
| 3.59%, 01/18/52 (Call 07/18/51)(a)(b) |
435 | 291,350 | ||||||
| 5.82%, 04/01/41(b) |
925 | 876,015 | ||||||
| 5.99%, 03/06/33 (Call 12/06/32)(b) |
315 | 313,905 | ||||||
| Korea Gas Corp. |
||||||||
| 2.88%, 07/16/29(b) |
755 | 679,255 | ||||||
| 6.25%, 01/20/42(b) |
460 | 517,793 | ||||||
| Nakilat Inc., 6.07%, 12/31/33(a)(b) |
406 | 416,830 | ||||||
| National Fuel Gas Co. |
||||||||
| 2.95%, 03/01/31 (Call 12/01/30) |
935 | 781,196 | ||||||
| 3.95%, 09/15/27 (Call 06/15/27) |
615 | 582,960 | ||||||
| 4.75%, 09/01/28 (Call 06/01/28) |
545 | 526,382 | ||||||
| 5.20%, 07/15/25 (Call 04/15/25) |
695 | 689,417 | ||||||
| 5.50%, 01/15/26 (Call 12/15/25) |
898 | 894,783 | ||||||
| 5.50%, 10/01/26 |
595 | 594,086 | ||||||
| NiSource Inc. |
||||||||
| 0.95%, 08/15/25 (Call 07/15/25) |
1,221 | 1,145,471 | ||||||
| 1.70%, 02/15/31 (Call 11/15/30) |
992 | 787,898 | ||||||
| 2.95%, 09/01/29 (Call 06/01/29) |
908 | 815,974 | ||||||
| 3.49%, 05/15/27 (Call 02/15/27) |
1,090 | 1,035,893 | ||||||
| 3.60%, 05/01/30 (Call 02/01/30) |
1,063 | 972,737 | ||||||
| 3.95%, 03/30/48 (Call 09/30/47) |
794 | 610,468 | ||||||
| 4.38%, 05/15/47 (Call 11/15/46) |
1,520 | 1,260,556 | ||||||
| 4.80%, 02/15/44 (Call 08/15/43) |
926 | 822,198 | ||||||
| 5.00%, 06/15/52 (Call 12/15/51)(a) |
775 | 702,872 | ||||||
| 82 | 2 0 2 4 I S H A R E S A N N U A L R E P O R T T O S H A R E H O L D E R S |
| Schedule of Investments (continued) February 29, 2024 |
iShares® Broad USD Investment Grade Corporate Bond ETF (Percentages shown are based on Net Assets) |
| Security | Par (000) |
Value | ||||||
| Gas (continued) |
||||||||
| 5.25%, 03/30/28 (Call 02/29/28) |
$ | 990 | $ | 994,360 | ||||
| 5.25%, 02/15/43 (Call 08/15/42) |
811 | 766,886 | ||||||
| 5.40%, 06/30/33 (Call 03/30/33)(a) |
375 | 374,999 | ||||||
| 5.65%, 02/01/45 (Call 08/01/44) |
790 | 773,709 | ||||||
| 5.80%, 02/01/42 (Call 08/01/41) |
360 | 340,109 | ||||||
| 5.95%, 06/15/41 (Call 12/15/40) |
334 | 337,766 | ||||||
| ONE Gas Inc. |
||||||||
| 2.00%, 05/15/30 (Call 02/15/30) |
433 | 360,679 | ||||||
| 4.25%, 09/01/32 (Call 06/01/32)(a) |
355 | 335,629 | ||||||
| 4.50%, 11/01/48 (Call 05/01/48)(a) |
606 | 520,990 | ||||||
| 4.66%, 02/01/44 (Call 08/01/43)(a) |
832 | 744,297 | ||||||
| 5.10%, 04/01/29 (Call 03/01/29) |
440 | 441,449 | ||||||
| Piedmont Natural Gas Co. Inc. |
||||||||
| 2.50%, 03/15/31 (Call 12/15/30) |
475 | 397,253 | ||||||
| 3.35%, 06/01/50 (Call 12/01/49) |
627 | 417,408 | ||||||
| 3.50%, 06/01/29 (Call 03/01/29)(a) |
1,094 | 1,007,471 | ||||||
| 3.64%, 11/01/46 (Call 05/01/46)(a) |
515 | 362,966 | ||||||
| 4.10%, 09/18/34 (Call 03/18/34) |
300 | 264,370 | ||||||
| 4.65%, 08/01/43 (Call 02/01/43)(a) |
449 | 386,673 | ||||||
| 5.05%, 05/15/52 (Call 11/15/51) |
520 | 467,785 | ||||||
| 5.40%, 06/15/33 (Call 03/15/33) |
450 | 450,950 | ||||||
| Promigas SA ESP/Gases del Pacifico SAC, 3.75%, 10/16/29 |
310 | 270,265 | ||||||
| Sempra Global, 3.25%, 01/15/32 (Call 10/15/31)(a)(b) |
647 | 524,482 | ||||||
| Southern California Gas Co. |
||||||||
| 2.95%, 04/15/27 (Call 03/15/27) |
1,010 | 949,782 | ||||||
| 3.20%, 06/15/25 (Call 03/15/25) |
844 | 823,173 | ||||||
| 3.75%, 09/15/42 (Call 03/15/42) |
854 | 672,970 | ||||||
| 4.45%, 03/15/44 (Call 09/15/43)(a) |
402 | 336,456 | ||||||
| 5.13%, 11/15/40(a) |
525 | 498,575 | ||||||
| 5.20%, 06/01/33 (Call 03/01/33) |
895 | 888,095 | ||||||
| 5.75%, 06/01/53 (Call 12/01/52)(a) |
460 | 465,068 | ||||||
| 6.35%, 11/15/52 (Call 05/15/52) |
655 | 720,415 | ||||||
| Series KK, 5.75%, 11/15/35(a) |
125 | 124,679 | ||||||
| Series TT, 2.60%, 06/15/26 (Call 03/15/26) |
832 | 788,231 | ||||||
| Series UU, 4.13%, 06/01/48 (Call 12/01/47) |
187 | 151,979 | ||||||
| Series VV, 4.30%, 01/15/49 (Call 07/15/48) |
575 | 471,456 | ||||||
| Series WW, 3.95%, 02/15/50 (Call 08/15/49) |
419 | 322,075 | ||||||
| Series XX, 2.55%, 02/01/30 (Call 11/01/29) |
1,015 | 881,287 | ||||||
| Southern Co. Gas Capital Corp. |
||||||||
| 3.25%, 06/15/26 (Call 03/15/26) |
466 | 445,453 | ||||||
| 3.88%, 11/15/25 (Call 08/15/25) |
972 | 945,518 | ||||||
| 3.95%, 10/01/46 (Call 04/01/46) |
882 | 668,665 | ||||||
| 4.40%, 06/01/43 (Call 12/01/42) |
780 | 645,985 | ||||||
| 4.40%, 05/30/47 (Call 11/30/46) |
940 | 762,714 | ||||||
| 5.15%, 09/15/32 (Call 03/15/32) |
625 | 620,477 | ||||||
| 5.75%, 09/15/33 (Call 03/15/33) |
610 | 625,002 | ||||||
| 5.88%, 03/15/41 (Call 09/15/40)(a) |
565 | 564,026 | ||||||
| 6.00%, 10/01/34 |
160 | 160,127 | ||||||
| Series 2020-A, 1.75%, 01/15/31 (Call 10/15/30)(a) |
634 | 507,793 | ||||||
| Series 21A, 3.15%, 09/30/51 (Call 03/30/51) |
670 | 433,984 | ||||||
| Southwest Gas Corp. |
||||||||
| 2.20%, 06/15/30 (Call 03/15/30) |
594 | 496,054 | ||||||
| 3.18%, 08/15/51 (Call 02/15/51) |
440 | 279,292 | ||||||
| 3.70%, 04/01/28 (Call 01/01/28) |
348 | 328,436 | ||||||
| 3.80%, 09/29/46 (Call 03/29/46)(a) |
145 | 105,939 | ||||||
| 4.05%, 03/15/32 (Call 12/15/31) |
735 | 672,161 | ||||||
| 4.15%, 06/01/49 (Call 12/01/48) |
476 | 362,526 | ||||||
| 5.45%, 03/23/28 (Call 02/23/28) |
315 | 317,954 | ||||||
| Security | Par (000) |
Value | ||||||
| Gas (continued) |
||||||||
| 5.80%, 12/01/27 (Call 11/01/27)(a) |
$ | 555 | $ | 565,292 | ||||
| Spire Inc. |
||||||||
| 4.70%, 08/15/44 (Call 02/15/44)(a) |
255 | 216,177 | ||||||
| 5.30%, 03/01/26(a) |
195 | 194,581 | ||||||
| Spire Missouri Inc. |
||||||||
| 3.30%, 06/01/51 (Call 12/01/50)(a) |
490 | 333,399 | ||||||
| 4.80%, 02/15/33 (Call 11/15/32)(a) |
315 | 306,353 | ||||||
| Washington Gas Light Co. |
||||||||
| 3.65%, 09/15/49 (Call 03/15/49)(a) |
775 | 565,624 | ||||||
| Series K, 3.80%, 09/15/46 (Call 03/15/46)(a) |
731 | 539,912 | ||||||
|
|
|
|||||||
| 74,864,019 | ||||||||
| Hand & Machine Tools — 0.1% | ||||||||
| Kennametal Inc. |
||||||||
| 2.80%, 03/01/31 (Call 12/01/30) |
399 | 333,989 | ||||||
| 4.63%, 06/15/28 (Call 03/15/28)(a) |
455 | 442,012 | ||||||
| Regal Rexnord Corp. |
||||||||
| 6.05%, 02/15/26(b) |
685 | 687,836 | ||||||
| 6.05%, 04/15/28 (Call 03/15/28)(b) |
1,430 | 1,438,980 | ||||||
| 6.30%, 02/15/30 (Call 12/15/29)(b) |
875 | 890,943 | ||||||
| 6.40%, 04/15/33 (Call 01/15/33)(a)(b) |
1,720 | 1,765,829 | ||||||
| Snap-on Inc. |
||||||||
| 3.10%, 05/01/50 (Call 11/01/49) |
786 | 551,836 | ||||||
| 3.25%, 03/01/27 (Call 12/01/26)(a) |
495 | 473,209 | ||||||
| 4.10%, 03/01/48 (Call 09/01/47) |
523 | 436,371 | ||||||
| Stanley Black & Decker Inc. |
||||||||
| 2.30%, 03/15/30 (Call 12/15/29)(a) |
1,321 | 1,109,440 | ||||||
| 2.75%, 11/15/50 (Call 05/15/50) |
1,035 | 600,990 | ||||||
| 3.00%, 05/15/32 (Call 02/15/32)(a) |
80 | 67,595 | ||||||
| 3.40%, 03/01/26 (Call 01/01/26) |
1,230 | 1,186,301 | ||||||
| 4.00%, 03/15/60 (Call 03/15/25), |
||||||||
| (5-year CMT + 2.657%)(d) |
826 | 736,542 | ||||||
| 4.25%, 11/15/28 (Call 08/15/28)(a) |
832 | 803,385 | ||||||
| 4.85%, 11/15/48 (Call 05/15/48) |
570 | 493,500 | ||||||
| 5.20%, 09/01/40 |
752 | 700,852 | ||||||
| 6.00%, 03/06/28 (Call 02/06/28)(a) |
715 | 738,495 | ||||||
| 6.27%, 03/06/26 (Call 03/11/24) |
35 | 35,000 | ||||||
|
|
|
|||||||
| 13,493,105 | ||||||||
| Health Care - Products — 1.1% | ||||||||
| Abbott Laboratories |
||||||||
| 1.15%, 01/30/28 (Call 11/30/27) |
1,242 | 1,089,635 | ||||||
| 1.40%, 06/30/30 (Call 03/30/30)(a) |
1,156 | 953,595 | ||||||
| 2.95%, 03/15/25 (Call 12/15/24) |
1,284 | 1,256,060 | ||||||
| 3.75%, 11/30/26 (Call 08/30/26) |
2,560 | 2,492,443 | ||||||
| 3.88%, 09/15/25 (Call 06/15/25) |
437 | 430,211 | ||||||
| 4.75%, 11/30/36 (Call 05/30/36) |
1,868 | 1,831,335 | ||||||
| 4.75%, 04/15/43 (Call 10/15/42) |
493 | 472,907 | ||||||
| 4.90%, 11/30/46 (Call 05/30/46) |
3,443 | 3,318,890 | ||||||
| 5.30%, 05/27/40 |
1,261 | 1,288,866 | ||||||
| 6.00%, 04/01/39 |
1,091 | 1,211,639 | ||||||
| 6.15%, 11/30/37(a) |
1,065 | 1,179,450 | ||||||
| Agilent Technologies Inc. |
||||||||
| 2.10%, 06/04/30 (Call 03/04/30) |
908 | 761,098 | ||||||
| 2.30%, 03/12/31 (Call 12/12/30) |
1,447 | 1,208,229 | ||||||
| 2.75%, 09/15/29 (Call 06/15/29) |
794 | 710,999 | ||||||
| 3.05%, 09/22/26 (Call 06/22/26) |
512 | 486,986 | ||||||
| Alcon Finance Corp. |
||||||||
| 2.60%, 05/27/30 (Call 02/27/30)(b) |
1,380 | 1,184,723 | ||||||
| 2.75%, 09/23/26 (Call 07/23/26)(b) |
633 | 594,197 | ||||||
| 3.00%, 09/23/29 (Call 06/23/29)(b) |
1,203 | 1,079,086 | ||||||
| 3.80%, 09/23/49 (Call 03/23/49)(a)(b) |
505 | 391,147 | ||||||
| S C H E D U L E O F I N V E S T M E N T S |
83 |
| Schedule of Investments (continued) February 29, 2024 |
iShares® Broad USD Investment Grade Corporate Bond ETF (Percentages shown are based on Net Assets) |
| Security | Par (000) |
Value | ||||||
| Health Care - Products (continued) |
||||||||
| 5.38%, 12/06/32 (Call 09/06/32)(b) |
$ | 1,188 | $ | 1,189,508 | ||||
| 5.75%, 12/06/52 (Call 06/06/52)(b) |
1,060 | 1,091,825 | ||||||
| Baxter International Inc. |
||||||||
| 1.73%, 04/01/31 (Call 01/01/31) |
1,506 | 1,189,424 | ||||||
| 1.92%, 02/01/27 (Call 01/01/27) |
2,381 | 2,165,830 | ||||||
| 2.27%, 12/01/28 (Call 10/01/28)(a) |
1,875 | 1,643,350 | ||||||
| 2.54%, 02/01/32 (Call 11/01/31)(a) |
985 | 807,600 | ||||||
| 2.60%, 08/15/26 (Call 05/15/26) |
814 | 763,628 | ||||||
| 3.13%, 12/01/51 (Call 06/01/51)(a) |
1,285 | 838,765 | ||||||
| 3.50%, 08/15/46 (Call 02/15/46) |
662 | 468,900 | ||||||
| 3.95%, 04/01/30 (Call 01/01/30) |
711 | 658,425 | ||||||
| 4.50%, 06/15/43 (Call 12/15/42) |
485 | 392,648 | ||||||
| 6.25%, 12/01/37(a) |
241 | 243,684 | ||||||
| Boston Scientific Corp. |
||||||||
| 1.90%, 06/01/25 (Call 05/01/25) |
912 | 874,468 | ||||||
| 2.65%, 06/01/30 (Call 03/01/30) |
1,947 | 1,701,928 | ||||||
| 3.75%, 03/01/26 (Call 01/01/26)(a) |
355 | 345,155 | ||||||
| 4.00%, 03/01/28 (Call 12/01/27) |
480 | 464,802 | ||||||
| 4.00%, 03/01/29 (Call 12/01/28)(a) |
250 | 238,805 | ||||||
| 4.55%, 03/01/39 (Call 09/01/38) |
555 | 514,793 | ||||||
| 4.70%, 03/01/49 (Call 09/01/48)(a) |
595 | 545,997 | ||||||
| 6.50%, 11/15/35 |
860 | 950,306 | ||||||
| 7.38%, 01/15/40 |
395 | 462,937 | ||||||
| Covidien International Finance SA, 6.55%, |
||||||||
| 10/15/37 |
248 | 275,224 | ||||||
| Danaher Corp. |
||||||||
| 2.60%, 10/01/50 (Call 04/01/50)(a) |
1,400 | 886,888 | ||||||
| 2.80%, 12/10/51 (Call 06/10/51)(a) |
1,675 | 1,088,896 | ||||||
| 3.35%, 09/15/25 (Call 06/15/25) |
857 | 835,786 | ||||||
| 4.38%, 09/15/45 (Call 03/15/45)(a) |
692 | 610,813 | ||||||
| Dentsply Sirona Inc., 3.25%, 06/01/30 (Call 03/01/30) |
1,044 | 908,654 | ||||||
| DH Europe Finance II Sarl |
||||||||
| 2.60%, 11/15/29 (Call 08/15/29)(a) |
1,155 | 1,026,846 | ||||||
| 3.25%, 11/15/39 (Call 05/15/39) |
479 | 381,129 | ||||||
| 3.40%, 11/15/49 (Call 05/15/49) |
1,189 | 889,645 | ||||||
| Edwards Lifesciences Corp., 4.30%, 06/15/28 (Call 03/15/28)(a) |
1,134 | 1,101,358 | ||||||
| GE HealthCare Technologies Inc. |
||||||||
| 5.60%, 11/15/25 (Call 10/15/25) |
2,125 | 2,132,050 | ||||||
| 5.65%, 11/15/27 (Call 10/15/27) |
2,484 | 2,523,065 | ||||||
| 5.86%, 03/15/30 (Call 01/15/30) |
1,265 | 1,307,628 | ||||||
| 5.91%, 11/22/32 (Call 08/22/32) |
785 | 815,821 | ||||||
| 6.38%, 11/22/52 (Call 05/22/52) |
1,570 | 1,743,550 | ||||||
| HCA Inc. |
||||||||
| 3.13%, 03/15/27 (Call 02/15/27) |
1,396 | 1,311,706 | ||||||
| 3.63%, 03/15/32 (Call 12/15/31) |
2,549 | 2,226,694 | ||||||
| 4.38%, 03/15/42 (Call 09/15/41) |
880 | 730,797 | ||||||
| Koninklijke Philips NV |
||||||||
| 5.00%, 03/15/42(a) |
731 | 661,770 | ||||||
| 6.88%, 03/11/38 |
1,260 | 1,353,613 | ||||||
| Medtronic Global Holdings SCA |
||||||||
| 4.25%, 03/30/28 (Call 02/29/28) |
1,150 | 1,124,847 | ||||||
| 4.50%, 03/30/33 (Call 12/30/32)(a) |
1,265 | 1,217,638 | ||||||
| Medtronic Inc. |
||||||||
| 4.38%, 03/15/35 |
2,445 | 2,305,144 | ||||||
| 4.63%, 03/15/45 |
2,624 | 2,435,483 | ||||||
| Olympus Corp., 2.14%, 12/08/26 |
||||||||
| (Call 11/08/26)(b) |
1,025 | 938,488 | ||||||
| Revvity Inc. |
||||||||
| 1.90%, 09/15/28 (Call 07/15/28)(a) |
930 | 802,795 | ||||||
| Security | Par (000) |
Value | ||||||
| Health Care - Products (continued) |
||||||||
| 2.25%, 09/15/31 (Call 06/15/31) |
$ | 460 | $ | 374,046 | ||||
| 2.55%, 03/15/31 (Call 12/15/30) |
855 | 716,105 | ||||||
| 3.30%, 09/15/29 (Call 06/15/29) |
1,275 | 1,147,819 | ||||||
| 3.63%, 03/15/51 (Call 09/15/50)(a) |
510 | 354,094 | ||||||
| Smith & Nephew PLC, 2.03%, 10/14/30 (Call 07/14/30)(a) |
1,557 | 1,274,970 | ||||||
| Solventum Corp. |
||||||||
| 5.40%, 03/01/29 (Call 02/01/29)(b) |
1,190 | 1,188,153 | ||||||
| 5.45%, 02/25/27 (Call 01/25/27)(b) |
710 | 711,339 | ||||||
| 5.45%, 03/13/31 (Call 01/13/31)(b) |
1,475 | 1,462,302 | ||||||
| 5.60%, 03/23/34 (Call 12/23/33)(a)(b) |
1,475 | 1,465,700 | ||||||
| 5.90%, 04/30/54 (Call 10/30/53)(a)(b) |
1,475 | 1,443,570 | ||||||
| 6.00%, 05/15/64 (Call 11/15/63)(b) |
1,475 | 1,432,535 | ||||||
| STERIS Irish FinCo UnLtd Co. |
||||||||
| 2.70%, 03/15/31 (Call 12/15/30)(a) |
1,147 | 973,778 | ||||||
| 3.75%, 03/15/51 (Call 09/15/50) |
939 | 694,613 | ||||||
| Stryker Corp. |
||||||||
| 1.15%, 06/15/25 (Call 05/15/25) |
662 | 628,025 | ||||||
| 1.95%, 06/15/30 (Call 03/15/30) |
1,543 | 1,291,132 | ||||||
| 2.90%, 06/15/50 (Call 12/15/49)(a) |
690 | 472,413 | ||||||
| 3.38%, 11/01/25 (Call 08/01/25) |
958 | 930,134 | ||||||
| 3.50%, 03/15/26 (Call 12/15/25) |
1,689 | 1,637,298 | ||||||
| 3.65%, 03/07/28 (Call 12/07/27) |
889 | 847,819 | ||||||
| 4.10%, 04/01/43 (Call 10/01/42) |
986 | 833,964 | ||||||
| 4.38%, 05/15/44 (Call 11/15/43)(a) |
588 | 518,633 | ||||||
| 4.63%, 03/15/46 (Call 09/15/45) |
1,138 | 1,035,603 | ||||||
| 4.85%, 12/08/28 (Call 11/08/28)(a) |
865 | 862,286 | ||||||
| Thermo Fisher Scientific Inc. |
||||||||
| 1.75%, 10/15/28 (Call 08/15/28)(a) |
1,147 | 1,007,409 | ||||||
| 2.00%, 10/15/31 (Call 07/15/31)(a) |
2,054 | 1,678,144 | ||||||
| 2.60%, 10/01/29 (Call 07/01/29) |
1,403 | 1,251,311 | ||||||
| 2.80%, 10/15/41 (Call 04/15/41)(a) |
1,730 | 1,245,221 | ||||||
| 4.10%, 08/15/47 (Call 02/15/47) |
1,118 | 937,134 | ||||||
| 4.80%, 11/21/27 (Call 10/21/27)(a) |
985 | 985,685 | ||||||
| 4.95%, 08/10/26 (Call 07/10/26) |
490 | 490,411 | ||||||
| 4.95%, 11/21/32 (Call 08/21/32) |
725 | 722,191 | ||||||
| 4.98%, 08/10/30 (Call 06/10/30) |
780 | 780,552 | ||||||
| 5.00%, 12/05/26 (Call 11/05/26) |
785 | 786,946 | ||||||
| 5.00%, 01/31/29 (Call 12/31/28) |
1,290 | 1,297,630 | ||||||
| 5.09%, 08/10/33 (Call 05/10/33)(a) |
840 | 844,906 | ||||||
| 5.20%, 01/31/34 (Call 10/31/33)(a) |
600 | 606,775 | ||||||
| 5.30%, 02/01/44 (Call 08/01/43) |
519 | 517,201 | ||||||
| 5.40%, 08/10/43 (Call 04/10/43)(a) |
885 | 894,537 | ||||||
| Zimmer Biomet Holdings Inc. |
||||||||
| 2.60%, 11/24/31 (Call 08/24/31) |
1,205 | 1,010,443 | ||||||
| 3.05%, 01/15/26 (Call 12/15/25) |
943 | 905,992 | ||||||
| 3.55%, 04/01/25 (Call 01/01/25) |
1,021 | 999,041 | ||||||
| 3.55%, 03/20/30 (Call 12/20/29)(a) |
710 | 642,996 | ||||||
| 4.25%, 08/15/35 (Call 02/15/35)(a) |
432 | 380,451 | ||||||
| 4.45%, 08/15/45 (Call 02/15/45)(a) |
545 | 482,329 | ||||||
| 5.35%, 12/01/28 (Call 11/01/28) |
660 | 667,370 | ||||||
| 5.75%, 11/30/39 |
517 | 513,923 | ||||||
|
|
|
|||||||
| 113,075,531 | ||||||||
| Health Care - Services — 2.8% | ||||||||
| AdventHealth Obligated Group, Series E, 2.80%, 11/15/51 (Call 05/15/51)(a) |
50 | 32,536 | ||||||
| Adventist Health System/West |
||||||||
| 2.95%, 03/01/29 (Call 12/01/28)(a) |
742 | 661,794 | ||||||
| 3.63%, 03/01/49 (Call 09/01/48) |
595 | 437,944 | ||||||
| 5.43%, 03/01/32 (Call 12/01/31)(a) |
480 | 480,951 | ||||||
| 84 | 2 0 2 4 I S H A R E S A N N U A L R E P O R T T O S H A R E H O L D E R S |
| Schedule of Investments (continued) February 29, 2024 |
iShares® Broad USD Investment Grade Corporate Bond ETF (Percentages shown are based on Net Assets) |
| Security | Par (000) |
Value | ||||||
| Health Care - Services (continued) |
||||||||
| Advocate Health & Hospitals Corp. |
||||||||
| 3.39%, 10/15/49 (Call 04/15/49) |
$ | 232 | $ | 174,192 | ||||
| 3.83%, 08/15/28 (Call 05/15/28) |
170 | 162,845 | ||||||
| 4.27%, 08/15/48 (Call 02/15/48) |
377 | 324,265 | ||||||
| Series 2020, 2.21%, 06/15/30 (Call 03/15/30) |
65 | 53,986 | ||||||
| Series 2020, 3.01%, 06/15/50 (Call 12/15/49) |
625 | 424,936 | ||||||
| Aetna Inc. |
||||||||
| 3.88%, 08/15/47 (Call 02/15/47) |
1,395 | 1,042,991 | ||||||
| 4.13%, 11/15/42 (Call 05/15/42) |
371 | 296,587 | ||||||
| 4.50%, 05/15/42 (Call 11/15/41) |
697 | 591,620 | ||||||
| 4.75%, 03/15/44 (Call 09/15/43) |
595 | 513,137 | ||||||
| 6.63%, 06/15/36 |
1,300 | 1,415,069 | ||||||
| 6.75%, 12/15/37 |
980 | 1,069,123 | ||||||
| AHS Hospital Corp. |
||||||||
| 5.02%, 07/01/45(a) |
760 | 725,298 | ||||||
| Series 2021, 2.78%, 07/01/51 |
810 | 529,791 | ||||||
| Allina Health System |
||||||||
| 2.90%, 11/15/51 (Call 05/15/51) |
155 | 101,512 | ||||||
| 4.81%, 11/15/45 (Call 05/15/45) |
360 | 330,490 | ||||||
| Series 2019, 3.89%, 04/15/49 (Call 10/15/48) |
888 | 724,726 | ||||||
| Ascension Health |
||||||||
| 3.95%, 11/15/46 |
900 | 757,519 | ||||||
| 4.85%, 11/15/53 |
522 | 499,243 | ||||||
| Series B, 2.53%, 11/15/29 |
867 | 772,091 | ||||||
| Series B, 3.11%, 11/15/39 |
1,210 | 943,538 | ||||||
| Banner Health |
||||||||
| 1.90%, 01/01/31 (Call 07/01/30) |
470 | 382,839 | ||||||
| 2.34%, 01/01/30 (Call 10/01/29) |
800 | 690,416 | ||||||
| 2.91%, 01/01/42 (Call 07/01/41) |
475 | 347,011 | ||||||
| 2.91%, 01/01/51 (Call 07/01/50)(a) |
535 | 345,240 | ||||||
| Series 2020, 3.18%, 01/01/50 (Call 07/01/49)(a) |
564 | 400,021 | ||||||
| Baptist Health South Florida Inc., |
605 | 526,998 | ||||||
| Baptist Health South Florida Obligated Group, Series 2021, 3.12%, 11/15/71 |
105 | 62,155 | ||||||
| Baptist Healthcare System Obligated Group, Series 20B, 3.54%, 08/15/50 |
494 | 366,473 | ||||||
| BayCare Health System Inc., |
350 | 286,571 | ||||||
| Baylor Scott & White Holdings |
||||||||
| 3.97%, 11/15/46 (Call 05/15/46) |
450 | 372,709 | ||||||
| 4.19%, 11/15/45 (Call 05/15/45) |
1,087 | 949,631 | ||||||
| Series 2021, 1.78%, 11/15/30 (Call 05/15/30) |
414 | 335,162 | ||||||
| Series 2021, 2.84%, 11/15/50 (Call 11/15/49) |
650 | 430,724 | ||||||
| Beth Israel Lahey Health Inc., Series L, 3.08%, 07/01/51 (Call 01/01/51) |
525 | 332,684 | ||||||
| Blue Cross and Blue Shield of Minnesota, 3.79%, 05/01/25 (Call 02/01/25)(b) |
1,040 | 1,008,182 | ||||||
| Bon Secours Mercy Health Inc. |
||||||||
| 3.46%, 06/01/30 (Call 12/01/29) |
840 | 766,388 | ||||||
| Series 2018, 4.30%, 07/01/28 (Call 01/01/28)(a) |
285 | 278,393 | ||||||
| Security | Par (000) |
Value | ||||||
| Health Care - Services (continued) |
||||||||
| Series 20-2, 2.10%, 06/01/31 (Call 12/01/30) |
$ | 650 | $ | 530,071 | ||||
| Series 20-2, 3.21%, 06/01/50 (Call 12/01/49) |
790 | 557,683 | ||||||
| Catholic Health Services of Long Island Obligated Group, Series 2020, 3.37%, 07/01/50 (Call 01/01/50) |
620 | 425,130 | ||||||
| Cedars-Sinai Health System, |
420 | 350,439 | ||||||
| Centene Corp. |
||||||||
| 2.45%, 07/15/28 (Call 05/15/28) |
2,745 | 2,419,262 | ||||||
| 2.50%, 03/01/31 (Call 12/01/30) |
2,815 | 2,306,401 | ||||||
| 2.63%, 08/01/31 (Call 05/01/31)(a) |
1,930 | 1,579,261 | ||||||
| 3.00%, 10/15/30 (Call 07/15/30) |
3,130 | 2,674,178 | ||||||
| 3.38%, 02/15/30 (Call 02/15/25)(a) |
2,600 | 2,293,583 | ||||||
| 4.25%, 12/15/27 (Call 03/18/24) |
2,255 | 2,145,062 | ||||||
| 4.63%, 12/15/29 (Call 12/15/24)(a) |
4,090 | 3,871,390 | ||||||
| Children’s Health System of Texas, 2.51%, 08/15/50 (Call 02/15/50)(a) |
1,040 | 646,180 | ||||||
| Children’s Hospital Corp. (The) |
||||||||
| Series 2017, 4.12%,
01/01/47 |
215 | 181,733 | ||||||
| Series 2020, 2.59%, 02/01/50 (Call 08/01/49) |
165 | 101,574 | ||||||
| Children’s Hospital Medical Center/Cincinnati OH, 4.27%, 05/15/44(a) |
669 | 590,168 | ||||||
| Children’s Hospital of Philadelphia (The), Series 2020, 2.70%, 07/01/50 (Call 01/01/50) |
610 | 398,093 | ||||||
| Children’s Hospital/DC, Series 2020, 2.93%, 07/15/50 (Call 01/15/50) |
515 | 329,856 | ||||||
| CHRISTUS Health, Series C, 4.34%, 07/01/28 (Call 04/01/28) |
875 | 853,742 | ||||||
| City of Hope |
||||||||
| Series 2013, 5.62%, 11/15/43 |
315 | 307,286 | ||||||
| Series 2018, 4.38%, 08/15/48 |
650 | 544,957 | ||||||
| Cleveland Clinic Foundation (The), 4.86%, 01/01/2114(a) |
405 | 368,310 | ||||||
| CommonSpirit Health |
||||||||
| 1.55%, 10/01/25 (Call 07/01/25) |
472 | 443,353 | ||||||
| 2.78%, 10/01/30 (Call 04/01/30) |
53 | 45,383 | ||||||
| 3.35%, 10/01/29 (Call 04/01/29) |
788 | 716,520 | ||||||
| 3.82%, 10/01/49 (Call 04/01/49) |
482 | 366,230 | ||||||
| 3.91%, 10/01/50 (Call 04/01/50) |
620 | 476,363 | ||||||
| 4.19%, 10/01/49 (Call 04/01/49) |
1,058 | 858,409 | ||||||
| 4.35%, 11/01/42 |
640 | 546,054 | ||||||
| 6.46%, 11/01/52 (Call 05/01/52)(a) |
300 | 338,367 | ||||||
| Community Health Network Inc., |
537 | 359,926 | ||||||
| Corewell Health Obligated Group, |
594 | 449,057 | ||||||
| Cottage Health Obligated Group, |
834 | 591,190 | ||||||
| Dartmouth-Hitchcock Health, Series B, 4.18%, 08/01/48 (Call 02/01/48) |
627 | 474,679 | ||||||
| Dignity Health |
||||||||
| 4.50%, 11/01/42 |
100 | 86,122 | ||||||
| 5.27%, 11/01/64(a) |
340 | 315,716 | ||||||
| Duke University Health System Inc., Series 2017, 3.92%, 06/01/47 (Call 12/01/46) |
1,082 | 895,701 | ||||||
| Elevance Health Inc. |
||||||||
| 1.50%, 03/15/26 (Call 02/15/26) |
1,271 | 1,180,740 | ||||||
| 2.25%, 05/15/30 (Call 02/15/30) |
1,846 | 1,567,290 | ||||||
| S C H E D U L E O F I N V E S T M E N T S |
85 |
| Schedule of Investments (continued) February 29, 2024 |
iShares® Broad USD Investment Grade Corporate Bond ETF (Percentages shown are based on Net Assets) |
| Security | |
Par (000) |
Value | |||||
| Health Care - Services (continued) | ||||||||
| 2.55%, 03/15/31 (Call 12/15/30) |
$ | 1,326 | $ | 1,124,112 | ||||
| 2.88%, 09/15/29 (Call 06/15/29) |
1,357 | 1,218,557 | ||||||
| 3.13%, 05/15/50 (Call 11/15/49) |
1,494 | 1,024,183 | ||||||
| 3.60%, 03/15/51 (Call 09/15/50) |
1,195 | 892,174 | ||||||
| 3.65%, 12/01/27 (Call 09/01/27) |
1,980 | 1,892,826 | ||||||
| 3.70%, 09/15/49 (Call 03/15/49) |
1,238 | 938,136 | ||||||
| 4.10%, 03/01/28 (Call 12/01/27) |
2,270 | 2,195,958 | ||||||
| 4.10%, 05/15/32 (Call 02/15/32) |
827 | 761,949 | ||||||
| 4.38%, 12/01/47 (Call 06/01/47) |
1,630 | 1,384,958 | ||||||
| 4.55%, 03/01/48 (Call 09/01/47) |
1,190 | 1,041,108 | ||||||
| 4.55%, 05/15/52 (Call 11/15/51) |
1,202 | 1,049,926 | ||||||
| 4.63%, 05/15/42 |
1,212 | 1,091,526 | ||||||
| 4.65%, 01/15/43(a) |
1,495 | 1,352,686 | ||||||
| 4.65%, 08/15/44 (Call 02/15/44) |
1,000 | 891,245 | ||||||
| 4.75%, 02/15/33 (Call 11/15/32) |
1,335 | 1,290,344 | ||||||
| 4.85%, 08/15/54 (Call 02/15/54) |
315 | 268,881 | ||||||
| 4.90%, 02/08/26 (Call 03/11/24)(a) |
845 | 839,096 | ||||||
| 5.10%, 01/15/44 |
1,016 | 958,768 | ||||||
| 5.13%, 02/15/53 (Call 08/15/52)(a) |
1,540 | 1,455,032 | ||||||
| 5.35%, 10/15/25 (Call 09/15/25) |
670 | 669,275 | ||||||
| 5.50%, 10/15/32 (Call 07/15/32) |
820 | 835,126 | ||||||
| 5.85%, 01/15/36(a) |
370 | 384,762 | ||||||
| 5.95%, 12/15/34 |
515 | 539,373 | ||||||
| 6.10%, 10/15/52 (Call 04/15/52) |
1,145 | 1,229,754 | ||||||
| 6.38%, 06/15/37 |
680 | 736,091 | ||||||
| Franciscan Missionaries of Our Lady Health System Inc., Series B, 3.91%, 07/01/49 (Call 01/01/49)(a) |
187 | 145,946 | ||||||
| Fred Hutchinson Cancer Center, 4.97%, |
265 | 251,296 | ||||||
| Fresenius Medical Care U.S. Finance III Inc. |
||||||||
| 1.88%, 12/01/26 (Call 11/01/26)(b) |
1,332 | 1,201,154 | ||||||
| 2.38%, 02/16/31 (Call 11/16/30)(a)(b) |
981 | 762,105 | ||||||
| 3.00%, 12/01/31 (Call 09/01/31)(a)(b) |
680 | 540,361 | ||||||
| 3.75%, 06/15/29 (Call 03/15/29)(b) |
859 | 763,217 | ||||||
| Hackensack Meridian Health Inc. |
||||||||
| 4.21%, 07/01/48 (Call 01/01/48) |
665 | 577,360 | ||||||
| 4.50%, 07/01/57 (Call 01/01/57) |
407 | 343,314 | ||||||
| Series 2020, 2.68%, 09/01/41 (Call 03/01/41)(a) |
725 | 505,066 | ||||||
| Series 2020, 2.88%, 09/01/50 (Call 03/01/50) |
750 | 498,967 | ||||||
| Hartford HealthCare Corp., 3.45%, 07/01/54(a) |
205 | 143,211 | ||||||
| HCA Inc. |
||||||||
| 2.38%, 07/15/31 (Call 04/15/31) |
1,315 | 1,070,173 | ||||||
| 3.38%, 03/15/29 (Call 01/15/29)(a) |
605 | 551,776 | ||||||
| 3.50%, 09/01/30 (Call 03/01/30) |
2,805 | 2,506,252 | ||||||
| 3.50%, 07/15/51 (Call 01/15/51) |
2,160 | 1,459,504 | ||||||
| 4.13%, 06/15/29 (Call 03/15/29) |
2,286 | 2,152,405 | ||||||
| 4.50%, 02/15/27 (Call 08/15/26) |
1,736 | 1,699,035 | ||||||
| 4.63%, 03/15/52 (Call 09/15/51) |
2,685 | 2,198,378 | ||||||
| 5.13%, 06/15/39 (Call 12/15/38) |
1,381 | 1,283,340 | ||||||
| 5.20%, 06/01/28 (Call 05/01/28)(a) |
560 | 557,915 | ||||||
| 5.25%, 04/15/25 |
1,698 | 1,690,036 | ||||||
| 5.25%, 06/15/26 (Call 12/15/25) |
1,870 | 1,858,616 | ||||||
| 5.25%, 06/15/49 (Call 12/15/48) |
2,293 | 2,064,733 | ||||||
| 5.38%, 09/01/26 (Call 03/01/26)(a) |
1,482 | 1,477,727 | ||||||
| 5.45%, 04/01/31 (Call 02/01/31)(a) |
255 | 253,794 | ||||||
| 5.50%, 06/01/33 (Call 03/01/33)(a) |
1,360 | 1,351,941 | ||||||
| 5.50%, 06/15/47 (Call 12/15/46) |
1,916 | 1,783,928 | ||||||
| 5.60%, 04/01/34 (Call 01/01/34) |
820 | 816,394 | ||||||
| Security | |
Par (000) |
Value | |||||
| Health Care - Services (continued) | ||||||||
| 5.63%, 09/01/28 (Call 03/01/28) |
$ | 2,258 | $ | 2,275,431 | ||||
| 5.88%, 02/15/26 (Call 08/15/25) |
2,157 | 2,165,940 | ||||||
| 5.88%, 02/01/29 (Call 08/01/28) |
1,720 | 1,750,638 | ||||||
| 5.90%, 06/01/53 (Call 12/01/52) |
1,340 | 1,316,179 | ||||||
| 6.00%, 04/01/54 (Call 10/01/53) |
670 | 664,961 | ||||||
| 6.10%, 04/01/64 (Call 10/01/63) |
1,100 | 1,086,174 | ||||||
| 7.50%, 11/06/33(a) |
525 | 584,305 | ||||||
| 7.69%, 06/15/25 |
600 | 614,785 | ||||||
| Health Care Service Corp. A Mutual Legal |
||||||||
| 1.50%, 06/01/25 (Call 05/01/25)(b) |
785 | 747,734 | ||||||
| 2.20%, 06/01/30 (Call 03/01/30)(b) |
1,634 | 1,368,083 | ||||||
| 3.20%, 06/01/50 (Call 12/01/49)(a)(b) |
631 | 427,837 | ||||||
| Highmark Inc. |
||||||||
| 1.45%, 05/10/26 (Call 04/10/26)(b) |
1,373 | 1,252,574 | ||||||
| 2.55%, 05/10/31 (Call 02/10/31)(b) |
932 | 731,362 | ||||||
| Hoag Memorial Hospital Presbyterian, 3.80%, |
400 | 326,451 | ||||||
| Humana Inc. |
||||||||
| 1.35%, 02/03/27 (Call 01/03/27) |
184 | 164,986 | ||||||
| 2.15%, 02/03/32 (Call 11/03/31) |
1,702 | 1,349,218 | ||||||
| 3.13%, 08/15/29 (Call 05/15/29)(a) |
215 | 194,616 | ||||||
| 3.70%, 03/23/29 (Call 02/23/29)(a) |
1,032 | 965,148 | ||||||
| 3.95%, 03/15/27 (Call 12/15/26) |
1,122 | 1,083,688 | ||||||
| 3.95%, 08/15/49 (Call 02/15/49) |
658 | 514,254 | ||||||
| 4.50%, 04/01/25 (Call 03/01/25) |
743 | 735,292 | ||||||
| 4.63%, 12/01/42 (Call 06/01/42) |
871 | 764,767 | ||||||
| 4.80%, 03/15/47 (Call 09/15/46) |
654 | 570,017 | ||||||
| 4.88%, 04/01/30 (Call 01/01/30)(a) |
1,085 | 1,067,593 | ||||||
| 4.95%, 10/01/44 (Call 04/01/44) |
954 | 860,430 | ||||||
| 5.50%, 03/15/53 (Call 09/15/52)(a) |
855 | 828,194 | ||||||
| 5.70%, 03/13/26 (Call 03/13/24) |
95 | 94,286 | ||||||
| 5.75%, 03/01/28 (Call 02/01/28) |
905 | 922,736 | ||||||
| 5.75%, 12/01/28 (Call 11/01/28) |
470 | 480,011 | ||||||
| 5.88%, 03/01/33 (Call 12/01/32)(a) |
745 | 765,788 | ||||||
| 5.95%, 03/15/34 (Call 12/15/33) |
605 | 625,484 | ||||||
| 8.15%, 06/15/38 |
570 | 679,378 | ||||||
| Indiana University Health Inc. Obligated Group |
||||||||
| 3.97%, 11/01/48 (Call 05/01/48) |
891 | 738,698 | ||||||
| Series 2021, 2.85%, 11/01/51 (Call 05/01/51)(a) |
325 | 213,438 | ||||||
| Inova Health System Foundation, 4.07%, 05/15/52 (Call 11/15/51)(a) |
465 | 396,285 | ||||||
| Integris Baptist Medical Center Inc., Series A, 3.88%, 08/15/50 (Call 02/15/50)(a) |
685 | 516,886 | ||||||
| Iowa Health System, Series 2020, 3.67%, 02/15/50 (Call 08/15/49) |
530 | 412,022 | ||||||
| IQVIA Inc. |
||||||||
| 5.70%, 05/15/28 (Call 04/15/28) |
1,005 | 1,012,296 | ||||||
| 6.25%, 02/01/29 (Call 01/01/29) |
180 | 185,197 | ||||||
| Johns Hopkins Health System Corp. (The), |
||||||||
| 3.84%, 05/15/46(a) |
765 | 624,426 | ||||||
| Kaiser Foundation Hospitals |
||||||||
| 3.15%, 05/01/27 (Call 02/01/27) |
1,135 | 1,079,087 | ||||||
| 4.15%, 05/01/47 (Call 11/01/46) |
2,162 | 1,864,209 | ||||||
| 4.88%, 04/01/42 |
957 | 908,792 | ||||||
| Series 2019, 3.27%, 11/01/49 |
1,102 | 809,776 | ||||||
| Series 2021, 2.81%, 06/01/41 |
655 | 478,409 | ||||||
| 86 | 2 0 2 4 I S H A R E S A N N U A L R E P O R T T O S H A R E H O L D E R S |
| Schedule of Investments (continued) February 29, 2024 |
iShares® Broad USD Investment Grade Corporate Bond ETF (Percentages shown are based on Net Assets) |
| Security | Par (000) |
Value | ||||||
| Health Care - Services (continued) | ||||||||
| Series 2021, 3.00%, 06/01/51 |
$ | 2,015 | $ | 1,381,190 | ||||
| Laboratory Corp. of America Holdings |
||||||||
| 1.55%, 06/01/26 (Call 05/01/26) |
995 | 917,460 | ||||||
| 2.70%, 06/01/31 (Call 03/01/31)(a) |
1,090 | 932,496 | ||||||
| 2.95%, 12/01/29 (Call 09/01/29) |
1,030 | 918,000 | ||||||
| 3.60%, 09/01/27 (Call 06/01/27) |
775 | 736,940 | ||||||
| 4.70%, 02/01/45 (Call 08/01/44) |
1,542 | 1,376,295 | ||||||
| Mass General Brigham Inc. |
||||||||
| Series 2017, 3.77%, 07/01/48 |
15 | 12,024 | ||||||
| Series 2020, 3.19%, 07/01/49 |
545 | 387,161 | ||||||
| Series 2020, 3.34%, 07/01/60 |
920 | 626,164 | ||||||
| Mayo Clinic |
||||||||
| 3.77%, 11/15/43 |
355 | 299,629 | ||||||
| Series 2013, 4.00%, 11/15/47(a) |
30 | 25,372 | ||||||
| Series 2016, 4.13%, 11/15/52(a) |
290 | 252,385 | ||||||
| Series 2021, 3.20%, 11/15/61 |
628 | 431,779 | ||||||
| McLaren Health Care Corp., Series A, 4.39%, 05/15/48 (Call 11/15/47)(a) |
508 | 438,047 | ||||||
| MedStar Health Inc., Series 20A, 3.63%, 08/15/49(a) |
300 | 226,832 | ||||||
| Memorial Health Services, 3.45%, 11/01/49 (Call 05/01/49) |
800 | 595,026 | ||||||
| Memorial Sloan-Kettering Cancer Center |
||||||||
| 4.13%, 07/01/52(a) |
388 | 330,090 | ||||||
| 5.00%, 07/01/42 |
285 | 276,143 | ||||||
| Series 2015, 4.20%, 07/01/55(a) |
312 | 261,671 | ||||||
| Series 2020, 2.96%, 01/01/50 (Call 07/01/49)(a) |
200 | 135,646 | ||||||
| Methodist Hospital (The), Series 20A, 2.71%, 12/01/50 (Call 06/01/50)(a) |
994 | 623,988 | ||||||
| Montefiore Obligated Group |
||||||||
| 4.29%, 09/01/50 |
329 | 203,268 | ||||||
| Series 18-C, 5.25%, 11/01/48 (Call 05/01/48) |
486 | 355,826 | ||||||
| Mount Nittany Medical Center Obligated Group, 3.80%, 11/15/52(a) |
345 | 270,032 | ||||||
| Mount Sinai Hospital |
||||||||
| Series 2017, 3.98%, 07/01/48(a) |
495 | 404,685 | ||||||
| Series 2019, 3.74%, 07/01/49 (Call 01/01/49)(a) |
800 | 588,913 | ||||||
| Series 2020, 3.39%, 07/01/50 (Call 07/01/49) |
630 | 420,829 | ||||||
| MultiCare Health System, 2.80%, 08/15/50 (Call 02/15/50) |
620 | 364,065 | ||||||
| MyMichigan Health, Series 2020, 3.41%, 06/01/50 (Call 12/01/49) |
610 | 444,147 | ||||||
| Nationwide Children’s Hospital Inc., 4.56%, 11/01/52 (Call 05/01/52)(a) |
559 | 513,908 | ||||||
| New York and Presbyterian Hospital (The) |
||||||||
| 2.26%, 08/01/40 (Call 02/01/40) |
170 | 114,526 | ||||||
| 2.61%, 08/01/60 (Call 02/01/60)(a) |
238 | 137,395 | ||||||
| 3.56%, 08/01/36 |
110 | 94,086 | ||||||
| 4.02%, 08/01/45(a) |
610 | 517,329 | ||||||
| 4.06%, 08/01/56 |
149 | 121,099 | ||||||
| 4.76%, 08/01/2116(a) |
255 | 219,504 | ||||||
| Series 2019, 3.95%, (Call 02/01/2119)(a) |
410 | 300,698 | ||||||
| Security | Par (000) |
Value | ||||||
| Health Care - Services (continued) | ||||||||
| Northwell Healthcare Inc. |
||||||||
| 3.81%, 11/01/49 (Call 11/01/48) |
$ | 372 | $ | 284,419 | ||||
| 3.98%, 11/01/46 (Call 11/01/45)(a) |
625 | 492,234 | ||||||
| 4.26%, 11/01/47 (Call 11/01/46) |
1,201 | 977,384 | ||||||
| 6.15%, 11/01/43 |
610 | 637,956 | ||||||
| Northwestern Memorial Healthcare Obligated Group, Series 2021, 2.63%, 07/15/51 (Call 01/15/51)(a) |
240 | 156,379 | ||||||
| Novant Health Inc. |
||||||||
| 2.64%, 11/01/36 (Call 08/01/36) |
1,135 | 858,510 | ||||||
| 3.17%, 11/01/51 (Call 05/01/51) |
1,129 | 768,821 | ||||||
| 3.32%, 11/01/61 (Call 05/01/61)(a) |
608 | 396,154 | ||||||
| 4.37%, 11/01/43 |
350 | 298,910 | ||||||
| NY Society for Relief of Ruptured & Crippled Maintaining Hosp Special Surgery, Series 2020, 2.67%, 10/01/50 (Call 04/01/50)(a) |
730 | 443,585 | ||||||
| Ochsner Clinic Foundation, 5.90%, 05/15/45 (Call 11/15/44)(a) |
495 | 476,383 | ||||||
| OhioHealth Corp. |
||||||||
| 2.30%, 11/15/31 (Call 05/15/31) |
700 | 576,818 | ||||||
| 2.83%, 11/15/41 (Call 05/15/41)(a) |
860 | 628,621 | ||||||
| Series 2020, 3.04%, 11/15/50 (Call 05/15/50) |
153 | 109,665 | ||||||
| Orlando Health Obligated Group |
||||||||
| 3.33%, 10/01/50 (Call 04/01/50)(a) |
385 | 282,092 | ||||||
| 4.09%, 10/01/48 (Call 04/01/48)(a) |
507 | 421,717 | ||||||
| PeaceHealth Obligated Group |
||||||||
| Series 2018, 4.79%, 11/15/48 |
640 | 559,040 | ||||||
| Series 2020, 1.38%, 11/15/25 |
586 | 544,706 | ||||||
| Series 2020, 3.22%, 11/15/50 |
785 | 517,511 | ||||||
| Piedmont Healthcare Inc. |
||||||||
| 2.04%, 01/01/32 (Call 07/01/31) |
735 | 593,079 | ||||||
| 2.86%, 01/01/52 (Call 07/01/51) |
710 | 454,998 | ||||||
| Series 2042, 2.72%, 01/01/42 (Call 07/01/41) |
555 | 391,637 | ||||||
| Premier Health Partners, Series G, 2.91%, 11/15/26 (Call 05/15/26) |
462 | 421,121 | ||||||
| Presbyterian Healthcare Services, 4.88%, 08/01/52 (Call 02/01/52) |
575 | 551,913 | ||||||
| Providence St Joseph Health Obligated Group |
280 | 279,003 | ||||||
| Series 19A, 2.53%, 10/01/29 (Call 07/01/29)(a) |
1,060 | 922,097 | ||||||
| Series 21A, 2.70%, 10/01/51 (Call 04/01/51)(a) |
1,023 | 616,596 | ||||||
| Series A, 3.93%, 10/01/48 (Call 04/01/48) |
717 | 551,561 | ||||||
| Series H, 2.75%, 10/01/26 (Call 07/01/26) |
706 | 660,992 | ||||||
| Series I, 3.74%, 10/01/47(a) |
603 | 453,606 | ||||||
| Queen’s Health Systems (The), 4.81%, |
150 | 139,726 | ||||||
| Quest Diagnostics Inc. |
||||||||
| 2.80%, 06/30/31 (Call 03/30/31)(a) |
667 | 570,314 | ||||||
| 2.95%, 06/30/30 (Call 03/30/30) |
1,293 | 1,139,895 | ||||||
| 3.45%, 06/01/26 (Call 03/01/26) |
910 | 875,626 | ||||||
| 3.50%, 03/30/25 (Call 12/30/24)(a) |
596 | 585,146 | ||||||
| 4.20%, 06/30/29 (Call 03/30/29) |
885 | 850,720 | ||||||
| 4.70%, 03/30/45 (Call 09/30/44)(a) |
536 | 469,996 | ||||||
| 6.40%, 11/30/33 (Call 08/30/33)(a) |
365 | 389,903 | ||||||
| S C H E D U L E O F I N V E S T M E N T S |
87 |
| Schedule of Investments (continued) February 29, 2024 |
iShares® Broad USD Investment Grade Corporate Bond ETF (Percentages shown are based on Net Assets) |
| Security | Par (000) |
Value | ||||||
| Health Care - Services (continued) | ||||||||
| Rady Children’s Hospital-San Diego, Series 21A, 3.15%, 08/15/51 (Call 08/15/50)(a) |
$ | 105 | $ | 71,214 | ||||
| Roche Holdings Inc. |
||||||||
| 0.99%, 03/05/26 (Call 02/05/26)(b) |
1,110 | 1,026,736 | ||||||
| 1.93%, 12/13/28 (Call 10/13/28)(b) |
2,900 | 2,540,754 | ||||||
| 2.08%, 12/13/31 (Call 09/13/31)(b) |
3,037 | 2,485,977 | ||||||
| 2.13%, 03/10/25 (Call 02/10/25)(a)(b) |
585 | 566,934 | ||||||
| 2.31%, 03/10/27 (Call 02/10/27)(b) |
1,100 | 1,025,179 | ||||||
| 2.38%, 01/28/27 (Call 10/28/26)(b) |
1,280 | 1,198,809 | ||||||
| 2.61%, 12/13/51 (Call 06/13/51)(b) |
2,720 | 1,715,003 | ||||||
| 2.63%, 05/15/26 (Call 02/15/26)(b) |
1,200 | 1,142,816 | ||||||
| 3.00%, 11/10/25 (Call 08/10/25)(a)(b) |
782 | 757,845 | ||||||
| 3.63%, 09/17/28 (Call 06/17/28)(a)(b) |
1,240 | 1,181,175 | ||||||
| 4.00%, 11/28/44 (Call 05/28/44)(a)(b) |
990 | 849,805 | ||||||
| 5.27%, 11/13/26 (Call 10/13/26)(a)(b) |
1,665 | 1,680,103 | ||||||
| 5.34%, 11/13/28 (Call 10/13/28)(a)(b) |
1,930 | 1,970,093 | ||||||
| 5.49%, 11/13/30 (Call 09/13/30)(b) |
2,060 | 2,121,952 | ||||||
| 5.59%, 11/13/33 (Call 08/13/33)(a)(b) |
1,975 | 2,064,451 | ||||||
| 7.00%, 03/01/39(b) |
1,205 | 1,448,672 | ||||||
| Rush Obligated Group, Series 2020, 3.92%, 11/15/29 (Call 08/15/29)(a) |
575 | 547,033 | ||||||
| RWJ Barnabas Health Inc. |
||||||||
| 3.48%, 07/01/49 (Call 01/01/49) |
610 | 454,484 | ||||||
| 3.95%, 07/01/46 (Call 07/01/45) |
725 | 580,265 | ||||||
| Seattle Children’s Hospital, |
857 | 552,625 | ||||||
| Sentara Healthcare, 2.93%, 11/01/51 (Call 05/01/51) |
140 | 94,561 | ||||||
| Sharp HealthCare, Series 20B, 2.68%, 08/01/50 (Call 08/01/49) |
60 | 37,559 | ||||||
| Southern Baptist Hospital of Florida Inc., 4.86%, 07/15/45 (Call 01/15/45) |
503 | 478,568 | ||||||
| SSM Health Care Corp. |
||||||||
| 4.89%, 06/01/28 (Call 03/01/28) |
545 | 549,156 | ||||||
| Series A, 3.82%, 06/01/27 |
938 | 902,684 | ||||||
| Stanford Health Care |
||||||||
| 3.03%, 08/15/51 (Call 02/15/51)(a) |
605 | 409,913 | ||||||
| Series 2018, 3.80%,
11/15/48 |
961 | 773,575 | ||||||
| Series 2020, 3.31%, 08/15/30 |
290 | 262,008 | ||||||
| Summa Health, 3.51%, 11/15/51 |
310 | 229,507 | ||||||
| Sutter Health |
||||||||
| 5.16%, 08/15/33 (Call 02/15/33) |
25 | 25,171 | ||||||
| Series 2018, 3.70%, 08/15/28 |
302 | 288,418 | ||||||
| Series 2018, 4.09%, 08/15/48 |
420 | 348,603 | ||||||
| Series 20A, 1.32%, 08/15/25 |
65 | 61,195 | ||||||
| Series 20A, 2.29%, 08/15/30 |
335 | 285,975 | ||||||
| Series 20A, 3.16%, 08/15/40 |
333 | 255,942 | ||||||
| Series 20A, 3.36%, 08/15/50 |
360 | 264,106 | ||||||
| Texas Health Resources |
||||||||
| 2.33%, 11/15/50 (Call 05/15/50)(a) |
375 | 225,541 | ||||||
| 4.33%, 11/15/55(a) |
380 | 332,612 | ||||||
| Toledo Hospital (The), 5.75%, 11/15/38 (Call 11/15/28)(a) |
394 | 393,558 | ||||||
| Trinity Health Corp. |
||||||||
| 4.13%, 12/01/45(a) |
865 | 732,001 | ||||||
| Security | Par (000) |
Value | ||||||
| Health Care - Services (continued) | ||||||||
| Series 2019, 3.43%, 12/01/48 |
$ | 485 | $ | 369,006 | ||||
| Series 2021, 2.63%, 12/01/40 (Call 06/01/40)(a) |
580 | 408,424 | ||||||
| UMass Memorial Health Care Obligated Group, 5.36%, 07/01/52 (Call 01/01/52) |
320 | 302,613 | ||||||
| UnitedHealth Group Inc. |
||||||||
| 3.70%, 05/15/27 (Call 04/15/27) |
680 | 658,488 | ||||||
| 1.15%, 05/15/26 (Call 04/15/26)(a) |
1,175 | 1,082,119 | ||||||
| 1.25%, 01/15/26 |
1,096 | 1,023,987 | ||||||
| 2.00%, 05/15/30 |
1,582 | 1,330,961 | ||||||
| 2.30%, 05/15/31 (Call 02/15/31) |
1,625 | 1,362,419 | ||||||
| 2.75%, 05/15/40 (Call 11/15/39) |
1,600 | 1,152,761 | ||||||
| 2.88%, 08/15/29(a) |
1,195 | 1,084,135 | ||||||
| 2.90%, 05/15/50 (Call 11/15/49) |
1,710 | 1,135,981 | ||||||
| 2.95%, 10/15/27 |
1,066 | 1,001,174 | ||||||
| 3.05%, 05/15/41 (Call 11/15/40) |
1,905 | 1,415,375 | ||||||
| 3.10%, 03/15/26 |
1,035 | 999,773 | ||||||
| 3.13%, 05/15/60 (Call 11/15/59) |
1,085 | 709,923 | ||||||
| 3.25%, 05/15/51 (Call 11/15/50)(a) |
2,560 | 1,795,302 | ||||||
| 3.38%, 04/15/27 |
1,035 | 994,936 | ||||||
| 3.45%, 01/15/27 |
1,127 | 1,087,562 | ||||||
| 3.50%, 08/15/39 (Call 02/15/39) |
1,836 | 1,482,901 | ||||||
| 3.70%, 12/15/25 |
12 | 11,740 | ||||||
| 3.70%, 08/15/49 (Call 02/15/49) |
1,531 | 1,175,042 | ||||||
| 3.75%, 07/15/25 |
1,626 | 1,595,510 | ||||||
| 3.75%, 10/15/47 (Call 04/15/47) |
1,609 | 1,254,494 | ||||||
| 3.85%, 06/15/28 |
1,630 | 1,569,690 | ||||||
| 3.88%, 12/15/28 |
1,406 | 1,349,351 | ||||||
| 3.88%, 08/15/59 (Call 02/15/59) |
1,252 | 963,346 | ||||||
| 3.95%, 10/15/42 (Call 04/15/42)(a) |
728 | 611,811 | ||||||
| 4.00%, 05/15/29 (Call 03/15/29) |
1,592 | 1,531,351 | ||||||
| 4.20%, 05/15/32 (Call 02/15/32) |
2,295 | 2,162,730 | ||||||
| 4.20%, 01/15/47 (Call 07/15/46) |
735 | 622,433 | ||||||
| 4.25%, 01/15/29 (Call 12/15/28) |
1,865 | 1,817,043 | ||||||
| 4.25%, 03/15/43 (Call 09/15/42) |
1,133 | 991,039 | ||||||
| 4.25%, 04/15/47 (Call 10/15/46) |
911 | 774,602 | ||||||
| 4.25%, 06/15/48 (Call 12/15/47) |
1,787 | 1,504,075 | ||||||
| 4.38%, 03/15/42 (Call 09/15/41) |
996 | 886,349 | ||||||
| 4.45%, 12/15/48 (Call 06/15/48) |
1,423 | 1,250,877 | ||||||
| 4.50%, 04/15/33 (Call 01/15/33) |
1,990 | 1,909,697 | ||||||
| 4.63%, 07/15/35 |
615 | 593,640 | ||||||
| 4.63%, 11/15/41 (Call 05/15/41) |
1,146 | 1,045,647 | ||||||
| 4.75%, 07/15/45 |
2,555 | 2,351,047 | ||||||
| 4.75%, 05/15/52 (Call 11/15/51) |
2,535 | 2,305,963 | ||||||
| 4.95%, 05/15/62 (Call 11/15/61) |
1,315 | 1,215,574 | ||||||
| 5.05%, 04/15/53 (Call 10/15/52) |
2,535 | 2,411,785 | ||||||
| 5.15%, 10/15/25 |
725 | 726,581 | ||||||
| 5.20%, 04/15/63 (Call 10/15/62) |
2,195 | 2,093,190 | ||||||
| 5.25%, 02/15/28 (Call 01/15/28) |
1,385 | 1,408,213 | ||||||
| 5.30%, 02/15/30 (Call 12/15/29)(a) |
1,500 | 1,528,813 | ||||||
| 5.35%, 02/15/33 (Call 11/15/32)(a) |
2,415 | 2,464,018 | ||||||
| 5.70%, 10/15/40 (Call 04/15/40) |
700 | 725,481 | ||||||
| 5.80%, 03/15/36 |
1,304 | 1,380,411 | ||||||
| 5.88%, 02/15/53 (Call 08/15/52) |
2,565 | 2,744,090 | ||||||
| 5.95%, 02/15/41 (Call 08/15/40) |
605 | 636,588 | ||||||
| 6.05%, 02/15/63 (Call 08/15/62) |
1,905 | 2,063,060 | ||||||
| 6.50%, 06/15/37 |
778 | 867,746 | ||||||
| 6.63%, 11/15/37 |
954 | 1,078,821 | ||||||
| 6.88%, 02/15/38 |
1,083 | 1,258,078 | ||||||
| Universal Health Services Inc. |
||||||||
| 1.65%, 09/01/26 (Call 08/01/26) |
1,116 | 1,014,648 | ||||||
| 88 | 2 0 2 4 I S H A R E S A N N U A L R E P O R T T O S H A R E H O L D E R S |
| Schedule of Investments (continued) February 29, 2024 |
iShares® Broad USD Investment Grade Corporate Bond ETF (Percentages shown are based on Net Assets) |
| Security | Par (000) |
Value | ||||||
| Health Care - Services (continued) | ||||||||
| 2.65%, 10/15/30 (Call 07/15/30) |
$ | 1,240 | $ | 1,035,246 | ||||
| 2.65%, 01/15/32 (Call 10/15/31)(a) |
907 | 737,333 | ||||||
| UPMC |
||||||||
| 5.04%, 05/15/33 (Call 02/15/33) |
30 | 29,619 | ||||||
| 5.38%, 05/15/43 (Call 11/15/42)(a) |
160 | 161,786 | ||||||
| Series D-1, 3.60%, 04/03/25(a) |
700 | 687,212 | ||||||
| WakeMed, Series A, 3.29%, 10/01/52 |
135 | 95,066 | ||||||
| West Virginia United Health System Obligated Group, Series 2020, 3.13%, 06/01/50 (Call 12/01/49)(a) |
201 | 126,517 | ||||||
| Willis-Knighton Medical Center |
||||||||
| Series 2018, 4.81%, 09/01/48 (Call 03/01/48) |
742 | 671,363 | ||||||
| Series 2021, 3.07%, 03/01/51 (Call 09/01/50)(a) |
323 | 211,987 | ||||||
| Yale-New Haven Health Services Corp., Series 2020, 2.50%, 07/01/50 |
190 | 109,406 | ||||||
|
|
|
|||||||
| 292,618,900 | ||||||||
| Holding Companies - Diversified — 0.5% | ||||||||
| Alfa SAB de CV, 6.88%, 03/25/44 (Call 09/25/43)(b) |
345 | 341,464 | ||||||
| Ares Capital Corp. |
||||||||
| 2.15%, 07/15/26 (Call 06/15/26) |
1,675 | 1,521,569 | ||||||
| 2.88%, 06/15/27 (Call 05/15/27) |
610 | 554,145 | ||||||
| 2.88%, 06/15/28 (Call 04/15/28) |
1,703 | 1,491,484 | ||||||
| 3.20%, 11/15/31 (Call 08/15/31) |
955 | 777,327 | ||||||
| 3.25%, 07/15/25 (Call 06/15/25) |
1,447 | 1,389,866 | ||||||
| 3.88%, 01/15/26 (Call 12/15/25)(a) |
1,561 | 1,497,601 | ||||||
| 4.25%, 03/01/25 (Call 01/01/25) |
809 | 793,402 | ||||||
| 5.88%, 03/01/29 (Call 02/01/29) |
680 | 664,571 | ||||||
| 7.00%, 01/15/27 |
235 | 239,682 | ||||||
| Bain Capital Specialty Finance Inc. |
||||||||
| 2.55%, 10/13/26 (Call 09/13/26)(a) |
684 | 622,836 | ||||||
| 2.95%, 03/10/26 (Call 02/10/26)(a) |
689 | 644,819 | ||||||
| Barings BDC Inc. |
||||||||
| 3.30%, 11/23/26 (Call 10/13/26) |
405 | 369,808 | ||||||
| 7.00%, 02/15/29 (Call 01/15/29) |
65 | 64,469 | ||||||
| Blackstone Private Credit Fund |
||||||||
| 2.63%, 12/15/26 (Call 11/15/26) |
1,570 | 1,418,248 | ||||||
| 3.25%, 03/15/27 (Call 02/15/27) |
1,551 | 1,418,489 | ||||||
| 4.00%, 01/15/29 (Call 11/15/28)(a) |
832 | 756,765 | ||||||
| 4.70%, 03/24/25(a) |
700 | 689,135 | ||||||
| 6.25%, 01/25/31 (Call 11/25/30)(b) |
325 | 322,163 | ||||||
| 7.05%, 09/29/25(a) |
1,095 | 1,109,382 | ||||||
| 7.30%, 11/27/28 (Call 10/27/28)(a)(b) |
435 | 448,949 | ||||||
| Blackstone Secured Lending Fund |
||||||||
| 2.13%, 02/15/27 (Call 01/15/27)(a) |
693 | 621,948 | ||||||
| 2.75%, 09/16/26 (Call 08/19/26)(a) |
1,165 | 1,069,016 | ||||||
| 2.85%, 09/30/28 (Call 07/30/28)(a) |
770 | 670,103 | ||||||
| 3.63%, 01/15/26 (Call 12/15/25) |
1,140 | 1,086,142 | ||||||
| Blue Owl Capital Corp. |
||||||||
| 2.63%, 01/15/27 (Call 12/15/26)(a) |
1,037 | 940,037 | ||||||
| 2.88%, 06/11/28 (Call 04/11/28) |
800 | 698,996 | ||||||
| 3.40%, 07/15/26 (Call 06/15/26) |
1,448 | 1,348,583 | ||||||
| 3.75%, 07/22/25 (Call 06/22/25) |
606 | 583,840 | ||||||
| 4.00%, 03/30/25 (Call 02/28/25)(a) |
481 | 469,620 | ||||||
| 4.25%, 01/15/26 (Call 12/15/25) |
757 | 729,654 | ||||||
| 5.95%, 03/15/29 (Call 02/15/29)(a) |
165 | 161,209 | ||||||
| Blue Owl Capital Corp. II, 8.45%, 11/15/26 (Call 10/15/26)(a)(b) |
25 | 25,649 | ||||||
| Security | Par (000) |
Value | ||||||
| Holding Companies - Diversified (continued) | ||||||||
| Blue Owl Capital Corp. III, 3.13%, 04/13/27 (Call 03/13/27)(a) |
$ | 605 | $ | 547,761 | ||||
| Blue Owl Credit Income Corp. |
||||||||
| 3.13%, 09/23/26 (Call 08/23/26)(a) |
790 | 719,246 | ||||||
| 4.70%, 02/08/27 (Call 01/08/27) |
940 | 885,123 | ||||||
| 5.50%, 03/21/25 |
704 | 696,699 | ||||||
| 6.65%, 03/15/31 (Call 01/15/31)(b) |
380 | 367,811 | ||||||
| 7.75%, 09/16/27 (Call 08/16/27) |
585 | 598,415 | ||||||
| 7.75%, 01/15/29 (Call 12/15/28)(b) |
30 | 30,636 | ||||||
| Blue Owl Technology Finance Corp. |
||||||||
| 2.50%, 01/15/27 (Call 12/15/26) |
382 | 336,096 | ||||||
| 3.75%, 06/17/26 (Call 05/17/26)(a)(b) |
556 | 511,395 | ||||||
| 4.75%, 12/15/25 (Call 11/15/25)(a)(b) |
905 | 862,439 | ||||||
| CK Hutchison International 17 II Ltd., 3.25%, 09/29/27(b) |
1,178 | 1,110,231 | ||||||
| CK Hutchison International 17 Ltd., 3.50%, 04/05/27(a)(b) |
550 | 526,071 | ||||||
| CK Hutchison International 19 II Ltd. |
||||||||
| 2.75%, 09/06/29 (Call 06/06/29)(a)(b) |
1,728 | 1,535,428 | ||||||
| 3.38%, 09/06/49 (Call 03/06/49)(a)(b) |
1,480 | 1,090,380 | ||||||
| CK Hutchison International 19 Ltd., 3.63%, 04/11/29 (Call 01/11/29)(b) |
414 | 387,648 | ||||||
| CK Hutchison International 21 Ltd., 1.50%, 04/15/26 (Call 03/15/26)(b) |
864 | 797,829 | ||||||
| FS KKR Capital Corp. |
||||||||
| 2.63%, 01/15/27 (Call 12/15/26) |
455 | 411,682 | ||||||
| 3.13%, 10/12/28 (Call 08/12/28) |
975 | 842,182 | ||||||
| 3.25%, 07/15/27 (Call 06/15/27)(a) |
637 | 578,231 | ||||||
| 3.40%, 01/15/26 (Call 12/15/25)(a) |
1,304 | 1,232,841 | ||||||
| 7.88%, 01/15/29 (Call 12/15/28) |
40 | 41,346 | ||||||
| Goldman Sachs BDC Inc., 2.88%, 01/15/26 (Call 12/15/25) |
486 | 463,154 | ||||||
| Golub Capital BDC Inc. |
||||||||
| 2.05%, 02/15/27 (Call 01/15/27)(a) |
710 | 626,052 | ||||||
| 2.50%, 08/24/26 (Call 07/24/26) |
671 | 612,341 | ||||||
| 7.05%, 12/05/28 (Call 11/05/28) |
80 | 81,507 | ||||||
| Hutchison Whampoa International 03/33 Ltd., 7.45%, 11/24/33(b) |
405 | 469,496 | ||||||
| JAB Holdings BV |
||||||||
| 2.20%, 11/23/30 (Call 08/23/30)(b) |
392 | 310,176 | ||||||
| 3.75%, 05/28/51 (Call 11/28/50)(b) |
815 | 530,166 | ||||||
| 4.50%, 04/08/52 (Call 10/08/51)(a)(b) |
630 | 465,527 | ||||||
| Main Street Capital Corp. |
||||||||
| 3.00%, 07/14/26 (Call 06/14/26) |
995 | 920,472 | ||||||
| 6.95%, 03/01/29 (Call 02/01/29) |
265 | 265,984 | ||||||
| Morgan Stanley Direct Lending Fund, 4.50%, 02/11/27 (Call 01/11/27) |
510 | 487,614 | ||||||
| Oaktree Specialty Lending Corp. |
||||||||
| 2.70%, 01/15/27 (Call 12/15/26) |
480 | 427,352 | ||||||
| 7.10%, 02/15/29 (Call 01/15/29)(a) |
520 | 526,231 | ||||||
| Prospect Capital Corp. |
||||||||
| 3.36%, 11/15/26 (Call 10/15/26)(a) |
705 | 635,245 | ||||||
| 3.44%, 10/15/28 (Call 08/15/28) |
469 | 398,193 | ||||||
| 3.71%, 01/22/26 (Call 12/22/25) |
578 | 543,807 | ||||||
| PTT Treasury Center Co. Ltd., 3.70%, 07/16/70 (Call 01/16/70)(a)(b) |
790 | 546,293 | ||||||
| Sixth Street Specialty Lending Inc. |
||||||||
| 2.50%, 08/01/26 (Call 07/01/26)(a) |
200 | 183,436 | ||||||
| 6.13%, 03/01/29 (Call 02/01/29)(a) |
25 | 24,610 | ||||||
|
|
|
|||||||
| 48,168,117 | ||||||||
| S C H E D U L E O F I N V E S T M E N T S |
89 |
| Schedule of Investments (continued) February 29, 2024 |
iShares® Broad USD Investment Grade Corporate Bond ETF (Percentages shown are based on Net Assets) |
| Security | Par (000) |
Value | ||||||
| Home Builders — 0.1% | ||||||||
| DR Horton Inc. |
||||||||
| 1.30%, 10/15/26 (Call 09/15/26) |
$ | 1,067 | $ | 965,371 | ||||
| 1.40%, 10/15/27 (Call 08/15/27)(a) |
932 | 821,604 | ||||||
| 2.60%, 10/15/25 (Call 09/15/25) |
713 | 682,217 | ||||||
| Lennar Corp. |
||||||||
| 4.75%, 05/30/25 (Call 02/28/25)(a) |
629 | 622,717 | ||||||
| 4.75%, 11/29/27 (Call 05/29/27)(a) |
992 | 976,165 | ||||||
| 5.00%, 06/15/27 (Call 12/15/26)(a) |
769 | 762,633 | ||||||
| 5.25%, 06/01/26 (Call 12/01/25) |
815 | 813,595 | ||||||
| MDC Holdings Inc. |
||||||||
| 2.50%, 01/15/31 (Call 07/15/30) |
870 | 734,986 | ||||||
| 3.85%, 01/15/30 (Call 07/15/29) |
505 | 465,545 | ||||||
| 3.97%, 08/06/61 (Call 02/06/61) |
347 | 264,347 | ||||||
| 6.00%, 01/15/43 (Call 10/15/42) |
1,050 | 1,047,499 | ||||||
| Meritage Homes Corp. |
||||||||
| 3.88%, 04/15/29 (Call 10/15/28)(a)(b) |
170 | 154,700 | ||||||
| 5.13%, 06/06/27 (Call 12/06/26)(a) |
100 | 98,490 | ||||||
| NVR Inc., 3.00%, 05/15/30 (Call 11/15/29) |
1,163 | 1,024,316 | ||||||
| PulteGroup Inc. |
||||||||
| 5.00%, 01/15/27 (Call 10/15/26)(a) |
962 | 957,716 | ||||||
| 5.50%, 03/01/26 (Call 12/01/25) |
734 | 735,458 | ||||||
| 6.00%, 02/15/35 |
614 | 630,535 | ||||||
| 6.38%, 05/15/33 |
735 | 775,073 | ||||||
| 7.88%, 06/15/32(a) |
433 | 500,565 | ||||||
| Toll Brothers Finance Corp. |
||||||||
| 3.80%, 11/01/29 (Call 08/01/29)(a) |
680 | 625,160 | ||||||
| 4.35%, 02/15/28 (Call 11/15/27) |
620 | 595,907 | ||||||
| 4.88%, 11/15/25 (Call 08/15/25) |
515 | 508,627 | ||||||
| 4.88%, 03/15/27 (Call 12/15/26)(a) |
925 | 909,590 | ||||||
|
|
|
|||||||
| 15,672,816 | ||||||||
| Home Furnishings — 0.1% | ||||||||
| Harman International Industries Inc., 4.15%, 05/15/25 (Call 02/15/25) |
642 | 631,283 | ||||||
| Leggett & Platt Inc. |
||||||||
| 3.50%, 11/15/27 (Call 08/15/27) |
1,005 | 938,500 | ||||||
| 3.50%, 11/15/51 (Call 05/15/51)(a) |
815 | 562,074 | ||||||
| 4.40%, 03/15/29 (Call 12/15/28) |
1,028 | 973,707 | ||||||
| Panasonic Holdings Corp., 3.11%, 07/19/29 (Call 04/19/29)(a)(b) |
605 | 549,868 | ||||||
| Whirlpool Corp. |
||||||||
| 2.40%, 05/15/31 (Call 02/15/31)(a) |
405 | 333,191 | ||||||
| 3.70%, 05/01/25 |
530 | 518,806 | ||||||
| 4.50%, 06/01/46 (Call 12/01/45)(a) |
565 | 454,720 | ||||||
| 4.60%, 05/15/50 (Call 11/15/49)(a) |
863 | 697,809 | ||||||
| 4.70%, 05/14/32 (Call 02/14/32) |
360 | 339,813 | ||||||
| 4.75%, 02/26/29 (Call 11/26/28)(a) |
1,124 | 1,097,494 | ||||||
| 5.15%, 03/01/43 |
391 | 345,106 | ||||||
| 5.50%, 03/01/33 (Call 12/01/32)(a) |
495 | 490,801 | ||||||
| 5.75%, 03/01/34 (Call 12/01/33)(a) |
375 | 372,194 | ||||||
|
|
|
|||||||
| 8,305,366 | ||||||||
| Household Products & Wares — 0.3% | ||||||||
| Avery Dennison Corp. |
||||||||
| 2.25%, 02/15/32 (Call 11/15/31) |
660 | 535,716 | ||||||
| 2.65%, 04/30/30 (Call 02/01/30) |
612 | 531,002 | ||||||
| 4.88%, 12/06/28 (Call 09/06/28) |
934 | 924,924 | ||||||
| 5.75%, 03/15/33 (Call 12/15/32) |
580 | 601,928 | ||||||
| Church & Dwight Co. Inc. |
||||||||
| 2.30%, 12/15/31 (Call 09/15/31) |
315 | 259,922 | ||||||
| 3.15%, 08/01/27 (Call 05/01/27) |
782 | 737,042 | ||||||
| 3.95%, 08/01/47 (Call 02/01/47) |
505 | 401,232 | ||||||
| Security | Par (000) |
Value | ||||||
| Household Products & Wares (continued) | ||||||||
| 5.00%, 06/15/52 (Call 12/15/51) |
$ | 885 | $ | 836,477 | ||||
| 5.60%, 11/15/32 (Call 08/15/32)(a) |
925 | 959,568 | ||||||
| Clorox Co. (The) |
||||||||
| 1.80%, 05/15/30 (Call 02/15/30) |
980 | 809,300 | ||||||
| 3.10%, 10/01/27 (Call 07/01/27)(a) |
988 | 926,825 | ||||||
| 3.90%, 05/15/28 (Call 02/15/28)(a) |
660 | 635,661 | ||||||
| 4.40%, 05/01/29 (Call 03/01/29)(a) |
505 | 492,322 | ||||||
| 4.60%, 05/01/32 (Call 02/01/32)(a) |
880 | 853,798 | ||||||
| Kimberly-Clark Corp. |
||||||||
| 1.05%, 09/15/27 (Call 07/15/27)(a) |
998 | 878,170 | ||||||
| 2.00%, 11/02/31 (Call 08/02/31)(a) |
940 | 774,233 | ||||||
| 2.65%, 03/01/25 |
483 | 471,208 | ||||||
| 2.75%, 02/15/26 |
675 | 648,276 | ||||||
| 2.88%, 02/07/50 (Call 08/07/49)(a) |
544 | 371,817 | ||||||
| 3.05%, 08/15/25(a) |
493 | 479,511 | ||||||
| 3.10%, 03/26/30 (Call 12/26/29) |
1,504 | 1,369,688 | ||||||
| 3.20%, 04/25/29 (Call 01/25/29) |
848 | 787,952 | ||||||
| 3.20%, 07/30/46 (Call 01/30/46)(a) |
455 | 330,911 | ||||||
| 3.70%, 06/01/43 |
405 | 317,035 | ||||||
| 3.90%, 05/04/47 (Call 11/04/46) |
629 | 507,949 | ||||||
| 3.95%, 11/01/28 (Call 08/01/28)(a) |
854 | 827,080 | ||||||
| 4.50%, 02/16/33 (Call 11/16/32) |
545 | 532,935 | ||||||
| 5.30%, 03/01/41 |
495 | 493,997 | ||||||
| 6.63%, 08/01/37(a) |
1,086 | 1,248,951 | ||||||
| Kimberly-Clark de Mexico SAB de CV |
||||||||
| 2.43%, 07/01/31 (Call 04/01/31)(b) |
520 | 438,004 | ||||||
| 3.25%, 03/12/25(a)(b) |
390 | 379,762 | ||||||
| Reckitt Benckiser Treasury Services PLC, 3.00%, 06/26/27 |
3,482 | 3,273,474 | ||||||
| SC Johnson & Son Inc. |
||||||||
| 4.00%, 05/15/43 (Call 02/15/43)(a)(b) |
555 | 447,330 | ||||||
| 4.35%, 09/30/44 (Call 03/30/44)(a)(b) |
645 | 530,056 | ||||||
| 4.75%, 10/15/46 (Call 04/16/46)(b) |
1,050 | 939,459 | ||||||
| 4.80%, 09/01/40(b) |
700 | 626,328 | ||||||
|
|
|
|||||||
| 26,179,843 | ||||||||
| Insurance — 4.4% | ||||||||
| Accident Fund Insurance Co. of America, 8.50%, 08/01/32 (Call 05/01/32)(b) |
10 | 9,887 | ||||||
| Aegon NV, 5.50%, 04/11/48 (Call 04/11/28), |
||||||||
| (6-mo. LIBOR US + 3.540%)(d) |
737 | 707,873 | ||||||
| Aflac Inc. |
||||||||
| 1.13%, 03/15/26 (Call 02/15/26) |
695 | 641,491 | ||||||
| 2.88%, 10/15/26 (Call 07/15/26) |
852 | 804,822 | ||||||
| 3.60%, 04/01/30 (Call 01/01/30)(a) |
1,528 | 1,416,362 | ||||||
| 4.00%, 10/15/46 (Call 04/15/46)(a) |
395 | 314,923 | ||||||
| 4.75%, 01/15/49 (Call 07/15/48)(a) |
677 | 612,122 | ||||||
| 6.45%, 08/15/40(a) |
455 | 494,288 | ||||||
| AIA Group Ltd. |
||||||||
| 3.20%, 03/11/25 (Call 12/11/24)(b) |
490 | 479,547 | ||||||
| 3.20%, 09/16/40 (Call 03/16/40)(b) |
2,497 | 1,863,375 | ||||||
| 3.38%, 04/07/30 (Call 01/07/30)(b) |
1,500 | 1,370,990 | ||||||
| 3.60%, 04/09/29 (Call 01/09/29)(b) |
1,985 | 1,862,692 | ||||||
| 3.90%, 04/06/28 (Call 01/06/28)(a)(b) |
1,005 | 967,465 | ||||||
| 4.50%, 03/16/46 (Call 09/16/45)(b) |
1,025 | 923,356 | ||||||
| 4.88%, 03/11/44(b) |
100 | 94,775 | ||||||
| 4.95%, 04/04/33 (Call 01/04/33)(b) |
550 | 548,798 | ||||||
| 5.63%, 10/25/27 (Call 09/25/27)(b) |
1,380 | 1,409,339 | ||||||
| AIG SunAmerica Global Financing X, 6.90%, 03/15/32(a)(b) |
1,136 | 1,235,536 | ||||||
| Alleghany Corp. |
||||||||
| 3.25%, 08/15/51 (Call 02/15/51) |
670 | 472,716 | ||||||
| 90 | 2 0 2 4 I S H A R E S A N N U A L R E P O R T T O S H A R E H O L D E R S |
| Schedule of Investments (continued) February 29, 2024 |
iShares® Broad USD Investment Grade Corporate Bond ETF (Percentages shown are based on Net Assets) |
| Security | Par (000) |
Value | ||||||
| Insurance (continued) | ||||||||
| 3.63%, 05/15/30 (Call 02/15/30) |
$ | 920 | $ | 855,189 | ||||
| 4.90%, 09/15/44 (Call 03/15/44)(a) |
347 | 324,914 | ||||||
| Allied World Assurance Co. Holdings Ltd., |
||||||||
| 4.35%, 10/29/25 (Call 07/29/25) |
834 | 808,880 | ||||||
| Allstate Corp. (The) |
||||||||
| 0.75%, 12/15/25 (Call 11/15/25) |
930 | 858,073 | ||||||
| 1.45%, 12/15/30 (Call 09/15/30) |
1,226 | 968,059 | ||||||
| 3.28%, 12/15/26 (Call 09/15/26) |
882 | 840,452 | ||||||
| 3.85%, 08/10/49 (Call 02/10/49) |
1,007 | 782,872 | ||||||
| 4.20%, 12/15/46 (Call 06/15/46) |
902 | 736,582 | ||||||
| 4.50%, 06/15/43 |
529 | 461,116 | ||||||
| 5.25%, 03/30/33 (Call 12/30/32)(a) |
445 | 443,308 | ||||||
| 5.35%, 06/01/33(a) |
265 | 265,442 | ||||||
| 5.55%, 05/09/35 |
846 | 860,060 | ||||||
| 5.95%, 04/01/36 |
400 | 417,294 | ||||||
| 6.50%, 05/15/67 (Call 05/15/37), |
||||||||
| (3-mo. LIBOR US + 2.120%)(a)(d) |
665 | 669,579 | ||||||
| American Equity Investment Life Holding Co., |
||||||||
| 5.00%, 06/15/27 (Call 03/15/27) |
1,062 | 1,021,500 | ||||||
| American Financial Group Inc./OH |
||||||||
| 4.50%, 06/15/47 (Call 12/15/46) |
690 | 561,881 | ||||||
| 5.25%, 04/02/30 (Call 01/02/30)(a) |
512 | 505,867 | ||||||
| American International Group Inc. |
||||||||
| 3.40%, 06/30/30 (Call 03/30/30) |
310 | 279,520 | ||||||
| 3.88%, 01/15/35 (Call 07/15/34) |
485 | 426,479 | ||||||
| 4.20%, 04/01/28 (Call 01/01/28) |
680 | 660,432 | ||||||
| 4.38%, 06/30/50 (Call 12/30/49) |
1,373 | 1,178,997 | ||||||
| 4.50%, 07/16/44 (Call 01/16/44) |
975 | 860,249 | ||||||
| 4.75%, 04/01/48 (Call 10/01/47)(a) |
1,346 | 1,228,255 | ||||||
| 4.80%, 07/10/45 (Call 01/10/45) |
991 | 907,304 | ||||||
| 5.13%, 03/27/33 (Call 12/27/32) |
905 | 892,667 | ||||||
| 6.25%, 05/01/36(a) |
820 | 854,373 | ||||||
| Series A-9, 5.75%, 04/01/48 (Call 04/01/28), |
||||||||
| (3-mo. LIBOR US + 2.868%)(d) |
910 | 893,989 | ||||||
| American National Group LLC, 6.14%, 06/13/32 |
||||||||
| (Call 03/13/32)(a)(b) |
65 | 61,150 | ||||||
| Americo Life Inc., 3.45%, 04/15/31 |
||||||||
| (Call 01/15/31)(b) |
673 | 521,949 | ||||||
| AmFam Holdings Inc. |
||||||||
| 2.81%, 03/11/31 (Call 12/11/30)(b) |
965 | 729,622 | ||||||
| 3.83%, 03/11/51 (Call 09/11/50)(a)(b) |
776 | 462,912 | ||||||
| Aon Corp. |
||||||||
| 2.80%, 05/15/30 (Call 02/15/30) |
1,688 | 1,467,494 | ||||||
| 3.75%, 05/02/29 (Call 02/02/29)(a) |
728 | 683,065 | ||||||
| 4.50%, 12/15/28 (Call 09/15/28) |
712 | 694,762 | ||||||
| 6.25%, 09/30/40 |
555 | 589,607 | ||||||
| 8.21%, 01/01/27 |
274 | 294,380 | ||||||
| Aon Corp./Aon Global Holdings PLC |
||||||||
| 2.05%, 08/23/31 (Call 05/23/31) |
650 | 521,892 | ||||||
| 2.60%, 12/02/31 (Call 09/02/31) |
555 | 461,368 | ||||||
| 2.85%, 05/28/27 (Call 04/28/27) |
980 | 913,061 | ||||||
| 2.90%, 08/23/51 (Call 02/23/51) |
810 | 505,526 | ||||||
| 3.90%, 02/28/52 (Call 08/28/51) |
1,312 | 993,138 | ||||||
| 5.00%, 09/12/32 (Call 06/12/32) |
1,000 | 976,756 | ||||||
| 5.35%, 02/28/33 (Call 11/28/32)(a) |
800 | 797,905 | ||||||
| Aon Global Ltd. |
||||||||
| 3.88%, 12/15/25 (Call 09/15/25) |
1,221 | 1,190,618 | ||||||
| 4.25%, 12/12/42 |
300 | 241,417 | ||||||
| 4.45%, 05/24/43 (Call 02/24/43) |
201 | 164,714 | ||||||
| 4.60%, 06/14/44 (Call 03/14/44) |
690 | 594,218 | ||||||
| 4.75%, 05/15/45 (Call 11/15/44) |
730 | 643,909 | ||||||
| Security | Par (000) |
Value | ||||||
| Insurance (continued) | ||||||||
| Aon North America Inc. |
||||||||
| 5.13%, 03/01/27 (Call 02/01/27) |
$ | 905 | $ | 904,344 | ||||
| 5.15%, 03/01/29 (Call 02/01/29) |
1,235 | 1,235,444 | ||||||
| 5.30%, 03/01/31 (Call 01/01/31) |
1,275 | 1,273,048 | ||||||
| 5.45%, 03/01/34 (Call 12/01/33) |
1,275 | 1,275,807 | ||||||
| 5.75%, 03/01/54 (Call 09/01/53) |
850 | 853,336 | ||||||
| Arch Capital Finance LLC |
||||||||
| 4.01%, 12/15/26 (Call 09/15/26) |
1,077 | 1,038,581 | ||||||
| 5.03%, 12/15/46 (Call 06/15/46)(a) |
789 | 722,241 | ||||||
| Arch Capital Group Ltd. |
||||||||
| 3.64%, 06/30/50 (Call 12/30/49) |
1,047 | 770,902 | ||||||
| 7.35%, 05/01/34 |
418 | 469,882 | ||||||
| Arch Capital Group U.S. Inc., 5.14%, 11/01/43 |
537 | 499,566 | ||||||
| Arthur J Gallagher & Co. |
||||||||
| 2.40%, 11/09/31 (Call 08/09/31)(a) |
788 | 636,085 | ||||||
| 3.05%, 03/09/52 (Call 09/09/51) |
746 | 472,217 | ||||||
| 3.50%, 05/20/51 (Call 11/20/50) |
1,345 | 933,879 | ||||||
| 5.45%, 07/15/34 (Call 04/15/34)(a) |
140 | 139,487 | ||||||
| 5.50%, 03/02/33 (Call 12/02/32) |
515 | 514,409 | ||||||
| 5.75%, 03/02/53 (Call 09/02/52) |
704 | 693,729 | ||||||
| 5.75%, 07/15/54 (Call 01/15/54) |
175 | 173,334 | ||||||
| 6.50%, 02/15/34 (Call 11/15/33) |
380 | 406,030 | ||||||
| 6.75%, 02/15/54 (Call 08/15/53) |
445 | 501,638 | ||||||
| Ascot Group Ltd., 4.25%, 12/15/30 |
||||||||
| (Call 12/15/25)(a)(b) |
175 | 141,914 | ||||||
| Assurant Inc. |
||||||||
| 2.65%, 01/15/32 (Call 10/15/31)(a) |
580 | 470,990 | ||||||
| 3.70%, 02/22/30 (Call 11/22/29) |
681 | 607,789 | ||||||
| 4.90%, 03/27/28 (Call 12/27/27) |
1,015 | 994,086 | ||||||
| 6.75%, 02/15/34 |
445 | 464,104 | ||||||
| Assured Guaranty Municipal Holdings Inc., |
||||||||
| 6.40%, 12/15/66 (Call 12/15/36), |
||||||||
| (1-mo. LIBOR US + 2.215%)(b)(d) |
160 | 146,606 | ||||||
| Assured Guaranty U.S. Holdings Inc. |
||||||||
| 3.15%, 06/15/31 (Call 03/15/31)(a) |
1,000 | 874,369 | ||||||
| 3.60%, 09/15/51 (Call 03/15/51) |
687 | 482,525 | ||||||
| 6.13%, 09/15/28 (Call 08/15/28) |
190 | 196,145 | ||||||
| Athene Global Funding |
||||||||
| 1.45%, 01/08/26(a)(b) |
732 | 675,674 | ||||||
| 1.61%, 06/29/26(a)(b) |
1,025 | 930,674 | ||||||
| 1.73%, 10/02/26(a)(b) |
935 | 841,193 | ||||||
| 1.99%, 08/19/28(b) |
1,035 | 887,389 | ||||||
| 2.45%, 08/20/27(a)(b) |
25 | 22,398 | ||||||
| 2.50%, 03/24/28(b) |
922 | 817,384 | ||||||
| 2.55%, 06/29/25(b) |
551 | 525,034 | ||||||
| 2.55%, 11/19/30(b) |
740 | 605,952 | ||||||
| 2.65%, 10/04/31(b) |
645 | 519,925 | ||||||
| 2.67%, 06/07/31(b) |
781 | 634,756 | ||||||
| 2.72%, 01/07/29(a)(b) |
780 | 678,303 | ||||||
| 2.95%, 11/12/26(a)(b) |
380 | 352,143 | ||||||
| 5.58%, 01/09/29(b) |
20 | 19,925 | ||||||
| Athene Holding Ltd. |
||||||||
| 3.45%, 05/15/52 (Call 11/15/51)(a) |
1,002 | 657,018 | ||||||
| 3.50%, 01/15/31 (Call 10/15/30)(a) |
755 | 656,228 | ||||||
| 3.95%, 05/25/51 (Call 11/25/50)(a) |
525 | 383,009 | ||||||
| 4.13%, 01/12/28 (Call 10/12/27)(a) |
1,395 | 1,336,248 | ||||||
| 5.88%, 01/15/34 (Call 10/15/33) |
925 | 917,633 | ||||||
| 6.15%, 04/03/30 (Call 01/03/30) |
635 | 653,359 | ||||||
| 6.65%, 02/01/33 (Call 11/01/32)(a) |
510 | 533,746 | ||||||
| Augustar Life Insurance Co., 6.88%, 06/15/42(a)(b) |
400 | 361,610 | ||||||
| S C H E D U L E O F I N V E S T M E N T S |
91 |
| Schedule of Investments (continued) February 29, 2024 |
iShares® Broad USD Investment Grade Corporate Bond ETF (Percentages shown are based on Net Assets) |
| Security | Par (000) |
Value | ||||||
| Insurance (continued) | ||||||||
| AXA SA, 8.60%, 12/15/30 |
$ | 185 | $ | 219,103 | ||||
| AXIS Specialty Finance LLC |
||||||||
| 3.90%, 07/15/29 (Call 04/15/29)(a) |
733 | 689,303 | ||||||
| 4.90%, 01/15/40 (Call 01/15/30), |
472 | 412,870 | ||||||
| AXIS Specialty Finance PLC |
||||||||
| 4.00%, 12/06/27 (Call 09/06/27)(a) |
890 | 849,552 | ||||||
| 5.15%, 04/01/45 |
395 | 341,312 | ||||||
| Belrose Funding Trust, 2.33%, 08/15/30 (Call 05/15/30)(b) |
658 | 516,432 | ||||||
| Berkshire Hathaway Finance Corp. |
||||||||
| 1.45%, 10/15/30 (Call 07/15/30) |
1,577 | 1,286,652 | ||||||
| 1.85%, 03/12/30 (Call 12/12/29) |
662 | 563,121 | ||||||
| 2.30%, 03/15/27 (Call 02/15/27) |
1,395 | 1,307,046 | ||||||
| 2.50%, 01/15/51 (Call 07/15/50)(a) |
1,115 | 689,030 | ||||||
| 2.85%, 10/15/50 (Call 04/15/50) |
2,570 | 1,697,473 | ||||||
| 2.88%, 03/15/32 (Call 12/15/31)(a) |
1,497 | 1,308,424 | ||||||
| 3.85%, 03/15/52 (Call 09/15/51) |
3,115 | 2,471,220 | ||||||
| 4.20%, 08/15/48 (Call 02/15/48) |
2,723 | 2,369,390 | ||||||
| 4.25%, 01/15/49 (Call 07/15/48) |
2,354 | 2,073,564 | ||||||
| 4.30%, 05/15/43(a) |
825 | 739,756 | ||||||
| 4.40%, 05/15/42 |
1,036 | 955,837 | ||||||
| 5.75%, 01/15/40 |
1,095 | 1,177,301 | ||||||
| Berkshire Hathaway Inc. |
||||||||
| 3.13%, 03/15/26 (Call 12/15/25) |
2,392 | 2,311,039 | ||||||
| 4.50%, 02/11/43(a) |
1,565 | 1,479,997 | ||||||
| Brighthouse Financial Global Funding |
||||||||
| 1.55%, 05/24/26(a)(b) |
667 | 608,235 | ||||||
| 2.00%, 06/28/28(b) |
638 | 547,327 | ||||||
| Brighthouse Financial Inc. |
||||||||
| 3.70%, 06/22/27 (Call 03/22/27) |
785 | 740,057 | ||||||
| 3.85%, 12/22/51 (Call 06/22/51)(a) |
520 | 339,390 | ||||||
| 4.70%, 06/22/47 (Call 12/22/46) |
769 | 595,813 | ||||||
| 5.63%, 05/15/30 (Call 02/15/30)(a) |
1,014 | 1,009,107 | ||||||
| Brown & Brown Inc. |
||||||||
| 2.38%, 03/15/31 (Call 12/15/30) |
1,453 | 1,189,586 | ||||||
| 4.20%, 03/17/32 (Call 12/17/31)(a) |
615 | 558,308 | ||||||
| 4.50%, 03/15/29 (Call 12/15/28) |
825 | 798,455 | ||||||
| 4.95%, 03/17/52 (Call 09/17/51) |
945 | 815,750 | ||||||
| Chubb Corp. (The) |
||||||||
| 6.00%, 05/11/37 |
705 | 756,655 | ||||||
| Series 1, 6.50%, 05/15/38 |
940 | 1,059,277 | ||||||
| Chubb INA Holdings Inc. |
||||||||
| 1.38%, 09/15/30 (Call 06/15/30)(a) |
1,415 | 1,145,389 | ||||||
| 2.85%, 12/15/51 (Call 06/15/51)(a) |
1,090 | 738,961 | ||||||
| 3.05%, 12/15/61 (Call 06/15/61) |
1,235 | 821,514 | ||||||
| 3.15%, 03/15/25 |
1,337 | 1,307,692 | ||||||
| 3.35%, 05/03/26 (Call 02/03/26) |
1,720 | 1,658,309 | ||||||
| 4.15%, 03/13/43(a) |
880 | 768,924 | ||||||
| 4.35%, 11/03/45 (Call 05/03/45) |
1,307 | 1,154,029 | ||||||
| 6.70%, 05/15/36(a) |
370 | 421,167 | ||||||
| Cincinnati Financial Corp. |
||||||||
| 6.13%, 11/01/34 |
975 | 1,017,233 | ||||||
| 6.92%, 05/15/28 |
690 | 733,284 | ||||||
| CNA Financial Corp. |
||||||||
| 2.05%, 08/15/30 (Call 05/15/30) |
910 | 751,673 | ||||||
| 3.45%, 08/15/27 (Call 05/15/27) |
858 | 812,601 | ||||||
| 3.90%, 05/01/29 (Call 02/01/29) |
974 | 914,015 | ||||||
| 4.50%, 03/01/26 (Call 12/01/25) |
842 | 828,532 | ||||||
| 5.13%, 02/15/34 (Call 11/15/33) |
160 | 154,704 | ||||||
| 5.50%, 06/15/33 (Call 03/15/33) |
105 | 105,891 | ||||||
| Security | Par (000) |
Value | ||||||
| Insurance (continued) | ||||||||
| CNO Financial Group Inc. |
||||||||
| 5.25%, 05/30/25 (Call 02/28/25) |
$ | 666 | $ | 662,164 | ||||
| 5.25%, 05/30/29 (Call 02/28/29) |
729 | 707,889 | ||||||
| CNO Global Funding |
||||||||
| 1.75%, 10/07/26(b) |
955 | 861,538 | ||||||
| 2.65%, 01/06/29(b) |
990 | 855,746 | ||||||
| Corebridge Financial Inc. |
||||||||
| 3.50%, 04/04/25 (Call 03/04/25) |
1,320 | 1,289,214 | ||||||
| 3.65%, 04/05/27 (Call 03/05/27) |
2,095 | 1,987,896 | ||||||
| 3.85%, 04/05/29 (Call 02/05/29) |
1,475 | 1,367,843 | ||||||
| 3.90%, 04/05/32 (Call 01/05/32) |
1,835 | 1,614,985 | ||||||
| 4.35%, 04/05/42 (Call 10/05/41) |
1,110 | 916,062 | ||||||
| 4.40%, 04/05/52 (Call 10/05/51) |
1,100 | 882,881 | ||||||
| 5.75%, 01/15/34 (Call 10/15/33) |
845 | 842,463 | ||||||
| 6.05%, 09/15/33 (Call 06/15/33)(b) |
925 | 944,360 | ||||||
| 6.88%, 12/15/52 (Call 09/15/27), |
575 | 574,068 | ||||||
| Corebridge Global Funding |
||||||||
| 0.90%, 09/22/25(a)(b) |
807 | 752,373 | ||||||
| 5.20%, 01/12/29(a)(b) |
485 | 479,637 | ||||||
| 5.75%, 07/02/26(b) |
1,395 | 1,396,058 | ||||||
| 5.90%, 09/19/28(b) |
75 | 76,455 | ||||||
| Dai-Ichi Life Insurance Co. Ltd. (The), |
440 | 420,130 | ||||||
| Doctors Co. An Interinsurance Exchange (The), 4.50%, 01/18/32 (Call 10/18/31)(b) |
350 | 273,205 | ||||||
| Empower Finance 2020 LP |
||||||||
| 1.36%, 09/17/27 (Call 07/17/27)(b) |
728 | 641,435 | ||||||
| 1.78%, 03/17/31 (Call 12/17/30)(b) |
632 | 499,536 | ||||||
| 3.08%, 09/17/51 (Call 03/17/51)(a)(b) |
700 | 466,361 | ||||||
| Enstar Finance LLC |
||||||||
| 5.50%, 01/15/42 (Call 01/15/27), |
50 | 45,031 | ||||||
| 5.75%, 09/01/40 (Call 09/01/25), |
25 | 23,913 | ||||||
| Enstar Group Ltd. |
||||||||
| 3.10%, 09/01/31 (Call 03/01/31) |
1,005 | 818,867 | ||||||
| 4.95%, 06/01/29 (Call 03/01/29) |
890 | 865,720 | ||||||
| Equitable Financial Life Global Funding |
||||||||
| 1.00%, 01/09/26(b) |
600 | 551,416 | ||||||
| 1.30%, 07/12/26(b) |
918 | 830,779 | ||||||
| 1.40%, 07/07/25(b) |
1,013 | 957,314 | ||||||
| 1.40%, 08/27/27(a)(b) |
67 | 57,979 | ||||||
| 1.70%, 11/12/26(a)(b) |
728 | 658,132 | ||||||
| 1.75%, 11/15/30(a)(b) |
537 | 426,968 | ||||||
| 1.80%, 03/08/28(b) |
930 | 815,059 | ||||||
| 5.45%, 03/03/28(b) |
560 | 555,613 | ||||||
| 5.50%, 12/02/25(b) |
510 | 508,773 | ||||||
| Equitable Holdings Inc. |
||||||||
| 4.35%, 04/20/28 (Call 01/20/28) |
1,831 | 1,763,046 | ||||||
| 5.00%, 04/20/48 (Call 10/20/47) |
1,846 | 1,669,169 | ||||||
| 5.59%, 01/11/33 (Call 10/11/32) |
810 | 816,457 | ||||||
| 7.00%, 04/01/28(a) |
850 | 901,039 | ||||||
| Everest Reinsurance Holdings Inc. |
||||||||
| 3.13%, 10/15/52 (Call 04/15/52)(a) |
1,265 | 806,872 | ||||||
| 3.50%, 10/15/50 (Call 04/15/50) |
1,755 | 1,227,013 | ||||||
| 4.87%, 06/01/44(a) |
340 | 303,801 | ||||||
| F&G Annuities & Life Inc., 7.40%, 01/13/28 (Call 12/13/27) |
565 | 580,514 | ||||||
| 92 | 2 0 2 4 I S H A R E S A N N U A L R E P O R T T O S H A R E H O L D E R S |
| Schedule of Investments (continued) February 29, 2024 |
iShares® Broad USD Investment Grade Corporate Bond ETF (Percentages shown are based on Net Assets) |
| Security | Par (000) |
Value | ||||||
| Insurance (continued) | ||||||||
| F&G Global Funding |
||||||||
| 1.75%, 06/30/26(b) |
$ | 1,195 | $ | 1,078,874 | ||||
| 2.00%, 09/20/28(b) |
925 | 778,744 | ||||||
| 2.30%, 04/11/27(a)(b) |
830 | 743,144 | ||||||
| 5.15%, 07/07/25(b) |
430 | 421,728 | ||||||
| Fairfax Financial Holdings Ltd. |
||||||||
| 3.38%, 03/03/31 (Call 12/03/30) |
940 | 814,887 | ||||||
| 4.63%, 04/29/30 (Call 01/29/30) |
972 | 916,915 | ||||||
| 4.85%, 04/17/28 (Call 01/17/28)(a) |
1,114 | 1,089,122 | ||||||
| 5.63%, 08/16/32 (Call 05/16/32) |
770 | 757,296 | ||||||
| 6.00%, 12/07/33 (Call 09/07/33)(a)(b) |
765 | 768,539 | ||||||
| Farmers Exchange Capital, 7.05%, 07/15/28(a)(b) |
640 | 644,556 | ||||||
| Farmers Exchange Capital II, |
660 | 606,434 | ||||||
| Farmers Exchange Capital III, |
830 | 677,662 | ||||||
| Farmers Insurance Exchange, |
606 | 447,039 | ||||||
| Fidelity & Guaranty Life Holdings Inc., |
991 | 978,466 | ||||||
| Fidelity National Financial Inc. |
||||||||
| 2.45%, 03/15/31 (Call 12/15/30) |
1,027 | 834,489 | ||||||
| 3.20%, 09/17/51 (Call 03/17/51) |
730 | 458,581 | ||||||
| 3.40%, 06/15/30 (Call 03/15/30)(a) |
1,065 | 939,775 | ||||||
| 4.50%, 08/15/28 (Call 05/15/28) |
607 | 584,674 | ||||||
| First American Financial Corp. |
||||||||
| 2.40%, 08/15/31 (Call 05/15/31) |
947 | 742,363 | ||||||
| 4.00%, 05/15/30 (Call 02/15/30) |
840 | 746,139 | ||||||
| Five Corners Funding Trust II, 2.85%, 05/15/30 (Call 02/15/30)(b) |
2,785 | 2,414,106 | ||||||
| Five Corners Funding Trust III, 5.79%, 02/15/33 (Call 11/15/32)(a)(b) |
1,070 | 1,098,747 | ||||||
| Five Corners Funding Trust IV, 6.00%, 02/15/53 (Call 08/15/52)(b) |
870 | 915,330 | ||||||
| GA Global Funding Trust |
||||||||
| 1.63%, 01/15/26(b) |
986 | 907,879 | ||||||
| 1.95%, 09/15/28(b) |
1,107 | 936,389 | ||||||
| 2.25%, 01/06/27(a)(b) |
700 | 636,319 | ||||||
| 2.90%, 01/06/32(a)(b) |
1,025 | 826,607 | ||||||
| 3.85%, 04/11/25(b) |
630 | 616,999 | ||||||
| 5.50%, 01/08/29(b) |
390 | 385,149 | ||||||
| Global Atlantic Fin Co. |
||||||||
| 3.13%, 06/15/31 (Call 03/15/31)(b) |
855 | 690,646 | ||||||
| 4.40%, 10/15/29 (Call 07/15/29)(a)(b) |
958 | 875,856 | ||||||
| 7.95%, 06/15/33 (Call 03/15/33)(b) |
776 | 848,881 | ||||||
| Globe Life Inc. |
||||||||
| 2.15%, 08/15/30 (Call 05/15/30) |
782 | 645,457 | ||||||
| 4.55%, 09/15/28 (Call 06/15/28) |
1,130 | 1,102,401 | ||||||
| 4.80%, 06/15/32 (Call 03/15/32)(a) |
395 | 380,150 | ||||||
| Great-West Lifeco Finance 2018 LP |
||||||||
| 4.05%, 05/17/28 (Call 02/17/28)(a)(b) |
620 | 598,571 | ||||||
| 4.58%, 05/17/48 (Call 11/17/47)(a)(b) |
383 | 337,100 | ||||||
| Great-West Lifeco Finance Delaware LP, 4.15%, 06/03/47 (Call 12/03/46)(b) |
1,195 | 960,569 | ||||||
| Great-West Lifeco U.S. Finance 2020 LP, 0.90%, 08/12/25 (Call 07/12/25)(b) |
700 | 657,056 | ||||||
| Security | Par (000) |
Value | ||||||
| Insurance (continued) | ||||||||
| Guardian Life Global Funding |
||||||||
| 0.88%, 12/10/25(b) |
$ | 778 | $ | 719,347 | ||||
| 1.10%, 06/23/25(b) |
626 | 593,353 | ||||||
| 1.25%, 05/13/26(a)(b) |
571 | 523,153 | ||||||
| 1.25%, 11/19/27(b) |
385 | 337,498 | ||||||
| 1.40%, 07/06/27(a)(b) |
520 | 461,483 | ||||||
| 1.63%, 09/16/28(a)(b) |
440 | 382,016 | ||||||
| 3.25%, 03/29/27(b) |
650 | 617,376 | ||||||
| 5.55%, 10/28/27(b) |
780 | 796,227 | ||||||
| 5.74%, 10/02/28(b) |
370 | 382,910 | ||||||
| Guardian Life Insurance Co. of America (The) |
||||||||
| 3.70%, 01/22/70 (Call 07/22/69)(a)(b) |
396 | 259,743 | ||||||
| 4.85%, 01/24/77(a)(b) |
616 | 507,196 | ||||||
| 4.88%, 06/19/64(a)(b) |
540 | 464,025 | ||||||
| Hanover Insurance Group Inc. (The) |
||||||||
| 2.50%, 09/01/30 (Call 06/01/30) |
873 | 724,520 | ||||||
| 4.50%, 04/15/26 (Call 01/15/26) |
956 | 937,097 | ||||||
| Hartford Financial Services Group Inc. (The) |
||||||||
| 2.80%, 08/19/29 (Call 05/19/29) |
1,019 | 910,729 | ||||||
| 2.90%, 09/15/51 (Call 03/15/51) |
920 | 589,182 | ||||||
| 3.60%, 08/19/49 (Call 02/19/49) |
780 | 587,379 | ||||||
| 4.30%, 04/15/43 |
518 | 442,968 | ||||||
| 4.40%, 03/15/48 (Call 09/15/47) |
591 | 508,413 | ||||||
| 5.95%, 10/15/36 |
703 | 726,200 | ||||||
| 6.10%, 10/01/41 |
497 | 517,120 | ||||||
| 6.63%, 03/30/40 |
532 | 570,686 | ||||||
| Hill City Funding Trust, 4.05%, 08/15/41 (Call 02/15/41)(a)(b) |
300 | 215,722 | ||||||
| Horace Mann Educators Corp. |
||||||||
| 4.50%, 12/01/25 (Call 09/01/25)(a) |
110 | 107,678 | ||||||
| 7.25%, 09/15/28 (Call 08/15/28) |
175 | 187,357 | ||||||
| Intact Financial Corp., 5.46%, 09/22/32 (Call 06/22/32)(b) |
1,020 | 1,013,929 | ||||||
| Jackson Financial Inc. |
||||||||
| 3.13%, 11/23/31 (Call 08/23/31)(a) |
1,040 | 859,839 | ||||||
| 4.00%, 11/23/51 (Call 05/23/51)(a) |
870 | 622,623 | ||||||
| 5.17%, 06/08/27 (Call 05/08/27)(a) |
377 | 374,555 | ||||||
| 5.67%, 06/08/32 (Call 03/08/32)(a) |
395 | 393,664 | ||||||
| Jackson National Life Global Funding |
||||||||
| 3.05%, 04/29/26(a)(b) |
656 | 615,791 | ||||||
| 3.05%, 06/21/29(b) |
812 | 692,489 | ||||||
| 3.88%, 06/11/25(a)(b) |
622 | 605,044 | ||||||
| 5.25%, 04/12/28(b) |
270 | 259,957 | ||||||
| 5.50%, 01/09/26(b) |
730 | 726,687 | ||||||
| Jackson National Life Insurance Co., 8.15%, 03/15/27(a)(b) |
515 | 537,975 | ||||||
| Kemper Corp. |
||||||||
| 2.40%, 09/30/30 (Call 06/30/30)(a) |
900 | 705,666 | ||||||
| 3.80%, 02/23/32 (Call 11/23/31) |
405 | 339,592 | ||||||
| Liberty Mutual Group Inc. |
||||||||
| 3.95%, 10/15/50 (Call 04/15/50)(a)(b) |
1,626 | 1,216,901 | ||||||
| 3.95%, 05/15/60 (Call 11/15/59)(b) |
884 | 632,482 | ||||||
| 4.57%, 02/01/29(b) |
1,981 | 1,909,388 | ||||||
| 4.85%, 08/01/44(a)(b) |
80 | 69,037 | ||||||
| 5.50%, 06/15/52 (Call 12/15/51)(a)(b) |
1,400 | 1,338,980 | ||||||
| 6.50%, 03/15/35(a)(b) |
607 | 604,979 | ||||||
| 6.50%, 05/01/42(b) |
550 | 542,808 | ||||||
| Liberty Mutual Insurance Co., 7.70%, 10/15/97(b) |
10 | 11,530 | ||||||
| Lincoln National Corp. |
||||||||
| 3.05%, 01/15/30 (Call 10/15/29)(a) |
578 | 505,524 | ||||||
| S C H E D U L E O F I N V E S T M E N T S |
93 |
| Schedule of Investments (continued) February 29, 2024 |
iShares® Broad USD Investment Grade Corporate Bond ETF (Percentages shown are based on Net Assets) |
| Security | Par (000) |
Value | ||||||
| Insurance (continued) | ||||||||
| 3.35%, 03/09/25(a) |
$ | 520 | $ | 507,811 | ||||
| 3.40%, 01/15/31 (Call 10/15/30) |
630 | 551,304 | ||||||
| 3.40%, 03/01/32 (Call 12/01/31) |
280 | 237,563 | ||||||
| 3.63%, 12/12/26 (Call 09/15/26)(a) |
750 | 715,877 | ||||||
| 3.80%, 03/01/28 (Call 12/01/27) |
511 | 485,944 | ||||||
| 4.35%, 03/01/48 (Call 09/01/47)(a) |
362 | 280,569 | ||||||
| 4.38%, 06/15/50 (Call 12/15/49) |
475 | 366,251 | ||||||
| 6.30%, 10/09/37 |
609 | 626,386 | ||||||
| 7.00%, 06/15/40(a) |
584 | 635,600 | ||||||
| Loews Corp. |
||||||||
| 3.20%, 05/15/30 (Call 02/15/30) |
1,205 | 1,088,084 | ||||||
| 3.75%, 04/01/26 (Call 01/01/26)(a) |
1,021 | 993,409 | ||||||
| 4.13%, 05/15/43 (Call 11/15/42) |
764 | 641,911 | ||||||
| 6.00%, 02/01/35(a) |
195 | 206,411 | ||||||
| Manulife Financial Corp. |
||||||||
| 2.48%, 05/19/27 (Call 03/19/27)(a) |
1,165 | 1,080,643 | ||||||
| 3.70%, 03/16/32 (Call 12/16/31)(a) |
705 | 642,144 | ||||||
| 4.06%, 02/24/32 (Call 02/24/27) |
920 | 875,850 | ||||||
| 4.15%, 03/04/26 |
1,396 | 1,368,527 | ||||||
| 5.38%, 03/04/46 |
905 | 886,251 | ||||||
| Maple Grove Funding Trust I, 4.16%, 08/15/51 |
795 | 546,199 | ||||||
| Markel Group Inc. |
||||||||
| 3.35%, 09/17/29 (Call 06/17/29) |
851 | 766,526 | ||||||
| 3.45%, 05/07/52 (Call 11/07/51)(a) |
1,040 | 713,474 | ||||||
| 3.50%, 11/01/27 (Call 08/01/27) |
567 | 534,033 | ||||||
| 4.15%, 09/17/50 (Call 03/17/50)(a) |
851 | 668,645 | ||||||
| 4.30%, 11/01/47 (Call 05/01/47) |
576 | 460,690 | ||||||
| 5.00%, 03/30/43(a) |
395 | 354,257 | ||||||
| 5.00%, 04/05/46 |
431 | 382,908 | ||||||
| 5.00%, 05/20/49 (Call 11/20/48)(a) |
605 | 544,921 | ||||||
| Marsh & McLennan Companies Inc. |
||||||||
| 2.25%, 11/15/30 (Call 08/15/30) |
945 | 797,807 | ||||||
| 2.38%, 12/15/31 (Call 09/15/31) |
365 | 303,246 | ||||||
| 2.90%, 12/15/51 (Call 06/15/51) |
530 | 339,816 | ||||||
| 3.50%, 03/10/25 (Call 12/10/24)(a) |
657 | 644,993 | ||||||
| 3.75%, 03/14/26 (Call 12/14/25) |
1,001 | 976,040 | ||||||
| 4.20%, 03/01/48 (Call 09/01/47) |
846 | 709,112 | ||||||
| 4.35%, 01/30/47 (Call 07/30/46) |
679 | 576,096 | ||||||
| 4.38%, 03/15/29 (Call 12/15/28) |
2,012 | 1,965,643 | ||||||
| 4.75%, 03/15/39 (Call 09/15/38) |
739 | 699,630 | ||||||
| 4.90%, 03/15/49 (Call 09/15/48) |
1,611 | 1,490,171 | ||||||
| 5.15%, 03/15/34 (Call 12/15/33) |
450 | 448,375 | ||||||
| 5.40%, 09/15/33 (Call 06/15/33)(a) |
725 | 737,536 | ||||||
| 5.45%, 03/15/53 (Call 09/15/52)(a) |
325 | 323,619 | ||||||
| 5.45%, 03/15/54 (Call 09/15/53) |
450 | 447,134 | ||||||
| 5.70%, 09/15/53 (Call 03/15/53) |
1,400 | 1,444,608 | ||||||
| 5.75%, 11/01/32 (Call 08/01/32) |
555 | 576,772 | ||||||
| 5.88%, 08/01/33(a) |
640 | 673,743 | ||||||
| 6.25%, 11/01/52 (Call 05/01/52)(a) |
395 | 435,582 | ||||||
| Massachusetts Mutual Life Insurance Co. |
||||||||
| 3.20%, 12/01/61(b) |
275 | 171,703 | ||||||
| 3.38%, 04/15/50(a)(b) |
803 | 550,901 | ||||||
| 3.73%, 10/15/70(a)(b) |
955 | 646,458 | ||||||
| 4.50%, 04/15/65(b) |
290 | 226,334 | ||||||
| 4.90%, 04/01/77(b) |
653 | 546,544 | ||||||
| 5.08%, 02/15/69 (Call 02/15/49), |
865 | 772,560 | ||||||
| 5.38%, 12/01/41(a)(b) |
782 | 706,307 | ||||||
| 5.67%, 12/01/52 (Call 06/01/52)(b) |
320 | 319,233 | ||||||
| Security | Par (000) |
Value | ||||||
| Insurance (continued) | ||||||||
| MassMutual Global Funding II |
||||||||
| 1.20%, 07/16/26(a)(b) |
$ | 640 | $ | 582,924 | ||||
| 1.55%, 10/09/30(b) |
1,118 | 890,559 | ||||||
| 2.15%, 03/09/31(a)(b) |
783 | 642,605 | ||||||
| 2.35%, 01/14/27(a)(b) |
600 | 557,884 | ||||||
| 3.40%, 03/08/26(a)(b) |
1,312 | 1,270,699 | ||||||
| 4.15%, 08/26/25(b) |
683 | 673,088 | ||||||
| 4.50%, 04/10/26(b) |
1,370 | 1,354,011 | ||||||
| 4.85%, 01/17/29(a)(b) |
600 | 593,747 | ||||||
| 5.05%, 12/07/27(a)(b) |
1,105 | 1,105,108 | ||||||
| 5.05%, 06/14/28(a)(b) |
725 | 723,484 | ||||||
| Meiji Yasuda Life Insurance Co. |
||||||||
| 5.10%, 04/26/48 (Call 04/26/28), |
640 | 624,747 | ||||||
| 5.20%, 10/20/45 (Call 10/20/25), |
1,510 | 1,484,156 | ||||||
| Mercury General Corp., 4.40%, 03/15/27 (Call 12/15/26) |
913 | 871,231 | ||||||
| Met Tower Global Funding |
||||||||
| 1.25%, 09/14/26(b) |
912 | 826,837 | ||||||
| 3.70%, 06/13/25(a)(b) |
967 | 946,897 | ||||||
| 4.85%, 01/16/27(a)(b) |
450 | 448,929 | ||||||
| 5.40%, 06/20/26(b) |
535 | 537,680 | ||||||
| MetLife Capital Trust IV, 7.88%, 12/15/67 |
939 | 1,005,118 | ||||||
| MetLife Inc. |
||||||||
| 3.00%, 03/01/25 |
453 | 442,620 | ||||||
| 3.60%, 11/13/25 (Call 08/13/25) |
870 | 849,161 | ||||||
| 4.05%, 03/01/45 |
1,242 | 1,023,464 | ||||||
| 4.13%, 08/13/42 |
1,290 | 1,093,251 | ||||||
| 4.55%, 03/23/30 (Call 12/23/29)(a) |
1,260 | 1,234,106 | ||||||
| 4.60%, 05/13/46 (Call 11/13/45) |
860 | 768,338 | ||||||
| 4.72%, 12/15/44 |
745 | 665,139 | ||||||
| 4.88%, 11/13/43 |
1,054 | 970,241 | ||||||
| 5.00%, 07/15/52 (Call 01/15/52) |
1,195 | 1,115,646 | ||||||
| 5.25%, 01/15/54 (Call 07/15/53)(a) |
1,235 | 1,193,178 | ||||||
| 5.38%, 07/15/33 (Call 04/15/33) |
925 | 928,810 | ||||||
| 5.70%, 06/15/35 |
1,631 | 1,686,584 | ||||||
| 5.88%, 02/06/41 |
1,191 | 1,244,084 | ||||||
| 6.38%, 06/15/34 |
1,023 | 1,103,672 | ||||||
| 6.40%, 12/15/66 (Call 12/15/31)(a) |
1,709 | 1,734,806 | ||||||
| 6.50%, 12/15/32(a) |
1,046 | 1,144,847 | ||||||
| 9.25%, 04/08/68 (Call 04/08/33)(b) |
255 | 290,866 | ||||||
| 10.75%, 08/01/69 (Call 08/01/34)(a) |
596 | 800,931 | ||||||
| Metropolitan Life Global Funding I |
||||||||
| 0.95%, 07/02/25(a)(b) |
1,315 | 1,241,496 | ||||||
| 1.55%, 01/07/31(b) |
1,245 | 976,660 | ||||||
| 1.88%, 01/11/27(a)(b) |
802 | 731,780 | ||||||
| 2.40%, 01/11/32(b) |
1,150 | 936,241 | ||||||
| 2.80%, 03/21/25(b) |
425 | 413,625 | ||||||
| 2.95%, 04/09/30(b) |
1,475 | 1,296,733 | ||||||
| 3.00%, 09/19/27(a)(b) |
1,699 | 1,578,725 | ||||||
| 3.05%, 06/17/29(a)(b) |
982 | 882,053 | ||||||
| 3.30%, 03/21/29(a)(b) |
590 | 541,727 | ||||||
| 3.45%, 12/18/26(b) |
1,679 | 1,608,863 | ||||||
| 4.05%, 08/25/25(a)(b) |
465 | 457,155 | ||||||
| 4.30%, 08/25/29(b) |
945 | 904,037 | ||||||
| 4.40%, 06/30/27(a)(b) |
410 | 399,140 | ||||||
| 4.85%, 01/08/29(a)(b) |
450 | 444,030 | ||||||
| 5.00%, 01/06/26(b) |
860 | 857,687 | ||||||
| 5.05%, 01/06/28(b) |
920 | 917,282 | ||||||
| 94 | 2 0 2 4 I S H A R E S A N N U A L R E P O R T T O S H A R E H O L D E R S |
| Schedule of Investments (continued) February 29, 2024 |
iShares® Broad USD Investment Grade Corporate Bond ETF (Percentages shown are based on Net Assets) |
| Security | Par (000) |
Value | ||||||
| Insurance (continued) | ||||||||
| 5.05%, 01/08/34(a)(b) |
$ | 600 | $ | 587,267 | ||||
| 5.15%, 03/28/33(a)(b) |
1,287 | 1,273,015 | ||||||
| 5.40%, 09/12/28(b) |
495 | 500,879 | ||||||
| Metropolitan Life Insurance Co., 7.80%, 11/01/25(b) |
535 | 551,301 | ||||||
| Mitsui Sumitomo Insurance Co. Ltd., |
255 | 245,583 | ||||||
| Muenchener Rueckversicherungs-Gesellschaft AG in Muenchen, 5.88%, 05/23/42 |
675 | 680,400 | ||||||
| Munich Re America Corp., Series B, 7.45%, 12/15/26 |
50 | 52,930 | ||||||
| Mutual of Omaha Companies Global Funding, 5.45%, 12/12/28(a)(b) |
400 | 403,643 | ||||||
| Mutual of Omaha Cos Global Funding, |
640 | 644,857 | ||||||
| Mutual of Omaha Insurance Co. |
||||||||
| 6.14%, 01/16/64 (Call 10/16/53), |
25 | 25,322 | ||||||
| 6.80%, 06/15/36(b) |
120 | 125,483 | ||||||
| National Life Insurance Co., 5.25%, 07/19/68 (Call 07/19/48), |
170 | 147,876 | ||||||
| Nationwide Financial Services Inc. |
||||||||
| 3.90%, 11/30/49 (Call 05/30/49)(b) |
1,705 | 1,324,609 | ||||||
| 5.30%, 11/18/44(a)(b) |
605 | 541,519 | ||||||
| 6.75%, 05/15/87 |
220 | 213,182 | ||||||
| Nationwide Mutual Insurance Co. |
||||||||
| 4.35%, 04/30/50 (Call 10/30/49)(a)(b) |
1,824 | 1,441,540 | ||||||
| 4.95%, 04/22/44(a)(b) |
802 | 688,483 | ||||||
| 7.88%, 04/01/33(b) |
463 | 510,131 | ||||||
| 8.25%, 12/01/31(a)(b) |
609 | 679,153 | ||||||
| 9.38%, 08/15/39(b) |
522 | 672,987 | ||||||
| New York Life Global Funding |
||||||||
| 0.85%, 01/15/26(a)(b) |
880 | 814,900 | ||||||
| 0.95%, 06/24/25(b) |
460 | 435,378 | ||||||
| 1.15%, 06/09/26(b) |
1,305 | 1,193,368 | ||||||
| 1.20%, 08/07/30(b) |
835 | 656,999 | ||||||
| 1.85%, 08/01/31(a)(b) |
269 | 214,395 | ||||||
| 2.35%, 07/14/26(a)(b) |
105 | 98,619 | ||||||
| 3.00%, 01/10/28(b) |
1,092 | 1,015,810 | ||||||
| 3.25%, 04/07/27(b) |
825 | 782,851 | ||||||
| 3.60%, 08/05/25(a)(b) |
1,132 | 1,108,421 | ||||||
| 4.55%, 01/28/33(b) |
1,395 | 1,328,339 | ||||||
| 4.70%, 04/02/26(a)(b) |
1,075 | 1,066,502 | ||||||
| 4.70%, 01/29/29(a)(b) |
955 | 941,907 | ||||||
| 4.85%, 01/09/28(b) |
1,415 | 1,406,524 | ||||||
| 4.90%, 06/13/28(b) |
899 | 896,400 | ||||||
| 5.00%, 01/09/34(b) |
1,055 | 1,036,087 | ||||||
| 5.45%, 09/18/26(a)(b) |
605 | 610,506 | ||||||
| New York Life Insurance Co. |
||||||||
| 3.75%, 05/15/50 (Call 11/15/49)(b) |
1,836 | 1,402,323 | ||||||
| 4.45%, 05/15/69 (Call 11/15/68)(b) |
995 | 802,215 | ||||||
| 5.88%, 05/15/33(b) |
1,373 | 1,419,566 | ||||||
| 6.75%, 11/15/39(a)(b) |
826 | 933,580 | ||||||
| Nippon Life Insurance Co. |
||||||||
| 2.75%, 01/21/51 (Call 01/21/31), |
1,870 | 1,543,290 | ||||||
| 2.90%, 09/16/51 (Call 09/16/31), |
895 | 736,165 | ||||||
| Security | Par (000) |
Value | ||||||
| Insurance (continued) | ||||||||
| 3.40%, 01/23/50 (Call 01/23/30), |
$ | 1,252 | $ | 1,099,239 | ||||
| 4.00%, 09/19/47 (Call 09/19/27), |
505 | 474,657 | ||||||
| 4.70%, 01/20/46 (Call 01/20/26), |
615 | 599,435 | ||||||
| 6.25%, 09/13/53 (Call 09/13/33), |
715 | 740,903 | ||||||
| Northwestern Mutual Global Funding |
||||||||
| 0.80%, 01/14/26(a)(b) |
1,053 | 973,070 | ||||||
| 1.70%, 06/01/28(a)(b) |
1,085 | 942,330 | ||||||
| 1.75%, 01/11/27(a)(b) |
1,367 | 1,249,407 | ||||||
| 4.00%, 07/01/25(b) |
710 | 699,758 | ||||||
| 4.35%, 09/15/27(b) |
320 | 311,914 | ||||||
| 4.70%, 04/06/26(b) |
235 | 232,200 | ||||||
| 4.71%, 01/10/29(b) |
515 | 507,348 | ||||||
| 4.90%, 06/12/28(b) |
760 | 751,950 | ||||||
| Northwestern Mutual Life Insurance Co. (The) |
|
|||||||
| 3.45%, 03/30/51 (Call 09/30/50)(b) |
1,015 | 716,972 | ||||||
| 3.63%, 09/30/59 (Call 03/30/59)(a)(b) |
1,439 | 1,006,605 | ||||||
| 3.85%, 09/30/47 (Call 03/30/47)(a)(b) |
2,047 | 1,593,833 | ||||||
| 6.06%, 03/30/40(a)(b) |
830 | 861,322 | ||||||
| Old Republic International Corp. |
||||||||
| 3.85%, 06/11/51 (Call 12/11/50) |
902 | 654,018 | ||||||
| 3.88%, 08/26/26 (Call 07/26/26) |
758 | 731,937 | ||||||
| OneAmerica Financial Partners Inc., 4.25%, 10/15/50 (Call 04/15/50)(b) |
445 | 307,891 | ||||||
| Pacific Life Global Funding II |
||||||||
| 1.20%, 06/24/25(b) |
769 | 729,765 | ||||||
| 1.38%, 04/14/26(a)(b) |
1,915 | 1,768,006 | ||||||
| 1.45%, 01/20/28(a)(b) |
697 | 613,887 | ||||||
| 1.60%, 09/21/28(b) |
902 | 765,536 | ||||||
| 2.45%, 01/11/32(b) |
720 | 576,013 | ||||||
| 4.90%, 04/04/28(b) |
585 | 576,076 | ||||||
| 4.90%, 01/11/29(a)(b) |
350 | 346,652 | ||||||
| 5.50%, 08/28/26(b) |
825 | 830,369 | ||||||
| 5.50%, 07/18/28(a)(b) |
655 | 663,274 | ||||||
| Pacific Life Insurance Co. |
||||||||
| 4.30%, 10/24/67 (Call 10/24/47), |
895 | 679,257 | ||||||
| 9.25%, 06/15/39(a)(b) |
35 | 45,608 | ||||||
| Pacific LifeCorp. |
||||||||
| 3.35%, 09/15/50 (Call 03/15/50)(b) |
950 | 656,241 | ||||||
| 5.13%, 01/30/43(b) |
525 | 488,047 | ||||||
| 5.40%, 09/15/52 (Call 03/15/52)(b) |
1,110 | 1,068,920 | ||||||
| 6.60%, 09/15/33(a)(b) |
500 | 538,298 | ||||||
| PartnerRe Finance B LLC |
||||||||
| 3.70%, 07/02/29 (Call 04/02/29)(a) |
745 | 699,424 | ||||||
| 4.50%, 10/01/50 (Call 04/01/30), |
710 | 633,008 | ||||||
| Penn Mutual Life Insurance Co. (The), 3.80%, 04/29/61(a)(b) |
496 | 325,245 | ||||||
| Pine Street Trust I, 4.57%, 02/15/29 |
826 | 781,088 | ||||||
| Pine Street Trust II, 5.57%, 02/15/49 |
835 | 769,478 | ||||||
| Pricoa Global Funding I |
||||||||
| 0.80%, 09/01/25(a)(b) |
567 | 530,742 | ||||||
| 1.20%, 09/01/26(a)(b) |
1,282 | 1,163,033 | ||||||
| 4.20%, 08/28/25(b) |
615 | 606,378 | ||||||
| 5.10%, 05/30/28(b) |
590 | 589,830 | ||||||
| S C H E D U L E O F I N V E S T M E N T S |
95 |
| Schedule of Investments (continued) February 29, 2024 |
iShares® Broad USD Investment Grade Corporate Bond ETF (Percentages shown are based on Net Assets) |
| Security | Par (000) |
Value | ||||||
| Insurance (continued) | ||||||||
| 5.55%, 08/28/26(b) |
$ | 255 | $ | 257,997 | ||||
| Primerica Inc., 2.80%, 11/19/31 (Call 08/19/31) |
749 | 621,835 | ||||||
| Principal Financial Group Inc. |
||||||||
| 2.13%, 06/15/30 (Call 03/15/30) |
638 | 530,664 | ||||||
| 3.10%, 11/15/26 (Call 08/15/26) |
550 | 521,477 | ||||||
| 3.40%, 05/15/25 (Call 02/15/25) |
184 | 179,741 | ||||||
| 3.70%, 05/15/29 (Call 02/15/29)(a) |
648 | 604,494 | ||||||
| 4.30%, 11/15/46 (Call 05/15/46) |
430 | 356,196 | ||||||
| 4.35%, 05/15/43(a) |
455 | 395,228 | ||||||
| 4.63%, 09/15/42(a) |
400 | 358,862 | ||||||
| 5.38%, 03/15/33 (Call 12/15/32)(a) |
520 | 523,829 | ||||||
| 5.50%, 03/15/53 (Call 09/15/52)(a) |
340 | 331,668 | ||||||
| 6.05%, 10/15/36 |
945 | 994,261 | ||||||
| Principal Life Global Funding II |
||||||||
| 0.88%, 01/12/26(a)(b) |
950 | 874,230 | ||||||
| 1.25%, 06/23/25(b) |
636 | 603,284 | ||||||
| 1.25%, 08/16/26(b) |
603 | 545,465 | ||||||
| 1.50%, 11/17/26(a)(b) |
334 | 303,518 | ||||||
| 1.50%, 08/27/30(a)(b) |
687 | 542,767 | ||||||
| 1.63%, 11/19/30(b) |
260 | 203,261 | ||||||
| 2.50%, 09/16/29(a)(b) |
647 | 557,884 | ||||||
| 3.00%, 04/18/26(b) |
1,390 | 1,321,001 | ||||||
| 5.00%, 01/16/27(b) |
325 | 325,669 | ||||||
| 5.10%, 01/25/29(a)(b) |
710 | 704,309 | ||||||
| 5.50%, 06/28/28(a)(b) |
740 | 740,195 | ||||||
| Progressive Corp. (The) |
||||||||
| 2.45%, 01/15/27 |
985 | 918,349 | ||||||
| 2.50%, 03/15/27 (Call 02/15/27)(a) |
785 | 730,664 | ||||||
| 3.00%, 03/15/32 (Call 12/15/31) |
557 | 482,278 | ||||||
| 3.20%, 03/26/30 (Call 12/26/29) |
1,095 | 989,135 | ||||||
| 3.70%, 01/26/45(a) |
387 | 313,348 | ||||||
| 3.70%, 03/15/52 (Call 09/15/51) |
530 | 410,353 | ||||||
| 3.95%, 03/26/50 (Call 09/26/49)(a) |
312 | 253,882 | ||||||
| 4.00%, 03/01/29 (Call 12/01/28) |
613 | 589,808 | ||||||
| 4.13%, 04/15/47 (Call 10/15/46) |
1,241 | 1,041,885 | ||||||
| 4.20%, 03/15/48 (Call 09/15/47) |
850 | 731,109 | ||||||
| 4.35%, 04/25/44 |
475 | 421,085 | ||||||
| 4.95%, 06/15/33 (Call 03/15/33)(a) |
515 | 511,386 | ||||||
| 6.25%, 12/01/32(a) |
795 | 860,691 | ||||||
| 6.63%, 03/01/29 |
690 | 741,271 | ||||||
| Protective Life Corp. |
||||||||
| 3.40%, 01/15/30 (Call 10/15/29)(a)(b) |
926 | 813,576 | ||||||
| 4.30%, 09/30/28 (Call 06/30/28)(a)(b) |
797 | 770,909 | ||||||
| Protective Life Global Funding |
||||||||
| 1.17%, 07/15/25(b) |
515 | 486,567 | ||||||
| 1.30%, 09/20/26(b) |
628 | 568,202 | ||||||
| 1.62%, 04/15/26(b) |
945 | 874,167 | ||||||
| 1.74%, 09/21/30(b) |
1,015 | 812,399 | ||||||
| 1.90%, 07/06/28(a)(b) |
470 | 413,464 | ||||||
| 3.22%, 03/28/25(b) |
650 | 636,259 | ||||||
| 4.71%, 07/06/27(b) |
515 | 507,489 | ||||||
| 4.99%, 01/12/27(b) |
550 | 548,452 | ||||||
| 5.21%, 04/14/26(a)(b) |
805 | 802,879 | ||||||
| 5.37%, 01/06/26(b) |
960 | 962,172 | ||||||
| 5.47%, 12/08/28(b) |
915 | 925,667 | ||||||
| Prudential Financial Inc. |
||||||||
| 1.50%, 03/10/26 (Call 02/10/26) |
1,118 | 1,041,777 | ||||||
| 2.10%, 03/10/30 (Call 12/10/29)(a) |
770 | 658,935 | ||||||
| 3.00%, 03/10/40 (Call 09/10/39) |
560 | 417,384 | ||||||
| 3.70%, 10/01/50 (Call 07/01/30), |
815 | 711,864 | ||||||
| Security | Par (000) |
Value | ||||||
| Insurance (continued) | ||||||||
| 3.70%, 03/13/51 (Call 09/13/50) |
$ | 1,963 | $ | 1,497,518 | ||||
| 3.88%, 03/27/28 (Call 12/27/27) |
465 | 446,600 | ||||||
| 3.91%, 12/07/47 (Call 06/07/47) |
1,202 | 947,041 | ||||||
| 3.94%, 12/07/49 (Call 06/07/49) |
1,407 | 1,104,210 | ||||||
| 4.35%, 02/25/50 (Call 08/25/49) |
1,314 | 1,112,165 | ||||||
| 4.42%, 03/27/48 (Call 09/27/47) |
614 | 524,480 | ||||||
| 4.50%, 09/15/47 (Call 09/15/27), |
912 | 850,534 | ||||||
| 4.60%, 05/15/44 |
1,005 | 894,514 | ||||||
| 5.13%, 03/01/52 (Call 11/28/31), |
195 | 182,293 | ||||||
| 5.38%, 05/15/45 (Call 05/15/25), |
433 | 426,318 | ||||||
| 5.70%, 12/14/36 |
1,288 | 1,327,818 | ||||||
| 5.70%, 09/15/48 (Call 09/15/28), |
1,347 | 1,308,870 | ||||||
| 5.75%, 07/15/33(a) |
866 | 908,198 | ||||||
| 6.00%, 09/01/52 (Call 06/01/32), |
955 | 952,417 | ||||||
| 6.63%, 12/01/37 |
580 | 646,737 | ||||||
| 6.63%, 06/21/40(a) |
450 | 494,372 | ||||||
| Prudential Funding Asia PLC |
||||||||
| 3.13%, 04/14/30(a) |
1,524 | 1,358,302 | ||||||
| 3.63%, 03/24/32 (Call 12/24/31)(a) |
565 | 504,757 | ||||||
| Prudential Insurance Co. of America (The), |
||||||||
| 8.30%, 07/01/25(b) |
280 | 287,451 | ||||||
| Reinsurance Group of America Inc. |
||||||||
| 3.15%, 06/15/30 (Call 03/15/30)(a) |
1,016 | 896,491 | ||||||
| 3.90%, 05/15/29 (Call 02/15/29) |
965 | 910,586 | ||||||
| 3.95%, 09/15/26 (Call 06/15/26) |
915 | 889,967 | ||||||
| 6.00%, 09/15/33 (Call 06/15/33) |
640 | 657,176 | ||||||
| Reliance Standard Life Global Funding II |
||||||||
| 1.51%, 09/28/26(b) |
1,324 | 1,180,586 | ||||||
| 2.75%, 05/07/25(b) |
832 | 800,918 | ||||||
| 2.75%, 01/21/27(b) |
752 | 686,096 | ||||||
| 5.24%, 02/02/26(a)(b) |
15 | 14,747 | ||||||
| RenaissanceRe Finance Inc. |
||||||||
| 3.45%, 07/01/27 (Call 04/01/27)(a) |
909 | 859,426 | ||||||
| 3.70%, 04/01/25 (Call 01/01/25) |
326 | 319,546 | ||||||
| RenaissanceRe Holdings Ltd. |
||||||||
| 3.60%, 04/15/29 (Call 01/15/29) |
600 | 553,038 | ||||||
| 5.75%, 06/05/33 (Call 03/05/33)(a) |
905 | 912,325 | ||||||
| RGA Global Funding |
||||||||
| 2.00%, 11/30/26(a)(b) |
695 | 632,453 | ||||||
| 2.70%, 01/18/29(a)(b) |
830 | 728,632 | ||||||
| 5.50%, 01/11/31(b) |
410 | 404,508 | ||||||
| 6.00%, 11/21/28(a)(b) |
410 | 418,500 | ||||||
| Sagicor Financial Co. Ltd., 5.30%, 05/13/28 |
5 | 4,790 | ||||||
| Sammons Financial Group Inc. |
||||||||
| 3.35%, 04/16/31 (Call 01/16/31)(b) |
1,155 | 933,327 | ||||||
| 4.45%, 05/12/27 (Call 02/12/27)(a)(b) |
865 | 819,047 | ||||||
| 4.75%, 04/08/32 (Call 01/08/32)(b) |
725 | 629,193 | ||||||
| SBL Holdings Inc. |
||||||||
| 5.00%, 02/18/31 (Call 11/18/30)(b) |
960 | 792,657 | ||||||
| 5.13%, 11/13/26 (Call 09/13/26)(b) |
835 | 783,046 | ||||||
| Securian Financial Group Inc., 4.80%, 04/15/48(b) |
560 | 453,417 | ||||||
| Selective Insurance Group Inc., 5.38%, 03/01/49 (Call 09/01/48) |
310 | 292,471 | ||||||
| 96 | 2 0 2 4 I S H A R E S A N N U A L R E P O R T T O S H A R E H O L D E R S |
| Schedule of Investments (continued) February 29, 2024 |
iShares® Broad USD Investment Grade Corporate Bond ETF (Percentages shown are based on Net Assets) |
| Security | Par (000) |
Value | ||||||
| Insurance (continued) | ||||||||
| SiriusPoint Ltd., 4.60%,
11/01/26 |
$ | 225 | $ | 212,735 | ||||
| Sompo International Holdings Ltd., 7.00%, 07/15/34(a) |
350 | 374,481 | ||||||
| Stewart Information Services Corp., 3.60%, 11/15/31 (Call 08/15/31) |
711 | 550,891 | ||||||
| Sumitomo Life Insurance Co. |
||||||||
| 3.38%, 04/15/81 (Call 04/15/31), |
923 | 788,763 | ||||||
| 4.00%, 09/14/77 (Call 09/14/27), |
675 | 633,495 | ||||||
| 5.88%, (Call 01/18/34), |
35 | 34,575 | ||||||
| Swiss Re America Holding Corp., 7.00%, 02/15/26 |
130 | 133,486 | ||||||
| Swiss Re Finance Luxembourg SA, |
994 | 963,639 | ||||||
| Teachers Insurance & Annuity Association of America |
||||||||
| 3.30%, 05/15/50 (Call 11/15/49)(b) |
1,882 | 1,316,446 | ||||||
| 4.27%, 05/15/47 (Call 11/15/46)(a)(b) |
2,571 | 2,114,136 | ||||||
| 4.90%, 09/15/44(a)(b) |
1,824 | 1,656,986 | ||||||
| 6.85%, 12/16/39(b) |
1,444 | 1,629,063 | ||||||
| Transatlantic Holdings Inc., 8.00%, 11/30/39(a) |
515 | 654,551 | ||||||
| Travelers Companies Inc. (The) |
||||||||
| 2.55%, 04/27/50 (Call 10/27/49) |
370 | 230,323 | ||||||
| 3.05%, 06/08/51 (Call 12/08/50) |
935 | 638,789 | ||||||
| 3.75%, 05/15/46 (Call 11/15/45) |
797 | 633,908 | ||||||
| 4.00%, 05/30/47 (Call 11/30/46) |
1,041 | 858,714 | ||||||
| 4.05%, 03/07/48 (Call 09/07/47) |
963 | 806,596 | ||||||
| 4.10%, 03/04/49 (Call 09/04/48) |
937 | 790,061 | ||||||
| 4.30%, 08/25/45 (Call 02/25/45) |
773 | 673,798 | ||||||
| 4.60%, 08/01/43 |
480 | 447,800 | ||||||
| 5.35%, 11/01/40 |
839 | 846,316 | ||||||
| 5.45%, 05/25/53 (Call 11/25/52)(a) |
570 | 581,275 | ||||||
| 6.25%, 06/15/37 |
805 | 884,898 | ||||||
| 6.75%, 06/20/36 |
760 | 864,902 | ||||||
| Travelers Property Casualty Corp., |
784 | 869,874 | ||||||
| Trinity Acquisition PLC |
||||||||
| 4.40%, 03/15/26 (Call 12/15/25) |
697 | 682,985 | ||||||
| 6.13%, 08/15/43 |
677 | 660,804 | ||||||
| Trustage Financial Group Inc., 4.63%, 04/15/32 |
265 | 228,352 | ||||||
| Unum Group |
||||||||
| 3.88%, 11/05/25 |
20 | 19,353 | ||||||
| 4.00%, 06/15/29 (Call 03/15/29) |
61 | 57,045 | ||||||
| 4.13%, 06/15/51 (Call 12/15/50) |
675 | 496,131 | ||||||
| 4.50%, 12/15/49 (Call 06/15/49) |
440 | 348,805 | ||||||
| 5.75%, 08/15/42(a) |
501 | 486,329 | ||||||
| W R Berkley Corp. |
||||||||
| 3.15%, 09/30/61 (Call 03/30/61)(a) |
300 | 178,773 | ||||||
| 3.55%, 03/30/52 (Call 09/30/51) |
452 | 309,626 | ||||||
| 4.00%, 05/12/50 (Call 11/12/49) |
585 | 449,146 | ||||||
| 4.75%, 08/01/44 |
705 | 609,337 | ||||||
| Western & Southern Financial Group Inc., |
||||||||
| 5.75%, 07/15/33(a)(b) |
545 | 565,052 | ||||||
| Western & Southern Life Insurance Co. (The) |
||||||||
| 3.75%, 04/28/61 (Call 10/28/60)(b) |
595 | 402,955 | ||||||
| 5.15%, 01/15/49 (Call 07/15/48)(a)(b) |
380 | 345,164 | ||||||
| Security | Par (000) |
Value | ||||||
| Insurance (continued) | ||||||||
| Willis North America Inc. |
||||||||
| 2.95%, 09/15/29 (Call 06/15/29) |
$ | 1,055 | $ | 938,596 | ||||
| 3.88%, 09/15/49 (Call 03/15/49)(a) |
461 | 341,912 | ||||||
| 4.50%, 09/15/28 (Call 06/15/28) |
1,252 | 1,208,510 | ||||||
| 4.65%, 06/15/27 (Call 05/15/27) |
615 | 603,584 | ||||||
| 5.05%, 09/15/48 (Call 03/15/48) |
370 | 329,406 | ||||||
| 5.35%, 05/15/33 (Call 02/15/33) |
475 | 466,962 | ||||||
| 5.90%, 03/05/54 (Call 09/05/53) |
950 | 947,788 | ||||||
| WR Berkley Corp., 6.25%, 02/15/37 |
200 | 205,474 | ||||||
| XL Group Ltd., 5.25%, 12/15/43 |
400 | 372,566 | ||||||
|
|
|
|||||||
| 459,323,809 | ||||||||
| Internet — 1.7% | ||||||||
| Alibaba Group Holding Ltd. |
||||||||
| 2.13%, 02/09/31 (Call 11/09/30) |
1,035 | 855,970 | ||||||
| 2.70%, 02/09/41 (Call 08/09/40)(a) |
805 | 556,015 | ||||||
| 3.15%, 02/09/51 (Call 08/09/50) |
1,445 | 953,347 | ||||||
| 3.25%, 02/09/61 (Call 08/09/60) |
1,035 | 656,951 | ||||||
| 3.40%, 12/06/27 (Call 09/06/27) |
3,087 | 2,915,179 | ||||||
| 4.00%, 12/06/37 (Call 06/06/37) |
1,683 | 1,450,914 | ||||||
| 4.20%, 12/06/47 (Call 06/06/47)(a) |
1,865 | 1,516,578 | ||||||
| 4.40%, 12/06/57 (Call 06/06/57)(a) |
1,325 | 1,083,896 | ||||||
| 4.50%, 11/28/34 (Call 05/28/34)(a) |
1,247 | 1,171,420 | ||||||
| Alphabet Inc. |
||||||||
| 0.45%, 08/15/25 (Call 07/15/25) |
1,448 | 1,362,230 | ||||||
| 0.80%, 08/15/27 (Call 06/15/27)(a) |
1,980 | 1,749,621 | ||||||
| 1.10%, 08/15/30 (Call 05/15/30) |
3,156 | 2,555,486 | ||||||
| 1.90%, 08/15/40 (Call 02/15/40)(a) |
1,795 | 1,189,273 | ||||||
| 2.00%, 08/15/26 (Call 05/15/26) |
3,081 | 2,895,028 | ||||||
| 2.05%, 08/15/50 (Call 02/15/50) |
3,320 | 1,960,894 | ||||||
| 2.25%, 08/15/60 (Call 02/15/60)(a) |
2,652 | 1,524,436 | ||||||
| Amazon.com Inc. |
||||||||
| 0.80%, 06/03/25 (Call 05/03/25) |
1,352 | 1,284,141 | ||||||
| 1.00%, 05/12/26 (Call 04/12/26) |
3,680 | 3,387,339 | ||||||
| 1.20%, 06/03/27 (Call 04/03/27) |
1,710 | 1,530,032 | ||||||
| 1.50%, 06/03/30 (Call 03/03/30) |
2,969 | 2,455,423 | ||||||
| 1.65%, 05/12/28 (Call 03/12/28) |
3,225 | 2,861,982 | ||||||
| 2.10%, 05/12/31 (Call 02/12/31) |
3,670 | 3,083,361 | ||||||
| 2.50%, 06/03/50 (Call 12/03/49)(a) |
3,124 | 1,962,535 | ||||||
| 2.70%, 06/03/60 (Call 12/03/59) |
2,511 | 1,547,881 | ||||||
| 2.88%, 05/12/41 (Call 11/12/40) |
2,617 | 1,965,269 | ||||||
| 3.00%, 04/13/25 |
695 | 679,066 | ||||||
| 3.10%, 05/12/51 (Call 11/12/50) |
4,470 | 3,155,330 | ||||||
| 3.15%, 08/22/27 (Call 05/22/27) |
4,036 | 3,831,666 | ||||||
| 3.25%, 05/12/61 (Call 11/12/60) |
1,946 | 1,338,954 | ||||||
| 3.30%, 04/13/27 (Call 03/13/27) |
2,732 | 2,619,202 | ||||||
| 3.45%, 04/13/29 (Call 02/13/29)(a) |
1,685 | 1,596,806 | ||||||
| 3.60%, 04/13/32 (Call 01/13/32) |
2,530 | 2,333,102 | ||||||
| 3.88%, 08/22/37 (Call 02/22/37) |
3,755 | 3,348,293 | ||||||
| 3.95%, 04/13/52 (Call 10/13/51)(a) |
3,074 | 2,541,037 | ||||||
| 4.05%, 08/22/47 (Call 02/22/47) |
4,673 | 4,004,576 | ||||||
| 4.10%, 04/13/62 (Call 10/13/61)(a) |
1,605 | 1,330,181 | ||||||
| 4.25%, 08/22/57 (Call 02/22/57) |
2,978 | 2,563,259 | ||||||
| 4.55%, 12/01/27 (Call 11/01/27) |
2,800 | 2,791,429 | ||||||
| 4.60%, 12/01/25 |
1,735 | 1,727,285 | ||||||
| 4.65%, 12/01/29 (Call 10/01/29) |
1,970 | 1,970,990 | ||||||
| 4.70%, 12/01/32 (Call 09/01/32)(a) |
2,795 | 2,780,627 | ||||||
| 4.80%, 12/05/34 (Call 06/05/34) |
1,855 | 1,855,292 | ||||||
| 4.95%, 12/05/44 (Call 06/05/44)(a) |
1,918 | 1,895,841 | ||||||
| 5.20%, 12/03/25 (Call 09/03/25) |
905 | 909,003 | ||||||
| Baidu Inc. |
||||||||
| 1.63%, 02/23/27 (Call 01/23/27)(a) |
235 | 211,448 | ||||||
| S C H E D U L E O F I N V E S T M E N T S |
97 |
| Schedule of Investments (continued) February 29, 2024 |
iShares® Broad USD Investment Grade Corporate Bond ETF (Percentages shown are based on Net Assets) |
| Security | Par (000) |
Value | ||||||
| Internet (continued) | ||||||||
| 2.38%, 08/23/31 (Call 05/23/31) |
$ | 465 | $ | 382,632 | ||||
| 3.08%, 04/07/25 (Call 03/07/25)(a) |
395 | 383,936 | ||||||
| 3.43%, 04/07/30 (Call 01/07/30) |
390 | 352,770 | ||||||
| 3.63%, 07/06/27(a) |
560 | 533,977 | ||||||
| 4.38%, 03/29/28 (Call 12/29/27)(a) |
594 | 575,034 | ||||||
| 4.88%, 11/14/28 (Call 08/14/28) |
455 | 451,378 | ||||||
| Booking Holdings Inc. |
||||||||
| 3.55%, 03/15/28 (Call 12/15/27) |
1,061 | 1,010,219 | ||||||
| 3.60%, 06/01/26 (Call 03/01/26) |
1,626 | 1,575,806 | ||||||
| 3.65%, 03/15/25 (Call 12/15/24)(a) |
950 | 933,964 | ||||||
| 4.63%, 04/13/30 (Call 01/13/30) |
2,356 | 2,314,575 | ||||||
| eBay Inc. |
||||||||
| 1.40%, 05/10/26 (Call 04/10/26)(a) |
932 | 859,563 | ||||||
| 1.90%, 03/11/25 (Call 02/11/25)(a) |
989 | 954,649 | ||||||
| 2.60%, 05/10/31 (Call 02/10/31)(a) |
931 | 789,517 | ||||||
| 2.70%, 03/11/30 (Call 12/11/29) |
1,382 | 1,207,291 | ||||||
| 3.60%, 06/05/27 (Call 03/05/27) |
1,332 | 1,273,547 | ||||||
| 3.65%, 05/10/51 (Call 11/10/50) |
1,110 | 804,485 | ||||||
| 4.00%, 07/15/42 (Call 01/15/42) |
976 | 775,040 | ||||||
| 5.90%, 11/22/25 (Call 10/22/25) |
465 | 468,821 | ||||||
| 5.95%, 11/22/27 (Call 10/22/27)(a) |
670 | 689,227 | ||||||
| 6.30%, 11/22/32 (Call 08/22/32) |
470 | 498,696 | ||||||
| Expedia Group Inc. |
||||||||
| 2.95%, 03/15/31 (Call 12/15/30)(a) |
944 | 808,365 | ||||||
| 3.25%, 02/15/30 (Call 11/15/29)(a) |
2,096 | 1,867,265 | ||||||
| 3.80%, 02/15/28 (Call 11/15/27) |
1,472 | 1,392,184 | ||||||
| 4.63%, 08/01/27 (Call 05/01/27) |
1,249 | 1,222,391 | ||||||
| 5.00%, 02/15/26 (Call 11/15/25) |
1,174 | 1,165,913 | ||||||
| 6.25%, 05/01/25 (Call 02/01/25)(b) |
1,271 | 1,276,731 | ||||||
| JD.com Inc. |
||||||||
| 3.38%, 01/14/30 (Call 10/14/29) |
214 | 193,433 | ||||||
| 3.88%, 04/29/26 |
225 | 217,969 | ||||||
| Meituan |
||||||||
| 2.13%, 10/28/25 (Call 09/28/25)(a)(b) |
265 | 249,658 | ||||||
| 3.05%, 10/28/30 (Call 07/28/30)(a)(b) |
820 | 693,665 | ||||||
| Meta Platforms Inc. |
||||||||
| 3.50%, 08/15/27 (Call 07/15/27)(a) |
3,867 | 3,706,446 | ||||||
| 3.85%, 08/15/32 (Call 05/15/32) |
3,775 | 3,496,724 | ||||||
| 4.45%, 08/15/52 (Call 02/15/52) |
3,665 | 3,202,116 | ||||||
| 4.60%, 05/15/28 (Call 04/15/28) |
1,755 | 1,747,327 | ||||||
| 4.65%, 08/15/62 (Call 02/15/62) |
1,887 | 1,671,961 | ||||||
| 4.80%, 05/15/30 (Call 03/15/30) |
1,370 | 1,369,527 | ||||||
| 4.95%, 05/15/33 (Call 02/15/33)(a) |
1,575 | 1,576,391 | ||||||
| 5.60%, 05/15/53 (Call 11/15/52) |
3,230 | 3,344,165 | ||||||
| 5.75%, 05/15/63 (Call 11/15/62) |
2,191 | 2,293,763 | ||||||
| Netflix Inc. |
||||||||
| 3.63%, 06/15/25 (Call 03/15/25)(b) |
700 | 684,633 | ||||||
| 4.38%, 11/15/26 |
1,475 | 1,451,216 | ||||||
| 4.88%, 04/15/28(a) |
2,390 | 2,385,173 | ||||||
| 4.88%, 06/15/30 (Call 03/15/30)(a)(b) |
1,329 | 1,318,490 | ||||||
| 5.38%, 11/15/29(b) |
1,445 | 1,467,348 | ||||||
| 5.88%, 11/15/28 |
2,247 | 2,325,576 | ||||||
| 6.38%, 05/15/29 |
1,185 | 1,258,106 | ||||||
| Prosus NV |
||||||||
| 3.06%, 07/13/31 (Call 04/13/31)(b) |
1,402 | 1,131,760 | ||||||
| 3.26%, 01/19/27 (Call 12/19/26)(b) |
500 | 460,211 | ||||||
| 3.68%, 01/21/30 (Call 10/21/29)(b) |
1,671 | 1,446,552 | ||||||
| 3.83%, 02/08/51 (Call 08/08/50)(b) |
1,942 | 1,197,520 | ||||||
| 4.03%, 08/03/50 (Call 02/03/50)(b) |
1,695 | 1,078,956 | ||||||
| 4.19%, 01/19/32 (Call 10/19/31)(b) |
485 | 415,531 | ||||||
| 4.85%, 07/06/27 (Call 04/06/27)(b) |
100 | 96,105 | ||||||
| Security | Par (000) |
Value | ||||||
| Internet (continued) | ||||||||
| 4.99%, 01/19/52 (Call 07/19/51)(a)(b) |
$ | 1,440 | $ | 1,056,053 | ||||
| Tencent Holdings Ltd. |
||||||||
| 1.81%, 01/26/26 (Call 12/26/25)(b) |
835 | 782,813 | ||||||
| 2.39%, 06/03/30 (Call 03/03/30)(a)(b) |
1,886 | 1,612,462 | ||||||
| 2.88%, 04/22/31 (Call 01/22/31)(a)(b) |
975 | 845,255 | ||||||
| 3.24%, 06/03/50 (Call 12/03/49)(a)(b) |
2,290 | 1,541,151 | ||||||
| 3.29%, 06/03/60 (Call 12/03/59)(a)(b) |
600 | 385,696 | ||||||
| 3.58%, 04/11/26 (Call 02/11/26)(b) |
1,027 | 991,983 | ||||||
| 3.60%, 01/19/28 (Call 10/19/27)(b) |
2,030 | 1,926,100 | ||||||
| 3.68%, 04/22/41 (Call 10/22/40)(b) |
980 | 778,239 | ||||||
| 3.84%, 04/22/51 (Call 10/22/50)(a)(b) |
1,885 | 1,416,429 | ||||||
| 3.93%, 01/19/38 (Call 07/19/37)(b) |
834 | 711,602 | ||||||
| 3.94%, 04/22/61 (Call 10/22/60)(b) |
1,215 | 891,197 | ||||||
| 3.98%, 04/11/29 (Call 01/11/29)(a)(b) |
2,666 | 2,526,875 | ||||||
| 4.53%, 04/11/49 (Call 10/11/48)(a)(b) |
560 | 478,884 | ||||||
| Tencent Music Entertainment Group |
||||||||
| 1.38%, 09/03/25 (Call 08/03/25)(a) |
100 | 94,087 | ||||||
| 2.00%, 09/03/30 (Call 06/03/30) |
855 | 696,441 | ||||||
| VeriSign Inc. |
||||||||
| 2.70%, 06/15/31 (Call 03/15/31) |
1,425 | 1,184,703 | ||||||
| 4.75%, 07/15/27 (Call 04/01/24)(a) |
1,375 | 1,348,525 | ||||||
| 5.25%, 04/01/25 (Call 01/01/25) |
705 | 702,485 | ||||||
| Weibo Corp., 3.38%, 07/08/30 |
1,310 | 1,123,443 | ||||||
|
|
|
|||||||
| 174,101,309 | ||||||||
| Iron & Steel — 0.3% | ||||||||
| ArcelorMittal SA |
||||||||
| 4.25%, 07/16/29 |
1,032 | 978,253 | ||||||
| 4.55%, 03/11/26(a) |
710 | 699,457 | ||||||
| 6.55%, 11/29/27 (Call 10/29/27)(a) |
1,625 | 1,692,424 | ||||||
| 6.75%, 03/01/41 |
741 | 761,971 | ||||||
| 6.80%, 11/29/32 (Call 08/29/32)(a) |
1,270 | 1,342,569 | ||||||
| 7.00%, 10/15/39(a) |
899 | 959,467 | ||||||
| Gerdau Trade Inc., 4.88%, 10/24/27(b) |
115 | 112,007 | ||||||
| GUSAP III LP, 4.25%, 01/21/30 |
695 | 649,537 | ||||||
| Nucor Corp. |
||||||||
| 2.00%, 06/01/25 (Call 05/01/25) |
790 | 757,965 | ||||||
| 2.70%, 06/01/30 (Call 03/01/30)(a) |
844 | 744,501 | ||||||
| 2.98%, 12/15/55 (Call 06/15/55)(a) |
877 | 565,918 | ||||||
| 3.13%, 04/01/32 (Call 01/01/32)(a) |
950 | 830,742 | ||||||
| 3.85%, 04/01/52 (Call 09/01/51)(a) |
940 | 738,531 | ||||||
| 3.95%, 05/23/25 |
580 | 570,913 | ||||||
| 3.95%, 05/01/28 (Call 02/01/28)(a) |
995 | 962,386 | ||||||
| 4.30%, 05/23/27 (Call 04/23/27) |
815 | 796,813 | ||||||
| 4.40%, 05/01/48 (Call 11/01/47)(a) |
330 | 289,783 | ||||||
| 5.20%, 08/01/43 (Call 02/01/43)(a) |
75 | 72,999 | ||||||
| 6.40%, 12/01/37(a) |
875 | 957,930 | ||||||
| POSCO |
||||||||
| 4.50%, 08/04/27(b) |
50 | 48,517 | ||||||
| 4.88%, 01/23/27(b) |
110 | 108,498 | ||||||
| 5.75%, 01/17/28(b) |
200 | 202,291 | ||||||
| Reliance Inc. |
||||||||
| 1.30%, 08/15/25 (Call 07/15/25) |
780 | 732,150 | ||||||
| 2.15%, 08/15/30 (Call 05/15/30) |
1,069 | 886,966 | ||||||
| 6.85%, 11/15/36 |
410 | 446,127 | ||||||
| Steel Dynamics Inc. |
||||||||
| 1.65%, 10/15/27 (Call 08/15/27)(a) |
252 | 223,571 | ||||||
| 2.40%, 06/15/25 (Call 05/15/25) |
832 | 799,310 | ||||||
| 3.25%, 01/15/31 (Call 10/15/30) |
820 | 726,912 | ||||||
| 3.25%, 10/15/50 (Call 04/15/50)(a) |
801 | 525,762 | ||||||
| 98 | 2 0 2 4 I S H A R E S A N N U A L R E P O R T T O S H A R E H O L D E R S |
| Schedule of Investments (continued) February 29, 2024 |
iShares® Broad USD Investment Grade Corporate Bond ETF (Percentages shown are based on Net Assets) |
| Security | Par (000) |
Value | ||||||
| Iron & Steel (continued) | ||||||||
| 3.45%, 04/15/30 (Call 01/15/30) |
$ | 840 | $ | 763,577 | ||||
| 5.00%, 12/15/26 (Call 04/01/24) |
1,131 | 1,122,181 | ||||||
| Vale Overseas Ltd. |
||||||||
| 3.75%, 07/08/30 (Call 04/08/30)(a) |
1,830 | 1,646,465 | ||||||
| 6.13%, 06/12/33 (Call 03/12/33) |
795 | 804,659 | ||||||
| 6.25%, 08/10/26(a) |
299 | 303,062 | ||||||
| 6.88%, 11/21/36 |
1,726 | 1,842,451 | ||||||
| 6.88%, 11/10/39(a) |
1,140 | 1,220,711 | ||||||
| 8.25%, 01/17/34(a) |
335 | 392,551 | ||||||
| Vale SA, 5.63%, 09/11/42(a) |
562 | 549,165 | ||||||
|
|
|
|||||||
| 27,829,092 | ||||||||
| Leisure Time — 0.0% | ||||||||
| Brunswick Corp. |
||||||||
| 2.40%, 08/18/31 (Call 05/18/31) |
865 | 681,017 | ||||||
| 4.40%, 09/15/32 (Call 06/15/32)(a) |
672 | 598,929 | ||||||
| 5.10%, 04/01/52 (Call 10/01/51)(a) |
599 | 473,156 | ||||||
| Harley-Davidson Financial Services Inc. |
||||||||
| 3.05%, 02/14/27 (Call 01/14/27)(a)(b) |
920 | 862,096 | ||||||
| 3.35%, 06/08/25 (Call 05/08/25)(a)(b) |
967 | 933,597 | ||||||
| 6.50%, 03/10/28 (Call 02/10/28)(a)(b) |
775 | 794,684 | ||||||
| Harley-Davidson Inc. |
||||||||
| 3.50%, 07/28/25 (Call 04/28/25)(a) |
299 | 290,479 | ||||||
| 4.63%, 07/28/45 (Call 01/28/45)(a) |
503 | 399,462 | ||||||
| Polaris Inc., 6.95%, 03/15/29 (Call 02/15/29)(a) |
120 | 126,459 | ||||||
|
|
|
|||||||
| 5,159,879 | ||||||||
| Lodging — 0.2% | ||||||||
| Choice Hotels International Inc. |
||||||||
| 3.70%, 12/01/29 (Call 09/01/29) |
673 | 589,617 | ||||||
| 3.70%, 01/15/31 (Call 10/15/30)(a) |
882 | 757,693 | ||||||
| Hyatt Hotels Corp. |
||||||||
| 4.38%, 09/15/28 (Call 06/15/28) |
826 | 793,892 | ||||||
| 4.85%, 03/15/26 (Call 12/15/25) |
1,052 | 1,039,828 | ||||||
| 5.38%, 04/23/25 (Call 03/23/25) |
877 | 875,254 | ||||||
| 5.75%, 01/30/27 (Call 12/30/26) |
590 | 597,480 | ||||||
| 5.75%, 04/23/30 (Call 01/23/30) |
820 | 835,609 | ||||||
| Las Vegas Sands Corp. |
||||||||
| 3.50%, 08/18/26 (Call 06/18/26)(a) |
20 | 18,805 | ||||||
| 3.90%, 08/08/29 (Call 05/08/29) |
20 | 18,088 | ||||||
| Marriott International Inc./MD |
||||||||
| 3.75%, 03/15/25 (Call 12/15/24) |
505 | 495,507 | ||||||
| 3.75%, 10/01/25 (Call 07/01/25) |
124 | 120,901 | ||||||
| 4.50%, 10/01/34 (Call 04/01/34)(a) |
490 | 452,348 | ||||||
| 4.88%, 05/15/29 (Call 04/15/29) |
250 | 246,663 | ||||||
| 4.90%, 04/15/29 (Call 03/15/29)(a) |
372 | 367,498 | ||||||
| 5.00%, 10/15/27 (Call 09/15/27) |
1,140 | 1,135,291 | ||||||
| 5.30%, 05/15/34 (Call 02/15/34) |
290 | 285,388 | ||||||
| 5.45%, 09/15/26 (Call 08/15/26) |
295 | 296,310 | ||||||
| 5.55%, 10/15/28 (Call 09/15/28) |
950 | 966,647 | ||||||
| Series AA, 4.65%, 12/01/28 |
725 | 710,020 | ||||||
| Series EE, 5.75%, 05/01/25 (Call 04/01/25) |
914 | 917,298 | ||||||
| Series FF, 4.63%, 06/15/30 (Call 03/15/30)(a) |
1,492 | 1,445,075 | ||||||
| Series GG, 3.50%, 10/15/32 (Call 07/15/32) |
1,520 | 1,327,352 | ||||||
| Series HH, 2.85%, 04/15/31 (Call 01/15/31) |
1,737 | 1,482,989 | ||||||
| Series II, 2.75%, 10/15/33 (Call 07/15/33)(a) |
435 | 350,323 | ||||||
| Series R, 3.13%, 06/15/26 (Call 03/15/26) |
1,506 | 1,437,865 | ||||||
| Series X, 4.00%, 04/15/28 (Call 01/15/28) |
827 | 792,322 | ||||||
| Sands China Ltd. |
||||||||
| 2.55%, 03/08/27 (Call 02/08/27) |
330 | 297,207 | ||||||
| 3.10%, 03/08/29 (Call 01/08/29) |
692 | 597,192 | ||||||
| Security | Par (000) |
Value | ||||||
| Lodging (continued) | ||||||||
| 3.25%, 08/08/31 (Call 05/08/31) |
$ | 975 | $ | 812,257 | ||||
| 4.05%, 01/08/26 (Call 12/08/25) |
528 | 506,301 | ||||||
| 4.63%, 06/18/30 (Call 03/18/30) |
795 | 725,849 | ||||||
| 5.13%, 08/08/25 (Call 06/08/25) |
550 | 542,083 | ||||||
| 5.40%, 08/08/28 (Call 05/08/28) |
2,335 | 2,278,400 | ||||||
|
|
|
|||||||
| 24,115,352 | ||||||||
| Machinery — 0.8% | ||||||||
| ABB Finance USA Inc. |
||||||||
| 3.80%, 04/03/28 (Call 01/03/28) |
466 | 452,792 | ||||||
| 4.38%, 05/08/42(a) |
625 | 562,094 | ||||||
| Caterpillar Financial Services Corp. |
||||||||
| 0.80%, 11/13/25 |
720 | 671,168 | ||||||
| 0.90%, 03/02/26 |
1,124 | 1,038,054 | ||||||
| 1.10%, 09/14/27 |
1,532 | 1,350,513 | ||||||
| 1.15%, 09/14/26(a) |
530 | 483,154 | ||||||
| 1.45%, 05/15/25 |
672 | 642,580 | ||||||
| 1.70%, 01/08/27 |
1,311 | 1,206,317 | ||||||
| 2.40%, 08/09/26(a) |
1,030 | 970,980 | ||||||
| 3.40%, 05/13/25 |
620 | 606,926 | ||||||
| 3.60%, 08/12/27 |
594 | 572,031 | ||||||
| 3.65%, 08/12/25 |
966 | 946,602 | ||||||
| 4.35%, 05/15/26 |
1,372 | 1,355,979 | ||||||
| 4.50%, 01/08/27 |
450 | 447,015 | ||||||
| 4.80%, 01/06/26(a) |
861 | 858,587 | ||||||
| 4.85%, 02/27/29 |
625 | 625,718 | ||||||
| 5.05%, 02/27/26 |
750 | 750,427 | ||||||
| 5.15%, 08/11/25 |
500 | 500,018 | ||||||
| 5.40%, 03/10/25 |
150 | 150,339 | ||||||
| Caterpillar Inc. |
||||||||
| 1.90%, 03/12/31 (Call 12/12/30)(a) |
872 | 732,084 | ||||||
| 2.60%, 09/19/29 (Call 06/19/29)(a) |
730 | 657,591 | ||||||
| 2.60%, 04/09/30 (Call 01/09/30) |
1,422 | 1,264,453 | ||||||
| 3.25%, 09/19/49 (Call 03/19/49) |
1,439 | 1,058,428 | ||||||
| 3.25%, 04/09/50 (Call 10/09/49)(a) |
1,539 | 1,140,436 | ||||||
| 3.80%, 08/15/42 |
2,087 | 1,741,630 | ||||||
| 4.30%, 05/15/44 (Call 11/15/43)(a) |
394 | 354,957 | ||||||
| 4.75%, 05/15/64 (Call 11/15/63) |
565 | 513,619 | ||||||
| 5.20%, 05/27/41 |
1,231 | 1,240,442 | ||||||
| 5.30%, 09/15/35 |
535 | 557,482 | ||||||
| 6.05%, 08/15/36 |
440 | 482,793 | ||||||
| CNH Industrial Capital LLC |
||||||||
| 1.45%, 07/15/26 (Call 06/15/26) |
665 | 608,271 | ||||||
| 1.88%, 01/15/26 (Call 12/15/25)(a) |
772 | 723,472 | ||||||
| 3.95%, 05/23/25 |
860 | 843,951 | ||||||
| 4.55%, 04/10/28 (Call 03/10/28)(a) |
915 | 895,902 | ||||||
| 5.45%, 10/14/25 |
430 | 430,474 | ||||||
| 5.50%, 01/12/29 (Call 12/12/28) |
600 | 608,183 | ||||||
| CNH Industrial NV, 3.85%, 11/15/27 |
867 | 831,909 | ||||||
| Deere & Co. |
||||||||
| 2.75%, 04/15/25 (Call 03/15/25) |
1,119 | 1,090,033 | ||||||
| 2.88%, 09/07/49 (Call 03/07/49) |
1,129 | 788,607 | ||||||
| 3.10%, 04/15/30 (Call 01/15/30) |
1,146 | 1,041,366 | ||||||
| 3.75%, 04/15/50 (Call 10/15/49) |
1,324 | 1,087,639 | ||||||
| 3.90%, 06/09/42 (Call 12/09/41) |
1,125 | 961,840 | ||||||
| 5.38%, 10/16/29 |
953 | 984,328 | ||||||
| 7.13%, 03/03/31(a) |
612 | 697,843 | ||||||
| 8.10%, 05/15/30 |
120 | 140,556 | ||||||
| Dover Corp. |
||||||||
| 2.95%, 11/04/29 (Call 08/04/29) |
703 | 625,612 | ||||||
| 3.15%, 11/15/25 (Call 08/15/25) |
585 | 563,640 | ||||||
| S C H E D U L E O F I N V E S T M E N T S |
99 |
| Schedule of Investments (continued) February 29, 2024 |
iShares® Broad USD Investment Grade Corporate Bond ETF (Percentages shown are based on Net Assets) |
| Security | Par (000) |
Value | ||||||
| Machinery (continued) | ||||||||
| 5.38%, 10/15/35(a) |
$ | 538 | $ | 542,554 | ||||
| 5.38%, 03/01/41 (Call 12/01/40)(a) |
407 | 398,003 | ||||||
| 6.60%, 03/15/38 |
335 | 364,587 | ||||||
| Flowserve Corp. |
||||||||
| 2.80%, 01/15/32 (Call 10/15/31) |
825 | 674,943 | ||||||
| 3.50%, 10/01/30 (Call 07/01/30) |
790 | 694,498 | ||||||
| IDEX Corp. |
||||||||
| 2.63%, 06/15/31 (Call 03/15/31)(a) |
845 | 712,392 | ||||||
| 3.00%, 05/01/30 (Call 02/01/30) |
905 | 789,913 | ||||||
| John Deere Capital Corp. |
||||||||
| 0.70%, 01/15/26 |
1,037 | 959,857 | ||||||
| 1.05%, 06/17/26(a) |
953 | 873,753 | ||||||
| 1.30%, 10/13/26 |
617 | 563,241 | ||||||
| 1.45%, 01/15/31 |
1,035 | 836,197 | ||||||
| 1.50%, 03/06/28(a) |
817 | 720,641 | ||||||
| 1.70%, 01/11/27(a) |
617 | 565,221 | ||||||
| 1.75%, 03/09/27 |
918 | 840,088 | ||||||
| 2.00%, 06/17/31(a) |
1,010 | 836,539 | ||||||
| 2.13%, 03/07/25(a) |
260 | 252,166 | ||||||
| 2.25%, 09/14/26 |
633 | 592,664 | ||||||
| 2.35%, 03/08/27(a) |
735 | 685,599 | ||||||
| 2.45%, 01/09/30 |
1,046 | 918,183 | ||||||
| 2.65%, 06/10/26 |
1,005 | 957,494 | ||||||
| 2.80%, 09/08/27 |
488 | 456,981 | ||||||
| 2.80%, 07/18/29(a) |
1,262 | 1,148,150 | ||||||
| 3.05%, 01/06/28 |
550 | 519,259 | ||||||
| 3.35%, 04/18/29 |
700 | 657,612 | ||||||
| 3.40%, 06/06/25 |
750 | 734,286 | ||||||
| 3.40%, 09/11/25 |
350 | 341,704 | ||||||
| 3.45%, 03/13/25 |
1,410 | 1,384,490 | ||||||
| 3.45%, 03/07/29 |
713 | 673,391 | ||||||
| 3.90%, 06/07/32(a) |
790 | 735,882 | ||||||
| 4.05%, 09/08/25 |
707 | 697,143 | ||||||
| 4.15%, 09/15/27(a) |
865 | 848,256 | ||||||
| 4.35%, 09/15/32(a) |
780 | 755,627 | ||||||
| 4.50%, 01/08/27 |
840 | 833,514 | ||||||
| 4.50%, 01/16/29 |
705 | 694,263 | ||||||
| 4.70%, 06/10/30 |
885 | 877,946 | ||||||
| 4.75%, 06/08/26 |
875 | 872,372 | ||||||
| 4.75%, 01/20/28 |
1,410 | 1,408,473 | ||||||
| 4.80%, 01/09/26(a) |
1,274 | 1,270,795 | ||||||
| 4.85%, 10/11/29(a) |
535 | 538,225 | ||||||
| 4.90%, 03/03/28(a) |
1,005 | 1,010,687 | ||||||
| 4.95%, 06/06/25 |
370 | 369,520 | ||||||
| 4.95%, 07/14/28 |
920 | 925,155 | ||||||
| 5.05%, 03/03/26(a) |
995 | 997,570 | ||||||
| Komatsu Finance America Inc., |
325 | 328,757 | ||||||
| nVent Finance Sarl |
||||||||
| 2.75%, 11/15/31 (Call 08/15/31)(a) |
491 | 401,148 | ||||||
| 4.55%, 04/15/28 (Call 01/15/28)(a) |
703 | 678,633 | ||||||
| 5.65%, 05/15/33 (Call 02/15/33) |
545 | 545,003 | ||||||
| Oshkosh Corp. |
||||||||
| 3.10%, 03/01/30 (Call 12/01/29) |
480 | 424,426 | ||||||
| 4.60%, 05/15/28 (Call 02/15/28)(a) |
725 | 706,171 | ||||||
| Otis Worldwide Corp. |
||||||||
| 2.06%, 04/05/25 (Call 03/05/25) |
1,415 | 1,363,566 | ||||||
| 2.29%, 04/05/27 (Call 02/05/27) |
690 | 638,433 | ||||||
| 2.57%, 02/15/30 (Call 11/15/29) |
2,174 | 1,895,913 | ||||||
| 3.11%, 02/15/40 (Call 08/15/39)(a) |
1,116 | 851,745 | ||||||
| 3.36%, 02/15/50 (Call 08/15/49) |
1,122 | 814,490 | ||||||
| Security | Par (000) |
Value | ||||||
| Machinery (continued) | ||||||||
| 5.25%, 08/16/28 (Call 07/16/28) |
$ | 665 | $ | 670,075 | ||||
| Rockwell Automation Inc. |
||||||||
| 1.75%, 08/15/31 (Call 05/15/31) |
740 | 594,586 | ||||||
| 2.80%, 08/15/61 (Call 02/15/61) |
745 | 442,032 | ||||||
| 2.88%, 03/01/25 (Call 12/01/24) |
550 | 537,359 | ||||||
| 3.50%, 03/01/29 (Call 12/01/28) |
268 | 255,184 | ||||||
| 4.20%, 03/01/49 (Call 09/01/48)(a) |
487 | 414,719 | ||||||
| 6.25%, 12/01/37(a) |
272 | 292,195 | ||||||
| 6.70%, 01/15/28(a) |
394 | 414,350 | ||||||
| Weir Group PLC (The), 2.20%, 05/13/26 |
445 | 412,194 | ||||||
| Westinghouse Air Brake Technologies Corp. |
||||||||
| 3.20%, 06/15/25 (Call 05/15/25) |
742 | 719,559 | ||||||
| 3.45%, 11/15/26 (Call 08/15/26) |
1,308 | 1,243,789 | ||||||
| 4.70%, 09/15/28 (Call 06/15/28) |
1,774 | 1,730,532 | ||||||
| Xylem Inc./NY |
||||||||
| 1.95%, 01/30/28 (Call 11/30/27)(a) |
1,063 | 950,535 | ||||||
| 2.25%, 01/30/31 (Call 10/30/30) |
1,038 | 871,831 | ||||||
| 3.25%, 11/01/26 (Call 08/01/26) |
861 | 822,221 | ||||||
| 4.38%, 11/01/46 (Call 05/01/46)(a) |
530 | 443,732 | ||||||
|
|
|
|||||||
| 88,851,847 | ||||||||
| Machinery - Diversified — 0.0% | ||||||||
| Ingersoll Rand Inc. |
||||||||
| 5.40%, 08/14/28 (Call 07/14/28) |
690 | 695,560 | ||||||
| 5.70%, 08/14/33 (Call 05/14/33) |
340 | 345,784 | ||||||
| John Deere Capital Corp. |
||||||||
| 5.15%, 09/08/26 |
450 | 453,019 | ||||||
| 5.15%, 09/08/33(a) |
455 | 462,803 | ||||||
| 5.30%, 09/08/25 |
425 | 426,863 | ||||||
| Nordson Corp. |
||||||||
| 5.60%, 09/15/28 (Call 08/15/28) |
255 | 259,239 | ||||||
| 5.80%, 09/15/33 (Call 06/15/33)(a) |
335 | 345,782 | ||||||
| Westinghouse Air Brake Technologies Corp., |
||||||||
| 5.61%, 03/11/34 (Call 12/11/33) |
130 | 130,540 | ||||||
|
|
|
|||||||
| 3,119,590 | ||||||||
| Manufacturing — 0.7% | ||||||||
| 3M Co. |
||||||||
| 2.25%, 09/19/26 (Call 06/19/26)(a) |
1,108 | 1,032,339 | ||||||
| 2.38%, 08/26/29 (Call 05/26/29) |
1,596 | 1,385,853 | ||||||
| 2.65%, 04/15/25 (Call 03/15/25)(a) |
721 | 697,994 | ||||||
| 2.88%, 10/15/27 (Call 07/15/27)(a) |
1,235 | 1,143,310 | ||||||
| 3.00%, 08/07/25(a) |
737 | 713,621 | ||||||
| 3.05%, 04/15/30 (Call 01/15/30)(a) |
1,133 | 1,003,789 | ||||||
| 3.13%, 09/19/46 (Call 03/19/46)(a) |
758 | 524,656 | ||||||
| 3.25%, 08/26/49 (Call 02/26/49)(a) |
1,445 | 999,007 | ||||||
| 3.38%, 03/01/29 (Call 12/01/28)(a) |
1,272 | 1,174,430 | ||||||
| 3.63%, 09/14/28 (Call 06/14/28)(a) |
824 | 777,474 | ||||||
| 3.63%, 10/15/47 (Call 04/15/47) |
503 | 364,826 | ||||||
| 3.70%, 04/15/50 (Call 10/15/49) |
777 | 573,571 | ||||||
| 3.88%, 06/15/44(a) |
180 | 141,532 | ||||||
| 4.00%, 09/14/48 (Call 03/14/48)(a) |
1,600 | 1,293,712 | ||||||
| 5.70%, 03/15/37(a) |
770 | 802,270 | ||||||
| Carlisle Companies Inc. |
||||||||
| 2.20%, 03/01/32 (Call 12/01/31)(a) |
770 | 609,587 | ||||||
| 2.75%, 03/01/30 (Call 12/01/29)(a) |
1,475 | 1,281,893 | ||||||
| 3.75%, 12/01/27 (Call 09/01/27) |
1,050 | 998,183 | ||||||
| Eaton Corp. |
||||||||
| 3.10%, 09/15/27 (Call 06/15/27) |
1,347 | 1,274,935 | ||||||
| 3.92%, 09/15/47 (Call 03/15/47)(a) |
262 | 212,694 | ||||||
| 4.00%, 11/02/32 |
1,400 | 1,314,694 | ||||||
| 100 | 2 0 2 4 I S H A R E S A N N U A L R E P O R T T O S H A R E H O L D E R S |
| Schedule of Investments (continued) February 29, 2024 |
iShares® Broad USD Investment Grade Corporate Bond ETF (Percentages shown are based on Net Assets) |
| Security | Par (000) |
Value | ||||||
| Manufacturing (continued) | ||||||||
| 4.15%, 03/15/33 (Call 12/15/32)(a) |
$ | 1,305 | $ | 1,228,184 | ||||
| 4.15%, 11/02/42 |
1,503 | 1,307,643 | ||||||
| 4.35%, 05/18/28 (Call 04/18/28)(a) |
375 | 369,325 | ||||||
| 4.70%, 08/23/52 (Call 02/23/52)(a) |
880 | 813,229 | ||||||
| GE Capital Funding LLC |
||||||||
| 3.45%, 05/15/25 (Call 04/15/25) |
435 | 424,851 | ||||||
| 4.55%, 05/15/32 (Call 02/15/32) |
845 | 811,930 | ||||||
| GE Capital International Funding Co. |
||||||||
| Unlimited Co. |
||||||||
| 3.37%, 11/15/25(a) |
435 | 421,256 | ||||||
| 4.42%, 11/15/35 |
1,510 | 1,415,042 | ||||||
| General Electric Co. |
||||||||
| 4.35%, 05/01/50 (Call 11/01/49) |
350 | 308,501 | ||||||
| 4.50%, 03/11/44(a) |
375 | 339,286 | ||||||
| 5.88%, 01/14/38(a) |
590 | 627,304 | ||||||
| 6.15%, 08/07/37(a) |
610 | 644,323 | ||||||
| 6.75%, 03/15/32 |
460 | 510,782 | ||||||
| 6.88%, 01/10/39(a) |
1,190 | 1,406,593 | ||||||
| Illinois Tool Works Inc. |
||||||||
| 2.65%, 11/15/26 (Call 08/15/26) |
1,501 | 1,426,677 | ||||||
| 3.90%, 09/01/42 (Call 03/01/42) |
1,275 | 1,086,249 | ||||||
| 4.88%, 09/15/41 (Call 03/15/41) |
505 | 484,860 | ||||||
| Parker-Hannifin Corp. |
||||||||
| 3.25%, 03/01/27 (Call 12/01/26) |
848 | 806,340 | ||||||
| 3.25%, 06/14/29 (Call 03/14/29) |
1,461 | 1,343,426 | ||||||
| 4.00%, 06/14/49 (Call 12/14/48) |
917 | 748,913 | ||||||
| 4.10%, 03/01/47 (Call 09/01/46)(a) |
770 | 633,049 | ||||||
| 4.20%, 11/21/34 (Call 05/21/34) |
719 | 662,501 | ||||||
| 4.25%, 09/15/27 (Call 08/15/27) |
1,475 | 1,443,549 | ||||||
| 4.45%, 11/21/44 (Call 05/21/44)(a) |
882 | 772,558 | ||||||
| 4.50%, 09/15/29 (Call 07/15/29) |
1,364 | 1,334,097 | ||||||
| 6.25%, 05/15/38 |
230 | 246,263 | ||||||
| Pentair Finance Sarl |
||||||||
| 4.50%, 07/01/29 (Call 04/01/29) |
790 | 761,202 | ||||||
| 5.90%, 07/15/32 (Call 04/15/32) |
499 | 511,893 | ||||||
| Siemens Financieringsmaatschappij NV |
||||||||
| 1.20%, 03/11/26(b) |
2,570 | 2,380,257 | ||||||
| 1.70%, 03/11/28(b) |
1,858 | 1,653,036 | ||||||
| 2.15%, 03/11/31(b) |
2,291 | 1,907,286 | ||||||
| 2.35%, 10/15/26(b) |
2,035 | 1,904,304 | ||||||
| 2.88%, 03/11/41(a)(b) |
2,210 | 1,655,304 | ||||||
| 3.25%, 05/27/25(a)(b) |
1,400 | 1,369,489 | ||||||
| 3.30%, 09/15/46(b) |
1,521 | 1,153,844 | ||||||
| 3.40%, 03/16/27(b) |
1,650 | 1,582,288 | ||||||
| 4.20%, 03/16/47(a)(b) |
1,704 | 1,494,760 | ||||||
| 4.40%, 05/27/45(b) |
1,932 | 1,740,922 | ||||||
| 6.13%, 08/17/26(b) |
2,585 | 2,651,959 | ||||||
| Teledyne Technologies Inc. |
||||||||
| 1.60%, 04/01/26 (Call 03/01/26) |
1,027 | 952,120 | ||||||
| 2.25%, 04/01/28 (Call 02/01/28) |
840 | 752,658 | ||||||
| 2.75%, 04/01/31 (Call 01/01/31) |
1,499 | 1,272,422 | ||||||
| Textron Inc. |
||||||||
| 2.45%, 03/15/31 (Call 12/15/30) |
772 | 644,667 | ||||||
| 3.00%, 06/01/30 (Call 03/01/30) |
970 | 850,841 | ||||||
| 3.38%, 03/01/28 (Call 12/01/27) |
597 | 559,284 | ||||||
| 3.65%, 03/15/27 (Call 12/15/26) |
595 | 569,186 | ||||||
| 3.88%, 03/01/25 (Call 12/01/24) |
475 | 467,557 | ||||||
| 3.90%, 09/17/29 (Call 06/17/29) |
780 | 730,473 | ||||||
| 4.00%, 03/15/26 (Call 12/15/25) |
977 | 950,620 | ||||||
| 6.10%, 11/15/33 (Call 08/15/33)(a) |
415 | 433,148 | ||||||
|
|
|
|||||||
| 68,886,621 | ||||||||
| Security | Par (000) |
Value | ||||||
| Media — 2.4% | ||||||||
| Charter Communications |
||||||||
| Operating LLC/Charter Communications |
||||||||
| Operating Capital |
||||||||
| 2.25%, 01/15/29 (Call 11/15/28) |
$ | 1,550 | $ | 1,307,910 | ||||
| 2.30%, 02/01/32 (Call 11/01/31) |
1,455 | 1,105,416 | ||||||
| 2.80%, 04/01/31 (Call 01/01/31) |
2,185 | 1,765,742 | ||||||
| 3.50%, 06/01/41 (Call 12/01/40) |
2,005 | 1,327,298 | ||||||
| 3.50%, 03/01/42 (Call 09/01/41) |
1,579 | 1,032,797 | ||||||
| 3.70%, 04/01/51 (Call 10/01/50) |
2,694 | 1,635,380 | ||||||
| 3.75%, 02/15/28 (Call 11/15/27) |
1,857 | 1,711,225 | ||||||
| 3.85%, 04/01/61 (Call 10/01/60)(a) |
2,282 | 1,325,473 | ||||||
| 3.90%, 06/01/52 (Call 12/01/51) |
3,180 | 1,999,262 | ||||||
| 3.95%, 06/30/62 (Call 12/30/61) |
1,865 | 1,098,594 | ||||||
| 4.20%, 03/15/28 (Call 12/15/27) |
1,603 | 1,502,595 | ||||||
| 4.40%, 04/01/33 (Call 01/01/33)(a) |
1,385 | 1,210,815 | ||||||
| 4.40%, 12/01/61 (Call 06/01/61) |
1,839 | 1,182,183 | ||||||
| 4.80%, 03/01/50 (Call 09/01/49) |
3,674 | 2,658,584 | ||||||
| 4.91%, 07/23/25 (Call 04/23/25) |
3,986 | 3,930,845 | ||||||
| 5.05%, 03/30/29 (Call 12/30/28) |
2,034 | 1,946,064 | ||||||
| 5.13%, 07/01/49 (Call 01/01/49) |
1,660 | 1,260,839 | ||||||
| 5.25%, 04/01/53 (Call 10/01/52)(a) |
2,000 | 1,552,765 | ||||||
| 5.38%, 04/01/38 (Call 10/01/37) |
1,065 | 917,538 | ||||||
| 5.38%, 05/01/47 (Call 11/01/46) |
3,186 | 2,515,955 | ||||||
| 5.50%, 04/01/63 (Call 10/01/62) |
1,355 | 1,048,091 | ||||||
| 5.75%, 04/01/48 (Call 10/01/47) |
3,195 | 2,659,739 | ||||||
| 6.15%, 11/10/26 (Call 10/10/26)(a) |
1,460 | 1,472,761 | ||||||
| 6.38%, 10/23/35 (Call 04/23/35) |
2,621 | 2,537,315 | ||||||
| 6.48%, 10/23/45 (Call 04/23/45) |
4,522 | 4,131,103 | ||||||
| 6.65%, 02/01/34 (Call 11/01/33)(a) |
1,365 | 1,369,687 | ||||||
| 6.83%, 10/23/55 (Call 04/23/55) |
675 | 639,599 | ||||||
| Comcast Corp. |
||||||||
| 1.50%, 02/15/31 (Call 11/15/30)(a) |
2,033 | 1,621,576 | ||||||
| 1.95%, 01/15/31 (Call 10/15/30) |
2,192 | 1,800,837 | ||||||
| 2.35%, 01/15/27 (Call 10/15/26) |
1,861 | 1,735,019 | ||||||
| 2.45%, 08/15/52 (Call 02/15/52) |
1,893 | 1,084,819 | ||||||
| 2.65%, 02/01/30 (Call 11/01/29) |
2,545 | 2,237,721 | ||||||
| 2.65%, 08/15/62 (Call 02/15/62) |
1,543 | 862,961 | ||||||
| 2.80%, 01/15/51 (Call 07/15/50) |
2,293 | 1,433,422 | ||||||
| 2.89%, 11/01/51 (Call 05/01/51) |
6,435 | 4,074,324 | ||||||
| 2.94%, 11/01/56 (Call 05/01/56)(a) |
7,532 | 4,634,678 | ||||||
| 2.99%, 11/01/63 (Call 05/01/63)(a) |
5,126 | 3,079,628 | ||||||
| 3.15%, 03/01/26 (Call 12/01/25) |
2,206 | 2,128,952 | ||||||
| 3.15%, 02/15/28 (Call 11/15/27) |
2,198 | 2,061,308 | ||||||
| 3.20%, 07/15/36 (Call 01/15/36) |
1,442 | 1,164,543 | ||||||
| 3.25%, 11/01/39 (Call 05/01/39) |
2,078 | 1,593,615 | ||||||
| 3.30%, 02/01/27 (Call 11/01/26) |
1,682 | 1,611,534 | ||||||
| 3.30%, 04/01/27 (Call 02/01/27) |
1,426 | 1,360,069 | ||||||
| 3.38%, 08/15/25 (Call 05/15/25) |
2,159 | 2,108,507 | ||||||
| 3.40%, 04/01/30 (Call 01/01/30) |
2,062 | 1,886,857 | ||||||
| 3.40%, 07/15/46 (Call 01/15/46) |
1,856 | 1,361,040 | ||||||
| 3.45%, 02/01/50 (Call 08/01/49) |
2,288 | 1,642,917 | ||||||
| 3.55%, 05/01/28 (Call 02/01/28) |
836 | 793,650 | ||||||
| 3.75%, 04/01/40 (Call 10/01/39) |
1,959 | 1,603,410 | ||||||
| 3.90%, 03/01/38 (Call 09/01/37) |
987 | 846,435 | ||||||
| 3.95%, 10/15/25 (Call 08/15/25) |
3,478 | 3,417,349 | ||||||
| 3.97%, 11/01/47 (Call 05/01/47) |
2,756 | 2,183,251 | ||||||
| 4.00%, 08/15/47 (Call 02/15/47) |
1,132 | 907,049 | ||||||
| 4.00%, 03/01/48 (Call 09/01/47) |
1,104 | 875,249 | ||||||
| 4.00%, 11/01/49 (Call 05/01/49) |
2,376 | 1,888,683 | ||||||
| 4.05%, 11/01/52 (Call 05/01/52) |
1,556 | 1,228,235 | ||||||
| 4.15%, 10/15/28 (Call 07/15/28) |
6,259 | 6,071,822 | ||||||
| S C H E D U L E O F I N V E S T M E N T S |
101 |
| Schedule of Investments (continued) February 29, 2024 |
iShares® Broad USD Investment Grade Corporate Bond ETF (Percentages shown are based on Net Assets) |
| Security | Par (000) |
Value | ||||||
| Media (continued) | ||||||||
| 4.20%, 08/15/34 (Call 02/15/34) |
$ | 1,221 | $ | 1,122,644 | ||||
| 4.25%, 10/15/30 (Call 07/15/30) |
1,931 | 1,847,405 | ||||||
| 4.25%, 01/15/33 |
2,264 | 2,119,987 | ||||||
| 4.40%, 08/15/35 (Call 02/15/35) |
971 | 902,165 | ||||||
| 4.55%, 01/15/29 (Call 12/15/28) |
1,395 | 1,372,479 | ||||||
| 4.60%, 10/15/38 (Call 04/15/38) |
1,165 | 1,072,505 | ||||||
| 4.60%, 08/15/45 (Call 02/15/45) |
972 | 860,530 | ||||||
| 4.65%, 02/15/33 (Call 11/15/32)(a) |
1,950 | 1,894,170 | ||||||
| 4.65%, 07/15/42 |
1,160 | 1,044,448 | ||||||
| 4.70%, 10/15/48 (Call 04/15/48) |
2,087 | 1,883,494 | ||||||
| 4.75%, 03/01/44 |
501 | 455,615 | ||||||
| 4.80%, 05/15/33 (Call 02/15/33)(a) |
520 | 508,103 | ||||||
| 4.95%, 10/15/58 (Call 04/15/58)(a) |
1,265 | 1,171,078 | ||||||
| 5.25%, 11/07/25 |
600 | 602,694 | ||||||
| 5.35%, 11/15/27 (Call 10/15/27) |
1,205 | 1,223,800 | ||||||
| 5.35%, 05/15/53 (Call 11/15/52) |
1,930 | 1,880,828 | ||||||
| 5.50%, 11/15/32 (Call 08/15/32) |
1,455 | 1,492,095 | ||||||
| 5.50%, 05/15/64 (Call 11/15/63) |
1,605 | 1,574,065 | ||||||
| 5.65%, 06/15/35(a) |
1,222 | 1,256,397 | ||||||
| 6.40%, 03/01/40 |
485 | 524,947 | ||||||
| 6.45%, 03/15/37 |
602 | 659,748 | ||||||
| 6.50%, 11/15/35 |
904 | 983,891 | ||||||
| 6.55%, 07/01/39(a) |
685 | 751,306 | ||||||
| 6.95%, 08/15/37 |
810 | 917,862 | ||||||
| 7.05%, 03/15/33 |
1,264 | 1,419,829 | ||||||
| Cox Communications Inc. |
||||||||
| 1.80%, 10/01/30 (Call 07/01/30)(b) |
890 | 708,529 | ||||||
| 2.60%, 06/15/31 (Call 03/15/31)(b) |
890 | 728,211 | ||||||
| 2.95%, 10/01/50 (Call 04/01/50)(b) |
480 | 292,682 | ||||||
| 3.35%, 09/15/26 (Call 06/15/26)(b) |
1,263 | 1,201,363 | ||||||
| 3.50%, 08/15/27 (Call 05/15/27)(b) |
1,091 | 1,029,282 | ||||||
| 3.60%, 06/15/51 (Call 12/15/50)(a)(b) |
595 | 412,561 | ||||||
| 4.50%, 06/30/43 (Call 12/30/42)(b) |
840 | 686,677 | ||||||
| 4.60%, 08/15/47 (Call 02/15/47)(b) |
375 | 300,954 | ||||||
| 4.70%, 12/15/42(b) |
645 | 538,403 | ||||||
| 4.80%, 02/01/35 (Call 08/01/34)(a)(b) |
1,061 | 975,254 | ||||||
| 5.45%, 09/15/28 (Call 08/15/28)(b) |
783 | 789,238 | ||||||
| 5.70%, 06/15/33 (Call 03/15/33)(a)(b) |
583 | 583,720 | ||||||
| 5.80%, 12/15/53 (Call 06/15/53)(a)(b) |
625 | 608,475 | ||||||
| 8.38%, 03/01/39(b) |
575 | 689,053 | ||||||
| Discovery Communications LLC |
||||||||
| 3.45%, 03/15/25 (Call 12/15/24) |
219 | 213,816 | ||||||
| 3.63%, 05/15/30 (Call 02/15/30)(a) |
1,353 | 1,189,238 | ||||||
| 3.95%, 06/15/25 (Call 03/15/25)(a) |
588 | 574,417 | ||||||
| 3.95%, 03/20/28 (Call 12/20/27) |
2,290 | 2,143,943 | ||||||
| 4.00%, 09/15/55 (Call 03/15/55) |
2,102 | 1,391,350 | ||||||
| 4.13%, 05/15/29 (Call 02/15/29) |
1,136 | 1,052,317 | ||||||
| 4.65%, 05/15/50 (Call 11/15/49) |
1,169 | 886,490 | ||||||
| 4.88%, 04/01/43(a) |
843 | 678,663 | ||||||
| 4.90%, 03/11/26 (Call 12/11/25) |
1,442 | 1,420,023 | ||||||
| 4.95%, 05/15/42(a) |
840 | 661,834 | ||||||
| 5.00%, 09/20/37 (Call 03/20/37)(a) |
1,015 | 869,403 | ||||||
| 5.20%, 09/20/47 (Call 03/20/47) |
1,720 | 1,398,674 | ||||||
| 5.30%, 05/15/49 (Call 11/15/48) |
1,048 | 857,259 | ||||||
| 6.35%, 06/01/40(a) |
897 | 861,292 | ||||||
| FactSet Research Systems Inc. |
||||||||
| 2.90%, 03/01/27 (Call 02/01/27) |
899 | 837,779 | ||||||
| 3.45%, 03/01/32 (Call 12/01/31)(a) |
940 | 817,302 | ||||||
| Fox Corp. |
||||||||
| 3.05%, 04/07/25 (Call 03/07/25) |
757 | 737,077 | ||||||
| 3.50%, 04/08/30 (Call 01/08/30)(a) |
1,043 | 939,386 | ||||||
| Security | Par (000) |
Value | ||||||
| Media (continued) | ||||||||
| 4.71%, 01/25/29 (Call 10/25/28) |
$ | 2,926 | $ | 2,854,924 | ||||
| 5.48%, 01/25/39 (Call 07/25/38)(a) |
1,878 | 1,754,386 | ||||||
| 5.58%, 01/25/49 (Call 07/25/48)(a) |
2,174 | 1,988,542 | ||||||
| 6.50%, 10/13/33 (Call 07/13/33) |
1,580 | 1,659,460 | ||||||
| Grupo Televisa SAB |
||||||||
| 5.00%, 05/13/45 (Call 11/13/44) |
440 | 368,084 | ||||||
| 5.25%, 05/24/49 (Call 11/24/48) |
0 | 391 | ||||||
| 6.13%, 01/31/46 (Call 07/31/45)(a) |
1,190 | 1,162,412 | ||||||
| 6.63%, 01/15/40(a) |
852 | 878,972 | ||||||
| 8.50%, 03/11/32(a) |
437 | 501,470 | ||||||
| NBCUniversal Media LLC |
||||||||
| 4.45%, 01/15/43 |
1,150 | 1,006,158 | ||||||
| 5.95%, 04/01/41(a) |
535 | 553,592 | ||||||
| 6.40%, 04/30/40 |
550 | 596,138 | ||||||
| Paramount Global |
||||||||
| 2.90%, 01/15/27 (Call 10/15/26) |
332 | 299,129 | ||||||
| 3.38%, 02/15/28 (Call 11/15/27) |
613 | 540,253 | ||||||
| 3.70%, 06/01/28 (Call 03/01/28) |
749 | 662,833 | ||||||
| 4.20%, 06/01/29 (Call 03/01/29)(a) |
487 | 428,682 | ||||||
| 4.20%, 05/19/32 (Call 02/19/32)(a) |
1,171 | 954,719 | ||||||
| 4.38%, 03/15/43 |
1,550 | 1,037,274 | ||||||
| 4.60%, 01/15/45 (Call 07/15/44) |
772 | 529,936 | ||||||
| 4.85%, 07/01/42 (Call 01/01/42) |
849 | 619,592 | ||||||
| 4.90%, 08/15/44 (Call 02/15/44)(a) |
710 | 499,882 | ||||||
| 4.95%, 01/15/31 (Call 10/15/30)(a) |
1,392 | 1,222,330 | ||||||
| 4.95%, 05/19/50 (Call 11/19/49) |
1,313 | 934,201 | ||||||
| 5.25%, 04/01/44 (Call 10/01/43)(a) |
426 | 316,843 | ||||||
| 5.50%, 05/15/33(a) |
523 | 454,568 | ||||||
| 5.85%, 09/01/43 (Call 03/01/43) |
1,575 | 1,273,887 | ||||||
| 5.90%, 10/15/40 (Call 04/15/40)(a) |
478 | 388,595 | ||||||
| 6.88%, 04/30/36 |
1,269 | 1,164,255 | ||||||
| 7.88%, 07/30/30 |
855 | 873,094 | ||||||
| Sky Group Finance Ltd., 6.50%, 10/15/35(a)(b) |
726 | 787,952 | ||||||
| TCI Communications Inc. |
||||||||
| 7.13%, 02/15/28 |
1,009 | 1,088,377 | ||||||
| 7.88%, 02/15/26 |
1,720 | 1,806,636 | ||||||
| Thomson Reuters Corp. |
||||||||
| 3.35%, 05/15/26 (Call 02/15/26) |
1,007 | 966,390 | ||||||
| 5.50%, 08/15/35(a) |
765 | 777,107 | ||||||
| 5.65%, 11/23/43 (Call 05/23/43) |
359 | 346,226 | ||||||
| 5.85%, 04/15/40(a) |
825 | 840,097 | ||||||
| Time Warner Cable Enterprises LLC, 8.38%, 07/15/33 |
1,238 | 1,373,918 | ||||||
| Time Warner Cable LLC |
||||||||
| 4.50%, 09/15/42 (Call 03/15/42) |
1,808 | 1,323,917 | ||||||
| 5.50%, 09/01/41 (Call 03/01/41) |
1,781 | 1,468,236 | ||||||
| 5.88%, 11/15/40 (Call 05/15/40) |
1,732 | 1,493,793 | ||||||
| 6.55%, 05/01/37 |
1,889 | 1,779,302 | ||||||
| 6.75%, 06/15/39 |
1,882 | 1,775,819 | ||||||
| 7.30%, 07/01/38 |
1,775 | 1,769,705 | ||||||
| TWDC Enterprises 18 Corp. |
||||||||
| 1.85%, 07/30/26 |
1,552 | 1,443,151 | ||||||
| 2.95%, 06/15/27 |
1,357 | 1,287,051 | ||||||
| 3.00%, 02/13/26(a) |
1,435 | 1,382,282 | ||||||
| 3.00%, 07/30/46 |
805 | 561,678 | ||||||
| 3.15%, 09/17/25 |
1,113 | 1,079,653 | ||||||
| 3.70%, 12/01/42(a) |
935 | 757,844 | ||||||
| 4.13%, 06/01/44 |
1,200 | 1,028,030 | ||||||
| 4.38%, 08/16/41 |
579 | 509,610 | ||||||
| Series B, 7.00%, 03/01/32(a) |
958 | 1,082,642 | ||||||
| Series E, 4.13%, 12/01/41 |
998 | 857,246 | ||||||
| 102 | 2 0 2 4 I S H A R E S A N N U A L R E P O R T T O S H A R E H O L D E R S |
| Schedule of Investments (continued) February 29, 2024 |
iShares® Broad USD Investment Grade Corporate Bond ETF (Percentages shown are based on Net Assets) |
| Security | Par (000) |
Value | ||||||
| Media (continued) | ||||||||
| Walt Disney Co. (The) |
||||||||
| 1.75%, 01/13/26 |
$ | 2,059 | $ | 1,942,103 | ||||
| 2.00%, 09/01/29 (Call 06/01/29) |
2,664 | 2,298,204 | ||||||
| 2.20%, 01/13/28(a) |
1,464 | 1,334,806 | ||||||
| 2.65%, 01/13/31(a) |
2,725 | 2,370,085 | ||||||
| 2.75%, 09/01/49 (Call 03/01/49) |
2,790 | 1,800,516 | ||||||
| 3.35%, 03/24/25(a) |
1,327 | 1,300,310 | ||||||
| 3.38%, 11/15/26 (Call 08/15/26) |
862 | 829,529 | ||||||
| 3.50%, 05/13/40 (Call 11/13/39) |
2,420 | 1,941,710 | ||||||
| 3.60%, 01/13/51 (Call 07/13/50) |
3,470 | 2,635,709 | ||||||
| 3.70%, 10/15/25 (Call 07/15/25) |
841 | 821,956 | ||||||
| 3.70%, 03/23/27 |
1,303 | 1,262,563 | ||||||
| 3.80%, 03/22/30(a) |
1,535 | 1,449,459 | ||||||
| 3.80%, 05/13/60 (Call 11/13/59) |
1,364 | 1,040,450 | ||||||
| 4.63%, 03/23/40 (Call 09/23/39) |
1,128 | 1,060,518 | ||||||
| 4.70%, 03/23/50 (Call 09/23/49)(a) |
2,120 | 1,940,559 | ||||||
| 4.75%, 09/15/44 (Call 03/15/44) |
943 | 866,579 | ||||||
| 4.75%, 11/15/46 (Call 05/15/46) |
717 | 648,525 | ||||||
| 4.95%, 10/15/45 (Call 04/15/45) |
688 | 642,436 | ||||||
| 5.40%, 10/01/43(a) |
604 | 608,632 | ||||||
| 6.15%, 03/01/37 |
415 | 449,540 | ||||||
| 6.15%, 02/15/41 |
842 | 908,799 | ||||||
| 6.20%, 12/15/34 |
1,380 | 1,507,202 | ||||||
| 6.40%, 12/15/35 |
1,339 | 1,476,657 | ||||||
| 6.55%, 03/15/33(a) |
70 | 77,878 | ||||||
| 6.65%, 11/15/37 |
1,630 | 1,846,365 | ||||||
| 7.75%, 12/01/45 |
309 | 395,743 | ||||||
|
|
|
|||||||
| 249,329,882 | ||||||||
| Metal Fabricate & Hardware — 0.0% | ||||||||
| Precision Castparts Corp. |
||||||||
| 3.25%, 06/15/25 (Call 03/15/25)(a) |
1,133 | 1,106,621 | ||||||
| 3.90%, 01/15/43 (Call 07/15/42)(a) |
220 | 182,638 | ||||||
| 4.20%, 06/15/35 (Call 12/15/34)(a) |
385 | 345,417 | ||||||
| 4.38%, 06/15/45 (Call 12/15/44) |
586 | 514,137 | ||||||
| Timken Co. (The) |
||||||||
| 4.13%, 04/01/32 (Call 01/01/32) |
615 | 559,954 | ||||||
| 4.50%, 12/15/28 (Call 09/15/28)(a) |
705 | 684,423 | ||||||
| Valmont Industries Inc. |
||||||||
| 5.00%, 10/01/44 (Call 04/01/44) |
429 | 375,605 | ||||||
| 5.25%, 10/01/54 (Call 04/01/54)(a) |
445 | 380,467 | ||||||
|
|
|
|||||||
| 4,149,262 | ||||||||
| Mining — 1.2% | ||||||||
| Alcoa Nederland Holding BV |
||||||||
| 4.13%, 03/31/29 (Call 03/31/24)(a)(b) |
1,095 | 1,002,650 | ||||||
| 5.50%, 12/15/27 (Call 04/02/24)(a)(b) |
1,555 | 1,528,219 | ||||||
| 6.13%, 05/15/28 (Call 04/02/24)(a)(b) |
825 | 825,151 | ||||||
| Anglo American Capital PLC |
||||||||
| 2.25%, 03/17/28 (Call 01/17/28)(b) |
976 | 860,276 | ||||||
| 2.63%, 09/10/30 (Call 06/10/30)(a)(b) |
1,110 | 934,507 | ||||||
| 2.88%, 03/17/31 (Call 12/17/30)(a)(b) |
783 | 657,618 | ||||||
| 3.88%, 03/16/29 (Call 01/16/29)(b) |
905 | 840,749 | ||||||
| 3.95%, 09/10/50 (Call 03/10/50)(a)(b) |
730 | 541,496 | ||||||
| 4.00%, 09/11/27(b) |
1,109 | 1,056,635 | ||||||
| 4.50%, 03/15/28 (Call 12/15/27)(a)(b) |
660 | 635,445 | ||||||
| 4.75%, 04/10/27(b) |
985 | 963,819 | ||||||
| 4.75%, 03/16/52 (Call 09/16/51)(a)(b) |
910 | 763,959 | ||||||
| 4.88%, 05/14/25(b) |
663 | 655,752 | ||||||
| 5.50%, 05/02/33 (Call 02/02/33)(a)(b) |
1,300 | 1,279,706 | ||||||
| 5.63%, 04/01/30 (Call 01/01/30)(a)(b) |
1,365 | 1,369,656 | ||||||
| Security | Par (000) |
Value | ||||||
| Mining (continued) | ||||||||
| AngloGold Ashanti Holdings PLC |
||||||||
| 3.38%, 11/01/28 (Call 09/01/28)(a) |
$ | 770 | $ | 689,671 | ||||
| 3.75%, 10/01/30 (Call 07/01/30)(a) |
752 | 652,277 | ||||||
| Antofagasta PLC, 5.63%,
05/13/32 |
215 | 213,563 | ||||||
| Barrick Gold Corp. |
||||||||
| 5.25%, 04/01/42 |
155 | 151,005 | ||||||
| 6.45%, 10/15/35 |
655 | 707,547 | ||||||
| Barrick International Barbados Corp., |
1,100 | 1,164,110 | ||||||
| Barrick North America Finance LLC |
||||||||
| 5.70%, 05/30/41 |
1,221 | 1,239,656 | ||||||
| 5.75%, 05/01/43 |
1,063 | 1,088,200 | ||||||
| 7.50%, 09/15/38(a) |
312 | 358,655 | ||||||
| Barrick PD Australia Finance Pty. Ltd., |
1,050 | 1,075,110 | ||||||
| BHP Billiton Finance USA Ltd. |
||||||||
| 4.13%, 02/24/42 |
1,654 | 1,425,151 | ||||||
| 4.75%, 02/28/28 (Call 01/28/28) |
1,175 | 1,167,055 | ||||||
| 4.88%, 02/27/26(a) |
1,125 | 1,120,155 | ||||||
| 4.90%, 02/28/33 (Call 11/28/32) |
1,180 | 1,164,284 | ||||||
| 5.00%, 09/30/43 |
3,226 | 3,085,761 | ||||||
| 5.10%, 09/08/28 (Call 08/08/28) |
1,490 | 1,499,070 | ||||||
| 5.25%, 09/08/26 |
1,607 | 1,616,945 | ||||||
| 5.25%, 09/08/30 (Call 07/08/30) |
1,406 | 1,417,128 | ||||||
| 5.25%, 09/08/33 (Call 06/08/33) |
2,060 | 2,069,165 | ||||||
| 5.50%, 09/08/53 (Call 03/08/53)(a) |
800 | 818,423 | ||||||
| 6.42%, 03/01/26 |
437 | 447,698 | ||||||
| Corp. Nacional del Cobre de Chile |
||||||||
| 3.00%, 09/30/29 (Call 06/30/29)(b) |
884 | 772,897 | ||||||
| 3.15%, 01/14/30 (Call 10/14/29)(a)(b) |
1,161 | 1,010,730 | ||||||
| 3.15%, 01/15/51 (Call 07/15/50)(b) |
682 | 413,310 | ||||||
| 3.63%, 08/01/27 (Call 05/01/27)(b) |
1,750 | 1,643,099 | ||||||
| 3.70%, 01/30/50 (Call 07/30/49)(b) |
4,463 | 2,982,159 | ||||||
| 3.75%, 01/15/31 (Call 10/15/30)(b) |
755 | 664,021 | ||||||
| 4.25%, 07/17/42(b) |
760 | 583,832 | ||||||
| 4.38%, 02/05/49 (Call 08/05/48)(b) |
1,710 | 1,301,242 | ||||||
| 4.50%, 09/16/25(a)(b) |
862 | 844,228 | ||||||
| 4.50%, 08/01/47 (Call 02/01/47)(b) |
1,570 | 1,207,189 | ||||||
| 4.88%, 11/04/44(a)(b) |
1,057 | 864,516 | ||||||
| 5.13%, 02/02/33 (Call 11/02/32)(a)(b) |
1,325 | 1,240,688 | ||||||
| 5.63%, 09/21/35(a)(b) |
409 | 391,759 | ||||||
| 5.63%, 10/18/43(a)(b) |
1,073 | 979,833 | ||||||
| 5.95%, 01/08/34 (Call 10/08/33)(a)(b) |
1,392 | 1,373,661 | ||||||
| 6.15%, 10/24/36(b) |
100 | 99,166 | ||||||
| 6.30%, 09/08/53 (Call 03/08/53)(b) |
1,020 | 985,527 | ||||||
| 6.44%, 01/26/36 (Call 10/26/35)(b) |
273 | 277,573 | ||||||
| Freeport Indonesia PT |
||||||||
| 4.76%, 04/14/27 (Call 03/14/27)(b) |
550 | 534,900 | ||||||
| 5.32%, 04/14/32 (Call 01/01/32)(b) |
1,730 | 1,675,734 | ||||||
| 6.20%, 04/14/52 (Call 10/14/51)(a)(b) |
1,330 | 1,271,708 | ||||||
| Freeport-McMoRan Inc. |
||||||||
| 4.13%, 03/01/28 (Call 04/01/24) |
785 | 744,808 | ||||||
| 4.25%, 03/01/30 (Call 03/01/25) |
940 | 878,278 | ||||||
| 4.38%, 08/01/28 (Call 04/01/24)(a) |
770 | 732,514 | ||||||
| 4.63%, 08/01/30 (Call 08/01/25)(a) |
876 | 834,814 | ||||||
| 5.00%, 09/01/27 (Call 04/01/24)(a) |
515 | 506,333 | ||||||
| 5.25%, 09/01/29 (Call 09/01/24)(a) |
750 | 745,982 | ||||||
| 5.40%, 11/14/34 (Call 05/14/34) |
1,105 | 1,074,939 | ||||||
| 5.45%, 03/15/43 (Call 09/15/42) |
2,335 | 2,174,226 | ||||||
| S C H E D U L E O F I N V E S T M E N T S |
103 |
| Schedule of Investments (continued) February 29, 2024 |
iShares® Broad USD Investment Grade Corporate Bond ETF (Percentages shown are based on Net Assets) |
| Security | Par (000) |
Value | ||||||
| Mining (continued) | ||||||||
| Fresnillo PLC, 4.25%,
10/02/50 |
$ | 714 | $ | 527,102 | ||||
| Glencore Canada Corp., 6.20%, 06/15/35(a) |
560 | 578,166 | ||||||
| Glencore Finance Canada Ltd. |
||||||||
| 5.55%, 10/25/42(a)(b) |
466 | 440,943 | ||||||
| 6.00%, 11/15/41(b) |
890 | 884,767 | ||||||
| 6.90%, 11/15/37(b) |
1,009 | 1,094,474 | ||||||
| Glencore Funding LLC |
||||||||
| 1.63%, 09/01/25 (Call 08/01/25)(b) |
1,310 | 1,237,378 | ||||||
| 1.63%, 04/27/26 (Call 03/27/26)(b) |
1,312 | 1,213,389 | ||||||
| 2.50%, 09/01/30 (Call 06/01/30)(a)(b) |
1,295 | 1,096,179 | ||||||
| 2.63%, 09/23/31 (Call 06/23/31)(b) |
990 | 821,365 | ||||||
| 2.85%, 04/27/31 (Call 01/27/31)(b) |
805 | 685,948 | ||||||
| 3.38%, 09/23/51 (Call 03/23/51)(a)(b) |
555 | 380,851 | ||||||
| 3.88%, 10/27/27 (Call 07/27/27)(b) |
660 | 627,719 | ||||||
| 3.88%, 04/27/51 (Call 10/27/50)(a)(b) |
392 | 293,912 | ||||||
| 4.00%, 04/16/25(b) |
800 | 786,089 | ||||||
| 4.00%, 03/27/27 (Call 12/27/26)(b) |
1,392 | 1,339,352 | ||||||
| 4.88%, 03/12/29 (Call 12/12/28)(a)(b) |
1,134 | 1,118,322 | ||||||
| 5.40%, 05/08/28 (Call 04/08/28)(b) |
940 | 945,143 | ||||||
| 5.70%, 05/08/33 (Call 02/08/33)(b) |
795 | 804,171 | ||||||
| 6.13%, 10/06/28 (Call 09/06/28)(b) |
1,030 | 1,063,124 | ||||||
| 6.38%, 10/06/30 (Call 08/06/30)(b) |
610 | 640,951 | ||||||
| 6.50%, 10/06/33 (Call 07/06/33)(a)(b) |
675 | 720,147 | ||||||
| Gold Fields Orogen Holdings BVI Ltd., |
110 | 111,371 | ||||||
| Indonesia Asahan Aluminium PT/Mineral |
||||||||
| Industri Indonesia Persero PT |
||||||||
| 4.75%, 05/15/25 (Call 04/15/25)(b) |
1,763 | 1,740,174 | ||||||
| 5.45%, 05/15/30 (Call 02/15/30)(a)(b) |
1,290 | 1,260,678 | ||||||
| 5.80%, 05/15/50 (Call 11/15/49)(b) |
445 | 409,455 | ||||||
| 6.53%, 11/15/28(a)(b) |
530 | 545,932 | ||||||
| 6.76%, 11/15/48(a)(b) |
550 | 569,308 | ||||||
| Industrias Penoles SAB de CV |
||||||||
| 4.15%, 09/12/29 (Call 06/12/29)(b) |
590 | 545,374 | ||||||
| 4.75%, 08/06/50 (Call 02/06/50)(b) |
471 | 363,471 | ||||||
| 5.65%, 09/12/49 (Call 03/12/49)(b) |
390 | 342,607 | ||||||
| Kinross Gold Corp. |
||||||||
| 4.50%, 07/15/27 (Call 04/15/27) |
1,075 | 1,044,749 | ||||||
| 6.25%, 07/15/33 (Call 04/15/33)(b) |
950 | 969,622 | ||||||
| 6.88%, 09/01/41 (Call 03/01/41) |
485 | 509,884 | ||||||
| Minera Mexico SA de CV, 4.50%, 01/26/50 (Call 07/26/49)(b) |
1,360 | 1,048,027 | ||||||
| Newcastle Coal Infrastructure Group Pty. Ltd. |
||||||||
| 4.40%, 09/29/27 (Call 06/29/27)(a)(b) |
499 | 468,578 | ||||||
| 4.70%, 05/12/31 (Call 02/12/31)(a)(b) |
881 | 789,482 | ||||||
| Newmont Corp. |
||||||||
| 2.25%, 10/01/30 (Call 07/01/30) |
1,402 | 1,172,418 | ||||||
| 2.60%, 07/15/32 (Call 04/15/32)(a) |
1,585 | 1,304,468 | ||||||
| 2.80%, 10/01/29 (Call 07/01/29)(a) |
1,141 | 1,013,557 | ||||||
| 4.88%, 03/15/42 (Call 09/15/41)(a) |
1,330 | 1,225,185 | ||||||
| 5.45%, 06/09/44 (Call 12/09/43) |
489 | 477,671 | ||||||
| 5.88%, 04/01/35(a) |
792 | 815,606 | ||||||
| 6.25%, 10/01/39 |
1,165 | 1,234,217 | ||||||
| Newmont Corp./Newcrest Finance Pty Ltd. |
||||||||
| 3.25%, 05/13/30 (Call 02/13/30)(b) |
1,091 | 975,772 | ||||||
| 4.20%, 05/13/50 (Call 11/13/49) |
625 | 514,391 | ||||||
| 5.75%, 11/15/41 (Call 08/15/41)(a) |
695 | 705,485 | ||||||
| Northern Star Resources Ltd., 6.13%, 04/11/33 (Call 01/11/33)(a)(b) |
860 | 859,770 | ||||||
| Security | Par (000) |
Value | ||||||
| Mining (continued) | ||||||||
| Rio Tinto Alcan Inc. |
||||||||
| 5.75%, 06/01/35(a) |
$ | 557 | $ | 577,363 | ||||
| 6.13%, 12/15/33 |
1,339 | 1,423,794 | ||||||
| 7.25%, 03/15/31 |
325 | 363,099 | ||||||
| Rio Tinto Finance USA Ltd. |
||||||||
| 2.75%, 11/02/51 (Call 05/02/51) |
1,415 | 897,692 | ||||||
| 5.20%, 11/02/40(a) |
1,716 | 1,689,427 | ||||||
| 7.13%, 07/15/28 |
1,340 | 1,459,574 | ||||||
| Rio Tinto Finance USA PLC |
||||||||
| 4.13%, 08/21/42 (Call 02/21/42) |
1,191 | 1,022,652 | ||||||
| 4.75%, 03/22/42 (Call 09/22/41)(a) |
969 | 908,151 | ||||||
| 5.00%, 03/09/33 (Call 12/09/32)(a) |
1,065 | 1,063,902 | ||||||
| 5.13%, 03/09/53 (Call 09/09/52) |
620 | 595,875 | ||||||
| South32 Treasury Ltd., 4.35%, 04/14/32 (Call 01/14/32)(a)(b) |
1,130 | 1,011,325 | ||||||
| Southern Copper Corp. |
||||||||
| 3.88%, 04/23/25 |
586 | 574,245 | ||||||
| 5.25%, 11/08/42 |
1,872 | 1,760,038 | ||||||
| 5.88%, 04/23/45 |
1,523 | 1,514,398 | ||||||
| 6.75%, 04/16/40 |
1,775 | 1,950,354 | ||||||
| 7.50%, 07/27/35 |
1,169 | 1,346,274 | ||||||
| Vale Canada Ltd., 7.20%, 09/15/32(a) |
60 | 64,650 | ||||||
| Yamana Gold Inc. |
||||||||
| 2.63%, 08/15/31 (Call 05/15/31)(a) |
1,030 | 851,052 | ||||||
| 4.63%, 12/15/27 (Call 09/15/27) |
406 | 389,146 | ||||||
|
|
|
|||||||
| 123,675,688 | ||||||||
| Office & Business Equipment — 0.1% | ||||||||
| CDW LLC/CDW Finance Corp. |
||||||||
| 2.67%, 12/01/26 (Call 11/01/26) |
1,455 | 1,347,606 | ||||||
| 3.25%, 02/15/29 (Call 04/01/24) |
1,170 | 1,043,225 | ||||||
| 3.28%, 12/01/28 (Call 10/01/28) |
985 | 881,161 | ||||||
| 3.57%, 12/01/31 (Call 09/01/31) |
1,075 | 933,003 | ||||||
| 4.13%, 05/01/25 (Call 04/01/24) |
925 | 905,899 | ||||||
| 4.25%, 04/01/28 (Call 04/01/24)(a) |
980 | 932,039 | ||||||
|
|
|
|||||||
| 6,042,933 | ||||||||
| Oil & Gas — 4.1% | ||||||||
| Aker BP ASA |
||||||||
| 2.00%, 07/15/26 (Call 06/15/26)(b) |
1,420 | 1,307,885 | ||||||
| 3.10%, 07/15/31 (Call 04/15/31)(b) |
1,555 | 1,313,372 | ||||||
| 3.75%, 01/15/30 (Call 10/15/29)(b) |
1,369 | 1,240,690 | ||||||
| 4.00%, 01/15/31 (Call 10/15/30)(b) |
1,080 | 975,748 | ||||||
| 5.60%, 06/13/28 (Call 05/13/28)(b) |
660 | 666,175 | ||||||
| 6.00%, 06/13/33 (Call 03/13/33)(b) |
960 | 976,152 | ||||||
| Apache Corp. |
||||||||
| 4.25%, 01/15/30 (Call 10/15/29)(a) |
370 | 339,775 | ||||||
| 4.38%, 10/15/28 (Call 07/15/28)(a) |
250 | 234,570 | ||||||
| 4.75%, 04/15/43 (Call 10/15/42)(a) |
890 | 683,364 | ||||||
| 5.10%, 09/01/40 (Call 03/01/40)(a) |
1,505 | 1,259,279 | ||||||
| 5.25%, 02/01/42 (Call 08/01/41)(a) |
440 | 362,560 | ||||||
| 5.35%, 07/01/49 (Call 01/01/49) |
740 | 599,918 | ||||||
| 6.00%, 01/15/37(a) |
780 | 758,090 | ||||||
| BG Energy Capital PLC, 5.13%, 10/15/41(b) |
1,590 | 1,480,376 | ||||||
| BP Capital Markets America Inc. |
||||||||
| 1.75%, 08/10/30 (Call 05/10/30) |
1,527 | 1,258,284 | ||||||
| 2.72%, 01/12/32 (Call 10/12/31)(a) |
2,540 | 2,155,258 | ||||||
| 2.77%, 11/10/50 (Call 05/10/50) |
1,635 | 1,040,244 | ||||||
| 2.94%, 06/04/51 (Call 12/04/50)(a) |
3,250 | 2,128,351 | ||||||
| 3.00%, 02/24/50 (Call 08/24/49) |
2,711 | 1,808,733 | ||||||
| 3.00%, 03/17/52 (Call 09/17/51)(a) |
1,733 | 1,149,962 | ||||||
| 3.02%, 01/16/27 (Call 10/16/26)(a) |
1,360 | 1,292,126 | ||||||
| 104 | 2 0 2 4 I S H A R E S A N N U A L R E P O R T T O S H A R E H O L D E R S |
| Schedule of Investments (continued) February 29, 2024 |
iShares® Broad USD Investment Grade Corporate Bond ETF (Percentages shown are based on Net Assets) |
| Security | Par (000) |
Value | ||||||
| Oil & Gas (continued) | ||||||||
| 3.06%, 06/17/41 (Call 12/17/40) |
$ | 2,188 | $ | 1,627,493 | ||||
| 3.07%, 03/30/50 (Call 09/30/49) |
100 | 91,745 | ||||||
| 3.12%, 05/04/26 (Call 02/04/26) |
1,576 | 1,514,614 | ||||||
| 3.38%, 02/08/61 (Call 08/08/60) |
2,638 | 1,776,635 | ||||||
| 3.41%, 02/11/26 (Call 12/11/25) |
1,417 | 1,374,095 | ||||||
| 3.54%, 04/06/27 (Call 02/06/27) |
997 | 957,244 | ||||||
| 3.59%, 04/14/27 (Call 01/14/27) |
1,094 | 1,051,824 | ||||||
| 3.63%, 04/06/30 (Call 01/06/30) |
1,637 | 1,526,692 | ||||||
| 3.80%, 09/21/25 (Call 07/21/25) |
1,410 | 1,382,973 | ||||||
| 3.94%, 09/21/28 (Call 06/21/28) |
1,481 | 1,423,222 | ||||||
| 4.23%, 11/06/28 (Call 08/06/28) |
2,770 | 2,692,640 | ||||||
| 4.70%, 04/10/29 (Call 03/10/29)(a) |
1,550 | 1,531,271 | ||||||
| 4.81%, 02/13/33 (Call 11/13/32) |
2,995 | 2,921,880 | ||||||
| 4.89%, 09/11/33 (Call 06/11/33) |
2,015 | 1,976,176 | ||||||
| 4.99%, 04/10/34 (Call 01/10/34) |
1,355 | 1,332,999 | ||||||
| BP Capital Markets PLC |
||||||||
| 3.28%, 09/19/27 (Call 06/19/27) |
2,153 | 2,038,323 | ||||||
| 3.72%, 11/28/28 (Call 08/28/28)(a) |
1,186 | 1,126,368 | ||||||
| 4.38%, (Call 06/22/25), |
555 | 546,879 | ||||||
| 4.88%, (Call 03/22/30), |
1,590 | 1,500,561 | ||||||
| Burlington Resources LLC |
||||||||
| 5.95%, 10/15/36(a) |
770 | 810,494 | ||||||
| 7.20%, 08/15/31 |
67 | 75,475 | ||||||
| 7.40%, 12/01/31 |
650 | 743,722 | ||||||
| Canadian Natural Resources Ltd. |
||||||||
| 2.05%, 07/15/25 (Call 06/15/25) |
847 | 808,257 | ||||||
| 2.95%, 07/15/30 (Call 04/15/30) |
964 | 837,469 | ||||||
| 3.85%, 06/01/27 (Call 03/01/27) |
1,563 | 1,498,033 | ||||||
| 4.95%, 06/01/47 (Call 12/01/46)(a) |
937 | 817,663 | ||||||
| 5.85%, 02/01/35(a) |
667 | 666,270 | ||||||
| 6.25%, 03/15/38 |
1,492 | 1,533,469 | ||||||
| 6.45%, 06/30/33 |
680 | 717,791 | ||||||
| 6.50%, 02/15/37 |
665 | 692,495 | ||||||
| 6.75%, 02/01/39(a) |
553 | 588,994 | ||||||
| 7.20%, 01/15/32 |
520 | 566,312 | ||||||
| Cenovus Energy Inc. |
||||||||
| 2.65%, 01/15/32 (Call 10/15/31) |
928 | 758,667 | ||||||
| 3.75%, 02/15/52 (Call 08/15/51)(a) |
1,237 | 883,594 | ||||||
| 4.25%, 04/15/27 (Call 01/15/27) |
261 | 252,819 | ||||||
| 5.25%, 06/15/37 (Call 12/15/36)(a) |
231 | 214,305 | ||||||
| 5.40%, 06/15/47 (Call 12/15/46) |
863 | 790,608 | ||||||
| 6.75%, 11/15/39(a) |
432 | 468,183 | ||||||
| Chevron Corp. |
||||||||
| 1.55%, 05/11/25 (Call 04/11/25) |
2,705 | 2,595,479 | ||||||
| 2.00%, 05/11/27 (Call 03/11/27) |
1,481 | 1,362,417 | ||||||
| 2.24%, 05/11/30 (Call 02/11/30) |
2,163 | 1,870,950 | ||||||
| 2.95%, 05/16/26 (Call 02/16/26) |
2,990 | 2,872,324 | ||||||
| 2.98%, 05/11/40 (Call 11/11/39)(a) |
360 | 270,990 | ||||||
| 3.08%, 05/11/50 (Call 11/11/49)(a) |
1,626 | 1,146,481 | ||||||
| 3.33%, 11/17/25 (Call 08/17/25) |
1,205 | 1,175,751 | ||||||
| Chevron USA Inc. |
||||||||
| 0.69%, 08/12/25 (Call 07/12/25) |
1,215 | 1,142,566 | ||||||
| 1.02%, 08/12/27 (Call 06/12/27) |
1,263 | 1,116,719 | ||||||
| 2.34%, 08/12/50 (Call 02/12/50)(a) |
1,254 | 750,389 | ||||||
| 3.25%, 10/15/29 (Call 07/15/29) |
1,109 | 1,033,095 | ||||||
| 3.85%, 01/15/28 (Call 10/15/27) |
794 | 772,666 | ||||||
| 5.25%, 11/15/43 (Call 05/15/43) |
405 | 408,431 | ||||||
| 6.00%, 03/01/41 (Call 09/01/40) |
120 | 130,647 | ||||||
| Security | Par (000) |
Value | ||||||
| Oil & Gas (continued) | ||||||||
| CNOOC Finance 2003 Ltd.,
5.50%, |
$ | 325 | $ | 332,573 | ||||
| CNOOC Finance 2011 Ltd.,
5.75%, |
1,000 | 1,056,550 | ||||||
| CNOOC Finance 2012 Ltd.,
5.00%, |
1,025 | 997,622 | ||||||
| CNOOC Finance 2013 Ltd. |
||||||||
| 2.88%, 09/30/29 (Call 06/30/29) |
485 | 439,250 | ||||||
| 3.30%, 09/30/49 (Call 03/30/49) |
500 | 364,085 | ||||||
| 4.25%, 05/09/43 |
200 | 176,234 | ||||||
| CNOOC Finance 2014 ULC, 4.88%, 04/30/44 |
385 | 367,656 | ||||||
| CNOOC Finance 2015 Australia Pty. Ltd., |
||||||||
| 4.20%, 05/05/45 |
330 | 288,317 | ||||||
| CNOOC Finance 2015 USA LLC |
||||||||
| 3.50%, 05/05/25 |
350 | 342,713 | ||||||
| 4.38%, 05/02/28 |
655 | 640,282 | ||||||
| CNOOC Petroleum North America ULC |
||||||||
| 5.88%, 03/10/35 |
649 | 681,110 | ||||||
| 6.40%, 05/15/37(a) |
1,149 | 1,267,884 | ||||||
| 7.50%, 07/30/39(a) |
675 | 819,727 | ||||||
| 7.88%, 03/15/32 |
489 | 578,599 | ||||||
| Conoco Funding Co., 7.25%, 10/15/31(a) |
730 | 827,741 | ||||||
| ConocoPhillips Co. |
||||||||
| 2.40%, 03/07/25 (Call 03/11/24) |
111 | 107,835 | ||||||
| 3.76%, 03/15/42 (Call 09/15/41) |
1,454 | 1,182,684 | ||||||
| 3.80%, 03/15/52 (Call 09/15/51) |
1,877 | 1,438,850 | ||||||
| 4.03%, 03/15/62 (Call 09/15/61) |
2,490 | 1,937,119 | ||||||
| 4.30%, 11/15/44 (Call 05/15/44) |
1,342 | 1,153,918 | ||||||
| 4.88%, 10/01/47 (Call 04/01/47) |
420 | 389,810 | ||||||
| 5.05%, 09/15/33 (Call 06/15/33)(a) |
455 | 453,590 | ||||||
| 5.30%, 05/15/53 (Call 11/15/52) |
1,045 | 1,022,808 | ||||||
| 5.55%, 03/15/54 (Call 09/15/53) |
960 | 971,243 | ||||||
| 5.70%, 09/15/63 (Call 03/15/63) |
905 | 924,439 | ||||||
| 5.90%, 10/15/32 |
739 | 789,958 | ||||||
| 5.90%, 05/15/38 |
325 | 340,464 | ||||||
| 5.95%, 03/15/46 (Call 09/15/45) |
155 | 161,259 | ||||||
| 6.50%, 02/01/39 |
1,555 | 1,748,200 | ||||||
| 6.95%, 04/15/29 |
1,505 | 1,649,362 | ||||||
| Continental Resources Inc./OK |
||||||||
| 2.27%, 11/15/26 (Call 04/01/24)(b) |
1,483 | 1,360,983 | ||||||
| 2.88%, 04/01/32 (Call 01/01/32)(a)(b) |
1,155 | 927,362 | ||||||
| 4.38%, 01/15/28 (Call 10/15/27) |
1,368 | 1,315,148 | ||||||
| 4.90%, 06/01/44 (Call 12/01/43)(a) |
1,106 | 897,162 | ||||||
| 5.75%, 01/15/31 (Call 07/15/30)(b) |
1,625 | 1,592,963 | ||||||
| Coterra Energy Inc. |
||||||||
| 3.90%, 05/15/27 (Call 02/15/27) |
1,275 | 1,226,174 | ||||||
| 4.38%, 03/15/29 (Call 12/15/28)(a) |
877 | 844,963 | ||||||
| 5.60%, 03/15/34 (Call 12/15/33) |
625 | 624,339 | ||||||
| Devon Energy Corp. |
||||||||
| 4.50%, 01/15/30 (Call 01/15/25)(a) |
1,099 | 1,048,837 | ||||||
| 4.75%, 05/15/42 (Call 11/15/41) |
1,342 | 1,135,569 | ||||||
| 5.00%, 06/15/45 (Call 12/15/44)(a) |
555 | 480,311 | ||||||
| 5.25%, 10/15/27 (Call 03/11/24) |
963 | 960,900 | ||||||
| 5.60%, 07/15/41 (Call 01/15/41) |
2,075 | 1,952,921 | ||||||
| 5.85%, 12/15/25 (Call 09/15/25) |
929 | 934,377 | ||||||
| 5.88%, 06/15/28 (Call 03/11/24)(a) |
780 | 784,706 | ||||||
| 7.88%, 09/30/31 |
324 | 368,050 | ||||||
| 7.95%, 04/15/32 |
645 | 735,724 | ||||||
| Diamondback Energy Inc. |
||||||||
| 3.13%, 03/24/31 (Call 12/24/30) |
1,151 | 1,009,123 | ||||||
| 3.25%, 12/01/26 (Call 10/01/26)(a) |
1,322 | 1,263,639 | ||||||
| S C H E D U L E O F I N V E S T M E N T S |
105 |
| Schedule of Investments (continued) February 29, 2024 |
iShares® Broad USD Investment Grade Corporate Bond ETF (Percentages shown are based on Net Assets) |
| Security | Par (000) |
Value | ||||||
| Oil & Gas (continued) | ||||||||
| 3.50%, 12/01/29 (Call 09/01/29) |
$ | 1,537 | $ | 1,411,005 | ||||
| 4.25%, 03/15/52 (Call 09/15/51) |
1,203 | 951,392 | ||||||
| 4.40%, 03/24/51 (Call 09/24/50)(a) |
975 | 787,413 | ||||||
| 6.25%, 03/15/33 (Call 12/15/32) |
1,480 | 1,555,948 | ||||||
| 6.25%, 03/15/53 (Call 09/15/52)(a) |
920 | 972,851 | ||||||
| Empresa Nacional del Petroleo |
||||||||
| 3.45%, 09/16/31 (Call 06/16/31)(b) |
225 | 188,811 | ||||||
| 3.75%, 08/05/26 (Call 05/05/26)(b) |
1,555 | 1,473,326 | ||||||
| 4.50%, 09/14/47 (Call 03/14/47)(b) |
896 | 654,686 | ||||||
| 5.25%, 11/06/29 (Call 08/06/29)(a)(b) |
435 | 420,215 | ||||||
| 6.15%, 05/10/33 (Call 02/10/33)(b) |
1,050 | 1,045,623 | ||||||
| Eni SpA |
||||||||
| 4.25%, 05/09/29 (Call 02/09/29)(a)(b) |
1,690 | 1,630,740 | ||||||
| 5.70%, 10/01/40(b) |
640 | 599,672 | ||||||
| Series X-R, 4.75%, 09/12/28(b) |
1,790 | 1,771,189 | ||||||
| Eni USA Inc., 7.30%, 11/15/27(a) |
820 | 871,490 | ||||||
| EOG Resources Inc. |
||||||||
| 3.15%, 04/01/25 (Call 01/01/25) |
805 | 787,000 | ||||||
| 3.90%, 04/01/35 (Call 10/01/34) |
1,031 | 926,601 | ||||||
| 4.15%, 01/15/26 (Call 10/15/25)(a) |
1,521 | 1,497,759 | ||||||
| 4.38%, 04/15/30 (Call 01/15/30) |
1,388 | 1,347,161 | ||||||
| 4.95%, 04/15/50 (Call 10/15/49)(a) |
1,425 | 1,327,860 | ||||||
| 5.10%, 01/15/36 (Call 07/15/35) |
105 | 102,346 | ||||||
| EQT Corp. |
||||||||
| 3.13%, 05/15/26 (Call 04/01/24)(b) |
1,054 | 996,768 | ||||||
| 3.63%, 05/15/31 (Call 05/15/30)(a)(b) |
795 | 694,911 | ||||||
| 3.90%, 10/01/27 (Call 07/01/27) |
1,335 | 1,262,924 | ||||||
| 5.00%, 01/15/29 (Call 07/15/28) |
593 | 577,930 | ||||||
| 5.70%, 04/01/28 (Call 03/01/28) |
881 | 887,292 | ||||||
| 5.75%, 02/01/34 (Call 11/01/33)(a) |
650 | 639,347 | ||||||
| 7.00%, 02/01/30 (Call 11/01/29)(a) |
675 | 714,716 | ||||||
| Equinor ASA |
||||||||
| 1.75%, 01/22/26 (Call 12/22/25) |
1,061 | 999,128 | ||||||
| 2.38%, 05/22/30 (Call 02/22/30) |
1,057 | 917,902 | ||||||
| 2.88%, 04/06/25 (Call 03/06/25) |
1,791 | 1,748,162 | ||||||
| 3.00%, 04/06/27 (Call 02/06/27) |
962 | 910,093 | ||||||
| 3.13%, 04/06/30 (Call 01/06/30)(a) |
1,888 | 1,722,044 | ||||||
| 3.25%, 11/18/49 (Call 05/18/49)(a) |
1,187 | 855,683 | ||||||
| 3.63%, 09/10/28 (Call 06/10/28) |
1,250 | 1,196,495 | ||||||
| 3.63%, 04/06/40 (Call 10/06/39) |
774 | 638,396 | ||||||
| 3.70%, 04/06/50 (Call 10/06/49)(a) |
1,527 | 1,192,621 | ||||||
| 3.95%, 05/15/43 |
1,242 | 1,037,403 | ||||||
| 4.25%, 11/23/41(a) |
684 | 602,205 | ||||||
| 4.80%, 11/08/43 |
898 | 843,561 | ||||||
| 5.10%, 08/17/40 |
1,008 | 991,418 | ||||||
| 6.50%, 12/01/28(b) |
605 | 645,810 | ||||||
| 6.80%, 01/15/28 |
625 | 663,097 | ||||||
| 7.15%, 11/15/25 |
628 | 647,784 | ||||||
| 7.15%, 01/15/29 |
115 | 125,307 | ||||||
| 7.25%, 09/23/27 |
734 | 790,167 | ||||||
| Exxon Mobil Corp. |
||||||||
| 2.28%, 08/16/26 (Call 06/16/26) |
1,674 | 1,581,694 | ||||||
| 2.44%, 08/16/29 (Call 05/16/29)(a) |
1,070 | 955,723 | ||||||
| 2.61%, 10/15/30 (Call 07/15/30) |
2,513 | 2,204,374 | ||||||
| 2.71%, 03/06/25 (Call 12/06/24) |
1,960 | 1,913,809 | ||||||
| 2.99%, 03/19/25 (Call 02/19/25) |
2,309 | 2,256,874 | ||||||
| 3.00%, 08/16/39 (Call 02/16/39) |
1,262 | 973,139 | ||||||
| 3.04%, 03/01/26 (Call 12/01/25) |
2,755 | 2,658,172 | ||||||
| 3.10%, 08/16/49 (Call 02/16/49) |
1,974 | 1,381,256 | ||||||
| 3.29%, 03/19/27 (Call 01/19/27)(a) |
1,772 | 1,707,054 | ||||||
| 3.45%, 04/15/51 (Call 10/15/50) |
3,231 | 2,391,317 | ||||||
| Security | Par (000) |
Value | ||||||
| Oil & Gas (continued) | ||||||||
| 3.48%, 03/19/30 (Call 12/19/29) |
$ | 2,520 | $ | 2,353,065 | ||||
| 3.57%, 03/06/45 (Call 09/06/44) |
1,580 | 1,234,648 | ||||||
| 4.11%, 03/01/46 (Call 09/01/45) |
3,207 | 2,717,613 | ||||||
| 4.23%, 03/19/40 (Call 09/19/39) |
2,911 | 2,610,129 | ||||||
| 4.33%, 03/19/50 (Call 09/19/49) |
3,081 | 2,672,536 | ||||||
| GS Caltex Corp., 4.50%, 01/05/26(b) |
455 | 446,130 | ||||||
| Helmerich & Payne Inc., 2.90%, 09/29/31 |
||||||||
| (Call 06/29/31)(a) |
942 | 783,486 | ||||||
| Hess Corp. |
||||||||
| 4.30%, 04/01/27 (Call 01/01/27) |
1,840 | 1,795,079 | ||||||
| 5.60%, 02/15/41(a) |
1,781 | 1,793,420 | ||||||
| 5.80%, 04/01/47 (Call 10/01/46) |
797 | 809,923 | ||||||
| 6.00%, 01/15/40 |
1,204 | 1,263,809 | ||||||
| 7.13%, 03/15/33 |
824 | 924,090 | ||||||
| 7.30%, 08/15/31 |
917 | 1,031,535 | ||||||
| 7.88%, 10/01/29(a) |
636 | 712,621 | ||||||
| HF Sinclair Corp. |
||||||||
| 4.50%, 10/01/30 (Call 07/01/30)(a) |
520 | 486,516 | ||||||
| 5.00%, 02/01/28 (Call 03/11/24)(b) |
265 | 255,185 | ||||||
| 5.88%, 04/01/26 (Call 01/01/26)(a) |
1,376 | 1,380,252 | ||||||
| 6.38%, 04/15/27 (Call 04/15/24)(a)(b) |
105 | 105,179 | ||||||
| Hunt Oil Co. of Peru LLC Sucursal Del Peru, |
||||||||
| 8.55%, 09/18/33 (Call 06/18/33)(b) |
100 | 105,768 | ||||||
| KazMunayGas National Co. JSC |
||||||||
| 3.50%, 04/14/33 (Call 10/14/32)(a)(b) |
490 | 397,513 | ||||||
| 4.75%, 04/19/27(a)(b) |
243 | 234,600 | ||||||
| 5.38%, 04/24/30(b) |
1,150 | 1,113,918 | ||||||
| 5.75%, 04/19/47(b) |
2,100 | 1,779,968 | ||||||
| 6.38%, 10/24/48(b) |
2,225 | 2,021,969 | ||||||
| Marathon Oil Corp. |
||||||||
| 4.40%, 07/15/27 (Call 04/15/27) |
1,814 | 1,762,238 | ||||||
| 5.20%, 06/01/45 (Call 12/01/44) |
699 | 606,727 | ||||||
| 6.60%, 10/01/37(a) |
1,210 | 1,261,599 | ||||||
| 6.80%, 03/15/32(a) |
768 | 819,933 | ||||||
| Marathon Petroleum Corp. |
||||||||
| 3.80%, 04/01/28 (Call 01/01/28) |
874 | 832,601 | ||||||
| 4.50%, 04/01/48 (Call 10/01/47)(a) |
754 | 620,056 | ||||||
| 4.70%, 05/01/25 (Call 04/01/25) |
1,217 | 1,205,501 | ||||||
| 4.75%, 09/15/44 (Call 03/15/44) |
1,422 | 1,241,497 | ||||||
| 5.00%, 09/15/54 (Call 03/15/54) |
328 | 280,064 | ||||||
| 5.13%, 12/15/26 (Call 09/15/26) |
1,216 | 1,214,679 | ||||||
| 5.85%, 12/15/45 (Call 06/15/45) |
321 | 310,571 | ||||||
| 6.50%, 03/01/41 (Call 09/01/40) |
1,395 | 1,480,574 | ||||||
| Motiva Enterprises LLC, 6.85%, 01/15/40(b) |
1,080 | 1,157,515 | ||||||
| Occidental Petroleum Corp. |
||||||||
| 0.00%, 10/10/36 (Put 10/10/24)(a)(f) |
1,457 | 768,787 | ||||||
| 3.40%, 04/15/26 (Call 01/15/26) |
330 | 315,889 | ||||||
| 3.50%, 08/15/29 (Call 05/15/29)(a) |
440 | 399,843 | ||||||
| 4.10%, 02/15/47 (Call 08/15/46)(a) |
274 | 201,442 | ||||||
| 4.20%, 03/15/48 (Call 09/15/47)(a) |
440 | 336,244 | ||||||
| 4.40%, 04/15/46 (Call 10/15/45)(a) |
470 | 375,534 | ||||||
| 4.40%, 08/15/49 (Call 02/15/49) |
492 | 363,834 | ||||||
| 4.63%, 06/15/45 (Call 12/15/44)(a) |
510 | 411,667 | ||||||
| 5.50%, 12/01/25 (Call 09/01/25) |
605 | 603,558 | ||||||
| 5.55%, 03/15/26 (Call 12/15/25)(a) |
455 | 455,499 | ||||||
| 5.88%, 09/01/25 (Call 06/01/25) |
85 | 85,204 | ||||||
| 6.13%, 01/01/31 (Call 07/01/30) |
1,295 | 1,328,333 | ||||||
| 6.20%, 03/15/40 |
1,050 | 1,066,442 | ||||||
| 6.38%, 09/01/28 (Call 03/01/28)(a) |
260 | 269,339 | ||||||
| 6.45%, 09/15/36 |
2,525 | 2,658,471 | ||||||
| 6.60%, 03/15/46 (Call 09/15/45)(a) |
1,455 | 1,545,486 | ||||||
| 106 | 2 0 2 4 I S H A R E S A N N U A L R E P O R T T O S H A R E H O L D E R S |
| Schedule of Investments (continued) February 29, 2024 |
iShares® Broad USD Investment Grade Corporate Bond ETF (Percentages shown are based on Net Assets) |
| Security | Par (000) |
Value | ||||||
| Oil & Gas (continued) | ||||||||
| 6.63%, 09/01/30 (Call 03/01/30) |
$ | 1,885 | $ | 1,983,774 | ||||
| 7.50%, 05/01/31 |
535 | 590,823 | ||||||
| 7.88%, 09/15/31 |
620 | 697,675 | ||||||
| 7.95%, 06/15/39(a) |
550 | 636,607 | ||||||
| 8.50%, 07/15/27 (Call 01/15/27)(a) |
180 | 195,250 | ||||||
| 8.88%, 07/15/30 (Call 01/15/30) |
1,130 | 1,303,275 | ||||||
| Ovintiv Inc. |
||||||||
| 5.38%, 01/01/26 (Call 10/01/25) |
994 | 989,184 | ||||||
| 5.65%, 05/15/25(a) |
540 | 540,106 | ||||||
| 5.65%, 05/15/28 (Call 04/15/28)(a) |
930 | 938,279 | ||||||
| 6.25%, 07/15/33 (Call 04/15/33)(a) |
645 | 663,184 | ||||||
| 6.50%, 08/15/34(a) |
1,085 | 1,137,129 | ||||||
| 6.50%, 02/01/38 |
432 | 441,348 | ||||||
| 6.63%, 08/15/37(a) |
666 | 686,889 | ||||||
| 7.10%, 07/15/53 (Call 01/15/53) |
453 | 494,609 | ||||||
| 7.20%, 11/01/31 |
687 | 741,852 | ||||||
| 7.38%, 11/01/31 |
695 | 757,420 | ||||||
| 8.13%, 09/15/30 |
498 | 558,029 | ||||||
| Patterson-UTI Energy Inc. |
||||||||
| 3.95%, 02/01/28 (Call 11/01/27) |
135 | 126,409 | ||||||
| 5.15%, 11/15/29 (Call 08/15/29)(a) |
125 | 120,640 | ||||||
| 7.15%, 10/01/33 (Call 07/01/33)(a) |
365 | 386,719 | ||||||
| Pertamina Persero PT |
||||||||
| 1.40%, 02/09/26 (Call 01/09/26)(b) |
987 | 911,494 | ||||||
| 2.30%, 02/09/31 (Call 11/09/30)(b) |
1,355 | 1,112,614 | ||||||
| 3.10%, 01/21/30 (Call 10/21/29)(b) |
450 | 398,768 | ||||||
| 3.10%, 08/27/30 (Call 05/25/30)(a)(b) |
720 | 632,124 | ||||||
| 3.65%, 07/30/29(a)(b) |
2,205 | 2,038,487 | ||||||
| 4.15%, 02/25/60 (Call 08/25/59)(a)(b) |
805 | 594,643 | ||||||
| 4.18%, 01/21/50 (Call 07/21/49)(b) |
1,195 | 912,986 | ||||||
| 4.70%, 07/30/49(b) |
867 | 721,203 | ||||||
| 5.63%, 05/20/43(a)(b) |
1,855 | 1,759,411 | ||||||
| 6.00%, 05/03/42(b) |
1,720 | 1,703,021 | ||||||
| 6.45%, 05/30/44(a)(b) |
1,692 | 1,755,597 | ||||||
| 6.50%, 05/27/41(b) |
350 | 366,564 | ||||||
| 6.50%, 11/07/48(b) |
1,000 | 1,047,339 | ||||||
| Petroliam Nasional Bhd, 7.63%, 10/15/26(b) |
590 | 624,120 | ||||||
| Petronas Capital Ltd. |
||||||||
| 2.48%, 01/28/32 (Call 10/28/31)(b) |
1,265 | 1,047,306 | ||||||
| 3.40%, 04/28/61 (Call 10/28/60)(a)(b) |
2,040 | 1,378,214 | ||||||
| 3.50%, 03/18/25(b) |
532 | 520,839 | ||||||
| 3.50%, 04/21/30 (Call 01/21/30)(b) |
3,273 | 2,989,353 | ||||||
| 4.50%, 03/18/45(b) |
1,790 | 1,570,671 | ||||||
| 4.55%, 04/21/50 (Call 10/21/49)(b) |
3,618 | 3,163,011 | ||||||
| 4.80%, 04/21/60 (Call 10/21/59)(a)(b) |
1,202 | 1,075,670 | ||||||
| Petronas Energy Canada Ltd., 2.11%, 03/23/28 |
810 | 724,711 | ||||||
| Phillips 66 |
||||||||
| 1.30%, 02/15/26 (Call 01/15/26) |
876 | 810,606 | ||||||
| 2.15%, 12/15/30 (Call 09/15/30)(a) |
1,091 | 906,123 | ||||||
| 3.30%, 03/15/52 (Call 09/15/51)(a) |
1,615 | 1,099,845 | ||||||
| 3.85%, 04/09/25 (Call 03/09/25) |
810 | 796,183 | ||||||
| 3.90%, 03/15/28 (Call 12/15/27) |
1,338 | 1,288,916 | ||||||
| 4.65%, 11/15/34 (Call 05/15/34) |
1,626 | 1,528,009 | ||||||
| 4.88%, 11/15/44 (Call 05/15/44) |
2,051 | 1,875,877 | ||||||
| 5.88%, 05/01/42 |
1,515 | 1,561,761 | ||||||
| Phillips 66 Co. |
||||||||
| 3.15%, 12/15/29 (Call 09/15/29) |
1,088 | 983,477 | ||||||
| 3.55%, 10/01/26 (Call 07/01/26) |
889 | 853,093 | ||||||
| 3.75%, 03/01/28 (Call 12/01/27) |
308 | 293,680 | ||||||
| 4.68%, 02/15/45 (Call 08/15/44) |
810 | 708,673 | ||||||
| Security | Par (000) |
Value | ||||||
| Oil & Gas (continued) | ||||||||
| 4.90%, 10/01/46 (Call 04/01/46) |
$ | 869 | $ | 775,967 | ||||
| 4.95%, 12/01/27 (Call 11/01/27) |
1,045 | 1,041,517 | ||||||
| 5.25%, 06/15/31 (Call 04/15/31) |
625 | 623,123 | ||||||
| 5.30%, 06/30/33 (Call 03/30/33) |
1,465 | 1,452,858 | ||||||
| 5.65%, 06/15/54 (Call 12/15/53) |
625 | 618,774 | ||||||
| Pioneer Natural Resources Co. |
||||||||
| 1.13%, 01/15/26 (Call 12/15/25) |
494 | 458,504 | ||||||
| 1.90%, 08/15/30 (Call 05/15/30) |
1,191 | 992,087 | ||||||
| 2.15%, 01/15/31 (Call 10/15/30)(a) |
693 | 579,764 | ||||||
| 5.10%, 03/29/26 |
995 | 993,917 | ||||||
| PTTEP Treasury Center Co. Ltd. |
||||||||
| 2.59%, 06/10/27 (Call 04/10/27)(a)(b) |
620 | 569,165 | ||||||
| 2.99%, 01/15/30 (Call 07/15/29)(a)(b) |
155 | 137,330 | ||||||
| 3.90%, 12/06/59(a)(b) |
435 | 329,056 | ||||||
| Qatar Energy |
||||||||
| 1.38%, 09/12/26 (Call 08/12/26)(a)(b) |
1,607 | 1,465,934 | ||||||
| 2.25%, 07/12/31 (Call 04/12/31)(a)(b) |
3,716 | 3,085,603 | ||||||
| 3.13%, 07/12/41 (Call 01/12/41)(a)(b) |
4,920 | 3,605,406 | ||||||
| 3.30%, 07/12/51 (Call 01/12/51)(b) |
5,587 | 3,861,176 | ||||||
| Raizen Fuels Finance SA, 5.30%, 01/20/27(b) |
415 | 413,134 | ||||||
| Ras Laffan Liquefied Natural Gas Co. Ltd. 3 |
||||||||
| 5.84%, 09/30/27(b) |
774 | 779,603 | ||||||
| 6.33%, 09/30/27(b) |
1,037 | 1,051,429 | ||||||
| Reliance Industries Ltd. |
||||||||
| 2.88%, 01/12/32(a)(b) |
2,435 | 2,060,289 | ||||||
| 3.63%, 01/12/52(b) |
1,935 | 1,405,220 | ||||||
| 3.67%, 11/30/27(b) |
100 | 94,419 | ||||||
| 3.75%, 01/12/62(b) |
980 | 694,909 | ||||||
| 4.88%, 02/10/45(b) |
165 | 149,625 | ||||||
| SA Global Sukuk Ltd. |
||||||||
| 1.60%, 06/17/26 (Call 05/17/26)(b) |
365 | 335,612 | ||||||
| 2.69%, 06/17/31 (Call 03/17/31)(a)(b) |
3,047 | 2,599,487 | ||||||
| Santos Finance Ltd. |
||||||||
| 3.65%, 04/29/31 (Call 01/29/31)(b) |
1,581 | 1,365,532 | ||||||
| 6.88%, 09/19/33 (Call 06/19/33)(b) |
1,025 | 1,067,368 | ||||||
| Saudi Arabian Oil Co. |
||||||||
| 1.63%, 11/24/25 (Call 10/24/25)(b) |
2,090 | 1,957,586 | ||||||
| 2.25%, 11/24/30 (Call 08/24/30)(b) |
2,293 | 1,917,246 | ||||||
| 3.25%, 11/24/50 (Call 05/24/50)(a)(b) |
2,554 | 1,689,732 | ||||||
| 3.50%, 04/16/29(a)(b) |
2,726 | 2,527,367 | ||||||
| 3.50%, 11/24/70 (Call 05/24/70)(a)(b) |
2,958 | 1,859,866 | ||||||
| 4.25%, 04/16/39(a)(b) |
4,257 | 3,665,558 | ||||||
| 4.38%, 04/16/49(b) |
4,531 | 3,688,007 | ||||||
| Shell International Finance BV |
||||||||
| 2.38%, 11/07/29 (Call 08/07/29) |
2,085 | 1,836,171 | ||||||
| 2.50%, 09/12/26(a) |
1,551 | 1,464,744 | ||||||
| 2.75%, 04/06/30 (Call 01/06/30)(a) |
2,461 | 2,191,326 | ||||||
| 2.88%, 05/10/26 |
2,526 | 2,417,436 | ||||||
| 2.88%, 11/26/41 (Call 05/26/41) |
855 | 624,041 | ||||||
| 3.00%, 11/26/51 (Call 05/26/51) |
1,470 | 988,108 | ||||||
| 3.13%, 11/07/49 (Call 05/07/49) |
1,467 | 1,016,049 | ||||||
| 3.25%, 05/11/25 |
2,158 | 2,110,451 | ||||||
| 3.25%, 04/06/50 (Call 10/06/49)(a) |
2,542 | 1,808,705 | ||||||
| 3.63%, 08/21/42 |
836 | 672,216 | ||||||
| 3.75%, 09/12/46 |
1,724 | 1,358,018 | ||||||
| 3.88%, 11/13/28 (Call 08/13/28)(a) |
2,035 | 1,963,942 | ||||||
| 4.00%, 05/10/46 |
2,895 | 2,376,021 | ||||||
| 4.13%, 05/11/35 |
2,264 | 2,098,040 | ||||||
| 4.38%, 05/11/45 |
2,901 | 2,534,172 | ||||||
| 4.55%, 08/12/43 |
1,431 | 1,299,081 | ||||||
| 5.50%, 03/25/40(a) |
1,415 | 1,456,614 | ||||||
| S C H E D U L E O F I N V E S T M E N T S |
107 |
| Schedule of Investments (continued) February 29, 2024 |
iShares® Broad USD Investment Grade Corporate Bond ETF (Percentages shown are based on Net Assets) |
| Security | Par (000) |
Value | ||||||
| Oil & Gas (continued) | ||||||||
| 6.38%, 12/15/38 |
$ | 3,283 | $ | 3,662,323 | ||||
| Sinopec Capital 2013 Ltd., 4.25%, 04/24/43(b) |
245 | 217,999 | ||||||
| Sinopec Group Overseas Development 2012 |
||||||||
| Ltd., 4.88%, 05/17/42(b) |
917 | 877,789 | ||||||
| Sinopec Group Overseas Development 2015 |
||||||||
| Ltd. |
||||||||
| 3.25%, 04/28/25(b) |
1,420 | 1,386,739 | ||||||
| 4.10%, 04/28/45(b) |
1,235 | 1,060,441 | ||||||
| Sinopec Group Overseas Development 2016 |
||||||||
| Ltd. |
||||||||
| 2.75%, 09/29/26(b) |
1,303 | 1,229,928 | ||||||
| 3.50%, 05/03/26(a)(b) |
565 | 546,609 | ||||||
| 4.25%, 05/03/46(b) |
790 | 691,124 | ||||||
| Sinopec Group Overseas Development 2017 |
||||||||
| Ltd. |
||||||||
| 3.25%, 09/13/27(b) |
1,165 | 1,102,394 | ||||||
| 3.63%, 04/12/27(b) |
2,060 | 1,983,415 | ||||||
| 4.00%, 09/13/47(b) |
710 | 592,580 | ||||||
| 4.25%, 04/12/47(a)(b) |
300 | 260,902 | ||||||
| Sinopec Group Overseas Development 2018 |
||||||||
| Ltd. |
||||||||
| 1.45%, 01/08/26 (Call 12/08/25)(b) |
385 | 360,525 | ||||||
| 2.15%, 05/13/25 (Call 04/13/25)(b) |
1,360 | 1,307,647 | ||||||
| 2.30%, 01/08/31 (Call 10/08/30)(a)(b) |
1,094 | 937,773 | ||||||
| 2.70%, 05/13/30 (Call 02/13/30)(a)(b) |
1,605 | 1,429,598 | ||||||
| 2.95%, 08/08/29 (Call 05/08/29)(a)(b) |
879 | 804,656 | ||||||
| 2.95%, 11/12/29 (Call 08/12/29)(b) |
624 | 567,160 | ||||||
| 3.10%, 01/08/51 (Call 07/08/50)(b) |
675 | 468,715 | ||||||
| 3.35%, 05/13/50 (Call 11/13/49)(b) |
1,084 | 796,200 | ||||||
| 3.44%, 11/12/49 (Call 05/12/49)(a)(b) |
435 | 326,672 | ||||||
| 3.68%, 08/08/49 (Call 02/08/49)(a)(b) |
987 | 777,731 | ||||||
| 4.13%, 09/12/25(a)(b) |
510 | 501,095 | ||||||
| 4.25%, 09/12/28(a)(b) |
865 | 844,944 | ||||||
| 4.60%, 09/12/48(b) |
938 | 859,548 | ||||||
| Suncor Energy Inc. |
||||||||
| 3.75%, 03/04/51 (Call 09/04/50)(a) |
1,010 | 735,251 | ||||||
| 4.00%, 11/15/47 (Call 05/15/47) |
885 | 674,787 | ||||||
| 5.95%, 12/01/34(a) |
564 | 587,161 | ||||||
| 6.50%, 06/15/38 |
1,701 | 1,780,719 | ||||||
| 6.80%, 05/15/38 |
1,285 | 1,372,254 | ||||||
| 6.85%, 06/01/39 |
936 | 1,007,578 | ||||||
| 7.00%, 11/15/28(a) |
205 | 218,836 | ||||||
| 7.15%, 02/01/32 |
820 | 897,924 | ||||||
| 7.88%, 06/15/26 |
595 | 624,468 | ||||||
| Tengizchevroil Finance Co. International Ltd. |
||||||||
| 2.63%, 08/15/25 (Call 05/15/25)(b) |
582 | 546,585 | ||||||
| 3.25%, 08/15/30 (Call 02/15/30)(a)(b) |
460 | 375,329 | ||||||
| 4.00%, 08/15/26(a)(b) |
685 | 641,501 | ||||||
| Thaioil Treasury Center Co. Ltd. |
||||||||
| 2.50%, 06/18/30(a)(b) |
615 | 514,948 | ||||||
| 3.50%, 10/17/49(a)(b) |
940 | 635,855 | ||||||
| 3.75%, 06/18/50(b) |
765 | 537,636 | ||||||
| 4.63%, 11/20/28(b) |
345 | 334,849 | ||||||
| 5.38%, 11/20/48(b) |
535 | 491,538 | ||||||
| Tosco Corp., 8.13%, 02/15/30 |
556 | 642,263 | ||||||
| TotalEnergies Capital International SA |
||||||||
| 2.83%, 01/10/30 (Call 10/10/29) |
1,591 | 1,430,563 | ||||||
| 2.99%, 06/29/41 (Call 12/29/40) |
1,408 | 1,044,700 | ||||||
| 3.13%, 05/29/50 (Call 11/29/49)(a) |
3,195 | 2,226,486 | ||||||
| 3.39%, 06/29/60 (Call 12/29/59) |
701 | 486,564 | ||||||
| 3.46%, 02/19/29 (Call 11/19/28) |
1,944 | 1,825,491 | ||||||
| Security | Par (000) |
Value | ||||||
| Oil & Gas (continued) | ||||||||
| 3.46%, 07/12/49 (Call 01/12/49) |
$ | 1,355 | $ | 1,014,098 | ||||
| TotalEnergies Capital SA, 3.88%, 10/11/28 |
1,609 | 1,551,057 | ||||||
| Valero Energy Corp. |
||||||||
| 2.15%, 09/15/27 (Call 07/15/27)(a) |
877 | 794,713 | ||||||
| 2.80%, 12/01/31 (Call 09/01/31)(a) |
1,235 | 1,043,207 | ||||||
| 2.85%, 04/15/25 (Call 03/15/25) |
82 | 79,637 | ||||||
| 3.40%, 09/15/26 (Call 06/15/26) |
260 | 248,402 | ||||||
| 3.65%, 12/01/51 (Call 06/01/51) |
1,280 | 901,680 | ||||||
| 4.00%, 04/01/29 (Call 01/01/29) |
392 | 374,129 | ||||||
| 4.00%, 06/01/52 (Call 12/01/51)(a) |
903 | 679,303 | ||||||
| 4.35%, 06/01/28 (Call 03/01/28) |
1,053 | 1,024,836 | ||||||
| 4.90%, 03/15/45(a) |
503 | 452,653 | ||||||
| 6.63%, 06/15/37 |
2,046 | 2,191,089 | ||||||
| 7.50%, 04/15/32 |
710 | 807,871 | ||||||
| Var Energi ASA |
||||||||
| 7.50%, 01/15/28 (Call 12/15/27)(b) |
620 | 652,883 | ||||||
| 8.00%, 11/15/32 (Call 08/15/32)(b) |
1,440 | 1,600,531 | ||||||
| Woodside Finance Ltd. |
||||||||
| 3.65%, 03/05/25 (Call 12/05/24)(b) |
1,350 | 1,320,126 | ||||||
| 3.70%, 09/15/26 (Call 06/15/26)(b) |
1,390 | 1,327,685 | ||||||
| 3.70%, 03/15/28 (Call 12/15/27)(b) |
1,465 | 1,364,608 | ||||||
| 4.50%, 03/04/29 (Call 12/04/28)(a)(b) |
1,576 | 1,502,926 | ||||||
| XTO Energy Inc., 6.75%, 08/01/37(a) |
662 | 744,233 | ||||||
|
|
|
|||||||
| 433,143,302 | ||||||||
| Oil & Gas Services — 0.3% | ||||||||
| Baker Hughes Holdings LLC, 5.13%, 09/15/40 |
1,460 | 1,418,942 | ||||||
| Baker Hughes Holdings LLC/Baker Hughes |
||||||||
| Co-Obligor Inc. |
||||||||
| 2.06%, 12/15/26 (Call 11/15/26) |
1,272 | 1,173,151 | ||||||
| 3.14%, 11/07/29 (Call 08/07/29)(a) |
910 | 830,867 | ||||||
| 3.34%, 12/15/27 (Call 09/15/27)(a) |
1,978 | 1,865,086 | ||||||
| 4.08%, 12/15/47 (Call 06/15/47) |
1,803 | 1,455,767 | ||||||
| 4.49%, 05/01/30 (Call 02/01/30) |
807 | 784,069 | ||||||
| Guara Norte Sarl, 5.20%, 06/15/34(b) |
236 | 212,350 | ||||||
| Halliburton Co. |
||||||||
| 2.92%, 03/01/30 (Call 12/01/29)(a) |
1,613 | 1,432,687 | ||||||
| 3.80%, 11/15/25 (Call 08/15/25) |
891 | 870,450 | ||||||
| 4.50%, 11/15/41 (Call 05/15/41) |
1,020 | 900,025 | ||||||
| 4.75%, 08/01/43 (Call 02/01/43) |
1,228 | 1,110,282 | ||||||
| 4.85%, 11/15/35 (Call 05/15/35) |
1,140 | 1,096,370 | ||||||
| 5.00%, 11/15/45 (Call 05/15/45)(a) |
2,113 | 1,966,265 | ||||||
| 6.70%, 09/15/38 |
1,272 | 1,426,651 | ||||||
| 7.45%, 09/15/39 |
1,398 | 1,678,828 | ||||||
| NOV Inc. |
||||||||
| 3.60%, 12/01/29 (Call 09/01/29) |
913 | 833,722 | ||||||
| 3.95%, 12/01/42 (Call 06/01/42) |
1,659 | 1,238,622 | ||||||
| Schlumberger Finance Canada Ltd., |
812 | 767,305 | ||||||
| Schlumberger Holdings Corp. |
||||||||
| 3.90%, 05/17/28 (Call 02/17/28)(b) |
1,522 | 1,459,558 | ||||||
| 4.00%, 12/21/25 (Call 09/21/25)(b) |
918 | 898,817 | ||||||
| 4.30%, 05/01/29 (Call 02/01/29)(b) |
1,039 | 1,005,475 | ||||||
| Schlumberger Investment SA |
||||||||
| 2.65%, 06/26/30 (Call 03/26/30)(a) |
1,654 | 1,453,950 | ||||||
| 4.50%, 05/15/28 (Call 04/15/28) |
450 | 445,817 | ||||||
| 4.85%, 05/15/33 (Call 02/15/33)(a) |
450 | 445,100 | ||||||
|
|
|
|||||||
| 26,770,156 | ||||||||
| Packaging & Containers — 0.3% | ||||||||
| Amcor Finance USA Inc. |
||||||||
| 3.63%, 04/28/26 (Call 01/28/26) |
20 | 19,254 | ||||||
| 108 | 2 0 2 4 I S H A R E S A N N U A L R E P O R T T O S H A R E H O L D E R S |
| Schedule of Investments (continued) February 29, 2024 |
iShares® Broad USD Investment Grade Corporate Bond ETF (Percentages shown are based on Net Assets) |
| Security | Par (000) |
Value | ||||||
| Packaging & Containers (continued) | ||||||||
| 4.50%, 05/15/28 (Call 02/15/28) |
$ | 950 | $ | 923,611 | ||||
| 5.63%, 05/26/33 (Call 02/26/33)(a) |
725 | 737,179 | ||||||
| Amcor Flexibles North America Inc. |
||||||||
| 2.63%, 06/19/30 (Call 03/19/30) |
1,323 | 1,128,741 | ||||||
| 2.69%, 05/25/31 (Call 02/25/31) |
1,103 | 931,792 | ||||||
| 3.10%, 09/15/26 (Call 06/15/26) |
625 | 583,614 | ||||||
| 4.00%, 05/17/25 (Call 04/17/25) |
199 | 195,196 | ||||||
| AptarGroup Inc., 3.60%, 03/15/32 |
||||||||
| (Call 12/15/31)(a) |
205 | 179,844 | ||||||
| Berry Global Inc. |
||||||||
| 1.57%, 01/15/26 (Call 12/15/25)(a) |
1,665 | 1,550,393 | ||||||
| 1.65%, 01/15/27 (Call 12/15/26)(a) |
705 | 634,867 | ||||||
| 4.88%, 07/15/26 (Call 04/01/24)(b) |
1,845 | 1,801,510 | ||||||
| 5.50%, 04/15/28 (Call 03/15/28)(a)(b) |
590 | 586,221 | ||||||
| 5.65%, 01/15/34 (Call 10/15/33)(a)(b) |
465 | 458,800 | ||||||
| Brambles USA Inc., 4.13%, 10/23/25 |
||||||||
| (Call 07/25/25)(b) |
1,062 | 1,037,502 | ||||||
| CCL Industries Inc. |
||||||||
| 3.05%, 06/01/30 (Call 03/01/30)(b) |
1,300 | 1,121,352 | ||||||
| 3.25%, 10/01/26 (Call 07/01/26)(b) |
590 | 556,071 | ||||||
| Graphic Packaging International LLC, |
977 | 893,082 | ||||||
| Packaging Corp. of America |
||||||||
| 3.00%, 12/15/29 (Call 09/15/29) |
885 | 793,691 | ||||||
| 3.05%, 10/01/51 (Call 04/01/51)(a) |
945 | 630,857 | ||||||
| 3.40%, 12/15/27 (Call 09/15/27) |
1,096 | 1,035,638 | ||||||
| 4.05%, 12/15/49 (Call 06/15/49) |
604 | 474,635 | ||||||
| 5.70%, 12/01/33 (Call 09/01/33) |
300 | 307,023 | ||||||
| Sealed Air Corp., 1.57%, 10/15/26 |
||||||||
| (Call 09/15/26)(b) |
1,173 | 1,055,651 | ||||||
| Silgan Holdings Inc., 1.40%, 04/01/26 |
||||||||
| (Call 03/01/26)(b) |
1,120 | 1,022,377 | ||||||
| Sonoco Products Co. |
||||||||
| 2.25%, 02/01/27 (Call 01/01/27) |
805 | 739,232 | ||||||
| 2.85%, 02/01/32 (Call 11/01/31) |
835 | 704,975 | ||||||
| 3.13%, 05/01/30 (Call 02/01/30)(a) |
1,255 | 1,115,048 | ||||||
| 5.75%, 11/01/40 (Call 05/01/40) |
25 | 25,124 | ||||||
| Stora Enso OYJ, 7.25%, 04/15/36(a)(b) |
410 | 433,930 | ||||||
| WestRock MWV LLC |
||||||||
| 7.95%, 02/15/31(a) |
515 | 586,834 | ||||||
| 8.20%, 01/15/30 |
470 | 534,684 | ||||||
| WRKCo Inc. |
||||||||
| 3.00%, 06/15/33 (Call 03/15/33)(a) |
1,097 | 925,514 | ||||||
| 3.38%, 09/15/27 (Call 06/15/27) |
734 | 690,655 | ||||||
| 3.75%, 03/15/25 (Call 01/15/25) |
884 | 867,683 | ||||||
| 3.90%, 06/01/28 (Call 03/01/28) |
905 | 857,689 | ||||||
| 4.00%, 03/15/28 (Call 12/15/27) |
858 | 819,021 | ||||||
| 4.20%, 06/01/32 (Call 03/01/32)(a) |
611 | 573,977 | ||||||
| 4.65%, 03/15/26 (Call 01/15/26) |
1,169 | 1,153,843 | ||||||
| 4.90%, 03/15/29 (Call 12/15/28)(a) |
984 | 974,954 | ||||||
|
|
|
|||||||
| 29,662,064 | ||||||||
| Pharmaceuticals — 4.7% | ||||||||
| AbbVie Inc. |
||||||||
| 2.95%, 11/21/26 (Call 09/21/26) |
4,810 | 4,560,658 | ||||||
| 3.20%, 05/14/26 (Call 02/14/26) |
2,916 | 2,807,204 | ||||||
| 3.20%, 11/21/29 (Call 08/21/29) |
6,848 | 6,265,444 | ||||||
| 3.60%, 05/14/25 (Call 02/14/25) |
3,350 | 3,283,038 | ||||||
| 3.80%, 03/15/25 (Call 12/15/24) |
2,281 | 2,245,959 | ||||||
| 4.05%, 11/21/39 (Call 05/21/39) |
5,063 | 4,438,897 | ||||||
| 4.25%, 11/14/28 (Call 08/14/28) |
2,122 | 2,073,380 | ||||||
| 4.25%, 11/21/49 (Call 05/21/49) |
7,399 | 6,347,612 | ||||||
| Security | Par (000) |
Value | ||||||
| Pharmaceuticals (continued) | ||||||||
| 4.30%, 05/14/36 (Call 11/14/35) |
$ | 1,428 | $ | 1,325,977 | ||||
| 4.40%, 11/06/42 |
3,189 | 2,859,278 | ||||||
| 4.45%, 05/14/46 (Call 11/14/45) |
2,591 | 2,291,399 | ||||||
| 4.50%, 05/14/35 (Call 11/14/34) |
3,330 | 3,172,336 | ||||||
| 4.55%, 03/15/35 (Call 09/15/34) |
2,283 | 2,187,252 | ||||||
| 4.63%, 10/01/42 (Call 04/01/42) |
415 | 379,750 | ||||||
| 4.70%, 05/14/45 (Call 11/14/44)(a) |
3,337 | 3,073,715 | ||||||
| 4.75%, 03/15/45 (Call 09/15/44) |
1,338 | 1,240,294 | ||||||
| 4.80%, 03/15/27 (Call 02/15/27) |
2,725 | 2,717,273 | ||||||
| 4.80%, 03/15/29 (Call 02/15/29) |
2,725 | 2,712,429 | ||||||
| 4.85%, 06/15/44 (Call 12/15/43) |
1,407 | 1,331,799 | ||||||
| 4.88%, 11/14/48 (Call 05/14/48) |
2,240 | 2,119,867 | ||||||
| 4.95%, 03/15/31 (Call 01/15/31) |
1,435 | 1,435,288 | ||||||
| 5.05%, 03/15/34 (Call 12/15/33)(a) |
1,150 | 1,155,725 | ||||||
| 5.35%, 03/15/44 (Call 09/15/43) |
820 | 827,540 | ||||||
| 5.40%, 03/15/54 (Call 09/15/53)(a) |
600 | 609,073 | ||||||
| 5.50%, 03/15/64 (Call 09/15/63)(a) |
700 | 708,054 | ||||||
| Astrazeneca Finance LLC |
||||||||
| 1.20%, 05/28/26 (Call 04/28/26) |
1,875 | 1,724,588 | ||||||
| 1.75%, 05/28/28 (Call 03/28/28) |
903 | 798,303 | ||||||
| 2.25%, 05/28/31 (Call 02/28/31) |
1,055 | 885,040 | ||||||
| 4.80%, 02/26/27 (Call 01/26/27) |
1,275 | 1,271,991 | ||||||
| 4.85%, 02/26/29 (Call 01/26/29) |
1,355 | 1,354,535 | ||||||
| 4.88%, 03/03/28 (Call 02/03/28) |
1,565 | 1,563,517 | ||||||
| 4.88%, 03/03/33 (Call 12/03/32)(a) |
800 | 798,131 | ||||||
| 4.90%, 03/03/30 (Call 01/03/30) |
925 | 926,753 | ||||||
| 4.90%, 02/26/31 (Call 12/26/30) |
1,275 | 1,272,243 | ||||||
| 5.00%, 02/26/34 (Call 11/26/33) |
1,275 | 1,279,280 | ||||||
| AstraZeneca PLC |
||||||||
| 0.70%, 04/08/26 (Call 03/08/26) |
1,667 | 1,525,384 | ||||||
| 1.38%, 08/06/30 (Call 05/06/30)(a) |
1,942 | 1,573,735 | ||||||
| 2.13%, 08/06/50 (Call 02/06/50) |
870 | 511,210 | ||||||
| 3.00%, 05/28/51 (Call 11/28/50)(a) |
1,390 | 963,276 | ||||||
| 3.13%, 06/12/27 (Call 03/12/27) |
1,170 | 1,111,802 | ||||||
| 3.38%, 11/16/25 |
2,540 | 2,470,248 | ||||||
| 4.00%, 01/17/29 (Call 10/17/28) |
1,462 | 1,412,386 | ||||||
| 4.00%, 09/18/42 |
1,180 | 1,007,106 | ||||||
| 4.38%, 11/16/45 |
1,279 | 1,131,046 | ||||||
| 4.38%, 08/17/48 (Call 02/17/48) |
911 | 810,483 | ||||||
| 6.45%, 09/15/37(a) |
2,945 | 3,319,663 | ||||||
| Bayer Corp., 6.65%, 02/15/28(b) |
244 | 248,459 | ||||||
| Bayer U.S. Finance II LLC |
||||||||
| 3.95%, 04/15/45 (Call 10/15/44)(b) |
508 | 351,236 | ||||||
| 4.20%, 07/15/34 (Call 01/15/34)(b) |
679 | 568,746 | ||||||
| 4.25%, 12/15/25 (Call 10/15/25)(b) |
3,307 | 3,215,412 | ||||||
| 4.38%, 12/15/28 (Call 09/15/28)(b) |
3,937 | 3,667,366 | ||||||
| 4.40%, 07/15/44 (Call 01/15/44)(a)(b) |
1,237 | 933,393 | ||||||
| 4.63%, 06/25/38 (Call 12/25/37)(b) |
1,342 | 1,104,419 | ||||||
| 4.65%, 11/15/43 (Call 05/15/43)(b) |
200 | 152,904 | ||||||
| 4.70%, 07/15/64 (Call 01/15/64)(b) |
960 | 687,183 | ||||||
| 4.88%, 06/25/48 (Call 12/25/47)(a)(b) |
2,820 | 2,234,594 | ||||||
| 5.50%, 08/15/25(b) |
398 | 393,838 | ||||||
| 5.50%, 07/30/35(a)(b) |
660 | 605,585 | ||||||
| Bayer U.S. Finance LLC |
||||||||
| 6.13%, 11/21/26 (Call 10/21/26)(a)(b) |
1,420 | 1,430,078 | ||||||
| 6.25%, 01/21/29 (Call 12/21/28)(b) |
710 | 715,308 | ||||||
| 6.38%, 11/21/30 (Call 09/21/30)(b) |
1,140 | 1,148,653 | ||||||
| 6.50%, 11/21/33 (Call 08/21/33)(b) |
1,410 | 1,410,769 | ||||||
| 6.88%, 11/21/53 (Call 05/21/53)(a)(b) |
890 | 890,640 | ||||||
| Becton Dickinson and Co. |
||||||||
| 1.96%, 02/11/31 (Call 11/11/30) |
1,477 | 1,201,795 | ||||||
| S C H E D U L E O F I N V E S T M E N T S |
109 |
| Schedule of Investments (continued) February 29, 2024 |
iShares® Broad USD Investment Grade Corporate Bond ETF (Percentages shown are based on Net Assets) |
| Security | Par (000) |
Value | ||||||
| Pharmaceuticals (continued) | ||||||||
| 2.82%, 05/20/30 (Call 02/20/30) |
$ | 1,016 | $ | 892,172 | ||||
| 3.70%, 06/06/27 (Call 03/06/27)(a) |
2,453 | 2,351,671 | ||||||
| 3.79%, 05/20/50 (Call 11/20/49)(a) |
765 | 592,098 | ||||||
| 4.30%, 08/22/32 (Call 05/22/32) |
850 | 796,631 | ||||||
| 4.67%, 06/06/47 (Call 12/06/46) |
2,099 | 1,859,147 | ||||||
| 4.69%, 02/13/28 (Call 01/13/28) |
1,110 | 1,093,644 | ||||||
| 4.69%, 12/15/44 (Call 06/15/44)(a) |
1,446 | 1,294,148 | ||||||
| 4.87%, 02/08/29 (Call 01/08/29) |
230 | 227,119 | ||||||
| 5.11%, 02/08/34 (Call 11/08/33) |
185 | 181,780 | ||||||
| Bristol-Myers Squibb Co. |
||||||||
| 0.75%, 11/13/25 (Call 10/13/25) |
1,399 | 1,301,328 | ||||||
| 1.13%, 11/13/27 (Call 09/13/27) |
1,518 | 1,330,794 | ||||||
| 1.45%, 11/13/30 (Call 08/13/30)(a) |
2,026 | 1,625,419 | ||||||
| 2.35%, 11/13/40 (Call 05/13/40) |
1,138 | 763,285 | ||||||
| 2.55%, 11/13/50 (Call 05/13/50) |
2,191 | 1,327,889 | ||||||
| 2.95%, 03/15/32 (Call 12/15/31) |
2,020 | 1,745,668 | ||||||
| 3.20%, 06/15/26 (Call 04/15/26) |
2,391 | 2,300,872 | ||||||
| 3.25%, 02/27/27 |
455 | 436,866 | ||||||
| 3.25%, 08/01/42(a) |
800 | 605,349 | ||||||
| 3.40%, 07/26/29 (Call 04/26/29) |
3,321 | 3,096,574 | ||||||
| 3.45%, 11/15/27 (Call 08/15/27)(a) |
960 | 915,936 | ||||||
| 3.55%, 03/15/42 (Call 09/15/41) |
1,705 | 1,344,305 | ||||||
| 3.70%, 03/15/52 (Call 09/15/51) |
2,717 | 2,062,157 | ||||||
| 3.90%, 02/20/28 (Call 11/20/27) |
1,168 | 1,127,677 | ||||||
| 3.90%, 03/15/62 (Call 09/15/61) |
1,279 | 954,729 | ||||||
| 4.13%, 06/15/39 (Call 12/15/38)(a) |
2,650 | 2,308,668 | ||||||
| 4.25%, 10/26/49 (Call 04/26/49) |
4,817 | 4,041,232 | ||||||
| 4.35%, 11/15/47 (Call 05/15/47) |
1,594 | 1,356,134 | ||||||
| 4.50%, 03/01/44 (Call 09/01/43) |
200 | 177,338 | ||||||
| 4.55%, 02/20/48 (Call 08/20/47) |
1,522 | 1,340,141 | ||||||
| 4.63%, 05/15/44 (Call 11/15/43) |
1,165 | 1,055,912 | ||||||
| 4.90%, 02/22/27 (Call 01/22/27) |
590 | 589,340 | ||||||
| 4.90%, 02/22/29 (Call 01/22/29) |
1,050 | 1,047,530 | ||||||
| 4.95%, 02/20/26 |
925 | 923,419 | ||||||
| 5.00%, 08/15/45 (Call 02/15/45)(a) |
755 | 717,701 | ||||||
| 5.10%, 02/22/31 (Call 12/22/30) |
425 | 426,739 | ||||||
| 5.20%, 02/22/34 (Call 11/22/33) |
2,615 | 2,636,244 | ||||||
| 5.50%, 02/22/44 (Call 08/22/43) |
345 | 349,147 | ||||||
| 5.55%, 02/22/54 (Call 08/22/53) |
1,725 | 1,745,450 | ||||||
| 5.65%, 02/22/64 (Call 08/22/63) |
1,920 | 1,937,572 | ||||||
| 5.75%, 02/01/31 (Call 12/01/30) |
1,185 | 1,235,411 | ||||||
| 5.88%, 11/15/36(a) |
497 | 524,103 | ||||||
| 5.90%, 11/15/33 (Call 08/15/33) |
1,190 | 1,259,155 | ||||||
| 6.25%, 11/15/53 (Call 05/15/53)(a) |
1,530 | 1,694,898 | ||||||
| 6.40%, 11/15/63 (Call 05/15/63) |
860 | 960,229 | ||||||
| 6.80%, 11/15/26 |
1,005 | 1,050,460 | ||||||
| Cardinal Health Inc. |
||||||||
| 3.41%, 06/15/27 (Call 03/15/27) |
1,516 | 1,437,464 | ||||||
| 3.75%, 09/15/25 (Call 06/15/25) |
717 | 699,395 | ||||||
| 4.37%, 06/15/47 (Call 12/15/46) |
807 | 663,411 | ||||||
| 4.50%, 11/15/44 (Call 05/15/44)(a) |
637 | 534,266 | ||||||
| 4.60%, 03/15/43 |
460 | 393,608 | ||||||
| 4.90%, 09/15/45 (Call 03/15/45) |
699 | 616,978 | ||||||
| 5.13%, 02/15/29 (Call 01/15/29) |
475 | 472,902 | ||||||
| 5.45%, 02/15/34 (Call 11/15/33)(a) |
270 | 270,086 | ||||||
| Cencora Inc. |
||||||||
| 2.70%, 03/15/31 (Call 12/15/30) |
1,605 | 1,371,238 | ||||||
| 2.80%, 05/15/30 (Call 02/15/30)(a) |
1,010 | 886,511 | ||||||
| 3.25%, 03/01/25 (Call 12/01/24) |
814 | 796,400 | ||||||
| 3.45%, 12/15/27 (Call 09/15/27) |
943 | 893,327 | ||||||
| 4.25%, 03/01/45 (Call 09/01/44)(a) |
485 | 423,093 | ||||||
| Security | Par (000) |
Value | ||||||
| Pharmaceuticals (continued) | ||||||||
| 4.30%, 12/15/47 (Call 06/15/47)(a) |
$ | 1,042 | $ | 886,974 | ||||
| 5.13%, 02/15/34 (Call 11/15/33) |
225 | 220,862 | ||||||
| Cigna Group (The) |
||||||||
| 1.25%, 03/15/26 (Call 02/15/26)(a) |
408 | 376,910 | ||||||
| 2.38%, 03/15/31 (Call 12/15/30) |
1,760 | 1,469,291 | ||||||
| 2.40%, 03/15/30 (Call 12/15/29) |
1,725 | 1,479,429 | ||||||
| 3.05%, 10/15/27 (Call 07/15/27)(a) |
998 | 932,860 | ||||||
| 3.20%, 03/15/40 (Call 09/15/39) |
1,214 | 904,909 | ||||||
| 3.25%, 04/15/25 (Call 01/15/25) |
905 | 883,341 | ||||||
| 3.40%, 03/01/27 (Call 12/01/26) |
1,665 | 1,585,233 | ||||||
| 3.40%, 03/15/50 (Call 09/15/49) |
1,860 | 1,302,574 | ||||||
| 3.40%, 03/15/51 (Call 09/15/50) |
2,095 | 1,464,674 | ||||||
| 3.88%, 10/15/47 (Call 04/15/47) |
1,334 | 1,025,400 | ||||||
| 4.38%, 10/15/28 (Call 07/15/28) |
4,350 | 4,222,262 | ||||||
| 4.50%, 02/25/26 (Call 11/27/25) |
1,022 | 1,007,786 | ||||||
| 4.80%, 08/15/38 (Call 02/15/38) |
2,833 | 2,627,447 | ||||||
| 4.80%, 07/15/46 (Call 01/16/46) |
2,054 | 1,835,553 | ||||||
| 4.90%, 12/15/48 (Call 06/15/48) |
3,548 | 3,188,720 | ||||||
| 5.00%, 05/15/29 (Call 04/15/29) |
675 | 670,424 | ||||||
| 5.13%, 05/15/31 (Call 03/15/31) |
725 | 716,980 | ||||||
| 5.25%, 02/15/34 (Call 11/15/33)(a) |
675 | 667,005 | ||||||
| 5.38%, 02/15/42 (Call 08/15/41) |
70 | 65,544 | ||||||
| 5.40%, 03/15/33 (Call 12/15/32) |
1,200 | 1,209,101 | ||||||
| 5.60%, 02/15/54 (Call 08/15/53) |
725 | 713,152 | ||||||
| 5.69%, 03/15/26 (Call 03/15/24) |
215 | 214,995 | ||||||
| 6.13%, 11/15/41 |
439 | 464,312 | ||||||
| CVS Health Corp. |
||||||||
| 1.30%, 08/21/27 (Call 06/21/27) |
3,054 | 2,685,054 | ||||||
| 1.75%, 08/21/30 (Call 05/21/30) |
1,500 | 1,218,416 | ||||||
| 1.88%, 02/28/31 (Call 11/28/30) |
1,750 | 1,407,240 | ||||||
| 2.13%, 09/15/31 (Call 06/15/31) |
1,420 | 1,145,677 | ||||||
| 2.70%, 08/21/40 (Call 02/21/40)(a) |
1,748 | 1,195,186 | ||||||
| 2.88%, 06/01/26 (Call 03/01/26) |
2,189 | 2,080,092 | ||||||
| 3.00%, 08/15/26 (Call 06/15/26)(a) |
1,129 | 1,071,986 | ||||||
| 3.25%, 08/15/29 (Call 05/15/29) |
2,462 | 2,242,407 | ||||||
| 3.63%, 04/01/27 (Call 02/01/27) |
1,351 | 1,296,484 | ||||||
| 3.75%, 04/01/30 (Call 01/01/30) |
2,059 | 1,899,830 | ||||||
| 3.88%, 07/20/25 (Call 04/20/25) |
2,671 | 2,616,471 | ||||||
| 4.10%, 03/25/25 (Call 01/25/25) |
1,104 | 1,089,944 | ||||||
| 4.13%, 04/01/40 (Call 10/01/39) |
1,456 | 1,197,801 | ||||||
| 4.25%, 04/01/50 (Call 10/01/49) |
1,200 | 958,066 | ||||||
| 4.30%, 03/25/28 (Call 12/25/27) |
6,511 | 6,318,931 | ||||||
| 4.78%, 03/25/38 (Call 09/25/37) |
5,681 | 5,162,382 | ||||||
| 4.88%, 07/20/35 (Call 01/20/35) |
308 | 293,588 | ||||||
| 5.00%, 02/20/26 (Call 01/20/26) |
1,945 | 1,936,173 | ||||||
| 5.00%, 01/30/29 (Call 12/30/28) |
1,410 | 1,405,401 | ||||||
| 5.05%, 03/25/48 (Call 09/25/47) |
10,204 | 9,101,697 | ||||||
| 5.13%, 02/21/30 (Call 12/21/29) |
1,970 | 1,957,729 | ||||||
| 5.13%, 07/20/45 (Call 01/20/45) |
4,633 | 4,214,170 | ||||||
| 5.25%, 01/30/31 (Call 11/30/30) |
1,050 | 1,048,778 | ||||||
| 5.25%, 02/21/33 (Call 11/21/32) |
2,325 | 2,301,308 | ||||||
| 5.30%, 06/01/33 (Call 03/01/33)(a) |
1,645 | 1,633,142 | ||||||
| 5.30%, 12/05/43 (Call 06/05/43) |
325 | 302,473 | ||||||
| 5.63%, 02/21/53 (Call 08/21/52) |
1,710 | 1,642,839 | ||||||
| 5.88%, 06/01/53 (Call 12/01/52)(a) |
1,755 | 1,749,244 | ||||||
| 6.00%, 06/01/63 (Call 12/01/62)(a) |
1,020 | 1,021,089 | ||||||
| 6.13%, 09/15/39(a) |
633 | 647,532 | ||||||
| 6.25%, 06/01/27(a) |
660 | 683,902 | ||||||
| Eli Lilly & Co. |
||||||||
| 2.25%, 05/15/50 (Call 11/15/49)(a) |
2,208 | 1,335,189 | ||||||
| 2.50%, 09/15/60 (Call 03/15/60) |
1,257 | 735,411 | ||||||
| 110 | 2 0 2 4 I S H A R E S A N N U A L R E P O R T T O S H A R E H O L D E R S |
| Schedule of Investments (continued) February 29, 2024 |
iShares® Broad USD Investment Grade Corporate Bond ETF (Percentages shown are based on Net Assets) |
| Security | Par (000) |
Value | ||||||
| Pharmaceuticals (continued) | ||||||||
| 2.75%, 06/01/25 (Call 03/01/25) |
$ | 952 | $ | 926,157 | ||||
| 3.10%, 05/15/27 (Call 02/15/27) |
716 | 681,067 | ||||||
| 3.38%, 03/15/29 (Call 12/15/28)(a) |
1,663 | 1,567,297 | ||||||
| 3.70%, 03/01/45 (Call 09/01/44) |
780 | 641,226 | ||||||
| 3.95%, 05/15/47 (Call 11/15/46) |
76 | 65,240 | ||||||
| 3.95%, 03/15/49 (Call 09/15/48) |
540 | 454,079 | ||||||
| 4.15%, 03/15/59 (Call 09/15/58)(a) |
740 | 625,293 | ||||||
| 4.50%, 02/09/27 (Call 01/09/27)(a) |
1,305 | 1,299,920 | ||||||
| 4.50%, 02/09/29 (Call 01/09/29)(a) |
1,275 | 1,267,702 | ||||||
| 4.70%, 02/27/33 (Call 11/27/32) |
845 | 838,028 | ||||||
| 4.70%, 02/09/34 (Call 11/09/33) |
1,275 | 1,258,584 | ||||||
| 4.88%, 02/27/53 (Call 08/27/52)(a) |
1,922 | 1,859,166 | ||||||
| 4.95%, 02/27/63 (Call 08/27/62) |
1,325 | 1,278,188 | ||||||
| 5.00%, 02/09/54 (Call 08/09/53) |
980 | 965,358 | ||||||
| 5.10%, 02/09/64 (Call 08/09/63) |
1,275 | 1,252,872 | ||||||
| 5.50%, 03/15/27 |
260 | 266,564 | ||||||
| 5.55%, 03/15/37 |
255 | 267,620 | ||||||
| 5.95%, 11/15/37(a) |
370 | 398,970 | ||||||
| EMD Finance LLC, 3.25%, 03/19/25 |
||||||||
| (Call 12/19/24)(b) |
1,399 | 1,367,489 | ||||||
| Evernorth Health Inc., 4.50%, 02/25/26 |
||||||||
| (Call 11/27/25)(a) |
581 | 571,231 | ||||||
| GlaxoSmithKline Capital Inc. |
||||||||
| 3.63%, 05/15/25 |
1,038 | 1,019,949 | ||||||
| 3.88%, 05/15/28(a) |
2,644 | 2,557,212 | ||||||
| 4.20%, 03/18/43 |
870 | 765,058 | ||||||
| 5.38%, 04/15/34(a) |
975 | 1,028,973 | ||||||
| 6.38%, 05/15/38 |
3,543 | 3,969,839 | ||||||
| GlaxoSmithKline Capital PLC, 3.38%, 06/01/29 |
||||||||
| (Call 03/01/29) |
1,004 | 943,546 | ||||||
| Johnson & Johnson |
||||||||
| 0.55%, 09/01/25 (Call 08/01/25)(a) |
1,372 | 1,287,182 | ||||||
| 0.95%, 09/01/27 (Call 07/01/27) |
2,421 | 2,142,163 | ||||||
| 1.30%, 09/01/30 (Call 06/01/30) |
1,876 | 1,535,968 | ||||||
| 2.10%, 09/01/40 (Call 03/01/40) |
1,265 | 859,687 | ||||||
| 2.25%, 09/01/50 (Call 03/01/50)(a) |
900 | 555,569 | ||||||
| 2.45%, 03/01/26 (Call 12/01/25) |
2,623 | 2,510,053 | ||||||
| 2.45%, 09/01/60 (Call 03/01/60)(a) |
1,343 | 792,659 | ||||||
| 2.90%, 01/15/28 (Call 10/15/27) |
1,380 | 1,305,747 | ||||||
| 2.95%, 03/03/27 (Call 12/03/26) |
1,738 | 1,662,421 | ||||||
| 3.40%, 01/15/38 (Call 07/15/37) |
1,431 | 1,214,576 | ||||||
| 3.50%, 01/15/48 (Call 07/15/47)(a) |
839 | 663,119 | ||||||
| 3.55%, 03/01/36 (Call 09/01/35) |
1,651 | 1,461,807 | ||||||
| 3.63%, 03/03/37 (Call 09/03/36) |
1,072 | 947,357 | ||||||
| 3.70%, 03/01/46 (Call 09/01/45) |
2,591 | 2,127,560 | ||||||
| 3.75%, 03/03/47 (Call 09/03/46) |
1,613 | 1,327,535 | ||||||
| 4.38%, 12/05/33 (Call 06/05/33)(a) |
1,407 | 1,389,923 | ||||||
| 4.50%, 09/01/40(a) |
555 | 527,838 | ||||||
| 4.50%, 12/05/43 (Call 06/05/43)(a) |
985 | 926,862 | ||||||
| 4.85%, 05/15/41(a) |
419 | 412,495 | ||||||
| 4.95%, 05/15/33(a) |
586 | 608,155 | ||||||
| 5.85%, 07/15/38(a) |
916 | 1,007,200 | ||||||
| 5.95%, 08/15/37 |
1,312 | 1,448,332 | ||||||
| 6.95%, 09/01/29 |
430 | 482,579 | ||||||
| McKesson Corp. |
||||||||
| 0.90%, 12/03/25 (Call 11/03/25) |
901 | 836,238 | ||||||
| 1.30%, 08/15/26 (Call 07/15/26) |
1,040 | 949,309 | ||||||
| 3.95%, 02/16/28 (Call 11/16/27) |
532 | 516,706 | ||||||
| 4.88%, 03/15/44 (Call 09/15/43)(a) |
652 | 576,426 | ||||||
| 4.90%, 07/15/28 (Call 06/15/28) |
450 | 450,065 | ||||||
| 5.10%, 07/15/33 (Call 04/15/33) |
340 | 338,902 | ||||||
| Security | Par (000) |
Value | ||||||
| Pharmaceuticals (continued) | ||||||||
| 5.25%, 02/15/26 (Call 04/01/24) |
$ | 370 | $ | 370,004 | ||||
| Mead Johnson Nutrition Co. |
||||||||
| 4.13%, 11/15/25 (Call 08/15/25) |
1,173 | 1,151,230 | ||||||
| 4.60%, 06/01/44 (Call 12/01/43)(a) |
530 | 470,915 | ||||||
| 5.90%, 11/01/39 |
295 | 307,066 | ||||||
| Merck & Co. Inc. |
||||||||
| 0.75%, 02/24/26 (Call 01/24/26) |
1,698 | 1,569,685 | ||||||
| 1.45%, 06/24/30 (Call 03/24/30) |
650 | 531,363 | ||||||
| 1.70%, 06/10/27 (Call 05/10/27) |
2,164 | 1,960,311 | ||||||
| 1.90%, 12/10/28 (Call 10/10/28)(a) |
1,557 | 1,374,163 | ||||||
| 2.15%, 12/10/31 (Call 09/10/31) |
3,360 | 2,783,368 | ||||||
| 2.35%, 06/24/40 (Call 12/24/39) |
598 | 414,605 | ||||||
| 2.45%, 06/24/50 (Call 12/24/49)(a) |
2,026 | 1,248,411 | ||||||
| 2.75%, 12/10/51 (Call 06/10/51) |
2,853 | 1,840,249 | ||||||
| 2.90%, 12/10/61 (Call 06/10/61)(a) |
2,010 | 1,249,060 | ||||||
| 3.40%, 03/07/29 (Call 12/07/28) |
2,648 | 2,486,495 | ||||||
| 3.60%, 09/15/42 (Call 03/15/42) |
882 | 715,987 | ||||||
| 3.70%, 02/10/45 (Call 08/10/44) |
2,276 | 1,842,132 | ||||||
| 3.90%, 03/07/39 (Call 09/07/38) |
1,621 | 1,421,993 | ||||||
| 4.00%, 03/07/49 (Call 09/07/48) |
1,722 | 1,437,547 | ||||||
| 4.05%, 05/17/28 (Call 04/17/28) |
350 | 343,061 | ||||||
| 4.15%, 05/18/43 |
1,854 | 1,618,658 | ||||||
| 4.30%, 05/17/30 (Call 03/17/30)(a) |
1,480 | 1,440,820 | ||||||
| 4.50%, 05/17/33 (Call 02/17/33) |
935 | 909,256 | ||||||
| 4.90%, 05/17/44 (Call 11/17/43)(a) |
1,100 | 1,056,651 | ||||||
| 5.00%, 05/17/53 (Call 11/17/52) |
1,895 | 1,836,609 | ||||||
| 5.15%, 05/17/63 (Call 11/17/62) |
1,290 | 1,258,786 | ||||||
| 6.50%, 12/01/33(a) |
1,225 | 1,380,739 | ||||||
| 6.55%, 09/15/37 |
520 | 582,573 | ||||||
| Merck Sharp & Dohme Corp. |
||||||||
| 5.75%, 11/15/36 |
223 | 237,560 | ||||||
| 5.85%, 06/30/39 |
255 | 268,382 | ||||||
| 5.95%, 12/01/28 |
1,260 | 1,321,640 | ||||||
| 6.40%, 03/01/28 |
740 | 782,828 | ||||||
| Mylan Inc. |
||||||||
| 4.55%, 04/15/28 (Call 01/15/28)(a) |
1,214 | 1,170,529 | ||||||
| 5.20%, 04/15/48 (Call 10/15/47) |
1,188 | 976,596 | ||||||
| 5.40%, 11/29/43 (Call 05/29/43) |
641 | 555,290 | ||||||
| Novartis Capital Corp. |
||||||||
| 2.00%, 02/14/27 (Call 12/14/26) |
1,861 | 1,724,827 | ||||||
| 2.20%, 08/14/30 (Call 05/14/30) |
2,314 | 1,989,460 | ||||||
| 2.75%, 08/14/50 (Call 02/14/50)(a) |
1,841 | 1,226,229 | ||||||
| 3.00%, 11/20/25 (Call 08/20/25) |
1,996 | 1,934,060 | ||||||
| 3.10%, 05/17/27 (Call 02/17/27) |
1,665 | 1,585,301 | ||||||
| 3.70%, 09/21/42 |
1,078 | 894,072 | ||||||
| 4.00%, 11/20/45 (Call 05/20/45) |
958 | 814,118 | ||||||
| 4.40%, 05/06/44 |
2,557 | 2,326,995 | ||||||
| Pfizer Inc. |
||||||||
| 0.80%, 05/28/25 (Call 04/28/25) |
959 | 910,305 | ||||||
| 1.70%, 05/28/30 (Call 02/28/30) |
1,600 | 1,332,893 | ||||||
| 1.75%, 08/18/31 (Call 05/18/31) |
1,423 | 1,148,665 | ||||||
| 2.55%, 05/28/40 (Call 11/28/39) |
1,766 | 1,238,952 | ||||||
| 2.63%, 04/01/30 (Call 01/01/30) |
1,988 | 1,758,813 | ||||||
| 2.70%, 05/28/50 (Call 11/28/49)(a) |
1,999 | 1,319,604 | ||||||
| 2.75%, 06/03/26 |
1,812 | 1,734,308 | ||||||
| 3.00%, 12/15/26 |
2,202 | 2,100,266 | ||||||
| 3.45%, 03/15/29 (Call 12/15/28) |
2,748 | 2,583,708 | ||||||
| 3.60%, 09/15/28 (Call 06/15/28)(a) |
1,543 | 1,474,467 | ||||||
| 3.90%, 03/15/39 (Call 09/15/38)(a) |
1,213 | 1,035,897 | ||||||
| 4.00%, 12/15/36 |
1,254 | 1,125,925 | ||||||
| 4.00%, 03/15/49 (Call 09/15/48)(a) |
1,809 | 1,493,327 | ||||||
| S C H E D U L E O F I N V E S T M E N T S |
111 |
| Schedule of Investments (continued) February 29, 2024 |
iShares® Broad USD Investment Grade Corporate Bond ETF (Percentages shown are based on Net Assets) |
| Security | Par (000) |
Value | ||||||
| Pharmaceuticals (continued) | ||||||||
| 4.10%, 09/15/38 (Call 03/15/38) |
$ | 1,283 | $ | 1,141,913 | ||||
| 4.13%, 12/15/46(a) |
1,874 | 1,571,804 | ||||||
| 4.20%, 09/15/48 (Call 03/15/48) |
1,626 | 1,385,328 | ||||||
| 4.30%, 06/15/43 |
1,246 | 1,093,828 | ||||||
| 4.40%, 05/15/44(a) |
1,338 | 1,204,331 | ||||||
| 5.60%, 09/15/40 |
952 | 978,431 | ||||||
| 7.20%, 03/15/39 |
2,950 | 3,505,704 | ||||||
| Pfizer Investment Enterprises Pte Ltd. |
||||||||
| 4.45%, 05/19/26 (Call 04/19/26) |
3,880 | 3,831,458 | ||||||
| 4.45%, 05/19/28 (Call 04/19/28) |
5,190 | 5,088,794 | ||||||
| 4.65%, 05/19/25 |
3,585 | 3,562,767 | ||||||
| 4.65%, 05/19/30 (Call 03/19/30) |
3,330 | 3,275,582 | ||||||
| 4.75%, 05/19/33 (Call 02/19/33) |
6,290 | 6,125,286 | ||||||
| 5.11%, 05/19/43 (Call 11/19/42) |
2,960 | 2,846,778 | ||||||
| 5.30%, 05/19/53 (Call 11/19/52)(a) |
7,840 | 7,669,065 | ||||||
| 5.34%, 05/19/63 (Call 11/19/62) |
3,620 | 3,486,978 | ||||||
| PRA Health Sciences Inc., 2.88%, 07/15/26 |
||||||||
| (Call 04/01/24)(b) |
275 | 254,221 | ||||||
| Sanofi SA, 3.63%, 06/19/28 (Call 03/19/28) |
1,626 | 1,570,363 | ||||||
| Shire Acquisitions Investments Ireland DAC, |
||||||||
| 3.20%, 09/23/26 (Call 06/23/26) |
3,521 | 3,353,914 | ||||||
| Takeda Pharmaceutical Co. Ltd. |
||||||||
| 2.05%, 03/31/30 (Call 12/31/29) |
3,040 | 2,558,647 | ||||||
| 3.03%, 07/09/40 (Call 01/09/40) |
2,085 | 1,553,094 | ||||||
| 3.18%, 07/09/50 (Call 01/09/50) |
2,850 | 1,961,520 | ||||||
| 3.38%, 07/09/60 (Call 01/09/60)(a) |
1,176 | 787,703 | ||||||
| 5.00%, 11/26/28 (Call 08/26/28) |
2,483 | 2,478,907 | ||||||
| Utah Acquisition Sub Inc. |
||||||||
| 3.95%, 06/15/26 (Call 03/15/26) |
2,466 | 2,380,124 | ||||||
| 5.25%, 06/15/46 (Call 12/15/45) |
1,401 | 1,144,698 | ||||||
| Viatris Inc. |
||||||||
| 1.65%, 06/22/25 (Call 05/22/25) |
1,170 | 1,110,409 | ||||||
| 2.30%, 06/22/27 (Call 04/22/27) |
1,188 | 1,074,593 | ||||||
| 2.70%, 06/22/30 (Call 03/22/30) |
1,538 | 1,295,390 | ||||||
| 3.85%, 06/22/40 (Call 12/22/39) |
1,866 | 1,371,376 | ||||||
| 4.00%, 06/22/50 (Call 12/22/49) |
2,563 | 1,749,450 | ||||||
| Wyeth LLC |
||||||||
| 5.95%, 04/01/37 |
2,396 | 2,559,862 | ||||||
| 6.00%, 02/15/36(a) |
930 | 995,117 | ||||||
| 6.50%, 02/01/34 |
1,143 | 1,258,332 | ||||||
| Zoetis Inc. |
||||||||
| 2.00%, 05/15/30 (Call 02/15/30) |
539 | 452,338 | ||||||
| 3.00%, 09/12/27 (Call 06/12/27)(a) |
914 | 854,713 | ||||||
| 3.00%, 05/15/50 (Call 11/15/49) |
751 | 515,121 | ||||||
| 3.90%, 08/20/28 (Call 05/20/28)(a) |
1,104 | 1,061,134 | ||||||
| 3.95%, 09/12/47 (Call 03/12/47) |
582 | 465,709 | ||||||
| 4.45%, 08/20/48 (Call 02/20/48) |
334 | 292,854 | ||||||
| 4.50%, 11/13/25 (Call 08/13/25)(a) |
1,302 | 1,286,079 | ||||||
| 4.70%, 02/01/43 (Call 08/01/42) |
1,821 | 1,666,305 | ||||||
| 5.40%, 11/14/25 (Call 10/14/25) |
615 | 616,129 | ||||||
| 5.60%, 11/16/32 (Call 08/16/32)(a) |
710 | 733,513 | ||||||
|
|
|
|||||||
| 487,471,946 | ||||||||
| Pipelines — 3.5% | ||||||||
| Abu Dhabi Crude Oil Pipeline LLC |
||||||||
| 3.65%, 11/02/29(b) |
755 | 706,869 | ||||||
| 4.60%, 11/02/47(b) |
2,545 | 2,259,960 | ||||||
| Boardwalk Pipelines LP |
||||||||
| 3.40%, 02/15/31 (Call 11/15/30) |
785 | 692,980 | ||||||
| 3.60%, 09/01/32 (Call 06/01/32)(a) |
855 | 743,326 | ||||||
| 4.45%, 07/15/27 (Call 04/15/27) |
993 | 967,801 | ||||||
| 4.80%, 05/03/29 (Call 02/03/29)(a) |
770 | 749,302 | ||||||
| Security | Par (000) |
Value | ||||||
| Pipelines (continued) | ||||||||
| 5.63%, 08/01/34 (Call 05/01/34) |
$ | 450 | $ | 446,387 | ||||
| 5.95%, 06/01/26 (Call 03/01/26) |
1,251 | 1,260,840 | ||||||
| Cameron LNG LLC |
||||||||
| 2.90%, 07/15/31 (Call 04/15/31)(b) |
1,385 | 1,193,175 | ||||||
| 3.30%, 01/15/35 (Call 09/15/34)(b) |
1,085 | 897,315 | ||||||
| 3.40%, 01/15/38 (Call 07/15/37)(b) |
1,215 | 996,666 | ||||||
| 3.70%, 01/15/39 (Call 07/15/38)(b) |
1,270 | 1,041,845 | ||||||
| Cheniere Corpus Christi Holdings LLC |
||||||||
| 2.74%, 12/31/39 (Call 07/04/39)(a) |
995 | 777,707 | ||||||
| 3.70%, 11/15/29 (Call 05/18/29) |
1,151 | 1,061,457 | ||||||
| 5.13%, 06/30/27 (Call 01/01/27) |
2,004 | 1,994,902 | ||||||
| 5.88%, 03/31/25 (Call 10/02/24) |
2,026 | 2,025,950 | ||||||
| Cheniere Energy Inc., 4.63%, 10/15/28 |
||||||||
| (Call 03/11/24) |
685 | 657,518 | ||||||
| Cheniere Energy Partners LP |
||||||||
| 3.25%, 01/31/32 (Call 01/31/27)(a) |
1,558 | 1,302,165 | ||||||
| 4.00%, 03/01/31 (Call 03/01/26) |
1,955 | 1,743,573 | ||||||
| 4.50%, 10/01/29 (Call 10/01/24)(a) |
1,545 | 1,447,147 | ||||||
| 5.95%, 06/30/33 (Call 12/30/32) |
1,711 | 1,722,236 | ||||||
| Colonial Enterprises Inc., 3.25%, 05/15/30 |
||||||||
| (Call 02/15/30)(b) |
1,057 | 941,427 | ||||||
| Colonial Pipeline Co. |
||||||||
| 3.75%, 10/01/25 (Call 07/01/25)(b) |
360 | 350,992 | ||||||
| 4.20%, 04/15/43 (Call 10/15/42)(a)(b) |
50 | 41,842 | ||||||
| 4.25%, 04/15/48 (Call 10/15/47)(a)(b) |
805 | 663,485 | ||||||
| 7.63%, 04/15/32(b) |
205 | 231,852 | ||||||
| Colorado Interstate Gas Co. LLC/Colorado |
481 | 464,567 | ||||||
| Columbia Pipeline Group Inc. |
||||||||
| 4.50%, 06/01/25 (Call 03/01/25) |
1,408 | 1,387,626 | ||||||
| 5.80%, 06/01/45 (Call 12/01/44) |
740 | 716,299 | ||||||
| Columbia Pipelines Holding Co. LLC |
||||||||
| 5.68%, 01/15/34 (Call 10/15/33)(a)(b) |
165 | 161,822 | ||||||
| 6.04%, 08/15/28 (Call 07/15/28)(b) |
1,415 | 1,441,120 | ||||||
| 6.06%, 08/15/26 (Call 07/15/26)(b) |
705 | 713,464 | ||||||
| Columbia Pipelines Operating Co. LLC |
||||||||
| 5.93%, 08/15/30 (Call 06/15/30)(a)(b) |
910 | 926,929 | ||||||
| 6.04%, 11/15/33 (Call 08/15/33)(a)(b) |
2,075 | 2,130,614 | ||||||
| 6.50%, 08/15/43 (Call 02/15/43)(b) |
1,020 | 1,079,372 | ||||||
| 6.54%, 11/15/53 (Call 05/15/53)(b) |
1,630 | 1,736,396 | ||||||
| 6.71%, 08/15/63 (Call 02/15/63)(b) |
800 | 866,282 | ||||||
| DCP Midstream Operating LP |
||||||||
| 3.25%, 02/15/32 (Call 08/15/31)(a) |
640 | 545,491 | ||||||
| 5.13%, 05/15/29 (Call 02/15/29) |
780 | 770,267 | ||||||
| 5.38%, 07/15/25 (Call 04/15/25) |
320 | 319,287 | ||||||
| 5.60%, 04/01/44 (Call 10/01/43) |
855 | 814,225 | ||||||
| 5.63%, 07/15/27 (Call 04/15/27) |
1,035 | 1,038,485 | ||||||
| 6.45%, 11/03/36(b) |
680 | 700,525 | ||||||
| 6.75%, 09/15/37(b) |
855 | 910,127 | ||||||
| 8.13%, 08/16/30(a) |
175 | 199,411 | ||||||
| DT Midstream Inc., 4.30%, 04/15/32 |
||||||||
| (Call 01/15/32)(b) |
1,080 | 960,271 | ||||||
| Eastern Gas Transmission & Storage Inc. |
||||||||
| 3.00%, 11/15/29 (Call 08/15/29) |
899 | 800,006 | ||||||
| 3.90%, 11/15/49 (Call 05/15/49) |
426 | 309,990 | ||||||
| 4.60%, 12/15/44 (Call 06/15/44) |
679 | 579,643 | ||||||
| 4.80%, 11/01/43 (Call 05/01/43) |
357 | 314,432 | ||||||
| EIG Pearl Holdings Sarl |
||||||||
| 3.55%, 08/31/36(b) |
420 | 356,580 | ||||||
| 4.39%, 11/30/46(b) |
460 | 354,114 | ||||||
| 112 | 2 0 2 4 I S H A R E S A N N U A L R E P O R T T O S H A R E H O L D E R S |
| Schedule of Investments (continued) February 29, 2024 |
iShares® Broad USD Investment Grade Corporate Bond ETF (Percentages shown are based on Net Assets) |
| Security | Par (000) |
Value | ||||||
| Pipelines (continued) | ||||||||
| El Paso Natural Gas Co. LLC |
||||||||
| 3.50%, 02/15/32 (Call 11/15/31)(b) |
$ | 565 | $ | 475,940 | ||||
| 8.38%, 06/15/32 |
535 | 617,115 | ||||||
| Enbridge Energy Partners LP |
||||||||
| 5.50%, 09/15/40 (Call 03/15/40)(a) |
569 | 552,631 | ||||||
| 5.88%, 10/15/25 (Call 07/15/25) |
524 | 527,416 | ||||||
| 7.38%, 10/15/45 (Call 04/15/45) |
917 | 1,055,681 | ||||||
| Series B, 7.50%, 04/15/38 |
710 | 821,180 | ||||||
| Enbridge Inc. |
||||||||
| 1.60%, 10/04/26 (Call 09/04/26) |
492 | 449,758 | ||||||
| 2.50%, 08/01/33 (Call 05/01/33)(a) |
1,520 | 1,201,411 | ||||||
| 3.13%, 11/15/29 (Call 08/15/29) |
1,520 | 1,371,895 | ||||||
| 3.40%, 08/01/51 (Call 02/01/51)(a) |
1,370 | 957,484 | ||||||
| 3.70%, 07/15/27 (Call 04/15/27)(a) |
1,775 | 1,696,512 | ||||||
| 4.00%, 11/15/49 (Call 05/15/49) |
825 | 635,395 | ||||||
| 4.25%, 12/01/26 (Call 09/01/26) |
799 | 781,826 | ||||||
| 4.50%, 06/10/44 (Call 12/10/43) |
969 | 804,709 | ||||||
| 5.50%, 12/01/46 (Call 06/01/46) |
712 | 688,444 | ||||||
| 5.50%, 07/15/77 (Call 07/15/27), |
975 | 906,529 | ||||||
| 5.70%, 03/08/33 (Call 12/08/32) |
2,755 | 2,786,082 | ||||||
| 5.90%, 11/15/26 (Call 10/15/26)(a) |
975 | 993,226 | ||||||
| 5.97%, 03/08/26 (Call 03/08/24)(a) |
460 | 459,877 | ||||||
| 6.00%, 11/15/28 (Call 10/15/28)(a) |
720 | 745,642 | ||||||
| 6.20%, 11/15/30 (Call 09/15/30) |
590 | 618,520 | ||||||
| 6.25%, 03/01/78 (Call 03/01/28), |
||||||||
| (3-mo. SOFR + 3.903%)(d) |
1,141 | 1,089,006 | ||||||
| 6.70%, 11/15/53 (Call 05/15/53)(a) |
1,680 | 1,877,950 | ||||||
| 7.38%, 01/15/83 (Call 10/15/27), |
||||||||
| (5-year CMT + 3.708%)(d) |
390 | 390,819 | ||||||
| 7.63%, 01/15/83 (Call 10/15/32), |
||||||||
| (5-year CMT + 4.418%)(d) |
65 | 65,827 | ||||||
| 8.25%, 01/15/84 (Call 10/15/28), |
||||||||
| (5-year CMT + 3.785%)(d) |
550 | 570,555 | ||||||
| 8.50%, 01/15/84 (Call 10/15/33), |
||||||||
| (5-year CMT + 4.431%)(a)(d) |
515 | 549,154 | ||||||
| Series 16-A, 6.00%, 01/15/77 |
||||||||
| (Call 01/15/27), |
||||||||
| (3-mo. SOFR + 4.152%)(a)(d) |
782 | 759,839 | ||||||
| Series 20-A, 5.75%, 07/15/80 |
||||||||
| (Call 04/15/30), (5-year CMT + 5.314%)(d) |
883 | 823,572 | ||||||
| Energy Transfer LP |
||||||||
| 2.90%, 05/15/25 (Call 04/15/25) |
1,409 | 1,364,291 | ||||||
| 3.75%, 05/15/30 (Call 02/15/30)(a) |
1,490 | 1,358,904 | ||||||
| 3.90%, 07/15/26 (Call 04/15/26) |
934 | 904,119 | ||||||
| 4.00%, 10/01/27 (Call 07/01/27) |
1,174 | 1,123,665 | ||||||
| 4.05%, 03/15/25 (Call 12/15/24) |
863 | 849,150 | ||||||
| 4.15%, 09/15/29 (Call 06/15/29) |
773 | 729,766 | ||||||
| 4.20%, 04/15/27 (Call 01/15/27) |
692 | 671,276 | ||||||
| 4.40%, 03/15/27 (Call 12/15/26) |
1,137 | 1,108,081 | ||||||
| 4.75%, 01/15/26 (Call 10/15/25)(a) |
1,504 | 1,486,602 | ||||||
| 4.90%, 03/15/35 (Call 09/15/34) |
868 | 809,341 | ||||||
| 4.95%, 05/15/28 (Call 02/15/28) |
1,137 | 1,122,118 | ||||||
| 4.95%, 06/15/28 (Call 03/15/28) |
1,450 | 1,428,167 | ||||||
| 4.95%, 01/15/43 (Call 07/15/42) |
604 | 519,474 | ||||||
| 5.00%, 05/15/44 (Call 11/15/43) |
595 | 516,251 | ||||||
| 5.00%, 05/15/50 (Call 11/15/49)(a) |
2,565 | 2,211,255 | ||||||
| 5.15%, 02/01/43 (Call 08/01/42) |
668 | 588,402 | ||||||
| 5.15%, 03/15/45 (Call 09/15/44) |
1,390 | 1,240,079 | ||||||
| 5.25%, 04/15/29 (Call 01/15/29) |
2,100 | 2,091,897 | ||||||
| 5.30%, 04/01/44 (Call 10/01/43) |
918 | 831,959 | ||||||
| Security | Par (000) |
Value | ||||||
| Pipelines (continued) | ||||||||
| 5.30%, 04/15/47 (Call 10/15/46) |
$ | 1,195 | $ | 1,070,298 | ||||
| 5.35%, 05/15/45 (Call 11/15/44) |
1,166 | 1,060,064 | ||||||
| 5.40%, 10/01/47 (Call 04/01/47) |
1,946 | 1,765,035 | ||||||
| 5.50%, 06/01/27 (Call 03/01/27)(a) |
1,528 | 1,533,237 | ||||||
| 5.55%, 02/15/28 (Call 01/15/28) |
1,035 | 1,042,985 | ||||||
| 5.55%, 05/15/34 (Call 02/15/34)(a) |
685 | 677,738 | ||||||
| 5.63%, 05/01/27 (Call 03/18/24)(b) |
295 | 292,351 | ||||||
| 5.75%, 04/01/25 (Call 04/01/24) |
30 | 29,951 | ||||||
| 5.75%, 02/15/33 (Call 11/15/32) |
1,630 | 1,641,240 | ||||||
| 5.95%, 12/01/25 (Call 09/01/25) |
26 | 26,156 | ||||||
| 5.95%, 10/01/43 (Call 04/01/43) |
682 | 663,179 | ||||||
| 5.95%, 05/15/54 (Call 11/15/53) |
1,485 | 1,449,318 | ||||||
| 6.00%, 02/01/29 (Call 04/01/24)(a)(b) |
425 | 426,173 | ||||||
| 6.00%, 06/15/48 (Call 12/15/47) |
1,325 | 1,298,701 | ||||||
| 6.05%, 12/01/26 (Call 11/01/26) |
1,550 | 1,577,440 | ||||||
| 6.05%, 06/01/41 (Call 12/01/40) |
782 | 774,786 | ||||||
| 6.10%, 12/01/28 (Call 11/01/28) |
705 | 728,735 | ||||||
| 6.10%, 02/15/42 |
452 | 447,020 | ||||||
| 6.13%, 12/15/45 (Call 06/15/45) |
1,380 | 1,371,238 | ||||||
| 6.25%, 04/15/49 (Call 10/15/48) |
2,251 | 2,272,749 | ||||||
| 6.40%, 12/01/30 (Call 10/01/30) |
1,370 | 1,437,577 | ||||||
| 6.50%, 02/01/42 (Call 08/01/41) |
1,375 | 1,440,884 | ||||||
| 6.55%, 12/01/33 (Call 09/01/33) |
1,830 | 1,941,081 | ||||||
| 6.63%, 10/15/36 |
545 | 570,191 | ||||||
| 6.85%, 02/15/40(a) |
170 | 175,437 | ||||||
| 7.38%, 02/01/31 (Call 02/01/26)(a)(b) |
480 | 502,248 | ||||||
| 7.50%, 07/01/38 |
475 | 538,055 | ||||||
| 8.00%, 04/01/29 (Call 04/01/24)(b) |
250 | 259,315 | ||||||
| 8.25%, 11/15/29 (Call 08/15/29) |
659 | 747,340 | ||||||
| Series 20Y, 5.80%, 06/15/38 |
745 | 736,566 | ||||||
| Enterprise Products Operating LLC |
||||||||
| 2.80%, 01/31/30 (Call 10/31/29) |
1,583 | 1,405,572 | ||||||
| 3.13%, 07/31/29 (Call 04/30/29) |
1,529 | 1,398,840 | ||||||
| 3.20%, 02/15/52 (Call 08/15/51)(a) |
1,379 | 942,852 | ||||||
| 3.30%, 02/15/53 (Call 08/15/52)(a) |
1,247 | 868,169 | ||||||
| 3.70%, 02/15/26 (Call 11/15/25) |
1,531 | 1,493,164 | ||||||
| 3.70%, 01/31/51 (Call 07/31/50) |
1,766 | 1,328,277 | ||||||
| 3.95%, 02/15/27 (Call 11/15/26) |
1,080 | 1,053,887 | ||||||
| 3.95%, 01/31/60 (Call 07/31/59) |
1,426 | 1,085,092 | ||||||
| 4.15%, 10/16/28 (Call 07/16/28) |
1,572 | 1,517,203 | ||||||
| 4.20%, 01/31/50 (Call 07/31/49) |
1,929 | 1,592,677 | ||||||
| 4.25%, 02/15/48 (Call 08/15/47) |
1,702 | 1,423,817 | ||||||
| 4.45%, 02/15/43 (Call 08/15/42) |
1,549 | 1,352,676 | ||||||
| 4.60%, 01/11/27 (Call 12/11/26) |
770 | 764,421 | ||||||
| 4.80%, 02/01/49 (Call 08/01/48)(a) |
1,630 | 1,476,707 | ||||||
| 4.85%, 01/31/34 (Call 10/31/33) |
735 | 715,936 | ||||||
| 4.85%, 08/15/42 (Call 02/15/42) |
975 | 891,854 | ||||||
| 4.85%, 03/15/44 (Call 09/15/43) |
1,546 | 1,418,321 | ||||||
| 4.90%, 05/15/46 (Call 11/15/45) |
725 | 662,097 | ||||||
| 4.95%, 10/15/54 (Call 04/15/54) |
577 | 526,174 | ||||||
| 5.05%, 01/10/26 |
1,355 | 1,354,069 | ||||||
| 5.10%, 02/15/45 (Call 08/15/44) |
1,636 | 1,536,760 | ||||||
| 5.35%, 01/31/33 (Call 10/31/32) |
1,440 | 1,459,172 | ||||||
| 5.38%, 02/15/78 (Call 02/15/28), |
||||||||
| (3-mo. SOFR + 2.832%)(a)(d) |
898 | 830,126 | ||||||
| 5.70%, 02/15/42(a) |
892 | 902,294 | ||||||
| 5.95%, 02/01/41 |
755 | 791,234 | ||||||
| 6.13%, 10/15/39 |
912 | 961,610 | ||||||
| 6.45%, 09/01/40(a) |
530 | 577,555 | ||||||
| 7.55%, 04/15/38 |
645 | 767,303 | ||||||
| S C H E D U L E O F I N V E S T M E N T S |
113 |
| Schedule of Investments (continued) February 29, 2024 |
iShares® Broad USD Investment Grade Corporate Bond ETF (Percentages shown are based on Net Assets) |
| Security | Par (000) |
Value | ||||||
| Pipelines (continued) | ||||||||
| Series D, 6.88%, 03/01/33 |
$ | 752 | $ | 838,076 | ||||
| Series E, 5.25%, 08/16/77 (Call 08/16/27), |
1,081 | 1,025,471 | ||||||
| Series H, 6.65%, 10/15/34 |
655 | 723,266 | ||||||
| Series J, 5.75%, 03/01/35 |
290 | 291,966 | ||||||
| Fermaca Enterprises S de RL de CV, |
308 | 297,602 | ||||||
| Flex Intermediate Holdco LLC |
||||||||
| 3.36%, 06/30/31 (Call 12/30/30)(b) |
1,200 | 975,700 | ||||||
| 4.32%, 12/30/39 (Call 06/30/39)(b) |
945 | 683,123 | ||||||
| FLNG Liquefaction 2 LLC, 4.13%, 03/31/38(b) |
852 | 739,644 | ||||||
| Florida Gas Transmission Co. LLC |
||||||||
| 2.30%, 10/01/31 (Call 07/01/31)(b) |
1,135 | 909,574 | ||||||
| 2.55%, 07/01/30 (Call 04/01/30)(a)(b) |
1,010 | 852,617 | ||||||
| 4.35%, 07/15/25 (Call 04/15/25)(b) |
840 | 824,168 | ||||||
| Galaxy Pipeline Assets Bidco Ltd. |
||||||||
| 1.75%, 09/30/27(b) |
162 | 151,336 | ||||||
| 2.16%, 03/31/34(b) |
2,098 | 1,797,314 | ||||||
| 2.63%, 03/31/36(b) |
100 | 81,006 | ||||||
| 2.94%, 09/30/40(b) |
131 | 104,015 | ||||||
| 3.25%, 09/30/40(b) |
1,345 | 1,015,311 | ||||||
| GNL Quintero SA, 4.63%, 07/31/29(b) |
482 | 473,285 | ||||||
| Gray Oak Pipeline LLC |
||||||||
| 2.60%, 10/15/25 (Call 09/15/25)(b) |
802 | 762,987 | ||||||
| 3.45%, 10/15/27 (Call 08/15/27)(a)(b) |
755 | 703,360 | ||||||
| Greensaif Pipelines Bidco Sarl |
||||||||
| 6.13%, 02/23/38(a)(b) |
1,055 | 1,071,483 | ||||||
| 6.51%, 02/23/42(b) |
1,000 | 1,030,613 | ||||||
| Gulfstream Natural Gas System LLC |
||||||||
| 4.60%, 09/15/25 (Call 06/15/25)(b) |
480 | 471,571 | ||||||
| 5.95%, 10/15/45 (Call 04/15/45)(b) |
489 | 440,747 | ||||||
| 6.19%, 11/01/25(b) |
860 | 862,988 | ||||||
| Kinder Morgan Energy Partners LP |
||||||||
| 4.70%, 11/01/42 (Call 05/01/42) |
654 | 550,177 | ||||||
| 5.00%, 08/15/42 (Call 02/15/42)(a) |
763 | 663,755 | ||||||
| 5.00%, 03/01/43 (Call 09/01/42) |
890 | 779,105 | ||||||
| 5.40%, 09/01/44 (Call 03/01/44) |
710 | 648,351 | ||||||
| 5.50%, 03/01/44 (Call 09/01/43) |
1,003 | 927,707 | ||||||
| 5.63%, 09/01/41 |
569 | 535,218 | ||||||
| 5.80%, 03/15/35 |
605 | 608,075 | ||||||
| 6.38%, 03/01/41 |
825 | 838,899 | ||||||
| 6.50%, 02/01/37 |
883 | 909,622 | ||||||
| 6.50%, 09/01/39 |
797 | 820,121 | ||||||
| 6.55%, 09/15/40(a) |
574 | 593,446 | ||||||
| 6.95%, 01/15/38 |
1,285 | 1,391,261 | ||||||
| 7.30%, 08/15/33 |
915 | 1,015,827 | ||||||
| 7.40%, 03/15/31(a) |
384 | 425,087 | ||||||
| 7.50%, 11/15/40 |
561 | 625,107 | ||||||
| 7.75%, 03/15/32 |
422 | 471,220 | ||||||
| Kinder Morgan Inc. |
||||||||
| 1.75%, 11/15/26 (Call 10/15/26) |
170 | 155,259 | ||||||
| 2.00%, 02/15/31 (Call 11/15/30) |
830 | 673,210 | ||||||
| 3.25%, 08/01/50 (Call 02/01/50)(a) |
750 | 486,046 | ||||||
| 3.60%, 02/15/51 (Call 08/15/50)(a) |
1,201 | 824,274 | ||||||
| 4.30%, 06/01/25 (Call 03/01/25) |
1,780 | 1,754,024 | ||||||
| 4.30%, 03/01/28 (Call 12/01/27)(a) |
1,357 | 1,316,253 | ||||||
| 4.80%, 02/01/33 (Call 11/01/32) |
843 | 795,644 | ||||||
| 5.00%, 02/01/29 (Call 01/01/29) |
1,010 | 1,001,150 | ||||||
| 5.05%, 02/15/46 (Call 08/15/45) |
396 | 345,413 | ||||||
| 5.20%, 06/01/33 (Call 03/01/33) |
1,160 | 1,129,354 | ||||||
| 5.20%, 03/01/48 (Call 09/01/47) |
956 | 849,539 | ||||||
| Security | Par (000) |
Value | ||||||
| Pipelines (continued) | ||||||||
| 5.30%, 12/01/34 (Call 06/01/34)(a) |
$ | 997 | $ | 971,839 | ||||
| 5.40%, 02/01/34 (Call 11/01/33)(a) |
1,275 | 1,253,724 | ||||||
| 5.45%, 08/01/52 (Call 02/01/52)(a) |
1,005 | 924,758 | ||||||
| 5.55%, 06/01/45 (Call 12/01/44) |
2,263 | 2,124,637 | ||||||
| 7.75%, 01/15/32 |
1,386 | 1,560,632 | ||||||
| 7.80%, 08/01/31 |
893 | 1,000,628 | ||||||
| Magellan Midstream Partners LP |
||||||||
| 3.95%, 03/01/50 (Call 09/01/49) |
700 | 512,950 | ||||||
| 5.00%, 03/01/26 (Call 12/01/25) |
1,063 | 1,054,875 | ||||||
| Midwest Connector Capital Co. LLC, |
710 | 684,096 | ||||||
| MPLX LP |
||||||||
| 1.75%, 03/01/26 (Call 02/01/26) |
2,288 | 2,134,495 | ||||||
| 2.65%, 08/15/30 (Call 05/15/30) |
1,955 | 1,664,530 | ||||||
| 4.00%, 03/15/28 (Call 12/15/27) |
1,817 | 1,742,144 | ||||||
| 4.13%, 03/01/27 (Call 12/01/26) |
1,757 | 1,703,667 | ||||||
| 4.25%, 12/01/27 (Call 09/01/27) |
1,202 | 1,163,314 | ||||||
| 4.50%, 04/15/38 (Call 10/15/37) |
2,382 | 2,073,107 | ||||||
| 4.70%, 04/15/48 (Call 10/15/47) |
2,030 | 1,700,799 | ||||||
| 4.80%, 02/15/29 (Call 11/15/28) |
1,121 | 1,097,834 | ||||||
| 4.88%, 06/01/25 (Call 03/01/25) |
1,180 | 1,169,438 | ||||||
| 4.90%, 04/15/58 (Call 10/15/57)(a) |
518 | 428,215 | ||||||
| 4.95%, 09/01/32 (Call 06/01/32) |
1,190 | 1,139,754 | ||||||
| 4.95%, 03/14/52 (Call 09/14/51) |
2,128 | 1,826,314 | ||||||
| 5.00%, 03/01/33 (Call 12/01/32) |
1,175 | 1,123,899 | ||||||
| 5.20%, 03/01/47 (Call 09/01/46) |
1,366 | 1,225,735 | ||||||
| 5.20%, 12/01/47 (Call 06/01/47) |
876 | 783,720 | ||||||
| 5.50%, 02/15/49 (Call 08/15/48) |
2,090 | 1,957,306 | ||||||
| 5.65%, 03/01/53 (Call 09/01/52) |
490 | 465,956 | ||||||
| NGPL PipeCo LLC |
||||||||
| 3.25%, 07/15/31 (Call 04/15/31)(a)(b) |
460 | 392,514 | ||||||
| 4.88%, 08/15/27 (Call 02/15/27)(b) |
1,346 | 1,313,879 | ||||||
| 7.77%, 12/15/37(b) |
617 | 682,733 | ||||||
| Northern Natural Gas Co. |
||||||||
| 3.40%, 10/16/51 (Call 04/16/51)(b) |
745 | 514,192 | ||||||
| 4.10%, 09/15/42 (Call 03/15/42)(b) |
585 | 452,092 | ||||||
| 4.30%, 01/15/49 (Call 07/15/48)(b) |
1,150 | 945,353 | ||||||
| 5.63%, 02/01/54 (Call 08/01/53)(a)(b) |
625 | 633,018 | ||||||
| Northwest Pipeline LLC, 4.00%, 04/01/27 |
||||||||
| (Call 01/01/27) |
595 | 577,441 | ||||||
| ONEOK Inc. |
||||||||
| 2.20%, 09/15/25 (Call 08/15/25) |
515 | 489,954 | ||||||
| 3.10%, 03/15/30 (Call 12/15/29) |
950 | 842,650 | ||||||
| 3.20%, 03/15/25 |
555 | 539,861 | ||||||
| 3.25%, 06/01/30 |
750 | 670,704 | ||||||
| 3.40%, 09/01/29 (Call 06/01/29) |
661 | 603,564 | ||||||
| 4.00%, 07/13/27 (Call 04/13/27) |
655 | 631,477 | ||||||
| 4.20%, 12/01/42 (Call 06/01/42) |
186 | 144,513 | ||||||
| 4.20%, 03/15/45(a) |
355 | 263,574 | ||||||
| 4.20%, 10/03/47 (Call 04/03/47) |
952 | 729,938 | ||||||
| 4.25%, 09/15/46 |
745 | 580,500 | ||||||
| 4.35%, 03/15/29 (Call 12/15/28)(a) |
1,119 | 1,077,184 | ||||||
| 4.45%, 09/01/49 (Call 03/01/49)(a) |
675 | 539,903 | ||||||
| 4.50%, 03/15/50 (Call 09/15/49)(a) |
685 | 549,032 | ||||||
| 4.55%, 07/15/28 (Call 04/15/28) |
1,109 | 1,083,406 | ||||||
| 4.85%, 02/01/49(a) |
740 | 632,186 | ||||||
| 4.95%, 07/13/47 (Call 01/06/47) |
1,179 | 1,017,380 | ||||||
| 5.15%, 10/15/43(a) |
601 | 541,878 | ||||||
| 5.20%, 07/15/48 (Call 01/15/48) |
1,359 | 1,227,573 | ||||||
| 5.55%, 11/01/26 (Call 10/01/26) |
1,320 | 1,329,820 | ||||||
| 5.65%, 11/01/28 (Call 10/01/28)(a) |
1,279 | 1,301,147 | ||||||
| 114 | 2 0 2 4 I S H A R E S A N N U A L R E P O R T T O S H A R E H O L D E R S |
| Schedule of Investments (continued) February 29, 2024 |
iShares® Broad USD Investment Grade Corporate Bond ETF (Percentages shown are based on Net Assets) |
| Security | Par (000) |
Value | ||||||
| Pipelines (continued) | ||||||||
| 5.80%, 11/01/30 (Call 09/01/30) |
$ | 780 | $ | 797,908 | ||||
| 5.85%, 01/15/26 (Call 12/15/25)(a) |
1,025 | 1,034,109 | ||||||
| 6.00%, 06/15/35(a) |
695 | 701,378 | ||||||
| 6.05%, 09/01/33 (Call 06/01/33) |
1,630 | 1,679,874 | ||||||
| 6.10%, 11/15/32 (Call 08/15/32) |
1,035 | 1,073,026 | ||||||
| 6.35%, 01/15/31 (Call 10/15/30) |
861 | 901,882 | ||||||
| 6.40%, 05/01/37(a) |
395 | 399,671 | ||||||
| 6.63%, 09/01/53 (Call 03/01/53)(a) |
1,645 | 1,767,763 | ||||||
| 7.15%, 01/15/51 (Call 07/15/50) |
724 | 807,982 | ||||||
| ONEOK Partners LP |
||||||||
| 4.90%, 03/15/25 (Call 12/15/24) |
802 | 795,874 | ||||||
| 6.13%, 02/01/41 (Call 08/01/40) |
709 | 720,310 | ||||||
| 6.20%, 09/15/43 (Call 03/15/43)(a) |
320 | 326,473 | ||||||
| 6.65%, 10/01/36 |
754 | 798,885 | ||||||
| 6.85%, 10/15/37 |
670 | 717,902 | ||||||
| Pipeline Funding Co. LLC, 7.50%, 01/15/30(a)(b) |
335 | 348,140 | ||||||
| Plains All American Pipeline LP/PAA Finance Corp. |
||||||||
| 3.55%, 12/15/29 (Call 09/15/29) |
1,412 | 1,281,077 | ||||||
| 3.80%, 09/15/30 (Call 06/15/30)(a) |
1,045 | 952,334 | ||||||
| 4.30%, 01/31/43 (Call 07/31/42) |
469 | 369,835 | ||||||
| 4.50%, 12/15/26 (Call 09/15/26)(a) |
1,110 | 1,088,696 | ||||||
| 4.65%, 10/15/25 (Call 07/15/25) |
1,454 | 1,434,932 | ||||||
| 4.70%, 06/15/44 (Call 12/15/43)(a) |
689 | 570,732 | ||||||
| 4.90%, 02/15/45 (Call 08/15/44) |
779 | 656,035 | ||||||
| 5.15%, 06/01/42 (Call 12/01/41) |
1,067 | 940,881 | ||||||
| 6.65%, 01/15/37(a) |
765 | 809,688 | ||||||
| QazaqGaz NC JSC, 4.38%, 09/26/27(b) |
310 | 288,765 | ||||||
| Sabal Trail Transmission LLC |
||||||||
| 4.25%, 05/01/28 (Call 02/01/28)(a)(b) |
1,375 | 1,319,876 | ||||||
| 4.68%, 05/01/38 (Call 11/01/37)(a)(b) |
637 | 575,955 | ||||||
| 4.83%, 05/01/48 (Call 11/01/47)(b) |
625 | 532,615 | ||||||
| Sabine Pass Liquefaction LLC |
||||||||
| 4.20%, 03/15/28 (Call 09/15/27) |
2,096 | 2,021,941 | ||||||
| 4.50%, 05/15/30 (Call 11/15/29)(a) |
2,771 | 2,651,607 | ||||||
| 5.00%, 03/15/27 (Call 09/15/26) |
1,805 | 1,791,560 | ||||||
| 5.63%, 03/01/25 (Call 12/01/24) |
2,559 | 2,555,460 | ||||||
| 5.88%, 06/30/26 (Call 12/31/25) |
2,178 | 2,195,652 | ||||||
| 5.90%, 09/15/37 (Call 03/15/37) |
840 | 870,037 | ||||||
| Southern Natural Gas Co. LLC |
||||||||
| 4.80%, 03/15/47 (Call 09/15/46)(b) |
1,098 | 892,756 | ||||||
| 8.00%, 03/01/32(a) |
437 | 496,378 | ||||||
| Spectra Energy Partners LP |
||||||||
| 3.38%, 10/15/26 (Call 07/15/26) |
950 | 907,967 | ||||||
| 3.50%, 03/15/25 (Call 12/15/24) |
835 | 818,403 | ||||||
| 4.50%, 03/15/45 (Call 09/15/44) |
1,034 | 867,328 | ||||||
| 5.95%, 09/25/43 (Call 03/25/43) |
563 | 559,433 | ||||||
| Targa Resources Corp. |
||||||||
| 4.20%, 02/01/33 (Call 11/01/32) |
1,165 | 1,048,627 | ||||||
| 4.95%, 04/15/52 (Call 10/15/51) |
1,070 | 915,435 | ||||||
| 5.20%, 07/01/27 (Call 06/01/27) |
1,490 | 1,482,625 | ||||||
| 6.13%, 03/15/33 (Call 12/15/32) |
760 | 782,464 | ||||||
| 6.15%, 03/01/29 (Call 02/01/29) |
490 | 505,036 | ||||||
| 6.25%, 07/01/52 (Call 01/01/52)(a) |
788 | 798,436 | ||||||
| 6.50%, 03/30/34 (Call 12/30/33) |
795 | 841,990 | ||||||
| 6.50%, 02/15/53 (Call 08/15/52) |
1,205 | 1,263,413 | ||||||
| Targa Resources Partners LP/Targa Resources Partners Finance Corp. |
||||||||
| 4.00%, 01/15/32 (Call 07/15/26)(a) |
1,492 | 1,331,394 | ||||||
| 4.88%, 02/01/31 (Call 02/01/26) |
1,481 | 1,403,153 | ||||||
| 5.00%, 01/15/28 (Call 04/01/24) |
828 | 809,772 | ||||||
| Security | Par (000) |
Value | ||||||
| Pipelines (continued) | ||||||||
| 5.50%, 03/01/30 (Call 03/01/25) |
$ | 1,404 | $ | 1,390,395 | ||||
| 6.50%, 07/15/27 (Call 04/01/24) |
1,283 | 1,296,320 | ||||||
| 6.88%, 01/15/29 (Call 04/01/24) |
670 | 690,274 | ||||||
| TC PipeLines LP |
||||||||
| 3.90%, 05/25/27 (Call 02/25/27) |
1,211 | 1,155,143 | ||||||
| 4.38%, 03/13/25 (Call 12/13/24) |
663 | 653,283 | ||||||
| Tennessee Gas Pipeline Co. LLC |
||||||||
| 2.90%, 03/01/30 (Call 12/01/29)(b) |
1,641 | 1,425,689 | ||||||
| 7.00%, 03/15/27 |
515 | 541,162 | ||||||
| 7.00%, 10/15/28(a) |
1,058 | 1,130,551 | ||||||
| 7.63%, 04/01/37 |
285 | 320,994 | ||||||
| Texas Eastern Transmission LP |
||||||||
| 3.50%, 01/15/28 (Call 10/15/27)(b) |
755 | 707,706 | ||||||
| 4.15%, 01/15/48 (Call 07/15/47)(a)(b) |
630 | 507,477 | ||||||
| 7.00%, 07/15/32 |
705 | 780,673 | ||||||
| TMS Issuer Sarl, 5.78%, 08/23/32(b) |
1,060 | 1,085,803 | ||||||
| TransCanada PipeLines Ltd. |
||||||||
| 2.50%, 10/12/31 (Call 07/12/31) |
1,575 | 1,290,903 | ||||||
| 4.10%, 04/15/30 (Call 01/15/30) |
1,636 | 1,531,012 | ||||||
| 4.25%, 05/15/28 (Call 02/15/28) |
1,890 | 1,820,690 | ||||||
| 4.63%, 03/01/34 (Call 12/01/33) |
1,090 | 1,010,373 | ||||||
| 4.75%, 05/15/38 (Call 11/15/37)(a) |
300 | 270,916 | ||||||
| 4.88%, 01/15/26 (Call 10/15/25) |
1,947 | 1,931,560 | ||||||
| 4.88%, 05/15/48 (Call 11/15/47) |
1,372 | 1,197,107 | ||||||
| 5.00%, 10/16/43 (Call 04/16/43) |
968 | 864,805 | ||||||
| 5.10%, 03/15/49 (Call 09/15/48)(a) |
1,459 | 1,341,505 | ||||||
| 5.60%, 03/31/34 |
530 | 529,885 | ||||||
| 5.85%, 03/15/36 |
619 | 618,552 | ||||||
| 6.10%, 06/01/40 |
985 | 1,005,082 | ||||||
| 6.20%, 03/09/26 (Call 03/18/24) |
1,560 | 1,560,022 | ||||||
| 6.20%, 10/15/37 |
1,705 | 1,750,788 | ||||||
| 7.25%, 08/15/38 |
1,015 | 1,135,522 | ||||||
| 7.63%, 01/15/39 |
1,315 | 1,535,416 | ||||||
| Transcanada Trust |
||||||||
| 5.30%, 03/15/77 (Call 03/15/27), |
1,622 | 1,491,451 | ||||||
| 5.50%, 09/15/79 (Call 09/15/29), |
1,084 | 969,290 | ||||||
| 5.60%, 03/07/82 (Call 12/07/31), |
975 | 853,145 | ||||||
| 5.63%, 05/20/75 (Call 05/20/25), |
499 | 482,928 | ||||||
| Series 16-A, 5.88%, 08/15/76 |
935 | 896,722 | ||||||
| Transcontinental Gas Pipe Line Co. LLC |
||||||||
| 3.25%, 05/15/30 (Call 02/15/30) |
1,261 | 1,134,264 | ||||||
| 3.95%, 05/15/50 (Call 11/15/49) |
700 | 544,207 | ||||||
| 4.00%, 03/15/28 (Call 12/15/27) |
763 | 732,642 | ||||||
| 4.45%, 08/01/42 (Call 02/01/42)(a) |
476 | 412,009 | ||||||
| 4.60%, 03/15/48 (Call 09/15/47) |
806 | 707,027 | ||||||
| 5.40%, 08/15/41 (Call 02/15/41) |
555 | 540,908 | ||||||
| 7.85%, 02/01/26 (Call 11/01/25) |
1,695 | 1,761,099 | ||||||
| Transportadora de Gas Internacional SA ESP, |
||||||||
| 5.55%, 11/01/28 (Call 08/01/28)(b) |
510 | 502,649 | ||||||
| Valero Energy Partners LP, 4.50%, 03/15/28 |
464 | 451,280 | ||||||
| Western Midstream Operating LP |
||||||||
| 3.95%, 06/01/25 (Call 03/01/25) |
225 | 219,495 | ||||||
| 4.05%, 02/01/30 (Call 11/01/29) |
1,180 | 1,090,868 | ||||||
| 4.50%, 03/01/28 (Call 12/01/27) |
365 | 348,903 | ||||||
| S C H E D U L E O F I N V E S T M E N T S |
115 |
| Schedule of Investments (continued) February 29, 2024 |
iShares® Broad USD Investment Grade Corporate Bond ETF (Percentages shown are based on Net Assets) |
| Security | Par (000) |
Value | ||||||
| Pipelines (continued) | ||||||||
| 4.65%, 07/01/26 (Call 04/01/26) |
$ | 330 | $ | 322,849 | ||||
| 4.75%, 08/15/28 (Call 05/15/28) |
1,000 | 965,553 | ||||||
| 5.25%, 02/01/50 (Call 08/01/49) |
1,035 | 915,618 | ||||||
| 5.30%, 03/01/48 (Call 09/01/47) |
1,060 | 913,499 | ||||||
| 5.45%, 04/01/44 (Call 10/01/43)(a) |
855 | 766,354 | ||||||
| 5.50%, 08/15/48 (Call 02/15/48) |
760 | 667,796 | ||||||
| 6.15%, 04/01/33 (Call 01/01/33) |
545 | 553,842 | ||||||
| 6.35%, 01/15/29 (Call 12/15/28) |
410 | 423,214 | ||||||
| Williams Companies Inc. (The) |
||||||||
| 2.60%, 03/15/31 (Call 12/15/30) |
1,740 | 1,467,221 | ||||||
| 3.50%, 11/15/30 (Call 08/15/30) |
1,192 | 1,075,715 | ||||||
| 3.50%, 10/15/51 (Call 04/15/51)(a) |
860 | 597,376 | ||||||
| 3.75%, 06/15/27 (Call 03/15/27) |
2,027 | 1,939,828 | ||||||
| 4.00%, 09/15/25 (Call 06/15/25) |
1,022 | 1,002,090 | ||||||
| 4.65%, 08/15/32 (Call 05/15/32) |
1,015 | 965,607 | ||||||
| 4.85%, 03/01/48 (Call 09/01/47) |
1,221 | 1,075,321 | ||||||
| 4.90%, 03/15/29 (Call 02/15/29) |
875 | 863,277 | ||||||
| 4.90%, 01/15/45 (Call 07/15/44) |
617 | 544,142 | ||||||
| 5.10%, 09/15/45 (Call 03/15/45) |
1,389 | 1,267,152 | ||||||
| 5.15%, 03/15/34 (Call 12/15/33) |
1,060 | 1,034,944 | ||||||
| 5.30%, 08/15/28 (Call 07/15/28) |
1,325 | 1,334,638 | ||||||
| 5.30%, 08/15/52 (Call 02/15/52)(a) |
820 | 767,250 | ||||||
| 5.40%, 03/02/26 |
420 | 420,977 | ||||||
| 5.40%, 03/04/44 (Call 09/04/43) |
696 | 652,174 | ||||||
| 5.65%, 03/15/33 (Call 12/15/32) |
920 | 935,506 | ||||||
| 5.75%, 06/24/44 (Call 12/24/43) |
110 | 107,903 | ||||||
| 5.80%, 11/15/43 (Call 05/15/43) |
550 | 538,982 | ||||||
| 6.30%, 04/15/40 |
1,717 | 1,786,748 | ||||||
| 7.75%, 06/15/31(a) |
552 | 605,533 | ||||||
| 8.75%, 03/15/32(a) |
653 | 778,192 | ||||||
| Series A, 7.50%, 01/15/31 |
447 | 496,456 | ||||||
|
|
|
|||||||
| 366,903,719 | ||||||||
| Private Equity — 0.1% | ||||||||
| Apollo Management Holdings LP |
||||||||
| 2.65%, 06/05/30 (Call 03/05/30)(a)(b) |
894 | 760,213 | ||||||
| 4.40%, 05/27/26 (Call 02/27/26)(b) |
873 | 851,201 | ||||||
| 4.87%, 02/15/29 (Call 11/15/28)(a)(b) |
1,035 | 1,020,508 | ||||||
| 5.00%, 03/15/48 (Call 09/15/47)(a)(b) |
590 | 534,463 | ||||||
| Carlyle Finance LLC, 5.65%, 09/15/48 |
630 | 591,304 | ||||||
| Carlyle Finance Subsidiary LLC, |
818 | 753,161 | ||||||
| Carlyle Holdings II Finance LLC, |
753 | 716,622 | ||||||
| KKR Group Finance Co. III LLC, |
888 | 808,757 | ||||||
| KKR Group Finance Co. VI LLC, |
1,293 | 1,197,884 | ||||||
| KKR Group Finance Co. VII LLC, |
825 | 580,584 | ||||||
| KKR Group Finance Co. VIII LLC, |
1,265 | 866,401 | ||||||
| KKR Group Finance Co. X LLC, |
470 | 314,686 | ||||||
|
|
|
|||||||
| 8,995,784 | ||||||||
| Real Estate — 0.2% | ||||||||
| American Homes 4 Rent LP, 5.50%, 02/01/34 (Call 11/01/33) |
500 | 490,343 | ||||||
| AvalonBay Communities Inc., 5.30%, 12/07/33 (Call 09/07/33)(a) |
690 | 691,929 | ||||||
| Security | Par (000) |
Value | ||||||
| Real Estate (continued) | ||||||||
| Brixmor Operating Partnership LP, |
$ | 295 | $ | 287,183 | ||||
| Brookfield Corp., 7.38%, 03/01/33(a) |
200 | 215,256 | ||||||
| Camden Property Trust, 4.90%, 01/15/34 |
395 | 379,939 | ||||||
| CBRE Services Inc. |
||||||||
| 2.50%, 04/01/31 (Call 01/01/31)(a) |
887 | 730,096 | ||||||
| 4.88%, 03/01/26 (Call 12/01/25)(a) |
1,226 | 1,212,331 | ||||||
| 5.95%, 08/15/34 (Call 05/15/34) |
750 | 756,879 | ||||||
| Corp. Inmobiliaria Vesta SAB de CV, |
280 | 237,094 | ||||||
| Essential Properties LP, 2.95%, 07/15/31 |
562 | 440,246 | ||||||
| GAIF Bond Issuer Pty. Ltd., 3.40%, 09/30/26 |
1,249 | 1,188,976 | ||||||
| Jones Lang LaSalle Inc., 6.88%, 12/01/28 |
180 | 189,281 | ||||||
| Kilroy Realty LP, 6.25%, 01/15/36 |
200 | 192,542 | ||||||
| Kite Realty Group LP, 5.50%, 03/01/34 |
5 | 4,886 | ||||||
| Mid-America Apartments LP, 5.00%, 03/15/34 |
250 | 243,277 | ||||||
| Mitsui Fudosan Co. Ltd. |
||||||||
| 2.57%, 01/21/32 (Call 10/21/31)(b) |
375 | 308,786 | ||||||
| 3.95%, 01/24/29 (Call 10/24/28)(b) |
190 | 180,658 | ||||||
| Ontario Teachers’ Cadillac Fairview Properties Trust |
||||||||
| 2.50%, 10/15/31 (Call 07/15/31)(b) |
1,290 | 1,023,021 | ||||||
| 3.88%, 03/20/27 (Call 12/20/26)(b) |
760 | 716,103 | ||||||
| 4.13%, 02/01/29 (Call 11/01/28)(b) |
1,175 | 1,089,494 | ||||||
| Prologis LP |
||||||||
| 5.00%, 03/15/34 (Call 12/15/33) |
625 | 614,214 | ||||||
| 5.25%, 03/15/54 (Call 09/15/53) |
635 | 609,755 | ||||||
| Realty Income Corp. |
||||||||
| 2.10%, 03/15/28 (Call 01/15/28) |
390 | 346,150 | ||||||
| 2.70%, 02/15/32 (Call 11/15/31) |
361 | 296,804 | ||||||
| 3.20%, 01/15/27 (Call 11/15/26) |
635 | 599,577 | ||||||
| 3.20%, 02/15/31 (Call 11/15/30) |
460 | 402,308 | ||||||
| 3.40%, 01/15/30 (Call 10/15/29) |
506 | 458,684 | ||||||
| 4.00%, 07/15/29 (Call 04/15/29)(a) |
791 | 745,904 | ||||||
| 5.13%, 02/15/34 (Call 11/15/33) |
500 | 483,753 | ||||||
| Regency Centers LP, 5.25%, 01/15/34 |
115 | 112,385 | ||||||
| Sinochem Overseas Capital Co. Ltd., |
15 | 16,123 | ||||||
| Sun Communities Operating LP, |
470 | 465,283 | ||||||
|
|
|
|||||||
| 15,729,260 | ||||||||
| Real Estate Investment Trusts — 3.1% | ||||||||
| Agree LP |
||||||||
| 2.00%, 06/15/28 (Call 04/15/28)(a) |
690 | 599,706 | ||||||
| 2.60%, 06/15/33 (Call 03/15/33)(a) |
530 | 410,576 | ||||||
| 2.90%, 10/01/30 (Call 07/01/30) |
200 | 170,447 | ||||||
| 4.80%, 10/01/32 (Call 07/01/32)(a) |
530 | 495,183 | ||||||
| Alexandria Real Estate Equities Inc. |
||||||||
| 1.88%, 02/01/33 (Call 11/01/32) |
1,236 | 924,918 | ||||||
| 2.00%, 05/18/32 (Call 02/18/32) |
1,120 | 865,998 | ||||||
| 2.75%, 12/15/29 (Call 09/15/29)(a) |
735 | 639,373 | ||||||
| 2.95%, 03/15/34 (Call 12/15/33) |
840 | 678,717 | ||||||
| 3.00%, 05/18/51 (Call 11/18/50)(a) |
1,097 | 690,162 | ||||||
| 116 | 2 0 2 4 I S H A R E S A N N U A L R E P O R T T O S H A R E H O L D E R S |
| Schedule of Investments (continued) February 29, 2024 |
iShares® Broad USD Investment Grade Corporate Bond ETF (Percentages shown are based on Net Assets) |
| Security | Par (000) |
Value | ||||||
| Real Estate Investment Trusts (continued) | ||||||||
| 3.38%, 08/15/31 (Call 05/15/31) |
$ | 1,087 | $ | 956,958 | ||||
| 3.45%, 04/30/25 (Call 02/28/25) |
566 | 552,743 | ||||||
| 3.55%, 03/15/52 (Call 09/15/51) |
1,320 | 915,862 | ||||||
| 3.80%, 04/15/26 (Call 02/15/26) |
676 | 656,576 | ||||||
| 3.95%, 01/15/27 (Call 10/15/26) |
480 | 463,032 | ||||||
| 3.95%, 01/15/28 (Call 10/15/27) |
575 | 547,997 | ||||||
| 4.00%, 02/01/50 (Call 08/01/49) |
933 | 705,056 | ||||||
| 4.30%, 01/15/26 (Call 10/15/25) |
645 | 631,728 | ||||||
| 4.50%, 07/30/29 (Call 04/30/29) |
377 | 360,975 | ||||||
| 4.70%, 07/01/30 (Call 04/01/30) |
621 | 597,102 | ||||||
| 4.75%, 04/15/35 (Call 01/15/35)(a) |
638 | 594,458 | ||||||
| 4.85%, 04/15/49 (Call 10/15/48)(a) |
468 | 408,023 | ||||||
| 4.90%, 12/15/30 (Call 09/15/30)(a) |
977 | 951,242 | ||||||
| 5.15%, 04/15/53 (Call 10/15/52) |
635 | 575,438 | ||||||
| 5.25%, 05/15/36 (Call 02/15/36) |
395 | 379,181 | ||||||
| 5.63%, 05/15/54 (Call 11/15/53) |
650 | 625,467 | ||||||
| American Assets Trust LP, 3.38%, 02/01/31 |
869 | 700,436 | ||||||
| American Homes 4 Rent LP |
||||||||
| 2.38%, 07/15/31 (Call 04/15/31) |
976 | 785,714 | ||||||
| 3.38%, 07/15/51 (Call 01/15/51) |
475 | 313,101 | ||||||
| 3.63%, 04/15/32 (Call 01/15/32) |
620 | 540,974 | ||||||
| 4.25%, 02/15/28 (Call 11/15/27) |
970 | 931,835 | ||||||
| 4.30%, 04/15/52 (Call 10/15/51)(a) |
190 | 147,422 | ||||||
| 4.90%, 02/15/29 (Call 11/15/28) |
912 | 888,621 | ||||||
| American Tower Corp. |
||||||||
| 1.30%, 09/15/25 (Call 08/15/25) |
284 | 267,015 | ||||||
| 1.45%, 09/15/26 (Call 08/15/26) |
944 | 858,035 | ||||||
| 1.50%, 01/31/28 (Call 11/30/27) |
896 | 777,966 | ||||||
| 1.60%, 04/15/26 (Call 03/15/26) |
1,136 | 1,051,992 | ||||||
| 1.88%, 10/15/30 (Call 07/15/30) |
744 | 597,846 | ||||||
| 2.10%, 06/15/30 (Call 03/15/30) |
1,053 | 866,498 | ||||||
| 2.30%, 09/15/31 (Call 06/15/31)(a) |
1,271 | 1,026,340 | ||||||
| 2.40%, 03/15/25 (Call 02/15/25) |
836 | 808,190 | ||||||
| 2.70%, 04/15/31 (Call 01/15/31) |
1,272 | 1,067,562 | ||||||
| 2.75%, 01/15/27 (Call 11/15/26) |
1,077 | 1,002,494 | ||||||
| 2.90%, 01/15/30 (Call 10/15/29) |
1,067 | 934,814 | ||||||
| 2.95%, 01/15/51 (Call 07/15/50)(a) |
1,458 | 925,363 | ||||||
| 3.10%, 06/15/50 (Call 12/15/49) |
1,625 | 1,063,323 | ||||||
| 3.13%, 01/15/27 (Call 10/15/26) |
668 | 630,128 | ||||||
| 3.38%, 10/15/26 (Call 07/15/26)(a) |
1,318 | 1,257,109 | ||||||
| 3.55%, 07/15/27 (Call 04/15/27) |
1,117 | 1,058,613 | ||||||
| 3.60%, 01/15/28 (Call 10/15/27) |
1,103 | 1,039,629 | ||||||
| 3.65%, 03/15/27 (Call 02/15/27) |
970 | 927,068 | ||||||
| 3.70%, 10/15/49 (Call 04/15/49) |
868 | 629,936 | ||||||
| 3.80%, 08/15/29 (Call 05/15/29) |
1,996 | 1,847,140 | ||||||
| 3.95%, 03/15/29 (Call 12/15/28) |
1,167 | 1,095,280 | ||||||
| 4.00%, 06/01/25 (Call 03/01/25) |
645 | 632,540 | ||||||
| 4.05%, 03/15/32 (Call 12/15/31)(a) |
570 | 518,471 | ||||||
| 4.40%, 02/15/26 (Call 11/15/25) |
1,083 | 1,065,018 | ||||||
| 5.25%, 07/15/28 (Call 06/15/28) |
715 | 712,425 | ||||||
| 5.50%, 03/15/28 (Call 02/15/28) |
993 | 997,086 | ||||||
| 5.55%, 07/15/33 (Call 04/15/33) |
745 | 744,457 | ||||||
| 5.65%, 03/15/33 (Call 12/15/32) |
1,121 | 1,128,274 | ||||||
| 5.80%, 11/15/28 (Call 10/15/28) |
1,390 | 1,416,687 | ||||||
| 5.90%, 11/15/33 (Call 08/15/33) |
1,210 | 1,240,954 | ||||||
| AvalonBay Communities Inc. |
||||||||
| 1.90%, 12/01/28 (Call 10/01/28) |
380 | 330,557 | ||||||
| 2.05%, 01/15/32 (Call 10/15/31)(a) |
990 | 807,000 | ||||||
| 2.30%, 03/01/30 (Call 12/01/29) |
905 | 777,807 | ||||||
| 2.45%, 01/15/31 (Call 10/17/30) |
595 | 507,854 | ||||||
| Security | Par (000) |
Value | ||||||
| Real Estate Investment Trusts (continued) | ||||||||
| 2.90%, 10/15/26 (Call 07/15/26) |
$ | 45 | $ | 42,541 | ||||
| 2.95%, 05/11/26 (Call 02/11/26) |
988 | 943,471 | ||||||
| 3.20%, 01/15/28 (Call 10/15/27)(a) |
536 | 501,398 | ||||||
| 3.30%, 06/01/29 (Call 03/01/29)(a) |
653 | 601,725 | ||||||
| 3.35%, 05/15/27 (Call 02/15/27) |
497 | 471,273 | ||||||
| 3.45%, 06/01/25 (Call 03/03/25) |
602 | 588,679 | ||||||
| 3.50%, 11/15/25 (Call 08/15/25) |
304 | 295,298 | ||||||
| 3.90%, 10/15/46 (Call 04/15/46) |
402 | 314,764 | ||||||
| 4.15%, 07/01/47 (Call 01/01/47) |
309 | 250,071 | ||||||
| 4.35%, 04/15/48 (Call 10/18/47)(a) |
357 | 301,829 | ||||||
| 5.00%, 02/15/33 (Call 11/15/32) |
259 | 253,840 | ||||||
| Boston Properties LP |
||||||||
| 2.45%, 10/01/33 (Call 07/01/33)(a) |
1,457 | 1,074,188 | ||||||
| 2.55%, 04/01/32 (Call 01/01/32)(a) |
1,531 | 1,190,283 | ||||||
| 2.75%, 10/01/26 (Call 07/01/26) |
1,361 | 1,259,738 | ||||||
| 2.90%, 03/15/30 (Call 12/15/29) |
1,265 | 1,067,209 | ||||||
| 3.25%, 01/30/31 (Call 10/30/30) |
1,392 | 1,172,890 | ||||||
| 3.40%, 06/21/29 (Call 03/21/29)(a) |
950 | 838,391 | ||||||
| 3.65%, 02/01/26 (Call 11/03/25) |
1,896 | 1,823,201 | ||||||
| 4.50%, 12/01/28 (Call 09/01/28) |
1,399 | 1,321,749 | ||||||
| 6.50%, 01/15/34 (Call 10/15/33)(a) |
485 | 494,880 | ||||||
| 6.75%, 12/01/27 (Call 11/01/27)(a) |
960 | 991,314 | ||||||
| Brixmor Operating Partnership LP |
||||||||
| 2.25%, 04/01/28 (Call 02/01/28) |
285 | 252,156 | ||||||
| 2.50%, 08/16/31 (Call 05/16/31)(a) |
500 | 407,148 | ||||||
| 3.90%, 03/15/27 (Call 12/15/26) |
672 | 640,888 | ||||||
| 4.05%, 07/01/30 (Call 04/01/30)(a) |
1,543 | 1,419,741 | ||||||
| 4.13%, 06/15/26 (Call 03/15/26) |
645 | 621,530 | ||||||
| 4.13%, 05/15/29 (Call 02/15/29) |
773 | 722,778 | ||||||
| Broadstone Net Lease LLC, 2.60%, 09/15/31 |
710 | 551,090 | ||||||
| Camden Property Trust |
||||||||
| 2.80%, 05/15/30 (Call 02/15/30) |
1,012 | 889,496 | ||||||
| 3.15%, 07/01/29 (Call 04/01/29) |
669 | 608,605 | ||||||
| 3.35%, 11/01/49 (Call 05/01/49)(a) |
402 | 286,747 | ||||||
| 4.10%, 10/15/28 (Call 07/15/28) |
560 | 539,372 | ||||||
| 5.85%, 11/03/26 (Call 10/03/26)(a) |
490 | 500,405 | ||||||
| Corporate Office Properties LP |
||||||||
| 2.00%, 01/15/29 (Call 11/15/28)(a) |
685 | 567,350 | ||||||
| 2.25%, 03/15/26 (Call 02/15/26)(a) |
570 | 533,054 | ||||||
| 2.75%, 04/15/31 (Call 01/15/31)(a) |
550 | 443,931 | ||||||
| 2.90%, 12/01/33 (Call 09/01/33) |
835 | 636,970 | ||||||
| Crown Castle Inc. |
||||||||
| 1.05%, 07/15/26 (Call 06/15/26) |
1,567 | 1,416,736 | ||||||
| 1.35%, 07/15/25 (Call 06/15/25)(a) |
614 | 580,982 | ||||||
| 2.10%, 04/01/31 (Call 01/01/31) |
1,212 | 973,015 | ||||||
| 2.25%, 01/15/31 (Call 10/15/30) |
1,516 | 1,238,769 | ||||||
| 2.50%, 07/15/31 (Call 04/15/31) |
955 | 782,341 | ||||||
| 2.90%, 03/15/27 (Call 02/15/27) |
1,059 | 985,931 | ||||||
| 2.90%, 04/01/41 (Call 10/01/40) |
1,265 | 877,387 | ||||||
| 3.10%, 11/15/29 (Call 08/15/29)(a) |
858 | 759,079 | ||||||
| 3.25%, 01/15/51 (Call 07/15/50)(a) |
1,387 | 938,776 | ||||||
| 3.30%, 07/01/30 (Call 04/01/30) |
1,075 | 949,042 | ||||||
| 3.65%, 09/01/27 (Call 06/01/27) |
1,630 | 1,539,103 | ||||||
| 3.70%, 06/15/26 (Call 03/15/26) |
988 | 951,404 | ||||||
| 3.80%, 02/15/28 (Call 11/15/27) |
1,500 | 1,412,705 | ||||||
| 4.00%, 03/01/27 (Call 12/01/26) |
962 | 926,638 | ||||||
| 4.00%, 11/15/49 (Call 05/15/49)(a) |
522 | 401,257 | ||||||
| 4.15%, 07/01/50 (Call 01/01/50) |
778 | 613,366 | ||||||
| 4.30%, 02/15/29 (Call 11/15/28) |
1,103 | 1,047,342 | ||||||
| 4.45%, 02/15/26 (Call 11/15/25) |
1,546 | 1,516,977 | ||||||
| S C H E D U L E O F I N V E S T M E N T S |
117 |
| Schedule of Investments (continued) February 29, 2024 |
iShares® Broad USD Investment Grade Corporate Bond ETF (Percentages shown are based on Net Assets) |
| Security | Par (000) |
Value | ||||||
| Real Estate Investment Trusts (continued) | ||||||||
| 4.75%, 05/15/47 (Call 11/15/46)(a) |
$ | 506 | $ | 425,961 | ||||
| 4.80%, 09/01/28 (Call 08/01/28) |
760 | 741,845 | ||||||
| 5.00%, 01/11/28 (Call 12/11/27) |
1,412 | 1,390,611 | ||||||
| 5.10%, 05/01/33 (Call 02/01/33) |
1,027 | 992,649 | ||||||
| 5.20%, 02/15/49 (Call 08/15/48) |
498 | 449,344 | ||||||
| 5.60%, 06/01/29 (Call 05/01/29) |
1,064 | 1,069,892 | ||||||
| 5.80%, 03/01/34 (Call 12/01/33) |
1,210 | 1,226,310 | ||||||
| CubeSmart LP |
||||||||
| 2.00%, 02/15/31 (Call 11/15/30)(a) |
615 | 493,373 | ||||||
| 2.25%, 12/15/28 (Call 10/15/28) |
657 | 571,548 | ||||||
| 2.50%, 02/15/32 (Call 11/15/31)(a) |
650 | 525,271 | ||||||
| 3.00%, 02/15/30 (Call 11/15/29)(a) |
531 | 462,506 | ||||||
| 3.13%, 09/01/26 (Call 06/01/26) |
872 | 824,432 | ||||||
| 4.00%, 11/15/25 (Call 08/15/25)(a) |
611 | 594,558 | ||||||
| 4.38%, 02/15/29 (Call 11/15/28)(a) |
590 | 561,220 | ||||||
| Digital Realty Trust LP |
||||||||
| 3.60%, 07/01/29 (Call 04/01/29)(a) |
1,562 | 1,439,008 | ||||||
| 3.70%, 08/15/27 (Call 05/15/27) |
1,392 | 1,327,981 | ||||||
| 4.45%, 07/15/28 (Call 04/15/28) |
930 | 899,704 | ||||||
| 5.55%, 01/15/28 (Call 12/15/27) |
1,275 | 1,287,792 | ||||||
| EPR Properties |
||||||||
| 3.60%, 11/15/31 (Call 08/15/31)(a) |
435 | 355,119 | ||||||
| 3.75%, 08/15/29 (Call 05/15/29) |
500 | 436,413 | ||||||
| 4.50%, 04/01/25 (Call 01/01/25)(a) |
300 | 294,493 | ||||||
| 4.50%, 06/01/27 (Call 03/01/27) |
325 | 307,206 | ||||||
| 4.75%, 12/15/26 (Call 09/15/26)(a) |
300 | 288,234 | ||||||
| 4.95%, 04/15/28 (Call 01/15/28) |
300 | 284,615 | ||||||
| Equinix Inc. |
||||||||
| 1.00%, 09/15/25 (Call 08/15/25) |
1,124 | 1,051,042 | ||||||
| 1.25%, 07/15/25 (Call 06/15/25) |
597 | 563,415 | ||||||
| 1.45%, 05/15/26 (Call 04/15/26) |
1,170 | 1,076,568 | ||||||
| 1.55%, 03/15/28 (Call 01/15/28) |
891 | 775,263 | ||||||
| 1.80%, 07/15/27 (Call 05/15/27) |
845 | 759,719 | ||||||
| 2.00%, 05/15/28 (Call 03/15/28) |
840 | 740,261 | ||||||
| 2.15%, 07/15/30 (Call 04/15/30) |
1,160 | 961,617 | ||||||
| 2.50%, 05/15/31 (Call 02/15/31)(a) |
1,821 | 1,518,525 | ||||||
| 2.90%, 11/18/26 (Call 09/18/26) |
2 | 1,883 | ||||||
| 2.95%, 09/15/51 (Call 03/15/51)(a) |
779 | 494,814 | ||||||
| 3.00%, 07/15/50 (Call 01/15/50) |
901 | 584,783 | ||||||
| 3.20%, 11/18/29 (Call 08/18/29) |
1,977 | 1,775,517 | ||||||
| 3.40%, 02/15/52 (Call 08/15/51) |
576 | 398,680 | ||||||
| 3.90%, 04/15/32 (Call 01/15/32) |
1,195 | 1,084,193 | ||||||
| ERP Operating LP |
||||||||
| 1.85%, 08/01/31 (Call 05/01/31) |
775 | 622,805 | ||||||
| 2.50%, 02/15/30 (Call 11/15/29) |
865 | 751,507 | ||||||
| 2.85%, 11/01/26 (Call 08/01/26)(a) |
735 | 693,614 | ||||||
| 3.00%, 07/01/29 (Call 04/01/29) |
800 | 725,115 | ||||||
| 3.25%, 08/01/27 (Call 05/01/27) |
450 | 422,697 | ||||||
| 3.38%, 06/01/25 (Call 03/01/25) |
420 | 409,622 | ||||||
| 3.50%, 03/01/28 (Call 12/01/27) |
637 | 601,189 | ||||||
| 4.00%, 08/01/47 (Call 02/01/47) |
120 | 92,223 | ||||||
| 4.15%, 12/01/28 (Call 09/01/28)(a) |
778 | 752,228 | ||||||
| 4.50%, 07/01/44 (Call 01/01/44) |
1,019 | 875,923 | ||||||
| 4.50%, 06/01/45 (Call 12/01/44) |
545 | 454,948 | ||||||
| Essex Portfolio LP |
||||||||
| 1.65%, 01/15/31 (Call 10/15/30) |
565 | 441,674 | ||||||
| 1.70%, 03/01/28 (Call 01/01/28) |
220 | 191,189 | ||||||
| 2.55%, 06/15/31 (Call 03/15/31) |
195 | 160,643 | ||||||
| 2.65%, 03/15/32 (Call 12/15/31)(a) |
628 | 511,063 | ||||||
| 2.65%, 09/01/50 (Call 03/01/50) |
470 | 273,076 | ||||||
| 3.00%, 01/15/30 (Call 10/15/29)(a) |
682 | 598,325 | ||||||
| Security | Par (000) |
Value | ||||||
| Real Estate Investment Trusts (continued) | ||||||||
| 3.38%, 04/15/26 (Call 01/15/26) |
$ | 723 | $ | 695,233 | ||||
| 3.50%, 04/01/25 (Call 01/01/25)(a) |
715 | 698,822 | ||||||
| 3.63%, 05/01/27 (Call 02/01/27) |
486 | 460,966 | ||||||
| 4.00%, 03/01/29 (Call 12/01/28)(a) |
791 | 747,849 | ||||||
| 4.50%, 03/15/48 (Call 09/15/47)(a) |
375 | 313,538 | ||||||
| Extra Space Storage LP |
||||||||
| 2.20%, 10/15/30 (Call 07/15/30) |
804 | 657,300 | ||||||
| 2.35%, 03/15/32 (Call 12/15/31) |
1,100 | 872,670 | ||||||
| 2.40%, 10/15/31 (Call 07/15/31) |
765 | 617,934 | ||||||
| 2.55%, 06/01/31 (Call 03/01/31) |
415 | 341,353 | ||||||
| 3.50%, 07/01/26 (Call 04/01/26)(a) |
1,089 | 1,042,790 | ||||||
| 3.88%, 12/15/27 (Call 09/15/27) |
728 | 691,487 | ||||||
| 3.90%, 04/01/29 (Call 02/01/29) |
170 | 158,743 | ||||||
| 4.00%, 06/15/29 (Call 03/15/29) |
622 | 583,742 | ||||||
| 5.40%, 02/01/34 (Call 11/01/33) |
495 | 485,226 | ||||||
| 5.50%, 07/01/30 (Call 05/01/30) |
475 | 477,209 | ||||||
| 5.70%, 04/01/28 (Call 03/01/28) |
475 | 481,631 | ||||||
| 5.90%, 01/15/31 (Call 11/15/30) |
260 | 266,266 | ||||||
| Federal Realty OP LP |
||||||||
| 1.25%, 02/15/26 (Call 01/15/26) |
652 | 600,728 | ||||||
| 3.20%, 06/15/29 (Call 03/15/29)(a) |
310 | 276,967 | ||||||
| 3.25%, 07/15/27 (Call 04/15/27) |
845 | 787,312 | ||||||
| 3.50%, 06/01/30 (Call 03/01/30) |
634 | 568,603 | ||||||
| 3.63%, 08/01/46 (Call 02/01/46)(a) |
444 | 284,856 | ||||||
| 4.50%, 12/01/44 (Call 06/01/44)(a) |
588 | 476,631 | ||||||
| 5.38%, 05/01/28 (Call 04/01/28) |
400 | 396,858 | ||||||
| GLP Capital LP/GLP Financing II Inc. |
||||||||
| 3.25%, 01/15/32 (Call 10/15/31) |
1,105 | 916,695 | ||||||
| 4.00%, 01/15/30 (Call 10/15/29)(a) |
1,167 | 1,050,248 | ||||||
| 4.00%, 01/15/31 (Call 10/15/30) |
903 | 796,770 | ||||||
| 5.25%, 06/01/25 (Call 03/01/25)(a) |
1,011 | 1,001,842 | ||||||
| 5.30%, 01/15/29 (Call 10/15/28) |
820 | 795,568 | ||||||
| 5.38%, 04/15/26 (Call 01/15/26) |
1,394 | 1,378,759 | ||||||
| 5.75%, 06/01/28 (Call 03/03/28) |
869 | 862,100 | ||||||
| 6.75%, 12/01/33 (Call 09/01/33)(a) |
350 | 363,183 | ||||||
| Goodman U.S. Finance Five LLC, |
75 | 68,344 | ||||||
| Goodman U.S. Finance Four LLC, |
415 | 348,080 | ||||||
| Goodman U.S. Finance Three LLC, |
822 | 760,049 | ||||||
| Healthcare Realty Holdings LP |
||||||||
| 2.00%, 03/15/31 (Call 12/15/30) |
677 | 530,696 | ||||||
| 2.05%, 03/15/31 (Call 12/15/30) |
838 | 636,673 | ||||||
| 2.40%, 03/15/30 (Call 12/15/29) |
745 | 597,569 | ||||||
| 3.10%, 02/15/30 (Call 11/15/29) |
709 | 610,245 | ||||||
| 3.50%, 08/01/26 (Call 05/01/26)(a) |
803 | 763,775 | ||||||
| 3.63%, 01/15/28 (Call 10/15/27) |
496 | 453,526 | ||||||
| 3.75%, 07/01/27 (Call 04/01/27) |
781 | 732,922 | ||||||
| Healthpeak OP LLC |
||||||||
| 1.35%, 02/01/27 (Call 01/01/27) |
1,058 | 951,608 | ||||||
| 2.13%, 12/01/28 (Call 10/01/28) |
767 | 666,984 | ||||||
| 2.88%, 01/15/31 (Call 10/15/30)(a) |
963 | 819,599 | ||||||
| 3.00%, 01/15/30 (Call 10/15/29) |
771 | 675,582 | ||||||
| 3.25%, 07/15/26 (Call 05/15/26) |
1,125 | 1,074,717 | ||||||
| 3.50%, 07/15/29 (Call 04/15/29) |
565 | 515,970 | ||||||
| 4.00%, 06/01/25 (Call 03/01/25) |
582 | 570,564 | ||||||
| 5.25%, 12/15/32 (Call 09/15/32)(a) |
935 | 914,548 | ||||||
| 6.75%, 02/01/41 (Call 08/01/40) |
397 | 433,400 | ||||||
| Highwoods Realty LP |
||||||||
| 2.60%, 02/01/31 (Call 11/01/30)(a) |
635 | 497,865 | ||||||
| 118 | 2 0 2 4 I S H A R E S A N N U A L R E P O R T T O S H A R E H O L D E R S |
| Schedule of Investments (continued) February 29, 2024 |
iShares® Broad USD Investment Grade Corporate Bond ETF (Percentages shown are based on Net Assets) |
| Security | Par (000) |
Value | ||||||
| Real Estate Investment Trusts (continued) | ||||||||
| 3.05%, 02/15/30 (Call 11/15/29) |
$ | 573 | $ | 480,663 | ||||
| 3.88%, 03/01/27 (Call 12/01/26) |
190 | 178,377 | ||||||
| 4.13%, 03/15/28 (Call 12/15/27) |
492 | 455,280 | ||||||
| 4.20%, 04/15/29 (Call 01/15/29)(a) |
559 | 503,525 | ||||||
| 7.65%, 02/01/34 (Call 11/01/33)(a) |
20 | 21,479 | ||||||
| Host Hotels & Resorts LP |
||||||||
| Series E, 4.00%, 06/15/25 (Call 03/15/25)(a) |
705 | 690,361 | ||||||
| Series F, 4.50%, 02/01/26 (Call 11/01/25) |
664 | 649,382 | ||||||
| Series H, 3.38%, 12/15/29 (Call 09/15/29) |
551 | 487,592 | ||||||
| Series I, 3.50%, 09/15/30 (Call 06/15/30)(a) |
636 | 560,836 | ||||||
| Series J, 2.90%, 12/15/31 (Call 09/15/31) |
785 | 647,990 | ||||||
| Invitation Homes Operating Partnership LP |
||||||||
| 2.00%, 08/15/31 (Call 05/15/31) |
801 | 625,658 | ||||||
| 2.30%, 11/15/28 (Call 09/15/28) |
830 | 725,950 | ||||||
| 2.70%, 01/15/34 (Call 10/15/33) |
570 | 443,783 | ||||||
| 4.15%, 04/15/32 (Call 01/15/32)(a) |
705 | 635,970 | ||||||
| 5.45%, 08/15/30 (Call 06/15/30) |
585 | 582,395 | ||||||
| 5.50%, 08/15/33 (Call 05/15/33)(a) |
655 | 646,969 | ||||||
| Kilroy Realty LP |
||||||||
| 2.50%, 11/15/32 (Call 08/15/32)(a) |
548 | 405,275 | ||||||
| 2.65%, 11/15/33 (Call 08/15/33)(a) |
660 | 480,590 | ||||||
| 3.05%, 02/15/30 (Call 11/15/29) |
857 | 718,370 | ||||||
| 4.25%, 08/15/29 (Call 05/15/29)(a) |
595 | 542,641 | ||||||
| 4.38%, 10/01/25 (Call 07/01/25) |
410 | 399,532 | ||||||
| 4.75%, 12/15/28 (Call 09/15/28)(a) |
555 | 522,647 | ||||||
| Kimco Realty OP LLC |
||||||||
| 1.90%, 03/01/28 (Call 01/01/28) |
518 | 453,745 | ||||||
| 2.25%, 12/01/31 (Call 09/01/31) |
480 | 381,770 | ||||||
| 2.70%, 10/01/30 (Call 07/01/30) |
781 | 663,422 | ||||||
| 2.80%, 10/01/26 (Call 07/01/26) |
604 | 566,202 | ||||||
| 3.20%, 04/01/32 (Call 01/01/32) |
380 | 322,912 | ||||||
| 3.25%, 08/15/26 (Call 05/15/26) |
690 | 650,772 | ||||||
| 3.70%, 10/01/49 (Call 04/01/49)(a) |
456 | 326,708 | ||||||
| 3.80%, 04/01/27 (Call 01/01/27) |
815 | 780,904 | ||||||
| 4.13%, 12/01/46 (Call 06/01/46) |
463 | 351,607 | ||||||
| 4.25%, 04/01/45 (Call 10/01/44)(a) |
344 | 268,999 | ||||||
| 4.45%, 09/01/47 (Call 03/01/47)(a) |
515 | 407,953 | ||||||
| 4.60%, 02/01/33 (Call 11/01/32)(a) |
1,035 | 970,225 | ||||||
| 6.40%, 03/01/34 (Call 12/01/33) |
675 | 710,298 | ||||||
| Kite Realty Group LP, 4.00%, 10/01/26 |
662 | 626,916 | ||||||
| Kite Realty Group Trust |
||||||||
| 4.00%, 03/15/25 (Call 12/15/24)(a) |
490 | 479,445 | ||||||
| 4.75%, 09/15/30 (Call 06/15/30)(a) |
510 | 481,170 | ||||||
| LXP Industrial Trust |
||||||||
| 2.38%, 10/01/31 (Call 07/01/31) |
488 | 387,420 | ||||||
| 2.70%, 09/15/30 (Call 06/15/30)(a) |
695 | 573,027 | ||||||
| 6.75%, 11/15/28 (Call 10/15/28)(a) |
140 | 144,536 | ||||||
| Mid-America Apartments LP |
||||||||
| 1.10%, 09/15/26 (Call 08/15/26) |
963 | 869,603 | ||||||
| 1.70%, 02/15/31 (Call 11/15/30) |
787 | 627,143 | ||||||
| 2.75%, 03/15/30 (Call 12/15/29)(a) |
585 | 514,128 | ||||||
| 2.88%, 09/15/51 (Call 03/15/51) |
379 | 240,411 | ||||||
| 3.60%, 06/01/27 (Call 03/01/27) |
500 | 477,747 | ||||||
| 3.95%, 03/15/29 (Call 12/15/28)(a) |
766 | 730,740 | ||||||
| 4.00%, 11/15/25 (Call 08/15/25)(a) |
250 | 244,607 | ||||||
| 4.20%, 06/15/28 (Call 03/15/28)(a) |
660 | 638,659 | ||||||
| National Health Investors Inc., 3.00%, 02/01/31 |
684 | 548,846 | ||||||
| NNN REIT Inc. |
||||||||
| 2.50%, 04/15/30 (Call 01/15/30) |
684 | 578,175 | ||||||
| Security | Par (000) |
Value | ||||||
| Real Estate Investment Trusts (continued) | ||||||||
| 3.00%, 04/15/52 (Call 10/15/51)(a) |
$ | 325 | $ | 207,563 | ||||
| 3.10%, 04/15/50 (Call 10/15/49)(a) |
278 | 179,591 | ||||||
| 3.50%, 10/15/27 (Call 07/15/27) |
560 | 525,372 | ||||||
| 3.50%, 04/15/51 (Call 10/15/50) |
445 | 316,824 | ||||||
| 3.60%, 12/15/26 (Call 09/15/26) |
516 | 491,137 | ||||||
| 4.00%, 11/15/25 (Call 08/15/25) |
442 | 431,185 | ||||||
| 4.30%, 10/15/28 (Call 07/15/28) |
297 | 285,200 | ||||||
| 4.80%, 10/15/48 (Call 04/15/48) |
622 | 533,541 | ||||||
| 5.60%, 10/15/33 (Call 07/15/33) |
679 | 677,136 | ||||||
| Omega Healthcare Investors Inc. |
||||||||
| 3.25%, 04/15/33 (Call 01/15/33) |
745 | 593,004 | ||||||
| 3.38%, 02/01/31 (Call 11/01/30) |
1,043 | 878,128 | ||||||
| 3.63%, 10/01/29 (Call 07/01/29) |
823 | 722,798 | ||||||
| 4.50%, 04/01/27 (Call 01/01/27) |
630 | 605,833 | ||||||
| 4.75%, 01/15/28 (Call 10/15/27) |
980 | 940,144 | ||||||
| 5.25%, 01/15/26 (Call 10/15/25)(a) |
1,070 | 1,060,442 | ||||||
| Phillips Edison Grocery Center Operating |
665 | 534,932 | ||||||
| Physicians Realty LP |
||||||||
| 2.63%, 11/01/31 (Call 08/01/31) |
721 | 586,985 | ||||||
| 3.95%, 01/15/28 (Call 10/15/27)(a) |
392 | 372,894 | ||||||
| 4.30%, 03/15/27 (Call 12/15/26) |
798 | 776,677 | ||||||
| Piedmont Operating Partnership LP |
||||||||
| 2.75%, 04/01/32 (Call 01/01/32) |
452 | 319,841 | ||||||
| 3.15%, 08/15/30 (Call 05/15/30)(a) |
346 | 264,042 | ||||||
| 9.25%, 07/20/28 (Call 06/20/28) |
115 | 121,496 | ||||||
| Prologis LP |
||||||||
| 1.25%, 10/15/30 (Call 07/15/30) |
823 | 653,181 | ||||||
| 1.63%, 03/15/31 (Call 12/15/30) |
402 | 319,266 | ||||||
| 1.75%, 07/01/30 (Call 04/01/30) |
545 | 446,842 | ||||||
| 1.75%, 02/01/31 (Call 11/01/30)(a) |
385 | 311,967 | ||||||
| 2.13%, 04/15/27 (Call 02/15/27) |
661 | 607,026 | ||||||
| 2.13%, 10/15/50 (Call 04/15/50)(a) |
601 | 329,918 | ||||||
| 2.25%, 04/15/30 (Call 01/15/30) |
1,336 | 1,145,721 | ||||||
| 2.25%, 01/15/32 (Call 10/15/31)(a) |
1,105 | 902,339 | ||||||
| 2.88%, 11/15/29 (Call 08/15/29)(a) |
613 | 549,377 | ||||||
| 3.00%, 04/15/50 (Call 10/15/49)(a) |
709 | 479,395 | ||||||
| 3.05%, 03/01/50 (Call 09/01/49)(a) |
572 | 388,612 | ||||||
| 3.25%, 06/30/26 (Call 03/30/26) |
880 | 845,291 | ||||||
| 3.25%, 10/01/26 (Call 07/01/26) |
643 | 613,509 | ||||||
| 3.38%, 12/15/27 (Call 09/15/27)(a) |
709 | 669,719 | ||||||
| 3.88%, 09/15/28 (Call 06/15/28) |
641 | 613,068 | ||||||
| 4.00%, 09/15/28 (Call 06/15/28) |
749 | 720,149 | ||||||
| 4.38%, 02/01/29 (Call 11/01/28)(a) |
544 | 531,725 | ||||||
| 4.38%, 09/15/48 (Call 03/15/48) |
440 | 372,723 | ||||||
| 4.63%, 01/15/33 (Call 10/15/32) |
525 | 505,227 | ||||||
| 4.75%, 06/15/33 (Call 03/15/33) |
1,280 | 1,241,173 | ||||||
| 4.88%, 06/15/28 (Call 05/15/28) |
630 | 629,227 | ||||||
| 5.13%, 01/15/34 (Call 10/15/33) |
790 | 781,957 | ||||||
| 5.25%, 06/15/53 (Call 12/15/52)(a) |
1,366 | 1,323,806 | ||||||
| Prologis Targeted U.S. Logistics Fund LP |
||||||||
| 5.25%, 04/01/29 (Call 03/01/29)(b) |
90 | 89,529 | ||||||
| 5.50%, 04/01/34 (Call 01/01/34)(b) |
105 | 104,242 | ||||||
| Public Storage Operating Co. |
||||||||
| 0.88%, 02/15/26 (Call 01/15/26) |
1,076 | 993,124 | ||||||
| 1.50%, 11/09/26 (Call 10/09/26) |
1,257 | 1,147,438 | ||||||
| 1.85%, 05/01/28 (Call 03/01/28) |
912 | 805,806 | ||||||
| 1.95%, 11/09/28 (Call 09/09/28)(a) |
915 | 803,142 | ||||||
| 2.25%, 11/09/31 (Call 08/09/31) |
730 | 601,851 | ||||||
| 2.30%, 05/01/31 (Call 02/01/31) |
775 | 651,869 | ||||||
| S C H E D U L E O F I N V E S T M E N T S |
119 |
| Schedule of Investments (continued) February 29, 2024 |
iShares® Broad USD Investment Grade Corporate Bond ETF (Percentages shown are based on Net Assets) |
| Security | Par (000) |
Value | ||||||
| Real Estate Investment Trusts (continued) | ||||||||
| 3.09%, 09/15/27 (Call 06/15/27) |
$ | 650 | $ | 611,487 | ||||
| 3.39%, 05/01/29 (Call 02/01/29) |
930 | 867,070 | ||||||
| 5.10%, 08/01/33 (Call 05/01/33) |
365 | 364,651 | ||||||
| 5.13%, 01/15/29 (Call 12/15/28)(a) |
720 | 726,948 | ||||||
| 5.35%, 08/01/53 (Call 02/01/53)(a) |
813 | 806,587 | ||||||
| Rayonier LP, 2.75%, 05/17/31 (Call 02/17/31)(a) |
762 | 619,247 | ||||||
| Realty Income Corp. |
||||||||
| 0.75%, 03/15/26 (Call 02/15/26) |
640 | 583,851 | ||||||
| 1.80%, 03/15/33 (Call 12/15/32)(a) |
495 | 372,639 | ||||||
| 2.20%, 06/15/28 (Call 04/15/28) |
77 | 68,345 | ||||||
| 2.85%, 12/15/32 (Call 09/15/32) |
1,012 | 833,892 | ||||||
| 3.00%, 01/15/27 (Call 10/15/26) |
72 | 67,890 | ||||||
| 3.10%, 12/15/29 (Call 09/15/29) |
925 | 831,773 | ||||||
| 3.25%, 06/15/29 (Call 03/15/29) |
611 | 558,577 | ||||||
| 3.25%, 01/15/31 (Call 10/15/30)(a) |
1,235 | 1,093,980 | ||||||
| 3.40%, 01/15/28 (Call 11/15/27) |
768 | 720,148 | ||||||
| 3.65%, 01/15/28 (Call 10/15/27) |
402 | 381,211 | ||||||
| 3.88%, 04/15/25 (Call 02/15/25)(a) |
648 | 636,808 | ||||||
| 3.95%, 08/15/27 (Call 05/15/27) |
168 | 162,251 | ||||||
| 4.13%, 10/15/26 (Call 07/15/26) |
694 | 675,628 | ||||||
| 4.45%, 09/15/26 (Call 06/15/26) |
662 | 644,375 | ||||||
| 4.63%, 11/01/25 (Call 09/01/25) |
1,023 | 1,010,787 | ||||||
| 4.65%, 03/15/47 (Call 09/15/46)(a) |
681 | 592,879 | ||||||
| 4.70%, 12/15/28 (Call 11/15/28) |
590 | 579,780 | ||||||
| 4.75%, 02/15/29 (Call 01/15/29)(a) |
865 | 846,293 | ||||||
| 4.85%, 03/15/30 (Call 01/15/30)(a) |
735 | 720,320 | ||||||
| 4.88%, 06/01/26 (Call 03/01/26) |
982 | 974,440 | ||||||
| 4.90%, 07/15/33 (Call 04/15/33)(a) |
990 | 944,546 | ||||||
| 5.05%, 01/13/26 (Call 03/11/24) |
115 | 114,505 | ||||||
| 5.63%, 10/13/32 (Call 07/13/32)(a) |
880 | 890,678 | ||||||
| 5.88%, 03/15/35(a) |
605 | 610,718 | ||||||
| Regency Centers LP |
||||||||
| 2.95%, 09/15/29 (Call 06/15/29)(a) |
761 | 673,627 | ||||||
| 3.60%, 02/01/27 (Call 11/01/26) |
563 | 537,664 | ||||||
| 3.70%, 06/15/30 (Call 03/15/30) |
563 | 513,240 | ||||||
| 3.90%, 11/01/25 (Call 08/01/25)(a) |
620 | 598,780 | ||||||
| 4.13%, 03/15/28 (Call 12/15/27) |
622 | 593,930 | ||||||
| 4.40%, 02/01/47 (Call 08/01/46)(a) |
543 | 434,723 | ||||||
| 4.65%, 03/15/49 (Call 09/15/48) |
570 | 483,784 | ||||||
| Retail Opportunity Investments Partnership LP, |
||||||||
| 6.75%, 10/15/28 (Call 09/15/28) |
55 | 56,851 | ||||||
| Rexford Industrial Realty LP |
||||||||
| 2.13%, 12/01/30 (Call 09/01/30) |
639 | 517,364 | ||||||
| 2.15%, 09/01/31 (Call 06/01/31) |
640 | 505,822 | ||||||
| 5.00%, 06/15/28 (Call 05/15/28) |
500 | 494,953 | ||||||
| Sabra Health Care LP |
||||||||
| 3.20%, 12/01/31 (Call 09/01/31) |
720 | 583,768 | ||||||
| 3.90%, 10/15/29 (Call 07/15/29) |
647 | 575,126 | ||||||
| 5.13%, 08/15/26 (Call 05/15/26) |
906 | 889,576 | ||||||
| Safehold GL Holdings LLC |
||||||||
| 2.80%, 06/15/31 (Call 03/15/31)(a) |
547 | 444,459 | ||||||
| 2.85%, 01/15/32 (Call 08/15/31)(a) |
400 | 321,667 | ||||||
| 6.10%, 04/01/34 (Call 01/01/34) |
200 | 197,914 | ||||||
| Scentre Group Trust 1/Scentre Group Trust 2 |
||||||||
| 3.25%, 10/28/25 (Call 07/30/25)(a)(b) |
966 | 931,605 | ||||||
| 3.63%, 01/28/26 (Call 12/28/25)(b) |
1,306 | 1,262,489 | ||||||
| 3.75%, 03/23/27 (Call 12/23/26)(a)(b) |
895 | 851,245 | ||||||
| 4.38%, 05/28/30 (Call 02/28/30)(a)(b) |
1,170 | 1,099,900 | ||||||
| Scentre Group Trust 2, 4.75%, 09/24/80 |
741 | 704,616 | ||||||
| Security | Par (000) |
Value | ||||||
| Real Estate Investment Trusts (continued) | ||||||||
| Simon Property Group LP |
||||||||
| 1.38%, 01/15/27 (Call 10/15/26) |
$ | 840 | $ | 761,820 | ||||
| 1.75%, 02/01/28 (Call 11/01/27) |
1,080 | 955,897 | ||||||
| 2.20%, 02/01/31 (Call 11/01/30)(a) |
990 | 811,868 | ||||||
| 2.25%, 01/15/32 (Call 10/15/31) |
945 | 760,646 | ||||||
| 2.45%, 09/13/29 (Call 06/13/29) |
1,629 | 1,420,652 | ||||||
| 2.65%, 07/15/30 (Call 04/15/30) |
1,114 | 966,564 | ||||||
| 2.65%, 02/01/32 (Call 12/01/31)(a) |
916 | 761,740 | ||||||
| 3.25%, 11/30/26 (Call 08/30/26) |
875 | 834,106 | ||||||
| 3.25%, 09/13/49 (Call 03/13/49)(a) |
1,707 | 1,183,023 | ||||||
| 3.30%, 01/15/26 (Call 10/15/25) |
1,290 | 1,244,942 | ||||||
| 3.38%, 06/15/27 (Call 03/15/27) |
979 | 928,963 | ||||||
| 3.38%, 12/01/27 (Call 09/01/27)(a) |
1,112 | 1,048,868 | ||||||
| 3.50%, 09/01/25 (Call 06/01/25)(a) |
1,442 | 1,406,950 | ||||||
| 3.80%, 07/15/50 (Call 01/15/50) |
527 | 399,199 | ||||||
| 4.25%, 10/01/44 (Call 04/01/44)(a) |
716 | 585,857 | ||||||
| 4.25%, 11/30/46 (Call 05/30/46) |
690 | 559,288 | ||||||
| 4.75%, 03/15/42 (Call 09/15/41) |
435 | 388,407 | ||||||
| 5.50%, 03/08/33 (Call 12/08/32)(a) |
910 | 917,660 | ||||||
| 5.85%, 03/08/53 (Call 09/03/52) |
855 | 865,587 | ||||||
| 6.25%, 01/15/34 (Call 10/15/33)(a) |
340 | 358,274 | ||||||
| 6.65%, 01/15/54 (Call 07/15/53)(a) |
385 | 433,080 | ||||||
| 6.75%, 02/01/40 (Call 11/01/39)(a) |
1,044 | 1,146,404 | ||||||
| SITE Centers Corp. |
||||||||
| 4.25%, 02/01/26 (Call 11/01/25) |
333 | 324,985 | ||||||
| 4.70%, 06/01/27 (Call 03/01/27) |
862 | 847,724 | ||||||
| Sixth Street Specialty Lending Inc., |
193 | 196,498 | ||||||
| Store Capital LLC |
||||||||
| 2.70%, 12/01/31 (Call 09/01/31)(a) |
485 | 377,603 | ||||||
| 2.75%, 11/18/30 (Call 08/18/30) |
600 | 473,212 | ||||||
| 4.50%, 03/15/28 (Call 12/15/27)(a) |
590 | 552,182 | ||||||
| 4.63%, 03/15/29 (Call 12/15/28)(a) |
586 | 546,777 | ||||||
| Sun Communities Operating LP |
||||||||
| 2.30%, 11/01/28 (Call 09/01/28)(a) |
645 | 559,780 | ||||||
| 2.70%, 07/15/31 (Call 04/15/31) |
558 | 455,096 | ||||||
| 4.20%, 04/15/32 (Call 01/15/32) |
770 | 684,167 | ||||||
| 5.70%, 01/15/33 (Call 10/15/32) |
665 | 654,566 | ||||||
| Tanger Properties LP |
||||||||
| 2.75%, 09/01/31 (Call 06/01/31)(a) |
620 | 500,235 | ||||||
| 3.13%, 09/01/26 (Call 06/01/26) |
691 | 644,944 | ||||||
| 3.88%, 07/15/27 (Call 04/15/27) |
425 | 390,068 | ||||||
| Trust Fibra Uno |
||||||||
| 4.87%, 01/15/30 (Call 10/30/29)(b) |
430 | 391,287 | ||||||
| 6.39%, 01/15/50 (Call 07/15/49)(b) |
769 | 646,945 | ||||||
| 6.95%, 01/30/44 (Call 07/30/43)(b) |
605 | 539,446 | ||||||
| UDR Inc. |
||||||||
| 1.90%, 03/15/33 (Call 12/15/32) |
613 | 457,298 | ||||||
| 2.10%, 08/01/32 (Call 05/01/32) |
450 | 347,920 | ||||||
| 2.10%, 06/15/33 (Call 03/15/33)(a) |
370 | 279,911 | ||||||
| 2.95%, 09/01/26 (Call 06/01/26) |
457 | 430,441 | ||||||
| 3.00%, 08/15/31 (Call 05/15/31)(a) |
948 | 813,413 | ||||||
| 3.10%, 11/01/34 (Call 08/01/34) |
443 | 356,273 | ||||||
| 3.20%, 01/15/30 (Call 10/15/29)(a) |
732 | 654,726 | ||||||
| 3.50%, 07/01/27 (Call 04/01/27) |
280 | 262,891 | ||||||
| 3.50%, 01/15/28 (Call 10/15/27) |
638 | 594,079 | ||||||
| 4.40%, 01/26/29 (Call 10/26/28) |
413 | 395,137 | ||||||
| Ventas Realty LP |
||||||||
| 2.50%, 09/01/31 (Call 06/01/31) |
700 | 569,258 | ||||||
| 3.00%, 01/15/30 (Call 10/15/29) |
742 | 647,712 | ||||||
| 3.25%, 10/15/26 (Call 07/15/26) |
771 | 727,857 | ||||||
| 120 | 2 0 2 4 I S H A R E S A N N U A L R E P O R T T O S H A R E H O L D E R S |
| Schedule of Investments (continued) February 29, 2024 |
iShares® Broad USD Investment Grade Corporate Bond ETF (Percentages shown are based on Net Assets) |
| Security | Par (000) |
Value | ||||||
| Real Estate Investment Trusts (continued) | ||||||||
| 3.85%, 04/01/27 (Call 01/01/27) |
$ | 720 | $ | 686,005 | ||||
| 4.00%, 03/01/28 (Call 12/01/27)(a) |
635 | 604,275 | ||||||
| 4.13%, 01/15/26 (Call 10/15/25) |
898 | 873,865 | ||||||
| 4.38%, 02/01/45 (Call 08/01/44) |
300 | 237,392 | ||||||
| 4.40%, 01/15/29 (Call 10/15/28) |
1,030 | 986,733 | ||||||
| 4.75%, 11/15/30 (Call 08/15/30) |
786 | 751,064 | ||||||
| 4.88%, 04/15/49 (Call 10/15/48) |
411 | 348,843 | ||||||
| 5.70%, 09/30/43 (Call 03/30/43) |
446 | 420,686 | ||||||
| VICI Properties LP |
||||||||
| 4.38%, 05/15/25 |
160 | 157,139 | ||||||
| 4.75%, 02/15/28 (Call 01/15/28) |
1,658 | 1,605,620 | ||||||
| 4.95%, 02/15/30 (Call 12/15/29)(a) |
1,315 | 1,251,902 | ||||||
| 5.13%, 05/15/32 (Call 02/15/32) |
2,105 | 1,975,255 | ||||||
| 5.63%, 05/15/52 (Call 11/15/51) |
1,195 | 1,082,037 | ||||||
| VICI Properties LP/VICI Note Co. Inc. |
||||||||
| 3.75%, 02/15/27 (Call 04/01/24)(b) |
1,435 | 1,349,904 | ||||||
| 3.88%, 02/15/29 (Call 11/15/28)(b) |
407 | 371,286 | ||||||
| 4.13%, 08/15/30 (Call 02/15/25)(b) |
1,320 | 1,184,009 | ||||||
| 4.25%, 12/01/26 (Call 04/01/24)(b) |
1,680 | 1,607,133 | ||||||
| 4.50%, 09/01/26 (Call 06/01/26)(b) |
705 | 680,170 | ||||||
| 4.50%, 01/15/28 (Call 10/15/27)(a)(b) |
560 | 532,073 | ||||||
| 4.63%, 06/15/25 (Call 03/15/25)(b) |
595 | 584,903 | ||||||
| 4.63%, 12/01/29 (Call 12/01/24)(a)(b) |
1,270 | 1,182,497 | ||||||
| 5.75%, 02/01/27 (Call 11/01/26)(b) |
760 | 756,504 | ||||||
| WEA Finance LLC |
||||||||
| 2.88%, 01/15/27 (Call 11/15/26)(b) |
2 | 1,817 | ||||||
| 3.50%, 06/15/29 (Call 03/15/29)(a)(b) |
690 | 598,911 | ||||||
| 4.13%, 09/20/28 (Call 06/20/28)(a)(b) |
381 | 339,991 | ||||||
| 4.63%, 09/20/48 (Call 03/20/48)(a)(b) |
697 | 476,186 | ||||||
| WEA Finance LLC/Westfield U.K. & Europe |
||||||||
| Finance PLC, 4.75%, 09/17/44 |
||||||||
| (Call 03/17/44)(a)(b) |
695 | 487,034 | ||||||
| Welltower OP LLC |
||||||||
| 2.05%, 01/15/29 (Call 11/15/28) |
715 | 619,309 | ||||||
| 2.70%, 02/15/27 (Call 12/15/26)(a) |
883 | 825,218 | ||||||
| 2.75%, 01/15/31 (Call 10/15/30) |
918 | 783,061 | ||||||
| 2.75%, 01/15/32 (Call 10/15/31)(a) |
875 | 727,889 | ||||||
| 2.80%, 06/01/31 (Call 03/01/31)(a) |
930 | 789,670 | ||||||
| 3.10%, 01/15/30 (Call 10/15/29) |
749 | 668,173 | ||||||
| 3.85%, 06/15/32 (Call 03/15/32)(a) |
545 | 489,290 | ||||||
| 4.00%, 06/01/25 (Call 03/01/25) |
1,058 | 1,038,855 | ||||||
| 4.13%, 03/15/29 (Call 12/15/28) |
1,094 | 1,040,672 | ||||||
| 4.25%, 04/01/26 (Call 01/01/26)(a) |
1,130 | 1,107,459 | ||||||
| 4.25%, 04/15/28 (Call 01/15/28) |
947 | 916,096 | ||||||
| 4.95%, 09/01/48 (Call 03/01/48) |
405 | 365,074 | ||||||
| 5.13%, 03/15/43 (Call 09/15/42) |
505 | 452,223 | ||||||
| 6.50%, 03/15/41 (Call 09/15/40) |
540 | 582,855 | ||||||
| Weyerhaeuser Co. |
||||||||
| 3.38%, 03/09/33 (Call 12/09/32) |
660 | 570,082 | ||||||
| 4.00%, 11/15/29 (Call 08/15/29) |
1,347 | 1,264,563 | ||||||
| 4.00%, 04/15/30 (Call 01/15/30) |
1,197 | 1,119,498 | ||||||
| 4.00%, 03/09/52 (Call 09/09/51) |
835 | 655,080 | ||||||
| 4.75%, 05/15/26 |
1,210 | 1,197,838 | ||||||
| 6.88%, 12/15/33 |
410 | 441,124 | ||||||
| 6.95%, 10/01/27 |
390 | 413,215 | ||||||
| 7.38%, 03/15/32(a) |
909 | 1,026,559 | ||||||
| WP Carey Inc. |
||||||||
| 2.25%, 04/01/33 (Call 01/01/33)(a) |
789 | 597,919 | ||||||
| 2.40%, 02/01/31 (Call 11/01/30)(a) |
454 | 373,660 | ||||||
| 2.45%, 02/01/32 (Call 11/01/31) |
345 | 274,786 | ||||||
| 3.85%, 07/15/29 (Call 04/15/29) |
659 | 609,228 | ||||||
| Security | Par (000) |
Value | ||||||
| Real Estate Investment Trusts (continued) | ||||||||
| 4.25%, 10/01/26 (Call 07/01/26) |
$ | 721 | $ | 701,577 | ||||
|
|
|
|||||||
| 329,092,315 | ||||||||
| Retail — 2.4% | ||||||||
| 7-Eleven Inc. |
||||||||
| 0.95%, 02/10/26 (Call 01/10/26)(a)(b) |
1,832 | 1,688,300 | ||||||
| 1.30%, 02/10/28 (Call 12/10/27)(a)(b) |
1,810 | 1,570,523 | ||||||
| 1.80%, 02/10/31 (Call 11/10/30)(b) |
2,665 | 2,123,393 | ||||||
| 2.50%, 02/10/41 (Call 08/10/40)(a)(b) |
1,167 | 780,758 | ||||||
| 2.80%, 02/10/51 (Call 08/02/50)(b) |
2,001 | 1,240,333 | ||||||
| Advance Auto Parts Inc., 3.50%, 03/15/32 |
||||||||
| (Call 12/15/31)(a) |
674 | 565,312 | ||||||
| Alimentation Couche-Tard Inc. |
||||||||
| 2.95%, 01/25/30 (Call 10/25/29)(a)(b) |
1,154 | 1,028,590 | ||||||
| 3.44%, 05/13/41 (Call 11/13/40)(a)(b) |
1,110 | 840,917 | ||||||
| 3.55%, 07/26/27 (Call 04/26/27)(b) |
1,258 | 1,198,733 | ||||||
| 3.63%, 05/13/51 (Call 11/13/50)(a)(b) |
345 | 251,579 | ||||||
| 3.80%, 01/25/50 (Call 07/25/49)(b) |
533 | 407,075 | ||||||
| 4.50%, 07/26/47 (Call 01/26/47)(b) |
910 | 760,983 | ||||||
| 5.27%, 02/12/34 (Call 11/12/33)(a)(b) |
450 | 445,810 | ||||||
| 5.62%, 02/12/54 (Call 08/12/53)(b) |
450 | 448,547 | ||||||
| AutoNation Inc. |
||||||||
| 1.95%, 08/01/28 (Call 06/01/28) |
390 | 333,568 | ||||||
| 2.40%, 08/01/31 (Call 05/01/31) |
734 | 581,329 | ||||||
| 3.80%, 11/15/27 (Call 08/15/27) |
590 | 549,205 | ||||||
| 3.85%, 03/01/32 (Call 12/01/31)(a) |
985 | 860,066 | ||||||
| 4.50%, 10/01/25 (Call 07/01/25) |
630 | 618,908 | ||||||
| 4.75%, 06/01/30 (Call 03/01/30)(a) |
705 | 670,552 | ||||||
| AutoZone Inc. |
||||||||
| 1.65%, 01/15/31 (Call 10/15/30) |
706 | 561,741 | ||||||
| 3.13%, 04/21/26 (Call 01/21/26) |
1,080 | 1,034,979 | ||||||
| 3.25%, 04/15/25 (Call 01/15/25) |
651 | 635,797 | ||||||
| 3.63%, 04/15/25 (Call 03/15/25) |
763 | 749,000 | ||||||
| 3.75%, 06/01/27 (Call 03/01/27)(a) |
903 | 867,404 | ||||||
| 3.75%, 04/18/29 (Call 01/18/29) |
844 | 792,630 | ||||||
| 4.00%, 04/15/30 (Call 01/15/30) |
930 | 875,343 | ||||||
| 4.50%, 02/01/28 (Call 01/01/28) |
770 | 754,195 | ||||||
| 4.75%, 08/01/32 (Call 05/01/32) |
1,010 | 969,888 | ||||||
| 4.75%, 02/01/33 (Call 11/01/32) |
760 | 728,101 | ||||||
| 5.05%, 07/15/26 |
445 | 444,051 | ||||||
| 5.20%, 08/01/33 (Call 05/01/33)(a) |
480 | 475,659 | ||||||
| 6.25%, 11/01/28 (Call 10/01/28) |
835 | 868,318 | ||||||
| 6.55%, 11/01/33 (Call 08/01/33)(a) |
690 | 745,403 | ||||||
| Best Buy Co. Inc. |
||||||||
| 1.95%, 10/01/30 (Call 07/01/30)(a) |
1,147 | 942,930 | ||||||
| 4.45%, 10/01/28 (Call 07/01/28)(a) |
1,132 | 1,109,447 | ||||||
| CK Hutchison International 20 Ltd., 3.38%, |
||||||||
| 05/08/50 (Call 11/08/49)(a)(b) |
1,020 | 751,596 | ||||||
| CK Hutchison International 21 Ltd., 3.13%, |
||||||||
| 04/15/41 (Call 10/15/40)(a)(b) |
772 | 587,670 | ||||||
| Costco Wholesale Corp. |
||||||||
| 1.38%, 06/20/27 (Call 04/20/27) |
1,810 | 1,628,263 | ||||||
| 1.60%, 04/20/30 (Call 01/20/30) |
2,744 | 2,286,271 | ||||||
| 1.75%, 04/20/32 (Call 01/20/32) |
1,484 | 1,186,692 | ||||||
| 3.00%, 05/18/27 (Call 02/18/27) |
1,556 | 1,484,512 | ||||||
| Darden Restaurants Inc. |
||||||||
| 3.85%, 05/01/27 (Call 02/01/27) |
1,140 | 1,094,722 | ||||||
| 4.55%, 02/15/48 (Call 08/15/47) |
476 | 386,962 | ||||||
| 6.30%, 10/10/33 (Call 07/10/33) |
350 | 365,593 | ||||||
| Dick’s Sporting Goods Inc. |
||||||||
| 3.15%, 01/15/32 (Call 10/15/31)(a) |
1,290 | 1,081,020 | ||||||
| 4.10%, 01/15/52 (Call 07/15/51)(a) |
1,190 | 841,227 | ||||||
| S C H E D U L E O F I N V E S T M E N T S |
121 |
| Schedule of Investments (continued) February 29, 2024 |
iShares® Broad USD Investment Grade Corporate Bond ETF (Percentages shown are based on Net Assets) |
| Security | Par (000) |
Value | ||||||
| Retail (continued) | ||||||||
| Dollar General Corp. |
||||||||
| 3.50%, 04/03/30 (Call 01/03/30) |
$ | 1,661 | $ | 1,502,908 | ||||
| 3.88%, 04/15/27 (Call 01/15/27) |
1,012 | 973,585 | ||||||
| 4.13%, 05/01/28 (Call 02/01/28) |
821 | 792,056 | ||||||
| 4.13%, 04/03/50 (Call 10/03/49) |
790 | 603,235 | ||||||
| 4.15%, 11/01/25 (Call 08/01/25) |
729 | 714,257 | ||||||
| 4.63%, 11/01/27 (Call 10/01/27) |
945 | 926,919 | ||||||
| 5.00%, 11/01/32 (Call 08/01/32)(a) |
950 | 923,342 | ||||||
| 5.20%, 07/05/28 (Call 06/05/28)(a) |
626 | 625,430 | ||||||
| 5.45%, 07/05/33 (Call 04/05/33)(a) |
852 | 846,208 | ||||||
| 5.50%, 11/01/52 (Call 05/01/52)(a) |
495 | 467,159 | ||||||
| Dollar Tree Inc. |
||||||||
| 2.65%, 12/01/31 (Call 09/01/31) |
1,405 | 1,169,383 | ||||||
| 3.38%, 12/01/51 (Call 06/01/51) |
735 | 483,277 | ||||||
| 4.00%, 05/15/25 (Call 03/15/25) |
1,409 | 1,383,781 | ||||||
| 4.20%, 05/15/28 (Call 02/15/28) |
2,141 | 2,064,928 | ||||||
| Genuine Parts Co. |
||||||||
| 1.88%, 11/01/30 (Call 08/01/30) |
888 | 714,972 | ||||||
| 2.75%, 02/01/32 (Call 11/01/31)(a) |
735 | 605,899 | ||||||
| 6.50%, 11/01/28 (Call 10/01/28) |
495 | 518,693 | ||||||
| 6.88%, 11/01/33 (Call 08/01/33)(a) |
560 | 611,853 | ||||||
| Home Depot Inc. (The) |
||||||||
| 0.90%, 03/15/28 (Call 01/15/28)(a) |
650 | 560,848 | ||||||
| 1.38%, 03/15/31 (Call 12/15/30) |
1,965 | 1,554,947 | ||||||
| 1.50%, 09/15/28 (Call 07/15/28)(a) |
1,152 | 1,003,663 | ||||||
| 1.88%, 09/15/31 (Call 06/15/31) |
1,530 | 1,239,361 | ||||||
| 2.13%, 09/15/26 (Call 06/15/26) |
1,433 | 1,339,721 | ||||||
| 2.38%, 03/15/51 (Call 09/15/50) |
1,675 | 985,501 | ||||||
| 2.50%, 04/15/27 (Call 02/15/27) |
1,230 | 1,146,224 | ||||||
| 2.70%, 04/15/25 (Call 03/15/25) |
485 | 472,514 | ||||||
| 2.70%, 04/15/30 (Call 01/15/30) |
2,112 | 1,868,063 | ||||||
| 2.75%, 09/15/51 (Call 03/15/51)(a) |
1,370 | 876,292 | ||||||
| 2.80%, 09/14/27 (Call 06/14/27) |
1,535 | 1,439,574 | ||||||
| 2.88%, 04/15/27 (Call 03/15/27) |
1,162 | 1,097,964 | ||||||
| 2.95%, 06/15/29 (Call 03/15/29) |
2,732 | 2,493,946 | ||||||
| 3.00%, 04/01/26 (Call 01/01/26) |
1,844 | 1,775,949 | ||||||
| 3.13%, 12/15/49 (Call 06/15/49) |
1,088 | 757,607 | ||||||
| 3.25%, 04/15/32 (Call 01/15/32) |
1,895 | 1,683,351 | ||||||
| 3.30%, 04/15/40 (Call 10/15/39) |
1,331 | 1,042,737 | ||||||
| 3.35%, 09/15/25 (Call 06/15/25) |
1,528 | 1,491,979 | ||||||
| 3.35%, 04/15/50 (Call 10/15/49)(a) |
1,925 | 1,393,421 | ||||||
| 3.50%, 09/15/56 (Call 03/15/56) |
965 | 712,883 | ||||||
| 3.63%, 04/15/52 (Call 10/15/51) |
2,035 | 1,537,215 | ||||||
| 3.90%, 12/06/28 (Call 09/06/28)(a) |
1,587 | 1,534,678 | ||||||
| 3.90%, 06/15/47 (Call 12/15/46) |
1,379 | 1,115,038 | ||||||
| 4.00%, 09/15/25 (Call 08/15/25) |
635 | 624,990 | ||||||
| 4.20%, 04/01/43 (Call 10/01/42) |
1,253 | 1,080,549 | ||||||
| 4.25%, 04/01/46 (Call 10/01/45) |
2,159 | 1,843,981 | ||||||
| 4.40%, 03/15/45 (Call 09/15/44) |
1,180 | 1,033,204 | ||||||
| 4.50%, 09/15/32 (Call 06/15/32) |
1,405 | 1,374,420 | ||||||
| 4.50%, 12/06/48 (Call 06/06/48) |
1,810 | 1,597,125 | ||||||
| 4.88%, 02/15/44 (Call 08/15/43) |
1,104 | 1,035,557 | ||||||
| 4.90%, 04/15/29 (Call 03/15/29) |
625 | 627,411 | ||||||
| 4.95%, 09/30/26 (Call 08/30/26)(a) |
630 | 630,345 | ||||||
| 4.95%, 09/15/52 (Call 03/15/52)(a) |
1,205 | 1,144,569 | ||||||
| 5.40%, 09/15/40 (Call 03/15/40) |
860 | 865,342 | ||||||
| 5.88%, 12/16/36 |
3,948 | 4,198,629 | ||||||
| 5.95%, 04/01/41 (Call 10/01/40) |
1,696 | 1,809,203 | ||||||
| InRetail Consumer, 3.25%, 03/22/28 |
||||||||
| (Call 01/22/28)(b) |
10 | 8,880 | ||||||
| Security | Par (000) |
Value | ||||||
| Retail (continued) | ||||||||
| Lowe’s Companies Inc. |
||||||||
| 1.30%, 04/15/28 (Call 02/15/28)(a) |
$ | 735 | $ | 637,478 | ||||
| 1.70%, 09/15/28 (Call 07/15/28) |
1,700 | 1,476,923 | ||||||
| 1.70%, 10/15/30 (Call 07/15/30) |
1,395 | 1,132,665 | ||||||
| 2.50%, 04/15/26 (Call 01/15/26) |
1,414 | 1,342,273 | ||||||
| 2.63%, 04/01/31 (Call 01/01/31) |
1,980 | 1,686,793 | ||||||
| 2.80%, 09/15/41 (Call 03/15/41) |
1,441 | 1,006,479 | ||||||
| 3.00%, 10/15/50 (Call 04/15/50) |
2,432 | 1,569,076 | ||||||
| 3.10%, 05/03/27 (Call 02/03/27) |
1,765 | 1,668,690 | ||||||
| 3.35%, 04/01/27 (Call 03/01/27)(a) |
1,198 | 1,141,882 | ||||||
| 3.38%, 09/15/25 (Call 06/15/25) |
1,305 | 1,269,973 | ||||||
| 3.50%, 04/01/51 (Call 10/01/50)(a) |
765 | 538,109 | ||||||
| 3.65%, 04/05/29 (Call 01/05/29)(a) |
2,162 | 2,037,841 | ||||||
| 3.70%, 04/15/46 (Call 10/15/45) |
1,842 | 1,385,737 | ||||||
| 3.75%, 04/01/32 (Call 01/01/32)(a) |
2,048 | 1,860,955 | ||||||
| 4.00%, 04/15/25 (Call 03/15/25) |
1,151 | 1,134,494 | ||||||
| 4.05%, 05/03/47 (Call 11/03/46) |
2,221 | 1,758,286 | ||||||
| 4.25%, 04/01/52 (Call 10/01/51) |
2,055 | 1,651,039 | ||||||
| 4.38%, 09/15/45 (Call 03/15/45) |
637 | 539,673 | ||||||
| 4.40%, 09/08/25(a) |
587 | 579,782 | ||||||
| 4.45%, 04/01/62 (Call 10/01/61) |
1,455 | 1,161,720 | ||||||
| 4.50%, 04/15/30 (Call 01/15/30)(a) |
1,862 | 1,809,115 | ||||||
| 4.55%, 04/05/49 (Call 10/05/48) |
725 | 609,496 | ||||||
| 4.65%, 04/15/42 (Call 10/15/41) |
484 | 432,183 | ||||||
| 4.80%, 04/01/26 (Call 03/01/26) |
840 | 834,868 | ||||||
| 5.00%, 04/15/33 (Call 01/15/33)(a) |
1,015 | 1,001,199 | ||||||
| 5.00%, 04/15/40 (Call 10/15/39) |
530 | 503,616 | ||||||
| 5.00%, 09/15/43 (Call 03/15/43)(a) |
271 | 246,326 | ||||||
| 5.13%, 04/15/50 (Call 10/15/49) |
600 | 554,897 | ||||||
| 5.15%, 07/01/33 (Call 04/01/33)(a) |
1,065 | 1,060,336 | ||||||
| 5.50%, 10/15/35(a) |
690 | 710,473 | ||||||
| 5.63%, 04/15/53 (Call 10/15/52)(a) |
1,690 | 1,677,263 | ||||||
| 5.75%, 07/01/53 (Call 01/01/53)(a) |
495 | 500,044 | ||||||
| 5.80%, 10/15/36 |
330 | 338,274 | ||||||
| 5.80%, 09/15/62 (Call 03/15/62)(a) |
1,069 | 1,066,567 | ||||||
| 5.85%, 04/01/63 (Call 10/01/62) |
860 | 867,547 | ||||||
| 6.50%, 03/15/29(a) |
595 | 637,263 | ||||||
| 6.88%, 02/15/28(a) |
785 | 844,442 | ||||||
| McDonald’s Corp. |
||||||||
| 1.45%, 09/01/25 (Call 08/01/25) |
262 | 248,017 | ||||||
| 2.13%, 03/01/30 (Call 12/01/29) |
727 | 622,197 | ||||||
| 2.63%, 09/01/29 (Call 06/01/29) |
1,081 | 967,381 | ||||||
| 3.30%, 07/01/25 (Call 06/01/25)(a) |
1,008 | 984,382 | ||||||
| 3.38%, 05/26/25 (Call 02/26/25) |
853 | 833,734 | ||||||
| 3.50%, 03/01/27 (Call 12/01/26) |
1,359 | 1,309,229 | ||||||
| 3.50%, 07/01/27 (Call 05/01/27) |
1,407 | 1,347,458 | ||||||
| 3.60%, 07/01/30 (Call 04/01/30)(a) |
999 | 925,796 | ||||||
| 3.63%, 05/01/43(a) |
960 | 755,831 | ||||||
| 3.63%, 09/01/49 (Call 03/01/49) |
2,346 | 1,757,297 | ||||||
| 3.70%, 01/30/26 (Call 10/30/25)(a) |
2,245 | 2,192,912 | ||||||
| 3.70%, 02/15/42 |
666 | 536,475 | ||||||
| 3.80%, 04/01/28 (Call 01/01/28) |
1,558 | 1,497,593 | ||||||
| 4.20%, 04/01/50 (Call 10/01/49)(a) |
965 | 798,184 | ||||||
| 4.45%, 03/01/47 (Call 09/01/46) |
1,425 | 1,224,474 | ||||||
| 4.45%, 09/01/48 (Call 03/01/48) |
748 | 647,798 | ||||||
| 4.60%, 09/09/32 (Call 06/09/32)(a) |
1,055 | 1,030,229 | ||||||
| 4.60%, 05/26/45 (Call 11/26/44)(a) |
420 | 373,091 | ||||||
| 4.70%, 12/09/35 (Call 06/09/35) |
1,307 | 1,255,604 | ||||||
| 4.80%, 08/14/28 (Call 07/14/28)(a) |
862 | 859,587 | ||||||
| 4.88%, 07/15/40(a) |
715 | 675,357 | ||||||
| 4.88%, 12/09/45 (Call 06/09/45) |
1,670 | 1,540,330 | ||||||
| 122 | 2 0 2 4 I S H A R E S A N N U A L R E P O R T T O S H A R E H O L D E R S |
| Schedule of Investments (continued) February 29, 2024 |
iShares® Broad USD Investment Grade Corporate Bond ETF (Percentages shown are based on Net Assets) |
| Security | Par (000) |
Value | ||||||
| Retail (continued) | ||||||||
| 4.95%, 08/14/33 (Call 05/14/33)(a) |
$ | 1,000 | $ | 992,063 | ||||
| 5.15%, 09/09/52 (Call 03/09/52) |
1,090 | 1,035,382 | ||||||
| 5.45%, 08/14/53 (Call 02/14/53)(a) |
1,175 | 1,171,057 | ||||||
| 5.70%, 02/01/39(a) |
816 | 838,999 | ||||||
| 6.30%, 10/15/37 |
1,302 | 1,420,608 | ||||||
| 6.30%, 03/01/38 |
735 | 802,793 | ||||||
| O’Reilly Automotive Inc. |
||||||||
| 1.75%, 03/15/31 (Call 12/15/30)(a) |
560 | 448,842 | ||||||
| 3.55%, 03/15/26 (Call 12/15/25) |
919 | 889,382 | ||||||
| 3.60%, 09/01/27 (Call 06/01/27) |
1,115 | 1,062,175 | ||||||
| 3.90%, 06/01/29 (Call 03/01/29)(a) |
781 | 741,377 | ||||||
| 4.20%, 04/01/30 (Call 01/01/30) |
1,007 | 955,869 | ||||||
| 4.35%, 06/01/28 (Call 03/01/28) |
942 | 918,622 | ||||||
| 4.70%, 06/15/32 (Call 03/15/32)(a) |
1,250 | 1,209,418 | ||||||
| 5.75%, 11/20/26 (Call 10/20/26) |
580 | 588,205 | ||||||
| Ross Stores Inc. |
||||||||
| 0.88%, 04/15/26 (Call 03/15/26) |
1,142 | 1,044,429 | ||||||
| 1.88%, 04/15/31 (Call 01/15/31) |
683 | 554,914 | ||||||
| 4.60%, 04/15/25 (Call 03/15/25) |
1,138 | 1,126,961 | ||||||
| Starbucks Corp. |
||||||||
| 2.00%, 03/12/27 (Call 01/12/27) |
778 | 713,564 | ||||||
| 2.25%, 03/12/30 (Call 12/12/29) |
995 | 850,860 | ||||||
| 2.45%, 06/15/26 (Call 03/15/26) |
906 | 855,488 | ||||||
| 2.55%, 11/15/30 (Call 08/15/30) |
1,359 | 1,167,340 | ||||||
| 3.00%, 02/14/32 (Call 11/14/31)(a) |
1,440 | 1,250,636 | ||||||
| 3.35%, 03/12/50 (Call 09/12/49) |
967 | 683,721 | ||||||
| 3.50%, 03/01/28 (Call 12/01/27) |
724 | 686,789 | ||||||
| 3.50%, 11/15/50 (Call 05/15/50)(a) |
1,877 | 1,374,307 | ||||||
| 3.55%, 08/15/29 (Call 05/15/29) |
1,058 | 992,357 | ||||||
| 3.75%, 12/01/47 (Call 06/01/47) |
735 | 564,981 | ||||||
| 3.80%, 08/15/25 (Call 06/15/25) |
1,287 | 1,260,219 | ||||||
| 4.00%, 11/15/28 (Call 08/15/28)(a) |
1,280 | 1,237,732 | ||||||
| 4.30%, 06/15/45 (Call 12/15/44)(a) |
535 | 453,877 | ||||||
| 4.45%, 08/15/49 (Call 02/15/49) |
1,227 | 1,049,648 | ||||||
| 4.50%, 11/15/48 (Call 05/15/48) |
1,414 | 1,223,229 | ||||||
| 4.75%, 02/15/26 (Call 01/15/26) |
1,540 | 1,529,787 | ||||||
| 4.80%, 02/15/33 (Call 11/15/32)(a) |
780 | 769,251 | ||||||
| 4.85%, 02/08/27 (Call 01/08/27) |
450 | 447,636 | ||||||
| 4.90%, 02/15/31 (Call 12/15/30)(a) |
450 | 444,554 | ||||||
| 5.00%, 02/15/34 (Call 11/15/33) |
450 | 442,857 | ||||||
| Target Corp. |
||||||||
| 1.95%, 01/15/27 (Call 12/15/26)(a) |
1,745 | 1,613,628 | ||||||
| 2.25%, 04/15/25 (Call 03/15/25) |
2,050 | 1,985,934 | ||||||
| 2.35%, 02/15/30 (Call 11/15/29) |
1,180 | 1,029,433 | ||||||
| 2.50%, 04/15/26 |
1,598 | 1,525,925 | ||||||
| 2.65%, 09/15/30 (Call 06/15/30) |
925 | 812,343 | ||||||
| 2.95%, 01/15/52 (Call 07/15/51)(a) |
1,430 | 951,648 | ||||||
| 3.38%, 04/15/29 (Call 01/15/29) |
1,339 | 1,257,940 | ||||||
| 3.63%, 04/15/46 |
915 | 713,377 | ||||||
| 3.90%, 11/15/47 (Call 05/15/47) |
752 | 614,505 | ||||||
| 4.00%, 07/01/42 |
1,567 | 1,355,652 | ||||||
| 4.40%, 01/15/33 (Call 10/15/32) |
865 | 835,432 | ||||||
| 4.50%, 09/15/32 (Call 06/15/32)(a) |
1,145 | 1,108,495 | ||||||
| 4.80%, 01/15/53 (Call 07/15/52)(a) |
1,545 | 1,428,497 | ||||||
| 6.35%, 11/01/32 |
249 | 272,015 | ||||||
| 6.50%, 10/15/37 |
692 | 772,899 | ||||||
| 7.00%, 01/15/38 |
600 | 701,350 | ||||||
| Tiffany & Co., 4.90%, 10/01/44 |
||||||||
| (Call 04/01/44)(a) |
460 | 427,041 | ||||||
| TJX Companies Inc. (The) |
||||||||
| 1.15%, 05/15/28 (Call 03/15/28)(a) |
695 | 599,144 | ||||||
| Security | Par (000) |
Value | ||||||
| Retail (continued) | ||||||||
| 1.60%, 05/15/31 (Call 02/15/31) |
$ | 770 | $ | 621,346 | ||||
| 2.25%, 09/15/26 (Call 06/15/26) |
1,580 | 1,484,623 | ||||||
| 3.88%, 04/15/30 (Call 01/15/30) |
1,102 | 1,045,175 | ||||||
| 4.50%, 04/15/50 (Call 10/15/49)(a) |
501 | 456,437 | ||||||
| Tractor Supply Co. |
||||||||
| 1.75%, 11/01/30 (Call 08/01/30)(a) |
1,030 | 828,385 | ||||||
| 5.25%, 05/15/33 (Call 02/15/33)(a) |
375 | 372,991 | ||||||
| Walmart Inc. |
||||||||
| 2.38%, 09/24/29 (Call 06/24/29)(a) |
264 | 235,776 | ||||||
| 2.50%, 09/22/41 (Call 03/22/41) |
1,740 | 1,228,923 | ||||||
| 2.65%, 09/22/51 (Call 03/22/51)(a) |
2,328 | 1,516,114 | ||||||
| 2.95%, 09/24/49 (Call 03/24/49) |
933 | 650,935 | ||||||
| 3.05%, 07/08/26 (Call 05/08/26) |
1,140 | 1,096,748 | ||||||
| 3.25%, 07/08/29 (Call 04/08/29)(a) |
972 | 913,366 | ||||||
| 3.55%, 06/26/25 (Call 04/26/25) |
760 | 746,774 | ||||||
| 3.63%, 12/15/47 (Call 06/15/47) |
1,025 | 810,056 | ||||||
| 3.70%, 06/26/28 (Call 03/26/28)(a) |
1,662 | 1,607,804 | ||||||
| 3.90%, 04/15/28 (Call 03/15/28) |
905 | 883,055 | ||||||
| 3.95%, 06/28/38 (Call 12/28/37) |
845 | 762,746 | ||||||
| 4.00%, 04/15/26 (Call 03/15/26) |
915 | 901,159 | ||||||
| 4.00%, 04/15/30 (Call 02/15/30)(a) |
578 | 560,303 | ||||||
| 4.00%, 04/11/43 (Call 10/11/42)(a) |
365 | 316,666 | ||||||
| 4.05%, 06/29/48 (Call 12/29/47) |
2,250 | 1,940,361 | ||||||
| 4.10%, 04/15/33 (Call 01/15/33) |
1,475 | 1,405,470 | ||||||
| 4.15%, 09/09/32 (Call 06/09/32) |
845 | 815,159 | ||||||
| 4.30%, 04/22/44 (Call 10/22/43)(a) |
70 | 63,003 | ||||||
| 4.50%, 09/09/52 (Call 03/09/52) |
1,311 | 1,193,781 | ||||||
| 4.50%, 04/15/53 (Call 10/15/52) |
1,755 | 1,595,366 | ||||||
| 4.88%, 07/08/40(a) |
245 | 244,484 | ||||||
| 5.00%, 10/25/40(a) |
655 | 661,510 | ||||||
| 5.25%, 09/01/35 |
1,805 | 1,871,481 | ||||||
| 5.63%, 04/01/40 |
710 | 753,577 | ||||||
| 5.63%, 04/15/41(a) |
160 | 169,999 | ||||||
| 5.88%, 04/05/27 |
50 | 51,940 | ||||||
| 6.20%, 04/15/38 |
1,010 | 1,134,589 | ||||||
| 6.50%, 08/15/37 |
1,315 | 1,507,601 | ||||||
| 7.55%, 02/15/30(a) |
970 | 1,123,596 | ||||||
|
|
|
|||||||
| 249,172,680 | ||||||||
| Savings & Loans — 0.1% | ||||||||
| Nationwide Building Society |
||||||||
| 1.50%, 10/13/26(a)(b) |
1,896 | 1,721,265 | ||||||
| 2.97%, 02/16/28 (Call 02/16/27), |
||||||||
| (1-day SOFR + 1.29%)(a)(b)(d) |
955 | 883,603 | ||||||
| 3.90%, 07/21/25(b) |
1,107 | 1,084,990 | ||||||
| 3.96%, 07/18/30 (Call 07/18/29), |
||||||||
| (3-mo. LIBOR US + 1.855%)(a)(b)(d) |
1,635 | 1,496,159 | ||||||
| 4.00%, 09/14/26(b) |
1,051 | 1,005,625 | ||||||
| 4.13%, 10/18/32 (Call 10/18/27), |
||||||||
| (5-year USD ICE Swap + 1.849%)(b)(d) |
693 | 633,810 | ||||||
| 4.30%, 03/08/29 (Call 03/08/28), |
||||||||
| (3-mo. LIBOR US + 1.452%)(a)(b)(d) |
1,115 | 1,060,459 | ||||||
| 4.85%, 07/27/27(b) |
1,385 | 1,368,501 | ||||||
| 6.56%, 10/18/27 (Call 10/18/26), |
||||||||
| (1-day SOFR + 1.910%)(b)(d) |
1,065 | 1,090,184 | ||||||
|
|
|
|||||||
| 10,344,596 | ||||||||
| Semiconductors — 2.2% | ||||||||
| Advanced Micro Devices Inc. |
||||||||
| 3.92%, 06/01/32 (Call 03/01/32)(a) |
1,125 | 1,051,768 | ||||||
| 4.39%, 06/01/52 (Call 12/01/51)(a) |
830 | 732,865 | ||||||
| S C H E D U L E O F I N V E S T M E N T S |
123 |
| Schedule of Investments (continued) February 29, 2024 |
iShares® Broad USD Investment Grade Corporate Bond ETF (Percentages shown are based on Net Assets) |
| Security | Par (000) |
Value | ||||||
| Semiconductors (continued) | ||||||||
| Analog Devices Inc. |
||||||||
| 1.70%, 10/01/28 (Call 08/01/28)(a) |
$ | 1,075 | $ | 938,701 | ||||
| 2.10%, 10/01/31 (Call 07/01/31) |
1,650 | 1,363,088 | ||||||
| 2.80%, 10/01/41 (Call 04/01/41) |
1,067 | 758,740 | ||||||
| 2.95%, 04/01/25 (Call 03/01/25) |
638 | 623,054 | ||||||
| 2.95%, 10/01/51 (Call 04/01/51) |
1,398 | 934,469 | ||||||
| 3.50%, 12/05/26 (Call 09/05/26)(a) |
1,214 | 1,172,614 | ||||||
| 4.25%, 10/01/32 (Call 07/01/32) |
85 | 80,256 | ||||||
| 5.30%, 12/15/45 (Call 06/15/45) |
285 | 276,689 | ||||||
| Applied Materials Inc. |
||||||||
| 1.75%, 06/01/30 (Call 03/01/30) |
1,000 | 834,076 | ||||||
| 2.75%, 06/01/50 (Call 12/01/49)(a) |
667 | 448,594 | ||||||
| 3.30%, 04/01/27 (Call 01/01/27) |
1,999 | 1,913,322 | ||||||
| 3.90%, 10/01/25 (Call 07/01/25) |
940 | 923,748 | ||||||
| 4.35%, 04/01/47 (Call 10/01/46) |
1,485 | 1,320,142 | ||||||
| 5.10%, 10/01/35 (Call 04/01/35)(a) |
558 | 565,216 | ||||||
| 5.85%, 06/15/41 |
1,110 | 1,196,362 | ||||||
| Broadcom Corp./Broadcom Cayman |
||||||||
| 3.50%, 01/15/28 (Call 10/15/27) |
1,288 | 1,213,475 | ||||||
| 3.88%, 01/15/27 (Call 10/15/26) |
3,882 | 3,751,052 | ||||||
| Broadcom Inc. |
||||||||
| 1.95%, 02/15/28 (Call 12/15/27)(a)(b) |
1,322 | 1,173,693 | ||||||
| 2.45%, 02/15/31 (Call 11/15/30)(b) |
3,290 | 2,748,507 | ||||||
| 2.60%, 02/15/33 (Call 11/15/32)(b) |
2,055 | 1,651,741 | ||||||
| 3.14%, 11/15/35 (Call 08/15/35)(b) |
4,223 | 3,352,158 | ||||||
| 3.15%, 11/15/25 (Call 10/15/25) |
321 | 309,703 | ||||||
| 3.19%, 11/15/36 (Call 08/15/36)(b) |
3,390 | 2,657,617 | ||||||
| 3.42%, 04/15/33 (Call 01/15/33)(b) |
3,265 | 2,788,609 | ||||||
| 3.46%, 09/15/26 (Call 07/15/26) |
1,233 | 1,183,095 | ||||||
| 3.47%, 04/15/34 (Call 01/15/34)(b) |
4,465 | 3,770,958 | ||||||
| 3.50%, 02/15/41 (Call 08/15/40)(b) |
3,984 | 3,046,615 | ||||||
| 3.75%, 02/15/51 (Call 08/15/50)(b) |
2,437 | 1,821,959 | ||||||
| 4.00%, 04/15/29 (Call 02/15/29)(b) |
1,320 | 1,249,856 | ||||||
| 4.11%, 09/15/28 (Call 06/15/28)(a) |
1,375 | 1,318,304 | ||||||
| 4.15%, 11/15/30 (Call 08/15/30) |
2,680 | 2,507,206 | ||||||
| 4.15%, 04/15/32 (Call 01/15/32)(b) |
1,615 | 1,483,177 | ||||||
| 4.30%, 11/15/32 (Call 08/15/32) |
2,339 | 2,166,050 | ||||||
| 4.75%, 04/15/29 (Call 01/15/29) |
1,345 | 1,319,476 | ||||||
| 4.93%, 05/15/37 (Call 02/15/37)(a)(b) |
3,150 | 2,934,801 | ||||||
| 5.00%, 04/15/30 (Call 01/15/30)(a) |
1,270 | 1,268,069 | ||||||
| Foundry JV Holdco LLC, 5.88%, 01/25/34 |
||||||||
| (Call 10/25/33)(b) |
615 | 611,883 | ||||||
| Intel Corp. |
||||||||
| 1.60%, 08/12/28 (Call 06/12/28) |
1,260 | 1,095,652 | ||||||
| 2.00%, 08/12/31 (Call 05/12/31) |
1,835 | 1,490,035 | ||||||
| 2.45%, 11/15/29 (Call 08/15/29) |
2,622 | 2,298,034 | ||||||
| 2.60%, 05/19/26 (Call 02/19/26) |
1,748 | 1,662,751 | ||||||
| 2.80%, 08/12/41 (Call 02/12/41) |
1,191 | 846,082 | ||||||
| 3.05%, 08/12/51 (Call 02/12/51)(a) |
1,725 | 1,141,473 | ||||||
| 3.10%, 02/15/60 (Call 08/15/59) |
1,338 | 847,724 | ||||||
| 3.15%, 05/11/27 (Call 02/11/27) |
1,394 | 1,321,486 | ||||||
| 3.20%, 08/12/61 (Call 02/12/61)(a) |
995 | 641,923 | ||||||
| 3.25%, 11/15/49 (Call 05/15/49) |
2,654 | 1,838,990 | ||||||
| 3.40%, 03/25/25 (Call 02/25/25) |
2,060 | 2,020,261 | ||||||
| 3.70%, 07/29/25 (Call 04/29/25) |
2,471 | 2,420,773 | ||||||
| 3.73%, 12/08/47 (Call 06/08/47) |
2,579 | 1,960,702 | ||||||
| 3.75%, 03/25/27 (Call 01/25/27) |
1,447 | 1,400,665 | ||||||
| 3.75%, 08/05/27 (Call 07/05/27) |
1,385 | 1,335,252 | ||||||
| 3.90%, 03/25/30 (Call 12/25/29) |
1,936 | 1,821,553 | ||||||
| 4.00%, 08/05/29 (Call 06/05/29) |
1,347 | 1,288,240 | ||||||
| Security | Par (000) |
Value | ||||||
| Semiconductors (continued) | ||||||||
| 4.00%, 12/15/32 |
$ | 1,198 | $ | 1,105,933 | ||||
| 4.10%, 05/19/46 (Call 11/19/45) |
1,556 | 1,291,229 | ||||||
| 4.10%, 05/11/47 (Call 11/11/46) |
1,212 | 999,725 | ||||||
| 4.15%, 08/05/32 (Call 05/05/32)(a) |
1,635 | 1,535,124 | ||||||
| 4.25%, 12/15/42(a) |
783 | 667,660 | ||||||
| 4.60%, 03/25/40 (Call 09/25/39)(a) |
768 | 713,432 | ||||||
| 4.75%, 03/25/50 (Call 09/25/49) |
2,945 | 2,624,769 | ||||||
| 4.80%, 10/01/41 |
1,145 | 1,069,926 | ||||||
| 4.88%, 02/10/26 |
2,420 | 2,411,590 | ||||||
| 4.88%, 02/10/28 (Call 01/10/28) |
2,355 | 2,349,572 | ||||||
| 4.90%, 07/29/45 (Call 01/29/45)(a) |
356 | 336,877 | ||||||
| 4.90%, 08/05/52 (Call 02/05/52) |
2,335 | 2,148,440 | ||||||
| 4.95%, 03/25/60 (Call 09/25/59)(a) |
1,051 | 959,168 | ||||||
| 5.00%, 02/21/31 (Call 12/21/30) |
490 | 486,885 | ||||||
| 5.05%, 08/05/62 (Call 02/05/62) |
1,275 | 1,175,089 | ||||||
| 5.13%, 02/10/30 (Call 12/10/29) |
1,745 | 1,759,231 | ||||||
| 5.15%, 02/21/34 (Call 11/21/33) |
675 | 668,094 | ||||||
| 5.20%, 02/10/33 (Call 11/10/32)(a) |
2,770 | 2,773,077 | ||||||
| 5.60%, 02/21/54 (Call 08/21/53) |
330 | 329,809 | ||||||
| 5.63%, 02/10/43 (Call 08/10/42) |
1,360 | 1,381,335 | ||||||
| 5.70%, 02/10/53 (Call 08/10/52) |
2,600 | 2,635,590 | ||||||
| 5.90%, 02/10/63 (Call 08/10/62) |
1,635 | 1,703,210 | ||||||
| KLA Corp. |
||||||||
| 3.30%, 03/01/50 (Call 08/28/49) |
1,079 | 779,544 | ||||||
| 4.10%, 03/15/29 (Call 12/15/28) |
1,643 | 1,595,397 | ||||||
| 4.65%, 07/15/32 (Call 04/15/32) |
1,295 | 1,262,565 | ||||||
| 4.70%, 02/01/34 (Call 11/01/33) |
500 | 486,838 | ||||||
| 4.95%, 07/15/52 (Call 01/15/52) |
1,800 | 1,704,617 | ||||||
| 5.00%, 03/15/49 (Call 09/15/48) |
567 | 540,957 | ||||||
| 5.25%, 07/15/62 (Call 01/15/62) |
1,090 | 1,069,406 | ||||||
| 5.65%, 11/01/34 (Call 07/01/34)(a) |
523 | 543,922 | ||||||
| Lam Research Corp. |
||||||||
| 1.90%, 06/15/30 (Call 03/15/30) |
1,333 | 1,118,163 | ||||||
| 2.88%, 06/15/50 (Call 12/15/49)(a) |
1,158 | 781,204 | ||||||
| 3.13%, 06/15/60 (Call 12/15/59)(a) |
796 | 522,805 | ||||||
| 3.75%, 03/15/26 (Call 01/15/26) |
1,406 | 1,371,792 | ||||||
| 3.80%, 03/15/25 (Call 12/15/24) |
493 | 485,745 | ||||||
| 4.00%, 03/15/29 (Call 12/15/28) |
1,594 | 1,538,927 | ||||||
| 4.88%, 03/15/49 (Call 09/15/48) |
995 | 937,650 | ||||||
| Marvell Technology Inc. |
||||||||
| 1.65%, 04/15/26 (Call 03/15/26)(a) |
790 | 732,683 | ||||||
| 2.45%, 04/15/28 (Call 02/15/28) |
1,280 | 1,149,245 | ||||||
| 2.95%, 04/15/31 (Call 01/15/31) |
1,245 | 1,067,091 | ||||||
| 4.88%, 06/22/28 (Call 03/22/28) |
853 | 839,080 | ||||||
| 5.75%, 02/15/29 (Call 01/15/29) |
360 | 366,771 | ||||||
| 5.95%, 09/15/33 (Call 06/15/33) |
540 | 557,761 | ||||||
| Microchip Technology Inc., 4.25%, 09/01/25 |
||||||||
| (Call 04/01/24)(a) |
1,475 | 1,447,462 | ||||||
| Micron Technology Inc. |
||||||||
| 2.70%, 04/15/32 (Call 01/15/32)(a) |
1,738 | 1,426,624 | ||||||
| 3.37%, 11/01/41 (Call 05/01/41) |
839 | 611,330 | ||||||
| 3.48%, 11/01/51 (Call 05/01/51)(a) |
660 | 458,884 | ||||||
| 4.19%, 02/15/27 (Call 12/15/26) |
1,477 | 1,435,815 | ||||||
| 4.66%, 02/15/30 (Call 11/15/29) |
1,238 | 1,197,651 | ||||||
| 4.98%, 02/06/26 (Call 12/06/25) |
951 | 946,012 | ||||||
| 5.30%, 01/15/31 (Call 11/15/30)(a) |
615 | 608,695 | ||||||
| 5.33%, 02/06/29 (Call 11/06/28)(a) |
1,078 | 1,079,308 | ||||||
| 5.38%, 04/15/28 (Call 03/15/28) |
1,017 | 1,022,427 | ||||||
| 5.88%, 02/09/33 (Call 11/09/32) |
1,056 | 1,078,768 | ||||||
| 5.88%, 09/15/33 (Call 06/15/33)(a) |
300 | 305,870 | ||||||
| 6.75%, 11/01/29 (Call 09/01/29) |
1,738 | 1,844,786 | ||||||
| 124 | 2 0 2 4 I S H A R E S A N N U A L R E P O R T T O S H A R E H O L D E R S |
| Schedule of Investments (continued) February 29, 2024 |
iShares® Broad USD Investment Grade Corporate Bond ETF (Percentages shown are based on Net Assets) |
| Security | Par (000) |
Value | ||||||
| Semiconductors (continued) | ||||||||
| NVIDIA Corp. |
||||||||
| 1.55%, 06/15/28 (Call 04/15/28)(a) |
$ | 2,440 | $ | 2,160,642 | ||||
| 2.00%, 06/15/31 (Call 03/15/31) |
1,755 | 1,465,912 | ||||||
| 2.85%, 04/01/30 (Call 01/01/30) |
2,405 | 2,165,880 | ||||||
| 3.20%, 09/16/26 (Call 06/16/26)(a) |
1,649 | 1,589,563 | ||||||
| 3.50%, 04/01/40 (Call 10/01/39) |
1,362 | 1,137,666 | ||||||
| 3.50%, 04/01/50 (Call 10/01/49) |
2,694 | 2,112,522 | ||||||
| 3.70%, 04/01/60 (Call 10/01/59) |
754 | 592,083 | ||||||
| NXP BV/NXP Funding LLC |
||||||||
| 5.35%, 03/01/26 (Call 01/01/26)(a) |
846 | 845,407 | ||||||
| 5.55%, 12/01/28 (Call 09/01/28) |
948 | 957,796 | ||||||
| NXP BV/NXP Funding LLC/NXP USA Inc. |
||||||||
| 2.50%, 05/11/31 (Call 02/11/31) |
1,543 | 1,277,130 | ||||||
| 2.65%, 02/15/32 (Call 11/15/31) |
1,288 | 1,056,706 | ||||||
| 2.70%, 05/01/25 (Call 04/01/25) |
432 | 417,839 | ||||||
| 3.13%, 02/15/42 (Call 08/15/41) |
900 | 638,181 | ||||||
| 3.15%, 05/01/27 (Call 03/01/27)(a) |
867 | 814,769 | ||||||
| 3.25%, 05/11/41 (Call 11/11/40) |
1,430 | 1,052,585 | ||||||
| 3.25%, 11/30/51 (Call 05/30/51) |
655 | 441,140 | ||||||
| 3.40%, 05/01/30 (Call 02/01/30) |
1,218 | 1,091,751 | ||||||
| 3.88%, 06/18/26 (Call 04/18/26)(a) |
1,197 | 1,159,002 | ||||||
| 4.30%, 06/18/29 (Call 03/18/29) |
1,759 | 1,679,957 | ||||||
| 4.40%, 06/01/27 (Call 05/01/27) |
759 | 740,907 | ||||||
| 5.00%, 01/15/33 (Call 10/15/32) |
144 | 139,059 | ||||||
| Qorvo Inc. |
||||||||
| 3.38%, 04/01/31 (Call 04/01/26)(b) |
1,127 | 949,481 | ||||||
| 4.38%, 10/15/29 (Call 10/15/24)(a) |
1,535 | 1,427,977 | ||||||
| QUALCOMM Inc. |
||||||||
| 1.30%, 05/20/28 (Call 02/20/28) |
1,837 | 1,598,313 | ||||||
| 1.65%, 05/20/32 (Call 02/20/32) |
1,746 | 1,363,084 | ||||||
| 2.15%, 05/20/30 (Call 02/20/30) |
925 | 792,273 | ||||||
| 3.25%, 05/20/27 (Call 02/20/27) |
2,374 | 2,263,599 | ||||||
| 3.25%, 05/20/50 (Call 11/20/49)(a) |
1,144 | 835,319 | ||||||
| 3.45%, 05/20/25 (Call 02/20/25) |
1,208 | 1,183,691 | ||||||
| 4.25%, 05/20/32 (Call 02/20/32) |
750 | 716,604 | ||||||
| 4.30%, 05/20/47 (Call 11/20/46) |
1,475 | 1,279,818 | ||||||
| 4.50%, 05/20/52 (Call 11/20/51)(a) |
1,471 | 1,302,479 | ||||||
| 4.65%, 05/20/35 (Call 11/20/34) |
1,672 | 1,637,613 | ||||||
| 4.80%, 05/20/45 (Call 11/20/44) |
1,945 | 1,832,850 | ||||||
| 5.40%, 05/20/33 (Call 02/20/33)(a) |
1,040 | 1,079,467 | ||||||
| 6.00%, 05/20/53 (Call 11/20/52) |
1,825 | 1,999,069 | ||||||
| Renesas Electronics Corp., 2.17%, 11/25/26 |
||||||||
| (Call 10/25/26)(b) |
1,525 | 1,384,797 | ||||||
| SK Hynix Inc. |
||||||||
| 1.50%, 01/19/26(b) |
1,155 | 1,069,315 | ||||||
| 2.38%, 01/19/31(b) |
450 | 370,161 | ||||||
| 5.50%, 01/16/27(b) |
260 | 259,740 | ||||||
| 5.50%, 01/16/29(b) |
155 | 154,756 | ||||||
| 6.38%, 01/17/28(b) |
410 | 422,370 | ||||||
| 6.50%, 01/17/33(a)(b) |
760 | 805,163 | ||||||
| Skyworks Solutions Inc. |
||||||||
| 1.80%, 06/01/26 (Call 05/01/26) |
997 | 919,124 | ||||||
| 3.00%, 06/01/31 (Call 03/01/31)(a) |
982 | 822,649 | ||||||
| Texas Instruments Inc. |
||||||||
| 1.13%, 09/15/26 (Call 08/15/26) |
852 | 776,962 | ||||||
| 1.38%, 03/12/25 (Call 02/12/25) |
987 | 949,451 | ||||||
| 1.75%, 05/04/30 (Call 02/04/30) |
1,275 | 1,067,490 | ||||||
| 1.90%, 09/15/31 (Call 06/15/31) |
905 | 747,033 | ||||||
| 2.25%, 09/04/29 (Call 06/04/29) |
1,255 | 1,107,864 | ||||||
| 2.70%, 09/15/51 (Call 03/15/51)(a) |
910 | 584,232 | ||||||
| 2.90%, 11/03/27 (Call 08/03/27)(a) |
1,129 | 1,060,418 | ||||||
| Security | Par (000) |
Value | ||||||
| Semiconductors (continued) | ||||||||
| 3.65%, 08/16/32 (Call 05/16/32) |
$ | 710 | $ | 652,382 | ||||
| 3.88%, 03/15/39 (Call 09/15/38) |
987 | 869,371 | ||||||
| 4.10%, 08/16/52 (Call 02/16/52)(a) |
515 | 430,889 | ||||||
| 4.15%, 05/15/48 (Call 11/15/47) |
1,779 | 1,510,522 | ||||||
| 4.60%, 02/08/27 (Call 01/08/27) |
375 | 373,743 | ||||||
| 4.60%, 02/15/28 (Call 01/15/28) |
990 | 988,097 | ||||||
| 4.60%, 02/08/29 (Call 01/08/29)(a) |
375 | 372,902 | ||||||
| 4.85%, 02/08/34 (Call 11/08/33) |
375 | 372,530 | ||||||
| 4.90%, 03/14/33 (Call 12/14/32) |
1,121 | 1,122,471 | ||||||
| 5.00%, 03/14/53 (Call 09/14/52)(a) |
945 | 918,166 | ||||||
| 5.05%, 05/18/63 (Call 11/18/62) |
1,572 | 1,503,027 | ||||||
| 5.15%, 02/08/54 (Call 08/08/53) |
375 | 371,460 | ||||||
| TSMC Arizona Corp. |
||||||||
| 1.75%, 10/25/26 (Call 09/25/26)(a) |
2,168 | 1,993,569 | ||||||
| 2.50%, 10/25/31 (Call 07/25/31) |
2,550 | 2,160,137 | ||||||
| 3.13%, 10/25/41 (Call 04/25/41) |
1,040 | 824,718 | ||||||
| 3.25%, 10/25/51 (Call 04/25/51)(a) |
980 | 744,202 | ||||||
| 3.88%, 04/22/27 (Call 03/22/27) |
1,775 | 1,719,778 | ||||||
| 4.13%, 04/22/29 (Call 02/22/29)(a) |
480 | 466,235 | ||||||
| 4.25%, 04/22/32 (Call 01/22/32)(a) |
910 | 886,996 | ||||||
| 4.50%, 04/22/52 (Call 10/22/51)(a) |
990 | 949,473 | ||||||
| TSMC Global Ltd. |
||||||||
| 0.75%, 09/28/25 (Call 08/28/25)(b) |
1,020 | 950,277 | ||||||
| 1.00%, 09/28/27 (Call 07/28/27)(a)(b) |
975 | 849,466 | ||||||
| 1.25%, 04/23/26 (Call 03/23/26)(b) |
1,150 | 1,060,332 | ||||||
| 1.38%, 09/28/30 (Call 06/28/30)(a)(b) |
447 | 358,845 | ||||||
| 1.75%, 04/23/28 (Call 02/23/28)(a)(b) |
1,360 | 1,198,806 | ||||||
| 2.25%, 04/23/31 (Call 01/23/31)(b) |
1,780 | 1,495,509 | ||||||
| 4.63%, 07/22/32 (Call 04/22/32)(b) |
250 | 246,751 | ||||||
| Xilinx Inc., 2.38%, 06/01/30 (Call 03/01/30) |
1,228 | 1,063,378 | ||||||
|
|
|
|||||||
| 231,688,555 | ||||||||
| Shipbuilding — 0.0% | ||||||||
| Huntington Ingalls Industries Inc. |
||||||||
| 2.04%, 08/16/28 (Call 06/16/28) |
900 | 782,404 | ||||||
| 3.48%, 12/01/27 (Call 09/01/27) |
966 | 905,284 | ||||||
| 3.84%, 05/01/25 (Call 04/01/25)(a) |
800 | 783,927 | ||||||
| 4.20%, 05/01/30 (Call 02/01/30) |
657 | 618,390 | ||||||
|
|
|
|||||||
| 3,090,005 | ||||||||
| Software — 2.2% | ||||||||
| Adobe Inc. |
||||||||
| 2.15%, 02/01/27 (Call 12/01/26) |
1,625 | 1,512,565 | ||||||
| 2.30%, 02/01/30 (Call 11/01/29) |
2,233 | 1,950,159 | ||||||
| Autodesk Inc. |
||||||||
| 2.40%, 12/15/31 (Call 09/15/31)(a) |
1,240 | 1,029,795 | ||||||
| 2.85%, 01/15/30 (Call 10/15/29)(a) |
1,113 | 987,614 | ||||||
| 3.50%, 06/15/27 (Call 03/15/27) |
1,109 | 1,061,448 | ||||||
| 4.38%, 06/15/25 (Call 03/15/25)(a) |
515 | 509,524 | ||||||
| Broadridge Financial Solutions Inc. |
||||||||
| 2.60%, 05/01/31 (Call 02/01/31) |
1,696 | 1,421,087 | ||||||
| 2.90%, 12/01/29 (Call 09/01/29) |
1,496 | 1,320,022 | ||||||
| 3.40%, 06/27/26 (Call 03/27/26) |
1,141 | 1,090,743 | ||||||
| Concentrix Corp. |
||||||||
| 6.60%, 08/02/28 (Call 07/02/28)(a) |
1,090 | 1,096,185 | ||||||
| 6.65%, 08/02/26 (Call 07/02/26)(a) |
940 | 953,553 | ||||||
| 6.85%, 08/02/33 (Call 05/02/33)(a) |
880 | 860,461 | ||||||
| Constellation Software Inc. |
||||||||
| 5.16%, 02/16/29 (Call 01/16/29)(a)(b) |
325 | 323,337 | ||||||
| 5.46%, 02/16/34 (Call 11/16/33)(b) |
230 | 229,977 | ||||||
| Electronic Arts Inc. |
||||||||
| 1.85%, 02/15/31 (Call 11/15/30) |
1,131 | 920,529 | ||||||
| S C H E D U L E O F I N V E S T M E N T S |
125 |
| Schedule of Investments (continued) February 29, 2024 |
iShares® Broad USD Investment Grade Corporate Bond ETF (Percentages shown are based on Net Assets) |
| Security | Par (000) |
Value | ||||||
| Software (continued) | ||||||||
| 2.95%, 02/15/51 (Call 08/15/50)(a) |
$ | 1,337 | $ | 890,959 | ||||
| 4.80%, 03/01/26 (Call 12/01/25) |
1,060 | 1,054,988 | ||||||
| Fidelity National Information Services Inc. |
||||||||
| 1.15%, 03/01/26 (Call 02/01/26) |
1,901 | 1,757,954 | ||||||
| 1.65%, 03/01/28 (Call 01/01/28)(a) |
1,327 | 1,169,312 | ||||||
| 2.25%, 03/01/31 (Call 12/01/30)(a) |
1,980 | 1,658,071 | ||||||
| 3.10%, 03/01/41 (Call 09/01/40) |
1,185 | 851,166 | ||||||
| 3.75%, 05/21/29 (Call 02/21/29)(a) |
365 | 347,140 | ||||||
| 4.50%, 07/15/25(a) |
683 | 676,371 | ||||||
| 4.50%, 08/15/46 (Call 02/15/46) |
560 | 462,690 | ||||||
| 4.70%, 07/15/27 (Call 06/15/27)(a) |
900 | 893,307 | ||||||
| 5.10%, 07/15/32 (Call 04/15/32)(a) |
920 | 919,920 | ||||||
| 5.63%, 07/15/52 (Call 01/15/52)(a) |
805 | 799,301 | ||||||
| Series 30Y, 4.75%, 05/15/48 (Call 11/15/47) |
392 | 329,241 | ||||||
| Fiserv Inc. |
||||||||
| 2.25%, 06/01/27 (Call 04/01/27) |
1,533 | 1,402,328 | ||||||
| 2.65%, 06/01/30 (Call 03/01/30) |
1,268 | 1,092,457 | ||||||
| 3.20%, 07/01/26 (Call 05/01/26) |
2,854 | 2,727,009 | ||||||
| 3.50%, 07/01/29 (Call 04/01/29) |
4,015 | 3,688,833 | ||||||
| 3.85%, 06/01/25 (Call 03/01/25) |
1,304 | 1,277,850 | ||||||
| 4.20%, 10/01/28 (Call 07/01/28) |
1,440 | 1,381,760 | ||||||
| 4.40%, 07/01/49 (Call 01/01/49) |
2,865 | 2,396,875 | ||||||
| 5.15%, 03/15/27 (Call 02/15/27) |
625 | 625,228 | ||||||
| 5.35%, 03/15/31 (Call 01/15/31) |
625 | 625,545 | ||||||
| 5.38%, 08/21/28 (Call 07/21/28) |
1,110 | 1,118,907 | ||||||
| 5.45%, 03/02/28 (Call 02/02/28) |
1,240 | 1,250,971 | ||||||
| 5.45%, 03/15/34 (Call 12/15/33) |
625 | 624,212 | ||||||
| 5.60%, 03/02/33 (Call 12/02/32) |
1,050 | 1,059,383 | ||||||
| 5.63%, 08/21/33 (Call 05/21/33)(a) |
920 | 929,636 | ||||||
| Infor Inc., 1.75%, 07/15/25 (Call 06/15/25)(b) |
884 | 835,369 | ||||||
| Intuit Inc. |
||||||||
| 0.95%, 07/15/25 (Call 06/15/25) |
776 | 732,187 | ||||||
| 1.35%, 07/15/27 (Call 05/15/27) |
1,094 | 976,261 | ||||||
| 1.65%, 07/15/30 (Call 04/15/30) |
1,060 | 869,468 | ||||||
| 5.13%, 09/15/28 (Call 08/15/28)(a) |
1,227 | 1,242,613 | ||||||
| 5.20%, 09/15/33 (Call 06/15/33) |
1,390 | 1,404,391 | ||||||
| 5.25%, 09/15/26 (Call 08/15/26) |
955 | 963,074 | ||||||
| 5.50%, 09/15/53 (Call 03/15/53) |
1,005 | 1,033,614 | ||||||
| Microsoft Corp. |
||||||||
| 1.35%, 09/15/30 (Call 06/15/30)(b) |
1,229 | 1,006,293 | ||||||
| 2.40%, 08/08/26 (Call 05/08/26) |
5,053 | 4,785,455 | ||||||
| 2.50%, 09/15/50 (Call 03/15/50)(b) |
2,113 | 1,342,838 | ||||||
| 2.53%, 06/01/50 (Call 12/01/49) |
7,404 | 4,767,386 | ||||||
| 2.68%, 06/01/60 (Call 12/01/59) |
4,872 | 3,074,904 | ||||||
| 2.92%, 03/17/52 (Call 09/17/51)(a) |
7,829 | 5,414,067 | ||||||
| 3.04%, 03/17/62 (Call 09/17/61)(a) |
2,586 | 1,762,364 | ||||||
| 3.13%, 11/03/25 (Call 08/03/25) |
2,929 | 2,846,928 | ||||||
| 3.30%, 02/06/27 (Call 11/06/26) |
5,410 | 5,225,291 | ||||||
| 3.40%, 09/15/26 (Call 06/15/26)(b) |
1,603 | 1,550,489 | ||||||
| 3.40%, 06/15/27 (Call 03/15/27)(a)(b) |
798 | 766,101 | ||||||
| 3.45%, 08/08/36 (Call 02/08/36) |
1,501 | 1,322,242 | ||||||
| 3.50%, 02/12/35 (Call 08/12/34)(a) |
2,247 | 2,041,368 | ||||||
| 3.50%, 11/15/42(a) |
930 | 779,167 | ||||||
| 3.70%, 08/08/46 (Call 02/08/46) |
2,000 | 1,671,420 | ||||||
| 3.75%, 02/12/45 (Call 08/12/44) |
460 | 393,885 | ||||||
| 3.95%, 08/08/56 (Call 02/08/56) |
650 | 546,728 | ||||||
| 4.00%, 02/12/55 (Call 08/12/54)(a) |
825 | 714,951 | ||||||
| 4.10%, 02/06/37 (Call 08/06/36) |
1,213 | 1,143,061 | ||||||
| 4.20%, 11/03/35 (Call 05/03/35)(a) |
1,086 | 1,051,206 | ||||||
| 4.25%, 02/06/47 (Call 08/06/46)(a) |
1,360 | 1,253,444 | ||||||
| 4.45%, 11/03/45 (Call 05/03/45)(a) |
1,161 | 1,107,136 | ||||||
| Security | Par (000) |
Value | ||||||
| Software (continued) | ||||||||
| 4.50%, 10/01/40(a) |
$ | 551 | $ | 537,192 | ||||
| 4.50%, 06/15/47 (Call 12/15/46)(b) |
852 | 794,490 | ||||||
| 4.50%, 02/06/57 (Call 08/06/56) |
730 | 690,558 | ||||||
| 4.75%, 11/03/55 (Call 05/03/55) |
100 | 98,303 | ||||||
| 5.20%, 06/01/39 |
525 | 555,640 | ||||||
| 5.30%, 02/08/41(a) |
1,157 | 1,239,744 | ||||||
| MSCI Inc. |
||||||||
| 3.25%, 08/15/33 (Call 08/15/27)(a)(b) |
1,110 | 910,258 | ||||||
| 3.63%, 09/01/30 (Call 03/01/25)(a)(b) |
1,655 | 1,459,764 | ||||||
| 3.63%, 11/01/31 (Call 11/01/26)(a)(b) |
905 | 783,711 | ||||||
| 3.88%, 02/15/31 (Call 06/01/25)(a)(b) |
930 | 827,280 | ||||||
| 4.00%, 11/15/29 (Call 11/15/24)(a)(b) |
795 | 729,810 | ||||||
| Open Text Corp., 6.90%, 12/01/27 |
||||||||
| (Call 11/01/27)(b) |
941 | 971,398 | ||||||
| Oracle Corp. |
||||||||
| 1.65%, 03/25/26 (Call 02/25/26) |
3,645 | 3,385,326 | ||||||
| 2.30%, 03/25/28 (Call 01/25/28) |
2,799 | 2,508,342 | ||||||
| 2.50%, 04/01/25 (Call 03/01/25) |
2,727 | 2,639,985 | ||||||
| 2.65%, 07/15/26 (Call 04/15/26) |
3,577 | 3,369,079 | ||||||
| 2.80%, 04/01/27 (Call 02/01/27) |
3,165 | 2,952,111 | ||||||
| 2.88%, 03/25/31 (Call 12/25/30) |
3,762 | 3,244,442 | ||||||
| 2.95%, 05/15/25 (Call 02/15/25) |
2,910 | 2,822,802 | ||||||
| 2.95%, 04/01/30 (Call 01/01/30) |
3,874 | 3,435,630 | ||||||
| 3.25%, 11/15/27 (Call 08/15/27) |
3,425 | 3,212,261 | ||||||
| 3.25%, 05/15/30 (Call 02/15/30)(a) |
995 | 891,886 | ||||||
| 3.60%, 04/01/40 (Call 10/01/39) |
3,890 | 3,003,191 | ||||||
| 3.60%, 04/01/50 (Call 10/01/49) |
5,766 | 4,059,495 | ||||||
| 3.65%, 03/25/41 (Call 09/25/40) |
2,999 | 2,306,010 | ||||||
| 3.80%, 11/15/37 (Call 05/15/37) |
2,331 | 1,919,600 | ||||||
| 3.85%, 07/15/36 (Call 01/15/36) |
1,868 | 1,570,566 | ||||||
| 3.85%, 04/01/60 (Call 10/01/59) |
4,771 | 3,320,361 | ||||||
| 3.90%, 05/15/35 (Call 11/15/34) |
1,809 | 1,553,330 | ||||||
| 3.95%, 03/25/51 (Call 09/25/50) |
4,261 | 3,178,502 | ||||||
| 4.00%, 07/15/46 (Call 01/15/46) |
3,887 | 2,989,489 | ||||||
| 4.00%, 11/15/47 (Call 05/15/47) |
2,932 | 2,246,170 | ||||||
| 4.10%, 03/25/61 (Call 09/25/60)(a) |
2,117 | 1,553,008 | ||||||
| 4.13%, 05/15/45 (Call 11/15/44) |
2,581 | 2,045,499 | ||||||
| 4.30%, 07/08/34 (Call 01/08/34) |
2,429 | 2,204,471 | ||||||
| 4.38%, 05/15/55 (Call 11/15/54) |
1,184 | 929,477 | ||||||
| 4.50%, 05/06/28 (Call 04/06/28)(a) |
1,120 | 1,098,303 | ||||||
| 4.50%, 07/08/44 (Call 01/08/44) |
1,386 | 1,166,885 | ||||||
| 4.65%, 05/06/30 (Call 03/06/30)(a) |
955 | 930,750 | ||||||
| 4.90%, 02/06/33 (Call 11/06/32) |
1,925 | 1,861,369 | ||||||
| 5.38%, 07/15/40 |
2,947 | 2,820,959 | ||||||
| 5.55%, 02/06/53 (Call 08/06/52) |
2,925 | 2,794,371 | ||||||
| 5.80%, 11/10/25(a) |
890 | 897,337 | ||||||
| 6.13%, 07/08/39 |
1,569 | 1,613,797 | ||||||
| 6.15%, 11/09/29 (Call 09/09/29) |
1,940 | 2,028,205 | ||||||
| 6.25%, 11/09/32 (Call 08/09/32) |
2,630 | 2,778,129 | ||||||
| 6.50%, 04/15/38 |
1,655 | 1,768,821 | ||||||
| 6.90%, 11/09/52 (Call 05/09/52) |
3,180 | 3,582,341 | ||||||
| Roper Technologies Inc. |
||||||||
| 1.00%, 09/15/25 (Call 08/15/25) |
950 | 889,986 | ||||||
| 1.40%, 09/15/27 (Call 07/15/27) |
1,257 | 1,111,519 | ||||||
| 1.75%, 02/15/31 (Call 11/15/30) |
1,491 | 1,192,404 | ||||||
| 2.00%, 06/30/30 (Call 03/30/30)(a) |
1,092 | 909,088 | ||||||
| 2.95%, 09/15/29 (Call 06/15/29) |
929 | 831,816 | ||||||
| 3.80%, 12/15/26 (Call 09/15/26) |
1,015 | 981,614 | ||||||
| 3.85%, 12/15/25 (Call 09/15/25) |
446 | 434,993 | ||||||
| 4.20%, 09/15/28 (Call 06/15/28) |
1,325 | 1,281,092 | ||||||
| 126 | 2 0 2 4 I S H A R E S A N N U A L R E P O R T T O S H A R E H O L D E R S |
| Schedule of Investments (continued) February 29, 2024 |
iShares® Broad USD Investment Grade Corporate Bond ETF (Percentages shown are based on Net Assets) |
| Security | Par (000) |
Value | ||||||
| Software (continued) | ||||||||
| Salesforce Inc. |
||||||||
| 1.50%, 07/15/28 (Call 05/15/28) |
$ | 1,661 | $ | 1,452,457 | ||||
| 1.95%, 07/15/31 (Call 04/15/31) |
1,815 | 1,486,342 | ||||||
| 2.70%, 07/15/41 (Call 01/15/41) |
1,753 | 1,251,474 | ||||||
| 2.90%, 07/15/51 (Call 01/15/51)(a) |
2,668 | 1,773,089 | ||||||
| 3.05%, 07/15/61 (Call 01/15/61) |
1,605 | 1,031,823 | ||||||
| 3.70%, 04/11/28 (Call 01/11/28) |
2,232 | 2,151,783 | ||||||
| ServiceNow Inc., 1.40%, 09/01/30 |
||||||||
| (Call 06/01/30) |
2,253 | 1,807,437 | ||||||
| Take-Two Interactive Software Inc. |
||||||||
| 3.55%, 04/14/25 |
835 | 817,881 | ||||||
| 3.70%, 04/14/27 (Call 03/14/27) |
1,025 | 980,120 | ||||||
| 4.00%, 04/14/32 (Call 01/14/32)(a) |
975 | 896,404 | ||||||
| 4.95%, 03/28/28 (Call 02/28/28) |
1,275 | 1,264,817 | ||||||
| 5.00%, 03/28/26(a) |
1,260 | 1,253,122 | ||||||
| VMware LLC |
||||||||
| 1.40%, 08/15/26 (Call 07/15/26) |
1,930 | 1,754,426 | ||||||
| 1.80%, 08/15/28 (Call 06/15/28)(a) |
1,113 | 964,871 | ||||||
| 2.20%, 08/15/31 (Call 05/15/31)(a) |
2,310 | 1,863,334 | ||||||
| 3.90%, 08/21/27 (Call 05/21/27) |
1,751 | 1,669,122 | ||||||
| 4.50%, 05/15/25 (Call 04/15/25) |
1,039 | 1,027,758 | ||||||
| 4.65%, 05/15/27 (Call 03/15/27)(a) |
1,018 | 996,458 | ||||||
| 4.70%, 05/15/30 (Call 02/15/30) |
1,215 | 1,169,051 | ||||||
| Workday Inc. |
||||||||
| 3.50%, 04/01/27 (Call 03/01/27) |
1,847 | 1,759,954 | ||||||
| 3.70%, 04/01/29 (Call 02/01/29) |
1,115 | 1,042,603 | ||||||
| 3.80%, 04/01/32 (Call 01/01/32) |
1,930 | 1,744,514 | ||||||
|
|
|
|||||||
| 231,973,914 | ||||||||
| Telecommunications — 4.0% | ||||||||
| America Movil SAB de CV |
||||||||
| 2.88%, 05/07/30 (Call 02/07/30)(a) |
1,240 | 1,088,202 | ||||||
| 3.63%, 04/22/29 (Call 01/22/29) |
1,275 | 1,186,675 | ||||||
| 4.38%, 07/16/42 |
1,995 | 1,727,443 | ||||||
| 4.38%, 04/22/49 (Call 10/22/48)(a) |
1,497 | 1,285,335 | ||||||
| 4.70%, 07/21/32 (Call 04/21/32) |
1,125 | 1,081,638 | ||||||
| 6.13%, 11/15/37(a) |
560 | 588,292 | ||||||
| 6.13%, 03/30/40 |
2,340 | 2,461,283 | ||||||
| 6.38%, 03/01/35 |
1,395 | 1,509,978 | ||||||
| AT&T Inc. |
||||||||
| 1.65%, 02/01/28 (Call 12/01/27) |
2,773 | 2,439,968 | ||||||
| 1.70%, 03/25/26 (Call 03/11/24) |
4,074 | 3,788,766 | ||||||
| 2.25%, 02/01/32 (Call 11/01/31) |
3,595 | 2,883,077 | ||||||
| 2.30%, 06/01/27 (Call 04/01/27) |
3,242 | 2,968,601 | ||||||
| 2.55%, 12/01/33 (Call 09/01/33) |
5,004 | 3,946,784 | ||||||
| 2.75%, 06/01/31 (Call 03/01/31) |
3,637 | 3,099,432 | ||||||
| 2.95%, 07/15/26 (Call 04/15/26) |
689 | 654,885 | ||||||
| 3.10%, 02/01/43 (Call 08/01/42)(a) |
1,143 | 822,738 | ||||||
| 3.30%, 02/01/52 (Call 08/01/51) |
1,465 | 991,580 | ||||||
| 3.50%, 06/01/41 (Call 12/01/40)(a) |
3,364 | 2,577,676 | ||||||
| 3.50%, 09/15/53 (Call 03/15/53) |
9,728 | 6,686,418 | ||||||
| 3.50%, 02/01/61 (Call 08/01/60)(a) |
1,015 | 679,925 | ||||||
| 3.55%, 09/15/55 (Call 03/15/55) |
9,840 | 6,703,286 | ||||||
| 3.65%, 06/01/51 (Call 12/01/50) |
3,939 | 2,818,568 | ||||||
| 3.65%, 09/15/59 (Call 03/15/59) |
7,994 | 5,407,179 | ||||||
| 3.80%, 02/15/27 (Call 11/15/26) |
1,403 | 1,353,159 | ||||||
| 3.80%, 12/01/57 (Call 06/01/57) |
7,090 | 4,989,832 | ||||||
| 3.85%, 06/01/60 (Call 12/01/59) |
2,050 | 1,450,310 | ||||||
| 3.88%, 01/15/26 (Call 10/15/25) |
522 | 509,468 | ||||||
| 4.10%, 02/15/28 (Call 11/15/27) |
2,080 | 2,005,751 | ||||||
| 4.25%, 03/01/27 (Call 12/01/26)(a) |
2,062 | 2,010,237 | ||||||
| 4.30%, 02/15/30 (Call 11/15/29) |
4,235 | 4,038,954 | ||||||
| Security | Par (000) |
Value | ||||||
| Telecommunications (continued) | ||||||||
| 4.30%, 12/15/42 (Call 06/15/42) |
$ | 1,893 | $ | 1,602,853 | ||||
| 4.35%, 03/01/29 (Call 12/01/28) |
4,020 | 3,879,433 | ||||||
| 4.35%, 06/15/45 (Call 12/15/44) |
1,630 | 1,363,535 | ||||||
| 4.50%, 05/15/35 (Call 11/15/34) |
3,365 | 3,098,580 | ||||||
| 4.50%, 03/09/48 (Call 09/09/47) |
2,405 | 2,011,711 | ||||||
| 4.55%, 03/09/49 (Call 09/09/48) |
1,490 | 1,256,260 | ||||||
| 4.65%, 06/01/44 (Call 12/01/43)(a) |
716 | 613,621 | ||||||
| 4.75%, 05/15/46 (Call 11/15/45) |
2,545 | 2,228,937 | ||||||
| 4.80%, 06/15/44 (Call 12/15/43) |
442 | 390,356 | ||||||
| 4.85%, 03/01/39 (Call 09/01/38) |
1,449 | 1,337,366 | ||||||
| 4.85%, 07/15/45 (Call 01/15/45)(a) |
395 | 346,458 | ||||||
| 4.90%, 08/15/37 (Call 02/14/37) |
1,081 | 1,014,079 | ||||||
| 5.15%, 03/15/42(a) |
416 | 394,596 | ||||||
| 5.15%, 11/15/46 (Call 05/15/46)(a) |
1,040 | 959,155 | ||||||
| 5.15%, 02/15/50 (Call 08/14/49) |
888 | 808,944 | ||||||
| 5.25%, 03/01/37 (Call 09/01/36) |
1,380 | 1,343,499 | ||||||
| 5.35%, 09/01/40(a) |
991 | 953,852 | ||||||
| 5.40%, 02/15/34 (Call 11/15/33) |
3,549 | 3,553,688 | ||||||
| 5.45%, 03/01/47 (Call 09/01/46)(a) |
868 | 845,055 | ||||||
| 5.54%, 02/20/26 (Call 03/11/24) |
590 | 589,714 | ||||||
| 5.55%, 08/15/41(a) |
513 | 502,577 | ||||||
| 5.65%, 02/15/47 (Call 08/15/46)(a) |
850 | 852,811 | ||||||
| 5.70%, 03/01/57 (Call 09/01/56)(a) |
425 | 411,175 | ||||||
| 6.00%, 08/15/40 (Call 05/15/40)(a) |
718 | 737,223 | ||||||
| 6.15%, 09/15/34 |
35 | 36,406 | ||||||
| 6.25%, 03/29/41(a) |
130 | 134,026 | ||||||
| 6.30%, 01/15/38(a) |
690 | 726,299 | ||||||
| 6.38%, 03/01/41 |
523 | 549,320 | ||||||
| 6.55%, 02/15/39(a) |
547 | 583,125 | ||||||
| Bell Telephone Co. of Canada or Bell Canada |
||||||||
| 3.65%, 08/15/52 (Call 02/15/52) |
1,125 | 827,689 | ||||||
| 4.30%, 07/29/49 (Call 01/29/49) |
792 | 652,356 | ||||||
| 4.46%, 04/01/48 (Call 10/01/47) |
1,513 | 1,286,154 | ||||||
| 5.10%, 05/11/33 (Call 02/11/33)(a) |
1,110 | 1,095,951 | ||||||
| 5.20%, 02/15/34 (Call 11/15/33) |
675 | 666,023 | ||||||
| 5.55%, 02/15/54 (Call 08/15/53) |
675 | 663,912 | ||||||
| Series US-4, 3.65%, 03/17/51 |
||||||||
| (Call 09/17/50)(a) |
661 | 486,904 | ||||||
| Series US-5, 2.15%, 02/15/32 |
||||||||
| (Call 11/15/31) |
1,000 | 800,762 | ||||||
| Series US-6, 3.20%, 02/15/52 |
||||||||
| (Call 08/15/51) |
870 | 586,347 | ||||||
| Bharti Airtel Ltd. |
||||||||
| 3.25%, 06/03/31 (Call 03/05/31)(b) |
210 | 183,925 | ||||||
| 4.38%, 06/10/25(b) |
675 | 663,089 | ||||||
| British Telecommunications PLC |
||||||||
| 3.25%, 11/08/29 (Call 08/08/29)(a)(b) |
1,557 | 1,400,031 | ||||||
| 4.25%, 11/08/49 (Call 05/08/49)(a)(b) |
790 | 635,589 | ||||||
| 5.13%, 12/04/28 (Call 09/04/28)(a) |
1,500 | 1,508,036 | ||||||
| 9.63%, 12/15/30 |
3,569 | 4,368,503 | ||||||
| Cisco Systems Inc. |
||||||||
| 2.50%, 09/20/26 (Call 06/20/26) |
1,957 | 1,846,757 | ||||||
| 2.95%, 02/28/26 |
1,533 | 1,477,959 | ||||||
| 3.50%, 06/15/25 |
537 | 526,966 | ||||||
| 4.80%, 02/26/27 (Call 01/26/27) |
1,800 | 1,801,498 | ||||||
| 4.85%, 02/26/29 (Call 01/26/29)(a) |
1,920 | 1,922,965 | ||||||
| 4.90%, 02/26/26 |
1,135 | 1,135,189 | ||||||
| 4.95%, 02/26/31 (Call 12/26/30) |
1,340 | 1,340,664 | ||||||
| 5.05%, 02/26/34 (Call 11/26/33) |
1,305 | 1,313,615 | ||||||
| 5.30%, 02/26/54 (Call 08/26/53) |
990 | 1,002,032 | ||||||
| 5.35%, 02/26/64 (Call 08/26/63) |
1,070 | 1,076,868 | ||||||
| S C H E D U L E O F I N V E S T M E N T S |
127 |
| Schedule of Investments (continued) February 29, 2024 |
iShares® Broad USD Investment Grade Corporate Bond ETF (Percentages shown are based on Net Assets) |
| Security | Par (000) |
Value | ||||||
| Telecommunications (continued) | ||||||||
| 5.50%, 01/15/40 |
$ | 2,710 | $ | 2,800,092 | ||||
| 5.90%, 02/15/39 |
2,851 | 3,059,754 | ||||||
| Corning Inc. |
||||||||
| 3.90%, 11/15/49 (Call 05/15/49)(a) |
446 | 343,913 | ||||||
| 4.38%, 11/15/57 (Call 05/15/57) |
970 | 798,519 | ||||||
| 4.70%, 03/15/37(a) |
655 | 601,114 | ||||||
| 4.75%, 03/15/42 |
545 | 485,490 | ||||||
| 5.35%, 11/15/48 (Call 05/15/48) |
826 | 793,518 | ||||||
| 5.45%, 11/15/79 (Call 05/19/79) |
1,201 | 1,112,842 | ||||||
| 5.75%, 08/15/40(a) |
636 | 635,909 | ||||||
| 5.85%, 11/15/68 (Call 05/15/68) |
428 | 417,010 | ||||||
| 7.25%, 08/15/36 (Call 08/15/26)(a) |
742 | 766,791 | ||||||
| Deutsche Telekom AG, 3.63%, 01/21/50 |
||||||||
| (Call 07/21/49)(b) |
1,152 | 860,759 | ||||||
| Deutsche Telekom International Finance BV |
||||||||
| 3.60%, 01/19/27 (Call 10/19/26)(b) |
858 | 829,861 | ||||||
| 4.38%, 06/21/28 (Call 03/21/28)(a)(b) |
1,160 | 1,129,254 | ||||||
| 4.75%, 06/21/38 (Call 12/21/37)(b) |
926 | 866,710 | ||||||
| 4.88%, 03/06/42(a)(b) |
1,113 | 1,025,959 | ||||||
| 8.75%, 06/15/30 |
4,759 | 5,615,372 | ||||||
| 9.25%, 06/01/32 |
761 | 960,522 | ||||||
| Empresa Nacional de Telecomunicaciones SA |
||||||||
| 3.05%, 09/14/32 (Call 06/14/32)(b) |
465 | 366,769 | ||||||
| 4.75%, 08/01/26 (Call 05/03/26)(a)(b) |
833 | 811,188 | ||||||
| Juniper Networks Inc. |
||||||||
| 1.20%, 12/10/25 (Call 11/10/25)(a) |
671 | 621,552 | ||||||
| 2.00%, 12/10/30 (Call 09/10/30)(a) |
798 | 642,920 | ||||||
| 3.75%, 08/15/29 (Call 05/15/29)(a) |
1,009 | 935,095 | ||||||
| 5.95%, 03/15/41 |
431 | 427,110 | ||||||
| Koninklijke KPN NV, 8.38%, 10/01/30 |
1,178 | 1,371,017 | ||||||
| KT Corp., 2.50%, 07/18/26(b) |
200 | 187,367 | ||||||
| Motorola Solutions Inc. |
||||||||
| 2.30%, 11/15/30 (Call 08/15/30) |
1,349 | 1,111,897 | ||||||
| 2.75%, 05/24/31 (Call 02/24/31) |
1,255 | 1,047,882 | ||||||
| 4.60%, 02/23/28 (Call 11/23/27)(a) |
1,482 | 1,455,066 | ||||||
| 4.60%, 05/23/29 (Call 02/23/29)(a) |
1,269 | 1,233,059 | ||||||
| 5.50%, 09/01/44 |
604 | 575,137 | ||||||
| 5.60%, 06/01/32 (Call 03/01/32) |
925 | 927,352 | ||||||
| 7.50%, 05/15/25 |
98 | 100,047 | ||||||
| NBN Co. Ltd. |
||||||||
| 1.45%, 05/05/26 (Call 04/05/26)(a)(b) |
1,911 | 1,761,486 | ||||||
| 1.63%, 01/08/27 (Call 12/08/26)(b) |
1,844 | 1,674,039 | ||||||
| 2.50%, 01/08/32 (Call 10/08/31)(b) |
1,345 | 1,108,202 | ||||||
| 2.63%, 05/05/31 (Call 02/05/31)(b) |
2,124 | 1,797,494 | ||||||
| 5.75%, 10/06/28 (Call 09/06/28)(a)(b) |
1,565 | 1,611,073 | ||||||
| 6.00%, 10/06/33 (Call 07/06/33)(a)(b) |
950 | 1,009,757 | ||||||
| Nokia OYJ |
||||||||
| 4.38%, 06/12/27(a) |
535 | 512,706 | ||||||
| 6.63%, 05/15/39 |
690 | 665,828 | ||||||
| NTT Finance Corp. |
||||||||
| 1.16%, 04/03/26 (Call 03/03/26)(b) |
3,824 | 3,522,663 | ||||||
| 1.59%, 04/03/28 (Call 02/03/28)(b) |
1,975 | 1,732,183 | ||||||
| 2.07%, 04/03/31 (Call 01/03/31)(b) |
1,457 | 1,198,100 | ||||||
| 4.24%, 07/25/25(a)(b) |
550 | 542,028 | ||||||
| 4.37%, 07/27/27 (Call 06/27/27)(b) |
1,015 | 995,087 | ||||||
| Ooredoo International Finance Ltd. |
||||||||
| 2.63%, 04/08/31(a)(b) |
945 | 809,449 | ||||||
| 3.75%, 06/22/26(b) |
1,713 | 1,660,623 | ||||||
| 3.88%, 01/31/28(a)(b) |
488 | 470,839 | ||||||
| 4.50%, 01/31/43(b) |
775 | 712,806 | ||||||
| Security | Par (000) |
Value | ||||||
| Telecommunications (continued) | ||||||||
| Orange SA |
||||||||
| 5.38%, 01/13/42(a) |
$ | 1,611 | $ | 1,585,207 | ||||
| 5.50%, 02/06/44 (Call 08/06/43) |
385 | 383,734 | ||||||
| 9.00%, 03/01/31 |
3,248 | 3,926,142 | ||||||
| Rogers Communications Inc. |
||||||||
| 2.90%, 11/15/26 (Call 08/15/26) |
1,267 | 1,192,592 | ||||||
| 2.95%, 03/15/25 |
1,120 | 1,090,166 | ||||||
| 3.20%, 03/15/27 (Call 02/15/27) |
2,081 | 1,959,416 | ||||||
| 3.63%, 12/15/25 (Call 09/15/25) |
1,019 | 987,622 | ||||||
| 3.70%, 11/15/49 (Call 05/15/49) |
1,378 | 995,560 | ||||||
| 3.80%, 03/15/32 (Call 12/15/31) |
2,606 | 2,315,996 | ||||||
| 4.30%, 02/15/48 (Call 08/15/47) |
992 | 793,244 | ||||||
| 4.35%, 05/01/49 (Call 11/01/48)(a) |
1,608 | 1,295,559 | ||||||
| 4.50%, 03/15/42 (Call 09/15/41) |
773 | 663,670 | ||||||
| 4.50%, 03/15/43 (Call 09/15/42) |
603 | 509,774 | ||||||
| 4.55%, 03/15/52 (Call 09/15/51) |
2,615 | 2,158,041 | ||||||
| 5.00%, 02/15/29 (Call 01/15/29) |
473 | 468,788 | ||||||
| 5.00%, 03/15/44 (Call 09/15/43) |
1,453 | 1,314,346 | ||||||
| 5.30%, 02/15/34 (Call 11/15/33) |
325 | 318,981 | ||||||
| 5.45%, 10/01/43 (Call 04/01/43) |
911 | 870,961 | ||||||
| 7.50%, 08/15/38(a) |
655 | 755,200 | ||||||
| Saudi Telecom Co., 3.89%, 05/13/29(a)(b) |
1,092 | 1,035,853 | ||||||
| SES Global Americas Holdings Inc., 5.30%, |
||||||||
| 03/25/44(b) |
654 | 501,383 | ||||||
| SES SA, 5.30%, 04/04/43(a)(b) |
610 | 440,665 | ||||||
| Sprint Capital Corp. |
||||||||
| 6.88%, 11/15/28 |
1,895 | 2,015,734 | ||||||
| 8.75%, 03/15/32 |
2,240 | 2,705,300 | ||||||
| Sprint LLC, 7.63%, 03/01/26 (Call 11/01/25) |
999 | 1,032,209 | ||||||
| Telefonica Emisiones SA |
||||||||
| 4.10%, 03/08/27 |
1,678 | 1,625,236 | ||||||
| 4.67%, 03/06/38(a) |
625 | 557,263 | ||||||
| 4.90%, 03/06/48 |
1,726 | 1,482,860 | ||||||
| 5.21%, 03/08/47 |
3,272 | 2,942,966 | ||||||
| 5.52%, 03/01/49 (Call 09/01/48) |
1,613 | 1,507,482 | ||||||
| 7.05%, 06/20/36(a) |
2,507 | 2,760,919 | ||||||
| Telefonica Europe BV, 8.25%, 09/15/30 |
1,855 | 2,108,845 | ||||||
| Telefonica Moviles Chile SA, 3.54%, 11/18/31 |
||||||||
| (Call 08/18/31)(b) |
400 | 297,201 | ||||||
| Telstra Corp. Ltd., 3.13%, 04/07/25 |
||||||||
| (Call 01/07/25)(b) |
1,044 | 1,018,739 | ||||||
| TELUS Corp. |
||||||||
| 2.80%, 02/16/27 (Call 11/16/26) |
1,277 | 1,196,122 | ||||||
| 3.40%, 05/13/32 (Call 02/13/32) |
1,246 | 1,081,451 | ||||||
| 3.70%, 09/15/27 (Call 06/15/27) |
1,177 | 1,117,648 | ||||||
| 4.30%, 06/15/49 (Call 12/15/48)(a) |
765 | 623,114 | ||||||
| 4.60%, 11/16/48 (Call 05/16/48) |
1,049 | 896,952 | ||||||
| T-Mobile USA Inc. |
||||||||
| 1.50%, 02/15/26 (Call 01/15/26) |
1,592 | 1,478,875 | ||||||
| 2.05%, 02/15/28 (Call 12/15/27)(a) |
2,419 | 2,155,277 | ||||||
| 2.25%, 02/15/26 (Call 03/11/24) |
2,350 | 2,213,969 | ||||||
| 2.25%, 11/15/31 (Call 08/15/31) |
1,522 | 1,234,852 | ||||||
| 2.40%, 03/15/29 (Call 01/15/29) |
1,150 | 1,012,952 | ||||||
| 2.55%, 02/15/31 (Call 11/15/30) |
2,562 | 2,160,098 | ||||||
| 2.63%, 04/15/26 (Call 03/11/24) |
1,940 | 1,835,921 | ||||||
| 2.63%, 02/15/29 (Call 03/11/24) |
2,063 | 1,829,219 | ||||||
| 2.70%, 03/15/32 (Call 12/15/31) |
1,640 | 1,364,948 | ||||||
| 2.88%, 02/15/31 (Call 02/15/26) |
1,835 | 1,578,259 | ||||||
| 3.00%, 02/15/41 (Call 08/15/40) |
3,486 | 2,517,834 | ||||||
| 3.30%, 02/15/51 (Call 08/15/50) |
4,062 | 2,792,602 | ||||||
| 3.38%, 04/15/29 (Call 04/15/24) |
2,891 | 2,650,533 | ||||||
| 128 | 2 0 2 4 I S H A R E S A N N U A L R E P O R T T O S H A R E H O L D E R S |
| Schedule of Investments (continued) February 29, 2024 |
iShares® Broad USD Investment Grade Corporate Bond ETF (Percentages shown are based on Net Assets) |
| Security | Par (000) |
Value | ||||||
| Telecommunications (continued) | ||||||||
| 3.40%, 10/15/52 (Call 04/15/52) |
$ | 3,760 | $ | 2,611,714 | ||||
| 3.50%, 04/15/25 (Call 03/15/25) |
2,839 | 2,775,397 | ||||||
| 3.50%, 04/15/31 (Call 04/15/26) |
3,815 | 3,404,101 | ||||||
| 3.60%, 11/15/60 (Call 05/15/60) |
2,316 | 1,601,966 | ||||||
| 3.75%, 04/15/27 (Call 02/15/27) |
5,234 | 5,017,085 | ||||||
| 3.88%, 04/15/30 (Call 01/15/30) |
8,692 | 8,068,053 | ||||||
| 4.38%, 04/15/40 (Call 10/15/39) |
2,691 | 2,359,069 | ||||||
| 4.50%, 04/15/50 (Call 10/15/49) |
3,979 | 3,367,075 | ||||||
| 4.75%, 02/01/28 (Call 03/11/24) |
1,905 | 1,871,513 | ||||||
| 4.80%, 07/15/28 (Call 06/15/28) |
1,285 | 1,268,451 | ||||||
| 4.85%, 01/15/29 (Call 12/15/28) |
1,650 | 1,628,493 | ||||||
| 4.95%, 03/15/28 (Call 02/15/28) |
1,570 | 1,560,881 | ||||||
| 5.05%, 07/15/33 (Call 04/15/33) |
2,895 | 2,831,470 | ||||||
| 5.15%, 04/15/34 (Call 01/15/34) |
810 | 797,589 | ||||||
| 5.20%, 01/15/33 (Call 10/15/32) |
1,100 | 1,093,459 | ||||||
| 5.38%, 04/15/27 (Call 03/11/24) |
104 | 103,787 | ||||||
| 5.50%, 01/15/55 (Call 07/15/54) |
580 | 564,886 | ||||||
| 5.65%, 01/15/53 (Call 07/15/52) |
2,396 | 2,382,931 | ||||||
| 5.75%, 01/15/34 (Call 10/15/33) |
1,450 | 1,492,508 | ||||||
| 5.75%, 01/15/54 (Call 07/15/53) |
1,732 | 1,754,003 | ||||||
| 5.80%, 09/15/62 (Call 03/15/62) |
995 | 1,011,764 | ||||||
| 6.00%, 06/15/54 (Call 12/15/53)(a) |
945 | 989,711 | ||||||
| Verizon Communications Inc. |
||||||||
| 0.85%, 11/20/25 (Call 10/20/25) |
1,892 | 1,756,336 | ||||||
| 1.45%, 03/20/26 (Call 02/20/26) |
3,097 | 2,871,564 | ||||||
| 1.50%, 09/18/30 (Call 06/18/30) |
2,220 | 1,782,178 | ||||||
| 1.68%, 10/30/30 (Call 07/30/30) |
1,658 | 1,336,636 | ||||||
| 1.75%, 01/20/31 (Call 10/20/30) |
3,052 | 2,447,718 | ||||||
| 2.10%, 03/22/28 (Call 01/22/28)(a) |
3,785 | 3,370,130 | ||||||
| 2.36%, 03/15/32 (Call 12/15/31) |
5,765 | 4,674,196 | ||||||
| 2.55%, 03/21/31 (Call 12/21/30) |
4,458 | 3,757,320 | ||||||
| 2.63%, 08/15/26 |
2,442 | 2,302,319 | ||||||
| 2.65%, 11/20/40 (Call 05/20/40) |
3,867 | 2,666,128 | ||||||
| 2.85%, 09/03/41 (Call 03/03/41) |
1,480 | 1,044,580 | ||||||
| 2.88%, 11/20/50 (Call 05/20/50)(a) |
3,443 | 2,193,370 | ||||||
| 2.99%, 10/30/56 (Call 04/30/56) |
4,896 | 3,041,964 | ||||||
| 3.00%, 03/22/27 (Call 01/22/27) |
1,396 | 1,313,998 | ||||||
| 3.00%, 11/20/60 (Call 05/20/60)(a) |
2,805 | 1,706,483 | ||||||
| 3.15%, 03/22/30 (Call 12/22/29)(a) |
1,248 | 1,115,959 | ||||||
| 3.40%, 03/22/41 (Call 09/22/40) |
4,443 | 3,404,072 | ||||||
| 3.55%, 03/22/51 (Call 09/22/50)(a) |
5,570 | 4,044,965 | ||||||
| 3.70%, 03/22/61 (Call 09/22/60)(a) |
3,882 | 2,742,987 | ||||||
| 3.85%, 11/01/42 (Call 05/01/42) |
1,139 | 915,041 | ||||||
| 3.88%, 02/08/29 (Call 11/08/28)(a) |
2,353 | 2,234,082 | ||||||
| 3.88%, 03/01/52 (Call 09/01/51) |
1,559 | 1,204,019 | ||||||
| 4.00%, 03/22/50 (Call 09/22/49) |
1,650 | 1,302,834 | ||||||
| 4.02%, 12/03/29 (Call 09/03/29)(a) |
4,845 | 4,590,983 | ||||||
| 4.13%, 03/16/27 |
3,925 | 3,816,291 | ||||||
| 4.13%, 08/15/46 |
1,377 | 1,132,598 | ||||||
| 4.27%, 01/15/36 |
530 | 481,356 | ||||||
| 4.33%, 09/21/28 |
5,943 | 5,768,143 | ||||||
| 4.40%, 11/01/34 (Call 05/01/34) |
2,640 | 2,455,534 | ||||||
| 4.50%, 08/10/33 |
3,042 | 2,870,749 | ||||||
| 4.52%, 09/15/48 |
1,520 | 1,330,010 | ||||||
| 4.67%, 03/15/55 |
770 | 680,447 | ||||||
| 4.75%, 11/01/41 |
965 | 888,307 | ||||||
| 4.81%, 03/15/39(a) |
1,555 | 1,453,692 | ||||||
| 4.86%, 08/21/46(a) |
3,100 | 2,841,286 | ||||||
| 5.01%, 04/15/49(a) |
620 | 598,923 | ||||||
| 5.01%, 08/21/54 |
565 | 524,518 | ||||||
| 5.05%, 05/09/33 (Call 02/09/33)(a) |
1,230 | 1,218,045 | ||||||
| Security | Par (000) |
Value | ||||||
| Telecommunications (continued) | ||||||||
| 5.25%, 03/16/37 |
$ | 1,578 | $ | 1,575,586 | ||||
| 5.50%, 03/16/47(a) |
585 | 587,067 | ||||||
| 5.50%, 02/23/54 (Call 08/23/53) |
375 | 370,481 | ||||||
| 5.85%, 09/15/35 |
565 | 591,288 | ||||||
| 6.40%, 09/15/33 |
350 | 376,472 | ||||||
| 6.55%, 09/15/43 |
1,120 | 1,250,197 | ||||||
| 7.75%, 12/01/30 |
1,340 | 1,531,447 | ||||||
| Vodafone Group PLC |
||||||||
| 4.13%, 05/30/25 |
1,829 | 1,799,597 | ||||||
| 4.25%, 09/17/50 |
2,327 | 1,831,133 | ||||||
| 4.38%, 05/30/28(a) |
1,215 | 1,194,177 | ||||||
| 4.38%, 02/19/43 |
1,880 | 1,582,501 | ||||||
| 4.88%, 06/19/49 |
2,622 | 2,270,267 | ||||||
| 5.00%, 05/30/38(a) |
442 | 425,726 | ||||||
| 5.13%, 06/19/59(a) |
389 | 342,169 | ||||||
| 5.25%, 05/30/48 |
371 | 346,025 | ||||||
| 5.63%, 02/10/53 (Call 08/10/52) |
1,260 | 1,219,284 | ||||||
| 5.75%, 02/10/63 (Call 08/10/62) |
390 | 381,494 | ||||||
| 6.15%, 02/27/37 |
2,199 | 2,293,559 | ||||||
| 6.25%, 11/30/32 |
1,121 | 1,189,561 | ||||||
| 7.88%, 02/15/30 |
1,263 | 1,432,956 | ||||||
| Xiaomi Best Time International Ltd. |
||||||||
| 2.88%, 07/14/31 (Call 04/14/31)(a)(b) |
610 | 502,054 | ||||||
| 3.38%, 04/29/30 (Call 01/29/30)(b) |
115 | 100,351 | ||||||
| 4.10%, 07/14/51 (Call 01/14/51)(b) |
275 | 194,282 | ||||||
|
|
|
|||||||
| 424,032,709 | ||||||||
| Toys, Games & Hobbies — 0.1% | ||||||||
| Hasbro Inc. |
||||||||
| 3.50%, 09/15/27 (Call 06/15/27) |
902 | 846,721 | ||||||
| 3.55%, 11/19/26 (Call 09/19/26) |
1,098 | 1,042,484 | ||||||
| 3.90%, 11/19/29 (Call 08/19/29) |
1,460 | 1,338,009 | ||||||
| 5.10%, 05/15/44 (Call 11/15/43) |
557 | 467,414 | ||||||
| 6.35%, 03/15/40(a) |
664 | 670,637 | ||||||
| Mattel Inc. |
||||||||
| 3.38%, 04/01/26 (Call 03/11/24)(b) |
290 | 275,221 | ||||||
| 3.75%, 04/01/29 (Call 04/01/24)(a)(b) |
992 | 905,983 | ||||||
| 5.45%, 11/01/41 (Call 05/01/41) |
480 | 433,506 | ||||||
| 5.88%, 12/15/27 (Call 04/01/24)(b) |
1,372 | 1,372,871 | ||||||
| 6.20%, 10/01/40(a) |
385 | 378,535 | ||||||
|
|
|
|||||||
| 7,731,381 | ||||||||
| Transportation — 1.8% | ||||||||
| AP Moller - Maersk A/S |
||||||||
| 4.50%, 06/20/29 (Call 03/20/29)(a)(b) |
1,440 | 1,408,854 | ||||||
| 5.88%, 09/14/33 (Call 06/14/33)(b) |
1,195 | 1,203,637 | ||||||
| Burlington Northern Santa Fe LLC |
||||||||
| 2.88%, 06/15/52 (Call 12/15/51) |
715 | 465,406 | ||||||
| 3.00%, 04/01/25 (Call 01/01/25) |
884 | 864,000 | ||||||
| 3.05%, 02/15/51 (Call 08/15/50) |
1,016 | 693,815 | ||||||
| 3.25%, 06/15/27 (Call 03/15/27) |
993 | 947,482 | ||||||
| 3.30%, 09/15/51 (Call 03/15/51)(a) |
1,187 | 849,868 | ||||||
| 3.55%, 02/15/50 (Call 08/15/49) |
1,009 | 761,139 | ||||||
| 3.65%, 09/01/25 (Call 06/01/25) |
373 | 365,233 | ||||||
| 3.90%, 08/01/46 (Call 02/01/46) |
949 | 766,818 | ||||||
| 4.05%, 06/15/48 (Call 12/15/47) |
981 | 811,903 | ||||||
| 4.13%, 06/15/47 (Call 12/15/46) |
1,120 | 933,676 | ||||||
| 4.15%, 04/01/45 (Call 10/01/44) |
457 | 386,116 | ||||||
| 4.15%, 12/15/48 (Call 06/15/48) |
1,034 | 865,640 | ||||||
| 4.38%, 09/01/42 (Call 03/01/42) |
887 | 786,661 | ||||||
| 4.40%, 03/15/42 (Call 09/15/41) |
1,075 | 956,606 | ||||||
| 4.45%, 03/15/43 (Call 09/15/42) |
1,207 | 1,074,797 | ||||||
| S C H E D U L E O F I N V E S T M E N T S |
129 |
| Schedule of Investments (continued) February 29, 2024 |
iShares® Broad USD Investment Grade Corporate Bond ETF (Percentages shown are based on Net Assets) |
| Security | Par (000) |
Value | ||||||
| Transportation (continued) | ||||||||
| 4.45%, 01/15/53 (Call 07/15/52) |
$ | 1,300 | $ | 1,143,175 | ||||
| 4.55%, 09/01/44 (Call 03/01/44) |
1,080 | 966,610 | ||||||
| 4.70%, 09/01/45 (Call 03/01/45)(a) |
807 | 740,704 | ||||||
| 4.90%, 04/01/44 (Call 10/01/43) |
1,097 | 1,039,068 | ||||||
| 4.95%, 09/15/41 (Call 03/15/41) |
690 | 659,176 | ||||||
| 5.05%, 03/01/41 (Call 09/01/40) |
580 | 564,404 | ||||||
| 5.15%, 09/01/43 (Call 03/01/43) |
910 | 889,841 | ||||||
| 5.20%, 04/15/54 (Call 10/15/53) |
1,780 | 1,745,995 | ||||||
| 5.40%, 06/01/41 (Call 12/01/40) |
902 | 907,259 | ||||||
| 5.75%, 05/01/40 (Call 11/01/39) |
1,160 | 1,213,824 | ||||||
| 6.15%, 05/01/37 |
937 | 1,022,993 | ||||||
| 6.20%, 08/15/36 |
499 | 543,349 | ||||||
| 7.00%, 12/15/25 |
509 | 526,032 | ||||||
| 7.95%, 08/15/30 |
200 | 232,281 | ||||||
| Canadian National Railway Co. |
||||||||
| 2.45%, 05/01/50 (Call 11/01/49) |
1,342 | 835,337 | ||||||
| 2.75%, 03/01/26 (Call 12/01/25) |
1,390 | 1,333,648 | ||||||
| 3.20%, 08/02/46 (Call 02/02/46) |
1,450 | 1,074,241 | ||||||
| 3.50%, 11/15/42 (Call 05/15/42) |
160 | 121,853 | ||||||
| 3.65%, 02/03/48 (Call 08/03/47) |
534 | 423,236 | ||||||
| 3.85%, 08/05/32 (Call 05/05/32) |
1,192 | 1,096,255 | ||||||
| 4.40%, 08/05/52 (Call 02/05/52) |
765 | 675,577 | ||||||
| 4.45%, 01/20/49 (Call 07/20/48) |
596 | 533,920 | ||||||
| 4.50%, 11/07/43 (Call 05/07/43) |
320 | 281,253 | ||||||
| 5.85%, 11/01/33 (Call 08/01/33) |
240 | 254,927 | ||||||
| 6.13%, 11/01/53 (Call 05/01/53) |
120 | 136,207 | ||||||
| 6.20%, 06/01/36 |
330 | 358,743 | ||||||
| 6.25%, 08/01/34 |
876 | 954,047 | ||||||
| 6.38%, 11/15/37(a) |
715 | 781,726 | ||||||
| 6.71%, 07/15/36(a) |
10 | 11,076 | ||||||
| 6.90%, 07/15/28(a) |
665 | 717,219 | ||||||
| Canadian Pacific Railway Co. |
||||||||
| 1.75%, 12/02/26 (Call 11/02/26) |
1,655 | 1,517,724 | ||||||
| 2.05%, 03/05/30 (Call 12/05/29) |
1,077 | 908,049 | ||||||
| 2.45%, 12/02/31 (Call 09/02/31) |
880 | 782,575 | ||||||
| 2.88%, 11/15/29 (Call 08/15/29) |
552 | 490,646 | ||||||
| 3.00%, 12/02/41 (Call 06/02/41) |
1,115 | 947,086 | ||||||
| 3.10%, 12/02/51 (Call 06/02/51)(a) |
2,455 | 1,668,335 | ||||||
| 3.50%, 05/01/50 (Call 11/01/49) |
954 | 699,277 | ||||||
| 3.70%, 02/01/26 (Call 11/01/25) |
773 | 750,234 | ||||||
| 4.00%, 06/01/28 (Call 03/01/28)(a) |
704 | 677,916 | ||||||
| 4.20%, 11/15/69 (Call 05/15/69) |
631 | 493,480 | ||||||
| 4.30%, 05/15/43 (Call 11/15/42) |
649 | 552,127 | ||||||
| 4.70%, 05/01/48 (Call 11/01/47) |
571 | 502,397 | ||||||
| 4.80%, 09/15/35 (Call 03/15/35)(a) |
760 | 726,616 | ||||||
| 4.80%, 08/01/45 (Call 02/01/45) |
768 | 695,562 | ||||||
| 4.95%, 08/15/45 (Call 02/15/45) |
654 | 599,900 | ||||||
| 5.75%, 03/15/33(a) |
665 | 682,717 | ||||||
| 5.75%, 01/15/42 |
627 | 617,775 | ||||||
| 5.95%, 05/15/37(a) |
882 | 911,375 | ||||||
| 6.13%, 09/15/2115 (Call 03/15/2115) |
586 | 618,724 | ||||||
| 7.13%, 10/15/31(a) |
570 | 636,732 | ||||||
| Central Japan Railway Co., 4.25%, 11/24/45 |
||||||||
| (Call 05/24/45)(b) |
165 | 140,484 | ||||||
| CH Robinson Worldwide Inc., 4.20%, 04/15/28 |
||||||||
| (Call 01/15/28) |
1,128 | 1,088,275 | ||||||
| CSX Corp. |
||||||||
| 2.40%, 02/15/30 (Call 11/15/29) |
1,171 | 1,017,339 | ||||||
| 2.50%, 05/15/51 (Call 11/15/50) |
424 | 258,301 | ||||||
| 2.60%, 11/01/26 (Call 08/01/26) |
1,710 | 1,613,807 | ||||||
| 3.25%, 06/01/27 (Call 03/01/27) |
1,572 | 1,492,301 | ||||||
| Security | Par (000) |
Value | ||||||
| Transportation (continued) | ||||||||
| 3.35%, 11/01/25 (Call 08/01/25) |
$ | 1,065 | $ | 1,033,837 | ||||
| 3.35%, 09/15/49 (Call 03/15/49) |
1,030 | 739,266 | ||||||
| 3.80%, 03/01/28 (Call 12/01/27) |
740 | 712,154 | ||||||
| 3.80%, 11/01/46 (Call 05/01/46) |
1,126 | 887,350 | ||||||
| 3.80%, 04/15/50 (Call 10/15/49) |
736 | 570,525 | ||||||
| 3.95%, 05/01/50 (Call 11/01/49)(a) |
493 | 396,585 | ||||||
| 4.10%, 11/15/32 (Call 08/15/32) |
1,085 | 1,013,740 | ||||||
| 4.10%, 03/15/44 (Call 09/15/43) |
838 | 706,638 | ||||||
| 4.25%, 03/15/29 (Call 12/15/28)(a) |
1,332 | 1,297,784 | ||||||
| 4.25%, 11/01/66 (Call 05/01/66) |
495 | 396,721 | ||||||
| 4.30%, 03/01/48 (Call 09/01/47) |
1,419 | 1,215,778 | ||||||
| 4.40%, 03/01/43 (Call 09/01/42)(a) |
590 | 521,974 | ||||||
| 4.50%, 03/15/49 (Call 09/15/48) |
803 | 701,854 | ||||||
| 4.50%, 11/15/52 (Call 05/15/52)(a) |
812 | 711,774 | ||||||
| 4.50%, 08/01/54 (Call 02/01/54) |
480 | 418,325 | ||||||
| 4.65%, 03/01/68 (Call 09/01/67) |
615 | 529,387 | ||||||
| 4.75%, 05/30/42 (Call 11/30/41) |
980 | 906,079 | ||||||
| 4.75%, 11/15/48 (Call 05/15/48) |
763 | 697,805 | ||||||
| 5.20%, 11/15/33 (Call 08/15/33)(a) |
995 | 1,001,926 | ||||||
| 5.50%, 04/15/41 (Call 10/15/40) |
775 | 781,056 | ||||||
| 6.00%, 10/01/36 |
510 | 543,063 | ||||||
| 6.15%, 05/01/37(a) |
786 | 852,145 | ||||||
| 6.22%, 04/30/40 |
918 | 995,020 | ||||||
| Empresa de los Ferrocarriles del Estado |
||||||||
| 3.07%, 08/18/50 (Call 02/18/50)(b) |
365 | 218,989 | ||||||
| 3.83%, 09/14/61 (Call 03/14/61)(a)(b) |
875 | 577,459 | ||||||
| Empresa de Transporte de Pasajeros Metro SA |
||||||||
| 3.65%, 05/07/30 (Call 02/07/30)(a)(b) |
723 | 657,602 | ||||||
| 3.69%, 09/13/61 (Call 03/13/61)(b) |
615 | 402,366 | ||||||
| 4.70%, 05/07/50 (Call 11/07/49)(b) |
1,394 | 1,121,043 | ||||||
| 5.00%, 01/25/47 (Call 07/25/46)(a)(b) |
437 | 373,075 | ||||||
| ENA Master Trust, 4.00%, 05/19/48 |
||||||||
| (Call 02/19/48)(b) |
155 | 108,423 | ||||||
| FedEx Corp. |
||||||||
| 2.40%, 05/15/31 (Call 02/15/31)(a) |
920 | 768,397 | ||||||
| 3.10%, 08/05/29 (Call 05/05/29)(a) |
1,220 | 1,107,012 | ||||||
| 3.25%, 04/01/26 (Call 01/01/26) |
1,517 | 1,462,505 | ||||||
| 3.25%, 05/15/41 (Call 11/15/40) |
1,100 | 814,418 | ||||||
| 3.40%, 02/15/28 (Call 11/15/27) |
704 | 664,555 | ||||||
| 3.88%, 08/01/42 |
753 | 597,702 | ||||||
| 3.90%, 02/01/35(a) |
988 | 871,927 | ||||||
| 4.05%, 02/15/48 (Call 08/15/47) |
1,323 | 1,041,939 | ||||||
| 4.10%, 04/15/43 |
691 | 563,539 | ||||||
| 4.10%, 02/01/45 |
1,053 | 843,672 | ||||||
| 4.20%, 10/17/28 (Call 07/17/28) |
615 | 592,505 | ||||||
| 4.25%, 05/15/30 (Call 02/15/30) |
920 | 877,528 | ||||||
| 4.40%, 01/15/47 (Call 07/15/46) |
1,114 | 925,376 | ||||||
| 4.50%, 02/01/65(a) |
173 | 134,901 | ||||||
| 4.55%, 04/01/46 (Call 10/01/45) |
1,713 | 1,458,486 | ||||||
| 4.75%, 11/15/45 (Call 05/15/45) |
1,947 | 1,704,956 | ||||||
| 4.90%, 01/15/34(a) |
890 | 866,739 | ||||||
| 4.95%, 10/17/48 (Call 04/17/48) |
958 | 865,090 | ||||||
| 5.10%, 01/15/44 |
1,004 | 930,861 | ||||||
| 5.25%, 05/15/50 (Call 11/15/49)(a) |
1,547 | 1,458,191 | ||||||
| JB Hunt Transport Services Inc., 3.88%, |
||||||||
| 03/01/26 (Call 01/01/26) |
1,098 | 1,072,107 | ||||||
| Kirby Corp., 4.20%, 03/01/28 (Call 12/01/27) |
964 | 921,207 | ||||||
| Misc Capital Two Labuan Ltd., 3.75%, 04/06/27 |
||||||||
| (Call 03/06/27)(a)(b) |
1,025 | 977,101 | ||||||
| Norfolk Southern Corp. |
||||||||
| 2.30%, 05/15/31 (Call 02/15/31) |
657 | 548,361 | ||||||
| 130 | 2 0 2 4 I S H A R E S A N N U A L R E P O R T T O S H A R E H O L D E R S |
| Schedule of Investments (continued) February 29, 2024 |
iShares® Broad USD Investment Grade Corporate Bond ETF (Percentages shown are based on Net Assets) |
| Security | Par (000) |
Value | ||||||
| Transportation (continued) | ||||||||
| 2.55%, 11/01/29 (Call 08/01/29) |
$ | 851 | $ | 748,416 | ||||
| 2.90%, 06/15/26 (Call 03/15/26) |
602 | 573,786 | ||||||
| 2.90%, 08/25/51 (Call 02/25/51) |
790 | 508,278 | ||||||
| 3.00%, 03/15/32 (Call 12/15/31) |
184 | 158,239 | ||||||
| 3.05%, 05/15/50 (Call 11/15/49) |
1,182 | 792,174 | ||||||
| 3.15%, 06/01/27 (Call 03/01/27)(a) |
408 | 386,558 | ||||||
| 3.16%, 05/15/55 (Call 11/15/54) |
919 | 603,653 | ||||||
| 3.40%, 11/01/49 (Call 05/01/49)(a) |
574 | 412,759 | ||||||
| 3.65%, 08/01/25 (Call 06/01/25)(a) |
535 | 522,751 | ||||||
| 3.70%, 03/15/53 (Call 09/15/52) |
551 | 409,734 | ||||||
| 3.80%, 08/01/28 (Call 05/01/28) |
550 | 526,627 | ||||||
| 3.94%, 11/01/47 (Call 05/01/47) |
1,068 | 845,930 | ||||||
| 3.95%, 10/01/42 (Call 04/01/42)(a) |
756 | 620,080 | ||||||
| 4.05%, 08/15/52 (Call 02/15/52) |
1,076 | 860,598 | ||||||
| 4.10%, 05/15/49 (Call 11/15/48) |
694 | 558,717 | ||||||
| 4.10%, 05/15/2121 (Call 11/15/2120)(a) |
625 | 449,968 | ||||||
| 4.15%, 02/28/48 (Call 08/28/47) |
1,017 | 840,646 | ||||||
| 4.45%, 03/01/33 (Call 12/01/32)(a) |
475 | 452,692 | ||||||
| 4.45%, 06/15/45 (Call 12/15/44) |
692 | 596,494 | ||||||
| 4.55%, 06/01/53 (Call 12/01/52)(a) |
1,150 | 1,000,469 | ||||||
| 4.65%, 01/15/46 (Call 07/15/45) |
665 | 589,700 | ||||||
| 4.80%, 08/15/43 (Call 02/15/43) |
75 | 66,249 | ||||||
| 4.84%, 10/01/41 |
881 | 818,536 | ||||||
| 5.05%, 08/01/30 (Call 06/01/30) |
1,025 | 1,023,852 | ||||||
| 5.10%, 12/31/49 (Call 02/01/2118) |
75 | 65,152 | ||||||
| 5.35%, 08/01/54 (Call 02/01/54) |
1,170 | 1,146,573 | ||||||
| 5.55%, 03/15/34 (Call 12/15/33) |
720 | 739,177 | ||||||
| 5.59%, 05/17/25 |
465 | 466,134 | ||||||
| 5.95%, 03/15/64 (Call 09/15/63) |
735 | 775,200 | ||||||
| 7.25%, 02/15/31(a) |
875 | 962,586 | ||||||
| 7.80%, 05/15/27 |
445 | 481,561 | ||||||
| Polar Tankers Inc., 5.95%, 05/10/37(a)(b) |
1,360 | 1,379,542 | ||||||
| Ryder System Inc. |
||||||||
| 1.75%, 09/01/26 (Call 08/01/26) |
885 | 810,758 | ||||||
| 2.85%, 03/01/27 (Call 02/01/27)(a) |
509 | 476,921 | ||||||
| 2.90%, 12/01/26 (Call 10/01/26)(a) |
779 | 732,741 | ||||||
| 3.35%, 09/01/25 (Call 08/01/25) |
719 | 697,097 | ||||||
| 4.30%, 06/15/27 (Call 05/15/27) |
470 | 457,420 | ||||||
| 4.63%, 06/01/25 (Call 05/01/25)(a) |
750 | 742,902 | ||||||
| 5.25%, 06/01/28 (Call 05/01/28) |
640 | 641,193 | ||||||
| 5.30%, 03/15/27 (Call 02/15/27)(a) |
335 | 335,404 | ||||||
| 5.38%, 03/15/29 (Call 02/15/29) |
475 | 474,653 | ||||||
| 5.65%, 03/01/28 (Call 02/01/28)(a) |
1,020 | 1,036,823 | ||||||
| 6.30%, 12/01/28 (Call 11/01/28) |
505 | 526,105 | ||||||
| 6.60%, 12/01/33 (Call 09/01/33) |
575 | 615,658 | ||||||
| TTX Co. |
||||||||
| 3.90%, 02/01/45 (Call 08/01/44)(b) |
50 | 39,897 | ||||||
| 4.20%, 07/01/46 (Call 01/01/46)(a)(b) |
780 | 638,062 | ||||||
| 4.60%, 02/01/49 (Call 08/01/48)(a)(b) |
599 | 523,597 | ||||||
| 4.65%, 06/15/44(b) |
110 | 94,910 | ||||||
| 5.50%, 09/25/26 (Call 08/25/26)(b) |
595 | 596,619 | ||||||
| 5.65%, 12/01/52 (Call 06/01/52)(b) |
585 | 594,645 | ||||||
| 5.75%, 11/22/33 (Call 08/22/33)(b) |
300 | 313,797 | ||||||
| Union Pacific Corp. |
||||||||
| 2.15%, 02/05/27 (Call 12/05/26) |
794 | 736,869 | ||||||
| 2.38%, 05/20/31 (Call 02/20/31) |
1,350 | 1,140,656 | ||||||
| 2.40%, 02/05/30 (Call 11/05/29) |
1,424 | 1,241,366 | ||||||
| 2.75%, 03/01/26 (Call 12/01/25) |
1,224 | 1,172,380 | ||||||
| 2.80%, 02/14/32 (Call 12/15/31)(a) |
1,650 | 1,416,181 | ||||||
| 2.89%, 04/06/36 (Call 01/06/36) |
1,155 | 931,631 | ||||||
| 2.95%, 03/10/52 (Call 09/10/51) |
1,305 | 872,686 | ||||||
| Security | Par (000) |
Value | ||||||
| Transportation (continued) | ||||||||
| 2.97%, 09/16/62 (Call 03/16/62) |
$ | 1,379 | $ | 858,599 | ||||
| 3.00%, 04/15/27 (Call 01/15/27) |
728 | 690,126 | ||||||
| 3.20%, 05/20/41 (Call 11/20/40) |
1,421 | 1,097,297 | ||||||
| 3.25%, 08/15/25 (Call 05/15/25) |
745 | 725,813 | ||||||
| 3.25%, 02/05/50 (Call 08/05/49) |
1,912 | 1,376,882 | ||||||
| 3.35%, 08/15/46 (Call 02/15/46) |
130 | 94,036 | ||||||
| 3.38%, 02/01/35 (Call 08/01/34) |
820 | 698,534 | ||||||
| 3.38%, 02/14/42 (Call 08/14/41) |
690 | 539,874 | ||||||
| 3.50%, 02/14/53 (Call 08/14/52) |
1,620 | 1,205,788 | ||||||
| 3.55%, 08/15/39 (Call 02/15/39) |
677 | 554,856 | ||||||
| 3.55%, 05/20/61 (Call 11/20/60)(a) |
818 | 586,162 | ||||||
| 3.60%, 09/15/37 (Call 03/15/37) |
837 | 715,673 | ||||||
| 3.70%, 03/01/29 (Call 12/01/28) |
1,406 | 1,341,108 | ||||||
| 3.75%, 07/15/25 (Call 05/15/25) |
732 | 718,247 | ||||||
| 3.75%, 02/05/70 (Call 08/05/69) |
795 | 581,499 | ||||||
| 3.80%, 10/01/51 (Call 04/01/51) |
1,520 | 1,202,616 | ||||||
| 3.80%, 04/06/71 (Call 10/06/70) |
805 | 589,894 | ||||||
| 3.84%, 03/20/60 (Call 09/20/59) |
2,427 | 1,843,655 | ||||||
| 3.85%, 02/14/72 (Call 08/14/71) |
585 | 431,527 | ||||||
| 3.88%, 02/01/55 (Call 08/01/54) |
670 | 522,610 | ||||||
| 3.95%, 09/10/28 (Call 06/10/28)(a) |
1,586 | 1,538,372 | ||||||
| 3.95%, 08/15/59 (Call 02/15/59) |
630 | 488,545 | ||||||
| 4.00%, 04/15/47 (Call 10/15/46)(a) |
705 | 576,875 | ||||||
| 4.05%, 11/15/45 (Call 05/15/45) |
635 | 520,868 | ||||||
| 4.05%, 03/01/46 (Call 09/01/45) |
723 | 596,949 | ||||||
| 4.10%, 09/15/67 (Call 03/15/67) |
672 | 532,157 | ||||||
| 4.30%, 03/01/49 (Call 09/01/48) |
778 | 659,593 | ||||||
| 4.50%, 01/20/33 (Call 10/20/32)(a) |
1,350 | 1,309,172 | ||||||
| 4.50%, 09/10/48 (Call 03/10/48) |
615 | 539,705 | ||||||
| 4.75%, 02/21/26 (Call 01/21/26)(a) |
835 | 833,021 | ||||||
| 4.95%, 09/09/52 (Call 03/09/52)(a) |
696 | 670,014 | ||||||
| 4.95%, 05/15/53 (Call 11/15/52)(a) |
770 | 736,845 | ||||||
| 5.15%, 01/20/63 (Call 07/20/62)(a) |
185 | 177,212 | ||||||
| 6.63%, 02/01/29(a) |
167 | 180,609 | ||||||
| United Parcel Service Inc. |
||||||||
| 2.40%, 11/15/26 (Call 08/15/26) |
928 | 874,427 | ||||||
| 2.50%, 09/01/29 (Call 06/01/29) |
809 | 721,078 | ||||||
| 3.05%, 11/15/27 (Call 08/15/27) |
1,611 | 1,514,791 | ||||||
| 3.40%, 03/15/29 (Call 12/15/28) |
1,309 | 1,237,195 | ||||||
| 3.40%, 11/15/46 (Call 05/15/46)(a) |
810 | 619,011 | ||||||
| 3.40%, 09/01/49 (Call 03/01/49)(a) |
668 | 500,401 | ||||||
| 3.63%, 10/01/42 |
406 | 326,021 | ||||||
| 3.75%, 11/15/47 (Call 05/15/47) |
1,725 | 1,367,841 | ||||||
| 3.90%, 04/01/25 (Call 03/01/25) |
1,424 | 1,404,626 | ||||||
| 4.25%, 03/15/49 (Call 09/15/48) |
1,004 | 866,637 | ||||||
| 4.45%, 04/01/30 (Call 01/01/30) |
1,172 | 1,153,619 | ||||||
| 4.88%, 03/03/33 (Call 12/03/32) |
1,400 | 1,388,146 | ||||||
| 4.88%, 11/15/40 (Call 05/15/40) |
844 | 808,813 | ||||||
| 5.05%, 03/03/53 (Call 09/03/52)(a) |
1,340 | 1,300,869 | ||||||
| 5.20%, 04/01/40 (Call 10/01/39) |
917 | 911,777 | ||||||
| 5.30%, 04/01/50 (Call 10/01/49)(a) |
1,565 | 1,569,652 | ||||||
| 6.20%, 01/15/38 |
2,099 | 2,297,279 | ||||||
| United Parcel Service of America Inc., 7.62%, |
||||||||
| 04/01/30(c) |
735 | 828,000 | ||||||
| Walmart Inc. |
||||||||
| 1.05%, 09/17/26 (Call 08/17/26)(a) |
1,755 | 1,603,297 | ||||||
| 1.50%, 09/22/28 (Call 07/22/28) |
1,835 | 1,611,366 | ||||||
| 1.80%, 09/22/31 (Call 06/22/31)(a) |
2,205 | 1,808,126 | ||||||
| 3.95%, 09/09/27 (Call 08/09/27)(a) |
715 | 700,882 | ||||||
| XPO Inc., 6.25%, 06/01/28 (Call 06/01/25)(b) |
1,225 | 1,227,755 | ||||||
|
|
|
|||||||
| 190,794,343 | ||||||||
| S C H E D U L E O F I N V E S T M E N T S |
131 |
| Schedule of Investments (continued) February 29, 2024 |
iShares® Broad USD Investment Grade Corporate Bond ETF (Percentages shown are based on Net Assets) |
| Security | Par (000) |
Value | ||||||
| Trucking & Leasing — 0.3% | ||||||||
| DAE Funding LLC |
||||||||
| 2.63%, 03/20/25 (Call 02/20/25)(b) |
$ | 1,480 | $ | 1,421,966 | ||||
| 3.38%, 03/20/28 (Call 01/20/28)(a)(b) |
695 | 636,655 | ||||||
| GATX Corp. |
||||||||
| 1.90%, 06/01/31 (Call 03/01/31) |
475 | 372,381 | ||||||
| 3.10%, 06/01/51 (Call 12/01/50)(a) |
440 | 283,482 | ||||||
| 3.25%, 03/30/25 (Call 12/30/24)(a) |
290 | 282,522 | ||||||
| 3.25%, 09/15/26 (Call 06/15/26) |
953 | 906,316 | ||||||
| 3.50%, 03/15/28 (Call 12/15/27)(a) |
473 | 443,386 | ||||||
| 3.50%, 06/01/32 (Call 03/01/32)(a) |
551 | 476,531 | ||||||
| 3.85%, 03/30/27 (Call 12/30/26)(a) |
511 | 489,568 | ||||||
| 4.00%, 06/30/30 (Call 03/30/30) |
630 | 583,515 | ||||||
| 4.50%, 03/30/45 (Call 09/30/44)(a) |
185 | 148,645 | ||||||
| 4.55%, 11/07/28 (Call 08/07/28)(a) |
450 | 438,679 | ||||||
| 4.70%, 04/01/29 (Call 01/01/29) |
675 | 659,897 | ||||||
| 4.90%, 03/15/33 (Call 12/15/32)(a) |
570 | 542,851 | ||||||
| 5.20%, 03/15/44 (Call 09/15/43)(a) |
290 | 264,439 | ||||||
| 5.40%, 03/15/27 (Call 02/15/27) |
115 | 115,233 | ||||||
| 5.45%, 09/15/33 (Call 06/15/33) |
385 | 382,779 | ||||||
| 6.05%, 03/15/34 (Call 12/15/33) |
445 | 454,249 | ||||||
| 6.90%, 05/01/34 (Call 02/01/34) |
350 | 380,449 | ||||||
| Penske Truck Leasing Co. LP/PTL |
||||||||
| Finance Corp. |
||||||||
| 1.20%, 11/15/25 (Call 10/15/25)(b) |
937 | 870,361 | ||||||
| 1.70%, 06/15/26 (Call 05/15/26)(b) |
1,437 | 1,322,750 | ||||||
| 3.35%, 11/01/29 (Call 08/01/29)(b) |
643 | 572,155 | ||||||
| 3.40%, 11/15/26 (Call 08/15/26)(b) |
1,023 | 968,615 | ||||||
| 3.95%, 03/10/25 (Call 01/10/25)(b) |
956 | 937,871 | ||||||
| 4.00%, 07/15/25 (Call 06/15/25)(b) |
694 | 678,122 | ||||||
| 4.20%, 04/01/27 (Call 01/01/27)(b) |
942 | 908,694 | ||||||
| 4.40%, 07/01/27 (Call 06/01/27)(b) |
622 | 603,554 | ||||||
| 4.45%, 01/29/26 (Call 11/29/25)(b) |
817 | 796,915 | ||||||
| 5.35%, 01/12/27 (Call 12/12/26)(a)(b) |
480 | 478,659 | ||||||
| 5.55%, 05/01/28 (Call 04/01/28)(b) |
780 | 784,713 | ||||||
| 5.70%, 02/01/28 (Call 01/01/28)(a)(b) |
975 | 983,839 | ||||||
| 5.75%, 05/24/26 (Call 04/24/26)(a)(b) |
680 | 683,529 | ||||||
| 5.88%, 11/15/27 (Call 10/15/27)(a)(b) |
945 | 959,533 | ||||||
| 6.05%, 08/01/28 (Call 07/01/28)(b) |
1,655 | 1,692,785 | ||||||
| 6.20%, 06/15/30 (Call 04/15/30)(b) |
640 | 662,915 | ||||||
| SMBC Aviation Capital Finance DAC |
||||||||
| 1.90%, 10/15/26 (Call 09/15/26)(b) |
1,140 | 1,036,565 | ||||||
| 2.30%, 06/15/28 (Call 04/15/28)(b) |
790 | 693,294 | ||||||
| 5.45%, 05/03/28 (Call 04/03/28)(b) |
740 | 738,501 | ||||||
| 5.70%, 07/25/33 (Call 04/25/33)(a)(b) |
1,185 | 1,184,899 | ||||||
|
|
|
|||||||
| 26,841,812 | ||||||||
| Venture Capital — 0.0% | ||||||||
| Hercules Capital Inc. |
||||||||
| 2.63%, 09/16/26 (Call 08/16/26). |
615 | 553,965 | ||||||
| 3.38%, 01/20/27 (Call 12/20/26)(a) |
507 | 459,921 | ||||||
|
|
|
|||||||
| 1,013,886 | ||||||||
| Water — 0.2% | ||||||||
| American Water Capital Corp. |
||||||||
| 2.30%, 06/01/31 (Call 03/01/31) |
730 | 604,945 | ||||||
| 2.80%, 05/01/30 (Call 02/01/30) |
885 | 776,672 | ||||||
| 2.95%, 09/01/27 (Call 06/01/27)(a) |
977 | 910,771 | ||||||
| 3.00%, 12/01/26 (Call 09/01/26)(a) |
525 | 493,655 | ||||||
| 3.25%, 06/01/51 (Call 12/01/50)(a) |
670 | 471,283 | ||||||
| 3.40%, 03/01/25 (Call 12/01/24) |
936 | 917,450 | ||||||
| 3.45%, 06/01/29 (Call 03/01/29) |
916 | 851,771 | ||||||
| 3.45%, 05/01/50 (Call 11/01/49) |
744 | 544,473 | ||||||
| Security | Par (000) |
Value | ||||||
| Water (continued) | ||||||||
| 3.75%, 09/01/28 (Call 06/01/28) |
$ | 647 | $ | 614,142 | ||||
| 3.75%, 09/01/47 (Call 03/01/47)(a) |
866 | 674,701 | ||||||
| 4.00%, 12/01/46 (Call 06/01/46) |
561 | 454,414 | ||||||
| 4.15%, 06/01/49 (Call 12/01/48)(a) |
788 | 651,284 | ||||||
| 4.20%, 09/01/48 (Call 03/01/48) |
822 | 691,902 | ||||||
| 4.30%, 12/01/42 (Call 06/01/42)(a) |
456 | 395,585 | ||||||
| 4.30%, 09/01/45 (Call 03/01/45) |
331 | 282,349 | ||||||
| 4.45%, 06/01/32 (Call 03/01/32)(a) |
720 | 688,701 | ||||||
| 5.15%, 03/01/34 (Call 12/01/33) |
625 | 619,813 | ||||||
| 5.45%, 03/01/54 (Call 09/01/53) |
625 | 614,801 | ||||||
| 6.59%, 10/15/37(a) |
799 | 898,494 | ||||||
| Essential Utilities Inc. |
||||||||
| 2.40%, 05/01/31 (Call 02/01/31)(a) |
830 | 681,093 | ||||||
| 2.70%, 04/15/30 (Call 01/15/30) |
819 | 704,797 | ||||||
| 3.35%, 04/15/50 (Call 10/15/49) |
487 | 336,527 | ||||||
| 3.57%, 05/01/29 (Call 02/01/29)(a) |
905 | 839,168 | ||||||
| 4.28%, 05/01/49 (Call 11/01/48)(a) |
806 | 651,376 | ||||||
| 5.30%, 05/01/52 (Call 11/01/51) |
560 | 522,500 | ||||||
| 5.38%, 01/15/34 (Call 10/15/33) |
390 | 383,536 | ||||||
| United Utilities PLC, 6.88%, 08/15/28 |
330 | 349,765 | ||||||
|
|
|
|||||||
| 16,625,968 | ||||||||
|
|
|
|||||||
| Total Corporate Bonds & Notes — 98.5% |
10,317,717,081 | |||||||
|
|
|
|||||||
| Foreign Government Obligations(g) |
||||||||
| Japan — 0.0% | ||||||||
| Development Bank of Japan Inc. |
||||||||
| 4.38%, 09/22/25(b) |
120 | 118,434 | ||||||
| 5.13%, 09/01/26(b) |
25 | 25,106 | ||||||
|
|
|
|||||||
| 143,540 | ||||||||
| Panama — 0.0% | ||||||||
| Banco Latinoamericano de Comercio |
||||||||
| Exterior SA, 2.38%, 09/14/25 |
||||||||
| (Call 08/15/25)(b) |
905 | 851,831 | ||||||
|
|
|
|||||||
| South Korea — 0.2% | ||||||||
| Korea Electric Power Corp. |
||||||||
| 1.13%, 06/15/25(b) |
632 | 598,850 | ||||||
| 3.63%, 06/14/25(b) |
200 | 195,687 | ||||||
| 4.00%, 06/14/27(b) |
140 | 135,161 | ||||||
| 4.88%, 01/31/27(b) |
600 | 598,957 | ||||||
| 5.13%, 04/23/34(a)(b) |
435 | 435,999 | ||||||
| 5.38%, 04/06/26(b) |
100 | 100,245 | ||||||
| 5.38%, 07/31/26(b) |
255 | 255,674 | ||||||
| 5.50%, 04/06/28(b) |
155 | 157,572 | ||||||
| 7.00%, 02/01/27(a) |
890 | 933,256 | ||||||
| Korea Gas Corp. |
||||||||
| 1.13%, 07/13/26(b) |
875 | 796,088 | ||||||
| 2.00%, 07/13/31(b) |
550 | 446,756 | ||||||
| 2.25%, 07/18/26(b) |
150 | 140,125 | ||||||
| 3.13%, 07/20/27(b) |
1,751 | 1,642,562 | ||||||
| 3.50%, 07/02/26(a)(b) |
580 | 557,769 | ||||||
| 3.88%, 07/13/27(a)(b) |
2,180 | 2,097,695 | ||||||
| Korea Housing Finance Corp. |
||||||||
| 4.63%, 02/24/28(b) |
695 | 688,419 | ||||||
| 4.63%, 02/24/33(a)(b) |
683 | 658,903 | ||||||
| 5.38%, 11/15/26(a)(b) |
1,270 | 1,281,490 | ||||||
| Korea Hydro & Nuclear Power Co. Ltd. |
||||||||
| 1.25%, 04/27/26(a)(b) |
555 | 508,849 | ||||||
| 132 | 2 0 2 4 I S H A R E S A N N U A L R E P O R T T O S H A R E H O L D E R S |
| Schedule of Investments (continued) February 29, 2024 |
iShares® Broad USD Investment Grade Corporate Bond ETF (Percentages shown are based on Net Assets) |
| Security | Par (000) |
Value | ||||||
| South Korea (continued) | ||||||||
| 3.13%, 07/25/27(b) |
$ | 1,170 | $ | 1,096,185 | ||||
| 4.25%, 07/27/27(b) |
70 | 68,002 | ||||||
| 5.00%, 07/18/28(b) |
95 | 94,860 | ||||||
| Korea National Oil Corp. |
||||||||
| 0.88%, 10/05/25(b) |
647 | 603,230 | ||||||
| 1.25%, 04/07/26(b) |
1,000 | 920,629 | ||||||
| 2.38%, 04/07/31(b) |
970 | 814,656 | ||||||
| 2.50%, 10/24/26(b) |
143 | 133,271 | ||||||
| 2.63%, 04/18/32(b) |
500 | 415,516 | ||||||
| 3.25%, 10/01/25(b) |
450 | 435,721 | ||||||
| 3.38%, 03/27/27(b) |
500 | 475,503 | ||||||
|
|
|
|||||||
| 17,287,630 | ||||||||
|
|
|
|||||||
| Total Foreign Government Obligations —0.2% |
|
18,283,001 | ||||||
|
|
|
|||||||
| Total Long-Term Investments — 98.7% |
|
10,336,000,082 | ||||||
|
|
|
|||||||
| Shares | ||||||||
| Short-Term Securities |
||||||||
| Money Market Funds — 11.7% | ||||||||
| BlackRock Cash Funds: Institutional, SL Agency Shares, 5.50%(h)(i)(j) |
1,212,696,770 | 1,213,303,118 | ||||||
| BlackRock Cash Funds: Treasury, SL Agency Shares, 5.30%(h)(i) |
14,600,000 | 14,600,000 | ||||||
|
|
|
|||||||
| Total Short-Term Securities — 11.7% |
|
1,227,903,118 | ||||||
|
|
|
|||||||
| Total Investments — 110.4% |
|
11,563,903,200 | ||||||
| Liabilities in Excess of Other Assets —(10.4)% |
|
(1,085,157,682 | ) | |||||
|
|
|
|||||||
| Net Assets—100.0% |
$ | 10,478,745,518 | ||||||
|
|
|
|||||||
| (a) | All or a portion of this security is on loan. |
| (b) | Security exempt from registration pursuant to Rule 144A under the Securities Act of 1933, as amended. These securities may be resold in transactions exempt from registration to qualified institutional investors. |
| (c) | Step coupon security. Coupon rate will either increase (step-up bond) or decrease (step-down bond) at regular intervals until maturity. Interest rate shown reflects the rate currently in effect. |
| (d) | Variable rate security. Interest rate resets periodically. The rate shown is the effective interest rate as of period end. Security description also includes the reference rate and spread if published and available. |
| (e) | Perpetual security with no stated maturity date. |
| (f) | Zero-coupon bond. |
| (g) | U.S. dollar denominated security issued by foreign domiciled entity. |
| (h) | Affiliate of the Fund. |
| (i) | Annualized 7-day yield as of period end. |
| (j) | All or a portion of this security was purchased with the cash collateral from loaned securities. |
Affiliates
Investments in issuers considered to be affiliate(s) of the Fund during the year ended February 29, 2024 for purposes of Section 2(a)(3) of the Investment Company Act of 1940, as amended, were as follows:
| Affiliated Issuer | Value at 02/28/23 |
Purchases at Cost |
Proceeds from Sale |
Net Realized Gain (Loss) |
Change in Unrealized Appreciation (Depreciation) |
Value at 02/29/24 |
Shares Held at 02/29/24 |
Income | Capital Gain Distributions from Underlying Funds |
|||||||||||||||||||||||||||
| BlackRock Cash Funds: Institutional, SL Agency Shares |
$ | 756,319,806 | $ | 457,090,561 | (a) | $ | — | $ | (53,157 | ) | $ | (54,092 | ) | $ | 1,213,303,118 | 1,212,696,770 | $ | 3,800,503 | (b) | $ | — | |||||||||||||||
| BlackRock Cash Funds: Treasury, SL Agency Shares |
65,729,000 | — | (51,129,000 | )(a) | — | — | 14,600,000 | 14,600,000 | 2,207,473 | — | ||||||||||||||||||||||||||
|
|
|
|
|
|
|
|
|
|
|
|||||||||||||||||||||||||||
| $ | (53,157 | ) | $ | (54,092 | ) | $ | 1,227,903,118 | $ | 6,007,976 | $ | — | |||||||||||||||||||||||||
|
|
|
|
|
|
|
|
|
|
|
|||||||||||||||||||||||||||
| (a) | Represents net amount purchased (sold). |
| (b) | All or a portion represents securities lending income earned from the reinvestment of cash collateral from loaned securities, net of fees and collateral investment expenses, and other payments to and from borrowers of securities. |
| S C H E D U L E O F I N V E S T M E N T S |
133 |
| Schedule of Investments (continued) February 29, 2024 |
iShares® Broad USD Investment Grade Corporate Bond ETF |
Fair Value Hierarchy as of Period End
Various inputs are used in determining the fair value of financial instruments. For a description of the input levels and information about the Fund’s policy regarding valuation of financial instruments, refer to the Notes to Financial Statements.
The following table summarizes the Fund’s financial instruments categorized in the fair value hierarchy. The breakdown of the Fund’s financial instruments into major categories is disclosed in the Schedule of Investments above.
|
|
||||||||||||||||||||||||||||
| Level 1 | Level 2 | Level 3 | Total | |||||||||||||||||||||||||
|
|
||||||||||||||||||||||||||||
| Assets |
||||||||||||||||||||||||||||
| Investments |
||||||||||||||||||||||||||||
| Long-Term Investments |
||||||||||||||||||||||||||||
| Corporate Bonds & Notes |
$ | — | $ | 10,317,717,081 | $ | — | $ | 10,317,717,081 | ||||||||||||||||||||
| Foreign Government Obligations |
— | 18,283,001 | — | 18,283,001 | ||||||||||||||||||||||||
| Short-Term Securities |
||||||||||||||||||||||||||||
| Money Market Funds |
1,227,903,118 | — | — | 1,227,903,118 | ||||||||||||||||||||||||
|
|
|
|
|
|
|
|
|
|||||||||||||||||||||
| $ | 1,227,903,118 | $ | 10,336,000,082 | $ | — | $ | 11,563,903,200 | |||||||||||||||||||||
|
|
|
|
|
|
|
|
|
|||||||||||||||||||||
See notes to financial statements.
| 134 | 2 0 2 4 I S H A R E S A N N U A L R E P O R T T O S H A R E H O L D E R S |
| Schedule of Investments February 29, 2024 |
iShares® 1-5 Year Investment Grade Corporate Bond ETF (Percentages shown are based on Net Assets) |
| Security | Par (000) |
Value | ||||||
| Corporate Bonds & Notes |
| |||||||
| Advertising — 0.1% | ||||||||
| Interpublic Group of Companies Inc. (The), |
||||||||
| 4.65%, 10/01/28 (Call 07/01/28)(a) |
$ | 2,695 | $ | 2,642,100 | ||||
| Omnicom Group Inc./Omnicom Capital Inc., |
||||||||
| 3.60%, 04/15/26 (Call 01/15/26) |
10,993 | 10,651,816 | ||||||
|
|
|
|||||||
| 13,293,916 | ||||||||
| Aerospace & Defense — 1.4% | ||||||||
| Airbus SE, 3.15%, 04/10/27 (Call 01/10/27)(a)(b) |
5,135 | 4,900,433 | ||||||
| BAE Systems Finance Inc., 7.50%, 07/01/27(a)(b) |
955 | 1,020,487 | ||||||
| BAE Systems Holdings Inc., 3.85%, 12/15/25 |
5,309 | 5,178,064 | ||||||
| Boeing Co. (The) |
||||||||
| 2.20%, 02/04/26 (Call 03/11/24) |
35,008 | 32,841,868 | ||||||
| 2.25%, 06/15/26 (Call 03/15/26)(a) |
2,655 | 2,471,168 | ||||||
| 2.50%, 03/01/25 (Call 12/01/24)(a) |
1,723 | 1,666,880 | ||||||
| 2.60%, 10/30/25 (Call 07/30/25)(a) |
2,240 | 2,136,135 | ||||||
| 2.70%, 02/01/27 (Call 12/01/26)(a) |
6,560 | 6,109,206 | ||||||
| 2.75%, 02/01/26 (Call 01/01/26)(a) |
9,150 | 8,689,142 | ||||||
| 2.80%, 03/01/27 (Call 12/01/26)(a) |
1,809 | 1,678,941 | ||||||
| 3.10%, 05/01/26 (Call 03/01/26)(a) |
4,299 | 4,095,598 | ||||||
| 3.25%, 02/01/28 (Call 12/01/27) |
7,373 | 6,840,546 | ||||||
| 3.25%, 03/01/28 (Call 12/01/27) |
2,870 | 2,655,082 | ||||||
| 3.45%, 11/01/28 (Call 08/01/28)(a) |
2,564 | 2,368,145 | ||||||
| 4.88%, 05/01/25 (Call 04/01/25) |
22,139 | 21,934,026 | ||||||
| 5.04%, 05/01/27 (Call 03/01/27)(a) |
12,762 | 12,641,701 | ||||||
| General Dynamics Corp. |
||||||||
| 1.15%, 06/01/26 (Call 05/01/26)(a) |
3,445 | 3,173,534 | ||||||
| 2.13%, 08/15/26 (Call 05/15/26) |
3,387 | 3,169,773 | ||||||
| 2.63%, 11/15/27 (Call 08/15/27)(a) |
1,370 | 1,267,235 | ||||||
| 3.25%, 04/01/25 (Call 03/01/25)(a) |
5,085 | 4,978,628 | ||||||
| 3.50%, 05/15/25 (Call 03/15/25)(a) |
5,099 | 5,001,844 | ||||||
| 3.50%, 04/01/27 (Call 02/01/27) |
5,458 | 5,251,998 | ||||||
| 3.75%, 05/15/28 (Call 02/15/28)(a) |
7,617 | 7,338,184 | ||||||
| HEICO Corp., 5.25%, 08/01/28 (Call 07/01/28) |
5,115 | 5,155,709 | ||||||
| Hexcel Corp. |
||||||||
| 4.20%, 02/15/27 (Call 11/15/26) |
2,565 | 2,444,463 | ||||||
| 4.95%, 08/15/25 (Call 05/15/25) |
2,520 | 2,480,152 | ||||||
| Howmet Aerospace Inc. |
||||||||
| 3.00%, 01/15/29 (Call 11/15/28) |
3,220 | 2,887,937 | ||||||
| 5.90%, 02/01/27(a) |
4,080 | 4,118,997 | ||||||
| 6.75%, 01/15/28(a) |
2,565 | 2,674,336 | ||||||
| 6.88%, 05/01/25 (Call 04/01/25) |
475 | 479,977 | ||||||
| L3Harris Technologies Inc. |
||||||||
| 3.83%, 04/27/25 (Call 01/27/25)(a) |
4,410 | 4,329,096 | ||||||
| 3.85%, 12/15/26 (Call 09/15/26)(a) |
3,689 | 3,563,208 | ||||||
| 4.40%, 06/15/28 (Call 03/15/28) |
12,606 | 12,254,746 | ||||||
| 5.40%, 01/15/27(a) |
8,040 | 8,090,025 | ||||||
| Lockheed Martin Corp. |
||||||||
| 3.55%, 01/15/26 (Call 10/15/25) |
6,673 | 6,502,987 | ||||||
| 4.45%, 05/15/28 (Call 04/15/28)(a) |
2,838 | 2,797,624 | ||||||
| 4.50%, 02/15/29 (Call 01/15/29) |
4,055 | 3,984,559 | ||||||
| 4.95%, 10/15/25 (Call 09/15/25)(a) |
3,900 | 3,893,494 | ||||||
| 5.10%, 11/15/27 (Call 10/15/27) |
5,142 | 5,198,877 | ||||||
| Northrop Grumman Corp. |
||||||||
| 3.20%, 02/01/27 (Call 11/01/26)(a) |
5,047 | 4,808,579 | ||||||
| 3.25%, 01/15/28 (Call 10/15/27) |
12,735 | 11,942,929 | ||||||
| 4.60%, 02/01/29 (Call 01/01/29)(a) |
3,725 | 3,647,815 | ||||||
| RTX Corp. |
||||||||
| 2.65%, 11/01/26 (Call 08/01/26)(a) |
4,661 | 4,388,082 | ||||||
| Security | Par (000) |
Value | ||||||
| Aerospace & Defense (continued) | ||||||||
| 3.13%, 05/04/27 (Call 02/04/27)(a) |
$ | 6,842 | $ | 6,456,550 | ||||
| 3.50%, 03/15/27 (Call 12/15/26) |
7,328 | 7,003,695 | ||||||
| 3.95%, 08/16/25 (Call 06/16/25) |
10,064 | 9,871,556 | ||||||
| 4.13%, 11/16/28 (Call 08/16/28) |
17,971 | 17,244,914 | ||||||
| 5.00%, 02/27/26 (Call 01/27/26) |
3,375 | 3,366,823 | ||||||
| 5.75%, 11/08/26 (Call 10/08/26)(a) |
10,460 | 10,609,592 | ||||||
| 5.75%, 01/15/29 (Call 12/15/28) |
5,200 | 5,354,185 | ||||||
| 6.70%, 08/01/28(a) |
1,345 | 1,429,180 | ||||||
| 7.20%, 08/15/27 |
2,445 | 2,579,606 | ||||||
|
|
|
|||||||
| 306,968,311 | ||||||||
| Agriculture — 1.1% | ||||||||
| Altria Group Inc. |
||||||||
| 2.35%, 05/06/25 (Call 04/06/25)(a) |
5,105 | 4,929,595 | ||||||
| 2.63%, 09/16/26 (Call 06/16/26) |
3,715 | 3,489,273 | ||||||
| 4.40%, 02/14/26 (Call 12/14/25) |
7,206 | 7,094,173 | ||||||
| 4.80%, 02/14/29 (Call 11/14/28)(a) |
3,800 | 3,731,112 | ||||||
| 6.20%, 11/01/28 (Call 10/01/28)(a) |
3,280 | 3,408,930 | ||||||
| Archer-Daniels-Midland Co., |
6,808 | 6,407,073 | ||||||
| BAT Capital Corp. |
||||||||
| 2.26%, 03/25/28 (Call 01/25/28) |
14,379 | 12,724,283 | ||||||
| 3.22%, 09/06/26 (Call 07/06/26) |
6,568 | 6,228,181 | ||||||
| 3.56%, 08/15/27 (Call 05/15/27) |
10,767 | 10,178,618 | ||||||
| 4.70%, 04/02/27 (Call 02/02/27)(a) |
7,965 | 7,795,223 | ||||||
| BAT International Finance PLC |
||||||||
| 1.67%, 03/25/26 (Call 02/25/26)(a) |
9,329 | 8,643,077 | ||||||
| 3.95%, 06/15/25(b) |
185 | 180,817 | ||||||
| 4.45%, 03/16/28 (Call 02/16/28) |
9,412 | 9,076,809 | ||||||
| 5.93%, 02/02/29 (Call 01/02/29) |
2,165 | 2,210,966 | ||||||
| Bunge Ltd. Finance Corp. |
||||||||
| 1.63%, 08/17/25 (Call 07/17/25) |
4,481 | 4,242,958 | ||||||
| 3.25%, 08/15/26 (Call 05/15/26) |
5,004 | 4,773,473 | ||||||
| 3.75%, 09/25/27 (Call 06/25/27)(a) |
4,050 | 3,876,063 | ||||||
| Cargill Inc. |
||||||||
| 0.75%, 02/02/26 (Call 01/02/26)(a)(b) |
3,398 | 3,135,309 | ||||||
| 3.50%, 04/22/25 (Call 04/01/24)(a)(b) |
3,550 | 3,482,125 | ||||||
| 3.63%, 04/22/27 (Call 03/22/27)(a)(b) |
3,475 | 3,344,088 | ||||||
| 4.50%, 06/24/26(a)(b) |
4,285 | 4,231,634 | ||||||
| 4.88%, 10/10/25 (Call 09/10/25)(b) |
5,090 | 5,069,744 | ||||||
| Imperial Brands Finance PLC |
||||||||
| 3.50%, 07/26/26 (Call 05/26/26)(b) |
5,014 | 4,769,654 | ||||||
| 4.25%, 07/21/25 (Call 04/21/25)(b) |
10,087 | 9,885,868 | ||||||
| 6.13%, 07/27/27 (Call 06/27/27)(b) |
6,646 | 6,765,553 | ||||||
| Philip Morris International Inc. |
||||||||
| 0.88%, 05/01/26 (Call 04/01/26) |
5,273 | 4,818,472 | ||||||
| 1.50%, 05/01/25 (Call 04/01/25)(a) |
4,809 | 4,609,299 | ||||||
| 2.75%, 02/25/26 (Call 11/25/25) |
5,106 | 4,875,289 | ||||||
| 3.13%, 08/17/27 (Call 05/17/27)(a) |
2,635 | 2,482,102 | ||||||
| 3.13%, 03/02/28 (Call 12/02/27) |
1,875 | 1,744,746 | ||||||
| 3.38%, 08/11/25 (Call 05/11/25) |
5,008 | 4,883,460 | ||||||
| 4.75%, 02/12/27 |
4,375 | 4,320,665 | ||||||
| 4.88%, 02/13/26 |
11,075 | 11,021,452 | ||||||
| 4.88%, 02/15/28 (Call 01/15/28) |
13,413 | 13,339,141 | ||||||
| 4.88%, 02/13/29 (Call 01/13/29) |
5,575 | 5,479,654 | ||||||
| 5.00%, 11/17/25 |
5,010 | 4,992,505 | ||||||
| 5.13%, 11/17/27 (Call 10/17/27) |
10,393 | 10,410,580 | ||||||
| 5.25%, 09/07/28 (Call 08/07/28) |
3,950 | 3,979,900 | ||||||
| Reynolds American Inc., |
13,741 | 13,530,184 | ||||||
| S C H E D U L E O F I N V E S T M E N T S |
135 |
| Schedule of Investments (continued) February 29, 2024 |
iShares® 1-5 Year Investment Grade Corporate Bond ETF (Percentages shown are based on Net Assets) |
| Security | Par (000) |
Value | ||||||
| Agriculture (continued) | ||||||||
| Viterra Finance BV |
||||||||
| 2.00%, 04/21/26 (Call 03/21/26)(b) |
$ | 4,147 | $ | 3,838,670 | ||||
| 4.90%, 04/21/27 (Call 03/21/27)(a)(b) |
3,025 | 2,961,178 | ||||||
|
|
|
|||||||
| 236,961,896 | ||||||||
| Airlines — 0.3% | ||||||||
| Delta Air Lines Inc., 7.00%, 05/01/25(b) |
5,002 | 5,083,991 | ||||||
| Delta Air Lines Inc./SkyMiles IP Ltd. |
||||||||
| 4.50%, 10/20/25(b) |
7,311 | 7,220,140 | ||||||
| 4.75%, 10/20/28(a)(b) |
11,840 | 11,573,731 | ||||||
| Mileage Plus Holdings LLC/Mileage Plus |
16,443 | 16,447,251 | ||||||
| Southwest Airlines Co. |
||||||||
| 3.00%, 11/15/26 (Call 08/15/26) |
882 | 832,564 | ||||||
| 3.45%, 11/16/27 (Call 08/16/27)(a) |
600 | 564,439 | ||||||
| 5.13%, 06/15/27 (Call 04/15/27) |
10,676 | 10,632,875 | ||||||
| 5.25%, 05/04/25 (Call 04/04/25) |
7,905 | 7,883,264 | ||||||
|
|
|
|||||||
| 60,238,255 | ||||||||
| Alternate Investments — 0.0% | ||||||||
| New Mountain Finance Corp., 6.88%, 02/01/29 |
1,005 | 983,653 | ||||||
| Oaktree Strategic Credit Fund, 8.40%, 11/14/28 |
550 | 577,973 | ||||||
|
|
|
|||||||
| 1,561,626 | ||||||||
| Apparel — 0.2% | ||||||||
| NIKE Inc. |
||||||||
| 2.38%, 11/01/26 (Call 08/01/26)(a) |
6,247 | 5,878,274 | ||||||
| 2.75%, 03/27/27 (Call 01/27/27)(a) |
7,180 | 6,770,882 | ||||||
| PVH Corp., |
3,127 | 3,082,602 | ||||||
| Ralph Lauren Corp., |
2,526 | 2,468,262 | ||||||
| Tapestry Inc. |
||||||||
| 4.13%, 07/15/27 (Call 04/15/27) |
3,260 | 3,098,609 | ||||||
| 4.25%, 04/01/25 (Call 01/01/25)(a) |
993 | 978,798 | ||||||
| 7.00%, 11/27/26(a) |
8,495 | 8,724,810 | ||||||
| 7.05%, 11/27/25 |
3,105 | 3,162,969 | ||||||
| 7.35%, 11/27/28 (Call 10/27/28) |
6,055 | 6,333,544 | ||||||
| VF Corp. |
||||||||
| 2.40%, 04/23/25 (Call 03/23/25)(a) |
4,700 | 4,505,138 | ||||||
| 2.80%, 04/23/27 (Call 02/23/27)(a) |
3,566 | 3,237,698 | ||||||
|
|
|
|||||||
| 48,241,586 | ||||||||
| Auto Manufacturers — 4.6% | ||||||||
| American Honda Finance Corp. |
||||||||
| 1.00%, 09/10/25 |
4,920 | 4,623,413 | ||||||
| 1.20%, 07/08/25 |
5,126 | 4,861,713 | ||||||
| 1.30%, 09/09/26(a) |
4,358 | 3,976,008 | ||||||
| 2.00%, 03/24/28 |
5,200 | 4,661,172 | ||||||
| 2.25%, 01/12/29 |
1,965 | 1,743,552 | ||||||
| 2.30%, 09/09/26(a) |
2,479 | 2,326,997 | ||||||
| 2.35%, 01/08/27 |
874 | 815,416 | ||||||
| 3.50%, 02/15/28(a) |
375 | 356,352 | ||||||
| 4.70%, 01/12/28 |
3,990 | 3,972,972 | ||||||
| 4.75%, 01/12/26 |
3,630 | 3,606,828 | ||||||
| 4.95%, 01/09/26(a) |
4,355 | 4,339,932 | ||||||
| 5.00%, 05/23/25(a) |
5,295 | 5,280,156 | ||||||
| 5.13%, 07/07/28 |
6,039 | 6,089,518 | ||||||
| 5.25%, 07/07/26(a) |
4,975 | 5,013,226 | ||||||
| 5.65%, 11/15/28 |
4,865 | 5,004,880 | ||||||
| 5.80%, 10/03/25(a) |
4,010 | 4,048,015 | ||||||
| Series A, 4.60%, 04/17/25(a) |
5,365 | 5,327,917 | ||||||
| Security | Par (000) |
Value | ||||||
| Auto Manufacturers (continued) | ||||||||
| BMW U.S. Capital LLC |
||||||||
| 1.25%, 08/12/26 (Call 07/12/26)(b) |
$ | 3,136 | $ | 2,865,340 | ||||
| 2.80%, 04/11/26 (Call 01/11/26)(a)(b) |
5,778 | 5,527,113 | ||||||
| 3.25%, 04/01/25(a)(b) |
3,255 | 3,186,056 | ||||||
| 3.30%, 04/06/27 (Call 01/06/27)(b) |
1,785 | 1,698,471 | ||||||
| 3.45%, 04/01/27 (Call 03/01/27)(a)(b) |
4,365 | 4,187,056 | ||||||
| 3.75%, 04/12/28 (Call 01/12/28)(b) |
5,580 | 5,353,270 | ||||||
| 3.90%, 04/09/25 (Call 03/09/25)(a)(b) |
9,729 | 9,592,659 | ||||||
| 3.95%, 08/14/28 (Call 05/14/28)(a)(b) |
665 | 639,334 | ||||||
| 5.05%, 08/11/28 (Call 07/11/28)(a)(b) |
7,930 | 7,977,944 | ||||||
| 5.30%, 08/11/25(b) |
4,855 | 4,868,623 | ||||||
| Cummins Inc. |
||||||||
| 0.75%, 09/01/25 (Call 08/01/25)(a) |
3,089 | 2,897,477 | ||||||
| 4.90%, 02/20/29 (Call 01/20/29)(a) |
1,085 | 1,080,361 | ||||||
| 7.13%, 03/01/28(a) |
5,713 | 6,136,058 | ||||||
| Daimler Trucks Finance North America LLC |
||||||||
| 2.00%, 12/14/26(a)(b) |
7,788 | 7,144,033 | ||||||
| 2.38%, 12/14/28(a)(b) |
4,680 | 4,142,513 | ||||||
| 3.50%, 04/07/25(b) |
3,622 | 3,544,128 | ||||||
| 3.65%, 04/07/27(a)(b) |
4,573 | 4,387,209 | ||||||
| 5.00%, 01/15/27(b) |
2,580 | 2,570,145 | ||||||
| 5.13%, 01/19/28(a)(b) |
3,345 | 3,341,492 | ||||||
| 5.15%, 01/16/26(b) |
4,260 | 4,246,940 | ||||||
| 5.40%, 09/20/28(b) |
3,830 | 3,873,571 | ||||||
| 5.60%, 08/08/25(b) |
3,855 | 3,863,876 | ||||||
| Ford Motor Co. |
||||||||
| 4.35%, 12/08/26 (Call 09/08/26) |
6,150 | 5,974,322 | ||||||
| 6.63%, 10/01/28(a) |
1,630 | 1,706,283 | ||||||
| Ford Motor Credit Co. LLC |
||||||||
| 2.70%, 08/10/26 (Call 07/10/26)(a) |
7,685 | 7,134,419 | ||||||
| 2.90%, 02/16/28 (Call 12/16/27)(a) |
5,515 | 4,941,404 | ||||||
| 2.90%, 02/10/29 (Call 12/10/28) |
3,850 | 3,354,219 | ||||||
| 3.38%, 11/13/25 (Call 10/13/25) |
8,910 | 8,548,465 | ||||||
| 3.82%, 11/02/27 (Call 08/02/27) |
5,570 | 5,194,307 | ||||||
| 4.13%, 08/04/25 |
4,055 | 3,957,133 | ||||||
| 4.13%, 08/17/27 (Call 06/17/27) |
7,570 | 7,164,425 | ||||||
| 4.27%, 01/09/27 (Call 11/09/26)(a) |
5,655 | 5,417,301 | ||||||
| 4.39%, 01/08/26 |
4,970 | 4,832,726 | ||||||
| 4.54%, 08/01/26 (Call 06/01/26)(a) |
4,905 | 4,755,349 | ||||||
| 4.95%, 05/28/27 (Call 04/28/27) |
9,740 | 9,469,369 | ||||||
| 5.13%, 06/16/25 (Call 05/16/25) |
6,280 | 6,216,395 | ||||||
| 5.80%, 03/05/27 (Call 02/05/27) |
7,345 | 7,330,776 | ||||||
| 6.80%, 05/12/28 (Call 04/12/28) |
10,040 | 10,360,857 | ||||||
| 6.80%, 11/07/28 (Call 10/07/28) |
9,170 | 9,503,967 | ||||||
| 6.95%, 03/06/26 (Call 02/06/26)(a) |
4,545 | 4,626,830 | ||||||
| 6.95%, 06/10/26 (Call 05/10/26)(a) |
3,095 | 3,156,584 | ||||||
| 7.35%, 11/04/27 (Call 10/04/27) |
10,305 | 10,770,520 | ||||||
| General Motors Co. |
||||||||
| 4.00%, 04/01/25(a) |
4,286 | 4,218,869 | ||||||
| 4.20%, 10/01/27 (Call 07/01/27)(a) |
4,976 | 4,800,767 | ||||||
| 5.00%, 10/01/28 (Call 07/01/28)(a) |
4,395 | 4,367,816 | ||||||
| 6.13%, 10/01/25 (Call 09/01/25)(a) |
13,509 | 13,618,619 | ||||||
| 6.80%, 10/01/27 (Call 08/01/27) |
6,660 | 6,954,359 | ||||||
| General Motors Financial Co. Inc. |
||||||||
| 1.25%, 01/08/26 (Call 12/08/25) |
9,929 | 9,200,704 | ||||||
| 1.50%, 06/10/26 (Call 05/10/26) |
8,171 | 7,485,202 | ||||||
| 2.35%, 02/26/27 (Call 01/26/27) |
6,343 | 5,814,585 | ||||||
| 2.40%, 04/10/28 (Call 02/10/28) |
7,700 | 6,863,674 | ||||||
| 2.40%, 10/15/28 (Call 08/15/28) |
7,575 | 6,659,973 | ||||||
| 2.70%, 08/20/27 (Call 06/20/27) |
5,937 | 5,446,565 | ||||||
| 2.75%, 06/20/25 (Call 05/20/25)(a) |
8,649 | 8,346,038 | ||||||
| 136 | 2 0 2 4 I S H A R E S A N N U A L R E P O R T T O S H A R E H O L D E R S |
| Schedule of Investments (continued) February 29, 2024 |
iShares® 1-5 Year Investment Grade Corporate Bond ETF (Percentages shown are based on Net Assets) |
| Security | Par (000) |
Value | ||||||
| Auto Manufacturers (continued) | ||||||||
| 3.80%, 04/07/25 |
$ | 7,234 | $ | 7,098,766 | ||||
| 3.85%, 01/05/28 (Call 10/05/27)(a) |
2,520 | 2,392,214 | ||||||
| 4.00%, 10/06/26 (Call 07/06/26)(a) |
4,995 | 4,829,273 | ||||||
| 4.30%, 07/13/25 (Call 04/13/25)(a) |
6,127 | 6,025,379 | ||||||
| 4.35%, 04/09/25 (Call 02/09/25)(a) |
6,947 | 6,856,672 | ||||||
| 4.35%, 01/17/27 (Call 10/17/26) |
8,338 | 8,115,208 | ||||||
| 5.00%, 04/09/27 (Call 03/09/27) |
8,709 | 8,625,174 | ||||||
| 5.25%, 03/01/26 (Call 12/01/25)(a) |
8,197 | 8,170,657 | ||||||
| 5.40%, 04/06/26 |
10,635 | 10,639,819 | ||||||
| 5.40%, 05/08/27 |
1,020 | 1,020,458 | ||||||
| 5.65%, 01/17/29 (Call 10/17/28) |
5,125 | 5,170,469 | ||||||
| 5.80%, 06/23/28 (Call 05/23/28) |
9,366 | 9,512,052 | ||||||
| 5.80%, 01/07/29 (Call 12/07/28)(a) |
6,000 | 6,072,991 | ||||||
| 6.00%, 01/09/28 (Call 12/09/27)(a) |
6,920 | 7,064,856 | ||||||
| 6.05%, 10/10/25 |
8,890 | 8,956,321 | ||||||
| Honda Motor Co. Ltd. |
||||||||
| 2.27%, 03/10/25 (Call 02/10/25) |
7,866 | 7,641,735 | ||||||
| 2.53%, 03/10/27 (Call 02/10/27)(a) |
11,640 | 10,871,157 | ||||||
| Hyundai Capital America |
||||||||
| 1.30%, 01/08/26 (Call 12/08/25)(a)(b) |
5,202 | 4,821,305 | ||||||
| 1.50%, 06/15/26 (Call 05/15/26)(b) |
5,169 | 4,730,353 | ||||||
| 1.65%, 09/17/26 (Call 08/17/26)(a)(b) |
5,910 | 5,386,609 | ||||||
| 1.80%, 10/15/25 (Call 09/15/25)(a)(b) |
4,722 | 4,450,782 | ||||||
| 1.80%, 01/10/28 (Call 11/08/27)(a)(b) |
4,560 | 4,007,732 | ||||||
| 2.00%, 06/15/28 (Call 04/15/28)(b) |
6,500 | 5,693,851 | ||||||
| 2.10%, 09/15/28 (Call 07/17/28)(a)(b) |
3,560 | 3,106,273 | ||||||
| 2.38%, 10/15/27 (Call 08/15/27)(a)(b) |
4,325 | 3,914,458 | ||||||
| 2.75%, 09/27/26(b) |
3,209 | 3,001,889 | ||||||
| 3.00%, 02/10/27 (Call 12/10/26)(a)(b) |
3,144 | 2,950,053 | ||||||
| 3.50%, 11/02/26 (Call 09/02/26)(a)(b) |
4,401 | 4,196,717 | ||||||
| 5.25%, 01/08/27(b) |
2,545 | 2,535,911 | ||||||
| 5.30%, 01/08/29 (Call 12/08/28)(b) |
3,745 | 3,736,171 | ||||||
| 5.50%, 03/30/26(a)(b) |
7,590 | 7,595,936 | ||||||
| 5.60%, 03/30/28 (Call 02/29/28)(b) |
5,960 | 6,014,962 | ||||||
| 5.65%, 06/26/26(a)(b) |
4,760 | 4,774,730 | ||||||
| 5.68%, 06/26/28 (Call 05/26/28)(a)(b) |
7,275 | 7,375,184 | ||||||
| 5.80%, 06/26/25(a)(b) |
3,780 | 3,794,192 | ||||||
| 5.88%, 04/07/25 (Call 03/07/25)(a)(b) |
4,022 | 4,033,709 | ||||||
| 5.95%, 09/21/26(a)(b) |
4,470 | 4,520,433 | ||||||
| 6.00%, 07/11/25(a)(b) |
1,920 | 1,930,003 | ||||||
| 6.10%, 09/21/28 (Call 08/21/28)(a)(b) |
6,215 | 6,400,159 | ||||||
| 6.25%, 11/03/25(a)(b) |
3,315 | 3,352,946 | ||||||
| 6.50%, 01/16/29 (Call 12/16/28)(a)(b) |
3,735 | 3,908,814 | ||||||
| Hyundai Capital Services Inc. |
||||||||
| 1.25%, 02/08/26(b) |
2,821 | 2,598,894 | ||||||
| 2.13%, 04/24/25(b) |
220 | 211,351 | ||||||
| 2.50%, 01/24/27(a)(b) |
3,695 | 3,402,598 | ||||||
| 3.63%, 08/29/27(a)(b) |
1,340 | 1,262,807 | ||||||
| 5.13%, 02/05/29(b) |
950 | 939,815 | ||||||
| Kia Corp. |
||||||||
| 1.75%, 10/16/26(a)(b) |
2,695 | 2,460,107 | ||||||
| 2.75%, 02/14/27(a)(b) |
4,260 | 3,964,932 | ||||||
| 3.25%, 04/21/26(b) |
905 | 864,588 | ||||||
| 3.50%, 10/25/27(b) |
350 | 327,849 | ||||||
| Mercedes-Benz Finance North America LLC |
||||||||
| 1.45%, 03/02/26(b) |
6,729 | 6,253,840 | ||||||
| 2.13%, 03/10/25(b) |
3,019 | 2,925,288 | ||||||
| 3.30%, 05/19/25(b) |
4,117 | 4,021,671 | ||||||
| 3.45%, 01/06/27(a)(b) |
4,663 | 4,476,605 | ||||||
| 3.50%, 08/03/25(b) |
3,233 | 3,158,057 | ||||||
| 3.75%, 02/22/28(a)(b) |
6,090 | 5,827,812 | ||||||
| Security | Par (000) |
Value | ||||||
| Auto Manufacturers (continued) | ||||||||
| 4.80%, 03/30/26(a)(b) |
$ | 6,760 | $ | 6,712,156 | ||||
| 4.80%, 01/11/27(a)(b) |
3,955 | 3,935,389 | ||||||
| 4.80%, 03/30/28(a)(b) |
6,892 | 6,840,447 | ||||||
| 4.85%, 01/11/29(a)(b) |
5,615 | 5,563,319 | ||||||
| 4.90%, 01/09/26(a)(b) |
3,880 | 3,865,899 | ||||||
| 4.95%, 03/30/25(a)(b) |
4,607 | 4,594,246 | ||||||
| 5.10%, 08/03/28(b) |
6,215 | 6,236,590 | ||||||
| 5.20%, 08/03/26(a)(b) |
3,730 | 3,737,532 | ||||||
| 5.25%, 11/29/27(a)(b) |
3,463 | 3,485,367 | ||||||
| 5.38%, 08/01/25(b) |
3,905 | 3,914,021 | ||||||
| 5.38%, 11/26/25(b) |
3,940 | 3,949,237 | ||||||
| Nissan Motor Acceptance Co. LLC |
||||||||
| 1.85%, 09/16/26 (Call 08/16/26)(a)(b) |
4,840 | 4,356,843 | ||||||
| 2.00%, 03/09/26 (Call 02/09/26)(b) |
6,210 | 5,724,526 | ||||||
| 2.45%, 09/15/28 (Call 07/15/28)(a)(b) |
1,520 | 1,300,330 | ||||||
| 2.75%, 03/09/28 (Call 01/09/28)(a)(b) |
5,678 | 4,998,377 | ||||||
| 6.95%, 09/15/26(a)(b) |
2,350 | 2,412,575 | ||||||
| 7.05%, 09/15/28 (Call 08/15/28)(a)(b) |
5,240 | 5,458,540 | ||||||
| Nissan Motor Co. Ltd. |
||||||||
| 3.52%, 09/17/25 (Call 08/17/25)(b) |
5,320 | 5,116,921 | ||||||
| 4.35%, 09/17/27 (Call 07/17/27)(a)(b) |
16,420 | 15,595,815 | ||||||
| PACCAR Financial Corp. |
||||||||
| 1.10%, 05/11/26(a) |
1,162 | 1,071,218 | ||||||
| 2.00%, 02/04/27(a) |
1,462 | 1,345,715 | ||||||
| 2.85%, 04/07/25(a) |
835 | 815,095 | ||||||
| 3.55%, 08/11/25(a) |
3,845 | 3,765,386 | ||||||
| 4.45%, 03/30/26 |
3,783 | 3,749,545 | ||||||
| 4.60%, 01/10/28(a) |
2,325 | 2,314,920 | ||||||
| 4.60%, 01/31/29(a) |
3,600 | 3,561,776 | ||||||
| 4.95%, 10/03/25 |
1,795 | 1,793,034 | ||||||
| 4.95%, 08/10/28(a) |
450 | 453,278 | ||||||
| 5.05%, 08/10/26 |
1,770 | 1,776,140 | ||||||
| 5.20%, 11/09/26(a) |
2,530 | 2,551,592 | ||||||
| Stellantis Finance U.S. Inc. |
||||||||
| 1.71%, 01/29/27 (Call 12/29/26)(a)(b) |
6,249 | 5,680,352 | ||||||
| 5.63%, 01/12/28 (Call 12/12/27)(a)(b) |
3,950 | 4,050,131 | ||||||
| Toyota Motor Corp. |
||||||||
| 1.34%, 03/25/26 (Call 02/25/26)(a) |
7,089 | 6,580,437 | ||||||
| 5.12%, 07/13/28 (Call 06/13/28)(a) |
4,805 | 4,899,370 | ||||||
| 5.28%, 07/13/26 (Call 06/13/26)(a) |
3,340 | 3,365,315 | ||||||
| Toyota Motor Credit Corp. |
||||||||
| 0.80%, 10/16/25(a) |
7,198 | 6,729,507 | ||||||
| 0.80%, 01/09/26(a) |
5,101 | 4,731,766 | ||||||
| 1.13%, 06/18/26(a) |
6,900 | 6,332,178 | ||||||
| 1.15%, 08/13/27(a) |
1,565 | 1,386,929 | ||||||
| 1.90%, 01/13/27 |
6,695 | 6,172,339 | ||||||
| 1.90%, 04/06/28(a) |
405 | 361,794 | ||||||
| 3.00%, 04/01/25 |
8,890 | 8,686,207 | ||||||
| 3.05%, 03/22/27(a) |
11,230 | 10,653,781 | ||||||
| 3.05%, 01/11/28(a) |
1,180 | 1,110,999 | ||||||
| 3.20%, 01/11/27(a) |
2,225 | 2,125,910 | ||||||
| 3.40%, 04/14/25 |
3,891 | 3,813,788 | ||||||
| 3.65%, 08/18/25 |
5,565 | 5,453,521 | ||||||
| 3.65%, 01/08/29 |
2,995 | 2,836,405 | ||||||
| 3.95%, 06/30/25 |
9,008 | 8,869,521 | ||||||
| 4.45%, 05/18/26 |
8,160 | 8,074,703 | ||||||
| 4.55%, 09/20/27 |
8,815 | 8,738,425 | ||||||
| 4.63%, 01/12/28(a) |
8,315 | 8,263,822 | ||||||
| 4.65%, 01/05/29(a) |
5,260 | 5,203,983 | ||||||
| 4.80%, 01/05/26 |
2,840 | 2,828,351 | ||||||
| 5.00%, 08/14/26 |
4,855 | 4,854,370 | ||||||
| S C H E D U L E O F I N V E S T M E N T S |
137 |
| Schedule of Investments (continued) February 29, 2024 |
iShares® 1-5 Year Investment Grade Corporate Bond ETF (Percentages shown are based on Net Assets) |
| Security | Par (000) |
Value | ||||||
| Auto Manufacturers (continued) | ||||||||
| 5.25%, 09/11/28(a) |
$ | 3,925 | $ | 3,984,209 | ||||
| 5.40%, 11/10/25 |
4,530 | 4,556,283 | ||||||
| 5.40%, 11/20/26 |
4,705 | 4,752,822 | ||||||
| 5.45%, 11/10/27(a) |
6,615 | 6,746,672 | ||||||
| 5.60%, 09/11/25(a) |
2,780 | 2,803,922 | ||||||
| Volkswagen Group of America Finance LLC |
||||||||
| 1.25%, 11/24/25 (Call 10/24/25)(b) |
8,276 | 7,706,480 | ||||||
| 1.63%, 11/24/27 (Call 09/24/27)(a)(b) |
3,550 | 3,136,541 | ||||||
| 3.20%, 09/26/26 (Call 07/26/26)(a)(b) |
4,608 | 4,376,925 | ||||||
| 3.35%, 05/13/25(b) |
6,907 | 6,728,243 | ||||||
| 3.95%, 06/06/25(a)(b) |
5,845 | 5,724,181 | ||||||
| 4.35%, 06/08/27 (Call 05/08/27)(a)(b) |
7,476 | 7,290,366 | ||||||
| 4.63%, 11/13/25(a)(b) |
5,206 | 5,136,931 | ||||||
| 4.75%, 11/13/28(a)(b) |
7,025 | 6,940,236 | ||||||
| 5.65%, 09/12/28 (Call 08/12/28)(a)(b) |
6,130 | 6,238,957 | ||||||
| 5.70%, 09/12/26(b) |
4,000 | 4,037,104 | ||||||
| 5.80%, 09/12/25(a)(b) |
5,545 | 5,568,591 | ||||||
| 6.00%, 11/16/26(a)(b) |
3,555 | 3,622,221 | ||||||
| 6.20%, 11/16/28 (Call 10/16/28)(a)(b) |
3,635 | 3,784,834 | ||||||
|
|
|
|||||||
| 981,292,396 | ||||||||
| Auto Parts & Equipment — 0.1% | ||||||||
| BorgWarner Inc., 2.65%, 07/01/27 |
7,873 | 7,269,727 | ||||||
| Denso Corp., 1.24%, 09/16/26 |
3,107 | 2,809,929 | ||||||
| Lear Corp., 3.80%, 09/15/27 (Call 06/15/27)(a) |
3,233 | 3,095,002 | ||||||
| LG Energy Solution Ltd. |
||||||||
| 5.63%, 09/25/26(b) |
200 | 200,548 | ||||||
| 5.75%, 09/25/28(a)(b) |
5,000 | 5,050,550 | ||||||
| Magna International Inc. |
||||||||
| 4.15%, 10/01/25 (Call 07/01/25) |
4,065 | 3,990,368 | ||||||
| 5.98%, 03/21/26 (Call 03/21/24)(a) |
550 | 550,091 | ||||||
|
|
|
|||||||
| 22,966,215 | ||||||||
| Banks — 32.6% | ||||||||
| ABN AMRO Bank NV |
||||||||
| 1.54%, 06/16/27 (Call 06/16/26), |
3,550 | 3,217,360 | ||||||
| 2.47%, 12/13/29 (Call 12/13/28), |
7,124 | 6,196,108 | ||||||
| 4.75%, 07/28/25(a)(b) |
7,598 | 7,453,941 | ||||||
| 4.80%, 04/18/26(b) |
4,606 | 4,493,743 | ||||||
| 6.34%, 09/18/27 (Call 09/18/26), |
6,125 | 6,229,001 | ||||||
| 6.58%, 10/13/26 (Call 10/13/25), |
2,300 | 2,321,883 | ||||||
| AIB Group PLC |
||||||||
| 6.61%, 09/13/29 (Call 09/13/28), |
2,640 | 2,739,345 | ||||||
| 7.58%, 10/14/26 (Call 10/14/25), |
680 | 697,379 | ||||||
| ANZ Bank New Zealand Ltd., |
||||||||
| 5.55%, 08/11/32 (Call 08/11/27), |
2,470 | 2,482,871 | ||||||
| ANZ New Zealand Int’l Ltd./London |
||||||||
| 1.25%, 06/22/26(b) |
1,788 | 1,633,171 | ||||||
| 3.45%, 07/17/27(a)(b) |
2,909 | 2,746,772 | ||||||
| 3.45%, 01/21/28(b) |
3,290 | 3,084,720 | ||||||
| 5.36%, 08/14/28(a)(b) |
7,595 | 7,657,014 | ||||||
| ASB Bank Ltd. |
||||||||
| 1.63%, 10/22/26(a)(b) |
1,788 | 1,627,678 | ||||||
| Security | Par (000) |
Value | ||||||
| Banks (continued) | ||||||||
| 5.35%, 06/15/26(a)(b) |
$ | 1,675 | $ | 1,674,343 | ||||
| 5.40%, 11/29/27(a)(b) |
3,260 | 3,281,135 | ||||||
| Australia & New Zealand Banking Group Ltd. |
||||||||
| 2.95%, 07/22/30 (Call 07/22/25), |
8,103 | 7,746,065 | ||||||
| 3.70%, 11/16/25 |
5,493 | 5,373,459 | ||||||
| 4.40%, 05/19/26(b) |
6,218 | 6,038,802 | ||||||
| 4.75%, 01/18/27 |
8,310 | 8,277,530 | ||||||
| 5.09%, 12/08/25 |
5,270 | 5,274,324 | ||||||
| 5.38%, 07/03/25(a) |
4,900 | 4,915,059 | ||||||
| 5.67%, 10/03/25(a) |
7,775 | 7,846,832 | ||||||
| Banco Bilbao Vizcaya Argentaria SA |
||||||||
| 1.13%, 09/18/25 |
4,233 | 3,958,196 | ||||||
| 5.86%, 09/14/26 (Call 09/14/25), |
5,918 | 5,914,937 | ||||||
| 6.14%, 09/14/28 (Call 09/14/27), |
3,985 | 4,044,485 | ||||||
| Banco de Bogota SA, |
260 | 246,417 | ||||||
| Banco de Credito del Peru SA |
||||||||
| 3.13%, 07/01/30 (Call 07/01/25), |
2,633 | 2,499,609 | ||||||
| 3.25%, 09/30/31 (Call 09/30/26), |
2,665 | 2,457,589 | ||||||
| 5.85%, 01/11/29 (Call 12/11/28)(a)(b) |
205 | 207,204 | ||||||
| Banco de Credito e Inversiones SA, |
695 | 654,480 | ||||||
| Banco General SA, |
330 | 312,510 | ||||||
| Banco Inbursa SA Institucion De Banca Multiple |
2,145 | 2,069,683 | ||||||
| Banco Internacional del Peru SAA Interbank, |
245 | 230,731 | ||||||
| Banco Santander Mexico SA Institucion de |
3,184 | 3,163,879 | ||||||
| Banco Santander SA |
||||||||
| 1.72%, 09/14/27 (Call 09/14/26), |
9,081 | 8,216,229 | ||||||
| 1.85%, 03/25/26 |
8,593 | 7,975,429 | ||||||
| 2.75%, 05/28/25(a) |
8,743 | 8,436,522 | ||||||
| 3.50%, 03/24/25(a) |
7,117 | 6,971,889 | ||||||
| 3.80%, 02/23/28(a) |
9,305 | 8,767,183 | ||||||
| 4.18%, 03/24/28 (Call 03/24/27), |
9,635 | 9,225,227 | ||||||
| 4.25%, 04/11/27(a) |
6,325 | 6,098,911 | ||||||
| 4.38%, 04/12/28 |
11,075 | 10,645,277 | ||||||
| 5.15%, 08/18/25 |
9,085 | 9,017,620 | ||||||
| 5.18%, 11/19/25 |
8,627 | 8,511,479 | ||||||
| 5.29%, 08/18/27 |
10,928 | 10,855,935 | ||||||
| 5.59%, 08/08/28(a) |
11,600 | 11,702,814 | ||||||
| 6.53%, 11/07/27 (Call 11/07/26), |
5,800 | 5,933,911 | ||||||
| 6.61%, 11/07/28(a) |
7,750 | 8,142,822 | ||||||
| Bangkok Bank PCL/Hong Kong |
||||||||
| 4.30%, 06/15/27 (Call 05/15/27)(b) |
605 | 586,647 | ||||||
| 4.45%, 09/19/28(b) |
60 | 58,047 | ||||||
| 5.30%, 09/21/28 (Call 08/21/28)(b) |
4,655 | 4,666,376 | ||||||
| 138 | 2 0 2 4 I S H A R E S A N N U A L R E P O R T T O S H A R E H O L D E R S |
| Schedule of Investments (continued) February 29, 2024 |
iShares® 1-5 Year Investment Grade Corporate Bond ETF (Percentages shown are based on Net Assets) |
| Security | Par (000) |
Value | ||||||
| Banks (continued) | ||||||||
| Bank of America Corp. |
||||||||
| 1.20%, 10/24/26 (Call 10/24/25), |
$ | 17,694 | $ | 16,484,985 | ||||
| 1.32%, 06/19/26 (Call 06/19/25), |
||||||||
| (1-day SOFR + 1.150%)(c) |
21,843 | 20,674,642 | ||||||
| 1.73%, 07/22/27 (Call 07/22/26), |
||||||||
| (1-day SOFR + 0.960%)(a)(c) |
43,976 | 40,325,171 | ||||||
| 2.09%, 06/14/29 (Call 06/14/28), |
||||||||
| (1-day SOFR + 1.060%)(c) |
11,450 | 10,062,033 | ||||||
| 2.55%, 02/04/28 (Call 02/04/27), |
||||||||
| (1-day SOFR + 1.050%)(c) |
14,243 | 13,181,061 | ||||||
| 3.25%, 10/21/27 (Call 10/21/26)(a) |
11,851 | 11,201,003 | ||||||
| 3.38%, 04/02/26 (Call 04/02/25), |
||||||||
| (1-day SOFR + 1.330%)(c) |
14,553 | 14,204,995 | ||||||
| 3.42%, 12/20/28 (Call 12/20/27), |
||||||||
| (3-mo. SOFR + 1.302%)(c) |
41,347 | 38,627,757 | ||||||
| 3.50%, 04/19/26 |
20,141 | 19,525,755 | ||||||
| 3.56%, 04/23/27 (Call 04/23/26), |
||||||||
| (3-mo. SOFR + 1.322%)(c) |
20,717 | 19,926,038 | ||||||
| 3.59%, 07/21/28 (Call 07/21/27), |
||||||||
| (3-mo. SOFR + 1.632%)(a)(c) |
16,940 | 16,060,134 | ||||||
| 3.71%, 04/24/28 (Call 04/24/27), |
||||||||
| (3-mo. SOFR + 1.774%)(a)(c) |
17,350 | 16,541,569 | ||||||
| 3.82%, 01/20/28 (Call 01/20/27), |
||||||||
| (3-mo. SOFR + 1.837%)(c) |
20,565 | 19,753,677 | ||||||
| 3.88%, 08/01/25 |
15,013 | 14,778,979 | ||||||
| 3.97%, 03/05/29 (Call 03/05/28), |
||||||||
| (3-mo. SOFR + 1.332%)(c) |
13,913 | 13,232,833 | ||||||
| 3.97%, 02/07/30 (Call 02/07/29), |
||||||||
| (3-mo. SOFR + 1.472%)(c) |
6,030 | 5,668,119 | ||||||
| 4.25%, 10/22/26 |
14,618 | 14,302,791 | ||||||
| 4.27%, 07/23/29 (Call 07/23/28), |
||||||||
| (3-mo. SOFR + 1.572%)(c) |
11,698 | 11,239,424 | ||||||
| 4.38%, 04/27/28 (Call 04/27/27), |
||||||||
| (1-day SOFR + 1.580%)(c) |
18,797 | 18,273,849 | ||||||
| 4.45%, 03/03/26 |
8,547 | 8,411,383 | ||||||
| 4.83%, 07/22/26 (Call 07/22/25), |
||||||||
| (1-day SOFR + 1.750%)(c) |
16,866 | 16,724,220 | ||||||
| 4.95%, 07/22/28 (Call 07/22/27), |
||||||||
| (1-day SOFR + 2.040%)(c) |
23,776 | 23,539,884 | ||||||
| 5.08%, 01/20/27 (Call 01/20/26), |
||||||||
| (1-day SOFR + 1.290%)(c) |
21,040 | 20,906,838 | ||||||
| 5.20%, 04/25/29 (Call 04/25/28), |
||||||||
| (1-day SOFR + 1.630%)(c) |
32,460 | 32,284,176 | ||||||
| 5.82%, 09/15/29 (Call 09/15/28), |
||||||||
| (1-day SOFR + 1.570%)(c) |
13,490 | 13,747,361 | ||||||
| 5.93%, 09/15/27 (Call 09/15/26), |
||||||||
| (1-day SOFR + 1.340%)(a)(c) |
6,125 | 6,206,938 | ||||||
| 6.20%, 11/10/28 (Call 11/10/27), |
||||||||
| (1-day SOFR + 1.990%)(c) |
11,945 | 12,323,748 | ||||||
| 6.22%, 09/15/26(a) |
2,609 | 2,667,720 | ||||||
| Series L, 3.95%, 04/21/25 |
17,920 | 17,624,620 | ||||||
| Series L, 4.18%, 11/25/27 (Call 11/25/26) |
17,169 | 16,600,322 | ||||||
| Series N, 1.66%, 03/11/27 (Call 03/11/26), |
||||||||
| (1-day SOFR + 0.910%)(c) |
20,136 | 18,684,074 | ||||||
| Bank of America NA |
||||||||
| 5.53%, 08/18/26 (Call 07/18/26) |
16,060 | 16,218,823 | ||||||
| 5.65%, 08/18/25 (Call 07/18/25) |
16,055 | 16,170,943 | ||||||
| Security | Par (000) |
Value | ||||||
| Banks (continued) | ||||||||
| Bank of Ireland Group PLC |
||||||||
| 2.03%, 09/30/27 (Call 09/30/26), |
||||||||
| (1-year CMT + 1.100%)(b)(c) |
$ | 3,099 | $ | 2,818,881 | ||||
| 6.25%, 09/16/26 (Call 09/16/25), |
||||||||
| (1-year CMT + 2.650%)(a)(b)(c) |
9,300 | 9,349,140 | ||||||
| Bank of Montreal |
||||||||
| 0.95%, 01/22/27 (Call 01/22/26), |
||||||||
| (1-day SOFR + 0.603%)(c) |
5,870 | 5,415,773 | ||||||
| 1.25%, 09/15/26 |
7,689 | 6,994,325 | ||||||
| 1.85%, 05/01/25 |
7,861 | 7,554,355 | ||||||
| 2.65%, 03/08/27 |
8,027 | 7,495,161 | ||||||
| 3.70%, 06/07/25 |
7,225 | 7,079,083 | ||||||
| 3.80%, 12/15/32 (Call 12/15/27), |
||||||||
| (5-year USD Swap + 1.432%)(c) |
7,985 | 7,351,708 | ||||||
| 5.20%, 02/01/28 (Call 01/01/28)(a) |
7,704 | 7,734,028 | ||||||
| 5.27%, 12/11/26 |
3,195 | 3,203,080 | ||||||
| 5.30%, 06/05/26(a) |
8,460 | 8,481,609 | ||||||
| 5.72%, 09/25/28 (Call 08/25/28) |
11,040 | 11,317,441 | ||||||
| 5.92%, 09/25/25 |
4,640 | 4,687,993 | ||||||
| Series H, 4.70%, 09/14/27 (Call 08/14/27)(a) |
6,428 | 6,364,630 | ||||||
| Bank of New York Mellon Corp. (The) |
||||||||
| 0.75%, 01/28/26 (Call 12/28/25)(a) |
4,108 | 3,790,378 | ||||||
| 1.05%, 10/15/26 (Call 09/15/26)(a) |
2,446 | 2,211,675 | ||||||
| 1.60%, 04/24/25 (Call 03/24/25) |
7,257 | 6,972,145 | ||||||
| 1.65%, 07/14/28 (Call 05/14/28)(a) |
493 | 431,413 | ||||||
| 2.05%, 01/26/27 (Call 12/26/26)(a) |
5,282 | 4,880,732 | ||||||
| 2.45%, 08/17/26 (Call 05/17/26) |
4,302 | 4,050,796 | ||||||
| 2.80%, 05/04/26 (Call 02/04/26) |
4,197 | 4,011,290 | ||||||
| 3.00%, 10/30/28 (Call 07/30/28)(a) |
2,560 | 2,347,965 | ||||||
| 3.25%, 05/16/27 (Call 02/16/27) |
5,385 | 5,120,428 | ||||||
| 3.40%, 01/29/28 (Call 10/29/27)(a) |
3,440 | 3,260,208 | ||||||
| 3.44%, 02/07/28 (Call 02/07/27), |
||||||||
| (3-mo. SOFR + 1.331%)(a)(c) |
6,366 | 6,085,766 | ||||||
| 3.85%, 04/28/28 |
5,865 | 5,663,904 | ||||||
| 3.95%, 11/18/25 (Call 10/18/25) |
1,902 | 1,862,246 | ||||||
| 3.99%, 06/13/28 (Call 06/13/27), |
||||||||
| (1-day SOFR + 1.151%)(c) |
3,998 | 3,874,990 | ||||||
| 4.41%, 07/24/26 (Call 07/24/25), |
||||||||
| (1-day SOFR + 1.345%)(c) |
7,410 | 7,308,151 | ||||||
| 4.54%, 02/01/29 (Call 02/01/28), |
||||||||
| (1-day SOFR + 1.168%)(a)(c) |
7,073 | 6,950,266 | ||||||
| 4.95%, 04/26/27 (Call 04/26/26), |
||||||||
| (1-day SOFR + 1.026%)(c) |
9,620 | 9,567,719 | ||||||
| 5.15%, 05/22/26 (Call 05/22/25), |
||||||||
| (1-day SOFR + 1.067%)(a)(c) |
2,680 | 2,673,696 | ||||||
| 5.80%, 10/25/28 (Call 10/25/27), |
||||||||
| (1-day SOFR + 1.802%)(c) |
7,398 | 7,579,058 | ||||||
| 6.32%, 10/25/29 (Call 10/25/28), |
||||||||
| (1-day SOFR + 1.598%)(c) |
5,995 | 6,285,640 | ||||||
| Series J, 1.90%, 01/25/29 (Call 11/25/28)(a) |
1,765 | 1,545,094 | ||||||
| Bank of New Zealand |
||||||||
| 1.00%, 03/03/26(a)(b) |
1,584 | 1,456,719 | ||||||
| 2.29%, 01/27/27(a)(b) |
2,286 | 2,104,483 | ||||||
| 4.85%, 02/07/28(b) |
4,563 | 4,514,726 | ||||||
| 5.08%, 01/30/29(b) |
5,635 | 5,607,476 | ||||||
| Bank of Nova Scotia (The) |
||||||||
| 1.05%, 03/02/26(a) |
5,831 | 5,377,001 | ||||||
| 1.30%, 06/11/25 |
6,784 | 6,447,243 | ||||||
| 1.30%, 09/15/26 (Call 06/15/26) |
5,610 | 5,110,259 | ||||||
| 1.35%, 06/24/26(a) |
4,694 | 4,308,453 | ||||||
| 1.95%, 02/02/27 |
4,555 | 4,182,149 | ||||||
| S C H E D U L E O F I N V E S T M E N T S |
139 |
| Schedule of Investments (continued) February 29, 2024 |
iShares® 1-5 Year Investment Grade Corporate Bond ETF (Percentages shown are based on Net Assets) |
| Security | Par (000) |
Value | ||||||
| Banks (continued) | ||||||||
| 2.70%, 08/03/26(a) |
$ | 7,880 | $ | 7,449,995 | ||||
| 2.95%, 03/11/27(a) |
4,161 | 3,916,056 | ||||||
| 3.45%, 04/11/25 |
11,492 | 11,248,870 | ||||||
| 4.50%, 12/16/25 |
8,884 | 8,732,379 | ||||||
| 4.75%, 02/02/26(a) |
8,278 | 8,212,510 | ||||||
| 4.90%, (Call 06/04/25), |
||||||||
| (5-year CMT + 4.551%)(a)(c)(d) |
7,858 | 7,530,448 | ||||||
| 5.25%, 06/12/28 |
6,035 | 6,063,747 | ||||||
| 5.35%, 12/07/26 |
6,815 | 6,839,774 | ||||||
| 5.45%, 06/12/25 |
7,885 | 7,888,498 | ||||||
| 8.63%, 10/27/82 (Call 10/27/27), |
||||||||
| (5-year CMT + 4.389%)(a)(c) |
4,700 | 4,835,421 | ||||||
| Series 2, 3.63%, 10/27/81 (Call 10/27/26), |
||||||||
| (5-year CMT + 2.613%)(c) |
3,836 | 3,011,683 | ||||||
| Bank OZK, 2.75%, 10/01/31 |
1,305 | 1,085,839 | ||||||
| BankUnited Inc., 4.88%, 11/17/25 |
820 | 797,139 | ||||||
| Banque Federative du Credit Mutuel SA |
||||||||
| 1.60%, 10/04/26(a)(b) |
3,250 | 2,964,254 | ||||||
| 4.52%, 07/13/25(a)(b) |
1,428 | 1,411,379 | ||||||
| 4.75%, 07/13/27(a)(b) |
4,630 | 4,569,862 | ||||||
| 4.94%, 01/26/26(a)(b) |
6,470 | 6,423,206 | ||||||
| 5.09%, 01/23/27(a)(b) |
5,860 | 5,849,056 | ||||||
| 5.79%, 07/13/28(b) |
6,735 | 6,887,217 | ||||||
| 5.90%, 07/13/26(a)(b) |
7,490 | 7,587,568 | ||||||
| Barclays PLC |
||||||||
| 2.28%, 11/24/27 (Call 11/24/26), |
||||||||
| (1-year CMT + 1.050%)(c) |
11,662 | 10,658,524 | ||||||
| 2.85%, 05/07/26 (Call 05/07/25), |
||||||||
| (1-day SOFR + 2.714%)(c) |
12,506 | 12,090,402 | ||||||
| 3.65%, 03/16/25 |
12,085 | 11,835,643 | ||||||
| 4.34%, 01/10/28 (Call 01/10/27) |
11,650 | 11,214,485 | ||||||
| 4.38%, 01/12/26(a) |
16,476 | 16,140,596 | ||||||
| 4.84%, 05/09/28 (Call 05/07/27) |
7,040 | 6,784,083 | ||||||
| 4.97%, 05/16/29 (Call 05/16/28), |
||||||||
| (3-mo. LIBOR US + 1.902%)(c) |
14,605 | 14,200,289 | ||||||
| 5.20%, 05/12/26 |
13,735 | 13,580,915 | ||||||
| 5.30%, 08/09/26 (Call 08/09/25), |
||||||||
| (1-year CMT + 2.300%)(c) |
9,157 | 9,098,525 | ||||||
| 5.50%, 08/09/28 (Call 08/09/27), |
||||||||
| (1-year CMT + 2.650%)(c) |
12,353 | 12,299,117 | ||||||
| 5.83%, 05/09/27 (Call 05/09/26), |
||||||||
| (1-day SOFR + 2.210%)(a)(c) |
13,010 | 13,042,924 | ||||||
| 6.49%, 09/13/29 (Call 09/13/28), |
||||||||
| (1-day SOFR + 2.220%)(a)(c) |
11,300 | 11,647,891 | ||||||
| 6.50%, 09/13/27 (Call 09/13/26), |
||||||||
| (1-day SOFR + 1.880%)(c) |
5,430 | 5,525,455 | ||||||
| 7.33%, 11/02/26 (Call 11/02/25), |
||||||||
| (1-year CMT + 3.050%)(a)(c) |
9,465 | 9,700,347 | ||||||
| 7.39%, 11/02/28 (Call 11/02/27), |
||||||||
| (1-year CMT + 3.300%)(a)(c) |
12,131 | 12,824,534 | ||||||
| BBVA Bancomer SA/Texas, |
2,125 | 2,008,943 | ||||||
| BNP Paribas SA |
||||||||
| 1.32%, 01/13/27 (Call 01/13/26), |
||||||||
| (1-day SOFR + 1.004%)(b)(c) |
12,978 | 12,002,916 | ||||||
| 1.68%, 06/30/27 (Call 06/30/26), |
||||||||
| (1-day SOFR + 0.912%)(a)(b)(c) |
14,293 | 13,078,390 | ||||||
| 1.90%, 09/30/28 (Call 09/30/27), |
||||||||
| (1-day SOFR + 1.609%)(b)(c) |
9,980 | 8,831,568 | ||||||
| Security | Par (000) |
Value | ||||||
| Banks (continued) | ||||||||
| 2.16%, 09/15/29 (Call 09/15/28), |
||||||||
| (1-day SOFR + 1.218%)(a)(b)(c) |
$ | 5,560 | $ | 4,810,898 | ||||
| 2.22%, 06/09/26 (Call 06/09/25), |
||||||||
| (1-day SOFR + 2.074%)(b)(c) |
10,484 | 10,036,271 | ||||||
| 2.59%, 01/20/28 (Call 01/20/27), |
||||||||
| (1-day SOFR + 1.228%)(b)(c) |
11,705 | 10,797,650 | ||||||
| 3.50%, 11/16/27(a)(b) |
7,125 | 6,706,355 | ||||||
| 4.38%, 09/28/25(b) |
580 | 568,089 | ||||||
| 4.38%, 05/12/26(b) |
6,575 | 6,381,802 | ||||||
| 4.38%, 03/01/33 (Call 03/01/28), |
||||||||
| (5-year USD Swap + 1.483%)(a)(b)(c) |
8,040 | 7,552,372 | ||||||
| 4.40%, 08/14/28(a)(b) |
19,670 | 18,971,350 | ||||||
| 4.63%, 03/13/27(a)(b) |
12,058 | 11,702,029 | ||||||
| 5.13%, 01/13/29 (Call 01/13/28), |
||||||||
| (1-year CMT + 1.450%)(a)(b)(c) |
6,275 | 6,230,538 | ||||||
| 5.18%, 01/09/30 (Call 01/09/29), |
||||||||
| (1-day SOFR + 1.520%)(a)(b)(c) |
11,639 | 11,530,068 | ||||||
| 5.20%, 01/10/30 (Call 01/10/29), |
||||||||
| (3-mo. SOFR + 2.829%)(a)(b)(c) |
1,270 | 1,256,938 | ||||||
| BPCE SA |
||||||||
| 1.00%, 01/20/26(a)(b) |
11,843 | 10,931,848 | ||||||
| 1.65%, 10/06/26 (Call 10/06/25), |
||||||||
| (1-day SOFR + 1.520%)(b)(c) |
8,757 | 8,186,457 | ||||||
| 2.05%, 10/19/27 (Call 10/19/26), |
||||||||
| (1-day SOFR + 1.087%)(b)(c) |
5,670 | 5,145,733 | ||||||
| 3.25%, 01/11/28(a)(b) |
7,000 | 6,499,339 | ||||||
| 3.38%, 12/02/26(a) |
3,275 | 3,132,025 | ||||||
| 3.50%, 10/23/27(a)(b) |
8,580 | 7,994,415 | ||||||
| 4.50%, 03/15/25(b) |
6,996 | 6,868,940 | ||||||
| 4.63%, 09/12/28(a)(b) |
2,145 | 2,072,958 | ||||||
| 4.75%, 07/19/27(a)(b) |
4,100 | 4,018,955 | ||||||
| 4.88%, 04/01/26(a)(b) |
4,143 | 4,051,474 | ||||||
| 5.10%, 01/26/26(a)(b) |
5,060 | 5,038,511 | ||||||
| 5.13%, 01/18/28(a)(b) |
5,153 | 5,111,959 | ||||||
| 5.20%, 01/18/27(a)(b) |
2,045 | 2,044,000 | ||||||
| 5.72%, 01/18/30 (Call 01/18/29), |
||||||||
| (1-year CMT + 1.959%)(a)(b)(c) |
5,100 | 5,078,353 | ||||||
| 5.98%, 01/18/27 (Call 01/18/26), |
||||||||
| (1-day SOFR + 2.10%)(b)(c) |
9,840 | 9,848,159 | ||||||
| 6.61%, 10/19/27 (Call 10/19/26), |
||||||||
| (1-day SOFR + 1.980%)(b)(c) |
6,325 | 6,451,701 | ||||||
| 6.71%, 10/19/29 (Call 10/19/28), |
||||||||
| (1-day SOFR + 2.270%)(a) |
6,010 | 6,239,248 | ||||||
| CaixaBank SA |
||||||||
| 6.21%, 01/18/29 (Call 01/18/28), |
||||||||
| (1-day SOFR + 2.700%)(a)(b)(c) |
7,170 | 7,269,951 | ||||||
| 6.68%, 09/13/27 (Call 09/13/26), |
||||||||
| (1-day SOFR + 2.080%)(a)(b)(c) |
3,080 | 3,139,597 | ||||||
| Canadian Imperial Bank of Commerce |
||||||||
| 0.95%, 10/23/25(a) |
8,753 | 8,183,432 | ||||||
| 1.25%, 06/22/26 (Call 05/22/26) |
2,521 | 2,310,607 | ||||||
| 3.30%, 04/07/25 |
6,270 | 6,125,235 | ||||||
| 3.45%, 04/07/27 (Call 03/07/27)(a) |
5,190 | 4,948,873 | ||||||
| 3.95%, 08/04/25 |
6,030 | 5,911,743 | ||||||
| 5.00%, 04/28/28 (Call 03/28/28)(a) |
8,215 | 8,185,515 | ||||||
| 5.14%, 04/28/25 |
6,380 | 6,357,734 | ||||||
| 5.62%, 07/17/26(a) |
1,265 | 1,277,460 | ||||||
| 5.93%, 10/02/26(a) |
3,945 | 4,018,276 | ||||||
| 5.99%, 10/03/28 (Call 09/03/28)(a) |
5,875 | 6,079,472 | ||||||
| CIMB Bank Bhd, 2.13%, 07/20/27(b) |
4,300 | 3,894,382 | ||||||
| 140 | 2 0 2 4 I S H A R E S A N N U A L R E P O R T T O S H A R E H O L D E R S |
| Schedule of Investments (continued) February 29, 2024 |
iShares® 1-5 Year Investment Grade Corporate Bond ETF (Percentages shown are based on Net Assets) |
| Security | Par (000) |
Value | ||||||
| Banks (continued) | ||||||||
| Citibank NA |
||||||||
| 5.49%, 12/04/26 (Call 11/04/26) |
$ | 19,075 | $ | 19,234,046 | ||||
| 5.80%, 09/29/28 (Call 08/29/28)(a) |
11,285 | 11,626,588 | ||||||
| 5.86%, 09/29/25 (Call 08/29/25) |
825 | 834,693 | ||||||
| Citigroup Inc. |
||||||||
| 1.12%, 01/28/27 (Call 01/28/26), |
19,035 | 17,542,494 | ||||||
| 1.46%, 06/09/27 (Call 06/09/26), |
20,231 | 18,529,718 | ||||||
| 3.07%, 02/24/28 (Call 02/24/27), |
19,830 | 18,574,524 | ||||||
| 3.11%, 04/08/26 (Call 04/08/25), |
25,833 | 25,143,554 | ||||||
| 3.20%, 10/21/26 (Call 07/21/26)(a) |
22,727 | 21,581,129 | ||||||
| 3.29%, 03/17/26 (Call 03/17/25), |
14,070 | 13,735,089 | ||||||
| 3.30%, 04/27/25 |
12,428 | 12,151,132 | ||||||
| 3.40%, 05/01/26 |
16,760 | 16,124,865 | ||||||
| 3.52%, 10/27/28 (Call 10/27/27), |
18,169 | 17,074,130 | ||||||
| 3.67%, 07/24/28 (Call 07/24/27), |
19,910 | 18,878,525 | ||||||
| 3.70%, 01/12/26(a) |
16,423 | 15,987,541 | ||||||
| 3.88%, 03/26/25 |
8,274 | 8,121,885 | ||||||
| 3.89%, 01/10/28 (Call 01/10/27), |
20,927 | 20,113,414 | ||||||
| 4.08%, 04/23/29 (Call 04/23/28), |
7,795 | 7,439,558 | ||||||
| 4.13%, 07/25/28 |
8,909 | 8,474,650 | ||||||
| 4.30%, 11/20/26 |
9,446 | 9,200,823 | ||||||
| 4.40%, 06/10/25 |
18,551 | 18,275,203 | ||||||
| 4.45%, 09/29/27 |
28,151 | 27,268,579 | ||||||
| 4.60%, 03/09/26 |
13,612 | 13,388,977 | ||||||
| 4.66%, 05/24/28 (Call 05/24/27), |
13,625 | 13,384,528 | ||||||
| 5.17%, 02/13/30 (Call 02/13/29), |
8,310 | 8,225,124 | ||||||
| 5.50%, 09/13/25 |
11,811 | 11,788,523 | ||||||
| 5.61%, 09/29/26 (Call 09/29/25), |
18,621 | 18,644,626 | ||||||
| 6.63%, 01/15/28(a) |
655 | 692,176 | ||||||
| Citizens Bank NA |
||||||||
| 2.25%, 04/28/25 (Call 03/28/25)(a) |
989 | 948,938 | ||||||
| 4.58%, 08/09/28 (Call 08/09/27), |
4,213 | 4,014,297 | ||||||
| Citizens Bank NA/Providence RI, 3.75%, 02/18/26 (Call 11/18/25)(a) |
3,171 | 3,037,700 | ||||||
| Citizens Financial Group Inc. |
||||||||
| 2.85%, 07/27/26 (Call 04/27/26)(a) |
3,170 | 2,954,929 | ||||||
| 4.30%, 12/03/25 (Call 11/03/25) |
1,789 | 1,741,888 | ||||||
| 5.84%, 01/23/30 (Call 01/23/29), |
3,595 | 3,551,957 | ||||||
| Comerica Bank, 4.00%, 07/27/25(a) |
758 | 735,265 | ||||||
| Comerica Inc., 3.80%, 07/22/26(a) |
970 | 927,181 | ||||||
| Commonwealth Bank of Australia |
||||||||
| 1.13%, 06/15/26(b) |
7,140 | 6,537,473 | ||||||
| 2.55%, 03/14/27(a)(b) |
5,902 | 5,501,271 | ||||||
| 2.63%, 09/06/26(a)(b) |
5,892 | 5,564,555 | ||||||
| 2.85%, 05/18/26(b) |
3,345 | 3,191,665 | ||||||
| 3.15%, 09/19/27(a)(b) |
4,025 | 3,777,643 | ||||||
| 3.90%, 03/16/28(a)(b) |
770 | 741,463 | ||||||
| Security | Par (000) |
Value | ||||||
| Banks (continued) | ||||||||
| 4.50%, 12/09/25(a)(b) |
$ | 3,402 | $ | 3,337,804 | ||||
| Commonwealth Bank of Australia/New York |
||||||||
| 5.32%, 03/13/26 |
6,322 | 6,351,783 | ||||||
| 5.50%, 09/12/25(a) |
3,985 | 4,007,768 | ||||||
| Cooperatieve Rabobank UA |
||||||||
| 1.00%, 09/24/26 (Call 09/24/25), |
12,889 | 12,010,301 | ||||||
| 1.11%, 02/24/27 (Call 02/24/26), |
11,827 | 10,843,109 | ||||||
| 1.34%, 06/24/26 (Call 06/24/25), |
6,129 | 5,791,526 | ||||||
| 1.98%, 12/15/27 (Call 12/15/26), |
7,875 | 7,144,054 | ||||||
| 3.65%, 04/06/28 (Call 04/06/27), |
6,739 | 6,384,810 | ||||||
| 3.75%, 07/21/26 |
6,331 | 6,068,308 | ||||||
| 4.38%, 08/04/25 |
9,288 | 9,109,506 | ||||||
| 4.66%, 08/22/28 (Call 08/22/27), |
5,984 | 5,830,314 | ||||||
| 4.80%, 01/09/29(a) |
3,150 | 3,120,313 | ||||||
| 4.85%, 01/09/26(a) |
3,070 | 3,057,020 | ||||||
| 5.04%, 03/05/27 |
3,000 | 3,000,770 | ||||||
| 5.45%, 03/05/30 (Call 03/05/29), |
6,250 | 6,250,058 | ||||||
| 5.56%, 02/28/29 (Call 02/28/28), |
6,775 | 6,798,610 | ||||||
| Cooperatieve Rabobank UA/NY |
||||||||
| 3.38%, 05/21/25 |
6,027 | 5,900,849 | ||||||
| 5.50%, 07/18/25(a) |
5,020 | 5,043,605 | ||||||
| 5.50%, 10/05/26(a) |
4,425 | 4,477,165 | ||||||
| Credicorp Ltd., 2.75%, 06/17/25 |
911 | 872,422 | ||||||
| Credit Agricole SA |
||||||||
| 1.25%, 01/26/27 (Call 01/26/26), |
8,483 | 7,830,465 | ||||||
| 2.02%, 01/11/27(a)(b) |
5,412 | 4,975,341 | ||||||
| 4.00%, 01/10/33 (Call 01/10/28), |
7,803 | 7,210,916 | ||||||
| 4.38%, 03/17/25(b) |
6,731 | 6,615,577 | ||||||
| 5.30%, 07/12/28(a)(b) |
8,895 | 8,961,195 | ||||||
| 5.34%, 01/10/30 (Call 01/10/29), |
4,725 | 4,687,193 | ||||||
| 5.57%, 02/28/25(b) |
250 | 250,017 | ||||||
| 5.59%, 07/05/26(a)(b) |
6,760 | 6,816,152 | ||||||
| 6.32%, 10/03/29 (Call 10/03/28), |
9,785 | 10,084,652 | ||||||
| Credit Agricole SA/London |
||||||||
| 1.91%, 06/16/26 (Call 06/16/25), |
7,847 | 7,476,511 | ||||||
| 4.13%, 01/10/27(a)(b) |
5,528 | 5,355,065 | ||||||
| Credit Suisse AG/New York |
||||||||
| 1.25%, 08/07/26(a) |
8,092 | 7,336,687 | ||||||
| 2.95%, 04/09/25 |
7,481 | 7,264,147 | ||||||
| 5.00%, 07/09/27 |
7,620 | 7,549,661 | ||||||
| 7.50%, 02/15/28 |
19,560 | 21,053,216 | ||||||
| Danske Bank A/S |
||||||||
| 1.55%, 09/10/27 (Call 09/10/26), |
3,471 | 3,152,139 | ||||||
| 1.62%, 09/11/26 (Call 09/11/25), |
4,237 | 3,972,048 | ||||||
| S C H E D U L E O F I N V E S T M E N T S |
141 |
| Schedule of Investments (continued) February 29, 2024 |
iShares® 1-5 Year Investment Grade Corporate Bond ETF (Percentages shown are based on Net Assets) |
| Security | Par (000) |
Value | ||||||
| Banks (continued) | ||||||||
| 4.30%, 04/01/28 (Call 04/01/27), |
$ | 7,156 | $ | 6,891,847 | ||||
| 4.38%, 06/12/28(b) |
4,218 | 4,076,151 | ||||||
| 5.43%, 03/01/28 (Call 03/01/27), |
4,600 | 4,606,759 | ||||||
| 5.71%, 03/01/30 (Call 03/01/29), |
4,600 | 4,609,768 | ||||||
| 6.26%, 09/22/26 (Call 09/22/25), |
7,545 | 7,622,786 | ||||||
| DBS Group Holdings Ltd. |
||||||||
| 1.19%, 03/15/27(b) |
3,060 | 2,735,757 | ||||||
| 5.48%, 09/12/25(b) |
50 | 50,256 | ||||||
| Deutsche Bank AG |
||||||||
| 4.10%, 01/13/26 |
973 | 947,124 | ||||||
| 4.50%, 04/01/25(a) |
7,195 | 7,057,070 | ||||||
| 5.71%, 02/08/28 (Call 02/08/27), |
||||||||
| (1-day SOFR + 1.594%)(c) |
6,850 | 6,802,586 | ||||||
| Deutsche Bank AG/New York |
||||||||
| 1.69%, 03/19/26(a) |
9,932 | 9,254,565 | ||||||
| 2.13%, 11/24/26 (Call 11/24/25), |
||||||||
| (1-day SOFR + 1.870%)(c) |
12,289 | 11,517,099 | ||||||
| 2.31%, 11/16/27 (Call 11/16/26), |
||||||||
| (1-day SOFR + 1.219%)(c) |
11,389 | 10,346,272 | ||||||
| 2.55%, 01/07/28 (Call 01/07/27), |
||||||||
| (1-day SOFR + 1.318%)(a)(c) |
8,753 | 7,981,184 | ||||||
| 4.10%, 01/13/26 |
475 | 463,332 | ||||||
| 4.16%, 05/13/25 |
1,730 | 1,703,083 | ||||||
| 4.88%, 12/01/32 (Call 12/01/27), |
6,485 | 6,002,704 | ||||||
| 5.37%, 09/09/27 |
1,630 | 1,632,987 | ||||||
| 6.12%, 07/14/26 (Call 07/14/25), |
||||||||
| (1-day SOFR + 3.190%)(c) |
7,145 | 7,160,434 | ||||||
| 6.72%, 01/18/29 (Call 01/18/28), |
||||||||
| (1-day SOFR + 3.180%)(a)(c) |
11,065 | 11,368,026 | ||||||
| 6.82%, 11/20/29 (Call 11/20/28), |
||||||||
| (1-day SOFR + 2.510%)(c) |
8,275 | 8,557,501 | ||||||
| 7.15%, 07/13/27 (Call 07/13/26), |
||||||||
| (1-day SOFR + 2.520%)(c) |
6,850 | 7,035,923 | ||||||
| Discover Bank |
||||||||
| 3.45%, 07/27/26 (Call 04/27/26)(a) |
5,404 | 5,125,056 | ||||||
| 4.25%, 03/13/26 |
1,522 | 1,478,223 | ||||||
| 4.65%, 09/13/28 (Call 06/13/28) |
6,100 | 5,824,824 | ||||||
| DNB Bank ASA |
||||||||
| 1.13%, 09/16/26 (Call 09/16/25), |
||||||||
| (1-year CMT + 0.850%)(a)(b)(c) |
2,853 | 2,661,266 | ||||||
| 1.54%, 05/25/27 (Call 05/25/26), |
||||||||
| (1-year CMT + 0.720%)(a)(b)(c) |
5,378 | 4,933,757 | ||||||
| 1.61%, 03/30/28 (Call 03/30/27), |
||||||||
| (1-year CMT + 0.680%)(a)(b)(c) |
4,170 | 3,712,163 | ||||||
| 5.90%, 10/09/26 (Call 10/09/25), |
||||||||
| (1-day SOFR + 1.950%)(a)(b)(c) |
3,755 | 3,774,661 | ||||||
| Federation des Caisses Desjardins du Quebec |
||||||||
| 4.40%, 08/23/25(a)(b) |
810 | 798,600 | ||||||
| 4.55%, 08/23/27(a)(b) |
1,938 | 1,901,919 | ||||||
| 5.25%, 04/26/29(a)(b) |
5,500 | 5,450,298 | ||||||
| 5.70%, 03/14/28(a)(b) |
5,387 | 5,446,290 | ||||||
| Fifth Third Bancorp. |
||||||||
| 1.71%, 11/01/27 (Call 11/01/26), |
||||||||
| (1-day SOFR + 0.685%)(c) |
10,900 | 9,787,735 | ||||||
| 2.55%, 05/05/27 (Call 04/05/27) |
4,085 | 3,751,202 | ||||||
| 3.95%, 03/14/28 (Call 02/14/28) |
1,905 | 1,812,072 | ||||||
| Security | Par (000) |
Value | ||||||
| Banks (continued) | ||||||||
| 4.06%, 04/25/28 (Call 04/25/27), |
||||||||
| (1-day SOFR + 1.355%)(c) |
$ | 2,330 | $ | 2,208,991 | ||||
| 6.34%, 07/27/29 (Call 07/27/28), |
||||||||
| (1-day SOFR + 2.340%)(c) |
9,240 | 9,481,726 | ||||||
| 6.36%, 10/27/28 (Call 10/27/27), |
||||||||
| (1-day SOFR + 2.192%)(a)(c) |
6,153 | 6,272,707 | ||||||
| Fifth Third Bank NA |
||||||||
| 2.25%, 02/01/27 (Call 01/01/27)(a) |
2,355 | 2,160,719 | ||||||
| 3.85%, 03/15/26 (Call 02/15/26) |
1,710 | 1,647,334 | ||||||
| 3.95%, 07/28/25 (Call 06/28/25)(a) |
1,932 | 1,890,911 | ||||||
| First Citizens BancShares Inc./NC, 3.38%, 03/15/30 (Call 03/15/25), |
1,730 | 1,654,277 | ||||||
| First Horizon Corp., 4.00%, 05/26/25 |
714 | 698,017 | ||||||
| First-Citizens Bank & Trust Co., 6.13%, 03/09/28(a) |
2,208 | 2,242,313 | ||||||
| FNB Corp., 5.15%, 08/25/25 (Call 07/25/25) |
870 | 854,198 | ||||||
| Goldman Sachs Group Inc. (The) |
||||||||
| 1.09%, 12/09/26 (Call 12/09/25), |
15,367 | 14,235,103 | ||||||
| 1.43%, 03/09/27 (Call 03/09/26), |
21,734 | 20,087,581 | ||||||
| 1.54%, 09/10/27 (Call 09/10/26), |
19,839 | 18,059,191 | ||||||
| 1.95%, 10/21/27 (Call 10/21/26), |
29,123 | 26,660,616 | ||||||
| 2.64%, 02/24/28 (Call 02/24/27), |
21,892 | 20,274,935 | ||||||
| 3.50%, 04/01/25 (Call 03/01/25) |
23,522 | 23,035,746 | ||||||
| 3.50%, 11/16/26 (Call 11/16/25) |
20,557 | 19,717,762 | ||||||
| 3.62%, 03/15/28 (Call 03/15/27), |
||||||||
| (1-day SOFR + 1.846%)(a)(c) |
23,519 | 22,423,766 | ||||||
| 3.69%, 06/05/28 (Call 06/05/27), |
||||||||
| (3-mo. SOFR + 1.772%)(a)(c) |
18,594 | 17,732,181 | ||||||
| 3.75%, 05/22/25 (Call 02/22/25) |
15,312 | 15,007,338 | ||||||
| 3.75%, 02/25/26 (Call 11/25/25)(a) |
16,247 | 15,834,232 | ||||||
| 3.81%, 04/23/29 (Call 04/23/28), |
||||||||
| (3-mo. SOFR + 1.420%)(c) |
16,505 | 15,582,927 | ||||||
| 3.85%, 01/26/27 (Call 01/26/26) |
19,333 | 18,670,424 | ||||||
| 4.22%, 05/01/29 (Call 05/01/28), |
||||||||
| (3-mo. SOFR + 1.563%)(a)(c) |
27,697 | 26,556,992 | ||||||
| 4.25%, 10/21/25(a) |
14,787 | 14,525,064 | ||||||
| 4.39%, 06/15/27 (Call 06/15/26), |
||||||||
| (1-day SOFR + 1.510%)(a)(c) |
6,663 | 6,539,880 | ||||||
| 4.48%, 08/23/28 (Call 08/23/27), |
||||||||
| (1-day SOFR + 1.725%)(a)(c) |
15,620 | 15,229,867 | ||||||
| 5.80%, 08/10/26 (Call 08/10/25), |
||||||||
| (1-day SOFR + 1.075%)(c) |
16,710 | 16,802,144 | ||||||
| 5.95%, 01/15/27 |
8,293 | 8,466,763 | ||||||
| 6.48%, 10/24/29 (Call 10/24/28), |
||||||||
| (1-day SOFR + 1.770%)(a)(c) |
18,205 | 19,074,332 | ||||||
| Hana Bank |
||||||||
| 1.25%, 12/16/26(b) |
380 | 340,151 | ||||||
| 3.25%, 03/30/27(a)(b) |
3,065 | 2,900,839 | ||||||
| 3.50%, (Call 10/19/26), |
||||||||
| (5-year CMT + 2.409%)(a)(b)(c)(d) |
1,520 | 1,425,696 | ||||||
| 5.75%, 10/24/28(b) |
445 | 457,717 | ||||||
| HSBC Holdings PLC |
||||||||
| 1.59%, 05/24/27 (Call 05/24/26), |
||||||||
| (1-day SOFR + 1.290%)(c) |
14,782 | 13,533,485 | ||||||
| 142 | 2 0 2 4 I S H A R E S A N N U A L R E P O R T T O S H A R E H O L D E R S |
| Schedule of Investments (continued) February 29, 2024 |
iShares® 1-5 Year Investment Grade Corporate Bond ETF (Percentages shown are based on Net Assets) |
| Security | Par (000) |
Value | ||||||
| Banks (continued) | ||||||||
| 1.65%, 04/18/26 (Call 04/18/25), |
||||||||
| (1-day SOFR + 1.538%)(c) |
$ | 15,338 | $ | 14,638,772 | ||||
| 2.01%, 09/22/28 (Call 09/22/27), |
||||||||
| (1-day SOFR + 1.732%)(a)(c) |
15,425 | 13,665,926 | ||||||
| 2.10%, 06/04/26 (Call 06/04/25), |
||||||||
| (1-day SOFR + 1.929%)(c) |
15,333 | 14,669,132 | ||||||
| 2.21%, 08/17/29 (Call 08/17/28), |
||||||||
| (1-day SOFR + 1.285%)(c) |
4,188 | 3,635,989 | ||||||
| 2.25%, 11/22/27 (Call 11/22/26), |
||||||||
| (1-day SOFR + 1.100%)(a)(c) |
19,835 | 18,169,748 | ||||||
| 3.00%, 03/10/26 (Call 03/10/25), |
||||||||
| (1-day SOFR + 1.430%)(a)(c) |
13,841 | 13,453,070 | ||||||
| 3.90%, 05/25/26 |
17,143 | 16,611,003 | ||||||
| 4.04%, 03/13/28 (Call 03/13/27), |
||||||||
| (3-mo. SOFR + 1.808%)(c) |
19,090 | 18,300,860 | ||||||
| 4.25%, 08/18/25 |
8,135 | 7,960,404 | ||||||
| 4.29%, 09/12/26 (Call 09/12/25), |
||||||||
| (3-mo. SOFR + 1.609%)(c) |
17,469 | 17,122,238 | ||||||
| 4.30%, 03/08/26(a) |
20,922 | 20,506,389 | ||||||
| 4.38%, 11/23/26 |
10,469 | 10,187,454 | ||||||
| 4.58%, 06/19/29 (Call 06/19/28), |
||||||||
| (3-mo. SOFR + 1.796%)(c) |
22,655 | 21,795,414 | ||||||
| 4.76%, 06/09/28 (Call 06/09/27), |
||||||||
| (1-day SOFR + 2.110%)(c) |
16,846 | 16,448,809 | ||||||
| 5.21%, 08/11/28 (Call 08/11/27), |
||||||||
| (1-day SOFR + 2.610%)(c) |
17,199 | 17,032,209 | ||||||
| 5.55%, 03/04/30 (Call 03/04/29), |
||||||||
| (1-day SOFR + 1.460%)(c) |
9,200 | 9,191,593 | ||||||
| 5.89%, 08/14/27 (Call 08/14/26), |
||||||||
| (1-day SOFR + 1.570%)(c) |
15,345 | 15,446,793 | ||||||
| 6.16%, 03/09/29 (Call 03/09/28), |
||||||||
| (1-day SOFR + 1.970%)(a)(c) |
17,415 | 17,793,160 | ||||||
| 7.34%, 11/03/26 (Call 11/03/25), |
||||||||
| (1-day SOFR + 3.030%)(a)(c) |
12,797 | 13,176,101 | ||||||
| 7.39%, 11/03/28 (Call 11/03/27), |
||||||||
| (1-day SOFR + 3.350%)(c) |
16,544 | 17,526,252 | ||||||
| HSBC USA Inc. |
||||||||
| 5.29%, 03/04/27 |
3,645 | 3,648,464 | ||||||
| 5.63%, 03/17/25 |
10,780 | 10,793,094 | ||||||
| Huntington Bancshares Inc./OH |
||||||||
| 4.00%, 05/15/25 (Call 04/15/25) |
424 | 416,381 | ||||||
| 4.44%, 08/04/28 (Call 08/04/27), |
3,910 | 3,755,187 | ||||||
| 6.21%, 08/21/29 (Call 08/21/28), |
9,085 | 9,238,178 | ||||||
| Huntington National Bank (The), 4.55%, 05/17/28 (Call 05/17/27), |
4,690 | 4,525,065 | ||||||
| ICICI Bank Ltd./Dubai, 4.00%, 03/18/26(b) |
3,132 | 3,040,974 | ||||||
| Industrial & Commercial Bank of China Ltd., |
||||||||
| 4.88%, 09/21/25(b) |
16,450 | 16,266,583 | ||||||
| Industrial & Commercial Bank of China Ltd./New York, 3.54%, 11/08/27(a) |
5,744 | 5,458,582 | ||||||
| ING Groep NV |
||||||||
| 1.40%, 07/01/26 (Call 07/01/25), |
||||||||
| (1-year CMT + 1.100%)(a)(b)(c) |
13,552 | 12,833,084 | ||||||
| 1.73%, 04/01/27 (Call 04/01/26), |
||||||||
| (1-day SOFR + 1.005%)(c) |
4,087 | 3,783,372 | ||||||
| 3.87%, 03/28/26 (Call 03/28/25), |
||||||||
| (1-day SOFR + 1.640%)(a)(c) |
822 | 806,756 | ||||||
| 3.95%, 03/29/27 |
8,787 | 8,461,990 | ||||||
| Security | Par (000) |
Value | ||||||
| Banks (continued) | ||||||||
| 4.02%, 03/28/28 (Call 03/28/27), |
||||||||
| (1-day SOFR + 1.830%)(c) |
$ | 7,550 | $ | 7,249,531 | ||||
| 4.55%, 10/02/28(a) |
7,365 | 7,187,135 | ||||||
| 4.63%, 01/06/26(b) |
21,846 | 21,573,464 | ||||||
| 6.08%, 09/11/27 (Call 09/11/26), |
||||||||
| (1-day SOFR + 1.560%)(c) |
5,880 | 5,957,729 | ||||||
| Intesa Sanpaolo SpA |
||||||||
| 3.88%, 07/14/27(a)(b) |
1,583 | 1,475,977 | ||||||
| 3.88%, 01/12/28(b) |
2,340 | 2,152,946 | ||||||
| 7.00%, 11/21/25(b) |
900 | 916,110 | ||||||
| JPMorgan Chase & Co. |
||||||||
| 1.04%, 02/04/27 (Call 02/04/26), |
||||||||
| (3-mo. SOFR + 0.695%)(a)(c) |
14,903 | 13,733,837 | ||||||
| 1.05%, 11/19/26 (Call 11/19/25), |
||||||||
| (1-day SOFR + 0.800%)(a)(c) |
20,313 | 18,886,704 | ||||||
| 1.05%, 06/23/27 (Call 12/23/25) |
10 | 8,721 | ||||||
| 1.47%, 09/22/27 (Call 09/22/26), |
||||||||
| (1-day SOFR + 0.765%)(a)(c) |
19,613 | 17,821,022 | ||||||
| 1.58%, 04/22/27 (Call 04/22/26), |
||||||||
| (1-day SOFR + 0.885%)(c) |
24,692 | 22,833,702 | ||||||
| 2.01%, 03/13/26 (Call 03/13/25), |
||||||||
| (3-mo. SOFR + 1.585%)(c) |
16,085 | 15,508,154 | ||||||
| 2.07%, 06/01/29 (Call 06/01/28), |
||||||||
| (1-day SOFR + 1.015%)(c) |
10,235 | 9,016,962 | ||||||
| 2.08%, 04/22/26 (Call 04/22/25), |
||||||||
| (1-day SOFR + 1.850%)(c) |
26,153 | 25,162,231 | ||||||
| 2.18%, 06/01/28 (Call 06/01/27), |
||||||||
| (1-day SOFR + 1.890%)(c) |
13,686 | 12,468,654 | ||||||
| 2.95%, 10/01/26 (Call 07/01/26) |
21,705 | 20,633,388 | ||||||
| 2.95%, 02/24/28 (Call 02/24/27), |
||||||||
| (1-day SOFR + 1.170%)(c) |
14,284 | 13,380,648 | ||||||
| 3.20%, 06/15/26 (Call 03/15/26)(a) |
14,263 | 13,726,477 | ||||||
| 3.30%, 04/01/26 (Call 01/01/26) |
19,491 | 18,797,497 | ||||||
| 3.51%, 01/23/29 (Call 01/23/28), |
||||||||
| (3-mo. SOFR + 1.207%)(a)(c) |
18,535 | 17,457,836 | ||||||
| 3.54%, 05/01/28 (Call 05/01/27), |
||||||||
| (3-mo. SOFR + 1.642%)(c) |
20,790 | 19,761,772 | ||||||
| 3.63%, 12/01/27 (Call 12/01/26) |
11,485 | 10,937,966 | ||||||
| 3.78%, 02/01/28 (Call 02/01/27), |
||||||||
| (3-mo. SOFR + 1.599%)(c) |
20,237 | 19,432,042 | ||||||
| 3.90%, 07/15/25 (Call 04/15/25)(a) |
18,960 | 18,638,634 | ||||||
| 3.96%, 01/29/27 (Call 01/29/26), |
||||||||
| (3-mo. SOFR + 1.507%)(c) |
15,462 | 15,095,438 | ||||||
| 4.01%, 04/23/29 (Call 04/23/28), |
||||||||
| (3-mo. SOFR + 1.382%)(c) |
14,125 | 13,494,958 | ||||||
| 4.08%, 04/26/26 (Call 04/26/25), |
||||||||
| (1-day SOFR + 1.320%)(c) |
22,828 | 22,458,792 | ||||||
| 4.13%, 12/15/26(a) |
15,584 | 15,213,959 | ||||||
| 4.20%, 07/23/29 (Call 07/23/28), |
||||||||
| (3-mo. SOFR + 1.522%)(c) |
11,025 | 10,585,750 | ||||||
| 4.25%, 10/01/27 |
13,285 | 13,016,765 | ||||||
| 4.32%, 04/26/28 (Call 04/26/27), |
||||||||
| (1-day SOFR + 1.560%)(c) |
23,225 | 22,664,085 | ||||||
| 4.45%, 12/05/29 (Call 12/05/28), |
||||||||
| (3-mo. SOFR + 1.592%)(c) |
14,334 | 13,865,232 | ||||||
| 4.85%, 07/25/28 (Call 07/25/27), |
||||||||
| (1-day SOFR + 1.990%)(a)(c) |
27,050 | 26,750,237 | ||||||
| 5.01%, 01/23/30 (Call 01/23/29), |
||||||||
| (1-day SOFR + 1.310%)(c) |
14,485 | 14,330,714 | ||||||
| 5.04%, 01/23/28 (Call 01/23/27), |
||||||||
| (1-day SOFR + 1.190%)(a)(c) |
7,435 | 7,395,474 | ||||||
| S C H E D U L E O F I N V E S T M E N T S |
143 |
| Schedule of Investments (continued) February 29, 2024 |
iShares® 1-5 Year Investment Grade Corporate Bond ETF (Percentages shown are based on Net Assets) |
| Security | Par (000) |
Value | ||||||
| Banks (continued) | ||||||||
| 5.30%, 07/24/29 (Call 07/24/28), |
||||||||
| (1-day SOFR + 1.450%)(c) |
$ | 21,985 | $ | 22,041,065 | ||||
| 6.07%, 10/22/27 (Call 10/22/26), |
||||||||
| (1-day SOFR + 1.330%)(a)(c) |
14,330 | 14,605,426 | ||||||
| 6.09%, 10/23/29 (Call 10/23/28), |
||||||||
| (1-day SOFR + 1.570%)(c) |
12,367 | 12,783,126 | ||||||
| 7.63%, 10/15/26 |
5,882 | 6,249,242 | ||||||
| 7.75%, 07/15/25 |
1,557 | 1,610,895 | ||||||
| 8.00%, 04/29/27(a) |
6,214 | 6,751,833 | ||||||
| JPMorgan Chase Bank NA, 5.11%, 12/08/26 (Call 11/08/26) |
15,310 | 15,329,957 | ||||||
| KBC Group NV, 5.80%, 01/19/29 |
||||||||
| (Call 01/19/28), (1-year CMT + 2.100%)(b)(c) |
5,790 | 5,825,153 | ||||||
| KeyBank NA, 4.70%, 01/26/26 |
2,640 | 2,565,851 | ||||||
| KeyBank NA/Cleveland OH |
||||||||
| 3.30%, 06/01/25 |
3,643 | 3,506,559 | ||||||
| 3.40%, 05/20/26 |
3,148 | 2,968,871 | ||||||
| 4.15%, 08/08/25(a) |
4,999 | 4,841,159 | ||||||
| 5.85%, 11/15/27 (Call 10/16/27)(a) |
6,753 | 6,669,449 | ||||||
| 6.95%, 02/01/28(a) |
500 | 510,231 | ||||||
| KeyCorp |
||||||||
| 2.25%, 04/06/27(a) |
4,499 | 4,018,631 | ||||||
| 4.10%, 04/30/28(a) |
5,545 | 5,193,002 | ||||||
| 4.15%, 10/29/25 |
2,369 | 2,295,441 | ||||||
| Kookmin Bank |
||||||||
| 1.75%, 05/04/25(b) |
790 | 756,721 | ||||||
| 4.63%, 04/21/28(a)(b) |
3,443 | 3,385,571 | ||||||
| Lloyds Bank PLC, 3.50%, 05/14/25 |
1,362 | 1,330,201 | ||||||
| Lloyds Banking Group PLC |
||||||||
| 1.63%, 05/11/27 (Call 05/11/26), |
||||||||
| (1-year CMT + 0.850%)(a)(c) |
6,064 | 5,561,791 | ||||||
| 3.51%, 03/18/26 (Call 03/18/25), |
||||||||
| (1-year CMT + 1.600%)(c) |
5,620 | 5,486,108 | ||||||
| 3.57%, 11/07/28 (Call 11/07/27), |
||||||||
| (3-mo. LIBOR US + 1.205%)(a)(c) |
10,620 | 9,917,971 | ||||||
| 3.75%, 01/11/27(a) |
7,667 | 7,357,209 | ||||||
| 3.75%, 03/18/28 (Call 03/18/27), |
||||||||
| (1-year CMT + 1.800%)(c) |
6,080 | 5,766,892 | ||||||
| 4.38%, 03/22/28 |
11,765 | 11,357,017 | ||||||
| 4.45%, 05/08/25 |
8,448 | 8,339,718 | ||||||
| 4.55%, 08/16/28 |
7,680 | 7,458,540 | ||||||
| 4.58%, 12/10/25(a) |
7,905 | 7,746,450 | ||||||
| 4.65%, 03/24/26 |
8,705 | 8,539,646 | ||||||
| 4.72%, 08/11/26 (Call 08/11/25), |
||||||||
| (1-year CMT + 1.750%)(a)(c) |
7,047 | 6,952,309 | ||||||
| 5.46%, 01/05/28 (Call 01/05/27), |
||||||||
| (1-year CMT + 1.375%)(c) |
6,475 | 6,447,291 | ||||||
| 5.87%, 03/06/29 (Call 03/06/28), |
||||||||
| (1-year CMT + 1.700%)(c) |
9,415 | 9,504,467 | ||||||
| 5.99%, 08/07/27 (Call 08/07/26), |
||||||||
| (1-year CMT + 1.480%)(a)(c) |
8,340 | 8,398,452 | ||||||
| M&T Bank Corp. |
||||||||
| 4.55%, 08/16/28 (Call 08/16/27), |
||||||||
| (1-day SOFR + 1.780%)(a)(c) |
3,675 | 3,504,944 | ||||||
| 7.41%, 10/30/29 (Call 10/30/28), |
||||||||
| (1-day SOFR + 2.800%)(a)(c) |
2,305 | 2,415,359 | ||||||
| Macquarie Bank Ltd. |
||||||||
| 3.23%, 03/21/25(a)(b) |
5,445 | 5,325,685 | ||||||
| 3.90%, 01/15/26(a)(b) |
3,919 | 3,817,298 | ||||||
| 4.00%, 07/29/25(a)(b) |
2,456 | 2,412,669 | ||||||
| Security | Par (000) |
Value | ||||||
| Banks (continued) | ||||||||
| 4.88%, 06/10/25(b) |
$ | 3,962 | $ | 3,911,310 | ||||
| 5.21%, 06/15/26(a)(b) |
3,360 | 3,354,463 | ||||||
| 5.39%, 12/07/26(a)(b) |
5,570 | 5,580,534 | ||||||
| Macquarie Group Ltd. |
||||||||
| 1.34%, 01/12/27 (Call 01/12/26), |
||||||||
| (1-day SOFR + 1.069%)(a)(b)(c) |
7,503 | 6,923,637 | ||||||
| 1.63%, 09/23/27 (Call 09/23/26), |
||||||||
| (1-day SOFR + 0.910%)(a)(b)(c) |
5,375 | 4,855,089 | ||||||
| 1.94%, 04/14/28 (Call 04/14/27), |
||||||||
| (1-day SOFR + 0.995%)(a)(b)(c) |
3,468 | 3,090,263 | ||||||
| 3.76%, 11/28/28 (Call 11/28/27), |
||||||||
| (3-mo. LIBOR US + 1.372%)(b)(c) |
5,885 | 5,497,564 | ||||||
| 4.10%, 06/21/28 (Call 06/21/27), |
||||||||
| (1-day SOFR + 2.125%)(a)(b)(c) |
3,225 | 3,074,384 | ||||||
| 4.65%, 03/27/29 (Call 03/27/28), |
||||||||
| (3-mo. LIBOR US + 1.727%)(a)(b)(c) |
875 | 845,588 | ||||||
| 5.03%, 01/15/30 (Call 01/15/29), |
||||||||
| (3-mo. LIBOR US + 1.750%)(a)(b)(c) |
4,291 | 4,235,369 | ||||||
| 5.11%, 08/09/26 (Call 08/09/25), |
||||||||
| (1-day SOFR + 2.208%)(a)(b)(c) |
3,987 | 3,961,423 | ||||||
| Manufacturers & Traders Trust Co. |
||||||||
| 3.40%, 08/17/27 |
1,855 | 1,694,350 | ||||||
| 4.65%, 01/27/26 (Call 12/27/25) |
6,525 | 6,354,740 | ||||||
| 4.70%, 01/27/28 (Call 12/27/27)(a) |
7,718 | 7,425,066 | ||||||
| 5.40%, 11/21/25 (Call 10/21/25) |
2,220 | 2,198,829 | ||||||
| Mitsubishi UFJ Financial Group Inc. |
||||||||
| 1.41%, 07/17/25 |
10,818 | 10,246,037 | ||||||
| 1.54%, 07/20/27 (Call 07/20/26), |
||||||||
| (1-year CMT + 0.750%)(c) |
12,941 | 11,839,689 | ||||||
| 1.64%, 10/13/27 (Call 10/13/26), |
||||||||
| (1-year CMT + 0.670%)(c) |
7,930 | 7,229,764 | ||||||
| 2.34%, 01/19/28 (Call 01/19/27), |
||||||||
| (1-year CMT + 0.830%)(c) |
8,205 | 7,573,964 | ||||||
| 2.76%, 09/13/26(a) |
6,101 | 5,754,391 | ||||||
| 3.29%, 07/25/27(a) |
6,385 | 6,038,789 | ||||||
| 3.68%, 02/22/27(a) |
2,732 | 2,632,308 | ||||||
| 3.78%, 03/02/25(a) |
4,016 | 3,949,794 | ||||||
| 3.84%, 04/17/26 (Call 04/17/25), |
||||||||
| (1-year CMT + 1.125%)(a)(c) |
3,420 | 3,354,075 | ||||||
| 3.85%, 03/01/26 |
14,624 | 14,259,064 | ||||||
| 3.96%, 03/02/28(a) |
2,220 | 2,137,962 | ||||||
| 4.05%, 09/11/28(a) |
200 | 193,840 | ||||||
| 4.08%, 04/19/28 (Call 04/19/27), |
||||||||
| (1-year CMT + 1.300%)(c) |
5,925 | 5,726,825 | ||||||
| 5.02%, 07/20/28 (Call 07/20/27), |
||||||||
| (1-year CMT + 1.950%)(a)(c) |
8,590 | 8,533,995 | ||||||
| 5.24%, 04/19/29 (Call 04/19/28), |
||||||||
| (1-year CMT + 1.700%)(a)(c) |
9,360 | 9,388,442 | ||||||
| 5.35%, 09/13/28 (Call 09/13/27), |
||||||||
| (1-year CMT + 1.900%)(c) |
8,520 | 8,548,759 | ||||||
| 5.42%, 02/22/29 (Call 02/22/28), |
||||||||
| (1-year CMT + 1.380%)(c) |
10,613 | 10,688,293 | ||||||
| 5.54%, 04/17/26 (Call 04/17/25), |
||||||||
| (1-year CMT + 1.500%)(a)(c) |
3,545 | 3,542,656 | ||||||
| Mizuho Bank Ltd., 3.20%, 03/26/25(b) |
315 | 307,808 | ||||||
| Mizuho Financial Group Inc. |
||||||||
| 1.23%, 05/22/27 (Call 05/22/26), |
||||||||
| (1-year CMT + 0.670%)(c) |
8,199 | 7,492,536 | ||||||
| 1.55%, 07/09/27 (Call 07/09/26), |
||||||||
| (1-year CMT + 0.750%)(c) |
6,265 | 5,747,225 | ||||||
| 144 | 2 0 2 4 I S H A R E S A N N U A L R E P O R T T O S H A R E H O L D E R S |
| Schedule of Investments (continued) February 29, 2024 |
iShares® 1-5 Year Investment Grade Corporate Bond ETF (Percentages shown are based on Net Assets) |
| Security | Par (000) |
Value | ||||||
| Banks (continued) | ||||||||
| 2.23%, 05/25/26 (Call 05/25/25), |
||||||||
| (3-mo. SOFR + 1.092%)(a)(c) |
$ | 3,199 | $ | 3,068,221 | ||||
| 2.65%, 05/22/26 (Call 05/22/25), |
||||||||
| (1-year CMT + 0.900%)(a)(c) |
2,089 | 2,016,536 | ||||||
| 2.84%, 09/13/26(a) |
5,544 | 5,219,902 | ||||||
| 3.17%, 09/11/27(a) |
6,180 | 5,787,389 | ||||||
| 3.48%, 04/12/26(a)(b) |
10,465 | 10,075,272 | ||||||
| 3.66%, 02/28/27(a) |
2,410 | 2,305,000 | ||||||
| 4.02%, 03/05/28(a) |
8,540 | 8,216,281 | ||||||
| 4.25%, 09/11/29 (Call 09/11/28), |
||||||||
| (3-mo. SOFR + 1.532%)(c) |
5,335 | 5,111,094 | ||||||
| 4.35%, 10/20/25(a)(b) |
3,767 | 3,676,815 | ||||||
| 5.41%, 09/13/28 (Call 09/13/27), |
||||||||
| (1-year CMT + 2.050%)(a)(c) |
5,990 | 6,019,748 | ||||||
| 5.67%, 05/27/29 (Call 05/27/28), |
||||||||
| (1-year CMT + 1.500%)(c) |
5,735 | 5,809,847 | ||||||
| 5.78%, 07/06/29 (Call 07/06/28), |
||||||||
| (1-year CMT + 1.650%)(c) |
17,985 | 18,323,934 | ||||||
| Morgan Stanley |
||||||||
| 0.99%, 12/10/26 (Call 12/10/25), |
||||||||
| (1-day SOFR + 0.720%)(c) |
17,548 | 16,190,475 | ||||||
| 1.51%, 07/20/27 (Call 07/20/26), |
||||||||
| (1-day SOFR + 0.858%)(a)(c) |
21,665 | 19,819,926 | ||||||
| 1.59%, 05/04/27 (Call 05/04/26), |
||||||||
| (1-day SOFR + 0.879%)(a)(c) |
26,067 | 24,031,429 | ||||||
| 2.19%, 04/28/26 (Call 04/28/25), |
||||||||
| (1-day SOFR + 1.990%)(a)(c) |
23,386 | 22,505,678 | ||||||
| 2.48%, 01/21/28 (Call 01/21/27), |
||||||||
| (1-day SOFR + 1.000%)(c) |
16,511 | 15,274,251 | ||||||
| 3.13%, 07/27/26 |
22,500 | 21,462,030 | ||||||
| 3.59%, 07/22/28 (Call 07/22/27)(c) |
20,812 | 19,700,742 | ||||||
| 3.63%, 01/20/27(a) |
22,835 | 22,016,474 | ||||||
| 3.77%, 01/24/29 (Call 01/24/28), |
||||||||
| (3-mo. SOFR + 1.402%)(a)(c) |
21,635 | 20,456,099 | ||||||
| 3.88%, 01/27/26 |
22,097 | 21,552,508 | ||||||
| 3.95%, 04/23/27(a) |
16,449 | 15,833,497 | ||||||
| 4.00%, 07/23/25(a) |
21,590 | 21,217,112 | ||||||
| 4.21%, 04/20/28 (Call 04/20/27), |
||||||||
| (1-day SOFR + 1.610%)(c) |
18,227 | 17,641,447 | ||||||
| 4.35%, 09/08/26 |
17,091 | 16,705,732 | ||||||
| 4.43%, 01/23/30 (Call 01/23/29), |
||||||||
| (3-mo. SOFR + 1.890%)(a)(c) |
3,630 | 3,484,369 | ||||||
| 4.68%, 07/17/26 (Call 07/17/25), |
||||||||
| (1-day SOFR + 1.669%)(a)(c) |
6,207 | 6,140,418 | ||||||
| 5.00%, 11/24/25 |
15,502 | 15,412,451 | ||||||
| 5.05%, 01/28/27 (Call 01/28/26), |
||||||||
| (1-day SOFR + 1.295%)(c) |
7,431 | 7,405,088 | ||||||
| 5.12%, 02/01/29 (Call 02/01/28), |
||||||||
| (1-day SOFR + 1.730%)(c) |
18,745 | 18,622,177 | ||||||
| 5.16%, 04/20/29 (Call 04/20/28), |
||||||||
| (1-day SOFR + 1.590%)(a)(c) |
24,004 | 23,866,713 | ||||||
| 5.17%, 01/16/30 (Call 01/16/29), |
||||||||
| (1-day SOFR + 1.450%)(c) |
23,481 | 23,333,577 | ||||||
| 5.45%, 07/20/29 (Call 07/20/28), |
||||||||
| (1-day SOFR + 1.630%)(c) |
7,074 | 7,100,929 | ||||||
| 6.14%, 10/16/26 (Call 10/16/25), |
||||||||
| (1-day SOFR + 1.770%)(c) |
8,482 | 8,582,151 | ||||||
| 6.25%, 08/09/26 |
7,501 | 7,678,573 | ||||||
| 6.30%, 10/18/28 (Call 10/18/27), |
||||||||
| (1-day SOFR + 2.240%)(c) |
17,798 | 18,397,623 | ||||||
| Security | Par (000) |
Value | ||||||
| Banks (continued) | ||||||||
| 6.41%, 11/01/29 (Call 11/01/28), |
||||||||
| (1-day SOFR + 1.830%)(c) |
$ | 8,615 | $ | 8,992,769 | ||||
| Morgan Stanley Bank NA |
||||||||
| 4.75%, 04/21/26 (Call 03/21/26)(a) |
14,276 | 14,185,405 | ||||||
| 4.95%, 01/14/28 (Call 01/14/27), |
||||||||
| (1-day SOFR + 1.080%)(c) |
17,435 | 17,346,834 | ||||||
| 5.48%, 07/16/25 (Call 06/16/25) |
1,920 | 1,927,977 | ||||||
| 5.88%, 10/30/26 (Call 09/30/26) |
17,150 | 17,465,260 | ||||||
| National Australia Bank Ltd. |
||||||||
| 1.89%, 01/12/27(a)(b) |
7,755 | 7,119,217 | ||||||
| 3.50%, 01/10/27(a)(b) |
4,510 | 4,331,560 | ||||||
| 4.75%, 12/10/25(a) |
4,590 | 4,568,140 | ||||||
| 4.79%, 01/10/29 |
6,695 | 6,652,010 | ||||||
| National Australia Bank Ltd./New York |
||||||||
| 2.50%, 07/12/26 |
8,024 | 7,568,517 | ||||||
| 3.38%, 01/14/26 |
3,854 | 3,738,230 | ||||||
| 3.50%, 06/09/25(a) |
1,719 | 1,685,365 | ||||||
| 3.91%, 06/09/27 |
7,431 | 7,202,641 | ||||||
| 4.90%, 06/13/28(a) |
6,325 | 6,308,355 | ||||||
| 4.94%, 01/12/28 |
6,593 | 6,589,769 | ||||||
| 4.97%, 01/12/26 |
6,616 | 6,604,263 | ||||||
| 5.20%, 05/13/25 |
3,300 | 3,303,475 | ||||||
| National Bank of Canada, 5.60%, 12/18/28 |
4,865 | 4,914,279 | ||||||
| National Securities Clearing Corp. |
||||||||
| 0.75%, 12/07/25 (Call 11/07/25)(a)(b) |
5,139 | 4,768,655 | ||||||
| 1.50%, 04/23/25 (Call 03/23/25)(b) |
5,948 | 5,711,320 | ||||||
| 5.00%, 05/30/28 (Call 04/30/28)(a)(b) |
4,980 | 5,015,797 | ||||||
| 5.10%, 11/21/27 (Call 10/21/27)(b) |
3,977 | 4,004,109 | ||||||
| 5.15%, 05/30/25(a)(b) |
1,525 | 1,525,157 | ||||||
| NatWest Group PLC |
||||||||
| 1.64%, 06/14/27 (Call 06/14/26), |
||||||||
| (1-year CMT + 0.900%)(a)(c) |
9,292 | 8,491,243 | ||||||
| 3.07%, 05/22/28 (Call 05/22/27), |
||||||||
| (1-year CMT + 2.550%)(c) |
6,323 | 5,867,041 | ||||||
| 4.80%, 04/05/26(a) |
8,542 | 8,436,418 | ||||||
| 4.89%, 05/18/29 (Call 05/18/28), |
||||||||
| (3-mo. LIBOR US + 1.754%)(c) |
13,255 | 12,913,988 | ||||||
| 5.08%, 01/27/30 (Call 01/27/29), |
||||||||
| (3-mo. LIBOR US + 1.905%)(c) |
7,960 | 7,775,709 | ||||||
| 5.52%, 09/30/28 (Call 09/30/27), |
||||||||
| (1-year CMT + 2.270%)(c) |
6,215 | 6,216,293 | ||||||
| 5.58%, 03/01/28 (Call 03/01/27), |
||||||||
| (1-year CMT + 1.100%)(a)(c) |
3,000 | 3,002,593 | ||||||
| 5.81%, 09/13/29 (Call 09/13/28), |
||||||||
| (1-year CMT + 1.950%)(a)(c) |
8,400 | 8,485,416 | ||||||
| 5.85%, 03/02/27 (Call 03/02/26), |
||||||||
| (1-year CMT + 1.350%)(a)(c) |
5,320 | 5,341,852 | ||||||
| 7.47%, 11/10/26 (Call 11/10/25), |
||||||||
| (1-year CMT + 2.850%)(c) |
7,935 | 8,152,499 | ||||||
| NatWest Markets PLC |
||||||||
| 1.60%, 09/29/26(a)(b) |
5,525 | 5,032,058 | ||||||
| 3.48%, 03/22/25(b) |
2,934 | 2,871,967 | ||||||
| NBK SPC Ltd., 1.63%, 09/15/27 (Call 09/15/26), |
||||||||
| (1-day SOFR + 1.050%)(b)(c) |
835 | 758,639 | ||||||
| NBK Tier 1 Financing 2 Ltd., 4.50%, |
||||||||
| (Call 08/27/25)(b)(c)(d) |
1,781 | 1,702,846 | ||||||
| NBK Tier 1 Ltd., 3.63%, (Call 08/24/26)(b)(c)(d) |
2,025 | 1,840,826 | ||||||
| NongHyup Bank |
||||||||
| 1.25%, 07/20/25(a)(b) |
6,150 | 5,807,142 | ||||||
| 1.25%, 07/28/26(b) |
925 | 839,924 | ||||||
| 4.00%, 01/06/26(b) |
150 | 146,352 | ||||||
| S C H E D U L E O F I N V E S T M E N T S |
145 |
| Schedule of Investments (continued) February 29, 2024 |
iShares® 1-5 Year Investment Grade Corporate Bond ETF (Percentages shown are based on Net Assets) |
| Security | Par (000) |
Value | ||||||
| Banks (continued) | ||||||||
| 4.25%, 07/06/27(a)(b) |
$ | 3,000 | $ | 2,904,990 | ||||
| 4.88%, 07/03/28(a)(b) |
4,200 | 4,161,924 | ||||||
| Nordea Bank Abp |
||||||||
| 0.75%, 08/28/25(a)(b) |
4,748 | 4,440,907 | ||||||
| 1.50%, 09/30/26(b) |
5,977 | 5,420,036 | ||||||
| 3.60%, 06/06/25(a)(b) |
2,462 | 2,411,469 | ||||||
| 4.63%, 09/13/33 (Call 09/13/28), |
205 | 192,559 | ||||||
| 4.75%, 09/22/25(a)(b) |
4,960 | 4,925,347 | ||||||
| 5.38%, 09/22/27(a)(b) |
5,398 | 5,416,889 | ||||||
| Norinchukin Bank (The) |
||||||||
| 1.28%, 09/22/26(a)(b) |
7,550 | 6,829,277 | ||||||
| 4.87%, 09/14/27(a)(b) |
5,195 | 5,128,003 | ||||||
| 5.43%, 03/09/28(a)(b) |
3,530 | 3,567,813 | ||||||
| Northern Trust Corp. |
||||||||
| 3.38%, 05/08/32 (Call 05/08/27), |
1,890 | 1,753,858 | ||||||
| 3.65%, 08/03/28 (Call 05/03/28)(a) |
2,100 | 2,009,421 | ||||||
| 3.95%, 10/30/25(a) |
830 | 813,778 | ||||||
| 4.00%, 05/10/27 (Call 04/10/27) |
5,535 | 5,377,728 | ||||||
| Oversea-Chinese Banking Corp. Ltd., 1.83%, 09/10/30 (Call 09/10/25), |
5,822 | 5,485,315 | ||||||
| PNC Bank NA |
||||||||
| 3.10%, 10/25/27 (Call 09/25/27) |
5,200 | 4,834,157 | ||||||
| 3.25%, 06/01/25 (Call 05/02/25) |
4,535 | 4,413,803 | ||||||
| 3.25%, 01/22/28 (Call 12/23/27)(a) |
5,860 | 5,448,092 | ||||||
| 3.88%, 04/10/25 (Call 03/10/25) |
2,262 | 2,219,032 | ||||||
| 4.05%, 07/26/28 |
7,860 | 7,434,497 | ||||||
| 4.20%, 11/01/25 (Call 10/02/25) |
2,131 | 2,082,723 | ||||||
| PNC Financial Services Group Inc. (The) |
||||||||
| 1.15%, 08/13/26 (Call 07/13/26)(a) |
2,807 | 2,549,438 | ||||||
| 2.60%, 07/23/26 (Call 05/23/26) |
4,647 | 4,369,659 | ||||||
| 3.15%, 05/19/27 (Call 04/19/27) |
2,433 | 2,291,712 | ||||||
| 4.76%, 01/26/27 (Call 01/26/26), |
17,285 | 17,077,081 | ||||||
| 5.30%, 01/21/28 (Call 01/21/27), |
4,135 | 4,129,845 | ||||||
| 5.35%, 12/02/28 (Call 12/02/27), |
7,270 | 7,273,099 | ||||||
| 5.58%, 06/12/29 (Call 06/12/28), |
17,312 | 17,407,466 | ||||||
| 5.81%, 06/12/26 (Call 06/12/25), |
4,602 | 4,608,682 | ||||||
| 6.62%, 10/20/27 (Call 10/20/26), |
6,160 | 6,327,781 | ||||||
| Regions Financial Corp. |
||||||||
| 1.80%, 08/12/28 (Call 06/12/28) |
2,385 | 2,029,160 | ||||||
| 2.25%, 05/18/25 (Call 04/18/25) |
778 | 744,982 | ||||||
| Rheinland-Pfalz Bank, 6.88%, 02/23/28(b)(e) |
15 | 15,911 | ||||||
| Royal Bank of Canada |
||||||||
| 0.88%, 01/20/26(a) |
8,225 | 7,614,758 | ||||||
| 1.15%, 06/10/25 |
8,471 | 8,044,343 | ||||||
| 1.15%, 07/14/26(a) |
14,930 | 13,648,086 | ||||||
| 1.20%, 04/27/26 |
11,070 | 10,189,267 | ||||||
| 1.40%, 11/02/26(a) |
6,106 | 5,552,413 | ||||||
| 2.05%, 01/21/27(a) |
3,495 | 3,227,498 | ||||||
| 3.38%, 04/14/25(a) |
7,365 | 7,214,265 | ||||||
| 3.63%, 05/04/27(a) |
7,560 | 7,248,772 | ||||||
| 4.24%, 08/03/27 |
8,208 | 7,999,792 | ||||||
| 4.65%, 01/27/26 |
10,212 | 10,118,486 | ||||||
| Security | Par (000) |
Value | ||||||
| Banks (continued) | ||||||||
| 4.88%, 01/12/26 |
$ | 7,136 | $ | 7,113,179 | ||||
| 4.88%, 01/19/27(a) |
6,880 | 6,848,345 | ||||||
| 4.90%, 01/12/28 |
5,025 | 5,013,591 | ||||||
| 4.95%, 04/25/25 |
9,060 | 9,033,206 | ||||||
| 4.95%, 02/01/29(a) |
3,725 | 3,698,042 | ||||||
| 5.20%, 07/20/26 |
6,755 | 6,778,664 | ||||||
| 5.20%, 08/01/28(a) |
6,595 | 6,637,157 | ||||||
| 6.00%, 11/01/27(a) |
8,821 | 9,082,687 | ||||||
| Santander Holdings USA Inc. |
||||||||
| 2.49%, 01/06/28 (Call 01/06/27), |
6,020 | 5,443,938 | ||||||
| 3.24%, 10/05/26 (Call 08/05/26) |
5,474 | 5,126,975 | ||||||
| 3.45%, 06/02/25 (Call 05/02/25) |
5,262 | 5,101,837 | ||||||
| 4.40%, 07/13/27 (Call 04/14/27) |
5,709 | 5,473,234 | ||||||
| 4.50%, 07/17/25 (Call 04/17/25) |
5,858 | 5,744,017 | ||||||
| 5.81%, 09/09/26 (Call 09/09/25), |
1,230 | 1,228,389 | ||||||
| 6.17%, 01/09/30 (Call 01/09/29), |
3,935 | 3,924,745 | ||||||
| 6.50%, 03/09/29 (Call 03/09/28), |
6,548 | 6,648,073 | ||||||
| 6.57%, 06/12/29 (Call 06/12/28), |
3,374 | 3,432,985 | ||||||
| Santander U.K. Group Holdings PLC |
||||||||
| 1.53%, 08/21/26 (Call 08/21/25), |
4,789 | 4,489,015 | ||||||
| 1.67%, 06/14/27 (Call 06/14/26), |
4,882 | 4,437,845 | ||||||
| 2.47%, 01/11/28 (Call 01/11/27), |
4,960 | 4,515,538 | ||||||
| 3.82%, 11/03/28 (Call 11/03/27), |
6,625 | 6,183,836 | ||||||
| 4.75%, 09/15/25(b) |
505 | 493,427 | ||||||
| 6.53%, 01/10/29 (Call 01/10/28), |
8,008 | 8,211,517 | ||||||
| 6.83%, 11/21/26 (Call 11/21/25), |
8,038 | 8,160,565 | ||||||
| Shinhan Bank Co. Ltd. |
||||||||
| 1.38%, 10/21/26(b) |
2,495 | 2,256,972 | ||||||
| 3.75%, 09/20/27(a)(b) |
205 | 192,591 | ||||||
| 4.50%, 04/12/28(b) |
4,165 | 4,077,108 | ||||||
| Shinhan Financial Group Co. Ltd. |
||||||||
| 1.35%, 01/10/26(b) |
248 | 230,083 | ||||||
| 2.88%, (Call 05/12/26), |
2,275 | 2,121,984 | ||||||
| 5.00%, 07/24/28(a) |
2,250 | 2,226,711 | ||||||
| Skandinaviska Enskilda Banken AB |
||||||||
| 0.85%, 09/02/25(a)(b) |
1,293 | 1,210,068 | ||||||
| 1.20%, 09/09/26(a)(b) |
2,343 | 2,118,897 | ||||||
| 1.40%, 11/19/25(a)(b) |
975 | 914,461 | ||||||
| 3.70%, 06/09/25(a)(b) |
850 | 833,457 | ||||||
| 5.13%, 03/05/27(b) |
3,800 | 3,796,411 | ||||||
| 5.38%, 03/05/29(b) |
3,800 | 3,786,464 | ||||||
| Societe Generale SA |
||||||||
| 1.38%, 07/08/25(a)(b) |
2,361 | 2,236,722 | ||||||
| 1.49%, 12/14/26 (Call 12/14/25), |
12,536 | 11,561,739 | ||||||
| 1.79%, 06/09/27 (Call 06/09/26), |
7,174 | 6,534,322 | ||||||
| 2.80%, 01/19/28 (Call 01/19/27), |
8,990 | 8,249,224 | ||||||
| 146 | 2 0 2 4 I S H A R E S A N N U A L R E P O R T T O S H A R E H O L D E R S |
| Schedule of Investments (continued) February 29, 2024 |
iShares® 1-5 Year Investment Grade Corporate Bond ETF (Percentages shown are based on Net Assets) |
| Security | Par (000) |
Value | ||||||
| Banks (continued) | ||||||||
| 4.00%, 01/12/27(a)(b) |
$ | 3,614 | $ | 3,459,176 | ||||
| 4.25%, 04/14/25(b) |
8,660 | 8,472,458 | ||||||
| 4.25%, 08/19/26(a)(b) |
5,891 | 5,625,741 | ||||||
| 4.68%, 06/15/27(a)(b) |
4,615 | 4,542,070 | ||||||
| 4.75%, 11/24/25(a)(b) |
5,679 | 5,561,008 | ||||||
| 4.75%, 09/14/28(a)(b) |
405 | 393,257 | ||||||
| 5.52%, 01/19/28 (Call 01/19/27), |
6,900 | 6,823,451 | ||||||
| 5.63%, 01/19/30 (Call 01/19/29), |
5,335 | 5,257,336 | ||||||
| 6.45%, 01/12/27 (Call 01/12/26), |
7,050 | 7,108,802 | ||||||
| 6.45%, 01/10/29 (Call 01/10/28), |
9,778 | 9,987,962 | ||||||
| Standard Chartered PLC |
||||||||
| 1.46%, 01/14/27 (Call 01/14/26), |
11,188 | 10,283,204 | ||||||
| 2.61%, 01/12/28 (Call 01/12/27), |
9,384 | 8,591,529 | ||||||
| 3.20%, 04/17/25(a)(b) |
2,295 | 2,232,209 | ||||||
| 3.97%, 03/30/26 (Call 03/30/25), |
5,550 | 5,422,720 | ||||||
| 4.05%, 04/12/26(b) |
8,105 | 7,859,013 | ||||||
| 4.30%, 02/19/27(a)(b) |
7,935 | 7,615,442 | ||||||
| 4.87%, 03/15/33 (Call 03/15/28), |
735 | 692,848 | ||||||
| 6.17%, 01/09/27 (Call 01/09/26), |
5,694 | 5,743,992 | ||||||
| 6.19%, 07/06/27 (Call 07/06/26), |
7,005 | 7,074,234 | ||||||
| 6.30%, 01/09/29 (Call 01/09/28), |
10,580 | 10,813,104 | ||||||
| 6.75%, 02/08/28 (Call 02/08/27), |
1,385 | 1,418,880 | ||||||
| 7.02%, 02/08/30 (Call 02/08/29), |
5,000 | 5,256,589 | ||||||
| 7.77%, 11/16/28 (Call 11/16/27), |
7,103 | 7,564,350 | ||||||
| State Street Corp. |
||||||||
| 1.68%, 11/18/27 (Call 11/18/26), |
2,945 | 2,696,504 | ||||||
| 2.20%, 02/07/28 (Call 02/07/27), |
3,940 | 3,632,045 | ||||||
| 2.65%, 05/19/26(a) |
4,167 | 3,961,040 | ||||||
| 2.90%, 03/30/26 (Call 03/30/25), |
2,373 | 2,309,817 | ||||||
| 3.55%, 08/18/25(a) |
7,242 | 7,096,234 | ||||||
| 4.14%, 12/03/29 (Call 12/03/28), |
2,566 | 2,460,543 | ||||||
| 5.10%, 05/18/26 (Call 05/18/25), |
4,855 | 4,836,345 | ||||||
| 5.27%, 08/03/26 (Call 07/03/26)(a) |
6,935 | 6,960,289 | ||||||
| 5.68%, 11/21/29 (Call 11/21/28), |
8,460 | 8,643,304 | ||||||
| 5.75%, 11/04/26 (Call 11/04/25), |
2,511 | 2,522,954 | ||||||
| 5.82%, 11/04/28 (Call 11/04/27), |
2,513 | 2,573,245 | ||||||
| Sumitomo Mitsui Financial Group Inc. |
||||||||
| 0.95%, 01/12/26 |
5,760 | 5,323,246 | ||||||
| 1.40%, 09/17/26(a) |
12,174 | 11,092,217 | ||||||
| Security | Par (000) |
Value | ||||||
| Banks (continued) | ||||||||
| 1.47%, 07/08/25 |
$ | 14,052 | $ | 13,354,387 | ||||
| 1.90%, 09/17/28 |
8,220 | 7,153,185 | ||||||
| 2.17%, 01/14/27 |
2,785 | 2,572,480 | ||||||
| 2.47%, 01/14/29 |
2,695 | 2,393,989 | ||||||
| 2.63%, 07/14/26 |
13,827 | 13,063,726 | ||||||
| 3.01%, 10/19/26(a) |
8,707 | 8,246,932 | ||||||
| 3.35%, 10/18/27 |
4,635 | 4,375,926 | ||||||
| 3.36%, 07/12/27(a) |
10,976 | 10,420,717 | ||||||
| 3.45%, 01/11/27(a) |
7,587 | 7,265,207 | ||||||
| 3.54%, 01/17/28 |
4,433 | 4,197,975 | ||||||
| 3.78%, 03/09/26(a) |
9,317 | 9,065,895 | ||||||
| 3.94%, 07/19/28(a) |
4,439 | 4,253,613 | ||||||
| 4.31%, 10/16/28(a) |
3,370 | 3,301,585 | ||||||
| 5.46%, 01/13/26 |
11,005 | 11,045,212 | ||||||
| 5.52%, 01/13/28(a) |
13,894 | 14,116,666 | ||||||
| 5.72%, 09/14/28(a) |
12,740 | 13,021,606 | ||||||
| 5.80%, 07/13/28(a) |
7,145 | 7,344,431 | ||||||
| 5.88%, 07/13/26 |
5,290 | 5,367,129 | ||||||
| Sumitomo Mitsui Trust Bank Ltd. |
||||||||
| 1.05%, 09/12/25(a)(b) |
1,172 | 1,098,971 | ||||||
| 1.35%, 09/16/26(a)(b) |
2,598 | 2,354,399 | ||||||
| 1.55%, 03/25/26(a)(b) |
7,642 | 7,089,213 | ||||||
| 2.55%, 03/10/25(b) |
905 | 879,088 | ||||||
| 2.80%, 03/10/27(a)(b) |
8,165 | 7,629,412 | ||||||
| 4.80%, 09/15/25(a)(b) |
898 | 890,430 | ||||||
| 4.95%, 09/15/27(a)(b) |
635 | 629,979 | ||||||
| 5.20%, 03/07/27(b) |
3,000 | 2,995,836 | ||||||
| 5.20%, 03/07/29 |
2,570 | 2,575,748 | ||||||
| 5.50%, 03/09/28(a)(b) |
3,190 | 3,227,682 | ||||||
| 5.55%, 09/14/28(a)(b) |
3,310 | 3,370,092 | ||||||
| 5.65%, 03/09/26(b) |
4,535 | 4,565,448 | ||||||
| 5.65%, 09/14/26(a)(b) |
2,090 | 2,107,176 | ||||||
| Svenska Handelsbanken AB |
||||||||
| 1.42%, 06/11/27 (Call 06/11/26), |
6,039 | 5,482,561 | ||||||
| 3.65%, 06/10/25(b) |
824 | 807,749 | ||||||
| 3.95%, 06/10/27(a)(b) |
3,965 | 3,830,602 | ||||||
| 5.25%, 06/15/26(b) |
865 | 863,741 | ||||||
| 5.50%, 06/15/28(a)(b) |
8,955 | 9,002,729 | ||||||
| Swedbank AB |
||||||||
| 1.54%, 11/16/26(a)(b) |
11,618 | 10,559,037 | ||||||
| 3.36%, 04/04/25(a)(b) |
985 | 963,990 | ||||||
| 5.34%, 09/20/27(b) |
3,535 | 3,526,475 | ||||||
| 5.47%, 06/15/26(a)(b) |
3,600 | 3,617,389 | ||||||
| 6.14%, 09/12/26(a)(b) |
2,315 | 2,343,492 | ||||||
| Synchrony Bank |
||||||||
| 5.40%, 08/22/25 (Call 07/22/25)(a) |
4,890 | 4,832,531 | ||||||
| 5.63%, 08/23/27 (Call 07/23/27) |
4,368 | 4,249,750 | ||||||
| Synovus Bank, 5.63%, 02/15/28 (Call 01/15/28) |
2,859 | 2,761,663 | ||||||
| Synovus Financial Corp., 5.20%, 08/11/25 (Call 07/11/25)(a) |
820 | 806,229 | ||||||
| Toronto-Dominion Bank (The) |
||||||||
| 0.75%, 09/11/25(a) |
7,890 | 7,391,235 | ||||||
| 0.75%, 01/06/26(a) |
9,217 | 8,523,140 | ||||||
| 1.15%, 06/12/25 |
6,571 | 6,236,998 | ||||||
| 1.20%, 06/03/26 |
9,667 | 8,869,453 | ||||||
| 1.25%, 09/10/26(a) |
10,754 | 9,793,422 | ||||||
| 1.95%, 01/12/27(a) |
6,212 | 5,717,142 | ||||||
| 2.80%, 03/10/27 |
10,562 | 9,906,545 | ||||||
| 3.63%, 09/15/31 (Call 09/15/26), |
10,231 | 9,779,705 | ||||||
| S C H E D U L E O F I N V E S T M E N T S |
147 |
| Schedule of Investments (continued) February 29, 2024 |
iShares® 1-5 Year Investment Grade Corporate Bond ETF (Percentages shown are based on Net Assets) |
| Security | Par (000) |
Value | ||||||
| Banks (continued) | ||||||||
| 3.77%, 06/06/25 |
$ | 10,561 | $ | 10,371,725 | ||||
| 4.11%, 06/08/27(a) |
12,475 | 12,121,830 | ||||||
| 4.69%, 09/15/27 |
12,313 | 12,173,313 | ||||||
| 5.10%, 01/09/26(a) |
4,460 | 4,466,239 | ||||||
| 5.16%, 01/10/28(a) |
10,630 | 10,666,400 | ||||||
| 5.26%, 12/11/26 |
5,540 | 5,575,297 | ||||||
| 5.52%, 07/17/28(a) |
9,810 | 9,974,674 | ||||||
| 5.53%, 07/17/26 |
12,675 | 12,785,486 | ||||||
| 8.13%, 10/31/82 (Call 10/31/27), |
9,270 | 9,647,836 | ||||||
| Truist Bank |
||||||||
| 1.50%, 03/10/25 (Call 02/10/25)(a) |
7,555 | 7,258,767 | ||||||
| 3.30%, 05/15/26 (Call 04/15/26) |
4,231 | 4,036,040 | ||||||
| 3.63%, 09/16/25 (Call 08/16/25) |
7,683 | 7,456,601 | ||||||
| 3.80%, 10/30/26 (Call 09/30/26) |
4,648 | 4,455,337 | ||||||
| 4.05%, 11/03/25 (Call 09/03/25)(a) |
3,063 | 2,995,400 | ||||||
| Truist Financial Corp. |
||||||||
| 1.13%, 08/03/27 (Call 06/03/27)(a) |
4,625 | 4,028,292 | ||||||
| 1.20%, 08/05/25 (Call 07/03/25)(a) |
4,289 | 4,033,752 | ||||||
| 1.27%, 03/02/27 (Call 03/02/26), |
7,593 | 6,969,891 | ||||||
| 1.89%, 06/07/29 (Call 06/07/28), |
7,096 | 6,103,295 | ||||||
| 3.70%, 06/05/25 (Call 05/05/25) |
5,517 | 5,399,139 | ||||||
| 4.00%, 05/01/25 (Call 03/01/25) |
5,174 | 5,081,119 | ||||||
| 4.12%, 06/06/28 (Call 06/06/27), |
5,675 | 5,463,901 | ||||||
| 4.26%, 07/28/26 (Call 07/28/25), |
9,313 | 9,123,338 | ||||||
| 4.87%, 01/26/29 (Call 01/26/28), |
11,785 | 11,494,046 | ||||||
| 5.44%, 01/24/30 (Call 01/24/29), |
3,925 | 3,882,074 | ||||||
| 5.90%, 10/28/26 (Call 10/28/25), |
4,575 | 4,594,585 | ||||||
| 6.05%, 06/08/27 (Call 06/08/26), |
8,320 | 8,404,044 | ||||||
| 7.16%, 10/30/29 (Call 10/30/28), |
13,825 | 14,632,012 | ||||||
| U.S. Bancorp. |
||||||||
| 1.45%, 05/12/25 (Call 04/11/25)(a) |
7,967 | 7,623,265 | ||||||
| 2.22%, 01/27/28 (Call 01/27/27), |
7,655 | 7,013,599 | ||||||
| 3.10%, 04/27/26 (Call 03/27/26)(a) |
5,535 | 5,286,821 | ||||||
| 3.90%, 04/26/28 (Call 03/24/28) |
5,481 | 5,249,773 | ||||||
| 3.95%, 11/17/25 (Call 10/17/25)(a) |
4,145 | 4,056,355 | ||||||
| 4.55%, 07/22/28 (Call 07/22/27), |
10,805 | 10,549,206 | ||||||
| 4.65%, 02/01/29 (Call 02/01/28), |
15,050 | 14,639,387 | ||||||
| 5.38%, 01/23/30 (Call 01/23/29), |
3,010 | 2,993,095 | ||||||
| 5.73%, 10/21/26 (Call 10/21/25), |
8,705 | 8,743,464 | ||||||
| 5.78%, 06/12/29 (Call 06/12/28), |
13,425 | 13,565,104 | ||||||
| 6.79%, 10/26/27 (Call 10/26/26), |
2,750 | 2,841,296 | ||||||
| Series V, 2.38%, 07/22/26 (Call 06/22/26)(a) |
8,311 | 7,789,879 | ||||||
| Series X, 3.15%, 04/27/27 (Call 03/27/27)(a) |
8,062 | 7,611,595 | ||||||
| Security | Par (000) |
Value | ||||||
| Banks (continued) | ||||||||
| UBS AG/London |
||||||||
| 1.25%, 06/01/26 |
$ | 7,594 | $ | 6,962,642 | ||||
| 5.65%, 09/11/28(a) |
12,380 | 12,615,174 | ||||||
| 5.80%, 09/11/25 |
6,390 | 6,435,794 | ||||||
| UBS AG/Stamford CT, 7.50%, 07/15/25 |
805 | 821,698 | ||||||
| UBS Group AG |
||||||||
| 1.31%, 02/02/27 (Call 02/02/26), |
13,712 | 12,606,581 | ||||||
| 1.36%, 01/30/27 (Call 01/30/26), |
9,319 | 8,585,360 | ||||||
| 1.49%, 08/10/27 (Call 08/10/26), |
13,250 | 12,004,002 | ||||||
| 2.19%, 06/05/26 (Call 06/05/25), |
10,042 | 9,608,416 | ||||||
| 3.75%, 03/26/25 |
15,409 | 15,091,369 | ||||||
| 3.87%, 01/12/29 (Call 01/12/28), |
13,360 | 12,565,051 | ||||||
| 4.13%, 09/24/25(b) |
18,350 | 17,949,162 | ||||||
| 4.13%, 04/15/26(b) |
13,791 | 13,390,218 | ||||||
| 4.25%, 03/23/28 (Call 03/23/27)(b) |
14,940 | 14,300,312 | ||||||
| 4.28%, 01/09/28 (Call 01/09/27)(b) |
15,240 | 14,625,305 | ||||||
| 4.49%, 05/12/26 (Call 05/12/25), |
8,165 | 8,032,088 | ||||||
| 4.55%, 04/17/26 |
13,386 | 13,152,242 | ||||||
| 4.70%, 08/05/27 (Call 08/05/26), |
11,895 | 11,659,354 | ||||||
| 4.75%, 05/12/28 (Call 05/12/27), |
8,520 | 8,309,806 | ||||||
| 5.43%, 02/08/30 (Call 02/08/29), |
7,635 | 7,583,953 | ||||||
| 5.71%, 01/12/27 (Call 01/12/26), |
11,950 | 11,946,200 | ||||||
| 6.25%, 09/22/29 (Call 09/22/28), |
7,470 | 7,672,924 | ||||||
| 6.33%, 12/22/27 (Call 12/22/26), |
8,495 | 8,665,878 | ||||||
| 6.37%, 07/15/26 (Call 07/15/25), |
10,515 | 10,587,145 | ||||||
| 6.44%, 08/11/28 (Call 08/11/27), |
12,011 | 12,344,455 | ||||||
| UniCredit SpA |
||||||||
| 1.98%, 06/03/27 (Call 06/03/26), |
8,929 | 8,194,330 | ||||||
| 2.57%, 09/22/26 (Call 09/22/25), |
2,280 | 2,159,522 | ||||||
| United Overseas Bank Ltd. |
||||||||
| 1.25%, 04/14/26(b) |
505 | 466,250 | ||||||
| 2.00%, 10/14/31 (Call 10/14/26), |
2,845 | 2,594,892 | ||||||
| 3.06%, 04/07/25(a)(b) |
510 | 498,433 | ||||||
| 3.86%, 10/07/32 (Call 10/07/27), |
6,163 | 5,848,158 | ||||||
| Wachovia Corp. |
||||||||
| 6.61%, 10/01/25 |
835 | 847,946 | ||||||
| 7.57%, 08/01/26(e) |
3,093 | 3,244,916 | ||||||
| Wells Fargo & Co. |
||||||||
| 2.19%, 04/30/26 (Call 04/30/25), |
22,343 | 21,438,815 | ||||||
| 2.39%, 06/02/28 (Call 06/02/27), |
23,952 | 21,846,170 | ||||||
| 3.00%, 04/22/26 |
26,457 | 25,240,183 | ||||||
| 148 | 2 0 2 4 I S H A R E S A N N U A L R E P O R T T O S H A R E H O L D E R S |
| Schedule of Investments (continued) February 29, 2024 |
iShares® 1-5 Year Investment Grade Corporate Bond ETF (Percentages shown are based on Net Assets) |
| Security | Par (000) |
Value | ||||||
| Banks (continued) | ||||||||
| 3.00%, 10/23/26 |
$ | 25,246 | $ | 23,867,577 | ||||
| 3.20%, 06/17/27 (Call 06/17/26), |
18,697 | 17,801,421 | ||||||
| 3.53%, 03/24/28 (Call 03/24/27), |
29,076 | 27,567,587 | ||||||
| 3.55%, 09/29/25 |
19,774 | 19,263,296 | ||||||
| 3.58%, 05/22/28 (Call 05/22/27), |
22,280 | 21,120,596 | ||||||
| 3.91%, 04/25/26 (Call 04/25/25), |
20,595 | 20,193,846 | ||||||
| 4.10%, 06/03/26 |
18,914 | 18,421,473 | ||||||
| 4.15%, 01/24/29 (Call 10/24/28)(a) |
1,835 | 1,756,493 | ||||||
| 4.30%, 07/22/27(a) |
19,727 | 19,149,891 | ||||||
| 4.54%, 08/15/26 (Call 08/15/25), |
11,160 | 11,005,803 | ||||||
| 4.81%, 07/25/28 (Call 07/25/27), |
22,308 | 21,908,064 | ||||||
| 5.20%, 01/23/30 (Call 01/23/29), |
17,325 | 17,176,192 | ||||||
| 5.57%, 07/25/29 (Call 07/25/28), |
27,755 | 27,936,755 | ||||||
| 6.30%, 10/23/29 (Call 10/23/28), |
15,875 | 16,454,157 | ||||||
| Wells Fargo Bank NA |
||||||||
| 4.81%, 01/15/26 (Call 12/15/25) |
8,275 | 8,233,279 | ||||||
| 5.25%, 12/11/26 (Call 11/09/26)(a) |
13,765 | 13,815,359 | ||||||
| 5.45%, 08/07/26 (Call 07/07/26) |
18,960 | 19,122,414 | ||||||
| 5.55%, 08/01/25 (Call 07/01/25) |
19,975 | 20,056,722 | ||||||
| Westpac Banking Corp. |
||||||||
| 1.15%, 06/03/26 |
8,102 | 7,446,322 | ||||||
| 1.95%, 11/20/28 |
7,500 | 6,582,240 | ||||||
| 2.70%, 08/19/26(a) |
5,309 | 5,041,832 | ||||||
| 2.85%, 05/13/26 |
8,494 | 8,113,623 | ||||||
| 3.35%, 03/08/27(a) |
7,135 | 6,827,016 | ||||||
| 3.40%, 01/25/28(a) |
3,770 | 3,574,012 | ||||||
| 3.74%, 08/26/25 |
3,969 | 3,894,701 | ||||||
| 4.04%, 08/26/27(a) |
6,100 | 5,969,863 | ||||||
| 4.32%, 11/23/31 (Call 11/23/26), |
8,939 | 8,584,808 | ||||||
| 5.46%, 11/18/27 |
9,360 | 9,517,665 | ||||||
| 5.51%, 11/17/25(a) |
6,000 | 6,046,332 | ||||||
| 5.54%, 11/17/28 |
12,480 | 12,772,673 | ||||||
| Westpac New Zealand Ltd. |
||||||||
| 4.90%, 02/15/28(a)(b) |
4,283 | 4,235,664 | ||||||
| 5.13%, 02/26/27(a)(b) |
4,045 | 4,040,597 | ||||||
| 5.20%, 02/28/29(b) |
4,000 | 3,997,239 | ||||||
| Woori Bank |
||||||||
| 0.75%, 02/01/26(b) |
800 | 733,984 | ||||||
| 4.88%, 01/26/28(a)(b) |
2,250 | 2,236,208 | ||||||
|
|
|
|||||||
| 6,955,784,213 | ||||||||
| Beverages — 1.2% | ||||||||
| Anheuser-Busch Companies LLC/Anheuser-Busch InBev Worldwide Inc., 3.65%, 02/01/26 (Call 11/01/25)(a) |
8,520 | 8,302,756 | ||||||
| Anheuser-Busch InBev Worldwide Inc. |
||||||||
| 4.00%, 04/13/28 (Call 01/13/28)(a) |
19,819 | 19,219,717 | ||||||
| 4.75%, 01/23/29 (Call 10/23/28) |
25,990 | 25,773,584 | ||||||
| Bacardi Ltd. |
||||||||
| 2.75%, 07/15/26 (Call 04/15/26)(a)(b) |
705 | 664,262 | ||||||
| 4.45%, 05/15/25 (Call 03/15/25)(b) |
5,253 | 5,175,428 | ||||||
| Security | Par (000) |
Value | ||||||
| Beverages (continued) | ||||||||
| 4.70%, 05/15/28 (Call 02/15/28)(b) |
$ | 310 | $ | 301,072 | ||||
| Bacardi Ltd./Bacardi-Martini BV, 5.25%, |
65 | 63,988 | ||||||
| Brown-Forman Corp., 3.50%, 04/15/25 |
1,788 | 1,750,876 | ||||||
| Coca-Cola Co. (The) |
||||||||
| 1.00%, 03/15/28(a) |
8,565 | 7,468,682 | ||||||
| 1.45%, 06/01/27(a) |
9,733 | 8,809,037 | ||||||
| 1.50%, 03/05/28(a) |
5,560 | 4,945,239 | ||||||
| 2.90%, 05/25/27 |
3,431 | 3,257,699 | ||||||
| 3.38%, 03/25/27 |
6,185 | 5,965,487 | ||||||
| Coca-Cola Consolidated Inc., 3.80%, 11/25/25 |
2,892 | 2,828,509 | ||||||
| Coca-Cola Europacific Partners PLC, 1.50%, |
2,278 | 2,058,390 | ||||||
| Constellation Brands Inc. |
||||||||
| 3.50%, 05/09/27 (Call 02/09/27) |
3,479 | 3,307,651 | ||||||
| 3.60%, 02/15/28 (Call 11/15/27) |
5,536 | 5,233,713 | ||||||
| 3.70%, 12/06/26 (Call 09/06/26) |
4,369 | 4,208,174 | ||||||
| 4.35%, 05/09/27 (Call 04/09/27)(a) |
4,059 | 3,969,669 | ||||||
| 4.40%, 11/15/25 (Call 09/15/25) |
3,619 | 3,564,971 | ||||||
| 4.65%, 11/15/28 (Call 08/15/28) |
3,115 | 3,057,745 | ||||||
| 4.75%, 12/01/25 |
2,559 | 2,531,799 | ||||||
| 4.80%, 01/15/29 (Call 12/15/28) |
2,490 | 2,454,089 | ||||||
| 5.00%, 02/02/26 (Call 03/11/24)(a) |
4,145 | 4,118,565 | ||||||
| Diageo Capital PLC |
||||||||
| 1.38%, 09/29/25 (Call 08/29/25) |
5,273 | 4,974,541 | ||||||
| 3.88%, 05/18/28 (Call 02/18/28) |
1,655 | 1,602,705 | ||||||
| 5.20%, 10/24/25(a) |
3,415 | 3,417,434 | ||||||
| 5.30%, 10/24/27 (Call 09/24/27) |
5,025 | 5,085,979 | ||||||
| 5.38%, 10/05/26 (Call 09/05/26) |
4,750 | 4,789,032 | ||||||
| Heineken NV, 3.50%, 01/29/28 |
7,245 | 6,913,913 | ||||||
| JDE Peet’s NV, 1.38%, 01/15/27 |
5,050 | 4,515,870 | ||||||
| Keurig Dr Pepper Inc. |
||||||||
| 2.55%, 09/15/26 (Call 06/15/26) |
2,583 | 2,422,017 | ||||||
| 3.40%, 11/15/25 (Call 08/15/25) |
3,493 | 3,384,153 | ||||||
| 3.43%, 06/15/27 (Call 03/15/27)(a) |
3,648 | 3,473,069 | ||||||
| 4.42%, 05/25/25 (Call 03/25/25)(a) |
3,977 | 3,933,297 | ||||||
| 4.60%, 05/25/28 (Call 02/25/28)(a) |
8,045 | 7,935,590 | ||||||
| Molson Coors Beverage Co., 3.00%, 07/15/26 |
13,044 | 12,423,503 | ||||||
| PepsiCo Inc. |
||||||||
| 2.38%, 10/06/26 (Call 07/06/26) |
6,585 | 6,204,420 | ||||||
| 2.63%, 03/19/27 (Call 01/19/27) |
4,005 | 3,765,505 | ||||||
| 2.75%, 04/30/25 (Call 01/30/25)(a) |
6,591 | 6,418,153 | ||||||
| 2.85%, 02/24/26 (Call 11/24/25) |
4,793 | 4,607,643 | ||||||
| 3.00%, 10/15/27 (Call 07/15/27) |
7,175 | 6,764,522 | ||||||
| 3.50%, 07/17/25 (Call 04/17/25)(a) |
4,794 | 4,697,254 | ||||||
| 3.60%, 02/18/28 (Call 01/18/28) |
6,632 | 6,380,073 | ||||||
| 4.45%, 05/15/28 (Call 04/15/28)(a) |
5,850 | 5,838,546 | ||||||
| 4.55%, 02/13/26 (Call 01/13/26)(a) |
3,367 | 3,347,043 | ||||||
| 5.13%, 11/10/26 (Call 10/10/26)(a) |
4,625 | 4,654,341 | ||||||
| 5.25%, 11/10/25(a) |
5,335 | 5,356,888 | ||||||
| Pepsico Singapore Financing I Pte Ltd. |
||||||||
| 4.55%, 02/16/29 (Call 01/16/29) |
2,700 | 2,675,601 | ||||||
| 4.65%, 02/16/27 (Call 01/16/27) |
2,525 | 2,507,122 | ||||||
| Pernod Ricard International Finance LLC, |
||||||||
| 1.25%, 04/01/28 (Call 02/01/28)(a)(b) |
3,954 | 3,407,462 | ||||||
| S C H E D U L E O F I N V E S T M E N T S |
149 |
| Schedule of Investments (continued) February 29, 2024 |
iShares® 1-5 Year Investment Grade Corporate Bond ETF (Percentages shown are based on Net Assets) |
| Security | Par (000) |
Value | ||||||
| Beverages (continued) | ||||||||
| Pernod Ricard SA, 3.25%, 06/08/26 |
$ | 4,609 | $ | 4,426,748 | ||||
|
|
|
|||||||
| 264,953,526 | ||||||||
| Biotechnology — 0.7% | ||||||||
| Amgen Inc. |
||||||||
| 1.65%, 08/15/28 (Call 06/15/28) |
7,045 | 6,137,327 | ||||||
| 2.20%, 02/21/27 (Call 12/21/26)(a) |
11,675 | 10,766,332 | ||||||
| 2.60%, 08/19/26 (Call 05/19/26)(a) |
8,764 | 8,271,748 | ||||||
| 3.00%, 02/22/29 (Call 12/22/28) |
1,155 | 1,059,323 | ||||||
| 3.13%, 05/01/25 (Call 02/01/25)(a) |
6,472 | 6,306,729 | ||||||
| 3.20%, 11/02/27 (Call 08/02/27) |
2,240 | 2,106,363 | ||||||
| 5.15%, 03/02/28 (Call 02/02/28) |
30,430 | 30,488,742 | ||||||
| 5.51%, 03/02/26 (Call 03/11/24)(a) |
5,295 | 5,288,102 | ||||||
| Baxalta Inc., 4.00%, 06/23/25 (Call 03/23/25) |
6,118 | 6,009,503 | ||||||
| Biogen Inc., 4.05%, 09/15/25 |
11,884 | 11,647,869 | ||||||
| Bio-Rad Laboratories Inc., 3.30%, 03/15/27 |
2,801 | 2,641,307 | ||||||
| CSL Finance PLC, 3.85%, 04/27/27 |
3,545 | 3,413,903 | ||||||
| Gilead Sciences Inc. |
||||||||
| 1.20%, 10/01/27 (Call 08/01/27) |
4,894 | 4,306,455 | ||||||
| 2.95%, 03/01/27 (Call 12/01/26)(a) |
8,147 | 7,697,114 | ||||||
| 3.65%, 03/01/26 (Call 12/01/25)(a) |
18,262 | 17,732,170 | ||||||
| Illumina Inc. |
||||||||
| 5.75%, 12/13/27 (Call 11/13/27) |
3,650 | 3,681,342 | ||||||
| 5.80%, 12/12/25 (Call 11/12/25) |
3,370 | 3,370,353 | ||||||
| Royalty Pharma PLC |
||||||||
| 1.20%, 09/02/25 (Call 08/02/25) |
6,916 | 6,475,078 | ||||||
| 1.75%, 09/02/27 (Call 07/02/27)(a) |
6,593 | 5,870,844 | ||||||
|
|
|
|||||||
| 143,270,604 | ||||||||
| Building Materials — 0.4% | ||||||||
| Carrier Global Corp. |
||||||||
| 2.49%, 02/15/27 (Call 12/15/26) |
6,131 | 5,693,928 | ||||||
| 5.80%, 11/30/25 |
8,900 | 8,962,711 | ||||||
| CRH America Finance Inc. |
||||||||
| 3.40%, 05/09/27 (Call 02/09/27)(a)(b) |
1,960 | 1,859,604 | ||||||
| 3.95%, 04/04/28 (Call 01/04/28)(b) |
7,081 | 6,822,099 | ||||||
| CRH America Inc., 3.88%, 05/18/25 |
8,400 | 8,215,335 | ||||||
| Fortune Brands Innovations Inc., 4.00%, |
3,820 | 3,747,115 | ||||||
| Holcim Finance U.S. LLC, 3.50%, 09/22/26 |
3,101 | 2,970,141 | ||||||
| Johnson Controls International PLC, 3.90%, |
3,462 | 3,373,527 | ||||||
| Lennox International Inc. |
||||||||
| 1.35%, 08/01/25 (Call 07/01/25)(a) |
2,346 | 2,212,337 | ||||||
| 1.70%, 08/01/27 (Call 06/01/27) |
2,393 | 2,142,493 | ||||||
| 5.50%, 09/15/28 (Call 08/15/28) |
4,380 | 4,420,169 | ||||||
| Martin Marietta Materials Inc. |
||||||||
| 3.45%, 06/01/27 (Call 03/01/27)(a) |
975 | 931,105 | ||||||
| 3.50%, 12/15/27 (Call 09/15/27) |
3,340 | 3,165,948 | ||||||
| Masco Corp. |
||||||||
| 1.50%, 02/15/28 (Call 12/15/27) |
4,210 | 3,658,354 | ||||||
| 3.50%, 11/15/27 (Call 08/15/27)(a) |
695 | 653,098 | ||||||
| Mohawk Industries Inc., 5.85%, 09/18/28 |
4,760 | 4,862,886 | ||||||
| Owens Corning, 3.40%, 08/15/26 |
3,088 | 2,949,791 | ||||||
| Security | Par (000) |
Value | ||||||
| Building Materials (continued) | ||||||||
| St Marys Cement Inc. Canada, 5.75%, 01/28/27 |
$ | 290 | $ | 288,766 | ||||
| Trane Technologies Financing Ltd., 3.50%, 03/21/26 (Call 01/21/26) |
3,241 | 3,132,942 | ||||||
| Trane Technologies Global Holding Co. Ltd., 3.75%, 08/21/28 (Call 05/21/28)(a) |
1,690 | 1,612,076 | ||||||
| Vulcan Materials Co. |
||||||||
| 3.90%, 04/01/27 (Call 01/01/27)(a) |
2,844 | 2,754,066 | ||||||
| 4.50%, 04/01/25 (Call 01/01/25)(a) |
3,190 | 3,155,036 | ||||||
| 5.80%, 03/01/26 (Call 03/01/24)(a) |
890 | 890,000 | ||||||
|
|
|
|||||||
| 78,473,527 | ||||||||
| Chemicals — 1.2% | ||||||||
| Air Liquide Finance SA, 2.50%, 09/27/26 |
6,079 | 5,718,050 | ||||||
| Air Products and Chemicals Inc. |
||||||||
| 1.50%, 10/15/25 (Call 09/15/25) |
4,084 | 3,860,651 | ||||||
| 1.85%, 05/15/27 (Call 03/15/27) |
4,481 | 4,096,540 | ||||||
| 4.60%, 02/08/29 (Call 01/08/29) |
6,395 | 6,318,768 | ||||||
| Albemarle Corp., 4.65%, 06/01/27 |
4,615 | 4,532,301 | ||||||
| Bayport Polymers LLC, 4.74%, 04/14/27 (Call 03/14/27)(a)(b) |
700 | 663,509 | ||||||
| Cabot Corp., 3.40%, 09/15/26 (Call 06/15/26) |
2,081 | 1,957,496 | ||||||
| Celanese U.S. Holdings LLC |
||||||||
| 1.40%, 08/05/26 (Call 07/05/26)(a) |
2,845 | 2,580,320 | ||||||
| 6.05%, 03/15/25 |
7,028 | 7,045,391 | ||||||
| 6.17%, 07/15/27 (Call 06/15/27)(a) |
12,948 | 13,145,016 | ||||||
| 6.35%, 11/15/28 (Call 10/15/28) |
5,950 | 6,119,305 | ||||||
| CF Industries Inc., 4.50%, 12/01/26(a)(b) |
5,063 | 4,934,076 | ||||||
| Chevron Phillips Chemical Co. LLC/Chevron Phillips Chemical Co. LP |
||||||||
| 3.40%, 12/01/26 (Call 09/01/26)(a)(b) |
3,185 | 3,034,701 | ||||||
| 3.70%, 06/01/28 (Call 03/01/28)(a)(b) |
5,205 | 4,935,784 | ||||||
| 5.13%, 04/01/25 (Call 03/01/25)(b) |
4,878 | 4,858,860 | ||||||
| Dow Chemical Co. (The), 4.80%, 11/30/28 (Call 08/30/28)(a) |
1,060 | 1,052,254 | ||||||
| DuPont de Nemours Inc. |
||||||||
| 4.49%, 11/15/25 (Call 09/15/25)(a) |
11,975 | 11,833,864 | ||||||
| 4.73%, 11/15/28 (Call 08/15/28)(a) |
11,665 | 11,600,272 | ||||||
| Eastman Chemical Co. |
||||||||
| 3.80%, 03/15/25 (Call 12/15/24) |
5,335 | 5,247,838 | ||||||
| 4.50%, 12/01/28 (Call 09/01/28)(a) |
1,110 | 1,077,147 | ||||||
| Ecolab Inc. |
||||||||
| 1.65%, 02/01/27 (Call 01/01/27) |
3,356 | 3,066,785 | ||||||
| 2.70%, 11/01/26 (Call 08/01/26)(a) |
4,616 | 4,381,280 | ||||||
| 3.25%, 12/01/27 (Call 09/01/27)(a) |
3,505 | 3,320,055 | ||||||
| 5.25%, 01/15/28 (Call 12/15/27)(a) |
3,575 | 3,628,477 | ||||||
| EIDP Inc. |
||||||||
| 1.70%, 07/15/25 (Call 06/15/25) |
3,800 | 3,610,543 | ||||||
| 4.50%, 05/15/26 (Call 04/15/26) |
790 | 777,807 | ||||||
| FMC Corp. |
||||||||
| 3.20%, 10/01/26 (Call 08/01/26)(a) |
3,368 | 3,155,515 | ||||||
| 5.15%, 05/18/26 (Call 04/18/26)(a) |
3,300 | 3,254,514 | ||||||
| International Flavors & Fragrances Inc. |
||||||||
| 1.23%, 10/01/25 (Call 09/01/25)(b) |
6,660 | 6,206,676 | ||||||
| 1.83%, 10/15/27 (Call 08/15/27)(b) |
7,845 | 6,894,602 | ||||||
| 4.45%, 09/26/28 (Call 06/26/28)(a) |
100 | 96,444 | ||||||
| LG Chem Ltd., 1.38%, 07/07/26(b) |
3,635 | 3,313,523 | ||||||
| Linde Inc./CT |
||||||||
| 3.20%, 01/30/26 (Call 10/30/25) |
4,627 | 4,484,767 | ||||||
| 4.70%, 12/05/25 (Call 11/05/25) |
4,080 | 4,060,912 | ||||||
| 150 | 2 0 2 4 I S H A R E S A N N U A L R E P O R T T O S H A R E H O L D E R S |
| Schedule of Investments (continued) February 29, 2024 |
iShares® 1-5 Year Investment Grade Corporate Bond ETF (Percentages shown are based on Net Assets) |
| Security | Par (000) |
Value | ||||||
| Chemicals (continued) | ||||||||
| LYB Finance Co. BV, 8.10%, 03/15/27(a)(b) |
$ | 2,985 | $ | 3,175,439 | ||||
| LYB International Finance II BV, 3.50%, 03/02/27 (Call 12/02/26) |
2,865 | 2,730,079 | ||||||
| LYB International Finance III LLC, 1.25%, 10/01/25 (Call 09/01/25)(a) |
3,626 | 3,388,243 | ||||||
| MEGlobal BV |
||||||||
| 2.63%, 04/28/28 (Call 01/28/28)(b) |
4,400 | 3,905,176 | ||||||
| 4.25%, 11/03/26(b) |
5,406 | 5,189,760 | ||||||
| MEGlobal Canada ULC, 5.00%, 05/18/25(a)(b) |
10,125 | 9,986,389 | ||||||
| Mosaic Co. (The) |
||||||||
| 4.05%, 11/15/27 (Call 08/15/27)(a) |
4,690 | 4,505,259 | ||||||
| 5.38%, 11/15/28 (Call 10/15/28)(a) |
3,575 | 3,601,490 | ||||||
| Nutrien Ltd. |
||||||||
| 3.00%, 04/01/25 (Call 01/01/25)(a) |
3,043 | 2,959,250 | ||||||
| 4.00%, 12/15/26 (Call 09/15/26) |
3,059 | 2,962,167 | ||||||
| 4.90%, 03/27/28 (Call 02/27/28)(a) |
6,676 | 6,621,240 | ||||||
| 5.95%, 11/07/25(a) |
3,540 | 3,568,575 | ||||||
| OCI NV, 4.63%, 10/15/25 (Call 04/02/24)(a)(b) |
999 | 979,499 | ||||||
| Orbia Advance Corp. SAB de CV |
||||||||
| 1.88%, 05/11/26 (Call 04/11/26)(b) |
3,949 | 3,602,085 | ||||||
| 4.00%, 10/04/27 (Call 07/04/27)(a)(b) |
2,905 | 2,735,010 | ||||||
| PPG Industries Inc. |
||||||||
| 1.20%, 03/15/26 (Call 02/15/26)(a) |
4,756 | 4,395,216 | ||||||
| 3.75%, 03/15/28 (Call 12/15/27) |
2,715 | 2,601,583 | ||||||
| RPM International Inc., 3.75%, 03/15/27 (Call 12/15/26) |
3,079 | 2,937,582 | ||||||
| SABIC Capital II BV, 4.50%, 10/10/28(b) |
4,280 | 4,173,069 | ||||||
| Sherwin-Williams Co. (The) |
||||||||
| 3.45%, 08/01/25 (Call 05/01/25)(a) |
2,920 | 2,846,212 | ||||||
| 3.45%, 06/01/27 (Call 03/01/27) |
10,382 | 9,887,658 | ||||||
| 3.95%, 01/15/26 (Call 10/15/25)(a) |
1,841 | 1,801,130 | ||||||
| 4.25%, 08/08/25(a) |
2,910 | 2,868,456 | ||||||
| Syngenta Finance NV |
||||||||
| 4.89%, 04/24/25 (Call 02/24/25)(b) |
4,757 | 4,691,642 | ||||||
| 5.18%, 04/24/28 (Call 01/24/28)(a)(b) |
2,715 | 2,663,209 | ||||||
| Westlake Corp., 3.60%, 08/15/26 |
5,091 | 4,898,191 | ||||||
| Yara International ASA |
||||||||
| 3.80%, 06/06/26 (Call 03/06/26)(a)(b) |
2,044 | 1,960,500 | ||||||
| 4.75%, 06/01/28 (Call 03/01/28)(b) |
2,860 | 2,764,655 | ||||||
|
|
|
|||||||
| 263,262,807 | ||||||||
| Commercial Services — 0.9% | ||||||||
| Adani Ports & Special Economic Zone Ltd. |
||||||||
| 4.00%, 07/30/27 (Call 06/30/27)(b) |
1,935 | 1,771,133 | ||||||
| 4.20%, 08/04/27 (Call 02/04/27)(b) |
2,360 | 2,171,196 | ||||||
| Ashtead Capital Inc. |
||||||||
| 1.50%, 08/12/26 (Call 07/12/26)(a)(b) |
3,748 | 3,393,204 | ||||||
| 4.00%, 05/01/28 (Call 03/11/24)(a)(b) |
4,420 | 4,134,084 | ||||||
| 4.38%, 08/15/27 (Call 03/18/24)(a)(b) |
4,095 | 3,911,294 | ||||||
| Automatic Data Processing Inc. |
||||||||
| 1.70%, 05/15/28 (Call 03/15/28) |
2,110 | 1,881,381 | ||||||
| 3.38%, 09/15/25 (Call 06/15/25) |
6,633 | 6,481,781 | ||||||
| Block Financial LLC |
||||||||
| 2.50%, 07/15/28 (Call 05/15/28) |
240 | 211,347 | ||||||
| 5.25%, 10/01/25 (Call 07/01/25)(a) |
1,974 | 1,962,074 | ||||||
| Cintas Corp. No. 2 |
||||||||
| 3.45%, 05/01/25 (Call 04/01/25) |
5,191 | 5,082,242 | ||||||
| 3.70%, 04/01/27 (Call 01/01/27)(a) |
4,562 | 4,423,311 | ||||||
| CK Hutchison International 23 Ltd., 4.75%, 04/21/28 (Call 03/21/28)(a)(b) |
5,795 | 5,741,487 | ||||||
| DP World Crescent Ltd., 4.85%, 09/26/28(b) |
225 | 220,876 | ||||||
| Security | Par (000) |
Value | ||||||
| Commercial Services (continued) | ||||||||
| Element Fleet Management Corp. |
||||||||
| 3.85%, 06/15/25 (Call 05/15/25)(a)(b) |
$ | 2,742 | $ | 2,667,158 | ||||
| 6.27%, 06/26/26 (Call 05/26/26)(a)(b) |
4,460 | 4,499,835 | ||||||
| 6.32%, 12/04/28 (Call 11/04/28)(a)(b) |
4,640 | 4,759,001 | ||||||
| Equifax Inc. |
||||||||
| 2.60%, 12/15/25 (Call 11/15/25) |
2,928 | 2,790,482 | ||||||
| 3.25%, 06/01/26 (Call 03/01/26)(a) |
2,300 | 2,197,138 | ||||||
| 5.10%, 12/15/27 (Call 11/15/27) |
5,555 | 5,536,590 | ||||||
| 5.10%, 06/01/28 (Call 05/01/28)(a) |
5,416 | 5,383,505 | ||||||
| ERAC USA Finance LLC |
||||||||
| 3.30%, 12/01/26 (Call 09/01/26)(b) |
2,140 | 2,037,113 | ||||||
| 3.80%, 11/01/25 (Call 08/01/25)(b) |
5,263 | 5,125,177 | ||||||
| 4.60%, 05/01/28 (Call 04/01/28)(b) |
6,745 | 6,629,042 | ||||||
| 5.00%, 02/15/29 (Call 01/15/29)(a)(b) |
4,270 | 4,243,191 | ||||||
| Experian Finance PLC, 4.25%, 02/01/29 (Call 11/01/28)(a)(b) |
580 | 560,563 | ||||||
| Gartner Inc., 4.50%, 07/01/28 (Call 04/01/24)(a)(b) |
1,628 | 1,541,039 | ||||||
| Global Payments Inc. |
||||||||
| 1.20%, 03/01/26 (Call 02/01/26)(a) |
6,985 | 6,429,784 | ||||||
| 2.15%, 01/15/27 (Call 12/15/26) |
4,841 | 4,442,873 | ||||||
| 4.45%, 06/01/28 (Call 03/01/28) |
1,595 | 1,538,383 | ||||||
| 4.80%, 04/01/26 (Call 01/01/26)(a) |
5,124 | 5,059,971 | ||||||
| 4.95%, 08/15/27 (Call 07/15/27) |
3,506 | 3,473,830 | ||||||
| GXO Logistics Inc., 1.65%, 07/15/26 (Call 06/15/26)(a) |
2,849 | 2,599,663 | ||||||
| Leland Stanford Junior University (The), 1.29%, 06/01/27 (Call 04/01/27)(a) |
497 | 446,062 | ||||||
| Moody’s Corp. |
||||||||
| 3.25%, 01/15/28 (Call 10/15/27)(a) |
1,360 | 1,280,041 | ||||||
| 3.75%, 03/24/25 (Call 02/24/25) |
5,169 | 5,081,312 | ||||||
| 4.25%, 02/01/29 (Call 11/01/28)(a) |
2,150 | 2,079,925 | ||||||
| PayPal Holdings Inc. |
||||||||
| 1.65%, 06/01/25 (Call 05/01/25) |
7,083 | 6,779,040 | ||||||
| 2.65%, 10/01/26 (Call 08/01/26)(a) |
8,436 | 7,950,452 | ||||||
| 3.90%, 06/01/27 (Call 05/01/27)(a) |
4,165 | 4,026,482 | ||||||
| Pelabuhan Indonesia Persero PT, 4.25%, 05/05/25(a)(b) |
10,330 | 10,153,920 | ||||||
| S&P Global Inc. |
||||||||
| 2.45%, 03/01/27 (Call 02/01/27)(a) |
9,217 | 8,592,574 | ||||||
| 2.95%, 01/22/27 (Call 10/22/26)(a) |
3,532 | 3,351,674 | ||||||
| 4.75%, 08/01/28 (Call 05/01/28) |
395 | 393,759 | ||||||
| Sodexo Inc., 1.63%, 04/16/26 (Call 03/16/26)(b) |
3,662 | 3,383,343 | ||||||
| Transurban Finance Co. Pty. Ltd. |
||||||||
| 3.38%, 03/22/27 (Call 12/22/26)(a)(b) |
2,744 | 2,585,075 | ||||||
| 4.13%, 02/02/26 (Call 11/02/25)(a)(b) |
3,715 | 3,622,055 | ||||||
| Triton Container International Ltd., 2.05%, 04/15/26 (Call 03/15/26)(a)(b) |
4,054 | 3,715,857 | ||||||
| UL Solutions Inc., 6.50%, 10/20/28 (Call 09/20/28)(a)(b) |
1,860 | 1,921,440 | ||||||
| Verisk Analytics Inc., 4.00%, 06/15/25 (Call 03/15/25) |
6,409 | 6,295,571 | ||||||
| Yale University, Series 2020, 0.87%, 04/15/25 (Call 03/15/25)(a) |
1,165 | 1,111,369 | ||||||
|
|
|
|||||||
| 185,669,699 | ||||||||
| Computers — 2.0% | ||||||||
| Apple Inc. |
||||||||
| 0.55%, 08/20/25 (Call 07/20/25) |
8,617 | 8,101,271 | ||||||
| 0.70%, 02/08/26 (Call 01/08/26)(a) |
16,239 | 15,011,588 | ||||||
| 1.13%, 05/11/25 (Call 04/11/25) |
14,663 | 14,000,172 | ||||||
| 1.20%, 02/08/28 (Call 12/08/27)(a) |
17,247 | 15,154,420 | ||||||
| S C H E D U L E O F I N V E S T M E N T S |
151 |
| Schedule of Investments (continued) February 29, 2024 |
iShares® 1-5 Year Investment Grade Corporate Bond ETF (Percentages shown are based on Net Assets) |
| Security | Par (000) |
Value | ||||||
| Computers (continued) | ||||||||
| 1.40%, 08/05/28 (Call 06/05/28) |
$ | 11,365 | $ | 9,934,696 | ||||
| 2.05%, 09/11/26 (Call 07/11/26) |
12,955 | 12,117,822 | ||||||
| 2.45%, 08/04/26 (Call 05/04/26) |
14,440 | 13,666,447 | ||||||
| 2.90%, 09/12/27 (Call 06/12/27)(a) |
13,176 | 12,432,668 | ||||||
| 3.00%, 06/20/27 (Call 03/20/27)(a) |
11,083 | 10,515,426 | ||||||
| 3.00%, 11/13/27 (Call 08/13/27)(a) |
9,678 | 9,155,059 | ||||||
| 3.20%, 05/13/25(a) |
13,032 | 12,760,325 | ||||||
| 3.20%, 05/11/27 (Call 02/11/27)(a) |
13,307 | 12,703,606 | ||||||
| 3.25%, 02/23/26 (Call 11/23/25)(a) |
21,242 | 20,608,745 | ||||||
| 3.35%, 02/09/27 (Call 11/09/26) |
14,636 | 14,080,536 | ||||||
| 4.00%, 05/10/28 (Call 04/10/28)(a) |
14,248 | 13,939,820 | ||||||
| 4.42%, 05/08/26 (Call 05/08/24)(a) |
20 | 19,916 | ||||||
| Booz Allen Hamilton Inc., 3.88%, 09/01/28 (Call 04/01/24)(b) |
3,080 | 2,857,867 | ||||||
| CGI Inc., 1.45%, 09/14/26 (Call 08/14/26) |
4,117 | 3,730,856 | ||||||
| Dell Inc., 7.10%, 04/15/28(a) |
490 | 525,594 | ||||||
| Dell International LLC/EMC Corp. |
||||||||
| 4.90%, 10/01/26 (Call 08/01/26) |
11,287 | 11,183,531 | ||||||
| 5.25%, 02/01/28 (Call 01/01/28)(a) |
6,637 | 6,686,691 | ||||||
| 5.85%, 07/15/25 (Call 06/15/25) |
6,829 | 6,859,159 | ||||||
| 6.02%, 06/15/26 (Call 03/15/26) |
22,146 | 22,388,920 | ||||||
| 6.10%, 07/15/27 (Call 05/15/27)(a) |
3,897 | 4,001,832 | ||||||
| DXC Technology Co. |
||||||||
| 1.80%, 09/15/26 (Call 08/15/26)(a) |
4,697 | 4,264,461 | ||||||
| 2.38%, 09/15/28 (Call 07/15/28)(a) |
975 | 840,948 | ||||||
| Fortinet Inc., 1.00%, 03/15/26 (Call 02/15/26) |
3,658 | 3,356,404 | ||||||
| Genpact Luxembourg SARL/Genpact USA Inc., 1.75%, 04/10/26 (Call 03/10/26)(a) |
2,710 | 2,454,766 | ||||||
| HCL America Inc., 1.38%, 03/10/26 (Call 02/10/26)(b) |
1,526 | 1,410,267 | ||||||
| Hewlett Packard Enterprise Co. |
||||||||
| 1.75%, 04/01/26 (Call 03/01/26)(a) |
5,441 | 5,055,388 | ||||||
| 4.90%, 10/15/25 (Call 07/15/25)(a) |
16,364 | 16,252,238 | ||||||
| 5.25%, 07/01/28 (Call 06/01/28)(a) |
4,552 | 4,557,725 | ||||||
| 6.10%, 04/01/26 (Call 04/01/24)(a) |
2,256 | 2,257,055 | ||||||
| HP Inc. |
||||||||
| 1.45%, 06/17/26 (Call 05/17/26) |
3,670 | 3,372,151 | ||||||
| 2.20%, 06/17/25 (Call 05/17/25)(a) |
7,893 | 7,577,567 | ||||||
| 3.00%, 06/17/27 (Call 04/17/27) |
6,980 | 6,518,729 | ||||||
| 4.75%, 01/15/28 (Call 12/15/27) |
5,905 | 5,846,555 | ||||||
| IBM International Capital Pte Ltd. |
||||||||
| 4.60%, 02/05/27 (Call 01/05/27) |
4,520 | 4,463,566 | ||||||
| 4.60%, 02/05/29 (Call 01/05/29) |
4,470 | 4,382,778 | ||||||
| 4.70%, 02/05/26 |
4,565 | 4,527,763 | ||||||
| International Business Machines Corp. |
||||||||
| 1.70%, 05/15/27 (Call 03/15/27) |
8,527 | 7,698,743 | ||||||
| 2.20%, 02/09/27 (Call 01/09/27)(a) |
4,390 | 4,060,103 | ||||||
| 3.30%, 05/15/26 |
19,175 | 18,457,381 | ||||||
| 3.30%, 01/27/27(a) |
2,966 | 2,835,214 | ||||||
| 3.45%, 02/19/26(a) |
8,731 | 8,470,049 | ||||||
| 4.00%, 07/27/25(a) |
6,504 | 6,402,392 | ||||||
| 4.15%, 07/27/27 (Call 06/27/27) |
5,168 | 5,039,126 | ||||||
| 4.50%, 02/06/26(a) |
5,270 | 5,223,282 | ||||||
| 4.50%, 02/06/28 (Call 01/06/28)(a) |
6,505 | 6,414,024 | ||||||
| 6.22%, 08/01/27 |
1,320 | 1,378,583 | ||||||
| 6.50%, 01/15/28 |
1,260 | 1,331,856 | ||||||
| 7.00%, 10/30/25 |
6,852 | 7,070,667 | ||||||
| Kyndryl Holdings Inc. |
||||||||
| 2.05%, 10/15/26 (Call 09/15/26)(a) |
4,450 | 4,063,216 | ||||||
| 2.70%, 10/15/28 (Call 08/15/28)(a) |
2,715 | 2,378,718 | ||||||
| Leidos Inc., 3.63%, 05/15/25 (Call 04/15/25) |
3,676 | 3,591,206 | ||||||
| Security | Par (000) |
Value | ||||||
| Computers (continued) | ||||||||
| Lenovo Group Ltd., 5.83%, 01/27/28 (Call 12/27/27)(b) |
$ | 200 | $ | 201,727 | ||||
| NetApp Inc. |
||||||||
| 1.88%, 06/22/25 (Call 05/22/25) |
5,252 | 5,014,228 | ||||||
| 2.38%, 06/22/27 (Call 04/22/27)(a) |
4,299 | 3,940,137 | ||||||
| Western Digital Corp., 2.85%, 02/01/29 (Call 12/01/28)(a) |
2,200 | 1,852,834 | ||||||
| Wipro IT Services LLC, 1.50%, 06/23/26 (Call 05/23/26)(a)(b) |
3,585 | 3,291,230 | ||||||
|
|
|
|||||||
| 428,290,044 | ||||||||
| Cosmetics & Personal Care — 0.7% | ||||||||
| Colgate-Palmolive Co. |
||||||||
| 3.10%, 08/15/25 |
4,062 | 3,960,231 | ||||||
| 3.10%, 08/15/27 (Call 07/15/27)(a) |
3,475 | 3,318,824 | ||||||
| 4.60%, 03/01/28 (Call 02/01/28) |
2,628 | 2,647,940 | ||||||
| 4.80%, 03/02/26(a) |
4,088 | 4,097,811 | ||||||
| Conopco Inc. |
||||||||
| Series E, 7.25%, 12/15/26(a) |
2,785 | 2,946,851 | ||||||
| Series F, 6.63%, 04/15/28(a) |
3,610 | 3,860,305 | ||||||
| Estee Lauder Companies Inc. (The) |
||||||||
| 3.15%, 03/15/27 (Call 12/15/26) |
3,550 | 3,384,255 | ||||||
| 4.38%, 05/15/28 (Call 04/15/28)(a) |
6,065 | 5,963,892 | ||||||
| Haleon U.K. Capital PLC |
||||||||
| 3.13%, 03/24/25(b) |
75 | 73,139 | ||||||
| 3.13%, 03/24/25(a) |
10,260 | 10,005,479 | ||||||
| Haleon U.S. Capital LLC, 3.38%, 03/24/27 (Call 02/24/27) |
12,890 | 12,243,615 | ||||||
| Kenvue Inc. |
||||||||
| 5.05%, 03/22/28 (Call 02/22/28) |
7,928 | 7,978,494 | ||||||
| 5.35%, 03/22/26 (Call 02/22/26)(a) |
5,510 | 5,545,789 | ||||||
| Procter & Gamble Co. (The) |
||||||||
| 0.55%, 10/29/25 |
6,993 | 6,520,450 | ||||||
| 1.00%, 04/23/26(a) |
6,265 | 5,799,149 | ||||||
| 1.90%, 02/01/27(a) |
6,515 | 6,035,526 | ||||||
| 2.45%, 11/03/26(a) |
5,661 | 5,351,844 | ||||||
| 2.70%, 02/02/26 |
4,146 | 3,992,513 | ||||||
| 2.80%, 03/25/27(a) |
4,065 | 3,848,704 | ||||||
| 2.85%, 08/11/27 |
4,535 | 4,283,848 | ||||||
| 3.95%, 01/26/28(a) |
5,260 | 5,169,866 | ||||||
| 4.10%, 01/26/26(a) |
4,440 | 4,389,161 | ||||||
| 4.35%, 01/29/29 |
3,450 | 3,419,302 | ||||||
| Unilever Capital Corp. |
||||||||
| 2.00%, 07/28/26(a) |
5,169 | 4,839,983 | ||||||
| 2.90%, 05/05/27 (Call 02/05/27) |
6,725 | 6,360,509 | ||||||
| 3.10%, 07/30/25(a) |
4,158 | 4,055,821 | ||||||
| 3.38%, 03/22/25 (Call 01/22/25) |
778 | 762,328 | ||||||
| 3.50%, 03/22/28 (Call 12/22/27)(a) |
6,585 | 6,298,912 | ||||||
| 4.88%, 09/08/28 (Call 08/08/28)(a) |
3,840 | 3,868,575 | ||||||
|
|
|
|||||||
| 141,023,116 | ||||||||
| Distribution & Wholesale — 0.1% | ||||||||
| Ferguson Finance PLC |
||||||||
| 4.25%, 04/20/27 (Call 03/20/27)(b) |
1,680 | 1,632,893 | ||||||
| 4.50%, 10/24/28 (Call 07/24/28)(b) |
4,185 | 4,080,318 | ||||||
| LKQ Corp., 5.75%, 06/15/28 (Call 05/15/28) |
5,685 | 5,744,954 | ||||||
| Mitsubishi Corp. |
||||||||
| 1.13%, 07/15/26 (Call 06/15/26)(b) |
12,050 | 10,959,589 | ||||||
| 5.00%, 07/05/28 (Call 06/05/28)(a)(b) |
6,115 | 6,120,198 | ||||||
|
|
|
|||||||
| 28,537,952 | ||||||||
| 152 | 2 0 2 4 I S H A R E S A N N U A L R E P O R T T O S H A R E H O L D E R S |
| Schedule of Investments (continued) February 29, 2024 |
iShares® 1-5 Year Investment Grade Corporate Bond ETF (Percentages shown are based on Net Assets) |
| Security | Par (000) |
Value | ||||||
| Diversified Financial Services — 4.6% | ||||||||
| AerCap Ireland Capital DAC/AerCap Global Aviation Trust |
||||||||
| 1.75%, 01/30/26 (Call 12/30/25) |
$ | 6,543 | $ | 6,078,756 | ||||
| 2.45%, 10/29/26 (Call 09/29/26) |
24,618 | 22,707,416 | ||||||
| 3.00%, 10/29/28 (Call 08/29/28)(a) |
19,910 | 17,890,452 | ||||||
| 3.65%, 07/21/27 (Call 04/21/27) |
7,269 | 6,839,875 | ||||||
| 3.88%, 01/23/28 (Call 10/23/27)(a) |
2,770 | 2,608,990 | ||||||
| 4.45%, 10/01/25 (Call 08/01/25)(a) |
4,354 | 4,270,030 | ||||||
| 4.45%, 04/03/26 (Call 02/03/26) |
3,933 | 3,853,606 | ||||||
| 4.63%, 10/15/27 (Call 08/15/27)(a) |
4,515 | 4,374,422 | ||||||
| 5.10%, 01/19/29 (Call 12/19/28)(a) |
10,985 | 10,797,720 | ||||||
| 5.75%, 06/06/28 (Call 05/06/28)(a) |
8,015 | 8,073,008 | ||||||
| 6.10%, 01/15/27 (Call 12/15/26)(a) |
4,535 | 4,591,666 | ||||||
| 6.45%, 04/15/27 (Call 03/15/27)(a)(b) |
2,690 | 2,753,377 | ||||||
| 6.50%, 07/15/25 (Call 06/15/25)(a) |
8,499 | 8,578,678 | ||||||
| Affiliated Managers Group Inc., 3.50%, 08/01/25 |
1,445 | 1,404,452 | ||||||
| Air Lease Corp. |
||||||||
| 1.88%, 08/15/26 (Call 07/15/26) |
7,891 | 7,245,999 | ||||||
| 2.10%, 09/01/28 (Call 07/01/28)(a) |
845 | 733,096 | ||||||
| 2.20%, 01/15/27 (Call 12/15/26)(a) |
4,880 | 4,473,916 | ||||||
| 2.88%, 01/15/26 (Call 12/15/25)(a) |
9,387 | 8,951,765 | ||||||
| 3.25%, 03/01/25 (Call 01/01/25) |
5,006 | 4,887,292 | ||||||
| 3.38%, 07/01/25 (Call 06/01/25) |
5,885 | 5,716,372 | ||||||
| 3.63%, 04/01/27 (Call 01/01/27)(a) |
4,187 | 3,934,140 | ||||||
| 3.63%, 12/01/27 (Call 09/01/27)(a) |
2,690 | 2,527,546 | ||||||
| 3.75%, 06/01/26 (Call 04/01/26)(a) |
5,063 | 4,877,727 | ||||||
| 4.63%, 10/01/28 (Call 07/01/28) |
3,050 | 2,946,536 | ||||||
| 5.10%, 03/01/29 (Call 02/01/29)(a) |
3,125 | 3,076,068 | ||||||
| 5.30%, 02/01/28 (Call 01/01/28)(a) |
5,110 | 5,085,518 | ||||||
| 5.85%, 12/15/27 (Call 11/15/27)(a) |
3,780 | 3,826,842 | ||||||
| AIR Lease Corp. Sukuk Ltd., 5.85%, 04/01/28 (Call 03/01/28)(b) |
4,830 | 4,818,453 | ||||||
| Aircastle Ltd. |
||||||||
| 2.85%, 01/26/28 (Call 11/26/27)(a)(b) |
3,935 | 3,500,158 | ||||||
| 4.25%, 06/15/26 (Call 04/15/26)(a) |
4,639 | 4,497,280 | ||||||
| 5.25%, 08/11/25 (Call 07/11/25)(b) |
5,208 | 5,147,857 | ||||||
| 5.95%, 02/15/29 (Call 01/15/29)(a)(b) |
3,675 | 3,630,405 | ||||||
| 6.50%, 07/18/28 (Call 06/18/28)(b) |
4,550 | 4,596,759 | ||||||
| Ally Financial Inc. |
||||||||
| 2.20%, 11/02/28 (Call 09/02/28) |
5,050 | 4,294,430 | ||||||
| 4.63%, 03/30/25(a) |
852 | 842,631 | ||||||
| 4.75%, 06/09/27 (Call 05/09/27)(a) |
3,730 | 3,623,000 | ||||||
| 5.80%, 05/01/25 (Call 04/01/25)(a) |
988 | 986,442 | ||||||
| 6.85%, 01/03/30 (Call 01/03/29), |
7,010 | 7,164,405 | ||||||
| 6.99%, 06/13/29 (Call 06/13/28), |
6,250 | 6,421,284 | ||||||
| 7.10%, 11/15/27 (Call 10/15/27)(a) |
4,745 | 4,940,620 | ||||||
| American Express Co. |
||||||||
| 1.65%, 11/04/26 (Call 10/04/26) |
6,472 | 5,920,229 | ||||||
| 2.25%, 03/04/25 (Call 02/01/25)(a) |
11,117 | 10,765,873 | ||||||
| 2.55%, 03/04/27 (Call 02/01/27)(a) |
11,512 | 10,684,313 | ||||||
| 3.13%, 05/20/26 (Call 04/20/26) |
5,333 | 5,122,812 | ||||||
| 3.30%, 05/03/27 (Call 04/03/27)(a) |
11,272 | 10,684,830 | ||||||
| 3.95%, 08/01/25 (Call 07/01/25) |
14,638 | 14,381,154 | ||||||
| 4.20%, 11/06/25 (Call 10/06/25) |
4,865 | 4,801,113 | ||||||
| 4.90%, 02/13/26 (Call 01/13/26)(a) |
7,690 | 7,665,419 | ||||||
| 4.99%, 05/01/26 (Call 05/01/25), |
8,352 | 8,302,995 | ||||||
| Security | Par (000) |
Value | ||||||
| Diversified Financial Services (continued) | ||||||||
| 5.10%, 02/16/28 (Call 02/16/27), |
$ | 3,310 | $ | 3,297,520 | ||||
| 5.28%, 07/27/29 (Call 07/27/28), |
15,730 | 15,810,377 | ||||||
| 5.39%, 07/28/27 (Call 07/28/26), |
5,910 | 5,926,299 | ||||||
| 5.85%, 11/05/27 (Call 10/05/27)(a) |
10,330 | 10,605,843 | ||||||
| 6.34%, 10/30/26 (Call 10/30/25), |
5,980 | 6,070,993 | ||||||
| American Express Credit Corp., 3.30%, 05/03/27 (Call 04/03/27)(a) |
1,755 | 1,666,209 | ||||||
| Ameriprise Financial Inc. |
||||||||
| 2.88%, 09/15/26 (Call 06/15/26)(a) |
3,682 | 3,494,483 | ||||||
| 3.00%, 04/02/25 (Call 03/02/25) |
2,193 | 2,137,174 | ||||||
| 5.70%, 12/15/28 (Call 11/15/28)(a) |
3,330 | 3,424,564 | ||||||
| Andrew W Mellon Foundation (The), Series 2020, 0.95%, 08/01/27 (Call 06/01/27) |
605 | 529,765 | ||||||
| Antares Holdings LP |
||||||||
| 2.75%, 01/15/27 (Call 12/15/26)(a)(b) |
1,225 | 1,091,409 | ||||||
| 3.75%, 07/15/27 (Call 06/15/27)(a)(b) |
3,500 | 3,159,333 | ||||||
| 3.95%, 07/15/26 (Call 06/15/26)(b) |
2,805 | 2,610,763 | ||||||
| 6.50%, 02/08/29 (Call 01/08/29)(a)(b) |
2,850 | 2,784,515 | ||||||
| 7.95%, 08/11/28 (Call 07/11/28)(b) |
250 | 258,486 | ||||||
| Ares Finance Co. III LLC, 4.13%, 06/30/51 (Call 06/30/26), (5-year CMT + 3.237%)(b)(c) |
3,125 | 2,823,125 | ||||||
| Ares Management Corp., 6.38%, 11/10/28 (Call 10/10/28)(a) |
1,120 | 1,167,167 | ||||||
| Aviation Capital Group LLC |
||||||||
| 1.95%, 01/30/26 (Call 12/30/25)(a)(b) |
5,321 | 4,945,620 | ||||||
| 1.95%, 09/20/26 (Call 08/20/26)(a)(b) |
5,613 | 5,107,404 | ||||||
| 3.50%, 11/01/27 (Call 07/01/27)(a)(b) |
2,365 | 2,181,235 | ||||||
| 4.13%, 08/01/25 (Call 06/01/25)(b) |
4,229 | 4,108,605 | ||||||
| 4.88%, 10/01/25 (Call 07/01/25)(b) |
1,707 | 1,672,683 | ||||||
| 6.25%, 04/15/28 (Call 03/15/28)(a)(b) |
4,265 | 4,327,869 | ||||||
| 6.75%, 10/25/28 (Call 09/25/28)(a)(b) |
3,625 | 3,756,350 | ||||||
| Avolon Holdings Funding Ltd. |
||||||||
| 2.13%, 02/21/26 (Call 01/21/26)(b) |
5,083 | 4,716,391 | ||||||
| 2.53%, 11/18/27 (Call 10/18/27)(a)(b) |
12,980 | 11,490,291 | ||||||
| 2.75%, 02/21/28 (Call 12/21/27)(a)(b) |
2,645 | 2,352,473 | ||||||
| 3.25%, 02/15/27 (Call 12/15/26)(b) |
4,377 | 4,044,226 | ||||||
| 4.25%, 04/15/26 (Call 03/15/26)(a)(b) |
6,664 | 6,425,617 | ||||||
| 4.38%, 05/01/26 (Call 03/01/26)(b) |
4,962 | 4,787,800 | ||||||
| 5.50%, 01/15/26 (Call 12/15/25)(a)(b) |
4,561 | 4,513,824 | ||||||
| 5.75%, 03/01/29 (Call 02/01/29)(b) |
4,725 | 4,656,832 | ||||||
| 6.38%, 05/04/28 (Call 04/04/28)(a)(b) |
6,235 | 6,326,983 | ||||||
| BGC Group Inc. |
||||||||
| 4.38%, 12/15/25 (Call 09/15/25)(a) |
1,592 | 1,536,872 | ||||||
| 8.00%, 05/25/28 (Call 04/25/28)(a) |
765 | 808,962 | ||||||
| Blackstone Holdings Finance Co. LLC |
||||||||
| 1.63%, 08/05/28 (Call 06/05/28)(a)(b) |
5,160 | 4,468,730 | ||||||
| 3.15%, 10/02/27 (Call 07/02/27)(a)(b) |
1,885 | 1,761,637 | ||||||
| 5.90%, 11/03/27 (Call 10/03/27)(a)(b) |
4,103 | 4,193,055 | ||||||
| Blue Owl Credit Income Corp., 7.95%, 06/13/28 (Call 05/13/28)(a)(b) |
3,500 | 3,611,228 | ||||||
| BOC Aviation Ltd. |
||||||||
| 3.25%, 04/29/25 (Call 03/29/25)(a)(b) |
10,459 | 10,158,931 | ||||||
| 3.50%, 09/18/27 (Call 06/18/27)(b) |
245 | 230,136 | ||||||
| 3.88%, 04/27/26 (Call 01/27/26)(a)(b) |
6,742 | 6,521,940 | ||||||
| BOC Aviation USA Corp., 5.75%, 11/09/28 (Call 10/09/28)(a)(b) |
785 | 802,674 | ||||||
| S C H E D U L E O F I N V E S T M E N T S |
153 |
| Schedule of Investments (continued) February 29, 2024 |
iShares® 1-5 Year Investment Grade Corporate Bond ETF (Percentages shown are based on Net Assets) |
| Security | Par (000) |
Value | ||||||
| Diversified Financial Services (continued) | ||||||||
| Brookfield Finance Inc. |
||||||||
| 3.90%, 01/25/28 (Call 10/25/27)(a) |
$ | 7,100 | $ | 6,811,191 | ||||
| 4.25%, 06/02/26 (Call 03/02/26) |
3,831 | 3,761,848 | ||||||
| Cantor Fitzgerald LP |
||||||||
| 4.50%, 04/14/27 (Call 01/14/27)(a)(b) |
2,315 | 2,193,197 | ||||||
| 7.20%, 12/12/28 (Call 11/12/28)(a)(b) |
4,190 | 4,300,662 | ||||||
| Capital One Financial Corp. |
||||||||
| 1.88%, 11/02/27 (Call 11/02/26), |
7,156 | 6,495,083 | ||||||
| 2.64%, 03/03/26 (Call 03/03/25), |
6,741 | 6,537,407 | ||||||
| 3.65%, 05/11/27 (Call 04/11/27)(a) |
5,999 | 5,713,711 | ||||||
| 3.75%, 07/28/26 (Call 06/28/26)(a) |
8,499 | 8,163,452 | ||||||
| 3.75%, 03/09/27 (Call 02/09/27) |
9,062 | 8,651,462 | ||||||
| 3.80%, 01/31/28 (Call 12/31/27)(a) |
10,869 | 10,279,676 | ||||||
| 4.20%, 10/29/25 (Call 09/29/25) |
8,945 | 8,744,653 | ||||||
| 4.25%, 04/30/25 (Call 03/31/25) |
3,757 | 3,706,247 | ||||||
| 4.93%, 05/10/28 (Call 05/10/27), |
10,178 | 9,958,288 | ||||||
| 4.99%, 07/24/26 (Call 07/24/25), |
7,960 | 7,887,306 | ||||||
| 5.47%, 02/01/29 (Call 02/01/28), |
8,090 | 8,045,265 | ||||||
| 5.70%, 02/01/30 (Call 02/01/29), |
1,620 | 1,623,642 | ||||||
| 6.31%, 06/08/29 (Call 06/08/28), |
12,910 | 13,215,100 | ||||||
| 7.15%, 10/29/27 (Call 10/29/26), |
3,850 | 3,990,728 | ||||||
| Cboe Global Markets Inc., 3.65%, 01/12/27 (Call 10/12/26) |
4,452 | 4,311,174 | ||||||
| Charles Schwab Corp. (The) |
||||||||
| 0.90%, 03/11/26 (Call 02/11/26)(a) |
8,132 | 7,458,619 | ||||||
| 1.15%, 05/13/26 (Call 04/13/26)(a) |
6,459 | 5,925,196 | ||||||
| 2.00%, 03/20/28 (Call 01/20/28)(a) |
9,655 | 8,564,388 | ||||||
| 2.45%, 03/03/27 (Call 02/03/27)(a) |
10,083 | 9,346,259 | ||||||
| 3.00%, 03/10/25 (Call 12/10/24)(a) |
2,030 | 1,982,003 | ||||||
| 3.20%, 03/02/27 (Call 12/02/26) |
4,057 | 3,850,377 | ||||||
| 3.20%, 01/25/28 (Call 10/25/27)(a) |
2,982 | 2,792,819 | ||||||
| 3.30%, 04/01/27 (Call 01/01/27) |
5,077 | 4,822,741 | ||||||
| 3.45%, 02/13/26 (Call 11/13/25)(a) |
2,138 | 2,068,994 | ||||||
| 3.63%, 04/01/25 (Call 01/01/25) |
2,413 | 2,367,110 | ||||||
| 3.85%, 05/21/25 (Call 03/21/25) |
4,376 | 4,293,991 | ||||||
| 4.00%, 02/01/29 (Call 11/01/28)(a) |
50 | 48,023 | ||||||
| 4.20%, 03/24/25 (Call 02/24/25) |
3,472 | 3,429,801 | ||||||
| 5.64%, 05/19/29 (Call 05/19/28), |
9,199 | 9,315,216 | ||||||
| 5.88%, 08/24/26 (Call 07/24/26) |
6,440 | 6,539,430 | ||||||
| 6.20%, 11/17/29 (Call 11/17/28), |
9,350 | 9,653,732 | ||||||
| China Cinda Finance 2015 I Ltd., 4.25%, 04/23/25(b) |
13,770 | 13,514,842 | ||||||
| Citadel Finance LLC, 3.38%, 03/09/26 (Call 02/09/26)(b) |
3,512 | 3,285,940 | ||||||
| Citadel LP, 4.88%, 01/15/27 (Call 11/15/26)(a)(b) |
3,611 | 3,506,019 | ||||||
| CME Group Inc. |
||||||||
| 3.00%, 03/15/25 (Call 12/15/24)(a) |
1,108 | 1,082,639 | ||||||
| 3.75%, 06/15/28 (Call 03/15/28) |
5,272 | 5,091,115 | ||||||
| DAE Sukuk Difc Ltd., 3.75%, 02/15/26(a)(b) |
5,131 | 4,930,542 | ||||||
| Discover Financial Services |
||||||||
| 3.75%, 03/04/25 (Call 12/04/24)(a) |
592 | 580,757 | ||||||
| Security | Par (000) |
Value | ||||||
| Diversified Financial Services (continued) | ||||||||
| 4.10%, 02/09/27 (Call 11/09/26) |
$ | 5,342 | $ | 5,123,469 | ||||
| 4.50%, 01/30/26 (Call 11/30/25)(a) |
2,254 | 2,218,006 | ||||||
| Drawbridge Special Opportunities Fund LP/Drawbridge Special Opportunities Fin, 3.88%, 02/15/26 (Call 12/15/25)(b) |
2,762 | 2,561,553 | ||||||
| Eaton Vance Corp., 3.50%, 04/06/27 (Call 01/06/27) |
2,488 | 2,369,820 | ||||||
| Enact Holdings Inc., 6.50%, 08/15/25 (Call 02/15/25)(a)(b) |
1,215 | 1,215,049 | ||||||
| Franklin Resources Inc., 2.85%, 03/30/25(a) |
1,709 | 1,665,064 | ||||||
| HPS Corporate Lending Fund, 6.75%, 01/30/29 (Call 12/30/28)(b) |
1,900 | 1,880,912 | ||||||
| ICBCIL Finance Co. Ltd., 3.63%, 05/19/26(a)(b) |
775 | 747,053 | ||||||
| Intercorp Financial Services Inc., 4.13%, 10/19/27 (Call 07/19/27)(b) |
110 | 102,369 | ||||||
| Invesco Finance PLC, 3.75%, 01/15/26(a) |
3,180 | 3,090,535 | ||||||
| Janus Henderson U.S. Holdings Inc., 4.88%, 08/01/25 (Call 05/01/25)(a) |
1,211 | 1,197,295 | ||||||
| Jefferies Financial Group Inc. |
||||||||
| 4.85%, 01/15/27(a) |
5,312 | 5,275,459 | ||||||
| 5.88%, 07/21/28 (Call 06/21/28)(a) |
11,165 | 11,384,130 | ||||||
| 6.45%, 06/08/27 |
2,692 | 2,774,330 | ||||||
| Lazard Group LLC |
||||||||
| 3.63%, 03/01/27 (Call 12/01/26)(a) |
2,058 | 1,949,510 | ||||||
| 4.50%, 09/19/28 (Call 06/19/28) |
5,395 | 5,170,070 | ||||||
| Legg Mason Inc., 4.75%, 03/15/26(a) |
3,440 | 3,418,890 | ||||||
| LPL Holdings Inc. |
||||||||
| 4.63%, 11/15/27 (Call 03/05/24)(a)(b) |
2,220 | 2,128,806 | ||||||
| 6.75%, 11/17/28 (Call 10/17/28)(a) |
2,180 | 2,275,509 | ||||||
| LSEGA Financing PLC |
||||||||
| 1.38%, 04/06/26 (Call 03/06/26)(b) |
6,754 | 6,231,845 | ||||||
| 2.00%, 04/06/28 (Call 02/06/28)(b) |
1,185 | 1,054,112 | ||||||
| Mastercard Inc. |
||||||||
| 2.95%, 11/21/26 (Call 08/21/26) |
5,263 | 5,021,314 | ||||||
| 3.30%, 03/26/27 (Call 01/26/27) |
7,710 | 7,396,151 | ||||||
| 3.50%, 02/26/28 (Call 11/26/27)(a) |
3,845 | 3,698,464 | ||||||
| 4.88%, 03/09/28 (Call 02/09/28)(a) |
5,600 | 5,662,582 | ||||||
| Mitsubishi HC Capital Inc. |
||||||||
| 3.64%, 04/13/25 (Call 03/13/25)(a)(b) |
4,610 | 4,510,276 | ||||||
| 5.08%, 09/15/27 (Call 08/15/27)(b) |
2,460 | 2,435,189 | ||||||
| Mitsubishi HC Finance America LLC, 5.81%, 09/12/28 (Call 08/12/28)(a)(b) |
2,615 | 2,659,111 | ||||||
| Nasdaq Inc. |
||||||||
| 3.85%, 06/30/26 (Call 03/30/26)(a) |
3,438 | 3,338,653 | ||||||
| 5.35%, 06/28/28 (Call 05/28/28) |
8,650 | 8,736,746 | ||||||
| 5.65%, 06/28/25 |
2,637 | 2,645,747 | ||||||
| Neuberger Berman Group LLC/Neuberger Berman Finance Corp., 4.50%, 03/15/27 |
2,327 | 2,232,270 | ||||||
| Nomura Holdings Inc. |
||||||||
| 1.65%, 07/14/26 |
8,090 | 7,404,791 | ||||||
| 1.85%, 07/16/25(a) |
9,678 | 9,191,288 | ||||||
| 2.17%, 07/14/28(a) |
8,265 | 7,199,224 | ||||||
| 2.33%, 01/22/27 |
7,754 | 7,113,136 | ||||||
| 2.71%, 01/22/29 |
2,990 | 2,636,301 | ||||||
| 5.10%, 07/03/25 |
4,130 | 4,089,889 | ||||||
| 5.39%, 07/06/27 |
3,385 | 3,378,426 | ||||||
| 5.71%, 01/09/26(a) |
4,000 | 4,008,287 | ||||||
| 5.84%, 01/18/28(a) |
3,735 | 3,781,635 | ||||||
| 6.07%, 07/12/28 |
6,160 | 6,309,512 | ||||||
| 154 | 2 0 2 4 I S H A R E S A N N U A L R E P O R T T O S H A R E H O L D E R S |
| Schedule of Investments (continued) February 29, 2024 |
iShares® 1-5 Year Investment Grade Corporate Bond ETF (Percentages shown are based on Net Assets) |
| Security | Par (000) |
Value | ||||||
| Diversified Financial Services (continued) | ||||||||
| Nuveen LLC, 4.00%, 11/01/28 |
$ | 1,340 | $ | 1,295,093 | ||||
| ORIX Corp. |
||||||||
| 3.70%, 07/18/27 |
630 | 602,367 | ||||||
| 5.00%, 09/13/27(a) |
8,329 | 8,320,368 | ||||||
| Power Finance Corp. Ltd., 6.15%, 12/06/28(b) |
280 | 286,915 | ||||||
| Radian Group Inc. |
||||||||
| 4.88%, 03/15/27 (Call 09/15/26)(a) |
3,824 | 3,709,613 | ||||||
| 6.20%, 05/15/29 (Call 02/15/29) |
3,075 | 3,083,827 | ||||||
| 6.63%, 03/15/25 (Call 09/15/24)(a) |
4,166 | 4,174,091 | ||||||
| REC Ltd., 5.63%, 04/11/28(a)(b) |
3,245 | 3,251,640 | ||||||
| SURA Asset Management SA, 4.38%, 04/11/27(b) |
35 | 33,558 | ||||||
| Synchrony Financial |
||||||||
| 3.70%, 08/04/26 (Call 05/04/26)(a) |
937 | 884,390 | ||||||
| 3.95%, 12/01/27 (Call 09/01/27) |
4,790 | 4,437,018 | ||||||
| 4.50%, 07/23/25 (Call 04/23/25) |
4,694 | 4,588,116 | ||||||
| 4.88%, 06/13/25 (Call 05/13/25) |
2,462 | 2,422,802 | ||||||
| USAA Capital Corp., 3.38%, 05/01/25(b) |
4,403 | 4,299,718 | ||||||
| Visa Inc. |
||||||||
| 0.75%, 08/15/27 (Call 06/15/27)(a) |
3,857 | 3,387,761 | ||||||
| 1.90%, 04/15/27 (Call 02/15/27)(a) |
10,066 | 9,274,445 | ||||||
| 2.75%, 09/15/27 (Call 06/15/27) |
4,891 | 4,582,694 | ||||||
| 3.15%, 12/14/25 (Call 09/14/25) |
25,594 | 24,813,786 | ||||||
| Voya Financial Inc. |
||||||||
| 3.65%, 06/15/26 |
4,270 | 4,097,726 | ||||||
| 4.70%, 01/23/48 (Call 01/23/28), |
2,298 | 1,928,533 | ||||||
| Western Union Co. (The), 1.35%, 03/15/26 (Call 02/15/26) |
4,390 | 4,043,671 | ||||||
|
|
|
|||||||
| 971,905,675 | ||||||||
| Electric — 5.9% | ||||||||
| Abu Dhabi National Energy Co. PJSC |
||||||||
| 2.00%, 04/29/28 (Call 01/29/28)(b) |
3,000 | 2,662,302 | ||||||
| 4.38%, 04/23/25(b) |
9,358 | 9,241,025 | ||||||
| 4.38%, 06/22/26(b) |
5,900 | 5,792,809 | ||||||
| Adani Transmission Step-One Ltd., 4.00%, 08/03/26(b) |
3,380 | 3,169,426 | ||||||
| AEP Texas Inc. |
||||||||
| 3.85%, 10/01/25 (Call 07/01/25)(b) |
2,120 | 2,051,956 | ||||||
| 3.95%, 06/01/28 (Call 03/01/28) |
4,520 | 4,324,174 | ||||||
| AEP Transmission Co. LLC, 3.10%, 12/01/26 (Call 09/01/26) |
3,126 | 2,977,218 | ||||||
| AES Corp. (The) |
||||||||
| 1.38%, 01/15/26 (Call 12/15/25) |
8,981 | 8,296,405 | ||||||
| 3.30%, 07/15/25 (Call 06/15/25)(a)(b) |
6,381 | 6,152,635 | ||||||
| 5.45%, 06/01/28 (Call 05/01/28) |
8,035 | 8,010,364 | ||||||
| Alabama Power Co. |
||||||||
| 2.80%, 04/01/25 (Call 01/01/25)(a) |
650 | 632,033 | ||||||
| 3.75%, 09/01/27 (Call 08/01/27) |
4,145 | 3,983,982 | ||||||
| Alexander Funding Trust II, 7.47%, 07/31/28 (Call 06/30/28)(a)(b) |
3,115 | 3,260,217 | ||||||
| Alliant Energy Finance LLC, 4.25%, 06/15/28 (Call 03/15/28)(a)(b) |
795 | 764,673 | ||||||
| Ameren Corp. |
||||||||
| 1.75%, 03/15/28 (Call 01/15/28) |
1,170 | 1,028,821 | ||||||
| 1.95%, 03/15/27 (Call 02/15/27)(a) |
3,756 | 3,432,247 | ||||||
| 3.65%, 02/15/26 (Call 11/15/25) |
2,618 | 2,531,285 | ||||||
| 5.00%, 01/15/29 (Call 12/15/28) |
4,325 | 4,288,253 | ||||||
| 5.70%, 12/01/26 (Call 11/01/26) |
4,660 | 4,713,083 | ||||||
| Security | Par (000) |
Value | ||||||
| Electric (continued) | ||||||||
| Ameren Illinois Co., 3.80%, 05/15/28 (Call 02/15/28) |
$ | 845 | $ | 815,049 | ||||
| American Electric Power Co. Inc. |
||||||||
| 3.20%, 11/13/27 (Call 08/13/27)(a) |
3,745 | 3,503,771 | ||||||
| 3.88%, 02/15/62 (Call 11/15/26), |
4,705 | 4,185,262 | ||||||
| 5.20%, 01/15/29 (Call 12/15/28) |
5,410 | 5,402,575 | ||||||
| 5.70%, 08/15/25 |
3,695 | 3,699,758 | ||||||
| 5.75%, 11/01/27 (Call 10/01/27) |
3,746 | 3,822,890 | ||||||
| Series J, 4.30%, 12/01/28 (Call 09/01/28) |
3,190 | 3,072,337 | ||||||
| Series N, 1.00%, 11/01/25 (Call 10/01/25) |
3,546 | 3,295,695 | ||||||
| Appalachian Power Co. |
||||||||
| 3.40%, 06/01/25 (Call 03/01/25) |
3,485 | 3,400,273 | ||||||
| Series X, 3.30%, 06/01/27 (Call 03/01/27) |
2,025 | 1,903,416 | ||||||
| Arizona Public Service Co. |
||||||||
| 2.55%, 09/15/26 (Call 06/15/26)(a) |
978 | 913,179 | ||||||
| 2.95%, 09/15/27 (Call 06/15/27)(a) |
1,381 | 1,292,224 | ||||||
| 3.15%, 05/15/25 (Call 02/15/25)(a) |
1,511 | 1,469,308 | ||||||
| Atlantic City Electric Co., 4.00%, 10/15/28 (Call 07/15/28) |
2,905 | 2,798,517 | ||||||
| Ausgrid Finance Pty Ltd., 4.35%, 08/01/28 (Call 05/01/28)(a)(b) |
205 | 195,886 | ||||||
| Avangrid Inc., 3.20%, 04/15/25 (Call 03/15/25) |
11,443 | 11,130,951 | ||||||
| Baltimore Gas & Electric Co., 2.40%, 08/15/26 (Call 05/15/26)(a) |
2,266 | 2,134,987 | ||||||
| Berkshire Hathaway Energy Co. |
||||||||
| 3.25%, 04/15/28 (Call 01/15/28)(a) |
1,348 | 1,262,592 | ||||||
| 4.05%, 04/15/25 (Call 03/15/25) |
7,780 | 7,669,133 | ||||||
| Black Hills Corp. |
||||||||
| 3.15%, 01/15/27 (Call 07/15/26)(a) |
3,431 | 3,246,750 | ||||||
| 3.95%, 01/15/26 (Call 07/15/25) |
2,553 | 2,477,333 | ||||||
| 5.95%, 03/15/28 (Call 02/15/28)(a) |
3,218 | 3,309,778 | ||||||
| CenterPoint Energy Houston Electric LLC |
||||||||
| 5.20%, 10/01/28 (Call 09/01/28)(a) |
3,800 | 3,833,111 | ||||||
| Series AA, 3.00%, 02/01/27 (Call 11/01/26) |
1,630 | 1,545,901 | ||||||
| Series Z, 2.40%, 09/01/26 (Call 06/01/26)(a) |
2,406 | 2,266,890 | ||||||
| CenterPoint Energy Inc. |
||||||||
| 1.45%, 06/01/26 (Call 05/01/26)(a) |
3,635 | 3,348,247 | ||||||
| 5.25%, 08/10/26 |
2,780 | 2,780,807 | ||||||
| Cleco Corporate Holdings LLC, 3.74%, |
||||||||
| 05/01/26 (Call 02/01/26)(a) |
4,331 | 4,160,814 | ||||||
| Cleveland Electric Illuminating Co. (The), 3.50%, 04/01/28 (Call 01/01/28)(a)(b) |
500 | 465,631 | ||||||
| CMS Energy Corp. |
||||||||
| 2.95%, 02/15/27 (Call 11/15/26) |
2,040 | 1,893,986 | ||||||
| 3.00%, 05/15/26 (Call 02/15/26)(a) |
2,550 | 2,422,595 | ||||||
| 3.45%, 08/15/27 (Call 05/15/27)(a) |
2,697 | 2,554,998 | ||||||
| 3.60%, 11/15/25 (Call 08/15/25)(a) |
2,296 | 2,219,361 | ||||||
| Colbun SA, 3.95%, 10/11/27 (Call 07/11/27)(b) |
2,235 | 2,129,614 | ||||||
| Comision Federal de Electricidad, 4.75%, 02/23/27(b) |
2,515 | 2,457,371 | ||||||
| Commonwealth Edison Co. |
||||||||
| 2.55%, 06/15/26 (Call 03/15/26) |
3,664 | 3,466,922 | ||||||
| 3.70%, 08/15/28 (Call 05/15/28)(a) |
2,505 | 2,386,572 | ||||||
| Series 122, 2.95%, 08/15/27 (Call 05/15/27)(a) |
2,398 | 2,247,215 | ||||||
| Connecticut Light & Power Co. (The) |
||||||||
| Series A, 0.75%, 12/01/25 (Call 11/01/25) |
2,754 | 2,551,336 | ||||||
| Series A, 3.20%, 03/15/27 (Call 12/15/26)(a) |
4,111 | 3,911,621 | ||||||
| Connecticut Light and Power Co. (The), 4.65%, 01/01/29 (Call 12/01/28) |
2,870 | 2,820,954 | ||||||
| S C H E D U L E O F I N V E S T M E N T S |
155 |
| Schedule of Investments (continued) February 29, 2024 |
iShares® 1-5 Year Investment Grade Corporate Bond ETF (Percentages shown are based on Net Assets) |
| Security | Par (000) |
Value | ||||||
| Electric (continued) | ||||||||
| Consolidated Edison Co. of New York Inc. |
||||||||
| 3.80%, 05/15/28 (Call 02/15/28)(a) |
$ | 755 | $ | 717,394 | ||||
| Series B, 2.90%, 12/01/26 (Call 09/01/26)(a) |
2,415 | 2,265,294 | ||||||
| Series B, 3.13%, 11/15/27 (Call 08/15/27) |
1,985 | 1,867,440 | ||||||
| Series D, 4.00%, 12/01/28 (Call 09/01/28)(a) |
1,750 | 1,688,830 | ||||||
| Constellation Energy Generation LLC |
||||||||
| 3.25%, 06/01/25 (Call 05/01/25)(a) |
6,215 | 6,036,512 | ||||||
| 5.60%, 03/01/28 (Call 02/01/28) |
5,720 | 5,795,917 | ||||||
| Consumers Energy Co. |
||||||||
| 3.80%, 11/15/28 (Call 08/15/28)(a) |
1,478 | 1,415,188 | ||||||
| 4.65%, 03/01/28 (Call 01/01/28)(a) |
2,900 | 2,883,156 | ||||||
| 4.90%, 02/15/29 (Call 12/15/28) |
1,850 | 1,845,238 | ||||||
| Dominion Energy Inc. |
||||||||
| 3.90%, 10/01/25 (Call 07/01/25) |
5,040 | 4,922,035 | ||||||
| 4.25%, 06/01/28 (Call 03/01/28) |
4,749 | 4,582,608 | ||||||
| Series A, 1.45%, 04/15/26 (Call 03/15/26) |
3,897 | 3,599,940 | ||||||
| Series A, 3.30%, 03/15/25 (Call 02/15/25)(a) |
2,725 | 2,663,054 | ||||||
| Series B, 3.60%, 03/15/27 (Call 01/15/27) |
2,583 | 2,470,939 | ||||||
| Series D, 2.85%, 08/15/26 (Call 05/15/26)(a) |
2,986 | 2,820,665 | ||||||
| DTE Electric Co. |
||||||||
| 4.85%, 12/01/26 |
960 | 958,263 | ||||||
| Series A, 1.90%, 04/01/28 (Call 02/01/28) |
535 | 476,638 | ||||||
| DTE Energy Co. |
||||||||
| 2.85%, 10/01/26 (Call 07/01/26) |
4,913 | 4,627,080 | ||||||
| 4.88%, 06/01/28 (Call 05/01/28) |
6,715 | 6,619,442 | ||||||
| 5.10%, 03/01/29 (Call 02/01/29)(a) |
5,000 | 4,957,823 | ||||||
| Series F, 1.05%, 06/01/25 (Call 05/01/25)(a) |
5,580 | 5,283,571 | ||||||
| Duke Energy Carolinas LLC |
||||||||
| 2.95%, 12/01/26 (Call 09/01/26) |
4,714 | 4,493,129 | ||||||
| 3.95%, 11/15/28 (Call 08/15/28)(a) |
4,605 | 4,436,125 | ||||||
| Series A, 6.00%, 12/01/28(a) |
1,921 | 2,004,737 | ||||||
| Duke Energy Corp. |
||||||||
| 0.90%, 09/15/25 (Call 08/15/25)(a) |
4,115 | 3,849,480 | ||||||
| 2.65%, 09/01/26 (Call 06/01/26) |
10,184 | 9,580,637 | ||||||
| 3.15%, 08/15/27 (Call 05/15/27)(a) |
4,430 | 4,153,039 | ||||||
| 3.25%, 01/15/82 (Call 01/15/27), |
3,183 | 2,684,431 | ||||||
| 4.30%, 03/15/28 (Call 02/15/28)(a) |
9,146 | 8,885,676 | ||||||
| 4.85%, 01/05/27 |
2,525 | 2,506,069 | ||||||
| 4.85%, 01/05/29 (Call 12/05/28) |
4,060 | 3,991,008 | ||||||
| 5.00%, 12/08/25(a) |
3,300 | 3,288,792 | ||||||
| 5.00%, 12/08/27 (Call 11/08/27) |
4,555 | 4,523,971 | ||||||
| Duke Energy Florida LLC |
||||||||
| 3.20%, 01/15/27 (Call 10/15/26)(a) |
2,372 | 2,264,780 | ||||||
| 3.80%, 07/15/28 (Call 04/15/28)(a) |
1,993 | 1,913,477 | ||||||
| Duke Energy Ohio Inc., 3.65%, 02/01/29 (Call 11/01/28) |
1,626 | 1,535,913 | ||||||
| Duke Energy Progress LLC |
||||||||
| 3.25%, 08/15/25 (Call 05/15/25)(a) |
3,434 | 3,348,904 | ||||||
| 3.70%, 09/01/28 (Call 06/01/28) |
530 | 505,465 | ||||||
| Duquesne Light Holdings Inc., 3.62%, 08/01/27 (Call 05/01/27)(a)(b) |
2,095 | 1,950,244 | ||||||
| Edison International |
||||||||
| 4.13%, 03/15/28 (Call 12/15/27)(a) |
6,205 | 5,929,620 | ||||||
| 4.70%, 08/15/25 |
2,397 | 2,363,357 | ||||||
| 4.95%, 04/15/25 (Call 03/15/25) |
2,582 | 2,559,439 | ||||||
| 5.25%, 11/15/28 (Call 10/15/28)(a) |
5,045 | 5,016,240 | ||||||
| 5.75%, 06/15/27 (Call 04/15/27) |
4,309 | 4,349,166 | ||||||
| EDP Finance BV, 1.71%, 01/24/28(b) |
6,055 | 5,324,618 | ||||||
| Electricite de France SA |
||||||||
| 3.63%, 10/13/25 (Call 07/13/25)(a)(b) |
12,004 | 11,698,157 | ||||||
| Security | Par (000) |
Value | ||||||
| Electric (continued) | ||||||||
| 4.50%, 09/21/28 (Call 06/21/28)(b) |
$ | 6,000 | $ | 5,814,237 | ||||
| 5.70%, 05/23/28 (Call 04/23/28)(a)(b) |
10,120 | 10,302,455 | ||||||
| Emera U.S. Finance LP, 3.55%, 06/15/26 (Call 03/15/26) |
5,722 | 5,487,410 | ||||||
| Enel Americas SA, 4.00%, 10/25/26 |
3,784 | 3,638,354 | ||||||
| Enel Chile SA, 4.88%, 06/12/28 (Call 03/12/28) |
4,840 | 4,708,529 | ||||||
| Enel Finance America LLC, 7.10%, 10/14/27 (Call 09/14/27)(b) |
6,940 | 7,302,516 | ||||||
| Enel Finance International NV |
||||||||
| 1.38%, 07/12/26 (Call 06/12/26)(b) |
8,616 | 7,850,258 | ||||||
| 1.88%, 07/12/28 (Call 05/12/28)(a)(b) |
2,500 | 2,166,995 | ||||||
| 3.50%, 04/06/28(a)(b) |
8,940 | 8,333,934 | ||||||
| 3.63%, 05/25/27(a)(b) |
5,430 | 5,161,085 | ||||||
| 4.25%, 06/15/25(a)(b) |
4,885 | 4,800,659 | ||||||
| 4.63%, 06/15/27 (Call 05/15/27)(a)(b) |
5,635 | 5,524,508 | ||||||
| 6.80%, 10/14/25(a)(b) |
5,250 | 5,352,096 | ||||||
| Entergy Arkansas LLC |
||||||||
| 3.50%, 04/01/26 (Call 01/01/26)(a) |
4,251 | 4,123,511 | ||||||
| 4.00%, 06/01/28 (Call 03/01/28)(a) |
720 | 692,655 | ||||||
| Entergy Corp. |
||||||||
| 0.90%, 09/15/25 (Call 08/15/25)(a) |
5,409 | 5,055,685 | ||||||
| 1.90%, 06/15/28 (Call 04/15/28)(a) |
5,185 | 4,556,237 | ||||||
| 2.95%, 09/01/26 (Call 06/01/26) |
4,678 | 4,439,443 | ||||||
| Entergy Louisiana LLC |
||||||||
| 2.40%, 10/01/26 (Call 07/01/26) |
2,848 | 2,660,056 | ||||||
| 3.12%, 09/01/27 (Call 06/01/27) |
1,918 | 1,805,835 | ||||||
| 3.25%, 04/01/28 (Call 01/01/28)(a) |
3,377 | 3,165,398 | ||||||
| 4.44%, 01/15/26 (Call 10/15/25) |
440 | 434,472 | ||||||
| Entergy Mississippi LLC, 2.85%, 06/01/28 (Call 03/01/28) |
935 | 855,913 | ||||||
| Evergy Kansas Central Inc. |
||||||||
| 2.55%, 07/01/26 (Call 04/01/26)(a) |
4,770 | 4,493,356 | ||||||
| 3.10%, 04/01/27 (Call 01/01/27)(a) |
1,650 | 1,555,192 | ||||||
| 3.25%, 12/01/25 (Call 09/01/25)(a) |
1,518 | 1,464,892 | ||||||
| Evergy Metro Inc., 3.65%, 08/15/25 |
1,763 | 1,720,055 | ||||||
| Evergy Missouri West Inc., 5.15%, 12/15/27 (Call 11/15/27)(a)(b) |
1,973 | 1,965,337 | ||||||
| Eversource Energy |
||||||||
| 2.90%, 03/01/27 (Call 02/01/27) |
4,975 | 4,652,324 | ||||||
| 3.35%, 03/15/26 (Call 12/15/25) |
1,843 | 1,770,102 | ||||||
| 4.60%, 07/01/27 (Call 06/01/27)(a) |
4,751 | 4,641,620 | ||||||
| 4.75%, 05/15/26 |
3,305 | 3,263,172 | ||||||
| 5.00%, 01/01/27 |
2,225 | 2,210,457 | ||||||
| 5.45%, 03/01/28 (Call 02/01/28)(a) |
11,770 | 11,831,089 | ||||||
| 5.95%, 02/01/29 (Call 01/01/29)(a) |
4,590 | 4,700,500 | ||||||
| Series M, 3.30%, 01/15/28 (Call 10/15/27) |
410 | 381,858 | ||||||
| Series Q, 0.80%, 08/15/25 (Call 07/15/25) |
2,353 | 2,197,521 | ||||||
| Series U, 1.40%, 08/15/26 (Call 07/15/26) |
1,807 | 1,643,162 | ||||||
| Exelon Corp. |
||||||||
| 2.75%, 03/15/27 (Call 02/15/27) |
5,160 | 4,799,973 | ||||||
| 3.40%, 04/15/26 (Call 01/15/26) |
4,999 | 4,813,083 | ||||||
| 3.95%, 06/15/25 (Call 03/15/25) |
5,586 | 5,481,616 | ||||||
| 5.15%, 03/15/28 (Call 02/15/28) |
13,055 | 13,019,479 | ||||||
| 5.15%, 03/15/29 (Call 02/15/29) |
940 | 935,976 | ||||||
| Fells Point Funding Trust, 3.05%, 01/31/27 (Call 12/31/26)(a)(b) |
6,954 | 6,506,847 | ||||||
| FirstEnergy Transmission LLC, 2.87%, 09/15/28 (Call 07/15/28)(a)(b) |
50 | 45,168 | ||||||
| 156 | 2 0 2 4 I S H A R E S A N N U A L R E P O R T T O S H A R E H O L D E R S |
| Schedule of Investments (continued) February 29, 2024 |
iShares® 1-5 Year Investment Grade Corporate Bond ETF (Percentages shown are based on Net Assets) |
| Security | Par (000) |
Value | ||||||
| Electric (continued) | ||||||||
| Florida Power & Light Co. |
||||||||
| 2.85%, 04/01/25 (Call 03/01/25) |
$ | 10,362 | $ | 10,103,921 | ||||
| 3.13%, 12/01/25 (Call 06/01/25) |
5,441 | 5,280,700 | ||||||
| 4.40%, 05/15/28 (Call 03/15/28)(a) |
11,674 | 11,462,113 | ||||||
| 4.45%, 05/15/26 (Call 04/15/26) |
3,835 | 3,800,932 | ||||||
| 5.05%, 04/01/28 (Call 03/01/28) |
11,294 | 11,378,628 | ||||||
| Series A, 3.30%, 05/30/27 (Call 02/28/27) |
2,388 | 2,265,540 | ||||||
| Fortis Inc./Canada, 3.06%, 10/04/26 (Call 07/04/26) |
7,573 | 7,153,600 | ||||||
| Georgia Power Co. |
||||||||
| 3.25%, 04/01/26 (Call 01/01/26)(a) |
1,914 | 1,838,986 | ||||||
| 3.25%, 03/30/27 (Call 12/30/26)(a) |
2,870 | 2,711,663 | ||||||
| 4.65%, 05/16/28 (Call 03/16/28) |
5,135 | 5,060,734 | ||||||
| 5.00%, 02/23/27 (Call 01/23/27) |
965 | 963,183 | ||||||
| Iberdrola International BV, 5.81%, 03/15/25 |
1,975 | 1,981,447 | ||||||
| Indiana Michigan Power Co., 3.85%, 05/15/28 (Call 02/15/28)(a) |
2,490 | 2,373,984 | ||||||
| Interstate Power & Light Co. |
||||||||
| 3.40%, 08/15/25 (Call 05/15/25)(a) |
794 | 770,053 | ||||||
| 4.10%, 09/26/28 (Call 06/26/28)(a) |
3,760 | 3,601,530 | ||||||
| ITC Holdings Corp. |
||||||||
| 3.25%, 06/30/26 (Call 03/30/26)(a) |
3,644 | 3,479,904 | ||||||
| 3.35%, 11/15/27 (Call 08/15/27) |
3,345 | 3,136,771 | ||||||
| 4.95%, 09/22/27 (Call 08/22/27)(b) |
6,607 | 6,563,830 | ||||||
| Jersey Central Power & Light Co., 4.30%, 01/15/26 (Call 10/15/25)(a)(b) |
4,565 | 4,455,711 | ||||||
| Kallpa Generacion SA |
||||||||
| 4.13%, 08/16/27 (Call 05/16/27)(b) |
3,600 | 3,397,433 | ||||||
| 4.88%, 05/24/26 (Call 02/24/26)(b) |
375 | 366,094 | ||||||
| Kentucky Utilities Co., 3.30%, 10/01/25 (Call 07/01/25) |
2,283 | 2,204,828 | ||||||
| Korea East-West Power Co. Ltd. |
||||||||
| 1.75%, 05/06/25(a)(b) |
8,049 | 7,712,320 | ||||||
| 3.60%, 05/06/25(b) |
270 | 264,270 | ||||||
| Korea Southern Power Co. Ltd., 0.75%, 01/27/26(b) |
1,830 | 1,679,066 | ||||||
| Liberty Utilities Co., 5.58%, 01/31/29 (Call 12/31/28)(a)(b) |
1,650 | 1,653,871 | ||||||
| Louisville Gas & Electric Co., Series 25, 3.30%, 10/01/25 (Call 07/01/25) |
1,075 | 1,043,310 | ||||||
| Metropolitan Edison Co. |
||||||||
| 4.00%, 04/15/25(a)(b) |
1,041 | 1,018,942 | ||||||
| 4.30%, 01/15/29 (Call 10/15/28)(a)(b) |
2,535 | 2,436,104 | ||||||
| 5.20%, 04/01/28 (Call 03/01/28)(a)(b) |
4,515 | 4,505,812 | ||||||
| MidAmerican Energy Co., 3.10%, 05/01/27 (Call 02/01/27) |
5,050 | 4,775,962 | ||||||
| Mid-Atlantic Interstate Transmission LLC, |
||||||||
| 4.10%, 05/15/28 (Call 02/15/28)(a)(b) |
5,465 | 5,233,834 | ||||||
| Mississippi Power Co., 3.95%, 03/30/28 (Call 12/30/27)(a) |
1,105 | 1,058,260 | ||||||
| Monongahela Power Co., 3.55%, 05/15/27 (Call 02/15/27)(a)(b) |
3,377 | 3,202,559 | ||||||
| Narragansett Electric Co. (The), 3.92%, 08/01/28 (Call 05/01/28)(a)(b) |
390 | 374,512 | ||||||
| National Grid PLC, 5.60%, 06/12/28 (Call 05/12/28) |
6,435 | 6,515,076 | ||||||
| National Rural Utilities Cooperative Finance Corp. |
||||||||
| 1.00%, 06/15/26 (Call 05/15/26)(a) |
4,721 | 4,308,752 | ||||||
| 3.05%, 04/25/27 (Call 01/25/27) |
2,820 | 2,680,172 | ||||||
| 3.25%, 11/01/25 (Call 08/01/25) |
2,847 | 2,760,128 | ||||||
| Security | Par (000) |
Value | ||||||
| Electric (continued) | ||||||||
| 3.40%, 02/07/28 (Call 11/07/27) |
$ | 4,935 | $ | 4,668,330 | ||||
| 3.45%, 06/15/25(a) |
2,198 | 2,147,905 | ||||||
| 3.90%, 11/01/28 (Call 08/01/28)(a) |
1,065 | 1,022,792 | ||||||
| 4.45%, 03/13/26 (Call 02/13/26) |
4,305 | 4,251,439 | ||||||
| 4.80%, 02/05/27 (Call 01/05/27)(a) |
3,765 | 3,746,235 | ||||||
| 4.80%, 03/15/28 (Call 02/15/28) |
4,368 | 4,347,858 | ||||||
| 4.85%, 02/07/29 (Call 01/07/29) |
2,800 | 2,774,335 | ||||||
| 5.05%, 09/15/28 (Call 08/15/28) |
4,475 | 4,488,522 | ||||||
| 5.25%, 04/20/46 (Call 04/20/26), |
65 | 62,950 | ||||||
| 5.45%, 10/30/25 |
3,180 | 3,190,380 | ||||||
| 5.60%, 11/13/26 (Call 10/13/26)(a) |
2,010 | 2,036,802 | ||||||
| 7.13%, 09/15/53 (Call 06/15/28), |
180 | 186,099 | ||||||
| New York State Electric & Gas Corp. |
||||||||
| 3.25%, 12/01/26 (Call 09/01/26)(a)(b) |
1,675 | 1,577,905 | ||||||
| 5.65%, 08/15/28 (Call 07/15/28)(a)(b) |
1,000 | 1,022,109 | ||||||
| NextEra Energy Capital Holdings Inc. |
||||||||
| 1.88%, 01/15/27 (Call 12/15/26) |
6,737 | 6,147,110 | ||||||
| 1.90%, 06/15/28 (Call 04/15/28) |
6,430 | 5,627,871 | ||||||
| 3.55%, 05/01/27 (Call 02/01/27) |
10,215 | 9,721,006 | ||||||
| 3.80%, 03/15/82 (Call 03/15/27), |
2,565 | 2,272,871 | ||||||
| 4.45%, 06/20/25 |
8,775 | 8,656,738 | ||||||
| 4.63%, 07/15/27 (Call 06/15/27) |
8,513 | 8,376,393 | ||||||
| 4.80%, 12/01/77 (Call 12/01/27), |
3,140 | 2,845,725 | ||||||
| 4.90%, 02/28/28 (Call 01/28/28)(a) |
14,885 | 14,759,537 | ||||||
| 4.90%, 03/15/29 (Call 02/15/29) |
5,750 | 5,678,456 | ||||||
| 4.95%, 01/29/26 |
5,850 | 5,804,329 | ||||||
| 5.75%, 09/01/25 |
4,425 | 4,448,636 | ||||||
| 6.05%, 03/01/25(a) |
9,620 | 9,654,597 | ||||||
| Niagara Mohawk Power Corp., 4.28%, 12/15/28 (Call 09/15/28)(a)(b) |
1,275 | 1,211,361 | ||||||
| NRG Energy Inc. |
||||||||
| 2.00%, 12/02/25 (Call 11/02/25)(a)(b) |
3,688 | 3,455,382 | ||||||
| 2.45%, 12/02/27 (Call 10/02/27)(b) |
6,505 | 5,809,922 | ||||||
| NSTAR Electric Co. |
||||||||
| 2.70%, 06/01/26 (Call 03/01/26)(a) |
993 | 938,157 | ||||||
| 3.20%, 05/15/27 (Call 02/15/27) |
3,151 | 3,003,514 | ||||||
| 3.25%, 11/15/25 (Call 08/15/25) |
1,380 | 1,332,457 | ||||||
| Oklahoma Gas & Electric Co., 3.80%, 08/15/28 (Call 02/15/28)(a) |
3,215 | 3,080,343 | ||||||
| Oncor Electric Delivery Co. LLC |
||||||||
| 0.55%, 10/01/25 (Call 09/01/25) |
3,350 | 3,114,811 | ||||||
| 2.95%, 04/01/25 (Call 01/01/25) |
2,397 | 2,337,769 | ||||||
| 3.70%, 11/15/28 (Call 08/15/28) |
3,385 | 3,207,264 | ||||||
| 4.30%, 05/15/28 (Call 04/15/28) |
1,220 | 1,187,874 | ||||||
| Pacific Gas and Electric Co. |
||||||||
| 2.10%, 08/01/27 (Call 06/01/27)(a) |
6,678 | 5,980,550 | ||||||
| 2.95%, 03/01/26 (Call 12/01/25) |
4,554 | 4,321,766 | ||||||
| 3.00%, 06/15/28 (Call 04/15/28)(a) |
5,636 | 5,117,322 | ||||||
| 3.15%, 01/01/26 |
12,903 | 12,334,259 | ||||||
| 3.30%, 03/15/27 (Call 12/15/26) |
2,805 | 2,628,939 | ||||||
| 3.30%, 12/01/27 (Call 09/01/27) |
7,540 | 6,976,766 | ||||||
| 3.45%, 07/01/25 |
5,864 | 5,695,390 | ||||||
| 3.50%, 06/15/25 (Call 03/15/25) |
4,254 | 4,127,169 | ||||||
| 3.75%, 07/01/28 |
5,785 | 5,385,395 | ||||||
| 4.65%, 08/01/28 (Call 05/01/28) |
2,050 | 1,960,105 | ||||||
| 4.95%, 06/08/25 |
2,257 | 2,235,424 | ||||||
| 5.45%, 06/15/27 (Call 05/15/27) |
2,902 | 2,897,399 | ||||||
| S C H E D U L E O F I N V E S T M E N T S |
157 |
| Schedule of Investments (continued) February 29, 2024 |
iShares® 1-5 Year Investment Grade Corporate Bond ETF (Percentages shown are based on Net Assets) |
| Security | Par (000) |
Value | ||||||
| Electric (continued) | ||||||||
| 5.55%, 05/15/29 (Call 04/15/29) |
$ | 4,350 | $ | 4,358,979 | ||||
| 6.10%, 01/15/29 (Call 12/15/28) |
1,235 | 1,264,224 | ||||||
| PacifiCorp |
||||||||
| 3.35%, 07/01/25 (Call 04/01/25)(a) |
1,800 | 1,752,617 | ||||||
| 5.10%, 02/15/29 (Call 01/15/29) |
3,325 | 3,313,896 | ||||||
| Palomino Funding Trust I, 7.23%, 05/17/28 (Call 04/17/28)(a)(b) |
3,050 | 3,178,409 | ||||||
| PECO Energy Co., 3.15%, 10/15/25 (Call 07/15/25)(a) |
2,146 | 2,085,322 | ||||||
| Pennsylvania Electric Co. |
||||||||
| 3.25%, 03/15/28 (Call 12/15/27)(a)(b) |
1,875 | 1,730,617 | ||||||
| Series 144A, 5.15%, 03/30/26(a)(b) |
2,115 | 2,095,505 | ||||||
| Perusahaan Perseroan Persero PT Perusahaan Listrik Negara |
||||||||
| 4.13%, 05/15/27(b) |
11,940 | 11,417,625 | ||||||
| 5.45%, 05/21/28(a)(b) |
8,045 | 7,995,656 | ||||||
| Pinnacle West Capital Corp., 1.30%, 06/15/25 (Call 05/15/25)(a) |
4,044 | 3,838,416 | ||||||
| PPL Capital Funding Inc., 3.10%, 05/15/26 (Call 02/15/26) |
5,283 | 5,036,312 | ||||||
| Public Service Co. of Colorado |
||||||||
| 2.90%, 05/15/25 (Call 11/15/24) |
1,905 | 1,846,765 | ||||||
| 3.70%, 06/15/28 (Call 12/15/27) |
700 | 667,409 | ||||||
| Public Service Co. of New Mexico, 3.85%, 08/01/25 (Call 05/01/25)(a) |
2,155 | 2,094,023 | ||||||
| Public Service Electric & Gas Co. |
||||||||
| 0.95%, 03/15/26 (Call 02/15/26)(a) |
3,478 | 3,217,580 | ||||||
| 2.25%, 09/15/26 (Call 06/15/26) |
3,233 | 3,030,436 | ||||||
| 3.00%, 05/15/25 (Call 02/15/25)(a) |
2,038 | 1,986,155 | ||||||
| 3.00%, 05/15/27 (Call 02/15/27) |
3,339 | 3,155,190 | ||||||
| 3.65%, 09/01/28 (Call 06/01/28)(a) |
420 | 400,141 | ||||||
| 3.70%, 05/01/28 (Call 02/01/28) |
400 | 382,603 | ||||||
| Public Service Enterprise Group Inc. |
||||||||
| 0.80%, 08/15/25 (Call 07/15/25) |
4,321 | 4,045,408 | ||||||
| 5.85%, 11/15/27 (Call 10/15/27)(a) |
4,685 | 4,800,546 | ||||||
| 5.88%, 10/15/28 (Call 09/15/28) |
5,875 | 6,030,465 | ||||||
| Puget Energy Inc. |
||||||||
| 2.38%, 06/15/28 (Call 04/15/28)(a) |
4,320 | 3,837,893 | ||||||
| 3.65%, 05/15/25 (Call 02/15/25) |
3,022 | 2,943,965 | ||||||
| Puget Sound Energy Inc., 7.02%, 12/01/27(a) |
1,120 | 1,175,532 | ||||||
| Rochester Gas and Electric Corp., 3.10%, 06/01/27 (Call 03/01/27)(a)(b) |
2,500 | 2,343,630 | ||||||
| San Diego Gas & Electric Co. |
||||||||
| 2.50%, 05/15/26 (Call 02/15/26) |
3,830 | 3,632,064 | ||||||
| 4.95%, 08/15/28 (Call 07/15/28)(a) |
5,495 | 5,493,710 | ||||||
| 6.00%, 06/01/26(a) |
2,085 | 2,122,851 | ||||||
| Sempra |
||||||||
| 3.25%, 06/15/27 (Call 03/15/27) |
4,398 | 4,138,158 | ||||||
| 3.30%, 04/01/25 (Call 03/01/25) |
2,140 | 2,089,277 | ||||||
| 3.40%, 02/01/28 (Call 11/01/27) |
6,060 | 5,698,779 | ||||||
| 4.13%, 04/01/52 (Call 01/01/27), |
7,658 | 7,025,985 | ||||||
| 5.40%, 08/01/26 (Call 07/01/26) |
5,070 | 5,082,683 | ||||||
| Sierra Pacific Power Co., 2.60%, 05/01/26 (Call 02/01/26) |
3,741 | 3,544,076 | ||||||
| Southern California Edison Co. |
||||||||
| 4.88%, 02/01/27 (Call 01/01/27) |
3,430 | 3,411,018 | ||||||
| 4.90%, 06/01/26 (Call 05/01/26) |
2,960 | 2,939,429 | ||||||
| 5.30%, 03/01/28 (Call 02/01/28) |
2,260 | 2,281,496 | ||||||
| 5.35%, 03/01/26 |
3,075 | 3,077,476 | ||||||
| 5.65%, 10/01/28 (Call 09/01/28) |
6,920 | 7,086,171 | ||||||
| Security | Par (000) |
Value | ||||||
| Electric (continued) | ||||||||
| 5.85%, 11/01/27 (Call 10/01/27) |
$ | 5,170 | $ | 5,293,686 | ||||
| Series 2020-C, 1.20%,
02/01/26 |
2,494 | 2,312,763 | ||||||
| Series B, 3.65%, 03/01/28 (Call 12/01/27) |
35 | 33,158 | ||||||
| Series C, 4.20%, 06/01/25(a) |
2,145 | 2,113,840 | ||||||
| Series D, 4.70%, 06/01/27 (Call 05/01/27)(a) |
4,560 | 4,510,152 | ||||||
| Series E, 3.70%, 08/01/25 (Call 06/01/25) |
6,005 | 5,865,793 | ||||||
| Southern Co. (The) |
||||||||
| 3.25%, 07/01/26 (Call 04/01/26) |
11,522 | 11,018,370 | ||||||
| 4.85%, 06/15/28 (Call 04/15/28) |
5,170 | 5,122,877 | ||||||
| 5.11%, 08/01/27 |
5,728 | 5,713,608 | ||||||
| 5.15%, 10/06/25 |
3,210 | 3,205,604 | ||||||
| 5.50%, 03/15/29 (Call 01/15/29) |
2,325 | 2,358,066 | ||||||
| Series 21-A, 3.75%, 09/15/51 (Call 06/15/26), |
6,200 | 5,814,715 | ||||||
| Series 21-B, 1.75%, 03/15/28 (Call 01/15/28) |
3,445 | 3,029,902 | ||||||
| Series B, 4.00%, 01/15/51 (Call 10/15/25), |
7,920 | 7,605,663 | ||||||
| Southern Power Co. |
||||||||
| 0.90%, 01/15/26 (Call 12/15/25) |
4,738 | 4,362,368 | ||||||
| 4.15%, 12/01/25 (Call 09/01/25)(a) |
5,163 | 5,075,045 | ||||||
| Southwestern Electric Power Co. |
||||||||
| Series K, 2.75%, 10/01/26 (Call 07/01/26)(a) |
3,053 | 2,866,136 | ||||||
| Series M, 4.10%, 09/15/28 (Call 06/15/28)(a) |
1,375 | 1,317,816 | ||||||
| Series N, 1.65%, 03/15/26 (Call 02/15/26)(a) |
3,243 | 3,017,217 | ||||||
| SP Group Treasury Pte. Ltd., 3.38%, 02/27/29 (Call 11/27/28)(b) |
25 | 23,282 | ||||||
| SP PowerAssets Ltd. |
||||||||
| 3.00%, 09/26/27(b) |
55 | 51,613 | ||||||
| 3.25%, 11/24/25(a)(b) |
2,088 | 2,022,430 | ||||||
| State Grid Overseas Investment BVI Ltd. |
||||||||
| 3.50%, 05/04/27(a)(b) |
15,364 | 14,751,035 | ||||||
| 4.25%, 05/02/28(a)(b) |
4,155 | 4,088,165 | ||||||
| System Energy Resources Inc., 6.00%, 04/15/28 (Call 03/15/28) |
3,234 | 3,271,672 | ||||||
| Tampa Electric Co., 4.90%, 03/01/29 (Call 02/01/29) |
2,120 | 2,108,748 | ||||||
| Three Gorges Finance I Cayman Islands Ltd. |
||||||||
| 1.30%, 09/22/25 (Call 08/22/25)(b) |
9,005 | 8,476,156 | ||||||
| 3.15%, 06/02/26(a)(b) |
5,305 | 5,084,626 | ||||||
| 3.70%, 06/10/25(b) |
1,574 | 1,542,866 | ||||||
| Trans-Allegheny Interstate Line Co., 3.85%, 06/01/25 (Call 03/01/25)(a)(b) |
3,783 | 3,702,563 | ||||||
| Union Electric Co., 2.95%, 06/15/27 |
3,046 | 2,857,137 | ||||||
| Virginia Electric & Power Co. |
||||||||
| Series A, 3.10%, 05/15/25 (Call 02/15/25) |
2,323 | 2,258,907 | ||||||
| Series A, 3.15%, 01/15/26 (Call 10/15/25) |
4,860 | 4,693,267 | ||||||
| Series A, 3.50%, 03/15/27 (Call 12/15/26) |
5,218 | 4,996,741 | ||||||
| Series A, 3.80%, 04/01/28 (Call 01/01/28) |
4,360 | 4,181,367 | ||||||
| Series B, 2.95%, 11/15/26 (Call 08/15/26) |
2,849 | 2,699,961 | ||||||
| Series B, 3.75%, 05/15/27 (Call 04/15/27) |
4,359 | 4,192,459 | ||||||
| Vistra Operations Co. LLC |
5,532 | 5,232,486 | ||||||
| 3.70%, 01/30/27 (Call 11/30/26)(a)(b) |
||||||||
| 5.13%, 05/13/25(b) |
5,427 | 5,382,269 | ||||||
| WEC Energy Group Inc. |
||||||||
| 1.38%, 10/15/27 (Call 08/15/27) |
3,568 | 3,138,630 | ||||||
| 2.20%, 12/15/28 (Call 10/15/28)(a) |
3,390 | 2,978,275 | ||||||
| 4.75%, 01/09/26 (Call 12/09/25) |
6,290 | 6,228,724 | ||||||
| 4.75%, 01/15/28 (Call 12/15/27)(a) |
3,310 | 3,271,592 | ||||||
| 158 | 2 0 2 4 I S H A R E S A N N U A L R E P O R T T O S H A R E H O L D E R S |
| Schedule of Investments (continued) February 29, 2024 |
iShares® 1-5 Year Investment Grade Corporate Bond ETF (Percentages shown are based on Net Assets) |
| Security | Par (000) |
Value | ||||||
| Electric (continued) | ||||||||
| 5.00%, 09/27/25 (Call 08/27/25)(a) |
$ | 3,420 | $ | 3,401,047 | ||||
| 5.15%, 10/01/27 (Call 09/01/27) |
5,500 | 5,494,483 | ||||||
| 5.60%, 09/12/26 (Call 08/12/26)(a) |
3,295 | 3,327,144 | ||||||
| Wisconsin Electric Power Co. |
||||||||
| 1.70%, 06/15/28 (Call 04/15/28)(a) |
24 | 21,143 | ||||||
| 3.10%, 06/01/25 (Call 03/01/25)(a) |
1,430 | 1,391,098 | ||||||
| Wisconsin Power and Light Co., 3.05%, 10/15/27 (Call 07/15/27) |
2,634 | 2,458,230 | ||||||
| Wisconsin Public Service Corp., 5.35%, 11/10/25 (Call 10/10/25)(a) |
2,132 | 2,135,836 | ||||||
| Xcel Energy Inc. |
||||||||
| 1.75%, 03/15/27 (Call 02/15/27) |
4,099 | 3,685,534 | ||||||
| 3.30%, 06/01/25 (Call 12/01/24) |
3,966 | 3,859,005 | ||||||
| 3.35%, 12/01/26 (Call 06/01/26) |
4,130 | 3,902,210 | ||||||
| 4.00%, 06/15/28 (Call 12/15/27)(a) |
3,720 | 3,550,496 | ||||||
|
|
|
|||||||
| 1,269,934,310 | ||||||||
| Electrical Components & Equipment — 0.1% | ||||||||
| Emerson Electric Co. |
||||||||
| 0.88%, 10/15/26 (Call 09/15/26)(a) |
4,927 | 4,456,495 | ||||||
| 1.80%, 10/15/27 (Call 08/15/27)(a) |
1,709 | 1,539,413 | ||||||
| 2.00%, 12/21/28 (Call 10/21/28)(a) |
3,135 | 2,764,680 | ||||||
| 3.15%, 06/01/25 (Call 03/01/25) |
3,524 | 3,443,457 | ||||||
| Molex Electronic Technologies LLC, 3.90%, 04/15/25 (Call 01/15/25)(a)(b) |
2,715 | 2,631,986 | ||||||
|
|
|
|||||||
| 14,836,031 | ||||||||
| Electronics — 0.6% | ||||||||
| Allegion U.S. Holding Co. Inc., 3.55%, 10/01/27 (Call 07/01/27)(a) |
1,760 | 1,663,992 | ||||||
| Amphenol Corp. |
||||||||
| 2.05%, 03/01/25 (Call 02/01/25) |
3,113 | 3,009,584 | ||||||
| 4.75%, 03/30/26 |
1,515 | 1,504,561 | ||||||
| Arrow Electronics Inc. |
||||||||
| 3.88%, 01/12/28 (Call 10/12/27)(a) |
4,005 | 3,783,502 | ||||||
| 4.00%, 04/01/25 (Call 01/01/25)(a) |
2,746 | 2,697,706 | ||||||
| 6.13%, 03/01/26 (Call 03/11/24)(a) |
4,265 | 4,261,056 | ||||||
| Avnet Inc. |
||||||||
| 4.63%, 04/15/26 (Call 01/15/26)(a) |
3,990 | 3,904,138 | ||||||
| 6.25%, 03/15/28 (Call 02/15/28)(a) |
3,770 | 3,834,216 | ||||||
| Flex Ltd. |
||||||||
| 3.75%, 02/01/26 (Call 01/01/26) |
4,400 | 4,253,381 | ||||||
| 4.75%, 06/15/25 (Call 03/15/25)(a) |
4,045 | 3,997,267 | ||||||
| 6.00%, 01/15/28 (Call 12/15/27) |
3,150 | 3,201,787 | ||||||
| Fortive Corp., 3.15%, 06/15/26 |
6,310 | 6,024,334 | ||||||
| Honeywell International Inc. |
||||||||
| 1.10%, 03/01/27 (Call 02/01/27)(a) |
6,207 | 5,575,339 | ||||||
| 1.35%, 06/01/25 (Call 05/01/25)(a) |
8,477 | 8,101,777 | ||||||
| 2.50%, 11/01/26 (Call 08/01/26)(a) |
9,972 | 9,398,606 | ||||||
| 4.25%, 01/15/29 (Call 12/15/28)(a) |
2,340 | 2,288,305 | ||||||
| 4.95%, 02/15/28 (Call 01/15/28)(a) |
3,403 | 3,437,503 | ||||||
| Hubbell Inc. |
||||||||
| 3.15%, 08/15/27 (Call 05/15/27) |
1,435 | 1,346,350 | ||||||
| 3.35%, 03/01/26 (Call 12/01/25)(a) |
2,706 | 2,612,854 | ||||||
| 3.50%, 02/15/28 (Call 11/15/27) |
3,640 | 3,437,820 | ||||||
| Jabil Inc. |
||||||||
| 1.70%, 04/15/26 (Call 03/15/26) |
3,696 | 3,421,104 | ||||||
| 3.95%, 01/12/28 (Call 10/12/27) |
1,560 | 1,473,621 | ||||||
| 4.25%, 05/15/27 (Call 04/15/27) |
5,618 | 5,422,135 | ||||||
| 5.45%, 02/01/29 (Call 01/01/29)(a) |
1,790 | 1,786,738 | ||||||
| Keysight Technologies Inc., 4.60%, 04/06/27 (Call 01/06/27) |
4,987 | 4,908,798 | ||||||
| Security | Par (000) |
Value | ||||||
| Electronics (continued) | ||||||||
| TD SYNNEX Corp. |
||||||||
| 1.75%, 08/09/26 (Call 07/09/26)(a) |
$ | 4,569 | $ | 4,161,129 | ||||
| 2.38%, 08/09/28 (Call 06/09/28)(a) |
1,910 | 1,661,591 | ||||||
| Trimble Inc., 4.90%, 06/15/28 (Call 03/15/28)(a) |
4,720 | 4,682,961 | ||||||
| Tyco Electronics Group SA |
||||||||
| 3.13%, 08/15/27 (Call 05/15/27)(a) |
2,799 | 2,642,825 | ||||||
| 3.70%, 02/15/26 (Call 11/15/25)(a) |
2,497 | 2,432,258 | ||||||
| 4.50%, 02/13/26(a) |
3,210 | 3,174,312 | ||||||
| Vontier Corp. |
||||||||
| 1.80%, 04/01/26 (Call 03/01/26) |
3,387 | 3,121,624 | ||||||
| 2.40%, 04/01/28 (Call 02/01/28) |
3,790 | 3,311,908 | ||||||
|
|
|
|||||||
| 120,535,082 | ||||||||
| Engineering & Construction — 0.1% | ||||||||
| Jacobs Engineering Group Inc., 6.35%, 08/18/28 (Call 07/18/28) |
6,575 | 6,786,255 | ||||||
| MasTec Inc., 4.50%, 08/15/28 |
550 | 515,756 | ||||||
| Mexico City Airport Trust |
||||||||
| 3.88%, 04/30/28 (Call 01/30/28)(b) |
3,525 | 3,266,668 | ||||||
| 4.25%, 10/31/26 (Call 07/31/26)(a)(b) |
6,619 | 6,339,702 | ||||||
| Ste Transcore Holdings Inc., 3.38%, 05/05/27 (Call 02/05/27)(b) |
7,025 | 6,688,381 | ||||||
| Sydney Airport Finance Co. Pty. Ltd. |
||||||||
| 3.38%, 04/30/25 (Call 01/30/25)(a)(b) |
2,134 | 2,079,829 | ||||||
| 3.63%, 04/28/26 (Call 01/28/26)(b) |
5,686 | 5,470,433 | ||||||
|
|
|
|||||||
| 31,147,024 | ||||||||
| Entertainment — 0.2% | ||||||||
| Warnermedia Holdings Inc. |
||||||||
| 3.64%, 03/15/25 |
11,687 | 11,440,381 | ||||||
| 3.76%, 03/15/27 (Call 02/15/27) |
25,750 | 24,365,649 | ||||||
| 3.79%, 03/15/25 (Call 03/11/24) |
3,807 | 3,731,936 | ||||||
| 6.41%, 03/15/26 (Call 03/15/24) |
5,465 | 5,463,567 | ||||||
|
|
|
|||||||
| 45,001,533 | ||||||||
| Environmental Control — 0.2% | ||||||||
| Republic Services Inc. |
||||||||
| 0.88%, 11/15/25 (Call 10/15/25)(a) |
2,520 | 2,338,368 | ||||||
| 2.90%, 07/01/26 (Call 04/01/26)(a) |
3,624 | 3,461,991 | ||||||
| 3.20%, 03/15/25 (Call 12/15/24) |
3,019 | 2,952,883 | ||||||
| 3.38%, 11/15/27 (Call 08/15/27) |
3,155 | 2,994,482 | ||||||
| 3.95%, 05/15/28 (Call 02/15/28) |
6,240 | 6,009,251 | ||||||
| Veralto Corp. |
||||||||
| 5.35%, 09/18/28 (Call 08/18/28)(b) |
5,605 | 5,643,020 | ||||||
| 5.50%, 09/18/26 (Call 08/18/26)(a)(b) |
4,590 | 4,609,723 | ||||||
| Waste Connections Inc., 4.25%, 12/01/28 (Call 09/01/28)(a) |
2,390 | 2,315,602 | ||||||
| Waste Management Inc. |
||||||||
| 0.75%, 11/15/25 (Call 10/15/25)(a) |
3,415 | 3,170,829 | ||||||
| 1.15%, 03/15/28 (Call 01/15/28)(a) |
4,795 | 4,158,222 | ||||||
| 3.15%, 11/15/27 (Call 08/15/27)(a) |
4,921 | 4,631,000 | ||||||
| 4.88%, 02/15/29 (Call 01/15/29)(a) |
4,305 | 4,308,955 | ||||||
| 7.00%, 07/15/28 |
175 | 190,081 | ||||||
|
|
|
|||||||
| 46,784,407 | ||||||||
| Food — 1.7% | ||||||||
| Bimbo Bakeries USA Inc., 6.05%, 01/15/29 (Call 12/15/28)(b) |
325 | 334,591 | ||||||
| Campbell Soup Co. |
||||||||
| 3.30%, 03/19/25 (Call 12/19/24) |
2,747 | 2,681,401 | ||||||
| 3.95%, 03/15/25 (Call 01/15/25) |
5,318 | 5,232,773 | ||||||
| 4.15%, 03/15/28 (Call 12/15/27)(a) |
7,855 | 7,578,890 | ||||||
| S C H E D U L E O F I N V E S T M E N T S |
159 |
| Schedule of Investments (continued) February 29, 2024 |
iShares® 1-5 Year Investment Grade Corporate Bond ETF (Percentages shown are based on Net Assets) |
| Security | Par (000) |
Value | ||||||
| Food (continued) | ||||||||
| Cencosud SA, 4.38%, 07/17/27 |
$ | 4,630 | $ | 4,455,374 | ||||
| Conagra Brands Inc. |
||||||||
| 1.38%, 11/01/27 (Call 09/01/27) |
6,652 | 5,783,468 | ||||||
| 4.60%, 11/01/25 (Call 09/01/25)(a) |
6,974 | 6,871,422 | ||||||
| 4.85%, 11/01/28 (Call 08/01/28)(a) |
5,860 | 5,756,600 | ||||||
| 5.30%, 10/01/26(a) |
3,675 | 3,675,870 | ||||||
| 7.00%, 10/01/28(a) |
7,035 | 7,515,353 | ||||||
| 7.13%, 10/01/26(a) |
2,065 | 2,150,154 | ||||||
| Danone SA, 2.95%, 11/02/26 (Call 08/02/26)(b) |
13,109 | 12,410,017 | ||||||
| Flowers Foods Inc., 3.50%, 10/01/26 (Call 07/01/26)(a) |
1,275 | 1,221,358 | ||||||
| General Mills Inc. |
||||||||
| 3.20%, 02/10/27 (Call 11/10/26)(a) |
5,054 | 4,803,746 | ||||||
| 4.00%, 04/17/25 (Call 02/17/25)(a) |
6,228 | 6,128,522 | ||||||
| 4.20%, 04/17/28 (Call 01/17/28)(a) |
14,240 | 13,826,710 | ||||||
| 4.70%, 01/30/27 (Call 12/20/26)(a) |
3,420 | 3,387,118 | ||||||
| 5.24%, 11/18/25 (Call 03/18/24)(a) |
2,610 | 2,607,089 | ||||||
| 5.50%, 10/17/28 (Call 09/17/28)(a) |
3,182 | 3,233,889 | ||||||
| Hershey Co. (The) |
||||||||
| 0.90%, 06/01/25 (Call 05/01/25)(a) |
2,428 | 2,307,153 | ||||||
| 2.30%, 08/15/26 (Call 05/15/26) |
3,944 | 3,721,953 | ||||||
| 3.20%, 08/21/25 (Call 05/21/25)(a) |
2,055 | 2,006,099 | ||||||
| 4.25%, 05/04/28 (Call 04/04/28)(a) |
1,700 | 1,671,931 | ||||||
| Hormel Foods Corp., 1.70%, 06/03/28 (Call 04/03/28)(a) |
6,305 | 5,565,575 | ||||||
| Ingredion Inc., 3.20%, 10/01/26 (Call 07/01/26) |
3,737 | 3,564,918 | ||||||
| J M Smucker Co. (The), 5.90%, 11/15/28 (Call 10/15/28) |
6,715 | 6,909,994 | ||||||
| JBS USA LUX SA/JBS USA Food Co./JBS USA Finance Inc. |
||||||||
| 2.50%, 01/15/27 (Call 12/15/26)(a) |
6,565 | 6,023,009 | ||||||
| 3.00%, 02/02/29 (Call 12/02/28) |
950 | 832,771 | ||||||
| 5.13%, 02/01/28 (Call 01/01/28) |
5,649 | 5,534,959 | ||||||
| JM Smucker Co. (The) |
||||||||
| 3.38%, 12/15/27 (Call 09/15/27)(a) |
3,480 | 3,281,423 | ||||||
| 3.50%, 03/15/25 |
7,493 | 7,339,823 | ||||||
| Kellanova |
||||||||
| 3.25%, 04/01/26(a) |
5,186 | 4,985,413 | ||||||
| 3.40%, 11/15/27 (Call 08/15/27)(a) |
4,210 | 3,969,677 | ||||||
| 4.30%, 05/15/28 (Call 02/15/28)(a) |
4,510 | 4,383,407 | ||||||
| Kraft Heinz Foods Co. |
||||||||
| 3.00%, 06/01/26 (Call 03/01/26)(a) |
12,657 | 12,072,207 | ||||||
| 3.88%, 05/15/27 (Call 02/15/27)(a) |
9,042 | 8,733,142 | ||||||
| 4.63%, 01/30/29 (Call 10/30/28) |
2,350 | 2,307,390 | ||||||
| Kroger Co. (The) |
||||||||
| 2.65%, 10/15/26 (Call 07/15/26)(a) |
5,056 | 4,752,069 | ||||||
| 3.50%, 02/01/26 (Call 11/01/25)(a) |
3,782 | 3,667,530 | ||||||
| 3.70%, 08/01/27 (Call 05/01/27) |
4,065 | 3,903,305 | ||||||
| 4.50%, 01/15/29 (Call 10/15/28) |
3,605 | 3,525,331 | ||||||
| Mars Inc. |
||||||||
| 0.88%, 07/16/26 (Call 06/16/26)(a)(b) |
3,898 | 3,534,956 | ||||||
| 2.70%, 04/01/25 (Call 03/01/25)(a)(b) |
5,127 | 4,989,400 | ||||||
| 4.55%, 04/20/28 (Call 03/20/28)(a)(b) |
7,966 | 7,855,638 | ||||||
| McCormick & Co. Inc./MD |
||||||||
| 0.90%, 02/15/26 (Call 01/15/26)(a) |
3,623 | 3,331,413 | ||||||
| 3.25%, 11/15/25 (Call 08/15/25) |
2,220 | 2,140,866 | ||||||
| 3.40%, 08/15/27 (Call 05/15/27) |
5,143 | 4,871,926 | ||||||
| Security | Par (000) |
Value | ||||||
| Food (continued) | ||||||||
| Mondelez International Holdings Netherlands BV |
||||||||
| 1.25%, 09/24/26 (Call 08/24/26)(b) |
$ | 2,690 | $ | 2,437,752 | ||||
| 4.25%, 09/15/25(b) |
3,500 | 3,445,615 | ||||||
| Mondelez International Inc. |
||||||||
| 1.50%, 05/04/25 (Call 04/04/25)(a) |
5,350 | 5,114,212 | ||||||
| 2.63%, 03/17/27 (Call 02/17/27) |
5,245 | 4,892,842 | ||||||
| 4.13%, 05/07/28 (Call 02/07/28)(a) |
3,078 | 3,015,039 | ||||||
| 4.75%, 02/20/29 (Call 01/20/29) |
3,150 | 3,113,780 | ||||||
| Nestle Holdings Inc. |
||||||||
| 0.63%, 01/15/26 (Call 12/15/25)(a)(b) |
5,332 | 4,917,748 | ||||||
| 1.00%, 09/15/27 (Call 07/15/27)(a)(b) |
7,148 | 6,284,245 | ||||||
| 1.15%, 01/14/27 (Call 12/14/26)(a)(b) |
3,503 | 3,159,709 | ||||||
| 1.50%, 09/14/28 (Call 07/14/28)(a)(b) |
5,745 | 4,992,457 | ||||||
| 3.50%, 09/24/25 (Call 07/24/25)(b) |
6,105 | 5,970,324 | ||||||
| 3.63%, 09/24/28 (Call 06/24/28)(a)(b) |
9,670 | 9,250,701 | ||||||
| 4.00%, 09/12/25 (Call 08/12/25)(a)(b) |
5,522 | 5,443,574 | ||||||
| 4.13%, 10/01/27 (Call 09/01/27)(a)(b) |
3,640 | 3,559,609 | ||||||
| 5.00%, 03/14/28 (Call 02/14/28)(b) |
6,218 | 6,275,650 | ||||||
| 5.00%, 09/12/28 (Call 08/12/28)(a)(b) |
3,195 | 3,226,050 | ||||||
| 5.25%, 03/13/26(a)(b) |
6,725 | 6,760,540 | ||||||
| Sigma Alimentos SA de CV, 4.13%, 05/02/26 (Call 02/02/26)(a)(b) |
6,729 | 6,517,387 | ||||||
| Sigma Finance Netherlands BV, 4.88%, 03/27/28 (Call 12/27/27)(b) |
90 | 87,583 | ||||||
| Smithfield Foods Inc., 4.25%, 02/01/27 (Call 11/01/26)(b) |
4,080 | 3,903,891 | ||||||
| Sysco Corp. |
||||||||
| 3.25%, 07/15/27 (Call 04/15/27) |
5,413 | 5,107,800 | ||||||
| 3.30%, 07/15/26 (Call 04/15/26)(a) |
6,732 | 6,460,077 | ||||||
| 3.75%, 10/01/25 (Call 07/01/25) |
5,598 | 5,458,294 | ||||||
| 5.75%, 01/17/29 (Call 12/17/28)(a) |
3,175 | 3,248,280 | ||||||
| Tyson Foods Inc. |
||||||||
| 3.55%, 06/02/27 (Call 03/02/27) |
9,057 | 8,584,073 | ||||||
| 4.00%, 03/01/26 (Call 01/01/26) |
5,942 | 5,801,238 | ||||||
| 5.40%, 03/15/29 (Call 02/15/29) |
3,075 | 3,074,654 | ||||||
| Walmart Inc., 3.90%, 09/09/25 |
11,055 | 10,885,740 | ||||||
|
|
|
|||||||
| 368,426,487 | ||||||||
| Forest Products & Paper — 0.2% | ||||||||
| Celulosa Arauco y Constitucion SA, 3.88%, 11/02/27 (Call 08/02/27) |
3,730 | 3,502,153 | ||||||
| Georgia-Pacific LLC |
||||||||
| 0.95%, 05/15/26 (Call 04/15/26)(a)(b) |
5,782 | 5,286,221 | ||||||
| 1.75%, 09/30/25 (Call 08/30/25)(b) |
6,152 | 5,824,103 | ||||||
| 2.10%, 04/30/27 (Call 02/28/27)(a)(b) |
4,350 | 3,978,388 | ||||||
| 7.25%, 06/01/28(a) |
330 | 351,992 | ||||||
| Inversiones CMPC SA, 4.38%, 04/04/27(a)(b) |
2,438 | 2,350,100 | ||||||
| Smurfit Kappa Treasury Funding DAC, 7.50%, 11/20/25(a) |
4,969 | 5,126,434 | ||||||
| Suzano Austria GmbH |
||||||||
| 2.50%, 09/15/28 (Call 07/15/28)(a) |
475 | 414,121 | ||||||
| 5.75%, 07/14/26(a)(b) |
780 | 778,749 | ||||||
| 6.00%, 01/15/29 (Call 10/15/28) |
1,460 | 1,459,111 | ||||||
| Suzano International Finance BV, 5.50%, 01/17/27 |
5,340 | 5,325,191 | ||||||
| UPM-Kymmene OYJ, 7.45%, 11/26/27(b) |
1,000 | 1,049,381 | ||||||
|
|
|
|||||||
| 35,445,944 | ||||||||
| Gas — 0.5% | ||||||||
| APA Infrastructure Ltd. |
||||||||
| 4.20%, 03/23/25 (Call 12/23/24)(a)(b) |
8,469 | 8,337,956 | ||||||
| 160 | 2 0 2 4 I S H A R E S A N N U A L R E P O R T T O S H A R E H O L D E R S |
| Schedule of Investments (continued) February 29, 2024 |
iShares® 1-5 Year Investment Grade Corporate Bond ETF (Percentages shown are based on Net Assets) |
| Security | Par (000) |
Value | ||||||
| Gas (continued) | ||||||||
| 4.25%, 07/15/27 (Call 04/15/27)(a)(b) |
$ | 4,285 | $ | 4,181,623 | ||||
| Atmos Energy Corp., 3.00%, 06/15/27 |
2,273 | 2,137,369 | ||||||
| Boston Gas Co., 3.15%, 08/01/27 |
3,315 | 3,077,639 | ||||||
| Brooklyn Union Gas Co. (The) |
||||||||
| 3.41%, 03/10/26 (Call 12/10/25)(a)(b) |
4,886 | 4,671,401 | ||||||
| 4.63%, 08/05/27 (Call 07/05/27)(b) |
2,150 | 2,079,367 | ||||||
| CenterPoint Energy Resources Corp. |
||||||||
| 4.00%, 04/01/28 (Call 01/01/28)(a) |
1,065 | 1,022,706 | ||||||
| 5.25%, 03/01/28 (Call 02/01/28) |
6,985 | 7,032,033 | ||||||
| East Ohio Gas Co. (The), 1.30%, 06/15/25 |
4,299 | 4,076,401 | ||||||
| KeySpan Gas East Corp., 2.74%, 08/15/26 |
6,226 | 5,811,376 | ||||||
| National Fuel Gas Co. |
||||||||
| 3.95%, 09/15/27 (Call 06/15/27) |
2,348 | 2,225,676 | ||||||
| 4.75%, 09/01/28 (Call 06/01/28)(a) |
1,150 | 1,110,715 | ||||||
| 5.20%, 07/15/25 (Call 04/15/25)(a) |
2,771 | 2,748,740 | ||||||
| 5.50%, 01/15/26 (Call 12/15/25)(a) |
3,670 | 3,656,852 | ||||||
| 5.50%, 10/01/26(a) |
2,035 | 2,031,876 | ||||||
| NiSource Inc. |
||||||||
| 0.95%, 08/15/25 (Call 07/15/25)(a) |
8,753 | 8,211,552 | ||||||
| 3.49%, 05/15/27 (Call 02/15/27) |
5,428 | 5,158,559 | ||||||
| 5.25%, 03/30/28 (Call 02/29/28)(a) |
6,105 | 6,131,886 | ||||||
| Southern California Gas Co. |
||||||||
| 2.95%, 04/15/27 (Call 03/15/27) |
3,935 | 3,700,387 | ||||||
| 3.20%, 06/15/25 (Call 03/15/25)(a) |
3,171 | 3,092,750 | ||||||
| Series TT, 2.60%, 06/15/26 (Call 03/15/26) |
4,865 | 4,609,066 | ||||||
| Southern Co. Gas Capital Corp. |
||||||||
| 3.25%, 06/15/26 (Call 03/15/26)(a) |
4,995 | 4,774,754 | ||||||
| 3.88%, 11/15/25 (Call 08/15/25)(a) |
2,545 | 2,475,662 | ||||||
| Southwest Gas Corp. |
||||||||
| 3.70%, 04/01/28 (Call 01/01/28) |
184 | 173,656 | ||||||
| 5.45%, 03/23/28 (Call 02/23/28)(a) |
2,852 | 2,878,749 | ||||||
| 5.80%, 12/01/27 (Call 11/01/27)(a) |
1,080 | 1,100,028 | ||||||
|
|
|
|||||||
| 96,508,779 | ||||||||
| Hand & Machine Tools — 0.1% | ||||||||
| Kennametal Inc., 4.63%, 06/15/28 |
2,520 | 2,448,066 | ||||||
| Regal Rexnord Corp. |
||||||||
| 6.05%, 02/15/26(b) |
5,635 | 5,658,330 | ||||||
| 6.05%, 04/15/28 (Call 03/15/28)(a)(b) |
8,698 | 8,752,621 | ||||||
| Snap-on Inc., 3.25%, 03/01/27 |
808 | 772,430 | ||||||
| Stanley Black & Decker Inc. |
||||||||
| 3.40%, 03/01/26 (Call 01/01/26) |
3,514 | 3,389,157 | ||||||
| 4.00%, 03/15/60 (Call 03/15/25), |
4,732 | 4,219,514 | ||||||
| 4.25%, 11/15/28 (Call 08/15/28)(a) |
2,640 | 2,549,202 | ||||||
| 6.00%, 03/06/28 (Call 02/06/28)(a) |
2,968 | 3,065,527 | ||||||
| 6.27%, 03/06/26 (Call 03/11/24) |
950 | 950,010 | ||||||
|
|
|
|||||||
| 31,804,857 | ||||||||
| Health Care - Products — 0.7% | ||||||||
| Abbott Laboratories |
||||||||
| 1.15%, 01/30/28 (Call 11/30/27)(a) |
1,440 | 1,263,344 | ||||||
| 3.75%, 11/30/26 (Call 08/30/26) |
11,040 | 10,748,659 | ||||||
| 3.88%, 09/15/25 (Call 06/15/25)(a) |
3,595 | 3,539,154 | ||||||
| Agilent Technologies Inc., 3.05%, 09/22/26 |
1,696 | 1,613,141 | ||||||
| Security | Par (000) |
Value | ||||||
| Health Care - Products (continued) |
||||||||
| Alcon Finance Corp., 2.75%, 09/23/26 |
$ | 3,634 | $ | 3,411,235 | ||||
| Baxter International Inc. |
||||||||
| 1.92%, 02/01/27 (Call 01/01/27) |
9,012 | 8,197,589 | ||||||
| 2.27%, 12/01/28 (Call 10/01/28) |
7,100 | 6,222,819 | ||||||
| 2.60%, 08/15/26 (Call 05/15/26) |
5,000 | 4,690,587 | ||||||
| Boston Scientific Corp. |
||||||||
| 1.90%, 06/01/25 (Call 05/01/25)(a) |
4,351 | 4,171,939 | ||||||
| 3.75%, 03/01/26 (Call 01/01/26)(a) |
432 | 420,020 | ||||||
| 4.00%, 03/01/28 (Call 12/01/27) |
600 | 581,003 | ||||||
| Danaher Corp., 3.35%, 09/15/25 |
4,125 | 4,022,888 | ||||||
| Edwards Lifesciences Corp., 4.30%, 06/15/28 |
1,535 | 1,490,815 | ||||||
| GE HealthCare Technologies Inc. |
||||||||
| 5.60%, 11/15/25 (Call 10/15/25) |
10,175 | 10,208,758 | ||||||
| 5.65%, 11/15/27 (Call 10/15/27) |
11,370 | 11,548,811 | ||||||
| HCA Inc., 3.13%, 03/15/27 (Call 02/15/27) |
6,389 | 6,003,216 | ||||||
| Medtronic Global Holdings SCA, 4.25%, |
8,003 | 7,827,958 | ||||||
| Olympus Corp., 2.14%, 12/08/26 |
2,672 | 2,446,479 | ||||||
| Revvity Inc., 1.90%, 09/15/28 (Call 07/15/28)(a) . |
1,540 | 1,329,359 | ||||||
| Solventum Corp. |
||||||||
| 5.40%, 03/01/29 (Call 02/01/29)(b) |
5,845 | 5,835,926 | ||||||
| 5.45%, 02/25/27 (Call 01/25/27)(b) |
3,485 | 3,491,571 | ||||||
| Stryker Corp. |
||||||||
| 1.15%, 06/15/25 (Call 05/15/25)(a) |
4,688 | 4,447,403 | ||||||
| 3.38%, 11/01/25 (Call 08/01/25)(a) |
4,859 | 4,717,660 | ||||||
| 3.50%, 03/15/26 (Call 12/15/25) |
7,196 | 6,975,722 | ||||||
| 3.65%, 03/07/28 (Call 12/07/27)(a) |
5,013 | 4,780,781 | ||||||
| 4.85%, 12/08/28 (Call 11/08/28) |
3,340 | 3,329,522 | ||||||
| Thermo Fisher Scientific Inc. |
||||||||
| 1.75%, 10/15/28 (Call 08/15/28)(a) |
4,365 | 3,833,777 | ||||||
| 4.80%, 11/21/27 (Call 10/21/27) |
4,134 | 4,136,876 | ||||||
| 4.95%, 08/10/26 (Call 07/10/26) |
4,980 | 4,984,181 | ||||||
| 5.00%, 12/05/26 (Call 11/05/26) |
3,755 | 3,764,311 | ||||||
| 5.00%, 01/31/29 (Call 12/31/28) |
6,240 | 6,276,906 | ||||||
| Zimmer Biomet Holdings Inc. |
||||||||
| 3.05%, 01/15/26 (Call 12/15/25) |
3,942 | 3,787,297 | ||||||
| 3.55%, 04/01/25 (Call 01/01/25) |
6,059 | 5,928,688 | ||||||
| 5.35%, 12/01/28 (Call 11/01/28) |
4,275 | 4,322,738 | ||||||
|
|
|
|||||||
| 160,351,133 | ||||||||
| Health Care - Services — 1.6% | ||||||||
| Advocate Health & Hospitals Corp., 3.83%, |
3,855 | 3,692,740 | ||||||
| Blue Cross and Blue Shield of Minnesota, |
2,092 | 2,027,998 | ||||||
| Bon Secours Mercy Health Inc., Series 2018, |
155 | 151,407 | ||||||
| Centene Corp. |
||||||||
| 2.45%, 07/15/28 (Call 05/15/28) |
12,372 | 10,903,863 | ||||||
| 4.25%, 12/15/27 (Call 03/18/24)(a) |
17,262 | 16,420,423 | ||||||
| CommonSpirit Health, 1.55%, 10/01/25 |
3,407 | 3,200,222 | ||||||
| Elevance Health Inc. |
||||||||
| 1.50%, 03/15/26 (Call 02/15/26)(a) |
6,651 | 6,178,678 | ||||||
| 3.65%, 12/01/27 (Call 09/01/27)(a) |
11,158 | 10,666,745 | ||||||
| 4.10%, 03/01/28 (Call 12/01/27) |
8,393 | 8,119,241 | ||||||
| 4.90%, 02/08/26 (Call 03/11/24)(a) |
4,098 | 4,069,368 | ||||||
| 5.35%, 10/15/25 (Call 09/15/25) |
2,775 | 2,771,995 | ||||||
| S C H E D U L E O F I N V E S T M E N T S |
161 |
| Schedule of Investments (continued) February 29, 2024 |
iShares® 1-5 Year Investment Grade Corporate Bond ETF (Percentages shown are based on Net Assets) |
| Security | Par (000) |
Value | ||||||
| Health Care - Services (continued) | ||||||||
| Fresenius Medical Care U.S. Finance III Inc., |
$ | 5,480 | $ | 4,941,684 | ||||
| HCA Inc. |
||||||||
| 4.50%, 02/15/27 (Call 08/15/26) |
7,450 | 7,291,364 | ||||||
| 5.20%, 06/01/28 (Call 05/01/28)(a) |
7,550 | 7,521,896 | ||||||
| 5.25%, 04/15/25 |
8,956 | 8,913,992 | ||||||
| 5.25%, 06/15/26 (Call 12/15/25) |
9,746 | 9,686,670 | ||||||
| 5.38%, 09/01/26 (Call 03/01/26) |
6,594 | 6,574,987 | ||||||
| 5.63%, 09/01/28 (Call 03/01/28)(a) |
10,760 | 10,843,061 | ||||||
| 5.88%, 02/15/26 (Call 08/15/25) |
9,970 | 10,011,321 | ||||||
| 5.88%, 02/01/29 (Call 08/01/28) |
1,650 | 1,679,391 | ||||||
| 7.69%, 06/15/25(a) |
2,300 | 2,356,677 | ||||||
| Health Care Service Corp. A Mutual Legal |
3,951 | 3,763,437 | ||||||
| Highmark Inc., 1.45%, 05/10/26 |
3,901 | 3,558,841 | ||||||
| Humana Inc. |
||||||||
| 1.35%, 02/03/27 (Call 01/03/27)(a) |
5,673 | 5,086,775 | ||||||
| 3.95%, 03/15/27 (Call 12/15/26)(a) |
4,544 | 4,388,839 | ||||||
| 4.50%, 04/01/25 (Call 03/01/25) |
4,417 | 4,371,176 | ||||||
| 5.70%, 03/13/26 (Call 03/13/24) |
700 | 694,739 | ||||||
| 5.75%, 03/01/28 (Call 02/01/28)(a) |
3,510 | 3,578,786 | ||||||
| 5.75%, 12/01/28 (Call 11/01/28)(a) |
2,360 | 2,410,268 | ||||||
| IQVIA Inc., 5.70%, 05/15/28 (Call 04/15/28)(a) |
5,315 | 5,353,587 | ||||||
| Kaiser Foundation Hospitals, 3.15%, 05/01/27 |
1,660 | 1,578,224 | ||||||
| Laboratory Corp. of America Holdings |
||||||||
| 1.55%, 06/01/26 (Call 05/01/26) |
3,825 | 3,526,921 | ||||||
| 3.60%, 09/01/27 (Call 06/01/27)(a) |
4,211 | 4,004,200 | ||||||
| PeaceHealth Obligated Group, Series 2020, |
2,636 | 2,450,249 | ||||||
| Premier Health Partners, Series G, 2.91%, |
1,017 | 927,012 | ||||||
| Providence St Joseph Health Obligated Group, |
1,030 | 964,337 | ||||||
| Quest Diagnostics Inc. |
||||||||
| 3.45%, 06/01/26 (Call 03/01/26)(a) |
3,936 | 3,787,321 | ||||||
| 3.50%, 03/30/25 (Call 12/30/24)(a) |
4,999 | 4,907,959 | ||||||
| Roche Holdings Inc. |
||||||||
| 0.99%, 03/05/26 (Call 02/05/26)(a)(b) |
4,347 | 4,020,922 | ||||||
| 1.93%, 12/13/28 (Call 10/13/28)(a)(b) |
8,915 | 7,810,628 | ||||||
| 2.31%, 03/10/27 (Call 02/10/27)(b) |
8,517 | 7,937,683 | ||||||
| 2.38%, 01/28/27 (Call 10/28/26)(a)(b) |
5,513 | 5,163,310 | ||||||
| 2.63%, 05/15/26 (Call 02/15/26)(b) |
6,100 | 5,809,315 | ||||||
| 3.00%, 11/10/25 (Call 08/10/25)(a)(b) |
3,462 | 3,355,065 | ||||||
| 5.27%, 11/13/26 (Call 10/13/26)(a)(b) |
7,100 | 7,164,405 | ||||||
| 5.34%, 11/13/28 (Call 10/13/28)(a)(b) |
9,295 | 9,488,090 | ||||||
| SSM Health Care Corp. |
||||||||
| 4.89%, 06/01/28 (Call 03/01/28) |
35 | 35,267 | ||||||
| Series A, 3.82%, 06/01/27 (Call 03/01/27) |
885 | 851,680 | ||||||
| Sutter Health, Series 20A, 1.32%, 08/15/25 |
653 | 614,774 | ||||||
| UnitedHealth Group Inc. |
||||||||
| 3.70%, 05/15/27 (Call 04/15/27) |
4,385 | 4,246,277 | ||||||
| 1.15%, 05/15/26 (Call 04/15/26)(a) |
6,982 | 6,430,090 | ||||||
| 1.25%, 01/15/26 |
3,679 | 3,437,269 | ||||||
| 2.95%, 10/15/27(a) |
6,208 | 5,830,475 | ||||||
| 3.10%, 03/15/26 |
6,910 | 6,674,814 | ||||||
| 3.38%, 04/15/27(a) |
4,241 | 4,076,836 | ||||||
| 3.45%, 01/15/27(a) |
5,254 | 5,070,141 | ||||||
| Security | Par (000) |
Value | ||||||
| Health Care - Services (continued) | ||||||||
| 3.70%, 12/15/25(a) |
$ | 2,713 | $ | 2,654,233 | ||||
| 3.75%, 07/15/25 |
13,433 | 13,181,107 | ||||||
| 3.85%, 06/15/28 |
7,906 | 7,613,480 | ||||||
| 3.88%, 12/15/28(a) |
5,785 | 5,551,917 | ||||||
| 4.25%, 01/15/29 (Call 12/15/28)(a) |
7,660 | 7,463,031 | ||||||
| 5.15%, 10/15/25 |
6,009 | 6,022,104 | ||||||
| 5.25%, 02/15/28 (Call 01/15/28)(a) |
6,784 | 6,897,699 | ||||||
| Universal Health Services Inc., 1.65%, 09/01/26 |
4,690 | 4,264,068 | ||||||
| UPMC, Series D-1, 3.60%, 04/03/25(a) |
3,140 | 3,082,637 | ||||||
|
|
|
|||||||
| 338,123,711 | ||||||||
| Holding Companies - Diversified — 1.0% | ||||||||
| Ares Capital Corp. |
||||||||
| 2.15%, 07/15/26 (Call 06/15/26)(a) |
6,975 | 6,336,086 | ||||||
| 2.88%, 06/15/27 (Call 05/15/27)(a) |
3,056 | 2,776,175 | ||||||
| 2.88%, 06/15/28 (Call 04/15/28)(a) |
6,826 | 5,978,198 | ||||||
| 3.25%, 07/15/25 (Call 06/15/25) |
8,214 | 7,889,678 | ||||||
| 3.88%, 01/15/26 (Call 12/15/25) |
7,791 | 7,474,574 | ||||||
| 4.25%, 03/01/25 (Call 01/01/25)(a) |
4,108 | 4,028,796 | ||||||
| 5.88%, 03/01/29 (Call 02/01/29) |
2,175 | 2,125,649 | ||||||
| 7.00%, 01/15/27 |
3,015 | 3,075,063 | ||||||
| Bain Capital Specialty Finance Inc. |
||||||||
| 2.55%, 10/13/26 (Call 09/13/26)(a) |
2,270 | 2,067,015 | ||||||
| 2.95%, 03/10/26 (Call 02/10/26)(a) |
2,504 | 2,343,434 | ||||||
| Barings BDC Inc. |
||||||||
| 3.30%, 11/23/26 (Call 10/13/26) |
2,315 | 2,113,844 | ||||||
| 7.00%, 02/15/29 (Call 01/15/29) |
25 | 24,796 | ||||||
| Blackstone Private Credit Fund |
||||||||
| 2.63%, 12/15/26 (Call 11/15/26)(a) |
7,962 | 7,192,412 | ||||||
| 3.25%, 03/15/27 (Call 02/15/27) |
6,285 | 5,748,036 | ||||||
| 4.00%, 01/15/29 (Call 11/15/28)(a) |
100 | 90,957 | ||||||
| 4.70%, 03/24/25(a) |
6,065 | 5,970,863 | ||||||
| 7.05%, 09/29/25(a) |
5,818 | 5,894,416 | ||||||
| 7.30%, 11/27/28 (Call 10/27/28)(a)(b) |
2,530 | 2,611,131 | ||||||
| Blackstone Secured Lending Fund |
||||||||
| 2.13%, 02/15/27 (Call 01/15/27)(a) |
4,054 | 3,638,352 | ||||||
| 2.75%, 09/16/26 (Call 08/19/26)(a) |
4,898 | 4,494,454 | ||||||
| 2.85%, 09/30/28 (Call 07/30/28)(a) |
3,840 | 3,341,814 | ||||||
| 3.63%, 01/15/26 (Call 12/15/25)(a) |
5,795 | 5,521,220 | ||||||
| Blue Owl Capital Corp. |
||||||||
| 2.63%, 01/15/27 (Call 12/15/26) |
3,277 | 2,970,590 | ||||||
| 2.88%, 06/11/28 (Call 04/11/28) |
2,955 | 2,581,915 | ||||||
| 3.40%, 07/15/26 (Call 06/15/26) |
6,972 | 6,493,315 | ||||||
| 3.75%, 07/22/25 (Call 06/22/25) |
3,683 | 3,548,319 | ||||||
| 4.00%, 03/30/25 (Call 02/28/25)(a) |
2,960 | 2,889,968 | ||||||
| 4.25%, 01/15/26 (Call 12/15/25)(a) |
4,189 | 4,037,674 | ||||||
| Blue Owl Capital Corp. II, 8.45%, 11/15/26 |
350 | 359,089 | ||||||
| Blue Owl Capital Corp. III, 3.13%, 04/13/27 |
2,139 | 1,936,629 | ||||||
| Blue Owl Credit Income Corp. |
||||||||
| 3.13%, 09/23/26 (Call 08/23/26)(a) |
2,490 | 2,266,991 | ||||||
| 4.70%, 02/08/27 (Call 01/08/27) |
3,440 | 3,239,172 | ||||||
| 5.50%, 03/21/25(a) |
4,053 | 4,010,970 | ||||||
| 7.75%, 09/16/27 (Call 08/16/27)(a) |
3,505 | 3,585,375 | ||||||
| 7.75%, 01/15/29 (Call 12/15/28)(b) |
1,510 | 1,542,022 | ||||||
| Blue Owl Technology Finance Corp. |
||||||||
| 2.50%, 01/15/27 (Call 12/15/26)(a) |
2,010 | 1,768,462 | ||||||
| 3.75%, 06/17/26 (Call 05/17/26)(a)(b) |
2,881 | 2,649,873 | ||||||
| 4.75%, 12/15/25 (Call 11/15/25)(a)(b) |
4,686 | 4,465,625 | ||||||
| 162 | 2 0 2 4 I S H A R E S A N N U A L R E P O R T T O S H A R E H O L D E R S |
| Schedule of Investments (continued) February 29, 2024 |
iShares® 1-5 Year Investment Grade Corporate Bond ETF (Percentages shown are based on Net Assets) |
| Security | Par (000) |
Value | ||||||
| Holding Companies - Diversified (continued) | ||||||||
| CK Hutchison International 16 Ltd.,
2.75%, |
$ | 4,630 | $ | 4,350,575 | ||||
| CK Hutchison International 17 II Ltd.,
3.25%, |
4,760 | 4,486,165 | ||||||
| CK Hutchison International 17 Ltd.,
3.50%, |
2,904 | 2,777,655 | ||||||
| CK Hutchison International 21 Ltd., 1.50%, |
5,635 | 5,203,432 | ||||||
| Franklin BSP Lending Corp., 3.25%, 03/30/26 |
2,625 | 2,423,298 | ||||||
| FS KKR Capital Corp. |
||||||||
| 2.63%, 01/15/27 (Call 12/15/26)(a) |
3,301 | 2,986,727 | ||||||
| 3.13%, 10/12/28 (Call 08/12/28)(a) |
4,115 | 3,554,439 | ||||||
| 3.25%, 07/15/27 (Call 06/15/27)(a) |
2,557 | 2,321,093 | ||||||
| 3.40%, 01/15/26 (Call 12/15/25) |
7,243 | 6,847,750 | ||||||
| 7.88%, 01/15/29 (Call 12/15/28) |
1,420 | 1,467,781 | ||||||
| Goldman Sachs BDC Inc., 2.88%, 01/15/26 |
4,260 | 4,059,749 | ||||||
| Golub Capital BDC Inc. |
||||||||
| 2.05%, 02/15/27 (Call 01/15/27)(a) |
2,466 | 2,174,428 | ||||||
| 2.50%, 08/24/26 (Call 07/24/26)(a) |
2,450 | 2,235,820 | ||||||
| 7.05%, 12/05/28 (Call 11/05/28) |
1,915 | 1,951,062 | ||||||
| Main Street Capital Corp. |
||||||||
| 3.00%, 07/14/26 (Call 06/14/26)(a) |
4,093 | 3,786,422 | ||||||
| 6.95%, 03/01/29 (Call 02/01/29) |
1,210 | 1,214,493 | ||||||
| Morgan Stanley Direct Lending Fund, 4.50%, |
1,559 | 1,490,570 | ||||||
| Oaktree Specialty Lending Corp., 2.70%, |
1,876 | 1,670,235 | ||||||
| Prospect Capital Corp. |
||||||||
| 3.36%, 11/15/26 (Call 10/15/26)(a) |
2,425 | 2,185,063 | ||||||
| 3.44%, 10/15/28 (Call 08/15/28)(a) |
1,945 | 1,651,356 | ||||||
| 3.71%, 01/22/26 (Call 12/22/25)(a) |
3,168 | 2,980,592 | ||||||
| Sixth Street Specialty Lending Inc., 2.50%, |
2,465 | 2,260,848 | ||||||
|
|
|
|||||||
| 203,162,505 | ||||||||
| Home Builders — 0.2% | ||||||||
| DR Horton Inc. |
||||||||
| 1.30%, 10/15/26 (Call 09/15/26) |
3,702 | 3,349,394 | ||||||
| 1.40%, 10/15/27 (Call 08/15/27)(a) |
815 | 718,463 | ||||||
| 2.60%, 10/15/25 (Call 09/15/25)(a) |
3,319 | 3,175,706 | ||||||
| Lennar Corp. |
||||||||
| 4.75%, 05/30/25 (Call 02/28/25) |
3,077 | 3,046,265 | ||||||
| 4.75%, 11/29/27 (Call 05/29/27) |
5,963 | 5,867,813 | ||||||
| 5.00%, 06/15/27 (Call 12/15/26)(a) |
2,185 | 2,166,908 | ||||||
| 5.25%, 06/01/26 (Call 12/01/25) |
2,425 | 2,420,818 | ||||||
| Meritage Homes Corp. |
||||||||
| 5.13%, 06/06/27 (Call 12/06/26)(a) |
55 | 54,169 | ||||||
| 6.00%, 06/01/25 (Call 03/01/25) |
40 | 39,931 | ||||||
| PulteGroup Inc. |
||||||||
| 5.00%, 01/15/27 (Call 10/15/26)(a) |
2,708 | 2,695,940 | ||||||
| 5.50%, 03/01/26 (Call 12/01/25) |
2,878 | 2,883,718 | ||||||
| Toll Brothers Finance Corp. |
||||||||
| 4.35%, 02/15/28 (Call 11/15/27)(a) |
2,933 | 2,819,024 | ||||||
| 4.88%, 11/15/25 (Call 08/15/25)(a) |
2,164 | 2,137,222 | ||||||
| 4.88%, 03/15/27 (Call 12/15/26)(a) |
3,020 | 2,969,690 | ||||||
|
|
|
|||||||
| 34,345,061 | ||||||||
| Home Furnishings — 0.0% | ||||||||
| Harman International Industries Inc., 4.15%, |
2,491 | 2,449,417 | ||||||
| Security | Par (000) |
Value | ||||||
| Home Furnishings (continued) | ||||||||
| Leggett & Platt Inc., 3.50%, 11/15/27 |
$ | 3,460 | $ | 3,231,055 | ||||
| Whirlpool Corp. |
||||||||
| 3.70%, 05/01/25 |
924 | 904,484 | ||||||
| 4.75%, 02/26/29 (Call 11/26/28)(a) |
3,640 | 3,554,161 | ||||||
|
|
|
|||||||
| 10,139,117 | ||||||||
| Household Products & Wares — 0.2% | ||||||||
| Avery Dennison Corp., 4.88%, 12/06/28 |
3,737 | 3,700,688 | ||||||
| Church & Dwight Co. Inc., 3.15%, 08/01/27 |
3,020 | 2,846,376 | ||||||
| Clorox Co. (The) |
||||||||
| 3.10%, 10/01/27 (Call 07/01/27)(a) |
1,765 | 1,655,714 | ||||||
| 3.90%, 05/15/28 (Call 02/15/28)(a) |
4,467 | 4,302,267 | ||||||
| Kimberly-Clark Corp. |
||||||||
| 1.05%, 09/15/27 (Call 07/15/27) |
1,968 | 1,731,701 | ||||||
| 2.65%, 03/01/25(a) |
1,805 | 1,760,931 | ||||||
| 2.75%, 02/15/26(a) |
2,746 | 2,637,282 | ||||||
| 3.05%, 08/15/25(a) |
2,550 | 2,480,231 | ||||||
| 3.95%, 11/01/28 (Call 08/01/28)(a) |
385 | 372,864 | ||||||
| Reckitt Benckiser Treasury Services PLC, |
16,006 | 15,047,450 | ||||||
|
|
|
|||||||
| 36,535,504 | ||||||||
| Insurance — 3.6% | ||||||||
| Aegon NV, 5.50%, 04/11/48 (Call 04/11/28), |
3,970 | 3,813,104 | ||||||
| Aflac Inc. |
||||||||
| 1.13%, 03/15/26 (Call 02/15/26)(a) |
3,310 | 3,055,158 | ||||||
| 2.88%, 10/15/26 (Call 07/15/26) |
2,772 | 2,618,505 | ||||||
| AIA Group Ltd. |
||||||||
| 3.20%, 03/11/25 (Call 12/11/24)(b) |
2,816 | 2,755,927 | ||||||
| 3.90%, 04/06/28 (Call 01/06/28)(a)(b) |
1,260 | 1,212,941 | ||||||
| 5.63%, 10/25/27 (Call 09/25/27)(a)(b) |
6,580 | 6,719,892 | ||||||
| Allied World Assurance Co. Holdings Ltd., |
2,374 | 2,302,495 | ||||||
| Allstate Corp. (The) |
||||||||
| 0.75%, 12/15/25 (Call 11/15/25) |
4,461 | 4,115,982 | ||||||
| 3.28%, 12/15/26 (Call 09/15/26) |
4,905 | 4,673,944 | ||||||
| American Equity Investment Life Holding Co., |
3,769 | 3,625,267 | ||||||
| American International Group Inc. |
||||||||
| 4.20%, 04/01/28 (Call 01/01/28) |
3,215 | 3,122,485 | ||||||
| Series A-9, 5.75%, 04/01/48 (Call 04/01/28), |
4,270 | 4,194,872 | ||||||
| Aon Corp. |
||||||||
| 4.50%, 12/15/28 (Call 09/15/28)(a) |
2,650 | 2,585,843 | ||||||
| 8.21%, 01/01/27(a) |
1,766 | 1,897,352 | ||||||
| Aon Corp./Aon Global Holdings PLC, 2.85%, |
5,356 | 4,990,155 | ||||||
| Aon Global Ltd., 3.88%, 12/15/25 |
5,413 | 5,278,308 | ||||||
| Aon North America Inc. |
||||||||
| 5.13%, 03/01/27 (Call 02/01/27) |
4,375 | 4,371,827 | ||||||
| 5.15%, 03/01/29 (Call 02/01/29) |
5,975 | 5,977,147 | ||||||
| Arch Capital Finance LLC, 4.01%, 12/15/26 |
4,119 | 3,972,065 | ||||||
| Assurant Inc., 4.90%, 03/27/28 (Call 12/27/27) |
850 | 832,486 | ||||||
| Assured Guaranty U.S. Holdings Inc., 6.13%, |
1,865 | 1,925,319 | ||||||
| S C H E D U L E O F I N V E S T M E N T S |
163 |
| Schedule of Investments (continued) February 29, 2024 |
iShares® 1-5 Year Investment Grade Corporate Bond ETF (Percentages shown are based on Net Assets) |
| Security | Par (000) |
Value | ||||||
| Insurance (continued) | ||||||||
| Athene Global Funding |
||||||||
| 1.45%, 01/08/26(a)(b) |
$ | 3,413 | $ | 3,150,374 | ||||
| 1.61%, 06/29/26(a)(b) |
3,565 | 3,236,928 | ||||||
| 1.73%, 10/02/26(a)(b) |
3,289 | 2,959,021 | ||||||
| 1.99%, 08/19/28(b) |
4,655 | 3,991,109 | ||||||
| 2.45%, 08/20/27(a)(b) |
2,955 | 2,647,486 | ||||||
| 2.50%, 03/24/28(b) |
7,610 | 6,746,523 | ||||||
| 2.55%, 06/29/25(a)(b) |
2,257 | 2,150,637 | ||||||
| 2.95%, 11/12/26(a)(b) |
3,647 | 3,379,644 | ||||||
| 5.58%, 01/09/29(a)(b) |
4,750 | 4,732,258 | ||||||
| Athene Holding Ltd., 4.13%, 01/12/28 |
6,840 | 6,551,927 | ||||||
| AXIS Specialty Finance PLC, 4.00%, 12/06/27 |
2,417 | 2,307,153 | ||||||
| Berkshire Hathaway Finance Corp., |
6,375 | 5,973,059 | ||||||
| Berkshire Hathaway Inc., 3.13%, 03/15/26 |
17,677 | 17,078,690 | ||||||
| Brighthouse Financial Global Funding |
||||||||
| 1.55%, 05/24/26(a)(b) |
4,320 | 3,939,394 | ||||||
| 2.00%, 06/28/28(b) |
2,020 | 1,732,917 | ||||||
| Brighthouse Financial Inc., 3.70%, 06/22/27 |
5,111 | 4,818,381 | ||||||
| Chubb INA Holdings Inc., 3.35%, 05/03/26 |
11,201 | 10,799,252 | ||||||
| Cincinnati Financial Corp., 6.92%, 05/15/28 |
60 | 63,764 | ||||||
| CNA Financial Corp. |
||||||||
| 3.45%, 08/15/27 (Call 05/15/27)(a) |
3,811 | 3,609,351 | ||||||
| 4.50%, 03/01/26 (Call 12/01/25) |
5,080 | 4,998,744 | ||||||
| CNO Financial Group Inc., 5.25%, 05/30/25 |
3,781 | 3,759,222 | ||||||
| CNO Global Funding |
||||||||
| 1.75%, 10/07/26(a)(b) |
4,098 | 3,696,947 | ||||||
| 2.65%, 01/06/29(a)(b) |
2,765 | 2,390,039 | ||||||
| Corebridge Financial Inc. |
||||||||
| 3.50%, 04/04/25 (Call 03/04/25)(a) |
8,860 | 8,653,362 | ||||||
| 3.65%, 04/05/27 (Call 03/05/27) |
9,157 | 8,688,861 | ||||||
| 6.88%, 12/15/52 (Call 09/15/27), |
6,104 | 6,094,109 | ||||||
| Corebridge Global Funding |
||||||||
| 0.90%, 09/22/25(a)(b) |
1,333 | 1,242,768 | ||||||
| 5.20%, 01/12/29(a)(b) |
3,680 | 3,639,306 | ||||||
| 5.75%, 07/02/26(a)(b) |
3,935 | 3,937,984 | ||||||
| 5.90%, 09/19/28(a)(b) |
1,180 | 1,202,888 | ||||||
| Dai-Ichi Life Insurance Co. Ltd. (The), 4.00%, |
8,545 | 8,159,115 | ||||||
| Empower Finance 2020 LP, 1.36%, 09/17/27 |
1,030 | 907,524 | ||||||
| Enstar Finance LLC |
||||||||
| 5.50%, 01/15/42 (Call 01/15/27), |
155 | 139,597 | ||||||
| 5.75%, 09/01/40 (Call 09/01/25), |
260 | 248,700 | ||||||
| Equitable Financial Life Global Funding |
||||||||
| 1.00%, 01/09/26(a)(b) |
3,237 | 2,974,891 | ||||||
| 1.30%, 07/12/26(a)(b) |
3,481 | 3,150,263 | ||||||
| 1.40%, 07/07/25(b) |
4,813 | 4,548,424 | ||||||
| 1.40%, 08/27/27(a)(b) |
3,794 | 3,283,196 | ||||||
| 1.70%, 11/12/26(a)(b) |
3,557 | 3,215,626 | ||||||
| 1.80%, 03/08/28(a)(b) |
455 | 398,765 | ||||||
| Security | Par (000) |
Value | ||||||
| Insurance (continued) | ||||||||
| 5.45%, 03/03/28(a)(b) |
$ | 4,325 | $ | 4,291,115 | ||||
| 5.50%, 12/02/25(a)(b) |
2,350 | 2,344,348 | ||||||
| Equitable Holdings Inc. |
||||||||
| 4.35%, 04/20/28 (Call 01/20/28) |
12,790 | 12,315,321 | ||||||
| 7.00%, 04/01/28(a) |
610 | 646,628 | ||||||
| F&G Annuities & Life Inc., 7.40%, 01/13/28 |
3,335 | 3,426,574 | ||||||
| F&G Global Funding |
||||||||
| 1.75%, 06/30/26(a)(b) |
5,541 | 5,002,545 | ||||||
| 2.00%, 09/20/28(b) |
585 | 492,503 | ||||||
| 2.30%, 04/11/27(a)(b) |
3,020 | 2,703,970 | ||||||
| 5.15%, 07/07/25(a)(b) |
1,655 | 1,623,161 | ||||||
| Fairfax Financial Holdings Ltd., |
3,885 | 3,798,239 | ||||||
| Farmers Exchange Capital, 7.05%, 07/15/28(a)(b) |
905 | 911,442 | ||||||
| Fidelity & Guaranty Life Holdings Inc., |
4,042 | 3,990,878 | ||||||
| Fidelity National Financial Inc., |
140 | 134,851 | ||||||
| GA Global Funding Trust |
||||||||
| 1.63%, 01/15/26(b) |
4,791 | 4,411,409 | ||||||
| 1.95%, 09/15/28(b) |
460 | 389,105 | ||||||
| 2.25%, 01/06/27(a)(b) |
4,230 | 3,845,185 | ||||||
| 3.85%, 04/11/25(b) |
3,064 | 3,000,769 | ||||||
| 5.50%, 01/08/29(b) |
4,240 | 4,187,261 | ||||||
| Globe Life Inc., 4.55%, 09/15/28 |
2,590 | 2,526,743 | ||||||
| Great-West Lifeco Finance 2018 LP, |
2,075 | 2,003,281 | ||||||
| Great-West Lifeco U.S. Finance 2020 LP, |
4,042 | 3,794,031 | ||||||
| Guardian Life Global Funding |
||||||||
| 0.88%, 12/10/25(b) |
3,674 | 3,397,019 | ||||||
| 1.10%, 06/23/25(b) |
3,141 | 2,977,192 | ||||||
| 1.25%, 05/13/26(a)(b) |
2,410 | 2,208,053 | ||||||
| 1.25%, 11/19/27(a)(b) |
3,673 | 3,219,817 | ||||||
| 1.40%, 07/06/27(a)(b) |
40 | 35,499 | ||||||
| 1.63%, 09/16/28(a)(b) |
250 | 217,055 | ||||||
| 3.25%, 03/29/27(a)(b) |
2,365 | 2,246,300 | ||||||
| 5.55%, 10/28/27(a)(b) |
3,327 | 3,396,214 | ||||||
| 5.74%, 10/02/28(a)(b) |
2,170 | 2,245,714 | ||||||
| Hanover Insurance Group Inc. (The), |
2,180 | 2,136,894 | ||||||
| Horace Mann Educators Corp. |
||||||||
| 4.50%, 12/01/25 (Call 09/01/25) |
439 | 429,733 | ||||||
| 7.25%, 09/15/28 (Call 08/15/28)(a) |
550 | 588,835 | ||||||
| Jackson Financial Inc., 5.17%, 06/08/27 |
971 | 964,703 | ||||||
| Jackson National Life Global Funding |
||||||||
| 3.05%, 04/29/26(a)(b) |
3,033 | 2,847,095 | ||||||
| 3.88%, 06/11/25(b) |
2,878 | 2,799,545 | ||||||
| 5.25%, 04/12/28(a)(b) |
2,295 | 2,209,635 | ||||||
| 5.50%, 01/09/26(a)(b) |
3,235 | 3,220,320 | ||||||
| Jackson National Life Insurance Co., |
5,960 | 6,225,883 | ||||||
| Liberty Mutual Group Inc., 4.57%, 02/01/29(a)(b) . |
1,155 | 1,113,247 | ||||||
| Lincoln National Corp. |
||||||||
| 3.35%, 03/09/25(a) |
2,731 | 2,666,982 | ||||||
| 3.63%, 12/12/26 (Call 09/15/26)(a) |
3,380 | 3,226,219 | ||||||
| 3.80%, 03/01/28 (Call 12/01/27)(a) |
3,390 | 3,223,779 | ||||||
| 164 | 2 0 2 4 I S H A R E S A N N U A L R E P O R T T O S H A R E H O L D E R S |
| Schedule of Investments (continued) February 29, 2024 |
iShares® 1-5 Year Investment Grade Corporate Bond ETF (Percentages shown are based on Net Assets) |
| Security | Par (000) |
Value | ||||||
| Insurance (continued) | ||||||||
| Loews Corp., 3.75%, 04/01/26 |
$ | 5,033 | $ | 4,896,989 | ||||
| Manulife Financial Corp. |
||||||||
| 2.48%, 05/19/27 (Call 03/19/27)(a) |
3,071 | 2,848,631 | ||||||
| 4.06%, 02/24/32 (Call 02/24/27), |
5,275 | 5,021,859 | ||||||
| 4.15%, 03/04/26 |
7,902 | 7,746,488 | ||||||
| Markel Group Inc., 3.50%, 11/01/27 |
1,635 | 1,539,937 | ||||||
| Marsh & McLennan Companies Inc., |
5,676 | 5,534,466 | ||||||
| MassMutual Global Funding II |
||||||||
| 1.20%, 07/16/26(a)(b) |
1,375 | 1,252,377 | ||||||
| 2.35%, 01/14/27(a)(b) |
4,281 | 3,980,500 | ||||||
| 2.80%, 03/21/25(a)(b) |
520 | 506,339 | ||||||
| 3.40%, 03/08/26(a)(b) |
5,948 | 5,760,759 | ||||||
| 4.15%, 08/26/25(b) |
4,937 | 4,865,350 | ||||||
| 4.50%, 04/10/26(b) |
4,110 | 4,062,032 | ||||||
| 4.85%, 01/17/29(a)(b) |
3,175 | 3,141,910 | ||||||
| 5.05%, 12/07/27(a)(b) |
4,740 | 4,740,464 | ||||||
| 5.05%, 06/14/28(a)(b) |
4,075 | 4,066,480 | ||||||
| Meiji Yasuda Life Insurance Co. |
||||||||
| 5.10%, 04/26/48 (Call 04/26/28), |
100 | 97,617 | ||||||
| 5.20%, 10/20/45 (Call 10/20/25), |
13,145 | 12,920,016 | ||||||
| Mercury General Corp., 4.40%, 03/15/27 |
2,054 | 1,960,032 | ||||||
| Met Tower Global Funding |
||||||||
| 1.25%, 09/14/26(b) |
3,326 | 3,015,416 | ||||||
| 3.70%, 06/13/25(a)(b) |
1,785 | 1,747,892 | ||||||
| 4.85%, 01/16/27(a)(b) |
1,950 | 1,945,360 | ||||||
| 5.40%, 06/20/26(a)(b) |
3,495 | 3,512,510 | ||||||
| MetLife Inc., 3.60%, 11/13/25 (Call 08/13/25) |
5,490 | 5,358,496 | ||||||
| Metropolitan Life Global Funding I |
||||||||
| 0.95%, 07/02/25(b) |
9,839 | 9,289,035 | ||||||
| 1.88%, 01/11/27(a)(b) |
6,175 | 5,634,341 | ||||||
| 2.80%, 03/21/25(b) |
2,151 | 2,093,427 | ||||||
| 3.00%, 09/19/27(a)(b) |
5,010 | 4,655,335 | ||||||
| 3.45%, 12/18/26(b) |
6,955 | 6,664,466 | ||||||
| 4.05%, 08/25/25(b) |
4,443 | 4,368,043 | ||||||
| 4.40%, 06/30/27(a)(b) |
3,425 | 3,334,277 | ||||||
| 4.85%, 01/08/29(a)(b) |
5,190 | 5,121,144 | ||||||
| 5.00%, 01/06/26(b) |
2,944 | 2,936,083 | ||||||
| 5.05%, 01/06/28(a)(b) |
3,990 | 3,978,212 | ||||||
| 5.40%, 09/12/28(b) |
2,915 | 2,949,624 | ||||||
| Metropolitan Life Insurance Co., |
2,100 | 2,163,986 | ||||||
| MGIC Investment Corp., 5.25%, 08/15/28 |
305 | 294,669 | ||||||
| Munich Re America Corp., Series B, |
5 | 5,293 | ||||||
| Mutual of Omaha Companies Global Funding, |
1,905 | 1,922,349 | ||||||
| Mutual of Omaha Cos Global Funding, |
2,220 | 2,236,847 | ||||||
| New York Life Global Funding |
||||||||
| 0.85%, 01/15/26(a)(b) |
5,357 | 4,960,704 | ||||||
| 0.95%, 06/24/25(b) |
3,443 | 3,258,713 | ||||||
| 1.15%, 06/09/26(b) |
3,968 | 3,628,571 | ||||||
| 2.35%, 07/14/26(a)(b) |
750 | 704,422 | ||||||
| Security | Par (000) |
Value | ||||||
| Insurance (continued) | ||||||||
| 3.00%, 01/10/28(a)(b) |
$ | 1,625 | $ | 1,511,622 | ||||
| 3.25%, 04/07/27(b) |
4,910 | 4,659,149 | ||||||
| 3.60%, 08/05/25(b) |
4,895 | 4,793,039 | ||||||
| 4.70%, 04/02/26(a)(b) |
5,650 | 5,605,336 | ||||||
| 4.70%, 01/29/29(a)(b) |
4,720 | 4,655,290 | ||||||
| 4.85%, 01/09/28(a)(b) |
8,870 | 8,816,868 | ||||||
| 4.90%, 06/13/28(b) |
5,348 | 5,332,530 | ||||||
| 5.45%, 09/18/26(b) |
4,165 | 4,202,901 | ||||||
| Nippon Life Insurance Co. |
||||||||
| 4.00%, 09/19/47 (Call 09/19/27), |
3,510 | 3,299,100 | ||||||
| 4.70%, 01/20/46 (Call 01/20/26), |
8,699 | 8,478,843 | ||||||
| Northwestern Mutual Global Funding |
||||||||
| 0.80%, 01/14/26(a)(b) |
5,248 | 4,849,642 | ||||||
| 1.70%, 06/01/28(b) |
3,480 | 3,022,404 | ||||||
| 1.75%, 01/11/27(a)(b) |
3,863 | 3,530,694 | ||||||
| 4.00%, 07/01/25(a)(b) |
4,375 | 4,311,891 | ||||||
| 4.35%, 09/15/27(a)(b) |
4,875 | 4,751,810 | ||||||
| 4.70%, 04/06/26(a)(b) |
3,495 | 3,453,364 | ||||||
| 4.71%, 01/10/29(a)(b) |
3,210 | 3,162,303 | ||||||
| 4.90%, 06/12/28(b) |
3,445 | 3,408,510 | ||||||
| Old Republic International Corp., |
4,918 | 4,748,898 | ||||||
| Pacific Life Global Funding II |
||||||||
| 1.20%, 06/24/25(a)(b) |
4,156 | 3,943,958 | ||||||
| 1.38%, 04/14/26(b) |
9,100 | 8,401,492 | ||||||
| 1.45%, 01/20/28(a)(b) |
915 | 805,892 | ||||||
| 1.60%, 09/21/28(b) |
610 | 517,713 | ||||||
| 4.90%, 04/04/28(a)(b) |
4,433 | 4,365,377 | ||||||
| 4.90%, 01/11/29(a)(b) |
2,100 | 2,079,913 | ||||||
| 5.50%, 08/28/26(a)(b) |
2,170 | 2,184,123 | ||||||
| 5.50%, 07/18/28(a)(b) |
4,075 | 4,126,473 | ||||||
| Pine Street Trust I, 4.57%, 02/15/29 |
100 | 94,563 | ||||||
| Pricoa Global Funding I |
||||||||
| 0.80%, 09/01/25(a)(b) |
2,623 | 2,455,268 | ||||||
| 1.20%, 09/01/26(a)(b) |
2,898 | 2,629,071 | ||||||
| 4.20%, 08/28/25(a)(b) |
1,725 | 1,700,816 | ||||||
| 5.10%, 05/30/28(b) |
3,920 | 3,918,871 | ||||||
| 5.55%, 08/28/26(b) |
2,165 | 2,190,448 | ||||||
| Principal Financial Group Inc. |
||||||||
| 3.10%, 11/15/26 (Call 08/15/26)(a) |
2,325 | 2,204,426 | ||||||
| 3.40%, 05/15/25 (Call 02/15/25) |
3,005 | 2,935,438 | ||||||
| Principal Life Global Funding II |
||||||||
| 0.88%, 01/12/26(a)(b) |
3,745 | 3,446,308 | ||||||
| 1.25%, 06/23/25(a)(b) |
3,662 | 3,473,623 | ||||||
| 1.25%, 08/16/26(b) |
6,240 | 5,644,616 | ||||||
| 1.50%, 11/17/26(b) |
4,050 | 3,680,378 | ||||||
| 3.00%, 04/18/26(a)(b) |
4,496 | 4,272,819 | ||||||
| 5.00%, 01/16/27(a)(b) |
1,915 | 1,918,945 | ||||||
| 5.10%, 01/25/29(a)(b) |
2,715 | 2,693,240 | ||||||
| 5.50%, 06/28/28(a)(b) |
2,085 | 2,085,550 | ||||||
| Progressive Corp. (The) |
||||||||
| 2.45%, 01/15/27(a) |
3,629 | 3,383,441 | ||||||
| 2.50%, 03/15/27 (Call 02/15/27)(a) |
4,130 | 3,844,131 | ||||||
| Protective Life Corp., 4.30%, 09/30/28 |
2,855 | 2,761,536 | ||||||
| Protective Life Global Funding |
||||||||
| 1.17%, 07/15/25(a)(b) |
2,677 | 2,529,202 | ||||||
| 1.30%, 09/20/26(a)(b) |
2,860 | 2,587,672 | ||||||
| S C H E D U L E O F I N V E S T M E N T S |
165 |
| Schedule of Investments (continued) February 29, 2024 |
iShares® 1-5 Year Investment Grade Corporate Bond ETF (Percentages shown are based on Net Assets) |
| Security | Par (000) |
Value | ||||||
| Insurance (continued) | ||||||||
| 1.62%, 04/15/26(a)(b) |
$ | 3,722 | $ | 3,443,017 | ||||
| 1.90%, 07/06/28(b) |
245 | 215,529 | ||||||
| 3.22%, 03/28/25(b) |
2,765 | 2,706,549 | ||||||
| 4.71%, 07/06/27(a)(b) |
2,510 | 2,473,392 | ||||||
| 4.99%, 01/12/27(a)(b) |
1,950 | 1,944,511 | ||||||
| 5.21%, 04/14/26(a)(b) |
3,105 | 3,096,820 | ||||||
| 5.37%, 01/06/26(b) |
4,150 | 4,159,391 | ||||||
| 5.47%, 12/08/28(a)(b) |
2,805 | 2,837,700 | ||||||
| Prudential Financial Inc. |
||||||||
| 1.50%, 03/10/26 (Call 02/10/26)(a) |
10,160 | 9,467,309 | ||||||
| 3.88%, 03/27/28 (Call 12/27/27) |
3,443 | 3,306,761 | ||||||
| 4.50%, 09/15/47 (Call 09/15/27), |
4,515 | 4,210,701 | ||||||
| 5.38%, 05/15/45 (Call 05/15/25), |
6,516 | 6,415,444 | ||||||
| 5.70%, 09/15/48 (Call 09/15/28), |
665 | 646,175 | ||||||
| Prudential Insurance Co. of America (The), |
1,840 | 1,888,962 | ||||||
| Reinsurance Group of America Inc., |
3,919 | 3,811,781 | ||||||
| Reliance Standard Life Global Funding II |
||||||||
| 1.51%, 09/28/26(b) |
3,523 | 3,141,394 | ||||||
| 2.75%, 05/07/25(a)(b) |
3,128 | 3,011,144 | ||||||
| 2.75%, 01/21/27(b) |
1,330 | 1,213,442 | ||||||
| 4.93%, 09/01/27(b) |
100 | 97,002 | ||||||
| 5.24%, 02/02/26(a)(b) |
415 | 407,998 | ||||||
| RenaissanceRe Finance Inc. |
||||||||
| 3.45%, 07/01/27 (Call 04/01/27)(a) |
1,135 | 1,073,101 | ||||||
| 3.70%, 04/01/25 (Call 01/01/25)(a) |
2,278 | 2,232,903 | ||||||
| RGA Global Funding |
||||||||
| 2.00%, 11/30/26(a)(b) |
2,510 | 2,284,112 | ||||||
| 2.70%, 01/18/29(a)(b) |
2,130 | 1,869,863 | ||||||
| 6.00%, 11/21/28(a)(b) |
2,250 | 2,296,644 | ||||||
| Sammons Financial Group Inc., 4.45%, 05/12/27 |
1,620 | 1,533,939 | ||||||
| SBL Holdings Inc., 5.13%, 11/13/26 |
2,799 | 2,624,846 | ||||||
| SiriusPoint Ltd., 4.60%, 11/01/26 |
1,545 | 1,460,778 | ||||||
| Sumitomo Life Insurance Co., 4.00%, 09/14/77 (Call 09/14/27), |
65 | 61,003 | ||||||
| Swiss Re America Holding Corp., |
165 | 169,425 | ||||||
| Trinity Acquisition PLC, 4.40%, 03/15/26 |
4,809 | 4,712,306 | ||||||
| Unum Group, 3.88%, 11/05/25 |
2,000 | 1,935,280 | ||||||
| Willis North America Inc. |
||||||||
| 4.50%, 09/15/28 (Call 06/15/28) |
1,440 | 1,389,979 | ||||||
| 4.65%, 06/15/27 (Call 05/15/27) |
5,870 | 5,761,038 | ||||||
|
|
|
|||||||
| 778,765,562 | ||||||||
| Internet — 1.6% | ||||||||
| Alibaba Group Holding Ltd., 3.40%, 12/06/27 |
15,585 | 14,717,547 | ||||||
| Alphabet Inc. |
||||||||
| 0.45%, 08/15/25 (Call 07/15/25)(a) |
7,304 | 6,871,360 | ||||||
| 0.80%, 08/15/27 (Call 06/15/27)(a) |
7,535 | 6,658,278 | ||||||
| 2.00%, 08/15/26 (Call 05/15/26)(a) |
12,980 | 12,196,515 | ||||||
| Amazon.com Inc. |
||||||||
| 0.80%, 06/03/25 (Call 05/03/25) |
7,768 | 7,378,111 | ||||||
| Security | Par (000) |
Value | ||||||
| Internet (continued) | ||||||||
| 1.00%, 05/12/26 (Call 04/12/26) |
$ | 16,802 | $ | 15,465,780 | ||||
| 1.20%, 06/03/27 (Call 04/03/27) |
8,731 | 7,812,113 | ||||||
| 1.65%, 05/12/28 (Call 03/12/28)(a) |
13,050 | 11,581,045 | ||||||
| 3.00%, 04/13/25 |
9,255 | 9,042,817 | ||||||
| 3.15%, 08/22/27 (Call 05/22/27) |
23,083 | 21,914,358 | ||||||
| 3.30%, 04/13/27 (Call 03/13/27) |
14,375 | 13,781,488 | ||||||
| 4.55%, 12/01/27 (Call 11/01/27) |
14,079 | 14,035,901 | ||||||
| 4.60%, 12/01/25 |
7,712 | 7,677,707 | ||||||
| 5.20%, 12/03/25 (Call 09/03/25) |
5,627 | 5,651,886 | ||||||
| Baidu Inc. |
||||||||
| 1.63%, 02/23/27 (Call 01/23/27)(a) |
2,140 | 1,925,529 | ||||||
| 1.72%, 04/09/26 (Call 03/09/26)(a) |
3,115 | 2,878,959 | ||||||
| 3.08%, 04/07/25 (Call 03/07/25)(a) |
4,378 | 4,255,372 | ||||||
| 3.63%, 07/06/27(a) |
3,740 | 3,566,203 | ||||||
| 4.13%, 06/30/25(a) |
1,995 | 1,951,669 | ||||||
| 4.38%, 03/29/28 (Call 12/29/27)(a) |
3,790 | 3,668,988 | ||||||
| 4.88%, 11/14/28 (Call 08/14/28) |
200 | 198,408 | ||||||
| Booking Holdings Inc. |
||||||||
| 3.55%, 03/15/28 (Call 12/15/27) |
5,210 | 4,960,643 | ||||||
| 3.60%, 06/01/26 (Call 03/01/26) |
6,204 | 6,012,483 | ||||||
| 3.65%, 03/15/25 (Call 12/15/24)(a) |
3,088 | 3,035,876 | ||||||
| eBay Inc. |
||||||||
| 1.40%, 05/10/26 (Call 04/10/26)(a) |
4,692 | 4,327,325 | ||||||
| 1.90%, 03/11/25 (Call 02/11/25)(a) |
4,968 | 4,795,444 | ||||||
| 3.60%, 06/05/27 (Call 03/05/27) |
5,642 | 5,394,408 | ||||||
| 5.90%, 11/22/25 (Call 10/22/25)(a) |
2,660 | 2,681,855 | ||||||
| 5.95%, 11/22/27 (Call 10/22/27)(a) |
2,128 | 2,189,066 | ||||||
| Expedia Group Inc. |
||||||||
| 3.80%, 02/15/28 (Call 11/15/27)(a) |
7,055 | 6,672,456 | ||||||
| 4.63%, 08/01/27 (Call 05/01/27) |
5,706 | 5,584,440 | ||||||
| 5.00%, 02/15/26 (Call 11/15/25)(a) |
4,690 | 4,657,694 | ||||||
| 6.25%, 05/01/25 (Call 02/01/25)(b) |
6,392 | 6,420,820 | ||||||
| Meituan, 2.13%, 10/28/25 (Call 09/28/25)(a)(b) |
4,695 | 4,423,180 | ||||||
| Meta Platforms Inc. |
||||||||
| 3.50%, 08/15/27 (Call 07/15/27)(a) |
17,544 | 16,815,591 | ||||||
| 4.60%, 05/15/28 (Call 04/15/28)(a) |
10,740 | 10,693,045 | ||||||
| Netflix Inc. |
||||||||
| 3.63%, 06/15/25 (Call 03/15/25)(b) |
5,455 | 5,335,251 | ||||||
| 4.38%, 11/15/26 |
7,917 | 7,789,339 | ||||||
| 4.88%, 04/15/28(a) |
11,562 | 11,538,648 | ||||||
| 5.88%, 11/15/28 |
13,425 | 13,894,463 | ||||||
| Prosus NV |
||||||||
| 3.26%, 01/19/27 (Call 12/19/26)(a)(b) |
4,250 | 3,911,794 | ||||||
| 4.85%, 07/06/27 (Call 04/06/27)(b) |
396 | 380,576 | ||||||
| Tencent Holdings Ltd. |
||||||||
| 1.81%, 01/26/26 (Call 12/26/25)(b) |
4,509 | 4,227,189 | ||||||
| 3.58%, 04/11/26 (Call 02/11/26)(b) |
3,850 | 3,718,727 | ||||||
| 3.60%, 01/19/28 (Call 10/19/27)(a)(b) |
15,345 | 14,559,611 | ||||||
| Tencent Music Entertainment Group, 1.38%, 09/03/25 (Call 08/03/25)(a) |
1,977 | 1,860,098 | ||||||
| VeriSign Inc. |
||||||||
| 4.75%, 07/15/27 (Call 04/01/24)(a) |
5,360 | 5,256,797 | ||||||
| 5.25%, 04/01/25 (Call 01/01/25) |
4,058 | 4,043,521 | ||||||
|
|
|
|||||||
| 338,410,374 | ||||||||
| Iron & Steel — 0.2% | ||||||||
| ArcelorMittal SA |
||||||||
| 4.55%, 03/11/26(a) |
2,920 | 2,876,639 | ||||||
| 6.55%, 11/29/27 (Call 10/29/27)(a) |
7,985 | 8,316,313 | ||||||
| Gerdau Trade Inc., 4.88%, 10/24/27(b) |
625 | 608,735 | ||||||
| Nucor Corp. |
||||||||
| 2.00%, 06/01/25 (Call 05/01/25)(a) |
3,653 | 3,504,870 | ||||||
| 166 | 2 0 2 4 I S H A R E S A N N U A L R E P O R T T O S H A R E H O L D E R S |
| Schedule of Investments (continued) February 29, 2024 |
iShares® 1-5 Year Investment Grade Corporate Bond ETF (Percentages shown are based on Net Assets) |
| Security | Par (000) |
Value | ||||||
| Iron & Steel (continued) | ||||||||
| 3.95%, 05/23/25 |
$ | 3,465 | $ | 3,410,711 | ||||
| 3.95%, 05/01/28 (Call 02/01/28)(a) |
755 | 730,252 | ||||||
| 4.30%, 05/23/27 (Call 04/23/27) |
3,510 | 3,431,675 | ||||||
| POSCO |
||||||||
| 4.38%, 08/04/25(b) |
4,000 | 3,932,305 | ||||||
| 4.50%, 08/04/27(b) |
592 | 574,445 | ||||||
| 5.63%, 01/17/26(b) |
660 | 660,490 | ||||||
| 5.75%, 01/17/28(a)(b) |
6,975 | 7,054,893 | ||||||
| Reliance Inc., 1.30%, 08/15/25 (Call 07/15/25) |
3,076 | 2,887,300 | ||||||
| Steel Dynamics Inc. |
||||||||
| 1.65%, 10/15/27 (Call 08/15/27)(a) |
1,054 | 935,093 | ||||||
| 2.40%, 06/15/25 (Call 05/15/25) |
3,293 | 3,163,616 | ||||||
| 5.00%, 12/15/26 (Call 04/01/24)(a) |
2,905 | 2,882,348 | ||||||
| Vale Overseas Ltd., 6.25%, 08/10/26(a) |
265 | 268,600 | ||||||
|
|
|
|||||||
| 45,238,285 | ||||||||
| Leisure Time — 0.1% | ||||||||
| Harley-Davidson Financial Services Inc. |
||||||||
| 3.05%, 02/14/27 (Call 01/14/27)(a)(b) |
3,576 | 3,350,930 | ||||||
| 3.35%, 06/08/25 (Call 05/08/25)(a)(b) |
4,340 | 4,190,086 | ||||||
| 6.50%, 03/10/28 (Call 02/10/28)(a)(b) |
5,190 | 5,321,820 | ||||||
| Harley-Davidson Inc., 3.50%, 07/28/25 |
2,827 | 2,746,436 | ||||||
| Royal Caribbean Cruises Ltd., 8.25%, 01/15/29 (Call 04/01/25)(a)(b) |
50 | 53,034 | ||||||
|
|
|
|||||||
| 15,662,306 | ||||||||
| Lodging — 0.4% | ||||||||
| Hyatt Hotels Corp. |
||||||||
| 4.38%, 09/15/28 (Call 06/15/28) |
3,170 | 3,046,775 | ||||||
| 4.85%, 03/15/26 (Call 12/15/25) |
2,628 | 2,597,592 | ||||||
| 5.38%, 04/23/25 (Call 03/23/25)(a) |
2,787 | 2,781,453 | ||||||
| 5.75%, 01/30/27 (Call 12/30/26)(a) |
3,685 | 3,731,720 | ||||||
| Las Vegas Sands Corp., 3.50%, 08/18/26 |
30 | 28,208 | ||||||
| Marriott International Inc./MD 3.75%, 03/15/25 (Call 12/15/24) |
2,054 | 2,015,387 | ||||||
| 3.75%, 10/01/25 (Call 07/01/25) |
2,131 | 2,077,750 | ||||||
| 4.88%, 05/15/29 (Call 04/15/29) |
1,230 | 1,213,581 | ||||||
| 5.00%, 10/15/27 (Call 09/15/27)(a) |
7,261 | 7,231,008 | ||||||
| 5.45%, 09/15/26 (Call 08/15/26)(a) |
1,930 | 1,938,573 | ||||||
| 5.55%, 10/15/28 (Call 09/15/28) |
4,940 | 5,026,567 | ||||||
| Series AA, 4.65%, 12/01/28 (Call 09/01/28)(a) |
1,413 | 1,383,804 | ||||||
| Series EE, 5.75%, 05/01/25 (Call 04/01/25) |
3,496 | 3,508,613 | ||||||
| Series R, 3.13%, 06/15/26 (Call 03/15/26) |
5,677 | 5,420,160 | ||||||
| Series X, 4.00%, 04/15/28 (Call 01/15/28) |
3,370 | 3,228,687 | ||||||
| Sands China Ltd. |
||||||||
| 2.55%, 03/08/27 (Call 02/08/27)(a) |
4,938 | 4,447,304 | ||||||
| 4.05%, 01/08/26 (Call 12/08/25) |
4,820 | 4,621,910 | ||||||
| 5.13%, 08/08/25 (Call 06/08/25) |
11,542 | 11,375,853 | ||||||
| 5.40%, 08/08/28 (Call 05/08/28) |
12,500 | 12,197,002 | ||||||
|
|
|
|||||||
| 77,871,947 | ||||||||
| Machinery — 1.2% | ||||||||
| Caterpillar Financial Services Corp. |
||||||||
| 0.80%, 11/13/25 |
6,349 | 5,918,394 | ||||||
| 0.90%, 03/02/26 |
4,923 | 4,546,568 | ||||||
| 1.10%, 09/14/27(a) |
4,719 | 4,159,968 | ||||||
| 1.15%, 09/14/26(a) |
3,169 | 2,888,897 | ||||||
| 1.45%, 05/15/25 |
4,019 | 3,843,047 | ||||||
| 1.70%, 01/08/27 |
3,224 | 2,966,565 | ||||||
| 2.40%, 08/09/26(a) |
2,070 | 1,951,387 | ||||||
| Security | Par (000) |
Value | ||||||
| Machinery (continued) | ||||||||
| 3.40%, 05/13/25(a) |
$ | 7,961 | $ | 7,793,125 | ||||
| 3.60%, 08/12/27(a) |
4,593 | 4,423,125 | ||||||
| 3.65%, 08/12/25 |
5,263 | 5,157,314 | ||||||
| 4.35%, 05/15/26 |
8,050 | 7,956,001 | ||||||
| 4.50%, 01/08/27 |
2,400 | 2,384,082 | ||||||
| 4.80%, 01/06/26(a) |
5,835 | 5,818,649 | ||||||
| 4.85%, 02/27/29 |
3,910 | 3,914,490 | ||||||
| 5.05%, 02/27/26(a) |
3,725 | 3,727,119 | ||||||
| 5.15%, 08/11/25 |
5,300 | 5,300,190 | ||||||
| 5.40%, 03/10/25 |
968 | 970,188 | ||||||
| CNH Industrial Capital LLC |
||||||||
| 1.45%, 07/15/26 (Call 06/15/26)(a) |
4,016 | 3,673,406 | ||||||
| 1.88%, 01/15/26 (Call 12/15/25) |
3,426 | 3,210,642 | ||||||
| 3.95%, 05/23/25 |
3,306 | 3,244,304 | ||||||
| 4.55%, 04/10/28 (Call 03/10/28)(a) |
5,295 | 5,184,481 | ||||||
| 5.45%, 10/14/25(a) |
2,535 | 2,537,793 | ||||||
| 5.50%, 01/12/29 (Call 12/12/28)(a) |
1,940 | 1,966,459 | ||||||
| CNH Industrial NV, 3.85%, 11/15/27 |
2,423 | 2,324,931 | ||||||
| Deere & Co., 2.75%, 04/15/25 (Call 03/15/25) |
5,013 | 4,883,232 | ||||||
| Dover Corp., 3.15%, 11/15/25 (Call 08/15/25)(a) . |
2,845 | 2,741,119 | ||||||
| John Deere Capital Corp. |
||||||||
| 0.70%, 01/15/26 |
6,260 | 5,794,316 | ||||||
| 1.05%, 06/17/26 |
4,145 | 3,800,322 | ||||||
| 1.30%, 10/13/26(a) |
2,950 | 2,692,968 | ||||||
| 1.50%, 03/06/28(a) |
1,680 | 1,481,857 | ||||||
| 1.70%, 01/11/27(a) |
2,323 | 2,128,051 | ||||||
| 1.75%, 03/09/27(a) |
3,620 | 3,312,764 | ||||||
| 2.25%, 09/14/26 |
3,416 | 3,198,325 | ||||||
| 2.35%, 03/08/27(a) |
3,959 | 3,692,905 | ||||||
| 2.65%, 06/10/26 |
3,490 | 3,325,029 | ||||||
| 2.80%, 09/08/27 |
2,653 | 2,484,367 | ||||||
| 3.05%, 01/06/28(a) |
1,325 | 1,250,943 | ||||||
| 3.40%, 06/06/25 |
6,820 | 6,677,107 | ||||||
| 3.40%, 09/11/25(a) |
2,540 | 2,479,794 | ||||||
| 4.05%, 09/08/25(a) |
5,535 | 5,457,834 | ||||||
| 4.15%, 09/15/27(a) |
6,421 | 6,296,706 | ||||||
| 4.50%, 01/08/27(a) |
3,450 | 3,423,362 | ||||||
| 4.50%, 01/16/29 |
5,085 | 5,007,556 | ||||||
| 4.75%, 06/08/26 |
4,270 | 4,257,177 | ||||||
| 4.75%, 01/20/28(a) |
7,246 | 7,238,153 | ||||||
| 4.80%, 01/09/26(a) |
7,915 | 7,895,087 | ||||||
| 4.90%, 03/03/28 |
5,470 | 5,500,951 | ||||||
| 4.95%, 06/06/25 |
4,245 | 4,239,492 | ||||||
| 4.95%, 07/14/28(a) |
10,315 | 10,372,799 | ||||||
| 5.05%, 03/03/26(a) |
2,725 | 2,732,038 | ||||||
| Komatsu Finance America Inc., 5.50%, 10/06/27 (Call 09/06/27)(a)(b) |
1,400 | 1,416,183 | ||||||
| nVent Finance Sarl, 4.55%, 04/15/28 |
870 | 839,844 | ||||||
| Oshkosh Corp., 4.60%, 05/15/28 (Call 02/15/28) |
835 | 813,314 | ||||||
| Otis Worldwide Corp. |
||||||||
| 2.06%, 04/05/25 (Call 03/05/25)(a) |
8,805 | 8,484,946 | ||||||
| 2.29%, 04/05/27 (Call 02/05/27) |
3,296 | 3,049,677 | ||||||
| 5.25%, 08/16/28 (Call 07/16/28)(a) |
6,080 | 6,126,398 | ||||||
| Weir Group PLC (The), 2.20%, 05/13/26 |
1,140 | 1,055,958 | ||||||
| Westinghouse Air Brake Technologies Corp. |
||||||||
| 3.20%, 06/15/25 (Call 05/15/25) |
3,574 | 3,465,908 | ||||||
| 3.45%, 11/15/26 (Call 08/15/26) |
5,199 | 4,943,777 | ||||||
| S C H E D U L E O F I N V E S T M E N T S |
167 |
| Schedule of Investments (continued) February 29, 2024 |
iShares® 1-5 Year Investment Grade Corporate Bond ETF (Percentages shown are based on Net Assets) |
| Security | Par (000) |
Value | ||||||
| Machinery (continued) | ||||||||
| 4.70%, 09/15/28 (Call 06/15/28) |
$ | 9,134 | $ | 8,910,194 | ||||
| Xylem Inc./NY |
||||||||
| 1.95%, 01/30/28 (Call 11/30/27)(a) |
3,388 | 3,029,551 | ||||||
| 3.25%, 11/01/26 (Call 08/01/26)(a) |
3,639 | 3,475,100 | ||||||
|
|
|
|||||||
| 253,836,229 | ||||||||
| Machinery - Diversified — 0.1% | ||||||||
| Ingersoll Rand Inc., 5.40%, 08/14/28 |
4,520 | 4,556,425 | ||||||
| John Deere Capital Corp. |
||||||||
| 5.15%, 09/08/26 |
2,465 | 2,481,538 | ||||||
| 5.30%, 09/08/25(a) |
2,740 | 2,752,008 | ||||||
| Nordson Corp., 5.60%, 09/15/28 (Call 08/15/28) |
2,120 | 2,155,240 | ||||||
|
|
|
|||||||
| 11,945,211 | ||||||||
| Manufacturing — 0.6% | ||||||||
| 3M Co. |
||||||||
| 2.25%, 09/19/26 (Call 06/19/26)(a) |
4,668 | 4,349,240 | ||||||
| 2.65%, 04/15/25 (Call 03/15/25)(a) |
3,213 | 3,110,477 | ||||||
| 2.88%, 10/15/27 (Call 07/15/27)(a) |
5,844 | 5,410,122 | ||||||
| 3.00%, 08/07/25(a) |
3,688 | 3,571,011 | ||||||
| 3.63%, 09/14/28 (Call 06/14/28)(a) |
4,375 | 4,127,970 | ||||||
| Carlisle Companies Inc., 3.75%, 12/01/27 |
4,135 | 3,930,940 | ||||||
| Eaton Corp. |
||||||||
| 3.10%, 09/15/27 (Call 06/15/27)(a) |
2,827 | 2,675,755 | ||||||
| 4.35%, 05/18/28 (Call 04/18/28) |
2,890 | 2,846,264 | ||||||
| GE Capital Funding LLC, 3.45%, 05/15/25 |
1,273 | 1,243,300 | ||||||
| GE Capital International Funding Co. Unlimited Co., 3.37%, 11/15/25 |
1,785 | 1,728,601 | ||||||
| Illinois Tool Works Inc., 2.65%, 11/15/26 |
6,785 | 6,449,038 | ||||||
| Parker-Hannifin Corp. |
||||||||
| 3.25%, 03/01/27 (Call 12/01/26) |
4,327 | 4,114,425 | ||||||
| 4.25%, 09/15/27 (Call 08/15/27) |
8,178 | 8,003,624 | ||||||
| Siemens Financieringsmaatschappij NV |
||||||||
| 1.20%, 03/11/26(b) |
11,461 | 10,614,836 | ||||||
| 1.70%, 03/11/28(a)(b) |
8,705 | 7,744,712 | ||||||
| 2.35%, 10/15/26(a)(b) |
10,714 | 10,025,903 | ||||||
| 3.25%, 05/27/25(a)(b) |
10,067 | 9,847,603 | ||||||
| 3.40%, 03/16/27(a)(b) |
8,461 | 8,113,781 | ||||||
| 6.13%, 08/17/26(a)(b) |
11,038 | 11,323,918 | ||||||
| Teledyne Technologies Inc. |
||||||||
| 1.60%, 04/01/26 (Call 03/01/26)(a) |
3,243 | 3,006,548 | ||||||
| 2.25%, 04/01/28 (Call 02/01/28)(a) |
4,775 | 4,278,501 | ||||||
| Textron Inc. |
||||||||
| 3.38%, 03/01/28 (Call 12/01/27)(a) |
804 | 753,206 | ||||||
| 3.65%, 03/15/27 (Call 12/15/26) |
2,664 | 2,548,423 | ||||||
| 3.88%, 03/01/25 (Call 12/01/24) |
2,350 | 2,313,176 | ||||||
| 4.00%, 03/15/26 (Call 12/15/25) |
2,458 | 2,391,631 | ||||||
|
|
|
|||||||
| 124,523,005 | ||||||||
| Media — 1.4% | ||||||||
| Charter Communications |
||||||||
| Operating LLC/Charter Communications |
||||||||
| Operating Capital |
||||||||
| 2.25%, 01/15/29 (Call 11/15/28)(a) |
7,591 | 6,405,385 | ||||||
| 3.75%, 02/15/28 (Call 11/15/27) |
6,865 | 6,326,097 | ||||||
| 4.20%, 03/15/28 (Call 12/15/27) |
9,256 | 8,676,246 | ||||||
| 4.91%, 07/23/25 (Call 04/23/25) |
29,838 | 29,425,129 | ||||||
| 6.15%, 11/10/26 (Call 10/10/26)(a) |
7,625 | 7,691,647 | ||||||
| Security | Par (000) |
Value | ||||||
| Media (continued) | ||||||||
| Comcast Corp. |
||||||||
| 2.35%, 01/15/27 (Call 10/15/26)(a) |
$ | 9,507 | $ | 8,863,419 | ||||
| 3.15%, 03/01/26 (Call 12/01/25) |
14,838 | 14,319,760 | ||||||
| 3.15%, 02/15/28 (Call 11/15/27) |
9,563 | 8,968,285 | ||||||
| 3.30%, 02/01/27 (Call 11/01/26) |
8,259 | 7,912,996 | ||||||
| 3.30%, 04/01/27 (Call 02/01/27) |
5,995 | 5,717,821 | ||||||
| 3.38%, 08/15/25 (Call 05/15/25)(a) |
10,230 | 9,990,751 | ||||||
| 3.55%, 05/01/28 (Call 02/01/28)(a) |
12,150 | 11,534,509 | ||||||
| 3.95%, 10/15/25 (Call 08/15/25) |
20,168 | 19,816,302 | ||||||
| 4.15%, 10/15/28 (Call 07/15/28) |
22,902 | 22,217,107 | ||||||
| 4.55%, 01/15/29 (Call 12/15/28) |
3,120 | 3,069,631 | ||||||
| 5.25%, 11/07/25 |
6,030 | 6,057,078 | ||||||
| 5.35%, 11/15/27 (Call 10/15/27) |
5,562 | 5,648,775 | ||||||
| Cox Communications Inc. |
||||||||
| 3.35%, 09/15/26 (Call 06/15/26)(b) |
7,576 | 7,206,275 | ||||||
| 3.50%, 08/15/27 (Call 05/15/27)(a)(b) |
5,184 | 4,890,742 | ||||||
| 5.45%, 09/15/28 (Call 08/15/28)(a)(b) |
1,575 | 1,587,548 | ||||||
| Discovery Communications LLC |
||||||||
| 3.45%, 03/15/25 (Call 12/15/24) |
2,344 | 2,288,516 | ||||||
| 3.95%, 06/15/25 (Call 03/15/25) |
3,499 | 3,418,170 | ||||||
| 3.95%, 03/20/28 (Call 12/20/27)(a) |
12,130 | 11,356,344 | ||||||
| 4.90%, 03/11/26 (Call 12/11/25)(a) |
6,468 | 6,369,422 | ||||||
| FactSet Research Systems Inc., 2.90%, 03/01/27 (Call 02/01/27) |
3,805 | 3,545,882 | ||||||
| Fox Corp. |
||||||||
| 3.05%, 04/07/25 (Call 03/07/25) |
6,301 | 6,135,166 | ||||||
| 4.71%, 01/25/29 (Call 10/25/28)(a) |
5,095 | 4,971,236 | ||||||
| Paramount Global |
||||||||
| 2.90%, 01/15/27 (Call 10/15/26)(a) |
2,629 | 2,368,704 | ||||||
| 3.38%, 02/15/28 (Call 11/15/27) |
2,150 | 1,894,850 | ||||||
| 3.70%, 06/01/28 (Call 03/01/28)(a) |
3,635 | 3,216,821 | ||||||
| TCI Communications Inc. |
||||||||
| 7.13%, 02/15/28 |
950 | 1,024,736 | ||||||
| 7.88%, 02/15/26 |
3,636 | 3,819,144 | ||||||
| Thomson Reuters Corp., 3.35%, 05/15/26 |
3,629 | 3,482,650 | ||||||
| TWDC Enterprises 18 Corp. |
||||||||
| 1.85%, 07/30/26(a) |
6,871 | 6,389,104 | ||||||
| 2.95%, 06/15/27(a) |
5,500 | 5,216,492 | ||||||
| 3.00%, 02/13/26(a) |
6,622 | 6,378,725 | ||||||
| 3.15%, 09/17/25 |
5,454 | 5,290,590 | ||||||
| Walt Disney Co. (The) |
||||||||
| 1.75%, 01/13/26 |
10,145 | 9,569,031 | ||||||
| 2.20%, 01/13/28(a) |
6,972 | 6,356,741 | ||||||
| 3.38%, 11/15/26 (Call 08/15/26) |
3,269 | 3,145,860 | ||||||
| 3.70%, 10/15/25 (Call 07/15/25)(a) |
4,416 | 4,316,002 | ||||||
| 3.70%, 03/23/27(a) |
3,843 | 3,723,736 | ||||||
|
|
|
|||||||
| 300,603,425 | ||||||||
| Metal Fabricate & Hardware — 0.0% | ||||||||
| Precision Castparts Corp., 3.25%, 06/15/25 |
5,827 | 5,691,333 | ||||||
| Timken Co. (The), 4.50%, 12/15/28 |
3,070 | 2,980,395 | ||||||
|
|
|
|||||||
| 8,671,728 | ||||||||
| Mining — 0.7% | ||||||||
| Alcoa Nederland Holding BV |
||||||||
| 5.50%, 12/15/27 (Call 04/02/24)(a)(b) |
5,812 | 5,711,904 | ||||||
| 6.13%, 05/15/28 (Call 04/02/24)(a)(b) |
3,300 | 3,300,604 | ||||||
| Anglo American Capital PLC |
||||||||
| 2.25%, 03/17/28 (Call 01/17/28)(b) |
4,165 | 3,671,158 | ||||||
| 168 | 2 0 2 4 I S H A R E S A N N U A L R E P O R T T O S H A R E H O L D E R S |
| Schedule of Investments (continued) February 29, 2024 |
iShares® 1-5 Year Investment Grade Corporate Bond ETF (Percentages shown are based on Net Assets) |
| Security | Par (000) |
Value | ||||||
| Mining (continued) | ||||||||
| 4.00%, 09/11/27(a)(b) |
$ | 4,440 | $ | 4,230,352 | ||||
| 4.50%, 03/15/28 (Call 12/15/27)(a)(b) |
5,135 | 4,943,954 | ||||||
| 4.75%, 04/10/27(b) |
4,912 | 4,806,376 | ||||||
| 4.88%, 05/14/25(b) |
2,742 | 2,712,026 | ||||||
| AngloGold Ashanti Holdings PLC, 3.38%, 11/01/28 (Call 09/01/28)(a) |
670 | 600,103 | ||||||
| BHP Billiton Finance USA Ltd. |
||||||||
| 4.75%, 02/28/28 (Call 01/28/28) |
7,198 | 7,149,327 | ||||||
| 4.88%, 02/27/26 |
5,150 | 5,127,822 | ||||||
| 5.10%, 09/08/28 (Call 08/08/28)(a) |
8,805 | 8,858,596 | ||||||
| 5.25%, 09/08/26 |
6,417 | 6,456,713 | ||||||
| 6.42%, 03/01/26(a) |
2,926 | 2,997,630 | ||||||
| Corp. Nacional del Cobre de Chile |
||||||||
| 3.63%, 08/01/27 (Call 05/01/27)(a)(b) |
9,331 | 8,761,003 | ||||||
| 4.50%, 09/16/25(b) |
315 | 308,505 | ||||||
| Freeport Indonesia PT, 4.76%, 04/14/27 |
6,420 | 6,243,736 | ||||||
| Freeport-McMoRan Inc. |
||||||||
| 4.13%, 03/01/28 (Call 04/01/24)(a) |
3,447 | 3,270,514 | ||||||
| 4.38%, 08/01/28 (Call 04/01/24)(a) |
4,505 | 4,285,681 | ||||||
| 5.00%, 09/01/27 (Call 04/01/24)(a) |
3,427 | 3,369,329 | ||||||
| Glencore Funding LLC |
||||||||
| 1.63%, 09/01/25 (Call 08/01/25)(b) |
6,354 | 6,001,755 | ||||||
| 1.63%, 04/27/26 (Call 03/27/26)(b) |
4,455 | 4,120,159 | ||||||
| 3.88%, 10/27/27 (Call 07/27/27)(b) |
1,363 | 1,296,335 | ||||||
| 4.00%, 04/16/25(b) |
3,386 | 3,327,123 | ||||||
| 4.00%, 03/27/27 (Call 12/27/26)(a)(b) |
6,870 | 6,610,164 | ||||||
| 5.40%, 05/08/28 (Call 04/08/28)(b) |
6,515 | 6,550,646 | ||||||
| 6.13%, 10/06/28 (Call 09/06/28)(b) |
3,820 | 3,942,850 | ||||||
| Indonesia Asahan Aluminium PT/Mineral Industri Indonesia Persero PT |
||||||||
| 4.75%, 05/15/25 (Call 04/15/25)(b) |
10,393 | 10,258,438 | ||||||
| 6.53%, 11/15/28(a)(b) |
2,879 | 2,965,545 | ||||||
| Kinross Gold Corp., 4.50%, 07/15/27 |
3,458 | 3,360,691 | ||||||
| Newcastle Coal Infrastructure Group Pty. Ltd., |
||||||||
| 4.40%, 09/29/27 (Call 06/29/27)(a)(b) |
872 | 819,665 | ||||||
| Rio Tinto Finance USA Ltd., 7.13%, 07/15/28(a) . |
6,135 | 6,682,451 | ||||||
| Southern Copper Corp., 3.88%, 04/23/25 |
3,829 | 3,752,192 | ||||||
| Yamana Gold Inc., 4.63%, 12/15/27 |
2,140 | 2,051,163 | ||||||
|
|
|
|||||||
| 148,544,510 | ||||||||
| Office & Business Equipment — 0.1% | ||||||||
| CDW LLC/CDW Finance Corp. |
||||||||
| 2.67%, 12/01/26 (Call 11/01/26)(a) |
6,370 | 5,899,830 | ||||||
| 3.25%, 02/15/29 (Call 04/01/24) |
1,585 | 1,413,257 | ||||||
| 3.28%, 12/01/28 (Call 10/01/28) |
2,888 | 2,583,547 | ||||||
| 4.13%, 05/01/25 (Call 04/01/24) |
4,141 | 4,055,489 | ||||||
| 4.25%, 04/01/28 (Call 04/01/24)(a) |
5,580 | 5,306,915 | ||||||
|
|
|
|||||||
| 19,259,038 | ||||||||
| Oil & Gas — 3.1% | ||||||||
| Aker BP ASA |
||||||||
| 2.00%, 07/15/26 (Call 06/15/26)(b) |
4,799 | 4,420,100 | ||||||
| 5.60%, 06/13/28 (Call 05/13/28)(b) |
4,380 | 4,420,977 | ||||||
| Apache Corp., 4.38%, 10/15/28 (Call 07/15/28) . |
1,120 | 1,050,874 | ||||||
| BP Capital Markets America Inc. |
||||||||
| 3.02%, 01/16/27 (Call 10/16/26)(a) |
5,737 | 5,450,680 | ||||||
| 3.12%, 05/04/26 (Call 02/04/26)(a) |
6,317 | 6,070,951 | ||||||
| 3.41%, 02/11/26 (Call 12/11/25) |
6,860 | 6,652,286 | ||||||
| 3.54%, 04/06/27 (Call 02/06/27)(a) |
3,496 | 3,356,594 | ||||||
| Security | Par (000) |
Value | ||||||
| Oil & Gas (continued) | ||||||||
| 3.59%, 04/14/27 (Call 01/14/27)(a) |
$ | 4,236 | $ | 4,072,694 | ||||
| 3.80%, 09/21/25 (Call 07/21/25)(a) |
5,616 | 5,508,351 | ||||||
| 3.94%, 09/21/28 (Call 06/21/28) |
12,660 | 12,166,100 | ||||||
| 4.23%, 11/06/28 (Call 08/06/28)(a) |
6,770 | 6,580,930 | ||||||
| BP Capital Markets PLC |
||||||||
| 3.28%, 09/19/27 (Call 06/19/27) |
9,384 | 8,884,173 | ||||||
| 3.72%, 11/28/28 (Call 08/28/28) |
7,220 | 6,856,978 | ||||||
| 4.38%, (Call 06/22/25), |
16,392 | 16,152,146 | ||||||
| Canadian Natural Resources Ltd. |
||||||||
| 2.05%, 07/15/25 (Call 06/15/25) |
4,258 | 4,063,233 | ||||||
| 3.85%, 06/01/27 (Call 03/01/27) |
8,690 | 8,328,793 | ||||||
| Cenovus Energy Inc., 4.25%, 04/15/27 |
1,782 | 1,726,146 | ||||||
| Chevron Corp. |
||||||||
| 1.55%, 05/11/25 (Call 04/11/25)(a) |
16,232 | 15,574,790 | ||||||
| 2.00%, 05/11/27 (Call 03/11/27) |
6,624 | 6,093,621 | ||||||
| 2.95%, 05/16/26 (Call 02/16/26)(a) |
14,458 | 13,888,984 | ||||||
| 3.33%, 11/17/25 (Call 08/17/25) |
5,085 | 4,961,572 | ||||||
| Chevron USA Inc. |
||||||||
| 0.69%, 08/12/25 (Call 07/12/25) |
5,393 | 5,071,490 | ||||||
| 1.02%, 08/12/27 (Call 06/12/27)(a) |
4,594 | 4,061,923 | ||||||
| 3.85%, 01/15/28 (Call 10/15/27)(a) |
4,050 | 3,941,179 | ||||||
| CNOOC Finance 2015 USA LLC, 3.50%, 05/05/25 |
16,475 | 16,131,990 | ||||||
| ConocoPhillips Co., 2.40%, 03/07/25 |
1,138 | 1,105,548 | ||||||
| Continental Resources Inc./OK |
||||||||
| 2.27%, 11/15/26 (Call 04/01/24)(b) |
5,356 | 4,915,322 | ||||||
| 4.38%, 01/15/28 (Call 10/15/27) |
6,803 | 6,540,172 | ||||||
| Coterra Energy Inc., 3.90%, 05/15/27 |
5,228 | 5,027,796 | ||||||
| Devon Energy Corp. |
||||||||
| 5.25%, 10/15/27 (Call 03/11/24)(a) |
3,370 | 3,362,650 | ||||||
| 5.85%, 12/15/25 (Call 09/15/25) |
4,021 | 4,044,274 | ||||||
| 5.88%, 06/15/28 (Call 03/11/24)(a) |
740 | 744,465 | ||||||
| Diamondback Energy Inc., 3.25%, 12/01/26 |
4,983 | 4,763,019 | ||||||
| Empresa Nacional del Petroleo, 3.75%, 08/05/26 (Call 05/05/26)(b) |
3,612 | 3,422,286 | ||||||
| Eni SpA, Series X-R, 4.75%, 09/12/28(a)(b) |
2,882 | 2,851,713 | ||||||
| Eni USA Inc., 7.30%, 11/15/27(a) |
4,567 | 4,853,775 | ||||||
| EOG Resources Inc. |
||||||||
| 3.15%, 04/01/25 (Call 01/01/25) |
4,004 | 3,914,470 | ||||||
| 4.15%, 01/15/26 (Call 10/15/25)(a) |
5,231 | 5,151,070 | ||||||
| EQT Corp. |
||||||||
| 3.13%, 05/15/26 (Call 04/01/24)(a)(b) |
2,741 | 2,592,163 | ||||||
| 3.90%, 10/01/27 (Call 07/01/27) |
8,100 | 7,662,683 | ||||||
| 5.00%, 01/15/29 (Call 07/15/28)(a) |
1,842 | 1,795,189 | ||||||
| 5.70%, 04/01/28 (Call 03/01/28)(a) |
3,993 | 4,021,515 | ||||||
| Equinor ASA |
||||||||
| 1.75%, 01/22/26 (Call 12/22/25) |
12,928 | 12,174,104 | ||||||
| 2.88%, 04/06/25 (Call 03/06/25) |
20,337 | 19,850,574 | ||||||
| 3.00%, 04/06/27 (Call 02/06/27)(a) |
6,284 | 5,944,929 | ||||||
| 3.63%, 09/10/28 (Call 06/10/28)(a) |
2,880 | 2,756,725 | ||||||
| 6.50%, 12/01/28(a)(b) |
3,500 | 3,736,090 | ||||||
| 6.80%, 01/15/28(a) |
660 | 700,231 | ||||||
| 7.15%, 11/15/25(a) |
2,534 | 2,613,831 | ||||||
| 7.15%, 01/15/29(a) |
1,550 | 1,688,916 | ||||||
| 7.25%, 09/23/27(a) |
1,419 | 1,527,584 | ||||||
| S C H E D U L E O F I N V E S T M E N T S |
169 |
| Schedule of Investments (continued) February 29, 2024 |
iShares® 1-5 Year Investment Grade Corporate Bond ETF (Percentages shown are based on Net Assets) |
| Security | Par (000) |
Value | ||||||
| Oil & Gas (continued) | ||||||||
| Exxon Mobil Corp. |
||||||||
| 2.28%, 08/16/26 (Call 06/16/26)(a) |
$ | 6,603 | $ | 6,238,902 | ||||
| 3.04%, 03/01/26 (Call 12/01/25)(a) |
15,811 | 15,255,304 | ||||||
| 3.29%, 03/19/27 (Call 01/19/27)(a) |
7,186 | 6,922,626 | ||||||
| GS Caltex Corp., 4.50%, 01/05/26(b) |
2,080 | 2,039,450 | ||||||
| Hess Corp., 4.30%, 04/01/27 (Call 01/01/27)(a) |
7,212 | 7,035,927 | ||||||
| HF Sinclair Corp. |
||||||||
| 5.00%, 02/01/28 (Call 03/11/24)(b) |
535 | 515,184 | ||||||
| 5.88%, 04/01/26 (Call 01/01/26)(a) |
5,600 | 5,617,305 | ||||||
| 6.38%, 04/15/27 (Call 04/15/24)(b) |
215 | 215,367 | ||||||
| KazMunayGas National Co. JSC, 4.75%, 04/19/27(a)(b) |
6,725 | 6,492,530 | ||||||
| Kunlun Energy Co. Ltd., 3.75%, 05/13/25(b) |
210 | 205,736 | ||||||
| Marathon Oil Corp., 4.40%, 07/15/27 |
6,968 | 6,769,170 | ||||||
| Marathon Petroleum Corp. |
||||||||
| 3.80%, 04/01/28 (Call 01/01/28)(a) |
2,340 | 2,229,162 | ||||||
| 4.70%, 05/01/25 (Call 04/01/25) |
9,146 | 9,059,579 | ||||||
| 5.13%, 12/15/26 (Call 09/15/26) |
4,944 | 4,938,630 | ||||||
| Occidental Petroleum Corp. |
||||||||
| 3.40%, 04/15/26 (Call 01/15/26)(a) |
890 | 851,944 | ||||||
| 5.50%, 12/01/25 (Call 09/01/25) |
3,545 | 3,536,550 | ||||||
| 5.55%, 03/15/26 (Call 12/15/25)(a) |
6,660 | 6,667,308 | ||||||
| 5.88%, 09/01/25 (Call 06/01/25)(a) |
4,885 | 4,896,724 | ||||||
| 6.38%, 09/01/28 (Call 03/01/28)(a) |
7,435 | 7,702,068 | ||||||
| 8.50%, 07/15/27 (Call 01/15/27)(a) |
3,530 | 3,829,062 | ||||||
| Ovintiv Inc. |
||||||||
| 5.38%, 01/01/26 (Call 10/01/25) |
3,298 | 3,282,022 | ||||||
| 5.65%, 05/15/25(a) |
4,465 | 4,465,880 | ||||||
| 5.65%, 05/15/28 (Call 04/15/28)(a) |
5,545 | 5,594,359 | ||||||
| Patterson-UTI Energy Inc., 3.95%, 02/01/28 |
560 | 524,363 | ||||||
| Pertamina Persero PT, 1.40%, 02/09/26 |
6,809 | 6,288,111 | ||||||
| Petroliam Nasional Bhd, 7.63%, 10/15/26(a)(b) |
2,113 | 2,235,195 | ||||||
| Petronas Capital Ltd., 3.50%, 03/18/25(b) |
11,158 | 10,923,905 | ||||||
| Petronas Energy Canada Ltd., 2.11%, 03/23/28 (Call 01/23/28)(b) |
5,260 | 4,706,148 | ||||||
| Phillips 66 |
||||||||
| 1.30%, 02/15/26 (Call 01/15/26) |
3,627 | 3,356,240 | ||||||
| 3.85%, 04/09/25 (Call 03/09/25) |
4,802 | 4,720,086 | ||||||
| 3.90%, 03/15/28 (Call 12/15/27) |
4,937 | 4,755,888 | ||||||
| Phillips 66 Co. |
||||||||
| 3.55%, 10/01/26 (Call 07/01/26) |
3,179 | 3,050,601 | ||||||
| 3.75%, 03/01/28 (Call 12/01/27) |
4,800 | 4,576,837 | ||||||
| 4.95%, 12/01/27 (Call 11/01/27)(a) |
5,506 | 5,487,651 | ||||||
| Pioneer Natural Resources Co. |
||||||||
| 1.13%, 01/15/26 (Call 12/15/25) |
2,378 | 2,207,130 | ||||||
| 5.10%, 03/29/26 |
5,540 | 5,533,973 | ||||||
| PTTEP Treasury Center Co. Ltd., 2.59%, 06/10/27 (Call 04/10/27)(b) |
345 | 316,713 | ||||||
| Qatar Energy, 1.38%, 09/12/26 (Call 08/12/26)(b) |
12,863 | 11,733,860 | ||||||
| Raizen Fuels Finance SA, 5.30%, 01/20/27(a)(b) . |
591 | 588,342 | ||||||
| Ras Laffan Liquefied Natural Gas Co. Ltd. 3 |
||||||||
| 5.84%, 09/30/27(a)(b) |
1,777 | 1,788,910 | ||||||
| 6.33%, 09/30/27(b) |
4,083 | 4,140,205 | ||||||
| Reliance Industries Ltd., 3.67%, 11/30/27(a)(b) |
540 | 509,865 | ||||||
| SA Global Sukuk Ltd., 1.60%, 06/17/26 |
13,330 | 12,256,722 | ||||||
| Security | Par (000) |
Value | ||||||
| Oil & Gas (continued) | ||||||||
| Saudi Arabian Oil Co., 1.63%, 11/24/25 |
$ | 10,231 | $ | 9,582,805 | ||||
| Shell International Finance BV |
||||||||
| 2.50%, 09/12/26(a) |
6,531 | 6,167,791 | ||||||
| 2.88%, 05/10/26 |
11,420 | 10,929,182 | ||||||
| 3.25%, 05/11/25 |
18,417 | 18,011,202 | ||||||
| 3.88%, 11/13/28 (Call 08/13/28)(a) |
3,424 | 3,304,442 | ||||||
| Sinopec Group Overseas Development 2015 Ltd., 3.25%, 04/28/25(b) |
10,951 | 10,694,493 | ||||||
| Sinopec Group Overseas Development 2016 Ltd. |
||||||||
| 2.75%, 09/29/26(b) |
5,513 | 5,203,831 | ||||||
| 3.50%, 05/03/26(a)(b) |
6,007 | 5,811,472 | ||||||
| Sinopec Group Overseas Development 2017 Ltd. |
||||||||
| 3.25%, 09/13/27(a)(b) |
5,450 | 5,157,123 | ||||||
| 3.63%, 04/12/27(a)(b) |
5,464 | 5,260,863 | ||||||
| Sinopec Group Overseas Development 2018 Ltd. |
||||||||
| 1.45%, 01/08/26 (Call 12/08/25)(a)(b) |
9,662 | 9,047,785 | ||||||
| 2.15%, 05/13/25 (Call 04/13/25)(a)(b) |
9,679 | 9,306,406 | ||||||
| 4.13%, 09/12/25(b) |
3,697 | 3,632,447 | ||||||
| Suncor Energy Inc. |
||||||||
| 7.00%, 11/15/28(a) |
2,250 | 2,401,857 | ||||||
| 7.88%, 06/15/26(a) |
1,670 | 1,752,708 | ||||||
| Tengizchevroil Finance Co. International Ltd. |
||||||||
| 2.63%, 08/15/25 (Call 05/15/25)(b) |
3,860 | 3,625,119 | ||||||
| 4.00%, 08/15/26(a)(b) |
5,320 | 4,982,169 | ||||||
| Thaioil Treasury Center Co. Ltd., 4.63%, 11/20/28(b) |
110 | 106,763 | ||||||
| TotalEnergies Capital International SA, 3.46%, 02/19/29 (Call 11/19/28)(a) |
2,850 | 2,676,260 | ||||||
| TotalEnergies Capital SA, 3.88%, 10/11/28 |
8,870 | 8,550,578 | ||||||
| Valero Energy Corp. |
||||||||
| 2.15%, 09/15/27 (Call 07/15/27)(a) |
4,136 | 3,747,926 | ||||||
| 2.85%, 04/15/25 (Call 03/15/25) |
640 | 621,557 | ||||||
| 3.40%, 09/15/26 (Call 06/15/26)(a) |
1,241 | 1,185,642 | ||||||
| 4.35%, 06/01/28 (Call 03/01/28)(a) |
5,176 | 5,037,559 | ||||||
| Var Energi ASA |
||||||||
| 5.00%, 05/18/27 (Call 04/18/27)(b) |
2,060 | 2,002,919 | ||||||
| 7.50%, 01/15/28 (Call 12/15/27)(b) |
7,701 | 8,109,435 | ||||||
| Woodside Finance Ltd. |
||||||||
| 3.65%, 03/05/25 (Call 12/05/24)(b) |
7,293 | 7,131,615 | ||||||
| 3.70%, 09/15/26 (Call 06/15/26)(b) |
5,299 | 5,061,442 | ||||||
| 3.70%, 03/15/28 (Call 12/15/27)(a)(b) |
6,510 | 6,063,890 | ||||||
|
|
|
|||||||
| 662,477,464 | ||||||||
| Oil & Gas Services — 0.2% | ||||||||
| Baker Hughes Holdings LLC/Baker Hughes Co-Obligor Inc. |
||||||||
| 2.06%, 12/15/26 (Call 11/15/26) |
4,191 | 3,865,312 | ||||||
| 3.34%, 12/15/27 (Call 09/15/27) |
9,095 | 8,575,813 | ||||||
| Halliburton Co., 3.80%, 11/15/25 (Call 08/15/25) |
3,573 | 3,490,591 | ||||||
| Schlumberger Finance Canada Ltd., 1.40%, 09/17/25 (Call 08/17/25) |
3,727 | 3,521,853 | ||||||
| Schlumberger Holdings Corp. |
||||||||
| 3.90%, 05/17/28 (Call 02/17/28)(a)(b) |
8,575 | 8,223,198 | ||||||
| 4.00%, 12/21/25 (Call 09/21/25)(a)(b) |
3,836 | 3,755,842 | ||||||
| 170 | 2 0 2 4 I S H A R E S A N N U A L R E P O R T T O S H A R E H O L D E R S |
| Schedule of Investments (continued) February 29, 2024 |
iShares® 1-5 Year Investment Grade Corporate Bond ETF (Percentages shown are based on Net Assets) |
| Security | Par (000) |
Value | ||||||
| Oil & Gas Services (continued) | ||||||||
| Schlumberger Investment SA, 4.50%, 05/15/28 (Call 04/15/28)(a) |
$ | 6,455 | $ | 6,394,999 | ||||
|
|
|
|||||||
| 37,827,608 | ||||||||
| Packaging & Containers — 0.3% | ||||||||
| Amcor Finance USA Inc. |
||||||||
| 3.63%, 04/28/26 (Call 01/28/26) |
3,401 | 3,274,107 | ||||||
| 4.50%, 05/15/28 (Call 02/15/28) |
980 | 952,778 | ||||||
| Amcor Flexibles North America Inc. |
||||||||
| 3.10%, 09/15/26 (Call 06/15/26)(a) |
2,133 | 1,991,758 | ||||||
| 4.00%, 05/17/25 (Call 04/17/25) |
3,747 | 3,675,368 | ||||||
| Berry Global Inc. |
||||||||
| 1.57%, 01/15/26 (Call 12/15/25)(a) |
9,721 | 9,051,875 | ||||||
| 1.65%, 01/15/27 (Call 12/15/26)(a) |
2,585 | 2,327,844 | ||||||
| 4.88%, 07/15/26 (Call 04/01/24)(a)(b) |
8,351 | 8,154,150 | ||||||
| 5.50%, 04/15/28 (Call 03/15/28)(a)(b) |
4,035 | 4,009,158 | ||||||
| Brambles USA Inc., 4.13%, 10/23/25 (Call 07/25/25)(a)(b) |
2,639 | 2,578,124 | ||||||
| CCL Industries Inc., 3.25%, 10/01/26 (Call 07/01/26)(a)(b) |
2,295 | 2,163,020 | ||||||
| Graphic Packaging International LLC, 1.51%, 04/15/26 (Call 03/15/26)(a)(b) |
2,787 | 2,547,614 | ||||||
| Packaging Corp. of America, 3.40%, 12/15/27 (Call 09/15/27) |
3,973 | 3,754,187 | ||||||
| Sealed Air Corp., 1.57%, 10/15/26 |
4,053 | 3,647,530 | ||||||
| Silgan Holdings Inc., 1.40%, 04/01/26 (Call 03/01/26)(a)(b) |
3,440 | 3,140,158 | ||||||
| Sonoco Products Co., 2.25%, 02/01/27 (Call 01/01/27) |
2,172 | 1,994,548 | ||||||
| WRKCo Inc. |
||||||||
| 3.38%, 09/15/27 (Call 06/15/27) |
3,505 | 3,298,021 | ||||||
| 3.75%, 03/15/25 (Call 01/15/25) |
4,603 | 4,518,037 | ||||||
| 3.90%, 06/01/28 (Call 03/01/28) |
1,130 | 1,070,926 | ||||||
| 4.00%, 03/15/28 (Call 12/15/27) |
5,105 | 4,873,081 | ||||||
| 4.65%, 03/15/26 (Call 01/15/26) |
5,204 | 5,136,527 | ||||||
|
|
|
|||||||
| 72,158,811 | ||||||||
| Pharmaceuticals — 3.8% | ||||||||
| AbbVie Inc. |
||||||||
| 2.95%, 11/21/26 (Call 09/21/26)(a) |
25,611 | 24,283,373 | ||||||
| 3.20%, 05/14/26 (Call 02/14/26) |
13,080 | 12,591,984 | ||||||
| 3.60%, 05/14/25 (Call 02/14/25) |
23,999 | 23,519,291 | ||||||
| 4.25%, 11/14/28 (Call 08/14/28)(a) |
10,155 | 9,922,324 | ||||||
| 4.80%, 03/15/27 (Call 02/15/27) |
13,325 | 13,287,216 | ||||||
| 4.80%, 03/15/29 (Call 02/15/29) |
13,325 | 13,263,531 | ||||||
| Astrazeneca Finance LLC |
||||||||
| 1.20%, 05/28/26 (Call 04/28/26)(a) |
8,085 | 7,436,426 | ||||||
| 1.75%, 05/28/28 (Call 03/28/28) |
7,324 | 6,474,831 | ||||||
| 4.80%, 02/26/27 (Call 01/26/27) |
6,300 | 6,285,132 | ||||||
| 4.85%, 02/26/29 (Call 01/26/29) |
7,585 | 7,582,397 | ||||||
| 4.88%, 03/03/28 (Call 02/03/28) |
7,955 | 7,947,460 | ||||||
| AstraZeneca PLC |
||||||||
| 0.70%, 04/08/26 (Call 03/08/26) |
7,878 | 7,208,743 | ||||||
| 3.13%, 06/12/27 (Call 03/12/27) |
5,147 | 4,890,977 | ||||||
| 3.38%, 11/16/25(a) |
13,383 | 13,015,483 | ||||||
| 4.00%, 01/17/29 (Call 10/17/28) |
3,145 | 3,038,272 | ||||||
| Bayer Corp., 6.65%, 02/15/28(b) |
595 | 605,872 | ||||||
| Bayer U.S. Finance II LLC |
||||||||
| 4.25%, 12/15/25 (Call 10/15/25)(b) |
16,740 | 16,276,383 | ||||||
| 4.38%, 12/15/28 (Call 09/15/28)(b) |
22,422 | 20,886,382 | ||||||
| 5.50%, 08/15/25(a)(b) |
1,161 | 1,148,859 | ||||||
| Security | Par (000) |
Value | ||||||
| Pharmaceuticals (continued) | ||||||||
| Bayer U.S. Finance LLC |
||||||||
| 6.13%, 11/21/26 (Call 10/21/26)(a)(b) |
$ | 6,290 | $ | 6,334,640 | ||||
| 6.25%, 01/21/29 (Call 12/21/28)(b) |
6,370 | 6,417,620 | ||||||
| Becton Dickinson and Co. |
||||||||
| 3.70%, 06/06/27 (Call 03/06/27) |
11,754 | 11,268,463 | ||||||
| 4.69%, 02/13/28 (Call 01/13/28) |
6,273 | 6,180,565 | ||||||
| 4.87%, 02/08/29 (Call 01/08/29) |
2,750 | 2,715,549 | ||||||
| Bristol-Myers Squibb Co. |
||||||||
| 0.75%, 11/13/25 (Call 10/13/25) |
7,123 | 6,625,702 | ||||||
| 1.13%, 11/13/27 (Call 09/13/27)(a) |
7,039 | 6,170,923 | ||||||
| 3.20%, 06/15/26 (Call 04/15/26) |
11,280 | 10,854,803 | ||||||
| 3.25%, 02/27/27(a) |
3,813 | 3,661,032 | ||||||
| 3.45%, 11/15/27 (Call 08/15/27)(a) |
2,365 | 2,256,446 | ||||||
| 3.90%, 02/20/28 (Call 11/20/27) |
10,635 | 10,267,847 | ||||||
| 4.90%, 02/22/27 (Call 01/22/27) |
2,890 | 2,886,769 | ||||||
| 4.90%, 02/22/29 (Call 01/22/29) |
7,425 | 7,407,533 | ||||||
| 4.95%, 02/20/26 |
4,595 | 4,587,147 | ||||||
| 6.80%, 11/15/26 |
725 | 757,794 | ||||||
| Cardinal Health Inc. |
||||||||
| 3.41%, 06/15/27 (Call 03/15/27) |
8,082 | 7,663,314 | ||||||
| 3.75%, 09/15/25 (Call 06/15/25) |
3,864 | 3,769,123 | ||||||
| 5.13%, 02/15/29 (Call 01/15/29) |
4,390 | 4,370,607 | ||||||
| Cencora Inc. |
||||||||
| 3.25%, 03/01/25 (Call 12/01/24) |
4,605 | 4,505,435 | ||||||
| 3.45%, 12/15/27 (Call 09/15/27) |
5,115 | 4,845,565 | ||||||
| Cigna Group (The) |
||||||||
| 1.25%, 03/15/26 (Call 02/15/26)(a) |
2,284 | 2,109,954 | ||||||
| 3.05%, 10/15/27 (Call 07/15/27) |
2,451 | 2,291,022 | ||||||
| 3.25%, 04/15/25 (Call 01/15/25) |
5,385 | 5,256,123 | ||||||
| 3.40%, 03/01/27 (Call 12/01/26)(a) |
8,899 | 8,472,664 | ||||||
| 4.38%, 10/15/28 (Call 07/15/28) |
33,885 | 32,889,967 | ||||||
| 4.50%, 02/25/26 (Call 11/27/25) |
5,414 | 5,338,703 | ||||||
| 5.69%, 03/15/26 (Call 03/15/24) |
940 | 939,980 | ||||||
| CVS Health Corp. |
||||||||
| 1.30%, 08/21/27 (Call 06/21/27) |
12,446 | 10,942,432 | ||||||
| 2.88%, 06/01/26 (Call 03/01/26) |
11,498 | 10,925,944 | ||||||
| 3.00%, 08/15/26 (Call 06/15/26)(a) |
4,782 | 4,540,513 | ||||||
| 3.63%, 04/01/27 (Call 02/01/27) |
2,596 | 2,491,245 | ||||||
| 3.88%, 07/20/25 (Call 04/20/25) |
18,433 | 18,056,688 | ||||||
| 4.10%, 03/25/25 (Call 01/25/25) |
6,427 | 6,345,173 | ||||||
| 4.30%, 03/25/28 (Call 12/25/27) |
40,981 | 39,772,093 | ||||||
| 5.00%, 02/20/26 (Call 01/20/26)(a) |
9,717 | 9,672,901 | ||||||
| 5.00%, 01/30/29 (Call 12/30/28) |
265 | 264,136 | ||||||
| 6.25%, 06/01/27(a) |
6,507 | 6,742,651 | ||||||
| Eli Lilly & Co. |
||||||||
| 2.75%, 06/01/25 (Call 03/01/25) |
4,747 | 4,618,137 | ||||||
| 3.10%, 05/15/27 (Call 02/15/27)(a) |
1,603 | 1,524,791 | ||||||
| 4.50%, 02/09/27 (Call 01/09/27)(a) |
6,350 | 6,325,281 | ||||||
| 4.50%, 02/09/29 (Call 01/09/29)(a) |
6,340 | 6,303,711 | ||||||
| 5.00%, 02/27/26 (Call 03/11/24) |
100 | 99,960 | ||||||
| 5.50%, 03/15/27(a) |
3,290 | 3,373,061 | ||||||
| EMD Finance LLC, 3.25%, 03/19/25 (Call 12/19/24)(a)(b) |
11,088 | 10,838,254 | ||||||
| Evernorth Health Inc., 4.50%, 02/25/26 (Call 11/27/25)(a) |
1,187 | 1,167,041 | ||||||
| GlaxoSmithKline Capital Inc. |
||||||||
| 3.63%, 05/15/25 |
7,436 | 7,306,688 | ||||||
| 3.88%, 05/15/28(a) |
15,464 | 14,956,401 | ||||||
| Johnson & Johnson |
||||||||
| 0.55%, 09/01/25 (Call 08/01/25)(a) |
5,926 | 5,559,652 | ||||||
| 0.95%, 09/01/27 (Call 07/01/27) |
9,320 | 8,246,576 | ||||||
| S C H E D U L E O F I N V E S T M E N T S |
171 |
| Schedule of Investments (continued) February 29, 2024 |
iShares® 1-5 Year Investment Grade Corporate Bond ETF (Percentages shown are based on Net Assets) |
| Security | Par (000) |
Value | ||||||
| Pharmaceuticals (continued) | ||||||||
| 2.45%, 03/01/26 (Call 12/01/25) |
$ | 13,553 | $ | 12,969,404 | ||||
| 2.90%, 01/15/28 (Call 10/15/27)(a) |
9,492 | 8,981,270 | ||||||
| 2.95%, 03/03/27 (Call 12/03/26) |
6,618 | 6,330,207 | ||||||
| McKesson Corp. |
||||||||
| 0.90%, 12/03/25 (Call 11/03/25)(a) |
3,977 | 3,691,142 | ||||||
| 1.30%, 08/15/26 (Call 07/15/26)(a) |
3,926 | 3,583,641 | ||||||
| 3.95%, 02/16/28 (Call 11/16/27)(a) |
3,038 | 2,950,666 | ||||||
| 4.90%, 07/15/28 (Call 06/15/28)(a) |
3,843 | 3,843,559 | ||||||
| 5.25%, 02/15/26 (Call 04/01/24)(a) |
3,778 | 3,778,044 | ||||||
| Mead Johnson Nutrition Co., 4.13%, 11/15/25 (Call 08/15/25)(a) |
5,616 | 5,511,772 | ||||||
| Merck & Co. Inc. |
||||||||
| 0.75%, 02/24/26 (Call 01/24/26)(a) |
6,827 | 6,311,096 | ||||||
| 1.70%, 06/10/27 (Call 05/10/27) |
9,803 | 8,880,283 | ||||||
| 1.90%, 12/10/28 (Call 10/10/28)(a) |
1,835 | 1,619,517 | ||||||
| 4.05%, 05/17/28 (Call 04/17/28) |
3,540 | 3,469,819 | ||||||
| Merck Sharp & Dohme Corp. |
||||||||
| 5.95%, 12/01/28 |
1,070 | 1,122,345 | ||||||
| 6.40%, 03/01/28(a) |
540 | 571,253 | ||||||
| Mylan Inc., 4.55%, 04/15/28 (Call 01/15/28) |
6,318 | 6,091,766 | ||||||
| Novartis Capital Corp. |
||||||||
| 2.00%, 02/14/27 (Call 12/14/26)(a) |
8,172 | 7,574,037 | ||||||
| 3.00%, 11/20/25 (Call 08/20/25)(a) |
11,935 | 11,564,631 | ||||||
| 3.10%, 05/17/27 (Call 02/17/27)(a) |
6,531 | 6,218,379 | ||||||
| Pfizer Inc. |
||||||||
| 0.80%, 05/28/25 (Call 04/28/25)(a) |
4,632 | 4,396,800 | ||||||
| 2.75%, 06/03/26(a) |
8,270 | 7,915,414 | ||||||
| 3.00%, 12/15/26(a) |
11,003 | 10,494,653 | ||||||
| 3.60%, 09/15/28 (Call 06/15/28)(a) |
1,355 | 1,294,817 | ||||||
| Pfizer Investment Enterprises Pte Ltd. |
||||||||
| 4.45%, 05/19/26 (Call 04/19/26) |
19,313 | 19,071,379 | ||||||
| 4.45%, 05/19/28 (Call 04/19/28)(a) |
31,535 | 30,920,063 | ||||||
| 4.65%, 05/19/25(a) |
19,825 | 19,702,052 | ||||||
| PRA Health Sciences Inc., 2.88%, 07/15/26 (Call 04/01/24)(a)(b) |
770 | 711,818 | ||||||
| Sanofi SA, 3.63%, 06/19/28 (Call 03/19/28) |
545 | 526,352 | ||||||
| Shire Acquisitions Investments Ireland DAC, 3.20%, 09/23/26 (Call 06/23/26) |
19,203 | 18,291,737 | ||||||
| Takeda Pharmaceutical Co. Ltd., 5.00%, 11/26/28 (Call 08/26/28) |
12,545 | 12,524,320 | ||||||
| Utah Acquisition Sub Inc., 3.95%, 06/15/26 (Call 03/15/26) |
14,226 | 13,730,593 | ||||||
| Viatris Inc. |
||||||||
| 1.65%, 06/22/25 (Call 05/22/25) |
5,279 | 5,010,125 | ||||||
| 2.30%, 06/22/27 (Call 04/22/27)(a) |
5,072 | 4,587,825 | ||||||
| Zoetis Inc. |
||||||||
| 3.00%, 09/12/27 (Call 06/12/27)(a) |
5,080 | 4,750,485 | ||||||
| 3.90%, 08/20/28 (Call 05/20/28)(a) |
1,450 | 1,393,700 | ||||||
| 4.50%, 11/13/25 (Call 08/13/25) |
5,898 | 5,825,879 | ||||||
| 5.40%, 11/14/25 (Call 10/14/25)(a) |
4,450 | 4,458,170 | ||||||
|
|
|
|||||||
| 821,252,568 | ||||||||
| Pipelines — 2.7% | ||||||||
| Boardwalk Pipelines LP |
||||||||
| 4.45%, 07/15/27 (Call 04/15/27) |
3,680 | 3,586,615 | ||||||
| 5.95%, 06/01/26 (Call 03/01/26)(a) |
3,877 | 3,907,497 | ||||||
| Cheniere Corpus Christi Holdings LLC |
||||||||
| 5.13%, 06/30/27 (Call 01/01/27) |
8,469 | 8,430,552 | ||||||
| 5.88%, 03/31/25 (Call 10/02/24)(a) |
11,029 | 11,028,727 | ||||||
| Cheniere Energy Inc., 4.63%, 10/15/28 (Call 03/11/24) |
5,282 | 5,070,089 | ||||||
| Security | Par (000) |
Value | ||||||
| Pipelines (continued) | ||||||||
| Colonial Pipeline Co., 3.75%, 10/01/25 |
$ | 2,070 | $ | 2,018,206 | ||||
| Colorado Interstate Gas Co. LLC/Colorado Interstate Issuing Corp., 4.15%, 08/15/26 |
2,571 | 2,483,161 | ||||||
| Columbia Pipeline Group Inc., 4.50%, 06/01/25 (Call 03/01/25) |
7,497 | 7,388,519 | ||||||
| Columbia Pipelines Holding Co. LLC |
||||||||
| 6.04%, 08/15/28 (Call 07/15/28)(a)(b) |
9,930 | 10,113,304 | ||||||
| 6.06%, 08/15/26 (Call 07/15/26)(b) |
2,040 | 2,064,491 | ||||||
| DCP Midstream Operating LP |
||||||||
| 5.38%, 07/15/25 (Call 04/15/25) |
6,545 | 6,530,413 | ||||||
| 5.63%, 07/15/27 (Call 04/15/27)(a) |
3,961 | 3,974,337 | ||||||
| Enbridge Energy Partners LP, 5.88%, 10/15/25 (Call 07/15/25)(a) |
3,493 | 3,515,772 | ||||||
| Enbridge Inc. |
||||||||
| 1.60%, 10/04/26 (Call 09/04/26) |
3,198 | 2,923,427 | ||||||
| 3.70%, 07/15/27 (Call 04/15/27) |
4,716 | 4,507,464 | ||||||
| 4.25%, 12/01/26 (Call 09/01/26) |
4,957 | 4,850,452 | ||||||
| 5.50%, 07/15/77 (Call 07/15/27), |
6,433 | 5,981,232 | ||||||
| 5.90%, 11/15/26 (Call 10/15/26)(a) |
5,010 | 5,103,653 | ||||||
| 5.97%, 03/08/26 (Call 03/08/24)(a) |
4,535 | 4,533,783 | ||||||
| 6.00%, 11/15/28 (Call 10/15/28)(a) |
5,955 | 6,167,079 | ||||||
| 6.25%, 03/01/78 (Call 03/01/28), |
5,230 | 4,991,675 | ||||||
| 7.38%, 01/15/83 (Call 10/15/27), |
3,235 | 3,241,793 | ||||||
| 8.25%, 01/15/84 (Call 10/15/28), |
50 | 51,869 | ||||||
| Series 16-A, 6.00%, 01/15/77 (Call 01/15/27), |
4,298 | 4,176,198 | ||||||
| Energy Transfer LP |
||||||||
| 2.90%, 05/15/25 (Call 04/15/25) |
6,818 | 6,601,657 | ||||||
| 3.90%, 07/15/26 (Call 04/15/26) |
3,712 | 3,593,242 | ||||||
| 4.00%, 10/01/27 (Call 07/01/27) |
5,009 | 4,794,240 | ||||||
| 4.05%, 03/15/25 (Call 12/15/24)(a) |
6,820 | 6,710,545 | ||||||
| 4.20%, 04/15/27 (Call 01/15/27)(a) |
4,276 | 4,147,941 | ||||||
| 4.40%, 03/15/27 (Call 12/15/26) |
4,926 | 4,800,709 | ||||||
| 4.75%, 01/15/26 (Call 10/15/25)(a) |
6,459 | 6,384,285 | ||||||
| 4.95%, 05/15/28 (Call 02/15/28)(a) |
6,336 | 6,253,070 | ||||||
| 4.95%, 06/15/28 (Call 03/15/28) |
6,444 | 6,346,970 | ||||||
| 5.50%, 06/01/27 (Call 03/01/27) |
6,495 | 6,517,261 | ||||||
| 5.55%, 02/15/28 (Call 01/15/28)(a) |
6,425 | 6,474,569 | ||||||
| 5.63%, 05/01/27 (Call 03/18/24)(a)(b) |
1,950 | 1,932,489 | ||||||
| 5.95%, 12/01/25 (Call 09/01/25)(a) |
2,622 | 2,637,752 | ||||||
| 6.00%, 02/01/29 (Call 04/01/24)(a)(b) |
2,400 | 2,406,624 | ||||||
| 6.05%, 12/01/26 (Call 11/01/26) |
6,385 | 6,498,034 | ||||||
| 6.10%, 12/01/28 (Call 11/01/28)(a) |
3,605 | 3,726,370 | ||||||
| Enterprise Products Operating LLC |
||||||||
| 3.70%, 02/15/26 (Call 11/15/25)(a) |
6,108 | 5,957,050 | ||||||
| 3.95%, 02/15/27 (Call 11/15/26) |
3,740 | 3,649,570 | ||||||
| 4.15%, 10/16/28 (Call 07/16/28) |
8,008 | 7,728,858 | ||||||
| 4.60%, 01/11/27 (Call 12/11/26)(a) |
3,800 | 3,772,468 | ||||||
| 5.05%, 01/10/26 |
5,215 | 5,211,416 | ||||||
| 5.38%, 02/15/78 (Call 02/15/28), |
3,250 | 3,004,353 | ||||||
| Series E, 5.25%, 08/16/77 (Call 08/16/27), (3-mo. SOFR + 3.295%)(c) |
6,465 | 6,132,904 | ||||||
| 172 | 2 0 2 4 I S H A R E S A N N U A L R E P O R T T O S H A R E H O L D E R S |
| Schedule of Investments (continued) February 29, 2024 |
iShares® 1-5 Year Investment Grade Corporate Bond ETF (Percentages shown are based on Net Assets) |
| Security | Par (000) |
Value | ||||||
| Pipelines (continued) | ||||||||
| Florida Gas Transmission Co. LLC, 4.35%, 07/15/25 (Call 04/15/25)(a)(b) |
$ | 3,996 | $ | 3,920,685 | ||||
| Galaxy Pipeline Assets Bidco Ltd., 1.75%, 09/30/27(b) |
270 | 252,428 | ||||||
| Gray Oak Pipeline LLC |
||||||||
| 2.60%, 10/15/25 (Call 09/15/25)(b) |
4,427 | 4,211,649 | ||||||
| 3.45%, 10/15/27 (Call 08/15/27)(a)(b) |
1,750 | 1,630,304 | ||||||
| Gulfstream Natural Gas System LLC |
||||||||
| 4.60%, 09/15/25 (Call 06/15/25)(a)(b) |
3,526 | 3,464,078 | ||||||
| 6.19%, 11/01/25(a)(b) |
2,808 | 2,817,755 | ||||||
| Kinder Morgan Inc. |
||||||||
| 1.75%, 11/15/26 (Call 10/15/26) |
3,403 | 3,107,925 | ||||||
| 4.30%, 06/01/25 (Call 03/01/25) |
10,659 | 10,503,449 | ||||||
| 4.30%, 03/01/28 (Call 12/01/27) |
9,724 | 9,432,017 | ||||||
| 5.00%, 02/01/29 (Call 01/01/29) |
4,860 | 4,817,414 | ||||||
| Magellan Midstream Partners LP, 5.00%, 03/01/26 (Call 12/01/25)(a) |
4,565 | 4,530,109 | ||||||
| MPLX LP |
||||||||
| 1.75%, 03/01/26 (Call 02/01/26)(a) |
10,215 | 9,529,663 | ||||||
| 4.00%, 03/15/28 (Call 12/15/27)(a) |
10,706 | 10,264,937 | ||||||
| 4.13%, 03/01/27 (Call 12/01/26) |
8,396 | 8,141,145 | ||||||
| 4.25%, 12/01/27 (Call 09/01/27)(a) |
4,980 | 4,819,719 | ||||||
| 4.80%, 02/15/29 (Call 11/15/28)(a) |
1,750 | 1,713,835 | ||||||
| 4.88%, 06/01/25 (Call 03/01/25) |
8,265 | 8,191,022 | ||||||
| NGPL PipeCo LLC, 4.88%, 08/15/27 (Call 02/15/27)(a)(b) |
4,845 | 4,729,379 | ||||||
| Northwest Pipeline LLC, 4.00%, 04/01/27 (Call 01/01/27) |
3,263 | 3,166,704 | ||||||
| ONEOK Inc. |
||||||||
| 2.20%, 09/15/25 (Call 08/15/25) |
3,036 | 2,888,352 | ||||||
| 3.20%, 03/15/25(a) |
1,190 | 1,157,539 | ||||||
| 4.00%, 07/13/27 (Call 04/13/27) |
2,031 | 1,958,060 | ||||||
| 4.55%, 07/15/28 (Call 04/15/28) |
4,830 | 4,718,532 | ||||||
| 5.55%, 11/01/26 (Call 10/01/26) |
5,045 | 5,082,532 | ||||||
| 5.65%, 11/01/28 (Call 10/01/28) |
7,390 | 7,517,966 | ||||||
| 5.85%, 01/15/26 (Call 12/15/25)(a) |
4,255 | 4,292,812 | ||||||
| ONEOK Partners LP, 4.90%, 03/15/25 (Call 12/15/24) |
3,734 | 3,705,479 | ||||||
| Plains All American Pipeline LP/PAA |
||||||||
| Finance Corp. |
||||||||
| 4.50%, 12/15/26 (Call 09/15/26)(a) |
5,299 | 5,197,298 | ||||||
| 4.65%, 10/15/25 (Call 07/15/25) |
7,232 | 7,137,157 | ||||||
| QazaqGaz NC JSC, 4.38%, 09/26/27(a)(b) |
3,553 | 3,309,619 | ||||||
| Sabal Trail Transmission LLC, 4.25%, 05/01/28 (Call 02/01/28)(a)(b) |
1,335 | 1,281,479 | ||||||
| Sabine Pass Liquefaction LLC |
||||||||
| 4.20%, 03/15/28 (Call 09/15/27) |
10,330 | 9,965,007 | ||||||
| 5.00%, 03/15/27 (Call 09/15/26) |
9,999 | 9,924,550 | ||||||
| 5.63%, 03/01/25 (Call 12/01/24) |
13,625 | 13,606,153 | ||||||
| 5.88%, 06/30/26 (Call 12/31/25) |
10,459 | 10,543,769 | ||||||
| Spectra Energy Partners LP |
||||||||
| 3.38%, 10/15/26 (Call 07/15/26) |
3,895 | 3,722,664 | ||||||
| 3.50%, 03/15/25 (Call 12/15/24) |
3,555 | 3,484,340 | ||||||
| Targa Resources Corp., 5.20%, 07/01/27 (Call 06/01/27) |
4,773 | 4,749,375 | ||||||
| Targa Resources Partners LP/Targa Resources Partners Finance Corp. |
||||||||
| 5.00%, 01/15/28 (Call 04/01/24)(a) |
8,377 | 8,192,580 | ||||||
| 6.50%, 07/15/27 (Call 04/01/24) |
5,575 | 5,632,880 | ||||||
| Security | Par (000) |
Value | ||||||
| Pipelines (continued) | ||||||||
| TC PipeLines LP |
||||||||
| 3.90%, 05/25/27 (Call 02/25/27) |
$ | 3,987 | $ | 3,803,102 | ||||
| 4.38%, 03/13/25 (Call 12/13/24) |
3,856 | 3,799,488 | ||||||
| Tennessee Gas Pipeline Co. LLC |
||||||||
| 7.00%, 03/15/27(a) |
2,332 | 2,450,464 | ||||||
| 7.00%, 10/15/28(a) |
3,565 | 3,809,464 | ||||||
| Texas Eastern Transmission LP, 3.50%, 01/15/28 (Call 10/15/27)(b) |
626 | 586,787 | ||||||
| TransCanada PipeLines Ltd. |
||||||||
| 4.25%, 05/15/28 (Call 02/15/28)(a) |
11,420 | 11,001,209 | ||||||
| 4.88%, 01/15/26 (Call 10/15/25) |
6,388 | 6,337,341 | ||||||
| 6.20%, 03/09/26 (Call 03/18/24) |
2,269 | 2,269,032 | ||||||
| Transcanada Trust |
||||||||
| 5.30%, 03/15/77 (Call 03/15/27), (3 mo. LIBOR US + 3.208%)(a)(c) |
9,460 | 8,698,599 | ||||||
| 5.63%, 05/20/75 (Call 05/20/25), (3-mo. LIBOR US + 3.528%)(a)(c) |
4,717 | 4,565,075 | ||||||
| Series 16-A, 5.88%, 08/15/76 (Call 08/15/26), (3 mo. LIBOR US + 4.640%)(a)(c) |
7,440 | 7,135,411 | ||||||
| Transcontinental Gas Pipe Line Co. LLC |
||||||||
| 4.00%, 03/15/28 (Call 12/15/27) |
610 | 585,730 | ||||||
| 7.85%, 02/01/26 (Call 11/01/25) |
7,099 | 7,375,836 | ||||||
| Transportadora de Gas Internacional SA ESP, |
||||||||
| 5.55%, 11/01/28 (Call 08/01/28)(b) |
250 | 246,397 | ||||||
| Valero Energy Partners LP, 4.50%, 03/15/28 (Call 12/15/27) |
4,145 | 4,031,369 | ||||||
| Western Midstream Operating LP |
||||||||
| 3.95%, 06/01/25 (Call 03/01/25)(a) |
3,045 | 2,970,504 | ||||||
| 4.50%, 03/01/28 (Call 12/01/27) |
6,676 | 6,381,582 | ||||||
| 4.65%, 07/01/26 (Call 04/01/26) |
2,965 | 2,900,752 | ||||||
| 4.75%, 08/15/28 (Call 05/15/28)(a) |
4,447 | 4,293,812 | ||||||
| 6.35%, 01/15/29 (Call 12/15/28)(a) |
895 | 923,845 | ||||||
| Williams Companies Inc. (The) |
||||||||
| 3.75%, 06/15/27 (Call 03/15/27) |
9,860 | 9,435,965 | ||||||
| 4.00%, 09/15/25 (Call 06/15/25) |
6,054 | 5,936,062 | ||||||
| 4.90%, 03/15/29 (Call 02/15/29) |
3,325 | 3,280,452 | ||||||
| 5.30%, 08/15/28 (Call 07/15/28) |
8,420 | 8,481,244 | ||||||
| 5.40%, 03/02/26 |
6,145 | 6,159,288 | ||||||
|
|
|
|||||||
| 566,693,855 | ||||||||
| Private Equity — 0.0% | ||||||||
| Apollo Management Holdings LP, 4.40%, 05/27/26 (Call 02/27/26)(a)(b) |
3,374 | 3,289,750 | ||||||
|
|
|
|||||||
| Real Estate — 0.1% | ||||||||
| CBRE Services Inc., 4.88%, 03/01/26 (Call 12/01/25)(a) |
3,766 | 3,724,011 | ||||||
| GAIF Bond Issuer Pty. Ltd., 3.40%, 09/30/26 (Call 06/30/26)(b) |
3,735 | 3,555,504 | ||||||
| Jones Lang LaSalle Inc., 6.88%, 12/01/28 (Call 11/01/28) |
2,010 | 2,113,635 | ||||||
| Ontario Teachers’ Cadillac Fairview Properties Trust, 3.88%, 03/20/27 (Call 12/20/26)(b) |
4,506 | 4,245,734 | ||||||
| Realty Income Corp. |
||||||||
| 2.10%, 03/15/28 (Call 01/15/28)(a) |
965 | 856,500 | ||||||
| 3.20%, 01/15/27 (Call 11/15/26)(a) |
1,798 | 1,697,699 | ||||||
| Sun Communities Operating LP, 5.50%, 01/15/29 (Call 12/15/28) |
3,115 | 3,083,740 | ||||||
|
|
|
|||||||
| 19,276,823 | ||||||||
| Real Estate Investment Trusts — 3.2% | ||||||||
| Agree LP, 2.00%, 06/15/28 (Call 04/15/28)(a) |
1,750 | 1,520,993 | ||||||
| S C H E D U L E O F I N V E S T M E N T S |
173 |
| Schedule of Investments (continued) February 29, 2024 |
iShares® 1-5 Year Investment Grade Corporate Bond ETF (Percentages shown are based on Net Assets) |
| Security | Par (000) |
Value | ||||||
| Real Estate Investment Trusts (continued) | ||||||||
| Alexandria Real Estate Equities Inc. |
||||||||
| 3.45%, 04/30/25 (Call 02/28/25)(a) |
$ | 3,911 | $ | 3,819,394 | ||||
| 3.80%, 04/15/26 (Call 02/15/26)(a) |
3,812 | 3,702,467 | ||||||
| 3.95%, 01/15/27 (Call 10/15/26)(a) |
2,415 | 2,329,629 | ||||||
| 3.95%, 01/15/28 (Call 10/15/27) |
3,028 | 2,885,799 | ||||||
| 4.30%, 01/15/26 (Call 10/15/25) |
816 | 799,210 | ||||||
| American Homes 4 Rent LP |
||||||||
| 4.25%, 02/15/28 (Call 11/15/27) |
3,565 | 3,424,735 | ||||||
| 4.90%, 02/15/29 (Call 11/15/28)(a) |
275 | 267,951 | ||||||
| American Tower Corp. |
||||||||
| 1.30%, 09/15/25 (Call 08/15/25) |
3,861 | 3,630,084 | ||||||
| 1.45%, 09/15/26 (Call 08/15/26)(a) |
4,167 | 3,787,534 | ||||||
| 1.50%, 01/31/28 (Call 11/30/27) |
4,410 | 3,829,054 | ||||||
| 1.60%, 04/15/26 (Call 03/15/26) |
4,487 | 4,155,184 | ||||||
| 2.40%, 03/15/25 (Call 02/15/25) |
5,484 | 5,301,569 | ||||||
| 2.75%, 01/15/27 (Call 11/15/26)(a) |
5,050 | 4,700,647 | ||||||
| 3.13%, 01/15/27 (Call 10/15/26) |
2,740 | 2,584,655 | ||||||
| 3.38%, 10/15/26 (Call 07/15/26)(a) |
6,664 | 6,356,125 | ||||||
| 3.55%, 07/15/27 (Call 04/15/27)(a) |
5,392 | 5,110,152 | ||||||
| 3.60%, 01/15/28 (Call 10/15/27) |
4,572 | 4,309,325 | ||||||
| 3.65%, 03/15/27 (Call 02/15/27) |
4,670 | 4,463,308 | ||||||
| 4.00%, 06/01/25 (Call 03/01/25)(a) |
5,482 | 5,376,098 | ||||||
| 4.40%, 02/15/26 (Call 11/15/25)(a) |
3,403 | 3,346,496 | ||||||
| 5.25%, 07/15/28 (Call 06/15/28)(a) |
7,758 | 7,730,056 | ||||||
| 5.50%, 03/15/28 (Call 02/15/28)(a) |
4,816 | 4,835,817 | ||||||
| 5.80%, 11/15/28 (Call 10/15/28)(a) |
5,505 | 5,610,693 | ||||||
| AvalonBay Communities Inc. |
||||||||
| 1.90%, 12/01/28 (Call 10/01/28) |
3,373 | 2,934,125 | ||||||
| 2.90%, 10/15/26 (Call 07/15/26)(a) |
1,886 | 1,782,925 | ||||||
| 2.95%, 05/11/26 (Call 02/11/26)(a) |
2,875 | 2,745,424 | ||||||
| 3.20%, 01/15/28 (Call 10/15/27)(a) |
3,410 | 3,189,863 | ||||||
| 3.35%, 05/15/27 (Call 02/15/27) |
2,432 | 2,306,111 | ||||||
| 3.45%, 06/01/25 (Call 03/03/25) |
3,486 | 3,408,861 | ||||||
| 3.50%, 11/15/25 (Call 08/15/25)(a) |
1,899 | 1,844,640 | ||||||
| Boston Properties LP |
||||||||
| 2.75%, 10/01/26 (Call 07/01/26) |
6,305 | 5,835,893 | ||||||
| 3.65%, 02/01/26 (Call 11/03/25)(a) |
6,324 | 6,081,184 | ||||||
| 4.50%, 12/01/28 (Call 09/01/28) |
1,950 | 1,842,324 | ||||||
| 6.75%, 12/01/27 (Call 11/01/27)(a) |
10,090 | 10,419,120 | ||||||
| Brixmor Operating Partnership LP |
||||||||
| 2.25%, 04/01/28 (Call 02/01/28)(a) |
2,115 | 1,871,265 | ||||||
| 3.90%, 03/15/27 (Call 12/15/26) |
2,629 | 2,507,283 | ||||||
| 4.13%, 06/15/26 (Call 03/15/26) |
3,757 | 3,620,292 | ||||||
| Camden Property Trust |
||||||||
| 4.10%, 10/15/28 (Call 07/15/28)(a) |
3,165 | 3,048,415 | ||||||
| 5.85%, 11/03/26 (Call 10/03/26)(a) |
2,680 | 2,736,911 | ||||||
| Corporate Office Properties LP |
||||||||
| 2.00%, 01/15/29 (Call 11/15/28)(a) |
2,355 | 1,950,523 | ||||||
| 2.25%, 03/15/26 (Call 02/15/26)(a) |
2,496 | 2,334,217 | ||||||
| Crown Castle Inc. |
||||||||
| 1.05%, 07/15/26 (Call 06/15/26) |
6,808 | 6,155,164 | ||||||
| 1.35%, 07/15/25 (Call 06/15/25)(a) |
4,602 | 4,354,528 | ||||||
| 2.90%, 03/15/27 (Call 02/15/27)(a) |
5,474 | 5,096,306 | ||||||
| 3.65%, 09/01/27 (Call 06/01/27) |
6,754 | 6,377,362 | ||||||
| 3.70%, 06/15/26 (Call 03/15/26) |
5,376 | 5,176,871 | ||||||
| 3.80%, 02/15/28 (Call 11/15/27) |
7,874 | 7,415,762 | ||||||
| 4.00%, 03/01/27 (Call 12/01/26) |
3,774 | 3,635,273 | ||||||
| 4.30%, 02/15/29 (Call 11/15/28) |
975 | 925,801 | ||||||
| 4.45%, 02/15/26 (Call 11/15/25) |
6,277 | 6,159,161 | ||||||
| 4.80%, 09/01/28 (Call 08/01/28) |
965 | 941,948 | ||||||
| 5.00%, 01/11/28 (Call 12/11/27) |
6,910 | 6,805,325 | ||||||
| Security | Par (000) |
Value | ||||||
| Real Estate Investment Trusts (continued) | ||||||||
| CubeSmart LP |
||||||||
| 2.25%, 12/15/28 (Call 10/15/28)(a) |
$ | 3,608 | $ | 3,138,731 | ||||
| 3.13%, 09/01/26 (Call 06/01/26)(a) |
1,715 | 1,621,447 | ||||||
| 4.00%, 11/15/25 (Call 08/15/25) |
1,511 | 1,470,340 | ||||||
| 4.38%, 02/15/29 (Call 11/15/28)(a) |
2,220 | 2,111,708 | ||||||
| Digital Realty Trust LP |
||||||||
| 3.70%, 08/15/27 (Call 05/15/27)(a) |
6,359 | 6,066,544 | ||||||
| 4.45%, 07/15/28 (Call 04/15/28)(a) |
2,555 | 2,471,767 | ||||||
| 5.55%, 01/15/28 (Call 12/15/27) |
6,515 | 6,580,363 | ||||||
| EPR Properties |
||||||||
| 4.50%, 04/01/25 (Call 01/01/25)(a) |
2,000 | 1,963,290 | ||||||
| 4.50%, 06/01/27 (Call 03/01/27)(a) |
3,075 | 2,906,644 | ||||||
| 4.75%, 12/15/26 (Call 09/15/26)(a) |
2,620 | 2,517,241 | ||||||
| 4.95%, 04/15/28 (Call 01/15/28) |
2,255 | 2,139,357 | ||||||
| Equinix Inc. |
||||||||
| 1.00%, 09/15/25 (Call 08/15/25)(a) |
13,915 | 13,011,793 | ||||||
| 1.25%, 07/15/25 (Call 06/15/25) |
896 | 845,594 | ||||||
| 1.45%, 05/15/26 (Call 04/15/26) |
2,586 | 2,379,491 | ||||||
| 1.55%, 03/15/28 (Call 01/15/28) |
2,385 | 2,075,199 | ||||||
| 1.80%, 07/15/27 (Call 05/15/27) |
4,435 | 3,987,400 | ||||||
| 2.00%, 05/15/28 (Call 03/15/28)(a) |
2,960 | 2,608,539 | ||||||
| 2.90%, 11/18/26 (Call 09/18/26)(a) |
5,299 | 4,988,761 | ||||||
| ERP Operating LP |
||||||||
| 2.85%, 11/01/26 (Call 08/01/26) |
3,077 | 2,903,740 | ||||||
| 3.25%, 08/01/27 (Call 05/01/27) |
2,460 | 2,310,742 | ||||||
| 3.38%, 06/01/25 (Call 03/01/25)(a) |
2,938 | 2,865,406 | ||||||
| 3.50%, 03/01/28 (Call 12/01/27) |
3,725 | 3,515,590 | ||||||
| 4.15%, 12/01/28 (Call 09/01/28)(a) |
4,768 | 4,610,057 | ||||||
| Essex Portfolio LP |
||||||||
| 1.70%, 03/01/28 (Call 01/01/28)(a) |
3,360 | 2,919,979 | ||||||
| 3.38%, 04/15/26 (Call 01/15/26) |
2,810 | 2,702,080 | ||||||
| 3.50%, 04/01/25 (Call 01/01/25)(a) |
2,860 | 2,795,287 | ||||||
| 3.63%, 05/01/27 (Call 02/01/27)(a) |
2,391 | 2,267,837 | ||||||
| Extra Space Storage LP |
||||||||
| 3.50%, 07/01/26 (Call 04/01/26) |
3,552 | 3,401,276 | ||||||
| 3.88%, 12/15/27 (Call 09/15/27)(a) |
3,135 | 2,977,765 | ||||||
| 5.70%, 04/01/28 (Call 03/01/28) |
3,755 | 3,807,421 | ||||||
| Federal Realty OP LP |
||||||||
| 1.25%, 02/15/26 (Call 01/15/26) |
5,760 | 5,307,049 | ||||||
| 3.25%, 07/15/27 (Call 04/15/27)(a) |
3,364 | 3,134,340 | ||||||
| 5.38%, 05/01/28 (Call 04/01/28)(a) |
3,245 | 3,219,511 | ||||||
| GLP Capital LP/GLP Financing II Inc. |
||||||||
| 5.25%, 06/01/25 (Call 03/01/25) |
5,282 | 5,234,155 | ||||||
| 5.30%, 01/15/29 (Call 10/15/28) |
3,645 | 3,536,399 | ||||||
| 5.38%, 04/15/26 (Call 01/15/26) |
6,015 | 5,949,236 | ||||||
| 5.75%, 06/01/28 (Call 03/03/28) |
4,225 | 4,191,453 | ||||||
| Goodman U.S. Finance Three LLC, 3.70%, 03/15/28 (Call 12/15/27)(a)(b) |
860 | 795,185 | ||||||
| Healthcare Realty Holdings LP |
||||||||
| 3.50%, 08/01/26 (Call 05/01/26)(a) |
3,705 | 3,524,019 | ||||||
| 3.63%, 01/15/28 (Call 10/15/27) |
305 | 278,882 | ||||||
| 3.75%, 07/01/27 (Call 04/01/27) |
3,601 | 3,379,325 | ||||||
| Healthpeak OP LLC |
||||||||
| 1.35%, 02/01/27 (Call 01/01/27)(a) |
4,590 | 4,128,430 | ||||||
| 2.13%, 12/01/28 (Call 10/01/28)(a) |
3,120 | 2,713,156 | ||||||
| 3.25%, 07/15/26 (Call 05/15/26)(a) |
4,029 | 3,848,921 | ||||||
| 4.00%, 06/01/25 (Call 03/01/25)(a) |
2,795 | 2,740,079 | ||||||
| Highwoods Realty LP |
||||||||
| 3.88%, 03/01/27 (Call 12/01/26) |
828 | 777,347 | ||||||
| 4.13%, 03/15/28 (Call 12/15/27)(a) |
2,555 | 2,364,309 | ||||||
| 174 | 2 0 2 4 I S H A R E S A N N U A L R E P O R T T O S H A R E H O L D E R S |
| Schedule of Investments (continued) February 29, 2024 |
iShares® 1-5 Year Investment Grade Corporate Bond ETF (Percentages shown are based on Net Assets) |
| Security | Par (000) |
Value | ||||||
| Real Estate Investment Trusts (continued) | ||||||||
| Host Hotels & Resorts LP |
||||||||
| Series E, 4.00%, 06/15/25 (Call 03/15/25)(a) |
$ | 3,232 | $ | 3,164,890 | ||||
| Series F, 4.50%, 02/01/26 (Call 11/01/25)(a) |
1,940 | 1,897,290 | ||||||
| Invitation Homes Operating Partnership LP, 2.30%, 11/15/28 (Call 09/15/28)(a) |
2,719 | 2,378,141 | ||||||
| Kilroy Realty LP |
||||||||
| 4.38%, 10/01/25 (Call 07/01/25)(a) |
2,765 | 2,694,404 | ||||||
| 4.75%, 12/15/28 (Call 09/15/28)(a) |
3,605 | 3,394,849 | ||||||
| Kimco Realty OP LLC |
||||||||
| 1.90%, 03/01/28 (Call 01/01/28)(a) |
3,270 | 2,864,373 | ||||||
| 2.80%, 10/01/26 (Call 07/01/26) |
2,787 | 2,612,593 | ||||||
| 3.25%, 08/15/26 (Call 05/15/26) |
1,560 | 1,471,311 | ||||||
| 3.80%, 04/01/27 (Call 01/01/27)(a) |
2,610 | 2,500,810 | ||||||
| Kite Realty Group LP, 4.00%, 10/01/26 (Call 07/01/26) |
1,891 | 1,790,782 | ||||||
| Kite Realty Group Trust, 4.00%, 03/15/25 (Call 12/15/24)(a) |
2,170 | 2,123,256 | ||||||
| LXP Industrial Trust, 6.75%, 11/15/28 (Call 10/15/28)(a) |
805 | 831,081 | ||||||
| Mid-America Apartments LP |
||||||||
| 1.10%, 09/15/26 (Call 08/15/26)(a) |
1,838 | 1,659,741 | ||||||
| 3.60%, 06/01/27 (Call 03/01/27)(a) |
3,320 | 3,172,241 | ||||||
| 4.00%, 11/15/25 (Call 08/15/25) |
2,802 | 2,741,555 | ||||||
| 4.20%, 06/15/28 (Call 03/15/28) |
2,165 | 2,094,995 | ||||||
| NNN REIT Inc. |
||||||||
| 3.50%, 10/15/27 (Call 07/15/27) |
1,775 | 1,665,241 | ||||||
| 3.60%, 12/15/26 (Call 09/15/26)(a) |
2,153 | 2,049,258 | ||||||
| 4.00%, 11/15/25 (Call 08/15/25) |
2,711 | 2,644,665 | ||||||
| 4.30%, 10/15/28 (Call 07/15/28)(a) |
2,695 | 2,587,926 | ||||||
| Omega Healthcare Investors Inc. |
||||||||
| 4.50%, 04/01/27 (Call 01/01/27) |
4,256 | 4,092,739 | ||||||
| 4.75%, 01/15/28 (Call 10/15/27) |
4,000 | 3,837,324 | ||||||
| 5.25%, 01/15/26 (Call 10/15/25)(a) |
3,474 | 3,442,968 | ||||||
| Physicians Realty LP |
||||||||
| 3.95%, 01/15/28 (Call 10/15/27)(a) |
2,735 | 2,601,694 | ||||||
| 4.30%, 03/15/27 (Call 12/15/26)(a) |
2,541 | 2,473,104 | ||||||
| Piedmont Operating Partnership LP, 9.25%, 07/20/28 (Call 06/20/28) |
2,760 | 2,915,900 | ||||||
| Prologis LP |
||||||||
| 2.13%, 04/15/27 (Call 02/15/27)(a) |
3,169 | 2,910,235 | ||||||
| 3.25%, 06/30/26 (Call 03/30/26)(a) |
2,249 | 2,160,295 | ||||||
| 3.25%, 10/01/26 (Call 07/01/26) |
2,366 | 2,257,485 | ||||||
| 3.38%, 12/15/27 (Call 09/15/27)(a) |
3,435 | 3,244,688 | ||||||
| 3.88%, 09/15/28 (Call 06/15/28)(a) |
3,215 | 3,074,906 | ||||||
| 4.00%, 09/15/28 (Call 06/15/28) |
815 | 783,607 | ||||||
| 4.38%, 02/01/29 (Call 11/01/28)(a) |
1,845 | 1,803,370 | ||||||
| 4.88%, 06/15/28 (Call 05/15/28) |
5,475 | 5,468,285 | ||||||
| Prologis Targeted U.S. Logistics Fund LP, 5.25%, 04/01/29 (Call 03/01/29)(b) |
425 | 422,777 | ||||||
| Public Storage Operating Co. |
||||||||
| 0.88%, 02/15/26 (Call 01/15/26)(a) |
3,170 | 2,925,838 | ||||||
| 1.50%, 11/09/26 (Call 10/09/26) |
4,000 | 3,651,353 | ||||||
| 1.85%, 05/01/28 (Call 03/01/28) |
4,635 | 4,095,296 | ||||||
| 1.95%, 11/09/28 (Call 09/09/28)(a) |
405 | 355,489 | ||||||
| 3.09%, 09/15/27 (Call 06/15/27) |
3,201 | 3,011,340 | ||||||
| 5.13%, 01/15/29 (Call 12/15/28)(a) |
3,835 | 3,872,006 | ||||||
| Realty Income Corp. |
||||||||
| 0.75%, 03/15/26 (Call 02/15/26)(a) |
2,146 | 1,957,725 | ||||||
| 2.20%, 06/15/28 (Call 04/15/28)(a) |
4,420 | 3,923,197 | ||||||
| 3.00%, 01/15/27 (Call 10/15/26)(a) |
3,824 | 3,605,724 | ||||||
| 3.40%, 01/15/28 (Call 11/15/27) |
4,890 | 4,585,320 | ||||||
| Security | Par (000) |
Value | ||||||
| Real Estate Investment Trusts (continued) | ||||||||
| 3.65%, 01/15/28 (Call 10/15/27) |
$ | 1,964 | $ | 1,862,432 | ||||
| 3.88%, 04/15/25 (Call 02/15/25) |
3,249 | 3,192,883 | ||||||
| 3.95%, 08/15/27 (Call 05/15/27) |
4,156 | 4,013,789 | ||||||
| 4.13%, 10/15/26 (Call 07/15/26)(a) |
3,859 | 3,756,843 | ||||||
| 4.45%, 09/15/26 (Call 06/15/26) |
1,955 | 1,902,952 | ||||||
| 4.63%, 11/01/25 (Call 09/01/25) |
3,521 | 3,478,964 | ||||||
| 4.70%, 12/15/28 (Call 11/15/28) |
1,770 | 1,739,339 | ||||||
| 4.75%, 02/15/29 (Call 01/15/29)(a) |
2,525 | 2,470,393 | ||||||
| 4.88%, 06/01/26 (Call 03/01/26) |
3,549 | 3,521,678 | ||||||
| 5.05%, 01/13/26 (Call 03/11/24) |
3,014 | 3,001,031 | ||||||
| Regency Centers LP |
||||||||
| 3.60%, 02/01/27 (Call 11/01/26) |
3,255 | 3,108,519 | ||||||
| 3.90%, 11/01/25 (Call 08/01/25)(a) |
1,735 | 1,675,617 | ||||||
| 4.13%, 03/15/28 (Call 12/15/27) |
2,605 | 2,487,441 | ||||||
| Retail Opportunity Investments Partnership LP, 6.75%, 10/15/28 (Call 09/15/28)(a) |
1,445 | 1,493,632 | ||||||
| Rexford Industrial Realty LP, 5.00%, 06/15/28 (Call 05/15/28)(a) |
2,495 | 2,469,814 | ||||||
| Sabra Health Care LP, 5.13%, 08/15/26 (Call 05/15/26) |
3,140 | 3,083,077 | ||||||
| Scentre Group Trust 1/Scentre Group Trust 2 |
||||||||
| 3.25%, 10/28/25 (Call 07/30/25)(b) |
3,317 | 3,198,896 | ||||||
| 3.63%, 01/28/26 (Call 12/28/25)(b) |
4,597 | 4,443,846 | ||||||
| 3.75%, 03/23/27 (Call 12/23/26)(a)(b) |
3,035 | 2,886,624 | ||||||
| Scentre Group Trust 2, 4.75%, 09/24/80 (Call 06/24/26), (5-year CMT + 4.379%)(a)(b)(c) |
4,682 | 4,452,109 | ||||||
| Simon Property Group LP |
||||||||
| 1.38%, 01/15/27 (Call 10/15/26)(a) |
3,650 | 3,310,287 | ||||||
| 1.75%, 02/01/28 (Call 11/01/27)(a) |
5,363 | 4,746,735 | ||||||
| 3.25%, 11/30/26 (Call 08/30/26)(a) |
4,629 | 4,412,660 | ||||||
| 3.30%, 01/15/26 (Call 10/15/25) |
5,185 | 5,003,894 | ||||||
| 3.38%, 06/15/27 (Call 03/15/27) |
5,165 | 4,901,014 | ||||||
| 3.38%, 12/01/27 (Call 09/01/27)(a) |
4,680 | 4,414,303 | ||||||
| 3.50%, 09/01/25 (Call 06/01/25)(a) |
7,138 | 6,964,502 | ||||||
| SITE Centers Corp. |
||||||||
| 4.25%, 02/01/26 (Call 11/01/25) |
2,606 | 2,543,277 | ||||||
| 4.70%, 06/01/27 (Call 03/01/27) |
3,498 | 3,440,066 | ||||||
| Sixth Street Specialty Lending Inc., 6.95%, 08/14/28 (Call 07/14/28) |
1,728 | 1,759,323 | ||||||
| Store Capital LLC, 4.50%, 03/15/28 |
2,645 | 2,475,460 | ||||||
| Sun Communities Operating LP, 2.30%, 11/01/28 (Call 09/01/28)(a) |
1,995 | 1,731,414 | ||||||
| Tanger Properties LP |
||||||||
| 3.13%, 09/01/26 (Call 06/01/26)(a) |
1,825 | 1,703,362 | ||||||
| 3.88%, 07/15/27 (Call 04/15/27)(a) |
1,920 | 1,762,189 | ||||||
| Trust Fibra Uno, 5.25%, 01/30/26 |
1,907 | 1,858,435 | ||||||
| UDR Inc. |
||||||||
| 2.95%, 09/01/26 (Call 06/01/26)(a) |
1,796 | 1,691,625 | ||||||
| 3.50%, 07/01/27 (Call 04/01/27)(a) |
2,145 | 2,013,935 | ||||||
| 3.50%, 01/15/28 (Call 10/15/27)(a) |
2,105 | 1,960,088 | ||||||
| 4.40%, 01/26/29 (Call 10/26/28) |
2,010 | 1,923,063 | ||||||
| Ventas Realty LP |
||||||||
| 3.25%, 10/15/26 (Call 07/15/26) |
2,662 | 2,513,043 | ||||||
| 3.85%, 04/01/27 (Call 01/01/27) |
2,516 | 2,397,205 | ||||||
| 4.00%, 03/01/28 (Call 12/01/27)(a) |
4,815 | 4,582,025 | ||||||
| 4.13%, 01/15/26 (Call 10/15/25) |
2,959 | 2,879,471 | ||||||
| 4.40%, 01/15/29 (Call 10/15/28) |
4,695 | 4,497,780 | ||||||
| S C H E D U L E O F I N V E S T M E N T S |
175 |
| Schedule of Investments (continued) February 29, 2024 |
iShares® 1-5 Year Investment Grade Corporate Bond ETF (Percentages shown are based on Net Assets) |
| Security | Par (000) |
Value | ||||||
| Real Estate Investment Trusts (continued) | ||||||||
| VICI Properties LP |
||||||||
| 4.38%, 05/15/25(a) |
$ | 3,151 | $ | 3,094,654 | ||||
| 4.75%, 02/15/28 (Call 01/15/28) |
8,310 | 8,047,471 | ||||||
| VICI Properties LP/VICI Note Co. Inc. |
||||||||
| 3.75%, 02/15/27 (Call 04/01/24)(a)(b) |
4,480 | 4,214,334 | ||||||
| 3.88%, 02/15/29 (Call 11/15/28)(b) |
100 | 91,225 | ||||||
| 4.25%, 12/01/26 (Call 04/01/24)(b) |
7,855 | 7,514,301 | ||||||
| 4.50%, 09/01/26 (Call 06/01/26)(a)(b) |
3,229 | 3,115,275 | ||||||
| 4.50%, 01/15/28 (Call 10/15/27)(a)(b) |
2,655 | 2,522,595 | ||||||
| 4.63%, 06/15/25 (Call 03/15/25)(b) |
4,805 | 4,723,459 | ||||||
| 5.75%, 02/01/27 (Call 11/01/26)(a)(b) |
4,439 | 4,418,581 | ||||||
| WEA Finance LLC |
||||||||
| 2.88%, 01/15/27 (Call 11/15/26)(a)(b) |
4,616 | 4,193,534 | ||||||
| 4.13%, 09/20/28 (Call 06/20/28)(a)(b) |
100 | 89,236 | ||||||
| Welltower OP LLC |
||||||||
| 2.05%, 01/15/29 (Call 11/15/28) |
3,138 | 2,718,029 | ||||||
| 2.70%, 02/15/27 (Call 12/15/26)(a) |
4,560 | 4,261,599 | ||||||
| 4.00%, 06/01/25 (Call 03/01/25) |
7,735 | 7,595,029 | ||||||
| 4.25%, 04/01/26 (Call 01/01/26) |
4,324 | 4,237,744 | ||||||
| 4.25%, 04/15/28 (Call 01/15/28) |
5,468 | 5,289,559 | ||||||
| Weyerhaeuser Co. |
||||||||
| 4.75%, 05/15/26 |
5,140 | 5,088,338 | ||||||
| 6.95%, 10/01/27(a) |
4,035 | 4,275,182 | ||||||
| WP Carey Inc., 4.25%, 10/01/26 |
2,118 | 2,060,943 | ||||||
|
|
|
|||||||
| 693,551,227 | ||||||||
| Retail — 1.7% | ||||||||
| 7-Eleven Inc. |
||||||||
| 0.95%, 02/10/26 (Call 01/10/26)(a)(b) |
8,067 | 7,434,235 | ||||||
| 1.30%, 02/10/28 (Call 12/10/27)(a)(b) |
6,660 | 5,778,829 | ||||||
| Alimentation Couche-Tard Inc., 3.55%, 07/26/27 (Call 04/26/27)(a)(b) |
6,924 | 6,597,795 | ||||||
| AutoNation Inc. |
||||||||
| 1.95%, 08/01/28 (Call 06/01/28) |
3,195 | 2,732,694 | ||||||
| 3.80%, 11/15/27 (Call 08/15/27)(a) |
2,450 | 2,280,599 | ||||||
| 4.50%, 10/01/25 (Call 07/01/25)(a) |
2,488 | 2,444,196 | ||||||
| AutoZone Inc. |
||||||||
| 3.13%, 04/21/26 (Call 01/21/26)(a) |
2,452 | 2,349,787 | ||||||
| 3.25%, 04/15/25 (Call 01/15/25) |
2,434 | 2,377,159 | ||||||
| 3.63%, 04/15/25 (Call 03/15/25) |
3,029 | 2,973,423 | ||||||
| 3.75%, 06/01/27 (Call 03/01/27) |
4,503 | 4,325,494 | ||||||
| 4.50%, 02/01/28 (Call 01/01/28)(a) |
3,100 | 3,036,369 | ||||||
| 5.05%, 07/15/26 |
2,795 | 2,789,040 | ||||||
| 6.25%, 11/01/28 (Call 10/01/28)(a) |
3,765 | 3,915,231 | ||||||
| Best Buy Co. Inc., 4.45%, 10/01/28 (Call 07/01/28)(a) |
3,450 | 3,381,265 | ||||||
| Costco Wholesale Corp. |
||||||||
| 1.38%, 06/20/27 (Call 04/20/27) |
8,260 | 7,430,637 | ||||||
| 3.00%, 05/18/27 (Call 02/18/27)(a) |
6,644 | 6,338,753 | ||||||
| Darden Restaurants Inc., 3.85%, 05/01/27 (Call 02/01/27)(a) |
4,013 | 3,853,612 | ||||||
| Dollar General Corp. |
||||||||
| 3.88%, 04/15/27 (Call 01/15/27) |
4,332 | 4,167,557 | ||||||
| 4.13%, 05/01/28 (Call 02/01/28)(a) |
1,641 | 1,583,146 | ||||||
| 4.15%, 11/01/25 (Call 08/01/25) |
3,068 | 3,005,954 | ||||||
| 4.63%, 11/01/27 (Call 10/01/27)(a) |
3,917 | 3,842,056 | ||||||
| 5.20%, 07/05/28 (Call 06/05/28)(a) |
2,750 | 2,747,495 | ||||||
| Dollar Tree Inc. |
||||||||
| 4.00%, 05/15/25 (Call 03/15/25)(a) |
6,136 | 6,026,173 | ||||||
| 4.20%, 05/15/28 (Call 02/15/28) |
8,193 | 7,901,892 | ||||||
| Security | Par (000) |
Value | ||||||
| Retail (continued) | ||||||||
| El Puerto de Liverpool SAB de CV, 3.88%, 10/06/26(a)(b) |
$ | 1,110 | $ | 1,068,988 | ||||
| Genuine Parts Co., 6.50%, 11/01/28 |
3,030 | 3,175,027 | ||||||
| Home Depot Inc. (The) |
||||||||
| 0.90%, 03/15/28 (Call 01/15/28)(a) |
997 | 860,255 | ||||||
| 1.50%, 09/15/28 (Call 07/15/28)(a) |
2,575 | 2,243,432 | ||||||
| 2.13%, 09/15/26 (Call 06/15/26)(a) |
6,328 | 5,916,088 | ||||||
| 2.50%, 04/15/27 (Call 02/15/27) |
4,740 | 4,417,156 | ||||||
| 2.70%, 04/15/25 (Call 03/15/25) |
2,645 | 2,576,906 | ||||||
| 2.80%, 09/14/27 (Call 06/14/27)(a) |
6,650 | 6,236,589 | ||||||
| 2.88%, 04/15/27 (Call 03/15/27) |
5,094 | 4,813,276 | ||||||
| 3.00%, 04/01/26 (Call 01/01/26)(a) |
8,228 | 7,924,354 | ||||||
| 3.35%, 09/15/25 (Call 06/15/25) |
6,441 | 6,289,161 | ||||||
| 3.90%, 12/06/28 (Call 09/06/28)(a) |
2,725 | 2,635,160 | ||||||
| 4.00%, 09/15/25 (Call 08/15/25) |
4,916 | 4,838,507 | ||||||
| 4.95%, 09/30/26 (Call 08/30/26)(a) |
4,295 | 4,297,351 | ||||||
| InRetail Consumer, 3.25%, 03/22/28 |
55 | 48,841 | ||||||
| Lowe’s Companies Inc. |
||||||||
| 1.30%, 04/15/28 (Call 02/15/28)(a) |
7,110 | 6,166,626 | ||||||
| 1.70%, 09/15/28 (Call 07/15/28)(a) |
8,185 | 7,110,951 | ||||||
| 2.50%, 04/15/26 (Call 01/15/26)(a) |
8,121 | 7,709,050 | ||||||
| 3.10%, 05/03/27 (Call 02/03/27)(a) |
10,024 | 9,477,027 | ||||||
| 3.35%, 04/01/27 (Call 03/01/27)(a) |
5,262 | 5,015,511 | ||||||
| 3.38%, 09/15/25 (Call 06/15/25) |
4,756 | 4,628,346 | ||||||
| 4.00%, 04/15/25 (Call 03/15/25) |
4,705 | 4,637,526 | ||||||
| 4.40%, 09/08/25(a) |
6,290 | 6,212,654 | ||||||
| 4.80%, 04/01/26 (Call 03/01/26)(a) |
6,310 | 6,271,446 | ||||||
| 6.88%, 02/15/28(a) |
45 | 48,407 | ||||||
| McDonald’s Corp. |
||||||||
| 1.45%, 09/01/25 (Call 08/01/25) |
3,231 | 3,058,560 | ||||||
| 3.30%, 07/01/25 (Call 06/01/25)(a) |
4,778 | 4,666,048 | ||||||
| 3.38%, 05/26/25 (Call 02/26/25)(a) |
4,187 | 4,092,434 | ||||||
| 3.50%, 03/01/27 (Call 12/01/26)(a) |
5,605 | 5,399,727 | ||||||
| 3.50%, 07/01/27 (Call 05/01/27)(a) |
6,754 | 6,468,179 | ||||||
| 3.70%, 01/30/26 (Call 10/30/25)(a) |
10,775 | 10,525,003 | ||||||
| 3.80%, 04/01/28 (Call 01/01/28) |
7,687 | 7,388,960 | ||||||
| 4.80%, 08/14/28 (Call 07/14/28) |
4,865 | 4,851,381 | ||||||
| O’Reilly Automotive Inc. |
||||||||
| 3.55%, 03/15/26 (Call 12/15/25)(a) |
3,128 | 3,027,191 | ||||||
| 3.60%, 09/01/27 (Call 06/01/27) |
5,695 | 5,425,189 | ||||||
| 4.35%, 06/01/28 (Call 03/01/28)(a) |
1,715 | 1,672,439 | ||||||
| 5.75%, 11/20/26 (Call 10/20/26) |
3,285 | 3,331,472 | ||||||
| Ross Stores Inc. |
||||||||
| 0.88%, 04/15/26 (Call 03/15/26)(a) |
3,050 | 2,789,413 | ||||||
| 4.60%, 04/15/25 (Call 03/15/25) |
4,290 | 4,248,387 | ||||||
| Starbucks Corp. |
||||||||
| 2.00%, 03/12/27 (Call 01/12/27)(a) |
3,947 | 3,620,097 | ||||||
| 2.45%, 06/15/26 (Call 03/15/26) |
2,689 | 2,539,080 | ||||||
| 3.50%, 03/01/28 (Call 12/01/27)(a) |
4,634 | 4,395,830 | ||||||
| 3.80%, 08/15/25 (Call 06/15/25) |
7,868 | 7,704,279 | ||||||
| 4.00%, 11/15/28 (Call 08/15/28)(a) |
3,918 | 3,788,619 | ||||||
| 4.75%, 02/15/26 (Call 01/15/26)(a) |
6,471 | 6,428,085 | ||||||
| 4.85%, 02/08/27 (Call 01/08/27) |
2,200 | 2,188,445 | ||||||
| Target Corp. |
||||||||
| 1.95%, 01/15/27 (Call 12/15/26)(a) |
5,980 | 5,529,797 | ||||||
| 2.25%, 04/15/25 (Call 03/15/25)(a) |
9,320 | 9,028,734 | ||||||
| 2.50%, 04/15/26(a) |
6,259 | 5,976,699 | ||||||
| 176 | 2 0 2 4 I S H A R E S A N N U A L R E P O R T T O S H A R E H O L D E R S |
| Schedule of Investments (continued) February 29, 2024 |
iShares® 1-5 Year Investment Grade Corporate Bond ETF (Percentages shown are based on Net Assets) |
| Security | Par (000) |
Value | ||||||
| Retail (continued) | ||||||||
| TJX Companies Inc. (The) |
||||||||
| 1.15%, 05/15/28 (Call 03/15/28) |
$ | 275 | $ | 237,071 | ||||
| 2.25%, 09/15/26 (Call 06/15/26) |
5,868 | 5,513,775 | ||||||
| Walmart Inc. |
||||||||
| 3.05%, 07/08/26 (Call 05/08/26)(a) |
5,115 | 4,920,934 | ||||||
| 3.55%, 06/26/25 (Call 04/26/25)(a) |
2,826 | 2,776,818 | ||||||
| 3.70%, 06/26/28 (Call 03/26/28)(a) |
1,540 | 1,489,782 | ||||||
| 3.90%, 04/15/28 (Call 03/15/28) |
8,318 | 8,116,296 | ||||||
| 4.00%, 04/15/26 (Call 03/15/26) |
4,330 | 4,264,501 | ||||||
| 5.88%, 04/05/27(a) |
1,175 | 1,220,580 | ||||||
|
|
|
|||||||
| 360,615,831 | ||||||||
| Savings & Loans — 0.2% | ||||||||
| Nationwide Building Society |
||||||||
| 1.50%, 10/13/26(a)(b) |
5,759 | 5,228,251 | ||||||
| 2.97%, 02/16/28 (Call 02/16/27), |
4,233 | 3,916,537 | ||||||
| 3.90%, 07/21/25(b) |
946 | 927,191 | ||||||
| 4.00%, 09/14/26(b) |
6,781 | 6,488,243 | ||||||
| 4.13%, 10/18/32 (Call 10/18/27), |
3,360 | 3,073,017 | ||||||
| 4.30%, 03/08/29 (Call 03/08/28), |
6,035 | 5,739,793 | ||||||
| 4.85%, 07/27/27(b) |
4,578 | 4,523,466 | ||||||
| 6.56%, 10/18/27 (Call 10/18/26), |
5,345 | 5,471,391 | ||||||
|
|
|
|||||||
| 35,367,889 | ||||||||
| Semiconductors — 1.6% | ||||||||
| Analog Devices Inc. |
||||||||
| 1.70%, 10/01/28 (Call 08/01/28)(a) |
5,325 | 4,649,843 | ||||||
| 2.95%, 04/01/25 (Call 03/01/25)(a) |
3,311 | 3,233,434 | ||||||
| 3.45%, 06/15/27 (Call 03/15/27)(a) |
870 | 833,105 | ||||||
| 3.50%, 12/05/26 (Call 09/05/26) |
6,178 | 5,967,387 | ||||||
| Applied Materials Inc. |
||||||||
| 3.30%, 04/01/27 (Call 01/01/27)(a) |
8,490 | 8,126,116 | ||||||
| 3.90%, 10/01/25 (Call 07/01/25)(a) |
4,923 | 4,837,885 | ||||||
| Broadcom Corp./Broadcom Cayman |
||||||||
| Finance Ltd. |
||||||||
| 3.50%, 01/15/28 (Call 10/15/27) |
5,798 | 5,462,521 | ||||||
| 3.88%, 01/15/27 (Call 10/15/26) |
18,474 | 17,850,832 | ||||||
| Broadcom Inc. |
||||||||
| 1.95%, 02/15/28 (Call 12/15/27)(a)(b) |
5,706 | 5,065,877 | ||||||
| 3.15%, 11/15/25 (Call 10/15/25) |
5,820 | 5,615,177 | ||||||
| 3.46%, 09/15/26 (Call 07/15/26)(a) |
4,982 | 4,780,355 | ||||||
| 4.11%, 09/15/28 (Call 06/15/28)(a) |
6,125 | 5,872,444 | ||||||
| Intel Corp. |
||||||||
| 1.60%, 08/12/28 (Call 06/12/28) |
1,640 | 1,426,087 | ||||||
| 2.60%, 05/19/26 (Call 02/19/26) |
6,709 | 6,381,805 | ||||||
| 3.15%, 05/11/27 (Call 02/11/27)(a) |
7,762 | 7,358,233 | ||||||
| 3.40%, 03/25/25 (Call 02/25/25)(a) |
8,922 | 8,749,889 | ||||||
| 3.70%, 07/29/25 (Call 04/29/25) |
14,923 | 14,619,669 | ||||||
| 3.75%, 03/25/27 (Call 01/25/27)(a) |
6,985 | 6,761,331 | ||||||
| 3.75%, 08/05/27 (Call 07/05/27)(a) |
8,295 | 7,997,053 | ||||||
| 4.88%, 02/10/26 |
10,155 | 10,119,708 | ||||||
| 4.88%, 02/10/28 (Call 01/10/28) |
14,739 | 14,705,031 | ||||||
| Lam Research Corp. |
||||||||
| 3.75%, 03/15/26 (Call 01/15/26)(a) |
5,419 | 5,287,154 | ||||||
| 3.80%, 03/15/25 (Call 12/15/24)(a) |
4,086 | 4,025,869 | ||||||
| Marvell Technology Inc. |
||||||||
| 1.65%, 04/15/26 (Call 03/15/26) |
3,619 | 3,356,432 | ||||||
| 2.45%, 04/15/28 (Call 02/15/28) |
4,290 | 3,851,766 | ||||||
| Security | Par (000) |
Value | ||||||
| Semiconductors (continued) | ||||||||
| 4.88%, 06/22/28 (Call 03/22/28) |
$ | 4,185 | $ | 4,116,706 | ||||
| 5.75%, 02/15/29 (Call 01/15/29) |
1,450 | 1,477,271 | ||||||
| Microchip Technology Inc., 4.25%, 09/01/25 |
7,861 | 7,714,235 | ||||||
| Micron Technology Inc. |
||||||||
| 4.19%, 02/15/27 (Call 12/15/26) |
5,826 | 5,663,547 | ||||||
| 4.98%, 02/06/26 (Call 12/06/25) |
3,621 | 3,602,008 | ||||||
| 5.33%, 02/06/29 (Call 11/06/28) |
3,800 | 3,804,610 | ||||||
| 5.38%, 04/15/28 (Call 03/15/28)(a) |
4,527 | 4,551,156 | ||||||
| NVIDIA Corp. |
||||||||
| 1.55%, 06/15/28 (Call 04/15/28)(a) |
4,193 | 3,712,940 | ||||||
| 3.20%, 09/16/26 (Call 06/16/26) |
6,485 | 6,251,253 | ||||||
| NXP BV/NXP Funding LLC |
||||||||
| 5.35%, 03/01/26 (Call 01/01/26)(a) |
3,383 | 3,380,628 | ||||||
| 5.55%, 12/01/28 (Call 09/01/28) |
4,260 | 4,304,022 | ||||||
| NXP BV/NXP Funding LLC/NXP USA Inc. |
||||||||
| 2.70%, 05/01/25 (Call 04/01/25) |
3,317 | 3,208,265 | ||||||
| 3.15%, 05/01/27 (Call 03/01/27) |
4,033 | 3,790,038 | ||||||
| 3.88%, 06/18/26 (Call 04/18/26)(a) |
4,974 | 4,816,105 | ||||||
| 4.40%, 06/01/27 (Call 05/01/27)(a) |
2,650 | 2,586,829 | ||||||
| QUALCOMM Inc. |
||||||||
| 1.30%, 05/20/28 (Call 02/20/28)(a) |
1,825 | 1,587,872 | ||||||
| 3.25%, 05/20/27 (Call 02/20/27) |
14,030 | 13,377,547 | ||||||
| 3.45%, 05/20/25 (Call 02/20/25) |
9,362 | 9,173,605 | ||||||
| Renesas Electronics Corp., 2.17%, 11/25/26 (Call 10/25/26)(b) |
5,661 | 5,140,547 | ||||||
| SK Hynix Inc. |
||||||||
| 1.50%, 01/19/26(a)(b) |
6,545 | 6,059,452 | ||||||
| 5.50%, 01/16/27(b) |
190 | 189,810 | ||||||
| 5.50%, 01/16/29(b) |
1,350 | 1,347,875 | ||||||
| 6.38%, 01/17/28(a)(b) |
6,780 | 6,984,558 | ||||||
| Skyworks Solutions Inc., 1.80%, 06/01/26 (Call 05/01/26)(a) |
3,678 | 3,390,710 | ||||||
| Texas Instruments Inc. |
||||||||
| 1.13%, 09/15/26 (Call 08/15/26)(a) |
3,730 | 3,401,487 | ||||||
| 2.90%, 11/03/27 (Call 08/03/27)(a) |
1,850 | 1,737,620 | ||||||
| 4.60%, 02/08/27 (Call 01/08/27)(a) |
1,875 | 1,868,716 | ||||||
| 4.60%, 02/15/28 (Call 01/15/28)(a) |
6,152 | 6,140,175 | ||||||
| 4.60%, 02/08/29 (Call 01/08/29)(a) |
3,265 | 3,246,732 | ||||||
| TSMC Arizona Corp. |
||||||||
| 1.75%, 10/25/26 (Call 09/25/26) |
7,796 | 7,168,755 | ||||||
| 3.88%, 04/22/27 (Call 03/22/27) |
5,705 | 5,527,512 | ||||||
| TSMC Global Ltd. |
||||||||
| 0.75%, 09/28/25 (Call 08/28/25)(a)(b) |
6,867 | 6,397,597 | ||||||
| 1.00%, 09/28/27 (Call 07/28/27)(a)(b) |
4,740 | 4,129,712 | ||||||
| 1.25%, 04/23/26 (Call 03/23/26)(a)(b) |
7,281 | 6,713,286 | ||||||
| 1.75%, 04/23/28 (Call 02/23/28)(a)(b) |
6,375 | 5,619,404 | ||||||
| 4.38%, 07/22/27 (Call 06/22/27)(a)(b) |
3,200 | 3,139,392 | ||||||
|
|
|
|||||||
| 332,256,980 | ||||||||
| Shipbuilding — 0.0% | ||||||||
| Huntington Ingalls Industries Inc. |
||||||||
| 2.04%, 08/16/28 (Call 06/16/28)(a) |
3,610 | 3,138,310 | ||||||
| 3.48%, 12/01/27 (Call 09/01/27) |
2,240 | 2,099,210 | ||||||
| 3.84%, 05/01/25 (Call 04/01/25) |
3,704 | 3,629,583 | ||||||
|
|
|
|||||||
| 8,867,103 | ||||||||
| Software — 2.1% | ||||||||
| Adobe Inc., 2.15%, 02/01/27 (Call 12/01/26) |
5,550 | 5,165,991 | ||||||
| Autodesk Inc. |
||||||||
| 3.50%, 06/15/27 (Call 03/15/27)(a) |
3,950 | 3,780,632 | ||||||
| 4.38%, 06/15/25 (Call 03/15/25)(a) |
2,631 | 2,603,023 | ||||||
| S C H E D U L E O F I N V E S T M E N T S |
177 |
| Schedule of Investments (continued) February 29, 2024 |
iShares® 1-5 Year Investment Grade Corporate Bond ETF (Percentages shown are based on Net Assets) |
| Security | Par (000) |
Value | ||||||
| Software (continued) | ||||||||
| Broadridge Financial Solutions Inc., 3.40%, 06/27/26 (Call 03/27/26) |
$ | 3,670 | $ | 3,508,349 | ||||
| Concentrix Corp. |
||||||||
| 6.60%, 08/02/28 (Call 07/02/28)(a) |
5,565 | 5,596,575 | ||||||
| 6.65%, 08/02/26 (Call 07/02/26)(a) |
5,320 | 5,396,705 | ||||||
| Constellation Software Inc., 5.16%, 02/16/29 (Call 01/16/29)(b) |
2,790 | 2,775,722 | ||||||
| Electronic Arts Inc., 4.80%, 03/01/26 (Call 12/01/25) |
4,179 | 4,159,239 | ||||||
| Fidelity National Information Services Inc. |
||||||||
| 1.15%, 03/01/26 (Call 02/01/26)(a) |
8,142 | 7,529,334 | ||||||
| 1.65%, 03/01/28 (Call 01/01/28)(a) |
5,759 | 5,074,656 | ||||||
| 4.50%, 07/15/25(a) |
5,431 | 5,378,292 | ||||||
| 4.70%, 07/15/27 (Call 06/15/27)(a) |
3,768 | 3,739,980 | ||||||
| Fiserv Inc. |
||||||||
| 2.25%, 06/01/27 (Call 04/01/27)(a) |
6,978 | 6,383,198 | ||||||
| 3.20%, 07/01/26 (Call 05/01/26) |
13,238 | 12,648,967 | ||||||
| 3.85%, 06/01/25 (Call 03/01/25) |
6,233 | 6,108,007 | ||||||
| 4.20%, 10/01/28 (Call 07/01/28) |
6,680 | 6,409,832 | ||||||
| 5.15%, 03/15/27 (Call 02/15/27) |
3,100 | 3,101,130 | ||||||
| 5.38%, 08/21/28 (Call 07/21/28) |
5,095 | 5,135,882 | ||||||
| 5.45%, 03/02/28 (Call 02/02/28) |
6,003 | 6,056,111 | ||||||
| Infor Inc., 1.75%, 07/15/25 (Call 06/15/25)(b) |
4,413 | 4,170,227 | ||||||
| Intuit Inc. |
||||||||
| 0.95%, 07/15/25 (Call 06/15/25) |
3,867 | 3,648,670 | ||||||
| 1.35%, 07/15/27 (Call 05/15/27)(a) |
3,930 | 3,507,042 | ||||||
| 5.13%, 09/15/28 (Call 08/15/28)(a) |
6,690 | 6,775,124 | ||||||
| 5.25%, 09/15/26 (Call 08/15/26)(a) |
5,320 | 5,364,975 | ||||||
| Microsoft Corp. |
||||||||
| 2.40%, 08/08/26 (Call 05/08/26) |
26,478 | 25,076,049 | ||||||
| 3.13%, 11/03/25 (Call 08/03/25)(a) |
19,930 | 19,371,553 | ||||||
| 3.30%, 02/06/27 (Call 11/06/26) |
26,798 | 25,883,059 | ||||||
| 3.40%, 09/15/26 (Call 06/15/26)(b) |
5,814 | 5,623,546 | ||||||
| 3.40%, 06/15/27 (Call 03/15/27)(a)(b) |
999 | 959,067 | ||||||
| Open Text Corp., 6.90%, 12/01/27 |
6,910 | 7,133,221 | ||||||
| Oracle Corp. |
||||||||
| 1.65%, 03/25/26 (Call 02/25/26)(a) |
17,771 | 16,504,971 | ||||||
| 2.30%, 03/25/28 (Call 01/25/28)(a) |
15,000 | 13,442,348 | ||||||
| 2.50%, 04/01/25 (Call 03/01/25) |
21,929 | 21,229,276 | ||||||
| 2.65%, 07/15/26 (Call 04/15/26) |
18,786 | 17,694,023 | ||||||
| 2.80%, 04/01/27 (Call 02/01/27)(a) |
14,848 | 13,849,271 | ||||||
| 2.95%, 05/15/25 (Call 02/15/25)(a) |
15,927 | 15,449,748 | ||||||
| 3.25%, 11/15/27 (Call 08/15/27) |
18,086 | 16,962,616 | ||||||
| 4.50%, 05/06/28 (Call 04/06/28)(a) |
7,030 | 6,893,812 | ||||||
| 5.80%, 11/10/25 |
6,647 | 6,701,797 | ||||||
| Roper Technologies Inc. |
||||||||
| 1.00%, 09/15/25 (Call 08/15/25) |
5,392 | 5,051,372 | ||||||
| 1.40%, 09/15/27 (Call 07/15/27)(a) |
5,751 | 5,085,397 | ||||||
| 3.80%, 12/15/26 (Call 09/15/26)(a) |
4,961 | 4,797,820 | ||||||
| 3.85%, 12/15/25 (Call 09/15/25) |
2,649 | 2,583,625 | ||||||
| 4.20%, 09/15/28 (Call 06/15/28) |
5,981 | 5,782,803 | ||||||
| Salesforce Inc. |
||||||||
| 1.50%, 07/15/28 (Call 05/15/28) |
8,100 | 7,083,025 | ||||||
| 3.70%, 04/11/28 (Call 01/11/28) |
11,842 | 11,416,406 | ||||||
| Take-Two Interactive Software Inc. |
||||||||
| 3.55%, 04/14/25 |
6,140 | 6,014,118 | ||||||
| 3.70%, 04/14/27 (Call 03/14/27) |
4,757 | 4,548,712 | ||||||
| 4.95%, 03/28/28 (Call 02/28/28) |
8,923 | 8,851,732 | ||||||
| 5.00%, 03/28/26 |
5,610 | 5,579,374 | ||||||
| Security | Par (000) |
Value | ||||||
| Software (continued) | ||||||||
| VMware LLC |
||||||||
| 1.40%, 08/15/26 (Call 07/15/26) |
$ | 9,903 | $ | 9,002,117 | ||||
| 1.80%, 08/15/28 (Call 06/15/28) |
4,145 | 3,593,341 | ||||||
| 3.90%, 08/21/27 (Call 05/21/27)(a) |
8,244 | 7,858,503 | ||||||
| 4.50%, 05/15/25 (Call 04/15/25) |
5,393 | 5,334,645 | ||||||
| 4.65%, 05/15/27 (Call 03/15/27) |
3,694 | 3,615,831 | ||||||
| Workday Inc., 3.50%, 04/01/27 (Call 03/01/27) |
7,720 | 7,356,171 | ||||||
|
|
|
|||||||
| 440,347,012 | ||||||||
| Telecommunications — 2.6% | ||||||||
| AT&T Inc. |
||||||||
| 1.65%, 02/01/28 (Call 12/01/27) |
15,090 | 13,277,718 | ||||||
| 1.70%, 03/25/26 (Call 03/11/24) |
19,827 | 18,438,850 | ||||||
| 2.30%, 06/01/27 (Call 04/01/27) |
16,761 | 15,347,541 | ||||||
| 2.95%, 07/15/26 (Call 04/15/26)(a) |
2,798 | 2,660,050 | ||||||
| 3.80%, 02/15/27 (Call 11/15/26) |
5,394 | 5,202,379 | ||||||
| 3.88%, 01/15/26 (Call 10/15/25) |
3,154 | 3,078,280 | ||||||
| 4.10%, 02/15/28 (Call 11/15/27) |
11,355 | 10,949,663 | ||||||
| 4.25%, 03/01/27 (Call 12/01/26) |
10,350 | 10,090,182 | ||||||
| 5.54%, 02/20/26 (Call 03/11/24) |
5,905 | 5,902,141 | ||||||
| Bharti Airtel Ltd., 4.38%, 06/10/25(a)(b) |
5,448 | 5,351,864 | ||||||
| British Telecommunications PLC, 5.13%, 12/04/28 (Call 09/04/28)(a) |
3,754 | 3,774,112 | ||||||
| Cisco Systems Inc. |
||||||||
| 2.50%, 09/20/26 (Call 06/20/26) |
9,852 | 9,297,013 | ||||||
| 2.95%, 02/28/26 |
4,948 | 4,770,348 | ||||||
| 3.50%, 06/15/25 |
3,825 | 3,753,530 | ||||||
| 4.80%, 02/26/27 (Call 01/26/27)(a) |
9,070 | 9,077,546 | ||||||
| 4.85%, 02/26/29 (Call 01/26/29) |
13,575 | 13,595,962 | ||||||
| 4.90%, 02/26/26(a) |
5,630 | 5,630,937 | ||||||
| Deutsche Telekom International Finance BV |
||||||||
| 3.60%, 01/19/27 (Call 10/19/26)(a)(b) |
1,875 | 1,813,507 | ||||||
| 4.38%, 06/21/28 (Call 03/21/28)(a)(b) |
7,045 | 6,858,269 | ||||||
| Empresa Nacional de Telecomunicaciones SA, 4.75%, 08/01/26 (Call 05/03/26)(a)(b) |
3,062 | 2,981,822 | ||||||
| Juniper Networks Inc., 1.20%, 12/10/25 (Call 11/10/25) |
2,854 | 2,643,680 | ||||||
| KT Corp., 2.50%, 07/18/26(b) |
210 | 196,735 | ||||||
| Motorola Solutions Inc. |
||||||||
| 4.60%, 02/23/28 (Call 11/23/27)(a) |
5,399 | 5,300,876 | ||||||
| 7.50%, 05/15/25 |
458 | 467,564 | ||||||
| NBN Co. Ltd. |
||||||||
| 1.45%, 05/05/26 (Call 04/05/26)(a)(b) |
9,006 | 8,301,384 | ||||||
| 1.63%, 01/08/27 (Call 12/08/26)(a)(b) |
7,645 | 6,940,360 | ||||||
| 5.75%, 10/06/28 (Call 09/06/28)(a)(b) |
10,260 | 10,562,049 | ||||||
| Nokia OYJ, 4.38%, 06/12/27(a) |
2,259 | 2,164,866 | ||||||
| NTT Finance Corp. |
||||||||
| 1.16%, 04/03/26 (Call 03/03/26)(b) |
20,794 | 19,155,403 | ||||||
| 1.59%, 04/03/28 (Call 02/03/28)(a)(b) |
10,005 | 8,774,933 | ||||||
| 4.24%, 07/25/25(a)(b) |
4,590 | 4,523,474 | ||||||
| 4.37%, 07/27/27 (Call 06/27/27)(a)(b) |
3,345 | 3,279,375 | ||||||
| Ooredoo International Finance Ltd. |
||||||||
| 3.75%, 06/22/26(a)(b) |
1,692 | 1,640,265 | ||||||
| 5.00%, 10/19/25(b) |
9,650 | 9,568,844 | ||||||
| Rogers Communications Inc. |
||||||||
| 2.90%, 11/15/26 (Call 08/15/26)(a) |
4,227 | 3,978,757 | ||||||
| 2.95%, 03/15/25 |
7,630 | 7,426,755 | ||||||
| 3.20%, 03/15/27 (Call 02/15/27)(a) |
9,200 | 8,662,485 | ||||||
| 3.63%, 12/15/25 (Call 09/15/25) |
5,327 | 5,162,964 | ||||||
| 5.00%, 02/15/29 (Call 01/15/29) |
2,740 | 2,715,602 | ||||||
| SK Telecom Co. Ltd., 6.63%, 07/20/27(a)(b) |
1,105 | 1,151,543 | ||||||
| Sprint Capital Corp., 6.88%, 11/15/28 |
13,295 | 14,142,051 | ||||||
| 178 | 2 0 2 4 I S H A R E S A N N U A L R E P O R T T O S H A R E H O L D E R S |
| Schedule of Investments (continued) February 29, 2024 |
iShares® 1-5 Year Investment Grade Corporate Bond ETF (Percentages shown are based on Net Assets) |
| Security | Par (000) |
Value | ||||||
| Telecommunications (continued) | ||||||||
| Sprint LLC, 7.63%, 03/01/26 (Call 11/01/25) |
$ | 11,690 | $ | 12,078,599 | ||||
| Telefonica Emisiones SA, 4.10%, 03/08/27(a) |
6,237 | 6,040,880 | ||||||
| Telstra Corp. Ltd., 3.13%, 04/07/25 |
8,949 | 8,732,465 | ||||||
| TELUS Corp. |
||||||||
| 2.80%, 02/16/27 (Call 11/16/26) |
4,212 | 3,945,234 | ||||||
| 3.70%, 09/15/27 (Call 06/15/27) |
3,600 | 3,418,464 | ||||||
| T-Mobile USA Inc. |
||||||||
| 1.50%, 02/15/26 (Call 01/15/26) |
7,210 | 6,697,668 | ||||||
| 2.05%, 02/15/28 (Call 12/15/27) |
11,605 | 10,339,806 | ||||||
| 2.25%, 02/15/26 (Call 03/11/24) |
12,211 | 11,504,159 | ||||||
| 2.63%, 04/15/26 (Call 03/11/24)(a) |
8,627 | 8,164,168 | ||||||
| 2.63%, 02/15/29 (Call 03/11/24) |
25 | 22,167 | ||||||
| 3.50%, 04/15/25 (Call 03/15/25) |
19,903 | 19,457,107 | ||||||
| 3.75%, 04/15/27 (Call 02/15/27) |
26,034 | 24,955,061 | ||||||
| 4.75%, 02/01/28 (Call 03/11/24)(a) |
10,235 | 10,055,086 | ||||||
| 4.80%, 07/15/28 (Call 06/15/28) |
7,166 | 7,073,712 | ||||||
| 4.85%, 01/15/29 (Call 12/15/28) |
9,650 | 9,524,216 | ||||||
| 4.95%, 03/15/28 (Call 02/15/28)(a) |
7,840 | 7,794,462 | ||||||
| 5.38%, 04/15/27 (Call 03/11/24)(a) |
4,701 | 4,691,390 | ||||||
| Verizon Communications Inc. |
||||||||
| 0.85%, 11/20/25 (Call 10/20/25)(a) |
10,249 | 9,514,106 | ||||||
| 1.45%, 03/20/26 (Call 02/20/26) |
13,257 | 12,292,000 | ||||||
| 2.10%, 03/22/28 (Call 01/22/28) |
22,905 | 20,394,406 | ||||||
| 2.63%, 08/15/26 |
12,435 | 11,723,726 | ||||||
| 3.00%, 03/22/27 (Call 01/22/27) |
5,302 | 4,990,556 | ||||||
| 3.88%, 02/08/29 (Call 11/08/28)(a) |
250 | 237,365 | ||||||
| 4.13%, 03/16/27(a) |
20,780 | 20,204,467 | ||||||
| 4.33%, 09/21/28(a) |
30,055 | 29,170,713 | ||||||
| Vodafone Group PLC |
||||||||
| 4.13%, 05/30/25 |
11,652 | 11,464,680 | ||||||
| 4.38%, 05/30/28(a) |
7,035 | 6,914,433 | ||||||
|
|
|
|||||||
| 560,012,775 | ||||||||
| Toys, Games & Hobbies — 0.1% | ||||||||
| Hasbro Inc. |
||||||||
| 3.50%, 09/15/27 (Call 06/15/27)(a) |
3,275 | 3,074,292 | ||||||
| 3.55%, 11/19/26 (Call 09/19/26) |
4,518 | 4,289,565 | ||||||
| Mattel Inc. |
||||||||
| 3.38%, 04/01/26 (Call 03/11/24)(a)(b) |
4,090 | 3,881,561 | ||||||
| 5.88%, 12/15/27 (Call 04/01/24)(b) |
5,385 | 5,388,420 | ||||||
|
|
|
|||||||
| 16,633,838 | ||||||||
| Transportation — 0.8% | ||||||||
| Burlington Northern Santa Fe LLC |
||||||||
| 3.00%, 04/01/25 (Call 01/01/25)(a) |
3,345 | 3,269,323 | ||||||
| 3.25%, 06/15/27 (Call 03/15/27) |
2,085 | 1,989,425 | ||||||
| 3.65%, 09/01/25 (Call 06/01/25) |
2,328 | 2,279,524 | ||||||
| 7.00%, 12/15/25 |
3,168 | 3,274,009 | ||||||
| Canadian National Railway Co. |
||||||||
| 2.75%, 03/01/26 (Call 12/01/25)(a) |
3,543 | 3,399,362 | ||||||
| 6.90%, 07/15/28(a) |
485 | 523,084 | ||||||
| Canadian Pacific Railway Co. |
||||||||
| 1.75%, 12/02/26 (Call 11/02/26) |
5,680 | 5,208,867 | ||||||
| 3.70%, 02/01/26 (Call 11/01/25) |
1,685 | 1,635,374 | ||||||
| 4.00%, 06/01/28 (Call 03/01/28)(a) |
2,590 | 2,494,038 | ||||||
| CH Robinson Worldwide Inc., 4.20%, 04/15/28 (Call 01/15/28)(a) |
4,140 | 3,994,199 | ||||||
| CSX Corp. |
||||||||
| 2.60%, 11/01/26 (Call 08/01/26)(a) |
4,667 | 4,404,466 | ||||||
| 3.25%, 06/01/27 (Call 03/01/27) |
5,518 | 5,238,241 | ||||||
| 3.35%, 11/01/25 (Call 08/01/25)(a) |
4,053 | 3,934,403 | ||||||
| Security | Par (000) |
Value | ||||||
| Transportation (continued) | ||||||||
| 3.80%, 03/01/28 (Call 12/01/27)(a) |
$ | 4,978 | $ | 4,790,682 | ||||
| FedEx Corp. |
||||||||
| 3.25%, 04/01/26 (Call 01/01/26)(a) |
5,177 | 4,991,028 | ||||||
| 3.40%, 02/15/28 (Call 11/15/27)(a) |
2,640 | 2,492,080 | ||||||
| 4.20%, 10/17/28 (Call 07/17/28) |
2,335 | 2,249,594 | ||||||
| JB Hunt Transport Services Inc., 3.88%, 03/01/26 (Call 01/01/26)(a) |
4,806 | 4,692,663 | ||||||
| Kirby Corp., 4.20%, 03/01/28 (Call 12/01/27) |
410 | 391,800 | ||||||
| Misc Capital Two Labuan Ltd., 3.75%, 04/06/27 (Call 03/06/27)(a)(b) |
5,410 | 5,157,185 | ||||||
| Norfolk Southern Corp. |
||||||||
| 2.90%, 06/15/26 (Call 03/15/26)(a) |
4,132 | 3,938,343 | ||||||
| 3.15%, 06/01/27 (Call 03/01/27)(a) |
940 | 890,600 | ||||||
| 3.65%, 08/01/25 (Call 06/01/25)(a) |
2,175 | 2,125,203 | ||||||
| 3.80%, 08/01/28 (Call 05/01/28) |
2,145 | 2,053,845 | ||||||
| 5.59%, 05/17/25 |
1,576 | 1,579,842 | ||||||
| 7.80%, 05/15/27 |
2,660 | 2,878,546 | ||||||
| Ryder System Inc. |
||||||||
| 1.75%, 09/01/26 (Call 08/01/26) |
2,404 | 2,202,330 | ||||||
| 2.85%, 03/01/27 (Call 02/01/27)(a) |
2,905 | 2,721,919 | ||||||
| 2.90%, 12/01/26 (Call 10/01/26)(a) |
1,826 | 1,717,568 | ||||||
| 3.35%, 09/01/25 (Call 08/01/25)(a) |
2,670 | 2,588,664 | ||||||
| 4.30%, 06/15/27 (Call 05/15/27) |
1,500 | 1,459,850 | ||||||
| 4.63%, 06/01/25 (Call 05/01/25)(a) |
2,682 | 2,656,616 | ||||||
| 5.25%, 06/01/28 (Call 05/01/28)(a) |
4,278 | 4,285,972 | ||||||
| 5.30%, 03/15/27 (Call 02/15/27) |
1,635 | 1,636,972 | ||||||
| 5.38%, 03/15/29 (Call 02/15/29) |
2,325 | 2,323,304 | ||||||
| 5.65%, 03/01/28 (Call 02/01/28)(a) |
3,440 | 3,496,736 | ||||||
| 6.30%, 12/01/28 (Call 11/01/28)(a) |
2,705 | 2,818,049 | ||||||
| TTX Co., 5.50%, 09/25/26 (Call 08/25/26)(b) |
2,245 | 2,251,110 | ||||||
| Union Pacific Corp. |
||||||||
| 2.15%, 02/05/27 (Call 12/05/26) |
1,120 | 1,039,412 | ||||||
| 2.75%, 03/01/26 (Call 12/01/25)(a) |
4,094 | 3,921,344 | ||||||
| 3.00%, 04/15/27 (Call 01/15/27)(a) |
3,323 | 3,150,120 | ||||||
| 3.25%, 08/15/25 (Call 05/15/25) |
3,201 | 3,118,559 | ||||||
| 3.75%, 07/15/25 (Call 05/15/25) |
3,322 | 3,259,585 | ||||||
| 3.95%, 09/10/28 (Call 06/10/28)(a) |
6,775 | 6,571,545 | ||||||
| 4.75%, 02/21/26 (Call 01/21/26)(a) |
3,130 | 3,122,580 | ||||||
| 6.63%, 02/01/29(a) |
270 | 292,002 | ||||||
| United Parcel Service Inc. |
||||||||
| 2.40%, 11/15/26 (Call 08/15/26)(a) |
1,147 | 1,080,784 | ||||||
| 3.05%, 11/15/27 (Call 08/15/27) |
6,396 | 6,014,032 | ||||||
| 3.90%, 04/01/25 (Call 03/01/25)(a) |
6,707 | 6,615,750 | ||||||
| Walmart Inc. |
||||||||
| 1.05%, 09/17/26 (Call 08/17/26)(a) |
7,792 | 7,118,455 | ||||||
| 1.50%, 09/22/28 (Call 07/22/28)(a) |
2,770 | 2,432,416 | ||||||
| 3.95%, 09/09/27 (Call 08/09/27)(a) |
7,455 | 7,307,793 | ||||||
| XPO Inc., 6.25%, 06/01/28 (Call 06/01/25)(a)(b) |
5,090 | 5,101,447 | ||||||
|
|
|
|||||||
| 170,180,640 | ||||||||
| Trucking & Leasing — 0.4% | ||||||||
| DAE Funding LLC |
||||||||
| 2.63%, 03/20/25 (Call 02/20/25)(a)(b) |
6,547 | 6,290,279 | ||||||
| 3.38%, 03/20/28 (Call 01/20/28)(a)(b) |
5,820 | 5,331,411 | ||||||
| GATX Corp. |
||||||||
| 3.25%, 03/30/25 (Call 12/30/24)(a) |
3,045 | 2,966,478 | ||||||
| 3.25%, 09/15/26 (Call 06/15/26) |
2,964 | 2,818,804 | ||||||
| 3.50%, 03/15/28 (Call 12/15/27) |
915 | 857,713 | ||||||
| 3.85%, 03/30/27 (Call 12/30/26)(a) |
1,988 | 1,904,621 | ||||||
| 4.55%, 11/07/28 (Call 08/07/28)(a) |
525 | 511,792 | ||||||
| 5.40%, 03/15/27 (Call 02/15/27) |
555 | 556,127 | ||||||
| S C H E D U L E O F I N V E S T M E N T S |
179 |
| Schedule of Investments (continued) February 29, 2024 |
iShares® 1-5 Year Investment Grade Corporate Bond ETF (Percentages shown are based on Net Assets) |
| Security | Par (000) |
Value | ||||||
| Trucking & Leasing (continued) | ||||||||
| Penske Truck Leasing Co. LP/PTL Finance Corp. |
||||||||
| 1.20%, 11/15/25 (Call 10/15/25)(b) |
$ | 4,749 | $ | 4,411,254 | ||||
| 1.70%, 06/15/26 (Call 05/15/26)(a)(b) |
4,950 | 4,556,445 | ||||||
| 3.40%, 11/15/26 (Call 08/15/26)(a)(b) |
3,707 | 3,509,929 | ||||||
| 3.95%, 03/10/25 (Call 01/10/25)(b) |
4,574 | 4,487,259 | ||||||
| 4.00%, 07/15/25 (Call 06/15/25)(b) |
3,284 | 3,208,866 | ||||||
| 4.20%, 04/01/27 (Call 01/01/27)(a)(b) |
2,796 | 2,697,142 | ||||||
| 4.40%, 07/01/27 (Call 06/01/27)(a)(b) |
4,825 | 4,681,914 | ||||||
| 4.45%, 01/29/26 (Call 11/29/25)(a)(b) |
2,577 | 2,513,649 | ||||||
| 5.35%, 01/12/27 (Call 12/12/26)(a)(b) |
2,110 | 2,104,105 | ||||||
| 5.55%, 05/01/28 (Call 04/01/28)(a)(b) |
4,900 | 4,929,609 | ||||||
| 5.70%, 02/01/28 (Call 01/01/28)(a)(b) |
4,615 | 4,656,837 | ||||||
| 5.75%, 05/24/26 (Call 04/24/26)(a)(b) |
4,570 | 4,593,719 | ||||||
| 5.88%, 11/15/27 (Call 10/15/27)(a)(b) |
3,295 | 3,345,672 | ||||||
| 6.05%, 08/01/28 (Call 07/01/28)(a)(b) |
7,165 | 7,328,583 | ||||||
| SMBC Aviation Capital Finance DAC |
||||||||
| 1.90%, 10/15/26 (Call 09/15/26)(b) |
3,946 | 3,587,970 | ||||||
| 2.30%, 06/15/28 (Call 04/15/28)(b) |
1,920 | 1,684,968 | ||||||
| 5.45%, 05/03/28 (Call 04/03/28)(a)(b) |
5,225 | 5,214,415 | ||||||
|
|
|
|||||||
| 88,749,561 | ||||||||
| Venture Capital — 0.0% | ||||||||
| Hercules Capital Inc. |
||||||||
| 2.63%, 09/16/26 (Call 08/16/26)(a) |
2,098 | 1,889,785 | ||||||
| 3.38%, 01/20/27 (Call 12/20/26)(a) |
2,515 | 2,281,463 | ||||||
|
|
|
|||||||
| 4,171,248 | ||||||||
| Water — 0.0% | ||||||||
| American Water Capital Corp. |
||||||||
| 2.95%, 09/01/27 (Call 06/01/27)(a) |
4,307 | 4,015,037 | ||||||
| 3.00%, 12/01/26 (Call 09/01/26) |
195 | 183,358 | ||||||
| 3.40%, 03/01/25 (Call 12/01/24)(a) |
4,210 | 4,126,563 | ||||||
| 3.75%, 09/01/28 (Call 06/01/28) |
1,350 | 1,281,440 | ||||||
| United Utilities PLC, 6.88%, 08/15/28(a) |
1,200 | 1,271,874 | ||||||
|
|
|
|||||||
| 10,878,272 | ||||||||
|
|
|
|||||||
| Total Corporate Bonds & Notes — 98.4% (Cost: $21,586,851,444) |
21,003,717,724 | |||||||
|
|
|
|||||||
| Foreign Government Obligations(f) |
||||||||
| Panama — 0.0% | ||||||||
| Banco Latinoamericano de Comercio Exterior SA, 2.38%, 09/14/25 (Call 08/15/25)(b) |
5,095 | 4,795,669 | ||||||
|
|
|
|||||||
| South Korea — 0.4% | ||||||||
| Korea Electric Power Corp. |
||||||||
| 1.13%, 06/15/25(a)(b) |
3,527 | 3,342,001 | ||||||
| 3.63%, 06/14/25(b) |
3,345 | 3,272,862 | ||||||
| 4.00%, 06/14/27(a)(b) |
3,040 | 2,934,919 | ||||||
| 4.88%, 01/31/27(b) |
465 | 464,192 | ||||||
| 5.38%, 04/06/26(a)(b) |
4,270 | 4,280,481 | ||||||
| 5.38%, 07/31/26(a)(b) |
740 | 741,956 | ||||||
| 5.50%, 04/06/28(a)(b) |
2,990 | 3,039,610 | ||||||
| 7.00%, 02/01/27(a) |
2,284 | 2,395,008 | ||||||
| Korea Gas Corp. |
||||||||
| 1.13%, 07/13/26(a)(b) |
4,746 | 4,317,983 | ||||||
| 2.25%, 07/18/26(a)(b) |
2,865 | 2,676,379 | ||||||
| 3.13%, 07/20/27(a)(b) |
1,105 | 1,036,568 | ||||||
| 3.50%, 07/02/26(a)(b) |
4,525 | 4,351,556 | ||||||
| 3.88%, 07/13/27(a)(b) |
3,470 | 3,338,992 | ||||||
| Security | Par (000) |
Value | ||||||
| South Korea (continued) | ||||||||
| 4.88%, 07/05/28(a)(b) |
$ | 4,080 | $ | 4,056,040 | ||||
| Korea Housing Finance Corp. |
||||||||
| 4.63%, 02/24/28(b) |
4,230 | 4,189,944 | ||||||
| 5.38%, 11/15/26(a)(b) |
805 | 812,283 | ||||||
| Korea Hydro & Nuclear Power Co. Ltd. |
|
|||||||
| 1.25%, 04/27/26(b) |
4,320 | 3,960,768 | ||||||
| 3.13%, 07/25/27(b) |
3,063 | 2,869,755 | ||||||
| 4.25%, 07/27/27(b) |
3,680 | 3,574,942 | ||||||
| 5.00%, 07/18/28(a)(b) |
4,045 | 4,039,054 | ||||||
| Korea National Oil Corp. |
||||||||
| 0.88%, 10/05/25(b) |
370 | 344,969 | ||||||
| 1.25%, 04/07/26(b) |
3,000 | 2,761,888 | ||||||
| 1.75%, 04/18/25(a)(b) |
5,000 | 4,800,956 | ||||||
| 2.13%, 04/18/27(b) |
5,000 | 4,567,379 | ||||||
| 2.50%, 10/24/26(b) |
4,609 | 4,295,423 | ||||||
| 2.63%, 04/14/26(b) |
1,966 | 1,861,841 | ||||||
| 3.25%, 10/01/25(b) |
1,734 | 1,678,978 | ||||||
| 3.38%, 03/27/27(b) |
3,000 | 2,853,015 | ||||||
| 4.75%, 04/03/26(b) |
2,000 | 1,973,480 | ||||||
| 4.88%, 04/03/28(b) |
3,000 | 2,962,410 | ||||||
|
|
|
|||||||
| 87,795,632 | ||||||||
|
|
|
|||||||
| Total Foreign Government Obligations — 0.4% |
|
92,591,301 | ||||||
|
|
|
|||||||
| Total Long-Term Investments — 98.8% |
|
21,096,309,025 | ||||||
|
|
|
|||||||
| Shares | ||||||||
| Short-Term Securities |
||||||||
| Money Market Funds — 7.9% | ||||||||
| BlackRock Cash Funds: Institutional, SL Agency Shares, 5.50%(g)(h)(i) |
1,626,047,630 | 1,626,860,654 | ||||||
| BlackRock Cash Funds: Treasury, SL Agency Shares, 5.30%(g)(h) |
49,160,000 | 49,160,000 | ||||||
|
|
|
|||||||
| Total Short-Term Securities — 7.9% (Cost: $1,675,363,139) |
1,676,020,654 | |||||||
|
|
|
|||||||
| Total Investments — 106.7% (Cost: $23,358,224,398) |
22,772,329,679 | |||||||
| Liabilities in Excess of Other Assets — (6.7)% |
(1,420,666,360 | ) | ||||||
|
|
|
|||||||
| Net Assets — 100.0% |
$ | 21,351,663,319 | ||||||
|
|
|
|||||||
| (a) | All or a portion of this security is on loan. |
| (b) | Security exempt from registration pursuant to Rule 144A under the Securities Act of 1933, as amended. These securities may be resold in transactions exempt from registration to qualified institutional investors. |
| (c) | Variable rate security. Interest rate resets periodically. The rate shown is the effective interest rate as of period end. Security description also includes the reference rate and spread if published and available. |
| (d) | Perpetual security with no stated maturity date. |
| (e) | Step coupon security. Coupon rate will either increase (step-up bond) or decrease (step-down bond) at regular intervals until maturity. Interest rate shown reflects the rate currently in effect. |
| (f) | U.S. dollar denominated security issued by foreign domiciled entity. |
| (g) | Affiliate of the Fund. |
| (h) | Annualized 7-day yield as of period end. |
| (i) | All or a portion of this security was purchased with the cash collateral from loaned securities. |
| 180 | 2 0 2 4 I S H A R E S A N N U A L R E P O R T T O S H A R E H O L D E R S |
| Schedule of Investments (continued) February 29, 2024 |
iShares® 1-5 Year Investment Grade Corporate Bond ETF |
Affiliates
Investments in issuers considered to be affiliate(s) of the Fund during the year ended February 29, 2024 for purposes of Section 2(a)(3) of the Investment Company Act of 1940, as amended, were as follows:
| Affiliated Issuer | Value at 02/28/23 |
Purchases at Cost |
Proceeds from Sale |
Net Realized Gain (Loss) |
Change in Unrealized Appreciation (Depreciation) |
Value at 02/29/24 |
Shares Held at 02/29/24 |
Income | Capital Gain Distributions from Underlying Funds |
|||||||||||||||||||||||||||||||
| BlackRock Cash Funds: Institutional, SL Agency Shares |
$ | 1,565,570,896 | $ | 61,530,956 | (a) | $ | — | $ | 143,234 | $ | (384,432 | ) | $ | 1,626,860,654 | 1,626,047,630 | $ | 5,854,331 | (b) | $ | — | ||||||||||||||||||||
| BlackRock Cash Funds: Treasury, SL Agency Shares |
41,030,000 | 8,130,000 | (a) | — | — | — | 49,160,000 | 49,160,000 | 2,710,497 | — | ||||||||||||||||||||||||||||||
|
|
|
|
|
|
|
|
|
|
|
|||||||||||||||||||||||||||||||
| $ | 143,234 | $ | (384,432 | ) | $ | 1,676,020,654 | $ | 8,564,828 | $ | — | ||||||||||||||||||||||||||||||
|
|
|
|
|
|
|
|
|
|
|
|||||||||||||||||||||||||||||||
| (a) | Represents net amount purchased (sold). |
| (b) | All or a portion represents securities lending income earned from the reinvestment of cash collateral from loaned securities, net of fees and collateral investment expenses, and other payments to and from borrowers of securities. |
Fair Value Hierarchy as of Period End
Various inputs are used in determining the fair value of financial instruments. For a description of the input levels and information about the Fund’s policy regarding valuation of financial instruments, refer to the Notes to Financial Statements.
The following table summarizes the Fund’s financial instruments categorized in the fair value hierarchy. The breakdown of the Fund’s financial instruments into major categories is disclosed in the Schedule of Investments above.
|
|
||||||||||||||||||||||||||||
| Level 1 | Level 2 | Level 3 | Total | |||||||||||||||||||||||||
|
|
||||||||||||||||||||||||||||
| Assets |
||||||||||||||||||||||||||||
| Investments |
||||||||||||||||||||||||||||
| Long-Term Investments |
||||||||||||||||||||||||||||
| Corporate Bonds & Notes |
$ | — | $ | 21,003,717,724 | $ | — | $ | 21,003,717,724 | ||||||||||||||||||||
| Foreign Government Obligations |
— | 92,591,301 | — | 92,591,301 | ||||||||||||||||||||||||
| Short-Term Securities |
||||||||||||||||||||||||||||
| Money Market Funds |
1,676,020,654 | — | — | 1,676,020,654 | ||||||||||||||||||||||||
|
|
|
|
|
|
|
|
|
|||||||||||||||||||||
| $ | 1,676,020,654 | $ | 21,096,309,025 | $ | — | $ | 22,772,329,679 | |||||||||||||||||||||
|
|
|
|
|
|
|
|
|
|||||||||||||||||||||
See notes to financial statements.
| S C H E D U L E O F I N V E S T M E N T S |
181 |
| Schedule of Investments February 29, 2024 |
iShares® 5-10 Year Investment Grade Corporate Bond ETF (Percentages shown are based on Net Assets) |
| Security | Par (000) |
Value | ||||||
| Corporate Bonds & Notes |
||||||||
| Advertising — 0.1% | ||||||||
| Interpublic Group of Companies Inc. (The) |
||||||||
| 2.40%, 03/01/31 (Call 12/01/30)(a) |
$ | 1,832 | $ | 1,526,977 | ||||
| 4.75%, 03/30/30 (Call 12/30/29)(a) |
4,689 | 4,561,833 | ||||||
| 5.38%, 06/15/33 (Call 03/15/33) |
1,745 | 1,726,031 | ||||||
| Omnicom Group Inc. |
||||||||
| 2.45%, 04/30/30 (Call 01/30/30) |
3,278 | 2,800,004 | ||||||
| 2.60%, 08/01/31 (Call 05/01/31)(a) |
3,899 | 3,271,276 | ||||||
| 4.20%, 06/01/30 (Call 03/01/30) |
3,589 | 3,399,221 | ||||||
|
|
|
|||||||
| 17,285,342 | ||||||||
| Aerospace & Defense — 1.2% | ||||||||
| BAE Systems PLC |
||||||||
| 1.90%, 02/15/31 (Call 11/15/30)(a)(b) |
5,741 | 4,647,489 | ||||||
| 3.40%, 04/15/30 (Call 01/15/30)(b) |
7,789 | 7,054,727 | ||||||
| Boeing Co. (The) |
||||||||
| 2.95%, 02/01/30 (Call 11/01/29) |
4,673 | 4,095,637 | ||||||
| 3.20%, 03/01/29 (Call 12/01/28) |
5,457 | 4,936,954 | ||||||
| 3.63%, 02/01/31 (Call 11/01/30) |
8,264 | 7,401,233 | ||||||
| 5.15%, 05/01/30 (Call 02/01/30) |
25,451 | 25,025,100 | ||||||
| 6.13%, 02/15/33(a) |
1,820 | 1,887,503 | ||||||
| General Dynamics Corp. |
||||||||
| 2.25%, 06/01/31 (Call 03/01/31)(a) |
2,998 | 2,519,093 | ||||||
| 3.63%, 04/01/30 (Call 01/01/30)(a) |
6,029 | 5,631,666 | ||||||
| HEICO Corp., 5.35%, 08/01/33 |
4,338 | 4,315,857 | ||||||
| L3Harris Technologies Inc. |
||||||||
| 1.80%, 01/15/31 (Call 10/15/30) |
4,319 | 3,475,263 | ||||||
| 2.90%, 12/15/29 (Call 09/15/29) |
2,788 | 2,472,074 | ||||||
| 5.40%, 07/31/33 (Call 04/30/33) |
9,793 | 9,799,927 | ||||||
| Lockheed Martin Corp. |
||||||||
| 1.85%, 06/15/30 (Call 03/15/30) |
2,962 | 2,477,466 | ||||||
| 3.90%, 06/15/32 (Call 03/15/32)(a) |
4,812 | 4,466,891 | ||||||
| 4.75%, 02/15/34 (Call 11/15/33)(a) |
140 | 136,792 | ||||||
| 5.25%, 01/15/33 (Call 10/15/32)(a) |
5,668 | 5,785,171 | ||||||
| Northrop Grumman Corp. |
||||||||
| 4.40%, 05/01/30 (Call 02/01/30) |
5,016 | 4,832,245 | ||||||
| 4.70%, 03/15/33 (Call 12/15/32)(a) |
6,580 | 6,351,730 | ||||||
| 4.90%, 06/01/34 (Call 03/01/34) |
3,200 | 3,114,947 | ||||||
| Northrop Grumman Systems Corp.,
7.75%, |
607 | 689,905 | ||||||
| RTX Corp. |
||||||||
| 1.90%, 09/01/31 (Call 06/01/31) |
5,611 | 4,474,283 | ||||||
| 2.25%, 07/01/30 (Call 04/01/30)(a) |
6,292 | 5,325,193 | ||||||
| 2.38%, 03/15/32 (Call 12/15/31) |
5,805 | 4,727,171 | ||||||
| 5.15%, 02/27/33 (Call 11/27/32) |
7,008 | 6,939,210 | ||||||
| 6.00%, 03/15/31 (Call 01/15/31) |
5,775 | 6,014,492 | ||||||
| 6.10%, 03/15/34 (Call 12/15/33)(a) |
6,543 | 6,908,295 | ||||||
| 7.50%, 09/15/29 |
2,823 | 3,131,547 | ||||||
|
|
|
|||||||
| 148,637,861 | ||||||||
| Agriculture — 1.5% | ||||||||
| Altria Group Inc. |
||||||||
| 2.45%, 02/04/32 (Call 11/04/31)(a) |
10,240 | 8,201,109 | ||||||
| 3.40%, 05/06/30 (Call 02/06/30)(a) |
11,936 | 10,742,788 | ||||||
| 6.88%, 11/01/33 (Call 08/01/33) |
2,195 | 2,371,420 | ||||||
| Archer-Daniels-Midland Co. |
||||||||
| 2.90%, 03/01/32 (Call 12/01/31) |
4,609 | 3,929,752 | ||||||
| 3.25%, 03/27/30 (Call 12/27/29) |
5,851 | 5,290,313 | ||||||
| 4.50%, 08/15/33 (Call 05/15/33)(a) |
1,900 | 1,817,741 | ||||||
| 5.94%, 10/01/32(a) |
830 | 875,432 | ||||||
| Security | Par (000) |
Value | ||||||
| Agriculture (continued) |
||||||||
| BAT Capital Corp. |
||||||||
| 2.73%, 03/25/31 (Call 12/25/30) |
$ | 7,149 | $ | 5,893,639 | ||||
| 3.46%, 09/06/29 (Call 06/06/29) |
3,169 | 2,867,424 | ||||||
| 4.74%, 03/16/32 (Call 12/16/31)(a) |
5,197 | 4,888,937 | ||||||
| 4.91%, 04/02/30 (Call 01/02/30)(a) |
6,381 | 6,201,362 | ||||||
| 5.83%, 02/20/31 (Call 12/20/30) |
1,545 | 1,539,657 | ||||||
| 6.00%, 02/20/34 (Call 11/20/33) |
1,700 | 1,681,771 | ||||||
| 6.34%, 08/02/30 (Call 06/02/30) |
5,088 | 5,254,367 | ||||||
| 6.42%, 08/02/33 (Call 05/02/33)(a) |
7,738 | 7,960,093 | ||||||
| 7.75%, 10/19/32 (Call 07/19/32)(a) |
3,407 | 3,807,629 | ||||||
| Bunge Ltd. Finance Corp., 2.75%, 05/14/31 |
5,949 | 5,058,854 | ||||||
| Cargill Inc. |
||||||||
| 1.70%, 02/02/31 (Call 11/02/30)(a)(b) |
2,958 | 2,380,215 | ||||||
| 2.13%, 04/23/30 (Call 01/23/30)(a)(b) |
4,959 | 4,215,821 | ||||||
| 2.13%, 11/10/31 (Call 08/10/31)(a)(b) |
5,758 | 4,682,391 | ||||||
| 3.25%, 05/23/29 (Call 02/23/29)(a)(b) |
2,848 | 2,652,992 | ||||||
| 4.00%, 06/22/32 (Call 03/22/32)(b) |
3,845 | 3,548,890 | ||||||
| 4.75%, 04/24/33 (Call 01/24/33)(b) |
3,064 | 2,972,100 | ||||||
| 5.13%, 10/11/32 (Call 07/11/32)(b) |
2,970 | 2,957,675 | ||||||
| Imperial Brands Finance PLC, 3.88%, 07/26/29 |
5,690 | 5,259,413 | ||||||
| JT International Financial Services BV, 6.88%, |
3,005 | 3,323,939 | ||||||
| Philip Morris International Inc. |
||||||||
| 1.75%, 11/01/30 (Call 08/01/30)(a) |
3,995 | 3,228,218 | ||||||
| 2.10%, 05/01/30 (Call 02/01/30) |
4,501 | 3,797,157 | ||||||
| 3.38%, 08/15/29 (Call 05/15/29)(a) |
4,785 | 4,394,678 | ||||||
| 5.13%, 02/15/30 (Call 12/15/29) |
11,351 | 11,296,059 | ||||||
| 5.13%, 02/13/31 (Call 12/13/30) |
4,560 | 4,491,157 | ||||||
| 5.25%, 02/13/34 (Call 11/13/33)(a) |
5,055 | 4,938,731 | ||||||
| 5.38%, 02/15/33 (Call 11/15/32) |
12,708 | 12,647,142 | ||||||
| 5.50%, 09/07/30 (Call 07/07/30) |
3,505 | 3,537,700 | ||||||
| 5.63%, 11/17/29 (Call 09/17/29) |
7,566 | 7,747,035 | ||||||
| 5.63%, 09/07/33 (Call 06/07/33) |
5,880 | 5,942,791 | ||||||
| 5.75%, 11/17/32 (Call 08/17/32) |
8,503 | 8,673,555 | ||||||
| Viterra Finance BV |
||||||||
| 3.20%, 04/21/31 (Call 01/21/31)(b) |
3,380 | 2,900,855 | ||||||
| 5.25%, 04/21/32 (Call 01/21/32)(a)(b) |
1,805 | 1,756,872 | ||||||
|
|
|
|||||||
| 185,727,674 | ||||||||
| Airlines — 0.0% | ||||||||
| Southwest Airlines Co., 2.63%, 02/10/30 |
3,826 | 3,308,889 | ||||||
|
|
|
|||||||
| Apparel — 0.3% | ||||||||
| NIKE Inc., 2.85%, 03/27/30 (Call 12/27/29)(a) |
9,193 | 8,276,773 | ||||||
| Ralph Lauren Corp., 2.95%, 06/15/30 |
4,555 | 4,051,872 | ||||||
| Tapestry Inc. |
||||||||
| 3.05%, 03/15/32 (Call 12/15/31)(a) |
3,072 | 2,489,226 | ||||||
| 7.70%, 11/27/30 (Call 09/27/30)(a) |
8,560 | 9,076,589 | ||||||
| 7.85%, 11/27/33 (Call 08/27/33)(a) |
6,445 | 6,971,853 | ||||||
| VF Corp. |
||||||||
| 2.95%, 04/23/30 (Call 01/23/30)(a) |
4,460 | 3,676,218 | ||||||
| 6.00%, 10/15/33(a) |
380 | 369,140 | ||||||
|
|
|
|||||||
| 34,911,671 | ||||||||
| Auto Manufacturers — 2.5% | ||||||||
| American Honda Finance Corp. |
||||||||
| 1.80%, 01/13/31(a) |
3,503 | 2,875,946 | ||||||
| 4.60%, 04/17/30(a) |
4,460 | 4,369,269 | ||||||
| 4.90%, 01/10/34(a) |
2,415 | 2,353,591 | ||||||
| 182 | 2 0 2 4 I S H A R E S A N N U A L R E P O R T T O S H A R E H O L D E R S |
| Schedule of Investments (continued) February 29, 2024 |
iShares® 5-10 Year Investment Grade Corporate Bond ETF (Percentages shown are based on Net Assets) |
| Security | Par (000) |
Value | ||||||
| Auto Manufacturers (continued) |
||||||||
| 5.85%, 10/04/30 |
$ | 3,194 | $ | 3,321,710 | ||||
| BMW Finance NV, 2.85%, 08/14/29 |
2,930 | 2,674,425 | ||||||
| BMW U.S. Capital LLC |
||||||||
| 1.95%, 08/12/31 (Call 05/12/31)(b) |
2,912 | 2,364,972 | ||||||
| 2.55%, 04/01/31 (Call 01/01/31)(a)(b) |
3,040 | 2,602,144 | ||||||
| 3.63%, 04/18/29 (Call 01/18/29)(a)(b) |
3,360 | 3,181,803 | ||||||
| 3.70%, 04/01/32 (Call 01/01/32)(b) |
2,630 | 2,382,739 | ||||||
| 4.15%, 04/09/30 (Call 01/09/30)(a)(b) |
6,282 | 6,036,948 | ||||||
| 5.15%, 08/11/33 (Call 05/11/33)(a)(b) |
3,005 | 3,005,456 | ||||||
| Cummins Inc. |
||||||||
| 1.50%, 09/01/30 (Call 06/01/30) |
5,043 | 4,076,097 | ||||||
| 5.15%, 02/20/34 (Call 11/20/33) |
735 | 733,960 | ||||||
| Daimler Trucks Finance North America LLC |
||||||||
| 2.50%, 12/14/31(b) |
4,470 | 3,665,385 | ||||||
| 5.38%, 01/18/34 (Call 10/18/33)(a)(b) |
1,270 | 1,265,678 | ||||||
| 5.50%, 09/20/33(b) |
4,973 | 5,002,792 | ||||||
| Ford Holdings LLC, 9.30%, 03/01/30 |
305 | 351,256 | ||||||
| Ford Motor Co. |
||||||||
| 3.25%, 02/12/32 (Call 11/12/31) |
16,486 | 13,519,459 | ||||||
| 6.10%, 08/19/32 (Call 05/19/32)(a) |
9,975 | 9,957,518 | ||||||
| 7.45%, 07/16/31(a) |
7,700 | 8,301,435 | ||||||
| 9.63%, 04/22/30 (Call 01/22/30)(a) |
1,050 | 1,226,632 | ||||||
| Ford Motor Credit Co. LLC |
||||||||
| 3.63%, 06/17/31 (Call 03/17/31)(a) |
4,740 | 4,040,809 | ||||||
| 4.00%, 11/13/30 (Call 08/13/30) |
8,785 | 7,767,282 | ||||||
| 5.11%, 05/03/29 (Call 02/03/29) |
5,305 | 5,112,247 | ||||||
| 6.05%, 03/05/31 (Call 01/05/31)(a) |
4,820 | 4,798,167 | ||||||
| 7.12%, 11/07/33 (Call 08/07/33) |
7,235 | 7,711,748 | ||||||
| 7.20%, 06/10/30 (Call 04/10/30)(a) |
5,203 | 5,479,334 | ||||||
| 7.35%, 03/06/30 (Call 01/06/30)(a) |
8,150 | 8,639,019 | ||||||
| General Motors Co. |
||||||||
| 5.40%, 10/15/29 (Call 08/15/29) |
7,872 | 7,852,813 | ||||||
| 5.60%, 10/15/32 (Call 07/15/32)(a) |
7,495 | 7,479,612 | ||||||
| General Motors Financial Co. Inc. |
||||||||
| 2.35%, 01/08/31 (Call 10/08/30) |
5,825 | 4,750,341 | ||||||
| 2.70%, 06/10/31 (Call 03/10/31) |
5,845 | 4,818,301 | ||||||
| 3.10%, 01/12/32 (Call 10/12/31)(a) |
7,221 | 6,032,068 | ||||||
| 3.60%, 06/21/30 (Call 03/21/30)(a) |
7,234 | 6,472,538 | ||||||
| 4.30%, 04/06/29 (Call 02/06/29) |
5,512 | 5,229,851 | ||||||
| 5.75%, 02/08/31 (Call 12/08/30)(a) |
1,260 | 1,256,340 | ||||||
| 5.85%, 04/06/30 (Call 02/06/30)(a) |
3,725 | 3,774,189 | ||||||
| 6.10%, 01/07/34 (Call 10/07/33) |
9,230 | 9,330,973 | ||||||
| 6.40%, 01/09/33 (Call 10/09/32)(a) |
5,975 | 6,211,485 | ||||||
| Honda Motor Co. Ltd., 2.97%, 03/10/32 |
5,293 | 4,650,490 | ||||||
| Hyundai Capital America |
||||||||
| 5.40%, 01/08/31 (Call 11/08/30)(a)(b) |
1,655 | 1,656,742 | ||||||
| 5.70%, 06/26/30 (Call 04/26/30)(a)(b) |
2,974 | 3,022,649 | ||||||
| 5.80%, 04/01/30 (Call 02/01/30)(b) |
2,820 | 2,879,059 | ||||||
| 6.20%, 09/21/30 (Call 07/21/30)(a)(b) |
3,168 | 3,307,913 | ||||||
| 6.38%, 04/08/30 (Call 01/08/30)(a)(b) |
3,503 | 3,684,590 | ||||||
| Mercedes-Benz Finance North America LLC |
||||||||
| 2.45%, 03/02/31(a)(b) |
1,932 | 1,652,894 | ||||||
| 2.63%, 03/10/30(a)(b) |
2,782 | 2,431,862 | ||||||
| 3.10%, 08/15/29(b) |
3,310 | 3,016,990 | ||||||
| 5.00%, 01/11/34(a)(b) |
1,935 | 1,899,508 | ||||||
| 5.05%, 08/03/33(a)(b) |
4,045 | 4,012,699 | ||||||
| 8.50%, 01/18/31(a) |
8,918 | 10,838,592 | ||||||
| Nissan Motor Co. Ltd., 4.81%, 09/17/30 |
13,805 | 12,710,753 | ||||||
| Security | Par (000) |
Value | ||||||
| Auto Manufacturers (continued) |
||||||||
| Stellantis Finance U.S. Inc. |
||||||||
| 2.69%, 09/15/31 (Call 06/15/31)(a)(b) |
$ | 6,042 | $ | 5,000,272 | ||||
| 6.38%, 09/12/32 (Call 06/12/32)(a)(b) |
4,093 | 4,355,095 | ||||||
| Toyota Motor Corp. |
||||||||
| 2.36%, 03/25/31 (Call 12/25/30)(a) |
2,608 | 2,250,545 | ||||||
| 2.76%, 07/02/29(a) |
2,262 | 2,084,080 | ||||||
| 5.12%, 07/13/33 (Call 04/13/33)(a) |
2,380 | 2,499,636 | ||||||
| Toyota Motor Credit Corp. |
||||||||
| 1.65%, 01/10/31(a) |
3,321 | 2,694,393 | ||||||
| 1.90%, 09/12/31 |
2,927 | 2,378,528 | ||||||
| 2.15%, 02/13/30 |
5,359 | 4,602,820 | ||||||
| 2.40%, 01/13/32(a) |
1,598 | 1,337,315 | ||||||
| 3.38%, 04/01/30 |
5,619 | 5,168,645 | ||||||
| 4.45%, 06/29/29(a) |
4,516 | 4,437,974 | ||||||
| 4.55%, 05/17/30(a) |
4,150 | 4,071,048 | ||||||
| 4.70%, 01/12/33(a) |
3,128 | 3,086,131 | ||||||
| 4.80%, 01/05/34 |
5,100 | 4,973,942 | ||||||
| 5.55%, 11/20/30 |
1,750 | 1,807,228 | ||||||
| Volkswagen Group of America Finance LLC |
||||||||
| 3.75%, 05/13/30(a)(b) |
3,061 | 2,837,701 | ||||||
| 4.60%, 06/08/29 (Call 04/08/29)(a)(b) |
2,821 | 2,746,869 | ||||||
| 5.90%, 09/12/33 (Call 06/12/33)(a)(b) |
2,815 | 2,861,408 | ||||||
| 6.45%, 11/16/30 (Call 09/16/30)(a)(b) |
2,515 | 2,656,711 | ||||||
|
|
|
|||||||
| 307,641,414 | ||||||||
| Auto Parts & Equipment — 0.1% | ||||||||
| Aptiv PLC, 4.35%, 03/15/29 (Call 12/15/28)(a) |
587 | 567,736 | ||||||
| Aptiv PLC/Aptiv Corp., 3.25%, 03/01/32 |
5,111 | 4,407,161 | ||||||
| Lear Corp. |
||||||||
| 2.60%, 01/15/32 (Call 10/15/31)(a) |
2,320 | 1,877,643 | ||||||
| 3.50%, 05/30/30 (Call 02/28/30)(a) |
2,607 | 2,328,798 | ||||||
| 4.25%, 05/15/29 (Call 02/15/29)(a) |
2,034 | 1,934,837 | ||||||
| Magna International Inc. |
||||||||
| 2.45%, 06/15/30 (Call 03/15/30) |
4,628 | 3,982,380 | ||||||
| 5.50%, 03/21/33 (Call 12/21/32)(a) |
3,041 | 3,118,237 | ||||||
|
|
|
|||||||
| 18,216,792 | ||||||||
| Banks — 23.4% | ||||||||
| ABN AMRO Bank NV, 3.32%, 03/13/37 |
4,926 | 3,917,034 | ||||||
| ANZ New Zealand Int’l Ltd./London,
2.55%, |
3,383 | 2,927,222 | ||||||
| ASB Bank Ltd. |
||||||||
| 2.38%, 10/22/31(a)(b) |
2,665 | 2,156,609 | ||||||
| 5.28%, 06/17/32 (Call 06/17/27), |
2,345 | 2,303,585 | ||||||
| Australia & New Zealand Banking Group Ltd. |
||||||||
| 2.57%, 11/25/35 (Call 11/25/30), |
7,451 | 6,028,107 | ||||||
| 6.74%, 12/08/32(a)(b) |
6,673 | 7,087,424 | ||||||
| Banco Bilbao Vizcaya Argentaria SA, 7.88%, |
||||||||
| 11/15/34 (Call 11/15/33), |
||||||||
| (1-year CMT + 3.300%)(c) |
4,100 | 4,370,823 | ||||||
| Banco de Chile, 2.99%, 12/09/31 |
915 | 782,956 | ||||||
| Banco de Credito e Inversiones SA, 2.88%, |
1,355 | 1,146,195 | ||||||
| Banco Nacional de Panama, 2.50%, 08/11/30 |
||||||||
| (Call 05/11/30)(b) |
6,385 | 4,820,675 | ||||||
| S C H E D U L E O F I N V E S T M E N T S |
183 |
| Schedule of Investments (continued) February 29, 2024 |
iShares® 5-10 Year Investment Grade Corporate Bond ETF (Percentages shown are based on Net Assets) |
| Security | Par (000) |
Value | ||||||
| Banks (continued) |
||||||||
| Banco Santander Chile, 3.18%, 10/26/31 |
$ | 1,460 | $ | 1,266,324 | ||||
| Banco Santander SA |
||||||||
| 2.75%, 12/03/30 |
9,745 | 7,926,354 | ||||||
| 2.96%, 03/25/31(a) |
5,996 | 5,114,058 | ||||||
| 3.23%, 11/22/32 (Call 08/22/31), |
5,594 | 4,627,394 | ||||||
| 3.31%, 06/27/29 |
5,802 | 5,262,735 | ||||||
| 3.49%, 05/28/30 |
5,717 | 5,128,137 | ||||||
| 6.92%, 08/08/33 |
9,865 | 10,243,936 | ||||||
| 6.94%, 11/07/33 |
10,420 | 11,359,431 | ||||||
| Bangkok Bank PCL/Hong Kong |
||||||||
| 3.47%, 09/23/36 (Call 09/23/31), |
4,715 | 3,959,899 | ||||||
| 5.50%, 09/21/33 (Call 06/21/33)(a)(b) |
3,100 | 3,113,270 | ||||||
| 9.03%, 03/15/29(a)(b) |
1,360 | 1,556,301 | ||||||
| Bank of America Corp. |
||||||||
| 1.90%, 07/23/31 (Call 07/23/30), |
16,294 | 13,224,405 | ||||||
| 1.92%, 10/24/31 (Call 10/24/30), |
14,707 | 11,867,487 | ||||||
| 2.30%, 07/21/32 (Call 07/21/31), |
19,679 | 15,928,564 | ||||||
| 2.48%, 09/21/36 (Call 09/21/31), |
11,628 | 9,167,039 | ||||||
| 2.50%, 02/13/31 (Call 02/13/30), |
20,377 | 17,371,404 | ||||||
| 2.57%, 10/20/32 (Call 10/20/31), |
18,570 | 15,219,982 | ||||||
| 2.59%, 04/29/31 (Call 04/29/30), |
17,983 | 15,369,843 | ||||||
| 2.69%, 04/22/32 (Call 04/22/31), |
25,795 | 21,601,435 | ||||||
| 2.88%, 10/22/30 (Call 10/22/29), |
11,644 | 10,254,400 | ||||||
| 2.97%, 02/04/33 (Call 02/04/32), |
20,698 | 17,384,374 | ||||||
| 3.19%, 07/23/30 (Call 07/23/29), |
14,262 | 12,839,026 | ||||||
| 3.85%, 03/08/37 (Call 03/08/32), |
14,233 | 12,425,600 | ||||||
| 4.57%, 04/27/33 (Call 04/27/32), |
23,050 | 21,670,043 | ||||||
| 5.02%, 07/22/33 (Call 07/22/32), |
28,087 | 27,376,999 | ||||||
| 5.29%, 04/25/34 (Call 04/25/33), |
28,063 | 27,665,659 | ||||||
| 5.47%, 01/23/35 (Call 01/23/34), |
26,235 | 26,159,108 | ||||||
| 5.87%, 09/15/34 (Call 09/15/33), |
23,200 | 23,789,552 | ||||||
| Series N, 2.65%, 03/11/32 (Call 03/11/31), |
11,740 | 9,825,056 | ||||||
| Bank of Montreal, 3.09%, 01/10/37 |
6,347 | 5,138,074 | ||||||
| Bank of New York Mellon Corp. (The) |
||||||||
| 1.65%, 01/28/31 (Call 10/28/30)(a) |
1,993 | 1,604,634 | ||||||
| 1.80%, 07/28/31 (Call 04/28/31)(a) |
2,776 | 2,237,672 | ||||||
| 2.50%, 01/26/32 (Call 10/26/31)(a) |
2,849 | 2,381,385 | ||||||
| 3.30%, 08/23/29 (Call 05/23/29)(a) |
4,684 | 4,298,040 | ||||||
| 3.85%, 04/26/29 (Call 02/26/29) |
1,835 | 1,757,548 | ||||||
| Security | Par (000) |
Value | ||||||
| Banks (continued) |
||||||||
| 4.29%, 06/13/33 (Call 06/13/32), |
$ | 4,530 | $ | 4,237,754 | ||||
| 4.60%, 07/26/30 (Call 07/26/29), |
2,905 | 2,837,057 | ||||||
| 4.71%, 02/01/34 (Call 02/01/33), |
4,313 | 4,133,873 | ||||||
| 4.97%, 04/26/34 (Call 04/26/33), |
5,741 | 5,594,690 | ||||||
| 5.83%, 10/25/33 (Call 10/25/32), |
8,692 | 9,026,219 | ||||||
| 6.47%, 10/25/34 (Call 10/25/33), |
6,240 | 6,768,848 | ||||||
| Bank of New Zealand, 2.87%, 01/27/32(a)(b) |
1,045 | 872,444 | ||||||
| Bank of Nova Scotia (The) |
||||||||
| 2.15%, 08/01/31 |
3,375 | 2,757,243 | ||||||
| 2.45%, 02/02/32 |
5,326 | 4,371,169 | ||||||
| 4.59%, 05/04/37 (Call 02/04/32), |
6,665 | 5,961,315 | ||||||
| 4.85%, 02/01/30 |
8,215 | 8,105,695 | ||||||
| 5.65%, 02/01/34 |
4,245 | 4,309,028 | ||||||
| BankUnited Inc., 5.13%, 06/11/30 |
1,948 | 1,763,356 | ||||||
| Barclays PLC |
||||||||
| 2.65%, 06/24/31 (Call 06/24/30), |
5,767 | 4,801,126 | ||||||
| 2.67%, 03/10/32 (Call 03/10/31), |
5,603 | 4,567,242 | ||||||
| 2.89%, 11/24/32 (Call 11/24/31), |
7,203 | 5,865,615 | ||||||
| 3.56%, 09/23/35 (Call 09/23/30), |
5,133 | 4,302,382 | ||||||
| 5.09%, 06/20/30 (Call 06/20/29), |
8,451 | 8,006,008 | ||||||
| 5.75%, 08/09/33 (Call 08/09/32), |
5,592 | 5,542,869 | ||||||
| 6.22%, 05/09/34 (Call 05/09/33), |
12,198 | 12,350,244 | ||||||
| 6.69%, 09/13/34 (Call 09/13/33), |
9,355 | 9,785,096 | ||||||
| 7.12%, 06/27/34 (Call 06/27/33), |
9,055 | 9,399,237 | ||||||
| 7.44%, 11/02/33 (Call 11/02/32), |
11,874 | 12,990,159 | ||||||
| BNP Paribas SA |
||||||||
| 2.59%, 08/12/35 (Call 08/12/30), |
7,695 | 6,149,557 | ||||||
| 2.87%, 04/19/32 (Call 04/19/31), |
13,577 | 11,352,759 | ||||||
| 3.05%, 01/13/31 (Call 01/13/30), |
3,955 | 3,448,552 | ||||||
| 3.13%, 01/20/33 (Call 01/20/32), |
7,993 | 6,724,000 | ||||||
| 5.34%, 06/12/29 (Call 06/12/28), |
100 | 99,954 | ||||||
| 5.50%, 05/20/30 (Call 05/20/29), |
4,805 | 4,783,463 | ||||||
| 5.74%, 02/20/35 (Call 02/20/34), |
6,380 | 6,317,449 | ||||||
| 5.89%, 12/05/34 (Call 12/05/33), |
11,915 | 12,177,734 | ||||||
| 184 | 2 0 2 4 I S H A R E S A N N U A L R E P O R T T O S H A R E H O L D E R S |
| Schedule of Investments (continued) February 29, 2024 |
iShares® 5-10 Year Investment Grade Corporate Bond ETF (Percentages shown are based on Net Assets) |
| Security | Par (000) |
Value | ||||||
| Banks (continued) |
||||||||
| BPCE SA |
||||||||
| 2.28%, 01/20/32 (Call 01/20/31), |
$ | 7,062 | $ | 5,652,619 | ||||
| 2.70%, 10/01/29(a)(b) |
5,185 | 4,543,713 | ||||||
| 3.12%, 10/19/32 (Call 10/19/31), |
5,971 | 4,815,350 | ||||||
| 3.65%, 01/14/37 (Call 01/14/32), |
1,705 | 1,381,485 | ||||||
| 5.75%, 07/19/33 (Call 07/19/32), |
5,338 | 5,280,102 | ||||||
| 6.51%, 01/18/35 (Call 01/18/34), |
3,375 | 3,344,093 | ||||||
| 7.00%, 10/19/34 (Call 10/19/33), |
9,283 | 9,905,350 | ||||||
| CaixaBank SA, 6.84%, 09/13/34 |
||||||||
| (Call 09/13/33), |
||||||||
| (1-day SOFR + 2.770%)(a)(b)(c) |
2,320 | 2,439,323 | ||||||
| Canadian Imperial Bank of Commerce |
||||||||
| 3.60%, 04/07/32 (Call 03/07/32)(a) |
5,718 | 5,110,596 | ||||||
| 6.09%, 10/03/33 (Call 07/03/33)(a) |
6,120 | 6,352,653 | ||||||
| Citigroup Inc. |
||||||||
| 2.52%, 11/03/32 (Call 11/03/31), |
10,613 | 8,614,456 | ||||||
| 2.56%, 05/01/32 (Call 05/01/31), |
17,539 | 14,440,321 | ||||||
| 2.57%, 06/03/31 (Call 06/03/30), |
20,790 | 17,580,307 | ||||||
| 2.67%, 01/29/31 (Call 01/29/30), |
10,849 | 9,307,744 | ||||||
| 2.98%, 11/05/30 (Call 11/05/29), |
13,283 | 11,706,313 | ||||||
| 3.06%, 01/25/33 (Call 01/25/32), |
17,515 | 14,706,311 | ||||||
| 3.79%, 03/17/33 (Call 03/17/32), |
15,395 | 13,622,019 | ||||||
| 3.98%, 03/20/30 (Call 03/20/29), |
14,870 | 13,938,556 | ||||||
| 4.41%, 03/31/31 (Call 03/31/30), |
23,719 | 22,406,005 | ||||||
| 4.91%, 05/24/33 (Call 05/24/32), |
14,773 | 14,144,998 | ||||||
| 5.83%, 02/13/35 (Call 02/13/34), |
12,020 | 11,760,014 | ||||||
| 5.88%, 02/22/33(a) |
3,381 | 3,448,665 | ||||||
| 6.00%, 10/31/33(a) |
3,610 | 3,731,111 | ||||||
| 6.17%, 05/25/34 (Call 05/25/33), |
18,298 | 18,435,145 | ||||||
| 6.27%, 11/17/33 (Call 11/17/32), |
16,020 | 16,805,728 | ||||||
| 6.63%, 06/15/32 |
6,589 | 7,015,882 | ||||||
| Citizens Financial Group Inc. |
||||||||
| 2.50%, 02/06/30 (Call 11/06/29)(a) |
2,057 | 1,706,414 | ||||||
| 2.64%, 09/30/32 (Call 07/02/32) |
1,270 | 964,308 | ||||||
| 3.25%, 04/30/30 (Call 01/30/30)(a) |
4,186 | 3,621,729 | ||||||
| 5.64%, 05/21/37 (Call 05/21/32), |
2,140 | 1,964,374 | ||||||
| Comerica Bank, 5.33%, 08/25/33 |
||||||||
| (Call 08/25/32), (1-day SOFR + 2.610%)(c) |
1,943 | 1,734,970 | ||||||
| Commonwealth Bank of Australia |
||||||||
| 1.88%, 09/15/31(a)(b) |
4,063 | 3,263,909 | ||||||
| 2.69%, 03/11/31(b) |
8,845 | 7,271,773 | ||||||
| Security | Par (000) |
Value | ||||||
| Banks (continued) |
||||||||
| 3.61%, 09/12/34 (Call 09/12/29), |
$ | 6,370 | $ | 5,666,767 | ||||
| 3.78%, 03/14/32(a)(b) |
6,365 | 5,567,813 | ||||||
| Cooperatieve Rabobank UA, 3.76%, 04/06/33 |
5,383 | 4,777,741 | ||||||
| Credit Agricole SA |
||||||||
| 3.25%, 01/14/30(a)(b) |
6,797 | 5,962,218 | ||||||
| 5.51%, 07/05/33(b) |
6,175 | 6,288,366 | ||||||
| 6.25%, 01/10/35 (Call 01/10/34), |
6,405 | 6,399,993 | ||||||
| Deutsche Bank AG/New York |
||||||||
| 3.04%, 05/28/32 (Call 05/28/31), |
5,070 | 4,192,328 | ||||||
| 3.55%, 09/18/31 (Call 09/18/30), |
9,715 | 8,429,208 | ||||||
| 3.73%, 01/14/32 (Call 10/14/30), |
7,110 | 5,823,814 | ||||||
| 3.74%, 01/07/33 (Call 10/07/31), |
6,850 | 5,505,113 | ||||||
| 5.88%, 07/08/31 (Call 04/08/30), |
2,500 | 2,393,094 | ||||||
| 7.08%, 02/10/34 (Call 11/10/32), |
8,175 | 8,148,318 | ||||||
| Discover Bank, 2.70%, 02/06/30 |
2,728 | 2,319,295 | ||||||
| Fifth Third Bancorp. |
||||||||
| 4.34%, 04/25/33 (Call 04/25/32), |
3,538 | 3,207,508 | ||||||
| 4.77%, 07/28/30 (Call 07/28/29), |
5,865 | 5,596,463 | ||||||
| 5.63%, 01/29/32 (Call 01/29/31), |
1,970 | 1,952,370 | ||||||
| First Horizon Bank, 5.75%, 05/01/30 |
2,159 | 2,017,194 | ||||||
| Goldman Sachs Group Inc. (The) |
||||||||
| 1.99%, 01/27/32 (Call 01/27/31), |
15,287 | 12,257,680 | ||||||
| 2.38%, 07/21/32 (Call 07/21/31), |
28,746 | 23,393,038 | ||||||
| 2.60%, 02/07/30 (Call 11/07/29) |
13,366 | 11,607,521 | ||||||
| 2.62%, 04/22/32 (Call 04/22/31), |
22,409 | 18,632,650 | ||||||
| 2.65%, 10/21/32 (Call 10/21/31), |
17,690 | 14,590,255 | ||||||
| 3.10%, 02/24/33 (Call 02/24/32), |
23,041 | 19,539,239 | ||||||
| 3.80%, 03/15/30 (Call 12/15/29)(a) |
16,184 | 15,047,704 | ||||||
| 6.13%, 02/15/33(a) |
5,825 | 6,248,557 | ||||||
| 6.56%, 10/24/34 (Call 10/24/33), |
6,815 | 7,341,159 | ||||||
| HBOS PLC, 6.00%, 11/01/33(b) |
190 | 179,488 | ||||||
| HSBC Capital Funding Dollar 1 LP, 10.18%, |
||||||||
| (Call 06/30/30), |
||||||||
| (3-mo. LIBOR US + 4.980%)(a)(b)(c)(d) |
4,520 | 5,664,681 | ||||||
| HSBC Holdings PLC |
||||||||
| 2.36%, 08/18/31 (Call 08/18/30), |
9,156 | 7,533,581 | ||||||
| 2.80%, 05/24/32 (Call 05/24/31), |
14,400 | 11,905,679 | ||||||
| 2.85%, 06/04/31 (Call 06/04/30), |
9,125 | 7,766,631 | ||||||
| S C H E D U L E O F I N V E S T M E N T S |
185 |
| Schedule of Investments (continued) February 29, 2024 |
iShares® 5-10 Year Investment Grade Corporate Bond ETF (Percentages shown are based on Net Assets) |
| Security | Par (000) |
Value | ||||||
| Banks (continued) |
||||||||
| 2.87%, 11/22/32 (Call 11/22/31), |
$ | 10,372 | $ | 8,555,790 | ||||
| 3.97%, 05/22/30 (Call 05/22/29), |
16,562 | 15,356,713 | ||||||
| 4.76%, 03/29/33 (Call 03/29/32), |
11,458 | 10,530,240 | ||||||
| 4.95%, 03/31/30 |
11,808 | 11,563,683 | ||||||
| 5.40%, 08/11/33 (Call 08/11/32), |
14,407 | 14,157,282 | ||||||
| 5.72%, 03/04/35 (Call 03/04/34), |
8,000 | 7,972,093 | ||||||
| 6.25%, 03/09/34 (Call 03/09/33), |
13,046 | 13,537,222 | ||||||
| 6.55%, 06/20/34 (Call 06/20/33), |
11,455 | 11,724,238 | ||||||
| 7.40%, 11/13/34 (Call 11/13/33), |
11,665 | 12,506,279 | ||||||
| 7.63%, 05/17/32(a) |
2,030 | 2,250,696 | ||||||
| 8.11%, 11/03/33 (Call 11/03/32), |
11,317 | 12,779,417 | ||||||
| Huntington Bancshares Inc./OH |
||||||||
| 2.49%, 08/15/36 (Call 08/15/31), |
2,746 | 2,077,254 | ||||||
| 2.55%, 02/04/30 (Call 11/04/29)(a) |
4,322 | 3,646,405 | ||||||
| 5.02%, 05/17/33 (Call 05/17/32), |
2,303 | 2,177,137 | ||||||
| 5.71%, 02/02/35 (Call 02/02/34), |
620 | 611,732 | ||||||
| Huntington National Bank (The), 5.65%, |
5,345 | 5,327,615 | ||||||
| ING Groep NV |
||||||||
| 2.73%, 04/01/32 (Call 04/01/31), |
4,032 | 3,394,204 | ||||||
| 4.05%, 04/09/29(a) |
5,158 | 4,877,940 | ||||||
| 4.25%, 03/28/33 (Call 03/28/32), |
5,265 | 4,846,715 | ||||||
| 6.11%, 09/11/34 (Call 09/11/33), |
7,030 | 7,250,577 | ||||||
| Intercorp Peru Ltd., 3.88%, 08/15/29 |
1,020 | 893,724 | ||||||
| Intesa Sanpaolo SpA |
||||||||
| 6.63%, 06/20/33(a)(b) |
7,260 | 7,339,642 | ||||||
| 7.20%, 11/28/33(a)(b) |
8,575 | 8,976,791 | ||||||
| 8.25%, 11/21/33 (Call 11/21/32), |
6,883 | 7,469,466 | ||||||
| Series NR, 4.00%, 09/23/29(b) |
50 | 45,420 | ||||||
| JPMorgan Chase & Co. |
||||||||
| 1.76%, 11/19/31 (Call 11/19/30), |
8,981 | 7,232,712 | ||||||
| 1.95%, 02/04/32 (Call 02/04/31), |
18,105 | 14,560,437 | ||||||
| 2.52%, 04/22/31 (Call 04/22/30), |
14,104 | 12,067,572 | ||||||
| 2.55%, 11/08/32 (Call 11/08/31), |
17,368 | 14,301,455 | ||||||
| 2.58%, 04/22/32 (Call 04/22/31), |
20,827 | 17,426,071 | ||||||
| 2.74%, 10/15/30 (Call 10/15/29), |
22,010 | 19,309,197 | ||||||
| 2.96%, 05/13/31 (Call 05/13/30), |
16,508 | 14,338,403 | ||||||
| Security | Par (000) |
Value | ||||||
| Banks (continued) |
||||||||
| 2.96%, 01/25/33 (Call 01/25/32), |
$ | 21,112 | $ | 17,831,027 | ||||
| 3.70%, 05/06/30 (Call 05/06/29), |
14,238 | 13,265,411 | ||||||
| 4.49%, 03/24/31 (Call 03/24/30), |
18,332 | 17,606,895 | ||||||
| 4.57%, 06/14/30 (Call 06/14/29), |
11,956 | 11,583,410 | ||||||
| 4.59%, 04/26/33 (Call 04/26/32), |
16,831 | 15,969,819 | ||||||
| 4.91%, 07/25/33 (Call 07/25/32), |
26,117 | 25,335,276 | ||||||
| 5.34%, 01/23/35 (Call 01/23/34), |
13,870 | 13,795,499 | ||||||
| 5.35%, 06/01/34 (Call 06/01/33), |
23,060 | 22,957,839 | ||||||
| 5.72%, 09/14/33 (Call 09/14/32), |
20,716 | 20,975,577 | ||||||
| 6.25%, 10/23/34 (Call 10/23/33), |
14,530 | 15,413,669 | ||||||
| 8.75%, 09/01/30 |
2,580 | 3,038,002 | ||||||
| KBC Group NV, 6.32%, 09/21/34 |
||||||||
| (Call 09/21/33), |
||||||||
| (1-year CMT + 2.050%)(a)(b)(c) |
5,385 | 5,580,234 | ||||||
| KeyBank NA, 5.00%, 01/26/33 (Call 10/26/32) |
6,308 | 5,758,432 | ||||||
| KeyBank NA/Cleveland OH |
||||||||
| 3.90%, 04/13/29 (Call 03/13/29)(a) |
1,778 | 1,580,226 | ||||||
| 4.90%, 08/08/32(a) |
4,210 | 3,693,641 | ||||||
| KeyCorp |
||||||||
| 2.55%, 10/01/29(a) |
4,200 | 3,512,736 | ||||||
| 4.79%, 06/01/33 (Call 06/01/32), |
4,343 | 3,928,603 | ||||||
| KKR Group Finance Co. XII LLC, 4.85%, |
||||||||
| 05/17/32 (Call 02/17/32)(a)(b) |
5,165 | 4,929,885 | ||||||
| Kookmin Bank, 2.50%, 11/04/30(b) |
980 | 806,701 | ||||||
| Lloyds Banking Group PLC |
||||||||
| 4.98%, 08/11/33 (Call 08/11/32), |
6,935 | 6,600,131 | ||||||
| 5.68%, 01/05/35 (Call 01/05/34), |
11,620 | 11,488,329 | ||||||
| 7.95%, 11/15/33 (Call 08/15/32), |
5,445 | 6,056,703 | ||||||
| M&T Bank Corp., 5.05%, 01/27/34 |
5,973 | 5,483,588 | ||||||
| Macquarie Bank Ltd. |
||||||||
| 3.05%, 03/03/36 (Call 03/03/31), |
4,728 | 3,849,373 | ||||||
| 3.62%, 06/03/30(a)(b) |
4,198 | 3,682,130 | ||||||
| 6.80%, 01/18/33(a)(b) |
6,713 | 7,073,130 | ||||||
| Macquarie Group Ltd. |
||||||||
| 2.69%, 06/23/32 (Call 06/23/31), |
5,485 | 4,510,585 | ||||||
| 2.87%, 01/14/33 (Call 01/14/32), |
6,778 | 5,577,215 | ||||||
| 4.44%, 06/21/33 (Call 06/21/32), |
3,200 | 2,950,963 | ||||||
| 5.49%, 11/09/33 (Call 11/09/32), |
4,620 | 4,580,207 | ||||||
| 5.89%, 06/15/34 (Call 06/15/33), |
4,050 | 4,090,959 | ||||||
| 186 | 2 0 2 4 I S H A R E S A N N U A L R E P O R T T O S H A R E H O L D E R S |
| Schedule of Investments (continued) February 29, 2024 |
iShares® 5-10 Year Investment Grade Corporate Bond ETF (Percentages shown are based on Net Assets) |
| Security | Par (000) |
Value | ||||||
| Banks (continued) | ||||||||
| 6.26%, 12/07/34 (Call 12/07/33), |
$ | 5,150 | $ | 5,328,657 | ||||
| Mitsubishi UFJ Financial Group Inc. |
||||||||
| 2.05%, 07/17/30 |
6,904 | 5,730,804 | ||||||
| 2.31%, 07/20/32 (Call 07/20/31), |
10,605 | 8,687,171 | ||||||
| 2.49%, 10/13/32 (Call 10/13/31), |
4,222 | 3,493,257 | ||||||
| 2.56%, 02/25/30(a) |
6,449 | 5,585,035 | ||||||
| 2.85%, 01/19/33 (Call 01/19/32), |
5,570 | 4,693,529 | ||||||
| 3.20%, 07/18/29 |
10,139 | 9,220,287 | ||||||
| 3.74%, 03/07/29 |
484 | 457,149 | ||||||
| 4.32%, 04/19/33 (Call 04/19/32), |
3,295 | 3,083,414 | ||||||
| 5.13%, 07/20/33 (Call 07/20/32), |
8,343 | 8,254,381 | ||||||
| 5.41%, 04/19/34 (Call 04/19/33), |
5,675 | 5,736,623 | ||||||
| 5.44%, 02/22/34 (Call 02/22/33), |
7,023 | 7,104,818 | ||||||
| 5.47%, 09/13/33 (Call 09/13/32), |
4,435 | 4,508,623 | ||||||
| 5.48%, 02/22/31 (Call 02/22/30), |
2,795 | 2,815,847 | ||||||
| Mizuho Financial Group Inc. |
||||||||
| 1.98%, 09/08/31 (Call 09/08/30), |
4,375 | 3,543,311 | ||||||
| 2.17%, 05/22/32 (Call 05/22/31), |
3,141 | 2,538,426 | ||||||
|
2.20%, 07/10/31 (Call 07/10/30), |
5,634 | 4,659,685 | ||||||
| 2.26%, 07/09/32 (Call 07/09/31), |
3,015 | 2,436,820 | ||||||
| 2.56%, 09/13/31 |
5,883 | 4,777,599 | ||||||
| 2.59%, 05/25/31 (Call 05/25/30), |
2,798 | 2,382,628 | ||||||
|
2.87%, 09/13/30 (Call 09/13/29), |
2,934 | 2,582,403 | ||||||
| 3.15%, 07/16/30 (Call 07/16/29), |
4,227 | 3,802,507 | ||||||
| 3.26%, 05/22/30 (Call 05/22/29), |
3,450 | 3,123,092 | ||||||
| 5.38%, 05/26/30 (Call 05/26/29), |
2,360 | 2,360,930 | ||||||
| 5.58%, 05/26/35 (Call 05/26/34), |
4,000 | 4,008,775 | ||||||
| 5.67%, 09/13/33 (Call 09/13/32), |
4,018 | 4,075,863 | ||||||
| 5.74%, 05/27/31 (Call 05/27/30), |
3,800 | 3,875,395 | ||||||
| 5.75%, 05/27/34 (Call 05/27/33), |
5,568 | 5,685,275 | ||||||
| 5.75%, 07/06/34 (Call 07/06/33), |
7,025 | 7,165,306 | ||||||
| Morgan Stanley |
||||||||
| 1.79%, 02/13/32 (Call 02/13/31), |
20,906 | 16,552,739 | ||||||
| 1.93%, 04/28/32 (Call 04/28/31), |
15,205 | 12,054,699 | ||||||
| Security | Par (000) |
Value | ||||||
| Banks (continued) | ||||||||
| 2.24%, 07/21/32 (Call 07/21/31), |
$ | 20,838 | $ | 16,787,415 | ||||
| 2.48%, 09/16/36 (Call 09/16/31), |
16,795 | 13,164,021 | ||||||
| 2.51%, 10/20/32 (Call 10/20/31), |
14,127 | 11,567,627 | ||||||
| 2.70%, 01/22/31 (Call 01/22/30), |
20,267 | 17,556,240 | ||||||
| 2.94%, 01/21/33 (Call 01/21/32), |
14,402 | 12,078,815 | ||||||
| 3.62%, 04/01/31 (Call 04/01/30), |
13,319 | 12,099,945 | ||||||
| 4.89%, 07/20/33 (Call 07/20/32), |
11,408 | 10,957,929 | ||||||
| 5.25%, 04/21/34 (Call 04/21/33), |
18,520 | 18,177,999 | ||||||
| 5.30%, 04/20/37 (Call 04/20/32), |
11,800 | 11,303,993 | ||||||
| 5.42%, 07/21/34 (Call 07/21/33), |
13,720 | 13,638,529 | ||||||
| 5.47%, 01/18/35 (Call 01/18/34), |
14,175 | 14,158,319 | ||||||
| 5.94%, 02/07/39 (Call 02/07/34), |
6,605 | 6,503,949 | ||||||
| 5.95%, 01/19/38 (Call 01/19/33), |
11,250 | 11,220,339 | ||||||
| 6.34%, 10/18/33 (Call 10/18/32), |
16,925 | 17,938,192 | ||||||
| 6.63%, 11/01/34 (Call 11/01/33), |
11,375 | 12,325,790 | ||||||
| 7.25%, 04/01/32(a) |
6,549 | 7,467,714 | ||||||
| National Australia Bank Ltd. |
||||||||
| 2.33%, 08/21/30(b) |
8,205 | 6,712,552 | ||||||
| 2.99%, 05/21/31(b) |
6,780 | 5,652,193 | ||||||
| 3.35%, 01/12/37 (Call 01/12/32), |
6,470 | 5,397,999 | ||||||
| 3.93%, 08/02/34 (Call 08/02/29), |
7,953 | 7,219,645 | ||||||
| 4.95%, 01/10/34(a)(b) |
3,685 | 3,637,653 | ||||||
| 6.43%, 01/12/33(a)(b) |
7,023 | 7,296,270 | ||||||
| NatWest Group PLC |
||||||||
| 3.03%, 11/28/35 (Call 08/28/30), |
3,867 | 3,185,979 | ||||||
| 4.45%, 05/08/30 (Call 05/08/29), |
6,992 | 6,619,530 | ||||||
| 5.78%, 03/01/35 (Call 03/01/34), |
2,600 | 2,594,829 | ||||||
| 6.02%, 03/02/34 (Call 03/02/33), |
6,368 | 6,492,777 | ||||||
| Norinchukin Bank (The) |
||||||||
| 2.08%, 09/22/31(a)(b) |
7,645 | 6,184,149 | ||||||
| 5.07%, 09/14/32(a)(b) |
1,500 | 1,483,237 | ||||||
| Northern Trust Corp. |
||||||||
| 1.95%, 05/01/30 (Call 02/01/30)(a) |
5,370 | 4,536,495 | ||||||
| 3.15%, 05/03/29 (Call 02/03/29)(a) |
2,665 | 2,468,454 | ||||||
| 6.13%, 11/02/32 (Call 08/02/32)(a) |
5,568 | 5,862,238 | ||||||
| PNC Bank NA, 2.70%, 10/22/29(a) |
4,243 | 3,659,421 | ||||||
| PNC Financial Services Group Inc. (The) |
||||||||
| 2.31%, 04/23/32 (Call 04/23/31), |
4,995 | 4,075,360 | ||||||
| 2.55%, 01/22/30 (Call 10/24/29)(a) |
11,138 | 9,567,907 | ||||||
| S C H E D U L E O F I N V E S T M E N T S |
187 |
| Schedule of Investments (continued) February 29, 2024 |
iShares® 5-10 Year Investment Grade Corporate Bond ETF (Percentages shown are based on Net Assets) |
| Security | Par (000) |
Value | ||||||
| Banks (continued) |
||||||||
| 3.45%, 04/23/29 (Call 01/23/29) |
$ | 8,190 | $ | 7,563,262 | ||||
| 4.63%, 06/06/33 (Call 06/06/32), |
4,768 | 4,418,466 | ||||||
| 5.07%, 01/24/34 (Call 01/24/33), |
9,048 | 8,700,522 | ||||||
| 5.68%, 01/22/35 (Call 01/22/34), |
8,500 | 8,524,507 | ||||||
| 5.94%, 08/18/34 (Call 08/18/33), |
5,003 | 5,096,936 | ||||||
| 6.04%, 10/28/33 (Call 10/28/32), |
8,718 | 8,946,652 | ||||||
| 6.88%, 10/20/34 (Call 10/20/33), |
13,205 | 14,304,823 | ||||||
| Royal Bank of Canada |
||||||||
| 2.30%, 11/03/31 |
8,947 | 7,324,931 | ||||||
| 3.88%, 05/04/32 |
6,183 | 5,644,671 | ||||||
| 5.00%, 02/01/33(a) |
10,661 | 10,484,070 | ||||||
| 5.00%, 05/02/33(a) |
6,121 | 6,024,242 | ||||||
| 5.15%, 02/01/34 |
4,575 | 4,505,078 | ||||||
| Santander Holdings USA Inc., 7.66%, 11/09/31 |
3,470 | 3,707,715 | ||||||
| Santander U.K. Group Holdings PLC, 2.90%, |
2,020 | 1,701,950 | ||||||
| Shinhan Bank Co. Ltd. |
||||||||
| 4.00%, 04/23/29(a)(b) |
1,150 | 1,062,510 | ||||||
| 4.38%, 04/13/32(b) |
820 | 747,815 | ||||||
| Societe Generale SA |
||||||||
| 2.89%, 06/09/32 (Call 06/09/31), |
7,329 | 5,941,209 | ||||||
| 3.00%, 01/22/30(b) |
7,307 | 6,309,024 | ||||||
| 3.34%, 01/21/33 (Call 01/21/32), |
6,271 | 5,178,276 | ||||||
| 3.65%, 07/08/35 (Call 07/08/30), |
1,670 | 1,402,002 | ||||||
| 6.07%, 01/19/35 (Call 01/19/34), |
5,170 | 5,094,164 | ||||||
| 6.22%, 06/15/33 (Call 06/15/32), |
7,258 | 7,115,510 | ||||||
| 6.69%, 01/10/34 (Call 01/10/33), |
8,980 | 9,276,717 | ||||||
| Standard Chartered Bank, 8.00%, 05/30/31(a)(b) |
1,850 | 1,997,010 | ||||||
| Standard Chartered PLC |
||||||||
| 2.68%, 06/29/32 (Call 06/29/31), |
7,315 | 5,929,100 | ||||||
| 3.27%, 02/18/36 (Call 11/18/30), |
6,420 | 5,318,894 | ||||||
| 3.60%, 01/12/33 (Call 01/12/32), |
5,440 | 4,570,932 | ||||||
| 4.31%, 05/21/30 (Call 05/21/29), |
4,486 | 4,176,439 | ||||||
| 4.64%, 04/01/31 (Call 04/01/30), |
11,273 | 10,686,132 | ||||||
| 6.10%, 01/11/35 (Call 01/11/34), |
8,665 | 8,732,237 | ||||||
| 6.30%, 07/06/34 (Call 07/06/33), |
6,528 | 6,725,018 | ||||||
| State Street Corp. |
||||||||
| 2.20%, 03/03/31(a) |
4,399 | 3,641,686 | ||||||
| 2.40%, 01/24/30(a) |
4,146 | 3,624,365 | ||||||
| Security | Par (000) |
Value | ||||||
| Banks (continued) |
||||||||
| 2.62%, 02/07/33 (Call 02/07/32), |
$ | 3,713 | $ | 3,082,495 | ||||
| 3.03%, 11/01/34 (Call 11/01/29), |
3,087 | 2,723,549 | ||||||
| 3.15%, 03/30/31 (Call 03/30/30), |
2,197 | 1,953,919 | ||||||
| 4.16%, 08/04/33 (Call 08/04/32), |
4,291 | 3,965,727 | ||||||
| 4.42%, 05/13/33 (Call 05/13/32), |
2,570 | 2,426,508 | ||||||
| 4.82%, 01/26/34 (Call 01/26/33), |
4,303 | 4,150,047 | ||||||
| 5.16%, 05/18/34 (Call 05/18/33), |
7,240 | 7,153,428 | ||||||
| 6.12%, 11/21/34 (Call 11/21/33), |
3,685 | 3,808,983 | ||||||
| Sumitomo Mitsui Financial Group Inc. |
||||||||
| 1.71%, 01/12/31 |
2,780 | 2,207,545 | ||||||
| 2.13%, 07/08/30 |
8,221 | 6,844,136 | ||||||
| 2.14%, 09/23/30 |
4,651 | 3,822,291 | ||||||
| 2.22%, 09/17/31 |
5,300 | 4,301,093 | ||||||
| 2.72%, 09/27/29(a) |
2,712 | 2,383,749 | ||||||
| 2.75%, 01/15/30 |
6,926 | 6,056,476 | ||||||
| 3.04%, 07/16/29(a) |
13,831 | 12,441,580 | ||||||
| 3.20%, 09/17/29(a) |
2,659 | 2,394,512 | ||||||
| 5.71%, 01/13/30 |
7,600 | 7,793,902 | ||||||
| 5.77%, 01/13/33(a) |
10,205 | 10,538,206 | ||||||
| 5.78%, 07/13/33 |
4,310 | 4,463,015 | ||||||
| 5.81%, 09/14/33(a) |
10,320 | 10,692,942 | ||||||
| 5.85%, 07/13/30(a) |
3,755 | 3,867,212 | ||||||
| Sumitomo Mitsui Trust Bank Ltd., 5.35%, |
2,600 | 2,617,690 | ||||||
| Toronto-Dominion Bank (The) |
||||||||
| 2.00%, 09/10/31(a) |
6,346 | 5,174,032 | ||||||
| 2.45%, 01/12/32(a) |
3,712 | 3,079,579 | ||||||
| 3.20%, 03/10/32(a) |
9,403 | 8,199,757 | ||||||
| 4.46%, 06/08/32(a) |
11,728 | 11,182,623 | ||||||
| Truist Bank, 2.25%, 03/11/30 (Call 12/11/29)(a) |
6,701 | 5,507,472 | ||||||
| Truist Financial Corp. |
||||||||
| 1.95%, 06/05/30 (Call 03/05/30) |
4,256 | 3,484,094 | ||||||
| 3.88%, 03/19/29 (Call 02/16/29)(a) |
3,421 | 3,147,170 | ||||||
| 4.92%, 07/28/33 (Call 07/28/32), |
5,985 | 5,504,445 | ||||||
| 5.12%, 01/26/34 (Call 01/26/33), |
8,715 | 8,266,770 | ||||||
| 5.71%, 01/24/35 (Call 01/24/34), |
11,225 | 11,113,072 | ||||||
| 5.87%, 06/08/34 (Call 06/08/33), |
10,088 | 10,086,970 | ||||||
| 6.12%, 10/28/33 (Call 10/28/32), |
4,478 | 4,556,846 | ||||||
| U.S. Bancorp. |
||||||||
| 1.38%, 07/22/30 (Call 04/22/30)(a) |
7,053 | 5,585,490 | ||||||
| 2.49%, 11/03/36 (Call 11/03/31), |
7,310 | 5,648,776 | ||||||
| 2.68%, 01/27/33 (Call 01/27/32), |
5,236 | 4,281,878 | ||||||
| 3.00%, 07/30/29 (Call 04/30/29) |
5,606 | 4,971,477 | ||||||
| 4.84%, 02/01/34 (Call 02/01/33), |
11,648 | 10,961,990 | ||||||
| 188 | 2 0 2 4 I S H A R E S A N N U A L R E P O R T T O S H A R E H O L D E R S |
| Schedule of Investments (continued) February 29, 2024 |
iShares® 5-10 Year Investment Grade Corporate Bond ETF (Percentages shown are based on Net Assets) |
| Security | Par (000) |
Value | ||||||
| Banks (continued) |
||||||||
| 4.97%, 07/22/33 (Call 07/22/32), |
$ | 7,470 | $ | 6,981,468 | ||||
| 5.68%, 01/23/35 (Call 01/23/34), |
11,570 | 11,543,097 | ||||||
| 5.84%, 06/12/34 (Call 06/10/33), |
9,798 | 9,893,619 | ||||||
| 5.85%, 10/21/33 (Call 10/21/32), |
8,618 | 8,723,998 | ||||||
| UBS Group AG |
||||||||
| 2.10%, 02/11/32 (Call 02/11/31), |
11,209 | 8,850,056 | ||||||
| 2.75%, 02/11/33 (Call 02/11/32), |
9,475 | 7,632,105 | ||||||
| 3.09%, 05/14/32 (Call 05/14/31), |
18,326 | 15,400,033 | ||||||
| 3.13%, 08/13/30 (Call 08/13/29), |
8,264 | 7,305,060 | ||||||
| 4.19%, 04/01/31 (Call 04/01/30), |
16,935 | 15,575,133 | ||||||
| 4.99%, 08/05/33 (Call 08/05/32), |
9,203 | 8,772,826 | ||||||
| 5.70%, 02/08/35 (Call 02/08/34), |
8,340 | 8,248,952 | ||||||
| 5.96%, 01/12/34 (Call 01/12/33), |
13,335 | 13,515,748 | ||||||
| 6.25%, 09/22/29 (Call 09/22/28), |
275 | 282,470 | ||||||
| 6.30%, 09/22/34 (Call 09/22/33), |
4,535 | 4,688,213 | ||||||
| 6.54%, 08/12/33 (Call 08/12/32), |
17,205 | 17,942,341 | ||||||
| 9.02%, 11/15/33 (Call 11/15/32), |
11,778 | 14,171,470 | ||||||
| UniCredit SpA, 3.13%, 06/03/32 (Call 06/03/31), |
5,656 | 4,729,462 | ||||||
| Webster Financial Corp., 4.10%, 03/25/29 |
1,128 | 1,027,041 | ||||||
| Wells Fargo & Co. |
||||||||
| 2.57%, 02/11/31 (Call 02/11/30), |
19,019 | 16,215,145 | ||||||
| 2.88%, 10/30/30 (Call 10/30/29), |
23,053 | 20,216,943 | ||||||
| 3.35%, 03/02/33 (Call 03/02/32), |
22,908 | 19,662,300 | ||||||
| 4.48%, 04/04/31 (Call 04/04/30), |
10,182 | 9,681,942 | ||||||
| 4.90%, 07/25/33 (Call 07/25/32), |
24,243 | 23,179,913 | ||||||
| 5.39%, 04/24/34 (Call 04/24/33), |
21,303 | 20,952,338 | ||||||
| 5.50%, 01/23/35 (Call 01/23/34), |
15,195 | 15,094,638 | ||||||
| 5.56%, 07/25/34 (Call 07/25/33), |
23,931 | 23,838,537 | ||||||
| 6.49%, 10/23/34 (Call 10/23/33), |
18,320 | 19,483,491 | ||||||
| Series B, 7.95%, 11/15/29 |
1,250 | 1,393,880 | ||||||
| Westpac Banking Corp. |
||||||||
| 2.15%, 06/03/31 |
6,126 | 5,078,367 | ||||||
| 2.65%, 01/16/30 |
4,385 | 3,889,602 | ||||||
| Security | Par (000) |
Value | ||||||
| Banks (continued) |
||||||||
| 2.67%, 11/15/35 (Call 11/15/30), |
$ | 7,855 | $ | 6,405,581 | ||||
| 3.02%, 11/18/36 (Call 11/18/31), |
6,438 | 5,237,376 | ||||||
| 4.11%, 07/24/34 (Call 07/24/29), |
7,353 | 6,716,574 | ||||||
| 5.41%, 08/10/33 (Call 08/10/32), |
5,208 | 5,105,574 | ||||||
| 6.82%, 11/17/33(a) |
4,540 | 4,871,890 | ||||||
| Wintrust Financial Corp., 4.85%, 06/06/29 |
908 | 823,911 | ||||||
| Zions Bancorp. NA, 3.25%, 10/29/29 |
2,070 | 1,688,349 | ||||||
|
|
|
|||||||
| 2,930,296,360 | ||||||||
| Beverages — 1.5% | ||||||||
| Anheuser-Busch InBev Worldwide Inc. |
||||||||
| 3.50%, 06/01/30 (Call 03/01/30)(a) |
9,998 | 9,249,493 | ||||||
| 4.90%, 01/23/31 (Call 10/23/30)(a) |
4,958 | 4,985,857 | ||||||
| 6.63%, 08/15/33 |
745 | 824,625 | ||||||
| Bacardi Ltd./Bacardi-Martini BV, 5.40%, |
5,498 | 5,407,990 | ||||||
| Becle SAB de CV, 2.50%, 10/14/31 |
4,410 | 3,451,839 | ||||||
| Brown-Forman Corp., 4.75%, 04/15/33 |
4,135 | 4,078,789 | ||||||
| Cia. Cervecerias Unidas SA, 3.35%, 01/19/32 |
1,320 | 1,129,920 | ||||||
| Coca-Cola Co. (The) |
||||||||
| 1.38%, 03/15/31(a) |
7,454 | 5,967,926 | ||||||
| 1.65%, 06/01/30(a) |
9,127 | 7,632,680 | ||||||
| 2.00%, 03/05/31 |
4,447 | 3,719,677 | ||||||
| 2.13%, 09/06/29(a) |
5,749 | 5,058,444 | ||||||
| 2.25%, 01/05/32(a) |
11,411 | 9,612,543 | ||||||
| 3.45%, 03/25/30 |
7,158 | 6,677,673 | ||||||
| Coca-Cola Femsa SAB de CV |
||||||||
| 1.85%, 09/01/32 (Call 06/01/32) |
1,950 | 1,523,516 | ||||||
| 2.75%, 01/22/30 (Call 10/22/29) |
5,859 | 5,152,991 | ||||||
| Constellation Brands Inc. |
||||||||
| 2.25%, 08/01/31 (Call 05/01/31) |
5,990 | 4,887,562 | ||||||
| 2.88%, 05/01/30 (Call 02/01/30)(a) |
4,097 | 3,598,134 | ||||||
| 3.15%, 08/01/29 (Call 05/01/29) |
4,800 | 4,354,854 | ||||||
| 4.75%, 05/09/32 (Call 02/09/32)(a) |
4,703 | 4,548,419 | ||||||
| 4.90%, 05/01/33 (Call 02/01/33)(a) |
5,283 | 5,123,542 | ||||||
| Diageo Capital PLC |
||||||||
| 2.00%, 04/29/30 (Call 01/29/30) |
5,866 | 4,947,502 | ||||||
| 2.13%, 04/29/32 (Call 01/29/32) |
4,580 | 3,706,787 | ||||||
| 2.38%, 10/24/29 (Call 07/24/29)(a) |
5,417 | 4,758,891 | ||||||
| 5.50%, 01/24/33 (Call 10/24/32) |
4,510 | 4,634,823 | ||||||
| 5.63%, 10/05/33 (Call 07/05/33) |
5,325 | 5,537,534 | ||||||
| JDE Peet’s NV, 2.25%, 09/24/31 |
3,122 | 2,442,415 | ||||||
| Keurig Dr Pepper Inc. |
||||||||
| 2.25%, 03/15/31 (Call 12/15/30)(a) |
3,037 | 2,523,745 | ||||||
| 3.20%, 05/01/30 (Call 02/01/30) |
4,686 | 4,233,694 | ||||||
| 3.95%, 04/15/29 (Call 02/15/29) |
5,570 | 5,306,877 | ||||||
| 4.05%, 04/15/32 (Call 01/15/32)(a) |
5,295 | 4,918,065 | ||||||
| PepsiCo Inc. |
||||||||
| 1.40%, 02/25/31 (Call 11/25/30) |
4,464 | 3,568,284 | ||||||
| 1.63%, 05/01/30 (Call 02/01/30) |
6,066 | 5,046,414 | ||||||
| 1.95%, 10/21/31 (Call 07/21/31)(a) |
7,612 | 6,241,138 | ||||||
| 2.63%, 07/29/29 (Call 04/29/29) |
5,740 | 5,171,724 | ||||||
| 2.75%, 03/19/30 (Call 12/19/29) |
8,591 | 7,672,039 | ||||||
| S C H E D U L E O F I N V E S T M E N T S |
189 |
| Schedule of Investments (continued) February 29, 2024 |
iShares® 5-10 Year Investment Grade Corporate Bond ETF (Percentages shown are based on Net Assets) |
| Security | Par (000) |
Value | ||||||
| Beverages (continued) |
||||||||
| 3.90%, 07/18/32 (Call 04/18/32) |
$ | 7,300 | $ | 6,850,160 | ||||
| 4.45%, 02/15/33 (Call 11/15/32)(a) |
5,748 | 5,698,590 | ||||||
| 7.00%, 03/01/29 |
2 | 2,208 | ||||||
| Pepsico Singapore Financing I Pte Ltd., 4.70%, |
2,275 | 2,237,830 | ||||||
| Pernod Ricard International Finance LLC, |
5,289 | 4,194,267 | ||||||
|
|
|
|||||||
| 186,679,461 | ||||||||
| Biotechnology — 0.9% | ||||||||
| Amgen Inc. |
||||||||
| 2.00%, 01/15/32 (Call 10/15/31) |
6,011 | 4,816,777 | ||||||
| 2.30%, 02/25/31 (Call 11/25/30) |
6,828 | 5,713,405 | ||||||
| 2.45%, 02/21/30 (Call 11/21/29) |
7,519 | 6,535,722 | ||||||
| 3.35%, 02/22/32 (Call 11/22/31)(a) |
5,980 | 5,291,919 | ||||||
| 4.05%, 08/18/29 (Call 06/18/29)(a) |
7,411 | 7,085,975 | ||||||
| 4.20%, 03/01/33 (Call 12/01/32) |
4,805 | 4,444,753 | ||||||
| 5.25%, 03/02/30 (Call 01/02/30) |
15,275 | 15,388,516 | ||||||
| 5.25%, 03/02/33 (Call 12/02/32) |
23,555 | 23,490,409 | ||||||
| Biogen Inc., 2.25%, 05/01/30 (Call 02/01/30) |
9,592 | 8,028,531 | ||||||
| Bio-Rad Laboratories Inc., 3.70%, 03/15/32 |
4,905 | 4,368,704 | ||||||
| CSL Finance PLC |
||||||||
| 4.05%, 04/27/29 (Call 02/27/29)(b) |
2,115 | 2,018,606 | ||||||
| 4.25%, 04/27/32 (Call 01/27/32)(b) |
5,955 | 5,623,227 | ||||||
| Gilead Sciences Inc. |
||||||||
| 1.65%, 10/01/30 (Call 07/01/30)(a) |
5,930 | 4,841,893 | ||||||
| 5.25%, 10/15/33 (Call 07/15/33)(a) |
4,291 | 4,341,002 | ||||||
| Illumina Inc., 2.55%, 03/23/31 (Call 12/23/30)(a) |
3,389 | 2,784,182 | ||||||
| Regeneron Pharmaceuticals Inc., 1.75%, |
7,817 | 6,323,408 | ||||||
| Royalty Pharma PLC |
||||||||
| 2.15%, 09/02/31 (Call 06/02/31)(a) |
3,720 | 2,968,990 | ||||||
| 2.20%, 09/02/30 (Call 06/02/30) |
6,273 | 5,163,918 | ||||||
|
|
|
|||||||
| 119,229,937 | ||||||||
| Building Materials — 0.6% | ||||||||
| Carrier Global Corp. |
||||||||
| 2.70%, 02/15/31 (Call 11/15/30) |
4,434 | 3,784,363 | ||||||
| 2.72%, 02/15/30 (Call 11/15/29)(a) |
11,742 | 10,280,245 | ||||||
| 5.90%, 03/15/34 (Call 12/15/33) |
1,045 | 1,084,040 | ||||||
| Eagle Materials Inc., 2.50%, 07/01/31 |
4,558 | 3,789,218 | ||||||
| Fortune Brands Innovations Inc. |
||||||||
| 3.25%, 09/15/29 (Call 06/15/29)(a) |
4,250 | 3,845,007 | ||||||
| 4.00%, 03/25/32 (Call 12/25/31)(a) |
2,425 | 2,201,531 | ||||||
| 5.88%, 06/01/33 (Call 03/01/33) |
4,071 | 4,133,302 | ||||||
| GCC SAB de CV, 3.61%, 04/20/32 |
250 | 211,955 | ||||||
| Johnson Controls International PLC/Tyco Fire & |
||||||||
| 1.75%, 09/15/30 (Call 06/15/30)(a) |
6,954 | 5,681,695 | ||||||
| 2.00%, 09/16/31 (Call 06/16/31)(a) |
2,582 | 2,071,925 | ||||||
| 4.90%, 12/01/32 (Call 09/01/32)(a) |
2,140 | 2,097,015 | ||||||
| Martin Marietta Materials Inc. |
||||||||
| 2.40%, 07/15/31 (Call 04/15/31)(a) |
5,512 | 4,586,611 | ||||||
| Series CB, 2.50%, 03/15/30 |
3,332 | 2,887,686 | ||||||
| Masco Corp. |
||||||||
| 2.00%, 10/01/30 (Call 07/01/30)(a) |
2,441 | 1,986,869 | ||||||
| 2.00%, 02/15/31 (Call 11/15/30) |
3,409 | 2,768,171 | ||||||
| Security | Par (000) |
Value | ||||||
| Building Materials (continued) |
||||||||
| Mohawk Industries Inc., 3.63%, 05/15/30 |
$ | 2,257 | $ | 2,057,510 | ||||
| Owens Corning |
||||||||
| 3.88%, 06/01/30 (Call 03/01/30) |
2,385 | 2,197,104 | ||||||
| 3.95%, 08/15/29 (Call 05/15/29)(a) |
4,270 | 4,026,602 | ||||||
| Trane Technologies Financing Ltd. |
||||||||
| 3.80%, 03/21/29 (Call 12/21/28)(a) |
3,991 | 3,773,413 | ||||||
| 5.25%, 03/03/33 (Call 12/03/32) |
3,950 | 3,983,518 | ||||||
| UltraTech Cement Ltd., 2.80%, 02/16/31 |
2,285 | 1,917,522 | ||||||
| Vulcan Materials Co., 3.50%, 06/01/30 |
4,904 | 4,466,591 | ||||||
|
|
|
|||||||
| 73,831,893 | ||||||||
| Chemicals — 1.5% | ||||||||
| Air Liquide Finance SA, 2.25%, 09/10/29 |
3,103 | 2,735,257 | ||||||
| Air Products and Chemicals Inc. |
||||||||
| 2.05%, 05/15/30 (Call 02/15/30) |
5,647 | 4,803,777 | ||||||
| 4.75%, 02/08/31 (Call 12/08/30) |
5,530 | 5,459,960 | ||||||
| 4.80%, 03/03/33 (Call 12/03/32)(a) |
3,851 | 3,796,833 | ||||||
| 4.85%, 02/08/34 (Call 11/08/33)(a) |
5,480 | 5,372,957 | ||||||
| Albemarle Corp., 5.05%, 06/01/32 |
4,080 | 3,874,452 | ||||||
| Alpek SAB de CV |
||||||||
| 3.25%, 02/25/31 (Call 11/25/30)(a)(b) |
4,000 | 3,352,401 | ||||||
| 4.25%, 09/18/29 (Call 06/18/29)(b) |
230 | 211,435 | ||||||
| Bayport Polymers LLC, 5.14%, 04/14/32 |
1,295 | 1,154,545 | ||||||
| Cabot Corp. |
||||||||
| 4.00%, 07/01/29 (Call 04/01/29)(a) |
1,939 | 1,804,553 | ||||||
| 5.00%, 06/30/32 (Call 03/30/32)(a) |
2,690 | 2,593,769 | ||||||
| Celanese U.S. Holdings LLC |
||||||||
| 6.33%, 07/15/29 (Call 05/15/29)(a) |
4,505 | 4,626,414 | ||||||
| 6.38%, 07/15/32 (Call 04/15/32)(a) |
5,975 | 6,121,839 | ||||||
| 6.55%, 11/15/30 (Call 09/15/30) |
6,175 | 6,420,032 | ||||||
| 6.70%, 11/15/33 (Call 08/15/33) |
5,705 | 5,993,019 | ||||||
| Dow Chemical Co. (The) |
||||||||
| 2.10%, 11/15/30 (Call 08/15/30)(a) |
5,486 | 4,579,972 | ||||||
| 5.15%, 02/15/34 (Call 11/15/33)(a) |
1,980 | 1,951,157 | ||||||
| 6.30%, 03/15/33 (Call 12/15/32)(a) |
3,688 | 3,950,886 | ||||||
| 7.38%, 11/01/29(a) |
6,421 | 7,122,151 | ||||||
| Eastman Chemical Co. |
||||||||
| 5.63%, 02/20/34 (Call 11/20/33)(a) |
2,215 | 2,198,738 | ||||||
| 5.75%, 03/08/33 (Call 12/08/32)(a) |
3,118 | 3,138,745 | ||||||
| Ecolab Inc. |
||||||||
| 1.30%, 01/30/31 (Call 10/30/30)(a) |
4,123 | 3,269,551 | ||||||
| 2.13%, 02/01/32 (Call 11/01/31) |
4,220 | 3,467,959 | ||||||
| 4.80%, 03/24/30 (Call 12/24/29)(a) |
4,526 | 4,522,279 | ||||||
| EIDP Inc. |
||||||||
| 2.30%, 07/15/30 (Call 04/15/30)(a) |
3,187 | 2,725,853 | ||||||
| 4.80%, 05/15/33 (Call 02/15/33)(a) |
1,085 | 1,061,609 | ||||||
| FMC Corp. |
||||||||
| 3.45%, 10/01/29 (Call 07/01/29)(a) |
3,173 | 2,820,461 | ||||||
| 5.65%, 05/18/33 (Call 02/18/33)(a) |
3,377 | 3,270,414 | ||||||
| GC Treasury Center Co. Ltd. |
||||||||
| 2.98%, 03/18/31 (Call 12/18/30)(a)(b) |
3,825 | 3,183,319 | ||||||
| 4.40%, 03/30/32 (Call 09/30/31)(a)(b) |
2,300 | 2,084,143 | ||||||
| Huntsman International LLC |
||||||||
| 2.95%, 06/15/31 (Call 03/15/31)(a) |
2,969 | 2,444,846 | ||||||
| 4.50%, 05/01/29 (Call 02/01/29)(a) |
4,306 | 4,089,864 | ||||||
| 190 | 2 0 2 4 I S H A R E S A N N U A L R E P O R T T O S H A R E H O L D E R S |
| Schedule of Investments (continued) February 29, 2024 |
iShares® 5-10 Year Investment Grade Corporate Bond ETF (Percentages shown are based on Net Assets) |
| Security | Par (000) |
Value | ||||||
| Chemicals (continued) | ||||||||
| International Flavors & Fragrances Inc., 2.30%, 11/01/30 (Call 08/01/30)(a)(b) |
$ | 7,068 | $ | 5,800,287 | ||||
| LG Chem Ltd. |
||||||||
| 2.38%, 07/07/31(b) |
2,900 | 2,385,019 | ||||||
| 3.63%, 04/15/29(b) |
1,135 | 1,051,580 | ||||||
| Linde Inc./CT, 1.10%, 08/10/30 (Call 05/10/30) |
4,523 | 3,621,717 | ||||||
| LYB International Finance III LLC |
||||||||
| 2.25%, 10/01/30 (Call 07/01/30)(a) |
3,279 | 2,730,929 | ||||||
| 5.50%, 03/01/34 (Call 12/01/33) |
4,025 | 3,993,491 | ||||||
| 5.63%, 05/15/33 (Call 02/15/33)(a) |
3,536 | 3,590,526 | ||||||
| MEGlobal Canada ULC, 5.88%, 05/18/30(a)(b) |
3,180 | 3,201,878 | ||||||
| Mosaic Co. (The), 5.45%, 11/15/33 |
30 | 29,663 | ||||||
| NewMarket Corp., 2.70%, 03/18/31 |
2,563 | 2,127,745 | ||||||
| Nutrien Ltd. |
||||||||
| 2.95%, 05/13/30 (Call 02/13/30) |
3,306 | 2,927,173 | ||||||
| 4.20%, 04/01/29 (Call 01/01/29)(a) |
3,912 | 3,760,333 | ||||||
| OCI NV, 6.70%, 03/16/33 (Call 12/16/32)(b) |
4,117 | 4,080,625 | ||||||
| Orbia Advance Corp. SAB de CV, 2.88%, 05/11/31 (Call 02/11/31)(b) |
3,025 | 2,451,042 | ||||||
| PPG Industries Inc. |
||||||||
| 2.55%, 06/15/30 (Call 03/15/30)(a) |
1,899 | 1,636,195 | ||||||
| 2.80%, 08/15/29 (Call 05/15/29)(a) |
2,012 | 1,799,004 | ||||||
| Rohm & Haas Co., 7.85%, 07/15/29 |
3,313 | 3,676,263 | ||||||
| RPM International Inc. |
||||||||
| 2.95%, 01/15/32 (Call 10/15/31)(a) |
2,211 | 1,867,346 | ||||||
| 4.55%, 03/01/29 (Call 12/01/28)(a) |
2,108 | 2,027,619 | ||||||
| Sherwin-Williams Co. (The) |
||||||||
| 2.20%, 03/15/32 (Call 12/15/31)(a) |
3,413 | 2,766,106 | ||||||
| 2.30%, 05/15/30 (Call 02/15/30) |
3,012 | 2,556,824 | ||||||
| 2.95%, 08/15/29 (Call 05/15/29) |
5,063 | 4,548,788 | ||||||
| Sociedad Quimica y Minera de Chile SA |
||||||||
| 4.25%, 05/07/29 (Call 02/07/29)(b) |
2,555 | 2,415,883 | ||||||
| 6.50%, 11/07/33 (Call 08/07/33)(a)(b) |
840 | 866,040 | ||||||
| Westlake Corp., 3.38%, 06/15/30 |
2,193 | 1,958,938 | ||||||
| Yara International ASA |
||||||||
| 3.15%, 06/04/30 (Call 03/04/30)(a)(b) |
4,562 | 3,955,182 | ||||||
| 7.38%, 11/14/32 (Call 08/14/32)(a)(b) |
3,695 | 4,060,662 | ||||||
|
|
|
|||||||
| 190,090,048 | ||||||||
| Coal — 0.0% | ||||||||
| Teck Resources Ltd., 3.90%, 07/15/30 |
2,842 | 2,591,176 | ||||||
|
|
|
|||||||
| Commercial Services — 1.5% | ||||||||
| Adani International Container Terminal Pvt Ltd., |
1,353 | 1,159,690 | ||||||
| Adani Ports & Special Economic Zone Ltd. |
||||||||
| 3.10%, 02/02/31(b) |
2,045 | 1,631,553 | ||||||
| 4.38%, 07/03/29(b) |
3,095 | 2,756,694 | ||||||
| Ashtead Capital Inc. |
||||||||
| 2.45%, 08/12/31 (Call 05/12/31)(a)(b) |
4,175 | 3,360,539 | ||||||
| 4.25%, 11/01/29 (Call 11/01/24)(b) |
3,785 | 3,491,976 | ||||||
| 5.50%, 08/11/32 (Call 05/11/32)(a)(b) |
4,224 | 4,129,359 | ||||||
| 5.55%, 05/30/33 (Call 02/28/33)(a)(b) |
2,955 | 2,890,343 | ||||||
| 5.95%, 10/15/33 (Call 07/15/33)(a)(b) |
4,435 | 4,458,005 | ||||||
| Automatic Data Processing Inc., 1.25%, |
6,118 | 4,961,014 | ||||||
| Block Financial LLC, 3.88%, 08/15/30 |
4,240 | 3,822,762 | ||||||
| Security | Par (000) |
Value | ||||||
| Commercial Services (continued) | ||||||||
| Cintas Corp. No. 2, 4.00%, 05/01/32 |
$ | 2,810 | $ | 2,637,152 | ||||
| CK Hutchison International 23 Ltd., 4.88%, |
6,540 | 6,453,340 | ||||||
| CoStar Group Inc., 2.80%, 07/15/30 |
6,107 | 5,163,547 | ||||||
| DP World Crescent Ltd., 3.75%, 01/30/30 |
3,455 | 3,184,885 | ||||||
| Emory University, Series 2020, 2.14%, 09/01/30 |
1,002 | 855,680 | ||||||
| Equifax Inc. |
||||||||
| 2.35%, 09/15/31 (Call 06/15/31)(a) |
6,280 | 5,125,473 | ||||||
| 3.10%, 05/15/30 (Call 02/15/30) |
3,905 | 3,444,684 | ||||||
| ERAC USA Finance LLC, 4.90%, 05/01/33 |
6,523 | 6,363,405 | ||||||
| Experian Finance PLC, 2.75%, 03/08/30 |
3,916 | 3,388,667 | ||||||
| Gartner Inc. |
||||||||
| 3.63%, 06/15/29 (Call 06/15/24)(b) |
88 | 78,848 | ||||||
| 3.75%, 10/01/30 (Call 10/01/25)(a)(b) |
1,720 | 1,522,321 | ||||||
| Global Payments Inc. |
||||||||
| 2.90%, 05/15/30 (Call 02/15/30) |
5,779 | 4,981,013 | ||||||
| 2.90%, 11/15/31 (Call 08/15/31)(a) |
4,311 | 3,598,025 | ||||||
| 3.20%, 08/15/29 (Call 05/15/29)(a) |
7,003 | 6,236,981 | ||||||
| 5.30%, 08/15/29 (Call 06/15/29) |
2,890 | 2,851,169 | ||||||
| 5.40%, 08/15/32 (Call 05/15/32)(a) |
4,308 | 4,250,538 | ||||||
| GXO Logistics Inc., 2.65%, 07/15/31 |
2,439 | 1,982,677 | ||||||
| Johns Hopkins University, 4.71%, 07/01/32 |
785 | 788,005 | ||||||
| Moody’s Corp. |
||||||||
| 2.00%, 08/19/31 (Call 05/19/31)(a) |
3,876 | 3,130,641 | ||||||
| 4.25%, 08/08/32 (Call 05/08/32)(a) |
3,030 | 2,863,046 | ||||||
| PayPal Holdings Inc. |
||||||||
| 2.30%, 06/01/30 (Call 03/01/30)(a) |
6,358 | 5,411,152 | ||||||
| 2.85%, 10/01/29 (Call 07/01/29) |
8,680 | 7,735,508 | ||||||
| 4.40%, 06/01/32 (Call 03/01/32)(a) |
5,953 | 5,711,222 | ||||||
| Quanta Services Inc. |
||||||||
| 2.35%, 01/15/32 (Call 10/15/31)(a) |
1,184 | 948,327 | ||||||
| 2.90%, 10/01/30 (Call 07/01/30) |
4,596 | 3,983,291 | ||||||
| RELX Capital Inc. |
||||||||
| 3.00%, 05/22/30 (Call 02/22/30) |
4,606 | 4,113,120 | ||||||
| 4.00%, 03/18/29 (Call 12/18/28) |
5,336 | 5,096,501 | ||||||
| 4.75%, 05/20/32 (Call 02/20/32) |
2,858 | 2,806,229 | ||||||
| S&P Global Inc. |
||||||||
| 1.25%, 08/15/30 (Call 05/15/30)(a) |
3,600 | 2,874,306 | ||||||
| 2.50%, 12/01/29 (Call 09/01/29)(a) |
2,915 | 2,568,685 | ||||||
| 2.70%, 03/01/29 (Call 01/01/29)(a) |
5,105 | 4,621,580 | ||||||
| 2.90%, 03/01/32 (Call 12/01/31) |
7,185 | 6,194,239 | ||||||
| 4.25%, 05/01/29 (Call 02/01/29)(a) |
5,225 | 5,065,981 | ||||||
| 5.25%, 09/15/33 (Call 06/15/33)(a)(b) |
4,330 | 4,380,091 | ||||||
| Sodexo Inc., 2.72%, 04/16/31 |
4,293 | 3,616,946 | ||||||
| Transurban Finance Co. Pty. Ltd., 2.45%, |
5,356 | 4,442,716 | ||||||
| Triton Container International Ltd., 3.15%, |
4,302 | 3,386,413 | ||||||
| Triton Container International Ltd./TAL |
||||||||
| International Container Corp., 3.25%, |
2,560 | 2,032,367 | ||||||
| S C H E D U L E O F I N V E S T M E N T S |
191 |
| Schedule of Investments (continued) February 29, 2024 |
iShares® 5-10 Year Investment Grade Corporate Bond ETF (Percentages shown are based on Net Assets) |
| Security | Par (000) |
Value | ||||||
| Commercial Services (continued) | ||||||||
| United Rentals North America Inc., 6.00%, 12/15/29 (Call 12/15/25)(b) |
$ | 8,375 | $ | 8,382,680 | ||||
| Verisk Analytics Inc. |
||||||||
| 4.13%, 03/15/29 (Call 12/15/28) |
3,338 | 3,204,495 | ||||||
| 5.75%, 04/01/33 (Call 01/01/33)(a) |
2,460 | 2,540,159 | ||||||
| Yale University, Series 2020, 1.48%, 04/15/30 (Call 01/15/30) |
1,636 | 1,370,682 | ||||||
|
|
|
|||||||
| 192,048,722 | ||||||||
| Computers — 1.6% | ||||||||
| Amdocs Ltd., 2.54%, 06/15/30 (Call 03/15/30) |
4,048 | 3,435,976 | ||||||
| Apple Inc. |
||||||||
| 1.25%, 08/20/30 (Call 05/20/30) |
7,061 | 5,719,057 | ||||||
| 1.65%, 05/11/30 (Call 02/11/30) |
9,952 | 8,327,435 | ||||||
| 1.65%, 02/08/31 (Call 11/08/30)(a) |
15,297 | 12,589,191 | ||||||
| 1.70%, 08/05/31 (Call 05/05/31) |
5,696 | 4,639,609 | ||||||
| 2.20%, 09/11/29 (Call 06/11/29)(a) |
10,394 | 9,188,883 | ||||||
| 3.25%, 08/08/29 (Call 06/08/29)(a) |
5,725 | 5,352,685 | ||||||
| 3.35%, 08/08/32 (Call 05/08/32)(a) |
8,705 | 7,904,415 | ||||||
| 4.15%, 05/10/30 (Call 03/10/30)(a) |
2,998 | 2,943,646 | ||||||
| 4.30%, 05/10/33 (Call 02/10/33)(a) |
5,915 | 5,851,888 | ||||||
| Booz Allen Hamilton Inc. |
||||||||
| 4.00%, 07/01/29 (Call 07/01/24)(a)(b) |
1,905 | 1,758,582 | ||||||
| 5.95%, 08/04/33 (Call 05/04/33)(a) |
3,338 | 3,424,009 | ||||||
| CGI Inc., 2.30%, 09/14/31 (Call 06/14/31) |
2,377 | 1,899,215 | ||||||
| Dell International LLC/EMC Corp. |
||||||||
| 5.30%, 10/01/29 (Call 07/01/29) |
10,175 | 10,198,855 | ||||||
| 5.75%, 02/01/33 (Call 11/01/32)(a) |
5,918 | 6,092,013 | ||||||
| 6.20%, 07/15/30 (Call 04/15/30) |
5,621 | 5,882,438 | ||||||
| Fortinet Inc., 2.20%, 03/15/31 (Call 12/15/30)(a) |
3,220 | 2,665,244 | ||||||
| HP Inc. |
||||||||
| 2.65%, 06/17/31 (Call 03/17/31)(a) |
6,200 | 5,185,383 | ||||||
| 3.40%, 06/17/30 (Call 03/17/30)(a) |
745 | 671,369 | ||||||
| 4.00%, 04/15/29 (Call 02/15/29)(a) |
5,625 | 5,359,168 | ||||||
| 4.20%, 04/15/32 (Call 01/15/32)(a) |
3,895 | 3,595,081 | ||||||
| 5.50%, 01/15/33 (Call 10/15/32)(a) |
6,488 | 6,507,904 | ||||||
| IBM International Capital Pte Ltd. |
||||||||
| 4.75%, 02/05/31 (Call 12/05/30) |
4,435 | 4,318,678 | ||||||
| 4.90%, 02/05/34 (Call 11/05/33) |
3,825 | 3,720,125 | ||||||
| International Business Machines Corp. |
||||||||
| 1.95%, 05/15/30 (Call 02/15/30) |
8,236 | 6,893,808 | ||||||
| 2.72%, 02/09/32 (Call 11/09/31)(a) |
2,485 | 2,152,986 | ||||||
| 3.50%, 05/15/29(a) |
18,251 | 17,055,080 | ||||||
| 4.40%, 07/27/32 (Call 04/27/32)(a) |
4,548 | 4,343,476 | ||||||
| 4.75%, 02/06/33 (Call 11/06/32)(a) |
4,170 | 4,071,372 | ||||||
| 5.88%, 11/29/32(a) |
3,270 | 3,465,925 | ||||||
| Kyndryl Holdings Inc. |
||||||||
| 3.15%, 10/15/31 (Call 07/15/31)(a) |
3,976 | 3,278,908 | ||||||
| 6.35%, 02/20/34 (Call 11/20/33) |
860 | 868,043 | ||||||
| Leidos Inc. |
||||||||
| 2.30%, 02/15/31 (Call 11/15/30) |
4,440 | 3,639,124 | ||||||
| 4.38%, 05/15/30 (Call 02/15/30) |
3,467 | 3,262,359 | ||||||
| 5.75%, 03/15/33 (Call 12/15/32)(a) |
4,160 | 4,227,880 | ||||||
| Lenovo Group Ltd. |
||||||||
| 3.42%, 11/02/30 (Call 08/02/30)(a)(b) |
4,960 | 4,314,868 | ||||||
| 6.54%, 07/27/32 (Call 04/27/32)(a)(b) |
3,505 | 3,675,666 | ||||||
| NetApp Inc., 2.70%, 06/22/30 (Call 03/22/30) |
4,318 | 3,706,691 | ||||||
| Teledyne FLIR LLC, 2.50%, 08/01/30 |
3,454 | 2,915,147 | ||||||
| Security | Par (000) |
Value | ||||||
| Computers (continued) | ||||||||
| Western Digital Corp., 3.10%, 02/01/32 |
$ | 1,770 | $ | 1,385,381 | ||||
|
|
|
|||||||
| 196,487,563 | ||||||||
| Cosmetics & Personal Care — 0.8% | ||||||||
| Colgate-Palmolive Co. |
||||||||
| 3.25%, 08/15/32 (Call 05/15/32)(a) |
3,013 | 2,704,461 | ||||||
| 4.60%, 03/01/33 (Call 12/01/32)(a) |
3,038 | 3,013,414 | ||||||
| Estee Lauder Companies Inc. (The) |
||||||||
| 1.95%, 03/15/31 (Call 12/15/30)(a) |
3,798 | 3,116,133 | ||||||
| 2.38%, 12/01/29 (Call 09/01/29)(a) |
3,758 | 3,284,826 | ||||||
| 2.60%, 04/15/30 (Call 01/15/30)(a) |
4,397 | 3,845,303 | ||||||
| 4.65%, 05/15/33 (Call 02/15/33)(a) |
4,105 | 3,981,675 | ||||||
| 5.00%, 02/14/34 (Call 11/14/33) |
2,195 | 2,156,573 | ||||||
| Haleon U.S. Capital LLC |
||||||||
| 3.38%, 03/24/29 (Call 01/24/29) |
250 | 231,029 | ||||||
| 3.63%, 03/24/32 (Call 12/24/31) |
11,425 | 10,234,570 | ||||||
| Kenvue Inc. |
||||||||
| 4.90%, 03/22/33 (Call 12/22/32) |
8,742 | 8,642,438 | ||||||
| 5.00%, 03/22/30 (Call 01/22/30) |
6,108 | 6,125,762 | ||||||
| Procter & Gamble Co. (The) |
||||||||
| 1.20%, 10/29/30 |
7,503 | 6,040,724 | ||||||
| 1.95%, 04/23/31 |
6,048 | 5,090,152 | ||||||
| 2.30%, 02/01/32(a) |
4,820 | 4,117,557 | ||||||
| 3.00%, 03/25/30(a) |
8,521 | 7,797,940 | ||||||
| 4.05%, 01/26/33(a) |
5,020 | 4,834,336 | ||||||
| 4.55%, 01/29/34(a) |
3,045 | 3,002,187 | ||||||
| Unilever Capital Corp. |
||||||||
| 1.38%, 09/14/30 (Call 06/14/30) |
2,975 | 2,403,881 | ||||||
| 1.75%, 08/12/31 (Call 05/12/31)(a) |
4,892 | 3,940,088 | ||||||
| 2.13%, 09/06/29 (Call 06/06/29)(a) |
4,860 | 4,233,128 | ||||||
| 5.00%, 12/08/33 (Call 09/08/33) |
3,750 | 3,755,847 | ||||||
| 5.90%, 11/15/32 |
5,020 | 5,350,418 | ||||||
|
|
|
|||||||
| 97,902,442 | ||||||||
| Distribution & Wholesale — 0.1% | ||||||||
| Ferguson Finance PLC |
||||||||
| 3.25%, 06/02/30 (Call 03/02/30)(a)(b) |
3,728 | 3,327,355 | ||||||
| 4.65%, 04/20/32 (Call 01/20/32)(b) |
4,170 | 3,976,877 | ||||||
| LKQ Corp., 6.25%, 06/15/33 (Call 03/15/33) |
3,335 | 3,427,273 | ||||||
|
|
|
|||||||
| 10,731,505 | ||||||||
| Diversified Financial Services — 3.5% | ||||||||
| AerCap Ireland Capital DAC/AerCap Global Aviation Trust |
||||||||
| 3.30%, 01/30/32 (Call 10/30/31)(a) |
22,810 | 19,290,028 | ||||||
| 3.40%, 10/29/33 (Call 07/29/33)(a) |
8,874 | 7,372,320 | ||||||
| 5.30%, 01/19/34 (Call 10/19/33)(a) |
4,230 | 4,080,429 | ||||||
| 6.15%, 09/30/30 (Call 07/30/30)(a) |
359 | 370,824 | ||||||
| Affiliated Managers Group Inc., 3.30%, 06/15/30 (Call 03/15/30)(a) |
2,567 | 2,257,943 | ||||||
| Air Lease Corp. |
||||||||
| 2.88%, 01/15/32 (Call 10/15/31)(a) |
4,620 | 3,835,328 | ||||||
| 3.00%, 02/01/30 (Call 11/01/29) |
3,895 | 3,391,266 | ||||||
| 3.13%, 12/01/30 (Call 09/01/30) |
4,348 | 3,747,754 | ||||||
| 3.25%, 10/01/29 (Call 07/01/29)(a) |
3,044 | 2,707,396 | ||||||
| Ally Financial Inc. |
||||||||
| 8.00%, 11/01/31(a) |
12,800 | 14,051,031 | ||||||
| 8.00%, 11/01/31 |
2,691 | 2,929,354 | ||||||
| American Express Co. |
||||||||
| 4.05%, 05/03/29 (Call 03/03/29)(a) |
5,032 | 4,869,361 | ||||||
| 4.42%, 08/03/33 (Call 08/03/32), |
8,173 | 7,744,626 | ||||||
| 192 | 2 0 2 4 I S H A R E S A N N U A L R E P O R T T O S H A R E H O L D E R S |
| Schedule of Investments (continued) February 29, 2024 |
iShares® 5-10 Year Investment Grade Corporate Bond ETF (Percentages shown are based on Net Assets) |
| Security | Par (000) |
Value | ||||||
| Diversified Financial Services (continued) | ||||||||
| 4.99%, 05/26/33 (Call 02/26/32), |
$ | 4,040 | $ | 3,925,996 | ||||
| 5.04%, 05/01/34 (Call 05/01/33), |
8,000 | 7,851,732 | ||||||
| 5.63%, 07/28/34 (Call 07/28/33), |
3,348 | 3,374,064 | ||||||
| 6.49%, 10/30/31 (Call 10/30/30), |
4,724 | 5,032,542 | ||||||
| Ameriprise Financial Inc. |
||||||||
| 4.50%, 05/13/32 (Call 02/13/32)(a) |
3,275 | 3,147,324 | ||||||
| 5.15%, 05/15/33 (Call 02/15/33) |
4,594 | 4,593,734 | ||||||
| Apollo Global Management Inc., 6.38%, |
2,610 | 2,802,089 | ||||||
| Ares Finance Co. II LLC, 3.25%, 06/15/30 |
2,685 | 2,344,604 | ||||||
| Aviation Capital Group LLC, 6.38%, 07/15/30 |
2,671 | 2,723,410 | ||||||
| Avolon Holdings Funding Ltd., 5.75%, 03/01/29 |
30 | 29,567 | ||||||
| Blackstone Holdings Finance Co. LLC |
||||||||
| 1.60%, 03/30/31 (Call 12/30/30)(b) |
3,475 | 2,690,858 | ||||||
| 2.00%, 01/30/32 (Call 10/30/31)(b) |
5,375 | 4,170,110 | ||||||
| 2.50%, 01/10/30 (Call 10/10/29)(a)(b) |
3,391 | 2,907,109 | ||||||
| 2.55%, 03/30/32 (Call 12/30/31)(a)(b) |
1,700 | 1,385,273 | ||||||
| 6.20%, 04/22/33 (Call 01/22/33)(a)(b) |
5,828 | 6,088,655 | ||||||
| Blue Owl Finance LLC |
||||||||
| 3.13%, 06/10/31 (Call 03/10/31)(a)(b) |
4,589 | 3,799,820 | ||||||
| 4.38%, 02/15/32 (Call 11/15/31)(a)(b) |
2,015 | 1,767,539 | ||||||
| BOC Aviation Ltd. |
||||||||
| 2.63%, 09/17/30 (Call 06/17/30)(a)(b) |
4,455 | 3,790,893 | ||||||
| 3.00%, 09/11/29 (Call 06/11/29)(a)(b) |
4,539 | 4,059,500 | ||||||
| BOC Aviation USA Corp., 4.88%, 05/03/33 |
3,320 | 3,237,083 | ||||||
| Brookfield Capital Finance LLC, 6.09%, |
4,011 | 4,149,003 | ||||||
| Brookfield Finance I U.K. PLC/Brookfield |
4,530 | 3,634,938 | ||||||
| Brookfield Finance Inc. |
||||||||
| 2.72%, 04/15/31 (Call 01/15/31) |
4,308 | 3,620,086 | ||||||
| 4.35%, 04/15/30 (Call 01/15/30) |
5,203 | 4,932,167 | ||||||
| 4.85%, 03/29/29 (Call 12/29/28)(a) |
5,434 | 5,358,506 | ||||||
| 6.35%, 01/05/34 (Call 10/05/33) |
3,040 | 3,194,374 | ||||||
| Capital One Financial Corp. |
||||||||
| 2.36%, 07/29/32 (Call 07/29/31), |
5,601 | 4,234,251 | ||||||
| 2.62%, 11/02/32 (Call 11/02/31), |
2,977 | 2,382,105 | ||||||
| 3.27%, 03/01/30 (Call 03/01/29), |
6,930 | 6,176,958 | ||||||
| 5.25%, 07/26/30 (Call 07/26/29), |
5,155 | 5,026,712 | ||||||
| 5.27%, 05/10/33 (Call 05/10/32), |
6,685 | 6,493,893 | ||||||
| 5.82%, 02/01/34 (Call 02/01/33), |
7,910 | 7,821,133 | ||||||
| 6.05%, 02/01/35 (Call 02/01/34), |
1,990 | 2,009,944 | ||||||
| 6.38%, 06/08/34 (Call 06/08/33), |
9,870 | 10,170,018 | ||||||
| Security | Par (000) |
Value | ||||||
| Diversified Financial Services (continued) | ||||||||
| 7.62%, 10/30/31 (Call 10/30/30), |
$ | 7,320 | $ | 8,010,588 | ||||
| Cboe Global Markets Inc. |
||||||||
| 1.63%, 12/15/30 (Call 09/15/30)(a) |
3,909 | 3,171,486 | ||||||
| 3.00%, 03/16/32 (Call 12/16/31)(a) |
2,025 | 1,746,198 | ||||||
| Charles Schwab Corp. (The) |
||||||||
| 1.65%, 03/11/31 (Call 12/11/30)(a) |
4,710 | 3,735,837 | ||||||
| 1.95%, 12/01/31 (Call 09/01/31)(a) |
5,078 | 4,032,502 | ||||||
| 2.30%, 05/13/31 (Call 02/13/31)(a) |
4,760 | 3,943,076 | ||||||
| 2.75%, 10/01/29 (Call 07/01/29) |
3,139 | 2,785,589 | ||||||
| 2.90%, 03/03/32 (Call 12/03/31)(a) |
5,751 | 4,877,232 | ||||||
| 3.25%, 05/22/29 (Call 02/22/29)(a) |
3,315 | 3,056,957 | ||||||
| 4.63%, 03/22/30 (Call 12/22/29)(a) |
3,666 | 3,620,355 | ||||||
| 5.85%, 05/19/34 (Call 05/19/33), |
8,139 | 8,265,208 | ||||||
| 6.14%, 08/24/34 (Call 08/24/33), |
7,704 | 7,981,426 | ||||||
| CI Financial Corp., 3.20%, 12/17/30 |
5,570 | 4,440,057 | ||||||
| CME Group Inc., 2.65%, 03/15/32 |
4,870 | 4,177,103 | ||||||
| Credit Suisse USA Inc., 7.13%, 07/15/32(a) |
5,135 | 5,730,887 | ||||||
| Discover Financial Services |
||||||||
| 6.70%, 11/29/32 (Call 08/29/32) |
4,610 | 4,824,897 | ||||||
| 7.96%, 11/02/34 (Call 11/02/33), |
5,383 | 6,029,365 | ||||||
| FMR LLC |
||||||||
| 4.95%, 02/01/33(a)(b) |
1,200 | 1,130,706 | ||||||
| 7.57%, 06/15/29(b) |
1,345 | 1,489,422 | ||||||
| Franklin Resources Inc., 1.60%, 10/30/30 |
5,949 | 4,803,238 | ||||||
| Jefferies Financial Group Inc. |
||||||||
| 2.63%, 10/15/31 (Call 07/15/31)(a) |
6,389 | 5,226,186 | ||||||
| 2.75%, 10/15/32 (Call 07/15/32)(a) |
2,765 | 2,231,464 | ||||||
| 4.15%, 01/23/30 |
6,197 | 5,765,693 | ||||||
| Lazard Group LLC, 4.38%, 03/11/29 |
2,745 | 2,613,693 | ||||||
| LPL Holdings Inc. |
||||||||
| 4.00%, 03/15/29 (Call 04/01/24)(a)(b) |
680 | 623,877 | ||||||
| 4.38%, 05/15/31 (Call 05/15/26)(a)(b) |
1,382 | 1,250,096 | ||||||
| LSEGA Financing PLC, 2.50%, 04/06/31 |
7,775 | 6,534,389 | ||||||
| Mastercard Inc. |
||||||||
| 1.90%, 03/15/31 (Call 12/15/30) |
3,800 | 3,155,413 | ||||||
| 2.00%, 11/18/31 (Call 08/18/31)(a) |
4,761 | 3,911,616 | ||||||
| 2.95%, 06/01/29 (Call 03/01/29) |
6,033 | 5,537,570 | ||||||
| 3.35%, 03/26/30 (Call 12/26/29) |
9,176 | 8,476,748 | ||||||
| 4.85%, 03/09/33 (Call 12/09/32)(a) |
4,436 | 4,430,477 | ||||||
| Mitsubishi HC Capital Inc., 3.97%, 04/13/30 |
425 | 386,070 | ||||||
| Mitsubishi HC Finance America LLC, 5.66%, |
3,395 | 3,422,563 | ||||||
| Nasdaq Inc. |
||||||||
| 1.65%, 01/15/31 (Call 10/15/30)(a) |
4,728 | 3,764,199 | ||||||
| 5.55%, 02/15/34 (Call 11/15/33) |
1,230 | 1,238,320 | ||||||
| Nomura Holdings Inc. |
||||||||
| 2.61%, 07/14/31 |
6,160 | 5,064,219 | ||||||
| 2.68%, 07/16/30 |
6,099 | 5,156,695 | ||||||
| 3.00%, 01/22/32 |
4,727 | 3,931,430 | ||||||
| 3.10%, 01/16/30 |
8,843 | 7,760,880 | ||||||
| 5.61%, 07/06/29 |
3,768 | 3,788,021 | ||||||
| S C H E D U L E O F I N V E S T M E N T S |
193 |
| Schedule of Investments (continued) February 29, 2024 |
iShares® 5-10 Year Investment Grade Corporate Bond ETF (Percentages shown are based on Net Assets) |
| Security | Par (000) |
Value | ||||||
| Diversified Financial Services (continued) | ||||||||
| 6.09%, 07/12/33(a) |
$ | 3,770 | $ | 3,934,475 | ||||
| 6.18%, 01/18/33(a) |
4,030 | 4,224,004 | ||||||
| ORIX Corp. |
||||||||
| 2.25%, 03/09/31(a) |
3,273 | 2,742,999 | ||||||
| 4.00%, 04/13/32(a) |
2,993 | 2,783,505 | ||||||
| 5.20%, 09/13/32(a) |
2,590 | 2,615,551 | ||||||
| Power Finance Corp. Ltd., 3.95%, 04/23/30(a)(b) |
4,526 | 4,116,924 | ||||||
| Raymond James Financial Inc., 4.65%, |
3,612 | 3,571,601 | ||||||
| Stifel Financial Corp., 4.00%, 05/15/30 |
2,683 | 2,424,441 | ||||||
| Synchrony Financial |
||||||||
| 2.88%, 10/28/31 (Call 07/28/31) |
4,292 | 3,369,236 | ||||||
| 5.15%, 03/19/29 (Call 12/19/28)(a) |
3,155 | 3,009,520 | ||||||
| USAA Capital Corp., 2.13%, 05/01/30 |
2,066 | 1,708,423 | ||||||
| Visa Inc. |
||||||||
| 1.10%, 02/15/31 (Call 11/15/30)(a) |
6,255 | 4,941,128 | ||||||
| 2.05%, 04/15/30 (Call 01/15/30)(a) |
8,758 | 7,513,603 | ||||||
| Western Union Co. (The), 2.75%, 03/15/31 |
1,900 | 1,560,409 | ||||||
|
|
|
|||||||
| 436,211,217 | ||||||||
| Electric — 7.5% | ||||||||
| Abu Dhabi National Energy Co. PJSC |
||||||||
| 4.70%, 04/24/33(a)(b) |
7,425 | 7,227,955 | ||||||
| 4.88%, 04/23/30(a)(b) |
5,884 | 5,867,325 | ||||||
| Adani Electricity Mumbai Ltd. |
||||||||
| 3.87%, 07/22/31 (Call 01/22/31)(b) |
1,015 | 841,729 | ||||||
| 3.95%, 02/12/30(b) |
4,067 | 3,486,744 | ||||||
| AEP Texas Inc. |
||||||||
| 4.70%, 05/15/32 (Call 02/15/32)(a) |
3,225 | 3,082,680 | ||||||
| 5.40%, 06/01/33 (Call 03/01/33) |
2,551 | 2,550,709 | ||||||
| Series E, 6.65%, 02/15/33(a) |
705 | 750,494 | ||||||
| Series I, 2.10%, 07/01/30 (Call 04/01/30)(a) |
3,825 | 3,166,227 | ||||||
| AES Corp. (The) |
||||||||
| 2.45%, 01/15/31 (Call 10/15/30)(a) |
8,773 | 7,156,412 | ||||||
| 3.95%, 07/15/30 (Call 04/15/30)(a)(b) |
4,086 | 3,712,285 | ||||||
| AES Panama Generation Holdings SRL, 4.38%, |
6,521 | 5,473,298 | ||||||
| Alabama Power Co. |
||||||||
| 3.05%, 03/15/32 (Call 12/15/31) |
3,383 | 2,929,091 | ||||||
| 3.94%, 09/01/32 (Call 03/01/32)(a) |
2,804 | 2,577,738 | ||||||
| 5.70%, 02/15/33 |
170 | 171,737 | ||||||
| 5.85%, 11/15/33 (Call 08/15/33) |
1,860 | 1,946,096 | ||||||
| Series 20-A, 1.45%, 09/15/30 |
3,558 | 2,860,991 | ||||||
| Alliant Energy Finance LLC, 3.60%, 03/01/32 |
1,410 | 1,216,991 | ||||||
| Ameren Corp., 3.50%, 01/15/31 |
4,937 | 4,445,110 | ||||||
| Ameren Illinois Co. |
||||||||
| 1.55%, 11/15/30 (Call 08/15/30)(a) |
2,329 | 1,864,696 | ||||||
| 3.85%, 09/01/32 (Call 06/01/32) |
2,830 | 2,579,849 | ||||||
| 4.95%, 06/01/33 (Call 03/01/33)(a) |
2,735 | 2,692,297 | ||||||
| American Electric Power Co. Inc. |
||||||||
| 2.30%, 03/01/30 (Call 12/01/29) |
2,629 | 2,220,244 | ||||||
| 5.63%, 03/01/33 (Call 12/01/32)(a) |
3,780 | 3,807,256 | ||||||
| 5.95%, 11/01/32 (Call 08/01/32)(a) |
3,374 | 3,491,191 | ||||||
| American Transmission Systems Inc., 2.65%, |
3,632 | 2,982,544 | ||||||
| Security | Par (000) |
Value | ||||||
| Electric (continued) | ||||||||
| Appalachian Power Co. |
||||||||
| 4.50%, 08/01/32 (Call 05/01/32)(a) |
$ | 2,950 | $ | 2,760,273 | ||||
| Series AA, 2.70%, 04/01/31 (Call 01/01/31) |
3,230 | 2,730,111 | ||||||
| Arizona Public Service Co. |
||||||||
| 2.20%, 12/15/31 (Call 09/15/31) |
2,110 | 1,695,615 | ||||||
| 2.60%, 08/15/29 (Call 05/15/29) |
2,467 | 2,174,847 | ||||||
| 5.55%, 08/01/33 (Call 05/01/33) |
2,710 | 2,718,912 | ||||||
| 6.35%, 12/15/32 (Call 09/15/32)(a) |
2,149 | 2,272,328 | ||||||
| Atlantic City Electric Co., 2.30%, 03/15/31 |
2,151 | 1,775,339 | ||||||
| Avangrid Inc., 3.80%, 06/01/29 |
5,819 | 5,428,852 | ||||||
| Baltimore Gas & Electric Co., 2.25%, 06/15/31 |
3,448 | 2,872,554 | ||||||
| Berkshire Hathaway Energy Co. |
||||||||
| 1.65%, 05/15/31 (Call 02/15/31)(a) |
3,095 | 2,450,601 | ||||||
| 3.70%, 07/15/30 (Call 04/15/30)(a) |
6,537 | 6,037,972 | ||||||
| Black Hills Corp. |
||||||||
| 2.50%, 06/15/30 (Call 03/15/30)(a) |
2,269 | 1,884,990 | ||||||
| 3.05%, 10/15/29 (Call 07/15/29)(a) |
2,420 | 2,144,313 | ||||||
| 4.35%, 05/01/33 (Call 02/01/33)(a) |
1,365 | 1,244,471 | ||||||
| CenterPoint Energy Houston Electric LLC |
||||||||
| 4.95%, 04/01/33 (Call 01/01/33)(a) |
4,813 | 4,742,237 | ||||||
| 5.15%, 03/01/34 (Call 12/01/33) |
1,510 | 1,507,206 | ||||||
| Series AE, 2.35%, 04/01/31 |
2,355 | 1,978,164 | ||||||
| Series AG, 3.00%, 03/01/32 (Call 12/01/31) |
1,729 | 1,495,776 | ||||||
| Series ai., 4.45%, 10/01/32 (Call 07/01/32) |
2,898 | 2,760,478 | ||||||
| Series K2, 6.95%, 03/15/33(a) |
310 | 350,708 | ||||||
| CenterPoint Energy Inc. |
||||||||
| 2.65%, 06/01/31 (Call 03/01/31)(a) |
3,034 | 2,543,831 | ||||||
| 2.95%, 03/01/30 (Call 12/01/29)(a) |
2,798 | 2,474,290 | ||||||
| Cleco Corporate Holdings LLC, 3.38%, |
1,816 | 1,579,058 | ||||||
| Cleveland Electric Illuminating Co. (The), |
2,329 | 2,169,704 | ||||||
| CMS Energy Corp. |
||||||||
| 3.75%, 12/01/50 (Call 09/01/30), |
1,909 | 1,526,882 | ||||||
| 4.75%, 06/01/50 (Call 03/01/30), |
2,635 | 2,414,478 | ||||||
| Colbun SA |
||||||||
| 3.15%, 03/06/30 (Call 12/06/29)(a)(b) |
2,715 | 2,379,977 | ||||||
| 3.15%, 01/19/32 (Call 10/19/31)(a)(b) |
2,665 | 2,250,077 | ||||||
| Comision Federal de Electricidad |
||||||||
| 3.35%, 02/09/31 (Call 11/09/30)(a)(b) |
6,340 | 5,345,461 | ||||||
| 3.88%, 07/26/33 (Call 04/26/33)(a)(b) |
3,310 | 2,712,524 | ||||||
| 4.69%, 05/15/29 (Call 03/15/29)(b) |
7,190 | 6,811,285 | ||||||
| Commonwealth Edison Co. |
||||||||
| 2.20%, 03/01/30 (Call 12/01/29) |
2,120 | 1,803,417 | ||||||
| 3.15%, 03/15/32 (Call 12/15/31) |
1,325 | 1,152,850 | ||||||
| 4.90%, 02/01/33 (Call 11/01/32)(a) |
1,259 | 1,238,681 | ||||||
| Connecticut Light & Power Co. (The) |
||||||||
| 4.90%, 07/01/33 (Call 04/01/33)(a) |
1,745 | 1,707,314 | ||||||
| Series A, 2.05%, 07/01/31 (Call 04/01/31) |
2,589 | 2,099,049 | ||||||
| Consolidated Edison Co. of New York Inc. |
||||||||
| 2.40%, 06/15/31 (Call 03/15/31) |
4,881 | 4,109,671 | ||||||
| 5.20%, 03/01/33 (Call 12/01/32)(a) |
2,525 | 2,544,014 | ||||||
| 5.50%, 03/15/34 (Call 12/15/33)(a) |
3,240 | 3,308,918 | ||||||
| Series 20A, 3.35%, 04/01/30 |
6,375 | 5,828,120 | ||||||
| 194 | 2 0 2 4 I S H A R E S A N N U A L R E P O R T T O S H A R E H O L D E R S |
| Schedule of Investments (continued) February 29, 2024 |
iShares® 5-10 Year Investment Grade Corporate Bond ETF (Percentages shown are based on Net Assets) |
| Security | Par (000) |
Value | ||||||
| Electric (continued) | ||||||||
| Constellation Energy Generation LLC |
||||||||
| 5.80%, 03/01/33 (Call 12/01/32) |
$ | 3,468 | $ | 3,544,609 | ||||
| 6.13%, 01/15/34 (Call 10/15/33) |
2,183 | 2,277,506 | ||||||
| Consumers Energy Co. |
||||||||
| 3.60%, 08/15/32 (Call 02/15/32) |
1,910 | 1,721,352 | ||||||
| 4.60%, 05/30/29 (Call 03/30/29) |
1,185 | 1,164,780 | ||||||
| 4.63%, 05/15/33 (Call 11/15/32) |
4,280 | 4,135,029 | ||||||
| Dominion Energy Inc. |
||||||||
| 4.35%, 08/15/32 (Call 05/15/32)(a) |
2,635 | 2,455,746 | ||||||
| 5.38%, 11/15/32 (Call 08/15/32)(a) |
5,643 | 5,610,432 | ||||||
| Series C, 2.25%, 08/15/31 (Call 05/15/31) |
7,603 | 6,155,203 | ||||||
| Series C, 3.38%, 04/01/30 (Call 01/01/30) |
9,881 | 8,884,375 | ||||||
| Series E, 6.30%, 03/15/33 |
715 | 746,253 | ||||||
| Series F, 5.25%, 08/01/33 |
850 | 835,609 | ||||||
| Dominion Energy South Carolina Inc. |
||||||||
| 5.30%, 05/15/33(a) |
990 | 998,206 | ||||||
| 6.63%, 02/01/32(a) |
420 | 465,810 | ||||||
| Series A, 2.30%, 12/01/31 (Call 09/01/31) |
2,160 | 1,771,029 | ||||||
| DTE Electric Co. |
||||||||
| 2.25%, 03/01/30 (Call 12/01/29)(a) |
3,714 | 3,188,633 | ||||||
| 5.20%, 04/01/33 (Call 01/01/33)(a) |
3,508 | 3,530,006 | ||||||
| 5.20%, 03/01/34 (Call 12/01/33) |
2,700 | 2,686,531 | ||||||
| Series A, 3.00%, 03/01/32 (Call 12/01/31) |
2,950 | 2,546,978 | ||||||
| Series C, 2.63%, 03/01/31 (Call 12/01/30)(a) |
2,110 | 1,812,808 | ||||||
| DTE Energy Co. |
||||||||
| 2.95%, 03/01/30 (Call 12/01/29)(a) |
2,002 | 1,751,693 | ||||||
| Series C, 3.40%, 06/15/29 (Call 03/15/29)(a) |
2,860 | 2,616,550 | ||||||
| Duke Energy Carolinas LLC |
||||||||
| 2.45%, 08/15/29 (Call 05/15/29) |
2,538 | 2,238,396 | ||||||
| 2.45%, 02/01/30 (Call 11/01/29) |
2,983 | 2,607,933 | ||||||
| 2.55%, 04/15/31 (Call 01/15/31) |
3,139 | 2,689,584 | ||||||
| 2.85%, 03/15/32 (Call 12/15/31)(a) |
2,655 | 2,255,910 | ||||||
| 4.85%, 01/15/34 (Call 10/15/33)(a) |
2,420 | 2,347,649 | ||||||
| 4.95%, 01/15/33 (Call 10/15/32)(a) |
6,889 | 6,790,590 | ||||||
| 6.45%, 10/15/32(a) |
2,250 | 2,437,618 | ||||||
| Duke Energy Corp. |
||||||||
| 2.45%, 06/01/30 (Call 03/01/30)(a) |
5,151 | 4,404,582 | ||||||
| 2.55%, 06/15/31 (Call 03/15/31) |
5,653 | 4,713,044 | ||||||
| 3.40%, 06/15/29 (Call 03/15/29) |
3,442 | 3,169,471 | ||||||
| 4.50%, 08/15/32 (Call 05/15/32) |
6,907 | 6,484,073 | ||||||
| 5.75%, 09/15/33 (Call 06/15/33)(a) |
4,530 | 4,614,961 | ||||||
| Duke Energy Florida LLC |
||||||||
| 1.75%, 06/15/30 (Call 03/15/30)(a) |
2,816 | 2,323,657 | ||||||
| 2.40%, 12/15/31 (Call 09/15/31) |
3,763 | 3,108,946 | ||||||
| 2.50%, 12/01/29 (Call 09/01/29)(a) |
4,776 | 4,198,127 | ||||||
| 5.88%, 11/15/33 (Call 08/15/33) |
2,540 | 2,658,977 | ||||||
| Duke Energy Indiana LLC, 5.25%, 03/01/34 |
1,600 | 1,595,840 | ||||||
| Duke Energy Ohio Inc. |
||||||||
| 2.13%, 06/01/30 (Call 03/01/30) |
2,470 | 2,075,383 | ||||||
| 5.25%, 04/01/33 (Call 01/01/33)(a) |
1,985 | 1,986,559 | ||||||
| Duke Energy Progress LLC |
||||||||
| 2.00%, 08/15/31 (Call 05/15/31)(a) |
3,530 | 2,853,656 | ||||||
| 3.40%, 04/01/32 (Call 01/01/32)(a) |
2,610 | 2,308,699 | ||||||
| 3.45%, 03/15/29 (Call 12/15/28) |
652 | 609,817 | ||||||
| 5.25%, 03/15/33 (Call 12/15/32)(a) |
2,050 | 2,046,438 | ||||||
| Duquesne Light Holdings Inc. |
||||||||
| 2.53%, 10/01/30 (Call 07/01/30)(a)(b) |
2,250 | 1,857,699 | ||||||
| 2.78%, 01/07/32 (Call 10/07/31)(a)(b) |
2,279 | 1,847,791 | ||||||
| Edison International, 6.95%, 11/15/29 |
3,810 | 4,060,848 | ||||||
| Security | Par (000) |
Value | ||||||
| Electric (continued) | ||||||||
| Electricite de France SA, 6.25%, 05/23/33 |
$ | 6,135 | $ | 6,409,038 | ||||
| Emera U.S. Finance LP, 2.64%, 06/15/31 |
2,315 | 1,877,172 | ||||||
| Enel Finance International NV |
||||||||
| 2.25%, 07/12/31 (Call 04/12/31)(b) |
6,400 | 5,114,325 | ||||||
| 4.88%, 06/14/29(a)(b) |
3,685 | 3,613,658 | ||||||
| 5.00%, 06/15/32 (Call 03/15/32)(a)(b) |
5,639 | 5,380,609 | ||||||
| 7.50%, 10/14/32 (Call 07/14/32)(b) |
7,340 | 8,167,211 | ||||||
| Engie Energia Chile SA, 3.40%, 01/28/30 |
2,601 | 2,264,010 | ||||||
| Entergy Arkansas LLC |
||||||||
| 5.15%, 01/15/33 (Call 10/15/32)(a) |
2,160 | 2,163,044 | ||||||
| 5.30%, 09/15/33 (Call 06/15/33)(a) |
980 | 982,701 | ||||||
| Entergy Corp. |
||||||||
| 2.40%, 06/15/31 (Call 03/05/31)(a) |
3,758 | 3,095,408 | ||||||
| 2.80%, 06/15/30 (Call 03/15/30)(a) |
3,600 | 3,113,203 | ||||||
| Entergy Louisiana LLC |
||||||||
| 1.60%, 12/15/30 (Call 09/15/30)(a) |
1,966 | 1,557,803 | ||||||
| 2.35%, 06/15/32 (Call 03/15/32)(a) |
3,160 | 2,560,040 | ||||||
| 3.05%, 06/01/31 (Call 03/01/31)(a) |
1,860 | 1,609,749 | ||||||
| 4.00%, 03/15/33 (Call 12/15/32)(a) |
4,440 | 4,042,742 | ||||||
| Entergy Mississippi LLC, 5.00%, 09/01/33 |
1,230 | 1,206,341 | ||||||
| Entergy Texas Inc. |
||||||||
| 1.75%, 03/15/31 (Call 12/15/30)(a) |
3,433 | 2,750,570 | ||||||
| 4.00%, 03/30/29 (Call 12/30/28) |
1,618 | 1,545,893 | ||||||
| Evergy Inc., 2.90%, 09/15/29 (Call 06/15/29)(a) |
5,377 | 4,763,829 | ||||||
| Evergy Kansas Central Inc., 5.90%, 11/15/33 |
2,425 | 2,522,110 | ||||||
| Evergy Metro Inc. |
||||||||
| 4.95%, 04/15/33 (Call 01/15/33)(a) |
1,810 | 1,769,711 | ||||||
| Series 2020, 2.25%, 06/01/30 |
2,487 | 2,100,256 | ||||||
| Evergy Missouri West Inc., 3.75%, 03/15/32 |
1,497 | 1,316,955 | ||||||
| Eversource Energy |
||||||||
| 2.55%, 03/15/31 (Call 12/15/30)(a) |
2,010 | 1,658,019 | ||||||
| 3.38%, 03/01/32 (Call 12/01/31) |
3,875 | 3,329,194 | ||||||
| 5.13%, 05/15/33 (Call 02/15/33) |
5,045 | 4,873,084 | ||||||
| 5.50%, 01/01/34 (Call 10/01/33) |
4,205 | 4,161,982 | ||||||
| Series O, 4.25%, 04/01/29 (Call 01/01/29) |
1,575 | 1,501,679 | ||||||
| Series R, 1.65%, 08/15/30 (Call 05/15/30)(a) |
3,503 | 2,789,009 | ||||||
| Exelon Corp. |
||||||||
| 3.35%, 03/15/32 (Call 12/15/31)(a) |
3,692 | 3,218,600 | ||||||
| 4.05%, 04/15/30 (Call 01/15/30) |
7,894 | 7,403,535 | ||||||
| 5.30%, 03/15/33 (Call 12/15/32)(a) |
5,753 | 5,695,931 | ||||||
| 5.45%, 03/15/34 (Call 12/15/33) |
1,655 | 1,646,950 | ||||||
| 7.60%, 04/01/32(a) |
2,345 | 2,653,724 | ||||||
| Florida Power & Light Co. |
||||||||
| 2.45%, 02/03/32 (Call 11/03/31) |
8,007 | 6,680,037 | ||||||
| 4.63%, 05/15/30 (Call 03/15/30) |
3,087 | 3,039,425 | ||||||
| 4.80%, 05/15/33 (Call 02/15/33) |
3,700 | 3,615,564 | ||||||
| 5.10%, 04/01/33 (Call 01/01/33) |
4,368 | 4,349,381 | ||||||
| 5.95%, 10/01/33(a) |
210 | 218,559 | ||||||
| Georgia Power Co. |
||||||||
| 4.70%, 05/15/32 (Call 02/15/32)(a) |
4,148 | 4,008,884 | ||||||
| 4.95%, 05/17/33 (Call 11/17/32)(a) |
5,485 | 5,370,247 | ||||||
| 5.25%, 03/15/34 (Call 09/15/33) |
2,700 | 2,687,804 | ||||||
| Series B, 2.65%, 09/15/29 (Call 06/15/29)(a) |
4,148 | 3,668,509 | ||||||
| S C H E D U L E O F I N V E S T M E N T S |
195 |
| Schedule of Investments (continued) February 29, 2024 |
iShares® 5-10 Year Investment Grade Corporate Bond ETF (Percentages shown are based on Net Assets) |
| Security | Par (000) |
Value | ||||||
| Electric (continued) | ||||||||
| Indianapolis Power & Light Co., 5.65%, |
$ | 1,500 | $ | 1,525,675 | ||||
| Interstate Power & Light Co. |
||||||||
| 2.30%, 06/01/30 (Call 03/01/30) |
1,721 | 1,450,531 | ||||||
| 3.60%, 04/01/29 (Call 01/01/29)(a) |
1,860 | 1,728,062 | ||||||
| 5.70%, 10/15/33 (Call 07/15/33) |
1,745 | 1,775,035 | ||||||
| IPALCO Enterprises Inc., 4.25%, 05/01/30 |
2,986 | 2,749,174 | ||||||
| ITC Holdings Corp. |
||||||||
| 2.95%, 05/14/30 (Call 02/14/30)(b) |
4,210 | 3,674,423 | ||||||
| 5.40%, 06/01/33 (Call 03/01/33)(b) |
3,245 | 3,205,128 | ||||||
| Jersey Central Power & Light Co., 2.75%, |
2,979 | 2,462,604 | ||||||
| Kentucky Power Co., 7.00%, 11/15/33 |
2,415 | 2,548,132 | ||||||
| Kentucky Utilities Co., 5.45%, 04/15/33 |
2,090 | 2,110,058 | ||||||
| Liberty Utilities Co., 5.87%, 01/31/34 |
1,775 | 1,783,139 | ||||||
| Liberty Utilities Finance GP 1, 2.05%, 09/15/30 |
5,031 | 3,992,358 | ||||||
| Louisville Gas & Electric Co., 5.45%, 04/15/33 |
2,645 | 2,670,708 | ||||||
| Massachusetts Electric Co., 1.73%, 11/24/30 |
2,085 | 1,638,893 | ||||||
| MidAmerican Energy Co. |
||||||||
| 3.65%, 04/15/29 (Call 01/15/29) |
609 | 574,578 | ||||||
| 5.35%, 01/15/34 (Call 10/15/33) |
1,875 | 1,911,394 | ||||||
| 6.75%, 12/30/31(a) |
1,075 | 1,206,696 | ||||||
| Minejesa Capital BV, 4.63%, 08/10/30(b) |
4,965 | 4,688,747 | ||||||
| Monongahela Power Co., 5.85%, 02/15/34 |
1,618 | 1,648,053 | ||||||
| Narragansett Electric Co. (The), 3.40%, |
4,319 | 3,918,031 | ||||||
| National Grid PLC |
||||||||
| 5.42%, 01/11/34 (Call 10/11/33) |
3,505 | 3,419,275 | ||||||
| 5.81%, 06/12/33 (Call 03/12/33) |
5,979 | 6,041,228 | ||||||
| National Grid USA, 8.00%, 11/15/30 |
340 | 379,900 | ||||||
| National Rural Utilities Cooperative |
||||||||
| Finance Corp. |
||||||||
| 1.35%, 03/15/31 (Call 12/15/30) |
2,563 | 1,991,919 | ||||||
| 1.65%, 06/15/31 (Call 03/15/31)(a) |
2,280 | 1,807,543 | ||||||
| 2.40%, 03/15/30 (Call 12/15/29) |
3,222 | 2,779,158 | ||||||
| 2.75%, 04/15/32 (Call 01/15/32) |
2,595 | 2,179,859 | ||||||
| 3.70%, 03/15/29 (Call 12/15/28) |
2,588 | 2,432,466 | ||||||
| 4.02%, 11/01/32 (Call 05/01/32)(a) |
2,260 | 2,074,610 | ||||||
| 4.15%, 12/15/32 (Call 09/15/32) |
2,345 | 2,160,700 | ||||||
| 5.00%, 02/07/31 (Call 12/07/30)(a) |
2,595 | 2,558,103 | ||||||
| 5.80%, 01/15/33 (Call 07/15/32) |
3,785 | 3,914,654 | ||||||
| Series C, 8.00%, 03/01/32 |
3,885 | 4,490,008 | ||||||
| Nevada Power Co. |
||||||||
| Series CC, 3.70%, 05/01/29 |
1,671 | 1,578,199 | ||||||
| Series DD, 2.40%, 05/01/30 |
2,401 | 2,042,300 | ||||||
| New York State Electric & Gas Corp. |
||||||||
| 2.15%, 10/01/31 (Call 07/01/31)(a)(b) |
3,180 | 2,520,289 | ||||||
| 5.85%, 08/15/33 (Call 05/15/33)(b) |
1,115 | 1,144,314 | ||||||
| NextEra Energy Capital Holdings Inc. |
||||||||
| 2.25%, 06/01/30 (Call 03/01/30)(a) |
12,112 | 10,185,491 | ||||||
| 2.44%, 01/15/32 (Call 10/15/31) |
5,698 | 4,627,691 | ||||||
| Security | Par (000) |
Value | ||||||
| Electric (continued) | ||||||||
| 2.75%, 11/01/29 (Call 08/01/29) |
$ | 6,414 | $ | 5,650,950 | ||||
| 3.50%, 04/01/29 (Call 01/01/29) |
2,845 | 2,632,866 | ||||||
| 5.00%, 02/28/30 (Call 12/28/29)(a) |
3,647 | 3,617,480 | ||||||
| 5.00%, 07/15/32 (Call 04/15/32) |
5,850 | 5,697,685 | ||||||
| 5.05%, 02/28/33 (Call 11/28/32)(a) |
6,350 | 6,195,578 | ||||||
| 5.25%, 03/15/34 (Call 12/15/33) |
4,925 | 4,830,659 | ||||||
| 5.65%, 05/01/79 (Call 05/01/29), |
2,776 | 2,662,754 | ||||||
| Niagara Mohawk Power Corp. |
||||||||
| 1.96%, 06/27/30 (Call 03/27/30)(a)(b) |
6,259 | 5,115,116 | ||||||
| 2.76%, 01/10/32 (Call 10/10/31)(a)(b) |
1,205 | 990,329 | ||||||
| 5.29%, 01/17/34 (Call 10/17/33)(b) |
3,035 | 2,961,074 | ||||||
| Northern States Power Co./MN, 2.25%, |
3,890 | 3,258,917 | ||||||
| NRG Energy Inc. |
||||||||
| 4.45%, 06/15/29 (Call 03/15/29)(b) |
2,926 | 2,719,439 | ||||||
| 7.00%, 03/15/33 (Call 12/15/32)(a)(b) |
4,510 | 4,695,562 | ||||||
| NSTAR Electric Co. |
||||||||
| 1.95%, 08/15/31 (Call 05/15/31)(a) |
1,804 | 1,440,261 | ||||||
| 3.25%, 05/15/29 (Call 02/15/29)(a) |
3,805 | 3,542,632 | ||||||
| 3.95%, 04/01/30 (Call 01/01/30)(a) |
2,358 | 2,210,106 | ||||||
| Oglethorpe Power Corp., 6.19%, 01/01/31(b) |
127 | 126,148 | ||||||
| Ohio Edison Co., 5.50%, 01/15/33 |
1,555 | 1,533,918 | ||||||
| Ohio Power Co. |
||||||||
| 5.00%, 06/01/33 (Call 03/01/33)(a) |
1,319 | 1,294,942 | ||||||
| Series D, 6.60%, 03/01/33 |
2,390 | 2,558,846 | ||||||
| Series G, 6.60%, 02/15/33 |
325 | 351,779 | ||||||
| Series P, 2.60%, 04/01/30 (Call 01/01/30)(a) |
1,900 | 1,645,230 | ||||||
| Series Q, 1.63%, 01/15/31 (Call 10/15/30)(a) |
2,410 | 1,922,565 | ||||||
| Oklahoma Gas & Electric Co. |
||||||||
| 3.25%, 04/01/30 (Call 10/01/29)(a) |
1,965 | 1,762,412 | ||||||
| 3.30%, 03/15/30 (Call 09/15/29)(a) |
1,889 | 1,700,317 | ||||||
| 5.40%, 01/15/33 (Call 07/15/32)(a) |
2,565 | 2,610,441 | ||||||
| Oncor Electric Delivery Co. LLC |
||||||||
| 2.75%, 05/15/30 (Call 02/15/30) |
3,754 | 3,301,127 | ||||||
| 4.15%, 06/01/32 (Call 03/01/32)(a) |
3,075 | 2,877,510 | ||||||
| 4.55%, 09/15/32 (Call 06/15/32) |
3,614 | 3,471,765 | ||||||
| 5.65%, 11/15/33 (Call 08/15/33)(a) |
4,320 | 4,462,698 | ||||||
| 7.00%, 05/01/32(a) |
2,540 | 2,827,416 | ||||||
| 7.25%, 01/15/33(a) |
1,525 | 1,733,308 | ||||||
| Pacific Gas and Electric Co. |
||||||||
| 2.50%, 02/01/31 (Call 11/01/30)(a) |
11,350 | 9,301,029 | ||||||
| 3.25%, 06/01/31 (Call 03/01/31)(a) |
6,204 | 5,322,990 | ||||||
| 4.20%, 03/01/29 (Call 01/01/29) |
495 | 466,674 | ||||||
| 4.40%, 03/01/32 (Call 12/01/31) |
2,755 | 2,504,282 | ||||||
| 4.55%, 07/01/30 (Call 01/01/30) |
17,417 | 16,346,455 | ||||||
| 5.80%, 05/15/34 (Call 02/15/34)(a) |
3,750 | 3,746,057 | ||||||
| 5.90%, 06/15/32 (Call 03/15/32)(a) |
3,556 | 3,575,679 | ||||||
| 6.10%, 01/15/29 (Call 12/15/28) |
2,065 | 2,113,865 | ||||||
| 6.15%, 01/15/33 (Call 10/15/32)(a) |
4,628 | 4,734,164 | ||||||
| 6.40%, 06/15/33 (Call 03/15/33)(a) |
6,880 | 7,153,208 | ||||||
| 6.95%, 03/15/34 (Call 12/15/33)(a) |
4,408 | 4,763,913 | ||||||
| PacifiCorp. |
||||||||
| 2.70%, 09/15/30 (Call 06/15/30) |
2,512 | 2,156,356 | ||||||
| 3.50%, 06/15/29 (Call 03/15/29)(a) |
1,631 | 1,502,233 | ||||||
| 5.30%, 02/15/31 (Call 12/15/30)(a) |
4,065 | 4,021,383 | ||||||
| 5.45%, 02/15/34 (Call 11/15/33) |
3,425 | 3,375,385 | ||||||
| 7.70%, 11/15/31(a) |
970 | 1,111,608 | ||||||
| PECO Energy Co., 4.90%, 06/15/33 |
3,235 | 3,207,519 | ||||||
| 196 | 2 0 2 4 I S H A R E S A N N U A L R E P O R T T O S H A R E H O L D E R S |
| Schedule of Investments (continued) February 29, 2024 |
iShares® 5-10 Year Investment Grade Corporate Bond ETF (Percentages shown are based on Net Assets) |
| Security | Par (000) |
Value | ||||||
| Electric (continued) | ||||||||
| Pennsylvania Electric Co., 3.60%, 06/01/29 |
$ | 1,830 | $ | 1,689,702 | ||||
| Perusahaan Perseroan Persero PT Perusahaan |
||||||||
| Listrik Negara |
||||||||
| 3.00%, 06/30/30 (Call 03/30/30)(a)(b) |
3,553 | 3,056,312 | ||||||
| 3.38%, 02/05/30(a)(b) |
3,645 | 3,234,937 | ||||||
| 3.88%, 07/17/29(b) |
3,982 | 3,666,325 | ||||||
| Potomac Electric Power Co., 5.20%, 03/15/34 |
1,825 | 1,815,593 | ||||||
| PPL Capital Funding Inc., 4.13%, 04/15/30 |
1,290 | 1,201,831 | ||||||
| PPL Electric Utilities Corp. |
||||||||
| 4.85%, 02/15/34 (Call 11/15/33) |
2,255 | 2,195,845 | ||||||
| 5.00%, 05/15/33 (Call 02/15/33) |
4,838 | 4,807,807 | ||||||
| Progress Energy Inc. |
||||||||
| 7.00%, 10/30/31(a) |
2,390 | 2,635,826 | ||||||
| 7.75%, 03/01/31 |
3,737 | 4,226,346 | ||||||
| Public Service Co. of Colorado |
||||||||
| 1.88%, 06/15/31 (Call 12/15/30) |
3,796 | 3,055,202 | ||||||
| 4.10%, 06/01/32 (Call 03/01/32)(a) |
1,520 | 1,409,562 | ||||||
| Series 35, 1.90%, 01/15/31 (Call 07/15/30) |
1,682 | 1,367,984 | ||||||
| Public Service Co. of New Hampshire |
||||||||
| 5.35%, 10/01/33 (Call 07/01/33) |
1,830 | 1,851,318 | ||||||
| Series V, 2.20%, 06/15/31 (Call 03/15/31) |
1,400 | 1,156,043 | ||||||
| Public Service Co. of Oklahoma |
||||||||
| 5.25%, 01/15/33 (Call 10/15/32) |
3,680 | 3,649,621 | ||||||
| Series J, 2.20%, 08/15/31 (Call 05/15/31) |
2,765 | 2,250,367 | ||||||
| Public Service Electric & Gas Co. |
||||||||
| 1.90%, 08/15/31 (Call 05/15/31) |
2,593 | 2,087,510 | ||||||
| 2.45%, 01/15/30 (Call 10/15/29) |
1,948 | 1,694,104 | ||||||
| 3.10%, 03/15/32 (Call 12/15/31) |
2,260 | 1,971,765 | ||||||
| 3.20%, 05/15/29 (Call 02/15/29) |
2,246 | 2,070,828 | ||||||
| 4.65%, 03/15/33 (Call 12/15/32)(a) |
2,790 | 2,700,413 | ||||||
| 4.90%, 12/15/32 (Call 09/15/32) |
2,330 | 2,301,759 | ||||||
| 5.20%, 08/01/33 (Call 05/01/33)(a) |
1,195 | 1,207,421 | ||||||
| 5.20%, 03/01/34 (Call 12/01/33) |
2,700 | 2,700,618 | ||||||
| Public Service Enterprise Group Inc. |
||||||||
| 1.60%, 08/15/30 (Call 05/15/30)(a) |
3,275 | 2,632,177 | ||||||
| 2.45%, 11/15/31 (Call 08/15/31) |
4,385 | 3,569,786 | ||||||
| 6.13%, 10/15/33 (Call 07/15/33)(a) |
2,391 | 2,491,847 | ||||||
| Puget Energy Inc. |
||||||||
| 4.10%, 06/15/30 (Call 03/15/30)(a) |
2,777 | 2,514,076 | ||||||
| 4.22%, 03/15/32 (Call 12/15/31) |
2,585 | 2,312,608 | ||||||
| San Diego Gas & Electric Co. |
||||||||
| Series VVV, 1.70%, 10/01/30 (Call 07/01/30) |
5,091 | 4,144,543 | ||||||
| Series XXX, 3.00%, 03/15/32 |
3,113 | 2,692,532 | ||||||
| Sempra |
||||||||
| 3.70%, 04/01/29 (Call 02/01/29) |
2,490 | 2,317,040 | ||||||
| 5.50%, 08/01/33 (Call 05/01/33) |
3,730 | 3,706,981 | ||||||
| Sociedad de Transmision Austral SA, 4.00%, |
1,895 | 1,662,863 | ||||||
| Southern California Edison Co. |
||||||||
| 2.25%, 06/01/30 (Call 03/01/30) |
3,511 | 2,964,247 | ||||||
| 2.75%, 02/01/32 (Call 11/01/31) |
2,385 | 2,005,488 | ||||||
| 2.85%, 08/01/29 (Call 05/01/29)(a) |
3,217 | 2,878,186 | ||||||
| 5.20%, 06/01/34 (Call 03/01/34) |
2,725 | 2,665,426 | ||||||
| 5.95%, 11/01/32 (Call 08/01/32)(a) |
4,430 | 4,619,195 | ||||||
| 6.00%, 01/15/34 |
195 | 203,557 | ||||||
| 6.65%, 04/01/29 |
2 | 2,100 | ||||||
| Series A, 4.20%, 03/01/29 (Call 12/01/28) |
2,866 | 2,760,110 | ||||||
| Security | Par (000) |
Value | ||||||
| Electric (continued) | ||||||||
| Series G, 2.50%, 06/01/31 (Call 03/01/31) |
$ | 3,231 | $ | 2,712,762 | ||||
| Southern Co. (The) |
||||||||
| 5.20%, 06/15/33 (Call 12/15/32)(a) |
4,585 | 4,513,353 | ||||||
| 5.70%, 10/15/32 (Call 04/15/32) |
3,040 | 3,112,441 | ||||||
| 5.70%, 03/15/34 (Call 09/15/33) |
2,025 | 2,062,837 | ||||||
| Series A, 3.70%, 04/30/30 (Call 01/30/30)(a) |
5,781 | 5,329,578 | ||||||
| Southwestern Electric Power Co., 5.30%, |
2,630 | 2,594,664 | ||||||
| Tampa Electric Co., 2.40%, 03/15/31 |
2,346 | 1,945,279 | ||||||
| Three Gorges Finance I Cayman Islands Ltd., |
85 | 72,521 | ||||||
| Tucson Electric Power Co. |
||||||||
| 1.50%, 08/01/30 (Call 05/01/30) |
3,149 | 2,527,953 | ||||||
| 3.25%, 05/15/32 (Call 02/15/32)(a) |
1,306 | 1,130,664 | ||||||
| Union Electric Co. |
||||||||
| 2.15%, 03/15/32 (Call 12/15/31)(a) |
3,045 | 2,449,817 | ||||||
| 2.95%, 03/15/30 (Call 12/15/29) |
1,559 | 1,381,636 | ||||||
| 3.50%, 03/15/29 (Call 12/15/28) |
2,163 | 2,017,097 | ||||||
| Virginia Electric & Power Co. |
||||||||
| 2.30%, 11/15/31 (Call 08/15/31)(a) |
2,838 | 2,339,235 | ||||||
| 2.40%, 03/30/32 (Call 12/30/31)(a) |
3,305 | 2,727,915 | ||||||
| 5.00%, 04/01/33 (Call 01/01/33) |
5,070 | 4,968,051 | ||||||
| 5.00%, 01/15/34 (Call 10/15/33)(a) |
2,500 | 2,430,187 | ||||||
| 5.30%, 08/15/33 (Call 05/15/33)(a) |
2,945 | 2,942,907 | ||||||
| Series A, 2.88%, 07/15/29 (Call 04/15/29)(a) |
2,988 | 2,703,762 | ||||||
| Vistra Operations Co. LLC |
||||||||
| 4.30%, 07/15/29 (Call 04/15/29)(b) |
4,585 | 4,273,366 | ||||||
| 6.95%, 10/15/33 (Call 07/15/33)(b) |
4,145 | 4,318,655 | ||||||
| WEC Energy Group Inc., 1.80%, 10/15/30 |
2,829 | 2,289,043 | ||||||
| Wisconsin Electric Power Co. |
||||||||
| 4.75%, 09/30/32 (Call 06/30/32)(a) |
4,275 | 4,192,040 | ||||||
| 5.63%, 05/15/33(a) |
545 | 571,030 | ||||||
| Wisconsin Power and Light Co. |
||||||||
| 1.95%, 09/16/31 (Call 06/16/31)(a) |
2,645 | 2,101,208 | ||||||
| 3.00%, 07/01/29 (Call 04/01/29)(a) |
1,413 | 1,289,201 | ||||||
| 3.95%, 09/01/32 (Call 06/01/32)(a) |
3,702 | 3,415,461 | ||||||
| 4.95%, 04/01/33 (Call 01/01/33) |
2,816 | 2,737,013 | ||||||
| Xcel Energy Inc. |
||||||||
| 2.35%, 11/15/31 (Call 05/15/31)(a) |
1,770 | 1,419,756 | ||||||
| 2.60%, 12/01/29 (Call 06/01/29)(a) |
3,005 | 2,615,297 | ||||||
| 3.40%, 06/01/30 (Call 12/01/29)(a) |
3,583 | 3,196,282 | ||||||
| 4.60%, 06/01/32 (Call 12/01/31)(a) |
3,395 | 3,165,659 | ||||||
| 5.45%, 08/15/33 (Call 02/15/33) |
3,810 | 3,772,308 | ||||||
| 5.50%, 03/15/34 (Call 09/15/33) |
4,025 | 3,956,173 | ||||||
|
|
|
|||||||
| 938,625,626 | ||||||||
| Electrical Components & Equipment — 0.1% | ||||||||
| Acuity Brands Lighting Inc., 2.15%, 12/15/30 |
3,226 | 2,643,824 | ||||||
| Emerson Electric Co. |
||||||||
| 1.95%, 10/15/30 (Call 07/15/30) |
3,035 | 2,546,563 | ||||||
| 2.20%, 12/21/31 (Call 09/21/31) |
6,184 | 5,130,651 | ||||||
| 6.00%, 08/15/32(a) |
55 | 57,810 | ||||||
|
|
|
|||||||
| 10,378,848 | ||||||||
| Electronics — 0.7% | ||||||||
| Allegion PLC, 3.50%, 10/01/29 (Call 07/01/29) |
2,424 | 2,212,811 | ||||||
| Allegion U.S. Holding Co. Inc., 5.41%, 07/01/32 |
3,433 | 3,430,214 | ||||||
| S C H E D U L E O F I N V E S T M E N T S |
197 |
| Schedule of Investments (continued) February 29, 2024 |
iShares® 5-10 Year Investment Grade Corporate Bond ETF (Percentages shown are based on Net Assets) |
| Security | Par (000) |
Value | ||||||
| Electronics (continued) | ||||||||
| Amphenol Corp. |
||||||||
| 2.20%, 09/15/31 (Call 06/15/31) |
$ | 4,315 | $ | 3,540,551 | ||||
| 2.80%, 02/15/30 (Call 11/15/29)(a) |
5,649 | 5,032,499 | ||||||
| 4.35%, 06/01/29 (Call 03/01/29) |
2,879 | 2,798,732 | ||||||
| Arrow Electronics Inc., 2.95%, 02/15/32 |
3,068 | 2,563,846 | ||||||
| Avnet Inc. |
||||||||
| 3.00%, 05/15/31 (Call 02/15/31) |
2,206 | 1,822,668 | ||||||
| 5.50%, 06/01/32 (Call 03/01/32) |
2,100 | 2,014,557 | ||||||
| Flex Ltd. |
||||||||
| 4.88%, 06/15/29 (Call 03/15/29) |
3,789 | 3,685,077 | ||||||
| 4.88%, 05/12/30 (Call 02/12/30) |
4,011 | 3,866,865 | ||||||
| Honeywell International Inc. |
||||||||
| 1.75%, 09/01/31 (Call 06/01/31)(a) |
8,451 | 6,795,791 | ||||||
| 1.95%, 06/01/30 (Call 03/01/30) |
6,452 | 5,454,756 | ||||||
| 2.70%, 08/15/29 (Call 05/15/29)(a) |
4,391 | 3,949,983 | ||||||
| 4.50%, 01/15/34 (Call 10/15/33) |
635 | 610,726 | ||||||
| 4.88%, 09/01/29 (Call 08/01/29) |
1,875 | 1,876,067 | ||||||
| 4.95%, 09/01/31 (Call 07/01/31) |
3,750 | 3,742,712 | ||||||
| 5.00%, 02/15/33 (Call 11/15/32)(a) |
6,207 | 6,218,055 | ||||||
| Hubbell Inc., 2.30%, 03/15/31 (Call 12/15/30)(a) |
1,746 | 1,441,094 | ||||||
| Jabil Inc. |
||||||||
| 3.00%, 01/15/31 (Call 10/15/30)(a) |
3,645 | 3,113,457 | ||||||
| 3.60%, 01/15/30 (Call 10/15/29)(a) |
3,098 | 2,790,583 | ||||||
| Keysight Technologies Inc., 3.00%, 10/30/29 |
3,272 | 2,910,214 | ||||||
| TD SYNNEX Corp., 2.65%, 08/09/31 |
2,956 | 2,345,156 | ||||||
| Trimble Inc., 6.10%, 03/15/33 (Call 12/15/32)(a) |
5,048 | 5,275,168 | ||||||
| Tyco Electronics Group SA, 2.50%, 02/04/32 |
3,026 | 2,560,184 | ||||||
| Vontier Corp., 2.95%, 04/01/31 (Call 01/01/31) |
3,505 | 2,883,697 | ||||||
|
|
|
|||||||
| 82,935,463 | ||||||||
| Engineering & Construction — 0.1% | ||||||||
| Jacobs Engineering Group Inc., 5.90%, |
1,965 | 1,964,226 | ||||||
| Sitios Latinoamerica SAB de CV, 5.38%, |
5,685 | 5,241,710 | ||||||
| Ste Transcore Holdings Inc., 3.75%, 05/05/32 |
2,140 | 1,944,982 | ||||||
| Summit Digitel Infrastructure Ltd., 2.88%, |
545 | 451,413 | ||||||
| Vinci SA, 3.75%, 04/10/29 (Call 01/10/29)(a)(b) |
5,583 | 5,312,317 | ||||||
|
|
|
|||||||
| 14,914,648 | ||||||||
| Entertainment — 0.3% | ||||||||
| Genm Capital Labuan Ltd., 3.88%, 04/19/31 |
2,635 | 2,281,905 | ||||||
| Warnermedia Holdings Inc. |
||||||||
| 4.05%, 03/15/29 (Call 01/15/29) |
5,845 | 5,414,038 | ||||||
| 4.28%, 03/15/32 (Call 12/15/31)(a) |
28,743 | 25,356,702 | ||||||
|
|
|
|||||||
| 33,052,645 | ||||||||
| Environmental Control — 0.5% | ||||||||
| Republic Services Inc. |
||||||||
| 1.45%, 02/15/31 (Call 11/15/30)(a) |
4,062 | 3,205,827 | ||||||
| 1.75%, 02/15/32 (Call 11/15/31) |
3,594 | 2,820,202 | ||||||
| 2.30%, 03/01/30 (Call 12/01/29) |
3,848 | 3,303,836 | ||||||
| 2.38%, 03/15/33 (Call 12/15/32)(a) |
3,835 | 3,072,382 | ||||||
| 4.88%, 04/01/29 (Call 03/01/29)(a) |
1,080 | 1,075,870 | ||||||
| 5.00%, 12/15/33 (Call 09/15/33) |
2,390 | 2,351,451 | ||||||
| Security | Par (000) |
Value | ||||||
| Environmental Control (continued) | ||||||||
| Veralto Corp., 5.45%, 09/18/33 |
$ | 5,253 | $ | 5,276,085 | ||||
| Waste Connections Inc. |
||||||||
| 2.20%, 01/15/32 (Call 10/15/31) |
3,997 | 3,241,487 | ||||||
| 2.60%, 02/01/30 (Call 11/01/29) |
3,733 | 3,285,213 | ||||||
| 3.20%, 06/01/32 (Call 03/01/32) |
2,907 | 2,531,404 | ||||||
| 3.50%, 05/01/29 (Call 02/01/29)(a) |
2,774 | 2,599,081 | ||||||
| 4.20%, 01/15/33 (Call 10/15/32)(a) |
4,342 | 4,059,119 | ||||||
| 5.00%, 03/01/34 (Call 12/01/33)(a) |
2,700 | 2,643,627 | ||||||
| Waste Management Inc. |
||||||||
| 1.50%, 03/15/31 (Call 12/15/30)(a) |
5,711 | 4,542,111 | ||||||
| 2.00%, 06/01/29 (Call 04/01/29) |
2,840 | 2,457,445 | ||||||
| 4.15%, 04/15/32 (Call 01/15/32)(a) |
5,580 | 5,257,616 | ||||||
| 4.63%, 02/15/30 (Call 12/15/29)(a) |
4,375 | 4,303,394 | ||||||
| 4.63%, 02/15/33 (Call 11/15/32) |
3,095 | 2,989,450 | ||||||
| 4.88%, 02/15/34 (Call 11/15/33) |
10 | 9,798 | ||||||
|
|
|
|||||||
| 59,025,398 | ||||||||
| Food — 1.7% | ||||||||
| Ahold Finance USA LLC, 6.88%, 05/01/29(a) |
4,200 | 4,559,010 | ||||||
| Bimbo Bakeries USA Inc., 6.40%, 01/15/34 |
2,000 | 2,138,200 | ||||||
| Campbell Soup Co., 2.38%, 04/24/30 |
3,415 | 2,897,975 | ||||||
| CK Hutchison International 20 Ltd., 2.50%, |
885 | 764,527 | ||||||
| CK Hutchison International 21 Ltd., 2.50%, |
3,655 | 3,101,317 | ||||||
| Conagra Brands Inc., 8.25%, 09/15/30(a) |
2,950 | 3,387,953 | ||||||
| Flowers Foods Inc., 2.40%, 03/15/31 |
3,150 | 2,633,555 | ||||||
| General Mills Inc. |
||||||||
| 2.25%, 10/14/31 (Call 07/14/31)(a) |
3,778 | 3,098,995 | ||||||
| 2.88%, 04/15/30 (Call 01/15/30)(a) |
4,870 | 4,303,880 | ||||||
| 4.95%, 03/29/33 (Call 12/29/32)(a) |
6,300 | 6,184,820 | ||||||
| Hershey Co. (The) |
||||||||
| 1.70%, 06/01/30 (Call 03/01/30)(a) |
2,308 | 1,927,366 | ||||||
| 2.45%, 11/15/29 (Call 08/15/29) |
1,757 | 1,556,158 | ||||||
| 4.50%, 05/04/33 (Call 02/04/33)(a) |
1,710 | 1,672,387 | ||||||
| Hormel Foods Corp., 1.80%, 06/11/30 |
6,018 | 4,990,947 | ||||||
| Ingredion Inc., 2.90%, 06/01/30 (Call 03/01/30) |
3,670 | 3,220,107 | ||||||
| J M Smucker Co. (The), 6.20%, 11/15/33 |
4,855 | 5,131,567 | ||||||
| JBS USA LUX SA/JBS USA Food Co./JBS USA |
||||||||
| 3.00%, 05/15/32 (Call 02/15/32) |
6,098 | 4,882,402 | ||||||
| 3.63%, 01/15/32 (Call 01/15/27)(a) |
5,640 | 4,742,310 | ||||||
| 3.75%, 12/01/31 (Call 12/01/26) |
3,232 | 2,748,284 | ||||||
| 5.50%, 01/15/30 (Call 01/15/25) |
8,075 | 7,870,232 | ||||||
| 5.75%, 04/01/33 (Call 01/01/33) |
11,805 | 11,448,703 | ||||||
| JM Smucker Co. (The) |
||||||||
| 2.13%, 03/15/32 (Call 12/15/31)(a) |
2,980 | 2,373,607 | ||||||
| 2.38%, 03/15/30 (Call 12/15/29)(a) |
3,584 | 3,075,855 | ||||||
| Kellanova |
||||||||
| 2.10%, 06/01/30 (Call 03/01/30)(a) |
3,508 | 2,956,340 | ||||||
| 5.25%, 03/01/33 (Call 12/01/32)(a) |
2,645 | 2,627,576 | ||||||
| Series B, 7.45%, 04/01/31 |
4,363 | 4,884,286 | ||||||
| Kraft Heinz Foods Co. |
||||||||
| 3.75%, 04/01/30 (Call 01/01/30)(a) |
5,173 | 4,827,638 | ||||||
| 4.25%, 03/01/31 (Call 12/01/30) |
2,474 | 2,350,727 | ||||||
| 6.75%, 03/15/32(a) |
2,732 | 2,987,966 | ||||||
| 198 | 2 0 2 4 I S H A R E S A N N U A L R E P O R T T O S H A R E H O L D E R S |
| Schedule of Investments (continued) February 29, 2024 |
iShares® 5-10 Year Investment Grade Corporate Bond ETF (Percentages shown are based on Net Assets) |
| Security | Par (000) |
Value | ||||||
| Food (continued) | ||||||||
| Kroger Co. (The) |
||||||||
| 1.70%, 01/15/31 (Call 10/15/30)(a) |
$ | 3,520 | $ | 2,807,375 | ||||
| 2.20%, 05/01/30 (Call 02/01/30)(a) |
2,597 | 2,187,794 | ||||||
| 7.50%, 04/01/31(a) |
1,565 | 1,766,169 | ||||||
| 8.00%, 09/15/29(a) |
2,874 | 3,263,425 | ||||||
| Series B, 7.70%, 06/01/29 |
1,535 | 1,703,677 | ||||||
| Mars Inc. |
||||||||
| 1.63%, 07/16/32 (Call 04/16/32)(a)(b) |
2,800 | 2,152,807 | ||||||
| 3.20%, 04/01/30 (Call 01/01/30)(b) |
4,332 | 3,926,806 | ||||||
| 4.65%, 04/20/31 (Call 02/20/31)(a)(b) |
3,145 | 3,079,386 | ||||||
| 4.75%, 04/20/33 (Call 01/20/33)(a)(b) |
6,065 | 5,906,428 | ||||||
| McCormick & Co. Inc./MD |
||||||||
| 1.85%, 02/15/31 (Call 11/15/30) |
3,057 | 2,456,608 | ||||||
| 2.50%, 04/15/30 (Call 01/15/30)(a) |
2,799 | 2,398,322 | ||||||
| 4.95%, 04/15/33 (Call 01/15/33)(a) |
3,528 | 3,443,252 | ||||||
| Mondelez International Inc. |
||||||||
| 1.50%, 02/04/31 (Call 11/04/30) |
3,042 | 2,420,536 | ||||||
| 1.88%, 10/15/32 (Call 07/15/32)(a) |
3,450 | 2,714,842 | ||||||
| 2.75%, 04/13/30 (Call 01/13/30) |
4,366 | 3,859,029 | ||||||
| 3.00%, 03/17/32 (Call 12/17/31) |
4,815 | 4,149,877 | ||||||
| 6.50%, 11/01/31(a) |
1,075 | 1,147,481 | ||||||
| Nestle Holdings Inc. |
||||||||
| 1.25%, 09/15/30 (Call 06/15/30)(a)(b) |
6,060 | 4,875,509 | ||||||
| 1.88%, 09/14/31 (Call 06/14/31)(a)(b) |
4,910 | 4,051,562 | ||||||
| 4.25%, 10/01/29 (Call 08/01/29)(a)(b) |
2,898 | 2,828,261 | ||||||
| 4.30%, 10/01/32 (Call 07/01/32)(a)(b) |
6,008 | 5,887,876 | ||||||
| 4.85%, 03/14/33 (Call 12/14/32)(a)(b) |
4,763 | 4,775,148 | ||||||
| 4.95%, 03/14/30 (Call 01/14/30)(a)(b) |
2,850 | 2,875,502 | ||||||
| 5.00%, 09/12/30 (Call 07/12/30)(a)(b) |
2,540 | 2,583,007 | ||||||
| 5.00%, 09/12/33 (Call 06/12/33)(a)(b) |
1,545 | 1,575,510 | ||||||
| Smithfield Foods Inc. |
||||||||
| 2.63%, 09/13/31 (Call 06/13/31)(a)(b) |
2,950 | 2,255,451 | ||||||
| 3.00%, 10/15/30 (Call 07/15/30)(b) |
2,999 | 2,469,111 | ||||||
| 5.20%, 04/01/29 (Call 01/01/29)(b) |
2,188 | 2,099,358 | ||||||
| Sysco Corp. |
||||||||
| 2.40%, 02/15/30 (Call 11/15/29)(a) |
3,007 | 2,586,448 | ||||||
| 2.45%, 12/14/31 (Call 09/14/31) |
2,672 | 2,208,514 | ||||||
| 5.95%, 04/01/30 (Call 01/01/30) |
6,184 | 6,434,865 | ||||||
| 6.00%, 01/17/34 (Call 10/17/33)(a) |
2,595 | 2,734,768 | ||||||
| Tyson Foods Inc., 5.70%, 03/15/34 |
2,700 | 2,696,508 | ||||||
|
|
|
|||||||
| 211,665,902 | ||||||||
| Forest Products & Paper — 0.3% | ||||||||
| Celulosa Arauco y Constitucion SA |
||||||||
| 4.20%, 01/29/30 (Call 10/29/29)(a)(b) |
2,352 | 2,151,157 | ||||||
| 4.25%, 04/30/29 (Call 01/30/29)(b) |
2,792 | 2,530,968 | ||||||
| Georgia-Pacific LLC |
||||||||
| 2.30%, 04/30/30 (Call 01/30/30)(b) |
6,028 | 5,139,075 | ||||||
| 7.75%, 11/15/29(a) |
3,231 | 3,670,755 | ||||||
| 8.88%, 05/15/31(a) |
1,091 | 1,338,402 | ||||||
| Inversiones CMPC SA |
||||||||
| 3.00%, 04/06/31 (Call 01/06/31)(a)(b) |
2,970 | 2,510,006 | ||||||
| 3.85%, 01/13/30 (Call 10/13/29)(a)(b) |
1,695 | 1,538,839 | ||||||
| 6.13%, 06/23/33 (Call 03/23/33)(a)(b) |
735 | 742,100 | ||||||
| Suzano Austria GmbH |
||||||||
| 3.13%, 01/15/32 (Call 10/15/31)(a) |
6,160 | 5,058,670 | ||||||
| 3.75%, 01/15/31 (Call 10/15/30)(a) |
7,164 | 6,268,012 | ||||||
| 5.00%, 01/15/30 (Call 10/15/29)(a) |
5,765 | 5,490,515 | ||||||
|
|
|
|||||||
| 36,438,499 | ||||||||
| Security | Par (000) |
Value | ||||||
| Gas — 0.7% | ||||||||
| Atmos Energy Corp. |
||||||||
| 1.50%, 01/15/31 (Call 10/15/30)(a) |
$ | 3,191 | $ | 2,541,100 | ||||
| 2.63%, 09/15/29 (Call 06/15/29)(a) |
2,631 | 2,341,809 | ||||||
| 5.45%, 10/15/32 (Call 07/15/32)(a) |
1,290 | 1,322,769 | ||||||
| 5.90%, 11/15/33 (Call 08/15/33)(a) |
2,474 | 2,601,570 | ||||||
| Boston Gas Co. |
||||||||
| 3.00%, 08/01/29 (Call 05/01/29)(b) |
2,923 | 2,563,437 | ||||||
| 3.76%, 03/16/32 (Call 12/16/31)(b) |
2,385 | 2,085,181 | ||||||
| Brooklyn Union Gas Co. (The) |
||||||||
| 3.87%, 03/04/29 (Call 12/04/28)(a)(b) |
2,556 | 2,352,259 | ||||||
| 4.87%, 08/05/32 (Call 05/05/32)(b) |
2,355 | 2,162,056 | ||||||
| 6.39%, 09/15/33 (Call 06/15/33)(a)(b) |
2,533 | 2,584,797 | ||||||
| CenterPoint Energy Resources Corp. |
||||||||
| 1.75%, 10/01/30 (Call 07/01/30) |
2,530 | 2,055,337 | ||||||
| 4.40%, 07/01/32 (Call 04/01/32)(a) |
2,940 | 2,782,327 | ||||||
| 5.40%, 03/01/33 (Call 12/01/32)(a) |
3,513 | 3,543,152 | ||||||
| East Ohio Gas Co. (The), 2.00%, 06/15/30 |
2,831 | 2,320,902 | ||||||
| ENN Energy Holdings Ltd., 2.63%, 09/17/30 |
70 | 59,604 | ||||||
| Grupo Energia Bogota SA ESP |
||||||||
| 4.88%, 05/15/30 (Call 02/15/30)(a)(b) |
2,145 | 2,033,704 | ||||||
| 7.85%, 11/09/33 (Call 07/09/33)(b) |
225 | 246,085 | ||||||
| KeySpan Gas East Corp., 5.99%, 03/06/33 |
2,916 | 2,905,868 | ||||||
| Korea Gas Corp., 2.88%, 07/16/29(a)(b) |
2,890 | 2,600,061 | ||||||
| Nakilat Inc., 6.07%, 12/31/33(b) |
62 | 64,194 | ||||||
| National Fuel Gas Co., 2.95%, 03/01/31 |
3,385 | 2,828,179 | ||||||
| NiSource Inc. |
||||||||
| 1.70%, 02/15/31 (Call 11/15/30) |
4,139 | 3,287,408 | ||||||
| 2.95%, 09/01/29 (Call 06/01/29) |
4,235 | 3,805,783 | ||||||
| 3.60%, 05/01/30 (Call 02/01/30) |
5,549 | 5,077,818 | ||||||
| 5.40%, 06/30/33 (Call 03/30/33)(a) |
2,175 | 2,174,995 | ||||||
| ONE Gas Inc. |
||||||||
| 2.00%, 05/15/30 (Call 02/15/30)(a) |
1,400 | 1,166,167 | ||||||
| 4.25%, 09/01/32 (Call 06/01/32)(a) |
740 | 699,620 | ||||||
| 5.10%, 04/01/29 (Call 03/01/29)(a) |
445 | 446,465 | ||||||
| Piedmont Natural Gas Co. Inc. |
||||||||
| 2.50%, 03/15/31 (Call 12/15/30)(a) |
1,974 | 1,650,899 | ||||||
| 3.50%, 06/01/29 (Call 03/01/29)(a) |
3,034 | 2,794,028 | ||||||
| 5.40%, 06/15/33 (Call 03/15/33)(a) |
2,160 | 2,164,560 | ||||||
| Promigas SA ESP/Gases del Pacifico SAC, |
2,595 | 2,262,383 | ||||||
| Sempra Global, 3.25%, 01/15/32 |
2,892 | 2,344,360 | ||||||
| Southern California Gas Co. |
||||||||
| 5.20%, 06/01/33 (Call 03/01/33) |
3,236 | 3,211,035 | ||||||
| Series XX, 2.55%, 02/01/30 |
3,545 | 3,077,992 | ||||||
| Southern Co. Gas Capital Corp. |
||||||||
| 5.15%, 09/15/32 (Call 03/15/32)(a) |
3,025 | 3,003,109 | ||||||
| 5.75%, 09/15/33 (Call 03/15/33) |
3,073 | 3,148,576 | ||||||
| Series 2020-A, 1.75%, 01/15/31 |
2,751 | 2,203,374 | ||||||
| Southwest Gas Corp. |
||||||||
| 2.20%, 06/15/30 (Call 03/15/30) |
2,194 | 1,832,228 | ||||||
| 4.05%, 03/15/32 (Call 12/15/31)(a) |
3,660 | 3,347,085 | ||||||
| Spire Missouri Inc., 4.80%, 02/15/33 |
1,085 | 1,055,215 | ||||||
|
|
|
|||||||
| 90,747,491 | ||||||||
| S C H E D U L E O F I N V E S T M E N T S |
199 |
| Schedule of Investments (continued) February 29, 2024 |
iShares® 5-10 Year Investment Grade Corporate Bond ETF (Percentages shown are based on Net Assets) |
| Security | Par (000) |
Value | ||||||
| Hand & Machine Tools — 0.2% | ||||||||
| Kennametal Inc., 2.80%, 03/01/31 |
$ | 1,642 | $ | 1,374,459 | ||||
| Regal Rexnord Corp. |
||||||||
| 6.30%, 02/15/30 (Call 12/15/29)(b) |
6,226 | 6,339,443 | ||||||
| 6.40%, 04/15/33 (Call 01/15/33)(a)(b) |
5,640 | 5,790,275 | ||||||
| Stanley Black & Decker Inc. |
||||||||
| 2.30%, 03/15/30 (Call 12/15/29)(a) |
4,734 | 3,975,843 | ||||||
| 3.00%, 05/15/32 (Call 02/15/32)(a) |
3,004 | 2,538,185 | ||||||
|
|
|
|||||||
| 20,018,205 | ||||||||
| Health Care - Products — 1.3% | ||||||||
| Abbott Laboratories, 1.40%, 06/30/30 |
4,105 | 3,386,253 | ||||||
| Agilent Technologies Inc. |
||||||||
| 2.10%, 06/04/30 (Call 03/04/30) |
3,211 | 2,691,505 | ||||||
| 2.30%, 03/12/31 (Call 12/12/30) |
5,381 | 4,493,074 | ||||||
| 2.75%, 09/15/29 (Call 06/15/29)(a) |
3,134 | 2,806,386 | ||||||
| Alcon Finance Corp. |
||||||||
| 2.60%, 05/27/30 (Call 02/27/30)(b) |
4,674 | 4,012,604 | ||||||
| 3.00%, 09/23/29 (Call 06/23/29)(b) |
5,571 | 4,997,162 | ||||||
| 5.38%, 12/06/32 (Call 09/06/32)(a)(b) |
4,498 | 4,503,711 | ||||||
| Baxter International Inc. |
||||||||
| 1.73%, 04/01/31 (Call 01/01/31)(a) |
4,184 | 3,304,483 | ||||||
| 2.54%, 02/01/32 (Call 11/01/31)(a) |
9,190 | 7,534,867 | ||||||
| 3.95%, 04/01/30 (Call 01/01/30)(a) |
3,199 | 2,962,448 | ||||||
| Boston Scientific Corp. |
||||||||
| 2.65%, 06/01/30 (Call 03/01/30) |
7,289 | 6,371,521 | ||||||
| 4.00%, 03/01/29 (Call 12/01/28)(a) |
650 | 620,893 | ||||||
| Dentsply Sirona Inc., 3.25%, 06/01/30 |
4,513 | 3,927,927 | ||||||
| DH Europe Finance II Sarl, 2.60%, 11/15/29 |
4,450 | 3,956,248 | ||||||
| GE HealthCare Technologies Inc. |
||||||||
| 5.86%, 03/15/30 (Call 01/15/30) |
7,240 | 7,483,974 | ||||||
| 5.91%, 11/22/32 (Call 08/22/32)(a) |
10,218 | 10,619,180 | ||||||
| HCA Inc., 3.63%, 03/15/32 (Call 12/15/31) |
12,714 | 11,106,389 | ||||||
| Medtronic Global Holdings SCA, 4.50%, |
6,253 | 6,018,887 | ||||||
| Revvity Inc. |
||||||||
| 2.25%, 09/15/31 (Call 06/15/31)(a) |
3,109 | 2,528,066 | ||||||
| 2.55%, 03/15/31 (Call 12/15/30)(a) |
2,698 | 2,259,708 | ||||||
| 3.30%, 09/15/29 (Call 06/15/29) |
4,925 | 4,433,732 | ||||||
| Smith & Nephew PLC, 2.03%, 10/14/30 |
6,220 | 5,093,330 | ||||||
| Solventum Corp. |
||||||||
| 5.45%, 03/13/31 (Call 01/13/31)(b) |
6,275 | 6,220,979 | ||||||
| 5.60%, 03/23/34 (Call 12/23/33)(a)(b) |
6,275 | 6,235,436 | ||||||
| STERIS Irish FinCo UnLtd Co., 2.70%, 03/15/31 |
4,042 | 3,431,571 | ||||||
| Stryker Corp., 1.95%, 06/15/30 (Call 03/15/30) |
5,910 | 4,945,293 | ||||||
| Thermo Fisher Scientific Inc. |
||||||||
| 2.00%, 10/15/31 (Call 07/15/31)(a) |
7,151 | 5,842,458 | ||||||
| 2.60%, 10/01/29 (Call 07/01/29)(a) |
5,024 | 4,480,816 | ||||||
| 4.95%, 11/21/32 (Call 08/21/32)(a) |
3,708 | 3,693,635 | ||||||
| 4.98%, 08/10/30 (Call 06/10/30) |
4,730 | 4,733,349 | ||||||
| 5.09%, 08/10/33 (Call 05/10/33)(a) |
4,710 | 4,737,510 | ||||||
| 5.20%, 01/31/34 (Call 10/31/33)(a) |
2,855 | 2,887,239 | ||||||
| Zimmer Biomet Holdings Inc. |
||||||||
| 2.60%, 11/24/31 (Call 08/24/31)(a) |
4,708 | 3,947,857 | ||||||
| 3.55%, 03/20/30 (Call 12/20/29)(a) |
1,958 | 1,773,220 | ||||||
|
|
|
|||||||
| 158,041,711 | ||||||||
| Security | Par (000) |
Value | ||||||
| Health Care - Services — 2.4% | ||||||||
| Adventist Health System/West |
||||||||
| 2.95%, 03/01/29 (Call 12/01/28)(a) |
$ | 1,640 | $ | 1,462,726 | ||||
| 5.43%, 03/01/32 (Call 12/01/31)(a) |
940 | 941,863 | ||||||
| Advocate Health & Hospitals Corp., Series |
||||||||
| 2020, 2.21%, 06/15/30 (Call 03/15/30)(a) |
295 | 245,014 | ||||||
| Ascension Health, Series B, 2.53%, 11/15/29 |
5,279 | 4,701,119 | ||||||
| Banner Health |
||||||||
| 1.90%, 01/01/31 (Call 07/01/30)(a) |
776 | 632,091 | ||||||
| 2.34%, 01/01/30 (Call 10/01/29)(a) |
1,830 | 1,579,326 | ||||||
| Baylor Scott & White Holdings, Series 2021, |
2,035 | 1,647,473 | ||||||
| Bon Secours Mercy Health Inc. |
||||||||
| 3.46%, 06/01/30 (Call 12/01/29)(a) |
2,615 | 2,385,838 | ||||||
| Series 20-2, 2.10%, 06/01/31 (Call 12/01/30) |
2,005 | 1,635,066 | ||||||
| Cedars-Sinai Health System, Series 2021, |
1,275 | 1,063,833 | ||||||
| Centene Corp. |
||||||||
| 2.50%, 03/01/31 (Call 12/01/30) |
12,563 | 10,293,187 | ||||||
| 2.63%, 08/01/31 (Call 05/01/31)(a) |
7,553 | 6,180,393 | ||||||
| 3.00%, 10/15/30 (Call 07/15/30) |
12,533 | 10,707,819 | ||||||
| 3.38%, 02/15/30 (Call 02/15/25)(a) |
11,336 | 10,000,023 | ||||||
| 4.63%, 12/15/29 (Call 12/15/24)(a) |
18,574 | 17,581,220 | ||||||
| CommonSpirit Health |
||||||||
| 2.78%, 10/01/30 (Call 04/01/30) |
910 | 779,212 | ||||||
| 3.35%, 10/01/29 (Call 04/01/29) |
3,963 | 3,603,516 | ||||||
| Elevance Health Inc. |
||||||||
| 2.25%, 05/15/30 (Call 02/15/30) |
6,017 | 5,108,551 | ||||||
| 2.55%, 03/15/31 (Call 12/15/30) |
6,309 | 5,348,433 | ||||||
| 2.88%, 09/15/29 (Call 06/15/29) |
5,735 | 5,149,909 | ||||||
| 4.10%, 05/15/32 (Call 02/15/32)(a) |
3,786 | 3,488,197 | ||||||
| 4.75%, 02/15/33 (Call 11/15/32)(a) |
5,560 | 5,374,017 | ||||||
| 5.50%, 10/15/32 (Call 07/15/32)(a) |
3,965 | 4,038,140 | ||||||
| Fresenius Medical Care U.S. Finance III Inc. |
||||||||
| 2.38%, 02/16/31 (Call 11/16/30)(a)(b) |
5,510 | 4,280,530 | ||||||
| 3.00%, 12/01/31 (Call 09/01/31)(a)(b) |
3,130 | 2,487,251 | ||||||
| 3.75%, 06/15/29 (Call 03/15/29)(a)(b) |
2,776 | 2,466,462 | ||||||
| HCA Inc. |
||||||||
| 2.38%, 07/15/31 (Call 04/15/31)(a) |
4,778 | 3,888,432 | ||||||
| 3.38%, 03/15/29 (Call 01/15/29)(a) |
2,740 | 2,498,952 | ||||||
| 3.50%, 09/01/30 (Call 03/01/30) |
15,329 | 13,696,376 | ||||||
| 4.13%, 06/15/29 (Call 03/15/29) |
11,158 | 10,505,922 | ||||||
| 5.45%, 04/01/31 (Call 02/01/31)(a) |
1,545 | 1,537,694 | ||||||
| 5.50%, 06/01/33 (Call 03/01/33)(a) |
7,625 | 7,579,817 | ||||||
| 5.60%, 04/01/34 (Call 01/01/34)(a) |
3,450 | 3,434,830 | ||||||
| 7.50%, 11/06/33(a) |
680 | 756,814 | ||||||
| Health Care Service Corp. A Mutual Legal |
4,779 | 4,001,266 | ||||||
| Highmark Inc., 2.55%, 05/10/31 |
2,909 | 2,282,760 | ||||||
| Humana Inc. |
||||||||
| 2.15%, 02/03/32 (Call 11/03/31) |
4,936 | 3,912,892 | ||||||
| 3.13%, 08/15/29 (Call 05/15/29)(a) |
3,341 | 3,024,247 | ||||||
| 3.70%, 03/23/29 (Call 02/23/29) |
663 | 620,052 | ||||||
| 4.88%, 04/01/30 (Call 01/01/30)(a) |
4,339 | 4,269,387 | ||||||
| 5.88%, 03/01/33 (Call 12/01/32)(a) |
4,761 | 4,893,847 | ||||||
| Laboratory Corp. of America Holdings |
||||||||
| 2.70%, 06/01/31 (Call 03/01/31)(a) |
3,145 | 2,690,550 | ||||||
| 2.95%, 12/01/29 (Call 09/01/29)(a) |
3,995 | 3,560,590 | ||||||
| 200 | 2 0 2 4 I S H A R E S A N N U A L R E P O R T T O S H A R E H O L D E R S |
| Schedule of Investments (continued) February 29, 2024 |
iShares® 5-10 Year Investment Grade Corporate Bond ETF (Percentages shown are based on Net Assets) |
| Security | Par (000) |
Value | ||||||
| Health Care - Services (continued) | ||||||||
| OhioHealth Corp., 2.30%, 11/15/31 |
$ | 1,660 | $ | 1,367,883 | ||||
| Piedmont Healthcare Inc., 2.04%, 01/01/32 |
1,380 | 1,113,537 | ||||||
| Providence St Joseph Health Obligated Group |
||||||||
| 5.40%, 10/01/33 (Call 04/01/33)(a) |
438 | 436,440 | ||||||
| Series 19A, 2.53%, 10/01/29 |
3,622 | 3,150,789 | ||||||
| Quest Diagnostics Inc. |
||||||||
| 2.80%, 06/30/31 (Call 03/30/31) |
2,583 | 2,208,579 | ||||||
| 2.95%, 06/30/30 (Call 03/30/30) |
5,382 | 4,744,715 | ||||||
| 4.20%, 06/30/29 (Call 03/30/29)(a) |
3,025 | 2,907,829 | ||||||
| 6.40%, 11/30/33 (Call 08/30/33)(a) |
4,545 | 4,855,092 | ||||||
| Roche Holdings Inc. |
||||||||
| 2.08%, 12/13/31 (Call 09/13/31)(a)(b) |
11,914 | 9,752,363 | ||||||
| 5.49%, 11/13/30 (Call 09/13/30)(a)(b) |
7,923 | 8,161,273 | ||||||
| 5.59%, 11/13/33 (Call 08/13/33)(b) |
8,350 | 8,728,184 | ||||||
| Rush Obligated Group, Series 2020, 3.92%, |
1,582 | 1,505,053 | ||||||
| Stanford Health Care, Series 2020, 3.31%, |
720 | 650,503 | ||||||
| Sutter Health |
||||||||
| 5.16%, 08/15/33 (Call 02/15/33) |
150 | 151,027 | ||||||
| Series 20A, 2.29%, 08/15/30 (Call 02/15/30) |
3,385 | 2,889,624 | ||||||
| UnitedHealth Group Inc. |
||||||||
| 2.00%, 05/15/30(a) |
7,766 | 6,533,657 | ||||||
| 2.30%, 05/15/31 (Call 02/15/31) |
9,070 | 7,604,391 | ||||||
| 2.88%, 08/15/29(a) |
6,054 | 5,492,343 | ||||||
| 4.00%, 05/15/29 (Call 03/15/29)(a) |
5,636 | 5,421,289 | ||||||
| 4.20%, 05/15/32 (Call 02/15/32) |
8,905 | 8,391,769 | ||||||
| 4.50%, 04/15/33 (Call 01/15/33)(a) |
8,844 | 8,487,113 | ||||||
| 5.30%, 02/15/30 (Call 12/15/29) |
5,958 | 6,072,445 | ||||||
| 5.35%, 02/15/33 (Call 11/15/32)(a) |
11,469 | 11,701,789 | ||||||
| Universal Health Services Inc. |
||||||||
| 2.65%, 10/15/30 (Call 07/15/30) |
4,714 | 3,935,606 | ||||||
| 2.65%, 01/15/32 (Call 10/15/31)(a) |
3,032 | 2,464,821 | ||||||
| UPMC, 5.04%, 05/15/33 (Call 02/15/33) |
435 | 429,472 | ||||||
|
|
|
|||||||
| 305,493,223 | ||||||||
| Holding Companies - Diversified — 0.1% | ||||||||
| Ares Capital Corp., 3.20%, 11/15/31 |
4,694 | 3,820,706 | ||||||
| Blackstone Private Credit Fund, 6.25%, |
1,350 | 1,338,214 | ||||||
| Blue Owl Credit Income Corp., 6.65%, 03/15/31 |
1,785 | 1,727,744 | ||||||
| CK Hutchison International 19 II Ltd., 2.75%, |
4,207 | 3,738,162 | ||||||
| CK Hutchison International 19 Ltd., 3.63%, |
3,448 | 3,228,529 | ||||||
| Golub Capital BDC Inc., 6.00%, 07/15/29 |
30 | 29,121 | ||||||
| JAB Holdings BV, 2.20%, 11/23/30 |
953 | 754,075 | ||||||
|
|
|
|||||||
| 14,636,551 | ||||||||
| Home Builders — 0.1% | ||||||||
| MDC Holdings Inc. |
||||||||
| 2.50%, 01/15/31 (Call 07/15/30)(a) |
2,194 | 1,853,515 | ||||||
| 3.85%, 01/15/30 (Call 07/15/29)(a) |
1,647 | 1,518,323 | ||||||
| NVR Inc., 3.00%, 05/15/30 (Call 11/15/29) |
5,679 | 5,001,797 | ||||||
| Security | Par (000) |
Value | ||||||
| Home Builders (continued) | ||||||||
| PulteGroup Inc. |
||||||||
| 6.38%, 05/15/33 |
$ | 2,960 | $ | 3,121,381 | ||||
| 7.88%, 06/15/32(a) |
2,525 | 2,918,999 | ||||||
| Toll Brothers Finance Corp., 3.80%, 11/01/29 |
2,213 | 2,034,528 | ||||||
|
|
|
|||||||
| 16,448,543 | ||||||||
| Home Furnishings — 0.1% | ||||||||
| Panasonic Holdings Corp., 3.11%, 07/19/29 |
2,270 | 2,063,143 | ||||||
| Whirlpool Corp. |
||||||||
| 2.40%, 05/15/31 (Call 02/15/31) |
1,805 | 1,484,962 | ||||||
| 4.70%, 05/14/32 (Call 02/14/32)(a) |
1,840 | 1,736,824 | ||||||
| 5.50%, 03/01/33 (Call 12/01/32)(a) |
2,290 | 2,270,572 | ||||||
| 5.75%, 03/01/34 (Call 12/01/33)(a) |
1,625 | 1,612,840 | ||||||
|
|
|
|||||||
| 9,168,341 | ||||||||
| Household Products & Wares — 0.3% | ||||||||
| Avery Dennison Corp. |
||||||||
| 2.25%, 02/15/32 (Call 11/15/31)(a) |
2,659 | 2,158,287 | ||||||
| 2.65%, 04/30/30 (Call 02/01/30)(a) |
3,118 | 2,705,336 | ||||||
| 5.75%, 03/15/33 (Call 12/15/32) |
2,310 | 2,397,333 | ||||||
| Church & Dwight Co. Inc. |
||||||||
| 2.30%, 12/15/31 (Call 09/15/31)(a) |
2,323 | 1,916,824 | ||||||
| 5.60%, 11/15/32 (Call 08/15/32) |
3,066 | 3,180,579 | ||||||
| Clorox Co. (The) |
||||||||
| 1.80%, 05/15/30 (Call 02/15/30)(a) |
3,352 | 2,768,138 | ||||||
| 4.40%, 05/01/29 (Call 03/01/29)(a) |
2,525 | 2,461,611 | ||||||
| 4.60%, 05/01/32 (Call 02/01/32)(a) |
4,090 | 3,968,221 | ||||||
| Kimberly-Clark Corp. |
||||||||
| 2.00%, 11/02/31 (Call 08/02/31)(a) |
3,567 | 2,937,967 | ||||||
| 3.10%, 03/26/30 (Call 12/26/29)(a) |
4,587 | 4,177,366 | ||||||
| 3.20%, 04/25/29 (Call 01/25/29)(a) |
3,862 | 3,588,526 | ||||||
| 4.50%, 02/16/33 (Call 11/16/32)(a) |
2,200 | 2,151,299 | ||||||
| Kimberly-Clark de Mexico SAB de CV, 2.43%, |
||||||||
| 07/01/31 (Call 04/01/31)(a)(b) |
1,940 | 1,634,093 | ||||||
| SC Johnson & Son Inc., 5.75%, 02/15/33(a)(b) |
55 | 55,340 | ||||||
|
|
|
|||||||
| 36,100,920 | ||||||||
| Insurance — 4.5% | ||||||||
| Accident Fund Insurance Co. of America, |
80 | 79,100 | ||||||
| Aflac Inc., 3.60%, 04/01/30 (Call 01/01/30)(a) |
6,436 | 5,965,775 | ||||||
| AIA Group Ltd. |
||||||||
| 3.38%, 04/07/30 (Call 01/07/30)(b) |
6,377 | 5,828,536 | ||||||
| 3.60%, 04/09/29 (Call 01/09/29)(b) |
5,469 | 5,132,021 | ||||||
| 4.95%, 04/04/33 (Call 01/04/33)(b) |
3,913 | 3,904,451 | ||||||
| AIG SunAmerica Global Financing X,
6.90%, |
5,115 | 5,563,176 | ||||||
| Alleghany Corp., 3.63%, 05/15/30 |
3,352 | 3,115,861 | ||||||
| Allianz SE, 6.35%, 09/06/53 (Call 03/06/33), |
2,125 | 2,216,324 | ||||||
| Allstate Corp. (The) |
||||||||
| 1.45%, 12/15/30 (Call 09/15/30) |
3,778 | 2,983,139 | ||||||
| 5.25%, 03/30/33 (Call 12/30/32)(a) |
5,867 | 5,844,698 | ||||||
| 5.35%, 06/01/33(a) |
120 | 120,200 | ||||||
| American Financial Group Inc./OH, 5.25%, |
1,468 | 1,450,414 | ||||||
| American International Group Inc. |
||||||||
| 3.40%, 06/30/30 (Call 03/30/30)(a) |
2,592 | 2,337,151 | ||||||
| 5.13%, 03/27/33 (Call 12/27/32)(a) |
5,246 | 5,174,512 | ||||||
| S C H E D U L E O F I N V E S T M E N T S |
201 |
| Schedule of Investments (continued) February 29, 2024 |
iShares® 5-10 Year Investment Grade Corporate Bond ETF (Percentages shown are based on Net Assets) |
| Security | Par (000) |
Value | ||||||
| Insurance (continued) | ||||||||
| American National Group LLC, 6.14%, 06/13/32 |
$ | 190 | $ | 178,747 | ||||
| Americo Life Inc., 3.45%, 04/15/31 |
2,454 | 1,903,213 | ||||||
| AmFam Holdings Inc., 2.81%, 03/11/31 |
3,258 | 2,463,324 | ||||||
| Aon Corp. |
||||||||
| 2.80%, 05/15/30 (Call 02/15/30) |
6,672 | 5,800,427 | ||||||
| 3.75%, 05/02/29 (Call 02/02/29)(a) |
4,532 | 4,252,267 | ||||||
| Aon Corp./Aon Global Holdings PLC |
||||||||
| 2.05%, 08/23/31 (Call 05/23/31) |
2,823 | 2,266,617 | ||||||
| 2.60%, 12/02/31 (Call 09/02/31) |
3,145 | 2,614,417 | ||||||
| 5.00%, 09/12/32 (Call 06/12/32) |
3,522 | 3,440,135 | ||||||
| 5.35%, 02/28/33 (Call 11/28/32)(a) |
4,713 | 4,700,658 | ||||||
| Aon North America Inc. |
||||||||
| 5.30%, 03/01/31 (Call 01/01/31) |
5,375 | 5,366,771 | ||||||
| 5.45%, 03/01/34 (Call 12/01/33) |
5,375 | 5,378,403 | ||||||
| Arthur J Gallagher & Co. |
||||||||
| 2.40%, 11/09/31 (Call 08/09/31)(a) |
2,649 | 2,138,313 | ||||||
| 5.45%, 07/15/34 (Call 04/15/34)(a) |
385 | 383,589 | ||||||
| 5.50%, 03/02/33 (Call 12/02/32)(a) |
1,704 | 1,702,044 | ||||||
| 6.50%, 02/15/34 (Call 11/15/33) |
1,040 | 1,111,241 | ||||||
| Ascot Group Ltd., 4.25%, 12/15/30 |
650 | 527,109 | ||||||
| Assurant Inc. |
||||||||
| 2.65%, 01/15/32 (Call 10/15/31)(a) |
2,250 | 1,827,117 | ||||||
| 3.70%, 02/22/30 (Call 11/22/29) |
2,472 | 2,206,248 | ||||||
| Assured Guaranty U.S. Holdings Inc., 3.15%, |
3,572 | 3,123,246 | ||||||
| Athene Global Funding |
||||||||
| 2.55%, 11/19/30(b) |
4,428 | 3,625,883 | ||||||
| 2.65%, 10/04/31(a)(b) |
2,900 | 2,337,647 | ||||||
| 2.67%, 06/07/31(b) |
3,284 | 2,669,065 | ||||||
| Athene Holding Ltd. |
||||||||
| 3.50%, 01/15/31 (Call 10/15/30) |
3,249 | 2,823,955 | ||||||
| 5.88%, 01/15/34 (Call 10/15/33)(a) |
3,965 | 3,933,422 | ||||||
| 6.15%, 04/03/30 (Call 01/03/30)(a) |
3,474 | 3,574,439 | ||||||
| 6.65%, 02/01/33 (Call 11/01/32)(a) |
2,658 | 2,781,759 | ||||||
| AXA SA, 8.60%, 12/15/30 |
5,155 | 6,105,266 | ||||||
| AXIS Specialty Finance LLC |
||||||||
| 3.90%, 07/15/29 (Call 04/15/29)(a) |
2,216 | 2,083,895 | ||||||
| 4.90%, 01/15/40 (Call 01/15/30), |
2,089 | 1,827,300 | ||||||
| Belrose Funding Trust, 2.33%, 08/15/30 |
2,644 | 2,075,145 | ||||||
| Berkshire Hathaway Finance Corp. |
||||||||
| 1.45%, 10/15/30 (Call 07/15/30) |
4,815 | 3,928,490 | ||||||
| 1.85%, 03/12/30 (Call 12/12/29) |
3,131 | 2,663,339 | ||||||
| 2.88%, 03/15/32 (Call 12/15/31)(a) |
6,608 | 5,775,597 | ||||||
| Brighthouse Financial Inc., 5.63%, 05/15/30 |
3,408 | 3,391,554 | ||||||
| Brown & Brown Inc. |
||||||||
| 2.38%, 03/15/31 (Call 12/15/30)(a) |
4,928 | 4,034,604 | ||||||
| 4.20%, 03/17/32 (Call 12/17/31)(a) |
3,890 | 3,531,410 | ||||||
| 4.50%, 03/15/29 (Call 12/15/28)(a) |
1,822 | 1,763,375 | ||||||
| Chubb INA Holdings Inc., 1.38%, 09/15/30 |
6,878 | 5,567,482 | ||||||
| CNA Financial Corp. |
||||||||
| 2.05%, 08/15/30 (Call 05/15/30)(a) |
3,225 | 2,663,897 | ||||||
| 3.90%, 05/01/29 (Call 02/01/29) |
3,298 | 3,094,887 | ||||||
| 5.13%, 02/15/34 (Call 11/15/33) |
1,345 | 1,300,480 | ||||||
| Security | Par (000) |
Value | ||||||
| Insurance (continued) | ||||||||
| 5.50%, 06/15/33 (Call 03/15/33)(a) |
$ | 1,265 | $ | 1,275,730 | ||||
| CNO Financial Group Inc., 5.25%, 05/30/29 |
3,300 | 3,204,434 | ||||||
| Corebridge Financial Inc. |
||||||||
| 3.85%, 04/05/29 (Call 02/05/29) |
5,783 | 5,362,871 | ||||||
| 3.90%, 04/05/32 (Call 01/05/32) |
8,190 | 7,208,026 | ||||||
| 5.75%, 01/15/34 (Call 10/15/33) |
4,295 | 4,282,105 | ||||||
| 6.05%, 09/15/33 (Call 06/15/33)(a)(b) |
3,250 | 3,318,021 | ||||||
| Doctors Co. An Interinsurance Exchange (The), |
1,090 | 850,839 | ||||||
| Empower Finance 2020 LP, 1.78%, 03/17/31 |
2,762 | 2,183,098 | ||||||
| Enstar Group Ltd. |
||||||||
| 3.10%, 09/01/31 (Call 03/01/31) |
3,333 | 2,715,705 | ||||||
| 4.95%, 06/01/29 (Call 03/01/29)(a) |
3,309 | 3,218,728 | ||||||
| Equitable Financial Life Global Funding,
1.75%, |
1,587 | 1,261,822 | ||||||
| Equitable Holdings Inc., 5.59%, 01/11/33 |
3,260 | 3,285,987 | ||||||
| Fairfax Financial Holdings Ltd. |
||||||||
| 3.38%, 03/03/31 (Call 12/03/30)(a) |
3,610 | 3,129,513 | ||||||
| 4.63%, 04/29/30 (Call 01/29/30) |
4,331 | 4,085,552 | ||||||
| 5.63%, 08/16/32 (Call 05/16/32) |
4,641 | 4,564,432 | ||||||
| 6.00%, 12/07/33 (Call 09/07/33)(b) |
3,115 | 3,129,411 | ||||||
| Farmers Exchange Capital II, 6.15%, 11/01/53 |
320 | 294,029 | ||||||
| Fidelity National Financial Inc. |
||||||||
| 2.45%, 03/15/31 (Call 12/15/30) |
4,123 | 3,350,143 | ||||||
| 3.40%, 06/15/30 (Call 03/15/30)(a) |
4,161 | 3,671,741 | ||||||
| First American Financial Corp. |
||||||||
| 2.40%, 08/15/31 (Call 05/15/31)(a) |
4,040 | 3,166,996 | ||||||
| 4.00%, 05/15/30 (Call 02/15/30) |
2,782 | 2,471,141 | ||||||
| Five Corners Funding Trust II, 2.85%, 05/15/30 |
8,948 | 7,756,344 | ||||||
| Five Corners Funding Trust III, 5.79%, 02/15/33 |
4,705 | 4,831,405 | ||||||
| GA Global Funding Trust, 2.90%, 01/06/32(a)(b) |
3,270 | 2,637,077 | ||||||
| Global Atlantic Fin Co. |
||||||||
| 3.13%, 06/15/31 (Call 03/15/31)(a)(b) |
4,088 | 3,302,177 | ||||||
| 4.40%, 10/15/29 (Call 07/15/29)(a)(b) |
3,468 | 3,170,637 | ||||||
| 7.95%, 06/15/33 (Call 03/15/33)(a)(b) |
3,942 | 4,312,229 | ||||||
| Globe Life Inc. |
||||||||
| 2.15%, 08/15/30 (Call 05/15/30)(a) |
2,381 | 1,965,261 | ||||||
| 4.80%, 06/15/32 (Call 03/15/32)(a) |
2,415 | 2,324,209 | ||||||
| Hanover Insurance Group Inc. (The), 2.50%, |
2,064 | 1,712,955 | ||||||
| Hartford Financial Services Group Inc. (The), |
3,847 | 3,438,249 | ||||||
| Intact Financial Corp., 5.46%, 09/22/32 |
3,660 | 3,638,215 | ||||||
| Jackson Financial Inc. |
||||||||
| 3.13%, 11/23/31 (Call 08/23/31)(a) |
2,925 | 2,418,296 | ||||||
| 5.67%, 06/08/32 (Call 03/08/32)(a) |
1,990 | 1,983,271 | ||||||
| Jackson National Life Global Funding,
3.05%, |
2,011 | 1,715,019 | ||||||
| Kemper Corp. |
||||||||
| 2.40%, 09/30/30 (Call 06/30/30)(a) |
2,633 | 2,064,464 | ||||||
| 3.80%, 02/23/32 (Call 11/23/31) |
2,545 | 2,133,980 | ||||||
| Lincoln National Corp. |
||||||||
| 3.05%, 01/15/30 (Call 10/15/29)(a) |
2,944 | 2,574,846 | ||||||
| 202 | 2 0 2 4 I S H A R E S A N N U A L R E P O R T T O S H A R E H O L D E R S |
| Schedule of Investments (continued) February 29, 2024 |
iShares® 5-10 Year Investment Grade Corporate Bond ETF (Percentages shown are based on Net Assets) |
| Security | Par (000) |
Value | ||||||
| Insurance (continued) | ||||||||
| 3.40%, 01/15/31 (Call 10/15/30)(a) |
$ | 2,903 | $ | 2,540,372 | ||||
| 3.40%, 03/01/32 (Call 12/01/31)(a) |
1,045 | 886,618 | ||||||
| Loews Corp., 3.20%, 05/15/30 (Call 02/15/30) |
3,272 | 2,954,532 | ||||||
| Manulife Financial Corp., 3.70%, 03/16/32 |
4,900 | 4,463,130 | ||||||
| Markel Group Inc., 3.35%, 09/17/29 |
2,574 | 2,318,495 | ||||||
| Marsh & McLennan Companies Inc. |
||||||||
| 2.25%, 11/15/30 (Call 08/15/30)(a) |
5,048 | 4,261,725 | ||||||
| 2.38%, 12/15/31 (Call 09/15/31)(a) |
2,729 | 2,267,284 | ||||||
| 4.38%, 03/15/29 (Call 12/15/28)(a) |
8,282 | 8,091,181 | ||||||
| 5.15%, 03/15/34 (Call 12/15/33) |
1,875 | 1,868,231 | ||||||
| 5.40%, 09/15/33 (Call 06/15/33)(a) |
3,720 | 3,784,320 | ||||||
| 5.75%, 11/01/32 (Call 08/01/32) |
3,425 | 3,559,356 | ||||||
| 5.88%, 08/01/33 |
725 | 763,224 | ||||||
| MassMutual Global Funding II |
||||||||
| 1.55%, 10/09/30(b) |
3,416 | 2,721,064 | ||||||
| 2.15%, 03/09/31(a)(b) |
3,135 | 2,572,881 | ||||||
| MetLife Inc. |
||||||||
| 4.55%, 03/23/30 (Call 12/23/29)(a) |
6,274 | 6,145,065 | ||||||
| 5.38%, 07/15/33 (Call 04/15/33)(a) |
6,525 | 6,551,879 | ||||||
| 6.50%, 12/15/32(a) |
2,034 | 2,226,213 | ||||||
| Metropolitan Life Global Funding I |
||||||||
| 1.55%, 01/07/31(a)(b) |
4,538 | 3,559,906 | ||||||
| 2.40%, 01/11/32(a)(b) |
4,435 | 3,610,634 | ||||||
| 2.95%, 04/09/30(a)(b) |
5,713 | 5,022,531 | ||||||
| 3.05%, 06/17/29(a)(b) |
2,993 | 2,688,374 | ||||||
| 4.30%, 08/25/29(b) |
3,268 | 3,126,343 | ||||||
| 5.05%, 01/08/34(a)(b) |
2,805 | 2,745,472 | ||||||
| 5.15%, 03/28/33(b) |
6,513 | 6,442,227 | ||||||
| Mitsui Sumitomo Insurance Co. Ltd., 4.95%, |
4,200 | 4,044,898 | ||||||
| Muenchener Rueckversicherungs-Gesellschaft |
8,320 | 8,386,560 | ||||||
| Nationwide Mutual Insurance Co. |
||||||||
| 7.88%, 04/01/33(a)(b) |
160 | 176,287 | ||||||
| 8.25%, 12/01/31(a)(b) |
1,830 | 2,040,805 | ||||||
| New York Life Global Funding |
||||||||
| 1.20%, 08/07/30(a)(b) |
3,502 | 2,755,462 | ||||||
| 1.85%, 08/01/31(a)(b) |
3,500 | 2,789,525 | ||||||
| 4.55%, 01/28/33(b) |
5,800 | 5,522,845 | ||||||
| 5.00%, 01/09/34(a)(b) |
5,300 | 5,204,985 | ||||||
| New York Life Insurance Co.,
5.88%, |
6,160 | 6,368,921 | ||||||
| Nippon Life Insurance Co. |
||||||||
| 2.75%, 01/21/51 (Call 01/21/31), |
8,443 | 6,967,913 | ||||||
| 2.90%, 09/16/51 (Call 09/16/31), |
5,230 | 4,301,835 | ||||||
| 3.40%, 01/23/50 (Call 01/23/30), |
5,698 | 5,002,768 | ||||||
| 6.25%, 09/13/53 (Call 09/13/33), |
2,915 | 3,020,603 | ||||||
| Pacific Life Global Funding II,
2.45%, |
2,295 | 1,836,042 | ||||||
| Pacific LifeCorp., 6.60%, 09/15/33(a)(b) |
350 | 376,808 | ||||||
| PartnerRe Finance B LLC |
||||||||
| 3.70%, 07/02/29 (Call 04/02/29)(a) |
3,515 | 3,299,969 | ||||||
| Security | Par (000) |
Value | ||||||
| Insurance (continued) | ||||||||
| 4.50%, 10/01/50 (Call 04/01/30), |
$ | 2,950 | $ | 2,630,102 | ||||
| Primerica Inc., 2.80%, 11/19/31 (Call 08/19/31) |
4,193 | 3,481,115 | ||||||
| Principal Financial Group Inc. |
||||||||
| 2.13%, 06/15/30 (Call 03/15/30) |
3,646 | 3,032,603 | ||||||
| 3.70%, 05/15/29 (Call 02/15/29)(a) |
3,462 | 3,229,563 | ||||||
| 5.38%, 03/15/33 (Call 12/15/32) |
2,615 | 2,634,255 | ||||||
| Principal Life Global Funding II |
||||||||
| 1.50%, 08/27/30(a)(b) |
2,400 | 1,896,130 | ||||||
| 1.63%, 11/19/30(a)(b) |
1,740 | 1,360,287 | ||||||
| 2.50%, 09/16/29(a)(b) |
2,515 | 2,168,592 | ||||||
| Progressive Corp. (The) |
||||||||
| 3.00%, 03/15/32 (Call 12/15/31) |
3,480 | 3,013,158 | ||||||
| 3.20%, 03/26/30 (Call 12/26/29)(a) |
3,740 | 3,378,415 | ||||||
| 4.00%, 03/01/29 (Call 12/01/28) |
2,985 | 2,872,065 | ||||||
| 4.95%, 06/15/33 (Call 03/15/33)(a) |
3,973 | 3,945,121 | ||||||
| 6.25%, 12/01/32 |
1,340 | 1,450,725 | ||||||
| 6.63%, 03/01/29 |
1,255 | 1,348,253 | ||||||
| Protective Life Corp., 3.40%, 01/15/30 |
2,784 | 2,446,001 | ||||||
| Protective Life Global Funding,
1.74%, |
3,137 | 2,510,833 | ||||||
| Prudential Financial Inc. |
||||||||
| 2.10%, 03/10/30 (Call 12/10/29)(a) |
3,320 | 2,841,123 | ||||||
| 3.70%, 10/01/50 (Call 07/01/30), |
4,774 | 4,169,863 | ||||||
| 5.13%, 03/01/52 (Call 11/28/31), |
5,755 | 5,379,991 | ||||||
| 5.75%, 07/15/33(a) |
1,750 | 1,835,274 | ||||||
| 6.00%, 09/01/52 (Call 06/01/32), |
6,703 | 6,684,870 | ||||||
| 6.75%, 03/01/53 (Call 12/01/32), |
2,835 | 2,947,212 | ||||||
| Prudential Funding Asia PLC |
||||||||
| 3.13%, 04/14/30(a) |
6,356 | 5,664,940 | ||||||
| 3.63%, 03/24/32 (Call 12/24/31)(a) |
2,592 | 2,315,630 | ||||||
| Reinsurance Group of America Inc. |
||||||||
| 3.15%, 06/15/30 (Call 03/15/30) |
3,884 | 3,427,135 | ||||||
| 3.90%, 05/15/29 (Call 02/15/29) |
3,710 | 3,500,803 | ||||||
| 6.00%, 09/15/33 (Call 06/15/33) |
3,000 | 3,080,511 | ||||||
| RenaissanceRe Holdings Ltd. |
||||||||
| 3.60%, 04/15/29 (Call 01/15/29) |
273 | 251,632 | ||||||
| 5.75%, 06/05/33 (Call 03/05/33)(a) |
5,351 | 5,394,308 | ||||||
| RGA Global Funding, 5.50%, 01/11/31(b) |
1,785 | 1,761,091 | ||||||
| Sammons Financial Group Inc. |
||||||||
| 3.35%, 04/16/31 (Call 01/16/31)(a)(b) |
4,927 | 3,981,386 | ||||||
| 4.75%, 04/08/32 (Call 01/08/32)(a)(b) |
2,185 | 1,896,259 | ||||||
| SBL Holdings Inc., 5.00%, 02/18/31 |
3,630 | 2,997,235 | ||||||
| Stewart Information Services Corp., 3.60%, |
2,670 | 2,068,746 | ||||||
| Sumitomo Life Insurance Co. |
||||||||
| 3.38%, 04/15/81 (Call 04/15/31), |
4,575 | 3,909,634 | ||||||
| 5.88%, (Call 01/18/34), |
2,850 | 2,815,429 | ||||||
| Swiss Re Finance Luxembourg SA, 5.00%, |
5,130 | 4,973,309 | ||||||
| Travelers Property Casualty Corp.,
6.38%, |
1,588 | 1,761,938 | ||||||
| S C H E D U L E O F I N V E S T M E N T S |
203 |
| Schedule of Investments (continued) February 29, 2024 |
iShares® 5-10 Year Investment Grade Corporate Bond ETF (Percentages shown are based on Net Assets) |
| Security | Par (000) |
Value | ||||||
| Insurance (continued) | ||||||||
| Trustage Financial Group Inc., 4.63%, 04/15/32 |
$ | 1,325 | $ | 1,141,759 | ||||
| Unum Group, 4.00%, 06/15/29 (Call 03/15/29) |
1,921 | 1,796,462 | ||||||
| Western & Southern Financial Group Inc., |
80 | 82,943 | ||||||
| Willis North America Inc. |
||||||||
| 2.95%, 09/15/29 (Call 06/15/29) |
4,894 | 4,354,017 | ||||||
| 5.35%, 05/15/33 (Call 02/15/33) |
5,005 | 4,920,309 | ||||||
|
|
|
|||||||
| 565,279,403 | ||||||||
| Internet — 1.8% | ||||||||
| Alibaba Group Holding Ltd., 2.13%, 02/09/31 |
8,805 | 7,281,949 | ||||||
| Alphabet Inc., 1.10%, 08/15/30 |
12,236 | 9,907,771 | ||||||
| Amazon.com Inc. |
||||||||
| 1.50%, 06/03/30 (Call 03/03/30)(a) |
11,581 | 9,577,722 | ||||||
| 2.10%, 05/12/31 (Call 02/12/31) |
16,957 | 14,246,474 | ||||||
| 3.45%, 04/13/29 (Call 02/13/29)(a) |
5,130 | 4,861,493 | ||||||
| 3.60%, 04/13/32 (Call 01/13/32)(a) |
14,029 | 12,937,189 | ||||||
| 4.65%, 12/01/29 (Call 10/01/29) |
8,998 | 9,002,521 | ||||||
| 4.70%, 12/01/32 (Call 09/01/32) |
12,963 | 12,896,340 | ||||||
| Baidu Inc. |
||||||||
| 2.38%, 10/09/30 (Call 07/09/30) |
1,250 | 1,050,034 | ||||||
| 2.38%, 08/23/31 (Call 05/23/31) |
2,560 | 2,106,534 | ||||||
| 3.43%, 04/07/30 (Call 01/07/30)(a) |
2,295 | 2,075,916 | ||||||
| Booking Holdings Inc., 4.63%, 04/13/30 |
9,048 | 8,888,911 | ||||||
| eBay Inc. |
||||||||
| 2.60%, 05/10/31 (Call 02/10/31)(a) |
4,527 | 3,839,036 | ||||||
| 2.70%, 03/11/30 (Call 12/11/29)(a) |
5,948 | 5,196,071 | ||||||
| 6.30%, 11/22/32 (Call 08/22/32)(a) |
2,565 | 2,721,606 | ||||||
| Expedia Group Inc. |
||||||||
| 2.95%, 03/15/31 (Call 12/15/30)(a) |
3,246 | 2,779,611 | ||||||
| 3.25%, 02/15/30 (Call 11/15/29)(a) |
7,747 | 6,901,576 | ||||||
| JD.com Inc., 3.38%, 01/14/30 (Call 10/14/29)(a) |
3,427 | 3,097,642 | ||||||
| Meituan, 3.05%, 10/28/30 (Call 07/28/30)(a)(b) |
6,120 | 5,177,113 | ||||||
| Meta Platforms Inc. |
||||||||
| 3.85%, 08/15/32 (Call 05/15/32)(a) |
16,983 | 15,731,089 | ||||||
| 4.80%, 05/15/30 (Call 03/15/30) |
7,098 | 7,095,548 | ||||||
| 4.95%, 05/15/33 (Call 02/15/33)(a) |
10,227 | 10,236,034 | ||||||
| Netflix Inc. |
||||||||
| 4.88%, 06/15/30 (Call 03/15/30)(a)(b) |
5,716 | 5,670,798 | ||||||
| 5.38%, 11/15/29(b) |
6,465 | 6,564,985 | ||||||
| 6.38%, 05/15/29(a) |
4,760 | 5,053,658 | ||||||
| Prosus NV |
||||||||
| 3.06%, 07/13/31 (Call 04/13/31)(b) |
9,320 | 7,523,537 | ||||||
| 3.68%, 01/21/30 (Call 10/21/29)(a)(b) |
5,912 | 5,117,903 | ||||||
| 4.19%, 01/19/32 (Call 10/19/31)(b) |
5,075 | 4,348,086 | ||||||
| Tencent Holdings Ltd. |
||||||||
| 2.39%, 06/03/30 (Call 03/03/30)(a)(b) |
10,860 | 9,284,907 | ||||||
| 2.88%, 04/22/31 (Call 01/22/31)(a)(b) |
3,145 | 2,726,489 | ||||||
| 3.98%, 04/11/29 (Call 01/11/29)(a)(b) |
13,143 | 12,457,135 | ||||||
| Tencent Music Entertainment Group, 2.00%, |
3,403 | 2,771,915 | ||||||
| VeriSign Inc., 2.70%, 06/15/31 |
4,905 | 4,077,871 | ||||||
| Weibo Corp., 3.38%, 07/08/30 |
5,513 | 4,727,894 | ||||||
|
|
|
|||||||
| 227,933,358 | ||||||||
| Security | Par (000) |
Value | ||||||
| Iron & Steel — 0.4% | ||||||||
| ArcelorMittal SA |
||||||||
| 4.25%, 07/16/29(a) |
$ | 3,223 | $ | 3,055,144 | ||||
| 6.80%, 11/29/32 (Call 08/29/32)(a) |
6,063 | 6,409,446 | ||||||
| GUSAP III LP, 4.25%, 01/21/30 |
2,920 | 2,728,990 | ||||||
| Nucor Corp. |
||||||||
| 2.70%, 06/01/30 (Call 03/01/30)(a) |
3,363 | 2,966,536 | ||||||
| 3.13%, 04/01/32 (Call 01/01/32)(a) |
3,597 | 3,145,450 | ||||||
| POSCO, 5.88%, 01/17/33(b) |
25 | 25,752 | ||||||
| Reliance Inc., 2.15%, 08/15/30 (Call 05/15/30) |
3,547 | 2,943,001 | ||||||
| Steel Dynamics Inc. |
||||||||
| 3.25%, 01/15/31 (Call 10/15/30)(a) |
3,121 | 2,766,696 | ||||||
| 3.45%, 04/15/30 (Call 01/15/30) |
3,655 | 3,322,467 | ||||||
| Vale Overseas Ltd. |
||||||||
| 3.75%, 07/08/30 (Call 04/08/30)(a) |
8,182 | 7,361,407 | ||||||
| 6.13%, 06/12/33 (Call 03/12/33)(a) |
8,325 | 8,426,149 | ||||||
| 8.25%, 01/17/34(a) |
2,050 | 2,402,180 | ||||||
|
|
|
|||||||
| 45,553,218 | ||||||||
| Leisure Time — 0.0% | ||||||||
| Brunswick Corp. |
||||||||
| 2.40%, 08/18/31 (Call 05/18/31) |
3,290 | 2,590,225 | ||||||
| 4.40%, 09/15/32 (Call 06/15/32)(a) |
2,865 | 2,553,470 | ||||||
| Polaris Inc., 6.95%, 03/15/29 (Call 02/15/29)(a) |
50 | 52,691 | ||||||
|
|
|
|||||||
| 5,196,386 | ||||||||
| Lodging — 0.3% | ||||||||
| Choice Hotels International Inc. |
||||||||
| 3.70%, 12/01/29 (Call 09/01/29)(a) |
2,390 | 2,093,886 | ||||||
| 3.70%, 01/15/31 (Call 10/15/30)(a) |
2,662 | 2,286,825 | ||||||
| Hyatt Hotels Corp., 5.75%, 04/23/30 |
2,682 | 2,733,052 | ||||||
| Marriott International Inc./MD |
||||||||
| 5.30%, 05/15/34 (Call 02/15/34) |
1,240 | 1,220,281 | ||||||
| Series FF, 4.63%, 06/15/30 (Call 03/15/30)(a). |
6,370 | 6,169,658 | ||||||
| Series GG, 3.50%, 10/15/32 |
6,105 | 5,331,238 | ||||||
| Series HH, 2.85%, 04/15/31 (Call 01/15/31) |
6,618 | 5,650,212 | ||||||
| Series II, 2.75%, 10/15/33 (Call 07/15/33)(a) |
4,481 | 3,608,733 | ||||||
| Sands China Ltd. |
||||||||
| 3.10%, 03/08/29 (Call 01/08/29) |
2,500 | 2,157,487 | ||||||
| 3.25%, 08/08/31 (Call 05/08/31)(a) |
3,870 | 3,224,035 | ||||||
| 4.63%, 06/18/30 (Call 03/18/30) |
3,749 | 3,422,902 | ||||||
|
|
|
|||||||
| 37,898,309 | ||||||||
| Machinery — 0.6% | ||||||||
| Caterpillar Inc. |
||||||||
| 1.90%, 03/12/31 (Call 12/12/30)(a) |
3,008 | 2,525,356 | ||||||
| 2.60%, 09/19/29 (Call 06/19/29)(a) |
2,820 | 2,540,283 | ||||||
| 2.60%, 04/09/30 (Call 01/09/30) |
5,024 | 4,467,377 | ||||||
| Deere & Co. |
||||||||
| 3.10%, 04/15/30 (Call 01/15/30)(a) |
4,212 | 3,827,430 | ||||||
| 5.38%, 10/16/29 |
3,398 | 3,509,703 | ||||||
| 7.13%, 03/03/31(a) |
350 | 399,093 | ||||||
| 8.10%, 05/15/30(a) |
770 | 901,903 | ||||||
| Dover Corp., 2.95%, 11/04/29 (Call 08/04/29) |
1,780 | 1,584,053 | ||||||
| Flowserve Corp. |
||||||||
| 2.80%, 01/15/32 (Call 10/15/31) |
2,859 | 2,338,984 | ||||||
| 3.50%, 10/01/30 (Call 07/01/30)(a) |
3,174 | 2,790,299 | ||||||
| IDEX Corp. |
||||||||
| 2.63%, 06/15/31 (Call 03/15/31) |
3,188 | 2,687,698 | ||||||
| 3.00%, 05/01/30 (Call 02/01/30) |
3,256 | 2,841,941 | ||||||
| 204 | 2 0 2 4 I S H A R E S A N N U A L R E P O R T T O S H A R E H O L D E R S |
| Schedule of Investments (continued) February 29, 2024 |
iShares® 5-10 Year Investment Grade Corporate Bond ETF (Percentages shown are based on Net Assets) |
| Security | Par (000) |
Value | ||||||
| Machinery (continued) | ||||||||
| John Deere Capital Corp. |
||||||||
| 1.45%, 01/15/31(a) |
$ | 3,708 | $ | 2,995,766 | ||||
| 2.00%, 06/17/31 |
3,515 | 2,911,320 | ||||||
| 2.45%, 01/09/30 |
3,334 | 2,926,599 | ||||||
| 2.80%, 07/18/29 |
3,428 | 3,118,748 | ||||||
| 3.35%, 04/18/29(a) |
3,191 | 2,997,773 | ||||||
| 3.45%, 03/07/29 |
212 | 200,223 | ||||||
| 3.90%, 06/07/32(a) |
2,976 | 2,772,131 | ||||||
| 4.35%, 09/15/32(a) |
3,080 | 2,983,759 | ||||||
| 4.70%, 06/10/30(a) |
5,725 | 5,679,368 | ||||||
| 4.85%, 10/11/29(a) |
2,452 | 2,466,779 | ||||||
| nVent Finance Sarl |
||||||||
| 2.75%, 11/15/31 (Call 08/15/31) |
1,760 | 1,437,924 | ||||||
| 5.65%, 05/15/33 (Call 02/15/33) |
1,816 | 1,816,010 | ||||||
| Oshkosh Corp., 3.10%, 03/01/30 |
1,860 | 1,644,649 | ||||||
| Otis Worldwide Corp., 2.57%, 02/15/30 |
8,823 | 7,694,408 | ||||||
| Rockwell Automation Inc. |
||||||||
| 1.75%, 08/15/31 (Call 05/15/31)(a) |
2,621 | 2,105,959 | ||||||
| 3.50%, 03/01/29 (Call 12/01/28)(a) |
1,171 | 1,115,000 | ||||||
| Xylem Inc./NY, 2.25%, 01/30/31 |
4,423 | 3,714,942 | ||||||
|
|
|
|||||||
| 78,995,478 | ||||||||
| Machinery - Diversified — 0.1% | ||||||||
| Ingersoll Rand Inc., 5.70%, 08/14/33 |
4,425 | 4,500,272 | ||||||
| John Deere Capital Corp., 5.15%, 09/08/33(a) |
2,690 | 2,736,133 | ||||||
| Nordson Corp., 5.80%, 09/15/33 |
1,945 | 2,007,603 | ||||||
| Westinghouse Air Brake Technologies Corp., |
545 | 547,264 | ||||||
|
|
|
|||||||
| 9,791,272 | ||||||||
| Manufacturing — 0.6% | ||||||||
| 3M Co. |
||||||||
| 2.38%, 08/26/29 (Call 05/26/29)(a) |
6,127 | 5,320,253 | ||||||
| 3.05%, 04/15/30 (Call 01/15/30)(a) |
4,056 | 3,593,440 | ||||||
| 3.38%, 03/01/29 (Call 12/01/28)(a) |
3,700 | 3,415,726 | ||||||
| Carlisle Companies Inc. |
||||||||
| 2.20%, 03/01/32 (Call 12/01/31) |
3,225 | 2,553,141 | ||||||
| 2.75%, 03/01/30 (Call 12/01/29)(a) |
4,817 | 4,186,359 | ||||||
| Eaton Corp. |
||||||||
| 4.00%, 11/02/32(a) |
3,430 | 3,221,001 | ||||||
| 4.15%, 03/15/33 (Call 12/15/32)(a) |
7,500 | 7,058,527 | ||||||
| GE Capital Funding LLC, 4.55%, 05/15/32 |
4,020 | 3,862,674 | ||||||
| General Electric Co., 6.75%, 03/15/32(a) |
5,955 | 6,612,412 | ||||||
| Parker-Hannifin Corp. |
||||||||
| 3.25%, 06/14/29 (Call 03/14/29) |
5,604 | 5,153,017 | ||||||
| 4.50%, 09/15/29 (Call 07/15/29)(a) |
5,605 | 5,482,122 | ||||||
| Pentair Finance Sarl |
||||||||
| 4.50%, 07/01/29 (Call 04/01/29)(a) |
2,263 | 2,180,507 | ||||||
| 5.90%, 07/15/32 (Call 04/15/32)(a) |
2,155 | 2,210,681 | ||||||
| Siemens Financieringsmaatschappij NV,
2.15%, |
10,102 | 8,410,040 | ||||||
| Teledyne Technologies Inc., 2.75%, 04/01/31 |
5,965 | 5,063,373 | ||||||
| Textron Inc. |
||||||||
| 2.45%, 03/15/31 (Call 12/15/30)(a) |
3,193 | 2,666,351 | ||||||
| 3.00%, 06/01/30 (Call 03/01/30) |
3,973 | 3,484,940 | ||||||
| Security | Par (000) |
Value | ||||||
| Manufacturing (continued) | ||||||||
| 3.90%, 09/17/29 (Call 06/17/29)(a) |
$ | 1,991 | $ | 1,864,580 | ||||
| 6.10%, 11/15/33 (Call 08/15/33)(a) |
2,615 | 2,729,354 | ||||||
|
|
|
|||||||
| 79,068,498 | ||||||||
| Media — 1.5% | ||||||||
| Charter Communications |
||||||||
| 2.30%, 02/01/32 (Call 11/01/31)(a) |
5,771 | 4,384,438 | ||||||
| 2.80%, 04/01/31 (Call 01/01/31) |
8,857 | 7,157,520 | ||||||
| 4.40%, 04/01/33 (Call 01/01/33)(a) |
5,733 | 5,011,986 | ||||||
| 5.05%, 03/30/29 (Call 12/30/28) |
6,587 | 6,302,225 | ||||||
| 6.65%, 02/01/34 (Call 11/01/33)(a) |
7,965 | 7,992,348 | ||||||
| Comcast Corp. |
||||||||
| 1.50%, 02/15/31 (Call 11/15/30)(a) |
9,890 | 7,888,532 | ||||||
| 1.95%, 01/15/31 (Call 10/15/30) |
7,818 | 6,422,876 | ||||||
| 2.65%, 02/01/30 (Call 11/01/29)(a) |
9,281 | 8,160,429 | ||||||
| 3.40%, 04/01/30 (Call 01/01/30)(a) |
9,103 | 8,329,805 | ||||||
| 4.25%, 10/15/30 (Call 07/15/30) |
8,716 | 8,338,677 | ||||||
| 4.25%, 01/15/33 |
9,589 | 8,979,045 | ||||||
| 4.65%, 02/15/33 (Call 11/15/32)(a) |
6,130 | 5,954,492 | ||||||
| 4.80%, 05/15/33 (Call 02/15/33)(a) |
5,668 | 5,538,326 | ||||||
| 5.50%, 11/15/32 (Call 08/15/32)(a) |
5,757 | 5,903,773 | ||||||
| 7.05%, 03/15/33 |
5,713 | 6,417,312 | ||||||
| Cox Communications Inc. |
||||||||
| 1.80%, 10/01/30 (Call 07/01/30)(b) |
3,412 | 2,716,292 | ||||||
| 2.60%, 06/15/31 (Call 03/15/31)(a)(b) |
3,437 | 2,812,203 | ||||||
| 5.70%, 06/15/33 (Call 03/15/33)(b) |
2,666 | 2,669,293 | ||||||
| Discovery Communications LLC |
||||||||
| 3.63%, 05/15/30 (Call 02/15/30)(a) |
6,736 | 5,920,700 | ||||||
| 4.13%, 05/15/29 (Call 02/15/29) |
4,179 | 3,871,156 | ||||||
| FactSet Research Systems Inc., 3.45%, |
3,553 | 3,089,228 | ||||||
| Fox Corp. |
||||||||
| 3.50%, 04/08/30 (Call 01/08/30)(a) |
4,198 | 3,780,962 | ||||||
| 6.50%, 10/13/33 (Call 07/13/33) |
6,067 | 6,372,116 | ||||||
| Grupo Televisa SAB, 8.50%, 03/11/32(a) |
1,360 | 1,560,639 | ||||||
| Paramount Global |
||||||||
| 4.20%, 06/01/29 (Call 03/01/29) |
1,565 | 1,377,592 | ||||||
| 4.20%, 05/19/32 (Call 02/19/32) |
5,600 | 4,565,695 | ||||||
| 4.95%, 01/15/31 (Call 10/15/30)(a) |
6,028 | 5,293,252 | ||||||
| 5.50%, 05/15/33 |
510 | 443,269 | ||||||
| 7.88%, 07/30/30(a) |
5,660 | 5,779,778 | ||||||
| Time Warner Cable Enterprises LLC,
8.38%, |
3,915 | 4,344,822 | ||||||
| TWDC Enterprises 18 Corp., Series B, 7.00%, |
2,379 | 2,688,522 | ||||||
| Walt Disney Co. (The) |
||||||||
| 2.00%, 09/01/29 (Call 06/01/29) |
10,972 | 9,465,426 | ||||||
| 2.65%, 01/13/31(a) |
14,854 | 12,919,356 | ||||||
| 3.80%, 03/22/30(a) |
7,195 | 6,794,043 | ||||||
| 6.55%, 03/15/33(a) |
1,660 | 1,846,816 | ||||||
|
|
|
|||||||
| 191,092,944 | ||||||||
| Metal Fabricate & Hardware — 0.0% | ||||||||
| Timken Co. (The), 4.13%, 04/01/32 |
1,930 | 1,757,253 | ||||||
|
|
|
|||||||
| Mining — 1.4% | ||||||||
| Alcoa Nederland Holding BV, 4.13%, 03/31/29 |
2,575 | 2,357,831 | ||||||
| Anglo American Capital PLC |
||||||||
| 2.63%, 09/10/30 (Call 06/10/30)(a)(b) |
5,954 | 5,012,664 | ||||||
| S C H E D U L E O F I N V E S T M E N T S |
205 |
| Schedule of Investments (continued) February 29, 2024 |
iShares® 5-10 Year Investment Grade Corporate Bond ETF (Percentages shown are based on Net Assets) |
| Security | Par (000) |
Value | ||||||
| Mining (continued) | ||||||||
| 2.88%, 03/17/31 (Call 12/17/30)(a)(b) |
$ | 3,684 | $ | 3,094,080 | ||||
| 3.88%, 03/16/29 (Call 01/16/29)(a)(b) |
2,629 | 2,442,353 | ||||||
| 5.50%, 05/02/33 (Call 02/02/33)(a)(b) |
5,190 | 5,108,980 | ||||||
| 5.63%, 04/01/30 (Call 01/01/30)(b) |
4,570 | 4,585,587 | ||||||
| AngloGold Ashanti Holdings PLC, 3.75%, |
4,335 | 3,760,137 | ||||||
| Antofagasta PLC |
||||||||
| 2.38%, 10/14/30 (Call 07/14/30)(a)(b) |
2,510 | 2,068,596 | ||||||
| 5.63%, 05/13/32 (Call 02/13/32)(b) |
595 | 591,022 | ||||||
| BHP Billiton Finance USA Ltd. |
||||||||
| 4.90%, 02/28/33 (Call 11/28/32) |
4,370 | 4,311,798 | ||||||
| 5.25%, 09/08/30 (Call 07/08/30)(a) |
6,130 | 6,178,518 | ||||||
| 5.25%, 09/08/33 (Call 06/08/33) |
8,115 | 8,151,105 | ||||||
| Corp. Nacional del Cobre de Chile |
||||||||
| 3.00%, 09/30/29 (Call 06/30/29)(b) |
6,775 | 5,923,504 | ||||||
| 3.15%, 01/14/30 (Call 10/14/29)(b) |
6,043 | 5,260,843 | ||||||
| 3.75%, 01/15/31 (Call 10/15/30)(b) |
4,955 | 4,357,914 | ||||||
| 5.13%, 02/02/33 (Call 11/02/32)(a)(b) |
6,060 | 5,674,392 | ||||||
| 5.95%, 01/08/34 (Call 10/08/33)(b) |
3,975 | 3,922,630 | ||||||
| Freeport Indonesia PT, 5.32%, 04/14/32 |
8,535 | 8,267,276 | ||||||
| Freeport-McMoRan Inc. |
||||||||
| 4.25%, 03/01/30 (Call 03/01/25) |
2,923 | 2,731,069 | ||||||
| 4.63%, 08/01/30 (Call 08/01/25)(a) |
4,060 | 3,869,117 | ||||||
| 5.25%, 09/01/29 (Call 09/01/24)(a) |
2,971 | 2,955,085 | ||||||
| Glencore Funding LLC |
||||||||
| 2.50%, 09/01/30 (Call 06/01/30)(a)(b) |
5,955 | 5,040,732 | ||||||
| 2.63%, 09/23/31 (Call 06/23/31)(a)(b) |
4,260 | 3,534,359 | ||||||
| 2.85%, 04/27/31 (Call 01/27/31)(a)(b) |
3,637 | 3,099,123 | ||||||
| 4.88%, 03/12/29 (Call 12/12/28)(a)(b) |
2,680 | 2,642,947 | ||||||
| 5.70%, 05/08/33 (Call 02/08/33)(b) |
3,118 | 3,153,970 | ||||||
| 6.38%, 10/06/30 (Call 08/06/30)(b) |
3,260 | 3,425,408 | ||||||
| 6.50%, 10/06/33 (Call 07/06/33)(a)(b) |
5,820 | 6,209,267 | ||||||
| Gold Fields Orogen Holdings BVI Ltd., 6.13%, |
1,065 | 1,078,274 | ||||||
| Indonesia Asahan Aluminium PT/Mineral |
6,396 | 6,250,619 | ||||||
| Industrias Penoles SAB de CV, 4.15%, 09/12/29 |
3,465 | 3,202,920 | ||||||
| Kinross Gold Corp., 6.25%, 07/15/33 |
5,341 | 5,451,314 | ||||||
| Newcastle Coal Infrastructure Group Pty. Ltd., |
2,676 | 2,397,874 | ||||||
| Newmont Corp. |
||||||||
| 2.25%, 10/01/30 (Call 07/01/30)(a) |
6,232 | 5,211,490 | ||||||
| 2.60%, 07/15/32 (Call 04/15/32)(a) |
6,441 | 5,300,997 | ||||||
| 2.80%, 10/01/29 (Call 07/01/29)(a) |
4,550 | 4,041,791 | ||||||
| Newmont Corp./Newcrest Finance Pty Ltd., |
3,435 | 3,072,206 | ||||||
| Northern Star Resources Ltd., 6.13%, 04/11/33 |
3,785 | 3,783,989 | ||||||
| Rio Tinto Alcan Inc. |
||||||||
| 6.13%, 12/15/33(a) |
1,920 | 2,041,587 | ||||||
| 7.25%, 03/15/31 |
4,182 | 4,672,242 | ||||||
| Rio Tinto Finance USA PLC, 5.00%, 03/09/33 |
3,705 | 3,701,180 | ||||||
| South32 Treasury Ltd., 4.35%, 04/14/32 |
4,322 | 3,868,093 | ||||||
| Vale Canada Ltd., 7.20%, 09/15/32(a) |
594 | 640,035 | ||||||
| Security | Par (000) |
Value | ||||||
| Mining (continued) | ||||||||
| Yamana Gold Inc., 2.63%, 08/15/31 |
$ | 3,428 | $ | 2,832,434 | ||||
|
|
|
|||||||
| 175,277,352 | ||||||||
| Office & Business Equipment — 0.0% | ||||||||
| CDW LLC/CDW Finance Corp., 3.57%, |
5,201 | 4,514,000 | ||||||
|
|
|
|||||||
| Oil & Gas — 4.3% | ||||||||
| Aker BP ASA |
||||||||
| 3.10%, 07/15/31 (Call 04/15/31)(b) |
5,874 | 4,961,253 | ||||||
| 3.75%, 01/15/30 (Call 10/15/29)(b) |
6,340 | 5,745,780 | ||||||
| 4.00%, 01/15/31 (Call 10/15/30)(a)(b) |
4,880 | 4,408,934 | ||||||
| 6.00%, 06/13/33 (Call 03/13/33)(b) |
3,655 | 3,716,495 | ||||||
| Apache Corp., 4.25%, 01/15/30 |
1,289 | 1,183,703 | ||||||
| BP Capital Markets America Inc. |
||||||||
| 1.75%, 08/10/30 (Call 05/10/30) |
6,492 | 5,349,560 | ||||||
| 2.72%, 01/12/32 (Call 10/12/31)(a) |
11,150 | 9,461,074 | ||||||
| 3.63%, 04/06/30 (Call 01/06/30) |
8,344 | 7,781,746 | ||||||
| 4.70%, 04/10/29 (Call 03/10/29)(a) |
3,825 | 3,778,782 | ||||||
| 4.81%, 02/13/33 (Call 11/13/32)(a) |
13,085 | 12,765,541 | ||||||
| 4.89%, 09/11/33 (Call 06/11/33)(a) |
8,368 | 8,206,768 | ||||||
| 4.99%, 04/10/34 (Call 01/10/34) |
3,825 | 3,762,894 | ||||||
| BP Capital Markets PLC, 4.88%, |
11,421 | 10,778,557 | ||||||
| Burlington Resources LLC |
||||||||
| 7.20%, 08/15/31(a) |
3,923 | 4,419,256 | ||||||
| 7.40%, 12/01/31 |
379 | 433,647 | ||||||
| Canadian Natural Resources Ltd. |
||||||||
| 2.95%, 07/15/30 (Call 04/15/30)(a) |
3,083 | 2,678,338 | ||||||
| 6.45%, 06/30/33 |
385 | 406,396 | ||||||
| 7.20%, 01/15/32(a) |
2,239 | 2,438,408 | ||||||
| Cenovus Energy Inc., 2.65%, 01/15/32 |
2,875 | 2,350,395 | ||||||
| Chevron Corp., 2.24%, 05/11/30 |
8,856 | 7,660,256 | ||||||
| Chevron USA Inc., 3.25%, 10/15/29 |
3,245 | 3,022,897 | ||||||
| CNOOC Finance 2003 Ltd., 5.50%, 05/21/33(b) |
100 | 102,330 | ||||||
| CNOOC Finance 2013 Ltd., 2.88%, 09/30/29 |
3,420 | 3,097,391 | ||||||
| CNOOC Petroleum North America ULC,
7.88%, |
3,100 | 3,668,013 | ||||||
| Conoco Funding Co., 7.25%, 10/15/31 |
3,695 | 4,189,728 | ||||||
| ConocoPhillips Co. |
||||||||
| 5.05%, 09/15/33 (Call 06/15/33)(a) |
5,430 | 5,413,177 | ||||||
| 5.90%, 10/15/32(a) |
2,115 | 2,260,840 | ||||||
| 6.95%, 04/15/29(a) |
7,848 | 8,600,795 | ||||||
| Continental Resources Inc./OK |
||||||||
| 2.88%, 04/01/32 (Call 01/01/32)(a)(b) |
4,690 | 3,765,650 | ||||||
| 5.75%, 01/15/31 (Call 07/15/30)(a)(b) |
8,953 | 8,776,492 | ||||||
| Coterra Energy Inc. |
||||||||
| 4.38%, 03/15/29 (Call 12/15/28)(a) |
1,855 | 1,787,236 | ||||||
| 5.60%, 03/15/34 (Call 12/15/33) |
2,700 | 2,697,143 | ||||||
| Devon Energy Corp. |
||||||||
| 4.50%, 01/15/30 (Call 01/15/25)(a) |
3,560 | 3,397,507 | ||||||
| 7.88%, 09/30/31(a) |
3,030 | 3,441,950 | ||||||
| 7.95%, 04/15/32 |
2,841 | 3,240,609 | ||||||
| Diamondback Energy Inc. |
||||||||
| 3.13%, 03/24/31 (Call 12/24/30)(a) |
4,888 | 4,285,485 | ||||||
| 206 | 2 0 2 4 I S H A R E S A N N U A L R E P O R T T O S H A R E H O L D E R S |
| Schedule of Investments (continued) February 29, 2024 |
iShares® 5-10 Year Investment Grade Corporate Bond ETF (Percentages shown are based on Net Assets) |
| Security | Par (000) |
Value | ||||||
| Oil & Gas (continued) | ||||||||
| 3.50%, 12/01/29 (Call 09/01/29)(a) |
$ | 6,274 | $ | 5,759,690 | ||||
| 6.25%, 03/15/33 (Call 12/15/32)(a) |
6,858 | 7,209,928 | ||||||
| Empresa Nacional del Petroleo |
||||||||
| 3.45%, 09/16/31 (Call 06/16/31)(b) |
3,255 | 2,731,463 | ||||||
| 5.25%, 11/06/29 (Call 08/06/29)(b) |
2,910 | 2,811,092 | ||||||
| 6.15%, 05/10/33 (Call 02/10/33)(a)(b) |
4,110 | 4,092,865 | ||||||
| Eni SpA, 4.25%, 05/09/29 (Call 02/09/29)(a)(b) |
5,360 | 5,172,052 | ||||||
| EOG Resources Inc., 4.38%, 04/15/30 |
4,710 | 4,571,417 | ||||||
| EQT Corp. |
||||||||
| 3.63%, 05/15/31 (Call 05/15/30)(a)(b) |
3,243 | 2,834,712 | ||||||
| 5.75%, 02/01/34 (Call 11/01/33)(a) |
2,805 | 2,759,029 | ||||||
| 7.00%, 02/01/30 (Call 11/01/29)(a) |
4,861 | 5,147,016 | ||||||
| Equinor ASA |
||||||||
| 2.38%, 05/22/30 (Call 02/22/30) |
3,371 | 2,927,385 | ||||||
| 3.13%, 04/06/30 (Call 01/06/30)(a) |
8,943 | 8,156,905 | ||||||
| Exxon Mobil Corp. |
||||||||
| 2.44%, 08/16/29 (Call 05/16/29)(a) |
7,397 | 6,606,993 | ||||||
| 2.61%, 10/15/30 (Call 07/15/30) |
11,615 | 10,188,542 | ||||||
| 3.48%, 03/19/30 (Call 12/19/29) |
11,590 | 10,822,231 | ||||||
| Helmerich & Payne Inc., 2.90%, 09/29/31 |
3,755 | 3,123,130 | ||||||
| Hess Corp. |
||||||||
| 7.13%, 03/15/33(a) |
3,360 | 3,768,134 | ||||||
| 7.30%, 08/15/31(a) |
5,249 | 5,904,608 | ||||||
| 7.88%, 10/01/29 |
4,693 | 5,258,384 | ||||||
| HF Sinclair Corp., 4.50%, 10/01/30 |
2,069 | 1,935,771 | ||||||
| Hunt Oil Co. of Peru LLC Sucursal Del Peru, |
135 | 142,787 | ||||||
| KazMunayGas National Co. JSC |
||||||||
| 3.50%, 04/14/33 (Call 10/14/32)(a)(b) |
3,475 | 2,819,094 | ||||||
| 5.38%, 04/24/30(a)(b) |
5,180 | 5,017,474 | ||||||
| Marathon Oil Corp., 6.80%, 03/15/32(a) |
4,719 | 5,038,105 | ||||||
| Occidental Petroleum Corp. |
||||||||
| 3.50%, 08/15/29 (Call 05/15/29)(a) |
1,320 | 1,199,530 | ||||||
| 6.13%, 01/01/31 (Call 07/01/30)(a) |
6,010 | 6,164,697 | ||||||
| 6.63%, 09/01/30 (Call 03/01/30)(a) |
8,497 | 8,942,243 | ||||||
| 7.50%, 05/01/31(a) |
5,310 | 5,864,061 | ||||||
| 7.88%, 09/15/31 |
3,098 | 3,486,123 | ||||||
| 8.88%, 07/15/30 (Call 01/15/30) |
4,798 | 5,533,731 | ||||||
| Ovintiv Inc. |
||||||||
| 6.25%, 07/15/33 (Call 04/15/33)(a) |
3,145 | 3,233,663 | ||||||
| 7.20%, 11/01/31 |
2,890 | 3,120,745 | ||||||
| 7.38%, 11/01/31(a) |
3,655 | 3,983,267 | ||||||
| 8.13%, 09/15/30 |
2,490 | 2,790,146 | ||||||
| Patterson-UTI Energy Inc. |
||||||||
| 5.15%, 11/15/29 (Call 08/15/29)(a) |
365 | 352,269 | ||||||
| 7.15%, 10/01/33 (Call 07/01/33)(a) |
2,290 | 2,426,267 | ||||||
| Pertamina Persero PT |
||||||||
| 2.30%, 02/09/31 (Call 11/09/30)(a)(b) |
5,135 | 4,216,438 | ||||||
| 3.10%, 01/21/30 (Call 10/21/29)(b) |
2,935 | 2,600,851 | ||||||
| 3.10%, 08/27/30 (Call 05/25/30)(a)(b) |
4,840 | 4,249,276 | ||||||
| 3.65%, 07/30/29(a)(b) |
4,270 | 3,947,546 | ||||||
| Petronas Capital Ltd. |
||||||||
| 2.48%, 01/28/32 (Call 10/28/31)(b) |
7,815 | 6,470,117 | ||||||
| 3.50%, 04/21/30 (Call 01/21/30)(b) |
13,739 | 12,548,341 | ||||||
| Phillips 66, 2.15%, 12/15/30 (Call 09/15/30)(a) |
5,224 | 4,338,760 | ||||||
| Phillips 66 Co. |
||||||||
| 3.15%, 12/15/29 (Call 09/15/29) |
3,509 | 3,171,896 | ||||||
| 5.25%, 06/15/31 (Call 04/15/31) |
2,675 | 2,666,966 | ||||||
| Security | Par (000) |
Value | ||||||
| Oil & Gas (continued) | ||||||||
| 5.30%, 06/30/33 (Call 03/30/33) |
$ | 5,913 | $ | 5,863,994 | ||||
| Pioneer Natural Resources Co. |
||||||||
| 1.90%, 08/15/30 (Call 05/15/30)(a) |
6,344 | 5,284,468 | ||||||
| 2.15%, 01/15/31 (Call 10/15/30)(a) |
5,309 | 4,441,513 | ||||||
| PTTEP Treasury Center Co. Ltd., 2.99%, |
2,310 | 2,046,661 | ||||||
| Qatar Energy, 2.25%, 07/12/31 |
19,560 | 16,241,763 | ||||||
| Reliance Industries Ltd., 2.88%, 01/12/32(a)(b) |
8,465 | 7,162,361 | ||||||
| SA Global Sukuk Ltd., 2.69%, 06/17/31 |
17,750 | 15,143,058 | ||||||
| Santos Finance Ltd. |
||||||||
| 3.65%, 04/29/31 (Call 01/29/31)(a)(b) |
5,989 | 5,172,783 | ||||||
| 6.88%, 09/19/33 (Call 06/19/33)(a)(b) |
4,710 | 4,904,684 | ||||||
| Saudi Arabian Oil Co. |
||||||||
| 2.25%, 11/24/30 (Call 08/24/30)(a)(b) |
12,055 | 10,079,547 | ||||||
| 3.50%, 04/16/29(b) |
15,775 | 14,625,539 | ||||||
| Shell International Finance BV |
||||||||
| 2.38%, 11/07/29 (Call 08/07/29) |
8,893 | 7,831,689 | ||||||
| 2.75%, 04/06/30 (Call 01/06/30) |
10,352 | 9,217,636 | ||||||
| Sinopec Group Overseas Development 2018 |
||||||||
| 2.30%, 01/08/31 (Call 10/08/30)(a)(b) |
7,505 | 6,433,261 | ||||||
| 2.70%, 05/13/30 (Call 02/13/30)(a)(b) |
9,570 | 8,524,143 | ||||||
| 2.95%, 08/08/29 (Call 05/08/29)(a)(b) |
4,392 | 4,020,532 | ||||||
| 2.95%, 11/12/29 (Call 08/12/29)(a)(b) |
6,197 | 5,632,515 | ||||||
| Suncor Energy Inc., 7.15%, 02/01/32 |
4,180 | 4,577,222 | ||||||
| Tengizchevroil Finance Co. International Ltd., |
3,528 | 2,878,608 | ||||||
| Thaioil Treasury Center Co. Ltd.,
2.50%, |
2,388 | 1,999,506 | ||||||
| Tosco Corp., 8.13%, 02/15/30(a) |
2,097 | 2,422,347 | ||||||
| TotalEnergies Capital International SA, 2.83%, |
7,553 | 6,791,354 | ||||||
| Valero Energy Corp. |
||||||||
| 2.80%, 12/01/31 (Call 09/01/31)(a) |
2,060 | 1,740,087 | ||||||
| 4.00%, 04/01/29 (Call 01/01/29)(a) |
1,130 | 1,078,485 | ||||||
| 7.50%, 04/15/32 |
4,820 | 5,484,422 | ||||||
| Var Energi ASA, 8.00%, 11/15/32 |
5,718 | 6,355,443 | ||||||
| Woodside Finance Ltd., 4.50%, 03/04/29 |
2,045 | 1,950,180 | ||||||
|
|
|
|||||||
| 538,044,567 | ||||||||
| Oil & Gas Services — 0.2% | ||||||||
| Baker Hughes Holdings LLC/Baker Hughes |
||||||||
| 3.14%, 11/07/29 (Call 08/07/29)(a) |
3,118 | 2,846,859 | ||||||
| 4.49%, 05/01/30 (Call 02/01/30)(a) |
3,111 | 3,022,598 | ||||||
| Halliburton Co., 2.92%, 03/01/30 |
6,390 | 5,675,679 | ||||||
| NOV Inc., 3.60%, 12/01/29 (Call 09/01/29)(a) |
3,274 | 2,989,711 | ||||||
| Schlumberger Holdings Corp., 4.30%, 05/01/29 |
4,527 | 4,380,931 | ||||||
| Schlumberger Investment SA |
||||||||
| 2.65%, 06/26/30 (Call 03/26/30)(a) |
7,105 | 6,245,655 | ||||||
| 4.85%, 05/15/33 (Call 02/15/33)(a) |
2,655 | 2,626,092 | ||||||
|
|
|
|||||||
| 27,787,525 | ||||||||
| Packaging & Containers — 0.3% | ||||||||
| Amcor Finance USA Inc., 5.63%, 05/26/33 |
3,695 | 3,757,070 | ||||||
| S C H E D U L E O F I N V E S T M E N T S |
207 |
| Schedule of Investments (continued) February 29, 2024 |
iShares® 5-10 Year Investment Grade Corporate Bond ETF (Percentages shown are based on Net Assets) |
| Security | Par (000) |
Value | ||||||
| Packaging & Containers (continued) | ||||||||
| Amcor Flexibles North America Inc. |
||||||||
| 2.63%, 06/19/30 (Call 03/19/30) |
$ | 3,259 | $ | 2,780,475 | ||||
| 2.69%, 05/25/31 (Call 02/25/31)(a) |
4,833 | 4,082,819 | ||||||
| AptarGroup Inc., 3.60%, 03/15/32 |
1,265 | 1,109,771 | ||||||
| Berry Global Inc., 5.65%, 01/15/34 |
4,565 | 4,504,136 | ||||||
| CCL Industries Inc., 3.05%, 06/01/30 |
3,698 | 3,189,815 | ||||||
| Packaging Corp. of America |
||||||||
| 3.00%, 12/15/29 (Call 09/15/29) |
3,298 | 2,957,732 | ||||||
| 5.70%, 12/01/33 (Call 09/01/33) |
1,505 | 1,540,232 | ||||||
| Sonoco Products Co. |
||||||||
| 2.85%, 02/01/32 (Call 11/01/31)(a) |
3,042 | 2,568,305 | ||||||
| 3.13%, 05/01/30 (Call 02/01/30)(a) |
3,969 | 3,526,395 | ||||||
| WestRock MWV LLC |
||||||||
| 7.95%, 02/15/31(a) |
1,800 | 2,051,071 | ||||||
| 8.20%, 01/15/30(a) |
2,305 | 2,622,229 | ||||||
| WRKCo Inc. |
||||||||
| 3.00%, 06/15/33 (Call 03/15/33)(a) |
3,755 | 3,168,007 | ||||||
| 4.20%, 06/01/32 (Call 03/01/32)(a) |
2,833 | 2,661,337 | ||||||
| 4.90%, 03/15/29 (Call 12/15/28)(a) |
3,149 | 3,120,052 | ||||||
|
|
|
|||||||
| 43,639,446 | ||||||||
| Pharmaceuticals — 3.3% | ||||||||
| AbbVie Inc. |
||||||||
| 3.20%, 11/21/29 (Call 08/21/29) |
30,491 | 27,897,143 | ||||||
| 4.95%, 03/15/31 (Call 01/15/31) |
6,070 | 6,071,219 | ||||||
| 5.05%, 03/15/34 (Call 12/15/33) |
4,865 | 4,889,217 | ||||||
| Astrazeneca Finance LLC |
||||||||
| 2.25%, 05/28/31 (Call 02/28/31)(a) |
4,199 | 3,522,543 | ||||||
| 4.88%, 03/03/33 (Call 12/03/32)(a) |
3,350 | 3,342,173 | ||||||
| 4.90%, 03/03/30 (Call 01/03/30)(a) |
3,670 | 3,676,957 | ||||||
| 4.90%, 02/26/31 (Call 12/26/30) |
5,660 | 5,647,761 | ||||||
| 5.00%, 02/26/34 (Call 11/26/33) |
5,375 | 5,393,044 | ||||||
| AstraZeneca PLC, 1.38%, 08/06/30 |
7,409 | 6,004,017 | ||||||
| Bayer U.S. Finance LLC |
||||||||
| 6.38%, 11/21/30 (Call 09/21/30)(b) |
5,335 | 5,375,494 | ||||||
| 6.50%, 11/21/33 (Call 08/21/33)(b) |
10,375 | 10,380,659 | ||||||
| Becton Dickinson and Co. |
||||||||
| 1.96%, 02/11/31 (Call 11/11/30) |
5,943 | 4,835,660 | ||||||
| 2.82%, 05/20/30 (Call 02/20/30)(a) |
4,730 | 4,153,519 | ||||||
| 4.30%, 08/22/32 (Call 05/22/32) |
3,174 | 2,974,713 | ||||||
| 5.11%, 02/08/34 (Call 11/08/33) |
1,125 | 1,105,418 | ||||||
| Bristol-Myers Squibb Co. |
||||||||
| 1.45%, 11/13/30 (Call 08/13/30) |
7,477 | 5,998,646 | ||||||
| 2.95%, 03/15/32 (Call 12/15/31)(a) |
10,280 | 8,883,895 | ||||||
| 3.40%, 07/26/29 (Call 04/26/29)(a) |
13,383 | 12,478,605 | ||||||
| 5.10%, 02/22/31 (Call 12/22/30) |
1,940 | 1,947,938 | ||||||
| 5.20%, 02/22/34 (Call 11/22/33)(a) |
11,180 | 11,270,827 | ||||||
| 5.75%, 02/01/31 (Call 12/01/30)(a) |
5,795 | 6,041,522 | ||||||
| 5.90%, 11/15/33 (Call 08/15/33)(a) |
4,795 | 5,073,655 | ||||||
| Cardinal Health Inc., 5.45%, 02/15/34 |
295 | 295,094 | ||||||
| Cencora Inc. |
||||||||
| 2.70%, 03/15/31 (Call 12/15/30) |
6,194 | 5,291,866 | ||||||
| 2.80%, 05/15/30 (Call 02/15/30)(a) |
3,275 | 2,874,577 | ||||||
| 5.13%, 02/15/34 (Call 11/15/33) |
1,250 | 1,227,013 | ||||||
| Cigna Group (The) |
||||||||
| 2.38%, 03/15/31 (Call 12/15/30) |
8,734 | 7,291,358 | ||||||
| 2.40%, 03/15/30 (Call 12/15/29) |
7,478 | 6,413,431 | ||||||
| Security | Par (000) |
Value | ||||||
| Pharmaceuticals (continued) | ||||||||
| 5.00%, 05/15/29 (Call 04/15/29)(a) |
$ | 2,825 | $ | 2,805,849 | ||||
| 5.13%, 05/15/31 (Call 03/15/31) |
3,340 | 3,303,052 | ||||||
| 5.25%, 02/15/34 (Call 11/15/33) |
3,170 | 3,132,455 | ||||||
| 5.40%, 03/15/33 (Call 12/15/32)(a) |
4,833 | 4,869,655 | ||||||
| CVS Health Corp. |
||||||||
| 1.75%, 08/21/30 (Call 05/21/30) |
7,281 | 5,914,192 | ||||||
| 1.88%, 02/28/31 (Call 11/28/30)(a) |
7,396 | 5,947,397 | ||||||
| 2.13%, 09/15/31 (Call 06/15/31)(a) |
5,914 | 4,771,501 | ||||||
| 3.25%, 08/15/29 (Call 05/15/29) |
9,969 | 9,079,835 | ||||||
| 3.75%, 04/01/30 (Call 01/01/30) |
8,627 | 7,960,095 | ||||||
| 5.13%, 02/21/30 (Call 12/21/29) |
8,595 | 8,541,460 | ||||||
| 5.25%, 01/30/31 (Call 11/30/30)(a) |
4,581 | 4,575,669 | ||||||
| 5.25%, 02/21/33 (Call 11/21/32)(a) |
10,041 | 9,938,680 | ||||||
| 5.30%, 06/01/33 (Call 03/01/33)(a) |
7,301 | 7,248,372 | ||||||
| Eli Lilly & Co. |
||||||||
| 3.38%, 03/15/29 (Call 12/15/28) |
5,137 | 4,841,375 | ||||||
| 4.70%, 02/27/33 (Call 11/27/32) |
6,113 | 6,062,559 | ||||||
| 4.70%, 02/09/34 (Call 11/09/33) |
5,515 | 5,443,991 | ||||||
| GlaxoSmithKline Capital PLC, 3.38%, 06/01/29 |
5,710 | 5,366,184 | ||||||
| Johnson & Johnson |
||||||||
| 1.30%, 09/01/30 (Call 06/01/30)(a) |
10,164 | 8,321,737 | ||||||
| 4.38%, 12/05/33 (Call 06/05/33)(a) |
475 | 469,235 | ||||||
| 4.95%, 05/15/33(a) |
950 | 985,916 | ||||||
| 6.95%, 09/01/29(a) |
1,345 | 1,509,462 | ||||||
| McKesson Corp., 5.10%, 07/15/33 |
2,126 | 2,119,135 | ||||||
| Merck & Co. Inc. |
||||||||
| 1.45%, 06/24/30 (Call 03/24/30)(a) |
7,232 | 5,912,030 | ||||||
| 2.15%, 12/10/31 (Call 09/10/31)(a) |
11,524 | 9,546,290 | ||||||
| 3.40%, 03/07/29 (Call 12/07/28) |
3 | 2,817 | ||||||
| 4.30%, 05/17/30 (Call 03/17/30)(a) |
4,555 | 4,434,416 | ||||||
| 4.50%, 05/17/33 (Call 02/17/33)(a) |
9,173 | 8,920,437 | ||||||
| 6.50%, 12/01/33(a) |
190 | 214,156 | ||||||
| Novartis Capital Corp., 2.20%, 08/14/30 |
9,117 | 7,838,335 | ||||||
| Pfizer Inc. |
||||||||
| 1.70%, 05/28/30 (Call 02/28/30) |
6,812 | 5,674,793 | ||||||
| 1.75%, 08/18/31 (Call 05/18/31) |
5,834 | 4,709,284 | ||||||
| 2.63%, 04/01/30 (Call 01/01/30) |
8,776 | 7,764,257 | ||||||
| Pfizer Investment Enterprises Pte Ltd. |
||||||||
| 4.65%, 05/19/30 (Call 03/19/30) |
13,460 | 13,240,039 | ||||||
| 4.75%, 05/19/33 (Call 02/19/33) |
28,513 | 27,766,338 | ||||||
| Takeda Pharmaceutical Co. Ltd., 2.05%, |
14,399 | 12,119,068 | ||||||
| Viatris Inc., 2.70%, 06/22/30 (Call 03/22/30)(a) |
9,533 | 8,029,225 | ||||||
| Wyeth LLC, 6.50%, 02/01/34 |
200 | 220,181 | ||||||
| Zoetis Inc. |
||||||||
| 2.00%, 05/15/30 (Call 02/15/30) |
4,735 | 3,973,693 | ||||||
| 5.60%, 11/16/32 (Call 08/16/32)(a) |
4,813 | 4,972,391 | ||||||
|
|
|
|||||||
| 408,903,520 | ||||||||
| Pipelines — 3.5% | ||||||||
| Abu Dhabi Crude Oil Pipeline LLC,
3.65%, |
3,340 | 3,127,075 | ||||||
| Boardwalk Pipelines LP |
||||||||
| 3.40%, 02/15/31 (Call 11/15/30) |
2,902 | 2,561,821 | ||||||
| 3.60%, 09/01/32 (Call 06/01/32)(a) |
2,938 | 2,554,258 | ||||||
| 4.80%, 05/03/29 (Call 02/03/29)(a) |
2,642 | 2,570,981 | ||||||
| 5.63%, 08/01/34 (Call 05/01/34) |
1,900 | 1,884,743 | ||||||
| Cameron LNG LLC, 2.90%, 07/15/31 |
5,077 | 4,373,828 | ||||||
| 208 | 2 0 2 4 I S H A R E S A N N U A L R E P O R T T O S H A R E H O L D E R S |
| Schedule of Investments (continued) February 29, 2024 |
iShares® 5-10 Year Investment Grade Corporate Bond ETF (Percentages shown are based on Net Assets) |
| Security | Par (000) |
Value | ||||||
| Pipelines (continued) | ||||||||
| Cheniere Corpus Christi Holdings LLC, 3.70%, |
$ | 7,181 | $ | 6,622,349 | ||||
| Cheniere Energy Partners LP |
||||||||
| 3.25%, 01/31/32 (Call 01/31/27)(a) |
7,457 | 6,232,508 | ||||||
| 4.00%, 03/01/31 (Call 03/01/26) |
8,570 | 7,643,182 | ||||||
| 4.50%, 10/01/29 (Call 10/01/24) |
8,623 | 8,076,859 | ||||||
| 5.95%, 06/30/33 (Call 12/30/32) |
8,197 | 8,250,830 | ||||||
| Colonial Enterprises Inc., 3.25%, 05/15/30 |
3,598 | 3,204,591 | ||||||
| Colonial Pipeline Co., 7.63%, 04/15/32(a)(b) |
975 | 1,102,709 | ||||||
| Columbia Pipelines Holding Co. LLC, 5.68%, |
1,220 | 1,196,504 | ||||||
| Columbia Pipelines Operating Co. LLC |
||||||||
| 5.93%, 08/15/30 (Call 06/15/30)(a)(b) |
2,860 | 2,913,205 | ||||||
| 6.04%, 11/15/33 (Call 08/15/33)(b) |
8,850 | 9,087,196 | ||||||
| DCP Midstream Operating LP |
||||||||
| 3.25%, 02/15/32 (Call 08/15/31) |
2,505 | 2,135,085 | ||||||
| 5.13%, 05/15/29 (Call 02/15/29)(a) |
3,615 | 3,569,892 | ||||||
| 8.13%, 08/16/30(a) |
2,490 | 2,837,333 | ||||||
| DT Midstream Inc., 4.30%, 04/15/32 |
3,765 | 3,347,612 | ||||||
| Eastern Gas Transmission & Storage Inc., |
2,675 | 2,380,440 | ||||||
| El Paso Natural Gas Co. LLC |
||||||||
| 3.50%, 02/15/32 (Call 11/15/31)(b) |
1,589 | 1,338,528 | ||||||
| 8.38%, 06/15/32(a) |
1,455 | 1,678,322 | ||||||
| Enbridge Inc. |
||||||||
| 2.50%, 08/01/33 (Call 05/01/33)(a) |
7,413 | 5,859,249 | ||||||
| 3.13%, 11/15/29 (Call 08/15/29)(a) |
5,640 | 5,090,454 | ||||||
| 5.70%, 03/08/33 (Call 12/08/32)(a) |
12,810 | 12,954,524 | ||||||
| 6.20%, 11/15/30 (Call 09/15/30) |
3,020 | 3,165,982 | ||||||
| 7.63%, 01/15/83 (Call 10/15/32), |
1,645 | 1,665,933 | ||||||
| 8.25%, 01/15/84 (Call 10/15/28), |
2,030 | 2,105,867 | ||||||
| 8.50%, 01/15/84 (Call 10/15/33), |
60 | 63,979 | ||||||
| Series 20-A, 5.75%, 07/15/80 |
5,273 | 4,918,114 | ||||||
| Energy Transfer LP |
||||||||
| 3.75%, 05/15/30 (Call 02/15/30) |
8,741 | 7,971,930 | ||||||
| 4.15%, 09/15/29 (Call 06/15/29)(a) |
3,326 | 3,139,977 | ||||||
| 5.25%, 04/15/29 (Call 01/15/29)(a) |
5,964 | 5,940,987 | ||||||
| 5.55%, 05/15/34 (Call 02/15/34)(a) |
1,895 | 1,874,911 | ||||||
| 5.75%, 02/15/33 (Call 11/15/32) |
8,582 | 8,641,181 | ||||||
| 6.40%, 12/01/30 (Call 10/01/30) |
4,947 | 5,191,016 | ||||||
| 6.55%, 12/01/33 (Call 09/01/33) |
8,275 | 8,777,292 | ||||||
| 7.38%, 02/01/31 (Call 02/01/26)(a)(b) |
5,100 | 5,336,385 | ||||||
| 8.25%, 11/15/29 (Call 08/15/29) |
1,705 | 1,933,558 | ||||||
| Enterprise Products Operating LLC |
||||||||
| 2.80%, 01/31/30 (Call 10/31/29) |
7,276 | 6,460,483 | ||||||
| 3.13%, 07/31/29 (Call 04/30/29) |
7,559 | 6,915,521 | ||||||
| 4.85%, 01/31/34 (Call 10/31/33) |
3,410 | 3,321,556 | ||||||
| 5.35%, 01/31/33 (Call 10/31/32) |
5,793 | 5,870,127 | ||||||
| Series D, 6.88%, 03/01/33 |
3,595 | 4,006,493 | ||||||
| Flex Intermediate Holdco LLC, 3.36%, 06/30/31 |
4,685 | 3,809,297 | ||||||
| Florida Gas Transmission Co. LLC |
||||||||
| 2.30%, 10/01/31 (Call 07/01/31)(b) |
4,012 | 3,215,163 | ||||||
| 2.55%, 07/01/30 (Call 04/01/30)(a)(b) |
3,294 | 2,780,712 | ||||||
| Security | Par (000) |
Value | ||||||
| Pipelines (continued) | ||||||||
| GNL Quintero SA, 4.63%, 07/31/29(a)(b) |
$ | 2,443 | $ | 2,398,189 | ||||
| Kinder Morgan Energy Partners LP |
||||||||
| 7.30%, 08/15/33(a) |
920 | 1,021,378 | ||||||
| 7.40%, 03/15/31(a) |
1,332 | 1,474,520 | ||||||
| 7.75%, 03/15/32(a) |
3,265 | 3,645,813 | ||||||
| Kinder Morgan Inc. |
||||||||
| 2.00%, 02/15/31 (Call 11/15/30)(a) |
5,721 | 4,640,282 | ||||||
| 4.80%, 02/01/33 (Call 11/01/32) |
5,146 | 4,856,919 | ||||||
| 5.20%, 06/01/33 (Call 03/01/33)(a) |
9,467 | 9,216,893 | ||||||
| 5.40%, 02/01/34 (Call 11/01/33)(a) |
5,340 | 5,250,892 | ||||||
| 7.75%, 01/15/32 |
5,454 | 6,141,187 | ||||||
| 7.80%, 08/01/31 |
2,953 | 3,308,909 | ||||||
| Midwest Connector Capital Co. LLC, 4.63%, |
3,713 | 3,577,536 | ||||||
| MPLX LP |
||||||||
| 2.65%, 08/15/30 (Call 05/15/30) |
8,974 | 7,640,659 | ||||||
| 4.95%, 09/01/32 (Call 06/01/32) |
6,030 | 5,775,392 | ||||||
| 5.00%, 03/01/33 (Call 12/01/32) |
6,630 | 6,341,662 | ||||||
| NGPL PipeCo LLC, 3.25%, 07/15/31 |
4,295 | 3,664,890 | ||||||
| ONEOK Inc. |
||||||||
| 3.10%, 03/15/30 (Call 12/15/29) |
5,274 | 4,678,038 | ||||||
| 3.25%, 06/01/30(a) |
2,808 | 2,511,114 | ||||||
| 3.40%, 09/01/29 (Call 06/01/29) |
4,371 | 3,991,191 | ||||||
| 4.35%, 03/15/29 (Call 12/15/28)(a) |
8 | 7,701 | ||||||
| 5.80%, 11/01/30 (Call 09/01/30) |
4,218 | 4,314,843 | ||||||
| 6.05%, 09/01/33 (Call 06/01/33)(a) |
9,867 | 10,168,909 | ||||||
| 6.10%, 11/15/32 (Call 08/15/32) |
4,243 | 4,398,887 | ||||||
| 6.35%, 01/15/31 (Call 10/15/30)(a) |
2,324 | 2,434,347 | ||||||
| Pipeline Funding Co. LLC, 7.50%, 01/15/30(a)(b). |
323 | 335,246 | ||||||
| Plains All American Pipeline LP/PAA |
||||||||
| Finance Corp. |
||||||||
| 3.55%, 12/15/29 (Call 09/15/29)(a) |
6,101 | 5,535,306 | ||||||
| 3.80%, 09/15/30 (Call 06/15/30) |
4,702 | 4,285,046 | ||||||
| Sabine Pass Liquefaction LLC, 4.50%, 05/15/30 |
12,203 | 11,677,214 | ||||||
| Southern Natural Gas Co. LLC,
8.00%, |
687 | 780,347 | ||||||
| Targa Resources Corp. |
||||||||
| 4.20%, 02/01/33 (Call 11/01/32) |
4,495 | 4,045,989 | ||||||
| 6.13%, 03/15/33 (Call 12/15/32) |
5,453 | 5,614,177 | ||||||
| 6.15%, 03/01/29 (Call 02/01/29) |
349 | 359,709 | ||||||
| 6.50%, 03/30/34 (Call 12/30/33) |
2,988 | 3,164,611 | ||||||
| Targa Resources Partners LP/Targa Resources |
||||||||
| 4.00%, 01/15/32 (Call 07/15/26) |
5,950 | 5,309,512 | ||||||
| 4.88%, 02/01/31 (Call 02/01/26) |
6,275 | 5,945,161 | ||||||
| 5.50%, 03/01/30 (Call 03/01/25) |
5,982 | 5,924,034 | ||||||
| Tennessee Gas Pipeline Co. LLC, 2.90%, |
6,009 | 5,220,577 | ||||||
| Texas Eastern Transmission LP,
7.00%, |
3,813 | 4,222,280 | ||||||
| TransCanada PipeLines Ltd. |
||||||||
| 2.50%, 10/12/31 (Call 07/12/31) |
6,129 | 5,023,456 | ||||||
| 4.10%, 04/15/30 (Call 01/15/30) |
7,456 | 6,977,523 | ||||||
| Transcanada Trust |
||||||||
| 5.50%, 09/15/79 (Call 09/15/29), |
5,827 | 5,210,381 | ||||||
| 5.60%, 03/07/82 (Call 12/07/31), |
4,556 | 3,986,594 | ||||||
| S C H E D U L E O F I N V E S T M E N T S |
209 |
| Schedule of Investments (continued) February 29, 2024 |
iShares® 5-10 Year Investment Grade Corporate Bond ETF (Percentages shown are based on Net Assets) |
| Security | Par (000) |
Value | ||||||
| Pipelines (continued) | ||||||||
| Transcontinental Gas Pipe Line Co. LLC, |
$ | 4,559 | $ | 4,100,801 | ||||
| Western Midstream Operating LP |
||||||||
| 4.05%, 02/01/30 (Call 11/01/29)(a) |
7,111 | 6,573,868 | ||||||
| 6.15%, 04/01/33 (Call 01/01/33) |
5,043 | 5,124,818 | ||||||
| Williams Companies Inc. (The) |
||||||||
| 2.60%, 03/15/31 (Call 12/15/30) |
8,364 | 7,052,779 | ||||||
| 3.50%, 11/15/30 (Call 08/15/30)(a) |
5,495 | 4,958,939 | ||||||
| 4.65%, 08/15/32 (Call 05/15/32)(a) |
6,032 | 5,738,463 | ||||||
| 5.15%, 03/15/34 (Call 12/15/33)(a) |
2,850 | 2,782,634 | ||||||
| 5.65%, 03/15/33 (Call 12/15/32)(a) |
5,223 | 5,311,032 | ||||||
| 7.75%, 06/15/31(a) |
1,832 | 2,009,666 | ||||||
| 8.75%, 03/15/32(a) |
2,246 | 2,676,598 | ||||||
| Series A, 7.50%, 01/15/31 |
2,547 | 2,828,802 | ||||||
|
|
|
|||||||
| 443,936,256 | ||||||||
| Private Equity — 0.1% | ||||||||
| Apollo Management Holdings LP, 2.65%, |
3,288 | 2,795,951 | ||||||
| Carlyle Finance Subsidiary LLC, 3.50%, |
2,862 | 2,635,142 | ||||||
| KKR Group Finance Co. VI LLC, 3.75%, |
4,514 | 4,181,941 | ||||||
|
|
|
|||||||
| 9,613,034 | ||||||||
| Real Estate — 0.3% | ||||||||
| American Homes 4 Rent LP, 5.50%, 02/01/34 |
2,340 | 2,294,804 | ||||||
| AvalonBay Communities Inc., 5.30%, 12/07/33 |
2,255 | 2,261,305 | ||||||
| Brixmor Operating Partnership LP, 5.50%, |
1,200 | 1,168,204 | ||||||
| Brookfield Corp., 7.38%, 03/01/33 |
10 | 10,763 | ||||||
| Camden Property Trust, 4.90%, 01/15/34 |
1,855 | 1,784,270 | ||||||
| CBRE Services Inc., 2.50%, 04/01/31 |
3,123 | 2,570,563 | ||||||
| Corp. Inmobiliaria Vesta SAB de CV, 3.63%, |
2,415 | 2,044,935 | ||||||
| Essential Properties LP, 2.95%, 07/15/31 |
2,249 | 1,761,769 | ||||||
| Mid-America Apartments LP, 5.00%, 03/15/34 |
1,150 | 1,119,074 | ||||||
| Mitsui Fudosan Co. Ltd., 2.57%, 01/21/32 |
250 | 205,858 | ||||||
| Ontario Teachers’ Cadillac Fairview Properties |
5,025 | 3,985,025 | ||||||
| Prologis LP, 5.00%, 03/15/34 (Call 12/15/33)(a) |
2,675 | 2,628,834 | ||||||
| Realty Income Corp. |
||||||||
| 2.70%, 02/15/32 (Call 11/15/31)(a) |
1,771 | 1,456,065 | ||||||
| 3.20%, 02/15/31 (Call 11/15/30) |
2,126 | 1,859,365 | ||||||
| 3.40%, 01/15/30 (Call 10/15/29)(a) |
2,932 | 2,657,830 | ||||||
| 4.00%, 07/15/29 (Call 04/15/29)(a) |
2,532 | 2,387,646 | ||||||
| 5.13%, 02/15/34 (Call 11/15/33) |
2,270 | 2,196,239 | ||||||
| Regency Centers LP, 5.25%, 01/15/34 |
720 | 703,626 | ||||||
|
|
|
|||||||
| 33,096,175 | ||||||||
| Real Estate Investment Trusts — 4.8% | ||||||||
| Agree LP |
||||||||
| 2.60%, 06/15/33 (Call 03/15/33) |
865 | 670,091 | ||||||
| 2.90%, 10/01/30 (Call 07/01/30) |
1,955 | 1,666,124 | ||||||
| 4.80%, 10/01/32 (Call 07/01/32)(a) |
1,535 | 1,434,163 | ||||||
| Security | Par (000) |
Value | ||||||
| Real Estate Investment Trusts (continued) | ||||||||
| Alexandria Real Estate Equities Inc. |
||||||||
| 1.88%, 02/01/33 (Call 11/01/32)(a) |
$ | 4,500 | $ | 3,367,421 | ||||
| 2.00%, 05/18/32 (Call 02/18/32) |
7,250 | 5,605,790 | ||||||
| 2.75%, 12/15/29 (Call 09/15/29)(a) |
2,232 | 1,941,607 | ||||||
| 3.38%, 08/15/31 (Call 05/15/31)(a) |
4,115 | 3,622,708 | ||||||
| 4.50%, 07/30/29 (Call 04/30/29) |
2,011 | 1,925,520 | ||||||
| 4.70%, 07/01/30 (Call 04/01/30) |
2,730 | 2,624,943 | ||||||
| 4.90%, 12/15/30 (Call 09/15/30)(a) |
4,168 | 4,058,113 | ||||||
| American Assets Trust LP, 3.38%, 02/01/31 |
2,950 | 2,377,775 | ||||||
| American Homes 4 Rent LP |
||||||||
| 2.38%, 07/15/31 (Call 04/15/31) |
2,328 | 1,874,122 | ||||||
| 3.63%, 04/15/32 (Call 01/15/32)(a) |
3,276 | 2,858,437 | ||||||
| American Tower Corp. |
||||||||
| 1.88%, 10/15/30 (Call 07/15/30) |
4,732 | 3,802,428 | ||||||
| 2.10%, 06/15/30 (Call 03/15/30)(a) |
4,705 | 3,871,674 | ||||||
| 2.30%, 09/15/31 (Call 06/15/31)(a) |
4,246 | 3,428,668 | ||||||
| 2.70%, 04/15/31 (Call 01/15/31) |
4,170 | 3,499,792 | ||||||
| 2.90%, 01/15/30 (Call 10/15/29)(a) |
4,685 | 4,104,596 | ||||||
| 3.80%, 08/15/29 (Call 05/15/29)(a) |
9,591 | 8,875,709 | ||||||
| 3.95%, 03/15/29 (Call 12/15/28) |
2,570 | 2,412,056 | ||||||
| 4.05%, 03/15/32 (Call 12/15/31)(a) |
4,014 | 3,651,128 | ||||||
| 5.55%, 07/15/33 (Call 04/15/33) |
4,515 | 4,511,712 | ||||||
| 5.65%, 03/15/33 (Call 12/15/32) |
4,946 | 4,978,095 | ||||||
| 5.90%, 11/15/33 (Call 08/15/33)(a) |
5,230 | 5,363,795 | ||||||
| AvalonBay Communities Inc. |
||||||||
| 2.05%, 01/15/32 (Call 10/15/31)(a) |
5,840 | 4,760,484 | ||||||
| 2.30%, 03/01/30 (Call 12/01/29)(a) |
4,163 | 3,577,913 | ||||||
| 2.45%, 01/15/31 (Call 10/17/30) |
2,966 | 2,531,589 | ||||||
| 3.30%, 06/01/29 (Call 03/01/29)(a) |
2,058 | 1,896,401 | ||||||
| 5.00%, 02/15/33 (Call 11/15/32)(a) |
910 | 891,870 | ||||||
| Boston Properties LP |
||||||||
| 2.45%, 10/01/33 (Call 07/01/33) |
4,165 | 3,070,689 | ||||||
| 2.55%, 04/01/32 (Call 01/01/32)(a) |
5,585 | 4,342,084 | ||||||
| 2.90%, 03/15/30 (Call 12/15/29) |
4,261 | 3,594,763 | ||||||
| 3.25%, 01/30/31 (Call 10/30/30)(a) |
6,998 | 5,896,469 | ||||||
| 3.40%, 06/21/29 (Call 03/21/29)(a) |
5,789 | 5,108,890 | ||||||
| 6.50%, 01/15/34 (Call 10/15/33)(a) |
640 | 653,038 | ||||||
| Brixmor Operating Partnership LP |
||||||||
| 2.50%, 08/16/31 (Call 05/16/31)(a) |
3,120 | 2,540,605 | ||||||
| 4.05%, 07/01/30 (Call 04/01/30)(a) |
4,820 | 4,434,966 | ||||||
| 4.13%, 05/15/29 (Call 02/15/29) |
4,278 | 4,000,057 | ||||||
| Broadstone Net Lease LLC, 2.60%, 09/15/31 |
2,327 | 1,806,177 | ||||||
| Camden Property Trust |
||||||||
| 2.80%, 05/15/30 (Call 02/15/30)(a) |
5,197 | 4,567,897 | ||||||
| 3.15%, 07/01/29 (Call 04/01/29)(a) |
3,751 | 3,412,371 | ||||||
| Cibanco SA Ibm/PLA Administradora Industrial |
2,335 | 2,243,992 | ||||||
| Corporate Office Properties LP |
||||||||
| 2.75%, 04/15/31 (Call 01/15/31)(a) |
3,401 | 2,745,105 | ||||||
| 2.90%, 12/01/33 (Call 09/01/33) |
235 | 179,267 | ||||||
| Crown Castle Inc. |
||||||||
| 2.10%, 04/01/31 (Call 01/01/31) |
6,151 | 4,938,131 | ||||||
| 2.25%, 01/15/31 (Call 10/15/30) |
6,555 | 5,356,287 | ||||||
| 2.50%, 07/15/31 (Call 04/15/31) |
4,878 | 3,996,082 | ||||||
| 3.10%, 11/15/29 (Call 08/15/29) |
3,577 | 3,164,599 | ||||||
| 3.30%, 07/01/30 (Call 04/01/30) |
4,583 | 4,046,007 | ||||||
| 5.10%, 05/01/33 (Call 02/01/33) |
4,771 | 4,611,422 | ||||||
| 5.60%, 06/01/29 (Call 05/01/29) |
4,550 | 4,575,196 | ||||||
| 210 | 2 0 2 4 I S H A R E S A N N U A L R E P O R T T O S H A R E H O L D E R S |
| Schedule of Investments (continued) February 29, 2024 |
iShares® 5-10 Year Investment Grade Corporate Bond ETF (Percentages shown are based on Net Assets) |
| Security | Par (000) |
Value | ||||||
| Real Estate Investment Trusts (continued) | ||||||||
| 5.80%, 03/01/34 (Call 12/01/33)(a) |
$ | 3,525 | $ | 3,572,514 | ||||
| CubeSmart LP |
||||||||
| 2.00%, 02/15/31 (Call 11/15/30)(a) |
1,220 | 978,724 | ||||||
| 2.50%, 02/15/32 (Call 11/15/31)(a) |
2,825 | 2,282,911 | ||||||
| 3.00%, 02/15/30 (Call 11/15/29)(a) |
2,081 | 1,812,569 | ||||||
| Digital Realty Trust LP, 3.60%, 07/01/29 |
5,528 | 5,092,725 | ||||||
| EPR Properties |
||||||||
| 3.60%, 11/15/31 (Call 08/15/31)(a) |
1,815 | 1,481,702 | ||||||
| 3.75%, 08/15/29 (Call 05/15/29)(a) |
2,300 | 2,007,500 | ||||||
| Equinix Inc. |
||||||||
| 2.15%, 07/15/30 (Call 04/15/30) |
6,479 | 5,370,965 | ||||||
| 2.50%, 05/15/31 (Call 02/15/31)(a) |
6,193 | 5,164,319 | ||||||
| 3.20%, 11/18/29 (Call 08/18/29)(a) |
7,446 | 6,687,152 | ||||||
| 3.90%, 04/15/32 (Call 01/15/32)(a) |
8,763 | 7,950,446 | ||||||
| ERP Operating LP |
||||||||
| 1.85%, 08/01/31 (Call 05/01/31)(a) |
3,882 | 3,119,650 | ||||||
| 2.50%, 02/15/30 (Call 11/15/29) |
2,982 | 2,590,744 | ||||||
| 3.00%, 07/01/29 (Call 04/01/29)(a) |
2,131 | 1,931,526 | ||||||
| Essex Portfolio LP |
||||||||
| 1.65%, 01/15/31 (Call 10/15/30)(a) |
2,055 | 1,606,442 | ||||||
| 2.55%, 06/15/31 (Call 03/15/31) |
1,607 | 1,323,866 | ||||||
| 2.65%, 03/15/32 (Call 12/15/31)(a) |
3,370 | 2,742,488 | ||||||
| 3.00%, 01/15/30 (Call 10/15/29)(a) |
3,266 | 2,865,294 | ||||||
| 4.00%, 03/01/29 (Call 12/01/28)(a) |
1,897 | 1,793,513 | ||||||
| Extra Space Storage LP |
||||||||
| 2.20%, 10/15/30 (Call 07/15/30) |
2,531 | 2,069,186 | ||||||
| 2.35%, 03/15/32 (Call 12/15/31) |
3,250 | 2,578,345 | ||||||
| 2.40%, 10/15/31 (Call 07/15/31) |
3,219 | 2,600,168 | ||||||
| 2.55%, 06/01/31 (Call 03/01/31)(a) |
2,545 | 2,093,356 | ||||||
| 3.90%, 04/01/29 (Call 02/01/29)(a) |
1,975 | 1,844,221 | ||||||
| 4.00%, 06/15/29 (Call 03/15/29) |
2,219 | 2,082,515 | ||||||
| 5.40%, 02/01/34 (Call 11/01/33) |
2,370 | 2,323,201 | ||||||
| 5.50%, 07/01/30 (Call 05/01/30) |
2,435 | 2,446,326 | ||||||
| 5.90%, 01/15/31 (Call 11/15/30) |
2,045 | 2,094,281 | ||||||
| Federal Realty OP LP |
||||||||
| 3.20%, 06/15/29 (Call 03/15/29)(a) |
2,430 | 2,171,063 | ||||||
| 3.50%, 06/01/30 (Call 03/01/30) |
2,369 | 2,124,637 | ||||||
| GLP Capital LP/GLP Financing II Inc. |
||||||||
| 3.25%, 01/15/32 (Call 10/15/31) |
4,581 | 3,800,343 | ||||||
| 4.00%, 01/15/30 (Call 10/15/29)(a) |
4,276 | 3,848,211 | ||||||
| 4.00%, 01/15/31 (Call 10/15/30)(a) |
4,264 | 3,762,380 | ||||||
| 6.75%, 12/01/33 (Call 09/01/33)(a) |
920 | 954,652 | ||||||
| Goodman U.S. Finance Five LLC, 4.63%, |
230 | 209,587 | ||||||
| Healthcare Realty Holdings LP |
||||||||
| 2.00%, 03/15/31 (Call 12/15/30)(a) |
4,768 | 3,737,605 | ||||||
| 2.05%, 03/15/31 (Call 12/15/30) |
1,695 | 1,287,781 | ||||||
| 2.40%, 03/15/30 (Call 12/15/29) |
1,735 | 1,391,655 | ||||||
| 3.10%, 02/15/30 (Call 11/15/29) |
3,668 | 3,157,093 | ||||||
| Healthpeak OP LLC |
||||||||
| 2.88%, 01/15/31 (Call 10/15/30)(a) |
3,568 | 3,036,687 | ||||||
| 3.00%, 01/15/30 (Call 10/15/29)(a) |
4,976 | 4,360,179 | ||||||
| 3.50%, 07/15/29 (Call 04/15/29) |
3,707 | 3,385,313 | ||||||
| 5.25%, 12/15/32 (Call 09/15/32)(a) |
4,054 | 3,965,323 | ||||||
| Highwoods Realty LP |
||||||||
| 2.60%, 02/01/31 (Call 11/01/30)(a) |
2,030 | 1,591,601 | ||||||
| 3.05%, 02/15/30 (Call 11/15/29)(a) |
2,253 | 1,889,938 | ||||||
| 4.20%, 04/15/29 (Call 01/15/29) |
1,861 | 1,676,313 | ||||||
| Host Hotels & Resorts LP |
||||||||
| Series H, 3.38%, 12/15/29 (Call 09/15/29)(a) |
2,385 | 2,110,541 | ||||||
| Security | Par (000) |
Value | ||||||
| Real Estate Investment Trusts (continued) | ||||||||
| Series I, 3.50%, 09/15/30 (Call 06/15/30)(a) |
$ | 6,290 | $ | 5,546,628 | ||||
| Series J, 2.90%, 12/15/31 (Call 09/15/31)(a) |
2,330 | 1,923,332 | ||||||
| Invitation Homes Operating Partnership LP |
||||||||
| 2.00%, 08/15/31 (Call 05/15/31)(a) |
3,719 | 2,904,894 | ||||||
| 2.70%, 01/15/34 (Call 10/15/33) |
270 | 210,213 | ||||||
| 4.15%, 04/15/32 (Call 01/15/32)(a) |
3,135 | 2,828,038 | ||||||
| 5.45%, 08/15/30 (Call 06/15/30)(a) |
2,670 | 2,658,111 | ||||||
| 5.50%, 08/15/33 (Call 05/15/33)(a) |
3,533 | 3,489,681 | ||||||
| Kilroy Realty LP |
||||||||
| 2.50%, 11/15/32 (Call 08/15/32) |
3,095 | 2,288,915 | ||||||
| 2.65%, 11/15/33 (Call 08/15/33)(a) |
975 | 709,963 | ||||||
| 3.05%, 02/15/30 (Call 11/15/29)(a) |
2,961 | 2,482,021 | ||||||
| 4.25%, 08/15/29 (Call 05/15/29)(a) |
1,571 | 1,432,754 | ||||||
| Kimco Realty OP LLC |
||||||||
| 2.25%, 12/01/31 (Call 09/01/31)(a) |
2,857 | 2,272,328 | ||||||
| 2.70%, 10/01/30 (Call 07/01/30)(a) |
3,757 | 3,191,392 | ||||||
| 3.20%, 04/01/32 (Call 01/01/32)(a) |
3,250 | 2,761,749 | ||||||
| 4.60%, 02/01/33 (Call 11/01/32)(a) |
3,575 | 3,351,259 | ||||||
| 6.40%, 03/01/34 (Call 12/01/33) |
983 | 1,034,405 | ||||||
| Kite Realty Group Trust, 4.75%, 09/15/30 |
1,905 | 1,797,310 | ||||||
| LXP Industrial Trust |
||||||||
| 2.38%, 10/01/31 (Call 07/01/31)(a) |
2,095 | 1,663,206 | ||||||
| 2.70%, 09/15/30 (Call 06/15/30)(a) |
2,291 | 1,888,928 | ||||||
| Mid-America Apartments LP |
||||||||
| 1.70%, 02/15/31 (Call 11/15/30)(a) |
2,572 | 2,049,570 | ||||||
| 2.75%, 03/15/30 (Call 12/15/29)(a) |
1,798 | 1,580,176 | ||||||
| 3.95%, 03/15/29 (Call 12/15/28)(a) |
2,493 | 2,378,243 | ||||||
| National Health Investors Inc., 3.00%, 02/01/31 |
2,318 | 1,859,977 | ||||||
| NNN REIT Inc. |
||||||||
| 2.50%, 04/15/30 (Call 01/15/30)(a) |
2,372 | 2,005,018 | ||||||
| 5.60%, 10/15/33 (Call 07/15/33)(a) |
3,115 | 3,106,449 | ||||||
| Omega Healthcare Investors Inc. |
||||||||
| 3.25%, 04/15/33 (Call 01/15/33)(a) |
3,052 | 2,429,326 | ||||||
| 3.38%, 02/01/31 (Call 11/01/30) |
4,050 | 3,409,797 | ||||||
| 3.63%, 10/01/29 (Call 07/01/29) |
2,895 | 2,542,528 | ||||||
| Phillips Edison Grocery Center Operating |
1,900 | 1,528,376 | ||||||
| Physicians Realty LP, 2.63%, 11/01/31 |
2,625 | 2,137,081 | ||||||
| Piedmont Operating Partnership LP |
||||||||
| 2.75%, 04/01/32 (Call 01/01/32)(a) |
1,340 | 948,202 | ||||||
| 3.15%, 08/15/30 (Call 05/15/30) |
2,764 | 2,109,284 | ||||||
| Prologis LP |
||||||||
| 1.25%, 10/15/30 (Call 07/15/30) |
5,230 | 4,150,833 | ||||||
| 1.63%, 03/15/31 (Call 12/15/30)(a) |
1,145 | 909,352 | ||||||
| 1.75%, 07/01/30 (Call 04/01/30) |
1,731 | 1,419,237 | ||||||
| 1.75%, 02/01/31 (Call 11/01/30)(a) |
3,904 | 3,163,425 | ||||||
| 2.25%, 04/15/30 (Call 01/15/30) |
5,957 | 5,108,576 | ||||||
| 2.25%, 01/15/32 (Call 10/15/31)(a) |
3,521 | 2,875,237 | ||||||
| 2.88%, 11/15/29 (Call 08/15/29)(a) |
2,062 | 1,847,987 | ||||||
| 4.63%, 01/15/33 (Call 10/15/32)(a) |
4,460 | 4,292,020 | ||||||
| 4.75%, 06/15/33 (Call 03/15/33) |
3,360 | 3,258,079 | ||||||
| 5.13%, 01/15/34 (Call 10/15/33) |
2,070 | 2,048,926 | ||||||
| Prologis Targeted U.S. Logistics Fund LP, |
240 | 238,267 | ||||||
| Public Storage Operating Co. |
||||||||
| 2.25%, 11/09/31 (Call 08/09/31) |
3,515 | 2,897,954 | ||||||
| 2.30%, 05/01/31 (Call 02/01/31)(a) |
3,538 | 2,975,889 | ||||||
| S C H E D U L E O F I N V E S T M E N T S |
211 |
| Schedule of Investments (continued) February 29, 2024 |
iShares® 5-10 Year Investment Grade Corporate Bond ETF (Percentages shown are based on Net Assets) |
| Security | Par (000) |
Value | ||||||
| Real Estate Investment Trusts (continued) | ||||||||
| 3.39%, 05/01/29 (Call 02/01/29) |
$ | 3,065 | $ | 2,857,600 | ||||
| 5.10%, 08/01/33 (Call 05/01/33) |
4,510 | 4,505,685 | ||||||
| Rayonier LP, 2.75%, 05/17/31 (Call 02/17/31) |
2,863 | 2,326,645 | ||||||
| Realty Income Corp. |
||||||||
| 1.80%, 03/15/33 (Call 12/15/32)(a) |
2,245 | 1,690,051 | ||||||
| 2.85%, 12/15/32 (Call 09/15/32) |
4,230 | 3,485,535 | ||||||
| 3.10%, 12/15/29 (Call 09/15/29)(a) |
3,645 | 3,277,637 | ||||||
| 3.25%, 06/15/29 (Call 03/15/29)(a) |
2,665 | 2,436,348 | ||||||
| 3.25%, 01/15/31 (Call 10/15/30) |
6,027 | 5,338,797 | ||||||
| 4.85%, 03/15/30 (Call 01/15/30)(a) |
3,625 | 3,552,598 | ||||||
| 4.90%, 07/15/33 (Call 04/15/33)(a) |
3,480 | 3,320,221 | ||||||
| 5.63%, 10/13/32 (Call 07/13/32)(a) |
4,125 | 4,175,051 | ||||||
| Regency Centers LP |
||||||||
| 2.95%, 09/15/29 (Call 06/15/29)(a) |
2,647 | 2,343,090 | ||||||
| 3.70%, 06/15/30 (Call 03/15/30) |
3,513 | 3,202,507 | ||||||
| Rexford Industrial Realty LP |
||||||||
| 2.13%, 12/01/30 (Call 09/01/30) |
1,358 | 1,099,500 | ||||||
| 2.15%, 09/01/31 (Call 06/01/31)(a) |
4,235 | 3,347,121 | ||||||
| Sabra Health Care LP |
||||||||
| 3.20%, 12/01/31 (Call 09/01/31)(a) |
4,568 | 3,703,684 | ||||||
| 3.90%, 10/15/29 (Call 07/15/29)(a) |
2,424 | 2,154,723 | ||||||
| Safehold GL Holdings LLC |
||||||||
| 2.80%, 06/15/31 (Call 03/15/31)(a) |
2,502 | 2,032,972 | ||||||
| 2.85%, 01/15/32 (Call 08/15/31)(a) |
755 | 607,147 | ||||||
| 6.10%, 04/01/34 (Call 01/01/34) |
800 | 791,656 | ||||||
| Scentre Group Trust 1/Scentre Group Trust 2, |
4,617 | 4,340,375 | ||||||
| Scentre Group Trust 2, 5.13%, 09/24/80 |
115 | 105,252 | ||||||
| Simon Property Group LP |
||||||||
| 2.20%, 02/01/31 (Call 11/01/30)(a) |
4,161 | 3,412,307 | ||||||
| 2.25%, 01/15/32 (Call 10/15/31)(a) |
3,818 | 3,073,171 | ||||||
| 2.45%, 09/13/29 (Call 06/13/29)(a) |
7,836 | 6,833,782 | ||||||
| 2.65%, 07/15/30 (Call 04/15/30) |
4,587 | 3,979,918 | ||||||
| 2.65%, 02/01/32 (Call 12/01/31)(a) |
3,835 | 3,189,164 | ||||||
| 5.50%, 03/08/33 (Call 12/08/32)(a) |
3,535 | 3,564,756 | ||||||
| 6.25%, 01/15/34 (Call 10/15/33)(a) |
1,220 | 1,285,571 | ||||||
| Store Capital LLC |
||||||||
| 2.70%, 12/01/31 (Call 09/01/31)(a) |
2,173 | 1,691,816 | ||||||
| 2.75%, 11/18/30 (Call 08/18/30)(a) |
1,919 | 1,513,490 | ||||||
| 4.63%, 03/15/29 (Call 12/15/28)(a) |
1,900 | 1,772,827 | ||||||
| Sun Communities Operating LP |
||||||||
| 2.70%, 07/15/31 (Call 04/15/31)(a) |
4,272 | 3,484,178 | ||||||
| 4.20%, 04/15/32 (Call 01/15/32) |
3,325 | 2,954,356 | ||||||
| 5.70%, 01/15/33 (Call 10/15/32) |
2,098 | 2,065,081 | ||||||
| Tanger Properties LP, 2.75%, 09/01/31 |
2,293 | 1,850,062 | ||||||
| Trust Fibra Uno |
||||||||
| 4.87%, 01/15/30 (Call 10/30/29)(b) |
3,365 | 3,062,044 | ||||||
| 7.38%, 02/13/34 (Call 11/13/33)(b) |
150 | 150,450 | ||||||
| UDR Inc. |
||||||||
| 1.90%, 03/15/33 (Call 12/15/32)(a) |
970 | 723,620 | ||||||
| 2.10%, 08/01/32 (Call 05/01/32) |
1,935 | 1,496,057 | ||||||
| 2.10%, 06/15/33 (Call 03/15/33)(a) |
2,540 | 1,921,553 | ||||||
| 3.00%, 08/15/31 (Call 05/15/31)(a) |
3,307 | 2,837,507 | ||||||
| 3.20%, 01/15/30 (Call 10/15/29)(a) |
3,863 | 3,455,201 | ||||||
| Ventas Realty LP |
||||||||
| 2.50%, 09/01/31 (Call 06/01/31) |
2,812 | 2,286,793 | ||||||
| 3.00%, 01/15/30 (Call 10/15/29) |
3,861 | 3,370,374 | ||||||
| 4.75%, 11/15/30 (Call 08/15/30)(a) |
2,782 | 2,658,347 | ||||||
| Security | Par (000) |
Value | ||||||
| Real Estate Investment Trusts (continued) | ||||||||
| VICI Properties LP |
||||||||
| 4.95%, 02/15/30 (Call 12/15/29)(a) |
$ | 5,696 | $ | 5,422,688 | ||||
| 5.13%, 05/15/32 (Call 02/15/32)(a) |
8,758 | 8,218,185 | ||||||
| VICI Properties LP/VICI Note Co. Inc. |
||||||||
| 4.13%, 08/15/30 (Call 02/15/25)(a)(b) |
5,520 | 4,951,308 | ||||||
| 4.63%, 12/01/29 (Call 12/01/24)(b) |
5,756 | 5,359,412 | ||||||
| WEA Finance LLC, 3.50%, 06/15/29 |
4,253 | 3,691,549 | ||||||
| Welltower OP LLC |
||||||||
| 2.75%, 01/15/31 (Call 10/15/30) |
3,327 | 2,837,957 | ||||||
| 2.75%, 01/15/32 (Call 10/15/31)(a) |
2,555 | 2,125,436 | ||||||
| 2.80%, 06/01/31 (Call 03/01/31)(a) |
4,758 | 4,040,052 | ||||||
| 3.10%, 01/15/30 (Call 10/15/29) |
4,380 | 3,907,339 | ||||||
| 3.85%, 06/15/32 (Call 03/15/32)(a) |
3,455 | 3,101,827 | ||||||
| 4.13%, 03/15/29 (Call 12/15/28) |
1,130 | 1,074,917 | ||||||
| Weyerhaeuser Co. |
||||||||
| 3.38%, 03/09/33 (Call 12/09/32) |
3,025 | 2,612,878 | ||||||
| 4.00%, 11/15/29 (Call 08/15/29) |
5,072 | 4,761,593 | ||||||
| 4.00%, 04/15/30 (Call 01/15/30) |
4,588 | 4,290,941 | ||||||
| 6.88%, 12/15/33 |
15 | 16,139 | ||||||
| 7.38%, 03/15/32(a) |
4,080 | 4,607,659 | ||||||
| WP Carey Inc. |
||||||||
| 2.25%, 04/01/33 (Call 01/01/33) |
627 | 475,152 | ||||||
| 2.40%, 02/01/31 (Call 11/01/30)(a) |
3,244 | 2,669,939 | ||||||
| 2.45%, 02/01/32 (Call 11/01/31) |
2,951 | 2,350,416 | ||||||
| 3.85%, 07/15/29 (Call 04/15/29)(a) |
2,106 | 1,946,941 | ||||||
|
|
|
|||||||
| 603,930,253 | ||||||||
| Retail — 2.5% | ||||||||
| 7-Eleven Inc., 1.80%, 02/10/31 |
11,001 | 8,765,270 | ||||||
| Advance Auto Parts Inc., 3.50%, 03/15/32 |
1,945 | 1,631,353 | ||||||
| Alimentation Couche-Tard Inc. |
||||||||
| 2.95%, 01/25/30 (Call 10/25/29)(a)(b) |
4,371 | 3,895,986 | ||||||
| 5.27%, 02/12/34 (Call 11/12/33)(a)(b) |
2,810 | 2,783,833 | ||||||
| AutoNation Inc. |
||||||||
| 2.40%, 08/01/31 (Call 05/01/31)(a) |
2,872 | 2,274,628 | ||||||
| 3.85%, 03/01/32 (Call 12/01/31)(a) |
4,156 | 3,628,866 | ||||||
| 4.75%, 06/01/30 (Call 03/01/30)(a) |
3,507 | 3,335,638 | ||||||
| AutoZone Inc. |
||||||||
| 1.65%, 01/15/31 (Call 10/15/30)(a) |
3,873 | 3,081,621 | ||||||
| 3.75%, 04/18/29 (Call 01/18/29)(a) |
2,040 | 1,915,837 | ||||||
| 4.00%, 04/15/30 (Call 01/15/30)(a) |
4,520 | 4,254,357 | ||||||
| 4.75%, 08/01/32 (Call 05/01/32)(a) |
4,675 | 4,489,333 | ||||||
| 4.75%, 02/01/33 (Call 11/01/32)(a) |
3,155 | 3,022,579 | ||||||
| 5.20%, 08/01/33 (Call 05/01/33)(a) |
1,905 | 1,887,773 | ||||||
| 6.55%, 11/01/33 (Call 08/01/33) |
2,640 | 2,851,976 | ||||||
| Best Buy Co. Inc., 1.95%, 10/01/30 |
4,092 | 3,363,965 | ||||||
| Costco Wholesale Corp. |
||||||||
| 1.60%, 04/20/30 (Call 01/20/30)(a) |
10,559 | 8,797,643 | ||||||
| 1.75%, 04/20/32 (Call 01/20/32) |
6,164 | 4,929,091 | ||||||
| Darden Restaurants Inc., 6.30%, 10/10/33 |
2,020 | 2,109,995 | ||||||
| Dick’s Sporting Goods Inc., 3.15%, 01/15/32 |
4,674 | 3,916,812 | ||||||
| Dollar General Corp. |
||||||||
| 3.50%, 04/03/30 (Call 01/03/30)(a) |
6,936 | 6,275,841 | ||||||
| 5.00%, 11/01/32 (Call 08/01/32)(a) |
4,972 | 4,832,481 | ||||||
| 5.45%, 07/05/33 (Call 04/05/33)(a) |
4,235 | 4,206,211 | ||||||
| 212 | 2 0 2 4 I S H A R E S A N N U A L R E P O R T T O S H A R E H O L D E R S |
| Schedule of Investments (continued) February 29, 2024 |
iShares® 5-10 Year Investment Grade Corporate Bond ETF (Percentages shown are based on Net Assets) |
| Security | Par (000) |
Value | ||||||
| Retail (continued) | ||||||||
| Dollar Tree Inc., 2.65%, 12/01/31 |
$ | 4,876 | $ | 4,058,299 | ||||
| Genuine Parts Co. |
||||||||
| 1.88%, 11/01/30 (Call 08/01/30) |
3,139 | 2,527,363 | ||||||
| 2.75%, 02/01/32 (Call 11/01/31)(a) |
3,138 | 2,586,816 | ||||||
| 6.88%, 11/01/33 (Call 08/01/33)(a) |
2,678 | 2,925,968 | ||||||
| Home Depot Inc. (The) |
||||||||
| 1.38%, 03/15/31 (Call 12/15/30) |
7,297 | 5,774,275 | ||||||
| 1.88%, 09/15/31 (Call 06/15/31)(a) |
5,752 | 4,659,349 | ||||||
| 2.70%, 04/15/30 (Call 01/15/30) |
9,324 | 8,247,072 | ||||||
| 2.95%, 06/15/29 (Call 03/15/29) |
9,921 | 9,056,529 | ||||||
| 3.25%, 04/15/32 (Call 01/15/32)(a) |
7,309 | 6,492,672 | ||||||
| 4.50%, 09/15/32 (Call 06/15/32)(a) |
7,212 | 7,055,031 | ||||||
| 4.90%, 04/15/29 (Call 03/15/29) |
2,735 | 2,745,549 | ||||||
| Lowe’s Companies Inc. |
||||||||
| 1.70%, 10/15/30 (Call 07/15/30) |
7,508 | 6,096,094 | ||||||
| 2.63%, 04/01/31 (Call 01/01/31) |
8,522 | 7,260,025 | ||||||
| 3.65%, 04/05/29 (Call 01/05/29)(a) |
509 | 479,769 | ||||||
| 3.75%, 04/01/32 (Call 01/01/32)(a) |
8,697 | 7,902,697 | ||||||
| 4.50%, 04/15/30 (Call 01/15/30)(a) |
7,091 | 6,889,601 | ||||||
| 5.00%, 04/15/33 (Call 01/15/33)(a) |
4,992 | 4,924,121 | ||||||
| 5.15%, 07/01/33 (Call 04/01/33)(a) |
7,340 | 7,307,856 | ||||||
| 6.50%, 03/15/29(a) |
1,336 | 1,430,896 | ||||||
| McDonald’s Corp. |
||||||||
| 2.13%, 03/01/30 (Call 12/01/29) |
4,512 | 3,861,556 | ||||||
| 2.63%, 09/01/29 (Call 06/01/29)(a) |
6,153 | 5,506,288 | ||||||
| 3.60%, 07/01/30 (Call 04/01/30)(a) |
5,994 | 5,554,774 | ||||||
| 4.60%, 09/09/32 (Call 06/09/32)(a) |
4,601 | 4,492,972 | ||||||
| 4.95%, 08/14/33 (Call 05/14/33)(a) |
4,668 | 4,630,949 | ||||||
| O’Reilly Automotive Inc. |
||||||||
| 1.75%, 03/15/31 (Call 12/15/30)(a) |
2,688 | 2,154,441 | ||||||
| 3.90%, 06/01/29 (Call 03/01/29) |
2,742 | 2,602,888 | ||||||
| 4.20%, 04/01/30 (Call 01/01/30) |
3,360 | 3,189,395 | ||||||
| 4.70%, 06/15/32 (Call 03/15/32)(a) |
5,350 | 5,176,307 | ||||||
| Ross Stores Inc., 1.88%, 04/15/31 |
3,429 | 2,785,943 | ||||||
| Starbucks Corp. |
||||||||
| 2.25%, 03/12/30 (Call 12/12/29) |
4,345 | 3,715,566 | ||||||
| 2.55%, 11/15/30 (Call 08/15/30)(a) |
7,584 | 6,514,429 | ||||||
| 3.00%, 02/14/32 (Call 11/14/31)(a) |
6,227 | 5,408,134 | ||||||
| 3.55%, 08/15/29 (Call 05/15/29)(a) |
5,512 | 5,170,011 | ||||||
| 4.80%, 02/15/33 (Call 11/15/32)(a) |
3,103 | 3,060,239 | ||||||
| 4.90%, 02/15/31 (Call 12/15/30)(a) |
2,390 | 2,361,074 | ||||||
| 5.00%, 02/15/34 (Call 11/15/33) |
1,995 | 1,963,333 | ||||||
| Target Corp. |
||||||||
| 2.35%, 02/15/30 (Call 11/15/29)(a) |
5,111 | 4,458,841 | ||||||
| 2.65%, 09/15/30 (Call 06/15/30)(a) |
2,904 | 2,550,319 | ||||||
| 3.38%, 04/15/29 (Call 01/15/29) |
5,500 | 5,167,041 | ||||||
| 4.40%, 01/15/33 (Call 10/15/32)(a) |
3,138 | 3,030,733 | ||||||
| 4.50%, 09/15/32 (Call 06/15/32)(a) |
6,158 | 5,961,671 | ||||||
| 6.35%, 11/01/32(a) |
770 | 841,171 | ||||||
| TJX Companies Inc. (The) |
||||||||
| 1.60%, 05/15/31 (Call 02/15/31)(a) |
3,037 | 2,450,685 | ||||||
| 3.88%, 04/15/30 (Call 01/15/30) |
3,458 | 3,279,686 | ||||||
| Tractor Supply Co. |
||||||||
| 1.75%, 11/01/30 (Call 08/01/30) |
4,129 | 3,320,779 | ||||||
| 5.25%, 05/15/33 (Call 02/15/33)(a) |
4,580 | 4,555,462 | ||||||
| Walmart Inc. |
||||||||
| 2.38%, 09/24/29 (Call 06/24/29)(a) |
1,865 | 1,665,612 | ||||||
| 3.25%, 07/08/29 (Call 04/08/29)(a) |
4,000 | 3,758,708 | ||||||
| 4.00%, 04/15/30 (Call 02/15/30)(a) |
3,441 | 3,335,643 | ||||||
| Security | Par (000) |
Value | ||||||
| Retail (continued) | ||||||||
| 4.10%, 04/15/33 (Call 01/15/33) |
$ | 8,175 | $ | 7,789,637 | ||||
| 4.15%, 09/09/32 (Call 06/09/32)(a) |
6,930 | 6,685,271 | ||||||
| 7.55%, 02/15/30(a) |
2,695 | 3,121,742 | ||||||
|
|
|
|||||||
| 314,792,371 | ||||||||
| Savings & Loans — 0.0% | ||||||||
| Nationwide Building Society, 3.96%, 07/18/30 |
5,216 | 4,773,067 | ||||||
|
|
|
|||||||
| Semiconductors — 2.8% | ||||||||
| Advanced Micro Devices Inc., 3.92%, 06/01/32 |
3,101 | 2,899,139 | ||||||
| Analog Devices Inc. |
||||||||
| 2.10%, 10/01/31 (Call 07/01/31)(a) |
5,985 | 4,944,294 | ||||||
| 4.25%, 10/01/32 (Call 07/01/32) |
200 | 188,838 | ||||||
| Applied Materials Inc., 1.75%, 06/01/30 |
4,844 | 4,040,264 | ||||||
| Broadcom Inc. |
||||||||
| 2.45%, 02/15/31 (Call 11/15/30)(b) |
15,576 | 13,012,386 | ||||||
| 2.60%, 02/15/33 (Call 11/15/32)(b) |
10,040 | 8,069,817 | ||||||
| 3.42%, 04/15/33 (Call 01/15/33)(a)(b) |
13,001 | 11,104,046 | ||||||
| 4.00%, 04/15/29 (Call 02/15/29)(b) |
3,968 | 3,757,142 | ||||||
| 4.15%, 11/15/30 (Call 08/15/30) |
11,203 | 10,480,682 | ||||||
| 4.15%, 04/15/32 (Call 01/15/32)(b) |
6,947 | 6,379,955 | ||||||
| 4.30%, 11/15/32 (Call 08/15/32) |
11,619 | 10,759,870 | ||||||
| 4.75%, 04/15/29 (Call 01/15/29) |
7,583 | 7,439,100 | ||||||
| 5.00%, 04/15/30 (Call 01/15/30)(a) |
4,361 | 4,354,370 | ||||||
| Foundry JV Holdco LLC, 5.88%, 01/25/34 |
4,455 | 4,432,419 | ||||||
| Intel Corp. |
||||||||
| 2.00%, 08/12/31 (Call 05/12/31) |
7,203 | 5,848,895 | ||||||
| 2.45%, 11/15/29 (Call 08/15/29) |
11,534 | 10,108,898 | ||||||
| 3.90%, 03/25/30 (Call 12/25/29) |
8,775 | 8,256,266 | ||||||
| 4.00%, 08/05/29 (Call 06/05/29)(a) |
5,330 | 5,097,490 | ||||||
| 4.00%, 12/15/32 |
4,321 | 3,988,927 | ||||||
| 4.15%, 08/05/32 (Call 05/05/32)(a) |
7,045 | 6,614,649 | ||||||
| 5.00%, 02/21/31 (Call 12/21/30) |
2,645 | 2,628,186 | ||||||
| 5.13%, 02/10/30 (Call 12/10/29) |
7,313 | 7,372,639 | ||||||
| 5.15%, 02/21/34 (Call 11/21/33) |
3,020 | 2,989,102 | ||||||
| 5.20%, 02/10/33 (Call 11/10/32)(a) |
12,495 | 12,508,878 | ||||||
| KLA Corp. |
||||||||
| 4.10%, 03/15/29 (Call 12/15/28)(a) |
1,486 | 1,442,946 | ||||||
| 4.65%, 07/15/32 (Call 04/15/32)(a) |
5,787 | 5,642,059 | ||||||
| 4.70%, 02/01/34 (Call 11/01/33) |
2,125 | 2,069,063 | ||||||
| Lam Research Corp. |
||||||||
| 1.90%, 06/15/30 (Call 03/15/30) |
4,812 | 4,036,461 | ||||||
| 4.00%, 03/15/29 (Call 12/15/28) |
5,323 | 5,139,090 | ||||||
| Marvell Technology Inc. |
||||||||
| 2.95%, 04/15/31 (Call 01/15/31)(a) |
4,875 | 4,178,367 | ||||||
| 5.95%, 09/15/33 (Call 06/15/33)(a) |
4,520 | 4,668,670 | ||||||
| Micron Technology Inc. |
||||||||
| 2.70%, 04/15/32 (Call 01/15/32) |
8,147 | 6,687,404 | ||||||
| 4.66%, 02/15/30 (Call 11/15/29) |
5,205 | 5,035,358 | ||||||
| 5.30%, 01/15/31 (Call 11/15/30) |
3,070 | 3,038,528 | ||||||
| 5.88%, 02/09/33 (Call 11/09/32) |
3,560 | 3,636,757 | ||||||
| 5.88%, 09/15/33 (Call 06/15/33)(a) |
4,507 | 4,595,189 | ||||||
| 6.75%, 11/01/29 (Call 09/01/29) |
7,513 | 7,974,615 | ||||||
| NVIDIA Corp. |
||||||||
| 2.00%, 06/15/31 (Call 03/15/31)(a) |
7,722 | 6,450,014 | ||||||
| 2.85%, 04/01/30 (Call 01/01/30) |
8,943 | 8,053,833 | ||||||
| S C H E D U L E O F I N V E S T M E N T S |
213 |
| Schedule of Investments (continued) February 29, 2024 |
iShares® 5-10 Year Investment Grade Corporate Bond ETF (Percentages shown are based on Net Assets) |
| Security | Par (000) |
Value | ||||||
| Semiconductors (continued) | ||||||||
| NXP BV/NXP Funding LLC/NXP USA Inc. |
||||||||
| 2.50%, 05/11/31 (Call 02/11/31) |
$ | 6,212 | $ | 5,141,627 | ||||
| 2.65%, 02/15/32 (Call 11/15/31) |
6,268 | 5,142,419 | ||||||
| 3.40%, 05/01/30 (Call 02/01/30) |
6,386 | 5,724,074 | ||||||
| 4.30%, 06/18/29 (Call 03/18/29) |
6,033 | 5,761,898 | ||||||
| 5.00%, 01/15/33 (Call 10/15/32) |
5,880 | 5,678,232 | ||||||
| Qorvo Inc. |
||||||||
| 3.38%, 04/01/31 (Call 04/01/26)(b) |
4,145 | 3,492,102 | ||||||
| 4.38%, 10/15/29 (Call 10/15/24)(a) |
4,948 | 4,603,017 | ||||||
| QUALCOMM Inc. |
||||||||
| 1.65%, 05/20/32 (Call 02/20/32)(a) |
7,252 | 5,661,562 | ||||||
| 2.15%, 05/20/30 (Call 02/20/30)(a) |
7,437 | 6,369,873 | ||||||
| 4.25%, 05/20/32 (Call 02/20/32) |
3,125 | 2,985,849 | ||||||
| 5.40%, 05/20/33 (Call 02/20/33)(a) |
3,645 | 3,783,323 | ||||||
| SK Hynix Inc. |
||||||||
| 2.38%, 01/19/31(b) |
4,623 | 3,802,789 | ||||||
| 6.50%, 01/17/33(a)(b) |
4,655 | 4,931,624 | ||||||
| Skyworks Solutions Inc., 3.00%, 06/01/31 |
3,009 | 2,520,723 | ||||||
| Texas Instruments Inc. |
||||||||
| 1.75%, 05/04/30 (Call 02/04/30) |
5,233 | 4,381,313 | ||||||
| 1.90%, 09/15/31 (Call 06/15/31)(a) |
2,200 | 1,815,992 | ||||||
| 2.25%, 09/04/29 (Call 06/04/29) |
4,676 | 4,127,785 | ||||||
| 3.65%, 08/16/32 (Call 05/16/32)(a) |
2,630 | 2,416,568 | ||||||
| 4.85%, 02/08/34 (Call 11/08/33)(a) |
1,600 | 1,589,459 | ||||||
| 4.90%, 03/14/33 (Call 12/14/32) |
3,750 | 3,754,922 | ||||||
| TSMC Arizona Corp. |
||||||||
| 2.50%, 10/25/31 (Call 07/25/31) |
8,039 | 6,809,937 | ||||||
| 4.13%, 04/22/29 (Call 02/22/29)(a) |
2,875 | 2,792,554 | ||||||
| 4.25%, 04/22/32 (Call 01/22/32)(a) |
5,125 | 4,995,446 | ||||||
| TSMC Global Ltd. |
||||||||
| 1.38%, 09/28/30 (Call 06/28/30)(a)(b) |
6,173 | 4,955,596 | ||||||
| 2.25%, 04/23/31 (Call 01/23/31)(b) |
8,095 | 6,801,204 | ||||||
| 4.63%, 07/22/32 (Call 04/22/32)(a)(b) |
2,110 | 2,082,576 | ||||||
| Xilinx Inc., 2.38%, 06/01/30 (Call 03/01/30)(a) |
4,834 | 4,185,970 | ||||||
|
|
|
|||||||
| 346,233,040 | ||||||||
| Shipbuilding — 0.0% | ||||||||
| Huntington Ingalls Industries Inc., 4.20%, |
2,827 | 2,660,863 | ||||||
|
|
|
|||||||
| Software — 1.9% | ||||||||
| Adobe Inc., 2.30%, 02/01/30 (Call 11/01/29) |
8,136 | 7,105,459 | ||||||
| Autodesk Inc. |
||||||||
| 2.40%, 12/15/31 (Call 09/15/31)(a) |
6,142 | 5,100,808 | ||||||
| 2.85%, 01/15/30 (Call 10/15/29) |
3,126 | 2,773,839 | ||||||
| Broadridge Financial Solutions Inc. |
||||||||
| 2.60%, 05/01/31 (Call 02/01/31) |
6,032 | 5,054,245 | ||||||
| 2.90%, 12/01/29 (Call 09/01/29) |
4,595 | 4,054,479 | ||||||
| Concentrix Corp., 6.85%, 08/02/33 |
3,843 | 3,757,673 | ||||||
| Constellation Software Inc., 5.46%, 02/16/34 |
1,125 | 1,124,885 | ||||||
| Electronic Arts Inc., 1.85%, 02/15/31 |
3,813 | 3,103,429 | ||||||
| Fidelity National Information Services Inc. |
||||||||
| 2.25%, 03/01/31 (Call 12/01/30)(a) |
7,899 | 6,614,699 | ||||||
| 3.75%, 05/21/29 (Call 02/21/29)(a) |
3,572 | 3,397,215 | ||||||
| 5.10%, 07/15/32 (Call 04/15/32)(a) |
4,363 | 4,362,622 | ||||||
| Fiserv Inc. |
||||||||
| 2.65%, 06/01/30 (Call 03/01/30) |
6,394 | 5,508,810 | ||||||
| 3.50%, 07/01/29 (Call 04/01/29) |
18,950 | 17,410,555 | ||||||
| Security | Par (000) |
Value | ||||||
| Software (continued) | ||||||||
| 5.35%, 03/15/31 (Call 01/15/31) |
$ | 2,675 | $ | 2,677,335 | ||||
| 5.45%, 03/15/34 (Call 12/15/33) |
2,675 | 2,671,628 | ||||||
| 5.60%, 03/02/33 (Call 12/02/32) |
5,492 | 5,541,077 | ||||||
| 5.63%, 08/21/33 (Call 05/21/33) |
5,580 | 5,638,444 | ||||||
| Intuit Inc. |
||||||||
| 1.65%, 07/15/30 (Call 04/15/30) |
3,603 | 2,955,372 | ||||||
| 5.20%, 09/15/33 (Call 06/15/33) |
6,391 | 6,457,168 | ||||||
| Microsoft Corp., 1.35%, 09/15/30 |
2,332 | 1,909,418 | ||||||
| MSCI Inc. |
||||||||
| 3.25%, 08/15/33 (Call 08/15/27)(a)(b) |
2,390 | 1,959,925 | ||||||
| 3.63%, 09/01/30 (Call 03/01/25)(b) |
5,360 | 4,727,693 | ||||||
| 3.63%, 11/01/31 (Call 11/01/26)(a)(b) |
3,815 | 3,303,712 | ||||||
| 3.88%, 02/15/31 (Call 06/01/25)(a)(b) |
5,990 | 5,328,394 | ||||||
| 4.00%, 11/15/29 (Call 11/15/24)(a)(b) |
5,910 | 5,425,380 | ||||||
| Oracle Corp. |
||||||||
| 2.88%, 03/25/31 (Call 12/25/30) |
18,459 | 15,919,499 | ||||||
| 2.95%, 04/01/30 (Call 01/01/30)(a) |
18,468 | 16,378,218 | ||||||
| 3.25%, 05/15/30 (Call 02/15/30)(a) |
2,896 | 2,595,881 | ||||||
| 4.65%, 05/06/30 (Call 03/06/30)(a) |
4,624 | 4,506,583 | ||||||
| 4.90%, 02/06/33 (Call 11/06/32)(a) |
8,841 | 8,548,760 | ||||||
| 6.15%, 11/09/29 (Call 09/09/29)(a) |
7,417 | 7,754,225 | ||||||
| 6.25%, 11/09/32 (Call 08/09/32) |
12,953 | 13,682,549 | ||||||
| Roper Technologies Inc. |
||||||||
| 1.75%, 02/15/31 (Call 11/15/30) |
6,013 | 4,808,803 | ||||||
| 2.00%, 06/30/30 (Call 03/30/30)(a) |
3,943 | 3,282,539 | ||||||
| 2.95%, 09/15/29 (Call 06/15/29)(a) |
4,281 | 3,833,161 | ||||||
| Salesforce Inc., 1.95%, 07/15/31 |
8,966 | 7,342,445 | ||||||
| ServiceNow Inc., 1.40%, 09/01/30 |
9,271 | 7,437,529 | ||||||
| Take-Two Interactive Software Inc., 4.00%, |
3,228 | 2,967,788 | ||||||
| VMware LLC |
||||||||
| 2.20%, 08/15/31 (Call 05/15/31) |
8,984 | 7,246,838 | ||||||
| 4.70%, 05/15/30 (Call 02/15/30)(a) |
4,714 | 4,535,725 | ||||||
| Workday Inc. |
||||||||
| 3.70%, 04/01/29 (Call 02/01/29) |
4,240 | 3,964,697 | ||||||
| 3.80%, 04/01/32 (Call 01/01/32)(a) |
7,855 | 7,100,080 | ||||||
|
|
|
|||||||
| 239,869,584 | ||||||||
| Telecommunications — 4.2% | ||||||||
| America Movil SAB de CV |
||||||||
| 2.88%, 05/07/30 (Call 02/07/30) |
5,656 | 4,963,604 | ||||||
| 3.63%, 04/22/29 (Call 01/22/29) |
5,087 | 4,734,600 | ||||||
| 4.70%, 07/21/32 (Call 04/21/32) |
4,455 | 4,283,285 | ||||||
| AT&T Inc. |
||||||||
| 2.25%, 02/01/32 (Call 11/01/31) |
15,089 | 12,100,904 | ||||||
| 2.55%, 12/01/33 (Call 09/01/33) |
21,280 | 16,784,086 | ||||||
| 2.75%, 06/01/31 (Call 03/01/31)(a) |
17,708 | 15,090,662 | ||||||
| 4.30%, 02/15/30 (Call 11/15/29) |
18,966 | 18,088,029 | ||||||
| 4.35%, 03/01/29 (Call 12/01/28)(a) |
4,106 | 3,962,426 | ||||||
| 5.40%, 02/15/34 (Call 11/15/33) |
7,730 | 7,740,210 | ||||||
| Bell Telephone Co. of Canada or Bell Canada |
||||||||
| 5.10%, 05/11/33 (Call 02/11/33)(a) |
4,835 | 4,773,806 | ||||||
| 5.20%, 02/15/34 (Call 11/15/33) |
3,195 | 3,152,511 | ||||||
| Series US-5, 2.15%, 02/15/32 |
2,199 | 1,760,875 | ||||||
| Bharti Airtel Ltd., 3.25%, 06/03/31 |
1,690 | 1,480,156 | ||||||
| 214 | 2 0 2 4 I S H A R E S A N N U A L R E P O R T T O S H A R E H O L D E R S |
| Schedule of Investments (continued) February 29, 2024 |
iShares® 5-10 Year Investment Grade Corporate Bond ETF (Percentages shown are based on Net Assets) |
| Security | Par (000) |
Value | ||||||
| Telecommunications (continued) | ||||||||
| British Telecommunications PLC |
||||||||
| 3.25%, 11/08/29 (Call 08/08/29)(a)(b) |
$ | 6,844 | $ | 6,154,022 | ||||
| 9.63%, 12/15/30 |
14,908 | 18,247,589 | ||||||
| Cisco Systems Inc. |
||||||||
| 4.95%, 02/26/31 (Call 12/26/30) |
5,850 | 5,852,898 | ||||||
| 5.05%, 02/26/34 (Call 11/26/33) |
6,070 | 6,110,073 | ||||||
| Deutsche Telekom International Finance BV |
||||||||
| 8.75%, 06/15/30 |
20,372 | 24,037,899 | ||||||
| 9.25%, 06/01/32 |
3,160 | 3,988,501 | ||||||
| Empresa Nacional de Telecomunicaciones SA, |
490 | 386,487 | ||||||
| Juniper Networks Inc. |
||||||||
| 2.00%, 12/10/30 (Call 09/10/30)(a) |
2,734 | 2,202,684 | ||||||
| 3.75%, 08/15/29 (Call 05/15/29)(a) |
3,070 | 2,845,134 | ||||||
| Koninklijke KPN NV, 8.38%, 10/01/30 |
5,482 | 6,380,232 | ||||||
| Motorola Solutions Inc. |
||||||||
| 2.30%, 11/15/30 (Call 08/15/30) |
5,635 | 4,644,580 | ||||||
| 2.75%, 05/24/31 (Call 02/24/31) |
5,512 | 4,602,330 | ||||||
| 4.60%, 05/23/29 (Call 02/23/29)(a) |
4,741 | 4,606,725 | ||||||
| 5.60%, 06/01/32 (Call 03/01/32)(a) |
3,802 | 3,811,669 | ||||||
| NBN Co. Ltd. |
||||||||
| 2.50%, 01/08/32 (Call 10/08/31)(a)(b) |
3,590 | 2,957,951 | ||||||
| 2.63%, 05/05/31 (Call 02/05/31)(a)(b) |
7,113 | 6,019,575 | ||||||
| 6.00%, 10/06/33 (Call 07/06/33)(a)(b) |
5,045 | 5,362,343 | ||||||
| NTT Finance Corp., 2.07%, 04/03/31 |
5,224 | 4,295,725 | ||||||
| Ooredoo International Finance Ltd.,
2.63%, |
5,585 | 4,783,888 | ||||||
| Orange SA, 9.00%, 03/01/31 |
14,941 | 18,060,494 | ||||||
| Rogers Communications Inc. |
||||||||
| 3.80%, 03/15/32 (Call 12/15/31) |
10,995 | 9,771,443 | ||||||
| 5.30%, 02/15/34 (Call 11/15/33)(a) |
580 | 569,259 | ||||||
| Saudi Telecom Co., 3.89%, 05/13/29(b) |
5,615 | 5,326,296 | ||||||
| Sprint Capital Corp., 8.75%, 03/15/32 |
11,506 | 13,896,061 | ||||||
| Telefonica Europe BV, 8.25%, 09/15/30(a) |
13,696 | 15,570,214 | ||||||
| Telefonica Moviles Chile SA, 3.54%, 11/18/31 |
1,270 | 943,614 | ||||||
| TELUS Corp., 3.40%, 05/13/32 (Call 02/13/32) |
5,552 | 4,818,794 | ||||||
| T-Mobile USA Inc. |
||||||||
| 2.25%, 11/15/31 (Call 08/15/31) |
5,763 | 4,675,723 | ||||||
| 2.40%, 03/15/29 (Call 01/15/29) |
2,234 | 1,967,769 | ||||||
| 2.55%, 02/15/31 (Call 11/15/30)(a) |
14,374 | 12,119,146 | ||||||
| 2.70%, 03/15/32 (Call 12/15/31)(a) |
5,877 | 4,891,340 | ||||||
| 2.88%, 02/15/31 (Call 02/15/26) |
6,390 | 5,495,955 | ||||||
| 3.38%, 04/15/29 (Call 04/15/24) |
12,915 | 11,840,760 | ||||||
| 3.50%, 04/15/31 (Call 04/15/26)(a) |
14,013 | 12,503,713 | ||||||
| 3.88%, 04/15/30 (Call 01/15/30) |
39,464 | 36,631,115 | ||||||
| 5.05%, 07/15/33 (Call 04/15/33)(a) |
14,562 | 14,242,440 | ||||||
| 5.15%, 04/15/34 (Call 01/15/34) |
1,620 | 1,595,179 | ||||||
| 5.20%, 01/15/33 (Call 10/15/32) |
7,046 | 7,004,102 | ||||||
| 5.75%, 01/15/34 (Call 10/15/33) |
1,285 | 1,322,671 | ||||||
| Verizon Communications Inc. |
||||||||
| 1.50%, 09/18/30 (Call 06/18/30)(a) |
6,787 | 5,448,486 | ||||||
| 1.68%, 10/30/30 (Call 07/30/30) |
6,814 | 5,493,269 | ||||||
| 1.75%, 01/20/31 (Call 10/20/30) |
12,630 | 10,129,318 | ||||||
| 2.36%, 03/15/32 (Call 12/15/31) |
25,960 | 21,048,069 | ||||||
| 2.55%, 03/21/31 (Call 12/21/30) |
20,757 | 17,494,546 | ||||||
| 3.15%, 03/22/30 (Call 12/22/29) |
8,726 | 7,802,771 | ||||||
| 4.02%, 12/03/29 (Call 09/03/29) |
22,212 | 21,047,456 | ||||||
| 4.50%, 08/10/33(a) |
6,683 | 6,306,777 | ||||||
| 5.05%, 05/09/33 (Call 02/09/33)(a) |
11,453 | 11,341,678 | ||||||
| Security | Par (000) |
Value | ||||||
| Telecommunications (continued) | ||||||||
| 6.40%, 09/15/33 |
$ | 3,300 | $ | 3,549,598 | ||||
| 7.75%, 12/01/30(a) |
3,384 | 3,867,476 | ||||||
| Vodafone Group PLC |
||||||||
| 6.25%, 11/30/32(a) |
3,635 | 3,857,319 | ||||||
| 7.88%, 02/15/30 |
8,012 | 9,090,137 | ||||||
| Xiaomi Best Time International Ltd. |
||||||||
| 2.88%, 07/14/31 (Call 04/14/31)(a)(b) |
3,670 | 3,020,552 | ||||||
| 3.38%, 04/29/30 (Call 01/29/30)(a)(b) |
2,390 | 2,085,553 | ||||||
|
|
|
|||||||
| 531,034,552 | ||||||||
| Toys, Games & Hobbies — 0.0% | ||||||||
| Hasbro Inc., 3.90%, 11/19/29 (Call 08/19/29)(a) |
5,295 | 4,852,575 | ||||||
| Mattel Inc., 3.75%, 04/01/29 |
1,970 | 1,799,180 | ||||||
|
|
|
|||||||
| 6,651,755 | ||||||||
| Transportation — 1.1% | ||||||||
| AP Moller - Maersk A/S |
||||||||
| 4.50%, 06/20/29 (Call 03/20/29)(a)(b) |
3,251 | 3,180,683 | ||||||
| 5.88%, 09/14/33 (Call 06/14/33)(b) |
4,643 | 4,676,558 | ||||||
| Burlington Northern Santa Fe LLC,
7.95%, |
855 | 993,002 | ||||||
| Canadian National Railway Co. |
||||||||
| 3.85%, 08/05/32 (Call 05/05/32) |
4,935 | 4,538,606 | ||||||
| 5.85%, 11/01/33 (Call 08/01/33) |
1,285 | 1,364,922 | ||||||
| Canadian Pacific Railway Co. |
||||||||
| 2.05%, 03/05/30 (Call 12/05/29) |
3,600 | 3,035,261 | ||||||
| 2.45%, 12/02/31 (Call 09/02/31)(a) |
8,818 | 7,841,761 | ||||||
| 2.88%, 11/15/29 (Call 08/15/29)(a) |
3,113 | 2,766,995 | ||||||
| 5.75%, 03/15/33(a) |
260 | 266,927 | ||||||
| 7.13%, 10/15/31(a) |
1,832 | 2,046,479 | ||||||
| CSX Corp. |
||||||||
| 2.40%, 02/15/30 (Call 11/15/29) |
2,907 | 2,525,537 | ||||||
| 4.10%, 11/15/32 (Call 08/15/32)(a) |
5,673 | 5,300,410 | ||||||
| 5.20%, 11/15/33 (Call 08/15/33)(a) |
5,180 | 5,216,057 | ||||||
| Empresa de Transporte de Pasajeros Metro SA, |
2,850 | 2,592,205 | ||||||
| FedEx Corp. |
||||||||
| 2.40%, 05/15/31 (Call 02/15/31)(a) |
6,263 | 5,230,944 | ||||||
| 3.10%, 08/05/29 (Call 05/05/29) |
6,115 | 5,548,670 | ||||||
| 4.25%, 05/15/30 (Call 02/15/30)(a) |
4,879 | 4,653,760 | ||||||
| 4.90%, 01/15/34(a) |
600 | 584,319 | ||||||
| Norfolk Southern Corp. |
||||||||
| 2.30%, 05/15/31 (Call 02/15/31)(a) |
3,286 | 2,742,641 | ||||||
| 2.55%, 11/01/29 (Call 08/01/29) |
2,856 | 2,511,722 | ||||||
| 3.00%, 03/15/32 (Call 12/15/31)(a) |
3,823 | 3,287,750 | ||||||
| 4.45%, 03/01/33 (Call 12/01/32)(a) |
3,313 | 3,157,404 | ||||||
| 5.05%, 08/01/30 (Call 06/01/30) |
4,020 | 4,015,499 | ||||||
| 5.55%, 03/15/34 (Call 12/15/33) |
2,605 | 2,674,383 | ||||||
| 7.25%, 02/15/31(a) |
235 | 258,523 | ||||||
| Ryder System Inc., 6.60%, 12/01/33 |
1,480 | 1,584,649 | ||||||
| TTX Co., 5.75%, 11/22/33 (Call 08/22/33)(a)(b) |
1,130 | 1,181,967 | ||||||
| Union Pacific Corp. |
||||||||
| 2.38%, 05/20/31 (Call 02/20/31)(a) |
6,048 | 5,110,138 | ||||||
| 2.40%, 02/05/30 (Call 11/05/29) |
4,823 | 4,204,431 | ||||||
| 2.80%, 02/14/32 (Call 12/15/31)(a) |
7,388 | 6,341,059 | ||||||
| 3.70%, 03/01/29 (Call 12/01/28)(a) |
4,696 | 4,479,262 | ||||||
| 4.50%, 01/20/33 (Call 10/20/32)(a) |
5,515 | 5,348,212 | ||||||
| United Parcel Service Inc. |
||||||||
| 2.50%, 09/01/29 (Call 06/01/29) |
2,768 | 2,467,175 | ||||||
| 3.40%, 03/15/29 (Call 12/15/28)(a) |
1,384 | 1,308,081 | ||||||
| S C H E D U L E O F I N V E S T M E N T S |
215 |
| Schedule of Investments (continued) February 29, 2024 |
iShares® 5-10 Year Investment Grade Corporate Bond ETF (Percentages shown are based on Net Assets) |
| Security | Par (000) |
Value | ||||||
| Transportation (continued) | ||||||||
| 4.45%, 04/01/30 (Call 01/01/30)(a) |
$ | 4,680 | $ | 4,606,603 | ||||
| 4.88%, 03/03/33 (Call 12/03/32)(a) |
5,758 | 5,709,245 | ||||||
| United Parcel Service of America Inc.,
7.62%, |
836 | 941,779 | ||||||
| Walmart Inc., 1.80%, 09/22/31 (Call 06/22/31) |
10,738 | 8,805,288 | ||||||
|
|
|
|||||||
| 133,098,907 | ||||||||
| Trucking & Leasing — 0.2% | ||||||||
| GATX Corp. |
||||||||
| 1.90%, 06/01/31 (Call 03/01/31)(a) |
2,262 | 1,773,319 | ||||||
| 3.50%, 06/01/32 (Call 03/01/32)(a) |
2,277 | 1,969,258 | ||||||
| 4.00%, 06/30/30 (Call 03/30/30) |
2,543 | 2,355,362 | ||||||
| 4.70%, 04/01/29 (Call 01/01/29)(a) |
2,676 | 2,616,124 | ||||||
| 4.90%, 03/15/33 (Call 12/15/32)(a) |
1,922 | 1,830,456 | ||||||
| 5.45%, 09/15/33 (Call 06/15/33)(a) |
1,855 | 1,844,297 | ||||||
| Penske Truck Leasing Co. LP/PTL |
||||||||
| 3.35%, 11/01/29 (Call 08/01/29)(b) |
1,982 | 1,763,627 | ||||||
| 6.20%, 06/15/30 (Call 04/15/30)(b) |
3,550 | 3,677,108 | ||||||
| SMBC Aviation Capital Finance DAC, 5.70%, |
5,888 | 5,887,499 | ||||||
|
|
|
|||||||
| 23,717,050 | ||||||||
| Water — 0.2% | ||||||||
| American Water Capital Corp. |
||||||||
| 2.30%, 06/01/31 (Call 03/01/31) |
2,950 | 2,444,640 | ||||||
| 2.80%, 05/01/30 (Call 02/01/30) |
3,390 | 2,975,048 | ||||||
| 3.45%, 06/01/29 (Call 03/01/29)(a) |
2,912 | 2,707,813 | ||||||
| 4.45%, 06/01/32 (Call 03/01/32)(a) |
4,960 | 4,744,384 | ||||||
| 5.15%, 03/01/34 (Call 12/01/33) |
2,700 | 2,677,592 | ||||||
| Essential Utilities Inc. |
||||||||
| 2.40%, 05/01/31 (Call 02/01/31)(a) |
3,343 | 2,743,245 | ||||||
| 2.70%, 04/15/30 (Call 01/15/30)(a) |
2,634 | 2,266,710 | ||||||
| 3.57%, 05/01/29 (Call 02/01/29)(a) |
1,937 | 1,796,097 | ||||||
| 5.38%, 01/15/34 (Call 10/15/33) |
1,810 | 1,780,001 | ||||||
|
|
|
|||||||
| 24,135,530 | ||||||||
|
|
|
|||||||
| Total Corporate Bonds & Notes — 98.4% |
|
12,347,796,947 | ||||||
|
|
|
|||||||
| Foreign Government Obligations(f) |
|
|||||||
| South Korea — 0.1% | ||||||||
| Korea Gas Corp., 2.00%, 07/13/31(b) |
2,620 | 2,128,185 | ||||||
| Korea Housing Finance Corp.,
4.63%, |
2,560 | 2,469,680 | ||||||
| Security | Par (000) |
Value | ||||||
| South Korea (continued) | ||||||||
| Korea National Oil Corp. |
||||||||
| 2.38%, 04/07/31(b) |
$ | 1,900 | $ | 1,595,718 | ||||
| 2.63%, 04/18/32(b) |
3,270 | 2,717,473 | ||||||
|
|
|
|||||||
| 8,911,056 | ||||||||
|
|
|
|||||||
| Total Foreign Government Obligations — 0.1% |
|
8,911,056 | ||||||
|
|
|
|||||||
| Total Long-Term Investments — 98.5% |
12,356,708,003 | |||||||
|
|
|
|||||||
| Shares |
||||||||
| Short-Term Securities |
||||||||
| Money Market Funds — 14.3% | ||||||||
| BlackRock Cash Funds: Institutional, SL Agency Shares, 5.50%(g)(h)(i) |
1,730,932,354 | 1,731,797,820 | ||||||
| BlackRock Cash Funds: Treasury, SL Agency Shares, 5.30%(g)(h) |
58,470,000 | 58,470,000 | ||||||
|
|
|
|||||||
| Total Short-Term Securities — 14.3% |
1,790,267,820 | |||||||
|
|
|
|||||||
| Total Investments — 112.8% |
14,146,975,823 | |||||||
| Liabilities in Excess of Other Assets — (12.8)% |
|
(1,607,375,229 | ) | |||||
|
|
|
|||||||
| Net Assets — 100.0% |
$ | 12,539,600,594 | ||||||
|
|
|
|||||||
| (a) | All or a portion of this security is on loan. |
| (b) | Security exempt from registration pursuant to Rule 144A under the Securities Act of 1933, as amended. These securities may be resold in transactions exempt from registration to qualified institutional investors. |
| (c) | Variable rate security. Interest rate resets periodically. The rate shown is the effective interest rate as of period end. Security description also includes the reference rate and spread if published and available. |
| (d) | Perpetual security with no stated maturity date. |
| (e) | Step coupon security. Coupon rate will either increase (step-up bond) or decrease (step-down bond) at regular intervals until maturity. Interest rate shown reflects the rate currently in effect. |
| (f) | U.S. dollar denominated security issued by foreign domiciled entity. |
| (g) | Affiliate of the Fund. |
| (h) | Annualized 7-day yield as of period end. |
| (i) | All or a portion of this security was purchased with the cash collateral from loaned securities. |
| 216 | 2 0 2 4 I S H A R E S A N N U A L R E P O R T T O S H A R E H O L D E R S |
| Schedule of Investments (continued) February 29, 2024 |
iShares® 5-10 Year Investment Grade Corporate Bond ETF |
Affiliates
Investments in issuers considered to be affiliate(s) of the Fund during the year ended February 29, 2024 for purposes of Section 2(a)(3) of the Investment Company Act of 1940, as amended, were as follows:
| Affiliated Issuer | Value at 02/28/23 |
Purchases at Cost |
Proceeds from Sale |
Net Gain (Loss) |
Change in Unrealized Appreciation (Depreciation) |
Value at 02/29/24 |
Shares Held at 02/29/24 |
Income | Capital Gain Distributions from Underlying Funds |
|||||||||||||||||||||||||||||||||||||
| BlackRock Cash Funds: Institutional, SL Agency Shares |
$ | 1,290,306,207 | $ | 441,696,772 | (a) | $ | — | $ | (95,544 | ) | $ | (109,615 | ) | $ | 1,731,797,820 | 1,730,932,354 | $ | 5,874,822 | (b) | $ | — | |||||||||||||||||||||||||
| BlackRock Cash Funds: Treasury, SL Agency Shares |
19,842,000 | 38,628,000 | (a) | — | — | — | 58,470,000 | 58,470,000 | 2,297,629 | — | ||||||||||||||||||||||||||||||||||||
|
|
|
|
|
|
|
|
|
|
|
|||||||||||||||||||||||||||||||||||||
| $ | (95,544 | ) | $ | (109,615 | ) | $ | 1,790,267,820 | $ | 8,172,451 | $ | — | |||||||||||||||||||||||||||||||||||
|
|
|
|
|
|
|
|
|
|
|
|||||||||||||||||||||||||||||||||||||
| (a) | Represents net amount purchased (sold). |
| (b) | All or a portion represents securities lending income earned from the reinvestment of cash collateral from loaned securities, net of fees and collateral investment expenses, and other payments to and from borrowers of securities. |
Fair Value Hierarchy as of Period End
Various inputs are used in determining the fair value of financial instruments. For a description of the input levels and information about the Fund’s policy regarding valuation of financial instruments, refer to the Notes to Financial Statements.
The following table summarizes the Fund’s financial instruments categorized in the fair value hierarchy. The breakdown of the Fund’s financial instruments into major categories is disclosed in the Schedule of Investments above.
|
|
||||||||||||||||
| Level 1 | Level 2 | Level 3 | Total | |||||||||||||
|
|
||||||||||||||||
| Assets |
||||||||||||||||
| Investments |
||||||||||||||||
| Long-Term Investments |
||||||||||||||||
| Corporate Bonds & Notes |
$ | — | $ | 12,347,796,947 | $ | — | $ | 12,347,796,947 | ||||||||
| Foreign Government Obligations |
— | 8,911,056 | — | 8,911,056 | ||||||||||||
| Short-Term Securities |
||||||||||||||||
| Money Market Funds |
1,790,267,820 | — | — | 1,790,267,820 | ||||||||||||
|
|
|
|
|
|
|
|
|
|||||||||
| $ | 1,790,267,820 | $ | 12,356,708,003 | $ | — | $ | 14,146,975,823 | |||||||||
|
|
|
|
|
|
|
|
|
|||||||||
See notes to financial statements.
| S C H E D U L E O F I N V E S T M E N T S |
217 |
| Schedule of Investments February 29, 2024 |
iShares® 10+ Year Investment Grade Corporate Bond ETF (Percentages shown are based on Net Assets) |
| Security | Par (000) |
Value | ||||||
| Corporate Bonds & Notes |
||||||||
| Advertising — 0.0% | ||||||||
| Interpublic Group of Companies Inc. (The) |
||||||||
| 3.38%, 03/01/41 (Call 09/01/40)(a) |
$ | 217 | $ | 159,255 | ||||
| 5.40%, 10/01/48 (Call 04/01/48) |
278 | 257,254 | ||||||
|
|
|
|||||||
| 416,509 | ||||||||
| Aerospace & Defense — 2.5% | ||||||||
| Airbus SE, 3.95%, 04/10/47 (Call 10/10/46)(a)(b) |
465 | 381,669 | ||||||
| BAE Systems Holdings Inc., 4.75%, 10/07/44(b) |
194 | 172,713 | ||||||
| BAE Systems PLC |
||||||||
| 3.00%, 09/15/50 (Call 03/15/50)(b) |
257 | 172,272 | ||||||
| 5.80%, 10/11/41(b) |
772 | 778,564 | ||||||
| Boeing Co. (The) |
||||||||
| 3.25%, 02/01/35 (Call 11/01/34) |
765 | 615,037 | ||||||
| 3.30%, 03/01/35 (Call 09/01/34) |
349 | 272,999 | ||||||
| 3.38%, 06/15/46 (Call 12/15/45)(a) |
387 | 262,712 | ||||||
| 3.50%, 03/01/39 (Call 09/01/38) |
157 | 119,091 | ||||||
| 3.50%, 03/01/45 (Call 09/01/44) |
358 | 246,288 | ||||||
| 3.55%, 03/01/38 (Call 09/01/37) |
413 | 319,581 | ||||||
| 3.60%, 05/01/34 (Call 02/01/34) |
379 | 318,563 | ||||||
| 3.63%, 03/01/48 (Call 09/01/47)(a) |
315 | 218,221 | ||||||
| 3.65%, 03/01/47 (Call 09/01/46)(a) |
242 | 170,185 | ||||||
| 3.75%, 02/01/50 (Call 08/01/49)(a) |
1,080 | 766,755 | ||||||
| 3.83%, 03/01/59 (Call 09/01/58) |
283 | 196,444 | ||||||
| 3.85%, 11/01/48 (Call 05/01/48) |
290 | 210,288 | ||||||
| 3.90%, 05/01/49 (Call 11/01/48) |
799 | 589,743 | ||||||
| 3.95%, 08/01/59 (Call 02/01/59)(a) |
1,097 | 781,912 | ||||||
| 5.71%, 05/01/40 (Call 11/01/39) |
2,453 | 2,389,484 | ||||||
| 5.81%, 05/01/50 (Call 11/01/49)(a) |
4,619 | 4,452,163 | ||||||
| 5.88%, 02/15/40(a) |
412 | 405,877 | ||||||
| 5.93%, 05/01/60 (Call 11/01/59) |
3,021 | 2,892,270 | ||||||
| 6.63%, 02/15/38(a) |
226 | 239,974 | ||||||
| 6.88%, 03/15/39 |
392 | 425,564 | ||||||
| General Dynamics Corp. |
||||||||
| 2.85%, 06/01/41 (Call 12/01/40) |
227 | 164,477 | ||||||
| 3.60%, 11/15/42 (Call 05/15/42) |
634 | 506,310 | ||||||
| 4.25%, 04/01/40 (Call 10/01/39) |
569 | 505,901 | ||||||
| 4.25%, 04/01/50 (Call 10/01/49) |
608 | 524,346 | ||||||
| Howmet Aerospace Inc., 5.95%, 02/01/37(a) |
630 | 639,703 | ||||||
| L3Harris Technologies Inc. |
||||||||
| 4.85%, 04/27/35 (Call 10/27/34) |
293 | 278,527 | ||||||
| 5.05%, 04/27/45 (Call 10/27/44) |
382 | 357,903 | ||||||
| 5.60%, 07/31/53 (Call 01/31/53) |
419 | 422,395 | ||||||
| 6.15%, 12/15/40 |
490 | 514,714 | ||||||
| Lockheed Martin Corp. |
||||||||
| 2.80%, 06/15/50 (Call 12/15/49) |
751 | 496,565 | ||||||
| 3.60%, 03/01/35 (Call 09/01/34) |
915 | 800,820 | ||||||
| 3.80%, 03/01/45 (Call 09/01/44) |
904 | 732,417 | ||||||
| 4.07%, 12/15/42 |
1,123 | 961,772 | ||||||
| 4.09%, 09/15/52 (Call 03/15/52) |
1,295 | 1,076,653 | ||||||
| 4.15%, 06/15/53 (Call 12/15/52) |
640 | 531,016 | ||||||
| 4.30%, 06/15/62 (Call 12/15/61) |
499 | 417,804 | ||||||
| 4.50%, 05/15/36 (Call 11/15/35) |
377 | 356,385 | ||||||
| 4.70%, 05/15/46 (Call 11/15/45) |
1,082 | 997,205 | ||||||
| 4.80%, 08/15/34 (Call 05/15/34) |
400 | 391,135 | ||||||
| 5.20%, 02/15/55 (Call 08/15/54) |
540 | 530,430 | ||||||
| 5.20%, 02/15/64 (Call 08/15/63) |
290 | 283,212 | ||||||
| 5.70%, 11/15/54 (Call 05/15/54)(a) |
827 | 872,935 | ||||||
| 5.72%, 06/01/40 |
333 | 348,847 | ||||||
| 5.90%, 11/15/63 (Call 05/15/63) |
595 | 647,776 | ||||||
| Series B, 6.15%, 09/01/36 |
660 | 714,288 | ||||||
| Security | Par (000) |
Value | ||||||
| Aerospace & Defense (continued) | ||||||||
| Northrop Grumman Corp. |
||||||||
| 3.85%, 04/15/45 (Call 10/15/44) |
$ | 659 | $ | 523,933 | ||||
| 4.03%, 10/15/47 (Call 04/15/47) |
1,997 | 1,611,796 | ||||||
| 4.75%, 06/01/43 |
852 | 773,772 | ||||||
| 4.95%, 03/15/53 (Call 09/15/52)(a) |
828 | 765,232 | ||||||
| 5.05%, 11/15/40 |
255 | 244,406 | ||||||
| 5.15%, 05/01/40 (Call 11/01/39) |
122 | 118,432 | ||||||
| 5.20%, 06/01/54 (Call 12/01/53) |
1,000 | 959,197 | ||||||
| 5.25%, 05/01/50 (Call 11/01/49) |
838 | 807,941 | ||||||
| RTX Corp. |
||||||||
| 2.82%, 09/01/51 (Call 03/01/51) |
901 | 563,399 | ||||||
| 3.03%, 03/15/52 (Call 09/15/51) |
1,089 | 711,888 | ||||||
| 3.13%, 07/01/50 (Call 01/01/50)(a) |
985 | 662,532 | ||||||
| 3.75%, 11/01/46 (Call 05/01/46) |
1,120 | 854,901 | ||||||
| 4.05%, 05/04/47 (Call 11/04/46) |
619 | 495,996 | ||||||
| 4.15%, 05/15/45 (Call 11/16/44) |
788 | 646,623 | ||||||
| 4.20%, 12/15/44 (Call 06/15/44)(a) |
335 | 265,227 | ||||||
| 4.35%, 04/15/47 (Call 10/15/46) |
953 | 797,757 | ||||||
| 4.45%, 11/16/38 (Call 05/16/38) |
513 | 457,282 | ||||||
| 4.50%, 06/01/42 |
3,150 | 2,754,075 | ||||||
| 4.63%, 11/16/48 (Call 05/16/48) |
1,592 | 1,391,082 | ||||||
| 4.70%, 12/15/41 |
300 | 268,111 | ||||||
| 4.80%, 12/15/43 (Call 06/15/43) |
124 | 111,608 | ||||||
| 4.88%, 10/15/40 |
277 | 255,563 | ||||||
| 5.38%, 02/27/53 (Call 08/27/52)(a) |
1,265 | 1,227,081 | ||||||
| 5.40%, 05/01/35 |
230 | 231,718 | ||||||
| 5.70%, 04/15/40 |
440 | 441,454 | ||||||
| 6.05%, 06/01/36 |
470 | 489,404 | ||||||
| 6.13%, 07/15/38(a) |
575 | 606,141 | ||||||
| 6.40%, 03/15/54 (Call 09/15/53)(a) |
1,525 | 1,688,176 | ||||||
|
|
|
|||||||
| 52,196,632 | ||||||||
| Agriculture — 1.4% | ||||||||
| Altria Group Inc. |
||||||||
| 3.40%, 02/04/41 (Call 08/04/40) |
1,164 | 837,079 | ||||||
| 3.70%, 02/04/51 (Call 08/04/50) |
1,304 | 887,827 | ||||||
| 3.88%, 09/16/46 (Call 03/16/46) |
1,176 | 865,221 | ||||||
| 4.00%, 02/04/61 (Call 08/04/60) |
839 | 603,661 | ||||||
| 4.25%, 08/09/42 |
772 | 618,883 | ||||||
| 4.45%, 05/06/50 (Call 11/06/49) |
507 | 399,826 | ||||||
| 4.50%, 05/02/43(a) |
599 | 497,287 | ||||||
| 5.38%, 01/31/44(a) |
1,554 | 1,510,288 | ||||||
| 5.80%, 02/14/39 (Call 08/14/38)(a) |
1,496 | 1,491,814 | ||||||
| 5.95%, 02/14/49 (Call 08/14/48)(a) |
2,164 | 2,155,742 | ||||||
| 6.20%, 02/14/59 (Call 08/14/58) |
226 | 229,654 | ||||||
| Archer-Daniels-Midland Co. |
||||||||
| 2.70%, 09/15/51 (Call 03/15/51) |
450 | 284,603 | ||||||
| 3.75%, 09/15/47 (Call 03/15/47) |
239 | 181,131 | ||||||
| 4.02%, 04/16/43(a) |
328 | 268,936 | ||||||
| 4.50%, 03/15/49 (Call 09/15/48)(a) |
304 | 264,184 | ||||||
| 4.54%, 03/26/42(a) |
386 | 344,707 | ||||||
| 5.38%, 09/15/35 |
750 | 748,930 | ||||||
| 5.77%, 03/01/41(c) |
169 | 170,971 | ||||||
| BAT Capital Corp. |
||||||||
| 3.73%, 09/25/40 (Call 03/25/40) |
513 | 373,102 | ||||||
| 3.98%, 09/25/50 (Call 03/25/50) |
1,023 | 698,236 | ||||||
| 4.39%, 08/15/37 (Call 02/15/37) |
2,057 | 1,686,950 | ||||||
| 4.54%, 08/15/47 (Call 02/15/47) |
2,013 | 1,509,798 | ||||||
| 4.76%, 09/06/49 (Call 03/06/49) |
952 | 736,505 | ||||||
| 5.28%, 04/02/50 (Call 10/02/49) |
375 | 310,925 | ||||||
| 5.65%, 03/16/52 (Call 09/16/51) |
483 | 424,260 | ||||||
| 7.08%, 08/02/43 (Call 02/02/43) |
657 | 684,656 | ||||||
| 218 | 2 0 2 4 I S H A R E S A N N U A L R E P O R T T O S H A R E H O L D E R S |
| Schedule of Investments (continued) February 29, 2024 |
iShares® 10+ Year Investment Grade Corporate Bond ETF (Percentages shown are based on Net Assets) |
| Security | Par (000) | Value | ||||||
| Agriculture (continued) | ||||||||
| 7.08%, 08/02/53 (Call 02/02/53) |
$ | 1,037 | $ | 1,073,523 | ||||
| Cargill Inc. |
||||||||
| 3.13%, 05/25/51 (Call 11/25/50)(a)(b) |
665 | 456,711 | ||||||
| 3.88%, 05/23/49 (Call 11/23/48)(b) |
258 | 203,108 | ||||||
| 4.38%, 04/22/52 (Call 10/22/51)(a)(b) |
486 | 420,317 | ||||||
| 4.76%, 11/23/45(a)(b) |
484 | 443,329 | ||||||
| Philip Morris International Inc. |
||||||||
| 3.88%, 08/21/42 |
639 | 503,998 | ||||||
| 4.13%, 03/04/43 |
658 | 538,461 | ||||||
| 4.25%, 11/10/44 |
1,115 | 919,370 | ||||||
| 4.38%, 11/15/41 |
658 | 559,320 | ||||||
| 4.50%, 03/20/42 |
662 | 572,093 | ||||||
| 4.88%, 11/15/43 |
661 | 594,970 | ||||||
| 6.38%, 05/16/38 |
1,378 | 1,486,794 | ||||||
| Reynolds American Inc. |
||||||||
| 5.70%, 08/15/35 (Call 02/15/35) |
618 | 590,311 | ||||||
| 5.85%, 08/15/45 (Call 02/15/45) |
1,844 | 1,675,281 | ||||||
| 6.15%, 09/15/43 |
531 | 513,500 | ||||||
| 7.25%, 06/15/37 |
476 | 509,234 | ||||||
|
|
|
|||||||
| 29,845,496 | ||||||||
| Apparel — 0.2% | ||||||||
| NIKE Inc. |
||||||||
| 3.25%, 03/27/40 (Call 09/27/39) |
529 | 420,312 | ||||||
| 3.38%, 11/01/46 (Call 05/01/46) |
594 | 451,235 | ||||||
| 3.38%, 03/27/50 (Call 09/27/49)(a) |
1,337 | 1,014,603 | ||||||
| 3.63%, 05/01/43 (Call 11/01/42) |
800 | 654,215 | ||||||
| 3.88%, 11/01/45 (Call 05/01/45) |
898 | 743,389 | ||||||
| VF Corp., 6.45%, 11/01/37(a) |
245 | 237,523 | ||||||
|
|
|
|||||||
| 3,521,277 | ||||||||
| Auto Manufacturers — 0.5% | ||||||||
| Cummins Inc. |
||||||||
| 2.60%, 09/01/50 (Call 03/01/50)(a) |
269 | 169,383 | ||||||
| 4.88%, 10/01/43 (Call 04/01/43) |
462 | 437,237 | ||||||
| 5.45%, 02/20/54 (Call 08/20/53) |
235 | 236,289 | ||||||
| Ford Motor Co. |
||||||||
| 4.75%, 01/15/43(a) |
1,760 | 1,423,870 | ||||||
| 5.29%, 12/08/46 (Call 06/08/46)(a) |
1,113 | 962,491 | ||||||
| 7.40%, 11/01/46 |
425 | 455,931 | ||||||
| General Motors Co. |
||||||||
| 5.00%, 04/01/35 |
644 | 601,729 | ||||||
| 5.15%, 04/01/38 (Call 10/01/37) |
799 | 740,155 | ||||||
| 5.20%, 04/01/45 |
1,096 | 967,342 | ||||||
| 5.40%, 04/01/48 (Call 10/01/47) |
692 | 619,616 | ||||||
| 5.95%, 04/01/49 (Call 10/01/48)(a) |
825 | 794,692 | ||||||
| 6.25%, 10/02/43 |
1,169 | 1,174,043 | ||||||
| 6.60%, 04/01/36 (Call 10/01/35)(a) |
1,245 | 1,309,910 | ||||||
| 6.75%, 04/01/46 (Call 10/01/45)(a) |
682 | 721,295 | ||||||
|
|
|
|||||||
| 10,613,983 | ||||||||
| Auto Parts & Equipment — 0.1% | ||||||||
| Aptiv PLC |
||||||||
| 3.10%, 12/01/51 (Call 06/01/51)(a) |
1,304 | 818,332 | ||||||
| 4.40%, 10/01/46 (Call 04/01/46) |
125 | 97,112 | ||||||
| 5.40%, 03/15/49 (Call 09/15/48)(a) |
230 | 206,541 | ||||||
| Aptiv PLC/Aptiv Corp., 4.15%, 05/01/52 |
872 | 667,179 | ||||||
| BorgWarner Inc., 4.38%, 03/15/45 |
240 | 195,474 | ||||||
| Security | Par (000) | Value | ||||||
| Auto Parts & Equipment (continued) | ||||||||
| Lear Corp. |
||||||||
| 3.55%, 01/15/52 (Call 07/15/51) |
$ | 235 | $ | 159,665 | ||||
| 5.25%, 05/15/49 (Call 11/15/48)(a) |
407 | 366,482 | ||||||
|
|
|
|||||||
| 2,510,785 | ||||||||
| Banks — 7.6% | ||||||||
| Bank of America Corp. |
||||||||
| 2.68%, 06/19/41 (Call 06/19/40), |
4,213 | 2,933,480 | ||||||
| 2.83%, 10/24/51 (Call 10/24/50), |
1,069 | 685,379 | ||||||
| 2.97%, 07/21/52 (Call 07/21/51), |
1,437 | 956,123 | ||||||
| 3.31%, 04/22/42 (Call 04/22/41), |
2,674 | 2,024,949 | ||||||
| 3.95%, 01/23/49 (Call 01/23/48), |
1,102 | 892,728 | ||||||
| 4.08%, 04/23/40 (Call 04/23/39), |
1,292 | 1,103,994 | ||||||
| 4.08%, 03/20/51 (Call 03/20/50), |
4,249 | 3,429,789 | ||||||
| 4.24%, 04/24/38 (Call 04/24/37), |
1,418 | 1,257,900 | ||||||
| 4.33%, 03/15/50 (Call 03/15/49), |
1,803 | 1,533,942 | ||||||
| 4.44%, 01/20/48 (Call 01/20/47), |
1,739 | 1,506,519 | ||||||
| 4.88%, 04/01/44 |
417 | 394,282 | ||||||
| 5.00%, 01/21/44 |
1,615 | 1,545,564 | ||||||
| 5.88%, 02/07/42 |
1,279 | 1,347,807 | ||||||
| 6.11%, 01/29/37 |
1,572 | 1,648,295 | ||||||
| 7.75%, 05/14/38 |
1,392 | 1,671,193 | ||||||
| Series L, 4.75%, 04/21/45 |
588 | 533,917 | ||||||
| Series N, 3.48%, 03/13/52 (Call 03/13/51), |
939 | 689,393 | ||||||
| Bank of America NA, 6.00%, 10/15/36 |
1,056 | 1,101,893 | ||||||
| Barclays PLC |
||||||||
| 3.33%, 11/24/42 (Call 11/24/41), |
712 | 515,451 | ||||||
| 3.81%, 03/10/42 (Call 03/10/41), |
710 | 532,427 | ||||||
| 4.95%, 01/10/47(a) |
1,451 | 1,319,042 | ||||||
| 5.25%, 08/17/45(a) |
1,558 | 1,489,189 | ||||||
| BNP Paribas SA, 2.82%, 01/26/41(a)(b) |
694 | 468,321 | ||||||
| BPCE SA, 3.58%, 10/19/42 (Call 10/19/41), |
309 | 218,208 | ||||||
| Citigroup Inc. |
||||||||
| 2.90%, 11/03/42 (Call 11/03/41), |
943 | 668,742 | ||||||
| 3.88%, 01/24/39 (Call 01/24/38), |
425 | 357,653 | ||||||
| 4.28%, 04/24/48 (Call 04/24/47), |
1,085 | 920,682 | ||||||
| 4.65%, 07/30/45 |
1,104 | 992,919 | ||||||
| 4.65%, 07/23/48 (Call 06/23/48) |
2,292 | 2,039,720 | ||||||
| 4.75%, 05/18/46 |
1,848 | 1,626,575 | ||||||
| 5.30%, 05/06/44 |
769 | 734,358 | ||||||
| 5.32%, 03/26/41 (Call 03/26/40), |
1,109 | 1,084,506 | ||||||
| 5.88%, 01/30/42(a) |
819 | 860,115 | ||||||
| 6.13%, 08/25/36 |
468 | 480,487 | ||||||
| 6.68%, 09/13/43 |
895 | 987,423 | ||||||
| S C H E D U L E O F I N V E S T M E N T S |
219 |
| Schedule of Investments (continued) February 29, 2024 |
iShares® 10+ Year Investment Grade Corporate Bond ETF (Percentages shown are based on Net Assets) |
| Security | Par (000) | Value | ||||||
| Banks (continued) | ||||||||
| 6.88%, 03/05/38 |
$ | 189 | $ | 204,564 | ||||
| 6.88%, 02/15/98 |
129 | 147,508 | ||||||
| 8.13%, 07/15/39 |
1,618 | 2,054,678 | ||||||
| Commonwealth Bank of Australia |
||||||||
| 3.31%, 03/11/41(a)(b) |
962 | 689,551 | ||||||
| 3.74%, 09/12/39(a)(b) |
900 | 706,694 | ||||||
| 3.90%, 07/12/47(b) |
1,179 | 967,785 | ||||||
| 4.32%, 01/10/48(a)(b) |
1,002 | 804,408 | ||||||
| Cooperatieve Rabobank UA |
||||||||
| 5.25%, 05/24/41 |
1,200 | 1,212,728 | ||||||
| 5.25%, 08/04/45 |
307 | 297,947 | ||||||
| 5.75%, 12/01/43 |
1,243 | 1,250,613 | ||||||
| 5.80%, (a)(b) |
220 | 197,997 | ||||||
| Credit Agricole SA, 2.81%, 01/11/41(b) |
884 | 593,601 | ||||||
| Fifth Third Bancorp., 8.25%, 03/01/38 |
603 | 712,976 | ||||||
| Goldman Sachs Group Inc. (The) |
||||||||
| 2.91%, 07/21/42 (Call 07/21/41), |
1,136 | 805,196 | ||||||
| 3.21%, 04/22/42 (Call 04/22/41), |
1,893 | 1,408,601 | ||||||
| 3.44%, 02/24/43 (Call 02/24/42), |
1,591 | 1,210,290 | ||||||
| 4.02%, 10/31/38 (Call 10/31/37), |
1,810 | 1,546,406 | ||||||
| 4.41%, 04/23/39 (Call 04/23/38), |
1,116 | 987,566 | ||||||
| 4.75%, 10/21/45 (Call 04/21/45) |
1,635 | 1,493,927 | ||||||
| 4.80%, 07/08/44 (Call 01/08/44) |
1,738 | 1,587,414 | ||||||
| 5.15%, 05/22/45(a) |
1,891 | 1,804,692 | ||||||
| 6.25%, 02/01/41 |
2,087 | 2,246,587 | ||||||
| 6.45%, 05/01/36(a) |
701 | 746,830 | ||||||
| 6.75%, 10/01/37 |
4,249 | 4,618,456 | ||||||
| HSBC Bank USA NA, 7.00%, 01/15/39 |
765 | 875,091 | ||||||
| HSBC Bank USA NA/New York, 5.63%, 08/15/35 |
331 | 324,449 | ||||||
| HSBC Holdings PLC |
||||||||
| 5.25%, 03/14/44(a) |
1,131 | 1,076,880 | ||||||
| 6.10%, 01/14/42(a) |
748 | 819,913 | ||||||
| 6.33%, 03/09/44 (Call 03/09/43), |
2,323 | 2,442,325 | ||||||
| 6.50%, 05/02/36 |
1,707 | 1,782,413 | ||||||
| 6.50%, 09/15/37(a) |
1,420 | 1,495,392 | ||||||
| 6.50%, 09/15/37 |
824 | 844,440 | ||||||
| 6.80%, 06/01/38 (a) |
940 | 999,900 | ||||||
| HSBC USA Inc., 7.20%, 07/15/97 |
252 | 301,084 | ||||||
| Intesa Sanpaolo SpA |
||||||||
| 7.78%, 06/20/54 (Call 06/20/53), |
1,285 | 1,298,352 | ||||||
| 7.80%, 11/28/53(b) |
1,285 | 1,388,230 | ||||||
| JPMorgan Chase & Co. |
||||||||
| 2.53%, 11/19/41 (Call 11/19/40), |
1,409 | 968,202 | ||||||
| 3.11%, 04/22/41 (Call 04/22/40), |
1,331 | 1,001,396 | ||||||
| 3.11%, 04/22/51 (Call 04/22/50), |
1,938 | 1,329,928 | ||||||
| 3.16%, 04/22/42 (Call 04/22/41), |
1,690 | 1,267,178 | ||||||
| 3.33%, 04/22/52 (Call 04/22/51), |
2,700 | 1,916,744 | ||||||
| 3.88%, 07/24/38 (Call 07/24/37), |
2,086 | 1,779,335 | ||||||
| Security | Par (000) | Value | ||||||
| Banks (continued) | ||||||||
| 3.90%, 01/23/49 (Call 01/23/48), |
$ | 1,747 | $ | 1,394,998 | ||||
| 3.96%, 11/15/48 (Call 11/15/47), |
3,009 | 2,415,416 | ||||||
| 4.03%, 07/24/48 (Call 07/24/47), |
1,437 | 1,168,164 | ||||||
| 4.26%, 02/22/48 (Call 02/22/47), |
1,883 | 1,600,090 | ||||||
| 4.85%, 02/01/44 |
818 | 768,111 | ||||||
| 4.95%, 06/01/45(a) |
1,584 | 1,487,187 | ||||||
| 5.40%, 01/06/42 |
1,027 | 1,039,768 | ||||||
| 5.50%, 10/15/40 |
1,109 | 1,133,948 | ||||||
| 5.60%, 07/15/41(a) |
1,467 | 1,513,566 | ||||||
| 5.63%, 08/16/43(a) |
1,008 | 1,034,515 | ||||||
| 6.40%, 05/15/38 |
2,082 | 2,322,825 | ||||||
| Lloyds Banking Group PLC |
||||||||
| 3.37%, 12/14/46 (Call 09/14/41), |
725 | 492,993 | ||||||
| 4.34%, 01/09/48 |
1,242 | 978,123 | ||||||
| 5.30%, 12/01/45(a) |
612 | 570,395 | ||||||
| Mitsubishi UFJ Financial Group Inc. |
||||||||
| 3.75%, 07/18/39 |
1,226 | 1,045,352 | ||||||
| 4.15%, 03/07/39 |
309 | 278,208 | ||||||
| 4.29%, 07/26/38(a) |
199 | 184,249 | ||||||
| Morgan Stanley |
||||||||
| 2.80%, 01/25/52 (Call 01/25/51), |
1,855 | 1,192,707 | ||||||
| 3.22%, 04/22/42 (Call 04/22/41), |
1,499 | 1,126,963 | ||||||
| 3.97%, 07/22/38 (Call 07/22/37)(d) |
1,307 | 1,115,065 | ||||||
| 4.30%, 01/27/45 |
2,279 | 1,975,088 | ||||||
| 4.38%, 01/22/47 |
1,988 | 1,715,494 | ||||||
| 4.46%, 04/22/39 (Call 04/22/38), |
619 | 556,011 | ||||||
| 5.60%, 03/24/51 (Call 03/24/50), |
1,839 | 1,909,418 | ||||||
| 6.38%, 07/24/42 |
1,627 | 1,809,604 | ||||||
| MUFG Bank Ltd., 4.70%, 03/10/44(b) |
105 | 94,057 | ||||||
| National Australia Bank Ltd., 2.65%, 01/14/41(b) |
579 | 374,180 | ||||||
| Regions Bank/Birmingham AL, 6.45%, 06/26/37 |
402 | 407,966 | ||||||
| Regions Financial Corp., 7.38%, 12/10/37(a) |
200 | 224,187 | ||||||
| Societe Generale SA |
||||||||
| 3.63%, 03/01/41(a)(b) |
754 | 504,883 | ||||||
| 4.03%, 01/21/43 (Call 01/21/42), |
535 | 372,441 | ||||||
| 5.63%, 11/24/45(a)(b) |
210 | 180,490 | ||||||
| 7.13%, 01/19/55 (Call 01/19/54), |
795 | 771,590 | ||||||
| 7.37%, 01/10/53(a)(b) |
1,017 | 1,040,894 | ||||||
| Standard Chartered PLC |
||||||||
| 5.30%, 01/09/43(a)(b) |
697 | 628,385 | ||||||
| 5.70%, 03/26/44(b) |
1,191 | 1,164,231 | ||||||
| Sumitomo Mitsui Financial Group Inc. |
||||||||
| 2.30%, 01/12/41 |
292 | 196,611 | ||||||
| 2.93%, 09/17/41(a) |
593 | 440,857 | ||||||
| 3.05%, 01/14/42 |
225 | 170,438 | ||||||
| 6.18%, 07/13/43 |
818 | 896,383 | ||||||
| UBS AG/London, 4.50%, 06/26/48 |
1,106 | 1,012,997 | ||||||
| UBS Group AG |
||||||||
| 3.18%, 02/11/43 (Call 02/11/42), |
1,342 | 966,202 | ||||||
| 220 | 2 0 2 4 I S H A R E S A N N U A L R E P O R T T O S H A R E H O L D E R S |
| Schedule of Investments (continued) February 29, 2024 |
iShares® 10+ Year Investment Grade Corporate Bond ETF (Percentages shown are based on Net Assets) |
| Security | Par (000) | Value | ||||||
| Banks (continued) | ||||||||
| 4.88%, 05/15/45(a) |
$ | 1,851 | $ | 1,700,873 | ||||
| 5.70%, 02/08/35 (Call 02/08/34), |
800 | 791,266 | ||||||
| 6.30%, 09/22/34 (Call 09/22/33), |
400 | 413,514 | ||||||
| Wachovia Corp. |
||||||||
| 5.50%, 08/01/35 |
769 | 754,087 | ||||||
| 7.50%, 04/15/35 |
221 | 252,653 | ||||||
| Wells Fargo & Co. |
||||||||
| 3.07%, 04/30/41 (Call 04/30/40), |
2,767 | 2,043,365 | ||||||
| 3.90%, 05/01/45(a) |
1,852 | 1,482,221 | ||||||
| 4.40%, 06/14/46 |
1,960 | 1,614,314 | ||||||
| 4.61%, 04/25/53 (Call 04/25/52), |
2,355 | 2,053,096 | ||||||
| 4.65%, 11/04/44 |
1,585 | 1,368,664 | ||||||
| 4.75%, 12/07/46 |
1,770 | 1,530,159 | ||||||
| 4.90%, 11/17/45 |
1,754 | 1,554,869 | ||||||
| 5.01%, 04/04/51 (Call 04/04/50), |
4,388 | 4,057,558 | ||||||
| 5.38%, 02/07/35(a) |
500 | 504,968 | ||||||
| 5.38%, 11/02/43 |
1,485 | 1,419,793 | ||||||
| 5.61%, 01/15/44 |
1,932 | 1,874,369 | ||||||
| 5.95%, 12/01/86 (Call 12/15/36) |
304 | 309,697 | ||||||
| Wells Fargo Bank NA |
||||||||
| 5.85%, 02/01/37 |
900 | 920,443 | ||||||
| 5.95%, 08/26/36 |
445 | 455,355 | ||||||
| 6.60%, 01/15/38 |
1,225 | 1,320,035 | ||||||
| Westpac Banking Corp. |
||||||||
| 2.96%, 11/16/40(a) |
757 | 517,211 | ||||||
| 3.13%, 11/18/41 |
814 | 563,498 | ||||||
| 4.42%, 07/24/39 |
710 | 616,214 | ||||||
|
|
|
|||||||
| 159,154,504 | ||||||||
| Beverages — 2.6% | ||||||||
| Anheuser-Busch Companies LLC/ |
||||||||
| 4.70%, 02/01/36 (Call 08/01/35) |
4,626 | 4,427,593 | ||||||
| 4.90%, 02/01/46 (Call 08/01/45) |
7,957 | 7,356,213 | ||||||
| Anheuser-Busch InBev Finance Inc. |
||||||||
| 4.63%, 02/01/44 |
695 | 627,037 | ||||||
| 4.70%, 02/01/36 (Call 08/01/35) |
715 | 684,334 | ||||||
| 4.90%, 02/01/46 (Call 08/01/45) |
1,637 | 1,513,400 | ||||||
| Anheuser-Busch InBev Worldwide Inc. |
||||||||
| 3.75%, 07/15/42(a) |
165 | 134,134 | ||||||
| 4.35%, 06/01/40 (Call 12/01/39) |
918 | 822,006 | ||||||
| 4.38%, 04/15/38 (Call 10/15/37) |
1,268 | 1,159,541 | ||||||
| 4.44%, 10/06/48 (Call 04/06/48) |
2,087 | 1,826,739 | ||||||
| 4.50%, 06/01/50 (Call 12/01/49) |
50 | 45,075 | ||||||
| 4.60%, 04/15/48 (Call 10/15/47) |
746 | 670,341 | ||||||
| 4.75%, 04/15/58 (Call 10/15/57)(a) |
878 | 797,104 | ||||||
| 4.95%, 01/15/42 |
1,170 | 1,116,022 | ||||||
| 5.45%, 01/23/39 (Call 07/23/38) |
1,835 | 1,866,056 | ||||||
| 5.55%, 01/23/49 (Call 07/23/48) |
3,121 | 3,199,526 | ||||||
| 5.80%, 01/23/59 (Call 07/23/58) |
1,779 | 1,888,528 | ||||||
| 5.88%, 06/15/35 |
430 | 455,524 | ||||||
| 8.00%, 11/15/39 |
404 | 507,871 | ||||||
| 8.20%, 01/15/39 |
1,148 | 1,479,102 | ||||||
| Bacardi Ltd. |
||||||||
| 5.15%, 05/15/38 (Call 11/15/37)(b) |
252 | 237,944 | ||||||
| 5.30%, 05/15/48 (Call 11/15/47)(a)(b) |
543 | 505,650 | ||||||
| Security | Par (000) | Value | ||||||
| Beverages (continued) | ||||||||
| Bacardi Ltd./Bacardi-Martini BV, 5.90%, 06/15/43 |
$ | 223 | $ | 220,989 | ||||
| Brown-Forman Corp. |
||||||||
| 3.75%, 01/15/43 (Call 07/15/42)(a) |
320 | 252,782 | ||||||
| 4.00%, 04/15/38 (Call 10/15/37)(a) |
290 | 253,292 | ||||||
| 4.50%, 07/15/45 (Call 01/15/45)(a) |
225 | 199,455 | ||||||
| Coca-Cola Co. (The) |
||||||||
| 2.50%, 06/01/40 |
683 | 487,912 | ||||||
| 2.50%, 03/15/51 |
1,404 | 878,722 | ||||||
| 2.60%, 06/01/50 |
1,545 | 999,584 | ||||||
| 2.75%, 06/01/60(a) |
808 | 512,605 | ||||||
| 2.88%, 05/05/41 |
612 | 459,079 | ||||||
| 3.00%, 03/05/51(a) |
1,584 | 1,116,129 | ||||||
| 4.20%, 03/25/50 |
607 | 536,252 | ||||||
| Coca-Cola Femsa SAB de CV, 5.25%, 11/26/43 |
239 | 230,394 | ||||||
| Constellation Brands Inc. |
||||||||
| 3.75%, 05/01/50 (Call 11/01/49) |
539 | 403,328 | ||||||
| 4.10%, 02/15/48 (Call 08/15/47) |
474 | 380,975 | ||||||
| 4.50%, 05/09/47 (Call 11/09/46)(a) |
404 | 340,835 | ||||||
| 5.25%, 11/15/48 (Call 05/15/48)(a) |
479 | 453,224 | ||||||
| Diageo Capital PLC |
||||||||
| 3.88%, 04/29/43 (Call 10/29/42)(a) |
483 | 409,263 | ||||||
| 5.88%, 09/30/36 |
467 | 497,942 | ||||||
| Diageo Investment Corp. |
||||||||
| 4.25%, 05/11/42(a) |
460 | 408,957 | ||||||
| 7.45%, 04/15/35 |
510 | 600,172 | ||||||
| Fomento Economico Mexicano SAB de CV, |
590 | 439,320 | ||||||
| Heineken NV |
||||||||
| 4.00%, 10/01/42(b) |
486 | 400,441 | ||||||
| 4.35%, 03/29/47 (Call 09/29/46)(a)(b) |
190 | 166,179 | ||||||
| Keurig Dr Pepper Inc. |
||||||||
| 3.35%, 03/15/51 (Call 09/15/50) |
577 | 402,939 | ||||||
| 3.80%, 05/01/50 (Call 11/01/49) |
777 | 591,082 | ||||||
| 4.42%, 12/15/46 (Call 06/15/46) |
391 | 327,701 | ||||||
| 4.50%, 11/15/45 (Call 05/15/45) |
500 | 431,337 | ||||||
| 4.50%, 04/15/52 (Call 10/15/51) |
1,086 | 922,110 | ||||||
| 5.09%, 05/25/48 (Call 11/25/47) |
235 | 220,110 | ||||||
| Molson Coors Beverage Co. |
||||||||
| 4.20%, 07/15/46 (Call 01/15/46) |
1,451 | 1,185,320 | ||||||
| 5.00%, 05/01/42 |
1,033 | 961,640 | ||||||
| PepsiCo Inc. |
||||||||
| 2.63%, 10/21/41 (Call 04/21/41) |
537 | 385,477 | ||||||
| 2.75%, 10/21/51 (Call 04/21/51)(a) |
1,021 | 671,975 | ||||||
| 2.88%, 10/15/49 (Call 04/15/49) |
1,002 | 692,524 | ||||||
| 3.38%, 07/29/49 (Call 01/29/49) |
715 | 538,916 | ||||||
| 3.45%, 10/06/46 (Call 04/06/46)(a) |
962 | 746,986 | ||||||
| 3.50%, 03/19/40 (Call 09/19/39) |
65 | 53,190 | ||||||
| 3.60%, 08/13/42(a) |
250 | 202,147 | ||||||
| 3.63%, 03/19/50 (Call 09/19/49) |
904 | 713,503 | ||||||
| 3.88%, 03/19/60 (Call 09/19/59) |
354 | 283,376 | ||||||
| 4.00%, 03/05/42(a) |
512 | 455,002 | ||||||
| 4.00%, 05/02/47 (Call 11/02/46) |
495 | 413,726 | ||||||
| 4.20%, 07/18/52 (Call 01/18/52) |
450 | 391,860 | ||||||
| 4.25%, 10/22/44 (Call 04/22/44) |
55 | 47,687 | ||||||
| 4.45%, 04/14/46 (Call 10/14/45) |
794 | 718,660 | ||||||
| 4.60%, 07/17/45 (Call 01/17/45) |
350 | 315,851 | ||||||
| 4.65%, 02/15/53 (Call 08/15/52) |
619 | 576,743 | ||||||
| 4.88%, 11/01/40(a) |
342 | 335,769 | ||||||
| 5.50%, 01/15/40(a) |
100 | 104,331 | ||||||
| S C H E D U L E O F I N V E S T M E N T S |
221 |
| Schedule of Investments (continued) February 29, 2024 |
iShares® 10+ Year Investment Grade Corporate Bond ETF (Percentages shown are based on Net Assets) |
| Security | Par (000) | Value | ||||||
| Beverages (continued) | ||||||||
| Pernod Ricard International Finance LLC, |
$ | 204 | $ | 127,953 | ||||
| Pernod Ricard SA, 5.50%, 01/15/42(a)(b) |
756 | 764,040 | ||||||
|
|
|
|||||||
| 55,549,526 | ||||||||
| Biotechnology — 1.8% | ||||||||
| Amgen Inc. |
||||||||
| 2.77%, 09/01/53 (Call 03/01/53) |
825 | 503,563 | ||||||
| 2.80%, 08/15/41 (Call 02/15/41) |
737 | 525,574 | ||||||
| 3.00%, 01/15/52 (Call 07/15/51)(a) |
863 | 576,496 | ||||||
| 3.15%, 02/21/40 (Call 08/21/39) |
1,429 | 1,072,071 | ||||||
| 3.38%, 02/21/50 (Call 08/21/49) |
1,928 | 1,383,892 | ||||||
| 4.20%, 02/22/52 (Call 08/22/51) |
914 | 739,112 | ||||||
| 4.40%, 05/01/45 (Call 11/01/44) |
2,105 | 1,797,113 | ||||||
| 4.40%, 02/22/62 (Call 08/22/61) |
1,004 | 807,436 | ||||||
| 4.56%, 06/15/48 (Call 12/15/47) |
1,137 | 985,508 | ||||||
| 4.66%, 06/15/51 (Call 12/15/50) |
2,977 | 2,590,849 | ||||||
| 4.88%, 03/01/53 (Call 09/01/52) |
830 | 744,729 | ||||||
| 4.95%, 10/01/41 |
413 | 384,591 | ||||||
| 5.15%, 11/15/41 (Call 05/15/41) |
716 | 681,041 | ||||||
| 5.60%, 03/02/43 (Call 09/02/42) |
2,268 | 2,270,473 | ||||||
| 5.65%, 06/15/42 (Call 12/15/41) |
406 | 407,379 | ||||||
| 5.65%, 03/02/53 (Call 09/02/52) |
3,483 | 3,481,551 | ||||||
| 5.75%, 03/15/40(a) |
357 | 361,446 | ||||||
| 5.75%, 03/02/63 (Call 09/02/62) |
2,244 | 2,244,208 | ||||||
| 6.38%, 06/01/37 |
391 | 418,656 | ||||||
| 6.40%, 02/01/39 |
310 | 335,173 | ||||||
| 6.90%, 06/01/38(a) |
265 | 296,557 | ||||||
| Baxalta Inc., 5.25%, 06/23/45 (Call 12/23/44)(a) |
340 | 327,895 | ||||||
| Biogen Inc. |
||||||||
| 3.15%, 05/01/50 (Call 11/01/49) |
1,341 | 885,832 | ||||||
| 3.25%, 02/15/51 (Call 08/15/50)(a) |
602 | 412,132 | ||||||
| 5.20%, 09/15/45 (Call 03/15/45) |
881 | 830,350 | ||||||
| CSL Finance PLC |
||||||||
| 4.63%, 04/27/42 (Call 10/27/41)(a)(b) |
335 | 305,741 | ||||||
| 4.75%, 04/27/52 (Call 10/27/51)(a)(b) |
929 | 839,922 | ||||||
| 4.95%, 04/27/62 (Call 10/27/61)(a)(b) |
369 | 334,285 | ||||||
| Gilead Sciences Inc. |
||||||||
| 2.60%, 10/01/40 (Call 04/01/40) |
499 | 348,375 | ||||||
| 2.80%, 10/01/50 (Call 04/01/50) |
1,324 | 853,263 | ||||||
| 4.00%, 09/01/36 (Call 03/01/36) |
520 | 460,101 | ||||||
| 4.15%, 03/01/47 (Call 09/01/46) |
1,513 | 1,250,559 | ||||||
| 4.50%, 02/01/45 (Call 08/01/44) |
1,514 | 1,332,316 | ||||||
| 4.60%, 09/01/35 (Call 03/01/35)(a) |
567 | 538,132 | ||||||
| 4.75%, 03/01/46 (Call 09/01/45) |
1,916 | 1,741,659 | ||||||
| 4.80%, 04/01/44 (Call 10/01/43) |
1,519 | 1,395,174 | ||||||
| 5.55%, 10/15/53 (Call 04/15/53) |
865 | 881,714 | ||||||
| 5.65%, 12/01/41 (Call 06/01/41) |
1,138 | 1,159,703 | ||||||
| Regeneron Pharmaceuticals Inc., 2.80%, 09/15/50 |
651 | 405,179 | ||||||
| Royalty Pharma PLC |
||||||||
| 3.30%, 09/02/40 (Call 03/02/40)(a) |
718 | 526,956 | ||||||
| 3.35%, 09/02/51 (Call 03/02/51) |
621 | 406,455 | ||||||
| 3.55%, 09/02/50 (Call 03/02/50)(a) |
878 | 597,667 | ||||||
|
|
|
|||||||
| 38,440,828 | ||||||||
| Building Materials — 0.5% | ||||||||
| Carrier Global Corp. |
||||||||
| 3.38%, 04/05/40 (Call 10/05/39) |
1,017 | 784,849 | ||||||
| 3.58%, 04/05/50 (Call 10/05/49)(a) |
1,678 | 1,237,990 | ||||||
| 6.20%, 03/15/54 (Call 09/15/53) |
1,355 | 1,478,967 | ||||||
| Security | Par (000) | Value | ||||||
| Building Materials (continued) | ||||||||
| CRH America Finance Inc. |
||||||||
| 4.40%, 05/09/47 (Call 11/09/46)(b) |
$ | 200 | $ | 172,045 | ||||
| 4.50%, 04/04/48 (Call 10/04/47)(b) |
408 | 359,450 | ||||||
| CRH America Inc., 5.13%, 05/18/45 |
381 | 360,073 | ||||||
| Fortune Brands Innovations Inc., 4.50%, 03/25/52 |
356 | 288,501 | ||||||
| Holcim Capital Corp. Ltd., 6.50%, 09/12/43(b) |
345 | 345,266 | ||||||
| Holcim Finance U.S. LLC, 4.75%, 09/22/46 |
200 | 175,863 | ||||||
| Holcim U.S. Finance Luxembourg SA,
6.88%, |
200 | 212,033 | ||||||
| Johnson Controls International PLC |
||||||||
| 4.50%, 02/15/47 (Call 08/15/46) |
428 | 367,811 | ||||||
| 4.63%, 07/02/44 (Call 01/02/44) |
376 | 327,764 | ||||||
| 4.95%, 07/02/64 (Call 01/02/64)(c) |
251 | 222,459 | ||||||
| 5.13%, 09/14/45 (Call 03/14/45) |
329 | 305,682 | ||||||
| 6.00%, 01/15/36 |
178 | 187,049 | ||||||
| Lafarge SA, 7.13%, 07/15/36 |
265 | 293,046 | ||||||
| Martin Marietta Materials Inc. |
||||||||
| 3.20%, 07/15/51 (Call 01/15/51) |
718 | 496,400 | ||||||
| 4.25%, 12/15/47 (Call 06/15/47) |
379 | 314,702 | ||||||
| Masco Corp. |
||||||||
| 3.13%, 02/15/51 (Call 08/15/50) |
224 | 149,332 | ||||||
| 4.50%, 05/15/47 (Call 11/15/46)(a) |
177 | 147,694 | ||||||
| Owens Corning |
||||||||
| 4.30%, 07/15/47 (Call 01/15/47)(a) |
404 | 331,382 | ||||||
| 4.40%, 01/30/48 (Call 07/30/47) |
369 | 304,811 | ||||||
| 7.00%, 12/01/36 |
369 | 410,342 | ||||||
| Trane Technologies Financing Ltd. |
||||||||
| 4.50%, 03/21/49 (Call 09/21/48)(a) |
163 | 144,550 | ||||||
| 4.65%, 11/01/44 (Call 05/01/44) |
172 | 154,667 | ||||||
| Trane Technologies Global Holding Co. Ltd. |
||||||||
| 4.30%, 02/21/48 (Call 08/21/47)(a) |
93 | 79,546 | ||||||
| 5.75%, 06/15/43 |
453 | 465,879 | ||||||
| Votorantim Cimentos International SA,
7.25%, |
205 | 223,734 | ||||||
| Vulcan Materials Co. |
||||||||
| 4.50%, 06/15/47 (Call 12/15/46)(a) |
575 | 496,681 | ||||||
| 4.70%, 03/01/48 (Call 09/01/47) |
382 | 341,178 | ||||||
|
|
|
|||||||
| 11,179,746 | ||||||||
| Chemicals — 1.6% | ||||||||
| Air Liquide Finance SA, 3.50%, 09/27/46 |
390 | 306,743 | ||||||
| Air Products and Chemicals Inc. |
||||||||
| 2.70%, 05/15/40 (Call 11/15/39) |
331 | 238,341 | ||||||
| 2.80%, 05/15/50 (Call 11/15/49) |
706 | 470,106 | ||||||
| Albemarle Corp. |
||||||||
| 5.45%, 12/01/44 (Call 06/01/44) |
147 | 133,732 | ||||||
| 5.65%, 06/01/52 (Call 12/01/51)(a) |
370 | 333,782 | ||||||
| CF Industries Inc. |
||||||||
| 4.95%, 06/01/43 |
900 | 800,270 | ||||||
| 5.38%, 03/15/44 |
599 | 560,042 | ||||||
| Dow Chemical Co. (The) |
||||||||
| 3.60%, 11/15/50 (Call 05/15/50) |
1,001 | 728,876 | ||||||
| 4.25%, 10/01/34 (Call 04/01/34)(a) |
654 | 601,965 | ||||||
| 4.38%, 11/15/42 (Call 05/15/42) |
1,116 | 938,684 | ||||||
| 4.63%, 10/01/44 (Call 04/01/44) |
331 | 286,038 | ||||||
| 4.80%, 05/15/49 (Call 11/15/48) |
595 | 519,259 | ||||||
| 5.25%, 11/15/41 (Call 05/15/41) |
719 | 676,885 | ||||||
| 5.55%, 11/30/48 (Call 05/30/48) |
789 | 768,148 | ||||||
| 222 | 2 0 2 4 I S H A R E S A N N U A L R E P O R T T O S H A R E H O L D E R S |
| Schedule of Investments (continued) February 29, 2024 |
iShares® 10+ Year Investment Grade Corporate Bond ETF (Percentages shown are based on Net Assets) |
| Security | Par (000) |
Value | ||||||
| Chemicals (continued) | ||||||||
| 5.60%, 02/15/54 (Call 08/15/53) |
$ | 300 | $ | 293,143 | ||||
| 6.90%, 05/15/53 (Call 11/15/52) |
795 | 910,244 | ||||||
| 9.40%, 05/15/39 |
526 | 700,147 | ||||||
| DuPont de Nemours Inc. |
||||||||
| 5.32%, 11/15/38 (Call 05/15/38) |
1,244 | 1,229,698 | ||||||
| 5.42%, 11/15/48 (Call 05/15/48) |
1,747 | 1,718,939 | ||||||
| Eastman Chemical Co. |
||||||||
| 4.65%, 10/15/44 (Call 04/15/44) |
359 | 304,674 | ||||||
| 4.80%, 09/01/42 (Call 03/01/42) |
655 | 572,380 | ||||||
| Ecolab Inc. |
||||||||
| 2.13%, 08/15/50 (Call 02/15/50) |
437 | 252,697 | ||||||
| 2.70%, 12/15/51 (Call 06/15/51)(a) |
661 | 419,191 | ||||||
| 2.75%, 08/18/55 (Call 02/18/55) |
712 | 442,994 | ||||||
| 3.95%, 12/01/47 (Call 06/01/47)(a) |
276 | 228,083 | ||||||
| 5.50%, 12/08/41(a) |
334 | 338,356 | ||||||
| FMC Corp. |
||||||||
| 4.50%, 10/01/49 (Call 04/01/49)(a) |
428 | 318,364 | ||||||
| 6.38%, 05/18/53 (Call 11/18/52)(a) |
431 | 420,418 | ||||||
| GC Treasury Center Co. Ltd., 4.30%, 03/18/51 |
436 | 329,257 | ||||||
| International Flavors & Fragrances Inc. |
||||||||
| 3.27%, 11/15/40 (Call 05/15/40)(b) |
218 | 152,804 | ||||||
| 3.47%, 12/01/50 (Call 06/01/50)(a)(b) |
1,199 | 789,068 | ||||||
| 4.38%, 06/01/47 (Call 12/01/46) |
395 | 294,674 | ||||||
| 5.00%, 09/26/48 (Call 03/26/48) |
665 | 559,500 | ||||||
| Linde Inc./CT |
||||||||
| 2.00%, 08/10/50 (Call 02/10/50)(a) |
242 | 135,587 | ||||||
| 3.55%, 11/07/42 (Call 05/07/42) |
845 | 674,866 | ||||||
| Lubrizol Corp. (The), 6.50%, 10/01/34 |
545 | 614,671 | ||||||
| LYB International Finance BV |
||||||||
| 4.88%, 03/15/44 (Call 09/15/43) |
919 | 808,169 | ||||||
| 5.25%, 07/15/43 |
727 | 667,103 | ||||||
| LYB International Finance III LLC |
||||||||
| 3.38%, 10/01/40 (Call 04/01/40) |
233 | 172,851 | ||||||
| 3.63%, 04/01/51 (Call 10/01/50)(a) |
818 | 568,966 | ||||||
| 3.80%, 10/01/60 (Call 04/01/60)(a) |
563 | 381,022 | ||||||
| 4.20%, 10/15/49 (Call 04/15/49) |
806 | 622,552 | ||||||
| 4.20%, 05/01/50 (Call 11/01/49) |
818 | 631,787 | ||||||
| LyondellBasell Industries NV, 4.63%, 02/26/55 |
910 | 746,737 | ||||||
| Mosaic Co. (The) |
||||||||
| 4.88%, 11/15/41 (Call 05/15/41) |
330 | 288,473 | ||||||
| 5.63%, 11/15/43 (Call 05/15/43) |
385 | 367,751 | ||||||
| Nutrien Ltd. |
||||||||
| 3.95%, 05/13/50 (Call 11/13/49) |
366 | 285,830 | ||||||
| 4.13%, 03/15/35 (Call 09/15/34) |
307 | 276,136 | ||||||
| 4.90%, 06/01/43 (Call 12/01/42)(a) |
285 | 257,607 | ||||||
| 5.00%, 04/01/49 (Call 10/01/48)(a) |
579 | 523,457 | ||||||
| 5.25%, 01/15/45 (Call 07/15/44) |
323 | 300,313 | ||||||
| 5.63%, 12/01/40 |
246 | 240,974 | ||||||
| 5.80%, 03/27/53 (Call 09/27/52) |
693 | 695,472 | ||||||
| 5.88%, 12/01/36 |
537 | 550,710 | ||||||
| 6.13%, 01/15/41 (Call 07/15/40) |
284 | 290,751 | ||||||
| Orbia Advance Corp. SAB de CV |
||||||||
| 5.50%, 01/15/48 (Call 07/15/47)(b) |
408 | 343,740 | ||||||
| 5.88%, 09/17/44(b) |
609 | 543,373 | ||||||
| 6.75%, 09/19/42(b) |
100 | 99,090 | ||||||
| PPG Industries Inc., 5.50%, 11/15/40 |
50 | 47,421 | ||||||
| RPM International Inc. |
||||||||
| 4.25%, 01/15/48 (Call 07/15/47)(a) |
215 | 172,694 | ||||||
| 5.25%, 06/01/45 (Call 12/01/44)(a) |
224 | 207,087 | ||||||
| Security | Par (000) |
Value | ||||||
| Chemicals (continued) | ||||||||
| Sherwin-Williams Co. (The) |
||||||||
| 2.90%, 03/15/52 (Call 09/15/51) |
$ | 398 | $ | 257,488 | ||||
| 3.30%, 05/15/50 (Call 11/15/49) |
424 | 297,955 | ||||||
| 3.80%, 08/15/49 (Call 02/15/49) |
396 | 305,456 | ||||||
| 4.00%, 12/15/42 (Call 06/15/42) |
374 | 305,811 | ||||||
| 4.50%, 06/01/47 (Call 12/01/46) |
1,044 | 904,809 | ||||||
| 4.55%, 08/01/45 (Call 02/01/45) |
346 | 297,221 | ||||||
| Sociedad Quimica y Minera de Chile SA |
||||||||
| 3.50%, 09/10/51 (Call 03/10/51)(b) |
556 | 363,974 | ||||||
| 4.25%, 01/22/50 (Call 07/22/49)(a)(b) |
210 | 158,902 | ||||||
| Westlake Corp. |
||||||||
| 2.88%, 08/15/41 (Call 02/15/41) |
192 | 130,801 | ||||||
| 3.13%, 08/15/51 (Call 02/15/51) |
475 | 298,495 | ||||||
| 3.38%, 08/15/61 (Call 02/15/61)(a) |
591 | 366,478 | ||||||
| 4.38%, 11/15/47 (Call 05/15/47)(a) |
308 | 250,113 | ||||||
| 5.00%, 08/15/46 (Call 02/15/46)(a) |
540 | 480,577 | ||||||
|
|
|
|||||||
| 33,570,772 | ||||||||
| Coal — 0.1% | ||||||||
| Teck Resources Ltd. |
||||||||
| 5.20%, 03/01/42 (Call 09/01/41) |
295 | 266,839 | ||||||
| 5.40%, 02/01/43 (Call 08/01/42) |
295 | 273,005 | ||||||
| 6.00%, 08/15/40 (Call 02/15/40) |
438 | 432,094 | ||||||
| 6.13%, 10/01/35 |
300 | 306,124 | ||||||
| 6.25%, 07/15/41 (Call 01/15/41) |
342 | 346,230 | ||||||
|
|
|
|||||||
| 1,624,292 | ||||||||
| Commercial Services — 1.7% | ||||||||
| Adani Ports & Special Economic Zone Ltd., |
120 | 97,192 | ||||||
| American University (The), Series 2019, |
485 | 391,732 | ||||||
| Brown University, Series A, 2.92%, 09/01/50 |
533 | 374,011 | ||||||
| California Endowment (The), Series 2021, |
220 | 135,401 | ||||||
| California Institute of Technology |
||||||||
| 3.65%, 09/01/2119 (Call 03/01/2119)(a) |
227 | 157,448 | ||||||
| 4.32%, 08/01/45 |
393 | 353,138 | ||||||
| 4.70%, 11/01/2111 |
320 | 283,992 | ||||||
| Case Western Reserve University, 5.41%, |
210 | 201,239 | ||||||
| Claremont Mckenna College, 3.78%, 01/01/2122 |
150 | 100,416 | ||||||
| DP World Ltd./United Arab Emirates |
||||||||
| 4.70%, 09/30/49 (Call 03/30/49)(b) |
360 | 292,068 | ||||||
| 5.63%, 09/25/48(b) |
1,004 | 937,234 | ||||||
| 6.85%, 07/02/37(a)(b) |
1,145 | 1,234,928 | ||||||
| Duke University |
||||||||
| 3.20%, 10/01/38(a) |
200 | 163,688 | ||||||
| 3.30%, 10/01/46(a) |
265 | 201,371 | ||||||
| Series 2020, 2.68%, 10/01/44 |
447 | 329,935 | ||||||
| Series 2020, 2.76%, 10/01/50 |
354 | 243,897 | ||||||
| Series 2020, 2.83%, 10/01/55 |
432 | 297,750 | ||||||
| Emory University, Series 2020, 2.97%, 09/01/50 |
361 | 250,893 | ||||||
| Equifax Inc., 7.00%, 07/01/37(a) |
230 | 253,377 | ||||||
| ERAC USA Finance LLC |
||||||||
| 4.20%, 11/01/46 (Call 05/01/46)(b) |
93 | 77,899 | ||||||
| 4.50%, 02/15/45 (Call 08/15/44)(b) |
329 | 288,567 | ||||||
| 5.20%, 10/30/34 (Call 07/30/34)(a)(b) |
150 | 148,783 | ||||||
| 5.40%, 05/01/53 (Call 11/01/52)(a)(b) |
950 | 952,260 | ||||||
| S C H E D U L E O F I N V E S T M E N T S |
223 |
| Schedule of Investments (continued) February 29, 2024 |
iShares® 10+ Year Investment Grade Corporate Bond ETF (Percentages shown are based on Net Assets) |
| Security | Par (000) |
Value | ||||||
| Commercial Services (continued) | ||||||||
| 5.63%, 03/15/42(b) |
$ | 487 | $ | 493,026 | ||||
| 6.70%, 06/01/34(b) |
300 | 330,501 | ||||||
| 7.00%, 10/15/37(b) |
1,215 | 1,380,890 | ||||||
| Ford Foundation (The) |
||||||||
| Series 2017, 3.86%, 06/01/47 (Call 12/01/46) |
334 | 273,401 | ||||||
| Series 2020, 2.42%, 06/01/50 (Call 12/01/49) |
80 | 50,322 | ||||||
| Series 2020, 2.82%, 06/01/70 (Call 12/01/69) |
350 | 207,861 | ||||||
| George Washington University (The) |
||||||||
| 4.87%, 09/15/45 |
270 | 260,027 | ||||||
| Series 2014, 4.30%, 09/15/44(a) |
282 | 244,980 | ||||||
| Series 2016, 3.55%, 09/15/46 |
230 | 179,142 | ||||||
| Series 2018, 4.13%, 09/15/48 (Call 03/15/48) |
677 | 578,413 | ||||||
| Georgetown University (The) |
||||||||
| 5.12%, 04/01/53 (Call 10/01/52)(a) |
160 | 161,236 | ||||||
| Series 20A, 2.94%, 04/01/50 (Call 10/01/49) |
341 | 232,792 | ||||||
| Series A, 5.22%, (Call 04/01/2118) |
185 | 171,564 | ||||||
| Series B, 4.32%, 04/01/49 (Call 10/01/48) |
310 | 276,253 | ||||||
| Global Payments Inc. |
||||||||
| 4.15%, 08/15/49 (Call 02/15/49) |
553 | 421,845 | ||||||
| 5.95%, 08/15/52 (Call 02/15/52)(a) |
565 | 555,102 | ||||||
| Howard University, 5.21%, 10/01/52 |
225 | 200,851 | ||||||
| ITR Concession Co. LLC, 5.18%, 07/15/35 |
184 | 158,884 | ||||||
| Johns Hopkins University |
||||||||
| Series 2013, 4.08%, 07/01/53(a) |
321 | 282,005 | ||||||
| Series A, 2.81%, 01/01/60 (Call 07/01/59)(a) |
240 | 155,083 | ||||||
| Leland Stanford Junior University (The) |
||||||||
| 2.41%, 06/01/50 (Call 12/01/49)(a) |
428 | 275,885 | ||||||
| 3.46%, 05/01/47 |
245 | 191,068 | ||||||
| 3.65%, 05/01/48 (Call 11/01/47) |
547 | 453,749 | ||||||
| Massachusetts Institute of Technology |
||||||||
| 3.07%, 04/01/52 (Call 10/01/51) |
345 | 252,055 | ||||||
| 3.89%, 07/01/2116(a) |
355 | 268,546 | ||||||
| 3.96%, 07/01/38 |
354 | 323,751 | ||||||
| 4.68%, |
399 | 364,903 | ||||||
| 5.60%, (a) |
577 | 621,620 | ||||||
| Series F, 2.99%, 07/01/50 (Call 01/01/50) |
499 | 360,182 | ||||||
| Series G, 2.29%, 07/01/51 (Call 01/01/51)(a) |
391 | 242,855 | ||||||
| Metropolitan Museum of Art (The), Series 2015, |
188 | 144,000 | ||||||
| Moody’s Corp. |
||||||||
| 2.55%, 08/18/60 (Call 02/18/60) |
294 | 164,950 | ||||||
| 2.75%, 08/19/41 (Call 02/19/41) |
435 | 305,019 | ||||||
| 3.10%, 11/29/61 (Call 05/29/61)(a) |
390 | 249,240 | ||||||
| 3.25%, 05/20/50 (Call 11/20/49)(a) |
222 | 157,190 | ||||||
| 3.75%, 02/25/52 (Call 08/25/51) |
365 | 283,573 | ||||||
| 4.88%, 12/17/48 (Call 06/17/48) |
289 | 267,160 | ||||||
| 5.25%, 07/15/44(a) |
590 | 576,273 | ||||||
| Northeastern University, Series 2020, 2.89%, 10/01/50(a) |
245 | 169,827 | ||||||
| Northwestern University |
||||||||
| 3.69%, 12/01/38 |
275 | 237,898 | ||||||
| 3.87%, 12/01/48(a) |
250 | 209,586 | ||||||
| 4.64%, 12/01/44(a) |
515 | 490,926 | ||||||
| Series 2017, 3.66%, 12/01/57 (Call 06/01/57)(a) |
190 | 150,718 | ||||||
| Series 2020, 2.64%, 12/01/50 (Call 06/01/50)(a) |
280 | 186,989 | ||||||
| PayPal Holdings Inc. |
||||||||
| 3.25%, 06/01/50 (Call 12/01/49)(a) |
914 | 636,144 | ||||||
| 5.05%, 06/01/52 (Call 12/01/51) |
810 | 759,968 | ||||||
| 5.25%, 06/01/62 (Call 12/01/61)(a) |
445 | 414,522 | ||||||
| Security | Par (000) |
Value | ||||||
| Commercial Services (continued) | ||||||||
| Pelabuhan Indonesia Persero PT, |
$ | 365 | $ | 345,454 | ||||
| President and Fellows of Harvard College |
||||||||
| 2.52%, 10/15/50 (Call 04/15/50)(a) |
482 | 314,487 | ||||||
| 3.15%, 07/15/46 (Call 01/15/46) |
465 | 347,948 | ||||||
| 3.30%, 07/15/56 (Call 01/15/56) |
249 | 184,483 | ||||||
| 3.62%, 10/01/37 |
252 | 222,882 | ||||||
| 3.75%, 11/15/52 (Call 05/15/52) |
325 | 271,008 | ||||||
| 4.88%, 10/15/40(a) |
155 | 153,100 | ||||||
| 6.50%, 01/15/39(b) |
565 | 657,467 | ||||||
| Quanta Services Inc., 3.05%, 10/01/41 |
488 | 343,869 | ||||||
| Rockefeller Foundation (The), Series 2020, |
487 | 308,961 | ||||||
| S&P Global Inc. |
||||||||
| 2.30%, 08/15/60 (Call 02/15/60) |
611 | 330,027 | ||||||
| 3.25%, 12/01/49 (Call 06/01/49) |
443 | 316,783 | ||||||
| 3.70%, 03/01/52 (Call 09/01/51)(a) |
908 | 703,253 | ||||||
| 3.90%, 03/01/62 (Call 09/01/61) |
401 | 311,992 | ||||||
| 4.50%, 05/15/48 (Call 11/15/47)(a) |
185 | 154,663 | ||||||
| 6.55%, 11/15/37(a) |
150 | 163,218 | ||||||
| Thomas Jefferson University, 3.85%, 11/01/57 |
250 | 187,205 | ||||||
| Trustees of Boston College |
||||||||
| 3.13%, 07/01/52(a) |
272 | 197,440 | ||||||
| 3.99%, 07/01/47 |
160 | 129,795 | ||||||
| Trustees of Boston University, Series CC, |
305 | 259,802 | ||||||
| Trustees of Dartmouth College, 3.47%, 06/01/46 |
260 | 202,949 | ||||||
| Trustees of Princeton University (The) |
||||||||
| 4.20%, 03/01/52 (Call 09/01/51) |
50 | 45,291 | ||||||
| 5.70%, 03/01/39(a) |
629 | 688,011 | ||||||
| Series 2020, 2.52%, 07/01/50 (Call 01/01/50)(a) |
225 | 151,313 | ||||||
| Trustees of the University of Pennsylvania (The) |
||||||||
| 3.61%, 02/15/2119 (Call 08/15/2118)(a) |
225 | 156,511 | ||||||
| 4.67%, 09/01/2112 |
190 | 168,156 | ||||||
| Series 2020, 2.40%, 10/01/50 (Call 04/01/50) |
315 | 195,676 | ||||||
| Trustees of Tufts College |
||||||||
| 3.10%, 08/15/51 (Call 02/15/51) |
220 | 160,561 | ||||||
| Series 2012, 5.02%, 04/15/2112(a) |
205 | 177,624 | ||||||
| University of Chicago (The) |
||||||||
| 3.00%, 10/01/52 (Call 04/01/52)(a) |
160 | 113,782 | ||||||
| 4.00%, 10/01/53 (Call 04/01/53) |
385 | 319,217 | ||||||
| Series 20B, 2.76%, 04/01/45 (Call 10/01/44) |
260 | 202,541 | ||||||
| Series C, 2.55%, 04/01/50 (Call 10/01/49)(a) |
320 | 216,488 | ||||||
| University of Miami, 4.06%, 04/01/52 |
400 | 336,766 | ||||||
| University of Notre Dame du Lac |
||||||||
| Series 2015, 3.44%, 02/15/45(a) |
407 | 326,812 | ||||||
| Series 2017, 3.39%, 02/15/48 (Call 08/15/47)(a) |
328 | 255,712 | ||||||
| University of Southern California |
||||||||
| 2.81%, 10/01/50 (Call 04/01/50) |
326 | 223,811 | ||||||
| 3.03%, 10/01/39 |
483 | 390,321 | ||||||
| 4.98%, 10/01/53 (Call 04/01/53) |
190 | 190,399 | ||||||
| 5.25%, 10/01/2111(a) |
185 | 182,468 | ||||||
| Series 2017, 3.84%, 10/01/47 (Call 04/01/47) |
285 | 238,285 | ||||||
| Series 21A, 2.95%, 10/01/51 (Call 04/01/51)(a) |
294 | 204,871 | ||||||
| Series A, 3.23%, 10/01/2120 |
180 | 109,738 | ||||||
| Verisk Analytics Inc. |
||||||||
| 3.63%, 05/15/50 (Call 11/15/49)(a) |
368 | 270,139 | ||||||
| 5.50%, 06/15/45 (Call 12/15/44)(a) |
183 | 174,665 | ||||||
| 224 | 2 0 2 4 I S H A R E S A N N U A L R E P O R T T O S H A R E H O L D E R S |
| Schedule of Investments (continued) February 29, 2024 |
iShares® 10+ Year Investment Grade Corporate Bond ETF (Percentages shown are based on Net Assets) |
| Security | Par (000) |
Value | ||||||
| Commercial Services (continued) | ||||||||
| Washington University (The) |
||||||||
| 3.52%, 04/15/54 (Call 10/15/53) |
$ | 405 | $ | 317,274 | ||||
| 4.35%, 04/15/2122 (Call 10/15/2121)(a) |
200 | 167,862 | ||||||
| Wesleyan University, 4.78%, 07/01/2116 |
191 | 160,909 | ||||||
| William Marsh Rice University |
||||||||
| 3.57%, 05/15/45 |
143 | 115,311 | ||||||
| 3.77%, 05/15/55(a) |
220 | 175,577 | ||||||
| WK Kellogg Foundation Trust, 2.44%, 10/01/50 |
130 | 79,859 | ||||||
| Yale University, Series 2020, 2.40%, 04/15/50 |
406 | 262,132 | ||||||
|
|
|
|||||||
| 36,024,862 | ||||||||
| Computers — 2.0% | ||||||||
| Apple Inc. |
||||||||
| 2.38%, 02/08/41 (Call 08/08/40) |
990 | 696,378 | ||||||
| 2.40%, 08/20/50 (Call 02/20/50)(a) |
1,070 | 667,127 | ||||||
| 2.55%, 08/20/60 (Call 02/20/60)(a) |
1,499 | 921,402 | ||||||
| 2.65%, 05/11/50 (Call 11/11/49) |
2,105 | 1,370,654 | ||||||
| 2.65%, 02/08/51 (Call 08/08/50) |
2,857 | 1,842,664 | ||||||
| 2.70%, 08/05/51 (Call 02/05/51) |
1,596 | 1,038,976 | ||||||
| 2.80%, 02/08/61 (Call 08/08/60) |
1,505 | 956,407 | ||||||
| 2.85%, 08/05/61 (Call 02/05/61) |
940 | 598,458 | ||||||
| 2.95%, 09/11/49 (Call 03/11/49) |
1,288 | 900,579 | ||||||
| 3.45%, 02/09/45 |
1,740 | 1,380,591 | ||||||
| 3.75%, 09/12/47 (Call 03/12/47) |
935 | 762,402 | ||||||
| 3.75%, 11/13/47 (Call 05/13/47) |
1,022 | 831,291 | ||||||
| 3.85%, 05/04/43 |
2,599 | 2,224,591 | ||||||
| 3.85%, 08/04/46 (Call 02/04/46) |
1,926 | 1,605,436 | ||||||
| 3.95%, 08/08/52 (Call 02/08/52) |
1,481 | 1,233,121 | ||||||
| 4.10%, 08/08/62 (Call 02/08/62) |
1,095 | 916,934 | ||||||
| 4.25%, 02/09/47 (Call 08/09/46) |
915 | 823,298 | ||||||
| 4.38%, 05/13/45 |
1,742 | 1,590,288 | ||||||
| 4.45%, 05/06/44(a) |
887 | 829,726 | ||||||
| 4.50%, 02/23/36 (Call 08/23/35) |
934 | 918,194 | ||||||
| 4.65%, 02/23/46 (Call 08/23/45) |
3,403 | 3,216,513 | ||||||
| 4.85%, 05/10/53 (Call 11/10/52)(a) |
1,086 | 1,061,584 | ||||||
| Dell Inc. |
||||||||
| 5.40%, 09/10/40(a) |
281 | 270,376 | ||||||
| 6.50%, 04/15/38 |
360 | 375,766 | ||||||
| Dell International LLC/EMC Corp. |
||||||||
| 3.38%, 12/15/41 (Call 06/15/41)(a) |
650 | 475,125 | ||||||
| 3.45%, 12/15/51 (Call 06/15/51) |
727 | 499,216 | ||||||
| 8.10%, 07/15/36 (Call 01/15/36) |
851 | 1,020,859 | ||||||
| 8.35%, 07/15/46 (Call 01/15/46) |
385 | 487,092 | ||||||
| Hewlett Packard Enterprise Co. |
||||||||
| 6.20%, 10/15/35 (Call 04/15/35) |
540 | 564,134 | ||||||
| 6.35%, 10/15/45 (Call 04/15/45)(a) |
1,183 | 1,222,538 | ||||||
| HP Inc., 6.00%, 09/15/41(a) |
1,072 | 1,099,043 | ||||||
| IBM International Capital Pte Ltd. |
||||||||
| 5.25%, 02/05/44 (Call 08/05/43) |
600 | 574,631 | ||||||
| 5.30%, 02/05/54 (Call 08/05/53) |
1,200 | 1,151,614 | ||||||
| International Business Machines Corp. |
||||||||
| 2.85%, 05/15/40 (Call 11/15/39) |
359 | 261,680 | ||||||
| 2.95%, 05/15/50 (Call 11/15/49) |
692 | 457,727 | ||||||
| 3.43%, 02/09/52 (Call 08/09/51) |
451 | 322,113 | ||||||
| 4.00%, 06/20/42(a) |
834 | 693,812 | ||||||
| 4.15%, 05/15/39 |
1,551 | 1,352,673 | ||||||
| 4.25%, 05/15/49 |
2,558 | 2,146,685 | ||||||
| 4.70%, 02/19/46 |
462 | 415,412 | ||||||
| 4.90%, 07/27/52 (Call 01/27/52) |
688 | 640,035 | ||||||
| 5.10%, 02/06/53 (Call 08/06/52) |
596 | 568,526 | ||||||
| Security | Par (000) |
Value | ||||||
| Computers (continued) | ||||||||
| 5.60%, 11/30/39 |
$ | 695 | $ | 715,561 | ||||
| 7.13%, 12/01/96(a) |
182 | 228,148 | ||||||
| Kyndryl Holdings Inc., 4.10%, 10/15/41 (Call 04/15/41) |
244 | 182,509 | ||||||
|
|
|
|||||||
| 42,111,889 | ||||||||
| Cosmetics & Personal Care — 0.4% | ||||||||
| Colgate-Palmolive Co. |
||||||||
| 3.70%, 08/01/47 (Call 02/01/47)(a) |
442 | 365,346 | ||||||
| 4.00%, 08/15/45 |
464 | 406,648 | ||||||
| Estee Lauder Companies Inc. (The) |
||||||||
| 3.13%, 12/01/49 (Call 06/01/49) |
691 | 472,347 | ||||||
| 3.70%, 08/15/42 |
246 | 185,991 | ||||||
| 4.15%, 03/15/47 (Call 09/15/46) |
373 | 306,276 | ||||||
| 4.38%, 06/15/45 (Call 12/15/44) |
341 | 292,213 | ||||||
| 5.15%, 05/15/53 (Call 11/15/52) |
530 | 509,163 | ||||||
| 6.00%, 05/15/37 |
345 | 368,182 | ||||||
| Haleon U.S. Capital LLC, 4.00%, 03/24/52 |
827 | 660,480 | ||||||
| Kenvue Inc. |
||||||||
| 5.05%, 03/22/53 (Call 09/22/52)(a) |
1,400 | 1,348,263 | ||||||
| 5.10%, 03/22/43 (Call 09/22/42)(a) |
471 | 460,298 | ||||||
| 5.20%, 03/22/63 (Call 09/22/62) |
615 | 595,839 | ||||||
| Procter & Gamble Co. (The) |
||||||||
| 3.50%, 10/25/47 |
320 | 255,602 | ||||||
| 3.55%, 03/25/40 |
356 | 305,062 | ||||||
| 3.60%, 03/25/50 |
451 | 370,302 | ||||||
| 5.55%, 03/05/37 |
725 | 778,298 | ||||||
| 5.80%, 08/15/34 |
224 | 246,229 | ||||||
| Unilever Capital Corp., Series 30Y, |
591 | 381,151 | ||||||
|
|
|
|||||||
| 8,307,690 | ||||||||
| Distribution & Wholesale — 0.1% | ||||||||
| WW Grainger Inc. |
||||||||
| 3.75%, 05/15/46 (Call 11/15/45) |
345 | 277,262 | ||||||
| 4.20%, 05/15/47 (Call 11/15/46) |
277 | 238,028 | ||||||
| 4.60%, 06/15/45 (Call 12/15/44)(a) |
847 | 774,988 | ||||||
|
|
|
|||||||
| 1,290,278 | ||||||||
| Diversified Financial Services — 1.2% | ||||||||
| AerCap Ireland Capital DAC/AerCap Global |
1,707 | 1,325,210 | ||||||
| American Express Co., 4.05%, 12/03/42(a) |
1,089 | 938,052 | ||||||
| Ares Finance Co. IV LLC, 3.65%, 02/01/52 |
390 | 269,604 | ||||||
| Blackstone Holdings Finance Co. LLC |
||||||||
| 2.80%, 09/30/50 (Call 03/30/50)(b) |
338 | 205,347 | ||||||
| 2.85%, 08/05/51 (Call 02/05/51)(a)(b) |
500 | 310,331 | ||||||
| 3.20%, 01/30/52 (Call 07/30/51)(a)(b) |
761 | 512,507 | ||||||
| 3.50%, 09/10/49 (Call 03/10/49)(a)(b) |
355 | 250,784 | ||||||
| 4.00%, 10/02/47 (Call 04/02/47)(a)(b) |
315 | 238,585 | ||||||
| 4.45%, 07/15/45(b) |
285 | 235,103 | ||||||
| 5.00%, 06/15/44(b) |
381 | 344,087 | ||||||
| 6.25%, 08/15/42(b) |
115 | 118,242 | ||||||
| Blue Owl Finance LLC, 4.13%, 10/07/51 |
260 | 174,831 | ||||||
| Brookfield Finance Inc. |
||||||||
| 3.50%, 03/30/51 (Call 09/30/50) |
663 | 470,370 | ||||||
| 3.63%, 02/15/52 (Call 08/15/51)(a) |
368 | 261,837 | ||||||
| 4.70%, 09/20/47 (Call 03/20/47)(a) |
741 | 630,601 | ||||||
| 5.97%, 03/04/54 (Call 09/04/53) |
195 | 196,531 | ||||||
| S C H E D U L E O F I N V E S T M E N T S |
225 |
| Schedule of Investments (continued) February 29, 2024 |
iShares® 10+ Year Investment Grade Corporate Bond ETF (Percentages shown are based on Net Assets) |
| Security | Par (000) |
Value | ||||||
| Diversified Financial Services (continued) | ||||||||
| Brookfield Finance LLC/Brookfield Finance Inc., |
||||||||
| 3.45%, 04/15/50 (Call 10/15/49) |
$ | 585 | $ | 404,750 | ||||
| CI Financial Corp., 4.10%, 06/15/51 |
||||||||
| (Call 12/15/50)(a) |
831 | 490,770 | ||||||
| CME Group Inc. |
||||||||
| 4.15%, 06/15/48 (Call 12/15/47) |
532 | 457,941 | ||||||
| 5.30%, 09/15/43 (Call 03/15/43) |
827 | 835,506 | ||||||
| FMR LLC |
||||||||
| 5.15%, 02/01/43(b) |
350 | 323,850 | ||||||
| 6.45%, 11/15/39(b) |
395 | 418,604 | ||||||
| 6.50%, 12/14/40(b) |
327 | 345,969 | ||||||
| Franklin Resources Inc., 2.95%, 08/12/51 |
||||||||
| (Call 02/12/51) |
350 | 213,954 | ||||||
| Invesco Finance PLC, 5.38%, 11/30/43 |
358 | 344,898 | ||||||
| Jefferies Financial Group Inc. |
||||||||
| 6.25%, 01/15/36 |
325 | 333,358 | ||||||
| 6.50%, 01/20/43 |
462 | 479,865 | ||||||
| 6.63%, 10/23/43 (Call 07/23/43)(a) |
153 | 156,474 | ||||||
| KKR Group Finance Co. II LLC, 5.50%, 02/01/43 |
||||||||
| (Call 08/01/42)(a)(b) |
411 | 390,823 | ||||||
| Legg Mason Inc., 5.63%, 01/15/44 |
380 | 381,304 | ||||||
| LSEGA Financing PLC, 3.20%, 04/06/41 |
||||||||
| (Call 10/06/40)(b) |
645 | 482,436 | ||||||
| Mastercard Inc. |
||||||||
| 2.95%, 03/15/51 (Call 09/15/50) |
609 | 424,127 | ||||||
| 3.65%, 06/01/49 (Call 12/01/48) |
812 | 647,982 | ||||||
| 3.80%, 11/21/46 (Call 05/21/46) |
394 | 324,217 | ||||||
| 3.85%, 03/26/50 (Call 09/26/49) |
1,241 | 1,025,159 | ||||||
| 3.95%, 02/26/48 (Call 08/26/47) |
334 | 283,315 | ||||||
| Nasdaq Inc. |
||||||||
| 2.50%, 12/21/40 (Call 06/21/40) |
569 | 377,266 | ||||||
| 3.25%, 04/28/50 (Call 10/28/49)(a) |
497 | 338,724 | ||||||
| 3.95%, 03/07/52 (Call 09/07/51) |
480 | 365,361 | ||||||
| 5.95%, 08/15/53 (Call 02/15/53)(a) |
655 | 673,510 | ||||||
| 6.10%, 06/28/63 (Call 12/28/62) |
695 | 724,676 | ||||||
| Neuberger Berman Group LLC/Neuberger Berman Finance Corp., 4.88%, 04/15/45 (Call 10/15/44)(b) |
261 | 209,252 | ||||||
| Raymond James Financial Inc. |
||||||||
| 3.75%, 04/01/51 (Call 10/01/50)(a) |
669 | 496,812 | ||||||
| 4.95%, 07/15/46(a) |
670 | 615,127 | ||||||
| Visa Inc. |
||||||||
| 2.00%, 08/15/50 (Call 02/15/50)(a) |
1,367 | 797,540 | ||||||
| 2.70%, 04/15/40 (Call 10/15/39) |
572 | 422,368 | ||||||
| 3.65%, 09/15/47 (Call 03/15/47) |
835 | 666,197 | ||||||
| 4.15%, 12/14/35 (Call 06/14/35)(a) |
1,166 | 1,096,061 | ||||||
| 4.30%, 12/14/45 (Call 06/14/45) |
3,100 | 2,771,483 | ||||||
| Voya Financial Inc. |
||||||||
| 4.80%, 06/15/46 |
199 | 168,707 | ||||||
| 5.70%, 07/15/43(a) |
552 | 535,260 | ||||||
| Western Union Co. (The) |
||||||||
| 6.20%, 11/17/36(a) |
584 | 589,562 | ||||||
| 6.20%, 06/21/40 |
254 | 253,621 | ||||||
|
|
|
|||||||
| 26,348,851 | ||||||||
| Electric — 12.7% | ||||||||
| Abu Dhabi National Energy Co. PJSC |
||||||||
| 3.40%, 04/29/51 (Call 10/29/50)(b) |
587 | 415,361 | ||||||
| 4.00%, 10/03/49(b) |
448 | 357,410 | ||||||
| 6.50%, 10/27/36(b) |
1,040 | 1,164,642 | ||||||
| AEP Texas Inc. |
||||||||
| 3.45%, 05/15/51 (Call 11/15/50) |
131 | 90,331 | ||||||
| Security | Par (000) |
Value | ||||||
| Electric (continued) | ||||||||
| 3.80%, 10/01/47 (Call 04/01/47) |
$ | 278 | $ | 206,854 | ||||
| 5.25%, 05/15/52 (Call 11/15/51) |
350 | 328,983 | ||||||
| Series G, 4.15%, 05/01/49 (Call 11/01/48) |
229 | 179,624 | ||||||
| Series H, 3.45%, 01/15/50 (Call 07/15/49) |
402 | 280,319 | ||||||
| AEP Transmission Co. LLC |
||||||||
| 3.15%, 09/15/49 (Call 03/15/49) |
350 | 238,974 | ||||||
| 3.75%, 12/01/47 (Call 06/01/47)(a) |
444 | 340,996 | ||||||
| 3.80%, 06/15/49 (Call 12/15/48) |
319 | 245,496 | ||||||
| 4.00%, 12/01/46 (Call 06/01/46) |
290 | 234,086 | ||||||
| 4.25%, 09/15/48 (Call 03/15/48) |
291 | 239,154 | ||||||
| 4.50%, 06/15/52 (Call 12/01/51) |
435 | 376,933 | ||||||
| 5.40%, 03/15/53 (Call 09/15/52)(a) |
615 | 608,979 | ||||||
| Series M, 3.65%, 04/01/50 (Call 10/01/49) |
474 | 356,179 | ||||||
| Series N, 2.75%, 08/15/51 (Call 02/15/51) |
457 | 284,752 | ||||||
| Alabama Power Co. |
||||||||
| 3.00%, 03/15/52 (Call 09/15/51)(a) |
584 | 389,107 | ||||||
| 3.13%, 07/15/51 (Call 01/15/51) |
505 | 343,398 | ||||||
| 3.45%, 10/01/49 (Call 04/01/49) |
452 | 328,796 | ||||||
| 3.75%, 03/01/45 (Call 09/01/44) |
624 | 489,739 | ||||||
| 3.85%, 12/01/42 |
220 | 177,157 | ||||||
| 4.10%, 01/15/42 |
320 | 259,461 | ||||||
| 4.15%, 08/15/44 (Call 02/15/44) |
364 | 303,295 | ||||||
| 4.30%, 01/02/46 (Call 07/02/45) |
355 | 298,960 | ||||||
| 5.50%, 03/15/41 |
263 | 258,303 | ||||||
| 6.00%, 03/01/39(a) |
257 | 270,888 | ||||||
| 6.13%, 05/15/38 |
415 | 434,287 | ||||||
| Series 11-C, 5.20%, 06/01/41(a) |
305 | 298,975 | ||||||
| Series A, 4.30%, 07/15/48 (Call 01/15/48) |
424 | 355,449 | ||||||
| Series B, 3.70%, 12/01/47 (Call 06/01/47) |
470 | 356,269 | ||||||
| Alfa Desarrollo SpA, 4.55%, 09/27/51 |
||||||||
| (Call 03/27/51)(b) |
597 | 443,945 | ||||||
| Ameren Illinois Co. |
||||||||
| 2.90%, 06/15/51 (Call 12/15/50)(a) |
156 | 101,366 | ||||||
| 3.25%, 03/15/50 (Call 09/15/49) |
332 | 232,681 | ||||||
| 3.70%, 12/01/47 (Call 06/01/47) |
347 | 268,093 | ||||||
| 4.15%, 03/15/46 (Call 09/15/45) |
415 | 343,591 | ||||||
| 4.30%, 07/01/44 (Call 01/01/44) |
195 | 161,245 | ||||||
| 4.50%, 03/15/49 (Call 09/15/48) |
418 | 362,639 | ||||||
| 4.80%, 12/15/43 (Call 06/15/43) |
280 | 248,487 | ||||||
| 5.90%, 12/01/52 (Call 06/01/52) |
420 | 445,929 | ||||||
| American Electric Power Co. Inc., 3.25%, 03/01/50 (Call 09/01/49) |
337 | 230,705 | ||||||
| American Transmission Systems Inc., 5.00%, 09/01/44 (Call 03/01/44)(b) |
216 | 193,879 | ||||||
| Appalachian Power Co. |
||||||||
| 4.40%, 05/15/44 (Call 11/15/43) |
273 | 223,345 | ||||||
| 4.45%, 06/01/45 (Call 12/01/44) |
316 | 260,223 | ||||||
| 7.00%, 04/01/38 |
475 | 532,224 | ||||||
| Series L, 5.80%, 10/01/35 |
285 | 292,379 | ||||||
| Series P, 6.70%, 08/15/37 |
285 | 308,925 | ||||||
| Series Y, 4.50%, 03/01/49 (Call 09/01/48) |
355 | 286,511 | ||||||
| Series Z, 3.70%, 05/01/50 (Call 11/01/49) |
440 | 315,180 | ||||||
| Arizona Public Service Co. |
||||||||
| 2.65%, 09/15/50 (Call 03/15/50)(a) |
530 | 314,777 | ||||||
| 3.35%, 05/15/50 (Call 11/15/49)(a) |
270 | 184,108 | ||||||
| 3.50%, 12/01/49 (Call 06/01/49) |
207 | 142,679 | ||||||
| 3.75%, 05/15/46 (Call 11/15/45) |
191 | 140,778 | ||||||
| 4.20%, 08/15/48 (Call 02/15/48) |
187 | 148,070 | ||||||
| 4.25%, 03/01/49 (Call 09/01/48) |
261 | 208,913 | ||||||
| 4.35%, 11/15/45 (Call 05/15/45) |
187 | 151,912 | ||||||
| 4.50%, 04/01/42 (Call 10/01/41) |
446 | 379,555 | ||||||
| 226 | 2 0 2 4 I S H A R E S A N N U A L R E P O R T T O S H A R E H O L D E R S |
| Schedule of Investments (continued) February 29, 2024 |
iShares® 10+ Year Investment Grade Corporate Bond ETF (Percentages shown are based on Net Assets) |
| Security | Par (000) |
Value | ||||||
| Electric (continued) | ||||||||
| 4.70%, 01/15/44 (Call 07/15/43) |
$ | 165 | $ | 137,151 | ||||
| 5.05%, 09/01/41 (Call 03/01/41)(a) |
427 | 389,004 | ||||||
| 5.50%, 09/01/35 |
300 | 294,523 | ||||||
| Avista Corp. |
||||||||
| 4.00%, 04/01/52 (Call 10/01/51)(a) |
218 | 165,432 | ||||||
| 4.35%, 06/01/48 (Call 12/01/47)(a) |
166 | 136,320 | ||||||
| Baltimore Gas & Electric Co. |
||||||||
| 2.90%, 06/15/50 (Call 12/15/49) |
333 | 215,916 | ||||||
| 3.20%, 09/15/49 (Call 03/15/49) |
447 | 306,376 | ||||||
| 3.50%, 08/15/46 (Call 02/15/46) |
484 | 357,135 | ||||||
| 3.75%, 08/15/47 (Call 02/15/47) |
295 | 222,317 | ||||||
| 4.25%, 09/15/48 (Call 03/15/48) |
275 | 227,604 | ||||||
| 4.55%, 06/01/52 (Call 12/01/51) |
461 | 401,576 | ||||||
| 5.40%, 06/01/53 (Call 12/01/52)(a) |
599 | 587,539 | ||||||
| 6.35%, 10/01/36 |
465 | 496,973 | ||||||
| Basin Electric Power Cooperative, 4.75%, 04/26/47 |
||||||||
| (Call 10/26/46)(a)(b) |
165 | 141,092 | ||||||
| Berkshire Hathaway Energy Co. |
||||||||
| 2.85%, 05/15/51 (Call 11/15/50) |
1,311 | 841,948 | ||||||
| 3.80%, 07/15/48 (Call 01/15/48)(a) |
662 | 503,146 | ||||||
| 4.25%, 10/15/50 (Call 04/15/50) |
728 | 586,494 | ||||||
| 4.45%, 01/15/49 (Call 07/15/48) |
933 | 786,928 | ||||||
| 4.50%, 02/01/45 (Call 08/01/44) |
556 | 493,336 | ||||||
| 4.60%, 05/01/53 (Call 11/01/52)(a) |
814 | 695,000 | ||||||
| 5.15%, 11/15/43 (Call 05/15/43) |
543 | 521,340 | ||||||
| 5.95%, 05/15/37 |
414 | 428,931 | ||||||
| 6.13%, 04/01/36 |
1,292 | 1,364,208 | ||||||
| Black Hills Corp. |
||||||||
| 3.88%, 10/15/49 (Call 04/15/49) |
238 | 169,399 | ||||||
| 4.20%, 09/15/46 (Call 03/15/46)(a) |
145 | 112,788 | ||||||
| Buffalo Energy Mexico Holdings/Buffalo Energy |
||||||||
| Infrastructure/Buffalo Energy, 7.88%, 02/15/39 |
||||||||
| (Call 11/15/38)(b) |
40 | 42,479 | ||||||
| Celeo Redes Operacion Chile SA, |
188 | 169,351 | ||||||
| CenterPoint Energy Houston Electric LLC |
||||||||
| 3.55%, 08/01/42 (Call 02/01/42) |
578 | 450,581 | ||||||
| 3.60%, 03/01/52 (Call 09/01/51) |
369 | 277,327 | ||||||
| 3.95%, 03/01/48 (Call 09/01/47) |
241 | 194,933 | ||||||
| 4.50%, 04/01/44 (Call 10/01/43) |
312 | 276,136 | ||||||
| 5.30%, 04/01/53 (Call 10/01/52) |
335 | 333,442 | ||||||
| Series AC, 4.25%, 02/01/49 (Call 08/01/48) |
715 | 606,039 | ||||||
| Series AD, 2.90%, 07/01/50 (Call 01/01/50) |
294 | 193,413 | ||||||
| Series AF, 3.35%, 04/01/51 (Call 10/01/50) |
600 | 431,372 | ||||||
| Series AJ, 4.85%, 10/01/52 (Call 04/01/52) |
287 | 264,818 | ||||||
| CenterPoint Energy Inc., 3.70%, 09/01/49 |
||||||||
| (Call 03/01/49)(a) |
225 | 164,028 | ||||||
| CEZ AS, 5.63%, 04/03/42(b) |
243 | 217,480 | ||||||
| Cleco Corporate Holdings LLC, 4.97%, 05/01/46 |
||||||||
| (Call 11/01/45) |
184 | 151,421 | ||||||
| Cleco Power LLC |
||||||||
| 6.00%, 12/01/40 |
253 | 256,446 | ||||||
| 6.50%, 12/01/35(a) |
310 | 319,855 | ||||||
| Cleveland Electric Illuminating Co. (The), |
341 | 339,814 | ||||||
| CMS Energy Corp. |
||||||||
| 4.70%, 03/31/43 (Call 09/30/42) |
510 | 443,124 | ||||||
| 4.88%, 03/01/44 (Call 09/01/43) |
187 | 171,726 | ||||||
| Cometa Energia SA de CV, 6.38%, 04/24/35 |
254 | 250,581 | ||||||
| Security | Par (000) |
Value | ||||||
| Electric (continued) | ||||||||
| Comision Federal de Electricidad |
||||||||
| 4.68%, 02/09/51 (Call 08/09/50)(b) |
$ | 632 | $ | 443,275 | ||||
| 5.75%, 02/14/42(a)(b) |
461 | 397,705 | ||||||
| 6.13%, 06/16/45(a)(b) |
535 | 473,475 | ||||||
| 6.26%, 02/15/52 (Call 08/15/51)(b) |
390 | 338,765 | ||||||
| Commonwealth Edison Co. |
||||||||
| 3.00%, 03/01/50 (Call 09/01/49) |
578 | 381,907 | ||||||
| 3.65%, 06/15/46 (Call 12/15/45) |
655 | 498,414 | ||||||
| 3.70%, 03/01/45 (Call 09/01/44)(a) |
348 | 271,334 | ||||||
| 3.80%, 10/01/42 (Call 04/01/42) |
298 | 239,453 | ||||||
| 4.00%, 03/01/48 (Call 09/01/47) |
711 | 572,889 | ||||||
| 4.00%, 03/01/49 (Call 09/01/48) |
368 | 294,098 | ||||||
| 4.35%, 11/15/45 (Call 05/15/45) |
398 | 338,557 | ||||||
| 4.60%, 08/15/43 (Call 02/15/43) |
395 | 350,315 | ||||||
| 4.70%, 01/15/44 (Call 07/15/43) |
240 | 213,828 | ||||||
| 5.30%, 02/01/53 (Call 08/01/52) |
516 | 499,452 | ||||||
| 6.45%, 01/15/38 |
394 | 427,529 | ||||||
| Series 123, 3.75%, 08/15/47 (Call 02/15/47) |
547 | 419,700 | ||||||
| Series 127, 3.20%, 11/15/49 (Call 05/15/49) |
210 | 144,674 | ||||||
| Series 130, 3.13%, 03/15/51 (Call 09/15/50) |
589 | 395,279 | ||||||
| Series 131, 2.75%, 09/01/51 (Call 03/01/51) |
340 | 209,847 | ||||||
| Series 133, 3.85%, 03/15/52 (Call 09/15/51)(a) |
415 | 319,437 | ||||||
| Connecticut Light & Power Co. (The) |
||||||||
| 4.00%, 04/01/48 (Call 10/01/47) |
707 | 575,729 | ||||||
| 4.30%, 04/15/44 (Call 10/15/43) |
309 | 262,895 | ||||||
| 5.25%, 01/15/53 (Call 07/15/52) |
436 | 424,997 | ||||||
| 6.35%, 06/01/36 |
235 | 250,857 | ||||||
| Series A, 4.15%, 06/01/45 (Call 12/01/44)(a) |
182 | 153,250 | ||||||
| Consolidated Edison Co. of New York Inc. |
||||||||
| 3.20%, 12/01/51 (Call 06/01/51) |
629 | 427,164 | ||||||
| 3.60%, 06/15/61 (Call 12/15/60) |
530 | 382,678 | ||||||
| 3.70%, 11/15/59 (Call 05/15/59) |
438 | 312,523 | ||||||
| 3.85%, 06/15/46 (Call 12/15/45) |
502 | 394,444 | ||||||
| 3.95%, 03/01/43 (Call 09/01/42)(a) |
650 | 533,228 | ||||||
| 4.45%, 03/15/44 (Call 09/15/43) |
571 | 496,632 | ||||||
| 4.50%, 12/01/45 (Call 06/01/45) |
561 | 485,648 | ||||||
| 4.50%, 05/15/58 (Call 11/15/57) |
567 | 476,976 | ||||||
| 4.63%, 12/01/54 (Call 06/01/54) |
558 | 479,140 | ||||||
| 5.70%, 06/15/40 |
360 | 362,264 | ||||||
| 5.90%, 11/15/53 (Call 05/15/53) |
855 | 901,680 | ||||||
| 6.15%, 11/15/52 (Call 05/15/52) |
640 | 693,563 | ||||||
| Series 05-A, 5.30%, 03/01/35 |
398 | 395,306 | ||||||
| Series 06-A, 5.85%, 03/15/36 |
440 | 451,414 | ||||||
| Series 06-B, 6.20%, 06/15/36 |
375 | 398,597 | ||||||
| Series 06-E, 5.70%, 12/01/36 |
312 | 312,590 | ||||||
| Series 07-A, 6.30%, 08/15/37(a) |
495 | 529,319 | ||||||
| Series 08-B, 6.75%, 04/01/38 |
575 | 640,565 | ||||||
| Series 09-C, 5.50%, 12/01/39 |
565 | 564,618 | ||||||
| Series 12-A, 4.20%, 03/15/42 |
401 | 335,171 | ||||||
| Series 2017, 3.88%, 06/15/47 (Call 12/15/46) |
405 | 314,699 | ||||||
| Series 20B, 3.95%, 04/01/50 (Call 10/01/49) |
841 | 673,657 | ||||||
| Series A, 4.13%, 05/15/49 (Call 11/15/48) |
523 | 420,111 | ||||||
| Series C, 3.00%, 12/01/60 (Call 06/01/60) |
470 | 286,950 | ||||||
| Series C, 4.00%, 11/15/57 (Call 05/15/57)(a) |
194 | 151,064 | ||||||
| Series C, 4.30%, 12/01/56 (Call 06/01/56)(a) |
338 | 276,752 | ||||||
| Series E, 4.65%, 12/01/48 (Call 06/01/48) |
474 | 414,317 | ||||||
| Consorcio Transmantaro SA, |
802 | 747,473 | ||||||
| Constellation Energy Generation LLC |
||||||||
| 5.60%, 06/15/42 (Call 12/15/41) |
754 | 734,522 | ||||||
| 5.75%, 10/01/41 (Call 04/01/41) |
415 | 406,082 | ||||||
| S C H E D U L E O F I N V E S T M E N T S |
227 |
| Schedule of Investments (continued) February 29, 2024 |
iShares® 10+ Year Investment Grade Corporate Bond ETF (Percentages shown are based on Net Assets) |
| Security | Par (000) |
Value | ||||||
| Electric (continued) | ||||||||
| 6.25%, 10/01/39 |
$ | 767 | $ | 790,692 | ||||
| 6.50%, 10/01/53 (Call 04/01/53) |
717 | 786,908 | ||||||
| Consumers Energy Co. |
||||||||
| 2.50%, 05/01/60 (Call 11/01/59) |
172 | 95,008 | ||||||
| 3.10%, 08/15/50 (Call 02/15/50) |
406 | 281,566 | ||||||
| 3.25%, 08/15/46 (Call 02/15/46) |
290 | 212,108 | ||||||
| 3.50%, 08/01/51 (Call 02/01/51) |
426 | 318,610 | ||||||
| 3.75%, 02/15/50 (Call 08/15/49) |
198 | 154,828 | ||||||
| 3.95%, 05/15/43 (Call 11/15/42) |
454 | 373,170 | ||||||
| 3.95%, 07/15/47 (Call 01/15/47) |
235 | 190,833 | ||||||
| 4.05%, 05/15/48 (Call 11/15/47) |
416 | 344,780 | ||||||
| 4.10%, 11/15/45 (Call 05/15/45) |
135 | 108,245 | ||||||
| 4.20%, 09/01/52 (Call 03/01/52) |
370 | 307,549 | ||||||
| 4.35%, 04/15/49 (Call 10/15/48) |
494 | 427,460 | ||||||
| 4.35%, 08/31/64 (Call 02/28/64) |
197 | 149,838 | ||||||
| Dayton Power & Light Co. (The), 3.95%, 06/15/49 |
||||||||
| (Call 12/15/48) |
258 | 189,723 | ||||||
| Delmarva Power & Light Co. |
||||||||
| 4.00%, 06/01/42 (Call 12/01/41) |
243 | 194,727 | ||||||
| 4.15%, 05/15/45 (Call 11/15/44)(a) |
326 | 260,875 | ||||||
| Dominion Energy Inc. |
||||||||
| 4.70%, 12/01/44 (Call 06/01/44) |
402 | 345,859 | ||||||
| 4.85%, 08/15/52 (Call 02/15/52) |
595 | 521,178 | ||||||
| 7.00%, 06/15/38 |
428 | 465,811 | ||||||
| Series A, 4.60%, 03/15/49 (Call 09/15/48) |
436 | 369,354 | ||||||
| Series B, 3.30%, 04/15/41 (Call 10/15/40) |
199 | 146,486 | ||||||
| Series B, 5.95%, 06/15/35 |
500 | 511,317 | ||||||
| Series C, 4.05%, 09/15/42 (Call 03/15/42) |
380 | 300,650 | ||||||
| Series C, 4.90%, 08/01/41 (Call 02/01/41) |
442 | 396,186 | ||||||
| Dominion Energy South Carolina Inc. |
||||||||
| 4.60%, 06/15/43 (Call 12/15/42) |
418 | 368,401 | ||||||
| 5.10%, 06/01/65 (Call 12/01/64) |
226 | 209,123 | ||||||
| 5.45%, 02/01/41 (Call 08/01/40)(a) |
352 | 344,541 | ||||||
| 6.05%, 01/15/38(a) |
398 | 420,625 | ||||||
| 6.25%, 10/15/53 (Call 04/15/53) |
405 | 447,720 | ||||||
| DTE Electric Co. |
||||||||
| 2.95%, 03/01/50 (Call 09/01/49) |
377 | 250,655 | ||||||
| 3.70%, 03/15/45 (Call 09/15/44) |
127 | 99,698 | ||||||
| 3.70%, 06/01/46 (Call 12/01/45) |
189 | 144,868 | ||||||
| 3.75%, 08/15/47 (Call 02/15/47) |
245 | 187,762 | ||||||
| 3.95%, 06/15/42 (Call 12/15/41)(a) |
235 | 187,340 | ||||||
| 3.95%, 03/01/49 (Call 09/01/48) |
728 | 588,450 | ||||||
| 4.30%, 07/01/44 (Call 01/01/44) |
181 | 154,896 | ||||||
| 5.40%, 04/01/53 (Call 10/01/52) |
506 | 501,335 | ||||||
| 5.70%, 10/01/37(a) |
258 | 260,241 | ||||||
| Series A, 4.00%, 04/01/43 (Call 10/01/42) |
296 | 245,139 | ||||||
| Series A, 4.05%, 05/15/48 (Call 11/15/47) |
575 | 469,999 | ||||||
| Series A, 6.63%, 06/01/36(a) |
340 | 372,330 | ||||||
| Series B, 3.25%, 04/01/51 (Call 10/01/50) |
482 | 335,447 | ||||||
| Series B, 3.65%, 03/01/52 (Call 09/01/51) |
485 | 364,286 | ||||||
| Duke Energy Carolinas LLC |
||||||||
| 3.20%, 08/15/49 (Call 02/15/49) |
671 | 463,479 | ||||||
| 3.45%, 04/15/51 (Call 10/15/50) |
373 | 265,223 | ||||||
| 3.55%, 03/15/52 (Call 09/15/51) |
553 | 398,046 | ||||||
| 3.70%, 12/01/47 (Call 06/01/47) |
542 | 403,765 | ||||||
| 3.75%, 06/01/45 (Call 12/01/44) |
447 | 345,843 | ||||||
| 3.88%, 03/15/46 (Call 09/15/45) |
408 | 317,902 | ||||||
| 3.95%, 03/15/48 (Call 09/15/47) |
478 | 378,177 | ||||||
| 4.00%, 09/30/42 (Call 03/30/42) |
483 | 395,296 | ||||||
| 4.25%, 12/15/41 (Call 06/15/41) |
469 | 397,291 | ||||||
| 5.30%, 02/15/40 |
605 | 593,511 | ||||||
| Security | Par (000) |
Value | ||||||
| Electric (continued) | ||||||||
| 5.35%, 01/15/53 (Call 07/15/52) |
$ | 770 | $ | 753,655 | ||||
| 5.40%, 01/15/54 (Call 07/15/53) |
732 | 713,193 | ||||||
| 6.00%, 01/15/38 |
419 | 439,802 | ||||||
| 6.05%, 04/15/38 |
439 | 461,169 | ||||||
| 6.10%, 06/01/37 |
417 | 435,503 | ||||||
| Duke Energy Corp. |
||||||||
| 3.30%, 06/15/41 (Call 12/15/40) |
136 | 100,046 | ||||||
| 3.50%, 06/15/51 (Call 12/15/50) |
621 | 429,918 | ||||||
| 3.75%, 09/01/46 (Call 03/01/46) |
1,388 | 1,035,721 | ||||||
| 3.95%, 08/15/47 (Call 02/15/47) |
521 | 397,501 | ||||||
| 4.20%, 06/15/49 (Call 12/15/48) |
503 | 395,856 | ||||||
| 4.80%, 12/15/45 (Call 06/15/45) |
541 | 475,094 | ||||||
| 5.00%, 08/15/52 (Call 02/15/52) |
968 | 862,398 | ||||||
| 6.10%, 09/15/53 (Call 03/15/53)(a) |
630 | 653,688 | ||||||
| Duke Energy Florida LLC |
||||||||
| 3.00%, 12/15/51 (Call 06/15/51) |
410 | 264,754 | ||||||
| 3.40%, 10/01/46 (Call 04/01/46) |
553 | 398,057 | ||||||
| 3.85%, 11/15/42 (Call 05/15/42) |
365 | 290,320 | ||||||
| 4.20%, 07/15/48 (Call 01/15/48) |
332 | 271,268 | ||||||
| 5.65%, 04/01/40 |
376 | 377,907 | ||||||
| 5.95%, 11/15/52 (Call 05/15/52) |
435 | 458,101 | ||||||
| 6.20%, 11/15/53 (Call 05/15/53) |
605 | 655,181 | ||||||
| 6.35%, 09/15/37 |
435 | 465,784 | ||||||
| 6.40%, 06/15/38 |
934 | 1,010,346 | ||||||
| Duke Energy Indiana LLC |
||||||||
| 2.75%, 04/01/50 (Call 10/01/49)(a) |
478 | 297,560 | ||||||
| 3.75%, 05/15/46 (Call 11/15/45) |
406 | 310,191 | ||||||
| 5.40%, 04/01/53 (Call 10/01/52) |
440 | 424,364 | ||||||
| 6.12%, 10/15/35(a) |
330 | 341,618 | ||||||
| 6.35%, 08/15/38 |
475 | 508,055 | ||||||
| 6.45%, 04/01/39 |
360 | 392,871 | ||||||
| Series UUU, 4.20%, 03/15/42 (Call 09/15/41) |
254 | 211,946 | ||||||
| Series WWW, 4.90%, 07/15/43 (Call 01/15/43) |
286 | 263,458 | ||||||
| Series YYY, 3.25%, 10/01/49 (Call 04/01/49)(a) |
411 | 283,792 | ||||||
| Duke Energy Ohio Inc. |
||||||||
| 3.70%, 06/15/46 (Call 12/15/45) |
368 | 276,318 | ||||||
| 4.30%, 02/01/49 (Call 08/01/48)(a) |
382 | 310,848 | ||||||
| 5.65%, 04/01/53 (Call 10/01/52) |
335 | 338,063 | ||||||
| Duke Energy Progress LLC |
||||||||
| 2.50%, 08/15/50 (Call 02/15/50) |
555 | 331,238 | ||||||
| 2.90%, 08/15/51 (Call 02/15/51) |
412 | 264,254 | ||||||
| 3.60%, 09/15/47 (Call 03/15/47) |
481 | 356,494 | ||||||
| 3.70%, 10/15/46 (Call 04/15/46) |
441 | 333,923 | ||||||
| 4.00%, 04/01/52 (Call 10/01/51) |
330 | 260,276 | ||||||
| 4.10%, 05/15/42 (Call 11/15/41) |
517 | 428,007 | ||||||
| 4.10%, 03/15/43 (Call 09/15/42) |
321 | 263,204 | ||||||
| 4.15%, 12/01/44 (Call 06/01/44) |
449 | 367,304 | ||||||
| 4.20%, 08/15/45 (Call 02/15/45) |
640 | 527,904 | ||||||
| 4.38%, 03/30/44 (Call 09/30/43) |
435 | 371,851 | ||||||
| 5.35%, 03/15/53 (Call 09/15/52) |
495 | 479,528 | ||||||
| 6.30%, 04/01/38 |
290 | 311,292 | ||||||
| E.ON International Finance BV, |
1,011 | 1,082,125 | ||||||
| El Paso Electric Co. |
||||||||
| 5.00%, 12/01/44 (Call 06/01/44)(a) |
190 | 162,291 | ||||||
| 6.00%, 05/15/35 |
531 | 533,826 | ||||||
| Electricite de France SA |
||||||||
| 4.75%, 10/13/35 (Call 04/13/35)(b) |
368 | 338,217 | ||||||
| 4.88%, 09/21/38 (Call 03/21/38)(b) |
491 | 435,777 | ||||||
| 4.88%, 01/22/44(b) |
808 | 704,975 | ||||||
| 4.95%, 10/13/45 (Call 04/13/45)(b) |
1,031 | 906,556 | ||||||
| 5.00%, 09/21/48 (Call 03/21/48)(b) |
1,194 | 1,049,783 | ||||||
| 228 | 2 0 2 4 I S H A R E S A N N U A L R E P O R T T O S H A R E H O L D E R S |
| Schedule of Investments (continued) February 29, 2024 |
iShares® 10+ Year Investment Grade Corporate Bond ETF (Percentages shown are based on Net Assets) |
| Security | Par (000) |
Value | ||||||
| Electric (continued) | ||||||||
| 5.25%, 10/13/55 (Call 04/13/55)(a)(b) |
$ | 216 | $ | 184,965 | ||||
| 5.60%, 01/27/40(a)(b) |
698 | 675,574 | ||||||
| 6.00%, 01/22/2114(a)(b) |
574 | 538,257 | ||||||
| 6.90%, 05/23/53 (Call 11/23/52)(a)(b) |
855 | 931,608 | ||||||
| 6.95%, 01/26/39(b) |
1,495 | 1,638,360 | ||||||
| Elm Road Generating Station Supercritical LLC, |
||||||||
| 6.09%, 02/11/40(a)(b) |
395 | 385,403 | ||||||
| Emera U.S. Finance LP, 4.75%, 06/15/46 |
||||||||
| (Call 12/15/45) |
764 | 625,404 | ||||||
| Empresa de Transmision Electrica SA, |
545 | 389,675 | ||||||
| Enel Finance America LLC, 2.88%, 07/12/41 |
||||||||
| (Call 01/12/41)(b) |
211 | 140,561 | ||||||
| Enel Finance International NV |
||||||||
| 4.75%, 05/25/47(b) |
1,126 | 946,373 | ||||||
| 5.50%, 06/15/52 (Call 12/15/51)(a)(b) |
840 | 765,001 | ||||||
| 6.00%, 10/07/39(b) |
1,169 | 1,169,810 | ||||||
| 6.80%, 09/15/37(b) |
991 | 1,062,885 | ||||||
| 7.75%, 10/14/52 (Call 04/14/52)(b) |
829 | 991,906 | ||||||
| Entergy Arkansas LLC |
||||||||
| 2.65%, 06/15/51 (Call 12/15/50)(a) |
647 | 388,750 | ||||||
| 3.35%, 06/15/52 (Call 12/15/51) |
410 | 280,431 | ||||||
| 4.20%, 04/01/49 (Call 10/01/48) |
553 | 453,928 | ||||||
| 4.95%, 12/15/44 (Call 12/15/24) |
175 | 153,439 | ||||||
| Entergy Corp., 3.75%, 06/15/50 (Call 12/15/49) |
595 | 430,521 | ||||||
| Entergy Louisiana LLC |
||||||||
| 2.90%, 03/15/51 (Call 09/15/50) |
655 | 411,324 | ||||||
| 3.10%, 06/15/41 (Call 12/15/40) |
359 | 263,331 | ||||||
| 4.20%, 09/01/48 (Call 03/01/48) |
714 | 577,535 | ||||||
| 4.20%, 04/01/50 (Call 10/01/49) |
443 | 358,239 | ||||||
| 4.75%, 09/15/52 (Call 03/15/52) |
415 | 362,396 | ||||||
| 4.95%, 01/15/45 (Call 01/15/25) |
240 | 218,400 | ||||||
| Entergy Mississippi LLC |
||||||||
| 3.50%, 06/01/51 (Call 03/01/51)(a) |
359 | 253,829 | ||||||
| 3.85%, 06/01/49 (Call 12/01/48) |
418 | 317,937 | ||||||
| Entergy Texas Inc. |
||||||||
| 3.55%, 09/30/49 (Call 03/30/49) |
335 | 241,949 | ||||||
| 4.50%, 03/30/39 (Call 09/30/38) |
108 | 96,085 | ||||||
| 5.00%, 09/15/52 (Call 03/15/52)(a) |
284 | 257,895 | ||||||
| 5.15%, 06/01/45 (Call 06/01/25) |
190 | 175,203 | ||||||
| 5.80%, 09/01/53 (Call 03/01/53)(a) |
302 | 311,271 | ||||||
| Evergy Kansas Central Inc. |
||||||||
| 3.25%, 09/01/49 (Call 03/01/49) |
276 | 189,650 | ||||||
| 3.45%, 04/15/50 (Call 10/15/49) |
340 | 238,679 | ||||||
| 4.10%, 04/01/43 (Call 10/01/42) |
394 | 320,770 | ||||||
| 4.13%, 03/01/42 (Call 09/01/41)(a) |
586 | 485,110 | ||||||
| 4.25%, 12/01/45 (Call 06/01/45) |
183 | 149,531 | ||||||
| 4.63%, 09/01/43 (Call 03/01/43) |
269 | 230,076 | ||||||
| 5.70%, 03/15/53 (Call 09/15/52) |
244 | 243,853 | ||||||
| Evergy Kansas South Inc., 4.30%, 07/15/44 |
||||||||
| (Call 01/15/44)(b) |
124 | 100,064 | ||||||
| Evergy Metro Inc. |
||||||||
| 4.20%, 06/15/47 (Call 12/15/46) |
196 | 157,685 | ||||||
| 4.20%, 03/15/48 (Call 09/15/47) |
135 | 110,136 | ||||||
| 5.30%, 10/01/41 (Call 04/01/41)(a) |
441 | 414,537 | ||||||
| Series 2019, 4.13%, 04/01/49 (Call 10/01/48) |
240 | 191,141 | ||||||
| Series B, 6.05%, 11/15/35(a) |
260 | 268,953 | ||||||
| Eversource Energy, 3.45%, 01/15/50 |
||||||||
| (Call 07/15/49)(a) |
498 | 340,588 | ||||||
| Exelon Corp. |
||||||||
| 4.10%, 03/15/52 (Call 09/15/51) |
600 | 465,230 | ||||||
| Security | Par (000) |
Value | ||||||
| Electric (continued) | ||||||||
| 4.45%, 04/15/46 (Call 10/15/45) |
$ | 649 | $ | 544,113 | ||||
| 4.70%, 04/15/50 (Call 10/15/49) |
726 | 630,090 | ||||||
| 4.95%, 06/15/35 (Call 12/15/34) |
95 | 89,035 | ||||||
| 5.10%, 06/15/45 (Call 12/15/44) |
626 | 571,689 | ||||||
| 5.60%, 03/15/53 (Call 09/15/52)(a) |
770 | 749,879 | ||||||
| 5.63%, 06/15/35 |
437 | 434,489 | ||||||
| FirstEnergy Transmission LLC |
||||||||
| 4.55%, 04/01/49 (Call 10/01/48)(b) |
135 | 111,680 | ||||||
| 5.45%, 07/15/44 (Call 01/15/44)(a)(b) |
164 | 154,417 | ||||||
| Florida Power & Light Co. |
||||||||
| 2.88%, 12/04/51 (Call 06/04/51)(a) |
1,025 | 666,285 | ||||||
| 3.15%, 10/01/49 (Call 04/01/49) |
655 | 451,568 | ||||||
| 3.70%, 12/01/47 (Call 06/01/47) |
353 | 274,730 | ||||||
| 3.80%, 12/15/42 (Call 06/15/42) |
394 | 322,109 | ||||||
| 3.95%, 03/01/48 (Call 09/01/47)(a) |
929 | 753,235 | ||||||
| 3.99%, 03/01/49 (Call 09/01/48) |
485 | 391,938 | ||||||
| 4.05%, 06/01/42 (Call 12/01/41) |
452 | 383,075 | ||||||
| 4.05%, 10/01/44 (Call 04/01/44) |
411 | 346,484 | ||||||
| 4.13%, 02/01/42 (Call 08/01/41) |
635 | 545,999 | ||||||
| 4.13%, 06/01/48 (Call 12/01/47) |
587 | 485,758 | ||||||
| 4.95%, 06/01/35 |
365 | 358,778 | ||||||
| 5.13%, 06/01/41 (Call 12/01/40)(a) |
275 | 261,505 | ||||||
| 5.25%, 02/01/41 (Call 08/01/40) |
324 | 319,736 | ||||||
| 5.30%, 04/01/53 (Call 10/01/52) |
631 | 623,721 | ||||||
| 5.65%, 02/01/37 |
233 | 239,700 | ||||||
| 5.69%, 03/01/40 |
446 | 456,555 | ||||||
| 5.95%, 02/01/38 |
563 | 599,118 | ||||||
| 5.96%, 04/01/39 |
455 | 489,019 | ||||||
| Georgia Power Co. |
||||||||
| 4.30%, 03/15/42(a) |
1,005 | 859,749 | ||||||
| 4.30%, 03/15/43 |
539 | 454,173 | ||||||
| 5.13%, 05/15/52 (Call 11/15/51)(a) |
680 | 644,592 | ||||||
| 5.40%, 06/01/40(a) |
220 | 211,465 | ||||||
| Series 10-C, 4.75%, 09/01/40 |
543 | 491,868 | ||||||
| Series A, 3.25%, 03/15/51 (Call 09/15/50) |
609 | 417,929 | ||||||
| Series B, 3.70%, 01/30/50 (Call 07/30/49) |
424 | 320,332 | ||||||
| Great River Energy, 6.25%, 07/01/38(a)(b) |
351 | 362,410 | ||||||
| Iberdrola International BV, 6.75%, 07/15/36(a) |
485 | 542,516 | ||||||
| Idaho Power Co. |
||||||||
| 3.65%, 03/01/45 (Call 09/01/44) |
294 | 214,848 | ||||||
| 5.50%, 03/15/53 (Call 09/15/52)(a) |
295 | 289,575 | ||||||
| 5.80%, 04/01/54 (Call 10/01/53)(a) |
260 | 264,838 | ||||||
| Series K, 4.20%, 03/01/48 (Call 09/01/47)(a) |
260 | 209,977 | ||||||
| Indiana Michigan Power Co. |
||||||||
| 3.25%, 05/01/51 (Call 11/01/50) |
380 | 256,707 | ||||||
| 4.25%, 08/15/48 (Call 02/15/48) |
460 | 373,321 | ||||||
| 5.63%, 04/01/53 (Call 10/01/52) |
430 | 430,331 | ||||||
| 6.05%, 03/15/37 |
368 | 382,475 | ||||||
| Series K, 4.55%, 03/15/46 (Call 09/15/45) |
355 | 303,728 | ||||||
| Series L, 3.75%, 07/01/47 (Call 01/01/47) |
285 | 212,308 | ||||||
| Indianapolis Power & Light Co. |
||||||||
| 4.05%, 05/01/46 (Call 11/01/45)(b) |
255 | 200,923 | ||||||
| 4.70%, 09/01/45 (Call 03/01/45)(b) |
191 | 159,466 | ||||||
| Infraestructura Energetica Nova SAPI de CV |
||||||||
| 4.75%, 01/15/51 (Call 07/15/50)(b) |
595 | 449,958 | ||||||
| 4.88%, 01/14/48(b) |
352 | 269,016 | ||||||
| Interchile SA, 4.50%, 06/30/56 (Call 12/30/55)(b) |
1,045 | 827,300 | ||||||
| International Transmission Co., 4.63%, 08/15/43 |
||||||||
| (Call 02/15/43)(a) |
325 | 277,920 | ||||||
| Interstate Power & Light Co. |
||||||||
| 3.10%, 11/30/51 (Call 05/30/51) |
218 | 139,426 | ||||||
| S C H E D U L E O F I N V E S T M E N T S |
229 |
| Schedule of Investments (continued) February 29, 2024 |
iShares® 10+ Year Investment Grade Corporate Bond ETF (Percentages shown are based on Net Assets) |
| Security | Par (000) |
Value | ||||||
| Electric (continued) | ||||||||
| 3.50%, 09/30/49 (Call 03/30/49)(a) |
$ | 429 | $ | 305,481 | ||||
| 3.70%, 09/15/46 (Call 03/15/46) |
184 | 136,552 | ||||||
| 4.70%, 10/15/43 (Call 04/15/43)(a) |
243 | 204,419 | ||||||
| 6.25%, 07/15/39 |
230 | 239,650 | ||||||
| ITC Holdings Corp., 5.30%, 07/01/43 |
||||||||
| (Call 01/01/43) |
493 | 462,289 | ||||||
| Jersey Central Power & Light Co., |
291 | 300,441 | ||||||
| Kentucky Utilities Co. |
||||||||
| 3.30%, 06/01/50 (Call 12/01/49) |
428 | 296,538 | ||||||
| 4.38%, 10/01/45 (Call 04/01/45) |
404 | 339,494 | ||||||
| 5.13%, 11/01/40 (Call 05/01/40) |
707 | 670,717 | ||||||
| Series 1, 4.65%, 11/15/43 (Call 05/15/43) |
239 | 205,322 | ||||||
| LLPL Capital Pte Ltd., 6.88%, 02/04/39(b) |
171 | 165,324 | ||||||
| Louisville Gas & Electric Co. |
||||||||
| 4.25%, 04/01/49 (Call 10/01/48) |
216 | 176,176 | ||||||
| 4.38%, 10/01/45 (Call 04/01/45) |
170 | 142,457 | ||||||
| 4.65%, 11/15/43 (Call 05/15/43) |
247 | 213,904 | ||||||
| 5.13%, 11/15/40 (Call 05/15/40) |
145 | 133,369 | ||||||
| Massachusetts Electric Co. |
||||||||
| 4.00%, 08/15/46 (Call 02/15/46)(b) |
275 | 210,585 | ||||||
| 5.87%, 02/26/54 (Call 08/26/53)(b) |
325 | 326,356 | ||||||
| 5.90%, 11/15/39(a)(b) |
544 | 541,027 | ||||||
| MidAmerican Energy Co. |
||||||||
| 2.70%, 08/01/52 (Call 02/01/52) |
425 | 261,411 | ||||||
| 3.15%, 04/15/50 (Call 10/15/49)(a) |
768 | 525,242 | ||||||
| 3.65%, 08/01/48 (Call 02/01/48) |
680 | 519,190 | ||||||
| 3.95%, 08/01/47 (Call 02/01/47) |
507 | 406,453 | ||||||
| 4.25%, 05/01/46 (Call 11/01/45) |
316 | 264,758 | ||||||
| 4.25%, 07/15/49 (Call 01/15/49) |
804 | 676,959 | ||||||
| 4.40%, 10/15/44 (Call 04/15/44)(a) |
520 | 446,476 | ||||||
| 4.80%, 09/15/43 (Call 03/15/43) |
356 | 325,453 | ||||||
| 5.30%, 02/01/55 (Call 08/01/54) |
250 | 243,042 | ||||||
| 5.75%, 11/01/35 |
426 | 443,181 | ||||||
| 5.80%, 10/15/36 |
255 | 262,787 | ||||||
| 5.85%, 09/15/54 (Call 03/15/54) |
845 | 889,716 | ||||||
| Minejesa Capital BV, 5.63%, 08/10/37(a)(b) |
506 | 441,485 | ||||||
| Mississippi Power Co. |
||||||||
| Series 12-A, 4.25%, 03/15/42 |
478 | 397,903 | ||||||
| Series B, 3.10%, 07/30/51 (Call 01/30/51)(a) |
305 | 198,402 | ||||||
| Monongahela Power Co., 5.40%, 12/15/43 |
||||||||
| (Call 06/15/43)(b) |
789 | 745,451 | ||||||
| Narragansett Electric Co. (The) |
||||||||
| 4.17%, 12/10/42(b) |
282 | 222,942 | ||||||
| 5.64%, 03/15/40(b) |
273 | 267,440 | ||||||
| National Grid USA, 5.80%, 04/01/35 |
320 | 316,548 | ||||||
| National Rural Utilities Cooperative Finance Corp. |
||||||||
| 4.30%, 03/15/49 (Call 09/15/48) |
204 | 169,917 | ||||||
| 4.40%, 11/01/48 (Call 05/01/48) |
188 | 158,583 | ||||||
| Nevada Power Co. |
||||||||
| 5.38%, 09/15/40 (Call 03/15/40) |
270 | 260,872 | ||||||
| 5.45%, 05/15/41 (Call 11/15/40)(a) |
270 | 260,999 | ||||||
| 5.90%, 05/01/53 (Call 11/01/52)(a) |
332 | 340,399 | ||||||
| 6.00%, 03/15/54 (Call 09/15/53) |
420 | 441,086 | ||||||
| Series EE, 3.13%, 08/01/50 (Call 02/01/50) |
259 | 169,226 | ||||||
| Series N, 6.65%, 04/01/36 |
394 | 422,645 | ||||||
| Series R, 6.75%, 07/01/37 |
290 | 320,913 | ||||||
| New England Power Co. |
||||||||
| 2.81%, 10/06/50 (Call 04/06/50)(b) |
295 | 182,053 | ||||||
| 3.80%, 12/05/47 (Call 06/05/47)(b) |
116 | 87,433 | ||||||
| 5.94%, 11/25/52 (Call 05/25/52)(b) |
205 | 208,299 | ||||||
| Security | Par (000) |
Value | ||||||
| Electric (continued) | ||||||||
| New York State Electric & Gas Corp., |
$ | 215 | $ | 140,681 | ||||
| NextEra Energy Capital Holdings Inc. |
||||||||
| 3.00%, 01/15/52 (Call 07/15/51) |
509 | 322,922 | ||||||
| 5.25%, 02/28/53 (Call 08/28/52) |
955 | 890,102 | ||||||
| 5.55%, 03/15/54 (Call 09/15/53) |
1,075 | 1,041,697 | ||||||
| Niagara Mohawk Power Corp. |
||||||||
| 3.03%, 06/27/50 (Call 12/27/49)(b) |
349 | 217,037 | ||||||
| 4.12%, 11/28/42(b) |
235 | 186,740 | ||||||
| 4.28%, 10/01/34 (Call 04/01/34)(b) |
413 | 367,395 | ||||||
| 5.66%, 01/17/54 (Call 07/17/53)(b) |
665 | 645,669 | ||||||
| 5.78%, 09/16/52 (Call 03/16/52)(a)(b) |
655 | 653,185 | ||||||
| Northern States Power Co./MN |
||||||||
| 2.60%, 06/01/51 (Call 12/01/50) |
640 | 395,238 | ||||||
| 2.90%, 03/01/50 (Call 09/01/49) |
519 | 338,795 | ||||||
| 3.20%, 04/01/52 (Call 10/01/51) |
316 | 217,311 | ||||||
| 3.40%, 08/15/42 (Call 02/15/42) |
413 | 313,393 | ||||||
| 3.60%, 05/15/46 (Call 11/15/45) |
422 | 321,711 | ||||||
| 3.60%, 09/15/47 (Call 03/15/47) |
477 | 361,309 | ||||||
| 4.00%, 08/15/45 (Call 02/15/45) |
250 | 201,566 | ||||||
| 4.13%, 05/15/44 (Call 11/15/43)(a) |
228 | 188,023 | ||||||
| 4.50%, 06/01/52 (Call 12/01/51) |
440 | 384,052 | ||||||
| 4.85%, 08/15/40 (Call 02/15/40) |
280 | 254,099 | ||||||
| 5.10%, 05/15/53 (Call 11/15/52)(a) |
593 | 566,970 | ||||||
| 5.25%, 07/15/35(a) |
284 | 283,204 | ||||||
| 5.35%, 11/01/39 |
333 | 328,452 | ||||||
| 5.40%, 03/15/54 (Call 09/15/53) |
670 | 662,883 | ||||||
| 6.20%, 07/01/37 |
320 | 343,373 | ||||||
| 6.25%, 06/01/36(a) |
361 | 391,097 | ||||||
| NorthWestern Corp., 4.18%, 11/15/44 |
||||||||
| (Call 05/15/44)(a) |
183 | 147,178 | ||||||
| NSTAR Electric Co. |
||||||||
| 3.10%, 06/01/51 (Call 12/01/50)(a) |
412 | 275,177 | ||||||
| 4.40%, 03/01/44 (Call 09/01/43) |
198 | 170,512 | ||||||
| 4.55%, 06/01/52 (Call 12/01/51) |
300 | 260,992 | ||||||
| 4.95%, 09/15/52 (Call 03/15/52)(a) |
390 | 361,363 | ||||||
| 5.50%, 03/15/40(a) |
472 | 469,543 | ||||||
| Oglethorpe Power Corp. |
||||||||
| 3.75%, 08/01/50 (Call 02/01/50) |
355 | 255,550 | ||||||
| 4.20%, 12/01/42 |
335 | 262,555 | ||||||
| 4.25%, 04/01/46 (Call 10/01/45) |
160 | 123,464 | ||||||
| 4.50%, 04/01/47 (Call 10/01/46) |
390 | 317,298 | ||||||
| 4.55%, 06/01/44 |
155 | 127,807 | ||||||
| 5.05%, 10/01/48 (Call 04/01/48) |
312 | 275,416 | ||||||
| 5.25%, 09/01/50 |
245 | 226,929 | ||||||
| 5.38%, 11/01/40 |
490 | 459,350 | ||||||
| 5.95%, 11/01/39 |
438 | 436,835 | ||||||
| 6.20%, 12/01/53 (Call 06/01/53)(a)(b) |
335 | 344,565 | ||||||
| Ohio Edison Co. |
||||||||
| 6.88%, 07/15/36(a) |
375 | 413,644 | ||||||
| 8.25%, 10/15/38 |
265 | 325,625 | ||||||
| Ohio Power Co. |
||||||||
| 4.00%, 06/01/49 (Call 12/01/48) |
422 | 327,285 | ||||||
| 4.15%, 04/01/48 (Call 10/01/47) |
305 | 242,891 | ||||||
| Series F, 5.85%, 10/01/35 |
275 | 278,391 | ||||||
| Series R, 2.90%, 10/01/51 (Call 04/01/51) |
540 | 346,156 | ||||||
| Oklahoma Gas & Electric Co. |
||||||||
| 3.85%, 08/15/47 (Call 02/15/47) |
225 | 170,597 | ||||||
| 3.90%, 05/01/43 (Call 11/01/42)(a) |
255 | 202,597 | ||||||
| 4.00%, 12/15/44 (Call 06/15/44) |
185 | 144,853 | ||||||
| 4.15%, 04/01/47 (Call 10/01/46) |
226 | 180,026 | ||||||
| 230 | 2 0 2 4 I S H A R E S A N N U A L R E P O R T T O S H A R E H O L D E R S |
| Schedule of Investments (continued) February 29, 2024 |
iShares® 10+ Year Investment Grade Corporate Bond ETF (Percentages shown are based on Net Assets) |
| Security | Par (000) |
Value | ||||||
| Electric (continued) | ||||||||
| 4.55%, 03/15/44 (Call 09/15/43)(a) |
$ | 166 | $ | 140,702 | ||||
| 5.25%, 05/15/41 (Call 11/15/40) |
190 | 178,871 | ||||||
| 5.60%, 04/01/53 (Call 10/01/52) |
218 | 219,575 | ||||||
| 5.85%, 06/01/40 |
260 | 261,798 | ||||||
| Oncor Electric Delivery Co. LLC |
||||||||
| 2.70%, 11/15/51 (Call 05/15/51) |
487 | 301,023 | ||||||
| 3.10%, 09/15/49 (Call 03/15/49) |
548 | 376,174 | ||||||
| 3.70%, 05/15/50 (Call 11/15/49) |
276 | 209,811 | ||||||
| 3.75%, 04/01/45 (Call 10/01/44) |
384 | 305,044 | ||||||
| 3.80%, 09/30/47 (Call 03/30/47) |
268 | 205,907 | ||||||
| 3.80%, 06/01/49 (Call 12/01/48) |
415 | 325,964 | ||||||
| 4.10%, 11/15/48 (Call 05/15/48) |
334 | 274,761 | ||||||
| 4.55%, 12/01/41 (Call 06/01/41) |
430 | 389,218 | ||||||
| 4.60%, 06/01/52 (Call 12/01/51) |
341 | 301,539 | ||||||
| 4.95%, 09/15/52 (Call 03/15/52) |
736 | 684,958 | ||||||
| 5.25%, 09/30/40 |
505 | 501,247 | ||||||
| 5.30%, 06/01/42 (Call 12/01/41) |
355 | 358,530 | ||||||
| 5.35%, 10/01/52 (Call 04/01/52)(a) |
242 | 240,218 | ||||||
| 7.50%, 09/01/38 |
383 | 457,038 | ||||||
| Pacific Gas and Electric Co. |
||||||||
| 3.30%, 08/01/40 (Call 02/01/40) |
681 | 490,403 | ||||||
| 3.50%, 08/01/50 (Call 02/01/50) |
1,692 | 1,139,054 | ||||||
| 3.75%, 08/15/42 (Call 02/15/42)(a) |
504 | 367,666 | ||||||
| 3.95%, 12/01/47 (Call 06/01/47) |
659 | 479,588 | ||||||
| 4.00%, 12/01/46 (Call 06/01/46)(a) |
547 | 398,854 | ||||||
| 4.20%, 06/01/41 (Call 12/01/40) |
308 | 242,114 | ||||||
| 4.25%, 03/15/46 (Call 09/15/45) |
338 | 257,544 | ||||||
| 4.30%, 03/15/45 (Call 09/15/44)(a) |
450 | 351,334 | ||||||
| 4.45%, 04/15/42 (Call 10/15/41) |
411 | 331,334 | ||||||
| 4.50%, 07/01/40 (Call 01/01/40) |
1,443 | 1,209,085 | ||||||
| 4.50%, 12/15/41 (Call 06/15/41) |
391 | 302,168 | ||||||
| 4.60%, 06/15/43 (Call 12/15/42) |
200 | 164,441 | ||||||
| 4.75%, 02/15/44 (Call 08/15/43)(a) |
579 | 483,403 | ||||||
| 4.95%, 07/01/50 (Call 01/01/50) |
2,680 | 2,274,863 | ||||||
| 5.25%, 03/01/52 (Call 09/01/51) |
535 | 474,360 | ||||||
| 6.70%, 04/01/53 (Call 10/01/52)(a) |
761 | 814,072 | ||||||
| 6.75%, 01/15/53 (Call 07/15/52) |
1,060 | 1,134,335 | ||||||
| PacifiCorp |
||||||||
| 2.90%, 06/15/52 (Call 12/15/51) |
962 | 586,091 | ||||||
| 3.30%, 03/15/51 (Call 09/15/50) |
490 | 321,666 | ||||||
| 4.10%, 02/01/42 (Call 08/01/41) |
380 | 300,168 | ||||||
| 4.13%, 01/15/49 (Call 07/15/48) |
440 | 343,594 | ||||||
| 4.15%, 02/15/50 (Call 08/15/49) |
412 | 320,622 | ||||||
| 5.25%, 06/15/35 |
350 | 340,881 | ||||||
| 5.35%, 12/01/53 (Call 06/01/53) |
655 | 605,003 | ||||||
| 5.50%, 05/15/54 (Call 11/15/53)(a) |
1,010 | 943,251 | ||||||
| 5.75%, 04/01/37 |
575 | 571,440 | ||||||
| 6.00%, 01/15/39(a) |
649 | 667,603 | ||||||
| 6.10%, 08/01/36 |
355 | 368,385 | ||||||
| 6.25%, 10/15/37 |
563 | 580,119 | ||||||
| 6.35%, 07/15/38 |
235 | 246,800 | ||||||
| PacifiCorp., 5.80%, 01/15/55 (Call 07/15/54) |
1,055 | 1,018,800 | ||||||
| PECO Energy Co. |
||||||||
| 2.80%, 06/15/50 (Call 12/15/49) |
297 | 192,130 | ||||||
| 2.85%, 09/15/51 (Call 03/15/51) |
335 | 215,069 | ||||||
| 3.00%, 09/15/49 (Call 03/15/49) |
340 | 227,483 | ||||||
| 3.05%, 03/15/51 (Call 09/15/50) |
295 | 197,654 | ||||||
| 3.70%, 09/15/47 (Call 03/15/47)(a) |
328 | 254,583 | ||||||
| 3.90%, 03/01/48 (Call 09/01/47) |
364 | 292,464 | ||||||
| 4.15%, 10/01/44 (Call 04/01/44) |
284 | 237,401 | ||||||
| 4.38%, 08/15/52 (Call 02/15/52) |
395 | 337,762 | ||||||
| Security | Par (000) |
Value | ||||||
| Electric (continued) | ||||||||
| 4.60%, 05/15/52 (Call 11/15/51) |
$ | 340 | $ | 301,591 | ||||
| 4.80%, 10/15/43 (Call 04/15/43) |
295 | 262,690 | ||||||
| 5.95%, 10/01/36 |
281 | 297,765 | ||||||
| Pennsylvania Electric Co., 6.15%, 10/01/38 |
274 | 278,415 | ||||||
| Perusahaan Perseroan Persero PT Perusahaan |
||||||||
| Listrik Negara |
||||||||
| 4.00%, 06/30/50 (Call 12/30/49)(b) |
623 | 442,378 | ||||||
| 4.38%, 02/05/50(b) |
390 | 296,248 | ||||||
| 4.88%, 07/17/49(b) |
463 | 377,760 | ||||||
| 5.25%, 10/24/42(b) |
905 | 810,604 | ||||||
| 5.25%, 05/15/47(a)(b) |
480 | 420,146 | ||||||
| 6.15%, 05/21/48(b) |
1,115 | 1,080,156 | ||||||
| 6.25%, 01/25/49(b) |
475 | 465,500 | ||||||
| Potomac Electric Power Co. |
||||||||
| 4.15%, 03/15/43 (Call 09/15/42) |
486 | 408,911 | ||||||
| 5.50%, 03/15/54 (Call 09/15/53) |
275 | 272,828 | ||||||
| 6.50%, 11/15/37 |
390 | 429,559 | ||||||
| 7.90%, 12/15/38(a) |
225 | 283,698 | ||||||
| PPL Electric Utilities Corp. |
||||||||
| 3.00%, 10/01/49 (Call 04/01/49) |
300 | 204,403 | ||||||
| 3.95%, 06/01/47 (Call 12/01/46) |
355 | 285,984 | ||||||
| 4.13%, 06/15/44 (Call 12/15/43) |
267 | 223,622 | ||||||
| 4.15%, 10/01/45 (Call 04/01/45) |
206 | 169,951 | ||||||
| 4.15%, 06/15/48 (Call 12/15/47) |
307 | 256,571 | ||||||
| 4.75%, 07/15/43 (Call 01/15/43) |
355 | 324,984 | ||||||
| 5.20%, 07/15/41 (Call 01/15/41)(a) |
185 | 176,889 | ||||||
| 5.25%, 05/15/53 (Call 11/15/52) |
633 | 615,013 | ||||||
| 6.25%, 05/15/39 |
260 | 281,190 | ||||||
| Progress Energy Inc., 6.00%, 12/01/39 |
545 | 550,130 | ||||||
| Public Service Co. of Colorado |
||||||||
| 3.55%, 06/15/46 (Call 12/15/45) |
212 | 148,976 | ||||||
| 3.60%, 09/15/42 (Call 03/15/42) |
473 | 363,789 | ||||||
| 3.80%, 06/15/47 (Call 12/15/46) |
336 | 253,468 | ||||||
| 3.95%, 03/15/43 (Call 09/15/42)(a) |
259 | 201,153 | ||||||
| 4.05%, 09/15/49 (Call 03/15/49) |
333 | 259,711 | ||||||
| 4.10%, 06/15/48 (Call 12/15/47) |
337 | 267,934 | ||||||
| 4.30%, 03/15/44 (Call 09/15/43) |
190 | 157,878 | ||||||
| 4.50%, 06/01/52 (Call 12/01/51) |
351 | 295,263 | ||||||
| 4.75%, 08/15/41 (Call 02/15/41) |
284 | 254,436 | ||||||
| 5.25%, 04/01/53 (Call 10/01/52)(a) |
696 | 658,152 | ||||||
| 6.50%, 08/01/38 |
275 | 301,125 | ||||||
| Series 17, 6.25%, 09/01/37 |
305 | 322,793 | ||||||
| Series 34, 3.20%, 03/01/50 (Call 09/01/49) |
485 | 328,885 | ||||||
| Series 36, 2.70%, 01/15/51 (Call 07/15/50) |
345 | 208,635 | ||||||
| Public Service Co. of New Hampshire |
||||||||
| 3.60%, 07/01/49 (Call 01/01/49)(a) |
179 | 135,785 | ||||||
| 5.15%, 01/15/53 (Call 07/15/52)(a) |
167 | 159,717 | ||||||
| Public Service Co. of Oklahoma |
||||||||
| Series G, 6.63%, 11/15/37 |
249 | 269,525 | ||||||
| Series K, 3.15%, 08/15/51 (Call 02/15/51)(a) |
287 | 192,189 | ||||||
| Public Service Electric & Gas Co. |
||||||||
| 2.05%, 08/01/50 (Call 02/01/50) |
266 | 148,089 | ||||||
| 2.70%, 05/01/50 (Call 11/01/49) |
236 | 151,559 | ||||||
| 3.00%, 03/01/51 (Call 09/01/50) |
227 | 149,776 | ||||||
| 3.15%, 01/01/50 (Call 07/01/49) |
239 | 166,433 | ||||||
| 3.20%, 08/01/49 (Call 02/01/49) |
305 | 215,580 | ||||||
| 3.60%, 12/01/47 (Call 06/01/47) |
317 | 242,003 | ||||||
| 3.65%, 09/01/42 (Call 03/01/42) |
365 | 288,118 | ||||||
| 3.80%, 01/01/43 (Call 07/01/42) |
375 | 305,379 | ||||||
| 3.80%, 03/01/46 (Call 09/01/45) |
356 | 279,978 | ||||||
| 3.85%, 05/01/49 (Call 11/01/48) |
331 | 264,521 | ||||||
| S C H E D U L E O F I N V E S T M E N T S |
231 |
| Schedule of Investments (continued) February 29, 2024 |
iShares® 10+ Year Investment Grade Corporate Bond ETF (Percentages shown are based on Net Assets) |
| Security | Par (000) |
Value | ||||||
| Electric (continued) | ||||||||
| 3.95%, 05/01/42 (Call 11/01/41) |
$ | 436 | $ | 364,700 | ||||
| 4.05%, 05/01/48 (Call 11/01/47)(a) |
285 | 237,140 | ||||||
| 4.15%, 11/01/45 (Call 05/01/45) |
184 | 148,224 | ||||||
| 5.13%, 03/15/53 (Call 09/15/52)(a) |
395 | 381,872 | ||||||
| 5.38%, 11/01/39 |
290 | 280,523 | ||||||
| 5.45%, 08/01/53 (Call 02/01/53)(a) |
383 | 384,888 | ||||||
| 5.45%, 03/01/54 (Call 09/01/53) |
425 | 425,273 | ||||||
| 5.50%, 03/01/40 |
275 | 275,499 | ||||||
| 5.70%, 12/01/36(a) |
274 | 282,752 | ||||||
| 5.80%, 05/01/37 |
397 | 409,550 | ||||||
| Series I, 4.00%, 06/01/44 (Call 12/01/43) |
135 | 107,369 | ||||||
| Series K, 4.05%, 05/01/45 (Call 11/01/44)(a) |
84 | 66,725 | ||||||
| Puget Sound Energy Inc. |
||||||||
| 2.89%, 09/15/51 (Call 03/15/51)(a) |
165 | 104,619 | ||||||
| 3.25%, 09/15/49 (Call 03/15/49) |
280 | 189,458 | ||||||
| 4.22%, 06/15/48 (Call 12/15/47) |
289 | 232,620 | ||||||
| 4.30%, 05/20/45 (Call 11/20/44)(a) |
181 | 148,905 | ||||||
| 4.43%, 11/15/41 (Call 05/15/41) |
266 | 223,357 | ||||||
| 5.45%, 06/01/53 (Call 12/01/52)(a) |
141 | 139,460 | ||||||
| 5.48%, 06/01/35 |
371 | 370,555 | ||||||
| 5.64%, 04/15/41 (Call 10/15/40) |
300 | 298,044 | ||||||
| 5.76%, 10/01/39(a) |
375 | 377,881 | ||||||
| 5.76%, 07/15/40(a) |
270 | 269,017 | ||||||
| 5.80%, 03/15/40(a) |
299 | 300,513 | ||||||
| 6.27%, 03/15/37(a) |
525 | 549,699 | ||||||
| 6.72%, 06/15/36 |
80 | 87,102 | ||||||
| Ruwais Power Co. PJSC, 6.00%, 08/31/36(a)(b) |
695 | 687,424 | ||||||
| San Diego Gas & Electric Co. |
||||||||
| 3.70%, 03/15/52 (Call 09/15/51) |
311 | 231,009 | ||||||
| 3.95%, 11/15/41(a) |
298 | 240,292 | ||||||
| 4.15%, 05/15/48 (Call 11/15/47) |
158 | 130,124 | ||||||
| 4.30%, 04/01/42 (Call 10/01/41) |
317 | 266,792 | ||||||
| 4.50%, 08/15/40 |
457 | 406,192 | ||||||
| 5.35%, 05/15/35 |
434 | 430,687 | ||||||
| 5.35%, 05/15/40 |
330 | 317,265 | ||||||
| 5.35%, 04/01/53 (Call 10/01/52) |
574 | 556,817 | ||||||
| 6.00%, 06/01/39 |
248 | 259,005 | ||||||
| Series FFF, 6.13%, 09/15/37(a) |
240 | 242,539 | ||||||
| Series RRR, 3.75%, 06/01/47 (Call 12/01/46) |
134 | 103,549 | ||||||
| Series TTT, 4.10%, 06/15/49 (Call 12/15/48)(a) |
196 | 158,402 | ||||||
| Series UUU, 3.32%, 04/15/50 (Call 10/15/49) |
244 | 169,520 | ||||||
| Series WWW, 2.95%, 08/15/51 |
502 | 334,136 | ||||||
| Saudi Electricity Global Sukuk Co. |
505 | 472,196 | ||||||
| Saudi Electricity Global Sukuk Co. |
622 | 604,895 | ||||||
| Sempra |
||||||||
| 3.80%, 02/01/38 (Call 08/01/37) |
608 | 498,887 | ||||||
| 4.00%, 02/01/48 (Call 08/01/47) |
673 | 523,332 | ||||||
| 6.00%, 10/15/39 |
877 | 886,777 | ||||||
| Sierra Pacific Power Co. |
||||||||
| 5.90%, 03/15/54 (Call 09/15/53)(b) |
327 | 334,482 | ||||||
| Series P, 6.75%, 07/01/37(a) |
150 | 159,309 | ||||||
| Solar Star Funding LLC, 5.38%, 06/30/35(b) |
74 | 73,147 | ||||||
| Southern California Edison Co. |
||||||||
| 3.45%, 02/01/52 (Call 08/01/51) |
605 | 422,096 | ||||||
| 3.65%, 02/01/50 (Call 08/01/49) |
1,089 | 797,068 | ||||||
| 3.90%, 12/01/41 (Call 06/01/41) |
395 | 313,454 | ||||||
| 4.00%, 04/01/47 (Call 10/01/46) |
1,404 | 1,095,664 | ||||||
| 4.05%, 03/15/42 (Call 09/15/41) |
415 | 340,676 | ||||||
| Security | Par (000) |
Value | ||||||
| Electric (continued) | ||||||||
| 4.50%, 09/01/40 (Call 03/01/40) |
$ | 422 | $ | 367,987 | ||||
| 4.65%, 10/01/43 (Call 04/01/43) |
561 | 491,293 | ||||||
| 5.50%, 03/15/40 |
508 | 502,465 | ||||||
| 5.63%, 02/01/36 |
364 | 362,927 | ||||||
| 5.70%, 03/01/53 (Call 09/01/52)(a) |
265 | 263,472 | ||||||
| 5.75%, 04/15/54 (Call 10/15/53) |
425 | 423,287 | ||||||
| 5.88%, 12/01/53 (Call 06/01/53) |
576 | 584,209 | ||||||
| 6.05%, 03/15/39 |
457 | 471,089 | ||||||
| Series 04-G, 5.75%, 04/01/35 |
385 | 387,477 | ||||||
| Series 05-B, 5.55%, 01/15/36(a) |
285 | 281,959 | ||||||
| Series 05-E, 5.35%, 07/15/35 |
385 | 383,793 | ||||||
| Series 06-E, 5.55%, 01/15/37(a) |
358 | 355,328 | ||||||
| Series 08-A, 5.95%, 02/01/38 |
532 | 545,577 | ||||||
| Series 13-A, 3.90%, 03/15/43 (Call 09/15/42) |
397 | 314,004 | ||||||
| Series 20A, 2.95%, 02/01/51 (Call 08/01/50)(a) |
480 | 308,410 | ||||||
| Series B, 4.88%, 03/01/49 (Call 09/01/48) |
571 | 507,900 | ||||||
| Series C, 3.60%, 02/01/45 (Call 08/01/44) |
324 | 239,720 | ||||||
| Series C, 4.13%, 03/01/48 (Call 09/01/47) |
1,063 | 850,154 | ||||||
| Series E, 5.45%, 06/01/52 (Call 12/01/51) |
280 | 268,466 | ||||||
| Series H, 3.65%, 06/01/51 (Call 12/01/50) |
319 | 234,275 | ||||||
| Southern Co. (The) |
||||||||
| 4.25%, 07/01/36 (Call 01/01/36) |
202 | 178,693 | ||||||
| 4.40%, 07/01/46 (Call 01/01/46)(a) |
1,654 | 1,394,083 | ||||||
| Southern Power Co. |
||||||||
| 5.15%, 09/15/41 |
470 | 433,004 | ||||||
| 5.25%, 07/15/43 |
265 | 244,538 | ||||||
| Series F, 4.95%, 12/15/46 (Call 06/15/46) |
318 | 278,631 | ||||||
| Southwestern Electric Power Co. |
||||||||
| 3.25%, 11/01/51 (Call 05/01/51)(a) |
635 | 416,902 | ||||||
| 6.20%, 03/15/40 |
324 | 334,049 | ||||||
| Series J, 3.90%, 04/01/45 (Call 10/01/44) |
348 | 265,942 | ||||||
| Series L, 3.85%, 02/01/48 (Call 08/01/47) |
406 | 296,617 | ||||||
| Southwestern Public Service Co. |
||||||||
| 3.40%, 08/15/46 (Call 02/15/46)(a) |
252 | 175,252 | ||||||
| 3.70%, 08/15/47 (Call 02/15/47) |
343 | 243,704 | ||||||
| 3.75%, 06/15/49 (Call 12/15/48) |
261 | 189,057 | ||||||
| 4.50%, 08/15/41 (Call 02/15/41) |
311 | 257,373 | ||||||
| 6.00%, 10/01/36 |
226 | 226,313 | ||||||
| Series 6, 4.40%, 11/15/48 (Call 05/15/48) |
202 | 160,917 | ||||||
| Series 8, 3.15%, 05/01/50 (Call 11/01/49)(a) |
493 | 317,399 | ||||||
| Star Energy Geothermal Darajat II/Star Energy |
||||||||
| Geothermal Salak, 4.85%, 10/14/38 |
||||||||
| (Call 10/14/29)(b) |
485 | 442,650 | ||||||
| State Grid Overseas Investment 2013 Ltd., |
235 | 213,773 | ||||||
| State Grid Overseas Investment 2014 Ltd., |
525 | 507,466 | ||||||
| State Grid Overseas Investment BVI Ltd., |
290 | 246,431 | ||||||
| Tampa Electric Co. |
||||||||
| 3.45%, 03/15/51 (Call 09/15/50) |
295 | 205,056 | ||||||
| 3.63%, 06/15/50 (Call 12/15/49) |
230 | 167,384 | ||||||
| 4.10%, 06/15/42 (Call 12/15/41) |
558 | 455,074 | ||||||
| 4.20%, 05/15/45 (Call 11/15/44) |
128 | 100,548 | ||||||
| 4.30%, 06/15/48 (Call 12/15/47) |
180 | 147,796 | ||||||
| 4.35%, 05/15/44 (Call 11/15/43) |
199 | 165,478 | ||||||
| 4.45%, 06/15/49 (Call 12/15/48) |
136 | 115,430 | ||||||
| 5.00%, 07/15/52 (Call 01/15/52)(a) |
270 | 245,794 | ||||||
| 6.15%, 05/15/37(a) |
315 | 324,752 | ||||||
| 6.55%, 05/15/36 |
240 | 254,693 | ||||||
| 232 | 2 0 2 4 I S H A R E S A N N U A L R E P O R T T O S H A R E H O L D E R S |
| Schedule of Investments (continued) February 29, 2024 |
iShares® 10+ Year Investment Grade Corporate Bond ETF (Percentages shown are based on Net Assets) |
| Security | Par (000) |
Value | ||||||
| Electric (continued) | ||||||||
| Tierra Mojada Luxembourg II Sarl, 5.75%, 12/01/40 |
||||||||
| (Call 12/01/37)(b) |
$ | 330 | $ | 294,897 | ||||
| Toledo Edison Co. (The), 6.15%, 05/15/37 |
370 | 389,886 | ||||||
| Tri-State Generation & Transmission |
||||||||
| Association Inc. |
||||||||
| 4.70%, 11/01/44 (Call 05/01/44) |
196 | 149,432 | ||||||
| 6.00%, 06/15/40(b) |
497 | 465,602 | ||||||
| Tucson Electric Power Co. |
||||||||
| 3.25%, 05/01/51 (Call 11/01/50) |
226 | 151,753 | ||||||
| 4.00%, 06/15/50 (Call 12/15/49) |
241 | 185,215 | ||||||
| 4.85%, 12/01/48 (Call 06/01/48)(a) |
189 | 167,136 | ||||||
| 5.50%, 04/15/53 (Call 10/15/52) |
275 | 268,656 | ||||||
| Union Electric Co. |
||||||||
| 2.63%, 03/15/51 (Call 09/15/50) |
601 | 362,967 | ||||||
| 3.25%, 10/01/49 (Call 04/01/49) |
347 | 236,492 | ||||||
| 3.65%, 04/15/45 (Call 10/15/44) |
376 | 282,924 | ||||||
| 3.90%, 09/15/42 (Call 03/15/42)(a) |
534 | 432,150 | ||||||
| 3.90%, 04/01/52 (Call 10/01/51) |
500 | 389,213 | ||||||
| 4.00%, 04/01/48 (Call 10/01/47) |
261 | 205,530 | ||||||
| 5.25%, 01/15/54 (Call 07/15/53) |
325 | 307,715 | ||||||
| 5.30%, 08/01/37 |
337 | 335,163 | ||||||
| 5.45%, 03/15/53 (Call 09/15/52)(a) |
334 | 327,707 | ||||||
| 8.45%, 03/15/39 |
377 | 479,611 | ||||||
| Virginia Electric & Power Co. |
||||||||
| 2.45%, 12/15/50 (Call 06/15/50) |
828 | 480,280 | ||||||
| 2.95%, 11/15/51 (Call 05/15/51) |
718 | 460,520 | ||||||
| 3.30%, 12/01/49 (Call 06/01/49) |
292 | 205,639 | ||||||
| 4.00%, 01/15/43 (Call 07/15/42) |
516 | 421,408 | ||||||
| 4.45%, 02/15/44 (Call 08/15/43) |
373 | 320,818 | ||||||
| 4.60%, 12/01/48 (Call 06/01/48) |
317 | 275,472 | ||||||
| 5.35%, 01/15/54 (Call 07/15/53)(a) |
375 | 360,908 | ||||||
| 5.45%, 04/01/53 (Call 10/01/52) |
617 | 604,232 | ||||||
| 5.70%, 08/15/53 (Call 02/15/53) |
540 | 546,488 | ||||||
| 6.35%, 11/30/37 |
432 | 461,852 | ||||||
| 8.88%, 11/15/38(a) |
592 | 787,188 | ||||||
| Series A, 6.00%, 05/15/37 |
433 | 449,554 | ||||||
| Series B, 3.80%, 09/15/47 (Call 03/15/47) |
494 | 376,381 | ||||||
| Series B, 4.20%, 05/15/45 (Call 11/15/44) |
272 | 224,126 | ||||||
| Series B, 6.00%, 01/15/36 |
588 | 614,686 | ||||||
| Series C, 4.00%, 11/15/46 (Call 05/15/46) |
407 | 323,641 | ||||||
| Series C, 4.63%, 05/15/52 (Call 11/15/51) |
528 | 455,865 | ||||||
| Series D, 4.65%, 08/15/43 (Call 02/15/43) |
513 | 453,710 | ||||||
| Wisconsin Electric Power Co. |
||||||||
| 3.65%, 12/15/42 (Call 06/15/42)(a) |
291 | 221,691 | ||||||
| 4.25%, 06/01/44 (Call 12/01/43) |
71 | 58,240 | ||||||
| 4.30%, 12/15/45 (Call 06/15/45)(a) |
181 | 147,870 | ||||||
| 4.30%, 10/15/48 (Call 04/15/48)(a) |
175 | 146,337 | ||||||
| 5.70%, 12/01/36(a) |
265 | 272,537 | ||||||
| Wisconsin Power and Light Co. |
||||||||
| 3.65%, 04/01/50 (Call 10/01/49) |
202 | 147,293 | ||||||
| 4.10%, 10/15/44 (Call 04/15/44) |
170 | 132,898 | ||||||
| 6.38%, 08/15/37(a) |
350 | 372,115 | ||||||
| 7.60%, 10/01/38 |
170 | 198,503 | ||||||
| Wisconsin Public Service Corp. |
||||||||
| 2.85%, 12/01/51 (Call 06/01/51) |
660 | 416,010 | ||||||
| 3.30%, 09/01/49 (Call 03/01/49)(a) |
199 | 139,671 | ||||||
| 3.67%, 12/01/42 |
448 | 350,285 | ||||||
| 4.75%, 11/01/44 (Call 05/01/44)(a) |
270 | 240,531 | ||||||
| Xcel Energy Inc. |
||||||||
| 3.50%, 12/01/49 (Call 06/01/49) |
406 | 279,411 | ||||||
| 4.80%, 09/15/41 (Call 03/15/41)(a) |
203 | 174,835 | ||||||
| Security | Par (000) |
Value | ||||||
| Electric (continued) | ||||||||
| 6.50%, 07/01/36(a) |
$ | 315 | $ | 331,234 | ||||
|
|
|
|||||||
| 267,342,390 | ||||||||
| Electrical Components & Equipment — 0.1% | ||||||||
| Emerson Electric Co. |
||||||||
| 2.75%, 10/15/50 (Call 04/15/50) |
416 | 266,047 | ||||||
| 2.80%, 12/21/51 (Call 06/21/51)(a) |
840 | 542,239 | ||||||
| 5.25%, 11/15/39 |
315 | 318,555 | ||||||
| 6.13%, 04/15/39(a) |
225 | 240,003 | ||||||
|
|
|
|||||||
| 1,366,844 | ||||||||
| Electronics — 0.2% | ||||||||
| Fortive Corp., 4.30%, 06/15/46 (Call 12/15/45) |
339 | 276,883 | ||||||
| Honeywell International Inc. |
||||||||
| 2.80%, 06/01/50 (Call 12/01/49)(a) |
494 | 343,255 | ||||||
| 3.81%, 11/21/47 (Call 05/21/47) |
360 | 289,074 | ||||||
| 5.00%, 03/01/35 (Call 12/01/34) |
575 | 573,288 | ||||||
| 5.25%, 03/01/54 (Call 09/01/53) |
575 | 573,831 | ||||||
| 5.35%, 03/01/64 (Call 09/01/63) |
575 | 574,283 | ||||||
| 5.38%, 03/01/41 |
469 | 478,764 | ||||||
| 5.70%, 03/15/36 |
571 | 602,935 | ||||||
| 5.70%, 03/15/37 |
591 | 617,943 | ||||||
| Tyco Electronics Group SA, 7.13%, 10/01/37 |
433 | 493,021 | ||||||
|
|
|
|||||||
| 4,823,277 | ||||||||
| Energy - Alternate Sources — 0.0% | ||||||||
| Sweihan PV Power Co. PJSC, 3.63%, 01/31/49(b) |
228 | 180,191 | ||||||
|
|
|
|||||||
| Engineering & Construction — 0.2% | ||||||||
| Aeropuerto Internacional de Tocumen SA |
||||||||
| 4.00%, 08/11/41 (Call 08/11/40)(a)(b) |
680 | 481,100 | ||||||
| 5.13%, 08/11/61 (Call 08/11/60)(b) |
1,120 | 782,768 | ||||||
| LBJ Infrastructure Group LLC, 3.80%, 12/31/57 |
||||||||
| (Call 06/30/57)(a)(b) |
332 | 224,067 | ||||||
| Mexico City Airport Trust |
||||||||
| 5.50%, 10/31/46 (Call 04/30/46)(b) |
461 | 381,682 | ||||||
| 5.50%, 07/31/47 (Call 01/31/47)(b) |
1,696 | 1,409,800 | ||||||
|
|
|
|||||||
| 3,279,417 | ||||||||
| Entertainment — 0.4% | ||||||||
| Warnermedia Holdings Inc. |
||||||||
| 5.05%, 03/15/42 (Call 09/15/41) |
3,205 | 2,695,141 | ||||||
| 5.14%, 03/15/52 (Call 09/15/51) |
5,803 | 4,715,492 | ||||||
| 5.39%, 03/15/62 (Call 09/15/61) |
2,555 | 2,061,184 | ||||||
|
|
|
|||||||
| 9,471,817 | ||||||||
| Environmental Control — 0.2% | ||||||||
| Nature Conservancy (The), Series A, |
190 | 161,140 | ||||||
| Republic Services Inc. |
||||||||
| 3.05%, 03/01/50 (Call 09/01/49) |
333 | 230,966 | ||||||
| 5.70%, 05/15/41 (Call 11/15/40) |
308 | 319,499 | ||||||
| 6.20%, 03/01/40 |
412 | 447,376 | ||||||
| Waste Connections Inc. |
||||||||
| 2.95%, 01/15/52 (Call 07/15/51)(a) |
654 | 432,944 | ||||||
| 3.05%, 04/01/50 (Call 10/01/49) |
415 | 282,607 | ||||||
| Waste Management Inc. |
||||||||
| 2.50%, 11/15/50 (Call 05/15/50) |
412 | 254,468 | ||||||
| 2.95%, 06/01/41 (Call 12/01/40) |
169 | 125,090 | ||||||
| 3.90%, 03/01/35 (Call 09/01/34) |
154 | 135,626 | ||||||
| 4.10%, 03/01/45 (Call 09/01/44) |
315 | 270,275 | ||||||
| 4.15%, 07/15/49 (Call 01/15/49) |
633 | 537,288 | ||||||
|
|
|
|||||||
| 3,197,279 | ||||||||
| S C H E D U L E O F I N V E S T M E N T S |
233 |
| Schedule of Investments (continued) February 29, 2024 |
iShares® 10+ Year Investment Grade Corporate Bond ETF (Percentages shown are based on Net Assets) |
| Security | Par (000) |
Value | ||||||
| Food — 1.9% | ||||||||
| Bimbo Bakeries USA Inc. |
||||||||
| 4.00%, 05/17/51 (Call 11/17/50)(b) |
$ | 535 | $ | 411,720 | ||||
| 5.38%, 01/09/36 (Call 10/09/35)(b) |
85 | 84,382 | ||||||
| Campbell Soup Co. |
||||||||
| 3.13%, 04/24/50 (Call 10/24/49)(a) |
463 | 300,905 | ||||||
| 4.80%, 03/15/48 (Call 09/15/47)(a) |
467 | 409,908 | ||||||
| Cencosud SA, 6.63%, 02/12/45 (Call 08/12/44)(b) |
200 | 203,500 | ||||||
| Conagra Brands Inc. |
||||||||
| 5.30%, 11/01/38 (Call 05/01/38) |
833 | 788,587 | ||||||
| 5.40%, 11/01/48 (Call 05/01/48)(a) |
785 | 724,823 | ||||||
| General Mills Inc. |
||||||||
| 3.00%, 02/01/51 (Call 08/01/50)(a) |
611 | 393,654 | ||||||
| 4.15%, 02/15/43 (Call 08/15/42) |
210 | 175,280 | ||||||
| 4.55%, 04/17/38 (Call 10/17/37) |
249 | 220,978 | ||||||
| 4.70%, 04/17/48 (Call 10/17/47)(a) |
227 | 202,145 | ||||||
| 5.40%, 06/15/40 |
436 | 425,843 | ||||||
| Grupo Bimbo SAB de CV |
||||||||
| 4.00%, 09/06/49 (Call 03/06/49)(a)(b) |
445 | 347,589 | ||||||
| 4.70%, 11/10/47 (Call 05/10/47)(b) |
599 | 516,857 | ||||||
| 4.88%, 06/27/44(b) |
295 | 261,363 | ||||||
| Hershey Co. (The) |
||||||||
| 2.65%, 06/01/50 (Call 12/01/49) |
298 | 193,474 | ||||||
| 3.13%, 11/15/49 (Call 05/15/49) |
235 | 168,677 | ||||||
| 3.38%, 08/15/46 (Call 02/15/46)(a) |
204 | 154,052 | ||||||
| Hormel Foods Corp., 3.05%, 06/03/51 |
||||||||
| (Call 12/03/50)(a) |
509 | 342,242 | ||||||
| Ingredion Inc. |
||||||||
| 3.90%, 06/01/50 (Call 12/01/49)(a) |
185 | 135,106 | ||||||
| 6.63%, 04/15/37 |
169 | 182,328 | ||||||
| J M Smucker Co. (The) |
||||||||
| 6.50%, 11/15/43 (Call 05/15/43)(a) |
720 | 771,139 | ||||||
| 6.50%, 11/15/53 (Call 05/15/53)(a) |
905 | 983,355 | ||||||
| JBS USA LUX SA/JBS USA Food Co./JBS |
||||||||
| Luxembourg SARL, 7.25%, 11/15/53 |
||||||||
| (Call 05/15/53)(a)(b) |
920 | 963,908 | ||||||
| JBS USA LUX SA/JBS USA Food Co./JBS USA |
||||||||
| Finance Inc. |
||||||||
| 4.38%, 02/02/52 (Call 08/02/51) |
975 | 701,442 | ||||||
| 6.50%, 12/01/52 (Call 06/01/52) |
1,425 | 1,370,149 | ||||||
| JM Smucker Co. (The) |
||||||||
| 2.75%, 09/15/41 (Call 03/15/41) |
141 | 94,104 | ||||||
| 3.55%, 03/15/50 (Call 09/15/49) |
204 | 142,431 | ||||||
| 4.25%, 03/15/35 |
499 | 447,672 | ||||||
| 4.38%, 03/15/45 |
472 | 394,950 | ||||||
| Kellanova, 4.50%, 04/01/46 |
475 | 409,475 | ||||||
| Koninklijke Ahold Delhaize NV, 5.70%, 10/01/40 |
380 | 377,108 | ||||||
| Kraft Heinz Foods Co. |
||||||||
| 4.38%, 06/01/46 (Call 12/01/45) |
2,285 | 1,893,077 | ||||||
| 4.63%, 10/01/39 (Call 04/01/39) |
90 | 81,279 | ||||||
| 4.88%, 10/01/49 (Call 04/01/49)(a) |
979 | 873,407 | ||||||
| 5.00%, 07/15/35 (Call 01/15/35) |
186 | 181,651 | ||||||
| 5.00%, 06/04/42 |
1,375 | 1,271,154 | ||||||
| 5.20%, 07/15/45 (Call 01/15/45) |
1,431 | 1,336,084 | ||||||
| 5.50%, 06/01/50 (Call 12/01/49) |
715 | 695,445 | ||||||
| 6.50%, 02/09/40 |
588 | 638,077 | ||||||
| 6.88%, 01/26/39 |
685 | 770,589 | ||||||
| 7.13%, 08/01/39(b) |
748 | 851,368 | ||||||
| Kroger Co. (The) |
||||||||
| 3.88%, 10/15/46 (Call 04/15/46) |
329 | 250,183 | ||||||
| 3.95%, 01/15/50 (Call 07/15/49) |
654 | 513,684 | ||||||
| 4.45%, 02/01/47 (Call 08/01/46)(a) |
1,099 | 929,426 | ||||||
| Security | Par (000) |
Value | ||||||
| Food (continued) | ||||||||
| 4.65%, 01/15/48 (Call 07/15/47) |
$ | 415 | $ | 361,661 | ||||
| 5.00%, 04/15/42 (Call 10/15/41) |
402 | 368,835 | ||||||
| 5.15%, 08/01/43 (Call 02/01/43) |
374 | 348,335 | ||||||
| 5.40%, 07/15/40 (Call 01/15/40) |
300 | 287,771 | ||||||
| 5.40%, 01/15/49 (Call 07/15/48) |
331 | 323,495 | ||||||
| 6.90%, 04/15/38 |
523 | 584,297 | ||||||
| Mars Inc. |
||||||||
| 2.38%, 07/16/40 (Call 01/16/40)(b) |
790 | 543,730 | ||||||
| 2.45%, 07/16/50 (Call 01/16/50)(a)(b) |
377 | 226,108 | ||||||
| 3.88%, 04/01/39 (Call 10/01/38)(a)(b) |
529 | 453,475 | ||||||
| 3.95%, 04/01/44 (Call 10/01/43)(b) |
242 | 197,801 | ||||||
| 3.95%, 04/01/49 (Call 10/01/48)(a)(b) |
758 | 612,705 | ||||||
| 4.13%, 04/01/54 (Call 10/01/53)(b) |
432 | 352,205 | ||||||
| 4.20%, 04/01/59 (Call 10/01/58)(b) |
531 | 436,567 | ||||||
| McCormick & Co. Inc./MD, 4.20%, 08/15/47 |
||||||||
| (Call 02/15/47)(a) |
189 | 156,041 | ||||||
| Mondelez International Inc., 2.63%, 09/04/50 |
||||||||
| (Call 03/04/50) |
1,035 | 649,461 | ||||||
| Nestle Holdings Inc. |
||||||||
| 2.50%, 09/14/41 (Call 03/14/41)(b) |
150 | 105,704 | ||||||
| 2.63%, 09/14/51 (Call 03/14/51)(b) |
711 | 457,369 | ||||||
| 3.90%, 09/24/38 (Call 03/24/38)(b) |
787 | 691,172 | ||||||
| 4.00%, 09/24/48 (Call 03/24/48)(b) |
1,692 | 1,428,277 | ||||||
| 4.70%, 01/15/53 (Call 07/15/52)(b) |
755 | 710,717 | ||||||
| Sysco Corp. |
||||||||
| 3.15%, 12/14/51 (Call 06/14/51)(a) |
641 | 434,753 | ||||||
| 3.30%, 02/15/50 (Call 08/15/49) |
394 | 278,284 | ||||||
| 4.45%, 03/15/48 (Call 09/15/47) |
468 | 394,057 | ||||||
| 4.50%, 04/01/46 (Call 10/01/45) |
366 | 313,415 | ||||||
| 4.85%, 10/01/45 (Call 04/01/45) |
420 | 381,892 | ||||||
| 5.38%, 09/21/35(a) |
320 | 322,702 | ||||||
| 6.60%, 04/01/40 (Call 10/01/39)(a) |
215 | 235,031 | ||||||
| 6.60%, 04/01/50 (Call 10/01/49) |
1,029 | 1,162,818 | ||||||
| Tesco PLC, 6.15%, 11/15/37(a)(b) |
445 | 446,090 | ||||||
| Tyson Foods Inc. |
||||||||
| 4.55%, 06/02/47 (Call 12/02/46) |
551 | 446,174 | ||||||
| 4.88%, 08/15/34 (Call 02/15/34)(a) |
543 | 515,668 | ||||||
| 5.10%, 09/28/48 (Call 03/28/48) |
1,238 | 1,092,270 | ||||||
| 5.15%, 08/15/44 (Call 02/15/44) |
417 | 375,290 | ||||||
|
|
|
|||||||
| 39,278,740 | ||||||||
| Forest Products & Paper — 0.2% | ||||||||
| Celulosa Arauco y Constitucion SA |
||||||||
| 5.15%, 01/29/50 (Call 07/29/49)(b) |
300 | 242,511 | ||||||
| 5.50%, 11/02/47 (Call 05/02/47) |
280 | 236,043 | ||||||
| 5.50%, 04/30/49 (Call 10/30/48)(a)(b) |
380 | 320,906 | ||||||
| International Paper Co. |
||||||||
| 4.35%, 08/15/48 (Call 02/15/48)(a) |
681 | 577,425 | ||||||
| 4.40%, 08/15/47 (Call 02/15/47)(a) |
684 | 568,247 | ||||||
| 4.80%, 06/15/44 (Call 12/15/43)(a) |
536 | 475,308 | ||||||
| 5.00%, 09/15/35 (Call 03/15/35) |
81 | 78,295 | ||||||
| 5.15%, 05/15/46 (Call 11/15/45)(a) |
170 | 156,036 | ||||||
| 6.00%, 11/15/41 (Call 05/15/41)(a) |
628 | 648,372 | ||||||
| 7.30%, 11/15/39 |
24 | 27,780 | ||||||
| Suzano Austria GmbH, 7.00%, 03/16/47 |
||||||||
| (Call 09/16/46)(a)(b) |
1,058 | 1,097,757 | ||||||
|
|
|
|||||||
| 4,428,680 | ||||||||
| Gas — 0.9% | ||||||||
| APA Infrastructure Ltd., 5.00%, 03/23/35 |
||||||||
| (Call 12/23/34)(b) |
185 | 171,629 | ||||||
| 234 | 2 0 2 4 I S H A R E S A N N U A L R E P O R T T O S H A R E H O L D E R S |
| Schedule of Investments (continued) February 29, 2024 |
iShares® 10+ Year Investment Grade Corporate Bond ETF (Percentages shown are based on Net Assets) |
| Security | Par (000) |
Value | ||||||
| Gas (continued) |
||||||||
| Atmos Energy Corp. |
||||||||
| 2.85%, 02/15/52 (Call 08/15/51)(a) |
$ | 477 | $ | 305,195 | ||||
| 3.38%, 09/15/49 (Call 03/15/49) |
405 | 291,677 | ||||||
| 4.13%, 10/15/44 (Call 04/15/44) |
599 | 510,908 | ||||||
| 4.13%, 03/15/49 (Call 09/15/48) |
377 | 310,898 | ||||||
| 4.15%, 01/15/43 (Call 07/15/42)(a) |
457 | 391,215 | ||||||
| 4.30%, 10/01/48 (Call 04/01/48) |
471 | 403,408 | ||||||
| 5.50%, 06/15/41 (Call 12/15/40) |
335 | 336,721 | ||||||
| 5.75%, 10/15/52 (Call 04/15/52) |
410 | 431,003 | ||||||
| 6.20%, 11/15/53 (Call 05/15/53) |
400 | 442,410 | ||||||
| Boston Gas Co. |
||||||||
| 4.49%, 02/15/42(b) |
430 | 350,852 | ||||||
| 6.12%, 07/20/53 (Call 01/20/53)(a)(b) |
325 | 327,118 | ||||||
| Brooklyn Union Gas Co. (The) |
||||||||
| 4.27%, 03/15/48 (Call 09/15/47)(a)(b) |
535 | 405,785 | ||||||
| 4.49%, 03/04/49 (Call 09/04/48)(b) |
347 | 267,760 | ||||||
| 4.50%, 03/10/46 (Call 09/10/45)(b) |
337 | 262,180 | ||||||
| CenterPoint Energy Resources Corp. |
||||||||
| 4.10%, 09/01/47 (Call 03/01/47) |
206 | 164,060 | ||||||
| 5.85%, 01/15/41 (Call 07/15/40) |
461 | 471,051 | ||||||
| 6.63%, 11/01/37(a) |
265 | 287,209 | ||||||
| Centrica PLC, 5.38%, 10/16/43 (Call 04/16/43)(b) |
379 | 331,989 | ||||||
| East Ohio Gas Co. (The), 3.00%, 06/15/50 (Call 12/15/49)(b) |
597 | 372,459 | ||||||
| KeySpan Gas East Corp. |
||||||||
| 3.59%, 01/18/52 (Call 07/18/51)(b) |
339 | 227,052 | ||||||
| 5.82%, 04/01/41(b) |
685 | 648,725 | ||||||
| Korea Gas Corp., 6.25%, 01/20/42(b) |
610 | 686,639 | ||||||
| Mega Advance Investments
Ltd., |
360 | 386,194 | ||||||
| NiSource Inc. |
||||||||
| 3.95%, 03/30/48 (Call 09/30/47) |
335 | 257,565 | ||||||
| 4.38%, 05/15/47 (Call 11/15/46) |
520 | 431,243 | ||||||
| 4.80%, 02/15/44 (Call 08/15/43) |
705 | 625,971 | ||||||
| 5.00%, 06/15/52 (Call 12/15/51) |
484 | 438,955 | ||||||
| 5.25%, 02/15/43 (Call 08/15/42) |
604 | 571,146 | ||||||
| 5.65%, 02/01/45 (Call 08/01/44) |
418 | 409,380 | ||||||
| 5.80%, 02/01/42 (Call 08/01/41) |
349 | 329,717 | ||||||
| 5.95%, 06/15/41 (Call 12/15/40) |
292 | 295,293 | ||||||
| ONE Gas Inc. |
||||||||
| 4.50%, 11/01/48 (Call 05/01/48)(a) |
292 | 251,038 | ||||||
| 4.66%, 02/01/44 (Call 08/01/43)(a) |
446 | 398,986 | ||||||
| Piedmont Natural Gas Co. Inc. |
||||||||
| 3.35%, 06/01/50 (Call 12/01/49) |
442 | 294,249 | ||||||
| 3.64%, 11/01/46 (Call 05/01/46) |
85 | 59,907 | ||||||
| 4.10%, 09/18/34 (Call 03/18/34) |
95 | 83,717 | ||||||
| 4.65%, 08/01/43 (Call 02/01/43) |
339 | 291,942 | ||||||
| 5.05%, 05/15/52 (Call 11/15/51) |
265 | 238,390 | ||||||
| Southern California Gas Co. |
||||||||
| 3.75%, 09/15/42 (Call 03/15/42)(a) |
530 | 417,651 | ||||||
| 4.45%, 03/15/44 (Call 09/15/43) |
175 | 146,467 | ||||||
| 5.13%, 11/15/40 |
264 | 250,712 | ||||||
| 5.75%, 06/01/53 (Call 12/01/52) |
400 | 404,407 | ||||||
| 6.35%, 11/15/52 (Call 05/15/52)(a) |
513 | 564,233 | ||||||
| Series KK, 5.75%, 11/15/35(a) |
320 | 319,178 | ||||||
| Series UU, 4.13%, 06/01/48 (Call 12/01/47) |
305 | 247,881 | ||||||
| Series VV, 4.30%, 01/15/49 (Call 07/15/48) |
429 | 351,747 | ||||||
| Series WW, 3.95%, 02/15/50 (Call 08/15/49) |
285 | 219,073 | ||||||
| Southern Co. Gas Capital Corp. |
||||||||
| 3.95%, 10/01/46 (Call 04/01/46) |
416 | 315,380 | ||||||
| 4.40%, 06/01/43 (Call 12/01/42) |
592 | 490,286 | ||||||
| Security | Par (000) |
Value | ||||||
| Gas (continued) |
||||||||
| 4.40%, 05/30/47 (Call 11/30/46) |
$ | 340 | $ | 275,875 | ||||
| 5.88%, 03/15/41 (Call 09/15/40) |
511 | 510,119 | ||||||
| 6.00%, 10/01/34 |
150 | 150,119 | ||||||
| Series 21A, 3.15%, 09/30/51 (Call 03/30/51) |
320 | 207,276 | ||||||
| Southwest Gas Corp. |
||||||||
| 3.18%, 08/15/51 (Call 02/15/51) |
221 | 140,281 | ||||||
| 3.80%, 09/29/46 (Call 03/29/46) |
165 | 120,552 | ||||||
| 4.15%, 06/01/49 (Call 12/01/48) |
237 | 180,501 | ||||||
| Spire Inc., 4.70%, 08/15/44 (Call 02/15/44) |
195 | 165,312 | ||||||
| Spire Missouri Inc., 3.30%, 06/01/51 |
230 | 156,493 | ||||||
| Washington Gas Light Co. |
||||||||
| 3.65%, 09/15/49 (Call 03/15/49)(a) |
300 | 218,951 | ||||||
| Series K, 3.80%, 09/15/46 (Call 03/15/46) |
346 | 255,553 | ||||||
|
|
|
|||||||
| 19,869,683 | ||||||||
| Hand & Machine Tools — 0.1% |
||||||||
| Snap-on Inc. |
||||||||
| 3.10%, 05/01/50 (Call 11/01/49) |
298 | 209,220 | ||||||
| 4.10%, 03/01/48 (Call 09/01/47) |
168 | 140,173 | ||||||
| Stanley Black & Decker Inc. |
||||||||
| 2.75%, 11/15/50 (Call 05/15/50) |
529 | 307,172 | ||||||
| 4.85%, 11/15/48 (Call 05/15/48) |
300 | 259,737 | ||||||
| 5.20%, 09/01/40 |
655 | 610,450 | ||||||
|
|
|
|||||||
| 1,526,752 | ||||||||
| Health Care - Products — 1.3% |
||||||||
| Abbott Laboratories |
||||||||
| 4.75%, 11/30/36 (Call 05/30/36) |
1,694 | 1,660,751 | ||||||
| 4.75%, 04/15/43 (Call 10/15/42) |
441 | 423,027 | ||||||
| 4.90%, 11/30/46 (Call 05/30/46) |
2,806 | 2,704,852 | ||||||
| 5.30%, 05/27/40 |
650 | 664,364 | ||||||
| 6.00%, 04/01/39(a) |
502 | 557,509 | ||||||
| 6.15%, 11/30/37 |
702 | 777,440 | ||||||
| Alcon Finance Corp. |
||||||||
| 3.80%, 09/23/49 (Call 03/23/49)(b) |
311 | 240,691 | ||||||
| 5.75%, 12/06/52 (Call 06/06/52)(b) |
635 | 654,065 | ||||||
| Baxter International Inc. |
||||||||
| 3.13%, 12/01/51 (Call 06/01/51)(a) |
758 | 494,774 | ||||||
| 3.50%, 08/15/46 (Call 02/15/46) |
188 | 133,162 | ||||||
| 4.50%, 06/15/43 (Call 12/15/42)(a) |
530 | 429,079 | ||||||
| 6.25%, 12/01/37(a) |
230 | 232,562 | ||||||
| Boston Scientific Corp. |
||||||||
| 4.55%, 03/01/39 (Call 09/01/38) |
369 | 342,268 | ||||||
| 4.70%, 03/01/49 (Call 09/01/48)(a) |
526 | 482,679 | ||||||
| 6.50%, 11/15/35 |
344 | 380,123 | ||||||
| 7.38%, 01/15/40(a) |
300 | 351,598 | ||||||
| Covidien International Finance SA, 6.55%, 10/15/37 |
295 | 327,384 | ||||||
| Danaher Corp. |
||||||||
| 2.60%, 10/01/50 (Call 04/01/50)(a) |
936 | 592,948 | ||||||
| 2.80%, 12/10/51 (Call 06/10/51)(a) |
989 | 642,936 | ||||||
| 4.38%, 09/15/45 (Call 03/15/45) |
320 | 282,457 | ||||||
| DH Europe Finance II Sarl |
||||||||
| 3.25%, 11/15/39 (Call 05/15/39) |
606 | 482,179 | ||||||
| 3.40%, 11/15/49 (Call 05/15/49) |
922 | 689,868 | ||||||
| GE HealthCare Technologies Inc., 6.38%, 11/22/52 |
884 | 981,719 | ||||||
| HCA Inc., 4.38%, 03/15/42 (Call 09/15/41) |
350 | 290,658 | ||||||
| Koninklijke Philips NV |
||||||||
| 5.00%, 03/15/42 |
494 | 447,215 | ||||||
| 6.88%, 03/11/38(a) |
959 | 1,030,250 | ||||||
| S C H E D U L E O F I N V E S T M E N T S |
235 |
| Schedule of Investments (continued) February 29, 2024 |
iShares® 10+ Year Investment Grade Corporate Bond ETF (Percentages shown are based on Net Assets) |
| Security | Par (000) |
Value | ||||||
| Health Care - Products (continued) |
||||||||
| Medtronic Inc. |
||||||||
| 4.00%, 04/01/43 (Call 10/01/42)(a) |
$ | 80 | $ | 68,300 | ||||
| 4.38%, 03/15/35 |
1,787 | 1,684,782 | ||||||
| 4.63%, 03/15/45 |
1,630 | 1,512,895 | ||||||
| Revvity Inc., 3.63%, 03/15/51 (Call 09/15/50) |
164 | 113,865 | ||||||
| Solventum Corp. |
||||||||
| 5.90%, 04/30/54 (Call 10/30/53)(a)(b) |
950 | 929,757 | ||||||
| 6.00%, 05/15/64 (Call 11/15/63)(b) |
950 | 922,650 | ||||||
| STERIS Irish FinCo UnLtd Co., 3.75%, 03/15/51 |
||||||||
| (Call 09/15/50) |
463 | 342,498 | ||||||
| Stryker Corp. |
||||||||
| 2.90%, 06/15/50 (Call 12/15/49)(a) |
295 | 201,974 | ||||||
| 4.10%, 04/01/43 (Call 10/01/42) |
427 | 361,159 | ||||||
| 4.38%, 05/15/44 (Call 11/15/43) |
298 | 262,844 | ||||||
| 4.63%, 03/15/46 (Call 09/15/45) |
800 | 728,016 | ||||||
| Thermo Fisher Scientific Inc. |
||||||||
| 2.80%, 10/15/41 (Call 04/15/41) |
1,026 | 738,495 | ||||||
| 4.10%, 08/15/47 (Call 02/15/47) |
933 | 782,062 | ||||||
| 5.30%, 02/01/44 (Call 08/01/43) |
358 | 356,759 | ||||||
| 5.40%, 08/10/43 (Call 04/10/43)(a) |
574 | 580,185 | ||||||
| Zimmer Biomet Holdings Inc. |
||||||||
| 4.25%, 08/15/35 (Call 02/15/35) |
194 | 170,851 | ||||||
| 4.45%, 08/15/45 (Call 02/15/45)(a) |
189 | 167,266 | ||||||
| 5.75%, 11/30/39 |
390 | 387,679 | ||||||
|
|
|
|||||||
| 26,608,595 | ||||||||
| Health Care - Services — 4.0% |
||||||||
| AdventHealth Obligated Group, Series E, |
182 | 118,433 | ||||||
| Adventist Health System/West, 3.63%, 03/01/49 |
225 | 165,609 | ||||||
| Advocate Health & Hospitals Corp. |
||||||||
| 3.39%, 10/15/49 (Call 04/15/49) |
248 | 186,205 | ||||||
| 4.27%, 08/15/48 (Call 02/15/48) |
228 | 196,107 | ||||||
| Series 2020, 3.01%, 06/15/50 (Call 12/15/49) |
145 | 98,585 | ||||||
| Aetna Inc. |
||||||||
| 3.88%, 08/15/47 (Call 02/15/47)(a) |
789 | 589,907 | ||||||
| 4.13%, 11/15/42 (Call 05/15/42) |
386 | 308,578 | ||||||
| 4.50%, 05/15/42 (Call 11/15/41) |
614 | 521,169 | ||||||
| 4.75%, 03/15/44 (Call 09/15/43) |
207 | 178,520 | ||||||
| 6.63%, 06/15/36 |
855 | 930,680 | ||||||
| 6.75%, 12/15/37 |
647 | 705,839 | ||||||
| AHS Hospital Corp. |
||||||||
| 5.02%, 07/01/45 |
329 | 313,978 | ||||||
| Series 2021, 2.78%, 07/01/51 (Call 01/01/51) |
84 | 54,941 | ||||||
| Allina Health System |
||||||||
| 2.90%, 11/15/51 (Call 05/15/51) |
240 | 157,180 | ||||||
| 4.81%, 11/15/45 (Call 05/15/45) |
160 | 146,885 | ||||||
| Series 2019, 3.89%, 04/15/49 (Call 10/15/48) |
186 | 151,801 | ||||||
| Ascension Health |
||||||||
| 3.95%, 11/15/46(a) |
894 | 752,469 | ||||||
| 4.85%, 11/15/53 |
410 | 392,126 | ||||||
| Series B, 3.11%, 11/15/39 (Call 05/15/39) |
454 | 354,022 | ||||||
| Banner Health |
||||||||
| 2.91%, 01/01/42 (Call 07/01/41) |
175 | 127,846 | ||||||
| 2.91%, 01/01/51 (Call 07/01/50)(a) |
250 | 161,327 | ||||||
| Series 2020, 3.18%, 01/01/50 (Call 07/01/49)(a) |
258 | 182,988 | ||||||
| Baptist Health South Florida Inc., Series 2017, |
||||||||
| 4.34%, 11/15/41 |
193 | 168,117 | ||||||
| Baptist Health South Florida Obligated Group, |
||||||||
| Series 2021, 3.12%, 11/15/71 (Call 05/15/71)(a) |
10 | 5,920 | ||||||
| Security | Par (000) |
Value | ||||||
| Health Care - Services (continued) |
||||||||
| Baptist Healthcare System Obligated Group, |
||||||||
| Series 20B, 3.54%, 08/15/50 (Call 02/15/50)(a) |
$ | 235 | $ | 174,334 | ||||
| BayCare Health System Inc., Series 2020, |
241 | 197,325 | ||||||
| Baylor Scott & White Holdings |
||||||||
| 3.97%, 11/15/46 (Call 05/15/46) |
260 | 215,343 | ||||||
| 4.19%, 11/15/45 (Call 05/15/45) |
173 | 151,137 | ||||||
| Series 2021, 2.84%, 11/15/50 (Call 11/15/49)(a) |
673 | 445,965 | ||||||
| Beth Israel Lahey Health Inc., Series L, |
195 | 123,568 | ||||||
| Bon Secours Mercy Health Inc., Series 20-2, |
||||||||
| 3.21%, 06/01/50 (Call 12/01/49) |
190 | 134,126 | ||||||
| Catholic Health Services of Long Island Obligated |
||||||||
| Group, Series 2020, 3.37%, 07/01/50 |
||||||||
| (Call 01/01/50)(a) |
192 | 131,653 | ||||||
| Children’s Health System of Texas, |
212 | 131,721 | ||||||
| Children’s Hospital Corp. (The) |
||||||||
| Series 2017, 4.12%, 01/01/47 (Call 07/01/46) |
197 | 166,518 | ||||||
| Series 2020, 2.59%, 02/01/50 (Call 08/01/49) |
201 | 123,735 | ||||||
| Children’s Hospital Medical Center/Cincinnati OH, |
||||||||
| 4.27%, 05/15/44 |
176 | 155,261 | ||||||
| Children’s Hospital of Philadelphia (The), |
150 | 97,892 | ||||||
| Children’s Hospital/DC, Series 2020, |
79 | 50,599 | ||||||
| City of Hope |
||||||||
| Series 2013, 5.62%, 11/15/43 |
337 | 328,747 | ||||||
| Series 2018, 4.38%, 08/15/48 (Call 02/15/48)(a) |
198 | 166,002 | ||||||
| Cleveland Clinic Foundation (The), |
335 | 304,651 | ||||||
| CommonSpirit Health |
||||||||
| 3.82%, 10/01/49 (Call 04/01/49) |
418 | 317,602 | ||||||
| 3.91%, 10/01/50 (Call 04/01/50) |
497 | 381,858 | ||||||
| 4.19%, 10/01/49 (Call 04/01/49) |
837 | 679,100 | ||||||
| 4.35%, 11/01/42(a) |
744 | 634,788 | ||||||
| 6.46%, 11/01/52 (Call 05/01/52)(a) |
215 | 242,496 | ||||||
| Community Health Network Inc., Series 20-A, |
||||||||
| 3.10%, 05/01/50 (Call 11/01/49) |
139 | 93,165 | ||||||
| Corewell Health Obligated Group, Series 19A, |
||||||||
| 3.49%, 07/15/49 (Call 01/15/49) |
154 | 116,422 | ||||||
| Cottage Health Obligated Group, Series 2020, |
||||||||
| 3.30%, 11/01/49 (Call 05/01/49)(a) |
279 | 197,772 | ||||||
| Dartmouth-Hitchcock Health, Series B, |
194 | 146,871 | ||||||
| Dignity Health |
||||||||
| 4.50%, 11/01/42 |
231 | 198,943 | ||||||
| 5.27%, 11/01/64(a) |
160 | 148,572 | ||||||
| Duke University Health System Inc., Series 2017, |
||||||||
| 3.92%, 06/01/47 (Call 12/01/46) |
279 | 230,962 | ||||||
| Elevance Health Inc. |
||||||||
| 3.13%, 05/15/50 (Call 11/15/49) |
742 | 508,664 | ||||||
| 3.60%, 03/15/51 (Call 09/15/50) |
1,084 | 809,303 | ||||||
| 3.70%, 09/15/49 (Call 03/15/49) |
861 | 652,452 | ||||||
| 4.38%, 12/01/47 (Call 06/01/47) |
1,213 | 1,030,647 | ||||||
| 4.55%, 03/01/48 (Call 09/01/47) |
747 | 653,536 | ||||||
| 4.55%, 05/15/52 (Call 11/15/51) |
696 | 607,944 | ||||||
| 4.63%, 05/15/42 |
866 | 779,919 | ||||||
| 4.65%, 01/15/43(a) |
760 | 687,653 | ||||||
| 4.65%, 08/15/44 (Call 02/15/44) |
692 | 616,741 | ||||||
| 4.85%, 08/15/54 (Call 02/15/54) |
152 | 129,746 | ||||||
| 236 | 2 0 2 4 I S H A R E S A N N U A L R E P O R T T O S H A R E H O L D E R S |
| Schedule of Investments (continued) February 29, 2024 |
iShares® 10+ Year Investment Grade Corporate Bond ETF (Percentages shown are based on Net Assets) |
| Security | Par (000) |
Value | ||||||
| Health Care - Services (continued) |
||||||||
| 5.10%, 01/15/44 |
$ | 595 | $ | 561,483 | ||||
| 5.13%, 02/15/53 (Call 08/15/52) |
992 | 937,267 | ||||||
| 5.85%, 01/15/36(a) |
403 | 419,079 | ||||||
| 5.95%, 12/15/34 |
373 | 390,653 | ||||||
| 6.10%, 10/15/52 (Call 04/15/52) |
764 | 820,552 | ||||||
| 6.38%, 06/15/37 |
396 | 428,665 | ||||||
| Franciscan Missionaries of Our Lady Health |
||||||||
| System Inc., Series B, 3.91%, 07/01/49 |
||||||||
| (Call 01/01/49)(a) |
155 | 120,971 | ||||||
| Fred Hutchinson Cancer Center, 4.97%, 01/01/52 |
||||||||
| (Call 07/01/51) |
120 | 113,794 | ||||||
| Hackensack Meridian Health Inc. |
||||||||
| 4.21%, 07/01/48 (Call 01/01/48)(a) |
385 | 334,261 | ||||||
| 4.50%, 07/01/57 (Call 01/01/57) |
150 | 126,528 | ||||||
| Series 2020, 2.68%, 09/01/41 (Call 03/01/41) |
380 | 264,724 | ||||||
| Series 2020, 2.88%, 09/01/50 (Call 03/01/50) |
304 | 202,248 | ||||||
| Hartford HealthCare Corp., 3.45%, 07/01/54(a) |
80 | 55,887 | ||||||
| HCA Inc. |
||||||||
| 3.50%, 07/15/51 (Call 01/15/51) |
1,494 | 1,009,490 | ||||||
| 4.63%, 03/15/52 (Call 09/15/51) |
1,803 | 1,476,229 | ||||||
| 5.13%, 06/15/39 (Call 12/15/38) |
946 | 879,102 | ||||||
| 5.25%, 06/15/49 (Call 12/15/48) |
1,831 | 1,648,725 | ||||||
| 5.50%, 06/15/47 (Call 12/15/46) |
1,267 | 1,179,664 | ||||||
| 5.90%, 06/01/53 (Call 12/01/52) |
935 | 918,379 | ||||||
| 6.00%, 04/01/54 (Call 10/01/53) |
635 | 630,224 | ||||||
| 6.10%, 04/01/64 (Call 10/01/63) |
725 | 715,887 | ||||||
| Health Care Service Corp. A Mutual Legal Reserve |
||||||||
| Co., 3.20%, 06/01/50 (Call 12/01/49)(b) |
519 | 351,897 | ||||||
| Hoag Memorial Hospital Presbyterian, |
222 | 181,180 | ||||||
| Humana Inc. |
||||||||
| 3.95%, 08/15/49 (Call 02/15/49) |
414 | 323,558 | ||||||
| 4.63%, 12/01/42 (Call 06/01/42) |
610 | 535,600 | ||||||
| 4.80%, 03/15/47 (Call 09/15/46) |
328 | 285,880 | ||||||
| 4.95%, 10/01/44 (Call 04/01/44) |
615 | 554,680 | ||||||
| 5.50%, 03/15/53 (Call 09/15/52)(a) |
615 | 595,718 | ||||||
| 8.15%, 06/15/38 |
269 | 320,619 | ||||||
| Indiana University Health Inc. Obligated Group |
||||||||
| 3.97%, 11/01/48 (Call 05/01/48) |
214 | 177,420 | ||||||
| Series 2021, 2.85%, 11/01/51 (Call 05/01/51) |
175 | 114,928 | ||||||
| Inova Health System Foundation, 4.07%, 05/15/52 |
||||||||
| (Call 11/15/51)(a) |
180 | 153,401 | ||||||
| Integris Baptist Medical Center Inc., Series A, |
||||||||
| 3.88%, 08/15/50 (Call 02/15/50) |
240 | 181,099 | ||||||
| Iowa Health System, Series 2020, 3.67%, 02/15/50 |
||||||||
| (Call 08/15/49) |
189 | 146,928 | ||||||
| Johns Hopkins Health System Corp. (The), |
341 | 278,339 | ||||||
| Kaiser Foundation Hospitals |
||||||||
| 4.15%, 05/01/47 (Call 11/01/46) |
1,169 | 1,007,984 | ||||||
| 4.88%, 04/01/42 |
539 | 511,848 | ||||||
| Series 2019, 3.27%, 11/01/49 (Call 05/01/49) |
892 | 655,463 | ||||||
| Series 2021, 2.81%, 06/01/41 (Call 12/01/40)(a) |
745 | 544,145 | ||||||
| Series 2021, 3.00%, 06/01/51 (Call 12/01/50) |
1,203 | 824,601 | ||||||
| Laboratory Corp. of America Holdings, |
652 | 581,935 | ||||||
| Mass General Brigham Inc. |
||||||||
| Series 2017, 3.77%, 07/01/48 (Call 01/01/48) |
142 | 113,829 | ||||||
| Series 2020, 3.19%, 07/01/49 (Call 01/01/49) |
89 | 63,224 | ||||||
| Series 2020, 3.34%, 07/01/60 (Call 01/01/60) |
399 | 271,564 | ||||||
| Security | Par (000) |
Value | ||||||
| Health Care - Services (continued) |
||||||||
| Mayo Clinic |
||||||||
| 3.77%, 11/15/43 |
$ | 45 | $ | 37,981 | ||||
| Series 2013, 4.00%, 11/15/47(a) |
100 | 84,572 | ||||||
| Series 2016, 4.13%, 11/15/52(a) |
253 | 220,184 | ||||||
| Series 2021, 3.20%, 11/15/61 (Call 05/15/61) |
431 | 296,333 | ||||||
| McLaren Health Care Corp., Series A, |
241 | 207,814 | ||||||
| MedStar Health Inc., Series 20A, 3.63%, 08/15/49 |
80 | 60,489 | ||||||
| Memorial Health Services, 3.45%, 11/01/49 |
||||||||
| (Call 05/01/49) |
262 | 194,871 | ||||||
| Memorial Sloan-Kettering Cancer Center |
||||||||
| 4.13%, 07/01/52 |
155 | 131,866 | ||||||
| 5.00%, 07/01/42 |
411 | 398,228 | ||||||
| Series 2015, 4.20%, 07/01/55 |
530 | 444,506 | ||||||
| Series 2020, 2.96%, 01/01/50 (Call 07/01/49) |
50 | 33,912 | ||||||
| Methodist Hospital (The), Series 20A, |
226 | 141,873 | ||||||
| Montefiore Obligated Group |
||||||||
| 4.29%, 09/01/50 |
135 | 83,408 | ||||||
| Series 18-C, 5.25%, 11/01/48 (Call 05/01/48) |
162 | 118,609 | ||||||
| Mount Nittany Medical Center Obligated Group, |
||||||||
| 3.80%, 11/15/52(a) |
199 | 155,758 | ||||||
| Mount Sinai Hospital |
||||||||
| Series 2017, 3.98%, 07/01/48 |
194 | 158,604 | ||||||
| Series 2019, 3.74%, 07/01/49 (Call 01/01/49) |
308 | 226,731 | ||||||
| Series 2020, 3.39%, 07/01/50 (Call 07/01/49) |
309 | 206,406 | ||||||
| MultiCare Health System, 2.80%, 08/15/50 |
||||||||
| (Call 02/15/50)(a) |
196 | 115,092 | ||||||
| MyMichigan Health, Series 2020, 3.41%, 06/01/50 |
||||||||
| (Call 12/01/49) |
188 | 136,885 | ||||||
| Nationwide Children’s Hospital Inc., |
197 | 181,109 | ||||||
| New York and Presbyterian Hospital (The) |
||||||||
| 2.26%, 08/01/40 (Call 02/01/40) |
185 | 124,632 | ||||||
| 2.61%, 08/01/60 (Call 02/01/60)(a) |
155 | 89,480 | ||||||
| 3.56%, 08/01/36 |
175 | 149,682 | ||||||
| 4.02%, 08/01/45(a) |
310 | 262,905 | ||||||
| 4.06%, 08/01/56 |
198 | 160,924 | ||||||
| 4.76%, 08/01/2116(a) |
180 | 154,944 | ||||||
| Series 2019, 3.95%, (Call 02/01/2119)(a) |
250 | 183,352 | ||||||
| Northwell Healthcare Inc. |
||||||||
| 3.81%, 11/01/49 (Call 11/01/48) |
444 | 339,468 | ||||||
| 3.98%, 11/01/46 (Call 11/01/45) |
145 | 114,198 | ||||||
| 4.26%, 11/01/47 (Call 11/01/46) |
669 | 544,438 | ||||||
| 6.15%, 11/01/43 |
295 | 308,520 | ||||||
| Northwestern Memorial Healthcare Obligated |
||||||||
| Group, Series 2021, 2.63%, 07/15/51 |
||||||||
| (Call 01/15/51)(a) |
189 | 123,148 | ||||||
| Novant Health Inc. |
||||||||
| 2.64%, 11/01/36 (Call 08/01/36) |
150 | 113,459 | ||||||
| 3.17%, 11/01/51 (Call 05/01/51) |
747 | 508,688 | ||||||
| 3.32%, 11/01/61 (Call 05/01/61)(a) |
327 | 213,063 | ||||||
| 4.37%, 11/01/43 |
310 | 264,749 | ||||||
| NY Society for Relief of Ruptured & Crippled |
||||||||
| Maintaining Hosp Special Surgery, Series 2020, |
||||||||
| 2.67%, 10/01/50 (Call 04/01/50)(a) |
54 | 32,813 | ||||||
| NYU Langone Hospitals |
||||||||
| 5.75%, 07/01/43(a) |
80 | 83,379 | ||||||
| Series 2020, 3.38%, 07/01/55 (Call 01/01/55) |
430 | 309,069 | ||||||
| Ochsner Clinic Foundation, 5.90%, 05/15/45 |
||||||||
| (Call 11/15/44)(a) |
195 | 187,666 | ||||||
| S C H E D U L E O F I N V E S T M E N T S |
237 |
| Schedule of Investments (continued) February 29, 2024 |
iShares® 10+ Year Investment Grade Corporate Bond ETF (Percentages shown are based on Net Assets) |
| Security | Par (000) | Value | ||||||
| Health Care - Services (continued) | ||||||||
| OhioHealth Corp. |
||||||||
| 2.83%, 11/15/41 (Call 05/15/41) |
$ | 175 | $ | 127,917 | ||||
| Series 2020, 3.04%, 11/15/50 (Call 05/15/50) |
177 | 126,868 | ||||||
| Orlando Health Obligated Group |
||||||||
| 3.33%, 10/01/50 (Call 04/01/50) |
105 | 76,934 | ||||||
| 4.09%, 10/01/48 (Call 04/01/48) |
190 | 158,040 | ||||||
| PeaceHealth Obligated Group |
||||||||
| Series 2018, 4.79%, 11/15/48 (Call 05/15/48)(a) |
266 | 232,351 | ||||||
| Series 2020, 3.22%, 11/15/50 (Call 05/15/50) |
440 | 290,070 | ||||||
| Piedmont Healthcare Inc. |
||||||||
| 2.86%, 01/01/52 (Call 07/01/51)(a) |
276 | 176,872 | ||||||
| Series 2042, 2.72%, 01/01/42 (Call 07/01/41)(a) |
105 | 74,094 | ||||||
| Presbyterian Healthcare Services, 4.88%, 08/01/52 |
205 | 196,769 | ||||||
| Providence St Joseph Health Obligated Group |
||||||||
| Series 21A, 2.70%, 10/01/51 (Call 04/01/51) |
750 | 452,050 | ||||||
| Series A, 3.93%, 10/01/48 (Call 04/01/48)(a) |
199 | 153,083 | ||||||
| Series I, 3.74%, 10/01/47(a) |
255 | 191,823 | ||||||
| Queen’s Health Systems (The), 4.81%, 07/01/52 |
135 | 125,753 | ||||||
| Quest Diagnostics Inc., 4.70%, 03/30/45 |
198 | 173,618 | ||||||
| Rady Children’s Hospital-San Diego, Series 21A, |
190 | 128,863 | ||||||
| Roche Holdings Inc. |
||||||||
| 2.61%, 12/13/51 (Call 06/13/51)(b) |
1,820 | 1,147,539 | ||||||
| 4.00%, 11/28/44 (Call 05/28/44)(b) |
568 | 487,565 | ||||||
| 7.00%, 03/01/39(b) |
685 | 823,519 | ||||||
| RWJ Barnabas Health Inc. |
||||||||
| 3.48%, 07/01/49 (Call 01/01/49) |
259 | 192,969 | ||||||
| 3.95%, 07/01/46 (Call 07/01/45) |
190 | 152,070 | ||||||
| Seattle Children’s Hospital, Series 2021, |
498 | 321,129 | ||||||
| Sentara Healthcare, 2.93%, 11/01/51 |
195 | 131,709 | ||||||
| Sharp HealthCare, Series 20B, 2.68%, 08/01/50 |
196 | 122,694 | ||||||
| Southern Baptist Hospital of Florida Inc., |
190 | 180,771 | ||||||
| Stanford Health Care |
||||||||
| 3.03%, 08/15/51 (Call 02/15/51) |
167 | 113,149 | ||||||
| Series 2018, 3.80%, 11/15/48 (Call 05/15/48) |
264 | 212,512 | ||||||
| Summa Health, 3.51%, 11/15/51 (Call 05/15/51)(a) |
193 | 142,887 | ||||||
| Sutter Health |
||||||||
| 5.55%, 08/15/53 (Call 02/15/53)(a) |
10 | 10,438 | ||||||
| Series 2018, 4.09%, 08/15/48 (Call 02/15/48) |
198 | 164,341 | ||||||
| Series 20A, 3.16%, 08/15/40 (Call 02/15/40) |
145 | 111,446 | ||||||
| Series 20A, 3.36%, 08/15/50 (Call 02/15/50)(a) |
390 | 286,115 | ||||||
| Texas Health Resources |
||||||||
| 2.33%, 11/15/50 (Call 05/15/50)(a) |
170 | 102,245 | ||||||
| 4.33%, 11/15/55(a) |
190 | 166,306 | ||||||
| Toledo Hospital (The), 5.75%, 11/15/38 |
170 | 169,809 | ||||||
| Trinity Health Corp. |
||||||||
| 4.13%, 12/01/45 |
168 | 142,169 | ||||||
| Series 2019, 3.43%, 12/01/48(a) |
218 | 165,863 | ||||||
| Series 2021, 2.63%, 12/01/40 (Call 06/01/40) |
236 | 166,186 | ||||||
| UMass Memorial Health Care Obligated Group, |
110 | 104,023 | ||||||
| UnitedHealth Group Inc. |
945 | 680,850 | ||||||
| Security | Par (000) | Value | ||||||
| Health Care - Services (continued) | ||||||||
| 2.90%, 05/15/50 (Call 11/15/49) |
$ | 1,146 | $ | 761,307 | ||||
| 3.05%, 05/15/41 (Call 11/15/40) |
1,057 | 785,329 | ||||||
| 3.13%, 05/15/60 (Call 11/15/59) |
810 | 529,989 | ||||||
| 3.25%, 05/15/51 (Call 11/15/50) |
1,425 | 999,338 | ||||||
| 3.50%, 08/15/39 (Call 02/15/39) |
532 | 429,686 | ||||||
| 3.70%, 08/15/49 (Call 02/15/49) |
1,105 | 848,087 | ||||||
| 3.75%, 10/15/47 (Call 04/15/47) |
866 | 675,197 | ||||||
| 3.88%, 08/15/59 (Call 02/15/59) |
1,175 | 904,099 | ||||||
| 3.95%, 10/15/42 (Call 04/15/42) |
600 | 504,240 | ||||||
| 4.20%, 01/15/47 (Call 07/15/46) |
820 | 694,415 | ||||||
| 4.25%, 03/15/43 (Call 09/15/42) |
674 | 589,550 | ||||||
| 4.25%, 04/15/47 (Call 10/15/46) |
698 | 593,493 | ||||||
| 4.25%, 06/15/48 (Call 12/15/47) |
1,116 | 939,311 | ||||||
| 4.38%, 03/15/42 (Call 09/15/41)(a) |
476 | 423,597 | ||||||
| 4.45%, 12/15/48 (Call 06/15/48) |
933 | 820,146 | ||||||
| 4.63%, 07/15/35 |
175 | 168,922 | ||||||
| 4.63%, 11/15/41 (Call 05/15/41) |
603 | 550,196 | ||||||
| 4.75%, 07/15/45 |
1,654 | 1,521,969 | ||||||
| 4.75%, 05/15/52 (Call 11/15/51) |
1,715 | 1,560,050 | ||||||
| 4.95%, 05/15/62 (Call 11/15/61) |
852 | 787,581 | ||||||
| 5.05%, 04/15/53 (Call 10/15/52) |
1,772 | 1,685,871 | ||||||
| 5.20%, 04/15/63 (Call 10/15/62) |
1,520 | 1,449,498 | ||||||
| 5.70%, 10/15/40 (Call 04/15/40) |
309 | 320,248 | ||||||
| 5.80%, 03/15/36 |
785 | 830,999 | ||||||
| 5.88%, 02/15/53 (Call 08/15/52) |
1,475 | 1,577,985 | ||||||
| 5.95%, 02/15/41 (Call 08/15/40) |
400 | 420,885 | ||||||
| 6.05%, 02/15/63 (Call 08/15/62) |
1,306 | 1,414,361 | ||||||
| 6.50%, 06/15/37 |
565 | 630,175 | ||||||
| 6.63%, 11/15/37 |
660 | 746,354 | ||||||
| 6.88%, 02/15/38 |
990 | 1,150,044 | ||||||
| UPMC, 5.38%, 05/15/43 (Call 11/15/42) |
102 | 103,139 | ||||||
| WakeMed, Series A, 3.29%, 10/01/52 |
80 | 56,336 | ||||||
| West Virginia United Health System Obligated |
190 | 119,594 | ||||||
| Willis-Knighton Medical Center |
||||||||
| Series 2018, 4.81%, 09/01/48 (Call 03/01/48) |
177 | 160,150 | ||||||
| Series 2021, 3.07%, 03/01/51 (Call 09/01/50)(a) |
268 | 175,890 | ||||||
| Yale-New Haven Health Services Corp., |
90 | 51,824 | ||||||
|
|
|
|||||||
| 84,809,689 | ||||||||
| Holding Companies - Diversified — 0.1% | ||||||||
| Alfa SAB de CV, 6.88%, 03/25/44 |
445 | 440,439 | ||||||
| CK Hutchison International 19 II Ltd., |
732 | 539,296 | ||||||
| JAB Holdings BV |
||||||||
| 3.75%, 05/28/51 (Call 11/28/50)(b) |
315 | 204,911 | ||||||
| 4.50%, 04/08/52 (Call 10/08/51)(b) |
415 | 306,657 | ||||||
| PTT Treasury Center Co. Ltd., 3.70%, 07/16/70 |
585 | 404,533 | ||||||
|
|
|
|||||||
| 1,895,836 | ||||||||
| Home Builders — 0.0% | ||||||||
| MDC Holdings Inc. |
||||||||
| 3.97%, 08/06/61 (Call 02/06/61) |
195 | 148,552 | ||||||
| 6.00%, 01/15/43 (Call 10/15/42) |
681 | 679,378 | ||||||
| PulteGroup Inc., 6.00%, 02/15/35 |
235 | 241,329 | ||||||
|
|
|
|||||||
| 1,069,259 | ||||||||
| 238 | 2 0 2 4 I S H A R E S A N N U A L R E P O R T T O S H A R E H O L D E R S |
| Schedule of Investments (continued) February 29, 2024 |
iShares® 10+ Year Investment Grade Corporate Bond ETF (Percentages shown are based on Net Assets) |
| Security | Par (000) |
Value | ||||||
| Home Furnishings — 0.1% | ||||||||
| Leggett & Platt Inc., 3.50%, 11/15/51 |
$ | 378 | $ | 260,692 | ||||
| Whirlpool Corp. |
||||||||
| 4.50%, 06/01/46 (Call 12/01/45)(a) |
286 | 230,177 | ||||||
| 4.60%, 05/15/50 (Call 11/15/49)(a) |
531 | 429,359 | ||||||
| 5.15%, 03/01/43 |
241 | 212,712 | ||||||
|
|
|
|||||||
| 1,132,940 | ||||||||
| Household Products & Wares — 0.2% | ||||||||
| Church & Dwight Co. Inc. |
||||||||
| 3.95%, 08/01/47 (Call 02/01/47) |
164 | 130,301 | ||||||
| 5.00%, 06/15/52 (Call 12/15/51) |
378 | 357,275 | ||||||
| Kimberly-Clark Corp. |
||||||||
| 2.88%, 02/07/50 (Call 08/07/49)(a) |
205 | 140,115 | ||||||
| 3.20%, 07/30/46 (Call 01/30/46) |
98 | 71,273 | ||||||
| 3.70%, 06/01/43 |
290 | 227,013 | ||||||
| 3.90%, 05/04/47 (Call 11/04/46) |
127 | 102,559 | ||||||
| 5.30%, 03/01/41 |
405 | 404,179 | ||||||
| 6.63%, 08/01/37(a) |
798 | 917,737 | ||||||
| SC Johnson & Son Inc. |
||||||||
| 4.00%, 05/15/43 (Call 02/15/43)(b) |
440 | 354,640 | ||||||
| 4.35%, 09/30/44 (Call 03/30/44)(a)(b) |
264 | 216,953 | ||||||
| 4.75%, 10/15/46 (Call 04/16/46)(b) |
680 | 608,411 | ||||||
| 4.80%, 09/01/40(b) |
473 | 423,219 | ||||||
|
|
|
|||||||
| 3,953,675 | ||||||||
| Insurance — 4.9% | ||||||||
| Aflac Inc. |
||||||||
| 4.00%, 10/15/46 (Call 04/15/46) |
151 | 120,388 | ||||||
| 4.75%, 01/15/49 (Call 07/15/48) |
364 | 329,117 | ||||||
| 6.45%, 08/15/40(a) |
399 | 433,453 | ||||||
| AIA Group Ltd. |
||||||||
| 3.20%, 09/16/40 (Call 03/16/40)(b) |
805 | 600,727 | ||||||
| 4.50%, 03/16/46 (Call 09/16/45)(b) |
335 | 301,780 | ||||||
| 4.88%, 03/11/44(b) |
282 | 267,264 | ||||||
| Alleghany Corp. |
||||||||
| 3.25%, 08/15/51 (Call 02/15/51) |
310 | 218,719 | ||||||
| 4.90%, 09/15/44 (Call 03/15/44)(a) |
199 | 186,334 | ||||||
| Allstate Corp. (The) |
||||||||
| 3.85%, 08/10/49 (Call 02/10/49) |
251 | 195,135 | ||||||
| 4.20%, 12/15/46 (Call 06/15/46) |
272 | 222,118 | ||||||
| 4.50%, 06/15/43 |
655 | 570,947 | ||||||
| 5.55%, 05/09/35 |
696 | 707,567 | ||||||
| 5.95%, 04/01/36 |
665 | 693,752 | ||||||
| 6.50%, 05/15/67 (Call 05/15/37), |
304 | 306,093 | ||||||
| American Financial Group Inc./OH, |
250 | 203,580 | ||||||
| American International Group Inc. |
||||||||
| 3.88%, 01/15/35 (Call 07/15/34) |
320 | 281,388 | ||||||
| 4.38%, 06/30/50 (Call 12/30/49) |
819 | 703,276 | ||||||
| 4.50%, 07/16/44 (Call 01/16/44) |
547 | 482,622 | ||||||
| 4.75%, 04/01/48 (Call 10/01/47)(a) |
906 | 826,745 | ||||||
| 4.80%, 07/10/45 (Call 01/10/45) |
606 | 554,820 | ||||||
| 6.25%, 05/01/36 |
700 | 729,343 | ||||||
| AmFam Holdings Inc., 3.83%, 03/11/51 |
247 | 147,345 | ||||||
| Aon Corp., 6.25%, 09/30/40(a) |
357 | 379,261 | ||||||
| Aon Corp./Aon Global Holdings PLC |
||||||||
| 2.90%, 08/23/51 (Call 02/23/51)(a) |
524 | 327,031 | ||||||
| 3.90%, 02/28/52 (Call 08/28/51) |
751 | 568,481 | ||||||
| Security | Par (000) |
Value | ||||||
| Insurance (continued) | ||||||||
| Aon Global Ltd. |
||||||||
| 4.25%, 12/12/42 |
$ | 276 | $ | 222,103 | ||||
| 4.45%, 05/24/43 (Call 02/24/43) |
280 | 229,453 | ||||||
| 4.60%, 06/14/44 (Call 03/14/44) |
475 | 409,063 | ||||||
| 4.75%, 05/15/45 (Call 11/15/44) |
408 | 359,883 | ||||||
| Aon North America Inc., 5.75%, 03/01/54 |
1,100 | 1,104,317 | ||||||
| Arch Capital Finance LLC, 5.03%, 12/15/46 |
315 | 288,347 | ||||||
| Arch Capital Group Ltd. |
||||||||
| 3.64%, 06/30/50 (Call 12/30/49) |
726 | 534,551 | ||||||
| 7.35%, 05/01/34 |
65 | 73,068 | ||||||
| Arch Capital Group U.S. Inc., 5.14%, 11/01/43 |
410 | 381,419 | ||||||
| Arthur J Gallagher & Co. |
||||||||
| 3.05%, 03/09/52 (Call 09/09/51) |
305 | 193,064 | ||||||
| 3.50%, 05/20/51 (Call 11/20/50) |
746 | 517,973 | ||||||
| 5.75%, 03/02/53 (Call 09/02/52) |
508 | 500,589 | ||||||
| 5.75%, 07/15/54 (Call 01/15/54) |
205 | 203,048 | ||||||
| 6.75%, 02/15/54 (Call 08/15/53) |
525 | 591,820 | ||||||
| Assured Guaranty Municipal Holdings Inc., |
255 | 233,653 | ||||||
| Assured Guaranty U.S. Holdings Inc., |
135 | 94,819 | ||||||
| Athene Holding Ltd. |
||||||||
| 3.45%, 05/15/52 (Call 11/15/51)(a) |
360 | 236,054 | ||||||
| 3.95%, 05/25/51 (Call 11/25/50)(a) |
391 | 285,250 | ||||||
| Augustar Life Insurance Co., 6.88%, 06/15/42(b) |
235 | 212,446 | ||||||
| AXA SA, 6.38%, (Call 12/14/36), |
250 | 272,573 | ||||||
| AXIS Specialty Finance PLC, 5.15%, 04/01/45 |
129 | 111,467 | ||||||
| Berkshire Hathaway Finance Corp. |
||||||||
| 2.50%, 01/15/51 (Call 07/15/50) |
626 | 386,846 | ||||||
| 2.85%, 10/15/50 (Call 04/15/50) |
1,446 | 955,076 | ||||||
| 3.85%, 03/15/52 (Call 09/15/51) |
2,250 | 1,784,991 | ||||||
| 4.20%, 08/15/48 (Call 02/15/48) |
1,881 | 1,636,733 | ||||||
| 4.25%, 01/15/49 (Call 07/15/48)(a) |
1,600 | 1,409,389 | ||||||
| 4.30%, 05/15/43 |
546 | 489,584 | ||||||
| 4.40%, 05/15/42 |
712 | 656,907 | ||||||
| 5.75%, 01/15/40 |
729 | 783,792 | ||||||
| Berkshire Hathaway Inc., 4.50%, 02/11/43(a) |
669 | 632,663 | ||||||
| Brighthouse Financial Inc. |
||||||||
| 3.85%, 12/22/51 (Call 06/22/51)(a) |
303 | 197,760 | ||||||
| 4.70%, 06/22/47 (Call 12/22/46) |
671 | 519,884 | ||||||
| Brown & Brown Inc., 4.95%, 03/17/52 |
425 | 366,872 | ||||||
| Chubb Corp. (The) |
||||||||
| 6.00%, 05/11/37 |
900 | 965,943 | ||||||
| Series 1, 6.50%, 05/15/38 |
723 | 814,741 | ||||||
| Chubb INA Holdings Inc. |
||||||||
| 2.85%, 12/15/51 (Call 06/15/51) |
434 | 294,228 | ||||||
| 3.05%, 12/15/61 (Call 06/15/61) |
784 | 521,512 | ||||||
| 4.15%, 03/13/43 |
604 | 527,762 | ||||||
| 4.35%, 11/03/45 (Call 05/03/45) |
960 | 847,642 | ||||||
| 6.70%, 05/15/36(a) |
651 | 741,027 | ||||||
| Cincinnati Financial Corp., 6.13%, 11/01/34(a) |
545 | 568,607 | ||||||
| Corebridge Financial Inc. |
||||||||
| 4.35%, 04/05/42 (Call 10/05/41) |
245 | 202,194 | ||||||
| 4.40%, 04/05/52 (Call 10/05/51) |
1,033 | 829,105 | ||||||
| Empower Finance 2020 LP, 3.08%, 09/17/51 |
507 | 337,779 | ||||||
| S C H E D U L E O F I N V E S T M E N T S |
239 |
| Schedule of Investments (continued) February 29, 2024 |
iShares® 10+ Year Investment Grade Corporate Bond ETF (Percentages shown are based on Net Assets) |
| Security | Par (000) | Value | ||||||
| Insurance (continued) | ||||||||
| Equitable Holdings Inc., 5.00%, 04/20/48 |
$ | 1,170 | $ | 1,057,924 | ||||
| Everest Reinsurance Holdings Inc. |
||||||||
| 3.13%, 10/15/52 (Call 04/15/52) |
818 | 521,756 | ||||||
| 3.50%, 10/15/50 (Call 04/15/50) |
801 | 560,021 | ||||||
| 4.87%, 06/01/44 |
245 | 218,915 | ||||||
| Farmers Exchange Capital III, 5.45%, 10/15/54 |
303 | 247,387 | ||||||
| Farmers Insurance Exchange, 4.75%, 11/01/57 |
202 | 149,013 | ||||||
| Fidelity National Financial Inc., 3.20%, 09/17/51 |
270 | 169,612 | ||||||
| Five Corners Funding Trust IV, 6.00%, 02/15/53 |
526 | 553,407 | ||||||
| Great-West Lifeco Finance 2018 LP, |
341 | 300,134 | ||||||
| Great-West Lifeco Finance Delaware LP, |
426 | 342,429 | ||||||
| Guardian Life Insurance Co. of America (The) |
||||||||
| 3.70%, 01/22/70 (Call 07/22/69)(b) |
239 | 156,764 | ||||||
| 4.85%, 01/24/77(b) |
443 | 364,753 | ||||||
| 4.88%, 06/19/64(a)(b) |
280 | 240,606 | ||||||
| Hartford Financial Services Group Inc. (The) |
||||||||
| 2.90%, 09/15/51 (Call 03/15/51) |
455 | 291,389 | ||||||
| 3.60%, 08/19/49 (Call 02/19/49) |
738 | 555,750 | ||||||
| 4.30%, 04/15/43 |
299 | 255,690 | ||||||
| 4.40%, 03/15/48 (Call 09/15/47) |
345 | 296,789 | ||||||
| 5.95%, 10/15/36 |
550 | 568,151 | ||||||
| 6.10%, 10/01/41 |
351 | 365,210 | ||||||
| 6.63%, 03/30/40 |
380 | 407,633 | ||||||
| Hill City Funding Trust, 4.05%, 08/15/41 |
170 | 122,243 | ||||||
| Jackson Financial Inc., 4.00%, 11/23/51 |
345 | 246,902 | ||||||
| Liberty Mutual Group Inc. |
||||||||
| 3.95%, 10/15/50 (Call 04/15/50)(b) |
1,125 | 841,952 | ||||||
| 3.95%, 05/15/60 (Call 11/15/59)(b) |
474 | 339,136 | ||||||
| 4.85%, 08/01/44(a)(b) |
105 | 90,611 | ||||||
| 5.50%, 06/15/52 (Call 12/15/51)(b) |
718 | 686,705 | ||||||
| 6.50%, 03/15/35(b) |
515 | 513,286 | ||||||
| 6.50%, 05/01/42(b) |
377 | 372,070 | ||||||
| Liberty Mutual Insurance Co., 7.70%, 10/15/97(a)(b). |
210 | 242,125 | ||||||
| Lincoln National Corp. |
||||||||
| 4.35%, 03/01/48 (Call 09/01/47) |
226 | 175,162 | ||||||
| 4.38%, 06/15/50 (Call 12/15/49) |
236 | 181,969 | ||||||
| 6.30%, 10/09/37 |
291 | 299,307 | ||||||
| 7.00%, 06/15/40(a) |
413 | 449,491 | ||||||
| Loews Corp. |
||||||||
| 4.13%, 05/15/43 (Call 11/15/42) |
710 | 596,540 | ||||||
| 6.00%, 02/01/35(a) |
481 | 509,146 | ||||||
| Manulife Financial Corp., 5.38%, 03/04/46(a) |
509 | 498,455 | ||||||
| Maple Grove Funding Trust I, 4.16%, 08/15/51 |
413 | 283,749 | ||||||
| Markel Group Inc. |
||||||||
| 3.45%, 05/07/52 (Call 11/07/51)(a) |
511 | 350,563 | ||||||
| 4.15%, 09/17/50 (Call 03/17/50) |
395 | 310,358 | ||||||
| 4.30%, 11/01/47 (Call 05/01/47) |
263 | 210,350 | ||||||
| 5.00%, 03/30/43(a) |
235 | 210,760 | ||||||
| 5.00%, 04/05/46 |
316 | 280,740 | ||||||
| Security | Par (000) | Value | ||||||
| Insurance (continued) | ||||||||
| 5.00%, 05/20/49 (Call 11/20/48)(a) |
$ | 498 | $ | 448,546 | ||||
| Marsh & McLennan Companies Inc. |
||||||||
| 2.90%, 12/15/51 (Call 06/15/51) |
325 | 208,378 | ||||||
| 4.20%, 03/01/48 (Call 09/01/47) |
439 | 367,967 | ||||||
| 4.35%, 01/30/47 (Call 07/30/46) |
394 | 334,288 | ||||||
| 4.75%, 03/15/39 (Call 09/15/38) |
50 | 47,336 | ||||||
| 4.90%, 03/15/49 (Call 09/15/48) |
1,081 | 999,922 | ||||||
| 5.45%, 03/15/53 (Call 09/15/52) |
620 | 617,366 | ||||||
| 5.45%, 03/15/54 (Call 09/15/53) |
350 | 347,771 | ||||||
| 5.70%, 09/15/53 (Call 03/15/53) |
842 | 868,828 | ||||||
| 6.25%, 11/01/52 (Call 05/01/52) |
430 | 474,177 | ||||||
| Massachusetts Mutual Life Insurance Co. |
||||||||
| 3.20%, 12/01/61(b) |
440 | 274,724 | ||||||
| 3.38%, 04/15/50(a)(b) |
699 | 479,551 | ||||||
| 3.73%, 10/15/70(a)(b) |
601 | 406,829 | ||||||
| 4.50%, 04/15/65(b) |
391 | 305,161 | ||||||
| 4.90%, 04/01/77(b) |
366 | 306,332 | ||||||
| 5.08%, 02/15/69 (Call 02/15/49), |
590 | 526,948 | ||||||
| 5.38%, 12/01/41(a)(b) |
391 | 353,154 | ||||||
| 5.67%, 12/01/52 (Call 06/01/52)(b) |
341 | 340,183 | ||||||
| MetLife Capital Trust IV, 7.88%, 12/15/67 |
555 | 594,079 | ||||||
| MetLife Inc. |
||||||||
| 4.05%, 03/01/45 |
793 | 653,468 | ||||||
| 4.13%, 08/13/42 |
902 | 764,428 | ||||||
| 4.60%, 05/13/46 (Call 11/13/45) |
627 | 560,172 | ||||||
| 4.72%, 12/15/44 |
412 | 367,835 | ||||||
| 4.88%, 11/13/43 |
812 | 747,473 | ||||||
| 5.00%, 07/15/52 (Call 01/15/52) |
890 | 830,899 | ||||||
| 5.25%, 01/15/54 (Call 07/15/53)(a) |
808 | 780,638 | ||||||
| 5.70%, 06/15/35 |
1,072 | 1,108,534 | ||||||
| 5.88%, 02/06/41 |
676 | 706,130 | ||||||
| 6.38%, 06/15/34 |
717 | 773,541 | ||||||
| 6.40%, 12/15/66 (Call 12/15/31) |
843 | 855,729 | ||||||
| 9.25%, 04/08/68 (Call 04/08/33)(a)(b) |
405 | 461,963 | ||||||
| 10.75%, 08/01/69 (Call 08/01/34) |
476 | 639,669 | ||||||
| Mutual of Omaha Insurance Co. |
||||||||
| 6.14%, 01/16/64 (Call 10/16/53), |
170 | 172,191 | ||||||
| 6.80%, 06/15/36(b) |
93 | 97,249 | ||||||
| National Life Insurance Co., 5.25%, 07/19/68 |
205 | 178,321 | ||||||
| Nationwide Financial Services Inc. |
||||||||
| 3.90%, 11/30/49 (Call 05/30/49)(b) |
510 | 396,217 | ||||||
| 5.30%, 11/18/44(a)(b) |
137 | 122,625 | ||||||
| 6.75%, 05/15/87 |
215 | 208,337 | ||||||
| Nationwide Mutual Insurance Co. |
||||||||
| 4.35%, 04/30/50 (Call 10/30/49)(b) |
1,060 | 837,737 | ||||||
| 4.95%, 04/22/44(b) |
224 | 192,295 | ||||||
| 9.38%, 08/15/39(b) |
763 | 983,695 | ||||||
| New York Life Insurance Co. |
||||||||
| 3.75%, 05/15/50 (Call 11/15/49)(b) |
1,023 | 781,360 | ||||||
| 4.45%, 05/15/69 (Call 11/15/68)(b) |
760 | 612,747 | ||||||
| 6.75%, 11/15/39(b) |
974 | 1,100,856 | ||||||
| Northwestern Mutual Life Insurance Co. (The) |
||||||||
| 3.45%, 03/30/51 (Call 09/30/50)(b) |
677 | 478,217 | ||||||
| 3.63%, 09/30/59 (Call 03/30/59)(b) |
1,058 | 740,089 | ||||||
| 3.85%, 09/30/47 (Call 03/30/47)(a)(b) |
904 | 703,872 | ||||||
| 6.06%, 03/30/40(b) |
1,201 | 1,246,323 | ||||||
| 240 | 2 0 2 4 I S H A R E S A N N U A L R E P O R T T O S H A R E H O L D E R S |
| Schedule of Investments (continued) February 29, 2024 |
iShares® 10+ Year Investment Grade Corporate Bond ETF (Percentages shown are based on Net Assets) |
| Security | Par (000) |
Value | ||||||
| Insurance (continued) |
||||||||
| Old Republic International Corp., 3.85%, 06/11/51 |
$ | 387 | $ | 280,604 | ||||
| OneAmerica Financial Partners Inc., |
226 | 156,367 | ||||||
| Pacific Life Insurance Co. |
||||||||
| 4.30%, 10/24/67 (Call 10/24/47), |
475 | 360,500 | ||||||
| 9.25%, 06/15/39(a)(b) |
330 | 430,017 | ||||||
| Pacific LifeCorp. |
||||||||
| 3.35%, 09/15/50 (Call 03/15/50)(b) |
539 | 372,331 | ||||||
| 5.13%, 01/30/43(b) |
474 | 440,637 | ||||||
| 5.40%, 09/15/52 (Call 03/15/52)(b) |
605 | 582,610 | ||||||
| Penn Mutual Life Insurance Co. (The), |
355 | 232,786 | ||||||
| Pine Street Trust II, 5.57%, 02/15/49 |
313 | 288,439 | ||||||
| Principal Financial Group Inc. |
||||||||
| 4.30%, 11/15/46 (Call 05/15/46) |
185 | 153,247 | ||||||
| 4.35%, 05/15/43(a) |
396 | 343,979 | ||||||
| 4.63%, 09/15/42 |
356 | 319,387 | ||||||
| 5.50%, 03/15/53 (Call 09/15/52) |
195 | 190,222 | ||||||
| 6.05%, 10/15/36(a) |
736 | 774,366 | ||||||
| Progressive Corp. (The) |
||||||||
| 3.70%, 01/26/45(a) |
274 | 221,854 | ||||||
| 3.70%, 03/15/52 (Call 09/15/51) |
395 | 305,829 | ||||||
| 3.95%, 03/26/50 (Call 09/26/49)(a) |
408 | 331,999 | ||||||
| 4.13%, 04/15/47 (Call 10/15/46) |
708 | 594,403 | ||||||
| 4.20%, 03/15/48 (Call 09/15/47) |
495 | 425,764 | ||||||
| 4.35%, 04/25/44 |
264 | 234,035 | ||||||
| Prudential Financial Inc. |
||||||||
| 3.00%, 03/10/40 (Call 09/10/39) |
312 | 232,542 | ||||||
| 3.70%, 03/13/51 (Call 09/13/50) |
1,250 | 953,590 | ||||||
| 3.91%, 12/07/47 (Call 06/07/47)(a) |
615 | 484,551 | ||||||
| 3.94%, 12/07/49 (Call 06/07/49) |
879 | 689,837 | ||||||
| 4.35%, 02/25/50 (Call 08/25/49) |
840 | 710,973 | ||||||
| 4.42%, 03/27/48 (Call 09/27/47) |
295 | 251,990 | ||||||
| 4.60%, 05/15/44 |
688 | 612,364 | ||||||
| 5.70%, 12/14/36 |
842 | 868,030 | ||||||
| 6.63%, 12/01/37 |
513 | 572,028 | ||||||
| 6.63%, 06/21/40(a) |
274 | 301,018 | ||||||
| Securian Financial Group Inc., 4.80%, 04/15/48(b) |
210 | 170,032 | ||||||
| Selective Insurance Group Inc., 5.38%, 03/01/49 |
177 | 166,992 | ||||||
| Sompo International Holdings Ltd., |
90 | 96,295 | ||||||
| Teachers Insurance & Annuity Association |
||||||||
| 3.30%, 05/15/50 (Call 11/15/49)(b) |
1,147 | 802,318 | ||||||
| 4.27%, 05/15/47 (Call 11/15/46)(a)(b) |
1,720 | 1,414,358 | ||||||
| 4.90%, 09/15/44(b) |
1,306 | 1,186,417 | ||||||
| 6.85%, 12/16/39(b) |
1,115 | 1,257,898 | ||||||
| Transatlantic Holdings Inc., 8.00%, 11/30/39 |
547 | 695,222 | ||||||
| Travelers Companies Inc. (The) |
||||||||
| 2.55%, 04/27/50 (Call 10/27/49) |
405 | 252,110 | ||||||
| 3.05%, 06/08/51 (Call 12/08/50) |
695 | 474,822 | ||||||
| 3.75%, 05/15/46 (Call 11/15/45) |
397 | 315,761 | ||||||
| 4.00%, 05/30/47 (Call 11/30/46) |
577 | 475,964 | ||||||
| 4.05%, 03/07/48 (Call 09/07/47) |
375 | 314,095 | ||||||
| 4.10%, 03/04/49 (Call 09/04/48) |
434 | 365,941 | ||||||
| 4.30%, 08/25/45 (Call 02/25/45) |
331 | 288,521 | ||||||
| 4.60%, 08/01/43 |
490 | 457,129 | ||||||
| Security | Par (000) |
Value | ||||||
| Insurance (continued) |
||||||||
| 5.35%, 11/01/40 |
$ | 705 | $ | 711,148 | ||||
| 5.45%, 05/25/53 (Call 11/25/52)(a) |
725 | 739,341 | ||||||
| 6.25%, 06/15/37 |
470 | 516,649 | ||||||
| 6.75%, 06/20/36 |
532 | 605,432 | ||||||
| Trinity Acquisition PLC, 6.13%, 08/15/43 |
289 | 282,086 | ||||||
| Unum Group |
||||||||
| 4.13%, 06/15/51 (Call 12/15/50) |
450 | 330,754 | ||||||
| 4.50%, 12/15/49 (Call 06/15/49) |
405 | 321,059 | ||||||
| 5.75%, 08/15/42 |
430 | 417,408 | ||||||
| W R Berkley Corp. |
||||||||
| 3.15%, 09/30/61 (Call 03/30/61)(a) |
234 | 139,443 | ||||||
| 3.55%, 03/30/52 (Call 09/30/51) |
342 | 234,274 | ||||||
| 4.00%, 05/12/50 (Call 11/12/49) |
362 | 277,933 | ||||||
| 4.75%, 08/01/44 |
223 | 192,741 | ||||||
| Western & Southern Life Insurance Co. (The) |
||||||||
| 3.75%, 04/28/61 (Call 10/28/60)(b) |
330 | 223,488 | ||||||
| 5.15%, 01/15/49 (Call 07/15/48)(b) |
250 | 227,082 | ||||||
| Willis North America Inc. |
||||||||
| 3.88%, 09/15/49 (Call 03/15/49) |
400 | 296,670 | ||||||
| 5.05%, 09/15/48 (Call 03/15/48)(a) |
226 | 201,205 | ||||||
| 5.90%, 03/05/54 (Call 09/05/53) |
625 | 623,545 | ||||||
| WR Berkley Corp., 6.25%, 02/15/37(a) |
245 | 251,705 | ||||||
| XL Group Ltd., 5.25%, 12/15/43 |
455 | 423,793 | ||||||
|
|
|
|||||||
| 104,188,316 | ||||||||
| Internet — 1.8% | ||||||||
| Alibaba Group Holding Ltd. |
||||||||
| 2.70%, 02/09/41 (Call 08/09/40)(a) |
723 | 499,378 | ||||||
| 3.15%, 02/09/51 (Call 08/09/50) |
1,310 | 864,280 | ||||||
| 3.25%, 02/09/61 (Call 08/09/60) |
835 | 530,004 | ||||||
| 4.00%, 12/06/37 (Call 06/06/37) |
637 | 549,158 | ||||||
| 4.20%, 12/06/47 (Call 06/06/47) |
1,497 | 1,217,329 | ||||||
| 4.40%, 12/06/57 (Call 06/06/57) |
754 | 616,798 | ||||||
| 4.50%, 11/28/34 (Call 05/28/34)(a) |
491 | 461,241 | ||||||
| Alphabet Inc. |
||||||||
| 1.90%, 08/15/40 (Call 02/15/40)(a) |
943 | 624,782 | ||||||
| 2.05%, 08/15/50 (Call 02/15/50) |
1,967 | 1,161,771 | ||||||
| 2.25%, 08/15/60 (Call 02/15/60)(a) |
1,652 | 949,611 | ||||||
| Amazon.com Inc. |
||||||||
| 2.50%, 06/03/50 (Call 12/03/49)(a) |
2,137 | 1,342,489 | ||||||
| 2.70%, 06/03/60 (Call 12/03/59) |
1,614 | 994,934 | ||||||
| 2.88%, 05/12/41 (Call 11/12/40) |
1,712 | 1,285,648 | ||||||
| 3.10%, 05/12/51 (Call 11/12/50) |
2,741 | 1,934,846 | ||||||
| 3.25%, 05/12/61 (Call 11/12/60) |
1,534 | 1,055,476 | ||||||
| 3.88%, 08/22/37 (Call 02/22/37) |
1,921 | 1,712,935 | ||||||
| 3.95%, 04/13/52 (Call 10/13/51)(a) |
2,114 | 1,747,480 | ||||||
| 4.05%, 08/22/47 (Call 02/22/47) |
2,962 | 2,538,317 | ||||||
| 4.10%, 04/13/62 (Call 10/13/61)(a) |
979 | 811,369 | ||||||
| 4.25%, 08/22/57 (Call 02/22/57) |
1,941 | 1,670,680 | ||||||
| 4.80%, 12/05/34 (Call 06/05/34) |
734 | 734,116 | ||||||
| 4.95%, 12/05/44 (Call 06/05/44) |
1,338 | 1,322,541 | ||||||
| eBay Inc. |
||||||||
| 3.65%, 05/10/51 (Call 11/10/50) |
260 | 188,438 | ||||||
| 4.00%, 07/15/42 (Call 01/15/42) |
715 | 567,780 | ||||||
| JD.com Inc., 4.13%, 01/14/50 (Call 07/14/49) |
203 | 157,693 | ||||||
| Meta Platforms Inc. |
||||||||
| 4.45%, 08/15/52 (Call 02/15/52) |
2,184 | 1,908,164 | ||||||
| 4.65%, 08/15/62 (Call 02/15/62) |
1,299 | 1,150,968 | ||||||
| 5.60%, 05/15/53 (Call 11/15/52) |
1,967 | 2,036,524 | ||||||
| 5.75%, 05/15/63 (Call 11/15/62) |
1,452 | 1,520,102 | ||||||
| Prosus NV |
||||||||
| 3.83%, 02/08/51 (Call 08/08/50)(b) |
1,410 | 869,466 | ||||||
| S C H E D U L E O F I N V E S T M E N T S |
241 |
| Schedule of Investments (continued) February 29, 2024 |
iShares® 10+ Year Investment Grade Corporate Bond ETF (Percentages shown are based on Net Assets) |
| Security | Par (000) |
Value | ||||||
| Internet (continued) |
||||||||
| 4.03%, 08/03/50 (Call 02/03/50)(b) |
$ | 672 | $ | 427,763 | ||||
| 4.99%, 01/19/52 (Call 07/19/51)(b) |
642 | 470,824 | ||||||
| Tencent Holdings Ltd. |
||||||||
| 3.24%, 06/03/50 (Call 12/03/49)(b) |
1,492 | 1,004,104 | ||||||
| 3.29%, 06/03/60 (Call 12/03/59)(a)(b) |
678 | 435,836 | ||||||
| 3.68%, 04/22/41 (Call 10/22/40)(b) |
547 | 434,385 | ||||||
| 3.84%, 04/22/51 (Call 10/22/50)(a)(b) |
1,265 | 950,548 | ||||||
| 3.93%, 01/19/38 (Call 07/19/37)(b) |
645 | 550,339 | ||||||
| 3.94%, 04/22/61 (Call 10/22/60)(b) |
590 | 432,762 | ||||||
| 4.53%, 04/11/49 (Call 10/11/48)(b) |
374 | 319,826 | ||||||
|
|
|
|||||||
| 38,050,705 | ||||||||
| Iron & Steel — 0.3% | ||||||||
| ArcelorMittal SA |
||||||||
| 6.75%, 03/01/41 |
478 | 491,528 | ||||||
| 7.00%, 10/15/39 |
705 | 752,418 | ||||||
| Nucor Corp. |
||||||||
| 2.98%, 12/15/55 (Call 06/15/55) |
636 | 410,404 | ||||||
| 3.85%, 04/01/52 (Call 09/01/51) |
476 | 373,980 | ||||||
| 4.40%, 05/01/48 (Call 11/01/47)(a) |
121 | 106,254 | ||||||
| 5.20%, 08/01/43 (Call 02/01/43)(a) |
282 | 274,475 | ||||||
| 6.40%, 12/01/37(a) |
735 | 804,662 | ||||||
| Reliance Inc., 6.85%, 11/15/36 |
270 | 293,791 | ||||||
| Steel Dynamics Inc., 3.25%, 10/15/50 |
277 | 181,818 | ||||||
| Vale Overseas Ltd. |
||||||||
| 6.88%, 11/21/36(a) |
1,167 | 1,245,736 | ||||||
| 6.88%, 11/10/39(a) |
968 | 1,036,533 | ||||||
| Vale SA, 5.63%, 09/11/42 |
416 | 406,499 | ||||||
|
|
|
|||||||
| 6,378,098 | ||||||||
| Leisure Time — 0.0% | ||||||||
| Brunswick Corp., 5.10%, 04/01/52 |
250 | 197,478 | ||||||
| Harley-Davidson Inc., 4.63%, 07/28/45 |
209 | 165,979 | ||||||
|
|
|
|||||||
| 363,457 | ||||||||
| Lodging — 0.0% | ||||||||
| Marriott International Inc./MD, 4.50%, 10/01/34 |
175 | 161,553 | ||||||
|
|
|
|||||||
| Machinery — 0.5% | ||||||||
| ABB Finance USA Inc., 4.38%, 05/08/42(a) |
466 | 419,290 | ||||||
| Caterpillar Inc. |
||||||||
| 3.25%, 09/19/49 (Call 03/19/49) |
843 | 620,052 | ||||||
| 3.25%, 04/09/50 (Call 10/09/49) |
969 | 718,052 | ||||||
| 3.80%, 08/15/42 |
1,423 | 1,187,513 | ||||||
| 4.30%, 05/15/44 (Call 11/15/43) |
351 | 316,218 | ||||||
| 4.75%, 05/15/64 (Call 11/15/63) |
352 | 319,989 | ||||||
| 5.20%, 05/27/41 |
676 | 681,185 | ||||||
| 5.30%, 09/15/35 |
282 | 293,850 | ||||||
| 6.05%, 08/15/36 |
703 | 771,371 | ||||||
| Deere & Co. |
||||||||
| 2.88%, 09/07/49 (Call 03/07/49) |
373 | 260,541 | ||||||
| 3.75%, 04/15/50 (Call 10/15/49) |
731 | 600,502 | ||||||
| 3.90%, 06/09/42 (Call 12/09/41)(a) |
1,130 | 966,115 | ||||||
| Dover Corp. |
||||||||
| 5.38%, 10/15/35(a) |
370 | 373,132 | ||||||
| 5.38%, 03/01/41 (Call 12/01/40) |
337 | 329,551 | ||||||
| 6.60%, 03/15/38 |
276 | 300,376 | ||||||
| Security | Par (000) |
Value | ||||||
| Machinery (continued) |
||||||||
| Otis Worldwide Corp. |
||||||||
| 3.11%, 02/15/40 (Call 08/15/39) |
$ | 400 | $ | 305,285 | ||||
| 3.36%, 02/15/50 (Call 08/15/49)(a) |
620 | 450,075 | ||||||
| Rockwell Automation Inc. |
||||||||
| 2.80%, 08/15/61 (Call 02/15/61) |
330 | 195,799 | ||||||
| 4.20%, 03/01/49 (Call 09/01/48)(a) |
384 | 327,006 | ||||||
| 6.25%, 12/01/37 |
260 | 279,304 | ||||||
| Xylem Inc./NY, 4.38%, 11/01/46 |
205 | 171,632 | ||||||
|
|
|
|||||||
| 9,886,838 | ||||||||
| Manufacturing — 0.7% | ||||||||
| 3M Co. |
||||||||
| 3.13%, 09/19/46 (Call 03/19/46)(a) |
418 | 289,322 | ||||||
| 3.25%, 08/26/49 (Call 02/26/49)(a) |
832 | 575,207 | ||||||
| 3.63%, 10/15/47 (Call 04/15/47)(a) |
411 | 298,098 | ||||||
| 3.70%, 04/15/50 (Call 10/15/49) |
563 | 415,599 | ||||||
| 3.88%, 06/15/44 |
200 | 157,257 | ||||||
| 4.00%, 09/14/48 (Call 03/14/48)(a) |
980 | 792,399 | ||||||
| 5.70%, 03/15/37(a) |
536 | 558,463 | ||||||
| Eaton Corp. |
||||||||
| 3.92%, 09/15/47 (Call 03/15/47)(a) |
185 | 150,185 | ||||||
| 4.15%, 11/02/42 |
980 | 852,621 | ||||||
| 4.70%, 08/23/52 (Call 02/23/52)(a) |
407 | 376,119 | ||||||
| GE Capital International Funding Co. Unlimited Co., 4.42%, 11/15/35 |
1,126 | 1,055,190 | ||||||
| General Electric Co. |
||||||||
| 4.35%, 05/01/50 (Call 11/01/49) |
236 | 208,018 | ||||||
| 4.50%, 03/11/44 |
405 | 366,429 | ||||||
| 5.88%, 01/14/38 |
710 | 754,891 | ||||||
| 6.15%, 08/07/37 |
236 | 249,279 | ||||||
| 6.88%, 01/10/39(a) |
725 | 856,958 | ||||||
| Illinois Tool Works Inc. |
||||||||
| 3.90%, 09/01/42 (Call 03/01/42) |
954 | 812,770 | ||||||
| 4.88%, 09/15/41 (Call 03/15/41) |
680 | 652,881 | ||||||
| Parker-Hannifin Corp. |
||||||||
| 4.00%, 06/14/49 (Call 12/14/48) |
604 | 493,286 | ||||||
| 4.10%, 03/01/47 (Call 09/01/46) |
394 | 323,924 | ||||||
| 4.20%, 11/21/34 (Call 05/21/34) |
502 | 462,553 | ||||||
| 4.45%, 11/21/44 (Call 05/21/44) |
332 | 290,804 | ||||||
| 6.25%, 05/15/38 |
290 | 310,505 | ||||||
| Siemens Financieringsmaatschappij NV |
||||||||
| 2.88%, 03/11/41(b) |
761 | 569,994 | ||||||
| 3.30%, 09/15/46(b) |
973 | 738,127 | ||||||
| 4.20%, 03/16/47(b) |
815 | 714,923 | ||||||
| 4.40%, 05/27/45(b) |
1,503 | 1,354,350 | ||||||
|
|
|
|||||||
| 14,680,152 | ||||||||
| Media — 4.2% | ||||||||
| Charter Communications Operating LLC/Charter Communications Operating Capital |
||||||||
| 3.50%, 06/01/41 (Call 12/01/40)(a) |
866 | 573,287 | ||||||
| 3.50%, 03/01/42 (Call 09/01/41) |
706 | 461,783 | ||||||
| 3.70%, 04/01/51 (Call 10/01/50) |
1,839 | 1,116,356 | ||||||
| 3.85%, 04/01/61 (Call 10/01/60)(a) |
1,690 | 981,616 | ||||||
| 3.90%, 06/01/52 (Call 12/01/51) |
2,123 | 1,334,727 | ||||||
| 3.95%, 06/30/62 (Call 12/30/61) |
1,386 | 816,435 | ||||||
| 4.40%, 12/01/61 (Call 06/01/61) |
1,077 | 692,339 | ||||||
| 4.80%, 03/01/50 (Call 09/01/49) |
2,449 | 1,772,148 | ||||||
| 5.13%, 07/01/49 (Call 01/01/49) |
1,346 | 1,022,343 | ||||||
| 5.25%, 04/01/53 (Call 10/01/52) |
1,332 | 1,034,142 | ||||||
| 5.38%, 04/01/38 (Call 10/01/37) |
322 | 277,415 | ||||||
| 5.38%, 05/01/47 (Call 11/01/46) |
2,047 | 1,616,497 | ||||||
| 242 | 2 0 2 4 I S H A R E S A N N U A L R E P O R T T O S H A R E H O L D E R S |
| Schedule of Investments (continued) February 29, 2024 |
iShares® 10+ Year Investment Grade Corporate Bond ETF (Percentages shown are based on Net Assets) |
| Security | Par (000) |
Value | ||||||
| Media (continued) |
||||||||
| 5.50%, 04/01/63 (Call 10/01/62) |
$ | 995 | $ | 769,631 | ||||
| 5.75%, 04/01/48 (Call 10/01/47) |
2,031 | 1,690,745 | ||||||
| 6.38%, 10/23/35 (Call 04/23/35)(a) |
1,503 | 1,455,011 | ||||||
| 6.48%, 10/23/45 (Call 04/23/45) |
2,875 | 2,626,475 | ||||||
| 6.83%, 10/23/55 (Call 04/23/55) |
585 | 554,319 | ||||||
| Comcast Corp. |
||||||||
| 2.45%, 08/15/52 (Call 02/15/52) |
1,282 | 734,674 | ||||||
| 2.65%, 08/15/62 (Call 02/15/62) |
1,067 | 596,746 | ||||||
| 2.80%, 01/15/51 (Call 07/15/50)(a) |
1,449 | 905,813 | ||||||
| 2.89%, 11/01/51 (Call 05/01/51)(a) |
4,225 | 2,675,061 | ||||||
| 2.94%, 11/01/56 (Call 05/01/56) |
4,992 | 3,071,736 | ||||||
| 2.99%, 11/01/63 (Call 05/01/63) |
3,364 | 2,021,043 | ||||||
| 3.20%, 07/15/36 (Call 01/15/36) |
892 | 720,369 | ||||||
| 3.25%, 11/01/39 (Call 05/01/39) |
945 | 724,719 | ||||||
| 3.40%, 07/15/46 (Call 01/15/46) |
859 | 629,921 | ||||||
| 3.45%, 02/01/50 (Call 08/01/49) |
1,632 | 1,171,871 | ||||||
| 3.75%, 04/01/40 (Call 10/01/39) |
1,323 | 1,082,854 | ||||||
| 3.90%, 03/01/38 (Call 09/01/37) |
992 | 850,723 | ||||||
| 3.97%, 11/01/47 (Call 05/01/47) |
1,322 | 1,047,263 | ||||||
| 4.00%, 08/15/47 (Call 02/15/47) |
785 | 629,005 | ||||||
| 4.00%, 03/01/48 (Call 09/01/47)(a) |
850 | 673,878 | ||||||
| 4.00%, 11/01/49 (Call 05/01/49) |
1,716 | 1,364,049 | ||||||
| 4.05%, 11/01/52 (Call 05/01/52) |
1,026 | 809,877 | ||||||
| 4.20%, 08/15/34 (Call 02/15/34) |
725 | 666,599 | ||||||
| 4.40%, 08/15/35 (Call 02/15/35) |
651 | 604,850 | ||||||
| 4.60%, 10/15/38 (Call 04/15/38)(a) |
812 | 747,532 | ||||||
| 4.60%, 08/15/45 (Call 02/15/45) |
705 | 624,150 | ||||||
| 4.65%, 07/15/42 |
526 | 473,603 | ||||||
| 4.70%, 10/15/48 (Call 04/15/48)(a) |
1,613 | 1,455,714 | ||||||
| 4.75%, 03/01/44 |
400 | 363,765 | ||||||
| 4.95%, 10/15/58 (Call 04/15/58) |
864 | 799,851 | ||||||
| 5.35%, 05/15/53 (Call 11/15/52)(a) |
1,415 | 1,378,949 | ||||||
| 5.50%, 05/15/64 (Call 11/15/63) |
1,122 | 1,100,374 | ||||||
| 5.65%, 06/15/35 |
606 | 623,058 | ||||||
| 6.40%, 03/01/40 |
175 | 189,414 | ||||||
| 6.45%, 03/15/37 |
535 | 586,321 | ||||||
| 6.50%, 11/15/35 |
537 | 584,457 | ||||||
| 6.55%, 07/01/39(a) |
235 | 257,747 | ||||||
| 6.95%, 08/15/37 |
293 | 332,017 | ||||||
| Cox Communications Inc. |
||||||||
| 2.95%, 10/01/50 (Call 04/01/50)(b) |
230 | 140,243 | ||||||
| 3.60%, 06/15/51 (Call 12/15/50)(a)(b) |
452 | 313,408 | ||||||
| 4.50%, 06/30/43 (Call 12/30/42)(b) |
341 | 278,758 | ||||||
| 4.60%, 08/15/47 (Call 02/15/47)(b) |
170 | 136,433 | ||||||
| 4.70%, 12/15/42(b) |
301 | 251,255 | ||||||
| 4.80%, 02/01/35 (Call 08/01/34)(a)(b) |
249 | 228,877 | ||||||
| 5.80%, 12/15/53 (Call 06/15/53)(a)(b) |
525 | 511,119 | ||||||
| 8.38%, 03/01/39(b) |
335 | 401,449 | ||||||
| Discovery Communications LLC |
||||||||
| 4.00%, 09/15/55 (Call 03/15/55)(a) |
1,772 | 1,172,917 | ||||||
| 4.65%, 05/15/50 (Call 11/15/49) |
960 | 727,999 | ||||||
| 4.88%, 04/01/43(a) |
453 | 364,691 | ||||||
| 4.95%, 05/15/42 |
446 | 351,402 | ||||||
| 5.00%, 09/20/37 (Call 03/20/37)(a) |
310 | 265,532 | ||||||
| 5.20%, 09/20/47 (Call 03/20/47) |
886 | 720,480 | ||||||
| 5.30%, 05/15/49 (Call 11/15/48) |
650 | 531,697 | ||||||
| 6.35%, 06/01/40(a) |
827 | 794,078 | ||||||
| Fox Corp. |
||||||||
| 5.48%, 01/25/39 (Call 07/25/38) |
811 | 757,618 | ||||||
| 5.58%, 01/25/49 (Call 07/25/48)(a) |
1,148 | 1,050,067 | ||||||
| Security | Par (000) |
Value | ||||||
| Media (continued) |
||||||||
| Grupo Televisa SAB |
||||||||
| 5.00%, 05/13/45 (Call 11/13/44) |
$ | 318 | $ | 266,024 | ||||
| 5.25%, 05/24/49 (Call 11/24/48)(a) |
205 | 178,148 | ||||||
| 6.13%, 01/31/46 (Call 07/31/45) |
371 | 362,399 | ||||||
| 6.63%, 01/15/40(a) |
1,067 | 1,100,778 | ||||||
| NBCUniversal Media LLC |
||||||||
| 4.45%, 01/15/43 |
665 | 581,822 | ||||||
| 5.95%, 04/01/41 |
381 | 394,240 | ||||||
| 6.40%, 04/30/40 |
350 | 379,361 | ||||||
| Paramount Global |
||||||||
| 4.38%, 03/15/43 |
1,103 | 738,138 | ||||||
| 4.60%, 01/15/45 (Call 07/15/44)(a) |
401 | 275,265 | ||||||
| 4.85%, 07/01/42 (Call 01/01/42)(a) |
427 | 311,620 | ||||||
| 4.90%, 08/15/44 (Call 02/15/44)(a) |
325 | 228,819 | ||||||
| 4.95%, 05/19/50 (Call 11/19/49) |
744 | 529,357 | ||||||
| 5.25%, 04/01/44 (Call 10/01/43)(a) |
200 | 148,752 | ||||||
| 5.85%, 09/01/43 (Call 03/01/43) |
1,076 | 870,287 | ||||||
| 5.90%, 10/15/40 (Call 04/15/40)(a) |
285 | 231,693 | ||||||
| 6.88%, 04/30/36(a) |
893 | 819,291 | ||||||
| Sky Group Finance Ltd., 6.50%, 10/15/35(b) |
388 | 421,110 | ||||||
| Thomson Reuters Corp. |
||||||||
| 5.50%, 08/15/35(a) |
363 | 368,745 | ||||||
| 5.65%, 11/23/43 (Call 05/23/43) |
190 | 183,239 | ||||||
| 5.85%, 04/15/40 |
375 | 381,862 | ||||||
| Time Warner Cable LLC |
||||||||
| 4.50%, 09/15/42 (Call 03/15/42) |
1,268 | 928,500 | ||||||
| 5.50%, 09/01/41 (Call 03/01/41) |
1,152 | 949,696 | ||||||
| 5.88%, 11/15/40 (Call 05/15/40) |
1,093 | 942,677 | ||||||
| 6.55%, 05/01/37 |
1,222 | 1,151,036 | ||||||
| 6.75%, 06/15/39(a) |
1,342 | 1,266,285 | ||||||
| 7.30%, 07/01/38 |
1,222 | 1,218,355 | ||||||
| TWDC Enterprises 18 Corp. |
||||||||
| 3.00%, 07/30/46(a) |
513 | 357,939 | ||||||
| 3.70%, 12/01/42 |
442 | 358,254 | ||||||
| 4.13%, 06/01/44 |
882 | 755,602 | ||||||
| 4.38%, 08/16/41 |
350 | 308,055 | ||||||
| Series E, 4.13%, 12/01/41 |
530 | 455,251 | ||||||
| Walt Disney Co. (The) |
||||||||
| 2.75%, 09/01/49 (Call 03/01/49) |
1,567 | 1,011,257 | ||||||
| 3.50%, 05/13/40 (Call 11/13/39)(a) |
1,288 | 1,033,439 | ||||||
| 3.60%, 01/13/51 (Call 07/13/50) |
2,055 | 1,560,917 | ||||||
| 3.80%, 05/13/60 (Call 11/13/59) |
603 | 459,964 | ||||||
| 4.63%, 03/23/40 (Call 09/23/39) |
661 | 621,456 | ||||||
| 4.70%, 03/23/50 (Call 09/23/49)(a) |
1,611 | 1,474,642 | ||||||
| 4.75%, 09/15/44 (Call 03/15/44) |
572 | 525,645 | ||||||
| 4.75%, 11/15/46 (Call 05/15/46) |
600 | 542,699 | ||||||
| 4.95%, 10/15/45 (Call 04/15/45) |
396 | 369,774 | ||||||
| 5.40%, 10/01/43 |
460 | 463,528 | ||||||
| 6.15%, 03/01/37 |
140 | 151,652 | ||||||
| 6.15%, 02/15/41 |
593 | 640,045 | ||||||
| 6.20%, 12/15/34 |
717 | 783,090 | ||||||
| 6.40%, 12/15/35 |
833 | 918,637 | ||||||
| 6.65%, 11/15/37 |
972 | 1,101,022 | ||||||
| 7.75%, 12/01/45 |
335 | 429,041 | ||||||
|
|
|
|||||||
| 87,840,703 | ||||||||
| Metal Fabricate & Hardware — 0.0% | ||||||||
| Precision Castparts Corp. |
||||||||
| 3.90%, 01/15/43 (Call 07/15/42)(a) |
366 | 303,844 | ||||||
| 4.20%, 06/15/35 (Call 12/15/34) |
168 | 150,728 | ||||||
| 4.38%, 06/15/45 (Call 12/15/44) |
173 | 151,784 | ||||||
| S C H E D U L E O F I N V E S T M E N T S |
243 |
| Schedule of Investments (continued) February 29, 2024 |
iShares® 10+ Year Investment Grade Corporate Bond ETF (Percentages shown are based on Net Assets) |
| Security | Par (000) |
Value | ||||||
| Metal Fabricate & Hardware (continued) |
||||||||
| Valmont Industries Inc. |
||||||||
| 5.00%, 10/01/44 (Call 04/01/44) |
$ | 295 | $ | 258,283 | ||||
| 5.25%, 10/01/54 (Call 04/01/54)(a) |
221 | 188,951 | ||||||
|
|
|
|||||||
| 1,053,590 | ||||||||
| Mining — 1.7% | ||||||||
| Anglo American Capital PLC |
||||||||
| 3.95%, 09/10/50 (Call 03/10/50)(a)(b) |
467 | 346,409 | ||||||
| 4.75%, 03/16/52 (Call 09/16/51)(b) |
578 | 485,240 | ||||||
| Barrick Gold Corp. |
||||||||
| 5.25%, 04/01/42(a) |
205 | 199,717 | ||||||
| 6.45%, 10/15/35 |
331 | 357,554 | ||||||
| Barrick International Barbados Corp., |
545 | 576,764 | ||||||
| Barrick North America Finance LLC |
||||||||
| 5.70%, 05/30/41 |
945 | 959,439 | ||||||
| 5.75%, 05/01/43 |
769 | 787,231 | ||||||
| 7.50%, 09/15/38 |
365 | 419,581 | ||||||
| Barrick PD Australia Finance Pty. Ltd., |
705 | 721,860 | ||||||
| BHP Billiton Finance USA Ltd. |
||||||||
| 4.13%, 02/24/42 |
951 | 819,418 | ||||||
| 5.00%, 09/30/43 |
2,219 | 2,122,537 | ||||||
| 5.50%, 09/08/53 (Call 03/08/53)(a) |
658 | 673,153 | ||||||
| Corp. Nacional del Cobre de Chile |
||||||||
| 3.15%, 01/15/51 (Call 07/15/50)(b) |
403 | 244,229 | ||||||
| 3.70%, 01/30/50 (Call 07/30/49)(b) |
2,483 | 1,659,131 | ||||||
| 4.25%, 07/17/42(a)(b) |
630 | 483,966 | ||||||
| 4.38%, 02/05/49 (Call 08/05/48)(b) |
1,661 | 1,263,955 | ||||||
| 4.50%, 08/01/47 (Call 02/01/47)(b) |
1,167 | 897,318 | ||||||
| 4.88%, 11/04/44(a)(b) |
825 | 674,764 | ||||||
| 5.63%, 09/21/35(b) |
64 | 61,302 | ||||||
| 5.63%, 10/18/43(b) |
978 | 893,082 | ||||||
| 6.15%, 10/24/36(a)(b) |
513 | 508,721 | ||||||
| 6.30%, 09/08/53 (Call 03/08/53)(b) |
795 | 768,131 | ||||||
| 6.44%, 01/26/36 (Call 10/26/35)(b) |
110 | 111,842 | ||||||
| Freeport Indonesia PT, 6.20%, 04/14/52 |
690 | 659,758 | ||||||
| Freeport-McMoRan Inc. |
||||||||
| 5.40%, 11/14/34 (Call 05/14/34) |
433 | 421,220 | ||||||
| 5.45%, 03/15/43 (Call 09/15/42) |
1,747 | 1,626,712 | ||||||
| Fresnillo PLC, 4.25%, 10/02/50 |
520 | 383,884 | ||||||
| Glencore Canada Corp., 6.20%, 06/15/35(a) |
330 | 340,705 | ||||||
| Glencore Finance Canada Ltd. |
||||||||
| 5.55%, 10/25/42(a)(b) |
375 | 354,836 | ||||||
| 6.00%, 11/15/41(b) |
603 | 599,454 | ||||||
| 6.90%, 11/15/37(b) |
593 | 643,234 | ||||||
| Glencore Funding LLC |
||||||||
| 3.38%, 09/23/51 (Call 03/23/51)(a)(b) |
200 | 137,243 | ||||||
| 3.88%, 04/27/51 (Call 10/27/50)(a)(b) |
75 | 56,233 | ||||||
| Indonesia Asahan Aluminium PT/Mineral Industri Indonesia Persero PT |
||||||||
| 5.80%, 05/15/50 (Call 11/15/49)(b) |
375 | 345,046 | ||||||
| 6.76%, 11/15/48(a)(b) |
264 | 273,268 | ||||||
| Industrias Penoles SAB de CV |
||||||||
| 4.75%, 08/06/50 (Call 02/06/50)(b) |
343 | 264,693 | ||||||
| 5.65%, 09/12/49 (Call 03/12/49)(b) |
305 | 267,936 | ||||||
| Kinross Gold Corp., 6.88%, 09/01/41 |
330 | 346,931 | ||||||
| Minera Mexico SA de CV, 4.50%, 01/26/50 |
852 | 656,558 | ||||||
| Security | Par (000) |
Value | ||||||
| Mining (continued) |
||||||||
| Newmont Corp. |
||||||||
| 4.88%, 03/15/42 (Call 09/15/41)(a) |
$ | 1,017 | $ | 936,852 | ||||
| 5.45%, 06/09/44 (Call 12/09/43) |
200 | 195,366 | ||||||
| 5.88%, 04/01/35 |
170 | 175,067 | ||||||
| 6.25%, 10/01/39 |
913 | 967,244 | ||||||
| Newmont Corp./Newcrest Finance Pty Ltd. |
||||||||
| 4.20%, 05/13/50 (Call 11/13/49) |
322 | 265,014 | ||||||
| 5.75%, 11/15/41 (Call 08/15/41)(a) |
577 | 585,705 | ||||||
| Rio Tinto Alcan Inc., 5.75%, 06/01/35 |
569 | 589,802 | ||||||
| Rio Tinto Finance USA Ltd. |
||||||||
| 2.75%, 11/02/51 (Call 05/02/51) |
1,035 | 656,616 | ||||||
| 5.20%, 11/02/40 |
1,078 | 1,061,306 | ||||||
| Rio Tinto Finance USA PLC |
||||||||
| 4.13%, 08/21/42 (Call 02/21/42) |
809 | 694,648 | ||||||
| 4.75%, 03/22/42 (Call 09/22/41) |
503 | 471,414 | ||||||
| 5.13%, 03/09/53 (Call 09/09/52)(a) |
893 | 858,253 | ||||||
| Southern Copper Corp. |
||||||||
| 5.25%, 11/08/42 |
1,123 | 1,055,835 | ||||||
| 5.88%, 04/23/45 |
1,056 | 1,050,036 | ||||||
| 6.75%, 04/16/40 |
957 | 1,051,543 | ||||||
| 7.50%, 07/27/35 |
1,025 | 1,180,437 | ||||||
|
|
|
|||||||
| 35,208,193 | ||||||||
| Oil & Gas — 5.7% | ||||||||
| Apache Corp. |
||||||||
| 4.75%, 04/15/43 (Call 10/15/42) |
473 | 363,181 | ||||||
| 5.10%, 09/01/40 (Call 03/01/40)(a) |
1,315 | 1,100,300 | ||||||
| 5.25%, 02/01/42 (Call 08/01/41) |
370 | 304,880 | ||||||
| 5.35%, 07/01/49 (Call 01/01/49) |
347 | 281,313 | ||||||
| 6.00%, 01/15/37(a) |
453 | 440,275 | ||||||
| BG Energy Capital PLC, 5.13%, 10/15/41(b) |
802 | 746,705 | ||||||
| BP Capital Markets America Inc. |
||||||||
| 2.77%, 11/10/50 (Call 05/10/50) |
1,420 | 903,454 | ||||||
| 2.94%, 06/04/51 (Call 12/04/50)(a) |
1,987 | 1,301,241 | ||||||
| 3.00%, 02/24/50 (Call 08/24/49) |
1,765 | 1,177,578 | ||||||
| 3.00%, 03/17/52 (Call 09/17/51)(a) |
1,120 | 743,195 | ||||||
| 3.06%, 06/17/41 (Call 12/17/40) |
740 | 550,432 | ||||||
| 3.38%, 02/08/61 (Call 08/08/60)(a) |
1,819 | 1,225,057 | ||||||
| Burlington Resources LLC, 5.95%, 10/15/36 |
459 | 483,139 | ||||||
| Canadian Natural Resources Ltd. |
||||||||
| 4.95%, 06/01/47 (Call 12/01/46) |
350 | 305,424 | ||||||
| 5.85%, 02/01/35 |
411 | 410,550 | ||||||
| 6.25%, 03/15/38 |
1,064 | 1,093,573 | ||||||
| 6.50%, 02/15/37 |
517 | 538,376 | ||||||
| 6.75%, 02/01/39 |
605 | 644,379 | ||||||
| Cenovus Energy Inc. |
||||||||
| 3.75%, 02/15/52 (Call 08/15/51)(a) |
796 | 568,586 | ||||||
| 5.25%, 06/15/37 (Call 12/15/36) |
252 | 233,787 | ||||||
| 5.40%, 06/15/47 (Call 12/15/46) |
424 | 388,433 | ||||||
| 6.75%, 11/15/39 |
484 | 524,539 | ||||||
| Chevron Corp. |
||||||||
| 2.98%, 05/11/40 (Call 11/11/39)(a) |
114 | 85,814 | ||||||
| 3.08%, 05/11/50 (Call 11/11/49)(a) |
819 | 577,471 | ||||||
| Chevron USA Inc. |
||||||||
| 2.34%, 08/12/50 (Call 02/12/50) |
738 | 441,616 | ||||||
| 5.25%, 11/15/43 (Call 05/15/43) |
96 | 96,813 | ||||||
| 6.00%, 03/01/41 (Call 09/01/40) |
75 | 81,655 | ||||||
| CNOOC Finance 2011 Ltd., 5.75%, 01/26/41(a)(b) |
500 | 528,275 | ||||||
| CNOOC Finance 2012 Ltd., 5.00%, 05/02/42(b) |
250 | 243,323 | ||||||
| CNOOC Finance 2013 Ltd. |
||||||||
| 3.30%, 09/30/49 (Call 03/30/49) |
470 | 342,240 | ||||||
| 4.25%, 05/09/43 |
220 | 193,857 | ||||||
| 244 | 2 0 2 4 I S H A R E S A N N U A L R E P O R T T O S H A R E H O L D E R S |
| Schedule of Investments (continued) February 29, 2024 |
iShares® 10+ Year Investment Grade Corporate Bond ETF (Percentages shown are based on Net Assets) |
| Security | Par (000) |
Value | ||||||
| Oil & Gas (continued) |
||||||||
| CNOOC Finance 2014 ULC, 4.88%, 04/30/44 |
$ | 405 | $ | 386,755 | ||||
| CNOOC Finance 2015 Australia Pty. Ltd., |
465 | 406,265 | ||||||
| CNOOC Petroleum North America ULC |
||||||||
| 5.88%, 03/10/35 |
122 | 128,036 | ||||||
| 6.40%, 05/15/37(a) |
1,055 | 1,164,158 | ||||||
| 7.50%, 07/30/39(a) |
410 | 497,908 | ||||||
| CNPC HK Overseas Capital Ltd., |
415 | 447,594 | ||||||
| ConocoPhillips Co. |
||||||||
| 3.76%, 03/15/42 (Call 09/15/41) |
212 | 172,441 | ||||||
| 3.80%, 03/15/52 (Call 09/15/51) |
929 | 712,143 | ||||||
| 4.03%, 03/15/62 (Call 09/15/61) |
1,540 | 1,198,057 | ||||||
| 4.30%, 11/15/44 (Call 05/15/44) |
579 | 497,853 | ||||||
| 4.88%, 10/01/47 (Call 04/01/47)(a) |
259 | 240,383 | ||||||
| 5.30%, 05/15/53 (Call 11/15/52) |
961 | 940,592 | ||||||
| 5.55%, 03/15/54 (Call 09/15/53) |
869 | 879,177 | ||||||
| 5.70%, 09/15/63 (Call 03/15/63) |
670 | 684,391 | ||||||
| 5.90%, 05/15/38 |
150 | 157,137 | ||||||
| 5.95%, 03/15/46 (Call 09/15/45)(a) |
265 | 275,701 | ||||||
| 6.50%, 02/01/39 |
1,060 | 1,191,699 | ||||||
| Continental Resources Inc./OK, 4.90%, 06/01/44 |
545 | 442,091 | ||||||
| Devon Energy Corp. |
||||||||
| 4.75%, 05/15/42 (Call 11/15/41) |
748 | 632,940 | ||||||
| 5.00%, 06/15/45 (Call 12/15/44)(a) |
412 | 356,555 | ||||||
| 5.60%, 07/15/41 (Call 01/15/41) |
1,128 | 1,061,636 | ||||||
| Diamondback Energy Inc. |
||||||||
| 4.25%, 03/15/52 (Call 09/15/51)(a) |
738 | 583,647 | ||||||
| 4.40%, 03/24/51 (Call 09/24/50) |
468 | 377,958 | ||||||
| 6.25%, 03/15/53 (Call 09/15/52)(a) |
612 | 647,157 | ||||||
| Empresa Nacional del Petroleo, 4.50%, 09/14/47 |
466 | 340,495 | ||||||
| Eni SpA, 5.70%, 10/01/40(b) |
455 | 426,329 | ||||||
| EOG Resources Inc. |
||||||||
| 3.90%, 04/01/35 (Call 10/01/34) |
177 | 159,077 | ||||||
| 4.95%, 04/15/50 (Call 10/15/49) |
508 | 473,370 | ||||||
| 5.10%, 01/15/36 (Call 07/15/35) |
190 | 185,198 | ||||||
| Equinor ASA |
||||||||
| 3.25%, 11/18/49 (Call 05/18/49) |
914 | 658,883 | ||||||
| 3.63%, 04/06/40 (Call 10/06/39) |
368 | 303,527 | ||||||
| 3.70%, 04/06/50 (Call 10/06/49) |
974 | 760,716 | ||||||
| 3.95%, 05/15/43 |
609 | 508,679 | ||||||
| 4.25%, 11/23/41 |
565 | 497,435 | ||||||
| 4.80%, 11/08/43(a) |
651 | 611,535 | ||||||
| 5.10%, 08/17/40 |
573 | 563,574 | ||||||
| Exxon Mobil Corp. |
||||||||
| 3.00%, 08/16/39 (Call 02/16/39) |
538 | 414,857 | ||||||
| 3.10%, 08/16/49 (Call 02/16/49) |
1,262 | 883,052 | ||||||
| 3.45%, 04/15/51 (Call 10/15/50) |
2,365 | 1,750,376 | ||||||
| 3.57%, 03/06/45 (Call 09/06/44) |
833 | 650,925 | ||||||
| 4.11%, 03/01/46 (Call 09/01/45) |
2,021 | 1,712,596 | ||||||
| 4.23%, 03/19/40 (Call 09/19/39)(a) |
1,708 | 1,531,467 | ||||||
| 4.33%, 03/19/50 (Call 09/19/49) |
2,354 | 2,041,918 | ||||||
| Hess Corp. |
||||||||
| 5.60%, 02/15/41(a) |
1,162 | 1,170,103 | ||||||
| 5.80%, 04/01/47 (Call 10/01/46) |
409 | 415,632 | ||||||
| 6.00%, 01/15/40 |
844 | 885,926 | ||||||
| KazMunayGas National Co. JSC |
||||||||
| 5.75%, 04/19/47(b) |
1,085 | 919,650 | ||||||
| 6.38%, 10/24/48(a)(b) |
1,355 | 1,231,356 | ||||||
| Security | Par (000) |
Value | ||||||
| Oil & Gas (continued) |
||||||||
| Marathon Oil Corp. |
||||||||
| 5.20%, 06/01/45 (Call 12/01/44) |
$ | 407 | $ | 353,273 | ||||
| 6.60%, 10/01/37(a) |
918 | 957,147 | ||||||
| Marathon Petroleum Corp. |
||||||||
| 4.50%, 04/01/48 (Call 10/01/47) |
246 | 202,300 | ||||||
| 4.75%, 09/15/44 (Call 03/15/44) |
545 | 475,820 | ||||||
| 5.00%, 09/15/54 (Call 03/15/54) |
353 | 301,411 | ||||||
| 5.85%, 12/15/45 (Call 06/15/45)(a) |
269 | 260,260 | ||||||
| 6.50%, 03/01/41 (Call 09/01/40)(a) |
1,198 | 1,271,490 | ||||||
| Motiva Enterprises LLC, 6.85%, 01/15/40(b) |
676 | 724,519 | ||||||
| Occidental Petroleum Corp. |
||||||||
| 0.00%, 10/10/36 (Put 10/10/24)(f) |
960 | 506,545 | ||||||
| 4.10%, 02/15/47 (Call 08/15/46) |
346 | 254,376 | ||||||
| 4.20%, 03/15/48 (Call 09/15/47) |
400 | 305,676 | ||||||
| 4.40%, 04/15/46 (Call 10/15/45)(a) |
515 | 411,489 | ||||||
| 4.40%, 08/15/49 (Call 02/15/49) |
304 | 224,808 | ||||||
| 4.63%, 06/15/45 (Call 12/15/44)(a) |
386 | 311,575 | ||||||
| 6.20%, 03/15/40 |
240 | 243,758 | ||||||
| 6.45%, 09/15/36 |
1,304 | 1,372,929 | ||||||
| 6.60%, 03/15/46 (Call 09/15/45)(a) |
1,049 | 1,114,237 | ||||||
| 7.95%, 06/15/39(a) |
185 | 214,131 | ||||||
| Ovintiv Inc. |
||||||||
| 6.50%, 08/15/34 |
430 | 450,659 | ||||||
| 6.50%, 02/01/38(a) |
453 | 462,802 | ||||||
| 6.63%, 08/15/37 |
413 | 425,954 | ||||||
| 7.10%, 07/15/53 (Call 01/15/53) |
409 | 446,568 | ||||||
| Pertamina Persero PT |
||||||||
| 4.15%, 02/25/60 (Call 08/25/59)(a)(b) |
515 | 380,424 | ||||||
| 4.18%, 01/21/50 (Call 07/21/49)(b) |
840 | 641,764 | ||||||
| 4.70%, 07/30/49(b) |
631 | 524,890 | ||||||
| 5.63%, 05/20/43(b) |
1,095 | 1,038,574 | ||||||
| 6.00%, 05/03/42(b) |
972 | 962,405 | ||||||
| 6.45%, 05/30/44(b) |
1,336 | 1,386,216 | ||||||
| 6.50%, 05/27/41(b) |
455 | 476,533 | ||||||
| 6.50%, 11/07/48(b) |
679 | 711,143 | ||||||
| Petronas Capital Ltd. |
||||||||
| 3.40%, 04/28/61 (Call 10/28/60)(b) |
1,515 | 1,023,527 | ||||||
| 4.50%, 03/18/45(b) |
1,222 | 1,072,268 | ||||||
| 4.55%, 04/21/50 (Call 10/21/49)(b) |
2,264 | 1,979,286 | ||||||
| 4.80%, 04/21/60 (Call 10/21/59)(b) |
828 | 740,977 | ||||||
| Phillips 66 |
||||||||
| 3.30%, 03/15/52 (Call 09/15/51)(a) |
835 | 568,651 | ||||||
| 4.65%, 11/15/34 (Call 05/15/34) |
1,037 | 974,505 | ||||||
| 4.88%, 11/15/44 (Call 05/15/44) |
1,395 | 1,275,889 | ||||||
| 5.88%, 05/01/42 |
1,239 | 1,277,242 | ||||||
| Phillips 66 Co. |
||||||||
| 4.68%, 02/15/45 (Call 08/15/44) |
334 | 292,218 | ||||||
| 4.90%, 10/01/46 (Call 04/01/46) |
609 | 543,802 | ||||||
| 5.65%, 06/15/54 (Call 12/15/53) |
425 | 420,766 | ||||||
| PTTEP Treasury Center Co. Ltd. |
||||||||
| 3.90%, 12/06/59(a)(b) |
655 | 495,475 | ||||||
| 6.35%, 06/12/42(b) |
315 | 343,901 | ||||||
| Qatar Energy |
||||||||
| 3.13%, 07/12/41 (Call 01/12/41)(b) |
2,633 | 1,929,478 | ||||||
| 3.30%, 07/12/51 (Call 01/12/51)(a)(b) |
3,543 | 2,448,567 | ||||||
| Reliance Industries Ltd. |
||||||||
| 3.63%, 01/12/52(a)(b) |
1,592 | 1,156,130 | ||||||
| 3.75%, 01/12/62(b) |
776 | 550,254 | ||||||
| Saudi Arabian Oil Co. |
||||||||
| 3.25%, 11/24/50 (Call 05/24/50)(b) |
1,961 | 1,297,402 | ||||||
| 3.50%, 11/24/70 (Call 05/24/70)(b) |
1,815 | 1,141,196 | ||||||
| S C H E D U L E O F I N V E S T M E N T S |
245 |
| Schedule of Investments (continued) February 29, 2024 |
iShares® 10+ Year Investment Grade Corporate Bond ETF (Percentages shown are based on Net Assets) |
| Security | Par (000) |
Value | ||||||
| Oil & Gas (continued) |
||||||||
| 4.25%, 04/16/39(b) |
$ | 2,463 | $ | 2,120,806 | ||||
| 4.38%, 04/16/49(b) |
2,103 | 1,711,737 | ||||||
| Shell International Finance BV |
||||||||
| 2.88%, 11/26/41 (Call 05/26/41) |
35 | 25,546 | ||||||
| 3.00%, 11/26/51 (Call 05/26/51) |
950 | 638,573 | ||||||
| 3.13%, 11/07/49 (Call 05/07/49) |
1,192 | 825,584 | ||||||
| 3.25%, 04/06/50 (Call 10/06/49)(a) |
1,756 | 1,249,444 | ||||||
| 3.63%, 08/21/42 |
488 | 392,394 | ||||||
| 3.75%, 09/12/46 |
1,119 | 881,452 | ||||||
| 4.00%, 05/10/46 |
1,913 | 1,570,061 | ||||||
| 4.13%, 05/11/35 |
1,372 | 1,271,427 | ||||||
| 4.38%, 05/11/45 |
2,535 | 2,214,452 | ||||||
| 4.55%, 08/12/43 |
1,117 | 1,014,027 | ||||||
| 5.50%, 03/25/40 |
948 | 975,880 | ||||||
| 6.38%, 12/15/38(a) |
2,331 | 2,600,327 | ||||||
| Sinopec Capital 2013 Ltd., 4.25%, 04/24/43(b) |
380 | 338,120 | ||||||
| Sinopec Group Overseas Development 2012 Ltd., 4.88%, 05/17/42(b) |
693 | 663,367 | ||||||
| Sinopec Group Overseas Development 2013 Ltd., 5.38%, 10/17/43(b) |
435 | 442,580 | ||||||
| Sinopec Group Overseas Development 2015 Ltd., 4.10%, 04/28/45(b) |
740 | 635,406 | ||||||
| Sinopec Group Overseas Development 2016 Ltd., 4.25%, 05/03/46(b) |
410 | 358,685 | ||||||
| Sinopec Group Overseas Development 2017 Ltd. |
||||||||
| 4.00%, 09/13/47(b) |
405 | 338,021 | ||||||
| 4.25%, 04/12/47(b) |
350 | 304,385 | ||||||
| Sinopec Group Overseas Development 2018 Ltd. |
||||||||
| 3.10%, 01/08/51 (Call 07/08/50)(b) |
400 | 277,757 | ||||||
| 3.35%, 05/13/50 (Call 11/13/49)(b) |
340 | 249,731 | ||||||
| 3.44%, 11/12/49 (Call 05/12/49)(b) |
395 | 296,633 | ||||||
| 3.68%, 08/08/49 (Call 02/08/49)(b) |
425 | 334,889 | ||||||
| 4.60%, 09/12/48(a)(b) |
403 | 369,294 | ||||||
| Suncor Energy Inc. |
||||||||
| 3.75%, 03/04/51 (Call 09/04/50)(a) |
342 | 248,966 | ||||||
| 4.00%, 11/15/47 (Call 05/15/47) |
556 | 423,934 | ||||||
| 5.95%, 12/01/34 |
690 | 718,336 | ||||||
| 6.50%, 06/15/38 |
1,131 | 1,184,005 | ||||||
| 6.80%, 05/15/38 |
903 | 964,315 | ||||||
| 6.85%, 06/01/39 |
760 | 818,119 | ||||||
| Thaioil Treasury Center Co. Ltd. |
||||||||
| 3.50%, 10/17/49(a)(b) |
511 | 345,661 | ||||||
| 3.75%, 06/18/50(b) |
390 | 274,089 | ||||||
| 5.38%, 11/20/48(b) |
405 | 372,099 | ||||||
| TotalEnergies Capital International SA |
||||||||
| 2.99%, 06/29/41 (Call 12/29/40) |
194 | 143,943 | ||||||
| 3.13%, 05/29/50 (Call 11/29/49)(a) |
2,223 | 1,549,133 | ||||||
| 3.39%, 06/29/60 (Call 12/29/59) |
701 | 486,564 | ||||||
| 3.46%, 07/12/49 (Call 01/12/49) |
785 | 587,503 | ||||||
| Valero Energy Corp. |
||||||||
| 3.65%, 12/01/51 (Call 06/01/51) |
676 | 476,200 | ||||||
| 4.00%, 06/01/52 (Call 12/01/51)(a) |
425 | 319,716 | ||||||
| 4.90%, 03/15/45(a) |
326 | 293,370 | ||||||
| 6.63%, 06/15/37 |
1,448 | 1,550,683 | ||||||
| XTO Energy Inc., 6.75%, 08/01/37 |
300 | 337,266 | ||||||
|
|
|
|||||||
| 120,238,101 | ||||||||
| Oil & Gas Services — 0.4% |
||||||||
| Baker Hughes Holdings LLC, 5.13%, 09/15/40(a) |
1,169 | 1,136,125 | ||||||
| Baker Hughes Holdings LLC/Baker Hughes |
||||||||
| Co-Obligor Inc., 4.08%, 12/15/47 |
||||||||
| (Call 06/15/47) |
804 | 649,161 | ||||||
| Security | Par (000) |
Value | ||||||
| Oil & Gas Services (continued) |
||||||||
| Halliburton Co. |
||||||||
| 4.50%, 11/15/41 (Call 05/15/41) |
$ | 452 | $ | 398,835 | ||||
| 4.75%, 08/01/43 (Call 02/01/43) |
823 | 744,106 | ||||||
| 4.85%, 11/15/35 (Call 05/15/35) |
832 | 800,158 | ||||||
| 5.00%, 11/15/45 (Call 05/15/45) |
1,508 | 1,403,279 | ||||||
| 6.70%, 09/15/38 |
768 | 861,374 | ||||||
| 7.45%, 09/15/39 |
828 | 994,327 | ||||||
| NOV Inc., 3.95%, 12/01/42 (Call 06/01/42) |
1,165 | 869,798 | ||||||
|
|
|
|||||||
| 7,857,163 | ||||||||
| Packaging & Containers — 0.1% |
||||||||
| Packaging Corp. of America |
||||||||
| 3.05%, 10/01/51 (Call 04/01/51)(a) |
600 | 400,544 | ||||||
| 4.05%, 12/15/49 (Call 06/15/49) |
253 | 198,812 | ||||||
| Sonoco Products Co., 5.75%, 11/01/40 |
||||||||
| (Call 05/01/40) |
415 | 417,064 | ||||||
| Stora Enso OYJ, 7.25%, 04/15/36(a)(b) |
375 | 396,887 | ||||||
|
|
|
|||||||
| 1,413,307 | ||||||||
| Pharmaceuticals — 7.1% |
||||||||
| AbbVie Inc. |
||||||||
| 4.05%, 11/21/39 (Call 05/21/39)(a) |
3,354 | 2,940,561 | ||||||
| 4.25%, 11/21/49 (Call 05/21/49) |
4,720 | 4,049,294 | ||||||
| 4.30%, 05/14/36 (Call 11/14/35) |
896 | 831,986 | ||||||
| 4.40%, 11/06/42 |
2,238 | 2,006,605 | ||||||
| 4.45%, 05/14/46 (Call 11/14/45) |
1,534 | 1,356,621 | ||||||
| 4.50%, 05/14/35 (Call 11/14/34) |
1,783 | 1,698,581 | ||||||
| 4.55%, 03/15/35 (Call 09/15/34) |
1,557 | 1,491,700 | ||||||
| 4.63%, 10/01/42 (Call 04/01/42) |
319 | 291,904 | ||||||
| 4.70%, 05/14/45 (Call 11/14/44) |
2,022 | 1,862,467 | ||||||
| 4.75%, 03/15/45 (Call 09/15/44) |
1,179 | 1,092,904 | ||||||
| 4.85%, 06/15/44 (Call 12/15/43) |
1,067 | 1,009,971 | ||||||
| 4.88%, 11/14/48 (Call 05/14/48) |
1,625 | 1,537,850 | ||||||
| 5.35%, 03/15/44 (Call 09/15/43) |
530 | 534,873 | ||||||
| 5.40%, 03/15/54 (Call 09/15/53) |
770 | 781,644 | ||||||
| 5.50%, 03/15/64 (Call 09/15/63) |
450 | 455,177 | ||||||
| AstraZeneca PLC |
||||||||
| 2.13%, 08/06/50 (Call 02/06/50) |
309 | 181,568 | ||||||
| 3.00%, 05/28/51 (Call 11/28/50) |
847 | 586,975 | ||||||
| 4.00%, 09/18/42 |
976 | 832,996 | ||||||
| 4.38%, 11/16/45(a) |
887 | 784,393 | ||||||
| 4.38%, 08/17/48 (Call 02/17/48) |
562 | 499,991 | ||||||
| 6.45%, 09/15/37 |
2,523 | 2,843,976 | ||||||
| Bayer U.S. Finance II LLC |
||||||||
| 3.95%, 04/15/45 (Call 10/15/44)(b) |
345 | 238,536 | ||||||
| 4.20%, 07/15/34 (Call 01/15/34)(b) |
178 | 149,097 | ||||||
| 4.40%, 07/15/44 (Call 01/15/44)(b) |
715 | 539,512 | ||||||
| 4.63%, 06/25/38 (Call 12/25/37)(b) |
586 | 482,258 | ||||||
| 4.65%, 11/15/43 (Call 05/15/43)(b) |
115 | 87,920 | ||||||
| 4.70%, 07/15/64 (Call 01/15/64)(b) |
645 | 461,701 | ||||||
| 4.88%, 06/25/48 (Call 12/25/47)(b) |
1,638 | 1,297,966 | ||||||
| 5.50%, 07/30/35(a)(b) |
280 | 256,915 | ||||||
| Bayer U.S. Finance LLC, 6.88%, 11/21/53 |
||||||||
| (Call 05/21/53)(a)(b) |
890 | 890,640 | ||||||
| Becton Dickinson and Co. |
||||||||
| 3.79%, 05/20/50 (Call 11/20/49) |
580 | 448,911 | ||||||
| 4.67%, 06/06/47 (Call 12/06/46) |
1,636 | 1,449,054 | ||||||
| 4.69%, 12/15/44 (Call 06/15/44) |
849 | 759,842 | ||||||
| Bristol-Myers Squibb Co. |
||||||||
| 2.35%, 11/13/40 (Call 05/13/40) |
651 | 436,642 | ||||||
| 2.55%, 11/13/50 (Call 05/13/50)(a) |
1,481 | 897,583 | ||||||
| 3.25%, 08/01/42 |
445 | 336,725 | ||||||
| 246 | 2 0 2 4 I S H A R E S A N N U A L R E P O R T T O S H A R E H O L D E R S |
| Schedule of Investments (continued) February 29, 2024 |
iShares® 10+ Year Investment Grade Corporate Bond ETF (Percentages shown are based on Net Assets) |
| Security | Par (000) |
Value | ||||||
| Pharmaceuticals (continued) |
||||||||
| 3.55%, 03/15/42 (Call 09/15/41) |
$ | 1,095 | $ | 863,351 | ||||
| 3.70%, 03/15/52 (Call 09/15/51) |
1,823 | 1,383,626 | ||||||
| 3.90%, 03/15/62 (Call 09/15/61) |
841 | 627,777 | ||||||
| 4.13%, 06/15/39 (Call 12/15/38) |
1,676 | 1,460,124 | ||||||
| 4.25%, 10/26/49 (Call 04/26/49) |
3,242 | 2,719,883 | ||||||
| 4.35%, 11/15/47 (Call 05/15/47) |
1,211 | 1,030,288 | ||||||
| 4.50%, 03/01/44 (Call 09/01/43) |
55 | 48,768 | ||||||
| 4.55%, 02/20/48 (Call 08/20/47) |
1,238 | 1,090,076 | ||||||
| 4.63%, 05/15/44 (Call 11/15/43) |
860 | 779,472 | ||||||
| 5.00%, 08/15/45 (Call 02/15/45) |
544 | 517,125 | ||||||
| 5.50%, 02/22/44 (Call 08/22/43) |
275 | 278,305 | ||||||
| 5.55%, 02/22/54 (Call 08/22/53) |
1,290 | 1,305,293 | ||||||
| 5.65%, 02/22/64 (Call 08/22/63) |
1,250 | 1,261,440 | ||||||
| 5.88%, 11/15/36(a) |
386 | 407,050 | ||||||
| 6.25%, 11/15/53 (Call 05/15/53)(a) |
1,100 | 1,218,554 | ||||||
| 6.40%, 11/15/63 (Call 05/15/63) |
1,025 | 1,144,459 | ||||||
| Cardinal Health Inc. |
||||||||
| 4.37%, 06/15/47 (Call 12/15/46) |
501 | 411,857 | ||||||
| 4.50%, 11/15/44 (Call 05/15/44) |
171 | 143,422 | ||||||
| 4.60%, 03/15/43 |
308 | 263,546 | ||||||
| 4.90%, 09/15/45 (Call 03/15/45) |
347 | 306,282 | ||||||
| Cencora Inc. |
||||||||
| 4.25%, 03/01/45 (Call 09/01/44)(a) |
287 | 250,366 | ||||||
| 4.30%, 12/15/47 (Call 06/15/47)(a) |
349 | 297,077 | ||||||
| Cigna Group (The) |
||||||||
| 3.20%, 03/15/40 (Call 09/15/39) |
527 | 392,823 | ||||||
| 3.40%, 03/15/50 (Call 09/15/49) |
1,240 | 868,383 | ||||||
| 3.40%, 03/15/51 (Call 09/15/50) |
1,498 | 1,047,295 | ||||||
| 3.88%, 10/15/47 (Call 04/15/47) |
842 | 647,216 | ||||||
| 4.80%, 08/15/38 (Call 02/15/38) |
2,004 | 1,858,597 | ||||||
| 4.80%, 07/15/46 (Call 01/16/46) |
1,205 | 1,076,846 | ||||||
| 4.90%, 12/15/48 (Call 06/15/48) |
2,522 | 2,266,615 | ||||||
| 5.38%, 02/15/42 (Call 08/15/41) |
136 | 127,343 | ||||||
| 5.60%, 02/15/54 (Call 08/15/53) |
575 | 565,603 | ||||||
| 6.13%, 11/15/41 |
404 | 427,294 | ||||||
| CVS Health Corp. |
||||||||
| 2.70%, 08/21/40 (Call 02/21/40)(a) |
1,059 | 724,086 | ||||||
| 4.13%, 04/01/40 (Call 10/01/39) |
735 | 604,659 | ||||||
| 4.25%, 04/01/50 (Call 10/01/49)(a) |
658 | 525,340 | ||||||
| 4.78%, 03/25/38 (Call 09/25/37) |
4,137 | 3,759,334 | ||||||
| 4.88%, 07/20/35 (Call 01/20/35) |
385 | 366,985 | ||||||
| 5.05%, 03/25/48 (Call 09/25/47) |
6,737 | 6,009,225 | ||||||
| 5.13%, 07/20/45 (Call 01/20/45) |
3,101 | 2,820,665 | ||||||
| 5.30%, 12/05/43 (Call 06/05/43) |
668 | 621,699 | ||||||
| 5.63%, 02/21/53 (Call 08/21/52) |
1,034 | 993,389 | ||||||
| 5.88%, 06/01/53 (Call 12/01/52)(a) |
1,063 | 1,059,514 | ||||||
| 6.00%, 06/01/63 (Call 12/01/62)(a) |
601 | 601,642 | ||||||
| 6.13%, 09/15/39 |
444 | 454,193 | ||||||
| Eli Lilly & Co. |
||||||||
| 2.25%, 05/15/50 (Call 11/15/49)(a) |
1,147 | 693,597 | ||||||
| 2.50%, 09/15/60 (Call 03/15/60) |
730 | 427,089 | ||||||
| 3.70%, 03/01/45 (Call 09/01/44) |
251 | 206,343 | ||||||
| 3.95%, 05/15/47 (Call 11/15/46) |
310 | 266,110 | ||||||
| 3.95%, 03/15/49 (Call 09/15/48) |
871 | 732,412 | ||||||
| 4.15%, 03/15/59 (Call 09/15/58) |
384 | 324,476 | ||||||
| 4.88%, 02/27/53 (Call 08/27/52) |
1,104 | 1,067,908 | ||||||
| 4.95%, 02/27/63 (Call 08/27/62) |
1,033 | 996,504 | ||||||
| 5.00%, 02/09/54 (Call 08/09/53) |
720 | 709,243 | ||||||
| 5.10%, 02/09/64 (Call 08/09/63) |
875 | 859,814 | ||||||
| 5.55%, 03/15/37(a) |
500 | 524,745 | ||||||
| 5.95%, 11/15/37(a) |
215 | 231,834 | ||||||
| Security | Par (000) |
Value | ||||||
| Pharmaceuticals (continued) |
||||||||
| GlaxoSmithKline Capital Inc. |
||||||||
| 4.20%, 03/18/43 |
$ | 514 | $ | 452,000 | ||||
| 6.38%, 05/15/38 |
2,365 | 2,649,921 | ||||||
| Johnson & Johnson |
||||||||
| 2.10%, 09/01/40 (Call 03/01/40) |
579 | 393,485 | ||||||
| 2.25%, 09/01/50 (Call 03/01/50)(a) |
843 | 520,383 | ||||||
| 2.45%, 09/01/60 (Call 03/01/60) |
1,021 | 602,610 | ||||||
| 3.40%, 01/15/38 (Call 07/15/37) |
843 | 715,505 | ||||||
| 3.50%, 01/15/48 (Call 07/15/47)(a) |
641 | 506,626 | ||||||
| 3.55%, 03/01/36 (Call 09/01/35) |
700 | 619,785 | ||||||
| 3.63%, 03/03/37 (Call 09/03/36) |
1,178 | 1,041,032 | ||||||
| 3.70%, 03/01/46 (Call 09/01/45) |
2,064 | 1,694,822 | ||||||
| 3.75%, 03/03/47 (Call 09/03/46) |
1,036 | 852,651 | ||||||
| 4.50%, 09/01/40 |
591 | 562,077 | ||||||
| 4.50%, 12/05/43 (Call 06/05/43) |
534 | 502,481 | ||||||
| 4.85%, 05/15/41 |
409 | 402,650 | ||||||
| 5.85%, 07/15/38(a) |
542 | 595,963 | ||||||
| 5.95%, 08/15/37 |
829 | 915,142 | ||||||
| McKesson Corp., 4.88%, 03/15/44 (Call 09/15/43) |
196 | 173,281 | ||||||
| Mead Johnson Nutrition Co. |
||||||||
| 4.60%, 06/01/44 (Call 12/01/43)(a) |
186 | 165,265 | ||||||
| 5.90%, 11/01/39 |
518 | 539,186 | ||||||
| Merck & Co. Inc. |
||||||||
| 2.35%, 06/24/40 (Call 12/24/39) |
575 | 398,659 | ||||||
| 2.45%, 06/24/50 (Call 12/24/49)(a) |
1,139 | 701,846 | ||||||
| 2.75%, 12/10/51 (Call 06/10/51) |
1,725 | 1,112,664 | ||||||
| 2.90%, 12/10/61 (Call 06/10/61) |
1,328 | 825,249 | ||||||
| 3.60%, 09/15/42 (Call 03/15/42) |
627 | 508,984 | ||||||
| 3.70%, 02/10/45 (Call 08/10/44) |
1,403 | 1,135,550 | ||||||
| 3.90%, 03/07/39 (Call 09/07/38) |
857 | 751,788 | ||||||
| 4.00%, 03/07/49 (Call 09/07/48) |
1,384 | 1,155,380 | ||||||
| 4.15%, 05/18/43 |
1,144 | 998,784 | ||||||
| 4.90%, 05/17/44 (Call 11/17/43) |
800 | 768,473 | ||||||
| 5.00%, 05/17/53 (Call 11/17/52) |
1,294 | 1,254,128 | ||||||
| 5.15%, 05/17/63 (Call 11/17/62) |
860 | 839,191 | ||||||
| 6.55%, 09/15/37 |
473 | 529,917 | ||||||
| Merck Sharp & Dohme Corp. |
||||||||
| 5.75%, 11/15/36 |
321 | 341,958 | ||||||
| 5.85%, 06/30/39 |
256 | 269,434 | ||||||
| Mylan Inc. |
||||||||
| 5.20%, 04/15/48 (Call 10/15/47) |
619 | 508,849 | ||||||
| 5.40%, 11/29/43 (Call 05/29/43) |
425 | 368,172 | ||||||
| Novartis Capital Corp. |
||||||||
| 2.75%, 08/14/50 (Call 02/14/50)(a) |
1,020 | 679,388 | ||||||
| 3.70%, 09/21/42 |
543 | 450,353 | ||||||
| 4.00%, 11/20/45 (Call 05/20/45) |
930 | 790,324 | ||||||
| 4.40%, 05/06/44 |
1,639 | 1,491,570 | ||||||
| Pfizer Inc. |
||||||||
| 2.55%, 05/28/40 (Call 11/28/39) |
884 | 620,177 | ||||||
| 2.70%, 05/28/50 (Call 11/28/49) |
1,138 | 751,231 | ||||||
| 3.90%, 03/15/39 (Call 09/15/38) |
533 | 455,180 | ||||||
| 4.00%, 12/15/36(a) |
747 | 670,706 | ||||||
| 4.00%, 03/15/49 (Call 09/15/48) |
1,096 | 904,746 | ||||||
| 4.10%, 09/15/38 (Call 03/15/38) |
522 | 464,598 | ||||||
| 4.13%, 12/15/46 |
1,220 | 1,023,266 | ||||||
| 4.20%, 09/15/48 (Call 03/15/48) |
1,391 | 1,185,112 | ||||||
| 4.30%, 06/15/43 |
779 | 683,862 | ||||||
| 4.40%, 05/15/44 |
895 | 805,588 | ||||||
| 5.60%, 09/15/40 |
495 | 508,743 | ||||||
| 7.20%, 03/15/39 |
1,898 | 2,255,534 | ||||||
| S C H E D U L E O F I N V E S T M E N T S |
247 |
| Schedule of Investments (continued) February 29, 2024 |
iShares® 10+ Year Investment Grade Corporate Bond ETF (Percentages shown are based on Net Assets) |
| Security | Par (000) |
Value | ||||||
| Pharmaceuticals (continued) | ||||||||
| Pfizer Investment Enterprises Pte Ltd. |
||||||||
| 5.11%, 05/19/43 (Call 11/19/42)(a) |
$ | 2,518 | $ | 2,421,685 | ||||
| 5.30%, 05/19/53 (Call 11/19/52) |
4,961 | 4,852,836 | ||||||
| 5.34%, 05/19/63 (Call 11/19/62) |
3,182 | 3,065,073 | ||||||
| Takeda Pharmaceutical Co. Ltd. |
||||||||
| 3.03%, 07/09/40 (Call 01/09/40) |
1,144 | 852,154 | ||||||
| 3.18%, 07/09/50 (Call 01/09/50) |
1,738 | 1,196,183 | ||||||
| 3.38%, 07/09/60 (Call 01/09/60) |
822 | 550,588 | ||||||
| Utah Acquisition Sub Inc., 5.25%, 06/15/46 |
||||||||
| (Call 12/15/45) |
809 | 661,000 | ||||||
| Viatris Inc. |
||||||||
| 3.85%, 06/22/40 (Call 12/22/39) |
1,313 | 964,960 | ||||||
| 4.00%, 06/22/50 (Call 12/22/49)(a) |
1,628 | 1,111,238 | ||||||
| Wyeth LLC |
||||||||
| 5.95%, 04/01/37 |
1,821 | 1,945,538 | ||||||
| 6.00%, 02/15/36(a) |
521 | 557,479 | ||||||
| Zoetis Inc. |
||||||||
| 3.00%, 05/15/50 (Call 11/15/49) |
309 | 211,947 | ||||||
| 3.95%, 09/12/47 (Call 03/12/47) |
332 | 265,662 | ||||||
| 4.45%, 08/20/48 (Call 02/20/48) |
247 | 216,572 | ||||||
| 4.70%, 02/01/43 (Call 08/01/42) |
1,085 | 992,829 | ||||||
|
|
|
|||||||
| 149,052,314 | ||||||||
| Pipelines — 4.7% | ||||||||
| Abu Dhabi Crude Oil Pipeline LLC, |
1,591 | 1,412,808 | ||||||
| Cameron LNG LLC |
||||||||
| 3.30%, 01/15/35 (Call 09/15/34)(a)(b) |
530 | 438,320 | ||||||
| 3.40%, 01/15/38 (Call 07/15/37)(b) |
434 | 356,011 | ||||||
| 3.70%, 01/15/39 (Call 07/15/38)(b) |
455 | 373,260 | ||||||
| Cheniere Corpus Christi Holdings LLC, |
177 | 138,346 | ||||||
| Colonial Pipeline Co. |
||||||||
| 4.20%, 04/15/43 (Call 10/15/42)(a)(b) |
110 | 92,052 | ||||||
| 4.25%, 04/15/48 (Call 10/15/47)(a)(b) |
421 | 346,990 | ||||||
| 6.38%, 08/01/37(b) |
70 | 71,210 | ||||||
| Columbia Pipeline Group Inc., 5.80%, 06/01/45 |
||||||||
| (Call 12/01/44) |
305 | 295,232 | ||||||
| Columbia Pipelines Operating Co. LLC |
||||||||
| 6.50%, 08/15/43 (Call 02/15/43)(b) |
312 | 330,161 | ||||||
| 6.54%, 11/15/53 (Call 05/15/53)(b) |
1,157 | 1,232,521 | ||||||
| 6.71%, 08/15/63 (Call 02/15/63)(b) |
426 | 461,295 | ||||||
| DCP Midstream Operating LP |
||||||||
| 5.60%, 04/01/44 (Call 10/01/43) |
299 | 284,741 | ||||||
| 6.45%, 11/03/36(b) |
430 | 442,979 | ||||||
| 6.75%, 09/15/37(b) |
563 | 599,300 | ||||||
| Eastern Gas Transmission & Storage Inc. |
||||||||
| 3.90%, 11/15/49 (Call 05/15/49) |
218 | 158,633 | ||||||
| 4.60%, 12/15/44 (Call 06/15/44) |
312 | 266,346 | ||||||
| 4.80%, 11/01/43 (Call 05/01/43) |
172 | 151,491 | ||||||
| EIG Pearl Holdings Sarl |
||||||||
| 3.55%, 08/31/36(b) |
265 | 224,985 | ||||||
| 4.39%, 11/30/46(b) |
985 | 758,265 | ||||||
| Enbridge Energy Partners LP |
||||||||
| 5.50%, 09/15/40 (Call 03/15/40) |
497 | 482,702 | ||||||
| 7.38%, 10/15/45 (Call 04/15/45) |
477 | 549,138 | ||||||
| Series B, 7.50%, 04/15/38 |
390 | 451,071 | ||||||
| Enbridge Inc. |
||||||||
| 3.40%, 08/01/51 (Call 02/01/51)(a) |
875 | 611,532 | ||||||
| 4.00%, 11/15/49 (Call 05/15/49)(a) |
448 | 345,039 | ||||||
| 4.50%, 06/10/44 (Call 12/10/43) |
413 | 342,977 | ||||||
| 5.50%, 12/01/46 (Call 06/01/46)(a) |
530 | 512,465 | ||||||
| Security | Par (000) |
Value | ||||||
| Pipelines (continued) | ||||||||
| 6.70%, 11/15/53 (Call 05/15/53)(a) |
$ | 1,060 | $ | 1,184,897 | ||||
| Energy Transfer LP |
||||||||
| 4.90%, 03/15/35 (Call 09/15/34) |
279 | 260,145 | ||||||
| 4.95%, 01/15/43 (Call 07/15/42)(a) |
338 | 290,699 | ||||||
| 5.00%, 05/15/44 (Call 11/15/43) |
540 | 468,530 | ||||||
| 5.00%, 05/15/50 (Call 11/15/49) |
1,787 | 1,540,551 | ||||||
| 5.15%, 02/01/43 (Call 08/01/42) |
409 | 360,264 | ||||||
| 5.15%, 03/15/45 (Call 09/15/44) |
922 | 822,556 | ||||||
| 5.30%, 04/01/44 (Call 10/01/43) |
623 | 564,608 | ||||||
| 5.30%, 04/15/47 (Call 10/15/46) |
842 | 754,134 | ||||||
| 5.35%, 05/15/45 (Call 11/15/44) |
830 | 754,591 | ||||||
| 5.40%, 10/01/47 (Call 04/01/47) |
1,283 | 1,163,690 | ||||||
| 5.95%, 10/01/43 (Call 04/01/43) |
398 | 387,017 | ||||||
| 5.95%, 05/15/54 (Call 11/15/53) |
1,016 | 991,587 | ||||||
| 6.00%, 06/15/48 (Call 12/15/47) |
935 | 916,442 | ||||||
| 6.05%, 06/01/41 (Call 12/01/40) |
654 | 647,966 | ||||||
| 6.10%, 02/15/42 |
265 | 262,080 | ||||||
| 6.13%, 12/15/45 (Call 06/15/45) |
946 | 939,993 | ||||||
| 6.25%, 04/15/49 (Call 10/15/48) |
1,512 | 1,526,609 | ||||||
| 6.50%, 02/01/42 (Call 08/01/41) |
864 | 905,399 | ||||||
| 6.63%, 10/15/36 |
686 | 717,708 | ||||||
| 6.85%, 02/15/40(a) |
165 | 170,277 | ||||||
| 7.50%, 07/01/38(a) |
564 | 638,870 | ||||||
| Series 20Y, 5.80%, 06/15/38 (Call 12/15/37) |
395 | 390,528 | ||||||
| Enterprise Products Operating LLC |
||||||||
| 3.20%, 02/15/52 (Call 08/15/51) |
908 | 620,819 | ||||||
| 3.30%, 02/15/53 (Call 08/15/52)(a) |
932 | 648,864 | ||||||
| 3.70%, 01/31/51 (Call 07/31/50) |
773 | 581,403 | ||||||
| 3.95%, 01/31/60 (Call 07/31/59) |
918 | 698,537 | ||||||
| 4.20%, 01/31/50 (Call 07/31/49) |
1,098 | 906,563 | ||||||
| 4.25%, 02/15/48 (Call 08/15/47) |
1,141 | 954,510 | ||||||
| 4.45%, 02/15/43 (Call 08/15/42) |
1,001 | 874,131 | ||||||
| 4.80%, 02/01/49 (Call 08/01/48) |
1,041 | 943,099 | ||||||
| 4.85%, 08/15/42 (Call 02/15/42) |
675 | 617,437 | ||||||
| 4.85%, 03/15/44 (Call 09/15/43) |
1,338 | 1,227,499 | ||||||
| 4.90%, 05/15/46 (Call 11/15/45) |
893 | 815,521 | ||||||
| 4.95%, 10/15/54 (Call 04/15/54) |
383 | 349,263 | ||||||
| 5.10%, 02/15/45 (Call 08/15/44) |
969 | 910,220 | ||||||
| 5.70%, 02/15/42 |
561 | 567,474 | ||||||
| 5.95%, 02/01/41 |
695 | 728,355 | ||||||
| 6.13%, 10/15/39 |
570 | 601,006 | ||||||
| 6.45%, 09/01/40(a) |
570 | 621,144 | ||||||
| 7.55%, 04/15/38 |
340 | 404,470 | ||||||
| Series H, 6.65%, 10/15/34 |
223 | 246,242 | ||||||
| Series J, 5.75%, 03/01/35 |
75 | 75,508 | ||||||
| Fermaca Enterprises S de RL de CV, |
150 | 145,172 | ||||||
| Flex Intermediate Holdco LLC, 4.32%, 12/30/39 |
||||||||
| (Call 06/30/39)(b) |
193 | 139,516 | ||||||
| FLNG Liquefaction 2 LLC, 4.13%, 03/31/38(b) |
410 | 355,175 | ||||||
| Galaxy Pipeline Assets Bidco Ltd. |
||||||||
| 2.63%, 03/31/36(a)(b) |
1,022 | 827,884 | ||||||
| 2.94%, 09/30/40(a)(b) |
1,467 | 1,167,939 | ||||||
| 3.25%, 09/30/40(a)(b) |
1,225 | 924,726 | ||||||
| Greensaif Pipelines Bidco Sarl |
||||||||
| 6.13%, 02/23/38(b) |
600 | 609,374 | ||||||
| 6.51%, 02/23/42(b) |
845 | 870,868 | ||||||
| Gulfstream Natural Gas System LLC, |
197 | 177,560 | ||||||
| Kinder Morgan Energy Partners LP |
||||||||
| 4.70%, 11/01/42 (Call 05/01/42) |
413 | 347,436 | ||||||
| 248 | 2 0 2 4 I S H A R E S A N N U A L R E P O R T T O S H A R E H O L D E R S |
| Schedule of Investments (continued) February 29, 2024 |
iShares® 10+ Year Investment Grade Corporate Bond ETF (Percentages shown are based on Net Assets) |
| Security | Par (000) |
Value | ||||||
| Pipelines (continued) | ||||||||
| 5.00%, 08/15/42 (Call 02/15/42)(a) |
$ | 565 | $ | 491,510 | ||||
| 5.00%, 03/01/43 (Call 09/01/42) |
627 | 548,875 | ||||||
| 5.40%, 09/01/44 (Call 03/01/44) |
480 | 438,322 | ||||||
| 5.50%, 03/01/44 (Call 09/01/43) |
634 | 586,407 | ||||||
| 5.63%, 09/01/41 |
337 | 316,992 | ||||||
| 5.80%, 03/15/35 |
470 | 472,389 | ||||||
| 6.38%, 03/01/41(a) |
499 | 507,407 | ||||||
| 6.50%, 02/01/37 |
241 | 248,266 | ||||||
| 6.50%, 09/01/39 |
486 | 500,099 | ||||||
| 6.55%, 09/15/40 |
362 | 374,264 | ||||||
| 6.95%, 01/15/38 |
1,105 | 1,196,377 | ||||||
| 7.50%, 11/15/40 |
325 | 362,139 | ||||||
| Kinder Morgan Inc. |
||||||||
| 3.25%, 08/01/50 (Call 02/01/50) |
552 | 357,730 | ||||||
| 3.60%, 02/15/51 (Call 08/15/50) |
1,029 | 706,227 | ||||||
| 5.05%, 02/15/46 (Call 08/15/45) |
688 | 600,111 | ||||||
| 5.20%, 03/01/48 (Call 09/01/47) |
723 | 642,486 | ||||||
| 5.30%, 12/01/34 (Call 06/01/34)(a) |
400 | 389,905 | ||||||
| 5.45%, 08/01/52 (Call 02/01/52)(a) |
711 | 654,231 | ||||||
| 5.55%, 06/01/45 (Call 12/01/44) |
1,663 | 1,561,321 | ||||||
| Magellan Midstream Partners LP, |
684 | 501,226 | ||||||
| MPLX LP |
||||||||
| 4.50%, 04/15/38 (Call 10/15/37) |
983 | 855,526 | ||||||
| 4.70%, 04/15/48 (Call 10/15/47) |
1,404 | 1,176,316 | ||||||
| 4.90%, 04/15/58 (Call 10/15/57)(a) |
403 | 333,148 | ||||||
| 4.95%, 03/14/52 (Call 09/14/51) |
1,293 | 1,109,691 | ||||||
| 5.20%, 03/01/47 (Call 09/01/46) |
970 | 870,398 | ||||||
| 5.20%, 12/01/47 (Call 06/01/47) |
656 | 586,896 | ||||||
| 5.50%, 02/15/49 (Call 08/15/48)(a) |
1,371 | 1,283,955 | ||||||
| 5.65%, 03/01/53 (Call 09/01/52) |
502 | 477,368 | ||||||
| NGPL PipeCo LLC, 7.77%, 12/15/37(b) |
541 | 598,637 | ||||||
| Northern Natural Gas Co. |
||||||||
| 3.40%, 10/16/51 (Call 04/16/51)(b) |
461 | 318,178 | ||||||
| 4.10%, 09/15/42 (Call 03/15/42)(b) |
338 | 261,209 | ||||||
| 4.30%, 01/15/49 (Call 07/15/48)(b) |
472 | 388,006 | ||||||
| 5.63%, 02/01/54 (Call 08/01/53)(b) |
400 | 405,132 | ||||||
| ONEOK Inc. |
||||||||
| 4.20%, 12/01/42 (Call 06/01/42)(a) |
291 | 226,092 | ||||||
| 4.20%, 03/15/45 |
204 | 151,462 | ||||||
| 4.20%, 10/03/47 (Call 04/03/47) |
473 | 362,669 | ||||||
| 4.25%, 09/15/46(a) |
481 | 374,793 | ||||||
| 4.45%, 09/01/49 (Call 03/01/49)(a) |
581 | 464,717 | ||||||
| 4.50%, 03/15/50 (Call 09/15/49) |
363 | 290,947 | ||||||
| 4.85%, 02/01/49 |
495 | 422,881 | ||||||
| 4.95%, 07/13/47 (Call 01/06/47) |
679 | 585,921 | ||||||
| 5.15%, 10/15/43(a) |
519 | 467,944 | ||||||
| 5.20%, 07/15/48 (Call 01/15/48) |
816 | 737,086 | ||||||
| 6.00%, 06/15/35 |
409 | 412,753 | ||||||
| 6.40%, 05/01/37(a) |
305 | 308,607 | ||||||
| 6.63%, 09/01/53 (Call 03/01/53) |
1,493 | 1,604,419 | ||||||
| 7.15%, 01/15/51 (Call 07/15/50) |
332 | 370,511 | ||||||
| ONEOK Partners LP |
||||||||
| 6.13%, 02/01/41 (Call 08/01/40) |
628 | 638,018 | ||||||
| 6.20%, 09/15/43 (Call 03/15/43) |
239 | 243,835 | ||||||
| 6.65%, 10/01/36 |
560 | 593,337 | ||||||
| 6.85%, 10/15/37 |
493 | 528,247 | ||||||
| Plains All American Pipeline LP/PAA Finance Corp. |
||||||||
| 4.30%, 01/31/43 (Call 07/31/42)(a) |
524 | 413,206 | ||||||
| 4.70%, 06/15/44 (Call 12/15/43)(a) |
515 | 426,599 | ||||||
| 4.90%, 02/15/45 (Call 08/15/44) |
614 | 517,081 | ||||||
| Security | Par (000) |
Value | ||||||
| Pipelines (continued) | ||||||||
| 5.15%, 06/01/42 (Call 12/01/41) |
$ | 544 | $ | 479,699 | ||||
| 6.65%, 01/15/37 |
549 | 581,070 | ||||||
| Sabal Trail Transmission LLC |
||||||||
| 4.68%, 05/01/38 (Call 11/01/37)(b) |
94 | 84,992 | ||||||
| 4.83%, 05/01/48 (Call 11/01/47)(b) |
274 | 233,499 | ||||||
| Sabine Pass Liquefaction LLC, 5.90%, 09/15/37 |
||||||||
| (Call 03/15/37) |
240 | 248,582 | ||||||
| Southern Natural Gas Co. LLC, 4.80%, 03/15/47 |
||||||||
| (Call 09/15/46)(b) |
400 | 325,230 | ||||||
| Spectra Energy Partners LP |
||||||||
| 4.50%, 03/15/45 (Call 09/15/44) |
541 | 453,795 | ||||||
| 5.95%, 09/25/43 (Call 03/25/43) |
265 | 263,321 | ||||||
| Targa Resources Corp. |
||||||||
| 4.95%, 04/15/52 (Call 10/15/51) |
740 | 633,105 | ||||||
| 6.25%, 07/01/52 (Call 01/01/52) |
450 | 455,960 | ||||||
| 6.50%, 02/15/53 (Call 08/15/52) |
752 | 788,453 | ||||||
| Tennessee Gas Pipeline Co. LLC, |
180 | 202,733 | ||||||
| Texas Eastern Transmission LP, 4.15%, 01/15/48 |
||||||||
| (Call 07/15/47)(b) |
218 | 175,603 | ||||||
| TransCanada PipeLines Ltd. |
||||||||
| 4.75%, 05/15/38 (Call 11/15/37)(a) |
185 | 167,065 | ||||||
| 4.88%, 05/15/48 (Call 11/15/47) |
789 | 688,424 | ||||||
| 5.00%, 10/16/43 (Call 04/16/43) |
635 | 567,305 | ||||||
| 5.10%, 03/15/49 (Call 09/15/48)(a) |
826 | 759,481 | ||||||
| 5.85%, 03/15/36 |
595 | 594,570 | ||||||
| 6.10%, 06/01/40 |
700 | 714,272 | ||||||
| 6.20%, 10/15/37 |
935 | 960,110 | ||||||
| 7.25%, 08/15/38 |
670 | 749,556 | ||||||
| 7.63%, 01/15/39 |
1,184 | 1,382,458 | ||||||
| Transcontinental Gas Pipe Line Co. LLC |
||||||||
| 3.95%, 05/15/50 (Call 11/15/49) |
415 | 322,637 | ||||||
| 4.45%, 08/01/42 (Call 02/01/42)(a) |
413 | 357,479 | ||||||
| 4.60%, 03/15/48 (Call 09/15/47) |
540 | 473,690 | ||||||
| 5.40%, 08/15/41 (Call 02/15/41) |
399 | 388,869 | ||||||
| Western Midstream Operating LP |
||||||||
| 5.25%, 02/01/50 (Call 08/01/49) |
1,028 | 909,425 | ||||||
| 5.30%, 03/01/48 (Call 09/01/47) |
570 | 491,221 | ||||||
| 5.45%, 04/01/44 (Call 10/01/43)(a) |
471 | 422,167 | ||||||
| 5.50%, 08/15/48 (Call 02/15/48) |
269 | 236,365 | ||||||
| Williams Companies Inc. (The) |
||||||||
| 3.50%, 10/15/51 (Call 04/15/51)(a) |
621 | 431,361 | ||||||
| 4.85%, 03/01/48 (Call 09/01/47) |
791 | 696,625 | ||||||
| 4.90%, 01/15/45 (Call 07/15/44) |
419 | 369,523 | ||||||
| 5.10%, 09/15/45 (Call 03/15/45) |
846 | 771,786 | ||||||
| 5.30%, 08/15/52 (Call 02/15/52) |
692 | 647,484 | ||||||
| 5.40%, 03/04/44 (Call 09/04/43) |
425 | 398,239 | ||||||
| 5.75%, 06/24/44 (Call 12/24/43) |
543 | 532,650 | ||||||
| 5.80%, 11/15/43 (Call 05/15/43) |
427 | 418,446 | ||||||
| 6.30%, 04/15/40 |
1,055 | 1,097,856 | ||||||
|
|
|
|||||||
| 98,083,701 | ||||||||
| Private Equity — 0.1% | ||||||||
| Apollo Management Holdings LP, 5.00%, 03/15/48 |
||||||||
| (Call 09/15/47)(a)(b) |
195 | 176,644 | ||||||
| Carlyle Finance LLC, 5.65%, 09/15/48 |
||||||||
| (Call 03/15/48)(b) |
249 | 233,706 | ||||||
| Carlyle Holdings II Finance LLC, |
499 | 474,893 | ||||||
| KKR Group Finance Co. III LLC, 5.13%, 06/01/44 |
||||||||
| (Call 12/01/43)(a)(b) |
833 | 758,666 | ||||||
| S C H E D U L E O F I N V E S T M E N T S |
249 |
| Schedule of Investments (continued) February 29, 2024 |
iShares® 10+ Year Investment Grade Corporate Bond ETF (Percentages shown are based on Net Assets) |
| Security | Par (000) |
Value | ||||||
| Private Equity (continued) | ||||||||
| KKR Group Finance Co. VII LLC, 3.63%, 02/25/50 |
||||||||
| (Call 08/25/49)(a)(b) |
$ | 431 | $ | 303,311 | ||||
| KKR Group Finance Co. VIII LLC, 3.50%, 08/25/50 |
||||||||
| (Call 02/25/50)(a)(b) |
671 | 459,569 | ||||||
| KKR Group Finance Co. X LLC, 3.25%, 12/15/51 |
||||||||
| (Call 06/15/51)(a)(b) |
641 | 429,178 | ||||||
|
|
|
|||||||
| 2,835,967 | ||||||||
| Real Estate — 0.1% | ||||||||
| CBRE Services Inc., 5.95%, 08/15/34 |
||||||||
| (Call 05/15/34) |
552 | 557,063 | ||||||
| Kilroy Realty LP, 6.25%, 01/15/36 (Call 10/15/35) |
120 | 115,525 | ||||||
| Prologis LP, 5.25%, 03/15/54 (Call 09/15/53) |
725 | 696,177 | ||||||
| Sinochem Overseas Capital Co. Ltd., |
170 | 182,730 | ||||||
|
|
|
|||||||
| 1,551,495 | ||||||||
| Real Estate Investment Trusts — 1.2% | ||||||||
| Alexandria Real Estate Equities Inc. |
||||||||
| 3.00%, 05/18/51 (Call 11/18/50)(a) |
884 | 556,156 | ||||||
| 3.55%, 03/15/52 (Call 09/15/51) |
890 | 617,513 | ||||||
| 4.00%, 02/01/50 (Call 08/01/49) |
637 | 481,372 | ||||||
| 4.75%, 04/15/35 (Call 01/15/35) |
813 | 757,514 | ||||||
| 4.85%, 04/15/49 (Call 10/15/48)(a) |
212 | 184,831 | ||||||
| 5.15%, 04/15/53 (Call 10/15/52)(a) |
443 | 401,447 | ||||||
| 5.25%, 05/15/36 (Call 02/15/36) |
265 | 254,388 | ||||||
| 5.63%, 05/15/54 (Call 11/15/53) |
400 | 384,903 | ||||||
| American Homes 4 Rent LP |
||||||||
| 3.38%, 07/15/51 (Call 01/15/51)(a) |
355 | 234,002 | ||||||
| 4.30%, 04/15/52 (Call 10/15/51)(a) |
280 | 217,254 | ||||||
| American Tower Corp. |
||||||||
| 2.95%, 01/15/51 (Call 07/15/50)(a) |
853 | 541,382 | ||||||
| 3.10%, 06/15/50 (Call 12/15/49) |
926 | 605,930 | ||||||
| 3.70%, 10/15/49 (Call 04/15/49) |
569 | 412,942 | ||||||
| AvalonBay Communities Inc. |
||||||||
| 3.90%, 10/15/46 (Call 04/15/46) |
311 | 243,512 | ||||||
| 4.15%, 07/01/47 (Call 01/01/47)(a) |
265 | 214,462 | ||||||
| 4.35%, 04/15/48 (Call 10/18/47) |
238 | 201,220 | ||||||
| Camden Property Trust, 3.35%, 11/01/49 |
||||||||
| (Call 05/01/49)(a) |
274 | 195,444 | ||||||
| Crown Castle Inc. |
||||||||
| 2.90%, 04/01/41 (Call 10/01/40) |
1,003 | 695,668 | ||||||
| 3.25%, 01/15/51 (Call 07/15/50)(a) |
895 | 605,771 | ||||||
| 4.00%, 11/15/49 (Call 05/15/49) |
288 | 221,383 | ||||||
| 4.15%, 07/01/50 (Call 01/01/50) |
563 | 443,862 | ||||||
| 4.75%, 05/15/47 (Call 11/15/46)(a) |
222 | 186,884 | ||||||
| 5.20%, 02/15/49 (Call 08/15/48) |
281 | 253,546 | ||||||
| Equinix Inc. |
||||||||
| 2.95%, 09/15/51 (Call 03/15/51)(a) |
439 | 278,849 | ||||||
| 3.00%, 07/15/50 (Call 01/15/50) |
328 | 212,884 | ||||||
| 3.40%, 02/15/52 (Call 08/15/51)(a) |
323 | 223,565 | ||||||
| ERP Operating LP |
||||||||
| 4.00%, 08/01/47 (Call 02/01/47)(a) |
300 | 230,557 | ||||||
| 4.50%, 07/01/44 (Call 01/01/44) |
566 | 486,529 | ||||||
| 4.50%, 06/01/45 (Call 12/01/44) |
267 | 222,883 | ||||||
| Essex Portfolio LP |
||||||||
| 2.65%, 09/01/50 (Call 03/01/50)(a) |
349 | 202,773 | ||||||
| 4.50%, 03/15/48 (Call 09/15/47)(a) |
240 | 200,664 | ||||||
| Federal Realty OP LP |
||||||||
| 3.63%, 08/01/46 (Call 02/01/46) |
259 | 166,166 | ||||||
| 4.50%, 12/01/44 (Call 06/01/44)(a) |
448 | 363,147 | ||||||
| Security | Par (000) |
Value | ||||||
| Real Estate Investment Trusts (continued) | ||||||||
| Goodman U.S. Finance Four LLC, 4.50%, 10/15/37 |
||||||||
| (Call 04/15/37)(b) |
$ | 173 | $ | 145,103 | ||||
| Healthpeak OP LLC, 6.75%, 02/01/41 |
||||||||
| (Call 08/01/40)(a) |
312 | 340,607 | ||||||
| Kimco Realty OP LLC |
||||||||
| 3.70%, 10/01/49 (Call 04/01/49)(a) |
357 | 255,778 | ||||||
| 4.13%, 12/01/46 (Call 06/01/46) |
281 | 213,394 | ||||||
| 4.25%, 04/01/45 (Call 10/01/44)(a) |
460 | 359,707 | ||||||
| 4.45%, 09/01/47 (Call 03/01/47) |
333 | 263,783 | ||||||
| Mid-America Apartments LP, 2.88%, 09/15/51 |
||||||||
| (Call 03/15/51) |
185 | 117,351 | ||||||
| NNN REIT Inc. |
||||||||
| 3.00%, 04/15/52 (Call 10/15/51)(a) |
473 | 302,084 | ||||||
| 3.10%, 04/15/50 (Call 10/15/49)(a) |
265 | 171,193 | ||||||
| 3.50%, 04/15/51 (Call 10/15/50) |
384 | 273,395 | ||||||
| 4.80%, 10/15/48 (Call 04/15/48) |
296 | 253,904 | ||||||
| Prologis LP |
||||||||
| 2.13%, 10/15/50 (Call 04/15/50) |
493 | 270,632 | ||||||
| 3.00%, 04/15/50 (Call 10/15/49)(a) |
624 | 421,921 | ||||||
| 3.05%, 03/01/50 (Call 09/01/49) |
296 | 201,100 | ||||||
| 4.38%, 09/15/48 (Call 03/15/48) |
280 | 237,187 | ||||||
| 5.25%, 06/15/53 (Call 12/15/52) |
825 | 799,517 | ||||||
| Public Storage Operating Co., 5.35%, 08/01/53 |
||||||||
| (Call 02/01/53) |
605 | 600,228 | ||||||
| Realty Income Corp. |
||||||||
| 4.65%, 03/15/47 (Call 09/15/46) |
484 | 421,371 | ||||||
| 5.88%, 03/15/35(a) |
275 | 277,599 | ||||||
| Regency Centers LP |
||||||||
| 4.40%, 02/01/47 (Call 08/01/46) |
364 | 291,416 | ||||||
| 4.65%, 03/15/49 (Call 09/15/48) |
333 | 282,632 | ||||||
| Simon Property Group LP |
||||||||
| 3.25%, 09/13/49 (Call 03/13/49)(a) |
1,009 | 699,280 | ||||||
| 3.80%, 07/15/50 (Call 01/15/50) |
684 | 518,125 | ||||||
| 4.25%, 10/01/44 (Call 04/01/44)(a) |
347 | 283,928 | ||||||
| 4.25%, 11/30/46 (Call 05/30/46) |
435 | 352,595 | ||||||
| 4.75%, 03/15/42 (Call 09/15/41) |
498 | 444,659 | ||||||
| 5.85%, 03/08/53 (Call 09/03/52) |
575 | 582,120 | ||||||
| 6.65%, 01/15/54 (Call 07/15/53)(a) |
425 | 478,075 | ||||||
| 6.75%, 02/01/40 (Call 11/01/39)(a) |
536 | 588,575 | ||||||
| Trust Fibra Uno |
||||||||
| 6.39%, 01/15/50 (Call 07/15/49)(b) |
500 | 420,640 | ||||||
| 6.95%, 01/30/44 (Call 07/30/43)(b) |
445 | 396,782 | ||||||
| UDR Inc., 3.10%, 11/01/34 (Call 08/01/34) |
235 | 188,994 | ||||||
| Ventas Realty LP |
||||||||
| 4.38%, 02/01/45 (Call 08/01/44) |
195 | 154,305 | ||||||
| 4.88%, 04/15/49 (Call 10/15/48) |
398 | 337,809 | ||||||
| 5.70%, 09/30/43 (Call 03/30/43) |
333 | 314,099 | ||||||
| VICI Properties LP, 5.63%, 05/15/52 |
||||||||
| (Call 11/15/51) |
685 | 620,247 | ||||||
| WEA Finance LLC, 4.63%, 09/20/48 |
||||||||
| (Call 03/20/48)(a)(b) |
423 | 288,991 | ||||||
| WEA Finance LLC/Westfield U.K. & Europe |
||||||||
| Finance PLC, 4.75%, 09/17/44 |
||||||||
| (Call 03/17/44)(b) |
437 | 306,236 | ||||||
| Welltower OP LLC |
||||||||
| 4.95%, 09/01/48 (Call 03/01/48) |
454 | 409,243 | ||||||
| 5.13%, 03/15/43 (Call 09/15/42) |
255 | 228,350 | ||||||
| 6.50%, 03/15/41 (Call 09/15/40) |
340 | 366,983 | ||||||
| Weyerhaeuser Co., 4.00%, 03/09/52 |
||||||||
| (Call 09/09/51) |
344 | 269,877 | ||||||
|
|
|
|||||||
| 26,249,218 | ||||||||
| 250 | 2 0 2 4 I S H A R E S A N N U A L R E P O R T T O S H A R E H O L D E R S |
| Schedule of Investments (continued) February 29, 2024 |
iShares® 10+ Year Investment Grade Corporate Bond ETF (Percentages shown are based on Net Assets) |
| Security | Par (000) |
Value | ||||||
| Retail — 2.8% | ||||||||
| 7-Eleven Inc. |
||||||||
| 2.50%, 02/10/41 (Call 08/10/40)(a)(b) |
$ | 231 | $ | 154,546 | ||||
| 2.80%, 02/10/51 (Call 08/02/50)(b) |
925 | 573,367 | ||||||
| Alimentation Couche-Tard Inc. |
||||||||
| 3.44%, 05/13/41 (Call 11/13/40)(b) |
236 | 178,790 | ||||||
| 3.63%, 05/13/51 (Call 11/13/50)(a)(b) |
390 | 284,393 | ||||||
| 3.80%, 01/25/50 (Call 07/25/49)(b) |
373 | 284,876 | ||||||
| 4.50%, 07/26/47 (Call 01/26/47)(b) |
469 | 392,199 | ||||||
| 5.62%, 02/12/54 (Call 08/12/53)(b) |
360 | 358,837 | ||||||
| CK Hutchison International 20 Ltd., |
665 | 490,011 | ||||||
| CK Hutchison International 21 Ltd., |
585 | 445,320 | ||||||
| Darden Restaurants Inc., 4.55%, 02/15/48 |
||||||||
| (Call 08/15/47) |
259 | 210,553 | ||||||
| Dick’s Sporting Goods Inc., 4.10%, 01/15/52 |
||||||||
| (Call 07/15/51) |
691 | 488,477 | ||||||
| Dollar General Corp. |
||||||||
| 4.13%, 04/03/50 (Call 10/03/49)(a) |
316 | 241,294 | ||||||
| 5.50%, 11/01/52 (Call 05/01/52)(a) |
170 | 160,438 | ||||||
| Dollar Tree Inc., 3.38%, 12/01/51 (Call 06/01/51) |
272 | 178,845 | ||||||
| Home Depot Inc. (The) |
||||||||
| 2.38%, 03/15/51 (Call 09/15/50) |
1,089 | 640,723 | ||||||
| 2.75%, 09/15/51 (Call 03/15/51) |
965 | 617,242 | ||||||
| 3.13%, 12/15/49 (Call 06/15/49) |
1,173 | 816,795 | ||||||
| 3.30%, 04/15/40 (Call 10/15/39) |
951 | 745,036 | ||||||
| 3.35%, 04/15/50 (Call 10/15/49) |
1,384 | 1,001,816 | ||||||
| 3.50%, 09/15/56 (Call 03/15/56) |
695 | 513,424 | ||||||
| 3.63%, 04/15/52 (Call 10/15/51) |
1,348 | 1,018,264 | ||||||
| 3.90%, 06/15/47 (Call 12/15/46) |
997 | 806,159 | ||||||
| 4.20%, 04/01/43 (Call 10/01/42) |
848 | 731,289 | ||||||
| 4.25%, 04/01/46 (Call 10/01/45) |
1,350 | 1,153,022 | ||||||
| 4.40%, 03/15/45 (Call 09/15/44) |
852 | 746,008 | ||||||
| 4.50%, 12/06/48 (Call 06/06/48)(a) |
1,291 | 1,139,164 | ||||||
| 4.88%, 02/15/44 (Call 08/15/43) |
885 | 830,134 | ||||||
| 4.95%, 09/15/52 (Call 03/15/52)(a) |
990 | 940,351 | ||||||
| 5.40%, 09/15/40 (Call 03/15/40) |
379 | 381,354 | ||||||
| 5.88%, 12/16/36 |
2,458 | 2,614,040 | ||||||
| 5.95%, 04/01/41 (Call 10/01/40) |
827 | 882,200 | ||||||
| Lowe’s Companies Inc. |
||||||||
| 2.80%, 09/15/41 (Call 03/15/41) |
661 | 461,681 | ||||||
| 3.00%, 10/15/50 (Call 04/15/50) |
1,540 | 993,576 | ||||||
| 3.50%, 04/01/51 (Call 10/01/50) |
500 | 351,705 | ||||||
| 3.70%, 04/15/46 (Call 10/15/45) |
1,119 | 841,824 | ||||||
| 4.05%, 05/03/47 (Call 11/03/46) |
1,325 | 1,048,955 | ||||||
| 4.25%, 04/01/52 (Call 10/01/51) |
1,324 | 1,063,735 | ||||||
| 4.38%, 09/15/45 (Call 03/15/45) |
329 | 278,732 | ||||||
| 4.45%, 04/01/62 (Call 10/01/61) |
945 | 754,519 | ||||||
| 4.55%, 04/05/49 (Call 10/05/48) |
592 | 497,685 | ||||||
| 4.65%, 04/15/42 (Call 10/15/41) |
464 | 414,325 | ||||||
| 5.00%, 04/15/40 (Call 10/15/39) |
610 | 579,634 | ||||||
| 5.00%, 09/15/43 (Call 03/15/43)(a) |
30 | 27,269 | ||||||
| 5.13%, 04/15/50 (Call 10/15/49) |
444 | 410,624 | ||||||
| 5.50%, 10/15/35 |
547 | 563,230 | ||||||
| 5.63%, 04/15/53 (Call 10/15/52) |
1,265 | 1,255,466 | ||||||
| 5.75%, 07/01/53 (Call 01/01/53) |
484 | 488,931 | ||||||
| 5.80%, 10/15/36 |
220 | 225,516 | ||||||
| 5.80%, 09/15/62 (Call 03/15/62) |
834 | 832,102 | ||||||
| 5.85%, 04/01/63 (Call 10/01/62) |
412 | 415,615 | ||||||
| McDonald’s Corp. |
||||||||
| 3.63%, 05/01/43 |
586 | 461,372 | ||||||
| Security | Par (000) |
Value | ||||||
| Retail (continued) | ||||||||
| 3.63%, 09/01/49 (Call 03/01/49) |
$ | 1,548 | $ | 1,159,547 | ||||
| 3.70%, 02/15/42 |
416 | 335,096 | ||||||
| 4.20%, 04/01/50 (Call 10/01/49) |
642 | 531,020 | ||||||
| 4.45%, 03/01/47 (Call 09/01/46) |
951 | 817,176 | ||||||
| 4.45%, 09/01/48 (Call 03/01/48) |
701 | 607,094 | ||||||
| 4.60%, 05/26/45 (Call 11/26/44) |
531 | 471,693 | ||||||
| 4.70%, 12/09/35 (Call 06/09/35) |
252 | 242,090 | ||||||
| 4.88%, 07/15/40(a) |
259 | 244,640 | ||||||
| 4.88%, 12/09/45 (Call 06/09/45) |
1,351 | 1,246,099 | ||||||
| 5.15%, 09/09/52 (Call 03/09/52) |
659 | 625,978 | ||||||
| 5.45%, 08/14/53 (Call 02/14/53) |
696 | 693,664 | ||||||
| 5.70%, 02/01/39(a) |
335 | 344,442 | ||||||
| 6.30%, 10/15/37 |
807 | 880,515 | ||||||
| 6.30%, 03/01/38 |
797 | 870,511 | ||||||
| Starbucks Corp. |
||||||||
| 3.35%, 03/12/50 (Call 09/12/49) |
438 | 309,690 | ||||||
| 3.50%, 11/15/50 (Call 05/15/50)(a) |
1,084 | 793,686 | ||||||
| 3.75%, 12/01/47 (Call 06/01/47)(a) |
374 | 287,487 | ||||||
| 4.30%, 06/15/45 (Call 12/15/44) |
231 | 195,973 | ||||||
| 4.45%, 08/15/49 (Call 02/15/49)(a) |
858 | 733,984 | ||||||
| 4.50%, 11/15/48 (Call 05/15/48) |
925 | 800,203 | ||||||
| Target Corp. |
||||||||
| 2.95%, 01/15/52 (Call 07/15/51) |
976 | 649,517 | ||||||
| 3.63%, 04/15/46 |
557 | 434,264 | ||||||
| 3.90%, 11/15/47 (Call 05/15/47) |
502 | 410,214 | ||||||
| 4.00%, 07/01/42 |
849 | 734,492 | ||||||
| 4.80%, 01/15/53 (Call 07/15/52)(a) |
1,050 | 970,823 | ||||||
| 6.50%, 10/15/37 |
324 | 361,878 | ||||||
| 7.00%, 01/15/38 |
440 | 514,323 | ||||||
| Tiffany & Co., 4.90%, 10/01/44 (Call 04/01/44)(a) |
216 | 200,524 | ||||||
| TJX Companies Inc. (The), 4.50%, 04/15/50 |
||||||||
| (Call 10/15/49) |
185 | 168,545 | ||||||
| Walmart Inc. |
||||||||
| 2.50%, 09/22/41 (Call 03/22/41) |
860 | 607,399 | ||||||
| 2.65%, 09/22/51 (Call 03/22/51)(a) |
1,395 | 908,496 | ||||||
| 2.95%, 09/24/49 (Call 03/24/49) |
711 | 496,050 | ||||||
| 3.63%, 12/15/47 (Call 06/15/47) |
492 | 388,827 | ||||||
| 3.95%, 06/28/38 (Call 12/28/37) |
179 | 161,576 | ||||||
| 4.00%, 04/11/43 (Call 10/11/42) |
295 | 255,936 | ||||||
| 4.05%, 06/29/48 (Call 12/29/47) |
1,620 | 1,397,060 | ||||||
| 4.30%, 04/22/44 (Call 10/22/43)(a) |
265 | 238,510 | ||||||
| 4.50%, 09/09/52 (Call 03/09/52) |
936 | 852,311 | ||||||
| 4.50%, 04/15/53 (Call 10/15/52) |
1,336 | 1,214,478 | ||||||
| 4.88%, 07/08/40(a) |
285 | 284,400 | ||||||
| 5.00%, 10/25/40 |
400 | 403,976 | ||||||
| 5.25%, 09/01/35 |
1,277 | 1,324,034 | ||||||
| 5.63%, 04/01/40 |
565 | 599,678 | ||||||
| 5.63%, 04/15/41(a) |
50 | 53,125 | ||||||
| 6.20%, 04/15/38 |
670 | 752,648 | ||||||
| 6.50%, 08/15/37 |
955 | 1,094,874 | ||||||
|
|
|
|||||||
| 59,654,009 | ||||||||
| Semiconductors — 2.3% | ||||||||
| Advanced Micro Devices Inc., 4.39%, 06/01/52 |
||||||||
| (Call 12/01/51)(a) |
321 | 283,433 | ||||||
| Analog Devices Inc. |
||||||||
| 2.80%, 10/01/41 (Call 04/01/41) |
458 | 325,682 | ||||||
| 2.95%, 10/01/51 (Call 04/01/51) |
795 | 531,404 | ||||||
| 5.30%, 12/15/45 (Call 06/15/45) |
160 | 155,334 | ||||||
| Applied Materials Inc. |
||||||||
| 2.75%, 06/01/50 (Call 12/01/49) |
414 | 278,437 | ||||||
| 4.35%, 04/01/47 (Call 10/01/46) |
780 | 693,408 | ||||||
| S C H E D U L E O F I N V E S T M E N T S |
251 |
| Schedule of Investments (continued) February 29, 2024 |
iShares® 10+ Year Investment Grade Corporate Bond ETF (Percentages shown are based on Net Assets) |
| Security | Par (000) |
Value | ||||||
| Semiconductors (continued) | ||||||||
| 5.10%, 10/01/35 (Call 04/01/35)(a) |
$ | 234 | $ | 237,026 | ||||
| 5.85%, 06/15/41 |
516 | 556,147 | ||||||
| Broadcom Inc. |
||||||||
| 3.14%, 11/15/35 (Call 08/15/35)(a)(b) |
2,787 | 2,212,282 | ||||||
| 3.19%, 11/15/36 (Call 08/15/36)(b) |
2,359 | 1,849,357 | ||||||
| 3.47%, 04/15/34 (Call 01/15/34)(b) |
1,383 | 1,168,026 | ||||||
| 3.50%, 02/15/41 (Call 08/15/40)(b) |
2,395 | 1,831,487 | ||||||
| 3.75%, 02/15/51 (Call 08/15/50)(b) |
1,602 | 1,197,693 | ||||||
| 4.93%, 05/15/37 (Call 02/15/37)(b) |
2,072 | 1,930,447 | ||||||
| Intel Corp. |
||||||||
| 2.80%, 08/12/41 (Call 02/12/41) |
505 | 358,750 | ||||||
| 3.05%, 08/12/51 (Call 02/12/51)(a) |
1,264 | 836,419 | ||||||
| 3.10%, 02/15/60 (Call 08/15/59) |
929 | 588,592 | ||||||
| 3.20%, 08/12/61 (Call 02/12/61) |
640 | 412,895 | ||||||
| 3.25%, 11/15/49 (Call 05/15/49) |
2,013 | 1,394,833 | ||||||
| 3.73%, 12/08/47 (Call 06/08/47) |
1,611 | 1,224,774 | ||||||
| 4.10%, 05/19/46 (Call 11/19/45) |
1,046 | 868,012 | ||||||
| 4.10%, 05/11/47 (Call 11/11/46) |
839 | 692,054 | ||||||
| 4.25%, 12/15/42(a) |
525 | 447,665 | ||||||
| 4.60%, 03/25/40 (Call 09/25/39)(a) |
559 | 519,282 | ||||||
| 4.75%, 03/25/50 (Call 09/25/49) |
1,960 | 1,746,875 | ||||||
| 4.80%, 10/01/41 |
644 | 601,775 | ||||||
| 4.90%, 07/29/45 (Call 01/29/45)(a) |
601 | 568,716 | ||||||
| 4.90%, 08/05/52 (Call 02/05/52) |
1,478 | 1,359,912 | ||||||
| 4.95%, 03/25/60 (Call 09/25/59)(a) |
753 | 687,206 | ||||||
| 5.05%, 08/05/62 (Call 02/05/62) |
820 | 755,743 | ||||||
| 5.60%, 02/21/54 (Call 08/21/53) |
215 | 214,876 | ||||||
| 5.63%, 02/10/43 (Call 08/10/42) |
815 | 827,786 | ||||||
| 5.70%, 02/10/53 (Call 08/10/52) |
1,700 | 1,723,270 | ||||||
| 5.90%, 02/10/63 (Call 08/10/62) |
1,101 | 1,146,932 | ||||||
| KLA Corp. |
||||||||
| 3.30%, 03/01/50 (Call 08/28/49) |
660 | 476,829 | ||||||
| 4.95%, 07/15/52 (Call 01/15/52) |
1,190 | 1,126,941 | ||||||
| 5.00%, 03/15/49 (Call 09/15/48) |
230 | 219,436 | ||||||
| 5.25%, 07/15/62 (Call 01/15/62) |
643 | 630,851 | ||||||
| 5.65%, 11/01/34 (Call 07/01/34)(a) |
220 | 228,801 | ||||||
| Lam Research Corp. |
||||||||
| 2.88%, 06/15/50 (Call 12/15/49)(a) |
563 | 379,808 | ||||||
| 3.13%, 06/15/60 (Call 12/15/59) |
389 | 255,492 | ||||||
| 4.88%, 03/15/49 (Call 09/15/48) |
605 | 570,129 | ||||||
| Micron Technology Inc. |
||||||||
| 3.37%, 11/01/41 (Call 05/01/41) |
309 | 225,150 | ||||||
| 3.48%, 11/01/51 (Call 05/01/51)(a) |
321 | 223,184 | ||||||
| NVIDIA Corp. |
||||||||
| 3.50%, 04/01/40 (Call 10/01/39) |
599 | 500,339 | ||||||
| 3.50%, 04/01/50 (Call 10/01/49) |
1,603 | 1,257,005 | ||||||
| 3.70%, 04/01/60 (Call 10/01/59) |
333 | 261,490 | ||||||
| NXP BV/NXP Funding LLC/NXP USA Inc. |
||||||||
| 3.13%, 02/15/42 (Call 08/15/41) |
308 | 218,400 | ||||||
| 3.25%, 05/11/41 (Call 11/11/40)(a) |
739 | 543,958 | ||||||
| 3.25%, 11/30/51 (Call 05/30/51) |
356 | 239,764 | ||||||
| QUALCOMM Inc. |
||||||||
| 3.25%, 05/20/50 (Call 11/20/49)(a) |
544 | 397,215 | ||||||
| 4.30%, 05/20/47 (Call 11/20/46) |
1,483 | 1,286,759 | ||||||
| 4.50%, 05/20/52 (Call 11/20/51) |
614 | 543,659 | ||||||
| 4.65%, 05/20/35 (Call 11/20/34) |
729 | 714,007 | ||||||
| 4.80%, 05/20/45 (Call 11/20/44) |
1,551 | 1,461,569 | ||||||
| 6.00%, 05/20/53 (Call 11/20/52) |
1,148 | 1,257,496 | ||||||
| Texas Instruments Inc. |
||||||||
| 2.70%, 09/15/51 (Call 03/15/51) |
389 | 249,743 | ||||||
| 3.88%, 03/15/39 (Call 09/15/38) |
504 | 443,934 | ||||||
| Security | Par (000) |
Value | ||||||
| Semiconductors (continued) | ||||||||
| 4.10%, 08/16/52 (Call 02/16/52) |
$ | 206 | $ | 172,356 | ||||
| 4.15%, 05/15/48 (Call 11/15/47) |
1,542 | 1,309,289 | ||||||
| 5.00%, 03/14/53 (Call 09/14/52)(a) |
578 | 561,587 | ||||||
| 5.05%, 05/18/63 (Call 11/18/62) |
1,272 | 1,216,190 | ||||||
| 5.15%, 02/08/54 (Call 08/08/53)(a) |
250 | 247,640 | ||||||
| TSMC Arizona Corp. |
||||||||
| 3.13%, 10/25/41 (Call 04/25/41) |
370 | 293,409 | ||||||
| 3.25%, 10/25/51 (Call 04/25/51)(a) |
739 | 561,189 | ||||||
| 4.50%, 04/22/52 (Call 10/22/51)(a) |
555 | 532,280 | ||||||
|
|
|
|||||||
| 48,832,429 | ||||||||
| Software — 2.7% | ||||||||
| Electronic Arts Inc., 2.95%, 02/15/51 |
||||||||
| (Call 08/15/50)(a) |
239 | 159,266 | ||||||
| Fidelity National Information Services Inc. |
||||||||
| 3.10%, 03/01/41 (Call 09/01/40)(a) |
593 | 425,942 | ||||||
| 4.50%, 08/15/46 (Call 02/15/46) |
230 | 190,034 | ||||||
| 5.63%, 07/15/52 (Call 01/15/52)(a) |
344 | 341,565 | ||||||
| Series 30Y, 4.75%, 05/15/48 (Call 11/15/47) |
190 | 159,581 | ||||||
| Fiserv Inc., 4.40%, 07/01/49 (Call 01/01/49) |
1,625 | 1,359,484 | ||||||
| Intuit Inc., 5.50%, 09/15/53 (Call 03/15/53) |
903 | 928,710 | ||||||
| Microsoft Corp. |
||||||||
| 2.50%, 09/15/50 (Call 03/15/50)(b) |
1,181 | 750,541 | ||||||
| 2.53%, 06/01/50 (Call 12/01/49) |
5,101 | 3,284,500 | ||||||
| 2.68%, 06/01/60 (Call 12/01/59)(a) |
3,091 | 1,950,847 | ||||||
| 2.92%, 03/17/52 (Call 09/17/51) |
5,119 | 3,539,958 | ||||||
| 3.04%, 03/17/62 (Call 09/17/61) |
1,634 | 1,113,574 | ||||||
| 3.45%, 08/08/36 (Call 02/08/36) |
1,400 | 1,233,270 | ||||||
| 3.50%, 02/12/35 (Call 08/12/34)(a) |
1,181 | 1,072,922 | ||||||
| 3.50%, 11/15/42(a) |
387 | 324,234 | ||||||
| 3.70%, 08/08/46 (Call 02/08/46) |
1,584 | 1,323,764 | ||||||
| 3.75%, 02/12/45 (Call 08/12/44)(a) |
632 | 541,164 | ||||||
| 3.95%, 08/08/56 (Call 02/08/56)(a) |
376 | 316,261 | ||||||
| 4.00%, 02/12/55 (Call 08/12/54)(a) |
456 | 395,173 | ||||||
| 4.10%, 02/06/37 (Call 08/06/36)(a) |
756 | 712,411 | ||||||
| 4.20%, 11/03/35 (Call 05/03/35)(a) |
583 | 564,322 | ||||||
| 4.25%, 02/06/47 (Call 08/06/46)(a) |
1,094 | 1,008,285 | ||||||
| 4.45%, 11/03/45 (Call 05/03/45)(a) |
910 | 867,781 | ||||||
| 4.50%, 10/01/40 |
378 | 368,581 | ||||||
| 4.50%, 06/15/47 (Call 12/15/46)(b) |
205 | 191,163 | ||||||
| 4.50%, 02/06/57 (Call 08/06/56) |
665 | 629,070 | ||||||
| 4.75%, 11/03/55 (Call 05/03/55) |
231 | 227,081 | ||||||
| 5.20%, 06/01/39(a) |
441 | 466,737 | ||||||
| 5.30%, 02/08/41(a) |
531 | 568,975 | ||||||
| Oracle Corp. |
||||||||
| 3.60%, 04/01/40 (Call 10/01/39) |
2,488 | 1,920,807 | ||||||
| 3.60%, 04/01/50 (Call 10/01/49) |
3,806 | 2,679,576 | ||||||
| 3.65%, 03/25/41 (Call 09/25/40) |
1,837 | 1,412,517 | ||||||
| 3.80%, 11/15/37 (Call 05/15/37) |
1,471 | 1,211,382 | ||||||
| 3.85%, 07/15/36 (Call 01/15/36) |
1,067 | 897,106 | ||||||
| 3.85%, 04/01/60 (Call 10/01/59) |
2,958 | 2,058,610 | ||||||
| 3.90%, 05/15/35 (Call 11/15/34) |
1,020 | 875,841 | ||||||
| 3.95%, 03/25/51 (Call 09/25/50)(a) |
2,873 | 2,143,121 | ||||||
| 4.00%, 07/15/46 (Call 01/15/46) |
2,474 | 1,902,751 | ||||||
| 4.00%, 11/15/47 (Call 05/15/47) |
1,843 | 1,411,900 | ||||||
| 4.10%, 03/25/61 (Call 09/25/60) |
1,339 | 982,276 | ||||||
| 4.13%, 05/15/45 (Call 11/15/44) |
1,740 | 1,378,988 | ||||||
| 4.30%, 07/08/34 (Call 01/08/34) |
1,298 | 1,178,017 | ||||||
| 4.38%, 05/15/55 (Call 11/15/54) |
1,115 | 875,310 | ||||||
| 4.50%, 07/08/44 (Call 01/08/44) |
872 | 734,144 | ||||||
| 5.38%, 07/15/40 |
1,815 | 1,737,374 | ||||||
| 5.55%, 02/06/53 (Call 08/06/52) |
2,077 | 1,984,242 | ||||||
| 252 | 2 0 2 4 I S H A R E S A N N U A L R E P O R T T O S H A R E H O L D E R S |
| Schedule of Investments (continued) February 29, 2024 |
iShares® 10+ Year Investment Grade Corporate Bond ETF (Percentages shown are based on Net Assets) |
| Security | Par (000) |
Value | ||||||
| Software (continued) |
||||||||
| 6.13%, 07/08/39 |
$ | 921 | $ | 947,296 | ||||
| 6.50%, 04/15/38(a) |
1,071 | 1,144,657 | ||||||
| 6.90%, 11/09/52 (Call 05/09/52) |
2,210 | 2,489,614 | ||||||
| Salesforce Inc. |
||||||||
| 2.70%, 07/15/41 (Call 01/15/41) |
964 | 688,204 | ||||||
| 2.90%, 07/15/51 (Call 01/15/51) |
1,576 | 1,047,372 | ||||||
| 3.05%, 07/15/61 (Call 01/15/61) |
1,168 | 750,884 | ||||||
|
|
|
|||||||
| 57,467,185 | ||||||||
| Telecommunications — 5.7% |
||||||||
| America Movil SAB de CV |
||||||||
| 4.38%, 07/16/42 |
1,008 | 872,813 | ||||||
| 4.38%, 04/22/49 (Call 10/22/48)(a) |
423 | 363,191 | ||||||
| 6.13%, 11/15/37(a) |
549 | 576,736 | ||||||
| 6.13%, 03/30/40 |
1,804 | 1,897,502 | ||||||
| 6.38%, 03/01/35 |
749 | 810,734 | ||||||
| AT&T Inc. |
||||||||
| 3.10%, 02/01/43 (Call 08/01/42)(a) |
501 | 360,623 | ||||||
| 3.30%, 02/01/52 (Call 08/01/51)(a) |
897 | 607,131 | ||||||
| 3.50%, 06/01/41 (Call 12/01/40)(a) |
2,096 | 1,606,067 | ||||||
| 3.50%, 09/15/53 (Call 03/15/53) |
6,438 | 4,425,078 | ||||||
| 3.50%, 02/01/61 (Call 08/01/60)(a) |
810 | 542,600 | ||||||
| 3.55%, 09/15/55 (Call 03/15/55) |
5,969 | 4,066,252 | ||||||
| 3.65%, 06/01/51 (Call 12/01/50)(a) |
2,298 | 1,644,343 | ||||||
| 3.65%, 09/15/59 (Call 03/15/59) |
4,862 | 3,288,679 | ||||||
| 3.80%, 12/01/57 (Call 06/01/57) |
5,207 | 3,664,606 | ||||||
| 3.85%, 06/01/60 (Call 12/01/59) |
1,393 | 985,503 | ||||||
| 4.30%, 12/15/42 (Call 06/15/42) |
1,039 | 879,749 | ||||||
| 4.35%, 06/15/45 (Call 12/15/44) |
889 | 743,670 | ||||||
| 4.50%, 05/15/35 (Call 11/15/34) |
1,993 | 1,835,206 | ||||||
| 4.50%, 03/09/48 (Call 09/09/47) |
1,631 | 1,364,283 | ||||||
| 4.55%, 03/09/49 (Call 09/09/48) |
874 | 736,894 | ||||||
| 4.65%, 06/01/44 (Call 12/01/43) |
535 | 458,502 | ||||||
| 4.75%, 05/15/46 (Call 11/15/45) |
1,700 | 1,488,878 | ||||||
| 4.80%, 06/15/44 (Call 12/15/43) |
449 | 396,538 | ||||||
| 4.85%, 03/01/39 (Call 09/01/38) |
840 | 775,285 | ||||||
| 4.85%, 07/15/45 (Call 01/15/45)(a) |
284 | 249,099 | ||||||
| 4.90%, 08/15/37 (Call 02/14/37) |
631 | 591,937 | ||||||
| 5.15%, 03/15/42(a) |
266 | 252,313 | ||||||
| 5.15%, 11/15/46 (Call 05/15/46) |
745 | 687,087 | ||||||
| 5.15%, 02/15/50 (Call 08/14/49) |
537 | 489,193 | ||||||
| 5.25%, 03/01/37 (Call 09/01/36) |
914 | 889,824 | ||||||
| 5.35%, 09/01/40 |
483 | 464,894 | ||||||
| 5.45%, 03/01/47 (Call 09/01/46) |
524 | 510,149 | ||||||
| 5.55%, 08/15/41 |
362 | 354,645 | ||||||
| 5.65%, 02/15/47 (Call 08/15/46)(a) |
765 | 767,529 | ||||||
| 5.70%, 03/01/57 (Call 09/01/56)(a) |
375 | 362,801 | ||||||
| 6.00%, 08/15/40 (Call 05/15/40) |
395 | 405,575 | ||||||
| 6.15%, 09/15/34 |
125 | 130,021 | ||||||
| 6.25%, 03/29/41 |
240 | 247,432 | ||||||
| 6.30%, 01/15/38 |
434 | 456,832 | ||||||
| 6.38%, 03/01/41(a) |
336 | 352,909 | ||||||
| 6.55%, 02/15/39 |
275 | 293,161 | ||||||
| Bell Telephone Co. of Canada or Bell Canada |
||||||||
| 3.65%, 08/15/52 (Call 02/15/52) |
504 | 370,805 | ||||||
| 4.30%, 07/29/49 (Call 01/29/49) |
424 | 349,241 | ||||||
| 4.46%, 04/01/48 (Call 10/01/47) |
836 | 710,658 | ||||||
| 5.55%, 02/15/54 (Call 08/15/53) |
475 | 467,197 | ||||||
| Series US-4, 3.65%, 03/17/51 (Call 09/17/50) |
334 | 246,030 | ||||||
| Series US-6, 3.20%, 02/15/52 (Call 08/15/51) |
437 | 294,521 | ||||||
| British Telecommunications PLC, 4.25%, 11/08/49 |
200 | 160,909 | ||||||
| Security | Par (000) |
Value | ||||||
| Telecommunications (continued) |
||||||||
| Cisco Systems Inc. |
||||||||
| 5.30%, 02/26/54 (Call 08/26/53) |
$ | 700 | $ | 708,508 | ||||
| 5.35%, 02/26/64 (Call 08/26/63) |
700 | 704,493 | ||||||
| 5.50%, 01/15/40 |
1,818 | 1,878,438 | ||||||
| 5.90%, 02/15/39 |
1,872 | 2,009,071 | ||||||
| Corning Inc. |
||||||||
| 3.90%, 11/15/49 (Call 05/15/49) |
220 | 169,643 | ||||||
| 4.38%, 11/15/57 (Call 05/15/57) |
648 | 533,444 | ||||||
| 4.70%, 03/15/37 |
420 | 385,447 | ||||||
| 4.75%, 03/15/42 |
476 | 424,025 | ||||||
| 5.35%, 11/15/48 (Call 05/15/48)(a) |
337 | 323,748 | ||||||
| 5.45%, 11/15/79 (Call 05/19/79) |
980 | 908,064 | ||||||
| 5.75%, 08/15/40 |
300 | 299,957 | ||||||
| 5.85%, 11/15/68 (Call 05/15/68)(a) |
139 | 135,431 | ||||||
| 7.25%, 08/15/36 (Call 08/15/26)(a) |
495 | 511,538 | ||||||
| Deutsche Telekom AG, 3.63%, 01/21/50 |
651 | 486,418 | ||||||
| Deutsche Telekom International Finance BV |
||||||||
| 4.75%, 06/21/38 (Call 12/21/37)(b) |
366 | 342,566 | ||||||
| 4.88%, 03/06/42(a)(b) |
742 | 683,973 | ||||||
| Juniper Networks Inc., 5.95%, 03/15/41(a) |
389 | 385,489 | ||||||
| Motorola Solutions Inc., 5.50%, 09/01/44 |
286 | 272,333 | ||||||
| Nokia OYJ, 6.63%, 05/15/39 |
583 | 562,576 | ||||||
| Ooredoo International Finance Ltd., |
493 | 453,207 | ||||||
| Orange SA |
||||||||
| 5.38%, 01/13/42(a) |
889 | 874,767 | ||||||
| 5.50%, 02/06/44 (Call 08/06/43) |
179 | 178,411 | ||||||
| Rogers Communications Inc. |
||||||||
| 3.70%, 11/15/49 (Call 05/15/49)(a) |
965 | 697,181 | ||||||
| 4.30%, 02/15/48 (Call 08/15/47) |
563 | 450,198 | ||||||
| 4.35%, 05/01/49 (Call 11/01/48)(a) |
1,135 | 914,464 | ||||||
| 4.50%, 03/15/42 (Call 09/15/41) |
176 | 151,107 | ||||||
| 4.50%, 03/15/43 (Call 09/15/42)(a) |
356 | 300,961 | ||||||
| 4.55%, 03/15/52 (Call 09/15/51) |
1,729 | 1,426,865 | ||||||
| 5.00%, 03/15/44 (Call 09/15/43) |
783 | 708,281 | ||||||
| 5.45%, 10/01/43 (Call 04/01/43)(a) |
481 | 459,860 | ||||||
| 7.50%, 08/15/38 |
628 | 724,070 | ||||||
| SES Global Americas Holdings Inc., |
159 | 121,896 | ||||||
| SES SA, 5.30%, 04/04/43(a)(b) |
370 | 267,288 | ||||||
| Telefonica Emisiones SA |
||||||||
| 4.67%, 03/06/38 |
259 | 230,930 | ||||||
| 4.90%, 03/06/48(a) |
972 | 835,075 | ||||||
| 5.21%, 03/08/47 |
1,975 | 1,776,393 | ||||||
| 5.52%, 03/01/49 (Call 09/01/48) |
890 | 831,779 | ||||||
| 7.05%, 06/20/36 |
1,873 | 2,062,705 | ||||||
| TELUS Corp. |
||||||||
| 4.30%, 06/15/49 (Call 12/15/48) |
167 | 136,026 | ||||||
| 4.60%, 11/16/48 (Call 05/16/48) |
448 | 383,064 | ||||||
| T-Mobile USA Inc. |
||||||||
| 3.00%, 02/15/41 (Call 08/15/40) |
2,072 | 1,496,544 | ||||||
| 3.30%, 02/15/51 (Call 08/15/50) |
2,717 | 1,867,922 | ||||||
| 3.40%, 10/15/52 (Call 04/15/52) |
2,511 | 1,744,152 | ||||||
| 3.60%, 11/15/60 (Call 05/15/60) |
1,372 | 949,006 | ||||||
| 4.38%, 04/15/40 (Call 10/15/39) |
1,572 | 1,378,096 | ||||||
| 4.50%, 04/15/50 (Call 10/15/49) |
2,682 | 2,269,539 | ||||||
| 5.50%, 01/15/55 (Call 07/15/54) |
635 | 618,453 | ||||||
| 5.65%, 01/15/53 (Call 07/15/52) |
1,575 | 1,566,409 | ||||||
| 5.75%, 01/15/54 (Call 07/15/53) |
1,185 | 1,200,054 | ||||||
| 5.80%, 09/15/62 (Call 03/15/62) |
647 | 657,901 | ||||||
| S C H E D U L E O F I N V E S T M E N T S |
253 |
| Schedule of Investments (continued) February 29, 2024 |
iShares® 10+ Year Investment Grade Corporate Bond ETF (Percentages shown are based on Net Assets) |
| Security | Par (000) |
Value | ||||||
| Telecommunications (continued) |
||||||||
| 6.00%, 06/15/54 (Call 12/15/53)(a) |
$ | 910 | $ | 953,055 | ||||
| Verizon Communications Inc. |
||||||||
| 2.65%, 11/20/40 (Call 05/20/40) |
2,385 | 1,644,354 | ||||||
| 2.85%, 09/03/41 (Call 03/03/41) |
733 | 517,349 | ||||||
| 2.88%, 11/20/50 (Call 05/20/50)(a) |
2,210 | 1,407,885 | ||||||
| 2.99%, 10/30/56 (Call 04/30/56) |
3,173 | 1,971,437 | ||||||
| 3.00%, 11/20/60 (Call 05/20/60)(a) |
1,764 | 1,073,168 | ||||||
| 3.40%, 03/22/41 (Call 09/22/40) |
2,818 | 2,159,054 | ||||||
| 3.55%, 03/22/51 (Call 09/22/50)(a) |
3,573 | 2,594,733 | ||||||
| 3.70%, 03/22/61 (Call 09/22/60)(a) |
2,712 | 1,916,275 | ||||||
| 3.85%, 11/01/42 (Call 05/01/42) |
567 | 455,512 | ||||||
| 3.88%, 03/01/52 (Call 09/01/51)(a) |
1,024 | 790,838 | ||||||
| 4.00%, 03/22/50 (Call 09/22/49) |
1,044 | 824,339 | ||||||
| 4.13%, 08/15/46 |
1,065 | 875,974 | ||||||
| 4.27%, 01/15/36 |
1,205 | 1,094,404 | ||||||
| 4.40%, 11/01/34 (Call 05/01/34) |
1,557 | 1,448,207 | ||||||
| 4.52%, 09/15/48 |
1,177 | 1,029,883 | ||||||
| 4.67%, 03/15/55(a) |
714 | 630,960 | ||||||
| 4.75%, 11/01/41 |
361 | 332,310 | ||||||
| 4.81%, 03/15/39(a) |
992 | 927,371 | ||||||
| 4.86%, 08/21/46(a) |
2,245 | 2,057,641 | ||||||
| 5.01%, 04/15/49(a) |
415 | 400,892 | ||||||
| 5.01%, 08/21/54 |
310 | 287,789 | ||||||
| 5.25%, 03/16/37 |
956 | 954,538 | ||||||
| 5.50%, 03/16/47(a) |
458 | 459,618 | ||||||
| 5.50%, 02/23/54 (Call 08/23/53) |
245 | 242,048 | ||||||
| 5.85%, 09/15/35(a) |
405 | 423,844 | ||||||
| 6.55%, 09/15/43(a) |
672 | 750,118 | ||||||
| Vodafone Group PLC |
||||||||
| 4.25%, 09/17/50 |
1,438 | 1,131,573 | ||||||
| 4.38%, 02/19/43 |
1,220 | 1,026,942 | ||||||
| 4.88%, 06/19/49 |
1,631 | 1,412,206 | ||||||
| 5.00%, 05/30/38(a) |
120 | 115,582 | ||||||
| 5.13%, 06/19/59(a) |
206 | 181,200 | ||||||
| 5.25%, 05/30/48(a) |
981 | 914,961 | ||||||
| 5.63%, 02/10/53 (Call 08/10/52) |
648 | 627,060 | ||||||
| 5.75%, 02/10/63 (Call 08/10/62) |
220 | 215,202 | ||||||
| 6.15%, 02/27/37 |
1,659 | 1,730,338 | ||||||
| Xiaomi Best Time International Ltd., |
210 | 148,361 | ||||||
|
|
|
|||||||
| 119,680,412 | ||||||||
| Toys, Games & Hobbies — 0.1% | ||||||||
| Hasbro Inc. |
||||||||
| 5.10%, 05/15/44 (Call 11/15/43) |
246 | 206,434 | ||||||
| 6.35%, 03/15/40(a) |
507 | 512,068 | ||||||
| Mattel Inc. |
||||||||
| 5.45%, 11/01/41 (Call 05/01/41)(a) |
355 | 320,613 | ||||||
| 6.20%, 10/01/40(a) |
330 | 324,459 | ||||||
|
|
|
|||||||
| 1,363,574 | ||||||||
| Transportation — 3.5% | ||||||||
| Burlington Northern Santa Fe LLC |
||||||||
| 2.88%, 06/15/52 (Call 12/15/51) |
626 | 407,474 | ||||||
| 3.05%, 02/15/51 (Call 08/15/50) |
557 | 380,369 | ||||||
| 3.30%, 09/15/51 (Call 03/15/51)(a) |
862 | 617,175 | ||||||
| 3.55%, 02/15/50 (Call 08/15/49) |
775 | 584,621 | ||||||
| 3.90%, 08/01/46 (Call 02/01/46) |
681 | 550,267 | ||||||
| 4.05%, 06/15/48 (Call 12/15/47) |
719 | 595,064 | ||||||
| 4.13%, 06/15/47 (Call 12/15/46) |
740 | 616,893 | ||||||
| 4.15%, 04/01/45 (Call 10/01/44) |
905 | 764,627 | ||||||
| 4.15%, 12/15/48 (Call 06/15/48) |
654 | 547,513 | ||||||
| Security | Par (000) |
Value | ||||||
| Transportation (continued) |
||||||||
| 4.38%, 09/01/42 (Call 03/01/42) |
$ | 610 | $ | 540,996 | ||||
| 4.40%, 03/15/42 (Call 09/15/41) |
488 | 434,255 | ||||||
| 4.45%, 03/15/43 (Call 09/15/42) |
708 | 630,453 | ||||||
| 4.45%, 01/15/53 (Call 07/15/52) |
890 | 782,635 | ||||||
| 4.55%, 09/01/44 (Call 03/01/44) |
770 | 689,157 | ||||||
| 4.70%, 09/01/45 (Call 03/01/45) |
621 | 569,984 | ||||||
| 4.90%, 04/01/44 (Call 10/01/43) |
949 | 898,884 | ||||||
| 4.95%, 09/15/41 (Call 03/15/41) |
263 | 251,251 | ||||||
| 5.05%, 03/01/41 (Call 09/01/40) |
393 | 382,432 | ||||||
| 5.15%, 09/01/43 (Call 03/01/43) |
591 | 577,907 | ||||||
| 5.20%, 04/15/54 (Call 10/15/53) |
1,391 | 1,364,426 | ||||||
| 5.40%, 06/01/41 (Call 12/01/40) |
510 | 512,973 | ||||||
| 5.75%, 05/01/40 (Call 11/01/39) |
597 | 624,701 | ||||||
| 6.15%, 05/01/37 |
473 | 516,410 | ||||||
| 6.20%, 08/15/36 |
400 | 435,551 | ||||||
| Canadian National Railway Co. |
||||||||
| 2.45%, 05/01/50 (Call 11/01/49) |
158 | 98,348 | ||||||
| 3.20%, 08/02/46 (Call 02/02/46) |
317 | 234,851 | ||||||
| 3.50%, 11/15/42 (Call 05/15/42)(a) |
458 | 348,805 | ||||||
| 3.65%, 02/03/48 (Call 08/03/47) |
454 | 359,830 | ||||||
| 4.40%, 08/05/52 (Call 02/05/52) |
394 | 347,944 | ||||||
| 4.45%, 01/20/49 (Call 07/20/48) |
456 | 408,502 | ||||||
| 4.50%, 11/07/43 (Call 05/07/43) |
238 | 209,182 | ||||||
| 6.13%, 11/01/53 (Call 05/01/53) |
230 | 261,064 | ||||||
| 6.20%, 06/01/36 |
580 | 630,518 | ||||||
| 6.25%, 08/01/34 |
345 | 375,738 | ||||||
| 6.38%, 11/15/37(a) |
469 | 512,769 | ||||||
| 6.71%, 07/15/36(a) |
167 | 184,964 | ||||||
| Canadian Pacific Railway Co. |
||||||||
| 3.00%, 12/02/41 (Call 06/02/41) |
866 | 735,584 | ||||||
| 3.10%, 12/02/51 (Call 06/02/51)(a) |
1,690 | 1,148,467 | ||||||
| 3.50%, 05/01/50 (Call 11/01/49) |
785 | 575,401 | ||||||
| 4.20%, 11/15/69 (Call 05/15/69) |
236 | 184,566 | ||||||
| 4.30%, 05/15/43 (Call 11/15/42) |
166 | 141,222 | ||||||
| 4.70%, 05/01/48 (Call 11/01/47) |
443 | 389,776 | ||||||
| 4.80%, 09/15/35 (Call 03/15/35)(a) |
95 | 90,827 | ||||||
| 4.80%, 08/01/45 (Call 02/01/45) |
456 | 412,990 | ||||||
| 4.95%, 08/15/45 (Call 02/15/45) |
372 | 341,228 | ||||||
| 5.75%, 01/15/42 |
443 | 436,482 | ||||||
| 5.95%, 05/15/37 |
664 | 686,114 | ||||||
| 6.13%, 09/15/2115 (Call 03/15/2115) |
474 | 500,470 | ||||||
| Central Japan Railway Co., 4.25%, 11/24/45 |
141 | 120,050 | ||||||
| CSX Corp. |
||||||||
| 2.50%, 05/15/51 (Call 11/15/50)(a) |
513 | 312,519 | ||||||
| 3.35%, 09/15/49 (Call 03/15/49) |
590 | 423,463 | ||||||
| 3.80%, 11/01/46 (Call 05/01/46) |
632 | 498,051 | ||||||
| 3.80%, 04/15/50 (Call 10/15/49) |
374 | 289,913 | ||||||
| 3.95%, 05/01/50 (Call 11/01/49) |
562 | 452,090 | ||||||
| 4.10%, 03/15/44 (Call 09/15/43) |
842 | 710,011 | ||||||
| 4.25%, 11/01/66 (Call 05/01/66) |
316 | 253,260 | ||||||
| 4.30%, 03/01/48 (Call 09/01/47) |
795 | 681,144 | ||||||
| 4.40%, 03/01/43 (Call 09/01/42) |
232 | 205,251 | ||||||
| 4.50%, 03/15/49 (Call 09/15/48) |
349 | 305,040 | ||||||
| 4.50%, 11/15/52 (Call 05/15/52) |
800 | 701,255 | ||||||
| 4.50%, 08/01/54 (Call 02/01/54) |
186 | 162,101 | ||||||
| 4.65%, 03/01/68 (Call 09/01/67) |
190 | 163,550 | ||||||
| 4.75%, 05/30/42 (Call 11/30/41)(a) |
576 | 532,552 | ||||||
| 4.75%, 11/15/48 (Call 05/15/48) |
614 | 561,536 | ||||||
| 5.50%, 04/15/41 (Call 10/15/40) |
497 | 500,884 | ||||||
| 6.00%, 10/01/36 |
529 | 563,295 | ||||||
| 254 | 2 0 2 4 I S H A R E S A N N U A L R E P O R T T O S H A R E H O L D E R S |
| Schedule of Investments (continued) February 29, 2024 |
iShares® 10+ Year Investment Grade Corporate Bond ETF (Percentages shown are based on Net Assets) |
| Security | Par (000) |
Value | ||||||
| Transportation (continued) |
||||||||
| 6.15%, 05/01/37 |
$ | 791 | $ | 857,566 | ||||
| 6.22%, 04/30/40 |
584 | 632,998 | ||||||
| Empresa de los Ferrocarriles del Estado |
||||||||
| 3.07%, 08/18/50 (Call 02/18/50)(b) |
295 | 176,992 | ||||||
| 3.83%, 09/14/61 (Call 03/14/61)(b) |
585 | 386,073 | ||||||
| Empresa de Transporte de Pasajeros Metro SA |
||||||||
| 3.69%, 09/13/61 (Call 03/13/61)(a)(b) |
545 | 356,569 | ||||||
| 4.70%, 05/07/50 (Call 11/07/49)(a)(b) |
808 | 649,786 | ||||||
| 5.00%, 01/25/47 (Call 07/25/46)(a)(b) |
555 | 473,814 | ||||||
| ENA Master Trust, 4.00%, 05/19/48 |
230 | 160,885 | ||||||
| FedEx Corp. |
||||||||
| 3.25%, 05/15/41 (Call 11/15/40) |
391 | 289,488 | ||||||
| 3.88%, 08/01/42 |
560 | 444,506 | ||||||
| 3.90%, 02/01/35 |
275 | 242,692 | ||||||
| 4.05%, 02/15/48 (Call 08/15/47) |
812 | 639,497 | ||||||
| 4.10%, 04/15/43 |
525 | 428,159 | ||||||
| 4.10%, 02/01/45 |
721 | 577,671 | ||||||
| 4.40%, 01/15/47 (Call 07/15/46) |
670 | 556,555 | ||||||
| 4.50%, 02/01/65 |
209 | 162,973 | ||||||
| 4.55%, 04/01/46 (Call 10/01/45) |
984 | 837,799 | ||||||
| 4.75%, 11/15/45 (Call 05/15/45) |
1,214 | 1,063,080 | ||||||
| 4.95%, 10/17/48 (Call 04/17/48)(a) |
732 | 661,009 | ||||||
| 5.10%, 01/15/44 |
710 | 658,278 | ||||||
| 5.25%, 05/15/50 (Call 11/15/49)(a) |
1,175 | 1,107,546 | ||||||
| Norfolk Southern Corp. |
||||||||
| 2.90%, 08/25/51 (Call 02/25/51) |
585 | 376,383 | ||||||
| 3.05%, 05/15/50 (Call 11/15/49)(a) |
768 | 514,712 | ||||||
| 3.16%, 05/15/55 (Call 11/15/54) |
767 | 503,810 | ||||||
| 3.40%, 11/01/49 (Call 05/01/49) |
357 | 256,716 | ||||||
| 3.70%, 03/15/53 (Call 09/15/52) |
403 | 299,678 | ||||||
| 3.94%, 11/01/47 (Call 05/01/47) |
661 | 523,558 | ||||||
| 3.95%, 10/01/42 (Call 04/01/42) |
620 | 508,531 | ||||||
| 4.05%, 08/15/52 (Call 02/15/52) |
698 | 558,269 | ||||||
| 4.10%, 05/15/49 (Call 11/15/48) |
379 | 305,121 | ||||||
| 4.10%, 05/15/2121 (Call 11/15/2120)(a) |
280 | 201,586 | ||||||
| 4.15%, 02/28/48 (Call 08/28/47) |
510 | 421,563 | ||||||
| 4.45%, 06/15/45 (Call 12/15/44) |
499 | 430,131 | ||||||
| 4.55%, 06/01/53 (Call 12/01/52) |
600 | 521,984 | ||||||
| 4.65%, 01/15/46 (Call 07/15/45) |
506 | 448,704 | ||||||
| 4.80%, 08/15/43 (Call 02/15/43) |
245 | 216,413 | ||||||
| 4.84%, 10/01/41 |
563 | 523,083 | ||||||
| 5.10%, 12/31/49 (Call 02/01/2118) |
180 | 156,364 | ||||||
| 5.35%, 08/01/54 (Call 02/01/54) |
1,005 | 984,877 | ||||||
| 5.95%, 03/15/64 (Call 09/15/63)(a) |
610 | 643,363 | ||||||
| Polar Tankers Inc., 5.95%, 05/10/37(a)(b) |
877 | 889,354 | ||||||
| TTX Co. |
||||||||
| 3.90%, 02/01/45 (Call 08/01/44)(b) |
240 | 191,506 | ||||||
| 4.20%, 07/01/46 (Call 01/01/46)(b) |
310 | 253,589 | ||||||
| 4.60%, 02/01/49 (Call 08/01/48)(b) |
311 | 271,851 | ||||||
| 4.65%, 06/15/44(b) |
240 | 207,075 | ||||||
| 5.65%, 12/01/52 (Call 06/01/52)(b) |
250 | 254,122 | ||||||
| Union Pacific Corp. |
||||||||
| 2.89%, 04/06/36 (Call 01/06/36) |
565 | 455,733 | ||||||
| 2.95%, 03/10/52 (Call 09/10/51)(a) |
867 | 579,784 | ||||||
| 2.97%, 09/16/62 (Call 03/16/62) |
831 | 517,401 | ||||||
| 3.20%, 05/20/41 (Call 11/20/40) |
623 | 481,081 | ||||||
| 3.25%, 02/05/50 (Call 08/05/49) |
1,545 | 1,112,596 | ||||||
| 3.35%, 08/15/46 (Call 02/15/46) |
269 | 194,583 | ||||||
| 3.38%, 02/01/35 (Call 08/01/34) |
435 | 370,564 | ||||||
| 3.38%, 02/14/42 (Call 08/14/41) |
275 | 215,167 | ||||||
| Security | Par (000) |
Value | ||||||
| Transportation (continued) |
||||||||
| 3.50%, 02/14/53 (Call 08/14/52)(a) |
$ | 1,165 | $ | 867,125 | ||||
| 3.55%, 08/15/39 (Call 02/15/39) |
232 | 190,143 | ||||||
| 3.55%, 05/20/61 (Call 11/20/60) |
560 | 401,284 | ||||||
| 3.60%, 09/15/37 (Call 03/15/37) |
348 | 297,556 | ||||||
| 3.75%, 02/05/70 (Call 08/05/69)(a) |
540 | 394,981 | ||||||
| 3.80%, 10/01/51 (Call 04/01/51) |
1,090 | 862,402 | ||||||
| 3.80%, 04/06/71 (Call 10/06/70) |
816 | 597,954 | ||||||
| 3.84%, 03/20/60 (Call 09/20/59) |
1,503 | 1,141,744 | ||||||
| 3.85%, 02/14/72 (Call 08/14/71) |
405 | 298,749 | ||||||
| 3.88%, 02/01/55 (Call 08/01/54) |
324 | 252,725 | ||||||
| 3.95%, 08/15/59 (Call 02/15/59)(a) |
332 | 257,455 | ||||||
| 4.00%, 04/15/47 (Call 10/15/46) |
460 | 376,401 | ||||||
| 4.05%, 11/15/45 (Call 05/15/45) |
362 | 296,936 | ||||||
| 4.05%, 03/01/46 (Call 09/01/45) |
443 | 365,765 | ||||||
| 4.10%, 09/15/67 (Call 03/15/67)(a) |
403 | 319,136 | ||||||
| 4.30%, 03/01/49 (Call 09/01/48) |
593 | 502,749 | ||||||
| 4.50%, 09/10/48 (Call 03/10/48) |
335 | 293,986 | ||||||
| 4.95%, 09/09/52 (Call 03/09/52)(a) |
558 | 537,167 | ||||||
| 4.95%, 05/15/53 (Call 11/15/52) |
420 | 401,916 | ||||||
| 5.15%, 01/20/63 (Call 07/20/62) |
305 | 292,161 | ||||||
| United Parcel Service Inc. |
||||||||
| 3.40%, 11/15/46 (Call 05/15/46) |
450 | 343,895 | ||||||
| 3.40%, 09/01/49 (Call 03/01/49)(a) |
482 | 361,068 | ||||||
| 3.63%, 10/01/42 |
573 | 460,124 | ||||||
| 3.75%, 11/15/47 (Call 05/15/47) |
984 | 780,264 | ||||||
| 4.25%, 03/15/49 (Call 09/15/48) |
758 | 654,294 | ||||||
| 4.88%, 11/15/40 (Call 05/15/40) |
565 | 541,445 | ||||||
| 5.05%, 03/03/53 (Call 09/03/52)(a) |
1,029 | 998,951 | ||||||
| 5.20%, 04/01/40 (Call 10/01/39) |
166 | 165,055 | ||||||
| 5.30%, 04/01/50 (Call 10/01/49)(a) |
1,017 | 1,020,023 | ||||||
| 6.20%, 01/15/38(a) |
1,611 | 1,763,181 | ||||||
|
|
|
|||||||
| 73,117,448 | ||||||||
| Trucking & Leasing — 0.0% | ||||||||
| GATX Corp. |
||||||||
| 3.10%, 06/01/51 (Call 12/01/50)(a) |
474 | 305,387 | ||||||
| 4.50%, 03/30/45 (Call 09/30/44) |
295 | 237,028 | ||||||
| 5.20%, 03/15/44 (Call 09/15/43) |
309 | 281,764 | ||||||
|
|
|
|||||||
| 824,179 | ||||||||
| Water — 0.2% | ||||||||
| American Water Capital Corp. |
||||||||
| 3.25%, 06/01/51 (Call 12/01/50)(a) |
445 | 313,016 | ||||||
| 3.45%, 05/01/50 (Call 11/01/49) |
405 | 296,386 | ||||||
| 3.75%, 09/01/47 (Call 03/01/47)(a) |
625 | 486,938 | ||||||
| 4.00%, 12/01/46 (Call 06/01/46) |
315 | 255,152 | ||||||
| 4.15%, 06/01/49 (Call 12/01/48) |
490 | 404,987 | ||||||
| 4.20%, 09/01/48 (Call 03/01/48) |
680 | 572,376 | ||||||
| 4.30%, 12/01/42 (Call 06/01/42) |
281 | 243,771 | ||||||
| 4.30%, 09/01/45 (Call 03/01/45) |
331 | 282,349 | ||||||
| 5.45%, 03/01/54 (Call 09/01/53) |
425 | 418,065 | ||||||
| 6.59%, 10/15/37 |
552 | 620,737 | ||||||
| Essential Utilities Inc. |
||||||||
| 3.35%, 04/15/50 (Call 10/15/49)(a) |
461 | 318,561 | ||||||
| 4.28%, 05/01/49 (Call 11/01/48)(a) |
350 | 282,855 | ||||||
| 5.30%, 05/01/52 (Call 11/01/51) |
415 | 387,210 | ||||||
|
|
|
|||||||
| 4,882,403 | ||||||||
|
|
|
|||||||
| Total Long-Term Investments — 97.7% |
2,057,857,494 | |||||||
|
|
|
|||||||
| S C H E D U L E O F I N V E S T M E N T S |
255 |
| Schedule of Investments (continued) February 29, 2024 |
iShares® 10+ Year Investment Grade Corporate Bond ETF (Percentages shown are based on Net Assets) |
| Security | Shares |
Value | ||||||
| Short-Term Securities |
||||||||
| Money Market Funds — 11.6% | ||||||||
| BlackRock Cash Funds: Institutional, SL Agency Shares, 5.50%(g)(h)(i) |
233,726,059 | $ | 233,842,922 | |||||
| BlackRock Cash Funds: Treasury, SL Agency Shares, 5.30%(g)(h) |
11,450,000 | 11,450,000 | ||||||
|
|
|
|||||||
| Total Short-Term Securities — 11.6% |
245,292,922 | |||||||
|
|
|
|||||||
| Total Investments — 109.3% |
2,303,150,416 | |||||||
| Liabilities in Excess of Other Assets — (9.3)% |
|
(195,631,195 | ) | |||||
|
|
|
|||||||
| Net Assets — 100.0% |
$ | 2,107,519,221 | ||||||
|
|
|
|||||||
| (a) | All or a portion of this security is on loan. |
| (b) | Security exempt from registration pursuant to Rule 144A under the Securities Act of 1933, as amended. These securities may be resold in transactions exempt from registration to qualified institutional investors. |
| (c) | Step coupon security. Coupon rate will either increase (step-up bond) or decrease (step-down bond) at regular intervals until maturity. Interest rate shown reflects the rate currently in effect. |
| (d) | Variable rate security. Interest rate resets periodically. The rate shown is the effective interest rate as of period end. Security description also includes the reference rate and spread if published and available. |
| (e) | Perpetual security with no stated maturity date. |
| (f) | Zero-coupon bond. |
| (g) | Affiliate of the Fund. |
| (h) | Annualized 7-day yield as of period end. |
| (i) | All or a portion of this security was purchased with the cash collateral from loaned securities. |
Affiliates
Investments in issuers considered to be affiliate(s) of the Fund during the year ended February 29, 2024 for purposes of Section 2(a)(3) of the Investment Company Act of 1940, as amended, were as follows:
| Affiliated Issuer | Value at 02/28/23 |
Purchases at Cost |
Proceeds from Sale |
Net Realized Gain (Loss) |
Change in |
Value at 02/29/24 |
Shares Held at 02/29/24 |
Income | Capital Gain Distributions from Underlying Funds |
|||||||||||||||||||||||||||||||||||||
| BlackRock Cash Funds: Institutional, |
$ | 124,087,027 | $ | 109,767,448 | (a) | $ | — | $ | (15,816 | ) | $ | 4,263 | $ | 233,842,922 | 233,726,059 | $ | 734,398 | (b) | $ | — | ||||||||||||||||||||||||||
| BlackRock Cash Funds: Treasury, |
14,420,000 | — | (2,970,000 | )(a) | — | — | 11,450,000 | 11,450,000 | 354,908 | — | ||||||||||||||||||||||||||||||||||||
|
|
|
|
|
|
|
|
|
|
|
|||||||||||||||||||||||||||||||||||||
| $ | (15,816 | ) | $ | 4,263 | $ | 245,292,922 | $ | 1,089,306 | $ | — | ||||||||||||||||||||||||||||||||||||
|
|
|
|
|
|
|
|
|
|
|
|||||||||||||||||||||||||||||||||||||
| (a) | Represents net amount purchased (sold). |
| (b) | All or a portion represents securities lending income earned from the reinvestment of cash collateral from loaned securities, net of fees and collateral investment expenses, and other payments to and from borrowers of securities. |
| 256 | 2 0 2 4 I S H A R E S A N N U A L R E P O R T T O S H A R E H O L D E R S |
| Schedule of Investments (continued) February 29, 2024 |
iShares® 10+ Year Investment Grade Corporate Bond ETF |
Fair Value Hierarchy as of Period End
Various inputs are used in determining the fair value of financial instruments. For a description of the input levels and information about the Fund’s policy regarding valuation of financial instruments, refer to the Notes to Financial Statements.
The following table summarizes the Fund’s financial instruments categorized in the fair value hierarchy. The breakdown of the Fund’s financial instruments into major categories is disclosed in the Schedule of Investments above.
|
|
||||||||||||||||
| Level 1 | Level 2 | Level 3 | Total | |||||||||||||
|
|
||||||||||||||||
| Assets |
||||||||||||||||
| Investments |
||||||||||||||||
| Long-Term Investments |
||||||||||||||||
| Corporate Bonds & Notes |
$ | — | $ | 2,057,857,494 | $ | — | $ | 2,057,857,494 | ||||||||
| Short-Term Securities |
||||||||||||||||
| Money Market Funds |
245,292,922 | — | — | 245,292,922 | ||||||||||||
|
|
|
|
|
|
|
|
|
|||||||||
| $ | 245,292,922 | $ | 2,057,857,494 | $ | — | $ | 2,303,150,416 | |||||||||
|
|
|
|
|
|
|
|
|
|||||||||
See notes to financial statements.
| S C H E D U L E O F I N V E S T M E N T S |
257 |
Statements of Assets and Liabilities
February 29, 2024
| iShares BBB Rated Corporate Bond ETF |
iShares Broad USD Investment Grade ETF |
iShares 1-5 Year Investment Bond ETF |
iShares 5-10 Year Investment Grade Corporate Bond ETF |
|||||||||||||||||||||||||
|
|
||||||||||||||||||||||||||||
| ASSETS |
|
|||||||||||||||||||||||||||
| Investments, at value — unaffiliated(a)(b) |
$ | 32,670,697 | $ | 10,336,000,082 | $ | 21,096,309,025 | $ | 12,356,708,003 | ||||||||||||||||||||
| Investments, at value — affiliated(c) |
3,381,987 | 1,227,903,118 | 1,676,020,654 | 1,790,267,820 | ||||||||||||||||||||||||
| Cash |
9,724 | — | — | — | ||||||||||||||||||||||||
| Foreign currency, at value(d) |
— | 83 | 55 | — | ||||||||||||||||||||||||
| Receivables: |
||||||||||||||||||||||||||||
| Investments sold |
214,675 | 36,424,825 | 85,087,510 | 35,583,765 | ||||||||||||||||||||||||
| Securities lending income — affiliated |
458 | 318,419 | 418,663 | 478,441 | ||||||||||||||||||||||||
| Capital shares sold |
— | 3,577,587 | 2,706,972 | 2,666,712 | ||||||||||||||||||||||||
| Dividends — affiliated |
2,106 | 78,436 | 110,953 | 161,592 | ||||||||||||||||||||||||
| Interest — unaffiliated |
409,921 | 123,829,535 | 220,969,893 | 141,989,503 | ||||||||||||||||||||||||
|
|
|
|
|
|
|
|
|
|||||||||||||||||||||
| Total assets |
36,689,568 | 11,728,132,085 | 23,081,623,725 | 14,327,855,836 | ||||||||||||||||||||||||
|
|
|
|
|
|
|
|
|
|||||||||||||||||||||
| LIABILITIES |
||||||||||||||||||||||||||||
| Bank overdraft |
— | 189,775 | 135,986 | 2,271,390 | ||||||||||||||||||||||||
| Collateral on securities loaned, at value |
2,754,078 | 1,213,303,280 | 1,626,669,165 | 1,731,817,648 | ||||||||||||||||||||||||
| Payables: |
||||||||||||||||||||||||||||
| Investments purchased |
— | 34,712,922 | 100,274,968 | 53,679,506 | ||||||||||||||||||||||||
| Capital shares redeemed |
— | 848,657 | 2,197,983 | 98,466 | ||||||||||||||||||||||||
| Investment advisory fees |
3,888 | 331,933 | 682,304 | 388,232 | ||||||||||||||||||||||||
|
|
|
|
|
|
|
|
|
|||||||||||||||||||||
| Total liabilities |
2,757,966 | 1,249,386,567 | 1,729,960,406 | 1,788,255,242 | ||||||||||||||||||||||||
|
|
|
|
|
|
|
|
|
|||||||||||||||||||||
| Commitments and contingent liabilities |
||||||||||||||||||||||||||||
| NET ASSETS |
$ | 33,931,602 | $ | 10,478,745,518 | $ | 21,351,663,319 | $ | 12,539,600,594 | ||||||||||||||||||||
|
|
|
|
|
|
|
|
|
|||||||||||||||||||||
| NET ASSETS CONSIST OF |
||||||||||||||||||||||||||||
| Paid-in capital |
$ | 37,286,610 | $ | 11,495,887,089 | $ | 22,305,442,618 | $ | 14,064,598,630 | ||||||||||||||||||||
| Accumulated loss |
(3,355,008 | ) | (1,017,141,571 | ) | (953,779,299 | ) | (1,524,998,036 | ) | ||||||||||||||||||||
|
|
|
|
|
|
|
|
|
|||||||||||||||||||||
| NET ASSETS |
$ | 33,931,602 | $ | 10,478,745,518 | $ | 21,351,663,319 | $ | 12,539,600,594 | ||||||||||||||||||||
|
|
|
|
|
|
|
|
|
|||||||||||||||||||||
| NET ASSET VALUE |
||||||||||||||||||||||||||||
| Shares outstanding |
400,000 | 208,100,000 | 418,050,000 | 245,400,000 | ||||||||||||||||||||||||
|
|
|
|
|
|
|
|
|
|||||||||||||||||||||
| Net asset value |
$ | 84.83 | $ | 50.35 | $ | 51.07 | $ | 51.10 | ||||||||||||||||||||
|
|
|
|
|
|
|
|
|
|||||||||||||||||||||
| Shares authorized |
Unlimited | Unlimited | Unlimited | Unlimited | ||||||||||||||||||||||||
|
|
|
|
|
|
|
|
|
|||||||||||||||||||||
| Par value |
None | None | None | None | ||||||||||||||||||||||||
|
|
|
|
|
|
|
|
|
|||||||||||||||||||||
| (a) Investments, at cost — unaffiliated |
$ | 35,169,183 | $ | 11,252,871,900 | $ | 21,682,861,259 | $ | 13,321,540,059 | ||||||||||||||||||||
| (b) Securities loaned, at value |
$ | 2,658,199 | $ | 1,171,249,623 | $ | 1,571,458,400 | $ | 1,672,759,782 | ||||||||||||||||||||
| (c) Investments, at cost — affiliated |
$ | 3,381,217 | $ | 1,227,506,429 | $ | 1,675,363,139 | $ | 1,789,642,318 | ||||||||||||||||||||
| (d) Foreign currency, at cost |
$ | — | $ | 78 | $ | 53 | $ | — | ||||||||||||||||||||
See notes to financial statements.
| 258 | 2 0 2 4 I S H A R E S A N N U A L R E P O R T T O S H A R E H O L D E R S |
Statements of Assets and Liabilities (continued)
February 29, 2024
| iShares 10+ Year Investment Grade Corporate Bond ETF |
||||
|
|
||||
| ASSETS |
| |||
| Investments, at value — unaffiliated(a)(b) |
$ | 2,057,857,494 | ||
| Investments, at value — affiliated(c) |
245,292,922 | |||
| Cash |
10,918 | |||
| Receivables: |
||||
| Investments sold |
12,092,892 | |||
| Securities lending income — affiliated |
66,517 | |||
| Capital shares sold |
1,760,930 | |||
| Dividends — affiliated |
48,817 | |||
| Interest — unaffiliated |
30,416,589 | |||
|
|
|
|||
| Total assets |
2,347,547,079 | |||
|
|
|
|||
| LIABILITIES |
||||
| Collateral on securities loaned, at value |
233,809,513 | |||
| Payables: |
||||
| Investments purchased |
5,925,515 | |||
| Capital shares redeemed |
225,845 | |||
| Investment advisory fees |
66,985 | |||
|
|
|
|||
| Total liabilities |
240,027,858 | |||
|
|
|
|||
| Commitments and contingent liabilities |
||||
| NET ASSETS |
$ | 2,107,519,221 | ||
|
|
|
|||
| NET ASSETS CONSIST OF |
||||
| Paid-in capital |
$ | 2,579,110,793 | ||
| Accumulated loss |
(471,591,572 | ) | ||
|
|
|
|||
| NET ASSETS |
$ | 2,107,519,221 | ||
|
|
|
|||
| NET ASSETVALUE |
||||
| Shares outstanding |
41,500,000 | |||
|
|
|
|||
| Net asset value |
$ | 50.78 | ||
|
|
|
|||
| Shares authorized |
Unlimited | |||
|
|
|
|||
| Par value |
None | |||
|
|
|
|||
| (a) Investments, at cost — unaffiliated |
$ | 2,452,457,628 | ||
| (b) Securities loaned, at value |
$ | 225,909,408 | ||
| (c) Investments, at cost — affiliated |
$ | 245,194,548 | ||
See notes to financial statements.
| F I N A N C I A L S T A T E M E N T S |
259 |
Year Ended February 29, 2024
| iShares BBB Rated |
iShares Broad USD Bond ETF |
iShares 1-5 Year Investment Corporate Bond ETF |
iShares 5-10 Year Corporate Bond ETF |
|||||||||||||||||||||||||
|
|
||||||||||||||||||||||||||||
| INVESTMENT INCOME |
||||||||||||||||||||||||||||
| Dividends — affiliated |
$ | 39,761 | $ | 2,207,473 | $ | 2,710,497 | $ | 2,297,629 | ||||||||||||||||||||
| Interest — unaffiliated |
1,156,653 | 389,949,923 | 766,227,145 | 459,915,393 | ||||||||||||||||||||||||
| Securities lending income — affiliated — net |
7,061 | 3,800,503 | 5,854,331 | 5,874,822 | ||||||||||||||||||||||||
| Other income — unaffiliated |
399 | 35,764 | 56,472 | 21,348 | ||||||||||||||||||||||||
| Foreign taxes withheld |
— | (1,738 | ) | (5,274 | ) | — | ||||||||||||||||||||||
|
|
|
|
|
|
|
|
|
|||||||||||||||||||||
| Total investment income |
1,203,874 | 395,991,925 | 774,843,171 | 468,109,192 | ||||||||||||||||||||||||
|
|
|
|
|
|
|
|
|
|||||||||||||||||||||
| EXPENSES |
||||||||||||||||||||||||||||
| Investment advisory |
41,593 | 3,732,573 | 9,034,670 | 4,608,906 | ||||||||||||||||||||||||
| Interest expense |
— | 9,132 | 1,910 | 2,907 | ||||||||||||||||||||||||
|
|
|
|
|
|
|
|
|
|||||||||||||||||||||
| Total expenses |
41,593 | 3,741,705 | 9,036,580 | 4,611,813 | ||||||||||||||||||||||||
|
|
|
|
|
|
|
|
|
|||||||||||||||||||||
| Net investment income |
1,162,281 | 392,250,220 | 765,806,591 | 463,497,379 | ||||||||||||||||||||||||
|
|
|
|
|
|
|
|
|
|||||||||||||||||||||
| REALIZED AND UNREALIZED GAIN (LOSS) |
||||||||||||||||||||||||||||
| Net realized gain (loss) from: |
||||||||||||||||||||||||||||
| Investments — unaffiliated |
(450,944 | ) | (58,121,171 | ) | (214,723,418 | ) | (296,552,735 | ) | ||||||||||||||||||||
| Investments — affiliated |
224 | (53,157 | ) | 143,234 | (95,544 | ) | ||||||||||||||||||||||
| In-kind redemptions — unaffiliated(a) |
(996,690 | ) | (25,841,090 | ) | (199,912,854 | ) | (9,606,642 | ) | ||||||||||||||||||||
|
|
|
|
|
|
|
|
|
|||||||||||||||||||||
| (1,447,410 | ) | (84,015,418 | ) | (414,493,038 | ) | (306,254,921 | ) | |||||||||||||||||||||
|
|
|
|
|
|
|
|
|
|||||||||||||||||||||
| Net change in unrealized appreciation (depreciation) on: |
||||||||||||||||||||||||||||
| Investments — unaffiliated |
2,182,960 | 234,705,588 | 906,939,072 | 585,953,213 | ||||||||||||||||||||||||
| Investments — affiliated |
(467 | ) | (54,092 | ) | (384,432 | ) | (109,615 | ) | ||||||||||||||||||||
| Foreign currency translations |
— | 2 | 1 | — | ||||||||||||||||||||||||
|
|
|
|
|
|
|
|
|
|||||||||||||||||||||
| 2,182,493 | 234,651,498 | 906,554,641 | 585,843,598 | |||||||||||||||||||||||||
|
|
|
|
|
|
|
|
|
|||||||||||||||||||||
| Net realized and unrealized gain |
735,083 | 150,636,080 | 492,061,603 | 279,588,677 | ||||||||||||||||||||||||
|
|
|
|
|
|
|
|
|
|||||||||||||||||||||
| NET INCREASE IN NET ASSETS RESULTING FROM OPERATIONS |
$ | 1,897,364 | $ | 542,886,300 | $ | 1,257,868,194 | $ | 743,086,056 | ||||||||||||||||||||
|
|
|
|
|
|
|
|
|
|||||||||||||||||||||
| (a) | See Note 2 of the Notes to Financial Statements. |
See notes to financial statements.
| 260 | 2 0 2 4 I S H A R E S A N N U A L R E P O R T T O S H A R E H O L D E R S |
Statements of Operations (continued)
Year Ended February 29, 2024
| iShares 10+ Year Investment Grade Corporate Bond ETF |
||||
|
|
||||
| INVESTMENT INCOME |
||||
| Dividends — affiliated |
$ | 354,908 | ||
| Interest — unaffiliated |
92,806,579 | |||
| Securities lending income — affiliated — net |
734,398 | |||
| Other income — unaffiliated |
6,724 | |||
|
|
|
|||
| Total investment income |
93,902,609 | |||
|
|
|
|||
| EXPENSES |
||||
| Investment advisory |
755,717 | |||
| Interest expense |
12 | |||
|
|
|
|||
| Total expenses |
755,729 | |||
|
|
|
|||
| Net investment income |
93,146,880 | |||
|
|
|
|||
| REALIZED AND UNREALIZED GAIN (LOSS) |
||||
| Net realized gain (loss) from: |
||||
| Investments — unaffiliated |
(35,275,298 | ) | ||
| Investments — affiliated |
(15,816 | ) | ||
| In-kind redemptions — unaffiliated(a) |
(9,417,307 | ) | ||
|
|
|
|||
| (44,708,421 | ) | |||
|
|
|
|||
| Net change in unrealized appreciation (depreciation) on: |
||||
| Investments — unaffiliated |
51,648,166 | |||
| Investments — affiliated |
4,263 | |||
|
|
|
|||
| 51,652,429 | ||||
|
|
|
|||
| Net realized and unrealized gain |
6,944,008 | |||
|
|
|
|||
| NET INCREASE IN NET ASSETS RESULTING FROM OPERATIONS |
$ | 100,090,888 | ||
|
|
|
|||
| (a) | See Note 2 of the Notes to Financial Statements. |
See notes to financial statements.
| F I N A N C I A L S T A T E M E N T S |
261 |
Statements of Changes in Net Assets
| iShares BBB Rated Corporate Bond ETF |
iShares Broad USD Investment Grade Corporate Bond ETF |
|||||||||||||||||||||||||||||||||||
|
|
|
|
|
|||||||||||||||||||||||||||||||||
| |
Year Ended 02/29/24 |
|
|
Year Ended 02/28/23 |
|
|
Year Ended 02/29/24 |
|
|
Year Ended 02/28/23 |
| |||||||||||||||||||||||||
|
|
||||||||||||||||||||||||||||||||||||
| INCREASE (DECREASE) IN NET ASSETS |
||||||||||||||||||||||||||||||||||||
| OPERATIONS |
||||||||||||||||||||||||||||||||||||
| Net investment income |
$ | 1,162,281 | $ | 1,292,119 | $ | 392,250,220 | $ | 226,482,444 | ||||||||||||||||||||||||||||
| Net realized loss |
(1,447,410 | ) | (7,788,010 | ) | (84,015,418 | ) | (149,612,711 | ) | ||||||||||||||||||||||||||||
| Net change in unrealized appreciation (depreciation) |
2,182,493 | (1,172,525 | ) | 234,651,498 | (770,111,027 | ) | ||||||||||||||||||||||||||||||
|
|
|
|
|
|
|
|
|
|||||||||||||||||||||||||||||
| Net increase (decrease) in net assets resulting from operations |
1,897,364 | (7,668,416 | ) | 542,886,300 | (693,241,294 | ) | ||||||||||||||||||||||||||||||
|
|
|
|
|
|
|
|
|
|||||||||||||||||||||||||||||
| DISTRIBUTIONS TO SHAREHOLDERS(a) |
||||||||||||||||||||||||||||||||||||
| Decrease in net assets resulting from distributions to shareholders |
(1,115,723 | ) | (1,613,872 | ) | (381,607,770 | ) | (216,611,047 | ) | ||||||||||||||||||||||||||||
|
|
|
|
|
|
|
|
|
|||||||||||||||||||||||||||||
| CAPITAL SHARE TRANSACTIONS |
||||||||||||||||||||||||||||||||||||
| Net increase (decrease) in net assets derived from capital share transactions |
8,316,480 | (37,800,662 | ) | 2,077,031,907 | 2,568,216,178 | |||||||||||||||||||||||||||||||
|
|
|
|
|
|
|
|
|
|||||||||||||||||||||||||||||
| NET ASSETS |
||||||||||||||||||||||||||||||||||||
| Total increase (decrease) in net assets |
9,098,121 | (47,082,950 | ) | 2,238,310,437 | 1,658,363,837 | |||||||||||||||||||||||||||||||
| Beginning of year |
24,833,481 | 71,916,431 | 8,240,435,081 | 6,582,071,244 | ||||||||||||||||||||||||||||||||
|
|
|
|
|
|
|
|
|
|||||||||||||||||||||||||||||
| End of year |
$ | 33,931,602 | $ | 24,833,481 | $ | 10,478,745,518 | $ | 8,240,435,081 | ||||||||||||||||||||||||||||
|
|
|
|
|
|
|
|
|
|||||||||||||||||||||||||||||
| (a) | Distributions for annual periods determined in accordance with U.S. federal income tax regulations. |
See notes to financial statements.
| 262 | 2 0 2 4 I S H A R E S A N N U A L R E P O R T T O S H A R E H O L D E R S |
Statements of Changes in Net Assets (continued)
| iShares 1-5 Year Investment Grade Corporate Bond ETF |
iShares 5-10 Year Investment Grade Corporate Bond ETF |
|||||||||||||||||||||||||||||||||||
|
|
|
|
|
|||||||||||||||||||||||||||||||||
| |
Year Ended 02/29/24 |
|
|
Year Ended 02/28/23 |
|
|
Year Ended 02/29/24 |
|
|
Year Ended 02/28/23 |
| |||||||||||||||||||||||||
|
|
||||||||||||||||||||||||||||||||||||
| INCREASE (DECREASE) IN NET ASSETS |
||||||||||||||||||||||||||||||||||||
| OPERATIONS |
||||||||||||||||||||||||||||||||||||
| Net investment income |
$ | 765,806,591 | $ | 485,018,271 | $ | 463,497,379 | $ | 307,490,313 | ||||||||||||||||||||||||||||
| Net realized loss |
(414,493,038 | ) | (294,233,741 | ) | (306,254,921 | ) | (410,662,939 | ) | ||||||||||||||||||||||||||||
| Net change in unrealized appreciation (depreciation) |
906,554,641 | (890,572,813 | ) | 585,843,598 | (967,731,868 | ) | ||||||||||||||||||||||||||||||
|
|
|
|
|
|
|
|
|
|||||||||||||||||||||||||||||
| Net increase (decrease) in net assets resulting from operations |
1,257,868,194 | (699,788,283 | ) | 743,086,056 | (1,070,904,494 | ) | ||||||||||||||||||||||||||||||
|
|
|
|
|
|
|
|
|
|||||||||||||||||||||||||||||
| DISTRIBUTIONS TO SHAREHOLDERS(a) |
||||||||||||||||||||||||||||||||||||
| Decrease in net assets resulting from distributions to shareholders |
(768,525,086 | ) | (471,445,863 | ) | (456,554,851 | ) | (299,895,987 | ) | ||||||||||||||||||||||||||||
|
|
|
|
|
|
|
|
|
|||||||||||||||||||||||||||||
| CAPITAL SHARE TRANSACTIONS |
||||||||||||||||||||||||||||||||||||
| Net increase (decrease) in net assets derived from capital share transactions |
(3,385,791,059 | ) | 2,983,143,833 | 1,226,381,589 | 1,208,588,801 | |||||||||||||||||||||||||||||||
|
|
|
|
|
|
|
|
|
|||||||||||||||||||||||||||||
| NET ASSETS |
||||||||||||||||||||||||||||||||||||
| Total increase (decrease) in net assets |
(2,896,447,951 | ) | 1,811,909,687 | 1,512,912,794 | (162,211,680 | ) | ||||||||||||||||||||||||||||||
| Beginning of year |
24,248,111,270 | 22,436,201,583 | 11,026,687,800 | 11,188,899,480 | ||||||||||||||||||||||||||||||||
|
|
|
|
|
|
|
|
|
|||||||||||||||||||||||||||||
| End of year |
$ | 21,351,663,319 | $ | 24,248,111,270 | $ | 12,539,600,594 | $ | 11,026,687,800 | ||||||||||||||||||||||||||||
|
|
|
|
|
|
|
|
|
|||||||||||||||||||||||||||||
| (a) | Distributions for annual periods determined in accordance with U.S. federal income tax regulations. |
See notes to financial statements.
| F I N A N C I A L S T A T E M E N T S |
263 |
Statements of Changes in Net Assets (continued)
| iShares 10+ Year Investment Grade Corporate Bond ETF |
||||||||||||||||
| Year Ended 02/29/24 |
Year Ended 02/28/23 |
|||||||||||||||
|
|
||||||||||||||||
| INCREASE (DECREASE) IN NET ASSETS |
||||||||||||||||
| OPERATIONS |
||||||||||||||||
| Net investment income |
$ | 93,146,880 | $ | 62,875,908 | ||||||||||||
| Net realized loss |
(44,708,421 | ) | (116,278,064 | ) | ||||||||||||
| Net change in unrealized appreciation (depreciation) |
51,652,429 | (245,428,510 | ) | |||||||||||||
|
|
|
|
|
|||||||||||||
| Net increase (decrease) in net assets resulting from operations |
100,090,888 | (298,830,666 | ) | |||||||||||||
|
|
|
|
|
|||||||||||||
| DISTRIBUTIONS TO SHAREHOLDERS(a) |
||||||||||||||||
| Decrease in net assets resulting from distributions to shareholders |
(90,769,438 | ) | (63,136,970 | ) | ||||||||||||
|
|
|
|
|
|||||||||||||
| CAPITAL SHARE TRANSACTIONS |
||||||||||||||||
| Net increase (decrease) in net assets derived from capital share transactions |
497,362,943 | (28,613,305 | ) | |||||||||||||
|
|
|
|
|
|||||||||||||
| NET ASSETS |
||||||||||||||||
| Total increase (decrease) in net assets |
506,684,393 | (390,580,941 | ) | |||||||||||||
| Beginning of year |
1,600,834,828 | 1,991,415,769 | ||||||||||||||
|
|
|
|
|
|||||||||||||
| End of year |
$ | 2,107,519,221 | $ | 1,600,834,828 | ||||||||||||
|
|
|
|
|
|||||||||||||
| (a) | Distributions for annual periods determined in accordance with U.S. federal income tax regulations. |
See notes to financial statements.
| 264 | 2 0 2 4 I S H A R E S A N N U A L R E P O R T T O S H A R E H O L D E R S |
(For a share outstanding throughout each period)
| iShares BBB Rated Corporate Bond ETF | ||||||||||||||||||||||||
| Period From | ||||||||||||||||||||||||
| Year Ended | Year Ended | 05/18/21 | (a) | |||||||||||||||||||||
| 02/29/24 | 02/28/23 | to 02/28/22 | ||||||||||||||||||||||
|
|
||||||||||||||||||||||||
| Net asset value, beginning of period |
$ | 82.78 | $ | 95.89 | $ | 100.00 | ||||||||||||||||||
|
|
|
|
|
|
|
|||||||||||||||||||
| Net investment income(b) |
3.50 | 2.48 | 1.70 | |||||||||||||||||||||
| Net realized and unrealized gain (loss)(c) |
2.02 | (12.15 | ) | (4.28 | ) | |||||||||||||||||||
|
|
|
|
|
|
|
|||||||||||||||||||
| Net increase (decrease) from investment operations |
5.52 | (9.67 | ) | (2.58 | ) | |||||||||||||||||||
|
|
|
|
|
|
|
|||||||||||||||||||
| Distributions(d) |
||||||||||||||||||||||||
| From net investment income |
(3.47 | ) | (2.71 | ) | (1.53 | ) | ||||||||||||||||||
| From net realized gain |
— | (0.73 | ) | — | ||||||||||||||||||||
|
|
|
|
|
|
|
|||||||||||||||||||
| Total distributions |
(3.47 | ) | (3.44 | ) | (1.53 | ) | ||||||||||||||||||
|
|
|
|
|
|
|
|||||||||||||||||||
| Net asset value, end of period |
$ | 84.83 | $ | 82.78 | $ | 95.89 | ||||||||||||||||||
|
|
|
|
|
|
|
|||||||||||||||||||
| Total Return(e) |
||||||||||||||||||||||||
| Based on net asset value |
6.81 | % | (10.14 | )% | (2.66 | )%(f) | ||||||||||||||||||
|
|
|
|
|
|
|
|||||||||||||||||||
| Ratios to Average Net Assets(g) |
||||||||||||||||||||||||
| Total expenses |
0.15 | % | 0.15 | % | 0.15 | %(h) | ||||||||||||||||||
|
|
|
|
|
|
|
|||||||||||||||||||
| Net investment income |
4.19 | % | 2.85 | % | 2.14 | %(h) | ||||||||||||||||||
|
|
|
|
|
|
|
|||||||||||||||||||
| Supplemental Data |
||||||||||||||||||||||||
| Net assets, end of period (000) |
$ | 33,932 | $ | 24,833 | $ | 71,916 | ||||||||||||||||||
|
|
|
|
|
|
|
|||||||||||||||||||
| Portfolio turnover rate(i) |
15 | % | 10 | % | 19 | %(f) | ||||||||||||||||||
|
|
|
|
|
|
|
|||||||||||||||||||
| (a) | Commencement of operations. |
| (b) | Based on average shares outstanding. |
| (c) | The amounts reported for a share outstanding may not accord with the change in aggregate gains and losses in securities for the fiscal period due to the timing of capital share transactions in relation to the fluctuating market values of the Fund’s underlying securities. |
| (d) | Distributions for annual periods determined in accordance with U.S. federal income tax regulations. |
| (e) | Where applicable, assumes the reinvestment of distributions. |
| (f) | Not annualized. |
| (g) | Excludes fees and expenses incurred indirectly as a result of investments in underlying funds. |
| (h) | Annualized. |
| (i) | Portfolio turnover rate excludes in-kind transactions, if any. |
See notes to financial statements.
| F I N A N C I A L H I G H L I G H T S |
265 |
Financial Highlights (continued)
(For a share outstanding throughout each period)
| iShares Broad USD Investment Grade Corporate Bond ETF | ||||||||||||||||||||||||
|
|
|
|||||||||||||||||||||||
| |
Year Ended 02/29/24 |
|
|
Year Ended 02/28/23 |
|
|
Year Ended 02/28/22 |
|
|
Year Ended 02/28/21 |
|
|
Year Ended 02/29/20 |
| ||||||||||
|
|
||||||||||||||||||||||||
| Net asset value, beginning of year |
$ | 49.43 | $ | 56.64 | $ | 60.09 | $ | 60.20 | $ | 53.97 | ||||||||||||||
|
|
|
|
|
|
|
|
|
|
|
|||||||||||||||
| Net investment income(a) |
2.09 | 1.66 | 1.36 | 1.67 | 1.97 | |||||||||||||||||||
| Net realized and unrealized gain (loss)(b) |
0.87 | (7.28 | ) | (3.43 | ) | (0.06 | ) | 6.21 | ||||||||||||||||
|
|
|
|
|
|
|
|
|
|
|
|||||||||||||||
| Net increase (decrease) from investment operations |
2.96 | (5.62 | ) | (2.07 | ) | 1.61 | 8.18 | |||||||||||||||||
|
|
|
|
|
|
|
|
|
|
|
|||||||||||||||
| Distributions from net investment income(c) |
(2.04 | ) | (1.59 | ) | (1.38 | ) | (1.72 | ) | (1.95 | ) | ||||||||||||||
|
|
|
|
|
|
|
|
|
|
|
|||||||||||||||
| Net asset value, end of year |
$ | 50.35 | $ | 49.43 | $ | 56.64 | $ | 60.09 | $ | 60.20 | ||||||||||||||
|
|
|
|
|
|
|
|
|
|
|
|||||||||||||||
| Total Return(d) |
||||||||||||||||||||||||
| Based on net asset value |
6.14 | % | (9.99 | )% | (3.51 | )% | 2.70 | % | 15.41 | % | ||||||||||||||
|
|
|
|
|
|
|
|
|
|
|
|||||||||||||||
| Ratios to Average Net Assets(e) |
||||||||||||||||||||||||
| Total expenses |
0.04 | % | 0.04 | % | 0.04 | % | 0.06 | % | 0.06 | % | ||||||||||||||
|
|
|
|
|
|
|
|
|
|
|
|||||||||||||||
| Net investment income |
4.20 | % | 3.27 | % | 2.27 | % | 2.77 | % | 3.44 | % | ||||||||||||||
|
|
|
|
|
|
|
|
|
|
|
|||||||||||||||
| Supplemental Data |
||||||||||||||||||||||||
| Net assets, end of year (000) |
$ | 10,478,746 | $ | 8,240,435 | $ | 6,582,071 | $ | 5,913,258 | $ | 4,277,259 | ||||||||||||||
|
|
|
|
|
|
|
|
|
|
|
|||||||||||||||
| Portfolio turnover rate(f) |
10 | % | 11 | % | 12 | % | 13 | % | 13 | % | ||||||||||||||
|
|
|
|
|
|
|
|
|
|
|
|||||||||||||||
| (a) | Based on average shares outstanding. |
| (b) | The amounts reported for a share outstanding may not accord with the change in aggregate gains and losses in securities for the fiscal period due to the timing of capital share transactions in relation to the fluctuating market values of the Fund’s underlying securities. |
| (c) | Distributions for annual periods determined in accordance with U.S. federal income tax regulations. |
| (d) | Where applicable, assumes the reinvestment of distributions. |
| (e) | Excludes fees and expenses incurred indirectly as a result of investments in underlying funds. |
| (f) | Portfolio turnover rate excludes in-kind transactions, if any. |
See notes to financial statements.
| 266 | 2 0 2 4 I S H A R E S A N N U A L R E P O R T T O S H A R E H O L D E R S |
Financial Highlights (continued)
(For a share outstanding throughout each period)
| iShares 1-5 Year Investment Grade Corporate Bond ETF | ||||||||||||||||||||
|
|
|
|||||||||||||||||||
| |
Year Ended 02/29/24 |
|
|
Year Ended 02/28/23 |
|
|
Year Ended 02/28/22 |
|
|
Year Ended 02/28/21 |
|
|
Year Ended 02/29/20 |
| ||||||
|
|
||||||||||||||||||||
| Net asset value, beginning of year |
$ | 49.89 | $ | 52.72 | $ | 54.88 | $ | 54.36 | $ | 52.28 | ||||||||||
|
|
|
|
|
|
|
|
|
|
|
|||||||||||
| Net investment income(a) |
1.71 | 1.11 | 0.81 | 1.19 | 1.64 | |||||||||||||||
| Net realized and unrealized gain(b) |
1.18 | (2.86 | ) | (2.02 | ) | 0.60 | 2.08 | |||||||||||||
|
|
|
|
|
|
|
|
|
|
|
|||||||||||
| Net increase from investment operations |
2.89 | (1.75 | ) | (1.21 | ) | 1.79 | 3.72 | |||||||||||||
|
|
|
|
|
|
|
|
|
|
|
|||||||||||
| Distributions(c) |
||||||||||||||||||||
| From net investment income |
(1.71 | ) | (1.07 | ) | (0.86 | ) | (1.27 | ) | (1.64 | ) | ||||||||||
| From net realized gain |
— | (0.01 | ) | (0.09 | ) | — | — | |||||||||||||
|
|
|
|
|
|
|
|
|
|
|
|||||||||||
| Total distributions |
(1.71 | ) | (1.08 | ) | (0.95 | ) | (1.27 | ) | (1.64 | ) | ||||||||||
|
|
|
|
|
|
|
|
|
|
|
|||||||||||
| Net asset value, end of year |
$ | 51.07 | $ | 49.89 | $ | 52.72 | $ | 54.88 | $ | 54.36 | ||||||||||
|
|
|
|
|
|
|
|
|
|
|
|||||||||||
| Total Return(d) |
||||||||||||||||||||
| Based on net asset value |
5.91 | % | (3.32 | )% | (2.20 | )% | 3.32 | % | 7.21 | % | ||||||||||
|
|
|
|
|
|
|
|
|
|
|
|||||||||||
| Ratios to Average Net Assets(e) |
||||||||||||||||||||
| Total expenses |
0.04 | % | 0.05 | % | 0.06 | % | 0.06 | % | 0.06 | % | ||||||||||
|
|
|
|
|
|
|
|
|
|
|
|||||||||||
| Net investment income |
3.39 | % | 2.21 | % | 1.50 | % | 2.18 | % | 3.08 | % | ||||||||||
|
|
|
|
|
|
|
|
|
|
|
|||||||||||
| Supplemental Data |
||||||||||||||||||||
| Net assets, end of year (000) |
$ | 21,351,663 | $ | 24,248,111 | $ | 22,436,202 | $ | 22,726,686 | $ | 14,260,460 | ||||||||||
|
|
|
|
|
|
|
|
|
|
|
|||||||||||
| Portfolio turnover rate(f) |
25 | % | 26 | % | 30 | % | 29 | % | 38 | % | ||||||||||
|
|
|
|
|
|
|
|
|
|
|
|||||||||||
| (a) | Based on average shares outstanding. |
| (b) | The amounts reported for a share outstanding may not accord with the change in aggregate gains and losses in securities for the fiscal period due to the timing of capital share transactions in relation to the fluctuating market values of the Fund’s underlying securities. |
| (c) | Distributions for annual periods determined in accordance with U.S. federal income tax regulations. |
| (d) | Where applicable, assumes the reinvestment of distributions. |
| (e) | Excludes fees and expenses incurred indirectly as a result of investments in underlying funds. |
| (f) | Portfolio turnover rate excludes in-kind transactions, if any. |
See notes to financial statements.
| F I N A N C I A L H I G H L I G H T S |
267 |
Financial Highlights (continued)
(For a share outstanding throughout each period)
| iShares 5-10 Year Investment Grade Corporate Bond ETF | ||||||||||||||||||||
|
|
|
|||||||||||||||||||
| |
Year Ended 02/29/24 |
|
|
Year Ended 02/28/23 |
|
|
Year Ended 02/28/22 |
|
|
Year Ended 02/28/21 |
|
|
Year Ended 02/29/20 |
| ||||||
|
|
||||||||||||||||||||
| Net asset value, beginning of year |
$ | 49.83 | $ | 56.71 | $ | 60.34 | $ | 59.76 | $ | 53.88 | ||||||||||
|
|
|
|
|
|
|
|
|
|
|
|||||||||||
| Net investment income(a) |
2.02 | 1.57 | 1.34 | 1.58 | 2.00 | |||||||||||||||
| Net realized and unrealized gain (loss)(b) |
1.25 | (6.91 | ) | (3.49 | ) | 0.65 | 5.86 | |||||||||||||
|
|
|
|
|
|
|
|
|
|
|
|||||||||||
| Net increase (decrease) from investment operations |
3.27 | (5.34 | ) | (2.15 | ) | 2.23 | 7.86 | |||||||||||||
|
|
|
|
|
|
|
|
|
|
|
|||||||||||
| Distributions(c) |
||||||||||||||||||||
| From net investment income |
(2.00 | ) | (1.54 | ) | (1.35 | ) | (1.65 | ) | (1.98 | ) | ||||||||||
| From net realized gain |
— | — | (0.13 | ) | — | — | ||||||||||||||
|
|
|
|
|
|
|
|
|
|
|
|||||||||||
| Total distributions |
(2.00 | ) | (1.54 | ) | (1.48 | ) | (1.65 | ) | (1.98 | ) | ||||||||||
|
|
|
|
|
|
|
|
|
|
|
|||||||||||
| Net asset value, end of year |
$ | 51.10 | $ | 49.83 | $ | 56.71 | $ | 60.34 | $ | 59.76 | ||||||||||
|
|
|
|
|
|
|
|
|
|
|
|||||||||||
| Total Return(d) |
||||||||||||||||||||
| Based on net asset value |
6.71 | % | (9.47 | )% | (3.62 | )% | 3.79 | % | 14.83 | % | ||||||||||
|
|
|
|
|
|
|
|
|
|
|
|||||||||||
| Ratios to Average Net Assets(e) |
||||||||||||||||||||
| Total expenses |
0.04 | % | 0.05 | % | 0.06 | % | 0.06 | % | 0.06 | % | ||||||||||
|
|
|
|
|
|
|
|
|
|
|
|||||||||||
| Net investment income |
4.02 | % | 3.07 | % | 2.24 | % | 2.64 | % | 3.49 | % | ||||||||||
|
|
|
|
|
|
|
|
|
|
|
|||||||||||
| Supplemental Data |
||||||||||||||||||||
| Net assets, end of year (000) |
$ | 12,539,601 | $ | 11,026,688 | $ | 11,188,899 | $ | 11,063,433 | $ | 9,387,751 | ||||||||||
|
|
|
|
|
|
|
|
|
|
|
|||||||||||
| Portfolio turnover rate(f) |
21 | % | 24 | % | 27 | % | 23 | % | 26 | % | ||||||||||
|
|
|
|
|
|
|
|
|
|
|
|||||||||||
| (a) | Based on average shares outstanding. |
| (b) | The amounts reported for a share outstanding may not accord with the change in aggregate gains and losses in securities for the fiscal period due to the timing of capital share transactions in relation to the fluctuating market values of the Fund’s underlying securities. |
| (c) | Distributions for annual periods determined in accordance with U.S. federal income tax regulations. |
| (d) | Where applicable, assumes the reinvestment of distributions. |
| (e) | Excludes fees and expenses incurred indirectly as a result of investments in underlying funds. |
| (f) | Portfolio turnover rate excludes in-kind transactions, if any. |
See notes to financial statements.
| 268 | 2 0 2 4 I S H A R E S A N N U A L R E P O R T T O S H A R E H O L D E R S |
Financial Highlights (continued)
(For a share outstanding throughout each period)
| iShares 10+ Year Investment Grade Corporate Bond ETF | ||||||||||||||||||||||||
|
|
|
|||||||||||||||||||||||
| |
Year Ended 02/29/24 |
|
|
Year Ended 02/28/23 |
|
|
Year Ended 02/28/22 |
|
|
Year Ended 02/28/21 |
|
|
Year Ended 02/29/20 |
| ||||||||||
|
|
||||||||||||||||||||||||
| Net asset value, beginning of year |
$ | 50.34 | $ | 63.42 | $ | 68.68 | $ | 70.27 | $ | 57.73 | ||||||||||||||
|
|
|
|
|
|
|
|
|
|
|
|||||||||||||||
| Net investment income(a) |
2.47 | 2.27 | 2.18 | 2.31 | 2.54 | |||||||||||||||||||
| Net realized and unrealized gain (loss)(b) |
0.39 | (13.06 | ) | (5.24 | ) | (1.57 | ) | 12.48 | ||||||||||||||||
|
|
|
|
|
|
|
|
|
|
|
|||||||||||||||
| Net increase (decrease) from investment operations |
2.86 | (10.79 | ) | (3.06 | ) | 0.74 | 15.02 | |||||||||||||||||
|
|
|
|
|
|
|
|
|
|
|
|||||||||||||||
| Distributions from net investment income(c) |
(2.42 | ) | (2.29 | ) | (2.20 | ) | (2.33 | ) | (2.48 | ) | ||||||||||||||
|
|
|
|
|
|
|
|
|
|
|
|||||||||||||||
| Net asset value, end of year |
$ | 50.78 | $ | 50.34 | $ | 63.42 | $ | 68.68 | $ | 70.27 | ||||||||||||||
|
|
|
|
|
|
|
|
|
|
|
|||||||||||||||
| Total Return(d) |
||||||||||||||||||||||||
| Based on net asset value |
5.87 | % | (17.18 | )% | (4.62 | )% | 1.05 | % | 26.50 | % | ||||||||||||||
|
|
|
|
|
|
|
|
|
|
|
|||||||||||||||
| Ratios to Average Net Assets(e) |
||||||||||||||||||||||||
| Total expenses |
0.04 | % | 0.05 | % | 0.06 | % | 0.06 | % | 0.06 | % | ||||||||||||||
|
|
|
|
|
|
|
|
|
|
|
|||||||||||||||
| Net investment income |
4.93 | % | 4.26 | % | 3.18 | % | 3.32 | % | 3.89 | % | ||||||||||||||
|
|
|
|
|
|
|
|
|
|
|
|||||||||||||||
| Supplemental Data |
||||||||||||||||||||||||
| Net assets, end of year (000) |
$ | 2,107,519 | $ | 1,600,835 | $ | 1,991,416 | $ | 2,403,908 | $ | 2,122,014 | ||||||||||||||
|
|
|
|
|
|
|
|
|
|
|
|||||||||||||||
| Portfolio turnover rate(f) |
7 | % | 9 | % | 9 | % | 10 | % | 15 | % | ||||||||||||||
|
|
|
|
|
|
|
|
|
|
|
|||||||||||||||
| (a) | Based on average shares outstanding. |
| (b) | The amounts reported for a share outstanding may not accord with the change in aggregate gains and losses in securities for the fiscal period due to the timing of capital share transactions in relation to the fluctuating market values of the Fund’s underlying securities. |
| (c) | Distributions for annual periods determined in accordance with U.S. federal income tax regulations. |
| (d) | Where applicable, assumes the reinvestment of distributions. |
| (e) | Excludes fees and expenses incurred indirectly as a result of investments in underlying funds. |
| (f) | Portfolio turnover rate excludes in-kind transactions, if any. |
See notes to financial statements.
| F I N A N C I A L H I G H L I G H T S |
269 |
1. ORGANIZATION
iShares Trust (the “Trust”) is registered under the Investment Company Act of 1940, as amended (the “1940 Act”), as an open-end management investment company. The Trust is organized as a Delaware statutory trust and is authorized to have multiple series or portfolios.
These financial statements relate only to the following funds (each, a “Fund” and collectively, the “Funds”):
| iShares ETF | Diversification Classification |
|||
| BBB Rated Corporate Bond |
Non-diversified | |||
| Broad USD Investment Grade Corporate Bond |
Diversified | |||
| 1-5 Year Investment Grade Corporate Bond |
Diversified | |||
| 5-10 Year Investment Grade Corporate Bond |
Diversified | |||
| 10+ Year Investment Grade Corporate Bond |
Diversified | |||
2. SIGNIFICANT ACCOUNTING POLICIES
The financial statements are prepared in conformity with accounting principles generally accepted in the United States of America (“U.S. GAAP”), which may require management to make estimates and assumptions that affect the reported amounts of assets and liabilities in the financial statements, disclosure of contingent assets and liabilities at the date of the financial statements and the reported amounts of increases and decreases in net assets from operations during the reporting period. Actual results could differ from those estimates. Each Fund is considered an investment company under U.S. GAAP and follows the accounting and reporting guidance applicable to investment companies. Below is a summary of significant accounting policies:
Investment Transactions and Income Recognition: For financial reporting purposes, investment transactions are recorded on the dates the transactions are executed. Realized gains and losses on investment transactions are determined using the specific identification method. Dividend income and capital gain distributions, if any, are recorded on the ex-dividend date. Non-cash dividends, if any, are recorded on the ex-dividend date at fair value. Interest income, including amortization and accretion of premiums and discounts on debt securities, is recognized daily on an accrual basis.
Foreign Currency Translation: Each Fund’s books and records are maintained in U.S. dollars. Securities and other assets and liabilities denominated in foreign currencies are translated into U.S. dollars using prevailing market rates as quoted by one or more data service providers. Purchases and sales of investments are recorded at the rates of exchange prevailing on the respective dates of such transactions. Generally, when the U.S. dollar rises in value against a foreign currency, the investments denominated in that currency will lose value; the opposite effect occurs if the U.S. dollar falls in relative value.
Each Fund does not isolate the effect of fluctuations in foreign exchange rates from the effect of fluctuations in the market prices of investments for financial reporting purposes. Accordingly, the effects of changes in exchange rates on investments are not segregated in the Statements of Operations from the effects of changes in market prices of those investments, but are included as a component of net realized and unrealized gain (loss) from investments. Each Fund reports realized currency gains (losses) on foreign currency related transactions as components of net realized gain (loss) for financial reporting purposes, whereas such components are generally treated as ordinary income for U.S. federal income tax purposes.
Foreign Taxes: The Funds may be subject to foreign taxes (a portion of which may be reclaimable) on income, stock dividends, capital gains on investments, or certain foreign currency transactions. All foreign taxes are recorded in accordance with the applicable foreign tax regulations and rates that exist in the foreign jurisdictions in which each Fund invests. These foreign taxes, if any, are paid by each Fund and are reflected in its Statements of Operations as follows: foreign taxes withheld at source are presented as a reduction of income, foreign taxes on securities lending income are presented as a reduction of securities lending income, foreign taxes on stock dividends are presented as “Other foreign taxes”, and foreign taxes on capital gains from sales of investments and foreign taxes on foreign currency transactions are included in their respective net realized gain (loss) categories. Foreign taxes payable or deferred as of February 29, 2024, if any, are disclosed in the Statements of Assets and Liabilities.
The Funds file withholding tax reclaims in certain jurisdictions to recover a portion of amounts previously withheld. The Funds may record a reclaim receivable based on collectability, which includes factors such as the jurisdiction’s applicable laws, payment history and market convention. The Statements of Operations includes tax reclaims recorded as well as professional and other fees, if any, associated with recovery of foreign withholding taxes.
Bank Overdraft: Certain Funds had outstanding cash disbursements exceeding deposited cash amounts at the custodian during the reporting period. The Funds are obligated to repay the custodian for any overdraft, including any related costs or expenses, where applicable. For financial reporting purposes, overdraft fees, if any, are included in interest expense in the Statements of Operations.
In-kind Redemptions: For financial reporting purposes, in-kind redemptions are treated as sales of securities resulting in realized capital gains or losses to the Funds. Because such gains or losses are not taxable to the Funds and are not distributed to existing Fund shareholders, the gains or losses are reclassified from accumulated net realized gain (loss) to paid-in capital at the end of the Funds’ tax year. These reclassifications have no effect on net assets or net asset value (“NAV”) per share.
Distributions: Dividends and distributions paid by each Fund are recorded on the ex-dividend dates. Distributions are determined on a tax basis and may differ from net investment income and net realized capital gains for financial reporting purposes. Dividends and distributions are paid in U.S. dollars and cannot be automatically reinvested in additional shares of the Funds.
| 270 | 2 0 2 4 I S H A R E S A N N U A L R E P O R T T O S H A R E H O L D E R S |
Notes to Financial Statements (continued)
Indemnifications: In the normal course of business, each Fund enters into contracts that contain a variety of representations that provide general indemnification. The Funds’ maximum exposure under these arrangements is unknown because it involves future potential claims against the Funds, which cannot be predicted with any certainty.
3. INVESTMENT VALUATION AND FAIR VALUE MEASUREMENTS
Investment Valuation Policies: Each Fund’s investments are valued at fair value (also referred to as “market value” within the financial statements) each day that the Fund’s listing exchange is open and, for financial reporting purposes, as of the report date. U.S. GAAP defines fair value as the price a fund would receive to sell an asset or pay to transfer a liability in an orderly transaction between market participants at the measurement date. The Board of Trustees of the Trust (the “Board”) of each Fund has approved the designation of BlackRock Fund Advisors (“BFA”), the Funds’ investment adviser, as the valuation designee for each Fund. Each Fund determines the fair values of its financial instruments using various independent dealers or pricing services under BFA’s policies. If a security’s market price is not readily available or does not otherwise accurately represent the fair value of the security, the security will be valued in accordance with BFA’s policies and procedures as reflecting fair value. BFA has formed a committee (the “Valuation Committee”) to develop pricing policies and procedures and to oversee the pricing function for all financial instruments, with assistance from other BlackRock pricing committees.
Fair Value Inputs and Methodologies: The following methods and inputs are used to establish the fair value of each Fund’s assets and liabilities:
| · | Fixed-income investments for which market quotations are readily available are generally valued using the last available bid price or current market quotations provided by independent dealers or third-party pricing services. Pricing services generally value fixed income securities assuming orderly transactions of an institutional round lot size, but a fund may hold or transact in such securities in smaller, odd lot sizes. Odd lots may trade at lower prices than institutional round lots. The pricing services may use matrix pricing or valuation models that utilize certain inputs and assumptions to derive values, including transaction data (e.g., recent representative bids and offers), market data, credit quality information, perceived market movements, news, and other relevant information. Certain fixed-income securities, including asset-backed and mortgage related securities may be valued based on valuation models that consider the estimated cash flows of each tranche of the entity, establish a benchmark yield and develop an estimated tranche specific spread to the benchmark yield based on the unique attributes of the tranche. The amortized cost method of valuation may be used with respect to debt obligations with sixty days or less remaining to maturity unless BFA determines such method does not represent fair value. |
| · | Investments in open-end U.S. mutual funds (including money market funds) are valued at that day’s published NAV. |
If events (e.g., market volatility, company announcement or a natural disaster) occur that are expected to materially affect the value of such investment, or in the event that application of these methods of valuation results in a price for an investment that is deemed not to be representative of the market value of such investment, or if a price is not available, the investment will be valued by the Valuation Committee, in accordance with BFA’s policies and procedures as reflecting fair value (“Fair Valued Investments”). The fair valuation approaches that may be used by the Valuation Committee include market approach, income approach and cost approach. Valuation techniques such as discounted cash flow, use of market comparables and matrix pricing are types of valuation approaches and are typically used in determining fair value. When determining the price for Fair Valued Investments, the Valuation Committee seeks to determine the price that each Fund might reasonably expect to receive or pay from the current sale or purchase of that asset or liability in an arm’s-length transaction. Fair value determinations shall be based upon all available factors that the Valuation Committee deems relevant and consistent with the principles of fair value measurement.
Fair value pricing could result in a difference between the prices used to calculate a fund’s NAV and the prices used by the fund’s underlying index, which in turn could result in a difference between the fund’s performance and the performance of the fund’s underlying index.
Fair Value Hierarchy: Various inputs are used in determining the fair value of financial instruments. These inputs to valuation techniques are categorized into a fair value hierarchy consisting of three broad levels for financial reporting purposes as follows:
| · | Level 1 – Unadjusted price quotations in active markets/exchanges for identical assets or liabilities that each Fund has the ability to access; |
| · | Level 2 – Other observable inputs (including, but not limited to, quoted prices for similar assets or liabilities in markets that are active, quoted prices for identical or similar assets or liabilities in markets that are not active, inputs other than quoted prices that are observable for the assets or liabilities (such as interest rates, yield curves, volatilities, prepayment speeds, loss severities, credit risks and default rates) or other market-corroborated inputs); and |
| · | Level 3 – Unobservable inputs based on the best information available in the circumstances, to the extent observable inputs are not available, (including the Valuation Committee’s assumptions used in determining the fair value of financial instruments). |
The hierarchy gives the highest priority to unadjusted quoted prices in active markets for identical assets or liabilities (Level 1 measurements) and the lowest priority to unobservable inputs (Level 3 measurements). Accordingly, the degree of judgment exercised in determining fair value is greatest for instruments categorized in Level 3. The inputs used to measure fair value may fall into different levels of the fair value hierarchy. In such cases, for disclosure purposes, the fair value hierarchy classification is determined based on the lowest level input that is significant to the fair value measurement in its entirety. Investments classified within Level 3 have significant unobservable inputs used by the Valuation Committee in determining the price for Fair Valued Investments. Level 3 investments include equity or debt issued by privately held companies or funds that may not have a secondary market and/or may have a limited number of investors. The categorization of a value determined for financial instruments is based on the pricing transparency of the financial instruments and is not necessarily an indication of the risks associated with investing in those securities.
| N O T E S T O F I N A N C I A L S T A T E M E N T S | 271 |
Notes to Financial Statements (continued)
4. SECURITIES AND OTHER INVESTMENTS
Securities Lending: Each Fund may lend its securities to approved borrowers, such as brokers, dealers and other financial institutions. The borrower pledges and maintains with the Fund collateral consisting of cash, an irrevocable letter of credit issued by an approved bank, or securities issued or guaranteed by the U.S. government. The initial collateral received by each Fund is required to have a value of at least 102% of the current market value of the loaned securities for securities traded on U.S. exchanges and a value of at least 105% for all other securities. The collateral is maintained thereafter at a value equal to at least 100% of the current value of the securities on loan. The market value of the loaned securities is determined at the close of each business day of the Fund and any additional required collateral is delivered to the Fund or excess collateral is returned by the Fund, on the next business day. During the term of the loan, each Fund is entitled to all distributions made on or in respect of the loaned securities but does not receive interest income on securities received as collateral. Loans of securities are terminable at any time and the borrower, after notice, is required to return borrowed securities within the standard time period for settlement of securities transactions.
As of period end, any securities on loan were collateralized by cash and/or U.S. Government obligations. Cash collateral invested in money market funds managed by BFA, or its affiliates is disclosed in the Schedule of Investments. Any non-cash collateral received cannot be sold, re-invested or pledged by the Fund, except in the event of borrower default. The securities on loan, if any, are also disclosed in each Fund’s Schedule of Investments. The market value of any securities on loan and the value of any related cash collateral are disclosed in the Statements of Assets and Liabilities.
Securities lending transactions are entered into by the Funds under Master Securities Lending Agreements (each, an “MSLA”) which provide the right, in the event of default (including bankruptcy or insolvency) for the non-defaulting party to liquidate the collateral and calculate a net exposure to the defaulting party or request additional collateral. In the event that a borrower defaults, the Funds, as lender, would offset the market value of the collateral received against the market value of the securities loaned. When the value of the collateral is greater than that of the market value of the securities loaned, the lender is left with a net amount payable to the defaulting party. However, bankruptcy or insolvency laws of a particular jurisdiction may impose restrictions on or prohibitions against such a right of offset in the event of an MSLA counterparty’s bankruptcy or insolvency. Under the MSLA, absent an event of default, the borrower can resell or re-pledge the loaned securities, and the Funds can reinvest cash collateral received in connection with loaned securities. Upon an event of default, the parties’ obligations to return the securities or collateral to the other party are extinguished, and the parties can resell or re-pledge the loaned securities or the collateral received in connection with the loaned securities in order to satisfy the defaulting party’s net payment obligation for all transactions under the MSLA. The defaulting party remains liable for any deficiency.
As of period end, the following table is a summary of the securities on loan by counterparty which are subject to offset under an MSLA:
| iShares ETF and Counterparty |
|
Securities Loaned at Value |
|
|
Cash Collateral Received |
(a) |
|
Non-Cash Collateral Received, at Fair Value |
(a) |
Net Amount | ||||||
| BBB Rated Corporate Bond |
||||||||||||||||
| Barclays Capital, Inc. |
$ | 66,906 | $ | (66,906 | ) | $ | — | $ | — | |||||||
| BMO Capital Markets Corp. |
91,035 | (91,035 | ) | — | — | |||||||||||
| BNP Paribas SA |
1,106,975 | (1,106,975 | ) | — | — | |||||||||||
| BofA Securities, Inc. |
156,968 | (156,968 | ) | — | — | |||||||||||
| HSBC Securities (USA), Inc. |
27,965 | (27,965 | ) | — | — | |||||||||||
| J.P. Morgan Securities LLC |
650,080 | (650,080 | ) | — | — | |||||||||||
| Jefferies LLC |
18,943 | (18,943 | ) | — | — | |||||||||||
| Mizuho Securities USA LLC |
7,337 | (7,337 | ) | — | — | |||||||||||
| Nomura Securities International, Inc. |
105,368 | (105,368 | ) | — | — | |||||||||||
| RBC Capital Markets LLC |
329,049 | (329,049 | ) | — | — | |||||||||||
| Scotia Capital (USA), Inc. |
30,576 | (30,576 | ) | — | — | |||||||||||
| State Street Bank & Trust Co. |
66,997 | (66,997 | ) | — | — | |||||||||||
|
|
|
|
|
|
|
|
|
|||||||||
| $ | 2,658,199 | $ | (2,658,199 | ) | $ | — | $ | — | ||||||||
|
|
|
|
|
|
|
|
|
|||||||||
| 272 | 2 0 2 4 I S H A R E S A N N U A L R E P O R T T O S H A R E H O L D E R S |
Notes to Financial Statements (continued)
| iShares ETF and Counterparty |
|
Securities Loaned at Value |
|
|
Cash Collateral Received |
(a) |
|
Non-Cash Collateral Received, at Fair Value |
(a) |
Net Amount | ||||||
| Broad USD Investment Grade Corporate Bond |
||||||||||||||||
| Barclays Bank PLC |
$ | 176,371,303 | $ | (176,371,303 | ) | $ | — | $ | — | |||||||
| Barclays Capital, Inc. |
18,350,009 | (18,350,009 | ) | — | — | |||||||||||
| BMO Capital Markets Corp. |
23,504,731 | (23,504,731 | ) | — | — | |||||||||||
| BNP Paribas SA |
176,498,766 | (176,498,766 | ) | — | — | |||||||||||
| BofA Securities, Inc. |
39,577,219 | (39,577,219 | ) | — | — | |||||||||||
| Citigroup Global Markets, Inc. |
32,849,018 | (32,849,018 | ) | — | — | |||||||||||
| Deutsche Bank Securities, Inc. |
21,246,718 | (21,246,718 | ) | — | — | |||||||||||
| Goldman Sachs & Co. LLC |
188,796,167 | (188,796,167 | ) | — | — | |||||||||||
| HSBC Securities (USA), Inc. |
6,118,711 | (6,118,711 | ) | — | — | |||||||||||
| J.P. Morgan Securities LLC |
211,792,292 | (211,792,292 | ) | — | — | |||||||||||
| Jefferies LLC |
15,062,558 | (15,062,558 | ) | — | — | |||||||||||
| Mitsubishi UFJ Securities Holdings Co., Ltd. |
9,139,129 | (9,139,129 | ) | — | — | |||||||||||
| Mizuho Securities USA LLC |
4,768,825 | (4,768,825 | ) | — | — | |||||||||||
| Morgan Stanley |
96,226,615 | (96,226,615 | ) | — | — | |||||||||||
| Nomura Securities International, Inc. |
18,389,507 | (18,389,507 | ) | — | — | |||||||||||
| Pershing LLC |
13,667,149 | (13,667,149 | ) | — | — | |||||||||||
| RBC Capital Markets LLC |
56,891,092 | (56,891,092 | ) | — | — | |||||||||||
| Scotia Capital (USA), Inc. |
7,018,796 | (7,018,796 | ) | — | — | |||||||||||
| State Street Bank & Trust Co. |
19,663,906 | (19,663,906 | ) | — | — | |||||||||||
| TD Securities (USA) LLC |
1,961,168 | (1,961,168 | ) | — | — | |||||||||||
| Toronto-Dominion Bank (The) |
1,271,539 | (1,271,539 | ) | — | — | |||||||||||
| UBS Securities LLC |
2,951,848 | (2,951,848 | ) | — | — | |||||||||||
| Wells Fargo Bank N.A |
2,320,235 | (2,320,235 | ) | — | — | |||||||||||
| Wells Fargo Securities LLC |
26,812,322 | (26,812,322 | ) | — | — | |||||||||||
|
|
|
|
|
|
|
|
|
|||||||||
| $ | 1,171,249,623 | $ | (1,171,249,623 | ) | $ | — | $ | — | ||||||||
|
|
|
|
|
|
|
|
|
|||||||||
| 1-5 Year Investment Grade Corporate Bond |
||||||||||||||||
| Barclays Bank PLC |
$ | 275,507,274 | $ | (275,507,274 | ) | $ | — | $ | — | |||||||
| Barclays Capital, Inc. |
8,427,426 | (8,427,426 | ) | — | — | |||||||||||
| BMO Capital Markets Corp. |
37,574,201 | (37,574,201 | ) | — | — | |||||||||||
| BNP Paribas SA |
187,949,634 | (187,949,634 | ) | — | — | |||||||||||
| BofA Securities, Inc. |
76,988,217 | (76,988,217 | ) | — | — | |||||||||||
| Citigroup Global Markets, Inc. |
51,629,686 | (51,629,686 | ) | — | — | |||||||||||
| Deutsche Bank Securities, Inc. |
48,076,331 | (48,076,331 | ) | — | — | |||||||||||
| Goldman Sachs & Co. LLC |
248,769,558 | (248,769,558 | ) | — | — | |||||||||||
| HSBC Securities (USA), Inc. |
9,314,149 | (9,314,149 | ) | — | — | |||||||||||
| J.P. Morgan Securities LLC |
246,345,049 | (246,345,049 | ) | — | — | |||||||||||
| Jefferies LLC |
5,617,175 | (5,617,175 | ) | — | — | |||||||||||
| Mitsubishi UFJ Securities Holdings Co., Ltd. |
7,264,771 | (7,264,771 | ) | — | — | |||||||||||
| Mizuho Securities USA LLC |
15,880,158 | (15,880,158 | ) | — | — | |||||||||||
| Morgan Stanley |
153,371,360 | (153,371,360 | ) | — | — | |||||||||||
| Nomura Securities International, Inc. |
18,080,926 | (18,080,926 | ) | — | — | |||||||||||
| Pershing LLC |
22,741,242 | (22,741,242 | ) | — | — | |||||||||||
| RBC Capital Markets LLC |
63,878,784 | (63,878,784 | ) | — | — | |||||||||||
| Scotia Capital (USA), Inc. |
22,137,469 | (22,137,469 | ) | — | — | |||||||||||
| State Street Bank & Trust Co. |
2,360,507 | (2,360,507 | ) | — | — | |||||||||||
| TD Securities (USA) LLC |
2,047,356 | (2,047,356 | ) | — | — | |||||||||||
| UBS Securities LLC |
7,425,810 | (7,425,810 | ) | — | — | |||||||||||
| Wells Fargo Bank N.A |
2,877 | (2,877 | ) | — | — | |||||||||||
| Wells Fargo Securities LLC |
60,068,440 | (60,068,440 | ) | — | — | |||||||||||
|
|
|
|
|
|
|
|
|
|||||||||
| $ | 1,571,458,400 | $ | (1,571,458,400 | ) | $ | — | $ | — | ||||||||
|
|
|
|
|
|
|
|
|
|||||||||
| N O T E S T O F I N A N C I A L S T A T E M E N T S |
273 |
Notes to Financial Statements (continued)
| iShares ETF and Counterparty |
|
Securities Loaned at Value |
|
|
Cash Collateral Received |
(a) |
|
Non-Cash Collateral Received, at Fair Value |
(a) |
Net Amount | ||||||
| 5-10 Year Investment Grade Corporate Bond |
||||||||||||||||
| Barclays Bank PLC |
$ | 260,959,343 | $ | (260,959,343 | ) | $ | — | $ | — | |||||||
| Barclays Capital, Inc. |
25,696,093 | (25,696,093 | ) | — | — | |||||||||||
| BMO Capital Markets Corp. |
37,548,465 | (37,548,465 | ) | — | — | |||||||||||
| BNP Paribas SA |
216,703,826 | (216,703,826 | ) | — | — | |||||||||||
| BofA Securities, Inc. |
62,326,299 | (62,326,299 | ) | — | — | |||||||||||
| Citigroup Global Markets, Inc. |
41,989,438 | (41,989,438 | ) | — | — | |||||||||||
| Deutsche Bank Securities, Inc. |
20,790,817 | (20,790,817 | ) | — | — | |||||||||||
| Goldman Sachs & Co. LLC |
218,461,184 | (218,461,184 | ) | — | — | |||||||||||
| HSBC Securities (USA), Inc. |
4,141,644 | (4,141,644 | ) | — | — | |||||||||||
| J.P. Morgan Securities LLC |
288,795,045 | (288,795,045 | ) | — | — | |||||||||||
| Jefferies LLC |
27,708,010 | (27,708,010 | ) | — | — | |||||||||||
| Mitsubishi UFJ Securities Holdings Co., Ltd. |
18,641,674 | (18,641,674 | ) | — | — | |||||||||||
| Mizuho Securities USA LLC |
6,450,825 | (6,450,825 | ) | — | — | |||||||||||
| Morgan Stanley |
107,543,096 | (107,543,096 | ) | — | — | |||||||||||
| Nomura Securities International, Inc. |
45,188,116 | (45,188,116 | ) | — | — | |||||||||||
| Pershing LLC |
10,677,484 | (10,677,484 | ) | — | — | |||||||||||
| RBC Capital Markets LLC |
110,225,258 | (110,225,258 | ) | — | — | |||||||||||
| Scotia Capital (USA), Inc. |
15,837,742 | (15,837,742 | ) | — | — | |||||||||||
| State Street Bank & Trust Co. |
29,089,999 | (29,089,999 | ) | — | — | |||||||||||
| TD Securities (USA) LLC |
4,010,120 | (4,010,120 | ) | — | — | |||||||||||
| Toronto-Dominion Bank (The) |
13,962,659 | (13,962,659 | ) | — | — | |||||||||||
| UBS Securities LLC |
7,612,107 | (7,612,107 | ) | — | — | |||||||||||
| Wells Fargo Bank N.A |
6,063,498 | (6,063,498 | ) | — | — | |||||||||||
| Wells Fargo Securities LLC |
92,337,040 | (92,337,040 | ) | — | — | |||||||||||
|
|
|
|
|
|
|
|
|
|||||||||
| $ | 1,672,759,782 | $ | (1,672,759,782 | ) | $ | — | $ | — | ||||||||
|
|
|
|
|
|
|
|
|
|||||||||
| 10+ Year Investment Grade Corporate Bond |
||||||||||||||||
| Barclays Bank PLC |
$ | 29,785,578 | $ | (29,785,578 | ) | $ | — | $ | — | |||||||
| BMO Capital Markets Corp. |
2,663,972 | (2,663,972 | ) | — | — | |||||||||||
| BNP Paribas SA |
38,322,147 | (38,322,147 | ) | — | — | |||||||||||
| BofA Securities, Inc. |
6,485,241 | (6,485,241 | ) | — | — | |||||||||||
| Citigroup Global Markets, Inc. |
3,213,292 | (3,213,292 | ) | — | — | |||||||||||
| Deutsche Bank Securities, Inc. |
1,566,565 | (1,566,565 | ) | — | — | |||||||||||
| Goldman Sachs & Co. LLC |
42,583,517 | (42,583,517 | ) | — | — | |||||||||||
| HSBC Securities (USA), Inc. |
2,668,142 | (2,668,142 | ) | — | — | |||||||||||
| J.P. Morgan Securities LLC |
45,293,412 | (45,293,412 | ) | — | — | |||||||||||
| Jefferies LLC |
3,112,827 | (3,112,827 | ) | — | — | |||||||||||
| Mitsubishi UFJ Securities Holdings Co., Ltd. |
658,005 | (658,005 | ) | — | — | |||||||||||
| Mizuho Securities USA LLC |
234,763 | (234,763 | ) | — | — | |||||||||||
| Morgan Stanley |
16,863,824 | (16,863,824 | ) | — | — | |||||||||||
| Nomura Securities International, Inc. |
4,111,131 | (4,111,131 | ) | — | — | |||||||||||
| Pershing LLC |
2,986,164 | (2,986,164 | ) | — | — | |||||||||||
| RBC Capital Markets LLC |
9,359,964 | (9,359,964 | ) | — | — | |||||||||||
| Scotia Capital (USA), Inc. |
4,230,973 | (4,230,973 | ) | — | — | |||||||||||
| State Street Bank & Trust Co. |
6,676,377 | (6,676,377 | ) | — | — | |||||||||||
| Toronto-Dominion Bank (The) |
68,229 | (68,229 | ) | — | — | |||||||||||
| UBS AG |
116,184 | (116,184 | ) | — | — | |||||||||||
| UBS Securities LLC |
92,165 | (92,165 | ) | — | — | |||||||||||
| Wells Fargo Bank N.A |
814,507 | (814,507 | ) | — | — | |||||||||||
| Wells Fargo Securities LLC |
4,002,429 | (4,002,429 | ) | — | — | |||||||||||
|
|
|
|
|
|
|
|
|
|||||||||
| $ | 225,909,408 | $ | (225,909,408 | ) | $ | — | $ | — | ||||||||
|
|
|
|
|
|
|
|
|
|||||||||
| (a) | Collateral received, if any, in excess of the market value of securities on loan is not presented in this table. The total cash collateral received by each Fund is disclosed in the Fund’s Statements of Assets and Liabilities. |
The risks of securities lending include the risk that the borrower may not provide additional collateral when required or may not return the securities when due. To mitigate these risks, each Fund benefits from a borrower default indemnity provided by BlackRock, Inc. (“BlackRock”). BlackRock’s indemnity allows for full replacement of the securities loaned to the extent the collateral received does not cover the value of the securities loaned in the event of borrower default. Each Fund could incur a loss if the value of an investment purchased with cash collateral falls below the market value of the loaned securities or if the value of an investment purchased with cash collateral falls below the value of the original cash collateral received. Such losses are borne entirely by each Fund.
| 274 | 2 0 2 4 I S H A R E S A N N U A L R E P O R T T O S H A R E H O L D E R S |
Notes to Financial Statements (continued)
5. INVESTMENT ADVISORY AGREEMENT AND OTHER TRANSACTIONS WITH AFFILIATES
Investment Advisory Fees: Pursuant to an Investment Advisory Agreement with the Trust, BFA manages the investment of each Fund’s assets. BFA is a California corporation indirectly owned by BlackRock. Under the Investment Advisory Agreement, BFA is responsible for substantially all expenses of the Funds, except (i) interest and taxes; (ii) brokerage commissions and other expenses connected with the execution of portfolio transactions; (iii) distribution fees; (iv) the advisory fee payable to BFA; and (v) litigation expenses and any extraordinary expenses (in each case as determined by a majority of the independent trustees).
For its investment advisory services to each of the following Funds, BFAis entitled to an annual investment advisory fee, accrued daily and paid monthly by the Funds, based on the average daily net assets of each Fund as follows:
| iShares ETF | Investment Advisory Fees | |||
| BBB Rated Corporate Bond |
0.15 | % | ||
| Broad USD Investment Grade Corporate Bond |
0.04 | |||
| 1-5 Year Investment Grade Corporate Bond |
0.04 | |||
| 5-10 Year Investment Grade Corporate Bond |
0.04 | |||
| 10+ Year Investment Grade Corporate Bond |
0.04 | |||
Distributor: BlackRock Investments, LLC (“BRIL”), an affiliate of BFA, is the distributor for each Fund. Pursuant to the distribution agreement, BFA is responsible for any fees or expenses for distribution services provided to the Funds.
ETF Servicing Fees: Each Fund has entered into an ETF Services Agreement with BRIL to perform certain order processing, Authorized Participant communications, and related services in connection with the issuance and redemption of Creation Units (“ETF Services”). BRIL is entitled to a transaction fee from Authorized Participants on each creation or redemption order for the ETF Services provided. The Funds do not pay BRIL for ETF Services.
Prior to January 08, 2024 (date of conversion for iShares Broad USD Investment Grade Corporate Bond ETF), ETF Services were performed by State Street Bank and Trust Company.
Prior to January 26, 2024 (date of conversion for iShares BBB Rated Corporate Bond ETF, iShares 1-5 Year Investment Grade Corporate Bond ETF, iShares 5-10 Year Investment Grade Corporate Bond ETF and iShares 10+ Year Investment Grade Corporate Bond ETF), ETF Services were performed by State Street Bank and Trust Company.
Securities Lending: The U.S. Securities and Exchange Commission (the “SEC”) has issued an exemptive order which permits BlackRock Institutional Trust Company, N.A. (“BTC”), an affiliate of BFA, to serve as securities lending agent for the Funds, subject to applicable conditions. As securities lending agent, BTC bears all operational costs directly related to securities lending, including any custodial costs. Each Fund is responsible for fees in connection with the investment of cash collateral received for securities on loan (the “collateral investment fees”). The cash collateral is invested in a money market fund, BlackRock Cash Funds: Institutional or BlackRock Cash Funds: Treasury, managed by BFA, or its affiliates. However, BTC has agreed to reduce the amount of securities lending income it receives in order to effectively limit the collateral investment fees each Fund bears to an annual rate of 0.04%. The SL Agency Shares of such money market fund will not be subject to a sales load, distribution fee or service fee. The money market fund in which the cash collateral has been invested may, under certain circumstances, impose a liquidity fee of up to 2% of the value redeemed or temporarily restrict redemptions for up to 10 business days during a 90 day period, in the event that the money market fund’s weekly liquid assets fall below certain thresholds.
Securities lending income is equal to the total of income earned from the reinvestment of cash collateral, net of fees and other payments to and from borrowers of securities, and less the collateral investment fees. Each Fund retains a portion of securities lending income and remits the remaining portion to BTC as compensation for its services as securities lending agent.
Pursuant to the current securities lending agreement, each Fund retains 82% of securities lending income (which excludes collateral investment fees), and the amount retained can never be less than 70% of the total of securities lending income plus the collateral investment fees.
In addition, commencing the business day following the date that the aggregate securities lending income plus the collateral investment fees generated across all 1940 Act iShares exchange-traded funds (the “iShares ETF Complex”) in that calendar year exceeds a specified threshold, each Fund, pursuant to the securities lending agreement, will retain for the remainder of that calendar year 85% of securities lending income (which excludes collateral investment fees) and the amount retained can never be less than 70% of the total of securities lending income plus the collateral investment fees.
The share of securities lending income earned by each Fund is shown as securities lending income – affiliated – net in its Statements of Operations. For the year ended February 29, 2024, the Funds paid BTC the following amounts for securities lending agent services:
| iShares ETF | Amounts | |||
| BBB Rated Corporate Bond |
$ | 2,079 | ||
| Broad USD Investment Grade Corporate Bond |
1,135,643 | |||
| 1-5 Year Investment Grade Corporate Bond |
1,741,902 | |||
| 5-10 Year Investment Grade Corporate Bond |
1,763,780 | |||
| 10+ Year Investment Grade Corporate Bond |
219,889 | |||
| N O T E S T O F I N A N C I A L S T A T E M E N T S |
275 |
Notes to Financial Statements (continued)
Officers and Trustees: Certain officers and/or trustees of the Trust are officers and/or trustees of BlackRock or its affiliates.
Other Transactions: Each Fund may invest its positive cash balances in certain money market funds managed by BFA or an affiliate. The income earned on these temporary cash investments is shown as dividends – affiliated in the Statements of Operations.
A fund, in order to improve its portfolio liquidity and its ability to track its underlying index, may invest in shares of other iShares funds that invest in securities in the fund’s underlying index.
| 6. | PURCHASES AND SALES |
For the year ended February 29, 2024, purchases and sales of investments, excluding short-term securities and in-kind transactions, were as follows:
| iShares ETF | Purchases | Sales | ||||||
| BBB Rated Corporate Bond |
$ | 4,418,609 | $ | 3,872,382 | ||||
| Broad USD Investment Grade Corporate Bond |
1,032,319,062 | 923,103,389 | ||||||
| 1-5 Year Investment Grade Corporate Bond |
5,559,178,837 | 5,563,969,116 | ||||||
| 5-10 Year Investment Grade Corporate Bond |
2,485,793,822 | 2,394,071,751 | ||||||
| 10+ Year Investment Grade Corporate Bond |
127,434,816 | 123,681,383 | ||||||
For the year ended February 29, 2024, in-kind transactions were as follows:
| iShares ETF | In-kind Purchases |
In-kind Sales |
||||||
| BBB Rated Corporate Bond |
$ | 60,267,698 | $ | 52,838,097 | ||||
| Broad USD Investment Grade Corporate Bond |
3,199,104,675 | 1,180,673,299 | ||||||
| 1-5 Year Investment Grade Corporate Bond |
8,104,983,267 | 11,428,322,698 | ||||||
| 5-10 Year Investment Grade Corporate Bond |
4,165,056,599 | 2,997,144,554 | ||||||
| 10+ Year Investment Grade Corporate Bond |
1,817,128,459 | 1,325,821,900 | ||||||
| 7. | INCOME TAX INFORMATION |
Each Fund is treated as an entity separate from the Trust’s other funds for federal income tax purposes. It is each Fund’s policy to comply with the requirements of the Internal Revenue Code of 1986, as amended, applicable to regulated investment companies, and to distribute substantially all of its taxable income to its shareholders. Therefore, no U.S. federal income tax provision is required.
Management has analyzed tax laws and regulations and their application to the Funds as of February 29, 2024, inclusive of the open tax return years, and does not believe that there are any uncertain tax positions that require recognition of a tax liability in the Funds’ financial statements.
U.S. GAAP requires that certain components of net assets be adjusted to reflect permanent differences between financial and tax reporting. These reclassifications have no effect on net assets or NAV per share. As of February 29, 2024, permanent differences attributable to realized gains (losses) from in-kind redemptions were reclassified to the following accounts:
| iShares ETF | Paid-in Capital | Accumulated Earnings (Loss) |
||||||
| BBB Rated Corporate Bond |
$ | (996,690 | ) | $ | 996,690 | |||
| Broad USD Investment Grade Corporate Bond |
(25,851,045 | ) | 25,851,045 | |||||
| 1-5 Year Investment Grade Corporate Bond |
(200,562,432 | ) | 200,562,432 | |||||
| 5-10 Year Investment Grade Corporate Bond |
(10,398,451 | ) | 10,398,451 | |||||
| 10+ Year Investment Grade Corporate Bond |
(9,417,307 | ) | 9,417,307 | |||||
The tax character of distributions paid was as follows:
| iShares ETF | Year Ended 02/29/24 |
Year Ended 02/28/23 |
||||||
| BBB Rated Corporate Bond |
||||||||
| Ordinary income |
$ | 1,115,723 | $ | 1,613,872 | ||||
|
|
|
|
|
|||||
| Broad USD Investment Grade Corporate Bond |
||||||||
| Ordinary income |
$ | 381,607,770 | $ | 216,611,047 | ||||
|
|
|
|
|
|||||
| 276 | 2 0 2 4 I S H A R E S A N N U A L R E P O R T T O S H A R E H O L D E R S |
Notes to Financial Statements (continued)
| iShares ETF | Year Ended 02/29/24 |
Year Ended 02/28/23 |
||||||
| 1-5 Year Investment Grade Corporate Bond |
||||||||
| Ordinary income |
$ | 768,525,086 | $ | 467,995,751 | ||||
| Long-term capital gains |
— | 3,450,112 | ||||||
|
|
|
|
|
|||||
| $ | 768,525,086 | $ | 471,445,863 | |||||
|
|
|
|
|
|||||
| 5-10 Year Investment Grade Corporate Bond |
||||||||
| Ordinary income |
$ | 456,554,851 | $ | 299,895,987 | ||||
|
|
|
|
|
|||||
| 10+ Year Investment Grade Corporate Bond |
||||||||
| Ordinary income |
$ | 90,769,438 | $ | 63,136,970 | ||||
|
|
|
|
|
|||||
As of February 29, 2024, the tax components of accumulated net earnings (losses) were as follows:
| iShares ETF | Undistributed Ordinary Income |
Non-expiring Capital Loss Carryforwards(a) |
Net Unrealized Gains (Losses)(b) |
Total | ||||||||||||
| BBB Rated Corporate Bond |
$ | 123,167 | $ | (967,836) | $ | (2,510,339) | $ | (3,355,008 | ) | |||||||
| Broad USD Investment Grade Corporate Bond |
39,029,382 | (133,995,749) | (922,175,204) | (1,017,141,571 | ) | |||||||||||
| 1-5 Year Investment Grade Corporate Bond |
69,116,652 | (419,486,614) | (603,409,337) | (953,779,299 | ) | |||||||||||
| 5-10 Year Investment Grade Corporate Bond |
44,837,617 | (597,245,704) | (972,589,949) | (1,524,998,036 | ) | |||||||||||
| 10+ Year Investment Grade Corporate Bond |
8,789,571 | (85,136,614) | (395,244,529) | (471,591,572 | ) | |||||||||||
| (a) | Amounts available to offset future realized capital gains. |
| (b) | The difference between book-basis and tax-basis unrealized gains (losses) was attributable primarily to the tax deferral of losses on wash sales, amortization methods for premiums and discounts on fixed income securities and the classification of investments. |
As of February 29, 2024, gross unrealized appreciation and depreciation based on cost of investments (including short positions and derivatives, if any) for U.S. federal income tax purposes were as follows:
| iShares ETF | Tax Cost | Gross Unrealized Appreciation |
Gross Unrealized Depreciation |
Net Unrealized Appreciation (Depreciation) |
||||||||||||
| BBB Rated Corporate Bond |
$ | 38,563,023 | $ | 160,323 | $ | (2,670,662) | $ | (2,510,339 | ) | |||||||
| Broad USD Investment Grade Corporate Bond |
12,486,078,409 | 30,393,136 | (952,568,345) | (922,175,209 | ) | |||||||||||
| 1-5 Year Investment Grade Corporate Bond |
23,375,739,018 | 77,956,106 | (681,365,445) | (603,409,339 | ) | |||||||||||
| 5-10 Year Investment Grade Corporate Bond |
15,119,565,772 | 57,325,278 | (1,029,915,227) | (972,589,949 | ) | |||||||||||
| 10+ Year Investment Grade Corporate Bond |
2,698,394,945 | 2,750,839 | (397,995,368) | (395,244,529 | ) | |||||||||||
| 8. | PRINCIPAL RISKS |
In the normal course of business, each Fund invests in securities or other instruments and may enter into certain transactions, and such activities subject the Fund to various risks, including, among others, fluctuations in the market (market risk) or failure of an issuer to meet all of its obligations. The value of securities or other instruments may also be affected by various factors, including, without limitation: (i) the general economy; (ii) the overall market as well as local, regional or global political and/or social instability; (iii) regulation, taxation or international tax treaties between various countries; or (iv) currency, interest rate or price fluctuations. Local, regional or global events such as war, acts of terrorism, the spread of infectious illness or other public health issues, recessions, or other events could have a significant impact on the Funds and their investments. Each Fund’s prospectus provides details of the risks to which the Fund is subject.
BFA uses an indexing approach to try to achieve each Fund’s investment objective. The Fund is not actively managed, and BFA generally does not attempt to take defensive positions under any market conditions, including declining markets.
The Funds may be exposed to additional risks when reinvesting cash collateral in money market funds that do not seek to maintain a stable NAV per share of $1.00, which may be subject to redemption gates or liquidity fees under certain circumstances.
Market Risk: Each Fund may be exposed to prepayment risk, which is the risk that borrowers may exercise their option to prepay principal earlier than scheduled during periods of declining interest rates, which would force each Fund to reinvest in lower yielding securities. Each Fund may also be exposed to reinvestment risk, which is the risk that income from each Fund’s portfolio will decline if each Fund invests the proceeds from matured, traded or called fixed-income securities at market interest rates that are below each Fund portfolio’s current earnings rate.
Counterparty Credit Risk: The Funds may be exposed to counterparty credit risk, or the risk that an entity may fail to or be unable to perform on its commitments related to unsettled or open transactions, including making timely interest and/or principal payments or otherwise honoring its obligations. The Funds manage counterparty credit risk by entering into transactions only with counterparties that BFA believes have the financial resources to honor their obligations and by monitoring the financial stability
| N O T E S T O F I N A N C I A L S T A T E M E N T S |
277 |
Notes to Financial Statements (continued)
of those counterparties. Financial assets, which potentially expose the Funds to market, issuer and counterparty credit risks, consist principally of financial instruments and receivables due from counterparties. The extent of the Funds’ exposure to market, issuer and counterparty credit risks with respect to these financial assets is approximately their value recorded in the Statements of Assets and Liabilities, less any collateral held by the Funds.
Geographic/Asset Class Risk: A diversified portfolio, where this is appropriate and consistent with a fund’s objectives, minimizes the risk that a price change of a particular investment will have a material impact on the NAV of a fund. The investment concentrations within each Fund’s portfolio are disclosed in its Schedule of Investments.
The Funds invest a significant portion of their assets in securities of issuers located in the United States. A decrease in imports or exports, changes in trade regulations, inflation and/or an economic recession in the United States may have a material adverse effect on the U.S. economy and the securities listed on U.S. exchanges. Proposed and adopted policy and legislative changes in the United States may also have a significant effect on U.S. markets generally, as well as on the value of certain securities. Governmental agencies project that the United States will continue to maintain elevated public debt levels for the foreseeable future which may constrain future economic growth. Circumstances could arise that could prevent the timely payment of interest or principal on U.S. government debt, such as reaching the legislative “debt ceiling.” Such non-payment would result in substantial negative consequences for the U.S. economy and the global financial system. If U.S. relations with certain countries deteriorate, it could adversely affect issuers that rely on the United States for trade. The United States has also experienced increased internal unrest and discord. If these trends were to continue, they may have an adverse impact on the U.S. economy and the issuers in which the the Funds invest.
Certain Funds invest a significant portion of their assets in high yield securities. High yield securities that are rated below investment-grade (commonly referred to as “junk bonds”) or are unrated may be deemed speculative, involve greater levels of risk than higher-rated securities of similar maturity and are more likely to default. High yield securities may be issued by less creditworthy issuers, and issuers of high yield securities may be unable to meet their interest or principal payment obligations. High yield securities are subject to extreme price fluctuations, may be less liquid than higher rated fixed-income securities, even under normal economic conditions, and frequently have redemption features.
The Funds invest a significant portion of their assets in fixed-income securities and/or use derivatives tied to the fixed-income markets. Changes in market interest rates or economic conditions may affect the value and/or liquidity of such investments. Interest rate risk is the risk that prices of bonds and other fixed-income securities will decrease as interest rates rise and increase as interest rates fall. The Funds may be subject to a greater risk of rising interest rates due to the period of historically low interest rates that ended in March 2022. The Federal Reserve has recently raised the federal funds rate as part of its efforts to address inflation. There is a risk that interest rates will continue to rise, which will likely drive down the prices of bonds and other fixed-income securities, and could negatively impact the Funds’ performance.
Certain Funds invest a significant portion of their assets within the financials sector. Performance of companies in the financials sector may be adversely impacted by many factors, including, among others, changes in government regulations, economic conditions, and interest rates, credit rating downgrades, adverse public perception, exposure concentration and decreased liquidity in credit markets. The impact of changes in capital requirements and recent or future regulation on any individual financial company, or on the financials sector as a whole, cannot be predicted, but may negatively impact the Funds.
Significant Shareholder Redemption Risk: Certain shareholders may own or manage a substantial amount of fund shares and/or hold their fund investments for a limited period of time. Large redemptions of fund shares by these shareholders may force a fund to sell portfolio securities, which may negatively impact the fund’s NAV, increase the fund’s brokerage costs, and/or accelerate the realization of taxable income/gains and cause the fund to make additional taxable distributions to shareholders.
LIBOR Transition Risk: The Funds may be exposed to financial instruments that recently transitioned from, or continue to be tied to the London Interbank Offered Rate (“LIBOR”) to determine payment obligations, financing terms, hedging strategies or investment value. The United Kingdom’s Financial Conduct Authority, which regulates LIBOR, has ceased publishing all LIBOR settings, but some USD LIBOR settings will continue to be published under a synthetic methodology until September 30, 2024 for certain legacy contracts. The Secured Overnight Financing Rate (“SOFR”) has been used increasingly on a voluntary basis in new instruments and transactions. Under U.S. regulations that implement a statutory fallback mechanism to replace LIBOR, benchmark rates based on SOFR have replaced LIBOR in certain financial contracts. The ultimate effect of the LIBOR transition process on the Funds is uncertain.
| 9. | CAPITAL SHARE TRANSACTIONS |
Capital shares are issued and redeemed by each Fund only in aggregations of a specified number of shares or multiples thereof (“Creation Units”) at NAV. Except when aggregated in Creation Units, shares of each Fund are not redeemable.
Transactions in capital shares were as follows:
| Year Ended 02/29/24 |
Year Ended 02/28/23 |
|||||||||||||||
| iShares ETF | Shares | Amount | Shares | Amount | ||||||||||||
| BBB Rated Corporate Bond |
||||||||||||||||
| Shares sold |
750,000 | $ | 63,347,650 | 300,000 | $ | 23,989,448 | ||||||||||
| Shares redeemed |
(650,000 | ) | (55,031,170 | ) | (750,000 | ) | (61,790,110 | ) | ||||||||
|
|
|
|
|
|
|
|
|
|||||||||
| 100,000 | $ | 8,316,480 | (450,000 | ) | $ | (37,800,662 | ) | |||||||||
|
|
|
|
|
|
|
|
|
|||||||||
| 278 | 2 0 2 4 I S H A R E S A N N U A L R E P O R T T O S H A R E H O L D E R S |
Notes to Financial Statements (continued)
| Year Ended 02/29/24 |
Year Ended 02/28/23 |
|||||||||||||||
| iShares ETF | Shares | Amount | Shares | Amount | ||||||||||||
| Broad USD Investment Grade Corporate Bond |
||||||||||||||||
| Shares sold |
66,350,000 | $ | 3,297,369,497 | 82,800,000 | $ | 4,226,077,150 | ||||||||||
| Shares redeemed |
(24,950,000 | ) | (1,220,337,590 | ) | (32,300,000 | ) | (1,657,860,972 | ) | ||||||||
|
|
|
|
|
|
|
|
|
|||||||||
| 41,400,000 | $ | 2,077,031,907 | 50,500,000 | $ | 2,568,216,178 | |||||||||||
|
|
|
|
|
|
|
|
|
|||||||||
| 1-5 Year Investment Grade Corporate Bond |
||||||||||||||||
| Shares sold |
164,550,000 | $ | 8,289,089,192 | 161,150,000 | $ | 8,066,556,091 | ||||||||||
| Shares redeemed |
(232,550,000 | ) | (11,674,880,251 | ) | (100,650,000 | ) | (5,083,412,258 | ) | ||||||||
|
|
|
|
|
|
|
|
|
|||||||||
| (68,000,000 | ) | $ | (3,385,791,059 | ) | 60,500,000 | $ | 2,983,143,833 | |||||||||
|
|
|
|
|
|
|
|
|
|||||||||
| 5-10 Year Investment Grade Corporate Bond |
||||||||||||||||
| Shares sold |
85,150,000 | $ | 4,289,592,867 | 68,800,000 | $ | 3,532,921,534 | ||||||||||
| Shares redeemed |
(61,050,000 | ) | (3,063,211,278 | ) | (44,800,000 | ) | (2,324,332,733 | ) | ||||||||
|
|
|
|
|
|
|
|
|
|||||||||
| 24,100,000 | $ | 1,226,381,589 | 24,000,000 | $ | 1,208,588,801 | |||||||||||
|
|
|
|
|
|
|
|
|
|||||||||
| 10+ Year Investment Grade Corporate Bond |
||||||||||||||||
| Shares sold |
37,100,000 | $ | 1,865,641,732 | 16,200,000 | $ | 857,334,969 | ||||||||||
| Shares redeemed |
(27,400,000 | ) | (1,368,278,789 | ) | (15,800,000 | ) | (885,948,274 | ) | ||||||||
|
|
|
|
|
|
|
|
|
|||||||||
| 9,700,000 | $ | 497,362,943 | 400,000 | $ | (28,613,305 | ) | ||||||||||
|
|
|
|
|
|
|
|
|
|||||||||
The consideration for the purchase of Creation Units of a fund in the Trust generally consists of the in-kind deposit of a designated portfolio of securities and a specified amount of cash. Certain funds in the Trust may be offered in Creation Units solely or partially for cash in U.S. dollars. Authorized Participants purchasing and redeeming Creation Units may pay a purchase transaction fee and a redemption transaction fee directly to BRIL, to offset transfer and other transaction costs associated with the issuance and redemption of Creation Units, including Creation Units for cash. Authorized Participants transacting in Creation Units for cash may also pay an additional variable charge to compensate the relevant fund for certain transaction costs (i.e., stamp taxes, taxes on currency or other financial transactions, and brokerage costs) and market impact expenses relating to investing in portfolio securities. Such variable charges, if any, are included in shares sold in the table above.
From time to time, settlement of securities related to in-kind contributions or in-kind redemptions may be delayed. In such cases, securities related to in-kind transactions are reflected as a receivable or a payable in the Statements of Assets and Liabilities.
| 10. | SUBSEQUENT EVENTS |
Management has evaluated the impact of all subsequent events on the Funds through the date the financial statements were available to be issued and has determined that there were no subsequent events requiring adjustment or additional disclosure in the financial statements.
| N O T E S T O F I N A N C I A L S T A T E M E N T S |
279 |
Report of Independent Registered Public Accounting Firm
To the Board of Trustees of
iShares Trust and Shareholders of each of the five funds listed in the table below
Opinions on the Financial Statements
We have audited the accompanying statements of assets and liabilities, including the schedules of investments, of each of the funds listed in the table below (five of the funds constituting iShares Trust, hereafter collectively referred to as the “Funds”) as of February 29, 2024, the related statements of operations for the year ended February 29, 2024, the statements of changes in net assets for each of the two years in the period ended February 29, 2024, including the related notes, and the financial highlights for each of the periods indicated therein (collectively referred to as the “financial statements”). In our opinion, the financial statements present fairly, in all material respects, the financial position of each of the Funds as of February 29, 2024, the results of each of their operations for the year then ended, the changes in each of their net assets for each of the two years in the period ended February 29, 2024 and each of the financial highlights for each of the periods indicated therein in conformity with accounting principles generally accepted in the United States of America.
iShares BBB Rated Corporate Bond ETF
iShares Broad USD Investment Grade Corporate Bond ETF
iShares 1-5 Year Investment Grade Corporate Bond ETF
iShares 5-10 Year Investment Grade Corporate Bond ETF
iShares 10+ Year Investment Grade Corporate Bond ETF
Basis for Opinions
These financial statements are the responsibility of the Funds’ management. Our responsibility is to express an opinion on the Funds’ financial statements based on our audits. We are a public accounting firm registered with the Public Company Accounting Oversight Board (United States) (PCAOB) and are required to be independent with respect to the Funds in accordance with the U.S. federal securities laws and the applicable rules and regulations of the Securities and Exchange Commission and the PCAOB.
We conducted our audits of these financial statements in accordance with the standards of the PCAOB. Those standards require that we plan and perform the audit to obtain reasonable assurance about whether the financial statements are free of material misstatement, whether due to error or fraud.
Our audits included performing procedures to assess the risks of material misstatement of the financial statements, whether due to error or fraud, and performing procedures that respond to those risks. Such procedures included examining, on a test basis, evidence regarding the amounts and disclosures in the financial statements. Our audits also included evaluating the accounting principles used and significant estimates made by management, as well as evaluating the overall presentation of the financial statements. Our procedures included confirmation of securities owned as of February 29, 2024 by correspondence with the custodian, transfer agent and brokers; when replies were not received from brokers, we performed other auditing procedures. We believe that our audits provide a reasonable basis for our opinions.
/s/PricewaterhouseCoopers LLP
Philadelphia, Pennsylvania
April 19, 2024
We have served as the auditor of one or more BlackRock investment companies since 2000.
| 280 | 2 0 2 4 I S H A R E S A N N U A L R E P O R T T O S H A R E H O L D E R S |
Important Tax Information (unaudited)
The Funds hereby designate the following amounts, or maximum amounts allowable by law, of distributions from direct federal obligation interest for the fiscal year ended February 29, 2024:
|
|
||||
| iShares ETF | Federal Obligation Interest |
|||
|
|
||||
| BBB Rated Corporate Bond |
$ | 6,231 | ||
| Broad USD Investment Grade Corporate Bond |
358,885 | |||
| 1-5 Year Investment Grade Corporate Bond |
433,571 | |||
| 5-10 Year Investment Grade Corporate Bond |
368,087 | |||
| 10+ Year Investment Grade Corporate Bond |
56,019 | |||
|
|
||||
The law varies in each state as to whether and what percent of ordinary income dividends attributable to federal obligations is exempt from state income tax. Shareholders are advised to check with their tax advisers to determine if any portion of the dividends received is exempt from state income tax.
The Funds hereby designate the following amounts, or maximum amounts allowable by law, as interest income eligible to be treated as a Section 163(j) interest dividend for the fiscal year ended February 29, 2024:
|
|
||||
| iShares ETF | Interest Dividends | |||
|
|
||||
| BBB Rated Corporate Bond |
$ | 1,159,229 | ||
| Broad USD Investment Grade Corporate Bond |
390,127,853 | |||
| 1-5 Year Investment Grade Corporate Bond |
766,210,134 | |||
| 5-10 Year Investment Grade Corporate Bond |
458,915,976 | |||
| 10+ Year Investment Grade Corporate Bond |
92,615,833 | |||
|
|
||||
The Funds hereby designate the following amounts, or maximum amounts allowable by law, as interest-related dividends eligible for exemption from U.S. withholding tax for nonresident aliens and foreign corporations for the fiscal year ended February 29, 2024:
|
|
||||
| iShares ETF | Interest-Related Dividends |
|||
|
|
||||
| BBB Rated Corporate Bond |
$ | 1,060,510 | ||
| Broad USD Investment Grade Corporate Bond |
304,094,116 | |||
| 1-5 Year Investment Grade Corporate Bond |
547,639,402 | |||
| 5-10 Year Investment Grade Corporate Bond |
348,809,449 | |||
| 10+ Year Investment Grade Corporate Bond |
78,123,085 | |||
|
|
||||
| I M P O R T A N T T A X I N F O R M A T I O N |
281 |
Statement Regarding Liquidity Risk Management Program (unaudited)
In compliance with Rule 22e-4 under the Investment Company Act of 1940, as amended (the “Liquidity Rule”), iShares Trust (the “Trust”) has adopted and implemented a liquidity risk management program (the “Program”) for iShares BBB Rated Corporate Bond ETF, iShares Broad USD Investment Grade Corporate Bond ETF, iShares 1-5 Year Investment Grade Corporate Bond ETF, iShares 5-10 Year Investment Grade Corporate Bond ETF and iShares 10+ Year Investment Grade Corporate Bond ETF (the “Funds” or “ETFs”), each a series of the Trust, which is reasonably designed to assess and manage each Fund’s liquidity risk.
The Board of Trustees (the “Board”) of the Trust, on behalf of the Funds, met on December 8, 2023 (the “Meeting”) to review the Program. The Board previously appointed BlackRock Fund Advisors (“BlackRock”), the investment adviser to the Funds, as the program administrator for each Fund’s Program. BlackRock also previously delegated oversight of the Program to the 40Act Liquidity Risk Management Committee (the “Committee”).At the Meeting, the Committee, on behalf of BlackRock, provided the Board with a report that addressed the operation of the Program and assessed its adequacy and effectiveness of implementation, including the management of each Fund’s Highly Liquid Investment Minimum (“HLIM”) where applicable, and any material changes to the Program (the “Report”). The Report covered the period from October 1, 2022 through September 30, 2023 (the “Program Reporting Period”).
The Report described the Program’s liquidity classification methodology for categorizing each Fund’s investments (including derivative transactions) into one of four liquidity buckets. It also referenced the methodology used by BlackRock to establish each Fund’s HLIM and noted that the Committee reviews and ratifies the HLIM assigned to each Fund no less frequently than annually. The Report also discussed notable events affecting liquidity over the Program Reporting Period, including extended market holidays, delays in the repatriation of the local currency in certain non-U.S. countries, the continued illiquidity of Russian equity securities and the suspension of select sanctions in Venezuela.
The Report noted that the Program complied with the key factors for consideration under the Liquidity Rule for assessing, managing and periodically reviewing each Fund’s liquidity risk, as follows:
| a) | The Fund’s investment strategy and liquidity of portfolio investments during both normal and reasonably foreseeable stressed conditions. During the Program Reporting Period, the Committee reviewed whether each Fund’s strategy is appropriate for an open-end fund structure, with a focus on funds with more significant and consistent holdings of less liquid and illiquid assets. The Committee also factored a fund’s concentration in an issuer into the liquidity classification methodology by taking issuer position sizes into account. Derivative exposure was also considered in the calculation of a fund’s liquidity bucketing. Finally, a factor for consideration under the Liquidity Rule is a Fund’s use of borrowings for investment purposes. However, the Funds do not borrow for investment purposes. |
| b) | Short-term and long-term cash flow projections during both normal and reasonably foreseeable stressed conditions. During the Program Reporting Period, the Committee reviewed historical redemption activity and used this information as a component to establish each ETF’s reasonably anticipated trading size utilized for liquidity classifications. The Committee may also take into consideration a fund’s shareholder ownership concentration (which, depending on product type and distribution channel, may or may not be available), a fund’s distribution channels, and the degree of certainty associated with a fund’s short-term and long-term cash flow projections. |
| c) | Holdings of cash and cash equivalents, as well as borrowing arrangements. The Committee considered that ETFs generally do not hold more than de minimis amounts of cash. The Committee also considered that ETFs generally do not engage in borrowing. |
| d) | The relationship between an ETF’s portfolio liquidity and the way in which, and the prices and spreads at which, ETF shares trade, including the efficiency of the arbitrage function and the level of active participation by market participants, including authorized participants. The Committee monitored the prevailing bid/ask spread and the ETF price premium (or discount) to NAV for all ETFs. However, there were no ETFs with persistent deviations of fund premium/discount or bid/ask spreads from long-term averages over the Program Reporting Period. |
| e) | The effect of the composition of baskets on the overall liquidity of an ETF’s portfolio. In reviewing the linkage between the composition of custom baskets accepted by an ETF and any significant change in the liquidity profile of such ETF, the Committee reviewed changes in the proportion of each ETF’s portfolio comprised of less liquid and illiquid holdings to determine if applicable thresholds were met requiring enhanced review. There were no ETFs for which the custom baskets accepted by the ETF had a significant change in its liquidity profile. |
There were no material changes to the Program during the Program Reporting Period other than the enhancement of certain model components in the Program’s classification methodology. The Report provided to the Board stated that the Committee concluded that based on the operation of the functions, as described in the Report, the Program is operating as intended and is effective in implementing the requirements of the Liquidity Rule.
| 282 | 2 0 2 4 I S H A R E S A N N U A L R E P O R T T O S H A R E H O L D E R S |
Supplemental Information (unaudited)
Section 19(a) Notices
The amounts and sources of distributions reported are estimates and are being provided pursuant to regulatory requirements and are not being provided for tax reporting purposes. The actual amounts and sources for tax reporting purposes will depend upon each Fund’s investment experience during the year and may be subject to changes based on tax regulations. Shareholders will receive a Form 1099-DIV each calendar year that will inform them how to report these distributions for federal income tax purposes.
February 29, 2024
|
|
Total Cumulative Distributions for the Fiscal Year |
% Breakdown of the Total Cumulative Distributions for the Fiscal Year |
||||||||||||||||||||||||||||||
| iShares ETF |
|
Net Investment Income |
|
|
Net Realized Capital Gains |
|
|
Return of Capital |
|
|
Total Per Share |
|
|
Net Investment Income |
|
|
Net Realized Capital Gains |
|
|
Return of Capital |
|
|
Total Per Share |
| ||||||||
| Broad USD Investment Grade Corporate Bond |
$ | 2.042041 | $ | — | $ | — | $ | 2.042041 | 100 | % | — | % | — | % | 100 | % | ||||||||||||||||
| 1-5 Year Investment Grade Corporate Bond |
1.709067 | — | — | 1.709067 | 100 | — | — | 100 | ||||||||||||||||||||||||
| 10+ Year Investment Grade Corporate Bond |
2.422933 | — | — | 2.422933 | 100 | — | — | 100 | ||||||||||||||||||||||||
Tailored Shareholder Reports for Open-End Mutual Funds and ETFs
Effective January 24, 2023, the SEC adopted rule and form amendments to require open-end mutual funds and ETFs to transmit concise and visually engaging streamlined annual and semiannual reports to shareholders that highlight key information. Other information, including financial statements, will no longer appear in a streamlined shareholder report but must be available online, delivered free of charge upon request, and filed on a semiannual basis on Form N-CSR. The rule and form amendments have a compliance date of July 24, 2024. At this time, management is evaluating the impact of these amendments on the shareholder reports for the Funds.
Premium/Discount Information
Information on the Fund’s net asset value, market price, premiums and discounts, and bid-ask spreads can be found at iShares.com.
Regulation under the Alternative Investment Fund Managers Directive
The Alternative Investment Fund Managers Directive, and its United Kingdom (“UK”) equivalent, (the “AIFMD”) impose detailed and prescriptive obligations on fund managers established in the European Union (the “EU”) and the UK. These do not currently apply to managers established outside of the EU or UK, such as BFA (the “Company”). However, the Company is required to comply with certain disclosure, reporting and transparency obligations of the AIFMD because it has registered the iShares 1-5 Year Investment Grade Corporate Bond ETF and iShares 5-10 Year Investment Grade Corporate Bond ETF (the “Funds”) to be marketed to investors in the EU and/or UK.
Report on Remuneration
BlackRock has a clear and well-defined pay-for-performance philosophy, and compensation programs which support that philosophy.
BlackRock operates a total compensation model for remuneration which includes a base salary, which is contractual, and a discretionary bonus scheme. Although all employees are eligible to receive a discretionary bonus, there is no contractual obligation to make a discretionary bonus award to any employees. For senior management and staff who have the ability to materially affect the risk profile of the Funds, a significant percentage of variable remuneration is deferred over time. All employees are subject to a clawback policy.
Remuneration decisions for employees are made once annually in January following the end of the performance year, based on BlackRock’s full-year financial results and other non-financial goals and objectives. Alongside financial performance, individual total compensation is also based on strategic and operating results and other considerations such as management and leadership capabilities. No set formulas are established and no fixed benchmarks are used in determining annual incentive awards.
Annual incentive awards are paid from a bonus pool which is reviewed throughout the year by BlackRock’s independent compensation committee, taking into account both actual and projected financial information together with information provided by the Enterprise Risk and Regulatory Compliance departments in relation to any activities, incidents or events that warrant consideration in making compensation decisions. Individuals are not involved in setting their own remuneration.
Each of the control functions (Enterprise Risk, Legal & Compliance, Finance, Human Resources and Internal Audit) each have their own organizational structures which are independent of the business units and therefore staff members in control functions are remunerated independently of the businesses they oversee. Functional bonus pools for those control functions are determined with reference to the performance of each individual function and the remuneration of the senior members of control functions is directly overseen by BlackRock’s independent remuneration committee.
The Company is required under the AIFMD to make quantitative disclosures of remuneration. These disclosures are made in line with BlackRock’s interpretation of currently available regulatory guidance on quantitative remuneration disclosures. As market or regulatory practice develops BlackRock may consider it appropriate to make changes to the way in which quantitative remuneration disclosures are calculated. Where such changes are made, this may result in disclosures in relation to a fund not being
| S U P P L E M E N T A L I N F O R M A T I O N |
283 |
Supplemental Information (unaudited) (continued)
comparable to the disclosures made in the prior year, or in relation to other BlackRock fund disclosures in that same year. BlackRock bases its proportionality approach on a combination of factors that it is entitled to take into account based on relevant guidelines.
Remuneration information at an individual AIF level is not readily available. Disclosures are provided in relation to (a) the staff of the Company; (b) staff who are senior management; (c) staff who have the ability to materially affect the risk profile of the Funds; and (d) staff of companies to which portfolio management and risk management has been formally delegated.
All individuals included in the aggregated figures disclosed are rewarded in line with BlackRock’s remuneration policy for their responsibilities across the relevant BlackRock business area. As all individuals have a number of areas of responsibilities, only the portion of remuneration for those individuals’ services attributable to the Funds is included in the aggregate figures disclosed.
Members of staff and senior management of the Company typically provide both AIFMD and non-AIFMD related services in respect of multiple funds, clients and functions of the Company and across the broader BlackRock group. Conversely, members of staff and senior management of the broader BlackRock group may provide both AIFMD and non-AIFMD related services in respect of multiple funds, clients and functions of the broader BlackRock group and of the Company. Therefore, the figures disclosed are a sum of individuals’ portion of remuneration attributable to the Company according to an objective apportionment methodology which acknowledges the multiple-service nature of the Company and the broader BlackRock group. Accordingly, the figures are not representative of any individual’s actual remuneration or their remuneration structure.
The amount of the total remuneration awarded to the Company’s staff in respect of the Company’s financial year ending December 31, 2023 was USD 5.43m. This figure is comprised of fixed remuneration of USD 0.74m and variable remuneration of USD 4.68m. There was a total of 8 beneficiaries of the remuneration described above.
The amount of the aggregate remuneration awarded by the Company in respect of the Company’s financial year ending December 31, 2023, to its senior management was USD 3.66m, and to other members of its staff whose actions potentially have a material impact on the risk profile of the Company or its funds was USD 1.77m.
Disclosures Under the EU Sustainable Finance Disclosure Regulation
The iShares 1-5 Year Investment Grade Corporate Bond ETF and iShares 5-10 Year Investment Grade Corporate Bond ETF (the “Funds”) are registered under the Alternative Investment Fund Managers Directive to be marketed to European Union (“EU”) investors, as noted above. As a result, certain disclosures are required under the EU Sustainable Finance Disclosure Regulation (“SFDR”).
Each Fund has not been categorized under the SFDR as an “Article 8” or “Article 9” product. In addition, each Fund’s investment strategy does not take into account the criteria for environmentally sustainable economic activities under the EU sustainable investment taxonomy regulation or principal adverse impacts (“PAIs”) on sustainability factors under the SFDR. PAIs are identified under the SFDR as the material impacts of investment decisions on sustainability factors relating to environmental, social and employee matters, respect for human rights, and anti-corruption and anti-bribery matters.
| 284 | 2 0 2 4 I S H A R E S A N N U A L R E P O R T T O S H A R E H O L D E R S |
Trustee and Officer Information (unaudited)
The Board of Trustees has responsibility for the overall management and operations of the Funds, including general supervision of the duties performed by BFA and other service providers. Each Trustee serves until he or she resigns, is removed, dies, retires or becomes incapacitated. Each officer shall hold office until his or her successor is elected and qualifies or until his or her death, resignation or removal. Trustees who are not “interested persons” (as defined in the 1940 Act) of the Trust are referred to as independent trustees (“Independent Trustees”).
The registered investment companies advised by BFA or its affiliates (the “BlackRock-advised Funds”) are organized into one complex of open-end equity, multi-asset, index and money market funds and ETFs (the “BlackRock Multi-Asset Complex”), one complex of closed-end funds and open-end non-index fixed-income funds (including ETFs) (the “BlackRock Fixed-Income Complex”) and one complex of ETFs (“Exchange-Traded Fund Complex”) (each, a “BlackRock Fund Complex”). Each Fund is included in the Exchange-Traded Fund Complex. Each Trustee also serves as a Director of iShares, Inc. and a Trustee of iShares U.S. ETF Trust and, as a result, oversees all of the funds within the Exchange-Traded Fund Complex, which consists of 401 funds as of February 29, 2024. With the exception of Robert S. Kapito and Aaron Wasserman, the address of each Trustee and officer is c/o BlackRock, Inc., 400 Howard Street, San Francisco, CA 94105. The address of Mr. Kapito and Mr. Wasserman is c/o BlackRock, Inc., 50 Hudson Yards, New York, NY 10001. The Board has designated John E. Kerrigan as its Independent Board Chair. Additional information about the Funds’ Trustees and officers may be found in the Funds’ combined Statement of Additional Information, which is available without charge, upon request, by calling toll-free 1-800-iShares (1-800-474-2737).
| Interested Trustees | ||||||
| Name (Year of Birth) |
Position(s) | Principal Occupation(s) During Past 5 Years |
Other Directorships Held by Trustee | |||
| Robert S. Kapito(a) (1957) |
Trustee (since 2009). | President, of BlackRock, Inc. (since 2006); Vice Chairman of BlackRock, Inc. and Head of BlackRock’s Portfolio Management Group (since its formation in 1998) and BlackRock, Inc.’s predecessor entities (since 1988); Trustee, University of Pennsylvania (since 2009); President of Board of Directors, Hope & Heroes Children’s Cancer Fund (since 2002). | Director of BlackRock, Inc. (since 2006); Director of iShares, Inc. (since 2009); Trustee of iShares U.S. ETF Trust (since 2011). | |||
| (a) | Robert S. Kapito is deemed to be an “interested person” (as defined in the 1940 Act) of the Trust due to his affiliations with BlackRock, Inc. and its affiliates. |
| Independent Trustees | ||||||
| Name (Year of Birth) |
Position(s) | Principal Occupation(s) During Past 5 Years |
Other Directorships Held by Trustee | |||
| John E. Kerrigan (1955) |
Trustee (since 2005); Independent Board Chair (since 2022). | Chief Investment Officer, Santa Clara University (since 2002). | Director of iShares, Inc. (since 2005); Trustee of iShares U.S. ETF Trust (since 2011); Independent Board Chair of iShares, Inc. and iShares U.S. ETF Trust (since 2022). | |||
| Jane D. Carlin (1956) |
Trustee (since 2015); Risk Committee Chair (since 2016). | Consultant (since 2012); Member of the Audit Committee (2012-2018), Chair of the Nominating and Governance Committee (2017-2018) and Director of PHH Corporation (mortgage solutions) (2012-2018); Managing Director and Global Head of Financial Holding Company Governance & Assurance and the Global Head of Operational Risk Management of Morgan Stanley (2006-2012). | Director of iShares, Inc. (since 2015); Trustee of iShares U.S. ETF Trust (since 2015); Member of the Audit Committee (since 2016), Chair of the Audit Committee (since 2020) and Director of The Hanover Insurance Group, Inc. (since 2016). | |||
| Richard L. Fagnani (1954) |
Trustee (since 2017); Audit Committee Chair (since 2019). | Partner, KPMG LLP (2002-2016); Director of One Generation Away (since 2021). | Director of iShares, Inc. (since 2017); Trustee of iShares U.S. ETF Trust (since 2017). | |||
| Cecilia H. Herbert (1949) |
Trustee (since 2005); Nominating and Governance and Equity Plus Committee Chairs (since 2022). | Chair of the Finance Committee (since 2019) and Trustee and Member of the Finance, Audit and Quality Committees of Stanford Health Care (since 2016); Trustee of WNET, New York’s public media company (since 2011) and Member of the Audit Committee (since 2018), Investment Committee (since 2011) and Personnel Committee (since 2022); Member of the Wyoming State Investment Funds Committee (since 2022); Director of the Jackson Hole Center for the Arts (since 2021); Trustee of Forward Funds (14 portfolios) (2009-2018); Trustee of Salient MF Trust (4 portfolios) (2015-2018). | Director of iShares, Inc. (since 2005); Trustee of iShares U.S. ETF Trust (since 2011). | |||
| Drew E. Lawton (1959) |
Trustee (since 2017); 15(c) Committee Chair (since 2017). | Senior Managing Director of New York Life Insurance Company (2010-2015). | Director of iShares, Inc. (since 2017); Trustee of iShares U.S. ETF Trust (since 2017); Director of Jackson Financial Inc. (since 2021). | |||
| T R U S T E E A N D O F F I C E R I N F O R M A T I O N |
285 |
Trustee and Officer Information (unaudited) (continued)
| Independent Trustees (continued) | ||||||
| Name (Year of Birth) |
Position(s) | Principal Occupation(s) During Past 5 Years |
Other Directorships Held by Trustee | |||
| John E. Martinez (1961) |
Trustee (since 2003); Securities Lending Committee Chair (since 2019). | Director of Real Estate Equity Exchange, Inc. (since 2005); Director of Cloudera Foundation (2017-2020); and Director of Reading Partners (2012-2016). | Director of iShares, Inc. (since 2003); Trustee of iShares U.S. ETF Trust (since 2011). | |||
| Madhav V. Rajan (1964) |
Trustee (since 2011); Fixed-Income Plus Committee Chair (since 2019). | Dean, and George Pratt Shultz Professor of Accounting, University of Chicago Booth School of Business (since 2017); Advisory Board Member (since 2016) and Director (since 2020) of C.M. Capital Corporation; Chair of the Board for the Center for Research in Security Prices, LLC (since 2020); Robert K. Jaedicke Professor of Accounting, Stanford University Graduate School of Business (2001-2017); Professor of Law (by courtesy), Stanford Law School (2005-2017); Senior Associate Dean for Academic Affairs and Head of MBA Program, Stanford University Graduate School of Business (2010-2016). | Director of iShares, Inc. (since 2011); Trustee of iShares U.S. ETF Trust (since 2011). | |||
| Officers | ||||
| Name (Year of Birth) |
Position(s) | Principal Occupation(s) During Past 5 Years | ||
| Dominik Rohé (1973) |
President (since 2023). | Managing Director, BlackRock, Inc. (since 2005); Head of Americas ETF and Index Investments (since 2023); Head of Latin America (2019-2023). | ||
| Trent Walker (1974) |
Treasurer and Chief Financial Officer (since 2020). | Managing Director, BlackRock, Inc. (since September 2019); Chief Financial Officer of iShares Delaware Trust Sponsor LLC, BlackRock Funds, BlackRock Funds II, BlackRock Funds IV, BlackRock Funds V and BlackRock Funds VI (since 2021); Executive Vice President of PIMCO (2016-2019); Senior Vice President of PIMCO (2008-2015); Treasurer (2013-2019) and Assistant Treasurer (2007-2017) of PIMCO Funds, PIMCO Variable Insurance Trust, PIMCO ETF Trust, PIMCO Equity Series, PIMCO Equity Series VIT, PIMCO Managed Accounts Trust, 2 PIMCO-sponsored interval funds and 21 PIMCO-sponsored closed-end funds. | ||
| Aaron Wasserman (1974) |
Chief Compliance Officer (iShares, Inc. and iShares Trust, since 2023; iShares U.S. ETF Trust, since 2023). | Managing Director of BlackRock, Inc. (since 2018); Chief Compliance Officer of the BlackRock Multi-Asset Complex, the BlackRock Fixed-Income Complex and the Exchange-Traded Fund Complex (since 2023); Deputy Chief Compliance Officer for the BlackRock Multi-Asset Complex, the BlackRock Fixed-Income Complex and the Exchange-Traded Fund Complex (2014-2023). | ||
| Marisa Rolland (1980) |
Secretary (since 2022). | Managing Director, of BlackRock, Inc. (since 2023); Director, of BlackRock, Inc. (2018-2022); Vice President, BlackRock, Inc. (2010-2017). | ||
| Rachel Aguirre (1982) |
Executive Vice President (since 2022). | Managing Director, of BlackRock, Inc. (since 2018); Director, BlackRock, Inc. (2009-2018); Head of U.S. iShares Product (since 2022); Head of EII U.S. Product Engineering of BlackRock, Inc. (since 2021); Co-Head of EII’s Americas Portfolio Engineering of BlackRock, Inc. (2020-2021); Head of Developed Markets Portfolio Engineering of BlackRock, Inc. (2016-2019). | ||
| Jennifer Hsui (1976) |
Executive Vice President (since 2022). | Managing Director of BlackRock, Inc. (since 2009); Co-Head of Index Equity of BlackRock, Inc. (since 2022). | ||
| James Mauro (1970) |
Executive Vice President (since 2022). | Managing Director, of BlackRock, Inc. (since 2010); Head of Fixed Income Index Investments in the Americas and Head of San Francisco Core Portfolio Management of BlackRock, Inc. (since 2020). | ||
Effective July 1, 2023, Aaron Wasserman replaced Charles Park as Chief Compliance Officer.
Effective February 1, 2024, Salim Ramji resigned as Trustee of the Trust.
Effective March 5, 2024, Stephen Cohen replaced Salim Ramji as Trustee of the Trust.
Effective March 5, 2024, Dominik Rohé resigned as President of the Trust.
Effective March 5, 2024, Jessica Tan replaced Dominik Rohé as President of the Trust.
Effective April 8, 2024, Laura Fergerson was appointed as Trustee of the Trust.
Effective April 8, 2024, James Lam was appointed as Trustee of the Trust.
| 286 | 2 0 2 4 I S H A R E S A N N U A L R E P O R T T O S H A R E H O L D E R S |
Electronic Delivery
Shareholders can sign up for e-mail notifications announcing that the shareholder report or prospectus has been posted on the iShares website at iShares.com. Once you have enrolled, you will no longer receive prospectuses and shareholder reports in the mail.
To enroll in electronic delivery:
| • | Go to icsdelivery.com. |
| • | If your brokerage firm is not listed, electronic delivery may not be available. Please contact your broker-dealer or financial advisor. |
Householding
Householding is an option available to certain fund investors. Householding is a method of delivery, based on the preference of the individual investor, in which a single copy of certain shareholder documents and Rule 30e-3 notices can be delivered to investors who share the same address, even if their accounts are registered under different names. Please contact your broker-dealer if you are interested in enrolling in householding and receiving a single copy of prospectuses and other shareholder documents, or if you are currently enrolled in householding and wish to change your householding status.
Availability of Quarterly Schedule of Investments
The Funds file their complete schedule of portfolio holdings with the SEC for the first and third quarters of each fiscal year as an exhibit to their reports on Form N-PORT. The Funds’ Forms N-PORT are available on the SEC’s website at sec.gov. Additionally, each Fund makes its portfolio holdings for the first and third quarters of each fiscal year available at iShares.com/fundreports.
Availability of Proxy Voting Policies and Proxy Voting Records
A description of the policies and procedures that the iShares Funds use to determine how to vote proxies relating to portfolio securities and information about how the iShares Funds voted proxies relating to portfolio securities during the most recent twelve-month period ending June 30 is available without charge, upon request (1) by calling toll-free 1-800-474-2737; (2) on the iShares website at iShares.com; and (3) on the SEC website at sec.gov.
A description of the Trust’s policies and procedures with respect to the disclosure of the Fund’s portfolio securities is available in the Fund Prospectus. The Fund discloses its portfolio holdings daily and provides information regarding its top holdings in Fund fact sheets at iShares.com.
| G E N E R A L I N F O R M A T I O N |
287 |
Glossary of Terms Used in this Report
| Portfolio Abbreviation | ||
| CMT | Constant Maturity Treasury | |
| JSC | Joint Stock Company | |
| LIBOR | London Interbank Offered Rate | |
| PJSC | Public Joint Stock Company | |
| REIT | Real Estate Investment Trust | |
| SOFR | Secured Overnight Financing Rate | |
| 288 | 2 0 2 4 I S H A R E S A N N U A L R E P O R T T O S H A R E H O L D E R S |
Want to know more?
iShares.com | 1-800-474-2737
This report is intended for the Funds’ shareholders. It may not be distributed to prospective investors unless it is preceded or accompanied by the current prospectus.
Investing involves risk, including possible loss of principal.
The iShares Funds are distributed by BlackRock Investments, LLC (together with its affiliates, “BlackRock”).
The iShares Funds are not sponsored, endorsed, issued, sold or promoted by ICE Data Indices, LLC or Markit Indices Limited, nor do these companies make any representation regarding the advisability of investing in the iShares Funds. BlackRock is not affiliated with the companies listed above.
©2024 BlackRock, Inc. All rights reserved. iSHARES and BLACKROCK are registered trademarks of BlackRock, Inc. or its subsidiaries. All other marks are the property of their respective owners.
iS-AR-212-0224
|
|

|

|
|
FEBRUARY 29, 2024 | |

| 2024 Annual Report
| ||
iShares Trust
| · | iShares ESG Advanced Investment Grade Corporate Bond ETF | ELQD | NYSE Arca |
| · | iShares ESG Advanced Total USD Bond Market ETF | EUSB | NYSE Arca |
Dear Shareholder,
The combination of continued economic growth and cooling inflation provided a supportive backdrop for investors during the 12-month reporting period ended February 29, 2024. Significantly tighter monetary policy helped to rein in inflation, and the Consumer Price Index decelerated substantially while remaining above pre-pandemic levels. A moderating labor market helped ease inflationary pressure, although wages continued to grow. Wage and job growth powered robust consumer spending, backstopping the economy. On October 7, 2023, Hamas launched a horrific attack on Israel. The ensuing war will have a significant humanitarian impact and could lead to heightened economic and market volatility. We see geopolitics as a structural market risk going forward. See our geopolitical risk dashboard at blackrock.com for more details.
Equity returns were robust during the period, as interest rates stabilized and the economy proved to be more resilient than many investors expected. The U.S. economy continued to show strength, and growth further accelerated in the second half of 2023. Large-capitalization U.S. stocks posted particularly substantial gains, supported by the performance of a few notable technology companies, while small-capitalization U.S. stocks advanced at a significantly slower pace. Meanwhile, international developed market equities also gained strongly, while emerging market stocks advanced at a more modest pace.
The 10-year U.S. Treasury yield rose during the reporting period, as investors reacted to elevated inflation and attempted to anticipate future interest rate changes. However, higher yields drove positive returns overall for 10-year U.S. Treasuries and solid gains in shorter-duration U.S. Treasuries. The corporate bond market benefited from improving economic sentiment, although high-yield corporate bond prices fared significantly better than investment-grade bonds as demand from yield-seeking investors remained strong.
The U.S. Federal Reserve (the “Fed”), attempting to manage persistent inflation, raised interest rates three times during the 12-month period, but paused its tightening after its July meeting. The Fed also continued to reduce its balance sheet by not replacing some of the securities that reach maturity.
Supply constraints appear to have become an embedded feature of the new macroeconomic environment, making it difficult for developed economies to increase production without sparking higher inflation. Geopolitical fragmentation and an aging population risk further exacerbating these constraints, keeping the labor market tight and wage growth high. Although the Fed has stopped tightening for now, we believe that the new economic regime means that the Fed will need to maintain high rates for an extended period despite the market’s hopes for rapid interest rate cuts, as reflected in the recent rally. In this new regime, we anticipate greater volatility and dispersion of returns, creating more opportunities for selective portfolio management.
Looking at developed market stocks, we have an overweight stance on U.S. stocks overall, particularly given the promise of emerging AI technologies. We are also overweight Japanese stocks as shareholder-friendly policies generate increased investor interest, although we maintain an underweight stance on European stocks. In credit, there are selective opportunities in the near term despite tighter credit and financial conditions. For fixed income investing with a six- to twelve-month horizon, we see the most attractive investments in short-term U.S. Treasuries and hard-currency emerging market bonds.
Overall, our view is that investors need to think globally, position themselves to be prepared for a decarbonizing economy, and be nimble as market conditions change. We encourage you to talk with your financial advisor and visit iShares.com for further insight about investing in today’s markets.

Rob Kapito
President, BlackRock Inc.

Rob Kapito
President, BlackRock Inc.
| Total Returns as of February 29, 2024
| ||||
|
6-Month
|
12-Month
| |||
|
U.S. large cap
equities
|
13.93% | 30.45% | ||
|
U.S. small cap
equities
|
8.97 | 10.05 | ||
|
International
equities
|
9.23 | 14.41 | ||
|
Emerging market equities
|
4.93 | 8.73 | ||
|
3-month Treasury
bills
|
2.69 | 5.22 | ||
|
U.S. Treasury
securities
|
0.58 | 0.69 | ||
|
U.S. investment
grade bonds
|
2.35 | 3.33 | ||
|
Tax-exempt
municipal bonds
|
4.33 | 5.42 | ||
|
U.S. high yield
bonds
|
6.18 | 11.01 | ||
| Past performance is not an indication of future results. Index performance is shown for illustrative purposes only. You cannot invest directly in an index.
| ||||
| 2 | T H I S P A G E I S N O T P A R T O F Y O U R F U N D R E P O R T |
| Page | ||||
| 2 | ||||
| Annual Report: |
||||
| 4 | ||||
| 5 | ||||
| 9 | ||||
| 9 | ||||
| 10 | ||||
| Financial Statements |
||||
| 61 | ||||
| 62 | ||||
| 63 | ||||
| 64 | ||||
| 66 | ||||
| 74 | ||||
| 75 | ||||
| 76 | ||||
| 77 | ||||
| 78 | ||||
| 81 | ||||
| 82 | ||||
iShares Trust
U.S. Bond Market Overview
U.S. investment-grade bonds produced a gain of 3.33% during the 12 months ended February 29, 2024 (the “reporting period”), as measured by the Bloomberg U.S. Aggregate Bond Index. Income made a sizable contribution to performance, and strength in credit-oriented market segments provided an additional boost to returns.
The 12-month gain for the index belies the challenging environment for the bond market through the first eight months of the period. During this time, yields drifted steadily higher (as prices fell) in response to better-than-expected economic growth and continued interest rate increases by the U.S. Federal Reserve (Fed). The Fed raised rates by a quarter-point at its meetings in March, May, and July 2023, moving its benchmark fed funds rate to a range of 5.25% - 5.50%. Although the Fed’s aggressive actions contributed to a decline in inflation, U.S. economic growth remained robust behind persistent strength in the labor market. This trend gave rise to expectations that the central bank would need to keep rates “higher for longer,” fueling a sharp sell-off in the bond market in the span from August through October 2023.
The investment backdrop improved considerably in the final two months of 2023, touching off a rally that helped the fixed-income market quickly recover its earlier losses. The headline Consumer Price Index fell to its lowest levels since early 2021 in the November report, surprising the markets and causing the consensus to shift toward the view that the Fed was in fact finished raising rates. In December, Fed Chairman Jerome Powell provided another positive surprise with his suggestion that rate cuts could begin as early as the first half of 2024. Bond prices moved surged in response, with the credit sectors leading the way amid a pronounced improvement in investor sentiment. While yields crept higher in January and February, the Bloomberg U.S. Aggregate Bond Index finished in positive territory on the strength of its earlier advance.
These trends were reflected in the U.S. Treasury market, where the yield on the two-year note entered the annual period at 4.81%, reached a high of 5.19% in mid-October, and subsequently finished February 2024 at 4.64%. The 10-year issue followed a similar path, climbing from 3.92% at the start of the period to a high of 4.98% before sliding to 4.25% on February 29, 2024. One result of these moves was that the yield curve’s inversion—i.e., the extent to which short-term rates exceeded those of longer-term issues—gradually moderated from the unusually high level reached in early 2023. Short-term Treasuries were the strongest performers on a total return basis, followed by intermediate-term issues. However, longer-dated government bonds (those with maturities of 10 years and above) posted a loss.
Investment-grade corporate bonds were the best performing segment of the index during the 12-month period. The asset class was helped by a larger contribution from yield, together with a decline in yield spreads relative to U.S. Treasuries. Securitized assets—a category that encompasses mortgage-backed securities (MBS), asset backed securities (ABS) and commercial mortgage-backed securities (CMBS)—underperformed the index. While ABS and CMBS both held up well, agency MBS failed to keep pace with the broader fixed-income market due to the combination of the Fed’s ongoing balance sheet reduction and lower buying demand from banks.
| 4 | 2 0 2 4 I S H A R E S A N N U A L R E P O R T T O S H A R E H O L D E R S |
| Fund Summary as of February 29, 2024
|
iShares® ESG Advanced Investment Grade Corporate Bond ETF |
Investment Objective
The iShares ESG Advanced Investment Grade Corporate Bond ETF (the “Fund”) seeks to track the investment results of an index composed of U.S. dollar-denominated, investment grade corporate bonds that applies extensive climate-based screens and other extensive screens for involvement in controversial activities, and reflects the performance of issuers with a favorable environmental, social and governance rating as identified by the index provider, as represented by the iBoxx MSCI ESG Advanced USD Liquid Investment Grade Index (the “Index”). The Fund invests in a representative sample of securities included in the Index that collectively has an investment profile similar to the Index. Due to the use of representative sampling, the Fund may or may not hold all of the securities that are included in the Index.
Performance
| Average Annual Total Returns |
Cumulative Total Returns | |||||||||||||||||||||||
| 1 Year | Since Inception |
1 Year | Since Inception |
|||||||||||||||||||||
| Fund NAV |
5.87 | % | (5.91 | )% | 5.87 | % | (13.12 | )% | ||||||||||||||||
| Fund Market |
5.89 | (5.82 | ) | 5.89 | (12.93 | ) | ||||||||||||||||||
| Index |
6.20 | (5.70 | ) | 6.20 | (12.68 | ) | ||||||||||||||||||
GROWTH OF $10,000 INVESTMENT
(SINCE INCEPTION AT NET ASSET VALUE)
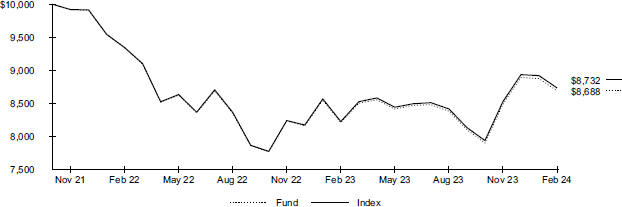
| The inception date of the Fund was November 8, 2021. The first day of secondary market trading was November 10, 2021. |
| Past performance is not an indication of future results. Performance results do not reflect the deduction of taxes that a shareholder would pay on fund distributions or on the redemption or sale of fund shares. See “About Fund Performance” for more information. |
Expense Example
| Actual | Hypothetical 5% Return | |||||||||||||||||||||||||||
|
|
|
|
|
|||||||||||||||||||||||||
| |
Beginning Account Value (09/01/23) |
|
|
Ending Account Value (02/29/24) |
|
|
Expenses Paid During the Period |
(a) |
|
Beginning Account Value (09/01/23) |
|
|
Ending Account Value (02/29/24) |
|
|
Expenses Paid During the Period |
(a) |
|
Annualized Expense Ratio |
| ||||||||
| $ 1,000.00 | $ 1,036.90 | $ 0.91 | $ 1,000.00 | $ 1,024.00 | $ 0.91 | 0.18 | % | |||||||||||||||||||||
| (a) | Expenses are equal to the annualized expense ratio, multiplied by the average account value over the period, multiplied by 182/366 (to reflect the one-half year period shown). Other fees, such as brokerage commissions and other fees to financial intermediaries, may be paid which are not reflected in the tables and examples above. See “Disclosure of Expenses” for more information. |
| F U N D S U M M A R Y |
5 |
| Fund Summary as of February 29, 2024 (continued)
|
iShares® ESG Advanced Investment Grade Corporate Bond ETF |
Portfolio Management Commentary
Returns for investment-grade corporate bonds with positive environmental, social and governance (“ESG”) characteristics were positive during the 12-month reporting period despite market volatility driven by shifting expectations around inflation and Federal Reserve (Fed) interest rate policy. In this vein, the yield on the 10-year Treasury bond began the period at 3.92% and rose more than 100 basis points to 4.98% before declining on an improved outlook for Fed rate cuts, ultimately ending the period at 4.25%. Corporate bonds were the best performing segment of the investment grade market as credit sentiment remained firm and yield spreads relative to U.S. Treasuries narrowed.
The iBoxx MSCI ESG Advanced USD Liquid Investment Grade Index (“the Index”) performed in line with the Markit iBoxx USD Liquid Investment Grade Index during the period. Within the Index, performance was strongly positive for both financial and industrial issues. In terms of quality, performance was led by lower rated bonds within the Baa ratings category. Relative to the broader market, the ESG selection process leads to overweight and underweight positions in bonds with higher or lower ESG characteristics, respectively. Consequently, the Index achieved an ESG quality score that was higher than the broader market, with lower exposure to carbon intensive companies.
Portfolio Information
CREDIT QUALITY ALLOCATION
| Moody’s Credit Rating* | |
Percent of Total Investments |
(a) | |
| Aaa |
4.4 | % | ||
| Aa |
2.8 | |||
| A |
48.5 | |||
| Baa |
41.5 | |||
| Ba |
2.7 | |||
| Not Rated |
0.1 |
MATURITY ALLOCATION
| Maturity | |
Percent of Total Investments |
(a) | |
| 1-5 Years |
20.7 | % | ||
| 5-10 Years |
36.3 | |||
| 10-15 Years |
8.0 | |||
| 15-20 Years |
7.9 | |||
| More than 20 Years |
27.1 |
| * | Credit quality ratings shown reflect the ratings assigned by Moody’s Investors Service (“Moody’s”), a widely used independent, nationally recognized statistical rating organization. Moody’s credit ratings are opinions of the credit quality of individual obligations or of an issuer’s general creditworthiness. Investment grade ratings are credit ratings of Baa or higher. Below investment grade ratings are credit ratings of Ba or lower. Unrated investments do not necessarily indicate low credit quality. Credit quality ratings are subject to change. |
| (a) | Excludes money market funds. |
| 6 | 2 0 2 4 I S H A R E S A N N U A L R E P O R T T O S H A R E H O L D E R S |
| Fund Summary as of February 29, 2024
|
iShares® ESG Advanced Total USD Bond Market ETF |
Investment Objective
The iShares ESG Advanced Total USD Bond Market ETF (the “Fund”) seeks to track the investment results of an index composed of U.S. dollar-denominated bonds that are rated either investment-grade or high-yield from issuers with a favorable environmental, social and governance rating as identified by the index provider, while applying extensive screens for involvement in controversial activities, as represented by the Bloomberg MSCI US Universal Choice ESG Screened Index (the “Index”). The Fund invests in a representative sample of securities included in the Index that collectively has an investment profile similar to the Index. Due to the use of representative sampling, the Fund may or may not hold all of the securities that are included in the Index.
Performance
| Average Annual Total Returns |
Cumulative Total Returns | |||||||||||||||||||||||
| 1 Year | Since Inception |
1 Year | Since Inception |
|||||||||||||||||||||
| Fund NAV |
3.70 | % | (2.44 | )% | 3.70 | % | (8.70 | )% | ||||||||||||||||
| Fund Market |
3.85 | (2.39 | ) | 3.85 | (8.53 | ) | ||||||||||||||||||
| Index |
3.81 | (2.30 | ) | 3.81 | (8.23 | ) | ||||||||||||||||||
GROWTH OF $10,000 INVESTMENT
(SINCE INCEPTION AT NET ASSET VALUE)
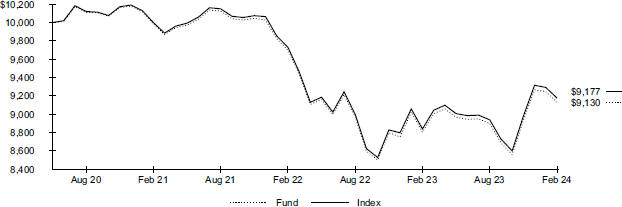
| The inception date of the Fund was June 23, 2020. The first day of secondary market trading was June 25, 2020. |
| Past performance is not an indication of future results. Performance results do not reflect the deduction of taxes that a shareholder would pay on fund distributions or on the redemption or sale of fund shares. See “About Fund Performance” for more information. |
Expense Example
| Actual | Hypothetical 5% Return | |||||||||||||||||||||||||||
|
|
|
|
|
|||||||||||||||||||||||||
| |
Beginning Account Value (09/01/23) |
|
|
Ending Account Value (02/29/24) |
|
|
Expenses Paid During the Period |
(a) |
|
Beginning Account Value (09/01/23) |
|
|
Ending Account Value (02/29/24) |
|
|
Expenses Paid During the Period |
(a) |
|
Annualized Expense Ratio |
| ||||||||
| $ 1,000.00 | $ 1,026.10 | $ 0.60 | $ 1,000.00 | $ 1,024.30 | $ 0.60 | 0.12 | % | |||||||||||||||||||||
| (a) | Expenses are equal to the annualized expense ratio, multiplied by the average account value over the period, multiplied by 182/366 (to reflect the one-half year period shown). Other fees, such as brokerage commissions and other fees to financial intermediaries, may be paid which are not reflected in the tables and examples above. See “Disclosure of Expenses” for more information. |
| F U N D S U M M A R Y |
7 |
| Fund Summary as of February 29, 2024 (continued)
|
iShares® ESG Advanced Total USD Bond Market ETF |
Portfolio Management Commentary
Returns for bonds with positive environmental, social and governance (“ESG”) characteristics were positive during the 12-month reporting period despite market volatility driven by shifting expectations around inflation and Federal Reserve (Fed) interest rate policy. In this vein, the yield on the 10-year Treasury bond began the period at 3.92% and rose more than 100 basis points to 4.98% before declining on an improved outlook for Fed rate cuts, ultimately ending the period at 4.25%.
The Bloomberg MSCI Universal Choice ESG Screened Index (“the Index”) slightly underperformed the broader bond market as represented by the Bloomberg U.S. Universal Index. Within the Index, corporate bonds were the best performing segment as credit sentiment remained firm and yield spreads relative to U.S. Treasuries narrowed. Returns were more muted for Treasuries as longer-term yields finished the period higher. Within securitized assets, demand for agency mortgage-backed securities was negatively impacted by the Fed’s post-pandemic balance sheet reduction efforts. In addition, banks curtailed their purchases given extended durations for the sector with the rise in mortgage rates seen since the beginning of the Fed’s hiking cycle along with an inverted yield curve that hurt net interest margins.
Relative to the broader market, the ESG selection process leads to overweight and underweight positions in bonds with higher or lower ESG characteristics, respectively. Consequently, the Index achieved an ESG quality score that was higher than the broader market, with lower exposure to carbon intensive companies.
Portfolio Information
CREDIT QUALITY ALLOCATION
| Moody’s Credit Rating* | |
Percent of Total Investments |
(a) | |
| Aaa |
63.9 | % | ||
| Aa |
2.7 | |||
| A |
12.0 | |||
| Baa |
14.0 | |||
| Ba |
3.3 | |||
| B |
1.7 | |||
| Caa |
0.4 | |||
| Ca |
0.2 | |||
| Not Rated |
1.8 |
PORTFOLIO COMPOSITION
| Investment Type | |
Percent of Total Investments |
(a) | |
| U.S. Government & Agency Obligations |
60.3 | % | ||
| Corporate Bonds & Notes |
32.1 | |||
| Foreign Government Obligations |
6.5 | |||
| Collaterized Mortgage Obligations |
0.9 | |||
| Asset-Backed Securities |
0.4 | |||
| TBA Sales Commitments |
(0.2 | ) |
| * | Credit quality ratings shown reflect the ratings assigned by Moody’s Investors Service (“Moody’s”), a widely used independent, nationally recognized statistical rating organization. Moody’s credit ratings are opinions of the credit quality of individual obligations or of an issuer’s general creditworthiness. Investment grade ratings are credit ratings of Baa or higher. Below investment grade ratings are credit ratings of Ba or lower. Unrated investments do not necessarily indicate low credit quality. Credit quality ratings are subject to change. |
| (a) | Excludes money market funds. |
| 8 | 2 0 2 4 I S H A R E S A N N U A L R E P O R T T O S H A R E H O L D E R S |
Past performance is not an indication of future results. Financial markets have experienced extreme volatility and trading in many instruments has been disrupted. These circumstances may continue for an extended period of time and may continue to affect adversely the value and liquidity of each Fund’s investments. As a result, current performance may be lower or higher than the performance data quoted. Performance data current to the most recent month-end is available at iShares.com. Performance results assume reinvestment of all dividends and capital gain distributions and do not reflect the deduction of taxes that a shareholder would pay on fund distributions or on the redemption or sale of fund shares. The investment return and principal value of shares will vary with changes in market conditions. Shares may be worth more or less than their original cost when they are redeemed or sold in the market. Performance for certain funds may reflect a waiver of a portion of investment advisory fees. Without such a waiver, performance would have been lower.
Net asset value or “NAV” is the value of one share of a fund as calculated in accordance with the standard formula for valuing mutual fund shares. Beginning August 10, 2020, the price used to calculate market return (“Market Price”) is the closing price. Prior to August 10, 2020, Market Price was determined using the midpoint between the highest bid and the lowest ask on the primary stock exchange on which shares of a fund are listed for trading, as of the time that such fund’s NAV is calculated. Since shares of a fund may not trade in the secondary market until after the fund’s inception, for the period from inception to the first day of secondary market trading in shares of the fund, the NAV of the fund is used as a proxy for the Market Price to calculate market returns. Market and NAV returns assume that dividends and capital gain distributions have been reinvested at Market Price and NAV, respectively.
An index is a statistical composite that tracks a specified financial market or sector. Unlike a fund, an index does not actually hold a portfolio of securities and therefore does not incur the expenses incurred by a fund. These expenses negatively impact fund performance. Also, index returns do not include brokerage commissions that may be payable on secondary market transactions. If brokerage commissions were included, index returns would be lower.
Shareholders of each Fund may incur the following charges: (1) transactional expenses, including brokerage commissions on purchases and sales of fund shares and (2) ongoing expenses, including management fees and other fund expenses. The expense examples shown (which are based on a hypothetical investment of $1,000 invested at the beginning of the period and held through the end of the period) are intended to assist shareholders both in calculating expenses based on an investment in each Fund and in comparing these expenses with similar costs of investing in other funds.
The expense examples provide information about actual account values and actual expenses. Annualized expense ratios reflect contractual and voluntary fee waivers, if any. In order to estimate the expenses a shareholder paid during the period covered by this report, shareholders can divide their account value by $1,000 and then multiply the result by the number under the heading entitled “Expenses Paid During the Period.”
The expense examples also provide information about hypothetical account values and hypothetical expenses based on a fund’s actual expense ratio and an assumed rate of return of 5% per year before expenses. In order to assist shareholders in comparing the ongoing expenses of investing in the Funds and other funds, compare the 5% hypothetical examples with the 5% hypothetical examples that appear in the shareholder reports of the other funds.
The expenses shown in the expense examples are intended to highlight shareholders’ ongoing costs only and do not reflect any transactional expenses, such as brokerage commissions and other fees paid on purchases and sales of fund shares. Therefore, the hypothetical examples are useful in comparing ongoing expenses only and will not help shareholders determine the relative total expenses of owning different funds. If these transactional expenses were included, shareholder expenses would have been higher.
| A B O U T F U N D P E R F O R M A N C E / D I S C L O S U R E O F E X P E N S E S |
9 |
|
February 29, 2024 |
iShares® ESG Advanced Investment Grade Corporate Bond ETF (Percentages shown are based on Net Assets) |
| Security | Par (000) |
Value | ||||||
| Corporate Bonds & Notes |
||||||||
| Apparel — 0.2% | ||||||||
| Tapestry Inc. |
||||||||
| 7.35%, 11/27/28 (Call 10/27/28) |
$ | 6 | $ | 6,280 | ||||
| 7.85%, 11/27/33 (Call 08/27/33) |
10 | 10,808 | ||||||
| VF Corp., 2.95%, 04/23/30 (Call 01/23/30)(a) |
10 | 8,252 | ||||||
|
|
|
|||||||
| 25,340 | ||||||||
| Auto Manufacturers — 1.2% | ||||||||
| General Motors Co. |
||||||||
| 5.15%, 04/01/38 (Call 10/01/37) |
25 | 23,159 | ||||||
| 5.20%, 04/01/45 |
10 | 8,756 | ||||||
| 5.60%, 10/15/32 (Call 07/15/32) |
15 | 14,951 | ||||||
| 6.25%, 10/02/43 |
10 | 10,046 | ||||||
| 6.80%, 10/01/27 (Call 08/01/27) |
25 | 26,067 | ||||||
| General Motors Financial Co. Inc. |
||||||||
| 2.40%, 04/10/28 (Call 02/10/28) |
15 | 13,385 | ||||||
| 2.70%, 06/10/31 (Call 03/10/31) |
50 | 41,169 | ||||||
| 3.10%, 01/12/32 (Call 10/12/31) |
15 | 12,525 | ||||||
|
|
|
|||||||
| 150,058 | ||||||||
| Auto Parts & Equipment — 0.1% | ||||||||
| Aptiv PLC/Aptiv Corp. |
||||||||
| 3.25%, 03/01/32 (Call 12/01/31)(a) |
10 | 8,610 | ||||||
| 4.15%, 05/01/52 (Call 11/01/51) |
10 | 7,647 | ||||||
|
|
|
|||||||
| 16,257 | ||||||||
| Banks — 29.5% | ||||||||
| Banco Santander SA, 4.25%, 04/11/27 |
200 | 192,613 | ||||||
| Bank of America Corp. |
||||||||
| 2.30%, 07/21/32 (Call 07/21/31), |
||||||||
| (1-day SOFR + 1.220%)(b) |
60 | 48,526 | ||||||
| 2.59%, 04/29/31 (Call 04/29/30), |
||||||||
| (1-day SOFR + 2.150%)(b) |
25 | 21,344 | ||||||
| 2.68%, 06/19/41 (Call 06/19/40), |
||||||||
| (1-day SOFR + 1.930%)(b) |
10 | 6,976 | ||||||
| 2.69%, 04/22/32 (Call 04/22/31), |
||||||||
| (1-day SOFR + 1.320%)(b) |
50 | 41,759 | ||||||
| 2.83%, 10/24/51 (Call 10/24/50), |
||||||||
| (1-day SOFR + 1.880%)(b) |
10 | 6,419 | ||||||
| 2.97%, 02/04/33 (Call 02/04/32), |
||||||||
| (1-day SOFR + 1.330%)(b) |
20 | 16,776 | ||||||
| 2.97%, 07/21/52 (Call 07/21/51), |
||||||||
| (1-day SOFR + 1.560%)(b) |
52 | 34,489 | ||||||
| 3.31%, 04/22/42 (Call 04/22/41), |
||||||||
| (1-day SOFR + 1.580%)(b) |
15 | 11,327 | ||||||
| 3.42%, 12/20/28 (Call 12/20/27), |
||||||||
| (3-mo. SOFR + 1.302%)(b) |
65 | 60,664 | ||||||
| 3.97%, 02/07/30 (Call 02/07/29), |
||||||||
| (3-mo. SOFR + 1.472%)(b) |
10 | 9,394 | ||||||
| 4.08%, 04/23/40 (Call 04/23/39), |
||||||||
| (3-mo. SOFR + 1.582%)(b) |
45 | 38,431 | ||||||
| 4.08%, 03/20/51 (Call 03/20/50), |
||||||||
| (3-mo. SOFR + 3.412%)(b) |
5 | 4,016 | ||||||
| 5.02%, 07/22/33 (Call 07/22/32), |
||||||||
| (1-day SOFR + 2.160%)(b) |
5 | 4,864 | ||||||
| 5.20%, 04/25/29 (Call 04/25/28), |
||||||||
| (1-day SOFR + 1.630%)(b) |
25 | 24,859 | ||||||
| 5.47%, 01/23/35 (Call 01/23/34), |
||||||||
| (1-day SOFR + 1.650%)(b) |
15 | 14,935 | ||||||
| Bank of Montreal, 2.65%, 03/08/27 |
45 | 42,015 | ||||||
| Bank of New York Mellon Corp. (The), 3.30%, 08/23/29 (Call 05/23/29) |
15 | 13,778 | ||||||
| Bank of Nova Scotia (The), 2.45%, 02/02/32 |
25 | 20,531 | ||||||
| Security | Par (000) |
Value | ||||||
| Banks (continued) | ||||||||
| Barclays PLC |
||||||||
| 5.50%, 08/09/28 (Call 08/09/27), |
||||||||
| (1-year CMT + 2.650%)(b) |
$ | 200 | $ | 198,930 | ||||
| 6.22%, 05/09/34 (Call 05/09/33), |
||||||||
| (1-day SOFR + 2.980%)(b) |
20 | 20,227 | ||||||
| Canadian Imperial Bank of Commerce |
||||||||
| 3.60%, 04/07/32 (Call 03/07/32)(a) |
10 | 8,929 | ||||||
| 6.09%, 10/03/33 (Call 07/03/33) |
6 | 6,229 | ||||||
| Citigroup Inc. |
||||||||
| 2.56%, 05/01/32 (Call 05/01/31), |
||||||||
| (1-day SOFR + 1.167%)(b) |
10 | 8,230 | ||||||
| 2.90%, 11/03/42 (Call 11/03/41), |
||||||||
| (1-day SOFR + 1.379%)(b) |
30 | 21,302 | ||||||
| 2.98%, 11/05/30 (Call 11/05/29), |
||||||||
| (1-day SOFR + 1.422%)(b) |
10 | 8,809 | ||||||
| 3.06%, 01/25/33 (Call 01/25/32), |
||||||||
| (1-day SOFR + 1.351%)(b) |
10 | 8,392 | ||||||
| 3.79%, 03/17/33 (Call 03/17/32), |
||||||||
| (1-day SOFR + 1.939%)(b) |
5 | 4,418 | ||||||
| 3.98%, 03/20/30 (Call 03/20/29), |
||||||||
| (3-mo. SOFR + 1.600%)(b) |
15 | 14,038 | ||||||
| 4.13%, 07/25/28 |
15 | 14,260 | ||||||
| 4.41%, 03/31/31 (Call 03/31/30), |
||||||||
| (1-day SOFR + 3.914%)(b) |
95 | 89,641 | ||||||
| 4.45%, 09/29/27 |
20 | 19,362 | ||||||
| 4.65%, 07/23/48 (Call 06/23/48) |
25 | 22,225 | ||||||
| 4.75%, 05/18/46 |
55 | 48,093 | ||||||
| 4.91%, 05/24/33 (Call 05/24/32), |
||||||||
| (1-day SOFR + 2.086%)(b) |
10 | 9,558 | ||||||
| 6.63%, 06/15/32 |
15 | 15,970 | ||||||
| Citizens Financial Group Inc., 3.25%, 04/30/30 |
||||||||
| (Call 01/30/30)(a) |
10 | 8,649 | ||||||
| Cooperatieve Rabobank UA, 5.25%, 05/24/41 |
40 | 40,426 | ||||||
| Fifth Third Bancorp. |
||||||||
| 4.77%, 07/28/30 (Call 07/28/29), |
||||||||
| (1-day SOFR + 2.127%)(b) |
10 | 9,543 | ||||||
| 6.34%, 07/27/29 (Call 07/27/28), |
||||||||
| (1-day SOFR + 2.340%)(b) |
10 | 10,257 | ||||||
| 8.25%, 03/01/38 |
6 | 7,092 | ||||||
| Goldman Sachs Group Inc. (The) |
||||||||
| 2.38%, 07/21/32 (Call 07/21/31), |
||||||||
| (1-day SOFR + 1.248%)(b) |
20 | 16,274 | ||||||
| 2.62%, 04/22/32 (Call 04/22/31), |
||||||||
| (1-day SOFR + 1.281%)(b) |
100 | 83,208 | ||||||
| 3.10%, 02/24/33 (Call 02/24/32), |
||||||||
| (1-day SOFR + 1.410%)(b) |
15 | 12,692 | ||||||
| 3.62%, 03/15/28 (Call 03/15/27), |
||||||||
| (1-day SOFR + 1.846%)(b) |
15 | 14,296 | ||||||
| 5.15%, 05/22/45 |
45 | 42,808 | ||||||
| 6.56%, 10/24/34 (Call 10/24/33), |
||||||||
| (1-day SOFR + 1.950%)(a)(b) |
15 | 16,100 | ||||||
| 6.75%, 10/01/37 |
75 | 81,468 | ||||||
| HSBC Holdings PLC |
||||||||
| 2.80%, 05/24/32 (Call 05/24/31), |
||||||||
| (1-day SOFR + 1.187%)(b) |
200 | 165,360 | ||||||
| 6.16%, 03/09/29 (Call 03/09/28), |
||||||||
| (1-day SOFR + 1.970%)(b) |
40 | 40,859 | ||||||
| Huntington Bancshares Inc./OH |
||||||||
| 2.55%, 02/04/30 (Call 11/04/29) |
5 | 4,218 | ||||||
| 6.21%, 08/21/29 (Call 08/21/28), |
||||||||
| (1-day SOFR + 2.020%)(b) |
15 | 15,249 | ||||||
| 10 | 2 0 2 4 I S H A R E S A N N U A L R E P O R T T O S H A R E H O L D E R S |
| Schedule of Investments (continued) February 29, 2024 |
iShares® ESG Advanced Investment Grade Corporate Bond ETF (Percentages shown are based on Net Assets) |
| Security | Par (000) |
Value | ||||||
| Banks (continued) | ||||||||
| ING Groep NV, 6.11%, 09/11/34 (Call 09/11/33), |
||||||||
| (1-day SOFR + 2.090%)(b) |
$ | 20 | $ | 20,604 | ||||
| JPMorgan Chase & Co. |
||||||||
| 2.58%, 04/22/32 (Call 04/22/31), |
||||||||
| (3-mo. SOFR + 1.250%)(b) |
110 | 91,984 | ||||||
| 2.74%, 10/15/30 (Call 10/15/29), |
||||||||
| (3-mo. SOFR + 1.510%)(b) |
15 | 13,159 | ||||||
| 3.33%, 04/22/52 (Call 04/22/51), |
||||||||
| (1-day SOFR + 1.580%)(b) |
10 | 7,113 | ||||||
| 4.03%, 07/24/48 (Call 07/24/47), |
||||||||
| (3-mo. SOFR + 1.722%)(b) |
15 | 12,175 | ||||||
| 4.49%, 03/24/31 (Call 03/24/30), |
||||||||
| (3-mo. SOFR + 3.790%)(b) |
15 | 14,385 | ||||||
| 4.57%, 06/14/30 (Call 06/14/29), |
||||||||
| (1-day SOFR + 1.750%)(b) |
10 | 9,694 | ||||||
| 4.85%, 07/25/28 (Call 07/25/27), |
||||||||
| (1-day SOFR + 1.990%)(b) |
30 | 29,662 | ||||||
| 4.91%, 07/25/33 (Call 07/25/32), |
||||||||
| (1-day SOFR + 2.080%)(b) |
15 | 14,524 | ||||||
| 5.30%, 07/24/29 (Call 07/24/28), |
||||||||
| (1-day SOFR + 1.450%)(b) |
33 | 33,059 | ||||||
| 5.35%, 06/01/34 (Call 06/01/33), |
||||||||
| (1-day SOFR + 1.845%)(b) |
15 | 14,914 | ||||||
| 5.40%, 01/06/42 |
15 | 15,136 | ||||||
| 6.40%, 05/15/38 |
95 | 105,854 | ||||||
| KeyCorp |
||||||||
| 2.55%, 10/01/29 |
20 | 16,717 | ||||||
| 4.79%, 06/01/33 (Call 06/01/32), |
||||||||
| (1-day SOFR + 2.060%)(b) |
10 | 9,040 | ||||||
| Lloyds Banking Group PLC, 5.68%, 01/05/35 |
||||||||
| (Call 01/05/34), (1-year CMT + 1.750%)(b) |
40 | 39,568 | ||||||
| Mitsubishi UFJ Financial Group Inc., 2.05%, 07/17/30 |
200 | 165,961 | ||||||
| Mizuho Financial Group Inc., 4.02%, 03/05/28 |
200 | 192,374 | ||||||
| Morgan Stanley |
||||||||
| 2.24%, 07/21/32 (Call 07/21/31), |
||||||||
| (1-day SOFR + 1.178%)(b) |
140 | 112,734 | ||||||
| 2.94%, 01/21/33 (Call 01/21/32), |
||||||||
| (1-day SOFR + 1.290%)(b) |
30 | 25,168 | ||||||
| 4.30%, 01/27/45 |
60 | 51,645 | ||||||
| 4.43%, 01/23/30 (Call 01/23/29), |
||||||||
| (3-mo. SOFR + 1.890%)(b) |
25 | 24,001 | ||||||
| 5.25%, 04/21/34 (Call 04/21/33), |
||||||||
| (1-day SOFR + 1.870%)(b) |
10 | 9,803 | ||||||
| 5.60%, 03/24/51 (Call 03/24/50), |
||||||||
| (1-day SOFR + 4.840%)(b) |
30 | 30,960 | ||||||
| 6.30%, 10/18/28 (Call 10/18/27), |
||||||||
| (1-day SOFR + 2.240%)(b) |
75 | 77,495 | ||||||
| 6.63%, 11/01/34 (Call 11/01/33), |
||||||||
| (1-day SOFR + 2.050%)(b) |
20 | 21,661 | ||||||
| NatWest Group PLC, 4.89%, 05/18/29 (Call 05/18/28), (3-mo. LIBOR US + 1.754%)(b) |
50 | 48,742 | ||||||
| Northern Trust Corp., 6.13%, 11/02/32 (Call 08/02/32) |
10 | 10,514 | ||||||
| PNC Financial Services Group Inc. (The) |
||||||||
| 2.55%, 01/22/30 (Call 10/24/29) |
50 | 42,907 | ||||||
| 5.58%, 06/12/29 (Call 06/12/28), |
||||||||
| (1-day SOFR + 1.841%)(b) |
15 | 15,090 | ||||||
| 6.04%, 10/28/33 (Call 10/28/32), |
||||||||
| (1-day SOFR + 2.140%)(b) |
16 | 16,390 | ||||||
| 6.88%, 10/20/34 (Call 10/20/33), |
||||||||
| (1-day SOFR + 2.284%)(b) |
20 | 21,626 | ||||||
| Security | Par (000) |
Value | ||||||
| Banks (continued) | ||||||||
| Royal Bank of Canada |
||||||||
| 2.30%, 11/03/31 |
$ | 10 | $ | 8,191 | ||||
| 5.00%, 02/01/33 |
10 | 9,819 | ||||||
| 5.15%, 02/01/34 |
10 | 9,835 | ||||||
| 5.20%, 08/01/28 |
10 | 10,053 | ||||||
| 6.00%, 11/01/27 |
25 | 25,721 | ||||||
| Santander Holdings USA Inc., 6.50%, 03/09/29 |
||||||||
| (Call 03/09/28), (1-day SOFR + 2.356%)(b) |
20 | 20,302 | ||||||
| State Street Corp., 2.20%, 03/03/31(a) |
5 | 4,127 | ||||||
| Sumitomo Mitsui Financial Group Inc., 3.35%, 10/18/27 |
200 | 188,325 | ||||||
| Toronto-Dominion Bank (The) |
||||||||
| 2.00%, 09/10/31 |
15 | 12,223 | ||||||
| 4.46%, 06/08/32 |
35 | 33,307 | ||||||
| Truist Financial Corp. |
||||||||
| 1.13%, 08/03/27 (Call 06/03/27) |
20 | 17,376 | ||||||
| 5.12%, 01/26/34 (Call 01/26/33), |
||||||||
| (1-day SOFR + 1.852%)(b) |
25 | 23,722 | ||||||
| 5.44%, 01/24/30 (Call 01/24/29), |
||||||||
| (1-day SOFR + 1.620%)(b) |
15 | 14,839 | ||||||
| 5.71%, 01/24/35 (Call 01/24/34), |
||||||||
| (1-day SOFR + 1.922%)(b) |
10 | 9,889 | ||||||
| 5.87%, 06/08/34 (Call 06/08/33), |
||||||||
| (1-day SOFR + 2.361%)(b) |
10 | 9,994 | ||||||
| U.S. Bancorp. |
||||||||
| 1.38%, 07/22/30 (Call 04/22/30) |
65 | 51,453 | ||||||
| 4.84%, 02/01/34 (Call 02/01/33), |
||||||||
| (1-day SOFR + 1.600%)(b) |
10 | 9,410 | ||||||
| 5.78%, 06/12/29 (Call 06/12/28), |
||||||||
| (1-day SOFR + 2.020%)(b) |
25 | 25,268 | ||||||
| 5.84%, 06/12/34 (Call 06/10/33), |
||||||||
| (1-day SOFR + 2.260%)(b) |
10 | 10,079 | ||||||
| UBS AG/London, 5.65%, 09/11/28 |
25 | 25,476 | ||||||
| Westpac Banking Corp. |
||||||||
| 2.15%, 06/03/31 |
15 | 12,423 | ||||||
| 2.96%, 11/16/40 |
10 | 6,827 | ||||||
| 5.54%, 11/17/28 |
15 | 15,346 | ||||||
| 6.82%, 11/17/33 |
5 | 5,368 | ||||||
|
|
|
|||||||
| 3,574,860 | ||||||||
| Beverages — 0.1% | ||||||||
| Keurig Dr Pepper Inc., 3.80%, 05/01/50 (Call 11/01/49) |
20 | 15,253 | ||||||
|
|
|
|||||||
| Biotechnology — 3.1% | ||||||||
| Amgen Inc. |
||||||||
| 1.65%, 08/15/28 (Call 06/15/28) |
50 | 43,544 | ||||||
| 2.00%, 01/15/32 (Call 10/15/31) |
25 | 20,027 | ||||||
| 4.40%, 05/01/45 (Call 11/01/44) |
15 | 12,757 | ||||||
| 4.40%, 02/22/62 (Call 08/22/61) |
15 | 12,051 | ||||||
| 4.66%, 06/15/51 (Call 12/15/50) |
75 | 65,008 | ||||||
| 5.25%, 03/02/30 (Call 01/02/30) |
27 | 27,224 | ||||||
| 5.25%, 03/02/33 (Call 12/02/32) |
27 | 26,884 | ||||||
| 5.60%, 03/02/43 (Call 09/02/42) |
28 | 28,000 | ||||||
| 5.75%, 03/02/63 (Call 09/02/62) |
12 | 11,989 | ||||||
| Biogen Inc. |
||||||||
| 2.25%, 05/01/30 (Call 02/01/30) |
20 | 16,725 | ||||||
| 3.15%, 05/01/50 (Call 11/01/49) |
5 | 3,297 | ||||||
| Gilead Sciences Inc. |
||||||||
| 1.65%, 10/01/30 (Call 07/01/30) |
25 | 20,391 | ||||||
| 4.00%, 09/01/36 (Call 03/01/36) |
20 | 17,715 | ||||||
| 4.75%, 03/01/46 (Call 09/01/45) |
50 | 45,445 | ||||||
| Regeneron Pharmaceuticals Inc., 1.75%, 09/15/30 |
||||||||
| (Call 06/15/30) |
15 | 12,125 | ||||||
| S C H E D U L E O F I N V E S T M E N T S |
11 |
| Schedule of Investments (continued) February 29, 2024 |
iShares® ESG Advanced Investment Grade Corporate Bond ETF (Percentages shown are based on Net Assets) |
| Security | Par (000) |
Value | ||||||
| Biotechnology (continued) | ||||||||
| Royalty Pharma PLC, 3.30%, 09/02/40 (Call 03/02/40) |
$ | 15 | $ | 10,916 | ||||
|
|
|
|||||||
| 374,098 | ||||||||
| Building Materials — 0.4% | ||||||||
| Carrier Global Corp. |
||||||||
| 2.72%, 02/15/30 (Call 11/15/29) |
15 | 13,136 | ||||||
| 3.38%, 04/05/40 (Call 10/05/39) |
10 | 7,685 | ||||||
| 3.58%, 04/05/50 (Call 10/05/49) |
20 | 14,700 | ||||||
| Martin Marietta Materials Inc. |
||||||||
| 2.40%, 07/15/31 (Call 04/15/31) |
5 | 4,167 | ||||||
| 3.20%, 07/15/51 (Call 01/15/51) |
5 | 3,451 | ||||||
|
|
|
|||||||
| 43,139 | ||||||||
| Chemicals — 0.9% | ||||||||
| Air Products and Chemicals Inc. |
||||||||
| 2.05%, 05/15/30 (Call 02/15/30) |
10 | 8,502 | ||||||
| 2.70%, 05/15/40 (Call 11/15/39) |
10 | 7,198 | ||||||
| Celanese U.S. Holdings LLC |
||||||||
| 6.17%, 07/15/27 (Call 06/15/27) |
13 | 13,196 | ||||||
| 6.70%, 11/15/33 (Call 08/15/33) |
19 | 19,926 | ||||||
| CF Industries Inc., 5.15%, 03/15/34 |
15 | 14,505 | ||||||
| DuPont de Nemours Inc., 5.32%, 11/15/38 (Call 05/15/38) |
30 | 29,523 | ||||||
| Nutrien Ltd., 5.00%, 04/01/49 (Call 10/01/48) |
10 | 9,023 | ||||||
| Sherwin-Williams Co. (The), 4.50%, 06/01/47 |
||||||||
| (Call 12/01/46) |
15 | 12,877 | ||||||
|
|
|
|||||||
| 114,750 | ||||||||
| Commercial Services — 0.6% | ||||||||
| Automatic Data Processing Inc., 1.25%, 09/01/30 |
||||||||
| (Call 06/01/30) |
15 | 12,119 | ||||||
| Global Payments Inc. |
||||||||
| 3.20%, 08/15/29 (Call 05/15/29) |
15 | 13,355 | ||||||
| 5.95%, 08/15/52 (Call 02/15/52)(a) |
10 | 9,833 | ||||||
| PayPal Holdings Inc. |
||||||||
| 2.30%, 06/01/30 (Call 03/01/30) |
20 | 17,040 | ||||||
| 4.40%, 06/01/32 (Call 03/01/32)(a) |
15 | 14,374 | ||||||
| S&P Global Inc. |
||||||||
| 2.90%, 03/01/32 (Call 12/01/31) |
10 | 8,605 | ||||||
| 3.70%, 03/01/52 (Call 09/01/51) |
5 | 3,854 | ||||||
|
|
|
|||||||
| 79,180 | ||||||||
| Computers — 4.4% | ||||||||
| Apple Inc. |
||||||||
| 1.40%, 08/05/28 (Call 06/05/28) |
200 | 174,615 | ||||||
| 2.65%, 05/11/50 (Call 11/11/49) |
35 | 22,858 | ||||||
| 2.65%, 02/08/51 (Call 08/08/50) |
10 | 6,436 | ||||||
| 2.70%, 08/05/51 (Call 02/05/51) |
40 | 25,972 | ||||||
| 2.80%, 02/08/61 (Call 08/08/60) |
10 | 6,333 | ||||||
| 3.35%, 08/08/32 (Call 05/08/32)(a) |
15 | 13,596 | ||||||
| 4.65%, 02/23/46 (Call 08/23/45) |
100 | 94,244 | ||||||
| Dell International LLC/EMC Corp. |
||||||||
| 3.38%, 12/15/41 (Call 06/15/41) |
5 | 3,659 | ||||||
| 5.30%, 10/01/29 (Call 07/01/29) |
40 | 40,095 | ||||||
| 5.75%, 02/01/33 (Call 11/01/32)(a) |
10 | 10,286 | ||||||
| 6.20%, 07/15/30 (Call 04/15/30) |
10 | 10,469 | ||||||
| Hewlett Packard Enterprise Co. |
||||||||
| 6.20%, 10/15/35 (Call 04/15/35) |
15 | 15,564 | ||||||
| 6.35%, 10/15/45 (Call 04/15/45) |
5 | 5,163 | ||||||
| HP Inc. |
||||||||
| 2.65%, 06/17/31 (Call 03/17/31) |
10 | 8,350 | ||||||
| 6.00%, 09/15/41 |
5 | 5,108 | ||||||
| International Business Machines Corp., 4.15%, 05/15/39 |
100 | 87,008 | ||||||
|
|
|
|||||||
| 529,756 | ||||||||
| Security | Par (000) |
Value | ||||||
| Cosmetics & Personal Care — 0.1% | ||||||||
| Kenvue Inc. |
||||||||
| 5.05%, 03/22/53 (Call 09/22/52) |
$ | 10 | $ | 9,580 | ||||
| 5.20%, 03/22/63 (Call 09/22/62) |
5 | 4,831 | ||||||
|
|
|
|||||||
| 14,411 | ||||||||
| Diversified Financial Services — 4.0% | ||||||||
| AerCap Ireland Capital DAC/AerCap Global Aviation Trust, 3.00%, 10/29/28 (Call 08/29/28) |
150 | 134,606 | ||||||
| Ally Financial Inc., 8.00%, 11/01/31(a) |
15 | 16,454 | ||||||
| American Express Co. |
||||||||
| 4.05%, 05/03/29 (Call 03/03/29) |
25 | 24,210 | ||||||
| 4.05%, 12/03/42 |
10 | 8,599 | ||||||
| Ameriprise Financial Inc., 5.15%, 05/15/33 (Call 02/15/33) |
5 | 4,993 | ||||||
| Capital One Financial Corp., 3.80%, 01/31/28 |
||||||||
| (Call 12/31/27) |
25 | 23,652 | ||||||
| Charles Schwab Corp. (The) |
||||||||
| 2.30%, 05/13/31 (Call 02/13/31) |
20 | 16,567 | ||||||
| 2.45%, 03/03/27 (Call 02/03/27) |
15 | 13,893 | ||||||
| CME Group Inc. |
||||||||
| 2.65%, 03/15/32 (Call 12/15/31) |
5 | 4,275 | ||||||
| 5.30%, 09/15/43 (Call 03/15/43) |
5 | 5,040 | ||||||
| Intercontinental Exchange Inc. |
||||||||
| 1.85%, 09/15/32 (Call 06/15/32) |
10 | 7,714 | ||||||
| 3.00%, 09/15/60 (Call 03/15/60) |
30 | 18,663 | ||||||
| 4.25%, 09/21/48 (Call 03/21/48) |
10 | 8,483 | ||||||
| 4.95%, 06/15/52 (Call 12/15/51) |
15 | 14,001 | ||||||
| Mastercard Inc. |
||||||||
| 3.35%, 03/26/30 (Call 12/26/29) |
40 | 36,930 | ||||||
| 3.85%, 03/26/50 (Call 09/26/49) |
10 | 8,226 | ||||||
| Nasdaq Inc., 5.55%, 02/15/34 (Call 11/15/33) |
30 | 30,207 | ||||||
| Nomura Holdings Inc., 6.07%, 07/12/28 |
50 | 51,132 | ||||||
| Raymond James Financial Inc., 3.75%, 04/01/51 |
||||||||
| (Call 10/01/50) |
10 | 7,409 | ||||||
| Synchrony Financial, 3.95%, 12/01/27 (Call 09/01/27) |
5 | 4,631 | ||||||
| Visa Inc. |
||||||||
| 1.10%, 02/15/31 (Call 11/15/30) |
10 | 7,887 | ||||||
| 2.05%, 04/15/30 (Call 01/15/30) |
15 | 12,855 | ||||||
| 4.30%, 12/14/45 (Call 06/14/45) |
25 | 22,300 | ||||||
|
|
|
|||||||
| 482,727 | ||||||||
| Electric — 0.1% | ||||||||
| Commonwealth Edison Co., 4.00%, 03/01/48 |
||||||||
| (Call 09/01/47) |
10 | 8,033 | ||||||
|
|
|
|||||||
| Electronics — 0.1% | ||||||||
| Amphenol Corp., 2.20%, 09/15/31 (Call 06/15/31) |
10 | 8,200 | ||||||
|
|
|
|||||||
| Entertainment — 0.7% | ||||||||
| Warnermedia Holdings Inc. |
||||||||
| 4.28%, 03/15/32 (Call 12/15/31) |
35 | 30,822 | ||||||
| 5.05%, 03/15/42 (Call 09/15/41) |
10 | 8,387 | ||||||
| 5.14%, 03/15/52 (Call 09/15/51) |
45 | 36,481 | ||||||
| 5.39%, 03/15/62 (Call 09/15/61) |
10 | 8,079 | ||||||
|
|
|
|||||||
| 83,769 | ||||||||
| Environmental Control — 0.4% | ||||||||
| Republic Services Inc., 3.95%, 05/15/28 (Call 02/15/28) |
20 | 19,250 | ||||||
| Waste Connections Inc., 4.20%, 01/15/33 (Call 10/15/32) |
12 | 11,203 | ||||||
| Waste Management Inc., 1.50%, 03/15/31 (Call 12/15/30) |
20 | 15,867 | ||||||
|
|
|
|||||||
| 46,320 | ||||||||
| Food — 1.0% | ||||||||
| Conagra Brands Inc., 5.30%, 11/01/38 (Call 05/01/38) |
15 | 14,166 | ||||||
| Hormel Foods Corp., 1.80%, 06/11/30 (Call 03/11/30) |
25 | 20,740 | ||||||
| J M Smucker Co. (The), 6.50%, 11/15/53 (Call 05/15/53) |
6 | 6,523 | ||||||
| 12 | 2 0 2 4 I S H A R E S A N N U A L R E P O R T T O S H A R E H O L D E R S |
| Schedule of Investments (continued) February 29, 2024 |
iShares® ESG Advanced Investment Grade Corporate Bond ETF (Percentages shown are based on Net Assets) |
| Security | Par (000) |
Value | ||||||
| Food (continued) | ||||||||
| Kraft Heinz Foods Co., 4.38%, 06/01/46 (Call 12/01/45) |
$ | 60 | $ | 49,565 | ||||
| Sysco Corp., 6.60%, 04/01/50 (Call 10/01/49) |
10 | 11,281 | ||||||
| Tyson Foods Inc., 5.10%, 09/28/48 |
20 | 17,641 | ||||||
|
|
|
|||||||
| 119,916 | ||||||||
| Hand & Machine Tools — 0.3% | ||||||||
| Regal Rexnord Corp. |
||||||||
| 6.30%, 02/15/30 (Call 12/15/29)(c) |
5 | 5,080 | ||||||
| 6.40%, 04/15/33 (Call 01/15/33)(c) |
10 | 10,266 | ||||||
| Stanley Black & Decker Inc., 2.30%, 03/15/30 |
||||||||
| (Call 12/15/29) |
22 | 18,483 | ||||||
|
|
|
|||||||
| 33,829 | ||||||||
| Health Care - Products — 2.3% | ||||||||
| Abbott Laboratories |
||||||||
| 4.75%, 11/30/36 (Call 05/30/36) |
15 | 14,652 | ||||||
| 4.90%, 11/30/46 (Call 05/30/46) |
15 | 14,415 | ||||||
| Baxter International Inc. |
||||||||
| 2.54%, 02/01/32 (Call 11/01/31)(a) |
15 | 12,285 | ||||||
| 3.13%, 12/01/51 (Call 06/01/51)(a) |
10 | 6,513 | ||||||
| DH Europe Finance II Sarl, 2.60%, 11/15/29 |
||||||||
| (Call 08/15/29) |
80 | 71,141 | ||||||
| GE HealthCare Technologies Inc., 5.65%, 11/15/27 |
||||||||
| (Call 10/15/27) |
100 | 101,505 | ||||||
| HCA Inc., 3.63%, 03/15/32 (Call 12/15/31) |
10 | 8,721 | ||||||
| Medtronic Global Holdings SCA, 4.50%, 03/30/33 |
||||||||
| (Call 12/30/32) |
15 | 14,419 | ||||||
| Medtronic Inc., 4.38%, 03/15/35 |
15 | 14,128 | ||||||
| Thermo Fisher Scientific Inc., 2.80%, 10/15/41 |
||||||||
| (Call 04/15/41) |
30 | 21,492 | ||||||
|
|
|
|||||||
| 279,271 | ||||||||
| Health Care - Services — 4.2% | ||||||||
| Aetna Inc., 3.88%, 08/15/47 (Call 02/15/47) |
15 | 11,157 | ||||||
| Centene Corp., 4.63%, 12/15/29 (Call 12/15/24) |
95 | 89,922 | ||||||
| Elevance Health Inc. |
||||||||
| 2.55%, 03/15/31 (Call 12/15/30) |
10 | 8,478 | ||||||
| 3.60%, 03/15/51 (Call 09/15/50) |
35 | 26,009 | ||||||
| 4.65%, 01/15/43 |
20 | 17,912 | ||||||
| 4.75%, 02/15/33 (Call 11/15/32) |
10 | 9,660 | ||||||
| HCA Inc. |
||||||||
| 2.38%, 07/15/31 (Call 04/15/31) |
15 | 12,154 | ||||||
| 3.50%, 09/01/30 (Call 03/01/30) |
10 | 8,918 | ||||||
| 3.50%, 07/15/51 (Call 01/15/51) |
45 | 30,421 | ||||||
| 4.13%, 06/15/29 (Call 03/15/29) |
10 | 9,398 | ||||||
| 5.25%, 06/15/49 (Call 12/15/48) |
10 | 8,976 | ||||||
| 5.50%, 06/01/33 (Call 03/01/33) |
20 | 19,843 | ||||||
| 5.63%, 09/01/28 (Call 03/01/28) |
10 | 10,074 | ||||||
| 5.88%, 02/01/29 (Call 08/01/28) |
10 | 10,177 | ||||||
| Humana Inc. |
||||||||
| 2.15%, 02/03/32 (Call 11/03/31) |
15 | 11,846 | ||||||
| 5.50%, 03/15/53 (Call 09/15/52) |
5 | 4,842 | ||||||
| Laboratory Corp. of America Holdings, 4.70%, 02/01/45 (Call 08/01/44) |
5 | 4,459 | ||||||
| UnitedHealth Group Inc. |
||||||||
| 4.00%, 05/15/29 (Call 03/15/29) |
20 | 19,245 | ||||||
| 4.20%, 05/15/32 (Call 02/15/32) |
51 | 47,986 | ||||||
| 4.20%, 01/15/47 (Call 07/15/46) |
5 | 4,227 | ||||||
| 4.75%, 05/15/52 (Call 11/15/51) |
92 | 83,729 | ||||||
| 5.20%, 04/15/63 (Call 10/15/62) |
15 | 14,290 | ||||||
| 5.35%, 02/15/33 (Call 11/15/32) |
15 | 15,279 | ||||||
| 6.05%, 02/15/63 (Call 08/15/62) |
15 | 16,261 | ||||||
| Security | Par (000) |
Value | ||||||
| Health Care - Services (continued) | ||||||||
| 6.88%, 02/15/38 |
$ | 10 | $ | 11,610 | ||||
|
|
|
|||||||
| 506,873 | ||||||||
| Insurance — 1.5% | ||||||||
| American International Group Inc. |
||||||||
| 4.38%, 06/30/50 (Call 12/30/49) |
5 | 4,292 | ||||||
| 4.80%, 07/10/45 (Call 01/10/45) |
10 | 9,150 | ||||||
| Aon Corp./Aon Global Holdings PLC, 5.35%, 02/28/33 |
||||||||
| (Call 11/28/32) |
10 | 9,970 | ||||||
| Chubb INA Holdings Inc. |
||||||||
| 3.05%, 12/15/61 (Call 06/15/61) |
15 | 9,975 | ||||||
| 4.35%, 11/03/45 (Call 05/03/45) |
15 | 13,242 | ||||||
| Equitable Holdings Inc., 5.00%, 04/20/48 (Call 10/20/47) |
10 | 9,073 | ||||||
| Everest Reinsurance Holdings Inc., 3.13%, 10/15/52 |
||||||||
| (Call 04/15/52) |
11 | 7,016 | ||||||
| Hartford Financial Services Group Inc. (The), 3.60%, |
||||||||
| 08/19/49 (Call 02/19/49) |
10 | 7,499 | ||||||
| Marsh & McLennan Companies Inc. |
||||||||
| 4.90%, 03/15/49 (Call 09/15/48) |
10 | 9,241 | ||||||
| 5.70%, 09/15/53 (Call 03/15/53) |
5 | 5,143 | ||||||
| MetLife Inc. |
||||||||
| 4.05%, 03/01/45 |
27 | 22,205 | ||||||
| 4.55%, 03/23/30 (Call 12/23/29)(a) |
15 | 14,687 | ||||||
| 5.00%, 07/15/52 (Call 01/15/52) |
10 | 9,325 | ||||||
| 5.70%, 06/15/35 |
15 | 15,514 | ||||||
| Progressive Corp. (The), 4.13%, 04/15/47 (Call 10/15/46) |
10 | 8,382 | ||||||
| Prudential Financial Inc., 4.35%, 02/25/50 (Call 08/25/49) |
25 | 21,083 | ||||||
| Travelers Companies Inc. (The), 3.05%, 06/08/51 |
||||||||
| (Call 12/08/50)(a) |
15 | 10,252 | ||||||
|
|
|
|||||||
| 186,049 | ||||||||
| Internet — 0.4% | ||||||||
| Alphabet Inc. |
||||||||
| 1.10%, 08/15/30 (Call 05/15/30) |
15 | 12,154 | ||||||
| 2.05%, 08/15/50 (Call 02/15/50) |
10 | 5,901 | ||||||
| 2.25%, 08/15/60 (Call 02/15/60)(a) |
10 | 5,735 | ||||||
| Booking Holdings Inc., 4.63%, 04/13/30 (Call 01/13/30) |
10 | 9,825 | ||||||
| eBay Inc. |
||||||||
| 2.70%, 03/11/30 (Call 12/11/29) |
10 | 8,741 | ||||||
| 3.65%, 05/10/51 (Call 11/10/50) |
10 | 7,233 | ||||||
|
|
|
|||||||
| 49,589 | ||||||||
| Lodging — 0.1% | ||||||||
| Marriott International Inc./MD, Series GG, 3.50%, 10/15/32 (Call 07/15/32) |
20 | 17,459 | ||||||
|
|
|
|||||||
| Machinery — 0.4% | ||||||||
| Caterpillar Inc., 3.25%, 09/19/49 (Call 03/19/49) |
30 | 22,025 | ||||||
| Deere & Co., 3.90%, 06/09/42 (Call 12/09/41) |
15 | 12,832 | ||||||
| Otis Worldwide Corp., 2.57%, 02/15/30 (Call 11/15/29) |
22 | 19,204 | ||||||
|
|
|
|||||||
| 54,061 | ||||||||
| Machinery - Diversified — 0.1% | ||||||||
| John Deere Capital Corp., 5.15%, 09/08/33 |
10 | 10,152 | ||||||
|
|
|
|||||||
| Manufacturing — 0.7% | ||||||||
| 3M Co. |
||||||||
| 2.88%, 10/15/27 (Call 07/15/27)(a) |
20 | 18,502 | ||||||
| 3.25%, 08/26/49 (Call 02/26/49)(a) |
10 | 6,889 | ||||||
| Eaton Corp., 4.15%, 03/15/33 (Call 12/15/32) |
15 | 14,099 | ||||||
| Illinois Tool Works Inc., 3.90%, 09/01/42 (Call 03/01/42) |
10 | 8,466 | ||||||
| Parker-Hannifin Corp., 3.25%, 06/14/29 (Call 03/14/29) |
40 | 36,835 | ||||||
|
|
|
|||||||
| 84,791 | ||||||||
| S C H E D U L E O F I N V E S T M E N T S |
13 |
| Schedule of Investments (continued) February 29, 2024 |
iShares® ESG Advanced Investment Grade Corporate Bond ETF (Percentages shown are based on Net Assets) |
| Security | Par (000) |
Value | ||||||
| Media — 6.5% | ||||||||
| Charter Communications Operating LLC/Charter |
||||||||
| Communications Operating Capital |
||||||||
| 2.30%, 02/01/32 (Call 11/01/31) |
$ | 10 | $ | 7,592 | ||||
| 3.50%, 03/01/42 (Call 09/01/41) |
15 | 9,825 | ||||||
| 3.85%, 04/01/61 (Call 10/01/60) |
33 | 19,137 | ||||||
| 4.20%, 03/15/28 (Call 12/15/27) |
13 | 12,187 | ||||||
| 4.40%, 04/01/33 (Call 01/01/33)(a) |
6 | 5,240 | ||||||
| 4.80%, 03/01/50 (Call 09/01/49) |
51 | 36,821 | ||||||
| 5.05%, 03/30/29 (Call 12/30/28) |
13 | 12,428 | ||||||
| 6.38%, 10/23/35 (Call 04/23/35) |
15 | 14,534 | ||||||
| 6.48%, 10/23/45 (Call 04/23/45) |
43 | 39,174 | ||||||
| 6.65%, 02/01/34 (Call 11/01/33) |
5 | 5,010 | ||||||
| Comcast Corp. |
||||||||
| 2.94%, 11/01/56 (Call 05/01/56) |
15 | 9,226 | ||||||
| 2.99%, 11/01/63 (Call 05/01/63) |
130 | 77,569 | ||||||
| 3.75%, 04/01/40 (Call 10/01/39) |
15 | 12,289 | ||||||
| 4.15%, 10/15/28 (Call 07/15/28) |
155 | 150,344 | ||||||
| 4.25%, 01/15/33 |
15 | 14,051 | ||||||
| 5.35%, 05/15/53 (Call 11/15/52) |
26 | 25,222 | ||||||
| 7.05%, 03/15/33 |
35 | 39,308 | ||||||
| Discovery Communications LLC |
||||||||
| 3.95%, 03/20/28 (Call 12/20/27) |
55 | 51,386 | ||||||
| 4.00%, 09/15/55 (Call 03/15/55) |
8 | 5,265 | ||||||
| 5.20%, 09/20/47 (Call 03/20/47) |
30 | 24,398 | ||||||
| Fox Corp. |
||||||||
| 4.71%, 01/25/29 (Call 10/25/28) |
15 | 14,643 | ||||||
| 5.48%, 01/25/39 (Call 07/25/38) |
10 | 9,278 | ||||||
| 5.58%, 01/25/49 (Call 07/25/48) |
10 | 9,130 | ||||||
| Paramount Global |
||||||||
| 4.38%, 03/15/43 |
30 | 20,058 | ||||||
| 4.95%, 01/15/31 (Call 10/15/30)(a) |
15 | 13,147 | ||||||
| Time Warner Cable Enterprises LLC, 8.38%, 07/15/33 |
5 | 5,540 | ||||||
| Time Warner Cable LLC |
||||||||
| 5.50%, 09/01/41 (Call 03/01/41) |
27 | 22,204 | ||||||
| 6.55%, 05/01/37 |
17 | 15,917 | ||||||
| Walt Disney Co. (The) |
||||||||
| 2.65%, 01/13/31 |
50 | 43,445 | ||||||
| 3.60%, 01/13/51 (Call 07/13/50) |
65 | 49,289 | ||||||
| 3.80%, 03/22/30 |
15 | 14,155 | ||||||
|
|
|
|||||||
| 787,812 | ||||||||
| Mining — 0.2% | ||||||||
| Newmont Corp. |
||||||||
| 2.25%, 10/01/30 (Call 07/01/30) |
10 | 8,385 | ||||||
| 6.25%, 10/01/39 |
10 | 10,553 | ||||||
|
|
|
|||||||
| 18,938 | ||||||||
| Office & Business Equipment — 0.1% | ||||||||
| CDW LLC/CDW Finance Corp., 3.57%, 12/01/31 |
||||||||
| (Call 09/01/31) |
11 | 9,540 | ||||||
|
|
|
|||||||
| Packaging & Containers — 0.0% | ||||||||
| Berry Global Inc., 5.65%, 01/15/34 (Call 10/15/33)(c) |
5 | 4,932 | ||||||
|
|
|
|||||||
| Pharmaceuticals — 10.1% | ||||||||
| AbbVie Inc. |
||||||||
| 3.20%, 11/21/29 (Call 08/21/29)(a) |
30 | 27,410 | ||||||
| 4.05%, 11/21/39 (Call 05/21/39) |
70 | 61,176 | ||||||
| 4.25%, 11/21/49 (Call 05/21/49) |
55 | 47,162 | ||||||
| 4.70%, 05/14/45 (Call 11/14/44) |
25 | 23,034 | ||||||
| AstraZeneca PLC, 6.45%, 09/15/37 |
40 | 44,958 | ||||||
| Security | Par (000) |
Value | ||||||
| Pharmaceuticals (continued) | ||||||||
| Becton Dickinson and Co. |
||||||||
| 2.82%, 05/20/30 (Call 02/20/30) |
$ | 30 | $ | 26,298 | ||||
| 4.67%, 06/06/47 (Call 12/06/46) |
10 | 8,833 | ||||||
| Bristol-Myers Squibb Co. |
||||||||
| 1.45%, 11/13/30 (Call 08/13/30) |
25 | 20,024 | ||||||
| 2.95%, 03/15/32 (Call 12/15/31) |
25 | 21,537 | ||||||
| 3.40%, 07/26/29 (Call 04/26/29) |
26 | 24,246 | ||||||
| 3.90%, 02/20/28 (Call 11/20/27) |
15 | 14,476 | ||||||
| 4.25%, 10/26/49 (Call 04/26/49) |
60 | 50,020 | ||||||
| 6.40%, 11/15/63 (Call 05/15/63) |
10 | 11,088 | ||||||
| Cencora Inc., 3.45%, 12/15/27 (Call 09/15/27) |
25 | 23,679 | ||||||
| Cigna Group (The) |
||||||||
| 4.90%, 12/15/48 (Call 06/15/48) |
65 | 58,333 | ||||||
| 5.60%, 02/15/54 (Call 08/15/53) |
10 | 9,814 | ||||||
| CVS Health Corp. |
||||||||
| 1.88%, 02/28/31 (Call 11/28/30) |
15 | 12,041 | ||||||
| 2.13%, 09/15/31 (Call 06/15/31) |
20 | 16,125 | ||||||
| 4.78%, 03/25/38 (Call 09/25/37) |
35 | 31,724 | ||||||
| 5.05%, 03/25/48 (Call 09/25/47) |
65 | 57,935 | ||||||
| 5.13%, 07/20/45 (Call 01/20/45) |
15 | 13,578 | ||||||
| 5.88%, 06/01/53 (Call 12/01/52) |
15 | 14,931 | ||||||
| 6.00%, 06/01/63 (Call 12/01/62) |
5 | 5,002 | ||||||
| Eli Lilly & Co. |
||||||||
| 2.25%, 05/15/50 (Call 11/15/49)(a) |
15 | 9,023 | ||||||
| 4.70%, 02/09/34 (Call 11/09/33) |
15 | 14,810 | ||||||
| 4.95%, 02/27/63 (Call 08/27/62) |
10 | 9,613 | ||||||
| 5.00%, 02/09/54 (Call 08/09/53) |
15 | 14,745 | ||||||
| 5.10%, 02/09/64 (Call 08/09/63) |
5 | 4,906 | ||||||
| GlaxoSmithKline Capital Inc., 3.88%, 05/15/28 |
40 | 38,725 | ||||||
| GlaxoSmithKline Capital PLC, 3.38%, 06/01/29 |
||||||||
| (Call 03/01/29) |
25 | 23,474 | ||||||
| Johnson & Johnson, 3.70%, 03/01/46 (Call 09/01/45) |
80 | 65,590 | ||||||
| Merck & Co. Inc. |
||||||||
| 1.45%, 06/24/30 (Call 03/24/30) |
35 | 28,596 | ||||||
| 2.90%, 12/10/61 (Call 06/10/61) |
10 | 6,207 | ||||||
| 3.70%, 02/10/45 (Call 08/10/44) |
60 | 48,565 | ||||||
| 5.00%, 05/17/53 (Call 11/17/52) |
25 | 24,201 | ||||||
| 5.15%, 05/17/63 (Call 11/17/62) |
5 | 4,873 | ||||||
| Novartis Capital Corp. |
||||||||
| 2.20%, 08/14/30 (Call 05/14/30) |
30 | 25,742 | ||||||
| 2.75%, 08/14/50 (Call 02/14/50) |
25 | 16,594 | ||||||
| Pfizer Inc. |
||||||||
| 2.70%, 05/28/50 (Call 11/28/49) |
30 | 19,725 | ||||||
| 3.45%, 03/15/29 (Call 12/15/28) |
15 | 14,093 | ||||||
| 4.13%, 12/15/46 |
15 | 12,581 | ||||||
| 7.20%, 03/15/39 |
35 | 41,563 | ||||||
| Pfizer Investment Enterprises Pte Ltd. |
||||||||
| 4.65%, 05/19/30 (Call 03/19/30) |
30 | 29,528 | ||||||
| 4.75%, 05/19/33 (Call 02/19/33) |
75 | 72,977 | ||||||
| 5.30%, 05/19/53 (Call 11/19/52) |
50 | 48,860 | ||||||
| 5.34%, 05/19/63 (Call 11/19/62) |
10 | 9,630 | ||||||
| Zoetis Inc., 5.60%, 11/16/32 (Call 08/16/32) |
15 | 15,494 | ||||||
|
|
|
|||||||
| 1,223,539 | ||||||||
| Real Estate — 0.0% | ||||||||
| CBRE Services Inc., 5.95%, 08/15/34 (Call 05/15/34) |
5 | 5,052 | ||||||
|
|
|
|||||||
| Real Estate Investment Trusts — 1.9% | ||||||||
| Alexandria Real Estate Equities Inc. |
||||||||
| 2.00%, 05/18/32 (Call 02/18/32) |
20 | 15,465 | ||||||
| 3.55%, 03/15/52 (Call 09/15/51) |
15 | 10,392 | ||||||
| 14 | 2 0 2 4 I S H A R E S A N N U A L R E P O R T T O S H A R E H O L D E R S |
| Schedule of Investments (continued) February 29, 2024 |
iShares® ESG Advanced Investment Grade Corporate Bond ETF (Percentages shown are based on Net Assets) |
| Security | Par (000) |
Value | ||||||
| Real Estate Investment Trusts (continued) | ||||||||
| American Tower Corp. |
||||||||
| 1.88%, 10/15/30 (Call 07/15/30) |
$ | 10 | $ | 8,024 | ||||
| 2.10%, 06/15/30 (Call 03/15/30) |
10 | 8,230 | ||||||
| 3.10%, 06/15/50 (Call 12/15/49) |
15 | 9,785 | ||||||
| 5.55%, 07/15/33 (Call 04/15/33) |
10 | 9,972 | ||||||
| Boston Properties LP, 2.45%, 10/01/33 (Call 07/01/33) |
30 | 22,112 | ||||||
| Brixmor Operating Partnership LP, 4.13%, 05/15/29 |
||||||||
| (Call 02/15/29) |
10 | 9,356 | ||||||
| Crown Castle Inc. |
||||||||
| 2.10%, 04/01/31 (Call 01/01/31) |
15 | 12,014 | ||||||
| 2.90%, 04/01/41 (Call 10/01/40) |
30 | 20,788 | ||||||
| 5.80%, 03/01/34 (Call 12/01/33) |
10 | 10,126 | ||||||
| Digital Realty Trust LP, 5.55%, 01/15/28 (Call 12/15/27) |
20 | 20,212 | ||||||
| Equinix Inc., 2.50%, 05/15/31 (Call 02/15/31) |
10 | 8,331 | ||||||
| Prologis LP, 4.75%, 06/15/33 (Call 03/15/33) |
20 | 19,359 | ||||||
| Simon Property Group LP, 2.65%, 07/15/30 |
||||||||
| (Call 04/15/30) |
50 | 43,414 | ||||||
|
|
|
|||||||
| 227,580 | ||||||||
| Retail — 3.8% | ||||||||
| AutoZone Inc., 4.00%, 04/15/30 (Call 01/15/30) |
10 | 9,414 | ||||||
| Dollar General Corp., 3.50%, 04/03/30 (Call 01/03/30) |
15 | 13,564 | ||||||
| Dollar Tree Inc., 4.20%, 05/15/28 (Call 02/15/28) |
20 | 19,286 | ||||||
| Home Depot Inc. (The) |
||||||||
| 2.75%, 09/15/51 (Call 03/15/51) |
115 | 73,322 | ||||||
| 2.95%, 06/15/29 (Call 03/15/29) |
45 | 41,035 | ||||||
| 5.88%, 12/16/36 |
15 | 15,977 | ||||||
| Lowe’s Companies Inc. |
||||||||
| 1.70%, 09/15/28 (Call 07/15/28) |
95 | 82,470 | ||||||
| 2.80%, 09/15/41 (Call 03/15/41) |
35 | 24,400 | ||||||
| 4.45%, 04/01/62 (Call 10/01/61) |
20 | 15,967 | ||||||
| 5.63%, 04/15/53 (Call 10/15/52) |
15 | 14,846 | ||||||
| McDonald’s Corp. |
||||||||
| 2.13%, 03/01/30 (Call 12/01/29) |
25 | 21,377 | ||||||
| 3.63%, 09/01/49 (Call 03/01/49) |
30 | 22,368 | ||||||
| 4.60%, 09/09/32 (Call 06/09/32) |
15 | 14,629 | ||||||
| 4.88%, 12/09/45 (Call 06/09/45) |
15 | 13,819 | ||||||
| 5.45%, 08/14/53 (Call 02/14/53) |
5 | 4,975 | ||||||
| Starbucks Corp. |
||||||||
| 3.50%, 11/15/50 (Call 05/15/50) |
15 | 10,948 | ||||||
| 3.55%, 08/15/29 (Call 05/15/29) |
42 | 39,432 | ||||||
| Target Corp. |
||||||||
| 2.35%, 02/15/30 (Call 11/15/29) |
10 | 8,722 | ||||||
| 2.95%, 01/15/52 (Call 07/15/51) |
5 | 3,325 | ||||||
| 4.80%, 01/15/53 (Call 07/15/52)(a) |
10 | 9,224 | ||||||
|
|
|
|||||||
| 459,100 | ||||||||
| Semiconductors — 4.9% | ||||||||
| Analog Devices Inc., 2.95%, 10/01/51 (Call 04/01/51) |
5 | 3,325 | ||||||
| Applied Materials Inc., 4.35%, 04/01/47 (Call 10/01/46) |
10 | 8,860 | ||||||
| Broadcom Inc. |
||||||||
| 2.45%, 02/15/31 (Call 11/15/30)(c) |
20 | 16,651 | ||||||
| 3.42%, 04/15/33 (Call 01/15/33)(c) |
10 | 8,530 | ||||||
| 3.47%, 04/15/34 (Call 01/15/34)(c) |
15 | 12,642 | ||||||
| 3.50%, 02/15/41 (Call 08/15/40)(c) |
15 | 11,472 | ||||||
| 3.75%, 02/15/51 (Call 08/15/50)(c) |
5 | 3,740 | ||||||
| 4.30%, 11/15/32 (Call 08/15/32) |
14 | 12,964 | ||||||
| 4.93%, 05/15/37 (Call 02/15/37)(c) |
75 | 69,864 | ||||||
| Intel Corp. |
||||||||
| 1.60%, 08/12/28 (Call 06/12/28) |
90 | 78,257 | ||||||
| 2.80%, 08/12/41 (Call 02/12/41) |
85 | 60,389 | ||||||
| 3.05%, 08/12/51 (Call 02/12/51) |
35 | 23,124 | ||||||
| Security | Par (000) |
Value | ||||||
| Semiconductors (continued) | ||||||||
| 3.73%, 12/08/47 (Call 06/08/47) |
$ | 10 | $ | 7,621 | ||||
| 4.60%, 03/25/40 (Call 09/25/39) |
10 | 9,257 | ||||||
| 5.13%, 02/10/30 (Call 12/10/29) |
25 | 25,213 | ||||||
| 5.90%, 02/10/63 (Call 08/10/62) |
21 | 21,807 | ||||||
| KLA Corp., 4.95%, 07/15/52 (Call 01/15/52) |
15 | 14,197 | ||||||
| Lam Research Corp., 4.88%, 03/15/49 (Call 09/15/48) |
5 | 4,703 | ||||||
| Marvell Technology Inc., 2.95%, 04/15/31 (Call 01/15/31) |
15 | 12,823 | ||||||
| Micron Technology Inc. |
||||||||
| 4.66%, 02/15/30 (Call 11/15/29) |
25 | 24,187 | ||||||
| 5.88%, 02/09/33 (Call 11/09/32) |
10 | 10,185 | ||||||
| NVIDIA Corp., 3.50%, 04/01/40 (Call 10/01/39) |
20 | 16,714 | ||||||
| NXP BV/NXP Funding LLC/NXP USA Inc., 3.25%, 05/11/41 (Call 11/11/40) |
25 | 18,300 | ||||||
| QUALCOMM Inc. |
||||||||
| 1.65%, 05/20/32 (Call 02/20/32) |
10 | 7,814 | ||||||
| 3.25%, 05/20/27 (Call 02/20/27) |
50 | 47,659 | ||||||
| 4.50%, 05/20/52 (Call 11/20/51) |
10 | 8,829 | ||||||
| 4.80%, 05/20/45 (Call 11/20/44) |
10 | 9,424 | ||||||
| 6.00%, 05/20/53 (Call 11/20/52) |
10 | 10,957 | ||||||
| Texas Instruments Inc. |
||||||||
| 3.88%, 03/15/39 (Call 09/15/38) |
15 | 13,186 | ||||||
| 4.15%, 05/15/48 (Call 11/15/47) |
20 | 16,928 | ||||||
|
|
|
|||||||
| 589,622 | ||||||||
| Software — 4.4% | ||||||||
| Adobe Inc., 2.30%, 02/01/30 (Call 11/01/29) |
10 | 8,733 | ||||||
| Autodesk Inc., 2.40%, 12/15/31 (Call 09/15/31) |
10 | 8,280 | ||||||
| Broadridge Financial Solutions Inc., 2.90%, 12/01/29 |
||||||||
| (Call 09/01/29) |
20 | 17,662 | ||||||
| Fidelity National Information Services Inc., 2.25%, |
||||||||
| 03/01/31 (Call 12/01/30)(a) |
20 | 16,733 | ||||||
| Fiserv Inc. |
||||||||
| 4.40%, 07/01/49 (Call 01/01/49) |
20 | 16,593 | ||||||
| 5.63%, 08/21/33 (Call 05/21/33) |
12 | 12,110 | ||||||
| Intuit Inc. |
||||||||
| 5.20%, 09/15/33 (Call 06/15/33) |
10 | 10,089 | ||||||
| 5.50%, 09/15/53 (Call 03/15/53) |
5 | 5,134 | ||||||
| Microsoft Corp. |
||||||||
| 2.50%, 09/15/50 (Call 03/15/50)(c) |
5 | 3,176 | ||||||
| 2.53%, 06/01/50 (Call 12/01/49) |
165 | 106,102 | ||||||
| Oracle Corp. |
||||||||
| 2.88%, 03/25/31 (Call 12/25/30) |
25 | 21,552 | ||||||
| 2.95%, 04/01/30 (Call 01/01/30) |
45 | 39,705 | ||||||
| 3.60%, 04/01/40 (Call 10/01/39) |
38 | 29,329 | ||||||
| 3.80%, 11/15/37 (Call 05/15/37) |
15 | 12,338 | ||||||
| 3.85%, 07/15/36 (Call 01/15/36) |
15 | 12,612 | ||||||
| 3.85%, 04/01/60 (Call 10/01/59) |
15 | 10,400 | ||||||
| 3.95%, 03/25/51 (Call 09/25/50) |
40 | 29,854 | ||||||
| 4.00%, 07/15/46 (Call 01/15/46) |
135 | 103,748 | ||||||
| 6.25%, 11/09/32 (Call 08/09/32) |
15 | 15,843 | ||||||
| Salesforce Inc. |
||||||||
| 1.95%, 07/15/31 (Call 04/15/31) |
15 | 12,281 | ||||||
| 2.90%, 07/15/51 (Call 01/15/51) |
20 | 13,280 | ||||||
| Workday Inc. |
||||||||
| 3.50%, 04/01/27 (Call 03/01/27) |
15 | 14,276 | ||||||
| 3.80%, 04/01/32 (Call 01/01/32) |
11 | 9,918 | ||||||
|
|
|
|||||||
| 529,748 | ||||||||
| Telecommunications — 7.2% | ||||||||
| AT&T Inc. |
||||||||
| 2.55%, 12/01/33 (Call 09/01/33) |
110 | 86,595 | ||||||
| 3.50%, 06/01/41 (Call 12/01/40) |
65 | 49,718 | ||||||
| S C H E D U L E O F I N V E S T M E N T S |
15 |
| Schedule of Investments (continued) February 29, 2024 |
iShares® ESG Advanced Investment Grade Corporate Bond ETF (Percentages shown are based on Net Assets) |
| Security | Par (000) |
Value | ||||||
| Telecommunications (continued) | ||||||||
| 3.55%, 09/15/55 (Call 03/15/55) |
$ | 95 | $ | 64,559 | ||||
| 3.65%, 06/01/51 (Call 12/01/50) |
85 | 61,146 | ||||||
| 3.65%, 09/15/59 (Call 03/15/59) |
15 | 10,109 | ||||||
| 4.10%, 02/15/28 (Call 11/15/27) |
20 | 19,280 | ||||||
| Bell Telephone Co. of Canada or Bell Canada, 4.46%, 04/01/48 (Call 10/01/47) |
15 | 12,706 | ||||||
| British Telecommunications PLC, 9.63%, 12/15/30 |
15 | 18,359 | ||||||
| Cisco Systems Inc. |
||||||||
| 5.05%, 02/26/34 (Call 11/26/33) |
15 | 15,083 | ||||||
| 5.30%, 02/26/54 (Call 08/26/53) |
15 | 15,195 | ||||||
| 5.90%, 02/15/39 |
25 | 26,798 | ||||||
| Corning Inc., 4.38%, 11/15/57 (Call 05/15/57) |
15 | 12,370 | ||||||
| Deutsche Telekom International Finance BV, 8.75%, 06/15/30 |
15 | 17,672 | ||||||
| Motorola Solutions Inc. |
||||||||
| 2.30%, 11/15/30 (Call 08/15/30) |
10 | 8,225 | ||||||
| 4.60%, 05/23/29 (Call 02/23/29) |
15 | 14,591 | ||||||
| Orange SA, 5.50%, 02/06/44 (Call 08/06/43) |
20 | 19,992 | ||||||
| Rogers Communications Inc. |
||||||||
| 3.80%, 03/15/32 (Call 12/15/31) |
10 | 8,888 | ||||||
| 4.35%, 05/01/49 (Call 11/01/48) |
20 | 16,082 | ||||||
| 4.55%, 03/15/52 (Call 09/15/51)(a) |
10 | 8,249 | ||||||
| 5.00%, 03/15/44 (Call 09/15/43) |
8 | 7,210 | ||||||
| Telefonica Emisiones SA, 7.05%, 06/20/36 |
55 | 60,472 | ||||||
| TELUS Corp., 4.60%, 11/16/48 (Call 05/16/48)(a) |
7 | 5,976 | ||||||
| Verizon Communications Inc. |
||||||||
| 2.55%, 03/21/31 (Call 12/21/30) |
30 | 25,301 | ||||||
| 2.99%, 10/30/56 (Call 04/30/56) |
100 | 61,854 | ||||||
| 3.15%, 03/22/30 (Call 12/22/29) |
20 | 17,920 | ||||||
| 3.40%, 03/22/41 (Call 09/22/40) |
125 | 95,841 | ||||||
| 3.88%, 02/08/29 (Call 11/08/28) |
20 | 18,999 | ||||||
| 4.33%, 09/21/28 |
40 | 38,794 | ||||||
| 4.50%, 08/10/33 |
15 | 14,137 | ||||||
| 4.86%, 08/21/46 |
5 | 4,581 | ||||||
| Vodafone Group PLC, 4.88%, 06/19/49 |
37 | 32,066 | ||||||
|
|
|
|||||||
| 868,768 | ||||||||
| Toys, Games & Hobbies — 0.1% | ||||||||
| Hasbro Inc., 3.90%, 11/19/29 (Call 08/19/29) |
10 | 9,174 | ||||||
|
|
|
|||||||
| Transportation — 0.6% | ||||||||
| FedEx Corp. |
||||||||
| 2.40%, 05/15/31 (Call 02/15/31)(a) |
11 | 9,183 | ||||||
| 4.55%, 04/01/46 (Call 10/01/45) |
37 | 31,498 | ||||||
| Security | Par (000) |
Value | ||||||
| Transportation (continued) | ||||||||
| United Parcel Service Inc. |
||||||||
| 3.75%, 11/15/47 (Call 05/15/47) |
$ | 27 | $ | 21,397 | ||||
| 6.20%, 01/15/38 |
15 | 16,407 | ||||||
|
|
|
|||||||
| 78,485 | ||||||||
| Water — 0.1% | ||||||||
| American Water Capital Corp., 3.75%, 09/01/47 |
||||||||
| (Call 03/01/47) |
10 | 7,756 | ||||||
|
|
|
|||||||
| Total Long-Term Investments — 96.8% |
11,728,187 | |||||||
|
|
|
|||||||
| Shares | ||||||||
| Short-Term Securities |
||||||||
| Money Market Funds — 4.6% | ||||||||
| BlackRock Cash Funds: Institutional, SL Agency Shares, 5.50%(d)(e)(f) |
268,485 | 268,619 | ||||||
| BlackRock Cash Funds: Treasury, SL Agency Shares, 5.30%(d)(e) |
290,000 | 290,000 | ||||||
|
|
|
|||||||
| Total Short-Term Securities — 4.6% |
558,619 | |||||||
|
|
|
|||||||
| Total Investments — 101.4% |
12,286,806 | |||||||
| Liabilities in Excess of Other Assets — (1.4)% |
(174,498 | ) | ||||||
|
|
|
|||||||
| Net Assets — 100.0% |
$ | 12,112,308 | ||||||
|
|
|
|||||||
| (a) | All or a portion of this security is on loan. |
| (b) | Variable rate security. Interest rate resets periodically. The rate shown is the effective interest rate as of period end. Security description also includes the reference rate and spread if published and available. |
| (c) | Security exempt from registration pursuant to Rule 144A under the Securities Act of 1933, as amended. These securities may be resold in transactions exempt from registration to qualified institutional investors. |
| (d) | Affiliate of the Fund. |
| (e) | Annualized 7-day yield as of period end. |
| (f) | All or a portion of this security was purchased with the cash collateral from loaned securities. |
| 16 | 2 0 2 4 I S H A R E S A N N U A L R E P O R T T O S H A R E H O L D E R S |
| Schedule of Investments (continued) February 29, 2024 |
iShares® ESG Advanced Investment Grade Corporate Bond ETF |
Affiliates
Investments in issuers considered to be affiliate(s) of the Fund during the year ended February 29, 2024 for purposes of Section 2(a)(3) of the Investment Company Act of 1940, as amended, were as follows:
| Affiliated Issuer | Value at 02/28/23 |
Purchases at Cost |
Proceeds from Sale |
Net Realized Gain (Loss) |
Change in Unrealized Appreciation (Depreciation) |
Value at 02/29/24 |
Shares Held at 02/29/24 |
Income | Capital Gain from Funds |
|||||||||||||||||||||||||||
| BlackRock Cash Funds: Institutional, |
$ | 580,588 | $ | — | $(311,857) | (a) | $ | (112 | ) | $ | — | $ | 268,619 | 268,485 | $ | 1,923 | (b) | $ | — | |||||||||||||||||
| BlackRock Cash Funds: Treasury, |
120,000 | 170,000 | (a) | — | — | — | 290,000 | 290,000 | 8,257 | — | ||||||||||||||||||||||||||
|
|
|
|
|
|
|
|
|
|
|
|||||||||||||||||||||||||||
| $ | (112 | ) | $ | — | $ | 558,619 | $ | 10,180 | $ | — | ||||||||||||||||||||||||||
|
|
|
|
|
|
|
|
|
|
|
|||||||||||||||||||||||||||
| (a) | Represents net amount purchased (sold). |
| (b) | All or a portion represents securities lending income earned from the reinvestment of cash collateral from loaned securities, net of fees and collateral investment expenses, and other payments to and from borrowers of securities. |
Fair Value Hierarchy as of Period End
Various inputs are used in determining the fair value of financial instruments. For a description of the input levels and information about the Fund’s policy regarding valuation of financial instruments, refer to the Notes to Financial Statements.
The following table summarizes the Fund’s financial instruments categorized in the fair value hierarchy. The breakdown of the Fund’s financial instruments into major categories is disclosed in the Schedule of Investments above.
| Level 1 | Level 2 | Level 3 | Total | |||||||||||||
| Assets |
||||||||||||||||
| Investments |
||||||||||||||||
| Long-Term Investments |
||||||||||||||||
| Corporate Bonds & Notes |
$ | — | $ | 11,728,187 | $ | — | $ | 11,728,187 | ||||||||
| Short-Term Securities |
||||||||||||||||
| Money Market Funds |
558,619 | — | — | 558,619 | ||||||||||||
|
|
|
|
|
|
|
|
|
|||||||||
| $ | 558,619 | $ | 11,728,187 | $ | — | $ | 12,286,806 | |||||||||
|
|
|
|
|
|
|
|
|
|||||||||
See notes to financial statements.
| S C H E D U L E O F I N V E S T M E N T S |
17 |
| Schedule of Investments February 29, 2024 |
iShares® ESG Advanced Total USD Bond Market ETF (Percentages shown are based on Net Assets) |
| Security | Par (000) |
Value | ||||||
| Asset-Backed Securities |
||||||||
| American Express Credit Account Master Trust Series 2022-2, Class A, 3.39%, 05/15/27 |
$ | 1,000 | $ | 978,666 | ||||
| Chase Issuance Trust, 4.60%, 01/16/29 |
860 | 854,414 | ||||||
| Santander Drive Auto Receivables Trust |
||||||||
| 5.23%, 12/15/28 |
90 | 89,788 | ||||||
| Series 2021-3, Class C, 0.95%, 09/15/27 (Call 06/15/25) |
40 | 39,603 | ||||||
| Toyota Auto Receivables Owner Trust Series 2021-B, Class A4, 0.53%, 10/15/26 (Call 07/15/25) |
75 | 71,058 | ||||||
| Verizon Master Trust Series 2021-1, Class A, 0.50%, 05/20/27 (Call 05/20/24) |
100 | 98,921 | ||||||
| World Omni Auto Receivables Trust, 4.86%, 03/15/29 |
280 | 278,648 | ||||||
|
|
|
|||||||
| Total Asset-Backed Securities — 0.4% |
2,411,098 | |||||||
|
|
|
|||||||
| Collaterized Mortgage Obligations |
||||||||
| Mortgage-Backed Securities — 0.9% | ||||||||
| Barclays Commercial Mortgage Trust, Series 2019-C3, Class A4, 3.58%, 05/15/52 (Call 05/15/29) |
100 | 92,382 | ||||||
| BBCMS Mortgage Trust, Series 2021-C11, Class A5, 2.32%, 09/15/54 |
200 | 165,409 | ||||||
| BBCMS Trust, Series 2021-C10, Class A5, 2.49%, 07/15/54 (Call 07/15/31) |
460 | 387,847 | ||||||
| Benchmark Mortgage Trust |
1,000 | 926,155 | ||||||
| Series 2018-B4, Class ASB, 4.06%, 07/15/51 (Call 07/15/28)(a) |
891 | 868,368 | ||||||
| Series 2020-B16, Class A5, 2.73%, 02/15/53 (Call 02/15/30) |
100 | 87,199 | ||||||
| Series 2020-B21, Class A4, 1.70%, 12/17/53 (Call 12/15/30) |
100 | 81,471 | ||||||
| CGMS Commercial Mortgage Trust, Series 2017-B1 AAB 3.24%, 08/15/50 (Call 08/15/27) |
111 | 106,616 | ||||||
| Commission Mortgage Trust, Series 2015-CR25, Class A4, 3.76%, 08/10/48 (Call 08/10/25) |
1,000 | 970,433 | ||||||
| CSAIL Commercial Mortgage Trust, Series 2015-C1, Class A4, 3.51%, 04/15/50 (Call 03/15/25) |
155 | 151,706 | ||||||
| GS Mortgage Securities Trust, Series 2017-GS7, Class AAB, 3.20%, 08/10/50 (Call 08/10/27) |
498 | 481,020 | ||||||
| JPMBB Commercial Mortgage Securities Trust |
||||||||
| Series 2014-C21, Class A5, 3.77%, 08/15/47 (Call 07/15/24) |
75 | 74,354 | ||||||
| Series 2015-C29, Class A4, 3.61%, 05/15/48 (Call 03/15/26) |
172 | 167,114 | ||||||
| Morgan Stanley Bank of America Merrill Lynch Trust, Series 2016-C32, Class A4, 3.72%, 12/15/49 (Call 01/15/27) |
100 | 94,577 | ||||||
| UBS Commercial Mortgage Trust, Series 2018-C13 ASB4.24%, 10/15/51 (Call 10/15/28) |
94 | 92,456 | ||||||
| Wells Fargo Commercial Mortgage Trust |
||||||||
| Series 2017-RC1, Class A4, 3.63%, 01/15/60 (Call 03/15/27) |
150 | 142,417 | ||||||
| Series 2021-C59, Class A5, 2.63%, 04/15/54 (Call 04/15/31) |
600 | 506,991 | ||||||
|
|
|
|||||||
| 5,396,515 | ||||||||
|
|
|
|||||||
| Total Collaterized Mortgage Obligations — 0.9% |
5,396,515 | |||||||
|
|
|
|||||||
| Security | Par (000) |
Value | ||||||
| Corporate Bonds & Notes |
||||||||
| Advertising — 0.1% | ||||||||
| Clear Channel International BV, 6.63%, 08/01/25 (Call 03/11/24)(b) |
$ | 20 | $ | 19,993 | ||||
| Clear Channel Outdoor Holdings Inc. |
||||||||
| 5.13%, 08/15/27 (Call 04/01/24)(b) |
70 | 65,467 | ||||||
| 7.50%, 06/01/29 (Call 06/01/24)(b)(c) |
60 | 49,916 | ||||||
| 7.75%, 04/15/28 (Call 04/15/24)(b)(c) |
55 | 47,621 | ||||||
| 9.00%, 09/15/28 (Call 09/15/25)(b)(c) |
40 | 41,716 | ||||||
| Interpublic Group of Companies Inc. (The) |
||||||||
| 2.40%, 03/01/31 (Call 12/01/30) |
50 | 41,646 | ||||||
| 3.38%, 03/01/41 (Call 09/01/40) |
25 | 18,375 | ||||||
| 4.75%, 03/30/30 (Call 12/30/29) |
68 | 66,133 | ||||||
| 5.40%, 10/01/48 (Call 04/01/48) |
20 | 18,482 | ||||||
| Omnicom Group Inc./Omnicom Capital Inc., 3.60%, 04/15/26 (Call 01/15/26) |
100 | 96,871 | ||||||
| Outfront Media Capital LLC/Outfront Media Capital Corp. |
||||||||
| 4.25%, 01/15/29 (Call 04/01/24)(b) |
27 | 24,250 | ||||||
| 4.63%, 03/15/30 (Call 03/15/25)(b) |
30 | 26,742 | ||||||
| 5.00%, 08/15/27 (Call 03/11/24)(b)(c) |
40 | 38,520 | ||||||
| 7.38%, 02/15/31 (Call 11/15/26)(b)(c) |
25 | 26,086 | ||||||
|
|
|
|||||||
| 581,818 | ||||||||
| Aerospace & Defense — 0.1% | ||||||||
| Hexcel Corp. |
||||||||
| 4.20%, 02/15/27 (Call 11/15/26) |
45 | 42,842 | ||||||
| 4.95%, 08/15/25 (Call 05/15/25) |
39 | 38,489 | ||||||
| Howmet Aerospace Inc. |
||||||||
| 3.00%, 01/15/29 (Call 11/15/28) |
41 | 36,748 | ||||||
| 5.90%, 02/01/27 |
41 | 41,403 | ||||||
| 5.95%, 02/01/37(c) |
35 | 35,739 | ||||||
| 6.75%, 01/15/28 |
25 | 26,068 | ||||||
| 6.88%, 05/01/25 (Call 04/01/25) |
34 | 34,345 | ||||||
| Spirit AeroSystems Inc. |
||||||||
| 4.60%, 06/15/28 (Call 03/15/28) |
40 | 35,114 | ||||||
| 9.38%, 11/30/29 (Call 11/30/25)(b) |
55 | 59,485 | ||||||
| 9.75%, 11/15/30 (Call 11/15/26)(b) |
65 | 69,642 | ||||||
| Triumph Group Inc. |
||||||||
| 7.75%, 08/15/25 (Call 03/06/24) |
25 | 25,000 | ||||||
| 9.00%, 03/15/28 (Call 03/15/25)(b) |
70 | 73,130 | ||||||
|
|
|
|||||||
| 518,005 | ||||||||
| Agriculture — 0.0% | ||||||||
| Darling Ingredients Inc. |
||||||||
| 5.25%, 04/15/27 (Call 03/11/24)(b) |
35 | 34,298 | ||||||
| 6.00%, 06/15/30 (Call 06/15/25)(b) |
60 | 59,120 | ||||||
|
|
|
|||||||
| 93,418 | ||||||||
| Airlines — 0.0% | ||||||||
| Allegiant Travel Co., 7.25%, 08/15/27 |
30 | 29,268 | ||||||
| Hawaiian Brand Intellectual Property Ltd./HawaiianMiles Loyalty Ltd., 5.75%, 01/20/26 (Call 03/11/24)(b) |
65 | 61,210 | ||||||
|
|
|
|||||||
| 90,478 | ||||||||
| Apparel — 0.1% | ||||||||
| Crocs Inc. |
||||||||
| 4.13%, 08/15/31 (Call 08/15/26)(b) |
20 | 17,115 | ||||||
| 4.25%, 03/15/29 (Call 04/01/24)(b) |
20 | 18,039 | ||||||
| Hanesbrands Inc. |
||||||||
| 4.88%, 05/15/26 (Call 02/15/26)(b) |
53 | 51,173 | ||||||
| 9.00%, 02/15/31 (Call 02/15/26)(b)(c) |
35 | 35,086 | ||||||
| 18 | 2 0 2 4 I S H A R E S A N N U A L R E P O R T T O S H A R E H O L D E R S |
| Schedule of Investments (continued) February 29, 2024 |
iShares® ESG Advanced Total USD Bond Market ETF (Percentages shown are based on Net Assets) |
| Security | Par (000) |
Value | ||||||
| Apparel (continued) | ||||||||
| Kontoor Brands Inc., 4.13%, 11/15/29 (Call 11/15/24)(b) |
$ | 25 | $ | 22,504 | ||||
| Tapestry Inc. |
||||||||
| 3.05%, 03/15/32 (Call 12/15/31) |
40 | 32,425 | ||||||
| 4.13%, 07/15/27 (Call 04/15/27) |
63 | 59,831 | ||||||
| 7.35%, 11/27/28 (Call 10/27/28) |
70 | 73,248 | ||||||
| 7.85%, 11/27/33 (Call 08/27/33) |
75 | 81,147 | ||||||
| Under Armour Inc., 3.25%, 06/15/26 (Call 03/15/26) |
35 | 32,997 | ||||||
| Wolverine World Wide Inc., 4.00%, 08/15/29 (Call 08/15/24)(b) |
30 | 24,046 | ||||||
|
|
|
|||||||
| 447,611 | ||||||||
| Auto Manufacturers — 0.3% | ||||||||
| Aston Martin Capital Holdings Ltd., 10.50%, 11/30/25 (Call 11/01/24)(b) |
70 | 70,993 | ||||||
| BMW Finance NV, 2.85%, 08/14/29 |
95 | 86,725 | ||||||
| BMW U.S. Capital LLC |
||||||||
| 1.25%, 08/12/26 (Call 07/12/26)(b) |
55 | 50,257 | ||||||
| 2.55%, 04/01/31 (Call 01/01/31)(b) |
75 | 64,087 | ||||||
| 2.80%, 04/11/26 (Call 01/11/26)(b) |
200 | 191,242 | ||||||
| 3.30%, 04/06/27 (Call 01/06/27)(b) |
25 | 23,793 | ||||||
| 3.63%, 04/18/29 (Call 01/18/29)(b) |
5 | 4,731 | ||||||
| 3.70%, 04/01/32 (Call 01/01/32)(b) |
10 | 9,075 | ||||||
| 3.90%, 04/09/25 (Call 03/09/25)(b) |
125 | 123,253 | ||||||
| 3.95%, 08/14/28 (Call 05/14/28)(b)(c) |
50 | 48,063 | ||||||
| 4.15%, 04/09/30 (Call 01/09/30)(b) |
85 | 81,622 | ||||||
| 5.15%, 08/11/33 (Call 05/11/33)(b)(c) |
55 | 54,963 | ||||||
| Cummins Inc. |
||||||||
| 0.75%, 09/01/25 (Call 08/01/25) |
22 | 20,637 | ||||||
| 1.50%, 09/01/30 (Call 06/01/30) |
70 | 56,543 | ||||||
| 2.60%, 09/01/50 (Call 03/01/50) |
45 | 28,222 | ||||||
| 4.88%, 10/01/43 (Call 04/01/43) |
40 | 37,745 | ||||||
| 5.45%, 02/20/54 (Call 08/20/53) |
65 | 65,340 | ||||||
| Daimler Trucks Finance North America LLC |
||||||||
| 2.50%, 12/14/31(b) |
85 | 69,792 | ||||||
| 3.65%, 04/07/27(b) |
15 | 14,382 | ||||||
| 5.40%, 09/20/28(b) |
150 | 151,728 | ||||||
| 5.60%, 08/08/25(b) |
150 | 150,265 | ||||||
| PACCAR Financial Corp., 1.10%, 05/11/26 |
60 | 55,309 | ||||||
| Wabash National Corp., 4.50%, 10/15/28 (Call 10/15/24)(b) |
25 | 22,870 | ||||||
|
|
|
|||||||
| 1,481,637 | ||||||||
| Auto Parts & Equipment — 0.2% | ||||||||
| American Axle & Manufacturing Inc. |
||||||||
| 5.00%, 10/01/29 (Call 10/01/24)(c) |
30 | 26,001 | ||||||
| 6.50%, 04/01/27 (Call 04/01/24)(c) |
35 | 34,525 | ||||||
| 6.88%, 07/01/28 (Call 03/11/24) |
25 | 24,143 | ||||||
| Aptiv PLC |
||||||||
| 3.10%, 12/01/51 (Call 06/01/51) |
90 | 56,349 | ||||||
| 4.35%, 03/15/29 (Call 12/15/28) |
12 | 11,596 | ||||||
| 4.40%, 10/01/46 (Call 04/01/46) |
2 | 1,571 | ||||||
| 5.40%, 03/15/49 (Call 09/15/48) |
25 | 22,668 | ||||||
| Aptiv PLC/Aptiv Corp. |
||||||||
| 3.25%, 03/01/32 (Call 12/01/31) |
55 | 47,426 | ||||||
| 4.15%, 05/01/52 (Call 11/01/51) |
70 | 53,431 | ||||||
| BorgWarner Inc. |
||||||||
| 2.65%, 07/01/27 (Call 05/01/27) |
140 | 129,221 | ||||||
| 4.38%, 03/15/45 (Call 09/15/44) |
15 | 12,209 | ||||||
| Cooper-Standard Automotive Inc., 5.63%, 05/15/27 (Call 01/31/25), (10.63% PIK)(b)(d) |
22 | 16,321 | ||||||
| Security | Par (000) |
Value | ||||||
| Auto Parts & Equipment (continued) | ||||||||
| Dana Financing Luxembourg Sarl, 5.75%, 04/15/25 (Call 04/02/24)(b)(c) |
$ | 12 | $ | 11,968 | ||||
| Dana Inc. |
||||||||
| 4.25%, 09/01/30 (Call 05/01/26) |
25 | 21,582 | ||||||
| 4.50%, 02/15/32 (Call 02/15/27)(c) |
21 | 17,619 | ||||||
| 5.38%, 11/15/27 (Call 03/11/24)(c) |
25 | 24,253 | ||||||
| 5.63%, 06/15/28 (Call 03/11/24) |
25 | 24,220 | ||||||
| Lear Corp. |
||||||||
| 3.50%, 05/30/30 (Call 02/28/30) |
10 | 8,936 | ||||||
| 3.55%, 01/15/52 (Call 07/15/51) |
35 | 23,726 | ||||||
| 3.80%, 09/15/27 (Call 06/15/27) |
20 | 19,142 | ||||||
| 4.25%, 05/15/29 (Call 02/15/29) |
45 | 42,820 | ||||||
| 5.25%, 05/15/49 (Call 11/15/48) |
40 | 35,920 | ||||||
| Magna International Inc. |
||||||||
| 2.45%, 06/15/30 (Call 03/15/30) |
45 | 38,705 | ||||||
| 4.15%, 10/01/25 (Call 07/01/25) |
87 | 85,398 | ||||||
| Tenneco Inc., 8.00%, 11/17/28 (Call 11/17/24)(b) |
105 | 95,714 | ||||||
|
|
|
|||||||
| 885,464 | ||||||||
| Banks — 6.7% | ||||||||
| ABN AMRO Bank NV |
||||||||
| 2.47%, 12/13/29 (Call 12/13/28), (1-year CMT + 1.100%)(a)(b) |
50 | 43,498 | ||||||
| 3.32%, 03/13/37 (Call 12/13/31), (5-year CMT + 1.900%)(a)(b) |
50 | 39,716 | ||||||
| 4.80%, 04/18/26(b) |
200 | 195,019 | ||||||
| Agricultural Bank of China Ltd./Singapore, 1.25%, 03/02/26(e) |
200 | 185,633 | ||||||
| Banc of California, |
20 | 17,593 | ||||||
| Banco de Credito del Peru SA |
||||||||
| 3.13%, 07/01/30 (Call 07/01/25), (5-year CMT + 3.000%)(a)(e) |
100 | 95,019 | ||||||
| 3.25%, 09/30/31 (Call 09/30/26), (5-year CMT + 2.450%)(a)(c)(e) |
100 | 91,992 | ||||||
| Banco do Brasil SA/Cayman, 6.25%, 04/18/30(e) |
200 | 202,993 | ||||||
| Bangkok Bank PCL/Hong Kong, 4.45%, 09/19/28(e) |
200 | 193,743 | ||||||
| Bank Negara Indonesia Persero Tbk PT, 3.75%, 03/30/26(e) |
200 | 190,814 | ||||||
| Bank of China Ltd., 3.50%, 04/20/27(e) |
200 | 191,924 | ||||||
| Bank of Communications Co. Ltd., 3.80%, (Call 11/18/25), (5-year CMT + 3.345%)(a)(e)(f) |
200 | 193,830 | ||||||
| Bank of Montreal |
||||||||
| (1-day SOFR + 0.603%)(a) |
55 | 50,747 | ||||||
| 1.25%, 09/15/26 |
250 | 227,523 | ||||||
| 1.85%, 05/01/25 |
140 | 134,512 | ||||||
| 2.65%, 03/08/27 |
105 | 97,966 | ||||||
| 3.09%, 01/10/37 (Call 01/10/32), (5-year CMT + 1.400%)(a) |
35 | 28,346 | ||||||
| 3.70%, 06/07/25 |
65 | 63,684 | ||||||
| 3.80%, 12/15/32 (Call 12/15/27), (5-year USD Swap + 1.432%)(a) |
70 | 64,387 | ||||||
| 5.20%, 02/01/28 (Call 01/01/28) |
115 | 115,426 | ||||||
| 5.27%, 12/11/26 |
50 | 50,120 | ||||||
| 5.92%, 09/25/25 |
210 | 212,165 | ||||||
| Series H, 4.70%, 09/14/27 (Call 08/14/27) |
85 | 84,147 | ||||||
| Bank of New York Mellon Corp. (The) |
||||||||
| 1.05%, 10/15/26 (Call 09/15/26) |
5 | 4,516 | ||||||
| 1.60%, 04/24/25 (Call 03/24/25) |
107 | 102,791 | ||||||
| 1.65%, 07/14/28 (Call 05/14/28) |
20 | 17,520 | ||||||
| 1.65%, 01/28/31 (Call 10/28/30) |
85 | 68,417 | ||||||
| S C H E D U L E O F I N V E S T M E N T S |
19 |
| Schedule of Investments (continued) February 29, 2024 |
iShares® ESG Advanced Total USD Bond Market ETF (Percentages shown are based on Net Assets) |
| Security | Par (000) |
Value | ||||||
| Banks (continued) | ||||||||
| 1.80%, 07/28/31 (Call 04/28/31) |
$ | 50 | $ | 40,321 | ||||
| 2.05%, 01/26/27 (Call 12/26/26) |
20 | 18,454 | ||||||
| 2.45%, 08/17/26 (Call 05/17/26) |
96 | 90,256 | ||||||
| 2.80%, 05/04/26 (Call 02/04/26) |
95 | 90,688 | ||||||
| 3.00%, 10/30/28 (Call 07/30/28) |
85 | 77,937 | ||||||
| 3.25%, 05/16/27 (Call 02/16/27) |
100 | 94,983 | ||||||
| 3.30%, 08/23/29 (Call 05/23/29) |
115 | 105,507 | ||||||
| 3.40%, 01/29/28 (Call 10/29/27) |
148 | 139,985 | ||||||
| 3.44%, 02/07/28 (Call 02/07/27), (3-mo. SOFR + 1.331%)(a) |
142 | 135,718 | ||||||
| 3.85%, 04/28/28 |
122 | 117,671 | ||||||
| 3.95%, 11/18/25 (Call 10/18/25) |
60 | 58,710 | ||||||
| 4.29%, 06/13/33 (Call 06/13/32), (1-day SOFR + 1.418%)(a) |
100 | 93,373 | ||||||
| 4.97%, 04/26/34 (Call 04/26/33), (1-day SOFR + 1.606%)(a) |
150 | 146,163 | ||||||
| 5.83%, 10/25/33 (Call 10/25/32), (1-day SOFR + 2.074%)(a) |
55 | 57,036 | ||||||
| Series J, 1.90%, 01/25/29 (Call 11/25/28) |
45 | 39,384 | ||||||
| Bank of Nova Scotia (The) |
||||||||
| 1.05%, 03/02/26 |
150 | 138,315 | ||||||
| 1.30%, 06/11/25 |
65 | 61,779 | ||||||
| 1.30%, 09/15/26 (Call 06/15/26) |
70 | 63,711 | ||||||
| 1.35%, 06/24/26 |
260 | 238,638 | ||||||
| 1.95%, 02/02/27 |
50 | 45,890 | ||||||
| 2.15%, 08/01/31 |
130 | 106,229 | ||||||
| 2.45%, 02/02/32 |
35 | 28,711 | ||||||
| 2.70%, 08/03/26 |
120 | 113,316 | ||||||
| 3.45%, 04/11/25 |
30 | 29,376 | ||||||
| 4.50%, 12/16/25 |
135 | 132,676 | ||||||
| 4.59%, 05/04/37 (Call 02/04/32), (5-year CMT + 2.050%)(a) |
105 | 93,982 | ||||||
| 4.75%, 02/02/26 |
35 | 34,733 | ||||||
| Banque Federative du Credit Mutuel SA |
||||||||
| 1.60%, 10/04/26(b) |
65 | 59,294 | ||||||
| 4.94%, 01/26/26(b) |
205 | 203,489 | ||||||
| BDO Unibank Inc., 2.13%, 01/13/26(e) |
200 | 188,044 | ||||||
| BPCE SA |
||||||||
| 1.65%, 10/06/26 (Call 10/06/25), (1-day SOFR + 1.520%)(a)(b) |
165 | 154,194 | ||||||
| 2.70%, 10/01/29(b) |
80 | 70,002 | ||||||
| 3.58%, 10/19/42 (Call 10/19/41), (1-day SOFR + 1.952%)(a)(b) |
55 | 38,922 | ||||||
| 4.50%, 03/15/25(b) |
200 | 196,329 | ||||||
| 4.88%, 04/01/26(b) |
225 | 220,012 | ||||||
| 6.71%, 10/19/29 (Call 10/19/28), (1-day SOFR + 2.270%) |
250 | 259,521 | ||||||
| 7.00%, 10/19/34 (Call 10/19/33), (1-day SOFR + 2.590%)(a)(b) |
255 | 272,484 | ||||||
| CaixaBank SA, 6.21%, 01/18/29 (Call 01/18/28), (1-day SOFR + 2.700%)(a)(b) |
220 | 223,068 | ||||||
| Comerica Inc., 4.00%, 02/01/29 (Call 11/03/28) |
115 | 103,374 | ||||||
| Cooperatieve Rabobank UA |
||||||||
| 1.34%, 06/24/26 (Call 06/24/25), (1-year CMT + 1.000%)(a)(b) |
280 | 264,542 | ||||||
| 1.98%, 12/15/27 (Call 12/15/26), (1-year CMT + 0.730%)(a)(b) |
255 | 231,331 | ||||||
| 5.25%, 05/24/41 |
171 | 172,770 | ||||||
| 5.25%, 08/04/45 |
35 | 33,938 | ||||||
| 5.75%, 12/01/43 |
65 | 65,240 | ||||||
| Security | Par (000) |
Value | ||||||
| Banks (continued) | ||||||||
| Cooperatieve Rabobank UA/NY |
||||||||
| 3.38%, 05/21/25 |
$ | 300 | $ | 293,780 | ||||
| 5.50%, 10/05/26 |
275 | 278,086 | ||||||
| Credit Agricole SA |
||||||||
| 4.00%, 01/10/33 (Call 01/10/28), (5-year USD Swap + 1.644%)(a)(b) |
270 | 249,074 | ||||||
| 6.32%, 10/03/29 (Call 10/03/28), (1-day SOFR + 1.860%)(a)(b) |
290 | 299,208 | ||||||
| Credit Agricole SA/London, 1.91%, 06/16/26 (Call 06/16/25), (1-day SOFR + 1.676%)(a)(b) |
250 | 238,136 | ||||||
| DBS Group Holdings Ltd., 1.82%, 03/10/31 (Call 03/10/26), (5-year CMT + 1.100%)(a)(e) |
200 | 185,562 | ||||||
| DIB Sukuk Ltd., 2.95%, 01/16/26(e) |
200 | 191,082 | ||||||
| Discover Bank, 4.65%, 09/13/28 (Call 06/13/28) |
250 | 238,700 | ||||||
| DNB Bank ASA |
||||||||
| 1.54%, 05/25/27 (Call 05/25/26), (1-year CMT + 0.720%)(a)(b) |
200 | 183,258 | ||||||
| 1.61%, 03/30/28 (Call 03/30/27), (1-year CMT + 0.680%)(a)(b) |
20 | 17,806 | ||||||
| Dresdner Funding Trust I, 8.15%, 06/30/31 (Call 06/30/29)(b) |
60 | 65,988 | ||||||
| Emirates NBD Bank PJSC, 4.25%, |
200 | 184,467 | ||||||
| First Abu Dhabi Bank PJSC, 4.50%, (Call 04/05/26), (5-year CMT + 4.138%)(a)(e)(f) |
200 | 192,398 | ||||||
| First Horizon Corp., 4.00%, 05/26/25 (Call 04/26/25) |
135 | 131,413 | ||||||
| Huntington Bancshares Inc./OH |
||||||||
| 2.49%, 08/15/36 (Call 08/15/31), (5-year CMT + 1.170%)(a) |
75 | 56,606 | ||||||
| 2.55%, 02/04/30 (Call 11/04/29) |
155 | 130,461 | ||||||
| 4.00%, 05/15/25 (Call 04/15/25) |
135 | 132,558 | ||||||
| Industrial & Commercial Bank of China Ltd., 4.88%, 09/21/25(e) |
200 | 197,573 | ||||||
| Industrial & Commercial Bank of China Ltd./Singapore, 1.20%, 09/09/25(e) |
200 | 188,200 | ||||||
| ING Groep NV |
||||||||
| 1.73%, 04/01/27 (Call 04/01/26), (1-day SOFR + 1.005%)(a) |
215 | 198,983 | ||||||
| 3.95%, 03/29/27 |
255 | 245,514 | ||||||
| 4.55%, 10/02/28 |
200 | 194,972 | ||||||
| Intesa Sanpaolo SpA |
||||||||
| 4.20%, 06/01/32 (Call 06/01/31), (1-year CMT + 2.600%)(a)(b) |
45 | 36,892 | ||||||
| 4.95%, 06/01/42 (Call 06/01/41), (1-year CMT + 2.750%)(a)(b) |
50 | 36,032 | ||||||
| 5.71%, 01/15/26(b) |
55 | 54,513 | ||||||
| 6.63%, 06/20/33(b) |
200 | 202,020 | ||||||
| 8.25%, 11/21/33 (Call 11/21/32), (1-year CMT + 4.400%)(a)(b) |
200 | 217,014 | ||||||
| Series XR, 4.00%, 09/23/29(b) |
200 | 181,740 | ||||||
| Kasikornbank PCL/Hong Kong, 3.34%, 10/02/31 (Call 10/02/26), (5-year CMT + 1.700%)(a)(e) |
200 | 185,386 | ||||||
| KeyCorp |
||||||||
| 2.25%, 04/06/27 |
166 | 148,071 | ||||||
| 2.55%, 10/01/29 |
114 | 95,384 | ||||||
| 4.10%, 04/30/28 |
90 | 84,239 | ||||||
| 4.15%, 10/29/25 |
165 | 159,971 | ||||||
| 4.79%, 06/01/33 (Call 06/01/32), (1-day SOFR + 2.060%)(a) |
40 | 36,125 | ||||||
| Kookmin Bank, 4.50%, 02/01/29(e) |
200 | 190,450 | ||||||
| Korea Development Bank (The), 2.00%, 10/25/31 |
200 | 163,469 | ||||||
| 20 | 2 0 2 4 I S H A R E S A N N U A L R E P O R T T O S H A R E H O L D E R S |
| Schedule of Investments (continued) February 29, 2024 |
iShares® ESG Advanced Total USD Bond Market ETF (Percentages shown are based on Net Assets) |
| Security | Par (000) | Value | ||||||
| Banks (continued) | ||||||||
| Kreditanstalt fuer Wiederaufbau |
||||||||
| 0.00%, 04/18/36(g) |
$ | 90 | $ | 52,134 | ||||
| 0.38%, 07/18/25 |
335 | 314,886 | ||||||
| 0.63%, 01/22/26 |
274 | 253,966 | ||||||
| 0.75%, 09/30/30 |
245 | 195,126 | ||||||
| 1.00%, 10/01/26 |
180 | 164,703 | ||||||
| 1.75%, 09/14/29 |
320 | 279,286 | ||||||
| 2.00%, 05/02/25 |
194 | 187,395 | ||||||
| 2.88%, 04/03/28 |
204 | 192,163 | ||||||
| 3.88%, 06/15/28 |
315 | 308,198 | ||||||
| 4.13%, 07/15/33 |
225 | 219,928 | ||||||
| 5.13%, 09/29/25 |
50 | 50,195 | ||||||
| Landeskreditbank Baden-Wuerttemberg Foerderbank |
||||||||
| 1.38%, 10/12/28(e) |
10 | 8,715 | ||||||
| 4.88%, 03/09/26(e) |
30 | 30,018 | ||||||
| Landwirtschaftliche Rentenbank |
||||||||
| 0.88%, 03/30/26 |
155 | 143,403 | ||||||
| 1.75%, 07/27/26 |
125 | 116,906 | ||||||
| 1.75%, 01/14/27(e) |
160 | 148,008 | ||||||
| 2.38%, 06/10/25 |
120 | 116,113 | ||||||
| 3.88%, 06/14/28 |
15 | 14,677 | ||||||
| 5.00%, 10/24/33 |
65 | 67,925 | ||||||
| Series 37, 2.50%, 11/15/27 |
125 | 116,630 | ||||||
| Series 40, 0.50%, 05/27/25 |
136 | 128,669 | ||||||
| M&T Bank Corp., 4.55%, 08/16/28 (Call 08/16/27), |
10 | 9,531 | ||||||
| Macquarie Bank Ltd. |
||||||||
| 3.05%, 03/03/36 (Call 03/03/31), |
115 | 93,659 | ||||||
| 3.62%, 06/03/30(b) |
75 | 65,870 | ||||||
| 4.88%, 06/10/25(b) |
35 | 34,536 | ||||||
| 5.21%, 06/15/26(b) |
190 | 189,599 | ||||||
| Manufacturers & Traders Trust Co., 4.70%, 01/27/28 (Call 12/27/27) |
250 | 240,471 | ||||||
| Mizuho Financial Group Inc. |
||||||||
| 2.26%, 07/09/32 (Call 07/09/31), |
220 | 177,742 | ||||||
| 2.59%, 05/25/31 (Call 05/25/30), |
220 | 187,150 | ||||||
| 2.65%, 05/22/26 (Call 05/22/25), |
455 | 439,188 | ||||||
| 4.02%, 03/05/28 |
280 | 269,185 | ||||||
| 5.38%, 05/26/30 (Call 05/26/29), |
200 | 200,040 | ||||||
| 5.67%, 05/27/29 (Call 05/27/28), |
200 | 202,677 | ||||||
| 5.75%, 07/06/34 (Call 07/06/33), |
70 | 71,318 | ||||||
| Morgan Stanley |
||||||||
| 0.99%, 12/10/26 (Call 12/10/25), |
260 | 239,902 | ||||||
| 1.51%, 07/20/27 (Call 07/20/26), |
259 | 236,881 | ||||||
| 1.59%, 05/04/27 (Call 05/04/26), |
279 | 257,222 | ||||||
| 1.79%, 02/13/32 (Call 02/13/31), |
185 | 146,487 | ||||||
| 1.93%, 04/28/32 (Call 04/28/31), |
150 | 119,069 | ||||||
| 2.19%, 04/28/26 (Call 04/28/25), |
120 | 115,486 | ||||||
| Security | Par (000) | Value | ||||||
| Banks (continued) | ||||||||
| 2.24%, 07/21/32 (Call 07/21/31), |
$ | 245 | $ | 197,525 | ||||
| 2.48%, 01/21/28 (Call 01/21/27), |
70 | 64,751 | ||||||
| 2.48%, 09/16/36 (Call 09/16/31), |
185 | 145,380 | ||||||
| 2.51%, 10/20/32 (Call 10/20/31), |
151 | 123,671 | ||||||
| 2.70%, 01/22/31 (Call 01/22/30), |
285 | 246,712 | ||||||
| 2.80%, 01/25/52 (Call 01/25/51), |
125 | 80,355 | ||||||
| 2.94%, 01/21/33 (Call 01/21/32), |
155 | 130,026 | ||||||
| 3.13%, 07/27/26 |
90 | 85,811 | ||||||
| 3.22%, 04/22/42 (Call 04/22/41), |
175 | 131,484 | ||||||
| 3.59%, 07/22/28 (Call 07/22/27)(a) |
144 | 136,274 | ||||||
| 3.62%, 04/01/31 (Call 04/01/30), |
195 | 177,071 | ||||||
| 3.63%, 01/20/27 |
255 | 245,855 | ||||||
| 3.77%, 01/24/29 (Call 01/24/28), |
240 | 226,831 | ||||||
| 3.88%, 01/27/26 |
170 | 165,868 | ||||||
| 3.95%, 04/23/27 |
215 | 206,933 | ||||||
| 3.97%, 07/22/38 (Call 07/22/37)(a) |
30 | 25,574 | ||||||
| 4.00%, 07/23/25 |
175 | 172,009 | ||||||
| 4.21%, 04/20/28 (Call 04/20/27), |
110 | 106,454 | ||||||
| 4.30%, 01/27/45 |
165 | 143,013 | ||||||
| 4.35%, 09/08/26 |
105 | 102,637 | ||||||
| 4.38%, 01/22/47 |
150 | 129,342 | ||||||
| 4.43%, 01/23/30 (Call 01/23/29), |
225 | 216,061 | ||||||
| 4.68%, 07/17/26 (Call 07/17/25), |
170 | 168,205 | ||||||
| 4.89%, 07/20/33 (Call 07/20/32), |
120 | 115,156 | ||||||
| 5.00%, 11/24/25 |
175 | 173,965 | ||||||
| 5.16%, 04/20/29 (Call 04/20/28), |
110 | 109,233 | ||||||
| 5.17%, 01/16/30 (Call 01/16/29), |
400 | 397,514 | ||||||
| 5.25%, 04/21/34 (Call 04/21/33), |
197 | 193,368 | ||||||
| 5.30%, 04/20/37 (Call 04/20/32), |
165 | 157,789 | ||||||
| 5.42%, 07/21/34 (Call 07/21/33), |
170 | 169,173 | ||||||
| 5.47%, 01/18/35 (Call 01/18/34), |
150 | 149,849 | ||||||
| 5.60%, 03/24/51 (Call 03/24/50), |
135 | 139,679 | ||||||
| 6.25%, 08/09/26 |
55 | 56,290 | ||||||
| 6.34%, 10/18/33 (Call 10/18/32), |
200 | 211,982 | ||||||
| 6.38%, 07/24/42 |
128 | 142,192 | ||||||
| 6.63%, 11/01/34 (Call 11/01/33), |
100 | 108,515 | ||||||
| 7.25%, 04/01/32 |
86 | 98,004 | ||||||
| National Bank of Canada, 5.60%, 12/18/28 |
50 | 50,493 | ||||||
| S C H E D U L E O F I N V E S T M E N T S |
21 |
| Schedule of Investments (continued) February 29, 2024 |
iShares® ESG Advanced Total USD Bond Market ETF (Percentages shown are based on Net Assets) |
| Security | Par (000) | Value | ||||||
| Banks (continued) | ||||||||
| NBK SPC Ltd., 1.63%, 09/15/27 (Call 09/15/26), |
$ | 200 | $ | 181,848 | ||||
| Nordea Bank Abp |
||||||||
| 0.75%, 08/28/25(b) |
290 | 271,498 | ||||||
| 1.50%, 09/30/26(b) |
105 | 95,251 | ||||||
| 4.63%, 09/13/33 (Call 09/13/28), |
100 | 94,374 | ||||||
| Norinchukin Bank (The), 2.08%, 09/22/31(b) |
50 | 40,422 | ||||||
| Northern Trust Corp. |
||||||||
| 1.95%, 05/01/30 (Call 02/01/30) |
95 | 80,069 | ||||||
| 3.15%, 05/03/29 (Call 02/03/29) |
60 | 55,532 | ||||||
| 3.38%, 05/08/32 (Call 05/08/27), |
42 | 38,954 | ||||||
| 3.65%, 08/03/28 (Call 05/03/28) |
95 | 90,835 | ||||||
| 3.95%, 10/30/25 |
75 | 73,565 | ||||||
| 4.00%, 05/10/27 (Call 04/10/27) |
38 | 36,905 | ||||||
| NRW Bank |
||||||||
| 0.63%, 05/19/25(e) |
125 | 118,400 | ||||||
| 0.88%, 03/09/26(e) |
35 | 32,371 | ||||||
| 3.88%, 05/26/26(e) |
20 | 19,610 | ||||||
| Oesterreichische Kontrollbank AG |
||||||||
| 0.38%, 09/17/25 |
240 | 224,025 | ||||||
| 4.13%, 01/20/26 |
10 | 9,881 | ||||||
| 4.13%, 01/18/29 |
75 | 74,118 | ||||||
| 4.25%, 03/01/28 |
20 | 19,827 | ||||||
| 5.00%, 10/23/26 |
15 | 15,149 | ||||||
| Oversea-Chinese Banking Corp. Ltd., 1.83%, |
178 | 167,822 | ||||||
| PNC Financial Services Group Inc. (The) |
||||||||
| 1.15%, 08/13/26 (Call 07/13/26) |
45 | 40,837 | ||||||
| 2.31%, 04/23/32 (Call 04/23/31), |
135 | 109,877 | ||||||
| 2.55%, 01/22/30 (Call 10/24/29) |
265 | 227,398 | ||||||
| 2.60%, 07/23/26 (Call 05/23/26) |
185 | 173,927 | ||||||
| 3.15%, 05/19/27 (Call 04/19/27) |
75 | 70,589 | ||||||
| 3.45%, 04/23/29 (Call 01/23/29) |
226 | 208,683 | ||||||
| 4.63%, 06/06/33 (Call 06/06/32), |
30 | 27,791 | ||||||
| 5.07%, 01/24/34 (Call 01/24/33), |
175 | 168,135 | ||||||
| 5.58%, 06/12/29 (Call 06/12/28), |
150 | 150,951 | ||||||
| 5.68%, 01/22/35 (Call 01/22/34), |
110 | 110,258 | ||||||
| 5.94%, 08/18/34 (Call 08/18/33), |
20 | 20,364 | ||||||
| 6.04%, 10/28/33 (Call 10/28/32), |
100 | 102,658 | ||||||
| 6.88%, 10/20/34 (Call 10/20/33), |
130 | 140,916 | ||||||
| QNB Finance Ltd., 2.63%, 05/12/25(e) |
200 | 192,393 | ||||||
| Regions Financial Corp. |
||||||||
| 1.80%, 08/12/28 (Call 06/12/28) |
55 | 46,842 | ||||||
| 2.25%, 05/18/25 (Call 04/18/25) |
145 | 138,841 | ||||||
| 7.38%, 12/10/37 |
26 | 29,234 | ||||||
| Shinhan Bank Co. Ltd., 3.88%, 03/24/26(e) |
200 | 192,561 | ||||||
| Shinhan Financial Group Co. Ltd., 5.00%, 07/24/28(e) |
200 | 198,132 | ||||||
| Skandinaviska Enskilda Banken AB, |
215 | 201,427 | ||||||
| Security | Par (000) | Value | ||||||
| Banks (continued) | ||||||||
| Standard Chartered PLC |
||||||||
| 2.61%, 01/12/28 (Call 01/12/27), |
$ | 350 | $ | 320,291 | ||||
| 2.68%, 06/29/32 (Call 06/29/31), |
210 | 170,027 | ||||||
| 3.27%, 02/18/36 (Call 11/18/30), |
210 | 173,717 | ||||||
| 3.97%, 03/30/26 (Call 03/30/25), |
200 | 195,462 | ||||||
| 4.64%, 04/01/31 (Call 04/01/30), |
200 | 189,324 | ||||||
| 6.30%, 01/09/29 (Call 01/09/28), |
250 | 255,510 | ||||||
| 6.30%, 07/06/34 (Call 07/06/33), |
200 | 205,631 | ||||||
| State Street Corp. |
||||||||
| 2.20%, 03/03/31 |
145 | 119,873 | ||||||
| 2.40%, 01/24/30 |
95 | 83,033 | ||||||
| 2.62%, 02/07/33 (Call 02/07/32), |
25 | 20,751 | ||||||
| 2.65%, 05/19/26(c) |
75 | 71,322 | ||||||
| 2.90%, 03/30/26 (Call 03/30/25), |
90 | 87,641 | ||||||
| 3.03%, 11/01/34 (Call 11/01/29), |
25 | 22,052 | ||||||
| 3.15%, 03/30/31 (Call 03/30/30), |
5 | 4,446 | ||||||
| 3.55%, 08/18/25 |
119 | 116,583 | ||||||
| 4.14%, 12/03/29 (Call 12/03/28), |
85 | 81,460 | ||||||
| 4.42%, 05/13/33 (Call 05/13/32), |
10 | 9,431 | ||||||
| 5.16%, 05/18/34 (Call 05/18/33), |
140 | 138,194 | ||||||
| Sumitomo Mitsui Financial Group Inc. |
||||||||
| 1.47%, 07/08/25 |
245 | 232,888 | ||||||
| 1.71%, 01/12/31 |
125 | 99,509 | ||||||
| 1.90%, 09/17/28 |
225 | 195,756 | ||||||
| 2.13%, 07/08/30 |
90 | 74,811 | ||||||
| 2.14%, 09/23/30 |
112 | 91,984 | ||||||
| 2.63%, 07/14/26 |
75 | 70,803 | ||||||
| 2.93%, 09/17/41 |
200 | 148,739 | ||||||
| 3.01%, 10/19/26 |
145 | 137,275 | ||||||
| 3.20%, 09/17/29 |
120 | 107,905 | ||||||
| 3.35%, 10/18/27 |
103 | 97,149 | ||||||
| 3.36%, 07/12/27 |
140 | 132,681 | ||||||
| 3.45%, 01/11/27 |
55 | 52,673 | ||||||
| 3.54%, 01/17/28 |
40 | 37,886 | ||||||
| 3.78%, 03/09/26 |
175 | 170,219 | ||||||
| 3.94%, 07/19/28 |
20 | 19,141 | ||||||
| 4.31%, 10/16/28(c) |
45 | 44,027 | ||||||
| 5.71%, 01/13/30 |
200 | 204,923 | ||||||
| 5.77%, 01/13/33 |
200 | 206,343 | ||||||
| 5.88%, 07/13/26 |
250 | 253,679 | ||||||
| Sumitomo Mitsui Trust Bank Ltd. |
||||||||
| 5.55%, 09/14/28(b) |
210 | 213,714 | ||||||
| 5.65%, 03/09/26(b) |
205 | 206,395 | ||||||
| Svenska Handelsbanken AB, 1.42%, 06/11/27 |
275 | 249,618 | ||||||
| 22 | 2 0 2 4 I S H A R E S A N N U A L R E P O R T T O S H A R E H O L D E R S |
| Schedule of Investments (continued) February 29, 2024 |
iShares® ESG Advanced Total USD Bond Market ETF (Percentages shown are based on Net Assets) |
| Security | Par (000) | Value | ||||||
| Banks (continued) | ||||||||
| Truist Bank |
||||||||
| 3.30%, 05/15/26 (Call 04/15/26) |
$ | 80 | $ | 76,189 | ||||
| 4.05%, 11/03/25 (Call 09/03/25) |
15 | 14,679 | ||||||
| Truist Financial Corp. |
||||||||
| 1.13%, 08/03/27 (Call 06/03/27) |
75 | 65,277 | ||||||
| 1.20%, 08/05/25 (Call 07/03/25) |
115 | 108,172 | ||||||
| 1.27%, 03/02/27 (Call 03/02/26), |
215 | 197,348 | ||||||
| 1.89%, 06/07/29 (Call 06/07/28), |
95 | 81,591 | ||||||
| 1.95%, 06/05/30 (Call 03/05/30) |
70 | 57,174 | ||||||
| 3.70%, 06/05/25 (Call 05/05/25) |
210 | 205,377 | ||||||
| 3.88%, 03/19/29 (Call 02/16/29) |
45 | 41,441 | ||||||
| 4.00%, 05/01/25 (Call 03/01/25) |
50 | 49,095 | ||||||
| 4.12%, 06/06/28 (Call 06/06/27), |
145 | 139,316 | ||||||
| 4.92%, 07/28/33 (Call 07/28/32), |
80 | 73,514 | ||||||
| 5.44%, 01/24/30 (Call 01/24/29), |
80 | 79,203 | ||||||
| 5.71%, 01/24/35 (Call 01/24/34), |
80 | 79,326 | ||||||
| 5.87%, 06/08/34 (Call 06/08/33), |
220 | 219,970 | ||||||
| 7.16%, 10/30/29 (Call 10/30/28), |
160 | 169,379 | ||||||
| U.S. Bancorp. |
||||||||
| 1.38%, 07/22/30 (Call 04/22/30) |
35 | 27,741 | ||||||
| 1.45%, 05/12/25 (Call 04/11/25) |
15 | 14,353 | ||||||
| 2.22%, 01/27/28 (Call 01/27/27), |
125 | 114,492 | ||||||
| 2.49%, 11/03/36 (Call 11/03/31), |
160 | 123,672 | ||||||
| 2.68%, 01/27/33 (Call 01/27/32), |
70 | 57,135 | ||||||
| 3.00%, 07/30/29 (Call 04/30/29) |
70 | 61,990 | ||||||
| 3.10%, 04/27/26 (Call 03/27/26) |
80 | 76,388 | ||||||
| 3.95%, 11/17/25 (Call 10/17/25) |
10 | 9,783 | ||||||
| 4.65%, 02/01/29 (Call 02/01/28), |
150 | 145,771 | ||||||
| 4.84%, 02/01/34 (Call 02/01/33), |
195 | 183,534 | ||||||
| 4.97%, 07/22/33 (Call 07/22/32), |
55 | 51,466 | ||||||
| 5.68%, 01/23/35 (Call 01/23/34), |
100 | 99,776 | ||||||
| 5.78%, 06/12/29 (Call 06/12/28), |
75 | 75,767 | ||||||
| 5.84%, 06/12/34 (Call 06/10/33), |
110 | 110,852 | ||||||
| 5.85%, 10/21/33 (Call 10/21/32), |
105 | 106,025 | ||||||
| Series V, 2.38%, 07/22/26 (Call 06/22/26) |
245 | 229,595 | ||||||
| Series X, 3.15%, 04/27/27 (Call 03/27/27) |
170 | 160,509 | ||||||
| United Overseas Bank Ltd., 1.25%, 04/14/26(b) |
30 | 27,707 | ||||||
| Valley National Bancorp., 3.00%, 06/15/31 |
20 | 15,536 | ||||||
| Webster Financial Corp., 4.10%, 03/25/29 |
70 | 63,597 | ||||||
| Western Alliance Bancorp., 3.00%, 06/15/31 |
35 | 30,656 | ||||||
| Security | Par (000) | Value | ||||||
| Banks (continued) | ||||||||
| Woori Bank, 0.75%, 02/01/26(e) |
$ | 200 | $ | 183,610 | ||||
| Yapi ve Kredi Bankasi A/S, 9.25%, 01/17/34, |
200 | 206,666 | ||||||
|
|
|
|||||||
| 39,544,177 | ||||||||
| Beverages — 0.1% | ||||||||
| Coca-Cola Femsa SAB de CV, 1.85%, 09/01/32 |
150 | 116,755 | ||||||
| Keurig Dr Pepper Inc. |
||||||||
| 2.25%, 03/15/31 (Call 12/15/30) |
25 | 20,758 | ||||||
| 2.55%, 09/15/26 (Call 06/15/26) |
65 | 60,957 | ||||||
| 3.20%, 05/01/30 (Call 02/01/30) |
80 | 72,141 | ||||||
| 3.35%, 03/15/51 (Call 09/15/50) |
45 | 31,285 | ||||||
| 3.43%, 06/15/27 (Call 03/15/27) |
40 | 38,073 | ||||||
| 3.80%, 05/01/50 (Call 11/01/49) |
45 | 34,224 | ||||||
| 3.95%, 04/15/29 (Call 02/15/29) |
55 | 52,359 | ||||||
| 4.05%, 04/15/32 (Call 01/15/32) |
55 | 51,015 | ||||||
| 4.42%, 12/15/46 (Call 06/15/46) |
30 | 25,319 | ||||||
| 4.50%, 11/15/45 (Call 05/15/45) |
40 | 34,486 | ||||||
| 4.50%, 04/15/52 (Call 10/15/51) |
70 | 59,405 | ||||||
| 4.60%, 05/25/28 (Call 02/25/28) |
5 | 4,925 | ||||||
| Primo Water Holdings Inc., 4.38%, 04/30/29 |
35 | 31,773 | ||||||
|
|
|
|||||||
| 633,475 | ||||||||
| Biotechnology — 0.6% | ||||||||
| Amgen Inc. |
||||||||
| 1.65%, 08/15/28 (Call 06/15/28) |
60 | 52,198 | ||||||
| 2.00%, 01/15/32 (Call 10/15/31) |
135 | 108,236 | ||||||
| 2.20%, 02/21/27 (Call 12/21/26) |
163 | 150,189 | ||||||
| 2.30%, 02/25/31 (Call 11/25/30) |
71 | 59,416 | ||||||
| 2.45%, 02/21/30 (Call 11/21/29) |
120 | 104,317 | ||||||
| 2.60%, 08/19/26 (Call 05/19/26) |
102 | 96,273 | ||||||
| 2.77%, 09/01/53 (Call 03/01/53) |
65 | 39,600 | ||||||
| 2.80%, 08/15/41 (Call 02/15/41) |
65 | 46,283 | ||||||
| 3.00%, 02/22/29 (Call 12/22/28) |
85 | 78,002 | ||||||
| 3.00%, 01/15/52 (Call 07/15/51) |
20 | 13,368 | ||||||
| 3.13%, 05/01/25 (Call 02/01/25) |
72 | 70,205 | ||||||
| 3.15%, 02/21/40 (Call 08/21/39) |
117 | 87,760 | ||||||
| 3.20%, 11/02/27 (Call 08/02/27) |
70 | 65,790 | ||||||
| 3.35%, 02/22/32 (Call 11/22/31) |
25 | 22,108 | ||||||
| 3.38%, 02/21/50 (Call 08/21/49) |
120 | 85,597 | ||||||
| 4.05%, 08/18/29 (Call 06/18/29) |
100 | 95,594 | ||||||
| 4.20%, 02/22/52 (Call 08/22/51) |
65 | 52,649 | ||||||
| 4.40%, 05/01/45 (Call 11/01/44) |
120 | 102,426 | ||||||
| 4.40%, 02/22/62 (Call 08/22/61) |
60 | 48,209 | ||||||
| 4.56%, 06/15/48 (Call 12/15/47) |
85 | 73,600 | ||||||
| 4.66%, 06/15/51 (Call 12/15/50) |
190 | 164,797 | ||||||
| 4.88%, 03/01/53 (Call 09/01/52) |
50 | 44,863 | ||||||
| 4.95%, 10/01/41 |
5 | 4,659 | ||||||
| 5.15%, 03/02/28 (Call 02/02/28) |
205 | 205,406 | ||||||
| 5.15%, 11/15/41 (Call 05/15/41) |
52 | 49,506 | ||||||
| 5.25%, 03/02/30 (Call 01/02/30) |
85 | 85,635 | ||||||
| 5.25%, 03/02/33 (Call 12/02/32) |
300 | 299,108 | ||||||
| 5.60%, 03/02/43 (Call 09/02/42) |
145 | 145,472 | ||||||
| 5.65%, 03/02/53 (Call 09/02/52) |
225 | 225,114 | ||||||
| 5.75%, 03/02/63 (Call 09/02/62) |
150 | 150,061 | ||||||
| 6.38%, 06/01/37 |
35 | 37,572 | ||||||
| 6.40%, 02/01/39 |
35 | 37,855 | ||||||
| Biogen Inc. |
||||||||
| 2.25%, 05/01/30 (Call 02/01/30) |
129 | 107,947 | ||||||
| 3.15%, 05/01/50 (Call 11/01/49) |
100 | 66,032 | ||||||
| S C H E D U L E O F I N V E S T M E N T S |
23 |
| Schedule of Investments (continued) February 29, 2024 |
iShares® ESG Advanced Total USD Bond Market ETF (Percentages shown are based on Net Assets) |
| Security | Par (000) | Value | ||||||
| Biotechnology (continued) | ||||||||
| 3.25%, 02/15/51 (Call 08/15/50) |
$ | 50 | $ | 34,103 | ||||
| 4.05%, 09/15/25 (Call 06/15/25) |
55 | 53,917 | ||||||
| 5.20%, 09/15/45 (Call 03/15/45) |
50 | 47,055 | ||||||
| CSL Finance PLC |
||||||||
| 4.05%, 04/27/29 (Call 02/27/29)(b) |
35 | 33,373 | ||||||
| 4.25%, 04/27/32 (Call 01/27/32)(b) |
20 | 18,884 | ||||||
| 4.63%, 04/27/42 (Call 10/27/41)(b) |
10 | 9,126 | ||||||
| 4.75%, 04/27/52 (Call 10/27/51)(b) |
95 | 85,745 | ||||||
| Illumina Inc. |
||||||||
| 2.55%, 03/23/31 (Call 12/23/30) |
80 | 65,635 | ||||||
| 5.75%, 12/13/27 (Call 11/13/27) |
15 | 15,108 | ||||||
| Regeneron Pharmaceuticals Inc. |
||||||||
| 1.75%, 09/15/30 (Call 06/15/30) |
80 | 64,583 | ||||||
| 2.80%, 09/15/50 (Call 03/15/50) |
56 | 34,890 | ||||||
| Royalty Pharma PLC |
||||||||
| 1.75%, 09/02/27 (Call 07/02/27) |
60 | 53,341 | ||||||
| 2.20%, 09/02/30 (Call 06/02/30) |
15 | 12,347 | ||||||
| 3.35%, 09/02/51 (Call 03/02/51) |
110 | 71,434 | ||||||
| 3.55%, 09/02/50 (Call 03/02/50) |
35 | 23,824 | ||||||
|
|
|
|||||||
| 3,699,212 | ||||||||
| Building Materials — 0.4% | ||||||||
| Boise Cascade Co., 4.88%, 07/01/30 |
25 | 23,170 | ||||||
| Builders FirstSource Inc. |
||||||||
| 4.25%, 02/01/32 (Call 08/01/26)(b) |
70 | 61,640 | ||||||
| 5.00%, 03/01/30 (Call 03/01/25)(b) |
30 | 28,314 | ||||||
| 6.38%, 06/15/32 (Call 06/15/27)(b) |
40 | 40,045 | ||||||
| Camelot Return Merger Sub Inc., 8.75%, 08/01/28 (Call 08/01/24)(b) |
30 | 30,781 | ||||||
| Carrier Global Corp. |
||||||||
| 2.49%, 02/15/27 (Call 12/15/26) |
39 | 36,243 | ||||||
| 2.70%, 02/15/31 (Call 11/15/30) |
55 | 46,884 | ||||||
| 2.72%, 02/15/30 (Call 11/15/29) |
179 | 156,651 | ||||||
| 3.38%, 04/05/40 (Call 10/05/39) |
97 | 74,830 | ||||||
| 3.58%, 04/05/50 (Call 10/05/49) |
125 | 92,112 | ||||||
| Cornerstone Building Brands Inc., 6.13%, 01/15/29 (Call 04/01/24)(b) |
20 | 18,021 | ||||||
| CRH America Finance Inc. |
||||||||
| 3.95%, 04/04/28 (Call 01/04/28)(b) |
55 | 52,950 | ||||||
| 4.40%, 05/09/47 (Call 11/09/46)(b) |
10 | 8,623 | ||||||
| 4.50%, 04/04/48 (Call 10/04/47)(b) |
11 | 9,681 | ||||||
| CRH America Inc., 5.13%, 05/18/45 (Call 11/18/44)(b) |
45 | 42,614 | ||||||
| Fortune Brands Innovations Inc. |
||||||||
| 3.25%, 09/15/29 (Call 06/15/29) |
72 | 65,046 | ||||||
| 4.00%, 06/15/25 (Call 03/15/25) |
50 | 49,062 | ||||||
| 5.88%, 06/01/33 (Call 03/01/33) |
40 | 40,630 | ||||||
| Griffon Corp., 5.75%, 03/01/28 (Call 04/01/24) |
55 | 53,244 | ||||||
| James Hardie International Finance DAC, 5.00%, 01/15/28 (Call 04/02/24)(b) |
25 | 24,102 | ||||||
| Jeld-Wen Inc. |
||||||||
| 4.63%, 12/15/25 (Call 04/01/24)(b)(c) |
12 | 11,741 | ||||||
| 4.88%, 12/15/27 (Call 04/01/24)(b) |
25 | 23,772 | ||||||
| Knife River Corp., 7.75%, 05/01/31 (Call 05/01/26)(b) |
30 | 31,082 | ||||||
| Lennox International Inc. |
||||||||
| 1.35%, 08/01/25 (Call 07/01/25) |
105 | 98,987 | ||||||
| 1.70%, 08/01/27 (Call 06/01/27) |
67 | 60,051 | ||||||
| Louisiana-Pacific Corp., 3.63%, 03/15/29 |
25 | 22,499 | ||||||
| Martin Marietta Materials Inc. |
||||||||
| 2.40%, 07/15/31 (Call 04/15/31) |
42 | 34,894 | ||||||
| 3.20%, 07/15/51 (Call 01/15/51) |
60 | 41,530 | ||||||
| Security | Par (000) | Value | ||||||
| Building Materials (continued) | ||||||||
| 3.45%, 06/01/27 (Call 03/01/27) |
$ | 25 | $ | 23,842 | ||||
| 3.50%, 12/15/27 (Call 09/15/27) |
70 | 66,413 | ||||||
| 4.25%, 12/15/47 (Call 06/15/47) |
40 | 33,241 | ||||||
| Series CB, 2.50%, 03/15/30 (Call 12/15/29) |
52 | 44,977 | ||||||
| Masco Corp. |
||||||||
| 2.00%, 10/01/30 (Call 07/01/30) |
75 | 61,024 | ||||||
| 2.00%, 02/15/31 (Call 11/15/30) |
20 | 16,241 | ||||||
| 3.13%, 02/15/51 (Call 08/15/50) |
10 | 6,660 | ||||||
| 3.50%, 11/15/27 (Call 08/15/27) |
35 | 32,899 | ||||||
| 4.50%, 05/15/47 (Call 11/15/46) |
40 | 33,404 | ||||||
| Masonite International Corp. |
||||||||
| 3.50%, 02/15/30 (Call 08/15/29)(b) |
25 | 22,085 | ||||||
| 5.38%, 02/01/28 (Call 04/01/24)(b) |
30 | 30,019 | ||||||
| Mohawk Industries Inc., 5.85%, 09/18/28 |
5 | 5,101 | ||||||
| Owens Corning |
||||||||
| 3.40%, 08/15/26 (Call 05/15/26) |
79 | 75,393 | ||||||
| 3.88%, 06/01/30 (Call 03/01/30) |
55 | 50,697 | ||||||
| 3.95%, 08/15/29 (Call 05/15/29) |
5 | 4,717 | ||||||
| 4.30%, 07/15/47 (Call 01/15/47) |
45 | 36,875 | ||||||
| 4.40%, 01/30/48 (Call 07/30/47) |
25 | 20,560 | ||||||
| 7.00%, 12/01/36 |
25 | 27,769 | ||||||
| PGT Innovations Inc., 4.38%, 10/01/29 |
35 | 35,269 | ||||||
| St Marys Cement Inc. Canada, 5.75%, 01/28/27 |
15 | 14,974 | ||||||
| Summit Materials LLC/Summit Materials Finance Corp. |
||||||||
| 5.25%, 01/15/29 (Call 03/11/24)(b)(c) |
46 | 44,405 | ||||||
| 6.50%, 03/15/27 (Call 03/11/24)(b) |
20 | 20,018 | ||||||
| 7.25%, 01/15/31 (Call 01/15/27)(b) |
40 | 41,459 | ||||||
| Trane Technologies Financing Ltd. |
||||||||
| 3.50%, 03/21/26 (Call 01/21/26) |
70 | 67,644 | ||||||
| 3.80%, 03/21/29 (Call 12/21/28) |
68 | 64,280 | ||||||
| 4.50%, 03/21/49 (Call 09/21/48) |
24 | 21,245 | ||||||
| 4.65%, 11/01/44 (Call 05/01/44) |
25 | 22,435 | ||||||
| Trane Technologies Global Holding Co. Ltd. |
||||||||
| 3.75%, 08/21/28 (Call 05/21/28) |
32 | 30,515 | ||||||
| 4.30%, 02/21/48 (Call 08/21/47) |
17 | 14,622 | ||||||
| 5.75%, 06/15/43 |
20 | 20,669 | ||||||
| Vulcan Materials Co. |
||||||||
| 3.50%, 06/01/30 (Call 03/01/30) |
85 | 77,466 | ||||||
| 4.50%, 04/01/25 (Call 01/01/25) |
50 | 49,468 | ||||||
| 4.50%, 06/15/47 (Call 12/15/46) |
27 | 23,351 | ||||||
| 4.70%, 03/01/48 (Call 09/01/47) |
45 | 40,298 | ||||||
|
|
|
|||||||
| 2,459,234 | ||||||||
| Chemicals — 0.7% | ||||||||
| Air Liquide Finance SA, 3.50%, 09/27/46 |
15 | 11,768 | ||||||
| Air Products and Chemicals Inc. |
||||||||
| 1.50%, 10/15/25 (Call 09/15/25) |
40 | 37,818 | ||||||
| 1.85%, 05/15/27 (Call 03/15/27) |
43 | 39,302 | ||||||
| 2.05%, 05/15/30 (Call 02/15/30) |
44 | 37,411 | ||||||
| 2.70%, 05/15/40 (Call 11/15/39) |
50 | 35,994 | ||||||
| 2.80%, 05/15/50 (Call 11/15/49) |
55 | 36,534 | ||||||
| 4.85%, 02/08/34 (Call 11/08/33) |
100 | 98,049 | ||||||
| Ashland Inc. |
||||||||
| 3.38%, 09/01/31 (Call 06/01/31)(b)(c) |
25 | 20,963 | ||||||
| 6.88%, 05/15/43 (Call 02/15/43)(c) |
15 | 15,087 | ||||||
| Avient Corp. |
||||||||
| 5.75%, 05/15/25 (Call 04/01/24)(b) |
35 | 34,816 | ||||||
| 24 | 2 0 2 4 I S H A R E S A N N U A L R E P O R T T O S H A R E H O L D E R S |
| Schedule of Investments (continued) February 29, 2024 |
iShares® ESG Advanced Total USD Bond Market ETF (Percentages shown are based on Net Assets) |
| Security | Par (000) | Value | ||||||
| Chemicals (continued) | ||||||||
| 7.13%, 08/01/30 (Call 08/01/25)(b) |
$ | 45 | $ | 46,015 | ||||
| Axalta Coating Systems Dutch Holding B BV, 7.25%, 02/15/31 (Call 11/15/26)(b) |
25 | 26,011 | ||||||
| Axalta Coating Systems LLC, 3.38%, 02/15/29 |
40 | 35,562 | ||||||
| Axalta Coating Systems LLC/Axalta Coating Systems Dutch Holding B BV, 4.75%, 06/15/27 (Call 04/01/24)(b) |
30 | 28,975 | ||||||
| Celanese U.S. Holdings LLC |
||||||||
| 1.40%, 08/05/26 (Call 07/05/26) |
40 | 36,222 | ||||||
| 6.17%, 07/15/27 (Call 06/15/27) |
165 | 167,529 | ||||||
| 6.38%, 07/15/32 (Call 04/15/32) |
90 | 92,405 | ||||||
| 6.70%, 11/15/33 (Call 08/15/33) |
80 | 83,988 | ||||||
| CF Industries Inc. |
||||||||
| 4.95%, 06/01/43 |
40 | 35,385 | ||||||
| 5.15%, 03/15/34 |
60 | 58,136 | ||||||
| 5.38%, 03/15/44 |
50 | 46,560 | ||||||
| Element Solutions Inc., 3.88%, 09/01/28 |
45 | 40,810 | ||||||
| FMC Corp. |
||||||||
| 3.45%, 10/01/29 (Call 07/01/29) |
10 | 8,886 | ||||||
| 4.50%, 10/01/49 (Call 04/01/49) |
35 | 26,014 | ||||||
| 5.65%, 05/18/33 (Call 02/18/33)(c) |
50 | 48,407 | ||||||
| 6.38%, 05/18/53 (Call 11/18/52) |
20 | 19,522 | ||||||
| HB Fuller Co. |
||||||||
| 4.00%, 02/15/27 (Call 11/15/26) |
20 | 19,074 | ||||||
| 4.25%, 10/15/28 (Call 04/01/24) |
15 | 13,939 | ||||||
| Ingevity Corp., 3.88%, 11/01/28 |
30 | 26,469 | ||||||
| International Flavors & Fragrances Inc. |
||||||||
| 1.23%, 10/01/25 (Call 09/01/25)(b) |
100 | 93,167 | ||||||
| 1.83%, 10/15/27 (Call 08/15/27)(b) |
115 | 101,107 | ||||||
| 2.30%, 11/01/30 (Call 08/01/30)(b) |
50 | 40,972 | ||||||
| 3.27%, 11/15/40 (Call 05/15/40)(b) |
30 | 20,971 | ||||||
| 3.47%, 12/01/50 (Call 06/01/50)(b) |
50 | 32,833 | ||||||
| 4.38%, 06/01/47 (Call 12/01/46) |
40 | 29,891 | ||||||
| 4.45%, 09/26/28 (Call 06/26/28) |
25 | 24,151 | ||||||
| 5.00%, 09/26/48 (Call 03/26/48) |
55 | 46,119 | ||||||
| Linde Inc./CT |
||||||||
| 1.10%, 08/10/30 (Call 05/10/30) |
34 | 27,203 | ||||||
| 2.00%, 08/10/50 (Call 02/10/50) |
40 | 22,450 | ||||||
| 3.20%, 01/30/26 (Call 10/30/25) |
100 | 96,924 | ||||||
| 3.55%, 11/07/42 (Call 05/07/42) |
25 | 19,965 | ||||||
| Methanex Corp. |
||||||||
| 5.13%, 10/15/27 (Call 04/15/27) |
40 | 38,465 | ||||||
| 5.25%, 12/15/29 (Call 09/15/29) |
40 | 38,039 | ||||||
| 5.65%, 12/01/44 (Call 06/01/44) |
20 | 17,105 | ||||||
| Mosaic Co. (The) |
||||||||
| 4.05%, 11/15/27 (Call 08/15/27) |
60 | 57,653 | ||||||
| 4.88%, 11/15/41 (Call 05/15/41) |
10 | 8,729 | ||||||
| 5.45%, 11/15/33 (Call 05/15/33) |
25 | 24,704 | ||||||
| 5.63%, 11/15/43 (Call 05/15/43) |
15 | 14,373 | ||||||
| Nutrien Ltd. |
||||||||
| 2.95%, 05/13/30 (Call 02/13/30) |
79 | 69,860 | ||||||
| 3.00%, 04/01/25 (Call 01/01/25) |
20 | 19,453 | ||||||
| 3.95%, 05/13/50 (Call 11/13/49) |
55 | 42,828 | ||||||
| 4.00%, 12/15/26 (Call 09/15/26) |
25 | 24,217 | ||||||
| 4.13%, 03/15/35 (Call 09/15/34) |
25 | 22,514 | ||||||
| 4.20%, 04/01/29 (Call 01/01/29) |
80 | 76,852 | ||||||
| 4.90%, 06/01/43 (Call 12/01/42) |
30 | 27,106 | ||||||
| 5.00%, 04/01/49 (Call 10/01/48) |
46 | 41,511 | ||||||
| 5.25%, 01/15/45 (Call 07/15/44) |
35 | 32,567 | ||||||
| Security | Par (000) | Value | ||||||
| Chemicals (continued) | ||||||||
| 5.63%, 12/01/40 |
$ | 10 | $ | 9,781 | ||||
| 5.80%, 03/27/53 (Call 09/27/52) |
30 | 30,030 | ||||||
| 5.88%, 12/01/36 |
35 | 35,818 | ||||||
| OCI NV, 4.63%, 10/15/25 (Call 04/02/24)(b) |
95 | 93,280 | ||||||
| Orbia Advance Corp. SAB de CV, 2.88%, 05/11/31 (Call 02/11/31)(e) |
200 | 162,239 | ||||||
| PPG Industries Inc. |
||||||||
| 1.20%, 03/15/26 (Call 02/15/26) |
40 | 36,970 | ||||||
| 2.55%, 06/15/30 (Call 03/15/30) |
75 | 64,705 | ||||||
| 3.75%, 03/15/28 (Call 12/15/27) |
134 | 128,329 | ||||||
| Rain Carbon Inc., 12.25%, 09/01/29 |
25 | 25,009 | ||||||
| Rayonier AM Products Inc., 7.63%, 01/15/26 |
30 | 26,723 | ||||||
| RPM International Inc., 4.25%, 01/15/48 |
35 | 28,135 | ||||||
| SABIC Capital II BV, 4.50%, 10/10/28(e) |
200 | 195,379 | ||||||
| Sherwin-Williams Co. (The) |
||||||||
| 2.20%, 03/15/32 (Call 12/15/31) |
25 | 20,228 | ||||||
| 2.30%, 05/15/30 (Call 02/15/30) |
75 | 63,758 | ||||||
| 2.90%, 03/15/52 (Call 09/15/51) |
25 | 16,127 | ||||||
| 2.95%, 08/15/29 (Call 05/15/29) |
115 | 103,421 | ||||||
| 3.30%, 05/15/50 (Call 11/15/49) |
40 | 27,992 | ||||||
| 3.45%, 08/01/25 (Call 05/01/25) |
35 | 34,106 | ||||||
| 3.45%, 06/01/27 (Call 03/01/27) |
139 | 132,373 | ||||||
| 3.80%, 08/15/49 (Call 02/15/49) |
40 | 30,858 | ||||||
| 3.95%, 01/15/26 (Call 10/15/25) |
20 | 19,572 | ||||||
| 4.50%, 06/01/47 (Call 12/01/46) |
70 | 60,424 | ||||||
| 4.55%, 08/01/45 (Call 02/01/45) |
21 | 18,078 | ||||||
| Sociedad Quimica y Minera de Chile SA, 4.25%, 05/07/29 (Call 02/07/29)(e) |
200 | 188,686 | ||||||
| Trinseo Materials Operating SCA/Trinseo Materials Finance Inc., 5.13%, 04/01/29 (Call 04/02/24)(b) |
25 | 9,539 | ||||||
| Tronox Inc., 4.63%, 03/15/29 (Call 04/01/24)(b)(c) |
55 | 48,704 | ||||||
| Westlake Corp. |
||||||||
| 3.38%, 08/15/61 (Call 02/15/61) |
25 | 15,481 | ||||||
| 4.38%, 11/15/47 (Call 05/15/47) |
90 | 73,939 | ||||||
| Yara International ASA |
||||||||
| 3.15%, 06/04/30 (Call 03/04/30)(b) |
85 | 73,409 | ||||||
| 3.80%, 06/06/26 (Call 03/06/26)(b) |
25 | 23,980 | ||||||
| 4.75%, 06/01/28 (Call 03/01/28)(b) |
77 | 74,454 | ||||||
| 7.38%, 11/14/32 (Call 08/14/32)(e) |
100 | 109,511 | ||||||
|
|
|
|||||||
| 4,320,418 | ||||||||
| Commercial Services — 1.0% | ||||||||
| ADT Security Corp. (The) |
||||||||
| 4.13%, 08/01/29 (Call 08/01/28)(b) |
50 | 45,343 | ||||||
| 4.88%, 07/15/32(b) |
40 | 36,251 | ||||||
| AMN Healthcare Inc. |
||||||||
| 4.00%, 04/15/29 (Call 04/15/24)(b) |
20 | 17,561 | ||||||
| 4.63%, 10/01/27 (Call 04/01/24)(b) |
35 | 32,924 | ||||||
| APi Group DE Inc. |
||||||||
| 4.13%, 07/15/29 (Call 07/15/24)(b) |
21 | 18,907 | ||||||
| 4.75%, 10/15/29 (Call 10/15/24)(b) |
20 | 18,624 | ||||||
| APX Group Inc. |
||||||||
| 5.75%, 07/15/29 (Call 07/15/24)(b) |
45 | 42,767 | ||||||
| 6.75%, 02/15/27 (Call 04/01/24)(b) |
35 | 35,059 | ||||||
| Ashtead Capital Inc. |
||||||||
| 1.50%, 08/12/26 (Call 07/12/26)(b) |
20 | 18,116 | ||||||
| 2.45%, 08/12/31 (Call 05/12/31)(b) |
30 | 24,167 | ||||||
| 4.00%, 05/01/28 (Call 03/11/24)(b) |
30 | 28,105 | ||||||
| 5.95%, 10/15/33 (Call 07/15/33)(b) |
200 | 201,067 | ||||||
| S C H E D U L E O F I N V E S T M E N T S |
25 |
| Schedule of Investments (continued) February 29, 2024 |
iShares® ESG Advanced Total USD Bond Market ETF (Percentages shown are based on Net Assets) |
| Security | Par (000) | Value | ||||||
| Commercial Services (continued) | ||||||||
| Automatic Data Processing Inc. |
||||||||
| 1.25%, 09/01/30 (Call 06/01/30) |
$ | 141 | $ | 114,206 | ||||
| 1.70%, 05/15/28 (Call 03/15/28) |
72 | 64,101 | ||||||
| 3.38%, 09/15/25 (Call 06/15/25) |
85 | 83,042 | ||||||
| Avis Budget Car Rental LLC/Avis Budget Finance Inc. |
||||||||
| 4.75%, 04/01/28 (Call 04/01/24)(b)(c) |
30 | 27,161 | ||||||
| 5.38%, 03/01/29 (Call 04/01/24)(b)(c) |
35 | 31,868 | ||||||
| 5.75%, 07/15/27 (Call 03/11/24)(b) |
25 | 23,817 | ||||||
| 5.75%, 07/15/27 (Call 04/01/24)(b) |
25 | 23,813 | ||||||
| 8.00%, 02/15/31 (Call 11/15/26)(b) |
30 | 28,984 | ||||||
| Block Financial LLC |
||||||||
| 2.50%, 07/15/28 (Call 05/15/28) |
25 | 22,019 | ||||||
| 3.88%, 08/15/30 (Call 05/15/30) |
30 | 27,047 | ||||||
| 5.25%, 10/01/25 (Call 07/01/25) |
30 | 29,775 | ||||||
| Carriage Services Inc., 4.25%, 05/15/29 |
30 | 26,088 | ||||||
| Cintas Corp. No. 2 |
||||||||
| 3.70%, 04/01/27 (Call 01/01/27) |
140 | 135,595 | ||||||
| 4.00%, 05/01/32 (Call 02/01/32) |
10 | 9,366 | ||||||
| Deluxe Corp., 8.00%, 06/01/29 |
30 | 26,189 | ||||||
| Element Fleet Management Corp., 3.85%, 06/15/25 (Call 05/15/25)(b) |
52 | 50,592 | ||||||
| ERAC USA Finance LLC |
||||||||
| 3.30%, 12/01/26 (Call 09/01/26)(b) |
135 | 128,515 | ||||||
| 3.80%, 11/01/25 (Call 08/01/25)(b) |
87 | 84,693 | ||||||
| 4.20%, 11/01/46 (Call 05/01/46)(b) |
47 | 39,320 | ||||||
| 4.50%, 02/15/45 (Call 08/15/44)(b) |
60 | 52,540 | ||||||
| 4.90%, 05/01/33 (Call 02/01/33)(b) |
5 | 4,872 | ||||||
| 5.00%, 02/15/29 (Call 01/15/29)(b) |
50 | 49,707 | ||||||
| 5.20%, 10/30/34 (Call 07/30/34)(b) |
100 | 99,182 | ||||||
| 5.40%, 05/01/53 (Call 11/01/52)(b) |
60 | 60,017 | ||||||
| 6.70%, 06/01/34(b) |
25 | 27,553 | ||||||
| 7.00%, 10/15/37(b) |
40 | 45,419 | ||||||
| Gartner Inc. |
||||||||
| 3.63%, 06/15/29 (Call 06/15/24)(b) |
35 | 31,381 | ||||||
| 3.75%, 10/01/30 (Call 10/01/25)(b) |
45 | 39,841 | ||||||
| 4.50%, 07/01/28 (Call 04/01/24)(b) |
55 | 52,088 | ||||||
| Global Payments Inc. |
||||||||
| 1.20%, 03/01/26 (Call 02/01/26) |
70 | 64,441 | ||||||
| 2.15%, 01/15/27 (Call 12/15/26) |
85 | 78,009 | ||||||
| 2.90%, 05/15/30 (Call 02/15/30) |
60 | 51,685 | ||||||
| 2.90%, 11/15/31 (Call 08/15/31) |
60 | 50,066 | ||||||
| 3.20%, 08/15/29 (Call 05/15/29) |
110 | 98,040 | ||||||
| 4.80%, 04/01/26 (Call 01/01/26) |
45 | 44,404 | ||||||
| 5.95%, 08/15/52 (Call 02/15/52) |
80 | 78,628 | ||||||
| GXO Logistics Inc. |
||||||||
| 1.65%, 07/15/26 (Call 06/15/26) |
75 | 68,771 | ||||||
| 2.65%, 07/15/31 (Call 04/15/31) |
45 | 36,550 | ||||||
| Herc Holdings Inc., 5.50%, 07/15/27 (Call 04/01/24)(b) |
71 | 69,506 | ||||||
| Hertz Corp. (The) |
||||||||
| 4.63%, 12/01/26 (Call 04/01/24)(b) |
25 | 22,139 | ||||||
| 5.00%, 12/01/29 (Call 12/01/24)(b)(c) |
55 | 42,174 | ||||||
| Korn Ferry, 4.63%, 12/15/27 (Call 04/01/24)(b) |
30 | 28,401 | ||||||
| Matthews International Corp., 5.25%, 12/01/25 |
21 | 20,636 | ||||||
| Mobius Merger Sub Inc., 9.00%, 06/01/30 |
30 | 29,383 | ||||||
| Moody’s Corp. |
||||||||
| 2.00%, 08/19/31 (Call 05/19/31)(c) |
40 | 32,339 | ||||||
| 3.10%, 11/29/61 (Call 05/29/61) |
25 | 15,993 | ||||||
| 3.25%, 01/15/28 (Call 10/15/27) |
12 | 11,290 | ||||||
| Security | Par (000) | Value | ||||||
| Commercial Services (continued) | ||||||||
| 3.25%, 05/20/50 (Call 11/20/49) |
$ | 30 | $ | 21,264 | ||||
| 3.75%, 03/24/25 (Call 02/24/25) |
40 | 39,329 | ||||||
| 3.75%, 02/25/52 (Call 08/25/51) |
25 | 19,347 | ||||||
| 4.25%, 02/01/29 (Call 11/01/28) |
52 | 50,369 | ||||||
| 4.88%, 12/17/48 (Call 06/17/48) |
29 | 26,754 | ||||||
| 5.25%, 07/15/44 |
45 | 44,021 | ||||||
| PayPal Holdings Inc. |
||||||||
| 1.65%, 06/01/25 (Call 05/01/25) |
79 | 75,637 | ||||||
| 2.30%, 06/01/30 (Call 03/01/30) |
75 | 63,799 | ||||||
| 2.65%, 10/01/26 (Call 08/01/26) |
95 | 89,580 | ||||||
| 2.85%, 10/01/29 (Call 07/01/29) |
124 | 110,576 | ||||||
| 3.25%, 06/01/50 (Call 12/01/49)(c) |
72 | 50,087 | ||||||
| 4.40%, 06/01/32 (Call 03/01/32)(c) |
60 | 57,551 | ||||||
| 5.05%, 06/01/52 (Call 12/01/51) |
40 | 37,533 | ||||||
| 5.25%, 06/01/62 (Call 12/01/61) |
45 | 41,889 | ||||||
| Prime Security Services Borrower LLC/Prime Finance Inc. |
||||||||
| 3.38%, 08/31/27 (Call 08/31/26)(b) |
60 | 54,965 | ||||||
| 5.75%, 04/15/26(b) |
75 | 74,448 | ||||||
| 6.25%, 01/15/28 (Call 04/01/24)(b) |
70 | 69,062 | ||||||
| Quanta Services Inc. |
||||||||
| 2.35%, 01/15/32 (Call 10/15/31) |
90 | 72,042 | ||||||
| 2.90%, 10/01/30 (Call 07/01/30) |
51 | 44,217 | ||||||
| 3.05%, 10/01/41 (Call 04/01/41) |
40 | 28,106 | ||||||
| RELX Capital Inc. |
||||||||
| 3.00%, 05/22/30 (Call 02/22/30) |
95 | 84,814 | ||||||
| 4.00%, 03/18/29 (Call 12/18/28) |
60 | 57,304 | ||||||
| RR Donnelley & Sons Co., 8.50%, 04/15/29(b) |
26 | 18,623 | ||||||
| S&P Global Inc. |
||||||||
| 1.25%, 08/15/30 (Call 05/15/30) |
44 | 35,110 | ||||||
| 2.30%, 08/15/60 (Call 02/15/60) |
50 | 27,015 | ||||||
| 2.45%, 03/01/27 (Call 02/01/27) |
75 | 69,912 | ||||||
| 2.50%, 12/01/29 (Call 09/01/29) |
25 | 22,028 | ||||||
| 2.70%, 03/01/29 (Call 01/01/29) |
105 | 94,959 | ||||||
| 2.90%, 03/01/32 (Call 12/01/31) |
65 | 55,975 | ||||||
| 2.95%, 01/22/27 (Call 10/22/26) |
22 | 20,846 | ||||||
| 3.25%, 12/01/49 (Call 06/01/49) |
50 | 35,621 | ||||||
| 3.70%, 03/01/52 (Call 09/01/51) |
50 | 38,661 | ||||||
| 3.90%, 03/01/62 (Call 09/01/61) |
30 | 23,348 | ||||||
| 4.25%, 05/01/29 (Call 02/01/29) |
95 | 92,119 | ||||||
| 4.75%, 08/01/28 (Call 05/01/28) |
70 | 69,720 | ||||||
| Service Corp. International/U.S. |
||||||||
| 3.38%, 08/15/30 (Call 08/15/25) |
45 | 38,643 | ||||||
| 4.00%, 05/15/31 (Call 05/15/26) |
45 | 39,543 | ||||||
| 4.63%, 12/15/27 (Call 04/01/24) |
30 | 28,756 | ||||||
| 5.13%, 06/01/29 (Call 06/01/24) |
40 | 38,802 | ||||||
| 7.50%, 04/01/27 |
15 | 15,491 | ||||||
| Sodexo Inc. |
||||||||
| 1.63%, 04/16/26 (Call 03/16/26)(b) |
145 | 133,941 | ||||||
| 2.72%, 04/16/31 (Call 01/16/31)(b) |
10 | 8,418 | ||||||
| Sotheby’s, 7.38%, 10/15/27 (Call 03/11/24)(b) |
45 | 43,261 | ||||||
| Sotheby’s/Bidfair Holdings Inc., 5.88%, 06/01/29 |
20 | 17,484 | ||||||
| Transurban Finance Co. Pty. Ltd. |
||||||||
| 2.45%, 03/16/31 (Call 12/16/30)(b) |
47 | 38,872 | ||||||
| 3.38%, 03/22/27 (Call 12/22/26)(b) |
55 | 51,802 | ||||||
| 4.13%, 02/02/26 (Call 11/02/25)(b) |
47 | 45,784 | ||||||
| TriNet Group Inc. |
||||||||
| 3.50%, 03/01/29 (Call 04/01/24)(b) |
30 | 26,708 | ||||||
| 7.13%, 08/15/31 (Call 08/15/26)(b) |
25 | 25,540 | ||||||
| 26 | 2 0 2 4 I S H A R E S A N N U A L R E P O R T T O S H A R E H O L D E R S |
| Schedule of Investments (continued) February 29, 2024 |
iShares® ESG Advanced Total USD Bond Market ETF (Percentages shown are based on Net Assets) |
| Security | Par (000) | Value | ||||||
| Commercial Services (continued) | ||||||||
| Triton Container International Ltd. |
||||||||
| 2.05%, 04/15/26 (Call 03/15/26)(b) |
$ | 57 | $ | 52,241 | ||||
| 3.15%, 06/15/31 (Call 03/15/31)(b) |
50 | 39,380 | ||||||
| Triton Container International Ltd./TAL International Container Corp., 3.25%, 03/15/32 (Call 12/15/31) |
35 | 27,854 | ||||||
| United Rentals North America Inc. |
||||||||
| 3.75%, 01/15/32 (Call 07/15/26) |
45 | 38,958 | ||||||
| 3.88%, 11/15/27 (Call 03/11/24) |
41 | 38,618 | ||||||
| 3.88%, 02/15/31 (Call 08/15/25) |
55 | 48,708 | ||||||
| 4.00%, 07/15/30 (Call 07/15/25) |
40 | 36,155 | ||||||
| 4.88%, 01/15/28 (Call 03/11/24) |
85 | 82,020 | ||||||
| 5.25%, 01/15/30 (Call 01/15/25)(c) |
45 | 43,570 | ||||||
| 5.50%, 05/15/27 (Call 04/01/24) |
34 | 33,807 | ||||||
| Valvoline Inc., 3.63%, 06/15/31 |
30 | 25,444 | ||||||
| Verisk Analytics Inc. |
||||||||
| 3.63%, 05/15/50 (Call 11/15/49) |
40 | 29,290 | ||||||
| 4.00%, 06/15/25 (Call 03/15/25) |
80 | 78,588 | ||||||
| 4.13%, 03/15/29 (Call 12/15/28) |
50 | 47,980 | ||||||
| 5.50%, 06/15/45 (Call 12/15/44) |
17 | 16,217 | ||||||
| 5.75%, 04/01/33 (Call 01/01/33) |
5 | 5,165 | ||||||
| Williams Scotsman Inc. |
||||||||
| 4.63%, 08/15/28 (Call 04/01/24)(b) |
30 | 28,173 | ||||||
| 6.13%, 06/15/25 (Call 03/18/24)(b) |
33 | 32,952 | ||||||
| 7.38%, 10/01/31 (Call 10/01/26)(b) |
25 | 25,899 | ||||||
| WW International Inc., 4.50%, 04/15/29 |
30 | 13,853 | ||||||
|
|
|
|||||||
| 5,914,685 | ||||||||
| Computers — 0.3% | ||||||||
| ASGN Inc., 4.63%, 05/15/28 (Call 04/01/24)(b) |
35 | 32,822 | ||||||
| Booz Allen Hamilton Inc. |
||||||||
| 3.88%, 09/01/28 (Call 04/01/24)(b) |
50 | 46,463 | ||||||
| 4.00%, 07/01/29 (Call 07/01/24)(b) |
35 | 32,333 | ||||||
| CGI Inc. |
||||||||
| 1.45%, 09/14/26 (Call 08/14/26) |
70 | 63,477 | ||||||
| 2.30%, 09/14/31 (Call 06/14/31) |
50 | 39,996 | ||||||
| Crowdstrike Holdings Inc., 3.00%, 02/15/29 |
40 | 35,300 | ||||||
| DXC Technology Co. |
||||||||
| 1.80%, 09/15/26 (Call 08/15/26) |
40 | 36,319 | ||||||
| 2.38%, 09/15/28 (Call 07/15/28) |
55 | 47,418 | ||||||
| Fortinet Inc. |
||||||||
| 1.00%, 03/15/26 (Call 02/15/26) |
42 | 38,539 | ||||||
| 2.20%, 03/15/31 (Call 12/15/30) |
42 | 34,732 | ||||||
| Hewlett Packard Enterprise Co. |
||||||||
| 1.75%, 04/01/26 (Call 03/01/26) |
110 | 102,237 | ||||||
| 4.90%, 10/15/25 (Call 07/15/25) |
104 | 103,331 | ||||||
| 6.20%, 10/15/35 (Call 04/15/35) |
50 | 52,203 | ||||||
| 6.35%, 10/15/45 (Call 04/15/45) |
60 | 62,021 | ||||||
| Kyndryl Holdings Inc. |
||||||||
| 2.05%, 10/15/26 (Call 09/15/26) |
40 | 36,537 | ||||||
| 4.10%, 10/15/41 (Call 04/15/41) |
30 | 22,441 | ||||||
| NCR Voyix Corp. |
||||||||
| 5.00%, 10/01/28 (Call 04/01/24)(b) |
35 | 32,482 | ||||||
| 5.13%, 04/15/29 (Call 04/15/24)(b) |
65 | 60,133 | ||||||
| 5.25%, 10/01/30 (Call 10/01/25)(b) |
27 | 24,410 | ||||||
| NetApp Inc. |
||||||||
| 1.88%, 06/22/25 (Call 05/22/25) |
61 | 58,163 | ||||||
| 2.70%, 06/22/30 (Call 03/22/30) |
77 | 66,017 | ||||||
| Seagate HDD Cayman |
||||||||
| 4.09%, 06/01/29 (Call 03/01/29) |
30 | 27,382 | ||||||
| 4.13%, 01/15/31 (Call 10/15/30) |
15 | 13,171 | ||||||
| Security | Par (000) | Value | ||||||
| Computers (continued) | ||||||||
| 4.88%, 06/01/27 (Call 03/01/27) |
$ | 30 | $ | 29,083 | ||||
| 5.75%, 12/01/34 (Call 06/01/34) |
25 | 23,964 | ||||||
| 8.25%, 12/15/29 (Call 07/15/26)(b) |
30 | 32,093 | ||||||
| 8.50%, 07/15/31 (Call 07/15/26)(b) |
30 | 32,396 | ||||||
| 9.63%, 12/01/32 (Call 12/01/27) |
46 | 52,214 | ||||||
| Teledyne FLIR LLC, 2.50%, 08/01/30 (Call 05/01/30) |
57 | 48,150 | ||||||
| Unisys Corp., 6.88%, 11/01/27 (Call 04/01/24)(b) |
30 | 26,944 | ||||||
| Virtusa Corp., 7.13%, 12/15/28 (Call 04/01/24)(b) |
21 | 18,633 | ||||||
| Western Digital Corp. |
||||||||
| 2.85%, 02/01/29 (Call 12/01/28) |
55 | 46,348 | ||||||
| 3.10%, 02/01/32 (Call 11/01/31) |
45 | 35,080 | ||||||
| 4.75%, 02/15/26 (Call 11/15/25) |
130 | 127,164 | ||||||
|
|
|
|||||||
| 1,539,996 | ||||||||
| Cosmetics & Personal Care — 0.1% | ||||||||
| Edgewell Personal Care Co. |
||||||||
| 4.13%, 04/01/29 (Call 04/01/24)(b) |
30 | 27,339 | ||||||
| 5.50%, 06/01/28 (Call 04/01/24)(b) |
40 | 39,051 | ||||||
| Estee Lauder Companies Inc. (The) |
||||||||
| 1.95%, 03/15/31 (Call 12/15/30) |
25 | 20,494 | ||||||
| 2.38%, 12/01/29 (Call 09/01/29) |
64 | 55,920 | ||||||
| 2.60%, 04/15/30 (Call 01/15/30) |
85 | 74,380 | ||||||
| 3.13%, 12/01/49 (Call 06/01/49) |
25 | 17,044 | ||||||
| 3.15%, 03/15/27 (Call 12/15/26) |
68 | 64,772 | ||||||
| 4.15%, 03/15/47 (Call 09/15/46) |
35 | 28,882 | ||||||
| 4.38%, 06/15/45 (Call 12/15/44) |
35 | 30,081 | ||||||
| 6.00%, 05/15/37 |
15 | 15,985 | ||||||
| Kenvue Inc. |
||||||||
| 5.05%, 03/22/28 (Call 02/22/28) |
205 | 206,285 | ||||||
| 5.05%, 03/22/53 (Call 09/22/52) |
210 | 202,100 | ||||||
|
|
|
|||||||
| 782,333 | ||||||||
| Distribution & Wholesale — 0.1% | ||||||||
| Ferguson Finance PLC |
||||||||
| 3.25%, 06/02/30 (Call 03/02/30)(b) |
30 | 26,765 | ||||||
| 4.50%, 10/24/28 (Call 07/24/28)(b) |
45 | 43,823 | ||||||
| 4.65%, 04/20/32 (Call 01/20/32)(b) |
50 | 47,667 | ||||||
| H&E Equipment Services Inc., 3.88%, 12/15/28 |
70 | 63,125 | ||||||
| LKQ Corp. |
||||||||
| 5.75%, 06/15/28 (Call 05/15/28) |
50 | 50,504 | ||||||
| 6.25%, 06/15/33 (Call 03/15/33) |
40 | 41,116 | ||||||
| OPENLANE Inc., 5.13%, 06/01/25 |
12 | 11,814 | ||||||
| Resideo Funding Inc., 4.00%, 09/01/29 |
20 | 17,686 | ||||||
| Ritchie Bros Holdings Inc. |
||||||||
| 6.75%, 03/15/28 (Call 03/15/25)(b) |
30 | 30,701 | ||||||
| 7.75%, 03/15/31 (Call 03/15/26)(b) |
45 | 47,280 | ||||||
| WW Grainger Inc. |
||||||||
| 3.75%, 05/15/46 (Call 11/15/45) |
55 | 44,139 | ||||||
| 4.20%, 05/15/47 (Call 11/15/46) |
35 | 30,062 | ||||||
| 4.60%, 06/15/45 (Call 12/15/44) |
37 | 33,685 | ||||||
|
|
|
|||||||
| 488,367 | ||||||||
| Diversified Financial Services — 2.5% | ||||||||
| AerCap Ireland Capital DAC/AerCap Global Aviation Trust |
||||||||
| 3.00%, 10/29/28 (Call 08/29/28) |
175 | 157,238 | ||||||
| 3.30%, 01/30/32 (Call 10/30/31) |
370 | 313,121 | ||||||
| 3.40%, 10/29/33 (Call 07/29/33) |
155 | 128,940 | ||||||
| 3.65%, 07/21/27 (Call 04/21/27) |
135 | 127,095 | ||||||
| 3.85%, 10/29/41 (Call 04/29/41) |
150 | 115,956 | ||||||
| 3.88%, 01/23/28 (Call 10/23/27) |
155 | 145,951 | ||||||
| S C H E D U L E O F I N V E S T M E N T S |
27 |
| Schedule of Investments (continued) February 29, 2024 |
iShares® ESG Advanced Total USD Bond Market ETF (Percentages shown are based on Net Assets) |
| Security | Par (000) | Value | ||||||
| Diversified Financial Services (continued) | ||||||||
| 4.45%, 10/01/25 (Call 08/01/25) |
$ | 200 | $ | 196,165 | ||||
| Affiliated Managers Group Inc. |
||||||||
| 3.30%, 06/15/30 (Call 03/15/30) |
55 | 48,400 | ||||||
| 3.50%, 08/01/25 |
35 | 34,040 | ||||||
| Air Lease Corp. |
||||||||
| 1.88%, 08/15/26 (Call 07/15/26) |
105 | 96,429 | ||||||
| 2.10%, 09/01/28 (Call 07/01/28) |
45 | 39,079 | ||||||
| 2.88%, 01/15/26 (Call 12/15/25) |
150 | 143,094 | ||||||
| 2.88%, 01/15/32 (Call 10/15/31) |
55 | 45,637 | ||||||
| 3.00%, 02/01/30 (Call 11/01/29) |
70 | 60,848 | ||||||
| 3.13%, 12/01/30 (Call 09/01/30) |
40 | 34,440 | ||||||
| 3.25%, 03/01/25 (Call 01/01/25) |
55 | 53,700 | ||||||
| 3.25%, 10/01/29 (Call 07/01/29) |
50 | 44,566 | ||||||
| 3.38%, 07/01/25 (Call 06/01/25) |
80 | 77,731 | ||||||
| 3.75%, 06/01/26 (Call 04/01/26) |
35 | 33,729 | ||||||
| 4.63%, 10/01/28 (Call 07/01/28) |
50 | 48,295 | ||||||
| Aircastle Ltd. |
||||||||
| 2.85%, 01/26/28 (Call 11/26/27)(b) |
70 | 62,254 | ||||||
| 6.50%, 07/18/28 (Call 06/18/28)(b) |
15 | 15,161 | ||||||
| Ally Financial Inc. |
||||||||
| 2.20%, 11/02/28 (Call 09/02/28) |
60 | 50,970 | ||||||
| 4.75%, 06/09/27 (Call 05/09/27) |
40 | 38,839 | ||||||
| 5.75%, 11/20/25 (Call 10/21/25) |
60 | 59,676 | ||||||
| 6.70%, 02/14/33 (Call 11/16/32) |
25 | 24,643 | ||||||
| 6.85%, 01/03/30 (Call 01/03/29), |
10 | 10,220 | ||||||
| 8.00%, 11/01/31 |
225 | 246,511 | ||||||
| American Express Co. |
||||||||
| 1.65%, 11/04/26 (Call 10/04/26) |
95 | 86,859 | ||||||
| 2.25%, 03/04/25 (Call 02/01/25) |
25 | 24,210 | ||||||
| 2.55%, 03/04/27 (Call 02/01/27) |
135 | 125,420 | ||||||
| 3.13%, 05/20/26 (Call 04/20/26) |
125 | 119,961 | ||||||
| 3.30%, 05/03/27 (Call 04/03/27) |
144 | 136,515 | ||||||
| 4.05%, 05/03/29 (Call 03/03/29) |
140 | 135,308 | ||||||
| 4.05%, 12/03/42 |
125 | 107,524 | ||||||
| 4.20%, 11/06/25 (Call 10/06/25) |
135 | 133,166 | ||||||
| 4.42%, 08/03/33 (Call 08/03/32), |
130 | 123,158 | ||||||
| 4.99%, 05/26/33 (Call 02/26/32), |
65 | 63,225 | ||||||
| 5.04%, 05/01/34 (Call 05/01/33), |
110 | 107,890 | ||||||
| 5.28%, 07/27/29 (Call 07/27/28), |
170 | 170,972 | ||||||
| American Express Credit Corp., 3.30%, 05/03/27 (Call 04/03/27) |
30 | 28,432 | ||||||
| Ameriprise Financial Inc. |
||||||||
| 2.88%, 09/15/26 (Call 06/15/26) |
90 | 85,383 | ||||||
| 3.00%, 04/02/25 (Call 03/02/25) |
82 | 79,848 | ||||||
| 4.50%, 05/13/32 (Call 02/13/32) |
45 | 43,174 | ||||||
| Apollo Global Management Inc., 6.38%, 11/15/33 (Call 08/15/33) |
30 | 32,194 | ||||||
| Aviation Capital Group LLC |
||||||||
| 1.95%, 01/30/26 (Call 12/30/25)(b) |
55 | 51,125 | ||||||
| 1.95%, 09/20/26 (Call 08/20/26)(b) |
55 | 50,046 | ||||||
| 3.50%, 11/01/27 (Call 07/01/27)(b) |
80 | 73,827 | ||||||
| 4.13%, 08/01/25 (Call 06/01/25)(b) |
80 | 77,742 | ||||||
| 4.88%, 10/01/25 (Call 07/01/25)(b) |
61 | 59,763 | ||||||
| 6.75%, 10/25/28 (Call 09/25/28)(b) |
5 | 5,182 | ||||||
| Avolon Holdings Funding Ltd. |
||||||||
| 2.13%, 02/21/26 (Call 01/21/26)(b) |
100 | 92,695 | ||||||
| Security | Par (000) | Value | ||||||
| Diversified Financial Services (continued) | ||||||||
| 2.53%, 11/18/27 (Call 10/18/27)(b) |
$ | 30 | $ | 26,532 | ||||
| 4.25%, 04/15/26 (Call 03/15/26)(b) |
70 | 67,486 | ||||||
| 6.38%, 05/04/28 (Call 04/04/28)(b) |
205 | 208,123 | ||||||
| BOC Aviation Ltd., 1.75%, 01/21/26 (Call 12/21/25)(e) |
200 | 186,857 | ||||||
| Bread Financial Holdings Inc., 9.75%, 03/15/29 |
50 | 51,158 | ||||||
| Burford Capital Global Finance LLC, 9.25%, 07/01/31 (Call 07/01/26)(b) |
20 | 20,993 | ||||||
| Capital One Financial Corp. |
||||||||
| 1.88%, 11/02/27 (Call 11/02/26), |
45 | 40,831 | ||||||
| 2.36%, 07/29/32 (Call 07/29/31), |
110 | 82,888 | ||||||
| 2.64%, 03/03/26 (Call 03/03/25), |
120 | 116,401 | ||||||
| 3.27%, 03/01/30 (Call 03/01/29), |
115 | 102,467 | ||||||
| 3.75%, 07/28/26 (Call 06/28/26) |
10 | 9,597 | ||||||
| 3.80%, 01/31/28 (Call 12/31/27) |
105 | 99,227 | ||||||
| 4.93%, 05/10/28 (Call 05/10/27), |
120 | 117,381 | ||||||
| 4.99%, 07/24/26 (Call 07/24/25), |
210 | 208,044 | ||||||
| 5.27%, 05/10/33 (Call 05/10/32), |
125 | 121,233 | ||||||
| 5.47%, 02/01/29 (Call 02/01/28), |
45 | 44,704 | ||||||
| 5.70%, 02/01/30 (Call 02/01/29), |
60 | 60,113 | ||||||
| 5.82%, 02/01/34 (Call 02/01/33), |
35 | 34,589 | ||||||
| 6.31%, 06/08/29 (Call 06/08/28), |
90 | 92,173 | ||||||
| 6.38%, 06/08/34 (Call 06/08/33), |
130 | 133,906 | ||||||
| 7.15%, 10/29/27 (Call 10/29/26), |
80 | 82,939 | ||||||
| 7.62%, 10/30/31 (Call 10/30/30), |
50 | 54,719 | ||||||
| Cboe Global Markets Inc. |
||||||||
| 3.00%, 03/16/32 (Call 12/16/31) |
15 | 12,973 | ||||||
| 3.65%, 01/12/27 (Call 10/12/26) |
65 | 62,902 | ||||||
| CCBL Cayman 1 Corp. Ltd., 1.60%, 09/15/26 |
200 | 182,149 | ||||||
| CDBL Funding 2, 2.75%, 03/02/25(e) |
200 | 194,616 | ||||||
| Charles Schwab Corp. (The) |
||||||||
| 0.90%, 03/11/26 (Call 02/11/26) |
30 | 27,509 | ||||||
| 1.15%, 05/13/26 (Call 04/13/26) |
60 | 55,048 | ||||||
| 1.65%, 03/11/31 (Call 12/11/30) |
100 | 79,144 | ||||||
| 1.95%, 12/01/31 (Call 09/01/31) |
65 | 51,594 | ||||||
| 2.00%, 03/20/28 (Call 01/20/28) |
85 | 75,355 | ||||||
| 2.30%, 05/13/31 (Call 02/13/31) |
35 | 28,971 | ||||||
| 2.75%, 10/01/29 (Call 07/01/29) |
65 | 57,664 | ||||||
| 2.90%, 03/03/32 (Call 12/03/31) |
40 | 33,857 | ||||||
| 3.20%, 03/02/27 (Call 12/02/26) |
55 | 52,193 | ||||||
| 3.20%, 01/25/28 (Call 10/25/27) |
100 | 93,622 | ||||||
| 3.25%, 05/22/29 (Call 02/22/29) |
40 | 36,873 | ||||||
| 3.30%, 04/01/27 (Call 01/01/27) |
25 | 23,749 | ||||||
| 3.45%, 02/13/26 (Call 11/13/25) |
35 | 33,878 | ||||||
| 3.85%, 05/21/25 (Call 03/21/25) |
80 | 78,504 | ||||||
| 4.00%, 02/01/29 (Call 11/01/28)(c) |
25 | 23,973 | ||||||
| 28 | 2 0 2 4 I S H A R E S A N N U A L R E P O R T T O S H A R E H O L D E R S |
| Schedule of Investments (continued) February 29, 2024 |
iShares® ESG Advanced Total USD Bond Market ETF (Percentages shown are based on Net Assets) |
| Security | Par (000) | Value | ||||||
| Diversified Financial Services (continued) | ||||||||
| 4.20%, 03/24/25 (Call 02/24/25) |
$ | 85 | $ | 84,058 | ||||
| 4.63%, 03/22/30 (Call 12/22/29)(c) |
75 | 74,034 | ||||||
| 6.14%, 08/24/34 (Call 08/24/33), |
100 | 103,725 | ||||||
| 6.20%, 11/17/29 (Call 11/17/28), |
100 | 103,271 | ||||||
| CICC Hong Kong Finance 2016 MTN Ltd., 2.00%, 01/26/26(e) |
200 | 188,223 | ||||||
| CME Group Inc. |
||||||||
| 3.00%, 03/15/25 (Call 12/15/24) |
65 | 63,508 | ||||||
| 3.75%, 06/15/28 (Call 03/15/28) |
85 | 82,003 | ||||||
| 4.15%, 06/15/48 (Call 12/15/47) |
30 | 25,753 | ||||||
| 5.30%, 09/15/43 (Call 03/15/43) |
50 | 50,609 | ||||||
| Discover Financial Services |
||||||||
| 4.10%, 02/09/27 (Call 11/09/26) |
85 | 81,692 | ||||||
| 4.50%, 01/30/26 (Call 11/30/25) |
70 | 68,783 | ||||||
| 6.70%, 11/29/32 (Call 08/29/32) |
35 | 36,625 | ||||||
| 7.96%, 11/02/34 (Call 11/02/33), |
60 | 67,241 | ||||||
| Eaton Vance Corp., 3.50%, 04/06/27 (Call 01/06/27) |
20 | 19,036 | ||||||
| Franklin Resources Inc. |
||||||||
| 1.60%, 10/30/30 (Call 07/30/30) |
60 | 48,393 | ||||||
| 2.85%, 03/30/25 |
50 | 48,712 | ||||||
| 2.95%, 08/12/51 (Call 02/12/51) |
25 | 15,361 | ||||||
| goeasy Ltd. |
||||||||
| 4.38%, 05/01/26 (Call 03/11/24)(b) |
20 | 19,129 | ||||||
| 7.63%, 07/01/29 (Call 07/01/26)(b) |
25 | 24,988 | ||||||
| 9.25%, 12/01/28 (Call 12/01/25)(b) |
25 | 26,537 | ||||||
| ICBCIL Finance Co. Ltd., 1.75%, 08/25/25(e) |
200 | 189,185 | ||||||
| Intercontinental Exchange Inc. |
||||||||
| 1.85%, 09/15/32 (Call 06/15/32) |
130 | 100,329 | ||||||
| 2.10%, 06/15/30 (Call 03/15/30) |
40 | 33,558 | ||||||
| 2.65%, 09/15/40 (Call 03/15/40) |
132 | 93,499 | ||||||
| 3.00%, 06/15/50 (Call 12/15/49) |
60 | 40,240 | ||||||
| 3.00%, 09/15/60 (Call 03/15/60) |
105 | 65,047 | ||||||
| 3.10%, 09/15/27 (Call 06/15/27) |
89 | 83,575 | ||||||
| 3.65%, 05/23/25 |
60 | 58,827 | ||||||
| 3.75%, 12/01/25 (Call 09/01/25) |
85 | 82,885 | ||||||
| 3.75%, 09/21/28 (Call 06/21/28)(c) |
35 | 33,405 | ||||||
| 4.00%, 09/15/27 (Call 08/15/27) |
105 | 101,397 | ||||||
| 4.25%, 09/21/48 (Call 03/21/48) |
22 | 18,620 | ||||||
| 4.60%, 03/15/33 (Call 12/15/32) |
115 | 109,930 | ||||||
| 4.95%, 06/15/52 (Call 12/15/51) |
50 | 46,668 | ||||||
| 5.20%, 06/15/62 (Call 12/15/61) |
70 | 67,271 | ||||||
| Legg Mason Inc. |
||||||||
| 4.75%, 03/15/26 |
75 | 74,473 | ||||||
| 5.63%, 01/15/44 |
34 | 34,065 | ||||||
| LPL Holdings Inc. |
||||||||
| 4.00%, 03/15/29 (Call 04/01/24)(b) |
55 | 50,438 | ||||||
| 4.38%, 05/15/31 (Call 05/15/26)(b) |
25 | 22,559 | ||||||
| 4.63%, 11/15/27 (Call 03/05/24)(b) |
35 | 33,498 | ||||||
| LSEGA Financing PLC |
||||||||
| 1.38%, 04/06/26 (Call 03/06/26)(b) |
30 | 27,679 | ||||||
| 2.00%, 04/06/28 (Call 02/06/28)(b) |
240 | 213,099 | ||||||
| 2.50%, 04/06/31 (Call 01/06/31)(b) |
25 | 21,000 | ||||||
| 3.20%, 04/06/41 (Call 10/06/40)(b) |
20 | 14,982 | ||||||
| Mastercard Inc. |
||||||||
| 1.90%, 03/15/31 (Call 12/15/30) |
37 | 30,695 | ||||||
| 2.00%, 03/03/25 (Call 02/03/25) |
65 | 62,997 | ||||||
| 2.00%, 11/18/31 (Call 08/18/31) |
25 | 20,509 | ||||||
| 2.95%, 11/21/26 (Call 08/21/26) |
74 | 70,584 | ||||||
| Security | Par (000) | Value | ||||||
| Diversified Financial Services (continued) | ||||||||
| 2.95%, 06/01/29 (Call 03/01/29) |
$ | 94 | $ | 86,297 | ||||
| 2.95%, 03/15/51 (Call 09/15/50) |
30 | 20,780 | ||||||
| 3.30%, 03/26/27 (Call 01/26/27) |
87 | 83,368 | ||||||
| 3.35%, 03/26/30 (Call 12/26/29) |
64 | 59,095 | ||||||
| 3.50%, 02/26/28 (Call 11/26/27) |
40 | 38,400 | ||||||
| 3.65%, 06/01/49 (Call 12/01/48) |
55 | 43,730 | ||||||
| 3.80%, 11/21/46 (Call 05/21/46) |
44 | 36,330 | ||||||
| 3.85%, 03/26/50 (Call 09/26/49) |
69 | 56,968 | ||||||
| 3.95%, 02/26/48 (Call 08/26/47) |
52 | 43,947 | ||||||
| Mitsubishi HC Capital Inc. |
||||||||
| 3.64%, 04/13/25 (Call 03/13/25)(b) |
10 | 9,756 | ||||||
| 3.97%, 04/13/30 (Call 01/13/30)(b) |
10 | 9,209 | ||||||
| Nasdaq Inc. |
||||||||
| 1.65%, 01/15/31 (Call 10/15/30) |
50 | 39,819 | ||||||
| 2.50%, 12/21/40 (Call 06/21/40) |
55 | 36,394 | ||||||
| 3.25%, 04/28/50 (Call 10/28/49) |
40 | 27,199 | ||||||
| 3.85%, 06/30/26 (Call 03/30/26) |
80 | 77,639 | ||||||
| 3.95%, 03/07/52 (Call 09/07/51) |
100 | 75,973 | ||||||
| 5.55%, 02/15/34 (Call 11/15/33) |
100 | 100,652 | ||||||
| 5.65%, 06/28/25 |
10 | 10,032 | ||||||
| OneMain Finance Corp. |
||||||||
| 3.50%, 01/15/27 (Call 04/01/24) |
35 | 32,139 | ||||||
| 3.88%, 09/15/28 (Call 09/15/24) |
35 | 30,580 | ||||||
| 4.00%, 09/15/30 (Call 09/15/25) |
50 | 42,142 | ||||||
| 5.38%, 11/15/29 (Call 05/15/29) |
40 | 37,124 | ||||||
| 6.63%, 01/15/28 (Call 07/15/27) |
45 | 44,772 | ||||||
| 6.88%, 03/15/25 |
70 | 70,695 | ||||||
| 7.13%, 03/15/26 |
90 | 91,428 | ||||||
| 7.88%, 03/15/30 (Call 12/15/26) |
30 | 30,517 | ||||||
| 9.00%, 01/15/29 (Call 07/15/25) |
50 | 52,505 | ||||||
| PennyMac Financial Services Inc. |
||||||||
| 4.25%, 02/15/29 (Call 04/01/24)(b) |
40 | 36,038 | ||||||
| 5.38%, 10/15/25 (Call 04/01/24)(b) |
35 | 34,470 | ||||||
| 5.75%, 09/15/31 (Call 09/15/26)(b) |
30 | 27,585 | ||||||
| 7.88%, 12/15/29 (Call 12/15/26)(b) |
35 | 35,801 | ||||||
| Pioneer Reward Ltd., 2.00%, 04/09/26(e) |
200 | 187,368 | ||||||
| PRA Group Inc. |
||||||||
| 5.00%, 10/01/29 (Call 10/01/24)(b)(c) |
20 | 16,739 | ||||||
| 7.38%, 09/01/25 (Call 04/01/24)(b) |
20 | 19,957 | ||||||
| 8.38%, 02/01/28 (Call 02/01/25)(b) |
25 | 24,436 | ||||||
| Radian Group Inc. |
||||||||
| 4.88%, 03/15/27 (Call 09/15/26) |
42 | 40,788 | ||||||
| 6.63%, 03/15/25 (Call 09/15/24) |
60 | 60,096 | ||||||
| Raymond James Financial Inc. |
||||||||
| 3.75%, 04/01/51 (Call 10/01/50) |
25 | 18,517 | ||||||
| 4.65%, 04/01/30 (Call 01/01/30) |
50 | 49,407 | ||||||
| 4.95%, 07/15/46 |
55 | 50,524 | ||||||
| Rocket Mortgage LLC/Rocket Mortgage Co-Issuer Inc. |
||||||||
| 2.88%, 10/15/26 (Call 04/01/24)(b) |
65 | 59,735 | ||||||
| 3.63%, 03/01/29 (Call 04/01/24)(b) |
40 | 35,519 | ||||||
| 3.88%, 03/01/31 (Call 03/01/26)(b) |
70 | 60,077 | ||||||
| 4.00%, 10/15/33 (Call 10/15/27)(b) |
50 | 41,533 | ||||||
| Shinhan Card Co. Ltd., 2.50%, 01/27/27(e) |
200 | 183,990 | ||||||
| SLM Corp. |
||||||||
| 3.13%, 11/02/26 (Call 10/02/26) |
30 | 27,638 | ||||||
| 4.20%, 10/29/25 (Call 09/29/25) |
30 | 29,102 | ||||||
| State Elite Global Ltd., 1.50%, 09/29/26(e) |
200 | 182,562 | ||||||
| Synchrony Financial |
||||||||
| 2.88%, 10/28/31 (Call 07/28/31) |
80 | 62,741 | ||||||
| 3.70%, 08/04/26 (Call 05/04/26) |
20 | 18,874 | ||||||
| 3.95%, 12/01/27 (Call 09/01/27) |
95 | 87,992 | ||||||
| S C H E D U L E O F I N V E S T M E N T S |
29 |
| Schedule of Investments (continued) February 29, 2024 |
iShares® ESG Advanced Total USD Bond Market ETF (Percentages shown are based on Net Assets) |
| Security | Par (000) | Value | ||||||
| Diversified Financial Services (continued) | ||||||||
| 4.50%, 07/23/25 (Call 04/23/25) |
$ | 120 | $ | 117,282 | ||||
| 5.15%, 03/19/29 (Call 12/19/28) |
74 | 70,592 | ||||||
| 7.25%, 02/02/33 (Call 11/02/32) |
40 | 38,994 | ||||||
| Visa Inc. |
||||||||
| 0.75%, 08/15/27 (Call 06/15/27) |
110 | 96,588 | ||||||
| 1.10%, 02/15/31 (Call 11/15/30) |
95 | 75,068 | ||||||
| 1.90%, 04/15/27 (Call 02/15/27) |
47 | 43,275 | ||||||
| 2.00%, 08/15/50 (Call 02/15/50) |
115 | 66,855 | ||||||
| 2.05%, 04/15/30 (Call 01/15/30) |
72 | 61,754 | ||||||
| 2.70%, 04/15/40 (Call 10/15/39) |
65 | 48,100 | ||||||
| 2.75%, 09/15/27 (Call 06/15/27) |
30 | 28,097 | ||||||
| 3.15%, 12/14/25 (Call 09/14/25) |
145 | 140,637 | ||||||
| 3.65%, 09/15/47 (Call 03/15/47) |
45 | 35,812 | ||||||
| 4.15%, 12/14/35 (Call 06/14/35) |
65 | 60,929 | ||||||
| 4.30%, 12/14/45 (Call 06/14/45) |
200 | 178,262 | ||||||
| Voya Financial Inc. |
||||||||
| 3.65%, 06/15/26 |
44 | 42,303 | ||||||
| 4.70%, 01/23/48 (Call 01/23/28), |
40 | 33,625 | ||||||
| 4.80%, 06/15/46 |
25 | 21,239 | ||||||
| 5.70%, 07/15/43 |
30 | 29,068 | ||||||
| Western Union Co. (The) |
||||||||
| 1.35%, 03/15/26 (Call 02/15/26) |
60 | 55,227 | ||||||
| 2.75%, 03/15/31 (Call 12/15/30) |
30 | 24,725 | ||||||
| 6.20%, 11/17/36 |
35 | 35,254 | ||||||
|
|
|
|||||||
| 14,648,642 | ||||||||
| Electric — 0.5% | ||||||||
| AEP Texas Inc. |
||||||||
| 3.45%, 05/15/51 (Call 11/15/50) |
35 | 24,111 | ||||||
| 3.80%, 10/01/47 (Call 04/01/47) |
40 | 29,650 | ||||||
| 4.70%, 05/15/32 (Call 02/15/32) |
60 | 57,171 | ||||||
| American Transmission Systems Inc. |
||||||||
| 2.65%, 01/15/32 (Call 10/15/31)(b) |
60 | 49,257 | ||||||
| 5.00%, 09/01/44 (Call 03/01/44)(b) |
45 | 40,175 | ||||||
| CenterPoint Energy Houston Electric LLC |
||||||||
| 3.55%, 08/01/42 (Call 02/01/42) |
55 | 42,845 | ||||||
| 3.95%, 03/01/48 (Call 09/01/47) |
45 | 36,331 | ||||||
| 4.50%, 04/01/44 (Call 10/01/43) |
30 | 26,488 | ||||||
| Series AC, 4.25%, 02/01/49 (Call 08/01/48) |
35 | 29,508 | ||||||
| Series AD, 2.90%, 07/01/50 (Call 01/01/50) |
45 | 29,579 | ||||||
| Series AE, 2.35%, 04/01/31 (Call 01/01/31) |
65 | 54,607 | ||||||
| Series AF, 3.35%, 04/01/51 (Call 10/01/50) |
90 | 64,690 | ||||||
| Series AG, 3.00%, 03/01/32 (Call 12/01/31) |
30 | 25,941 | ||||||
| Series ai., 4.45%, 10/01/32 (Call 07/01/32) |
10 | 9,521 | ||||||
| Series K2, 6.95%, 03/15/33 |
10 | 11,280 | ||||||
| Cleveland Electric Illuminating Co. (The), 4.55%, 11/15/30 (Call 08/15/30)(b) |
35 | 32,628 | ||||||
| Commonwealth Edison Co. |
||||||||
| 3.70%, 03/01/45 (Call 09/01/44) |
5 | 3,895 | ||||||
| 4.00%, 03/01/48 (Call 09/01/47) |
95 | 75,910 | ||||||
| 5.30%, 02/01/53 (Call 08/01/52) |
65 | 63,010 | ||||||
| 5.90%, 03/15/36 |
195 | 203,935 | ||||||
| Series 130, 3.13%, 03/15/51 (Call 09/15/50) |
45 | 30,111 | ||||||
| Series 133, 3.85%, 03/15/52 (Call 09/15/51) |
60 | 46,149 | ||||||
| Duke Energy Florida Project Finance LLC, Series 2035, 3.11%, 09/01/38(c) |
25 | 20,594 | ||||||
| FirstEnergy Transmission LLC |
||||||||
| 2.87%, 09/15/28 (Call 07/15/28)(b) |
40 | 36,125 | ||||||
| 4.55%, 04/01/49 (Call 10/01/48)(b) |
40 | 33,119 | ||||||
| 5.45%, 07/15/44 (Call 01/15/44)(b) |
40 | 37,603 | ||||||
| Security | Par (000) | Value | ||||||
| Electric (continued) | ||||||||
| ITC Holdings Corp. |
||||||||
| 2.95%, 05/14/30 (Call 02/14/30)(b) |
$ | 56 | $ | 48,862 | ||||
| 3.25%, 06/30/26 (Call 03/30/26) |
50 | 47,754 | ||||||
| 3.35%, 11/15/27 (Call 08/15/27) |
35 | 32,830 | ||||||
| 5.30%, 07/01/43 (Call 01/01/43) |
20 | 18,719 | ||||||
| Jersey Central Power & Light Co., 2.75%, 03/01/32 (Call 12/01/31)(b) |
30 | 24,769 | ||||||
| Metropolitan Edison Co., 4.30%, 01/15/29 |
30 | 28,805 | ||||||
| Mid-Atlantic Interstate Transmission LLC, 4.10%, 05/15/28 (Call 02/15/28)(b) |
45 | 43,109 | ||||||
| National Rural Utilities Cooperative Finance Corp. |
||||||||
| 1.00%, 06/15/26 (Call 05/15/26) |
15 | 13,689 | ||||||
| 3.40%, 02/07/28 (Call 11/07/27) |
50 | 47,230 | ||||||
| 4.02%, 11/01/32 (Call 05/01/32) |
50 | 45,999 | ||||||
| 4.30%, 03/15/49 (Call 09/15/48) |
31 | 25,750 | ||||||
| 4.40%, 11/01/48 (Call 05/01/48) |
25 | 21,069 | ||||||
| 4.80%, 03/15/28 (Call 02/15/28) |
130 | 129,298 | ||||||
| 5.25%, 04/20/46 (Call 04/20/26), |
45 | 43,652 | ||||||
| 5.45%, 10/30/25 |
150 | 150,386 | ||||||
| 5.80%, 01/15/33 (Call 07/15/32) |
80 | 82,727 | ||||||
| Ohio Power Co. |
||||||||
| 4.00%, 06/01/49 (Call 12/01/48) |
40 | 31,216 | ||||||
| 4.15%, 04/01/48 (Call 10/01/47) |
50 | 40,033 | ||||||
| Series P, 2.60%, 04/01/30 (Call 01/01/30) |
45 | 38,938 | ||||||
| Series Q, 1.63%, 01/15/31 (Call 10/15/30) |
50 | 39,871 | ||||||
| Series R, 2.90%, 10/01/51 (Call 04/01/51) |
35 | 22,285 | ||||||
| Oncor Electric Delivery Co. LLC |
||||||||
| 2.70%, 11/15/51 (Call 05/15/51) |
15 | 9,315 | ||||||
| 2.75%, 05/15/30 (Call 02/15/30) |
110 | 96,623 | ||||||
| 2.95%, 04/01/25 (Call 01/01/25) |
10 | 9,751 | ||||||
| 3.10%, 09/15/49 (Call 03/15/49) |
31 | 21,253 | ||||||
| 3.70%, 11/15/28 (Call 08/15/28) |
81 | 76,750 | ||||||
| 3.70%, 05/15/50 (Call 11/15/49) |
30 | 22,873 | ||||||
| 3.75%, 04/01/45 (Call 10/01/44) |
25 | 19,827 | ||||||
| 3.80%, 09/30/47 (Call 03/30/47) |
45 | 34,715 | ||||||
| 3.80%, 06/01/49 (Call 12/01/48) |
60 | 47,069 | ||||||
| 4.10%, 11/15/48 (Call 05/15/48) |
40 | 32,779 | ||||||
| 4.15%, 06/01/32 (Call 03/01/32) |
5 | 4,683 | ||||||
| 4.55%, 09/15/32 (Call 06/15/32) |
55 | 52,762 | ||||||
| 4.55%, 12/01/41 (Call 06/01/41) |
10 | 9,067 | ||||||
| 4.60%, 06/01/52 (Call 12/01/51) |
20 | 17,587 | ||||||
| 5.25%, 09/30/40 |
35 | 34,734 | ||||||
| 5.35%, 10/01/52 (Call 04/01/52) |
30 | 29,763 | ||||||
| 5.65%, 11/15/33 (Call 08/15/33) |
15 | 15,466 | ||||||
| 7.00%, 05/01/32 |
40 | 44,558 | ||||||
| Pennsylvania Electric Co., 3.60%, 06/01/29 |
20 | 18,460 | ||||||
| Potomac Electric Power Co., 4.15%, 03/15/43 |
137 | 115,132 | ||||||
| PPL Electric Utilities Corp. |
||||||||
| 3.00%, 10/01/49 (Call 04/01/49) |
30 | 20,465 | ||||||
| 3.95%, 06/01/47 (Call 12/01/46) |
25 | 20,179 | ||||||
| 4.13%, 06/15/44 (Call 12/15/43) |
25 | 20,962 | ||||||
| 4.15%, 06/15/48 (Call 12/15/47) |
40 | 33,521 | ||||||
| 5.25%, 05/15/53 (Call 11/15/52) |
40 | 38,830 | ||||||
| 6.25%, 05/15/39 |
25 | 27,149 | ||||||
| Trans-Allegheny Interstate Line Co., 3.85%, 06/01/25 (Call 03/01/25)(b) |
10 | 9,777 | ||||||
|
|
|
|||||||
| 2,975,274 | ||||||||
| 30 | 2 0 2 4 I S H A R E S A N N U A L R E P O R T T O S H A R E H O L D E R S |
| Schedule of Investments (continued) February 29, 2024 |
iShares® ESG Advanced Total USD Bond Market ETF (Percentages shown are based on Net Assets) |
| Security | Par (000) | Value | ||||||
| Electrical Components & Equipment — 0.1% | ||||||||
| Acuity Brands Lighting Inc., 2.15%, 12/15/30 |
$ | 45 | $ | 36,880 | ||||
| Energizer Holdings Inc. |
||||||||
| 4.38%, 03/31/29 (Call 04/01/24)(b) |
45 | 39,796 | ||||||
| 4.75%, 06/15/28 (Call 04/01/24)(b) |
35 | 32,109 | ||||||
| 6.50%, 12/31/27 (Call 08/31/24)(b) |
20 | 19,846 | ||||||
| EnerSys |
||||||||
| 4.38%, 12/15/27 (Call 09/15/27)(b) |
20 | 18,823 | ||||||
| 6.63%, 01/15/32 (Call 01/15/27)(b) |
15 | 15,053 | ||||||
| WESCO Distribution Inc. |
||||||||
| 7.13%, 06/15/25 (Call 04/01/24)(b) |
85 | 85,228 | ||||||
| 7.25%, 06/15/28 (Call 04/01/24)(b) |
75 | 76,699 | ||||||
|
|
|
|||||||
| 324,434 | ||||||||
| Electronics — 0.2% | ||||||||
| Allegion PLC, 3.50%, 10/01/29 (Call 07/01/29) |
32 | 29,221 | ||||||
| Allegion U.S. Holding Co. Inc., 3.55%, 10/01/27 |
20 | 18,918 | ||||||
| Amphenol Corp. |
||||||||
| 2.05%, 03/01/25 (Call 02/01/25) |
27 | 26,096 | ||||||
| 2.20%, 09/15/31 (Call 06/15/31) |
55 | 45,121 | ||||||
| 2.80%, 02/15/30 (Call 11/15/29) |
80 | 71,248 | ||||||
| 4.35%, 06/01/29 (Call 03/01/29) |
40 | 38,882 | ||||||
| Arrow Electronics Inc., 3.88%, 01/12/28 |
5 | 4,722 | ||||||
| Atkore Inc., 4.25%, 06/01/31 (Call 06/01/26)(b) |
30 | 26,360 | ||||||
| Avnet Inc. |
||||||||
| 3.00%, 05/15/31 (Call 02/15/31) |
50 | 41,270 | ||||||
| 4.63%, 04/15/26 (Call 01/15/26) |
60 | 58,720 | ||||||
| Coherent Corp., 5.00%, 12/15/29 (Call 12/14/24)(b) |
60 | 55,960 | ||||||
| Flex Ltd. |
||||||||
| 3.75%, 02/01/26 (Call 01/01/26) |
55 | 53,184 | ||||||
| 4.88%, 06/15/29 (Call 03/15/29) |
41 | 39,881 | ||||||
| 4.88%, 05/12/30 (Call 02/12/30) |
50 | 48,173 | ||||||
| Fortive Corp., 4.30%, 06/15/46 (Call 12/15/45) |
42 | 34,653 | ||||||
| Hubbell Inc. |
||||||||
| 2.30%, 03/15/31 (Call 12/15/30) |
7 | 5,785 | ||||||
| 3.15%, 08/15/27 (Call 05/15/27) |
30 | 28,149 | ||||||
| 3.35%, 03/01/26 (Call 12/01/25) |
20 | 19,295 | ||||||
| 3.50%, 02/15/28 (Call 11/15/27) |
27 | 25,505 | ||||||
| Jabil Inc. |
||||||||
| 1.70%, 04/15/26 (Call 03/15/26) |
72 | 66,600 | ||||||
| 3.00%, 01/15/31 (Call 10/15/30) |
40 | 34,129 | ||||||
| 3.60%, 01/15/30 (Call 10/15/29) |
40 | 36,034 | ||||||
| 3.95%, 01/12/28 (Call 10/12/27) |
32 | 30,263 | ||||||
| Keysight Technologies Inc. |
||||||||
| 3.00%, 10/30/29 (Call 07/30/29) |
57 | 50,691 | ||||||
| 4.60%, 04/06/27 (Call 01/06/27) |
60 | 59,040 | ||||||
| Sensata Technologies BV |
||||||||
| 4.00%, 04/15/29 (Call 04/15/24)(b) |
55 | 49,938 | ||||||
| 5.00%, 10/01/25(b) |
46 | 45,572 | ||||||
| 5.88%, 09/01/30 (Call 09/01/25)(b) |
30 | 29,253 | ||||||
| Sensata Technologies Inc. |
||||||||
| 3.75%, 02/15/31 (Call 02/15/26)(b) |
40 | 34,200 | ||||||
| 4.38%, 02/15/30 (Call 11/15/29)(b) |
25 | 22,783 | ||||||
| Trimble Inc., 4.90%, 06/15/28 (Call 03/15/28) |
72 | 71,352 | ||||||
| TTM Technologies Inc., 4.00%, 03/01/29 |
30 | 26,930 | ||||||
| Tyco Electronics Group SA |
||||||||
| 3.13%, 08/15/27 (Call 05/15/27) |
65 | 61,440 | ||||||
| 7.13%, 10/01/37 |
20 | 22,958 | ||||||
| Security | Par (000) | Value | ||||||
| Electronics (continued) | ||||||||
| Vontier Corp. |
||||||||
| 1.80%, 04/01/26 (Call 03/01/26) |
$ | 59 | $ | 54,428 | ||||
| 2.40%, 04/01/28 (Call 02/01/28) |
45 | 39,395 | ||||||
| 2.95%, 04/01/31 (Call 01/01/31) |
38 | 31,281 | ||||||
|
|
|
|||||||
| 1,437,430 | ||||||||
| Energy - Alternate Sources — 0.0% | ||||||||
| Contemporary Ruiding Development Ltd., 1.88%, 09/17/25 (Call 08/17/25)(e) |
200 | 189,204 | ||||||
| Enviva Partners LP/Enviva Partners Finance Corp., 6.50%, 01/15/26 (Call 04/01/24)(b)(c) |
30 | 11,136 | ||||||
|
|
|
|||||||
| 200,340 | ||||||||
| Engineering & Construction — 0.1% | ||||||||
| AECOM, 5.13%, 03/15/27 (Call 12/15/26) |
55 | 53,863 | ||||||
| Arcosa Inc., 4.38%, 04/15/29 (Call 04/15/24)(b) |
25 | 23,082 | ||||||
| Cellnex Finance Co. SA, 3.88%, 07/07/41 |
35 | 27,227 | ||||||
| Dycom Industries Inc., 4.50%, 04/15/29 |
30 | 27,747 | ||||||
| Great Lakes Dredge & Dock Corp., 5.25%, 06/01/29 (Call 06/01/24)(b) |
20 | 17,484 | ||||||
| INNOVATE Corp., 8.50%, 02/01/26 (Call 03/11/24)(b) |
20 | 14,900 | ||||||
| Sydney Airport Finance Co. Pty. Ltd. |
||||||||
| 3.38%, 04/30/25 (Call 01/30/25)(b) |
27 | 26,315 | ||||||
| 3.63%, 04/28/26 (Call 01/28/26)(b) |
90 | 86,664 | ||||||
| TopBuild Corp. |
||||||||
| 3.63%, 03/15/29 (Call 04/01/24)(b) |
25 | 22,443 | ||||||
| 4.13%, 02/15/32 (Call 10/15/26)(b) |
30 | 26,449 | ||||||
| VM Consolidated Inc., 5.50%, 04/15/29 |
27 | 25,535 | ||||||
|
|
|
|||||||
| 351,709 | ||||||||
| Entertainment — 0.3% | ||||||||
| AMC Entertainment Holdings Inc. |
||||||||
| 7.50%, 02/15/29 (Call 02/15/25)(b)(c) |
55 | 38,018 | ||||||
| 10.00%, 06/15/26 (Call 03/11/24), |
65 | 51,418 | ||||||
| Cedar Fair LP, 5.25%, 07/15/29 (Call 07/15/24)(c) |
30 | 28,315 | ||||||
| Cedar Fair LP/Canada’s Wonderland Co./Magnum Management Corp./Millennium Op |
||||||||
| 5.38%, 04/15/27 (Call 04/01/24) |
30 | 29,682 | ||||||
| 5.50%, 05/01/25 (Call 04/01/24)(b) |
55 | 54,823 | ||||||
| 6.50%, 10/01/28 (Call 03/18/24) |
15 | 15,030 | ||||||
| Cinemark USA Inc. |
||||||||
| 5.25%, 07/15/28 (Call 07/15/24)(b)(c) |
45 | 42,115 | ||||||
| 5.88%, 03/15/26 (Call 04/01/24)(b) |
25 | 24,698 | ||||||
| 8.75%, 05/01/25 (Call 04/01/24)(b)(c) |
11 | 11,041 | ||||||
| Lions Gate Capital Holdings LLC, 5.50%, 04/15/29 (Call 04/15/24)(b) |
40 | 30,247 | ||||||
| Merlin Entertainments Ltd., 5.75%, 06/15/26 |
25 | 24,716 | ||||||
| Motion Bondco DAC, 6.63%, 11/15/27 |
25 | 24,054 | ||||||
| Odeon Finco PLC, 12.75%, 11/01/27 |
25 | 25,483 | ||||||
| SeaWorld Parks & Entertainment Inc. |
||||||||
| 5.25%, 08/15/29 (Call 08/15/24)(b) |
40 | 37,305 | ||||||
| 8.75%, 05/01/25 (Call 04/01/24)(b) |
20 | 20,089 | ||||||
| Six Flags Entertainment Corp. |
||||||||
| 5.50%, 04/15/27 (Call 04/01/24)(b) |
30 | 29,462 | ||||||
| 7.25%, 05/15/31 (Call 05/15/26)(b)(c) |
45 | 45,282 | ||||||
| S C H E D U L E O F I N V E S T M E N T S |
31 |
| Schedule of Investments (continued) February 29, 2024 |
iShares® ESG Advanced Total USD Bond Market ETF (Percentages shown are based on Net Assets) |
| Security | Par (000) | Value | ||||||
| Entertainment (continued) | ||||||||
| Six Flags Theme Parks Inc., 7.00%, 07/01/25 |
$ | 25 | $ | 25,084 | ||||
| Vail Resorts Inc., 6.25%, 05/15/25 (Call 04/01/24)(b) |
40 | 40,116 | ||||||
| Warnermedia Holdings Inc. |
||||||||
| 3.76%, 03/15/27 (Call 02/15/27) |
300 | 283,929 | ||||||
| 4.05%, 03/15/29 (Call 01/15/29) |
135 | 124,766 | ||||||
| 4.28%, 03/15/32 (Call 12/15/31) |
240 | 211,809 | ||||||
| 5.05%, 03/15/42 (Call 09/15/41) |
255 | 214,023 | ||||||
| 5.14%, 03/15/52 (Call 09/15/51) |
385 | 312,619 | ||||||
| 5.39%, 03/15/62 (Call 09/15/61) |
105 | 84,516 | ||||||
| WMG Acquisition Corp. |
||||||||
| 3.00%, 02/15/31 (Call 02/15/26)(b)(c) |
45 | 37,810 | ||||||
| 3.75%, 12/01/29 (Call 12/01/24)(b) |
30 | 26,602 | ||||||
| 3.88%, 07/15/30 (Call 07/15/25)(b) |
35 | 30,881 | ||||||
|
|
|
|||||||
| 1,923,933 | ||||||||
| Environmental Control — 0.2% | ||||||||
| Covanta Holding Corp. |
||||||||
| 4.88%, 12/01/29 (Call 12/01/24)(b) |
45 | 39,444 | ||||||
| 5.00%, 09/01/30 (Call 09/01/25) |
25 | 21,694 | ||||||
| Republic Services Inc. |
||||||||
| 0.88%, 11/15/25 (Call 10/15/25) |
12 | 11,129 | ||||||
| 1.45%, 02/15/31 (Call 11/15/30) |
60 | 47,253 | ||||||
| 1.75%, 02/15/32 (Call 11/15/31) |
102 | 79,970 | ||||||
| 2.30%, 03/01/30 (Call 12/01/29) |
69 | 59,263 | ||||||
| 2.90%, 07/01/26 (Call 04/01/26) |
90 | 85,949 | ||||||
| 3.05%, 03/01/50 (Call 09/01/49) |
35 | 24,234 | ||||||
| 3.20%, 03/15/25 (Call 12/15/24) |
62 | 60,535 | ||||||
| 3.38%, 11/15/27 (Call 08/15/27) |
78 | 73,956 | ||||||
| 3.95%, 05/15/28 (Call 02/15/28) |
33 | 31,746 | ||||||
| 5.70%, 05/15/41 (Call 11/15/40) |
5 | 5,187 | ||||||
| 6.20%, 03/01/40 |
40 | 43,580 | ||||||
| Veralto Corp., 5.45%, 09/18/33 |
10 | 10,045 | ||||||
| Waste Connections Inc. |
||||||||
| 2.20%, 01/15/32 (Call 10/15/31) |
25 | 20,235 | ||||||
| 2.60%, 02/01/30 (Call 11/01/29) |
60 | 52,866 | ||||||
| 2.95%, 01/15/52 (Call 07/15/51) |
50 | 33,083 | ||||||
| 3.05%, 04/01/50 (Call 10/01/49) |
35 | 23,633 | ||||||
| 3.50%, 05/01/29 (Call 02/01/29) |
50 | 46,836 | ||||||
| 4.25%, 12/01/28 (Call 09/01/28) |
35 | 33,892 | ||||||
| Waste Management Inc. |
||||||||
| 0.75%, 11/15/25 (Call 10/15/25) |
52 | 48,303 | ||||||
| 1.15%, 03/15/28 (Call 01/15/28) |
105 | 90,957 | ||||||
| 1.50%, 03/15/31 (Call 12/15/30) |
52 | 41,268 | ||||||
| 2.50%, 11/15/50 (Call 05/15/50) |
22 | 13,591 | ||||||
| 3.13%, 03/01/25 (Call 12/01/24) |
50 | 48,935 | ||||||
| 3.15%, 11/15/27 (Call 08/15/27) |
59 | 55,523 | ||||||
| 4.10%, 03/01/45 (Call 09/01/44) |
65 | 55,789 | ||||||
| 4.15%, 04/15/32 (Call 01/15/32) |
50 | 47,099 | ||||||
| 4.15%, 07/15/49 (Call 01/15/49) |
35 | 29,575 | ||||||
| 4.88%, 02/15/34 (Call 11/15/33) |
80 | 78,288 | ||||||
|
|
|
|||||||
| 1,313,858 | ||||||||
| Food — 0.7% | ||||||||
| B&G Foods Inc. |
||||||||
| 5.25%, 04/01/25 (Call 04/01/24) |
18 | 17,922 | ||||||
| 5.25%, 09/15/27 (Call 04/01/24)(c) |
35 | 32,559 | ||||||
| 8.00%, 09/15/28 (Call 09/15/25)(b)(c) |
30 | 31,227 | ||||||
| Campbell Soup Co. |
||||||||
| 2.38%, 04/24/30 (Call 01/24/30) |
70 | 59,437 | ||||||
| 4.15%, 03/15/28 (Call 12/15/27) |
80 | 77,166 | ||||||
| 4.80%, 03/15/48 (Call 09/15/47) |
70 | 61,396 | ||||||
| Security | Par (000) | Value | ||||||
| Food (continued) | ||||||||
| China Mengniu Dairy Co. Ltd., 2.50%, 06/17/30 |
$ | 200 | $ | 170,103 | ||||
| Conagra Brands Inc. |
||||||||
| 1.38%, 11/01/27 (Call 09/01/27) |
80 | 69,513 | ||||||
| 4.60%, 11/01/25 (Call 09/01/25) |
115 | 113,295 | ||||||
| 4.85%, 11/01/28 (Call 08/01/28) |
116 | 113,991 | ||||||
| 5.30%, 11/01/38 (Call 05/01/38) |
78 | 73,653 | ||||||
| 5.40%, 11/01/48 (Call 05/01/48) |
50 | 46,144 | ||||||
| 8.25%, 09/15/30 |
45 | 51,673 | ||||||
| Flowers Foods Inc. |
||||||||
| 2.40%, 03/15/31 (Call 12/15/30) |
35 | 29,236 | ||||||
| 3.50%, 10/01/26 (Call 07/01/26) |
15 | 14,383 | ||||||
| General Mills Inc. |
||||||||
| 2.25%, 10/14/31 (Call 07/14/31) |
55 | 45,075 | ||||||
| 2.88%, 04/15/30 (Call 01/15/30) |
75 | 66,221 | ||||||
| 3.00%, 02/01/51 (Call 08/01/50) |
50 | 32,228 | ||||||
| 3.20%, 02/10/27 (Call 11/10/26) |
75 | 71,288 | ||||||
| 4.00%, 04/17/25 (Call 02/17/25) |
90 | 88,571 | ||||||
| 4.15%, 02/15/43 (Call 08/15/42) |
5 | 4,180 | ||||||
| 4.20%, 04/17/28 (Call 01/17/28) |
96 | 93,084 | ||||||
| 4.70%, 04/17/48 (Call 10/17/47)(c) |
35 | 31,564 | ||||||
| 5.40%, 06/15/40 |
22 | 21,625 | ||||||
| Hormel Foods Corp. |
||||||||
| 1.70%, 06/03/28 (Call 04/03/28) |
30 | 26,483 | ||||||
| 1.80%, 06/11/30 (Call 03/11/30) |
65 | 53,941 | ||||||
| 3.05%, 06/03/51 (Call 12/03/50) |
70 | 46,974 | ||||||
| Ingredion Inc. |
||||||||
| 2.90%, 06/01/30 (Call 03/01/30) |
60 | 52,723 | ||||||
| 3.20%, 10/01/26 (Call 07/01/26) |
52 | 49,587 | ||||||
| 3.90%, 06/01/50 (Call 12/01/49) |
25 | 18,312 | ||||||
| J M Smucker Co. (The) |
||||||||
| 5.90%, 11/15/28 (Call 10/15/28) |
50 | 51,467 | ||||||
| 6.20%, 11/15/33 (Call 08/15/33) |
60 | 63,472 | ||||||
| 6.50%, 11/15/53 (Call 05/15/53) |
60 | 65,326 | ||||||
| JM Smucker Co. (The) |
||||||||
| 2.13%, 03/15/32 (Call 12/15/31) |
25 | 19,950 | ||||||
| 2.38%, 03/15/30 (Call 12/15/29) |
60 | 51,463 | ||||||
| 2.75%, 09/15/41 (Call 03/15/41) |
10 | 6,680 | ||||||
| 3.38%, 12/15/27 (Call 09/15/27) |
35 | 33,003 | ||||||
| 3.55%, 03/15/50 (Call 09/15/49) |
20 | 14,008 | ||||||
| 4.25%, 03/15/35 |
60 | 53,729 | ||||||
| 4.38%, 03/15/45 |
40 | 33,426 | ||||||
| Kellanova |
||||||||
| 3.25%, 04/01/26 |
105 | 100,928 | ||||||
| 4.30%, 05/15/28 (Call 02/15/28) |
70 | 67,978 | ||||||
| Series B, 7.45%, 04/01/31 |
50 | 55,939 | ||||||
| Kraft Heinz Foods Co. |
||||||||
| 3.00%, 06/01/26 (Call 03/01/26) |
100 | 95,414 | ||||||
| 3.75%, 04/01/30 (Call 01/01/30) |
70 | 65,260 | ||||||
| 3.88%, 05/15/27 (Call 02/15/27) |
115 | 110,996 | ||||||
| 4.25%, 03/01/31 (Call 12/01/30) |
35 | 33,237 | ||||||
| 4.38%, 06/01/46 (Call 12/01/45) |
120 | 99,542 | ||||||
| 4.63%, 01/30/29 (Call 10/30/28) |
35 | 34,326 | ||||||
| 4.63%, 10/01/39 (Call 04/01/39) |
40 | 36,125 | ||||||
| 4.88%, 10/01/49 (Call 04/01/49) |
85 | 75,851 | ||||||
| 5.00%, 07/15/35 (Call 01/15/35) |
70 | 68,330 | ||||||
| 5.00%, 06/04/42 |
60 | 55,350 | ||||||
| 5.20%, 07/15/45 (Call 01/15/45) |
85 | 79,344 | ||||||
| 5.50%, 06/01/50 (Call 12/01/49) |
35 | 34,064 | ||||||
| 6.50%, 02/09/40 |
55 | 59,327 | ||||||
| 6.75%, 03/15/32 |
25 | 27,500 | ||||||
| 32 | 2 0 2 4 I S H A R E S A N N U A L R E P O R T T O S H A R E H O L D E R S |
| Schedule of Investments (continued) February 29, 2024 |
iShares® ESG Advanced Total USD Bond Market ETF (Percentages shown are based on Net Assets) |
| Security | Par (000) | Value | ||||||
| Food (continued) | ||||||||
| 6.88%, 01/26/39 |
$ | 45 | $ | 50,397 | ||||
| 7.13%, 08/01/39(b) |
45 | 51,167 | ||||||
| Lamb Weston Holdings Inc. |
||||||||
| 4.13%, 01/31/30 (Call 01/31/25)(b) |
55 | 49,757 | ||||||
| 4.38%, 01/31/32 (Call 01/31/27)(b) |
40 | 35,684 | ||||||
| 4.88%, 05/15/28 (Call 11/15/27)(b) |
30 | 29,055 | ||||||
| McCormick & Co. Inc./MD |
||||||||
| 0.90%, 02/15/26 (Call 01/15/26) |
45 | 41,400 | ||||||
| 1.85%, 02/15/31 (Call 11/15/30) |
25 | 20,098 | ||||||
| 2.50%, 04/15/30 (Call 01/15/30) |
55 | 47,071 | ||||||
| 3.40%, 08/15/27 (Call 05/15/27) |
60 | 56,754 | ||||||
| 4.20%, 08/15/47 (Call 02/15/47)(c) |
27 | 22,342 | ||||||
| Post Holdings Inc. |
||||||||
| 4.50%, 09/15/31 (Call 09/15/26)(b) |
65 | 57,832 | ||||||
| 4.63%, 04/15/30 (Call 04/15/25)(b) |
80 | 72,669 | ||||||
| 5.50%, 12/15/29 (Call 12/15/24)(b) |
70 | 66,843 | ||||||
| 5.63%, 01/15/28 (Call 03/18/24)(b) |
50 | 49,068 | ||||||
| Smithfield Foods Inc. |
||||||||
| 2.63%, 09/13/31 (Call 06/13/31)(b) |
60 | 46,206 | ||||||
| 3.00%, 10/15/30 (Call 07/15/30)(b) |
20 | 16,439 | ||||||
| 4.25%, 02/01/27 (Call 11/01/26)(b) |
95 | 90,814 | ||||||
| 5.20%, 04/01/29 (Call 01/01/29)(b) |
5 | 4,793 | ||||||
| TreeHouse Foods Inc., 4.00%, 09/01/28 |
27 | 23,877 | ||||||
| U.S. Foods Inc. |
||||||||
| 4.63%, 06/01/30 (Call 06/01/25)(b) |
30 | 27,504 | ||||||
| 4.75%, 02/15/29 (Call 04/01/24)(b) |
50 | 46,923 | ||||||
| 6.88%, 09/15/28 (Call 09/15/25)(b) |
30 | 30,549 | ||||||
| 7.25%, 01/15/32 (Call 09/15/26)(b) |
25 | 25,820 | ||||||
| United Natural Foods Inc., 6.75%, 10/15/28 |
30 | 24,976 | ||||||
|
|
|
|||||||
| 4,143,627 | ||||||||
| Food Service — 0.0% | ||||||||
| Aramark Services Inc. |
||||||||
| 5.00%, 04/01/25 (Call 04/01/24)(b) |
25 | 24,828 | ||||||
| 5.00%, 02/01/28 (Call 04/01/24)(b) |
65 | 62,364 | ||||||
|
|
|
|||||||
| 87,192 | ||||||||
| Forest Products & Paper — 0.1% | ||||||||
| Domtar Corp., 6.75%, 10/01/28 |
35 | 32,377 | ||||||
| Glatfelter Corp., 4.75%, 11/15/29 |
30 | 25,231 | ||||||
| International Paper Co. |
||||||||
| 4.35%, 08/15/48 (Call 02/15/48) |
54 | 45,734 | ||||||
| 4.40%, 08/15/47 (Call 02/15/47)(c) |
39 | 32,412 | ||||||
| 4.80%, 06/15/44 (Call 12/15/43) |
33 | 29,383 | ||||||
| 5.00%, 09/15/35 (Call 03/15/35) |
30 | 29,082 | ||||||
| 5.15%, 05/15/46 (Call 11/15/45) |
25 | 23,198 | ||||||
| 6.00%, 11/15/41 (Call 05/15/41) |
50 | 51,501 | ||||||
| Inversiones CMPC SA, 6.13%, 06/23/33 |
200 | 202,011 | ||||||
| Mercer International Inc. |
||||||||
| 5.13%, 02/01/29 (Call 03/11/24) |
50 | 43,148 | ||||||
| 5.50%, 01/15/26 (Call 04/01/24) |
16 | 15,468 | ||||||
| 12.88%, 10/01/28 (Call 10/01/25)(b) |
15 | 15,889 | ||||||
|
|
|
|||||||
| 545,434 | ||||||||
| Hand & Machine Tools — 0.1% | ||||||||
| Regal Rexnord Corp. |
||||||||
| 6.05%, 04/15/28 (Call 03/15/28)(b) |
70 | 70,405 | ||||||
| 6.30%, 02/15/30 (Call 12/15/29)(b) |
100 | 101,750 | ||||||
| 6.40%, 04/15/33 (Call 01/15/33)(b) |
80 | 82,102 | ||||||
| Security | Par (000) | Value | ||||||
| Hand & Machine Tools (continued) | ||||||||
| Snap-on Inc. |
||||||||
| 3.10%, 05/01/50 (Call 11/01/49) |
$ | 35 | $ | 24,567 | ||||
| 3.25%, 03/01/27 (Call 12/01/26) |
7 | 6,702 | ||||||
| 4.10%, 03/01/48 (Call 09/01/47) |
25 | 20,865 | ||||||
| Stanley Black & Decker Inc. |
||||||||
| 2.30%, 03/15/30 (Call 12/15/29) |
80 | 67,160 | ||||||
| 2.75%, 11/15/50 (Call 05/15/50) |
65 | 37,877 | ||||||
| 3.40%, 03/01/26 (Call 01/01/26) |
37 | 35,662 | ||||||
| 4.00%, 03/15/60 (Call 03/15/25), |
30 | 26,705 | ||||||
| 4.25%, 11/15/28 (Call 08/15/28) |
20 | 19,297 | ||||||
| 4.85%, 11/15/48 (Call 05/15/48) |
30 | 25,959 | ||||||
| 5.20%, 09/01/40 |
21 | 19,706 | ||||||
|
|
|
|||||||
| 538,757 | ||||||||
| Health Care - Products — 0.4% | ||||||||
| Agilent Technologies Inc. |
||||||||
| 2.10%, 06/04/30 (Call 03/04/30) |
55 | 46,075 | ||||||
| 2.30%, 03/12/31 (Call 12/12/30) |
80 | 66,746 | ||||||
| 2.75%, 09/15/29 (Call 06/15/29) |
50 | 44,736 | ||||||
| 3.05%, 09/22/26 (Call 06/22/26) |
50 | 47,545 | ||||||
| Alcon Finance Corp. |
||||||||
| 2.60%, 05/27/30 (Call 02/27/30)(b) |
50 | 42,921 | ||||||
| 3.00%, 09/23/29 (Call 06/23/29)(b) |
70 | 62,759 | ||||||
| 3.80%, 09/23/49 (Call 03/23/49)(b) |
65 | 50,363 | ||||||
| Avantor Funding Inc. |
||||||||
| 3.88%, 11/01/29 (Call 11/01/24)(b) |
45 | 40,341 | ||||||
| 4.63%, 07/15/28 (Call 04/01/24)(b) |
90 | 84,929 | ||||||
| Danaher Corp. |
||||||||
| 2.60%, 10/01/50 (Call 04/01/50) |
65 | 40,924 | ||||||
| 2.80%, 12/10/51 (Call 06/10/51)(c) |
45 | 29,160 | ||||||
| 3.35%, 09/15/25 (Call 06/15/25) |
30 | 29,261 | ||||||
| 4.38%, 09/15/45 (Call 03/15/45) |
50 | 44,302 | ||||||
| Dentsply Sirona Inc., 3.25%, 06/01/30 (Call 03/01/30) |
80 | 69,724 | ||||||
| DH Europe Finance II Sarl |
||||||||
| 2.60%, 11/15/29 (Call 08/15/29) |
65 | 57,726 | ||||||
| 3.25%, 11/15/39 (Call 05/15/39) |
35 | 27,807 | ||||||
| 3.40%, 11/15/49 (Call 05/15/49) |
82 | 61,091 | ||||||
| Embecta Corp. |
||||||||
| 5.00%, 02/15/30 (Call 02/15/27)(b) |
30 | 23,899 | ||||||
| 6.75%, 02/15/30 (Call 02/15/27)(b)(c) |
15 | 12,908 | ||||||
| GE HealthCare Technologies Inc. |
||||||||
| 5.65%, 11/15/27 (Call 10/15/27) |
105 | 106,608 | ||||||
| 5.91%, 11/22/32 (Call 08/22/32) |
115 | 119,391 | ||||||
| 6.38%, 11/22/52 (Call 05/22/52) |
110 | 121,905 | ||||||
| HCA Inc. |
||||||||
| 3.13%, 03/15/27 (Call 02/15/27) |
45 | 42,291 | ||||||
| 3.63%, 03/15/32 (Call 12/15/31) |
90 | 78,632 | ||||||
| 4.38%, 03/15/42 (Call 09/15/41) |
20 | 16,576 | ||||||
| Hologic Inc. |
||||||||
| 3.25%, 02/15/29 (Call 04/01/24)(b) |
55 | 49,044 | ||||||
| 4.63%, 02/01/28 (Call 04/01/24)(b) |
20 | 19,167 | ||||||
| Neogen Food Safety Corp., 8.63%, 07/20/30 |
20 | 21,277 | ||||||
| Revvity Inc. |
||||||||
| 1.90%, 09/15/28 (Call 07/15/28) |
25 | 21,597 | ||||||
| 2.25%, 09/15/31 (Call 06/15/31) |
50 | 40,640 | ||||||
| 2.55%, 03/15/31 (Call 12/15/30) |
17 | 14,238 | ||||||
| 3.30%, 09/15/29 (Call 06/15/29) |
43 | 38,710 | ||||||
| 3.63%, 03/15/51 (Call 09/15/50) |
33 | 22,963 | ||||||
| STERIS Irish FinCo UnLtd Co., 2.70%, 03/15/31 |
90 | 76,537 | ||||||
| S C H E D U L E O F I N V E S T M E N T S |
33 |
| Schedule of Investments (continued) February 29, 2024 |
iShares® ESG Advanced Total USD Bond Market ETF (Percentages shown are based on Net Assets) |
| Security | Par (000) | Value | ||||||
| Health Care - Products (continued) | ||||||||
| Stryker Corp. |
||||||||
| 1.95%, 06/15/30 (Call 03/15/30) |
$ | 150 | $ | 125,566 | ||||
| 3.50%, 03/15/26 (Call 12/15/25) |
125 | 121,206 | ||||||
| 4.63%, 03/15/46 (Call 09/15/45) |
110 | 99,651 | ||||||
| Teleflex Inc. |
||||||||
| 4.25%, 06/01/28 (Call 04/01/24)(b) |
30 | 28,068 | ||||||
| 4.63%, 11/15/27 (Call 03/18/24) |
30 | 28,647 | ||||||
| Varex Imaging Corp., 7.88%, 10/15/27 |
19 | 19,221 | ||||||
| Zimmer Biomet Holdings Inc. |
||||||||
| 2.60%, 11/24/31 (Call 08/24/31) |
85 | 71,100 | ||||||
| 3.05%, 01/15/26 (Call 12/15/25) |
100 | 96,061 | ||||||
|
|
|
|||||||
| 2,262,313 | ||||||||
| Health Care - Services — 0.8% | ||||||||
| Acadia Healthcare Co. Inc. |
||||||||
| 5.00%, 04/15/29 (Call 04/01/24)(b) |
30 | 28,357 | ||||||
| 5.50%, 07/01/28 (Call 04/01/24)(b) |
30 | 29,082 | ||||||
| AHP Health Partners Inc., 5.75%, 07/15/29 |
||||||||
| (Call 07/15/24)(b) |
20 | 18,113 | ||||||
| Catalent Pharma Solutions Inc. |
||||||||
| 3.13%, 02/15/29 (Call 04/01/24)(b) |
35 | 33,840 | ||||||
| 3.50%, 04/01/30 (Call 04/01/25)(b) |
40 | 38,612 | ||||||
| 5.00%, 07/15/27 (Call 04/01/24)(b) |
30 | 29,585 | ||||||
| Charles River Laboratories International Inc. |
||||||||
| 3.75%, 03/15/29 (Call 04/01/24)(b) |
30 | 27,158 | ||||||
| 4.00%, 03/15/31 (Call 03/15/26)(b) |
30 | 26,452 | ||||||
| 4.25%, 05/01/28 (Call 03/18/24)(b) |
30 | 28,143 | ||||||
| DaVita Inc. |
||||||||
| 3.75%, 02/15/31 (Call 02/15/26)(b) |
80 | 65,631 | ||||||
| 4.63%, 06/01/30 (Call 06/01/25)(b) |
150 | 131,920 | ||||||
| Elevance Health Inc. |
||||||||
| 2.25%, 05/15/30 (Call 02/15/30) |
120 | 101,939 | ||||||
| 2.55%, 03/15/31 (Call 12/15/30) |
100 | 84,759 | ||||||
| 2.88%, 09/15/29 (Call 06/15/29) |
75 | 67,253 | ||||||
| 3.13%, 05/15/50 (Call 11/15/49) |
85 | 58,016 | ||||||
| 3.60%, 03/15/51 (Call 09/15/50) |
95 | 70,721 | ||||||
| 3.65%, 12/01/27 (Call 09/01/27) |
111 | 106,145 | ||||||
| 3.70%, 09/15/49 (Call 03/15/49) |
20 | 15,148 | ||||||
| 4.10%, 03/01/28 (Call 12/01/27) |
150 | 145,081 | ||||||
| 4.10%, 05/15/32 (Call 02/15/32) |
10 | 9,217 | ||||||
| 4.38%, 12/01/47 (Call 06/01/47) |
95 | 80,671 | ||||||
| 4.55%, 03/01/48 (Call 09/01/47) |
75 | 65,314 | ||||||
| 4.55%, 05/15/52 (Call 11/15/51) |
20 | 17,346 | ||||||
| 4.63%, 05/15/42 |
35 | 31,492 | ||||||
| 4.65%, 01/15/43 |
40 | 36,097 | ||||||
| 4.65%, 08/15/44 (Call 02/15/44) |
5 | 4,444 | ||||||
| 4.75%, 02/15/33 (Call 11/15/32) |
120 | 115,901 | ||||||
| 5.13%, 02/15/53 (Call 08/15/52) |
90 | 85,191 | ||||||
| 6.10%, 10/15/52 (Call 04/15/52) |
65 | 69,726 | ||||||
| 6.38%, 06/15/37 |
20 | 21,569 | ||||||
| Encompass Health Corp. |
||||||||
| 4.50%, 02/01/28 (Call 04/01/24) |
47 | 44,460 | ||||||
| 4.63%, 04/01/31 (Call 04/01/26) |
25 | 22,584 | ||||||
| 4.75%, 02/01/30 (Call 02/01/25) |
45 | 41,748 | ||||||
| 5.75%, 09/15/25 (Call 04/01/24) |
20 | 19,915 | ||||||
| Fortrea Holdings Inc., 7.50%, 07/01/30 |
35 | 35,792 | ||||||
| HCA Inc. |
||||||||
| 2.38%, 07/15/31 (Call 04/15/31) |
75 | 60,986 | ||||||
| 3.38%, 03/15/29 (Call 01/15/29) |
55 | 50,155 | ||||||
| 3.50%, 09/01/30 (Call 03/01/30) |
125 | 111,741 | ||||||
| Security | Par (000) | Value | ||||||
| Health Care - Services (continued) | ||||||||
| 3.50%, 07/15/51 (Call 01/15/51) |
$ | 90 | $ | 60,751 | ||||
| 4.13%, 06/15/29 (Call 03/15/29) |
100 | 94,042 | ||||||
| 4.50%, 02/15/27 (Call 08/15/26) |
148 | 144,926 | ||||||
| 4.63%, 03/15/52 (Call 09/15/51) |
110 | 90,020 | ||||||
| 5.20%, 06/01/28 (Call 05/01/28) |
15 | 14,938 | ||||||
| 5.25%, 04/15/25 |
95 | 94,576 | ||||||
| 5.25%, 06/15/26 (Call 12/15/25) |
135 | 134,174 | ||||||
| 5.25%, 06/15/49 (Call 12/15/48) |
115 | 103,020 | ||||||
| 5.38%, 09/01/26 (Call 03/01/26) |
120 | 119,652 | ||||||
| 5.50%, 06/01/33 (Call 03/01/33) |
70 | 69,518 | ||||||
| 5.50%, 06/15/47 (Call 12/15/46) |
90 | 83,881 | ||||||
| 5.63%, 09/01/28 (Call 03/01/28) |
100 | 100,742 | ||||||
| 5.88%, 02/15/26 (Call 08/15/25) |
165 | 165,728 | ||||||
| 5.88%, 02/01/29 (Call 08/01/28) |
60 | 61,067 | ||||||
| 5.90%, 06/01/53 (Call 12/01/52) |
65 | 63,849 | ||||||
| 6.00%, 04/01/54 (Call 10/01/53) |
80 | 79,401 | ||||||
| 6.10%, 04/01/64 (Call 10/01/63) |
40 | 39,531 | ||||||
| HealthEquity Inc., 4.50%, 10/01/29 (Call 10/01/24)(b) |
30 | 27,597 | ||||||
| Humana Inc. |
||||||||
| 1.35%, 02/03/27 (Call 01/03/27) |
120 | 107,660 | ||||||
| 2.15%, 02/03/32 (Call 11/03/31) |
55 | 43,521 | ||||||
| 3.13%, 08/15/29 (Call 05/15/29) |
60 | 54,202 | ||||||
| 3.70%, 03/23/29 (Call 02/23/29) |
70 | 65,434 | ||||||
| 3.95%, 03/15/27 (Call 12/15/26) |
68 | 65,581 | ||||||
| 3.95%, 08/15/49 (Call 02/15/49) |
35 | 27,356 | ||||||
| 4.50%, 04/01/25 (Call 03/01/25) |
20 | 19,793 | ||||||
| 4.63%, 12/01/42 (Call 06/01/42) |
27 | 23,436 | ||||||
| 4.80%, 03/15/47 (Call 09/15/46) |
30 | 26,137 | ||||||
| 4.88%, 04/01/30 (Call 01/01/30) |
62 | 61,003 | ||||||
| 4.95%, 10/01/44 (Call 04/01/44) |
55 | 49,590 | ||||||
| 5.50%, 03/15/53 (Call 09/15/52) |
45 | 43,594 | ||||||
| IQVIA Inc. |
||||||||
| 5.00%, 10/15/26 (Call 04/01/24)(b) |
60 | 58,698 | ||||||
| 5.00%, 05/15/27 (Call 04/01/24)(b) |
50 | 48,687 | ||||||
| 6.50%, 05/15/30 (Call 05/15/26)(b) |
35 | 35,503 | ||||||
| ModivCare Inc., 5.88%, 11/15/25 |
35 | 34,177 | ||||||
| Molina Healthcare Inc. |
||||||||
| 3.88%, 11/15/30 (Call 08/17/30)(b) |
40 | 35,109 | ||||||
| 3.88%, 05/15/32 (Call 02/15/32)(b) |
45 | 38,725 | ||||||
| 4.38%, 06/15/28 (Call 04/01/24)(b) |
45 | 42,003 | ||||||
| Pediatrix Medical Group Inc., 5.38%, 02/15/30 |
25 | 22,476 | ||||||
| Quest Diagnostics Inc. |
||||||||
| 2.80%, 06/30/31 (Call 03/30/31) |
25 | 21,337 | ||||||
| 2.95%, 06/30/30 (Call 03/30/30) |
96 | 84,505 | ||||||
| 3.45%, 06/01/26 (Call 03/01/26) |
75 | 72,157 | ||||||
| 3.50%, 03/30/25 (Call 12/30/24) |
37 | 36,325 | ||||||
| 4.20%, 06/30/29 (Call 03/30/29) |
45 | 43,255 | ||||||
| 4.70%, 03/30/45 (Call 09/30/44)(c) |
25 | 22,081 | ||||||
| 6.40%, 11/30/33 (Call 08/30/33) |
5 | 5,347 | ||||||
| Select Medical Corp., 6.25%, 08/15/26 |
72 | 71,848 | ||||||
| Surgery Center Holdings Inc. |
||||||||
| 6.75%, 07/01/25 (Call 04/01/24)(b)(c) |
15 | 14,967 | ||||||
| 10.00%, 04/15/27 (Call 04/01/24)(b)(c) |
14 | 14,193 | ||||||
|
|
|
|||||||
| 4,866,417 | ||||||||
| Home Builders — 0.2% | ||||||||
| Beazer Homes USA Inc. |
||||||||
| 5.88%, 10/15/27 (Call 03/18/24)(c) |
20 | 19,455 | ||||||
| 6.75%, 03/15/25 (Call 03/18/24)(c) |
20 | 19,991 | ||||||
| 7.25%, 10/15/29 (Call 10/15/24) |
20 | 20,017 | ||||||
| 34 | 2 0 2 4 I S H A R E S A N N U A L R E P O R T T O S H A R E H O L D E R S |
| Schedule of Investments (continued) February 29, 2024 |
iShares® ESG Advanced Total USD Bond Market ETF (Percentages shown are based on Net Assets) |
| Security | Par (000) | Value | ||||||
| Home Builders (continued) | ||||||||
| Century Communities Inc. |
||||||||
| 3.88%, 08/15/29 (Call 02/15/29)(b) |
$ | 30 | $ | 26,485 | ||||
| 6.75%, 06/01/27 (Call 04/01/24) |
30 | 30,052 | ||||||
| DR Horton Inc. |
||||||||
| 1.40%, 10/15/27 (Call 08/15/27) |
5 | 4,410 | ||||||
| 2.60%, 10/15/25 (Call 09/15/25) |
10 | 9,569 | ||||||
| Installed Building Products Inc., 5.75%, 02/01/28 (Call 03/18/24)(b) |
20 | 19,650 | ||||||
| KB Home |
||||||||
| 4.00%, 06/15/31 (Call 12/15/30)(c) |
20 | 17,434 | ||||||
| 4.80%, 11/15/29 (Call 05/15/29) |
15 | 14,148 | ||||||
| 6.88%, 06/15/27 (Call 12/15/26) |
20 | 20,627 | ||||||
| 7.25%, 07/15/30 (Call 07/15/25)(c) |
20 | 20,665 | ||||||
| LGI Homes Inc. |
||||||||
| 4.00%, 07/15/29 (Call 01/15/29)(b) |
20 | 17,258 | ||||||
| 8.75%, 12/15/28 (Call 12/15/25)(b) |
25 | 26,200 | ||||||
| M/I Homes Inc. |
||||||||
| 3.95%, 02/15/30 (Call 08/15/29) |
15 | 13,375 | ||||||
| 4.95%, 02/01/28 (Call 03/18/24) |
20 | 19,030 | ||||||
| MDC Holdings Inc. |
||||||||
| 2.50%, 01/15/31 (Call 07/15/30)(c) |
50 | 42,249 | ||||||
| 3.85%, 01/15/30 (Call 07/15/29) |
30 | 27,673 | ||||||
| 3.97%, 08/06/61 (Call 02/06/61) |
20 | 15,217 | ||||||
| 6.00%, 01/15/43 (Call 10/15/42) |
30 | 29,895 | ||||||
| Meritage Homes Corp. |
||||||||
| 3.88%, 04/15/29 (Call 10/15/28)(b)(c) |
30 | 27,315 | ||||||
| 5.13%, 06/06/27 (Call 12/06/26) |
20 | 19,702 | ||||||
| NVR Inc., 3.00%, 05/15/30 (Call 11/15/29) |
84 | 74,031 | ||||||
| PulteGroup Inc. |
||||||||
| 5.00%, 01/15/27 (Call 10/15/26)(c) |
25 | 24,888 | ||||||
| 5.50%, 03/01/26 (Call 12/01/25) |
44 | 44,083 | ||||||
| 6.00%, 02/15/35 |
41 | 42,104 | ||||||
| 6.38%, 05/15/33 |
25 | 26,434 | ||||||
| 7.88%, 06/15/32(c) |
20 | 23,131 | ||||||
| Taylor Morrison Communities Inc. |
||||||||
| 5.13%, 08/01/30 (Call 02/01/30)(b) |
30 | 28,332 | ||||||
| 5.75%, 01/15/28 (Call 10/15/27)(b) |
30 | 29,590 | ||||||
| 5.88%, 06/15/27 (Call 03/15/27)(b) |
30 | 29,920 | ||||||
| Thor Industries Inc., 4.00%, 10/15/29 |
35 | 30,984 | ||||||
| Toll Brothers Finance Corp., 4.88%, 03/15/27 |
5 | 4,916 | ||||||
| Tri Pointe Homes Inc. |
||||||||
| 5.25%, 06/01/27 (Call 12/01/26) |
20 | 19,608 | ||||||
| 5.70%, 06/15/28 (Call 12/15/27) |
20 | 19,660 | ||||||
| Winnebago Industries Inc., 6.25%, 07/15/28 |
20 | 19,738 | ||||||
|
|
|
|||||||
| 877,836 | ||||||||
| Home Furnishings — 0.0% | ||||||||
| Leggett & Platt Inc. |
||||||||
| 3.50%, 11/15/51 (Call 05/15/51) |
30 | 20,684 | ||||||
| 4.40%, 03/15/29 (Call 12/15/28) |
32 | 30,317 | ||||||
| Tempur Sealy International Inc. |
||||||||
| 3.88%, 10/15/31 (Call 10/15/26)(b) |
45 | 37,475 | ||||||
| 4.00%, 04/15/29 (Call 04/15/24)(b) |
45 | 40,365 | ||||||
| Whirlpool Corp. |
||||||||
| 2.40%, 05/15/31 (Call 02/15/31) |
65 | 53,306 | ||||||
| 4.50%, 06/01/46 (Call 12/01/45) |
30 | 24,120 | ||||||
| 4.60%, 05/15/50 (Call 11/15/49)(c) |
35 | 28,180 | ||||||
| 4.75%, 02/26/29 (Call 11/26/28)(c) |
15 | 14,647 | ||||||
| Security | Par (000) | Value | ||||||
| Home Furnishings (continued) | ||||||||
| 5.50%, 03/01/33 (Call 12/01/32) |
$ | 20 | $ | 19,830 | ||||
|
|
|
|||||||
| 268,924 | ||||||||
| Household Products & Wares — 0.1% | ||||||||
| ACCO Brands Corp., 4.25%, 03/15/29 (Call 03/18/24)(b) |
35 | 31,027 | ||||||
| Avery Dennison Corp. |
||||||||
| 2.25%, 02/15/32 (Call 11/15/31) |
70 | 56,831 | ||||||
| 2.65%, 04/30/30 (Call 02/01/30) |
18 | 15,657 | ||||||
| 4.88%, 12/06/28 (Call 09/06/28) |
30 | 29,699 | ||||||
| Church & Dwight Co. Inc. |
||||||||
| 2.30%, 12/15/31 (Call 09/15/31) |
10 | 8,252 | ||||||
| 3.15%, 08/01/27 (Call 05/01/27) |
75 | 70,667 | ||||||
| 3.95%, 08/01/47 (Call 02/01/47) |
65 | 51,942 | ||||||
| 5.00%, 06/15/52 (Call 12/15/51) |
5 | 4,716 | ||||||
| 5.60%, 11/15/32 (Call 08/15/32) |
5 | 5,185 | ||||||
| Clorox Co. (The) |
||||||||
| 1.80%, 05/15/30 (Call 02/15/30) |
85 | 70,217 | ||||||
| 3.90%, 05/15/28 (Call 02/15/28) |
50 | 48,053 | ||||||
| 4.60%, 05/01/32 (Call 02/01/32)(c) |
10 | 9,703 | ||||||
| Kimberly-Clark Corp. |
||||||||
| 1.05%, 09/15/27 (Call 07/15/27) |
64 | 56,302 | ||||||
| 2.00%, 11/02/31 (Call 08/02/31) |
15 | 12,326 | ||||||
| 2.75%, 02/15/26 |
20 | 19,248 | ||||||
| 2.88%, 02/07/50 (Call 08/07/49) |
35 | 23,907 | ||||||
| 3.05%, 08/15/25 |
55 | 53,480 | ||||||
| 3.10%, 03/26/30 (Call 12/26/29) |
25 | 22,742 | ||||||
| 3.20%, 04/25/29 (Call 01/25/29) |
50 | 46,392 | ||||||
| 3.20%, 07/30/46 (Call 01/30/46) |
25 | 18,254 | ||||||
| 3.90%, 05/04/47 (Call 11/04/46) |
30 | 24,302 | ||||||
| 3.95%, 11/01/28 (Call 08/01/28) |
35 | 33,945 | ||||||
| 5.30%, 03/01/41 |
22 | 22,003 | ||||||
| 6.63%, 08/01/37 |
25 | 28,801 | ||||||
| SC Johnson & Son Inc. |
||||||||
| 4.00%, 05/15/43 (Call 02/15/43)(b) |
15 | 12,147 | ||||||
| 4.75%, 10/15/46 (Call 04/16/46)(b) |
35 | 31,179 | ||||||
| 4.80%, 09/01/40(b) |
15 | 13,382 | ||||||
| Spectrum Brands Inc. |
||||||||
| 3.88%, 03/15/31 (Call 03/15/26)(b)(c) |
30 | 28,496 | ||||||
| 5.50%, 07/15/30 (Call 07/15/25)(b) |
25 | 24,501 | ||||||
|
|
|
|||||||
| 873,356 | ||||||||
| Housewares — 0.0% | ||||||||
| Newell Brands Inc. |
||||||||
| 4.88%, 06/01/25 (Call 05/01/25) |
26 | 25,459 | ||||||
| 5.20%, 04/01/26 (Call 01/01/26) |
115 | 111,645 | ||||||
| 6.38%, 09/15/27 (Call 06/15/27)(c) |
25 | 24,285 | ||||||
| 6.38%, 04/01/36 (Call 10/01/35) |
25 | 21,936 | ||||||
| 6.50%, 04/01/46 (Call 10/01/45) |
40 | 31,964 | ||||||
| 6.63%, 09/15/29 (Call 06/15/29)(c) |
25 | 23,931 | ||||||
|
|
|
|||||||
| 239,220 | ||||||||
| Insurance — 1.7% | ||||||||
| ACE Capital Trust II, Series N, 9.70%, 04/01/30 |
40 | 46,987 | ||||||
| Aflac Inc. |
||||||||
| 1.13%, 03/15/26 (Call 02/15/26) |
15 | 13,855 | ||||||
| 2.88%, 10/15/26 (Call 07/15/26) |
45 | 42,490 | ||||||
| 3.60%, 04/01/30 (Call 01/01/30) |
88 | 81,573 | ||||||
| 4.00%, 10/15/46 (Call 04/15/46) |
20 | 15,922 | ||||||
| 4.75%, 01/15/49 (Call 07/15/48) |
55 | 49,767 | ||||||
| AIA Group Ltd., 3.20%, 09/16/40 |
210 | 156,906 | ||||||
| American International Group Inc. |
||||||||
| 4.20%, 04/01/28 (Call 01/01/28) |
10 | 9,712 | ||||||
| S C H E D U L E O F I N V E S T M E N T S |
35 |
| Schedule of Investments (continued) February 29, 2024 |
iShares® ESG Advanced Total USD Bond Market ETF (Percentages shown are based on Net Assets) |
| Security | Par (000) | Value | ||||||
| Insurance (continued) | ||||||||
| 4.38%, 06/30/50 (Call 12/30/49) |
$ | 75 | $ | 64,343 | ||||
| 4.50%, 07/16/44 (Call 01/16/44) |
5 | 4,415 | ||||||
| 4.75%, 04/01/48 (Call 10/01/47) |
75 | 68,503 | ||||||
| 4.80%, 07/10/45 (Call 01/10/45) |
70 | 64,107 | ||||||
| 6.25%, 05/01/36 |
50 | 51,877 | ||||||
| Series A-9, 5.75%, 04/01/48 (Call 04/01/28), |
90 | 88,355 | ||||||
| Aon Corp./Aon Global Holdings PLC |
||||||||
| 3.90%, 02/28/52 (Call 08/28/51) |
100 | 75,678 | ||||||
| 5.00%, 09/12/32 (Call 06/12/32) |
70 | 68,381 | ||||||
| 5.35%, 02/28/33 (Call 11/28/32) |
60 | 59,893 | ||||||
| Aon Global Ltd., 4.75%, 05/15/45 (Call 11/15/44) |
100 | 88,149 | ||||||
| Arch Capital Finance LLC |
||||||||
| 4.01%, 12/15/26 (Call 09/15/26) |
20 | 19,312 | ||||||
| 5.03%, 12/15/46 (Call 06/15/46) |
29 | 26,661 | ||||||
| Arch Capital Group Ltd. |
||||||||
| 3.64%, 06/30/50 (Call 12/30/49) |
70 | 51,566 | ||||||
| 7.35%, 05/01/34 |
15 | 16,828 | ||||||
| Arch Capital Group U.S. Inc., 5.14%, 11/01/43 |
30 | 27,918 | ||||||
| Arthur J Gallagher & Co. |
||||||||
| 2.40%, 11/09/31 (Call 08/09/31) |
15 | 12,146 | ||||||
| 3.50%, 05/20/51 (Call 11/20/50) |
20 | 13,885 | ||||||
| 5.75%, 03/02/53 (Call 09/02/52) |
80 | 78,763 | ||||||
| 6.75%, 02/15/54 (Call 08/15/53) |
40 | 44,793 | ||||||
| Assurant Inc. |
||||||||
| 4.90%, 03/27/28 (Call 12/27/27) |
65 | 63,668 | ||||||
| 7.00%, 03/27/48 (Call 03/27/28), |
25 | 25,306 | ||||||
| AXA SA, 6.38%, (Call 12/14/36), |
30 | 32,850 | ||||||
| AXIS Specialty Finance LLC, 4.90%, 01/15/40 |
5 | 4,413 | ||||||
| AXIS Specialty Finance PLC, 4.00%, 12/06/27 |
25 | 23,903 | ||||||
| Brown & Brown Inc. |
||||||||
| 2.38%, 03/15/31 (Call 12/15/30) |
15 | 12,257 | ||||||
| 4.95%, 03/17/52 (Call 09/17/51) |
60 | 51,696 | ||||||
| Chubb Corp. (The) |
||||||||
| 6.00%, 05/11/37 |
15 | 16,098 | ||||||
| Series 1, 6.50%, 05/15/38 |
30 | 33,707 | ||||||
| Chubb INA Holdings Inc. |
||||||||
| 2.85%, 12/15/51 (Call 06/15/51) |
55 | 37,224 | ||||||
| 3.05%, 12/15/61 (Call 06/15/61) |
105 | 69,708 | ||||||
| 3.15%, 03/15/25 |
25 | 24,441 | ||||||
| 3.35%, 05/03/26 (Call 02/03/26) |
180 | 173,530 | ||||||
| 4.15%, 03/13/43 |
25 | 21,854 | ||||||
| 4.35%, 11/03/45 (Call 05/03/45) |
60 | 52,973 | ||||||
| 6.70%, 05/15/36 |
35 | 39,801 | ||||||
| Corebridge Global Funding, 0.90%, 09/22/25(b) |
75 | 69,929 | ||||||
| Dai-Ichi Life Insurance Co. Ltd. (The), 4.00%, |
30 | 28,669 | ||||||
| Empower Finance 2020 LP |
||||||||
| 1.36%, 09/17/27 (Call 07/17/27)(b) |
35 | 30,835 | ||||||
| 1.78%, 03/17/31 (Call 12/17/30)(b) |
95 | 75,280 | ||||||
| 3.08%, 09/17/51 (Call 03/17/51)(b) |
30 | 20,063 | ||||||
| Everest Reinsurance Holdings Inc. |
||||||||
| 3.13%, 10/15/52 (Call 04/15/52) |
115 | 72,065 | ||||||
| 3.50%, 10/15/50 (Call 04/15/50) |
5 | 3,511 | ||||||
| Great-West Lifeco Finance 2018 LP |
||||||||
| 4.05%, 05/17/28 (Call 02/17/28)(b) |
45 | 43,496 | ||||||
| 4.58%, 05/17/48 (Call 11/17/47)(b) |
5 | 4,399 | ||||||
| Security | Par (000) | Value | ||||||
| Insurance (continued) | ||||||||
| Great-West Lifeco Finance Delaware LP, 4.15%, 06/03/47 (Call 12/03/46)(b) |
$ | 75 | $ | 60,478 | ||||
| Great-West Lifeco U.S. Finance 2020 LP, 0.90%, 08/12/25 (Call 07/12/25)(b) |
47 | 44,056 | ||||||
| Hanover Insurance Group Inc. (The) |
||||||||
| 2.50%, 09/01/30 (Call 06/01/30) |
50 | 41,521 | ||||||
| 4.50%, 04/15/26 (Call 01/15/26) |
60 | 58,851 | ||||||
| Hartford Financial Services Group Inc. (The) |
||||||||
| 2.90%, 09/15/51 (Call 03/15/51) |
30 | 19,227 | ||||||
| 3.60%, 08/19/49 (Call 02/19/49) |
26 | 19,566 | ||||||
| 4.30%, 04/15/43 |
20 | 17,078 | ||||||
| 4.40%, 03/15/48 (Call 09/15/47) |
40 | 34,544 | ||||||
| 5.95%, 10/15/36 |
15 | 15,509 | ||||||
| 6.10%, 10/01/41 |
35 | 36,467 | ||||||
| Jackson Financial Inc., 3.13%, 11/23/31 |
85 | 70,381 | ||||||
| Liberty Mutual Group Inc. |
||||||||
| 3.95%, 10/15/50 (Call 04/15/50)(b) |
5 | 3,752 | ||||||
| 3.95%, 05/15/60 (Call 11/15/59)(b) |
45 | 32,230 | ||||||
| 4.13%, 12/15/51 (Call 09/15/26), |
25 | 21,929 | ||||||
| 4.30%, 02/01/61 (Call 02/01/26)(b) |
40 | 25,469 | ||||||
| 5.50%, 06/15/52 (Call 12/15/51)(b) |
135 | 129,147 | ||||||
| 7.80%, 03/07/87(b) |
25 | 25,661 | ||||||
| Lincoln National Corp. |
||||||||
| 3.05%, 01/15/30 (Call 10/15/29) |
50 | 43,767 | ||||||
| 3.35%, 03/09/25 |
40 | 39,032 | ||||||
| 3.40%, 01/15/31 (Call 10/15/30) |
50 | 43,769 | ||||||
| 3.63%, 12/12/26 (Call 09/15/26)(c) |
45 | 42,962 | ||||||
| 3.80%, 03/01/28 (Call 12/01/27) |
26 | 24,734 | ||||||
| 4.35%, 03/01/48 (Call 09/01/47) |
25 | 19,362 | ||||||
| 4.38%, 06/15/50 (Call 12/15/49) |
24 | 18,526 | ||||||
| 6.30%, 10/09/37 |
5 | 5,129 | ||||||
| 7.00%, 06/15/40 |
50 | 54,519 | ||||||
| Marsh & McLennan Companies Inc. |
||||||||
| 2.25%, 11/15/30 (Call 08/15/30) |
81 | 68,297 | ||||||
| 3.50%, 03/10/25 (Call 12/10/24) |
67 | 65,807 | ||||||
| 3.75%, 03/14/26 (Call 12/14/25) |
81 | 79,025 | ||||||
| 4.20%, 03/01/48 (Call 09/01/47) |
65 | 54,112 | ||||||
| 4.35%, 01/30/47 (Call 07/30/46) |
30 | 25,450 | ||||||
| 4.38%, 03/15/29 (Call 12/15/28) |
140 | 136,913 | ||||||
| 4.75%, 03/15/39 (Call 09/15/38) |
85 | 80,024 | ||||||
| 4.90%, 03/15/49 (Call 09/15/48) |
77 | 71,202 | ||||||
| 5.45%, 03/15/54 (Call 09/15/53) |
100 | 99,371 | ||||||
| 5.70%, 09/15/53 (Call 03/15/53) |
60 | 62,142 | ||||||
| 5.75%, 11/01/32 (Call 08/01/32) |
15 | 15,665 | ||||||
| 5.88%, 08/01/33 |
70 | 73,884 | ||||||
| Massachusetts Mutual Life Insurance Co., 3.20%, 12/01/61(b) |
200 | 125,095 | ||||||
| MassMutual Global Funding II |
||||||||
| 2.15%, 03/09/31(b) |
85 | 69,563 | ||||||
| 4.50%, 04/10/26(b) |
205 | 202,715 | ||||||
| 5.05%, 06/14/28(b) |
205 | 204,563 | ||||||
| Meiji Yasuda Life Insurance Co. |
||||||||
| 5.10%, 04/26/48 (Call 04/26/28), |
40 | 39,048 | ||||||
| 5.20%, 10/20/45 (Call 10/20/25), |
35 | 34,430 | ||||||
| Metropolitan Life Global Funding I |
||||||||
| 0.95%, 07/02/25(b) |
30 | 28,332 | ||||||
| 1.55%, 01/07/31(b) |
70 | 55,097 | ||||||
| 36 | 2 0 2 4 I S H A R E S A N N U A L R E P O R T T O S H A R E H O L D E R S |
| Schedule of Investments (continued) February 29, 2024 |
iShares® ESG Advanced Total USD Bond Market ETF (Percentages shown are based on Net Assets) |
| Security | Par (000) | Value | ||||||
| Insurance (continued) | ||||||||
| 1.88%, 01/11/27(b) |
$ | 165 | $ | 150,595 | ||||
| 2.95%, 04/09/30(b) |
155 | 136,115 | ||||||
| 3.45%, 12/18/26(b) |
120 | 114,958 | ||||||
| 5.15%, 03/28/33(b) |
150 | 148,459 | ||||||
| MGIC Investment Corp., 5.25%, 08/15/28 (Call 03/18/24) |
35 | 33,821 | ||||||
| Munich Re America Corp., Series B, 7.45%, 12/15/26 |
90 | 95,361 | ||||||
| New York Life Global Funding |
||||||||
| 0.85%, 01/15/26(b) |
185 | 171,282 | ||||||
| 1.20%, 08/07/30(b) |
10 | 7,869 | ||||||
| 3.60%, 08/05/25(b) |
140 | 137,076 | ||||||
| 4.55%, 01/28/33(b) |
220 | 209,208 | ||||||
| 4.90%, 06/13/28(b) |
165 | 164,461 | ||||||
| 5.00%, 01/09/34(b) |
100 | 98,210 | ||||||
| New York Life Insurance Co. |
||||||||
| 3.75%, 05/15/50 (Call 11/15/49)(b) |
165 | 125,707 | ||||||
| 4.45%, 05/15/69 (Call 11/15/68)(b) |
15 | 12,031 | ||||||
| 5.88%, 05/15/33(b) |
20 | 20,680 | ||||||
| Primerica Inc., 2.80%, 11/19/31 (Call 08/19/31) |
40 | 33,198 | ||||||
| Principal Financial Group Inc. |
||||||||
| 2.13%, 06/15/30 (Call 03/15/30) |
60 | 49,911 | ||||||
| 3.10%, 11/15/26 (Call 08/15/26) |
40 | 37,952 | ||||||
| 3.40%, 05/15/25 (Call 02/15/25) |
20 | 19,534 | ||||||
| 3.70%, 05/15/29 (Call 02/15/29) |
25 | 23,320 | ||||||
| 4.30%, 11/15/46 (Call 05/15/46) |
30 | 24,844 | ||||||
| 4.35%, 05/15/43 |
22 | 19,120 | ||||||
| 4.63%, 09/15/42 |
20 | 17,927 | ||||||
| 6.05%, 10/15/36 |
51 | 53,653 | ||||||
| Principal Life Global Funding II |
||||||||
| 0.88%, 01/12/26(b) |
50 | 46,008 | ||||||
| 1.25%, 06/23/25(b) |
63 | 59,761 | ||||||
| 1.50%, 08/27/30(b) |
40 | 31,593 | ||||||
| 1.63%, 11/19/30(b) |
15 | 11,713 | ||||||
| 2.50%, 09/16/29(b) |
21 | 18,215 | ||||||
| 3.00%, 04/18/26(b) |
85 | 80,795 | ||||||
| Progressive Corp. (The) |
||||||||
| 2.45%, 01/15/27 |
35 | 32,658 | ||||||
| 3.20%, 03/26/30 (Call 12/26/29) |
65 | 58,721 | ||||||
| 3.70%, 01/26/45 |
25 | 20,223 | ||||||
| 3.95%, 03/26/50 (Call 09/26/49) |
35 | 28,494 | ||||||
| 4.00%, 03/01/29 (Call 12/01/28) |
27 | 25,971 | ||||||
| 4.13%, 04/15/47 (Call 10/15/46) |
62 | 52,068 | ||||||
| 4.20%, 03/15/48 (Call 09/15/47) |
40 | 34,385 | ||||||
| 4.35%, 04/25/44 |
15 | 13,276 | ||||||
| 6.25%, 12/01/32 |
73 | 79,246 | ||||||
| Protective Life Corp. |
||||||||
| 3.40%, 01/15/30 (Call 10/15/29)(b) |
90 | 79,041 | ||||||
| 4.30%, 09/30/28 (Call 06/30/28)(b)(c) |
60 | 57,980 | ||||||
| Prudential Financial Inc. |
||||||||
| 1.50%, 03/10/26 (Call 02/10/26) |
60 | 55,901 | ||||||
| 2.10%, 03/10/30 (Call 12/10/29) |
79 | 67,554 | ||||||
| 3.00%, 03/10/40 (Call 09/10/39) |
45 | 33,544 | ||||||
| 3.70%, 10/01/50 (Call 07/01/30), |
75 | 65,398 | ||||||
| 3.70%, 03/13/51 (Call 09/13/50) |
80 | 60,738 | ||||||
| 3.88%, 03/27/28 (Call 12/27/27) |
60 | 57,646 | ||||||
| 3.91%, 12/07/47 (Call 06/07/47) |
65 | 51,309 | ||||||
| 3.94%, 12/07/49 (Call 06/07/49) |
82 | 64,268 | ||||||
| 4.35%, 02/25/50 (Call 08/25/49) |
75 | 63,416 | ||||||
| 4.42%, 03/27/48 (Call 09/27/47) |
45 | 38,412 | ||||||
| Security | Par (000) | Value | ||||||
| Insurance (continued) | ||||||||
| 5.13%, 03/01/52 (Call 11/28/31), |
$ | 30 | $ | 28,031 | ||||
| 5.70%, 12/14/36 |
67 | 69,133 | ||||||
| 5.70%, 09/15/48 (Call 09/15/28), |
105 | 102,566 | ||||||
| 5.75%, 07/15/33 |
23 | 24,133 | ||||||
| 6.00%, 09/01/52 (Call 06/01/32), |
95 | 94,695 | ||||||
| 6.63%, 12/01/37 |
25 | 27,803 | ||||||
| Reinsurance Group of America Inc. |
||||||||
| 3.15%, 06/15/30 (Call 03/15/30) |
72 | 63,640 | ||||||
| 3.90%, 05/15/29 (Call 02/15/29) |
73 | 68,870 | ||||||
| 3.95%, 09/15/26 (Call 06/15/26) |
25 | 24,448 | ||||||
| Reliance Standard Life Global Funding II |
||||||||
| 1.51%, 09/28/26(b) |
75 | 66,877 | ||||||
| 2.75%, 05/07/25(b) |
15 | 14,451 | ||||||
| 2.75%, 01/21/27(b) |
40 | 36,551 | ||||||
| Selective Insurance Group Inc., 5.38%, 03/01/49 (Call 09/01/48) |
15 | 14,200 | ||||||
| Swiss Re Finance Luxembourg SA, 5.00%, 04/02/49 (Call 04/02/29), (5-year CMT + 3.582%)(a)(b) |
200 | 193,580 | ||||||
| Travelers Companies Inc. (The) |
||||||||
| 2.55%, 04/27/50 (Call 10/27/49) |
65 | 40,462 | ||||||
| 3.75%, 05/15/46 (Call 11/15/45) |
39 | 30,920 | ||||||
| 4.00%, 05/30/47 (Call 11/30/46) |
60 | 49,478 | ||||||
| 4.05%, 03/07/48 (Call 09/07/47) |
30 | 25,149 | ||||||
| 4.10%, 03/04/49 (Call 09/04/48) |
37 | 31,098 | ||||||
| 4.30%, 08/25/45 (Call 02/25/45) |
45 | 39,218 | ||||||
| 4.60%, 08/01/43 |
25 | 23,222 | ||||||
| 5.35%, 11/01/40 |
30 | 30,329 | ||||||
| 5.45%, 05/25/53 (Call 11/25/52) |
50 | 51,004 | ||||||
| 6.25%, 06/15/37 |
60 | 65,934 | ||||||
| 6.75%, 06/20/36 |
50 | 57,008 | ||||||
| Trinity Acquisition PLC, 4.40%, 03/15/26 (Call 12/15/25) |
70 | 68,594 | ||||||
| Unum Group, 4.13%, 06/15/51 (Call 12/15/50) |
65 | 47,705 | ||||||
| Willis North America Inc. |
||||||||
| 2.95%, 09/15/29 (Call 06/15/29) |
88 | 78,197 | ||||||
| 3.88%, 09/15/49 (Call 03/15/49) |
39 | 28,913 | ||||||
| 4.50%, 09/15/28 (Call 06/15/28) |
57 | 55,002 | ||||||
| 4.65%, 06/15/27 (Call 05/15/27) |
25 | 24,535 | ||||||
| 5.05%, 09/15/48 (Call 03/15/48) |
20 | 17,906 | ||||||
| XL Group Ltd., 5.25%, 12/15/43 |
30 | 28,023 | ||||||
| Zurich Finance Ireland Designated Activity Co., |
200 | 162,633 | ||||||
|
|
|
|||||||
| 9,890,796 | ||||||||
| Internet — 0.4% | ||||||||
| Alibaba Group Holding Ltd. |
||||||||
| 2.13%, 02/09/31 (Call 11/09/30) |
50 | 41,359 | ||||||
| 4.00%, 12/06/37 (Call 06/06/37) |
15 | 12,934 | ||||||
| 4.20%, 12/06/47 (Call 06/06/47) |
255 | 207,407 | ||||||
| 4.50%, 11/28/34 (Call 05/28/34) |
200 | 187,297 | ||||||
| Baidu Inc., 2.38%, 08/23/31 (Call 05/23/31) |
210 | 173,223 | ||||||
| Booking Holdings Inc. |
||||||||
| 3.55%, 03/15/28 (Call 12/15/27) |
90 | 85,645 | ||||||
| 3.60%, 06/01/26 (Call 03/01/26) |
81 | 78,499 | ||||||
| 3.65%, 03/15/25 (Call 12/15/24) |
95 | 93,418 | ||||||
| 4.63%, 04/13/30 (Call 01/13/30) |
105 | 103,182 | ||||||
| Cars.com Inc., 6.38%, 11/01/28 (Call 04/01/24)(b) |
25 | 24,204 | ||||||
| S C H E D U L E O F I N V E S T M E N T S |
37 |
| Schedule of Investments (continued) February 29, 2024 |
iShares® ESG Advanced Total USD Bond Market ETF (Percentages shown are based on Net Assets) |
| Security | Par (000) | Value | ||||||
| Internet (continued) | ||||||||
| Cogent Communications Group Inc. |
||||||||
| 3.50%, 05/01/26 (Call 02/01/26)(b)(c) |
$ | 35 | $ | 33,418 | ||||
| 7.00%, 06/15/27 (Call 06/15/24)(b) |
25 | 24,968 | ||||||
| eBay Inc. |
||||||||
| 1.40%, 05/10/26 (Call 04/10/26) |
75 | 69,157 | ||||||
| 1.90%, 03/11/25 (Call 02/11/25) |
138 | 133,164 | ||||||
| 2.60%, 05/10/31 (Call 02/10/31) |
55 | 46,619 | ||||||
| 2.70%, 03/11/30 (Call 12/11/29) |
70 | 61,160 | ||||||
| 3.60%, 06/05/27 (Call 03/05/27) |
77 | 73,540 | ||||||
| 3.65%, 05/10/51 (Call 11/10/50) |
60 | 43,390 | ||||||
| 4.00%, 07/15/42 (Call 01/15/42) |
65 | 51,566 | ||||||
| Gen Digital Inc. |
||||||||
| 5.00%, 04/15/25 (Call 03/11/24)(b) |
60 | 59,404 | ||||||
| 6.75%, 09/30/27 (Call 09/30/24)(b) |
50 | 50,302 | ||||||
| 7.13%, 09/30/30 (Call 09/30/25)(b)(c) |
35 | 35,754 | ||||||
| Go Daddy Operating Co. LLC/GD Finance Co. Inc. |
||||||||
| 3.50%, 03/01/29 (Call 04/01/24)(b) |
45 | 40,081 | ||||||
| 5.25%, 12/01/27 (Call 04/01/24)(b) |
40 | 38,828 | ||||||
| GrubHub Holdings Inc., 5.50%, 07/01/27 (Call 03/11/24)(b) |
30 | 26,160 | ||||||
| Meituan, 2.13%, 10/28/25 (Call 09/28/25)(e) |
200 | 188,460 | ||||||
| Prosus NV |
||||||||
| 3.68%, 01/21/30 (Call 10/21/29)(e) |
200 | 172,532 | ||||||
| 4.99%, 01/19/52 (Call 07/19/51)(e) |
200 | 146,728 | ||||||
| Rakuten Group Inc. |
||||||||
| 5.13%, (Call 04/22/26), |
45 | 38,261 | ||||||
| 6.25%, (Call 04/22/31), |
40 | 28,826 | ||||||
| VeriSign Inc. |
||||||||
| 2.70%, 06/15/31 (Call 03/15/31) |
75 | 62,343 | ||||||
| 4.75%, 07/15/27 (Call 04/01/24) |
40 | 39,213 | ||||||
| Ziff Davis Inc., 4.63%, 10/15/30 |
25 | 22,426 | ||||||
|
|
|
|||||||
| 2,493,468 | ||||||||
| Iron & Steel — 0.2% | ||||||||
| ATI Inc. |
||||||||
| 4.88%, 10/01/29 (Call 10/01/24) |
20 | 18,583 | ||||||
| 5.13%, 10/01/31 (Call 10/01/26) |
20 | 18,301 | ||||||
| 5.88%, 12/01/27 (Call 04/01/24) |
25 | 24,491 | ||||||
| 7.25%, 08/15/30 (Call 08/15/26) |
25 | 25,711 | ||||||
| Carpenter Technology Corp. |
||||||||
| 6.38%, 07/15/28 (Call 04/01/24) |
20 | 19,925 | ||||||
| 7.63%, 03/15/30 (Call 03/15/25) |
20 | 20,656 | ||||||
| Cleveland-Cliffs Inc. |
||||||||
| 4.63%, 03/01/29 (Call 04/01/24)(b)(c) |
25 | 23,137 | ||||||
| 4.88%, 03/01/31 (Call 03/01/26)(b)(c) |
20 | 18,012 | ||||||
| 5.88%, 06/01/27 (Call 04/01/24) |
31 | 30,676 | ||||||
| 6.25%, 10/01/40 |
15 | 13,095 | ||||||
| 6.75%, 03/15/26 (Call 04/01/24)(b) |
45 | 45,372 | ||||||
| 6.75%, 04/15/30 (Call 04/15/26)(b) |
45 | 44,673 | ||||||
| Commercial Metals Co. |
||||||||
| 3.88%, 02/15/31 (Call 02/15/26) |
20 | 17,495 | ||||||
| 4.13%, 01/15/30 (Call 01/15/25) |
15 | 13,697 | ||||||
| 4.38%, 03/15/32 (Call 03/15/27) |
20 | 17,808 | ||||||
| GUSAP III LP, 4.25%, 01/21/30 |
200 | 186,973 | ||||||
| Mineral Resources Ltd. |
||||||||
| 8.00%, 11/01/27 (Call 11/01/24)(b) |
30 | 30,537 | ||||||
| 8.13%, 05/01/27 (Call 04/01/24)(b) |
46 | 46,405 | ||||||
| 8.50%, 05/01/30 (Call 05/01/25)(b) |
40 | 41,343 | ||||||
| 9.25%, 10/01/28 (Call 10/01/25)(b) |
55 | 57,760 | ||||||
| Security | Par (000) | Value | ||||||
| Iron & Steel (continued) | ||||||||
| Reliance Inc. |
||||||||
| 1.30%, 08/15/25 (Call 07/15/25) |
$ | 115 | $ | 107,941 | ||||
| 2.15%, 08/15/30 (Call 05/15/30) |
70 | 58,078 | ||||||
| Steel Dynamics Inc. |
||||||||
| 1.65%, 10/15/27 (Call 08/15/27) |
60 | 53,332 | ||||||
| 2.40%, 06/15/25 (Call 05/15/25) |
62 | 59,558 | ||||||
| 3.25%, 01/15/31 (Call 10/15/30) |
25 | 22,155 | ||||||
| 3.25%, 10/15/50 (Call 04/15/50) |
15 | 9,824 | ||||||
| 3.45%, 04/15/30 (Call 01/15/30) |
30 | 27,263 | ||||||
| 5.00%, 12/15/26 (Call 04/01/24) |
40 | 39,673 | ||||||
| U.S. Steel Corp., 6.65%, 06/01/37 |
15 | 15,493 | ||||||
|
|
|
|||||||
| 1,107,967 | ||||||||
| Leisure Time — 0.1% | ||||||||
| Brunswick Corp. |
||||||||
| 2.40%, 08/18/31 (Call 05/18/31) |
25 | 19,671 | ||||||
| 4.40%, 09/15/32 (Call 06/15/32)(c) |
15 | 13,379 | ||||||
| 5.10%, 04/01/52 (Call 10/01/51) |
25 | 19,761 | ||||||
| Harley-Davidson Financial Services Inc., 3.05%, 02/14/27 (Call 01/14/27)(b) |
10 | 9,370 | ||||||
| Harley-Davidson Inc., 4.63%, 07/28/45 (Call 01/28/45) |
28 | 22,086 | ||||||
| NCL Corp. Ltd. |
||||||||
| 5.88%, 03/15/26 (Call 12/15/25)(b) |
80 | 78,116 | ||||||
| 5.88%, 02/15/27 (Call 03/11/24)(b) |
60 | 59,284 | ||||||
| 7.75%, 02/15/29 (Call 11/15/28)(b)(c) |
35 | 35,865 | ||||||
| 8.13%, 01/15/29 (Call 01/15/26)(b) |
40 | 42,144 | ||||||
| 8.38%, 02/01/28 (Call 02/01/25)(b) |
30 | 31,512 | ||||||
| NCL Finance Ltd., 6.13%, 03/15/28 (Call 12/15/27)(b)(c) |
25 | 24,389 | ||||||
|
|
|
|||||||
| 355,577 | ||||||||
| Lodging — 0.1% | ||||||||
| Hilton Domestic Operating Co. Inc. |
||||||||
| 3.63%, 02/15/32 (Call 08/15/26)(b) |
85 | 72,614 | ||||||
| 3.75%, 05/01/29 (Call 05/01/24)(b) |
45 | 40,978 | ||||||
| 4.00%, 05/01/31 (Call 05/01/26)(b) |
61 | 54,219 | ||||||
| 4.88%, 01/15/30 (Call 01/15/25) |
50 | 47,548 | ||||||
| 5.38%, 05/01/25 (Call 03/11/24)(b) |
26 | 25,975 | ||||||
| 5.75%, 05/01/28 (Call 04/01/24)(b) |
35 | 34,913 | ||||||
| Hilton Grand Vacations Borrower Escrow LLC/Hilton Grand Vacations Borrower Esc |
||||||||
| 4.88%, 07/01/31 (Call 07/01/26)(b) |
30 | 26,475 | ||||||
| 5.00%, 06/01/29 (Call 06/01/24)(b) |
50 | 46,346 | ||||||
| 6.63%, 01/15/32 (Call 01/15/27)(b) |
50 | 50,004 | ||||||
| Hilton Worldwide Finance LLC/Hilton Worldwide Finance Corp., 4.88%, 04/01/27 (Call 03/18/24) |
35 | 34,152 | ||||||
| Hyatt Hotels Corp. |
||||||||
| 5.75%, 01/30/27 (Call 12/30/26) |
90 | 91,078 | ||||||
| 5.75%, 04/23/30 (Call 01/23/30) |
35 | 35,665 | ||||||
| Marriott Ownership Resorts Inc. |
||||||||
| 4.50%, 06/15/29 (Call 06/15/24)(b)(c) |
30 | 27,210 | ||||||
| 4.75%, 01/15/28 (Call 04/01/24) |
25 | 23,236 | ||||||
| Studio City Co. Ltd., 7.00%, 02/15/27 |
50 | 49,801 | ||||||
| Studio City Finance Ltd., 5.00%, 01/15/29 |
70 | 61,260 | ||||||
| Travel & Leisure Co. |
||||||||
| 4.50%, 12/01/29 (Call 09/01/29)(b) |
35 | 32,102 | ||||||
| 4.63%, 03/01/30 (Call 12/01/29)(b)(c) |
20 | 18,055 | ||||||
| 6.00%, 04/01/27 (Call 01/01/27) |
30 | 29,849 | ||||||
| 6.60%, 10/01/25 (Call 07/01/25) |
25 | 25,244 | ||||||
| 38 | 2 0 2 4 I S H A R E S A N N U A L R E P O R T T O S H A R E H O L D E R S |
| Schedule of Investments (continued) February 29, 2024 |
iShares® ESG Advanced Total USD Bond Market ETF (Percentages shown are based on Net Assets) |
| Security | Par (000) | Value | ||||||
| Lodging (continued) | ||||||||
| 6.63%, 07/31/26 (Call 04/30/26)(b) |
$ | 35 | $ | 35,360 | ||||
|
|
|
|||||||
| 862,084 | ||||||||
| Machinery — 0.7% | ||||||||
| ABB Finance USA Inc., 4.38%, 05/08/42 |
10 | 8,975 | ||||||
| ATS Corp., 4.13%, 12/15/28 (Call 04/01/24)(b) |
25 | 22,809 | ||||||
| Caterpillar Financial Services Corp. |
||||||||
| 0.80%, 11/13/25 |
45 | 41,947 | ||||||
| 0.90%, 03/02/26 |
105 | 96,923 | ||||||
| 1.10%, 09/14/27 |
169 | 148,916 | ||||||
| 1.15%, 09/14/26 |
10 | 9,116 | ||||||
| 1.45%, 05/15/25 |
95 | 90,853 | ||||||
| 1.70%, 01/08/27 |
55 | 50,574 | ||||||
| 2.40%, 08/09/26(c) |
50 | 47,143 | ||||||
| Caterpillar Inc. |
||||||||
| 1.90%, 03/12/31 (Call 12/12/30) |
25 | 20,978 | ||||||
| 2.60%, 09/19/29 (Call 06/19/29) |
106 | 95,425 | ||||||
| 2.60%, 04/09/30 (Call 01/09/30) |
44 | 39,092 | ||||||
| 3.25%, 09/19/49 (Call 03/19/49) |
50 | 36,800 | ||||||
| 3.25%, 04/09/50 (Call 10/09/49) |
65 | 48,050 | ||||||
| 3.80%, 08/15/42 |
60 | 50,066 | ||||||
| 4.30%, 05/15/44 (Call 11/15/43) |
50 | 45,160 | ||||||
| 4.75%, 05/15/64 (Call 11/15/63) |
40 | 36,170 | ||||||
| 5.20%, 05/27/41 |
75 | 75,776 | ||||||
| 6.05%, 08/15/36 |
40 | 43,818 | ||||||
| Chart Industries Inc. |
||||||||
| 7.50%, 01/01/30 (Call 01/01/26)(b) |
80 | 82,538 | ||||||
| 9.50%, 01/01/31 (Call 01/01/26)(b) |
31 | 33,300 | ||||||
| CNH Industrial Capital LLC |
||||||||
| 1.45%, 07/15/26 (Call 06/15/26) |
12 | 10,972 | ||||||
| 1.88%, 01/15/26 (Call 12/15/25) |
75 | 70,291 | ||||||
| 5.50%, 01/12/29 (Call 12/12/28) |
20 | 20,266 | ||||||
| CNH Industrial NV, 3.85%, 11/15/27 (Call 08/15/27) |
104 | 99,788 | ||||||
| Deere & Co. |
||||||||
| 2.75%, 04/15/25 (Call 03/15/25) |
112 | 109,071 | ||||||
| 2.88%, 09/07/49 (Call 03/07/49) |
40 | 27,835 | ||||||
| 3.10%, 04/15/30 (Call 01/15/30) |
81 | 73,698 | ||||||
| 3.75%, 04/15/50 (Call 10/15/49) |
60 | 49,118 | ||||||
| 3.90%, 06/09/42 (Call 12/09/41) |
75 | 64,000 | ||||||
| 5.38%, 10/16/29 |
25 | 25,812 | ||||||
| 7.13%, 03/03/31 |
25 | 28,543 | ||||||
| Dover Corp. |
||||||||
| 2.95%, 11/04/29 (Call 08/04/29) |
50 | 44,601 | ||||||
| 3.15%, 11/15/25 (Call 08/15/25) |
72 | 69,428 | ||||||
| 5.38%, 10/15/35 |
10 | 10,169 | ||||||
| 5.38%, 03/01/41 (Call 12/01/40) |
37 | 36,392 | ||||||
| Flowserve Corp. |
||||||||
| 2.80%, 01/15/32 (Call 10/15/31) |
25 | 20,436 | ||||||
| 3.50%, 10/01/30 (Call 07/01/30) |
49 | 43,103 | ||||||
| IDEX Corp. |
||||||||
| 2.63%, 06/15/31 (Call 03/15/31) |
50 | 42,141 | ||||||
| 3.00%, 05/01/30 (Call 02/01/30) |
74 | 64,612 | ||||||
| John Deere Capital Corp. |
||||||||
| 0.70%, 01/15/26 |
62 | 57,393 | ||||||
| 1.05%, 06/17/26 |
57 | 52,253 | ||||||
| 1.30%, 10/13/26 |
35 | 31,977 | ||||||
| 1.45%, 01/15/31 |
22 | 17,758 | ||||||
| 1.50%, 03/06/28 |
12 | 10,569 | ||||||
| 1.75%, 03/09/27 |
75 | 68,575 | ||||||
| 2.00%, 06/17/31 |
32 | 26,451 | ||||||
| 2.25%, 09/14/26 |
90 | 84,250 | ||||||
| 2.45%, 01/09/30 |
71 | 62,390 | ||||||
| Security | Par (000) | Value | ||||||
| Machinery (continued) | ||||||||
| 2.65%, 06/10/26 |
$ | 77 | $ | 73,388 | ||||
| 2.80%, 09/08/27 |
90 | 84,218 | ||||||
| 2.80%, 07/18/29 |
60 | 54,539 | ||||||
| 3.05%, 01/06/28 |
43 | 40,568 | ||||||
| 3.40%, 06/06/25 |
114 | 111,696 | ||||||
| 3.40%, 09/11/25 |
68 | 66,397 | ||||||
| 3.45%, 03/13/25 |
91 | 89,372 | ||||||
| 3.45%, 03/07/29 |
72 | 67,895 | ||||||
| 4.15%, 09/15/27 |
40 | 39,201 | ||||||
| 4.50%, 01/16/29 |
200 | 197,094 | ||||||
| Manitowoc Co. Inc. (The), 9.00%, 04/01/26 (Call 03/18/24)(b)(c) |
21 | 20,997 | ||||||
| Mueller Water Products Inc., 4.00%, 06/15/29 (Call 06/15/24)(b)(c) |
26 | 23,651 | ||||||
| nVent Finance Sarl, 2.75%, 11/15/31 (Call 08/15/31) |
60 | 48,914 | ||||||
| Otis Worldwide Corp. |
||||||||
| 2.06%, 04/05/25 (Call 03/05/25) |
166 | 159,895 | ||||||
| 2.29%, 04/05/27 (Call 02/05/27) |
75 | 69,303 | ||||||
| 2.57%, 02/15/30 (Call 11/15/29) |
120 | 104,512 | ||||||
| 3.11%, 02/15/40 (Call 08/15/39) |
70 | 53,224 | ||||||
| 3.36%, 02/15/50 (Call 08/15/49) |
35 | 25,314 | ||||||
| Rockwell Automation Inc. |
||||||||
| 2.80%, 08/15/61 (Call 02/15/61) |
25 | 14,938 | ||||||
| 3.50%, 03/01/29 (Call 12/01/28) |
110 | 104,816 | ||||||
| 4.20%, 03/01/49 (Call 09/01/48) |
45 | 38,343 | ||||||
| SPX FLOW Inc., 8.75%,
04/01/30 |
30 | 29,404 | ||||||
| Terex Corp., 5.00%, 05/15/29 (Call 05/15/24)(b) |
35 | 32,780 | ||||||
| Vertiv Group Corp., 4.13%, 11/15/28 (Call 11/15/24)(b) |
50 | 46,162 | ||||||
| Weir Group PLC (The), 2.20%, 05/13/26 (Call 04/13/26)(b) |
55 | 50,945 | ||||||
| Westinghouse Air Brake Technologies Corp. |
||||||||
| 3.45%, 11/15/26 (Call 08/15/26) |
45 | 42,789 | ||||||
| 4.70%, 09/15/28 (Call 06/15/28) |
60 | 58,529 | ||||||
| Xylem Inc./NY |
||||||||
| 1.95%, 01/30/28 (Call 11/30/27) |
55 | 49,141 | ||||||
| 2.25%, 01/30/31 (Call 10/30/30) |
50 | 41,891 | ||||||
| 3.25%, 11/01/26 (Call 08/01/26) |
75 | 71,602 | ||||||
| 4.38%, 11/01/46 (Call 05/01/46) |
22 | 18,613 | ||||||
|
|
|
|||||||
| 4,376,452 | ||||||||
| Machinery - Diversified — 0.0% | ||||||||
| Ingersoll Rand Inc., 5.70%, 08/14/33 (Call 05/14/33) |
20 | 20,355 | ||||||
|
|
|
|||||||
| Manufacturing — 0.3% | ||||||||
| Carlisle Companies Inc. |
||||||||
| 2.75%, 03/01/30 (Call 12/01/29) |
41 | 35,659 | ||||||
| 3.75%, 12/01/27 (Call 09/01/27) |
64 | 60,820 | ||||||
| Eaton Corp. |
||||||||
| 3.10%, 09/15/27 (Call 06/15/27) |
115 | 108,686 | ||||||
| 3.92%, 09/15/47 (Call 03/15/47) |
20 | 16,363 | ||||||
| 4.00%, 11/02/32 |
35 | 32,793 | ||||||
| 4.15%, 11/02/42 |
60 | 52,087 | ||||||
| 4.70%, 08/23/52 (Call 02/23/52) |
45 | 41,519 | ||||||
| Enpro Inc., 5.75%, 10/15/26 (Call 04/01/24) |
25 | 24,722 | ||||||
| Gates Global LLC/Gates Corp., 6.25%, 01/15/26 (Call 04/01/24)(b)(c) |
30 | 29,968 | ||||||
| Hillenbrand Inc. |
||||||||
| 3.75%, 03/01/31 (Call 03/01/26) |
25 | 21,317 | ||||||
| 5.00%, 09/15/26 (Call 07/15/26) |
21 | 20,566 | ||||||
| 5.75%, 06/15/25 (Call 03/11/24) |
20 | 19,898 | ||||||
| Illinois Tool Works Inc. |
||||||||
| 2.65%, 11/15/26 (Call 08/15/26) |
70 | 66,549 | ||||||
| S C H E D U L E O F I N V E S T M E N T S |
39 |
| Schedule of Investments (continued) February 29, 2024 |
iShares® ESG Advanced Total USD Bond Market ETF (Percentages shown are based on Net Assets) |
| Security | Par (000) | Value | ||||||
| Manufacturing (continued) | ||||||||
| 3.90%, 09/01/42 (Call 03/01/42) |
$ | 48 | $ | 40,869 | ||||
| 4.88%, 09/15/41 (Call 03/15/41) |
67 | 64,737 | ||||||
| Parker-Hannifin Corp. |
||||||||
| 3.25%, 03/01/27 (Call 12/01/26) |
5 | 4,756 | ||||||
| 3.25%, 06/14/29 (Call 03/14/29) |
81 | 74,531 | ||||||
| 4.00%, 06/14/49 (Call 12/14/48) |
40 | 32,637 | ||||||
| 4.10%, 03/01/47 (Call 09/01/46) |
35 | 28,740 | ||||||
| 4.20%, 11/21/34 (Call 05/21/34) |
56 | 51,564 | ||||||
| 4.45%, 11/21/44 (Call 05/21/44) |
30 | 26,316 | ||||||
| Pentair Finance Sarl, 4.50%, 07/01/29 (Call 04/01/29) |
45 | 43,400 | ||||||
| Siemens Financieringsmaatschappij NV |
||||||||
| 1.70%, 03/11/28(b) |
250 | 222,572 | ||||||
| 2.15%, 03/11/31(b) |
280 | 233,381 | ||||||
| 3.30%, 09/15/46(b) |
260 | 196,589 | ||||||
| 6.13%, 08/17/26(b) |
270 | 276,898 | ||||||
| Teledyne Technologies Inc. |
||||||||
| 1.60%, 04/01/26 (Call 03/01/26) |
80 | 74,180 | ||||||
| 2.25%, 04/01/28 (Call 02/01/28) |
120 | 107,526 | ||||||
| Trinity Industries Inc., 7.75%, 07/15/28 |
20 | 20,705 | ||||||
|
|
|
|||||||
| 2,030,348 | ||||||||
| Media — 1.7% | ||||||||
| Belo Corp. |
||||||||
| 7.25%, 09/15/27(c) |
15 | 15,203 | ||||||
| 7.75%, 06/01/27(c) |
15 | 15,376 | ||||||
| Cable One Inc., 4.00%, 11/15/30 |
40 | 30,201 | ||||||
| CCO Holdings LLC/CCO Holdings Capital Corp. |
||||||||
| 4.25%, 02/01/31 (Call 07/01/25)(b) |
200 | 160,806 | ||||||
| 4.25%, 01/15/34 (Call 01/15/28)(b) |
110 | 82,265 | ||||||
| 4.50%, 08/15/30 (Call 02/15/25)(b) |
200 | 165,901 | ||||||
| 4.50%, 05/01/32 (Call 05/01/26) |
170 | 134,332 | ||||||
| 4.50%, 06/01/33 (Call 06/01/27)(b) |
100 | 76,955 | ||||||
| 4.75%, 03/01/30 (Call 09/01/24)(b) |
200 | 170,163 | ||||||
| 4.75%, 02/01/32 (Call 02/01/27)(b) |
65 | 52,474 | ||||||
| 5.00%, 02/01/28 (Call 03/18/24)(b) |
200 | 184,728 | ||||||
| 5.13%, 05/01/27 (Call 04/01/24)(b) |
175 | 165,401 | ||||||
| 5.38%, 06/01/29 (Call 06/01/24)(b) |
45 | 40,614 | ||||||
| Charter Communications Operating LLC/Charter Communications Operating Capital |
||||||||
| 2.30%, 02/01/32 (Call 11/01/31) |
40 | 30,385 | ||||||
| 3.50%, 06/01/41 (Call 12/01/40) |
160 | 105,862 | ||||||
| 3.85%, 04/01/61 (Call 10/01/60) |
365 | 211,513 | ||||||
| 3.90%, 06/01/52 (Call 12/01/51) |
550 | 345,136 | ||||||
| 4.20%, 03/15/28 (Call 12/15/27) |
165 | 154,599 | ||||||
| 4.40%, 04/01/33 (Call 01/01/33)(c) |
95 | 82,967 | ||||||
| 4.80%, 03/01/50 (Call 09/01/49) |
50 | 36,125 | ||||||
| 4.91%, 07/23/25 (Call 04/23/25) |
265 | 261,303 | ||||||
| 5.05%, 03/30/29 (Call 12/30/28) |
145 | 138,712 | ||||||
| 5.75%, 04/01/48 (Call 10/01/47) |
75 | 62,327 | ||||||
| 6.38%, 10/23/35 (Call 04/23/35) |
190 | 183,569 | ||||||
| 6.48%, 10/23/45 (Call 04/23/45) |
400 | 365,313 | ||||||
| 6.65%, 02/01/34 (Call 11/01/33)(c) |
5 | 5,009 | ||||||
| 6.83%, 10/23/55 (Call 04/23/55) |
5 | 4,729 | ||||||
| Comcast Corp. |
||||||||
| 1.50%, 02/15/31 (Call 11/15/30) |
200 | 159,359 | ||||||
| 1.95%, 01/15/31 (Call 10/15/30) |
210 | 172,452 | ||||||
| 2.45%, 08/15/52 (Call 02/15/52) |
105 | 60,247 | ||||||
| 2.65%, 02/01/30 (Call 11/01/29) |
145 | 127,617 | ||||||
| 2.65%, 08/15/62 (Call 02/15/62)(c) |
90 | 50,177 | ||||||
| 2.80%, 01/15/51 (Call 07/15/50) |
100 | 62,470 | ||||||
| 2.89%, 11/01/51 (Call 05/01/51) |
300 | 190,044 | ||||||
| Security | Par (000) | Value | ||||||
| Media (continued) | ||||||||
| 2.94%, 11/01/56 (Call 05/01/56) |
$ | 385 | $ | 237,060 | ||||
| 2.99%, 11/01/63 (Call 05/01/63) |
250 | 149,595 | ||||||
| 3.15%, 03/01/26 (Call 12/01/25) |
55 | 53,083 | ||||||
| 3.15%, 02/15/28 (Call 11/15/27) |
45 | 42,202 | ||||||
| 3.20%, 07/15/36 (Call 01/15/36) |
15 | 12,112 | ||||||
| 3.25%, 11/01/39 (Call 05/01/39) |
80 | 61,437 | ||||||
| 3.30%, 02/01/27 (Call 11/01/26) |
120 | 115,041 | ||||||
| 3.30%, 04/01/27 (Call 02/01/27) |
50 | 47,699 | ||||||
| 3.40%, 04/01/30 (Call 01/01/30) |
205 | 187,610 | ||||||
| 3.40%, 07/15/46 (Call 01/15/46) |
50 | 36,678 | ||||||
| 3.45%, 02/01/50 (Call 08/01/49) |
160 | 114,902 | ||||||
| 3.55%, 05/01/28 (Call 02/01/28) |
30 | 28,469 | ||||||
| 3.75%, 04/01/40 (Call 10/01/39) |
100 | 81,726 | ||||||
| 3.90%, 03/01/38 (Call 09/01/37) |
95 | 81,520 | ||||||
| 3.95%, 10/15/25 (Call 08/15/25) |
170 | 167,054 | ||||||
| 3.97%, 11/01/47 (Call 05/01/47) |
115 | 91,215 | ||||||
| 4.00%, 03/01/48 (Call 09/01/47) |
75 | 59,462 | ||||||
| 4.00%, 11/01/49 (Call 05/01/49) |
145 | 114,677 | ||||||
| 4.05%, 11/01/52 (Call 05/01/52) |
80 | 63,098 | ||||||
| 4.15%, 10/15/28 (Call 07/15/28) |
315 | 305,779 | ||||||
| 4.20%, 08/15/34 (Call 02/15/34) |
55 | 50,528 | ||||||
| 4.25%, 10/15/30 (Call 07/15/30) |
100 | 95,569 | ||||||
| 4.25%, 01/15/33 |
165 | 154,550 | ||||||
| 4.40%, 08/15/35 (Call 02/15/35) |
35 | 32,425 | ||||||
| 4.60%, 10/15/38 (Call 04/15/38) |
30 | 27,604 | ||||||
| 4.70%, 10/15/48 (Call 04/15/48) |
105 | 94,788 | ||||||
| 4.80%, 05/15/33 (Call 02/15/33) |
125 | 122,140 | ||||||
| 4.95%, 10/15/58 (Call 04/15/58) |
70 | 64,641 | ||||||
| 5.25%, 11/07/25 |
140 | 140,611 | ||||||
| 5.35%, 05/15/53 (Call 11/15/52) |
50 | 48,765 | ||||||
| 6.50%, 11/15/35 |
130 | 141,785 | ||||||
| 7.05%, 03/15/33 |
5 | 5,620 | ||||||
| Discovery Communications LLC |
||||||||
| 3.45%, 03/15/25 (Call 12/15/24) |
40 | 39,060 | ||||||
| 3.63%, 05/15/30 (Call 02/15/30) |
80 | 70,306 | ||||||
| 3.95%, 06/15/25 (Call 03/15/25) |
40 | 39,053 | ||||||
| 3.95%, 03/20/28 (Call 12/20/27) |
115 | 107,514 | ||||||
| 4.00%, 09/15/55 (Call 03/15/55) |
81 | 53,618 | ||||||
| 4.13%, 05/15/29 (Call 02/15/29) |
50 | 46,205 | ||||||
| 4.65%, 05/15/50 (Call 11/15/49) |
62 | 47,072 | ||||||
| 4.88%, 04/01/43 |
59 | 47,234 | ||||||
| 4.90%, 03/11/26 (Call 12/11/25) |
55 | 54,150 | ||||||
| 5.00%, 09/20/37 (Call 03/20/37) |
40 | 34,228 | ||||||
| 5.20%, 09/20/47 (Call 03/20/47) |
77 | 62,632 | ||||||
| 5.30%, 05/15/49 (Call 11/15/48) |
58 | 47,304 | ||||||
| 6.35%, 06/01/40 |
40 | 38,452 | ||||||
| Gray Television Inc. |
||||||||
| 4.75%, 10/15/30 (Call 10/15/25)(b)(c) |
45 | 28,996 | ||||||
| 5.38%, 11/15/31 (Call 11/15/26)(b)(c) |
68 | 44,031 | ||||||
| 5.88%, 07/15/26 (Call 04/01/24)(b) |
40 | 37,967 | ||||||
| 7.00%, 05/15/27 (Call 03/11/24)(b)(c) |
40 | 36,131 | ||||||
| Grupo Televisa SAB, 6.13%, 01/31/46 (Call 07/31/45) |
200 | 195,152 | ||||||
| iHeartCommunications Inc. |
||||||||
| 4.75%, 01/15/28 (Call 04/01/24)(b) |
30 | 21,577 | ||||||
| 5.25%, 08/15/27 (Call 03/18/24)(b)(c) |
40 | 29,650 | ||||||
| 6.38%, 05/01/26 (Call 03/18/24) |
45 | 37,622 | ||||||
| 8.38%, 05/01/27 (Call 03/18/24)(c) |
50 | 29,723 | ||||||
| NBCUniversal Media LLC, 4.45%, 01/15/43 |
120 | 104,871 | ||||||
| Nexstar Media Inc. |
||||||||
| 4.75%, 11/01/28 (Call 03/11/24)(b)(c) |
55 | 48,891 | ||||||
| 5.63%, 07/15/27 (Call 03/11/24)(b) |
90 | 85,299 | ||||||
| 40 | 2 0 2 4 I S H A R E S A N N U A L R E P O R T T O S H A R E H O L D E R S |
| Schedule of Investments (continued) February 29, 2024 |
iShares® ESG Advanced Total USD Bond Market ETF (Percentages shown are based on Net Assets) |
| Security | Par (000) |
Value | ||||||
| Media (continued) | ||||||||
| Scripps Escrow II Inc. |
||||||||
| 3.88%, 01/15/29 (Call 04/01/24)(b) |
$ | 30 | $ | 23,451 | ||||
| 5.38%, 01/15/31 (Call 01/15/26)(b) |
25 | 14,248 | ||||||
| Scripps Escrow Inc., 5.88%, 07/15/27 (Call 04/01/24)(b) |
25 | 20,750 | ||||||
| Sirius XM Radio Inc. |
||||||||
| 3.13%, 09/01/26 (Call 04/01/24)(b) |
55 | 51,389 | ||||||
| 3.88%, 09/01/31 (Call 09/01/26)(b)(c) |
85 | 70,375 | ||||||
| 4.00%, 07/15/28 (Call 07/15/24)(b) |
105 | 94,665 | ||||||
| 4.13%, 07/01/30 (Call 07/01/25)(b) |
80 | 69,058 | ||||||
| 5.00%, 08/01/27 (Call 04/01/24)(b) |
85 | 81,142 | ||||||
| 5.50%, 07/01/29 (Call 07/01/24)(b) |
70 | 66,216 | ||||||
| Sky Group Finance Ltd., 6.50%, 10/15/35(b) |
40 | 43,609 | ||||||
| TEGNA Inc. |
||||||||
| 4.63%, 03/15/28 (Call 04/01/24)(c) |
50 | 45,167 | ||||||
| 4.75%, 03/15/26 (Call 04/01/24)(b) |
31 | 29,985 | ||||||
| 5.00%, 09/15/29 (Call 09/15/24) |
60 | 52,818 | ||||||
| Thomson Reuters Corp. |
||||||||
| 3.35%, 05/15/26 (Call 02/15/26) |
21 | 20,142 | ||||||
| 5.50%, 08/15/35 |
25 | 25,378 | ||||||
| 5.65%, 11/23/43 (Call 05/23/43) |
25 | 24,280 | ||||||
| 5.85%, 04/15/40 |
27 | 27,408 | ||||||
| Time Warner Cable Enterprises LLC, 8.38%, 07/15/33 |
65 | 72,084 | ||||||
| Time Warner Cable LLC |
||||||||
| 5.50%, 09/01/41 (Call 03/01/41) |
270 | 222,471 | ||||||
| 6.55%, 05/01/37 |
5 | 4,694 | ||||||
| 7.30%, 07/01/38 |
170 | 169,388 | ||||||
| VZ Secured Financing BV, 5.00%, 01/15/32 (Call 01/15/27)(b) |
85 | 72,744 | ||||||
| Ziggo Bond Co. BV |
||||||||
| 5.13%, 02/28/30 (Call 02/15/25)(b) |
30 | 25,659 | ||||||
| 6.00%, 01/15/27 (Call 04/02/24)(b) |
25 | 24,412 | ||||||
| Ziggo BV, 4.88%, 01/15/30 (Call 10/15/24)(b) |
50 | 44,559 | ||||||
|
|
|
|||||||
| 9,916,609 | ||||||||
| Metal Fabricate & Hardware — 0.0% | ||||||||
| Advanced Drainage Systems Inc. |
||||||||
| 5.00%, 09/30/27 (Call 03/18/24)(b) |
25 | 24,166 | ||||||
| 6.38%, 06/15/30 (Call 07/15/25)(b) |
30 | 30,114 | ||||||
| Timken Co. (The), 4.50%, 12/15/28 (Call 09/15/28) |
30 | 29,119 | ||||||
| Valmont Industries Inc., 5.00%, 10/01/44 (Call 04/01/44) |
37 | 32,231 | ||||||
|
|
|
|||||||
| 115,630 | ||||||||
| Mining — 0.2% | ||||||||
| Antofagasta PLC, 5.63%, 05/13/32 (Call 02/13/32)(e) |
200 | 199,912 | ||||||
| Century Aluminum Co., 7.50%, 04/01/28 (Call 04/01/24)(b)(c) |
15 | 14,550 | ||||||
| Coeur Mining Inc., 5.13%, 02/15/29 (Call 04/01/24)(b)(c) |
20 | 18,424 | ||||||
| Compass Minerals International Inc., 6.75%, 12/01/27 (Call 03/11/24)(b) |
30 | 29,338 | ||||||
| Constellium SE |
||||||||
| 3.75%, 04/15/29 (Call 04/15/24)(b) |
30 | 26,701 | ||||||
| 5.63%, 06/15/28 (Call 03/11/24)(b) |
20 | 19,319 | ||||||
| 5.88%, 02/15/26 (Call 04/02/24)(b) |
20 | 19,829 | ||||||
| FMG Resources August 2006 Pty. Ltd. |
||||||||
| 4.38%, 04/01/31 (Call 01/01/31)(b) |
85 | 76,061 | ||||||
| 4.50%, 09/15/27 (Call 06/15/27)(b) |
30 | 28,790 | ||||||
| FMG Resources August Pty. Ltd. |
||||||||
| 5.88%, 04/15/30 (Call 01/15/30)(b) |
40 | 39,135 | ||||||
| Security | Par (000) |
Value | ||||||
| Mining (continued) | ||||||||
| 6.13%, 04/15/32 (Call 01/15/32)(b) |
$ | 45 | $ | 44,460 | ||||
| Hecla Mining Co., 7.25%, 02/15/28 (Call 03/18/24) |
30 | 29,939 | ||||||
| Kaiser Aluminum Corp. |
||||||||
| 4.50%, 06/01/31 (Call 06/01/26)(b) |
30 | 25,671 | ||||||
| 4.63%, 03/01/28 (Call 04/01/24)(b) |
30 | 27,704 | ||||||
| Kinross Gold Corp., 4.50%, 07/15/27 (Call 04/15/27) |
105 | 102,044 | ||||||
| New Gold Inc., 7.50%,
07/15/27 |
25 | 24,833 | ||||||
| Newmont Corp., 4.88%, 03/15/42 (Call 09/15/41) |
150 | 137,806 | ||||||
| Newmont Corp./Newcrest Finance Pty Ltd. |
||||||||
| 3.25%, 05/13/30 (Call 02/13/30)(b) |
100 | 89,571 | ||||||
| 4.20%, 05/13/50 (Call 11/13/49) |
30 | 24,519 | ||||||
| Perenti Finance Pty Ltd., 6.50%, 10/07/25 (Call 03/11/24)(b) |
30 | 29,803 | ||||||
| Taseko Mines Ltd., 7.00%, 02/15/26 (Call 04/01/24)(b) |
25 | 24,667 | ||||||
| Yamana Gold Inc., 2.63%, 08/15/31 (Call 05/15/31) |
50 | 41,240 | ||||||
|
|
|
|||||||
| 1,074,316 | ||||||||
| Miscellaneous – Manufacturing — 0.0% | ||||||||
| Hillenbrand Inc., 6.25%, 02/15/29 (Call 02/15/26) |
16 | 16,003 | ||||||
|
|
|
|||||||
| Office & Business Equipment — 0.1% | ||||||||
| CDW LLC/CDW Finance Corp. |
74 | 68,682 | ||||||
| 3.25%, 02/15/29 (Call 04/01/24) |
45 | 40,112 | ||||||
| 3.28%, 12/01/28 (Call 10/01/28) |
60 | 54,020 | ||||||
| 3.57%, 12/01/31 (Call 09/01/31) |
55 | 47,695 | ||||||
| 4.13%, 05/01/25 (Call 04/01/24) |
30 | 29,408 | ||||||
| 4.25%, 04/01/28 (Call 04/01/24) |
40 | 38,085 | ||||||
| Pitney Bowes Inc. |
25 | 22,536 | ||||||
| 7.25%, 03/15/29 (Call 03/15/24)(b)(c) |
20 | 17,314 | ||||||
| Xerox Corp. |
15 | 11,362 | ||||||
| 6.75%, 12/15/39 |
17 | 14,539 | ||||||
| Xerox Holdings Corp. |
45 | 44,260 | ||||||
| 5.50%, 08/15/28 (Call 07/15/28)(b) |
40 | 36,170 | ||||||
|
|
|
|||||||
| 424,183 | ||||||||
| Office Furnishings — 0.0% | ||||||||
| Interface Inc., 5.50%, 12/01/28 (Call 03/18/24)(b) |
15 | 14,130 | ||||||
| Steelcase Inc., 5.13%, 01/18/29 (Call 10/18/28) |
27 | 25,583 | ||||||
|
|
|
|||||||
| 39,713 | ||||||||
| Packaging & Containers — 0.3% | ||||||||
| AptarGroup Inc., 3.60%, 03/15/32 (Call 12/15/31) |
10 | 8,781 | ||||||
| Ball Corp. |
||||||||
| 2.88%, 08/15/30 (Call 05/15/30)(c) |
70 | 59,252 | ||||||
| 3.13%, 09/15/31 (Call 06/15/31)(c) |
40 | 33,681 | ||||||
| 6.00%, 06/15/29 (Call 05/15/26) |
65 | 65,350 | ||||||
| 6.88%, 03/15/28 (Call 11/15/24) |
40 | 40,989 | ||||||
| Berry Global Inc. |
||||||||
| 1.57%, 01/15/26 (Call 12/15/25) |
125 | 116,449 | ||||||
| 4.50%, 02/15/26 (Call 04/01/24)(b) |
20 | 19,388 | ||||||
| 5.63%, 07/15/27 (Call 04/01/24)(b)(c) |
30 | 29,601 | ||||||
| 5.65%, 01/15/34 (Call 10/15/33)(b) |
50 | 49,349 | ||||||
| Brambles USA Inc., 4.13%, 10/23/25 (Call 07/25/25)(b) |
60 | 58,645 | ||||||
| Cascades Inc./Cascades USA Inc. |
||||||||
| 5.13%, 01/15/26 (Call 04/01/24)(b)(c) |
15 | 14,616 | ||||||
| 5.38%, 01/15/28 (Call 04/01/24)(b) |
27 | 26,105 | ||||||
| Clearwater Paper Corp., 4.75%, 08/15/28 (Call 03/18/24)(b) |
20 | 18,505 | ||||||
| S C H E D U L E O F I N V E S T M E N T S |
41 |
| Schedule of Investments (continued) February 29, 2024 |
iShares® ESG Advanced Total USD Bond Market ETF (Percentages shown are based on Net Assets) |
| Security | Par (000) |
Value | ||||||
| Packaging & Containers (continued) | ||||||||
| Crown Americas LLC, 5.25%, 04/01/30 (Call 01/01/30) |
$ | 25 | $ | 24,080 | ||||
| Crown Americas LLC/Crown Americas Capital Corp. V, 4.25%, 09/30/26 (Call 03/31/26) |
15 | 14,406 | ||||||
| Crown Cork & Seal Co. Inc., 7.38%, 12/15/26 |
20 | 21,047 | ||||||
| OI European Group BV, 4.75%, 02/15/30 (Call 11/15/24)(b)(c) |
25 | 23,032 | ||||||
| Owens-Brockway Glass Container Inc. |
||||||||
| 6.63%, 05/13/27 (Call 04/01/24)(b) |
35 | 34,944 | ||||||
| 7.25%, 05/15/31 (Call 05/15/26)(b) |
40 | 40,472 | ||||||
| Packaging Corp. of America, 3.05%, 10/01/51 (Call 04/01/51) |
105 | 69,968 | ||||||
| Sealed Air Corp. |
||||||||
| 1.57%, 10/15/26 (Call 09/15/26)(b) |
115 | 103,485 | ||||||
| 4.00%, 12/01/27 (Call 09/01/27)(b) |
25 | 23,329 | ||||||
| 5.00%, 04/15/29 (Call 04/15/25)(b)(c) |
25 | 23,795 | ||||||
| 5.50%, 09/15/25 (Call 06/15/25)(b) |
25 | 24,951 | ||||||
| 6.88%, 07/15/33(b) |
25 | 25,840 | ||||||
| Sealed Air Corp./Sealed Air Corp. U.S. |
||||||||
| 6.13%, 02/01/28 (Call 02/01/25)(b) |
45 | 44,905 | ||||||
| 7.25%, 02/15/31 (Call 11/15/26)(b) |
20 | 20,667 | ||||||
| Silgan Holdings Inc., 4.13%, 02/01/28 (Call 03/18/24) |
25 | 23,410 | ||||||
| Sonoco Products Co. |
||||||||
| 2.25%, 02/01/27 (Call 01/01/27) |
10 | 9,177 | ||||||
| 2.85%, 02/01/32 (Call 11/01/31) |
5 | 4,220 | ||||||
| 3.13%, 05/01/30 (Call 02/01/30) |
75 | 66,555 | ||||||
| TriMas Corp., 4.13%,
04/15/29 |
25 | 22,784 | ||||||
| Trivium Packaging Finance BV |
||||||||
| 5.50%, 08/15/26 (Call 04/02/24)(b) |
60 | 58,520 | ||||||
| 8.50%, 08/15/27 (Call 03/11/24)(b) |
40 | 38,988 | ||||||
| WestRock MWV LLC, 8.20%, 01/15/30 |
5 | 5,685 | ||||||
| WRKCo Inc. |
||||||||
| 3.00%, 06/15/33 (Call 03/15/33) |
50 | 42,138 | ||||||
| 3.38%, 09/15/27 (Call 06/15/27) |
10 | 9,410 | ||||||
| 3.75%, 03/15/25 (Call 01/15/25) |
30 | 29,382 | ||||||
| 3.90%, 06/01/28 (Call 03/01/28) |
20 | 18,957 | ||||||
| 4.00%, 03/15/28 (Call 12/15/27) |
60 | 57,271 | ||||||
| 4.20%, 06/01/32 (Call 03/01/32) |
20 | 18,792 | ||||||
| 4.65%, 03/15/26 (Call 01/15/26) |
155 | 152,961 | ||||||
| 4.90%, 03/15/29 (Call 12/15/28) |
40 | 39,603 | ||||||
|
|
|
|||||||
| 1,633,485 | ||||||||
| Pharmaceuticals — 0.5% | ||||||||
| 180 Medical Inc., 3.88%, 10/15/29 (Call 10/07/24)(b) |
35 | 31,326 | ||||||
| AdaptHealth LLC |
||||||||
| 4.63%, 08/01/29 (Call 04/01/24)(b) |
30 | 24,976 | ||||||
| 5.13%, 03/01/30 (Call 03/01/25)(b) |
35 | 29,276 | ||||||
| 6.13%, 08/01/28 (Call 03/11/24)(b) |
10 | 9,198 | ||||||
| Astrazeneca Finance LLC |
||||||||
| 4.80%, 02/26/27 (Call 01/26/27) |
210 | 209,460 | ||||||
| 4.85%, 02/26/29 (Call 01/26/29) |
260 | 259,899 | ||||||
| 5.00%, 02/26/34 (Call 11/26/33) |
100 | 100,370 | ||||||
| AstraZeneca PLC |
||||||||
| 4.38%, 08/17/48 (Call 02/17/48) |
100 | 88,790 | ||||||
| 6.45%, 09/15/37 |
160 | 180,177 | ||||||
| Bausch Health Americas Inc. |
||||||||
| 8.50%, 01/31/27 (Call 04/01/24)(b)(c) |
40 | 22,712 | ||||||
| 9.25%, 04/01/26 (Call 04/01/24)(b) |
40 | 37,468 | ||||||
| Bausch Health Companies Inc. |
||||||||
| 4.88%, 06/01/28 (Call 06/01/24)(b) |
95 | 54,005 | ||||||
| 5.00%, 01/30/28 (Call 03/18/24)(b) |
25 | 11,197 | ||||||
| 5.00%, 02/15/29 (Call 03/11/24)(b)(c) |
25 | 11,023 | ||||||
| Security | Par (000) |
Value | ||||||
| Pharmaceuticals (continued) | ||||||||
| 5.25%, 01/30/30 (Call 01/30/25)(b)(c) |
$ | 50 | $ | 21,701 | ||||
| 5.25%, 02/15/31 (Call 02/15/26)(b)(c) |
25 | 10,829 | ||||||
| 5.50%, 11/01/25 (Call 04/01/24)(b)(c) |
90 | 83,628 | ||||||
| 5.75%, 08/15/27 (Call 03/18/24)(b) |
30 | 18,342 | ||||||
| 6.13%, 02/01/27 (Call 04/01/24)(b)(c) |
55 | 35,109 | ||||||
| 6.25%, 02/15/29 (Call 03/11/24)(b) |
50 | 22,971 | ||||||
| 7.25%, 05/30/29 (Call 05/30/24)(b) |
20 | 8,889 | ||||||
| 9.00%, 12/15/25 (Call 04/01/24)(b) |
55 | 52,282 | ||||||
| 11.00%, 09/30/28(b)(c) |
125 | 84,207 | ||||||
| 14.00%, 10/15/30 (Call 10/15/25)(b)(c) |
20 | 11,596 | ||||||
| Elanco Animal Health Inc., 6.65%, 08/28/28 (Call 05/28/28) |
45 | 45,580 | ||||||
| EMD Finance LLC, 3.25%, 03/19/25 (Call 12/19/24)(b) |
100 | 97,790 | ||||||
| Grifols SA, 4.75%, 10/15/28 (Call 10/15/24)(b) |
45 | 37,289 | ||||||
| Herbalife Nutrition Ltd./HLF Financing Inc., |
35 | 34,089 | ||||||
| HLF Financing Sarl LLC/Herbalife International Inc., 4.88%, 06/01/29 (Call 06/01/24)(b)(c) |
35 | 25,003 | ||||||
| Jazz Securities DAC, 4.38%, 01/15/29 (Call 07/15/24)(b) |
85 | 78,274 | ||||||
| Novartis Capital Corp. |
||||||||
| 2.20%, 08/14/30 (Call 05/14/30) |
100 | 85,898 | ||||||
| 3.10%, 05/17/27 (Call 02/17/27) |
170 | 161,754 | ||||||
| 4.40%, 05/06/44 |
205 | 186,572 | ||||||
| Option Care Health Inc., 4.38%, 10/31/29 (Call 10/31/24)(b)(c) |
30 | 27,390 | ||||||
| Organon & Co./Organon Foreign Debt Co.-Issuer BV |
||||||||
| 4.13%, 04/30/28 (Call 04/30/24)(b) |
110 | 100,564 | ||||||
| 5.13%, 04/30/31 (Call 04/30/26)(b) |
110 | 94,166 | ||||||
| Owens & Minor Inc. |
||||||||
| 4.50%, 03/31/29 (Call 04/01/24)(b)(c) |
30 | 26,811 | ||||||
| 6.63%, 04/01/30 (Call 04/01/25)(b)(c) |
30 | 29,013 | ||||||
| Perrigo Finance Unlimited Co. |
||||||||
| 4.38%, 03/15/26 (Call 12/15/25) |
40 | 38,636 | ||||||
| 4.65%, 06/15/30 (Call 03/15/30) |
40 | 35,919 | ||||||
| 4.90%, 12/15/44 (Call 06/15/44) |
20 | 15,642 | ||||||
| Zoetis Inc. |
||||||||
| 3.00%, 09/12/27 (Call 06/12/27) |
45 | 42,122 | ||||||
| 3.00%, 05/15/50 (Call 11/15/49) |
55 | 37,648 | ||||||
| 3.90%, 08/20/28 (Call 05/20/28) |
30 | 28,840 | ||||||
| 3.95%, 09/12/47 (Call 03/12/47) |
48 | 38,663 | ||||||
| 4.45%, 08/20/48 (Call 02/20/48) |
20 | 17,495 | ||||||
| 4.50%, 11/13/25 (Call 08/13/25) |
60 | 59,245 | ||||||
| 4.70%, 02/01/43 (Call 08/01/42) |
50 | 45,674 | ||||||
|
|
|
|||||||
| 2,809,508 | ||||||||
| Private Equity — 0.0% | ||||||||
| Apollo Management Holdings LP, 4.87%, 02/15/29 (Call 11/15/28)(b)(c) |
15 | 14,795 | ||||||
| Carlyle Finance LLC, 5.65%, 09/15/48 (Call 03/15/48)(b) |
25 | 23,410 | ||||||
| Carlyle Finance Subsidiary LLC, 3.50%, 09/19/29 (Call 06/19/29)(b) |
65 | 59,872 | ||||||
| Carlyle Holdings II Finance LLC, 5.63%, 03/30/43(b) |
35 | 33,309 | ||||||
|
|
|
|||||||
| 131,386 | ||||||||
| Real Estate — 0.3% | ||||||||
| American Homes 4 Rent LP, 5.50%, 02/01/34 (Call 11/01/33) |
40 | 39,267 | ||||||
| Anywhere Real Estate Group LLC/Anywhere |
29 | 26,459 | ||||||
| 42 | 2 0 2 4 I S H A R E S A N N U A L R E P O R T T O S H A R E H O L D E R S |
| Schedule of Investments (continued) February 29, 2024 |
iShares® ESG Advanced Total USD Bond Market ETF (Percentages shown are based on Net Assets) |
| Security | Par (000) |
Value | ||||||
| Real Estate (continued) | ||||||||
| AvalonBay Communities Inc., 5.30%, 12/07/33 (Call 09/07/33) |
$ | 25 | $ | 25,063 | ||||
| CBRE Services Inc. |
||||||||
| 2.50%, 04/01/31 (Call 01/01/31)(c) |
25 | 20,530 | ||||||
| 4.88%, 03/01/26 (Call 12/01/25) |
65 | 64,218 | ||||||
| Corp. Inmobiliaria Vesta SAB de CV, 3.63%, 05/13/31 (Call 02/13/31)(e) |
200 | 169,387 | ||||||
| Cushman & Wakefield U.S. Borrower LLC |
||||||||
| 6.75%, 05/15/28 (Call 04/01/24)(b) |
40 | 39,429 | ||||||
| 8.88%, 09/01/31 (Call 09/01/26)(b) |
25 | 26,119 | ||||||
| HAT Holdings I LLC/HAT Holdings II LLC, |
30 | 31,161 | ||||||
| Hongkong Land Finance Cayman Islands Co. Ltd. (The), 2.88%, 05/27/30 (Call 02/27/30)(e) |
200 | 173,203 | ||||||
| Howard Hughes Corp. (The) |
40 | 35,559 | ||||||
| 4.38%, 02/01/31 (Call 02/01/26)(b) |
35 | 29,908 | ||||||
| 5.38%, 08/01/28 (Call 04/01/24)(b) |
45 | 42,476 | ||||||
| Hysan MTN Ltd., 2.88%, 06/02/27 (Call 03/02/27)(e) |
200 | 183,022 | ||||||
| Kennedy-Wilson Inc. |
||||||||
| 4.75%, 03/01/29 (Call 04/01/24) |
30 | 24,337 | ||||||
| 4.75%, 02/01/30 (Call 09/01/24) |
35 | 27,700 | ||||||
| 5.00%, 03/01/31 (Call 03/01/26) |
35 | 27,211 | ||||||
| MAF Sukuk Ltd., 3.93%, 02/28/30(e) |
200 | 186,303 | ||||||
| Mid-America Apartments LP, |
20 | 19,466 | ||||||
| Realogy Group LLC/Realogy Co-Issuer Corp. |
||||||||
| 5.25%, 04/15/30 (Call 04/15/25)(b)(c) |
8 | 5,604 | ||||||
| 5.75%, 01/15/29 (Call 03/18/24)(b) |
33 | 24,551 | ||||||
| Sun Hung Kai Properties Capital Market Ltd., |
200 | 173,024 | ||||||
| Swire Properties MTN Financing Ltd., |
200 | 187,813 | ||||||
| Vanke Real Estate Hong Kong Co. Ltd., |
200 | 90,712 | ||||||
| Wharf REIC Finance BVI Ltd., 2.38%, 05/07/25(e) |
200 | 192,269 | ||||||
|
|
|
|||||||
| 1,864,791 | ||||||||
| Real Estate Investment Trusts — 2.1% | ||||||||
| Alexandria Real Estate Equities Inc. |
80 | 61,756 | ||||||
| 2.75%, 12/15/29 (Call 09/15/29) |
15 | 13,050 | ||||||
| 2.95%, 03/15/34 (Call 12/15/33) |
105 | 84,646 | ||||||
| 3.00%, 05/18/51 (Call 11/18/50) |
82 | 51,453 | ||||||
| 3.38%, 08/15/31 (Call 05/15/31) |
60 | 52,688 | ||||||
| 3.45%, 04/30/25 (Call 02/28/25) |
50 | 48,830 | ||||||
| 3.55%, 03/15/52 (Call 09/15/51) |
40 | 27,755 | ||||||
| 3.80%, 04/15/26 (Call 02/15/26) |
90 | 87,236 | ||||||
| 3.95%, 01/15/27 (Call 10/15/26) |
48 | 46,274 | ||||||
| 4.00%, 02/01/50 (Call 08/01/49) |
40 | 30,134 | ||||||
| 4.30%, 01/15/26 (Call 10/15/25) |
35 | 34,336 | ||||||
| 4.50%, 07/30/29 (Call 04/30/29) |
50 | 47,940 | ||||||
| 4.70%, 07/01/30 (Call 04/01/30) |
55 | 52,865 | ||||||
| 4.85%, 04/15/49 (Call 10/15/48) |
15 | 13,108 | ||||||
| 4.90%, 12/15/30 (Call 09/15/30) |
81 | 78,833 | ||||||
| 5.63%, 05/15/54 (Call 11/15/53) |
35 | 33,683 | ||||||
| American Homes 4 Rent LP |
||||||||
| 3.38%, 07/15/51 (Call 01/15/51) |
5 | 3,304 | ||||||
| 3.63%, 04/15/32 (Call 01/15/32) |
100 | 87,130 | ||||||
| 4.90%, 02/15/29 (Call 11/15/28) |
10 | 9,746 | ||||||
| American Tower Corp. |
||||||||
| 1.30%, 09/15/25 (Call 08/15/25) |
20 | 18,809 | ||||||
| Security | Par (000) |
Value | ||||||
| Real Estate Investment Trusts (continued) | ||||||||
| 1.45%, 09/15/26 (Call 08/15/26) |
$ | 50 | $ | 45,450 | ||||
| 1.50%, 01/31/28 (Call 11/30/27) |
90 | 78,162 | ||||||
| 1.60%, 04/15/26 (Call 03/15/26) |
45 | 41,659 | ||||||
| 1.88%, 10/15/30 (Call 07/15/30) |
60 | 48,187 | ||||||
| 2.10%, 06/15/30 (Call 03/15/30) |
59 | 48,562 | ||||||
| 2.30%, 09/15/31 (Call 06/15/31) |
60 | 48,426 | ||||||
| 2.40%, 03/15/25 (Call 02/15/25) |
85 | 82,220 | ||||||
| 2.70%, 04/15/31 (Call 01/15/31) |
50 | 41,939 | ||||||
| 2.75%, 01/15/27 (Call 11/15/26) |
89 | 82,887 | ||||||
| 2.90%, 01/15/30 (Call 10/15/29) |
60 | 52,631 | ||||||
| 2.95%, 01/15/51 (Call 07/15/50)(c) |
60 | 38,009 | ||||||
| 3.10%, 06/15/50 (Call 12/15/49) |
35 | 22,869 | ||||||
| 3.13%, 01/15/27 (Call 10/15/26) |
44 | 41,494 | ||||||
| 3.38%, 10/15/26 (Call 07/15/26) |
89 | 84,871 | ||||||
| 3.55%, 07/15/27 (Call 04/15/27) |
64 | 60,668 | ||||||
| 3.60%, 01/15/28 (Call 10/15/27) |
104 | 97,867 | ||||||
| 3.70%, 10/15/49 (Call 04/15/49) |
27 | 19,720 | ||||||
| 3.80%, 08/15/29 (Call 05/15/29) |
81 | 74,974 | ||||||
| 3.95%, 03/15/29 (Call 12/15/28) |
66 | 61,939 | ||||||
| 4.00%, 06/01/25 (Call 03/01/25) |
49 | 48,035 | ||||||
| 4.40%, 02/15/26 (Call 11/15/25) |
50 | 49,167 | ||||||
| 5.65%, 03/15/33 (Call 12/15/32) |
90 | 90,503 | ||||||
| 5.90%, 11/15/33 (Call 08/15/33) |
45 | 46,146 | ||||||
| Apollo Commercial Real Estate Finance Inc., |
20 | 16,561 | ||||||
| AvalonBay Communities Inc. |
||||||||
| 2.05%, 01/15/32 (Call 10/15/31)(c) |
75 | 61,190 | ||||||
| 2.45%, 01/15/31 (Call 10/17/30) |
80 | 68,220 | ||||||
| 3.20%, 01/15/28 (Call 10/15/27) |
5 | 4,685 | ||||||
| 3.35%, 05/15/27 (Call 02/15/27) |
50 | 47,424 | ||||||
| 3.90%, 10/15/46 (Call 04/15/46) |
40 | 31,241 | ||||||
| 4.15%, 07/01/47 (Call 01/01/47) |
25 | 20,280 | ||||||
| Blackstone Mortgage Trust Inc., |
20 | 17,543 | ||||||
| Boston Properties LP |
||||||||
| 2.45%, 10/01/33 (Call 07/01/33) |
50 | 36,900 | ||||||
| 2.55%, 04/01/32 (Call 01/01/32) |
65 | 50,508 | ||||||
| 2.75%, 10/01/26 (Call 07/01/26) |
70 | 64,805 | ||||||
| 2.90%, 03/15/30 (Call 12/15/29) |
50 | 42,262 | ||||||
| 3.25%, 01/30/31 (Call 10/30/30) |
85 | 71,563 | ||||||
| 3.40%, 06/21/29 (Call 03/21/29) |
80 | 70,597 | ||||||
| 3.65%, 02/01/26 (Call 11/03/25) |
95 | 91,358 | ||||||
| 4.50%, 12/01/28 (Call 09/01/28) |
50 | 47,241 | ||||||
| Brandywine Operating Partnership LP |
||||||||
| 3.95%, 11/15/27 (Call 08/15/27) |
25 | 21,977 | ||||||
| 4.55%, 10/01/29 (Call 07/01/29)(c) |
20 | 16,735 | ||||||
| 7.80%, 03/15/28 (Call 02/15/28)(c) |
20 | 19,825 | ||||||
| Brixmor Operating Partnership LP |
||||||||
| 2.25%, 04/01/28 (Call 02/01/28) |
43 | 38,034 | ||||||
| 2.50%, 08/16/31 (Call 05/16/31) |
20 | 16,241 | ||||||
| 3.90%, 03/15/27 (Call 12/15/26) |
50 | 47,634 | ||||||
| 4.05%, 07/01/30 (Call 04/01/30) |
55 | 50,506 | ||||||
| 4.13%, 06/15/26 (Call 03/15/26) |
32 | 30,977 | ||||||
| 4.13%, 05/15/29 (Call 02/15/29) |
25 | 23,357 | ||||||
| Brookfield Property REIT Inc./BPR Cumulus LLC/BPR Nimbus LLC/GGSI Sellco LL |
||||||||
| 4.50%, 04/01/27 (Call 04/01/24)(b) |
45 | 39,626 | ||||||
| 5.75%, 05/15/26 (Call 03/11/24)(b) |
55 | 53,069 | ||||||
| Camden Property Trust |
||||||||
| 2.80%, 05/15/30 (Call 02/15/30) |
31 | 27,241 | ||||||
| 3.15%, 07/01/29 (Call 04/01/29) |
34 | 30,930 | ||||||
| S C H E D U L E O F I N V E S T M E N T S |
43 |
| Schedule of Investments (continued) February 29, 2024 |
iShares® ESG Advanced Total USD Bond Market ETF (Percentages shown are based on Net Assets) |
| Security | Par (000) |
Value | ||||||
| Real Estate Investment Trusts (continued) | ||||||||
| 3.35%, 11/01/49 (Call 05/01/49) |
$ | 25 | $ | 17,824 | ||||
| 4.10%, 10/15/28 (Call 07/15/28) |
20 | 19,261 | ||||||
| Corporate Office Properties LP |
||||||||
| 2.00%, 01/15/29 (Call 11/15/28) |
40 | 33,116 | ||||||
| 2.25%, 03/15/26 (Call 02/15/26) |
53 | 49,563 | ||||||
| 2.75%, 04/15/31 (Call 01/15/31) |
40 | 32,264 | ||||||
| 2.90%, 12/01/33 (Call 09/01/33) |
25 | 19,110 | ||||||
| Crown Castle Inc. |
||||||||
| 1.05%, 07/15/26 (Call 06/15/26) |
70 | 63,275 | ||||||
| 1.35%, 07/15/25 (Call 06/15/25) |
70 | 66,229 | ||||||
| 2.10%, 04/01/31 (Call 01/01/31) |
91 | 72,962 | ||||||
| 2.25%, 01/15/31 (Call 10/15/30) |
67 | 54,762 | ||||||
| 2.50%, 07/15/31 (Call 04/15/31) |
86 | 70,426 | ||||||
| 2.90%, 03/15/27 (Call 02/15/27) |
10 | 9,312 | ||||||
| 2.90%, 04/01/41 (Call 10/01/40) |
122 | 84,687 | ||||||
| 3.10%, 11/15/29 (Call 08/15/29) |
55 | 48,667 | ||||||
| 3.25%, 01/15/51 (Call 07/15/50) |
53 | 35,769 | ||||||
| 3.30%, 07/01/30 (Call 04/01/30) |
67 | 59,172 | ||||||
| 3.65%, 09/01/27 (Call 06/01/27) |
109 | 102,871 | ||||||
| 3.70%, 06/15/26 (Call 03/15/26) |
115 | 110,820 | ||||||
| 3.80%, 02/15/28 (Call 11/15/27) |
55 | 51,791 | ||||||
| 4.00%, 03/01/27 (Call 12/01/26) |
25 | 24,064 | ||||||
| 4.00%, 11/15/49 (Call 05/15/49) |
33 | 25,386 | ||||||
| 4.15%, 07/01/50 (Call 01/01/50) |
50 | 39,538 | ||||||
| 4.30%, 02/15/29 (Call 11/15/28) |
57 | 54,175 | ||||||
| 4.45%, 02/15/26 (Call 11/15/25) |
77 | 75,557 | ||||||
| 5.80%, 03/01/34 (Call 12/01/33) |
105 | 106,521 | ||||||
| CubeSmart LP, 2.50%, 02/15/32 (Call 11/15/31) |
50 | 40,374 | ||||||
| Digital Realty Trust LP |
||||||||
| 3.60%, 07/01/29 (Call 04/01/29) |
85 | 78,368 | ||||||
| 3.70%, 08/15/27 (Call 05/15/27) |
155 | 147,725 | ||||||
| 4.45%, 07/15/28 (Call 04/15/28) |
60 | 58,053 | ||||||
| EPR Properties, 4.95%, 04/15/28 (Call 01/15/28) |
15 | 14,217 | ||||||
| Equinix Inc. |
||||||||
| 1.00%, 09/15/25 (Call 08/15/25) |
40 | 37,395 | ||||||
| 1.25%, 07/15/25 (Call 06/15/25) |
99 | 93,405 | ||||||
| 1.55%, 03/15/28 (Call 01/15/28) |
55 | 47,873 | ||||||
| 1.80%, 07/15/27 (Call 05/15/27) |
60 | 53,931 | ||||||
| 2.00%, 05/15/28 (Call 03/15/28) |
45 | 39,682 | ||||||
| 2.15%, 07/15/30 (Call 04/15/30) |
124 | 102,816 | ||||||
| 2.50%, 05/15/31 (Call 02/15/31) |
20 | 16,701 | ||||||
| 2.90%, 11/18/26 (Call 09/18/26) |
69 | 64,972 | ||||||
| 2.95%, 09/15/51 (Call 03/15/51) |
45 | 28,598 | ||||||
| 3.00%, 07/15/50 (Call 01/15/50) |
35 | 22,696 | ||||||
| 3.20%, 11/18/29 (Call 08/18/29) |
65 | 58,418 | ||||||
| 3.40%, 02/15/52 (Call 08/15/51) |
10 | 6,930 | ||||||
| 3.90%, 04/15/32 (Call 01/15/32) |
25 | 22,687 | ||||||
| Federal Realty OP LP |
||||||||
| 1.25%, 02/15/26 (Call 01/15/26) |
25 | 23,049 | ||||||
| 3.20%, 06/15/29 (Call 03/15/29) |
60 | 53,612 | ||||||
| 3.25%, 07/15/27 (Call 04/15/27) |
25 | 23,354 | ||||||
| 3.50%, 06/01/30 (Call 03/01/30) |
45 | 40,360 | ||||||
| 4.50%, 12/01/44 (Call 06/01/44) |
20 | 16,276 | ||||||
| Goodman U.S. Finance Three LLC, 3.70%, 03/15/28 (Call 12/15/27)(b)(c) |
50 | 46,139 | ||||||
| HAT Holdings I LLC/HAT Holdings II LLC |
||||||||
| 3.38%, 06/15/26 (Call 03/15/26)(b) |
60 | 56,263 | ||||||
| 3.75%, 09/15/30(b)(c) |
25 | 20,619 | ||||||
| 6.00%, 04/15/25 (Call 04/01/24)(b) |
25 | 24,864 | ||||||
| Healthpeak OP LLC |
||||||||
| 1.35%, 02/01/27 (Call 01/01/27) |
35 | 31,491 | ||||||
| Security | Par (000) |
Value | ||||||
| Real Estate Investment Trusts (continued) | ||||||||
| 2.88%, 01/15/31 (Call 10/15/30) |
$ | 61 | $ | 51,875 | ||||
| 3.00%, 01/15/30 (Call 10/15/29) |
50 | 43,869 | ||||||
| 3.25%, 07/15/26 (Call 05/15/26) |
40 | 38,210 | ||||||
| 3.50%, 07/15/29 (Call 04/15/29) |
10 | 9,137 | ||||||
| 4.00%, 06/01/25 (Call 03/01/25) |
25 | 24,527 | ||||||
| 5.25%, 12/15/32 (Call 09/15/32) |
45 | 43,997 | ||||||
| 6.75%, 02/01/41 (Call 08/01/40) |
34 | 37,240 | ||||||
| Highwoods Realty LP, 3.88%, |
20 | 18,773 | ||||||
| Host Hotels & Resorts LP |
||||||||
| Series F, 4.50%, 02/01/26 (Call 11/01/25) |
52 | 50,898 | ||||||
| Series H, 3.38%, 12/15/29 (Call 09/15/29) |
72 | 63,701 | ||||||
| Series I, 3.50%, 09/15/30 (Call 06/15/30) |
52 | 45,842 | ||||||
| Series J, 2.90%, 12/15/31 (Call 09/15/31) |
15 | 12,385 | ||||||
| Hudson Pacific Properties LP |
||||||||
| 3.25%, 01/15/30 (Call 10/15/29) |
35 | 26,307 | ||||||
| 3.95%, 11/01/27 (Call 08/01/27) |
20 | 17,280 | ||||||
| 4.65%, 04/01/29 (Call 01/01/29) |
30 | 24,996 | ||||||
| Invitation Homes Operating Partnership LP |
||||||||
| 4.15%, 04/15/32 (Call 01/15/32) |
160 | 144,597 | ||||||
| 5.50%, 08/15/33 (Call 05/15/33)(c) |
10 | 9,877 | ||||||
| Iron Mountain Inc. |
||||||||
| 4.50%, 02/15/31 (Call 02/15/26)(b) |
55 | 48,689 | ||||||
| 4.88%, 09/15/27 (Call 03/11/24)(b) |
57 | 54,677 | ||||||
| 4.88%, 09/15/29 (Call 09/15/24)(b) |
55 | 51,153 | ||||||
| 5.00%, 07/15/28 (Call 03/11/24)(b) |
30 | 28,374 | ||||||
| 5.25%, 03/15/28 (Call 03/11/24)(b) |
45 | 43,348 | ||||||
| 5.25%, 07/15/30 (Call 07/15/25)(b) |
65 | 60,833 | ||||||
| 5.63%, 07/15/32 (Call 07/15/26)(b) |
35 | 32,508 | ||||||
| 7.00%, 02/15/29 (Call 08/15/25)(b) |
60 | 60,921 | ||||||
| Iron Mountain Information Management Services Inc., 5.00%, 07/15/32 (Call 07/15/27)(b) |
40 | 35,741 | ||||||
| Kilroy Realty LP |
||||||||
| 2.50%, 11/15/32 (Call 08/15/32) |
40 | 29,641 | ||||||
| 2.65%, 11/15/33 (Call 08/15/33) |
35 | 25,499 | ||||||
| 3.05%, 02/15/30 (Call 11/15/29) |
15 | 12,564 | ||||||
| 4.25%, 08/15/29 (Call 05/15/29) |
50 | 45,621 | ||||||
| 4.38%, 10/01/25 (Call 07/01/25) |
40 | 38,988 | ||||||
| 4.75%, 12/15/28 (Call 09/15/28) |
30 | 28,254 | ||||||
| Kimco Realty OP LLC |
||||||||
| 1.90%, 03/01/28 (Call 01/01/28) |
20 | 17,522 | ||||||
| 2.70%, 10/01/30 (Call 07/01/30) |
75 | 63,788 | ||||||
| 2.80%, 10/01/26 (Call 07/01/26) |
19 | 17,802 | ||||||
| 3.80%, 04/01/27 (Call 01/01/27) |
35 | 33,538 | ||||||
| 4.13%, 12/01/46 (Call 06/01/46) |
30 | 22,837 | ||||||
| 4.25%, 04/01/45 (Call 10/01/44) |
30 | 23,476 | ||||||
| 4.60%, 02/01/33 (Call 11/01/32) |
135 | 126,539 | ||||||
| Mid-America Apartments LP |
||||||||
| 1.70%, 02/15/31 (Call 11/15/30) |
40 | 31,889 | ||||||
| 2.88%, 09/15/51 (Call 03/15/51) |
20 | 12,700 | ||||||
| 4.20%, 06/15/28 (Call 03/15/28) |
5 | 4,838 | ||||||
| MPT Operating Partnership LP/MPT Finance Corp. |
||||||||
| 3.50%, 03/15/31 (Call 03/15/26)(c) |
70 | 46,899 | ||||||
| 4.63%, 08/01/29 (Call 08/01/24) |
50 | 37,255 | ||||||
| 5.00%, 10/15/27 (Call 04/01/24)(c) |
75 | 61,271 | ||||||
| 5.25%, 08/01/26 (Call 04/01/24)(c) |
30 | 26,702 | ||||||
| NNN REIT Inc. |
||||||||
| 3.50%, 04/15/51 (Call 10/15/50) |
75 | 53,458 | ||||||
| 5.60%, 10/15/33 (Call 07/15/33) |
75 | 74,740 | ||||||
| Omega Healthcare Investors Inc. |
||||||||
| 3.25%, 04/15/33 (Call 01/15/33) |
60 | 47,695 | ||||||
| 44 | 2 0 2 4 I S H A R E S A N N U A L R E P O R T T O S H A R E H O L D E R S |
| Schedule of Investments (continued) February 29, 2024 |
iShares® ESG Advanced Total USD Bond Market ETF (Percentages shown are based on Net Assets) |
| Security | Par (000) |
Value | ||||||
| Real Estate Investment Trusts (continued) | ||||||||
| 3.38%, 02/01/31 (Call 11/01/30) |
$ | 57 | $ | 47,984 | ||||
| 4.75%, 01/15/28 (Call 10/15/27) |
50 | 47,975 | ||||||
| Park Intermediate Holdings LLC/PK Domestic |
||||||||
| Property LLC/PK Finance Co-Issuer |
||||||||
| 4.88%, 05/15/29 (Call 05/15/24)(b) |
45 | 41,462 | ||||||
| 5.88%, 10/01/28 (Call 04/01/24)(b) |
40 | 38,993 | ||||||
| 7.50%, 06/01/25 (Call 04/01/24)(b) |
35 | 35,180 | ||||||
| Physicians Realty LP |
||||||||
| 2.63%, 11/01/31 (Call 08/01/31) |
30 | 24,429 | ||||||
| 3.95%, 01/15/28 (Call 10/15/27) |
10 | 9,514 | ||||||
| 4.30%, 03/15/27 (Call 12/15/26) |
20 | 19,434 | ||||||
| Piedmont Operating Partnership LP, 3.15%, |
15 | 11,508 | ||||||
| Prologis LP |
||||||||
| 1.25%, 10/15/30 (Call 07/15/30) |
35 | 27,750 | ||||||
| 1.63%, 03/15/31 (Call 12/15/30) |
80 | 63,440 | ||||||
| 1.75%, 07/01/30 (Call 04/01/30) |
44 | 36,170 | ||||||
| 2.13%, 04/15/27 (Call 02/15/27) |
51 | 46,801 | ||||||
| 2.13%, 10/15/50 (Call 04/15/50) |
42 | 22,933 | ||||||
| 2.25%, 04/15/30 (Call 01/15/30) |
119 | 102,043 | ||||||
| 2.88%, 11/15/29 (Call 08/15/29) |
24 | 21,551 | ||||||
| 3.00%, 04/15/50 (Call 10/15/49) |
37 | 25,021 | ||||||
| 3.05%, 03/01/50 (Call 09/01/49) |
27 | 18,322 | ||||||
| 3.25%, 06/30/26 (Call 03/30/26) |
45 | 43,224 | ||||||
| 3.25%, 10/01/26 (Call 07/01/26) |
55 | 52,522 | ||||||
| 3.38%, 12/15/27 (Call 09/15/27) |
15 | 14,160 | ||||||
| 3.88%, 09/15/28 (Call 06/15/28) |
50 | 47,837 | ||||||
| 4.00%, 09/15/28 (Call 06/15/28) |
41 | 39,469 | ||||||
| 4.38%, 09/15/48 (Call 03/15/48) |
45 | 38,237 | ||||||
| 4.63%, 01/15/33 (Call 10/15/32) |
35 | 33,677 | ||||||
| 4.75%, 06/15/33 (Call 03/15/33) |
50 | 48,430 | ||||||
| 5.13%, 01/15/34 (Call 10/15/33) |
45 | 44,541 | ||||||
| 5.25%, 06/15/53 (Call 12/15/52) |
45 | 43,606 | ||||||
| Public Storage Operating Co. |
||||||||
| 2.30%, 05/01/31 (Call 02/01/31) |
160 | 134,246 | ||||||
| 5.10%, 08/01/33 (Call 05/01/33) |
80 | 79,905 | ||||||
| 5.35%, 08/01/53 (Call 02/01/53) |
30 | 29,828 | ||||||
| Regency Centers LP |
||||||||
| 3.60%, 02/01/27 (Call 11/01/26) |
95 | 90,843 | ||||||
| 3.70%, 06/15/30 (Call 03/15/30) |
40 | 36,447 | ||||||
| 4.40%, 02/01/47 (Call 08/01/46) |
20 | 16,002 | ||||||
| 4.65%, 03/15/49 (Call 09/15/48) |
35 | 29,628 | ||||||
| RHP Hotel Properties LP/RHP Finance Corp. |
||||||||
| 4.50%, 02/15/29 (Call 04/01/24)(b) |
30 | 27,872 | ||||||
| 4.75%, 10/15/27 (Call 04/01/24)(c) |
35 | 33,440 | ||||||
| 7.25%, 07/15/28 (Call 07/15/25)(b) |
25 | 25,687 | ||||||
| SBA Communications Corp. |
||||||||
| 3.13%, 02/01/29 (Call 04/01/24) |
85 | 75,257 | ||||||
| 3.88%, 02/15/27 (Call 03/11/24) |
80 | 75,540 | ||||||
| Scentre Group Trust 1/Scentre Group Trust 2 |
||||||||
| 3.25%, 10/28/25 (Call 07/30/25)(b) |
75 | 72,246 | ||||||
| 3.63%, 01/28/26 (Call 12/28/25)(b) |
90 | 87,000 | ||||||
| 3.75%, 03/23/27 (Call 12/23/26)(b) |
30 | 28,577 | ||||||
| 4.38%, 05/28/30 (Call 02/28/30)(b) |
65 | 61,099 | ||||||
| Scentre Group Trust 2, 5.13%, 09/24/80 |
35 | 31,974 | ||||||
| Simon Property Group LP |
||||||||
| 1.75%, 02/01/28 (Call 11/01/27) |
95 | 84,097 | ||||||
| 2.45%, 09/13/29 (Call 06/13/29) |
272 | 236,967 | ||||||
| 2.65%, 07/15/30 (Call 04/15/30) |
60 | 52,065 | ||||||
| 3.25%, 11/30/26 (Call 08/30/26) |
45 | 42,895 | ||||||
| Security | Par (000) |
Value | ||||||
| Real Estate Investment Trusts (continued) | ||||||||
| 3.25%, 09/13/49 (Call 03/13/49) |
$ | 85 | $ | 59,105 | ||||
| 3.30%, 01/15/26 (Call 10/15/25) |
265 | 255,700 | ||||||
| 3.38%, 12/01/27 (Call 09/01/27) |
60 | 56,593 | ||||||
| 3.80%, 07/15/50 (Call 01/15/50) |
110 | 83,129 | ||||||
| 6.75%, 02/01/40 (Call 11/01/39) |
80 | 88,026 | ||||||
| Starwood Property Trust Inc. |
||||||||
| 3.63%, 07/15/26 (Call 01/15/26)(b) |
25 | 23,308 | ||||||
| 4.38%, 01/15/27 (Call 07/15/26)(b) |
30 | 28,137 | ||||||
| 4.75%, 03/15/25 (Call 09/15/24)(c) |
30 | 29,590 | ||||||
| Uniti Group LP/Uniti Fiber Holdings Inc./CSL |
40 | 29,214 | ||||||
| Uniti Group LP/Uniti Group Finance Inc./CSL Capital LLC |
||||||||
| 4.75%, 04/15/28 (Call 04/15/24)(b) |
35 | 30,493 | ||||||
| 6.50%, 02/15/29 (Call 03/11/24)(b) |
65 | 50,272 | ||||||
| 10.50%, 02/15/28 (Call 09/15/25)(b) |
145 | 150,077 | ||||||
| Ventas Realty LP |
||||||||
| 3.00%, 01/15/30 (Call 10/15/29) |
35 | 30,549 | ||||||
| 3.25%, 10/15/26 (Call 07/15/26) |
35 | 33,043 | ||||||
| 3.85%, 04/01/27 (Call 01/01/27) |
47 | 44,803 | ||||||
| 4.00%, 03/01/28 (Call 12/01/27) |
27 | 25,694 | ||||||
| 4.13%, 01/15/26 (Call 10/15/25) |
70 | 68,143 | ||||||
| 4.38%, 02/01/45 (Call 08/01/44) |
15 | 11,877 | ||||||
| 4.40%, 01/15/29 (Call 10/15/28) |
52 | 49,786 | ||||||
| 4.75%, 11/15/30 (Call 08/15/30) |
12 | 11,479 | ||||||
| 4.88%, 04/15/49 (Call 10/15/48) |
17 | 14,383 | ||||||
| 5.70%, 09/30/43 (Call 03/30/43) |
30 | 28,339 | ||||||
| WEA Finance LLC |
||||||||
| 2.88%, 01/15/27 (Call 11/15/26)(b) |
70 | 63,535 | ||||||
| 3.50%, 06/15/29 (Call 03/15/29)(b) |
55 | 47,570 | ||||||
| 4.13%, 09/20/28 (Call 06/20/28)(b) |
35 | 31,500 | ||||||
| 4.63%, 09/20/48 (Call 03/20/48)(b)(c) |
45 | 30,781 | ||||||
| WEA Finance LLC/Westfield U.K. & Europe Finance PLC, 4.75%, 09/17/44 |
10 | 6,985 | ||||||
| Welltower OP LLC |
||||||||
| 2.05%, 01/15/29 (Call 11/15/28) |
55 | 47,638 | ||||||
| 2.75%, 01/15/31 (Call 10/15/30) |
60 | 51,145 | ||||||
| 2.75%, 01/15/32 (Call 10/15/31) |
35 | 29,099 | ||||||
| 2.80%, 06/01/31 (Call 03/01/31) |
45 | 38,179 | ||||||
| 4.00%, 06/01/25 (Call 03/01/25) |
225 | 220,864 | ||||||
| 4.13%, 03/15/29 (Call 12/15/28) |
60 | 57,042 | ||||||
| 4.25%, 04/15/28 (Call 01/15/28) |
35 | 33,853 | ||||||
| 4.95%, 09/01/48 (Call 03/01/48) |
25 | 22,480 | ||||||
| 6.50%, 03/15/41 (Call 09/15/40) |
30 | 32,417 | ||||||
| WP Carey Inc. |
||||||||
| 2.25%, 04/01/33 (Call 01/01/33) |
90 | 68,335 | ||||||
| 2.40%, 02/01/31 (Call 11/01/30) |
35 | 28,793 | ||||||
| 3.85%, 07/15/29 (Call 04/15/29) |
20 | 18,504 | ||||||
| 4.25%, 10/01/26 (Call 07/01/26) |
35 | 34,066 | ||||||
| XHR LP |
||||||||
| 4.88%, 06/01/29 (Call 06/01/24)(b) |
30 | 27,715 | ||||||
| 6.38%, 08/15/25 (Call 03/11/24)(b) |
30 | 30,030 | ||||||
|
|
|
|||||||
| 12,429,851 | ||||||||
| Retail — 1.3% | ||||||||
| 1011778 BC ULC/New Red Finance Inc. |
40 | 36,072 | ||||||
| 3.88%, 01/15/28 (Call 04/01/24)(b) |
85 | 79,173 | ||||||
| 4.00%, 10/15/30 (Call 10/15/25)(b) |
155 | 136,182 | ||||||
| 4.38%, 01/15/28 (Call 04/01/24)(b) |
50 | 46,919 | ||||||
| Advance Auto Parts Inc. |
42 | 36,293 | ||||||
| S C H E D U L E O F I N V E S T M E N T S |
45 |
| Schedule of Investments (continued) February 29, 2024 |
iShares® ESG Advanced Total USD Bond Market ETF (Percentages shown are based on Net Assets) |
| Security | Par (000) |
Value | ||||||
| Retail (continued) | ||||||||
| 3.50%, 03/15/32 (Call 12/15/31)(c) |
$ | 20 | $ | 16,645 | ||||
| 3.90%, 04/15/30 (Call 01/15/30) |
27 | 24,110 | ||||||
| Asbury Automotive Group Inc. |
||||||||
| 4.50%, 03/01/28 (Call 03/11/24) |
20 | 18,671 | ||||||
| 4.63%, 11/15/29 (Call 11/15/24)(b)(c) |
47 | 42,835 | ||||||
| 4.75%, 03/01/30 (Call 03/01/25) |
25 | 22,757 | ||||||
| 5.00%, 02/15/32 (Call 11/15/26)(b) |
35 | 31,145 | ||||||
| AutoNation Inc. |
||||||||
| 2.40%, 08/01/31 (Call 05/01/31) |
70 | 55,425 | ||||||
| 3.80%, 11/15/27 (Call 08/15/27) |
45 | 41,868 | ||||||
| 4.50%, 10/01/25 (Call 07/01/25) |
15 | 14,725 | ||||||
| 4.75%, 06/01/30 (Call 03/01/30) |
55 | 52,290 | ||||||
| AutoZone Inc. |
||||||||
| 4.00%, 04/15/30 (Call 01/15/30) |
25 | 23,499 | ||||||
| 4.75%, 08/01/32 (Call 05/01/32) |
120 | 115,307 | ||||||
| 4.75%, 02/01/33 (Call 11/01/32) |
20 | 19,158 | ||||||
| 6.25%, 11/01/28 (Call 10/01/28) |
50 | 52,018 | ||||||
| 6.55%, 11/01/33 (Call 08/01/33) |
55 | 59,364 | ||||||
| Bath & Body Works Inc. |
||||||||
| 5.25%, 02/01/28 |
40 | 38,853 | ||||||
| 6.63%, 10/01/30 (Call 10/01/25)(b)(c) |
60 | 60,374 | ||||||
| 6.75%, 07/01/36 |
50 | 49,244 | ||||||
| 6.88%, 11/01/35 |
60 | 60,007 | ||||||
| 6.95%, 03/01/33 |
15 | 14,605 | ||||||
| 7.50%, 06/15/29 (Call 06/15/24)(c) |
25 | 25,746 | ||||||
| Beacon Roofing Supply Inc. |
||||||||
| 4.13%, 05/15/29 (Call 05/15/24)(b) |
20 | 18,003 | ||||||
| 4.50%, 11/15/26 (Call 04/01/24)(b)(c) |
15 | 14,475 | ||||||
| 6.50%, 08/01/30 (Call 08/01/26)(b) |
35 | 35,197 | ||||||
| Best Buy Co. Inc., 4.45%, 10/01/28 (Call 07/01/28) |
45 | 44,070 | ||||||
| Bloomin’ Brands Inc./OSI Restaurant Partners LLC, 5.13%, 04/15/29 (Call 04/15/24)(b) |
20 | 18,468 | ||||||
| BlueLinx Holdings Inc., 6.00%, 11/15/29 (Call 11/15/24)(b)(c) |
20 | 19,074 | ||||||
| Brinker International Inc., 8.25%, 07/15/30 (Call 06/27/26)(b) |
20 | 20,967 | ||||||
| Darden Restaurants Inc., 6.30%, 10/10/33 (Call 07/10/33) |
55 | 57,391 | ||||||
| Dave & Buster’s Inc., 7.63%, 11/01/25 (Call 04/01/24)(b) |
31 | 31,236 | ||||||
| Dollar General Corp. |
||||||||
| 3.50%, 04/03/30 (Call 01/03/30) |
30 | 27,129 | ||||||
| 3.88%, 04/15/27 (Call 01/15/27) |
65 | 62,462 | ||||||
| 4.13%, 05/01/28 (Call 02/01/28) |
40 | 38,644 | ||||||
| 4.13%, 04/03/50 (Call 10/03/49) |
55 | 42,020 | ||||||
| 4.15%, 11/01/25 (Call 08/01/25) |
65 | 63,667 | ||||||
| 4.63%, 11/01/27 (Call 10/01/27) |
50 | 49,016 | ||||||
| 5.45%, 07/05/33 (Call 04/05/33)(c) |
65 | 64,501 | ||||||
| Dollar Tree Inc. |
||||||||
| 2.65%, 12/01/31 (Call 09/01/31) |
15 | 12,487 | ||||||
| 3.38%, 12/01/51 (Call 06/01/51) |
30 | 19,824 | ||||||
| 4.00%, 05/15/25 (Call 03/15/25) |
25 | 24,562 | ||||||
| 4.20%, 05/15/28 (Call 02/15/28) |
80 | 77,075 | ||||||
| Foot Locker Inc., 4.00%, 10/01/29 (Call 10/01/24)(b)(c) |
25 | 21,185 | ||||||
| Genuine Parts Co. |
||||||||
| 1.88%, 11/01/30 (Call 08/01/30) |
30 | 24,076 | ||||||
| 6.88%, 11/01/33 (Call 08/01/33) |
80 | 87,383 | ||||||
| Group 1 Automotive Inc., 4.00%, 08/15/28 (Call 04/01/24)(b) |
42 | 38,373 | ||||||
| GYP Holdings III Corp., 4.63%, 05/01/29 (Call 05/01/24)(b) |
20 | 18,561 | ||||||
| Security | Par (000) |
Value | ||||||
| Retail (continued) | ||||||||
| Home Depot Inc. (The) |
||||||||
| 0.90%, 03/15/28 (Call 01/15/28) |
$ | 135 | $ | 116,423 | ||||
| 1.38%, 03/15/31 (Call 12/15/30) |
105 | 83,067 | ||||||
| 1.50%, 09/15/28 (Call 07/15/28) |
70 | 60,982 | ||||||
| 1.88%, 09/15/31 (Call 06/15/31) |
20 | 16,204 | ||||||
| 2.38%, 03/15/51 (Call 09/15/50) |
95 | 55,805 | ||||||
| 2.70%, 04/15/30 (Call 01/15/30) |
109 | 96,424 | ||||||
| 2.75%, 09/15/51 (Call 03/15/51) |
55 | 35,025 | ||||||
| 2.88%, 04/15/27 (Call 03/15/27) |
100 | 94,357 | ||||||
| 2.95%, 06/15/29 (Call 03/15/29) |
115 | 104,970 | ||||||
| 3.13%, 12/15/49 (Call 06/15/49) |
100 | 69,586 | ||||||
| 3.25%, 04/15/32 (Call 01/15/32) |
30 | 26,607 | ||||||
| 3.30%, 04/15/40 (Call 10/15/39) |
125 | 97,962 | ||||||
| 3.35%, 09/15/25 (Call 06/15/25) |
90 | 87,799 | ||||||
| 3.35%, 04/15/50 (Call 10/15/49) |
100 | 72,476 | ||||||
| 3.50%, 09/15/56 (Call 03/15/56) |
45 | 32,957 | ||||||
| 3.63%, 04/15/52 (Call 10/15/51) |
40 | 30,235 | ||||||
| 3.90%, 12/06/28 (Call 09/06/28) |
120 | 116,119 | ||||||
| 3.90%, 06/15/47 (Call 12/15/46) |
115 | 92,632 | ||||||
| 4.20%, 04/01/43 (Call 10/01/42) |
15 | 12,920 | ||||||
| 4.40%, 03/15/45 (Call 09/15/44) |
70 | 61,434 | ||||||
| 4.50%, 12/06/48 (Call 06/06/48) |
105 | 92,650 | ||||||
| 4.88%, 02/15/44 (Call 08/15/43) |
50 | 46,906 | ||||||
| 5.40%, 09/15/40 (Call 03/15/40) |
60 | 60,351 | ||||||
| 5.88%, 12/16/36 |
204 | 217,307 | ||||||
| 5.95%, 04/01/41 (Call 10/01/40) |
50 | 53,345 | ||||||
| KFC Holding Co./Pizza Hut Holdings LLC/Taco Bell of America LLC, 4.75%, 06/01/27 (Call 04/01/24)(b) |
45 | 44,028 | ||||||
| Lithia Motors Inc. |
||||||||
| 3.88%, 06/01/29 (Call 06/01/24)(b) |
45 | 40,154 | ||||||
| 4.38%, 01/15/31 (Call 10/15/25)(b) |
35 | 31,037 | ||||||
| 4.63%, 12/15/27 (Call 04/01/24)(b) |
25 | 23,837 | ||||||
| Lowe’s Companies Inc. |
||||||||
| 1.30%, 04/15/28 (Call 02/15/28) |
30 | 25,997 | ||||||
| 1.70%, 09/15/28 (Call 07/15/28) |
125 | 108,613 | ||||||
| 1.70%, 10/15/30 (Call 07/15/30) |
105 | 85,135 | ||||||
| 2.50%, 04/15/26 (Call 01/15/26) |
70 | 66,450 | ||||||
| 2.63%, 04/01/31 (Call 01/01/31) |
130 | 110,854 | ||||||
| 2.80%, 09/15/41 (Call 03/15/41) |
25 | 17,450 | ||||||
| 3.00%, 10/15/50 (Call 04/15/50) |
110 | 70,965 | ||||||
| 3.10%, 05/03/27 (Call 02/03/27) |
135 | 127,579 | ||||||
| 3.35%, 04/01/27 (Call 03/01/27) |
30 | 28,583 | ||||||
| 3.38%, 09/15/25 (Call 06/15/25) |
90 | 87,552 | ||||||
| 3.50%, 04/01/51 (Call 10/01/50) |
65 | 45,848 | ||||||
| 3.65%, 04/05/29 (Call 01/05/29) |
90 | 84,856 | ||||||
| 3.70%, 04/15/46 (Call 10/15/45) |
55 | 41,401 | ||||||
| 3.75%, 04/01/32 (Call 01/01/32) |
160 | 145,202 | ||||||
| 4.00%, 04/15/25 (Call 03/15/25) |
200 | 197,111 | ||||||
| 4.05%, 05/03/47 (Call 11/03/46) |
120 | 95,065 | ||||||
| 4.25%, 04/01/52 (Call 10/01/51) |
90 | 72,370 | ||||||
| 4.38%, 09/15/45 (Call 03/15/45) |
5 | 4,238 | ||||||
| 4.45%, 04/01/62 (Call 10/01/61) |
85 | 67,954 | ||||||
| 4.50%, 04/15/30 (Call 01/15/30) |
60 | 58,290 | ||||||
| 4.55%, 04/05/49 (Call 10/05/48) |
10 | 8,455 | ||||||
| 4.65%, 04/15/42 (Call 10/15/41) |
35 | 31,303 | ||||||
| 5.00%, 04/15/40 (Call 10/15/39) |
35 | 33,255 | ||||||
| 5.13%, 04/15/50 (Call 10/15/49) |
50 | 46,118 | ||||||
| 5.15%, 07/01/33 (Call 04/01/33) |
150 | 149,281 | ||||||
| 5.50%, 10/15/35 |
56 | 57,595 | ||||||
| 5.63%, 04/15/53 (Call 10/15/52) |
60 | 59,618 | ||||||
| 5.80%, 09/15/62 (Call 03/15/62) |
60 | 59,896 | ||||||
| 46 | 2 0 2 4 I S H A R E S A N N U A L R E P O R T T O S H A R E H O L D E R S |
| Schedule of Investments (continued) February 29, 2024 |
iShares® ESG Advanced Total USD Bond Market ETF (Percentages shown are based on Net Assets) |
| Security | Par (000) |
Value | ||||||
| Retail (continued) | ||||||||
| Nordstrom Inc. |
||||||||
| 4.00%, 03/15/27 (Call 12/15/26)(c) |
$ | 20 | $ | 18,834 | ||||
| 4.25%, 08/01/31 (Call 05/01/31) |
25 | 21,073 | ||||||
| 4.38%, 04/01/30 (Call 01/01/30)(c) |
30 | 26,500 | ||||||
| 5.00%, 01/15/44 (Call 07/15/43) |
55 | 39,283 | ||||||
| 6.95%, 03/15/28 |
15 | 15,193 | ||||||
| Papa John’s International Inc., 3.88%, 09/15/29 (Call 09/15/24)(b)(c) |
25 | 22,156 | ||||||
| Patrick Industries Inc., 4.75%, 05/01/29 (Call 05/01/24)(b) |
20 | 18,316 | ||||||
| Ross Stores Inc. |
||||||||
| 0.88%, 04/15/26 (Call 03/15/26) |
100 | 91,459 | ||||||
| 4.60%, 04/15/25 (Call 03/15/25) |
35 | 34,663 | ||||||
| Sally Holdings LLC/Sally Capital Inc. |
||||||||
| 5.63%, 12/01/25 (Call 03/13/24) |
35 | 34,992 | ||||||
| 6.75%, 03/01/32 (Call 03/01/27) |
25 | 24,905 | ||||||
| Target Corp. |
||||||||
| 1.95%, 01/15/27 (Call 12/15/26)(c) |
100 | 92,436 | ||||||
| 2.25%, 04/15/25 (Call 03/15/25) |
65 | 62,976 | ||||||
| 2.35%, 02/15/30 (Call 11/15/29) |
75 | 65,422 | ||||||
| 2.50%, 04/15/26 |
50 | 47,755 | ||||||
| 2.65%, 09/15/30 (Call 06/15/30) |
55 | 48,239 | ||||||
| 2.95%, 01/15/52 (Call 07/15/51) |
30 | 19,915 | ||||||
| 3.38%, 04/15/29 (Call 01/15/29) |
70 | 65,606 | ||||||
| 3.63%, 04/15/46 |
65 | 50,700 | ||||||
| 3.90%, 11/15/47 (Call 05/15/47) |
75 | 61,150 | ||||||
| 4.00%, 07/01/42 |
55 | 47,329 | ||||||
| 4.80%, 01/15/53 (Call 07/15/52)(c) |
35 | 32,300 | ||||||
| 6.50%, 10/15/37 |
135 | 150,818 | ||||||
| TJX Companies Inc. (The) |
||||||||
| 1.15%, 05/15/28 (Call 03/15/28) |
15 | 12,928 | ||||||
| 2.25%, 09/15/26 (Call 06/15/26) |
105 | 98,633 | ||||||
| 4.50%, 04/15/50 (Call 10/15/49) |
30 | 27,331 | ||||||
| Tractor Supply Co. |
||||||||
| 1.75%, 11/01/30 (Call 08/01/30) |
5 | 4,026 | ||||||
| 5.25%, 05/15/33 (Call 02/15/33) |
55 | 54,659 | ||||||
| Victoria’s Secret & Co., 4.63%, 07/15/29 (Call 07/15/24)(b) |
35 | 29,527 | ||||||
| Walgreen Co., 4.40%, 09/15/42 |
15 | 12,218 | ||||||
| Walgreens Boots Alliance Inc. |
||||||||
| 3.20%, 04/15/30 (Call 01/15/30)(c) |
25 | 21,599 | ||||||
| 3.45%, 06/01/26 (Call 03/01/26) |
75 | 71,517 | ||||||
| 4.10%, 04/15/50 (Call 10/15/49)(c) |
45 | 32,744 | ||||||
| 4.50%, 11/18/34 (Call 05/18/34) |
15 | 13,292 | ||||||
| 4.80%, 11/18/44 (Call 05/18/44)(c) |
50 | 41,634 | ||||||
| Yum! Brands Inc. |
||||||||
| 3.63%, 03/15/31 (Call 12/15/30) |
57 | 50,037 | ||||||
| 4.63%, 01/31/32 (Call 10/01/26) |
60 | 55,060 | ||||||
| 4.75%, 01/15/30 (Call 10/15/29)(b) |
45 | 42,705 | ||||||
| 5.35%, 11/01/43 (Call 05/01/43) |
15 | 14,364 | ||||||
| 5.38%, 04/01/32 (Call 04/01/27) |
55 | 52,833 | ||||||
| 6.88%, 11/15/37 |
20 | 21,698 | ||||||
|
|
|
|||||||
| 7,812,589 | ||||||||
| Savings & Loans — 0.1% | ||||||||
| Nationwide Building Society |
||||||||
| 1.00%, 08/28/25(b) |
88 | 82,594 | ||||||
| 3.96%, 07/18/30 (Call 07/18/29), |
40 | 36,602 | ||||||
| 4.30%, 03/08/29 (Call 03/08/28), |
220 | 209,187 | ||||||
| Security | Par (000) |
Value | ||||||
| Savings & Loans (continued) | ||||||||
| 6.56%, 10/18/27 (Call 10/18/26), |
$ | 200 | $ | 204,704 | ||||
|
|
|
|||||||
| 533,087 | ||||||||
| Semiconductors — 1.7% |
||||||||
| ams-OSRAM AG, 12.25%, 03/30/29 (Call 03/30/26)(b) |
25 | 25,379 | ||||||
| Analog Devices Inc. |
||||||||
| 1.70%, 10/01/28 (Call 08/01/28) |
40 | 34,908 | ||||||
| 2.10%, 10/01/31 (Call 07/01/31) |
60 | 49,503 | ||||||
| 2.80%, 10/01/41 (Call 04/01/41) |
80 | 56,773 | ||||||
| 2.95%, 04/01/25 (Call 03/01/25) |
27 | 26,374 | ||||||
| 2.95%, 10/01/51 (Call 04/01/51) |
73 | 48,627 | ||||||
| 3.50%, 12/05/26 (Call 09/05/26) |
90 | 86,921 | ||||||
| Applied Materials Inc. |
||||||||
| 1.75%, 06/01/30 (Call 03/01/30) |
60 | 50,038 | ||||||
| 2.75%, 06/01/50 (Call 12/01/49) |
55 | 36,988 | ||||||
| 3.30%, 04/01/27 (Call 01/01/27) |
92 | 88,062 | ||||||
| 3.90%, 10/01/25 (Call 07/01/25) |
50 | 49,123 | ||||||
| 4.35%, 04/01/47 (Call 10/01/46) |
62 | 54,973 | ||||||
| 5.10%, 10/01/35 (Call 04/01/35) |
40 | 40,488 | ||||||
| 5.85%, 06/15/41 |
39 | 41,946 | ||||||
| Broadcom Corp./Broadcom Cayman Finance Ltd. |
||||||||
| 3.50%, 01/15/28 (Call 10/15/27) |
40 | 37,678 | ||||||
| 3.88%, 01/15/27 (Call 10/15/26) |
85 | 82,172 | ||||||
| Broadcom Inc. |
||||||||
| 2.45%, 02/15/31 (Call 11/15/30)(b) |
195 | 162,310 | ||||||
| 2.60%, 02/15/33 (Call 11/15/32)(b) |
110 | 88,281 | ||||||
| 3.14%, 11/15/35 (Call 08/15/35)(b) |
210 | 166,442 | ||||||
| 3.15%, 11/15/25 (Call 10/15/25) |
30 | 28,958 | ||||||
| 3.19%, 11/15/36 (Call 08/15/36)(b) |
180 | 140,674 | ||||||
| 3.42%, 04/15/33 (Call 01/15/33)(b) |
178 | 152,002 | ||||||
| 3.46%, 09/15/26 (Call 07/15/26) |
30 | 28,777 | ||||||
| 3.47%, 04/15/34 (Call 01/15/34)(b) |
115 | 97,099 | ||||||
| 3.50%, 02/15/41 (Call 08/15/40)(b) |
165 | 126,067 | ||||||
| 4.00%, 04/15/29 (Call 02/15/29)(b) |
40 | 37,850 | ||||||
| 4.11%, 09/15/28 (Call 06/15/28) |
120 | 115,007 | ||||||
| 4.15%, 11/15/30 (Call 08/15/30) |
185 | 172,946 | ||||||
| 4.15%, 04/15/32 (Call 01/15/32)(b) |
80 | 73,445 | ||||||
| 4.30%, 11/15/32 (Call 08/15/32) |
100 | 92,602 | ||||||
| 4.93%, 05/15/37 (Call 02/15/37)(b) |
125 | 116,470 | ||||||
| 5.00%, 04/15/30 (Call 01/15/30) |
20 | 19,930 | ||||||
| Entegris Inc. |
||||||||
| 3.63%, 05/01/29 (Call 05/01/24)(b)(c) |
30 | 26,592 | ||||||
| 4.38%, 04/15/28 (Call 03/11/24)(b) |
20 | 18,711 | ||||||
| 4.75%, 04/15/29 (Call 01/15/29)(b) |
50 | 47,211 | ||||||
| 5.95%, 06/15/30 (Call 06/15/25)(b) |
55 | 53,935 | ||||||
| Intel Corp. |
||||||||
| 2.60%, 05/19/26 (Call 02/19/26) |
150 | 142,671 | ||||||
| 3.05%, 08/12/51 (Call 02/12/51) |
5 | 3,304 | ||||||
| 3.20%, 08/12/61 (Call 02/12/61) |
10 | 6,433 | ||||||
| 3.73%, 12/08/47 (Call 06/08/47) |
270 | 204,646 | ||||||
| 4.88%, 02/10/26 |
300 | 299,034 | ||||||
| 4.88%, 02/10/28 (Call 01/10/28) |
365 | 363,984 | ||||||
| 5.13%, 02/10/30 (Call 12/10/29) |
310 | 312,444 | ||||||
| 5.15%, 02/21/34 (Call 11/21/33) |
50 | 49,509 | ||||||
| 5.20%, 02/10/33 (Call 11/10/32) |
170 | 170,073 | ||||||
| 5.60%, 02/21/54 (Call 08/21/53) |
120 | 119,980 | ||||||
| 5.63%, 02/10/43 (Call 08/10/42) |
205 | 208,354 | ||||||
| 5.70%, 02/10/53 (Call 08/10/52) |
375 | 378,959 | ||||||
| 5.90%, 02/10/63 (Call 08/10/62) |
190 | 197,927 | ||||||
| KLA Corp. |
||||||||
| 4.10%, 03/15/29 (Call 12/15/28) |
20 | 19,397 | ||||||
| S C H E D U L E O F I N V E S T M E N T S |
47 |
| Schedule of Investments (continued) February 29, 2024 |
iShares® ESG Advanced Total USD Bond Market ETF (Percentages shown are based on Net Assets) |
| Security | Par (000) |
Value | ||||||
| Semiconductors (continued) | ||||||||
| 4.65%, 07/15/32 (Call 04/15/32) |
$ | 55 | $ | 53,613 | ||||
| 4.95%, 07/15/52 (Call 01/15/52) |
100 | 94,793 | ||||||
| 5.25%, 07/15/62 (Call 01/15/62) |
60 | 58,297 | ||||||
| Lam Research Corp. |
||||||||
| 1.90%, 06/15/30 (Call 03/15/30) |
65 | 54,549 | ||||||
| 2.88%, 06/15/50 (Call 12/15/49)(c) |
55 | 37,185 | ||||||
| 3.13%, 06/15/60 (Call 12/15/59) |
44 | 28,846 | ||||||
| 3.75%, 03/15/26 (Call 01/15/26) |
100 | 97,592 | ||||||
| 3.80%, 03/15/25 (Call 12/15/24) |
27 | 26,604 | ||||||
| 4.00%, 03/15/29 (Call 12/15/28) |
83 | 79,981 | ||||||
| 4.88%, 03/15/49 (Call 09/15/48) |
35 | 32,932 | ||||||
| Marvell Technology Inc. |
||||||||
| 1.65%, 04/15/26 (Call 03/15/26) |
50 | 46,382 | ||||||
| 2.45%, 04/15/28 (Call 02/15/28) |
22 | 19,753 | ||||||
| 2.95%, 04/15/31 (Call 01/15/31) |
80 | 68,509 | ||||||
| 4.88%, 06/22/28 (Call 03/22/28) |
50 | 49,116 | ||||||
| Microchip Technology Inc., |
35 | 34,360 | ||||||
| Micron Technology Inc. |
||||||||
| 2.70%, 04/15/32 (Call 01/15/32) |
40 | 32,814 | ||||||
| 3.37%, 11/01/41 (Call 05/01/41) |
40 | 29,095 | ||||||
| 3.48%, 11/01/51 (Call 05/01/51) |
35 | 24,313 | ||||||
| 4.19%, 02/15/27 (Call 12/15/26) |
122 | 118,549 | ||||||
| 4.66%, 02/15/30 (Call 11/15/29) |
75 | 72,432 | ||||||
| 4.98%, 02/06/26 (Call 12/06/25) |
75 | 74,561 | ||||||
| 5.33%, 02/06/29 (Call 11/06/28) |
76 | 76,074 | ||||||
| 5.88%, 02/09/33 (Call 11/09/32) |
60 | 61,233 | ||||||
| 5.88%, 09/15/33 (Call 06/15/33) |
50 | 50,961 | ||||||
| NVIDIA Corp. |
||||||||
| 2.00%, 06/15/31 (Call 03/15/31) |
70 | 58,478 | ||||||
| 2.85%, 04/01/30 (Call 01/01/30) |
146 | 131,472 | ||||||
| 3.20%, 09/16/26 (Call 06/16/26) |
110 | 106,033 | ||||||
| 3.50%, 04/01/40 (Call 10/01/39) |
104 | 87,100 | ||||||
| 3.50%, 04/01/50 (Call 10/01/49) |
60 | 47,008 | ||||||
| 3.70%, 04/01/60 (Call 10/01/59) |
42 | 33,034 | ||||||
| NXP BV/NXP Funding LLC, 5.35%, 03/01/26 |
40 | 39,936 | ||||||
| NXP BV/NXP Funding LLC/NXP USA Inc. |
||||||||
| 2.50%, 05/11/31 (Call 02/11/31) |
50 | 41,395 | ||||||
| 2.65%, 02/15/32 (Call 11/15/31) |
70 | 57,467 | ||||||
| 2.70%, 05/01/25 (Call 04/01/25) |
22 | 21,276 | ||||||
| 3.13%, 02/15/42 (Call 08/15/41) |
40 | 28,430 | ||||||
| 3.15%, 05/01/27 (Call 03/01/27) |
77 | 72,389 | ||||||
| 3.25%, 05/11/41 (Call 11/11/40) |
50 | 36,744 | ||||||
| 3.25%, 11/30/51 (Call 05/30/51) |
40 | 26,904 | ||||||
| 3.40%, 05/01/30 (Call 02/01/30) |
89 | 79,672 | ||||||
| 3.88%, 06/18/26 (Call 04/18/26) |
45 | 43,546 | ||||||
| 4.30%, 06/18/29 (Call 03/18/29) |
40 | 38,186 | ||||||
| 4.40%, 06/01/27 (Call 05/01/27) |
10 | 9,769 | ||||||
| 5.00%, 01/15/33 (Call 10/15/32) |
35 | 33,822 | ||||||
| ON Semiconductor Corp., 3.88%, 09/01/28 (Call 04/01/24)(b) |
40 | 36,603 | ||||||
| Qorvo Inc. |
||||||||
| 3.38%, 04/01/31 (Call 04/01/26)(b) |
65 | 54,862 | ||||||
| 4.38%, 10/15/29 (Call 10/15/24) |
69 | 64,167 | ||||||
| QUALCOMM Inc. |
||||||||
| 1.30%, 05/20/28 (Call 02/20/28) |
40 | 34,777 | ||||||
| 1.65%, 05/20/32 (Call 02/20/32) |
205 | 160,006 | ||||||
| 2.15%, 05/20/30 (Call 02/20/30) |
10 | 8,553 | ||||||
| 3.25%, 05/20/27 (Call 02/20/27) |
205 | 195,453 | ||||||
| 3.25%, 05/20/50 (Call 11/20/49) |
30 | 21,848 | ||||||
| Security | Par (000) |
Value | ||||||
| Semiconductors (continued) | ||||||||
| 3.45%, 05/20/25 (Call 02/20/25) |
$ | 35 | $ | 34,276 | ||||
| 4.30%, 05/20/47 (Call 11/20/46) |
105 | 91,011 | ||||||
| 4.50%, 05/20/52 (Call 11/20/51) |
75 | 66,060 | ||||||
| 4.65%, 05/20/35 (Call 11/20/34) |
60 | 58,663 | ||||||
| 5.40%, 05/20/33 (Call 02/20/33) |
35 | 36,266 | ||||||
| 6.00%, 05/20/53 (Call 11/20/52) |
80 | 87,702 | ||||||
| Renesas Electronics Corp., 2.17%, 11/25/26 (Call 10/25/26)(b) |
35 | 31,820 | ||||||
| SK Hynix Inc. |
||||||||
| 1.50%, 01/19/26(e) |
200 | 185,265 | ||||||
| 2.38%, 01/19/31(e) |
200 | 164,085 | ||||||
| Skyworks Solutions Inc., 3.00%, 06/01/31 (Call 03/01/31) |
47 | 39,362 | ||||||
| Synaptics Inc., 4.00%,
06/15/29 |
30 | 26,875 | ||||||
| Texas Instruments Inc. |
||||||||
| 1.13%, 09/15/26 (Call 08/15/26) |
35 | 31,940 | ||||||
| 1.38%, 03/12/25 (Call 02/12/25) |
70 | 67,334 | ||||||
| 1.75%, 05/04/30 (Call 02/04/30) |
60 | 50,209 | ||||||
| 1.90%, 09/15/31 (Call 06/15/31) |
65 | 53,643 | ||||||
| 2.25%, 09/04/29 (Call 06/04/29) |
105 | 92,666 | ||||||
| 2.70%, 09/15/51 (Call 03/15/51) |
55 | 35,297 | ||||||
| 2.90%, 11/03/27 (Call 08/03/27) |
52 | 48,810 | ||||||
| 3.88%, 03/15/39 (Call 09/15/38) |
80 | 70,323 | ||||||
| 4.15%, 05/15/48 (Call 11/15/47) |
104 | 88,316 | ||||||
| 5.05%, 05/18/63 (Call 11/18/62) |
75 | 71,736 | ||||||
| TSMC Arizona Corp. |
||||||||
| 2.50%, 10/25/31 (Call 07/25/31) |
200 | 169,305 | ||||||
| 3.13%, 10/25/41 (Call 04/25/41) |
200 | 158,557 | ||||||
| TSMC Global Ltd. |
||||||||
| 1.00%, 09/28/27 (Call 07/28/27)(e) |
200 | 174,359 | ||||||
| 1.38%, 09/28/30 (Call 06/28/30)(e) |
200 | 160,168 | ||||||
| Xilinx Inc., 2.38%, 06/01/30 (Call 03/01/30) |
81 | 70,096 | ||||||
|
|
|
|||||||
| 10,107,595 | ||||||||
| Software — 0.7% |
||||||||
| ACI Worldwide Inc., 5.75%, 08/15/26 (Call 04/01/24)(b) |
25 | 24,675 | ||||||
| Adobe Inc. |
||||||||
| 2.15%, 02/01/27 (Call 12/01/26) |
110 | 102,392 | ||||||
| 2.30%, 02/01/30 (Call 11/01/29) |
106 | 92,465 | ||||||
| Autodesk Inc. |
||||||||
| 2.40%, 12/15/31 (Call 09/15/31) |
80 | 66,363 | ||||||
| 2.85%, 01/15/30 (Call 10/15/29) |
50 | 44,323 | ||||||
| 3.50%, 06/15/27 (Call 03/15/27) |
27 | 25,816 | ||||||
| 4.38%, 06/15/25 (Call 03/15/25) |
42 | 41,521 | ||||||
| Black Knight InfoServ LLC, 3.63%, 09/01/28 (Call 03/11/24)(b) |
60 | 56,453 | ||||||
| Broadridge Financial Solutions Inc. |
||||||||
| 2.60%, 05/01/31 (Call 02/01/31) |
65 | 54,460 | ||||||
| 2.90%, 12/01/29 (Call 09/01/29) |
85 | 74,827 | ||||||
| 3.40%, 06/27/26 (Call 03/27/26) |
45 | 43,011 | ||||||
| Camelot Finance SA, 4.50%, 11/01/26 (Call 04/02/24)(b) |
40 | 38,225 | ||||||
| Central Parent Inc./CDK Global Inc., 7.25%, 06/15/29 (Call 06/15/25)(b) |
45 | 45,297 | ||||||
| Clarivate Science Holdings Corp. |
||||||||
| 3.88%, 07/01/28 (Call 06/30/24)(b) |
50 | 45,652 | ||||||
| 4.88%, 07/01/29 (Call 06/30/24)(b) |
55 | 49,863 | ||||||
| Concentrix Corp. |
||||||||
| 6.60%, 08/02/28 (Call 07/02/28) |
55 | 55,253 | ||||||
| 6.85%, 08/02/33 (Call 05/02/33) |
25 | 24,447 | ||||||
| 48 | 2 0 2 4 I S H A R E S A N N U A L R E P O R T T O S H A R E H O L D E R S |
| Schedule of Investments (continued) February 29, 2024 |
iShares® ESG Advanced Total USD Bond Market ETF (Percentages shown are based on Net Assets) |
| Security | Par (000) |
Value | ||||||
| Software (continued) | ||||||||
| Consensus Cloud Solutions Inc. |
||||||||
| 6.00%, 10/15/26 (Call 04/01/24)(b)(c) |
$ | 20 | $ | 19,040 | ||||
| 6.50%, 10/15/28 (Call 10/15/26)(b)(c) |
30 | 26,809 | ||||||
| Elastic NV, 4.13%, 07/15/29 (Call 07/15/24)(b) |
35 | 31,471 | ||||||
| Electronic Arts Inc. |
||||||||
| 1.85%, 02/15/31 (Call 11/15/30) |
75 | 61,044 | ||||||
| 2.95%, 02/15/51 (Call 08/15/50) |
50 | 33,227 | ||||||
| 4.80%, 03/01/26 (Call 12/01/25) |
37 | 36,803 | ||||||
| Fair Isaac Corp. |
||||||||
| 4.00%, 06/15/28 (Call 03/18/24)(b) |
55 | 51,073 | ||||||
| 5.25%, 05/15/26 (Call 02/15/26)(b) |
30 | 29,681 | ||||||
| Fidelity National Information Services Inc. |
||||||||
| 1.15%, 03/01/26 (Call 02/01/26) |
105 | 97,115 | ||||||
| 1.65%, 03/01/28 (Call 01/01/28) |
30 | 26,439 | ||||||
| 2.25%, 03/01/31 (Call 12/01/30) |
90 | 75,213 | ||||||
| 3.10%, 03/01/41 (Call 09/01/40) |
66 | 47,520 | ||||||
| 4.50%, 08/15/46 (Call 02/15/46) |
25 | 20,491 | ||||||
| 5.10%, 07/15/32 (Call 04/15/32)(c) |
65 | 64,961 | ||||||
| 5.63%, 07/15/52 (Call 01/15/52) |
25 | 24,726 | ||||||
| Fiserv Inc. |
||||||||
| 2.25%, 06/01/27 (Call 04/01/27) |
140 | 128,102 | ||||||
| 2.65%, 06/01/30 (Call 03/01/30) |
74 | 63,631 | ||||||
| 3.20%, 07/01/26 (Call 05/01/26) |
164 | 156,626 | ||||||
| 3.50%, 07/01/29 (Call 04/01/29) |
140 | 128,735 | ||||||
| 3.85%, 06/01/25 (Call 03/01/25) |
82 | 80,361 | ||||||
| 4.20%, 10/01/28 (Call 07/01/28) |
45 | 43,166 | ||||||
| 4.40%, 07/01/49 (Call 01/01/49) |
127 | 106,215 | ||||||
| 5.63%, 08/21/33 (Call 05/21/33) |
130 | 131,460 | ||||||
| Intuit Inc. |
||||||||
| 0.95%, 07/15/25 (Call 06/15/25) |
52 | 49,061 | ||||||
| 1.35%, 07/15/27 (Call 05/15/27) |
32 | 28,549 | ||||||
| 1.65%, 07/15/30 (Call 04/15/30) |
102 | 83,639 | ||||||
| 5.25%, 09/15/26 (Call 08/15/26) |
60 | 60,523 | ||||||
| 5.50%, 09/15/53 (Call 03/15/53) |
70 | 72,185 | ||||||
| MicroStrategy Inc., 6.13%, 06/15/28 (Call 06/15/24)(b) |
30 | 29,026 | ||||||
| Open Text Corp. |
||||||||
| 3.88%, 02/15/28 (Call 04/01/24)(b) |
50 | 45,981 | ||||||
| 3.88%, 12/01/29 (Call 12/01/24)(b) |
45 | 39,770 | ||||||
| Open Text Holdings Inc. |
||||||||
| 4.13%, 02/15/30 (Call 02/15/25)(b) |
50 | 44,171 | ||||||
| 4.13%, 12/01/31 (Call 12/01/26)(b) |
37 | 31,683 | ||||||
| PTC Inc., 4.00%, 02/15/28 (Call 04/01/24)(b) |
25 | 23,306 | ||||||
| Rackspace Technology Global Inc. |
||||||||
| 3.50%, 02/15/28 (Call 04/01/24)(b) |
30 | 12,083 | ||||||
| 5.38%, 12/01/28 (Call 04/01/24)(b) |
27 | 7,940 | ||||||
| RingCentral Inc., 8.50%, 08/15/30 (Call 08/15/26)(b)(c) |
25 | 25,837 | ||||||
| Roper Technologies Inc. |
||||||||
| 1.00%, 09/15/25 (Call 08/15/25) |
60 | 56,188 | ||||||
| 1.40%, 09/15/27 (Call 07/15/27) |
70 | 61,834 | ||||||
| 1.75%, 02/15/31 (Call 11/15/30) |
111 | 88,679 | ||||||
| 2.00%, 06/30/30 (Call 03/30/30) |
65 | 53,996 | ||||||
| 2.95%, 09/15/29 (Call 06/15/29) |
55 | 49,234 | ||||||
| 3.80%, 12/15/26 (Call 09/15/26) |
84 | 81,195 | ||||||
| 3.85%, 12/15/25 (Call 09/15/25) |
37 | 36,098 | ||||||
| 4.20%, 09/15/28 (Call 06/15/28) |
30 | 28,988 | ||||||
| ServiceNow Inc., 1.40%, 09/01/30 (Call 06/01/30) |
125 | 100,270 | ||||||
| Twilio Inc. |
||||||||
| 3.63%, 03/15/29 (Call 03/15/24) |
30 | 26,734 | ||||||
| 3.88%, 03/15/31 (Call 03/15/26) |
30 | 26,122 | ||||||
| VMware LLC |
||||||||
| 1.40%, 08/15/26 (Call 07/15/26) |
40 | 36,367 | ||||||
| Security | Par (000) |
Value | ||||||
| Software (continued) | ||||||||
| 2.20%, 08/15/31 (Call 05/15/31) |
$ | 115 | $ | 92,725 | ||||
| 3.90%, 08/21/27 (Call 05/21/27) |
107 | 102,021 | ||||||
| 4.50%, 05/15/25 (Call 04/15/25) |
50 | 49,448 | ||||||
| 4.65%, 05/15/27 (Call 03/15/27) |
92 | 90,057 | ||||||
| 4.70%, 05/15/30 (Call 02/15/30) |
82 | 78,854 | ||||||
| Workday Inc. |
||||||||
| 3.50%, 04/01/27 (Call 03/01/27) |
50 | 47,597 | ||||||
| 3.70%, 04/01/29 (Call 02/01/29) |
5 | 4,673 | ||||||
| 3.80%, 04/01/32 (Call 01/01/32) |
70 | 63,274 | ||||||
| ZoomInfo Technologies LLC/ZoomInfo Finance Corp., |
||||||||
| 3.88%, 02/01/29 (Call 03/11/24)(b) |
40 | 35,825 | ||||||
|
|
|
|||||||
| 4,132,885 | ||||||||
| Telecommunications — 1.5% |
||||||||
| America Movil SAB de CV |
||||||||
| 4.38%, 04/22/49 (Call 10/22/48) |
30 | 25,795 | ||||||
| 6.13%, 03/30/40 |
210 | 219,769 | ||||||
| 6.38%, 03/01/35 |
110 | 119,186 | ||||||
| Bell Telephone Co. of Canada or Bell Canada |
||||||||
| 3.65%, 08/15/52 (Call 02/15/52) |
45 | 33,082 | ||||||
| 4.30%, 07/29/49 (Call 01/29/49) |
30 | 24,688 | ||||||
| 4.46%, 04/01/48 (Call 10/01/47) |
70 | 59,497 | ||||||
| 5.10%, 05/11/33 (Call 02/11/33) |
5 | 4,947 | ||||||
| 5.20%, 02/15/34 (Call 11/15/33) |
80 | 78,939 | ||||||
| 5.55%, 02/15/54 (Call 08/15/53) |
50 | 49,194 | ||||||
| Series US-4, 3.65%, 03/17/51 (Call 09/17/50) |
35 | 25,767 | ||||||
| Series US-6, 3.20%, 02/15/52 (Call 08/15/51) |
35 | 23,506 | ||||||
| Bharti Airtel Ltd., 4.38%, 06/10/25(e) |
200 | 196,565 | ||||||
| Ciena Corp., 4.00%, 01/31/30 (Call 01/31/25)(b)(c) |
20 | 17,902 | ||||||
| CommScope Inc. |
||||||||
| 4.75%, 09/01/29 (Call 09/01/24)(b) |
60 | 41,094 | ||||||
| 6.00%, 03/01/26 (Call 04/01/24)(b) |
85 | 76,500 | ||||||
| 7.13%, 07/01/28 (Call 04/01/24)(b) |
35 | 13,882 | ||||||
| 8.25%, 03/01/27 (Call 04/01/24)(b) |
50 | 21,868 | ||||||
| CommScope Technologies LLC |
||||||||
| 5.00%, 03/15/27 (Call 03/11/24)(b)(c) |
40 | 14,246 | ||||||
| 6.00%, 06/15/25 (Call 03/11/24)(b) |
64 | 52,161 | ||||||
| Connect Finco Sarl/Connect U.S. Finco LLC, 6.75%, 10/01/26 (Call 03/11/24)(b) |
20 | 19,632 | ||||||
| Consolidated Communications Inc. |
||||||||
| 5.00%, 10/01/28 (Call 03/11/24)(b) |
25 | 20,626 | ||||||
| 6.50%, 10/01/28 (Call 03/11/24)(b) |
40 | 34,439 | ||||||
| Corning Inc. |
||||||||
| 3.90%, 11/15/49 (Call 05/15/49) |
37 | 28,631 | ||||||
| 4.38%, 11/15/57 (Call 05/15/57) |
37 | 30,436 | ||||||
| 4.70%, 03/15/37 |
14 | 12,859 | ||||||
| 4.75%, 03/15/42 |
30 | 26,876 | ||||||
| 5.35%, 11/15/48 (Call 05/15/48) |
36 | 34,571 | ||||||
| 5.45%, 11/15/79 (Call 05/19/79) |
60 | 55,414 | ||||||
| 5.75%, 08/15/40 |
16 | 15,992 | ||||||
| 5.85%, 11/15/68 (Call 05/15/68) |
15 | 14,757 | ||||||
| Frontier Communications Holdings LLC |
||||||||
| 5.00%, 05/01/28 (Call 05/01/24)(b) |
110 | 101,967 | ||||||
| 5.88%, 10/15/27 (Call 04/01/24)(b) |
60 | 57,985 | ||||||
| 5.88%, 11/01/29 (Call 11/01/24) |
45 | 38,489 | ||||||
| 6.00%, 01/15/30 (Call 10/15/24)(b) |
55 | 47,024 | ||||||
| 6.75%, 05/01/29 (Call 05/01/24)(b) |
55 | 49,428 | ||||||
| 8.63%, 03/15/31 (Call 03/15/26)(b) |
45 | 45,579 | ||||||
| 8.75%, 05/15/30 (Call 05/15/25)(b) |
65 | 66,288 | ||||||
| HKT Capital No. 5 Ltd., 3.25%, 09/30/29(e) |
200 | 180,553 | ||||||
| Intelsat Jackson Holdings SA, 6.50%, 03/15/30 |
160 | 149,030 | ||||||
| S C H E D U L E O F I N V E S T M E N T S |
49 |
| Schedule of Investments (continued) February 29, 2024 |
iShares® ESG Advanced Total USD Bond Market ETF (Percentages shown are based on Net Assets) |
| Security | Par (000) |
Value | ||||||
| Telecommunications (continued) | ||||||||
| Juniper Networks Inc. |
||||||||
| 1.20%, 12/10/25 (Call 11/10/25) |
$ | 47 | $ | 43,562 | ||||
| 2.00%, 12/10/30 (Call 09/10/30) |
22 | 17,713 | ||||||
| 3.75%, 08/15/29 (Call 05/15/29) |
45 | 41,710 | ||||||
| 5.95%, 03/15/41 |
25 | 24,732 | ||||||
| Level 3 Financing Inc. |
||||||||
| 3.40%, 03/01/27 |
40 | 40,800 | ||||||
| 3.63%, 01/15/29 |
45 | 26,325 | ||||||
| 3.75%, 07/15/29 |
45 | 26,325 | ||||||
| 3.88%, 11/15/29 |
45 | 46,350 | ||||||
| 4.25%, 07/01/28 |
60 | 36,900 | ||||||
| 4.63%, 09/15/27 |
50 | 32,250 | ||||||
| 10.50%, 05/15/30 |
42 | 43,220 | ||||||
| 11.00%, 11/15/29 (Call 03/22/27)(h) |
51 | 50,968 | ||||||
| Lumen Technologies Inc. |
||||||||
| 4.00%, 02/15/27 |
55 | 33,240 | ||||||
| 4.50%, 01/15/29 (Call 03/11/24)(b) |
10 | 3,141 | ||||||
| 5.38%, 06/15/29 (Call 06/15/24)(b) |
15 | 4,940 | ||||||
| Series G, 6.88%, 01/15/28 |
12 | 5,982 | ||||||
| Series P, 7.60%, 09/15/39 |
20 | 6,639 | ||||||
| Series U, 7.65%, 03/15/42 |
15 | 4,954 | ||||||
| Millicom International Cellular SA, 6.25%, 03/25/29 (Call 03/25/24)(e) |
180 | 174,499 | ||||||
| Nokia OYJ |
||||||||
| 4.38%, 06/12/27 |
30 | 28,752 | ||||||
| 6.63%, 05/15/39 |
30 | 28,948 | ||||||
| Ooredoo International Finance Ltd., 2.63%, 04/08/31(e) |
200 | 171,540 | ||||||
| Qwest Corp., 7.25%, 09/15/25 |
15 | 14,510 | ||||||
| Rogers Communications Inc. |
||||||||
| 2.90%, 11/15/26 (Call 08/15/26) |
69 | 64,938 | ||||||
| 3.63%, 12/15/25 (Call 09/15/25) |
105 | 101,753 | ||||||
| 3.80%, 03/15/32 (Call 12/15/31) |
100 | 88,840 | ||||||
| 4.30%, 02/15/48 (Call 08/15/47) |
80 | 63,914 | ||||||
| 4.35%, 05/01/49 (Call 11/01/48) |
76 | 61,040 | ||||||
| 4.50%, 03/15/42 (Call 09/15/41) |
50 | 42,934 | ||||||
| 4.50%, 03/15/43 (Call 09/15/42) |
45 | 38,057 | ||||||
| 4.55%, 03/15/52 (Call 09/15/51) |
80 | 66,023 | ||||||
| 5.00%, 03/15/44 (Call 09/15/43) |
75 | 67,644 | ||||||
| 5.25%, 03/15/82 (Call 03/15/27), (5-year CMT + 3.590%)(a)(b) |
45 | 42,893 | ||||||
| 5.30%, 02/15/34 (Call 11/15/33) |
70 | 68,720 | ||||||
| 5.45%, 10/01/43 (Call 04/01/43) |
65 | 62,164 | ||||||
| 7.50%, 08/15/38 |
30 | 34,498 | ||||||
| SES Global Americas Holdings Inc., 5.30%, 03/25/44(b) |
20 | 15,365 | ||||||
| Telecom Italia Capital SA |
||||||||
| 6.00%, 09/30/34 |
60 | 55,680 | ||||||
| 6.38%, 11/15/33 |
50 | 47,933 | ||||||
| 7.20%, 07/18/36 |
55 | 54,708 | ||||||
| 7.72%, 06/04/38 |
55 | 56,228 | ||||||
| Telstra Corp. Ltd., 3.13%, 04/07/25 (Call 01/07/25)(b) |
40 | 39,030 | ||||||
| TELUS Corp. |
||||||||
| 2.80%, 02/16/27 (Call 11/16/26) |
37 | 34,663 | ||||||
| 3.40%, 05/13/32 (Call 02/13/32) |
50 | 43,382 | ||||||
| 3.70%, 09/15/27 (Call 06/15/27) |
65 | 61,697 | ||||||
| 4.30%, 06/15/49 (Call 12/15/48) |
25 | 20,314 | ||||||
| 4.60%, 11/16/48 (Call 05/16/48) |
50 | 42,727 | ||||||
| U.S. Cellular Corp., 6.70%, 12/15/33 |
30 | 29,520 | ||||||
| Verizon Communications Inc. |
||||||||
| 0.85%, 11/20/25 (Call 10/20/25) |
116 | 107,652 | ||||||
| Security | Par (000) |
Value | ||||||
| Telecommunications (continued) | ||||||||
| 1.45%, 03/20/26 (Call 02/20/26) |
$ | 45 | $ | 41,726 | ||||
| 1.50%, 09/18/30 (Call 06/18/30) |
67 | 53,754 | ||||||
| 1.68%, 10/30/30 (Call 07/30/30) |
60 | 48,281 | ||||||
| 1.75%, 01/20/31 (Call 10/20/30) |
100 | 80,193 | ||||||
| 2.10%, 03/22/28 (Call 01/22/28) |
209 | 186,087 | ||||||
| 2.36%, 03/15/32 (Call 12/15/31) |
271 | 219,495 | ||||||
| 2.55%, 03/21/31 (Call 12/21/30) |
194 | 163,439 | ||||||
| 2.63%, 08/15/26 |
170 | 160,312 | ||||||
| 2.65%, 11/20/40 (Call 05/20/40) |
139 | 95,827 | ||||||
| 2.85%, 09/03/41 (Call 03/03/41) |
50 | 35,218 | ||||||
| 2.88%, 11/20/50 (Call 05/20/50) |
140 | 89,201 | ||||||
| 2.99%, 10/30/56 (Call 04/30/56) |
205 | 127,438 | ||||||
| 3.00%, 03/22/27 (Call 01/22/27) |
182 | 171,242 | ||||||
| 3.00%, 11/20/60 (Call 05/20/60)(c) |
112 | 67,991 | ||||||
| 3.15%, 03/22/30 (Call 12/22/29) |
74 | 66,245 | ||||||
| 3.40%, 03/22/41 (Call 09/22/40) |
187 | 143,197 | ||||||
| 3.55%, 03/22/51 (Call 09/22/50) |
234 | 169,917 | ||||||
| 3.70%, 03/22/61 (Call 09/22/60) |
185 | 131,590 | ||||||
| 3.85%, 11/01/42 (Call 05/01/42) |
45 | 36,193 | ||||||
| 3.88%, 02/08/29 (Call 11/08/28) |
94 | 89,308 | ||||||
| 3.88%, 03/01/52 (Call 09/01/51) |
65 | 50,078 | ||||||
| 4.00%, 03/22/50 (Call 09/22/49) |
69 | 54,417 | ||||||
| 4.02%, 12/03/29 (Call 09/03/29) |
243 | 230,649 | ||||||
| 4.13%, 03/16/27 |
259 | 251,889 | ||||||
| 4.13%, 08/15/46 |
60 | 49,105 | ||||||
| 4.33%, 09/21/28 |
200 | 194,158 | ||||||
| 4.40%, 11/01/34 (Call 05/01/34) |
142 | 131,986 | ||||||
| 4.50%, 08/10/33 |
151 | 142,291 | ||||||
| 4.52%, 09/15/48 |
105 | 91,872 | ||||||
| 4.67%, 03/15/55 |
30 | 26,458 | ||||||
| 4.75%, 11/01/41 |
47 | 43,252 | ||||||
| 4.81%, 03/15/39 |
79 | 73,679 | ||||||
| 4.86%, 08/21/46 |
120 | 110,163 | ||||||
| 5.01%, 04/15/49(c) |
50 | 48,605 | ||||||
| 5.25%, 03/16/37 |
65 | 64,800 | ||||||
| 5.50%, 03/16/47 |
27 | 27,177 | ||||||
| 5.50%, 02/23/54 (Call 08/23/53) |
60 | 59,284 | ||||||
| 5.85%, 09/15/35 |
22 | 22,974 | ||||||
| 6.40%, 09/15/33 |
7 | 7,524 | ||||||
| 6.55%, 09/15/43 |
42 | 46,787 | ||||||
| 7.75%, 12/01/30 |
25 | 28,521 | ||||||
| Viasat Inc., 7.50%, 05/30/31 (Call 05/30/26)(b) |
50 | 35,130 | ||||||
| ViaSat Inc. |
||||||||
| 5.63%, 04/15/27 (Call 03/11/24)(b) |
100 | 93,895 | ||||||
| 6.50%, 07/15/28 (Call 04/01/24)(b)(c) |
20 | 14,812 | ||||||
| Viavi Solutions Inc., 3.75%, 10/01/29 (Call 10/01/24)(b) |
25 | 21,693 | ||||||
| Windstream Escrow LLC/Windstream Escrow Finance Corp., 7.75%, 08/15/28 |
75 | 70,011 | ||||||
|
|
|
|||||||
| 8,617,345 | ||||||||
| Toys, Games & Hobbies — 0.0% |
||||||||
| Hasbro Inc. |
||||||||
| 3.50%, 09/15/27 (Call 06/15/27) |
15 | 14,075 | ||||||
| 3.55%, 11/19/26 (Call 09/19/26) |
55 | 52,158 | ||||||
| 3.90%, 11/19/29 (Call 08/19/29) |
90 | 82,582 | ||||||
| 5.10%, 05/15/44 (Call 11/15/43) |
15 | 12,598 | ||||||
| 6.35%, 03/15/40 |
25 | 25,337 | ||||||
|
|
|
|||||||
| 186,750 | ||||||||
| 50 | 2 0 2 4 I S H A R E S A N N U A L R E P O R T T O S H A R E H O L D E R S |
| Schedule of Investments (continued) February 29, 2024 |
iShares® ESG Advanced Total USD Bond Market ETF (Percentages shown are based on Net Assets) |
| Security | Par (000) |
Value | ||||||
| Transportation — 0.2% | ||||||||
| AP Moller - Maersk A/S |
||||||||
| 4.50%, 06/20/29 (Call 03/20/29)(b) |
$ | 50 | $ | 48,892 | ||||
| 5.88%, 09/14/33 (Call 06/14/33)(b) |
5 | 5,035 | ||||||
| Cargo Aircraft Management Inc., 4.75%, 02/01/28 (Call 03/18/24)(b) |
35 | 30,951 | ||||||
| CH Robinson Worldwide Inc., 4.20%, 04/15/28 (Call 01/15/28) |
55 | 53,024 | ||||||
| JB Hunt Transport Services Inc., 3.88%, 03/01/26 (Call 01/01/26) |
65 | 63,448 | ||||||
| MTR Corp. Ltd., 1.63%, 08/19/30(e) |
200 | 165,582 | ||||||
| RXO Inc., 7.50%, 11/15/27 (Call 11/15/24)(b) |
20 | 20,723 | ||||||
| Ryder System Inc. |
||||||||
| 2.85%, 03/01/27 (Call 02/01/27) |
60 | 56,109 | ||||||
| 2.90%, 12/01/26 (Call 10/01/26) |
50 | 46,979 | ||||||
| 3.35%, 09/01/25 (Call 08/01/25) |
50 | 48,463 | ||||||
| 4.63%, 06/01/25 (Call 05/01/25) |
57 | 56,462 | ||||||
| 6.30%, 12/01/28 (Call 11/01/28) |
5 | 5,210 | ||||||
| 6.60%, 12/01/33 (Call 09/01/33) |
50 | 53,535 | ||||||
| SF Holding Investment 2021 Ltd., 3.13%, 11/17/31(e) |
200 | 172,719 | ||||||
| XPO CNW Inc., 6.70%, 05/01/34 |
15 | 15,558 | ||||||
| XPO Inc. |
||||||||
| 7.13%, 06/01/31 (Call 06/01/26)(b) |
50 | 51,106 | ||||||
| 7.13%, 02/01/32 (Call 02/01/27)(b) |
45 | 45,714 | ||||||
|
|
|
|||||||
| 939,510 | ||||||||
| Trucking & Leasing — 0.1% | ||||||||
| AerCap Global Aviation Trust, 6.50%, 06/15/45 |
||||||||
| (Call 06/15/25), (3-mo. SOFR + 4.562%)(a)(b) |
30 | 29,794 | ||||||
| GATX Corp. |
||||||||
| 1.90%, 06/01/31 (Call 03/01/31) |
50 | 39,338 | ||||||
| 3.10%, 06/01/51 (Call 12/01/50) |
45 | 28,921 | ||||||
| 3.25%, 03/30/25 (Call 12/30/24) |
15 | 14,625 | ||||||
| 3.25%, 09/15/26 (Call 06/15/26) |
30 | 28,590 | ||||||
| 3.50%, 03/15/28 (Call 12/15/27) |
25 | 23,446 | ||||||
| 3.85%, 03/30/27 (Call 12/30/26) |
30 | 28,779 | ||||||
| 4.00%, 06/30/30 (Call 03/30/30) |
65 | 60,294 | ||||||
| 4.55%, 11/07/28 (Call 08/07/28)(c) |
20 | 19,529 | ||||||
| 4.70%, 04/01/29 (Call 01/01/29) |
30 | 29,328 | ||||||
| 5.20%, 03/15/44 (Call 09/15/43) |
25 | 22,817 | ||||||
| 6.05%, 03/15/34 (Call 12/15/33) |
60 | 61,422 | ||||||
|
|
|
|||||||
| 386,883 | ||||||||
| Water — 0.1% | ||||||||
| American Water Capital Corp. |
||||||||
| 2.80%, 05/01/30 (Call 02/01/30) |
65 | 56,892 | ||||||
| 2.95%, 09/01/27 (Call 06/01/27) |
5 | 4,662 | ||||||
| 3.40%, 03/01/25 (Call 12/01/24) |
35 | 34,315 | ||||||
| 3.45%, 06/01/29 (Call 03/01/29) |
52 | 48,340 | ||||||
| 3.45%, 05/01/50 (Call 11/01/49) |
34 | 24,867 | ||||||
| 3.75%, 09/01/28 (Call 06/01/28) |
45 | 42,690 | ||||||
| 3.75%, 09/01/47 (Call 03/01/47) |
31 | 24,059 | ||||||
| 4.00%, 12/01/46 (Call 06/01/46) |
25 | 20,226 | ||||||
| 4.15%, 06/01/49 (Call 12/01/48) |
37 | 30,583 | ||||||
| 4.20%, 09/01/48 (Call 03/01/48) |
25 | 20,995 | ||||||
| 4.30%, 12/01/42 (Call 06/01/42) |
52 | 45,405 | ||||||
| 4.30%, 09/01/45 (Call 03/01/45) |
20 | 17,063 | ||||||
| 4.45%, 06/01/32 (Call 03/01/32) |
45 | 43,027 | ||||||
| 6.59%, 10/15/37 |
55 | 61,757 | ||||||
|
|
|
|||||||
| 474,881 | ||||||||
|
|
|
|||||||
| Total Corporate Bonds & Notes — 31.5% |
186,143,071 | |||||||
|
|
|
|||||||
| Security | Par (000) |
Value | ||||||
| Foreign Government Obligations(i) |
| |||||||
| Argentina — 0.2% | ||||||||
| Argentina Bonar Bonds |
||||||||
| 0.75%, 07/09/30(j) |
$ | 355 | $ | 153,538 | ||||
| 1.00%, 07/09/29 |
60 | 25,808 | ||||||
| 3.50%, 07/09/41(j) |
50 | 17,126 | ||||||
| 3.63%, 07/09/35(j) |
470 | 168,243 | ||||||
| 4.25%, 01/09/38(j) |
190 | 71,588 | ||||||
| Argentine Republic Government International Bond |
||||||||
| 0.75%, 07/09/30 (Call 04/03/24)(j) |
420 | 194,099 | ||||||
| 1.00%, 07/09/29 (Call 04/01/24)(c) |
100 | 46,272 | ||||||
| 3.50%, 07/09/41 (Call 04/03/24)(j) |
225 | 80,850 | ||||||
| 3.63%, 07/09/35 (Call 04/03/24)(j) |
420 | 155,400 | ||||||
| 3.63%, 07/09/46 (Call 04/03/24)(c)(j) |
55 | 21,312 | ||||||
| 4.25%, 01/09/38 (Call 04/03/24)(j) |
285 | 118,779 | ||||||
|
|
|
|||||||
| 1,053,015 | ||||||||
| Bermuda — 0.0% | ||||||||
| Bermuda Government International Bond, 2.38%, 08/20/30 |
155 | 129,635 | ||||||
|
|
|
|||||||
| Brazil — 0.2% | ||||||||
| Brazilian Government International Bond |
||||||||
| 5.63%, 01/07/41 |
300 | 269,294 | ||||||
| 7.13%, 01/20/37(c) |
225 | 239,827 | ||||||
| 8.25%, 01/20/34 |
160 | 183,229 | ||||||
| 10.13%, 05/15/27(c) |
120 | 137,136 | ||||||
|
|
|
|||||||
| 829,486 | ||||||||
| Canada — 0.6% | ||||||||
| Canada Government International Bond |
||||||||
| 0.75%, 05/19/26 |
140 | 128,697 | ||||||
| 2.88%, 04/28/25 |
205 | 200,103 | ||||||
| CDP Financial Inc. |
||||||||
| 0.88%, 06/10/25(b) |
60 | 56,896 | ||||||
| 1.00%, 05/26/26(b) |
50 | 46,029 | ||||||
| 4.25%, 07/25/28(b) |
250 | 246,076 | ||||||
| Export Development Canada |
||||||||
| 3.38%, 08/26/25 |
5 | 4,893 | ||||||
| 3.88%, 02/14/28 |
420 | 411,238 | ||||||
| 4.13%, 02/13/29 |
120 | 118,574 | ||||||
| Ontario Teachers’ Finance Trust, 2.00%, 04/16/31(b) |
250 | 208,771 | ||||||
| Province of Alberta Canada |
||||||||
| 1.00%, 05/20/25 |
100 | 95,214 | ||||||
| 1.30%, 07/22/30 |
115 | 94,347 | ||||||
| 2.05%, 08/17/26(b) |
100 | 93,798 | ||||||
| 3.30%, 03/15/28 |
80 | 76,188 | ||||||
| Province of British Columbia Canada |
||||||||
| 0.90%, 07/20/26 |
155 | 141,825 | ||||||
| 1.30%, 01/29/31(c) |
70 | 56,750 | ||||||
| 2.25%, 06/02/26 |
30 | 28,428 | ||||||
| 4.20%, 07/06/33 |
100 | 96,634 | ||||||
| 7.25%, 09/01/36 |
20 | 24,422 | ||||||
| Province of Manitoba Canada, 2.13%, 06/22/26 |
225 | 212,186 | ||||||
| Province of New Brunswick Canada, 3.63%, 02/24/28 |
20 | 19,177 | ||||||
| Province of Ontario Canada |
||||||||
| 0.63%, 01/21/26 |
116 | 107,292 | ||||||
| 1.05%, 04/14/26 |
10 | 9,257 | ||||||
| 1.05%, 05/21/27 |
100 | 89,360 | ||||||
| 1.13%, 10/07/30 |
90 | 72,563 | ||||||
| 1.60%, 02/25/31 |
75 | 61,849 | ||||||
| 1.80%, 10/14/31 |
105 | 86,531 | ||||||
| 2.00%, 10/02/29 |
30 | 26,262 | ||||||
| S C H E D U L E O F I N V E S T M E N T S |
51 |
| Schedule of Investments (continued) February 29, 2024 |
iShares® ESG Advanced Total USD Bond Market ETF (Percentages shown are based on Net Assets) |
| Security | Par (000) |
Value | ||||||
| Canada (continued) | ||||||||
| 2.30%, 06/15/26 |
$ | 60 | $ | 56,842 | ||||
| 2.50%, 04/27/26 |
115 | 109,720 | ||||||
| 4.20%, 01/18/29 |
110 | 108,392 | ||||||
| Province of Quebec Canada |
||||||||
| 0.60%, 07/23/25 |
215 | 202,409 | ||||||
| 2.50%, 04/20/26 |
50 | 47,732 | ||||||
| 2.75%, 04/12/27 |
58 | 54,880 | ||||||
| 4.50%, 09/08/33 |
105 | 103,651 | ||||||
| Series PD, 7.50%, 09/15/29 |
110 | 125,553 | ||||||
|
|
|
|||||||
| 3,622,539 | ||||||||
| Chile — 0.1% | ||||||||
| Chile Government International Bond |
||||||||
| 3.24%, 02/06/28 (Call 11/06/27) |
200 | 187,212 | ||||||
| 3.50%, 01/25/50 (Call 07/25/49) |
200 | 144,928 | ||||||
| 3.63%, 10/30/42 |
200 | 155,389 | ||||||
| 3.86%, 06/21/47 |
200 | 156,793 | ||||||
| 4.00%, 01/31/52 (Call 07/31/51) |
200 | 156,973 | ||||||
|
|
|
|||||||
| 801,295 | ||||||||
| Colombia — 0.1% | ||||||||
| Colombia Government International Bond |
200 | 182,479 | ||||||
| 6.13%, 01/18/41 |
300 | 255,461 | ||||||
| 7.38%, 09/18/37 |
300 | 294,361 | ||||||
|
|
|
|||||||
| 732,301 | ||||||||
| Costa Rica — 0.0% | ||||||||
| Costa Rica Government International Bond, 6.55%, 04/03/34 (Call 01/03/34)(e) |
200 | 206,017 | ||||||
|
|
|
|||||||
| Finland — 0.1% | ||||||||
| Finland Government International Bond, 6.95%, 02/15/26 |
95 | 98,232 | ||||||
| Kuntarahoitus OYJ, 4.88%, 01/13/27(b) |
200 | 201,308 | ||||||
|
|
|
|||||||
| 299,540 | ||||||||
| France — 0.3% | ||||||||
| Caisse d’Amortissement de la Dette Sociale |
||||||||
| 0.38%, 09/23/25(b) |
365 | 340,368 | ||||||
| 1.38%, 01/20/31(b) |
325 | 264,607 | ||||||
| 3.00%, 05/17/25(b) |
300 | 292,559 | ||||||
| 3.75%, 05/24/28(b) |
305 | 296,229 | ||||||
| 4.88%, 09/19/26(b) |
200 | 201,081 | ||||||
|
|
|
|||||||
| 1,394,844 | ||||||||
| Germany — 0.0% | ||||||||
| State of North Rhine-Westphalia Germany, 1.00%, 04/21/26(e) |
100 | 92,387 | ||||||
|
|
|
|||||||
| Hong Kong — 0.1% | ||||||||
| Airport Authority |
||||||||
| 1.75%, 01/12/27 (Call 12/12/26)(b) |
200 | 183,801 | ||||||
| 2.63%, 02/04/51 (Call 08/04/50)(b) |
200 | 129,965 | ||||||
| Hong Kong Government International Bond, 1.38%, 02/02/31(b) |
200 | 164,095 | ||||||
|
|
|
|||||||
| 477,861 | ||||||||
| Hungary — 0.1% | ||||||||
| Hungary Government International Bond |
||||||||
| 2.13%, 09/22/31(e) |
200 | 156,342 | ||||||
| 6.25%, 09/22/32(e) |
200 | 206,377 | ||||||
| 7.63%, 03/29/41 |
166 | 190,169 | ||||||
| Magyar Export-Import Bank Zrt, 6.13%, 12/04/27 (Call 11/04/27)(e) |
200 | 200,747 | ||||||
|
|
|
|||||||
| 753,635 | ||||||||
| Security | Par (000) |
Value | ||||||
| Indonesia — 0.4% | ||||||||
| Indonesia Government International Bond |
||||||||
| 2.85%, 02/14/30 |
$ | 200 | $ | 177,302 | ||||
| 3.05%, 03/12/51 |
200 | 139,436 | ||||||
| 3.20%, 09/23/61 (Call 03/23/61) |
200 | 130,111 | ||||||
| 4.35%, 01/11/48 |
200 | 172,507 | ||||||
| 4.55%, 01/11/28 (Call 12/11/27) |
200 | 196,775 | ||||||
| 4.65%, 09/20/32 (Call 06/20/32) |
200 | 193,175 | ||||||
| 4.85%, 01/11/33 (Call 10/11/32) |
200 | 196,239 | ||||||
| 5.25%, 01/17/42(e) |
200 | 197,825 | ||||||
| 6.75%, 01/15/44(e) |
200 | 231,386 | ||||||
| Perusahaan Penerbit SBSN Indonesia III |
||||||||
| 2.55%, 06/09/31(e) |
200 | 170,358 | ||||||
| 4.15%, 03/29/27(e) |
200 | 195,302 | ||||||
| 4.40%, 06/06/27(e) |
200 | 196,590 | ||||||
| 4.70%, 06/06/32(e) |
200 | 195,773 | ||||||
|
|
|
|||||||
| 2,392,779 | ||||||||
| Israel — 0.1% | ||||||||
| Israel Government International Bond, 2.88%, 03/16/26 |
200 | 189,769 | ||||||
| State of Israel |
||||||||
| 3.38%, 01/15/50 |
400 | 268,277 | ||||||
| 3.80%, 05/13/60(e) |
200 | 136,768 | ||||||
|
|
|
|||||||
| 594,814 | ||||||||
| Italy — 0.1% | ||||||||
| Republic of Italy Government International Bond |
||||||||
| 2.88%, 10/17/29 |
205 | 180,603 | ||||||
| 3.88%, 05/06/51 |
20 | 13,842 | ||||||
| 5.38%, 06/15/33 |
170 | 166,841 | ||||||
|
|
|
|||||||
| 361,286 | ||||||||
| Japan — 0.3% | ||||||||
| Development Bank of Japan Inc., 4.50%, 01/30/34(b) |
200 | 197,927 | ||||||
| Japan Bank for International Cooperation |
||||||||
| 0.63%, 07/15/25 |
200 | 188,085 | ||||||
| 1.25%, 01/21/31 |
105 | 84,079 | ||||||
| 1.63%, 01/20/27 |
200 | 183,227 | ||||||
| 1.88%, 04/15/31 |
200 | 165,991 | ||||||
| 2.13%, 02/16/29 |
115 | 102,024 | ||||||
| 2.25%, 11/04/26 |
20 | 18,730 | ||||||
| 2.50%, 05/28/25 |
35 | 33,862 | ||||||
| 2.75%, 11/16/27 |
15 | 13,997 | ||||||
| 2.88%, 04/14/25 |
220 | 214,348 | ||||||
| 2.88%, 06/01/27 |
75 | 70,842 | ||||||
| 3.25%, 07/20/28 |
20 | 18,885 | ||||||
| 4.63%, 07/19/28 |
220 | 219,509 | ||||||
| Japan International Cooperation Agency |
||||||||
| 1.00%, 07/22/30(c) |
25 | 19,861 | ||||||
| 2.13%, 10/20/26 |
46 | 42,909 | ||||||
| 4.00%, 05/23/28 |
200 | 194,011 | ||||||
|
|
|
|||||||
| 1,768,287 | ||||||||
| Kazakhstan — 0.0% | ||||||||
| Kazakhstan Government International Bond, 4.88%, 10/14/44(e) |
200 | 187,264 | ||||||
|
|
|
|||||||
| Malaysia — 0.0% | ||||||||
| Malaysia Sovereign Sukuk Bhd, 4.24%, 04/22/45(e) |
200 | 183,640 | ||||||
|
|
|
|||||||
| Netherlands — 0.1% | ||||||||
| BNG Bank NV |
||||||||
| 3.50%, 05/19/28(b) |
300 | 288,387 | ||||||
| 4.25%, 01/25/29(b) |
200 | 198,288 | ||||||
| 52 | 2 0 2 4 I S H A R E S A N N U A L R E P O R T T O S H A R E H O L D E R S |
| Schedule of Investments (continued) February 29, 2024 |
iShares® ESG Advanced Total USD Bond Market ETF (Percentages shown are based on Net Assets) |
| Security | Par (000) |
Value | ||||||
| Netherlands (continued) | ||||||||
| Nederlandse Waterschapsbank NV |
||||||||
| 1.00%, 05/28/30(b) |
$ | 45 | $ | 36,507 | ||||
| 4.00%, 06/01/28(b) |
200 | 196,065 | ||||||
|
|
|
|||||||
| 719,247 | ||||||||
| Norway — 0.1% | ||||||||
| Kommunalbanken AS |
||||||||
| 0.88%, 03/12/25(b)(c) |
365 | 349,266 | ||||||
| 1.13%, 06/14/30(b) |
200 | 162,665 | ||||||
|
|
|
|||||||
| 511,931 | ||||||||
| Panama — 0.2% | ||||||||
| Panama Government International Bond |
||||||||
| 3.16%, 01/23/30 (Call 10/23/29) |
200 | 164,340 | ||||||
| 3.75%, 04/17/26(e) |
100 | 94,303 | ||||||
| 4.50%, 05/15/47 (Call 11/15/46) |
400 | 267,057 | ||||||
| 4.50%, 04/16/50 (Call 10/16/49) |
200 | 130,171 | ||||||
| 6.70%, 01/26/36 |
180 | 170,203 | ||||||
| 8.88%, 09/30/27 |
35 | 37,723 | ||||||
| 9.38%, 04/01/29 |
100 | 110,480 | ||||||
|
|
|
|||||||
| 974,277 | ||||||||
| Paraguay — 0.0% | ||||||||
| Paraguay Government International Bond, 3.85%, 06/28/33 (Call 03/28/33)(e) |
200 | 172,762 | ||||||
|
|
|
|||||||
| Peru — 0.1% | ||||||||
| Peruvian Government International Bond |
||||||||
| 1.86%, 12/01/32 (Call 09/01/32) |
100 | 75,693 | ||||||
| 2.39%, 01/23/26 (Call 12/23/25) |
70 | 66,261 | ||||||
| 2.78%, 01/23/31 (Call 10/23/30) |
145 | 123,341 | ||||||
| 2.78%, 12/01/60 (Call 06/01/60)(c) |
60 | 34,407 | ||||||
| 3.00%, 01/15/34 (Call 10/15/33) |
100 | 81,299 | ||||||
| 3.30%, 03/11/41 (Call 09/11/40) |
60 | 44,514 | ||||||
| 3.55%, 03/10/51 (Call 09/10/50) |
75 | 53,823 | ||||||
| 3.60%, 01/15/72 (Call 07/15/71) |
35 | 22,983 | ||||||
| 5.63%, 11/18/50 |
90 | 89,073 | ||||||
| 6.55%, 03/14/37 |
70 | 75,501 | ||||||
| 8.75%, 11/21/33 |
100 | 122,757 | ||||||
|
|
|
|||||||
| 789,652 | ||||||||
| Poland — 0.1% | ||||||||
| Republic of Poland Government International Bond |
||||||||
| 3.25%, 04/06/26 |
90 | 87,541 | ||||||
| 4.88%, 10/04/33 (Call 07/04/33) |
90 | 88,118 | ||||||
| 5.50%, 11/16/27 (Call 08/16/27) |
50 | 51,183 | ||||||
| 5.50%, 04/04/53 (Call 10/04/52) |
155 | 154,811 | ||||||
| 5.75%, 11/16/32 (Call 08/16/32) |
50 | 52,131 | ||||||
|
|
|
|||||||
| 433,784 | ||||||||
| Qatar — 0.2% | ||||||||
| Qatar Government International Bond |
||||||||
| 3.75%, 04/16/30(e) |
200 | 191,146 | ||||||
| 4.00%, 03/14/29(e) |
200 | 194,662 | ||||||
| 4.40%, 04/16/50(e) |
200 | 175,020 | ||||||
| 4.50%, 04/23/28(e) |
200 | 199,003 | ||||||
| 4.63%, 06/02/46(e) |
200 | 182,630 | ||||||
| 4.82%, 03/14/49(e) |
200 | 185,255 | ||||||
| 5.10%, 04/23/48(e) |
200 | 192,768 | ||||||
|
|
|
|||||||
| 1,320,484 | ||||||||
| Romania — 0.1% | ||||||||
| Romanian Government International Bond |
||||||||
| 3.00%, 02/27/27(e) |
50 | 46,522 | ||||||
| 3.00%, 02/14/31(e) |
100 | 83,055 | ||||||
| 3.63%, 03/27/32(e) |
66 | 55,770 | ||||||
| Security | Par (000) |
Value | ||||||
| Romania (continued) | ||||||||
| 4.00%, 02/14/51(e) |
$ | 120 | $ | 83,014 | ||||
| 5.13%, 06/15/48(e) |
50 | 41,583 | ||||||
| 5.25%, 11/25/27(e) |
50 | 49,028 | ||||||
| 6.00%, 05/25/34(e) |
50 | 48,671 | ||||||
| 6.13%, 01/22/44(e) |
50 | 47,570 | ||||||
| 6.38%, 01/30/34(b) |
200 | 198,881 | ||||||
| 7.13%, 01/17/33(e) |
40 | 42,135 | ||||||
|
|
|
|||||||
| 696,229 | ||||||||
| South Africa — 0.1% | ||||||||
| Republic of South Africa Government International Bond |
||||||||
| 4.88%, 04/14/26 |
200 | 194,541 | ||||||
| 5.65%, 09/27/47 |
200 | 145,338 | ||||||
| 6.25%, 03/08/41 |
225 | 185,228 | ||||||
|
|
|
|||||||
| 525,107 | ||||||||
| South Korea — 0.1% | ||||||||
| Korea Development Bank (The), 1.25%, 06/03/25(e) |
400 | 381,047 | ||||||
| Korea International Bond, 1.75%, 10/15/31 |
200 | 164,809 | ||||||
|
|
|
|||||||
| 545,856 | ||||||||
| Supranational — 2.1% | ||||||||
| Africa Finance Corp., 4.38%, 04/17/26(e) |
200 | 191,873 | ||||||
| African Development Bank |
||||||||
| 0.88%, 03/23/26 |
215 | 199,012 | ||||||
| 0.88%, 07/22/26 |
245 | 224,354 | ||||||
| 4.38%, 11/03/27 |
15 | 14,947 | ||||||
| 4.63%, 01/04/27 |
25 | 25,047 | ||||||
| Asian Development Bank |
||||||||
| 0.38%, 09/03/25 |
230 | 215,114 | ||||||
| 0.50%, 02/04/26 |
345 | 318,489 | ||||||
| 0.63%, 04/29/25 |
181 | 172,116 | ||||||
| 0.75%, 10/08/30 |
165 | 130,753 | ||||||
| 1.00%, 04/14/26 |
264 | 244,648 | ||||||
| 1.25%, 06/09/28 |
35 | 30,714 | ||||||
| 1.50%, 01/20/27 |
115 | 105,711 | ||||||
| 1.50%, 03/04/31 |
60 | 49,645 | ||||||
| 1.75%, 08/14/26 |
35 | 32,720 | ||||||
| 1.75%, 09/19/29 |
230 | 200,273 | ||||||
| 1.88%, 01/24/30 |
70 | 60,800 | ||||||
| 2.00%, 04/24/26 |
114 | 107,821 | ||||||
| 2.13%, 03/19/25(c) |
79 | 76,621 | ||||||
| 2.38%, 08/10/27 |
115 | 107,427 | ||||||
| 2.50%, 11/02/27 |
45 | 42,040 | ||||||
| 2.63%, 01/12/27 |
20 | 18,989 | ||||||
| 2.75%, 01/19/28 |
35 | 32,888 | ||||||
| 2.88%, 05/06/25 |
40 | 39,028 | ||||||
| 3.13%, 09/26/28 |
20 | 18,956 | ||||||
| 3.13%, 04/27/32 |
5 | 4,562 | ||||||
| 4.00%, 01/12/33 |
5 | 4,850 | ||||||
| 4.13%, 01/12/34 |
200 | 195,535 | ||||||
| 4.25%, 01/09/26 |
10 | 9,914 | ||||||
| 5.82%, 06/16/28 |
105 | 110,242 | ||||||
| 6.22%, 08/15/27 |
77 | 80,529 | ||||||
| 6.38%, 10/01/28 |
35 | 37,333 | ||||||
| Council of Europe Development Bank |
||||||||
| 0.88%, 09/22/26(c) |
210 | 191,282 | ||||||
| 3.75%, 05/25/26 |
5 | 4,903 | ||||||
| European Bank for Reconstruction & Development |
||||||||
| 0.50%, 05/19/25 |
249 | 235,851 | ||||||
| 0.50%, 11/25/25 |
75 | 69,681 | ||||||
| 4.13%, 01/25/29 |
150 | 148,299 | ||||||
| S C H E D U L E O F I N V E S T M E N T S |
53 |
| Schedule of Investments (continued) February 29, 2024 |
iShares® ESG Advanced Total USD Bond Market ETF (Percentages shown are based on Net Assets) |
| Security | Par (000) |
Value | ||||||
| Supranational (continued) | ||||||||
| European Investment Bank |
||||||||
| 0.00%, 11/06/26(g) |
$ | 10 | $ | 8,861 | ||||
| 0.38%, 12/15/25 |
170 | 157,360 | ||||||
| 0.38%, 03/26/26 |
275 | 252,104 | ||||||
| 0.63%, 07/25/25 |
120 | 113,156 | ||||||
| 0.63%, 10/21/27 |
45 | 39,292 | ||||||
| 0.75%, 10/26/26 |
280 | 253,857 | ||||||
| 0.75%, 09/23/30 |
60 | 47,833 | ||||||
| 0.88%, 05/17/30 |
89 | 72,218 | ||||||
| 1.25%, 02/14/31 |
70 | 57,216 | ||||||
| 1.38%, 03/15/27(c) |
85 | 77,584 | ||||||
| 1.63%, 03/14/25 |
277 | 267,522 | ||||||
| 1.63%, 10/09/29 |
50 | 43,270 | ||||||
| 1.63%, 05/13/31 |
5 | 4,174 | ||||||
| 1.75%, 03/15/29 |
10 | 8,833 | ||||||
| 2.13%, 04/13/26 |
155 | 147,218 | ||||||
| 2.38%, 05/24/27 |
235 | 220,457 | ||||||
| 3.25%, 11/15/27 |
30 | 28,789 | ||||||
| 3.88%, 03/15/28 |
5 | 4,901 | ||||||
| 4.00%, 02/15/29 |
510 | 501,749 | ||||||
| 4.13%, 02/13/34 |
200 | 196,122 | ||||||
| 4.88%, 02/15/36 |
105 | 108,867 | ||||||
| European Stability Mechanism, 0.38%, 09/10/25(b) |
215 | 200,972 | ||||||
| Inter-American Development Bank |
||||||||
| 0.63%, 07/15/25 |
105 | 99,046 | ||||||
| 0.63%, 09/16/27 |
90 | 78,789 | ||||||
| 0.88%, 04/03/25 |
115 | 109,923 | ||||||
| 0.88%, 04/20/26 |
320 | 295,673 | ||||||
| 1.13%, 07/20/28 |
15 | 13,059 | ||||||
| 1.13%, 01/13/31 |
195 | 157,560 | ||||||
| 1.75%, 03/14/25 |
125 | 120,799 | ||||||
| 2.00%, 06/02/26 |
75 | 70,764 | ||||||
| 2.00%, 07/23/26 |
185 | 174,129 | ||||||
| 2.25%, 06/18/29 |
126 | 113,329 | ||||||
| 2.38%, 07/07/27 |
95 | 88,827 | ||||||
| 3.13%, 09/18/28 |
219 | 207,536 | ||||||
| 3.20%, 08/07/42 |
5 | 4,032 | ||||||
| 3.50%, 09/14/29 |
205 | 195,977 | ||||||
| 3.88%, 10/28/41 |
75 | 66,773 | ||||||
| 4.38%, 02/01/27 |
10 | 9,962 | ||||||
| 4.38%, 01/24/44 |
29 | 27,547 | ||||||
| International Bank for Reconstruction & Development |
||||||||
| 0.38%, 07/28/25 |
215 | 201,886 | ||||||
| 0.50%, 10/28/25 |
250 | 232,994 | ||||||
| 0.63%, 04/22/25 |
337 | 320,778 | ||||||
| 0.65%, 02/10/26 (Call 05/10/24) |
5 | 4,597 | ||||||
| 0.75%, 03/11/25 |
240 | 229,727 | ||||||
| 0.75%, 11/24/27(c) |
209 | 182,669 | ||||||
| 0.75%, 08/26/30 |
151 | 120,050 | ||||||
| 0.85%, 02/10/27 (Call 05/10/24) |
30 | 26,558 | ||||||
| 0.88%, 07/15/26 |
55 | 50,457 | ||||||
| 0.88%, 05/14/30 |
154 | 124,559 | ||||||
| 1.13%, 09/13/28 |
380 | 329,454 | ||||||
| 1.25%, 02/10/31 |
176 | 143,103 | ||||||
| 1.38%, 04/20/28 |
110 | 97,391 | ||||||
| 1.63%, 11/03/31 |
215 | 176,769 | ||||||
| 1.75%, 10/23/29 |
265 | 230,198 | ||||||
| 1.88%, 10/27/26 |
263 | 245,597 | ||||||
| 2.13%, 03/03/25 |
35 | 33,997 | ||||||
| 2.50%, 07/29/25 |
387 | 374,403 | ||||||
| 2.50%, 11/22/27 |
95 | 88,705 | ||||||
| Security | Par (000) |
Value | ||||||
| Supranational (continued) | ||||||||
| 3.13%, 11/20/25 |
$ | 60 | $ | 58,345 | ||||
| 3.88%, 02/14/30 |
20 | 19,455 | ||||||
| 4.00%, 01/10/31 |
300 | 292,734 | ||||||
| 4.75%, 11/14/33 |
130 | 133,536 | ||||||
| 4.75%, 02/15/35 |
25 | 25,342 | ||||||
| Nordic Investment Bank, 0.38%, 09/11/25 |
355 | 331,860 | ||||||
|
|
|
|||||||
| 12,474,211 | ||||||||
| Sweden — 0.1% | ||||||||
| Svensk Exportkredit AB |
||||||||
| 0.50%, 08/26/25 |
215 | 201,119 | ||||||
| 0.63%, 05/14/25 |
220 | 208,560 | ||||||
|
|
|
|||||||
| 409,679 | ||||||||
| United Arab Emirates — 0.3% | ||||||||
| Abu Dhabi Government International Bond |
||||||||
| 1.70%, 03/02/31(e) |
200 | 164,777 | ||||||
| 1.88%, 09/15/31(e) |
200 | 164,616 | ||||||
| 2.50%, 09/30/29(e) |
200 | 178,435 | ||||||
| 3.13%, 10/11/27(e) |
200 | 189,514 | ||||||
| 3.13%, 09/30/49(e) |
200 | 138,837 | ||||||
| 4.13%, 10/11/47(e) |
200 | 166,739 | ||||||
| Dubai DOF Sukuk Ltd., 2.76%, 09/09/30(e) |
200 | 179,079 | ||||||
| Finance Department Government of Sharjah, 3.63%, 03/10/33(e) |
200 | 165,602 | ||||||
| UAE International Government Bond, 2.88%, 10/19/41(e) |
400 | 290,273 | ||||||
|
|
|
|||||||
| 1,637,872 | ||||||||
| Uruguay — 0.1% | ||||||||
| Uruguay Government International Bond |
||||||||
| 4.13%, 11/20/45 |
50 | 43,543 | ||||||
| 4.38%, 01/23/31 (Call 10/23/30) |
60 | 58,422 | ||||||
| 4.98%, 04/20/55 |
88 | 81,943 | ||||||
| 5.10%, 06/18/50 |
154 | 147,870 | ||||||
| 7.63%, 03/21/36 |
100 | 120,112 | ||||||
| 7.88%, 01/15/33, (7.88% PIK)(c)(d) |
70 | 83,459 | ||||||
|
|
|
|||||||
| 535,349 | ||||||||
|
|
|
|||||||
| Total Foreign Government Obligations — 6.4% |
37,627,065 | |||||||
|
|
|
|||||||
| U.S. Government & Agency Obligations |
||||||||
| Mortgage-Backed Securities — 23.4% | ||||||||
| Federal Home Loan Mortgage Corp. |
||||||||
| 3.00%, 05/01/29 |
381 | 369,533 | ||||||
| 4.00%, 01/01/48 |
35 | 32,701 | ||||||
| Federal National Mortgage Association |
||||||||
| Series 2017-M3, Class A2, 2.47%, 12/25/26(a) |
148 | 139,441 | ||||||
| Series 2018-M12, Class A2, 3.63%, 08/25/30(a) |
50 | 46,747 | ||||||
| Series 2021-M13, Class A2, 1.60%, 04/25/31(a) |
340 | 274,923 | ||||||
| Series 2021-M17, Class A2, 1.71%, 07/25/31(a) |
250 | 203,172 | ||||||
| Series 2022-M1, Class A2, 1.67%, 10/25/31(a) |
490 | 394,019 | ||||||
| Freddie Mac Multifamily Structured Pass Through Certificates |
||||||||
| Series K043, Class A2, 3.06%, 12/25/24 (Call 01/25/25) |
74 | 72,334 | ||||||
| Series K048, Class A2, 3.28%, 06/25/25 (Call 08/25/25)(a) |
100 | 97,758 | ||||||
| Series K058, Class A2, 2.65%, 08/25/26 (Call 09/25/26) |
75 | 71,240 | ||||||
| Series K064, Class A2, 3.22%, 03/25/27 (Call 05/25/27) |
100 | 95,788 | ||||||
| 54 | 2 0 2 4 I S H A R E S A N N U A L R E P O R T T O S H A R E H O L D E R S |
| Schedule of Investments (continued) February 29, 2024 |
iShares® ESG Advanced Total USD Bond Market ETF (Percentages shown are based on Net Assets) |
| Security | Par (000) |
Value | ||||||
| Mortgage-Backed Securities (continued) | ||||||||
| Series K070, Class A2, 3.30%, 11/25/27 (Call 12/25/27)(a) |
$ | 200 | $ | 190,411 | ||||
| Series K115, Class A2, 1.38%, 06/25/30 (Call 07/25/30) |
50 | 40,901 | ||||||
| Series K131, Class A2, 1.85%, 07/25/31 (Call 09/25/31) |
1,000 | 822,155 | ||||||
| Series K735, Class A2, 2.86%, 05/25/26 (Call 06/25/26) |
684 | 656,236 | ||||||
| Series K739, Class A2, 1.34%, 09/25/27 (Call 09/25/27) |
180 | 161,581 | ||||||
| Government National Mortgage Association |
||||||||
| 2.00%, 08/20/50 |
155 | 126,691 | ||||||
| 2.00%, 11/20/50 |
415 | 338,631 | ||||||
| 2.00%, 12/20/50 |
2,993 | 2,440,447 | ||||||
| 2.00%, 01/20/51 |
4,079 | 3,320,215 | ||||||
| 2.00%, 02/20/51 |
1,581 | 1,288,650 | ||||||
| 2.00%, 10/20/51 |
1,960 | 1,595,244 | ||||||
| 2.00%, 12/20/51 |
384 | 312,536 | ||||||
| 2.50%, 10/20/50 |
503 | 426,062 | ||||||
| 2.50%, 01/20/51 |
179 | 151,241 | ||||||
| 2.50%, 02/20/51 |
183 | 155,415 | ||||||
| 2.50%, 05/20/51 |
1,978 | 1,675,573 | ||||||
| 2.50%, 08/20/51 |
118 | 100,119 | ||||||
| 2.50%, 11/20/51 |
3,354 | 2,838,192 | ||||||
| 2.50%, 12/20/51 |
846 | 715,898 | ||||||
| 2.50%, 02/20/52 |
1,751 | 1,481,128 | ||||||
| 2.50%, 08/20/52 |
349 | 295,002 | ||||||
| 3.00%, 03/20/45 |
31 | 27,660 | ||||||
| 3.00%, 12/20/45 |
4 | 3,269 | ||||||
| 3.00%, 01/20/46 |
4 | 3,277 | ||||||
| 3.00%, 03/20/46 |
248 | 220,343 | ||||||
| 3.00%, 05/20/46 |
2 | 2,012 | ||||||
| 3.00%, 08/20/46 |
10 | 8,688 | ||||||
| 3.00%, 09/20/46 |
89 | 79,157 | ||||||
| 3.00%, 04/20/49 |
46 | 40,628 | ||||||
| 3.00%, 10/15/49 |
31 | 27,237 | ||||||
| 3.00%, 12/20/49 |
994 | 878,641 | ||||||
| 3.00%, 01/20/50 |
140 | 123,550 | ||||||
| 3.00%, 02/20/50 |
347 | 306,736 | ||||||
| 3.00%, 07/20/50 |
116 | 101,955 | ||||||
| 3.00%, 12/20/50 |
160 | 141,067 | ||||||
| 3.00%, 08/20/51 |
1,039 | 911,905 | ||||||
| 3.00%, 09/20/51 |
882 | 773,715 | ||||||
| 3.00%, 10/20/51 |
582 | 510,170 | ||||||
| 3.00%, 11/20/51 |
135 | 118,075 | ||||||
| 3.00%, 12/20/51 |
433 | 379,828 | ||||||
| 3.00%, 02/20/52 |
888 | 778,039 | ||||||
| 3.50%, 10/20/42 |
727 | 672,901 | ||||||
| 3.50%, 05/20/47 |
408 | 373,642 | ||||||
| 3.50%, 09/20/47 |
781 | 714,268 | ||||||
| 3.50%, 02/20/48 |
142 | 129,482 | ||||||
| 3.50%, 03/20/49 |
347 | 317,360 | ||||||
| 3.50%, 09/20/49 |
216 | 197,038 | ||||||
| 3.50%, 10/20/49 |
144 | 131,874 | ||||||
| 3.50%, 12/20/49 |
61 | 55,356 | ||||||
| 3.50%, 01/20/50 |
323 | 294,545 | ||||||
| 3.50%, 01/20/52 |
904 | 818,350 | ||||||
| 3.50%, 02/20/52 |
319 | 288,442 | ||||||
| 3.50%, 03/20/54(k) |
200 | 180,881 | ||||||
| 4.00%, 02/20/49 |
764 | 720,161 | ||||||
| 4.00%, 01/20/50 |
44 | 41,002 | ||||||
| Security | Par (000) |
Value | ||||||
| Mortgage-Backed Securities (continued) | ||||||||
| 4.00%, 07/20/52 |
$ | 89 | $ | 83,020 | ||||
| 4.00%, 08/20/52 |
327 | 304,078 | ||||||
| 4.00%, 09/20/52 |
754 | 701,008 | ||||||
| 4.00%, 12/20/52 |
214 | 199,350 | ||||||
| 4.50%, 07/20/41 |
176 | 172,807 | ||||||
| 4.50%, 09/20/48 |
87 | 83,908 | ||||||
| 4.50%, 01/20/49 |
172 | 166,540 | ||||||
| 4.50%, 06/20/53 |
646 | 616,389 | ||||||
| 4.50%, 03/20/54(k) |
825 | 787,782 | ||||||
| 5.00%, 07/20/52 |
47 | 46,405 | ||||||
| 5.00%, 09/20/52 |
483 | 471,875 | ||||||
| 5.00%, 12/20/52 |
375 | 366,429 | ||||||
| 5.00%, 01/20/53 |
237 | 231,237 | ||||||
| 5.00%, 04/20/53 |
142 | 138,756 | ||||||
| 5.00%, 03/20/54(k) |
390 | 380,914 | ||||||
| 5.50%, 12/20/52 |
688 | 683,574 | ||||||
| 5.50%, 01/20/53 |
70 | 69,581 | ||||||
| 5.50%, 04/20/53 |
276 | 273,756 | ||||||
| 5.50%, 06/20/53 |
191 | 189,302 | ||||||
| 5.50%, 07/20/53 |
253 | 252,858 | ||||||
| 6.00%, 09/20/53 |
145 | 145,962 | ||||||
| 6.00%, 10/20/53 |
217 | 218,064 | ||||||
| 6.00%, 01/20/54 |
94 | 94,316 | ||||||
| 6.00%, 03/20/54(k) |
700 | 703,413 | ||||||
| 6.50%, 11/20/53 |
106 | 107,738 | ||||||
| 6.50%, 03/20/54(k) |
500 | 506,781 | ||||||
| Uniform Mortgage-Backed Securities |
||||||||
| 1.50%, 03/01/36 |
157 | 135,958 | ||||||
| 1.50%, 10/01/36 |
61 | 53,141 | ||||||
| 1.50%, 02/01/37 |
1,257 | 1,085,483 | ||||||
| 1.50%, 03/01/37 |
1,585 | 1,369,294 | ||||||
| 1.50%, 04/01/37 |
123 | 106,475 | ||||||
| 1.50%, 08/01/37 |
107 | 92,693 | ||||||
| 1.50%, 11/01/50 |
435 | 325,903 | ||||||
| 1.50%, 03/01/51 |
620 | 463,147 | ||||||
| 1.50%, 04/01/51 |
457 | 341,304 | ||||||
| 1.50%, 05/01/51 |
879 | 657,307 | ||||||
| 1.50%, 07/01/51 |
1,571 | 1,173,862 | ||||||
| 2.00%, 12/01/35 |
44 | 39,198 | ||||||
| 2.00%, 02/01/36 |
735 | 652,608 | ||||||
| 2.00%, 03/01/36 |
144 | 127,796 | ||||||
| 2.00%, 04/01/36 |
52 | 46,327 | ||||||
| 2.00%, 05/01/36 |
31 | 27,537 | ||||||
| 2.00%, 06/01/36 |
577 | 510,324 | ||||||
| 2.00%, 08/01/36 |
394 | 348,672 | ||||||
| 2.00%, 09/01/36 |
705 | 622,397 | ||||||
| 2.00%, 10/01/36 |
233 | 205,895 | ||||||
| 2.00%, 11/01/36 |
205 | 181,265 | ||||||
| 2.00%, 12/01/36 |
442 | 391,202 | ||||||
| 2.00%, 01/01/37 |
607 | 535,370 | ||||||
| 2.00%, 02/01/37 |
749 | 660,610 | ||||||
| 2.00%, 04/01/37 |
1,935 | 1,708,114 | ||||||
| 2.00%, 05/01/37 |
292 | 257,243 | ||||||
| 2.00%, 06/01/37 |
625 | 551,326 | ||||||
| 2.00%, 03/18/39(k) |
150 | 132,307 | ||||||
| 2.00%, 07/01/50 |
254 | 201,417 | ||||||
| 2.00%, 08/01/50 |
800 | 637,102 | ||||||
| 2.00%, 09/01/50 |
330 | 262,016 | ||||||
| 2.00%, 10/01/50 |
755 | 598,445 | ||||||
| 2.00%, 11/01/50 |
1,671 | 1,322,111 | ||||||
| 2.00%, 12/01/50 |
57 | 45,297 | ||||||
| S C H E D U L E O F I N V E S T M E N T S |
55 |
| Schedule of Investments (continued) February 29, 2024 |
iShares® ESG Advanced Total USD Bond Market ETF (Percentages shown are based on Net Assets) |
| Security | Par (000) |
Value | ||||||
| Mortgage-Backed Securities (continued) | ||||||||
| 2.00%, 01/01/51 |
$ | 698 | $ | 553,339 | ||||
| 2.00%, 02/01/51 |
385 | 305,700 | ||||||
| 2.00%, 03/01/51 |
2,126 | 1,680,921 | ||||||
| 2.00%, 04/01/51 |
1,600 | 1,266,001 | ||||||
| 2.00%, 05/01/51 |
1,060 | 837,649 | ||||||
| 2.00%, 06/01/51 |
812 | 643,918 | ||||||
| 2.00%, 07/01/51 |
612 | 484,462 | ||||||
| 2.00%, 08/01/51 |
1,961 | 1,546,295 | ||||||
| 2.00%, 10/01/51 |
2,768 | 2,189,437 | ||||||
| 2.00%, 11/01/51 |
3,186 | 2,519,286 | ||||||
| 2.00%, 12/01/51 |
2,673 | 2,122,316 | ||||||
| 2.00%, 01/01/52 |
2,646 | 2,088,495 | ||||||
| 2.00%, 02/01/52 |
433 | 340,482 | ||||||
| 2.00%, 03/01/52 |
45 | 35,281 | ||||||
| 2.50%, 07/01/32 |
337 | 315,011 | ||||||
| 2.50%, 11/01/34 |
37 | 34,166 | ||||||
| 2.50%, 10/01/35 |
106 | 96,709 | ||||||
| 2.50%, 03/01/36 |
84 | 76,799 | ||||||
| 2.50%, 05/01/36 |
451 | 409,350 | ||||||
| 2.50%, 06/01/36 |
83 | 75,705 | ||||||
| 2.50%, 07/01/36 |
325 | 294,832 | ||||||
| 2.50%, 08/01/36 |
89 | 80,482 | ||||||
| 2.50%, 04/01/37 |
324 | 294,154 | ||||||
| 2.50%, 05/01/37 |
355 | 322,064 | ||||||
| 2.50%, 06/01/37 |
355 | 322,681 | ||||||
| 2.50%, 03/18/39(k) |
475 | 430,606 | ||||||
| 2.50%, 10/01/50 |
96 | 80,866 | ||||||
| 2.50%, 11/01/50 |
1,263 | 1,049,042 | ||||||
| 2.50%, 12/01/50 |
290 | 239,790 | ||||||
| 2.50%, 01/01/51 |
289 | 237,697 | ||||||
| 2.50%, 03/01/51 |
510 | 423,525 | ||||||
| 2.50%, 04/01/51 |
133 | 109,504 | ||||||
| 2.50%, 07/01/51 |
382 | 316,364 | ||||||
| 2.50%, 08/01/51 |
1,465 | 1,220,656 | ||||||
| 2.50%, 09/01/51 |
1,578 | 1,308,088 | ||||||
| 2.50%, 10/01/51 |
1,083 | 893,524 | ||||||
| 2.50%, 11/01/51 |
2,354 | 1,941,448 | ||||||
| 2.50%, 12/01/51 |
3,332 | 2,760,169 | ||||||
| 2.50%, 01/01/52 |
2,987 | 2,462,311 | ||||||
| 2.50%, 02/01/52 |
446 | 369,231 | ||||||
| 2.50%, 03/01/52 |
1,341 | 1,102,516 | ||||||
| 2.50%, 04/01/52 |
1,759 | 1,453,450 | ||||||
| 3.00%, 03/01/30 |
82 | 78,939 | ||||||
| 3.00%, 09/01/34 |
381 | 356,237 | ||||||
| 3.00%, 03/01/35 |
35 | 32,375 | ||||||
| 3.00%, 07/01/35 |
26 | 24,296 | ||||||
| 3.00%, 03/18/39(k) |
1,025 | 949,639 | ||||||
| 3.00%, 11/01/46 |
90 | 78,768 | ||||||
| 3.00%, 12/01/46 |
81 | 71,131 | ||||||
| 3.00%, 04/01/48 |
579 | 514,392 | ||||||
| 3.00%, 11/01/48 |
118 | 103,052 | ||||||
| 3.00%, 02/01/49 |
831 | 729,763 | ||||||
| 3.00%, 12/01/49 |
1,168 | 1,016,403 | ||||||
| 3.00%, 07/01/50 |
31 | 26,431 | ||||||
| 3.00%, 08/01/50 |
169 | 147,074 | ||||||
| 3.00%, 10/01/50 |
249 | 213,864 | ||||||
| 3.00%, 01/01/51 |
73 | 63,214 | ||||||
| 3.00%, 04/01/51 |
77 | 65,890 | ||||||
| 3.00%, 07/01/51 |
1,072 | 924,750 | ||||||
| 3.00%, 08/01/51 |
414 | 355,549 | ||||||
| 3.00%, 11/01/51 |
66 | 56,534 | ||||||
| Security | Par (000) |
Value | ||||||
| Mortgage-Backed Securities (continued) | ||||||||
| 3.00%, 01/01/52 |
$ | 1,231 | $ | 1,060,913 | ||||
| 3.00%, 02/01/52 |
456 | 391,479 | ||||||
| 3.00%, 04/01/52 |
4,443 | 3,822,184 | ||||||
| 3.00%, 05/01/52 |
905 | 778,093 | ||||||
| 3.00%, 03/13/54(k) |
25 | 21,380 | ||||||
| 3.50%, 02/01/34 |
104 | 100,240 | ||||||
| 3.50%, 03/18/39(k) |
575 | 543,962 | ||||||
| 3.50%, 07/01/45 |
1,642 | 1,494,311 | ||||||
| 3.50%, 07/01/47 |
57 | 51,839 | ||||||
| 3.50%, 09/01/47 |
599 | 542,449 | ||||||
| 3.50%, 10/01/47 |
311 | 281,572 | ||||||
| 3.50%, 11/01/47 |
76 | 68,460 | ||||||
| 3.50%, 02/01/48 |
363 | 329,178 | ||||||
| 3.50%, 02/01/49 |
59 | 53,318 | ||||||
| 3.50%, 03/01/49 |
233 | 211,414 | ||||||
| 3.50%, 06/01/49 |
343 | 310,483 | ||||||
| 3.50%, 08/01/49 |
66 | 60,075 | ||||||
| 3.50%, 12/01/49 |
305 | 272,976 | ||||||
| 3.50%, 02/01/51 |
1,640 | 1,477,157 | ||||||
| 3.50%, 10/01/51 |
726 | 657,324 | ||||||
| 3.50%, 06/01/52 |
906 | 812,821 | ||||||
| 3.50%, 07/01/52 |
313 | 281,749 | ||||||
| 4.00%, 08/01/37 |
31 | 29,676 | ||||||
| 4.00%, 09/01/37 |
45 | 43,566 | ||||||
| 4.00%, 11/01/37 |
61 | 58,736 | ||||||
| 4.00%, 02/01/38 |
33 | 31,346 | ||||||
| 4.00%, 05/01/38 |
28 | 27,299 | ||||||
| 4.00%, 11/01/38 |
18 | 17,417 | ||||||
| 4.00%, 03/18/39(k) |
525 | 505,617 | ||||||
| 4.00%, 09/01/47 |
38 | 35,808 | ||||||
| 4.00%, 05/01/48 |
1,143 | 1,068,127 | ||||||
| 4.00%, 09/01/48 |
340 | 317,427 | ||||||
| 4.00%, 03/01/49 |
173 | 161,213 | ||||||
| 4.00%, 07/01/49 |
695 | 649,195 | ||||||
| 4.00%, 08/01/49 |
251 | 235,307 | ||||||
| 4.00%, 04/01/50 |
523 | 487,900 | ||||||
| 4.00%, 05/01/50 |
246 | 228,956 | ||||||
| 4.00%, 03/01/51 |
1,215 | 1,133,932 | ||||||
| 4.00%, 05/01/52 |
511 | 470,913 | ||||||
| 4.00%, 06/01/52 |
658 | 606,859 | ||||||
| 4.00%, 08/01/52 |
598 | 550,814 | ||||||
| 4.00%, 03/13/54(k) |
600 | 551,985 | ||||||
| 4.50%, 04/01/49 |
79 | 76,374 | ||||||
| 4.50%, 09/01/50 |
387 | 372,191 | ||||||
| 4.50%, 10/01/50 |
141 | 134,608 | ||||||
| 4.50%, 05/01/52 |
155 | 149,030 | ||||||
| 4.50%, 06/01/52 |
739 | 699,290 | ||||||
| 4.50%, 09/01/52 |
1,046 | 992,204 | ||||||
| 4.50%, 10/01/52 |
1,894 | 1,799,455 | ||||||
| 4.50%, 11/01/52 |
43 | 40,492 | ||||||
| 4.50%, 12/01/52 |
327 | 312,356 | ||||||
| 4.50%, 08/01/53 |
38 | 36,079 | ||||||
| 5.00%, 09/01/49 |
27 | 26,316 | ||||||
| 5.00%, 08/01/52 |
116 | 112,786 | ||||||
| 5.00%, 09/01/52 |
273 | 267,110 | ||||||
| 5.00%, 10/01/52 |
402 | 392,407 | ||||||
| 5.00%, 11/01/52 |
348 | 340,081 | ||||||
| 5.00%, 12/01/52 |
299 | 292,533 | ||||||
| 5.00%, 01/01/53 |
826 | 804,015 | ||||||
| 5.00%, 03/01/53 |
94 | 92,351 | ||||||
| 5.00%, 04/01/53 |
236 | 228,700 | ||||||
| 56 | 2 0 2 4 I S H A R E S A N N U A L R E P O R T T O S H A R E H O L D E R S |
| Schedule of Investments (continued) February 29, 2024 |
iShares® ESG Advanced Total USD Bond Market ETF (Percentages shown are based on Net Assets) |
| Security | Par (000) |
Value | ||||||
| Mortgage-Backed Securities (continued) | ||||||||
| 5.00%, 06/01/53 |
$ | 193 | $ | 188,984 | ||||
| 5.00%, 03/01/54(k) |
1,500 | 1,454,532 | ||||||
| 5.50%, 09/01/52 |
114 | 114,446 | ||||||
| 5.50%, 11/01/52 |
163 | 162,099 | ||||||
| 5.50%, 12/01/52 |
628 | 627,930 | ||||||
| 5.50%, 01/01/53 |
728 | 728,741 | ||||||
| 5.50%, 02/01/53 |
324 | 322,565 | ||||||
| 5.50%, 03/01/53 |
190 | 189,624 | ||||||
| 5.50%, 04/01/53 |
155 | 155,293 | ||||||
| 5.50%, 05/01/53 |
647 | 640,793 | ||||||
| 5.50%, 06/01/53 |
44 | 44,175 | ||||||
| 5.50%, 03/13/54(k) |
1,055 | 1,043,577 | ||||||
| 6.00%, 01/01/53 |
72 | 73,616 | ||||||
| 6.00%, 06/01/53 |
84 | 85,076 | ||||||
| 6.00%, 07/01/53 |
225 | 225,430 | ||||||
| 6.00%, 08/01/53 |
337 | 342,235 | ||||||
| 6.00%, 09/01/53 |
438 | 442,911 | ||||||
| 6.00%, 11/01/53 |
642 | 647,563 | ||||||
| 6.00%, 12/01/53 |
195 | 196,577 | ||||||
| 6.00%, 02/01/54 |
119 | 120,403 | ||||||
| 6.00%, 03/13/54(k) |
1,125 | 1,129,692 | ||||||
| 6.00%, 04/11/54(k) |
575 | 577,308 | ||||||
| 6.50%, 10/01/53 |
53 | 53,857 | ||||||
| 6.50%, 11/01/53 |
63 | 64,156 | ||||||
| 6.50%, 12/01/53 |
616 | 632,327 | ||||||
| 6.50%, 01/01/54 |
417 | 426,361 | ||||||
| 6.50%, 02/01/54 |
505 | 520,815 | ||||||
| 6.50%, 03/13/54(k) |
2,400 | 2,441,964 | ||||||
|
|
|
|||||||
| 137,965,748 | ||||||||
| U.S. Government Obligations — 35.9% | ||||||||
| U.S. Treasury Note/Bond |
||||||||
| 0.25%, 05/31/25 |
1,250 | 1,179,785 | ||||||
| 0.25%, 06/30/25 |
1,150 | 1,082,168 | ||||||
| 0.25%, 07/31/25 |
1,200 | 1,125,234 | ||||||
| 0.25%, 08/31/25 |
300 | 280,395 | ||||||
| 0.25%, 09/30/25 |
1,280 | 1,192,450 | ||||||
| 0.25%, 10/31/25 |
1,300 | 1,207,172 | ||||||
| 0.38%, 04/30/25 |
1,590 | 1,508,326 | ||||||
| 0.38%, 11/30/25 |
1,000 | 927,734 | ||||||
| 0.38%, 12/31/25(c) |
1,560 | 1,443,183 | ||||||
| 0.38%, 01/31/26 |
3,370 | 3,107,377 | ||||||
| 0.38%, 09/30/27 |
1,100 | 955,969 | ||||||
| 0.50%, 02/28/26 |
800 | 737,500 | ||||||
| 0.50%, 05/31/27 |
1,000 | 883,203 | ||||||
| 0.50%, 08/31/27 |
780 | 682,988 | ||||||
| 0.50%, 10/31/27 |
230 | 200,226 | ||||||
| 0.63%, 07/31/26 |
2,000 | 1,823,437 | ||||||
| 0.63%, 11/30/27 |
700 | 610,695 | ||||||
| 0.63%, 12/31/27 |
1,445 | 1,256,924 | ||||||
| 0.63%, 05/15/30 |
115 | 92,332 | ||||||
| 0.63%, 08/15/30 |
2,050 | 1,632,152 | ||||||
| 0.75%, 03/31/26 |
300 | 277,383 | ||||||
| 0.75%, 04/30/26 |
1,400 | 1,290,406 | ||||||
| 0.75%, 08/31/26 |
600 | 547,313 | ||||||
| 0.75%, 01/31/28 |
1,700 | 1,482,453 | ||||||
| 0.88%, 06/30/26 |
2,300 | 2,116,359 | ||||||
| 0.88%, 09/30/26 |
1,900 | 1,735,234 | ||||||
| 0.88%, 11/15/30 |
1,190 | 957,950 | ||||||
| 1.00%, 07/31/28 |
2,100 | 1,823,883 | ||||||
| 1.13%, 01/15/25(c) |
390 | 376,883 | ||||||
| 1.13%, 10/31/26 |
1,100 | 1,008,219 | ||||||
| Security | Par (000) |
Value | ||||||
| U.S. Government Obligations (continued) | ||||||||
| 1.13%, 02/28/27 |
$ | 700 | $ | 635,961 | ||||
| 1.13%, 02/29/28 |
2,130 | 1,881,722 | ||||||
| 1.13%, 08/31/28 |
2,400 | 2,091,188 | ||||||
| 1.13%, 02/15/31 |
1,015 | 827,701 | ||||||
| 1.13%, 05/15/40 |
1,300 | 802,141 | ||||||
| 1.13%, 08/15/40 |
1,590 | 971,391 | ||||||
| 1.25%, 11/30/26 |
1,900 | 1,743,844 | ||||||
| 1.25%, 12/31/26 |
1,700 | 1,557,625 | ||||||
| 1.25%, 03/31/28 |
2,550 | 2,259,539 | ||||||
| 1.25%, 04/30/28 |
1,400 | 1,237,687 | ||||||
| 1.25%, 05/31/28 |
1,600 | 1,411,375 | ||||||
| 1.25%, 06/30/28 |
1,660 | 1,461,189 | ||||||
| 1.25%, 09/30/28 |
1,700 | 1,486,570 | ||||||
| 1.25%, 08/15/31 |
1,550 | 1,255,016 | ||||||
| 1.25%, 05/15/50 |
1,055 | 535,907 | ||||||
| 1.38%, 10/31/28 |
1,970 | 1,729,752 | ||||||
| 1.38%, 12/31/28 |
1,400 | 1,224,125 | ||||||
| 1.38%, 11/15/31 |
1,950 | 1,583,156 | ||||||
| 1.38%, 11/15/40 |
1,480 | 939,569 | ||||||
| 1.38%, 08/15/50 |
1,440 | 756,000 | ||||||
| 1.50%, 02/15/25 |
760 | 734,439 | ||||||
| 1.50%, 08/15/26 |
1,400 | 1,302,547 | ||||||
| 1.50%, 01/31/27 |
2,000 | 1,841,250 | ||||||
| 1.50%, 11/30/28 |
1,300 | 1,146,133 | ||||||
| 1.63%, 05/15/26 |
1,650 | 1,548,680 | ||||||
| 1.63%, 10/31/26 |
600 | 557,344 | ||||||
| 1.63%, 05/15/31 |
1,800 | 1,508,906 | ||||||
| 1.63%, 11/15/50 |
1,600 | 898,750 | ||||||
| 1.75%, 03/15/25 |
910 | 879,821 | ||||||
| 1.75%, 01/31/29 |
2,300 | 2,044,664 | ||||||
| 1.75%, 08/15/41 |
1,820 | 1,212,291 | ||||||
| 1.88%, 02/28/27 |
1,000 | 929,141 | ||||||
| 1.88%, 02/28/29 |
1,050 | 937,699 | ||||||
| 1.88%, 02/15/32 |
2,150 | 1,805,664 | ||||||
| 1.88%, 02/15/41 |
1,350 | 930,234 | ||||||
| 1.88%, 02/15/51 |
1,770 | 1,060,064 | ||||||
| 1.88%, 11/15/51 |
1,570 | 936,112 | ||||||
| 2.00%, 08/15/25 |
1,100 | 1,056,559 | ||||||
| 2.00%, 11/15/26 |
2,000 | 1,875,156 | ||||||
| 2.00%, 11/15/41 |
1,300 | 899,844 | ||||||
| 2.00%, 02/15/50 |
900 | 560,531 | ||||||
| 2.00%, 08/15/51 |
1,850 | 1,140,062 | ||||||
| 2.25%, 11/15/25 |
1,550 | 1,487,273 | ||||||
| 2.25%, 03/31/26 |
600 | 572,250 | ||||||
| 2.25%, 02/15/27 |
570 | 535,934 | ||||||
| 2.25%, 08/15/27 |
700 | 652,586 | ||||||
| 2.25%, 11/15/27 |
1,000 | 928,516 | ||||||
| 2.25%, 05/15/41 |
1,550 | 1,131,742 | ||||||
| 2.25%, 08/15/46 |
1,300 | 882,984 | ||||||
| 2.25%, 02/15/52 |
1,320 | 863,981 | ||||||
| 2.38%, 05/15/27 |
600 | 564,047 | ||||||
| 2.38%, 03/31/29 |
680 | 621,456 | ||||||
| 2.38%, 05/15/29 |
1,000 | 912,344 | ||||||
| 2.38%, 02/15/42 |
1,300 | 955,703 | ||||||
| 2.38%, 05/15/51 |
2,000 | 1,350,312 | ||||||
| 2.50%, 03/31/27 |
700 | 661,938 | ||||||
| 2.50%, 02/15/45 |
1,075 | 779,207 | ||||||
| 2.50%, 02/15/46 |
760 | 545,419 | ||||||
| 2.50%, 05/15/46 |
900 | 644,203 | ||||||
| 2.63%, 01/31/26 |
560 | 539,350 | ||||||
| 2.63%, 05/31/27 |
1,400 | 1,325,406 | ||||||
| S C H E D U L E O F I N V E S T M E N T S |
57 |
| Schedule of Investments (continued) February 29, 2024 |
iShares® ESG Advanced Total USD Bond Market ETF (Percentages shown are based on Net Assets) |
| Security | Par (000) |
Value | ||||||
| U.S. Government Obligations (continued) | ||||||||
| 2.63%, 02/15/29 |
$ | 1,000 | $ | 926,562 | ||||
| 2.63%, 07/31/29 |
1,000 | 921,250 | ||||||
| 2.75%, 05/15/25 |
1,800 | 1,754,227 | ||||||
| 2.75%, 04/30/27 |
3,000 | 2,854,453 | ||||||
| 2.75%, 02/15/28 |
1,400 | 1,319,828 | ||||||
| 2.75%, 05/31/29 |
900 | 836,086 | ||||||
| 2.75%, 08/15/32 |
2,400 | 2,142,750 | ||||||
| 2.75%, 08/15/42 |
290 | 225,566 | ||||||
| 2.75%, 11/15/42 |
400 | 310,000 | ||||||
| 2.75%, 08/15/47 |
550 | 408,891 | ||||||
| 2.75%, 11/15/47 |
600 | 445,219 | ||||||
| 2.88%, 05/31/25 |
600 | 585,258 | ||||||
| 2.88%, 06/15/25 |
650 | 633,598 | ||||||
| 2.88%, 05/15/28 |
1,000 | 944,922 | ||||||
| 2.88%, 08/15/28 |
600 | 565,500 | ||||||
| 2.88%, 04/30/29 |
800 | 748,625 | ||||||
| 2.88%, 05/15/32 |
2,000 | 1,808,125 | ||||||
| 2.88%, 05/15/43 |
200 | 157,406 | ||||||
| 2.88%, 08/15/45 |
960 | 741,300 | ||||||
| 2.88%, 11/15/46 |
600 | 459,094 | ||||||
| 2.88%, 05/15/49 |
200 | 151,219 | ||||||
| 2.88%, 05/15/52 |
1,300 | 979,469 | ||||||
| 3.00%, 07/15/25 |
1,300 | 1,268,160 | ||||||
| 3.00%, 09/30/25 |
480 | 467,025 | ||||||
| 3.00%, 10/31/25 |
250 | 243,008 | ||||||
| 3.00%, 05/15/42 |
250 | 202,578 | ||||||
| 3.00%, 11/15/44 |
500 | 396,641 | ||||||
| 3.00%, 05/15/45 |
990 | 783,028 | ||||||
| 3.00%, 11/15/45 |
400 | 315,188 | ||||||
| 3.00%, 02/15/47 |
500 | 390,703 | ||||||
| 3.00%, 05/15/47 |
600 | 468,188 | ||||||
| 3.00%, 02/15/48 |
800 | 621,750 | ||||||
| 3.00%, 08/15/48 |
700 | 543,156 | ||||||
| 3.00%, 08/15/52 |
1,400 | 1,083,031 | ||||||
| 3.13%, 08/15/25 |
1,130 | 1,103,207 | ||||||
| 3.13%, 11/15/28 |
1,100 | 1,045,859 | ||||||
| 3.13%, 08/31/29 |
700 | 660,680 | ||||||
| 3.13%, 02/15/43 |
500 | 410,391 | ||||||
| 3.13%, 08/15/44 |
500 | 405,703 | ||||||
| 3.13%, 05/15/48 |
550 | 437,078 | ||||||
| 3.25%, 06/30/27 |
900 | 868,711 | ||||||
| 3.25%, 06/30/29 |
700 | 665,930 | ||||||
| 3.25%, 05/15/42 |
700 | 588,875 | ||||||
| 3.38%, 05/15/33 |
2,800 | 2,612,750 | ||||||
| 3.38%, 08/15/42 |
400 | 342,063 | ||||||
| 3.38%, 05/15/44 |
100 | 84,547 | ||||||
| 3.38%, 11/15/48 |
1,500 | 1,245,937 | ||||||
| 3.50%, 09/15/25 |
1,000 | 980,781 | ||||||
| 3.50%, 01/31/28 |
638 | 618,860 | ||||||
| 3.50%, 04/30/28 |
1,000 | 969,062 | ||||||
| 3.50%, 01/31/30 |
700 | 671,727 | ||||||
| 3.50%, 04/30/30 |
800 | 766,500 | ||||||
| 3.50%, 02/15/33 |
2,400 | 2,264,250 | ||||||
| 3.63%, 05/15/26 |
1,300 | 1,274,406 | ||||||
| 3.63%, 03/31/28 |
800 | 779,125 | ||||||
| 3.63%, 05/31/28 |
1,400 | 1,362,922 | ||||||
| 3.63%, 03/31/30 |
700 | 675,664 | ||||||
| 3.63%, 08/15/43 |
200 | 176,313 | ||||||
| 3.63%, 02/15/53 |
1,114 | 974,402 | ||||||
| 3.63%, 05/15/53 |
1,030 | 901,733 | ||||||
| 3.75%, 04/15/26 |
2,050 | 2,015,246 | ||||||
| Security | Par (000) |
Value | ||||||
| U.S. Government Obligations (continued) | ||||||||
| 3.75%, 12/31/28 |
$ | 1,200 | $ | 1,172,812 | ||||
| 3.75%, 05/31/30 |
400 | 388,406 | ||||||
| 3.75%, 06/30/30 |
438 | 425,202 | ||||||
| 3.75%, 12/31/30 |
800 | 775,375 | ||||||
| 3.75%, 11/15/43 |
300 | 269,016 | ||||||
| 3.88%, 03/31/25 |
700 | 691,633 | ||||||
| 3.88%, 01/15/26 |
100 | 98,578 | ||||||
| 3.88%, 11/30/27 |
800 | 786,750 | ||||||
| 3.88%, 12/31/27 |
800 | 786,688 | ||||||
| 3.88%, 09/30/29 |
700 | 686,109 | ||||||
| 3.88%, 11/30/29 |
700 | 685,836 | ||||||
| 3.88%, 12/31/29 |
800 | 783,563 | ||||||
| 3.88%, 08/15/33 |
2,200 | 2,134,344 | ||||||
| 3.88%, 02/15/43 |
488 | 446,978 | ||||||
| 3.88%, 05/15/43 |
486 | 444,462 | ||||||
| 4.00%, 12/15/25 |
513 | 506,748 | ||||||
| 4.00%, 02/15/26 |
1,900 | 1,877,437 | ||||||
| 4.00%, 02/29/28 |
1,000 | 987,734 | ||||||
| 4.00%, 06/30/28 |
538 | 531,527 | ||||||
| 4.00%, 01/31/29(c) |
1,000 | 988,437 | ||||||
| 4.00%, 02/28/30 |
800 | 788,187 | ||||||
| 4.00%, 07/31/30 |
600 | 590,719 | ||||||
| 4.00%, 01/31/31 |
600 | 590,344 | ||||||
| 4.00%, 02/15/34 |
1,000 | 980,469 | ||||||
| 4.00%, 11/15/42 |
488 | 455,670 | ||||||
| 4.00%, 11/15/52 |
900 | 843,047 | ||||||
| 4.13%, 01/31/25 |
600 | 594,773 | ||||||
| 4.13%, 06/15/26 |
1,441 | 1,427,603 | ||||||
| 4.13%, 09/30/27 |
900 | 892,758 | ||||||
| 4.13%, 07/31/28 |
500 | 496,484 | ||||||
| 4.13%, 08/31/30 |
300 | 297,328 | ||||||
| 4.13%, 11/15/32 |
2,800 | 2,770,687 | ||||||
| 4.13%, 08/15/53 |
1,338 | 1,281,971 | ||||||
| 4.25%, 05/31/25 |
526 | 521,665 | ||||||
| 4.25%, 10/15/25 |
820 | 813,370 | ||||||
| 4.25%, 01/31/26(c) |
800 | 794,062 | ||||||
| 4.25%, 02/28/31 |
1,000 | 998,906 | ||||||
| 4.25%, 05/15/39 |
400 | 395,563 | ||||||
| 4.38%, 08/15/26 |
1,200 | 1,196,062 | ||||||
| 4.38%, 12/15/26 |
1,500 | 1,497,070 | ||||||
| 4.38%, 08/31/28 |
800 | 802,562 | ||||||
| 4.38%, 11/30/28 |
2,300 | 2,309,883 | ||||||
| 4.38%, 11/30/30 |
1,200 | 1,206,750 | ||||||
| 4.38%, 08/15/43 |
963 | 943,138 | ||||||
| 4.50%, 11/15/25 |
701 | 698,262 | ||||||
| 4.50%, 07/15/26 |
501 | 500,609 | ||||||
| 4.50%, 11/15/33 |
2,800 | 2,853,375 | ||||||
| 4.50%, 02/15/36 |
100 | 103,438 | ||||||
| 4.63%, 02/28/25 |
851 | 847,410 | ||||||
| 4.63%, 06/30/25 |
700 | 697,758 | ||||||
| 4.63%, 03/15/26 |
2,000 | 2,000,000 | ||||||
| 4.63%, 09/15/26 |
1,400 | 1,404,047 | ||||||
| 4.63%, 10/15/26 |
1,400 | 1,404,703 | ||||||
| 4.63%, 11/15/26 |
1,000 | 1,003,750 | ||||||
| 4.63%, 09/30/28 |
600 | 608,109 | ||||||
| 4.63%, 09/30/30 |
600 | 611,813 | ||||||
| 4.75%, 07/31/25 |
524 | 523,345 | ||||||
| 4.75%, 02/15/37 |
600 | 633,281 | ||||||
| 4.75%, 11/15/43 |
910 | 936,731 | ||||||
| 4.75%, 11/15/53 |
1,400 | 1,490,562 | ||||||
| 4.88%, 11/30/25 |
800 | 801,969 | ||||||
| 58 | 2 0 2 4 I S H A R E S A N N U A L R E P O R T T O S H A R E H O L D E R S |
| Schedule of Investments (continued) February 29, 2024 |
iShares® ESG Advanced Total USD Bond Market ETF (Percentages shown are based on Net Assets) |
| Security | Par (000) |
Value | ||||||
| U.S. Government Obligations (continued) | ||||||||
| 4.88%, 10/31/28 |
$ | 1,400 | $ | 1,434,234 | ||||
| 4.88%, 10/31/30 |
500 | 517,031 | ||||||
| 5.00%, 05/15/37 |
400 | 431,500 | ||||||
|
|
|
|||||||
| 211,760,492 | ||||||||
|
|
|
|||||||
| Total U.S. Government & Agency Obligations — 59.3% |
349,726,240 | |||||||
|
|
|
|||||||
| Total Long-Term Investments — 98.5% |
581,303,989 | |||||||
|
|
|
|||||||
| Shares | ||||||||
| Short-Term Securities | ||||||||
| Money Market Funds — 4.7% | ||||||||
| BlackRock Cash Funds: Treasury, SL Agency Shares, 5.30%(l)(m)(n) |
27,853,397 | 27,853,397 | ||||||
|
|
|
|||||||
| Total Short-Term Securities — 4.7% |
27,853,397 | |||||||
|
|
|
|||||||
| Total Investments Before TBA Sales Commitments — 103.2% |
609,157,386 | |||||||
|
|
|
|||||||
| Par (000) |
||||||||
| TBA Sales Commitments(k) | ||||||||
| Mortgage-Backed Securities — (0.2)% | ||||||||
| Uniform Mortgage-Backed Securities |
||||||||
| 6.00%, 03/13/54 |
(575 | ) | (577,398 | ) | ||||
| 6.50%, 03/13/54 |
(725 | ) | (737,677 | ) | ||||
|
|
|
|||||||
| Total TBA Sales Commitments — (0.2)% |
(1,315,075 | ) | ||||||
|
|
|
|||||||
| Total Investments, Net of TBA Sales Commitments — 103.0% |
607,842,311 | |||||||
| Liabilities in Excess of Other Assets — (3.0)% | (17,502,635) | |||||||
|
|
|
|||||||
| Net Assets — 100.0% | $590,339,676 | |||||||
|
|
|
|||||||
| (a) | Variable rate security. Interest rate resets periodically. The rate shown is the effective interest rate as of period end. Security description also includes the reference rate and spread if published and available. |
| (b) | Security exempt from registration pursuant to Rule 144A under the Securities Act of 1933, as amended. These securities may be resold in transactions exempt from registration to qualified institutional investors. |
| (c) | All or a portion of this security is on loan. |
| (d) | Payment-in-kind security which may pay interest/dividends in additional par/shares and/or in cash. Rates shown are the current rate and possible payment rates. |
| (e) | This security may be resold to qualified foreign investors and foreign institutional buyers under Regulation S of the Securities Act of 1933. |
| (f) | Perpetual security with no stated maturity date. |
| (g) | Zero-coupon bond. |
| (h) | Security is valued using significant unobservable inputs and is classified as Level 3 in the fair value hierarchy. |
| (i) | U.S. dollar denominated security issued by foreign domiciled entity. |
| (j) | Step coupon security. Coupon rate will either increase (step-up bond) or decrease (step-down bond) at regular intervals until maturity. Interest rate shown reflects the rate currently in effect. |
| (k) | Represents or includes a TBA transaction. |
| (l) | Affiliate of the Fund. |
| (m) | Annualized 7-day yield as of period end. |
| (n) | All or a portion of this security was purchased with the cash collateral from loaned securities. |
Affiliates
Investments in issuers considered to be affiliate(s) of the Fund during the year ended February 29, 2024 for purposes of Section 2(a)(3) of the Investment Company Act of 1940, as amended, were as follows:
|
|
||||||||||||||||||||||||||||||||||||
| Affiliated Issuer | Value at 02/28/23 |
Purchases at Cost |
Proceeds from Sale |
Net Realized Gain (Loss) |
Change in Unrealized Appreciation (Depreciation) |
Value at 02/29/24 |
Shares Held at 02/29/24 |
Income | Capital Gain from Funds |
|||||||||||||||||||||||||||
|
|
||||||||||||||||||||||||||||||||||||
| BlackRock Cash Funds: Treasury, SL Agency Shares |
$ | 18,430,070 | $ | 9,423,327 | (a) | $ | — | $ | — | $ | — | $ | 27,853,397 | 27,853,397 | $ | 823,260 | (b) | $ | — | |||||||||||||||||
|
|
|
|
|
|
|
|
|
|
|
|||||||||||||||||||||||||||
| (a) | Represents net amount purchased (sold). |
| (b) | All or a portion represents securities lending income earned from the reinvestment of cash collateral from loaned securities, net of fees and collateral investment expenses, and other payments to and from borrowers of securities. |
| S C H E D U L E O F I N V E S T M E N T S |
59 |
| Schedule of Investments (continued) February 29, 2024 |
iShares® ESG Advanced Total USD Bond Market ETF |
Fair Value Hierarchy as of Period End
Various inputs are used in determining the fair value of financial instruments. For a description of the input levels and information about the Fund’s policy regarding valuation of financial instruments, refer to the Notes to Financial Statements.
The following table summarizes the Fund’s financial instruments categorized in the fair value hierarchy. The breakdown of the Fund’s financial instruments into major categories is disclosed in the Schedule of Investments above.
|
|
||||||||||||||||
| Level 1 | Level 2 | Level 3 | Total | |||||||||||||
|
|
||||||||||||||||
| Assets |
||||||||||||||||
| Investments |
||||||||||||||||
| Long-Term Investments |
||||||||||||||||
| Asset-Backed Securities |
$ | — | $ | 2,411,098 | $ | — | $ | 2,411,098 | ||||||||
| Collaterized Mortgage Obligations |
— | 5,396,515 | — | 5,396,515 | ||||||||||||
| Corporate Bonds & Notes |
— | 186,092,103 | 50,968 | 186,143,071 | ||||||||||||
| Foreign Government Obligations |
— | 37,627,065 | — | 37,627,065 | ||||||||||||
| U.S. Government & Agency Obligations |
— | 349,726,240 | — | 349,726,240 | ||||||||||||
| Short-Term Securities |
||||||||||||||||
| Money Market Funds |
27,853,397 | — | — | 27,853,397 | ||||||||||||
| Liabilities |
||||||||||||||||
| Investments |
||||||||||||||||
| TBA Sales Commitments |
— | (1,315,075 | ) | — | (1,315,075 | ) | ||||||||||
|
|
|
|
|
|
|
|
|
|||||||||
| $ | 27,853,397 | $ | 579,937,946 | $ | 50,968 | $ | 607,842,311 | |||||||||
|
|
|
|
|
|
|
|
|
|||||||||
See notes to financial statements.
| 60 | 2 0 2 4 I S H A R E S A N N U A L R E P O R T T O S H A R E H O L D E R S |
Statements of Assets and Liabilities
February 29, 2024
| iShares ESG Advanced Investment Grade Corporate Bond ETF |
iShares ESG Advanced Total USD Bond Market ETF |
|||||||
|
|
||||||||
| ASSETS |
||||||||
| Investments, at value — unaffiliated(a)(b) |
$ | 11,728,187 | $ | 581,303,989 | ||||
| Investments, at value — affiliated(c) |
558,619 | 27,853,397 | ||||||
| Cash |
423 | 96,658 | ||||||
| Foreign currency, at value(d) |
— | 569 | ||||||
| Receivables: |
||||||||
| Investments sold |
125,039 | 9,954,448 | ||||||
| Securities lending income — affiliated |
120 | 5,635 | ||||||
| TBA sales commitments |
— | 1,314,223 | ||||||
| Capital shares sold |
— | 24,396 | ||||||
| Dividends — affiliated |
1,157 | 63,813 | ||||||
| Interest — unaffiliated |
149,278 | 4,205,208 | ||||||
|
|
|
|
|
|||||
| Total assets |
12,562,823 | 624,822,336 | ||||||
|
|
|
|
|
|||||
| LIABILITIES |
||||||||
| Collateral on securities loaned, at value |
268,431 | 12,763,397 | ||||||
| TBA sales commitments, at value(e) |
— | 1,315,075 | ||||||
| Payables: |
||||||||
| Investments purchased |
180,347 | 20,349,141 | ||||||
| Investment advisory fees |
1,737 | 55,047 | ||||||
|
|
|
|
|
|||||
| Total liabilities |
450,515 | 34,482,660 | ||||||
|
|
|
|
|
|||||
| Commitments and contingent liabilities |
||||||||
| NET ASSETS |
$ | 12,112,308 | $ | 590,339,676 | ||||
|
|
|
|
|
|||||
| NET ASSETS CONSIST OF |
||||||||
| Paid-in capital |
$ | 15,158,203 | $ | 680,968,566 | ||||
| Accumulated loss |
(3,045,895 | ) | (90,628,890 | ) | ||||
|
|
|
|
|
|||||
| NET ASSETS |
$ | 12,112,308 | $ | 590,339,676 | ||||
|
|
|
|
|
|||||
| NET ASSETVALUE |
||||||||
| Shares outstanding |
150,000 | 13,900,000 | ||||||
|
|
|
|
|
|||||
| Net asset value |
$ | 80.75 | $ | 42.47 | ||||
|
|
|
|
|
|||||
| Shares authorized |
Unlimited | Unlimited | ||||||
|
|
|
|
|
|||||
| Par value |
None | None | ||||||
|
|
|
|
|
|||||
| (a) Investments, at cost — unaffiliated |
$ | 13,580,840 | $ | 645,084,875 | ||||
| (b) Securities loaned, at value |
$ | 259,311 | $ | 9,714,028 | ||||
| (c) Investments, at cost — affiliated |
$ | 558,479 | $ | 27,853,397 | ||||
| (d) Foreign currency, at cost |
$ | — | $ | 563 | ||||
| (e) Proceeds from TBA sales commitments |
$ | — | $ | 1,314,223 | ||||
See notes to financial statements.
| F I N A N C I A L S T A T E M E N T S |
61 |
Year Ended February 29, 2024
| iShares ESG Investment Grade Corporate Bond ETF |
iShares ESG Advanced Total USD Bond Market ETF |
|||||||
|
|
||||||||
| INVESTMENT INCOME |
||||||||
| Dividends — affiliated |
$ | 8,257 | $ | 750,117 | ||||
| Interest — unaffiliated |
479,266 | 18,469,136 | ||||||
| Securities lending income — affiliated — net |
1,923 | 73,143 | ||||||
| Other income — unaffiliated |
— | 588 | ||||||
|
|
|
|
|
|||||
| Total investment income |
489,446 | 19,292,984 | ||||||
|
|
|
|
|
|||||
| EXPENSES |
||||||||
| Investment advisory |
21,541 | 700,859 | ||||||
| Interest expense |
— | 63 | ||||||
|
|
|
|
|
|||||
| Total expenses |
21,541 | 700,922 | ||||||
| Less: |
||||||||
| Investment advisory fees waived |
— | (13,124 | ) | |||||
|
|
|
|
|
|||||
| Total expenses after fees waived |
21,541 | 687,798 | ||||||
|
|
|
|
|
|||||
| Net investment income |
467,905 | 18,605,186 | ||||||
|
|
|
|
|
|||||
| REALIZED AND UNREALIZED GAIN (LOSS) |
||||||||
| Net realized gain (loss) from: |
||||||||
| Investments — unaffiliated |
(371,208 | ) | (7,243,308 | ) | ||||
| Investments — affiliated |
(112 | ) | — | |||||
| Foreign currency transactions |
— | (1 | ) | |||||
| In-kind redemptions — unaffiliated(a) |
— | (5,362,181 | ) | |||||
|
|
|
|
|
|||||
| (371,320 | ) | (12,605,490 | ) | |||||
|
|
|
|
|
|||||
| Net change in unrealized appreciation (depreciation) on: |
||||||||
| Investments — unaffiliated |
587,277 | 12,108,464 | ||||||
| Foreign currency translations |
— | 10 | ||||||
|
|
|
|
|
|||||
| 587,277 | 12,108,474 | |||||||
|
|
|
|
|
|||||
| Net realized and unrealized gain (loss) |
215,957 | (497,016 | ) | |||||
|
|
|
|
|
|||||
| NET INCREASE IN NET ASSETS RESULTING FROM OPERATIONS |
$ | 683,862 | $ | 18,108,170 | ||||
|
|
|
|
|
|||||
| (a) | See Note 2 of the Notes to Financial Statements. |
See notes to financial statements.
| 62 | 2 0 2 4 I S H A R E S A N N U A L R E P O R T T O S H A R E H O L D E R S |
Statements of Changes in Net Assets
| iShares ESG Advanced Investment Grade Corporate Bond ETF |
iShares ESG Advanced Total USD Bond Market ETF |
|||||||||||||||||||
| Year Ended 02/29/24 |
Year Ended 02/28/23 |
Year Ended 02/29/24 |
Year Ended 02/28/23 |
|||||||||||||||||
|
|
||||||||||||||||||||
|
INCREASE (DECREASE) IN NET ASSETS |
||||||||||||||||||||
| OPERATIONS |
||||||||||||||||||||
| Net investment income |
$ | 467,905 | $ | 457,695 | $ | 18,605,186 | $ | 17,739,911 | ||||||||||||
| Net realized loss |
(371,320 | ) | (1,752,499 | ) | (12,605,490 | ) | (41,430,926 | ) | ||||||||||||
| Net change in unrealized appreciation (depreciation) |
587,277 | (1,000,276 | ) | 12,108,474 | (50,521,134 | ) | ||||||||||||||
|
|
|
|
|
|
|
|
|
|||||||||||||
| Net increase (decrease) in net assets resulting from operations |
683,862 | (2,295,080 | ) | 18,108,170 | (74,212,149 | ) | ||||||||||||||
|
|
|
|
|
|
|
|
|
|||||||||||||
| DISTRIBUTIONS TO SHAREHOLDERS(a) |
||||||||||||||||||||
| Decrease in net assets resulting from distributions to shareholders |
(464,156 | ) | (457,951 | ) | (18,397,296 | ) | (17,304,554 | ) | ||||||||||||
|
|
|
|
|
|
|
|
|
|||||||||||||
| CAPITAL SHARE TRANSACTIONS |
||||||||||||||||||||
| Net increase (decrease) in net assets derived from capital share transactions |
— | (3,953,019 | ) | 19,935,401 | 52,415,316 | |||||||||||||||
|
|
|
|
|
|
|
|
|
|||||||||||||
| NET ASSETS |
||||||||||||||||||||
| Total increase (decrease) in net assets |
219,706 | (6,706,050 | ) | 19,646,275 | (39,101,387 | ) | ||||||||||||||
| Beginning of year |
11,892,602 | 18,598,652 | 570,693,401 | 609,794,788 | ||||||||||||||||
|
|
|
|
|
|
|
|
|
|||||||||||||
| End of year |
$ | 12,112,308 | $ | 11,892,602 | $ | 590,339,676 | $ | 570,693,401 | ||||||||||||
|
|
|
|
|
|
|
|
|
|||||||||||||
| (a) | Distributions for annual periods determined in accordance with U.S. federal income tax regulations. |
See notes to financial statements.
| F I N A N C I A L S T A T E M E N T S |
63 |
(For a share outstanding throughout each period)
| iShares ESG Advanced Investment Grade Corporate Bond ETF | ||||||||||||||||
| |
Year Ended 02/29/24 |
|
|
Year Ended 02/28/23 |
|
|
Period From 11/08/21 to 02/28/22 |
(a)
| ||||||||
|
|
||||||||||||||||
| Net asset value, beginning of period |
$ | 79.28 | $ | 92.99 | $ | 100.00 | ||||||||||
|
|
|
|
|
|
|
|||||||||||
| Net investment income(b) |
3.12 | 2.45 | 0.64 | |||||||||||||
| Net realized and unrealized gain (loss)(c) |
1.44 | (13.69 | ) | (7.19 | ) | |||||||||||
|
|
|
|
|
|
|
|||||||||||
| Net increase (decrease) from investment operations |
4.56 | (11.24 | ) | (6.55 | ) | |||||||||||
|
|
|
|
|
|
|
|||||||||||
| Distributions from net investment income(d) |
(3.09 | ) | (2.47 | ) | (0.46 | ) | ||||||||||
|
|
|
|
|
|
|
|||||||||||
| Net asset value, end of period |
$ | 80.75 | $ | 79.28 | $ | 92.99 | ||||||||||
|
|
|
|
|
|
|
|||||||||||
| Total Return(e) |
||||||||||||||||
| Based on net asset value |
5.87 | % | (12.17 | )% | (6.56 | )%(f) | ||||||||||
|
|
|
|
|
|
|
|||||||||||
| Ratios to Average Net Assets(g) |
||||||||||||||||
| Total expenses |
0.18 | % | 0.18 | % | 0.18 | %(h) | ||||||||||
|
|
|
|
|
|
|
|||||||||||
| Net investment income |
3.91 | % | 2.97 | % | 2.16 | %(h) | ||||||||||
|
|
|
|
|
|
|
|||||||||||
| Supplemental Data |
||||||||||||||||
| Net assets, end of period (000) |
$ | 12,112 | $ | 11,893 | $ | 18,599 | ||||||||||
|
|
|
|
|
|
|
|||||||||||
| Portfolio turnover rate(i) |
29 | % | 35 | % | 7 | %(f) | ||||||||||
|
|
|
|
|
|
|
|||||||||||
| (a) | Commencement of operations. |
| (b) | Based on average shares outstanding. |
| (c) | The amounts reported for a share outstanding may not accord with the change in aggregate gains and losses in securities for the fiscal period due to the timing of capital share transactions in relation to the fluctuating market values of the Fund’s underlying securities. |
| (d) | Distributions for annual periods determined in accordance with U.S. federal income tax regulations. |
| (e) | Where applicable, assumes the reinvestment of distributions. |
| (f) | Not annualized. |
| (g) | Excludes fees and expenses incurred indirectly as a result of investments in underlying funds. |
| (h) | Annualized. |
| (i) | Portfolio turnover rate excludes in-kind transactions, if any. |
See notes to financial statements.
| 64 | 2 0 2 4 I S H A R E S A N N U A L R E P O R T T O S H A R E H O L D E R S |
Financial Highlights (continued)
(For a share outstanding throughout each period)
| iShares ESG Advanced Total USD Bond Market ETF | ||||||||||||||||
| |
Year Ended 02/29/24 |
|
|
Year Ended 02/28/23 |
|
|
Year Ended 02/28/22 |
|
|
Period From 06/23/20 to 02/28/21 |
(a)
| |||||
|
|
||||||||||||||||
| Net asset value, beginning of period |
$ | 42.27 | $ | 47.64 | $ | 49.61 | $ | 50.00 | ||||||||
|
|
|
|
|
|
|
|
|
|||||||||
| Net investment income(b) |
1.35 | 1.01 | 0.60 | 0.35 | ||||||||||||
| Net realized and unrealized gain (loss)(c) |
0.19 | (5.38 | ) | (2.01 | ) | (0.42 | ) | |||||||||
|
|
|
|
|
|
|
|
|
|||||||||
| Net increase (decrease) from investment operations |
1.54 | (4.37 | ) | (1.41 | ) | (0.07 | ) | |||||||||
|
|
|
|
|
|
|
|
|
|||||||||
| Distributions from net investment income(d) |
(1.34 | ) | (1.00 | ) | (0.56 | ) | (0.32 | ) | ||||||||
|
|
|
|
|
|
|
|
|
|||||||||
| Net asset value, end of period |
$ | 42.47 | $ | 42.27 | $ | 47.64 | $ | 49.61 | ||||||||
|
|
|
|
|
|
|
|
|
|||||||||
| Total Return(e) |
||||||||||||||||
| Based on net asset value |
3.70 | % | (9.22 | )% | (2.85 | )% | (0.16 | )%(f) | ||||||||
|
|
|
|
|
|
|
|
|
|||||||||
| Ratios to Average Net Assets(g) |
||||||||||||||||
| Total expenses |
0.12 | % | 0.12 | % | 0.12 | % | 0.12 | %(h) | ||||||||
|
|
|
|
|
|
|
|
|
|||||||||
| Total expenses after fees waived |
0.12 | % | 0.11 | % | 0.11 | % | 0.11 | %(h) | ||||||||
|
|
|
|
|
|
|
|
|
|||||||||
| Net investment income |
3.19 | % | 2.32 | % | 1.23 | % | 1.03 | %(h) | ||||||||
|
|
|
|
|
|
|
|
|
|||||||||
| Supplemental Data |
||||||||||||||||
| Net assets, end of period (000) |
$ | 590,340 | $ | 570,693 | $ | 609,795 | $ | 188,521 | ||||||||
|
|
|
|
|
|
|
|
|
|||||||||
| Portfolio turnover rate(i)(j) |
63 | % | 167 | % | 243 | % | 216 | %(f) | ||||||||
|
|
|
|
|
|
|
|
|
|||||||||
| (a) | Commencement of operations. |
| (b) | Based on average shares outstanding. |
| (c) | The amounts reported for a share outstanding may not accord with the change in aggregate gains and losses in securities for the fiscal period due to the timing of capital share transactions in relation to the fluctuating market values of the Fund’s underlying securities. |
| (d) | Distributions for annual periods determined in accordance with U.S. federal income tax regulations. |
| (e) | Where applicable, assumes the reinvestment of distributions. |
| (f) | Not annualized. |
| (g) | Excludes fees and expenses incurred indirectly as a result of investments in underlying funds. |
| (h) | Annualized. |
| (i) | Portfolio turnover rate excludes in-kind transactions, if any. |
| (j) | Includes mortgage dollar roll transactions (“MDRs”). |
See notes to financial statements.
| F I N A N C I A L H I G H L I G H T S |
65 |
1. ORGANIZATION
iShares Trust (the “Trust”) is registered under the Investment Company Act of 1940, as amended (the “1940 Act”), as an open-end management investment company. The Trust is organized as a Delaware statutory trust and is authorized to have multiple series or portfolios.
These financial statements relate only to the following funds (each, a “Fund” and collectively, the “Funds”):
| iShares ETF | Diversification Classification |
|||
| ESG Advanced Investment Grade Corporate Bond |
Non-diversified | |||
| ESG Advanced Total USD Bond Market |
Diversified | (a) | ||
| (a) | The Fund’s classification changed from non-diversified to diversified during the reporting period. |
2. SIGNIFICANT ACCOUNTING POLICIES
The financial statements are prepared in conformity with accounting principles generally accepted in the United States of America (“U.S. GAAP”), which may require management to make estimates and assumptions that affect the reported amounts of assets and liabilities in the financial statements, disclosure of contingent assets and liabilities at the date of the financial statements and the reported amounts of increases and decreases in net assets from operations during the reporting period. Actual results could differ from those estimates. Each Fund is considered an investment company under U.S. GAAP and follows the accounting and reporting guidance applicable to investment companies. Below is a summary of significant accounting policies:
Investment Transactions and Income Recognition: For financial reporting purposes, investment transactions are recorded on the dates the transactions are executed (the “trade dates”). Realized gains and losses on investment transactions are determined using the specific identification method. Dividend income and capital gain distributions, if any, are recorded on the ex-dividend date. Non-cash dividends, if any, are recorded on the ex-dividend date at fair value. Interest income, including amortization and accretion of premiums and discounts on debt securities, and payment-in-kind interest are recognized daily on an accrual basis.
Foreign Currency Translation: Each Fund’s books and records are maintained in U.S. dollars. Securities and other assets and liabilities denominated in foreign currencies are translated into U.S. dollars using prevailing market rates as quoted by one or more data service providers. Purchases and sales of investments are recorded at the rates of exchange prevailing on the respective dates of such transactions. Generally, when the U.S. dollar rises in value against a foreign currency, the investments denominated in that currency will lose value; the opposite effect occurs if the U.S. dollar falls in relative value.
Each Fund does not isolate the effect of fluctuations in foreign exchange rates from the effect of fluctuations in the market prices of investments for financial reporting purposes. Accordingly, the effects of changes in exchange rates on investments are not segregated in the Statements of Operations from the effects of changes in market prices of those investments, but are included as a component of net realized and unrealized gain (loss) from investments. Each Fund reports realized currency gains (losses) on foreign currency related transactions as components of net realized gain (loss) for financial reporting purposes, whereas such components are generally treated as ordinary income for U.S. federal income tax purposes.
Collateralization: If required by an exchange or counterparty agreement, the Funds may be required to deliver/deposit cash and/or securities to/with an exchange, or broker-dealer or custodian as collateral for certain investments.
In-kind Redemptions: For financial reporting purposes, in-kind redemptions are treated as sales of securities resulting in realized capital gains or losses to the Funds. Because such gains or losses are not taxable to the Funds and are not distributed to existing Fund shareholders, the gains or losses are reclassified from accumulated net realized gain (loss) to paid-in capital at the end of the Funds’ tax year. These reclassifications have no effect on net assets or net asset value (“NAV”) per share.
Distributions: Dividends and distributions paid by each Fund are recorded on the ex-dividend dates. Distributions are determined on a tax basis and may differ from net investment income and net realized capital gains for financial reporting purposes. Dividends and distributions are paid in U.S. dollars and cannot be automatically reinvested in additional shares of the Funds.
Indemnifications: In the normal course of business, each Fund enters into contracts that contain a variety of representations that provide general indemnification. The Funds’ maximum exposure under these arrangements is unknown because it involves future potential claims against the Funds, which cannot be predicted with any certainty.
3. INVESTMENT VALUATION AND FAIR VALUE MEASUREMENTS
Investment Valuation Policies: Each Fund’s investments are valued at fair value (also referred to as “market value” within the financial statements) each day that the Fund’s listing exchange is open and, for financial reporting purposes, as of the report date. U.S. GAAP defines fair value as the price a fund would receive to sell an asset or pay to transfer a liability in an orderly transaction between market participants at the measurement date. The Board of Trustees of the Trust (the “Board”) of each Fund has approved the designation of BlackRock Fund Advisors (“BFA”), the Funds’ investment adviser, as the valuation designee for each Fund. Each Fund determines the fair values of its financial instruments using various independent dealers or pricing services under BFA’s policies. If a security’s market price is not readily available or does not otherwise accurately represent the fair value of the security, the security will be valued in accordance with BFA’s policies and procedures as reflecting fair value. BFA has
| 66 | 2 0 2 4 I S H A R E S A N N U A L R E P O R T T O S H A R E H O L D E R S |
Notes to Financial Statements (continued)
formed a committee (the “Valuation Committee”) to develop pricing policies and procedures and to oversee the pricing function for all financial instruments, with assistance from other BlackRock pricing committees.
Fair Value Inputs and Methodologies: The following methods and inputs are used to establish the fair value of each Fund’s assets and liabilities:
| • | Fixed-income investments for which market quotations are readily available are generally valued using the last available bid price or current market quotations provided by independent dealers or third-party pricing services. Pricing services generally value fixed income securities assuming orderly transactions of an institutional round lot size, but a fund may hold or transact in such securities in smaller, odd lot sizes. Odd lots may trade at lower prices than institutional round lots. The pricing services may use matrix pricing or valuation models that utilize certain inputs and assumptions to derive values, including transaction data (e.g., recent representative bids and offers), market data, credit quality information, perceived market movements, news, and other relevant information. Certain fixed-income securities, including asset-backed and mortgage related securities may be valued based on valuation models that consider the estimated cash flows of each tranche of the entity, establish a benchmark yield and develop an estimated tranche specific spread to the benchmark yield based on the unique attributes of the tranche. The amortized cost method of valuation may be used with respect to debt obligations with sixty days or less remaining to maturity unless BFA determines such method does not represent fair value. |
| • | Investments in open-end U.S. mutual funds (including money market funds) are valued at that day’s published NAV. |
If events (e.g., market volatility, company announcement or a natural disaster) occur that are expected to materially affect the value of such investment, or in the event that application of these methods of valuation results in a price for an investment that is deemed not to be representative of the market value of such investment, or if a price is not available, the investment will be valued by the Valuation Committee, in accordance with BFA’s policies and procedures as reflecting fair value (“Fair Valued Investments”). The fair valuation approaches that may be used by the Valuation Committee include market approach, income approach and cost approach. Valuation techniques such as discounted cash flow, use of market comparables and matrix pricing are types of valuation approaches and are typically used in determining fair value. When determining the price for Fair Valued Investments, the Valuation Committee seeks to determine the price that each Fund might reasonably expect to receive or pay from the current sale or purchase of that asset or liability in an arm’s-length transaction. Fair value determinations shall be based upon all available factors that the Valuation Committee deems relevant and consistent with the principles of fair value measurement.
Fair value pricing could result in a difference between the prices used to calculate a fund’s NAV and the prices used by the fund’s underlying index, which in turn could result in a difference between the fund’s performance and the performance of the fund’s underlying index.
Fair Value Hierarchy: Various inputs are used in determining the fair value of financial instruments. These inputs to valuation techniques are categorized into a fair value hierarchy consisting of three broad levels for financial reporting purposes as follows:
| • | Level 1 – Unadjusted price quotations in active markets/exchanges for identical assets or liabilities that each Fund has the ability to access; |
| • | Level 2 – Other observable inputs (including, but not limited to, quoted prices for similar assets or liabilities in markets that are active, quoted prices for identical or similar assets or liabilities in markets that are not active, inputs other than quoted prices that are observable for the assets or liabilities (such as interest rates, yield curves, volatilities, prepayment speeds, loss severities, credit risks and default rates) or other market-corroborated inputs); and |
| • | Level 3 – Unobservable inputs based on the best information available in the circumstances, to the extent observable inputs are not available, (including the Valuation Committee’s assumptions used in determining the fair value of financial instruments). |
The hierarchy gives the highest priority to unadjusted quoted prices in active markets for identical assets or liabilities (Level 1 measurements) and the lowest priority to unobservable inputs (Level 3 measurements). Accordingly, the degree of judgment exercised in determining fair value is greatest for instruments categorized in Level 3. The inputs used to measure fair value may fall into different levels of the fair value hierarchy. In such cases, for disclosure purposes, the fair value hierarchy classification is determined based on the lowest level input that is significant to the fair value measurement in its entirety. Investments classified within Level 3 have significant unobservable inputs used by the Valuation Committee in determining the price for Fair Valued Investments. Level 3 investments include equity or debt issued by privately held companies or funds that may not have a secondary market and/or may have a limited number of investors. The categorization of a value determined for financial instruments is based on the pricing transparency of the financial instruments and is not necessarily an indication of the risks associated with investing in those securities.
4. SECURITIES AND OTHER INVESTMENTS
Asset-Backed and Mortgage-Backed Securities: Asset-backed securities are generally issued as pass-through certificates or as debt instruments. Asset-backed securities issued as pass-through certificates represent undivided fractional ownership interests in an underlying pool of assets. Asset-backed securities issued as debt instruments, which are also known as collateralized obligations, are typically issued as the debt of a special purpose entity organized solely for the purpose of owning such assets and issuing such debt. Asset-backed securities are often backed by a pool of assets representing the obligations of a number of different parties. The yield characteristics of certain asset-backed securities may differ from traditional debt securities. One such major difference is that all or a principal part of the obligations may be prepaid at any time because the underlying assets (i.e., loans) may be prepaid at any time. As a result, a decrease in interest rates in the market may result in increases in the level of prepayments as borrowers, particularly mortgagors, refinance and repay their loans. An increased prepayment rate with respect to an asset-backed security will have the effect of shortening the maturity of the security. In addition, a fund may subsequently have to reinvest the proceeds at lower interest rates. If a fund has purchased such an asset-backed security at a premium, a faster than anticipated prepayment rate could result in a loss of principal to the extent of the premium paid.
For mortgage pass-through securities (the “Mortgage Assets”) there are a number of important differences among the agencies and instrumentalities of the U.S. Government that issue mortgage-related securities and among the securities that they issue. For example, mortgage-related securities guaranteed by Ginnie Mae are
| N O T E S T O F I N A N C I A L S T A T E M E N T S |
67 |
Notes to Financial Statements (continued)
guaranteed as to the timely payment of principal and interest by Ginnie Mae and such guarantee is backed by the full faith and credit of the United States. However, mortgage-related securities issued by Freddie Mac and Fannie Mae, including Freddie Mac and Fannie Mae guaranteed mortgage pass-through certificates, which are solely the obligations of Freddie Mac and Fannie Mae, are not backed by or entitled to the full faith and credit of the United States, but are supported by the right of the issuer to borrow from the U.S. Treasury.
Non-agency mortgage-backed securities are securities issued by non-governmental issuers and have no direct or indirect government guarantees of payment and are subject to various risks. Non-agency mortgage loans are obligations of the borrowers thereunder only and are not typically insured or guaranteed by any other person or entity. The ability of a borrower to repay a loan is dependent upon the income or assets of the borrower. A number of factors, including a general economic downturn, acts of God, terrorism, social unrest and civil disturbances, may impair a borrower’s ability to repay its loans.
Zero-Coupon Bonds: Zero-coupon bonds are normally issued at a significant discount from face value and do not provide for periodic interest payments. These bonds may experience greater volatility in market value than other debt obligations of similar maturity which provide for regular interest payments.
TBA Commitments: TBA commitments are forward agreements for the purchase or sale of securities, including mortgage-backed securities for a fixed price, with payment and delivery on an agreed upon future settlement date. The specific securities to be delivered are not identified at the trade date. However, delivered securities must meet specified terms, including issuer, rate and mortgage terms. When entering into TBA commitments, a fund may take possession of or deliver the underlying mortgage-backed securities but can extend the settlement or roll the transaction. TBA commitments involve a risk of loss if the value of the security to be purchased or sold declines or increases, respectively, prior to settlement date, if there are expenses or delays in connection with the TBA transactions, or if the counterparty fails to complete the transaction.
To mitigate counterparty risk, a fund enters into a two-way collateral agreement for TBA transactions with certain counterparties. Under such agreement, the “in-the-money” party of a TBA transaction may at any time require the other party to pledge collateral assets (in the form of cash or securities) to offset any loss the in-the-money party would incur upon cancellation of the TBA transaction. A party is in-the-money if they are the buyer and the market value of the TBA transaction increases or if they are the seller and the market value of the TBA transaction decreases. Cash collateral received from the counterparty may be reinvested in money market funds, including those managed by the Funds’ investment adviser, or its affiliates. Such collateral, if any, is noted in the Schedule of Investments and the obligation to return the collateral is presented as a liability in the Statements of Assets and Liabilities. Securities pledged as collateral by a fund, if any, are noted in the Schedule of Investments.
Mortgage Dollar Roll Transactions: Certain Funds may sell TBA mortgage-backed securities and simultaneously contract to repurchase substantially similar (i.e., same type, coupon and maturity) securities on a specific future date at an agreed upon price. During the period between the sale and repurchase, a fund is not entitled to receive interest and principal payments on the securities sold. Mortgage dollar roll transactions are treated as purchases and sales and a fund realizes gains and losses on these transactions. Mortgage dollar rolls involve the risk that the market value of the securities that a fund is required to purchase may decline below the agreed upon repurchase price of those securities.
Securities Lending: Each Fund may lend its securities to approved borrowers, such as brokers, dealers and other financial institutions. The borrower pledges and maintains with the Fund collateral consisting of cash, an irrevocable letter of credit issued by an approved bank, or securities issued or guaranteed by the U.S. government. The initial collateral received by each Fund is required to have a value of at least 102% of the current market value of the loaned securities for securities traded on U.S. exchanges and a value of at least 105% for all other securities. The collateral is maintained thereafter at a value equal to at least 100% of the current value of the securities on loan. The market value of the loaned securities is determined at the close of each business day of the Fund and any additional required collateral is delivered to the Fund or excess collateral is returned by the Fund, on the next business day. During the term of the loan, each Fund is entitled to all distributions made on or in respect of the loaned securities but does not receive interest income on securities received as collateral. Loans of securities are terminable at any time and the borrower, after notice, is required to return borrowed securities within the standard time period for settlement of securities transactions.
As of period end, any securities on loan were collateralized by cash and/or U.S. Government obligations. Cash collateral invested in money market funds managed by BFA, or its affiliates is disclosed in the Schedule of Investments. Any non-cash collateral received cannot be sold, re-invested or pledged by the Fund, except in the event of borrower default. The securities on loan, if any, are also disclosed in each Fund’s Schedule of Investments. The market value of any securities on loan and the value of any related cash collateral are disclosed in the Statements of Assets and Liabilities.
Securities lending transactions are entered into by the Funds under Master Securities Lending Agreements (each, an “MSLA”) which provide the right, in the event of default (including bankruptcy or insolvency) for the non-defaulting party to liquidate the collateral and calculate a net exposure to the defaulting party or request additional collateral. In the event that a borrower defaults, the Funds, as lender, would offset the market value of the collateral received against the market value of the securities loaned. When the value of the collateral is greater than that of the market value of the securities loaned, the lender is left with a net amount payable to the defaulting party. However, bankruptcy or insolvency laws of a particular jurisdiction may impose restrictions on or prohibitions against such a right of offset in the event of an MSLA counterparty’s bankruptcy or insolvency. Under the MSLA, absent an event of default, the borrower can resell or re-pledge the loaned securities, and the Funds can reinvest cash collateral received in connection with loaned securities. Upon an event of default, the parties’ obligations to return the securities or collateral to the other party are extinguished, and the parties can resell or re-pledge the loaned securities or the collateral received in connection with the loaned securities in order to satisfy the defaulting party’s net payment obligation for all transactions under the MSLA. The defaulting party remains liable for any deficiency.
| 68 | 2 0 2 4 I S H A R E S A N N U A L R E P O R T T O S H A R E H O L D E R S |
Notes to Financial Statements (continued)
As of period end, the following table is a summary of the securities on loan by counterparty which are subject to offset under an MSLA:
|
|
||||||||||||||||
| iShares ETF and Counterparty |
|
Securities Loaned at Value |
|
|
Cash Collateral Received |
(a) |
|
Non-Cash Collateral Received, at Fair Value |
(a) |
Net Amount | ||||||
|
|
||||||||||||||||
| ESG Advanced Investment Grade Corporate Bond |
||||||||||||||||
| Barclays Capital, Inc. |
$ | 40,310 | $ | (40,310 | ) | $ | — | $ | — | |||||||
| BMO Capital Markets Corp. |
25,583 | (25,583 | ) | — | — | |||||||||||
| BofA Securities, Inc. |
39,608 | (39,608 | ) | — | — | |||||||||||
| J.P. Morgan Securities LLC |
78,577 | (78,577 | ) | — | — | |||||||||||
| Nomura Securities International, Inc. |
22,926 | (22,926 | ) | — | — | |||||||||||
| RBC Capital Markets LLC |
37,280 | (37,280 | ) | — | — | |||||||||||
| Scotia Capital (USA), Inc. |
15,027 | (15,027 | ) | — | — | |||||||||||
|
|
|
|
|
|
|
|
|
|||||||||
| $ | 259,311 | $ | (259,311 | ) | $ | — | $ | — | ||||||||
|
|
|
|
|
|
|
|
|
|||||||||
| ESG Advanced Total USD Bond Market |
||||||||||||||||
| Barclays Bank PLC |
$ | 738,225 | $ | (738,225 | ) | $ | — | $ | — | |||||||
| Barclays Capital, Inc. |
58,677 | (58,677 | ) | — | — | |||||||||||
| BMO Capital Markets Corp. |
77,869 | (77,869 | ) | — | — | |||||||||||
| BNP Paribas SA |
582,421 | (582,421 | ) | — | — | |||||||||||
| BofA Securities, Inc. |
348,425 | (348,425 | ) | — | — | |||||||||||
| Citigroup Global Markets, Inc. |
1,387,391 | (1,387,391 | ) | — | — | |||||||||||
| Goldman Sachs & Co. LLC |
2,418,602 | (2,418,602 | ) | — | — | |||||||||||
| J.P. Morgan Securities LLC |
2,835,565 | (2,835,565 | ) | — | — | |||||||||||
| Jefferies LLC |
280,506 | (280,506 | ) | — | — | |||||||||||
| Morgan Stanley |
405,676 | (405,676 | ) | — | — | |||||||||||
| Nomura Securities International, Inc. |
34,718 | (34,718 | ) | — | — | |||||||||||
| Pershing LLC |
69,420 | (69,420 | ) | — | — | |||||||||||
| RBC Capital Markets LLC |
175,475 | (175,475 | ) | — | — | |||||||||||
| Scotia Capital (USA), Inc. |
16,927 | (16,927 | ) | — | — | |||||||||||
| State Street Bank & Trust Co. |
89,311 | (89,311 | ) | — | — | |||||||||||
| UBS AG |
59,637 | (59,637 | ) | — | — | |||||||||||
| UBS Securities LLC |
30,706 | (30,706 | ) | — | — | |||||||||||
| Wells Fargo Securities LLC |
104,477 | (104,477 | ) | — | — | |||||||||||
|
|
|
|
|
|
|
|
|
|||||||||
| $ | 9,714,028 | $ | (9,714,028 | ) | $ | — | $ | — | ||||||||
|
|
|
|
|
|
|
|
|
|||||||||
| (a) | Collateral received, if any, in excess of the market value of securities on loan is not presented in this table. The total cash collateral received by each Fund is disclosed in the Fund’s Statements of Assets and Liabilities. |
The risks of securities lending include the risk that the borrower may not provide additional collateral when required or may not return the securities when due. To mitigate these risks, each Fund benefits from a borrower default indemnity provided by BlackRock, Inc. (“BlackRock”). BlackRock’s indemnity allows for full replacement of the securities loaned to the extent the collateral received does not cover the value of the securities loaned in the event of borrower default. Each Fund could incur a loss if the value of an investment purchased with cash collateral falls below the market value of the loaned securities or if the value of an investment purchased with cash collateral falls below the value of the original cash collateral received. Such losses are borne entirely by each Fund.
5. INVESTMENT ADVISORY AGREEMENT AND OTHER TRANSACTIONS WITH AFFILIATES
Investment Advisory Fees: Pursuant to an Investment Advisory Agreement with the Trust, BFA manages the investment of each Fund’s assets. BFA is a California corporation indirectly owned by BlackRock. Under the Investment Advisory Agreement, BFA is responsible for substantially all expenses of the Funds, except (i) interest and taxes; (ii) brokerage commissions and other expenses connected with the execution of portfolio transactions; (iii) distribution fees; (iv) the advisory fee payable to BFA; and (v) litigation expenses and any extraordinary expenses (in each case as determined by a majority of the independent trustees).
For its investment advisory services to each of the following Funds, BFAis entitled to an annual investment advisory fee, accrued daily and paid monthly by the Funds, based on the average daily net assets of each Fund as follows:
| iShares ETF | Investment Advisory Fees | |||
| ESG Advanced Investment Grade Corporate Bond |
0.18 | % | ||
| ESG Advanced Total USD Bond Market |
0.12 | |||
| N O T E S T O F I N A N C I A L S T A T E M E N T S |
69 |
Notes to Financial Statements (continued)
Expense Waivers: A fund may incur its pro rata share of fees and expenses attributable to its investments in other investment companies (“acquired fund fees and expenses”). The total of the investment advisory fee and acquired fund fees and expenses, if any, is a fund’s total annual operating expenses. Total expenses as shown in the Statements of Operations does not include acquired fund fees and expenses.
For the iShares ESG Advanced Total USD Bond Market ETF, BFA has contractually agreed to waive a portion of its investment advisory fee for the Fund through June 30, 2025 in an amount equal to the acquired fund fees and expenses, if any, attributable to investments by the Fund in other registered investment companies advised by BFA or its affiliates.
This amount is included in investment advisory fees waived in the Statements of Operations. For the year ended February 29, 2024, the amounts waived in investment advisory fees pursuant to this arrangement were as follows:
| iShares ETF | Amounts Waived | |||
| ESG Advanced Total USD Bond Market |
$ | 13,124 | ||
Distributor: BlackRock Investments, LLC (“BRIL”), an affiliate of BFA, is the distributor for each Fund. Pursuant to the distribution agreement, BFA is responsible for any fees or expenses for distribution services provided to the Funds.
ETF Servicing Fees: Each Fund has entered into an ETF Services Agreement with BRIL to perform certain order processing, Authorized Participant communications, and related services in connection with the issuance and redemption of Creation Units (“ETF Services”). BRIL is entitled to a transaction fee from Authorized Participants on each creation or redemption order for the ETF Services provided. The Funds do not pay BRIL for ETF Services.
Prior to January 26, 2024 (date of conversion for respective funds), ETF Services were performed by State Street Bank and Trust Company.
Securities Lending: The U.S. Securities and Exchange Commission (the “SEC”) has issued an exemptive order which permits BlackRock Institutional Trust Company, N.A. (“BTC”), an affiliate of BFA, to serve as securities lending agent for the Funds, subject to applicable conditions. As securities lending agent, BTC bears all operational costs directly related to securities lending, including any custodial costs. Each Fund is responsible for fees in connection with the investment of cash collateral received for securities on loan (the “collateral investment fees”). The cash collateral is invested in a money market fund, BlackRock Cash Funds: Institutional or BlackRock Cash Funds: Treasury, managed by BFA, or its affiliates. However, BTC has agreed to reduce the amount of securities lending income it receives in order to effectively limit the collateral investment fees each Fund bears to an annual rate of 0.04%. The SL Agency Shares of such money market fund will not be subject to a sales load, distribution fee or service fee. The money market fund in which the cash collateral has been invested may, under certain circumstances, impose a liquidity fee of up to 2% of the value redeemed or temporarily restrict redemptions for up to 10 business days during a 90 day period, in the event that the money market fund’s weekly liquid assets fall below certain thresholds.
Securities lending income is equal to the total of income earned from the reinvestment of cash collateral, net of fees and other payments to and from borrowers of securities, and less the collateral investment fees. Each Fund retains a portion of securities lending income and remits the remaining portion to BTC as compensation for its services as securities lending agent.
Pursuant to the current securities lending agreement, each Fund retains 82% of securities lending income (which excludes collateral investment fees), and the amount retained can never be less than 70% of the total of securities lending income plus the collateral investment fees.
In addition, commencing the business day following the date that the aggregate securities lending income plus the collateral investment fees generated across all 1940 Act iShares exchange-traded funds (the “iShares ETF Complex”) in that calendar year exceeds a specified threshold, each Fund, pursuant to the securities lending agreement, will retain for the remainder of that calendar year 85% of securities lending income (which excludes collateral investment fees) and the amount retained can never be less than 70% of the total of securities lending income plus the collateral investment fees.
The share of securities lending income earned by each Fund is shown as securities lending income – affiliated – net in its Statements of Operations. For the year ended February 29, 2024, the Funds paid BTC the following amounts for securities lending agent services:
| iShares ETF | Amounts | |||
| ESG Advanced Investment Grade Corporate Bond |
$ | 577 | ||
| ESG Advanced Total USD Bond Market |
17,576 | |||
Officers and Trustees: Certain officers and/or trustees of the Trust are officers and/or trustees of BlackRock or its affiliates.
Other Transactions: Each Fund may invest its positive cash balances in certain money market funds managed by BFA or an affiliate. The income earned on these temporary cash investments is shown as dividends – affiliated in the Statements of Operations.
A fund, in order to improve its portfolio liquidity and its ability to track its underlying index, may invest in shares of other iShares funds that invest in securities in the fund’s underlying index.
| 70 | 2 0 2 4 I S H A R E S A N N U A L R E P O R T T O S H A R E H O L D E R S |
Notes to Financial Statements (continued)
6. PURCHASES AND SALES
For the year ended February 29, 2024, purchases and sales of investments, including mortgage dollar rolls and excluding short-term securities and in-kind transactions, were as follows:
| U.S. Government Securities | Other Securities | |||||||||||||||
| iShares ETF | Purchases | Sales | Purchases | Sales | ||||||||||||
| ESG Advanced Investment Grade Corporate Bond |
$ | — | $ | — | $ | 3,393,963 | $ | 3,360,398 | ||||||||
| ESG Advanced Total USD Bond Market |
325,065,184 | 313,242,576 | 44,108,833 | 47,575,713 | ||||||||||||
For the year ended February 29, 2024, in-kind transactions were as follows:
| iShares ETF | In-kind Purchases |
In-kind Sales |
||||||
| ESG Advanced Total USD Bond Market |
$ | 70,760,450 | $ | 58,559,419 | ||||
7. INCOME TAX INFORMATION
Each Fund is treated as an entity separate from the Trust’s other funds for federal income tax purposes. It is each Fund’s policy to comply with the requirements of the Internal Revenue Code of 1986, as amended, applicable to regulated investment companies, and to distribute substantially all of its taxable income to its shareholders. Therefore, no U.S. federal income tax provision is required.
Management has analyzed tax laws and regulations and their application to the Funds as of February 29, 2024 and does not believe that there are any uncertain tax positions that require recognition of a tax liability in the Funds’ financial statements.
U.S. GAAP requires that certain components of net assets be adjusted to reflect permanent differences between financial and tax reporting. These reclassifications have no effect on net assets or NAV per share. As of February 29, 2024, permanent differences attributable to realized gains (losses) from in-kind redemptions were reclassified to the following accounts:
| iShares ETF | Paid-in Capital | Accumulated Earnings (Loss) |
||||||
| ESG Advanced Total USD Bond Market |
$ | (5,364,802) | $ | 5,364,802 | ||||
The tax character of distributions paid was as follows:
| iShares ETF | Year Ended 02/29/24 |
Year Ended 02/28/23 |
||||||
| ESG Advanced Investment Grade Corporate Bond |
||||||||
| Ordinary income |
$ | 464,156 | $ | 457,951 | ||||
|
|
|
|
|
|||||
| ESG Advanced Total USD Bond Market |
||||||||
| Ordinary income |
$ | 18,397,296 | $ | 17,304,554 | ||||
|
|
|
|
|
|||||
As of February 29, 2024, the tax components of accumulated net earnings (losses) were as follows:
| iShares ETF | |
Undistributed Ordinary Income |
|
|
Non-expiring Capital Loss Carryforwards |
(a) |
|
Net Unrealized Gains (Losses) |
(b) |
Total | ||||||
| ESG Advanced Investment Grade Corporate Bond |
$ | 42,815 | $ | (1,229,795) | $ | (1,858,915) | $ | (3,045,895) | ||||||||
| ESG Advanced Total USD Bond Market |
1,723,158 | (28,347,698) | (64,004,350) | (90,628,890) |
| (a) | Amounts available to offset future realized capital gains. |
| (b) | The difference between book-basis and tax-basis unrealized gains (losses) was attributable primarily to the tax deferral of losses on wash sales, amortization methods for premiums and discounts on fixed income securities, the classification of investments and TBA transactions. |
| N O T E S T O F I N A N C I A L S T A T E M E N T S |
71 |
Notes to Financial Statements (continued)
As of February 29, 2024, gross unrealized appreciation and depreciation based on cost of investments (including short positions and derivatives, if any) for U.S. federal income tax purposes were as follows:
| iShares ETF | Tax Cost | |
Gross Unrealized Appreciation |
|
|
Gross Unrealized Depreciation |
|
|
Net Unrealized Appreciation (Depreciation) |
| ||||||
| ESG Advanced Investment Grade Corporate Bond |
$ | 14,145,721 | $ | 57,632 | $ | (1,916,547) | $ | (1,858,915) | ||||||||
| ESG Advanced Total USD Bond Market |
673,160,890 | 1,299,688 | (65,304,044) | (64,004,356) |
8. PRINCIPAL RISKS
In the normal course of business, each Fund invests in securities or other instruments and may enter into certain transactions, and such activities subject the Fund to various risks, including, among others, fluctuations in the market (market risk) or failure of an issuer to meet all of its obligations. The value of securities or other instruments may also be affected by various factors, including, without limitation: (i) the general economy; (ii) the overall market as well as local, regional or global political and/or social instability; (iii) regulation, taxation or international tax treaties between various countries; or (iv) currency, interest rate or price fluctuations. Local, regional or global events such as war, acts of terrorism, the spread of infectious illness or other public health issues, recessions, or other events could have a significant impact on the Funds and their investments. Each Fund’s prospectus provides details of the risks to which the Fund is subject.
BFA uses an indexing approach to try to achieve each Fund’s investment objective. The Fund is not actively managed, and BFA generally does not attempt to take defensive positions under any market conditions, including declining markets.
The Funds may be exposed to additional risks when reinvesting cash collateral in money market funds that do not seek to maintain a stable NAV per share of $1.00, which may be subject to redemption gates or liquidity fees under certain circumstances.
Market Risk: Each Fund may be exposed to prepayment risk, which is the risk that borrowers may exercise their option to prepay principal earlier than scheduled during periods of declining interest rates, which would force each Fund to reinvest in lower yielding securities. Each Fund may also be exposed to reinvestment risk, which is the risk that income from each Fund’s portfolio will decline if each Fund invests the proceeds from matured, traded or called fixed-income securities at market interest rates that are below each Fund portfolio’s current earnings rate.
Valuation Risk: The price each Fund could receive upon the sale of any particular portfolio investment may differ from each Fund’s valuation of the investment, particularly for securities that trade in thin or volatile markets or that are valued using a fair valuation technique or a price provided by an independent pricing service. Changes to significant unobservable inputs and assumptions (i.e., publicly traded company multiples, growth rate, time to exit) due to the lack of observable inputs may significantly impact the resulting fair value and therefore each Fund’s results of operations. As a result, the price received upon the sale of an investment may be less than the value ascribed by each Fund, and each Fund could realize a greater than expected loss or lesser than expected gain upon the sale of the investment. Each Fund’s ability to value its investments may also be impacted by technological issues and/or errors by pricing services or other third-party service providers.
Counterparty Credit Risk: The Funds may be exposed to counterparty credit risk, or the risk that an entity may fail to or be unable to perform on its commitments related to unsettled or open transactions, including making timely interest and/or principal payments or otherwise honoring its obligations. The Funds manage counterparty credit risk by entering into transactions only with counterparties that BFA believes have the financial resources to honor their obligations and by monitoring the financial stability of those counterparties. Financial assets, which potentially expose the Funds to market, issuer and counterparty credit risks, consist principally of financial instruments and receivables due from counterparties. The extent of the Funds’ exposure to market, issuer and counterparty credit risks with respect to these financial assets is approximately their value recorded in the Statements of Assets and Liabilities, less any collateral held by the Funds.
Geographic/Asset Class Risk: A diversified portfolio, where this is appropriate and consistent with a fund’s objectives, minimizes the risk that a price change of a particular investment will have a material impact on the NAV of a fund. The investment concentrations within each Fund’s portfolio are disclosed in its Schedule of Investments.
The Funds invest a significant portion of their assets in securities of issuers located in the United States. A decrease in imports or exports, changes in trade regulations, inflation and/or an economic recession in the United States may have a material adverse effect on the U.S. economy and the securities listed on U.S. exchanges. Proposed and adopted policy and legislative changes in the United States may also have a significant effect on U.S. markets generally, as well as on the value of certain securities. Governmental agencies project that the United States will continue to maintain elevated public debt levels for the foreseeable future which may constrain future economic growth. Circumstances could arise that could prevent the timely payment of interest or principal on U.S. government debt, such as reaching the legislative “debt ceiling.” Such non-payment would result in substantial negative consequences for the U.S. economy and the global financial system. If U.S. relations with certain countries deteriorate, it could adversely affect issuers that rely on the United States for trade. The United States has also experienced increased internal unrest and discord. If these trends were to continue, they may have an adverse impact on the U.S. economy and the issuers in which the the Funds invest.
Certain Funds invest a significant portion of their assets in securities within a single or limited number of market sectors. When a fund concentrates its investments in this manner, it assumes the risk that economic, regulatory, political and social conditions affecting such sectors may have a significant impact on the fund and could affect the income from, or the value or liquidity of, the fund’s portfolio. Investment percentages in specific sectors are presented in the Schedule of Investments.
The Funds invest a significant portion of their assets in fixed-income securities and/or uses derivatives tied to the fixed-income markets. Changes in market interest rates or economic conditions may affect the value and/or liquidity of such investments. Interest rate risk is the risk that prices of bonds and other fixed-income securities will
| 72 | 2 0 2 4 I S H A R E S A N N U A L R E P O R T T O S H A R E H O L D E R S |
Notes to Financial Statements (continued)
decrease as interest rates rise and increase as interest rates fall. The Funds may be subject to a greater risk of rising interest rates due to the period of historically low interest rates that ended in March 2022. The Federal Reserve has recently raised the federal funds rate as part of its efforts to address inflation. There is a risk that interest rates will continue to rise, which will likely drive down the prices of bonds and other fixed-income securities, and could negatively impact the Funds’ performance.
The Funds invest a significant portion of their assets in securities backed by commercial or residential mortgage loans or in issuers that hold mortgage and other asset-backed securities. When a fund concentrates its investments in this manner, it assumes a greater risk of prepayment or payment extension by securities issuers. Changes in economic conditions, including delinquencies and/or defaults on assets underlying these securities, can affect the value, income and/or liquidity of such positions. Investment percentages in these securities are presented in the Schedule of Investments.
Significant Shareholder Redemption Risk: Certain shareholders may own or manage a substantial amount of fund shares and/or hold their fund investments for a limited period of time. Large redemptions of fund shares by these shareholders may force a fund to sell portfolio securities, which may negatively impact the fund’s NAV, increase the fund’s brokerage costs, and/or accelerate the realization of taxable income/gains and cause the fund to make additional taxable distributions to shareholders.
LIBOR Transition Risk: The Funds may be exposed to financial instruments that recently transitioned from, or continue to be tied to the London Interbank Offered Rate (“LIBOR”) to determine payment obligations, financing terms, hedging strategies or investment value. The United Kingdom’s Financial Conduct Authority, which regulates LIBOR, has ceased publishing all LIBOR settings, but some USD LIBOR settings will continue to be published under a synthetic methodology until September 30, 2024 for certain legacy contracts. The Secured Overnight Financing Rate (“SOFR”) has been used increasingly on a voluntary basis in new instruments and transactions. Under U.S. regulations that implement a statutory fallback mechanism to replace LIBOR, benchmark rates based on SOFR have replaced LIBOR in certain financial contracts. The ultimate effect of the LIBOR transition process on the Funds is uncertain.
9. CAPITAL SHARE TRANSACTIONS
Capital shares are issued and redeemed by each Fund only in aggregations of a specified number of shares or multiples thereof (“Creation Units”) at NAV. Except when aggregated in Creation Units, shares of each Fund are not redeemable.
Transactions in capital shares were as follows:
|
|
||||||||||||||||
| Year Ended 02/29/24 |
Year Ended 02/28/23 |
|||||||||||||||
| iShares ETF | Shares | Amount | Shares | Amount | ||||||||||||
|
|
||||||||||||||||
| ESG Advanced Investment Grade Corporate Bond |
||||||||||||||||
| Shares redeemed |
— | $ | — | (50,000 | ) | $ | (3,953,019 | ) | ||||||||
|
|
|
|
|
|
|
|
|
|||||||||
| ESG Advanced Total USD Bond Market |
||||||||||||||||
| Shares sold |
2,300,000 | $ | 97,601,454 | 7,800,000 | $ | 359,712,060 | ||||||||||
| Shares redeemed |
(1,900,000 | ) | (77,666,053 | ) | (7,100,000 | ) | (307,296,744 | ) | ||||||||
|
|
|
|
|
|
|
|
|
|||||||||
| 400,000 | $ | 19,935,401 | 700,000 | $ | 52,415,316 | |||||||||||
|
|
|
|
|
|
|
|
|
|||||||||
The consideration for the purchase of Creation Units of a fund in the Trust generally consists of the in-kind deposit of a designated portfolio of securities and a specified amount of cash. Certain funds in the Trust may be offered in Creation Units solely or partially for cash in U.S. dollars. Authorized Participants purchasing and redeeming Creation Units may pay a purchase transaction fee and a redemption transaction fee directly to BRIL, to offset transfer and other transaction costs associated with the issuance and redemption of Creation Units, including Creation Units for cash. Authorized Participants transacting in Creation Units for cash may also pay an additional variable charge to compensate the relevant fund for certain transaction costs (i.e., stamp taxes, taxes on currency or other financial transactions, and brokerage costs) and market impact expenses relating to investing in portfolio securities. Such variable charges, if any, are included in shares sold in the table above.
From time to time, settlement of securities related to in-kind contributions or in-kind redemptions may be delayed. In such cases, securities related to in-kind transactions are reflected as a receivable or a payable in the Statements of Assets and Liabilities.
10. SUBSEQUENT EVENTS
Management has evaluated the impact of all subsequent events on the Funds through the date the financial statements were available to be issued and has determined that there were no subsequent events requiring adjustment or additional disclosure in the financial statements.
| N O T E S T O F I N A N C I A L S T A T E M E N T S |
73 |
Report of Independent Registered Public Accounting Firm
To the Board of Trustees of
iShares Trust and Shareholders of each of the two funds listed in the table below
Opinions on the Financial Statements
We have audited the accompanying statements of assets and liabilities, including the schedules of investments, of each of the funds listed in the table below (two of the funds constituting iShares Trust, hereafter collectively referred to as the “Funds”) as of February 29, 2024, the related statements of operations for the year ended February 29, 2024, the statements of changes in net assets for each of the two years in the period ended February 29, 2024, including the related notes, and the financial highlights for each of the periods indicated therein (collectively referred to as the “financial statements”). In our opinion, the financial statements present fairly, in all material respects, the financial position of each of the Funds as of February 29, 2024, the results of each of their operations for the year then ended, the changes in each of their net assets for each of the two years in the period ended February 29, 2024 and each of the financial highlights for each of the periods indicated therein in conformity with accounting principles generally accepted in the United States of America.
| iShares ESG Advanced Investment Grade Corporate Bond ETF iShares ESG Advanced Total USD Bond Market ETF |
Basis for Opinions
These financial statements are the responsibility of the Funds’ management. Our responsibility is to express an opinion on the Funds’ financial statements based on our audits. We are a public accounting firm registered with the Public Company Accounting Oversight Board (United States) (PCAOB) and are required to be independent with respect to the Funds in accordance with the U.S. federal securities laws and the applicable rules and regulations of the Securities and Exchange Commission and the PCAOB.
We conducted our audits of these financial statements in accordance with the standards of the PCAOB. Those standards require that we plan and perform the audit to obtain reasonable assurance about whether the financial statements are free of material misstatement, whether due to error or fraud.
Our audits included performing procedures to assess the risks of material misstatement of the financial statements, whether due to error or fraud, and performing procedures that respond to those risks. Such procedures included examining, on a test basis, evidence regarding the amounts and disclosures in the financial statements. Our audits also included evaluating the accounting principles used and significant estimates made by management, as well as evaluating the overall presentation of the financial statements. Our procedures included confirmation of securities owned as of February 29, 2024 by correspondence with the custodian, transfer agent and brokers; when replies were not received from brokers, we performed other auditing procedures. We believe that our audits provide a reasonable basis for our opinions.
/s/PricewaterhouseCoopers LLP
Philadelphia, Pennsylvania
April 19, 2024
We have served as the auditor of one or more BlackRock investment companies since 2000.
| 74 | 2 0 2 4 I S H A R E S A N N U A L R E P O R T T O S H A R E H O L D E R S |
Important Tax Information (unaudited)
The Funds hereby designate the following amounts, or maximum amounts allowable by law, of distributions from direct federal obligation interest for the fiscal year ended February 29, 2024:
| iShares ETF | Federal Obligation Interest |
|||
| ESG Advanced Investment Grade Corporate Bond |
$ | 1,242 | ||
| ESG Advanced Total USD Bond Market |
5,359,062 | |||
The law varies in each state as to whether and what percent of ordinary income dividends attributable to federal obligations is exempt from state income tax. Shareholders are advised to check with their tax advisers to determine if any portion of the dividends received is exempt from state income tax.
The Funds hereby designate the following amounts, or maximum amounts allowable by law, as interest income eligible to be treated as a Section 163(j) interest dividend for the fiscal year ended February 29, 2024:
| iShares ETF | Interest Dividends | |||
| ESG Advanced Investment Grade Corporate Bond |
$ | 468,381 | ||
| ESG Advanced Total USD Bond Market |
18,588,492 | |||
The Funds hereby designate the following amounts, or maximum amounts allowable by law, as interest-related dividends eligible for exemption from U.S. withholding tax for nonresident aliens and foreign corporations for the fiscal year ended February 29, 2024:
| iShares ETF | Interest-Related Dividends |
|||
| ESG Advanced Investment Grade Corporate Bond |
$ | 378,403 | ||
| ESG Advanced Total USD Bond Market |
15,710,183 | |||
| I M P O R T A N T T A X I N F O R M A T I O N |
75 |
Statement Regarding Liquidity Risk Management Program (unaudited)
In compliance with Rule 22e-4 under the Investment Company Act of 1940, as amended (the “Liquidity Rule”), iShares Trust (the “Trust”) has adopted and implemented a liquidity risk management program (the “Program”) for iShares ESG Advanced Investment Grade Corporate Bond ETF and iShares ESG Advanced Total USD Bond Market ETF (the “Funds” or “ETFs”), each a series of the Trust, which is reasonably designed to assess and manage each Fund’s liquidity risk.
The Board of Trustees (the “Board”) of the Trust, on behalf of the Funds, met on December 8, 2023 (the “Meeting”) to review the Program. The Board previously appointed BlackRock Fund Advisors (“BlackRock”), the investment adviser to the Funds, as the program administrator for each Fund’s Program. BlackRock also previously delegated oversight of the Program to the 40Act Liquidity Risk Management Committee (the “Committee”).At the Meeting, the Committee, on behalf of BlackRock, provided the Board with a report that addressed the operation of the Program and assessed its adequacy and effectiveness of implementation, including the management of each Fund’s Highly Liquid Investment Minimum (“HLIM”) where applicable, and any material changes to the Program (the “Report”). The Report covered the period from October 1, 2022 through September 30, 2023 (the “Program Reporting Period”).
The Report described the Program’s liquidity classification methodology for categorizing each Fund’s investments (including derivative transactions) into one of four liquidity buckets. It also referenced the methodology used by BlackRock to establish each Fund’s HLIM and noted that the Committee reviews and ratifies the HLIM assigned to each Fund no less frequently than annually. The Report also discussed notable events affecting liquidity over the Program Reporting Period, including extended market holidays, delays in the repatriation of the local currency in certain non-U.S. countries, the continued illiquidity of Russian equity securities and the suspension of select sanctions in Venezuela.
The Report noted that the Program complied with the key factors for consideration under the Liquidity Rule for assessing, managing and periodically reviewing each Fund’s liquidity risk, as follows:
| a) | The Fund’s investment strategy and liquidity of portfolio investments during both normal and reasonably foreseeable stressed conditions. During the Program Reporting Period, the Committee reviewed whether each Fund’s strategy is appropriate for an open-end fund structure, with a focus on funds with more significant and consistent holdings of less liquid and illiquid assets. The Committee also factored a fund’s concentration in an issuer into the liquidity classification methodology by taking issuer position sizes into account. Derivative exposure was also considered in the calculation of a fund’s liquidity bucketing. Finally, a factor for consideration under the Liquidity Rule is a Fund’s use of borrowings for investment purposes. However, the Funds do not borrow for investment purposes. |
| b) | Short-term and long-term cash flow projections during both normal and reasonably foreseeable stressed conditions. During the Program Reporting Period, the Committee reviewed historical redemption activity and used this information as a component to establish each ETF’s reasonably anticipated trading size utilized for liquidity classifications. The Committee may also take into consideration a fund’s shareholder ownership concentration (which, depending on product type and distribution channel, may or may not be available), a fund’s distribution channels, and the degree of certainty associated with a fund’s short-term and long-term cash flow projections. |
| c) | Holdings of cash and cash equivalents, as well as borrowing arrangements. The Committee considered that ETFs generally do not hold more than de minimis amounts of cash. The Committee also considered that ETFs generally do not engage in borrowing. |
| d) | The relationship between an ETF’s portfolio liquidity and the way in which, and the prices and spreads at which, ETF shares trade, including the efficiency of the arbitrage function and the level of active participation by market participants, including authorized participants. The Committee monitored the prevailing bid/ask spread and the ETF price premium (or discount) to NAV for all ETFs. However, there were no ETFs with persistent deviations of fund premium/discount or bid/ask spreads from long-term averages over the Program Reporting Period. |
| e) | The effect of the composition of baskets on the overall liquidity of an ETF’s portfolio. In reviewing the linkage between the composition of custom baskets accepted by an ETF and any significant change in the liquidity profile of such ETF, the Committee reviewed changes in the proportion of each ETF’s portfolio comprised of less liquid and illiquid holdings to determine if applicable thresholds were met requiring enhanced review. There were no ETFs for which the custom baskets accepted by the ETF had a significant change in its liquidity profile. |
There were no material changes to the Program during the Program Reporting Period other than the enhancement of certain model components in the Program’s classification methodology. The Report provided to the Board stated that the Committee concluded that based on the operation of the functions, as described in the Report, the Program is operating as intended and is effective in implementing the requirements of the Liquidity Rule.
| 76 | 2 0 2 4 I S H A R E S A N N U A L R E P O R T T O S H A R E H O L D E R S |
Supplemental Information (unaudited)
Tailored Shareholder Reports for Open-End Mutual Funds and ETFs
Effective January 24, 2023, the SEC adopted rule and form amendments to require open-end mutual funds and ETFs to transmit concise and visually engaging streamlined annual and semiannual reports to shareholders that highlight key information. Other information, including financial statements, will no longer appear in a streamlined shareholder report but must be available online, delivered free of charge upon request, and filed on a semiannual basis on Form N-CSR. The rule and form amendments have a compliance date of July 24, 2024. At this time, management is evaluating the impact of these amendments on the shareholder reports for the Funds.
Premium/Discount Information
Information on the Fund’s net asset value, market price, premiums and discounts, and bid-ask spreads can be found at iShares.com.
| S U P P L E M E N T A L I N F O R M A T I O N |
77 |
Trustee and Officer Information (unaudited)
The Board of Trustees has responsibility for the overall management and operations of the Funds, including general supervision of the duties performed by BFA and other service providers. Each Trustee serves until he or she resigns, is removed, dies, retires or becomes incapacitated. Each officer shall hold office until his or her successor is elected and qualifies or until his or her death, resignation or removal. Trustees who are not “interested persons” (as defined in the 1940 Act) of the Trust are referred to as independent trustees (“Independent Trustees”).
The registered investment companies advised by BFA or its affiliates (the “BlackRock-advised Funds”) are organized into one complex of open-end equity, multi-asset, index and money market funds and ETFs (the “BlackRock Multi-Asset Complex”), one complex of closed-end funds and open-end non-index fixed-income funds (including ETFs) (the “BlackRock Fixed-Income Complex”) and one complex of ETFs (“Exchange-Traded Fund Complex”) (each, a “BlackRock Fund Complex”). Each Fund is included in the Exchange-Traded Fund Complex. Each Trustee also serves as a Director of iShares, Inc. and a Trustee of iShares U.S. ETF Trust and, as a result, oversees all of the funds within the Exchange-Traded Fund Complex, which consists of 401 funds as of February 29, 2024. With the exception of Robert S. Kapito and Aaron Wasserman, the address of each Trustee and officer is c/o BlackRock, Inc., 400 Howard Street, San Francisco, CA 94105. The address of Mr. Kapito and Mr. Wasserman is c/o BlackRock, Inc., 50 Hudson Yards, New York, NY 10001. The Board has designated John E. Kerrigan as its Independent Board Chair. Additional information about the Funds’ Trustees and officers may be found in the Funds’ combined Statement of Additional Information, which is available without charge, upon request, by calling toll-free 1-800-iShares (1-800-474-2737).
| Interested Trustees | ||||||
| Name (Year of Birth) |
Position(s) | Principal Occupation(s) During Past 5 Years |
Other Directorships Held by Trustee | |||
| Robert S. Kapito(a) (1957) |
Trustee (since 2009). |
President, of BlackRock, Inc. (since 2006); Vice Chairman of BlackRock, Inc. and Head of BlackRock’s Portfolio Management Group (since its formation in 1998) and BlackRock, Inc.’s predecessor entities (since 1988); Trustee, University of Pennsylvania (since 2009); President of Board of Directors, Hope & Heroes Children’s Cancer Fund (since 2002). | Director of BlackRock, Inc. (since 2006); Director of iShares, Inc. (since 2009); Trustee of iShares U.S. ETF Trust (since 2011). | |||
|
(a) Robert S. Kapito is deemed to be an “interested person” (as defined in the 1940 Act) of the Trust due to his affiliations with BlackRock, Inc. and its affiliates. | ||||||
| Independent Trustees | ||||||
| Name (Year of Birth) |
Position(s) | Principal Occupation(s) During Past 5 Years |
Other Directorships Held by Trustee | |||
| John E. Kerrigan (1955) |
Trustee (since 2005); Independent Board Chair (since 2022). | Chief Investment Officer, Santa Clara University (since 2002). | Director of iShares, Inc. (since 2005); Trustee of iShares U.S. ETF Trust (since 2011); Independent Board Chair of iShares, Inc. and iShares U.S. ETF Trust (since 2022). | |||
| Jane D. Carlin (1956) |
Trustee (since 2015); Risk Committee Chair (since 2016). | Consultant (since 2012); Member of the Audit Committee (2012-2018), Chair of the Nominating and Governance Committee (2017-2018) and Director of PHH Corporation (mortgage solutions) (2012-2018); Managing Director and Global Head of Financial Holding Company Governance & Assurance and the Global Head of Operational Risk Management of Morgan Stanley (2006-2012). | Director of iShares, Inc. (since 2015); Trustee of iShares U.S. ETF Trust (since 2015); Member of the Audit Committee (since 2016), Chair of the Audit Committee (since 2020) and Director of The Hanover Insurance Group, Inc. (since 2016). | |||
| Richard L. Fagnani (1954) |
Trustee (since 2017); Audit Committee Chair (since 2019). |
Partner, KPMG LLP (2002-2016); Director of One Generation Away (since 2021). | Director of iShares, Inc. (since 2017); Trustee of iShares U.S. ETF Trust (since 2017). | |||
| Cecilia H. Herbert (1949) |
Trustee (since 2005); Nominating and Governance and Equity Plus Committee Chairs (since 2022). | Chair of the Finance Committee (since 2019) and Trustee and Member of the Finance, Audit and Quality Committees of Stanford Health Care (since 2016); Trustee of WNET, New York’s public media company (since 2011) and Member of the Audit Committee (since 2018), Investment Committee (since 2011) and Personnel Committee (since 2022); Member of the Wyoming State Investment Funds Committee (since 2022); Director of the Jackson Hole Center for the Arts (since 2021); Trustee of Forward Funds (14 portfolios) (2009-2018); Trustee of Salient MF Trust (4 portfolios) (2015-2018). | Director of iShares, Inc. (since 2005); Trustee of iShares U.S. ETF Trust (since 2011). | |||
| Drew E. Lawton (1959) |
Trustee (since 2017); 15(c) Committee Chair (since 2017). | Senior Managing Director of New York Life Insurance Company (2010-2015). | Director of iShares, Inc. (since 2017); Trustee of iShares U.S. ETF Trust (since 2017); Director of Jackson Financial Inc. (since 2021). | |||
| 78 | 2 0 2 4 I S H A R E S A N N U A L R E P O R T T O S H A R E H O L D E R S |
Trustee and Officer Information (unaudited) (continued)
| Independent Trustees (continued) | ||||||
| Name (Year of Birth) |
Position(s) | Principal Occupation(s) During Past 5 Years |
Other Directorships Held by Trustee | |||
| John E. Martinez (1961) |
Trustee (since 2003); Securities Lending Committee Chair (since 2019). |
Director of Real Estate Equity Exchange, Inc. (since 2005); Director of Cloudera Foundation (2017-2020); and Director of Reading Partners (2012-2016). | Director of iShares, Inc. (since 2003); Trustee of iShares U.S. ETF Trust (since 2011). | |||
| Madhav V. Rajan (1964) |
Trustee (since 2011); Fixed-Income Plus Committee Chair (since 2019). |
Dean, and George Pratt Shultz Professor of Accounting, University of Chicago Booth School of Business (since 2017); Advisory Board Member (since 2016) and Director (since 2020) of C.M. Capital Corporation; Chair of the Board for the Center for Research in Security Prices, LLC (since 2020); Robert K. Jaedicke Professor of Accounting, Stanford University Graduate School of Business (2001-2017); Professor of Law (by courtesy), Stanford Law School (2005-2017); Senior Associate Dean for Academic Affairs and Head of MBA Program, Stanford University Graduate School of Business (2010-2016). | Director of iShares, Inc. (since 2011); Trustee of iShares U.S. ETF Trust (since 2011). | |||
| Officers | ||||
| Name (Year of Birth) |
Position(s) | Principal Occupation(s) During Past 5 Years | ||
| Dominik Rohé (1973) |
President (since 2023). |
Managing Director, BlackRock, Inc. (since 2005); Head of Americas ETF and Index Investments (since 2023); Head of Latin America (2019-2023). | ||
| Trent Walker (1974) |
Treasurer and Chief Financial Officer (since 2020). |
Managing Director, BlackRock, Inc. (since September 2019); Chief Financial Officer of iShares Delaware Trust Sponsor LLC, BlackRock Funds, BlackRock Funds II, BlackRock Funds IV, BlackRock Funds V and BlackRock Funds VI (since 2021); Executive Vice President of PIMCO (2016-2019); Senior Vice President of PIMCO (2008-2015); Treasurer (2013-2019) and Assistant Treasurer (2007-2017) of PIMCO Funds, PIMCO Variable Insurance Trust, PIMCO ETF Trust, PIMCO Equity Series, PIMCO Equity Series VIT, PIMCO Managed Accounts Trust, 2 PIMCO-sponsored interval funds and 21 PIMCO-sponsored closed-end funds. | ||
| Aaron Wasserman (1974) |
Chief Compliance Officer (iShares, Inc. and iShares Trust, since 2023; iShares U.S. ETF Trust, since 2023). | Managing Director of BlackRock, Inc. (since 2018); Chief Compliance Officer of the BlackRock Multi-Asset Complex, the BlackRock Fixed-Income Complex and the Exchange-Traded Fund Complex (since 2023); Deputy Chief Compliance Officer for the BlackRock Multi-Asset Complex, the BlackRock Fixed-Income Complex and the Exchange-Traded Fund Complex (2014-2023). | ||
| Marisa Rolland (1980) |
Secretary (since 2022). |
Managing Director, of BlackRock, Inc. (since 2023); Director, of BlackRock, Inc. (2018-2022); Vice President, BlackRock, Inc. (2010-2017). | ||
| Rachel Aguirre (1982) |
Executive Vice President (since 2022). |
Managing Director, of BlackRock, Inc. (since 2018); Director, BlackRock, Inc. (2009-2018); Head of U.S. iShares Product (since 2022); Head of EII U.S. Product Engineering of BlackRock, Inc. (since 2021); Co-Head of EII’s Americas Portfolio Engineering of BlackRock, Inc. (2020-2021); Head of Developed Markets Portfolio Engineering of BlackRock, Inc. (2016-2019). | ||
| Jennifer Hsui (1976) |
Executive Vice President (since 2022). |
Managing Director of BlackRock, Inc. (since 2009); Co-Head of Index Equity of BlackRock, Inc. (since 2022). | ||
| James Mauro (1970) |
Executive Vice President (since 2022). |
Managing Director, of BlackRock, Inc. (since 2010); Head of Fixed Income Index Investments in the Americas and Head of San Francisco Core Portfolio Management of BlackRock, Inc. (since 2020). | ||
Effective July 1, 2023, Aaron Wasserman replaced Charles Park as Chief Compliance Officer.
Effective February 1, 2024, Salim Ramji resigned as Trustee of the Trust.
Effective March 5, 2024, Stephen Cohen replaced Salim Ramji as Trustee of the Trust.
Effective March 5, 2024, Dominik Rohé resigned as President of the Trust.
Effective March 5, 2024, Jessica Tan replaced Dominik Rohé as President of the Trust.
Effective April 8, 2024, Laura Fergerson was appointed as Trustee of the Trust.
| T R U S T E E A N D O F F I C E R I N F O R M A T I O N |
79 |
Trustee and Officer Information (unaudited) (continued)
Effective April 8, 2024, James Lam was appointed as Trustee of the Trust.
| 80 | 2 0 2 4 I S H A R E S A N N U A L R E P O R T T O S H A R E H O L D E R S |
Electronic Delivery
Shareholders can sign up for e-mail notifications announcing that the shareholder report or prospectus has been posted on the iShares website at iShares.com. Once you have enrolled, you will no longer receive prospectuses and shareholder reports in the mail.
To enroll in electronic delivery:
| • | Go to icsdelivery.com. |
| • | If your brokerage firm is not listed, electronic delivery may not be available. Please contact your broker-dealer or financial advisor. |
Householding
Householding is an option available to certain fund investors. Householding is a method of delivery, based on the preference of the individual investor, in which a single copy of certain shareholder documents and Rule 30e-3 notices can be delivered to investors who share the same address, even if their accounts are registered under different names. Please contact your broker-dealer if you are interested in enrolling in householding and receiving a single copy of prospectuses and other shareholder documents, or if you are currently enrolled in householding and wish to change your householding status.
Availability of Quarterly Schedule of Investments
The Funds file their complete schedule of portfolio holdings with the SEC for the first and third quarters of each fiscal year as an exhibit to their reports on Form N-PORT. The Funds’ Forms N-PORT are available on the SEC’s website at sec.gov. Additionally, each Fund makes its portfolio holdings for the first and third quarters of each fiscal year available at iShares.com/fundreports.
Availability of Proxy Voting Policies and Proxy Voting Records
A description of the policies and procedures that the iShares Funds use to determine how to vote proxies relating to portfolio securities and information about how the iShares Funds voted proxies relating to portfolio securities during the most recent twelve-month period ending June 30 is available without charge, upon request (1) by calling toll-free 1-800-474-2737; (2) on the iShares website at iShares.com; and (3) on the SEC website at sec.gov.
A description of the Trust’s policies and procedures with respect to the disclosure of the Fund’s portfolio securities is available in the Fund Prospectus. The Fund discloses its portfolio holdings daily and provides information regarding its top holdings in Fund fact sheets at iShares.com.
| G E N E R A L I N F O R M A T I O N |
81 |
Glossary of Terms Used in this Report
Portfolio Abbreviation
| CMT | Constant Maturity Treasury | |
| LIBOR | London Interbank Offered Rate | |
| PIK | Payment-in-kind | |
| PJSC | Public Joint Stock Company | |
| REIT | Real Estate Investment Trust | |
| SOFR | Secured Overnight Financing Rate | |
| TBA | To-Be-Announced | |
| 82 | 2 0 2 4 I S H A R E S A N N U A L R E P O R T T O S H A R E H O L D E R S |
Want to know more?
iShares.com | 1-800-474-2737
This report is intended for the Funds’ shareholders. It may not be distributed to prospective investors unless it is preceded or accompanied by the current prospectus.
Investing involves risk, including possible loss of principal.
The iShares Funds are distributed by BlackRock Investments, LLC (together with its affiliates, “BlackRock”).
The iShares Funds are not sponsored, endorsed, issued, sold or promoted by Bloomberg Index Services Limited or Markit Indices Limited, nor do these companies make any representation regarding the advisability of investing in the iShares Funds. BlackRock is not affiliated with the companies listed above.
©2024 BlackRock, Inc. All rights reserved. iSHARES and BLACKROCK are registered trademarks of BlackRock, Inc. or its subsidiaries. All other marks are the property of their respective owners.
iS-AR-213-0224
|
|

|
(b) Not Applicable
| Item 2. | Code of Ethics. |
The registrant has adopted a code of ethics, as of the end of the period covered by this report, applicable to the registrant’s principal executive officer, principal financial officer, principal accounting officer or controller, or persons performing similar functions. During the period covered by this report, the registrant has not amended the code of ethics and there have been no waivers granted under the code of ethics. The registrant undertakes to provide a copy of the code of ethics to any person upon request, without charge, by calling 1-800-474-2737.
| Item 3. | Audit Committee Financial Expert. |
The registrant’s Board of Trustees has determined that the registrant has more than one audit committee financial expert, as that term is defined under Item 3(b) and 3(c), serving on its audit committee. The audit committee financial experts serving on the registrant’s audit committee are Richard L. Fagnani and Madhav V. Rajan, all of whom are independent, as that term is defined under Item 3(a)(2).
| Item 4. | Principal Accountant Fees and Services. |
The principal accountant fees disclosed in items 4(a), 4(b), 4(c), 4(d) and 4(g) are for the eleven series of the registrant for which the fiscal year-end is February 29, 2024 (the “Funds”), and whose annual financial statements are reported in Item 1.
| (a) | Audit Fees – The aggregate fees billed for each of the last two fiscal years for professional services rendered by the principal accountant for the audit of the Funds’ annual financial statements or services that are normally provided by the accountant in connection with statutory and regulatory filings or engagements for those fiscal years were $151,850 for the fiscal year ended February 28, 2023 and $151,850 for the fiscal year ended February 29, 2024. |
| (b) | Audit-Related Fees – There were no fees billed for the fiscal years ended February 28, 2023 and February 29, 2024 for assurance and related services by the principal accountant that were reasonably related to the performance of the audit of the Fund’s financial statements and are not reported under (a) of this Item. |
| (c) | Tax Fees – The aggregate fees billed in each of the last two fiscal years for professional services rendered by the principal accountant for tax compliance, tax advice and tax planning for the Funds were $106,700 for the fiscal year ended February 28, 2023 and $106,700 for the fiscal year ended February 29, 2024. These services related to the review of the Funds’ tax returns and excise tax calculations. |
| (d) | All Other Fees – There were no other fees billed in each of the fiscal years ended February 28, 2023 and February 29, 2024 for products and services provided by the principal accountant, other than the services reported in (a) through (c) of this Item. |
| (e) | (1) The registrant’s audit committee charter, as amended, provides that the audit committee is responsible for the approval, prior to appointment, of the engagement of the principal accountant to annually audit and provide their opinion on the registrant’s financial statements. The audit committee must also approve, prior to appointment, the engagement of the principal accountant to provide non-audit services to the registrant or to any entity controlling, controlled by or under common control with the registrant’s investment adviser (“Adviser Affiliate”) that provides ongoing services to the registrant, if the engagement relates directly to the operations and financial reporting of the registrant. |
(2) There were no services described in (b) through (d) above that were approved by the audit committee pursuant to paragraph (c)(7)(i)(C) of Rule 2-01 of Regulation S-X.
| (f) | Not Applicable |
| (g) | The aggregate non-audit fees billed by the registrant’s principal accountant for services rendered to the Funds, and rendered to the registrant’s investment adviser, and any Adviser Affiliate that provides ongoing services to the registrant for the last two fiscal years were $106,700 for the fiscal year ended February 28, 2023 and $106,700 for the fiscal year ended February 29, 2024. |
| (h) | The registrant’s audit committee has considered whether the provision of non-audit services rendered to the registrant’s investment adviser and any Adviser Affiliate that provides ongoing services to the registrant that were not pre-approved pursuant to paragraph (c)(7)(ii) of Rule 2-01 of Regulation S-X, if any, is compatible with maintaining the principal accountant’s independence, and has determined that the provision of these services, if any, does not compromise the principal accountant’s independence. |
| (i) | Not Applicable |
| (j) | Not Applicable |
| Item 5. | Audit Committee of Listed Registrants. |
(a) The registrant is a listed issuer as defined in Rule 10A-3 under the Exchange Act of 1934 and has a separately-designated standing audit committee established in accordance with Section 3(a)(58)(A) of the Exchange Act of 1934. The registrant’s audit committee members are Richard L. Fagnani, Cecilia H. Herbert and Madhav V. Rajan.
(b) Not applicable.
| Item 6. | Investments. |
(a) Schedules of investments are included as part of the reports to shareholders filed under Item 1 of this Form.
(b) Not applicable.
| Item 7. | Disclosure of Proxy Voting Policies and Procedures for Closed-End Management Investment Companies. |
Not applicable to the registrant.
| Item 8. | Portfolio Managers of Closed-End Management Investment Companies. |
Not applicable to the registrant.
| Item 9. | Purchases of Equity Securities by Closed-End Management Investment Company and Affiliated Purchasers. |
Not applicable to the registrant.
| Item 10. | Submission of Matters to a Vote of Security Holders. |
There were no material changes to the procedures by which shareholders may recommend nominees to the registrant’s Board of Trustees.
| Item 11. | Controls and Procedures. |
(a) The President (the registrant’s Principal Executive Officer) and Treasurer and Chief Financial Officer (the registrant’s Principal Financial Officer) have concluded that the registrant’s disclosure controls and procedures (as defined in Rule 30a-3(c) under the Investment Company Act of 1940) are effective as of a date within 90 days of the filing date of this report, based on their evaluation of these controls and procedures required by Rule 30a-3(b) under the Investment Company Act of 1940 and Rules 13a-15(b) or 15d-15(b) under the Exchange Act of 1934.
(b) There were no changes in the registrant’s internal control over financial reporting (as defined in Rule 30a-3(d) under the Investment Company Act of 1940) that occurred during the period covered by this report that have materially affected, or are reasonably likely to materially affect, the registrant’s internal control over financial reporting.
| Item 12. | Disclosure of Securities Lending Activities for Closed-End Management Investment Companies. |
Not applicable to the registrant.
| Item 13. | Recovery of Erroneously Awarded Compensation. |
Not applicable
| Item 14. | Exhibits. |
(a) (1) Code of Ethics is not filed as an exhibit; please refer to Item 2.
(a) (2) Section 302 Certifications are attached.
(a) (3) Any written solicitation to purchase securities under Rule 23c-1 – Not Applicable
(a) (4) Change in Registrant’s independent public accountant – Not Applicable
(b) Section 906 Certifications are attached.
SIGNATURES
Pursuant to the requirements of the Securities Exchange Act of 1934 and the Investment Company Act of 1940, the registrant has duly caused this report to be signed on its behalf by the undersigned, thereunto duly authorized.
| iShares Trust | ||
| By: /s/ Jessica Tan |
||
| Jessica Tan, President (Principal Executive Officer) |
||
| Date: April 19, 2024 |
||
Pursuant to the requirements of the Securities Exchange Act of 1934 and the Investment Company Act of 1940, this report has been signed below by the following persons on behalf of the registrant and in the capacities and on the dates indicated.
| By: /s/ Jessica Tan |
||
| Jessica Tan, President (Principal Executive Officer) |
||
| Date: April 19, 2024 |
||
| By: /s/ Trent Walker |
||
| Trent Walker, Treasurer and Chief Financial Officer (Principal Financial Officer) | ||
| Date: April 19, 2024 |
||