|
|
| |
(as revised March 13, 2024) |
 |
2023 Prospectus |
• iShares 25+ Year Treasury STRIPS Bond ETF | GOVZ | CBOE BZX
The Securities and Exchange Commission (“SEC”) has not approved or disapproved these securities or passed upon the adequacy of this prospectus. Any representation to the contrary is a criminal offense.
Table of Contents
ICE® is a trademark of ICE Data Indices, LLC or its affiliates and has been licensed for use for certain purposes by BlackRock Fund Advisors or its affiliates. BofA® is a registered trademark of Bank of America Corporation licensed by Bank of America Corporation and its affiliates (“BofA”), and may not be used without BofA’s prior written approval. iShares® and BlackRock® are registered trademarks of BlackRock Fund Advisors and its affiliates.
i
iSHARES® 25+ YEAR TREASURY STRIPS BOND ETF
Ticker: GOVZStock Exchange: Cboe BZX
Investment Objective
The iShares 25+ Year Treasury STRIPS Bond ETF (the “Fund”) seeks to track the investment results of an index composed of the principal payments of U.S. Treasury bonds (specifically principal “STRIPS”, also known as “Separate Trading of Registered Interest and Principal of Securities”) with remaining maturities of at least 25 years.
Fees and Expenses
The following table describes the fees and expenses that you will incur if you buy, hold and sell shares of the Fund. The investment advisory agreement between iShares Trust (the “Trust”) and BlackRock Fund Advisors (“BFA”) (the “Investment Advisory Agreement”) provides that BFA will pay all operating expenses of the Fund, except: (i) the management fees, (ii) interest expenses, (iii) taxes, (iv) expenses incurred with respect to the acquisition and disposition of portfolio securities and the execution of portfolio transactions, including brokerage commissions, (v) distribution fees or expenses, and (vi) litigation expenses and any extraordinary expenses. BFA, the investment adviser to the Fund, has contractually agreed to waive a portion of its management fee so that the Fund’s total annual fund operating expenses after the fee waiver will not exceed 0.10% through February 28, 2029. The contractual waiver may be terminated prior to February 28, 2029 only upon written agreement of the Trust and BFA.
You may pay other fees, such as brokerage commissions and other fees to financial intermediaries, which are not reflected in the tables and examples below.
| | |||||
| Management Fees |
Distribution and Service (12b-1) Fees |
Other Expenses |
Total Annual Fund Operating Expenses |
Fee Waiver |
Total Annual Fund Operating Expenses After Fee Waiver |
| |
|
|
|
( |
|
1
2
S-1
| 1 Year |
3 Years |
5 Years |
10 Years |
| $ |
$ |
$ |
$ |
Principal Investment Strategies
The Fund seeks to track the investment results of the ICE® BofA® Long US Treasury Principal STRIPS Index (the “Underlying Index”), which measures the performance of long maturity Separate Trading of Registered Interest and Principal of Securities (“STRIPS”) representing the final principal payment of U.S. Treasury bonds. Qualifying principal STRIPS must have at least 25 years remaining term to final maturity and must be stripped from U.S. Treasury bonds having at least $1 billion in outstanding face value. As of February 28, 2023, there were 20 issues in the Underlying Index.
Underlying Index constituents are weighted based on the market price of each constituent multiplied by an assumed face value of $1 billion per constituent. The Underlying Index is rebalanced quarterly.
BFA uses an indexing approach to try to achieve the Fund’s investment objective. Unlike many investment companies, the Fund does not try to “beat” the index it tracks and does not seek temporary defensive positions when markets decline or appear overvalued.
Indexing may eliminate the chance that the Fund will substantially outperform the Underlying Index but also may reduce some of the risks of active management, such as poor security selection. Indexing seeks to achieve lower costs and better after-tax performance by aiming to keep portfolio turnover low in comparison to actively managed investment companies.
BFA uses a representative sampling indexing strategy to manage the Fund. “Representative sampling” is an indexing strategy that involves investing in a representative sample of securities that collectively has an investment profile similar to that of an applicable underlying index. The securities selected are expected to have, in the aggregate, investment characteristics
S-2
(based on factors such as market value and industry weightings), fundamental characteristics (such as return variability, duration (i.e., a security's price sensitivity to a change in interest rates), maturity or credit ratings and yield) and liquidity measures similar to those of an applicable underlying index. The Fund may or may not hold all of the securities in the Underlying Index.
The Fund will invest at least 80% of its assets in the component securities of the Underlying Index, and the Fund will invest at least 90% of its assets in U.S. Treasury securities that BFA believes will help the Fund track the Underlying Index. The Fund will invest no more than 10% of its assets in futures, options and swaps contracts that BFA believes will help the Fund track the Underlying Index. Cash and cash equivalent investments associated with a derivative position will be treated as part of that position for the purposes of calculating the percentage of investments included in the Underlying Index. The Fund seeks to track the investment results of the Underlying Index before fees and expenses of the Fund.
The Fund may lend securities representing up to one-third of the value of the Fund's total assets (including the value of any collateral received).
The Underlying Index is sponsored by ICE Data Indices, LLC (the “Index Provider” or “IDI”), which is independent of the Fund and BFA. The Index Provider determines the composition and relative weightings of the securities in the Underlying Index and publishes information regarding the market value of the Underlying Index.
Summary of Principal Risks
Asset Class Risk. Securities in the Underlying Index or in the Fund's portfolio may underperform in comparison to the general financial markets, a particular financial market or other asset classes.
Authorized Participant Concentration Risk. Only an Authorized Participant (as defined in the Creations and Redemptions section of this prospectus (the “Prospectus”)) may engage in creation or redemption transactions directly with the Fund, and none of those Authorized Participants is obligated to engage in creation and/or redemption transactions. The Fund has a limited number of institutions that may act as Authorized Participants on an agency basis (i.e., on behalf of other market participants). To the extent that Authorized Participants exit the business or are unable to proceed with creation or redemption orders with respect to the Fund and no other Authorized Participant is able to step forward to create or redeem, Fund shares may be more likely to trade at a premium or discount to NAV and possibly face trading halts or delisting.
Concentration Risk. The Fund may be susceptible to an increased risk of loss,
S-3
including losses due to adverse events that affect the Fund’s investments more than the market as a whole, to the extent that the Fund's investments are concentrated in the securities and/or other assets of a particular issuer or issuers, country, group of countries, region, market, industry, group of industries, sector, market segment or asset class.
Cybersecurity Risk. Failures or breaches of the electronic systems of the Fund, the Fund's adviser, distributor, the Index Provider and other service providers, market makers, Authorized Participants or the issuers of securities in which the Fund invests have the ability to cause disruptions, negatively impact the Fund’s business operations and/or potentially result in financial losses to the Fund and its shareholders. While the Fund has established business continuity plans and risk management systems seeking to address system breaches or failures, there are inherent limitations in such plans and systems. Furthermore, the Fund cannot control the cybersecurity plans and systems of the Fund’s Index Provider and other service providers, market makers, Authorized Participants or issuers of securities in which the Fund invests.
Income Risk. The Fund's income may decline if interest rates fall. This decline in income can occur because the Fund may subsequently invest in lower-yielding bonds as bonds in its portfolio mature, are near maturity or are called, bonds in the Underlying Index are substituted, or the Fund otherwise needs to purchase additional bonds.
Index-Related Risk. There is no guarantee that the Fund’s investment results will have a high degree of correlation to those of the Underlying
Index or that the Fund will achieve its investment objective. Market disruptions and regulatory restrictions could have an adverse effect on the Fund’s ability to adjust its exposure to the required levels in order to track the Underlying Index. Errors in index data, index computations or the construction of the Underlying Index in accordance with its methodology may occur from time to time and may not be identified and corrected by the Index Provider for a period of time or at all, which may have an adverse impact on the Fund and its shareholders. Unusual market conditions or other unforeseen circumstances (such as natural disasters, political unrest or war) may impact the Index Provider or a third-party data provider, and could cause the Index Provider to postpone a scheduled rebalance. This could cause the Underlying Index to vary from its normal or expected composition.
Indexing Investment Risk. The Fund is not actively managed, and BFA generally does not attempt to take defensive positions under any market conditions, including declining markets.
Infectious Illness Risk. A widespread outbreak of an infectious illness, such as the COVID-19 pandemic, may result in travel restrictions, disruption of healthcare services, prolonged quarantines, cancellations, supply chain disruptions, business closures, lower consumer demand, layoffs, ratings downgrades, defaults and other significant economic, social and political impacts. Markets may experience temporary closures, extreme volatility, severe losses, reduced liquidity and increased trading costs. Such events may adversely affect the Fund and its investments and may impact the Fund’s ability to purchase or sell securities or
S-4
cause elevated tracking error and increased premiums or discounts to the Fund's NAV. Despite the development of vaccines, the duration of the COVID-19 pandemic and its effects cannot be predicted with certainty.
Interest Rate Risk. During periods of very low or negative interest rates, the Fund may be unable to maintain positive returns or pay dividends to Fund shareholders. Very low or negative interest rates may magnify interest rate risk. Changing interest rates, including rates that fall below zero, may have unpredictable effects on markets, result in heightened market volatility and detract from the Fund’s performance to the extent the Fund is exposed to such interest rates. Additionally, under certain market conditions in which interest rates are low and the market prices for portfolio securities have increased, the Fund may have a very low or even negative yield. A low or negative yield would cause the Fund to lose money in certain conditions and over certain time periods. An increase in interest rates will generally cause the value of securities held by the Fund to decline, may lead to heightened volatility in the fixed-income markets and may adversely affect the liquidity of certain fixed-income investments, including those held by the Fund. The historically low interest rate environment in recent years heightens the risks associated with rising interest rates.
Issuer Risk. The performance of the Fund depends on the performance of individual securities to which the Fund has exposure. The Fund may be adversely affected if an issuer of underlying securities held by the Fund is unable or unwilling to repay principal or interest when due.
Management Risk. As the Fund will not fully replicate the Underlying Index, it is subject to the risk that BFA's investment strategy may not produce the intended results.
Market Risk. The Fund could lose money over short periods due to short-term market movements and over longer periods during more prolonged market downturns. Local, regional or global events such as war, acts of terrorism, public health issues, recessions, the prospect or occurrence of a sovereign default or other financial crisis, or other events could have a significant impact on the Fund and its investments and could result in increased premiums or discounts to the Fund’s NAV.
Market Trading Risk. The Fund faces numerous market trading risks, including the potential lack of an active market for Fund shares, losses from trading in secondary markets, periods of high volatility and disruptions in the creation/redemption process. ANY OF THESE FACTORS, AMONG OTHERS, MAY LEAD TO THE FUND'S SHARES TRADING AT A PREMIUM OR DISCOUNT TO NAV.
Operational Risk. The Fund is exposed to operational risks arising from a number of factors, including, but not limited to, human error, processing and communication errors, errors of the Fund’s service providers, counterparties or other third parties, failed or inadequate processes and technology or systems failures. The Fund and BFA seek to reduce these operational risks through controls and procedures. However, these measures do not address every possible risk and may be inadequate to address significant operational risks.
S-5
Risk of Investing in U.S. Treasury STRIPS. U.S. Treasury STRIPS are created when the interest and principal components of a U.S. Treasury note or bond are separated and sold as separate securities. STRIPS are also called “zero-coupon” securities because they do not make periodic interest payments and therefore have longer durations than U.S. Treasury securities of similar maturities that distribute interest on a current basis. As a result, the market value of U.S. Treasury STRIPS generally fluctuates more in response to interest rate movements than the value of traditional notes or bonds. U.S. Treasury STRIPS generally lose value when interest rates rise.
Risk of Investing in the U.S. Certain changes in the U.S. economy, such as when the U.S. economy weakens or when its financial markets decline, may have an adverse effect on the securities to which the Fund has exposure.
Securities Lending Risk. The Fund may engage in securities lending. Securities lending involves the risk that the Fund may lose money because the borrower of the loaned securities fails to return the securities in a timely manner or at all. The Fund could also lose money in the event of a decline in the value of collateral provided for loaned securities or a decline in the value of any investments made with cash collateral. These events could also trigger adverse tax consequences for the Fund.
Tracking Error Risk. The Fund may be subject to “tracking error,” which is the
divergence of the Fund’s performance from that of the Underlying Index. Tracking error may occur because of differences between the securities held in the Fund’s portfolio and those included in the Underlying Index, pricing differences, transaction costs incurred by the Fund, the Fund’s holding of uninvested cash, differences in timing of the accrual or the valuation of distributions, the requirements to maintain pass-through tax treatment, portfolio transactions carried out to minimize the distribution of capital gains to shareholders, acceptance of custom baskets, changes to the Underlying Index or the costs to the Fund of complying with various new or existing regulatory requirements, among other reasons. This risk may be heightened during times of increased market volatility or other unusual market conditions. Tracking error also may result because the Fund incurs fees and expenses, while the Underlying Index does not. BFA EXPECTS THAT THE FUND MAY EXPERIENCE HIGHER TRACKING ERROR THAN IS TYPICAL FOR SIMILAR INDEX EXCHANGE-TRADED FUNDS (“ETFs”).
U.S. Treasury Obligations Risk. U.S. Treasury obligations may differ from other securities in their interest rates, maturities, times of issuance and other characteristics and may provide relatively lower returns than those of other securities. Similar to other issuers, changes to the financial condition or credit rating of the U.S. government may cause the value of the Fund's U.S. Treasury obligations to decline.
S-6
Performance Information
Year by Year Returns1 (Years Ended December 31)
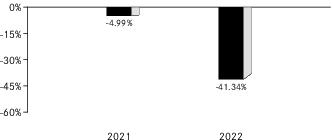
1
The best calendar quarter return during the periods shown above was 10.53 % in the 2nd quarter of 2021 ; the worst was -19.32 % in the 1st quarter of 2021 .
Updated performance information, including the Fund’s current NAV, may be obtained by visiting our website at www.iShares.com or by calling 1-800-iShares (1-800-474-2737) (toll free) .
S-7
Average Annual Total Returns
(for the periods ended December 31, 2022)
(for the periods ended December 31, 2022)
| |
One Year |
Since Fund Inception |
| (Inception Date: |
|
|
| Return Before Taxes |
- |
- |
| Return After Taxes on Distributions1 |
- |
- |
| Return After Taxes on Distributions and Sale of Fund Shares1 |
- |
- |
| ICE BofA Long US Treasury Principal STRIPS Index2(Index returns do not reflect deductions for fees, expenses, or taxes) |
- |
- |
1
2
S-8
Management
Investment Adviser. BlackRock Fund Advisors.
Portfolio Managers. James Mauro and Karen Uyehara (the “Portfolio Managers”) are primarily responsible for the day-to-day management of the Fund. Each Portfolio Manager supervises a portfolio management team. Mr. Mauro and Ms. Uyehara have been Portfolio Managers of the Fund since 2020 and 2021, respectively.
Purchase and Sale of Fund Shares
The Fund is an ETF. Individual shares of the Fund may only be bought and sold in the secondary market through a broker-dealer. Because ETF shares trade at market prices rather than at NAV, shares may trade at a price greater than NAV (a premium) or less than NAV (a discount). An investor may incur costs attributable to the difference between the highest price a buyer is willing to pay to purchase shares of the Fund (bid) and the lowest price a seller is willing to accept for shares of the Fund (ask) when buying or selling shares in the secondary market (the “bid-ask spread”).
Tax Information
The Fund intends to make distributions that may be taxable to you as ordinary income or capital gains, unless you are investing through a tax-deferred arrangement such as a 401(k) plan or an IRA, in which case, your distributions generally will be taxed when withdrawn. Certain states and localities may exempt from tax distributions attributable to interest from U.S. federal government obligations. Please consult your personal tax advisor.
Payments to Broker-Dealers and Other Financial Intermediaries
If you purchase shares of the Fund through a broker-dealer or other financial intermediary (such as a bank), BFA or other related companies may pay the intermediary for marketing activities and presentations, educational training programs, conferences, the development of technology platforms and reporting systems or other services related to the sale or promotion of the Fund. These payments may create a conflict of interest by influencing the broker-dealer or other intermediary and your salesperson to recommend the Fund over another investment. Ask your salesperson or visit your financial intermediary’s website for more information.
S-9
More Information About the Fund
This Prospectus contains important information about investing in the Fund. Please read this Prospectus carefully before you make any investment decisions. Additional information regarding the Fund is available at www.iShares.com.
BFA is the investment adviser to the Fund. Shares of the Fund are listed for trading on Cboe BZX Exchange, Inc. (“Cboe BZX”). The market price for a share of the Fund may be different from the Fund’s most recent NAV.
ETFs are funds that trade like other publicly-traded securities. The Fund is designed to track an index. Similar to shares of an index mutual fund, each share of the Fund represents an ownership interest in an underlying portfolio of securities and other instruments intended to track a market index. Unlike shares of a mutual fund, which can be bought and redeemed from the issuing fund by all shareholders at a price based on NAV, shares of the Fund may be purchased or redeemed directly from the Fund at NAV solely by Authorized Participants and only in aggregations of a specified number of shares (“Creation Units”). Also unlike shares of a mutual fund, shares of the Fund are listed on a national securities exchange and trade in the secondary market at market prices that change throughout the day.
The Fund invests in a particular segment of the securities markets and seeks to track the performance of a securities index that is not representative of the market as a whole. The Fund is designed to be used as part of broader asset allocation strategies. Accordingly, an investment in the Fund should not constitute a complete investment program.
An index is a financial calculation, based on a grouping of financial instruments, and is not an investment product, while the Fund is an actual investment portfolio. The performance of the Fund and the Underlying Index may vary for a number of reasons, including but not limited to, transaction costs, asset valuations, timing variances and differences between the Fund’s portfolio and the Underlying Index resulting from the Fund's use of representative sampling or from legal restrictions (such as diversification requirements) that apply to the Fund but not to the Underlying Index. From time to time, the Index Provider may make changes to the methodology or other adjustments to the Underlying Index. Unless otherwise determined by BFA, any such change or adjustment will be reflected in the calculation of the Underlying Index performance on a going-forward basis after the effective date of such change or adjustment. Therefore, the Underlying Index performance shown for periods prior to the effective date of any such change or adjustment will generally not be recalculated or restated to reflect such change or adjustment.
Because the Fund uses a representative sampling indexing strategy, it can be expected to have a larger tracking error than if it used a replication indexing strategy. “Replication” is an indexing strategy in which a fund invests in substantially all of the securities in its underlying index in approximately the same proportions as in the underlying index.
1
An investment in the Fund is not a bank deposit and it is not insured or guaranteed by the Federal Deposit Insurance Corporation or any other government agency, BFA or any of its affiliates.
The Fund's investment objective and the Underlying Index may be changed without shareholder approval.
A Further Discussion of Principal Risks
The Fund is subject to various risks, including the principal risks noted below, any of which may adversely affect the Fund’s NAV, trading price, yield, total return and ability to meet its investment objective. You could lose all or part of your investment in the Fund, and the Fund could underperform other investments. The order of the below risk factors does not indicate the significance of any particular risk factor. The Fund discloses its portfolio holdings daily at www.iShares.com.
Asset Class Risk. The securities in the Underlying Index or in the Fund’s portfolio may underperform in comparison to other securities or indexes that track other countries, groups of countries, regions, industries, groups of industries, markets, market segments, asset classes or sectors. Various types of securities and indexes may experience cycles of outperformance and underperformance in comparison to the general financial markets depending upon a number of factors including, among other things, inflation, interest rates, productivity, global demand for local products or resources, and regulation and governmental controls. This may cause the Fund to underperform other investment vehicles that invest in different asset classes.
Authorized Participant Concentration Risk. Only an Authorized Participant may engage in creation or redemption transactions directly with the Fund, and none of those Authorized Participants is obligated to engage in creation and/or redemption transactions. The Fund has a limited number of institutions that may act as Authorized Participants on an agency basis (i.e., on behalf of other market participants). To the extent that Authorized Participants exit the business or are unable to proceed with creation or redemption orders with respect to the Fund and no other Authorized Participant is able to step forward to create or redeem Creation Units, Fund shares may be more likely to trade at a premium or discount to NAV and possibly face trading halts or delisting.
Concentration Risk. The Fund may be susceptible to an increased risk of loss, including losses due to adverse events that affect the Fund’s investments more than the market as a whole, to the extent that the Fund's investments are concentrated in the securities and/or other assets of a particular issuer or issuers, country, group of countries, region, market, industry, group of industries, project types, group of project types, sector, market segment or asset class. The Fund may be more adversely affected by the underperformance of those securities and/or other assets, may experience increased price volatility and may be more susceptible to adverse economic, market, political or regulatory occurrences affecting those securities and/or other assets than a fund that does not concentrate its investments.
Cybersecurity Risk. The Fund, Authorized Participants, service providers and the relevant listing exchange are susceptible to operational, information security and
2
related “cyber” risks both directly and through their service providers. Similar types of cybersecurity risks are also present for issuers of securities in which the Fund invests, which could result in material adverse consequences for such issuers and may cause the Fund’s investment in such issuers to lose value. In general, cyber incidents can result from deliberate attacks or unintentional events. Cyber incidents include, but are not limited to, gaining unauthorized access to digital systems (e.g., through “hacking” or malicious software coding) for purposes of misappropriating assets or sensitive information, corrupting data, or causing operational disruption. Cyberattacks may also be carried out in a manner that does not require gaining unauthorized access, such as causing denial-of-service attacks on websites (i.e., efforts to make network services unavailable to intended users). Geopolitical tensions may increase the scale and sophistication of deliberate attacks, particularly those from nation-states or from entities with nation-state backing.
Cybersecurity failures by, or breaches of, the systems of the Fund's adviser, distributor and other service providers (including, but not limited to, index and benchmark providers, fund accountants, custodians, transfer agents and administrators), market makers, Authorized Participants or the issuers of securities in which the Fund invests have the ability to cause disruptions and impact business operations, potentially resulting in: financial losses, interference with the Fund’s ability to calculate its NAV, disclosure of confidential trading information, impediments to trading, submission of erroneous trades or erroneous creation or redemption orders, the inability of the Fund or its service providers to transact business, violations of applicable privacy and other laws, regulatory fines, penalties, reputational damage, reimbursement or other compensation costs, or additional compliance costs. In addition, cyberattacks may render records of Fund assets and transactions, shareholder ownership of Fund shares, and other data integral to the functioning of the Fund inaccessible, inaccurate or incomplete. Substantial costs may be incurred by the Fund in order to resolve or prevent cyber incidents. While the Fund has established business continuity plans in the event of, and risk management systems to prevent, such cyber incidents, there are inherent limitations in such plans and systems, including the possibility that certain risks have not been identified, that prevention and remediation efforts will not be successful or that cyberattacks will go undetected. Furthermore, the Fund cannot control the cybersecurity plans and systems put in place by service providers to the Fund, issuers in which the Fund invests, the Index Provider, market makers or Authorized Participants. The Fund and its shareholders could be negatively impacted as a result.
Income Risk. The Fund’s income may decline if interest rates fall. This decline in income can occur because the Fund may subsequently invest in lower-yielding bonds as bonds in its portfolio mature or are near maturity, or bonds in the Underlying Index are substituted, or the Fund otherwise needs to purchase additional bonds. The Index Provider’s substitution of bonds in the Underlying Index may occur, for example, when the time to maturity for the bond no longer matches the Underlying Index’s stated maturity guidelines.
Index-Related Risk. The Fund seeks to achieve a return that corresponds generally to the price and yield performance, before fees and expenses, of the Underlying Index as
3
published by the Index Provider. There is no assurance that the Index Provider or any agents that may act on its behalf will compile the Underlying Index accurately, or that the Underlying Index will be determined, composed or calculated accurately. While the Index Provider provides descriptions of what the Underlying Index is designed to achieve, neither the Index Provider nor its agents provide any warranty or accept any liability in relation to the quality, accuracy or completeness of the Underlying Index or its related data, and they do not guarantee that the Underlying Index will be in line with the Index Provider’s methodology. BFA’s mandate as described in this Prospectus is to manage the Fund consistently with the Underlying Index provided by the Index Provider to BFA. BFA does not provide any warranty or guarantee against the Index Provider’s or any agent’s errors. Errors in respect of the quality, accuracy and completeness of the data used to compile the Underlying Index may occur from time to time and may not be identified and corrected by the Index Provider for a period of time or at all, particularly where the indices are less commonly used as benchmarks by funds or managers. Such errors may negatively or positively impact the Fund and its shareholders. For example, during a period where the Underlying Index contains incorrect constituents, the Fund would have market exposure to such constituents and would be underexposed to the Underlying Index’s other constituents. Shareholders should understand that any gains from Index Provider errors will be kept by the Fund and its shareholders and any losses or costs resulting from Index Provider errors will be borne by the Fund and its shareholders.
Unusual market conditions or other unforeseen circumstances (such as natural disasters, political unrest or war) may impact the Index Provider or a third-party data provider, and could cause the Index Provider to postpone a scheduled rebalance to the Underlying Index. This could cause the Underlying Index to vary from its normal or expected composition. The postponement of a scheduled rebalance could mean that constituents of the Underlying Index that would otherwise be removed at rebalance due to changes in market value, issuer credit ratings, or other reasons may remain, causing the performance and constituents of the Underlying Index to vary from those expected under normal conditions. Apart from scheduled rebalances, the Index Provider or its agents may carry out additional ad hoc rebalances to the Underlying Index due to reaching certain weighting constraints, unusual market conditions or corporate events or, for example, to correct an error in the selection of index constituents. When the Underlying Index is rebalanced and the Fund in turn rebalances its portfolio to attempt to increase the correlation between the Fund’s portfolio and the Underlying Index, any transaction costs and market exposure arising from such portfolio rebalancing will be borne directly by the Fund and its shareholders. Therefore, errors and additional ad hoc rebalances carried out by the Index Provider or its agents to the Underlying Index may increase the costs to and the tracking error risk of the Fund.
Indexing Investment Risk. The Fund is not actively managed and may be affected by a general decline in market segments related to the Underlying Index. The Fund invests in securities included in, or representative of, the Underlying Index, regardless of their investment merits. BFA generally does not attempt to invest the Fund's assets in defensive positions under any market conditions, including declining markets.
4
Infectious Illness Risk. A widespread outbreak of an infectious illness, such as the COVID-19 pandemic, may adversely affect the economies of many nations and the global economy and may impact individual issuers and capital markets in ways that cannot be foreseen.
An infectious illness outbreak may result in travel restrictions, closed international borders, disruption of healthcare services, prolonged quarantines, cancellations, supply chain disruptions, lower consumer demand, temporary and permanent closures of businesses, layoffs, defaults and other significant economic, social and political impacts, as well as general concern and uncertainty.
An infectious illness outbreak may result in extreme volatility, severe losses, credit deterioration of issuers, and disruptions in markets, which could adversely impact the Fund and its investments, including impairing any hedging activity.
Certain local markets may be subject to closures. Any suspension of trading in markets in which the Fund invests will have an impact on the Fund and its investments and will impact the Fund’s ability to purchase or sell securities in such markets. Market or economic disruptions could result in elevated tracking error and increased premiums or discounts to the Fund's NAV. Additionally, an outbreak could impair the operations of the Fund’s service providers, including BFA, which could adversely impact the Fund.
Governmental and quasi-governmental authorities and regulators throughout the world may respond to an outbreak and any resulting economic disruptions with a variety of fiscal and monetary policy changes, including direct capital infusions into companies and other issuers, new monetary policy tools, and changes in interest rates. A reversal of these policies, or the ineffectiveness of such policies, is likely to increase market volatility, which could adversely affect the Fund’s investments.
An outbreak may exacerbate other pre-existing political, social and economic risks in certain countries or globally, which could adversely affect the Fund and its investments and could result in increased premiums or discounts to the Fund's NAV.
Despite the development of vaccines, the duration of the COVID-19 pandemic and its effects cannot be predicted with certainty.
Interest Rate Risk. If interest rates rise, the value of fixed-income securities or other instruments held by the Fund would likely decrease. A measure investors commonly use to determine this price sensitivity is called duration. Fixed-income securities with longer durations tend to be more sensitive to interest rate changes, usually making their prices more volatile than those of securities with shorter durations. For example, if a bond has a duration of five years and interest rates rise, the price of the bond will likely decline by a greater percentage than if the bond had a one year duration. To the extent the Fund invests a substantial portion of its assets in fixed-income securities with longer duration, rising interest rates may cause the value of the Fund's investments to decline significantly, which would adversely affect the value of the Fund. An increase in interest rates may lead to heightened volatility in the fixed-income markets and adversely affect certain fixed-income investments, including those held by the Fund. In addition, decreases in fixed income dealer market-making capacity may lead to lower trading volume, heightened volatility, wider bid-ask spreads and less transparent pricing in certain fixed-income markets.
5
The historically low interest rate environment in recent years was created in part by the world’s major central banks keeping their overnight policy interest rates at, near or below zero percent and implementing monetary policy facilities, such as asset purchase programs, to anchor longer-term interest rates below historical levels. During periods of very low or negative interest rates, the Fund may be unable to maintain positive returns or pay dividends to Fund shareholders. Certain countries have recently experienced negative interest rates on certain fixed-income instruments. Very low or negative interest rates may magnify interest rate risk. Changing interest rates, including rates that fall below zero, may have unpredictable effects on markets, result in heightened market volatility and detract from the Fund’s performance to the extent the Fund is exposed to such interest rates. Additionally, under certain market conditions in which interest rates are set at low levels and the market prices of portfolio securities have increased, the Fund may have a very low or even negative yield. A low or negative yield would cause the Fund to lose money in certain conditions and over certain time periods. Central banks may increase their short-term policy rates or begin phasing out, or “tapering,” accommodative monetary policy facilities in the future. The timing, coordination, magnitude and effect of such policy changes on various markets are uncertain, and such changes in monetary policy may adversely affect the value of the Fund’s investments.
Issuer Risk. The performance of the Fund depends on the performance of individual securities to which the Fund has exposure. The Fund may be adversely affected if an issuer of underlying securities held by the Fund is unable or unwilling to repay principal or interest when due.
Management Risk. Because BFA uses a representative sampling indexing strategy, the Fund will not fully replicate the Underlying Index and may hold securities not included in the Underlying Index. As a result, the Fund is subject to the risk that BFA’s investment strategy, the implementation of which is subject to a number of constraints, may not produce the intended results.
Market Risk. The Fund could lose money over short periods due to short-term market movements and over longer periods during more prolonged market downturns. The value of a financial instrument or other asset may decline due to changes in general market conditions, economic trends or events that are not specifically related to the particular instrument or asset, or factors that affect one or more issuers, counterparties, exchanges, countries, regions, markets, industries, sectors or asset classes, as applicable. Local, regional or global events such as war, acts of terrorism, public health issues, recessions, the prospect or occurrence of a sovereign default or other financial crisis, or other events could have a significant impact on the Fund and its investments and could result in increased premiums or discounts to the Fund’s NAV. Changes in market and economic conditions generally do not have the same impact on all types of instruments and assets.
Market Trading Risk.
Absence of Active Market. Although shares of the Fund are listed for trading on one or more stock exchanges, there can be no assurance that an active trading market for such shares will develop or be maintained by market makers or Authorized Participants.
6
Risk of Secondary Listings. The Fund's shares may be listed or traded on U.S. and non-U.S. stock exchanges other than the U.S. stock exchange where the Fund's primary listing is maintained, and may otherwise be made available to non-U.S. investors through funds or structured investment vehicles similar to depositary receipts. There can be no assurance that the Fund’s shares will continue to trade on any such stock exchange or in any market or that the Fund’s shares will continue to meet the requirements for listing or trading on any exchange or in any market. The Fund's shares may be less actively traded in certain markets than in others, and investors are subject to the execution and settlement risks and market standards of the market where they or their broker direct their trades for execution. Certain information available to investors who trade Fund shares on a U.S. stock exchange during regular U.S. market hours may not be available to investors who trade in other markets, which may result in secondary market prices in such markets being less efficient.
Secondary Market Trading Risk. Shares of the Fund may trade in the secondary market at times when the Fund does not accept orders to purchase or redeem shares. At such times, shares may trade in the secondary market with more significant premiums or discounts than might be experienced at times when the Fund accepts purchase and redemption orders.
Secondary market trading in Fund shares may be halted by a stock exchange because of market conditions or for other reasons. In addition, trading in Fund shares on a stock exchange or in any market may be subject to trading halts caused by extraordinary market volatility pursuant to “circuit breaker” rules on the stock exchange or market.
Shares of the Fund, similar to shares of other issuers listed on a stock exchange, may be sold short and are therefore subject to the risk of increased volatility and price decreases associated with being sold short. In addition, trading activity in derivative products based on the Fund may lead to increased trading volume and volatility in the secondary market for the shares of the Fund.
Shares of the Fund May Trade at Prices Other Than NAV. Shares of the Fund trade on stock exchanges at prices at, above or below the Fund’s most recent NAV. The NAV of the Fund is calculated at the end of each business day and fluctuates with changes in the market value of the Fund’s holdings. The trading price of the Fund's shares fluctuates continuously throughout trading hours based on both market supply of and demand for Fund shares and the underlying value of the Fund's portfolio holdings or NAV. As a result, the trading prices of the Fund’s shares may deviate significantly from NAV during periods of market volatility, including during periods of significant redemption requests or other unusual market conditions. ANY OF THESE FACTORS, AMONG OTHERS, MAY LEAD TO THE FUND'S SHARES TRADING AT A PREMIUM OR DISCOUNT TO NAV. However, because shares can be created and redeemed in Creation Units at NAV, BFA believes that large discounts or premiums to the NAV of the Fund are not likely to be sustained over the long term (unlike shares of many closed-end funds, which frequently trade at appreciable discounts from, and sometimes at premiums to, their NAVs). While the creation/redemption feature is designed to make it more likely that the Fund’s shares normally will trade on stock exchanges at prices close to the Fund’s next calculated NAV, exchange prices are not expected to correlate
7
exactly with the Fund's NAV due to timing reasons, supply and demand imbalances and other factors. In addition, disruptions to creations and redemptions, including disruptions at market makers, Authorized Participants, or other market participants, and during periods of significant market volatility, may result in trading prices for shares of the Fund that differ significantly from its NAV. Authorized Participants may be less willing to create or redeem Fund shares if there is a lack of an active market for such shares or its underlying investments, which may contribute to the Fund’s shares trading at a premium or discount to NAV.
Costs of Buying or Selling Fund Shares. Buying or selling Fund shares on an exchange involves two types of costs that apply to all securities transactions. When buying or selling shares of the Fund through a broker, you will likely incur a brokerage commission and other charges. In addition, you may incur the cost of the “spread”; that is, the difference between what investors are willing to pay for Fund shares (the “bid” price) and the price at which they are willing to sell Fund shares (the “ask” price). The spread, which varies over time for shares of the Fund based on trading volume and market liquidity, is generally narrower if the Fund has more trading volume and market liquidity and wider if the Fund has less trading volume and market liquidity. In addition, increased market volatility may cause wider spreads. There may also be regulatory and other charges that are incurred as a result of trading activity. Because of the costs inherent in buying or selling Fund shares, frequent trading may detract significantly from investment results and an investment in Fund shares may not be advisable for investors who anticipate regularly making small investments through a brokerage account.
Operational Risk. The Fund is exposed to operational risks arising from a number of factors, including, but not limited to, human error, processing and communication errors, errors of the Fund's service providers, counterparties or other third parties, failed or inadequate processes and technology or systems failures. The Fund and BFA seek to reduce these operational risks through controls and procedures. However, these measures do not address every possible risk and may be inadequate to address significant operational risks.
Risk of Investing in U.S. Treasury STRIPS. U.S. Treasury STRIPS are created when the interest and principal components of a U.S. Treasury note or bond are separated and sold as separate securities. STRIPS are also called “zero-coupon” securities because they do not make periodic interest payments and therefore have longer durations than U.S. Treasury securities of similar maturities that distribute interest on a current basis. Instead, they are typically sold at a discount from their face value and can be redeemed at face value when they mature. U.S. Treasury STRIPS only make a payment upon maturity. As a result, the market value of U.S. Treasury STRIPS is generally more volatile than the value of other fixed-income securities with similar maturities that make periodic interest payments. U.S. Treasury STRIPS generally respond to changes in interest rates to a greater degree than other fixed-income securities with similar maturities and credit quality. U.S. Treasury STRIPS generally lose value when interest rates rise. The Fund is generally required to distribute investment income as cash dividends to Fund shareholders, but because U.S. Treasury STRIPS do not pay interest and are typically purchased at an “original issue discount,” the Fund
8
does not receive cash interest payments on the STRIPS in which it invests. As a result, the Fund may need to liquidate assets, at potentially inopportune times, to satisfy such income dividend distribution requirements. The timely payment of principal on these securities remains guaranteed by the full faith and credit of the U.S. government.
Risk of Investing in the U.S. A decrease in imports or exports, changes in trade regulations, inflation and/or an economic recession in the U.S. may have a material adverse effect on the U.S. economy and the securities listed on U.S. exchanges. Proposed and adopted policy and legislative changes in the U.S. are changing many aspects of financial, commercial, public health, environmental, and other regulation and may have a significant effect on U.S. markets generally, as well as on the value of certain securities. Governmental agencies project that the U.S. will continue to maintain elevated public debt levels for the foreseeable future. Although elevated debt levels do not necessarily indicate or cause economic problems, elevated public debt service costs may constrain future economic growth. Circumstances could arise that could prevent the timely payment of interest or principal on U.S. government debt, such as reaching the legislative “debt ceiling.” Such non-payment would result in substantial negative consequences for the U.S. economy and the global financial system.
If U.S. relations with certain countries deteriorate, it could adversely affect U.S. issuers as well as non-U.S. issuers that rely on the U.S. for trade. The U.S. has also experienced increased internal unrest and discord. If these trends were to continue, it may have an adverse impact on the U.S. economy and the issuers in which the Fund invests.
Securities Lending Risk. The Fund may engage in securities lending. Securities lending involves the risk that the Fund may lose money because the borrower of the loaned securities fails to return the securities in a timely manner or at all. The Fund could also lose money in the event of a decline in the value of collateral provided for loaned securities or a decline in the value of any investments made with cash collateral. These events could also trigger adverse tax consequences for the Fund. BlackRock Institutional Trust Company, N.A. (“BTC”), the Fund's securities lending agent, will take into account the tax impact to shareholders of substitute payments for dividends when managing the Fund's securities lending program.
Tracking Error Risk. The Fund may be subject to “tracking error,” which is the divergence of the Fund’s performance from that of the Underlying Index. Tracking error may occur because of differences between the securities held in the Fund’s portfolio and those included in the Underlying Index, pricing differences, transaction costs incurred by the Fund, the Fund’s holding of uninvested cash, differences in timing of the accrual or the valuation of distributions, the requirements to maintain pass-through tax treatment, portfolio transactions carried out to minimize the distribution of capital gains to shareholders, acceptance of custom baskets, changes to the Underlying Index or the costs to the Fund of complying with various new or existing regulatory requirements, among other reasons. This risk may be heightened during times of increased market volatility or other unusual market conditions. Tracking error also may result because the Fund incurs fees and expenses, while the Underlying Index does
9
not. BFA EXPECTS THAT THE FUND MAY EXPERIENCE HIGHER TRACKING ERROR THAN IS TYPICAL FOR SIMILAR INDEX ETFs.
U.S. Treasury Obligations Risk. U.S. Treasury obligations may differ from other securities in their interest rates, maturities, times of issuance and other characteristics. Similar to other issuers, changes to the financial condition or credit rating of the U.S. government may cause the value of the Fund's U.S. Treasury obligations to decline. U.S. Treasury securities are rated AA+ by S&P Global Ratings. A downgrade of the rating of U.S. Treasury securities may cause the value of the Fund's U.S. Treasury obligations to decline. Because U.S. government debt obligations are often used as a benchmark for other borrowing arrangements, a downgrade could also result in higher interest rates for a range of borrowers, cause disruptions in the international bond markets and have a substantial adverse effect on the U.S. and global economy.
A high national debt level may increase market pressures to meet government funding needs, which may drive debt cost higher and lead the government to issue additional debt, thereby increasing refinancing risk. A high national debt also raises concerns that the U.S. government will not be able to make principal or interest payments when they are due. If market participants determine that U.S. sovereign debt levels have become unsustainable, the value of the U.S. dollar could decline, thus increasing inflationary pressures, particularly with respect to services outsourced to non-U.S. providers and imported goods and constrain or prevent the U.S. government from implementing effective countercyclical fiscal policy in economic downturns. Direct obligations of the U.S. Treasury have historically involved little risk of loss of principal if held to maturity. However, due to fluctuations in interest rates, the market value of such securities may vary during the period that shareholders own shares of the Fund. Notwithstanding that U.S. Treasury obligations are backed by the full faith and credit of the United States, circumstances could arise that could prevent the timely payment of interest or principal, such as reaching the legislative “debt ceiling.” Such non-payment would result in losses to the Fund and substantial negative consequences for the U.S. economy and the global financial system.
A Further Discussion of Other Risks
The Fund may also be subject to certain other risks associated with its investments and investment strategies. The order of the below risk factors does not indicate the significance of any particular risk factor.
Close-Out Risk for Qualified Financial Contracts. Regulations adopted by global prudential regulators require counterparties that are part of U.S. or foreign global systemically important banking organizations to include contractual restrictions on close-out and cross-default in agreements relating to qualified financial contracts. Qualified financial contracts include agreements relating to swaps, currency forwards and other derivatives as well as repurchase agreements and securities lending agreements. The restrictions prevent the Fund from closing out a qualified financial contract during a specified time period if the counterparty is subject to resolution proceedings and also prohibit the Fund from exercising default rights due to a
10
receivership or similar proceeding of an affiliate of the counterparty. These requirements may increase credit risk and other risks to the Fund.
Illiquid Investments Risk. The Fund may not acquire any illiquid investment if, immediately after the acquisition, the Fund would have invested more than 15% of its net assets in illiquid investments. An illiquid investment is any investment that the Fund reasonably expects cannot be sold or disposed of in current market conditions in seven calendar days or less without significantly changing the market value of the investment. Liquid investments may become illiquid after purchase by the Fund, particularly during periods of market turmoil. There can be no assurance that a security or instrument that is deemed to be liquid when purchased will continue to be liquid for as long as it is held by the Fund, and any security or instrument held by the Fund may be deemed an illiquid investment pursuant to the Fund’s liquidity risk management program. To the extent the Fund holds illiquid investments, the illiquid investments may reduce the returns of the Fund because the Fund may be unable to transact at advantageous times or prices. An investment may be illiquid due to, among other things, the reduced number and capacity of traditional market participants to make a market in securities or instruments or the lack of an active market for such securities or instruments. To the extent that the Fund invests in securities or instruments with substantial market and/or credit risk, the Fund will tend to have increased exposure to the risks associated with illiquid investments. Illiquid investments may be harder to value, especially in changing markets. Although the Fund primarily seeks to redeem shares of the Fund on an in-kind basis, if the Fund is forced to sell underlying investments at reduced prices or under unfavorable conditions to meet redemption requests or for other cash needs, the Fund may suffer a loss. This may be magnified in a rising interest rate environment or other circumstances where redemptions from the Fund may be greater than normal. Other market participants may be attempting to liquidate holdings at the same time as the Fund, causing increased supply of the Fund’s underlying investments in the market and contributing to illiquid investments risk and downward pricing pressure. In addition, if the Fund is limited in its ability to sell illiquid investments during periods when shareholders are redeeming their shares, the Fund will need to sell liquid securities to meet redemption requests and illiquid securities will become a larger portion of the Fund’s holdings. During periods of market volatility, liquidity in the market for the Fund’s shares may be impacted by the liquidity in the market for the underlying securities or instruments held by the Fund, which could lead to the Fund’s shares trading at a premium or discount to the Fund's NAV.
Large Shareholder and Large-Scale Redemption Risk. Certain shareholders, including an Authorized Participant, a third-party investor, the Fund’s adviser or an affiliate of the Fund’s adviser, a market maker, or another entity, may from time to time own or manage a substantial amount of Fund shares or may invest in the Fund and hold their investment for a limited period of time. These shareholders may also pledge or loan Fund shares (to secure financing or otherwise), which may result in the shares becoming concentrated in another party. There can be no assurance that any large shareholder or large group of shareholders would not redeem their investment or that the size of the Fund would be maintained. Redemptions of a large number of Fund shares by these shareholders may adversely affect the Fund’s liquidity and net assets. To the extent the Fund permits redemptions in cash, these redemptions may force the
11
Fund to sell portfolio securities when it might not otherwise do so, which may negatively impact the Fund’s NAV, have a material effect on the market price of the Shares and increase the Fund’s brokerage costs and/or accelerate the realization of taxable income and/or gains and cause the Fund to make taxable distributions to its shareholders earlier than the Fund otherwise would have. In addition, under certain circumstances, non-redeeming shareholders may be treated as receiving a disproportionately large taxable distribution during or with respect to such tax year. The Fund also may be required to sell its more liquid Fund investments to meet a large redemption, in which case the Fund’s remaining assets may be less liquid, more volatile, and more difficult to price. To the extent these large shareholders transact in shares on the secondary market, such transactions may account for a large percentage of the trading volume for the shares of the Fund and may, therefore, have a material upward or downward effect on the market price of the Fund shares. In addition, large purchases of Fund shares may adversely affect the Fund’s performance to the extent that the Fund is delayed in investing new cash and is required to maintain a larger cash position than it ordinarily would, diluting its investment returns.
Threshold/Underinvestment Risk. If certain aggregate and/or fund-level ownership thresholds are reached through transactions undertaken by BFA, its affiliates or the Fund, or as a result of third-party transactions or actions by an issuer or regulator, the ability of BFA and its affiliates on behalf of clients (including the Fund) to purchase or dispose of investments, or exercise rights or undertake business transactions, may be restricted by regulation or otherwise impaired. The capacity of the Fund to make investments in certain securities may be affected by the relevant threshold limits, and such limitations may have adverse effects on the liquidity and performance of the Fund’s portfolio holdings compared to the performance of the Underlying Index. This may increase the risk of the Fund being underinvested to the Underlying Index and increase the risk of tracking error.
For example, in certain circumstances where the Fund invests in securities issued by companies that operate in certain regulated industries or in certain emerging or international markets, is subject to corporate or regulatory ownership restrictions, or invests in certain futures or other derivative transactions, there may be limits on the aggregate and/or fund-level amount invested or voted by BFA and its affiliates for their proprietary accounts and for client accounts (including the Fund) that may not be exceeded without the grant of a license or other regulatory or corporate consent or, if exceeded, may cause BFA and its affiliates, the Fund or other client accounts to suffer disadvantages or business restrictions.
Portfolio Holdings Information
A description of the Trust's policies and procedures with respect to the disclosure of the Fund’s portfolio securities is available in the Fund's Statement of Additional Information (“SAI”). The Fund discloses its portfolio holdings daily at www.iShares.com. Fund fact sheets providing information regarding the Fund's top holdings are posted on www.iShares.com when available and may be requested by calling 1-800-iShares (1-800-474-2737).
12
Management
Investment Adviser. As investment adviser, BFA has overall responsibility for the general management and administration of the Fund. BFA provides an investment program for the Fund and manages the investment of the Fund’s assets. In managing the Fund, BFA may draw upon the research and expertise of its asset management affiliates with respect to certain portfolio securities. In seeking to achieve the Fund's investment objective, BFA uses teams of portfolio managers, investment strategists and other investment specialists. This team approach brings together many disciplines and leverages BFA’s extensive resources.
Pursuant to the Investment Advisory Agreement between BFA and the Trust (entered into on behalf of the Fund), BFA is responsible for substantially all expenses of the Fund, except the management fees, interest expenses, taxes, expenses incurred with respect to the acquisition and disposition of portfolio securities and the execution of portfolio transactions, including brokerage commissions, distribution fees or expenses, and litigation expenses and any extraordinary expenses (as determined by a majority of the Trustees who are not “interested persons” of the Trust).
For the fiscal year ended February 28, 2023, BFA was paid a management fee from the Fund, as a percentage of the Fund’s average daily net assets, net of any applicable waivers, at the annual rate of 0.04%. BFA has contractually agreed to waive a portion of its management fee so that the Fund’s total annual fund operating expenses after the fee waiver will not exceed 0.10% through February 28, 2029. The contractual waiver may be terminated prior to February 28, 2029 only upon written agreement of the Trust and BFA. In addition, BFA may from time to time voluntarily waive and/or reimburse fees or expenses in order to limit total annual fund operating expenses (excluding acquired fund fees and expenses, if any). Any such voluntary waiver or reimbursement may be eliminated by BFA at any time.
BFA is located at 400 Howard Street, San Francisco, CA 94105. It is an indirect wholly-owned subsidiary of BlackRock, Inc. (“BlackRock”). As of March 31, 2023, BFA and its affiliates provided investment advisory services for assets of approximately $9.1 trillion. BFA and its affiliates trade and invest for their own accounts in the actual securities and types of securities in which the Fund may also invest, which may affect the price of such securities.
A discussion regarding the basis for the approval by the Trust's Board of Trustees (the “Board”) of the Investment Advisory Agreement with BFA is available in the Fund's Semi-Annual Report for the period ended August 31.
Portfolio Managers. James Mauro and Karen Uyehara are primarily responsible for the day-to-day management of the Fund. The Portfolio Managers are responsible for various functions related to portfolio management, including, but not limited to, investing cash inflows, coordinating with members of their respective portfolio management teams to focus on certain asset classes, implementing investment strategy, researching and reviewing investment strategy and overseeing members of their respective portfolio management teams who have more limited responsibilities.
13
James Mauro has been employed by BFA or its affiliates as a portfolio manager since 2011. Prior to that, Mr. Mauro was a Vice President at State Street Global Advisors. Mr. Mauro has been a Portfolio Manager of the Fund since 2020.
Karen Uyehara has been employed by BFA or its affiliates as a senior portfolio manager since 2010. Prior to that, Ms. Uyehara was a portfolio manager at Western Asset Management Company (WAMCO). Ms. Uyehara has been a Portfolio Manager of the Fund since 2021.
The Fund's SAI provides additional information about the Portfolio Managers' compensation, other accounts managed by the Portfolio Managers and the Portfolio Managers' ownership (if any) of shares in the Fund.
Administrator, Custodian and Transfer Agent. State Street Bank and Trust Company (“State Street”) is the administrator, custodian and transfer agent for the Fund. JPMorgan Chase Bank, N.A. serves as custodian for the Fund in connection with certain securities lending activities.
Conflicts of Interest. The investment activities of BFA and its affiliates (including BlackRock and its subsidiaries (collectively, the “Affiliates”)), and their respective directors, officers or employees, in the management of, or their interest in, their own accounts and other accounts they manage, may present conflicts of interest that could disadvantage the Fund and its shareholders. BFA and its Affiliates provide investment management services to other funds and discretionary managed accounts that may follow investment programs similar to that of the Fund. BFA and its Affiliates are involved worldwide with a broad spectrum of financial services and asset management activities and may engage in the ordinary course of business in activities in which their interests or the interests of their clients may conflict with those of the Fund. BFA or one or more Affiliates act, or may act, as an investor, research provider, investment manager, commodity pool operator, commodity trading advisor, financier, underwriter, adviser, trader, lender, index provider, agent and/or principal, and have other direct and indirect interests in securities, currencies, commodities, derivatives and other instruments in which the Fund may directly or indirectly invest. The Fund may invest in securities of, or engage in other transactions with, companies with which an Affiliate has significant debt or equity investments or other interests. The Fund may also invest in issuances (such as structured notes) by entities for which an Affiliate provides and is compensated for cash management services relating to the proceeds from the sale of such issuances. The Fund also may invest in securities of, or engage in other transactions with, companies for which an Affiliate provides or may in the future provide research coverage. An Affiliate may have business relationships with, and purchase or distribute or sell services or products from or to, distributors, consultants or others who recommend the Fund or who engage in transactions with or for the Fund, and may receive compensation for such services. BFA or one or more Affiliates may engage in proprietary trading and advise accounts and funds that have investment objectives similar to those of the Fund and/or that engage in and compete for transactions in the same types of securities, currencies and other instruments as the Fund. This may include transactions in securities issued by other open-end and closed-end investment companies (which may include investment companies that are affiliated with the Fund and BFA, to the extent permitted under the Investment
14
Company Act of 1940, as amended (the “1940 Act”)). The trading activities of BFA and these Affiliates are carried out without reference to positions held directly or indirectly by the Fund and may result in BFA or an Affiliate having positions in certain securities that are senior or junior to, or have interests different from or adverse to, the securities that are owned by the Fund.
Neither BlackRock nor any Affiliate is under any obligation to share any investment opportunity, idea or strategy with the Fund. As a result, an Affiliate may compete with the Fund for appropriate investment opportunities. The results of the Fund's investment activities, therefore, may differ from those of an Affiliate and of other accounts managed by BlackRock or an Affiliate, and it is possible that the Fund could sustain losses during periods in which one or more Affiliates and other accounts achieve profits on their trading for proprietary or other accounts. The opposite result is also possible.
In addition, the Fund may, from time to time, enter into transactions in which BFA or an Affiliate or its or their directors, officers, employees or clients have an adverse interest. Furthermore, transactions undertaken by clients advised or managed by BFA or its Affiliates may adversely impact the Fund. Transactions by one or more clients or by BFA or its Affiliates or their directors, officers or employees may have the effect of diluting or otherwise disadvantaging the values, prices or investment strategies of the Fund.
The Fund's activities may be limited because of regulatory restrictions applicable to BFA or one or more Affiliates and/or their internal policies designed to comply with such restrictions.
Under a securities lending program approved by the Board, the Fund has retained BTC, an Affiliate of BFA, to serve as the securities lending agent for the Fund to the extent that the Fund participates in the securities lending program. For these services, the securities lending agent will receive a fee from the Fund, including a fee based on the returns earned on the Fund’s investment of the cash received as collateral for the loaned securities. In addition, one or more Affiliates may be among the entities to which the Fund may lend its portfolio securities under the securities lending program.
Under an ETF Services Agreement, the Fund has retained BlackRock Investments, LLC (the “Distributor” or “BRIL”), an Affiliate of BFA, to perform certain order processing, Authorized Participant communications, and related services in connection with the issuance and redemption of Creation Units of the Fund (“ETF Services”). BRIL will retain a portion of the standard transaction fee received from Authorized Participants on each creation or redemption order from the Authorized Participant for the ETF Services provided. BlackRock collaborated with, and received payment from, Citibank, N.A. (“Citibank”) on the design and development of the ETF Services platform. Citibank may have, or from time to time may develop, additional relationships with BlackRock or funds managed by BFA and its affiliates.
It is also possible that, from time to time, BlackRock and/or its advisory clients (including other funds and separately managed accounts) may, subject to compliance with applicable law, purchase and hold shares of the Fund. The price, availability,
15
liquidity, and (in some cases) expense ratio of the Fund may be impacted by purchases and sales of the Fund by BlackRock and/or its advisory clients.
The activities of BFA and its Affiliates and their respective directors, officers or employees may give rise to other conflicts of interest that could disadvantage the Fund and its shareholders. BFA has adopted policies and procedures designed to address these potential conflicts of interest. See the SAI for further information.
Shareholder Information
Additional shareholder information, including how to buy and sell shares of the Fund, is available free of charge by calling toll-free: 1-800-iShares (1-800-474-2737) or visiting our website at www.iShares.com.
Buying and Selling Shares. Shares of the Fund may be acquired or redeemed directly from the Fund only in Creation Units or multiples thereof, as discussed in the Creations and Redemptions section of this Prospectus. Only an Authorized Participant may engage in creation or redemption transactions directly with the Fund. Once created, shares of the Fund generally trade in the secondary market in amounts less than a Creation Unit.
Shares of the Fund are listed on a national securities exchange for trading during the trading day. Shares can be bought and sold throughout the trading day like shares of other publicly-traded companies. The Trust does not impose any minimum investment for shares of the Fund purchased on an exchange or otherwise in the secondary market. The Fund's shares trade under the ticker symbol “GOVZ.”
Buying or selling Fund shares on an exchange or other secondary market involves two types of costs that may apply to all securities transactions. When buying or selling shares of the Fund through a broker, you may incur a brokerage commission and other charges. The commission is frequently a fixed amount and may be a significant proportional cost for investors seeking to buy or sell small amounts of shares. In addition, you may incur the cost of the “spread,” that is, any difference between the bid price and the ask price. The spread varies over time for shares of the Fund based on the Fund’s trading volume and market liquidity, and is generally lower if the Fund has high trading volume and market liquidity, and higher if the Fund has little trading volume and market liquidity (which is often the case for funds that are newly launched or small in size). The Fund's spread may also be impacted by the liquidity or illiquidity of the underlying securities held by the Fund, particularly for newly launched or smaller funds or in instances of significant volatility of the underlying securities.
The Fund does not impose restrictions on the frequency of purchases and redemptions of Fund shares directly with the Fund. The Board determined not to adopt policies and procedures designed to prevent or monitor for frequent purchases and redemptions of Fund shares because the Fund generally sells and redeems its shares directly through transactions that are in-kind and/or for cash, with a deadline for placing cash-related transactions no later than the close of the primary markets for the Fund’s portfolio securities. However, the Fund has taken certain measures (e.g., imposing transaction fees on purchases and redemptions of Creation Units and reserving the right to reject purchases of Creation Units under certain circumstances) to minimize the potential
16
consequences of frequent cash purchases and redemptions by Authorized Participants, such as increased tracking error, disruption of portfolio management, dilution to the Fund, and/or increased transaction costs. Further, the vast majority of trading in Fund shares occurs on the secondary market, which does not involve the Fund directly, and such trading is unlikely to cause many of the harmful effects of frequent cash purchases or redemptions of Fund shares.
The national securities exchange on which the Fund's shares are listed is open for trading Monday through Friday and is closed on weekends and the following holidays (or the days on which they are observed): New Year’s Day, Martin Luther King, Jr. Day, Presidents’ Day, Good Friday, Memorial Day, Juneteenth, Independence Day, Labor Day, Thanksgiving Day and Christmas Day. The Fund’s primary listing exchange is Cboe BZX.
Section 12(d)(1) of the 1940 Act generally restricts investments by investment companies, including foreign and unregistered investment companies, in the securities of other investment companies. For example, a registered investment company (the “Acquired Fund”), such as the Fund, may not knowingly sell or otherwise dispose of any security issued by the Acquired Fund to any investment company (the “Acquiring Fund”) or any company or companies controlled by the Acquiring Fund if, immediately after such sale or disposition: (i) more than 3% of the total outstanding voting stock of the Acquired Fund is owned by the Acquiring Fund and any company or companies controlled by the Acquiring Fund, or (ii) more than 10% of the total outstanding voting stock of the Acquired Fund is owned by the Acquiring Fund and other investment companies and companies controlled by them. However, registered investment companies are permitted to invest in the Fund beyond the limits set forth in Section 12(d)(1), subject to certain terms and conditions set forth in SEC rules. In order for a registered investment company to invest in shares of the Fund beyond the limitations of Section 12(d)(1) in reliance on Rule 12d1-4 under the 1940 Act, the registered investment company must, among other things, enter into an agreement with the Trust. Foreign investment companies are permitted to invest in the Fund only up to the limits set forth in Section 12(d)(1), subject to any applicable SEC no-action relief.
Book Entry. Shares of the Fund are held in book-entry form, which means that no stock certificates are issued. The Depository Trust Company (“DTC”) or its nominee is the record owner of, and holds legal title to, all outstanding shares of the Fund.
Investors owning shares of the Fund are beneficial owners as shown on the records of DTC or its participants. DTC serves as the securities depository for shares of the Fund. DTC participants include securities brokers and dealers, banks, trust companies, clearing corporations and other institutions that directly or indirectly maintain a custodial relationship with DTC. As a beneficial owner of shares, you are not entitled to receive physical delivery of stock certificates or to have shares registered in your name, and you are not considered a registered owner of shares. Therefore, to exercise any right as an owner of shares, you must rely upon the procedures of DTC and its participants. These procedures are the same as those that apply to any other securities that you hold in book-entry or “street name” form.
Share Prices. The trading prices of the Fund’s shares in the secondary market generally differ from the Fund’s daily NAV and are affected by market forces such as
17
the supply of and demand for ETF shares and underlying securities held by the Fund, economic conditions and other factors.
Determination of Net Asset Value. The NAV of the Fund normally is determined once daily Monday through Friday, generally as of the close of regular trading hours of the New York Stock Exchange (“NYSE”) (normally 4:00 p.m., Eastern time) on each day that the NYSE is open for trading, based on prices at the time of closing, provided that any Fund assets or liabilities denominated in currencies other than the U.S. dollar are translated into U.S. dollars at the prevailing market rates on the date of valuation as quoted by one or more data service providers. The NAV of the Fund is calculated by dividing the value of the net assets of the Fund (i.e., the value of its total assets less total liabilities) by the total number of outstanding shares of the Fund, generally rounded to the nearest cent.
The value of the securities and other assets and liabilities held by the Fund is determined pursuant to BFA’s valuation policies and procedures. BFA has been designated by the Board as the valuation designee for the Fund pursuant to Rule 2a-5 under the Investment Company Act.
The Fund values fixed-income portfolio securities using last available bid prices or current market quotations provided by dealers or prices (including evaluated prices) supplied by the Fund's approved independent third-party pricing services, each in accordance with BFA's valuation policies and procedures. Pricing services may use matrix pricing or valuation models that utilize certain inputs and assumptions to derive values. Pricing services generally value fixed-income securities assuming orderly transactions of an institutional round lot size, but the Fund may hold or transact in such securities in smaller odd lot sizes. Odd lots often trade at lower prices than institutional round lots. An amortized cost method of valuation may be used with respect to debt obligations with sixty days or less remaining to maturity unless BFA determines in good faith that such method does not represent fair value.
Generally, trading in non-U.S. securities and money market instruments is substantially completed each day at various times prior to the close of regular trading hours of the NYSE. The values of such securities used in computing the NAV of the Fund are determined as of such times.
When market quotations are not readily available or are believed by BFA to be unreliable, BFA will fair value the Fund’s investments in accordance with its policies and procedures. BFA may conclude that a market quotation is not readily available or is unreliable if a security or other asset or liability does not have a price source due to its lack of trading or other reasons, if a market quotation differs significantly from recent price quotations or otherwise no longer appears to reflect fair value, where the security or other asset or liability is thinly traded, when there is a significant event subsequent to the most recent market quotation, or if the trading market on which a security is listed is suspended or closed and no appropriate alternative trading market is available. A “significant event” is deemed to occur if BFA determines, in its reasonable business judgment prior to or at the time of pricing the Fund’s assets or liabilities, that the event is likely to cause a material change to the last exchange closing price or closing market price of one or more assets held by, or liabilities of, the Fund.
18
Fair value represents a good faith approximation of the value of an asset or liability. The fair value of an asset or liability held by the Fund is the amount the Fund might reasonably expect to receive from the current sale of that asset or the cost to extinguish that liability in an arm’s-length transaction. Valuing the Fund’s investments using fair value pricing will result in prices that may differ from current market valuations and that may not be the prices at which those investments could have been sold during the period in which the particular fair values were used. Use of fair value prices and certain current market valuations could result in a difference between the prices used to calculate the Fund’s NAV and the prices used by the Underlying Index, which, in turn, could result in a difference between the Fund’s performance and the performance of the Underlying Index.
Dividends and Distributions.
General Policies. Dividends from net investment income, if any, generally are declared and paid at least once a year by the Fund. Distributions of net realized securities gains, if any, generally are declared and paid once a year, but the Trust may make distributions on a more frequent basis for the Fund. The Trust reserves the right to declare special distributions if, in its reasonable discretion, such action is necessary or advisable to preserve its status as a regulated investment company or to avoid imposition of income or excise taxes on undistributed income or realized gains.
Dividends and other distributions on shares of the Fund are distributed on a pro rata basis to beneficial owners of such shares. Dividend payments are made through DTC participants and indirect participants to beneficial owners then of record with proceeds received from the Fund.
Dividend Reinvestment Service. No dividend reinvestment service is provided by the Trust. Broker-dealers may make available the DTC book-entry Dividend Reinvestment Service for use by beneficial owners of the Fund for reinvestment of their dividend distributions. Beneficial owners should contact their broker to determine the availability and costs of the service and the details of participation therein. Brokers may require beneficial owners to adhere to specific procedures and timetables. If this service is available and used, dividend distributions of both income and realized gains will be automatically reinvested in additional whole shares of the Fund purchased in the secondary market.
Note on Tax Information. The following sections summarize some of the consequences under current U.S. federal tax law of an investment in the Fund. It is not a substitute for personal tax advice. You may also be subject to state and local taxation on Fund distributions and sales of shares. Certain states and localities may exempt from tax distributions attributable to interest from U.S. federal government obligations. Consult your personal tax advisor about the potential tax consequences of an investment in shares of the Fund under all applicable tax laws.
Taxes. As with any investment, you should consider how your investment in shares of the Fund will be taxed. The tax information in this Prospectus is provided as general information, based on current law. There is no guarantee that shares of the Fund will receive certain regulatory or accounting treatment. You should consult your own tax professional about the tax consequences of an investment in shares of the Fund.
19
Unless your investment in Fund shares is made through a tax-exempt entity or tax-deferred retirement account, such as an IRA, in which case your distributions generally will be taxable when withdrawn, you need to be aware of the possible tax consequences when the Fund makes distributions or you sell Fund shares.
Taxes on Distributions. Distributions from the Fund’s net investment income, including distributions of income from securities lending and distributions out of the Fund's net short-term capital gains, if any, are taxable to you as ordinary income. The Fund's distributions of net long-term capital gains, if any, in excess of net short-term capital losses are taxable as long-term capital gains, regardless of how long you have held the shares. Long-term capital gains are eligible for taxation at a maximum rate of 15% or 20% for non-corporate shareholders, depending on whether their income exceeds certain threshold amounts. Distributions from the Fund are subject to a 3.8% U.S. federal Medicare contribution tax on “net investment income,” for individuals with incomes exceeding $200,000 ($250,000 if married and filing jointly) and of estates and trusts. In general, your distributions are subject to U.S. federal income tax for the year when they are paid. Certain distributions paid in January, however, may be treated as paid on December 31 of the prior year.
If the Fund's distributions exceed current and accumulated earnings and profits, all or a portion of the distributions made in the taxable year may be recharacterized as a return of capital to shareholders. Distributions in excess of the Fund’s minimum distribution requirements, but not in excess of the Fund’s earnings and profits, will be taxable to shareholders and will not constitute nontaxable returns of capital. A return of capital distribution generally will not be taxable but will reduce the shareholder's cost basis and will result in a higher capital gain or lower capital loss when those shares on which the distribution was received are sold. Once a shareholder's cost basis is reduced to zero, further distributions will be treated as capital gain, if the shareholder holds shares of the Fund as capital assets.
If you are neither a resident nor a citizen of the U.S. or if you are a non-U.S. entity (other than a pass-through entity to the extent owned by U.S. persons), the Fund’s ordinary income dividends (which include distributions of net short-term capital gains) will generally be subject to a 30% U.S. federal withholding tax, unless a lower treaty rate applies provided that withholding tax will generally not apply to any gain or income realized by a non-U.S. shareholder in respect of any distributions of long-term capital gains or upon the sale or other disposition of shares of the Fund.
Separately, a 30% withholding tax is currently imposed on U.S.-source dividends, interest and other income items paid to (i) foreign financial institutions, including non-U.S. investment funds, unless they agree to collect and disclose to the U.S. Internal Revenue Service (“IRS”) information regarding their direct and indirect U.S. account holders and (ii) certain other foreign entities, unless they certify certain information regarding their direct and indirect U.S. owners. To avoid withholding, foreign financial institutions will need to (i) enter into agreements with the IRS that state that they will provide the IRS information, including the names, addresses and taxpayer identification numbers of direct and indirect U.S. account holders; comply with due diligence procedures with respect to the identification of U.S. accounts; report to the IRS certain information with respect to U.S. accounts maintained, agree to withhold tax
20
on certain payments made to non-compliant foreign financial institutions or to account holders who fail to provide the required information; and determine certain other information concerning their account holders, or (ii) in the event that an applicable intergovernmental agreement and implementing legislation are adopted, provide local revenue authorities with similar account holder information. Other foreign entities may need to report the name, address, and taxpayer identification number of each substantial U.S. owner or provide certifications of no substantial U.S. ownership, unless certain exceptions apply.
If you are a resident or a citizen of the U.S., by law, backup withholding at a 24% rate will apply to your distributions and proceeds if you have not provided a taxpayer identification number or social security number and made other required certifications.
Taxes When Shares Are Sold. Currently, any capital gain or loss realized upon a sale of Fund shares is generally treated as a long-term gain or loss if the shares have been held for more than one year. Any capital gain or loss realized upon a sale of Fund shares held for one year or less is generally treated as short-term gain or loss, except that any capital loss on the sale of shares held for six months or less is treated as long-term capital loss to the extent that capital gain dividends were paid with respect to such shares. Any such capital gains, including from sales of Fund shares or from capital gain dividends, are included in “net investment income” for purposes of the 3.8% U.S. federal Medicare contribution tax mentioned above.
Creations and Redemptions. Prior to trading in the secondary market, shares of the Fund are “created” at NAV by market makers, large investors and institutions only in block-size Creation Units or multiples thereof. Each “creator” or authorized participant (an “Authorized Participant”) has entered into an agreement with the Fund's distributor, BlackRock Investments, LLC (the “Distributor” or “BRIL”), an affiliate of BFA. An Authorized Participant is a member or participant of a clearing agency registered with the SEC, which has a written agreement with the Fund or one of its service providers that allows such member or participant to place orders for the purchase and redemption of Creation Units.
A creation transaction, which is subject to acceptance by the Distributor and the Fund, generally takes place when an Authorized Participant deposits into the Fund a designated portfolio of securities, assets or other positions (a “creation basket”), and an amount of cash (including any cash representing the value of substituted securities, assets or other positions), if any, which together approximate the holdings of the Fund in exchange for a specified number of Creation Units. Similarly, shares can be redeemed only in Creation Units, generally for a designated portfolio of securities, assets or other positions (a “redemption basket”) held by the Fund and an amount of cash (including any portion of such securities for which cash may be substituted). The Fund may, in certain circumstances, offer Creation Units partially or solely for cash. Except when aggregated in Creation Units, shares are not redeemable by the Fund. Creation and redemption baskets may differ and the Fund will accept “custom baskets.” More information regarding custom baskets is contained in the Fund's SAI.
The prices at which creations and redemptions occur are based on the next calculation of NAV after a creation or redemption order is received in an acceptable form under the authorized participant agreement.
Only an Authorized Participant may create or redeem Creation Units with the Fund. Authorized Participants may create or redeem Creation Units for their own accounts or for customers, including, without limitation, affiliates of the Fund.
21
In the event of a system failure or other interruption, including disruptions at market makers or Authorized Participants, orders to purchase or redeem Creation Units either may not be executed according to the Fund's instructions or may not be executed at all, or the Fund may not be able to place or change orders.
To the extent the Fund engages in in-kind transactions, the Fund intends to comply with the U.S. federal securities laws in accepting securities for deposit and satisfying redemptions with redemption securities by, among other means, assuring that any securities accepted for deposit and any securities used to satisfy redemption requests will be sold in transactions that would be exempt from registration under the Securities Act of 1933, as amended (the “1933 Act”). Further, an Authorized Participant that is not a “qualified institutional buyer,” as such term is defined in Rule 144A under the 1933 Act, will not be able to receive restricted securities eligible for resale under Rule 144A.
Creations and redemptions must be made through a firm that is either a member of the Continuous Net Settlement System of the National Securities Clearing Corporation or a DTC participant that has executed an agreement with the Distributor with respect to creations and redemptions of Creation Unit aggregations. Information about the procedures regarding creation and redemption of Creation Units (including the cut-off times for receipt of creation and redemption orders) is included in the Fund's SAI.
Because new shares may be created and issued on an ongoing basis, at any point during the life of the Fund a “distribution,” as such term is used in the 1933 Act, may be occurring. Broker-dealers and other persons are cautioned that some activities on their part may, depending on the circumstances, result in their being deemed participants in a distribution in a manner that could render them statutory underwriters subject to the prospectus delivery and liability provisions of the 1933 Act. Any determination of whether one is an underwriter must take into account all the relevant facts and circumstances of each particular case.
Broker-dealers should also note that dealers who are not “underwriters” but are participating in a distribution (as contrasted to ordinary secondary transactions), and thus dealing with shares that are part of an “unsold allotment” within the meaning of Section 4(a)(3)(C) of the 1933 Act, would be unable to take advantage of the prospectus delivery exemption provided by Section 4(a)(3) of the 1933 Act. For delivery of prospectuses to exchange members, the prospectus delivery mechanism of Rule 153 under the 1933 Act is available only with respect to transactions on a national securities exchange.
Householding. Householding is an option available to certain Fund investors. Householding is a method of delivery, based on the preference of the individual investor, in which a single copy of certain shareholder documents can be delivered to investors who share the same address, even if their accounts are registered under different names. Please contact your broker-dealer if you are interested in enrolling in householding and receiving a single copy of prospectuses and other shareholder documents, or if you are currently enrolled in householding and wish to change your householding status.
22
Distribution
The Distributor or its agent distributes Creation Units for the Fund on an agency basis. The Distributor does not maintain a secondary market in shares of the Fund. The Distributor has no role in determining the policies of the Fund or the securities that are purchased or sold by the Fund. The Distributor’s principal address is 50 Hudson Yards, New York, NY 10001.
BFA or its affiliates make payments to broker-dealers, registered investment advisers, banks or other intermediaries (together, “intermediaries”) related to marketing activities and presentations, educational training programs, conferences, the development of technology platforms and reporting systems, data provision services, or their making shares of the Fund and certain other iShares funds available to their customers generally and in certain investment programs. Such payments, which may be significant to the intermediary, are not made by the Fund. Rather, such payments are made by BFA or its affiliates from their own resources, which come directly or indirectly in part from fees paid by the iShares funds complex. Payments of this type are sometimes referred to as revenue-sharing payments. A financial intermediary may make decisions about which investment options it recommends or makes available, or the level of services provided, to its customers based on the payments or other financial incentives it is eligible to receive. Therefore, such payments or other financial incentives offered or made to an intermediary create conflicts of interest between the intermediary and its customers and may cause the intermediary to recommend the Fund or other iShares funds over another investment. More information regarding these payments is contained in the Fund's SAI. Please contact your salesperson or other investment professional for more information regarding any such payments his or her firm may receive from BFA or its affiliates.
23
Financial Highlights
The financial highlights table is intended to help investors understand the Fund’s financial performance since inception. Certain information reflects financial results for a single share of the Fund. The total returns in the table represent the rate that an investor would have earned (or lost) on an investment in the Fund, assuming reinvestment of all dividends and distributions. This information has been audited by PricewaterhouseCoopers LLP, whose report is included, along with the Fund's financial statements, in the Fund's Annual Report (available upon request).
Financial Highlights
(For a share outstanding throughout each period)
(For a share outstanding throughout each period)
| |
iShares 25+ Year Treasury STRIPS Bond ETF | ||
| |
Year Ended 02/28/23 |
Year Ended 02/28/22 |
Period From 09/22/20(a) to 02/28/21 |
| Net asset value, beginning of period |
$20.52 |
$20.61 |
$25.06 |
| Net investment income(b) |
0.47 |
0.45 |
0.17 |
| Net realized and unrealized loss(c) |
(7.44 ) |
(0.14 ) |
(4.50 ) |
| Net increase (decrease) from investment operations |
(6.97 ) |
0.31 |
(4.33 ) |
| Distributions from net investment income(d) |
(0.47 ) |
(0.40 ) |
(0.12 ) |
| Net asset value, end of period |
$13.08 |
$20.52 |
$20.61 |
| Total Return(e) |
|
|
|
| Based on net asset value |
(34.23 )% |
1.44 % |
(17.33 )%(f) |
| Ratios to Average Net Assets(g) |
|
|
|
| Total expenses |
0.15 % |
0.15 % |
0.15 %(h) |
| Total expenses after fees waived |
0.04 % |
0.04 % |
0.07 %(h) |
| Net investment income |
3.17 % |
2.10 % |
1.71 %(h) |
| Supplemental Data |
|
|
|
| Net assets, end of period (000) |
$281,979 |
$324,196 |
$28,853 |
| Portfolio turnover rate(i) |
50 % |
40 % |
36 % |
| (a) | |||
| (b) | |||
| (c) securities for the fiscal period due to the timing of capital share transactions in relation to the fluctuating market values of the Fund’s underlying securities. | |||
| (d) | |||
| (e) | |||
| (f) | |||
| (g) | |||
| (h) | |||
| (i) | |||
24
Index Provider
The Underlying Index is owned, maintained and administered by IDI. IDI is not affiliated with the Trust, BFA, the Distributor or any of their respective affiliates.
BFA or its affiliates have entered into a license agreement with the Index Provider to use the Underlying Index. BFA, or its affiliates, sublicenses rights in the Underlying Index to the Trust at no charge.
Disclaimers
ICE® is a registered trademark of IDI or its affiliates and BofA® is a registered trademark of BofA licensed by BofA and its affiliates and may not be used without BofA’s prior written approval. These trademarks have been licensed, along with the Underlying Index, for use by BlackRock, Inc. and its affiliates (“BlackRock”) in connection with the Fund. Neither BlackRock, Inc., the Trust nor the Fund, as applicable, is sponsored, endorsed, sold or promoted by IDI, its affiliates or its third party suppliers (“IDI and its Suppliers”). IDI and its Suppliers make no representations or warranties regarding the advisability of investing in securities generally, in the Fund particularly, the Trust or the ability of the Underlying Index to track general market performance. IDI’s only relationship to BlackRock is the licensing of certain trademarks and trade names and the Underlying Index or components thereof. The Underlying Index is determined, composed and calculated by IDI without regard to BlackRock or the Fund or its holders. IDI has no obligation to take the needs of BlackRock or the holders of the Fund into consideration in determining, composing or calculating the Underlying Index. IDI is not responsible for and has not participated in the determination of the timing of, prices of, or quantities of the Fund to be issued or in the determination or calculation of the equation by which the Fund is to be priced, sold, purchased, or redeemed. Except for certain custom index calculation services, all information provided by IDI is general in nature and not tailored to the needs of BlackRock or any other person, entity or group of persons. IDI has no obligation or liability in connection with the administration, marketing, or trading of the Fund. IDI is not an investment adviser. Inclusion of a security within an index is not a recommendation by IDI to buy, sell, or hold such security, nor is it considered to be investment advice.
IDI AND ITS SUPPLIERS DISCLAIM ANY AND ALL WARRANTIES AND REPRESENTATIONS, EXPRESS AND/OR IMPLIED, INCLUDING ANY WARRANTIES OF MERCHANTABILITY OR FITNESS FOR A PARTICULAR PURPOSE OR USE, INCLUDING THE UNDERLYING INDEX, INDEX DATA AND ANY INFORMATION INCLUDED IN, RELATED TO, OR DERIVED THEREFROM (“INDEX DATA”). IDI AND ITS SUPPLIERS SHALL NOT BE SUBJECT TO ANY DAMAGES OR LIABILITY WITH RESPECT TO THE ADEQUACY, ACCURACY, TIMELINESS OR COMPLETENESS OF THE UNDERLYING INDEX AND THE INDEX DATA, WHICH ARE PROVIDED ON AN “AS IS” BASIS AND YOUR USE IS AT YOUR OWN RISK.
25
Shares of the Fund are not sponsored, endorsed or promoted by Cboe BZX. Cboe BZX makes no representation or warranty, express or implied, to the owners of shares of the Fund or any member of the public regarding the ability of the Fund to track the total return performance of the Underlying Index or the ability of the Underlying Index to track market performance. Cboe BZX is not responsible for, nor has it participated in, the determination of the compilation or the calculation of the Underlying Index, nor in the determination of the timing of, prices of, or quantities of shares of the Fund to be issued, nor in the determination or calculation of the equation by which the shares are redeemable. Cboe BZX has no obligation or liability to owners of shares of the Fund in connection with the administration, marketing or trading of the shares of the Fund.
Cboe BZX does not guarantee the accuracy and/or the completeness of the Underlying Index or any data included therein. Cboe BZX makes no warranty, express or implied, as to results to be obtained by the Trust on behalf of the Fund as licensee, licensee’s customers and counterparties, owners of shares of the Fund, or any other person or entity from the use of the Underlying Index or any data included therein in connection with the rights licensed as described herein or for any other use.
Cboe BZX makes no express or implied warranties and hereby expressly disclaims all warranties of merchantability or fitness for a particular purpose with respect to the Underlying Index or any data included therein. Without limiting any of the foregoing, in no event shall Cboe BZX have any liability for any direct, indirect, special, punitive, consequential or any other damages (including lost profits) even if notified of the possibility of such damages.
The past performance of the Underlying Index is not a guide to future performance. BFA and its affiliates do not guarantee the accuracy or the completeness of the Underlying Index or any data included therein and BFA and its affiliates shall have no liability for any errors, omissions or interruptions therein. BFA and its affiliates make no warranty, express or implied, to the owners of shares of the Fund or to any other person or entity, as to results to be obtained by the Fund from the use of the Underlying Index or any data included therein. Without limiting any of the foregoing, in no event shall BFA or its affiliates have any liability for any special, punitive, direct, indirect, consequential or any other damages (including lost profits), even if notified of the possibility of such damages.
26
Want to know more?
iShares.com | 1-800-474-2737
Information on the Fund’s net asset value, market price, premiums and discounts, and bid-ask spreads can be found at www.iShares.com. Copies of the Prospectus, SAI, shareholder reports and other information, as applicable and when available, can be found on our website at www.iShares.com. For more information about the Fund, you may request a copy of the SAI. The SAI provides detailed information about the Fund and is incorporated by reference into this Prospectus. This means that the SAI, for legal purposes, is a part of this Prospectus.
Additional information about the Fund's investments is, or will be, available in the Fund's Annual and Semi-Annual Reports to shareholders. In the Fund's Annual Report, you will find a discussion of the market conditions and investment strategies that significantly affected the Fund's performance during the last fiscal year.
If you have any questions about the Trust or shares of the Fund or you wish to obtain the SAI, Semi-Annual or Annual Report free of charge, please:
| Call: |
1-800-iShares or 1-800-474-2737 (toll free) Monday through Friday, 8:30 a.m. to 6:30 p.m. (Eastern time) |
| Email: |
iSharesETFs@blackrock.com |
| Write: |
c/o BlackRock Investments, LLC 1 University Square Drive, Princeton, NJ 08540 |
Reports and other information about the Fund are available on the EDGAR database on the SEC's website at www.sec.gov, and copies of this information may be obtained, after paying a duplicating fee, by electronic request at the following e-mail address: publicinfo@sec.gov.
No person is authorized to give any information or to make any representations about the Fund and its shares not contained in this Prospectus and you should not rely on any other information. Read and keep this Prospectus for future reference.
©2023 BlackRock, Inc. All rights reserved. iSHARES® and BLACKROCK®are registered trademarks of BFA and its affiliates. All other marks are the property of their respective owners.
Investment Company Act File No.: 811-09729
IS-P-GOVZ-0324