Table of Contents
UNITED STATES
SECURITIES AND EXCHANGE COMMISSION
Washington, D.C. 20549
FORM N-CSR
CERTIFIED SHAREHOLDER REPORT OF REGISTERED
MANAGEMENT INVESTMENT COMPANIES
Investment Company Act file number 811-09729
iShares Trust
(Exact name of registrant as specified in charter)
c/o: State Street Bank and Trust Company
200 Clarendon Street, Boston, MA 02116
(Address of principal executive offices) (Zip code)
CT Corporation System
1209 Orange Street, Wilmington, DE 19801
(Name and address of agent for service)
Registrant’s telephone number, including area code: 1-800-474-2737
Date of fiscal year end: July 31, 2007
Date of reporting period: July 31, 2007
Table of Contents
| Item 1. | Reports to Stockholders. |

Table of Contents
iShares®
iShares Trust
Supplement dated September 28, 2007
to the Prospectus dated December 1, 2006
for the iShares FTSE/Xinhua China 25 Index Fund (the “Prospectus”)
The information in this Supplement updates the information in, and should be read in conjunction with, the Prospectus for the iShares FTSE/Xinhua China 25 Index Fund.
The following information supplements the information found under the heading “Investment Adviser” on page 9:
Effective August 1, 2007, for its investment advisory services to the iShares FTSE/Xinhua China 25 Index Fund, BGFA is paid management fees equal to 0.74% per year of the Fund’s net assets less than or equal to $6 billion, plus 0.67% per year of the Fund’s net assets between $6 billion and $12 billion, plus 0.60% per year of the Fund’s net assets in excess of $12 billion.
If you have any additional questions, please call 1-800-iShares (1-800-474-2737).
| iShares® is a registered trademark of Barclays Global Investors, N.A. |
PLEASE RETAIN THIS SUPPLEMENT
FOR FUTURE REFERENCE
Table of Contents
Table of Contents
| 1 | ||
| 9 | ||
| 10 | ||
| 10 | ||
| 12 | ||
| 25 | ||
| 34 | ||
| 43 | ||
| 47 | ||
| 51 | ||
| 59 | ||
| 60 | ||
| Board Review and Approval of Investment Advisory Contract (Unaudited) |
61 | |
| 64 | ||
| 66 | ||
| 72 |
Table of Contents
Management’s Discussion of Fund Performance
iSHARES® FTSE/XINHUA CHINA 25 INDEX FUND
Performance as of July 31, 2007
| Average Annual Total Returns | Cumulative Total Returns | |||||||||||||||
| Year Ended 7/31/07 | Inception to 7/31/07 | Inception to 7/31/07 | ||||||||||||||
| NAV | MARKET | INDEX | NAV | MARKET | INDEX | NAV | MARKET | INDEX | ||||||||
| 82.72% | 79.24% | 82.81% | 42.51% | 41.85% | 43.21% | 171.75% | 168.20% | 175.32% | ||||||||
Total returns for the periods since inception are calculated from the inception date of the Fund (10/5/04). “Average Annual Total Returns” represent the average annual change in value of an investment over the periods indicated. “Cumulative Total Returns” represent the total change in value of an investment over the periods indicated.
Certain sectors and markets performed exceptionally well based on market conditions during the one-year period. Achieving such exceptional returns involves the risk of volatility and investors should not expect that such exceptional returns will be repeated.
The Fund’s per share net asset value or “NAV” is the value of one share of the Fund as calculated in accordance with the standard formula for valuing mutual fund shares. The NAV return is based on the NAV of the Fund, and the market return is based on the market price per share of the Fund. The price used to calculate market return (“Market Price”) is determined by using the midpoint between the highest bid and the lowest offer on the stock exchange on which shares of the Fund are listed for trading, as of the time that the Fund’s NAV is calculated. Since shares of the Fund did not trade in the secondary market until several days after the Fund’s inception, for the period from inception to the first day of secondary market trading in shares of the Fund (10/8/04), the NAV of the Fund is used as a proxy for the secondary market trading price to calculate market returns. Market and NAV returns assume that dividends and capital gain distributions have been reinvested in the Fund at Market Price and NAV, respectively.
An index is a statistical composite that tracks a specified financial market or sector. Unlike the Fund, an index does not actually hold a portfolio of securities and therefore does not incur the expenses incurred by the Fund. These expenses negatively impact the performance of the Fund. Also, market returns do not include brokerage commissions that may be payable on secondary market transactions. If brokerage commissions were included, market returns would be lower. The returns shown in the tables above do not reflect the deduction of taxes that a shareholder would pay on fund distributions or the redemption or sale of fund shares. The investment return and principal value of shares of the Fund will vary with changes in market conditions. Shares of the Fund may be worth more or less than their original cost when they are redeemed or sold in the market. The Fund’s past performance is no guarantee of future results.

Performance figures assume reinvestment of all dividends and capital gain distributions and do not reflect the deduction of taxes that a shareholder would pay on fund distributions or the redemption of fund shares. An index is a statistical composite that tracks a specified financial market or sector. Unlike the Fund, an index does not actually hold a portfolio of securities and therefore does not incur the expenses incurred by the Fund. These expenses negatively impact the performance of the Fund. The Fund’s past performance is no guarantee of future results.
| MANAGEMENT’S DISCUSSIONS OF FUND PERFORMANCE |
1 |
Table of Contents
Management’s Discussion of Fund Performance (Continued)
iSHARES® FTSE/XINHUA CHINA 25 INDEX FUND
The iShares FTSE/Xinhua China 25 Index Fund (the “Fund”) seeks investment results that correspond generally to the price and yield performance, before fees and expenses, of the FTSE/Xinhua China 25 Index (the “Index”). The Index is designed to represent the performance of the largest companies in the China equity market that are available to international investors. The Index consists of Class H and “Red Chip” shares of 25 of the largest and most liquid Chinese companies. The Fund invests in a representative sample of securities included in the Index that collectively has an investment profile similar to the Index. Due to the use of representative sampling, the Fund may or may not hold all of the securities that are included in the Index. For the 12-month period ended July 31, 2007 (the “reporting period”), the Fund returned 82.72%, while the Index returned 82.81%.
China’s market performance was robust during the reporting period, reflecting continued strong economic growth. The annualized gross domestic product (GDP) growth rate reached 11.9% in the second quarter of 2007, its fastest pace since 1995. In July 2007, export levels climbed by more than 34% from a year earlier, their fastest pace in five months. Additionally, industrial output grew by more than 19%.
The People’s Bank of China responded to the strong economic growth by continuing to raise its key interest rate in an attempt to prevent the economy from overheating. An appreciating Chinese currency, the yuan, also helped to relieve some inflationary pressure from the surging economy. Even so, inflation was on the rise toward the end of the reporting period, reaching 4.4% in June 2007.
The ten largest holdings of the Fund represented approximately 60% of the net assets of the Fund as of July 31, 2007. Among the Fund’s ten largest holdings as of July 31, 2007, performance was positive for the reporting period. Ping An Insurance (Group) Co. of China Ltd. Class H, China Life Insurance Co. Ltd. Class H and China Shenhua Energy Co. Ltd. Class H were the strongest performers for the reporting period. China Mobile Ltd. also performed strongly, as did China Construction Bank Class H. The most modest return among the Fund’s ten largest holdings came from PetroChina Co. Ltd. Class H.
| 2 |
2007 iSHARES ANNUAL REPORT TO SHAREHOLDERS |
Table of Contents
Management’s Discussion of Fund Performance
iSHARES® MSCI EAFE INDEX FUND
Performance as of July 31, 2007
| Average Annual Total Returns | ||||||||||||||||
| Year Ended 7/31/07 | Five Years Ended 7/31/07 | Inception to 7/31/07 | ||||||||||||||
| NAV | MARKET | INDEX | NAV | MARKET | INDEX | NAV | MARKET | INDEX | ||||||||
| 23.75% | 22.30% | 23.91% | 19.62% | 19.14% | 19.85% | 12.72% | 12.55% | 12.89% | ||||||||
| Cumulative Total Returns | ||||||||||||||||
| Year Ended 7/31/07 | Five Years Ended 7/31/07 | Inception to 7/31/07 | ||||||||||||||
| NAV | MARKET | INDEX | NAV | MARKET | INDEX | NAV | MARKET | INDEX | ||||||||
| 23.75% | 22.30% | 23.91% | 144.90% | 140.08% | 147.26% | 104.29% | 102.43% | 105.97% | ||||||||
Total returns for the periods since inception are calculated from the inception date of the Fund (8/14/01). “Average Annual Total Returns” represent the average annual change in value of an investment over the periods indicated. “Cumulative Total Returns” represent the total change in value of an investment over the periods indicated.
The Fund’s per share net asset value or “NAV” is the value of one share of the Fund as calculated in accordance with the standard formula for valuing mutual fund shares. The NAV return is based on the NAV of the Fund, and the market return is based on the market price per share of the Fund. The price used to calculate market return (“Market Price”) is determined by using the midpoint between the highest bid and the lowest offer on the stock exchange on which the shares of the Fund are listed for trading, as of the time that the Fund’s NAV is calculated. Since shares of the Fund did not trade in the secondary market until several days after the Fund’s inception, for the period from inception to the first day of secondary market trading in shares of the Fund (8/17/01), the NAV of the Fund is used as a proxy for secondary market trading price to calculate market returns. Market and NAV returns assume that dividends and capital gain distributions have been reinvested in the Fund at Market Price and NAV, respectively.
An index is a statistical composite that tracks a specified financial market or sector. Unlike the Fund, an index does not actually hold a portfolio of securities and therefore does not incur the expenses incurred by the Fund. These expenses negatively impact the performance of the Fund. Also, market returns do not include brokerage commissions that may be payable on secondary market transactions. If brokerage commissions were included, market returns would be lower. The returns shown in the tables above do not reflect the deduction of taxes that a shareholder would pay on fund distributions or the redemption or sale of fund shares. The investment return and principal value of shares of the Fund will vary with changes in market conditions. Shares of the Fund may be worth more or less than their original cost when they are redeemed or sold in the market. The Fund’s past performance is no guarantee of future results.

Performance figures assume reinvestment of all dividends and capital gain distributions and do not reflect the deduction of taxes that a shareholder would pay on fund distributions or the redemption of fund shares. An index is a statistical composite that tracks a specified financial market or sector. Unlike the Fund, an index does not actually hold a portfolio of securities and therefore does not incur the expenses incurred by the Fund. These expenses negatively impact the performance of the Fund. The Fund’s past performance is no guarantee of future results.
| MANAGEMENT’S DISCUSSIONS OF FUND PERFORMANCE |
3 |
Table of Contents
Management’s Discussion of Fund Performance (Continued)
iSHARES® MSCI EAFE INDEX FUND
The iShares MSCI EAFE Index Fund (the “Fund”) seeks investment results that correspond generally to the price and yield performance, before fees and expenses, of the MSCI EAFE Index (the “Index”). The Index has been developed by Morgan Stanley Capital International, Inc. as an equity benchmark for international stock performance. The Index includes stocks from Europe, Australasia and the Far East. The Fund invests in a representative sample of securities included in the Index that collectively has an investment profile similar to the Index. Due to the use of representative sampling, the Fund may or may not hold all of the securities that are included in the Index. For the 12-month period ended July 31, 2007 (the “reporting period”), the Fund returned 23.75%, while the Index returned 23.91%.
International markets generally delivered solid gains for the reporting period, driven by sound global economic growth. Around the world, strong demand, relatively low inflation levels, and improving employment rates supported economic growth. Healthy economic growth in Europe led the European Central Bank to raise rates five times during the reporting period. Germany registered annualized gross domestic product (GDP) growth of 3% for the first calendar quarter of 2007, its highest rate since 2000. France also witnessed economic expansion, although GDP growth in France slowed for the second quarter as business investment slipped. In the United Kingdom, sound economic growth and declining unemployment rates led the Bank of England to raise its base rate during the reporting period from 4.50% to 5.75%, its highest rate in six years.
Japan, which appeared to emerge from its long-standing deflationary environment, also experienced economic expansion. The Bank of Japan raised rates once during the reporting period, from 0.25% to 0.50%. However, at its July 2007 meeting, the Bank of Japan held rates steady, saying it would await additional evidence that economic growth would be sustained and inflation would take hold.
The ten largest holdings of the Fund represented approximately 12% of the net assets of the Fund as of July 31, 2007. Among the Fund’s ten largest holdings as of July 31, 2007, performance was mostly positive for the reporting period. Wireless telecommunications company Vodafone Group PLC (United Kingdom) was the strongest performer among the ten largest holdings. High energy prices benefited Total SA (France) and the Class A shares of Royal Dutch Shell PLC (United Kingdom). Toyota Motor Corp. (Japan) and Nestle SA (Switzerland) also performed well. Pharmaceutical companies Novartis AG (Switzerland) and GlaxoSmithKline PLC (United Kingdom) both declined for the reporting period.
| 4 |
2007 iSHARES ANNUAL REPORT TO SHAREHOLDERS |
Table of Contents
Management’s Discussion of Fund Performance
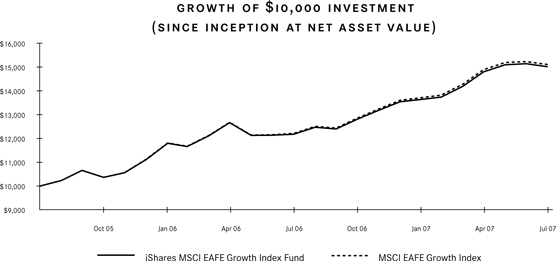
iSHARES® MSCI EAFE GROWTH INDEX FUND
Performance as of July 31, 2007
| Average Annual Total Returns | Cumulative Total Returns | |||||||||||||||
| Year Ended 7/31/07 | Inception to 7/31/07 | Inception to 7/31/07 | ||||||||||||||
| NAV | MARKET | INDEX | NAV | MARKET | INDEX | NAV | MARKET | INDEX | ||||||||
| 23.28% | 22.06% | 23.70% | 22.54% | 22.14% | 22.93% | 50.16% | 49.19% | 51.11% | ||||||||
Total returns for the periods since inception are calculated from the inception date of the Fund (8/1/05). “Average Annual Total Returns” represent the average annual change in value of an investment over the periods indicated. “Cumulative Total Returns” represent the total change in value of an investment over the periods indicated.
The Fund’s per share net asset value or “NAV” is the value of one share of the Fund as calculated in accordance with the standard formula for valuing mutual fund shares. The NAV return is based on the NAV of the Fund, and the market return is based on the market price per share of the Fund. The price used to calculate market return (“Market Price”) is determined by using the midpoint between the highest bid and the lowest offer on the stock exchange on which the shares of the Fund are listed for trading, as of the time that the Fund’s NAV is calculated. Since shares of the Fund did not trade in the secondary market until several days after the Fund’s inception, for the period from inception to the first day of secondary market trading in shares of the Fund (8/5/05), the NAV of the Fund is used as a proxy for secondary market trading price to calculate market returns. Market and NAV returns assume that dividends and capital gain distributions have been reinvested in the Fund at Market Price and NAV, respectively.
An index is a statistical composite that tracks a specified financial market or sector. Unlike the Fund, an index does not actually hold a portfolio of securities and therefore does not incur the expenses incurred by the Fund. These expenses negatively impact the performance of the Fund. Also, market returns do not include brokerage commissions that may be payable on secondary market transactions. If brokerage commissions were included, market returns would be lower. The returns shown in the tables above do not reflect the deduction of taxes that a shareholder would pay on fund distributions or the redemption or sale of fund shares. The investment return and principal value of shares of the Fund will vary with changes in market conditions. Shares of the Fund may be worth more or less than their original cost when they are redeemed or sold in the market. The Fund’s past performance is no guarantee of future results.
Performance figures assume reinvestment of all dividends and capital gain distributions and do not reflect the deduction of taxes that a shareholder would pay on fund distributions or the redemption of fund shares. An index is a statistical composite that tracks a specified financial market or sector. Unlike the Fund, an index does not actually hold a portfolio of securities and therefore does not incur the expenses incurred by the Fund. These expenses negatively impact the performance of the Fund. The Fund’s past performance is no guarantee of future results.
| MANAGEMENT’S DISCUSSIONS OF FUND PERFORMANCE |
5 |
Table of Contents
Management’s Discussion of Fund Performance (Continued)
iSHARES® MSCI EAFE GROWTH INDEX FUND
The iShares MSCI EAFE Growth Index Fund (the “Fund”) seeks investment results that correspond generally to the price and yield performance, before fees and expenses, of the MSCI EAFE Growth Index (the “Index”). The Index is a subset of the MSCI EAFE Index and consists of those securities classified by Morgan Stanley Capital International, Inc. as most representing the growth style. The Fund invests in a representative sample of securities included in the Index that collectively has an investment profile similar to the Index. Due to the use of representative sampling, the Fund may or may not hold all of the securities that are included in the Index. For the 12-month period ended July 31, 2007 (the “reporting period”), the Fund returned 23.28%, while the Index returned 23.70%.
International markets generally delivered solid gains for the reporting period, driven by sound global economic growth. Around the world, strong demand, relatively low inflation levels, and improving employment rates supported economic growth. Healthy economic growth in Europe led the European Central Bank to raise rates five times during the reporting period. Germany registered annualized gross domestic product (GDP) growth of 3% for the first calendar quarter of 2007, its highest rate since 2000. France also witnessed economic expansion, although GDP growth in France slowed for the second quarter as business investment slipped. In the United Kingdom, sound economic growth and declining unemployment rates led the Bank of England to raise its base rate during the reporting period from 4.50% to 5.75%, its highest rate in six years.
Japan, which appeared to emerge from its long-standing deflationary environment, also experienced economic expansion. The Bank of Japan raised rates once during the reporting period, from 0.25% to 0.50%. However, at its July 2007 meeting, the Bank of Japan held rates steady, saying it would await additional evidence that economic growth would be sustained and inflation would take hold.
The ten largest holdings of the Fund represented approximately 15% of the net assets of the Fund as of July 31, 2007. Among the Fund’s ten largest holdings as of July 31, 2007, performance was mostly positive for the reporting period. Siemens AG (Germany) was the strongest performer, followed by mining company BHP Billiton Ltd. (Australia) and mobile phone company Nokia OYJ (Finland). Pharmaceutical companies AstraZeneca PLC (United Kingdom), Novartis AG (Switzerland) and GlaxoSmithKline PLC (United Kingdom) all declined for the reporting period.
| 6 |
2007 iSHARES ANNUAL REPORT TO SHAREHOLDERS |
Table of Contents
Management’s Discussion of Fund Performance
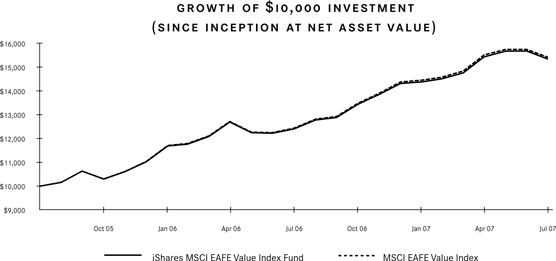
iSHARES® MSCI EAFE VALUE INDEX FUND
Performance as of July 31, 2007
| Average Annual Total Returns | Cumulative Total Returns | |||||||||||||||
| Year Ended 7/31/07 | Inception to 7/31/07 | Inception to 7/31/07 | ||||||||||||||
| NAV | MARKET | INDEX | NAV | MARKET | INDEX | NAV | MARKET | INDEX | ||||||||
| 23.70% | 22.18% | 24.03% | 23.94% | 23.54% | 24.26% | 53.62% | 52.62% | 54.40% | ||||||||
Total returns for the periods since inception are calculated from the inception date of the Fund (8/1/05). “Average Annual Total Returns” represent the average annual change in value of an investment over the periods indicated. “Cumulative Total Returns” represent the total change in value of an investment over the periods indicated.
The Fund’s per share net asset value or “NAV” is the value of one share of the Fund as calculated in accordance with the standard formula for valuing mutual fund shares. The NAV return is based on the NAV of the Fund, and the market return is based on the market price per share of the Fund. The price used to calculate market return (“Market Price”) is determined by using the midpoint between the highest bid and the lowest offer on the stock exchange on which the shares of the Fund are listed for trading, as of the time that the Fund’s NAV is calculated. Since shares of the Fund did not trade in the secondary market until several days after the Fund’s inception, for the period from inception to the first day of secondary market trading in shares of the Fund (8/5/05), the NAV of the Fund is used as a proxy for secondary market trading price to calculate market returns. Market and NAV returns assume that dividends and capital gain distributions have been reinvested in the Fund at Market Price and NAV, respectively.
An index is a statistical composite that tracks a specified financial market or sector. Unlike the Fund, an index does not actually hold a portfolio of securities and therefore does not incur the expenses incurred by the Fund. These expenses negatively impact the performance of the Fund. Also, market returns do not include brokerage commissions that may be payable on secondary market transactions. If brokerage commissions were included, market returns would be lower. The returns shown in the tables above do not reflect the deduction of taxes that a shareholder would pay on fund distributions or the redemption or sale of fund shares. The investment return and principal value of shares of the Fund will vary with changes in market conditions. Shares of the Fund may be worth more or less than their original cost when they are redeemed or sold in the market. The Fund’s past performance is no guarantee of future results.
Performance figures assume reinvestment of all dividends and capital gain distributions and do not reflect the deduction of taxes that a shareholder would pay on fund distributions or the redemption of fund shares. An index is a statistical composite that tracks a specified financial market or sector. Unlike the Fund, an index does not actually hold a portfolio of securities and therefore does not incur the expenses incurred by the Fund. These expenses negatively impact the performance of the Fund. The Fund’s past performance is no guarantee of future results.
| MANAGEMENT’S DISCUSSIONS OF FUND PERFORMANCE |
7 |
Table of Contents
Management’s Discussion of Fund Performance (Continued)
iSHARES® MSCI EAFE VALUE INDEX FUND
The iShares MSCI EAFE Value Index Fund (the “Fund”) seeks investment results that correspond generally to the price and yield performance, before fees and expenses, of the MSCI EAFE Value Index (the “Index”). The Index is a subset of the MSCI EAFE Index and consists of those securities classified by Morgan Stanley Capital International, Inc. as most representing the value style. The Fund invests in a representative sample of securities included in the Index that collectively has an investment profile similar to the Index. Due to the use of representative sampling, the Fund may or may not hold all of the securities that are included in the Index. For the 12-month period ended July 31, 2007 (the “reporting period”), the Fund returned 23.70%, while the Index returned 24.03%.
International markets generally delivered solid gains for the reporting period, driven by sound global economic growth. Around the world, strong demand, relatively low inflation levels, and improving employment rates supported economic growth. Healthy economic growth in Europe led the European Central Bank to raise rates five times during the reporting period. Germany registered annualized gross domestic product (GDP) growth of 3% for the first calendar quarter of 2007, its highest rate since 2000. France also witnessed economic expansion, although GDP growth in France slowed for the second quarter as business investment slipped. In the United Kingdom, sound economic growth and declining unemployment rates led the Bank of England to raise its base rate during the reporting period from 4.50% to 5.75%, its highest rate in six years.
Japan, which appeared to emerge from its long-standing deflationary environment, also experienced economic expansion. The Bank of Japan raised rates once during the reporting period, from 0.25% to 0.50%. However, at its July 2007 meeting, the Bank of Japan held rates steady, saying it would await additional evidence that economic growth would be sustained and inflation would take hold.
The ten largest holdings of the Fund represented approximately 23% of the net assets of the Fund as of July 31, 2007. Among the Fund’s ten largest holdings as of July 31, 2007, performance was positive for the reporting period. Wireless telecommunications company Vodafone Group PLC (United Kingdom) was the strongest performer among the ten largest holdings. Banco Santander Central Hispano SA (Spain) also posted sound gains. Total SA (France) and Nestle SA (Switzerland) both performed well, as did Royal Bank of Scotland Group PLC (United Kingdom). The Fund’s largest holding at July 31, 2007, oil company BP PLC (United Kingdom), posted a slight gain for the reporting period.
| 8 |
2007 iSHARES ANNUAL REPORT TO SHAREHOLDERS |
Table of Contents
Shareholder Expenses (Unaudited)
iSHARES® TRUST
As a shareholder of a Fund, you incur two types of costs: (1) transaction costs, including brokerage commissions on purchases and sales of fund shares and (2) ongoing costs, including management fees and other fund expenses. The following Example is intended to help you understand your ongoing costs (in dollars and cents) of investing in a Fund and to compare these costs with the ongoing costs of investing in other funds.
The Example is based on an investment of $1,000 invested at the beginning of the period and held for the entire period from February 1, 2007 to July 31, 2007.
ACTUAL EXPENSES
The first line under each Fund in the table below provides information about actual account values and actual expenses. You may use the information in this line, together with the amount you invested, to estimate the expenses that you paid over the period. Simply divide your account value by $1,000 (for example, an $8,600 account value divided by $1,000 = 8.6), then multiply the result by the number in the first line for your Fund under the heading entitled “Expenses Paid During Period” to estimate the expenses you paid on your account during this period.
HYPOTHETICAL EXAMPLE FOR COMPARISON PURPOSES
The second line under each Fund in the table below provides information about hypothetical account values and hypothetical expenses based on each Fund’s actual expense ratio and an assumed rate of return of 5% per year before expenses, which is not the Fund’s actual return. The hypothetical account values and expenses may not be used to estimate the actual ending account balance or expenses you paid for the period. You may use this information to compare the ongoing costs of investing in your Fund and other funds. To do so, compare this 5% hypothetical example with the 5% hypothetical examples that appear in the shareholder reports of the other funds.
Please note that the expenses shown in the table are meant to highlight your ongoing costs only and do not reflect any transactional costs, such as brokerage commissions paid on purchases and sales of fund shares. Therefore, the second line under each Fund in the table is useful in comparing ongoing costs only and will not help you determine the relative total costs of owning different funds. In addition, if these transactional costs were included, your costs would have been higher.
| iShares Index Fund | Beginning Account Value (2/1/07) |
Ending Account Value (7/31/07) |
Annualized Expense Ratio |
Expenses Paid During Perioda (2/1/07 to 7/31/07) | |||||
| FTSE/Xinhua China 25 |
|||||||||
| Actual |
$ 1,000.00 | $ 1,356.80 | 0.74 | % | $ 4.32 | ||||
| Hypothetical (5% return before expenses) |
1,000.00 | 1,021.10 | 0.74 | 3.71 | |||||
| MSCI EAFE |
|||||||||
| Actual |
1,000.00 | 1,083.90 | 0.34 | 1.76 | |||||
| Hypothetical (5% return before expenses) |
1,000.00 | 1,023.10 | 0.34 | 1.71 | |||||
| MSCI EAFE Growth |
|||||||||
| Actual |
1,000.00 | 1,100.50 | 0.40 | 2.08 | |||||
| Hypothetical (5% return before expenses) |
1,000.00 | 1,022.80 | 0.40 | 2.01 | |||||
| MSCI EAFE Value |
|||||||||
| Actual |
1,000.00 | 1,066.40 | 0.40 | 2.05 | |||||
| Hypothetical (5% return before expenses) |
1,000.00 | 1,022.80 | 0.40 | 2.01 |
| a |
Expenses are calculated using each Fund’s annualized expense ratio (as disclosed in the table), multiplied by the average account value for the period, multiplied by the number of days in the period (181 days) and divided by the number of days in the year (365 days). |
| SHAREHOLDER EXPENSES |
9 |
Table of Contents
iSHARES® FTSE/XINHUA CHINA 25 INDEX FUND
July 31, 2007
| 10 |
2007 iSHARES ANNUAL REPORT TO SHAREHOLDERS |
Table of Contents
Schedule of Investments (Continued)
iSHARES® FTSE/XINHUA CHINA 25 INDEX FUND
July 31, 2007
| SCHEDULES OF INVESTMENTS |
11 |
Table of Contents
Schedule of Investments
July 31, 2007
| 12 |
2007 iSHARES ANNUAL REPORT TO SHAREHOLDERS |
Table of Contents
Schedule of Investments (Continued)
iSHARES® MSCI EAFE INDEX FUND
July 31, 2007
| SCHEDULES OF INVESTMENTS |
13 |
Table of Contents
Schedule of Investments (Continued)
iSHARES® MSCI EAFE INDEX FUND
July 31, 2007
| 14 |
2007 iSHARES ANNUAL REPORT TO SHAREHOLDERS |
Table of Contents
Schedule of Investments (Continued)
iSHARES® MSCI EAFE INDEX FUND
July 31, 2007
| SCHEDULES OF INVESTMENTS |
15 |
Table of Contents
Schedule of Investments (Continued)
iSHARES® MSCI EAFE INDEX FUND
July 31, 2007
| 16 |
2007 iSHARES ANNUAL REPORT TO SHAREHOLDERS |
Table of Contents
Schedule of Investments (Continued)
iSHARES® MSCI EAFE INDEX FUND
July 31, 2007
| SCHEDULES OF INVESTMENTS |
17 |
Table of Contents
Schedule of Investments (Continued)
iSHARES® MSCI EAFE INDEX FUND
July 31, 2007
| 18 |
2007 iSHARES ANNUAL REPORT TO SHAREHOLDERS |
Table of Contents
Schedule of Investments (Continued)
iSHARES® MSCI EAFE INDEX FUND
July 31, 2007
| SCHEDULES OF INVESTMENTS |
19 |
Table of Contents
Schedule of Investments (Continued)
iSHARES® MSCI EAFE INDEX FUND
July 31, 2007
| 20 |
2007 iSHARES ANNUAL REPORT TO SHAREHOLDERS |
Table of Contents
Schedule of Investments (Continued)
iSHARES® MSCI EAFE INDEX FUND
July 31, 2007
| SCHEDULES OF INVESTMENTS |
21 |
Table of Contents
Schedule of Investments (Continued)
iSHARES® MSCI EAFE INDEX FUND
July 31, 2007
| 22 |
2007 iSHARES ANNUAL REPORT TO SHAREHOLDERS |
Table of Contents
Schedule of Investments (Continued)
iSHARES® MSCI EAFE INDEX FUND
July 31, 2007
| SCHEDULES OF INVESTMENTS |
23 |
Table of Contents
Schedule of Investments (Continued)
iSHARES® MSCI EAFE INDEX FUND
July 31, 2007
| 24 |
2007 iSHARES ANNUAL REPORT TO SHAREHOLDERS |
Table of Contents
Schedule of Investments
iSHARES® MSCI EAFE GROWTH INDEX FUND
July 31, 2007
| SCHEDULES OF INVESTMENTS |
25 |
Table of Contents
Schedule of Investments (Continued)
iSHARES® MSCI EAFE GROWTH INDEX FUND
July 31, 2007
| 26 |
2007 iSHARES ANNUAL REPORT TO SHAREHOLDERS |
Table of Contents
Schedule of Investments (Continued)
iSHARES® MSCI EAFE GROWTH INDEX FUND
July 31, 2007
| SCHEDULES OF INVESTMENTS |
27 |
Table of Contents
Schedule of Investments (Continued)
iSHARES® MSCI EAFE GROWTH INDEX FUND
July 31, 2007
| 28 |
2007 iSHARES ANNUAL REPORT TO SHAREHOLDERS |
Table of Contents
Schedule of Investments (Continued)
iSHARES® MSCI EAFE GROWTH INDEX FUND
July 31, 2007
| SCHEDULES OF INVESTMENTS |
29 |
Table of Contents
Schedule of Investments (Continued)
iSHARES® MSCI EAFE GROWTH INDEX FUND
July 31, 2007
| 30 |
2007 iSHARES ANNUAL REPORT TO SHAREHOLDERS |
Table of Contents
Schedule of Investments (Continued)
iSHARES® MSCI EAFE GROWTH INDEX FUND
July 31, 2007
| SCHEDULES OF INVESTMENTS |
31 |
Table of Contents
Schedule of Investments (Continued)
iSHARES® MSCI EAFE GROWTH INDEX FUND
July 31, 2007
| 32 |
2007 iSHARES ANNUAL REPORT TO SHAREHOLDERS |
Table of Contents
Schedule of Investments (Continued)
iSHARES® MSCI EAFE GROWTH INDEX FUND
July 31, 2007
| SCHEDULES OF INVESTMENTS |
33 |
Table of Contents
Schedule of Investments
iSHARES® MSCI EAFE VALUE INDEX FUND
July 31, 2007
| 34 |
2007 iSHARES ANNUAL REPORT TO SHAREHOLDERS |
Table of Contents
Schedule of Investments (Continued)
iSHARES® MSCI EAFE VALUE INDEX FUND
July 31, 2007
| SCHEDULES OF INVESTMENTS |
35 |
Table of Contents
Schedule of Investments (Continued)
iSHARES® MSCI EAFE VALUE INDEX FUND
July 31, 2007
| 36 |
2007 iSHARES ANNUAL REPORT TO SHAREHOLDERS |
Table of Contents
Schedule of Investments (Continued)
iSHARES® MSCI EAFE VALUE INDEX FUND
July 31, 2007
| SCHEDULES OF INVESTMENTS |
37 |
Table of Contents
Schedule of Investments (Continued)
iSHARES® MSCI EAFE VALUE INDEX FUND
July 31, 2007
| 38 |
2007 iSHARES ANNUAL REPORT TO SHAREHOLDERS |
Table of Contents
Schedule of Investments (Continued)
iSHARES® MSCI EAFE VALUE INDEX FUND
July 31, 2007
| SCHEDULES OF INVESTMENTS |
39 |
Table of Contents
Schedule of Investments (Continued)
iSHARES® MSCI EAFE VALUE INDEX FUND
July 31, 2007
| 40 |
2007 iSHARES ANNUAL REPORT TO SHAREHOLDERS |
Table of Contents
Schedule of Investments (Continued)
iSHARES® MSCI EAFE VALUE INDEX FUND
July 31, 2007
| SCHEDULES OF INVESTMENTS |
41 |
Table of Contents
Schedule of Investments (Continued)
iSHARES® MSCI EAFE VALUE INDEX FUND
July 31, 2007
| 42 |
2007 iSHARES ANNUAL REPORT TO SHAREHOLDERS |
Table of Contents
Statements of Assets and Liabilities
iSHARES® TRUST
July 31, 2007
| iShares FTSE/Xinhua China 25 Index Fund |
iShares MSCI EAFE Index Fund |
iShares MSCI EAFE Growth Index Fund |
iShares MSCI EAFE Value Index Fund | ||||||||||||
| ASSETS |
|||||||||||||||
| Investments, at cost: |
|||||||||||||||
| Unaffiliated issuers |
$ | 3,952,990,220 | $ | 33,520,505,714 | $ | 427,523,088 | $ | 1,076,956,697 | |||||||
| Affiliated issuers (Note 2) |
1,070,826,857 | 1,531,814,193 | 5,039,673 | 21,487,473 | |||||||||||
| Total cost of investments |
$ | 5,023,817,077 | $ | 35,052,319,907 | $ | 432,562,761 | $ | 1,098,444,170 | |||||||
| Investments in securities, at value |
|||||||||||||||
| Unaffiliated issuers |
$ | 5,835,953,274 | $ | 45,875,556,753 | $ | 510,927,264 | $ | 1,176,447,029 | |||||||
| Affiliated issuers (Note 2) |
1,070,826,857 | 1,602,004,127 | 5,039,673 | 22,830,430 | |||||||||||
| Total value of investments |
6,906,780,131 | 47,477,560,880 | 515,966,937 | 1,199,277,459 | |||||||||||
| Foreign currencies, at valueb |
9,293,494 | 88,020,483 | 916,913 | 2,410,429 | |||||||||||
| Receivables: |
|||||||||||||||
| Investment securities sold |
– | 32,088,580 | 342,339 | – | |||||||||||
| Due from custodian |
7,556,836 | 2,033,160 | – | 1,768,758 | |||||||||||
| Dividends and interest |
7,868,934 | 73,144,977 | 490,635 | 2,149,352 | |||||||||||
| Capital shares sold |
42,001 | 1,413,501 | – | – | |||||||||||
| Total Assets |
6,931,541,396 | 47,674,261,581 | 517,716,824 | 1,205,605,998 | |||||||||||
| LIABILITIES |
|||||||||||||||
| Payables: |
|||||||||||||||
| Investment securities purchased |
7,556,836 | 32,295,982 | 406,901 | 2,142,625 | |||||||||||
| Collateral for securities on loan (Note 5) |
1,067,799,739 | 1,301,813,682 | 4,977,430 | 6,402,735 | |||||||||||
| Capital shares redeemed |
1,739,581 | – | – | – | |||||||||||
| Investment advisory fees (Note 2) |
3,586,659 | 13,598,717 | 178,249 | 402,901 | |||||||||||
| Total Liabilities |
1,080,682,815 | 1,347,708,381 | 5,562,580 | 8,948,261 | |||||||||||
| NET ASSETS |
$ | 5,850,858,581 | $ | 46,326,553,200 | $ | 512,154,244 | $ | 1,196,657,737 | |||||||
| Net assets consist of: |
|||||||||||||||
| Paid-in capital |
$ | 3,944,316,713 | $ | 33,349,165,812 | $ | 422,310,591 | $ | 1,062,907,758 | |||||||
| Undistributed net investment income |
52,087,836 | 685,879,058 | 6,629,658 | 18,741,510 | |||||||||||
| Undistributed net realized gain (accumulated net realized loss) |
(28,518,625 | ) | (135,706,376 | ) | (205,039 | ) | 14,128,072 | ||||||||
| Net unrealized appreciation on investments and translation of assets and liabilities in foreign currencies |
1,882,972,657 | 12,427,214,706 | 83,419,034 | 100,880,397 | |||||||||||
| NET ASSETS |
$ | 5,850,858,581 | $ | 46,326,553,200 | $ | 512,154,244 | $ | 1,196,657,737 | |||||||
| Shares outstandingc |
41,500,000 | 582,000,000 | 6,800,000 | 15,600,000 | |||||||||||
| Net asset value per share |
$ | 140.98 | $ | 79.60 | $ | 75.32 | $ | 76.71 | |||||||
| a |
Securities on loan with market values of $990,953,607, $1,254,772,740, $4,924,722 and $6,073,303, respectively. See Note 5. |
| b |
Cost of foreign currencies: $9,297,569, $87,377,180, $910,828 and $2,393,777, respectively. |
| c |
No par value, unlimited number of shares authorized. |
See notes to financial statements.
| FINANCIAL STATEMENTS |
43 |
Table of Contents
Statements of Operations
iSHARES® TRUST
Year ended July 31, 2007
| iShares FTSE/Xinhua China 25 Index Fund |
iShares MSCI EAFE Index Fund |
iShares MSCI EAFE Growth Index Fund |
iShares MSCI EAFE Value Index Fund | ||||||||||
| NET INVESTMENT INCOME |
|||||||||||||
| Dividends from unaffiliated issuersa |
$ | 102,133,242 | $ | 1,065,125,399 | $ | 9,536,798 | $ | 26,193,428 | |||||
| Dividends from affiliated issuers (Note 2) |
– | 10,959,992 | – | 420,348 | |||||||||
| Interest from affiliated issuers (Note 2) |
169,735 | 756,887 | 8,962 | 16,791 | |||||||||
| Securities lending income from unaffiliated issuers |
7,112,766 | 2,695,586 | 19,504 | 10,956 | |||||||||
| Securities lending income from affiliated issuers (Note 2) |
1,415,130 | 949,952 | 5,787 | 4,637 | |||||||||
| Total investment income |
110,830,873 | 1,080,487,816 | 9,571,051 | 26,646,160 | |||||||||
| EXPENSES (Note 2) |
|||||||||||||
| Investment advisory fees |
33,072,709 | 131,359,287 | 1,641,713 | 3,181,820 | |||||||||
| Interest expenses |
– | 86,926 | – | – | |||||||||
| Total expenses |
33,072,709 | 131,446,213 | 1,641,713 | 3,181,820 | |||||||||
| Net investment income |
77,758,164 | 949,041,603 | 7,929,338 | 23,464,340 | |||||||||
| NET REALIZED AND UNREALIZED GAIN (LOSS) |
|||||||||||||
| Net realized gain (loss) from: |
|||||||||||||
| Investments in unaffiliated issuers |
31,882,705 | (85,065 | ) | 1,390,209 | 15,947,134 | ||||||||
| Investments in affiliated issuers (Note 2) |
– | 265,622 | – | 5,112 | |||||||||
| In-kind redemptions |
1,094,979,091 | 52,410,245 | – | 8,809,485 | |||||||||
| Foreign currency transactions |
12,467 | 7,781,418 | 81,296 | 174,233 | |||||||||
| Net realized gain |
1,126,874,263 | 60,372,220 | 1,471,505 | 24,935,964 | |||||||||
| Net change in unrealized appreciation (depreciation) on: |
|||||||||||||
| Investments |
1,427,333,811 | 6,662,478,751 | 73,922,137 | 92,607,174 | |||||||||
| Translation of assets and liabilities in foreign currencies |
9,984 | 805,665 | 6,362 | 22,927 | |||||||||
| Net change in unrealized appreciation (depreciation) |
1,427,343,795 | 6,663,284,416 | 73,928,499 | 92,630,101 | |||||||||
| Net realized and unrealized gain |
2,554,218,058 | 6,723,656,636 | 75,400,004 | 117,566,065 | |||||||||
| NET INCREASE IN NET ASSETS RESULTING FROM OPERATIONS |
$ | 2,631,976,222 | $ | 7,672,698,239 | $ | 83,329,342 | $ | 141,030,405 | |||||
| a |
Net of foreign withholding tax of $–, $96,517,243, $831,357 and $2,593,481, respectively. |
See notes to financial statements.
| 44 |
2007 iSHARES ANNUAL REPORT TO SHAREHOLDERS |
Table of Contents
Statements of Changes in Net Assets
iSHARES® TRUST
| iShares FTSE/Xinhua China 25 Index Fund |
iShares MSCI EAFE Index Fund |
|||||||||||||||
| Year ended July 31, 2007 |
Year ended July 31, 2006 |
Year ended July 31, 2007 |
Year ended July 31, 2006 |
|||||||||||||
| INCREASE (DECREASE) IN NET ASSETS |
||||||||||||||||
| OPERATIONS: |
||||||||||||||||
| Net investment income |
$ | 77,758,164 | $ | 50,847,625 | $ | 949,041,603 | $ | 663,739,560 | ||||||||
| Net realized gain |
1,126,874,263 | 48,136,877 | 60,372,220 | 679,430,810 | ||||||||||||
| Net change in unrealized appreciation (depreciation) |
1,427,343,795 | 358,547,348 | 6,663,284,416 | 3,521,912,454 | ||||||||||||
| Net increase in net assets resulting from operations |
2,631,976,222 | 457,531,850 | 7,672,698,239 | 4,865,082,824 | ||||||||||||
| DISTRIBUTIONS TO SHAREHOLDERS: |
||||||||||||||||
| From net investment income |
(65,514,203 | ) | (27,301,474 | ) | (769,182,031 | ) | (426,787,928 | ) | ||||||||
| Total distributions to shareholders |
(65,514,203 | ) | (27,301,474 | ) | (769,182,031 | ) | (426,787,928 | ) | ||||||||
| CAPITAL SHARE TRANSACTIONS: |
||||||||||||||||
| Proceeds from shares sold |
2,989,557,517 | 1,933,830,791 | 10,201,668,788 | 8,873,661,857 | ||||||||||||
| Cost of shares redeemed |
(2,678,572,825 | ) | (391,601,168 | ) | (99,448,531 | ) | (1,712,628,875 | ) | ||||||||
| Net increase in net assets from capital share transactions |
310,984,692 | 1,542,229,623 | 10,102,220,257 | 7,161,032,982 | ||||||||||||
| INCREASE IN NET ASSETS |
2,877,446,711 | 1,972,459,999 | 17,005,736,465 | 11,599,327,878 | ||||||||||||
| NET ASSETS |
||||||||||||||||
| Beginning of year |
2,973,411,870 | 1,000,951,871 | 29,320,816,735 | 17,721,488,857 | ||||||||||||
| End of year |
$ | 5,850,858,581 | $ | 2,973,411,870 | $ | 46,326,553,200 | $ | 29,320,816,735 | ||||||||
| Undistributed net investment income included in net assets at end of year |
$ | 52,087,836 | $ | 39,831,408 | $ | 685,879,058 | $ | 497,902,008 | ||||||||
| SHARES ISSUED AND REDEEMED |
||||||||||||||||
| Shares sold |
28,200,000 | 27,150,000 | 136,800,000 | 146,400,000 | ||||||||||||
| Shares redeemed |
(24,750,000 | ) | (5,400,000 | ) | (1,200,000 | ) | (28,200,000 | ) | ||||||||
| Net increase in shares outstanding |
3,450,000 | 21,750,000 | 135,600,000 | 118,200,000 | ||||||||||||
See notes to financial statements.
| FINANCIAL STATEMENTS |
45 |
Table of Contents
Statements of Changes in Net Assets (Continued)
iSHARES® TRUST
| iShares MSCI EAFE Growth Index Fund |
iShares MSCI EAFE Value Index Fund |
|||||||||||||||
| Year ended July 31, 2007 |
Period from August 1, 2005a to July 31, 2006 |
Year ended July 31, 2007 |
Period from August 1, 2005a to July 31, 2006 |
|||||||||||||
| INCREASE (DECREASE) IN NET ASSETS |
||||||||||||||||
| OPERATIONS: |
||||||||||||||||
| Net investment income |
$ | 7,929,338 | $ | 2,714,386 | $ | 23,464,340 | $ | 6,919,493 | ||||||||
| Net realized gain |
1,471,505 | 221,471 | 24,935,964 | 3,528,693 | ||||||||||||
| Net change in unrealized appreciation (depreciation) |
73,928,499 | 9,490,535 | 92,630,101 | 8,250,296 | ||||||||||||
| Net increase in net assets resulting from operations |
83,329,342 | 12,426,392 | 141,030,405 | 18,698,482 | ||||||||||||
| DISTRIBUTIONS TO SHAREHOLDERS: |
||||||||||||||||
| From net investment income |
(4,132,532 | ) | (185,328 | ) | (11,447,878 | ) | (406,634 | ) | ||||||||
| Total distributions to shareholders |
(4,132,532 | ) | (185,328 | ) | (11,447,878 | ) | (406,634 | ) | ||||||||
| CAPITAL SHARE TRANSACTIONS: |
||||||||||||||||
| Proceeds from shares sold |
186,093,474 | 259,573,684 | 770,306,651 | 405,595,376 | ||||||||||||
| Cost of shares redeemed |
– | (24,950,788 | ) | (56,337,675 | ) | (70,780,990 | ) | |||||||||
| Net increase in net assets from capital share transactions |
186,093,474 | 234,622,896 | 713,968,976 | 334,814,386 | ||||||||||||
| INCREASE IN NET ASSETS |
265,290,284 | 246,863,960 | 843,551,503 | 353,106,234 | ||||||||||||
| NET ASSETS |
||||||||||||||||
| Beginning of period |
246,863,960 | – | 353,106,234 | – | ||||||||||||
| End of period |
$ | 512,154,244 | $ | 246,863,960 | $ | 1,196,657,737 | $ | 353,106,234 | ||||||||
| Undistributed net investment income included in net assets at end of period |
$ | 6,629,658 | $ | 2,558,228 | $ | 18,741,510 | $ | 6,531,400 | ||||||||
| SHARES ISSUED AND REDEEMED |
||||||||||||||||
| Shares sold |
2,800,000 | 4,400,000 | 10,800,000 | 6,800,000 | ||||||||||||
| Shares redeemed |
– | (400,000 | ) | (800,000 | ) | (1,200,000 | ) | |||||||||
| Net increase in shares outstanding |
2,800,000 | 4,000,000 | 10,000,000 | 5,600,000 | ||||||||||||
| a |
Commencement of operations. |
See notes to financial statements.
| 46 |
2007 iSHARES ANNUAL REPORT TO SHAREHOLDERS |
Table of Contents
iSHARES® TRUST
(For a share outstanding throughout each period)
| iShares FTSE/Xinhua China 25 Index Fund | ||||||||||||
| Year ended Jul. 31, 2007 |
Year ended Jul. 31, 2006 |
Period from Oct. 5, 2004a to Jul. 31, 2005 |
||||||||||
| Net asset value, beginning of period |
$ | 78.14 | $ | 61.41 | $ | 53.60 | ||||||
| Income from investment operations: |
||||||||||||
| Net investment income |
1.78 | b | 1.84 | b | 0.99 | |||||||
| Net realized and unrealized gainc |
62.37 | 16.14 | 6.82 | |||||||||
| Total from investment operations |
64.15 | 17.98 | 7.81 | |||||||||
| Less distributions from: |
||||||||||||
| Net investment income |
(1.31 | ) | (1.25 | ) | – | |||||||
| Total distributions |
(1.31 | ) | (1.25 | ) | – | |||||||
| Net asset value, end of period |
$ | 140.98 | $ | 78.14 | $ | 61.41 | ||||||
| Total return |
82.72 | % | 29.81 | % | 14.57 | %d | ||||||
| Ratios/Supplemental data: |
||||||||||||
| Net assets, end of period (000s) |
$ | 5,850,859 | $ | 2,973,412 | $ | 1,000,952 | ||||||
| Ratio of expenses to average net assetse |
0.74 | % | 0.74 | % | 0.78 | % | ||||||
| Ratio of net investment income to average net assetse |
1.74 | % | 2.62 | % | 2.97 | % | ||||||
| Portfolio turnover ratef |
36 | % | 45 | % | 13 | % | ||||||
| a |
Commencement of operations. |
| b |
Based on average shares outstanding throughout the period. |
| c |
The amounts reported may not accord with the change in aggregate gains and losses in securities due to the timing of capital share transactions. |
| d |
Not annualized. |
| e |
Annualized for periods of less than one year. |
| f |
Portfolio turnover rates exclude portfolio securities received or delivered as a result of processing capital share transactions in Creation Units. |
See notes to financial statements.
| FINANCIAL HIGHLIGHTS |
47 |
Table of Contents
Financial Highlights (Continued)
iSHARES® TRUST
(For a share outstanding throughout each period)
| iShares MSCI EAFE Index Fund | ||||||||||||||||||||
| Year ended Jul. 31, 2007 |
Year ended Jul. 31, 2006 |
Year ended Jul. 31, 2005 |
Year ended Jul. 31, 2004 |
Year ended Jul. 31, 2003 |
||||||||||||||||
| Net asset value, beginning of year |
$ | 65.68 | $ | 54.00 | $ | 45.49 | $ | 36.88 | $ | 35.41 | ||||||||||
| Income from investment operations: |
||||||||||||||||||||
| Net investment income |
1.85 | a | 1.70 | a | 0.97 | 0.65 | 0.86 | |||||||||||||
| Net realized and unrealized gainb |
13.60 | 11.09 | 8.34 | 8.48 | 1.24 | |||||||||||||||
| Total from investment operations |
15.45 | 12.79 | 9.31 | 9.13 | 2.10 | |||||||||||||||
| Less distributions from: |
||||||||||||||||||||
| Net investment income |
(1.53 | ) | (1.11 | ) | (0.80 | ) | (0.52 | ) | (0.63 | ) | ||||||||||
| Total distributions |
(1.53 | ) | (1.11 | ) | (0.80 | ) | (0.52 | ) | (0.63 | ) | ||||||||||
| Net asset value, end of year |
$ | 79.60 | $ | 65.68 | $ | 54.00 | $ | 45.49 | $ | 36.88 | ||||||||||
| Total return |
23.75 | % | 23.91 | % | 20.53 | % | 24.81 | % | 6.17 | % | ||||||||||
| Ratios/Supplemental data: |
||||||||||||||||||||
| Net assets, end of year (000s) |
$ | 46,326,553 | $ | 29,320,817 | $ | 17,721,489 | $ | 8,733,741 | $ | 3,009,772 | ||||||||||
| Ratio of expenses to average net assets |
0.34 | % | 0.35 | % | 0.36 | % | 0.35 | % | 0.35 | % | ||||||||||
| Ratio of net investment income to average net assets |
2.48 | % | 2.77 | % | 2.57 | % | 2.34 | % | 2.31 | % | ||||||||||
| Portfolio turnover ratec |
5 | % | 7 | % | 8 | % | 7 | % | 8 | % | ||||||||||
| a |
Based on average shares outstanding throughout the period. |
| b |
The amounts reported may not accord with the change in aggregate gains and losses in securities due to the timing of capital share transactions. |
| c |
Portfolio turnover rates exclude portfolio securities received or delivered as a result of processing capital share transactions in Creation Units. |
See notes to financial statements.
| 48 |
2007 iSHARES ANNUAL REPORT TO SHAREHOLDERS |
Table of Contents
Financial Highlights (Continued)
iSHARES® TRUST
(For a share outstanding throughout each period)
| iShares MSCI EAFE Growth Index Fund |
||||||||
| Year ended Jul. 31, 2007 |
Period from Aug. 1, 2005a Jul. 31, 2006 |
|||||||
| Net asset value, beginning of period |
$ | 61.72 | $ | 50.88 | ||||
| Income from investment operations: |
||||||||
| Net investment incomeb |
1.35 | 1.34 | ||||||
| Net realized and unrealized gainc |
12.94 | 9.73 | ||||||
| Total from investment operations |
14.29 | 11.07 | ||||||
| Less distributions from: |
||||||||
| Net investment income |
(0.69 | ) | (0.23 | ) | ||||
| Total distributions |
(0.69 | ) | (0.23 | ) | ||||
| Net asset value, end of period |
$ | 75.32 | $ | 61.72 | ||||
| Total return |
23.28 | % | 21.80 | %d | ||||
| Ratios/Supplemental data: |
||||||||
| Net assets, end of period (000s) |
$ | 512,154 | $ | 246,864 | ||||
| Ratio of expenses to average net assetse |
0.40 | % | 0.40 | % | ||||
| Ratio of net investment income to average net assetse |
1.93 | % | 2.25 | % | ||||
| Portfolio turnover ratef |
28 | % | 35 | % | ||||
| a |
Commencement of operations. |
| b |
Based on average shares outstanding throughout each period. |
| c |
The amounts reported may not accord with the change in aggregate gains and losses in securities due to the timing of capital share transactions. |
| d |
Not annualized. |
| e |
Annualized for periods of less than one year. |
| f |
Portfolio turnover rates exclude portfolio securities received or delivered as a result of processing capital share transactions in Creation Units. |
See notes to financial statements.
| FINANCIAL HIGHLIGHTS |
49 |
Table of Contents
Financial Highlights (Continued)
iSHARES® TRUST
(For a share outstanding throughout each period)
| iShares MSCI EAFE Value Index Fund |
||||||||
| Year ended Jul. 31, 2007 |
Period from Aug. 1, 2005a Jul. 31, 2006 |
|||||||
| Net asset value, beginning of period |
$ | 63.05 | $ | 51.00 | ||||
| Income from investment operations: |
||||||||
| Net investment incomeb |
2.16 | 2.61 | ||||||
| Net realized and unrealized gainc |
12.69 | 9.69 | ||||||
| Total from investment operations |
14.85 | 12.30 | ||||||
| Less distributions from: |
||||||||
| Net investment income |
(1.19 | ) | (0.25 | ) | ||||
| Total distributions |
(1.19 | ) | (0.25 | ) | ||||
| Net asset value, end of period |
$ | 76.71 | $ | 63.05 | ||||
| Total return |
23.70 | % | 24.18 | %d | ||||
| Ratios/Supplemental data: |
||||||||
| Net assets, end of period (000s) |
$ | 1,196,658 | $ | 353,106 | ||||
| Ratio of expenses to average net assetse |
0.40 | % | 0.40 | % | ||||
| Ratio of net investment income to average net assetse |
2.95 | % | 4.34 | % | ||||
| Portfolio turnover ratef |
21 | % | 31 | % | ||||
| a |
Commencement of operations. |
| b |
Based on average shares outstanding throughout each period. |
| c |
The amounts reported may not accord with the change in aggregate gains and losses in securities due to the timing of capital share transactions. |
| d |
Not annualized. |
| e |
Annualized for periods of less than one year. |
| f |
Portfolio turnover rates exclude portfolio securities received or delivered as a result of processing capital share transactions in Creation Units. |
See notes to financial statements.
| 50 |
2007 iSHARES ANNUAL REPORT TO SHAREHOLDERS |
Table of Contents
iSHARES® TRUST
iShares Trust (the “Trust”) is registered under the Investment Company Act of 1940, as amended (the “1940 Act”), as an open-end management investment company. The Trust was established as a Delaware statutory trust pursuant to an Agreement and Declaration of Trust dated December 16, 1999. As of July 31, 2007, the Trust offered 111 investment portfolios or funds.
These financial statements relate only to the iShares FTSE/Xinhua China 25, iShares MSCI EAFE, iShares MSCI EAFE Growth and iShares MSCI EAFE Value Index Funds (each, a “Fund,” collectively, the “Funds”).
The investment objective of each Fund is to seek investment results that correspond generally to the price and yield performance, before fees and expenses, of its underlying index. The investment adviser uses a “passive” or index approach to achieve each Fund’s investment objective. Each of the Funds is classified as a non-diversified fund under the 1940 Act. Non-diversified funds generally hold securities of fewer companies than diversified funds and may be more susceptible to the risks associated with these particular companies, or to a single economic, political or regulatory occurrence affecting these companies.
Each Fund invests in the securities of non-U.S. issuers that may trade in non-U.S. markets. This may involve certain considerations and risks not typically associated with securities of U.S. issuers. Such risks include, but are not limited to: generally less liquid and less efficient securities markets; generally greater price volatility; exchange rate fluctuations and exchange controls; imposition of restrictions on the expatriation of funds or other assets of the Fund; less publicly available information about issuers; the imposition of withholding or other taxes; higher transaction and custody costs; settlement delays and risk of loss attendant in settlement procedures; difficulties in enforcing contractual obligations; less regulation of securities markets; different accounting, disclosure and reporting requirements; more substantial governmental involvement in the economy; higher inflation rates; greater social, economic and political uncertainties; the risk of nationalization or expropriation of assets and the risk of war.
Pursuant to the Trust’s organizational documents, the Funds’ officers and trustees are indemnified against certain liabilities that may arise out of the performance of their duties to the Funds. Additionally, in the normal course of business, the Funds enter into contracts with service providers that contain general indemnification clauses. The Funds’ maximum exposure under these arrangements is unknown as this would involve future claims that may be made against the Funds that have not yet occurred.
1. SIGNIFICANT ACCOUNTING POLICIES
The following significant accounting policies are consistently followed by the Trust in the preparation of its financial statements in conformity with accounting principles generally accepted in the United States of America (“U.S. GAAP”) for investment companies. The preparation of financial statements in conformity with U.S. GAAP requires management to make certain estimates and assumptions that affect the reported amounts of assets and liabilities and disclosures of contingent assets and liabilities at the date of the financial statements and the reported amounts of revenue and expenses during the reporting period. Actual results could differ from those estimates.
SECURITY VALUATION
The securities and other assets of each Fund are generally valued using market valuations. A market valuation generally means a valuation (i) obtained from an exchange, a pricing service or a major market maker (or dealer), (ii) based on a price quotation or other equivalent indication of value supplied by an exchange, a pricing service or a major market maker (or dealer) or (iii) based on amortized cost. In the case of shares of funds that are not traded on an exchange, a market valuation means such fund’s published net asset value per share. The investment adviser may use various pricing services or discontinue the use of any pricing service. A price obtained from a pricing service based on such pricing service’s valuation matrix may be considered a market valuation. In the event that current market valuations are not readily available or such valuations do not reflect current market values, the affected investments will be valued using fair value pricing pursuant to the pricing policy and procedures approved by the Board of Trustees of the Trust (the “Board”).
| NOTES TO FINANCIAL STATEMENTS |
51 |
Table of Contents
Notes to Financial Statements (Continued)
iSHARES® TRUST
Investments that may be valued using fair value pricing include, but are not limited to: (i) an unlisted security related to corporate actions; (ii) a restricted security (i.e., one that may not be publicly sold without registration under the Securities Act of 1933, as amended); (iii) a security whose trading has been suspended or which has been de-listed from its primary trading exchange; (iv) a security that is thinly traded; (v) a security in default or bankruptcy proceedings for which there is no current market quotation; (vi) a security affected by currency controls or restrictions; and (vii) a security affected by a significant event (i.e., an event that occurs after the close of the markets on which the security is traded but before the time as of which the Fund’s NAV is computed and that may materially affect the value of the Fund’s investments). Examples of events that may be “significant events” are government actions, natural disasters, armed conflict, acts of terrorism, and significant market fluctuations.
Valuing a Fund’s investments using fair value pricing will result in using prices for those investments that may differ from current market valuations. Accordingly, fair value pricing could result in a difference between the prices used to calculate a Fund’s net asset value and the prices used by the Fund’s benchmark index, which, in turn, could result in a difference between the Fund’s performance and the performance of the Fund’s benchmark index.
SECURITY TRANSACTIONS AND INCOME RECOGNITION
Security transactions are accounted for on trade date. Dividend income is recognized on the ex-dividend date, net of any foreign taxes withheld at source, and interest income is accrued daily. Realized gains and losses on investment transactions are determined using the specific identification method.
FOREIGN CURRENCY TRANSLATION
The accounting records of the Funds are maintained in U.S. dollars. Foreign currencies, as well as investment securities and other assets and liabilities denominated in foreign currencies are translated into U.S. dollars using exchange rates deemed appropriate by the investment adviser. Purchases and sales of securities, income receipts and expense payments are translated into U.S. dollars on the respective dates of such transactions.
Each Fund does not isolate the effect of fluctuations in foreign exchange rates from the effect of fluctuations in the market prices of securities. Such fluctuations are reflected by the Funds as a component of realized and unrealized gains and losses from investments for financial reporting purposes.
DISTRIBUTIONS TO SHAREHOLDERS
Distributions to shareholders from net investment income, if any, are declared and distributed at least annually by each Fund. Distributions of net realized capital gains, if any, generally are declared and distributed once a year. Distributions are determined on a tax basis and may differ from net investment income and net realized capital gains for financial reporting purposes. Dividends and distributions are paid in U.S. dollars and cannot be automatically reinvested in additional shares of the Funds.
| 52 |
2007 iSHARES ANNUAL REPORT TO SHAREHOLDERS |
Table of Contents
Notes to Financial Statements (Continued)
iSHARES® TRUST
As of July 31, 2007, the tax year-end of the Funds, the components of net distributable earnings on a tax basis were as follows:
| iShares Index Fund | Undistributed Ordinary Income |
Undistributed Long Term Capital Gains |
Unrealized Appreciation |
Capital and Other Losses |
Net Distributable Earnings | |||||||||||
| FTSE/Xinhua China 25 |
$ | 52,087,836 | $ | – | $ | 1,857,786,743 | $ | (3,332,711 | ) | $ | 1,906,541,868 | |||||
| MSCI EAFE |
804,458,879 | – | 12,199,758,669 | (26,830,160 | ) | 12,977,387,388 | ||||||||||
| MSCI EAFE Growth |
6,997,693 | 90,576 | 82,755,384 | – | 89,843,653 | |||||||||||
| MSCI EAFE Value |
31,788,617 | 4,801,512 | 97,159,850 | – | 133,749,979 | |||||||||||
For the years ended July 31, 2007 and July 31, 2006, the tax characterization of distributions paid for each Fund was equal to the book characterization of distributions paid. The total distributions and distributions per share are disclosed in the accompanying Statements of Changes in Net Assets and the Financial Highlights for all Funds.
FEDERAL INCOME TAXES
Each Fund is treated as a separate entity for federal income tax purposes. It is the policy of each Fund to qualify as a regulated investment company by complying with the provisions applicable to regulated investment companies, as defined under Subchapter M of the Internal Revenue Code of 1986, as amended, and to annually distribute substantially all of its net income and any net gains (taking into account any capital loss carryforwards) sufficient to relieve it from all, or substantially all, federal income and excise taxes. Accordingly, no provision for federal income taxes was required for the year ended July 31, 2007.
Certain Funds had tax basis net capital loss carryforwards as of July 31, 2007, the tax year-end of the Funds, as follows:
| iShares Index Fund | Expiring 2012 |
Expiring 2013 |
Expiring 2014 |
Total | ||||||||
| FTSE/Xinhua China 25 |
$ | – | $ | – | $ | 3,332,711 | $ | 3,332,711 | ||||
| MSCI EAFE |
26,679,808 | 150,352 | – | 26,830,160 | ||||||||
Net capital loss carryforwards may be applied against any net realized taxable gains in each succeeding year or until their respective expiration dates, whichever occurs first.
The Funds may own shares in certain foreign investment entities, referred to, under U.S. tax law, as “passive foreign investment companies.” The Funds may elect to mark-to-market annually the shares of each passive foreign investment company and would be required to distribute to shareholders any such mark-to-market gains.
For the year ended July 31, 2007, certain Funds realized net capital gains or losses resulting from in-kind redemptions of large blocks of shares or multiples thereof (“Creation Units”). Because such gains or losses are not taxable to the Funds and are not distributed to existing Fund shareholders, the gains or losses are reclassified from accumulated net realized gains or losses to paid-in-capital at the end of the Funds’ tax year. These reclassifications have no effect on net assets or net asset values per share. The net realized in-kind gains or losses for the year ended July 31, 2007 are disclosed in the Funds’ Statements of Operations.
| NOTES TO FINANCIAL STATEMENTS |
53 |
Table of Contents
Notes to Financial Statements (Continued)
iSHARES® TRUST
As of July 31, 2007, gross unrealized appreciation and gross unrealized depreciation based on cost for federal income tax purposes were as follows:
| iShares Index Fund | Tax Cost | Gross Unrealized Appreciation |
Gross Unrealized Depreciation |
Net Unrealized Appreciation | |||||||||
| FTSE/Xinhua China 25 |
$ | 5,049,002,991 | $ | 1,863,935,195 | $ | (6,158,055 | ) | $ | 1,857,777,140 | ||||
| MSCI EAFE |
35,279,775,944 | 12,393,670,295 | (195,885,359 | ) | 12,197,784,936 | ||||||||
| MSCI EAFE Growth |
433,226,411 | 90,283,493 | (7,542,967 | ) | 82,740,526 | ||||||||
| MSCI EAFE Value |
1,102,164,717 | 115,049,792 | (17,937,050 | ) | 97,112,742 | ||||||||
REPURCHASE AGREEMENTS
Each Fund may enter into repurchase agreements with banks and securities dealers. These transactions involve the purchase of securities with a simultaneous commitment to resell the securities to the bank or the dealer at an agreed-upon date and price. A repurchase agreement is accounted for as an investment by the Fund, collateralized by securities, which are delivered to the Fund’s custodian or to an agent bank under a tri-party agreement. The securities are marked-to-market daily and additional securities are acquired as needed, to ensure that their value equals or exceeds the repurchase price plus accrued interest.
2. AGREEMENTS AND OTHER TRANSACTIONS WITH AFFILIATES
Pursuant to an Investment Advisory Agreement with the Trust, Barclays Global Fund Advisors (“BGFA”) manages the investment of each Fund’s assets. BGFA is a California corporation indirectly owned by Barclays Bank PLC. Under the Investment Advisory Agreement, BGFA is responsible for all expenses (“Covered Expenses”) of the Trust, including the cost of transfer agency, custody, fund administration, legal, audit and other services, except interest, taxes, brokerage commissions and other expenses connected with the execution of portfolio transactions, distribution fees and extraordinary expenses.
For its investment advisory services to the iShares FTSE/Xinhua China 25, iShares MSCI EAFE Growth and iShares MSCI EAFE Value Index Funds, BGFA is entitled to an annual investment advisory fee based on the average daily net assets of each Fund as follows:
| 54 |
2007 iSHARES ANNUAL REPORT TO SHAREHOLDERS |
Table of Contents
Notes to Financial Statements (Continued)
iSHARES® TRUST
The Board approved a change to the investment advisory fee structure for the iShares FTSE/Xinhua China 25 Index Fund effective August 1, 2007. For its investment advisory services to the iShares FTSE/Xinhua China 25 Index Fund, BGFA will be entitled to an annual investment advisory fee based on the average daily net assets of the Fund as follows:
For its investment advisory services to the iShares MSCI EAFE Index Fund, BGFA is entitled to an annual investment advisory fee based on the average daily net assets of the Fund as follows:
State Street Bank and Trust Company (“State Street”) serves as administrator, custodian and transfer agent for the Trust. As compensation for its services, State Street receives certain out-of-pocket costs, transaction fees and asset-based fees which are accrued daily and paid monthly. These fees and expenses are Covered Expenses as defined above.
SEI Investments Distribution Co. (“SEI”) serves as each Fund’s underwriter and distributor of the shares of each Fund, pursuant to a Distribution Agreement with the Trust. SEI does not receive a fee from the Funds for its distribution services.
Pursuant to an exemptive order issued by the U.S. Securities and Exchange Commission (“SEC”), the Funds are permitted to lend portfolio securities to Barclays Capital Inc. (“BarCap”). Pursuant to the same exemptive order, Barclays Global Investors, N.A. (“BGI”) serves as securities lending agent for the Trust. BarCap and BGI are affiliates of BGFA, the Funds’ investment adviser. As securities lending agent, BGI receives, as fees, a share of the income earned on investment of the cash collateral received for the loan of securities. For the year ended July 31, 2007, BGI earned securities lending agent fees as follows:
Each Fund may invest in the Institutional Shares of certain money market funds managed by BGFA, the Funds’ investment adviser, including the Government Money Market Fund (“GMMF”), Institutional Money Market Fund (“IMMF”), Prime Money Market Fund (“PMMF”) and Treasury Money Market Fund (“TMMF”) of Barclays Global Investors Funds. The GMMF, IMMF, PMMF and TMMF are feeder funds in a master/feeder fund structure that invest substantially all of their assets in the Government Money Market Master Portfolio, Money Market Master Portfolio, Prime Money Market Master Portfolio and Treasury Money Market Master Portfolio (collectively, the “Money Market Master
| NOTES TO FINANCIAL STATEMENTS |
55 |
Table of Contents
Notes to Financial Statements (Continued)
iSHARES® TRUST
Portfolios”), respectively, which are also managed by BGFA. While the GMMF, IMMF, PMMF and TMMF do not directly charge an investment advisory fee, the Money Market Master Portfolios in which they invest do charge an investment advisory fee. Income distributions from the GMMF, IMMF, PMMF and TMMF are declared daily and paid monthly from net investment income. Income distributions earned by the Funds from temporary cash investments are recorded as interest from affiliated issuers in the accompanying Statements of Operations. Income distributions earned by the Funds from the investment of securities lending collateral, if any, are included in securities lending income in the accompanying Statements of Operations.
Each Fund may invest its securities lending cash collateral, if any, in the BGI Cash Premier Fund LLC (“Premier Fund”), an affiliated private money market fund managed by BGFA. Although the Premier Fund is not registered as an investment company under the 1940 Act, it intends to operate as a money market fund in compliance with Rule 2a-7 under the 1940 Act. See Note 5 for additional information regarding the Premier Fund.
For the year ended July 31, 2007, certain Funds had direct investments (exclusive of short-term investments) in issuers of which BGFA is an affiliate or issuers of which the Fund owns 5% or more of the outstanding voting securities as follows:
| iShares Index Fund and Name of Affiliated Issuer |
Number of Shares Held Beginning of Year (in 000s) |
Gross Additions (in 000s) |
Gross Reductions (in 000s) |
Number of Shares Held End of Year (in 000s) |
Value at End of Year |
Dividend Income |
Net Realized Gain | ||||||||||
| MSCI EAFE |
|||||||||||||||||
| Barclays PLC |
16,388 | 4,906 | 173 | 21,121 | $ | 300,004,443 | $ | 10,959,992 | $ | 265,622 | |||||||
| MSCI EAFE Value |
|||||||||||||||||
| Barclays PLC |
396 | 733 | 7 | 1,122 | 15,934,577 | 420,348 | 5,112 | ||||||||||
As of July 31, 2007, certain trustees and officers of the Trust are also officers of BGI and/or BGFA.
3. INVESTMENT PORTFOLIO TRANSACTIONS
Purchases and sales of investments (excluding in-kind transactions and short-term investments) for the year ended July 31, 2007 were as follows:
| iShares Index Fund | Purchases | Sales | ||||
| FTSE/Xinhua China 25 |
$ | 1,661,550,864 | $ | 1,601,663,218 | ||
| MSCI EAFE |
2,251,292,749 | 1,821,549,672 | ||||
| MSCI EAFE Growth |
120,957,821 | 111,065,206 | ||||
| MSCI EAFE Value |
232,278,209 | 166,465,414 | ||||
| 56 |
2007 iSHARES ANNUAL REPORT TO SHAREHOLDERS |
Table of Contents
Notes to Financial Statements (Continued)
iSHARES® TRUST
In-kind transactions (see Note 4) for the year ended July 31, 2007 were as follows:
| iShares Index Fund | In-kind Purchases |
In-kind Sales | ||||
| FTSE/Xinhua China 25 |
$ | 2,915,401,162 | $ | 2,660,660,695 | ||
| MSCI EAFE |
10,006,570,792 | 98,269,698 | ||||
| MSCI EAFE Growth |
181,546,837 | – | ||||
| MSCI EAFE Value |
704,916,855 | 46,335,087 | ||||
4. CAPITAL SHARE TRANSACTIONS
Capital shares are issued and redeemed by each Fund only in Creation Units or multiples thereof. Except when aggregated in Creation Units, shares of each Fund are not redeemable. Transactions in capital shares for each Fund are disclosed in detail in the Statements of Changes in Net Assets.
The consideration for the purchase of Creation Units of a Fund generally consists of the in-kind deposit of a designated portfolio of equity securities, which constitutes a substantial replication, or a portfolio sampling representation, of the securities involved in the relevant Fund’s underlying index and an amount of cash. Investors purchasing and redeeming Creation Units pay a purchase transaction fee and a redemption transaction fee directly to State Street, the administrator, to offset transfer and other transaction costs associated with the issuance and redemption of Creation Units.
5. LOANS OF PORTFOLIO SECURITIES
Each Fund may lend its investment securities to approved borrowers, such as brokers, dealers and other financial institutions. The borrower pledges and maintains with the Fund collateral consisting of cash, an irrevocable letter of credit issued by a bank, or securities issued or guaranteed by the U.S. government. The initial collateral received by each Fund is required to have a value of at least 102% of the market value of the loaned securities for securities traded on U.S. exchanges and a value of at least 105% for all other securities. The collateral is maintained thereafter, at a value equal to at least 100% of the current market value of the securities on loan. The risks to the Funds of securities lending are that the borrower may not provide additional collateral when required or may not return the securities when due.
During the year ended July 31, 2007, the Funds received cash as collateral for securities loaned. The cash collateral received was invested in a joint account and in the Premier Fund. Pursuant to an exemptive order issued by the SEC, a portion of the cash collateral received was invested in a joint account with other investment funds managed by BGFA. The joint account invests in securities with remaining maturities of 397 days or less, repurchase agreements and money market mutual funds, including money market funds managed by BGFA. Repurchase agreements are fully collateralized by U.S. government securities or non-U.S. government debt securities. The Premier Fund seeks to achieve its investment objective by investing in a portfolio of high-quality, short-term fixed-income instruments, including money market funds (which may be managed by BGFA or its affiliate) and other instruments that, at the time of investment, have remaining maturities of 397 calendar days or less from the date of acquisition.
The market value of the securities on loan as of July 31, 2007 and the value of the related collateral are disclosed in the Statements of Assets and Liabilities. Securities lending income, as disclosed in the Funds’ Statements of Operations, represents the income earned from the investment of the cash collateral, net of rebates paid to, or fees paid by, borrowers and less the fees paid to BGI as securities lending agent.
| NOTES TO FINANCIAL STATEMENTS |
57 |
Table of Contents
Notes to Financial Statements (Continued)
iSHARES® TRUST
6. RECENTLY ISSUED ACCOUNTING PRONOUNCEMENTS
In June 2006, the Financial Accounting Standards Board (“FASB”) issued FASB Interpretation No. 48 (“FIN 48”), “Accounting for Uncertainty in Income Taxes – an interpretation of FASB Statement No. 109.” FIN 48 clarifies the accounting for uncertainty in income taxes recognized in accordance with FASB Statement No. 109, “Accounting for Income Taxes.” This interpretation prescribes a recognition threshold and measurement attribute for the financial statement recognition and measurement of a tax position taken or expected to be taken in a tax return. It also provides guidance on de-recognition, classification, interest and penalties, accounting in interim periods, disclosure and transition. FIN 48 is effective for fiscal years beginning after December 15, 2006. The SEC staff has stated that it would not object if a fund does not implement FIN 48 in its NAV calculation until the date of the fund’s last NAV calculation in the first required financial statement reporting period for its fiscal year beginning after December 15, 2006. The Trust is currently evaluating the impact of applying the various provisions of FIN 48.
In September 2006, FASB issued Statement of Financial Accounting Standards No. 157 (“FAS 157”), “Fair Value Measurements.” FAS 157 defines fair value, establishes a framework for measuring fair value in accordance with generally accepted accounting principles and expands disclosure about fair value measurements. FAS 157 is effective for fiscal years beginning after November 15, 2007. The Trust is currently evaluating the impact the adoption of FAS 157 will have on the Funds’ financial statement disclosures.
| 58 |
2007 iSHARES ANNUAL REPORT TO SHAREHOLDERS |
Table of Contents
Report of Independent Registered Public Accounting Firm
To the Shareholders and Board of Trustees of
iShares Trust:
In our opinion, the accompanying statements of assets and liabilities, including the schedules of investments, and the related statements of operations and of changes in net assets and the financial highlights present fairly, in all material respects, the financial position of the iShares FTSE/Xinhua China 25 Index Fund, iShares MSCI EAFE Index Fund, iShares MSCI EAFE Growth Index Fund and iShares MSCI EAFE Value Index Fund, each a fund of iShares Trust (the “Funds”), at July 31, 2007, the results of each of their operations, the changes in each of their net assets and their financial highlights for each of the periods presented, in conformity with accounting principles generally accepted in the United States of America. These financial statements and financial highlights (hereafter referred to as “financial statements”) are the responsibility of the Funds’ management; our responsibility is to express an opinion on these financial statements based on our audits. We conducted our audits of these financial statements in accordance with the standards of the Public Company Accounting Oversight Board (United States). Those standards require that we plan and perform the audits to obtain reasonable assurance about whether the financial statements are free of material misstatement. An audit includes examining, on a test basis, evidence supporting the amounts and disclosures in the financial statements, assessing the accounting principles used and significant estimates made by management, and evaluating the overall financial statement presentation. We believe that our audits, which included confirmation of securities at July 31, 2007 by correspondence with the custodian and brokers, provide a reasonable basis for our opinion.
PricewaterhouseCoopers LLP
San Francisco, California
September 21, 2007
| REPORT OF INDEPENDENT REGISTERED PUBLIC ACCOUNTING FIRM |
59 |
Table of Contents
iSHARES® TRUST
For the fiscal year ended July 31, 2007, certain Funds earned foreign source income and paid foreign taxes which they intend to pass through to their shareholders pursuant to Section 853 of the Internal Revenue Code (the “Code”) as follows:
Under Section 854(b)(2) of the Code, the Funds hereby designate the following maximum amounts as qualified dividend income for purposes of the maximum rate under Section 1(h)(11) of the Code for the fiscal year ended July 31, 2007:
In January 2008, shareholders will receive Form 1099-DIV which will include their share of qualified dividend income distributed during the calendar year 2007. Shareholders are advised to check with their tax advisers for information on the treatment of these amounts on their income tax returns.
| 60 |
2007 iSHARES ANNUAL REPORT TO SHAREHOLDERS |
Table of Contents
Board Review and Approval of Investment Advisory Contract (Unaudited)
iSHARES® TRUST
Under Section 15(c) of the Investment Company Act of 1940 (the “1940 Act”), the Trust’s Board of Trustees (the “Board”), including a majority of Trustees who are not “interested persons” of the Trust (as that term is defined in the 1940 Act) (the “Independent Trustees”), is required annually to consider the Investment Advisory Contract between the Trust and BGFA (the “Advisory Contract”) on behalf of the Funds. As required by Section 15(c), the Board requested and BGFA provided such information as the Board deemed reasonably necessary to evaluate the terms of the Advisory Contract. At a meeting held on June 13, 2007, the Board approved the selection of BGFA and the continuance of the Advisory Contract, based on its review of qualitative and quantitative information provided by BGFA. In selecting BGFA and approving the Advisory Contract for the Funds, the Board, including the Independent Trustees, advised by their independent counsel, considered the following factors, none of which was controlling, and made the following conclusions:
NATURE, EXTENT AND QUALITY OF SERVICES PROVIDED BY BGFA
The Board determined that there would be no diminution in the scope of services required of BGFA under the Advisory Contract for the coming year as compared to the scope of services provided by BGFA over the past year. In reviewing the scope of these services, the Board considered BGFA’s investment philosophy and experience, noting that BGFA and its affiliates have committed significant resources over time, including over the past year, including investment in technology and increasing the number of their employees supporting the Funds. The Board also considered BGFA’s compliance program and its compliance record with respect to the Funds. In that regard, the Board noted that BGFA reports to the Board about portfolio management and compliance matters on a periodic basis in connection with regularly scheduled meetings of the Board, and has made appropriate officers available as needed to provide further assistance with these matters. The Board also reviewed the background and experience of the persons responsible for the day-to-day management of the Funds. In addition to the above considerations, the Board considered BGFA’s investment processes and strategies, and matters related to BGFA’s portfolio transaction policies and procedures. The Board also reviewed the performance of other series of registered investment companies with substantially similar investment objectives and strategies as the iShares MSCI EAFE Index Fund (the “EAFE Fund”) for which BGFA provides investment advisory services, noting that BGFA generally performed in line with its various benchmarks over relevant periods. The Board further noted that BGFA does not serve as investment adviser for any other series of registered investment companies with substantially similar investment objectives and strategies as the iShares FTSE/Xinhua China 25 Index, iShares MSCI EAFE Value Index and iShares MSCI EAFE Growth Index Funds; therefore, comparative performance information was generally not available for those particular Funds. The Board also noted that the Funds had met their investment objectives consistently since their respective inception dates. Based on review of this information, the Board concluded that the nature, extent and quality of services to be provided by BGFA to the Funds under the Advisory Contract were appropriate and mitigated in favor of the Board’s approval of the Advisory Contract for the coming year.
FUNDS’ EXPENSES AND PERFORMANCE OF THE FUNDS
The Board reviewed statistical information prepared by Lipper Inc. (“Lipper”), an independent provider of investment company data, regarding the expense ratio components, including advisory fees, waivers/reimbursements, and gross and net total expenses of each Fund in comparison with the same information for other funds registered under the 1940 Act objectively selected solely by Lipper as comprising each Fund’s applicable peer group (the “Lipper Group”). In addition, the Board reviewed statistical information prepared by Lipper regarding the performance of each Fund for the one-, three-, and five-year and “last quarter” periods ended March 31, 2007, as applicable, and a comparison of each Fund’s performance to that of the funds in its Lipper Group for the same periods. Because there are few, if any, exchange traded funds or index funds that track indexes similar to those tracked by the Funds, the Lipper Groups included in part, at the request of BGFA, mutual funds, closed-end funds, exchange traded funds, and funds with differing investment objective classifications, investment focuses and other characteristics (e.g., actively managed funds and funds sponsored by “at cost” service providers). In support of its review of the statistical information, the Board was provided with a detailed description of the methodology used by Lipper to determine the applicable Lipper Groups and to prepare this information. The Board further noted that due to the limitations in providing
| BOARD REVIEW AND APPROVAL OF INVESTMENT ADVISORY CONTRACT |
61 |
Table of Contents
Board Review and Approval of Investment Advisory Contract (Unaudited) (Continued)
iSHARES® TRUST
comparable funds in the various Lipper Groups, the statistical information may or may not provide meaningful direct comparisons to the Funds. The Board noted that most of the Funds generally performed in line with the funds in their respective Lipper Groups over the relevant periods; however, certain of the Funds may have underperformed or outperformed funds in their respective Lipper Groups over such periods. In considering this information, the Board noted that the Lipper Groups include funds that may have different investment objectives and/or benchmarks from the Funds. In addition, the Board noted that each Fund seeks to track an index and that during the prior year the Board received periodic reports on the Funds’ performance in comparison with their relevant benchmark indexes. Such comparative performance information was also considered by the Board.
The Board also noted that the investment advisory fees and overall expenses for the Funds were generally lower than the median or average investment advisory fee rates and overall expense components of the funds in their respective Lipper Groups. The Board also reviewed statistical information from Lipper displaying the effects of the current breakpoints in the investment advisory fee rates for the EAFE Fund and the effects of the proposed breakpoints in the investment advisory fee rates for the iShares FTSE/Xinhua China 25 Index Fund (the “Xinhua Fund”) (as discussed below) at various assets levels of such Funds as compared to their Lipper Group. Based on this review, the Board concluded that the investment advisory fees and expense levels and the historical performance of each Fund, as managed by BGFA, as compared to the investment advisory fees and expense levels and performance of the funds in the relevant Lipper Group, were satisfactory for the purposes of approving the Advisory Contract for the coming year.
COSTS OF SERVICES PROVIDED TO FUNDS AND PROFITS REALIZED BY BGFA AND AFFILIATES
The Board reviewed information about the profitability to BGFA of the Funds based on the fees payable to BGFA and its affiliates (including fees under the Advisory Contract), and all other sources of revenue and expense to BGFA and its affiliates for the last calendar year. The Board discussed the sources of direct and ancillary revenue with management, including the revenues to BGI from securities lending by the Trust (including any securities lending by the Funds). The Board also discussed BGFA’s profit margin as reflected in the Funds’ profitability analysis and reviewed information regarding economies of scale (as discussed below). Based on this review, the Board concluded that the profits to be realized by BGFA and its affiliates under the Advisory Contract and from other relationships between the Funds and BGFA and/or its affiliates, if any, were within the range the Board considered reasonable and appropriate.
ECONOMIES OF SCALE
In connection with its review of the Funds’ profitability analysis, the Board reviewed information regarding economies of scale or other efficiencies that may result from increases in the Funds’ assets. The Board was also presented with materials regarding the current breakpoints in the investment advisory fee rates for the EAFE Fund and the proposed breakpoints in the investment advisory fee rates at certain asset levels of the Xinhua Fund. The Board noted that the Advisory Contract did not provide for any breakpoints in the other Funds’ investment advisory fee rates as the assets of the Funds increase. However, the Board further noted that possible future economies of scale for the other Funds had been taken into consideration by fixing the investment advisory fees at rates at the lower end of the marketplace, effectively giving Fund shareholders, from inception, the benefits of the lower average fee shareholders would have received from a fee structure with declining breakpoints where the initial fee was higher. The Board discussed the substantial growth in assets of certain iShares funds, including the EAFE Fund, over the last few years. The Board also reviewed BGFA’s historic profitability as investment adviser to the iShares fund complex and noted that BGFA had made a significant investment in the iShares funds and had incurred operating losses during earlier years when the iShares funds, including the Funds, had not yet reached scale. In light of this history, the Board determined that the current breakpoints for the EAFE Fund and the proposed breakpoints for the Xinhua Fund were appropriate and warranted for these Funds but that reductions in fee rates or additions of breakpoints were not warranted at this juncture for the other Funds. Based on this review, as well as the discussions described above in connection with the Lipper Group comparisons, the Board, recognizing its responsibility to consider this issue at least annually, concluded that the structure of the investment advisory fees, with
| 62 |
2007 iSHARES ANNUAL REPORT TO SHAREHOLDERS |
Table of Contents
Board Review and Approval of Investment Advisory Contract (Unaudited) (Continued)
iSHARES® TRUST
the current breakpoints for the EAFE Fund and the proposed breakpoints for the Xinhua Fund, reflects the current sharing and potential further sharing of economies of scale with the Funds’ shareholders.
FEES AND SERVICES PROVIDED FOR OTHER COMPARABLE FUNDS/ACCOUNTS MANAGED BY BGFA AND ITS AFFILIATES
The Board received and considered information regarding the Funds’ annual investment advisory fee rates under the Advisory Contract in comparison to the investment advisory/management fee rates for other funds/accounts for which BGFA or BGI, an affiliate of BGFA, provides investment advisory/management services, including other funds registered under the 1940 Act, collective funds and separate accounts (together, the “Other Accounts”). The Board noted that comparative investment advisory/management fee information was available for the EAFE Fund but not the other Funds, as BGFA and its affiliates do not manage any Other Accounts with substantially similar investment objectives and strategies as those Funds. However, the Board also noted that BGFA provided the Board with general information regarding how the level of services provided to the Other Accounts differed from the level of services provided to the Funds. In reviewing the comparative investment advisory/management fee information for the EAFE Fund, the Board considered the general structure of investment advisory/management fees in relation to the nature and extent of services provided to the EAFE Fund in comparison with the nature and extent of services provided to the Other Accounts, including, among other things, the level of complexity in managing the EAFE Fund and the Other Accounts under differing regulatory requirements and client guidelines. The Board noted that the investment advisory fee rate for the EAFE Fund under the Advisory Contract was generally higher than the investment advisory/management fee rates for the Other Accounts for which BGFA or BGI provides investment advisory/management services, but that the differences appeared to be attributable to, among other things, the type and level of services provided and/or the asset levels of the Other Accounts. Based on this review, the Board determined that the investment advisory fee rates under the Advisory Contract, with the current breakpoints for the EAFE Fund and the proposed breakpoints for the Xinhua Fund, do not constitute fees that are so disproportionately large as to bear no reasonable relationship to the services rendered and that could not have been the product of arm’s-length bargaining, and concluded that the investment advisory fee rates under the Advisory Contract are fair and reasonable.
OTHER BENEFITS TO BGFA AND/OR ITS AFFILIATES
The Board reviewed any ancillary revenue received by BGFA and/or its affiliates in connection with the services provided to the Funds by BGFA, such as any payment of revenue to BGI, the Trust’s securities lending agent, for loaning any portfolio securities, and payment of advisory fees and/or administration fees to BGFA and BGI in connection with any investments by the Funds in other funds for which BGFA provides investment advisory services and/or BGI provides administration services. The Board noted that BGFA does not use soft dollars or consider the value of research or other services that may be provided to BGFA (including its affiliates) in selecting brokers for portfolio transactions for the Funds. The Board further noted that any portfolio transactions on behalf of the Funds placed through a BGFA affiliate are reported to the Board pursuant to Rule 10f-3 and Rule 17e-1, as applicable, under the 1940 Act. The Board concluded that any such ancillary benefits would not be disadvantageous to the Funds’ shareholders.
Based on this analysis, the Board determined that the Advisory Contract, including the investment advisory fee rates, with the current breakpoints for the EAFE Fund and the proposed breakpoints for the Xinhua Fund, is fair and reasonable in light of all relevant circumstances, and concluded that it is in the best interest of the Funds and their shareholders to approve the Advisory Contract, with the fee schedule to the Advisory Contract as proposed to be amended to reflect the addition of breakpoints for the Xinhua Fund, for the coming year.
| BOARD REVIEW AND APPROVAL OF INVESTMENT ADVISORY CONTRACT |
63 |
Table of Contents
Supplemental Information (Unaudited)
iSHARES® TRUST
The tables that follow present information about the differences between the daily market price on secondary markets for shares of a Fund and that Fund’s net asset value. Net asset value, or “NAV,” is the price per share at which each Fund issues and redeems shares. It is calculated in accordance with the standard formula for valuing mutual fund shares. The “Market Price” of each Fund generally is determined using the midpoint between the highest bid and the lowest offer on the stock exchange on which the shares of such Fund is listed for trading, as of the time that the Fund’s NAV is calculated. Each Fund’s Market Price may be at, above or below its NAV. The NAV of each Fund will fluctuate with changes in the market value of its portfolio holdings. The Market Price of each Fund will fluctuate in accordance with changes in its NAV, as well as market supply and demand.
Premiums or discounts are the differences (expressed as a percentage) between the NAV and Market Price of a Fund on a given day, generally at the time NAV is calculated. A premium is the amount that a Fund is trading above the reported NAV, expressed as a percentage of the NAV. A discount is the amount that a Fund is trading below the reported NAV, expressed as a percentage of the NAV.
The following information shows the frequency distributions of premiums and discounts for each of the Funds included in this report. The information shown for each Fund is for five calendar years (or for each full calendar quarter completed after the inception date of such Fund if less than five years) through the date of the most recent calendar quarter-end. The specific periods covered for each Fund are disclosed in the table for such Fund.
Each line in the table shows the number of trading days in which the Fund traded within the premium/discount range indicated. The number of trading days in each premium/discount range is also shown as a percentage of the total number of trading days in the period covered by each table. All data presented here represents past performance, which cannot be used to predict future results.
iShares FTSE/Xinhua China 25 Index Fund
Period Covered: January 1, 2005 through June 30, 2007
| Premium/Discount Range |
Number of Days |
Percentage of Total Days |
|||
| Greater than 4.0% and Less than 4.5% |
2 | 0.32 | % | ||
| Greater than 3.5% and Less than 4.0% |
1 | 0.16 | |||
| Greater than 3.0% and Less than 3.5% |
1 | 0.16 | |||
| Greater than 2.5% and Less than 3.0% |
4 | 0.64 | |||
| Greater than 2.0% and Less than 2.5% |
5 | 0.80 | |||
| Greater than 1.5% and Less than 2.0% |
17 | 2.71 | |||
| Greater than 1.0% and Less than 1.5% |
64 | 10.21 | |||
| Greater than 0.5% and Less than 1.0% |
158 | 25.20 | |||
| Between 0.5% and –0.5% |
248 | 39.54 | |||
| Less than –0.5% and Greater than –1.0% |
65 | 10.37 | |||
| Less than –1.0% and Greater than –1.5% |
30 | 4.78 | |||
| Less than –1.5% and Greater than –2.0% |
13 | 2.07 | |||
| Less than –2.0% and Greater than –2.5% |
8 | 1.28 | |||
| Less than –2.5% and Greater than –3.0% |
4 | 0.64 | |||
| Less than –3.0% and Greater than –3.5% |
2 | 0.32 | |||
| Less than –3.5% |
5 | 0.80 | |||
| 627 | 100.00 | % | |||
| 64 |
2007 iSHARES ANNUAL REPORT TO SHAREHOLDERS |
Table of Contents
Supplemental Information (Unaudited) (Continued)
iSHARES® TRUST
iShares MSCI EAFE Index Fund
Period Covered: January 1, 2002 through June 30, 2007
| Premium/Discount Range |
Number of Days |
Percentage of Total Days |
|||
| Greater than 2.5% and Less than 3.0% |
4 | 0.29 | % | ||
| Greater than 2.0% and Less than 2.5% |
3 | 0.22 | |||
| Greater than 1.5% and Less than 2.0% |
17 | 1.23 | |||
| Greater than 1.0% and Less than 1.5% |
104 | 7.53 | |||
| Greater than 0.5% and Less than 1.0% |
395 | 28.60 | |||
| Between 0.5% and –0.5% |
762 | 55.18 | |||
| Less than –0.5% and Greater than –1.0% |
75 | 5.43 | |||
| Less than –1.0% and Greater than –1.5% |
17 | 1.23 | |||
| Less than –1.5% and Greater than –2.0% |
3 | 0.22 | |||
| Less than –2.0% and Greater than –2.5% |
1 | 0.07 | |||
| 1,381 | 100.00 | % | |||
iShares MSCI EAFE Growth Index Fund
Period Covered: October 1, 2005 through June 30, 2007
| Premium/Discount Range |
Number of Days |
Percentage of Total Days |
|||
| Greater than 2.5% and Less than 3.0% |
1 | 0.23 | % | ||
| Greater than 2.0% and Less than 2.5% |
1 | 0.23 | |||
| Greater than 1.5% and Less than 2.0% |
1 | 0.23 | |||
| Greater than 1.0% and Less than 1.5% |
25 | 5.72 | |||
| Greater than 0.5% and Less than 1.0% |
129 | 29.52 | |||
| Between 0.5% and –0.5% |
267 | 61.09 | |||
| Less than –0.5% and Greater than –1.0% |
10 | 2.29 | |||
| Less than –1.0% and Greater than –1.5% |
2 | 0.46 | |||
| Less than –1.5% |
1 | 0.23 | |||
| 437 | 100.00 | % | |||
iShares MSCI EAFE Value Index Fund
Period Covered: October 1, 2005 through June 30, 2007
| Premium/Discount Range |
Number of Days |
Percentage of Total Days |
|||
| Greater than 2.5% and Less than 3.0% |
1 | 0.23 | % | ||
| Greater than 2.0% and Less than 2.5% |
1 | 0.23 | |||
| Greater than 1.5% and Less than 2.0% |
5 | 1.14 | |||
| Greater than 1.0% and Less than 1.5% |
24 | 5.49 | |||
| Greater than 0.5% and Less than 1.0% |
137 | 31.35 | |||
| Between 0.5% and –0.5% |
253 | 57.89 | |||
| Less than –0.5% and Greater than –1.0% |
12 | 2.75 | |||
| Less than –1.0% and Greater than –1.5% |
2 | 0.46 | |||
| Less than –1.5% |
2 | 0.46 | |||
| 437 | 100.00 | % | |||
| SUPPLEMENTAL INFORMATION |
65 |
Table of Contents
Trustee and Officer Information (Unaudited)
iSHARES® TRUST
The Board of Trustees has responsibility for the overall management and operations of the Trust, including general supervision of the duties performed by BGFA and other service providers. Each Trustee serves until he or she resigns, is removed, dies, retires or becomes incapacitated. Each Officer serves until he or she resigns, is removed, dies, retires or becomes disqualified.
iShares Trust, iShares, Inc., Barclays Global Investors Funds (“BGIF”), Master Investment Portfolio (“MIP”) and Barclays Foundry Investment Trust (“BFIT”) are considered to be members of the same fund complex, as defined in Form N-1A under the 1940 Act. Each Trustee of iShares Trust also serves as a Director for iShares, Inc. and oversees 135 portfolios within the fund complex. In addition, Lee T. Kranefuss serves as a Trustee for BGIF, MIP and BFIT and oversees an additional 24 portfolios within the fund complex.
Unless otherwise noted in the tables below, the address for each Trustee and Officer is c/o Barclays Global Investors, N.A., 45 Fremont Street, San Francisco, California 94105. The Board has designated George G.C. Parker as its Lead Independent Trustee. Additional information about the Funds’ Trustees and Officers may be found in the Funds’ combined Statement of Additional Information, which is available without charge, upon request, by calling toll-free 1-800-474-2737.
Interested Trustees and Officers
| Name, Year of Birth | Position(s), Length of Service |
Principal Occupation(s) During Past 5 Years |
Other Directorships Held | |||
| *Lee T. Kranefuss, 1961 |
Trustee and Chairman (since 2003). | Chief Executive Officer of the Intermediary Investor and Exchange Traded Products Business of BGI (since 2003); Director of Barclays Global Fund Advisors (since 2005); Director, President and Chief Executive Officer of Barclays Global Investors International, Inc. (since 2005); Director, Chairman and Chief Executive Officer of Barclays Global Investors Services (since 2005); Chief Executive Officer of the Individual Investor Business of BGI (1999-2003). | Director (since 2003) of iShares, Inc.; Trustee (since 2001) of BGlF and MIP; Trustee (since 2007) of BFIT; Director (since 2003) of BGI Cayman Prime Money Market Fund, Ltd. | |||
| *John E. Martinez, 1962 |
Trustee (since 2003). | Co-Chief Executive Officer of Global Index and Markets Group of BGI (2001-2003); Chairman of Barclays Global Investors Services (2000-2003). | Director (since 2003) of iShares, Inc.; Director (since 2005) of Real Estate Equity Exchange. | |||
| * | Lee T. Kranefuss and John E. Martinez are deemed to be “interested persons” (as defined in the 1940 Act) of the Trust due to their affiliations with BGFA, the Funds’ investment adviser, BGI, the parent company of BGFA, and Barclays Global Investors Services, an affiliate of BGFA and BGI. |
| 66 |
2007 iSHARES ANNUAL REPORT TO SHAREHOLDERS |
Table of Contents
Trustee and Officer Information (Unaudited) (Continued)
iSHARES® TRUST
Independent Trustees
| Name, Year of Birth | Position(s), Length of Service |
Principal Occupation(s) During Past 5 Years |
Other Directorships Held | |||
| George G.C. Parker, 1939 |
Trustee (since 2000); Lead Independent Trustee (since 2006). |
Dean Witter Distinguished Professor of Finance, Emeritus (since 1994); Formerly Senior Associate Dean for Academic Affairs, Director of MBA Program, Stanford University: Graduate School of Business (1993-2001). | Director (since 2002) of iShares, Inc.; Director (since 1996) of Continental Airlines, Inc.; Director (since 1995) of Community First Financial Group; Director (since 1999) of Tejon Ranch Company; Director (since 2003) of First Republic Bank; Director (since 2004) of Threshold Pharmaceuticals; Director (since 2007) of NETGEAR, Inc. | |||
| Cecilia H. Herbert, 1949 |
Trustee (since 2005). |
Member of Finance Council, Archdiocese of San Francisco (1999-2006); Chair of Investment Committee, Archdiocese of San Francisco (1994-2005); Director (since 1998) and President (since 2007) of the Board of Directors, Catholic Charities CYO; Trustee (2004-2005) of Pacific Select Funds; Trustee (1992-2003) of the Montgomery Funds; Trustee (since 2002) and chair of Finance and Investment Committee (since 2006) of the Thacher School. | Director (since 2005) of iShares, Inc. | |||
| Charles A. Hurty, 1943 |
Trustee (since 2005). |
Retired; Partner, KPMG LLP (1968-2001). | Director (since 2005) of iShares, Inc.; Director (since 2002) of GMAM Absolute Return Strategy Fund (1 portfolio); Director (since 2002) of Citigroup Alternative Investments Multi-Adviser Hedge Fund Portfolios LLC (1 portfolio); Director (since 2005) of CSFB Alternative Investments Fund (6 portfolios). | |||
| John E. Kerrigan, 1955 |
Trustee (since 2005). |
Chief Investment Officer, Santa Clara University (since 2002); Managing Director, Merrill Lynch (1994-2002). | Director (since 2005) of iShares, Inc.; Member (since 2004) of Advisory Council for Commonfund Distressed Debt Partners II. | |||
| TRUSTEE AND OFFICER INFORMATION |
67 |
Table of Contents
Trustee and Officer Information (Unaudited) (Continued)
iSHARES® TRUST
Independent Trustees (Continued)
| Name, Year of Birth | Position(s), Length of Service |
Principal Occupation(s) During Past 5 Years |
Other Directorships Held | |||
| Robert H. Silver, 1955 |
Trustee (since 2007). |
President and Co-Founder of The Bravitas Group, Inc. (since 2006); Member, Non- Investor Advisory Board of Russia Partners II, LP (since 2006); President and Chief Operating Officer (2003-2005) and Director (1999-2005) of UBS Financial Services, Inc.; President and Chief Executive Officer of UBS Services USA, LLC (1999-2005); Managing Director, UBS America, Inc. (2000-2005); Director and Vice Chairman of the YMCA of Greater NYC (since 2001); Broadway Producer (since 2006). | Director (since 2007) of iShares, Inc.; Director and Member (since 2006) of the Audit and Compensation Committee of EPAM Systems, Inc. | |||
| Officers
| ||||||
| Name, Year of Birth | Position(s), Length of Service |
Principal Occupation(s) During Past 5 Years |
Other Directorships Held | |||
| Michael A. Latham, 1965 |
President (since 2007). |
Head of Americas iShares (since 2007); Chief Operating Officer of the Intermediary Investor and Exchange Traded Products Business of BGI (2003-2007); Director and Chief Financial Officer of Barclays Global Investors International, Inc. (since 2005); Director of Mutual Fund Delivery in the U.S. Individual Investor Business of BGI (2000-2003). | None. | |||
| Geoffrey D. Flynn, 1956 |
Treasurer and Chief Financial Officer (since 2007). | Director of Mutual Fund Operations of BGI (since 2007); President of Van Kampen Investor Services (2003-2007); Managing Director of Morgan Stanley (2002-2007); President of Morgan Stanley Trust, FSB (2002- 2007). | None. | |||
| 68 |
2007 iSHARES ANNUAL REPORT TO SHAREHOLDERS |
Table of Contents
Trustee and Officer Information (Unaudited) (Continued)
iSHARES® TRUST
Officers (Continued)
| Name, Year of Birth | Position(s), Length of Service |
Principal Occupation(s) During Past 5 Years | Other Directorships Held | |||
| Eilleen M. Clavere, 1952 |
Secretary (since 2007). |
Head of Legal Administration of Intermediary Investor Business of BGI (since 2006); Legal Counsel and Vice President of Atlas Funds, Atlas Advisers, Inc. and Atlas Securities, Inc. (2005-2006); Counsel of Kirkpatrick & Lockhart LLP (2001-2005). | None. | |||
| Ira P. Shapiro, 1963 |
Vice President and Chief Legal Officer (since 2007). |
Associate General Counsel of BGI (since 2004); First Vice President of Merrill Lynch Investment Managers (1993-2004). | None. | |||
| Amy Schioldager, 1962 |
Executive Vice President (since 2007). |
Head of U.S. Indexing of BGI (since 2006); Head of Domestic Equity Portfolio Management of BGI (2001-2006). | None. | |||
| H. Michael Williams, 1960 |
Executive Vice President (since 2007). |
Head of Global Index and Markets Group of BGI (since 2006); Global Head of Securities Lending of BGI (2002-2006). | Trustee (since 2007) of BFIT. | |||
| Patrick O’Connor, 1967 |
Vice President (since 2007). |
Head of iShares Portfolio Management of BGI (since 2006); Senior Portfolio Manager of BGI (1999-2006). | None. | |||
| Lee Sterne, 1965 |
Vice President (since 2007). |
Senior Portfolio Manager of BGI (since 2004); Portfolio Manager of BGI (2001-2004). | None. | |||
| Matt Tucker, 1972 |
Vice President (since 2007). |
Head of U.S. Fixed-Income Investment Solutions of BGI (since 2005); Fixed- Income Investment Strategist of BGI (2003-2005); Fixed-Income Portfolio Manager of BGI (1997-2003). | None. | |||
| TRUSTEE AND OFFICER INFORMATION |
69 |
Table of Contents
Notes:
| 70 |
2007 iSHARES ANNUAL REPORT TO SHAREHOLDERS |
Table of Contents
Notes:
| NOTES |
71 |
Table of Contents
The following is a list of iShares Funds being offered, along with their respective exchange trading symbols. Please call 1-800-iShares (1-800-474-2737) to obtain a prospectus for any iShares Fund. The prospectus contains more complete information, including charges, expenses, investment objectives and risk factors that should be carefully considered to determine if the Fund(s) are an appropriate investment for you. Read the prospectus(es) carefully before investing. Investing involves risk, including possible loss of principal.
iShares® is a registered trade mark of Barclays Global Investors, N.A. The iShares Funds are not sponsored, endorsed or issued by Lehman Brothers, nor are they sponsored, endorsed, issued, sold or promoted by Cohen & Steers Capital Management, Inc., Dow Jones & Company, Inc., FTSE International Limited (“FTSE”), FTSE/Xinhua Index Limited (“FXI”), iBoxx, KLD Research & Analytics, Inc., Morgan Stanley Capital International, Morningstar, Inc., The NASDAQ Stock Market, Inc., National Association of Real Estate Investment Trusts (“NAREIT”), New York Stock Exchange, Inc., Frank Russell Company, or Standard & Poor’s. None of these companies make any representation regarding the advisability of investing in the iShares Funds. Neither SEI nor BGI, nor any of their affiliates, are affiliated with the companies listed above. iBoxx is a registered trademark of International Index Company Limited. FXI does not make any warranty regarding the FTSE/Xinhua Index. All rights in the FTSE/Xinhua Index vest in FXI. Neither FTSE nor NAREIT makes any warranty regarding the FTSE NAREIT Real Estate 50 Index, FTSE NAREIT Residential Index, FTSE NAREIT Retail Index, FTSE NAREIT Mortgage REITs Index or FTSE NAREIT Industrial/Office Index; all rights vest in NAREIT. “FTSE” is a trade and service mark of London Stock Exchange and The Financial Times; “Xinhua” is a trade and service mark of Xinhua Financial Network Limited. “NAREIT®” is a trademark of NAREIT.
An investment in the Fund(s) is not a deposit of a bank and it is not insured or guaranteed by the Federal Deposit Insurance Corporation or any other government agency.
This advertising section does not constitute part of the 2007 Annual Report.
5241-iS-0907
| 72 |
2007 iSHARES ANNUAL REPORT TO SHAREHOLDERS |
Table of Contents
Table of Contents

Table of Contents
| 1 | ||
| 15 | ||
| 17 | ||
| 17 | ||
| 21 | ||
| 22 | ||
| 23 | ||
| 24 | ||
| 26 | ||
| 47 | ||
| 50 | ||
| 58 | ||
| 65 | ||
| 72 | ||
| 73 | ||
| Board Review and Approval of Investment Advisory Contract (Unaudited) |
74 | |
| 77 | ||
| 80 | ||
| 86 |
Table of Contents
Management’s Discussion of Fund Performance
iSHARES® S&P GSTI™ TECHNOLOGY INDEX FUND
Performance as of July 31, 2007
| Average Annual Total Returns | ||||||||||||||||
| Year Ended 7/31/07 | Five Years Ended 7/31/07 | Inception to 7/31/07 | ||||||||||||||
| NAV | MARKET | INDEX | NAV | MARKET | INDEX | NAV | MARKET | INDEX | ||||||||
| 31.09% | 31.25% | 31.68% | 13.36% | 13.44% | 13.92% | 0.00% | 0.01% | 0.48% | ||||||||
| Cumulative Total Returns | ||||||||||||||||
| Year Ended 7/31/07 | Five Years Ended 7/31/07 | Inception to 7/31/07 | ||||||||||||||
| NAV | MARKET | INDEX | NAV | MARKET | INDEX | NAV | MARKET | INDEX | ||||||||
| 31.09% | 31.25% | 31.68% | 87.23% | 87.87% | 91.84% | (0.02)% | 0.05% | 3.11% | ||||||||
Effective May 9, 2007, the Fund and the Index changed their names from the iShares Goldman Sachs Technology Index Fund and the Goldman Sachs Technology Sector Index to the iShares S&P GSTI™ Technology Index Fund and the S&P GSTI™ Technology Index, respectively. On June 15, 2007, S&P changed the underlying methodology of the Index. Performance shown reflects the Goldman Sachs methodology through June 14, 2007 and the S&P methodology thereafter.
Total returns for the periods since inception are calculated from the inception date of the Fund (3/13/01). “Average Annual Total Returns” represent the average annual change in value of an investment over the periods indicated. “Cumulative Total Returns” represent the total change in value of an investment over the periods indicated.
The Fund’s per share net asset value or “NAV” is the value of one share of the Fund as calculated in accordance with the standard formula for valuing mutual fund shares. The NAV return is based on the NAV of the Fund, and the market return is based on the market price per share of the Fund. The price used to calculate market return (“Market Price”) is determined by using the midpoint between the highest bid and the lowest offer on the stock exchange on which the shares of the Fund are listed for trading, as of the time that the Fund’s NAV is calculated. Since shares of the Fund did not trade in the secondary market until several days after the Fund’s inception, for the period from inception to the first day of secondary market trading in shares of the Fund (3/19/01), the NAV of the Fund is used as a proxy for secondary market trading price to calculate market returns. Market and NAV returns assume that dividends and capital gain distributions have been reinvested in the Fund at Market Price and NAV, respectively.
An index is a statistical composite that tracks a specified financial market or sector. Unlike the Fund, an index does not actually hold a portfolio of securities and therefore does not incur the expenses incurred by the Fund. These expenses negatively impact the performance of the Fund. Also, market returns do not include brokerage commissions that may be payable on secondary market transactions. If brokerage commissions were included, market returns would be lower. The returns shown in the tables above do not reflect the deduction of taxes that a shareholder would pay on fund distributions or the redemption or sale of fund shares. The investment return and principal value of shares of the Fund will vary with changes in market conditions. Shares of the Fund may be worth more or less than their original cost when they are redeemed or sold in the market. The Fund’s past performance is no guarantee of future results.
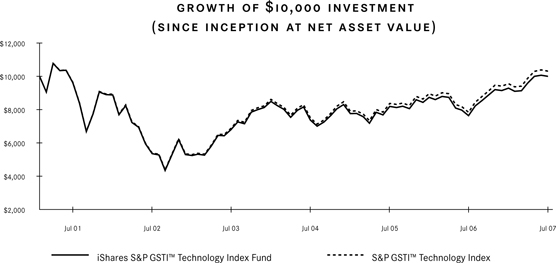
Effective May 9, 2007, the Fund and the Index changed their names from the iShares Goldman Sachs Technology Index Fund and the Goldman Sachs Technology Sector Index to the iShares S&P GSTI™ Technology Index Fund and the S&P GSTI™ Technology Index, respectively. On June 15, 2007, S&P changed the underlying methodology of the Index. Performance shown reflects the Goldman Sachs methodology through June 14, 2007 and the S&P methodology thereafter.
Performance figures assume reinvestment of all dividends and capital gain distributions and do not reflect the deduction of taxes that a shareholder would pay on fund distributions or the redemption of fund shares. An index is a statistical composite that tracks a specified financial market or sector. Unlike the Fund, an index does not actually hold a portfolio of securities and therefore does not incur the expenses incurred by the Fund. These expenses negatively impact the performance of the Fund. The Fund’s past performance is no guarantee of future results.
| MANAGEMENT’S DISCUSSIONS OF FUND PERFORMANCE |
1 |
Table of Contents
Management’s Discussion of Fund Performance (Continued)
iSHARES® S&P GSTI™ TECHNOLOGY INDEX FUND
The iShares S&P GSTI™ Technology Index Fund (the “Fund”) seeks investment results that correspond generally to the price and yield performance, before fees and expenses, of the S&P GSTI™ Technology Index (the “Index”). The Index has been developed as an equity benchmark for U.S.-traded technology-related stocks. The Index includes companies in the following categories: producers of sophisticated computer-related devices; electronics networking and internet services; producers of computer and internet software; consultants for information technology; and providers of computer services. The Fund invests in a representative sample of securities included in the Index that collectively has an investment profile similar to the Index. Due to the use of representative sampling, the Fund may or may not hold all of the securities that are included in the Index. For the 12-month period ended July 31, 2007 (the “reporting period”), the Fund returned 31.09%, while the Index returned 31.68%.
Domestic equity markets delivered solid gains for the reporting period. A pause in interest-rate moves by the Federal Reserve Board (the “Fed”), sound economic growth, slowing inflation, and healthy corporate earnings levels all contributed to equity market strength during the reporting period. After raising rates eight times in the previous reporting period, the Fed held rates steady at 5.25% during the entire 12-month period ended July 31, 2007. Economic growth, as measured by gross domestic product (GDP) growth, continued to be healthy. Although growth slowed somewhat in the first calendar quarter of 2007, GDP growth rebounded in the second quarter to an annualized rate of 3.4%, its highest rate since the first quarter of 2006. Inflation levels provided another source of encouraging data, as core inflation declined during the second quarter of 2007, reaching its lowest level in three years. Corporate earnings levels remained healthy and continued to exceed many analysts’ expectations. Countering those factors, a slowing housing market and concerns surrounding lenders of sub-prime mortgages weighed on market performance in the final months of the reporting period, causing the markets to give back some of the strong gains achieved earlier in the reporting period.
Performance within the technology sector was very strong for the reporting period. Computer companies, chip makers and software producers all benefited from increased levels of spending on computers during the period. Select companies within the sector also enjoyed gains from high consumer demand for innovative new products.
All of the Fund’s ten largest holdings as of July 31, 2007 delivered double-digit gains for the reporting period. The strongest performer was Apple Inc., which introduced its popular iPhone® product during the reporting period. Cisco Systems Inc. and Hewlett-Packard Co. also performed well, as did computer maker International Business Machines Corp. QUALCOMM Inc. posted the most modest gain among the ten largest holdings for the reporting period.
| 2 |
2007 iSHARES ANNUAL REPORT TO SHAREHOLDERS |
Table of Contents
Management’s Discussion of Fund Performance
iSHARES® S&P GSTI™ NETWORKING INDEX FUND
Performance as of July 31, 2007
| Average Annual Total Returns | ||||||||||||||||
| Year Ended 7/31/07 | Five Years Ended 7/31/07 | Inception to 7/31/07 | ||||||||||||||
| NAV | MARKET | INDEX | NAV | MARKET | INDEX | NAV | MARKET | INDEX | ||||||||
| 34.59% | 34.96% | 37.90% | 21.97% | 21.88% | 22.70% | (0.46)% | (0.42)% | 0.18% | ||||||||
| Cumulative Total Returns | ||||||||||||||||
| Year Ended 7/31/07 | Five Years Ended 7/31/07 | Inception to 7/31/07 | ||||||||||||||
| NAV | MARKET | INDEX | NAV | MARKET | INDEX | NAV | MARKET | INDEX | ||||||||
| 34.59% | 34.96% | 37.90% | 169.90% | 169.00% | 178.15% | (2.73)% | (2.53)% | 1.09% | ||||||||
Effective May 9, 2007, the Fund and the Index changed their names from the iShares Goldman Sachs Networking Index Fund and the Goldman Sachs Technology Industry Multimedia Networking Index to the iShares S&P GSTI™ Networking Index Fund and the S&P GSTI™ Multimedia Networking Index, respectively. On June 15, 2007, S&P changed the underlying methodology of the Index. Performance shown reflects the Goldman Sachs methodology through June 14, 2007 and the S&P methodology thereafter.
Total returns for the periods since inception are calculated from the inception date of the Fund (7/10/01). “Average Annual Total Returns” represent the average annual change in value of an investment over the periods indicated. “Cumulative Total Returns” represent the total change in value of an investment over the periods indicated.
For purposes of calculating the total return of the Index, dividends and distributions made by companies included in the Index generally are assumed to be reinvested in the securities issued by those companies. However, prior to December 31, 2002, the total returns of the Index did not reflect reinvestment of dividends and distributions. The performance of the Index would have been higher for periods prior to that date had dividends and distributions been assumed to be reinvested.
The Fund’s per share net asset value or “NAV” is the value of one share of the Fund as calculated in accordance with the standard formula for valuing mutual fund shares. The NAV return is based on the NAV of the Fund, and the market return is based on the market price per share of the Fund. The price used to calculate market return (“Market Price”) is determined by using the midpoint between the highest bid and the lowest offer on the stock exchange on which the shares of the Fund are listed for trading, as of the time that the Fund’s NAV is calculated. Since shares of the Fund did not trade in the secondary market until several days after the Fund’s inception, for the period from inception to the first day of secondary market trading in shares of the Fund (7/13/01), the NAV of the Fund is used as a proxy for secondary market trading price to calculate market returns. Market and NAV returns assume that dividends and capital gain distributions have been reinvested in the Fund at Market Price and NAV, respectively.
An index is a statistical composite that tracks a specified financial market or sector. Unlike the Fund, an index does not actually hold a portfolio of securities and therefore does not incur the expenses incurred by the Fund. These expenses negatively impact the performance of the Fund. Also, market returns do not include brokerage commissions that may be payable on secondary market transactions. If brokerage commissions were included, market returns would be lower. The returns shown in the tables above do not reflect the deduction of taxes that a shareholder would pay on fund distributions or the redemption or sale of fund shares. The investment return and principal value of shares of the Fund will vary with changes in market conditions. Shares of the Fund may be worth more or less than their original cost when they are redeemed or sold in the market. The Fund’s past performance is no guarantee of future results.
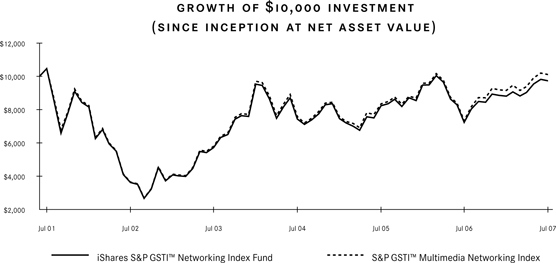
Effective May 9, 2007, the Fund and the Index changed their names from the iShares Goldman Sachs Networking Index Fund and the Goldman Sachs Technology Industry Multimedia Networking Index to the iShares S&P GSTI™ Networking Index Fund and the S&P GSTI™ Multimedia Networking Index, respectively. On June 15, 2007, S&P changed the underlying methodology of the Index. Performance shown reflects the Goldman Sachs methodology through June 14, 2007 and the S&P methodology thereafter.
Performance figures assume reinvestment of all dividends and capital gain distributions and do not reflect the deduction of taxes that a shareholder would pay on fund distributions or the redemption of fund shares. However, prior to December 31, 2002, the total returns of the Index did not reflect reinvestment of dividends and distributions. An index is a statistical composite that tracks a specified financial market or sector. Unlike the Fund, an index does not actually hold a portfolio of securities and therefore does not incur the expenses incurred by the Fund. These expenses negatively impact the performance of the Fund. The Fund’s past performance is no guarantee of future results.
| MANAGEMENT’S DISCUSSIONS OF FUND PERFORMANCE |
3 |
Table of Contents
Management’s Discussion of Fund Performance (Continued)
iSHARES® S&P GSTI™ NETWORKING INDEX FUND
The iShares S&P GSTI™ Networking Index Fund (the “Fund”) seeks investment results that correspond generally to the price and yield performance, before fees and expenses, of the S&P GSTI™ Multimedia Networking Index (the “Index”). The Index has been developed as an equity benchmark for U.S.-traded multimedia networking stocks. The Index includes companies that are producers of telecom equipment, data networking and wireless equipment. The Fund invests in a representative sample of securities included in the Index that collectively has an investment profile similar to the Index. Due to the use of representative sampling, the Fund may or may not hold all of the securities that are included in the Index. For the 12-month period ended July 31, 2007 (the “reporting period”), the Fund returned 34.59%, while the Index returned 37.90%.
Domestic equity markets delivered solid gains for the reporting period. A pause in interest-rate moves by the Federal Reserve Board (the “Fed”), sound economic growth, slowing inflation, and healthy corporate earnings levels all contributed to equity market strength during the reporting period. After raising rates eight times in the previous reporting period, the Fed held rates steady at 5.25% during the entire 12-month period ended July 31, 2007. Economic growth, as measured by gross domestic product (GDP) growth, continued to be healthy. Although growth slowed some what in the first calendar quarter of 2007, GDP growth rebounded in the second quarter to an annualized rate of 3.4%, its highest rate since the first quarter of 2006. Inflation levels provided another source of encouraging data, as core inflation declined during the second quarter of 2007, reaching its lowest level in three years. Corporate earnings levels remained healthy and continued to exceed many analysts’ expectations. Countering those factors, a slowing housing market and concerns surrounding lenders of sub-prime mortgages weighed on market performance in the final months of the reporting period, causing the markets to give back some of the strong gains achieved earlier in the reporting period.
Networking stocks as a group posted healthy gains for the reporting period as increased global demand and innovative products translated into strong performance for many companies in the group. Additionally, buyouts by private equity firms drove up stock prices for some companies.
Most of the Fund’s ten largest holdings as of July 31, 2007 posted gains for the reporting period. Research in Motion Ltd., maker of BlackBerry® devices, delivered triple-digit gains for the reporting period, as did Juniper Networks Inc. Avaya Inc. and Cisco Systems Inc. also logged strong gains. Motorola Inc. posted a decline for the reporting period.
| 4 |
2007 iSHARES ANNUAL REPORT TO SHAREHOLDERS |
Table of Contents
Management’s Discussion of Fund Performance
iSHARES® S&P GSTI™ SEMICONDUCTOR INDEX FUND
Performance as of July 31, 2007
| Average Annual Total Returns | ||||||||||||||||
| Year Ended 7/31/07 | Five Years Ended 7/31/07 | Inception to 7/31/07 | ||||||||||||||
| NAV | MARKET | INDEX | NAV | MARKET | INDEX | NAV | MARKET | INDEX | ||||||||
| 19.16% | 19.26% | 19.82% | 9.73% | 9.78% | 10.27% | 0.14% | 0.15% | 0.61% | ||||||||
| Cumulative Total Returns | ||||||||||||||||
| Year Ended 7/31/07 | Five Years Ended 7/31/07 | Inception to 7/31/07 | ||||||||||||||
| NAV | MARKET | INDEX | NAV | MARKET | INDEX | NAV | MARKET | INDEX | ||||||||
| 19.16% | 19.26% | 19.82% | 59.09% | 59.47% | 63.02% | 0.88% | 0.92% | 3.72% | ||||||||
Effective May 9, 2007, the Fund and the Index changed their names from the iShares Goldman Sachs Semiconductor Index Fund and the Goldman Sachs Technology Industry Semiconductor Index to the iShares S&P GSTI™ Semiconductor Index Fund and the S&P GSTI™ Semiconductor Index, respectively. On June 15, 2007, S&P changed the underlying methodology of the Index. Performance shown reflects the Goldman Sachs methodology through June 14, 2007 and the S&P methodology thereafter.
Total returns for the periods since inception are calculated from the inception date of the Fund (7/10/01). “Average Annual Total Returns” represent the average annual change in value of an investment over the periods indicated. “Cumulative Total Returns” represent the total change in value of an investment over the periods indicated.
For purposes of calculating the total return of the Index, dividends and distributions made by companies included in the Index generally are assumed to be reinvested in the securities issued by those companies. However, prior to December 31, 2002, the total returns of the Index did not reflect reinvestment of dividends and distributions. The performance of the Index would have been higher for periods prior to that date had dividends and distributions been assumed to be reinvested.
The Fund’s per share net asset value or “NAV” is the value of one share of the Fund as calculated in accordance with the standard formula for valuing mutual fund shares. The NAV return is based on the NAV of the Fund, and the market return is based on the market price per share of the Fund. The price used to calculate market return (“Market Price”) is determined by using the midpoint between the highest bid and the lowest offer on the stock exchange on which the shares of the Fund are listed for trading, as of the time that the Fund’s NAV is calculated. Since shares of the Fund did not trade in the secondary market until several days after the Fund’s inception, for the period from inception to the first day of secondary market trading in shares of the Fund (7/13/01), the NAV of the Fund is used as a proxy for secondary market trading price to calculate market returns. Market and NAV returns assume that dividends and capital gain distributions have been reinvested in the Fund at Market Price and NAV, respectively.
An index is a statistical composite that tracks a specified financial market or sector. Unlike the Fund, an index does not actually hold a portfolio of securities and therefore does not incur the expenses incurred by the Fund. These expenses negatively impact the performance of the Fund. Also, market returns do not include brokerage commissions that may be payable on secondary market transactions. If brokerage commissions were included, market returns would be lower. The returns shown in the tables above do not reflect the deduction of taxes that a shareholder would pay on fund distributions or the redemption or sale of fund shares. The investment return and principal value of shares of the Fund will vary with changes in market conditions. Shares of the Fund may be worth more or less than their original cost when they are redeemed or sold in the market. The Fund’s past performance is no guarantee of future results.
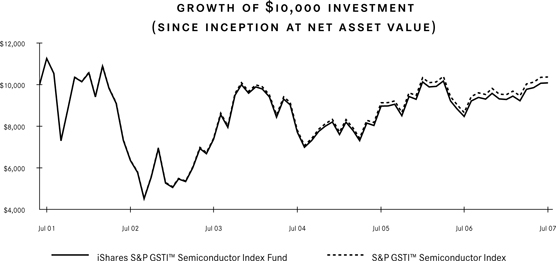
Effective May 9, 2007, the Fund and the Index changed their names from the iShares Goldman Sachs Semiconductor Index Fund and the Goldman Sachs Technology Industry Semiconductor Index to the iShares S&P GSTI™ Semiconductor Index Fund and the S&P GSTI™ Semiconductor Index, respectively. On June 15, 2007, S&P changed the underlying methodology of the Index. Performance shown reflects the Goldman Sachs methodology through June 14, 2007 and the S&P methodology thereafter.
Performance figures assume reinvestment of all dividends and capital gain distributions and do not reflect the deduction of taxes that a shareholder would pay on fund distributions or the redemption of fund shares. However, prior to December 31, 2002, the total returns of the Index did not reflect reinvestment of dividends and distributions. An index is a statistical composite that tracks a specified financial market or sector. Unlike the Fund, an index does not actually hold a portfolio of securities and therefore does not incur the expenses incurred by the Fund. These expenses negatively impact the performance of the Fund. The Fund’s past performance is no guarantee of future results.
| MANAGEMENT’S DISCUSSIONS OF FUND PERFORMANCE |
5 |
Table of Contents
Management’s Discussion of Fund Performance (Continued)
iSHARES® S&P GSTI™ SEMICONDUCTOR INDEX FUND
The iShares S&P GSTI™ Semiconductor Index Fund (the “Fund”) seeks investment results that correspond generally to the price and yield performance, before fees and expenses, of the S&P GSTI™ Semiconductor Index (the “Index”). The Index has been developed as an equity benchmark for U.S-traded semiconductor stocks. The Index includes companies that are producers of capital equipment or manufacturers of wafers and chips. The Fund invests in a representative sample of securities included in the Index that collectively has an investment profile similar to the Index. Due to the use of representative sampling, the Fund may or may not hold all of the securities that are included in the Index. For the 12-month period ended July 31, 2007 (the “reporting period”), the Fund returned 19.16%, while the Index returned 19.82%.
Domestic equity markets delivered solid gains for the reporting period. A pause in interest-rate moves by the Federal Reserve Board (the “Fed”), sound economic growth, slowing inflation, and healthy corporate earnings levels all contributed to equity market strength during the reporting period. After raising rates eight times in the previous reporting period, the Fed held rates steady at 5.25% during the entire 12-month period ended July 31, 2007. Economic growth, as measured by gross domestic product (GDP) growth, continued to be healthy. Although growth slowed somewhat in the first calendar quarter of 2007, GDP growth rebounded in the second quarter to an annualized rate of 3.4%, its highest rate since the first quarter of 2006. Inflation levels provided another source of encouraging data, as core inflation declined during the second quarter of 2007, reaching its lowest level in three years. Corporate earnings levels remained healthy and continued to exceed many analysts’ expectations. Countering those factors, a slowing housing market and concerns surrounding lenders of sub-prime mortgages weighed on market performance in the final months of the reporting period, causing the markets to give back some of the strong gains achieved earlier in the reporting period.
The semiconductor group as a whole delivered solid gains for the reporting period, although performance within the group was mixed. In general, demand for electronics equipment helped to drive up share prices for chip makers. Companies involved in innovative areas, including solar applications, also performed well during the reporting period.
All of the Fund’s ten largest holdings as of July 31, 2007 posted gains for the reporting period. Graphics chip maker NVIDIA Corp. and wafer producer MEMC Electronic Materials Inc. both logged triple-digit gains for the reporting period. Applied Materials Inc. and the Class A shares of Broadcom Corp. also performed well, as did KLA-Tencor Corp. and Intel Corp. Maxim Integrated Products Inc. posted the most modest return among the Fund’s ten largest holdings, yet still produced a double-digit gain.
| 6 |
2007 iSHARES ANNUAL REPORT TO SHAREHOLDERS |
Table of Contents
Management’s Discussion of Fund Performance
iSHARES® S&P GSTI™ SOFTWARE INDEX FUND
Performance as of July 31, 2007
| Average Annual Total Returns | ||||||||||||||||
| Year Ended 7/31/07 | Five Years Ended 7/31/07 | Inception to 7/31/07 | ||||||||||||||
| NAV | MARKET | INDEX | NAV | MARKET | INDEX | NAV | MARKET | INDEX | ||||||||
| 21.79% | 22.19% | 22.15% | 14.32% | 14.47% | 14.92% | (1.04)% | (0.99)% | (0.52)% | ||||||||
| Cumulative Total Returns | ||||||||||||||||
| Year Ended 7/31/07 | Five Years Ended 7/31/07 | Inception to 7/31/07 | ||||||||||||||
| NAV | MARKET | INDEX | NAV | MARKET | INDEX | NAV | MARKET | INDEX | ||||||||
| 21.79% | 22.19% | 22.15% | 95.25% | 96.55% | 100.46% | (6.15)% | (5.85)% | (3.11)% | ||||||||
Effective May 9, 2007, the Fund and the Index changed their names from the iShares Goldman Sachs Software Index Fund and the Goldman Sachs Technology Industry Software Index to the iShares S&P GSTI™ Software Index Fund and the S&P GSTI™ Software Index, respectively. On June 15, 2007, S&P changed the underlying methodology of the Index. Performance shown reflects the Goldman Sachs methodology through June 14, 2007 and the S&P methodology thereafter.
Total returns for the periods since inception are calculated from the inception date of the Fund (7/10/01). “Average Annual Total Returns” represent the average annual change in value of an investment over the periods indicated. “Cumulative Total Returns” represent the total change in value of an investment over the periods indicated.
For purposes of calculating the total return of the Index, dividends and distributions made by companies included in the Index generally are assumed to be reinvested in the securities issued by those companies. However, prior to December 31, 2002, the total returns of the Index did not reflect reinvestment of dividends and distributions. The performance of the Index would have been higher for periods prior to that date had dividends and distributions been assumed to be reinvested.
The Fund’s per share net asset value or “NAV” is the value of one share of the Fund as calculated in accordance with the standard formula for valuing mutual fund shares. The NAV return is based on the NAV of the Fund, and the market return is based on the market price per share of the Fund. The price used to calculate market return (“Market Price”) is determined by using the midpoint between the highest bid and the lowest offer on the stock exchange on which the shares of the Fund are listed for trading, as of the time that the Fund’s NAV is calculated. Since shares of the Fund did not trade in the secondary market until several days after the Fund’s inception, for the period from inception to the first day of secondary market trading in shares of the Fund (7/13/01), the NAV of the Fund is used as a proxy for secondary market trading price to calculate market returns. Market and NAV returns assume that dividends and capital gain distributions have been reinvested in the Fund at Market Price and NAV, respectively.
An index is a statistical composite that tracks a specified financial market or sector. Unlike the Fund, an index does not actually hold a portfolio of securities and therefore does not incur the expenses incurred by the Fund. These expenses negatively impact the performance of the Fund. Also, market returns do not include brokerage commissions that may be payable on secondary market transactions. If brokerage commissions were included, market returns would be lower. The returns shown in the tables above do not reflect the deduction of taxes that a shareholder would pay on fund distributions or the redemption or sale of fund shares. The investment return and principal value of shares of the Fund will vary with changes in market conditions. Shares of the Fund may be worth more or less than their original cost when they are redeemed or sold in the market. The Fund’s past performance is no guarantee of future results.
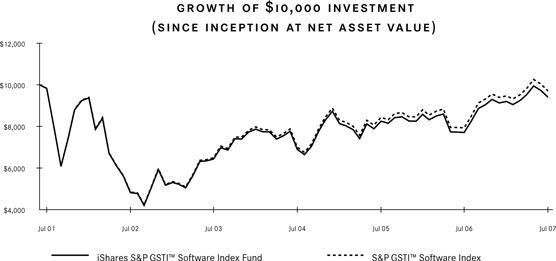
Effective May 9, 2007, the Fund and the Index changed their names from the iShares Goldman Sachs Software Index Fund and the Goldman Sachs Technology Industry Software Index to the iShares S&P GSTI™ Software Index Fund and the S&P GSTI™ Software Index, respectively. On June 15, 2007, S&P changed the underlying methodology of the Index. Performance shown reflects the Goldman Sachs methodology through June 14, 2007 and the S&P methodology thereafter.
Performance figures assume reinvestment of all dividends and capital gain distributions and do not reflect the deduction of taxes that a shareholder would pay on fund distributions or the redemption of fund shares. However, prior to December 31, 2002, the total returns of the Index did not reflect reinvestment of dividends and distributions. An index is a statistical composite that tracks a specified financial market or sector. Unlike the Fund, an index does not actually hold a portfolio of securities and therefore does not incur the expenses incurred by the Fund. These expenses negatively impact the performance of the Fund. The Fund’s past performance is no guarantee of future results.
| MANAGEMENT’S DISCUSSIONS OF FUND PERFORMANCE |
7 |
Table of Contents
Management’s Discussion of Fund Performance (Continued)
iSHARES® S&P GSTI™ SOFTWARE INDEX FUND
The iShares S&P GSTI™ Software Index Fund (the “Fund”) seeks investment results that correspond generally to the price and yield performance, before fees and expenses, of the S&P GSTI™ Software Index (the “Index”). The Index has been developed as an equity benchmark for U.S.-traded software-related stocks. The Index includes companies that are producers of client/server applications, enterprise software, internet software, PC and entertainment software. The Fund invests in a representative sample of securities included in the Index that collectively has an investment profile similar to the Index. Due to the use of representative sampling, the Fund may or may not hold all of the securities included in the Index. For the 12-month period ended July 31, 2007 (the “reporting period”), the Fund returned 21.79%, while the Index returned 22.15%.
Domestic equity markets delivered solid gains for the reporting period. A pause in interest-rate moves by the Federal Reserve Board (the “Fed”), sound economic growth, slowing inflation, and healthy corporate earnings levels all contributed to equity market strength during the reporting period. After raising rates eight times in the previous reporting period, the Fed held rates steady at 5.25% during the entire 12-month period ended July 31, 2007. Economic growth, as measured by gross domestic product (GDP) growth, continued to be healthy. Although growth slowed somewhat in the first calendar quarter of 2007, GDP growth rebounded in the second quarter to an annualized rate of 3.4%, its highest rate since the first quarter of 2006. Inflation levels provided another source of encouraging data, as core inflation declined during the second quarter of 2007, reaching its lowest level in three years. Corporate earnings levels remained healthy and continued to exceed many analysts’ expectations. Countering those factors, a slowing housing market and concerns surrounding lenders of sub-prime mortgages weighed on market performance in the final months of the reporting period, causing the markets to give back some of the strong gains achieved earlier in the reporting period.
The software market segment generally delivered strong gains for the reporting period, amid growing global consumer and business demand for computers and mobile devices. Demand for these products, in turn, translated into demand for software.
Nine of the Fund’s ten largest holdings as of July 31, 2007 delivered gains for the reporting period. Adobe Systems Inc. was the strongest performer, followed by Cadence Design Systems Inc. Software firms Oracle Corp. and Microsoft Corp. both performed well, as did Autodesk Inc. Intuit Inc. was the lone decliner amongst the ten largest holdings for the reporting period.
| 8 |
2007 iSHARES ANNUAL REPORT TO SHAREHOLDERS |
Table of Contents
Management’s Discussion of Fund Performance
iSHARES® S&P GSSI™ NATURAL RESOURCES INDEX FUND
Performance as of July 31, 2007
| Average Annual Total Returns | ||||||||||||||||
| Year Ended 7/31/07 | Five Years Ended 7/31/07 | Inception to 7/31/07 | ||||||||||||||
| NAV | MARKET | INDEX | NAV | MARKET | INDEX | NAV | MARKET | INDEX | ||||||||
| 19.56% | 19.66% | 20.17% | 25.21% | 25.26% | 25.83% | 19.00% | 19.00% | 19.53% | ||||||||
| Cumulative Total Returns | ||||||||||||||||
| Year Ended 7/31/07 | Five Years Ended 7/31/07 | Inception to 7/31/07 | ||||||||||||||
| NAV | MARKET | INDEX | NAV | MARKET | INDEX | NAV | MARKET | INDEX | ||||||||
| 19.56% | 19.66% | 20.17% | 207.76% | 208.35% | 215.46% | 173.05% | 173.12% | 180.38% | ||||||||
Effective May 9, 2007, the Fund and the Index changed their names from the iShares Goldman Sachs Natural Resources Index Fund and the Goldman Sachs Natural Resources Sector Index to the iShares S&P GSSI™ Natural Resources Index Fund and the S&P GSSI™ Natural Resources Index, respectively. On June 15, 2007, S&P changed the underlying methodology of the Index. Performance shown reflects the Goldman Sachs methodology through June 14, 2007 and the S&P methodology thereafter.
Total returns for the periods since inception are calculated from the inception date of the Fund (10/22/01). “Average Annual Total Returns” represent the average annual change in value of an investment over the periods indicated. “Cumulative Total Returns” represent the total change in value of an investment over the periods indicated.
The Fund’s per share net asset value or “NAV” is the value of one share of the Fund as calculated in accordance with the standard formula for valuing mutual fund shares. The NAV return is based on the NAV of the Fund, and the market return is based on the market price per share of the Fund. The price used to calculate market return (“Market Price”) is determined by using the midpoint between the highest bid and the lowest offer on the stock exchange on which the shares of the Fund are listed for trading, as of the time that the Fund’s NAV is calculated. Since shares of the Fund did not trade in the secondary market until several days after the Fund’s inception, for the period from inception to the first day of secondary market trading in shares of the Fund (10/26/01), the NAV of the Fund is used as a proxy for secondary market trading price to calculate market returns. Market and NAV returns assume that dividends and capital gain distributions have been reinvested in the Fund at Market Price and NAV, respectively.
An index is a statistical composite that tracks a specified financial market or sector. Unlike the Fund, an index does not actually hold a portfolio of securities and therefore does not incur the expenses incurred by the Fund. These expenses negatively impact the performance of the Fund. Also, market returns do not include brokerage commissions that may be payable on secondary market transactions. If brokerage commissions were included, market returns would be lower. The returns shown in the tables above do not reflect the deduction of taxes that a shareholder would pay on fund distributions or the redemption or sale of fund shares. The investment return and principal value of shares of the Fund will vary with changes in market conditions. Shares of the Fund may be worth more or less than their original cost when they are redeemed or sold in the market. The Fund’s past performance is no guarantee of future results.
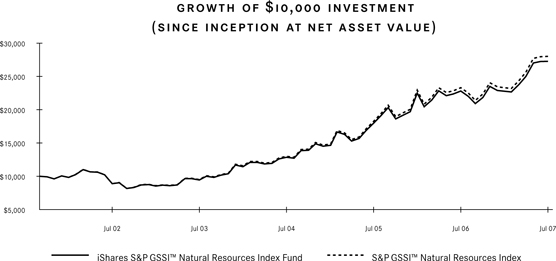
Effective May 9, 2007, the Fund and the Index changed their names from the iShares Goldman Sachs Natural Resources Index Fund and the Goldman Sachs Natural Resources Sector Index to the iShares S&P GSSI™ Natural Resources Index Fund and the S&P GSSI™ Natural Resources Index, respectively. On June 15, 2007, S&P changed the underlying methodology of the Index. Performance shown reflects the Goldman Sachs methodology through June 14, 2007 and the S&P methodology thereafter.
Performance figures assume reinvestment of all dividends and capital gain distributions and do not reflect the deduction of taxes that a shareholder would pay on fund distributions or the redemption of fund shares. An index is a statistical composite that tracks a specified financial market or sector. Unlike the Fund, an index does not actually hold a portfolio of securities and therefore does not incur the expenses incurred by the Fund. These expenses negatively impact the performance of the Fund. The Fund’s past performance is no guarantee of future results.
| MANAGEMENT’S DISCUSSIONS OF FUND PERFORMANCE |
9 |
Table of Contents
Management’s Discussion of Fund Performance (Continued)
iSHARES® S&P GSSI™ NATURAL RESOURCES INDEX FUND
The iShares S&P GSSI™ Natural Resources Index Fund (the “Fund”) seeks investment results that correspond generally to the price and yield performance, before fees and expenses, of the S&P GSSI™ Natural Resources Index (the “Index”). The Index has been developed as an equity benchmark for U.S.-traded natural resource-related stocks. The Index includes companies in the following categories: extractive industries, energy companies, owners and operators of timber tracts, forestry services, producers of pulp and paper, and owners of plantations. The Fund invests in a representative sample of securities included in the Index that collectively has an investment profile similar to the Index. Due to the use of representative sampling, the Fund may or may not hold all of the securities included in the Index. For the 12-month period ended July 31, 2007 (the “reporting period”), the Fund returned 19.56%, while the Index returned 20.17%.
Domestic equity markets delivered solid gains for the reporting period. A pause in interest-rate moves by the Federal Reserve Board (the “Fed”), sound economic growth, slowing inflation, and healthy corporate earnings levels all contributed to equity market strength during the reporting period. After raising rates eight times in the previous reporting period, the Fed held rates steady at 5.25% during the entire 12-month period ended July 31, 2007. Economic growth, as measured by gross domestic product (GDP) growth, continued to be healthy. Although growth slowed somewhat in the first calendar quarter of 2007, GDP growth rebounded in the second quarter to an annualized rate of 3.4%, its highest rate since the first quarter of 2006. Inflation levels provided another source of encouraging data, as core inflation declined during the second quarter of 2007, reaching its lowest level in three years. Corporate earnings levels remained healthy and continued to exceed many analysts’ expectations. Countering those factors, a slowing housing market and concerns surrounding lenders of sub-prime mortgages weighed on market performance in the final months of the reporting period, causing the markets to give back some of the strong gains achieved earlier in the reporting period.
Natural resources as a group performed strongly during the reporting period. High oil prices continued to benefit the share prices of oil companies. In addition, increased global demand for, and low inventories of, metals drove up prices of many metals and mining companies during the reporting period.
All of the Fund’s ten largest holdings as of July 31, 2007 delivered gains for the reporting period. Metals company Alcan Inc. was the strongest performer, logging triple-digit gains. Oil exploration and service company Schlumberger Ltd. also performed well. In addition, oil companies Chevron Corp. and Exxon Mobil Corp. both delivered solid gains. Valero Energy Corp. posted a slight gain for the reporting period.
| 10 |
2007 iSHARES ANNUAL REPORT TO SHAREHOLDERS |
Table of Contents
Management’s Discussion of Fund Performance
iSHARES® NYSE COMPOSITE INDEX FUND
Performance as of July 31, 2007
| Average Annual Total Returns | Cumulative Total Returns | |||||||||||||||
| Year Ended 7/31/07 | Inception to 7/31/07 | Inception to 7/31/07 | ||||||||||||||
| NAV | MARKET | INDEX | NAV | MARKET | INDEX | NAV | MARKET | INDEX | ||||||||
| 18.10% | 17.86% | 18.42% | 13.95% | 13.91% | 14.25% | 54.66% | 54.50% | 56.04% | ||||||||
Total returns for the periods since inception are calculated from the inception date of the Fund (3/30/04). “Average Annual Total Returns” represent the average annual change in value of an investment over the periods indicated. “Cumulative Total Returns” represent the total change in value of an investment over the periods indicated.
The Fund’s per share net asset value or “NAV” is the value of one share of the Fund as calculated in accordance with the standard formula for valuing mutual fund shares. The NAV return is based on the NAV of the Fund, and the market return is based on the market price per share of the Fund. The price used to calculate market return (“Market Price”) is determined by using the midpoint between the highest bid and the lowest offer on the stock exchange on which the shares of the Fund are listed for trading, as of the time that the Fund’s NAV is calculated. Since shares of the Fund did not trade in the secondary market until several days after the Fund’s inception, for the period from inception to the first day of secondary market trading in shares of the Fund (4/2/04), the NAV of the Fund is used as a proxy for secondary market trading price to calculate market returns. Market and NAV returns assume that dividends and capital gain distributions have been reinvested in the Fund at Market Price and NAV, respectively.
An index is a statistical composite that tracks a specified financial market or sector. Unlike the Fund, an index does not actually hold a portfolio of securities and therefore does not incur the expenses incurred by the Fund. These expenses negatively impact the performance of the Fund. Also, market returns do not include brokerage commissions that may be payable on secondary market transactions. If brokerage commissions were included, market returns would be lower. The returns shown in the tables above do not reflect the deduction of taxes that a shareholder would pay on fund distributions or the redemption or sale of fund shares. The investment return and principal value of shares of the Fund will vary with changes in market conditions. Shares of the Fund may be worth more or less than their original cost when they are redeemed or sold in the market. The Fund’s past performance is no guarantee of future results.
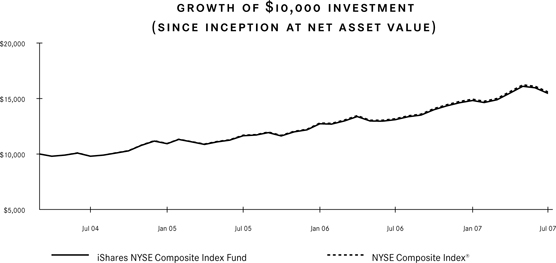
Performance figures assume reinvestment of all dividends and capital gain distributions and do not reflect the deduction of taxes that a shareholder would pay on fund distributions or the redemption of fund shares. An index is a statistical composite that tracks a specified financial market or sector. Unlike the Fund, an index does not actually hold a portfolio of securities and therefore does not incur the expenses incurred by the Fund. These expenses negatively impact the performance of the Fund. The Fund’s past performance is no guarantee of future results.
| MANAGEMENT’S DISCUSSIONS OF FUND PERFORMANCE |
11 |
Table of Contents
Management’s Discussion of Fund Performance (Continued)
iSHARES® NYSE COMPOSITE INDEX FUND
The iShares NYSE Composite Index Fund (the “Fund”) seeks investment results that correspond generally to the price and yield performance, before fees and expenses, of the NYSE Composite Index® (the “Index”). The Index measures the performance of all common stocks, American Depositary Receipts (“ADRs”), real estate investment trusts (“REITs”) and tracking stocks listed on the NYSE. The securities in the Index represent a broad spectrum of large-, mid- and small-capitalization companies. The Fund invests in a representative sample of securities included in the Index that collectively has an investment profile similar to the Index. Due to the use of representative sampling, the Fund may or may not hold all of the securities included in the Index. For the 12-month period ended July 31, 2007 (the “reporting period”), the Fund returned 18.10%, while the Index returned 18.42%.
Domestic equity markets delivered solid gains for the reporting period. A pause in interest-rate moves by the Federal Reserve Board (the “Fed”), sound economic growth, slowing inflation, and healthy corporate earnings levels all contributed to equity market strength during the reporting period. After raising rates eight times in the previous reporting period, the Fed held rates steady at 5.25% during the entire 12-month period ended July 31, 2007. Economic growth, as measured by gross domestic product (GDP) growth, continued to be healthy. Although growth slowed somewhat in the first calendar quarter of 2007, GDP growth rebounded in the second quarter to an annualized rate of 3.4%, its highest rate since the first quarter of 2006. Inflation levels provided another source of encouraging data, as core inflation declined during the second quarter of 2007, reaching its lowest level in three years. Corporate earnings levels remained healthy and continued to exceed many analysts’ expectations. Countering those factors, a slowing housing market and concerns surrounding lenders of sub-prime mortgages weighed on market performance in the final months of the reporting period, causing the markets to give back some of the strong gains achieved earlier in the reporting period.
All of the Index’s ten sectors posted positive returns for the reporting period. The materials sector and telecommunications services sector were the two strongest performers, although combined they represented less than 14% of the Index as of July 31, 2007. Industrials and information technology both also performed well, as did energy. Healthcare delivered the most modest gains among the sectors for the reporting period.
Among the Fund’s ten largest holdings as of July 31, 2007, performance was mostly positive for the reporting period. The strongest performer was telecommunications company AT&T Inc. Oil companies Chevron Corp. and Exxon Mobil Corp. both performed well, as did General Electric Co. Bank of America Corp. and BP PLC SP ADR both declined for the reporting period.
| * | Sector classifications used to describe the portfolio may differ from sector classifications used to describe the Fund’s corresponding index elsewhere in this report. |
| 12 |
2007 iSHARES ANNUAL REPORT TO SHAREHOLDERS |
Table of Contents
Management’s Discussion of Fund Performance
iSHARES® NYSE 100 INDEX FUND
Performance as of July 31, 2007
| Average Annual Total Returns | Cumulative Total Returns | |||||||||||||||
| Year Ended 7/31/07 | Inception to 7/31/07 | Inception to 7/31/07 | ||||||||||||||
| NAV | MARKET | INDEX | NAV | MARKET | INDEX | NAV | MARKET | INDEX | ||||||||
| 13.73% | 13.12% | 13.94% | 8.99% | 8.93% | 9.20% | 33.33% | 33.08% | 34.18% | ||||||||
Total returns for the periods since inception are calculated from the inception date of the Fund (3/29/04). “Average Annual Total Returns” represent the average annual change in value of an investment over the periods indicated. “Cumulative Total Returns” represent the total change in value of an investment over the periods indicated.
The Fund’s per share net asset value or “NAV” is the value of one share of the Fund as calculated in accordance with the standard formula for valuing mutual fund shares. The NAV return is based on the NAV of the Fund, and the market return is based on the market price per share of the Fund. The price used to calculate market return (“Market Price”) is determined by using the midpoint between the highest bid and the lowest offer on the stock exchange on which the shares of the Fund are listed for trading, as of the time that the Fund’s NAV is calculated. Since shares of the Fund did not trade in the secondary market until several days after the Fund’s inception, for the period from inception to the first day of secondary market trading in shares of the Fund (4/2/04), the NAV of the Fund is used as a proxy for secondary market trading price to calculate market returns. Market and NAV returns assume that dividends and capital gain distributions have been reinvested in the Fund at Market Price and NAV, respectively.
An index is a statistical composite that tracks a specified financial market or sector. Unlike the Fund, an index does not actually hold a portfolio of securities and therefore does not incur the expenses incurred by the Fund. These expenses negatively impact the performance of the Fund. Also, market returns do not include brokerage commissions that may be payable on secondary market transactions. If brokerage commissions were included, market returns would be lower. The returns shown in the tables above do not reflect the deduction of taxes that a shareholder would pay on fund distributions or the redemption or sale of fund shares. The investment return and principal value of shares of the Fund will vary with changes in market conditions. Shares of the Fund may be worth more or less than their original cost when they are redeemed or sold in the market. The Fund’s past performance is no guarantee of future results.
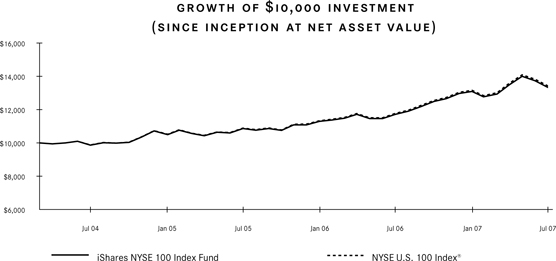
Performance figures assume reinvestment of all dividends and capital gain distributions and do not reflect the deduction of taxes that a shareholder would pay on fund distributions or the redemption of fund shares. An index is a statistical composite that tracks a specified financial market or sector. Unlike the Fund, an index does not actually hold a portfolio of securities and therefore does not incur the expenses incurred by the Fund. These expenses negatively impact the performance of the Fund. The Fund’s past performance is no guarantee of future results.
| MANAGEMENT’S DISCUSSIONS OF FUND PERFORMANCE |
13 |
Table of Contents
Management’s Discussion of Fund Performance (Continued)
iSHARES® NYSE 100 INDEX FUND
The iShares NYSE 100 Index Fund (the “Fund”) seeks investment results that correspond generally to the price and yield performance, before fees and expenses, of the NYSE U.S.100 Index® (the “Index”). The Index measures the performance of the largest 100 U.S. companies, based on market capitalization, listed on the NYSE. The Fund invests in a representative sample of securities included in the Index that collectively has an investment profile similar to the Index. Due to the use of representative sampling, the Fund may or may not hold all of the securities included in the Index. For the 12-month period ended July 31, 2007 (the “reporting period”), the Fund returned 13.73%, while the Index returned 13.94%.
Domestic equity markets delivered solid gains for the reporting period. A pause in interest-rate moves by the Federal Reserve Board (the “Fed”), sound economic growth, slowing inflation, and healthy corporate earnings levels all contributed to equity market strength during the reporting period. After raising rates eight times in the previous reporting period, the Fed held rates steady at 5.25% during the entire 12-month period ended July 31, 2007. Economic growth, as measured by gross domestic product (GDP) growth, continued to be healthy. Although growth slowed somewhat in the first calendar quarter of 2007, GDP growth rebounded in the second quarter to an annualized rate of 3.4%, its highest rate since the first quarter of 2006. Inflation levels provided another source of encouraging data, as core inflation declined during the second quarter of 2007, reaching its lowest level in three years. Corporate earnings levels remained healthy and continued to exceed many analysts’ expectations. Countering those factors, a slowing housing market and concerns surrounding lenders of sub-prime mortgages weighed on market performance in the final months of the reporting period, causing the markets to give back some of the strong gains achieved earlier in the reporting period.
All of the Index’s ten sectors posted positive returns for the reporting period. The telecommunications services and information technology sectors were the two strongest performing sectors, although they combined to represent less than 13% of the Index at July 31, 2007. Additionally, energy and industrials both performed well. The largest sector weighting in the Index, financials, delivered the most modest gain amongst the sectors for the reporting period.
Among the Fund’s ten largest holdings as of July 31, 2007, performance was mostly positive for the reporting period. The strongest performer was telecommunications company AT&T Inc. Oil companies Chevron Corp. and Exxon Mobil Corp. both performed well, as did General Electric Co. Pharmaceutical company Pfizer Inc. and Bank of America Corp. both declined for the reporting period.
| * | Sector classifications used to describe the portfolio may differ from sector classifications used to describe the Fund’s corresponding index elsewhere in this report. |
| 14 |
2007 iSHARES ANNUAL REPORT TO SHAREHOLDERS |
Table of Contents
Shareholder Expenses (Unaudited)
iSHARES® TRUST
As a shareholder of a Fund, you incur two types of costs: (1) transaction costs, including brokerage commissions on purchases and sales of fund shares and (2) ongoing costs, including management fees and other fund expenses. The following Example is intended to help you understand your ongoing costs (in dollars and cents) of investing in a Fund and to compare these costs with the ongoing costs of investing in other funds.
The Example is based on an investment of $1,000 invested at the beginning of the period and held for the entire period from February 1, 2007 to July 31, 2007.
ACTUAL EXPENSES
The first line under each Fund in the table below provides information about actual account values and actual expenses. You may use the information in this line, together with the amount you invested, to estimate the expenses that you paid over the period. Simply divide your account value by $1,000 (for example, an $8,600 account value divided by $1,000 = 8.6), then multiply the result by the number in the first line for your Fund under the heading entitled “Expenses Paid During Period” to estimate the expenses you paid on your account during this period.
HYPOTHETICAL EXAMPLE FOR COMPARISON PURPOSES
The second line under each Fund in the table below provides information about hypothetical account values and hypothetical expenses based on each Fund’s actual expense ratio and an assumed rate of return of 5% per year before expenses, which is not the Fund’s actual return. The hypothetical account values and expenses may not be used to estimate the actual ending account balance or expenses you paid for the period. You may use this information to compare the ongoing costs of investing in your Fund and other funds. To do so, compare this 5% hypothetical example with the 5% hypothetical examples that appear in the shareholder reports of the other funds.
Please note that the expenses shown in the table are meant to highlight your ongoing costs only and do not reflect any transactional costs, such as brokerage commissions paid on purchases and sales of fund shares. Therefore, the second line under each Fund in the table is useful in comparing ongoing costs only and will not help you determine the relative total costs of owning different funds. In addition, if these transactional costs were included, your costs would have been higher.
| iShares Index Fund | Beginning Account Value (2/1/07) |
Ending Account Value (7/31/07) |
Annualized Expense Ratio |
Expenses Paid During Perioda (2/1/07 to 7/31/07) | |||||
| S&P GSTI™ Technology |
|||||||||
| Actual |
$ 1,000.00 | $ 1,076.70 | 0.48 | % | $ 2.47 | ||||
| Hypothetical (5% return before expenses) |
1,000.00 | 1,022.40 | 0.48 | 2.41 | |||||
| S&P GSTI™ Networking |
|||||||||
| Actual |
1,000.00 | 1,103.70 | 0.48 | 2.50 | |||||
| Hypothetical (5% return before expenses) |
1,000.00 | 1,022.40 | 0.48 | 2.41 | |||||
| S&P GSTI™ Semiconductor |
|||||||||
| Actual |
1,000.00 | 1,086.70 | 0.48 | 2.48 | |||||
| Hypothetical (5% return before expenses) |
1,000.00 | 1,022.40 | 0.48 | 2.41 | |||||
| S&P GSTI™ Software |
|||||||||
| Actual |
1,000.00 | 1,020.70 | 0.48 | 2.40 | |||||
| Hypothetical (5% return before expenses) |
1,000.00 | 1,022.40 | 0.48 | 2.41 | |||||
| S&P GSSI™ Natural Resources |
|||||||||
| Actual |
1,000.00 | 1,198.10 | 0.48 | 2.62 | |||||
| Hypothetical (5% return before expenses) |
1,000.00 | 1,022.40 | 0.48 | 2.41 |
| SHAREHOLDER EXPENSES |
15 |
Table of Contents
Shareholder Expenses (Unaudited) (Continued)
iSHARES® TRUST
| iShares Index Fund | Beginning Account Value (2/1/07) |
Ending Account Value (7/31/07) |
Annualized Expense Ratio |
Expenses Paid During Perioda (2/1/07 to 7/31/07) | |||||
| NYSE Composite |
|||||||||
| Actual |
$ 1,000.00 | $ 1,043.20 | 0.25 | % | $ 1.27 | ||||
| Hypothetical (5% return before expenses) |
1,000.00 | 1,023.60 | 0.25 | 1.25 | |||||
| NYSE 100 |
|||||||||
| Actual |
1,000.00 | 1,018.30 | 0.20 | 1.00 | |||||
| Hypothetical (5% return before expenses) |
1,000.00 | 1,023.80 | 0.20 | 1.00 |
| a |
Expenses are calculated using each Fund’s annualized expense ratio (as disclosed in the table), multiplied by the average account value for the period, multiplied by the number of days in the period (181 days) and divided by the number of days in the year (365 days). |
| 16 |
2007 iSHARES ANNUAL REPORT TO SHAREHOLDERS |
Table of Contents
iSHARES® S&P GSTI™ TECHNOLOGY INDEX FUND
July 31, 2007
| SCHEDULES OF INVESTMENTS |
17 |
Table of Contents
Schedule of Investments (Continued)
iSHARES® S&P GSTI™ TECHNOLOGY INDEX FUND
July 31, 2007
| 18 |
2007 iSHARES ANNUAL REPORT TO SHAREHOLDERS |
Table of Contents
Schedule of Investments (Continued)
iSHARES® S&P GSTI™ TECHNOLOGY INDEX FUND
July 31, 2007
| SCHEDULES OF INVESTMENTS |
19 |
Table of Contents
Schedule of Investments (Continued)
iSHARES® S&P GSTI™ TECHNOLOGY INDEX FUND
July 31, 2007
| 20 |
2007 iSHARES ANNUAL REPORT TO SHAREHOLDERS |
Table of Contents
Schedule of Investments
iSHARES® S&P GSTI™ NETWORKING INDEX FUND
July 31, 2007
| SCHEDULES OF INVESTMENTS |
21 |
Table of Contents
Schedule of Investments
iSHARES® S&P GSTI™ SEMICONDUCTOR INDEX FUND
July 31, 2007
| 22 |
2007 iSHARES ANNUAL REPORT TO SHAREHOLDERS |
Table of Contents
Schedule of Investments
iSHARES® S&P GSTI™ SOFTWARE INDEX FUND
July 31, 2007
| SCHEDULES OF INVESTMENTS |
23 |
Table of Contents
Schedule of Investments
iSHARES® S&P GSSI™ NATURAL RESOURCES INDEX FUND
July 31, 2007
| 24 |
2007 iSHARES ANNUAL REPORT TO SHAREHOLDERS |
Table of Contents
Schedule of Investments (Continued)
iSHARES® S&P GSSI™ NATURAL RESOURCES INDEX FUND
July 31, 2007
| SCHEDULES OF INVESTMENTS |
25 |
Table of Contents
Schedule of Investments
iSHARES® NYSE COMPOSITE INDEX FUND
July 31, 2007
| 26 |
2007 iSHARES ANNUAL REPORT TO SHAREHOLDERS |
Table of Contents
Schedule of Investments (Continued)
iSHARES® NYSE COMPOSITE INDEX FUND
July 31, 2007
| SCHEDULES OF INVESTMENTS |
27 |
Table of Contents
Schedule of Investments (Continued)
iSHARES® NYSE COMPOSITE INDEX FUND
July 31, 2007
| 28 |
2007 iSHARES ANNUAL REPORT TO SHAREHOLDERS |
Table of Contents
Schedule of Investments (Continued)
iSHARES® NYSE COMPOSITE INDEX FUND
July 31, 2007
| SCHEDULES OF INVESTMENTS |
29 |
Table of Contents
Schedule of Investments (Continued)
iSHARES® NYSE COMPOSITE INDEX FUND
July 31, 2007
| 30 |
2007 iSHARES ANNUAL REPORT TO SHAREHOLDERS |
Table of Contents
Schedule of Investments (Continued)
iSHARES® NYSE COMPOSITE INDEX FUND
July 31, 2007
| SCHEDULES OF INVESTMENTS |
31 |
Table of Contents
Schedule of Investments (Continued)
iSHARES® NYSE COMPOSITE INDEX FUND
July 31, 2007
| 32 |
2007 iSHARES ANNUAL REPORT TO SHAREHOLDERS |
Table of Contents
Schedule of Investments (Continued)
iSHARES® NYSE COMPOSITE INDEX FUND
July 31, 2007
| SCHEDULES OF INVESTMENTS |
33 |
Table of Contents
Schedule of Investments (Continued)
iSHARES® NYSE COMPOSITE INDEX FUND
July 31, 2007
| 34 |
2007 iSHARES ANNUAL REPORT TO SHAREHOLDERS |
Table of Contents
Schedule of Investments (Continued)
iSHARES® NYSE COMPOSITE INDEX FUND
July 31, 2007
| SCHEDULES OF INVESTMENTS |
35 |
Table of Contents
Schedule of Investments (Continued)
iSHARES® NYSE COMPOSITE INDEX FUND
July 31, 2007
| 36 |
2007 iSHARES ANNUAL REPORT TO SHAREHOLDERS |
Table of Contents
Schedule of Investments (Continued)
iSHARES® NYSE COMPOSITE INDEX FUND
July 31, 2007
| SCHEDULES OF INVESTMENTS |
37 |
Table of Contents
Schedule of Investments (Continued)
iSHARES® NYSE COMPOSITE INDEX FUND
July 31, 2007
| 38 |
2007 iSHARES ANNUAL REPORT TO SHAREHOLDERS |
Table of Contents
Schedule of Investments (Continued)
iSHARES® NYSE COMPOSITE INDEX FUND
July 31, 2007
| SCHEDULES OF INVESTMENTS |
39 |
Table of Contents
Schedule of Investments (Continued)
iSHARES® NYSE COMPOSITE INDEX FUND
July 31, 2007
| 40 |
2007 iSHARES ANNUAL REPORT TO SHAREHOLDERS |
Table of Contents
Schedule of Investments (Continued)
iSHARES® NYSE COMPOSITE INDEX FUND
July 31, 2007
| SCHEDULES OF INVESTMENTS |
41 |
Table of Contents
Schedule of Investments (Continued)
iSHARES® NYSE COMPOSITE INDEX FUND
July 31, 2007
| 42 |
2007 iSHARES ANNUAL REPORT TO SHAREHOLDERS |
Table of Contents
Schedule of Investments (Continued)
iSHARES® NYSE COMPOSITE INDEX FUND
July 31, 2007
| SCHEDULES OF INVESTMENTS |
43 |
Table of Contents
Schedule of Investments (Continued)
iSHARES® NYSE COMPOSITE INDEX FUND
July 31, 2007
| 44 |
2007 iSHARES ANNUAL REPORT TO SHAREHOLDERS |
Table of Contents
Schedule of Investments (Continued)
iSHARES® NYSE COMPOSITE INDEX FUND
July 31, 2007
| SCHEDULES OF INVESTMENTS |
45 |
Table of Contents
Schedule of Investments (Continued)
iSHARES® NYSE COMPOSITE INDEX FUND
July 31, 2007
| 46 |
2007 iSHARES ANNUAL REPORT TO SHAREHOLDERS |
Table of Contents
Schedule of Investments
July 31, 2007
| SCHEDULES OF INVESTMENTS |
47 |
Table of Contents
Schedule of Investments (Continued)
iSHARES® NYSE 100 INDEX FUND
July 31, 2007
| 48 |
2007 iSHARES ANNUAL REPORT TO SHAREHOLDERS |
Table of Contents
Schedule of Investments (Continued)
iSHARES® NYSE 100 INDEX FUND
July 31, 2007
| SCHEDULES OF INVESTMENTS |
49 |
Table of Contents
Statements of Assets and Liabilities
iSHARES® TRUST
July 31, 2007
| iShares S&P GSTI™ | ||||||||||||||||
| Technology Index Fund |
Networking Index Fund |
Semiconductor Index Fund |
Software Index Fund |
|||||||||||||
| ASSETS |
||||||||||||||||
| Investments, at cost: |
||||||||||||||||
| Unaffiliated issuers |
$ | 377,630,019 | $ | 241,883,512 | $ | 328,257,735 | $ | 205,033,733 | ||||||||
| Affiliated issuers (Note 2) |
3,015,268 | 14,187,146 | 11,958,754 | 2,488,740 | ||||||||||||
| Total cost of investments |
$ | 380,645,287 | $ | 256,070,658 | $ | 340,216,489 | $ | 207,522,473 | ||||||||
| Investments in securities, at value (including |
||||||||||||||||
| Unaffiliated issuers |
$ | 367,315,501 | $ | 225,980,025 | $ | 302,949,444 | $ | 190,126,154 | ||||||||
| Affiliated issuers (Note 2) |
3,015,268 | 14,187,146 | 11,958,754 | 2,488,740 | ||||||||||||
| Total value of investments |
370,330,769 | 240,167,171 | 314,908,198 | 192,614,894 | ||||||||||||
| Receivables: |
||||||||||||||||
| Dividends and interest |
43,407 | 16,031 | 93,485 | 3,959 | ||||||||||||
| Total Assets |
370,374,176 | 240,183,202 | 315,001,683 | 192,618,853 | ||||||||||||
| LIABILITIES |
||||||||||||||||
| Payables: |
||||||||||||||||
| Collateral for securities on loan (Note 5) |
2,725,785 | 13,966,245 | 11,664,559 | 2,337,284 | ||||||||||||
| Capital shares redeemed |
4,101 | 4,553 | – | – | ||||||||||||
| Investment advisory fees (Note 2) |
146,103 | 80,849 | 126,736 | 79,499 | ||||||||||||
| Total Liabilities |
2,875,989 | 14,051,647 | 11,791,295 | 2,416,783 | ||||||||||||
| NET ASSETS |
$ | 367,498,187 | $ | 226,131,555 | $ | 303,210,388 | $ | 190,202,070 | ||||||||
| Net assets consist of: |
||||||||||||||||
| Paid-in capital |
$ | 388,344,612 | $ | 289,576,120 | $ | 353,179,034 | $ | 210,392,525 | ||||||||
| Accumulated net realized loss |
(10,531,907 | ) | (47,541,078 | ) | (24,660,355 | ) | (5,282,876 | ) | ||||||||
| Net unrealized depreciation |
(10,314,518 | ) | (15,903,487 | ) | (25,308,291 | ) | (14,907,579 | ) | ||||||||
| NET ASSETS |
$ | 367,498,187 | $ | 226,131,555 | $ | 303,210,388 | $ | 190,202,070 | ||||||||
| Shares outstandingb |
6,550,000 | 6,400,000 | 4,600,000 | 4,150,000 | ||||||||||||
| Net asset value per share |
$ | 56.11 | $ | 35.33 | $ | 65.92 | $ | 45.83 | ||||||||
| a |
Securities on loan with market values of $2,570,414, $13,332,971, $11,110,385 and $2,196,356, respectively. See Note 5. |
| b |
No par value, unlimited number of shares authorized. |
See notes to financial statements.
| 50 |
2007 iSHARES ANNUAL REPORT TO SHAREHOLDERS |
Table of Contents
Statements of Assets and Liabilities (Continued)
iSHARES® TRUST
July 31, 2007
| iShares S&P GSSI™ |
iShares NYSE | |||||||||||
| Natural Resources Index Fund |
Composite Index Fund |
100 Index Fund |
||||||||||
| ASSETS |
||||||||||||
| Investments, at cost: |
||||||||||||
| Unaffiliated issuers |
$ | 1,504,589,427 | $ | 108,878,876 | $ | 247,314,247 | ||||||
| Affiliated issuers (Note 2) |
14,457,215 | 767,262 | 363,500 | |||||||||
| Total cost of investments |
$ | 1,519,046,642 | $ | 109,646,138 | $ | 247,677,747 | ||||||
| Investments in securities, at value (including securities on loana) (Note 1): |
||||||||||||
| Unaffiliated issuers |
$ | 1,865,575,839 | $ | 117,284,260 | $ | 255,098,560 | ||||||
| Affiliated issuers (Note 2) |
14,457,215 | 793,183 | 363,500 | |||||||||
| Total value of investments |
1,880,033,054 | 118,077,443 | 255,462,060 | |||||||||
| Receivables: |
||||||||||||
| Investment securities sold |
– | 13,003 | – | |||||||||
| Dividends and interest |
895,371 | 146,747 | 357,241 | |||||||||
| Capital shares sold |
6,411 | – | – | |||||||||
| Total Assets |
1,880,934,836 | 118,237,193 | 255,819,301 | |||||||||
| LIABILITIES |
||||||||||||
| Payables: |
||||||||||||
| Investment securities purchased |
– | 7,955 | 358,009 | |||||||||
| Due to custodian |
– | 5,048 | – | |||||||||
| Collateral for securities on loan (Note 5) |
12,479,267 | 201,529 | – | |||||||||
| Investment advisory fees (Note 2) |
776,523 | 25,050 | 56,786 | |||||||||
| Total Liabilities |
13,255,790 | 239,582 | 414,795 | |||||||||
| NET ASSETS |
$ | 1,867,679,046 | $ | 117,997,611 | $ | 255,404,506 | ||||||
| Net assets consist of: |
||||||||||||
| Paid-in capital |
$ | 1,520,810,118 | $ | 109,741,746 | $ | 248,193,865 | ||||||
| Undistributed net investment income |
– | 93,831 | 378,394 | |||||||||
| Accumulated net realized loss |
(14,117,484 | ) | (269,271 | ) | (952,066 | ) | ||||||
| Net unrealized appreciation |
360,986,412 | 8,431,305 | 7,784,313 | |||||||||
| NET ASSETS |
$ | 1,867,679,046 | $ | 117,997,611 | $ | 255,404,506 | ||||||
| Shares outstandingb |
15,550,000 | 1,350,000 | 3,350,000 | |||||||||
| Net asset value per share |
$ | 120.11 | $ | 87.41 | $ | 76.24 | ||||||
| a |
Securities on loan with market values of $12,019,918, $191,700 and $–, respectively. See Note 5. |
| b |
No par value, unlimited number of shares authorized. |
See notes to financial statements.
| FINANCIAL STATEMENTS |
51 |
Table of Contents
Statements of Operations
iSHARES® TRUST
Year ended July 31, 2007
| iShares S&P GSTI™ | ||||||||||||||||
| Technology Index Fund |
Networking Index Fund |
Semiconductor Index Fund |
Software Index Fund |
|||||||||||||
| NET INVESTMENT INCOME |
||||||||||||||||
| Dividends from unaffiliated issuersa |
$ | 1,702,212 | $ | 384,387 | $ | 2,361,445 | $ | 366,855 | ||||||||
| Interest from affiliated issuers (Note 2) |
15,852 | 7,414 | 12,214 | 10,370 | ||||||||||||
| Securities lending income from unaffiliated issuers |
10,746 | 41,269 | 6,330 | 43,004 | ||||||||||||
| Securities lending income from affiliated issuers (Note 2) |
8,033 | 3,336 | 16,029 | 14,053 | ||||||||||||
| Total investment income |
1,736,843 | 436,406 | 2,396,018 | 434,282 | ||||||||||||
| EXPENSES |
||||||||||||||||
| Investment advisory fees (Note 2) |
1,452,126 | 922,362 | 1,433,489 | 955,292 | ||||||||||||
| Total expenses |
1,452,126 | 922,362 | 1,433,489 | 955,292 | ||||||||||||
| Net investment income (loss) |
284,717 | (485,956 | ) | 962,529 | (521,010 | ) | ||||||||||
| NET REALIZED AND UNREALIZED GAIN (LOSS) |
||||||||||||||||
| Net realized gain (loss) from: |
||||||||||||||||
| Investments in unaffiliated issuers |
(6,037,364 | ) | (25,748,296 | ) | (20,381,096 | ) | (3,073,136 | ) | ||||||||
| In-kind redemptions |
41,399,115 | 17,803,610 | 24,136,736 | 24,180,155 | ||||||||||||
| Net realized gain (loss) |
35,361,751 | (7,944,686 | ) | 3,755,640 | 21,107,019 | |||||||||||
| Net change in unrealized appreciation (depreciation) |
32,776,681 | 56,346,484 | 41,872,219 | 3,402,542 | ||||||||||||
| Net realized and unrealized gain |
68,138,432 | 48,401,798 | 45,627,859 | 24,509,561 | ||||||||||||
| NET INCREASE IN NET ASSETS RESULTING FROM OPERATIONS |
$ | 68,423,149 | $ | 47,915,842 | $ | 46,590,388 | $ | 23,988,551 | ||||||||
| a |
Net of foreign withholding tax of $4,835, $–, $34,014 and $–, respectively. |
See notes to financial statements.
| 52 |
2007 iSHARES ANNUAL REPORT TO SHAREHOLDERS |
Table of Contents
Statements of Operations (Continued)
iSHARES® TRUST
Year ended July 31, 2007
| iShares S&P GSSI™ |
iShares NYSE | |||||||||||
| Natural Resources Index Fund |
Composite Index Fund |
100 Index Fund |
||||||||||
| NET INVESTMENT INCOME |
||||||||||||
| Dividends from unaffiliated issuersa |
$ | 23,922,625 | $ | 2,286,858 | $ | 8,039,849 | ||||||
| Dividends from affiliated issuers (Note 2) |
– | 16,874 | – | |||||||||
| Interest from affiliated issuers (Note 2) |
101,980 | 7,993 | 22,903 | |||||||||
| Securities lending income from unaffiliated issuers |
242,435 | 3,036 | – | |||||||||
| Securities lending income from affiliated issuers (Note 2) |
51,440 | 1,632 | – | |||||||||
| Total investment income |
24,318,480 | 2,316,393 | 8,062,752 | |||||||||
| EXPENSES |
||||||||||||
| Investment advisory fees (Note 2) |
7,215,169 | 255,569 | 703,805 | |||||||||
| Total expenses |
7,215,169 | 255,569 | 703,805 | |||||||||
| Net investment income |
17,103,311 | 2,060,824 | 7,358,947 | |||||||||
| NET REALIZED AND UNREALIZED GAIN (LOSS) |
||||||||||||
| Net realized gain (loss) from: |
||||||||||||
| Investments in unaffiliated issuers |
(6,737,784 | ) | (324,023 | ) | (587,470 | ) | ||||||
| Investments in affiliated issuers (Note 2) |
– | 47,992 | – | |||||||||
| In-kind redemptions |
173,189,605 | 7,841,779 | 46,395,325 | |||||||||
| Net realized gain |
166,451,821 | 7,565,748 | 45,807,855 | |||||||||
| Net change in unrealized appreciation (depreciation) |
74,275,458 | 4,917,546 | (1,471,063 | ) | ||||||||
| Net realized and unrealized gain |
240,727,279 | 12,483,294 | 44,336,792 | |||||||||
| NET INCREASE IN NET ASSETS RESULTING FROM OPERATIONS |
$ | 257,830,590 | $ | 14,544,118 | $ | 51,695,739 | ||||||
| a |
Net of foreign withholding tax of $385,608, $98,564 and $964, respectively. |
See notes to financial statements.
| FINANCIAL STATEMENTS |
53 |
Table of Contents
Statements of Changes in Net Assets
iSHARES® TRUST
| iShares S&P GSTI™ Technology Index Fund |
iShares S&P GSTI™ Networking Index Fund |
|||||||||||||||
| Year ended July 31, 2007 |
Year ended July 31, 2006 |
Year ended July 31, 2007 |
Year ended July 31, 2006 |
|||||||||||||
| INCREASE (DECREASE) IN NET ASSETS |
||||||||||||||||
| OPERATIONS: |
||||||||||||||||
| Net investment income (loss) |
$ | 284,717 | $ | 122,956 | $ | (485,956 | ) | $ | (789,826 | ) | ||||||
| Net realized gain (loss) |
35,361,751 | 16,248,166 | (7,944,686 | ) | 4,764,830 | |||||||||||
| Net change in unrealized appreciation (depreciation) |
32,776,681 | (37,980,008 | ) | 56,346,484 | (56,067,931 | ) | ||||||||||
| Net increase (decrease) in net assets resulting from operations |
68,423,149 | (21,608,886 | ) | 47,915,842 | (52,092,927 | ) | ||||||||||
| DISTRIBUTIONS TO SHAREHOLDERS: |
||||||||||||||||
| From net investment income |
(281,985 | ) | (217,577 | ) | – | – | ||||||||||
| Return of capital |
(116,401 | ) | – | – | – | |||||||||||
| Total distributions to shareholders |
(398,386 | ) | (217,577 | ) | – | – | ||||||||||
| CAPITAL SHARE TRANSACTIONS: |
||||||||||||||||
| Proceeds from shares sold |
475,606,798 | 122,820,443 | 249,021,810 | 292,116,819 | ||||||||||||
| Cost of shares redeemed |
(377,591,377 | ) | (194,240,812 | ) | (228,323,892 | ) | (230,492,029 | ) | ||||||||
| Net increase (decrease) in net assets from capital share transactions |
98,015,421 | (71,420,369 | ) | 20,697,918 | 61,624,790 | |||||||||||
| INCREASE (DECREASE) IN NET ASSETS |
166,040,184 | (93,246,832 | ) | 68,613,760 | 9,531,863 | |||||||||||
| NET ASSETS |
||||||||||||||||
| Beginning of year |
201,458,003 | 294,704,835 | 157,517,795 | 147,985,932 | ||||||||||||
| End of year |
$ | 367,498,187 | $ | 201,458,003 | $ | 226,131,555 | $ | 157,517,795 | ||||||||
| SHARES ISSUED AND REDEEMED |
||||||||||||||||
| Shares sold |
9,100,000 | 2,500,000 | 7,450,000 | 8,550,000 | ||||||||||||
| Shares redeemed |
(7,250,000 | ) | (4,200,000 | ) | (7,050,000 | ) | (7,500,000 | ) | ||||||||
| Net increase (decrease) in shares outstanding |
1,850,000 | (1,700,000 | ) | 400,000 | 1,050,000 | |||||||||||
See notes to financial statements.
| 54 |
2007 iSHARES ANNUAL REPORT TO SHAREHOLDERS |
Table of Contents
Statements of Changes in Net Assets (Continued)
iSHARES® TRUST
| iShares S&P GSTI™ Semiconductor Index Fund |
iShares S&P GSTI™ Software Index Fund |
|||||||||||||||
| Year ended July 31, 2007 |
Year ended July 31, 2006 |
Year ended July 31, 2007 |
Year ended July 31, 2006 |
|||||||||||||
| INCREASE (DECREASE) IN NET ASSETS |
||||||||||||||||
| OPERATIONS: |
||||||||||||||||
| Net investment income (loss) |
$ | 962,529 | $ | 300,331 | $ | (521,010 | ) | $ | (550,685 | ) | ||||||
| Net realized gain (loss) |
3,755,640 | 56,846,932 | 21,107,019 | (4,669,025 | ) | |||||||||||
| Net change in unrealized appreciation (depreciation) |
41,872,219 | (89,017,891 | ) | 3,402,542 | (5,512,402 | ) | ||||||||||
| Net increase (decrease) in net assets resulting from operations |
46,590,388 | (31,870,628 | ) | 23,988,551 | (10,732,112 | ) | ||||||||||
| DISTRIBUTIONS TO SHAREHOLDERS: |
||||||||||||||||
| From net investment income |
(962,529 | ) | (300,331 | ) | – | – | ||||||||||
| Return of capital |
(69,405 | ) | (129,193 | ) | – | – | ||||||||||
| Total distributions to shareholders |
(1,031,934 | ) | (429,524 | ) | – | – | ||||||||||
| CAPITAL SHARE TRANSACTIONS: |
||||||||||||||||
| Proceeds from shares sold |
563,361,788 | 419,456,784 | 472,172,671 | 247,903,295 | ||||||||||||
| Cost of shares redeemed |
(569,388,021 | ) | (667,794,134 | ) | (386,859,411 | ) | (385,912,331 | ) | ||||||||
| Net increase (decrease) in net assets from capital share transactions |
(6,026,233 | ) | (248,337,350 | ) | 85,313,260 | (138,009,036 | ) | |||||||||
| INCREASE (DECREASE) IN NET ASSETS |
39,532,221 | (280,637,502 | ) | 109,301,811 | (148,741,148 | ) | ||||||||||
| NET ASSETS |
||||||||||||||||
| Beginning of year |
263,678,167 | 544,315,669 | 80,900,259 | 229,641,407 | ||||||||||||
| End of year |
$ | 303,210,388 | $ | 263,678,167 | $ | 190,202,070 | $ | 80,900,259 | ||||||||
| SHARES ISSUED AND REDEEMED |
||||||||||||||||
| Shares sold |
8,900,000 | 6,650,000 | 10,500,000 | 6,100,000 | ||||||||||||
| Shares redeemed |
(9,050,000 | ) | (11,150,000 | ) | (8,500,000 | ) | (9,650,000 | ) | ||||||||
| Net increase (decrease) in shares outstanding |
(150,000 | ) | (4,500,000 | ) | 2,000,000 | (3,550,000 | ) | |||||||||
See notes to financial statements.
| FINANCIAL STATEMENTS |
55 |
Table of Contents
Statements of Changes in Net Assets (Continued)
iSHARES® TRUST
| iShares S&P GSSI™ Natural Resources Index Fund |
iShares NYSE Composite Index Fund |
|||||||||||||||
| Year ended July 31, 2007 |
Year ended July 31, 2006 |
Year ended July 31, 2007 |
Year ended July 31, 2006 |
|||||||||||||
| INCREASE (DECREASE) IN NET ASSETS |
||||||||||||||||
| OPERATIONS: |
||||||||||||||||
| Net investment income |
$ | 17,103,311 | $ | 13,414,750 | $ | 2,060,824 | $ | 768,216 | ||||||||
| Net realized gain |
166,451,821 | 126,163,040 | 7,565,748 | 4,444 | ||||||||||||
| Net change in unrealized appreciation (depreciation) |
74,275,458 | 117,296,207 | 4,917,546 | 2,459,829 | ||||||||||||
| Net increase in net assets resulting from operations |
257,830,590 | 256,873,997 | 14,544,118 | 3,232,489 | ||||||||||||
| DISTRIBUTIONS TO SHAREHOLDERS: |
||||||||||||||||
| From net investment income |
(17,216,999 | ) | (12,876,808 | ) | (2,083,187 | ) | (650,906 | ) | ||||||||
| Return of capital |
(74,715 | ) | – | – | – | |||||||||||
| Total distributions to shareholders |
(17,291,714 | ) | (12,876,808 | ) | (2,083,187 | ) | (650,906 | ) | ||||||||
| CAPITAL SHARE TRANSACTIONS: |
||||||||||||||||
| Proceeds from shares sold |
736,865,560 | 654,898,497 | 82,437,231 | 40,405,675 | ||||||||||||
| Cost of shares redeemed |
(562,841,466 | ) | (246,665,878 | ) | (33,548,345 | ) | – | |||||||||
| Net increase in net assets from capital share transactions |
174,024,094 | 408,232,619 | 48,888,886 | 40,405,675 | ||||||||||||
| INCREASE IN NET ASSETS |
414,562,970 | 652,229,808 | 61,349,817 | 42,987,258 | ||||||||||||
| NET ASSETS |
||||||||||||||||
| Beginning of year |
1,453,116,076 | 800,886,268 | 56,647,794 | 13,660,536 | ||||||||||||
| End of year |
$ | 1,867,679,046 | $ | 1,453,116,076 | $ | 117,997,611 | $ | 56,647,794 | ||||||||
| Undistributed net investment income included in net assets at end of year |
$ | – | $ | 279,339 | $ | 93,831 | $ | 129,919 | ||||||||
| SHARES ISSUED AND REDEEMED |
||||||||||||||||
| Shares sold |
6,650,000 | 7,000,000 | 1,000,000 | 550,000 | ||||||||||||
| Shares redeemed |
(5,400,000 | ) | (2,600,000 | ) | (400,000 | ) | – | |||||||||
| Net increase in shares outstanding |
1,250,000 | 4,400,000 | 600,000 | 550,000 | ||||||||||||
See notes to financial statements.
| 56 |
2007 iSHARES ANNUAL REPORT TO SHAREHOLDERS |
Table of Contents
Statements of Changes in Net Assets (Continued)
iSHARES® TRUST
| iShares NYSE 100 Index Fund |
||||||||
| Year ended July 31, 2007 |
Year ended July 31, 2006 |
|||||||
| INCREASE (DECREASE) IN NET ASSETS |
||||||||
| OPERATIONS: |
||||||||
| Net investment income |
$ | 7,358,947 | $ | 1,080,280 | ||||
| Net realized gain |
45,807,855 | 47,306 | ||||||
| Net change in unrealized appreciation (depreciation) |
(1,471,063 | ) | 7,919,247 | |||||
| Net increase in net assets resulting from operations |
51,695,739 | 9,046,833 | ||||||
| DISTRIBUTIONS TO SHAREHOLDERS: |
||||||||
| From net investment income |
(7,354,788 | ) | (773,733 | ) | ||||
| Total distributions to shareholders |
(7,354,788 | ) | (773,733 | ) | ||||
| CAPITAL SHARE TRANSACTIONS: |
||||||||
| Proceeds from shares sold |
172,836,575 | 280,783,091 | ||||||
| Cost of shares redeemed |
(279,887,723 | ) | (3,212,892 | ) | ||||
| Net increase (decrease) in net assets from capital share transactions |
(107,051,148 | ) | 277,570,199 | |||||
| INCREASE (DECREASE) IN NET ASSETS |
(62,710,197 | ) | 285,843,299 | |||||
| NET ASSETS |
||||||||
| Beginning of year |
318,114,703 | 32,271,404 | ||||||
| End of year |
$ | 255,404,506 | $ | 318,114,703 | ||||
| Undistributed net investment income included in net assets at end of year |
$ | 378,394 | $ | 374,670 | ||||
| SHARES ISSUED AND REDEEMED |
||||||||
| Shares sold |
2,300,000 | 4,200,000 | ||||||
| Shares redeemed |
(3,600,000 | ) | (50,000 | ) | ||||
| Net increase (decrease) in shares outstanding |
(1,300,000 | ) | 4,150,000 | |||||
See notes to financial statements.
| FINANCIAL STATEMENTS |
57 |
Table of Contents
iSHARES® TRUST
(For a share outstanding throughout each period)
| iShares S&P GSTI™ Technology Index Fund | ||||||||||||||||||||
| Year ended Jul. 31, 2007 |
Year ended Jul. 31, 2006 |
Year ended Jul. 31, 2005 |
Year ended Jul. 31, 2004 |
Year ended Jul. 31, 2003 |
||||||||||||||||
| Net asset value, beginning of year |
$ | 42.86 | $ | 46.05 | $ | 41.79 | $ | 38.51 | $ | 30.28 | ||||||||||
| Income from investment operations: |
||||||||||||||||||||
| Net investment income (loss) |
0.05 | a | 0.02 | a | 0.35 | (0.06 | ) | (0.04 | ) | |||||||||||
| Net realized and unrealized gain (loss)b |
13.27 | (3.17 | ) | 4.28 | 3.34 | 8.27 | ||||||||||||||
| Total from investment operations |
13.32 | (3.15 | ) | 4.63 | 3.28 | 8.23 | ||||||||||||||
| Less distributions from: |
||||||||||||||||||||
| Net investment income |
(0.05 | ) | (0.04 | ) | (0.34 | ) | – | – | ||||||||||||
| Return of capital |
(0.02 | ) | – | (0.03 | ) | – | – | |||||||||||||
| Total distributions |
(0.07 | ) | (0.04 | ) | (0.37 | ) | – | – | ||||||||||||
| Net asset value, end of year |
$ | 56.11 | $ | 42.86 | $ | 46.05 | $ | 41.79 | $ | 38.51 | ||||||||||
| Total return |
31.09 | % | (6.85 | )% | 11.10 | % | 8.52 | % | 27.18 | % | ||||||||||
| Ratios/Supplemental data: |
||||||||||||||||||||
| Net assets, end of year (000s) |
$ | 367,498 | $ | 201,458 | $ | 294,705 | $ | 185,966 | $ | 103,984 | ||||||||||
| Ratio of expenses to average net assets |
0.48 | % | 0.50 | % | 0.50 | % | 0.50 | % | 0.50 | % | ||||||||||
| Ratio of net investment income (loss) to average net assets |
0.09 | % | 0.04 | % | 0.81 | % | (0.20 | )% | (0.18 | )% | ||||||||||
| Portfolio turnover ratec |
20 | % | 5 | % | 7 | % | 5 | % | 11 | % | ||||||||||
| a |
Based on average shares outstanding throughout the period. |
| b |
The amounts reported may not accord with the change in aggregate gains and losses in securities due to the timing of capital share transactions. |
| c |
Portfolio turnover rates exclude portfolio securities received or delivered as a result of processing capital share transactions in Creation Units. |
See notes to financial statements.
| 58 |
2007 iSHARES ANNUAL REPORT TO SHAREHOLDERS |
Table of Contents
Financial Highlights (Continued)
iSHARES® TRUST
(For a share outstanding throughout each period)
| iShares S&P GSTI™ Networking Index Fund | ||||||||||||||||||||
| Year ended Jul. 31, 2007 |
Year ended Jul. 31, 2006 |
Year ended Jul. 31, 2005 |
Year ended Jul. 31, 2004 |
Year ended Jul. 31, 2003 |
||||||||||||||||
| Net asset value, beginning of year |
$ | 26.25 | $ | 29.90 | $ | 26.97 | $ | 20.75 | $ | 13.09 | ||||||||||
| Income from investment operations: |
||||||||||||||||||||
| Net investment loss |
(0.08 | )a | (0.10 | )a | (0.08 | ) | (0.07 | ) | (0.01 | ) | ||||||||||
| Net realized and unrealized gain (loss)b |
9.16 | (3.55 | ) | 3.01 | 6.29 | 7.67 | ||||||||||||||
| Total from investment operations |
9.08 | (3.65 | ) | 2.93 | 6.22 | 7.66 | ||||||||||||||
| Net asset value, end of year |
$ | 35.33 | $ | 26.25 | $ | 29.90 | $ | 26.97 | $ | 20.75 | ||||||||||
| Total return |
34.59 | % | (12.21 | )% | 10.86 | % | 29.98 | % | 58.52 | % | ||||||||||
| Ratios/Supplemental data: |
||||||||||||||||||||
| Net assets, end of year (000s) |
$ | 226,132 | $ | 157,518 | $ | 147,986 | $ | 146,986 | $ | 80,917 | ||||||||||
| Ratio of expenses to average net assets |
0.48 | % | 0.50 | % | 0.50 | % | 0.50 | % | 0.50 | % | ||||||||||
| Ratio of net investment loss to average net assets |
(0.25 | )% | (0.31 | )% | (0.26 | )% | (0.31 | )% | (0.17 | )% | ||||||||||
| Portfolio turnover ratec |
53 | % | 32 | % | 16 | % | 12 | % | 26 | % | ||||||||||
| a |
Based on average shares outstanding throughout the period. |
| b |
The amounts reported may not accord with the change in aggregate gains and losses in securities due to the timing of capital share transactions. |
| c |
Portfolio turnover rates exclude portfolio securities received or delivered as a result of processing capital share transactions in Creation Units. |
See notes to financial statements.
| FINANCIAL HIGHLIGHTS |
59 |
Table of Contents
Financial Highlights (Continued)
iSHARES® TRUST
(For a share outstanding throughout each period)
| iShares S&P GSTI™ Semiconductor Index Fund | ||||||||||||||||||||
| Year ended Jul. 31, 2007 |
Year ended Jul. 31, 2006 |
Year ended Jul. 31, 2005 |
Year ended Jul. 31, 2004 |
Year ended Jul. 31, 2003 |
||||||||||||||||
| Net asset value, beginning of year |
$ | 55.51 | $ | 58.84 | $ | 50.64 | $ | 48.34 | $ | 41.63 | ||||||||||
| Income from investment operations: |
||||||||||||||||||||
| Net investment income (loss) |
0.20 | a | 0.04 | a | (0.03 | ) | (0.16 | ) | (0.06 | ) | ||||||||||
| Net realized and unrealized gain (loss)b |
10.43 | (3.30 | ) | 8.23 | 2.46 | 6.77 | ||||||||||||||
| Total from investment operations |
10.63 | (3.26 | ) | 8.20 | 2.30 | 6.71 | ||||||||||||||
| Less distributions from: |
||||||||||||||||||||
| Net investment income |
(0.21 | ) | (0.05 | ) | – | – | – | |||||||||||||
| Return of capital |
(0.01 | ) | (0.02 | ) | – | (0.00 | )c | – | ||||||||||||
| Total distributions |
(0.22 | ) | (0.07 | ) | – | (0.00 | )c | – | ||||||||||||
| Net asset value, end of year |
$ | 65.92 | $ | 55.51 | $ | 58.84 | $ | 50.64 | $ | 48.34 | ||||||||||
| Total return |
19.16 | % | (5.56 | )% | 16.19 | % | 4.76 | % | 16.12 | % | ||||||||||
| Ratios/Supplemental data: |
||||||||||||||||||||
| Net assets, end of year (000s) |
$ | 303,210 | $ | 263,678 | $ | 544,316 | $ | 124,066 | $ | 101,516 | ||||||||||
| Ratio of expenses to average net assets |
0.48 | % | 0.50 | % | 0.50 | % | 0.50 | % | 0.50 | % | ||||||||||
| Ratio of net investment income (loss) to average net assets |
0.32 | % | 0.07 | % | (0.09 | )% | (0.20 | )% | (0.20 | )% | ||||||||||
| Portfolio turnover rated |
25 | % | 6 | % | 10 | % | 6 | % | 11 | % | ||||||||||
| a |
Based on average shares outstanding throught the period. |
| b |
The amounts reported may not accord with the change in aggregate gains and losses in securities due to the timing of capital share transactions. |
| c |
Rounds to less than $0.01. |
| d |
Portfolio turnover rates exclude portfolio securities received or delivered as a result of processing capital share transactions in Creation Units. |
See notes to financial statements.
| 60 |
2007 iSHARES ANNUAL REPORT TO SHAREHOLDERS |
Table of Contents
Financial Highlights (Continued)
iSHARES® TRUST
(For a share outstanding throughout each period)
| iShares S&P GSTI™ Software Index Fund | ||||||||||||||||||||
| Year ended Jul. 31, 2007 |
Year ended Jul. 31, 2006 |
Year ended Jul. 31, 2005 |
Year ended Jul. 31, 2004 |
Year ended Jul. 31, 2003 |
||||||||||||||||
| Net asset value, beginning of year |
$ | 37.63 | $ | 40.29 | $ | 33.85 | $ | 31.56 | $ | 23.61 | ||||||||||
| Income from investment operations: |
||||||||||||||||||||
| Net investment income (loss) |
(0.12 | )a | (0.13 | )a | 0.20 | (0.15 | ) | (0.06 | ) | |||||||||||
| Net realized and unrealized gain (loss)b |
8.32 | (2.53 | ) | 6.48 | 2.44 | 8.01 | ||||||||||||||
| Total from investment operations |
8.20 | (2.66 | ) | 6.68 | 2.29 | 7.95 | ||||||||||||||
| Less distributions from: |
||||||||||||||||||||
| Net investment income |
– | – | (0.24 | ) | – | – | ||||||||||||||
| Total distributions |
– | – | (0.24 | ) | – | – | ||||||||||||||
| Net asset value, end of year |
$ | 45.83 | $ | 37.63 | $ | 40.29 | $ | 33.85 | $ | 31.56 | ||||||||||
| Total return |
21.79 | % | (6.60 | )% | 19.72 | % | 7.26 | % | 33.67 | % | ||||||||||
| Ratios/Supplemental data: |
||||||||||||||||||||
| Net assets, end of year (000s) |
$ | 190,202 | $ | 80,900 | $ | 229,641 | $ | 115,077 | $ | 115,197 | ||||||||||
| Ratio of expenses to average net assets |
0.48 | % | 0.50 | % | 0.50 | % | 0.50 | % | 0.50 | % | ||||||||||
| Ratio of net investment income (loss) to average net assets |
(0.26 | )% | (0.31 | )% | 0.59 | % | (0.40 | )% | (0.43 | )% | ||||||||||
| Portfolio turnover ratec |
25 | % | 16 | % | 13 | % | 11 | % | 9 | % | ||||||||||
| a |
Based on average shares outstanding throughout the period. |
| b |
The amounts reported may not accord with the change in aggregate gains and losses in securities due to the timing of capital share transactions. |
| c |
Portfolio turnover rates exclude portfolio securities received or delivered as a result of processing capital share transactions in Creation Units. |
See notes to financial statements.
| FINANCIAL HIGHLIGHTS |
61 |
Table of Contents
Financial Highlights (Continued)
iSHARES® TRUST
(For a share outstanding throughout each period)
| iShares S&P GSSI™ Natural Resources Index Fund | ||||||||||||||||||||
| Year ended Jul. 31, 2007 |
Year ended Jul. 31, 2006 |
Year ended Jul. 31, 2005 |
Year ended Jul. 31, 2004 |
Year ended Jul. 31, 2003 |
||||||||||||||||
| Net asset value, beginning of year |
$ | 101.62 | $ | 80.90 | $ | 58.51 | $ | 43.52 | $ | 41.64 | ||||||||||
| Income from investment operations: |
||||||||||||||||||||
| Net investment income |
1.20 | a | 1.04 | a | 0.81 | 0.67 | 0.76 | |||||||||||||
| Net realized and unrealized gainb |
18.49 | 20.67 | 22.39 | 15.04 | 1.83 | |||||||||||||||
| Total from investment operations |
19.69 | 21.71 | 23.20 | 15.71 | 2.59 | |||||||||||||||
| Less distributions from: |
||||||||||||||||||||
| Net investment income |
(1.19 | ) | (0.99 | ) | (0.81 | ) | (0.72 | ) | (0.71 | ) | ||||||||||
| Return of capital |
(0.01 | ) | – | – | – | – | ||||||||||||||
| Total distributions |
(1.20 | ) | (0.99 | ) | (0.81 | ) | (0.72 | ) | (0.71 | ) | ||||||||||
| Net asset value, end of year |
$ | 120.11 | $ | 101.62 | $ | 80.90 | $ | 58.51 | $ | 43.52 | ||||||||||
| Total return |
19.56 | % | 26.96 | % | 39.92 | % | 36.34 | % | 6.27 | % | ||||||||||
| Ratios/Supplemental data: |
||||||||||||||||||||
| Net assets, end of year (000s) |
$ | 1,867,679 | $ | 1,453,116 | $ | 800,886 | $ | 263,270 | $ | 52,219 | ||||||||||
| Ratio of expenses to average net assets |
0.48 | % | 0.50 | % | 0.50 | % | 0.50 | % | 0.50 | % | ||||||||||
| Ratio of net investment income to average net assets |
1.14 | % | 1.12 | % | 1.20 | % | 1.33 | % | 1.92 | % | ||||||||||
| Portfolio turnover ratec |
18 | % | 7 | % | 8 | % | 7 | % | 7 | % | ||||||||||
| a |
Based on average shares outstanding throughout the period. |
| b |
The amounts reported may not accord with the change in aggregate gains and losses in securities due to the timing of capital share transactions. |
| c |
Portfolio turnover rates exclude portfolio securities received or delivered as a result of processing capital share transactions in Creation Units. |
See notes to financial statements.
| 62 |
2007 iSHARES ANNUAL REPORT TO SHAREHOLDERS |
Table of Contents
Financial Highlights (Continued)
iSHARES® TRUST
(For a share outstanding throughout each period)
| iShares NYSE Composite Index Fund | ||||||||||||||||
| Year ended Jul. 31, 2007 |
Year ended Jul. 31, 2006 |
Year ended Jul. 31, 2005 |
Period from Mar. 30, 2004a to Jul. 31, 2004 |
|||||||||||||
| Net asset value, beginning of period |
$ | 75.53 | $ | 68.30 | $ | 58.82 | $ | 60.34 | ||||||||
| Income from investment operations: |
||||||||||||||||
| Net investment income |
1.70 | b | 1.66 | b | 1.63 | 0.34 | ||||||||||
| Net realized and unrealized gain (loss)c |
11.90 | 6.74 | 9.46 | (1.60 | ) | |||||||||||
| Total from investment operations |
13.60 | 8.40 | 11.09 | (1.26 | ) | |||||||||||
| Less distributions from: |
||||||||||||||||
| Net investment income |
(1.72 | ) | (1.17 | ) | (1.61 | ) | (0.26 | ) | ||||||||
| Total distributions |
(1.72 | ) | (1.17 | ) | (1.61 | ) | (0.26 | ) | ||||||||
| Net asset value, end of period |
$ | 87.41 | $ | 75.53 | $ | 68.30 | $ | 58.82 | ||||||||
| Total return |
18.10 | % | 12.40 | % | 19.03 | % | (2.10 | )%d | ||||||||
| Ratios/Supplemental data: |
||||||||||||||||
| Net assets, end of period (000s) |
$ | 117,998 | $ | 56,648 | $ | 13,661 | $ | 14,705 | ||||||||
| Ratio of expenses to average net assetse |
0.25 | % | 0.25 | % | 0.25 | % | 0.25 | % | ||||||||
| Ratio of net investment income to average net assetse |
2.02 | % | 2.26 | % | 2.01 | % | 1.98 | % | ||||||||
| Portfolio turnover ratef |
7 | % | 4 | % | 5 | % | 1 | % | ||||||||
| a |
Commencement of operations. |
| b |
Based on average shares outstanding throughout the period. |
| c |
The amounts reported may not accord with the change in aggregate gains and losses in securities due to the timing of capital share transactions. |
| d |
Not annualized. |
| e |
Annualized for periods of less than one year. |
| f |
Portfolio turnover rates exclude portfolio securities received or delivered as a result of processing capital share transactions in Creation Units. |
See notes to financial statements.
| FINANCIAL HIGHLIGHTS |
63 |
Table of Contents
Financial Highlights (Continued)
iSHARES® TRUST
(For a share outstanding throughout each period)
| iShares NYSE 100 Index Fund | ||||||||||||||||
| Year ended Jul. 31, 2007 |
Year ended Jul. 31, 2006 |
Year ended Jul. 31, 2005 |
Period from Mar. 29, 2004a to Jul. 31, 2004 |
|||||||||||||
| Net asset value, beginning of period |
$ | 68.41 | $ | 64.54 | $ | 59.80 | $ | 60.80 | ||||||||
| Income from investment operations: |
||||||||||||||||
| Net investment income |
1.56 | b | 1.21 | b | 1.25 | 0.33 | ||||||||||
| Net realized and unrealized gain (loss)c |
7.79 | 3.85 | 4.73 | (1.13 | ) | |||||||||||
| Total from investment operations |
9.35 | 5.06 | 5.98 | (0.80 | ) | |||||||||||
| Less distributions from: |
||||||||||||||||
| Net investment income |
(1.52 | ) | (1.19 | ) | (1.24 | ) | (0.20 | ) | ||||||||
| Total distributions |
(1.52 | ) | (1.19 | ) | (1.24 | ) | (0.20 | ) | ||||||||
| Net asset value, end of period |
$ | 76.24 | $ | 68.41 | $ | 64.54 | $ | 59.80 | ||||||||
| Total return |
13.73 | % | 7.93 | % | 10.06 | % | (1.32 | )%d | ||||||||
| Ratios/Supplemental data: |
||||||||||||||||
| Net assets, end of period (000s) |
$ | 255,405 | $ | 318,115 | $ | 32,271 | $ | 32,888 | ||||||||
| Ratio of expenses to average net assetse |
0.20 | % | 0.20 | % | 0.20 | % | 0.20 | % | ||||||||
| Ratio of net investment income to average net assetse |
2.09 | % | 1.83 | % | 2.03 | % | 1.89 | % | ||||||||
| Portfolio turnover ratef |
10 | % | 6 | % | 7 | % | 3 | % | ||||||||
| a |
Commencement of operations. |
| b |
Based on average shares outstanding throughout the period. |
| c |
The amounts reported may not accord with the change in aggregate gains and losses in securities due to the timing of capital share transactions. |
| d |
Not annualized. |
| e |
Annualized for periods of less than one year. |
| f |
Portfolio turnover rates exclude portfolio securities received or delivered as a result of processing capital share transactions in Creation Units. |
See notes to financial statements.
| 64 |
2007 iSHARES ANNUAL REPORT TO SHAREHOLDERS |
Table of Contents
iSHARES® TRUST
iShares Trust (the “Trust”) is registered under the Investment Company Act of 1940, as amended (the “1940 Act”), as an open-end management investment company. The Trust was established as a Delaware statutory trust pursuant to an Agreement and Declaration of Trust dated December 16, 1999. As of July 31, 2007, the Trust offered 111 investment portfolios or funds.
These financial statements relate only to the iShares S&P GSTI™ Technology (formerly iShares Goldman Sachs Technology Index Fund), iShares S&P GSTI™ Networking (formerly iShares Goldman Sachs Networking Index Fund), iShares S&P GSTI™ Semiconductor (formerly iShares Goldman Sachs Semiconductor Index Fund), iShares S&P GSTI™ Software (formerly iShares Goldman Sachs Software Index Fund), iShares S&P GSSI™ Natural Resources (formerly iShares Goldman Sachs Natural Resources Index Fund), iShares NYSE Composite and iShares NYSE 100 Index Funds (each, a “Fund,” collectively, the “Funds”).
The investment objective of each Fund is to seek investment results that correspond generally to the price and yield performance, before fees and expenses, of its underlying index. The investment adviser uses a “passive” or index approach to achieve each Fund’s investment objective. Each of the Funds is classified as a non-diversified fund under the 1940 Act, except for the iShares NYSE Composite and iShares NYSE 100 Index Funds, which are classified as diversified funds. Non-diversified funds generally hold securities of fewer companies than diversified funds and may be more susceptible to the risks associated with these particular companies, or to a single economic, political or regulatory occurrence affecting these companies.
Pursuant to the Trust’s organizational documents, the Funds’ officers and trustees are indemnified against certain liabilities that may arise out of the performance of their duties to the Funds. Additionally, in the normal course of business, the Funds enter into contracts with service providers that contain general indemnification clauses. The Funds’ maximum exposure under these arrangements is unknown as this would involve future claims that may be made against the Funds that have not yet occurred.
1. SIGNIFICANT ACCOUNTING POLICIES
The following significant accounting policies are consistently followed by the Trust in the preparation of its financial statements in conformity with accounting principles generally accepted in the United States of America (“U.S. GAAP”) for investment companies. The preparation of financial statements in conformity with U.S. GAAP requires management to make certain estimates and assumptions that affect the reported amounts of assets and liabilities and disclosures of contingent assets and liabilities at the date of the financial statements and the reported amounts of revenue and expenses during the reporting period. Actual results could differ from those estimates.
SECURITY VALUATION
The securities and other assets of each Fund are generally valued using market valuations. A market valuation generally means a valuation (i) obtained from an exchange, a pricing service or a major market maker (or dealer), (ii) based on a price quotation or other equivalent indication of value supplied by an exchange, a pricing service or a major market maker (or dealer) or (iii) based on amortized cost. In the case of shares of funds that are not traded on an exchange, a market valuation means such fund’s published net asset value per share. The investment adviser may use various pricing services or discontinue the use of any pricing service. A price obtained from a pricing service based on such pricing service’s valuation matrix may be considered a market valuation. In the event that current market valuations are not readily available or such valuations do not reflect current market values, the affected investments will be valued using fair value pricing pursuant to the pricing policy and procedures approved by the Board of Trustees of the Trust (the “Board”).
Investments that may be valued using fair value pricing include, but are not limited to: (i) an unlisted security related to corporate actions; (ii) a restricted security (i.e., one that may not be publicly sold without registration under the Securities Act of 1933, as amended); (iii) a security whose trading has been suspended or which has been de-listed from its primary trading exchange; (iv) a security that is thinly
| NOTES TO FINANCIAL STATEMENTS |
65 |
Table of Contents
Notes to Financial Statements (Continued)
iSHARES® TRUST
traded; (v) a security in default or bankruptcy proceedings for which there is no current market quotation; (vi) a security affected by currency controls or restrictions; and (vii) a security affected by a significant event (i.e., an event that occurs after the close of the markets on which the security is traded but before the time as of which the Fund’s NAV is computed and that may materially affect the value of the Fund’s investments). Examples of events that may be “significant events” are government actions, natural disasters, armed conflict, acts of terrorism, and significant market fluctuations.
Valuing a Fund’s investments using fair value pricing will result in using prices for those investments that may differ from current market valuations. Accordingly, fair value pricing could result in a difference between the prices used to calculate a Fund’s net asset value and the prices used by the Fund’s benchmark index, which, in turn, could result in a difference between the Fund’s performance and the performance of the Fund’s benchmark index.
SECURITY TRANSACTIONS AND INCOME RECOGNITION
Security transactions are accounted for on trade date. Dividend income is recognized on the ex-dividend date, net of any foreign taxes withheld at source, and interest income is accrued daily. Distributions received by the Funds may include a return of capital that is estimated by management. Such amounts are recorded as a reduction of the cost of investments or reclassified to capital gains. Realized gains and losses on investment transactions are determined using the specific identification method.
DISTRIBUTIONS TO SHAREHOLDERS
Distributions to shareholders from net investment income, if any, are declared and distributed at least annually by each Fund. Distributions of net realized capital gains, if any, generally are declared and distributed once a year. Distributions are determined on a tax basis and may differ from net investment income and net realized capital gains for financial reporting purposes. Dividends and distributions cannot be automatically reinvested in additional shares of the Funds.
As of July 31, 2007, the tax year-end of the Funds, the components of net distributable earnings (accumulated losses) on a tax basis were as follows:
| iShares Index Fund | Undistributed Ordinary Income |
Unrealized Appreciation (Depreciation) |
Capital and Other Losses |
Net Distributable Earnings (Accumulated Losses) |
|||||||||||
| S&P GSTI™ Technology |
$ | – | $ | (13,346,662 | ) | $ | (7,499,763 | ) | $ | (20,846,425 | ) | ||||
| S&P GSTI™ Networking |
– | (20,071,167 | ) | (43,373,398 | ) | (63,444,565 | ) | ||||||||
| S&P GSTI™ Semiconductor |
– | (28,144,281 | ) | (21,824,365 | ) | (49,968,646 | ) | ||||||||
| S&P GSTI™ Software |
– | (15,473,321 | ) | (4,717,134 | ) | (20,190,455 | ) | ||||||||
| S&P GSSI™ Natural Resources |
– | 352,571,939 | (5,703,011 | ) | 346,868,928 | ||||||||||
| NYSE Composite |
93,831 | 8,421,535 | (259,501 | ) | 8,255,865 | ||||||||||
| NYSE 100 |
378,394 | 7,456,056 | (623,809 | ) | 7,210,641 | ||||||||||
For the years ended July 31, 2007 and July 31, 2006, the tax characterization of distributions paid for each Fund was equal to the book characterization of distributions paid. The total distributions and distributions per share are disclosed in the accompanying Statements of Changes in Net Assets and the Financial Highlights for all Funds.
| 66 |
2007 iSHARES ANNUAL REPORT TO SHAREHOLDERS |
Table of Contents
Notes to Financial Statements (Continued)
iSHARES® TRUST
FEDERAL INCOME TAXES
Each Fund is treated as a separate entity for federal income tax purposes. It is the policy of each Fund to qualify as a regulated investment company by complying with the provisions applicable to regulated investment companies, as defined under Subchapter M of the Internal Revenue Code of 1986, as amended, and to annually distribute substantially all of its net income and any net gains (taking into account any capital loss carry forwards) sufficient to relieve it from all, or substantially all, federal income and excise taxes. Accordingly, no provision for federal income taxes was required for the year ended July 31, 2007.
From November 1, 2006 to July 31, 2007, the Funds incurred net realized capital losses. As permitted by tax regulations, the Funds have elected to defer those losses and treat them as arising in the year ending July 31, 2008, as follows:
The Funds had tax basis net capital loss carry forwards as of July 31, 2007, the tax year-end of the Funds, as follows:
| iShares Index Fund | Expiring 2010 |
Expiring 2011 |
Expiring 2012 |
Expiring 2013 |
Expiring 2014 |
Expiring 2015 |
Total | ||||||||||||||
| S&P GSTI™ Technology |
$ | 638,692 | $ | 1,579,887 | $ | 2,523,700 | $ | 143,622 | $ | 184,019 | $ | 1,580,603 | $ | 6,650,523 | |||||||
| S&P GSTI™ Networking |
130,370 | 5,798,354 | 3,242,309 | 981,871 | 4,629,661 | 8,142,402 | 22,924,967 | ||||||||||||||
| S&P GSTI™ Semiconductor |
175,882 | 472,453 | 510,075 | 2,373 | 1,635,360 | 5,309,649 | 8,105,792 | ||||||||||||||
| S&P GSTI™ Software |
– | 797,714 | 761,567 | – | 38,268 | 2,827,824 | 4,425,373 | ||||||||||||||
| S&P GSSI™ Natural Resources |
– | 256,427 | 187,450 | – | 1,870,831 | 785,924 | 3,100,632 | ||||||||||||||
| NYSE Composite |
– | – | – | – | – | 8,687 | 8,687 | ||||||||||||||
| NYSE 100 |
– | – | 25,021 | – | 208,513 | 123,690 | 357,224 | ||||||||||||||
Net capital loss carry forwards may be applied against any net realized taxable gains in each succeeding year or until their respective expiration dates, whichever occurs first.
For the year ended July 31, 2007, the Funds realized net capital gains or losses resulting from in-kind redemptions of large blocks of shares or multiples thereof (“Creation Units”). Because such gains or losses are not taxable to the Funds and are not distributed to existing Fund shareholders, the gains or losses are reclassified from accumulated net realized gains or losses to paid-in-capital at the end of the Funds’ tax year. These reclassifications have no effect on net assets or net asset values per share. The net realized in-kind gains or losses for the year ended July 31, 2007 are disclosed in the Funds’ Statements of Operations.
| NOTES TO FINANCIAL STATEMENTS |
67 |
Table of Contents
Notes to Financial Statements (Continued)
iSHARES® TRUST
As of July 31, 2007, gross unrealized appreciation and gross unrealized depreciation based on cost for federal income tax purposes were as follows:
| iShares Index Fund | Tax Cost | Gross Unrealized Appreciation |
Gross Unrealized Depreciation |
Net Unrealized Appreciation (Depreciation) |
||||||||||
| S&P GSTI™ Technology |
$ | 383,677,431 | $ | 14,192,494 | $ | (27,539,156 | ) | $ | (13,346,662 | ) | ||||
| S&P GSTI™ Networking |
260,238,338 | 5,291,535 | (25,362,702 | ) | (20,071,167 | ) | ||||||||
| S&P GSTI™ Semiconductor |
343,052,479 | 5,243,233 | (33,387,514 | ) | (28,144,281 | ) | ||||||||
| S&P GSTI™ Software |
208,088,215 | 1,375,680 | (16,849,001 | ) | (15,473,321 | ) | ||||||||
| S&P GSSI™ Natural Resources |
1,527,461,115 | 368,712,470 | (16,140,531 | ) | 352,571,939 | |||||||||
| NYSE Composite |
109,655,908 | 11,286,476 | (2,864,941 | ) | 8,421,535 | |||||||||
| NYSE 100 |
248,006,004 | 13,769,222 | (6,313,166 | ) | 7,456,056 | |||||||||
REPURCHASE AGREEMENTS
Each Fund may enter into repurchase agreements with banks and securities dealers. These transactions involve the purchase of securities with a simultaneous commitment to resell the securities to the bank or the dealer at an agreed-upon date and price. A repurchase agreement is accounted for as an investment by the Fund, collateralized by securities, which are delivered to the Fund’s custodian or to an agent bank under a tri-party agreement. The securities are marked-to-market daily and additional securities are acquired as needed, to ensure that their value equals or exceeds the repurchase price plus accrued interest.
2. AGREEMENTS AND OTHER TRANSACTIONS WITH AFFILIATES
Pursuant to an Investment Advisory Agreement with the Trust, Barclays Global Fund Advisors (“BGFA”) manages the investment of each Fund’s assets. BGFA is a California corporation indirectly owned by Barclays Bank PLC. Under the Investment Advisory Agreement, BGFA is responsible for all expenses (“Covered Expenses”) of the Trust, including the cost of transfer agency, custody, fund administration, legal, audit and other services, except interest, taxes, brokerage commissions and other expenses connected with the execution of portfolio transactions, distribution fees and extraordinary expenses.
For its investment advisory services to each Fund, BGFA is entitled to an annual investment advisory fee based on the average daily net assets of each Fund as follows:
| 68 |
2007 iSHARES ANNUAL REPORT TO SHAREHOLDERS |
Table of Contents
Notes to Financial Statements (Continued)
iSHARES® TRUST
State Street Bank and Trust Company (“State Street”) serves as administrator, custodian and transfer agent for the Trust. As compensation for its services, State Street receives certain out-of-pocket costs, transaction fees and asset-based fees which are accrued daily and paid monthly. These fees and expenses are Covered Expenses as defined above.
SEI Investments Distribution Co. (“SEI”) serves as each Fund’s underwriter and distributor of the shares of each Fund, pursuant to a Distribution Agreement with the Trust. SEI does not receive a fee from the Funds for its distribution services.
Pursuant to an exemptive order issued by the U.S. Securities and Exchange Commission (“SEC”), the Funds are permitted to lend portfolio securities to Barclays Capital Inc. (“BarCap”). Pursuant to the same exemptive order, Barclays Global Investors, N.A. (“BGI”) serves as securities lending agent for the Trust. BarCap and BGI are affiliates of BGFA, the Funds’ investment adviser. As securities lending agent, BGI receives, as fees, a share of the income earned on investment of the cash collateral received for the loan of securities. For the year ended July 31, 2007, BGI earned securities lending agent fees as follows:
Cross trades for the year ended July 31, 2007, if any, were executed by the Funds pursuant to Rule 17a-7 under the 1940 Act. Cross trading is the buying or selling of portfolio securities between funds to which BGFA (or an affiliate) serves as investment adviser. At its regularly scheduled quarterly meetings, the Board reviews such transactions as of the most recent calendar quarter for compliance with the requirements and restrictions set forth by Rule 17a-7.
Each Fund may invest in the Institutional Shares of certain money market funds managed by BGFA, the Funds’ investment adviser, including the Government Money Market Fund (“GMMF”), Institutional Money Market Fund (“IMMF”), Prime Money Market Fund (“PMMF”) and Treasury Money Market Fund (“TMMF”) of Barclays Global Investors Funds. The GMMF, IMMF, PMMF and TMMF are feeder funds in a master/feeder fund structure that invest substantially all of their assets in the Government Money Market Master Portfolio, Money Market Master Portfolio, Prime Money Market Master Portfolio and Treasury Money Market Master Portfolio (collectively, the “Money Market Master Portfolios”), respectively, which are also managed by BGFA. While the GMMF, IMMF, PMMF and TMMF do not directly charge an investment advisory fee, the Money Market Master Portfolios in which they invest do charge an investment advisory fee. Income distributions from the GMMF, IMMF, PMMF and TMMF are declared daily and paid monthly from net investment income. Income distributions earned by the Funds from temporary cash investments are recorded as interest from affiliated issuers in the accompanying Statements of Operations. Income distributions earned by the Funds from the investment of securities lending collateral, if any, are included in securities lending income in the accompanying Statements of Operations.
Each Fund may invest its securities lending cash collateral, if any, in the BGI Cash Premier Fund LLC (“Premier Fund”), an affiliated private money market fund managed by BGFA. Although the Premier Fund is not registered as an investment company under the 1940 Act, it intends to operate as a money market fund in compliance with Rule 2a-7 under the 1940 Act. See Note 5 for additional information regarding the Premier Fund.
| NOTES TO FINANCIAL STATEMENTS |
69 |
Table of Contents
Notes to Financial Statements (Continued)
iSHARES® TRUST
For the year ended July 31, 2007, the iShares NYSE Composite Index Fund had direct investments (exclusive of short-term investments) in issuers of which BGFA is an affiliate or issuers of which the Fund owns 5% or more of the outstanding voting securities as follows:
| Name of Affiliated Issuer | Number of Shares Held Beginning of Year (in 000s) |
Gross Additions (in 000s) |
Gross Reductions (in 000s) |
Number of Shares Held End of Year (in 000s) |
Value at End of Year |
Dividend Income |
Net Realized Gain | ||||||||||
| Barclays PLC SP ADR |
5 | 8 | 3 | 10 | $ | 542,767 | $ | 16,874 | $ | 47,992 | |||||||
As of July 31, 2007, certain trustees and officers of the Trust are also officers of BGI and/or BGFA.
3. INVESTMENT PORTFOLIO TRANSACTIONS
Purchases and sales of investments (excluding in-kind transactions and short-term investments) for the year ended July 31, 2007 were as follows:
| iShares Index Fund | Purchases | Sales | ||||
| S&P GSTI™ Technology |
$ | 61,628,308 | $ | 58,997,738 | ||
| S&P GSTI™ Networking |
100,838,796 | 101,667,542 | ||||
| S&P GSTI™ Semiconductor |
73,555,912 | 73,660,942 | ||||
| S&P GSTI™ Software |
51,917,479 | 48,045,245 | ||||
| S&P GSSI™ Natural Resources |
276,260,434 | 266,920,760 | ||||
| NYSE Composite |
8,579,924 | 7,005,488 | ||||
| NYSE 100 |
33,635,337 | 37,001,286 | ||||
In-kind transactions (see Note 4) for the year ended July 31, 2007 were as follows:
| iShares Index Fund | In-kind Purchases |
In-kind Sales | ||||
| S&P GSTI™ Technology |
$ | 475,109,981 | $ | 376,868,001 | ||
| S&P GSTI™ Networking |
248,847,010 | 227,907,784 | ||||
| S&P GSTI™ Semiconductor |
562,376,473 | 568,589,464 | ||||
| S&P GSTI™ Software |
471,388,187 | 385,733,200 | ||||
| S&P GSSI™ Natural Resources |
733,862,531 | 558,143,874 | ||||
| NYSE Composite |
82,169,425 | 33,347,045 | ||||
| NYSE 100 |
172,485,109 | 276,137,055 | ||||
4. CAPITAL SHARE TRANSACTIONS
Capital shares are issued and redeemed by each Fund only in Creation Units or multiples thereof. Except when aggregated in Creation Units, shares of each Fund are not redeemable. Transactions in capital shares for each Fund are disclosed in detail in the Statements of Changes in Net Assets.
| 70 |
2007 iSHARES ANNUAL REPORT TO SHAREHOLDERS |
Table of Contents
Notes to Financial Statements (Continued)
iSHARES® TRUST
The consideration for the purchase of Creation Units of a Fund generally consists of the in-kind deposit of a designated portfolio of equity securities, which constitutes a substantial replication, or a portfolio sampling representation, of the securities involved in the relevant Fund’s underlying index and an amount of cash. Investors purchasing and redeeming Creation Units pay a purchase transaction fee and a redemption transaction fee directly to State Street, the administrator, to offset transfer and other transaction costs associated with the issuance and redemption of Creation Units.
5. LOANS OF PORTFOLIO SECURITIES
Each Fund may lend its investment securities to approved borrowers, such as brokers, dealers and other financial institutions. The borrower pledges and maintains with the Fund collateral consisting of cash, an irrevocable letter of credit issued by a bank, or securities issued or guaranteed by the U.S. government. The initial collateral received by each Fund is required to have a value of at least 102% of the market value of the loaned securities for securities traded on U.S. exchanges and a value of at least 105% for all other securities. The collateral is maintained thereafter, at a value equal to at least 100% of the current market value of the securities on loan. The risks to the Funds of securities lending are that the borrower may not provide additional collateral when required or may not return the securities when due.
During the year ended July 31, 2007, certain Funds received cash as collateral for securities loaned. The cash collateral received was invested in a joint account and in the Premier Fund. Pursuant to an exemptive order issued by the SEC, a portion of the cash collateral received was invested in a joint account with other investment funds managed by BGFA. The joint account invests in securities with remaining maturities of 397 days or less, repurchase agreements and money market mutual funds, including money market funds managed by BGFA. Repurchase agreements are fully collateralized by U.S. government securities or non-U.S. government debt securities. The Premier Fund seeks to achieve its investment objective by investing in a portfolio of high-quality, short-term fixed-income instruments, including money market funds (which may be managed by BGFA or its affiliate) and other instruments that, at the time of investment, have remaining maturities of 397 calendar days or less from the date of acquisition.
The market value of the securities on loan as of July 31, 2007 and the value of the related collateral are disclosed in the Statements of Assets and Liabilities. Securities lending income, as disclosed in the Funds’ Statements of Operations, represents the income earned from the investment of the cash collateral, net of rebates paid to, or fees paid by, borrowers and less the fees paid to BGI as securities lending agent.
6. RECENTLY ISSUED ACCOUNTING PRONOUNCEMENTS
In June 2006, the Financial Accounting Standards Board (“FASB”) issued FASB Interpretation No. 48 (“FIN 48”), “Accounting for Uncertainty in Income Taxes – an interpretation of FASB Statement No. 109.” FIN 48 clarifies the accounting for uncertainty in income taxes recognized in accordance with FASB Statement No. 109, “Accounting for Income Taxes.” This interpretation prescribes a recognition threshold and measurement attribute for the financial statement recognition and measurement of a tax position taken or expected to be taken in a tax return. It also provides guidance on de-recognition, classification, interest and penalties, accounting in interim periods, disclosure and transition. FIN 48 is effective for fiscal years beginning after December 15, 2006. The SEC staff has stated that it would not object if a fund does not implement FIN 48 in its NAV calculation until the date of the fund’s last NAV calculation in the first required financial statement reporting period for its fiscal year beginning after December 15, 2006. The Trust is currently evaluating the impact of applying the various provisions of FIN 48.
In September 2006, FASB issued Statement of Financial Accounting Standards No. 157 (“FAS 157”), “Fair Value Measurements.” FAS 157 defines fair value, establishes a framework for measuring fair value in accordance with generally accepted accounting principles and expands disclosure about fair value measurements. FAS 157 is effective for fiscal years beginning after November 15, 2007. The Trust is currently evaluating the impact the adoption of FAS 157 will have on the Funds’ financial statement disclosures.
| NOTES TO FINANCIAL STATEMENTS |
71 |
Table of Contents
Report of Independent Registered Public Accounting Firm
To the Shareholders and Board of Trustees of
iShares Trust:
In our opinion, the accompanying statements of assets and liabilities, including the schedules of investments, and the related statements of operations and of changes in net assets and the financial highlights present fairly, in all material respects, the financial position of the iShares S&P GSTI™ Technology Index Fund (formerly iShares Goldman Sachs Technology Index Fund), iShares S&P GSTI™ Networking Index Fund (formerly iShares Goldman Sachs Networking Index Fund), iShares S&P GSTI™ Semiconductor Index Fund (formerly iShares Goldman Sachs Semiconductor Index Fund), iShares S&P GSTI™ Software Index Fund (formerly iShares Goldman Sachs Software Index Fund), iShares S&P GSSI™ Natural Resources Index Fund (formerly iShares Goldman Sachs Natural Resources Index Fund), iShares NYSE Composite Index Fund and iShares NYSE 100 Index Fund, each a fund of iShares Trust (the “Funds”), at July 31, 2007, the results of each of their operations, the changes in each of their net assets and their financial highlights for each of the periods presented, in conformity with accounting principles generally accepted in the United States of America. These financial statements and financial highlights (hereafter referred to as “financial statements”) are the responsibility of the Funds’ management; our responsibility is to express an opinion on these financial statements based on our audits. We conducted our audits of these financial statements in accordance with standards of the Public Company Accounting Oversight Board (United States). Those standards require that we plan and perform the audits to obtain reasonable assurance about whether the financial statements are free of material misstatement. An audit includes examining, on a test basis, evidence supporting the amounts and disclosures in the financial statements, assessing the accounting principles used and significant estimates made by management, and evaluating the overall financial statement presentation. We believe that our audits, which included confirmation of securities at July 31, 2007 by correspondence with the custodian and brokers, provide a reasonable basis for our opinion.
PricewaterhouseCoopers LLP
San Francisco, California
September 21, 2007
| 72 |
2007 iSHARES ANNUAL REPORT TO SHAREHOLDERS |
Table of Contents
iSHARES® TRUST
For corporate shareholders, the following percentages of the income dividends paid by certain Funds during the fiscal year ended July 31, 2007 qualified for the dividends-received deduction:
Under Section 854(b)(2) of the Internal Revenue Code (the “Code”), certain Funds hereby designate the following maximum amounts as qualified dividend income for purposes of the maximum rate under Section 1(h)(11) of the Code for the fiscal year ended July 31, 2007:
In January 2008, shareholders will receive Form 1099-DIV which will include their share of qualified dividend income distributed during the calendar year 2007. Shareholders are advised to check with their tax advisers for information on the treatment of these amounts on their income tax returns.
| TAX INFORMATION |
73 |
Table of Contents
Board Review and Approval of Investment Advisory Contract (Unaudited)
iSHARES TRUST
Under Section 15(c) of the Investment Company Act of 1940 (the “1940 Act”), the Trust’s Board of Trustees (the “Board”), including a majority of Trustees who are not “interested persons” of the Trust (as that term is defined in the 1940 Act) (the “Independent Trustees”), is required annually to consider the Investment Advisory Contract between the Trust and BGFA (the “Advisory Contract”) on behalf of the Funds. As required by Section 15(c), the Board requested and BGFA provided such information as the Board deemed reasonably necessary to evaluate the terms of the Advisory Contract. At a meeting held on June 13, 2007, the Board approved the selection of BGFA and the continuance of the Advisory Contract, based on its review of qualitative and quantitative information provided by BGFA. In selecting BGFA and approving the Advisory Contract for the Funds, the Board, including the Independent Trustees, advised by their independent counsel, considered the following factors, none of which was controlling, and made the following conclusions:
NATURE, EXTENT AND QUALITY OF SERVICES PROVIDED BY BGFA
The Board determined that there would be no diminution in the scope of services required of BGFA under the Advisory Contract for the coming year as compared to the scope of services provided by BGFA over the past year. In reviewing the scope of these services, the Board considered BGFA’s investment philosophy and experience, noting that BGFA and its affiliates have committed significant resources over time, including over the past year, including investment in technology and increasing the number of their employees supporting the Funds. The Board also considered BGFA’s compliance program and its compliance record with respect to the Funds. In that regard, the Board noted that BGFA reports to the Board about portfolio management and compliance matters on a periodic basis in connection with regularly scheduled meetings of the Board, and has made appropriate officers available as needed to provide further assistance with these matters. The Board also reviewed the background and experience of the persons responsible for the day-to-day management of the Funds. In addition to the above considerations, the Board considered BGFA’s investment processes and strategies, and matters related to BGFA’s portfolio transaction policies and procedures. The Board further noted that BGFA does not serve as investment adviser for any other series of registered investment companies with substantially similar investment objectives and strategies as the Funds; therefore, comparative performance information was generally not available. However, the Board also noted that the Funds had met their investment objectives consistently since their respective inception dates. Based on review of this information, the Board concluded that the nature, extent and quality of services to be provided by BGFA to the Funds under the Advisory Contract were appropriate and mitigated in favor of the Board’s approval of the Advisory Contract for the coming year.
FUNDS’ EXPENSES AND PERFORMANCE OF THE FUNDS
The Board reviewed statistical information prepared by Lipper Inc. (“Lipper”), an independent provider of investment company data, regarding the expense ratio components, including advisory fees, waivers/reimbursements, and gross and net total expenses of each Fund in comparison with the same information for other funds registered under the 1940 Act objectively selected solely by Lipper as comprising each Fund’s applicable peer group (the “Lipper Group”). In addition, the Board reviewed statistical information prepared by Lipper regarding the performance of each Fund for the one-, three- and five-year periods, as applicable, and the “last quarter” period ended March 31, 2007, and a comparison of each Fund’s performance to that of the funds in its Lipper Group for the same periods. Because there are few, if any, exchange traded funds or index funds that track indexes similar to those tracked by the Funds, the Lipper Groups included in part, at the request of BGFA, mutual funds, closed-end funds, exchange traded funds, and funds with differing investment objective classifications, investment focuses and other characteristics (e.g., actively managed funds and funds sponsored by “at cost” service providers). In support of its review of the statistical information, the Board was provided with a detailed description of the methodology used by Lipper to determine the applicable Lipper Groups and to prepare this information. The Board further noted that due to the limitations in providing comparable funds in the various Lipper Groups, the statistical information may or may not provide meaningful direct comparisons to the Funds. The Board noted that most of the Funds generally performed in line with the funds in their respective Lipper Groups over the relevant periods; however, certain of the Funds may have underperformed or outperformed funds in their respective Lipper Groups over such periods. In considering this information, the Board noted that the Lipper Groups include funds that may have different investment
| 74 |
2007 iSHARES ANNUAL REPORT TO SHAREHOLDERS |
Table of Contents
Board Review and Approval of Investment Advisory Contract (Unaudited) (Continued)
iSHARES TRUST
objectives and/or benchmarks from the Funds. In addition, the Board noted that each Fund seeks to track an index and that during the prior year the Board received periodic reports on the Funds’ performance in comparison with their relevant benchmark indexes. Such comparative performance information was also considered by the Board.
The Board also noted that the investment advisory fees and overall expenses for the Funds were generally lower than the median or average investment advisory fee rates and overall expense components of the funds in their respective Lipper Groups. Based on this review, the Board concluded that the investment advisory fees and expense levels and the historical performance of each Fund, as managed by BGFA, as compared to the investment advisory fees and expense levels and performance of the funds in the relevant Lipper Group, were satisfactory for the purposes of approving the Advisory Contract for the coming year.
COSTS OF SERVICES PROVIDED TO FUNDS AND PROFITS REALIZED BY BGFA AND AFFILIATES
The Board reviewed information about the profitability to BGFA of the Funds based on the fees payable to BGFA and its affiliates (including fees under the Advisory Contract), and all other sources of revenue and expense to BGFA and its affiliates for the last calendar year. The Board discussed the sources of direct and ancillary revenue with management, including the revenues to BGI from securities lending by the Trust (including any securities lending by the Funds). The Board also discussed BGFA’s profit margin as reflected in the Funds’ profitability analysis and reviewed information regarding economies of scale (as discussed below). Based on this review, the Board concluded that the profits to be realized by BGFA and its affiliates under the Advisory Contract and from other relationships between the Funds and BGFA and/or its affiliates, if any, were within the range the Board considered reasonable and appropriate.
ECONOMIES OF SCALE
In connection with its review of the Funds’ profitability analysis, the Board reviewed information regarding economies of scale or other efficiencies that may result from increases in the Funds’ assets. The Board noted that the Advisory Contract did not provide for any breakpoints in the Funds’ investment advisory fee rates as the assets of the Funds increase. However, the Board further noted that possible future economies of scale for the Funds had been taken into consideration by fixing the investment advisory fees at rates at the lower end of the marketplace, effectively giving Fund shareholders, from inception, the benefits of the lower average fee shareholders would have received from a fee structure with declining breakpoints where the initial fee was higher. In addition, the Board noted that at its meeting held on March 9, 2006, it approved a reduction in the investment advisory fee rates for the iShares S&P GSSI™/GSTI™ series sector Funds. The Board also reviewed BGFA’s historic profitability as investment adviser to the iShares fund complex and noted that BGFA had made a significant investment in the iShares funds and had incurred operating losses during earlier years when the iShares funds, including the Funds, had not yet reached scale. In light of this history, the Board determined that further reductions in fee rates or additions of breakpoints were not warranted at this juncture for the Funds. Based on this review, as well as the discussions described above in connection with the Lipper Group comparisons, the Board, recognizing its responsibility to consider this issue at least annually, concluded that the structure of the investment advisory fees reflects the sharing of economies of scale with the Funds’ shareholders.
FEES AND SERVICES PROVIDED FOR OTHER COMPARABLE FUNDS/ACCOUNTS MANAGED BY BGFA AND ITS AFFILIATES
The Board received and considered information regarding the Funds’ annual investment advisory fee rates under the Advisory Contract in comparison to the investment advisory/management fee rates for other funds/accounts for which BGFA or BGI, an affiliate of BGFA, provides investment advisory/management services, including other funds registered under the 1940 Act, collective funds and separate accounts (together, the “Other Accounts”). The Board noted that comparative investment advisory/management fee information was not available, as BGFA and its affiliates do not manage any Other Accounts with substantially similar investment objectives and strategies as
| BOARD REVIEW AND APPROVAL OF INVESTMENT ADVISORY CONTRACT |
75 |
Table of Contents
Board Review and Approval of Investment Advisory Contract (Unaudited) (Continued)
iSHARES TRUST
the Funds. However, the Board noted that BGFA provided the Board with general information regarding how the level of services provided to the Other Accounts differed from the level of services provided to the Funds. Based on this review, the Board determined that the investment advisory fee rates under the Advisory Contract do not constitute fees that are so disproportionately large as to bear no reasonable relationship to the services rendered and that could not have been the product of arm’s-length bargaining, and concluded that the investment advisory fee rates under the Advisory Contract are fair and reasonable.
OTHER BENEFITS TO BGFA AND/OR ITS AFFILIATES
The Board reviewed any ancillary revenue received by BGFA and/or its affiliates in connection with the services provided to the Funds by BGFA, such as any payment of revenue to BGI, the Trust’s securities lending agent, for loaning any portfolio securities, and the payment of advisory fees and/or administration fees to BGFA and BGI in connection with any investment by the Funds in other funds for which BGFA provides investment advisory services and/or BGI provides administration services. The Board noted that BGFA does not use soft dollars or consider the value of research or other services that may be provided to BGFA (including its affiliates) in selecting brokers for portfolio transactions for the Funds. The Board further noted that any portfolio transactions on behalf of the Funds placed through a BGFA affiliate are reported to the Board pursuant to Rule 10f-3 and Rule 17e-1, as applicable, under the 1940 Act. The Board concluded that any such ancillary benefits would not be disadvantageous to the Funds’ shareholders.
Based on this analysis, the Board determined that the Advisory Contract, including the investment advisory fee rates there under, is fair and reasonable in light of all relevant circumstances, and concluded that it is in the best interest of the Funds and their shareholders to approve the Advisory Contract for the coming year.
| 76 |
2007 iSHARES ANNUAL REPORT TO SHAREHOLDERS |
Table of Contents
Supplemental Information (Unaudited)
iSHARES® TRUST
The tables that follow present information about the differences between the daily market price on secondary markets for shares of a Fund and that Fund’s net asset value. Net asset value, or “NAV,” is the price per share at which each Fund issues and redeems shares. It is calculated in accordance with the standard formula for valuing mutual fund shares. The “Market Price” of each Fund generally is determined using the midpoint between the highest bid and the lowest offer on the stock exchange on which the shares of such Fund is listed for trading, as of the time that the Fund’s NAV is calculated. Each Fund’s Market Price may be at, above or below its NAV. The NAV of each Fund will fluctuate with changes in the market value of its portfolio holdings. The Market Price of each Fund will fluctuate in accordance with changes in its NAV, as well as market supply and demand.
Premiums or discounts are the differences (expressed as a percentage) between the NAV and Market Price of a Fund on a given day, generally at the time NAV is calculated. A premium is the amount that a Fund is trading above the reported NAV, expressed as a percentage of the NAV. A discount is the amount that a Fund is trading below the reported NAV, expressed as a percentage of the NAV.
The following information shows the frequency distributions of premiums and discounts for each of the Funds included in this report. The information shown for each Fund is for five calendar years (or for each full calendar quarter completed after the inception date of such Fund if less than five years) through the date of the most recent calendar quarter-end. The specific periods covered for each Fund are disclosed in the table for such Fund.
Each line in the table shows the number of trading days in which the Fund traded within the premium/discount range indicated. The number of trading days in each premium/discount range is also shown as a percentage of the total number of trading days in the period covered by each table. All data presented here represents past performance, which cannot be used to predict future results.
iShares S&P GSTI™ Technology Index Fund
Period Covered: January 1, 2002 through June 30, 2007
| Premium/Discount Range |
Number of Days |
Percentage of Total Days |
|||
| Greater than 1.5% and Less than 2.0% |
1 | 0.07 | % | ||
| Greater than 1.0% and Less than 1.5% |
1 | 0.07 | |||
| Greater than 0.5% and Less than 1.0% |
8 | 0.58 | |||
| Between 0.5% and –0.5% |
1,352 | 97.91 | |||
| Less than –0.5% and Greater than –1.0% |
14 | 1.01 | |||
| Less than –1.0% and Greater than –1.5% |
4 | 0.29 | |||
| Less than –1.5% and Greater than –2.0% |
1 | 0.07 | |||
| 1,381 | 100.00 | % | |||
iShares S&P GSTI™ Networking Index Fund
Period Covered: January 1, 2002 through June 30, 2007
| Premium/Discount Range |
Number of Days |
Percentage of Total Days |
|||
| Greater than 1.5% |
1 | 0.07 | % | ||
| Greater than 1.0% and Less than 1.5% |
3 | 0.22 | |||
| Greater than 0.5% and Less than 1.0% |
37 | 2.68 | |||
| Between 0.5% and –0.5% |
1,288 | 93.27 | |||
| Less than –0.5% and Greater than –1.0% |
40 | 2.90 | |||
| Less than –1.0% and Greater than –1.5% |
6 | 0.43 | |||
| Less than –1.5% and Greater than –2.0% |
4 | 0.29 | |||
| Less than –2.0% |
2 | 0.14 | |||
| 1,381 | 100.00 | % | |||
| SUPPLEMENTAL INFORMATION |
77 |
Table of Contents
Supplemental Information (Unaudited) (Continued)
iSHARES® TRUST
iShares S&P GSTI™ Semiconductor Index Fund
Period Covered: January 1, 2002 through June 30, 2007
| Premium/Discount Range |
Number of Days |
Percentage of Total Days |
|||
| Greater than 1.0% and Less than 1.5% |
3 | 0.22 | % | ||
| Greater than 0.5% and Less than 1.0% |
13 | 0.94 | |||
| Between 0.5% and –0.5% |
1,339 | 96.95 | |||
| Less than –0.5% and Greater than –1.0% |
20 | 1.45 | |||
| Less than –1.0% and Greater than –1.5% |
3 | 0.22 | |||
| Less than –1.5% and Greater than –2.0% |
3 | 0.22 | |||
| 1,381 | 100.00 | % | |||
iShares S&P GSTI™ Software Index Fund
Period Covered: January 1, 2002 through June 30, 2007
| Premium/Discount Range |
Number of Days |
Percentage of Total Days |
|||
| Greater than 2.0% and Less than 2.5% |
1 | 0.07 | % | ||
| Greater than 1.5% and Less than 2.0% |
1 | 0.07 | |||
| Greater than 1.0% and Less than 1.5% |
1 | 0.07 | |||
| Greater than 0.5% and Less than 1.0% |
13 | 0.94 | |||
| Between 0.5% and –0.5% |
1,342 | 97.19 | |||
| Less than –0.5% and Greater than –1.0% |
19 | 1.38 | |||
| Less than –1.0% and Greater than –1.5% |
2 | 0.14 | |||
| Less than –1.5% and Greater than –2.0% |
2 | 0.14 | |||
| 1,381 | 100.00 | % | |||
iShares S&P GSSI™ Natural Resources Index Fund
Period Covered: January 1, 2002 through June 30, 2007
| Premium/Discount Range |
Number of Days |
Percentage of Total Days |
|||
| Greater than 0.5% |
1 | 0.07 | % | ||
| Between 0.5% and –0.5% |
1,373 | 99.43 | |||
| Less than –0.5% and Greater than –1.0% |
5 | 0.36 | |||
| Less than –1.0% and Greater than –1.5% |
2 | 0.14 | |||
| 1,381 | 100.00 | % | |||
| 78 |
2007 iSHARES ANNUAL REPORT TO SHAREHOLDERS |
Table of Contents
Supplemental Information (Unaudited) (Continued)
iSHARES® TRUST
iShares NYSE Composite Index Fund
Period Covered: April 2, 2004 through June 30, 2007*
| Premium/Discount Range |
Number of Days |
Percentage of Total Days |
|||
| Greater than 1.0% and Less than 1.5% |
1 | 0.12 | % | ||
| Greater than 0.5% and Less than 1.0% |
42 | 5.15 | |||
| Between 0.5% and –0.5% |
769 | 94.24 | |||
| Less than –0.5% and Greater than –1.0% |
3 | 0.37 | |||
| Less than –1.0% |
1 | 0.12 | |||
| 816 | 100.00 | % | |||
iShares NYSE 100 Index Fund
Period Covered: April 2, 2004 through June 30, 2007*
| Premium/Discount Range |
Number of Days |
Percentage of Total Days |
|||
| Greater than 1.0% |
1 | 0.12 | % | ||
| Greater than 0.5% and Less than 1.0% |
6 | 0.74 | |||
| Between 0.5% and –0.5% |
804 | 98.53 | |||
| Less than –0.5% and Greater than –1.0% |
5 | 0.61 | |||
| 816 | 100.00 | % | |||
| * | April 2, 2004 is the first day of trading on the stock exchange on which the shares of the Fund are listed for trading. |
| SUPPLEMENTAL INFORMATION |
79 |
Table of Contents
Trustee and Officer Information (Unaudited)
iSHARES® TRUST
The Board of Trustees has responsibility for the overall management and operations of the Trust, including general supervision of the duties performed by BGFA and other service providers. Each Trustee serves until he or she resigns, is removed, dies, retires or becomes incapacitated. Each Officer serves until he or she resigns, is removed, dies, retires or becomes disqualified.
iShares Trust, iShares, Inc., Barclays Global Investors Funds (“BGIF”), Master Investment Portfolio (“MIP”) and Barclays Foundry Investment Trust (“BFIT”) are considered to be members of the same fund complex, as defined in Form N-1A under the 1940 Act. Each Trustee of iShares Trust also serves as a Director for iShares, Inc. and oversees 135 portfolios within the fund complex. In addition, Lee T. Kranefuss serves as a Trustee for BGIF, MIP and BFIT and oversees an additional 24 portfolios within the fund complex.
Unless otherwise noted in the tables below, the address for each Trustee and Officer is c/o Barclays Global Investors, N.A., 45 Fremont Street, San Francisco, California 94105. The Board has designated George G.C. Parker as its Lead Independent Trustee. Additional information about the Funds’ Trustees and Officers may be found in the Funds’ combined Statement of Additional Information, which is available without charge, upon request, by calling toll-free 1-800-474-2737.
Interested Trustees and Officers
| Name, Year of Birth | Position(s), Length of Service |
Principal Occupation(s) During Past 5 Years |
Other Directorships Held | |||
| *Lee T. Kranefuss, 1961 |
Trustee and (since 2003). |
Chief Executive Officer of the Intermediary Investor and Exchange Traded Products Business of BGI (since 2003); Director of Barclays Global Fund Advisors (since 2005); Director, President and Chief Executive Officer of Barclays Global Investors International, Inc. (since 2005); Director, Chairman and Chief Executive Officer of Barclays Global Investors Services (since 2005); Chief Executive Officer of the Individual Investor Business of BGI (1999-2003). | Director (since 2003) of iShares, Inc.; Trustee (since 2001) of BGlF and MIP; Trustee (since 2007) of BFIT; Director (since 2003) of BGI Cayman Prime Money Market Fund, Ltd. | |||
| *John E. Martinez, 1962 |
Trustee (since 2003). |
Co-Chief Executive Officer of Global Index and Markets Group of BGI (2001-2003); Chairman of Barclays Global Investors Services (2000-2003). | Director (since 2003) of iShares, Inc.; Director (since 2005) of Real Estate Equity Exchange. | |||
| * | Lee T. Kranefuss and John E. Martinez are deemed to be “interested persons” (as defined in the 1940 Act) of the Trust due to their affiliations with BGFA, the Funds’ investment adviser, BGI, the parent company of BGFA, and Barclays Global Investors Services, an affiliate of BGFA and BGI. |
| 80 |
2007 iSHARES ANNUAL REPORT TO SHAREHOLDERS |
Table of Contents
Trustee and Officer Information (Unaudited) (Continued)
iSHARES® TRUST
Independent Trustees
| Name, Year of Birth | Position(s), Length of Service |
Principal Occupation(s) During Past 5 Years |
Other Directorships Held | |||
| George G.C. Parker, 1939 |
Trustee (since 2000); Lead Independent Trustee (since 2006). |
Dean Witter Distinguished Professor of Finance, Emeritus (since 1994); Formerly Senior Associate Dean for Academic Affairs, Director of MBA Program, Stanford University: Graduate School of Business (1993-2001). | Director (since 2002) of iShares, Inc.; Director (since 1996) of Continental Airlines, Inc.; Director (since 1995) of Community First Financial Group; Director (since 1999) of Tejon Ranch Company; Director (since 2003) of First Republic Bank; Director (since 2004) of Threshold Pharmaceuticals; Director (since 2007) of NETGEAR, Inc. | |||
| Cecilia H. Herbert, 1949 |
Trustee (since 2005). |
Member of Finance Council, Archdiocese of San Francisco (1999-2006); Chair of Investment Committee, Archdiocese of San Francisco (1994-2005); Director (since 1998) and President (since 2007) of the Board of Directors, Catholic Charities CYO; Trustee (2004-2005) of Pacific Select Funds; Trustee (1992-2003) of the Montgomery Funds; Trustee (since 2002) and chair of Finance and Investment Committee (since 2006) of the Thacher School. | Director (since 2005) of iShares, Inc. | |||
| Charles A. Hurty, 1943 |
Trustee (since 2005). |
Retired; Partner, KPMG LLP (1968-2001). | Director (since 2005) of iShares, Inc.; Director (since 2002) of GMAM Absolute Return Strategy Fund (1 portfolio); Director (since 2002) of Citigroup Alternative Investments Multi-Adviser Hedge Fund Portfolios LLC (1 portfolio); Director (since 2005) of CSFB Alternative Investments Fund (6 portfolios). | |||
| John E. Kerrigan, 1955 |
Trustee (since 2005). |
Chief Investment Officer, Santa Clara University (since 2002); Managing Director, Merrill Lynch (1994-2002). | Director (since 2005) of iShares, Inc.; Member (since 2004) of Advisory Council for Commonfund Distressed Debt Partners II. | |||
| TRUSTEE AND OFFICER INFORMATION |
81 |
Table of Contents
Trustee and Officer Information (Unaudited) (Continued)
iSHARES® TRUST
Independent Trustees (Continued)
| Name, Year of Birth | Position(s), Length of Service |
Principal Occupation(s) During Past 5 Years |
Other Directorships Held | |||
| Robert H. Silver, 1955 |
Trustee (since 2007). |
President and Co-Founder of The Bravitas Group, Inc. (since 2006); Member, Non-Investor Advisory Board of Russia Partners II, LP (since 2006); President and Chief Operating Officer (2003-2005) and Director (1999-2005) of UBS Financial Services, Inc.; President and Chief Executive Officer of UBS Services USA, LLC (1999-2005); Managing Director, UBS America, Inc. (2000-2005); Director and Vice Chairman of the YMCA of Greater NYC (since 2001); Broadway Producer (since 2006). | Director (since 2007) of iShares, Inc.; Director and Member (since 2006) of the Audit and Compensation Committee of EPAM Systems, Inc. | |||
| Officers
| ||||||
| Name, Year of Birth | Position(s), Length of Service |
Principal Occupation(s) During Past 5 Years |
Other Directorships Held | |||
| Michael A. Latham, 1965 |
President (since 2007). |
Head of Americas iShares (since 2007); Chief Operating Officer of the Intermediary Investor and Exchange Traded Products Business of BGI (2003-2007); Director and Chief Financial Officer of Barclays Global Investors International, Inc. (Since 2005); Director of Mutual Fund Delivery in the U.S. Individual Investor Business of BGI (2000-2003). | None. | |||
| Geoffrey D. Flynn, 1956 |
Treasurer and Chief Financial Officer (since 2007). |
Director of Mutual Fund Operations of BGI (since 2007); President of Van Kampen Investor Services (2003-2007); Managing Director of Morgan Stanley (2002-2007); President of Morgan Stanley Trust, FSB (2002-2007). | None. | |||
| 82 |
2007 iSHARES ANNUAL REPORT TO SHAREHOLDERS |
Table of Contents
Trustee and Officer Information (Unaudited) (Continued)
iSHARES® TRUST
Officers (Continued)
| Name, Year of Birth | Position(s), Length of Service |
Principal Occupation(s) During Past 5 Years |
Other Directorships Held | |||
| Eilleen M. Clavere, 1952 |
Secretary (since 2007). |
Head of Legal Administration of Intermediary Investor Business of BGI (since 2006); Legal Counsel and Vice President of Atlas Funds, Atlas Advisers, Inc. and Atlas Securities, Inc. (2005-2006); Counsel of Kirkpatrick & Lockhart LLP (2001-2005). | None. | |||
| Ira P. Shapiro, 1963 |
Vice President and Chief Legal Officer (since 2007). |
Associate General Counsel of BGI (since 2004); First Vice President of Merrill Lynch Investment Managers (1993-2004). | None. | |||
| Amy Schioldager, 1962 |
Executive Vice President (since 2007). |
Head of U.S. Indexing of BGI (since 2006); Head of Domestic Equity Portfolio Management of BGI (2001-2006). | None. | |||
| H. Michael Williams, 1960 |
Executive Vice President (since 2007). |
Head of Global Index and Markets Group of BGI (since 2006); Global Head of Securities Lending of BGI (2002-2006). |
Trustee (since 2007) of BFIT. | |||
| Patrick O’Connor, 1967 |
Vice President (since 2007). |
Head of iShares Portfolio Management of BGI (since 2006); Senior Portfolio Manager of BGI (1999-2006). | None. | |||
| Lee Sterne, 1965 |
Vice President (since 2007). |
Senior Portfolio Manager of BGI (since 2004); Portfolio Manager of BGI (2001-2004). | None. | |||
| Matt Tucker, 1972 |
Vice President (since 2007). |
Head of U.S. Fixed-Income Investment Solutions of BGI (since 2005); Fixed- Income Investment Strategist of BGI (2003-2005); Fixed-Income Portfolio Manager of BGI (1997-2003). | None. | |||
| TRUSTEE AND OFFICER INFORMATION |
83 |
Table of Contents
Notes:
| 84 |
2007 iSHARES ANNUAL REPORT TO SHAREHOLDERS |
Table of Contents
Notes:
| NOTES |
85 |
Table of Contents
The following is a list of iShares Funds being offered, along with their respective exchange trading symbols. Please call 1-800-iShares (1-800-474-2737) to obtain a prospectus for any iShares Fund. The prospectus contains more complete information, including charges, expenses, investment objectives and risk factors that should be carefully considered to determine if the Fund(s) are an appropriate investment for you. Read the prospectus(es) carefully before investing. Investing involves risk, including possible loss of principal.
iShares® is a registered trademark of Barclays Global Investors, N.A. The iShares Funds are not sponsored, endorsed or issued by Lehman Brothers, nor are they sponsored, endorsed, issued, sold or promoted by Cohen & Steers Capital Management, Inc., Dow Jones & Company, Inc., FTSE International Limited (“FTSE”), FTSE/Xinhua Index Limited (“FXI”), iBoxx, KLD Research & Analytics, Inc., Morgan Stanley Capital International, Morningstar, Inc., The NASDAQ Stock Market, Inc., National Association of Real Estate Investment Trusts (“NAREIT”), New York Stock Exchange, Inc., Frank Russell Company, or Standard & Poor’s. None of these companies make any representation regarding the advisability of investing in the iShares Funds. Neither SEI nor BGI, nor any of their affiliates, are affiliated with the companies listed above. iBoxx is a registered trademark of International Index Company Limited. FXI does not make any warranty regarding the FTSE/Xinhua Index. All rights in the FTSE/Xinhua Index vest in FXI. Neither FTSE nor NAREIT makes any warranty regarding the FTSENAREIT Real Estate 50 Index, FTSENAREIT Residential Index, FTSENAREIT Retail Index, FTSENAREIT Mortgage REITs Index or FTSENAREIT Industrial/Office Index; all rights vest in NAREIT. “FTSE” is a trade and service mark of London Stock Exchange and The Financial Times; “Xinhua” is a trade and service mark of Xinhua Financial Network Limited. “NAREIT®” is a trademark of NAREIT.
An investment in the Fund(s) is not a deposit of a bank and it is not insured or guaranteed by the Federal Deposit Insurance Corporation or any other government agency.
This advertising section does not constitute part of the 2007 Annual Report.
5241-iS-0907
| 86 |
2007 iSHARES ANNUAL REPORT TO SHAREHOLDERS |
Table of Contents
Table of Contents
| Item 2. | Code of Ethics. |
As of July 31, 2007, iShares Trust (the “Registrant”) had adopted a code of ethics that applies to persons appointed by the Registrant’s Board of Trustees as the President and/or Chief Financial Officer, and any persons performing similar functions. For the fiscal year ended July 31, 2007, there were no amendments to any provision of this code of ethics, nor were there any waivers granted from any provision of this code of ethics. A copy of this code of ethics is filed with this Form N-CSR under Item 12(a)(1).
| Item 3. | Audit Committee Financial Expert. |
The Registrant’s Board of Trustees has determined that the Registrant has more than one audit committee financial expert, as that term is defined under Item 3(b) and 3(c), serving on its audit committee. The audit committee financial experts serving on the Registrant’s audit committee are Charles A. Hurty, John E. Kerrigan, George G.C. Parker and Robert H. Silver, all of whom are independent, as that term is defined under Item 3(a)(2).
| Item 4. | Principal Accountant Fees and Services. |
The principal accountant fees disclosed in items 4(a), 4(b), 4(c), 4(d) and 4(g) are for eleven series of the Registrant for which the fiscal year-end is July 31, 2007 (the “Funds”), and whose annual financial statements are reported in Item 1.
| (a) | Audit Fees – The aggregate fees billed for each of the last two fiscal years for professional services rendered by the principal accountant for the audit of the Funds’ annual financial statements or services that are normally provided by the accountant in connection with statutory and regulatory filings or engagements for those fiscal years, were $158,616 for the fiscal year ended July 31, 2006 and $165,347 for the fiscal year ended July 31, 2007. |
| (b) | Audit-Related Fees – There were no fees billed for the fiscal years ended July 31, 2006 and July 31, 2007 for assurance and related services by the principal accountant that were reasonably related to the performance of the audit of the Funds’ financial statements and are not reported under (a) of this Item. |
| (c) | Tax Fees – The aggregate fees billed in each of the last two fiscal years for professional services rendered by the principal accountant for the review of the Funds’ tax returns and excise tax calculations, were $66,438 for the fiscal year ended July 31, 2006 and $70,965 for the fiscal year ended July 31, 2007. |
| (d) | All Other Fees – There were no other fees billed for the fiscal years ended July 31, 2006 and July 31, 2007 for products and services provided by the principal accountant, other than the services reported in (a) through (c) of this Item. |
| (e) | (1) The Registrant’s audit committee charter, as amended, provides that the audit committee is responsible for the approval, prior to appointment, of the engagement of the principal accountant to annually audit and provide their opinion on the Registrant’s financial statements. The audit committee must also approve, prior to appointment, the engagement of the principal accountant to provide non-audit services to the Registrant or to any entity controlling, controlled by or under common control with the Registrant’s investment adviser (“Adviser Affiliate”) that provides ongoing services to the Registrant, if the engagement relates directly to the operations and financial reporting of the Registrant. |
| (2) There were no services described in (b) through (d) above (including services required by the audit committee pursuant to paragraph (c)(7)(ii) of Rule 2-01 of Regulation S-X) that were approved by the audit committee pursuant to paragraph (c)(7)(i)(C) of Rule 2-01 of Regulation S-X. |
| (f) | None of the hours expended on the principal accountant’s engagement to audit the Funds’ financial statements for the fiscal year ended July 31, 2007 were attributable to work performed by persons other than the principal accountant’s full-time, permanent employees. |
| (g) | The aggregate non-audit fees billed by the Registrant’s principal accountant for services rendered to the Funds, and rendered to the Registrant’s investment adviser, and any Adviser Affiliate that provides ongoing services to the Registrant for the last two fiscal years, were $1,590,313 for the fiscal year ended July 31, 2006 and $2,247,779 for the fiscal year ended July 31, 2007. |
| (h) | The Registrant’s audit committee has considered whether the provision of non-audit services rendered to the Registrant’s investment adviser and any Adviser Affiliate that were not pre-approved pursuant to paragraph (c)(7)(ii) of Rule 2-01 of Regulation S-X, if any, are compatible with maintaining the principal accountant’s independence, and has determined that the provision of these services do not compromise the principal accountant’s independence. |
Table of Contents
| Item 5. | Audit Committee of Listed Registrants. |
The Registrant is a listed issuer as defined in Rule 10A-3 under the Exchange Act and has a separately-designated standing audit committee established in accordance with Section 3(a)(58)(A) of the Exchange Act. The Registrant’s audit committee members are George G.C. Parker, Cecilia H. Herbert, Charles A. Hurty, John E. Kerrigan and Robert H. Silver.
| Item 6. | Schedule of Investments. |
The Funds’ full schedules of investments are included as part of the reports to shareholders filed under Item 1 of this Form.
| Item 7. | Disclosure of Proxy Voting Policies and Procedures for Closed-End Management Investment Companies. |
Not applicable to the Registrant.
| Item 8. | Portfolio Managers of Closed-End Management Investment Companies. |
Not applicable to the Registrant.
| Item 9. | Purchases of Equity Securities by Closed-End Management Investment Company and Affiliated Purchasers. |
Not applicable to the Registrant.
| Item 10. | Submission of Matters to a Vote of Security Holders. |
There were no material changes to the procedures by which shareholders may recommend nominees to the Registrant’s Board of Trustees.
| Item 11. | Controls and Procedures. |
(a) The President (the Registrant’s Principal Executive Officer) and Chief Financial Officer (the Registrant’s Principal Financial Officer) have concluded that, based on their evaluation as of a date within 90 days of the filing date of this report, the disclosure controls and procedures of the Registrant (as defined in Rule 30a-3(c) under the Investment Company Act of 1940) are reasonably designed to achieve the purposes described in Section 4(a) of the attached certification.
(b) There were no changes in the Registrant’s internal control over financial reporting (as defined in Rule 30a-3(d) under the Investment Company Act of 1940) that occurred during the Registrant’s second fiscal quarter of the period covered by this report that have materially affected, or are reasonably likely to materially affect, the Registrant’s internal control over financial reporting.
| Item 12. | Exhibits. |
(a) (1) Code of Ethics for Senior Officers that is the subject of Item 2 is attached.
(a) (2) Section 302 Certifications are attached.
(a) (3) Not applicable to the Registrant.
(b) Section 906 Certifications are attached.
Table of Contents
Pursuant to the requirements of the Securities Exchange Act of 1934 and the Investment Company Act of 1940, the Registrant has duly caused this report to be signed on its behalf by the undersigned, thereunto duly authorized.
| iShares Trust | ||
| By: | /s/ Michael A. Latham | |
| Michael A. Latham, President (Principal Executive Officer) | ||
| Date: September 24, 2007 | ||
Pursuant to the requirements of the Securities Exchange Act of 1934 and the Investment Company Act of 1940, this report has been signed below by the following persons on behalf of the Registrant and in the capacities and on the dates indicated.
| By: | /s/ Michael A. Latham | |
| Michael A. Latham, President (Principal Executive Officer) | ||
| Date: September 24, 2007 | ||
| By: | /s/ Geoffrey D. Flynn | |
| Geoffrey D. Flynn, Treasurer and Chief Financial Officer (Principal Financial Officer) | ||
| Date: September 24, 2007 |