UNITED STATES
SECURITIES AND EXCHANGE COMMISSION
Washington, D.C. 20549
FORM N-CSR
CERTIFIED SHAREHOLDER REPORT OF REGISTERED MANAGEMENT INVESTMENT COMPANIES
Investment Company Act file number: 811-02405, 811-09739 and 811-21434
Name of Fund: BlackRock Balanced Capital Fund, Inc., Master Large Cap Core Portfolio of Master Large Cap Series LLC and Master Total Return Portfolio of Master Bond LLC
Fund Address: 100 Bellevue Parkway, Wilmington, DE 19809
Name and address of agent for service: John M. Perlowski, Chief Executive Officer, BlackRock Balanced Capital Fund, Inc., Master Large Cap Core Portfolio of Master Large Cap Series LLC and Master Total Return Portfolio of Master Bond LLC, 55 East 52nd Street, New York, NY 10055
Registrants’ telephone number, including area code: (800) 441-7762
Date of fiscal year end: 09/30/2016
Date of reporting period: 03/31/2016
| Item 1 – | Report to Stockholders |
MARCH 31, 2016
|
SEMI-ANNUAL REPORT (UNAUDITED)
|
BLACKROCK® |
BlackRock Balanced Capital Fund, Inc.
| Not FDIC Insured ¡ May Lose Value ¡ No Bank Guarantee |
| Table of Contents |
| Page | ||||
| 3 | ||||
| Semi-Annual Report: |
||||
| 4 | ||||
| 6 | ||||
| 6 | ||||
| 7 | ||||
| 7 | ||||
| Fund Financial Statements: |
||||
| 8 | ||||
| 9 | ||||
| 10 | ||||
| 11 | ||||
| 16 | ||||
| 21 | ||||
| Master Large Cap Core Portfolio Financial Statements: |
||||
| 22 | ||||
| 25 | ||||
| 26 | ||||
| 27 | ||||
| 28 | ||||
| Master Large Cap Core Portfolio Notes to Financial Statements |
29 | |||
| 35 | ||||
| 36 | ||||
| Master Total Return Portfolio Consolidated Financial Statements: |
||||
| 37 | ||||
| 90 | ||||
| 91 | ||||
| 92 | ||||
| 93 | ||||
| 94 | ||||
| Master Total Return Portfolio Notes to Consolidated Financial Statements |
95 | |||
| 112 | ||||
| 113 |
|
|
Shareholders can sign up for e-mail notifications of quarterly statements, annual and semi-annual shareholder reports and prospectuses by enrolling in the electronic delivery program. Electronic copies of shareholder reports and prospectuses are also available on BlackRock’s website.
TO ENROLL IN ELECTRONIC DELIVERY:
Shareholders Who Hold Accounts with Investment Advisors, Banks or Brokerages: Please contact your financial advisor. Please note that not all investment advisors, banks or brokerages may offer this service.
Shareholders Who Hold Accounts Directly with BlackRock: 1. Access the BlackRock website at blackrock.com 2. Select “Access Your Account” 3. Next, select “eDelivery” in the “Related Resources” box and follow the sign-up instructions
|

| 2 | BLACKROCK BALANCED CAPITAL FUND, INC. | MARCH 31, 2016 |


| THIS PAGE NOT PART OF YOUR FUND REPORT | 3 |
| Fund Summary as of March 31, 2016 |
| Investment Objective |
BlackRock Balanced Capital Fund, Inc.’s (the “Fund”) investment objective is to seek the highest total investment return through a fully managed investment policy utilizing equity, debt (including money market) and convertible securities.
| Portfolio Management Commentary |
The views expressed reflect the opinions of BlackRock as of the date of this report and are subject to change based on changes in market, economic or other conditions. These views are not intended to be a forecast of future events and are no guarantee of future results.
| 4 | BLACKROCK BALANCED CAPITAL FUND, INC. | MARCH 31, 2016 |
| Total Return Based on a $10,000 Investment |
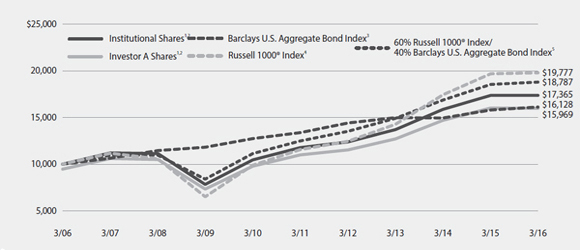
| 1 | Assuming maximum sales charges, if any, transaction costs and other operating expenses, including investment advisory and administration fees. Institutional Shares do not have a sales charge. |
| 2 | The Fund invests in equity securities (including common stock, preferred stock, securities convertible into common stock, or securities or other instruments whose price is linked to the value of common stock) and fixed-income securities (including debt securities, convertible securities and short term securities). |
| 3 | A widely recognized unmanaged market-weighted index, comprised of investment-grade corporate bonds rated BBB or better, mortgages and U.S. Treasury and U.S. Government agency issues with at least one year to maturity. |
| 4 | An index that measures the performance of the large cap segment of the U.S. equity universe. It is a subset of the Russell 3000® Index and includes approximately 1,000 of the largest securities based on a combination of their market capitalization and current index membership. The index represents approximately 92% of the total market capitalization of the Russell 3000® Index. |
| 5 | A customized weighted index comprised of the returns of the Russell 1000® Index (60%) and Barclays U.S. Aggregate Bond Index (40%). |
| Performance Summary for the Period Ended March 31, 2016 |
| Average Annual Total Returns6 | |||||||||||||||||||||||||||||||||||
| 1 Year | 5 Years | 10 Years | |||||||||||||||||||||||||||||||||
| 6-Month Total Returns |
w/o sales charge |
w/ sales charge |
w/o sales charge |
w/ sales charge |
w/o sales charge |
w/ sales charge | |||||||||||||||||||||||||||||
| Institutional |
4.48 | % | (0.05 | )% | N/A | 8.06 | % | N/A | 5.67 | % | N/A | ||||||||||||||||||||||||
| Investor A |
4.30 | (0.33 | ) | (5.56 | )% | 7.75 | 6.59 | % | 5.36 | 4.79 | % | ||||||||||||||||||||||||
| Investor B |
3.69 | (1.44 | ) | (5.70 | ) | 6.63 | 6.32 | 4.57 | 4.57 | ||||||||||||||||||||||||||
| Investor C |
3.94 | (1.08 | ) | (2.02 | ) | 6.91 | 6.91 | 4.53 | 4.53 | ||||||||||||||||||||||||||
| Class R |
4.10 | (0.70 | ) | N/A | 7.35 | N/A | 4.96 | N/A | |||||||||||||||||||||||||||
| 60% Russell 1000® Index/40% Barclays U.S. Aggregate Bond Index |
5.78 | 1.33 | N/A | 8.48 | N/A | 6.51 | N/A | ||||||||||||||||||||||||||||
| Barclays U.S. Aggregate Bond Index |
2.44 | 1.96 | N/A | 3.78 | N/A | 4.90 | N/A | ||||||||||||||||||||||||||||
| Russell 1000® Index |
7.75 | 0.50 | N/A | 11.35 | N/A | 7.06 | N/A | ||||||||||||||||||||||||||||
| 6 | Assuming maximum sales charges, if any. Average annual total returns with and without sales charges reflect reductions for distribution and service fees. See “About Fund Performance” on page 6 for a detailed description of share classes, including any related sales charges and fees. |
| N/A — Not applicable as share class and index do not have a sales charge. |
| Past performance is not indicative of future results. |
| Expense Example |
| Actual |
Hypothetical8 |
|||||||||||||
| Beginning Account Value October 1, 2015 |
Ending Account Value March 31, 2016 |
Expenses Paid During the Period7 |
Beginning Account Value October 1, 2015 |
Ending Account Value March 31, 2016 |
Expenses Paid During the Period7 |
Annualized Expense Ratio | ||||||||
| Institutional |
$1,000.00 | $1,044.80 | $ 3.22 | $1,000.00 | $1,021.85 | $ 3.18 | 0.63% | |||||||
| Investor A |
$1,000.00 | $1,043.00 | $ 4.65 | $1,000.00 | $1,020.45 | $ 4.60 | 0.91% | |||||||
| Investor B |
$1,000.00 | $1,036.90 | $10.80 | $1,000.00 | $1,014.40 | $10.68 | 2.12% | |||||||
| Investor C |
$1,000.00 | $1,039.40 | $ 8.46 | $1,000.00 | $1,016.70 | $ 8.37 | 1.66% | |||||||
| Class R |
$1,000.00 | $ 993.00 | $ 6.33 | $1,000.00 | $1,018.65 | $ 6.41 | 1.27% | |||||||
| 7 | For each class of the Fund, expenses are equal to the annualized expense ratio for the class, multiplied by the average account value over the period, multiplied by 183/366 (to reflect the one-half year period shown). Because the Fund invests significantly in the Master Portfolios, the expense example reflects the net expenses of both the Fund and the Master Portfolios in which it invests. |
| 8 | Hypothetical 5% annual return before expenses is calculated by prorating the number of days in the most recent fiscal half year divided by 366. |
| See “Disclosure of Expenses” on page 6 for further information on how expenses were calculated. |
| BLACKROCK BALANCED CAPITAL FUND, INC. | MARCH 31, 2016 | 5 |
| About Fund Performance |
| Disclosure of Expenses |
| 6 | BLACKROCK BALANCED CAPITAL FUND, INC. | MARCH 31, 2016 |
| The Benefits and Risks of Leveraging |
| Derivative Financial Instruments |
| BLACKROCK BALANCED CAPITAL FUND, INC. | MARCH 31, 2016 | 7 |
| Statement of Assets and Liabilities | BlackRock Balanced Capital Fund, Inc. |
| March 31, 2016 (Unaudited) | ||||
| Assets | ||||
| Investments at value — Master Large Cap Core Portfolio (cost — $490,083,067) |
$ | 590,769,423 | ||
| Investments at value — Master Total Return Portfolio (cost — $342,643,175) |
342,837,244 | |||
| Investments in BlackRock Liquidity Funds, Tempfund, Institutional Class, 0.37% (shares — 20,167,919; cost — $20,167,919) |
20,167,919 | |||
| Capital shares sold receivable |
1,093,501 | |||
| Dividends receivable — affiliated |
5,763 | |||
| Prepaid expenses |
64,196 | |||
|
|
|
|||
| Total assets |
954,938,046 | |||
|
|
|
|||
| Liabilities | ||||
| Payable: |
||||
| Capital shares redeemed |
897,484 | |||
| Investment advisory fees |
84,022 | |||
| Officer’s fees |
10,529 | |||
| Other accrued expenses |
96,449 | |||
| Other affiliates |
12,003 | |||
| Service and distribution fees |
195,999 | |||
| Transfer agent fees |
263,100 | |||
|
|
|
|||
| Total liabilities |
1,559,586 | |||
|
|
|
|||
| Net Assets |
$ | 953,378,460 | ||
|
|
|
|||
| Net Assets Consist of | ||||
| Paid-in capital |
$ | 826,606,859 | ||
| Undistributed net investment income |
2,434,526 | |||
| Accumulated net realized gain |
23,456,650 | |||
| Net unrealized appreciation (depreciation) |
100,880,425 | |||
|
|
|
|||
| Net Assets |
$ | 953,378,460 | ||
|
|
|
|||
| Net Asset Value | ||||
| Institutional — Based on net assets of $347,572,843 and 15,090,726 shares outstanding, 400 million shares authorized, $0.10 par value |
$ | 23.03 | ||
|
|
|
|||
| Investor A — Based on net assets of $481,531,319 and 20,970,100 shares outstanding, 200 million shares authorized, $0.10 par value |
$ | 22.96 | ||
|
|
|
|||
| Investor B — Based on net assets of $1,362,349 and 61,248 shares outstanding, 500 million shares authorized, $0.10 par value |
$ | 22.24 | ||
|
|
|
|||
| Investor C — Based on net assets of $113,092,657 and 5,482,251 shares outstanding, 200 million shares authorized, $0.10 par value |
$ | 20.63 | ||
|
|
|
|||
| Class R — Based on net assets of $9,819,292 and 455,345 shares outstanding, 500 million shares authorized, $0.10 par value |
$ | 21.56 | ||
|
|
|
|||
See Notes to Financial Statements.
| 8 | BLACKROCK BALANCED CAPITAL FUND, INC. | MARCH 31, 2016 |
| Statement of Operations | BlackRock Balanced Capital Fund, Inc. |
| Six Months Ended March 31, 2016 (Unaudited) | ||||
| Investment Income | ||||
| Dividends — affiliated |
$ | 23,106 | ||
| Net investment income (loss) allocated from the Master Portfolios: |
||||
| Interest — unaffiliated |
5,594,618 | |||
| Interest — affiliated |
2 | |||
| Dividends — affiliated |
92,715 | |||
| Dividends — unaffiliated |
4,826,750 | |||
| Securities lending — affiliated — net |
3,838 | |||
| Foreign taxes withheld |
(32,740 | ) | ||
| Total expenses |
(1,754,806 | ) | ||
| Fees waived |
5,100 | |||
|
|
|
|||
| Total income |
8,758,583 | |||
|
|
|
|||
| Fund Expenses | ||||
| Investment advisory |
2,006,324 | |||
| Service and distribution — class specific |
1,128,683 | |||
| Transfer agent — class specific |
525,785 | |||
| Printing |
38,686 | |||
| Professional |
63,278 | |||
| Registration |
48,567 | |||
| Officer |
17,006 | |||
| Custodian |
1,101 | |||
| Miscellaneous |
11,882 | |||
|
|
|
|||
| Total expenses |
3,841,312 | |||
| Less fees waived by the Manager |
(1,456,409 | ) | ||
|
|
|
|||
| Total expenses after fees waived |
2,384,903 | |||
|
|
|
|||
| Net investment income |
6,373,680 | |||
|
|
|
|||
| Realized and Unrealized Gain (Loss) Allocated from the Master Portfolios | ||||
| Net realized gain from investments, futures contracts, options written, interest rate caps, swaps, foreign currency transactions, borrowed bonds and capital gain distributions received from affiliated investment companies |
3,719,639 | |||
| Capital gain distributions received from affiliated investment companies |
524 | |||
| Net change in unrealized appreciation (depreciation) on investments, futures contracts, options written, unfunded floating rate loan interests, short sales, interest rate caps, swaps, foreign currency translations and borrowed bonds |
28,593,186 | |||
|
|
|
|||
| Total realized and unrealized gain |
32,313,349 | |||
|
|
|
|||
| Net Increase in Net Assets Resulting from Operations |
$ | 38,687,029 | ||
|
|
|
|||
See Notes to Financial Statements.
| BLACKROCK BALANCED CAPITAL FUND, INC. | MARCH 31, 2016 | 9 |
| Statements of Changes in Net Assets | BlackRock Balanced Capital Fund, Inc. |
| Increase (Decrease) in Net Assets: | Six Months Ended March 31, 2016 (Unaudited) |
Year Ended September 30, 2015 |
||||||
| Operations | ||||||||
| Net investment income |
$ | 6,373,680 | $ | 12,180,933 | ||||
| Net realized gain |
3,720,163 | 44,177,839 | ||||||
| Net change in unrealized appreciation (depreciation) |
28,593,186 | (48,771,208 | ) | |||||
|
|
|
|||||||
| Net increase in net assets resulting from operations |
38,687,029 | 7,587,564 | ||||||
|
|
|
|||||||
| Distributions to Shareholders1 | ||||||||
| From net investment income: |
||||||||
| Institutional |
(3,668,063 | ) | (6,172,788 | ) | ||||
| Investor A |
(4,508,896 | ) | (6,813,018 | ) | ||||
| Investor B |
(4,343 | ) | (13,241 | ) | ||||
| Investor C |
(721,353 | ) | (692,627 | ) | ||||
| Class R |
(97,402 | ) | (108,414 | ) | ||||
| From net realized gain: |
||||||||
| Institutional |
(11,859,346 | ) | (40,073,428 | ) | ||||
| Investor A |
(16,712,647 | ) | (53,303,235 | ) | ||||
| Investor B |
(59,792 | ) | (346,522 | ) | ||||
| Investor C |
(3,851,175 | ) | (9,717,422 | ) | ||||
| Class R |
(416,488 | ) | (1,028,941 | ) | ||||
|
|
|
|||||||
| Decrease in net assets resulting from distributions to shareholders |
(41,899,505 | ) | (118,269,636 | ) | ||||
|
|
|
|||||||
| Capital Share Transactions | ||||||||
| Net increase in net assets derived from capital share transactions |
54,828,557 | 99,317,078 | ||||||
|
|
|
|||||||
| Net Assets | ||||||||
| Total increase (decrease) in net assets |
51,616,081 | (11,364,994 | ) | |||||
| Beginning of period |
901,762,379 | 913,127,373 | ||||||
|
|
|
|||||||
| End of period |
$ | 953,378,460 | $ | 901,762,379 | ||||
|
|
|
|||||||
| Undistributed net investment income, end of period |
$ | 2,434,526 | $ | 5,060,903 | ||||
|
|
|
|||||||
| 1 | Distributions for annual periods determined in accordance with federal income tax regulations. |
See Notes to Financial Statements.
| 10 | BLACKROCK BALANCED CAPITAL FUND, INC. | MARCH 31, 2016 |
| Financial Highlights | BlackRock Balanced Capital Fund, Inc. |
| Institutional | ||||||||||||||||||||||||
| Six Months Ended March 31, 2016 (Unaudited) |
Year Ended September 30, |
|||||||||||||||||||||||
| 2015 | 2014 | 2013 | 2012 | 2011 | ||||||||||||||||||||
| Per Share Operating Performance | ||||||||||||||||||||||||
| Net asset value, beginning of period |
$ | 23.09 | $ | 26.07 | $ | 25.16 | $ | 23.77 | $ | 20.18 | $ | 20.28 | ||||||||||||
|
|
|
|||||||||||||||||||||||
| Net investment income1 |
0.19 | 0.37 | 0.48 | 0.47 | 0.55 | 0.51 | ||||||||||||||||||
| Net realized and unrealized gain (loss) |
0.85 | (0.03 | ) | 3.05 | 2.35 | 3.55 | (0.13 | ) | ||||||||||||||||
|
|
|
|||||||||||||||||||||||
| Net increase from investment operations |
1.04 | 0.34 | 3.53 | 2.82 | 4.10 | 0.38 | ||||||||||||||||||
|
|
|
|||||||||||||||||||||||
| Distributions:2 |
||||||||||||||||||||||||
| From net investment income |
(0.26 | ) | (0.43 | ) | (0.56 | ) | (0.53 | ) | (0.51 | ) | (0.48 | ) | ||||||||||||
| From net realized gain |
(0.84 | ) | (2.89 | ) | (2.06 | ) | (0.90 | ) | — | — | ||||||||||||||
|
|
|
|||||||||||||||||||||||
| Total distributions |
(1.10 | ) | (3.32 | ) | (2.62 | ) | (1.43 | ) | (0.51 | ) | (0.48 | ) | ||||||||||||
|
|
|
|||||||||||||||||||||||
| Net asset value, end of period |
$ | 23.03 | $ | 23.09 | $ | 26.07 | $ | 25.16 | $ | 23.77 | $ | 20.18 | ||||||||||||
|
|
|
|||||||||||||||||||||||
| Total Return3 | ||||||||||||||||||||||||
| Based on net asset value |
4.48 | %4 | 0.82 | % | 14.77 | % | 12.42 | % | 20.52 | % | 1.67 | % | ||||||||||||
|
|
|
|||||||||||||||||||||||
| Ratios to Average Net Assets5 | ||||||||||||||||||||||||
| Total expenses |
0.94 | %6 | 0.92 | % | 0.95 | % | 0.98 | % | 0.96 | % | 1.07 | % | ||||||||||||
|
|
|
|||||||||||||||||||||||
| Total expenses after fees waived and/or reimbursed |
0.63 | %6 | 0.59 | % | 0.63 | % | 0.66 | % | 0.66 | % | 0.76 | % | ||||||||||||
|
|
|
|||||||||||||||||||||||
| Net investment income |
1.64 | %6 | 1.52 | % | 1.88 | % | 1.87 | % | 2.45 | % | 2.33 | % | ||||||||||||
|
|
|
|||||||||||||||||||||||
| Supplemental Data | ||||||||||||||||||||||||
| Net assets, end of period (000) |
$ | 347,573 | $ | 341,225 | $ | 348,345 | $ | 317,572 | $ | 426,027 | $ | 511,458 | ||||||||||||
|
|
|
|||||||||||||||||||||||
| Portfolio turnover rate of the Fund7 |
— | — | — | — | — | — | ||||||||||||||||||
|
|
|
|||||||||||||||||||||||
| Portfolio turnover rate of the Master Total Return Portfolio8 |
463 | % | 1,015 | % | 750 | % | 777 | % | 1,346 | % | 1,771 | % | ||||||||||||
|
|
|
|||||||||||||||||||||||
| Portfolio turnover rate of the Master Large Cap Core Portfolio |
19 | % | 41 | % | 40 | % | 50 | % | 128 | % | 129 | % | ||||||||||||
|
|
|
|||||||||||||||||||||||
| 1 | Based on average shares outstanding. |
| 2 | Distributions for annual periods determined in accordance with federal income tax regulations. |
| 3 | Where applicable, assumes the reinvestment of distributions. |
| 4 | Aggregate total return. |
| 5 | Includes the Fund’s share of the Master Portfolios’ allocated expenses and/or net investment income. |
| 6 | Annualized. |
| 7 | Excludes transactions in the Master Portfolios. |
| 8 | Includes mortgage dollar roll transactions. Additional information regarding portfolio turnover rate is as follows: |
| Six Months Ended March 31, 2016 (Unaudited) |
Year Ended September 30, | |||||||||||||||||||||||||
| 2015 | 2014 | 2013 | 2012 | 2011 | ||||||||||||||||||||||
| Portfolio turnover rate (excluding mortgage dollar roll transactions) |
336 | % | 725 | % | 529 | % | 450 | % | 752 | % | 1,379 | % | ||||||||||||||
See Notes to Financial Statements.
| BLACKROCK BALANCED CAPITAL FUND, INC. | MARCH 31, 2016 | 11 |
| Financial Highlights (continued) | BlackRock Balanced Capital Fund, Inc. |
| Investor A | ||||||||||||||||||||||||
| Six Months Ended March 31, 2016 (Unaudited) |
Year Ended September 30, |
|||||||||||||||||||||||
| 2015 | 2014 | 2013 | 2012 | 2011 | ||||||||||||||||||||
| Per Share Operating Performance | ||||||||||||||||||||||||
| Net asset value, beginning of period |
$ | 23.03 | $ | 26.00 | $ | 25.11 | $ | 23.68 | $ | 20.10 | $ | 20.21 | ||||||||||||
|
|
|
|||||||||||||||||||||||
| Net investment income1 |
0.16 | 0.30 | 0.40 | 0.38 | 0.47 | 0.40 | ||||||||||||||||||
| Net realized and unrealized gain (loss) |
0.84 | (0.02 | ) | 3.03 | 2.37 | 3.55 | (0.10 | ) | ||||||||||||||||
|
|
|
|||||||||||||||||||||||
| Net increase from investment operations |
1.00 | 0.28 | 3.43 | 2.75 | 4.02 | 0.30 | ||||||||||||||||||
|
|
|
|||||||||||||||||||||||
| Distributions:2 |
||||||||||||||||||||||||
| From net investment income |
(0.23 | ) | (0.36 | ) | (0.48 | ) | (0.42 | ) | (0.44 | ) | (0.41 | ) | ||||||||||||
| From net realized gain |
(0.84 | ) | (2.89 | ) | (2.06 | ) | (0.90 | ) | — | — | ||||||||||||||
|
|
|
|||||||||||||||||||||||
| Total distributions |
(1.07 | ) | (3.25 | ) | (2.54 | ) | (1.32 | ) | (0.44 | ) | (0.41 | ) | ||||||||||||
|
|
|
|||||||||||||||||||||||
| Net asset value, end of period |
$ | 22.96 | $ | 23.03 | $ | 26.00 | $ | 25.11 | $ | 23.68 | $ | 20.10 | ||||||||||||
|
|
|
|||||||||||||||||||||||
| Total Return3 | ||||||||||||||||||||||||
| Based on net asset value |
4.30 | %4 | 0.57 | % | 14.39 | % | 12.14 | % | 20.16 | % | 1.31 | % | ||||||||||||
|
|
|
|||||||||||||||||||||||
| Ratios to Average Net Assets5 | ||||||||||||||||||||||||
| Total expenses |
1.22 | %6 | 1.20 | % | 1.25 | % | 1.29 | % | 1.28 | % | 1.39 | % | ||||||||||||
|
|
|
|||||||||||||||||||||||
| Total expenses after fees waived and/or reimbursed |
0.91 | %6 | 0.88 | % | 0.92 | % | 0.97 | % | 0.97 | % | 1.07 | % | ||||||||||||
|
|
|
|||||||||||||||||||||||
| Net investment income |
1.36 | %6 | 1.23 | % | 1.58 | % | 1.51 | % | 2.12 | % | 1.83 | % | ||||||||||||
|
|
|
|||||||||||||||||||||||
| Supplemental Data | ||||||||||||||||||||||||
| Net assets, end of period (000) |
$ | 481,531 | $ | 461,642 | $ | 476,919 | $ | 445,295 | $ | 447,620 | $ | 426,819 | ||||||||||||
|
|
|
|||||||||||||||||||||||
| Portfolio turnover rate of the Fund7 |
— | — | — | — | — | — | ||||||||||||||||||
|
|
|
|||||||||||||||||||||||
| Portfolio turnover rate of the Master Total Return Portfolio8 |
463 | % | 1,015 | % | 750 | % | 777 | % | 1,346 | % | 1,771 | % | ||||||||||||
|
|
|
|||||||||||||||||||||||
| Portfolio turnover rate of the Master Large Cap Core Portfolio |
19 | % | 41 | % | 40 | % | 50 | % | 128 | % | 129 | % | ||||||||||||
|
|
|
|||||||||||||||||||||||
| 1 | Based on average shares outstanding. |
| 2 | Distributions for annual periods determined in accordance with federal income tax regulations. |
| 3 | Where applicable, excludes the effects of any sales charges and assumes the reinvestment of distributions. |
| 4 | Aggregate total return. |
| 5 | Includes the Fund’s share of the Master Portfolios’ allocated expenses and/or net investment income. |
| 6 | Annualized. |
| 7 | Excludes transactions in the Master Portfolios. |
| 8 | Includes mortgage dollar roll transactions. Additional information regarding portfolio turnover rate is as follows: |
| Six Months Ended March 31, 2016 (Unaudited) |
Year Ended September 30, | |||||||||||||||||||||||||
| 2015 | 2014 | 2013 | 2012 | 2011 | ||||||||||||||||||||||
| Portfolio turnover rate (excluding mortgage dollar roll transactions) |
336 | % | 725 | % | 529 | % | 450 | % | 752 | % | 1,379 | % | ||||||||||||||
See Notes to Financial Statements.
| 12 | BLACKROCK BALANCED CAPITAL FUND, INC. | MARCH 31, 2016 |
| Financial Highlights (continued) | BlackRock Balanced Capital Fund, Inc. |
| Investor B | ||||||||||||||||||||||||
| Six Months Ended (Unaudited) |
Year Ended September 30, |
|||||||||||||||||||||||
| 2015 | 2014 | 2013 | 2012 | 2011 | ||||||||||||||||||||
| Per Share Operating Performance | ||||||||||||||||||||||||
| Net asset value, beginning of period |
$ | 22.31 | $ | 25.30 | $ | 24.47 | $ | 23.07 | $ | 19.55 | $ | 19.65 | ||||||||||||
|
|
|
|||||||||||||||||||||||
| Net investment income1 |
0.02 | 0.03 | 0.14 | 0.13 | 0.24 | 0.18 | ||||||||||||||||||
| Net realized and unrealized gain (loss) |
0.81 | (0.02 | ) | 2.96 | 2.29 | 3.46 | (0.10 | ) | ||||||||||||||||
|
|
|
|||||||||||||||||||||||
| Net increase from investment operations |
0.83 | 0.01 | 3.10 | 2.42 | 3.70 | 0.08 | ||||||||||||||||||
|
|
|
|||||||||||||||||||||||
| Distributions:2 |
||||||||||||||||||||||||
| From net investment income |
(0.06 | ) | (0.11 | ) | (0.21 | ) | (0.12 | ) | (0.18 | ) | (0.18 | ) | ||||||||||||
| From net realized gain |
(0.84 | ) | (2.89 | ) | (2.06 | ) | (0.90 | ) | — | — | ||||||||||||||
|
|
|
|||||||||||||||||||||||
| Total distributions |
(0.90 | ) | (3.00 | ) | (2.27 | ) | (1.02 | ) | (0.18 | ) | (0.18 | ) | ||||||||||||
|
|
|
|||||||||||||||||||||||
| Net asset value, end of period |
$ | 22.24 | $ | 22.31 | $ | 25.30 | $ | 24.47 | $ | 23.07 | $ | 19.55 | ||||||||||||
|
|
|
|||||||||||||||||||||||
| Total Return3 | ||||||||||||||||||||||||
| Based on net asset value |
3.69 | %4 | (0.54 | )% | 13.27 | % | 10.94 | % | 19.01 | % | 0.34 | % | ||||||||||||
|
|
|
|||||||||||||||||||||||
| Ratios to Average Net Assets5 | ||||||||||||||||||||||||
| Total expenses |
2.43 | %6 | 2.28 | % | 2.26 | % | 2.33 | % | 2.29 | % | 2.36 | % | ||||||||||||
|
|
|
|||||||||||||||||||||||
| Total expenses after fees waived and/or reimbursed |
2.12 | %6 | 1.96 | % | 1.93 | % | 2.01 | % | 1.98 | % | 2.04 | % | ||||||||||||
|
|
|
|||||||||||||||||||||||
| Net investment income |
0.15 | %6 | 0.14 | % | 0.56 | % | 0.51 | % | 1.13 | % | 0.86 | % | ||||||||||||
|
|
|
|||||||||||||||||||||||
| Supplemental Data | ||||||||||||||||||||||||
| Net assets, end of period (000) |
$ | 1,362 | $ | 2,049 | $ | 3,633 | $ | 4,926 | $ | 7,128 | $ | 8,786 | ||||||||||||
|
|
|
|||||||||||||||||||||||
| Portfolio turnover rate of the Fund7 |
— | — | — | — | — | — | ||||||||||||||||||
|
|
|
|||||||||||||||||||||||
| Portfolio turnover rate of the Master Total Return Portfolio8 |
463 | % | 1,015 | % | 750 | % | 777 | % | 1,346 | % | 1,771 | % | ||||||||||||
|
|
|
|||||||||||||||||||||||
| Portfolio turnover rate of the Master Large Cap Core Portfolio |
19 | % | 41 | % | 40 | % | 50 | % | 128 | % | 129 | % | ||||||||||||
|
|
|
|||||||||||||||||||||||
| 1 | Based on average shares outstanding. |
| 2 | Distributions for annual periods determined in accordance with federal income tax regulations. |
| 3 | Where applicable, excludes the effects of any sales charges and assumes the reinvestment of distributions. |
| 4 | Aggregate total return. |
| 5 | Includes the Fund’s share of the Master Portfolios’ allocated expenses and/or net investment income. |
| 6 | Annualized. |
| 7 | Excludes transactions in the Master Portfolios. |
| 8 | Includes mortgage dollar roll transactions. Additional information regarding portfolio turnover rate is as follows: |
| Six Months Ended March 31, 2016 (Unaudited) |
Year Ended September 30, | |||||||||||||||||||||||||
| 2015 | 2014 | 2013 | 2012 | 2011 | ||||||||||||||||||||||
| Portfolio turnover rate (excluding mortgage dollar roll transactions) |
336 | % | 725 | % | 529 | % | 450 | % | 752 | % | 1,379 | % | ||||||||||||||
See Notes to Financial Statements.
| BLACKROCK BALANCED CAPITAL FUND, INC. | MARCH 31, 2016 | 13 |
| Financial Highlights (continued) | BlackRock Balanced Capital Fund, Inc. |
| Investor C | ||||||||||||||||||||||||
| Six Months Ended March 31, 2016 (Unaudited) |
Year Ended September 30, |
|||||||||||||||||||||||
| 2015 | 2014 | 2013 | 2012 | 2011 | ||||||||||||||||||||
| Per Share Operating Performance | ||||||||||||||||||||||||
| Net asset value, beginning of period |
$ | 20.80 | $ | 23.80 | $ | 23.20 | $ | 21.92 | $ | 18.64 | $ | 18.77 | ||||||||||||
|
|
|
|||||||||||||||||||||||
| Net investment income1 |
0.06 | 0.10 | 0.19 | 0.18 | 0.28 | 0.21 | ||||||||||||||||||
| Net realized and unrealized gain (loss) |
0.77 | (0.01 | ) | 2.79 | 2.17 | 3.28 | (0.08 | ) | ||||||||||||||||
|
|
|
|||||||||||||||||||||||
| Net increase from investment operations |
0.83 | 0.09 | 2.98 | 2.35 | 3.56 | 0.13 | ||||||||||||||||||
|
|
|
|||||||||||||||||||||||
| Distributions:2 |
||||||||||||||||||||||||
| From net investment income |
(0.16 | ) | (0.20 | ) | (0.32 | ) | (0.17 | ) | (0.28 | ) | (0.26 | ) | ||||||||||||
| From net realized gain |
(0.84 | ) | (2.89 | ) | (2.06 | ) | (0.90 | ) | — | — | ||||||||||||||
|
|
|
|||||||||||||||||||||||
| Total distributions |
(1.00 | ) | (3.09 | ) | (2.38 | ) | (1.07 | ) | (0.28 | ) | (0.26 | ) | ||||||||||||
|
|
|
|||||||||||||||||||||||
| Net asset value, end of period |
$ | 20.63 | $ | 20.80 | $ | 23.80 | $ | 23.20 | $ | 21.92 | $ | 18.64 | ||||||||||||
|
|
|
|||||||||||||||||||||||
| Total Return3 | ||||||||||||||||||||||||
| Based on net asset value |
3.94 | %4 | (0.21 | )% | 13.51 | % | 11.22 | % | 19.22 | % | 0.55 | % | ||||||||||||
|
|
|
|||||||||||||||||||||||
| Ratios to Average Net Assets5 | ||||||||||||||||||||||||
| Total expenses |
1.97 | %6 | 1.97 | % | 2.02 | % | 2.07 | % | 2.06 | % | 2.18 | % | ||||||||||||
|
|
|
|||||||||||||||||||||||
| Total expenses after fees waived and/or reimbursed |
1.66 | %6 | 1.65 | % | 1.69 | % | 1.75 | % | 1.75 | % | 1.87 | % | ||||||||||||
|
|
|
|||||||||||||||||||||||
| Net investment income |
0.61 | %6 | 0.47 | % | 0.81 | % | 0.72 | % | 1.33 | % | 1.04 | % | ||||||||||||
|
|
|
|||||||||||||||||||||||
| Supplemental Data | ||||||||||||||||||||||||
| Net assets, end of period (000) |
$ | 113,093 | $ | 86,397 | $ | 74,908 | $ | 63,952 | $ | 61,541 | $ | 56,608 | ||||||||||||
|
|
|
|||||||||||||||||||||||
| Portfolio turnover rate of the Fund7 |
— | — | — | — | — | — | ||||||||||||||||||
|
|
|
|||||||||||||||||||||||
| Portfolio turnover rate of the Master Total Return Portfolio8 |
463 | % | 1,015 | % | 750 | % | 777 | % | 1,346 | % | 1,771 | % | ||||||||||||
|
|
|
|||||||||||||||||||||||
| Portfolio turnover rate of the Master Large Cap Core Portfolio |
19 | % | 41 | % | 40 | % | 50 | % | 128 | % | 129 | % | ||||||||||||
|
|
|
|||||||||||||||||||||||
| 1 | Based on average shares outstanding. |
| 2 | Distributions for annual periods determined in accordance with federal income tax regulations. |
| 3 | Where applicable, excludes the effects of any sales charges and assumes the reinvestment of distributions. |
| 4 | Aggregate total return. |
| 5 | Includes the Fund’s share of the Master Portfolios’ allocated expenses and/or net investment income. |
| 6 | Annualized. |
| 7 | Excludes transactions in the Master Portfolios. |
| 8 | Includes mortgage dollar roll transactions. Additional information regarding portfolio turnover rate is as follows: |
| Six Months Ended (Unaudited) |
Year Ended September 30, | |||||||||||||||||||||||||
| 2015 | 2014 | 2013 | 2012 | 2011 | ||||||||||||||||||||||
| Portfolio turnover rate (excluding mortgage dollar roll transactions) |
336 | % | 725 | % | 529 | % | 450 | % | 752 | % | 1,379 | % | ||||||||||||||
See Notes to Financial Statements.
| 14 | BLACKROCK BALANCED CAPITAL FUND, INC. | MARCH 31, 2016 |
| Financial Highlights (concluded) | BlackRock Balanced Capital Fund, Inc. |
| Class R | ||||||||||||||||||||||||
| Six Months Ended March 31, 2016 (Unaudited) |
Year Ended September 30, |
|||||||||||||||||||||||
| 2015 | 2014 | 2013 | 2012 | 2011 | ||||||||||||||||||||
| Per Share Operating Performance | ||||||||||||||||||||||||
| Net asset value, beginning of period |
$ | 21.70 | $ | 24.68 | $ | 23.96 | $ | 22.63 | $ | 19.22 | $ | 19.33 | ||||||||||||
|
|
|
|||||||||||||||||||||||
| Net investment income1 |
0.11 | 0.21 | 0.30 | 0.28 | 0.37 | 0.30 | ||||||||||||||||||
| Net realized and unrealized gain (loss) |
0.79 | (0.02 | ) | 2.89 | 2.24 | 3.39 | (0.09 | ) | ||||||||||||||||
|
|
|
|||||||||||||||||||||||
| Net increase from investment operations |
0.90 | 0.19 | 3.19 | 2.52 | 3.76 | 0.21 | ||||||||||||||||||
|
|
|
|||||||||||||||||||||||
| Distributions:2 |
||||||||||||||||||||||||
| From net investment income |
(0.20 | ) | (0.28 | ) | (0.41 | ) | (0.29 | ) | (0.35 | ) | (0.32 | ) | ||||||||||||
| From net realized gain |
(0.84 | ) | (2.89 | ) | (2.06 | ) | (0.90 | ) | — | — | ||||||||||||||
|
|
|
|||||||||||||||||||||||
| Total distributions |
(1.04 | ) | (3.17 | ) | (2.47 | ) | (1.19 | ) | (0.35 | ) | (0.32 | ) | ||||||||||||
|
|
|
|||||||||||||||||||||||
| Net asset value, end of period |
$ | 21.56 | $ | 21.70 | $ | 24.68 | $ | 23.96 | $ | 22.63 | $ | 19.22 | ||||||||||||
|
|
|
|||||||||||||||||||||||
| Total Return3 | ||||||||||||||||||||||||
| Based on net asset value |
4.10 | %4 | 0.23 | % | 14.03 | % | 11.66 | % | 19.73 | % | 0.96 | % | ||||||||||||
|
|
|
|||||||||||||||||||||||
| Ratios to Average Net Assets5 | ||||||||||||||||||||||||
| Total expenses |
1.59 | %6 | 1.53 | % | 1.59 | % | 1.66 | % | 1.67 | % | 1.77 | % | ||||||||||||
|
|
|
|||||||||||||||||||||||
| Total expenses after fees waived and/or reimbursed |
1.27 | %6 | 1.21 | % | 1.27 | % | 1.33 | % | 1.36 | % | 1.46 | % | ||||||||||||
|
|
|
|||||||||||||||||||||||
| Net investment income |
0.99 | %6 | 0.91 | % | 1.23 | % | 1.16 | % | 1.73 | % | 1.44 | % | ||||||||||||
|
|
|
|||||||||||||||||||||||
| Supplemental Data | ||||||||||||||||||||||||
| Net assets, end of period (000) |
$ | 9,819 | $ | 10,448 | $ | 9,322 | $ | 8,542 | $ | 8,963 | $ | 8,118 | ||||||||||||
|
|
|
|||||||||||||||||||||||
| Portfolio turnover rate of the Fund7 |
— | — | — | — | — | — | ||||||||||||||||||
|
|
|
|||||||||||||||||||||||
| Portfolio turnover rate of the Master Total Return Portfolio8 |
463 | % | 1,015 | % | 750 | % | 777 | % | 1,346 | % | 1,771 | % | ||||||||||||
|
|
|
|||||||||||||||||||||||
| Portfolio turnover rate of the Master Large Cap Core Portfolio |
19 | % | 41 | % | 40 | % | 50 | % | 128 | % | 129 | % | ||||||||||||
|
|
|
|||||||||||||||||||||||
| 1 | Based on average shares outstanding. |
| 2 | Distributions for annual periods determined in accordance with federal income tax regulations. |
| 3 | Where applicable, assumes the reinvestment of distributions. |
| 4 | Aggregate total return. |
| 5 | Includes the Fund’s share of the Master Portfolios’ allocated expenses and/or net investment income. |
| 6 | Annualized. |
| 7 | Excludes transactions in the Master Portfolios. |
| 8 | Includes mortgage dollar roll transactions. Additional information regarding portfolio turnover rate is as follows: |
| Six Months Ended March 31, 2016 (Unaudited) |
Year Ended September 30, | |||||||||||||||||||||||||
| 2015 | 2014 | 2013 | 2012 | 2011 | ||||||||||||||||||||||
| Portfolio turnover rate (excluding mortgage dollar roll transactions) |
336 | % | 725 | % | 529 | % | 450 | % | 752 | % | 1,379 | % | ||||||||||||||
See Notes to Financial Statements.
| BLACKROCK BALANCED CAPITAL FUND, INC. | MARCH 31, 2016 | 15 |
| Notes to Financial Statements (Unaudited) | BlackRock Balanced Capital Fund, Inc. |
1. Organization:
BlackRock Balanced Capital Fund, Inc. (the “Fund”) is registered under the Investment Company Act of 1940, as amended (the “1940 Act”). The Fund is registered as a diversified, open-end management investment company. The Fund is organized as a Maryland corporation. The Fund seeks to achieve its investment objective by investing directly in equity and fixed-income securities, indirectly through one or more funds that invest in such securities, or in a combination of securities and funds. The Fund intends to invest a significant portion of its fixed income assets in Master Total Return Portfolio (the “Master Total Return Portfolio”) of Master Bond LLC, a mutual fund that has an investment objective and strategy consistent with that of the fixed income portion of the Fund. The Fund intends to invest a significant portion of its equity assets in Master Large Cap Core Portfolio (the “Master Large Cap Core Portfolio”) of Master Large Cap Series LLC, a mutual fund that has an investment objective and strategy consistent with that of the equity portion of the Fund. Master Total Return Portfolio and Master Large Cap Core Portfolio, both affiliates of the Fund, are collectively referred to as the “Master Portfolios.” The value of the Fund’s investment in the Master Portfolios reflects the Fund’s proportionate interest in the net assets of the Master Portfolios. The performance of the Fund is directly affected by the performance of the Master Portfolios as well as the Fund’s direct investments. At March 31, 2016, the percentages of the Master Large Cap Core Portfolio and Master Total Return Portfolio owned by the Fund were 26.9% and 3.9%, respectively. The financial statements of the Master Portfolios, including the Schedules of Investments, are included elsewhere in this report and should be read in conjunction with the Fund’s financial statements.
The Fund offers multiple classes of shares. All classes of shares have identical voting, dividend, liquidation and other rights and are subject to the same terms and conditions, except that certain classes bear expenses related to the shareholder servicing and distribution of such shares. Institutional Shares are sold only to certain eligible investors. Investor B Shares are only available through exchanges and distribution reinvestments by current holders and for purchase by certain employer-sponsored retirement plans. Investor A and Investor C Shares are generally available through financial intermediaries. Class R shares are available only to certain employer-sponsored retirement plans. Each class has exclusive voting rights with respect to matters relating to its shareholder servicing and distribution expenditures (except that Investor B shareholders may vote on material changes to the Investor A distribution and service plan).
| Share Class | Initial Sales Charge | CDSC | Conversion Privilege | |||
| Institutional and Class R Shares |
No | No | None | |||
| Investor A Shares |
Yes | No1 | None | |||
| Investor B Shares |
No | Yes | To Investor A Shares after approximately 8 years | |||
| Investor C Shares |
No | Yes | None |
| 1 | Investor A Shares may be subject to a CDSC for certain redemptions where no initial sales charge was paid at the time of purchase. |
The Fund, together with certain other registered investment companies advised by the Manager or its affiliates, is included in a complex of open-end funds referred to as the Equity-Bond Complex.
2. Significant Accounting Policies:
The financial statements are prepared in conformity with accounting principles generally accepted in the United States of America (“U.S. GAAP”), which may require management to make estimates and assumptions that affect the reported amounts of assets and liabilities in the financial statements, disclosure of contingent assets and liabilities at the date of the financial statements and the reported amounts of increases and decreases in net assets from operations during the reporting period. Actual results could differ from those estimates. The Fund is considered an investment company under U.S. GAAP and follows the accounting and reporting guidance applicable to investment companies. Below is a summary of significant accounting policies:
Investment Transactions and Investment Income: For financial reporting purposes, contributions to and withdrawals from the Master Portfolios are accounted on a trade date basis. The Fund records its proportionate share of the Master Portfolios’ income, expenses and realized and unrealized gains and losses on a daily basis. Realized and unrealized gains and losses are adjusted utilizing partnership tax allocation rules. In addition, the Fund accrues its own expenses. Income, expenses and realized and unrealized gains and losses are allocated daily to each class based on its relative net assets.
Distributions: Distributions paid by the Fund are recorded on the ex-dividend date. The character and timing of distributions are determined in accordance with federal income tax regulations, which may differ from U.S. GAAP.
Net income and realized gains from investments held by the Master Total Return Portfolio’s investment in BlackRock Cayman Master Total Return Portfolio I, Ltd. (the “Subsidiary”) are treated as ordinary income for tax purposes. If a net loss is realized by the Subsidiary in any taxable year, the loss will generally not be available to offset the Fund’s ordinary income and/or capital gains for that year.
Indemnifications: In the normal course of business, the Fund enters into contracts that contain a variety of representations that provide general indemnification. The Fund’s maximum exposure under these arrangements is unknown because it involves future potential claims against the Fund, which cannot be predicted with any certainty.
| 16 | BLACKROCK BALANCED CAPITAL FUND, INC. | MARCH 31, 2016 |
| Notes to Financial Statements (continued) | BlackRock Balanced Capital Fund, Inc. |
Other: Expenses directly related to the Fund or its classes are charged to the Fund or the applicable class. Other operating expenses shared by several funds, including other funds managed by the Manager, are prorated among those funds on the basis of relative net assets or other appropriate methods. Expenses directly related to the Fund and other shared expenses prorated to the Fund are allocated daily to each class based on its relative net assets or other appropriate methods.
The Fund has an arrangement with its custodian whereby fees may be reduced by credits earned on uninvested cash balances, which, if applicable, are shown as fees paid indirectly in the Statement of Operations. The custodian imposes fees on overdrawn cash balances, which can be offset by accumulated credits earned or may result in additional custody charges.
3. Investment Valuation and Fair Value Measurements:
Investment Valuation Policies: The Fund’s policy is to value its financial instruments at fair value. The Fund records its investment in the Master Portfolios at fair value based on the Fund’s proportionate interest in the net assets of the Master Portfolios. Valuation of securities held by the Master Portfolios is discussed in Note 3 of the Master Portfolios’ Notes to Financial Statements, which are included elsewhere in this report.
Fair Value Inputs and Methodologies: The following methods (or “techniques”) and inputs are used to establish the fair value of the Fund’s assets and liabilities:
| • | Investments in open-end U.S. mutual funds are valued at NAV each business day. |
Fair Value Hierarchy: Various inputs are used in determining the fair value of investments. These inputs to valuation techniques are categorized into a fair value hierarchy consisting of three broad levels for financial statement purposes as follows:
| • | Level 1 — unadjusted price quotations in active markets/exchanges for identical assets or liabilities that the Fund has the ability to access |
| • | Level 2 — other observable inputs (including, but not limited to, quoted prices for similar assets or liabilities in markets that are active, quoted prices for identical or similar assets or liabilities in markets that are not active, inputs other than quoted prices that are observable for the assets or liabilities (such as interest rates, yield curves, volatilities, prepayment speeds, loss severities, credit risks and default rates) or other market–corroborated inputs) |
| • | Level 3 — unobservable inputs based on the best information available in the circumstances, to the extent observable inputs are not available (including the Fund’s own assumptions used in determining the fair value of investments |
The hierarchy gives the highest priority to unadjusted quoted prices in active markets for identical assets or liabilities (Level 1 measurements) and the lowest priority to unobservable inputs (Level 3 measurements). Accordingly, the degree of judgment exercised in determining fair value is greatest for instruments categorized in Level 3. The inputs used to measure fair value may fall into different levels of the fair value hierarchy. In such cases, for disclosure purposes, the fair value hierarchy classification is determined based on the lowest level input that is significant to the fair value measurement in its entirety. The significant unobservable inputs used by the Global Valuation Committee in determining the price for Fair Valued Investments are typically categorized as Level 3.
Changes in valuation techniques may result in transfers into or out of an assigned level within the hierarchy. In accordance with the Fund’s policy, transfers between different levels of the fair value hierarchy are deemed to have occurred as of the beginning of the reporting period. The categorization of a value determined for investments is based on the pricing transparency of the investments and is not necessarily an indication of the risks associated with investing in those securities.
As of period end, the following table summarizes the Fund’s investment categorized in the disclosure hierarchy.
| Level 1 | Level 2 | Level 3 | Total | |||||||||||||
| BlackRock Liquidity Funds, TempFund, Institutional Class |
$ | 20,167,919 | — | — | $20,167,919 | |||||||||||
4. Investment Advisory Agreement and Other Transactions with Affiliates:
The PNC Financial Services Group, Inc. is the largest stockholder and an affiliate of BlackRock, Inc. (“BlackRock”), for 1940 Act purposes.
Investment Advisory
The Fund entered into an Investment Advisory Agreement with the Manager, the Fund’s investment advisor, an indirect, wholly owned subsidiary of BlackRock, to provide investment advisory and administration services. The Manager is responsible for the management of the Fund’s portfolio and provides the personnel, facilities, equipment and certain other services necessary to the operations of the Fund. For such services, the Fund pays
| BLACKROCK BALANCED CAPITAL FUND, INC. | MARCH 31, 2016 | 17 |
| Notes to Financial Statements (continued) | BlackRock Balanced Capital Fund, Inc. |
the Manager a monthly fee based on a percentage of the Fund’s average daily net assets at the following annual rates:
| Average Daily Net Assets | Investment Advisory Fee | |
| First $250 million |
0.500% | |
| $250 million - $300 million |
0.450% | |
| $300 million - $400 million |
0.425% | |
| Greater than $400 million |
0.400% |
The Fund also pays an investment advisory fee to the Manager, which is the investment advisor of Master Total Return Portfolio and Master Large Cap Core Portfolio, to the extent it invests in the Master Total Return Portfolio and Master Large Cap Core Portfolio. The Manager has contractually agreed to waive its investment advisory fee by the amount of any management fees the Fund pays indirectly through its investments in the Master Portfolios. For the six months ended March 31, 2016, the Manager waived $1,449,895, which is included in fees waived by the Manager in the Statement of Operations.
Investments in issuers considered to be an affiliate of the Fund for purposes of Section 2(a)(3) of the 1940 Act were as follows:
| Affiliate |
Shares Held at September 30, 2015 |
Net Activity |
Shares Held at March 31, 2016 |
Income | Capital Gain | |||||||||||||
| BlackRock Liquidity Funds, TempFund, Institutional Class |
4,220,698 | 15,947,221 | 20,167,919 | $23,106 | $524 |
The Manager voluntarily agreed to waive its investment advisory fees by the amount of investment advisory fees the Fund pays to the Manager indirectly through its investment in affiliated money market funds. For the six months ended March 31, 2016, the Manager waived $6,514, which is included in fees waived by the Manager in the Statement of Operations. However, the Manager does not waive its investment advisory fees by the amount of investment advisory fees paid in connection with the Fund’s investment in other affiliated investment companies except to the extent noted above with respect to Master Total Return Portfolio and Master Large Cap Core Portfolio, if any.
Service and Distribution Fees
The Manager, on behalf of the Fund, entered into a Distribution Agreement and a Distribution and Service Plan with BlackRock Investments, LLC (“BRIL”), an affiliate of the Manager. Pursuant to the Distribution and Service Plan and in accordance with Rule 12b-1 under the 1940 Act, the Fund pays BRIL ongoing service and distribution fees. The fees are accrued daily and paid monthly at annual rates based upon the average daily net assets of the relevant share class of the Fund as follows:
|
Service Fee |
Distribution Fee | |||||||
| Investor A |
0.25% | — | ||||||
| Investor B |
0.25% | 0.75% | ||||||
| Investor C |
0.25% | 0.75% | ||||||
| Class R |
0.25% | 0.25% | ||||||
Pursuant to sub-agreements with BRIL, broker-dealers and BRIL provide shareholder servicing and distribution services to the Fund. The ongoing service and/or distribution fee compensates BRIL and each broker-dealer for providing shareholder servicing and/or distribution related services to the shareholders.
For the six months ended March 31, 2016, the following table shows the class specific service and distribution fees borne directly by each share class of the Fund:
| Investor A |
$ 589,619 | |
| Investor B |
8,255 | |
| Investor C |
504,579 | |
| Class R |
26,230 | |
| Total |
$1,128,683 | |
|
|
| 18 | BLACKROCK BALANCED CAPITAL FUND, INC. | MARCH 31, 2016 |
| Notes to Financial Statements (continued) | BlackRock Balanced Capital Fund, Inc. |
Transfer Agent
Pursuant to written agreements, certain financial intermediaries, some of which may be affiliates, provide the Fund with sub-accounting, recordkeeping, sub-transfer agency and other administrative services with respect to sub-accounts they service. For these services, these entities receive an asset-based fee or annual fee per shareholder account, which will vary depending on share class and/or net assets. For the six months ended March 31, 2016, the Fund paid the following amounts to affiliates of BlackRock in return for these services, which are included in transfer agent — class specific in the Statement of Operations:
| Institutional |
$14 |
The Manager maintains a call center, that is responsible for providing certain shareholder services to the Fund. Shareholder services include responding to shareholder inquiries and processing subscriptions and redemptions based upon instructions from shareholders. For the six months ended March 31, 2016, the Fund reimbursed the Manager the following amounts for costs incurred in running the call center, which are included in transfer agent — class specific in the Statement of Operations:
| Institutional |
$ 8,798 | |
| Investor A |
$12,489 | |
| Investor B |
$ 245 | |
| Investor C |
$ 2,923 | |
| Class R |
$ 48 |
For the six months ended March 31, 2016, the following table shows the class specific transfer agent fees borne directly by each class of the Fund:
| Institutional |
$156,397 | |
| Investor A |
290,524 | |
| Investor B |
4,776 | |
| Investor C |
61,626 | |
| Class R |
12,462 | |
| Total |
$525,785 | |
|
|
For the six months ended March 31, 2016, affiliates earned underwriting discounts, direct commissions and dealer concessions on sales of the Fund’s Investor A Shares, which totaled $23,289.
For the six months ended March 31, 2016, affiliates received CDSCs as follows:
| Investor A |
$1,296 | |
| Investor B |
$ 179 | |
| Investor C |
$5,786 |
Officers and Directors
Certain officers and/or directors of the Fund are officers and/or directors of BlackRock or its affiliates. The Fund reimburses the Manager for a portion of the compensation paid to the Fund’s Chief Compliance Officer, which is included in Officer in the Statement of Operations.
5. Income Tax Information:
It is the Fund’s policy to comply with the requirements of the Internal Revenue Code of 1986, as amended, applicable to regulated investment companies, and to distribute substantially all of its taxable income to its shareholders. Therefore, no federal income tax provision is required.
The Fund files U.S. federal and various state and local tax returns. No income tax returns are currently under examination. The statute of limitations on the Fund’s U.S. federal tax returns remains open for each of the four years ended September 30, 2015. The statutes of limitations on the Fund’s state and local tax returns may remain open for an additional year depending upon the jurisdiction.
Management has analyzed tax laws and regulations and their application to the Fund as of March 31, 2016, inclusive of the open tax return years, and does not believe there are any uncertain tax positions that require recognition of a tax liability in the Fund’s financial statements.
6. Bank Borrowings:
The Fund, along with certain other funds managed by the Manager and its affiliates (“Participating Funds”), is a party to a 364-day, $2.1 billion credit agreement with a group of lenders, under which the Fund may borrow to fund shareholder redemptions. Excluding commitments designated for certain individual funds, the Participating Funds, including the Fund, can borrow up to an aggregate commitment amount of $1.6 billion at any time outstanding, subject to asset coverage and other limitations as specified in the agreement. The credit agreement has the following terms: a fee of 0.06% per annum on unused commitment amounts and interest at a rate equal to the higher of (a) one-month LIBOR (but, in any event, not less than 0.00%) on the date the loan is made plus 0.80% per annum or (b) the Fed Funds rate (but, in any event, not less than 0.00%) in effect from time to time plus
| BLACKROCK BALANCED CAPITAL FUND, INC. | MARCH 31, 2016 | 19 |
| Notes to Financial Statements (concluded) | BlackRock Balanced Capital Fund, Inc. |
0.80% per annum on amounts borrowed. The agreement expires in April 2016 unless extended or renewed. Participating Funds paid administration, legal and arrangement fees, which, if applicable, are included in miscellaneous expenses in the Statement of Operations, and along with commitment fees, were allocated among such funds based upon portions of the aggregate commitment available to them and relative net assets of Participating Funds. During the six months ended March 31, 2016, the Fund did not borrow under the credit agreement.
7. Capital Share Transactions:
Transactions in capital shares for each class were as follows:
| Six Months Ended March 31, 2016 |
Year Ended September 30, 2015 |
|||||||||||||||||
| Shares | Amount | Shares | Amount | |||||||||||||||
| Institutional |
||||||||||||||||||
| Shares sold |
1,781,933 | $ | 41,200,200 | 2,824,672 | $ | 70,713,607 | ||||||||||||
| Shares issued to shareholders in reinvestment of distributions |
562,181 | 12,958,228 | 1,582,567 | 38,187,966 | ||||||||||||||
| Shares redeemed |
(2,029,734 | ) | (47,447,344 | ) | (2,993,401 | ) | (74,150,517 | ) | ||||||||||
|
|
|
|
|
|||||||||||||||
| Net increase |
314,380 | $ | 6,711,084 | 1,413,838 | $ | 34,751,056 | ||||||||||||
|
|
|
|
|
|||||||||||||||
| Investor A |
||||||||||||||||||
| Shares sold and automatic conversion of shares |
2,040,650 | $ | 46,839,772 | 3,011,631 | $ | 73,895,968 | ||||||||||||
| Shares issued to shareholders in reinvestment of distributions |
827,323 | 19,028,351 | 2,214,522 | 53,320,829 | ||||||||||||||
| Shares redeemed |
(1,946,486 | ) | (44,494,604 | ) | (3,520,738 | ) | (86,161,203 | ) | ||||||||||
|
|
|
|
|
|||||||||||||||
| Net increase |
921,487 | $ | 21,373,519 | 1,705,415 | $ | 41,055,594 | ||||||||||||
|
|
|
|
|
|||||||||||||||
| Investor B |
||||||||||||||||||
| Shares sold |
5,110 | $ | 113,028 | 14,834 | $ | 355,476 | ||||||||||||
| Shares issued to shareholders in reinvestment of distributions |
2,206 | 49,321 | 12,134 | 284,294 | ||||||||||||||
| Shares redeemed and automatic conversion of shares |
(37,925 | ) | (846,275 | ) | (78,718 | ) | (1,891,537 | ) | ||||||||||
|
|
|
|
|
|||||||||||||||
| Net decrease |
(30,609 | ) | $ | (683,926 | ) | (51,750 | ) | $ | (1,251,767 | ) | ||||||||
|
|
|
|
|
|||||||||||||||
| Investor C |
||||||||||||||||||
| Shares sold |
1,781,337 | $ | 37,115,625 | 1,373,663 | $ | 30,657,383 | ||||||||||||
| Shares issued to shareholders in reinvestment of distributions |
204,863 | 4,240,659 | 430,767 | 9,395,517 | ||||||||||||||
| Shares redeemed |
(657,682 | ) | (13,429,420 | ) | (798,157 | ) | (17,617,743 | ) | ||||||||||
|
|
|
|
|
|||||||||||||||
| Net increase |
1,328,518 | $ | 27,926,864 | 1,006,273 | $ | 22,435,157 | ||||||||||||
|
|
|
|
|
|||||||||||||||
| Class R |
||||||||||||||||||
| Shares sold |
103,008 | $ | 2,207,088 | 204,126 | $ | 4,700,412 | ||||||||||||
| Shares issued to shareholders in reinvestment of distributions |
23,769 | 513,889 | 50,047 | 1,137,349 | ||||||||||||||
| Shares redeemed |
(152,969 | ) | (3,219,961 | ) | (150,375 | ) | (3,510,723 | ) | ||||||||||
|
|
|
|
|
|||||||||||||||
| Net increase (decrease) |
(26,192 | ) | $ | (498,984 | ) | 103,798 | $ | 2,327,038 | ||||||||||
|
|
|
|
|
|||||||||||||||
| Total Net Increase |
2,507,584 | $ | 54,828,557 | 4,177,574 | $ | 99,317,078 | ||||||||||||
|
|
|
|
|
|||||||||||||||
8. Subsequent Events:
Management’s evaluation of the impact of all subsequent events on the Fund’s financial statements was completed through the date the financial statements were issued and the following item was noted:
Effective April 21, 2016, the credit agreement was extended until April 2017. The updated agreement includes the following terms: A fee of 0.12% per annum on the unused commitment amounts and interest at a rate equal to the higher of (a) one-month LIBOR (but in any event, not less than 0.00%) on the date the loan is made plus 0.80% per annum or (b) the Fed Funds rate (but in any event, not less than 0.00%) in effect from time to time plus 0.80% per annum on amounts borrowed. The commitment amounts remain unchanged. Administration, legal and arrangement fees in connection with the amended credit agreement, and along with commitment fees, are allocated among the Participating Funds based upon portions of the aggregate commitment available to them and relative net assets of the Participating Funds.
| 20 | BLACKROCK BALANCED CAPITAL FUND, INC. | MARCH 31, 2016 |
| Portfolio Information as of March 31, 2016 (Unaudited) | Master Large Cap Core Portfolio |
| As of March 31, 2016 |
| BLACKROCK BALANCED CAPITAL FUND, INC. | MARCH 31, 2016 | 21 |
| Schedule of Investments March 31, 2016 (Unaudited) | Master Large Cap Core Portfolio | |||
| (Percentages shown are based on Net Assets) |
| Portfolio Abbreviations | ||
| ADR | American Depositary Receipts | |
| SPDR | Standard & Poor’s Depositary Receipts | |
See Notes to Financial Statements.
| 22 | BLACKROCK BALANCED CAPITAL FUND, INC. | MARCH 31, 2016 |
| Schedule of Investments (continued) | Master Large Cap Core Portfolio | |||
| Notes to Schedule of Investments |
| (a) | Non-income producing security. |
| (b) | During the six months ended March 31, 2016, investments in issuers considered to be affiliates of the Portfolio for purposes of Section 2(a)(3) of the Investment Company Act of 1940, as amended, were as follows: |
| Affiliate | Shares/Beneficial Interest Held at September 30, 2015 |
Net Activity |
Shares/Beneficial Interest Held at March 31, 2016 |
Income | Realized Gain | |||||||||||||
| BlackRock Liquidity Funds, TempFund, Institutional Class |
29,818,476 | 30,581,454 | 60,399,930 | $ | 72,532 | $500 | ||||||||||||
| BlackRock Liquidity Series, LLC, Money Market Series |
— | — | — | 7,211 | 1 | — | ||||||||||||
| Total |
$ | 79,743 | $500 | |||||||||||||||
|
|
| |||||||||||||||||
| 1 | Represents securities lending income earned from the reinvestment of cash collateral from loaned securities, net of fees and collateral investment expenses, and other payments to and from borrowers of securities. |
| (c) | Current yield as of period end. |
See Notes to Financial Statements.
| BLACKROCK BALANCED CAPITAL FUND, INC. | MARCH 31, 2016 | 23 |
| Schedule of Investments (concluded) | Master Large Cap Core Portfolio |
| • | For Portfolio compliance purposes, the Portfolio’s industry classifications refer to one or more of the industry sub-classifications used by one or more widely recognized market indexes or ratings group indexes, and/or as defined by the investment advisor. These definitions may not apply for purposes of this report, which may combine such industry sub-classifications for reporting ease. |
| Derivative Financial Instruments Categorized by Risk Exposure |
For the six months ended March 31, 2016, the effect of derivative financial instruments in the Statements of Operation was as follows:
|
Commodity Contracts |
Credit Contracts |
Equity Contracts |
Foreign Currency Exchange Contracts |
Interest Rate Contracts |
Other Contracts |
Total | ||||||||||||||||||||
| Net Realized Gain from: |
||||||||||||||||||||||||||
| Futures contracts |
— | — | $4,978,545 | — | — | — | $4,978,545 | |||||||||||||||||||
| Average Quarterly Balances of Outstanding Derivative Financial Instruments |
| Futures contracts: |
||
| Average notional value of contracts — long |
$43,343,2441 |
| 1 | Actual amounts for the six months are shown due to limited outstanding derivative financial instruments as of each quarter. |
For more information about the Portfolio’s investment risks regarding derivative financial instruments, refer to the Notes to Financial Statements.
| Fair Value Hierarchy as of Period End |
Various inputs are used in determining the fair value of investments. For information about the Portfolio’s policy regarding valuation of investments, refer to the Notes to Financial Statements.
The following table summarizes the Portfolio’s investments categorized in the disclosure hierarchy:
| Level 1 | Level 2 | Level 3 | Total | |||||||||
| Assets: |
||||||||||||
| Investments: |
||||||||||||
| Long-Term Investments: |
||||||||||||
| Common Stocks1 |
$ | 2,141,558,165 | — | — | $ | 2,141,558,165 | ||||||
| Investment Companies |
9,328,560 | — | — | 9,328,560 | ||||||||
| Short-Term Securities |
60,399,930 | — | — | 60,399,930 | ||||||||
|
|
|
|||||||||||
| Total |
$ | 2,211,286,655 | — | — | $ | 2,211,286,655 | ||||||
|
|
|
|||||||||||
| 1 | See above Schedule of Investments for values in each industry. |
During the six months ended March 31, 2016, there were no transfers between levels.
See Notes to Financial Statements.
| 24 | BLACKROCK BALANCED CAPITAL FUND, INC. | MARCH 31, 2016 |
| Statement of Assets and Liabilities | Master Large Cap Core Portfolio |
| March 31, 2016 (Unaudited) | ||||
| Assets | ||||
| Investments at value — unaffiliated (cost — $1,691,944,526) |
$ | 2,150,886,725 | ||
| Investments at value — affiliated (cost — $60,399,930) |
60,399,930 | |||
| Receivables: |
||||
| Investments sold |
9,597,152 | |||
| Contributions from investors |
1,712,583 | |||
| Dividends — affiliated |
25,950 | |||
| Dividends — unaffiliated |
2,572,942 | |||
| Prepaid expenses |
6,887 | |||
|
|
|
|||
| Total assets |
2,225,202,169 | |||
|
|
|
|||
| Liabilities | ||||
| Payables: |
||||
| Directors’ fees |
15,726 | |||
| Investment advisory fees |
868,843 | |||
| Other accrued expenses |
94,510 | |||
| Other affiliates |
6,429 | |||
| Withdrawals to investors |
30,384,773 | |||
|
|
|
|||
| Total liabilities |
31,370,281 | |||
|
|
|
|||
| Net Assets |
$ | 2,193,831,888 | ||
|
|
|
|||
| Net Assets Consist of | ||||
| Investors’ capital |
$ | 1,734,889,689 | ||
| Net unrealized appreciation (depreciation) |
458,942,199 | |||
|
|
|
|||
| Net Assets |
$ | 2,193,831,888 | ||
|
|
|
|||
See Notes to Financial Statements.
| BLACKROCK BALANCED CAPITAL FUND, INC. | MARCH 31, 2016 | 25 |
| Statement of Operations | Master Large Cap Core Portfolio |
| Six Months Ended March 31, 2016 (Unaudited) | ||||
| Investment Income | ||||
| Dividends — affiliated |
$ | 72,532 | ||
| Dividends — unaffiliated |
18,289,675 | |||
| Securities lending — affiliated — net |
7,211 | |||
| Foreign taxes withheld |
(123,872 | ) | ||
|
|
|
|||
| Total income |
18,245,546 | |||
|
|
|
|||
| Expenses | ||||
| Investment advisory |
5,199,456 | |||
| Accounting services |
196,851 | |||
| Directors |
32,094 | |||
| Professional |
31,779 | |||
| Custodian |
31,511 | |||
| Printing |
1,286 | |||
| Miscellaneous |
16,231 | |||
|
|
|
|||
| Total expenses |
5,509,208 | |||
| Less fees waived by the Manager |
(17,182 | ) | ||
|
|
|
|||
| Total expenses after fees waived |
5,492,026 | |||
|
|
|
|||
| Net investment income |
12,753,520 | |||
|
|
|
|||
| Realized and Unrealized Gain (Loss) | ||||
| Net realized gain from: |
||||
| Capital gain distributions received from affiliated investment companies |
500 | |||
| Futures contracts |
4,978,545 | |||
| Investments |
19,959,836 | |||
|
|
|
|||
| 24,938,881 | ||||
|
|
|
|||
| Net change in unrealized appreciation (depreciation) on investments |
78,434,312 | |||
|
|
|
|||
| Total realized and unrealized gain |
103,373,193 | |||
|
|
|
|||
| Net Increase in Net Assets Resulting from Operations |
$ | 116,126,713 | ||
|
|
|
|||
See Notes to Financial Statements.
| 26 | BLACKROCK BALANCED CAPITAL FUND, INC. | MARCH 31, 2016 |
| Statements of Changes in Net Assets | Master Large Cap Core Portfolio |
| Increase (Decrease) in Net Assets: | Six Months Ended March 31, 2016 (Unaudited) |
Year Ended September 30, 2015 |
||||||
| Operations | ||||||||
| Net investment income |
$ | 12,753,520 | $ | 25,910,700 | ||||
| Net realized gain |
24,938,881 | 143,142,291 | ||||||
| Net change in unrealized appreciation (depreciation) |
78,434,312 | (174,949,314 | ) | |||||
|
|
|
|||||||
| Net increase (decrease) in net assets resulting from operations |
116,126,713 | (5,896,323 | ) | |||||
|
|
|
|||||||
| Capital Transactions | ||||||||
| Proceeds from contributions |
143,822,542 | 241,299,172 | ||||||
| Value of withdrawals |
(219,448,528 | ) | (417,574,858 | ) | ||||
|
|
|
|||||||
| Net decrease in net assets derived from capital transactions |
(75,625,986 | ) | (176,275,686 | ) | ||||
|
|
|
|||||||
| Net Assets | ||||||||
| Total increase (decrease) in net assets |
40,500,727 | (182,172,009 | ) | |||||
| Beginning of period |
2,153,331,161 | 2,335,503,170 | ||||||
|
|
|
|||||||
| End of period |
$ | 2,193,831,888 | $ | 2,153,331,161 | ||||
|
|
|
|||||||
See Notes to Financial Statements.
| BLACKROCK BALANCED CAPITAL FUND, INC. | MARCH 31, 2016 | 27 |
| Financial Highlights | Master Large Cap Core Portfolio |
| Master Large Cap Core Portfolio | ||||||||||||||||||||||||
| Six Months Ended March 31, 2016 |
Year Ended September 30, | |||||||||||||||||||||||
| (Unaudited) | 2015 | 2014 | 2013 | 2012 | 2011 | |||||||||||||||||||
| Total Return | ||||||||||||||||||||||||
| Total return |
5.22 | %1 | (0.89 | )% | 19.44 | % | 20.39 | % | 29.97 | % | (1.61)% | |||||||||||||
|
|
|
|||||||||||||||||||||||
| Ratios to Average Net Assets | ||||||||||||||||||||||||
| Total expenses |
0.50 | %2 | 0.50 | % | 0.50 | % | 0.50 | % | 0.50 | % | 0.49% | |||||||||||||
|
|
|
|||||||||||||||||||||||
| Total expenses after fees waived |
0.50 | %2 | 0.50 | % | 0.50 | % | 0.50 | % | 0.50 | % | 0.49% | |||||||||||||
|
|
|
|||||||||||||||||||||||
| Net investment income |
1.16 | %2 | 1.09 | % | 1.08 | % | 1.29 | % | 1.67 | % | 1.13% | |||||||||||||
|
|
|
|||||||||||||||||||||||
| Supplemental Data | ||||||||||||||||||||||||
| Net assets, end of period (000) |
$2,193,832 | $ | 2,153,331 | $ | 2,335,503 | $ | 2,308,896 | $ | 2,318,851 | $ | 2,306,714 | |||||||||||||
|
|
|
|||||||||||||||||||||||
| Portfolio turnover rate |
19 | % | 41 | % | 40 | % | 50 | % | 128 | % | 129% | |||||||||||||
|
|
|
|||||||||||||||||||||||
| 1 | Aggregate total return. |
| 2 | Annualized. |
See Notes to Financial Statements.
| 28 | BLACKROCK BALANCED CAPITAL FUND, INC. | MARCH 31, 2016 |
| Notes to Financial Statements (Unaudited) | Master Large Cap Core Portfolio |
1. Organization:
Master Large Cap Core Portfolio (the “Portfolio”) is a series of Master Large Cap Series LLC (the “Master LLC”). The Master LLC is registered under the Investment Company Act of 1940, as amended (the “1940 Act”), as an open-end management investment company and is organized as a Delaware limited liability company. The Portfolio is classified as diversified. The Limited Liability Company Agreement of the Master LLC permits the Board of Directors of the Master LLC (the “Board”) to issue non-transferable interests in the Master LLC, subject to certain limitations.
The Portfolio, together with certain other registered investment companies advised by BlackRock Advisors, LLC (the “Manager”) or its affiliates, is included in a complex of open-end funds referred to as the Equity-Liquidity Complex.
2. Significant Accounting Policies:
The financial statements are prepared in conformity with accounting principles generally accepted in the United States of America (“U.S. GAAP”), which may require management to make estimates and assumptions that affect the reported amounts of assets and liabilities in the financial statements, disclosure of contingent assets and liabilities at the date of the financial statements and the reported amounts of increases and decreases in net assets from operations during the reporting period. Actual results could differ from those estimates. The Portfolio is considered an investment company under U.S. GAAP and follows the accounting and reporting guidance applicable to investment companies. Below is a summary of significant accounting policies:
Segregation and Collateralization: In cases where the Portfolio enters into certain investments (e.g., futures contracts) that would be treated as “senior securities” for 1940 Act purposes, the Portfolio may segregate or designate on its books and records cash or liquid assets having a market value at least equal to the amount of their future obligations under such investments or borrowings. Doing so allows the investment to be excluded from treatment as a “senior security.” Furthermore, if required by an exchange or counterparty agreement, the Portfolio may be required to deliver/deposit cash and/or securities to/with an exchange, or broker-dealer or custodian as collateral for certain investments or obligations.
Investment Transactions and Investment Income: For financial reporting purposes, investment transactions are recorded on the dates the transactions are entered into (the trade dates). Realized gains and losses on investment transactions are determined on the identified cost basis. Dividend income is recorded on the ex-dividend date. Dividends from foreign securities where the ex-dividend date may have passed are subsequently recorded when the Portfolio is informed of the ex-dividend date. Under the applicable foreign tax laws, a withholding tax at various rates may be imposed on capital gains, dividends and interest. Upon notification from issuers, some of the dividend income received from a real estate investment trust may be redesignated as a reduction of cost of the related investment and/or realized gain.
Indemnifications: In the normal course of business, the Portfolio enters into contracts that contain a variety of representations that provide general indemnification. The Portfolio’s maximum exposure under these arrangements is unknown because it involves future potential claims against the Portfolio, which cannot be predicted with any certainty.
Other: Expenses directly related to the Portfolio are charged to the Portfolio. Other operating expenses shared by several funds, including other funds managed by the Manager, are prorated among those funds on the basis of relative net assets or other appropriate methods.
The Portfolio has an arrangement with its custodian whereby fees may be reduced by credits earned on uninvested cash balances, which, if applicable, are shown as fees paid indirectly in the Statement of Operations. The custodian imposes fees on overdrawn cash balances, which can be offset by accumulated credits earned or may result in additional custody charges.
3. Investment Valuation and Fair Value Measurements:
Investment Valuation Policies: The Portfolio’s investments are valued at fair value (also referred to as “market value” within the financial statements) as of the close of trading on the New York Stock Exchange (“NYSE”) (generally 4:00 p.m., Eastern time). U.S. GAAP defines fair value as the price the Portfolio would receive to sell an asset or pay to transfer a liability in an orderly transaction between market participants at the measurement date. The Portfolio determines the fair values of its financial instruments using independent dealers or pricing services under policies approved by the Board. The BlackRock Global Valuation Methodologies Committee (the “Global Valuation Committee”) is the committee formed by management to develop global pricing policies and procedures and to provide oversight of the pricing function for the Portfolio for all financial instruments.
Fair Value Inputs and Methodologies: The following methods (or “techniques”) and inputs are used to establish the fair value of the Portfolio’s assets and liabilities:
| • | Equity investments traded on a recognized securities exchange are valued at the official close price each day, if available. For equity investments traded on more than one exchange, the official close price on the exchange where the stock is primarily traded is used. Equity investments traded on a recognized exchange for which there were no sales on that day may be valued at the last available bid (long positions) or ask (short positions) price. |
| BLACKROCK BALANCED CAPITAL FUND, INC. | MARCH 31, 2016 | 29 |
| Notes to Financial Statements (continued) | Master Large Cap Core Portfolio |
| • | Investments in open-end U.S. mutual funds are valued at NAV each business day. |
| • | The Portfolio values its investment in BlackRock Liquidity Series, LLC, Money Market Series (the “Money Market Series”) at fair value, which is ordinarily based upon its pro rata ownership in the underlying fund’s net assets. The Money Market Series seeks current income consistent with maintaining liquidity and preserving capital. Although the Money Market Series is not registered under the 1940 Act, its investments will follow the parameters of investments by a money market fund that is subject to Rule 2a-7 under the 1940 Act. The Portfolio may withdraw up to 25% of its investment daily, although the manager of the Money Market Series, in its sole discretion, may permit an investor to withdraw more than 25% on any one day. |
| • | Futures contracts traded on exchanges are valued at their last sale price. |
If events (e.g., a company announcement, market volatility or a natural disaster) occur that are expected to materially affect the value of such instruments, or in the event that the application of these methods of valuation results in a price for an investment that is deemed not to be representative of the market value of such investment, or if a price is not available, the investment will be valued by the Global Valuation Committee, or its delegate, in accordance with a policy approved by the Board as reflecting fair value (“Fair Valued Investments”). When determining the price for Fair Valued Investments, the Global Valuation Committee, or its delegate, seeks to determine the price that the Portfolio might reasonably expect to receive or pay from the current sale or purchase of that asset or liability in an arm’s-length transaction. Fair value determinations shall be based upon all available factors that the Global Valuation Committee, or its delegate, deems relevant consistent with the principles of fair value measurement. The pricing of all Fair Valued Investments is subsequently reported to the Board or a committee thereof on a quarterly basis.
Fair Value Hierarchy: Various inputs are used in determining the fair value of investments and derivative financial instruments. These inputs to valuation techniques are categorized into a fair value hierarchy consisting of three broad levels for financial statement purposes as follows:
| • | Level 1 — unadjusted price quotations in active markets/exchanges for identical assets or liabilities that the Portfolio has the ability to access |
| • | Level 2 — other observable inputs (including, but not limited to, quoted prices for similar assets or liabilities in markets that are active, quoted prices for identical or similar assets or liabilities in markets that are not active, inputs other than quoted prices that are observable for the assets or liabilities (such as interest rates, yield curves, volatilities, prepayment speeds, loss severities, credit risks and default rates) or other market-corroborated inputs) |
| • | Level 3 — unobservable inputs based on the best information available in the circumstances, to the extent observable inputs are not available (including the Portfolio’s own assumptions used in determining the fair value of instruments and derivative financial instruments) |
The hierarchy gives the highest priority to unadjusted quoted prices in active markets for identical assets or liabilities (Level 1 measurements) and the lowest priority to unobservable inputs (Level 3 measurements). Accordingly, the degree of judgment exercised in determining fair value is greatest for instruments categorized in Level 3. The inputs used to measure fair value may fall into different levels of the fair value hierarchy. In such cases, for disclosure purposes, the fair value hierarchy classification is determined based on the lowest level input that is significant to the fair value measurement in its entirety. The significant unobservable inputs used by the Global Valuation Committee in determining the price for Fair Valued Investments are typically categorized as Level 3. The fair value hierarchy for the Portfolio’s investments and derivative financial instruments has been included in the Schedule of Investments.
Changes in valuation techniques may result in transfers into or out of an assigned level within the hierarchy. In accordance with the Portfolio’s policy, transfers between different levels of the fair value hierarchy are deemed to have occurred as of the beginning of the reporting period. The categorization of a value determined for investments and derivative financial instruments is based on the pricing transparency of the investment and is not necessarily an indication of the risks associated with investing in those securities.
4. Securities and Other Investments:
Securities Lending: The Portfolio may lend its securities to approved borrowers, such as brokers, dealers and other financial institutions. The borrower pledges and maintains with the Portfolio collateral consisting of cash, an irrevocable letter of credit issued by a bank, or securities issued or guaranteed by the U.S. Government. The initial collateral received by the Portfolio is required to have a value of at least 102% of the current value of the loaned securities for securities traded on U.S. exchanges and a value of at least 105% for all other securities. The collateral is maintained thereafter, at a value equal to at least 100% of the current market value of the securities on loan. The market value of the loaned securities is determined at the close of each business day of the Portfolio and any additional required collateral is delivered to the Portfolio, or excess collateral returned by the Portfolio, on the next business day. During the term of the loan, the Portfolio is entitled to all distributions made on or in respect of the loaned securities. Loans of securities are terminable at any time and the borrower, after notice, is required to return borrowed securities within the standard time period for settlement of securities transactions.
| 30 | BLACKROCK BALANCED CAPITAL FUND, INC. | MARCH 31, 2016 |
| Notes to Financial Statements (continued) | Master Large Cap Core Portfolio |
The market value of securities on loan, all of which were classified as common stocks in the Portfolio’s Schedule of Investments, and the value of the related collateral are shown separately in the Statement of Assets and Liabilities as a component of investments at value — unaffiliated, and collateral on securities loaned at value, respectively. As of period end, any securities on loan were collateralized by cash. The cash collateral invested by the securities lending agent, BlackRock Investment Management, LLC (“BIM”), if any, is disclosed in the Schedule of Investments.
Securities lending transactions are entered into by the Portfolio under Master Securities Lending Agreements (each, an “MSLA”), which provide the right, in the event of default (including bankruptcy or insolvency), for the non-defaulting party to liquidate the collateral and calculate a net exposure to the defaulting party or request additional collateral. In the event that a borrower defaults, the Portfolio, as lender, would offset the market value of the collateral received against the market value of the securities loaned. When the value of the collateral is greater than that of the market value of the securities loaned, the lender is left with a net amount payable to the defaulting party. However, bankruptcy or insolvency laws of a particular jurisdiction may impose restrictions on or prohibitions against such a right of offset in the event of an MSLA counterparty’s bankruptcy or insolvency. Under the MSLA, absent an event of default the borrower can resell or re-pledge the loaned securities, and the Portfolio can reinvest cash collateral received in connection with loaned securities. Upon an event of default, the parties’ obligations to return the securities or collateral to the other party are extinguished, and the parties can resell or re-pledge the loaned securities or the collateral received in connection with the loaned securities in order to satisfy the defaulting party’s net payment obligation for all transactions under the MSLA. The defaulting party remains liable for any deficiency.
The risks of securities lending include the risk that the borrower may not provide additional collateral when required or may not return the securities when due. To mitigate these risks, the Portfolios benefit from a borrower default indemnity provided by BIM. BIM’s indemnity allows for full replacement of the securities loaned if the collateral received does not cover the value on the securities loaned in the event of borrower default. Each Portfolio could suffer a loss if the value of an investment purchased with cash collateral falls below the market value of loaned securities or if the value of an investment purchased with cash collateral falls below the value of the original cash collateral received.
5. Derivative Financial Instruments:
The Portfolio engages in various portfolio investment strategies using derivative contracts both to increase the returns of the Portfolio and/or to manage its exposure to certain risks such as credit risk, equity risk, interest rate risk, foreign currency exchange rate risk, commodity price risk or other risks (e.g., inflation risk). Derivative financial instruments categorized by risk exposure are included in the Schedule of Investments. These contracts may be transacted on an exchange or over-the-counter (“OTC”).
Futures Contracts: The Portfolio may invest in long and/or short positions in futures contracts and options on futures to gain exposure to, or manage exposure to, changes in interest rates (interest rate risk), changes in the value of equity securities (equity risk) or foreign currencies (foreign currency exchange rate risk).
Futures contracts are agreements between the Portfolio and a counterparty to buy or sell a specific quantity of an underlying instrument at a specified price and on specified date. Depending on the terms of a contract, it is settled either through physical delivery of the underlying instrument on the settlement date or by payment of a cash amount on the settlement date.
Upon entering into a futures contract, the Portfolio is required to deposit initial margin with the broker in the form of cash or securities in an amount that varies depending on a contract’s size and risk profile. The initial margin deposit must then be maintained at an established level over the life of the contract.
Securities deposited as initial margin are designated in the Schedule of Investments and cash deposited, if any, is shown as cash pledged for futures contracts in the Statement of Assets and Liabilities. Pursuant to the contract, the Portfolio agrees to receive from or pay to the broker an amount of cash equal to the daily fluctuation in market value of the contract (“variation margin”). Variation margin is recorded as unrealized appreciation (depreciation) and, if any, shown as variation margin receivable (or payable) on futures contracts in the Statement of Assets and Liabilities. When the contract is closed, a realized gain or loss is recorded in the Statement of Operations equal to the difference between the value of the contract at the time it was opened and the value at the time it was closed. The use of futures contracts involves the risk of an imperfect correlation in the movements in the price of futures contracts, and interest, foreign currency exchange rates or underlying assets.
6. Investment Advisory Agreement and Other Transactions with Affiliates:
The PNC Financial Services Group, Inc. is the largest stockholder and an affiliate of BlackRock, Inc. (“BlackRock”) for 1940 Act purposes.
Investment Advisory
The Master LLC, on behalf of the Portfolio, entered into an Investment Advisory Agreement with the Manager, the Portfolio’s investment advisor, an indirect, wholly owned subsidiary of BlackRock, to provide investment advisory and administration services. The Manager is responsible for the management of the Portfolio and provides the personnel, facilities, equipment and certain other services necessary to the operations of the Portfolio.
| BLACKROCK BALANCED CAPITAL FUND, INC. | MARCH 31, 2016 | 31 |
| Notes to Financial Statements (continued) | Master Large Cap Core Portfolio |
For such services, the Portfolio pays the Manager a monthly fee based on a percentage of the Portfolio’s average daily net assets at the following annual rates:
| Average Daily Net Assets | Investment
Advisory Fee | |
| Not exceeding $1 Billion |
0.50% | |
| In excess of $1 Billion, but not exceeding $5 Billion |
0.45% | |
| In excess of $5 Billion |
0.40% |
Expense Limitations, Waivers and Reimbursements
The Manager voluntarily agreed to waive its investment advisory fees by the amount of investment advisory fees the Portfolio pays to the Manager indirectly through its investment in affiliated money market funds. This amount is shown as fees waived by the Manager in the Statement of Operations. However, the Manager does not waive its investment advisory fees by the amount of investment advisory fees paid in connection with the Portfolio’s investment in other affiliated investment companies, if any.
For the six months ended March 31, 2016, the Portfolio reimbursed the Manager $12,241 for certain accounting services, which is included in accounting services in the Statement of Operations.
Securities Lending
The U.S. Securities and Exchange Commission has issued an exemptive order which permits BIM, an affiliate of the Manager, to serve as securities lending agent for the Portfolio, subject to applicable conditions. As securities lending agent, BIM bears all operational costs directly related to securities lending. The Portfolio is responsible for expenses in connection with the investment of cash collateral received for securities on loan (the “collateral investment expenses”). The cash collateral is invested in a private investment company managed by the Manager or its affiliates. However, BIM has agreed to cap the collateral investment expenses of the private investment company to an annual rate of 0.04%. The investment advisor to the private investment company will not charge any advisory fees with respect to shares purchased by the Portfolio.
Securities lending income is equal to the total of income earned from the reinvestment of cash collateral, net of fees and other payments to and from borrowers of securities, and less the collateral investment expenses. The Portfolio retains a portion of securities lending income and remits a remaining portion to BIM as compensation for its services as securities lending agent. Pursuant to a securities lending agreement, BIM may lend securities only when the difference between the borrower rebate rate and the risk free rate exceeds a certain level (such securities, the “specials only securities”).
Pursuant to such agreement, the Portfolio retains 80% of securities lending income. In addition, commencing the business day following the date that the aggregate securities lending income earned across certain funds in the Equity-Liquidity Complex in a calendar year exceeds a specified threshold, the Portfolio, pursuant to the securities lending agreement, will retain for the remainder of the calendar year securities lending income in an amount equal to 85% of securities lending income.
The share of securities lending income earned by the Portfolio is shown as securities lending — affiliated — net in the Statement of Operations. For the six months ended March 31, 2016, the Portfolio paid BIM $1,781 for securities lending agent services.
Officers and Directors
Certain officers and/or directors of the Master LLC are officers and/or directors of BlackRock or its affiliates.
7. Purchases and Sales:
Purchases and sales of investments, excluding short-term securities, for the six months ended March 31, 2016, were $419,588,493 and $487,283,065, respectively.
8. Income Tax Information
The Portfolio is classified as a partnership for federal income tax purposes. As such, each investor in the Portfolio is treated as the owner of its proportionate share of net assets, income, expenses and realized and unrealized gains and losses of the Portfolio. Therefore, no federal income tax provision is required. It is intended that the Portfolio’s assets will be managed so an investor in the Portfolio can satisfy the requirements of Subchapter M of the Internal Revenue Code of 1986, as amended.
The Portfolio files U.S. federal and various state and local tax returns. No income tax returns are currently under examination. The statute of limitations on the Portfolio’s U.S. federal tax returns remains open for each of the four years ended September 30, 2015. The statutes of limitations on the Portfolio’s state and local tax returns may remain open for an additional year depending upon the jurisdiction.
| 32 | BLACKROCK BALANCED CAPITAL FUND, INC. | MARCH 31, 2016 |
| Notes to Financial Statements (continued) | Master Large Cap Core Portfolio |
Management has analyzed tax laws and regulations and their application to the Portfolio as of March 31, 2016, inclusive of the open tax return years, and does not believe that there are any uncertain tax positions that require recognition of a tax liability in the Portfolio’s financial statements.
As of March 31, 2016, gross unrealized appreciation and depreciation based on cost for federal income tax purposes were as follows:
| Tax cost |
$ | 1,756,374,524 | ||
|
|
|
|||
| Gross unrealized appreciation |
$ | 495,737,843 | ||
| Gross unrealized depreciation |
(40,825,712 | ) | ||
|
|
|
|||
| Net unrealized appreciation |
$ | 454,912,131 |
9. Bank Borrowings:
The Master LLC, on behalf of the Portfolio, along with certain other funds managed by the Manager and its affiliates (“Participating Funds”), is a party to a 364-day, $2.1 billion credit agreement with a group of lenders, under which the Portfolio may borrow to fund shareholder redemptions. Excluding commitments designated for certain individual funds, the Participating Funds, including the Portfolio, can borrow up to an aggregate commitment amount of $1.6 billion at any time outstanding, subject to asset coverage and other limitations as specified in the agreement. The credit agreement has the following terms: a fee of 0.06% per annum on unused commitment amounts and interest at a rate equal to the higher of (a) one-month LIBOR (but, in any event, not less than 0.00%) on the date the loan is made plus 0.80% per annum or (b) the Fed Funds rate (but, in any event, not less than 0.00%) in effect from time to time plus 0.80% per annum on amounts borrowed. The agreement expires in April 2016 unless extended or renewed. Participating Funds paid administration, legal and arrangement fees, which, if applicable, are included in miscellaneous expenses in the Statement of Operations, and along with commitment fees, were allocated among such funds based upon portions of the aggregate commitment available to them and relative net assets of Participating Funds. During the six months ended March 31, 2016, the Portfolio did not borrow under the credit agreement.
10. Principal Risks:
In the normal course of business, the Portfolio invests in securities and enters into transactions where risks exist due to fluctuations in the market (market risk) or failure of the issuer to meet all its obligations, including the ability to pay principal and interest when due (issuer credit risk). The value of securities held by the Portfolio may decline in response to certain events, including those directly involving the issuers of securities owned by the Portfolio. Changes arising from the general economy, the overall market and local, regional or global political and/or social instability, as well as currency, interest rate and price fluctuations, may also affect the securities’ value.
Counterparty Credit Risk: Similar to issuer credit risk, the Portfolio may be exposed to counterparty credit risk, or the risk that an entity may fail to or be unable to perform on its commitments related to unsettled or open transactions. The Portfolio manages counterparty credit risk by entering into transactions only with counterparties that the Manager believes have the financial resources to honor their obligations and by monitoring the financial stability of those counterparties. Financial assets, which potentially expose the Portfolio to market, issuer and counterparty credit risks, consist principally of financial instruments and receivables due from counterparties. The extent of the Portfolio’s exposure to market, issuer and counterparty credit risks with respect to these financial assets is approximately their value recorded in the Statement of Assets and Liabilities, less any collateral held by the Portfolio.
A derivative contract may suffer a mark-to-market loss if the value of the contract decreases due to an unfavorable change in the market rates or values of the underlying instrument. Losses can also occur if the counterparty does not perform under the contract.
With futures, there is less counterparty credit risk to the Portfolio since the exchange or clearinghouse, as counterparty to such instruments, guarantees against a possible default. The clearinghouse stands between the buyer and the seller of the contract; therefore, credit risk is limited to failure of the clearinghouse. While offset rights may exist under applicable law, the Portfolio does not have a contractual right of offset against a clearing broker or clearinghouse in the event of a default (including the bankruptcy or insolvency). Additionally, credit risk exists in exchange-traded futures with respect to initial and variation margin that is held in a clearing broker’s customer accounts. While clearing brokers are required to segregate customer margin from their own assets, in the event that a clearing broker becomes insolvent or goes into bankruptcy and at that time there is a shortfall in the aggregate amount of margin held by the clearing broker for all its clients, typically the shortfall would be allocated on a pro rata basis across all the clearing broker’s customers, potentially resulting in losses to the Portfolio.
Concentration Risk: As of period end, the Portfolio invested a significant portion of its assets in securities in the information technology sector. Changes in economic conditions affecting such sector would have a greater impact on the Portfolio and could affect the value, income and/or liquidity of positions in such securities.
| BLACKROCK BALANCED CAPITAL FUND, INC. | MARCH 31, 2016 | 33 |
| Notes to Financial Statements (concluded) | Master Large Cap Core Portfolio |
11. Subsequent Events:
Management’s evaluation of the impact of all subsequent events on the Master LLC’s financial statements was completed through the date the financial statements were issued and the following items were noted:
Effective April 21, 2016, the credit agreement was extended until April 2017. The updated agreement includes the following terms: A fee of 0.12% per annum on the unused commitment amounts and interest at a rate equal to the higher of (a) one-month LIBOR (but in any event, not less than 0.00%) on the date the loan is made plus 0.80% per annum or (b) the Fed Funds rate (but in any event, not less than 0.00%) in effect from time to time plus 0.80% per annum on amounts borrowed. The commitment amounts remain unchanged. Administration, legal and arrangement fees in connection with the amended credit agreement, and along with commitment fees, are allocated among the Participating Funds based upon portions of the aggregate commitment available to them and relative net assets of the Participating Funds.
| 34 | BLACKROCK BALANCED CAPITAL FUND, INC. | MARCH 31, 2016 |
| Officers and Directors of Master Large Cap Series LLC |
Rodney D. Johnson, Chair of the Board and Director
David O. Beim, Director
Susan J. Carter, Director
Collette Chilton, Director
Neil A. Cotty, Director
Dr. Matina S. Horner, Director
Cynthia A. Montgomery, Director
Barbara G. Novick, Director
Joseph P. Platt, Director
Robert C. Robb, Jr., Director
Mark Stalnecker, Director
Kenneth L. Urish, Director
Claire A. Walton, Director
Frederick W. Winter, Director
John M. Perlowski, Director, President and Chief Executive Officer
Jennifer McGovern, Vice President
Neal J. Andrews, Chief Financial Officer
Jay M. Fife, Treasurer
Charles Park, Chief Compliance Officer
Fernanda Piedra, Anti-Money Laundering Compliance Officer
Benjamin Archibald, Secretary
Effective December 31, 2015, Herbert I. London and Toby Rosenblatt retired as Directors of the Master LLC.
Effective February 5, 2016, Frank J. Fabozzi resigned as a Director of the Master LLC.
Effective February 8, 2016, Susan J. Carter, Neil A. Cotty and Claire A. Walton were elected to serve as Directors of the Master LLC.
| Investment Advisor BlackRock Advisors, LLC Wilmington, DE 19809 |
Accounting Agent and Transfer Agent BNY Mellon Investment Servicing (U.S.) Inc. Wilmington, DE 19809 |
Custodian Brown Brothers Harriman & Co. Boston, MA 02109 |
Address of the Master LLC 100 Bellevue Parkway Wilmington, DE 19809 | |||
| Legal Counsel Sidley Austin LLP New York, NY 10019 |
Independent Registered Public Accounting Firm Deloitte & Touche LLP Philadelphia, PA 19103 |
Distributor BlackRock Investments, LLC New York, NY 10022 |
||||
| BLACKROCK BALANCED CAPITAL FUND, INC. | MARCH 31, 2016 | 35 |
| Master Portfolio Information | Master Total Return Portfolio |
| As of March 31, 2016 |
| 36 | BLACKROCK BALANCED CAPITAL FUND, INC. | MARCH 31, 2016 |
| Consolidated Schedule of Investments March 31, 2016 (Unaudited) | Master Total Return Portfolio | |||
| (Percentages shown are based on Net Assets) |
| Portfolio Abbreviations | ||||||||||
| ABS | Asset-Backed Security | COP | Columbian Peso | OTC | Over-the-counter | |||||
| ADR | American Depositary Receipt | DKK | Danish Krone | PIK | Payment-in-kind | |||||
| AKA | Also Known As | ETF | Exchange-Traded Fund | PLN | Polish Zloty | |||||
| AMBAC | American Municipal Bond Assurance Corporation | EUR | Euro | RB | Revenue Bonds | |||||
| AGM | Assured Guaranty Municipal Corp. | EURIBOR | Euro Interbank Offered Rate | REMIC | Real Estate Mortgage Investment Conduit | |||||
| AUD | Australian Dollar | FKA | Formerly Known As | RUB | Russian Ruble | |||||
| BRL | Brazilian Real | GBP | British Pound | S&P | Standard & Poor’s | |||||
| BZDIOVER | Overnight Brazil CETIP - Interbank Rate | GO | General Obligation | SAR | Saudi Arabian Riyal | |||||
| CAD | Canadian Dollar | HKD | Hong Kong Dollar | SGD | Singapore Dollar | |||||
| CDO | Collateralized Debt Obligation | IDR | Indonesian Rupiah | TBA | To-be-announced | |||||
| CHF | Swiss Franc | INR | Indian Rupee | TRY | Turkish Lira | |||||
| CLO | Collateralized Loan Obligation | JPY | Japanese Yen | TWD | Taiwan New Dollar | |||||
| CLP | Chilean Peso | KRW | South Korean Won | USD | U.S. Dollar | |||||
| CNH | Chinese Yuan Offshore | LIBOR | London Interbank Offered Rate | WIBOR | Warsaw Interbank Offered Rate | |||||
| CNY | Chinese Yuan | MXIBTIIE | Mexico Interbank TIIE 28-Day Rate | ZAR | South African Rand | |||||
| COOIS | Colombia Overnight Interbank Reference Rate | MXN | Mexican Peso | |||||||
See Notes to Consolidated Financial Statements.
| BLACKROCK BALANCED CAPITAL FUND, INC. | MARCH 31, 2016 | 37 |
| Consolidated Schedule of Investments (continued) | Master Total Return Portfolio | |||
See Notes to Consolidated Financial Statements.
| 38 | BLACKROCK BALANCED CAPITAL FUND, INC. | MARCH 31, 2016 |
| Consolidated Schedule of Investments (continued) | Master Total Return Portfolio | |||
See Notes to Consolidated Financial Statements.
| BLACKROCK BALANCED CAPITAL FUND, INC. | MARCH 31, 2016 | 39 |
| Consolidated Schedule of Investments (continued) | Master Total Return Portfolio | |
See Notes to Consolidated Financial Statements.
| 40 | BLACKROCK BALANCED CAPITAL FUND, INC. | MARCH 31, 2016 |
| Consolidated Schedule of Investments (continued) | Master Total Return Portfolio | |||
See Notes to Consolidated Financial Statements.
| BLACKROCK BALANCED CAPITAL FUND, INC. | MARCH 31, 2016 | 41 |
| Consolidated Schedule of Investments (continued) | Master Total Return Portfolio | |||
See Notes to Consolidated Financial Statements.
| 42 | BLACKROCK BALANCED CAPITAL FUND, INC. | MARCH 31, 2016 |
| Consolidated Schedule of Investments (continued) | Master Total Return Portfolio | |||
See Notes to Consolidated Financial Statements.
| BLACKROCK BALANCED CAPITAL FUND, INC. | MARCH 31, 2016 | 43 |
| Consolidated Schedule of Investments (continued) | Master Total Return Portfolio | |||
See Notes to Financial Statements.
| 44 | BLACKROCK BALANCED CAPITAL FUND, INC. | MARCH 31, 2016 |
| Consolidated Schedule of Investments (continued) | Master Total Return Portfolio | |||
See Notes to Financial Statements.
| BLACKROCK BALANCED CAPITAL FUND, INC. | MARCH 31, 2016 | 45 |
| Consolidated Schedule of Investments (continued) | Master Total Return Portfolio | |||
See Notes to Financial Statements.
| 46 | BLACKROCK BALANCED CAPITAL FUND, INC. | MARCH 31, 2016 |
| Consolidated Schedule of Investments (continued) | Master Total Return Portfolio | |||
See Notes to Consolidated Financial Statements.
| BLACKROCK BALANCED CAPITAL FUND, INC. | MARCH 31, 2016 | 47 |
| Consolidated Schedule of Investments (continued) | Master Total Return Portfolio | |||
See Notes to Consolidated Financial Statements.
| 48 | BLACKROCK BALANCED CAPITAL FUND, INC. | MARCH 31, 2016 |
| Consolidated Schedule of Investments (continued) | Master Total Return Portfolio | |||
See Notes to Consolidated Financial Statements.
| BLACKROCK BALANCED CAPITAL FUND, INC. | MARCH 31, 2016 | 49 |
| Consolidated Schedule of Investments (continued) | Master Total Return Portfolio | |||
See Notes to Consolidated Financial Statements.
| 50 | BLACKROCK BALANCED CAPITAL FUND, INC. | MARCH 31, 2016 |
| Consolidated Schedule of Investments (continued) | Master Total Return Portfolio | |||
See Notes to Consolidated Financial Statements.
| BLACKROCK BALANCED CAPITAL FUND, INC. | MARCH 31, 2016 | 51 |
| Consolidated Schedule of Investments (continued) | Master Total Return Portfolio | |||
See Notes to Consolidated Financial Statements.
| 52 | BLACKROCK BALANCED CAPITAL FUND, INC. | MARCH 31, 2016 |
| Consolidated Schedule of Investments (continued) | Master Total Return Portfolio | |||
See Notes to Consolidated Financial Statements.
| BLACKROCK BALANCED CAPITAL FUND, INC. | MARCH 31, 2016 | 53 |
| Consolidated Schedule of Investments (continued) | Master Total Return Portfolio | |||
See Notes to Consolidated Financial Statements.
| 54 | BLACKROCK BALANCED CAPITAL FUND, INC. | MARCH 31, 2016 |
| Consolidated Schedule of Investments (continued) | Master Total Return Portfolio | |||
See Notes to Consolidated Financial Statements.
| BLACKROCK BALANCED CAPITAL FUND, INC. | MARCH 31, 2016 | 55 |
| Consolidated Schedule of Investments (continued) | Master Total Return Portfolio | |||
See Notes to Consolidated Financial Statements.
| 56 | BLACKROCK BALANCED CAPITAL FUND, INC. | MARCH 31, 2016 |
| Consolidated Schedule of Investments (continued) | Master Total Return Portfolio | |||
See Notes to Consolidated Financial Statements.
| BLACKROCK BALANCED CAPITAL FUND, INC. | MARCH 31, 2016 | 57 |
| Consolidated Schedule of Investments (continued) | Master Total Return Portfolio | |||
See Notes to Consolidated Financial Statements.
| 58 | BLACKROCK BALANCED CAPITAL FUND, INC. | MARCH 31, 2016 |
| Consolidated Schedule of Investments (continued) | Master Total Return Portfolio | |||
See Notes to Consolidated Financial Statements.
| BLACKROCK BALANCED CAPITAL FUND, INC. | MARCH 31, 2016 | 59 |
| Consolidated Schedule of Investments (continued) | Master Total Return Portfolio | |||
See Notes to Consolidated Financial Statements.
| 60 | BLACKROCK BALANCED CAPITAL FUND, INC. | MARCH 31, 2016 |
| Consolidated Schedule of Investments (continued) | Master Total Return Portfolio | |||
See Notes to Consolidated Financial Statements.
| BLACKROCK BALANCED CAPITAL FUND, INC. | MARCH 31, 2016 | 61 |
| Consolidated Schedule of Investments (continued) | Master Total Return Portfolio | |||
See Notes to Consolidated Financial Statements.
| 62 | BLACKROCK BALANCED CAPITAL FUND, INC. | MARCH 31, 2016 |
| Consolidated Schedule of Investments (continued) | Master Total Return Portfolio | |||
See Notes to Consolidated Financial Statements.
| BLACKROCK BALANCED CAPITAL FUND, INC. | MARCH 31, 2016 | 63 |
| Consolidated Schedule of Investments (continued) | Master Total Return Portfolio | |||
| Notes to Consolidated Schedule of Investments |
| (a) | Security exempt from registration pursuant to Rule 144A under the Securities Act of 1933, as amended. These securities may be resold in transactions exempt from registration to qualified institutional investors. |
| (b) | Variable rate security. Rate as of period end. |
| (c) | Step-up bond that pays an initial coupon rate for the first period and then a higher coupon rate for the following periods. Rate as of period end. |
| (d) | Non-income producing security. |
| (e) | Security contractually bound to one or more other securities to form a single saleable unit which cannot be sold separately. |
| (f) | Payment-in-kind security which may pay interest/dividends in additional par/shares and/or in cash. Rates shown are the current rate and possible payment rates. |
| (g) | Convertible security. |
| (h) | Zero-coupon bond. |
| (i) | Issuer filed for bankruptcy and/or is in default of interest payments. |
| (j) | All or a portion of security has been pledged as collateral in connection with outstanding reverse repurchase agreements. |
| (k) | Security, or a portion of security, is on loan. |
| (l) | During the six months ended March 31, 2016, investments in issuers considered to be affiliates of the Master Portfolio for purposes of Section 2(a)(3) of the Investment Company Act of 1940, as amended, were as follows: |
| Affiliate |
Par/Shares September 30, |
Par/Shares/ Beneficial Interest Purchased |
Par/Shares Sold |
Par/Shares Held at March 31, 2016 |
Value at March 31, 2016 |
Income |
Realized Loss / Capital Gain |
|||||||||||||||||||||
| BlackRock Capital Finance LP, Series 1997-R2, Class AP |
$ | 7,237 | — | $ | (217 | ) | $ | 7,020 | $ | 6,591 | $ | 51 | $ | 1 | ||||||||||||||
| BlackRock Liquidity Funds, TempFund, Institutional Class |
— | 4,790,121 | 1 | — | 4,790,121 | 4,790,121 | 20,081 | 645 | ||||||||||||||||||||
| BlackRock Liquidity Series, LLC, Money Market Series |
— | $ | 33,383,250 | 1 | — | $ | 33,383,250 | 33,383,250 | 45,615 | — | ||||||||||||||||||
| iShares iBoxx $ High Yield Corporate Bond ETF |
424,587 | 3,208,667 | (1,316,570 | ) | 2,316,684 | 189,249,916 | 1,856,952 | (7,795,664 | ) | |||||||||||||||||||
| iShares U.S. Preferred Stock ETF |
— | 1,100,000 | — | 1,100,000 | 42,933,000 | — | — | |||||||||||||||||||||
| Total |
$ | 270,362,878 | $ | 1,922,699 | $ | (7,795,018 | ) | |||||||||||||||||||||
|
|
|
|||||||||||||||||||||||||||
| 1 | Represents net shares/beneficial interest purchased. |
| (m) | Other interests represent beneficial interests in liquidation trusts and other reorganization or private entities. |
| (n) | Perpetual security with no stated maturity date. |
| (o) | When-issued security. |
| (p) | Represents or includes a TBA transaction. As of period end, unsettled TBA transactions were as follows: |
| Counterparty | Value | Unrealized Appreciation (Depreciation) |
||||||
| Barclays Capital, Inc. |
$ | 30,803,028 | $ | 214,787 | ||||
| BNP Paribas Securities Corp. |
$ | 6,225,418 | $ | 31,663 | ||||
| Citigroup Global Markets, Inc. |
$ | 35,807,515 | $ | 49,557 | ||||
| Credit Suisse Securities (USA) LLC |
$ | (176,182,391 | ) | $ | (856,471 | ) | ||
| Deutsche Bank Securities, Inc. |
$ | (56,716,641 | ) | $ | (388,771 | ) | ||
| Goldman Sachs & Co. |
$ | (191,517,562 | ) | $ | (821,142 | ) | ||
| J.P. Morgan Securities LLC |
$ | (170,751,942 | ) | $ | (990,961 | ) | ||
| Merrill Lynch, Pierce, Fenner & Smith, Inc. |
$ | (15,363,966 | ) | $ | (277,967 | ) | ||
| Morgan Stanley & Co. LLC |
$ | (61,962,951 | ) | $ | (149,533 | ) | ||
| Nomura Securities International, Inc. |
$ | 25,333,283 | $ | (35,789 | ) | |||
See Notes to Consolidated Financial Statements.
| 64 | BLACKROCK BALANCED CAPITAL FUND, INC. | MARCH 31, 2016 |
| Consolidated Schedule of Investments (continued) | Master Total Return Portfolio |
| RBC Capital Markets, LLC |
$ | 80,137 | $ | 25,897 | ||||
| Wells Fargo Securities, LLC |
$ | 9,327,102 | $ | 36,905 |
| (q) | All or a portion of security has been pledged as collateral in connection with outstanding TBA commitments. |
| (r) | All or a portion of security has been pledged as collateral in connection with outstanding borrowed bonds. |
| (s) | Certain agreements have no stated maturity and can be terminated by either party at any time. |
| (t) | The amount to be repurchased assumes the maturity will be the day after the period end. |
| (u) | Current yield as of period end. |
| (v) | Security was purchased with the cash collateral from loaned securities. The Master Portfolio may withdraw up to 25% of its investment daily, although the manager of the BlackRock Liquidity Series, LLC, Money Market Series, in its sole discretion, may permit an investor to withdraw more than 25% on any one day. |
| • | For Master Portfolio compliance purposes, the Master Portfolio’s industry classifications refer to any one or more of the industry sub-classifications used by one or more widely recognized market indexes or ratings group indexes, and/or as defined by the investment advisor. These definitions may not apply for purposes of this report, which may combine such industry sub-classifications for reporting ease. |
Reverse Repurchase Agreements
| Counterparty | Interest Rate |
Trade Date |
Maturity Date1 |
Face Value |
Face Value Including Accrued Interest |
Type of Underlying Collateral |
Remaining Contractual Maturity of the Agreements |
|||||||||||||
| Barclays Capital, Inc. |
(4.75%) | 11/23/15 | Open | $ | 349,375 | $ | 343,428 | Corporate Bonds | Open/Demand1 | |||||||||||
| Deutsche Bank Securities, Inc. |
0.52% | 3/04/16 | 4/06/16 | 8,321,950 | 8,325,256 | U.S. Treasury Obligations | Up to 30 Days | |||||||||||||
| Credit Agricole CIB |
0.47% | 3/14/16 | Open | 133,281,250 | 133,310,831 | U.S. Treasury Obligations | Open/Demand1 | |||||||||||||
| Bank of Montreal |
0.45% | 3/16/16 | Open | 99,500,000 | 99,519,900 | U.S. Treasury Obligations | Open/Demand1 | |||||||||||||
| Credit Agricole CIB |
0.36% | 3/21/16 | Open | 76,593,750 | 76,602,175 | U.S. Treasury Obligations | Open/Demand1 | |||||||||||||
| Amherst Pierpont Securities LLC |
0.51% | 3/31/16 | 4/01/16 | 82,700,000 | 82,701,172 | U.S. Treasury Obligations | Overnight | |||||||||||||
| Amherst Pierpont Securities LLC |
0.51% | 3/31/16 | 4/01/16 | 84,200,000 | 84,201,193 | U.S. Treasury Obligations | Overnight | |||||||||||||
| Barclays Capital, Inc. |
0.15% | 3/31/16 | 4/01/16 | 178,544,013 | 178,544,757 | U.S. Treasury Obligations | Overnight | |||||||||||||
| Deutsche Bank Securities, Inc. |
0.10% | 3/31/16 | 4/01/16 | 301,307,843 | 301,308,679 | U.S. Treasury Obligations | Overnight | |||||||||||||
| J.P. Morgan Securities LLC |
0.49% | 3/31/16 | 4/01/16 | 492,472,837 | 492,479,541 | U.S. Treasury Obligations | Overnight | |||||||||||||
| Merrill Lynch, Pierce, Fenner & Smith, Inc. |
0.65% | 3/31/16 | 4/01/16 | 4,110,000 | 4,110,074 | U.S. Treasury Obligations | Overnight | |||||||||||||
| Merrill Lynch, Pierce, Fenner & Smith, Inc. |
0.65% | 3/31/16 | 4/01/16 | 90,886,250 | 90,887,891 | U.S. Treasury Obligations | Overnight | |||||||||||||
| Merrill Lynch, Pierce, Fenner & Smith, Inc. |
(0.06%) | 3/31/16 | 4/01/16 | 162,785,980 | 162,785,709 | U.S. Treasury Obligations | Overnight | |||||||||||||
| Merrill Lynch, Pierce, Fenner & Smith, Inc. |
(0.07%) | 3/31/16 | 4/01/16 | 192,355,589 | 192,355,215 | U.S. Treasury Obligations | Overnight | |||||||||||||
| Nomura Securities International, Inc. |
0.42% | 3/31/16 | 4/01/16 | 156,842,809 | 156,844,638 | U.S. Treasury Obligations | Overnight | |||||||||||||
| Total |
$ | 2,064,251,646 | $ | 2,064,320,459 | ||||||||||||||||
|
|
|
|||||||||||||||||||
| 1 | Certain agreements have no stated maturity and can be terminated by either party at any time. |
| Derivative Financial Instruments Outstanding as of Period End |
Futures Contracts
| Contracts Long/ (Short) |
Issue | Expiration |
Notional Value |
Unrealized Appreciation (Depreciation) |
||||||||||||||
| 24 | Hang Seng China Enterprises Index | April 2016 | USD | 1,392,537 | $ 17,573 | |||||||||||||
| 120 | CBOE Volatility Index Futures | May 2016 | USD | 2,115,000 | (120,670 | ) | ||||||||||||
| 100 | Euro-Bund 8.5 to 10.5-Year Bond Futures Put Options, Strike Price EUR 161 | May 2016 | USD | 15,931 | (84,305 | ) | ||||||||||||
| 280 | Australian Government Bonds (3 Year) | June 2016 | USD | 24,031,076 | (403 | ) | ||||||||||||
| 620 | Euro Dollar (1 Year) Mid-Curve | June 2016 | USD | — | (78,593 | ) | ||||||||||||
| 190 | Euro STOXX 50 Index | June 2016 | USD | 6,336,865 | (139,867 | ) | ||||||||||||
| (415 | ) | Euro-Bobl | June 2016 | USD | 61,909,286 | 110,209 | ||||||||||||
| (276 | ) | Euro-Bund | June 2016 | USD | 51,292,452 | (217,291 | ) | |||||||||||
| (50 | ) | Euro-Schatz | June 2016 | USD | 6,360,021 | 12,475 | ||||||||||||
| (48 | ) | Japanese Government Bonds (10 Year) | June 2016 | USD | 64,528,855 | 180,144 | ||||||||||||
| (40 | ) | Long Gilt British | June 2016 | USD | 6,964,065 | (47,727 | ) | |||||||||||
| (493 | ) | S&P 500 E-Mini Index | June 2016 | USD | 50,569,475 | 78,639 | ||||||||||||
See Notes to Consolidated Financial Statements.
| BLACKROCK BALANCED CAPITAL FUND, INC. | MARCH 31, 2016 | 65 |
| Consolidated Schedule of Investments (continued) | Master Total Return Portfolio |
| Contracts Long/ (Short) |
Issue | Expiration |
Notional Value |
Unrealized Appreciation (Depreciation) |
||||||||||||||
| 1,171 | U.S. Treasury Bonds (30 Year) | June 2016 | USD | 192,556,312 | $ (399,993 | ) | ||||||||||||
| 3,537 | U.S. Treasury Notes (2 Year) | June 2016 | USD | 773,718,750 | 1,939,123 | |||||||||||||
| (376 | ) | U.S. Treasury Notes (5 Year) | June 2016 | USD | 45,557,688 | (133,483 | ) | |||||||||||
| (1,139 | ) | U.S. Treasury Notes (10 Year) | June 2016 | USD | 148,514,922 | (804,612 | ) | |||||||||||
| (123 | ) | U.S. Ultra Treasury Bonds | June 2016 | USD | 21,221,344 | (250,916 | ) | |||||||||||
| (138 | ) | WTI Light Sweet Crude Oil Futures1 | June 2016 | USD | 5,485,500 | 347,120 | ||||||||||||
| 143 | WTI Light Sweet Crude Oil Futures1 | September 2016 | USD | 5,991,700 | (262,495 | ) | ||||||||||||
| (10 | ) | Euro Dollar Futures | December 2016 | USD | 2,479,375 | (4,891 | ) | |||||||||||
| Total | $ 140,037 | |||||||||||||||||
|
|
|
|||||||||||||||||
| 1 | All or a portion of security is held by a wholly owned subsidiary. See Note 1 of the Notes to Consolidated Financial Statements for details on the wholly owned subsidiary. |
Forward Foreign Currency Exchange Contracts
| Currency Purchased |
Currency Sold |
Counterparty | Settlement Date |
Unrealized Appreciation (Depreciation) |
||||||||||||||||
| EUR | 9,202,000 | USD | 10,420,714 | Morgan Stanley & Co. International PLC | 4/01/16 | $ 50,574 | ||||||||||||||
| MXN | 37,983,433 | USD | 2,091,000 | Deutsche Bank AG | 4/01/16 | 107,276 | ||||||||||||||
| RUB | 209,275,350 | USD | 2,741,000 | Deutsche Bank AG | 4/01/16 | 372,973 | ||||||||||||||
| USD | 2,091,000 | MXN | 37,584,186 | Citibank N.A. | 4/01/16 | (84,170 | ) | |||||||||||||
| USD | 2,417,100 | RUB | 171,638,271 | Deutsche Bank AG | 4/01/16 | (136,841 | ) | |||||||||||||
| USD | 2,116,000 | ZAR | 34,048,768 | JPMorgan Chase Bank N.A. | 4/01/16 | (189,787 | ) | |||||||||||||
| ZAR | 33,220,142 | USD | 2,116,000 | Bank of America N.A. | 4/01/16 | 133,672 | ||||||||||||||
| BRL | 3,691,377 | USD | 988,056 | BNP Paribas S.A. | 4/04/16 | 37,434 | ||||||||||||||
| EUR | 2,500,000 | USD | 2,789,565 | Bank of America N.A. | 4/04/16 | 55,528 | ||||||||||||||
| EUR | 9,202,000 | USD | 10,474,637 | HSBC Bank PLC | 4/04/16 | (2,420 | ) | |||||||||||||
| MXN | 74,903,542 | USD | 4,167,000 | Goldman Sachs International | 4/04/16 | 166,817 | ||||||||||||||
| RUB | 27,295,823 | EUR | 323,219 | BNP Paribas S.A. | 4/04/16 | 37,955 | ||||||||||||||
| RUB | 94,970,070 | EUR | 1,131,000 | Deutsche Bank AG | 4/04/16 | 124,739 | ||||||||||||||
| USD | 988,056 | BRL | 3,974,949 | BNP Paribas S.A. | 4/04/16 | (116,212 | ) | |||||||||||||
| USD | 2,712,963 | EUR | 2,500,000 | Bank of America N.A. | 4/04/16 | (132,130 | ) | |||||||||||||
| USD | 1,712,413 | EUR | 1,568,799 | BNP Paribas S.A. | 4/04/16 | (72,938 | ) | |||||||||||||
| USD | 558,028 | EUR | 506,576 | State Street Bank and Trust Co. | 4/04/16 | (18,474 | ) | |||||||||||||
| USD | 2,500,200 | MXN | 43,542,333 | Goldman Sachs International | 4/04/16 | (19,100 | ) | |||||||||||||
| USD | 1,207,877 | MXN | 21,187,370 | Goldman Sachs International | 4/04/16 | (17,995 | ) | |||||||||||||
| AUD | 6,011,326 | USD | 4,590,000 | Bank of America N.A. | 4/05/16 | 16,913 | ||||||||||||||
| CAD | 5,992,026 | USD | 4,590,000 | Bank of America N.A. | 4/05/16 | 23,719 | ||||||||||||||
| EUR | 4,061,434 | USD | 4,590,000 | Bank of America N.A. | 4/05/16 | 32,199 | ||||||||||||||
| EUR | 2,500,000 | USD | 2,804,000 | Commonwealth Bank of Australia | 4/05/16 | 41,177 | ||||||||||||||
| EUR | 1,700,000 | USD | 1,873,686 | Commonwealth Bank of Australia | 4/05/16 | 61,034 | ||||||||||||||
| EUR | 1,500,000 | USD | 1,677,871 | JPMorgan Chase Bank N.A. | 4/05/16 | 29,235 | ||||||||||||||
| EUR | 1,500,000 | USD | 1,694,302 | Morgan Stanley & Co. International PLC | 4/05/16 | 12,804 | ||||||||||||||
| EUR | 5,100,000 | USD | 5,539,929 | Royal Bank of Scotland PLC | 4/05/16 | 264,232 | ||||||||||||||
| GBP | 3,189,330 | USD | 4,590,000 | Bank of America N.A. | 4/05/16 | (9,270 | ) | |||||||||||||
| MXN | 43,597,984 | USD | 2,507,000 | BNP Paribas S.A. | 4/05/16 | 15,288 | ||||||||||||||
| USD | 4,590,000 | AUD | 5,970,218 | Bank of America N.A. | 4/05/16 | 14,589 | ||||||||||||||
| USD | 766,774 | AUD | 1,074,000 | UBS AG | 4/05/16 | (56,310 | ) | |||||||||||||
| USD | 4,590,000 | CAD | 5,936,441 | Goldman Sachs International | 4/05/16 | 19,080 | ||||||||||||||
| USD | 27,506,031 | CAD | 36,374,000 | JPMorgan Chase Bank N.A. | 4/05/16 | (501,093 | ) | |||||||||||||
See Notes to Consolidated Financial Statements.
| 66 | BLACKROCK BALANCED CAPITAL FUND, INC. | MARCH 31, 2016 |
| Consolidated Schedule of Investments (continued) | Master Total Return Portfolio |
| Currency Purchased |
Currency Sold |
Counterparty | Settlement Date |
Unrealized Appreciation (Depreciation) |
||||||||||||||||
| USD | 69,948,430 | CAD | 94,658,000 | State Street Bank and Trust Co. | 4/05/16 | $ | (2,936,002 | ) | ||||||||||||
| USD | 4,590,000 | EUR | 4,042,165 | Bank of America N.A. | 4/05/16 | (10,269 | ) | |||||||||||||
| USD | 234,475,452 | EUR | 215,166,000 | Morgan Stanley & Co. International PLC | 4/05/16 | (10,398,679 | ) | |||||||||||||
| USD | 470,461 | EUR | 429,000 | Royal Bank of Scotland PLC | 4/05/16 | (17,771 | ) | |||||||||||||
| USD | 4,590,000 | GBP | 3,177,811 | Bank of America N.A. | 4/05/16 | 25,815 | ||||||||||||||
| USD | 1,165,718 | GBP | 820,000 | Morgan Stanley & Co. International PLC | 4/05/16 | (12,021 | ) | |||||||||||||
| USD | 724,221 | GBP | 500,000 | Morgan Stanley & Co. International PLC | 4/05/16 | 6,088 | ||||||||||||||
| USD | 32,786,123 | GBP | 23,661,000 | Royal Bank of Scotland PLC | 4/05/16 | (1,197,391 | ) | |||||||||||||
| USD | 252,768 | JPY | 28,694,000 | State Street Bank and Trust Co. | 4/05/16 | (2,227 | ) | |||||||||||||
| USD | 2,507,000 | MXN | 43,521,470 | Goldman Sachs International | 4/05/16 | (10,862 | ) | |||||||||||||
| USD | 4,604,087 | MXN | 83,633,000 | Morgan Stanley & Co. International PLC | 4/05/16 | (234,360 | ) | |||||||||||||
| MXN | 102,012,526 | USD | 5,909,615 | Citibank N.A. | 4/06/16 | (8,393 | ) | |||||||||||||
| MXN | 42,023,302 | USD | 2,335,133 | State Street Bank and Trust Co. | 4/06/16 | 95,831 | ||||||||||||||
| TWD | 108,143,750 | USD | 3,250,000 | Bank of America N.A. | 4/06/16 | 110,380 | ||||||||||||||
| USD | 7,891,553 | MXN | 144,035,827 | Bank of America N.A. | 4/06/16 | (440,633 | ) | |||||||||||||
| USD | 3,250,000 | TWD | 108,387,500 | JPMorgan Chase Bank N.A. | 4/06/16 | (117,954 | ) | |||||||||||||
| RUB | 154,902,720 | USD | 2,136,000 | Deutsche Bank AG | 4/07/16 | 164,760 | ||||||||||||||
| USD | 2,136,000 | RUB | 153,065,760 | Deutsche Bank AG | 4/07/16 | (137,476 | ) | |||||||||||||
| CAD | 4,371,931 | USD | 3,362,000 | Citibank N.A. | 4/11/16 | 4,312 | ||||||||||||||
| HKD | 133,911,700 | USD | 17,240,000 | HSBC Bank PLC | 4/11/16 | 23,944 | ||||||||||||||
| USD | 3,362,000 | CAD | 4,497,273 | UBS AG | 4/11/16 | (100,823 | ) | |||||||||||||
| USD | 17,240,000 | HKD | 134,285,808 | HSBC Bank PLC | 4/11/16 | (72,174 | ) | |||||||||||||
| USD | 3,994,000 | ZAR | 61,777,802 | Bank of America N.A. | 4/11/16 | (181,378 | ) | |||||||||||||
| USD | 2,048,750 | ZAR | 31,698,744 | Bank of America N.A. | 4/11/16 | (93,674 | ) | |||||||||||||
| ZAR | 93,416,504 | USD | 6,042,750 | BNP Paribas S.A. | 4/11/16 | 270,994 | ||||||||||||||
| INR | 142,014,880 | USD | 2,086,000 | JPMorgan Chase Bank N.A. | 4/12/16 | 53,632 | ||||||||||||||
| USD | 2,086,000 | INR | 140,554,680 | JPMorgan Chase Bank N.A. | 4/12/16 | (31,633 | ) | |||||||||||||
| TRY | 7,546,029 | USD | 2,649,000 | BNP Paribas S.A. | 4/13/16 | 18,801 | ||||||||||||||
| CLP | 1,365,123,474 | USD | 1,999,800 | BNP Paribas S.A. | 4/14/16 | 35,436 | ||||||||||||||
| CLP | 902,669,724 | USD | 1,333,200 | Credit Suisse International | 4/14/16 | 12,572 | ||||||||||||||
| EUR | 2,488,000 | USD | 2,749,758 | Goldman Sachs International | 4/14/16 | 82,517 | ||||||||||||||
| USD | 2,333,100 | CLP | 1,596,493,668 | Credit Suisse International | 4/14/16 | (47,081 | ) | |||||||||||||
| USD | 999,900 | CLP | 683,761,617 | Credit Suisse International | 4/14/16 | (19,507 | ) | |||||||||||||
| USD | 2,698,497 | EUR | 2,488,000 | UBS AG | 4/14/16 | (133,777 | ) | |||||||||||||
| PLN | 25,601,265 | USD | 6,237,745 | JPMorgan Chase Bank N.A. | 4/15/16 | 621,994 | ||||||||||||||
| PLN | 25,824,668 | USD | 6,260,445 | Royal Bank of Canada | 4/15/16 | 659,154 | ||||||||||||||
| RUB | 104,950,830 | USD | 1,451,000 | Deutsche Bank AG | 4/15/16 | 104,086 | ||||||||||||||
| RUB | 283,048,255 | USD | 3,943,000 | JPMorgan Chase Bank N.A. | 4/15/16 | 251,006 | ||||||||||||||
| USD | 4,530,182 | EUR | 4,153,937 | State Street Bank and Trust Co. | 4/15/16 | (198,691 | ) | |||||||||||||
| USD | 13,651,532 | PLN | 54,696,910 | HSBC Bank PLC | 4/15/16 | (1,004,250 | ) | |||||||||||||
| USD | 5,662,850 | RUB | 387,707,025 | Deutsche Bank AG | 4/15/16 | (81,915 | ) | |||||||||||||
| USD | 1,165,750 | RUB | 79,993,765 | Deutsche Bank AG | 4/15/16 | (19,540 | ) | |||||||||||||
| EUR | 1,570,000 | PLN | 6,751,217 | State Street Bank and Trust Co. | 4/18/16 | (21,411 | ) | |||||||||||||
| JPY | 51,370,595 | USD | 451,800 | Deutsche Bank AG | 4/18/16 | 4,897 | ||||||||||||||
| JPY | 131,183,428 | USD | 1,153,747 | Deutsche Bank AG | 4/18/16 | 12,504 | ||||||||||||||
| JPY | 467,637,351 | USD | 4,153,000 | HSBC Bank PLC | 4/18/16 | 4,405 | ||||||||||||||
| JPY | 290,656,159 | USD | 2,573,835 | Morgan Stanley & Co. International PLC | 4/18/16 | 10,166 | ||||||||||||||
| JPY | 294,140,130 | USD | 2,604,618 | Morgan Stanley & Co. International PLC | 4/18/16 | 10,357 | ||||||||||||||
See Notes to Consolidated Financial Statements.
| BLACKROCK BALANCED CAPITAL FUND, INC. | MARCH 31, 2016 | 67 |
| Consolidated Schedule of Investments (continued) | Master Total Return Portfolio |
| Currency Purchased |
Currency Sold |
Counterparty | Settlement Date |
Unrealized Appreciation (Depreciation) |
||||||||||||||||
| JPY | 471,546,653 | USD | 4,153,000 | Morgan Stanley & Co. International PLC | 4/18/16 | $ 39,160 | ||||||||||||||
| RUB | 22,272,660 | USD | 323,900 | BNP Paribas S.A. | 4/18/16 | 5,824 | ||||||||||||||
| RUB | 179,236,650 | USD | 2,595,000 | JPMorgan Chase Bank N.A. | 4/18/16 | 58,412 | ||||||||||||||
| USD | 4,292,000 | JPY | 487,882,327 | Deutsche Bank AG | 4/18/16 | (45,388 | ) | |||||||||||||
| USD | 4,153,000 | KRW | 4,972,802,200 | HSBC Bank PLC | 4/18/16 | (193,323 | ) | |||||||||||||
| USD | 4,153,000 | KRW | 4,928,572,750 | JPMorgan Chase Bank N.A. | 4/18/16 | (154,666 | ) | |||||||||||||
| USD | 2,492,000 | KRW | 2,980,182,800 | JPMorgan Chase Bank N.A. | 4/18/16 | (112,736 | ) | |||||||||||||
| USD | 1,459,450 | RUB | 101,023,129 | Deutsche Bank AG | 4/18/16 | (36,092 | ) | |||||||||||||
| EUR | 2,151,900 | RUB | 195,284,925 | Deutsche Bank AG | 4/21/16 | (438,218 | ) | |||||||||||||
| EUR | 2,231,600 | USD | 2,534,982 | Citibank N.A. | 4/21/16 | 5,939 | ||||||||||||||
| MXN | 11,145,834 | USD | 617,007 | JPMorgan Chase Bank N.A. | 4/21/16 | 26,870 | ||||||||||||||
| USD | 1,206,684 | EUR | 1,115,000 | State Street Bank and Trust Co. | 4/21/16 | (62,866 | ) | |||||||||||||
| USD | 1,211,066 | EUR | 1,116,600 | State Street Bank and Trust Co. | 4/21/16 | (60,306 | ) | |||||||||||||
| USD | 2,175,393 | MXN | 39,288,199 | Morgan Stanley & Co. International PLC | 4/21/16 | (94,223 | ) | |||||||||||||
| USD | 2,173,379 | MXN | 39,252,843 | State Street Bank and Trust Co. | 4/21/16 | (94,194 | ) | |||||||||||||
| COP | 5,203,278,490 | USD | 1,671,333 | Credit Suisse International | 4/22/16 | 61,741 | ||||||||||||||
| MXN | 104,240,251 | USD | 6,015,955 | Citibank N.A. | 4/22/16 | 5,285 | ||||||||||||||
| USD | 1,671,333 | COP | 5,121,165,883 | Credit Suisse International | 4/22/16 | (34,392 | ) | |||||||||||||
| USD | 1,537,438 | MXN | 27,609,557 | Barclays Bank PLC | 4/22/16 | (57,376 | ) | |||||||||||||
| USD | 2,500,000 | MXN | 44,212,500 | Goldman Sachs International | 4/22/16 | (53,851 | ) | |||||||||||||
| RUB | 149,600,000 | USD | 2,200,000 | Deutsche Bank AG | 4/25/16 | 10,035 | ||||||||||||||
| USD | 2,200,000 | RUB | 154,176,000 | JPMorgan Chase Bank N.A. | 4/25/16 | (77,636 | ) | |||||||||||||
| USD | 2,159,000 | ZAR | 33,157,490 | BNP Paribas S.A. | 4/25/16 | (75,867 | ) | |||||||||||||
| MXN | 95,143,289 | USD | 5,472,000 | BNP Paribas S.A. | 4/28/16 | 20,747 | ||||||||||||||
| MXN | 7,939,274 | USD | 458,923 | HSBC Bank PLC | 4/28/16 | (578 | ) | |||||||||||||
| USD | 2,756,771 | MXN | 50,966,307 | Citibank N.A. | 4/28/16 | (185,581 | ) | |||||||||||||
| USD | 2,315,870 | MXN | 41,604,081 | JPMorgan Chase Bank N.A. | 4/28/16 | (85,988 | ) | |||||||||||||
| BRL | 6,806,034 | USD | 1,854,000 | Goldman Sachs International | 4/29/16 | 23,809 | ||||||||||||||
| BRL | 33,424,455 | USD | 9,105,000 | Goldman Sachs International | 4/29/16 | 116,924 | ||||||||||||||
| INR | 124,125,300 | USD | 1,854,000 | JPMorgan Chase Bank N.A. | 4/29/16 | 10,095 | ||||||||||||||
| INR | 609,579,750 | USD | 9,105,000 | JPMorgan Chase Bank N.A. | 4/29/16 | 49,579 | ||||||||||||||
| RUB | 129,001,320 | USD | 1,854,000 | Deutsche Bank AG | 4/29/16 | 49,453 | ||||||||||||||
| RUB | 633,525,900 | USD | 9,105,000 | Deutsche Bank AG | 4/29/16 | 242,866 | ||||||||||||||
| TRY | 5,348,964 | USD | 1,854,000 | Barclays Bank PLC | 4/29/16 | 28,247 | ||||||||||||||
| TRY | 26,268,781 | USD | 9,105,000 | Barclays Bank PLC | 4/29/16 | 138,720 | ||||||||||||||
| TWD | 218,200,750 | USD | 6,745,000 | JPMorgan Chase Bank N.A. | 4/29/16 | 36,826 | ||||||||||||||
| USD | 9,105,000 | DKK | 60,497,808 | Royal Bank of Scotland PLC | 4/29/16 | (140,874 | ) | |||||||||||||
| USD | 1,854,000 | DKK | 12,318,829 | Royal Bank of Scotland PLC | 4/29/16 | (28,685 | ) | |||||||||||||
| USD | 9,105,000 | EUR | 8,116,123 | Standard Chartered Bank | 4/29/16 | (138,287 | ) | |||||||||||||
| USD | 1,854,000 | EUR | 1,652,641 | Standard Chartered Bank | 4/29/16 | (28,159 | ) | |||||||||||||
| USD | 9,105,000 | GBP | 6,376,617 | Morgan Stanley & Co. International PLC | 4/29/16 | (54,212 | ) | |||||||||||||
| USD | 1,854,000 | GBP | 1,298,435 | Morgan Stanley & Co. International PLC | 4/29/16 | (11,039 | ) | |||||||||||||
| USD | 9,105,000 | SEK | 75,156,674 | Barclays Bank PLC | 4/29/16 | (162,217 | ) | |||||||||||||
| USD | 1,854,000 | SEK | 15,303,731 | Barclays Bank PLC | 4/29/16 | (33,031 | ) | |||||||||||||
| USD | 6,745,000 | TWD | 216,615,675 | Deutsche Bank AG | 4/29/16 | 12,439 | ||||||||||||||
| ZAR | 28,759,248 | USD | 1,854,000 | BNP Paribas S.A. | 4/29/16 | 82,900 | ||||||||||||||
| ZAR | 141,236,760 | USD | 9,105,000 | BNP Paribas S.A. | 4/29/16 | 407,121 | ||||||||||||||
| BRL | 4,935,086 | USD | 1,348,200 | Deutsche Bank AG | 5/02/16 | 12,259 | ||||||||||||||
See Notes to Consolidated Financial Statements.
| 68 | BLACKROCK BALANCED CAPITAL FUND, INC. | MARCH 31, 2016 |
| Consolidated Schedule of Investments (continued) | Master Total Return Portfolio |
| Currency Purchased |
Currency Sold |
Counterparty | Settlement Date |
Unrealized Appreciation (Depreciation) |
||||||||||||||||
| USD | 2,576,000 | COP | 7,802,704,000 | Credit Suisse International | 5/02/16 | $ (21,419 | ) | |||||||||||||
| USD | 9,105,000 | JPY | 1,031,368,875 | Deutsche Bank AG | 5/02/16 | (67,946 | ) | |||||||||||||
| USD | 1,854,000 | JPY | 210,011,850 | Deutsche Bank AG | 5/02/16 | (13,836 | ) | |||||||||||||
| RUB | 136,856,400 | EUR | 1,770,000 | Deutsche Bank AG | 5/04/16 | 601 | ||||||||||||||
| USD | 794,419 | AUD | 1,033,000 | UBS AG | 5/04/16 | 3,823 | ||||||||||||||
| USD | 101,233,253 | CAD | 130,936,000 | Westpac Banking Corp. | 5/04/16 | 411,950 | ||||||||||||||
| USD | 7,699,979 | EUR | 6,795,000 | Citibank N.A. | 5/04/16 | (39,966 | ) | |||||||||||||
| USD | 223,590,438 | EUR | 196,101,000 | Morgan Stanley & Co. International PLC | 5/04/16 | 218,697 | ||||||||||||||
| USD | 34,514,034 | GBP | 24,003,000 | Royal Bank of Scotland PLC | 5/04/16 | 36,261 | ||||||||||||||
| USD | 4,110,410 | MXN | 71,157,000 | JPMorgan Chase Bank N.A. | 5/04/16 | 4,769 | ||||||||||||||
| USD | 4,556,746 | MXN | 83,721,665 | Morgan Stanley & Co. International PLC | 5/04/16 | (273,856 | ) | |||||||||||||
| USD | 274,167 | JPY | 30,825,000 | Barclays Bank PLC | 5/09/16 | (38 | ) | |||||||||||||
| USD | 274,396 | JPY | 30,825,000 | Royal Bank of Scotland PLC | 5/09/16 | 192 | ||||||||||||||
| TWD | 45,802,200 | USD | 1,380,000 | Deutsche Bank AG | 5/16/16 | 43,814 | ||||||||||||||
| USD | 1,380,000 | TWD | 45,802,200 | JPMorgan Chase Bank N.A. | 5/16/16 | (43,814 | ) | |||||||||||||
| USD | 455,845 | RUB | 37,251,157 | Morgan Stanley & Co. International PLC | 5/20/16 | (90,920 | ) | |||||||||||||
| CNH | 15,552,550 | USD | 2,307,500 | Citibank N.A. | 5/23/16 | 93,109 | ||||||||||||||
| CNH | 18,669,983 | USD | 2,769,000 | Citibank N.A. | 5/23/16 | 112,800 | ||||||||||||||
| CNH | 28,029,895 | USD | 4,153,500 | HSBC Bank PLC | 5/23/16 | 173,046 | ||||||||||||||
| CNY | 62,154,820 | USD | 9,230,000 | Standard Chartered Bank | 5/23/16 | 358,945 | ||||||||||||||
| USD | 9,230,000 | CNH | 62,293,270 | Standard Chartered Bank | 5/23/16 | (385,260 | ) | |||||||||||||
| USD | 2,769,000 | CNY | 18,642,293 | Bank of America N.A. | 5/23/16 | (107,043 | ) | |||||||||||||
| USD | 2,307,500 | CNY | 15,538,705 | Bank of America N.A. | 5/23/16 | (89,736 | ) | |||||||||||||
| USD | 4,153,500 | CNY | 27,994,590 | HSBC Bank PLC | 5/23/16 | (165,370 | ) | |||||||||||||
| USD | 4,646,443 | MXN | 81,111,685 | Citibank N.A. | 5/23/16 | (24,964 | ) | |||||||||||||
| CNH | 73,533,164 | USD | 10,844,000 | BNP Paribas S.A. | 5/25/16 | 505,081 | ||||||||||||||
| USD | 10,844,000 | CNH | 73,533,164 | JPMorgan Chase Bank N.A. | 5/25/16 | (505,081 | ) | |||||||||||||
| USD | 2,241,189 | MXN | 38,926,994 | Bank of America N.A. | 5/26/16 | (55 | ) | |||||||||||||
| USD | 38,464,000 | CNH | 253,804,704 | Standard Chartered Bank | 6/01/16 | (694,126 | ) | |||||||||||||
| USD | 5,876,841 | MXN | 102,012,526 | Citibank N.A. | 6/06/16 | 9,073 | ||||||||||||||
| USD | 5,705,728 | MXN | 99,433,090 | JPMorgan Chase Bank N.A. | 6/06/16 | (13,671 | ) | |||||||||||||
| AUD | 56,320,000 | USD | 43,308,785 | BNP Paribas S.A. | 6/15/16 | (290,865 | ) | |||||||||||||
| AUD | 3,255,000 | USD | 2,469,591 | JPMorgan Chase Bank N.A. | 6/15/16 | 16,618 | ||||||||||||||
| AUD | 1,445,000 | USD | 1,087,854 | Northern Trust Corp. | 6/15/16 | 15,855 | ||||||||||||||
| CAD | 4,337,577 | USD | 3,250,000 | Commonwealth Bank of Australia | 6/15/16 | 90,025 | ||||||||||||||
| CHF | 1,870,000 | JPY | 216,020,904 | HSBC Bank PLC | 6/15/16 | 27,838 | ||||||||||||||
| CHF | 4,130,000 | JPY | 476,829,976 | Royal Bank of Scotland PLC | 6/15/16 | 63,838 | ||||||||||||||
| JPY | 692,613,600 | CHF | 6,000,000 | JPMorgan Chase Bank N.A. | 6/15/16 | (93,789 | ) | |||||||||||||
| MXN | 84,928,582 | USD | 4,765,000 | Deutsche Bank AG | 6/15/16 | 116,477 | ||||||||||||||
| USD | 3,481,972 | AUD | 4,700,000 | Credit Suisse International | 6/15/16 | (107,947 | ) | |||||||||||||
| USD | 43,073,834 | AUD | 57,090,000 | Morgan Stanley & Co. International PLC | 6/15/16 | (532,222 | ) | |||||||||||||
| USD | 42,311,245 | AUD | 56,320,000 | Westpac Banking Corp. | 6/15/16 | (706,675 | ) | |||||||||||||
| USD | 3,250,000 | CAD | 4,294,964 | State Street Bank and Trust Co. | 6/15/16 | (57,212 | ) | |||||||||||||
| USD | 3,037,212 | EUR | 2,730,000 | Goldman Sachs International | 6/15/16 | (76,742 | ) | |||||||||||||
| USD | 10,497,302 | EUR | 9,202,000 | HSBC Bank PLC | 6/15/16 | 1,111 | ||||||||||||||
| USD | 10,443,913 | EUR | 9,202,000 | Morgan Stanley & Co. International PLC | 6/15/16 | (52,278 | ) | |||||||||||||
| USD | 1,465,000 | MXN | 25,477,822 | Citibank N.A. | 6/15/16 | 600 | ||||||||||||||
| USD | 1,834,000 | MXN | 31,725,328 | Citibank N.A. | 6/15/16 | 10,510 | ||||||||||||||
See Notes to Consolidated Financial Statements.
| BLACKROCK BALANCED CAPITAL FUND, INC. | MARCH 31, 2016 | 69 |
| Consolidated Schedule of Investments (continued) | Master Total Return Portfolio |
| Currency Purchased |
Currency Sold |
Counterparty | Settlement Date |
Unrealized Appreciation (Depreciation) |
||||||||||||||||
| USD | 1,466,000 | MXN | 25,754,603 | Goldman Sachs International | 6/15/16 | $ (14,308) | ||||||||||||||
| USD | 3,979,870 | IDR | 52,924,308,875 | Deutsche Bank AG | 6/16/16 | 39,117 | ||||||||||||||
| USD | 10,776,179 | IDR | 142,892,136,755 | Deutsche Bank AG | 6/16/16 | 136,407 | ||||||||||||||
| USD | 21,433,292 | IDR | 284,977,047,790 | Deutsche Bank AG | 6/16/16 | 213,854 | ||||||||||||||
| USD | 2,357,956 | EUR | 2,075,375 | Morgan Stanley & Co. International PLC | 6/22/16 | (9,843 | ) | |||||||||||||
| USD | 1,349,827 | EUR | 1,182,927 | Morgan Stanley & Co. International PLC | 6/22/16 | 223 | ||||||||||||||
| USD | 2,600,000 | SGD | 3,598,473 | JPMorgan Chase Bank N.A. | 6/30/16 | (68,081 | ) | |||||||||||||
| MXN | 44,970,918 | USD | 2,492,421 | HSBC Bank PLC | 7/06/16 | 87,790 | ||||||||||||||
| USD | 2,430,846 | MXN | 43,587,506 | BNP Paribas S.A. | 7/06/16 | (69,991 | ) | |||||||||||||
| USD | 2,411,091 | MXN | 43,233,264 | BNP Paribas S.A. | 7/06/16 | (69,422 | ) | |||||||||||||
| USD | 2,283,873 | MXN | 41,434,025 | UBS AG | 7/06/16 | (93,408 | ) | |||||||||||||
| USD | 2,267,312 | MXN | 41,126,777 | State Street Bank and Trust Co. | 7/08/16 | (91,916 | ) | |||||||||||||
| MXN | 43,561,425 | USD | 2,411,685 | HSBC Bank PLC | 7/20/16 | 84,515 | ||||||||||||||
| USD | 2,257,522 | MXN | 41,920,915 | State Street Bank and Trust Co. | 7/20/16 | (144,671 | ) | |||||||||||||
| USD | 2,433,817 | MXN | 44,727,167 | State Street Bank and Trust Co. | 7/20/16 | (129,183 | ) | |||||||||||||
| CNH | 404,200,740 | USD | 60,360,000 | JPMorgan Chase Bank N.A. | 7/29/16 | 1,805,946 | ||||||||||||||
| USD | 25,302,000 | CNH | 170,813,802 | Bank of America N.A. | 7/29/16 | (969,109 | ) | |||||||||||||
| USD | 44,000,000 | CNH | 299,268,200 | HSBC Bank PLC | 7/29/16 | (2,027,354 | ) | |||||||||||||
| USD | 28,415,000 | CNH | 189,243,900 | Standard Chartered Bank | 7/29/16 | (690,652 | ) | |||||||||||||
| USD | 25,316,000 | SAR | 96,555,224 | BNP Paribas S.A. | 11/23/16 | (276,353 | ) | |||||||||||||
| USD | 25,703,333 | SAR | 97,981,107 | Citibank N.A. | 11/23/16 | (266,956 | ) | |||||||||||||
| USD | 19,029,000 | SAR | 72,319,715 | Citibank N.A. | 11/23/16 | (139,633 | ) | |||||||||||||
| HKD | 135,373,250 | USD | 17,245,000 | HSBC Bank PLC | 2/03/17 | 206,261 | ||||||||||||||
| USD | 17,245,000 | HKD | 134,597,225 | HSBC Bank PLC | 2/03/17 | (106,221 | ) | |||||||||||||
| HKD | 69,472,537 | USD | 8,965,000 | HSBC Bank PLC | 2/27/17 | (10,030 | ) | |||||||||||||
| USD | 18,000,000 | HKD | 140,211,000 | HSBC Bank PLC | 2/27/17 | (73,116 | ) | |||||||||||||
| HKD | 132,970,084 | USD | 16,790,000 | Goldman Sachs International | 1/19/18 | 297,091 | ||||||||||||||
| USD | 16,790,000 | HKD | 131,339,775 | Goldman Sachs International | 1/19/18 | (87,591 | ) | |||||||||||||
| Total | $(20,306,709 | ) | ||||||||||||||||||
|
|
|
|||||||||||||||||||
Interest Indexed Caps Purchased
| Description | Exercise Rate | Counterparty | Expiration Date |
Notional Amount (000) |
Value | Premiums Received |
Unrealized Depreciation |
|||||||||||||||||||
| 10Y-2Y CMS Index Cap1 |
1.30% | Bank of America N.A. |
10/20/16 | USD | 187,100 | $32,810 | $134,979 | $(102,169 | ) | |||||||||||||||||
| 1 | Master Portfolio pays the upfront premium and receives the greater of the exercise rate minus the difference of the 10-year CMS Index and 2-year CMS Index or $0. |
Exchange-Traded Options Purchased
| Description | Put/ Call |
Expiration Date |
Strike Price |
Contracts | Value | |||||||||||
| Nikkei 225 Index |
Call | 4/08/16 | JPY | 17,500.00 | 94 | $12,111 | ||||||||||
| Alibaba Group Holding Ltd. |
Call | 4/15/16 | USD | 80.00 | 555 | 67,155 | ||||||||||
| BorgWarner, Inc. |
Call | 4/15/16 | USD | 37.50 | 263 | 38,792 | ||||||||||
| EURO STOXX Banks Index |
Call | 4/15/16 | EUR | 115.00 | 948 | 51,240 | ||||||||||
| Health Care SPDR ETF |
Call | 4/15/16 | USD | 68.00 | 327 | 22,400 | ||||||||||
| CBOE Volatility Index |
Call | 4/20/16 | USD | 22.00 | 356 | 9,790 | ||||||||||
| SPDR Gold Trust ETF1 |
Call | 5/20/16 | USD | 125.00 | 570 | 50,445 | ||||||||||
See Notes to Consolidated Financial Statements.
| 70 | BLACKROCK BALANCED CAPITAL FUND, INC. | MARCH 31, 2016 |
| Consolidated Schedule of Investments (continued) | Master Total Return Portfolio |
| Description | Put/ Call |
Expiration Date |
Strike Price |
Contracts | Value | |||||||||||||||
| Financial Select Sector SPDR Fund |
Call | 6/17/16 | USD | 23.00 | 4,752 | $ 209,088 | ||||||||||||||
| Health Care SPDR ETF |
Call | 6/17/16 | USD | 70.00 | 327 | 29,267 | ||||||||||||||
| Euro Dollar 90-Day |
Call | 12/16/16 | USD | 99.13 | 7,012 | 2,980,100 | ||||||||||||||
| U.S. Treasury Notes (10 Year) |
Put | 4/01/16 | USD | 130.00 | 187 | 20,453 | ||||||||||||||
| U.S. Treasury Notes (10 Year) |
Put | 4/01/16 | USD | 130.25 | 94 | 17,625 | ||||||||||||||
| Energy Select Sector SPDR Fund |
Put | 4/15/16 | USD | 59.00 | 1,170 | 32,760 | ||||||||||||||
| EURO STOXX 50 Index |
Put | 4/15/16 | EUR | 3,000.00 | 252 | 135,060 | ||||||||||||||
| EURO STOXX 50 Index |
Put | 4/15/16 | EUR | 3,025.00 | 162 | 108,576 | ||||||||||||||
| FTSE 100 Index |
Put | 4/15/16 | GBP | 5,700.00 | 45 | 4,201 | ||||||||||||||
| HP, Inc. |
Put | 4/15/16 | USD | 10.00 | 1,410 | 2,115 | ||||||||||||||
| S&P 500 Index |
Put | 4/15/16 | USD | 1,940.00 | 12 | 1,740 | ||||||||||||||
| EURO STOXX 50 Index |
Put | 5/20/16 | EUR | 2,950.00 | 118 | 121,785 | ||||||||||||||
| S&P 500 Index |
Put | 5/20/16 | USD | 2,040.00 | 55 | 184,525 | ||||||||||||||
| Utilities SPDR ETF |
Put | 6/17/16 | USD | 48.00 | 2,160 | 185,760 | ||||||||||||||
| Total |
$4,284,988 | |||||||||||||||||||
|
|
|
|||||||||||||||||||
| 1 | All or a portion of security is held by a wholly owned subsidiary. |
OTC Barrier Options Purchased
| Description | Type of Options | Counterparty | Expiration Date |
Strike Price |
Barrier Price |
Notional Amount (000) |
Value | |||||||||||||||||||||
| USD Currency | Under-and-Out | Deutsche Bank AG |
05/16/16 | CNH | 6.62 | CNH | 6.90 | USD | 5,065 | $ 5,326 | ||||||||||||||||||
| USD Currency | Down-and-Out | Deutsche Bank AG |
04/26/16 | MXN | 17.30 | MXN | 16.80 | USD | 5,312 | 10,240 | ||||||||||||||||||
| Total |
$15,566 | |||||||||||||||||||||||||||
|
|
|
|||||||||||||||||||||||||||
OTC Options Purchased
| Description | Put/ Call |
Counterparty | Expiration Date |
Strike Price |
Notional Amount (000) |
Value | ||||||||||||||||
| USD Currency |
Call | Citibank N.A. | 4/06/16 | JPY | 119.50 | USD | 9,000 | $ 1 | ||||||||||||||
| USD Currency |
Call | Deutsche Bank AG | 4/06/16 | JPY | 122.00 | USD | 9,000 | 1 | ||||||||||||||
| USD Currency |
Call | HSBC Bank PLC | 4/13/16 | SGD | 1.50 | USD | 16,800 | 2 | ||||||||||||||
| USD Currency |
Call | BNP Paribas S.A. | 4/22/16 | TRY | 2.95 | USD | 4,391 | 7,884 | ||||||||||||||
| USD Currency |
Call | BNP Paribas S.A. | 4/22/16 | TRY | 2.90 | USD | 2,635 | 11,440 | ||||||||||||||
| USD Currency |
Call | Goldman Sachs International | 4/26/16 | BRL | 3.75 | USD | 2,247 | 23,709 | ||||||||||||||
| USD Currency |
Call | Goldman Sachs International | 4/28/16 | ZAR | 17.00 | USD | 3,565 | 2,673 | ||||||||||||||
| USD Currency |
Call | BNP Paribas S.A. | 4/29/16 | JPY | 115.00 | USD | 18,000 | 60,412 | ||||||||||||||
| USD Currency |
Call | Deutsche Bank AG | 5/12/16 | TWD | 34.00 | USD | 12,500 | 4,211 | ||||||||||||||
| USD Currency |
Call | Goldman Sachs International | 5/13/16 | BRL | 3.85 | USD | 2,907 | 30,122 | ||||||||||||||
| USD Currency |
Call | Deutsche Bank AG | 5/19/16 | KRW | 1,165.00 | USD | 3,760 | 31,134 | ||||||||||||||
| USD Currency |
Call | Bank of America N.A. | 5/20/16 | SGD | 1.43 | USD | 9,600 | 7,820 | ||||||||||||||
| USD Currency |
Call | BNP Paribas S.A. | 5/20/16 | TWD | 32.60 | USD | 9,600 | 43,355 | ||||||||||||||
| USD Currency |
Call | JPMorgan Chase Bank N.A. | 5/20/16 | TWD | 34.20 | USD | 11,905 | 4,706 | ||||||||||||||
| USD Currency |
Call | Morgan Stanley & Co. International PLC |
5/20/16 | SGD | 1.50 | USD | 11,905 | 323 | ||||||||||||||
| USD Currency |
Call | Deutsche Bank AG | 5/23/16 | CNH | 6.53 | USD | 38,455 | 256,691 | ||||||||||||||
| USD Currency |
Call | Deutsche Bank AG | 5/23/16 | JPY | 115.00 | USD | 18,000 | 98,820 | ||||||||||||||
| USD Currency |
Call | JPMorgan Chase Bank N.A. | 5/23/16 | CNH | 6.85 | USD | 49,990 | 77,485 | ||||||||||||||
| USD Currency |
Call | BNP Paribas S.A. | 6/17/16 | CNY | 6.80 | USD | 23,810 | 75,254 | ||||||||||||||
| USD Currency |
Call | Standard Chartered Bank | 6/17/16 | CNY | 6.60 | USD | 23,810 | 155,070 | ||||||||||||||
| USD Currency |
Call | BNP Paribas S.A. | 7/19/16 | JPY | 124.00 | USD | 17,000 | 19,225 | ||||||||||||||
| USD Currency |
Call | Deutsche Bank AG | 7/19/16 | JPY | 124.00 | USD | 17,000 | 19,225 | ||||||||||||||
| USD Currency |
Call | JPMorgan Chase Bank N.A. | 7/19/16 | JPY | 120.00 | USD | 17,000 | 52,452 | ||||||||||||||
See Notes to Consolidated Financial Statements.
| BLACKROCK BALANCED CAPITAL FUND, INC. | MARCH 31, 2016 | 71 |
| Consolidated Schedule of Investments (continued) | Master Total Return Portfolio |
| Description | Put/ Call |
Counterparty | Expiration Date |
Strike Price |
Notional Amount (000) |
Value | ||||||||||||||||
| GBP Currency |
Call | Deutsche Bank AG | 7/22/16 | USD | 1.47 | GBP | 83,310 | $ | 2,767,886 | |||||||||||||
| GBP Currency |
Call | Deutsche Bank AG | 7/22/16 | USD | 1.47 | GBP | 35,185 | 1,168,984 | ||||||||||||||
| USD Currency |
Call | HSBC Bank PLC | 7/29/16 | CNH | 6.75 | USD | 110,000 | 781,891 | ||||||||||||||
| USD Currency |
Call | HSBC Bank PLC | 8/09/16 | CHF | 1.05 | USD | 19,215 | 37,494 | ||||||||||||||
| USD Currency |
Call | Royal Bank of Scotland PLC | 8/09/16 | CHF | 1.04 | USD | 38,120 | 89,037 | ||||||||||||||
| USD Currency |
Call | Bank of America N.A. | 8/12/16 | CNH | 7.00 | USD | 17,500 | 72,005 | ||||||||||||||
| USD Currency |
Call | Deutsche Bank AG | 8/12/16 | CNY | 7.00 | USD | 17,500 | 72,005 | ||||||||||||||
| USD Currency |
Call | Deutsche Bank AG | 8/12/16 | CNH | 7.25 | USD | 17,500 | 43,367 | ||||||||||||||
| USD Currency |
Call | BNP Paribas S.A. | 8/15/16 | SAR | 3.79 | USD | 26,190 | 112,177 | ||||||||||||||
| USD Currency |
Call | BNP Paribas S.A. | 8/16/16 | SAR | 3.78 | USD | 37,400 | 172,552 | ||||||||||||||
| USD Currency |
Call | Citibank N.A. | 8/16/16 | SAR | 3.78 | USD | 37,440 | 172,737 | ||||||||||||||
| USD Currency |
Call | Deutsche Bank AG | 9/06/16 | CHF | 1.03 | USD | 20,000 | 85,306 | ||||||||||||||
| USD Currency |
Call | Deutsche Bank AG | 9/06/16 | CHF | 1.08 | USD | 20,000 | 27,256 | ||||||||||||||
| EUR Currency |
Call | HSBC Bank PLC | 9/27/16 | CHF | 1.15 | EUR | 12,000 | 53,770 | ||||||||||||||
| USD Currency |
Call | BNP Paribas S.A. | 9/27/16 | HKD | 7.80 | USD | 37,360 | 104,227 | ||||||||||||||
| USD Currency |
Call | Deutsche Bank AG | 12/06/16 | CHF | 1.05 | USD | 20,000 | 105,738 | ||||||||||||||
| USD Currency |
Call | Deutsche Bank AG | 12/06/16 | CHF | 1.10 | USD | 8,571 | 20,359 | ||||||||||||||
| USD Currency |
Call | Deutsche Bank AG | 12/15/16 | CNH | 6.75 | USD | 6,551 | 106,915 | ||||||||||||||
| EUR Currency |
Put | Deutsche Bank AG | 4/01/16 | USD | 1.05 | EUR | 7,521 | 1 | ||||||||||||||
| EUR Currency |
Put | HSBC Bank PLC | 4/01/16 | USD | 1.09 | EUR | 5,014 | 1 | ||||||||||||||
| USD Currency |
Put | Deutsche Bank AG | 4/06/16 | JPY | 114.00 | USD | 9,000 | 139,423 | ||||||||||||||
| EUR Currency |
Put | Deutsche Bank AG | 4/07/16 | PLN | 4.18 | EUR | 24,000 | 15,913 | ||||||||||||||
| EUR Currency |
Put | Deutsche Bank AG | 4/11/16 | USD | 1.05 | EUR | 20,000 | 2 | ||||||||||||||
| EUR Currency |
Put | JPMorgan Chase Bank N.A. | 4/11/16 | USD | 1.07 | EUR | 20,000 | 20 | ||||||||||||||
| GBP Currency |
Put | Bank of America N.A. | 4/14/16 | USD | 1.41 | GBP | 4,700 | 14,222 | ||||||||||||||
| USD Currency |
Put | Goldman Sachs International | 4/15/16 | MXN | 18.00 | USD | 4,317 | 215,038 | ||||||||||||||
| USD Currency |
Put | BNP Paribas S.A. | 4/19/16 | JPY | 112.00 | USD | 17,000 | 123,323 | ||||||||||||||
| USD Currency |
Put | HSBC Bank PLC | 4/19/16 | JPY | 114.00 | USD | 17,000 | 308,251 | ||||||||||||||
| EUR Currency |
Put | Deutsche Bank AG | 4/29/16 | RUB | 83.00 | EUR | 3,985 | 384,777 | ||||||||||||||
| EUR Currency |
Put | Deutsche Bank AG | 5/17/16 | RUB | 82.00 | EUR | 3,701 | 317,443 | ||||||||||||||
| CHF Currency |
Put | Bank of America N.A. | 6/17/16 | JPY | 122.00 | CHF | 24,000 | 1,090,836 | ||||||||||||||
| CHF Currency |
Put | Bank of America N.A. | 6/17/16 | JPY | 118.00 | CHF | 24,000 | 505,247 | ||||||||||||||
| CHF Currency |
Put | BNP Paribas S.A. | 6/17/16 | JPY | 116.00 | CHF | 25,000 | 331,202 | ||||||||||||||
| CHF Currency |
Put | JPMorgan Chase Bank N.A. | 6/17/16 | JPY | 112.00 | CHF | 25,000 | 129,426 | ||||||||||||||
| CHF Currency |
Put | JPMorgan Chase Bank N.A. | 6/17/16 | JPY | 108.00 | CHF | 5,351 | 10,854 | ||||||||||||||
| GBP Currency |
Put | Barclays Bank PLC | 6/17/16 | USD | 1.40 | GBP | 8,500 | 191,430 | ||||||||||||||
| GBP Currency |
Put | Deutsche Bank AG | 6/17/16 | USD | 1.45 | GBP | 15,920 | 659,443 | ||||||||||||||
| USD Currency |
Put | JPMorgan Chase Bank N.A. | 6/24/16 | JPY | 114.00 | USD | 9,700 | 277,178 | ||||||||||||||
| EUR Currency |
Put | JPMorgan Chase Bank N.A. | 7/22/16 | USD | 1.07 | EUR | 100,810 | 572,114 | ||||||||||||||
| USD Currency |
Put | JPMorgan Chase Bank N.A. | 9/30/16 | JPY | 115.00 | USD | 9,700 | 434,449 | ||||||||||||||
| Total |
$ | 12,696,314 | ||||||||||||||||||||
|
|
|
|||||||||||||||||||||
Exchange-Traded Options Written
| Description | Put/ Call |
Expiration Date |
Strike Price |
Contracts | Value | |||||||||||||||
| Nikkei 225 Index |
Call | 4/08/16 | JPY | 18,000.00 | 46 | $(1,226 | ) | |||||||||||||
| EURO STOXX Banks Index |
Call | 4/15/16 | EUR | 120.00 | 948 | (24,271 | ) | |||||||||||||
| iShares iBoxx $ High Yield Corporate Bond ETF |
Call | 4/15/16 | USD | 82.00 | 1,874 | (56,220 | ) | |||||||||||||
| CBOE Volatility Index |
Call | 4/20/16 | USD | 19.00 | 892 | (46,830 | ) | |||||||||||||
| CBOE Volatility Index |
Call | 4/20/16 | USD | 20.00 | 1,783 | (75,778 | ) | |||||||||||||
| CBOE Volatility Index |
Call | 4/20/16 | USD | 18.00 | 1,784 | (115,960 | ) | |||||||||||||
| Alibaba Group Holding Ltd. |
Call | 4/29/16 | USD | 80.00 | 732 | (148,962 | ) | |||||||||||||
| Utilities SPDR ETF |
Call | 6/17/16 | USD | 48.00 | 2,160 | (518,400 | ) | |||||||||||||
| Euro Dollar 90-Day |
Call | 12/16/16 | USD | 98.38 | 4,676 | (2,484,125 | ) | |||||||||||||
See Notes to Consolidated Financial Statements.
| 72 | BLACKROCK BALANCED CAPITAL FUND, INC. | MARCH 31, 2016 |
| Consolidated Schedule of Investments (continued) | Master Total Return Portfolio |
| Description | Put/ Call |
Expiration Date |
Strike Price |
Contracts | Value | |||||||||||||||
| Financial Select Sector SPDR Fund |
Put | 6/17/16 | USD | 23.00 | 4,752 | $(468,072) | ||||||||||||||
| Total |
$ | (3,939,844 | ) | |||||||||||||||||
|
|
|
|||||||||||||||||||
OTC Options Written
| Description | Put/ Call |
Counterparty | Expiration Date |
Strike Price |
Notional Amount (000) |
Value | ||||||||||||||||
| USD Currency |
Call | Deutsche Bank AG | 4/06/16 | JPY | 119.50 | USD | 9,000 | $ | (1 | ) | ||||||||||||
| USD Currency |
Call | Goldman Sachs International | 4/15/16 | MXN | 19.00 | USD | 4,317 | (24 | ) | |||||||||||||
| USD Currency |
Call | BNP Paribas S.A. | 4/29/16 | JPY | 118.00 | USD | 18,000 | (13,057 | ) | |||||||||||||
| USD Currency |
Call | Deutsche Bank AG | 5/12/16 | TWD | 35.00 | USD | 12,500 | (344 | ) | |||||||||||||
| USD Currency |
Call | Bank of America N.A. | 5/20/16 | SGD | 1.50 | USD | 11,905 | (323 | ) | |||||||||||||
| USD Currency |
Call | BNP Paribas S.A. | 5/20/16 | TWD | 34.20 | USD | 11,905 | (4,706 | ) | |||||||||||||
| USD Currency |
Call | JPMorgan Chase Bank N.A. | 5/20/16 | TWD | 32.60 | USD | 9,600 | (43,355 | ) | |||||||||||||
| USD Currency |
Call | Morgan Stanley & Co. International PLC |
5/20/16 | SGD | 1.43 | USD | 9,600 | (7,820 | ) | |||||||||||||
| USD Currency |
Call | Deutsche Bank AG | 5/23/16 | JPY | 118.00 | USD | 27,000 | (46,435 | ) | |||||||||||||
| USD Currency |
Call | Deutsche Bank AG | 5/23/16 | CNH | 6.85 | USD | 49,990 | (77,484 | ) | |||||||||||||
| USD Currency |
Call | JPMorgan Chase Bank N.A. | 5/23/16 | CNH | 6.53 | USD | 38,455 | (256,691 | ) | |||||||||||||
| USD Currency |
Call | BNP Paribas S.A. | 6/17/16 | CNY | 6.60 | USD | 23,810 | (155,070 | ) | |||||||||||||
| USD Currency |
Call | Standard Chartered Bank | 6/17/16 | CNY | 6.80 | USD | 23,810 | (75,254 | ) | |||||||||||||
| USD Currency |
Call | Deutsche Bank AG | 7/19/16 | JPY | 120.00 | USD | 17,000 | (52,452 | ) | |||||||||||||
| USD Currency |
Call | JPMorgan Chase Bank N.A. | 7/19/16 | JPY | 124.00 | USD | 34,000 | (38,451 | ) | |||||||||||||
| GBP Currency |
Call | Deutsche Bank AG | 7/22/16 | USD | 1.56 | GBP | 35,185 | (258,336 | ) | |||||||||||||
| GBP Currency |
Call | Deutsche Bank AG | 7/22/16 | USD | 1.53 | GBP | 35,185 | (451,943 | ) | |||||||||||||
| GBP Currency |
Call | Deutsche Bank AG | 7/22/16 | USD | 1.56 | GBP | 83,310 | (611,681 | ) | |||||||||||||
| GBP Currency |
Call | Deutsche Bank AG | 7/22/16 | USD | 1.53 | GBP | 83,310 | (1,070,098 | ) | |||||||||||||
| GBP Currency |
Call | JPMorgan Chase Bank N.A. | 7/22/16 | USD | 1.50 | GBP | 79,860 | (1,699,821 | ) | |||||||||||||
| USD Currency |
Call | UBS AG | 8/09/16 | CHF | 1.05 | USD | 19,215 | (37,494 | ) | |||||||||||||
| USD Currency |
Call | UBS AG | 8/09/16 | CHF | 1.04 | USD | 38,120 | (89,037 | ) | |||||||||||||
| USD Currency |
Call | Bank of America N.A. | 8/12/16 | CNH | 7.25 | USD | 17,500 | (34,671 | ) | |||||||||||||
| USD Currency |
Call | Deutsche Bank AG | 8/12/16 | CNY | 7.25 | USD | 17,500 | (34,671 | ) | |||||||||||||
| USD Currency |
Call | Deutsche Bank AG | 8/12/16 | CNH | 7.00 | USD | 17,500 | (82,241 | ) | |||||||||||||
| USD Currency |
Call | Deutsche Bank AG | 9/06/16 | CHF | 1.08 | USD | 20,000 | (27,256 | ) | |||||||||||||
| USD Currency |
Call | Deutsche Bank AG | 9/06/16 | CHF | 1.03 | USD | 20,000 | (85,306 | ) | |||||||||||||
| EUR Currency |
Call | Deutsche Bank AG | 9/27/16 | CHF | 1.15 | EUR | 12,000 | (53,770 | ) | |||||||||||||
| USD Currency |
Call | BNP Paribas S.A. | 9/27/16 | HKD | 8.00 | USD | 37,360 | (70,009 | ) | |||||||||||||
| USD Currency |
Call | Deutsche Bank AG | 12/06/16 | CHF | 1.10 | USD | 20,000 | (45,392 | ) | |||||||||||||
| USD Currency |
Call | Deutsche Bank AG | 12/15/16 | CNH | 7.10 | USD | 6,551 | (60,926 | ) | |||||||||||||
| EUR Currency |
Put | HSBC Bank PLC | 4/01/16 | USD | 1.05 | EUR | 7,521 | (1 | ) | |||||||||||||
| USD Currency |
Put | Deutsche Bank AG | 4/06/16 | JPY | 116.50 | USD | 9,000 | (331,750 | ) | |||||||||||||
| EUR Currency |
Put | Deutsche Bank AG | 4/11/16 | USD | 1.07 | EUR | 20,000 | (20 | ) | |||||||||||||
| EUR Currency |
Put | JPMorgan Chase Bank N.A. | 4/11/16 | USD | 1.05 | EUR | 20,000 | (2 | ) | |||||||||||||
| USD Currency |
Put | BNP Paribas S.A. | 4/19/16 | JPY | 114.00 | USD | 17,000 | (308,251 | ) | |||||||||||||
| USD Currency |
Put | HSBC Bank PLC | 4/19/16 | JPY | 112.00 | USD | 17,000 | (123,323 | ) | |||||||||||||
| USD Currency |
Put | Goldman Sachs International | 4/26/16 | BRL | 3.55 | USD | 2,247 | (31,314 | ) | |||||||||||||
| USD Currency |
Put | Goldman Sachs International | 4/28/16 | ZAR | 15.50 | USD | 3,565 | (170,359 | ) | |||||||||||||
| EUR Currency |
Put | Deutsche Bank AG | 5/17/16 | RUB | 77.00 | EUR | 5,346 | (197,120 | ) | |||||||||||||
| CHF Currency |
Put | Bank of America N.A. | 6/17/16 | JPY | 118.00 | CHF | 24,000 | (505,247 | ) | |||||||||||||
| CHF Currency |
Put | Bank of America N.A. | 6/17/16 | JPY | 122.00 | CHF | 24,000 | (1,090,836 | ) | |||||||||||||
| CHF Currency |
Put | BNP Paribas S.A. | 6/17/16 | JPY | 108.00 | CHF | 5,351 | (10,854 | ) | |||||||||||||
| CHF Currency |
Put | BNP Paribas S.A. | 6/17/16 | JPY | 112.00 | CHF | 25,000 | (129,427 | ) | |||||||||||||
| CHF Currency |
Put | JPMorgan Chase Bank N.A. | 6/17/16 | JPY | 116.00 | CHF | 25,000 | (331,202 | ) | |||||||||||||
| GBP Currency |
Put | Bank of America N.A. | 6/17/16 | USD | 1.40 | GBP | 7,960 | (179,269 | ) | |||||||||||||
See Notes to Consolidated Financial Statements.
| BLACKROCK BALANCED CAPITAL FUND, INC. | MARCH 31, 2016 | 73 |
| Consolidated Schedule of Investments (continued) | Master Total Return Portfolio |
| Description | Put/ Call |
Counterparty | Expiration Date |
Strike Price |
Notional (000) |
Value | ||||||||||||||||
| GBP Currency |
Put | Barclays Bank PLC | 6/17/16 | USD | 1.35 | GBP | 8,500 | $ | (104,513 | ) | ||||||||||||
| GBP Currency |
Put | Deutsche Bank AG | 6/17/16 | USD | 1.40 | GBP | 15,920 | (358,537 | ) | |||||||||||||
| USD Currency |
Put | JPMorgan Chase Bank N.A. | 6/24/16 | JPY | 116.50 | USD | 9,700 | (436,002 | ) | |||||||||||||
| USD Currency |
Put | JPMorgan Chase Bank N.A. | 9/30/16 | JPY | 117.50 | USD | 9,700 | (595,412 | ) | |||||||||||||
| Total |
$ | (10,387,558 | ) | |||||||||||||||||||
|
|
|
|||||||||||||||||||||
Centrally Cleared Credit Default Swaps — Buy Protection
| Index | Pay Fixed Rate |
Expiration Date |
Notional (000) |
Unrealized Depreciation |
||||||||||||||||
| iTraxx Crossover Series 24 Version 1 |
5.00% | 12/20/20 | EUR | 6,300 | $ (9,119 | ) | ||||||||||||||
| iTraxx Europe Crossover Series 25 Version 1 |
5.00% | 6/20/21 | EUR | 5,500 | (9,435 | ) | ||||||||||||||
| CDX.NA.HY Series 26 Version 1 |
5.00% | 6/20/21 | USD | 32,255 | (390,354 | ) | ||||||||||||||
| Total |
$(408,908 | ) | ||||||||||||||||||
|
|
|
|||||||||||||||||||
Centrally Cleared Credit Default Swaps — Sell Protection
| Index | Receive Fixed Rate |
Expiration Date |
Credit Rating1 |
Notional |
Unrealized Appreciation (Depreciation) |
|||||||||||||||
| iTraxx Europe Series 21 Version 1 |
1.00% | 6/20/19 | BBB+ | EUR | 1,445 | $ 4,312 | ||||||||||||||
| iTraxx Europe Series 23 Version 1 |
1.00% | 6/20/20 | BBB+ | EUR | 2,628 | (10,154 | ) | |||||||||||||
| iTraxx Financials Series 24 Version 1 |
1.00% | 12/20/20 | A | EUR | 20,300 | 16,801 | ||||||||||||||
| Total |
$ 10,959 | |||||||||||||||||||
|
|
|
|||||||||||||||||||
| 1 | Using S&P’s rating of the underlying securities of the index. |
| 2 | The maximum potential amount the Master Portfolio may pay should a negative credit event take place as defined under the terms of the agreement. |
Centrally Cleared Interest Rate Swaps
| Fixed Rate | Floating Rate | Effective Date | Expiration Date |
Notional Amount (000) |
Unrealized Appreciation (Depreciation) |
|||||||||||
| 0.65%1 |
3-month LIBOR | N/A | 11/26/16 | USD | 12,695 | $ 16,897 | ||||||||||
| 1.26%1 |
3-month LIBOR | N/A | 1/12/17 | USD | 283,520 | (1,551,015 | ) | |||||||||
| 0.65%2 |
3-month Canadian Bankers Acceptance | N/A | 1/12/18 | CAD | 86,000 | (291,501 | ) | |||||||||
| 0.62%2 |
3-month Canadian Bankers Acceptance | N/A | 1/14/18 | CAD | 86,000 | (329,148 | ) | |||||||||
| 0.92%2 |
3-month LIBOR | 3/01/173 | 3/01/18 | USD | 353,992 | (91,418 | ) | |||||||||
| 1.14%1 |
3-month LIBOR | 3/01/183 | 3/01/19 | USD | 353,992 | 70,426 | ||||||||||
| 0.99%1 |
3-month Canadian Bankers Acceptance | N/A | 1/12/21 | CAD | 33,000 | (39,819 | ) | |||||||||
| 0.88%1 |
3-month Canadian Bankers Acceptance | N/A | 1/14/21 | CAD | 33,000 | 101,164 | ||||||||||
| 2.13%2 |
3-month LIBOR | N/A | 8/25/25 | USD | 2,360 | 114,057 | ||||||||||
| 2.27%1 |
3-month LIBOR | N/A | 9/11/25 | USD | 1,800 | (108,968 | ) | |||||||||
| 2.83%2 |
6-month Australian Bank Bill Rate | N/A | 1/15/26 | AUD | 130,530 | 2,107,055 | ||||||||||
| 1.95%1 |
3-month LIBOR | N/A | 1/19/26 | USD | 93,240 | (3,025,502 | ) | |||||||||
| 2.46%1 |
3-month LIBOR | N/A | 1/15/46 | USD | 24,040 | (1,920,752 | ) | |||||||||
| 2.26%2 |
3-month LIBOR | N/A | 2/10/46 | USD | 24,040 | 745,683 | ||||||||||
| 2.21%1 |
3-month LIBOR | N/A | 3/09/46 | USD | 20,200 | (372,966 | ) | |||||||||
|
2.20%1 |
3-month LIBOR | N/A | 3/22/46 | USD | 26,803 | (416,652 | ) | |||||||||
| Total |
$(4,992,459 | ) | ||||||||||||||
|
|
|
|||||||||||||||
| 1 | Master Portfolio pays the fixed rate and receives the floating rate. |
| 2 | Master Portfolio pays the floating rate and receives the fixed rate. |
| 3 | Forward swap. |
See Notes to Consolidated Financial Statements.
| 74 | BLACKROCK BALANCED CAPITAL FUND, INC. | MARCH 31, 2016 |
| Consolidated Schedule of Investments (continued) | Master Total Return Portfolio |
OTC Credit Default Swaps — Buy Protection
| Issuer/Index | Pay Fixed Rate |
Counterparty | Expiration Date |
Notional (000) |
Value | Premiums Paid (Received) |
Unrealized Appreciation (Depreciation) |
|||||||||||||||||||||
| Altice Finco SA |
5.00 | % | Citibank N.A. | 12/20/16 | EUR | 780 | $ (29,166 | ) | $ (20,633 | ) | $ (8,533 | ) | ||||||||||||||||
| Banca Monte dei Paschi di Siena SpA |
5.00 | % | Deutsche Bank AG | 12/20/16 | EUR | 750 | 45,058 | 34,450 | 10,608 | |||||||||||||||||||
| Numericable SFR SA |
5.00 | % | Citibank N.A. | 12/20/16 | EUR | 780 | (29,694 | ) | (26,379 | ) | (3,315 | ) | ||||||||||||||||
| Stena AB |
5.00 | % | Credit Suisse International | 12/20/16 | EUR | 800 | (14,931 | ) | (12,907 | ) | (2,024 | ) | ||||||||||||||||
| Transocean Ltd. |
1.00 | % | Goldman Sachs Bank USA | 12/20/16 | USD | 5,750 | (39,369 | ) | (7,929 | ) | (31,440 | ) | ||||||||||||||||
| Banca Monte dei Paschi di Siena SpA |
5.00 | % | JPMorgan Chase Bank N.A. | 3/20/17 | EUR | 3,800 | 275,216 | 147,833 | 127,383 | |||||||||||||||||||
| Republic of Ireland |
1.00 | % | Citibank N.A. | 3/20/17 | USD | 2,000 | (16,698 | ) | 72,725 | (89,423 | ) | |||||||||||||||||
| CDX.NA.IG Series 18 Version 1 |
1.00 | % | Credit Suisse International | 6/20/17 | USD | 103,800 | (973,299 | ) | (3,006 | ) | (970,293 | ) | ||||||||||||||||
| ArcelorMittal |
5.00 | % | Goldman Sachs International | 12/20/17 | EUR | 260 | (10,662 | ) | 19,123 | (29,785 | ) | |||||||||||||||||
| Volkswagen AG |
1.00 | % | JPMorgan Chase Bank N.A. | 12/20/17 | EUR | 370 | (379 | ) | 3,784 | (4,163 | ) | |||||||||||||||||
| Volkswagen AG |
1.00 | % | JPMorgan Chase Bank N.A. | 12/20/17 | EUR | 370 | (379 | ) | 3,920 | (4,299 | ) | |||||||||||||||||
| Volkswagen AG |
1.00 | % | Morgan Stanley & Co. International PLC |
12/20/17 | EUR | 740 | (758 | ) | 6,347 | (7,105 | ) | |||||||||||||||||
| Buoni Poliennali Del Tesoro |
1.00 | % | Barclays Bank PLC | 3/20/18 | USD | 6,000 | (46,725 | ) | 144,949 | (191,674 | ) | |||||||||||||||||
| iTraxx Europe Series 9 3-6% |
5.00 | % | Citibank N.A. | 6/20/18 | EUR | 3,780 | (283,977 | ) | 248,283 | (532,260 | ) | |||||||||||||||||
| Republic of France |
0.25 | % | Barclays Bank PLC | 6/20/18 | USD | 2,530 | (8,643 | ) | 20,187 | (28,830 | ) | |||||||||||||||||
| Republic of France |
0.25 | % | Citibank N.A. | 6/20/18 | USD | 2,740 | (9,361 | ) | 24,761 | (34,122 | ) | |||||||||||||||||
| Republic of France |
0.25 | % | JPMorgan Chase Bank N.A. | 6/20/18 | USD | 2,735 | (9,344 | ) | 18,976 | (28,320 | ) | |||||||||||||||||
| Bayerische Motoren Werke AG |
1.00 | % | Citibank N.A. | 12/20/18 | EUR | 900 | (16,556 | ) | (452 | ) | (16,104 | ) | ||||||||||||||||
| iTraxx Financials Series 20 Version 1 |
1.00 | % | Barclays Bank PLC | 12/20/18 | EUR | 1,450 | (21,716 | ) | (5,503 | ) | (16,213 | ) | ||||||||||||||||
| iTraxx Financials Series 20 Version 1 |
1.00 | % | Citibank N.A. | 12/20/18 | EUR | 3,120 | (46,728 | ) | (11,607 | ) | (35,121 | ) | ||||||||||||||||
| Federative Republic of Brazil |
1.00 | % | Bank of America N.A. | 6/20/19 | USD | 1,187 | 48,495 | 29,975 | 18,520 | |||||||||||||||||||
| Federative Republic of Brazil |
1.00 | % | Citibank N.A. | 6/20/19 | USD | 1,155 | 47,187 | 33,917 | 13,270 | |||||||||||||||||||
| GDF Suez |
1.00 | % | Bank of America N.A. | 6/20/19 | EUR | 795 | (16,439 | ) | (17,768 | ) | 1,329 | |||||||||||||||||
| GDF Suez |
1.00 | % | Citibank N.A. | 6/20/19 | EUR | 455 | (9,408 | ) | (9,309 | ) | (99 | ) | ||||||||||||||||
| GDF Suez |
1.00 | % | Deutsche Bank AG | 6/20/19 | EUR | 450 | (9,305 | ) | (10,058 | ) | 753 | |||||||||||||||||
| Republic of Portugal |
1.00 | % | BNP Paribas S.A. | 9/20/19 | USD | 875 | 27,001 | 17,882 | 9,119 | |||||||||||||||||||
| Boyd Gaming Corp. |
5.00 | % | Citibank N.A. | 6/20/20 | USD | 1,300 | (134,219 | ) | (61,772 | ) | (72,447 | ) | ||||||||||||||||
| Boyd Gaming Corp. |
5.00 | % | JPMorgan Chase Bank N.A. | 6/20/20 | USD | 1,200 | (123,893 | ) | (61,989 | ) | (61,904 | ) | ||||||||||||||||
| United Mexican States |
1.00 | % | JPMorgan Chase Bank N.A. | 6/20/20 | USD | 7,452 | 88,783 | 55,379 | 33,404 | |||||||||||||||||||
| Boyd Gaming Corp. |
5.00 | % | Citibank N.A. | 9/20/20 | USD | 1,160 | (114,568 | ) | (102,377 | ) | (12,191 | ) | ||||||||||||||||
| United Mexican States |
1.00 | % | Bank of America N.A. | 9/20/20 | USD | 7,452 | 118,281 | 83,841 | 34,440 | |||||||||||||||||||
| 21st Century Fox, Class A |
1.00 | % | Barclays Bank PLC | 12/20/20 | USD | 5,435 | (156,404 | ) | (75,555 | ) | (80,849 | ) | ||||||||||||||||
| Australia & New Zealand Banking Group Ltd. |
1.00 | % | JPMorgan Chase Bank N.A. | 12/20/20 | USD | 1,000 | 4,080 | (341 | ) | 4,421 | ||||||||||||||||||
| Australia and New Zealand Banking Group Ltd. |
1.00 | % | JPMorgan Chase Bank N.A. | 12/20/20 | USD | 1,205 | 4,917 | (5,307 | ) | 10,224 | ||||||||||||||||||
| Australia and New Zealand Banking Group Ltd. |
1.00 | % | JPMorgan Chase Bank N.A. | 12/20/20 | USD | 795 | 3,245 | (3,859 | ) | 7,104 | ||||||||||||||||||
| AutoZone, Inc. |
1.00 | % | JPMorgan Chase Bank N.A. | 12/20/20 | USD | 3,300 | (111,841 | ) | (102,175 | ) | (9,666 | ) | ||||||||||||||||
| Banco Comercial Portugues SA |
5.00 | % | BNP Paribas S.A. | 12/20/20 | EUR | 216 | 2,839 | (3,600 | ) | 6,439 | ||||||||||||||||||
| Bank of America Corp. |
1.00 | % | BNP Paribas S.A. | 12/20/20 | USD | 1,200 | (4,358 | ) | (2,023 | ) | (2,335 | ) | ||||||||||||||||
| Barrick Gold Corp. |
1.00 | % | JPMorgan Chase Bank N.A. | 12/20/20 | USD | 2,800 | 76,805 | 111,909 | (35,104 | ) | ||||||||||||||||||
| Bayerische Motoren Werke AG |
1.00 | % | Goldman Sachs International | 12/20/20 | EUR | 900 | (17,115 | ) | (6,682 | ) | (10,433 | ) | ||||||||||||||||
| BNP Paribas SA |
1.00 | % | Citibank N.A. | 12/20/20 | EUR | 800 | (10,358 | ) | (7,689 | ) | (2,669 | ) | ||||||||||||||||
See Notes to Consolidated Financial Statements.
| BLACKROCK BALANCED CAPITAL FUND, INC. | MARCH 31, 2016 | 75 |
| Consolidated Schedule of Investments (continued) | Master Total Return Portfolio |
| Issuer/Index | Pay Fixed Rate |
Counterparty | Expiration Date |
Notional Amount (000) |
Value | Premiums Paid (Received) |
Unrealized Appreciation (Depreciation) |
|||||||||||||||||||
| Boeing Co. |
1.00 | % | JPMorgan Chase Bank N.A. | 12/20/20 | USD | 1,200 | $ (34,774 | ) | $ (39,980 | ) | $ 5,206 | |||||||||||||||
| Boeing Co. |
1.00 | % | JPMorgan Chase Bank N.A. | 12/20/20 | USD | 1,200 | (34,774 | ) | (39,449 | ) | 4,675 | |||||||||||||||
| Boyd Gaming Corp. |
5.00 | % | BNP Paribas S.A. | 12/20/20 | USD | 1,000 | (94,089 | ) | (72,944 | ) | (21,145 | ) | ||||||||||||||
| Boyd Gaming Corp. |
5.00 | % | Citibank N.A. | 12/20/20 | USD | 800 | (75,270 | ) | (58,354 | ) | (16,916 | ) | ||||||||||||||
| Boyd Gaming Corp. |
5.00 | % | Citibank N.A. | 12/20/20 | USD | 500 | (47,045 | ) | (36,523 | ) | (10,522 | ) | ||||||||||||||
| Boyd Gaming Corp. |
5.00 | % | Citibank N.A. | 12/20/20 | USD | 500 | (47,044 | ) | (33,479 | ) | (13,565 | ) | ||||||||||||||
| Cable & Wireless Ltd. |
5.00 | % | Bank of America N.A. | 12/20/20 | EUR | 54 | (8,879 | ) | (6,779 | ) | (2,100 | ) | ||||||||||||||
| Cable & Wireless Ltd. |
5.00 | % | Barclays Bank PLC | 12/20/20 | EUR | 295 | (48,429 | ) | (36,211 | ) | (12,218 | ) | ||||||||||||||
| Cable & Wireless Ltd. |
5.00 | % | Morgan Stanley & Co. International PLC |
12/20/20 | EUR | 101 | (16,679 | ) | (12,734 | ) | (3,945 | ) | ||||||||||||||
| Caterpillar, Inc. |
1.00 | % | JPMorgan Chase Bank N.A. | 12/20/20 | USD | 4,200 | (43,819 | ) | 26,712 | (70,531 | ) | |||||||||||||||
| Citigroup, Inc. |
1.00 | % | BNP Paribas S.A. | 12/20/20 | USD | 1,200 | (5,118 | ) | 2,791 | (7,909 | ) | |||||||||||||||
| Clariant AG |
1.00 | % | Barclays Bank PLC | 12/20/20 | EUR | 42 | (105 | ) | 587 | (692 | ) | |||||||||||||||
| Clariant AG |
1.00 | % | Barclays Bank PLC | 12/20/20 | EUR | 42 | (105 | ) | 587 | (692 | ) | |||||||||||||||
| Clariant AG |
1.00 | % | Barclays Bank PLC | 12/20/20 | EUR | 42 | (104 | ) | 628 | (732 | ) | |||||||||||||||
| Clariant AG |
1.00 | % | Barclays Bank PLC | 12/20/20 | EUR | 41 | (102 | ) | 573 | (675 | ) | |||||||||||||||
| Clariant AG |
1.00 | % | BNP Paribas S.A. | 12/20/20 | EUR | 250 | (624 | ) | 4,341 | (4,965 | ) | |||||||||||||||
| Clariant AG |
1.00 | % | BNP Paribas S.A. | 12/20/20 | EUR | 83 | (207 | ) | 423 | (630 | ) | |||||||||||||||
| Commonwealth Bank of Australia |
1.00 | % | JPMorgan Chase Bank N.A. | 12/20/20 | USD | 1,150 | 4,575 | (3,983 | ) | 8,558 | ||||||||||||||||
| Commonwealth Bank of Australia |
1.00 | % | JPMorgan Chase Bank N.A. | 12/20/20 | USD | 1,000 | 3,978 | (2,555 | ) | 6,533 | ||||||||||||||||
| Credit Agricole SA |
1.00 | % | Citibank N.A. | 12/20/20 | EUR | 680 | (8,281 | ) | (265 | ) | (8,016 | ) | ||||||||||||||
| Credit Suisse Group Funding Guernsey Ltd. |
1.00 | % | Goldman Sachs International |
12/20/20 | EUR | 700 | 16,301 | 2,948 | 13,353 | |||||||||||||||||
| CSX Corp. |
1.00 | % | JPMorgan Chase Bank N.A. | 12/20/20 | USD | 1,650 | (48,300 | ) | (42,814 | ) | (5,486 | ) | ||||||||||||||
| Daimler AG |
1.00 | % | Citibank N.A. | 12/20/20 | EUR | 900 | (18,117 | ) | (9,878 | ) | (8,239 | ) | ||||||||||||||
| Dow Chemical Co. |
1.00 | % | BNP Paribas S.A. | 12/20/20 | USD | 1,400 | (27,161 | ) | (16,457 | ) | (10,704 | ) | ||||||||||||||
| Dow Chemical Co. |
1.00 | % | JPMorgan Chase Bank N.A. | 12/20/20 | USD | 1,200 | (23,281 | ) | 1,213 | (24,494 | ) | |||||||||||||||
| EI du Pont de Nemours & Co. |
1.00 | % | BNP Paribas S.A. | 12/20/20 | USD | 1,400 | (37,318 | ) | (33,336 | ) | (3,982 | ) | ||||||||||||||
| EI du Pont de Nemours & Co. |
1.00 | % | JPMorgan Chase Bank N.A. | 12/20/20 | USD | 1,200 | (31,986 | ) | (16,587 | ) | (15,399 | ) | ||||||||||||||
| GKN Holdings PLC |
1.00 | % | BNP Paribas S.A. | 12/20/20 | EUR | 500 | 11,938 | 10,942 | 996 | |||||||||||||||||
| GKN Holdings PLC |
1.00 | % | Goldman Sachs International |
12/20/20 | EUR | 250 | 5,969 | 6,991 | (1,022 | ) | ||||||||||||||||
| Halliburton Co. |
1.00 | % | Barclays Bank PLC | 12/20/20 | USD | 408 | 1,469 | 15,137 | (13,668 | ) | ||||||||||||||||
| Halliburton Co. |
1.00 | % | Barclays Bank PLC | 12/20/20 | USD | 204 | 735 | 6,880 | (6,145 | ) | ||||||||||||||||
| Halliburton Co. |
1.00 | % | Barclays Bank PLC | 12/20/20 | USD | 204 | 735 | 8,433 | (7,698 | ) | ||||||||||||||||
| Halliburton Co. |
1.00 | % | BNP Paribas S.A. | 12/20/20 | USD | 423 | 1,522 | 17,411 | (15,889 | ) | ||||||||||||||||
| Halliburton Co. |
1.00 | % | JPMorgan Chase Bank N.A. | 12/20/20 | USD | 779 | 2,804 | 22,132 | (19,328 | ) | ||||||||||||||||
| Halliburton Co. |
1.00 | % | JPMorgan Chase Bank N.A. | 12/20/20 | USD | 593 | 2,135 | 24,409 | (22,274 | ) | ||||||||||||||||
| Halliburton Co. |
1.00 | % | JPMorgan Chase Bank N.A. | 12/20/20 | USD | 365 | 1,314 | 13,541 | (12,227 | ) | ||||||||||||||||
| Halliburton Co. |
1.00 | % | Morgan Stanley Capital Services LLC |
12/20/20 | USD | 424 | 1,526 | 13,335 | (11,809 | ) | ||||||||||||||||
| Home Depot, Inc. |
1.00 | % | Goldman Sachs International |
12/20/20 | USD | 3,300 | (117,000 | ) | (124,620 | ) | 7,620 | |||||||||||||||
| Home Depot, Inc. |
1.00 | % | Goldman Sachs International |
12/20/20 | USD | 2,475 | (87,749 | ) | (85,434 | ) | (2,315 | ) | ||||||||||||||
| Home Depot, Inc. |
1.00 | % | Goldman Sachs International |
12/20/20 | USD | 2,475 | (87,750 | ) | (80,690 | ) | (7,060 | ) | ||||||||||||||
| Home Depot, Inc. |
1.00 | % | JPMorgan Chase Bank N.A. | 12/20/20 | USD | 4,950 | (175,499 | ) | (177,530 | ) | 2,031 | |||||||||||||||
| Iberdrola International BV |
1.00 | % | Barclays Bank PLC | 12/20/20 | EUR | 150 | (1,795 | ) | 555 | (2,350 | ) | |||||||||||||||
| Iberdrola International BV |
1.00 | % | JPMorgan Chase Bank N.A. | 12/20/20 | EUR | 600 | (6,135 | ) | 1,609 | (7,744 | ) | |||||||||||||||
| Itochu Corp. |
1.00 | % | Goldman Sachs International |
12/20/20 | JPY | 32,023 | (6,114 | ) | (2,347 | ) | (3,767 | ) | ||||||||||||||
See Notes to Consolidated Financial Statements.
| 76 | BLACKROCK BALANCED CAPITAL FUND, INC. | MARCH 31, 2016 |
| Consolidated Schedule of Investments (continued) | Master Total Return Portfolio |
| Issuer/Index | Pay Fixed Rate |
Counterparty | Expiration Date |
Notional Amount (000) |
Value | Premiums Paid (Received) |
Unrealized Appreciation (Depreciation) |
|||||||||||||||||||||
| Itochu Corp. |
1.00 | % | Goldman Sachs International | 12/20/20 | JPY | 29,326 | $ (5,599 | ) | $ (2,045 | ) | $ (3,554 | ) | ||||||||||||||||
| Itochu Corp. |
1.00 | % | Goldman Sachs International | 12/20/20 | JPY | 29,326 | (5,599 | ) | (1,929 | ) | (3,670 | ) | ||||||||||||||||
| Itochu Corp. |
1.00 | % | Goldman Sachs International | 12/20/20 | JPY | 29,326 | (5,600 | ) | (1,483 | ) | (4,117 | ) | ||||||||||||||||
| ITV PLC |
5.00 | % | Barclays Bank PLC | 12/20/20 | EUR | 230 | (47,268 | ) | (41,966 | ) | (5,302 | ) | ||||||||||||||||
| ITV PLC |
5.00 | % | BNP Paribas S.A. | 12/20/20 | EUR | 230 | (47,268 | ) | (42,814 | ) | (4,454 | ) | ||||||||||||||||
| ITV PLC |
5.00 | % | JPMorgan Chase Bank N.A. | 12/20/20 | EUR | 240 | (49,323 | ) | (44,499 | ) | (4,824 | ) | ||||||||||||||||
| JPMorgan Chase & Co. |
1.00 | % | BNP Paribas S.A. | 12/20/20 | USD | 1,200 | (17,432 | ) | (5,253 | ) | (12,179 | ) | ||||||||||||||||
| JPMorgan Chase and Co. |
1.00 | % | BNP Paribas S.A. | 12/20/20 | USD | 1,400 | (20,338 | ) | (8,079 | ) | (12,259 | ) | ||||||||||||||||
| Ladbrokes PLC |
1.00 | % | Citibank N.A. | 12/20/20 | EUR | 79 | 6,646 | 5,352 | 1,294 | |||||||||||||||||||
| Lanxess AG |
1.00 | % | Bank of America N.A. | 12/20/20 | EUR | 400 | (4,088 | ) | 5,004 | (9,092 | ) | |||||||||||||||||
| Lanxess AG |
1.00 | % | Barclays Bank PLC | 12/20/20 | EUR | 124 | (1,267 | ) | (244 | ) | (1,023 | ) | ||||||||||||||||
| Lanxess AG |
1.00 | % | Citibank N.A. | 12/20/20 | EUR | 443 | (4,545 | ) | (1,295 | ) | (3,250 | ) | ||||||||||||||||
| Lanxess AG |
1.00 | % | Citibank N.A. | 12/20/20 | EUR | 400 | (4,088 | ) | 4,188 | (8,276 | ) | |||||||||||||||||
| Lanxess AG |
1.00 | % | Citibank N.A. | 12/20/20 | EUR | 366 | (3,740 | ) | 6,985 | (10,725 | ) | |||||||||||||||||
| Lanxess AG |
1.00 | % | Goldman Sachs International | 12/20/20 | EUR | 367 | (3,750 | ) | 7,189 | (10,939 | ) | |||||||||||||||||
| Lanxess AG |
1.00 | % | JPMorgan Chase Bank N.A. | 12/20/20 | EUR | 509 | (5,202 | ) | 7,354 | (12,556 | ) | |||||||||||||||||
| Lanxess AG |
1.00 | % | JPMorgan Chase Bank N.A. | 12/20/20 | EUR | 367 | (3,751 | ) | 7,602 | (11,353 | ) | |||||||||||||||||
| Lanxess AG |
1.00 | % | JPMorgan Chase Bank N.A. | 12/20/20 | EUR | 317 | (3,240 | ) | 5,506 | (8,746 | ) | |||||||||||||||||
| Lanxess AG |
1.00 | % | JPMorgan Chase Bank N.A. | 12/20/20 | EUR | 317 | (3,240 | ) | 5,506 | (8,746 | ) | |||||||||||||||||
| Loews Corp. |
1.00 | % | Barclays Bank PLC | 12/20/20 | USD | 4,245 | (130,325 | ) | (141,398 | ) | 11,073 | |||||||||||||||||
| Macquarie Bank Ltd. |
1.00 | % | Deutsche Bank AG | 12/20/20 | USD | 700 | 20,729 | 52,126 | (31,397 | ) | ||||||||||||||||||
| Melia Hotels International SA |
5.00 | % | Citibank N.A. | 12/20/20 | EUR | 260 | (56,016 | ) | (50,173 | ) | (5,843 | ) | ||||||||||||||||
| Melia Hotels International SA |
5.00 | % | Goldman Sachs International | 12/20/20 | EUR | 360 | (77,459 | ) | (67,949 | ) | (9,510 | ) | ||||||||||||||||
| Meliá Hotels International SA |
5.00 | % | Citibank N.A. | 12/20/20 | EUR | 250 | (53,792 | ) | (45,319 | ) | (8,473 | ) | ||||||||||||||||
| Metsä Board Oyj |
5.00 | % | Goldman Sachs International | 12/20/20 | EUR | 385 | (78,777 | ) | (74,336 | ) | (4,441 | ) | ||||||||||||||||
| Metsä Board Oyj |
5.00 | % | JPMorgan Chase Bank N.A. | 12/20/20 | EUR | 385 | (78,777 | ) | (74,336 | ) | (4,441 | ) | ||||||||||||||||
| Mitsubishi Corp. |
1.00 | % | Barclays Bank PLC | 12/20/20 | JPY | 47,573 | (8,633 | ) | (7,374 | ) | (1,259 | ) | ||||||||||||||||
| Mitsubishi Corp. |
1.00 | % | Goldman Sachs International | 12/20/20 | JPY | 29,326 | (5,322 | ) | (4,027 | ) | (1,295 | ) | ||||||||||||||||
| Mitsui & Co. Ltd. |
1.00 | % | Goldman Sachs International | 12/20/20 | JPY | 58,651 | (7,863 | ) | (3,164 | ) | (4,699 | ) | ||||||||||||||||
| Mitsui & Co. Ltd. |
1.00 | % | Goldman Sachs International | 12/20/20 | JPY | 29,326 | (3,931 | ) | (1,133 | ) | (2,798 | ) | ||||||||||||||||
| Monitchem HoldCo 3 SA |
5.00 | % | Credit Suisse International | 12/20/20 | EUR | 291 | (28,820 | ) | (24,493 | ) | (4,327 | ) | ||||||||||||||||
| Monitchem HoldCo 3 SA |
5.00 | % | Credit Suisse International | 12/20/20 | EUR | 219 | (21,615 | ) | (18,048 | ) | (3,567 | ) | ||||||||||||||||
| Monitchem HoldCo 3 SA |
5.00 | % | Goldman Sachs International | 12/20/20 | EUR | 240 | (23,735 | ) | (9,399 | ) | (14,336 | ) | ||||||||||||||||
| Morgan Stanley |
1.00 | % | BNP Paribas S.A. | 12/20/20 | USD | 1,200 | (622 | ) | 3,323 | (3,945 | ) | |||||||||||||||||
| Morgan Stanley |
1.00 | % | Goldman Sachs International | 12/20/20 | USD | 3,300 | (1,712 | ) | 89,702 | (91,414 | ) | |||||||||||||||||
| National Australia Bank Ltd. |
1.00 | % | JPMorgan Chase Bank N.A. | 12/20/20 | USD | 1,000 | 6,667 | (1,289 | ) | 7,956 | ||||||||||||||||||
| New Look |
5.00 | % | Credit Suisse International | 12/20/20 | EUR | 280 | (17,593 | ) | (4,624 | ) | (12,969 | ) | ||||||||||||||||
| New Look |
5.00 | % | Credit Suisse International | 12/20/20 | EUR | 120 | (7,540 | ) | (2,534 | ) | (5,006 | ) | ||||||||||||||||
| People’s Republic of China |
1.00 | % | Citibank N.A. | 12/20/20 | USD | 3,900 | 17,255 | 82,454 | (65,199 | ) | ||||||||||||||||||
| People’s Republic of China |
1.00 | % | Goldman Sachs International | 12/20/20 | USD | 1,900 | 8,406 | 25,690 | (17,284 | ) | ||||||||||||||||||
| Repsol International Finance BV |
1.00 | % | JPMorgan Chase Bank N.A. | 12/20/20 | EUR | 250 | 19,174 | 30,351 | (11,177 | ) | ||||||||||||||||||
| Repsol SA |
1.00 | % | Goldman Sachs International | 12/20/20 | EUR | 500 | 38,363 | 74,250 | (35,887 | ) | ||||||||||||||||||
See Notes to Consolidated Financial Statements.
| BLACKROCK BALANCED CAPITAL FUND, INC. | MARCH 31, 2016 | 77 |
| Consolidated Schedule of Investments (continued) | Master Total Return Portfolio |
| Issuer/Index | Pay Fixed Rate |
Counterparty | Expiration Date |
Notional Amount (000) |
Value | Premiums Paid (Received) |
Unrealized Appreciation (Depreciation) |
|||||||||||||||||||||
| Rexel SA |
5.00 | % | Barclays Bank PLC | 12/20/20 | EUR | 51 | $ (8,194 | ) | $ (5,538 | ) | $ (2,656 | ) | ||||||||||||||||
| Rexel SA |
5.00 | % | Barclays Bank PLC | 12/20/20 | EUR | 39 | (6,197 | ) | (4,888 | ) | (1,309 | ) | ||||||||||||||||
| Rexel SA |
5.00 | % | Credit Suisse International | 12/20/20 | EUR | 156 | (24,826 | ) | (21,521 | ) | (3,305 | ) | ||||||||||||||||
| Rexel SA |
5.00 | % | Goldman Sachs International | 12/20/20 | EUR | 390 | (62,065 | ) | (52,349 | ) | (9,716 | ) | ||||||||||||||||
| Royal Caribbean Cruises Ltd. |
5.00 | % | Credit Suisse International | 12/20/20 | USD | 1,000 | (141,704 | ) | (148,655 | ) | 6,951 | |||||||||||||||||
| Royal Caribbean Cruises Ltd. |
5.00 | % | JPMorgan Chase Bank N.A. | 12/20/20 | USD | 1,400 | (198,385 | ) | (129,603 | ) | (68,782 | ) | ||||||||||||||||
| Royal Caribbean Cruises Ltd. |
5.00 | % | JPMorgan Chase Bank N.A. | 12/20/20 | USD | 1,100 | (155,875 | ) | (142,839 | ) | (13,036 | ) | ||||||||||||||||
| Royal Caribbean Cruises Ltd. |
5.00 | % | JPMorgan Chase Bank N.A. | 12/20/20 | USD | 800 | (113,364 | ) | (112,566 | ) | (798 | ) | ||||||||||||||||
| Société Générale SA |
1.00 | % | Citibank N.A. | 12/20/20 | EUR | 900 | (11,108 | ) | (9,839 | ) | (1,269 | ) | ||||||||||||||||
| Solvay SA |
1.00 | % | Bank of America N.A. | 12/20/20 | EUR | 350 | 167 | (2,288 | ) | 2,455 | ||||||||||||||||||
| Solvay SA |
1.00 | % | Barclays Bank PLC | 12/20/20 | EUR | 110 | 53 | (734 | ) | 787 | ||||||||||||||||||
| Solvay SA |
1.00 | % | Citibank N.A. | 12/20/20 | EUR | 210 | 100 | (1,390 | ) | 1,490 | ||||||||||||||||||
| Solvay SA |
1.00 | % | Credit Suisse International | 12/20/20 | EUR | 84 | 40 | 2,067 | (2,027 | ) | ||||||||||||||||||
| Southwest Airlines Co. |
1.00 | % | Goldman Sachs International | 12/20/20 | USD | 3,300 | (67,340 | ) | (53,441 | ) | (13,899 | ) | ||||||||||||||||
| Standard Chartered PLC |
1.00 | % | BNP Paribas S.A. | 12/20/20 | EUR | 810 | 19,651 | 19,647 | 4 | |||||||||||||||||||
| Standard Chartered PLC |
1.00 | % | BNP Paribas S.A. | 12/20/20 | EUR | 460 | 11,160 | 11,633 | (473 | ) | ||||||||||||||||||
| Standard Chartered PLC |
1.00 | % | Goldman Sachs International | 12/20/20 | EUR | 610 | 14,799 | 6,591 | 8,208 | |||||||||||||||||||
| Standard Chartered PLC |
1.00 | % | Morgan Stanley & Co. International PLC |
12/20/20 | EUR | 240 | 5,822 | 6,188 | (366 | ) | ||||||||||||||||||
| Statoil ASA |
1.00 | % | JPMorgan Chase Bank N.A. | 12/20/20 | EUR | 500 | (8,526 | ) | 5,981 | (14,507 | ) | |||||||||||||||||
| STMicroelectronics NV |
1.00 | % | Bank of America N.A. | 12/20/20 | EUR | 400 | 12,925 | 3,032 | 9,893 | |||||||||||||||||||
| STMicroelectronics NV |
1.00 | % | Barclays Bank PLC | 12/20/20 | EUR | 400 | 12,925 | 4,210 | 8,715 | |||||||||||||||||||
| STMicroelectronics NV |
1.00 | % | Citibank N.A. | 12/20/20 | EUR | 400 | 12,926 | 4,015 | 8,911 | |||||||||||||||||||
| Sumitomo Mitsui Banking Corp. |
1.00 | % | Barclays Bank PLC | 12/20/20 | JPY | 24,938 | (2,920 | ) | 1,184 | (4,104 | ) | |||||||||||||||||
| Sumitomo Mitsui Banking Corp. |
1.00 | % | JPMorgan Chase Bank N.A. | 12/20/20 | JPY | 25,316 | (2,965 | ) | 2,003 | (4,968 | ) | |||||||||||||||||
| Target Corp. |
1.00 | % | Goldman Sachs International | 12/20/20 | USD | 2,475 | (88,818 | ) | (79,558 | ) | (9,260 | ) | ||||||||||||||||
| Target Corp. |
1.00 | % | Goldman Sachs International | 12/20/20 | USD | 2,475 | (88,818 | ) | (79,527 | ) | (9,291 | ) | ||||||||||||||||
| Target Corp. |
1.00 | % | Goldman Sachs International | 12/20/20 | USD | 1,650 | (59,212 | ) | (56,808 | ) | (2,404 | ) | ||||||||||||||||
| Target Corp. |
1.00 | % | Goldman Sachs International | 12/20/20 | USD | 1,650 | (59,212 | ) | (54,574 | ) | (4,638 | ) | ||||||||||||||||
| Target Corp. |
1.00 | % | JPMorgan Chase Bank N.A. | 12/20/20 | USD | 4,950 | (177,636 | ) | (158,731 | ) | (18,905 | ) | ||||||||||||||||
| Total SA |
1.00 | % | Barclays Bank PLC | 12/20/20 | EUR | 900 | (15,810 | ) | 52 | (15,862 | ) | |||||||||||||||||
| Valero Energy Corp. |
1.00 | % | Barclays Bank PLC | 12/20/20 | USD | 1,781 | 25,396 | 32,443 | (7,047 | ) | ||||||||||||||||||
| Valero Energy Corp. |
1.00 | % | Morgan Stanley Capital Services LLC |
12/20/20 | USD | 4,450 | 63,453 | 103,775 | (40,322 | ) | ||||||||||||||||||
| Volkswagen AG |
1.00 | % | Citibank N.A. | 12/20/20 | EUR | 500 | 15,596 | 29,371 | (13,775 | ) | ||||||||||||||||||
| Volkswagen AG |
1.00 | % | Citibank N.A. | 12/20/20 | EUR | 350 | 10,917 | 23,754 | (12,837 | ) | ||||||||||||||||||
| Volkswagen AG |
1.00 | % | Goldman Sachs International | 12/20/20 | EUR | 355 | 11,073 | 18,436 | (7,363 | ) | ||||||||||||||||||
| Volkswagen AG |
1.00 | % | Goldman Sachs International | 12/20/20 | EUR | 355 | 11,073 | 18,597 | (7,524 | ) | ||||||||||||||||||
| Wells Fargo & Co. |
1.00 | % | BNP Paribas S.A. | 12/20/20 | USD | 1,200 | (24,917 | ) | (17,788 | ) | (7,129 | ) | ||||||||||||||||
| Westpac Banking Corp. |
1.00 | % | Citibank N.A. | 12/20/20 | USD | 1,000 | 3,067 | (3,004 | ) | 6,071 | ||||||||||||||||||
| Australia & New Zealand Banking Group Ltd. |
1.00 | % | BNP Paribas S.A. | 6/20/21 | USD | 2,167 | 21,226 | 24,382 | (3,156 | ) | ||||||||||||||||||
| Australia & New Zealand Banking Group Ltd. |
1.00 | % | Deutsche Bank AG | 6/20/21 | USD | 44,463 | 435,605 | 486,426 | (50,821 | ) | ||||||||||||||||||
See Notes to Consolidated Financial Statements.
| 78 | BLACKROCK BALANCED CAPITAL FUND, INC. | MARCH 31, 2016 |
| Consolidated Schedule of Investments (continued) | Master Total Return Portfolio |
| Issuer/Index | Pay Fixed Rate |
Counterparty | Expiration Date |
Notional (000) |
Value | Premiums Paid (Received) |
Unrealized Appreciation (Depreciation) |
|||||||||||||||||||||
| Australia & New Zealand Banking Group Ltd. |
1.00 | % | Deutsche Bank AG | 6/20/21 | USD | 11,962 | $117,187 | $221,604 | $(104,417 | ) | ||||||||||||||||||
| Australia & New Zealand Banking Group Ltd. |
1.00 | % | Goldman Sachs International | 6/20/21 | USD | 42,133 | 412,776 | 366,203 | 46,573 | |||||||||||||||||||
| Australia & New Zealand Banking Group Ltd. |
1.00 | % | Goldman Sachs International | 6/20/21 | USD | 5,068 | 49,655 | 93,900 | (44,245 | ) | ||||||||||||||||||
| Australia & New Zealand Banking Group Ltd. |
1.00 | % | JPMorgan Chase Bank N.A. | 6/20/21 | USD | 32,680 | 320,164 | 356,047 | (35,883 | ) | ||||||||||||||||||
| Australia & New Zealand Banking Group Ltd. |
1.00 | % | JPMorgan Chase Bank N.A. | 6/20/21 | USD | 8,937 | 87,554 | 98,047 | (10,493 | ) | ||||||||||||||||||
| CBS Corp. |
1.00 | % | Barclays Bank PLC | 6/20/21 | USD | 1,000 | 394 | 2,595 | (2,201 | ) | ||||||||||||||||||
| Commonwealth Bank of Australia |
1.00 | % | Deutsche Bank AG | 6/20/21 | USD | 15,960 | 155,339 | 164,360 | (9,021 | ) | ||||||||||||||||||
| Commonwealth Bank of Australia |
1.00 | % | Deutsche Bank AG | 6/20/21 | USD | 12,533 | 121,985 | 232,192 | (110,207 | ) | ||||||||||||||||||
| Commonwealth Bank of Australia |
1.00 | % | Deutsche Bank AG | 6/20/21 | USD | 4,517 | 43,963 | 83,276 | (39,313 | ) | ||||||||||||||||||
| Commonwealth Bank of Australia |
1.00 | % | JPMorgan Chase Bank N.A. | 6/20/21 | USD | 18,600 | 181,033 | 195,116 | (14,083 | ) | ||||||||||||||||||
| Credit Agricole SA |
1.00 | % | Barclays Bank PLC | 6/20/21 | EUR | 3,000 | (29,601 | ) | (25,351 | ) | (4,250 | ) | ||||||||||||||||
| Dry Mix Solutions Investissements SAS |
5.00 | % | Credit Suisse International | 6/20/21 | EUR | 600 | (92,355 | ) | (81,568 | ) | (10,787 | ) | ||||||||||||||||
| Federation of Malaysia |
1.00 | % | Barclays Bank PLC | 6/20/21 | USD | 8,517 | 219,879 | 240,601 | (20,722 | ) | ||||||||||||||||||
| HSBC Bank PLC |
1.00 | % | Bank of America N.A. | 6/20/21 | EUR | 11,710 | 34,442 | 728 | 33,714 | |||||||||||||||||||
| HSBC Bank PLC |
1.00 | % | Bank of America N.A. | 6/20/21 | EUR | 9,298 | 27,348 | (20,446 | ) | 47,794 | ||||||||||||||||||
| HSBC Bank PLC |
1.00 | % | Bank of America N.A. | 6/20/21 | EUR | 7,282 | 21,418 | (16,013 | ) | 37,431 | ||||||||||||||||||
| HSBC Bank PLC |
1.00 | % | Citibank N.A. | 6/20/21 | EUR | 22,933 | 67,452 | 242,767 | (175,315 | ) | ||||||||||||||||||
| HSBC Bank PLC |
1.00 | % | Citibank N.A. | 6/20/21 | EUR | 14,970 | 44,031 | 141,484 | (97,453 | ) | ||||||||||||||||||
| HSBC Bank PLC |
1.00 | % | Citibank N.A. | 6/20/21 | EUR | 9,360 | 27,530 | (22,695 | ) | 50,225 | ||||||||||||||||||
| HSBC Bank PLC |
1.00 | % | Citibank N.A. | 6/20/21 | EUR | 4,856 | 14,282 | (11,775 | ) | 26,057 | ||||||||||||||||||
| HSBC Bank PLC |
1.00 | % | Citibank N.A. | 6/20/21 | EUR | 3,844 | 11,306 | (9,321 | ) | 20,627 | ||||||||||||||||||
| HSBC Bank PLC |
1.00 | % | Citibank N.A. | 6/20/21 | EUR | 2,515 | 7,397 | (6,098 | ) | 13,495 | ||||||||||||||||||
| HSBC Bank PLC |
1.00 | % | Citibank N.A. | 6/20/21 | EUR | 2,387 | 7,021 | (5,788 | ) | 12,809 | ||||||||||||||||||
| HSBC Bank PLC |
1.00 | % | Citibank N.A. | 6/20/21 | EUR | 1,285 | 3,779 | (3,116 | ) | 6,895 | ||||||||||||||||||
| HSBC Bank PLC |
1.00 | % | Credit Suisse International | 6/20/21 | EUR | 7,412 | 21,800 | 35,189 | (13,389 | ) | ||||||||||||||||||
| HSBC Bank PLC |
1.00 | % | JPMorgan Chase Bank N.A. | 6/20/21 | EUR | 13,820 | 40,647 | (57,813 | ) | 98,460 | ||||||||||||||||||
| HSBC Bank PLC |
1.00 | % | JPMorgan Chase Bank N.A. | 6/20/21 | EUR | 13,272 | 39,036 | (16,932 | ) | 55,968 | ||||||||||||||||||
| HSBC Bank PLC |
1.00 | % | JPMorgan Chase Bank N.A. | 6/20/21 | EUR | 328 | 965 | (1,372 | ) | 2,337 | ||||||||||||||||||
| HSBC Bank PLC |
1.00 | % | Société Générale | 6/20/21 | EUR | 14,436 | 42,460 | 885 | 41,575 | |||||||||||||||||||
| HSBC Bank PLC |
1.00 | % | Société Générale | 6/20/21 | EUR | 14,013 | 41,216 | 859 | 40,357 | |||||||||||||||||||
| Ladbrokes Group Finance PLC |
1.00 | % | BNP Paribas S.A. | 6/20/21 | EUR | 355 | 36,510 | 31,335 | 5,175 | |||||||||||||||||||
| Louis Dreyfus Commodities BV |
5.00 | % | Goldman Sachs International | 6/20/21 | EUR | 564 | (895 | ) | 31,735 | (32,630 | ) | |||||||||||||||||
| National Australia Bank Ltd. |
1.00 | % | JPMorgan Chase Bank N.A. | 6/20/21 | USD | 15,960 | 189,032 | 175,097 | 13,935 | |||||||||||||||||||
| Republic of South Africa |
1.00 | % | Bank of America N.A. | 6/20/21 | USD | 3,375 | 322,842 | 367,668 | (44,826 | ) | ||||||||||||||||||
| Republic of South Africa |
1.00 | % | Barclays Bank PLC | 6/20/21 | USD | 7,900 | 755,690 | 894,749 | (139,059 | ) | ||||||||||||||||||
| Republic of South Africa |
1.00 | % | Barclays Bank PLC | 6/20/21 | USD | 4,045 | 386,932 | 426,832 | (39,900 | ) | ||||||||||||||||||
| Republic of South Africa |
1.00 | % | BNP Paribas S.A. | 6/20/21 | USD | 2,125 | 203,271 | 243,707 | (40,436 | ) | ||||||||||||||||||
| Republic of South Africa |
1.00 | % | BNP Paribas S.A. | 6/20/21 | USD | 1,955 | 187,009 | 212,770 | (25,761 | ) | ||||||||||||||||||
| Republic of South Africa |
1.00 | % | Citibank N.A. | 6/20/21 | USD | 2,213 | 211,689 | 236,321 | (24,632 | ) | ||||||||||||||||||
| Republic of South Africa |
1.00 | % | Citibank N.A. | 6/20/21 | USD | 68 | 6,505 | 7,315 | (810 | ) | ||||||||||||||||||
| Republic of South Africa |
1.00 | % | Goldman Sachs International | 6/20/21 | USD | 2,090 | 199,923 | 240,106 | (40,183 | ) | ||||||||||||||||||
| Republic of South Africa |
1.00 | % | HSBC Bank PLC | 6/20/21 | USD | 2,275 | 217,620 | 262,982 | (45,362 | ) | ||||||||||||||||||
| Republic of South Africa |
1.00 | % | HSBC Bank PLC | 6/20/21 | USD | 2,170 | 207,575 | 242,841 | (35,266 | ) | ||||||||||||||||||
| Republic of South Africa |
1.00 | % | JPMorgan Chase Bank N.A. | 6/20/21 | USD | 4,845 | 463,458 | 521,706 | (58,248 | ) | ||||||||||||||||||
See Notes to Consolidated Financial Statements.
| BLACKROCK BALANCED CAPITAL FUND, INC. | MARCH 31, 2016 | 79 |
| Consolidated Schedule of Investments (continued) | Master Total Return Portfolio |
| Issuer/Index |
Pay Rate |
Counterparty |
Expiration Date |
Notional Amount (000) |
Value | Premiums Paid (Received) |
Unrealized Appreciation (Depreciation) |
|||||||||||||||||||||
| Republic of the Philippines |
1.00% | JPMorgan Chase Bank N.A. | 6/20/21 | USD | 7,939 | $ | 19,595 | $ | 44,782 | $ (25,187 | ) | |||||||||||||||||
| Russian Federation |
1.00% | Barclays Bank PLC | 6/20/21 | USD | 7,100 | 621,735 | 711,601 | (89,866 | ) | |||||||||||||||||||
| Standard Chartered Bank |
1.00% | Goldman Sachs International | 6/20/21 | EUR | 890 | 96,427 | 101,068 | (4,641 | ) | |||||||||||||||||||
| Standard Chartered PLC |
1.00% | Bank of America N.A. | 6/20/21 | EUR | 13,950 | 428,165 | 325,337 | 102,828 | ||||||||||||||||||||
| Standard Chartered PLC |
1.00% | Bank of America N.A. | 6/20/21 | EUR | 6,830 | 209,632 | 159,287 | 50,345 | ||||||||||||||||||||
| Standard Chartered PLC |
1.00% | Bank of America N.A. | 6/20/21 | EUR | 1,371 | 42,080 | 31,974 | 10,106 | ||||||||||||||||||||
| Standard Chartered PLC |
1.00% | BNP Paribas S.A. | 6/20/21 | EUR | 9,458 | 290,292 | 520,830 | (230,538 | ) | |||||||||||||||||||
| Standard Chartered PLC |
1.00% | BNP Paribas S.A. | 6/20/21 | EUR | 4,249 | 130,414 | 119,663 | 10,751 | ||||||||||||||||||||
| Standard Chartered PLC |
1.00% | BNP Paribas S.A. | 6/20/21 | EUR | 2,221 | 68,169 | 62,549 | 5,620 | ||||||||||||||||||||
| Standard Chartered PLC |
1.00% | BNP Paribas S.A. | 6/20/21 | EUR | 1,758 | 53,958 | 49,510 | 4,448 | ||||||||||||||||||||
| Standard Chartered PLC |
1.00% | BNP Paribas S.A. | 6/20/21 | EUR | 679 | 20,840 | 19,122 | 1,718 | ||||||||||||||||||||
| Standard Chartered PLC |
1.00% | Citibank N.A. | 6/20/21 | EUR | 13,540 | 415,580 | 663,936 | (248,356 | ) | |||||||||||||||||||
| Standard Chartered PLC |
1.00% | Citibank N.A. | 6/20/21 | EUR | 8,450 | 259,354 | 414,347 | (154,993 | ) | |||||||||||||||||||
| Standard Chartered PLC |
1.00% | Citibank N.A. | 6/20/21 | EUR | 1,431 | 43,921 | 70,169 | (26,248 | ) | |||||||||||||||||||
| Standard Chartered PLC |
1.00% | JPMorgan Chase Bank N.A. | 6/20/21 | EUR | 16,070 | 493,233 | 885,114 | (391,881 | ) | |||||||||||||||||||
| Techem GmbH |
5.00% | Credit Suisse International | 6/20/21 | EUR | 390 | (81,731 | ) | (82,350 | ) | 619 | ||||||||||||||||||
| Techem GmbH |
5.00% | Credit Suisse International | 6/20/21 | EUR | 260 | (54,487 | ) | (56,038 | ) | 1,551 | ||||||||||||||||||
| Tui AG |
5.00% | Citibank N.A. | 6/20/21 | EUR | 500 | (95,560 | ) | (97,491 | ) | 1,931 | ||||||||||||||||||
| CMBX.NA Series 8 AAA |
0.50% | Credit Suisse International | 10/17/57 | USD | 2,360 | 106,130 | 106,301 | (171 | ) | |||||||||||||||||||
| CMBX.NA Series 9 A |
2.00% | J.P. Morgan Securities LLC | 9/17/58 | USD | 2,160 | 265,043 | 306,807 | (41,764 | ) | |||||||||||||||||||
| CMBX.NA Series 9 A |
2.00% | Morgan Stanley & Co. International PLC | 9/17/58 | USD | 1,780 | 218,415 | 232,801 | (14,386 | ) | |||||||||||||||||||
| Total |
$ | 5,024,883 | $ | 9,852,123 | $(4,827,240 | ) | ||||||||||||||||||||||
|
|
|
|||||||||||||||||||||||||||
OTC Credit Default Swaps — Sell Protection
| Issuer/Index |
Receive Rate |
Counterparty | Expiration Date |
Credit Rating1 |
Notional Amount (000)2 |
Value | Premiums Paid (Received) |
Unrealized Appreciation (Depreciation) |
||||||||||||||||||||
| Banca Monte dei Paschi di Siena SpA | 3.00% | BNP Paribas S.A. | 9/20/16 | Not Rated | EUR | 2,000 | $ | (98,692 | ) | $ (65,249 | ) | $ (33,443 | ) | |||||||||||||||
| Banca Monte dei Paschi di Siena SpA | 5.00% | Deutsche Bank AG | 9/20/16 | Not Rated | EUR | 750 | (28,588 | ) | (6,974 | ) | (21,614 | ) | ||||||||||||||||
| Banca Monte dei Paschi di Siena SpA | 3.00% | JPMorgan Chase Bank N.A. | 9/20/16 | Not Rated | EUR | 2,200 | (108,562 | ) | (46,155 | ) | (62,407 | ) | ||||||||||||||||
| CDX.NA.IG Series 18 Version 1 | 1.00% | Citibank N.A. | 6/20/17 | BBB+ | USD | 103,800 | 973,299 | 28,579 | 944,720 | |||||||||||||||||||
| SAS AB | 5.00% | Goldman Sachs International | 12/20/17 | Not Rated | EUR | 270 | (8,681 | ) | (10,164 | ) | 1,483 | |||||||||||||||||
| Buoni Poliennali Del Tesoro | 1.00% | Barclays Bank PLC | 3/20/18 | BBB- | EUR | 4,500 | 53,665 | (122,053 | ) | 175,718 | ||||||||||||||||||
| Buoni Poliennali Del Tesoro | 1.00% | Barclays Bank PLC | 3/20/18 | BBB- | USD | 37 | 288 | (1,172 | ) | 1,460 | ||||||||||||||||||
| Bayerische Landesbank Gtd. | 1.00% | Barclays Bank PLC | 12/20/18 | Not Rated | EUR | 790 | 14,374 | 1,512 | 12,862 | |||||||||||||||||||
| iTraxx Sub Financials Series 20 Version 1 | 5.00% | Barclays Bank PLC | 12/20/18 | A- | EUR | 1,160 | 141,790 | 167,807 | (26,017 | ) | ||||||||||||||||||
| iTraxx Sub Financials Series 20 Version 1 | 5.00% | Citibank N.A. | 12/20/18 | A- | EUR | 1,660 | 202,906 | 237,967 | (35,061 | ) | ||||||||||||||||||
| iTraxx Sub Financials Series 20 Version 1 | 5.00% | Deutsche Bank AG | 12/20/18 | A- | EUR | 830 | 101,453 | 119,527 | (18,074 | ) | ||||||||||||||||||
| CNH Industrial NV | 5.00% | Citibank N.A. | 3/20/19 | BB+ | EUR | 240 | 22,119 | 31,612 | (9,493 | ) | ||||||||||||||||||
| CNH Industrial NV | 5.00% | Citibank N.A. | 3/20/19 | BB+ | EUR | 240 | 22,120 | 32,227 | (10,107 | ) | ||||||||||||||||||
| SAS AB | 5.00% | Goldman Sachs International | 6/20/19 | Not Rated | EUR | 1,000 | (85,325 | ) | (92,343 | ) | 7,018 | |||||||||||||||||
| Transocean Ltd. | 1.00% | Goldman Sachs International | 6/20/19 | BB+ | USD | 350 | (107,253 | ) | (7,058 | ) | (100,195 | ) | ||||||||||||||||
| Altice Finco SA | 5.00% | Citibank N.A. | 12/20/19 | B- | EUR | 120 | 10,081 | 1,419 | 8,662 | |||||||||||||||||||
| Transocean Ltd. | 1.00% | Bank of America N.A. | 12/20/19 | BB+ | USD | 720 | (258,103 | ) | (43,234 | ) | (214,869 | ) | ||||||||||||||||
| Transocean Ltd. | 1.00% | Bank of America N.A. | 12/20/19 | BB+ | USD | 595 | (213,293 | ) | (34,551 | ) | (178,742 | ) | ||||||||||||||||
See Notes to Consolidated Financial Statements.
| 80 | BLACKROCK BALANCED CAPITAL FUND, INC. | MARCH 31, 2016 |
| Consolidated Schedule of Investments (continued) | Master Total Return Portfolio |
| Issuer/Index |
Receive Rate |
Counterparty | Expiration Date |
Credit Rating1 |
Notional Amount (000)2 |
Value | Premiums Paid (Received) |
Unrealized Appreciation (Depreciation) |
||||||||||||||||||||
| Transocean Ltd. | 1.00% | Bank of America N.A. | 12/20/19 | BB+ | USD | 595 | $ | (213,293 | ) | $ | (33,729 | ) | $ | (179,564 | ) | |||||||||||||
| Transocean Ltd. | 1.00% | Barclays Bank PLC | 3/20/20 | BB+ | USD | 1,100 | (422,784 | ) | (188,812 | ) | (233,972 | ) | ||||||||||||||||
| Transocean Ltd. | 1.00% | Goldman Sachs International | 3/20/20 | BB+ | USD | 1,100 | (422,783 | ) | (303,593 | ) | (119,190 | ) | ||||||||||||||||
| United Mexican States | 1.00% | Bank of America N.A. | 6/20/20 | BBB+ | USD | 7,452 | (88,784 | ) | (64,192 | ) | (24,592 | ) | ||||||||||||||||
| People’s Republic of China | 1.00% | Barclays Bank PLC | 9/20/20 | AA- | USD | 1,000 | (1,544 | ) | (7,253 | ) | 5,709 | |||||||||||||||||
| People’s Republic of China | 1.00% | Goldman Sachs International | 9/20/20 | AA- | USD | 1,000 | (1,545 | ) | (7,670 | ) | 6,125 | |||||||||||||||||
| United Mexican States | 1.00% | JPMorgan Chase Bank N.A. | 9/20/20 | BBB+ | USD | 7,452 | (118,281 | ) | (73,040 | ) | (45,241 | ) | ||||||||||||||||
| Altice Finco SA | 5.00% | Citibank N.A. | 12/20/20 | B- | EUR | 349 | 24,329 | 9,201 | 15,128 | |||||||||||||||||||
| Altice Finco SA | 5.00% | Citibank N.A. | 12/20/20 | B- | EUR | 151 | 10,543 | 3,987 | 6,556 | |||||||||||||||||||
| Anglo American Capital PLC | 5.00% | Barclays Bank PLC | 12/20/20 | BB | EUR | 60 | (3,789 | ) | (3,926 | ) | 137 | |||||||||||||||||
| Anglo American Capital PLC | 5.00% | Credit Suisse International | 12/20/20 | BB | EUR | 150 | (9,471 | ) | (12,287 | ) | 2,816 | |||||||||||||||||
| Anglo American Capital PLC | 5.00% | Goldman Sachs International | 12/20/20 | BB | EUR | 150 | (9,471 | ) | (12,656 | ) | 3,185 | |||||||||||||||||
| Anglo American Capital PLC | 5.00% | JPMorgan Chase Bank N.A. | 12/20/20 | BB | EUR | 600 | (37,883 | ) | (36,530 | ) | (1,353 | ) | ||||||||||||||||
| Casino Guichard Perrachon SA | 1.00% | Barclays Bank PLC | 12/20/20 | BB+ | EUR | 702 | (73,830 | ) | (52,485 | ) | (21,345 | ) | ||||||||||||||||
| Casino Guichard Perrachon SA | 1.00% | Barclays Bank PLC | 12/20/20 | BB+ | EUR | 340 | (35,757 | ) | (22,790 | ) | (12,967 | ) | ||||||||||||||||
| Casino Guichard Perrachon SA | 1.00% | Barclays Bank PLC | 12/20/20 | BB+ | EUR | 160 | (16,827 | ) | (29,013 | ) | 12,186 | |||||||||||||||||
| Casino Guichard Perrachon SA | 1.00% | Barclays Bank PLC | 12/20/20 | BB+ | EUR | 160 | (16,827 | ) | (12,031 | ) | (4,796 | ) | ||||||||||||||||
| Casino Guichard Perrachon SA | 1.00% | Goldman Sachs International | 12/20/20 | BB+ | EUR | 350 | (36,810 | ) | (22,161 | ) | (14,649 | ) | ||||||||||||||||
| Casino Guichard Perrachon SA | 1.00% | JPMorgan Chase Bank N.A. | 12/20/20 | BB+ | EUR | 198 | (20,824 | ) | (14,888 | ) | (5,936 | ) | ||||||||||||||||
| Fiat Finance North America, Inc. | 5.00% | Bank of America N.A. | 12/20/20 | BB | EUR | 42 | 3,503 | 3,774 | (271 | ) | ||||||||||||||||||
| Fiat Finance North America, Inc. | 5.00% | Bank of America N.A. | 12/20/20 | BB | EUR | 0 | 33 | 36 | (3 | ) | ||||||||||||||||||
| Fiat Finance North America, Inc. | 5.00% | Barclays Bank PLC | 12/20/20 | BB | EUR | 86 | 7,225 | 8,574 | (1,349 | ) | ||||||||||||||||||
| Fiat Finance North America, Inc. | 5.00% | Barclays Bank PLC | 12/20/20 | BB | EUR | 61 | 5,160 | 6,124 | (964 | ) | ||||||||||||||||||
| Fiat Industrial Finance Europe SA | 5.00% | BNP Paribas S.A. | 12/20/20 | BB+ | EUR | 43 | 4,433 | 4,680 | (247 | ) | ||||||||||||||||||
| iTraxx Asia ex-Japan IG Series 24 Version 1 | 1.00% | Goldman Sachs International | 12/20/20 | A- | USD | 1,825 | (21,250 | ) | (48,163 | ) | 26,913 | |||||||||||||||||
| Republic of Indonesia | 1.00% | Barclays Bank PLC | 12/20/20 | BB+ | USD | 1,000 | (35,533 | ) | (66,334 | ) | 30,801 | |||||||||||||||||
| Republic of Indonesia | 1.00% | Citibank N.A. | 12/20/20 | BB+ | USD | 2,000 | (71,066 | ) | (120,055 | ) | 48,989 | |||||||||||||||||
| Republic of Indonesia | 1.00% | HSBC Bank PLC | 12/20/20 | BB+ | USD | 1,800 | (63,960 | ) | (115,859 | ) | 51,899 | |||||||||||||||||
| Tesco PLC | 1.00% | Barclays Bank PLC | 12/20/20 | BB+ | EUR | 500 | (40,728 | ) | (45,522 | ) | 4,794 | |||||||||||||||||
| Anglo American Capital PLC | 5.00% | Goldman Sachs International | 6/20/21 | BB | EUR | 630 | (51,538 | ) | (56,096 | ) | 4,558 | |||||||||||||||||
| Federative Republic of Brazil | 1.00% | Barclays Bank PLC | 6/20/21 | BB | USD | 2,676 | (313,074 | ) | (306,123 | ) | (6,951 | ) | ||||||||||||||||
| Republic of Indonesia | 1.00% | Barclays Bank PLC | 6/20/21 | BB+ | USD | 2,097 | (98,681 | ) | (110,490 | ) | 11,809 | |||||||||||||||||
| Republic of France | 0.25% | Barclays Bank PLC | 6/20/23 | AA | USD | 1,550 | (23,071 | ) | (86,634 | ) | 63,563 | |||||||||||||||||
| Republic of France | 0.25% | Citibank N.A. | 6/20/23 | AA | USD | 1,670 | (24,857 | ) | (98,574 | ) | 73,717 | |||||||||||||||||
| Republic of France | 0.25% | JPMorgan Chase Bank N.A. | 6/20/23 | AA | USD | 1,670 | (24,858 | ) | (91,594 | ) | 66,736 | |||||||||||||||||
| CMBX.NA Series 7 AAA | 0.50% | Morgan Stanley Capital Services LLC | 1/17/47 | AAA | USD | 5,000 | (154,940 | ) | (166,881 | ) | 11,941 | |||||||||||||||||
| CMBX.NA Series 3 AM | 0.50% | Credit Suisse International | 12/13/49 | BBB | USD | 920 | (18,502 | ) | (84,235 | ) | 65,733 | |||||||||||||||||
| CMBX.NA Series 3 AM | 0.50% | Goldman Sachs International | 12/13/49 | BBB | USD | 2,320 | (46,658 | ) | (215,105 | ) | 168,447 | |||||||||||||||||
| CMBX.NA Series 3 AM | 0.50% | JPMorgan Chase Bank N.A. | 12/13/49 | BBB | USD | 5,000 | (100,555 | ) | (439,899 | ) | 339,344 | |||||||||||||||||
| CMBX.NA Series 4 AM | 0.50% | Deutsche Bank AG | 2/17/51 | BB | USD | 2,000 | (56,056 | ) | (276,714 | ) | 220,658 | |||||||||||||||||
See Notes to Consolidated Financial Statements.
| BLACKROCK BALANCED CAPITAL FUND, INC. | MARCH 31, 2016 | 81 |
| Consolidated Schedule of Investments (continued) | Master Total Return Portfolio |
| Issuer/Index |
Receive Rate |
Counterparty | Expiration Date |
Credit Rating1 |
Notional Amount (000)2 |
Value | Premiums Paid (Received) |
Unrealized Appreciation (Depreciation) |
||||||||||||||||||||
| CMBX.NA Series 8 A |
2.00% | Morgan Stanley & Co. International PLC | 10/17/57 | Not Rated | USD | 1,800 | $ (182,567 | ) | $ (192,666 | ) | $ 10,099 | |||||||||||||||||
| CMBX.NA Series 8 A |
2.00% | Morgan Stanley & Co. International PLC | 10/17/57 | Not Rated | USD | 1,780 | (180,539 | ) | (200,569 | ) | 20,030 | |||||||||||||||||
| CMBX.NA Series 8 A |
2.00% | Morgan Stanley & Co. International PLC | 10/17/57 | Not Rated | USD | 1,720 | (174,453 | ) | (264,532 | ) | 90,079 | |||||||||||||||||
| CMBX.NA Series 8 A |
2.00% | Morgan Stanley & Co. International PLC | 10/17/57 | Not Rated | USD | 1,720 | (174,453 | ) | (264,198 | ) | 89,745 | |||||||||||||||||
| CMBX.NA Series 8 A |
2.00% | Morgan Stanley & Co. International PLC | 10/17/57 | Not Rated | USD | 890 | (90,270 | ) | (106,682 | ) | 16,412 | |||||||||||||||||
| CMBX.NA Series 8 A |
2.00% | Morgan Stanley & Co. International PLC | 10/17/57 | Not Rated | USD | 880 | (89,255 | ) | (106,894 | ) | 17,639 | |||||||||||||||||
| CMBX.NA Series 8 A |
2.00% | Morgan Stanley & Co. International PLC | 10/17/57 | Not Rated | USD | 450 | (45,642 | ) | (48,617 | ) | 2,975 | |||||||||||||||||
| CMBX.NA Series 8 A |
2.00% | Goldman Sachs International | 10/17/57 | Not Rated | USD | 2,140 | (216,696 | ) | (224,942 | ) | 8,246 | |||||||||||||||||
| CMBX.NA Series 8 AA |
1.50% | Goldman Sachs International | 10/17/57 | Not Rated | USD | 1,610 | (115,313 | ) | (162,408 | ) | 47,095 | |||||||||||||||||
| CMBX.NA Series 8 BBB- |
3.00% | Barclays Bank PLC | 10/17/57 | Not Rated | USD | 1,290 | (223,194 | ) | (139,994 | ) | (83,200 | ) | ||||||||||||||||
| CMBX.NA Series 8 BBB- |
3.00% | Credit Suisse International | 10/17/57 | Not Rated | USD | 640 | (110,892 | ) | (67,625 | ) | (43,267 | ) | ||||||||||||||||
| CMBX.NA Series 9 A |
2.00% | J.P. Morgan Securities LLC | 9/17/58 | Not Rated | USD | 551 | (67,663 | ) | (69,508 | ) | 1,845 | |||||||||||||||||
| CMBX.NA Series 9 A |
2.00% | Morgan Stanley & Co. International PLC | 9/17/58 | Not Rated | USD | 3,740 | (458,950 | ) | (615,351 | ) | 156,401 | |||||||||||||||||
| CMBX.NA Series 9 A |
2.00% | Morgan Stanley & Co. International PLC | 9/17/58 | Not Rated | USD | 880 | (107,981 | ) | (124,841 | ) | 16,860 | |||||||||||||||||
| CMBX.NA Series 9 A |
2.00% | Morgan Stanley & Co. International PLC | 9/17/58 | Not Rated | USD | 870 | (106,753 | ) | (150,728 | ) | 43,975 | |||||||||||||||||
| CMBX.NA Series 9 BBB- |
3.00% | Credit Suisse International | 9/17/58 | Not Rated | USD | 1,810 | (349,445 | ) | (351,163 | ) | 1,718 | |||||||||||||||||
| Total |
$(4,681,072 | ) | $(6,087,979 | ) | $1,406,907 | |||||||||||||||||||||||
|
|
|
|||||||||||||||||||||||||||
| 1 | Using S&P’s rating of the issuer or the underlying securities of the index, as applicable. |
| 2 | The maximum potential amount the Master Portfolio may pay should a negative credit event take place as defined under the terms of the agreement. |
OTC Interest Rate Swaps
| Fixed Rate |
Floating Rate |
Counterparty | Effective Date |
Expiration Date |
Notional Amount (000) |
Value | Premiums Paid (Received) |
Unrealized Appreciation (Depreciation) |
||||||||||||||||||
| 6.44%1 |
1-day COOIS | Credit Suisse International | N/A | 5/23/16 | COP | 63,467,022 | $ (17,692 | ) | — | $ (17,692 | ) | |||||||||||||||
| 6.64%1 |
1-day COOIS | Credit Suisse International | N/A | 8/22/16 | COP | 42,569,344 | 18,982 | — | 18,982 | |||||||||||||||||
| 1.92%1 |
3-month KRW Certificate of Deposit |
Deutsche Bank AG | N/A | 11/10/17 | KRW | 10,139,328 | 71,638 | $21,737 | 49,901 | |||||||||||||||||
| 1.69%2 |
3-month KRW Certificate of Deposit |
Deutsche Bank AG | N/A | 11/10/17 | KRW | 10,139,328 | (36,327 | ) | — | (36,327 | ) | |||||||||||||||
| 2.26%1 |
7-day China Fixing Repo Rates | Deutsche Bank AG | N/A | 11/12/17 | CNY | 61,675 | (369 | ) | 10 | (379 | ) | |||||||||||||||
| 4.30%2 |
28-day MXIBTIIE | Bank of America N.A. | N/A | 12/07/17 | MXN | 23,670 | 5,691 | 31 | 5,660 | |||||||||||||||||
| 4.30%2 |
28-day MXIBTIIE | Bank of America N.A. | N/A | 12/18/17 | MXN | 269,761 | 67,233 | 315 | 66,918 | |||||||||||||||||
| 4.55%2 |
28-day MXIBTIIE | Barclays Bank PLC | N/A | 3/21/18 | MXN | 39,525 | 2,299 | 505 | 1,794 | |||||||||||||||||
| 1.47%1 |
6-month WIBOR | Barclays Bank PLC | 6/15/163 | 6/15/18 | PLN | 180,000 | (6,923 | ) | — | (6,923 | ) | |||||||||||||||
| 4.85%2 |
28-day MXIBTIIE | Bank of America N.A. | N/A | 11/01/18 | MXN | 23,232 | (3,921 | ) | 52 | (3,973 | ) | |||||||||||||||
| 4.77%2 |
28-day MXIBTIIE | Citibank N.A. | N/A | 12/05/18 | MXN | 16,034 | (306 | ) | 33 | (339 | ) | |||||||||||||||
| 4.70%2 |
28-day MXIBTIIE | Bank of America N.A. | N/A | 12/06/18 | MXN | 16,034 | 1,391 | 32 | 1,359 | |||||||||||||||||
| 4.76%2 |
28-day MXIBTIIE | Citibank N.A. | N/A | 12/06/18 | MXN | 16,034 | (34 | ) | 33 | (67 | ) | |||||||||||||||
| 5.41%1 |
28-day MXIBTIIE | Goldman Sachs International | N/A | 1/01/21 | MXN | 148,665 | 65,632 | (1,240 | ) | 66,872 | ||||||||||||||||
| 11.41%2 |
1-day BZDIOVER | Bank of America N.A. | N/A | 1/04/21 | BRL | 4,756 | 179,338 | — | 179,338 | |||||||||||||||||
| 12.05%1 |
1-day BZDIOVER | Bank of America N.A. | N/A | 1/04/21 | BRL | 2,974 | (80,123 | ) | — | (80,123 | ) | |||||||||||||||
| 11.84%1 |
1-day BZDIOVER | HSBC Bank PLC | N/A | 1/04/21 | BRL | 1,990 | (60,207 | ) | — | (60,207 | ) | |||||||||||||||
| 3.27%2 |
3-month LIBOR | Deutsche Bank AG | N/A | 5/16/21 | USD | 9,510 | (1,095,439 | ) | — | (1,095,439 | ) | |||||||||||||||
See Notes to Consolidated Financial Statements.
| 82 | BLACKROCK BALANCED CAPITAL FUND, INC. | MARCH 31, 2016 |
| Consolidated Schedule of Investments (continued) | Master Total Return Portfolio |
| Fixed Rate |
Floating Rate |
Counterparty | Effective Date |
Expiration Date |
Notional Amount (000) |
Value | Premiums Paid (Received) |
Unrealized Appreciation (Depreciation) |
||||||||||||||||||
| 1.82%2 |
6-month WIBOR | Barclays Bank PLC | 6/15/163 | 6/15/21 | PLN | 75,000 | $ | (23,553 | ) | — | $ | (23,553 | ) | |||||||||||||
| 5.84%1 |
28-day MXIBTIIE | Deutsche Bank AG | N/A | 11/14/24 | MXN | 37,523 | (10,787 | ) | $ | (181 | ) | (10,606 | ) | |||||||||||||
| 5.85%1 |
28-day MXIBTIIE | Deutsche Bank AG | N/A | 11/14/24 | MXN | 16,314 | (4,169 | ) | (79 | ) | (4,090 | ) | ||||||||||||||
| 5.73%2 |
28-day MXIBTIIE | Bank of America N.A. | N/A | 1/03/25 | MXN | 23,376 | 19,049 | 290 | 18,759 | |||||||||||||||||
| 5.55%1 |
28-day MXIBTIIE | Bank of America N.A. | N/A | 1/13/25 | MXN | 31,430 | (49,525 | ) | (129 | ) | (49,396 | ) | ||||||||||||||
| 5.56%1 |
28-day MXIBTIIE | Goldman Sachs International | N/A | 1/13/25 | MXN | 45,012 | (70,005 | ) | (185 | ) | (69,820 | ) | ||||||||||||||
| 6.33%1 |
28-day MXIBTIIE | Citibank N.A. | N/A | 6/09/25 | MXN | 14,869 | 21,684 | (81 | ) | 21,765 | ||||||||||||||||
| 6.33%1 |
28-day MXIBTIIE | Citibank N.A. | N/A | 7/17/25 | MXN | 36,610 | 54,546 | (178 | ) | 54,724 | ||||||||||||||||
| 6.32%1 |
28-day MXIBTIIE | Morgan Stanley Capital Services LLC | N/A | 7/17/25 | MXN | 73,475 | 107,916 | (355 | ) | 108,271 | ||||||||||||||||
| 6.32%1 |
28-day MXIBTIIE | Goldman Sachs International | N/A | 8/06/25 | MXN | 109,616 | 148,860 | (525 | ) | 149,385 | ||||||||||||||||
| 6.31%2 |
28-day MXIBTIIE | Bank of America N.A. | N/A | 8/11/25 | MXN | 36,783 | (51,875 | ) | 170 | (52,045 | ) | |||||||||||||||
| 6.31%2 |
28-day MXIBTIIE | Bank of America N.A. | N/A | 8/11/25 | MXN | 36,783 | (51,875 | ) | 170 | (52,045 | ) | |||||||||||||||
| 6.31%2 |
28-day MXIBTIIE | Deutsche Bank AG | N/A | 8/11/25 | MXN | 136,536 | (190,912 | ) | 630 | (191,542 | ) | |||||||||||||||
| 6.27%1 |
28-day MXIBTIIE | Bank of America N.A. | N/A | 12/05/25 | MXN | 4,348 | 4,804 | (58 | ) | 4,862 | ||||||||||||||||
| 5.96%1 |
28-day MXIBTIIE | Citibank N.A. | N/A | 1/30/26 | MXN | 117,761 | (40,157 | ) | (1,598 | ) | (38,559 | ) | ||||||||||||||
| 6.23%1 |
28-day MXIBTIIE | Citibank N.A. | N/A | 2/23/26 | MXN | 91,669 | 74,741 | (304 | ) | 75,045 | ||||||||||||||||
|
6.24%1 |
28-day MXIBTIIE | Goldman Sachs International | N/A | 2/23/26 | MXN | 106,905 | 94,347 | (357 | ) | 94,704 | ||||||||||||||||
| Total |
$ | (856,048 | ) | $ | 18,738 | $ | (874,786 | ) | ||||||||||||||||||
|
|
|
|||||||||||||||||||||||||
| 1 | Master Portfolio pays the floating rate and receives the fixed rate. |
| 2 | Master Portfolio pays the fixed rate and receives the floating rate. |
| 3 | Forward swap. |
OTC Total Return Swaps
| Reference Entity | Fixed Rate/ |
Counterparty | Expiration Date |
Contract Amount |
Value |
Premiums Paid |
Unrealized Depreciation |
|||||||||||||||||
| Schlumberger NV | 3-month LIBOR minus 0.25%1 |
BNP Paribas S.A. | 6/30/16 | USD | 23,286 | $ | (103,400 | ) | — | $ | (103,400 | ) | ||||||||||||
| Market Vector Semiconductor ETF | 3-month LIBOR minus 0.75%1 |
Bank of America N.A. | 12/30/16 | USD | 17,875 | (46,852 | ) | — | (46,852 | ) | ||||||||||||||
| Market Vector Semiconductor ETF | 3-month LIBOR minus 1.10%1 |
BNP Paribas S.A. | 12/30/16 | USD | 17,624 | (103,953 | ) | — | (103,953 | ) | ||||||||||||||
| Schlumberger NV | 3-month LIBOR minus 0.25%1 |
BNP Paribas S.A. | 12/30/16 | USD | 9,282 | (36,980 | ) | — | (36,980 | ) | ||||||||||||||
| Total |
$ | (291,185 | ) | — | $ | (291,185 | ) | |||||||||||||||||
|
|
|
|||||||||||||||||||||||
| 1 | Master Portfolio pays the total return of the reference entity and receives the floating rate. Net payment made at termination. |
OTC Total Return Swaps1
| Reference Entity | Counterparty | Expiration Dates |
Net Notional |
Unrealized Depreciation |
Net Value of Reference Entities |
|||||||||||
| Equity Securities Long/Short |
Bank of America N.A. | 4/07/17-5/22/17 | USD 1,761,636 | $(36,494 | )2 | $1,715,817 | ||||||||||
| 1 | The Master Portfolio receives or pays the total return on a portfolio of long and short positions underlying the total return swap. In addition, the Master Portfolio pays or receives a variable rate of interest, based on a specified benchmark, plus or minus a spread in a range of 24-175 basis points. The benchmark and spread are determined based upon the country and/or currency of the individual underlying positions. The following are the specified benchmarks used in determining the variable rate of interest: |
| Intercontinental Exchange 1 Week GBP LIBOR |
| Intercontinental Exchange 1 Week EURIBOR |
| 2 | Amount includes $9,325 of dividends. |
See Notes to Consolidated Financial Statements.
| BLACKROCK BALANCED CAPITAL FUND, INC. | MARCH 31, 2016 | 83 |
| Consolidated Schedule of Investments (continued) | Master Total Return Portfolio |
| Transactions in Options Written for the Six Months Ended March 31, 2016 | ||||||||||||||||||||||||||||||||
| Calls |
||||||||||||||||||||||||||||||||
|
|
|
|||||||||||||||||||||||||||||||
| Notional (000) |
||||||||||||||||||||||||||||||||
|
|
|
|||||||||||||||||||||||||||||||
| Number of Contracts |
AUD | EUR | GBP | JPY | KRW | USD | Premiums Received |
|||||||||||||||||||||||||
|
|
|
|||||||||||||||||||||||||||||||
| Outstanding options, beginning of period |
961 | — | — | — | — | 10,139,328 | 198,657 | $ | 2,163,391 | |||||||||||||||||||||||
| Options written |
3,502,961 | 11,800 | 476,211 | 316,850 | 3,577,356 | — | 1,093,137 | 36,823,905 | ||||||||||||||||||||||||
| Options exercised |
— | — | (186,798 | ) | — | (3,421,486 | ) | — | (87,083 | ) | (6,124,005) | |||||||||||||||||||||
| Options expired |
(3,414,704 | ) | (11,800 | ) | (249,605 | ) | — | (155,870 | ) | (10,139,328 | ) | (298,959 | ) | (3,960,187) | ||||||||||||||||||
| Options closed |
(74,323 | ) | — | (27,808 | ) | — | — | — | (391,114 | ) | (15,137,310) | |||||||||||||||||||||
|
|
|
|||||||||||||||||||||||||||||||
| Outstanding options, end of period |
14,895 | — | 12,000 | 316,850 | — | — | 514,638 | $ | 13,765,794 | |||||||||||||||||||||||
|
|
|
|||||||||||||||||||||||||||||||
|
Puts |
||||||||||||||||||||||||||||||||
| Notional (000) |
||||||||||||||||||||||||||||||||
|
|
|
|||||||||||||||||||||||||||||||
| Number of Contracts |
AUD | CAD | CHF | EUR | GBP | USD | Premiums Received |
|||||||||||||||||||||||||
|
|
|
|||||||||||||||||||||||||||||||
| Outstanding options, beginning of period |
11,202 | 900 | — | 79,743 | — | 13,375 | $ | 4,295,928 | ||||||||||||||||||||||||
| Options written |
3,444,196 | 60,360 | 8,210 | 114,351 | 465,787 | 67,600 | 407,373 | 23,030,052 | ||||||||||||||||||||||||
| Options exercised |
(25 | ) | — | — | — | (30,860 | ) | — | (30,729 | ) | (673,071) | |||||||||||||||||||||
| Options expired |
(3,407,992 | ) | (61,260 | ) | — | — | (461,803 | ) | (35,220 | ) | (79,448 | ) | (8,862,232) | |||||||||||||||||||
| Options closed |
(42,629 | ) | — | (8,210 | ) | (11,000 | ) | — | — | (242,359 | ) | (12,233,508) | ||||||||||||||||||||
|
|
|
|||||||||||||||||||||||||||||||
| Outstanding options, end of period |
4,752 | — | — | 103,351 | 52,867 | 32,380 | 68,212 | $ | 5,557,169 | |||||||||||||||||||||||
|
|
|
|||||||||||||||||||||||||||||||
As of period end, the value of portfolio securities subject to covered call options written was $16,709,118.
| Derivative Financial Instruments Categorized by Risk Exposure |
As of period end, the fair values of derivative financial instruments located in the Consolidated Statement of Assets and Liabilities were as follows:
| Assets - Derivative Financial Instruments | Commodity Contracts |
Credit Contracts |
Equity Contracts |
Foreign Currency Exchange Contracts |
Interest Rate Contracts |
Other Contracts |
Total | |||||||||||||||||||||
| Futures contracts |
Net unrealized appreciation1 |
$347,120 | — | $ | 96,212 | — | $ | 2,241,951 | — | $ | 2,685,283 | |||||||||||||||||
| Forward foreign currency exchange contracts |
Unrealized appreciation on forward foreign currency exchange contracts |
— | — | — | $ | 10,832,377 | — | — | 10,832,377 | |||||||||||||||||||
| Interest rate caps |
Interest rate caps premiums paid |
— | — | — | — | 134,979 | — | 134,979 | ||||||||||||||||||||
| Options purchased |
Investments at value — unaffiliated2 |
— | — | 1,266,810 | 12,711,880 | 3,018,178 | — | 16,996,868 | ||||||||||||||||||||
| Swaps - centrally cleared |
Net unrealized appreciation1 |
— | $ | 21,113 | — | — | 3,155,282 | — | 3,176,395 | |||||||||||||||||||
| Unrealized appreciation on OTC swaps; |
||||||||||||||||||||||||||||
| Swaps - OTC |
Swap premiums paid |
— | 18,389,953 | — | — | 942,347 | — | 19,332,300 | ||||||||||||||||||||
|
|
||||||||||||||||||||||||||||
| Total |
$347,120 | $ | 18,411,066 | $ | 1,363,022 | $ | 23,544,257 | $ | 9,492,737 | — | $ | 53,158,202 | ||||||||||||||||
|
|
|
|||||||||||||||||||||||||||
See Notes to Consolidated Financial Statements.
| 84 | BLACKROCK BALANCED CAPITAL FUND, INC. | MARCH 31, 2016 |
| Consolidated Schedule of Investments (continued) | Master Total Return Portfolio |
| Liabilities - Derivative Financial Instruments |
Commodity Contracts |
Credit Contracts |
Equity Contracts |
Foreign Currency Exchange Contracts |
Interest Rate Contracts |
Other Contracts |
Total | |||||||||||||||||||||
| Futures contracts |
Net unrealized depreciation1 |
$262,495 | — | $ | 260,537 | — | $ | 2,022,214 | — | $ 2,545,246 | ||||||||||||||||||
| Forward foreign currency exchange contracts |
Unrealized depreciation on forward foreign currency exchange contracts |
— | — | — | $ | 31,139,086 | — | — | 31,139,086 | |||||||||||||||||||
| Interest rate caps |
Net unrealized depreciation |
— | — | — | — | 102,169 | — | 102,169 | ||||||||||||||||||||
| Options written |
Options written at value |
— | — | 1,455,719 | 10,387,558 | 2,484,125 | — | 14,327,402 | ||||||||||||||||||||
| Swaps - centrally cleared |
Net unrealized depreciation1 |
— | $ | 419,062 | — | — | 8,147,741 | — | 8,566,803 | |||||||||||||||||||
| Unrealized depreciation on OTC swaps; |
||||||||||||||||||||||||||||
| Swaps - OTC |
Swap premiums received |
— | 18,046,142 | 327,679 | — | 1,798,395 | — | 20,172,216 | ||||||||||||||||||||
|
|
||||||||||||||||||||||||||||
| Total |
$262,495 | $ | 18,465,204 | $ | 2,043,935 | $ | 41,526,644 | $ | 14,554,644 | — | $76,852,922 | |||||||||||||||||
|
|
|
|||||||||||||||||||||||||||
| 1 | Includes cumulative appreciation (depreciation) on futures contracts and centrally cleared swaps, if any, as reported in the Consolidated Schedule of Investments. Only current day’s variation margin is reported within the Consolidated Statement of Assets and Liabilities. |
| 2 | Includes options purchased at value as reported in the Consolidated Schedule of Investments. |
For the six months ended March 31, 2016, the effect of derivative financial instruments in the Consolidated Statement of Operations was as follows:
| Net Realized Gain (Loss) from: | Commodity Contracts |
Credit Contracts |
Equity Contracts |
Foreign Currency Exchange Contracts |
Interest Rate Contracts |
Other Contracts |
Total | |||||||||||||||||||||
| Futures contracts |
$(35,335 | ) | — | $ | (2,397,144 | ) | $ 104,283 | $(6,599,761 | ) | — | $ | (8,927,957 | ) | |||||||||||||||
| Forward foreign currency exchange contracts |
— | — | — | 1,308,726 | — | — | 1,308,726 | |||||||||||||||||||||
| Interest rate caps |
— | — | — | — | (108,251 | ) | — | (108,251 | ) | |||||||||||||||||||
| Options purchased1 |
— | $ | (304,832 | ) | (3,612,797 | ) | (10,349,239 | ) | (4,353,423 | ) | — | (18,620,291 | ) | |||||||||||||||
| Options written |
— | 84,631 | 5,096,483 | 12,098,752 | 1,986,420 | — | 19,266,286 | |||||||||||||||||||||
| Swaps |
— | (5,342,237 | ) | 325,320 | — | (421,093 | ) | — | (5,438,010 | ) | ||||||||||||||||||
|
|
|
|||||||||||||||||||||||||||
| $(35,335 | ) | $ | (5,562,438 | ) | $ | (588,138 | ) | $ 3,162,522 | $(9,496,108 | ) | — | $ | (12,519,497 | ) | ||||||||||||||
|
|
|
|||||||||||||||||||||||||||
| Net Change in Unrealized Appreciation (Depreciation) on: | Commodity Contracts |
Credit Contracts |
Equity Contracts |
Foreign Currency Exchange Contracts |
Interest Rate Contracts |
Other Contracts |
Total | |||||||||||||||||||||
| Futures contracts |
$ 84,625 | — | $ | (222,934 | ) | $ 25,787 | $ 6,784,579 | — | $ | 6,672,057 | ||||||||||||||||||
| Forward foreign currency exchange contracts |
— | — | — | (15,664,843 | ) | — | — | (15,664,843 | ) | |||||||||||||||||||
| Interest rate caps |
— | — | — | — | (102,169 | ) | — | (102,169 | ) | |||||||||||||||||||
| Options purchased2 |
— | $ | 64,013 | (2,243,506 | ) | (7,731,004 | ) | 2,745,592 | — | (7,164,905 | ) | |||||||||||||||||
| Options written |
— | (3,624 | ) | 264,432 | 5,642,803 | (847,377 | ) | — | 5,056,234 | |||||||||||||||||||
| Swaps |
— | (58,017 | ) | (1,552,878 | ) | — | (2,640,807 | ) | — | (4,251,702 | ) | |||||||||||||||||
|
|
|
|||||||||||||||||||||||||||
| Total |
$ 84,625 | $ | 2,372 | $ | (3,754,886 | ) | $(17,727,257 | ) | $ 5,939,818 | — | $ | (15,455,328 | ) | |||||||||||||||
|
|
|
|||||||||||||||||||||||||||
| 1 | Options purchased are included in net realized gain (loss) from investments. |
| 2 | Options purchased are included in net change in unrealized appreciation (depreciation) on investments. |
| Average Quarterly Balances of Outstanding Derivative Financial Instruments |
| Futures contracts: |
||||
| Average notional value of contracts — long |
$ | 1,095,420,474 | ||
| Average notional value of contracts — short |
$ | 1,227,652,290 | ||
| Forward foreign currency exchange contracts: |
||||
| Average amounts purchased — in USD |
$ | 1,192,344,282 | ||
| Average amounts sold — in USD |
$ | 435,288,254 | ||
| Options: |
||||
| Average value of option contracts purchased |
$ | 17,480,092 | ||
| Average value of option contracts written |
$ | 13,355,447 | ||
| Average notional value of swaption contracts purchased |
$ | 83,030,000 | ||
| Average value of interest rate caps purchased |
$ | 49,759 | ||
| Credit default swaps: |
||||
| Average notional value — buy protection |
$ | 714,498,717 | ||
| Average notional value — sell protection. |
$ | 246,392,598 |
See Notes to Consolidated Financial Statements.
| BLACKROCK BALANCED CAPITAL FUND, INC. | MARCH 31, 2016 | 85 |
| Consolidated Schedule of Investments (continued) | Master Total Return Portfolio |
| Interest rate swaps: |
||||
| Average notional value — pays fixed rate |
$ | 717,070,201 | ||
| Average notional value — receives fixed rate |
$ | 479,623,896 | ||
| Total return swaps: |
||||
| Average notional value |
$ | 11,701,993 |
For more information about the Master Portfolio’s investment risks regarding derivative financial instruments, refer to the Consolidated Notes to Financial Statements.
| Derivative Financial Instruments — Offsetting as of Period End |
The Master Portfolio’s derivative assets and liabilities (by type) were as follows:
| Assets | Liabilities | |||||||||
| Derivative Financial Instruments: |
||||||||||
| Futures contracts |
$ 1,789,346 | $ 960,455 | ||||||||
| Forward foreign currency exchange contracts |
10,832,377 | 31,139,086 | ||||||||
| Interest rate caps1 |
134,979 | 102,169 | ||||||||
| Options |
16,996,868 | 2 | 14,327,402 | |||||||
| Swaps — Centrally cleared |
— | 1,084,563 | ||||||||
| Swaps — OTC3 |
19,332,300 | 20,172,216 | ||||||||
|
|
| |||||||||
| Total derivative assets and liabilities in the Consolidated Statements of Assets and Liabilities |
$49,085,870 | $67,785,891 | ||||||||
| Derivatives not subject to a Master Netting Agreement or similar agreement (“MNA”) |
(6,074,334 | ) | (5,984,862 | ) | ||||||
|
|
| |||||||||
| Total derivative assets and liabilities subject to an MNA |
$43,011,536 | $61,801,029 | ||||||||
|
|
| |||||||||
| 1 | Includes unrealized appreciation (depreciation) and premiums paid on interest rate caps in the Consolidated Statement of Assets and Liabilities. |
| 2 | Includes options purchased at value which is included in Investments at value — unaffiliated in the Consolidated Statement of Assets and Liabilities and reported in the Consolidated Schedule of Investments. |
| 3 | Includes unrealized appreciation (depreciation) on OTC swaps and swap premiums paid/received in the Consolidated Statement of Assets and Liabilities. |
The following tables present the Master Portfolio’s derivative assets and liabilities by counterparty net of amounts for offset under an MNA and net of the related collateral received and pledged by the Master Portfolio:
| Counterparty | Derivative Assets Subject to an MNA by Counterparty |
Derivatives Available for Offset1 |
Non-cash Collateral Received |
Cash Collateral Received2 |
Net Amount of Derivative Assets3 |
|||||||||||||
| Bank of America N.A. |
$ 3,875,391 | $ (3,875,391) | — | — | — | |||||||||||||
| Barclays Bank PLC |
3,397,110 | (3,015,602) | — | $ (381,508 | ) | — | ||||||||||||
| BNP Paribas S.A. |
3,919,843 | (2,616,477) | — | (530,000 | ) | $ 773,366 | ||||||||||||
| Citibank N.A. |
4,483,949 | (3,431,096) | — | (1,052,853 | ) | — | ||||||||||||
| Commonwealth Bank of Australia |
192,236 | — | — | — | 192,236 | |||||||||||||
| Credit Suisse International |
316,240 | (316,240) | — | — | — | |||||||||||||
| Deutsche Bank AG |
9,807,281 | (6,840,268) | — | — | 2,967,013 | |||||||||||||
| Goldman Sachs International |
2,740,094 | (2,740,094) | — | — | — | |||||||||||||
| HSBC Bank PLC |
2,348,041 | (2,348,041) | — | — | — | |||||||||||||
| J.P. Morgan Securities LLC |
308,652 | (111,272) | — | — | 197,380 | |||||||||||||
| JPMorgan Chase Bank N.A. |
8,089,570 | (8,089,570) | — | — | — | |||||||||||||
| Morgan Stanley & Co. International PLC |
1,057,943 | (1,057,943) | — | — | — | |||||||||||||
| Morgan Stanley Capital Services LLC |
237,322 | (219,367) | — | — | 17,955 | |||||||||||||
| Northern Trust Corp. |
15,855 | — | — | — | 15,855 | |||||||||||||
| Royal Bank of Canada |
659,154 | — | — | — | 659,154 | |||||||||||||
| Royal Bank of Scotland PLC |
453,560 | (453,560) | — | — | — | |||||||||||||
| Société Générale |
83,676 | — | — | — | 83,676 | |||||||||||||
| Standard Chartered Bank |
514,015 | (514,015) | — | — | — | |||||||||||||
| State Street Bank and Trust Co. |
95,831 | (95,831) | — | — | — | |||||||||||||
| UBS AG |
3,823 | (3,823) | — | — | — | |||||||||||||
| Westpac Banking Corp. |
411,950 | (411,950) | — | — | — | |||||||||||||
|
|
|
|||||||||||||||||
| Total |
$43,011,536 | $(36,140,540) | — | $(1,964,361 | ) | $4,906,635 | ||||||||||||
|
|
|
|||||||||||||||||
See Notes to Consolidated Financial Statements.
| 86 | BLACKROCK BALANCED CAPITAL FUND, INC. | MARCH 31, 2016 |
| Consolidated Schedule of Investments (continued) | Master Total Return Portfolio |
| Counterparty |
Derivative Subject to an Counterparty |
Derivatives for Offset1 |
Non-cash Collateral Pledged |
Cash Collateral Pledged4 |
Net Amount of Derivative Liabilities5 |
|||||||||||||
| Bank of America N.A. |
$ 5,159,986 | $ (3,875,391) | — | — | $ 1,284,595 | |||||||||||||
| Barclays Bank PLC |
3,015,602 | (3,015,602) | — | — | — | |||||||||||||
| BNP Paribas S.A. |
2,616,477 | (2,616,477) | — | — | — | |||||||||||||
| Citibank N.A. |
3,431,096 | (3,431,096) | — | — | — | |||||||||||||
| Credit Suisse International |
2,290,224 | (316,240) | — | $(1,683,000 | ) | 290,984 | ||||||||||||
| Deutsche Bank AG |
6,840,268 | (6,840,268) | — | — | — | |||||||||||||
| Goldman Sachs Bank USA |
39,369 | — | — | — | 39,369 | |||||||||||||
| Goldman Sachs International |
3,236,281 | (2,740,094) | — | (496,187 | ) | — | ||||||||||||
| HSBC Bank PLC |
4,034,854 | (2,348,041) | — | (760,000 | ) | 926,813 | ||||||||||||
| J.P. Morgan Securities LLC |
111,272 | (111,272) | — | — | — | |||||||||||||
| JPMorgan Chase Bank N.A. |
8,490,010 | (8,089,570) | — | — | 400,440 | |||||||||||||
| Morgan Stanley & Co. International PLC |
13,885,087 | (1,057,943) | — | (1,260,000 | ) | 11,567,144 | ||||||||||||
| Morgan Stanley Capital Services LLC |
219,367 | (219,367) | — | — | — | |||||||||||||
| Royal Bank of Scotland PLC |
1,384,721 | (453,560) | — | — | 931,161 | |||||||||||||
| Standard Chartered Bank |
2,011,738 | (514,015) | — | — | 1,497,723 | |||||||||||||
| State Street Bank and Trust Co. |
3,817,153 | (95,831) | — | — | 3,721,322 | |||||||||||||
| UBS AG |
510,849 | (3,823) | — | — | 507,026 | |||||||||||||
| Westpac Banking Corp. |
706,675 | (411,950) | — | — | 294,725 | |||||||||||||
|
|
|
|||||||||||||||||
| Total |
$61,801,029 | $(36,140,540) | — | $(4,199,187 | ) | $21,461,302 | ||||||||||||
|
|
|
|||||||||||||||||
| 1 | The amount of derivatives available for offset is limited to the amount of derivative assets and/or liabilities that are subject to an MNA. |
| 2 | Excess of collateral received from the individual counterparty is not shown for financial reporting purposes. |
| 3 | Net amount represents the net amount receivable from the counterparty in the event of default. |
| 4 | Excess of collateral pledged to the individual counterparty is not shown for financial reporting purposes. |
| 5 | Net amount represents the net amount payable due to the counterparty in the event of default. Net amount may be offset further by the options written receivable/payable on the Consolidated Statement of Assets and Liabilities. |
| Fair Value Hierarchy as of Period End |
Various inputs are used in determining the fair value of investments and derivative financial instruments. For information about the Master Portfolio’s policy regarding valuation of investments and derivative financial instruments, refer to the Consolidated Notes to Financial Statements.
The following tables summarize the Master Portfolio’s investments and derivative financial instruments categorized in the disclosure hierarchy:
| Level 1 | Level 2 | Level 3 | Total | |||||||||||||
| Assets: |
||||||||||||||||
| Investments: |
||||||||||||||||
| Long-Term Investments: |
||||||||||||||||
| Asset-Backed Securities |
— | $ | 568,139,769 | $ | 150,890,415 | $ | 719,030,184 | |||||||||
| Common Stocks1 |
$ | 9,689,149 | — | — | 9,689,149 | |||||||||||
| Corporate Bonds |
— | 2,181,738,097 | 377,549 | 2,182,115,646 | ||||||||||||
| Floating Rate Loan Interests |
— | 70,919,856 | — | 70,919,856 | ||||||||||||
| Foreign Agency Obligations |
— | 23,799,889 | — | 23,799,889 | ||||||||||||
| Foreign Government Obligations |
— | 391,667,968 | — | 391,667,968 | ||||||||||||
| Investment Companies |
232,182,916 | — | — | 232,182,916 | ||||||||||||
| Non-Agency Mortgage-Backed Securities |
— | 533,252,636 | 57,202,668 | 590,455,304 | ||||||||||||
| Other Interests |
— | — | 925 | 925 | ||||||||||||
| Preferred Securities |
23,994,065 | 67,887,614 | 1,568,081 | 93,449,760 | ||||||||||||
| Taxable Municipal Bonds |
— | 295,282,394 | — | 295,282,394 | ||||||||||||
| U.S. Government Sponsored Agency Securities |
— | 4,590,365,266 | 5,543,058 | 4,595,908,324 | ||||||||||||
| U.S. Treasury Obligations |
— | 3,088,360,671 | — | 3,088,360,671 | ||||||||||||
| Short-Term Securities: |
||||||||||||||||
| Borrowed Bond Agreements |
— | 327,254,153 | — | 327,254,153 | ||||||||||||
| Money Market Funds |
4,790,121 | 33,383,250 | — | 38,173,371 | ||||||||||||
| Options Purchased: |
||||||||||||||||
| Equity Contracts |
1,266,810 | — | — | 1,266,810 | ||||||||||||
| Foreign Currency Exchange Contracts |
— | 12,711,880 | — | 12,711,880 | ||||||||||||
| Interest Rate Contracts |
3,018,178 | — | — | 3,018,178 | ||||||||||||
See Notes to Consolidated Financial Statements.
| BLACKROCK BALANCED CAPITAL FUND, INC. | MARCH 31, 2016 | 87 |
| Consolidated Schedule of Investments (continued) | Master Total Return Portfolio |
| Level 1 | Level 2 | Level 3 | Total | |||||||||||||
| Liabilities: |
||||||||||||||||
| Investments: |
||||||||||||||||
| Borrowed Bonds |
— | $ (328,392,673 | ) | — | $ (328,392,673) | |||||||||||
| TBA Sale Commitments |
— | (2,043,174,517 | ) | — | (2,043,174,517) | |||||||||||
| Total |
$274,941,239 | $ 9,813,196,253 | $215,582,696 | $10,303,720,188 | ||||||||||||
|
|
|
|||||||||||||||
|
1 See above Consolidated Schedule of Investments for values in each industry. |
| |||||||||||||||
| Level 1 | Level 2 | Level 3 | Total | |||||||||||
| Derivative Financial Instruments1 |
||||||||||||||
| Assets: |
||||||||||||||
| Commodity contracts |
$ | 347,120 | — | — | $ | 347,120 | ||||||||
| Credit contracts |
— | $ | 4,081,037 | — | 4,081,037 | |||||||||
| Equity contracts |
96,212 | — | — | 96,212 | ||||||||||
| Foreign currency exchange contracts |
— | 10,832,377 | — | 10,832,377 | ||||||||||
| Interest rate contracts |
2,241,951 | 4,073,621 | — | 6,315,572 | ||||||||||
| Liabilities: |
||||||||||||||
| Commodity contracts |
(262,495 | ) | — | — | (262,495 | ) | ||||||||
| Credit contracts |
— | (7,899,319 | ) | — | (7,899,319 | ) | ||||||||
| Equity contracts |
(1,716,256 | ) | (327,679 | ) | — | (2,043,935 | ) | |||||||
| Foreign currency exchange contracts |
— | (41,526,644 | ) | — | (41,526,644 | ) | ||||||||
| Interest rate contracts |
(4,506,339 | ) | (10,043,035 | ) | — | (14,549,374 | ) | |||||||
| Total |
$ | (3,799,807 | ) | $ | (40,809,642 | ) | — | $ | (44,609,449 | ) | ||||
|
|
|
|||||||||||||
| 1 Derivative financial instruments are swaps, futures contracts, forward foreign currency exchange contracts and options written. Swaps, futures contracts and forward foreign currency exchange contracts are valued at the unrealized appreciation (depreciation) on the instrument and options written are shown at value. |
| |||||||||||||
|
The Master Portfolio may hold assets and/or liabilities in which the fair value approximates the carrying amount or face value, including accrued interest, for financial statement purposes. As of period end, such assets and/or liabilities are categorized within the disclosure hierarchy as follows:
|
| |||||||||||||
| Level 1 | Level 2 | Level 3 | Total | |||||||||||
| Assets: |
||||||||||||||
| Cash |
$ | 6,976,675 | — | — | $ | 6,976,675 | ||||||||
| Foreign currency at value |
8,337,507 | — | — | 8,337,507 | ||||||||||
| Cash pledged: |
||||||||||||||
| Collateral - borrowed bond agreements |
509,000 | — | — | 509,000 | ||||||||||
| Collateral - OTC derivatives |
6,963,000 | — | — | 6,963,000 | ||||||||||
| Futures contracts |
11,042,010 | — | — | 11,042,010 | ||||||||||
| Centrally cleared swaps |
9,065,630 | — | — | 9,065,630 | ||||||||||
| Liabilities: |
||||||||||||||
| Reverse repurchase agreements |
— | $ | (2,064,320,459 | ) | — | (2,064,320,459 | ) | |||||||
| Collateral on securities loaned |
— | (33,383,250 | ) | — | (33,383,250 | ) | ||||||||
| Cash received: |
||||||||||||||
| Collateral - reverse repurchase agreements |
— | (2,650,000 | ) | — | (2,650,000 | ) | ||||||||
| Collateral - OTC derivatives |
— | (2,340,000 | ) | — | (2,340,000 | ) | ||||||||
| Collateral - TBA commitments |
— | (340,000 | ) | — | (340,000 | ) | ||||||||
|
|
|
|||||||||||||
| Total |
$ | 42,893,822 | $ | (2,103,033,709 | ) | — | $ | (2,060,139,887 | ) | |||||
|
|
|
|||||||||||||
| During the six months ended March 31, 2016, there were no transfers between levels. | ||||||||||||||
See Notes to Consolidated Financial Statements.
| 88 | BLACKROCK BALANCED CAPITAL FUND, INC. | MARCH 31, 2016 |
| Consolidated Schedule of Investments (concluded) | Master Total Return Portfolio |
A reconciliation of Level 3 investments is presented when the Master Portfolio had a significant amount of Level 3 investments at the beginning and/or end of the period in relation to net assets. The following table is a reconciliation of Level 3 investments for which significant unobservable inputs were used in determining fair value:
| Asset-Backed Securities |
Corporate Bonds |
Floating Rate Loan Interests |
Non-Agency Mortgage-Backed |
Other Interests |
Preferred Securities |
U.S. Government Sponsored Agency Securities |
Total | |||||||||||||||||||||||||
| Assets: |
||||||||||||||||||||||||||||||||
| Opening Balance, as of September 30, 2015 |
$140,664,025 | — | $ 9,415,789 | $ 48,193,804 | $ 1 | $ | 1,504,998 | — | $ | 199,778,617 | ||||||||||||||||||||||
| Transfers into Level 3 |
3,071,384 | $ | 1,128,457 | — | — | — | — | $4,111,216 | 8,311,057 | |||||||||||||||||||||||
| Transfers out of Level 3 |
(2,900,624 | ) | — | (8,811,310 | ) | (15,484,280 | ) | — | — | — | (27,196,214 | ) | ||||||||||||||||||||
| Accrued discounts/premiums |
113,534 | 4,180 | 58 | 101,189 | — | — | 3 | 218,964 | ||||||||||||||||||||||||
| Net realized gain (loss) |
196,163 | 41,780 | 1,408 | 72,046 | — | — | 5 | 311,402 | ||||||||||||||||||||||||
| Net change in unrealized appreciation (depreciation)1,2 |
(2,796,682 | ) | (26,906 | ) | 1,909 | (767,620 | ) | 924 | 63,083 | 73,154 | (3,452,138 | ) | ||||||||||||||||||||
| Purchases |
40,157,328 | — | — | 34,260,654 | — | — | 1,600,000 | 76,017,982 | ||||||||||||||||||||||||
| Sales |
(27,614,713 | ) | (769,962 | ) | (607,854 | ) | (9,173,125 | ) | — | — | (241,320 | ) | (38,406,974 | ) | ||||||||||||||||||
|
|
|
|||||||||||||||||||||||||||||||
| Closing Balance, as of March 31, 2016 |
$150,890,415 | $ | 377,549 | — | $ 57,202,668 | $925 | $ | 1,568,081 | $5,543,058 | $ | 215,582,696 | |||||||||||||||||||||
|
|
|
|||||||||||||||||||||||||||||||
| Net change in unrealized appreciation (depreciation) on investments still held at March 31, 20162 |
$ (2,696,146 | ) | $ | (26,906 | ) | — | $ (735,078 | ) | $924 | $ | 63,083 | $ 73,154 | $ | (3,320,969 | ) | |||||||||||||||||
|
|
|
|||||||||||||||||||||||||||||||
| 1 | Included in the related net change in unrealized appreciation (depreciation) in the Consolidated Statement of Operations. |
| 2 | Any difference between net change in unrealized appreciation (depreciation) and net change in unrealized appreciation (depreciation) on investments still held at March 31, 2016, is generally due to investments no longer held or categorized as Level 3 at period end. |
The Master Portfolio’s investments that are categorized as Level 3 were valued utilizing third party pricing information without adjustment. Such valuations are based on unobservable inputs. A significant change in third party information could result in a significantly lower or higher value of such Level 3 investments.
See Notes to Consolidated Financial Statements.
| BLACKROCK BALANCED CAPITAL FUND, INC. | MARCH 31, 2016 | 89 |
| Consolidated Statement of Assets and Liabilities | Master Total Return Portfolio |
| March 31, 2016 (Unaudited) | ||||
| Assets | ||||
| Investments at value — unaffiliated (including securities loaned at value of $32,757,690) (cost — $12,334,786,116) |
$ | 12,404,924,500 | ||
| Investments at value — affiliated (cost — $266,350,411) |
270,362,878 | |||
| Cash |
6,976,675 | |||
| Cash pledged: |
||||
| Collateral — borrowed bond agreements |
509,000 | |||
| Collateral — OTC derivatives |
6,963,000 | |||
| Futures contracts |
11,042,010 | |||
| Centrally cleared swaps |
9,065,630 | |||
| Foreign currency at value (cost — $8,259,663) |
8,337,507 | |||
| Receivables: |
||||
| Investments sold — unaffiliated |
131,706,180 | |||
| Securities lending income — affiliated |
6,047 | |||
| Swaps |
615,752 | |||
| TBA sale commitments |
2,035,312,666 | |||
| Contributions from investors |
85,309,466 | |||
| Dividends — affiliated |
5,153 | |||
| Dividends — unaffiliated |
43,027 | |||
| Interest |
49,384,303 | |||
| Principal paydowns |
55,281 | |||
| Variation margin on futures contracts |
1,789,346 | |||
| Interest rate caps premiums paid |
134,979 | |||
| Swap premiums paid |
14,354,037 | |||
| Unrealized appreciation on: |
||||
| Forward foreign currency exchange contracts |
10,832,377 | |||
| OTC swaps |
4,978,263 | |||
| Prepaid expenses |
28,652 | |||
| Other assets |
99,259 | |||
|
|
|
|||
| Total assets |
15,052,835,988 | |||
|
|
|
|||
| Liabilities | ||||
| Cash received: |
||||
| Collateral — reverse repurchase agreements |
2,650,000 | |||
| Collateral — OTC derivatives |
2,340,000 | |||
| Collateral — TBA commitments |
340,000 | |||
| Borrowed bonds at value (proceeds — $325,036,719) |
328,392,673 | |||
| Collateral on securities loaned at value |
33,383,250 | |||
| Options written at value (premiums received — $19,322,963) |
14,327,402 | |||
| TBA sale commitments at value (proceeds — $2,035,312,666) |
2,043,174,517 | |||
| Reverse repurchase agreements |
2,064,320,459 | |||
| Payables: |
||||
| Investments purchased — unaffiliated |
1,630,955,758 | |||
| Swaps |
142,775 | |||
| Withdrawals to investors |
34,388,955 | |||
| Directors’ fees |
28,942 | |||
| Interest expense |
913,536 | |||
| Investment advisory fees |
408,982 | |||
| Other accrued expenses |
441,476 | |||
| Other affiliates |
3,032 | |||
| Variation margin on futures contracts |
960,455 | |||
| Variation margin on centrally cleared swaps |
1,084,563 | |||
| Swap premiums received |
10,571,155 | |||
| Unrealized depreciation on: |
||||
| Forward foreign currency exchange contracts |
31,139,086 | |||
| OTC swaps |
9,601,061 | |||
| Interest rate caps |
102,169 | |||
|
|
|
|||
| Total liabilities |
6,209,670,246 | |||
|
|
|
|||
| Net Assets |
$ | 8,843,165,742 | ||
|
|
|
|||
| Net Assets Consist of | ||||
| Investors’ capital |
$ | 8,806,690,960 | ||
| Net unrealized appreciation (depreciation) |
36,474,782 | |||
|
|
|
|||
| Net Assets |
$ | 8,843,165,742 | ||
|
|
|
|||
See Notes to Consolidated Financial Statements.
| 90 | BLACKROCK BALANCED CAPITAL FUND, INC. | MARCH 31, 2016 |
| Consolidated Statement of Operations | Master Total Return Portfolio |
| Six Months Ended March 31, 2016 (Unaudited) | ||||
| Investment Income | ||||
| Interest — unaffiliated |
$ | 130,191,437 | ||
| Interest — affiliated |
51 | |||
| Dividends — unaffiliated |
991,192 | |||
| Dividends — affiliated |
1,877,033 | |||
| Securities lending — affiliated — net |
45,615 | |||
|
|
|
|||
| Total income |
133,105,328 | |||
|
|
|
|||
| Expenses | ||||
| Investment advisory |
2,242,373 | |||
| Custodian |
381,819 | |||
| Accounting services |
295,890 | |||
| Professional |
91,001 | |||
| Directors |
61,451 | |||
| Printing |
3,392 | |||
| Miscellaneous |
172,560 | |||
|
|
|
|||
| Total expenses excluding interest expense |
3,248,486 | |||
| Interest expense |
4,415,342 | |||
|
|
|
|||
| Total expenses |
7,663,828 | |||
| Less fees waived by the Manager |
(11,576 | ) | ||
|
|
|
|||
| Total expenses after fees waived |
7,652,252 | |||
|
|
|
|||
| Net investment income |
125,453,076 | |||
|
|
|
|||
| Realized and Unrealized Gain (Loss) | ||||
| Net realized gain (loss) from: |
||||
| Investments — unaffiliated |
(76,202,648 | ) | ||
| Investments — affiliated |
(7,795,663 | ) | ||
| Foreign currency transactions |
8,028,799 | |||
| Options written |
19,266,286 | |||
| Swaps |
(5,438,010 | ) | ||
| Futures contracts |
(8,927,957 | ) | ||
| Borrowed bonds |
3,467,116 | |||
| Capital gain distributions received from affiliated investment companies |
645 | |||
| Interest rate caps |
(108,251 | ) | ||
|
|
|
|||
| (67,709,683 | ) | |||
|
|
|
|||
| Net change in unrealized appreciation (depreciation) on: |
||||
| Investments — unaffiliated |
129,896,989 | |||
| Investments — affiliated |
4,733,647 | |||
| Options written |
5,056,234 | |||
| Borrowed bonds |
(3,475,694 | ) | ||
| Unfunded floating rate loan interests |
39,319 | |||
| Short sales |
3,396 | |||
| Swaps |
(4,251,702 | ) | ||
| Futures contracts |
6,672,057 | |||
| Foreign currency translations |
(15,093,012 | ) | ||
| Interest rate caps |
(102,169 | ) | ||
|
|
|
|||
| 123,479,065 | ||||
|
|
|
|||
| Total realized and unrealized gain |
55,769,382 | |||
|
|
|
|||
| Net Increase in Net Assets Resulting from Operations |
$ | 181,222,458 | ||
|
|
|
|||
See Notes to Consolidated Financial Statements.
| BLACKROCK BALANCED CAPITAL FUND, INC. | MARCH 31, 2016 | 91 |
| Consolidated Statements of Changes in Net Assets | Master Total Return Portfolio |
| Increase (Decrease) in Net Assets: | Six Months Ended March 31, 2016 (Unaudited) |
Year Ended September 30, 2015 |
||||||
| Operations | ||||||||
| Net investment income |
$ | 125,453,076 | $ | 192,133,433 | ||||
| Net realized gain (loss) |
(67,709,683 | ) | 88,195,950 | |||||
| Net change in unrealized appreciation (depreciation) |
123,479,065 | (138,522,195) | ||||||
|
|
|
|||||||
| Net increase in net assets resulting from operations |
181,222,458 | 141,807,188 | ||||||
|
|
|
|||||||
| Capital Transactions | ||||||||
| Proceeds from contributions |
2,414,449,792 | 5,883,556,3531 | ||||||
| Value of withdrawals |
(1,170,542,264 | ) | (2,039,097,181) | |||||
|
|
|
|||||||
| Net increase in net assets derived from capital transactions |
1,243,907,528 | 3,844,459,172 | ||||||
|
|
|
|||||||
| Net Assets | ||||||||
| Total increase in net assets |
1,425,129,986 | 3,986,266,360 | ||||||
| Beginning of period |
7,418,035,756 | 3,431,769,396 | ||||||
|
|
|
|||||||
| End of period |
$ | 8,843,165,742 | $ | 7,418,035,756 | ||||
|
|
|
|||||||
|
1 Includes reimbursement from affiliate relating to processing errors. |
| |||||||
See Notes to Consolidated Financial Statements.
| 92 | BLACKROCK BALANCED CAPITAL FUND, INC. | MARCH 31, 2016 |
| Consolidated Statement of Cash Flows | Master Total Return Portfolio |
| Six Months Ended March 31, 2016 (Unaudited) | ||||
| Cash Used for Operating Activities | ||||
| Net increase in net assets resulting from operations |
$ | 181,222,458 | ||
| Adjustments to reconcile net increase in net assets resulting from operations to net cash used for operating activities: |
||||
| Proceeds from sales of long-term investments |
43,421,057,994 | |||
| Purchases of long term investments |
(44,888,262,767 | ) | ||
| Net purchases of short-term securities |
(249,361,481 | ) | ||
| Amortization of premium and accretion of discount on investments |
4,044,623 | |||
| Payments for borrowed bonds |
(1,277,892,689 | ) | ||
| Proceeds from borrowed bonds |
1,491,304,720 | |||
| Premiums paid on closing options written |
(20,968,693 | ) | ||
| Premiums received from options written |
59,984,922 | |||
| Net realized loss from investments, futures contracts, options written, swaps, foreign currency transactions, interest rate caps, borrowed bonds and capital gain distributions received from affiliated investment companies |
61,264,264 | |||
| Net change in unrealized appreciation (depreciation) on investments, futures contracts, options written, short sales, swaps, foreign currency translations, interest rate caps, unfunded floating rate loan interests and borrowed bonds |
(120,725,354 | ) | ||
| (Increase) decrease in assets: |
||||
| Cash pledged: |
||||
| Collateral — borrowed bond agreements |
(509,000 | ) | ||
| Collateral — OTC derivatives |
(4,166,000 | ) | ||
| Futures contracts |
(2,953,000 | ) | ||
| Centrally cleared swaps |
(682,360 | ) | ||
| Receivables: |
||||
| Swaps |
3,410,546 | |||
| Dividends — affiliated |
(4,748 | ) | ||
| Dividends — unaffiliated |
33,472 | |||
| Interest |
(6,108,152 | ) | ||
| Options written |
130,965 | |||
| Principal paydowns |
90,736 | |||
| Securities lending income — affiliated |
(6,047 | ) | ||
| Variation margin on futures contracts |
(705,054 | ) | ||
| Interest rate caps premiums paid |
(134,979 | ) | ||
| Swap premiums paid |
(9,026,557 | ) | ||
| Prepaid expenses |
(26,197 | ) | ||
| Other assets |
(11,576 | ) | ||
| Increase (decrease) in liabilities: |
||||
| Cash received: |
||||
| Collateral — borrowed bond agreements |
(204,000 | ) | ||
| Collateral — reverse repurchase agreements |
2,650,000 | |||
| Collateral — OTC derivatives |
330,000 | |||
| Collateral — TBA commitments |
(2,019,000 | ) | ||
| Collateral on securities loaned at value |
33,383,250 | |||
| Payables: |
||||
| Swaps |
(935,534 | ) | ||
| Directors’ fees |
2,399 | |||
| Interest expense |
291,579 | |||
| Investment advisory fees |
75,798 | |||
| Other accrued expenses |
(9,162 | ) | ||
| Other affiliates |
(34,359 | ) | ||
| Variation margin on futures contracts |
(34,349 | ) | ||
| Variation margin on centrally cleared swaps |
721,344 | |||
| Swap premiums received |
2,809,771 | |||
|
|
|
|||
| Cash used for operating activities |
(1,321,972,217 | ) | ||
|
|
|
|||
| Cash Provided by Financing Activities | ||||
| Payments on redemption of capital shares |
(1,156,681,722 | ) | ||
| Proceeds from issuance of capital shares |
2,360,381,672 | |||
| Net borrowing of reverse repurchase agreements |
112,295,608 | |||
|
|
|
|||
| Cash provided by financing activities |
1,315,995,558 | |||
|
|
|
|||
| Cash Impact from Foreign Exchange Fluctuations | ||||
| Cash impact from foreign exchange fluctuations |
361,037 | |||
|
|
|
|||
| Cash and Foreign Currency | ||||
| Net decrease in cash and foreign currency |
(5,615,622 | ) | ||
| Cash and foreign currency at beginning of period |
20,929,804 | |||
|
|
|
|||
| Cash and foreign currency at end of period |
$ | 15,314,182 | ||
|
|
|
|||
| Supplemental Disclosure of Cash Flow Information | ||||
| Cash paid during the period for interest expense |
$ | 4,073,195 | ||
|
|
|
|||
See Notes to Consolidated Financial Statements.
| BLACKROCK BALANCED CAPITAL FUND, INC. | MARCH 31, 2016 | 93 |
| Financial Highlights | Master Total Return Portfolio |
| Six Months Ended March 31, 2016 (Unaudited)1
|
||||||||||||
| Year Ended September 30, | ||||||||||||
|
20151
|
20141
|
20131
|
20121
|
2011
| ||||||||
| Total Return | ||||||||||||
| Total return |
2.15%2 | 3.13% | 7.15% | 1.30% | 10.04% | 2.82% | ||||||
|
| ||||||||||||
| Ratios to Average Net Assets | ||||||||||||
| Total expenses |
0.19%3 | 0.14% | 0.25% | 0.32% | 0.29% | 0.56% | ||||||
|
| ||||||||||||
| Total expenses after fees waived and paid indirectly |
0.19%3 | 0.14% | 0.25% | 0.32% | 0.29% | 0.56% | ||||||
|
| ||||||||||||
| Total expenses after fees waived and paid indirectly and excluding interest expense |
0.08%3 | 0.09% | 0.14% | 0.12% | 0.12% | 0.11% | ||||||
|
| ||||||||||||
| Net investment income |
3.17%3 | 3.07% | 4.03% | 3.59% | 4.20% | 4.67% | ||||||
|
| ||||||||||||
| Supplemental Data | ||||||||||||
| Net assets, end of period (000) |
$8,843,166 | $7,418,036 | $3,431,769 | $3,331,158 | $3,470,151 | $3,899,364 | ||||||
|
| ||||||||||||
| Portfolio turnover rate4 |
463% | 1,015% | 750% | 777% | 1,346% | 1,771% | ||||||
|
| ||||||||||||
| 1 | Consolidated Financial Highlights. |
| 2 | Aggregate total return. |
| 3 | Annualized. |
| 4 | Includes mortgage dollar roll transactions. Additional information regarding portfolio turnover rate is as follows: |
| Six Months Ended March 31, 2016 (Unaudited)1 |
||||||||||||
| Year Ended September 30, | ||||||||||||
| 20151 | 20141 | 20131 | 20121 | 2011 | ||||||||
| Portfolio turnover rate (excluding mortgage dollar roll transactions) |
336% | 725% | 529% | 450% | 752% | 1,379% | ||||||
See Notes to Consolidated Financial Statements.
| 94 | BLACKROCK BALANCED CAPITAL FUND, INC. | MARCH 31, 2016 |
| Notes to Consolidated Financial Statements (Unaudited) | Master Total Return Portfolio |
1. Organization:
Master Total Return Portfolio (the “Master Portfolio”), a series of Master Bond LLC (the “Master LLC”), is registered under the Investment Company Act of 1940, as amended (the “1940 Act”), as a diversified, open-end management investment company. The Master LLC is organized as a Delaware limited liability company. The Limited Liability Company Agreement of the Master LLC permits the Board of Directors of the Master LLC (the “Board”) to issue nontransferable interests in the Master LLC, subject to certain limitations.
Basis of Consolidation: The accompanying consolidated financial statements include the accounts of BlackRock Cayman Master Total Return Portfolio I, Ltd. (the “Subsidiary”), which is a wholly owned subsidiary of the Master Portfolio and primarily invests in commodity-related instruments. The Subsidiary enables the Master Portfolio to hold these commodity-related instruments while allowing its investors to satisfy regulated investment company tax requirements. The Master Portfolio may invest up to 25% of its total assets in the Subsidiary. Intercompany accounts and transactions, if any, have been eliminated. The Subsidiary is subject to the same investment policies and restrictions that apply to the Master Portfolio, except that the Subsidiary may invest without limitation in commodity-related instruments.
The following table shows a summary of the selected financial information of the Subsidiary included in the consolidated financial statements:
| Consolidated Statement of Assets and Liabilities | ||||
| Total assets |
$ | 10,156,019 | ||
| Total liabilities |
(193 | ) | ||
|
|
|
|||
| Net assets |
$ | 10,155,826 | ||
| Consolidated Statement of Operations | ||||
| Net investment income |
$ | 26 | ||
| Net realized gain from: |
||||
| Investments - unaffiliated |
489,828 | |||
| Futures contracts |
62,522 | |||
| Foreign currency transactions |
862 | |||
| Options written |
41,197 | |||
|
|
|
|||
| 594,409 | ||||
|
|
|
|||
| Net change in unrealized appreciation (depreciation) on: |
||||
| Investments - unaffiliated |
(43,560 | ) | ||
| Futures contracts |
84,625 | |||
|
|
|
|||
| 41,065 | ||||
|
|
|
|||
| Net increase in net assets resulting from operations |
$ | 635,500 | ||
| Consolidated Statement of Changes in Net Assets | ||||
| Net investment income |
$ | 26 | ||
| Net realized gain |
594,409 | |||
| Net change in unrealized appreciation (depreciation) |
41,065 | |||
|
|
|
|||
| Net increase in net assets resulting from operations |
$ | 635,500 | ||
2. Significant Accounting Policies:
The consolidated financial statements are prepared in conformity with accounting principles generally accepted in the United States of America (“U.S. GAAP”), which may require management to make estimates and assumptions that affect the reported amounts of assets and liabilities in the consolidated financial statements, disclosure of contingent assets and liabilities at the date of the financial statements and the reported amounts of increases and decreases in net assets from operations during the reporting period. Actual results could differ from those estimates. The Master Portfolio is considered an investment company under U.S. GAAP and follows the accounting and reporting guidance applicable to investment companies. Below is a summary of significant accounting policies:
Foreign Currency: The Master Portfolio’s books and records are maintained in U.S. dollars. Purchases and sales of investments are recorded at the rates of exchange prevailing on the respective dates of such transactions. Generally, when the U.S. dollar rises in value against a foreign currency, the investments denominated in that currency will lose value; the opposite effect occurs if the U.S. dollar falls in relative value.
The Master Portfolio does not isolate changes in the exchange rates from the changes in the market prices of investments held or sold for financial reporting purposes. Accordingly, the effects of changes in exchange rates on investments are not segregated in the Consolidated Statement of Operations from the effects of changes in market prices of those investments, but are included as a component of net realized and unrealized gain (loss) from investments. The Master Portfolio reports realized currency gains (losses) on foreign currency related transactions as components of net realized gain (loss) for financial reporting purposes, whereas such components are generally treated as ordinary income for federal income tax purposes.
The Master Portfolio does not isolate the portion of the results of operations arising as a result of changes in the foreign exchange rates from the changes in the market prices of investments held or sold for financial reporting purposes. Accordingly, the effects of changes in exchange rates on investments are not segregated in the Consolidated Statement of Operations from the effects of changes in market prices of those investments, but are
| BLACKROCK BALANCED CAPITAL FUND, INC. | MARCH 31, 2016 | 95 |
| Notes to Consolidated Financial Statements (continued) | Master Total Return Portfolio |
included as a component of net realized and unrealized gain (loss) from investments. The Master Portfolio reports realized currency gains (losses) on foreign currency related transactions as components of net realized gain (loss) for financial reporting purposes, whereas such components are generally treated as ordinary income for federal income tax purposes. The Master Portfolio has elected to treat realized gains (losses) from certain forward foreign currency exchange contracts as capital gain (loss) for federal income tax purposes.
Segregation and Collateralization: In cases where the Master Portfolio enters into certain investments (e.g., dollar rolls, TBA sale commitments, futures contracts, forward foreign currency exchange contracts, options written, swaps, short sales and structured options), or certain borrowings (e.g., reverse repurchase transactions and treasury roll transactions) that would be treated as “senior securities” for 1940 Act purposes, the Master Portfolio may segregate or designate on its books and records cash or liquid assets having a market value at least equal to the amount of its future obligations under such investments or borrowings. Doing so allows the investment or borrowing to be excluded from treatment as a “senior security.” Furthermore, if required by an exchange or counterparty agreement, the Master Portfolio may be required to deliver/deposit cash and/or securities to/with an exchange, or broker-dealer or custodian as collateral for certain investments or obligations.
Investment Transactions and Investment Income: For financial reporting purposes, investment transactions are recorded on the dates the transactions are entered into (the trade dates). Realized gains and losses on investment transactions are determined on the identified cost basis. Dividend income is recorded on the ex-dividend date. Dividends from foreign securities where the ex-dividend date may have passed are subsequently recorded when the Master Portfolio is informed of the ex-dividend date. Under the applicable foreign tax laws, a withholding tax at various rates may be imposed on capital gains, dividends and interest. Upon notification from issuers, some of the dividend income received from a real estate investment trust may be redesignated as a reduction of cost of the related investment and/or realized gain. Interest income, including amortization and accretion of premiums and discounts on debt securities, is recognized on the accrual basis. Income, expenses and realized and unrealized gains and losses are allocated daily to each class based on its relative net assets.
Indemnifications: In the normal course of business, the Master Portfolio enters into contracts that contain a variety of representations that provide general indemnification. The Master Portfolio’s maximum exposure under these arrangements is unknown because it involves future potential claims against the Master Portfolio, which cannot be predicted with any certainty.
Other: Expenses directly related to the Master Portfolio are charged to the Master Portfolio. Other operating expenses shared by several funds, including other funds managed by the Manager, are prorated among those funds on the basis of relative net assets or other appropriate methods.
The Master Portfolio has an arrangement with its custodian whereby fees may be reduced by credits earned on uninvested cash balances, which, if applicable, are shown as fees paid indirectly in the Consolidated Statement of Operations. The custodian imposes fees on overdrawn cash balances, which can be offset by accumulated credits earned or may result in additional custody charges.
3. Investment Valuation and Fair Value Measurements:
Investment Valuation Policies: The Master Portfolio’s investments are valued at fair value (also referred to as “market value” within the financial statements) as of the close of trading on the New York Stock Exchange (“NYSE”) (generally 4:00 p.m., Eastern time). U.S. GAAP defines fair value as the price the Master Portfolio would receive to sell an asset or pay to transfer a liability in an orderly transaction between market participants at the measurement date. The Master Portfolio determines the fair values of its financial instruments using independent dealers or pricing services under policies approved by the Board. The BlackRock Global Valuation Methodologies Committee (the “Global Valuation Committee”) is the committee formed by management to develop global pricing policies and procedures and to provide oversight of the pricing function for the Master Portfolio for all financial instruments.
Fair Value Inputs and Methodologies: The following methods (or “techniques”) and inputs are used to establish the fair value of the Master Portfolio’s assets and liabilities:
| • | Equity investments traded on a recognized securities exchange are valued at the official closing price each day, if available. For equity investments traded on more than one exchange, the official close price on the exchange where the stock is primarily traded is used. Equity investments traded on a recognized exchange for which there were no sales on that day may be valued at the last available bid (long positions) or ask (short positions) price. |
| • | Bond investments are valued on the basis of last available bid prices or current market quotations provided by dealers or pricing services. Floating rate loan interests are valued at the mean of the bid prices from one or more brokers or dealers as obtained from a pricing service. In determining the value of a particular investment, pricing services may use certain information with respect to transactions in such investments, quotations from dealers, pricing matrixes, market transactions in comparable investments, various relationships observed in the market between investments and calculated yield measures. Asset-backed and mortgage-backed securities are valued by independent pricing services using models that consider estimated cash flows of each tranche of the security, establish a benchmark yield and develop an estimated tranche-specific spread to the benchmark yield based on the unique attributes of the tranche. |
| 96 | BLACKROCK BALANCED CAPITAL FUND, INC. | MARCH 31, 2016 |
| Notes to Consolidated Financial Statements (continued) | Master Total Return Portfolio |
| • | Generally, trading in foreign instruments is substantially completed each day at various times prior to the close of business on the NYSE. Occasionally, events affecting the values of such instruments may occur between the foreign market close and the close of business on the NYSE that may not be reflected in the computation of the Master Portfolio’s net assets. Each business day, the Master Portfolio uses a pricing service to assist with the valuation of certain foreign exchange-traded equity securities and foreign exchange-traded and over-the-counter (“OTC”) options (the “Systematic Fair Value Price”). Using current market factors, the Systematic Fair Value Price is designed to value such foreign securities and foreign options at fair value as of the close of business on the NYSE, which follows the close of the local markets. |
| • | Municipal investments (including commitments to purchase such investments on a “when-issued” basis) are valued on the basis of prices provided by dealers or pricing services. In determining the value of a particular investment, pricing services may use certain information with respect to transactions in such investments, quotations from dealers, pricing matrixes, market transactions in comparable investments and information with respect to various relationships between investments. |
| • | TBA commitments are valued on the basis of last available bid prices or current market quotations provided by pricing services. |
| • | Investments in open-end U.S. mutual funds are valued at net asset value each business day. |
| • | The Master Portfolio values its investment in BlackRock Liquidity Series, LLC, Money Market Series (the “Money Market Series”) at fair value, which is ordinarily based upon its pro rata ownership in the underlying fund’s net assets. The Money Market Series seeks current income consistent with maintaining liquidity and preserving capital. Although the Money Market Series is not registered under the 1940 Act, its investments may follow the parameters of investments by a money market fund that is subject to Rule 2a-7 under the 1940 Act. The Master Portfolio may withdraw up to 25% of its investment daily, although the manager of the Money Market Series, in its sole discretion, may permit an investor to withdraw more than 25% on any one day. |
| • | Futures contracts traded on exchanges are valued at their last sale price. |
| • | Securities and other assets and liabilities denominated in foreign currencies are translated into U.S. dollars using exchange rates determined as of the close of business on the NYSE. Forward foreign currency exchange contracts are valued at the mean between the bid and ask prices and are determined as of the close of business on the NYSE. Interpolated values are derived when the settlement date of the contract is an interim date for which quotations are not available. |
| • | Exchange-traded options are valued at the mean between the last bid and ask prices at the close of the options market in which the options trade. An exchange-traded option for which there is no mean price is valued at the last bid (long positions) or ask (short positions) price. If no bid or ask price is available, the prior day’s price will be used, unless it is determined that the prior day’s price no longer reflects the fair value of the option. OTC options and options on swaps (“swaptions”) are valued by an independent pricing service using a mathematical model, which incorporates a number of market data factors, such as the trades and prices of the underlying instruments. |
| • | Swap agreements are valued utilizing quotes received daily by the Master Portfolio’s pricing service or through brokers, which are derived using daily swap curves and models that incorporate a number of market data factors, such as discounted cash flows, trades and values of the underlying reference instruments. |
If events (e.g., a company announcement, market volatility or a natural disaster) occur that are expected to materially affect the value of such instruments, or in the event that the application of these methods of valuation results in a price for an investment that is deemed not to be representative of the market value of such investment, or if a price is not available, the investment will be valued by the Global Valuation Committee, or its delegate, in accordance with a policy approved by the Board as reflecting fair value (“Fair Valued Investments”). When determining the price for Fair Valued Investments, the Global Valuation Committee, or its delegate, seeks to determine the price that the Master Portfolio might reasonably expect to receive or pay from the current sale or purchase of that asset or liability in an arm’s-length transaction. Fair value determinations shall be based upon all available factors that the Global Valuation Committee, or its delegate, deems relevant consistent with the principles of fair value measurement, which include the market approach, income approach and/or in the case of recent investments, the cost approach, as appropriate. The market approach generally consists of using comparable market transactions. The income approach generally is used to discount future cash flows to present value and is adjusted for liquidity as appropriate. These factors include but are not limited to: (i) attributes specific to the investment or asset; (ii) the principal market for the investment or asset; (iii) the customary participants in the principal market for the investment or asset; (iv) data assumptions by market participants for the investment or asset, if reasonably available; (v) quoted prices for similar investments or assets in active markets; and (vi) other factors, such as future cash flows, interest rates, yield curves, volatilities, prepayment speeds, loss severities, credit risks, recovery rates, liquidation amounts and/or default rates. Due to the inherent uncertainty of valuations of such investments, the fair values may differ from the values that would have been used had an active market existed. The Global Valuation Committee, or its delegate, employs various methods for calibrating valuation approaches for investments where an active market does not exist, including regular due diligence of the Master Portfolio’s pricing vendors, regular reviews of key inputs and assumptions, transactional back-testing or disposition analysis to compare unrealized gains and losses to realized gains and losses,
| BLACKROCK BALANCED CAPITAL FUND, INC. | MARCH 31, 2016 | 97 |
| Notes to Consolidated Financial Statements (continued) | Master Total Return Portfolio |
reviews of missing or stale prices and large movements in market values and reviews of any market related activity. The pricing of all Fair Valued Investments is subsequently reported to the Board or a committee thereof on a quarterly basis.
Fair Value Hierarchy: Various inputs are used in determining the fair value of investments and derivative financial instruments. These inputs to valuation techniques are categorized into a fair value hierarchy consisting of three broad levels for financial statement purposes as follows:
| • | Level 1 — unadjusted price quotations in active markets/exchanges for identical assets or liabilities that the Master Portfolio has the ability to access |
| • | Level 2 — other observable inputs (including, but not limited to, quoted prices for similar assets or liabilities in markets that are active, quoted prices for identical or similar assets or liabilities in markets that are not active, inputs other than quoted prices that are observable for the assets or liabilities (such as interest rates, yield curves, volatilities, prepayment speeds, loss severities, credit risks and default rates) or other market-corroborated inputs) |
| • | Level 3 — unobservable inputs based on the best information available in the circumstances, to the extent observable inputs are not available (including the Master Portfolio’s own assumptions used in determining the fair value of investments and derivative financial instruments) |
The hierarchy gives the highest priority to unadjusted quoted prices in active markets for identical assets or liabilities (Level 1 measurements) and the lowest priority to unobservable inputs (Level 3 measurements). Accordingly, the degree of judgment exercised in determining fair value is greatest for instruments categorized in Level 3. The inputs used to measure fair value may fall into different levels of the fair value hierarchy. In such cases, for disclosure purposes, the fair value hierarchy classification is determined based on the lowest level input that is significant to the fair value measurement in its entirety. The significant unobservable inputs used by the Global Valuation Committee in determining the price for Fair Valued Investments are typically categorized as Level 3. The fair value hierarchy for the Master Portfolio’s investments and derivative financial instruments have been included in the Consolidated Schedule of Investments.
Changes in valuation techniques may result in transfers into or out of an assigned level within the hierarchy. In accordance with the Master Portfolio’s policy, transfers between different levels of the fair value hierarchy are deemed to have occurred as of the beginning of the reporting period. The categorization of a value determined for investments and derivative financial instruments is based on the pricing transparency of the investments and derivative financial instruments and is not necessarily an indication of the risks associated with investing in those securities.
4. Securities and Other Investments:
Asset-Backed and Mortgage-Backed Securities: Asset-backed securities are generally issued as pass-through certificates or as debt instruments. Asset-backed securities issued as pass-through certificates represent undivided fractional ownership interests in an underlying pool of assets. Asset-backed securities issued as debt instruments, which are also known as collateralized obligations, are typically issued as the debt of a special purpose entity organized solely for the purpose of owning such assets and issuing such debt. Asset-backed securities are often backed by a pool of assets representing the obligations of a number of different parties. The yield characteristics of certain asset-backed securities may differ from traditional debt securities. One such major difference is that all or a principal part of the obligations may be prepaid at any time because the underlying assets (i.e., loans) may be prepaid at any time. As a result, a decrease in interest rates in the market may result in increases in the level of prepayments as borrowers, particularly mortgagors, refinance and repay their loans. An increased prepayment rate with respect to an asset-backed security will have the effect of shortening the maturity of the security. In addition, the Master Portfolio may subsequently have to reinvest the proceeds at lower interest rates. If the Master Portfolio has purchased such an asset-backed security at a premium, a faster than anticipated prepayment rate could result in a loss of principal to the extent of the premium paid.
For mortgage pass-through securities (the “Mortgage Assets”) there are a number of important differences among the agencies and instrumentalities of the U.S. Government that issue mortgage-related securities and among the securities that they issue. For example, mortgage-related securities guaranteed by Ginnie Mae are guaranteed as to the timely payment of principal and interest by Ginnie Mae and such guarantee is backed by the full faith and credit of the United States. However, mortgage-related securities issued by Freddie Mac and Fannie Mae, including Freddie Mac and Fannie Mae guaranteed mortgage pass-through certificates, which are solely the obligations of Freddie Mac and Fannie Mae, are not backed by or entitled to the full faith and credit of the United States, but are supported by the right of the issuer to borrow from the U.S. Treasury.
Non-agency mortgage-backed securities are securities issued by non-governmental issuers and have no direct or indirect government guarantees of payment and are subject to various risks. Non-agency mortgage loans are obligations of the borrowers thereunder only and are not typically insured or guaranteed by any other person or entity. The ability of a borrower to repay a loan is dependent upon the income or assets of the borrower. A number of factors, including a general economic downturn, acts of God, terrorism, social unrest and civil disturbances, may impair a borrower’s ability to repay its loans.
| 98 | BLACKROCK BALANCED CAPITAL FUND, INC. | MARCH 31, 2016 |
| Notes to Consolidated Financial Statements (continued) | Master Total Return Portfolio |
Collateralized Debt Obligations: Collateralized debt obligations (“CDOs”), include collateralized bond obligations (“CBOs”) and collateralized loan obligations (“CLOs”), are types of asset-backed securities. A CDO is an entity that is backed by a diversified pool of debt securities (CBOs) or syndicated bank loans (CLOs). The cash flows of the CDO can be split into multiple segments, called “tranches,” which will vary in risk profile and yield. The riskiest segment is the subordinated or “equity” tranche. This tranche bears the greatest risk of defaults from the underlying assets in the CDO and serves to protect the other, more senior, tranches from default in all but the most severe circumstances. Since it is shielded from defaults by the more junior tranches, a “senior” tranche will typically have higher credit ratings and lower yields than their underlying securities, and often receive investment grade ratings from one or more of the nationally recognized rating agencies. Despite the protection from the more junior tranches, senior tranches can experience substantial losses due to actual defaults, increased sensitivity to future defaults and the disappearance of one or more protecting tranches as a result of changes in the credit profile of the underlying pool of assets.
Inflation-Indexed Bonds: Inflation-indexed bonds are fixed income securities whose principal value is periodically adjusted according to the rate of inflation. If the index measuring inflation rises or falls, the principal value of inflation-indexed bonds will be adjusted upward or downward, and consequently the interest payable on these securities (calculated with respect to a larger or smaller principal amount) will be increased or reduced, respectively. Any upward or downward adjustment in the principal amount of an inflation-indexed bond will be included as interest income in the Consolidated Statement of Operations, even though investors do not receive their principal until maturity. Repayment of the original bond principal upon maturity (as adjusted for inflation) is guaranteed in the case of U.S. Treasury inflation-indexed bonds. For bonds that do not provide a similar guarantee, the adjusted principal value of the bond repaid at maturity may be less than the original principal.
Multiple Class Pass-Through Securities: Multiple class pass-through securities, including collateralized mortgage obligations (“CMOs”) and commercial mortgage-backed securities, may be issued by Ginnie Mae, U.S. Government agencies or instrumentalities or by trusts formed by private originators of, or investors in, mortgage loans. In general, CMOs are debt obligations of a legal entity that are collateralized by, a pool of residential or commercial mortgage loans or Mortgage Assets. The payments on these are used to make payments on the CMOs or multiple pass-through securities. Classes of CMOs include interest only (“IOs”), principal only (“POs”), planned amortization classes and targeted amortization classes. IOs and POs are stripped mortgage-backed securities representing interests in a pool of mortgages, the cash flow from which has been separated into interest and principal components. IOs receive the interest portion of the cash flow while POs receive the principal portion. IOs and POs can be extremely volatile in response to changes in interest rates. As interest rates rise and fall, the value of IOs tends to move in the same direction as interest rates. POs perform best when prepayments on the underlying mortgages rise since this increases the rate at which the principal is returned and the yield to maturity on the PO. When payments on mortgages underlying a PO are slower than anticipated, the life of the PO is lengthened and the yield to maturity is reduced. If the underlying Mortgage Assets experience greater than anticipated prepayments of principal, the Master Portfolio’s initial investment in the IOs may not fully recoup.
Stripped Mortgage-Backed Securities: Stripped mortgage-backed securities issued by the U.S. Government, its agencies and instrumentalities. Stripped mortgage-backed securities are usually structured with two classes that receive different proportions of the interest (IOs) and principal (POs) distributions on a pool of Mortgage Assets. The Master Portfolio also may invest in stripped mortgage-backed securities that are privately issued.
Zero-Coupon Bonds: Zero-coupon bonds, are normally issued at a significant discount from face value and do not provide for periodic interest payments. These bonds may experience greater volatility in market value than other debt obligations of similar maturity which provide for regular interest payments.
Capital Securities and Trust Preferred Securities: Capital securities, including trust preferred securities are typically issued by corporations, generally in the form of interest-bearing notes with preferred securities characteristics, or in the case of trust preferred securities, by an affiliated business trust of a corporation, generally in the form of beneficial interests in subordinated debentures or similarly structured securities. The securities can be structured as either fixed or adjustable coupon securities that can have either a perpetual or stated maturity date. For trust preferred securities, the issuing bank or corporation pays interest to the trust, which is then distributed to holders of the trust preferred securities as a dividend. Dividends can be deferred without creating an event of default or acceleration, although maturity cannot take place unless all cumulative payment obligations have been met. The deferral of payments does not affect the purchase or sale of these securities in the open market. Payments on these securities are treated as interest rather than dividends for federal income tax purposes. These securities generally are rated below that of the issuing company’s senior debt securities and are freely callable at the issuer’s option.
Preferred Stock: Preferred stock has a preference over common stock in liquidation (and generally in receiving dividends as well) but is subordinated to the liabilities of the issuer in all respects. As a general rule, the market value of preferred stock with a fixed dividend rate and no conversion element varies inversely with interest rates and perceived credit risk, while the market price of convertible preferred stock generally also reflects some element of conversion value. Because preferred stock is junior to debt securities and other obligations of the issuer, deterioration in the credit quality of the issuer will cause greater changes in the value of a preferred stock than in a more senior debt security with similar stated yield characteristics. Unlike interest payments on debt securities, preferred stock dividends are payable only if declared by the issuer’s board of directors. Preferred stock also may be subject to optional or mandatory redemption provisions.
| BLACKROCK BALANCED CAPITAL FUND, INC. | MARCH 31, 2016 | 99 |
| Notes to Consolidated Financial Statements (continued) | Master Total Return Portfolio |
Floating Rate Loan Interests: Floating rate loan interests are typically issued to companies (the “borrower”) by banks, other financial institutions, or privately and publicly offered corporations (the “lender”). Floating rate loan interests are generally non-investment grade, often involve borrowers whose financial condition is troubled or uncertain and companies that are highly leveraged. The Master Portfolio may invest in obligations of borrowers who are in bankruptcy proceedings. In addition, transactions in floating rate loan interests may settle on a delayed basis, which may result to proceeds from the sale to not be readily available for the Master Portfolio to make additional investments or meet its redemption obligations. Floating rate loan interests may include fully funded term loans or revolving lines of credit. Floating rate loan interests are typically senior in the corporate capital structure of the borrower. Floating rate loan interests generally pay interest at rates that are periodically determined by reference to a base lending rate plus a premium. The base lending rates are generally the lending rate offered by one or more European banks, such as the London Interbank Offered Rate (“LIBOR”), the prime rate offered by one or more U.S. banks or the certificate of deposit rate. Floating rate loan interests may involve foreign borrowers, and investments may be denominated in foreign currencies. These investments are treated as investments in debt securities for purposes of the Master Portfolio’s investment policies.
When the Master Portfolio purchases a floating rate loan interest, it may receive a facility fee and when it sells a floating rate loan interest, it may pay a facility fee. On an ongoing basis, the Master Portfolio may receive a commitment fee based on the undrawn portion of the underlying line of credit amount of a floating rate loan interest. Facility and commitment fees are typically amortized to income over the term of the loan or term of the commitment, respectively. Consent and amendment fees are recorded to income as earned. Prepayment penalty fees, which may be received by the Master Portfolio upon the prepayment of a floating rate loan interest by a borrower, are recorded as realized gains. The Master Portfolio may invest in multiple series or tranches of a loan. A different series or tranche may have varying terms and carry different associated risks.
Floating rate loan interests are usually freely callable at the borrower’s option. The Master Portfolio may invest in such loans in the form of participations in loans (“Participations”) or assignments (“Assignments”) of all or a portion of loans from third parties. Participations typically will result in the Master Portfolio having a contractual relationship only with the lender, not with the borrower. The Master Portfolio will have the right to receive payments of principal, interest and any fees to which it is entitled only from the lender selling the Participation and only upon receipt by the lender of the payments from the borrower. In connection with purchasing Participations, the Master Portfolio generally will have no right to enforce compliance by the borrower with the terms of the loan agreement, nor any rights of offset against the borrower. The Master Portfolio may not benefit directly from any collateral supporting the loan in which it has purchased the Participation. As a result, the Master Portfolio assumes the credit risk of both the borrower and the lender that is selling the Participation. The Master Portfolio’s investment in loan participation interests involves the risk of insolvency of the financial intermediaries who are parties to the transactions. In the event of the insolvency of the lender selling the Participation, the Master Portfolio may be treated as a general creditor of the lender and may not benefit from any offset between the lender and the borrower. Assignments typically result in the Master Portfolio having a direct contractual relationship with the borrower, and the Master Portfolio may enforce compliance by the borrower with the terms of the loan agreement.
In connection with floating rate loan interests, the Master Portfolio may also enter into unfunded floating rate loan interests (“commitments”). In connection with these commitments, the Master Portfolio earns a commitment fee, typically set as a percentage of the commitment amount. Such fee income, which is included in interest income in the Consolidated Statement of Operations, is recognized ratably over the commitment period. Unfunded floating rate loan interests are marked-to-market daily, and any unrealized appreciation (depreciation) is included in the Consolidated Statement of Assets and Liabilities and Consolidated Statement of Operations. As of period end, the Master Portfolio had no unfunded floating rate loan interests.
Forward Commitments and When-Issued Delayed Delivery Securities: The Master Portfolio may purchase securities on a when-issued basis and may purchase or sell securities on a forward commitment basis. Settlement of such transactions normally occurs within a month or more after the purchase or sale commitment is made. The Master Portfolio may purchase securities under such conditions with the intention of actually acquiring them, but may enter into a separate agreement to sell the securities before the settlement date. Since the value of securities purchased may fluctuate prior to settlement, the Master Portfolio may be required to pay more at settlement than the security is worth. In addition, the Master Portfolio is not entitled to any of the interest earned prior to settlement. When purchasing a security on a delayed delivery basis, the Master Portfolio assumes the rights and risks of ownership of the security, including the risk of price and yield fluctuations. In the event of default by the counterparty, the Master Portfolio’s maximum amount of loss is the unrealized appreciation of unsettled when-issued transactions.
TBA Commitments: TBA commitments are forward agreements for the purchase or sale of mortgage-backed securities for a fixed price, with payment and delivery on an agreed upon future settlement date. The specific securities to be delivered are not identified at the trade date. However, delivered securities must meet specified terms, including issuer, rate and mortgage terms. When entering into TBA commitments, the Master Portfolio may take possession of or deliver the underlying mortgage-backed securities but can extend the settlement or roll the transaction. TBA commitments involve a risk of loss if the value of the security to be purchased or sold declines or increases, respectively, prior to settlement date.
In order to better define contractual rights and to secure rights that will help the Master Portfolio mitigate its counterparty risk, TBA commitments may be entered into by the Master Portfolio under Master Securities Forward Transaction Agreements (each, an “MSFTA”). An MSFTA typically contains, among other things, collateral posting terms and netting provisions in the event of default and/or termination. The collateral requirements are typically
| 100 | BLACKROCK BALANCED CAPITAL FUND, INC. | MARCH 31, 2016 |
| Notes to Consolidated Financial Statements (continued) | Master Total Return Portfolio |
calculated by netting the mark-to-market amount for each transaction under such agreement and comparing that amount to the value of the collateral currently pledged by the Master Portfolio and the counterparty. Cash collateral that has been pledged to cover the obligations of the Master Portfolio and cash collateral received from the counterparty, if any, is reported separately on the Consolidated Statement of Assets and Liabilities as cash pledged as collateral for TBA commitments or cash received as collateral for TBA commitments, respectively. Non-cash collateral pledged by the Master Portfolio, if any, is noted in the Consolidated Schedule of Investments. Typically, the Master Portfolio is permitted to sell, repledge or use the collateral it receives; however, the counterparty is not permitted to do so. To the extent amounts due to the Master Portfolio are not fully collateralized, contractually or otherwise, the Master Portfolio bears the risk of loss from counterparty non-performance.
Mortgage Dollar Roll Transactions: The Master Portfolio may sell TBA mortgage-backed securities and simultaneously contract to repurchase substantially similar (i.e., same type, coupon and maturity) securities on a specific future date at an agreed upon price. During the period between the sale and repurchase, the Master Portfolio is not entitled to receive interest and principal payments on the securities sold. Mortgage dollar roll transactions are treated as purchases and sales and realize gains and losses on these transactions. Mortgage dollar rolls involve the risk that the market value of the securities that the Master Portfolio is required to purchase may decline below the agreed upon repurchase price of those securities.
Borrowed Bond Agreements: Repurchase agreements may be referred to as borrowed bond agreements when entered into in connection with short sales of bonds. In a borrowed bond agreement, the Master Portfolio borrows a bond from a counterparty in exchange for cash collateral. The agreement contains a commitment that the security and the cash will be returned to the counterparty and the Master Portfolio at a mutually agreed upon date. Certain agreements have no stated maturity and can be terminated by either party at any time. Earnings on cash collateral and compensation to the lender of the bond are based on agreed upon rates between the Master Portfolio and the counterparty. The value of the underlying cash collateral approximates the market value and accrued interest of the borrowed bond. To the extent that a borrowed bond transaction exceeds one business day, the value of the cash collateral in the possession of the counterparty is monitored on a daily basis to ensure the adequacy of the collateral. As the market value of the borrowed bond changes, the cash collateral is periodically increased or decreased with a frequency and in amounts prescribed in the borrowed bond agreement. The Master Portfolio may also experience delays in gaining access to the collateral.
Reverse Repurchase Agreements: Reverse repurchase agreements are agreements with qualified third party broker dealers in which the Master Portfolio sells securities to a bank or broker-dealer and agrees to repurchase the same securities at a mutually agreed upon date and price. The Master Portfolio receives cash from the sale to use for other investment purposes. During the term of the reverse repurchase agreement, the Master Portfolio continues to receive the principal and interest payments on the securities sold. Certain agreements have no stated maturity and can be terminated by either party at any time. Interest on the value of the reverse repurchase agreements issued and outstanding is based upon competitive market rates determined at the time of issuance. The Master Portfolio may utilize reverse repurchase agreements when it is anticipated that the interest income to be earned from the investment of the proceeds of the transaction is greater than the interest expense of the transaction. Reverse repurchase agreements involve leverage risk. If the Master Portfolio suffers a loss on its investment of the transaction proceeds from a reverse repurchase agreement, the Master Portfolio would still be required to pay the full repurchase price. Further, the Master Portfolio remains subject to the risk that the market value of the securities repurchased declines below the repurchase price. In such cases, the Master Portfolio would be required to return a portion of the cash received from the transaction or provide additional securities to the counterparty.
Cash received in exchange for securities delivered plus accrued interest due to the counterparty is recorded as a liability in the Consolidated Statement of Assets and Liabilities at face value including accrued interest. Due to the short-term nature of the reverse repurchase agreements, face value approximates fair value. Interest payments made by the Master Portfolio to the counterparties are recorded as a component of interest expense in the Consolidated Statement of Operations. In periods of increased demand for the security, the Master Portfolio may receive a fee for use of the security by the counterparty, which may result in interest income to the Master Portfolio.
For the six months ended March 31, 2016, the average amount of reverse repurchase agreements outstanding and the daily weighted average interest rate for the Master Portfolio were $1,952,247,010 and (0.58)%, respectively.
Treasury Roll Transactions: In a treasury roll transaction, the Master Portfolio sells a Treasury security to a counterparty with a simultaneous agreement to repurchase the same security at an agreed upon price and future settlement date. The Master Portfolio receives cash from the sale of the Treasury security to use for other investment purposes. The difference between the sale price and repurchase price represents net interest income or net interest expense reflective of an agreed upon rate between the Master Portfolio and the counterparty over the term of the borrowing. For U.S. GAAP purposes, a treasury roll transaction is accounted for as a secured borrowing and not as a purchase or sale. During the term of the borrowing, interest income from the Treasury security and the related interest expense on the secured borrowing is recorded by the Master Portfolio on an accrual basis. The Master Portfolio will benefit from the transaction if the income earned on the investment purchased with the cash received in the treasury roll transaction exceeds the interest expense incurred by the Master Portfolio. If the interest expense exceeds the income earned, the Master Portfolio’s net investment income and dividends to shareholders may be adversely impacted. Treasury roll transactions involve leverage risk. If the Master Portfolio suffers a loss on its investment of the transaction proceeds from a Treasury roll transaction, the Master Portfolio would be required to pay the full repurchase price.
| BLACKROCK BALANCED CAPITAL FUND, INC. | MARCH 31, 2016 | 101 |
| Notes to Consolidated Financial Statements (continued) | Master Total Return Portfolio |
Further, the Master Portfolio remains subject to the risk that the market value of the Treasury securities that the Master Portfolio is required to repurchase may decline below the agreed upon repurchase price of those securities. In such cases, the Master Portfolio would need to return a portion of the cash received from the transaction or provide additional Treasury securities to the counterparty.
Borrowed bond agreements, reverse repurchase transactions and treasury roll transactions are entered into by the Master Portfolio under Master Repurchase Agreements (each, an “MRA”), which permit the Master Portfolio, under certain circumstances, including an event of default (such as bankruptcy or insolvency), to offset payables and/or receivables under the MRA with collateral held and/or posted to the counterparty and create one single net payment due to or from the Master Portfolio. With borrowed bond agreements reverse repurchase transactions and treasury roll transactions, typically the Master Portfolio and counterparty under an MRA are permitted to sell, re-pledge, or use the collateral associated with the transaction. Bankruptcy or insolvency laws of a particular jurisdiction may impose restrictions on or prohibitions against such a right of offset in the event of the MRA counterparty’s bankruptcy or insolvency. Pursuant to the terms of the MRA, the Master Portfolio receives or posts securities as collateral with a market value in excess of the repurchase price to be paid or received by the Master Portfolio upon the maturity of the transaction. Upon a bankruptcy or insolvency of the MRA counterparty, the Master Portfolio is considered an unsecured creditor with respect to excess collateral and, as such, the return of excess collateral may be delayed.
As of period end, the following table is a summary of the Master Portfolio’s open borrowed bond agreements and reverse repurchase agreements by counterparty which are subject to offset under an MRA on a net basis:
| Counterparty |
Borrowed Bond Agreements1 |
Reverse Repurchase Agreements |
Borrowed Bonds at Value Including Accrued Interest2 |
Net Amount Before Collateral |
Non-cash Collateral Received |
Cash Collateral Received |
Non-cash Collateral Pledged |
Cash Collateral Pledged |
Net Collateral (Received)/ Pledged3 |
Net Exposure Due (to)/ from Counterparty4 |
||||||||||||||||||||||||||||||
| Amherst Pierpont Securities LLC |
— | $ | (166,902,365 | ) | — | $ | (166,902,365 | ) | — | — | $ | 166,902,365 | — | $ | 166,902,365 | — | ||||||||||||||||||||||||
| Bank of Montreal |
— | (99,519,900 | ) | — | (99,519,900 | ) | $ | (707,624 | ) | — | 100,227,524 | — | 99,519,900 | — | ||||||||||||||||||||||||||
| Barclays Bank PLC |
$ | 2,828,134 | — | $ | (2,908,972 | ) | (80,838 | ) | — | — | — | — | — | $ (80,838 | ) | |||||||||||||||||||||||||
| Barclays Capital, Inc. |
— | (178,888,185 | ) | — | (178,888,185 | ) | — | — | 178,888,185 | — | 178,888,185 | — | ||||||||||||||||||||||||||||
| BNP Paribas Securities Corp. |
694,213 | — | (701,968 | ) | (7,755 | ) | — | — | — | — | — | (7,755 | ) | |||||||||||||||||||||||||||
| Citigroup Global Markets Ltd. |
539,650 | — | (517,761 | ) | 21,889 | — | — | — | — | — | 21,889 | |||||||||||||||||||||||||||||
| Citigroup Global Markets, Inc. |
11,981,375 | — | (12,799,035 | ) | (817,660 | ) | — | — | 506,558 | — | 506,558 | (311,102 | ) | |||||||||||||||||||||||||||
| Credit Agricole CIB |
— | (209,913,006 | ) | — | (209,913,006 | ) | — | $ | (2,650,000 | ) | 212,563,006 | — | 209,913,006 | — | ||||||||||||||||||||||||||
| Deutsche Bank Securities, Inc. |
26,165,880 | (309,633,935 | ) | (26,372,476 | ) | (309,840,531 | ) | — | — | 309,840,531 | — | 309,840,531 | — | |||||||||||||||||||||||||||
| J.P. Morgan Securities LLC |
— | (492,479,541 | ) | — | (492,479,541 | ) | — | — | 492,479,541 | — | 492,479,541 | — | ||||||||||||||||||||||||||||
| J.P. Morgan Securities PLC |
4,273,904 | — | (4,226,198 | ) | 47,706 | — | — | — | — | — | 47,706 | |||||||||||||||||||||||||||||
| Merrill Lynch, Pierce, Fenner & Smith, Inc. |
44,378,747 | (450,138,889 | ) | (44,560,172 | ) | (450,320,314 | ) | — | — | 450,320,314 | — | 450,320,314 | — | |||||||||||||||||||||||||||
| Nomura Securities International, Inc. |
222,610,000 | (156,844,638 | ) | (222,807,261 | ) | (157,041,899 | ) | — | — | 156,899,003 | — | 156,899,003 | (142,896 | ) | ||||||||||||||||||||||||||
| RBC Capital Markets, LLC |
13,782,250 | — | (14,403,766 | ) | (621,516 | ) | — | — | — | $509,000 | 509,000 | (112,516 | ) | |||||||||||||||||||||||||||
|
|
|
|||||||||||||||||||||||||||||||||||||||
| Total |
$ | 327,254,153 | $ | (2,064,320,459 | ) | $ | (329,297,609 | ) | $ | (2,066,363,915 | ) | $ | (707,624 | ) | $ | (2,650,000 | ) | $ | 2,068,627,027 | $509,000 | $ | 2,065,778,403 | $(585,512 | ) | ||||||||||||||||
|
|
|
|||||||||||||||||||||||||||||||||||||||
| 1 | Included in Investments at value-unaffiliated in the Consolidated Statement of Assets and Liabilities. |
| 2 | Includes accrued interest on borrowed bonds in the amount of $904,935 which is included in interest expense payable in the Consolidated Statement of Assets and Liabilities. |
| 3 | Net collateral with a value of $2,070,812,282 has been pledged/received in connection with open reverse repurchase agreements. Excess of net collateral pledged to the individual counterparty is not shown for financial reporting purposes. |
| 4 | Net exposure represents the net receivable (payable) that would be due from/to the counterparty in the event of default. |
When the Master Portfolio enters into an MRA and International Swaps and Derivatives Association, Inc. (an “ISDA”) and/or Master Securities Lending Agreements (“MSLA”) with the same counterparty, the agreements may contain a set-off provision allowing a fund to offset a net amount payable with a net amount receivable upon default of the counterparty. Bankruptcy or insolvency laws of a particular jurisdiction may restrict or prohibit the right of offset in bankruptcy, insolvency or other events. For example, regardless of the contractual rights included in an MRA, such laws may prohibit the Master Portfolio from setting off amounts owed to a defaulting counterparty under an MRA against amounts owed to the Master Portfolio by affiliates of the defaulting counterparty. However, the insolvency regimes of many jurisdictions generally permit set-off of simultaneous payables and receivables with the same legal entity under certain types of financial contracts. These rules would apply upon a default of the legal entity, regardless of the existence of a contractual set-off right in those contracts.
| 102 | BLACKROCK BALANCED CAPITAL FUND, INC. | MARCH 31, 2016 |
| Notes to Consolidated Financial Statements (continued) | Master Total Return Portfolio |
In the event the counterparty of securities under an MRA files for bankruptcy or becomes insolvent, the Master Portfolio’s use of the proceeds from the agreement may be restricted while the counterparty, or its trustee or receiver, determines whether or not to enforce the Master Portfolio’s obligation to repurchase the securities.
Short Sales Transactions (Borrowed Bonds): In short sale transactions, the Master Portfolio sells a security it does not hold in anticipation of a decline in the market price of that security. When the Master Portfolio makes a short sale, it will borrow the security sold short (borrowed bond) and deliver the security to the counterparty to which it sold the security short. An amount equal to the proceeds received by the Master Portfolio is reflected as an asset and an equivalent liability. The amount of the liability is subsequently marked-to-market to reflect the market value of the short sale. The Master Portfolio is required to repay the counterparty interest on the security sold short, which, if applicable, is shown as interest expense in the Consolidated Statement of Operations. The Master Portfolio is exposed to market risk based on the amount, if any, that the market value of the security increases beyond the market value at which the position was sold. Thus, a short sale of a security involves the risk that instead of declining, the price of the security sold short will rise. The short sale of securities involves the possibility of an unlimited loss since there is an unlimited potential for the market price of the security sold short to increase. A gain is limited to the price at which the Master Portfolio sold the security short. A realized gain or loss is recognized upon the termination of a short sale if the market price is either less than or greater than the proceeds originally received. There is no assurance the Master Portfolio will be able to close out a short position at a particular time or at an acceptable price.
Short Sales Transactions (Investments Sold Short): In short sale transactions, the Master Portfolio sells a security it does not hold in anticipation of a decline in the market price of that security. When the Master Portfolio makes a short sale, it will borrow the security sold short from a broker/ counterparty and deliver the security to the purchaser. To close out a short position, the Master Portfolio delivers the same security to the broker and records a liability to reflect the obligation to return the security to the broker. The amount of the liability is subsequently marked-to-market to reflect the market value of the short sale. The Master Portfolio maintains a segregated account of securities or deposits cash with the broker-dealer as collateral for the short sales. Cash deposited with the broker is recorded as an asset in the Consolidated Statement of Assets and Liabilities. Securities segregated as collateral are denoted in the Consolidated Schedule of Investments. The Master Portfolio may pay a financing fee for the difference between the market value of the short position and the cash collateral deposited with the broker which would be recorded as interest expense. The Master Portfolio is required to repay the counterparty any dividends received on the security sold short, which, if applicable, is shown as dividend expense in the Consolidated Statement of Operations. The Master Portfolio may pay a fee on the assets borrowed from the counterparty, which, if applicable, is shown as stock loan fees in the Consolidated Statement of Operations. The Master Portfolio is exposed to market risk based on the amount, if any, that the market value of the security increases beyond the market value at which the position was sold. Thus, a short sale of a security involves the risk that instead of declining, the price of the security sold short will rise. The short sale of securities involves the possibility of an unlimited loss since there is an unlimited potential for the market price of the security sold short to increase. A gain is limited to the price at which the Master Portfolio sold the security short. A realized gain or loss is recognized upon the termination of a short sale if the market price is either less than or greater than the proceeds originally received. There is no assurance that the Master Portfolio will be able to close out a short position at a particular time or at an acceptable price.
Securities Lending: The Master Portfolio may lend its securities to approved borrowers, such as brokers, dealers and other financial institutions. The borrower pledges and maintains with the Master Portfolio collateral consisting of cash, an irrevocable letter of credit issued by a bank, or securities issued or guaranteed by the U.S. Government. The initial collateral received by the Master Portfolio is required to have a value of at least 102% of the current value of the loaned securities for securities traded on U.S. exchanges and a value of at least 105% for all other securities. The collateral is maintained thereafter at a value equal to at least 100% of the current market value of the securities on loan. The market value of the loaned securities is determined at the close of each business day of the Master Portfolio and any additional required collateral is delivered to the Master Portfolio, or excess collateral returned by the Master Portfolio, on the next business day. During the term of the loan, the Master Portfolio is entitled to all distributions made on or in respect of the loaned securities. Loans of securities are terminable at any time and the borrower, after notice, is required to return borrowed securities within the standard time period for settlement of securities transactions.
The market value of any securities on loan, all of which were classified as investment companies in the Master Portfolio’s Consolidated Schedule of Investments, and the value of any related collateral are shown separately in the Consolidated Statement of Assets and Liabilities as a component of investments at value — unaffiliated, and collateral on securities loaned at value, respectively. As of period end, any securities on loan were collateralized by cash. The cash collateral invested by the securities lending agent, BlackRock Investment Management, LLC (“BIM”), if any, is disclosed in the Consolidated Schedule of Investments.
Securities lending transactions are entered into by the Master Portfolio under an MSLA, which provide the right, in the event of default (including bankruptcy or insolvency), for the non-defaulting party to liquidate the collateral and calculate a net exposure to the defaulting party or request additional collateral. In the event that a borrower defaults, the Master Portfolio, as lender, would offset the market value of the collateral received against the market value of the securities loaned. When the value of the collateral is greater than that of the market value of the securities loaned, the lender is left with a net amount payable to the defaulting party. However, bankruptcy or insolvency laws of a particular jurisdiction may impose restrictions on or prohibitions against such a right of offset in the event of an MSLA counterparty’s bankruptcy or insolvency. Under the MSLA, absent an event of default
| BLACKROCK BALANCED CAPITAL FUND, INC. | MARCH 31, 2016 | 103 |
| Notes to Consolidated Financial Statements (continued) | Master Total Return Portfolio |
the borrower can resell or re-pledge the loaned securities, and the Master Portfolio can reinvest cash collateral received in connection with loaned securities. Upon an event of default, the parties’ obligations to return the securities or collateral to the other party are extinguished, and the parties can resell or re-pledge the loaned securities or the collateral received in connection with the loaned securities in order to satisfy the defaulting party’s net payment obligation for all transactions under the MSLA. The defaulting party remains liable for any deficiency.
As of period end, the following table is a summary of the Master Portfolio’s securities lending agreements by counterparty which are subject to offset under an MSLA:
| Counterparty |
Securities Loaned at Value |
Cash Collateral Received1 |
Net Amount | |||
| Merrill Lynch, Pierce, Fenner & Smith, Inc. |
$32,757,690 | $(32,757,690) | — | |||
|
| ||||||
| 1 | Collateral with a value of $33,383,250 has been received in connection with securities lending agreements. Collateral received in excess of the value of securities loaned from the individual counterparty is not shown for financial reporting purposes in the table above. |
The risks of securities lending include the risk that the borrower may not provide additional collateral when required or may not return the securities when due. To mitigate these risks, the Master Portfolio benefits from a borrower default indemnity provided by BIM. BIM’s indemnity allows for full replacement of the securities loaned if the collateral received does not cover the value on the securities loaned in the event of borrower default. The Master Portfolio could suffer a loss if the value of an investment purchased with cash collateral falls below the market value of loaned securities or if the value of an investment purchased with cash collateral falls below the value of the original cash collateral received.
5. Derivative Financial Instruments:
The Master Portfolio engages in various portfolio investment strategies using derivative contracts both to increase the returns of the Master Portfolio and/or to manage its exposure to certain risks such as credit risk, equity risk, interest rate risk, foreign currency exchange rate risk, commodity price risk or other risks (e.g. inflation risk). Derivative financial instruments categorized by risk exposure are included in the Consolidated Schedule of Investments. These contracts may be transacted on an exchange or OTC.
Futures Contracts: The Master Portfolio invests in long and/or short positions in futures contracts and options on futures contracts to gain exposure to, or manage exposure to changes in interest rates (interest rate risk), changes in the value of equity securities (equity risk) or foreign currencies (foreign currency exchange rate risk).
Futures contracts are agreements between the Master Portfolio and a counterparty to buy or sell a specific quantity of an underlying instrument at a specified price and on a specified date. Depending on the terms of a contract, it is settled either through physical delivery of the underlying instrument on the settlement date or by payment of a cash amount on the settlement date.
Upon entering into a futures contract, the Master Portfolio is required to deposit initial margin with the broker in the form of cash or securities in an amount that varies depending on a contract’s size and risk profile. The initial margin deposit must then be maintained at an established level over the life of the contract.
Securities deposited as initial margin are designated in the Consolidated Schedule of Investments and cash deposited, if any, is shown as cash pledged for futures contracts in the Consolidated Statement of Assets and Liabilities. Pursuant to the contract, the Master Portfolio agrees to receive from or pay to the broker an amount of cash equal to the daily fluctuation in market value of the contract (“variation margin”). Variation margin is recorded as unrealized appreciation (depreciation) and, if any, shown as variation margin receivable (or payable) on futures contracts in the Consolidated Statement of Assets and Liabilities.
When the contract is closed, a realized gain or loss is recorded in the Consolidated Statement of Operations equal to the difference between the value of the contract at the time it was opened and the value at the time it was closed. The use of futures contracts involves the risk of an imperfect correlation in the movements in the price of futures contracts and interest foreign currency exchange rates or underlying assets.
Forward Foreign Currency Exchange Contracts: The Master Portfolio enters into forward foreign currency exchange contracts to gain or reduce exposure to foreign currencies (foreign currency exchange rate risk).
A forward foreign currency exchange contract is an agreement between two parties to buy and sell a currency at a set exchange rate on a specified date. These contracts help to manage the overall exposure to the currencies in which some of the investments held by the Master Portfolio is denominated and in some cases, may be used to obtain exposure to a particular market.
The daily and the change in market value is recorded as unrealized appreciation (depreciation) in the Consolidated Statement of Assets and Liabilities. When a contract is closed, a realized gain or loss is recorded in the Consolidated Statement of Operations equal to the difference between the value at the time it was opened and the value at the time it was closed. Non-deliverable forward foreign currency exchange contracts are settled with the
| 104 | BLACKROCK BALANCED CAPITAL FUND, INC. | MARCH 31, 2016 |
| Notes to Consolidated Financial Statements (continued) | Master Total Return Portfolio |
counterparty in cash without the delivery of foreign currency. The use of forward foreign currency exchange contracts involves the risk that the value of a forward foreign currency exchange contract changes unfavorably due to movements in the value of the referenced foreign currencies.
Options: The Master Portfolio purchases and writes call and put options to increase or decrease its exposure to the risks of underlying instruments, including equity risk, interest rate risk and/or commodity price risk) and/or, in the case of options written, to generate gains from options premiums.
A call option gives the purchaser (holder) of the option the right (but not the obligation) to buy, and obligates the seller (writer) to sell (when the option is exercised) the underlying instrument at the exercise or strike price at any time or at a specified time during the option period. A put option gives the holder the right to sell and obligates the writer to buy the underlying instrument at the exercise or strike price at any time or at a specified time during the option period.
Premiums paid on options purchased and premiums received on options written, as well as the daily fluctuation in market value, are included in investments at value — unaffiliated and options written at value, respectively, in the Consolidated Statement of Assets and Liabilities. When an instrument is purchased or sold through the exercise of an option, the premium is offset against the cost or proceeds of the underlying instrument. When an option expires, a realized gain or loss is recorded in the Consolidated Statement of Operations to the extent of the premiums received or paid. When an option is closed or sold, a gain or loss is recorded in the Consolidated Statement of Operations to the extent the cost of the closing transaction exceeds the premiums received or paid). When the Master Portfolio writes a call option, such option is typically “covered,” meaning that it holds the underlying instrument subject to being called by the option counterparty. When the Master Portfolio writes a put option, such option is covered by cash in an amount sufficient to cover the obligation.
| • | Swaptions — The Master Portfolio purchases and writes options on swaps (“swaptions”) primarily to preserve a return or spread on a particular investment or portion of the Master Portfolio’s holdings, as a duration management technique or to protect against an increase in the price of securities it anticipates purchasing at a later date. The purchaser and writer of a swaption is buying or granting the right to enter into a previously agreed upon interest rate or credit default swap agreement (interest rate risk and/or credit risk) at any time before the expiration of the option. |
| • | Foreign Currency options — The Master Portfolio purchases and writes foreign currency options, foreign currency futures and options on foreign currency futures to gain or reduce exposure to foreign currencies (foreign currency exchange rate risk). Foreign currency options give the purchaser the right to buy from or sell to the writer a foreign currency at any time before the expiration of the option. |
| • | Barrier options — The Master Portfolio may purchase and write a variety of options with non-standard payout structures or other features (“barrier options”) that are generally traded OTC. |
The Master Portfolio may invest in various types of barrier options, including down-and-out options, under-and-out options, down-and-in options, double no-touch options, one-touch options and up-and-out options. Down-and-out options expire worthless to the purchaser if the price of the underlying instrument falls below a specific barrier price level prior to the expiration date. Down-and-in options expire worthless to the purchaser unless the price of the underlying instrument falls below a specific barrier price level prior to the expiration date. Double no-touch options provide the purchaser an agreed-upon payout if the price of the underlying instrument does not reach or surpass predetermined barrier price levels prior to the option’s expiration date. One-touch options provide the purchaser an agreed-upon payout if the price of the underlying instrument reaches or surpasses predetermined barrier price levels prior to the expiration date. Up-and-out options expire worthless if the price of the underlying instrument increases beyond a predetermined barrier price level prior to the expiration date.
| • | Structured options — The Master Portfolio invests in structured options to increase or decrease its exposure to an underlying index or group of securities (equity risk). |
These options may consist of single or multiple OTC options which are priced as a single instrument. They may only be exercised at the expiration date, but may be transferred/sold prior to the expiration date. The value of a structured option may either increase or decrease with the underlying index or group of securities, depending on the combination of options used. Structured options are issued in units whereby each unit represents a structure based on the specific index with an initial reference strike price. One type of structure involves the combination of selling a put while buying a call on a specific index. This option would rise in value as the underlying index increases and fall in value as the underlying index decreases. Alternatively, another structure involves the sale of a call and the purchase of a put. This option structure would rise in value as the underlying index decreases and fall in value as the underlying index increases. Upon the exercise of the structured option, the Master Portfolio will receive a payment from, or be required to remit a payment to the counterparty, depending on the value of the underlying index at exercise.
In purchasing and writing options, the Master Portfolio bears the risk of an unfavorable change in the value of the underlying instrument or the risk that it may not be able to enter into a closing transaction due to an illiquid market. Exercise of a written option could result in the Master Portfolio purchasing or selling a security when it otherwise would not, or at a price different from the current market value.
| BLACKROCK BALANCED CAPITAL FUND, INC. | MARCH 31, 2016 | 105 |
| Notes to Consolidated Financial Statements (continued) | Master Total Return Portfolio |
Swaps: The Master Portfolio enters into swap contracts to manage exposure to issuers, markets and securities. Such contracts are agreements between the Master Portfolio and a counterparty to make periodic net payments on a specified notional amount or a net payment upon termination. Swap agreements are privately negotiated in the OTC market and may be entered into as a bilateral contract (“OTC swaps”) or centrally cleared (“centrally cleared swaps”).
For OTC swaps, any upfront premiums paid and any upfront fees received are shown as swap premiums paid and swap premiums received, respectively, in the Consolidated Statement of Assets and Liabilities and amortized over the term of the contract. The daily fluctuation in market value is recorded as unrealized appreciation (depreciation) on OTC Swaps in the Consolidated Statement of Assets and Liabilities. Payments received or paid are recorded in the Consolidated Statement of Operations as realized gains or losses, respectively. When an OTC swap is terminated, a realized gain or loss is recorded in the Consolidated Statement of Operations equal to the difference between the proceeds from (or cost of) the closing transaction and the Master Portfolio’s basis in the contract, if any. Generally, the basis of the contract is the premium received or paid.
In a centrally cleared swap, immediately following execution of the swap contract, the swap contract is novated to a central counterparty (the “CCP”) and the Master Portfolio’s counterparty on the swap agreement becomes the CCP. The Master Portfolio is required to interface with the CCP through the broker. Upon entering into a centrally cleared swap, the Master Portfolio is required to deposit initial margin with the broker in the form of cash or securities in an amount that varies depending on the size and risk profile of the particular swap. Securities deposited as initial margin are designated in the Consolidated Schedule of Investments and cash deposited is shown as cash pledged for centrally cleared swaps in the Consolidated Statement of Assets and Liabilities. Pursuant to the contract, the Master Portfolio agrees to receive from or pay to the broker an amount of cash equal to the daily fluctuation in market value of the contract (“variation margin”). Variation margin is recorded as unrealized appreciation (depreciation) and shown as variation margin receivable (or payable) on centrally cleared swaps in the Consolidated Statement of Assets and Liabilities. Payments received from (paid to) the counterparty, including at termination, are recorded as realized gains (losses) in the Consolidated Statement of Operations.
| • | Credit default swaps — The Master Portfolio enters into credit default swaps to manage its exposure to the market or certain sectors of the market, to reduce its risk exposure to defaults of corporate and/or sovereign issuers or to create exposure to corporate and/or sovereign issuers to which it is not otherwise exposed (credit risk). |
The Master Portfolio may either buy or sell (write) credit default swaps on single-name issuers (corporate or sovereign), a combination or basket of single-name issuers or traded indexes. Credit default swaps are agreements in which the protection buyer pays fixed periodic payments to the seller in consideration for a promise from the protection seller to make a specific payment should a negative credit event take place with respect to the referenced entity (e.g., bankruptcy, failure to pay, obligation acceleration, repudiation, moratorium or restructuring). As a buyer, if an underlying credit event occurs, the Master Portfolio will either (i) receive from the seller an amount equal to the notional amount of the swap and deliver the referenced security or underlying securities comprising the index, or (ii) receive a net settlement of cash equal to the notional amount of the swap less the recovery value of the security or underlying securities comprising the index. As a seller (writer), if an underlying credit event occurs, the Master Portfolio will either pay the buyer an amount equal to the notional amount of the swap and take delivery of the referenced security or underlying securities comprising the index or pay a net settlement of cash equal to the notional amount of the swap less the recovery value of the security or underlying securities comprising the index.
| • | Total return swaps — The Master Portfolio enters into total return swaps to obtain exposure to a security or market without owning such security or investing directly in such market or to exchange the risk/return of one market (e.g., fixed income) with another market (e.g., equity or commodity prices) (equity risk, commodity price risk and/or interest rate risk). |
Total return swaps are agreements in which there is an exchange of cash flows whereby one party commits to make payments based on the total return (distributions plus capital gains/losses) of an underlying instrument in exchange for fixed or floating rate interest payments. If the total return of the instrument or index underlying the transaction exceeds or falls short of the offsetting fixed or floating interest rate obligation, the Master Portfolio receives a payment from or makes a payment to the counterparty.
| • | Total return swaps — The Master Portfolio enters into total return swaps to obtain exposure to a portfolio of long and short securities without owning such securities. |
Under the terms of a contract, the swap is designed to function as a portfolio of direct investments in long and short equity positions. This means that the Master Portfolio has the ability to trade in and out of these long and short positions within the swap and will receive the economic benefits and risks equivalent to direct investment in these positions, subject to certain adjustments due to events related to the counterparty and its hedge. Benefits and risks include capital appreciation (depreciation), corporate actions and dividends received and paid, all of which are reflected in the swap’s market value. The market value also includes interest charges and credits (“financing fees”) related to the notional values of the long and short positions and cash balances within the swap. These interest charges and credits are based on a specified benchmark rate plus or minus a specified spread determined based upon the country and/or currency of the positions in the portfolio.
| 106 | BLACKROCK BALANCED CAPITAL FUND, INC. | MARCH 31, 2016 |
| Notes to Consolidated Financial Statements (continued) | Master Total Return Portfolio |
Positions within the swap and financing fees are reset periodically. During a reset, any unrealized appreciation (depreciation) on positions and accrued financing fees become available for cash settlement between the Master Portfolio and the counterparty. The amounts that are available for cash settlement are recorded as realized gains or losses in the Consolidated Statement of Operations. Cash settlement in and out of the swap may occur at a reset date or any other date, at the discretion of the Master Portfolio and the counterparty, over the life of the agreement. Certain swaps have no stated expiration and can be terminated by either party at any time.
| • | Interest rate swaps — The Master Portfolio enters into interest rate swaps to gain or reduce exposure to interest rates or to manage duration, the yield curve or interest rate (interest rate risk). |
Interest rate swaps are agreements in which one party pays a stream of interest payments, either fixed or floating, in exchange for another party’s stream of interest payments, either fixed or floating, on the same notional amount for a specified period of time. In more complex interest rate swaps, the notional principal amount may decline (or amortize) over time.
| • | Currency swaps — The Master Portfolio enters into cross-currency swaps to gain or reduce exposure to foreign currencies (foreign currency exchange rate risk). |
Currency swaps are interest rate swaps in which one party pays a stream of interest payments, either fixed or floating, in exchange for another party’s stream of interest payments, either fixed or floating, based on the notional amounts of two different currencies. The notional amounts are typically determined based on the spot exchange rates at the inception of the trade. Currency swaps may also involve an exchange of notional amounts at the start, during and/or at expiration of the contract, either at the current spot rate or another specified rate.
| • | Forward swaps — The Master Portfolio may enter into forward interest rate swaps and forward total return swaps. In a forward swap, the Master Portfolio and the counterparty agree to make periodic net payments beginning on a specified date or a net payment at termination. |
Swap transactions involve, to varying degrees, elements of interest rate, credit and market risk in excess of the amounts recognized in the Consolidated Statement of Assets and Liabilities. Such risks involve the possibility that there will be no liquid market for these agreements, that the counterparty to the agreements may default on its obligation to perform or disagree as to the meaning of the contractual terms in the agreements, and that there may be unfavorable changes in interest rates and/or market values associated with these transactions.
Master Netting Arrangements: In order to define its contractual rights and to secure rights that will help it mitigate its counterparty risk, the Master Portfolio may enter into an International Swaps and Derivatives Association, Inc. Master Agreement (“ISDA Master Agreement”) or similar agreement with its counterparties. An ISDA Master Agreement is a bilateral agreement between the Master Portfolio and a counterparty that governs certain OTC derivatives and typically contains, among other things, collateral posting terms and netting provisions in the event of a default and/or termination event. Under an ISDA Master Agreement, the Master Portfolio may, under certain circumstances, offset with the counterparty certain derivative financial instruments’ payables and/or receivables with collateral held and/or posted and create one single net payment. The provisions of the ISDA Master Agreement typically permit a single net payment in the event of default including the bankruptcy or insolvency of the counterparty. Bankruptcy or insolvency laws of a particular jurisdiction may restrict or prohibit the right of offset in bankruptcy, insolvency or other events. In addition, certain ISDA Master Agreements allow counterparties to terminate derivative contracts prior to maturity in the event the Master Portfolio’s net assets decline by a stated percentage or the Master Portfolio fails to meet the terms of its ISDA Master Agreements. The result would cause the Master Portfolio to accelerate payment of any net liability owed to the counterparty.
Collateral Requirements: For derivatives traded under an ISDA Master Agreement, the collateral requirements are typically calculated by netting the mark-to-market amount for each transaction under such agreement and comparing that amount to the value of any collateral currently pledged by the Master Portfolio and the counterparty.
Cash collateral that has been pledged to cover obligations of the Master Portfolio and cash collateral received from the counterparty, if any, is reported separately on the Consolidated Statement of Assets and Liabilities as cash pledged as collateral and cash received as collateral, respectively. Non-cash collateral pledged by the Master Portfolio, if any, is noted in the Consolidated Schedule of Investments. Generally, the amount of collateral due from or to a counterparty is subject to a certain minimum transfer amount threshold before a transfer is required, which is determined at the close of business of the Master Portfolio. Any additional required collateral is delivered to/pledged by the Master Portfolio on the next business day. Typically, the counterparty is not permitted to sell, re-pledge or use cash and non-cash collateral it receives. The Master Portfolio generally agrees not to use non-cash collateral that it receives but may, absent default or certain other circumstances defined in the underlying ISDA Master Agreement, be permitted to use cash collateral received. In such cases, interest may be paid pursuant to the collateral arrangement with the counterparty. To the extent amounts due to the Master Portfolio from its counterparties are not fully collateralized, it bears the risk of loss from counterparty non-performance. Likewise, to the extent the Master Portfolio has delivered collateral to a counterparty and stands ready to perform under the terms of its agreement with such counterparty, it bears the risk of loss from a counterparty in the amount of the value of the collateral in the event the counterparty fails to return such collateral. Based on the terms of agreements, collateral may not be required for all derivative contracts.
| BLACKROCK BALANCED CAPITAL FUND, INC. | MARCH 31, 2016 | 107 |
| Notes to Consolidated Financial Statements (continued) | Master Total Return Portfolio |
For financial reporting purposes, the Master Portfolio does not offset derivative assets and derivative liabilities that are subject to netting arrangements, if any, in the Consolidated Statement of Assets and Liabilities.
6. Investment Advisory Agreement and Other Transactions with Affiliates:
The PNC Financial Services Group, Inc. is the largest stockholder and an affiliate of BlackRock, Inc. (“BlackRock”) for 1940 Act purposes.
Investment Advisory
The Master LLC, on behalf of the Master Portfolio, entered into an Investment Advisory Agreement with BlackRock Advisors, LLC (the “Manager”), the Master LLC’s investment advisor, an indirect, wholly owned subsidiary of BlackRock, to provide investment advisory and administration services. The Manager is responsible for the management of the Master Portfolio’s portfolio and provides the personnel, facilities, equipment and certain other services necessary to the operations of the Master Portfolio. For such services, the Master Portfolio pays the Manager a monthly fee based on the percentage of the Master Portfolio’s average daily net assets at the following annual rates:
| Average Daily Net Assets | Investment Advisory Fee | |
| First $250 Million |
0.16% | |
| $250 Million - $500 Million |
0.12% | |
| $500 Million - $750 Million |
0.08% | |
| Greater than $750 Million |
0.05% |
The Manager provides investment management and other services to the Subsidiary. The Manager does not receive separate compensation from the Subsidiary for providing investment management or administrative services. However, the Master Portfolio pays the Manager based on the Master Portfolio’s net assets, which includes the assets of the Subsidiary.
The Manager, with respect to the Master Portfolio, entered into sub-advisory agreements with BlackRock International Limited (“BIL”) and BlackRock (Singapore) Limited (“BRS”), each an affiliate of the Manager. The Manager pays BIL and BRS for services they provide, a monthly fee that is a percentage of the investment advisory fees paid by the Master Portfolio to the Manager.
Expense Waivers
The Manager, with respect to the Master Portfolio, voluntarily agreed to waive its investment advisory fees by the amount of investment advisory fees the Master Portfolio pays to the Manager indirectly through its investment in affiliated money market funds. This amount is included in fees waived by the Manager in the Consolidated Statement of Operations. This amount is shown as fees waived by the Manager in the Consolidated Statement of Operations. However, the Manager does not waive its investment advisory fees by the amount of investment advisory fees paid in connection with the Master Portfolio’s investments in other affiliated investment companies, if any.
For the six months ended March 31, 2016, the Master LLC reimbursed the Manager $11,576 for certain accounting services, which is included in accounting services in the Consolidated Statement of Operations.
Securities Lending
The U.S. Securities and Exchange Commission has issued an exemptive order which permits BIM, an affiliate of the Manager, to serve as securities lending agent for the Master Portfolio, subject to applicable conditions. As securities lending agent, BIM bears all operational costs directly related to securities lending. The Master Portfolio is responsible for expenses in connection with the investment of cash collateral received for securities on loan (the “collateral investment expenses”). The cash collateral is invested in a private investment company managed by the Manager or its affiliates. However, BIM has agreed to cap the collateral investment expenses of the private investment company to an annual rate of 0.04%. The investment advisor to the private investment company will not charge any advisory fees with respect to shares purchased by the Master Portfolio.
Securities lending income is equal to the total of income earned from the reinvestment of cash collateral, net of fees and other payments to and from borrowers of securities, and less the collateral investment expenses. The Master Portfolio retains a portion of securities lending income and remits a remaining portion to BIM as compensation for its services as securities lending agent.
Pursuant to a securities lending agreement, the Master Portfolio retains 80% of securities lending income (which excludes collateral investment expenses), and this amount retained can never be less than 70% of the total of securities lending income plus the collateral investment expenses.
In addition, commencing the business day following the date that the aggregate securities lending income earned across the Equity-Bond Complex in a calendar year exceeds a specified threshold, the Master Portfolio, pursuant to the securities lending agreement, will retain for the remainder of that calendar year securities lending income as follows: 85% of securities lending income, and this amount retained can never be less than 70% of the total of securities lending income plus the collateral investment expenses.
| 108 | BLACKROCK BALANCED CAPITAL FUND, INC. | MARCH 31, 2016 |
| Notes to Consolidated Financial Statements (continued) | Master Total Return Portfolio |
The share of securities lending income earned by the Master Portfolio is shown as securities lending — affiliated — net in the Consolidated Statement of Operations. For the six months ended March 31, 2016, the Master Portfolio paid BIM $8,998 for securities lending agent services.
Officers and Directors
Certain officers and/or directors of the Master LLC are officers and/or directors of BlackRock or its affiliates.
Other Transactions
The Master Portfolio may purchase securities from, or sell securities to, an affiliated fund provided the affiliation is due solely to having a common investment advisor, common officers, or common trustees. For the six months ended March 31, 2016, the purchase and sale transactions with an affiliated fund in compliance with Rule 17a-7 under the 1940 Act were $2,154,615 and $12,559,905, respectively.
7. Purchases and Sales:
For the six months ended March 31, 2016, purchases and sales of investments, including paydown and mortgage dollar rolls and excluding short-term securities, were as follows:
| Purchases | Sales | |||||||
| Non-U.S. Government Securities |
$ | 29,551,515,572 | $ | 32,558,229,483 | ||||
| U.S. Government Securities |
$ | 12,948,850,398 | $ | 12,199,845,899 | ||||
|
|
||||||||
For the six months ended March 31, 2016, purchases and sales related to mortgage dollar rolls were as follows:
| Purchases |
$ | 11,651,636,346 | ||
| Sales |
$ | 11,641,498,597 |
8. Income Tax Information:
The Master Portfolio is classified as a partnership for federal income tax purposes. As such, each investor in the Master Portfolio is treated as the owner of its proportionate share of net assets, income, expenses and realized and unrealized gains and losses of the Master Portfolio. Therefore, no federal income tax provision is required. It is intended that the Master Portfolio’s assets will be managed so an investor in the Master Portfolio can satisfy the requirements of Subchapter M of the Internal Revenue Code of 1986, as amended.
The Master Portfolio files U.S. federal and various state and local tax returns. No income tax returns are currently under examination. The statute of limitations on the Master Portfolio’s U.S. federal tax returns remains open for each of the four years ended September 30, 2015. The statutes of limitations on Master Portfolio’s state and local tax returns may remain open for an additional year depending upon the jurisdiction.
Management has analyzed tax laws and regulations and their application to the Master Portfolio as of March 31, 2016, inclusive of the open tax return years, and does not believe there are any uncertain tax positions that require recognition of a tax liability in the Master Portfolio’s financial statements.
As of March 31, 2016, gross unrealized appreciation and depreciation based on cost for federal income tax purposes were as follows:
| Tax cost |
$ | 12,621,059,985 | ||
|
|
|
|||
| Gross unrealized appreciation |
$ | 144,431,472 | ||
| Gross unrealized depreciation |
(90,204,079 | ) | ||
|
|
|
|||
| Net unrealized appreciation |
$ | 54,227,393 | ||
|
|
|
|||
9. Bank Borrowings:
The Master LLC, on behalf of the Master Portfolio, along with certain other funds managed by the Manager and its affiliates (“Participating Funds”), is a party to a 364-day, $2.1 billion credit agreement with a group of lenders, under which the Master Portfolio may borrow to fund shareholder redemptions. Excluding commitments designated for certain individual funds, the Participating Funds, including the Master Portfolio, can borrow up to an aggregate commitment amount of $1.6 billion at any time outstanding, subject to asset coverage and other limitations as specified in the agreement. The credit agreement has the following terms: a fee of 0.06% per annum on unused commitment amounts and interest at a rate equal to the higher of (a) one-month LIBOR (but, in any event, not less than 0.00%) on the date the loan is made plus 0.80% per annum or (b) the Fed Funds rate (but, in any event, not less than 0.00%) in effect from time to time plus 0.80% per annum on amounts borrowed. The agreement expires in April 2016 unless extended or renewed. Participating Funds paid administration, legal and arrangement fees, which, if applicable, are included in miscellaneous expenses in the Consolidated Statement of Operations, and along with commitment fees, were allocated among such funds based upon portions of the aggregate commitment available to them and relative net assets of Participating Funds. During the six months ended March 31, 2016, the Master Portfolio did not borrow under the credit agreement.
| BLACKROCK BALANCED CAPITAL FUND, INC. | MARCH 31, 2016 | 109 |
| Notes to Consolidated Financial Statements (continued) | Master Total Return Portfolio |
10. Principal Risks:
Many municipalities insure repayment of their bonds, which may reduce the potential for loss due to credit risk. The market value of these bonds may fluctuate for other reasons, including market perception of the value of such insurance, and there is no guarantee that the insurer will meet its obligation.
Inventories of municipal bonds held by brokers and dealers may decrease, which would lessen their ability to make a market in these securities. Such a reduction in market making capacity could potentially decrease the Master Portfolio’s ability to buy or sell bonds. As a result, the Master Portfolio may sell a security at a lower price, sell other securities to raise cash, or give up an investment opportunity, any of which could have a negative impact on performance. If the Master Portfolio needed to sell large blocks of bonds, those sales could further reduce the bonds’ prices and impact performance.
In the normal course of business, the Master Portfolio invests in securities and enters into transactions where risks exist due to fluctuations in the market (market risk) or failure of the issuer of a security to meet all its obligations, including to pay principal and interest when due (issuer credit risk). The value of securities held by the Master Portfolio may decline in response to certain events, including those directly involving the issuers of securities owned by the Master Portfolio. Changes arising from the general economy, the overall market and local, regional or global political and/or social instability, as well as currency, interest rate and price fluctuations, may also affect the securities’ value.
Counterparty Credit Risk: Similar to issuer credit risk, the Master Portfolio may be exposed to counterparty credit risk, or the risk that an entity may fail to or be unable to perform on its commitments related to unsettled or open transactions. The Master Portfolio manages counterparty credit risk by entering into transactions only with counterparties that the Manager believes have the financial resources to honor their obligations and by monitoring the financial stability of those counterparties. Financial assets, which potentially expose the Master Portfolio to market, issuer and counterparty credit risks, consist principally of financial instruments and receivables due from counterparties. The extent of the Master Portfolio’s exposure to market, issuer and counterparty credit risks with respect to these financial assets is approximately their value recorded in the Consolidated Statement of Assets and Liabilities, less any collateral held by the Master Portfolio.
A derivative contract may suffer a mark-to-market loss if the value of the contract decreases due to an unfavorable change in the market rates or values of the underlying instrument. Losses can also occur if the counterparty does not perform under the contract.
The Master Portfolio’s risk of loss from counterparty credit risk on OTC derivatives is generally limited to the aggregate unrealized gain less the value of any collateral held by the Master Portfolio.
For OTC options purchased, the Master Portfolio bears the risk of loss in the amount of the premiums paid plus the positive change in market values net of any collateral held by the Master Portfolio should the counterparty fail to perform under the contracts. Options written by the Master Portfolio do not typically give rise to counterparty credit risk, as options written generally obligate the Master Portfolio, and not the counterparty, to perform. The Master Portfolio may be exposed to counterparty credit risk with respect to options written to the extent the Master Portfolio deposits collateral with its counterparty to a written option.
With exchange-traded options purchased and futures and centrally cleared swaps, there is less counterparty credit risk to the Master Portfolio since the exchange or clearinghouse, as counterparty to such instruments, guarantees against a possible default. The clearinghouse stands between the buyer and the seller of the contract; therefore, credit risk is limited to failure of the clearinghouse. While offset rights may exist under applicable law, the Master Portfolio does not have a contractual right of offset against a clearing broker or clearinghouse in the event of a default (including the bankruptcy or insolvency). Additionally, credit risk exists in exchange-traded futures and centrally cleared swaps with respect to initial and variation margin that is held in a clearing broker’s customer accounts. While clearing brokers are required to segregate customer margin from their own assets, in the event that a clearing broker becomes insolvent or goes into bankruptcy and at that time there is a shortfall in the aggregate amount of margin held by the clearing broker for all its clients, typically the shortfall would be allocated on a pro rata basis across all the clearing broker’s customers, potentially resulting in losses to the Master Portfolio.
The Master Portfolio may be exposed to prepayment risk, which is the risk that borrowers may exercise their option to prepay principal earlier than scheduled during periods of declining interest rates, which would force the Master Portfolio to reinvest in lower yielding securities. The Master Portfolio may also be exposed to reinvestment risk, which is the risk that income from the Master Portfolio’s portfolio will decline if the Master Portfolio invests the proceeds from matured, traded or called fixed income securities at market interest rates that are below the Master Portfolio portfolio’s current earnings rate.
Concentration Risk: The Master Portfolio invests a significant portion of its assets in fixed income securities and/or uses derivatives tied to the fixed-income markets. Changes in market interest rates or economic conditions, may affect the value and/or liquidity of such investments. Interest rate risk is the risk that prices of bonds and other fixed-income securities will increase as interest rates fall and decrease as interest rates rise. The Master Portfolio may be subject to a greater risk of rising interest rates due to the current period of historically low rates.
| 110 | BLACKROCK BALANCED CAPITAL FUND, INC. | MARCH 31, 2016 |
| Notes to Consolidated Financial Statements (concluded) | Master Total Return Portfolio |
The Master Portfolio invests a significant portion of its assets in securities backed by commercial or residential mortgage loans or in issuers that hold mortgage and other asset-backed securities. Investment percentages in these securities are presented in the Consolidated Schedule of Investments. Changes in economic conditions, including delinquencies and/or defaults on assets underlying these securities, can affect the value, income and/or liquidity of such positions.
11. Subsequent Events:
Management’s evaluation of the impact of all subsequent events on the Master Portfolio’s financial statements was completed through the date the financial statements were issued and the following item was noted:
Effective April 21, 2016, the credit agreement was extended until April 2017. The updated agreement includes the following terms: A fee of 0.12% per annum on the unused commitment amounts and interest at a rate equal to the higher of (a) one-month LIBOR (but in any event, not less than 0.00%) on the date the loan is made plus 0.80% per annum or (b) the Fed Funds rate (but in any event, not less than 0.00%) in effect from time to time plus 0.80% per annum on amounts borrowed. The commitment amounts remain unchanged. Administration, legal and arrangement fees in connection with the amended credit agreement, and along with commitment fees, are allocated among the Participating Funds based upon portions of the aggregate commitment available to them and relative net assets of the Participating Funds.
| BLACKROCK BALANCED CAPITAL FUND, INC. | MARCH 31, 2016 | 111 |
| Officers and Directors |
Robert M. Hernandez, Chair of the Board and Director
Fred G. Weiss, Vice Chair of the Board and Director
James H. Bodurtha, Director
Bruce R. Bond, Director
Valerie G. Brown, Director
Donald W. Burton, Director
Honorable Stuart E. Eizenstat, Director
Robert Fairbairn, Director
Kenneth A. Froot, Director
Henry Gabbay, Director
John F. O’Brien, Director
Donald C. Opatrny, Director
Roberta Cooper Ramo, Director
David H. Walsh, Director
John M. Perlowski, Director, President and Chief Executive Officer
Jennifer McGovern, Vice President
Neal J. Andrews, Chief Financial Officer
Jay M. Fife, Treasurer
Charles Park, Chief Compliance Officer
Fernanda Piedra, Anti-Money Laundering Compliance Officer
Benjamin Archibald, Secretary
Effective May 6, 2016, Valerie G. Brown resigned as a Director of the Fund/Master LLC.
Effective May 10, 2016, Kenneth A. Froot resigned as a Director of the Fund/Master LLC.
| Investment Advisor BlackRock Advisors, LLC Wilmington, DE 19809 |
Independent Registered Public Accounting Firm Deloitte & Touche LLP Philadelphia, PA 19103 |
Custodian Bank of New York Mellon New York, NY 10286 |
Legal Counsel Willkie Farr & Gallagher LLP New York, NY 10019 | |||
| Sub-Advisors BlackRock International Limited Edinburgh, EH3 8BL United Kingdom
BlackRock (Singapore) Limited 079912 Singapore |
Accounting Agent and Transfer Agent BNY Mellon Investment Servicing (US) Inc. Wilmington, DE 19809 |
Distributor BlackRock Investments, LLC New York, NY 10022 |
Address of the Fund/ Master LLC 100 Bellevue Parkway Wilmington, DE 19809 | |||
| 112 | BLACKROCK BALANCED CAPITAL FUND, INC. | MARCH 31, 2016 |
| Additional Information |
| Proxy Results |
A Special Meeting of Investors of the Master Large Cap Series LLC was held on February 8, 2016 for investors of record on December 11, 2015, to elect a Board of Directors of the Master Large Cap Series LLC.
| Votes For | Votes Withheld | |||||||||
| Approved the Directors* as follows: |
David O. Beim | 4,070,657,983 | 125,140,954 | |||||||
| Susan J. Carter | 4,082,313,915 | 113,485,022 | ||||||||
| Collette Chilton | 4,081,559,846 | 114,239,091 | ||||||||
| Neil A. Cotty | 4,070,640,271 | 125,158,666 | ||||||||
| Matina S. Horner | 4,075,403,342 | 120,395,595 | ||||||||
| Rodney D. Johnson | 4,070,537,985 | 125,260,952 | ||||||||
| Cynthia A. Montgomery | 4,079,360,848 | 116,438,089 | ||||||||
| Joseph P. Platt | 4,069,525,328 | 126,273,609 | ||||||||
| Robert C. Robb, Jr. | 4,063,157,338 | 132,641,599 | ||||||||
| Mark Stalnecker | 4,076,340,203 | 119,458,734 | ||||||||
| Kenneth L. Urish | 4,078,308,156 | 117,490,781 | ||||||||
| Claire A. Walton | 4,076,521,223 | 119,277,714 | ||||||||
| Frederick W. Winter | 4,073,787,184 | 122,011,753 | ||||||||
| Barbara G. Novick | 4,081,307,576 | 114,491,361 | ||||||||
| John M. Perlowski | 4,067,662,775 | 128,136,162 | ||||||||
| * | Denotes Master Large Cap Series LLC-wide proposal and voting results. |
| General Information |
Householding
The Fund will mail only one copy of shareholder documents, including prospectuses, annual and semi-annual reports and proxy statements, to shareholders with multiple accounts at the same address. This practice is commonly called “householding” and is intended to reduce expenses and eliminate duplicate mailings of shareholder documents. Mailings of your shareholder documents may be householded indefinitely unless you instruct us otherwise. If you do not want the mailing of these documents to be combined with those for other members of your household, please call the Fund at (800) 441-7762.
Availability of Quarterly Schedule of Investments
The Fund/Master LLCs file their complete schedules of portfolio holdings with the SEC for the first and third quarters of each fiscal year on Form N-Q. The Fund/Master LLCs’ Forms N-Q are available on the SEC’s website at http://www.sec.gov and may also be reviewed and copied at the SEC’s Public Reference Room in Washington, D.C. Information on how to access documents on the SEC’s website without charge may be obtained by calling (800) SEC-0330. The Fund/Master LLCs’ Forms N-Q may also be obtained upon request and without charge by calling (800) 441-7762.
Availability of Proxy Voting Policies and Procedures
A description of the policies and procedures that the Fund/Master LLCs use to determine how to vote proxies relating to portfolio securities is available upon request and without charge (1) by calling (800) 441-7762; (2) at http://www.blackrock.com; and (3) on the SEC’s website at http:// www.sec.gov.
Availability of Proxy Voting Record
Information about how the Fund/Master LLCs voted proxies relating to securities held in the Fund/Master LLCs’ portfolios during the most recent
12-month period ended June 30 is available upon request and without charge (1) at http://www.blackrock.com or by calling (800) 441-7762 and (2) on the SEC’s website at http://www.sec.gov.
BlackRock’s Mutual Fund Family
BlackRock offers a diverse lineup of open-end mutual funds crossing all investment styles and managed by experts in equity, fixed income and tax-exempt investing. Visit http://www.blackrock.com for more information.
| BLACKROCK BALANCED CAPITAL FUND, INC. | MARCH 31, 2016 | 113 |
| Additional Information (concluded) |
| Shareholder Privileges |
Account Information
Call us at (800) 441-7762 from 8:00 AM to 6:00 PM EST on any business day to get information about your account balances, recent transactions and share prices. You can also reach us on the Web at http://www.blackrock.com/funds.
Automatic Investment Plans
Investor Class shareholders who want to invest regularly can arrange to have $50 or more automatically deducted from their checking or savings account and invested in any of the BlackRock funds.
Systematic Withdrawal Plans
Investor Class shareholders can establish a systematic withdrawal plan and receive periodic payments of $50 or more from their BlackRock funds, as long as their account balance is at least $10,000.
Retirement Plans
Shareholders may make investments in conjunction with Traditional, Rollover, Roth, Coverdell, Simple IRAs, SEP IRAs and 403(b) Plans.
| BlackRock Privacy Principles |
BlackRock is committed to maintaining the privacy of its current and former fund investors and individual clients (collectively, “Clients”) and to safeguarding their non-public personal information. The following information is provided to help you understand what personal information BlackRock collects, how we protect that information and why in certain cases we share such information with select parties.
If you are located in a jurisdiction where specific laws, rules or regulations require BlackRock to provide you with additional or different privacy-related rights beyond what is set forth below, then BlackRock will comply with those specific laws, rules or regulations.
BlackRock obtains or verifies personal non-public information from and about you from different sources, including the following: (i) information we receive from you or, if applicable, your financial intermediary, on applications, forms or other documents; (ii) information about your transactions with us, our affiliates, or others; (iii) information we receive from a consumer reporting agency; and (iv) from visits to our websites.
BlackRock does not sell or disclose to non-affiliated third parties any non-public personal information about its Clients, except as permitted by law or as is necessary to respond to regulatory requests or to service Client accounts. These non-affiliated third parties are required to protect the confidentiality and security of this information and to use it only for its intended purpose.
We may share information with our affiliates to service your account or to provide you with information about other BlackRock products or services that may be of interest to you. In addition, BlackRock restricts access to non-public personal information about its Clients to those BlackRock employees with a legitimate business need for the information. BlackRock maintains physical, electronic and procedural safeguards that are designed to protect the non-public personal information of its Clients, including procedures relating to the proper storage and disposal of such information.
| 114 | BLACKROCK BALANCED CAPITAL FUND, INC. | MARCH 31, 2016 |
This report is intended for existing shareholders. It is not authorized for use as an offer of sale or a solicitation of an offer to buy shares of a Fund unless preceded or accompanied by the Funds’ current prospectus. Past performance results shown in this report should not be considered a representation of future performance. Investment returns and principal value of shares will fluctuate so that shares, when redeemed, may be worth more or less than their original cost. Statements and other information herein are as dated and are subject to change.

| BC-3/16-SAR |

| |
| Item 2 – | Code of Ethics – Not Applicable to this semi-annual report |
| Item 3 – | Audit Committee Financial Expert – Not Applicable to this semi-annual report |
| Item 4 – | Principal Accountant Fees and Services – Not Applicable to this semi-annual report |
| Item 5 – | Audit Committee of Listed Registrants – Not Applicable |
| Item 6 – | Investments |
(a) The registrants’ Schedules of Investments are included as part of the Report to Stockholders filed under Item 1 of this Form.
(b) Not Applicable due to no such divestments during the semi-annual period covered since the previous Form N-CSR filing.
| Item 7 – | Disclosure of Proxy Voting Policies and Procedures for Closed-End Management Investment Companies – Not Applicable |
| Item 8 – | Portfolio Managers of Closed-End Management Investment Companies – Not Applicable |
| Item 9 – | Purchases of Equity Securities by Closed-End Management Investment Company and Affiliated Purchasers – Not Applicable |
| Item 10 – | Submission of Matters to a Vote of Security Holders – There have been no material changes to these procedures. |
| Item 11 – | Controls and Procedures |
(a) – The registrants’ principal executive and principal financial officers, or persons performing similar functions, have concluded that the registrants’ disclosure controls and procedures (as defined in Rule 30a-3(c) under the Investment Company Act of 1940, as amended (the “1940 Act”)) are effective as of a date within 90 days of the filing of this report based on the evaluation of these controls and procedures required by Rule 30a-3(b) under the 1940 Act and Rule 15d-15(b) under the Securities Exchange Act of 1934, as amended.
(b) – There were no changes in the registrants’ internal control over financial reporting (as defined in Rule 30a-3(d) under the 1940 Act) that occurred during the second fiscal quarter of the period covered by this report that have materially affected, or are reasonably likely to materially affect, the registrants’ internal control over financial reporting.
| Item 12 – | Exhibits attached hereto |
(a)(1) – Code of Ethics – Not Applicable to this semi-annual report
(a)(2) – Certifications – Attached hereto
(a)(3) – Not Applicable
(b) – Certifications – Attached hereto
2
Pursuant to the requirements of the Securities Exchange Act of 1934 and the Investment Company Act of 1940, each registrant has duly caused this report to be signed on its behalf by the undersigned, thereunto duly authorized.
BlackRock Balanced Capital Fund, Inc., Master Large Cap Core Portfolio of Master Large Cap Series LLC and Master Total Return Portfolio of Master Bond LLC
| By: | /s/ John M. Perlowski | |||
| John M. Perlowski | ||||
| Chief Executive Officer (principal executive officer) of | ||||
| BlackRock Balanced Capital Fund, Inc., Master Large Cap Core Portfolio of Master Large Cap Series LLC and Master Total Return Portfolio of Master Bond LLC | ||||
| Date: June 2, 2016 | ||||
Pursuant to the requirements of the Securities Exchange Act of 1934 and the Investment Company Act of 1940, this report has been signed below by the following persons on behalf of each registrant and in the capacities and on the dates indicated.
| By: | /s/ John M. Perlowski | |||
| John M. Perlowski | ||||
| Chief Executive Officer (principal executive officer) of | ||||
| BlackRock Balanced Capital Fund, Inc., Master Large Cap Core Portfolio of Master Large Cap Series LLC and Master Total Return Portfolio of Master Bond LLC | ||||
| Date: June 2, 2016 | ||||
| By: | /s/ Neal J. Andrews | |||
| Neal J. Andrews | ||||
| Chief Financial Officer (principal financial officer) of | ||||
| BlackRock Balanced Capital Fund, Inc., Master Large Cap Core Portfolio of Master Large Cap Series LLC and Master Total Return Portfolio of Master Bond LLC | ||||
| Date: June 2, 2016 | ||||
3