Toyota’s mission is “Producing Happiness for All” by expanding the possibilities of people, companies and communities through addressing the challenges of mobility as a mobility company. In order to do so, Toyota will continue to create new and unique value with various partners by relentlessly committing towards (manufacturing), and by fostering imagination for people and society.
monozukuri
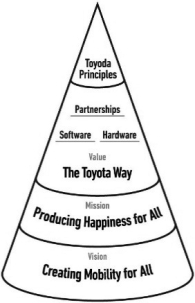 |
MISSION | Producing Happiness for All Using our technology, we work towards a future of convenience and happiness, available to all | ||||
| VISION | Creating Mobility for All Toyota strives to raise the quality and availability of mobility so that individuals, businesses, municipalities and communities can do more, while achieving a sustainable relationship with our planet | |||||
| VALUE | We unite our three strengths (Software, Hardware and Partnerships) to create new and unique value that comes from the Toyota Way | |||||
Toyota Production System (“TPS”)
TPS is imbued with the desire of Sakichi Toyoda, the founder of the Toyota Group, and Kiichiro Toyoda, the founder, “to make someone’s work easier.”
TPS was established based on two concepts: which can be loosely translated as “automation with a human touch,”—an idea of stopping equipment immediately when a problem occurs, in order to prevent defective products from being produced—and “” (“JIT”), a concept based on the idea that “each process produces only what is needed for the next process in a continuous flow.” Based on the basic philosophies of and JIT, through TPS, Toyota aims to efficiently and quickly produce vehicles of sound quality, one at a time, to fully satisfy customer requirements.
Jidoka,
Just in Time
jidoka
Toyota believes that improving upon TPS is essential to its future survival. Toyota has introduced TPS into development departments and administrative departments. Toyota applies TPS to its development departments not only to shorten development times and reduce costs, but also to develop our human resources, thus leading to the manufacturing of ever-better cars that customers will love.
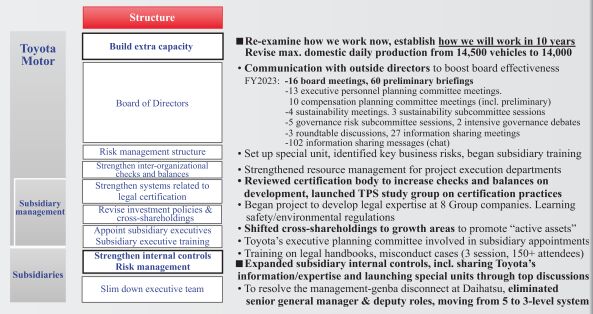
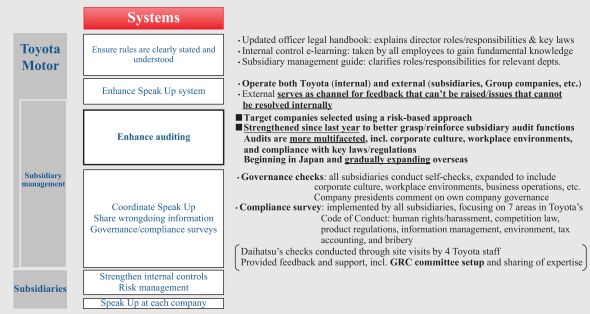
Selected Initiatives
We made a New Management Policy & Direction Announcement on April 7, 2023. Our new management structure’s theme is “inheritance and evolution.” The most important value we have cultivated is “Let’s make ever-better cars!” While talking about cars on the front lines and striving hard to bring smiles to customers’ faces, we continue to pursue ever-better cars. Together with the 370,000 employees of Toyota around the world, our suppliers, and our dealers, we all make cars together.
Car-making
is a team effort. We will accelerate the taking on of challenges for the future, with a new management style of “simultaneously and organically working as a team.” 10