FALSE2020Q312/310000109380us-gaap:AccountingStandardsUpdate201613Memberus-gaap:AccountingStandardsUpdate201708Memberus-gaap:AccountingStandardsUpdate201613Member00001093802020-01-012020-09-300000109380exch:XNASus-gaap:CommonStockMember2020-01-012020-09-300000109380zions:SeriesAFloatingRateNonCumulativePerpetualPreferredStockMemberexch:XNAS2020-01-012020-09-300000109380zions:SeriesGFixedFloatingRateNonCumulativePerpetualPreferredStockMemberexch:XNAS2020-01-012020-09-300000109380exch:XNASzions:SeriesH575NonCumulativePerpetualPreferredStockMember2020-01-012020-09-300000109380zions:FixedToFloatingRateSubordinatedNotesMemberexch:XNAS2020-01-012020-09-30xbrli:shares00001093802020-10-28iso4217:USD00001093802020-09-3000001093802019-12-31iso4217:USDxbrli:shares00001093802020-07-012020-09-3000001093802019-07-012019-09-3000001093802019-01-012019-09-300000109380us-gaap:PreferredStockMember2020-06-300000109380us-gaap:CommonStockMember2020-06-300000109380us-gaap:AdditionalPaidInCapitalMember2020-06-300000109380us-gaap:RetainedEarningsMember2020-06-300000109380us-gaap:AccumulatedOtherComprehensiveIncomeMember2020-06-3000001093802020-06-300000109380us-gaap:RetainedEarningsMember2020-07-012020-09-300000109380us-gaap:AccumulatedOtherComprehensiveIncomeMember2020-07-012020-09-300000109380us-gaap:CommonStockMember2020-07-012020-09-300000109380us-gaap:AdditionalPaidInCapitalMember2020-07-012020-09-300000109380us-gaap:PreferredStockMember2020-09-300000109380us-gaap:CommonStockMember2020-09-300000109380us-gaap:AdditionalPaidInCapitalMember2020-09-300000109380us-gaap:RetainedEarningsMember2020-09-300000109380us-gaap:AccumulatedOtherComprehensiveIncomeMember2020-09-300000109380us-gaap:PreferredStockMember2019-06-300000109380us-gaap:CommonStockMember2019-06-300000109380us-gaap:AdditionalPaidInCapitalMember2019-06-300000109380us-gaap:RetainedEarningsMember2019-06-300000109380us-gaap:AccumulatedOtherComprehensiveIncomeMember2019-06-3000001093802019-06-300000109380us-gaap:RetainedEarningsMember2019-07-012019-09-300000109380us-gaap:AccumulatedOtherComprehensiveIncomeMember2019-07-012019-09-300000109380us-gaap:CommonStockMember2019-07-012019-09-300000109380us-gaap:AdditionalPaidInCapitalMember2019-07-012019-09-300000109380us-gaap:PreferredStockMember2019-09-300000109380us-gaap:CommonStockMember2019-09-300000109380us-gaap:AdditionalPaidInCapitalMember2019-09-300000109380us-gaap:RetainedEarningsMember2019-09-300000109380us-gaap:AccumulatedOtherComprehensiveIncomeMember2019-09-3000001093802019-09-300000109380us-gaap:PreferredStockMember2019-12-310000109380us-gaap:CommonStockMember2019-12-310000109380us-gaap:AdditionalPaidInCapitalMember2019-12-310000109380us-gaap:RetainedEarningsMember2019-12-310000109380us-gaap:AccumulatedOtherComprehensiveIncomeMember2019-12-310000109380us-gaap:RetainedEarningsMember2020-01-012020-09-300000109380us-gaap:AccumulatedOtherComprehensiveIncomeMember2020-01-012020-09-3000001093802019-01-012019-12-310000109380us-gaap:RetainedEarningsMembersrt:CumulativeEffectPeriodOfAdoptionAdjustmentMember2019-12-310000109380srt:CumulativeEffectPeriodOfAdoptionAdjustmentMember2019-12-310000109380us-gaap:CommonStockMember2020-01-012020-09-300000109380us-gaap:AdditionalPaidInCapitalMember2020-01-012020-09-300000109380us-gaap:PreferredStockMember2018-12-310000109380us-gaap:CommonStockMember2018-12-310000109380us-gaap:AdditionalPaidInCapitalMember2018-12-310000109380us-gaap:RetainedEarningsMember2018-12-310000109380us-gaap:AccumulatedOtherComprehensiveIncomeMember2018-12-3100001093802018-12-310000109380us-gaap:RetainedEarningsMember2019-01-012019-09-300000109380us-gaap:AccumulatedOtherComprehensiveIncomeMember2019-01-012019-09-3000001093802018-01-012018-12-310000109380us-gaap:RetainedEarningsMembersrt:CumulativeEffectPeriodOfAdoptionAdjustmentMember2018-12-310000109380srt:CumulativeEffectPeriodOfAdoptionAdjustmentMember2018-12-310000109380us-gaap:CommonStockMember2019-01-012019-09-300000109380us-gaap:AdditionalPaidInCapitalMember2019-01-012019-09-30zions:statezions:segment0000109380us-gaap:RetainedEarningsMemberus-gaap:AccountingStandardsUpdate201613Membersrt:CumulativeEffectPeriodOfAdoptionAdjustmentMember2020-01-010000109380us-gaap:FairValueInputsLevel1Memberus-gaap:USTreasurySecuritiesMember2020-09-300000109380us-gaap:USTreasurySecuritiesMemberus-gaap:FairValueInputsLevel2Member2020-09-300000109380us-gaap:FairValueInputsLevel3Memberus-gaap:USTreasurySecuritiesMember2020-09-300000109380us-gaap:USTreasurySecuritiesMember2020-09-300000109380us-gaap:AvailableforsaleSecuritiesMemberus-gaap:FairValueInputsLevel2Member2020-09-300000109380us-gaap:AvailableforsaleSecuritiesMember2020-09-300000109380us-gaap:AssetBackedSecuritiesMemberus-gaap:FairValueInputsLevel2Member2020-09-300000109380us-gaap:AssetBackedSecuritiesMember2020-09-300000109380us-gaap:FairValueInputsLevel1Member2020-09-300000109380us-gaap:FairValueInputsLevel2Member2020-09-300000109380us-gaap:FairValueInputsLevel3Member2020-09-300000109380zions:BankownedlifeinsuranceMemberus-gaap:FairValueInputsLevel2Member2020-09-300000109380zions:BankownedlifeinsuranceMember2020-09-300000109380us-gaap:PrivateEquityFundsMemberus-gaap:FairValueInputsLevel1Member2020-09-300000109380us-gaap:PrivateEquityFundsMemberus-gaap:FairValueInputsLevel3Member2020-09-300000109380us-gaap:PrivateEquityFundsMember2020-09-300000109380us-gaap:FairValueInputsLevel3Memberus-gaap:InterestOnlyStripMember2020-09-300000109380us-gaap:InterestOnlyStripMember2020-09-300000109380us-gaap:FairValueInputsLevel1Memberus-gaap:DeferredCompensationArrangementWithIndividualByTypeOfCompensationPensionAndOtherPostretirementBenefitsMemberus-gaap:WarrantyRightsAndObligationsFairValueOptionMember2020-09-300000109380us-gaap:DeferredCompensationArrangementWithIndividualByTypeOfCompensationPensionAndOtherPostretirementBenefitsMemberus-gaap:WarrantyRightsAndObligationsFairValueOptionMember2020-09-300000109380zions:InterestRateSwapsForCustomersMemberus-gaap:FairValueInputsLevel2Member2020-09-300000109380zions:InterestRateSwapsForCustomersMember2020-09-300000109380us-gaap:FairValueInputsLevel1Memberus-gaap:ForeignExchangeContractMember2020-09-300000109380us-gaap:ForeignExchangeContractMember2020-09-300000109380us-gaap:FairValueInputsLevel1Memberus-gaap:USTreasurySecuritiesMember2019-12-310000109380us-gaap:USTreasurySecuritiesMemberus-gaap:FairValueInputsLevel2Member2019-12-310000109380us-gaap:FairValueInputsLevel3Memberus-gaap:USTreasurySecuritiesMember2019-12-310000109380us-gaap:USTreasurySecuritiesMember2019-12-310000109380us-gaap:AvailableforsaleSecuritiesMemberus-gaap:FairValueInputsLevel2Member2019-12-310000109380us-gaap:AvailableforsaleSecuritiesMember2019-12-310000109380us-gaap:AssetBackedSecuritiesMemberus-gaap:FairValueInputsLevel2Member2019-12-310000109380us-gaap:AssetBackedSecuritiesMember2019-12-310000109380us-gaap:FairValueInputsLevel1Member2019-12-310000109380us-gaap:FairValueInputsLevel2Member2019-12-310000109380us-gaap:FairValueInputsLevel3Member2019-12-310000109380zions:BankownedlifeinsuranceMemberus-gaap:FairValueInputsLevel2Member2019-12-310000109380zions:BankownedlifeinsuranceMember2019-12-310000109380us-gaap:PrivateEquityFundsMemberus-gaap:FairValueInputsLevel1Member2019-12-310000109380us-gaap:PrivateEquityFundsMemberus-gaap:FairValueInputsLevel3Member2019-12-310000109380us-gaap:PrivateEquityFundsMember2019-12-310000109380us-gaap:FairValueInputsLevel3Memberus-gaap:InterestOnlyStripMember2019-12-310000109380us-gaap:InterestOnlyStripMember2019-12-310000109380us-gaap:FairValueInputsLevel1Memberus-gaap:DeferredCompensationArrangementWithIndividualByTypeOfCompensationPensionAndOtherPostretirementBenefitsMemberus-gaap:WarrantyRightsAndObligationsFairValueOptionMember2019-12-310000109380us-gaap:DeferredCompensationArrangementWithIndividualByTypeOfCompensationPensionAndOtherPostretirementBenefitsMemberus-gaap:WarrantyRightsAndObligationsFairValueOptionMember2019-12-310000109380zions:InterestRateSwapsForCustomersMemberus-gaap:FairValueInputsLevel2Member2019-12-310000109380zions:InterestRateSwapsForCustomersMember2019-12-310000109380us-gaap:FairValueInputsLevel1Memberus-gaap:ForeignExchangeContractMember2019-12-310000109380us-gaap:ForeignExchangeContractMember2019-12-310000109380us-gaap:FairValueInputsLevel3Memberus-gaap:PrivateEquityFundsMember2020-06-300000109380us-gaap:FairValueInputsLevel3Memberus-gaap:ServicingContractsMember2020-06-300000109380us-gaap:FairValueInputsLevel3Memberus-gaap:PrivateEquityFundsMember2019-06-300000109380us-gaap:FairValueInputsLevel3Memberus-gaap:ServicingContractsMember2019-06-300000109380us-gaap:FairValueInputsLevel3Memberus-gaap:PrivateEquityFundsMember2019-12-310000109380us-gaap:FairValueInputsLevel3Memberus-gaap:ServicingContractsMember2019-12-310000109380us-gaap:FairValueInputsLevel3Memberus-gaap:PrivateEquityFundsMember2018-12-310000109380us-gaap:FairValueInputsLevel3Memberus-gaap:ServicingContractsMember2018-12-310000109380us-gaap:FairValueInputsLevel3Memberus-gaap:PrivateEquityFundsMember2020-07-012020-09-300000109380us-gaap:FairValueInputsLevel3Memberus-gaap:ServicingContractsMember2020-07-012020-09-300000109380us-gaap:FairValueInputsLevel3Memberus-gaap:PrivateEquityFundsMember2019-07-012019-09-300000109380us-gaap:FairValueInputsLevel3Memberus-gaap:ServicingContractsMember2019-07-012019-09-300000109380us-gaap:FairValueInputsLevel3Memberus-gaap:PrivateEquityFundsMember2020-01-012020-09-300000109380us-gaap:FairValueInputsLevel3Memberus-gaap:ServicingContractsMember2020-01-012020-09-300000109380us-gaap:FairValueInputsLevel3Memberus-gaap:PrivateEquityFundsMember2019-01-012019-09-300000109380us-gaap:FairValueInputsLevel3Memberus-gaap:ServicingContractsMember2019-01-012019-09-300000109380us-gaap:FairValueInputsLevel3Memberus-gaap:PrivateEquityFundsMember2020-09-300000109380us-gaap:FairValueInputsLevel3Memberus-gaap:ServicingContractsMember2020-09-300000109380us-gaap:FairValueInputsLevel3Memberus-gaap:PrivateEquityFundsMember2019-09-300000109380us-gaap:FairValueInputsLevel3Memberus-gaap:ServicingContractsMember2019-09-300000109380us-gaap:FairValueInputsLevel3Member2020-07-012020-09-300000109380us-gaap:FairValueInputsLevel3Member2019-07-012019-09-300000109380us-gaap:FairValueInputsLevel3Member2020-01-012020-09-300000109380us-gaap:FairValueInputsLevel3Member2019-01-012019-09-300000109380us-gaap:PrivateEquityFundsMemberus-gaap:FairValueInputsLevel1Memberus-gaap:FairValueMeasurementsNonrecurringMember2020-09-300000109380us-gaap:PrivateEquityFundsMemberus-gaap:FairValueMeasurementsNonrecurringMemberus-gaap:FairValueInputsLevel2Member2020-09-300000109380us-gaap:PrivateEquityFundsMemberus-gaap:FairValueInputsLevel3Memberus-gaap:FairValueMeasurementsNonrecurringMember2020-09-300000109380us-gaap:PrivateEquityFundsMemberus-gaap:FairValueMeasurementsNonrecurringMember2020-09-300000109380us-gaap:PrivateEquityFundsMemberus-gaap:FairValueInputsLevel1Memberus-gaap:FairValueMeasurementsNonrecurringMember2019-12-310000109380us-gaap:PrivateEquityFundsMemberus-gaap:FairValueMeasurementsNonrecurringMemberus-gaap:FairValueInputsLevel2Member2019-12-310000109380us-gaap:PrivateEquityFundsMemberus-gaap:FairValueInputsLevel3Memberus-gaap:FairValueMeasurementsNonrecurringMember2019-12-310000109380us-gaap:PrivateEquityFundsMemberus-gaap:FairValueMeasurementsNonrecurringMember2019-12-310000109380us-gaap:FairValueInputsLevel1Memberzions:CollateralDependentLoansMemberus-gaap:FairValueMeasurementsNonrecurringMember2020-09-300000109380zions:CollateralDependentLoansMemberus-gaap:FairValueMeasurementsNonrecurringMemberus-gaap:FairValueInputsLevel2Member2020-09-300000109380us-gaap:FairValueInputsLevel3Memberzions:CollateralDependentLoansMemberus-gaap:FairValueMeasurementsNonrecurringMember2020-09-300000109380zions:CollateralDependentLoansMemberus-gaap:FairValueMeasurementsNonrecurringMember2020-09-300000109380us-gaap:FairValueInputsLevel1Memberzions:CollateralDependentLoansMemberus-gaap:FairValueMeasurementsNonrecurringMember2019-12-310000109380zions:CollateralDependentLoansMemberus-gaap:FairValueMeasurementsNonrecurringMemberus-gaap:FairValueInputsLevel2Member2019-12-310000109380us-gaap:FairValueInputsLevel3Memberzions:CollateralDependentLoansMemberus-gaap:FairValueMeasurementsNonrecurringMember2019-12-310000109380zions:CollateralDependentLoansMemberus-gaap:FairValueMeasurementsNonrecurringMember2019-12-310000109380us-gaap:FairValueInputsLevel1Memberus-gaap:FairValueMeasurementsNonrecurringMemberzions:OtherRealEstateOwnedMember2020-09-300000109380us-gaap:FairValueMeasurementsNonrecurringMemberzions:OtherRealEstateOwnedMemberus-gaap:FairValueInputsLevel2Member2020-09-300000109380us-gaap:FairValueInputsLevel3Memberus-gaap:FairValueMeasurementsNonrecurringMemberzions:OtherRealEstateOwnedMember2020-09-300000109380us-gaap:FairValueMeasurementsNonrecurringMemberzions:OtherRealEstateOwnedMember2020-09-300000109380us-gaap:FairValueInputsLevel1Memberus-gaap:FairValueMeasurementsNonrecurringMemberzions:OtherRealEstateOwnedMember2019-12-310000109380us-gaap:FairValueMeasurementsNonrecurringMemberzions:OtherRealEstateOwnedMemberus-gaap:FairValueInputsLevel2Member2019-12-310000109380us-gaap:FairValueInputsLevel3Memberus-gaap:FairValueMeasurementsNonrecurringMemberzions:OtherRealEstateOwnedMember2019-12-310000109380us-gaap:FairValueMeasurementsNonrecurringMemberzions:OtherRealEstateOwnedMember2019-12-310000109380us-gaap:FairValueInputsLevel1Memberus-gaap:FairValueMeasurementsNonrecurringMember2020-09-300000109380us-gaap:FairValueMeasurementsNonrecurringMemberus-gaap:FairValueInputsLevel2Member2020-09-300000109380us-gaap:FairValueInputsLevel3Memberus-gaap:FairValueMeasurementsNonrecurringMember2020-09-300000109380us-gaap:FairValueMeasurementsNonrecurringMember2020-09-300000109380us-gaap:FairValueInputsLevel1Memberus-gaap:FairValueMeasurementsNonrecurringMember2019-12-310000109380us-gaap:FairValueMeasurementsNonrecurringMemberus-gaap:FairValueInputsLevel2Member2019-12-310000109380us-gaap:FairValueInputsLevel3Memberus-gaap:FairValueMeasurementsNonrecurringMember2019-12-310000109380us-gaap:FairValueMeasurementsNonrecurringMember2019-12-310000109380us-gaap:PrivateEquityFundsMemberus-gaap:FairValueMeasurementsNonrecurringMember2020-07-012020-09-300000109380us-gaap:PrivateEquityFundsMemberus-gaap:FairValueMeasurementsNonrecurringMember2019-07-012019-09-300000109380us-gaap:PrivateEquityFundsMemberus-gaap:FairValueMeasurementsNonrecurringMember2020-01-012020-09-300000109380us-gaap:PrivateEquityFundsMemberus-gaap:FairValueMeasurementsNonrecurringMember2019-01-012019-09-300000109380zions:CollateralDependentLoansMemberus-gaap:FairValueMeasurementsNonrecurringMember2020-07-012020-09-300000109380zions:CollateralDependentLoansMemberus-gaap:FairValueMeasurementsNonrecurringMember2019-07-012019-09-300000109380zions:CollateralDependentLoansMemberus-gaap:FairValueMeasurementsNonrecurringMember2020-01-012020-09-300000109380zions:CollateralDependentLoansMemberus-gaap:FairValueMeasurementsNonrecurringMember2019-01-012019-09-300000109380us-gaap:FairValueMeasurementsNonrecurringMemberzions:OtherRealEstateOwnedMember2020-07-012020-09-300000109380us-gaap:FairValueMeasurementsNonrecurringMemberzions:OtherRealEstateOwnedMember2019-07-012019-09-300000109380us-gaap:FairValueMeasurementsNonrecurringMemberzions:OtherRealEstateOwnedMember2020-01-012020-09-300000109380us-gaap:FairValueMeasurementsNonrecurringMemberzions:OtherRealEstateOwnedMember2019-01-012019-09-300000109380us-gaap:FairValueMeasurementsNonrecurringMember2020-07-012020-09-300000109380us-gaap:FairValueMeasurementsNonrecurringMember2019-07-012019-09-300000109380us-gaap:FairValueMeasurementsNonrecurringMember2020-01-012020-09-300000109380us-gaap:FairValueMeasurementsNonrecurringMember2019-01-012019-09-300000109380zions:OtherRealEstateOwnedPropertiesMember2020-07-012020-09-300000109380zions:OtherRealEstateOwnedPropertiesMember2019-07-012019-09-300000109380zions:OtherRealEstateOwnedPropertiesMember2020-01-012020-09-300000109380zions:OtherRealEstateOwnedPropertiesMember2019-01-012019-09-300000109380zions:OtherRealEstateOwnedPropertiesMember2020-09-300000109380zions:OtherRealEstateOwnedPropertiesMember2019-09-300000109380us-gaap:CarryingReportedAmountFairValueDisclosureMemberus-gaap:FairValueInputsLevel2Member2020-09-300000109380us-gaap:EstimateOfFairValueFairValueDisclosureMemberus-gaap:FairValueInputsLevel2Member2020-09-300000109380us-gaap:CarryingReportedAmountFairValueDisclosureMemberus-gaap:FairValueInputsLevel2Member2019-12-310000109380us-gaap:EstimateOfFairValueFairValueDisclosureMemberus-gaap:FairValueInputsLevel2Member2019-12-310000109380us-gaap:FairValueInputsLevel3Memberus-gaap:CarryingReportedAmountFairValueDisclosureMember2020-09-300000109380us-gaap:EstimateOfFairValueFairValueDisclosureMemberus-gaap:FairValueInputsLevel3Member2020-09-300000109380us-gaap:FairValueInputsLevel3Memberus-gaap:CarryingReportedAmountFairValueDisclosureMember2019-12-310000109380us-gaap:EstimateOfFairValueFairValueDisclosureMemberus-gaap:FairValueInputsLevel3Member2019-12-310000109380us-gaap:SecuritiesInvestmentMember2020-09-300000109380us-gaap:SecuritiesInvestmentMember2019-12-310000109380us-gaap:USStatesAndPoliticalSubdivisionsMember2020-09-300000109380us-gaap:AgencySecuritiesMember2020-09-300000109380zions:AgencyGuaranteedMortgageBackedSecuritiesMember2020-09-300000109380zions:SmallBusinessAdministrationLoanBackedSecuritiesMember2020-09-300000109380zions:AvailableforsaleOtherdebtsecuritiesMember2020-09-300000109380us-gaap:USStatesAndPoliticalSubdivisionsMember2019-12-310000109380us-gaap:AgencySecuritiesMember2019-12-310000109380zions:AgencyGuaranteedMortgageBackedSecuritiesMember2019-12-310000109380zions:SmallBusinessAdministrationLoanBackedSecuritiesMember2019-12-310000109380zions:AvailableforsaleOtherdebtsecuritiesMember2019-12-310000109380us-gaap:USStatesAndPoliticalSubdivisionsMember2020-09-30xbrli:pure0000109380us-gaap:USTreasurySecuritiesMember2020-09-300000109380us-gaap:AgencySecuritiesMember2020-09-300000109380zions:AgencyGuaranteedMortgageBackedSecuritiesMember2020-09-300000109380zions:SmallBusinessAdministrationLoanBackedSecuritiesMember2020-09-300000109380zions:AvailableforsaleOtherdebtsecuritiesMember2020-09-300000109380zions:AvailableforsaleUnrealizedlossesOtherMember2020-09-300000109380zions:AvailableforsaleUnrealizedlossesOtherMember2019-12-31zions:security0000109380zions:TaxableMemberus-gaap:HeldtomaturitySecuritiesMember2020-07-012020-09-300000109380us-gaap:HeldtomaturitySecuritiesMemberzions:NontaxableMember2020-07-012020-09-300000109380us-gaap:HeldtomaturitySecuritiesMember2020-07-012020-09-300000109380zions:TaxableMemberus-gaap:HeldtomaturitySecuritiesMember2019-07-012019-09-300000109380us-gaap:HeldtomaturitySecuritiesMemberzions:NontaxableMember2019-07-012019-09-300000109380us-gaap:HeldtomaturitySecuritiesMember2019-07-012019-09-300000109380zions:TaxableMemberus-gaap:AvailableforsaleSecuritiesMember2020-07-012020-09-300000109380us-gaap:AvailableforsaleSecuritiesMemberzions:NontaxableMember2020-07-012020-09-300000109380us-gaap:AvailableforsaleSecuritiesMember2020-07-012020-09-300000109380zions:TaxableMemberus-gaap:AvailableforsaleSecuritiesMember2019-07-012019-09-300000109380us-gaap:AvailableforsaleSecuritiesMemberzions:NontaxableMember2019-07-012019-09-300000109380us-gaap:AvailableforsaleSecuritiesMember2019-07-012019-09-300000109380zions:TaxableMemberus-gaap:OtherTradingMember2020-07-012020-09-300000109380us-gaap:OtherTradingMemberzions:NontaxableMember2020-07-012020-09-300000109380us-gaap:OtherTradingMember2020-07-012020-09-300000109380zions:TaxableMemberus-gaap:OtherTradingMember2019-07-012019-09-300000109380us-gaap:OtherTradingMemberzions:NontaxableMember2019-07-012019-09-300000109380us-gaap:OtherTradingMember2019-07-012019-09-300000109380zions:TaxableMember2020-07-012020-09-300000109380zions:NontaxableMember2020-07-012020-09-300000109380zions:TaxableMember2019-07-012019-09-300000109380zions:NontaxableMember2019-07-012019-09-300000109380zions:TaxableMemberus-gaap:HeldtomaturitySecuritiesMember2020-01-012020-09-300000109380us-gaap:HeldtomaturitySecuritiesMemberzions:NontaxableMember2020-01-012020-09-300000109380us-gaap:HeldtomaturitySecuritiesMember2020-01-012020-09-300000109380zions:TaxableMemberus-gaap:HeldtomaturitySecuritiesMember2019-01-012019-09-300000109380us-gaap:HeldtomaturitySecuritiesMemberzions:NontaxableMember2019-01-012019-09-300000109380us-gaap:HeldtomaturitySecuritiesMember2019-01-012019-09-300000109380zions:TaxableMemberus-gaap:AvailableforsaleSecuritiesMember2020-01-012020-09-300000109380us-gaap:AvailableforsaleSecuritiesMemberzions:NontaxableMember2020-01-012020-09-300000109380us-gaap:AvailableforsaleSecuritiesMember2020-01-012020-09-300000109380zions:TaxableMemberus-gaap:AvailableforsaleSecuritiesMember2019-01-012019-09-300000109380us-gaap:AvailableforsaleSecuritiesMemberzions:NontaxableMember2019-01-012019-09-300000109380us-gaap:AvailableforsaleSecuritiesMember2019-01-012019-09-300000109380zions:TaxableMemberus-gaap:OtherTradingMember2020-01-012020-09-300000109380us-gaap:OtherTradingMemberzions:NontaxableMember2020-01-012020-09-300000109380us-gaap:OtherTradingMember2020-01-012020-09-300000109380zions:TaxableMemberus-gaap:OtherTradingMember2019-01-012019-09-300000109380us-gaap:OtherTradingMemberzions:NontaxableMember2019-01-012019-09-300000109380us-gaap:OtherTradingMember2019-01-012019-09-300000109380zions:TaxableMember2020-01-012020-09-300000109380zions:NontaxableMember2020-01-012020-09-300000109380zions:TaxableMember2019-01-012019-09-300000109380zions:NontaxableMember2019-01-012019-09-300000109380zions:CommercialAndIndustrialMemberus-gaap:CommercialPortfolioSegmentMember2020-09-300000109380zions:CommercialAndIndustrialMemberus-gaap:CommercialPortfolioSegmentMember2019-12-310000109380zions:PPPMemberus-gaap:CommercialPortfolioSegmentMember2020-09-300000109380zions:PPPMemberus-gaap:CommercialPortfolioSegmentMember2019-12-310000109380us-gaap:CommercialPortfolioSegmentMemberus-gaap:FinanceLeasesPortfolioSegmentMember2020-09-300000109380us-gaap:CommercialPortfolioSegmentMemberus-gaap:FinanceLeasesPortfolioSegmentMember2019-12-310000109380us-gaap:CommercialPortfolioSegmentMemberzions:OwnerOccupiedMember2020-09-300000109380us-gaap:CommercialPortfolioSegmentMemberzions:OwnerOccupiedMember2019-12-310000109380us-gaap:CommercialPortfolioSegmentMemberzions:MunicipalMember2020-09-300000109380us-gaap:CommercialPortfolioSegmentMemberzions:MunicipalMember2019-12-310000109380us-gaap:CommercialPortfolioSegmentMember2020-09-300000109380us-gaap:CommercialPortfolioSegmentMember2019-12-310000109380us-gaap:CommercialRealEstatePortfolioSegmentMemberzions:ConstructionAndLandDevelopmentMember2020-09-300000109380us-gaap:CommercialRealEstatePortfolioSegmentMemberzions:ConstructionAndLandDevelopmentMember2019-12-310000109380zions:TermMemberus-gaap:CommercialRealEstatePortfolioSegmentMember2020-09-300000109380zions:TermMemberus-gaap:CommercialRealEstatePortfolioSegmentMember2019-12-310000109380us-gaap:CommercialRealEstatePortfolioSegmentMember2020-09-300000109380us-gaap:CommercialRealEstatePortfolioSegmentMember2019-12-310000109380us-gaap:ConsumerPortfolioSegmentMemberus-gaap:HomeEquityMember2020-09-300000109380us-gaap:ConsumerPortfolioSegmentMemberus-gaap:HomeEquityMember2019-12-310000109380us-gaap:ConsumerPortfolioSegmentMemberzions:OneThroughFourFamilyResidentialMember2020-09-300000109380us-gaap:ConsumerPortfolioSegmentMemberzions:OneThroughFourFamilyResidentialMember2019-12-310000109380us-gaap:ConsumerPortfolioSegmentMemberzions:ConstructionAndOtherConsumerRealEstateMember2020-09-300000109380us-gaap:ConsumerPortfolioSegmentMemberzions:ConstructionAndOtherConsumerRealEstateMember2019-12-310000109380us-gaap:ConsumerPortfolioSegmentMemberzions:BankcardAndOtherRevolvingPlansMember2020-09-300000109380us-gaap:ConsumerPortfolioSegmentMemberzions:BankcardAndOtherRevolvingPlansMember2019-12-310000109380us-gaap:ConsumerPortfolioSegmentMemberzions:OtherConsumerLoansMember2020-09-300000109380us-gaap:ConsumerPortfolioSegmentMemberzions:OtherConsumerLoansMember2019-12-310000109380us-gaap:ConsumerPortfolioSegmentMember2020-09-300000109380us-gaap:ConsumerPortfolioSegmentMember2019-12-310000109380us-gaap:CommercialRealEstatePortfolioSegmentMemberzions:LandAcquisitionAndDevelopmentMember2020-09-300000109380us-gaap:CommercialRealEstatePortfolioSegmentMemberzions:LandAcquisitionAndDevelopmentMember2019-12-310000109380us-gaap:CommercialRealEstatePortfolioSegmentMember2020-01-012020-09-300000109380us-gaap:ConsumerPortfolioSegmentMember2020-01-012020-09-300000109380us-gaap:ConsumerPortfolioSegmentMemberzions:ClosedEndConsumerLoanMember2020-01-012020-09-300000109380us-gaap:CommercialPortfolioSegmentMember2020-06-300000109380us-gaap:CommercialRealEstatePortfolioSegmentMember2020-06-300000109380us-gaap:ConsumerPortfolioSegmentMember2020-06-300000109380us-gaap:CommercialPortfolioSegmentMember2020-07-012020-09-300000109380us-gaap:CommercialRealEstatePortfolioSegmentMember2020-07-012020-09-300000109380us-gaap:ConsumerPortfolioSegmentMember2020-07-012020-09-300000109380us-gaap:CommercialPortfolioSegmentMembersrt:CumulativeEffectPeriodOfAdoptionAdjustmentMember2019-12-310000109380us-gaap:CommercialRealEstatePortfolioSegmentMembersrt:CumulativeEffectPeriodOfAdoptionAdjustmentMember2019-12-310000109380us-gaap:ConsumerPortfolioSegmentMembersrt:CumulativeEffectPeriodOfAdoptionAdjustmentMember2019-12-310000109380us-gaap:CommercialPortfolioSegmentMembersrt:CumulativeEffectPeriodOfAdoptionAdjustedBalanceMember2019-12-310000109380srt:CumulativeEffectPeriodOfAdoptionAdjustedBalanceMemberus-gaap:CommercialRealEstatePortfolioSegmentMember2019-12-310000109380us-gaap:ConsumerPortfolioSegmentMembersrt:CumulativeEffectPeriodOfAdoptionAdjustedBalanceMember2019-12-310000109380srt:CumulativeEffectPeriodOfAdoptionAdjustedBalanceMember2019-12-310000109380us-gaap:CommercialPortfolioSegmentMember2020-01-012020-09-300000109380us-gaap:CommercialPortfolioSegmentMember2019-06-300000109380us-gaap:CommercialRealEstatePortfolioSegmentMember2019-06-300000109380us-gaap:ConsumerPortfolioSegmentMember2019-06-300000109380us-gaap:CommercialPortfolioSegmentMember2019-07-012019-09-300000109380us-gaap:CommercialRealEstatePortfolioSegmentMember2019-07-012019-09-300000109380us-gaap:ConsumerPortfolioSegmentMember2019-07-012019-09-300000109380us-gaap:CommercialPortfolioSegmentMember2019-09-300000109380us-gaap:CommercialRealEstatePortfolioSegmentMember2019-09-300000109380us-gaap:ConsumerPortfolioSegmentMember2019-09-300000109380us-gaap:CommercialPortfolioSegmentMember2018-12-310000109380us-gaap:CommercialRealEstatePortfolioSegmentMember2018-12-310000109380us-gaap:ConsumerPortfolioSegmentMember2018-12-310000109380us-gaap:CommercialPortfolioSegmentMember2019-01-012019-09-300000109380us-gaap:CommercialRealEstatePortfolioSegmentMember2019-01-012019-09-300000109380us-gaap:ConsumerPortfolioSegmentMember2019-01-012019-09-300000109380zions:CommercialAndIndustrialMemberus-gaap:CommercialPortfolioSegmentMemberzions:FinancialAsset30To89DaysPastDueMember2020-09-300000109380zions:CommercialAndIndustrialMemberus-gaap:CommercialPortfolioSegmentMemberus-gaap:FinancingReceivablesEqualToGreaterThan90DaysPastDueMember2020-09-300000109380zions:CommercialAndIndustrialMemberus-gaap:CommercialPortfolioSegmentMemberus-gaap:FinancingReceivables1To29DaysPastDueMember2020-09-300000109380zions:PPPMemberus-gaap:CommercialPortfolioSegmentMemberzions:FinancialAsset30To89DaysPastDueMember2020-09-300000109380zions:PPPMemberus-gaap:CommercialPortfolioSegmentMemberus-gaap:FinancingReceivablesEqualToGreaterThan90DaysPastDueMember2020-09-300000109380zions:PPPMemberus-gaap:CommercialPortfolioSegmentMemberus-gaap:FinancingReceivables1To29DaysPastDueMember2020-09-300000109380us-gaap:CommercialPortfolioSegmentMemberzions:FinancialAsset30To89DaysPastDueMemberus-gaap:FinanceLeasesPortfolioSegmentMember2020-09-300000109380us-gaap:CommercialPortfolioSegmentMemberus-gaap:FinancingReceivablesEqualToGreaterThan90DaysPastDueMemberus-gaap:FinanceLeasesPortfolioSegmentMember2020-09-300000109380us-gaap:CommercialPortfolioSegmentMemberus-gaap:FinanceLeasesPortfolioSegmentMemberus-gaap:FinancingReceivables1To29DaysPastDueMember2020-09-300000109380us-gaap:CommercialPortfolioSegmentMemberzions:OwnerOccupiedMemberzions:FinancialAsset30To89DaysPastDueMember2020-09-300000109380us-gaap:CommercialPortfolioSegmentMemberzions:OwnerOccupiedMemberus-gaap:FinancingReceivablesEqualToGreaterThan90DaysPastDueMember2020-09-300000109380us-gaap:CommercialPortfolioSegmentMemberzions:OwnerOccupiedMemberus-gaap:FinancingReceivables1To29DaysPastDueMember2020-09-300000109380us-gaap:CommercialPortfolioSegmentMemberzions:FinancialAsset30To89DaysPastDueMemberzions:MunicipalMember2020-09-300000109380us-gaap:CommercialPortfolioSegmentMemberus-gaap:FinancingReceivablesEqualToGreaterThan90DaysPastDueMemberzions:MunicipalMember2020-09-300000109380us-gaap:CommercialPortfolioSegmentMemberus-gaap:FinancingReceivables1To29DaysPastDueMemberzions:MunicipalMember2020-09-300000109380us-gaap:CommercialPortfolioSegmentMemberzions:FinancialAsset30To89DaysPastDueMember2020-09-300000109380us-gaap:CommercialPortfolioSegmentMemberus-gaap:FinancingReceivablesEqualToGreaterThan90DaysPastDueMember2020-09-300000109380us-gaap:CommercialPortfolioSegmentMemberus-gaap:FinancingReceivables1To29DaysPastDueMember2020-09-300000109380us-gaap:CommercialRealEstatePortfolioSegmentMemberzions:ConstructionAndLandDevelopmentMemberzions:FinancialAsset30To89DaysPastDueMember2020-09-300000109380us-gaap:FinancingReceivablesEqualToGreaterThan90DaysPastDueMemberus-gaap:CommercialRealEstatePortfolioSegmentMemberzions:ConstructionAndLandDevelopmentMember2020-09-300000109380us-gaap:CommercialRealEstatePortfolioSegmentMemberzions:ConstructionAndLandDevelopmentMemberus-gaap:FinancingReceivables1To29DaysPastDueMember2020-09-300000109380zions:TermMemberus-gaap:CommercialRealEstatePortfolioSegmentMemberzions:FinancialAsset30To89DaysPastDueMember2020-09-300000109380zions:TermMemberus-gaap:FinancingReceivablesEqualToGreaterThan90DaysPastDueMemberus-gaap:CommercialRealEstatePortfolioSegmentMember2020-09-300000109380zions:TermMemberus-gaap:CommercialRealEstatePortfolioSegmentMemberus-gaap:FinancingReceivables1To29DaysPastDueMember2020-09-300000109380us-gaap:CommercialRealEstatePortfolioSegmentMemberzions:FinancialAsset30To89DaysPastDueMember2020-09-300000109380us-gaap:FinancingReceivablesEqualToGreaterThan90DaysPastDueMemberus-gaap:CommercialRealEstatePortfolioSegmentMember2020-09-300000109380us-gaap:CommercialRealEstatePortfolioSegmentMemberus-gaap:FinancingReceivables1To29DaysPastDueMember2020-09-300000109380us-gaap:ConsumerPortfolioSegmentMemberzions:FinancialAsset30To89DaysPastDueMemberus-gaap:HomeEquityMember2020-09-300000109380us-gaap:ConsumerPortfolioSegmentMemberus-gaap:FinancingReceivablesEqualToGreaterThan90DaysPastDueMemberus-gaap:HomeEquityMember2020-09-300000109380us-gaap:ConsumerPortfolioSegmentMemberus-gaap:FinancingReceivables1To29DaysPastDueMemberus-gaap:HomeEquityMember2020-09-300000109380us-gaap:ConsumerPortfolioSegmentMemberzions:OneThroughFourFamilyResidentialMemberzions:FinancialAsset30To89DaysPastDueMember2020-09-300000109380us-gaap:ConsumerPortfolioSegmentMemberzions:OneThroughFourFamilyResidentialMemberus-gaap:FinancingReceivablesEqualToGreaterThan90DaysPastDueMember2020-09-300000109380us-gaap:ConsumerPortfolioSegmentMemberzions:OneThroughFourFamilyResidentialMemberus-gaap:FinancingReceivables1To29DaysPastDueMember2020-09-300000109380us-gaap:ConsumerPortfolioSegmentMemberzions:ConstructionAndOtherConsumerRealEstateMemberzions:FinancialAsset30To89DaysPastDueMember2020-09-300000109380us-gaap:ConsumerPortfolioSegmentMemberzions:ConstructionAndOtherConsumerRealEstateMemberus-gaap:FinancingReceivablesEqualToGreaterThan90DaysPastDueMember2020-09-300000109380us-gaap:ConsumerPortfolioSegmentMemberzions:ConstructionAndOtherConsumerRealEstateMemberus-gaap:FinancingReceivables1To29DaysPastDueMember2020-09-300000109380us-gaap:ConsumerPortfolioSegmentMemberzions:BankcardAndOtherRevolvingPlansMemberzions:FinancialAsset30To89DaysPastDueMember2020-09-300000109380us-gaap:ConsumerPortfolioSegmentMemberzions:BankcardAndOtherRevolvingPlansMemberus-gaap:FinancingReceivablesEqualToGreaterThan90DaysPastDueMember2020-09-300000109380us-gaap:ConsumerPortfolioSegmentMemberzions:BankcardAndOtherRevolvingPlansMemberus-gaap:FinancingReceivables1To29DaysPastDueMember2020-09-300000109380us-gaap:ConsumerPortfolioSegmentMemberzions:FinancialAsset30To89DaysPastDueMemberzions:OtherConsumerLoansMember2020-09-300000109380us-gaap:ConsumerPortfolioSegmentMemberus-gaap:FinancingReceivablesEqualToGreaterThan90DaysPastDueMemberzions:OtherConsumerLoansMember2020-09-300000109380us-gaap:ConsumerPortfolioSegmentMemberzions:OtherConsumerLoansMemberus-gaap:FinancingReceivables1To29DaysPastDueMember2020-09-300000109380us-gaap:ConsumerPortfolioSegmentMemberzions:FinancialAsset30To89DaysPastDueMember2020-09-300000109380us-gaap:ConsumerPortfolioSegmentMemberus-gaap:FinancingReceivablesEqualToGreaterThan90DaysPastDueMember2020-09-300000109380us-gaap:ConsumerPortfolioSegmentMemberus-gaap:FinancingReceivables1To29DaysPastDueMember2020-09-300000109380zions:FinancialAsset30To89DaysPastDueMember2020-09-300000109380us-gaap:FinancingReceivablesEqualToGreaterThan90DaysPastDueMember2020-09-300000109380us-gaap:FinancingReceivables1To29DaysPastDueMember2020-09-300000109380zions:CommercialAndIndustrialMemberus-gaap:CommercialPortfolioSegmentMemberzions:FinancialAsset30To89DaysPastDueMember2019-12-310000109380zions:CommercialAndIndustrialMemberus-gaap:CommercialPortfolioSegmentMemberus-gaap:FinancingReceivablesEqualToGreaterThan90DaysPastDueMember2019-12-310000109380zions:CommercialAndIndustrialMemberus-gaap:CommercialPortfolioSegmentMemberus-gaap:FinancingReceivables1To29DaysPastDueMember2019-12-310000109380zions:PPPMemberus-gaap:CommercialPortfolioSegmentMemberzions:FinancialAsset30To89DaysPastDueMember2019-12-310000109380zions:PPPMemberus-gaap:CommercialPortfolioSegmentMemberus-gaap:FinancingReceivablesEqualToGreaterThan90DaysPastDueMember2019-12-310000109380zions:PPPMemberus-gaap:CommercialPortfolioSegmentMemberus-gaap:FinancingReceivables1To29DaysPastDueMember2019-12-310000109380us-gaap:CommercialPortfolioSegmentMemberzions:FinancialAsset30To89DaysPastDueMemberus-gaap:FinanceLeasesPortfolioSegmentMember2019-12-310000109380us-gaap:CommercialPortfolioSegmentMemberus-gaap:FinancingReceivablesEqualToGreaterThan90DaysPastDueMemberus-gaap:FinanceLeasesPortfolioSegmentMember2019-12-310000109380us-gaap:CommercialPortfolioSegmentMemberus-gaap:FinanceLeasesPortfolioSegmentMemberus-gaap:FinancingReceivables1To29DaysPastDueMember2019-12-310000109380us-gaap:CommercialPortfolioSegmentMemberzions:OwnerOccupiedMemberzions:FinancialAsset30To89DaysPastDueMember2019-12-310000109380us-gaap:CommercialPortfolioSegmentMemberzions:OwnerOccupiedMemberus-gaap:FinancingReceivablesEqualToGreaterThan90DaysPastDueMember2019-12-310000109380us-gaap:CommercialPortfolioSegmentMemberzions:OwnerOccupiedMemberus-gaap:FinancingReceivables1To29DaysPastDueMember2019-12-310000109380us-gaap:CommercialPortfolioSegmentMemberzions:FinancialAsset30To89DaysPastDueMemberzions:MunicipalMember2019-12-310000109380us-gaap:CommercialPortfolioSegmentMemberus-gaap:FinancingReceivablesEqualToGreaterThan90DaysPastDueMemberzions:MunicipalMember2019-12-310000109380us-gaap:CommercialPortfolioSegmentMemberus-gaap:FinancingReceivables1To29DaysPastDueMemberzions:MunicipalMember2019-12-310000109380us-gaap:CommercialPortfolioSegmentMemberzions:FinancialAsset30To89DaysPastDueMember2019-12-310000109380us-gaap:CommercialPortfolioSegmentMemberus-gaap:FinancingReceivablesEqualToGreaterThan90DaysPastDueMember2019-12-310000109380us-gaap:CommercialPortfolioSegmentMemberus-gaap:FinancingReceivables1To29DaysPastDueMember2019-12-310000109380us-gaap:CommercialRealEstatePortfolioSegmentMemberzions:ConstructionAndLandDevelopmentMemberzions:FinancialAsset30To89DaysPastDueMember2019-12-310000109380us-gaap:FinancingReceivablesEqualToGreaterThan90DaysPastDueMemberus-gaap:CommercialRealEstatePortfolioSegmentMemberzions:ConstructionAndLandDevelopmentMember2019-12-310000109380us-gaap:CommercialRealEstatePortfolioSegmentMemberzions:ConstructionAndLandDevelopmentMemberus-gaap:FinancingReceivables1To29DaysPastDueMember2019-12-310000109380zions:TermMemberus-gaap:CommercialRealEstatePortfolioSegmentMemberzions:FinancialAsset30To89DaysPastDueMember2019-12-310000109380zions:TermMemberus-gaap:FinancingReceivablesEqualToGreaterThan90DaysPastDueMemberus-gaap:CommercialRealEstatePortfolioSegmentMember2019-12-310000109380zions:TermMemberus-gaap:CommercialRealEstatePortfolioSegmentMemberus-gaap:FinancingReceivables1To29DaysPastDueMember2019-12-310000109380us-gaap:CommercialRealEstatePortfolioSegmentMemberzions:FinancialAsset30To89DaysPastDueMember2019-12-310000109380us-gaap:FinancingReceivablesEqualToGreaterThan90DaysPastDueMemberus-gaap:CommercialRealEstatePortfolioSegmentMember2019-12-310000109380us-gaap:CommercialRealEstatePortfolioSegmentMemberus-gaap:FinancingReceivables1To29DaysPastDueMember2019-12-310000109380us-gaap:ConsumerPortfolioSegmentMemberzions:FinancialAsset30To89DaysPastDueMemberus-gaap:HomeEquityMember2019-12-310000109380us-gaap:ConsumerPortfolioSegmentMemberus-gaap:FinancingReceivablesEqualToGreaterThan90DaysPastDueMemberus-gaap:HomeEquityMember2019-12-310000109380us-gaap:ConsumerPortfolioSegmentMemberus-gaap:FinancingReceivables1To29DaysPastDueMemberus-gaap:HomeEquityMember2019-12-310000109380us-gaap:ConsumerPortfolioSegmentMemberzions:OneThroughFourFamilyResidentialMemberzions:FinancialAsset30To89DaysPastDueMember2019-12-310000109380us-gaap:ConsumerPortfolioSegmentMemberzions:OneThroughFourFamilyResidentialMemberus-gaap:FinancingReceivablesEqualToGreaterThan90DaysPastDueMember2019-12-310000109380us-gaap:ConsumerPortfolioSegmentMemberzions:OneThroughFourFamilyResidentialMemberus-gaap:FinancingReceivables1To29DaysPastDueMember2019-12-310000109380us-gaap:ConsumerPortfolioSegmentMemberzions:ConstructionAndOtherConsumerRealEstateMemberzions:FinancialAsset30To89DaysPastDueMember2019-12-310000109380us-gaap:ConsumerPortfolioSegmentMemberzions:ConstructionAndOtherConsumerRealEstateMemberus-gaap:FinancingReceivablesEqualToGreaterThan90DaysPastDueMember2019-12-310000109380us-gaap:ConsumerPortfolioSegmentMemberzions:ConstructionAndOtherConsumerRealEstateMemberus-gaap:FinancingReceivables1To29DaysPastDueMember2019-12-310000109380us-gaap:ConsumerPortfolioSegmentMemberzions:BankcardAndOtherRevolvingPlansMemberzions:FinancialAsset30To89DaysPastDueMember2019-12-310000109380us-gaap:ConsumerPortfolioSegmentMemberzions:BankcardAndOtherRevolvingPlansMemberus-gaap:FinancingReceivablesEqualToGreaterThan90DaysPastDueMember2019-12-310000109380us-gaap:ConsumerPortfolioSegmentMemberzions:BankcardAndOtherRevolvingPlansMemberus-gaap:FinancingReceivables1To29DaysPastDueMember2019-12-310000109380us-gaap:ConsumerPortfolioSegmentMemberzions:FinancialAsset30To89DaysPastDueMemberzions:OtherConsumerLoansMember2019-12-310000109380us-gaap:ConsumerPortfolioSegmentMemberus-gaap:FinancingReceivablesEqualToGreaterThan90DaysPastDueMemberzions:OtherConsumerLoansMember2019-12-310000109380us-gaap:ConsumerPortfolioSegmentMemberzions:OtherConsumerLoansMemberus-gaap:FinancingReceivables1To29DaysPastDueMember2019-12-310000109380us-gaap:ConsumerPortfolioSegmentMemberzions:FinancialAsset30To89DaysPastDueMember2019-12-310000109380us-gaap:ConsumerPortfolioSegmentMemberus-gaap:FinancingReceivablesEqualToGreaterThan90DaysPastDueMember2019-12-310000109380us-gaap:ConsumerPortfolioSegmentMemberus-gaap:FinancingReceivables1To29DaysPastDueMember2019-12-310000109380zions:FinancialAsset30To89DaysPastDueMember2019-12-310000109380us-gaap:FinancingReceivablesEqualToGreaterThan90DaysPastDueMember2019-12-310000109380us-gaap:FinancingReceivables1To29DaysPastDueMember2019-12-310000109380zions:CommercialAndIndustrialMemberus-gaap:CommercialPortfolioSegmentMemberus-gaap:PassMember2020-09-300000109380zions:CommercialAndIndustrialMemberus-gaap:CommercialPortfolioSegmentMemberus-gaap:SpecialMentionMember2020-09-300000109380zions:CommercialAndIndustrialMemberus-gaap:CommercialPortfolioSegmentMemberzions:AccruingSubstandardMember2020-09-300000109380zions:CommercialAndIndustrialMemberus-gaap:CommercialPortfolioSegmentMemberzions:NonaccrualMember2020-09-300000109380zions:PPPMemberus-gaap:CommercialPortfolioSegmentMemberus-gaap:PassMember2020-09-300000109380zions:PPPMemberus-gaap:CommercialPortfolioSegmentMemberus-gaap:SpecialMentionMember2020-09-300000109380zions:PPPMemberus-gaap:CommercialPortfolioSegmentMemberzions:AccruingSubstandardMember2020-09-300000109380zions:PPPMemberus-gaap:CommercialPortfolioSegmentMemberzions:NonaccrualMember2020-09-300000109380us-gaap:CommercialPortfolioSegmentMemberus-gaap:PassMemberus-gaap:FinanceLeasesPortfolioSegmentMember2020-09-300000109380us-gaap:CommercialPortfolioSegmentMemberus-gaap:SpecialMentionMemberus-gaap:FinanceLeasesPortfolioSegmentMember2020-09-300000109380us-gaap:CommercialPortfolioSegmentMemberzions:AccruingSubstandardMemberus-gaap:FinanceLeasesPortfolioSegmentMember2020-09-300000109380us-gaap:CommercialPortfolioSegmentMemberzions:NonaccrualMemberus-gaap:FinanceLeasesPortfolioSegmentMember2020-09-300000109380us-gaap:CommercialPortfolioSegmentMemberus-gaap:PassMemberzions:OwnerOccupiedMember2020-09-300000109380us-gaap:CommercialPortfolioSegmentMemberus-gaap:SpecialMentionMemberzions:OwnerOccupiedMember2020-09-300000109380us-gaap:CommercialPortfolioSegmentMemberzions:AccruingSubstandardMemberzions:OwnerOccupiedMember2020-09-300000109380us-gaap:CommercialPortfolioSegmentMemberzions:NonaccrualMemberzions:OwnerOccupiedMember2020-09-300000109380us-gaap:CommercialPortfolioSegmentMemberus-gaap:PassMemberzions:MunicipalMember2020-09-300000109380us-gaap:CommercialPortfolioSegmentMemberus-gaap:SpecialMentionMemberzions:MunicipalMember2020-09-300000109380us-gaap:CommercialPortfolioSegmentMemberzions:AccruingSubstandardMemberzions:MunicipalMember2020-09-300000109380us-gaap:CommercialPortfolioSegmentMemberzions:NonaccrualMemberzions:MunicipalMember2020-09-300000109380us-gaap:PassMemberus-gaap:CommercialRealEstatePortfolioSegmentMemberzions:ConstructionAndLandDevelopmentMember2020-09-300000109380us-gaap:SpecialMentionMemberus-gaap:CommercialRealEstatePortfolioSegmentMemberzions:ConstructionAndLandDevelopmentMember2020-09-300000109380zions:AccruingSubstandardMemberus-gaap:CommercialRealEstatePortfolioSegmentMemberzions:ConstructionAndLandDevelopmentMember2020-09-300000109380zions:NonaccrualMemberus-gaap:CommercialRealEstatePortfolioSegmentMemberzions:ConstructionAndLandDevelopmentMember2020-09-300000109380zions:TermMemberus-gaap:PassMemberus-gaap:CommercialRealEstatePortfolioSegmentMember2020-09-300000109380zions:TermMemberus-gaap:SpecialMentionMemberus-gaap:CommercialRealEstatePortfolioSegmentMember2020-09-300000109380zions:TermMemberzions:AccruingSubstandardMemberus-gaap:CommercialRealEstatePortfolioSegmentMember2020-09-300000109380zions:TermMemberzions:NonaccrualMemberus-gaap:CommercialRealEstatePortfolioSegmentMember2020-09-300000109380us-gaap:ConsumerPortfolioSegmentMemberus-gaap:PassMemberus-gaap:HomeEquityMember2020-09-300000109380us-gaap:ConsumerPortfolioSegmentMemberzions:AccruingSubstandardMemberus-gaap:HomeEquityMember2020-09-300000109380us-gaap:ConsumerPortfolioSegmentMemberzions:NonaccrualMemberus-gaap:HomeEquityMember2020-09-300000109380us-gaap:ConsumerPortfolioSegmentMemberzions:OneThroughFourFamilyResidentialMemberus-gaap:PassMember2020-09-300000109380us-gaap:ConsumerPortfolioSegmentMemberzions:OneThroughFourFamilyResidentialMemberzions:AccruingSubstandardMember2020-09-300000109380us-gaap:ConsumerPortfolioSegmentMemberzions:OneThroughFourFamilyResidentialMemberzions:NonaccrualMember2020-09-300000109380us-gaap:ConsumerPortfolioSegmentMemberus-gaap:PassMemberzions:ConstructionAndOtherConsumerRealEstateMember2020-09-300000109380us-gaap:ConsumerPortfolioSegmentMemberzions:ConstructionAndOtherConsumerRealEstateMemberzions:AccruingSubstandardMember2020-09-300000109380us-gaap:ConsumerPortfolioSegmentMemberzions:NonaccrualMemberzions:ConstructionAndOtherConsumerRealEstateMember2020-09-300000109380us-gaap:ConsumerPortfolioSegmentMemberzions:BankcardAndOtherRevolvingPlansMemberus-gaap:PassMember2020-09-300000109380us-gaap:ConsumerPortfolioSegmentMemberzions:BankcardAndOtherRevolvingPlansMemberzions:AccruingSubstandardMember2020-09-300000109380us-gaap:ConsumerPortfolioSegmentMemberzions:BankcardAndOtherRevolvingPlansMemberzions:NonaccrualMember2020-09-300000109380us-gaap:ConsumerPortfolioSegmentMemberus-gaap:PassMemberzions:OtherConsumerLoansMember2020-09-300000109380us-gaap:ConsumerPortfolioSegmentMemberzions:AccruingSubstandardMemberzions:OtherConsumerLoansMember2020-09-300000109380us-gaap:ConsumerPortfolioSegmentMemberzions:NonaccrualMemberzions:OtherConsumerLoansMember2020-09-300000109380zions:CommercialAndIndustrialMemberus-gaap:CommercialPortfolioSegmentMemberzions:FinancingReceivableAccruingMemberzions:InterestRateBelowMarketMember2020-01-012020-09-300000109380zions:CommercialAndIndustrialMemberus-gaap:CommercialPortfolioSegmentMemberzions:FinancingReceivableAccruingMemberzions:MaturityOrTermExtensionMember2020-01-012020-09-300000109380zions:CommercialAndIndustrialMemberus-gaap:CommercialPortfolioSegmentMemberzions:FinancingReceivableAccruingMemberus-gaap:PrincipalForgivenessMember2020-01-012020-09-300000109380zions:CommercialAndIndustrialMemberus-gaap:CommercialPortfolioSegmentMemberzions:FinancingReceivableAccruingMemberus-gaap:PaymentDeferralMember2020-01-012020-09-300000109380zions:CommercialAndIndustrialMemberus-gaap:CommercialPortfolioSegmentMemberzions:FinancingReceivableAccruingMemberzions:OtherRecordedInvestmentResultingFromFollowingModificationMember2020-01-012020-09-300000109380zions:CommercialAndIndustrialMemberus-gaap:CommercialPortfolioSegmentMemberzions:FinancingReceivableAccruingMemberzions:MultipleModificationTypesMember2020-01-012020-09-300000109380zions:CommercialAndIndustrialMemberus-gaap:CommercialPortfolioSegmentMemberzions:FinancingReceivableAccruingMember2020-01-012020-09-300000109380us-gaap:CommercialPortfolioSegmentMemberzions:FinancingReceivableAccruingMemberzions:InterestRateBelowMarketMemberzions:OwnerOccupiedMember2020-01-012020-09-300000109380us-gaap:CommercialPortfolioSegmentMemberzions:FinancingReceivableAccruingMemberzions:OwnerOccupiedMemberzions:MaturityOrTermExtensionMember2020-01-012020-09-300000109380us-gaap:CommercialPortfolioSegmentMemberzions:FinancingReceivableAccruingMemberus-gaap:PrincipalForgivenessMemberzions:OwnerOccupiedMember2020-01-012020-09-300000109380us-gaap:CommercialPortfolioSegmentMemberzions:FinancingReceivableAccruingMemberzions:OwnerOccupiedMemberus-gaap:PaymentDeferralMember2020-01-012020-09-300000109380us-gaap:CommercialPortfolioSegmentMemberzions:FinancingReceivableAccruingMemberzions:OwnerOccupiedMemberzions:OtherRecordedInvestmentResultingFromFollowingModificationMember2020-01-012020-09-300000109380us-gaap:CommercialPortfolioSegmentMemberzions:FinancingReceivableAccruingMemberzions:MultipleModificationTypesMemberzions:OwnerOccupiedMember2020-01-012020-09-300000109380us-gaap:CommercialPortfolioSegmentMemberzions:FinancingReceivableAccruingMemberzions:OwnerOccupiedMember2020-01-012020-09-300000109380us-gaap:CommercialPortfolioSegmentMemberzions:FinancingReceivableAccruingMemberzions:InterestRateBelowMarketMember2020-01-012020-09-300000109380us-gaap:CommercialPortfolioSegmentMemberzions:FinancingReceivableAccruingMemberzions:MaturityOrTermExtensionMember2020-01-012020-09-300000109380us-gaap:CommercialPortfolioSegmentMemberzions:FinancingReceivableAccruingMemberus-gaap:PrincipalForgivenessMember2020-01-012020-09-300000109380us-gaap:CommercialPortfolioSegmentMemberzions:FinancingReceivableAccruingMemberus-gaap:PaymentDeferralMember2020-01-012020-09-300000109380us-gaap:CommercialPortfolioSegmentMemberzions:FinancingReceivableAccruingMemberzions:OtherRecordedInvestmentResultingFromFollowingModificationMember2020-01-012020-09-300000109380us-gaap:CommercialPortfolioSegmentMemberzions:FinancingReceivableAccruingMemberzions:MultipleModificationTypesMember2020-01-012020-09-300000109380us-gaap:CommercialPortfolioSegmentMemberzions:FinancingReceivableAccruingMember2020-01-012020-09-300000109380zions:TermMemberzions:FinancingReceivableAccruingMemberzions:InterestRateBelowMarketMemberus-gaap:CommercialRealEstatePortfolioSegmentMember2020-01-012020-09-300000109380zions:TermMemberzions:FinancingReceivableAccruingMemberus-gaap:CommercialRealEstatePortfolioSegmentMemberzions:MaturityOrTermExtensionMember2020-01-012020-09-300000109380zions:TermMemberzions:FinancingReceivableAccruingMemberus-gaap:PrincipalForgivenessMemberus-gaap:CommercialRealEstatePortfolioSegmentMember2020-01-012020-09-300000109380zions:TermMemberzions:FinancingReceivableAccruingMemberus-gaap:CommercialRealEstatePortfolioSegmentMemberus-gaap:PaymentDeferralMember2020-01-012020-09-300000109380zions:TermMemberzions:FinancingReceivableAccruingMemberus-gaap:CommercialRealEstatePortfolioSegmentMemberzions:OtherRecordedInvestmentResultingFromFollowingModificationMember2020-01-012020-09-300000109380zions:TermMemberzions:FinancingReceivableAccruingMemberzions:MultipleModificationTypesMemberus-gaap:CommercialRealEstatePortfolioSegmentMember2020-01-012020-09-300000109380zions:TermMemberzions:FinancingReceivableAccruingMemberus-gaap:CommercialRealEstatePortfolioSegmentMember2020-01-012020-09-300000109380zions:FinancingReceivableAccruingMemberzions:InterestRateBelowMarketMemberus-gaap:CommercialRealEstatePortfolioSegmentMember2020-01-012020-09-300000109380zions:FinancingReceivableAccruingMemberus-gaap:CommercialRealEstatePortfolioSegmentMemberzions:MaturityOrTermExtensionMember2020-01-012020-09-300000109380zions:FinancingReceivableAccruingMemberus-gaap:PrincipalForgivenessMemberus-gaap:CommercialRealEstatePortfolioSegmentMember2020-01-012020-09-300000109380zions:FinancingReceivableAccruingMemberus-gaap:CommercialRealEstatePortfolioSegmentMemberus-gaap:PaymentDeferralMember2020-01-012020-09-300000109380zions:FinancingReceivableAccruingMemberus-gaap:CommercialRealEstatePortfolioSegmentMemberzions:OtherRecordedInvestmentResultingFromFollowingModificationMember2020-01-012020-09-300000109380zions:FinancingReceivableAccruingMemberzions:MultipleModificationTypesMemberus-gaap:CommercialRealEstatePortfolioSegmentMember2020-01-012020-09-300000109380zions:FinancingReceivableAccruingMemberus-gaap:CommercialRealEstatePortfolioSegmentMember2020-01-012020-09-300000109380us-gaap:ConsumerPortfolioSegmentMemberzions:FinancingReceivableAccruingMemberzions:InterestRateBelowMarketMemberus-gaap:HomeEquityMember2020-01-012020-09-300000109380us-gaap:ConsumerPortfolioSegmentMemberzions:FinancingReceivableAccruingMemberzions:MaturityOrTermExtensionMemberus-gaap:HomeEquityMember2020-01-012020-09-300000109380us-gaap:ConsumerPortfolioSegmentMemberzions:FinancingReceivableAccruingMemberus-gaap:PrincipalForgivenessMemberus-gaap:HomeEquityMember2020-01-012020-09-300000109380us-gaap:ConsumerPortfolioSegmentMemberzions:FinancingReceivableAccruingMemberus-gaap:PaymentDeferralMemberus-gaap:HomeEquityMember2020-01-012020-09-300000109380us-gaap:ConsumerPortfolioSegmentMemberzions:FinancingReceivableAccruingMemberzions:OtherRecordedInvestmentResultingFromFollowingModificationMemberus-gaap:HomeEquityMember2020-01-012020-09-300000109380us-gaap:ConsumerPortfolioSegmentMemberzions:FinancingReceivableAccruingMemberzions:MultipleModificationTypesMemberus-gaap:HomeEquityMember2020-01-012020-09-300000109380us-gaap:ConsumerPortfolioSegmentMemberzions:FinancingReceivableAccruingMemberus-gaap:HomeEquityMember2020-01-012020-09-300000109380us-gaap:ConsumerPortfolioSegmentMemberzions:OneThroughFourFamilyResidentialMemberzions:FinancingReceivableAccruingMemberzions:InterestRateBelowMarketMember2020-01-012020-09-300000109380us-gaap:ConsumerPortfolioSegmentMemberzions:OneThroughFourFamilyResidentialMemberzions:FinancingReceivableAccruingMemberzions:MaturityOrTermExtensionMember2020-01-012020-09-300000109380us-gaap:ConsumerPortfolioSegmentMemberzions:OneThroughFourFamilyResidentialMemberzions:FinancingReceivableAccruingMemberus-gaap:PrincipalForgivenessMember2020-01-012020-09-300000109380us-gaap:ConsumerPortfolioSegmentMemberzions:OneThroughFourFamilyResidentialMemberzions:FinancingReceivableAccruingMemberus-gaap:PaymentDeferralMember2020-01-012020-09-300000109380us-gaap:ConsumerPortfolioSegmentMemberzions:OneThroughFourFamilyResidentialMemberzions:FinancingReceivableAccruingMemberzions:OtherRecordedInvestmentResultingFromFollowingModificationMember2020-01-012020-09-300000109380us-gaap:ConsumerPortfolioSegmentMemberzions:OneThroughFourFamilyResidentialMemberzions:FinancingReceivableAccruingMemberzions:MultipleModificationTypesMember2020-01-012020-09-300000109380us-gaap:ConsumerPortfolioSegmentMemberzions:OneThroughFourFamilyResidentialMemberzions:FinancingReceivableAccruingMember2020-01-012020-09-300000109380us-gaap:ConsumerPortfolioSegmentMemberzions:FinancingReceivableAccruingMemberzions:ConstructionAndOtherConsumerRealEstateMemberzions:InterestRateBelowMarketMember2020-01-012020-09-300000109380us-gaap:ConsumerPortfolioSegmentMemberzions:FinancingReceivableAccruingMemberzions:ConstructionAndOtherConsumerRealEstateMemberzions:MaturityOrTermExtensionMember2020-01-012020-09-300000109380us-gaap:ConsumerPortfolioSegmentMemberzions:FinancingReceivableAccruingMemberzions:ConstructionAndOtherConsumerRealEstateMemberus-gaap:PrincipalForgivenessMember2020-01-012020-09-300000109380us-gaap:ConsumerPortfolioSegmentMemberzions:FinancingReceivableAccruingMemberzions:ConstructionAndOtherConsumerRealEstateMemberus-gaap:PaymentDeferralMember2020-01-012020-09-300000109380us-gaap:ConsumerPortfolioSegmentMemberzions:FinancingReceivableAccruingMemberzions:ConstructionAndOtherConsumerRealEstateMemberzions:OtherRecordedInvestmentResultingFromFollowingModificationMember2020-01-012020-09-300000109380us-gaap:ConsumerPortfolioSegmentMemberzions:FinancingReceivableAccruingMemberzions:ConstructionAndOtherConsumerRealEstateMemberzions:MultipleModificationTypesMember2020-01-012020-09-300000109380us-gaap:ConsumerPortfolioSegmentMemberzions:FinancingReceivableAccruingMemberzions:ConstructionAndOtherConsumerRealEstateMember2020-01-012020-09-300000109380us-gaap:ConsumerPortfolioSegmentMemberzions:FinancingReceivableAccruingMemberzions:InterestRateBelowMarketMember2020-01-012020-09-300000109380us-gaap:ConsumerPortfolioSegmentMemberzions:FinancingReceivableAccruingMemberzions:MaturityOrTermExtensionMember2020-01-012020-09-300000109380us-gaap:ConsumerPortfolioSegmentMemberzions:FinancingReceivableAccruingMemberus-gaap:PrincipalForgivenessMember2020-01-012020-09-300000109380us-gaap:ConsumerPortfolioSegmentMemberzions:FinancingReceivableAccruingMemberus-gaap:PaymentDeferralMember2020-01-012020-09-300000109380us-gaap:ConsumerPortfolioSegmentMemberzions:FinancingReceivableAccruingMemberzions:OtherRecordedInvestmentResultingFromFollowingModificationMember2020-01-012020-09-300000109380us-gaap:ConsumerPortfolioSegmentMemberzions:FinancingReceivableAccruingMemberzions:MultipleModificationTypesMember2020-01-012020-09-300000109380us-gaap:ConsumerPortfolioSegmentMemberzions:FinancingReceivableAccruingMember2020-01-012020-09-300000109380zions:FinancingReceivableAccruingMemberzions:InterestRateBelowMarketMember2020-01-012020-09-300000109380zions:FinancingReceivableAccruingMemberzions:MaturityOrTermExtensionMember2020-01-012020-09-300000109380zions:FinancingReceivableAccruingMemberus-gaap:PrincipalForgivenessMember2020-01-012020-09-300000109380zions:FinancingReceivableAccruingMemberus-gaap:PaymentDeferralMember2020-01-012020-09-300000109380zions:FinancingReceivableAccruingMemberzions:OtherRecordedInvestmentResultingFromFollowingModificationMember2020-01-012020-09-300000109380zions:FinancingReceivableAccruingMemberzions:MultipleModificationTypesMember2020-01-012020-09-300000109380zions:FinancingReceivableAccruingMember2020-01-012020-09-300000109380zions:CommercialAndIndustrialMemberus-gaap:CommercialPortfolioSegmentMemberzions:FinancingReceivableNonaccruingMemberzions:InterestRateBelowMarketMember2020-01-012020-09-300000109380zions:CommercialAndIndustrialMemberus-gaap:CommercialPortfolioSegmentMemberzions:FinancingReceivableNonaccruingMemberzions:MaturityOrTermExtensionMember2020-01-012020-09-300000109380zions:CommercialAndIndustrialMemberus-gaap:CommercialPortfolioSegmentMemberzions:FinancingReceivableNonaccruingMemberus-gaap:PrincipalForgivenessMember2020-01-012020-09-300000109380zions:CommercialAndIndustrialMemberus-gaap:CommercialPortfolioSegmentMemberzions:FinancingReceivableNonaccruingMemberus-gaap:PaymentDeferralMember2020-01-012020-09-300000109380zions:CommercialAndIndustrialMemberus-gaap:CommercialPortfolioSegmentMemberzions:FinancingReceivableNonaccruingMemberzions:OtherRecordedInvestmentResultingFromFollowingModificationMember2020-01-012020-09-300000109380zions:CommercialAndIndustrialMemberus-gaap:CommercialPortfolioSegmentMemberzions:FinancingReceivableNonaccruingMemberzions:MultipleModificationTypesMember2020-01-012020-09-300000109380zions:CommercialAndIndustrialMemberus-gaap:CommercialPortfolioSegmentMemberzions:FinancingReceivableNonaccruingMember2020-01-012020-09-300000109380us-gaap:CommercialPortfolioSegmentMemberzions:FinancingReceivableNonaccruingMemberzions:InterestRateBelowMarketMemberzions:OwnerOccupiedMember2020-01-012020-09-300000109380us-gaap:CommercialPortfolioSegmentMemberzions:FinancingReceivableNonaccruingMemberzions:OwnerOccupiedMemberzions:MaturityOrTermExtensionMember2020-01-012020-09-300000109380us-gaap:CommercialPortfolioSegmentMemberzions:FinancingReceivableNonaccruingMemberus-gaap:PrincipalForgivenessMemberzions:OwnerOccupiedMember2020-01-012020-09-300000109380us-gaap:CommercialPortfolioSegmentMemberzions:FinancingReceivableNonaccruingMemberzions:OwnerOccupiedMemberus-gaap:PaymentDeferralMember2020-01-012020-09-300000109380us-gaap:CommercialPortfolioSegmentMemberzions:FinancingReceivableNonaccruingMemberzions:OwnerOccupiedMemberzions:OtherRecordedInvestmentResultingFromFollowingModificationMember2020-01-012020-09-300000109380us-gaap:CommercialPortfolioSegmentMemberzions:FinancingReceivableNonaccruingMemberzions:MultipleModificationTypesMemberzions:OwnerOccupiedMember2020-01-012020-09-300000109380us-gaap:CommercialPortfolioSegmentMemberzions:FinancingReceivableNonaccruingMemberzions:OwnerOccupiedMember2020-01-012020-09-300000109380us-gaap:CommercialPortfolioSegmentMemberzions:FinancingReceivableNonaccruingMemberzions:InterestRateBelowMarketMember2020-01-012020-09-300000109380us-gaap:CommercialPortfolioSegmentMemberzions:FinancingReceivableNonaccruingMemberzions:MaturityOrTermExtensionMember2020-01-012020-09-300000109380us-gaap:CommercialPortfolioSegmentMemberzions:FinancingReceivableNonaccruingMemberus-gaap:PrincipalForgivenessMember2020-01-012020-09-300000109380us-gaap:CommercialPortfolioSegmentMemberzions:FinancingReceivableNonaccruingMemberus-gaap:PaymentDeferralMember2020-01-012020-09-300000109380us-gaap:CommercialPortfolioSegmentMemberzions:FinancingReceivableNonaccruingMemberzions:OtherRecordedInvestmentResultingFromFollowingModificationMember2020-01-012020-09-300000109380us-gaap:CommercialPortfolioSegmentMemberzions:FinancingReceivableNonaccruingMemberzions:MultipleModificationTypesMember2020-01-012020-09-300000109380us-gaap:CommercialPortfolioSegmentMemberzions:FinancingReceivableNonaccruingMember2020-01-012020-09-300000109380zions:TermMemberzions:FinancingReceivableNonaccruingMemberzions:InterestRateBelowMarketMemberus-gaap:CommercialRealEstatePortfolioSegmentMember2020-01-012020-09-300000109380zions:TermMemberzions:FinancingReceivableNonaccruingMemberus-gaap:CommercialRealEstatePortfolioSegmentMemberzions:MaturityOrTermExtensionMember2020-01-012020-09-300000109380zions:TermMemberzions:FinancingReceivableNonaccruingMemberus-gaap:PrincipalForgivenessMemberus-gaap:CommercialRealEstatePortfolioSegmentMember2020-01-012020-09-300000109380zions:TermMemberzions:FinancingReceivableNonaccruingMemberus-gaap:CommercialRealEstatePortfolioSegmentMemberus-gaap:PaymentDeferralMember2020-01-012020-09-300000109380zions:TermMemberzions:FinancingReceivableNonaccruingMemberus-gaap:CommercialRealEstatePortfolioSegmentMemberzions:OtherRecordedInvestmentResultingFromFollowingModificationMember2020-01-012020-09-300000109380zions:TermMemberzions:FinancingReceivableNonaccruingMemberzions:MultipleModificationTypesMemberus-gaap:CommercialRealEstatePortfolioSegmentMember2020-01-012020-09-300000109380zions:TermMemberzions:FinancingReceivableNonaccruingMemberus-gaap:CommercialRealEstatePortfolioSegmentMember2020-01-012020-09-300000109380zions:FinancingReceivableNonaccruingMemberzions:InterestRateBelowMarketMemberus-gaap:CommercialRealEstatePortfolioSegmentMember2020-01-012020-09-300000109380zions:FinancingReceivableNonaccruingMemberus-gaap:CommercialRealEstatePortfolioSegmentMemberzions:MaturityOrTermExtensionMember2020-01-012020-09-300000109380zions:FinancingReceivableNonaccruingMemberus-gaap:PrincipalForgivenessMemberus-gaap:CommercialRealEstatePortfolioSegmentMember2020-01-012020-09-300000109380zions:FinancingReceivableNonaccruingMemberus-gaap:CommercialRealEstatePortfolioSegmentMemberus-gaap:PaymentDeferralMember2020-01-012020-09-300000109380zions:FinancingReceivableNonaccruingMemberus-gaap:CommercialRealEstatePortfolioSegmentMemberzions:OtherRecordedInvestmentResultingFromFollowingModificationMember2020-01-012020-09-300000109380zions:FinancingReceivableNonaccruingMemberzions:MultipleModificationTypesMemberus-gaap:CommercialRealEstatePortfolioSegmentMember2020-01-012020-09-300000109380zions:FinancingReceivableNonaccruingMemberus-gaap:CommercialRealEstatePortfolioSegmentMember2020-01-012020-09-300000109380us-gaap:ConsumerPortfolioSegmentMemberzions:FinancingReceivableNonaccruingMemberzions:InterestRateBelowMarketMemberus-gaap:HomeEquityMember2020-01-012020-09-300000109380us-gaap:ConsumerPortfolioSegmentMemberzions:FinancingReceivableNonaccruingMemberzions:MaturityOrTermExtensionMemberus-gaap:HomeEquityMember2020-01-012020-09-300000109380us-gaap:ConsumerPortfolioSegmentMemberzions:FinancingReceivableNonaccruingMemberus-gaap:PrincipalForgivenessMemberus-gaap:HomeEquityMember2020-01-012020-09-300000109380us-gaap:ConsumerPortfolioSegmentMemberzions:FinancingReceivableNonaccruingMemberus-gaap:PaymentDeferralMemberus-gaap:HomeEquityMember2020-01-012020-09-300000109380us-gaap:ConsumerPortfolioSegmentMemberzions:FinancingReceivableNonaccruingMemberzions:OtherRecordedInvestmentResultingFromFollowingModificationMemberus-gaap:HomeEquityMember2020-01-012020-09-300000109380us-gaap:ConsumerPortfolioSegmentMemberzions:FinancingReceivableNonaccruingMemberzions:MultipleModificationTypesMemberus-gaap:HomeEquityMember2020-01-012020-09-300000109380us-gaap:ConsumerPortfolioSegmentMemberzions:FinancingReceivableNonaccruingMemberus-gaap:HomeEquityMember2020-01-012020-09-300000109380us-gaap:ConsumerPortfolioSegmentMemberzions:OneThroughFourFamilyResidentialMemberzions:FinancingReceivableNonaccruingMemberzions:InterestRateBelowMarketMember2020-01-012020-09-300000109380us-gaap:ConsumerPortfolioSegmentMemberzions:OneThroughFourFamilyResidentialMemberzions:FinancingReceivableNonaccruingMemberzions:MaturityOrTermExtensionMember2020-01-012020-09-300000109380us-gaap:ConsumerPortfolioSegmentMemberzions:OneThroughFourFamilyResidentialMemberzions:FinancingReceivableNonaccruingMemberus-gaap:PrincipalForgivenessMember2020-01-012020-09-300000109380us-gaap:ConsumerPortfolioSegmentMemberzions:OneThroughFourFamilyResidentialMemberzions:FinancingReceivableNonaccruingMemberus-gaap:PaymentDeferralMember2020-01-012020-09-300000109380us-gaap:ConsumerPortfolioSegmentMemberzions:OneThroughFourFamilyResidentialMemberzions:FinancingReceivableNonaccruingMemberzions:OtherRecordedInvestmentResultingFromFollowingModificationMember2020-01-012020-09-300000109380us-gaap:ConsumerPortfolioSegmentMemberzions:OneThroughFourFamilyResidentialMemberzions:FinancingReceivableNonaccruingMemberzions:MultipleModificationTypesMember2020-01-012020-09-300000109380us-gaap:ConsumerPortfolioSegmentMemberzions:OneThroughFourFamilyResidentialMemberzions:FinancingReceivableNonaccruingMember2020-01-012020-09-300000109380us-gaap:ConsumerPortfolioSegmentMemberzions:FinancingReceivableNonaccruingMemberzions:InterestRateBelowMarketMember2020-01-012020-09-300000109380us-gaap:ConsumerPortfolioSegmentMemberzions:FinancingReceivableNonaccruingMemberzions:MaturityOrTermExtensionMember2020-01-012020-09-300000109380us-gaap:ConsumerPortfolioSegmentMemberzions:FinancingReceivableNonaccruingMemberus-gaap:PrincipalForgivenessMember2020-01-012020-09-300000109380us-gaap:ConsumerPortfolioSegmentMemberzions:FinancingReceivableNonaccruingMemberus-gaap:PaymentDeferralMember2020-01-012020-09-300000109380us-gaap:ConsumerPortfolioSegmentMemberzions:FinancingReceivableNonaccruingMemberzions:OtherRecordedInvestmentResultingFromFollowingModificationMember2020-01-012020-09-300000109380us-gaap:ConsumerPortfolioSegmentMemberzions:FinancingReceivableNonaccruingMemberzions:MultipleModificationTypesMember2020-01-012020-09-300000109380us-gaap:ConsumerPortfolioSegmentMemberzions:FinancingReceivableNonaccruingMember2020-01-012020-09-300000109380zions:FinancingReceivableNonaccruingMemberzions:InterestRateBelowMarketMember2020-01-012020-09-300000109380zions:FinancingReceivableNonaccruingMemberzions:MaturityOrTermExtensionMember2020-01-012020-09-300000109380zions:FinancingReceivableNonaccruingMemberus-gaap:PrincipalForgivenessMember2020-01-012020-09-300000109380zions:FinancingReceivableNonaccruingMemberus-gaap:PaymentDeferralMember2020-01-012020-09-300000109380zions:FinancingReceivableNonaccruingMemberzions:OtherRecordedInvestmentResultingFromFollowingModificationMember2020-01-012020-09-300000109380zions:FinancingReceivableNonaccruingMemberzions:MultipleModificationTypesMember2020-01-012020-09-300000109380zions:FinancingReceivableNonaccruingMember2020-01-012020-09-300000109380zions:InterestRateBelowMarketMember2020-01-012020-09-300000109380zions:MaturityOrTermExtensionMember2020-01-012020-09-300000109380us-gaap:PrincipalForgivenessMember2020-01-012020-09-300000109380us-gaap:PaymentDeferralMember2020-01-012020-09-300000109380zions:OtherRecordedInvestmentResultingFromFollowingModificationMember2020-01-012020-09-300000109380zions:MultipleModificationTypesMember2020-01-012020-09-300000109380zions:CommercialAndIndustrialMemberus-gaap:CommercialPortfolioSegmentMemberzions:FinancingReceivableAccruingMemberzions:InterestRateBelowMarketMember2019-01-012019-12-310000109380zions:CommercialAndIndustrialMemberus-gaap:CommercialPortfolioSegmentMemberzions:FinancingReceivableAccruingMemberzions:MaturityOrTermExtensionMember2019-01-012019-12-310000109380zions:CommercialAndIndustrialMemberus-gaap:CommercialPortfolioSegmentMemberzions:FinancingReceivableAccruingMemberus-gaap:PrincipalForgivenessMember2019-01-012019-12-310000109380zions:CommercialAndIndustrialMemberus-gaap:CommercialPortfolioSegmentMemberzions:FinancingReceivableAccruingMemberus-gaap:PaymentDeferralMember2019-01-012019-12-310000109380zions:CommercialAndIndustrialMemberus-gaap:CommercialPortfolioSegmentMemberzions:FinancingReceivableAccruingMemberzions:OtherRecordedInvestmentResultingFromFollowingModificationMember2019-01-012019-12-310000109380zions:CommercialAndIndustrialMemberus-gaap:CommercialPortfolioSegmentMemberzions:FinancingReceivableAccruingMemberzions:MultipleModificationTypesMember2019-01-012019-12-310000109380zions:CommercialAndIndustrialMemberus-gaap:CommercialPortfolioSegmentMemberzions:FinancingReceivableAccruingMember2019-01-012019-12-310000109380us-gaap:CommercialPortfolioSegmentMemberzions:FinancingReceivableAccruingMemberzions:InterestRateBelowMarketMemberzions:OwnerOccupiedMember2019-01-012019-12-310000109380us-gaap:CommercialPortfolioSegmentMemberzions:FinancingReceivableAccruingMemberzions:OwnerOccupiedMemberzions:MaturityOrTermExtensionMember2019-01-012019-12-310000109380us-gaap:CommercialPortfolioSegmentMemberzions:FinancingReceivableAccruingMemberus-gaap:PrincipalForgivenessMemberzions:OwnerOccupiedMember2019-01-012019-12-310000109380us-gaap:CommercialPortfolioSegmentMemberzions:FinancingReceivableAccruingMemberzions:OwnerOccupiedMemberus-gaap:PaymentDeferralMember2019-01-012019-12-310000109380us-gaap:CommercialPortfolioSegmentMemberzions:FinancingReceivableAccruingMemberzions:OwnerOccupiedMemberzions:OtherRecordedInvestmentResultingFromFollowingModificationMember2019-01-012019-12-310000109380us-gaap:CommercialPortfolioSegmentMemberzions:FinancingReceivableAccruingMemberzions:MultipleModificationTypesMemberzions:OwnerOccupiedMember2019-01-012019-12-310000109380us-gaap:CommercialPortfolioSegmentMemberzions:FinancingReceivableAccruingMemberzions:OwnerOccupiedMember2019-01-012019-12-310000109380us-gaap:CommercialPortfolioSegmentMemberzions:FinancingReceivableAccruingMemberzions:InterestRateBelowMarketMember2019-01-012019-12-310000109380us-gaap:CommercialPortfolioSegmentMemberzions:FinancingReceivableAccruingMemberzions:MaturityOrTermExtensionMember2019-01-012019-12-310000109380us-gaap:CommercialPortfolioSegmentMemberzions:FinancingReceivableAccruingMemberus-gaap:PrincipalForgivenessMember2019-01-012019-12-310000109380us-gaap:CommercialPortfolioSegmentMemberzions:FinancingReceivableAccruingMemberus-gaap:PaymentDeferralMember2019-01-012019-12-310000109380us-gaap:CommercialPortfolioSegmentMemberzions:FinancingReceivableAccruingMemberzions:OtherRecordedInvestmentResultingFromFollowingModificationMember2019-01-012019-12-310000109380us-gaap:CommercialPortfolioSegmentMemberzions:FinancingReceivableAccruingMemberzions:MultipleModificationTypesMember2019-01-012019-12-310000109380us-gaap:CommercialPortfolioSegmentMemberzions:FinancingReceivableAccruingMember2019-01-012019-12-310000109380zions:TermMemberzions:FinancingReceivableAccruingMemberzions:InterestRateBelowMarketMemberus-gaap:CommercialRealEstatePortfolioSegmentMember2019-01-012019-12-310000109380zions:TermMemberzions:FinancingReceivableAccruingMemberus-gaap:CommercialRealEstatePortfolioSegmentMemberzions:MaturityOrTermExtensionMember2019-01-012019-12-310000109380zions:TermMemberzions:FinancingReceivableAccruingMemberus-gaap:PrincipalForgivenessMemberus-gaap:CommercialRealEstatePortfolioSegmentMember2019-01-012019-12-310000109380zions:TermMemberzions:FinancingReceivableAccruingMemberus-gaap:CommercialRealEstatePortfolioSegmentMemberus-gaap:PaymentDeferralMember2019-01-012019-12-310000109380zions:TermMemberzions:FinancingReceivableAccruingMemberus-gaap:CommercialRealEstatePortfolioSegmentMemberzions:OtherRecordedInvestmentResultingFromFollowingModificationMember2019-01-012019-12-310000109380zions:TermMemberzions:FinancingReceivableAccruingMemberzions:MultipleModificationTypesMemberus-gaap:CommercialRealEstatePortfolioSegmentMember2019-01-012019-12-310000109380zions:TermMemberzions:FinancingReceivableAccruingMemberus-gaap:CommercialRealEstatePortfolioSegmentMember2019-01-012019-12-310000109380zions:FinancingReceivableAccruingMemberzions:InterestRateBelowMarketMemberus-gaap:CommercialRealEstatePortfolioSegmentMember2019-01-012019-12-310000109380zions:FinancingReceivableAccruingMemberus-gaap:CommercialRealEstatePortfolioSegmentMemberzions:MaturityOrTermExtensionMember2019-01-012019-12-310000109380zions:FinancingReceivableAccruingMemberus-gaap:PrincipalForgivenessMemberus-gaap:CommercialRealEstatePortfolioSegmentMember2019-01-012019-12-310000109380zions:FinancingReceivableAccruingMemberus-gaap:CommercialRealEstatePortfolioSegmentMemberus-gaap:PaymentDeferralMember2019-01-012019-12-310000109380zions:FinancingReceivableAccruingMemberus-gaap:CommercialRealEstatePortfolioSegmentMemberzions:OtherRecordedInvestmentResultingFromFollowingModificationMember2019-01-012019-12-310000109380zions:FinancingReceivableAccruingMemberzions:MultipleModificationTypesMemberus-gaap:CommercialRealEstatePortfolioSegmentMember2019-01-012019-12-310000109380zions:FinancingReceivableAccruingMemberus-gaap:CommercialRealEstatePortfolioSegmentMember2019-01-012019-12-310000109380us-gaap:ConsumerPortfolioSegmentMemberzions:FinancingReceivableAccruingMemberzions:InterestRateBelowMarketMemberus-gaap:HomeEquityMember2019-01-012019-12-310000109380us-gaap:ConsumerPortfolioSegmentMemberzions:FinancingReceivableAccruingMemberzions:MaturityOrTermExtensionMemberus-gaap:HomeEquityMember2019-01-012019-12-310000109380us-gaap:ConsumerPortfolioSegmentMemberzions:FinancingReceivableAccruingMemberus-gaap:PrincipalForgivenessMemberus-gaap:HomeEquityMember2019-01-012019-12-310000109380us-gaap:ConsumerPortfolioSegmentMemberzions:FinancingReceivableAccruingMemberus-gaap:PaymentDeferralMemberus-gaap:HomeEquityMember2019-01-012019-12-310000109380us-gaap:ConsumerPortfolioSegmentMemberzions:FinancingReceivableAccruingMemberzions:OtherRecordedInvestmentResultingFromFollowingModificationMemberus-gaap:HomeEquityMember2019-01-012019-12-310000109380us-gaap:ConsumerPortfolioSegmentMemberzions:FinancingReceivableAccruingMemberzions:MultipleModificationTypesMemberus-gaap:HomeEquityMember2019-01-012019-12-310000109380us-gaap:ConsumerPortfolioSegmentMemberzions:FinancingReceivableAccruingMemberus-gaap:HomeEquityMember2019-01-012019-12-310000109380us-gaap:ConsumerPortfolioSegmentMemberzions:OneThroughFourFamilyResidentialMemberzions:FinancingReceivableAccruingMemberzions:InterestRateBelowMarketMember2019-01-012019-12-310000109380us-gaap:ConsumerPortfolioSegmentMemberzions:OneThroughFourFamilyResidentialMemberzions:FinancingReceivableAccruingMemberzions:MaturityOrTermExtensionMember2019-01-012019-12-310000109380us-gaap:ConsumerPortfolioSegmentMemberzions:OneThroughFourFamilyResidentialMemberzions:FinancingReceivableAccruingMemberus-gaap:PrincipalForgivenessMember2019-01-012019-12-310000109380us-gaap:ConsumerPortfolioSegmentMemberzions:OneThroughFourFamilyResidentialMemberzions:FinancingReceivableAccruingMemberus-gaap:PaymentDeferralMember2019-01-012019-12-310000109380us-gaap:ConsumerPortfolioSegmentMemberzions:OneThroughFourFamilyResidentialMemberzions:FinancingReceivableAccruingMemberzions:OtherRecordedInvestmentResultingFromFollowingModificationMember2019-01-012019-12-310000109380us-gaap:ConsumerPortfolioSegmentMemberzions:OneThroughFourFamilyResidentialMemberzions:FinancingReceivableAccruingMemberzions:MultipleModificationTypesMember2019-01-012019-12-310000109380us-gaap:ConsumerPortfolioSegmentMemberzions:OneThroughFourFamilyResidentialMemberzions:FinancingReceivableAccruingMember2019-01-012019-12-310000109380us-gaap:ConsumerPortfolioSegmentMemberzions:FinancingReceivableAccruingMemberzions:ConstructionAndOtherConsumerRealEstateMemberzions:InterestRateBelowMarketMember2019-01-012019-12-310000109380us-gaap:ConsumerPortfolioSegmentMemberzions:FinancingReceivableAccruingMemberzions:ConstructionAndOtherConsumerRealEstateMemberzions:MaturityOrTermExtensionMember2019-01-012019-12-310000109380us-gaap:ConsumerPortfolioSegmentMemberzions:FinancingReceivableAccruingMemberzions:ConstructionAndOtherConsumerRealEstateMemberus-gaap:PrincipalForgivenessMember2019-01-012019-12-310000109380us-gaap:ConsumerPortfolioSegmentMemberzions:FinancingReceivableAccruingMemberzions:ConstructionAndOtherConsumerRealEstateMemberus-gaap:PaymentDeferralMember2019-01-012019-12-310000109380us-gaap:ConsumerPortfolioSegmentMemberzions:FinancingReceivableAccruingMemberzions:ConstructionAndOtherConsumerRealEstateMemberzions:OtherRecordedInvestmentResultingFromFollowingModificationMember2019-01-012019-12-310000109380us-gaap:ConsumerPortfolioSegmentMemberzions:FinancingReceivableAccruingMemberzions:ConstructionAndOtherConsumerRealEstateMemberzions:MultipleModificationTypesMember2019-01-012019-12-310000109380us-gaap:ConsumerPortfolioSegmentMemberzions:FinancingReceivableAccruingMemberzions:ConstructionAndOtherConsumerRealEstateMember2019-01-012019-12-310000109380us-gaap:ConsumerPortfolioSegmentMemberzions:FinancingReceivableAccruingMemberzions:InterestRateBelowMarketMember2019-01-012019-12-310000109380us-gaap:ConsumerPortfolioSegmentMemberzions:FinancingReceivableAccruingMemberzions:MaturityOrTermExtensionMember2019-01-012019-12-310000109380us-gaap:ConsumerPortfolioSegmentMemberzions:FinancingReceivableAccruingMemberus-gaap:PrincipalForgivenessMember2019-01-012019-12-310000109380us-gaap:ConsumerPortfolioSegmentMemberzions:FinancingReceivableAccruingMemberus-gaap:PaymentDeferralMember2019-01-012019-12-310000109380us-gaap:ConsumerPortfolioSegmentMemberzions:FinancingReceivableAccruingMemberzions:OtherRecordedInvestmentResultingFromFollowingModificationMember2019-01-012019-12-310000109380us-gaap:ConsumerPortfolioSegmentMemberzions:FinancingReceivableAccruingMemberzions:MultipleModificationTypesMember2019-01-012019-12-310000109380us-gaap:ConsumerPortfolioSegmentMemberzions:FinancingReceivableAccruingMember2019-01-012019-12-310000109380zions:FinancingReceivableAccruingMemberzions:InterestRateBelowMarketMember2019-01-012019-12-310000109380zions:FinancingReceivableAccruingMemberzions:MaturityOrTermExtensionMember2019-01-012019-12-310000109380zions:FinancingReceivableAccruingMemberus-gaap:PrincipalForgivenessMember2019-01-012019-12-310000109380zions:FinancingReceivableAccruingMemberus-gaap:PaymentDeferralMember2019-01-012019-12-310000109380zions:FinancingReceivableAccruingMemberzions:OtherRecordedInvestmentResultingFromFollowingModificationMember2019-01-012019-12-310000109380zions:FinancingReceivableAccruingMemberzions:MultipleModificationTypesMember2019-01-012019-12-310000109380zions:FinancingReceivableAccruingMember2019-01-012019-12-310000109380zions:CommercialAndIndustrialMemberus-gaap:CommercialPortfolioSegmentMemberzions:FinancingReceivableNonaccruingMemberzions:InterestRateBelowMarketMember2019-01-012019-12-310000109380zions:CommercialAndIndustrialMemberus-gaap:CommercialPortfolioSegmentMemberzions:FinancingReceivableNonaccruingMemberzions:MaturityOrTermExtensionMember2019-01-012019-12-310000109380zions:CommercialAndIndustrialMemberus-gaap:CommercialPortfolioSegmentMemberzions:FinancingReceivableNonaccruingMemberus-gaap:PrincipalForgivenessMember2019-01-012019-12-310000109380zions:CommercialAndIndustrialMemberus-gaap:CommercialPortfolioSegmentMemberzions:FinancingReceivableNonaccruingMemberus-gaap:PaymentDeferralMember2019-01-012019-12-310000109380zions:CommercialAndIndustrialMemberus-gaap:CommercialPortfolioSegmentMemberzions:FinancingReceivableNonaccruingMemberzions:OtherRecordedInvestmentResultingFromFollowingModificationMember2019-01-012019-12-310000109380zions:CommercialAndIndustrialMemberus-gaap:CommercialPortfolioSegmentMemberzions:FinancingReceivableNonaccruingMemberzions:MultipleModificationTypesMember2019-01-012019-12-310000109380zions:CommercialAndIndustrialMemberus-gaap:CommercialPortfolioSegmentMemberzions:FinancingReceivableNonaccruingMember2019-01-012019-12-310000109380us-gaap:CommercialPortfolioSegmentMemberzions:FinancingReceivableNonaccruingMemberzions:InterestRateBelowMarketMemberzions:OwnerOccupiedMember2019-01-012019-12-310000109380us-gaap:CommercialPortfolioSegmentMemberzions:FinancingReceivableNonaccruingMemberzions:OwnerOccupiedMemberzions:MaturityOrTermExtensionMember2019-01-012019-12-310000109380us-gaap:CommercialPortfolioSegmentMemberzions:FinancingReceivableNonaccruingMemberus-gaap:PrincipalForgivenessMemberzions:OwnerOccupiedMember2019-01-012019-12-310000109380us-gaap:CommercialPortfolioSegmentMemberzions:FinancingReceivableNonaccruingMemberzions:OwnerOccupiedMemberus-gaap:PaymentDeferralMember2019-01-012019-12-310000109380us-gaap:CommercialPortfolioSegmentMemberzions:FinancingReceivableNonaccruingMemberzions:OwnerOccupiedMemberzions:OtherRecordedInvestmentResultingFromFollowingModificationMember2019-01-012019-12-310000109380us-gaap:CommercialPortfolioSegmentMemberzions:FinancingReceivableNonaccruingMemberzions:MultipleModificationTypesMemberzions:OwnerOccupiedMember2019-01-012019-12-310000109380us-gaap:CommercialPortfolioSegmentMemberzions:FinancingReceivableNonaccruingMemberzions:OwnerOccupiedMember2019-01-012019-12-310000109380us-gaap:CommercialPortfolioSegmentMemberzions:FinancingReceivableNonaccruingMemberzions:InterestRateBelowMarketMember2019-01-012019-12-310000109380us-gaap:CommercialPortfolioSegmentMemberzions:FinancingReceivableNonaccruingMemberzions:MaturityOrTermExtensionMember2019-01-012019-12-310000109380us-gaap:CommercialPortfolioSegmentMemberzions:FinancingReceivableNonaccruingMemberus-gaap:PrincipalForgivenessMember2019-01-012019-12-310000109380us-gaap:CommercialPortfolioSegmentMemberzions:FinancingReceivableNonaccruingMemberus-gaap:PaymentDeferralMember2019-01-012019-12-310000109380us-gaap:CommercialPortfolioSegmentMemberzions:FinancingReceivableNonaccruingMemberzions:OtherRecordedInvestmentResultingFromFollowingModificationMember2019-01-012019-12-310000109380us-gaap:CommercialPortfolioSegmentMemberzions:FinancingReceivableNonaccruingMemberzions:MultipleModificationTypesMember2019-01-012019-12-310000109380us-gaap:CommercialPortfolioSegmentMemberzions:FinancingReceivableNonaccruingMember2019-01-012019-12-310000109380zions:TermMemberzions:FinancingReceivableNonaccruingMemberzions:InterestRateBelowMarketMemberus-gaap:CommercialRealEstatePortfolioSegmentMember2019-01-012019-12-310000109380zions:TermMemberzions:FinancingReceivableNonaccruingMemberus-gaap:CommercialRealEstatePortfolioSegmentMemberzions:MaturityOrTermExtensionMember2019-01-012019-12-310000109380zions:TermMemberzions:FinancingReceivableNonaccruingMemberus-gaap:PrincipalForgivenessMemberus-gaap:CommercialRealEstatePortfolioSegmentMember2019-01-012019-12-310000109380zions:TermMemberzions:FinancingReceivableNonaccruingMemberus-gaap:CommercialRealEstatePortfolioSegmentMemberus-gaap:PaymentDeferralMember2019-01-012019-12-310000109380zions:TermMemberzions:FinancingReceivableNonaccruingMemberus-gaap:CommercialRealEstatePortfolioSegmentMemberzions:OtherRecordedInvestmentResultingFromFollowingModificationMember2019-01-012019-12-310000109380zions:TermMemberzions:FinancingReceivableNonaccruingMemberzions:MultipleModificationTypesMemberus-gaap:CommercialRealEstatePortfolioSegmentMember2019-01-012019-12-310000109380zions:TermMemberzions:FinancingReceivableNonaccruingMemberus-gaap:CommercialRealEstatePortfolioSegmentMember2019-01-012019-12-310000109380zions:FinancingReceivableNonaccruingMemberzions:InterestRateBelowMarketMemberus-gaap:CommercialRealEstatePortfolioSegmentMember2019-01-012019-12-310000109380zions:FinancingReceivableNonaccruingMemberus-gaap:CommercialRealEstatePortfolioSegmentMemberzions:MaturityOrTermExtensionMember2019-01-012019-12-310000109380zions:FinancingReceivableNonaccruingMemberus-gaap:PrincipalForgivenessMemberus-gaap:CommercialRealEstatePortfolioSegmentMember2019-01-012019-12-310000109380zions:FinancingReceivableNonaccruingMemberus-gaap:CommercialRealEstatePortfolioSegmentMemberus-gaap:PaymentDeferralMember2019-01-012019-12-310000109380zions:FinancingReceivableNonaccruingMemberus-gaap:CommercialRealEstatePortfolioSegmentMemberzions:OtherRecordedInvestmentResultingFromFollowingModificationMember2019-01-012019-12-310000109380zions:FinancingReceivableNonaccruingMemberzions:MultipleModificationTypesMemberus-gaap:CommercialRealEstatePortfolioSegmentMember2019-01-012019-12-310000109380zions:FinancingReceivableNonaccruingMemberus-gaap:CommercialRealEstatePortfolioSegmentMember2019-01-012019-12-310000109380us-gaap:ConsumerPortfolioSegmentMemberzions:FinancingReceivableNonaccruingMemberzions:InterestRateBelowMarketMemberus-gaap:HomeEquityMember2019-01-012019-12-310000109380us-gaap:ConsumerPortfolioSegmentMemberzions:FinancingReceivableNonaccruingMemberzions:MaturityOrTermExtensionMemberus-gaap:HomeEquityMember2019-01-012019-12-310000109380us-gaap:ConsumerPortfolioSegmentMemberzions:FinancingReceivableNonaccruingMemberus-gaap:PrincipalForgivenessMemberus-gaap:HomeEquityMember2019-01-012019-12-310000109380us-gaap:ConsumerPortfolioSegmentMemberzions:FinancingReceivableNonaccruingMemberus-gaap:PaymentDeferralMemberus-gaap:HomeEquityMember2019-01-012019-12-310000109380us-gaap:ConsumerPortfolioSegmentMemberzions:FinancingReceivableNonaccruingMemberzions:OtherRecordedInvestmentResultingFromFollowingModificationMemberus-gaap:HomeEquityMember2019-01-012019-12-310000109380us-gaap:ConsumerPortfolioSegmentMemberzions:FinancingReceivableNonaccruingMemberzions:MultipleModificationTypesMemberus-gaap:HomeEquityMember2019-01-012019-12-310000109380us-gaap:ConsumerPortfolioSegmentMemberzions:FinancingReceivableNonaccruingMemberus-gaap:HomeEquityMember2019-01-012019-12-310000109380us-gaap:ConsumerPortfolioSegmentMemberzions:OneThroughFourFamilyResidentialMemberzions:FinancingReceivableNonaccruingMemberzions:InterestRateBelowMarketMember2019-01-012019-12-310000109380us-gaap:ConsumerPortfolioSegmentMemberzions:OneThroughFourFamilyResidentialMemberzions:FinancingReceivableNonaccruingMemberzions:MaturityOrTermExtensionMember2019-01-012019-12-310000109380us-gaap:ConsumerPortfolioSegmentMemberzions:OneThroughFourFamilyResidentialMemberzions:FinancingReceivableNonaccruingMemberus-gaap:PrincipalForgivenessMember2019-01-012019-12-310000109380us-gaap:ConsumerPortfolioSegmentMemberzions:OneThroughFourFamilyResidentialMemberzions:FinancingReceivableNonaccruingMemberus-gaap:PaymentDeferralMember2019-01-012019-12-310000109380us-gaap:ConsumerPortfolioSegmentMemberzions:OneThroughFourFamilyResidentialMemberzions:FinancingReceivableNonaccruingMemberzions:OtherRecordedInvestmentResultingFromFollowingModificationMember2019-01-012019-12-310000109380us-gaap:ConsumerPortfolioSegmentMemberzions:OneThroughFourFamilyResidentialMemberzions:FinancingReceivableNonaccruingMemberzions:MultipleModificationTypesMember2019-01-012019-12-310000109380us-gaap:ConsumerPortfolioSegmentMemberzions:OneThroughFourFamilyResidentialMemberzions:FinancingReceivableNonaccruingMember2019-01-012019-12-310000109380us-gaap:ConsumerPortfolioSegmentMemberzions:FinancingReceivableNonaccruingMemberzions:InterestRateBelowMarketMember2019-01-012019-12-310000109380us-gaap:ConsumerPortfolioSegmentMemberzions:FinancingReceivableNonaccruingMemberzions:MaturityOrTermExtensionMember2019-01-012019-12-310000109380us-gaap:ConsumerPortfolioSegmentMemberzions:FinancingReceivableNonaccruingMemberus-gaap:PrincipalForgivenessMember2019-01-012019-12-310000109380us-gaap:ConsumerPortfolioSegmentMemberzions:FinancingReceivableNonaccruingMemberus-gaap:PaymentDeferralMember2019-01-012019-12-310000109380us-gaap:ConsumerPortfolioSegmentMemberzions:FinancingReceivableNonaccruingMemberzions:OtherRecordedInvestmentResultingFromFollowingModificationMember2019-01-012019-12-310000109380us-gaap:ConsumerPortfolioSegmentMemberzions:FinancingReceivableNonaccruingMemberzions:MultipleModificationTypesMember2019-01-012019-12-310000109380us-gaap:ConsumerPortfolioSegmentMemberzions:FinancingReceivableNonaccruingMember2019-01-012019-12-310000109380zions:FinancingReceivableNonaccruingMemberzions:InterestRateBelowMarketMember2019-01-012019-12-310000109380zions:FinancingReceivableNonaccruingMemberzions:MaturityOrTermExtensionMember2019-01-012019-12-310000109380zions:FinancingReceivableNonaccruingMemberus-gaap:PrincipalForgivenessMember2019-01-012019-12-310000109380zions:FinancingReceivableNonaccruingMemberus-gaap:PaymentDeferralMember2019-01-012019-12-310000109380zions:FinancingReceivableNonaccruingMemberzions:OtherRecordedInvestmentResultingFromFollowingModificationMember2019-01-012019-12-310000109380zions:FinancingReceivableNonaccruingMemberzions:MultipleModificationTypesMember2019-01-012019-12-310000109380zions:FinancingReceivableNonaccruingMember2019-01-012019-12-310000109380zions:InterestRateBelowMarketMember2019-01-012019-12-310000109380zions:MaturityOrTermExtensionMember2019-01-012019-12-310000109380us-gaap:PrincipalForgivenessMember2019-01-012019-12-310000109380us-gaap:PaymentDeferralMember2019-01-012019-12-310000109380zions:OtherRecordedInvestmentResultingFromFollowingModificationMember2019-01-012019-12-310000109380zions:MultipleModificationTypesMember2019-01-012019-12-310000109380zions:InterestRateBelowMarketIncludingMultipleModificationTypesMember2020-01-012020-09-300000109380zions:InterestRateBelowMarketIncludingMultipleModificationTypesMember2019-01-012019-12-310000109380zions:CommercialAndIndustrialMemberus-gaap:CommercialPortfolioSegmentMemberzions:FinancingReceivableAccruingMember2020-07-012020-09-300000109380zions:CommercialAndIndustrialMemberus-gaap:CommercialPortfolioSegmentMemberzions:FinancingReceivableNonaccruingMember2020-07-012020-09-300000109380zions:CommercialAndIndustrialMemberus-gaap:CommercialPortfolioSegmentMember2020-07-012020-09-300000109380zions:CommercialAndIndustrialMemberus-gaap:CommercialPortfolioSegmentMemberzions:FinancingReceivableAccruingMember2019-07-012019-09-300000109380zions:CommercialAndIndustrialMemberus-gaap:CommercialPortfolioSegmentMemberzions:FinancingReceivableNonaccruingMember2019-07-012019-09-300000109380zions:CommercialAndIndustrialMemberus-gaap:CommercialPortfolioSegmentMember2019-07-012019-09-300000109380zions:FinancingReceivableAccruingMember2020-07-012020-09-300000109380zions:FinancingReceivableNonaccruingMember2020-07-012020-09-300000109380zions:FinancingReceivableAccruingMember2019-07-012019-09-300000109380zions:FinancingReceivableNonaccruingMember2019-07-012019-09-300000109380zions:CommercialAndIndustrialMemberus-gaap:CommercialPortfolioSegmentMember2020-01-012020-09-300000109380zions:CommercialAndIndustrialMemberus-gaap:CommercialPortfolioSegmentMemberzions:FinancingReceivableAccruingMember2019-01-012019-09-300000109380zions:CommercialAndIndustrialMemberus-gaap:CommercialPortfolioSegmentMemberzions:FinancingReceivableNonaccruingMember2019-01-012019-09-300000109380zions:CommercialAndIndustrialMemberus-gaap:CommercialPortfolioSegmentMember2019-01-012019-09-300000109380us-gaap:CommercialPortfolioSegmentMemberzions:OwnerOccupiedMember2020-01-012020-09-300000109380us-gaap:CommercialPortfolioSegmentMemberzions:FinancingReceivableAccruingMemberzions:OwnerOccupiedMember2019-01-012019-09-300000109380us-gaap:CommercialPortfolioSegmentMemberzions:FinancingReceivableNonaccruingMemberzions:OwnerOccupiedMember2019-01-012019-09-300000109380us-gaap:CommercialPortfolioSegmentMemberzions:OwnerOccupiedMember2019-01-012019-09-300000109380us-gaap:CommercialPortfolioSegmentMemberzions:FinancingReceivableAccruingMember2019-01-012019-09-300000109380us-gaap:CommercialPortfolioSegmentMemberzions:FinancingReceivableNonaccruingMember2019-01-012019-09-300000109380zions:FinancingReceivableAccruingMember2019-01-012019-09-300000109380zions:FinancingReceivableNonaccruingMember2019-01-012019-09-3000001093802019-10-012020-09-3000001093802018-10-012019-09-300000109380zions:CommercialAndIndustrialMemberus-gaap:CommercialPortfolioSegmentMemberzions:SingleFamilyResidentialAgricultureMember2020-09-300000109380us-gaap:CommercialPortfolioSegmentMemberus-gaap:CommercialRealEstateMemberzions:OwnerOccupiedMember2020-09-300000109380zions:MultifamilyHotelAndMotelRetailMemberzions:TermMemberus-gaap:CommercialRealEstatePortfolioSegmentMember2020-09-300000109380us-gaap:ConsumerPortfolioSegmentMemberzions:SingleFamilyResidentialMemberus-gaap:HomeEquityMember2020-09-300000109380us-gaap:ConsumerPortfolioSegmentMemberzions:OneThroughFourFamilyResidentialMemberzions:SingleFamilyResidentialMember2020-09-30zions:derivative0000109380us-gaap:InterestRateSwapMemberus-gaap:FairValueHedgingMemberus-gaap:DesignatedAsHedgingInstrumentMember2020-09-300000109380us-gaap:InterestRateSwapMemberus-gaap:FairValueHedgingMemberus-gaap:DesignatedAsHedgingInstrumentMember2019-12-3100001093802020-03-31zions:derivative_instrument0000109380zions:InterestRateSwapTerminatedOneMember2020-03-310000109380zions:InterestRateSwapTerminatedTwoMember2020-03-310000109380zions:AssetHedgePayFixedInterestRateSwapMemberus-gaap:FairValueHedgingMemberus-gaap:DesignatedAsHedgingInstrumentMember2020-09-300000109380zions:AssetHedgePayFixedInterestRateSwapMember2020-07-012020-09-300000109380us-gaap:InterestRateSwapMemberus-gaap:CashFlowHedgingMemberus-gaap:DesignatedAsHedgingInstrumentMember2020-09-300000109380us-gaap:OtherLiabilitiesMember2020-09-300000109380us-gaap:CashFlowHedgingMemberus-gaap:InterestRateFloorMemberus-gaap:DesignatedAsHedgingInstrumentMember2020-09-300000109380us-gaap:CashFlowHedgingMemberus-gaap:InterestRateFloorMemberus-gaap:OtherAssetsMemberus-gaap:DesignatedAsHedgingInstrumentMember2020-09-300000109380us-gaap:CashFlowHedgingMemberus-gaap:InterestRateFloorMemberus-gaap:OtherLiabilitiesMemberus-gaap:DesignatedAsHedgingInstrumentMember2020-09-300000109380us-gaap:CashFlowHedgingMemberus-gaap:InterestRateFloorMemberus-gaap:DesignatedAsHedgingInstrumentMember2019-12-310000109380us-gaap:CashFlowHedgingMemberus-gaap:InterestRateFloorMemberus-gaap:OtherAssetsMemberus-gaap:DesignatedAsHedgingInstrumentMember2019-12-310000109380us-gaap:CashFlowHedgingMemberus-gaap:InterestRateFloorMemberus-gaap:OtherLiabilitiesMemberus-gaap:DesignatedAsHedgingInstrumentMember2019-12-310000109380us-gaap:InterestRateSwapMemberus-gaap:CashFlowHedgingMemberus-gaap:OtherAssetsMemberus-gaap:DesignatedAsHedgingInstrumentMember2020-09-300000109380us-gaap:InterestRateSwapMemberus-gaap:CashFlowHedgingMemberus-gaap:OtherLiabilitiesMemberus-gaap:DesignatedAsHedgingInstrumentMember2020-09-300000109380us-gaap:InterestRateSwapMemberus-gaap:CashFlowHedgingMemberus-gaap:DesignatedAsHedgingInstrumentMember2019-12-310000109380us-gaap:InterestRateSwapMemberus-gaap:CashFlowHedgingMemberus-gaap:OtherAssetsMemberus-gaap:DesignatedAsHedgingInstrumentMember2019-12-310000109380us-gaap:InterestRateSwapMemberus-gaap:CashFlowHedgingMemberus-gaap:OtherLiabilitiesMemberus-gaap:DesignatedAsHedgingInstrumentMember2019-12-310000109380us-gaap:InterestRateSwapMemberus-gaap:OtherAssetsMemberus-gaap:FairValueHedgingMemberus-gaap:DesignatedAsHedgingInstrumentMember2020-09-300000109380us-gaap:InterestRateSwapMemberus-gaap:FairValueHedgingMemberus-gaap:OtherLiabilitiesMemberus-gaap:DesignatedAsHedgingInstrumentMember2020-09-300000109380us-gaap:InterestRateSwapMemberus-gaap:OtherAssetsMemberus-gaap:FairValueHedgingMemberus-gaap:DesignatedAsHedgingInstrumentMember2019-12-310000109380us-gaap:InterestRateSwapMemberus-gaap:FairValueHedgingMemberus-gaap:OtherLiabilitiesMemberus-gaap:DesignatedAsHedgingInstrumentMember2019-12-310000109380zions:AssetHedgePayFixedInterestRateSwapMemberus-gaap:OtherAssetsMemberus-gaap:FairValueHedgingMemberus-gaap:DesignatedAsHedgingInstrumentMember2020-09-300000109380zions:AssetHedgePayFixedInterestRateSwapMemberus-gaap:FairValueHedgingMemberus-gaap:OtherLiabilitiesMemberus-gaap:DesignatedAsHedgingInstrumentMember2020-09-300000109380zions:AssetHedgePayFixedInterestRateSwapMemberus-gaap:FairValueHedgingMemberus-gaap:DesignatedAsHedgingInstrumentMember2019-12-310000109380zions:AssetHedgePayFixedInterestRateSwapMemberus-gaap:OtherAssetsMemberus-gaap:FairValueHedgingMemberus-gaap:DesignatedAsHedgingInstrumentMember2019-12-310000109380zions:AssetHedgePayFixedInterestRateSwapMemberus-gaap:FairValueHedgingMemberus-gaap:OtherLiabilitiesMemberus-gaap:DesignatedAsHedgingInstrumentMember2019-12-310000109380us-gaap:DesignatedAsHedgingInstrumentMember2020-09-300000109380us-gaap:OtherAssetsMemberus-gaap:DesignatedAsHedgingInstrumentMember2020-09-300000109380us-gaap:OtherLiabilitiesMemberus-gaap:DesignatedAsHedgingInstrumentMember2020-09-300000109380us-gaap:DesignatedAsHedgingInstrumentMember2019-12-310000109380us-gaap:OtherAssetsMemberus-gaap:DesignatedAsHedgingInstrumentMember2019-12-310000109380us-gaap:OtherLiabilitiesMemberus-gaap:DesignatedAsHedgingInstrumentMember2019-12-310000109380zions:InterestRateSwapsForCustomersMemberus-gaap:NondesignatedMember2020-09-300000109380zions:InterestRateSwapsForCustomersMemberus-gaap:OtherAssetsMemberus-gaap:NondesignatedMember2020-09-300000109380zions:InterestRateSwapsForCustomersMemberus-gaap:OtherLiabilitiesMemberus-gaap:NondesignatedMember2020-09-300000109380zions:InterestRateSwapsForCustomersMemberus-gaap:NondesignatedMember2019-12-310000109380zions:InterestRateSwapsForCustomersMemberus-gaap:OtherAssetsMemberus-gaap:NondesignatedMember2019-12-310000109380zions:InterestRateSwapsForCustomersMemberus-gaap:OtherLiabilitiesMemberus-gaap:NondesignatedMember2019-12-310000109380zions:OffsettingInterestRateDerivativesMemberus-gaap:NondesignatedMember2020-09-300000109380zions:OffsettingInterestRateDerivativesMemberus-gaap:OtherAssetsMemberus-gaap:NondesignatedMember2020-09-300000109380zions:OffsettingInterestRateDerivativesMemberus-gaap:OtherLiabilitiesMemberus-gaap:NondesignatedMember2020-09-300000109380zions:OffsettingInterestRateDerivativesMemberus-gaap:NondesignatedMember2019-12-310000109380zions:OffsettingInterestRateDerivativesMemberus-gaap:OtherAssetsMemberus-gaap:NondesignatedMember2019-12-310000109380zions:OffsettingInterestRateDerivativesMemberus-gaap:OtherLiabilitiesMemberus-gaap:NondesignatedMember2019-12-310000109380us-gaap:OtherContractMemberus-gaap:NondesignatedMember2020-09-300000109380us-gaap:OtherContractMemberus-gaap:OtherAssetsMemberus-gaap:NondesignatedMember2020-09-300000109380us-gaap:OtherContractMemberus-gaap:OtherLiabilitiesMemberus-gaap:NondesignatedMember2020-09-300000109380us-gaap:OtherContractMemberus-gaap:NondesignatedMember2019-12-310000109380us-gaap:OtherContractMemberus-gaap:OtherAssetsMemberus-gaap:NondesignatedMember2019-12-310000109380us-gaap:OtherContractMemberus-gaap:OtherLiabilitiesMemberus-gaap:NondesignatedMember2019-12-310000109380us-gaap:ForeignExchangeContractMemberus-gaap:NondesignatedMember2020-09-300000109380us-gaap:OtherAssetsMemberus-gaap:ForeignExchangeContractMemberus-gaap:NondesignatedMember2020-09-300000109380us-gaap:ForeignExchangeContractMemberus-gaap:OtherLiabilitiesMemberus-gaap:NondesignatedMember2020-09-300000109380us-gaap:ForeignExchangeContractMemberus-gaap:NondesignatedMember2019-12-310000109380us-gaap:OtherAssetsMemberus-gaap:ForeignExchangeContractMemberus-gaap:NondesignatedMember2019-12-310000109380us-gaap:ForeignExchangeContractMemberus-gaap:OtherLiabilitiesMemberus-gaap:NondesignatedMember2019-12-310000109380us-gaap:NondesignatedMember2020-09-300000109380us-gaap:OtherAssetsMemberus-gaap:NondesignatedMember2020-09-300000109380us-gaap:OtherLiabilitiesMemberus-gaap:NondesignatedMember2020-09-300000109380us-gaap:NondesignatedMember2019-12-310000109380us-gaap:OtherAssetsMemberus-gaap:NondesignatedMember2019-12-310000109380us-gaap:OtherLiabilitiesMemberus-gaap:NondesignatedMember2019-12-310000109380us-gaap:OtherAssetsMember2020-09-300000109380us-gaap:OtherAssetsMember2019-12-310000109380us-gaap:OtherLiabilitiesMember2019-12-310000109380zions:InterestRateSwapsForCustomersMemberus-gaap:OtherAssetsMemberus-gaap:FairValueHedgingMemberus-gaap:NondesignatedMember2020-09-300000109380zions:InterestRateSwapsForCustomersMemberus-gaap:FairValueHedgingMemberus-gaap:OtherLiabilitiesMemberus-gaap:NondesignatedMember2020-09-300000109380zions:InterestRateSwapsForCustomersMemberus-gaap:OtherAssetsMemberus-gaap:FairValueHedgingMemberus-gaap:NondesignatedMember2019-12-310000109380zions:InterestRateSwapsForCustomersMemberus-gaap:FairValueHedgingMemberus-gaap:OtherLiabilitiesMemberus-gaap:NondesignatedMember2019-12-310000109380zions:OffsettingInterestRateDerivativesMemberus-gaap:OtherAssetsMemberus-gaap:FairValueHedgingMemberus-gaap:NondesignatedMember2020-09-300000109380zions:OffsettingInterestRateDerivativesMemberus-gaap:FairValueHedgingMemberus-gaap:OtherLiabilitiesMemberus-gaap:NondesignatedMember2020-09-300000109380zions:OffsettingInterestRateDerivativesMemberus-gaap:OtherAssetsMemberus-gaap:FairValueHedgingMemberus-gaap:NondesignatedMember2019-12-310000109380zions:OffsettingInterestRateDerivativesMemberus-gaap:FairValueHedgingMemberus-gaap:OtherLiabilitiesMemberus-gaap:NondesignatedMember2019-12-310000109380us-gaap:CashFlowHedgingMemberus-gaap:InterestRateFloorMemberus-gaap:DesignatedAsHedgingInstrumentMember2020-07-012020-09-300000109380us-gaap:InterestRateSwapMemberus-gaap:CashFlowHedgingMemberus-gaap:DesignatedAsHedgingInstrumentMember2020-07-012020-09-300000109380us-gaap:InterestRateContractMemberus-gaap:FairValueHedgingMemberus-gaap:DesignatedAsHedgingInstrumentMember2020-07-012020-09-300000109380zions:TerminatedSwapsOnLongTermDebtMemberus-gaap:FairValueHedgingMemberus-gaap:DesignatedAsHedgingInstrumentMember2020-07-012020-09-300000109380us-gaap:DesignatedAsHedgingInstrumentMember2020-07-012020-09-300000109380us-gaap:CashFlowHedgingMemberus-gaap:InterestRateFloorMemberus-gaap:DesignatedAsHedgingInstrumentMember2019-07-012019-09-300000109380us-gaap:InterestRateSwapMemberus-gaap:CashFlowHedgingMemberus-gaap:DesignatedAsHedgingInstrumentMember2019-07-012019-09-300000109380us-gaap:InterestRateContractMemberus-gaap:FairValueHedgingMemberus-gaap:DesignatedAsHedgingInstrumentMember2019-07-012019-09-300000109380zions:TerminatedSwapsOnLongTermDebtMemberus-gaap:FairValueHedgingMemberus-gaap:DesignatedAsHedgingInstrumentMember2019-07-012019-09-300000109380us-gaap:DesignatedAsHedgingInstrumentMember2019-07-012019-09-300000109380us-gaap:CashFlowHedgingMemberus-gaap:InterestRateFloorMemberus-gaap:DesignatedAsHedgingInstrumentMember2020-01-012020-09-300000109380us-gaap:InterestRateSwapMemberus-gaap:CashFlowHedgingMemberus-gaap:DesignatedAsHedgingInstrumentMember2020-01-012020-09-300000109380us-gaap:InterestRateContractMemberus-gaap:FairValueHedgingMemberus-gaap:DesignatedAsHedgingInstrumentMember2020-01-012020-09-300000109380zions:TerminatedSwapsOnLongTermDebtMemberus-gaap:FairValueHedgingMemberus-gaap:DesignatedAsHedgingInstrumentMember2020-01-012020-09-300000109380us-gaap:DesignatedAsHedgingInstrumentMember2020-01-012020-09-300000109380us-gaap:CashFlowHedgingMemberus-gaap:InterestRateFloorMemberus-gaap:DesignatedAsHedgingInstrumentMember2019-01-012019-09-300000109380us-gaap:InterestRateSwapMemberus-gaap:CashFlowHedgingMemberus-gaap:DesignatedAsHedgingInstrumentMember2019-01-012019-09-300000109380us-gaap:InterestRateContractMemberus-gaap:FairValueHedgingMemberus-gaap:DesignatedAsHedgingInstrumentMember2019-01-012019-09-300000109380zions:TerminatedSwapsOnLongTermDebtMemberus-gaap:FairValueHedgingMemberus-gaap:DesignatedAsHedgingInstrumentMember2019-01-012019-09-300000109380us-gaap:DesignatedAsHedgingInstrumentMember2019-01-012019-09-300000109380us-gaap:FairValueHedgingMemberus-gaap:DesignatedAsHedgingInstrumentMember2020-09-300000109380us-gaap:CashFlowHedgingMemberus-gaap:DesignatedAsHedgingInstrumentMember2020-09-300000109380zions:InterestRateSwapsForCustomersMemberus-gaap:NondesignatedMember2020-07-012020-09-300000109380zions:InterestRateSwapsForCustomersMemberus-gaap:NondesignatedMember2020-01-012020-09-300000109380zions:InterestRateSwapsForCustomersMemberus-gaap:NondesignatedMember2019-07-012019-09-300000109380zions:InterestRateSwapsForCustomersMemberus-gaap:NondesignatedMember2019-01-012019-09-300000109380zions:OffsettingInterestRateDerivativesMemberus-gaap:NondesignatedMember2020-07-012020-09-300000109380zions:OffsettingInterestRateDerivativesMemberus-gaap:NondesignatedMember2020-01-012020-09-300000109380zions:OffsettingInterestRateDerivativesMemberus-gaap:NondesignatedMember2019-07-012019-09-300000109380zions:OffsettingInterestRateDerivativesMemberus-gaap:NondesignatedMember2019-01-012019-09-300000109380us-gaap:OtherContractMemberus-gaap:NondesignatedMember2020-07-012020-09-300000109380us-gaap:OtherContractMemberus-gaap:NondesignatedMember2020-01-012020-09-300000109380us-gaap:OtherContractMemberus-gaap:NondesignatedMember2019-07-012019-09-300000109380us-gaap:OtherContractMemberus-gaap:NondesignatedMember2019-01-012019-09-300000109380us-gaap:ForeignExchangeContractMemberus-gaap:NondesignatedMember2020-07-012020-09-300000109380us-gaap:ForeignExchangeContractMemberus-gaap:NondesignatedMember2020-01-012020-09-300000109380us-gaap:ForeignExchangeContractMemberus-gaap:NondesignatedMember2019-07-012019-09-300000109380us-gaap:ForeignExchangeContractMemberus-gaap:NondesignatedMember2019-01-012019-09-300000109380us-gaap:NondesignatedMember2020-07-012020-09-300000109380us-gaap:NondesignatedMember2020-01-012020-09-300000109380us-gaap:NondesignatedMember2019-07-012019-09-300000109380us-gaap:NondesignatedMember2019-01-012019-09-300000109380us-gaap:InterestRateSwapMember2020-07-012020-09-300000109380us-gaap:InterestRateSwapMember2019-07-012019-09-300000109380zions:AssetHedgePayFixedInterestRateSwapMember2019-07-012019-09-300000109380us-gaap:InterestRateSwapMember2020-01-012020-09-300000109380us-gaap:InterestRateSwapMember2019-01-012019-09-300000109380zions:AssetHedgePayFixedInterestRateSwapMember2020-01-012020-09-300000109380zions:AssetHedgePayFixedInterestRateSwapMember2019-01-012019-09-300000109380us-gaap:FairValueHedgingMember2020-09-300000109380us-gaap:FairValueHedgingMember2019-12-31zions:branch0000109380zions:A350SeniorNotesMemberus-gaap:SeniorNotesMember2020-04-012020-06-300000109380zions:A350SeniorNotesMemberus-gaap:SeniorNotesMember2020-06-300000109380us-gaap:SeniorNotesMemberzions:A335SeniorNotesMember2020-04-012020-06-300000109380us-gaap:SeniorNotesMemberzions:A335SeniorNotesMember2020-06-300000109380zions:SubordinatedNotesInterestRate325PercentMemberus-gaap:SubordinatedDebtMember2020-09-300000109380us-gaap:SubordinatedDebtMemberzions:A335SeniorNotesMember2020-09-3000001093802020-01-012020-03-310000109380us-gaap:WarrantMember2020-05-220000109380us-gaap:AccumulatedNetUnrealizedInvestmentGainLossMember2019-12-310000109380us-gaap:AccumulatedGainLossNetCashFlowHedgeParentMember2019-12-310000109380us-gaap:AccumulatedDefinedBenefitPlansAdjustmentMember2019-12-310000109380us-gaap:AccumulatedNetUnrealizedInvestmentGainLossMember2020-01-012020-09-300000109380us-gaap:AccumulatedGainLossNetCashFlowHedgeParentMember2020-01-012020-09-300000109380us-gaap:AccumulatedDefinedBenefitPlansAdjustmentMember2020-01-012020-09-300000109380us-gaap:AccumulatedNetUnrealizedInvestmentGainLossMember2020-09-300000109380us-gaap:AccumulatedGainLossNetCashFlowHedgeParentMember2020-09-300000109380us-gaap:AccumulatedDefinedBenefitPlansAdjustmentMember2020-09-300000109380us-gaap:AccumulatedNetUnrealizedInvestmentGainLossMember2018-12-310000109380us-gaap:AccumulatedGainLossNetCashFlowHedgeParentMember2018-12-310000109380us-gaap:AccumulatedDefinedBenefitPlansAdjustmentMember2018-12-310000109380us-gaap:AccumulatedNetUnrealizedInvestmentGainLossMember2019-01-012019-09-300000109380us-gaap:AccumulatedGainLossNetCashFlowHedgeParentMember2019-01-012019-09-300000109380us-gaap:AccumulatedDefinedBenefitPlansAdjustmentMember2019-01-012019-09-300000109380us-gaap:AccumulatedNetUnrealizedInvestmentGainLossMember2019-09-300000109380us-gaap:AccumulatedGainLossNetCashFlowHedgeParentMember2019-09-300000109380us-gaap:AccumulatedDefinedBenefitPlansAdjustmentMember2019-09-300000109380us-gaap:AccumulatedGainLossNetCashFlowHedgeParentMemberus-gaap:ReclassificationOutOfAccumulatedOtherComprehensiveIncomeMember2020-07-012020-09-300000109380us-gaap:AccumulatedGainLossNetCashFlowHedgeParentMemberus-gaap:ReclassificationOutOfAccumulatedOtherComprehensiveIncomeMember2019-07-012019-09-300000109380us-gaap:AccumulatedGainLossNetCashFlowHedgeParentMemberus-gaap:ReclassificationOutOfAccumulatedOtherComprehensiveIncomeMember2020-01-012020-09-300000109380us-gaap:AccumulatedGainLossNetCashFlowHedgeParentMemberus-gaap:ReclassificationOutOfAccumulatedOtherComprehensiveIncomeMember2019-01-012019-09-300000109380us-gaap:StandbyLettersOfCreditMember2020-09-300000109380us-gaap:StandbyLettersOfCreditMember2019-12-310000109380us-gaap:PerformanceGuaranteeMember2020-09-300000109380us-gaap:PerformanceGuaranteeMember2019-12-310000109380srt:MinimumMember2020-09-300000109380srt:MaximumMember2020-09-300000109380zions:ZionsBankSegmentMemberzions:ProductsAndServicesCommercialAccountFeesMemberus-gaap:OperatingSegmentsMember2020-07-012020-09-300000109380zions:ZionsBankSegmentMemberzions:ProductsAndServicesCommercialAccountFeesMemberus-gaap:OperatingSegmentsMember2019-07-012019-09-300000109380zions:ProductsAndServicesCommercialAccountFeesMemberus-gaap:OperatingSegmentsMemberzions:AmegyCorporationSegmentMember2020-07-012020-09-300000109380zions:ProductsAndServicesCommercialAccountFeesMemberus-gaap:OperatingSegmentsMemberzions:AmegyCorporationSegmentMember2019-07-012019-09-300000109380zions:ProductsAndServicesCommercialAccountFeesMemberus-gaap:OperatingSegmentsMemberzions:CaliforniaBankAndTrustSegmentMember2020-07-012020-09-300000109380zions:ProductsAndServicesCommercialAccountFeesMemberus-gaap:OperatingSegmentsMemberzions:CaliforniaBankAndTrustSegmentMember2019-07-012019-09-300000109380zions:ZionsBankSegmentMemberus-gaap:OperatingSegmentsMemberzions:ProductsAndServicesCardFeesMember2020-07-012020-09-300000109380zions:ZionsBankSegmentMemberus-gaap:OperatingSegmentsMemberzions:ProductsAndServicesCardFeesMember2019-07-012019-09-300000109380us-gaap:OperatingSegmentsMemberzions:AmegyCorporationSegmentMemberzions:ProductsAndServicesCardFeesMember2020-07-012020-09-300000109380us-gaap:OperatingSegmentsMemberzions:AmegyCorporationSegmentMemberzions:ProductsAndServicesCardFeesMember2019-07-012019-09-300000109380us-gaap:OperatingSegmentsMemberzions:ProductsAndServicesCardFeesMemberzions:CaliforniaBankAndTrustSegmentMember2020-07-012020-09-300000109380us-gaap:OperatingSegmentsMemberzions:ProductsAndServicesCardFeesMemberzions:CaliforniaBankAndTrustSegmentMember2019-07-012019-09-300000109380zions:ZionsBankSegmentMemberus-gaap:OperatingSegmentsMemberzions:ProductsAndServicesRetailAndBusinessBankingFeesMember2020-07-012020-09-300000109380zions:ZionsBankSegmentMemberus-gaap:OperatingSegmentsMemberzions:ProductsAndServicesRetailAndBusinessBankingFeesMember2019-07-012019-09-300000109380us-gaap:OperatingSegmentsMemberzions:AmegyCorporationSegmentMemberzions:ProductsAndServicesRetailAndBusinessBankingFeesMember2020-07-012020-09-300000109380us-gaap:OperatingSegmentsMemberzions:AmegyCorporationSegmentMemberzions:ProductsAndServicesRetailAndBusinessBankingFeesMember2019-07-012019-09-300000109380us-gaap:OperatingSegmentsMemberzions:ProductsAndServicesRetailAndBusinessBankingFeesMemberzions:CaliforniaBankAndTrustSegmentMember2020-07-012020-09-300000109380us-gaap:OperatingSegmentsMemberzions:ProductsAndServicesRetailAndBusinessBankingFeesMemberzions:CaliforniaBankAndTrustSegmentMember2019-07-012019-09-300000109380zions:ZionsBankSegmentMemberzions:ProductsAndServicesCapitalMarketsAndForeignExchangeFeesMemberus-gaap:OperatingSegmentsMember2020-07-012020-09-300000109380zions:ZionsBankSegmentMemberzions:ProductsAndServicesCapitalMarketsAndForeignExchangeFeesMemberus-gaap:OperatingSegmentsMember2019-07-012019-09-300000109380zions:ProductsAndServicesCapitalMarketsAndForeignExchangeFeesMemberus-gaap:OperatingSegmentsMemberzions:AmegyCorporationSegmentMember2020-07-012020-09-300000109380zions:ProductsAndServicesCapitalMarketsAndForeignExchangeFeesMemberus-gaap:OperatingSegmentsMemberzions:AmegyCorporationSegmentMember2019-07-012019-09-300000109380zions:ProductsAndServicesCapitalMarketsAndForeignExchangeFeesMemberus-gaap:OperatingSegmentsMemberzions:CaliforniaBankAndTrustSegmentMember2020-07-012020-09-300000109380zions:ProductsAndServicesCapitalMarketsAndForeignExchangeFeesMemberus-gaap:OperatingSegmentsMemberzions:CaliforniaBankAndTrustSegmentMember2019-07-012019-09-300000109380zions:ZionsBankSegmentMemberus-gaap:OperatingSegmentsMemberzions:ProductsAndServicesWealthManagementAndTrustFeesMember2020-07-012020-09-300000109380zions:ZionsBankSegmentMemberus-gaap:OperatingSegmentsMemberzions:ProductsAndServicesWealthManagementAndTrustFeesMember2019-07-012019-09-300000109380us-gaap:OperatingSegmentsMemberzions:AmegyCorporationSegmentMemberzions:ProductsAndServicesWealthManagementAndTrustFeesMember2020-07-012020-09-300000109380us-gaap:OperatingSegmentsMemberzions:AmegyCorporationSegmentMemberzions:ProductsAndServicesWealthManagementAndTrustFeesMember2019-07-012019-09-300000109380us-gaap:OperatingSegmentsMemberzions:CaliforniaBankAndTrustSegmentMemberzions:ProductsAndServicesWealthManagementAndTrustFeesMember2020-07-012020-09-300000109380us-gaap:OperatingSegmentsMemberzions:CaliforniaBankAndTrustSegmentMemberzions:ProductsAndServicesWealthManagementAndTrustFeesMember2019-07-012019-09-300000109380zions:ZionsBankSegmentMemberus-gaap:OperatingSegmentsMemberzions:ProductsAndServicesOtherCustomerRelatedFeesMember2020-07-012020-09-300000109380zions:ZionsBankSegmentMemberus-gaap:OperatingSegmentsMemberzions:ProductsAndServicesOtherCustomerRelatedFeesMember2019-07-012019-09-300000109380us-gaap:OperatingSegmentsMemberzions:AmegyCorporationSegmentMemberzions:ProductsAndServicesOtherCustomerRelatedFeesMember2020-07-012020-09-300000109380us-gaap:OperatingSegmentsMemberzions:AmegyCorporationSegmentMemberzions:ProductsAndServicesOtherCustomerRelatedFeesMember2019-07-012019-09-300000109380us-gaap:OperatingSegmentsMemberzions:ProductsAndServicesOtherCustomerRelatedFeesMemberzions:CaliforniaBankAndTrustSegmentMember2020-07-012020-09-300000109380us-gaap:OperatingSegmentsMemberzions:ProductsAndServicesOtherCustomerRelatedFeesMemberzions:CaliforniaBankAndTrustSegmentMember2019-07-012019-09-300000109380zions:ZionsBankSegmentMemberus-gaap:OperatingSegmentsMember2020-07-012020-09-300000109380zions:ZionsBankSegmentMemberus-gaap:OperatingSegmentsMember2019-07-012019-09-300000109380us-gaap:OperatingSegmentsMemberzions:AmegyCorporationSegmentMember2020-07-012020-09-300000109380us-gaap:OperatingSegmentsMemberzions:AmegyCorporationSegmentMember2019-07-012019-09-300000109380us-gaap:OperatingSegmentsMemberzions:CaliforniaBankAndTrustSegmentMember2020-07-012020-09-300000109380us-gaap:OperatingSegmentsMemberzions:CaliforniaBankAndTrustSegmentMember2019-07-012019-09-300000109380zions:ProductsAndServicesCommercialAccountFeesMemberus-gaap:OperatingSegmentsMemberzions:NationalBankOfArizonaSegmentMember2020-07-012020-09-300000109380zions:ProductsAndServicesCommercialAccountFeesMemberus-gaap:OperatingSegmentsMemberzions:NationalBankOfArizonaSegmentMember2019-07-012019-09-300000109380zions:ProductsAndServicesCommercialAccountFeesMemberus-gaap:OperatingSegmentsMemberzions:NevadaStateBankSegmentMember2020-07-012020-09-300000109380zions:ProductsAndServicesCommercialAccountFeesMemberus-gaap:OperatingSegmentsMemberzions:NevadaStateBankSegmentMember2019-07-012019-09-300000109380zions:ProductsAndServicesCommercialAccountFeesMemberus-gaap:OperatingSegmentsMemberzions:VectraBankColoradoSegmentMember2020-07-012020-09-300000109380zions:ProductsAndServicesCommercialAccountFeesMemberus-gaap:OperatingSegmentsMemberzions:VectraBankColoradoSegmentMember2019-07-012019-09-300000109380us-gaap:OperatingSegmentsMemberzions:NationalBankOfArizonaSegmentMemberzions:ProductsAndServicesCardFeesMember2020-07-012020-09-300000109380us-gaap:OperatingSegmentsMemberzions:NationalBankOfArizonaSegmentMemberzions:ProductsAndServicesCardFeesMember2019-07-012019-09-300000109380us-gaap:OperatingSegmentsMemberzions:NevadaStateBankSegmentMemberzions:ProductsAndServicesCardFeesMember2020-07-012020-09-300000109380us-gaap:OperatingSegmentsMemberzions:NevadaStateBankSegmentMemberzions:ProductsAndServicesCardFeesMember2019-07-012019-09-300000109380us-gaap:OperatingSegmentsMemberzions:ProductsAndServicesCardFeesMemberzions:VectraBankColoradoSegmentMember2020-07-012020-09-300000109380us-gaap:OperatingSegmentsMemberzions:ProductsAndServicesCardFeesMemberzions:VectraBankColoradoSegmentMember2019-07-012019-09-300000109380us-gaap:OperatingSegmentsMemberzions:ProductsAndServicesRetailAndBusinessBankingFeesMemberzions:NationalBankOfArizonaSegmentMember2020-07-012020-09-300000109380us-gaap:OperatingSegmentsMemberzions:ProductsAndServicesRetailAndBusinessBankingFeesMemberzions:NationalBankOfArizonaSegmentMember2019-07-012019-09-300000109380us-gaap:OperatingSegmentsMemberzions:ProductsAndServicesRetailAndBusinessBankingFeesMemberzions:NevadaStateBankSegmentMember2020-07-012020-09-300000109380us-gaap:OperatingSegmentsMemberzions:ProductsAndServicesRetailAndBusinessBankingFeesMemberzions:NevadaStateBankSegmentMember2019-07-012019-09-300000109380us-gaap:OperatingSegmentsMemberzions:ProductsAndServicesRetailAndBusinessBankingFeesMemberzions:VectraBankColoradoSegmentMember2020-07-012020-09-300000109380us-gaap:OperatingSegmentsMemberzions:ProductsAndServicesRetailAndBusinessBankingFeesMemberzions:VectraBankColoradoSegmentMember2019-07-012019-09-300000109380zions:ProductsAndServicesCapitalMarketsAndForeignExchangeFeesMemberus-gaap:OperatingSegmentsMemberzions:NationalBankOfArizonaSegmentMember2020-07-012020-09-300000109380zions:ProductsAndServicesCapitalMarketsAndForeignExchangeFeesMemberus-gaap:OperatingSegmentsMemberzions:NationalBankOfArizonaSegmentMember2019-07-012019-09-300000109380zions:ProductsAndServicesCapitalMarketsAndForeignExchangeFeesMemberus-gaap:OperatingSegmentsMemberzions:NevadaStateBankSegmentMember2020-07-012020-09-300000109380zions:ProductsAndServicesCapitalMarketsAndForeignExchangeFeesMemberus-gaap:OperatingSegmentsMemberzions:NevadaStateBankSegmentMember2019-07-012019-09-300000109380zions:ProductsAndServicesCapitalMarketsAndForeignExchangeFeesMemberus-gaap:OperatingSegmentsMemberzions:VectraBankColoradoSegmentMember2020-07-012020-09-300000109380zions:ProductsAndServicesCapitalMarketsAndForeignExchangeFeesMemberus-gaap:OperatingSegmentsMemberzions:VectraBankColoradoSegmentMember2019-07-012019-09-300000109380us-gaap:OperatingSegmentsMemberzions:NationalBankOfArizonaSegmentMemberzions:ProductsAndServicesWealthManagementAndTrustFeesMember2020-07-012020-09-300000109380us-gaap:OperatingSegmentsMemberzions:NationalBankOfArizonaSegmentMemberzions:ProductsAndServicesWealthManagementAndTrustFeesMember2019-07-012019-09-300000109380us-gaap:OperatingSegmentsMemberzions:NevadaStateBankSegmentMemberzions:ProductsAndServicesWealthManagementAndTrustFeesMember2020-07-012020-09-300000109380us-gaap:OperatingSegmentsMemberzions:NevadaStateBankSegmentMemberzions:ProductsAndServicesWealthManagementAndTrustFeesMember2019-07-012019-09-300000109380us-gaap:OperatingSegmentsMemberzions:VectraBankColoradoSegmentMemberzions:ProductsAndServicesWealthManagementAndTrustFeesMember2020-07-012020-09-300000109380us-gaap:OperatingSegmentsMemberzions:VectraBankColoradoSegmentMemberzions:ProductsAndServicesWealthManagementAndTrustFeesMember2019-07-012019-09-300000109380us-gaap:OperatingSegmentsMemberzions:ProductsAndServicesOtherCustomerRelatedFeesMemberzions:NationalBankOfArizonaSegmentMember2020-07-012020-09-300000109380us-gaap:OperatingSegmentsMemberzions:ProductsAndServicesOtherCustomerRelatedFeesMemberzions:NationalBankOfArizonaSegmentMember2019-07-012019-09-300000109380us-gaap:OperatingSegmentsMemberzions:ProductsAndServicesOtherCustomerRelatedFeesMemberzions:NevadaStateBankSegmentMember2020-07-012020-09-300000109380us-gaap:OperatingSegmentsMemberzions:ProductsAndServicesOtherCustomerRelatedFeesMemberzions:NevadaStateBankSegmentMember2019-07-012019-09-300000109380us-gaap:OperatingSegmentsMemberzions:ProductsAndServicesOtherCustomerRelatedFeesMemberzions:VectraBankColoradoSegmentMember2020-07-012020-09-300000109380us-gaap:OperatingSegmentsMemberzions:ProductsAndServicesOtherCustomerRelatedFeesMemberzions:VectraBankColoradoSegmentMember2019-07-012019-09-300000109380us-gaap:OperatingSegmentsMemberzions:NationalBankOfArizonaSegmentMember2020-07-012020-09-300000109380us-gaap:OperatingSegmentsMemberzions:NationalBankOfArizonaSegmentMember2019-07-012019-09-300000109380us-gaap:OperatingSegmentsMemberzions:NevadaStateBankSegmentMember2020-07-012020-09-300000109380us-gaap:OperatingSegmentsMemberzions:NevadaStateBankSegmentMember2019-07-012019-09-300000109380us-gaap:OperatingSegmentsMemberzions:VectraBankColoradoSegmentMember2020-07-012020-09-300000109380us-gaap:OperatingSegmentsMemberzions:VectraBankColoradoSegmentMember2019-07-012019-09-300000109380zions:ProductsAndServicesCommercialAccountFeesMemberus-gaap:OperatingSegmentsMemberzions:CommerceBankOfWashingtonSegmentMember2020-07-012020-09-300000109380zions:ProductsAndServicesCommercialAccountFeesMemberus-gaap:OperatingSegmentsMemberzions:CommerceBankOfWashingtonSegmentMember2019-07-012019-09-300000109380zions:ProductsAndServicesCommercialAccountFeesMemberzions:CorporateReconcilingItemsAndEliminationsMember2020-07-012020-09-300000109380zions:ProductsAndServicesCommercialAccountFeesMemberzions:CorporateReconcilingItemsAndEliminationsMember2019-07-012019-09-300000109380zions:ProductsAndServicesCommercialAccountFeesMember2020-07-012020-09-300000109380zions:ProductsAndServicesCommercialAccountFeesMember2019-07-012019-09-300000109380us-gaap:OperatingSegmentsMemberzions:CommerceBankOfWashingtonSegmentMemberzions:ProductsAndServicesCardFeesMember2020-07-012020-09-300000109380us-gaap:OperatingSegmentsMemberzions:CommerceBankOfWashingtonSegmentMemberzions:ProductsAndServicesCardFeesMember2019-07-012019-09-300000109380zions:CorporateReconcilingItemsAndEliminationsMemberzions:ProductsAndServicesCardFeesMember2020-07-012020-09-300000109380zions:CorporateReconcilingItemsAndEliminationsMemberzions:ProductsAndServicesCardFeesMember2019-07-012019-09-300000109380zions:ProductsAndServicesCardFeesMember2020-07-012020-09-300000109380zions:ProductsAndServicesCardFeesMember2019-07-012019-09-300000109380us-gaap:OperatingSegmentsMemberzions:CommerceBankOfWashingtonSegmentMemberzions:ProductsAndServicesRetailAndBusinessBankingFeesMember2020-07-012020-09-300000109380us-gaap:OperatingSegmentsMemberzions:CommerceBankOfWashingtonSegmentMemberzions:ProductsAndServicesRetailAndBusinessBankingFeesMember2019-07-012019-09-300000109380zions:ProductsAndServicesRetailAndBusinessBankingFeesMemberzions:CorporateReconcilingItemsAndEliminationsMember2020-07-012020-09-300000109380zions:ProductsAndServicesRetailAndBusinessBankingFeesMemberzions:CorporateReconcilingItemsAndEliminationsMember2019-07-012019-09-300000109380zions:ProductsAndServicesRetailAndBusinessBankingFeesMember2020-07-012020-09-300000109380zions:ProductsAndServicesRetailAndBusinessBankingFeesMember2019-07-012019-09-300000109380zions:ProductsAndServicesCapitalMarketsAndForeignExchangeFeesMemberus-gaap:OperatingSegmentsMemberzions:CommerceBankOfWashingtonSegmentMember2020-07-012020-09-300000109380zions:ProductsAndServicesCapitalMarketsAndForeignExchangeFeesMemberus-gaap:OperatingSegmentsMemberzions:CommerceBankOfWashingtonSegmentMember2019-07-012019-09-300000109380zions:ProductsAndServicesCapitalMarketsAndForeignExchangeFeesMemberzions:CorporateReconcilingItemsAndEliminationsMember2020-07-012020-09-300000109380zions:ProductsAndServicesCapitalMarketsAndForeignExchangeFeesMemberzions:CorporateReconcilingItemsAndEliminationsMember2019-07-012019-09-300000109380zions:ProductsAndServicesCapitalMarketsAndForeignExchangeFeesMember2020-07-012020-09-300000109380zions:ProductsAndServicesCapitalMarketsAndForeignExchangeFeesMember2019-07-012019-09-300000109380us-gaap:OperatingSegmentsMemberzions:CommerceBankOfWashingtonSegmentMemberzions:ProductsAndServicesWealthManagementAndTrustFeesMember2020-07-012020-09-300000109380us-gaap:OperatingSegmentsMemberzions:CommerceBankOfWashingtonSegmentMemberzions:ProductsAndServicesWealthManagementAndTrustFeesMember2019-07-012019-09-300000109380zions:CorporateReconcilingItemsAndEliminationsMemberzions:ProductsAndServicesWealthManagementAndTrustFeesMember2020-07-012020-09-300000109380zions:CorporateReconcilingItemsAndEliminationsMemberzions:ProductsAndServicesWealthManagementAndTrustFeesMember2019-07-012019-09-300000109380zions:ProductsAndServicesWealthManagementAndTrustFeesMember2020-07-012020-09-300000109380zions:ProductsAndServicesWealthManagementAndTrustFeesMember2019-07-012019-09-300000109380us-gaap:OperatingSegmentsMemberzions:ProductsAndServicesOtherCustomerRelatedFeesMemberzions:CommerceBankOfWashingtonSegmentMember2020-07-012020-09-300000109380us-gaap:OperatingSegmentsMemberzions:ProductsAndServicesOtherCustomerRelatedFeesMemberzions:CommerceBankOfWashingtonSegmentMember2019-07-012019-09-300000109380zions:ProductsAndServicesOtherCustomerRelatedFeesMemberzions:CorporateReconcilingItemsAndEliminationsMember2020-07-012020-09-300000109380zions:ProductsAndServicesOtherCustomerRelatedFeesMemberzions:CorporateReconcilingItemsAndEliminationsMember2019-07-012019-09-300000109380zions:ProductsAndServicesOtherCustomerRelatedFeesMember2020-07-012020-09-300000109380zions:ProductsAndServicesOtherCustomerRelatedFeesMember2019-07-012019-09-300000109380us-gaap:OperatingSegmentsMemberzions:CommerceBankOfWashingtonSegmentMember2020-07-012020-09-300000109380us-gaap:OperatingSegmentsMemberzions:CommerceBankOfWashingtonSegmentMember2019-07-012019-09-300000109380zions:CorporateReconcilingItemsAndEliminationsMember2020-07-012020-09-300000109380zions:CorporateReconcilingItemsAndEliminationsMember2019-07-012019-09-300000109380zions:ZionsBankSegmentMemberzions:ProductsAndServicesCommercialAccountFeesMemberus-gaap:OperatingSegmentsMember2020-01-012020-09-300000109380zions:ZionsBankSegmentMemberzions:ProductsAndServicesCommercialAccountFeesMemberus-gaap:OperatingSegmentsMember2019-01-012019-09-300000109380zions:ProductsAndServicesCommercialAccountFeesMemberus-gaap:OperatingSegmentsMemberzions:AmegyCorporationSegmentMember2020-01-012020-09-300000109380zions:ProductsAndServicesCommercialAccountFeesMemberus-gaap:OperatingSegmentsMemberzions:AmegyCorporationSegmentMember2019-01-012019-09-300000109380zions:ProductsAndServicesCommercialAccountFeesMemberus-gaap:OperatingSegmentsMemberzions:CaliforniaBankAndTrustSegmentMember2020-01-012020-09-300000109380zions:ProductsAndServicesCommercialAccountFeesMemberus-gaap:OperatingSegmentsMemberzions:CaliforniaBankAndTrustSegmentMember2019-01-012019-09-300000109380zions:ZionsBankSegmentMemberus-gaap:OperatingSegmentsMemberzions:ProductsAndServicesCardFeesMember2020-01-012020-09-300000109380zions:ZionsBankSegmentMemberus-gaap:OperatingSegmentsMemberzions:ProductsAndServicesCardFeesMember2019-01-012019-09-300000109380us-gaap:OperatingSegmentsMemberzions:AmegyCorporationSegmentMemberzions:ProductsAndServicesCardFeesMember2020-01-012020-09-300000109380us-gaap:OperatingSegmentsMemberzions:AmegyCorporationSegmentMemberzions:ProductsAndServicesCardFeesMember2019-01-012019-09-300000109380us-gaap:OperatingSegmentsMemberzions:ProductsAndServicesCardFeesMemberzions:CaliforniaBankAndTrustSegmentMember2020-01-012020-09-300000109380us-gaap:OperatingSegmentsMemberzions:ProductsAndServicesCardFeesMemberzions:CaliforniaBankAndTrustSegmentMember2019-01-012019-09-300000109380zions:ZionsBankSegmentMemberus-gaap:OperatingSegmentsMemberzions:ProductsAndServicesRetailAndBusinessBankingFeesMember2020-01-012020-09-300000109380zions:ZionsBankSegmentMemberus-gaap:OperatingSegmentsMemberzions:ProductsAndServicesRetailAndBusinessBankingFeesMember2019-01-012019-09-300000109380us-gaap:OperatingSegmentsMemberzions:AmegyCorporationSegmentMemberzions:ProductsAndServicesRetailAndBusinessBankingFeesMember2020-01-012020-09-300000109380us-gaap:OperatingSegmentsMemberzions:AmegyCorporationSegmentMemberzions:ProductsAndServicesRetailAndBusinessBankingFeesMember2019-01-012019-09-300000109380us-gaap:OperatingSegmentsMemberzions:ProductsAndServicesRetailAndBusinessBankingFeesMemberzions:CaliforniaBankAndTrustSegmentMember2020-01-012020-09-300000109380us-gaap:OperatingSegmentsMemberzions:ProductsAndServicesRetailAndBusinessBankingFeesMemberzions:CaliforniaBankAndTrustSegmentMember2019-01-012019-09-300000109380zions:ZionsBankSegmentMemberzions:ProductsAndServicesCapitalMarketsAndForeignExchangeFeesMemberus-gaap:OperatingSegmentsMember2020-01-012020-09-300000109380zions:ZionsBankSegmentMemberzions:ProductsAndServicesCapitalMarketsAndForeignExchangeFeesMemberus-gaap:OperatingSegmentsMember2019-01-012019-09-300000109380zions:ProductsAndServicesCapitalMarketsAndForeignExchangeFeesMemberus-gaap:OperatingSegmentsMemberzions:AmegyCorporationSegmentMember2020-01-012020-09-300000109380zions:ProductsAndServicesCapitalMarketsAndForeignExchangeFeesMemberus-gaap:OperatingSegmentsMemberzions:AmegyCorporationSegmentMember2019-01-012019-09-300000109380zions:ProductsAndServicesCapitalMarketsAndForeignExchangeFeesMemberus-gaap:OperatingSegmentsMemberzions:CaliforniaBankAndTrustSegmentMember2020-01-012020-09-300000109380zions:ProductsAndServicesCapitalMarketsAndForeignExchangeFeesMemberus-gaap:OperatingSegmentsMemberzions:CaliforniaBankAndTrustSegmentMember2019-01-012019-09-300000109380zions:ZionsBankSegmentMemberus-gaap:OperatingSegmentsMemberzions:ProductsAndServicesWealthManagementAndTrustFeesMember2020-01-012020-09-300000109380zions:ZionsBankSegmentMemberus-gaap:OperatingSegmentsMemberzions:ProductsAndServicesWealthManagementAndTrustFeesMember2019-01-012019-09-300000109380us-gaap:OperatingSegmentsMemberzions:AmegyCorporationSegmentMemberzions:ProductsAndServicesWealthManagementAndTrustFeesMember2020-01-012020-09-300000109380us-gaap:OperatingSegmentsMemberzions:AmegyCorporationSegmentMemberzions:ProductsAndServicesWealthManagementAndTrustFeesMember2019-01-012019-09-300000109380us-gaap:OperatingSegmentsMemberzions:CaliforniaBankAndTrustSegmentMemberzions:ProductsAndServicesWealthManagementAndTrustFeesMember2020-01-012020-09-300000109380us-gaap:OperatingSegmentsMemberzions:CaliforniaBankAndTrustSegmentMemberzions:ProductsAndServicesWealthManagementAndTrustFeesMember2019-01-012019-09-300000109380zions:ZionsBankSegmentMemberus-gaap:OperatingSegmentsMemberzions:ProductsAndServicesOtherCustomerRelatedFeesMember2020-01-012020-09-300000109380zions:ZionsBankSegmentMemberus-gaap:OperatingSegmentsMemberzions:ProductsAndServicesOtherCustomerRelatedFeesMember2019-01-012019-09-300000109380us-gaap:OperatingSegmentsMemberzions:AmegyCorporationSegmentMemberzions:ProductsAndServicesOtherCustomerRelatedFeesMember2020-01-012020-09-300000109380us-gaap:OperatingSegmentsMemberzions:AmegyCorporationSegmentMemberzions:ProductsAndServicesOtherCustomerRelatedFeesMember2019-01-012019-09-300000109380us-gaap:OperatingSegmentsMemberzions:ProductsAndServicesOtherCustomerRelatedFeesMemberzions:CaliforniaBankAndTrustSegmentMember2020-01-012020-09-300000109380us-gaap:OperatingSegmentsMemberzions:ProductsAndServicesOtherCustomerRelatedFeesMemberzions:CaliforniaBankAndTrustSegmentMember2019-01-012019-09-300000109380zions:ZionsBankSegmentMemberus-gaap:OperatingSegmentsMember2020-01-012020-09-300000109380zions:ZionsBankSegmentMemberus-gaap:OperatingSegmentsMember2019-01-012019-09-300000109380us-gaap:OperatingSegmentsMemberzions:AmegyCorporationSegmentMember2020-01-012020-09-300000109380us-gaap:OperatingSegmentsMemberzions:AmegyCorporationSegmentMember2019-01-012019-09-300000109380us-gaap:OperatingSegmentsMemberzions:CaliforniaBankAndTrustSegmentMember2020-01-012020-09-300000109380us-gaap:OperatingSegmentsMemberzions:CaliforniaBankAndTrustSegmentMember2019-01-012019-09-300000109380zions:ProductsAndServicesCommercialAccountFeesMemberus-gaap:OperatingSegmentsMemberzions:NationalBankOfArizonaSegmentMember2020-01-012020-09-300000109380zions:ProductsAndServicesCommercialAccountFeesMemberus-gaap:OperatingSegmentsMemberzions:NationalBankOfArizonaSegmentMember2019-01-012019-09-300000109380zions:ProductsAndServicesCommercialAccountFeesMemberus-gaap:OperatingSegmentsMemberzions:NevadaStateBankSegmentMember2020-01-012020-09-300000109380zions:ProductsAndServicesCommercialAccountFeesMemberus-gaap:OperatingSegmentsMemberzions:NevadaStateBankSegmentMember2019-01-012019-09-300000109380zions:ProductsAndServicesCommercialAccountFeesMemberus-gaap:OperatingSegmentsMemberzions:VectraBankColoradoSegmentMember2020-01-012020-09-300000109380zions:ProductsAndServicesCommercialAccountFeesMemberus-gaap:OperatingSegmentsMemberzions:VectraBankColoradoSegmentMember2019-01-012019-09-300000109380us-gaap:OperatingSegmentsMemberzions:NationalBankOfArizonaSegmentMemberzions:ProductsAndServicesCardFeesMember2020-01-012020-09-300000109380us-gaap:OperatingSegmentsMemberzions:NationalBankOfArizonaSegmentMemberzions:ProductsAndServicesCardFeesMember2019-01-012019-09-300000109380us-gaap:OperatingSegmentsMemberzions:NevadaStateBankSegmentMemberzions:ProductsAndServicesCardFeesMember2020-01-012020-09-300000109380us-gaap:OperatingSegmentsMemberzions:NevadaStateBankSegmentMemberzions:ProductsAndServicesCardFeesMember2019-01-012019-09-300000109380us-gaap:OperatingSegmentsMemberzions:ProductsAndServicesCardFeesMemberzions:VectraBankColoradoSegmentMember2020-01-012020-09-300000109380us-gaap:OperatingSegmentsMemberzions:ProductsAndServicesCardFeesMemberzions:VectraBankColoradoSegmentMember2019-01-012019-09-300000109380us-gaap:OperatingSegmentsMemberzions:ProductsAndServicesRetailAndBusinessBankingFeesMemberzions:NationalBankOfArizonaSegmentMember2020-01-012020-09-300000109380us-gaap:OperatingSegmentsMemberzions:ProductsAndServicesRetailAndBusinessBankingFeesMemberzions:NationalBankOfArizonaSegmentMember2019-01-012019-09-300000109380us-gaap:OperatingSegmentsMemberzions:ProductsAndServicesRetailAndBusinessBankingFeesMemberzions:NevadaStateBankSegmentMember2020-01-012020-09-300000109380us-gaap:OperatingSegmentsMemberzions:ProductsAndServicesRetailAndBusinessBankingFeesMemberzions:NevadaStateBankSegmentMember2019-01-012019-09-300000109380us-gaap:OperatingSegmentsMemberzions:ProductsAndServicesRetailAndBusinessBankingFeesMemberzions:VectraBankColoradoSegmentMember2020-01-012020-09-300000109380us-gaap:OperatingSegmentsMemberzions:ProductsAndServicesRetailAndBusinessBankingFeesMemberzions:VectraBankColoradoSegmentMember2019-01-012019-09-300000109380zions:ProductsAndServicesCapitalMarketsAndForeignExchangeFeesMemberus-gaap:OperatingSegmentsMemberzions:NationalBankOfArizonaSegmentMember2020-01-012020-09-300000109380zions:ProductsAndServicesCapitalMarketsAndForeignExchangeFeesMemberus-gaap:OperatingSegmentsMemberzions:NationalBankOfArizonaSegmentMember2019-01-012019-09-300000109380zions:ProductsAndServicesCapitalMarketsAndForeignExchangeFeesMemberus-gaap:OperatingSegmentsMemberzions:NevadaStateBankSegmentMember2020-01-012020-09-300000109380zions:ProductsAndServicesCapitalMarketsAndForeignExchangeFeesMemberus-gaap:OperatingSegmentsMemberzions:NevadaStateBankSegmentMember2019-01-012019-09-300000109380zions:ProductsAndServicesCapitalMarketsAndForeignExchangeFeesMemberus-gaap:OperatingSegmentsMemberzions:VectraBankColoradoSegmentMember2020-01-012020-09-300000109380zions:ProductsAndServicesCapitalMarketsAndForeignExchangeFeesMemberus-gaap:OperatingSegmentsMemberzions:VectraBankColoradoSegmentMember2019-01-012019-09-300000109380us-gaap:OperatingSegmentsMemberzions:NationalBankOfArizonaSegmentMemberzions:ProductsAndServicesWealthManagementAndTrustFeesMember2020-01-012020-09-300000109380us-gaap:OperatingSegmentsMemberzions:NationalBankOfArizonaSegmentMemberzions:ProductsAndServicesWealthManagementAndTrustFeesMember2019-01-012019-09-300000109380us-gaap:OperatingSegmentsMemberzions:NevadaStateBankSegmentMemberzions:ProductsAndServicesWealthManagementAndTrustFeesMember2020-01-012020-09-300000109380us-gaap:OperatingSegmentsMemberzions:NevadaStateBankSegmentMemberzions:ProductsAndServicesWealthManagementAndTrustFeesMember2019-01-012019-09-300000109380us-gaap:OperatingSegmentsMemberzions:VectraBankColoradoSegmentMemberzions:ProductsAndServicesWealthManagementAndTrustFeesMember2020-01-012020-09-300000109380us-gaap:OperatingSegmentsMemberzions:VectraBankColoradoSegmentMemberzions:ProductsAndServicesWealthManagementAndTrustFeesMember2019-01-012019-09-300000109380us-gaap:OperatingSegmentsMemberzions:ProductsAndServicesOtherCustomerRelatedFeesMemberzions:NationalBankOfArizonaSegmentMember2020-01-012020-09-300000109380us-gaap:OperatingSegmentsMemberzions:ProductsAndServicesOtherCustomerRelatedFeesMemberzions:NationalBankOfArizonaSegmentMember2019-01-012019-09-300000109380us-gaap:OperatingSegmentsMemberzions:ProductsAndServicesOtherCustomerRelatedFeesMemberzions:NevadaStateBankSegmentMember2020-01-012020-09-300000109380us-gaap:OperatingSegmentsMemberzions:ProductsAndServicesOtherCustomerRelatedFeesMemberzions:NevadaStateBankSegmentMember2019-01-012019-09-300000109380us-gaap:OperatingSegmentsMemberzions:ProductsAndServicesOtherCustomerRelatedFeesMemberzions:VectraBankColoradoSegmentMember2020-01-012020-09-300000109380us-gaap:OperatingSegmentsMemberzions:ProductsAndServicesOtherCustomerRelatedFeesMemberzions:VectraBankColoradoSegmentMember2019-01-012019-09-300000109380us-gaap:OperatingSegmentsMemberzions:NationalBankOfArizonaSegmentMember2020-01-012020-09-300000109380us-gaap:OperatingSegmentsMemberzions:NationalBankOfArizonaSegmentMember2019-01-012019-09-300000109380us-gaap:OperatingSegmentsMemberzions:NevadaStateBankSegmentMember2020-01-012020-09-300000109380us-gaap:OperatingSegmentsMemberzions:NevadaStateBankSegmentMember2019-01-012019-09-300000109380us-gaap:OperatingSegmentsMemberzions:VectraBankColoradoSegmentMember2020-01-012020-09-300000109380us-gaap:OperatingSegmentsMemberzions:VectraBankColoradoSegmentMember2019-01-012019-09-300000109380zions:ProductsAndServicesCommercialAccountFeesMemberus-gaap:OperatingSegmentsMemberzions:CommerceBankOfWashingtonSegmentMember2020-01-012020-09-300000109380zions:ProductsAndServicesCommercialAccountFeesMemberus-gaap:OperatingSegmentsMemberzions:CommerceBankOfWashingtonSegmentMember2019-01-012019-09-300000109380zions:ProductsAndServicesCommercialAccountFeesMemberzions:CorporateReconcilingItemsAndEliminationsMember2020-01-012020-09-300000109380zions:ProductsAndServicesCommercialAccountFeesMemberzions:CorporateReconcilingItemsAndEliminationsMember2019-01-012019-09-300000109380zions:ProductsAndServicesCommercialAccountFeesMember2020-01-012020-09-300000109380zions:ProductsAndServicesCommercialAccountFeesMember2019-01-012019-09-300000109380us-gaap:OperatingSegmentsMemberzions:CommerceBankOfWashingtonSegmentMemberzions:ProductsAndServicesCardFeesMember2020-01-012020-09-300000109380us-gaap:OperatingSegmentsMemberzions:CommerceBankOfWashingtonSegmentMemberzions:ProductsAndServicesCardFeesMember2019-01-012019-09-300000109380zions:CorporateReconcilingItemsAndEliminationsMemberzions:ProductsAndServicesCardFeesMember2020-01-012020-09-300000109380zions:CorporateReconcilingItemsAndEliminationsMemberzions:ProductsAndServicesCardFeesMember2019-01-012019-09-300000109380zions:ProductsAndServicesCardFeesMember2020-01-012020-09-300000109380zions:ProductsAndServicesCardFeesMember2019-01-012019-09-300000109380us-gaap:OperatingSegmentsMemberzions:CommerceBankOfWashingtonSegmentMemberzions:ProductsAndServicesRetailAndBusinessBankingFeesMember2020-01-012020-09-300000109380us-gaap:OperatingSegmentsMemberzions:CommerceBankOfWashingtonSegmentMemberzions:ProductsAndServicesRetailAndBusinessBankingFeesMember2019-01-012019-09-300000109380zions:ProductsAndServicesRetailAndBusinessBankingFeesMemberzions:CorporateReconcilingItemsAndEliminationsMember2020-01-012020-09-300000109380zions:ProductsAndServicesRetailAndBusinessBankingFeesMemberzions:CorporateReconcilingItemsAndEliminationsMember2019-01-012019-09-300000109380zions:ProductsAndServicesRetailAndBusinessBankingFeesMember2020-01-012020-09-300000109380zions:ProductsAndServicesRetailAndBusinessBankingFeesMember2019-01-012019-09-300000109380zions:ProductsAndServicesCapitalMarketsAndForeignExchangeFeesMemberus-gaap:OperatingSegmentsMemberzions:CommerceBankOfWashingtonSegmentMember2020-01-012020-09-300000109380zions:ProductsAndServicesCapitalMarketsAndForeignExchangeFeesMemberus-gaap:OperatingSegmentsMemberzions:CommerceBankOfWashingtonSegmentMember2019-01-012019-09-300000109380zions:ProductsAndServicesCapitalMarketsAndForeignExchangeFeesMemberzions:CorporateReconcilingItemsAndEliminationsMember2020-01-012020-09-300000109380zions:ProductsAndServicesCapitalMarketsAndForeignExchangeFeesMemberzions:CorporateReconcilingItemsAndEliminationsMember2019-01-012019-09-300000109380zions:ProductsAndServicesCapitalMarketsAndForeignExchangeFeesMember2020-01-012020-09-300000109380zions:ProductsAndServicesCapitalMarketsAndForeignExchangeFeesMember2019-01-012019-09-300000109380us-gaap:OperatingSegmentsMemberzions:CommerceBankOfWashingtonSegmentMemberzions:ProductsAndServicesWealthManagementAndTrustFeesMember2020-01-012020-09-300000109380us-gaap:OperatingSegmentsMemberzions:CommerceBankOfWashingtonSegmentMemberzions:ProductsAndServicesWealthManagementAndTrustFeesMember2019-01-012019-09-300000109380zions:CorporateReconcilingItemsAndEliminationsMemberzions:ProductsAndServicesWealthManagementAndTrustFeesMember2020-01-012020-09-300000109380zions:CorporateReconcilingItemsAndEliminationsMemberzions:ProductsAndServicesWealthManagementAndTrustFeesMember2019-01-012019-09-300000109380zions:ProductsAndServicesWealthManagementAndTrustFeesMember2020-01-012020-09-300000109380zions:ProductsAndServicesWealthManagementAndTrustFeesMember2019-01-012019-09-300000109380us-gaap:OperatingSegmentsMemberzions:ProductsAndServicesOtherCustomerRelatedFeesMemberzions:CommerceBankOfWashingtonSegmentMember2020-01-012020-09-300000109380us-gaap:OperatingSegmentsMemberzions:ProductsAndServicesOtherCustomerRelatedFeesMemberzions:CommerceBankOfWashingtonSegmentMember2019-01-012019-09-300000109380zions:ProductsAndServicesOtherCustomerRelatedFeesMemberzions:CorporateReconcilingItemsAndEliminationsMember2020-01-012020-09-300000109380zions:ProductsAndServicesOtherCustomerRelatedFeesMemberzions:CorporateReconcilingItemsAndEliminationsMember2019-01-012019-09-300000109380zions:ProductsAndServicesOtherCustomerRelatedFeesMember2020-01-012020-09-300000109380zions:ProductsAndServicesOtherCustomerRelatedFeesMember2019-01-012019-09-300000109380us-gaap:OperatingSegmentsMemberzions:CommerceBankOfWashingtonSegmentMember2020-01-012020-09-300000109380us-gaap:OperatingSegmentsMemberzions:CommerceBankOfWashingtonSegmentMember2019-01-012019-09-300000109380zions:CorporateReconcilingItemsAndEliminationsMember2020-01-012020-09-300000109380zions:CorporateReconcilingItemsAndEliminationsMember2019-01-012019-09-300000109380us-gaap:RestrictedStockUnitsRSUMember2020-07-012020-09-300000109380us-gaap:RestrictedStockUnitsRSUMember2019-07-012019-09-300000109380us-gaap:RestrictedStockUnitsRSUMember2020-01-012020-09-300000109380us-gaap:RestrictedStockUnitsRSUMember2019-01-012019-09-300000109380us-gaap:EmployeeStockOptionMember2020-07-012020-09-300000109380us-gaap:EmployeeStockOptionMember2019-07-012019-09-300000109380us-gaap:EmployeeStockOptionMember2020-01-012020-09-300000109380us-gaap:EmployeeStockOptionMember2019-01-012019-09-300000109380zions:ZionsBankSegmentMemberstpr:UT2020-09-300000109380zions:ZionsBankSegmentMemberstpr:ID2020-09-300000109380stpr:WYzions:ZionsBankSegmentMember2020-09-300000109380zions:AmegyCorporationSegmentMemberstpr:TX2020-09-300000109380stpr:CAzions:CaliforniaBankAndTrustSegmentMember2020-09-300000109380stpr:AZzions:NationalBankOfArizonaSegmentMember2020-09-300000109380stpr:NVzions:NevadaStateBankSegmentMember2020-09-300000109380stpr:COzions:VectraBankColoradoSegmentMember2020-09-300000109380stpr:NMzions:VectraBankColoradoSegmentMember2020-09-300000109380stpr:WAzions:CommerceBankOfWashingtonSegmentMember2020-09-300000109380zions:CommerceBankOfWashingtonSegmentMemberstpr:OR2020-09-30
UNITED STATES
SECURITIES AND EXCHANGE COMMISSION
Washington, D.C. 20549
FORM 10-Q
(Mark One)
☒ QUARTERLY REPORT PURSUANT TO SECTION 13 OR 15(d) OF THE SECURITIES EXCHANGE ACT OF 1934 For the quarterly period ended September 30, 2020 OR
☐ TRANSITION REPORT PURSUANT TO SECTION 13 OR 15(d) OF THE SECURITIES EXCHANGE ACT OF 1934 For the transition period from __________ to __________
COMMISSION FILE NUMBER 001-12307
ZIONS BANCORPORATION, NATIONAL ASSOCIATION
(Exact name of registrant as specified in its charter)
| | | | | |
United States of America | 87-0189025 |
(State or other jurisdiction of
incorporation or organization) | (I.R.S. Employer
Identification No.) |
| One South Main | |
Salt Lake City, Utah | 84133-1109 |
| (Address of principal executive offices) | (Zip Code) |
Registrant’s telephone number, including area code: (801) 844-7637
Securities registered pursuant to Section 12(b) of the Act:
| | | | | | | | |
| Title of Each Class | Trading Symbols | Name of Each Exchange on Which Registered |
Common Stock, par value $0.001 | ZION | The NASDAQ Stock Market LLC |
| Depositary Shares each representing a 1/40th ownership interest in a share of: | | |
Series A Floating-Rate Non-Cumulative Perpetual Preferred Stock | ZIONP | The NASDAQ Stock Market LLC |
Series G Fixed/Floating-Rate Non-Cumulative Perpetual Preferred Stock | ZIONO | The NASDAQ Stock Market LLC |
Series H 5.75% Non-Cumulative Perpetual Preferred Stock | ZIONN | The NASDAQ Stock Market LLC |
6.95% Fixed-to-Floating Rate Subordinated Notes due September 15, 2028 | ZIONL | The NASDAQ Stock Market LLC |
Indicate by check mark whether the registrant (1) has filed all reports required to be filed by Section 13 or 15(d) of the Securities Exchange Act of 1934 during the preceding 12 months (or for such shorter period that the registrant was required to file such reports), and (2) has been subject to such filing requirements for the past 90 days. Yes ý No ¨
Indicate by check mark whether the registrant has submitted electronically every Interactive Data File required to be submitted pursuant to Rule 405 of Regulation S-T (§232.405 of this chapter) during the preceding 12 months (or for such shorter period that the registrant was required to submit such files). Yes ý No ¨
Indicate by check mark whether the registrant is a large accelerated filer, an accelerated filer, a non-accelerated filer, a smaller reporting company, or an emerging growth company. See the definitions of “large accelerated filer,” “accelerated filer,” “smaller reporting company,” and “emerging growth company” in Rule 12b-2 of the Exchange Act.
Large accelerated filer ý Accelerated filer ¨ Non-accelerated filer ¨ Smaller reporting company ☐ Emerging growth company ¨
If an emerging growth company, indicate by check mark if the registrant has elected not to use the extended transition period for complying with any new or revised financial accounting standards provided pursuant to Section 13(a) of the Exchange Act. ¨
Indicate by check mark whether the registrant is a shell company (as defined in Rule 12b-2 of the Exchange Act). Yes ¨ No ý
Indicate the number of shares outstanding of each of the issuer’s classes of common stock, as of the latest practicable date.
Number of common shares outstanding at October 28, 2020 164,011,595 shares
ZIONS BANCORPORATION, NATIONAL ASSOCIATION AND SUBSIDIARIES
Table of Contents
| | | | | | | | |
| | Page |
| |
| | |
| Item 1. | | |
| | |
| | |
| | |
| | |
| | |
| | |
| | |
| | |
| Item 2. | | |
| | |
| Item 3. | | |
| | |
| Item 4. | | |
| |
| |
| | |
| Item 1. | | |
| | |
| Item 1A. | | |
| | |
| Item 2. | | |
| | |
| Item 6. | | |
| |
| |
ZIONS BANCORPORATION, NATIONAL ASSOCIATION AND SUBSIDIARIES
PART I. FINANCIAL INFORMATION
ITEM 2. MANAGEMENT’S DISCUSSION AND ANALYSIS OF FINANCIAL CONDITION AND RESULTS OF OPERATIONS
FORWARD-LOOKING INFORMATION
This quarterly report on Form 10-Q includes "forward-looking statements" as that term is defined in the Private Securities Litigation Reform Act of 1995. These statements are based on management’s current expectations and assumptions regarding future events or determinations, all of which are subject to known and unknown risks, uncertainties and other factors that may cause our actual results, performance or achievements, market trends, industry results or regulatory outcomes to differ materially from those expressed or implied by such forward-looking statements. Forward-looking statements include, among others:
•statements with respect to the beliefs, plans, objectives, goals, targets, commitments, designs, guidelines, expectations, anticipations, and future financial condition, results of operations and performance of Zions Bancorporation, National Association and its subsidiaries (collectively “Zions Bancorporation, N.A.,” “the Bank,” “we,” “our,” “us”), and statements concerning the potential effects of the COVID-19 pandemic on the Bank's businesses and financial results and condition; and
•statements preceded by, followed by, or that include the words “may,” “might,” “can,” “continue,” “could,” “should,” “would,” “believe,” “anticipate,” “estimate,” “forecasts,” “expect,” “intend,” “target,” “commit,” “design,” “plan,” “projects,” “will,” and the negative thereof and similar words and expressions.
These forward-looking statements are not guarantees of future performance, nor should they be relied upon as representing management’s views as of any subsequent date. Forward-looking statements by their nature address matters that are, to different degrees, uncertain, such as statements about future financial and operating results. Actual results and outcomes may differ materially from those presented, either expressed or implied, including, but not limited to, those presented in Management’s Discussion and Analysis. Important risk factors that may cause such material differences include, but are not limited to:
•the effect of the COVID-19 pandemic, and other infectious illness outbreaks that may arise in the future, on the Bank’s customers, businesses, liquidity, financial results and overall condition and which has created significant uncertainties in U.S. and global markets, including our customers' ability to make timely payments on obligations, fee income revenue due to reduced loan origination activity and card swipe income, and operating expense due to alternative approaches to doing business;
•changes in governmental policy and regulation, including measures taken in response to economic, business, political and social conditions, such as the Small Business Administration’s (“SBA”) Paycheck Protection Program (“PPP”), the Federal Reserve Board's efforts to provide liquidity to the financial system and provide credit to private commercial and municipal borrowers, and other programs designed to address the effects of the COVID-19 pandemic;
•the Bank's participation as a lender in the PPP and similar programs and its effect on the Bank's liquidity, financial results, businesses and customers, including the availability of program funds and the ability of customers to comply with requirements and otherwise perform with respect to loans obtained under such programs;
•the Bank’s ability to successfully execute its business plans, manage its risks, and achieve its objectives, including its operating leverage;
•the impact of acquisitions, dispositions, and corporate restructurings;
•increases in the levels of losses, customer bankruptcies, bank failures, claims, and assessments;
•the ability of the Bank to retain and recruit executives and other personnel necessary for their businesses and competitiveness;
•changes in local, national and international political and economic conditions, including without limitation the political and economic effects of the fiscal imbalance in the United States (“U.S.”) and other countries, potential
ZIONS BANCORPORATION, NATIONAL ASSOCIATION AND SUBSIDIARIES
or actual downgrades in ratings of sovereign debt issued by the U. S. and other countries, and other major developments, including wars, military actions, and terrorist attacks;
•changes in business, financial and commodity market prices and conditions, either internationally, nationally or locally in areas in which the Bank conducts its operations, including without limitation rates of business formation and growth, commercial and residential real estate development, real estate prices, agricultural-related commodity prices, and oil and gas-related commodity prices, particularly with respect to the effects on the economy and the Bank’s customers, businesses, and financial results of segments subject to high volatility and stress that may be exacerbated by the COVID-19 pandemic, such as the recent sudden decreases in oil and gas prices;
•changes in markets for equity, fixed-income, and other securities, commodities, including availability, market liquidity levels, and pricing;
•changes in interest rates, the quality and composition of the loan and securities portfolios, demand for loan products, deposit flows and competition;
•uncertainty regarding the future of the London Interbank Offered Rate ("LIBOR"), and the potential transition away from LIBOR toward new benchmark interest rates;
•the rate of change of the Bank’s interest-sensitive assets and liabilities relative to changes in benchmark interest rates;
•changes in fiscal, monetary, regulatory, trade and tax policies and laws, and regulatory assessments and fees, including policies of the U.S. Department of Treasury, the Office of the Comptroller of the Currency (“OCC”), the Board of Governors of the Federal Reserve System, the Federal Deposit Insurance Corporation (“FDIC”), the Securities and Exchange Commission (“SEC”), and the Consumer Financial Protection Bureau (“CFPB”);
•changes in consumer spending and savings habits;
•inflation and deflation;
•increased competitive challenges and expanding product and pricing pressures among financial institutions;
•legislation or regulatory changes which adversely affect the Bank’s operations or business;
•the Bank’s ability to comply with applicable laws and regulations;
•costs of deposit insurance and changes with respect to FDIC insurance coverage levels;
•any impairment of our goodwill or other intangibles, or any adjustment of valuation allowances on our deferred tax assets (“DTAs”) due to adverse changes in the economic environment, declining operations of the reporting unit, or a change to the corporate statutory tax rate or other similar changes if and as implemented by local and national governments, or other factors;
•the impact of rules and regulations on our required regulatory capital and liquidity levels, governmental assessments on us, the scope of business activities in which we may engage, the manner in which we engage in such activities, and the fees we may charge for certain products and services;
•uncertainties related to the application of the National Bank Act of 1863, 12 U.S.C. 38 (the “National Bank Act”) and OCC regulations to the Bank’s corporate affairs as more fully described under “Risk Factors” in our 2019 Annual Report on Form 10-K;
•changes in accounting policies or procedures as may be required by the Financial Accounting Standards Board (“FASB”) or regulatory agencies;
•risks and uncertainties related to the ability to obtain shareholder and regulatory approvals when required, or the possibility that such approvals may be delayed;
•new legal claims against the Bank, including litigation, arbitration and proceedings brought by governmental or self-regulatory agencies, or changes in existing legal matters;
•economies of scale attendant to the development of digital and other technologies by much larger bank and non-bank competitors, and the possible entry of technology “platform” companies into the financial services business;
ZIONS BANCORPORATION, NATIONAL ASSOCIATION AND SUBSIDIARIES
•the Bank’s ability to develop and maintain secure and reliable information technology systems, including as necessary to guard against fraud, cybersecurity and privacy risks; and
•the Bank’s implementation of new technologies, including its core deposit system, to remain competitive.
Further, statements about the potential effects of the COVID-19 pandemic on the Bank’s businesses and financial results and condition may constitute forward-looking statements and are subject to the risk that the actual effects may differ, possibly materially, from what is reflected in those forward-looking statements due to factors and future developments that are uncertain, unpredictable and in many cases beyond the Bank’s control, including the scope and duration of the pandemic, actions taken by governmental authorities in response to the pandemic, and the direct and indirect impact of the pandemic on the Bank, its customers and third parties.
We caution against the undue reliance on forward-looking statements, which reflect our views only as of the date they are made. Except to the extent required by law, the Bank specifically disclaims any obligation to update any factors or to publicly announce the result of revisions to any of the forward-looking statements included herein to reflect future events or developments.
GLOSSARY OF ACRONYMS
| | | | | | | | | | | |
| ACL | Allowance for Credit Losses | FHLB | Federal Home Loan Bank |
| AFS | Available-for-Sale | FTP | Funds Transfer Pricing |
| ALCO | Asset/Liability Committee | GAAP | Generally Accepted Accounting Principles |
| ALLL | Allowance for Loan and Lease Losses | HECL | Home Equity Credit Line |
| ALM | Asset Liability Management | HTM | Held-to-Maturity |
| Amegy | Amegy Bank, a division of Zions Bancorporation, National Association | IMG | International Manufacturing Group |
| AOCI | Accumulated Other Comprehensive Income | LIBOR | London Interbank Offered Rate |
| ASC | Accounting Standards Codification | MD&A | Management’s Discussion and Analysis |
| ASU | Accounting Standards Update | Municipalities | State and Local Governments |
| bps | basis points | NASDAQ | National Association of Securities Dealers Automated Quotations |
| CB&T | California Bank & Trust, a division of Zions Bancorporation, National Association | NBAZ | National Bank of Arizona, a division of Zions Bancorporation, National Association |
| CECL | Current Expected Credit Loss | NIM | Net Interest Margin |
| CET1 | Common Equity Tier 1 (Basel III) | NSB | Nevada State Bank, a division of Zions Bancorporation, National Association |
| CFPB | Consumer Financial Protection Bureau | OCC | Office of the Comptroller of the Currency |
| CLTV | Combined Loan-to-Value Ratio | OCI | Other Comprehensive Income |
| COSO | Committee of Sponsoring Organizations of the Treadway Commission | OREO | Other Real Estate Owned |
| CRE | Commercial Real Estate | OTTI | Other-Than-Temporary Impairment |
| CVA | Credit Valuation Adjustment | PEI | Private Equity Investment |
| Dodd-Frank Act | Dodd-Frank Wall Street Reform and Consumer Protection Act | PPNR | Pre-provision Net Revenue |
| DTA | Deferred Tax Asset | PPP | Paycheck Protection Program |
| EaR | Earnings at Risk | PPPLF | Payroll Protection Program Liquidity Facility |
| ERM | Enterprise Risk Management | ROC | Risk Oversight Committee |
| EVE | Economic Value of Equity at Risk | ROU | Right-of-Use |
| FASB | Financial Accounting Standards Board | RULC | Reserve for Unfunded Lending Commitments |
| FDIC | Federal Deposit Insurance Corporation | S&P | Standard and Poor's |
| FDICIA | Federal Deposit Insurance Corporation Improvement Act | SBA | Small Business Administration |
ZIONS BANCORPORATION, NATIONAL ASSOCIATION AND SUBSIDIARIES
| | | | | | | | | | | |
| SBIC | Small Business Investment Company | Tier 1 | Common Equity Tier 1 (Basel III) and Additional Tier 1 Capital |
| SEC | Securities and Exchange Commission | U.S. | United States |
| TCBW | The Commerce Bank of Washington, a division of Zions Bancorporation, National Association | Vectra | Vectra Bank Colorado, a division of Zions Bancorporation, National Association |
| TDR | Troubled Debt Restructuring | Zions Bank | Zions Bank, a division of Zions Bancorporation, National Association |
GAAP to NON-GAAP RECONCILIATIONS
This Form 10-Q presents non-GAAP financial measures, in addition to GAAP financial measures, to provide investors with additional information. The adjustments to reconcile from the applicable GAAP financial measures to the non-GAAP financial measures are presented in the following schedules. We consider these adjustments to be relevant to ongoing operating results and provide a meaningful base for period-to-period and company-to-company comparisons. These non-GAAP financial measures are used by management to assess the performance and financial position of the Bank and for presentations of Bank performance to investors. We further believe that presenting these non-GAAP financial measures will permit investors to assess the performance of the Bank on the same basis as that applied by management.
Non-GAAP financial measures have inherent limitations, and are not required to be uniformly applied by individual entities. Although non-GAAP financial measures are frequently used by stakeholders to evaluate a company, they have limitations as an analytical tool and should not be considered in isolation or as a substitute for analysis of results reported under GAAP. The following are non-GAAP financial measures presented in this Form 10-Q and a discussion of the reasons for which management uses these non-GAAP measures:
Return on Average Tangible Common Equity – this schedule also includes “net earnings applicable to common shareholders, excluding the effects of the adjustment, net of tax” and “average tangible common equity.” Return on average tangible common equity is a non-GAAP financial measure that management believes provides useful information to management and others about our use of shareholders’ equity. Management believes the use of ratios that utilize tangible equity provides additional useful information about performance because they present measures of those assets that can generate income.
RETURN ON AVERAGE TANGIBLE COMMON EQUITY (NON-GAAP)
| | | | | | | | | | | | | | | | | | | | | | | | | | |
| | Three Months Ended |
| (Dollar amounts in millions) | | September 30,
2020 | | June 30,
2020 | | March 31,
2020 | | September 30,
2019 |
| | | | | | | | |
Net earnings applicable to common shareholders (GAAP) | | $ | 167 | | | $ | 57 | | | $ | 6 | | | $ | 214 | |
| Adjustment, net of tax: | | | | | | | | |
| Amortization of core deposit and other intangibles | | — | | | — | | | — | | | — | |
Net earnings applicable to common shareholders, excluding the effects of the adjustment, net of tax (non-GAAP) | (a) | $ | 167 | | | $ | 57 | | | $ | 6 | | | $ | 214 | |
| Average common equity (GAAP) | | $ | 7,078 | | | $ | 7,030 | | | $ | 6,924 | | | $ | 7,002 | |
| Average goodwill and intangibles | | (1,015) | | | (1,014) | | | (1,014) | | | (1,014) | |
| Average tangible common equity (non-GAAP) | (b) | $ | 6,063 | | | $ | 6,016 | | | $ | 5,910 | | | $ | 5,988 | |
| Number of days in quarter | (c) | 92 | | | 91 | | | 91 | | | 92 | |
| Number of days in year | (d) | 366 | | | 366 | | | 366 | | | 365 | |
Return on average tangible common equity (non-GAAP) | (a/b/c)*d | 11.0 | % | | 3.8 | % | | 0.4 | % | | 14.2 | % |
ZIONS BANCORPORATION, NATIONAL ASSOCIATION AND SUBSIDIARIES
Tangible Equity Ratio, Tangible Common Equity Ratio, and Tangible Book Value per Common Share – this schedule also includes “tangible equity,” “tangible common equity,” and “tangible assets.” Tangible equity ratio, tangible common equity ratio and tangible book value per common share are non-GAAP financial measures that management believes provides additional useful information about the levels of tangible assets and tangible equity in relation to outstanding shares of common stock. Management believes the use of ratios that utilize tangible equity provides additional useful information to management and others about capital adequacy because they present measures of those assets that can generate income.
TANGIBLE EQUITY RATIO, TANGIBLE COMMON EQUITY RATIO, AND TANGIBLE BOOK VALUE PER COMMON SHARE (ALL NON-GAAP MEASURES)
| | | | | | | | | | | | | | | | | | | | | | | | | | |
| (Dollar amounts in millions, except per share amounts) | | September 30,
2020 | | June 30,
2020 | | March 31,
2020 | | September 30,
2019 |
| | | | | | | | |
| Total shareholders’ equity (GAAP) | | $ | 7,668 | | | $ | 7,575 | | | $ | 7,472 | | | $ | 7,509 | |
| Goodwill and intangibles | | (1,016) | | | (1,014) | | | (1,014) | | | (1,014) | |
| Tangible equity (non-GAAP) | (a) | 6,652 | | | 6,561 | | | 6,458 | | | 6,495 | |
| Preferred stock | | (566) | | | (566) | | | (566) | | | (566) | |
| Tangible common equity (non-GAAP) | (b) | $ | 6,086 | | | $ | 5,995 | | | $ | 5,892 | | | $ | 5,929 | |
| Total assets (GAAP) | | $ | 78,357 | | | $ | 76,447 | | | $ | 71,467 | | | $ | 70,361 | |
| Goodwill and intangibles | | (1,016) | | | (1,014) | | | (1,014) | | | (1,014) | |
| Tangible assets (non-GAAP) | (c) | $ | 77,341 | | | $ | 75,433 | | | $ | 70,453 | | | $ | 69,347 | |
| Common shares outstanding (thousands) | (d) | 164,009 | | | 163,978 | | | 163,852 | | | 170,373 | |
| Tangible equity ratio (non-GAAP) | (a/c) | 8.6 | % | | 8.7 | % | | 9.2 | % | | 9.4 | % |
| Tangible common equity ratio (non-GAAP) | (b/c) | 7.9 | % | | 7.9 | % | | 8.4 | % | | 8.5 | % |
| Tangible book value per common share (non-GAAP) | (b/d) | $ | 37.11 | | | $ | 36.56 | | | $ | 35.96 | | | $ | 34.80 | |
ZIONS BANCORPORATION, NATIONAL ASSOCIATION AND SUBSIDIARIES
Efficiency Ratio and Adjusted Pre-Provision Net Revenue – this schedule also includes “adjusted noninterest expense,” “taxable-equivalent net interest income,” “adjusted taxable-equivalent revenue” and “pre-provision net revenue" (“PPNR”). The methodology of determining the efficiency ratio may differ among companies. Management makes adjustments to exclude certain items as identified in the subsequent schedule which it believes allows for more consistent comparability among periods. Management believes the efficiency ratio provides useful information regarding the cost of generating revenue. Adjusted noninterest expense provides a measure as to how well we are managing our expenses, and adjusted PPNR enables management and others to assess the Bank’s ability to generate capital to cover credit losses through a credit cycle. Taxable-equivalent net interest income allows management to assess the comparability of revenue arising from both taxable and tax-exempt sources.
EFFICIENCY RATIO (NON-GAAP) AND ADJUSTED PRE-PROVISION NET REVENUE (NON-GAAP)
| | | | | | | | | | | | | | | | | | | | | | | | | | | | | | | | | | | | | | |
| | Three Months Ended | | Nine Months Ended | | Year Ended |
| (Dollar amounts in millions) | | September 30,
2020 | | June 30,
2020 | | September 30,
2019 | | September 30,
2020 | | September 30,
2019 | | December 31,
2019 |
| | | | | | | | | | | | |
| Noninterest expense (GAAP) | (a) | $ | 442 | | | $ | 430 | | | $ | 415 | | | $ | 1,279 | | | $ | 1,270 | | | $ | 1,742 | |
| Adjustments: | | | | | | | | | | | | |
Severance costs | | 1 | | | — | | | 2 | | | — | | | 4 | | | 25 | |
Other real estate expense, net | | — | | | — | | | (2) | | | — | | | (3) | | | (3) | |
| | | | | | | | | | | | |
Amortization of core deposit and other intangibles | | — | | | — | | | — | | | — | | | — | | | 1 | |
Restructuring costs | | 1 | | | — | | | — | | | 2 | | | — | | | 15 | |
Pension termination-related expense | | — | | | 28 | | | — | | | 28 | | | — | | | — | |
Total adjustments | (b) | 2 | | | 28 | | | — | | | 30 | | | 1 | | | 38 | |
Adjusted noninterest expense (non-GAAP) | (a-b)=(c) | $ | 440 | | | $ | 402 | | | $ | 415 | | | $ | 1,249 | | | $ | 1,269 | | | $ | 1,704 | |
| Net interest income (GAAP) | (d) | $ | 555 | | | $ | 563 | | | $ | 567 | | | $ | 1,665 | | | $ | 1,713 | | | $ | 2,272 | |
Fully taxable-equivalent adjustments | (e) | 7 | | | 6 | | | 7 | | | 21 | | | 19 | | | 26 | |
Taxable-equivalent net interest income (non-GAAP) | (d+e)=f | 562 | | | 569 | | | 574 | | | 1,686 | | | 1,732 | | | 2,298 | |
| Noninterest income (GAAP) | g | 157 | | | 117 | | | 146 | | | 408 | | | 410 | | | 562 | |
Combined income (non-GAAP) | (f+g)=(h) | 719 | | | 686 | | | 720 | | | 2,094 | | | 2,142 | | | 2,860 | |
| Adjustments: | | | | | | | | | | | | |
Fair value and nonhedge derivative gain (loss) | | 8 | | | (12) | | | (6) | | | (15) | | | (15) | | | (9) | |
Securities gains (losses), net | | 4 | | | (4) | | | 2 | | | (5) | | | — | | | 3 | |
Total adjustments | (i) | 12 | | | (16) | | | (4) | | | (20) | | | (15) | | | (6) | |
Adjusted taxable-equivalent revenue (non-GAAP) | (h-i)=(j) | $ | 707 | | | $ | 702 | | | $ | 724 | | | $ | 2,114 | | | $ | 2,157 | | | $ | 2,866 | |
Pre-provision net revenue (PPNR) (non-GAAP) | (h)-(a) | $ | 277 | | | $ | 256 | | | $ | 305 | | | $ | 815 | | | $ | 872 | | | $ | 1,118 | |
| Adjusted PPNR (non-GAAP) | (j)-(c) | 267 | | | 300 | | | 309 | | | 865 | | | 888 | | | 1,162 | |
Efficiency ratio (non-GAAP) 1 | (c/j) | 62.2 | % | | 57.3 | % | | 57.3 | % | | 59.1 | % | | 58.8 | % | | 59.5 | % |
1 Excluding the $30 million charitable contribution, the efficiency ratio for the three months and nine months ended September 30, 2020, would have been 58.0% and 57.7%, respectively.
ZIONS BANCORPORATION, NATIONAL ASSOCIATION AND SUBSIDIARIES
RESULTS OF OPERATIONS
Executive Summary
The financial performance in the third quarter of 2020 improved from the first half of 2020, as net income was more than double that of the first two quarters combined, reflecting a decline in the provision for credit losses. Highlights in the third quarter of 2020 include diluted earnings per share of $1.01, which was a level similar to those experienced throughout much of 2019. The lower interest rate environment continued to drive loan yields down more quickly than deposit rates, contributing to a 17-basis point decline in the net interest margin, which was 3.06% in the third quarter. Loans reflected growth in PPP loans, while deposit growth, assisted by various recent government economic stimulus programs, reduced the need for more expensive borrowed funds. Customer-related fee income increased in the third quarter of 2020, when compared with the second quarter of 2020, primarily from strength in residential mortgage loan originations and sales, as a result of lower benchmark interest rates and an enhanced customer-facing digital fulfillment process. Noninterest expenses, after normalizing for the $30 million charitable contribution to our foundation, were down relative to the year-ago period even as business investment continued.
COVID-19 Pandemic
During the third quarter of 2020, the COVID-19 pandemic continued to impact our operations. These impacts included:
•Alternative work arrangements as most employees continued to work remotely, and branch operating hours and lobby access were restricted in many cases.
•Significant support to employees through an increase in flexibility with paid leave and vacation policies, and more frequent cleaning of facilities to enable a safer environment for those employees who are not able to work from home.
•Increased flexibility with customers, as some borrowers requested and received temporary forbearance or re-deferrals of loan obligations. See "COVID-19 Modifications and Deferrals" on page 30 for more information.
•Facilitation of government lending programs. See "SBA's Paycheck Protection Program" and "Federal Reserve's Main Street Lending Program" in this section for more information.
•Support to our communities, including a $30 million charitable contribution associated with the PPP lending activity.
•Maintained our capital ratios and allowance for credit losses ("ACL") at strong levels. On January 1, 2020, we adopted Accounting Standards Update (“ASU”) 2016-13, Credit Losses (Topic 326): Measurement of Credit Losses on Financial Instruments, and its subsequent updates, often referred to as the Current Expected Credit Loss ("CECL") accounting standard. See "Critical Accounting Policies and Significant Estimates" on page 41 for more information on CECL.
Select Industries with Elevated Risk Related to COVID-19
Select industries have elevated risk due to the COVID-19 pandemic, and as a result, we are more closely managing our credit exposure to these industries, including ongoing detailed industry credit reviews during the second and third quarters of 2020. The following schedule shows $4.1 billion, or 8.5%, of our non-PPP loan balances as of September 30, 2020, in these industries. Approximately 3% of these loans were deferring payments, and 98% were secured by collateral. The oil and gas-related industry has also been affected by the COVID-19 pandemic. For more information see "Oil and Gas-Related Exposure" on page 26 of Management's Discussion and Analysis.
ZIONS BANCORPORATION, NATIONAL ASSOCIATION AND SUBSIDIARIES
COVID-19 ELEVATED RISK EXPOSURE
| | | | | | | | | | | |
| September 30, 2020 |
| (Dollar amounts in millions) | Amount | | % of total non-PPP loans |
| | | |
| CRE | | | |
| Retail | $1,121 | | 2.4 | % |
| Hotel/motel | 611 | | 1.3 | % |
| C&I | | | |
| Retail | 431 | | 0.9 | % |
| Tech, telecom, media | 427 | | 0.9 | % |
| Entertainment, recreation | 383 | | 0.8 | % |
| Transportation | 373 | | 0.8 | % |
| Consumer services | 256 | | 0.5 | % |
Other 1 | 452 | | 0.9 | % |
| Total | $4,054 | | 8.5 | % |
| | | |
1 No other industry group exceeds 0.5% of total non-PPP loans.
Line utilization of revolving loans for the COVID-19 industries with elevated risk has declined since the first quarter of 2020 to 29% at September 30, 2020, compared with 34% at June 30, 2020, and 43% at March 31, 2020.
SBA's Paycheck Protection Program
During 2020, we provided assistance to many small businesses through the PPP. This program provides small businesses with funds to be used for certain expenses as defined by the SBA.
As of September 30, 2020, we had processed more than $7 billion of PPP loans for more than 47,000 customers, which included more than 14,000 new customers. We continue to work diligently to solidify those new relationships. While we are the 37th largest financial institution in the United States when measured by total deposits, we ranked as the ninth largest originator of PPP loans by dollar volume of all the participating financial institutions, as disclosed by the SBA.
Loan processing fees paid to us from the SBA are accounted for as loan origination fees. These fees, net of loan origination costs, are deferred and recognized over the life of the loan as a yield adjustment. Toward the end of the third quarter of 2020, we extended the maturity dates of PPP loans with an initial two-year maturity to five years, which lengthened the period of time the remaining unamortized net deferred fees will be recognized into interest income as a yield adjustment. When a loan is paid off or forgiven by the SBA prior to its maturity date, the remaining unamortized net deferred fees are recognized into interest income at that time, and will therefore impact the PPP loan portfolio yield in that period. Beginning in October 2020, the SBA initiated forgiveness of certain PPP loans.
Federal Reserve's Main Street Lending Program
We are a participant in the Federal Reserve's Main Street Lending Program to support lending to small and medium-sized businesses and nonprofit organizations that were in sound financial condition before the onset of the COVID-19 pandemic. As of September 30, 2020, we had funded a limited number of loans under this program and expect to fund more Main Street Lending Program loans by the end of the year.
ZIONS BANCORPORATION, NATIONAL ASSOCIATION AND SUBSIDIARIES
Third Quarter 2020 Financial Performance
| | | | | | | | | | | | | | | | | | | | |
Net Earnings Applicable to Common Shareholders
(in millions) | | Provision for Credit Losses (in millions) | | Adjusted PPNR
(in millions) | | Efficiency ratio |
| | | | | | | | | | | | | | | | | | | | |
| | | | | | |
Net earnings decreased in the third quarter of 2020 from the third quarter of 2019, primarily from a higher provision for credit losses. The increase in net earnings from the second quarter of 2020 to the third quarter of 2020 was primarily due to a lower provision for credit losses. | | The increased provision for credit losses in the second and third quarters of 2020, compared with the third quarter of 2019, is due to experienced and expected economic stress caused by the COVID-19 pandemic. The provision in the third quarter of 2020 was down from the second quarter of 2020 as the effect of changes in economic forecasts and credit quality were offset by other portfolio changes. | | Adjusted PPNR decreased in the third quarter of 2020 from both the second quarter of 2020 and the third quarter of 2019. The decrease in adjusted PPNR is primarily a result of a $30 million charitable contribution to our foundation, which was associated with the PPP lending activity. Excluding this contribution, our adjusted PPNR would have been $297 million. | | Our efficiency ratio in the third quarter of 2020 was also affected by the $30 million charitable contribution. Excluding this contribution, our efficiency ratio was 58.0%. |
We reported net earnings applicable to common shareholders of $167 million, or $1.01 per diluted common share for the third quarter of 2020, compared with net earnings applicable to common shareholders of $214 million, or $1.17 per diluted common share for the third quarter of 2019.
We entered the current economic environment with a strong capital and reserve position, a robust liquidity profile, and a loan portfolio that has been substantially “de-risked” in recent years and that largely tends to have collateral as a secondary source of repayment – a characteristic that has historically resulted in lower loss rates per dollar of troubled loans. Additionally, beginning in the second quarter of 2020, we suspended share repurchase activity to assist in maintaining our strong capital position.
During this time of economic uncertainty, we have also materially strengthened our allowance for credit losses, which increased 74% to $917 million at the end of the third quarter of 2020, from $526 million at January 1, 2020. Net charge-offs increased during 2020, primarily from charge-offs related to oil and gas-related loans, and were $52 million during the third quarter of 2020, compared with $1 million during the same prior year period.
Net income decreased by $47 million to $175 million in the third quarter of 2020, from $222 million in the third quarter of 2019, primarily due to a $45 million increase in the provision for credit losses, a $30 million charitable contribution, and a decrease of $12 million in net interest income. These adverse impacts were partially offset by a $26 million reduction in income taxes and a $14 million improvement in credit valuation adjustments on client-related interest rate swaps.
Net interest income was $555 million in the third quarter of 2020, compared with $567 million in the same prior year period. Interest income decreased $96 million, while interest expense decreased $84 million. Both were impacted by lower benchmark interest rates. Interest income also benefited from loan growth of 12%, which was primarily due to PPP loan originations. Excluding PPP loans, loans decreased 2%.
ZIONS BANCORPORATION, NATIONAL ASSOCIATION AND SUBSIDIARIES
Adjusted PPNR of $267 million for the third quarter of 2020 was down $42 million, or 14%, from the third quarter of 2019. Adjusted noninterest expense increased by $25 million in the same time period as a result of the $30 million charitable contribution, but also reflected expense control and the reduction in workforce announced in October 2019. Excluding the $30 million charitable contribution, adjusted PPNR for the third quarter of 2020 was $297 million, down 4%, and adjusted noninterest expense was $410 million, down 1%. Our efficiency ratio was 62.2% in the third quarter of 2020, compared with 57.3% in both the second quarter of 2020 and the third quarter of 2019. Excluding the $30 million charitable contribution, the efficiency ratio in the third quarter of 2020 was 58.0%. See “GAAP to Non-GAAP Reconciliations” on page 6 for more information regarding the calculation of the adjusted PPNR and the efficiency ratio.
Our average loan portfolio increased $6.2 billion, or 13%, from the third quarter of 2019, but declined by $606 million when excluding PPP loans. Average PPP loans for the third quarter of 2020 were $6.8 billion. The yield on average loans decreased by 107 basis points (“bps”), reflecting the decline in benchmark interest rates and the impact of lower-yielding PPP loans. Overall, for the third quarter of 2020, compared with the third quarter of 2019, classified loans increased by $840 million, or 105%, and nonaccrual loans increased by $133 million, or 57%. The annualized ratio of net loan charge-offs to average loans was 0.38% for the third quarter of 2020, compared with 0.01% for the third quarter of 2019.
Areas of focus for 2020
We started 2020 with a continued focus on initiatives related to Bank profitability and returns on- and of-equity as detailed in our 2019 Annual Report on Form 10-K (see “Focus for 2020” in our 2019 Annual Report on
Form 10-K). More recently, the human and economic crises caused by the COVID-19 pandemic has shifted our focus toward serving our customers, communities, and employees who have been negatively impacted by the COVID-19 pandemic, as well as heightening our vigilance in managing emerging risks.
Net Interest Income and Net Interest Margin
Net interest income is the difference between interest earned on interest-earning assets and interest paid on interest-bearing liabilities, and is more than three-quarters of our revenue. Net interest income is derived from both the volume of interest-earning assets and interest-bearing liabilities and their respective yields and rates.
Net interest income decreased $12 million to $555 million in the third quarter of 2020, from $567 million in the third quarter of 2019. Yields on loans and securities decreased by 107 bps and 33 bps, respectively, while yields on deposits and borrowed funds decreased by 66 bps and 123 bps, respectively. The impact of lower interest rates was partially offset by loan growth from PPP loans, and a shift in liability balances from federal funds purchased and other short-term borrowings to lower-cost deposits. The net interest margin (“NIM”) compressed to 3.06% in the third quarter of 2020, compared with 3.48% in the same prior year period, and 3.23% in the second quarter of 2020. Excluding the effect of the PPP loans, the NIM may continue to compress over the next several quarters, primarily attributable to benchmark interest rate-related pressure on earning asset yields.
Average interest-earning assets increased $7.6 billion, or 12%, in the third quarter of 2020, from the third quarter of 2019, with average yields decreasing 95 bps. The yield on average interest earning assets includes the dilutive effect of $6.8 billion, or 9% of earning assets, of PPP loans with a yield of 3.03%, as compared with a yield on the non-PPP loan portfolio of 3.77%.
As of September 30, 2020, we received about 10,000 applications for PPP loan forgiveness, representing more than 20% of our PPP loans by count. Beginning in October 2020, the SBA initiated forgiveness of some of these loans and also announced a streamlined forgiveness process for borrowers with PPP loans of $50 thousand or less, which represents approximately $540 million, or 8%, of our PPP loan balance outstanding. When a loan is paid off or forgiven by the SBA prior to its maturity date, the remaining unamortized net deferred fees are recognized into interest income at that time.
The PPP loan yield in the third quarter of 2020 was 3.03%. As previously discussed, toward the end of the third quarter of 2020, we extended the maturity dates of PPP loans with an initial two-year maturity to five years, which
ZIONS BANCORPORATION, NATIONAL ASSOCIATION AND SUBSIDIARIES
lengthened the period of time the remaining unamortized net deferred fees will be recognized into interest income as a yield adjustment. As of September 30, 2020, there was approximately $141 million of unamortized net origination fees related to the PPP loans, which will be recognized over the remaining life of these loans. Using a five-year contractual maturity, these fees will add approximately 0.7% to the loan coupon rate of 1.0%. Prepayment or SBA forgiveness of these loans will accelerate the recognition of yield-enhancing fees and increase the net yield accordingly.
Average interest-bearing liabilities decreased $119 million in the third quarter of 2020, from the third quarter of 2019, and the average rate paid on interest-bearing liabilities decreased 87 bps to 0.27%.

 The loan growth in the third quarter of 2020, from the third quarter of 2019, was primarily due to PPP loans, which were funded primarily through deposit growth. The average loan yield decreased 107 bps over the same prior year period, with decreases of 87 bps, 158 bps, and 62 bps in non-PPP commercial loans, CRE, and consumer loans, respectively. Recently, as benchmark interest rates have settled at a lower level, yields on new loans have been only modestly lower than yields on maturing loans.
Benchmark interest rates decreased in 2019 and 2020, resulting in the previously discussed negative effect on yields. A portion of our variable-rate loans, such as those with longer initial fixed rate periods or longer reset frequencies (e.g., 5- and 7-year fixed rate adjustable mortgages), have not yet been affected by declines in benchmark interest rates. Also, our interest-earning assets generally reprice more quickly than our funding sources, in part because nearly half of our deposits are noninterest-bearing.
Average total deposits were $66.5 billion at an average cost of 11 bps for the third quarter of 2020, compared with $55.3 billion at an average cost of 50 bps for the third quarter of 2019. Various government stimulus programs contributed significantly to the deposit growth. Average interest-bearing deposits grew 12%, and were $35.7 billion at an average cost of 20 bps for the third quarter of 2020, compared with $31.9 billion at an average cost of 86 bps for the same prior year period. The 39 bps decline in the cost of total deposits and the 66 bps decline in the cost of interest bearing deposits was primarily due to the daily average benchmark federal funds target rate decrease from 2.31% to 0.25%, or 206 bps, between the third quarter of 2019 and the third quarter of 2020. This was partially attributable to our strong noninterest-bearing deposit growth and reduced competitive pricing pressure for deposits.
Although we consider a wide variety of sources when determining our funding needs, we benefit from access to deposits from a significant number of small- to mid-sized business customers, which provides us with a low cost of
ZIONS BANCORPORATION, NATIONAL ASSOCIATION AND SUBSIDIARIES
funds that has a positive impact on our NIM. Because many of our deposit accounts are of an operating nature for businesses and households, we expect our noninterest-bearing deposits to remain a competitive advantage. Average noninterest-bearing demand deposits increased by $7.4 billion, or 32%, in the third quarter of 2020, from the third quarter of 2019. Average noninterest-bearing deposits comprised 46% and 42% of average total deposits for the third quarters of 2020 and 2019, respectively. The net positive impact of noninterest-bearing sources of funds on the NIM was 0.13% during the third quarter of 2020, compared with 0.47% during the third quarter of 2019, reflecting the decline in benchmark interest rates.
The spread on average interest-bearing funds was 2.93% and 3.01% for the third quarters of 2020 and 2019, respectively, and was affected by the same factors that impacted the NIM. Interest rate spreads and margins are impacted by the mix of assets we hold, the composition of our loan and securities portfolios, and the type of funding used. Our estimates of our interest rate risk position are highly dependent upon a number of assumptions regarding the repricing behavior of various deposit and loan types in response to changes in both short-term and long-term interest rates, balance sheet composition, other modeling assumptions, and the actions of competitors and customers in response to those changes. Further detail on interest rate risk is discussed in “Interest Rate and Market Risk Management” on page 31.
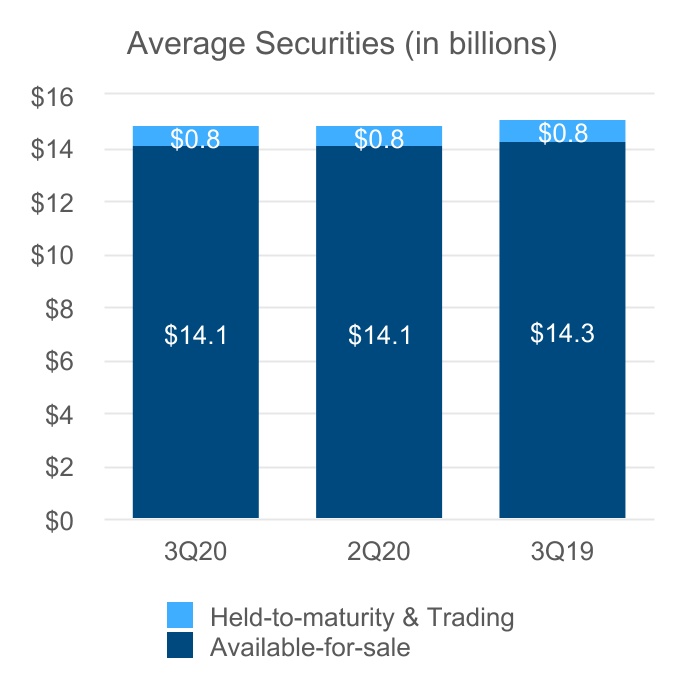
 Average available-for-sale (“AFS”) securities balances decreased by $240 million in the third quarter of 2020, from the third quarter of 2019. Yields on average AFS securities decreased by 34 bps over the same time period. The duration of the securities portfolio is 2.8 years. Runoff volume during the third quarter of 2020 was $1.5 billion, or 10% of the June 30, 2020 balance. We purchased $1.9 billion of securities during the third quarter of 2020 at an average yield of 1.2%. Given our current excess liquidity, we anticipate security purchases to exceed runoff by similar amounts over the next few quarters.
Average borrowed funds decreased $3.9 billion in the third quarter of 2020, from the third quarter of 2019, with average short-term borrowings decreasing $4.0 billion, and average long-term borrowings increasing by $0.1 billion during the same time period, reflecting less reliance on federal funds purchased and other short-term borrowings because of strong deposit growth. The average interest rate paid on short-term borrowings and long-term debt decreased by 220 bps and 133 bps, respectively, in the third quarter of 2020, from the third quarter of 2019.
The following schedule summarizes the average balances, the amount of interest earned or incurred, and the applicable yields for interest-earning assets and the costs of interest-bearing liabilities that generate taxable-equivalent net interest income.
ZIONS BANCORPORATION, NATIONAL ASSOCIATION AND SUBSIDIARIES
CONSOLIDATED AVERAGE BALANCE SHEETS, YIELDS AND RATES
| | | | | | | | | | | | | | | | | | | | | | | | | | | | | | | | | | | |
| (Unaudited) | Three Months Ended
September 30, 2020 | | Three Months Ended
September 30, 2019 |
| (Dollar amounts in millions) | Average
balance | | Amount of interest 1 | | Average
yield/rate | | Average
balance | | Amount of interest 1 | | Average
yield/rate |
| ASSETS | | | | | | | | | | | |
| Money market investments | $ | 3,116 | | | $ | 2 | | | 0.25 | % | | $ | 1,413 | | | $ | 8 | | | 2.41 | % |
| Securities: | | | | | | | | | | | |
| Held-to-maturity | 672 | | | 6 | | | 3.39 | | | 693 | | | 6 | | | 3.66 | |
| Available-for-sale | 14,083 | | | 69 | | | 1.95 | | | 14,323 | | | 82 | | | 2.29 | |
| Trading account | 158 | | | 1 | | | 4.31 | | | 135 | | | 2 | | | 4.50 | |
Total securities 2 | 14,913 | | | 76 | | | 2.04 | | | 15,151 | | | 90 | | | 2.37 | |
| Loans held for sale | 86 | | | 1 | | | 4.32 | | | 89 | | | 1 | | | 3.67 | |
Loans and leases 3 | | | | | | | | | | | |
| Commercial - excluding PPP loans | 24,909 | | | 248 | | | 3.96 | | | 25,284 | | | 308 | | | 4.83 | |
| Commercial - PPP loans | 6,771 | | | 52 | | | 3.03 | | | — | | | — | | | — | |
| Commercial real estate | 11,986 | | | 106 | | | 3.52 | | | 11,849 | | | 153 | | | 5.10 | |
| Consumer | 11,327 | | | 103 | | | 3.60 | | | 11,695 | | | 124 | | | 4.22 | |
| Total loans and leases | 54,993 | | | 509 | | | 3.68 | | | 48,828 | | | 585 | | | 4.75 | |
| Total interest-earning assets | 73,108 | | | 588 | | | 3.20 | | | 65,481 | | | 684 | | | 4.15 | |
| Cash and due from banks | 583 | | | | | | | 616 | | | | | |
| Allowance for credit losses on loans and debt securities | (852) | | | | | | | (502) | | | | | |
| Goodwill and intangibles | 1,015 | | | | | | | 1,014 | | | | | |
| Other assets | 4,129 | | | | | | | 3,643 | | | | | |
| Total assets | $ | 77,983 | | | | | | | $ | 70,252 | | | | | |
| LIABILITIES AND SHAREHOLDERS’ EQUITY | | | | | | | | | | |
| Interest-bearing deposits: | | | | | | | | | | | |
| Savings and money market | $ | 32,111 | | | $ | 9 | | | 0.11 | % | | $ | 26,962 | | | $ | 44 | | | 0.65 | % |
| Time | 3,602 | | | 9 | | | 0.96 | | | 4,963 | | | 25 | | | 1.99 | |
| | | | | | | | | | | |
| Total interest-bearing deposits | 35,713 | | | 18 | | | 0.20 | | | 31,925 | | | 69 | | | 0.86 | |
| Borrowed funds: | | | | | | | | | | | |
Federal funds purchased and other short-term borrowings | 1,078 | | | — | | | 0.09 | | | 5,099 | | | 30 | | | 2.29 | |
| Long-term debt | 1,353 | | | 8 | | | 2.32 | | | 1,239 | | | 11 | | | 3.65 | |
| Total borrowed funds | 2,431 | | | 8 | | | 1.33 | | | 6,338 | | | 41 | | | 2.56 | |
| Total interest-bearing liabilities | 38,144 | | | 26 | | | 0.27 | | | 38,263 | | | 110 | | | 1.14 | |
| Noninterest-bearing demand deposits | 30,789 | | | | | | | 23,359 | | | | | |
| Other liabilities | 1,406 | | | | | | | 1,062 | | | | | |
| Total liabilities | 70,339 | | | | | | | 62,684 | | | | | |
| Shareholders’ equity: | | | | | | | | | | | |
| Preferred equity | 566 | | | | | | | 566 | | | | | |
| Common equity | 7,078 | | | | | | | 7,002 | | | | | |
| Total shareholders’ equity | 7,644 | | | | | | | 7,568 | | | | | |
| Total liabilities and shareholders’ equity | $ | 77,983 | | | | | | | $ | 70,252 | | | | | |
| Spread on average interest-bearing funds | | | | | 2.93 | % | | | | | | 3.01 | % |
| Net impact of noninterest-bearing sources of funds | | | | | 0.13 | | | | | | | 0.47 | |
Net interest margin | | | $ | 562 | | | 3.06 | | | | | $ | 574 | | | 3.48 | |
| Memo: total loans and leases, excluding PPP loans | $ | 48,222 | | | 457 | | 3.77 | | | $ | 48,828 | | | 585 | | 4.75 | |
| | | | | | | | | | | |
Memo: total cost of deposits | | | | | 0.11 | | | | | | | 0.50 | |
| Memo: total deposits and interest-bearing liabilities | 68,933 | | | 26 | | | 0.15 | | | 61,622 | | | 110 | | | 0.71 | |
1 Rates are calculated using amounts in thousands and the statutory taxable-equivalent rates where applicable. The taxable-equivalent rates used are the rates that were applicable at the time of each respective reporting period.
2 Interest on total securities includes $26 million and $33 million of taxable-equivalent premium amortization for the third quarters of 2020 and 2019, respectively.
3 Net of unearned income and fees, net of related costs. Loans include nonaccrual and restructured loans.
ZIONS BANCORPORATION, NATIONAL ASSOCIATION AND SUBSIDIARIES
| | | | | | | | | | | | | | | | | | | | | | | | | | | | | | | | | | | |
| (Unaudited) | Nine Months Ended
September 30, 2020 | | Nine Months Ended
September 30, 2019 |
| (Dollar amounts in millions) | Average
balance | | Amount of interest 1 | | Average
yield/rate | | Average
balance | | Amount of interest 1 | | Average
yield/rate |
| ASSETS | | | | | | | | | | | |
| Money market investments | $ | 2,250 | | | $ | 11 | | | 0.65 | % | | $ | 1,315 | | | $ | 26 | | | 2.59 | % |
| Securities: | | | | | | | | | | | |
| Held-to-maturity | 632 | | | 17 | | | 3.56 | | | 736 | | | 20 | | | 3.69 | |
| Available-for-sale | 13,967 | | | 220 | | | 2.11 | | | 14,597 | | | 262 | | | 2.40 | |
| Trading account | 157 | | | 5 | | | 4.29 | | | 138 | | | 5 | | | 4.49 | |
Total securities 2 | 14,756 | | | 242 | | | 2.19 | | | 15,471 | | | 287 | | | 2.48 | |
| Loans held for sale | 106 | | | 4 | | | 4.19 | | | 74 | | | 1 | | | 2.65 | |
Loans and leases 3 | | | | | | | | | | | |
| Commercial - excluding PPP loans | 25,398 | | | 794 | | | 4.18 | | | 24,899 | | | 919 | | | 4.94 | |
| Commercial - PPP loans | 3,938 | | | 91 | | | 3.08 | | | — | | | — | | | — | |
| Commercial real estate | 11,800 | | | 351 | | | 3.98 | | | 11,656 | | | 454 | | | 5.21 | |
| Consumer | 11,558 | | | 325 | | | 3.75 | | | 11,559 | | | 369 | | | 4.26 | |
| Total loans and leases | 52,694 | | | 1,561 | | | 3.96 | | | 48,114 | | | 1,742 | | | 4.84 | |
| Total interest-earning assets | 69,806 | | | 1,818 | | | 3.48 | | | 64,974 | | | 2,056 | | | 4.23 | |
| Cash and due from banks | 625 | | | | | | | 588 | | | | | |
| Allowance for loan losses | (692) | | | | | | | (499) | | | | | |
| Goodwill and intangibles | 1,014 | | | | | | | 1,014 | | | | | |
| Other assets | 3,960 | | | | | | | 3,493 | | | | | |
| Total assets | $ | 74,713 | | | | | | | $ | 69,570 | | | | | |
| LIABILITIES AND SHAREHOLDERS’ EQUITY | | | | | | | | | | |
| Interest-bearing deposits: | | | | | | | | | | | |
| Savings and money market | $ | 30,360 | | | $ | 53 | | | 0.23 | % | | $ | 26,418 | | | $ | 120 | | | 0.61 | % |
| Time | 3,968 | | | 39 | | | 1.33 | | | 4,889 | | | 72 | | | 1.97 | |
| | | | | | | | | | | |
| Total interest-bearing deposits | 34,328 | | | 92 | | | 0.36 | | | 31,307 | | | 192 | | | 0.82 | |
| Borrowed funds: | | | | | | | | | | | |
Federal funds purchased and other short-term borrowings | 2,073 | | | 10 | | | 0.61 | | | 5,394 | | | 100 | | | 2.46 | |
| Long-term debt | 1,611 | | | 30 | | | 2.50 | | | 1,117 | | | 32 | | | 3.83 | |
| Total borrowed funds | 3,684 | | | 40 | | | 1.44 | | | 6,511 | | | 132 | | | 2.70 | |
| Total interest-bearing liabilities | 38,012 | | | 132 | | | 0.46 | | | 37,818 | | | 324 | | | 1.14 | |
| Noninterest-bearing demand deposits | 27,825 | | | | | | | 23,214 | | | | | |
| Other liabilities | 1,299 | | | | | | | 974 | | | | | |
| Total liabilities | 67,136 | | | | | | | 62,006 | | | | | |
| Shareholders’ equity: | | | | | | | | | | | |
| Preferred equity | 566 | | | | | | | 566 | | | | | |
| Common equity | 7,011 | | | | | | | 6,998 | | | | | |
| Total shareholders’ equity | 7,577 | | | | | | | 7,564 | | | | | |
| Total liabilities and shareholders’ equity | $ | 74,713 | | | | | | | $ | 69,570 | | | | | |
| Spread on average interest-bearing funds | | | | | 3.02 | % | | | | | | 3.09 | % |
| Net impact of noninterest-bearing sources of funds | | | | | 0.21 | | | | | | | 0.47 | |
Net interest margin | | | $ | 1,686 | | | 3.23 | | | | | $ | 1,732 | | | 3.56 | |
| Memo: total loans and leases, excluding PPP loans | $ | 48,756 | | | 1,470 | | | 4.03 | | | $ | 48,114 | | | 1,742 | | | 4.84 | |
| | | | | | | | | | | |
Memo: total cost of deposits | | | | | 0.20 | | | | | | | 0.47 | |
| Memo: total deposits and interest-bearing liabilities | 65,837 | | | 132 | | | 0.26 | | | 61,032 | | | 324 | | | 0.70 | |
1 Rates are calculated using amounts in thousands and the statutory taxable-equivalent rates where applicable. The taxable-equivalent rates used are the rates that were applicable at the time of each respective reporting period.
2 Interest on total securities includes $80 million and $96 million of taxable-equivalent premium amortization for the first nine months of 2020 and 2019, respectively.
3 Net of unearned income and fees, net of related costs. Loans include nonaccrual and restructured loans.
ZIONS BANCORPORATION, NATIONAL ASSOCIATION AND SUBSIDIARIES
Provision for Credit Losses
The allowance for credit losses (“ACL”) is the combination of both the allowance for loan and lease losses (“ALLL”) and the reserve for unfunded lending commitments (“RULC”). The ALLL represents the estimated current expected credit losses over the contractual term of the loan and lease portfolio as of the balance sheet date. The RULC represents the estimated reserve for current expected credit losses associated with off-balance sheet commitments. Changes in the ALLL and RULC, including changes in net charge-offs, are recorded in the provision for loan and lease losses and the provision for unfunded lending commitments in the income statement, respectively. The ACL for debt securities is estimated separately from loans.
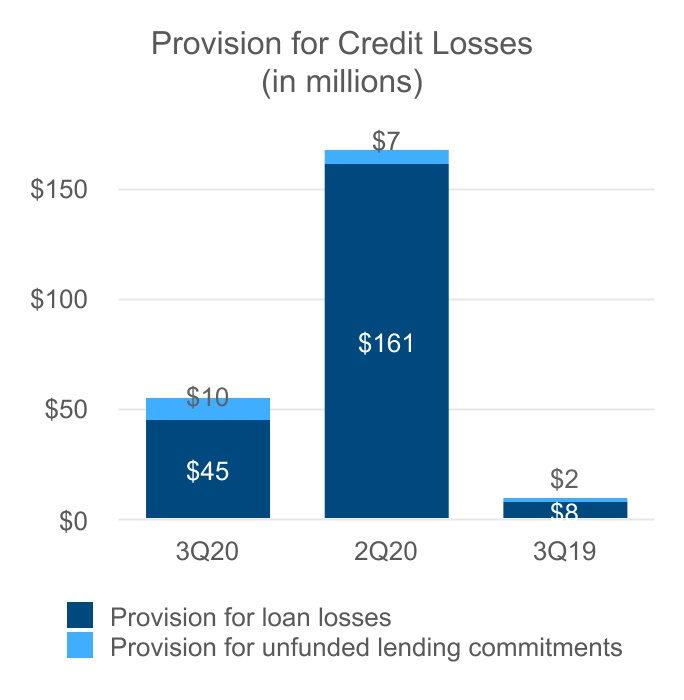

The provision for credit losses, which is the combination of both the provision for loan losses and the provision for unfunded lending commitments, was $55 million in the third quarter of 2020, compared with $10 million in the third quarter of 2019, and $168 million in the second quarter of 2020. The ACL increased $345 million to $917 million at September 30, 2020, compared with $572 million at September 30, 2019. The year-over-year increase in the ACL is almost entirely due to experienced and expected economic stress caused by the COVID-19 pandemic. The annualized ratio of net charge-offs to average loans during the third quarter of 2020 was 0.38%, compared with 0.01% during the third quarter of 2019. The provision for credit losses for debt securities was less than $1 million in the third quarter of 2020.
ZIONS BANCORPORATION, NATIONAL ASSOCIATION AND SUBSIDIARIES
The total ACL was $917 million at September 30, 2020, compared with $914 million at June 30, 2020. The bar chart above shows the broad categories of change. The second bar represents the change in economic forecast. The $50 million increase from the prior quarter is our estimate of the change in credit losses due to slower economic recovery than previously forecast. Our base forecast shows economic improvement beginning in late 2020, gradually stabilizing by 2022. Credit quality factors represented by the third bar include risk-grade migration and specific reserves against loans, which, when combined, add $24 million to the ACL when compared with the prior quarter, showing moderate credit quality deterioration. Lastly, portfolio changes, driven by non-PPP loan balances declining, the aging of the portfolio, decreased utilization, and other similar factors, generated a $71 million reduction in the ACL.
On January 1, 2020, we adopted ASU 2016-13, or CECL. Upon adoption of the ASU, we recorded the full amount of the ACL for loans and leases of $526 million, compared with $554 million at December 31, 2019, resulting in an after-tax increase to retained earnings of $20 million. The impact of the adoption of CECL for our securities portfolio was less than $1 million. As a result of this new accounting standard, our ACL has become more volatile and we expect this to continue primarily because, under the new process, the allowance is subject to economic forecasts that may change materially from period to period.
Note 6 of our 2019 Annual Report on Form 10-K and “Credit Risk Management” on page 24 contains information on how we determine the appropriate level for the ALLL and the RULC. Also, for more information see “Critical Accounting Policies and Significant Estimates” on page 41.
Noninterest Income
Noninterest income represents revenues we earn for products and services that have no associated interest rate or yield. We believe a subtotal of customer-related fees provides a better view of income over which we have more direct near-term control. It excludes items such as dividends, insurance-related income, mark-to-market adjustments on certain derivatives, and securities gains and losses. Growing noninterest income is a key strategic priority, and several strategic initiatives are underway to support this effort. We are working to leverage our focus on commercial and small business customers to accelerate sales of capital markets products, treasury management, and wealth advisory services. Noninterest income accounted for 22% and 20% of net revenue during the third quarters of 2020 and 2019, respectively.
ZIONS BANCORPORATION, NATIONAL ASSOCIATION AND SUBSIDIARIES
The following schedule presents a comparison of the major components of noninterest income.
NONINTEREST INCOME
| | | | | | | | | | | | | | | | | | | | | | | | | | | | | | | | | | | | | | | | | | | | | | | |
| Three Months Ended
September 30, | | Amount
change | | Percent
change | | Nine Months Ended
September 30, | | Amount
change | | Percent
change |
| (Dollar amounts in millions) | 2020 | | 2019 | | | 2020 | | 2019 | |
| | | | | | | | | | | | | | | |
Commercial account fees | $ | 32 | | | $ | 31 | | | $ | 1 | | | 3 | % | | $ | 93 | | | $ | 90 | | | $ | 3 | | | 3 | % |
Card fees | 21 | | | 24 | | | (3) | | | (13) | | | 61 | | | 70 | | | (9) | | | (13) | |
| Retail and business banking fees | 17 | | | 20 | | | (3) | | | (15) | | | 50 | | | 58 | | | (8) | | | (14) | |
| Loan-related fees and income | 32 | | | 21 | | | 11 | | | 52 | | | 84 | | | 55 | | | 29 | | | 53 | |
| Capital markets and foreign exchange fees | 16 | | | 23 | | | (7) | | | (30) | | | 58 | | | 59 | | | (1) | | | (2) | |
| Wealth management and trust fees | 14 | | | 16 | | | (2) | | | (13) | | | 46 | | | 45 | | | 1 | | | 2 | |
| Other customer-related fees | 7 | | | 5 | | | 2 | | | 40 | | | 19 | | | 15 | | | 4 | | | 27 | |
Customer-related fees | 139 | | | 140 | | | (1) | | | (1) | | | 411 | | | 392 | | | 19 | | | 5 | |
| Fair value and nonhedge derivative income (loss) | 8 | | | (6) | | | 14 | | | NM | | (15) | | | (15) | | | — | | | — | |
| Dividends and other income | 6 | | | 10 | | | (4) | | | (40) | | | 17 | | | 33 | | | (16) | | | (48) | |
| Securities gains (losses), net | 4 | | | 2 | | | 2 | | | NM | | (5) | | | — | | | (5) | | | NM |
Total noninterest income | $ | 157 | | | $ | 146 | | | $ | 11 | | | 8 | % | | $ | 408 | | | $ | 410 | | | $ | (2) | | | — | % |
Total noninterest income for the third quarter of 2020 increased by $11 million, or 8%, to $157 million for the third quarter of 2020, from $146 million for the third quarter of 2019. Total customer-related fees decreased slightly to $139 million for the third quarter of 2020, from $140 million for the third quarter of 2019. Loan-related fees and income increased $11 million due to residential mortgage loan originations and sales for the same period, which benefited from the reduction in benchmark interest rates and our enhanced customer-facing digital fulfillment process. Capital markets and foreign exchange fees decreased by $7 million in the third quarter of 2020, from the third quarter of 2019, due largely to reduced income from arranging interest rate hedges for our loan customers. Retail and business banking fees decreased by $3 million in the third quarter of 2020, from the third quarter of 2019, due to waiving of fees as a result of the COVID-19 pandemic. Card fees also decreased by $3 million during this same period from reduced economic activity and transactions volume in the third quarter of 2020.
In the third quarter of 2020, we recognized an $8 million positive credit valuation adjustment (“CVA”) on client-related interest rate swaps, compared with a $12 million negative CVA in the second quarter of 2020, and a $6 million negative CVA in the prior year period. Dividends and other income decreased to $6 million in the third quarter of 2020 from $10 million in the third quarter of 2019, primarily due to lower dividends received from the Federal Home Loan Bank (“FHLB”), reflecting less FHLB activity stock held by the Bank.
Customer-related fees for the first nine months of 2020 increased by $19 million, or 5%, primarily from loan-related fees and income and other customer-related fees, and was partially offset by a decrease in card fees and retail and business banking fees.
Noninterest Expense
Noninterest expense increased by $27 million, or 7%, in the third quarter of 2020, from the third quarter of 2019. Adjusted noninterest expense increased $25 million, or 6%, over the same time period. The following schedule presents a comparison of the major components of noninterest expense.
ZIONS BANCORPORATION, NATIONAL ASSOCIATION AND SUBSIDIARIES
NONINTEREST EXPENSE
| | | | | | | | | | | | | | | | | | | | | | | | | | | | | | | | | | | | | | | | | | | | | | | |
| Three Months Ended
September 30, | | Amount
change | | Percent
change | | Nine Months Ended
September 30, | | Amount
change | | Percent
change |
| (Dollar amounts in millions) | 2020 | | 2019 | | | 2020 | | 2019 | |
| | | | | | | | | | | | | | | |
| Salaries and employee benefits | $ | 269 | | | $ | 273 | | | $ | (4) | | | (1) | % | | $ | 810 | | | $ | 835 | | | $ | (25) | | | (3) | % |
| Occupancy, net | 33 | | | 34 | | | (1) | | | (3) | | | 97 | | | 99 | | | (2) | | | (2) | |
| Furniture, equipment and software, net | 32 | | | 34 | | | (2) | | | (6) | | | 97 | | | 101 | | | (4) | | | (4) | |
| Other real estate expense, net | — | | | (2) | | | 2 | | | NM | | — | | | (3) | | | 3 | | | NM |
| Credit-related expense | 6 | | | 2 | | | 4 | | | NM | | 16 | | | 16 | | | — | | | — | |
| Professional and legal services | 12 | | | 10 | | | 2 | | | 20 | | | 34 | | | 33 | | | 1 | | | 3 | |
| Advertising | 7 | | | 6 | | | 1 | | | 17 | | | 13 | | | 17 | | | (4) | | | (24) | |
| FDIC premiums | 7 | | | 7 | | | — | | | — | | | 18 | | | 19 | | | (1) | | | (5) | |
| Other | 76 | | | 51 | | | 25 | | | 49 | | | 194 | | | 153 | | | 41 | | | 27 | |
Total noninterest expense | $ | 442 | | | $ | 415 | | | $ | 27 | | | 7 | % | | $ | 1,279 | | | $ | 1,270 | | | $ | 9 | | | 1 | % |
Adjusted noninterest expense 1 | $ | 440 | | | $ | 415 | | | $ | 25 | | | 6 | % | | $ | 1,249 | | | $ | 1,269 | | | $ | (20) | | | (2) | % |
1 For information on non-GAAP financial measures, see “GAAP to Non-GAAP Reconciliations” on page 6.
The $27 million increase in noninterest expense from the third quarter of 2019 to the third quarter of 2020 was attributable to a $30 million charitable contribution to our foundation, which was associated with the PPP lending activity, and was reflected in other noninterest expense. This increase in other noninterest expense was partially offset by a $5 million decline in travel and entertainment expenses. Salaries and employee benefits expense declined $4 million from the third quarter of 2019 to the third quarter of 2020, and includes $3 million of PPP-related bonuses. Full-time equivalent employees decreased from 10,255 to 9,726 from the third quarter of 2019 to the third quarter of 2020, primarily as a result of the 5% workforce reduction announced in October 2019. Credit-related expense increased by $4 million during the same time from increased appraisal and other fees. During the third quarter of 2020, advertising expense included $3 million associated with our efforts to retain "new to Bank" PPP recipients.
Adjusted noninterest expense for the third quarter of 2020 increased $25 million, or 6%, to $440 million, and includes the previously discussed $30 million charitable contribution, compared with $415 million for the same prior year period. The efficiency ratio was 62.2% in the third quarter of 2020, compared with 57.3% for both the second quarter of 2020 and the third quarter of 2019. Excluding the $30 million charitable contribution, the efficiency ratio for the third quarter of 2020 would have been 58.0%. The efficiency ratio and adjusted noninterest expense exclude certain expense items (see “GAAP to Non-GAAP Reconciliations” on page 6 for more information regarding the calculation of the efficiency ratio).
Noninterest expense for both the first nine months of 2020 and 2019 was $1.3 billion. Other noninterest expense increased by $41 million, primarily due to the previously mentioned $30 million charitable contribution in the third quarter of 2020 and a $28 million pension plan termination-related expense in the second quarter of 2020. These increases were partially offset by a $25 million decrease in salaries and employee benefits for the same time period.
Income Taxes
Income tax expense for the third quarter of 2020 was $40 million, compared with $66 million for the same prior year period as a result of lower pretax income during the third quarter of 2020. The effective income tax rates were 18.6% and 22.9% for the third quarters of 2020 and 2019, respectively, as a result of the proportional increase in nontaxable items and tax credits relative to pretax income as compared with the prior year period.
Income tax expense for the first nine months of 2020 was $58 million, compared with $185 million for the first nine months of 2019. The effective tax rates for these year-to-date periods were 18.5% and 22.6%, respectively. Note 13 of the Notes to Consolidated Financial Statements contains additional information about the factors that influenced the income tax rates and information about deferred income tax assets and liabilities.
ZIONS BANCORPORATION, NATIONAL ASSOCIATION AND SUBSIDIARIES
Preferred Stock Dividends
Preferred stock dividends have been consistent over the past year and were $8 million for both the third quarters of 2020 and 2019 and $25 million for both the first nine months 2020 and 2019.
BALANCE SHEET ANALYSIS
Interest-Earning Assets
Interest-earning assets are those assets that have interest rates or yields associated with them. One of our goals is to maintain a high level of interest-earning assets relative to total assets while keeping non-earning assets at a minimum. Interest-earning assets consist of money market investments, securities, loans, and leases.
For information regarding the average balances of our interest-earning assets, the amount of revenue generated by them, and their respective yields, see the average balance sheet on page 15.
Average interest-earning assets were $69.8 billion for the first nine months of 2020, compared with $65.0 billion for the first nine months of 2019. Average interest-earning assets as a percentage of total average assets for the first nine months of 2020 and 2019 were both 93%.
Average loans were $52.7 billion and $48.1 billion for the first nine months of 2020 and 2019, respectively. Average loans as a percentage of total average assets for the first nine months of 2020 were 71%, compared with 69% in the same prior year period.
Average money market investments, consisting of interest-bearing deposits, federal funds sold, and security resell agreements, increased by 71% to $2.3 billion for the first nine months of 2020, compared with $1.3 billion for the first nine months of 2019. Average securities decreased by 5% for the first nine months of 2020, compared with the first nine months of 2019.
Investment Securities Portfolio
We invest in securities to actively manage liquidity and interest rate risk, in addition to generating revenue for the Bank. Refer to the “Liquidity Risk Management” section on page 37 for additional information on management of liquidity and funding. The following schedule presents a profile of our investment securities portfolio. The amortized cost amounts represent the original cost of the investments, adjusted for related accumulated amortization or accretion of any yield adjustments, and for impairment losses, including credit-related impairment. The estimated fair value measurement levels and methodology are discussed in Note 3 of our 2019 Annual Report on Form 10-K.
INVESTMENT SECURITIES PORTFOLIO
| | | | | | | | | | | | | | | | | | | | | | | | | | | | | | | | | | | | | | | |
| September 30, 2020 | | December 31, 2019 |
| (In millions) | Par value | | Amortized
cost | | | | Estimated
fair
value | | Par value | | Amortized
cost | | | | Estimated
fair
value |
| Held-to-maturity | | | | | | | | | | | | | | | |
| Municipal securities | $ | 592 | | | $ | 592 | | | | | $ | 596 | | | $ | 592 | | | $ | 592 | | | | | $ | 597 | |
| | | | | | | | | | | | | | | |
| | | | | | | | | | | | | | | |
| | | | | | | | | | | | | | | |
| Available-for-sale | | | | | | | | | | | | | | | |
| U.S. Treasury securities | 205 | | | 195 | | | | | 199 | | | 25 | | | 25 | | | | | 25 | |
U.S. Government agencies and corporations: | | | | | | | | | | | | | | | |
| Agency securities | 1,058 | | | 1,058 | | | | | 1,093 | | | 1,301 | | | 1,301 | | | | | 1,302 | |
Agency guaranteed mortgage-backed securities | 10,314 | | | 10,461 | | | | | 10,736 | | | 9,406 | | | 9,518 | | | | | 9,559 | |
Small Business Administration loan-backed securities | 1,177 | | | 1,277 | | | | | 1,239 | | | 1,414 | | | 1,535 | | | | | 1,495 | |
| Municipal securities | 1,154 | | | 1,254 | | | | | 1,320 | | | 1,175 | | | 1,282 | | | | | 1,319 | |
| Other debt securities | 75 | | | 75 | | | | | 75 | | | 25 | | | 25 | | | | | 25 | |
| | | | | | | | | | | | | | | |
| | | | | | | | | | | | | | | |
| | | | | | | | | | | | | | | |
| | | | | | | | | | | | | | | |
| | | | | | | | | | | | | | | |
| | | | | | | | | | | | | | | |
| | | | | | | | | | | | | | | |
| Total available-for-sale | 13,983 | | | 14,320 | | | | | 14,662 | | | 13,346 | | | 13,686 | | | | | 13,725 | |
| Total investment securities | $ | 14,575 | | | $ | 14,912 | | | | | $ | 15,258 | | | $ | 13,938 | | | $ | 14,278 | | | | | $ | 14,322 | |
ZIONS BANCORPORATION, NATIONAL ASSOCIATION AND SUBSIDIARIES
The amortized cost of investment securities at September 30, 2020 increased by 4% from the balances at December 31, 2019. Approximately 26% of the investment securities are floating rate as of September 30, 2020.
The investment securities portfolio includes $337 million of net premium that is distributed across various asset classes as illustrated in the preceding schedule. Premium amortization for the three months ended September 30, 2020, was $26 million, compared with $33 million for the same period in 2019.
As of September 30, 2020, under the GAAP fair value accounting hierarchy, 1.4% of the $14.7 billion fair value of the AFS securities portfolio was valued at Level 1, 98.6% was valued at Level 2, and there were no Level 3 AFS securities. At December 31, 2019, 0.2% of the $13.7 billion fair value of AFS securities portfolio was valued at Level 1, 99.8% was valued at Level 2, and there were no Level 3 AFS securities. See Note 3 of our 2019 Annual Report on Form 10-K for further discussion of fair value accounting.
Exposure to State and Local Governments
We provide multiple products and services to state and local governments (referred to collectively as “municipalities”), including deposit services, loans, and investment banking services, and we invest in securities issued by the municipalities. The following schedule summarizes our exposure to state and local municipalities:
MUNICIPALITIES
| | | | | | | | | | | |
| (In millions) | September 30,
2020 | | December 31,
2019 |
| | | |
| Loans and leases | $ | 2,706 | | | $ | 2,393 | |
| Held-to-maturity – municipal securities | 592 | | | 592 | |
| Available-for-sale – municipal securities | 1,321 | | | 1,319 | |
| | | |
| Trading account – municipal securities | 168 | | | 107 | |
| Unfunded lending commitments | 310 | | | 200 | |
Total direct exposure to municipalities | $ | 5,097 | | | $ | 4,611 | |
Most of the municipal portfolio is secured by real estate or equipment, or is a general obligation of a municipal entity. Our municipal securities and loans are primarily from municipalities located within our geographic footprint. At September 30, 2020, no municipal loans were on nonaccrual. Municipal securities are internally graded, similar to loans, using risk-grading systems which vary based on the size and type of credit risk exposure. The internal risk grades assigned to our municipal securities follow our definitions of Pass, Special Mention, and Substandard, which are consistent with published definitions of regulatory risk classifications. As of September 30, 2020, all municipal securities were classified as Pass. See Notes 5 and 6 of the Notes to Consolidated Financial Statements for additional information about the credit quality of these municipal loans and securities.
Foreign Exposure and Operations
Our credit exposure to foreign sovereign risks and total foreign credit exposure is not significant. We also do not have significant foreign exposure to derivative counterparties. We had no foreign deposits at September 30, 2020 and December 31, 2019.
Loan and Lease Portfolio
For the first nine months of 2020 and 2019, average loans accounted for 71% and 69%, respectively, of total average assets. As presented in the following schedule, the largest category was commercial and industrial loans, which constituted 25% of our loan portfolio at September 30, 2020.
ZIONS BANCORPORATION, NATIONAL ASSOCIATION AND SUBSIDIARIES
LOAN AND LEASE PORTFOLIO
| | | | | | | | | | | | | | | | | | | | | | | |
| September 30, 2020 | | December 31, 2019 |
| (Dollar amounts in millions) | Amount | | % of
total loans | | Amount | | % of
total loans |
| Commercial: | | | | | | | |
| Commercial and industrial | $ | 13,543 | | | 24.7 | % | | $ | 14,760 | | | 30.3 | % |
| PPP | 6,810 | | | 12.4 | | | — | | | — | |
| Leasing | 319 | | | 0.6 | | | 334 | | | 0.7 | |
| Owner-occupied | 8,136 | | | 14.9 | | | 7,901 | | | 16.2 | |
| Municipal | 2,706 | | | 4.9 | | | 2,393 | | | 4.9 | |
| Total commercial | 31,514 | | | 57.5 | | | 25,388 | | | 52.1 | |
| Commercial real estate: | | | | | | | |
| Construction and land development | 2,298 | | | 4.2 | | | 2,211 | | | 4.5 | |
| Term | 9,729 | | | 17.8 | | | 9,344 | | | 19.2 | |
| Total commercial real estate | 12,027 | | | 22.0 | | | 11,555 | | | 23.7 | |
| Consumer: | | | | | | | |
| Home equity credit line | 2,797 | | | 5.1 | | | 2,917 | | | 6.0 | |
| 1-4 family residential | 7,209 | | | 13.2 | | | 7,568 | | | 15.6 | |
| Construction and other consumer real estate | 633 | | | 1.2 | | | 624 | | | 1.3 | |
| Bankcard and other revolving plans | 431 | | | 0.8 | | | 502 | | | 1.0 | |
| Other | 134 | | | 0.2 | | | 155 | | | 0.3 | |
| Total consumer | 11,204 | | | 20.5 | | | 11,766 | | | 24.2 | |
| Total net loans and leases | $ | 54,745 | | | 100.0 | % | | $ | 48,709 | | | 100.0 | % |
Loan portfolio growth during the first nine months of 2020 was primarily due to the origination of PPP loans across our geographic footprint. Excluding PPP loans, commercial and industrial loans decreased, as the stressed economic environment adversely impacted demand for these loans. This decrease was partially offset by increases in municipal loans and commercial owner-occupied loans. Term commercial real estate loans increased primarily due to the conversion of construction loans to term loans. Consumer loans decreased mainly because of increased refinancing activity away from the Bank. The growth in the loan portfolio during the first nine months of 2020 was primarily at CB&T, Amegy Bank, and Zions Bank.
Other Noninterest-Bearing Investments
During the first nine months of 2020, we decreased our short-term borrowings with the FHLB by $1 billion. This decrease also led to a $40 million decrease in FHLB activity stock. The value of our SBIC investments decreased by $23 million during the same period as a result of lower valuations and disposition of investments. Aside from these decreases, other noninterest-bearing investments remained relatively stable as illustrated in the following schedule.
OTHER NONINTEREST-BEARING INVESTMENTS
| | | | | | | | | | | |
| (In millions) | September 30,
2020 | | December 31,
2019 |
| | | |
| Bank-owned life insurance | $ | 534 | | | $ | 525 | |
| Federal Home Loan Bank stock | 10 | | | 50 | |
| Federal Reserve stock | 97 | | | 107 | |
Farmer Mac stock1 | 44 | | | 47 | |
| SBIC investments | 131 | | | 154 | |
| Non-SBIC investment funds | 11 | | | 12 | |
| Other | 3 | | | 3 | |
| Total other noninterest-bearing investments | $ | 830 | | | $ | 898 | |
1 As a result of the merger of our former bank holding company into the Bank, we agreed to dispose of our Farmer Mac Class C stock to resolve questions about the permissibility of national bank investments in such shares, and initiated sales of the stock in the first quarter of 2020.
ZIONS BANCORPORATION, NATIONAL ASSOCIATION AND SUBSIDIARIES
Premises, Equipment, and Software
Net premises, equipment, and software increased $45 million, or 3.9%, during the first nine months of 2020. In 2017, we implemented the first phase of our core lending and deposit systems replacement project, which replaced our primary consumer lending systems. During the first quarter of 2019, we successfully implemented the second phase of this project by replacing our primary commercial and CRE lending systems. With this milestone reached, we now have substantially all in-scope retail, commercial and CRE loans on a new modern core platform. We are well underway with the project to convert our deposit servicing system by 2022. The total core replacement project spend amount is comprised of both capitalized amounts and amounts that are expensed as incurred. The useful life for most of the capitalized costs is 10 years. The following schedule shows the total amount of costs capitalized, less accumulated depreciation, by phase for the core replacement project.
| | | | | | | | | | | | | | | | | | | | | | | |
| September 30, 2020 |
| (In millions) | Phase 1 | | Phase 2 | | Phase 3 | | Total |
| Capitalized costs for the core replacement project | | | | | | | |
| Total amount capitalized, less accumulated depreciation | $ | 48 | | | $ | 76 | | | $ | 87 | | | $ | 211 | |
Deposits
Deposits, both interest-bearing and noninterest-bearing, are a primary source of our funding. Average total deposits for the first nine months of 2020 increased by 14%, compared with the first nine months of 2019, with average interest-bearing deposits increasing by 10% and average noninterest-bearing deposits increasing by 20%. The average interest rate paid for interest-bearing deposits was 46 bps lower during the first nine months of 2020, compared with the first nine months of 2019.
Demand, savings, and money market deposits were 95% and 92% of total deposits at September 30, 2020 and December 31, 2019, respectively. At September 30, 2020 and December 31, 2019, total deposits included $1.4 billion and $2.3 billion, respectively, of brokered deposits. See “Liquidity Risk Management” on page 37 for additional information on funding and borrowed funds.
RISK ELEMENTS
Since risk is inherent in substantially all of our operations, management of risk is an integral part of our operations and is also a key determinant of our overall performance. The Board of Directors has appointed a Risk Oversight Committee (“ROC”) that consists of appointed Board members who oversee the Bank’s risk management processes. The ROC meets on a regular basis to monitor and review Enterprise Risk Management (“ERM”) activities. As required by its charter, the ROC performs oversight for various ERM activities and approves ERM policies and activities as detailed in the ROC charter.
Management applies various strategies to reduce the risks to which the Bank’s operations are exposed, including credit risk, interest rate and market risk, liquidity risk, strategic risk, business and corporate governance risk, operational/technology risk, cyber risk, capital/financial reporting risk, legal/compliance risk (including regulatory risk); and reputational risk. These risks are overseen by the various management committees of which the Enterprise Risk Management Committee is the focal point for the monitoring and review of enterprise risk. For a more comprehensive discussion of these risks, see “Risk Factors” in our 2019 Annual Report on Form 10-K.
Credit Risk Management
Credit risk is the possibility of loss from the failure of a borrower, guarantor, or another obligor to fully perform under the terms of a credit-related contract. Credit risk arises primarily from our lending activities, as well as from off-balance sheet credit instruments. For a more comprehensive discussion of credit risk management, see “Credit Risk Management” in our 2019 Annual Report on Form 10-K.
Government Agency Guaranteed Loans
We participate in various guaranteed lending programs sponsored by U.S. government agencies, such as the Small Business Administration (“SBA”), Federal Housing Authority, Veterans’ Administration, Export-Import Bank of
ZIONS BANCORPORATION, NATIONAL ASSOCIATION AND SUBSIDIARIES
the U.S., and the U.S. Department of Agriculture. As of September 30, 2020, the principal balance of these loans was $7.4 billion, and the guaranteed portion of these loans was $7.2 billion. Most of these loans were guaranteed by the SBA. The following schedule presents the composition of government agency guaranteed loans and includes $6.8 billion of the previously-mentioned PPP loans.
GOVERNMENT GUARANTEES
| | | | | | | | | | | | | | | | | | | | | | | |
| (Dollar amounts in millions) | September 30,
2020 | | Percent
guaranteed | | December 31,
2019 | | Percent
guaranteed |
| | | | | | | |
| Commercial | $ | 7,369 | | | 98 | % | | $ | 555 | | | 74 | % |
| Commercial real estate | 18 | | | 78 | | | 18 | | | 78 | |
| Consumer | 6 | | | 100 | | | 7 | | | 100 | |
| Total loans | $ | 7,393 | | | 98 | % | | $ | 580 | | | 75 | % |
Commercial Lending
The following schedule provides selected information regarding lending concentrations to certain industries in our commercial lending portfolio.
COMMERCIAL LENDING BY INDUSTRY GROUP
| | | | | | | | | | | | | | | | | | | | | | | |
| September 30, 2020 | | December 31, 2019 |
| (Dollar amounts in millions) | Amount | | Percent | | Amount | | Percent |
| | | | | | | |
| Healthcare and social assistance | $ | 2,814 | | | 8.9 | % | | $ | 1,916 | | | 7.5 | % |
| Retail trade | 2,799 | | | 8.9 | | | 2,606 | | | 10.3 | |
| Manufacturing | 2,686 | | | 8.5 | | | 2,160 | | | 8.5 | |
| Real estate, rental and leasing | 2,393 | | | 7.6 | | | 2,401 | | | 9.5 | |
| Construction | 2,129 | | | 6.8 | | | 1,158 | | | 4.6 | |
| Finance and insurance | 2,113 | | | 6.7 | | | 1,837 | | | 7.2 | |
| Wholesale trade | 1,827 | | | 5.8 | | | 1,639 | | | 6.4 | |
| Professional, scientific, and technical services | 1,808 | | | 5.7 | | | 950 | | | 3.7 | |
| Hospitality and food services | 1,625 | | | 5.2 | | | 983 | | | 3.9 | |
| Transportation and warehousing | 1,587 | | | 5.0 | | | 1,454 | | | 5.7 | |
Utilities1 | 1,563 | | | 5.0 | | | 1,411 | | | 5.6 | |
| Public Administration | 1,329 | | | 4.2 | | | 1,189 | | | 4.7 | |
| Mining, quarrying, and oil and gas extraction | 1,314 | | | 4.2 | | | 1,429 | | | 5.6 | |
| Other Services (except Public Administration) | 1,291 | | | 4.1 | | | 890 | | | 3.5 | |
Other2 | 4,236 | | | 13.4 | | | 3,365 | | | 13.3 | |
| Total | $ | 31,514 | | | 100.0 | % | | $ | 25,388 | | | 100.0 | % |
1 Includes primarily utilities, power, and renewable energy.
2 No other industry group exceeds 3.8%.
ZIONS BANCORPORATION, NATIONAL ASSOCIATION AND SUBSIDIARIES
Oil and Gas-Related Exposure
Various industries represented in the previous schedule, including mining, quarrying and oil and gas extraction, manufacturing, and transportation and warehousing, contain certain loans we categorize as oil and gas-related. At September 30, 2020, we had approximately $4.3 billion of total oil and gas-related credit exposure. The distribution of oil and gas-related loans by customer market segment is shown in the following schedule:
OIL AND GAS-RELATED EXPOSURE 1
| | | | | | | | | | | | | | | | | | | | | | | | | | | | | | | | | | | | | | | | | | | | | | |
| (Dollar amounts in millions) | September 30, 2020 | | December 31, 2019 | | | | | | | | | | | December 31, 2014 |
| | | | | | | | | | | | | | | | | | | | |
| Loans and leases | Amount | | Percent | | Amount | | Percent | | | | | | | | | | | Amount | | Percent |
| Upstream | $ | 965 | | | 39 | % | | $ | 1,041 | | | 42 | % | | | | | | | | | | | $ | 1,107 | | | 36 | % |
| Midstream | 853 | | | 35 | | | 863 | | | 34 | | | | | | | | | | | | 579 | | | 19 | |
| Oil and gas services | 417 | | | 17 | | | 439 | | | 18 | | | | | | | | | | | | 1,277 | | | 41 | |
| Downstream | 210 | | | 9 | | | 158 | | | 6 | | | | | | | | | | | | 110 | | | 4 | |
| Total loan and lease balances | 2,445 | | | 100 | % | | 2,501 | | | 100 | % | | | | | | | | | | | 3,073 | | | 100 | % |
| Unfunded lending commitments | 1,884 | | | | | 2,171 | | | | | | | | | | | | | | 2,700 | | | |
| Total oil and gas-related credit exposure | $ | 4,329 | | | | | $ | 4,672 | | | | | | | | | | | | | | $ | 5,773 | | | |
| | | | | | | | | | | | | | | | | | | | |
| | | | | | | | | | | | | | | | | | | | |
| | | | | | | | | | | | | | | | | | | | |
| | | | | | | | | | | | | | | | | | | | |
| | | | | | | | | | | | | | | | | | | | |
| | | | | | | | | | | | | | | | | | | | |
| | | | | | | | | | | | | | | | | | | | |
1 Because many borrowers operate in multiple businesses, judgment has been applied in characterizing a borrower as oil and
gas-related, including a particular segment of oil and gas-related activity, e.g., upstream or midstream; typically, 50% of
revenues coming from the oil and gas sector is used as a guide.
At September 30, 2020, oil and gas-related loans represented approximately 5% of the total loan portfolio, compared with 8% at December 31, 2014, or the beginning of the last energy cycle. Due to active risk management of the portfolio, the mix of oil and gas-related loans at September 30, 2020 consists of 39% upstream, 35% midstream, 17% oil and gas-related services, and 9% downstream, compared with 36%, 19%, 41%, and 4%, respectively, at December 31, 2014.
We use disciplined underwriting practices to mitigate risk. Upstream loans are made to reserve-based borrowers where approximately 82% of those loans are collateralized by the value of the borrower’s oil and gas reserves. The following schedule presents certain credit quality measures of our oil and gas-related loan portfolio.
| | | | | | | | | | | | | |
| September 30, 2020 | | | | December 31, 2019 |
| Credit quality measures | | | | | |
| Classified loan ratio | 10.6 | % | | | | 2.2 | % |
| Nonaccrual loan ratio | 3.2 | % | | | | 0.7 | % |
| Ratio of nonaccrual loans that are current | 74.4 | % | | | | 66.7 | % |
Net charge-offs, annualized1 | 3.4 | % | | | | 0.5 | % |
| Ratio of allowance for credit losses to oil and gas-related loans, at period end | 5.4 | % | | | | 3.1 | % |
1 Calculated as the ratio of annualized net charge-offs for each respective period to loan balances at each period end.
Oil and gas-related net charge-offs for the third quarter of 2020 were $21 million, compared with $3 million for the fourth quarter of 2019. For the third quarter of 2020, the classified oil and gas-related loan ratio was 10.6%, the annualized net charge-off ratio was 3.4%, and the ACL related to oil and gas-related loans was 5.4%.
ZIONS BANCORPORATION, NATIONAL ASSOCIATION AND SUBSIDIARIES
Commercial Real Estate Loans
Select information indicative of credit quality regarding our CRE loan portfolio is presented in the following schedule.
COMMERCIAL REAL ESTATE PORTFOLIO BY LOAN TYPE AND COLLATERAL LOCATION
| | | | | | | | | | | | | | | | | | | | | | | | | | | | | | | | | | | | | | | | | | | | | | | | | | | | | | | | | | | | | | | | | | | | |
| (Dollar amounts in millions) | | Collateral Location | | | | |
| Loan type | | As of
date | | Arizona | | California | | Colorado | | Nevada | | Texas | | Utah/
Idaho | | Wash-ington | | Other 1 | | Total | | % of
total
CRE |
| Commercial term | | | | | | | | | | | | | | | | | | | | | | |
Balance outstanding | | 9/30/2020 | | $ | 1,187 | | | $ | 3,190 | | | $ | 620 | | | $ | 671 | | | $ | 1,586 | | | $ | 1,436 | | | $ | 529 | | | $ | 510 | | | $ | 9,729 | | | 80.9 | % |
| % of loan type | | | | 12.2 | % | | 32.8 | % | | 6.4 | % | | 6.9 | % | | 16.3 | % | | 14.8 | % | | 5.4 | % | | 5.2 | % | | 100.0 | % | | |
Delinquency rates 2: | | | | | | | | | | | | | | | | | | | | | | |
30-89 days | | 9/30/2020 | | 0.1 | % | | 0.1 | % | | — | % | | — | % | | 0.4 | % | | — | % | | — | % | | 0.2 | % | | 0.1 | % | | |
| | 12/31/2019 | | 0.1 | % | | 0.1 | % | | — | % | | 0.2 | % | | — | % | | 0.1 | % | | — | % | | 0.2 | % | | 0.1 | % | | |
≥ 90 days | | 9/30/2020 | | — | % | | 0.2 | % | | 0.3 | % | | — | % | | — | % | | 0.3 | % | | — | % | | 0.2 | % | | 0.1 | % | | |
| | 12/31/2019 | | — | % | | 0.1 | % | | — | % | | — | % | | — | % | | — | % | | — | % | | 0.2 | % | | — | % | | |
Accruing loans past due 90 days or more | | 9/30/2020 | | $ | — | | | $ | — | | | $ | 2 | | | $ | — | | | $ | — | | | $ | — | | | $ | — | | | $ | — | | | $ | 2 | | | |
| | 12/31/2019 | | — | | | — | | | — | | | — | | | — | | | — | | | — | | | — | | | — | | | |
Nonaccrual loans | | 9/30/2020 | | $ | — | | | $ | 9 | | | $ | — | | | $ | — | | | $ | 19 | | | $ | 7 | | | $ | — | | | $ | 2 | | | $ | 37 | | | |
| | 12/31/2019 | | — | | | 3 | | | — | | | — | | | 3 | | | 6 | | | — | | | 4 | | | 16 | | | |
| Residential construction and land development | | | | | | | | | | | | | | | | |
Balance outstanding | | 9/30/2020 | | $ | 52 | | | $ | 162 | | | $ | 49 | | | $ | — | | | $ | 191 | | | $ | 113 | | | $ | 9 | | | $ | 3 | | | $ | 579 | | | 4.8 | % |
| % of loan type | | | | 9.0 | % | | 28.0 | % | | 8.5 | % | | — | % | | 33.0 | % | | 19.5 | % | | 1.5 | % | | 0.5 | % | | 100.0 | % | | |
Delinquency rates 2: | | | | | | | | | | | | | | | | | | | | | | |
30-89 days | | 9/30/2020 | | — | % | | 1.9 | % | | — | % | | — | % | | — | % | | — | % | | — | % | | — | % | | 0.5 | % | | |
| | 12/31/2019 | | — | % | | 1.2 | % | | — | % | | — | % | | — | % | | — | % | | — | % | | — | % | | 0.4 | % | | |
≥ 90 days | | 9/30/2020 | | — | % | | — | % | | — | % | | — | % | | — | % | | — | % | | — | % | | — | % | | — | % | | |
| | 12/31/2019 | | — | % | | — | % | | — | % | | — | % | | — | % | | — | % | | — | % | | — | % | | — | % | | |
Accruing loans past due 90 days or more | | 9/30/2020 | | $ | — | | | $ | — | | | $ | — | | | $ | — | | | $ | — | | | $ | — | | | $ | — | | | $ | — | | | $ | — | | | |
| | 12/31/2019 | | — | | | — | | | — | | | — | | | — | | | — | | | — | | | — | | | — | | | |
Nonaccrual loans | | 9/30/2020 | | $ | — | | | $ | — | | | $ | — | | | $ | — | | | $ | — | | | $ | — | | | $ | — | | | $ | — | | | $ | — | | | |
| | 12/31/2019 | | — | | | — | | | — | | | — | | | — | | | — | | | — | | | — | | | — | | | |
| Commercial construction and land development | | | | | | | | | | | | | | | | |
Balance outstanding | | 9/30/2020 | | $ | 114 | | | $ | 313 | | | $ | 59 | | | $ | 115 | | | $ | 467 | | | $ | 512 | | | $ | 96 | | | $ | 43 | | | $ | 1,719 | | | 14.3 | % |
| % of loan type | | | | 6.6 | % | | 18.2 | % | | 3.4 | % | | 6.7 | % | | 27.2 | % | | 29.8 | % | | 5.6 | % | | 2.5 | % | | 100.0 | % | | |
Delinquency rates 2: | | | | | | | | | | | | | | | | | | | | | | |
30-89 days | | 9/30/2020 | | — | % | | 1.3 | % | | — | % | | — | % | | — | % | | — | % | | — | % | | — | % | | 0.2 | % | | |
| | 12/31/2019 | | — | % | | 0.4 | % | | — | % | | — | % | | — | % | | 0.2 | % | | — | % | | — | % | | 0.1 | % | | |
≥ 90 days | | 9/30/2020 | | — | % | | — | % | | — | % | | — | % | | — | % | | — | % | | — | % | | — | % | | — | % | | |
| | 12/31/2019 | | — | % | | — | % | | — | % | | — | % | | — | % | | — | % | | — | % | | — | % | | — | % | | |
Accruing loans past due 90 days or more | | 9/30/2020 | | $ | — | | | $ | — | | | $ | — | | | $ | — | | | $ | — | | | $ | — | | | $ | — | | | $ | — | | | $ | — | | | |
| | 12/31/2019 | | — | | | — | | | — | | | — | | | — | | | — | | | — | | | — | | | — | | | |
Nonaccrual loans | | 9/30/2020 | | $ | — | | | $ | — | | | $ | — | | | $ | — | | | $ | — | | | $ | — | | | $ | — | | | $ | — | | | $ | — | | | |
| | 12/31/2019 | | — | | | — | | | — | | | — | | | — | | | — | | | — | | | — | | | — | | | |
Total construction and land development | | 9/30/2020 | | $ | 166 | | | $ | 475 | | | $ | 108 | | | $ | 115 | | | $ | 658 | | | $ | 625 | | | $ | 105 | | | $ | 46 | | | $ | 2,298 | | | |
Total commercial real estate | | 9/30/2020 | | $ | 1,353 | | | $ | 3,665 | | | $ | 728 | | | $ | 786 | | | $ | 2,244 | | | $ | 2,061 | | | $ | 634 | | | $ | 556 | | | $ | 12,027 | | | 100.0 | % |
1 No other geography exceeds $92 million for all three loan types.
2 Delinquency rates include nonaccrual loans.
At September 30, 2020, our CRE construction and land development and term loan portfolios represent approximately 22% of the total loan portfolio. The majority of our CRE loans are secured by real estate located within our geographical footprint. Approximately 24% of the CRE loan portfolio matures in the next 12 months.
ZIONS BANCORPORATION, NATIONAL ASSOCIATION AND SUBSIDIARIES
Construction and land development loans generally mature in 18 to 36 months and contain full or partial recourse guarantee structures with one to five-year extension options or roll-to-perm options that often result in term debt. Term CRE loans generally mature within a three to seven-year period and consist of full, partial, and non-recourse guarantee structures. Typical term CRE loan structures include annually-tested operating covenants that require loan rebalancing based on minimum debt service coverage, debt yield, or loan-to-value tests.
Approximately $119 million, or 5%, of the construction and land development portfolio at September 30, 2020 consists of land acquisition and development loans. Most of these land acquisition and development loans are secured by specific retail, apartment, office, or other projects. For a more comprehensive discussion of CRE loans, see the “Commercial Real Estate Loans” section in our 2019 Annual Report on Form 10-K.
Consumer Loans
We have mainly been an originator of first and second mortgages, generally considered to be of prime quality. We generally hold variable-rate loans in our portfolio and sell “conforming” fixed-rate loans to third parties, including Federal National Mortgage Association and Federal Home Loan Mortgage Corporation, for which we make representations and warranties that the loans meet certain underwriting and collateral documentation standards.
We are also engaged in Home Equity Credit Line (“HECL”) lending. At September 30, 2020 and December 31, 2019, our HECL portfolio totaled $2.8 billion and $2.9 billion, respectively. The following schedule describes the composition of our HECL portfolio by lien status.
HECL PORTFOLIO BY LIEN STATUS
| | | | | | | | | | | |
| (In millions) | September 30,
2020 | | December 31,
2019 |
| | | |
| Secured by first deeds of trust | $ | 1,365 | | | $ | 1,392 | |
| Secured by second (or junior) liens | 1,432 | | | 1,525 | |
| Total | $ | 2,797 | | | $ | 2,917 | |
At September 30, 2020, loans representing less than 1% of the outstanding balance in the HECL portfolio were estimated to have combined loan-to-value ratios (“CLTV”) above 100%. An estimated CLTV ratio is the ratio of our loan plus any prior lien amounts divided by the estimated current collateral value. At origination, underwriting standards for the HECL portfolio generally include a maximum 80% CLTV with high credit scores at origination.
Approximately 90% of our HECL portfolio is still in the draw period, and approximately 18% of those loans are scheduled to begin amortizing within the next five years. We regularly analyze the risk of borrower default in the event of a loan becoming fully amortizing and the risk of higher interest rates. The analysis indicates that the risk of loss from this factor is minimal in the current economic environment. The annualized ratio of net charge-offs to average balances for the first nine months of 2020 and 2019 for the HECL portfolio was (0.01)% and (0.02)%, respectively. See Note 6 of the Notes to Consolidated Financial Statements for additional information on the credit quality of this portfolio.
Nonperforming Assets
Nonperforming assets as a percentage of loans and leases and other real estate owned (“OREO”) increased to 0.68% at September 30, 2020, compared with 0.51% at December 31, 2019.
Total nonaccrual loans at September 30, 2020 increased $123 million from December 31, 2019, primarily in the commercial and industrial loan portfolio.
The balance of nonaccrual loans can decrease due to paydowns, charge-offs, and the return of loans to accrual status under certain conditions. If a nonaccrual loan is refinanced or restructured, the new note is immediately placed on nonaccrual. If a restructured loan performs under the new terms for at least a period of six months, the loan can be considered for return to accrual status. See “Restructured Loans” following for more information. See also Note 6 of the Notes to Consolidated Financial Statements for more information on nonaccrual loans.
ZIONS BANCORPORATION, NATIONAL ASSOCIATION AND SUBSIDIARIES
The following schedule presents our nonperforming assets:
NONPERFORMING ASSETS
| | | | | | | | | | | |
| (Dollar amounts in millions) | September 30,
2020 | | December 31,
2019 |
| | | |
Nonaccrual loans 1 | $ | 366 | | | $ | 243 | |
| Other real estate owned | 6 | | | 8 | |
| Total nonperforming assets | $ | 372 | | | $ | 251 | |
Ratio of nonperforming assets to net loans and leases1 and other real estate owned | 0.68 | % | | 0.51 | % |
| Accruing loans past due 90 days or more | $ | 9 | | | $ | 10 | |
Ratio of accruing loans past due 90 days or more to loans and leases1 | 0.02 | % | | 0.02 | % |
| Nonaccrual loans and accruing loans past due 90 days or more | $ | 375 | | | $ | 253 | |
Ratio of nonaccrual loans and accruing loans past due 90 days or more to loans and leases1 | 0.68 | % | | 0.52 | % |
| Accruing loans past due 30-89 days | $ | 58 | | | $ | 75 | |
Nonaccrual loans1 current as to principal and interest payments | 56.3 | % | | 53.1 | % |
1 Includes loans held for sale.
Restructured Loans
Troubled debt restructurings (“TDRs”) are loans that have been modified to accommodate a borrower who is experiencing financial difficulties, and for whom we have granted a concession that we would not otherwise consider. TDRs increased $128 million, or 84%, during the first nine months of 2020. Commercial loans may be modified to provide the borrower more time to complete the project, to achieve a higher lease-up percentage, to sell the property, or for other reasons. Consumer loan TDRs represent loan modifications in which a concession has been granted to the borrower who is unable to refinance the loan with another lender, or who is experiencing economic hardship. Such consumer loan TDRs may include first-lien residential mortgage loans and home equity loans.
If the restructured loan performs for at least six months according to the modified terms, and an analysis of the customer’s financial condition indicates that we are reasonably assured of repayment of the modified principal and interest, the loan may be returned to accrual status. The borrower’s payment performance prior to and following the restructuring is taken into account to determine whether a loan should be returned to accrual status.
ACCRUING AND NONACCRUING TROUBLED DEBT RESTRUCTURED LOANS
| | | | | | | | | | | |
| (In millions) | September 30,
2020 | | December 31,
2019 |
| | | |
| Restructured loans – accruing | $ | 197 | | | $ | 78 | |
| Restructured loans – nonaccruing | 84 | | | 75 | |
| Total | $ | 281 | | | $ | 153 | |
In the periods following the calendar year in which a loan was restructured, a loan may no longer be reported as a TDR if it is on accrual, is in compliance with its modified terms, and yields a market rate (as determined and documented at the time of the modification or restructure). See Note 6 of the Notes to Consolidated Financial Statements for additional information regarding TDRs.
ZIONS BANCORPORATION, NATIONAL ASSOCIATION AND SUBSIDIARIES
TROUBLED DEBT RESTRUCTURED LOANS ROLLFORWARD
| | | | | | | | | | | | | | | | | | | | | | | | | | |
| Three Months Ended
September 30, | | Nine Months Ended
September 30, | |
| (In millions) | 2020 | | 2019 | | 2020 | | 2019 | |
| | | | | | | | |
| Balance at beginning of period | $ | 285 | | | $ | 176 | | | $ | 153 | | | $ | 202 | | |
| New identified TDRs and principal increases | 50 | | | 27 | | | 222 | | | 47 | | |
| Payments and payoffs | (13) | | | (21) | | | (35) | | | (60) | | |
| Charge-offs | (33) | | | — | | | (48) | | | (5) | | |
| No longer reported as TDRs | — | | | — | | | (2) | | | — | | |
| Sales and other | (8) | | | — | | | (9) | | | (2) | | |
| Balance at end of period | $ | 281 | | | $ | 182 | | | $ | 281 | | | $ | 182 | | |
COVID-19 Modifications and Deferrals
As described previously, we developed various debt relief programs for our borrowers that have been adversely impacted by the COVID-19 pandemic. These programs primarily began in the second quarter of 2020 and generally consisted of short-term, or 90-day, principal and interest loan payment deferrals. Consistent with accounting and regulatory guidance, loan modifications provided to borrowers experiencing financial difficulties exclusively related to the COVID-19 pandemic, in which we provided these short-term modifications or payment deferrals, are not classified as TDRs. Other loan modifications above and beyond these short-term modifications or payment deferrals were assessed for TDR classification.
During the first nine months of 2020, we provided payment deferrals or other payment modifications related to COVID-19 hardships, representing about $4.3 billion of total loan balances. Of this amount, $3.6 billion, or 84%, had payments deferred, and the remaining $0.7 billion, or 16%, had their regularly scheduled payments otherwise modified. At September 30, 2020, less than $300 million, or 0.6%, of total non-PPP loan balances were actively in deferral, including re-deferrals. Of the $4.0 billion of total loan balances at September 30, 2020 that, at one point, had their payments deferred or otherwise modified, approximately $40 million, or 1.0%, were 30 days or more past due.
Allowance for Credit Losses
In analyzing the adequacy of the ALLL, we utilize a comprehensive loan grading system to determine the risk potential in the portfolio and also consider the results of independent internal credit reviews. To determine the adequacy of the allowance, our loan and lease portfolio is broken into segments based on loan type.
ZIONS BANCORPORATION, NATIONAL ASSOCIATION AND SUBSIDIARIES
The following schedule shows the changes in the allowance for loan losses and a summary of loan loss experience:
SUMMARY OF LOAN LOSS EXPERIENCE
| | | | | | | | | | | | | | | | | |
| (Dollar amounts in millions) | Nine Months Ended September 30, 2020 | | Twelve Months Ended
December 31, 2019 | | Nine Months Ended September 30, 2019 |
| | | | | |
| Loans and leases outstanding (net of unearned income) | $ | 54,745 | | | $ | 48,709 | | | $ | 48,835 | |
| Average loans and leases outstanding (net of unearned income) | $ | 52,694 | | | $ | 48,265 | | | $ | 48,114 | |
| Allowance for loan losses: | | | | | |
Balance at beginning of period1 | $ | 497 | | | $ | 495 | | | $ | 495 | |
| Provision for loan losses | 446 | | | 37 | | | 30 | |
| Charge-offs: | | | | | |
| Commercial | 95 | | | 57 | | | 33 | |
| Commercial real estate | 1 | | | 4 | | | 1 | |
| Consumer | 11 | | | 17 | | | 12 | |
| Total | 107 | | | 78 | | | 46 | |
| Recoveries: | | | | | |
| Commercial | 11 | | | 25 | | | 19 | |
| Commercial real estate | — | | | 6 | | | 4 | |
| Consumer | 6 | | | 10 | | | 8 | |
| Total | 17 | | | 41 | | | 31 | |
| Net loan and lease charge-offs (recoveries) | 90 | | | 37 | | | 15 | |
| Balance at end of period | $ | 853 | | | $ | 495 | | | $ | 510 | |
| Ratio of annualized net charge-offs to average loans and leases | 0.23 | % | | 0.08 | % | | 0.04 | % |
Ratio of allowance for loan losses to net loans2 and leases, at period end | 1.56 | % | | 1.02 | % | | 1.04 | % |
Ratio of allowance for loan losses to nonaccrual loans2, at period end | 242 | % | | 204 | % | | 219 | % |
Ratio of allowance for loan losses to nonaccrual loans and accruing loans past due 90 days or more, at period end | 236 | % | | 196 | % | | 213 | % |
1 Beginning balances at January 1, 2020 for the allowance for loan losses do not agree to their respective ending balances at December 31, 2019 because of the adoption of the CECL accounting standard.
2 Does not include loans held for sale.
The total ALLL increased during the first nine months of 2020 by $358 million, primarily as a result of experienced and expected economic stress caused by the COVID-19 pandemic and stress in the oil and gas-related sector.
The RULC represents a reserve for potential losses associated with off-balance sheet commitments and standby letters of credit. The reserve is separately shown in the balance sheet and any related increases or decreases in the reserve are shown separately in the statement of income. At September 30, 2020, the reserve was $64 million, an increase of $5 million and $2 million from December 31, 2019, and September 30, 2019, respectively.
See Note 6 of the Notes to Consolidated Financial Statements for additional information related to the ACL and credit trends experienced in each portfolio segment.
Interest Rate and Market Risk Management
Interest rate and market risk are managed centrally. Interest rate risk is the potential for reduced net interest income and other rate-sensitive income resulting from adverse changes in the level of interest rates. Market risk is the potential for loss arising from adverse changes in the fair value of fixed-income securities, equity securities, other earning assets, and derivative financial instruments as a result of changes in interest rates or other factors. As a financial institution that engages in transactions involving an array of financial products, we are exposed to both interest rate risk and market risk.
ZIONS BANCORPORATION, NATIONAL ASSOCIATION AND SUBSIDIARIES
Our Board of Directors is responsible for approving the overall policies relating to the management of our financial risk, including interest rate and market risk management. The Board has established the Asset/Liability Committee (“ALCO”) consisting of members of management, to which it has delegated the responsibility of managing our interest rate and market risk. ALCO establishes and periodically revises policy limits and reviews with the ROC the limits and limit exceptions reported by management.
Interest Rate Risk
Interest rate risk is one of the most significant risks to which we are regularly exposed. In general, our goal in managing interest rate risk is to manage balance sheet sensitivity to reduce net income volatility due to changes in interest rates.
Over the course of the last several years, we have actively reduced the level of asset sensitivity through the purchase of short-to-medium duration agency pass-through securities and funding these purchases by reducing money market investments and increasing short-term borrowings. This repositioning of the investment portfolio has increased current net interest income while dampening the impact of lower rates on net interest income contraction. We anticipate moderately lower net interest income in the current rate environment as the rates earned on our assets continue to decline. Due to our concentration in noninterest-bearing deposits as well as the low interest rates paid on our interest-bearing deposits, there is little room to reduce deposit costs.
At December 31, 2019, we had $1.5 billion of fixed-to-floating interest rate swaps hedging long-term debt (effectively converting the fixed-rate debt into floating-rate debt). In late March 2020, we terminated $1.0 billion of swaps (i.e. two $500 million swaps with maturities in August 2021 and February 2022) with a combined fair value of $36 million that adjusted the carrying value of the debt by the same amount. The basis adjustment will be amortized as an adjustment to interest expense through the maturity of the debt, thereby reducing the effective interest rate. For more information on derivatives designated as qualifying hedges, see Note 7 – Derivative Instruments and Hedging Activities.
The following schedule presents all derivatives utilized in our asset-liability management ("ALM") activities that are designated in qualifying hedging relationships as defined by GAAP as of September 30, 2020 and December 31, 2019. The schedule includes the notional amount, fair value, and the weighted-average receive-fixed rate for each category of interest rate derivatives. The schedule for the current quarter has cash flow hedges shown by maturity for the next five years. Fair value hedges are shown by maturity every five to ten years, while the previous year's schedule has all categories shown by maturity for the next five years.
ZIONS BANCORPORATION, NATIONAL ASSOCIATION AND SUBSIDIARIES
| | | | | | | | | | | | | | | | | | | | | | | | | | | | | | | | | | | | | | | | | | | | | | | |
| September 30, 2020 |
| | | Contractual Maturity |
| (Dollar amounts in millions) | Total | | 2020 | | 2021 | | 2022 | | 2023 | | 2024 | | Thereafter | | Maturities-to-date 2020 |
| Cash flow hedges | | | | | | | | | | | | | | | |
| | | | | | | | | | | | | | | |
| | | | | | | | | | | | | | | |
| | | | | | | | | | | | | | | |
| | | | | | | | | | | | | | | |
| Receive-fixed interest rate swaps | | | | | | | | | | | | | | | |
Net fair value1 | $ | 115 | | | $ | — | | | $ | 1 | | | $ | 67 | | | $ | 16 | | | $ | 31 | | | $ | — | | | $ | — | |
| Total notional amount | 3,200 | | | 50 | | | 50 | | | 2,400 | | | 300 | | | 400 | | | — | | | 388 | |
| Weighted-average fixed-rate | 2.11 | % | | 1.26 | % | | 1.81 | % | | 2.06 | % | | 2.35 | % | | 2.35 | % | | — | % | | 1.59 | % |
| | | | | | | | | | | | | | | |
| Fair value hedges | | | 2025 | | 2030 | | 2035 | | 2040 | | 2050 | | Thereafter | | |
Fair value debt hedges3 | | | | | | | | | | | | | | | |
Net fair value1 | $ | 45 | | | $ | — | | | $ | 45 | | | $ | — | | | $ | — | | | $ | — | | | $ | — | | | $ | — | |
| Total notional amount | 500 | | | — | | | 500 | | | — | | | — | | | — | | | — | | | — | |
| Weighted-average fixed-rate | 1.70 | % | | — | % | | 1.70 | % | | — | % | | — | % | | — | % | | — | % | | — | % |
| | | | | | | | | | | | | | | |
Fair value asset hedges2,3 | | | | | | | | | | | | | | | |
Net fair value1 | $ | 4 | | | $ | — | | | $ | — | | | $ | 1 | | | $ | — | | | $ | 3 | | | $ | — | | | $ | — | |
| Total notional amount | 316 | | | — | | | — | | | 161 | | | — | | | 155 | | | — | | | — | |
| Weighted-average fixed-rate | 1.41 | % | | — | % | | — | % | | 1.76 | % | | — | % | | 1.04 | % | | — | % | | — | % |
| | | | | | | | | | | | | | | |
| Total ALM fair value hedges | | | | | | | | | | | | | | | |
Net fair value1 | $ | 49 | | | $ | — | | | $ | 45 | | | $ | 1 | | | $ | — | | | $ | 3 | | | $ | — | | | $ | — | |
| Total notional amount | 816 | | | — | | | 500 | | | 161 | | | — | | | 155 | | | — | | | — | |
| | | | | | | | | | | | | | | | | | | | | | | | | | | | | | | | | | | | | | | | | | | | | | | |
| December 31, 2019 |
| | | Contractual Maturity |
| (Dollar amounts in millions) | Total | | 2020 | | 2021 | | 2022 | | 2023 | | 2024 | | Thereafter | | Matured in 2019 |
| Cash flow hedges | | | | | | | | | | | | | | | |
| | | | | | | | | | | | | | | |
| | | | | | | | | | | | | | | |
| | | | | | | | | | | | | | | |
| | | | | | | | | | | | | | | |
| Receive-fixed interest rate swaps | | | | | | | | | | | | | | | |
Net fair value1 | $ | 48 | | | $ | — | | | $ | — | | | $ | 27 | | | $ | 8 | | | $ | 13 | | | $ | — | | | $ | — | |
| Total notional amount | 3,588 | | | 438 | | | 50 | | | 2,400 | | | 300 | | | 400 | | | — | | | 200 | |
| Weighted-average fixed-rate | 2.05 | % | | 1.56 | % | | 1.81 | % | | 2.06 | % | | 2.35 | % | | 2.35 | % | | — | % | | 1.62 | % |
| | | | | | | | | | | | | | | |
| Fair value hedges | | | | | | | | | | | | | | | |
| Receive-fixed interest rate swaps | | | | | | | | | | | | | | | |
Net fair value1 | $ | 9 | | | $ | — | | | $ | 10 | | | $ | 9 | | | $ | — | | | $ | — | | | $ | (10) | | | $ | — | |
| Total notional amount | 1,500 | | | — | | | 500 | | | 500 | | | — | | | — | | | 500 | | | — | |
| Weighted-average fixed-rate | 2.39 | % | | — | % | | 2.99 | % | | 2.46 | % | | — | % | | — | % | | 1.70 | % | | — | % |
| | | | | | | | | | | | | | | |
| Total ALM interest rate derivatives | | | | | | | | | | | | | | | |
Net fair value1 | $ | 57 | | | $ | — | | | $ | 10 | | | $ | 36 | | | $ | 8 | | | $ | 13 | | | $ | (10) | | | $ | — | |
| Total notional amount | 5,088 | | | 438 | | | 550 | | | 2,900 | | | 300 | | | 400 | | | 500 | | | 200 | |
1Fair values shown in the schedule above are presented net and exclude the effects of collateral settlements for centrally cleared derivatives.
2Fair value asset hedges consist of pay-fixed swaps hedging AFS fixed-rate securities executed during the third quarter of 2020.
3Fair value hedges of both our fixed rate debt and AFS securities are longer dated than traditional cash flow hedges. Consequently, the maturity schedule above aggregates trades maturing in each column to include all trades maturing after the end of year of the previous column and prior to or during the year of the column the amounts are contained within.
ZIONS BANCORPORATION, NATIONAL ASSOCIATION AND SUBSIDIARIES
Interest Rate Risk Measurement
We monitor interest rate risk through the use of two complementary measurement methods: net interest income simulation, or Earnings at Risk (“EaR”), and Economic Value of Equity at Risk (“EVE”). EaR analyzes the expected change in near term (one year) net interest income in response to changes in interest rates. In the EVE method, we measure the expected changes in the fair value of equity in response to changes in interest rates.
EaR is an estimate of the change in total net interest income that would be recognized under different interest rate environments over a one-year period. This simulated impact to net interest income due to a change in rates uses as its base a modeled net interest income that is not necessarily the same as the most recent quarter's or year's reported net interest income. Rather, EaR employs estimated net interest income under an unchanged interest rate scenario as the basis for comparison. The EaR process then simulates changes to the base net interest income under several interest rate scenarios, including parallel and nonparallel interest rate shifts across the yield curve, taking into account deposit repricing assumptions and estimates of the possible exercise of embedded options within the portfolio (e.g., a borrower’s ability to refinance a loan under a lower-rate environment). The EaR model does not contemplate changes in fee income that are amortized into interest income (e.g. premiums, discounts, origination points and costs, etc.). Our policy contains a trigger for a 10% decline in rate-sensitive income as well as a risk capacity of a 13% decline if rates were to immediately rise or fall in parallel by 200 bps. As of December 31, 2018 the EaR declined by 12% for a 200 bps decline in rates. This trigger violation informed our decision to move to a less asset-sensitive position throughout 2019 and into 2020. As of September 30, 2020 the EaR declined by 1% for a 200 bps decline in rates.
EVE is calculated as the fair value of all assets minus the fair value of liabilities. We measure changes in the dollar amount of EVE for parallel shifts in interest rates. Due to embedded optionality and asymmetric rate risk, changes in EVE can be useful in quantifying risks not apparent for small rate changes. Examples of such risks may include out-of-the-money interest rate caps (or limits) on loans, which have little effect under small rate movements but may become important if large rate changes were to occur, or substantial prepayment deceleration for low-rate mortgages in a higher-rate environment. Our policy contains a trigger for an 8% decline in EVE as well as a risk capacity of a 10% decline if rates were to immediately rise or fall in parallel by 200 bps. Exceptions to the EVE limits are subject to notification and approval by the ROC.
Estimating the impact on net interest income and EVE requires that we assess a number of variables and make various assumptions in managing our exposure to changes in interest rates. The assessments address deposit withdrawals and deposit product migration (e.g., customers moving money from checking accounts to certificates of deposit), competitive pricing (e.g., existing loans and deposits are assumed to roll into new loans and deposits at similar spreads relative to benchmark interest rates), loan and security prepayments, and the effects of other similar embedded options. As a result of uncertainty about the maturity and repricing characteristics of both deposits and loans, we also calculate the sensitivity of EaR and EVE results to key assumptions. As most of our liabilities are comprised of indeterminate maturity and managed rate deposits, the modeled results are highly sensitive to the assumptions used for these deposits, such as checking, savings and money market accounts, and also to prepayment assumptions used for loans with prepayment options. We use historical regression analysis as a guide for setting such assumptions; however, due to the current low interest rate environment, which has little historical precedent, estimated deposit behavior may not reflect actual future results. Additionally, competition for funding in the marketplace has and may again result in changes to deposit pricing on interest-bearing accounts that are greater or less than changes in benchmark interest rates such as LIBOR or the federal funds rate.
Under most rising interest rate environments, we would expect some customers to move balances from demand deposits to interest-bearing accounts such as money market, savings, or certificates of deposit. The models are particularly sensitive to the assumption about the rate of such migration.
In addition, we assume certain correlation rates, often referred to as a “deposit beta,” of interest-bearing deposits, wherein the rates paid to customers change at a different pace when compared with changes in average benchmark interest rates. Generally, certificates of deposit are assumed to have a high correlation rate, while interest-on-checking accounts are assumed to have a lower correlation rate. Actual results may differ materially due to factors
ZIONS BANCORPORATION, NATIONAL ASSOCIATION AND SUBSIDIARIES
including the shape of the yield curve, competitive pricing, money supply, credit worthiness of the Bank, and so forth; however, we use our historical experience as well as industry data to inform our assumptions.
The previously mentioned migration and correlation assumptions result in deposit durations presented in the following schedule.
DEPOSIT ASSUMPTIONS
| | | | | | | | | | | | | | |
| | September 30, 2020 |
| Product | | Effective duration (unchanged) | | Effective duration
(+200 bps) |
| | | | |
| Demand deposits | | 4.9 | % | | 3.0 | % |
| Money market | | 3.7 | % | | 1.5 | % |
| Savings and interest-on-checking | | 3.1 | % | | 2.4 | % |
As of the dates indicated and incorporating the assumptions previously described, the following schedule shows EaR, or percentage change in net interest income, based on a static balance sheet size, in the first year after the interest rate change if interest rates were to sustain immediate parallel changes ranging from -100 bps to +300 bps.
INCOME SIMULATION – CHANGE IN NET INTEREST INCOME
| | | | | | | | | | | | | | | | | | | | | | | | | | | | | | | | |
| | September 30, 2020 |
| | Parallel shift in rates (in bps)1 |
| Repricing scenario | | -100 | | 0 | | +100 | | +200 | | +300 |
| | | | | | | | | | |
| Earnings at Risk | | (1.4) | % | | — | % | | 8.5 | % | | 16.2 | % | | 23.6 | % |
1 Assumes rates cannot go below zero in the negative rate shift.
For non-maturity interest-bearing deposits, the weighted average modeled beta is 23%. If the weighted average deposit beta were to increase 6%, the EaR in the +100 bps rate shock would change from 8.5% to 7.7%.
For comparative purposes, the December 31, 2019 measures are presented in the following schedule.
| | | | | | | | | | | | | | | | | | | | | | | | | | | | | | | | |
| | December 31, 2019 |
| | Parallel shift in rates (in bps)1 |
| Repricing scenario | | -100 | | 0 | | +100 | | +200 | | +300 |
| | | | | | | | | | |
| Earnings at Risk | | (4.6) | % | | — | % | | 3.0 | % | | 6.0 | % | | 8.9 | % |
| | | | | | | | | | |
| | | | | | | | | | |
| | | | | | | | | | |
1 Assumes rates cannot go below zero in the negative rate shift.
The asset sensitivity as measured by EaR increased quarter over quarter primarily due to changes in the deposit beta for money market accounts. The lower beta is consistent with our prior experience with the federal funds target rate in the range of 0%-0.25%.
The EaR analysis focuses on parallel rate shocks across the term structure of rates. The yield curve typically does not move in a parallel manner. If we consider a flattening rate shock where the short-term rate moves +200 bps but the ten-year rate only moves +30 bps, the increase in EaR is 18% less over 24 months compared with the parallel +200 bps rate shock.
CHANGES IN ECONOMIC VALUE OF EQUITY
As of the dates indicated, the following schedule shows our estimated percentage change in EVE under parallel interest rate changes ranging from -100 bps to +300 bps. For non-maturity interest-bearing deposits, the weighted average modeled beta is 23%. If the weighted average deposit beta were to increase 6% it would change the EVE in the +100 bps rate shock from 15.5% to 14.4%. In the -100 bps rate shock the EVE would increase due to the fact that we cap the value of our indeterminate deposits at their par value, or equivalently we assume no premium would be required to dispose of these liabilities given that depositors could be repaid at par. Since our assets increase in value as rates fall and the majority of our liabilities are indeterminate deposits, EVE increases disproportionately.
ZIONS BANCORPORATION, NATIONAL ASSOCIATION AND SUBSIDIARIES
| | | | | | | | | | | | | | | | | | | | | | | | | | | | | | | | |
| | September 30, 2020 |
| | Parallel shift in rates (in bps)1 |
| Repricing scenario | | -100 | | 0 | | +100 | | +200 | | +300 |
| | | | | | | | | | |
| Economic Value of Equity | | 13.1 | % | | — | % | | 15.5 | % | | 18.1 | % | | 18.9 | % |
| | | | | | | | | | |
| | | | | | | | | | |
| | | | | | | | | | |
1 Assumes rates cannot go below zero in the negative rate shift.
For comparative purposes, the December 31, 2019 measures are presented in the following schedule. The changes in EVE measures from December 31, 2019 are primarily driven by the behavior of the deposit models. For non-maturity deposits, the deposit premium (or discount below par value) is floored at zero in a low-rate environment.
| | | | | | | | | | | | | | | | | | | | | | | | | | | | | | | | |
| | December 31, 2019 |
| | Parallel shift in rates (in bps)1 |
| Repricing scenario | | -100 | | 0 | | +100 | | +200 | | +300 |
| | | | | | | | | | |
| Economic Value of Equity | | 8.0 | % | | — | % | | 1.1 | % | | 0.4 | % | | (0.6) | % |
| | | | | | | | | | |
| | | | | | | | | | |
1 Assumes rates cannot go below zero in the negative rate shift.
Our focus on business banking also plays a significant role in determining the nature of our asset-liability management posture. At September 30, 2020, $21 billion of our commercial lending and CRE loan balances were scheduled to reprice in the next six months. Of these variable-rate loans, approximately 97% are tied to either the prime rate or LIBOR. For these variable-rate loans, we have executed $3.2 billion of cash flow hedges by receiving fixed rates on interest rate swaps or through purchased interest rate floors. Additionally, asset sensitivity is reduced due to $4 billion of variable-rate loans being priced at floored rates at September 30, 2020, which were above the “index plus spread” rate by an average of 69 bps. At September 30, 2020, we also had $3 billion of variable-rate consumer loans scheduled to reprice in the next three months. Of these variable-rate consumer loans, approximately $1 billion were priced at floored rates, which were above the “index plus spread” rate by an average of 36 bps.
See Notes 3 and 7 of the Notes to Consolidated Financial Statements for additional information regarding derivative instruments.
LIBOR Exposure
In July 2017, the Financial Conduct Authority, the authority regulating LIBOR, along with various other regulatory bodies, announced that LIBOR would likely be discontinued at the end of 2021. We have a significant number of assets and liabilities that reference LIBOR such as commercial loans, commercial real estate term loans, adjustable-rate mortgage loans, unfunded loan commitments, derivatives, and debt securities. As of September 30, 2020, we had more than $38 billion of assets, consisting mostly of commercial loans, that reference LIBOR. The amount of borrowed funds that reference LIBOR as of September 30, 2020 was less than $1 billion. These amounts exclude derivative assets and liabilities on our consolidated balance sheet. As of September 30, 2020, the notional amount of our LIBOR-referenced interest rate derivative contracts was more than $15 billion, of which more than $9 billion related to contracts with central counterparty clearinghouses. Each of the LIBOR-referenced amounts discussed above will vary in future periods as current contracts expire with potential replacement contracts using either LIBOR or an alternative reference rate. We, and other industry participants, continue to review alternative reference rates that could be utilized as a replacement for LIBOR.
We manage interest rate and market risk centrally and are actively working to address any impacted contracts, but realize that amending certain contracts indexed to LIBOR may require consent from the counterparties, which could be difficult and costly to obtain in certain limited circumstances. For more information on the transition from LIBOR see Risk Factors in our 2019 Form 10-K.
Market Risk – Fixed Income
We engage in the underwriting and trading of municipal securities. This trading activity exposes us to a risk of loss arising from adverse changes in the prices of these fixed-income securities.
ZIONS BANCORPORATION, NATIONAL ASSOCIATION AND SUBSIDIARIES
At September 30, 2020, we had a relatively small amount, $198 million, of trading assets and $71 million of securities sold, not yet purchased, compared with $182 million and $66 million, respectively, at December 31, 2019.
We are exposed to market risk through changes in fair value. We are also exposed to market risk for interest rate swaps used to hedge interest rate risk. Changes in the fair value of AFS securities and in interest rate swaps that qualify as cash flow hedges are included in accumulated other comprehensive income (“AOCI”) for each financial reporting period. During the third quarter of 2020, the after-tax change in AOCI attributable to AFS securities decreased by $13 million, due largely to changes in the interest rate environment, compared with a $19 million increase in the same prior year period.
Market Risk – Equity Investments
Through our equity investment activities, we own equity securities that are publicly-traded. In addition, we own equity securities in companies and governmental entities, e.g., the Federal Reserve Bank and an FHLB, that are not publicly-traded. The accounting for equity investments may use the cost, fair value, equity, or full consolidation methods of accounting, depending on our ownership position and degree of involvement in influencing the investees’ affairs. Regardless of the accounting method, the value of our investment is subject to fluctuation. Because the fair value of these securities may fall below our investment costs, we are exposed to the possibility of loss. Equity investments in private and public companies are approved, monitored and evaluated by our Equity Investment Committee consisting of members of management.
We hold both direct and indirect investments in predominantly pre-public companies, primarily through various small business investment company ("SBIC") venture capital funds. Our equity exposure to these investments was $131 million and $154 million at September 30, 2020 and December 31, 2019, respectively. On occasion, some of the companies within our SBIC investments may issue an initial public offering. In this case, the fund is generally subject to a lockout period before liquidating the investment, which can introduce additional market risk.
Liquidity Risk Management
Liquidity refers to our capacity to meet our cash and collateral obligations and to manage both expected and unexpected cash flows without adversely impacting our operations or financial strength. Sources of liquidity include both traditional forms of funding, such as deposits, borrowings, and equity and unencumbered assets, such as marketable loans and securities.
Since liquidity risk is closely linked to both credit risk and market risk, many of the previously discussed risk control mechanisms also apply to the monitoring and management of liquidity risk. We manage our liquidity to provide adequate funds for our customers’ credit needs, capital plan actions, anticipated financial and contractual obligations, which include withdrawals by depositors, debt and capital service requirements, and lease obligations.
We continue to perform liquidity stress tests and assess our portfolio of highly liquid assets (sufficient to cover 30-day funding needs under the stress scenarios). At September 30, 2020, our investment securities portfolio of $15.5 billion and cash and money market investments of $4.2 billion collectively comprised 25% of total assets.
Our consolidated cash, interest-bearing deposits held as investments, and security resell agreements were $4.2 billion at September 30, 2020, compared with $1.8 billion at December 31, 2019, and $2.3 billion at September 30, 2019. During the first nine months of 2020, the primary sources of cash were from an increase in deposits and net cash provided by operating activities. Uses of cash during the same period were primarily from (1) loan originations and purchases (2) a decrease in short-term borrowings, (3) an increase in investment securities, (3) repayment of long-term debt, (4) dividends on common and preferred stock, and (5) repurchases of our common stock.
Total deposits were $67.1 billion at September 30, 2020, compared with $57.1 billion at December 31, 2019 and $56.1 billion at September 30, 2019. The increase for the first nine months of 2020 was a result of a $7.8 billion and $3.5 billion increase in noninterest-bearing demand deposits and savings and money market deposits, respectively, partially offset by a $1.3 billion decrease in time deposits. The funding of PPP loan proceeds into customer deposit accounts contributed meaningfully to overall deposit growth. Our core deposits, consisting of noninterest-bearing
ZIONS BANCORPORATION, NATIONAL ASSOCIATION AND SUBSIDIARIES
demand deposits, savings and money market deposits, and time deposits under $250,000, were $64.8 billion at September 30, 2020, compared with $53.9 billion at December 31, 2019 and $52.8 billion at September 30, 2019.
At September 30, 2020, maturities of our long-term senior and subordinated debt ranged from August 2021 to October 2029.
Our cash payments for interest, reflected in operating expenses, decreased to $164 million during the first nine months of 2020 from $315 million during the first nine months of 2019. This decrease is primarily due to lower interest rates paid on deposits and borrowed funds and lower borrowed funds. Additionally, we paid approximately $195 million of dividends on preferred stock and common stock for the first nine months of 2020, compared with $196 million for the first nine months of 2019. Dividends paid per common share were $0.34 in the third quarter of 2019 and have remained at $0.34 during 2020. In October 2020, the Board approved a quarterly common dividend of $0.34 per share.
General financial market and economic conditions impact our access to and cost of external financing. Access to funding markets is also directly affected by the credit ratings received from various rating agencies. The ratings not only influence the costs associated with the borrowings, but can also influence the sources of the borrowings. All of the credit rating agencies rate our debt at an investment-grade level. Although our credit ratings did not change during the first nine months of 2020, Fitch and S&P revised their outlook to Negative from Stable due to disruption in economic activity and financial markets from the COVID-19 pandemic and our oil and gas exposure. Our credit ratings and outlooks are presented in the following schedule.
| | | | | | | | | | | | | | | | | | | | | | | | | | |
| CREDIT RATINGS | | | | | | |
| as of October 31, 2020: |
| Rating agency | | Outlook | | Long-term issuer/senior
debt rating | | Subordinated debt rating | | Short-term debt rating |
| | | | | | | | |
| Kroll | | Stable | | A- | | BBB+ | | K2 |
| S&P | | Negative | | BBB+ | | BBB | | NR |
| Fitch | | Negative | | BBB+ | | BBB | | F1 |
| Moody's | | Stable | | Baa2 | | NR | | NR |
The FHLB system and Federal Reserve Banks have been and are a source of back-up liquidity and a significant source of funding. Zions Bancorporation, N.A. is a member of the FHLB of Des Moines. The FHLB allows member banks to borrow against their eligible loans and securities to satisfy liquidity and funding requirements. We are required to invest in FHLB and Federal Reserve stock to maintain our borrowing capacity.
The amount available for additional FHLB and Federal Reserve borrowings was approximately $17.6 billion at September 30, 2020, compared with $15.3 billion at December 31, 2019 and $14.5 billion at September 30, 2019. Loans with a carrying value of approximately $26.3 billion at September 30, 2020 have been pledged at the FHLB of Des Moines and the Federal Reserve as collateral for current and potential borrowings, compared with $21.5 billion at December 31, 2019. At September 30, 2020, we had no FHLB or Federal Reserve borrowings outstanding, compared with $1.0 billion of short-term FHLB borrowings and no long-term FHLB or Federal Reserve borrowings outstanding at December 31, 2019. At September 30, 2020, our total investment in FHLB and Federal Reserve stock was $10 million and $97 million, respectively, compared with $50 million and $107 million at December 31, 2019.
During the second quarter of 2020, the Federal Reserve established the Payroll Protection Program Liquidity Facility (“PPPLF”). Under the PPPLF, we can obtain term financing for PPP loans by pledging them to the FRB before December 31, 2020. We also have the ability to increase our borrowing capacity at the FHLB of Des Moines by pledging the PPP loans. The ability to pledge PPP loans to the FHLB of Des Moines does not have a defined expiry and funding terms may vary.
Our AFS investment securities are primarily held as a source of contingent liquidity. We target securities that can be easily turned into cash through sale or repurchase agreements and whose value remains relatively stable during
ZIONS BANCORPORATION, NATIONAL ASSOCIATION AND SUBSIDIARIES
market disruptions. We regularly manage our short-term funding needs through secured borrowing with the securities pledged as collateral. Interest rate risk management is another consideration for selection of investment securities. Our AFS securities balances increased by $937 million during the first nine months of 2020.
Our loan to total deposit ratio was 82% at September 30, 2020, compared with 85% at December 31, 2019, indicating a higher deposit growth pattern compared with the loan growth pattern for the first nine months of 2020. If our operating, investing and deposit activity do not provide the loan funding required, we may rely on more expensive wholesale funding for a portion of our loan growth. Our use of borrowed funds (both short- and long-term) decreased by $1.2 billion during the first nine months of 2020 as our deposit growth funded average loan growth over the period. Due to the increase in average deposits of $3.5 billion during the third quarter of 2020 and with average loans only increasing $725 million, the surplus cash went to paying down borrowings and increasing short-term investments, which increased $1.5 billion from the second quarter of 2020.
We may also, from time to time, issue additional preferred stock, senior or subordinated notes or other forms of capital or debt instruments, depending on our capital, funding, asset-liability management or other needs as market conditions warrant and subject to any required regulatory approvals. Management believes that the sources of available liquidity are adequate to meet all reasonably foreseeable short-term and intermediate-term demands. A more comprehensive discussion of liquidity risk management, including certain contractual obligations, is contained in our 2019 Annual Report on Form 10-K.
Operational/Technology and Cyber Risk Management
Operational risk is the risk to current or anticipated earnings or capital arising from inadequate or failed internal processes or systems, human errors or misconduct, or adverse external events. In our ongoing efforts to identify and manage operational risk, we have an ERM department whose responsibility is to help employees, management and the Board of Directors to assess, understand, measure, manage, and monitor risk in accordance with our Risk Appetite Framework. We have documented both controls and the Control Self-Assessment related to financial reporting under the 2013 framework issued by the Committee of Sponsoring Organizations of the Treadway Commission (“COSO”) and the FDICIA.
To manage and minimize our operational risk, we have in place transactional documentation requirements; systems and procedures to monitor transactions and positions; systems and procedures to detect and mitigate attempts to commit fraud, penetrate our systems or telecommunications, access customer data, and/or deny normal access to those systems to our legitimate customers; regulatory compliance reviews; and periodic reviews by our Compliance Risk Management, Internal Audit and Credit Examination departments.
The number and sophistication of attempts to disrupt or penetrate our systems, sometimes referred to as hacking, cyber fraud, cyberattacks, or other similar names continues to grow. To combat the ever increasing sophistication of cyberattacks, we have upgraded key detection software and expanded the number of staff and expertise to monitor and manage cyberattacks. In addition, we have elevated our oversight and internal reporting to the Board and respective committees. We have also implemented an advisory group made up of cyber industry and academic experts, and from time-to-time, we may hire consultants to assist us in better managing this critical risk.
While we have significant internal resources, policies and procedures designed to prevent or limit the effect of the possible failure, interruption or security breach of our information systems, we have experienced security breaches due to cyberattacks in the past and there can be no assurance that any such failure, interruption or security breach will not occur in the future, or, if they do occur, that they will be adequately addressed. It is impossible to determine the potential effects of these events with any certainty but any such breach could result in material adverse consequences for us and our customers.
For a more comprehensive discussion of operational/technology and cyber risk management see our 2019 Annual Report on Form 10-K.
ZIONS BANCORPORATION, NATIONAL ASSOCIATION AND SUBSIDIARIES
CAPITAL MANAGEMENT
Overview
We believe that a strong capital position is vital to continued profitability and to promoting depositor and investor confidence. We have a fundamental financial objective to consistently improve risk-adjusted returns on our shareholders’ capital. We entered the economic downturn resulting from the COVID-19 pandemic with a strong capital position.
Our primary regulator is the OCC. We continue to be subject to examinations by the CFPB with respect to consumer financial regulations. Under the National Bank Act and OCC regulations, certain capital transactions may be subject to the approval of the OCC.
We continue to utilize stress testing as the primary mechanism to inform our decisions on the appropriate level of capital and capital actions, based upon actual and hypothetically-stressed economic conditions. The results of our internal stress tests are publicly available on our website. The timing and amount of capital actions are subject to various factors, including our financial performance, business needs, prevailing and anticipated economic conditions, stress testing, and OCC approval.
Capital Management Actions
Weighted average diluted shares outstanding decreased by 0.6 million and 9.2 million from the second and first quarters of 2020 to the third quarter of 2020, respectively. The decrease from the first quarter of 2020 was primarily due to a lower average Bank common share price and the expiration of common stock warrants. On May 22, 2020, 29.2 million common stock warrants (NASDAQ: ZIONW) expired, with an exercise price of $33.31. Each common stock warrant was convertible into 1.10 shares.
Total shareholders’ equity has increased moderately and was $7.7 billion at September 30, 2020, compared with $7.4 billion at December 31, 2019 and $7.5 billion at September 30, 2019. The increase during the first nine months of 2020 was primarily due to net income of $255 million and a $229 million after-tax increase in unrealized gains on AFS securities, which was due largely to changes in the interest rate environment. The increase was partially offset by $195 million of common and preferred stock dividends paid and $75 million of repurchases of Bank common stock from publicly announced plans. Common stock and additional paid-in capital decreased $55 million, or 2%, during the first nine months of 2020 primarily due to common stock repurchases.
During the first quarter of 2020, we repurchased 1.7 million shares of common stock, or 1% of common stock outstanding as of December 31, 2019, for $75 million at an average price of $45.02 per share. Beginning in the second quarter of 2020, we suspended share repurchase activity until visibility on earnings is improved. We expect to maintain the appropriate amount of capital to cover inherent risk. The timing and amount of additional common share repurchases will be subject to various factors, including our financial performance, business needs, prevailing economic conditions, stress testing, and OCC approval. The magnitude, timing and form of capital return will be determined by the Board. Shares may be repurchased occasionally in the open market, through privately negotiated transactions, utilizing Rule 10b5-1 plans or otherwise.
We paid common dividends of $169 million during the first nine months of 2020, compared with $170 million during the first nine months of 2019. In October 2020 the Board of Directors declared a quarterly dividend of $0.34 per common share payable on November 19, 2020 to shareholders of record on November 12, 2020. We also paid dividends on preferred stock of $26 million for both the first nine months of 2020 and 2019. See Note 9 for additional detail about capital management transactions during the first nine months of 2020.
Basel III Capital Requirements
We are subject to Basel III capital requirements to maintain adequate levels of capital as measured by several regulatory capital ratios. We met all capital adequacy requirements under the Basel III Capital Rules as of September 30, 2020. The following schedule presents our capital and performance ratios as of September 30, 2020, December 31, 2019 and September 30, 2019.
ZIONS BANCORPORATION, NATIONAL ASSOCIATION AND SUBSIDIARIES
A final rule adopted by the federal banking agencies in February 2019 provides banking organizations with the option to phase in, over a three-year period, the adverse day-one regulatory capital effects of the adoption of CECL. On March 27, 2020, the federal banking agencies issued an interim final rule that gives banking organizations that implement CECL before the end of 2020 the option to reduce for two years a portion of CECL’s adverse effect on regulatory capital. This is in addition to the three-year transition period already in place, resulting in an optional five-year transition. We adopted the provisions of this guidance beginning with the first quarter 2020 financial statements. As a result, we will delay recognizing the full amount of the September 30, 2020 impact of the ACL on regulatory capital until after a two-year deferral period, which for us extends through December 31, 2021. Beginning on January 1, 2022, we will be required to phase in 25% of the previously deferred estimated capital impact of the ACL, with an additional 25% to be phased in at the beginning of each subsequent year until fully phased in by the first quarter of 2025. At September 30, 2020, the application of these provisions improved our CET1, Tier 1 risk-based and Total risk-based capital ratios by 14 bps each, and improved our Tier 1 leverage capital ratio by 9 bps.
CAPITAL RATIOS
| | | | | | | | | | | | | | | | | |
| September 30,
2020 | | December 31,
2019 | | September 30,
2019 |
| | | | | |
Tangible common equity ratio1 | 7.9 | % | | 8.5 | % | | 8.5 | % |
Tangible equity ratio1 | 8.6 | | | 9.3 | | | 9.4 | |
| Average equity to average assets (three months ended) | 9.8 | | | 10.7 | | | 10.8 | |
| Basel III risk-based capital ratios: | | | | | |
| Common equity tier 1 capital | 10.4 | | | 10.2 | | | 10.4 | |
| Tier 1 leverage | 8.3 | | | 9.2 | | | 9.3 | |
| Tier 1 risk-based | 11.4 | | | 11.2 | | | 11.4 | |
| Total risk-based | 13.7 | | | 13.2 | | | 12.6 | |
| Return on average common equity (three months ended) | 9.4 | | | 10.1 | | | 12.1 | |
Return on average tangible common equity (three months ended)1 | 11.0 | | | 11.8 | | | 14.2 | |
1 See “GAAP to Non-GAAP Reconciliations” on page 6 for more information regarding these ratios.
At September 30, 2020, Basel III regulatory tier 1 risk-based capital and total risk-based capital was $6.4 billion and $7.7 billion, respectively, compared with $6.3 billion and $7.4 billion, respectively, at December 31, 2019. A more detailed discussion of capital management and Basel III requirements, including implications for the Bank, is contained in “Capital Standards – Basel Framework” under Part 1, Item 1, “Capital Management," and Note 15 of the Notes to Consolidated Financial Statements in our 2019 Annual Report on Form 10-K.
CRITICAL ACCOUNTING POLICIES AND SIGNIFICANT ESTIMATES
On January 1, 2020, we adopted ASU 2016-13, or CECL. Upon adoption of the ASU, we recorded the full amount of the ACL for loans and leases of $526 million, compared with $554 million at December 31, 2019, resulting in an after-tax increase to retained earnings of $20 million. The impact of the adoption of CECL for our securities portfolio was less than $1 million.
The CECL allowance is calculated based on quantitative models and management qualitative judgment based on many factors over the life of loan. The primary assumptions of the CECL quantitative model are the economic forecast, the length of the reasonable and supportable forecast period, the length of the reversion period, prepayment rates, and the credit quality of the portfolio.
ZIONS BANCORPORATION, NATIONAL ASSOCIATION AND SUBSIDIARIES
As a result of this accounting standard, our ACL has become more volatile and we expect this to continue primarily because, under the new methodology, the allowance is subject to economic forecasts that may change materially from period to period. Although we believe that our methodology for determining an appropriate level for the allowance adequately addresses the various components that could potentially result in credit losses, the processes and their elements include features that may be susceptible to significant change. Any unfavorable differences between the actual outcome of credit-related events and our estimates could require an additional provision for credit losses.
We estimate CECL over the contractual remaining life of each loan, which considers historical credit loss experience, current conditions, and reasonable and supportable forecasts about the future. We use the following two types of credit loss estimation models:
•Econometric loss models, which rely on statistical analyses of our historical loss experience, are dependent upon economic factors and other loan-level characteristics. Statistically relevant economic factors vary depending upon the type of loan, but include variables such as unemployment, real estate price indices, energy prices, GDP, etc.
•Loss models that are based on our long-term average historical credit loss experience since 2008, which rely on statistical analyses of our historical loss experience dependent upon loan-level characteristics.
Estimated credit losses during the first 12 months of a loan’s contractual remaining life, or reasonable and supportable period, are derived from the econometric loss models. Over a subsequent 12-month reversion period, we blend the estimated credit losses from the two models on a straight-line basis. For the remaining life of the loan, the estimated credit losses are derived from the long-term average historical credit loss models.
In addition to our quantitative allowance for loan losses, we also consider other qualitative and environmental factors related to current conditions and reasonable and supportable forecasts that may indicate current expected credit losses may differ from the historical information reflected in our quantitative models. Although the qualitative process is subjective, it represents our best estimate of qualitative factors impacting the determination of the ACL as of the financial reporting date.
Note 6 of the Notes to Consolidated Financial Statements and “Credit Risk Management” on page 24 contain further information and more specific descriptions of the processes and methodologies used to estimate the allowance for credit losses.
ITEM 1. FINANCIAL STATEMENTS (Unaudited)
ZIONS BANCORPORATION, NATIONAL ASSOCIATION AND SUBSIDIARIES
CONSOLIDATED BALANCE SHEETS
| | | | | | | | | | | |
| (In millions, shares in thousands) | September 30,
2020 | | December 31,
2019 |
| (Unaudited) | | |
| ASSETS | | | |
| Cash and due from banks | $ | 576 | | | $ | 705 | |
| Money market investments: | | | |
| Interest-bearing deposits | 856 | | | 743 | |
| Federal funds sold and security resell agreements | 2,804 | | | 484 | |
| Investment securities: | | | |
Held-to-maturity, at amortized cost (approximate fair value $596 and $597) | 592 | | | 592 | |
| Available-for-sale, at fair value | 14,662 | | | 13,725 | |
| Trading account, at fair value | 198 | | | 182 | |
| | | |
| Total securities | 15,452 | | | 14,499 | |
| Loans held for sale | 89 | | | 129 | |
| Loans and leases, net of unearned income and fees | 54,745 | | | 48,709 | |
| Less allowance for loan losses | 853 | | | 495 | |
| Loans held for investment, net of allowance | 53,892 | | | 48,214 | |
| Other noninterest-bearing investments | 830 | | | 898 | |
| Premises, equipment and software, net | 1,187 | | | 1,142 | |
| Goodwill and intangibles | 1,016 | | | 1,014 | |
| Other real estate owned | 6 | | | 8 | |
| Other assets | 1,649 | | | 1,336 | |
| Total Assets | $ | 78,357 | | | $ | 69,172 | |
| LIABILITIES AND SHAREHOLDERS’ EQUITY | | | |
| Deposits: | | | |
| Noninterest-bearing demand | $ | 31,338 | | | $ | 23,576 | |
| Interest-bearing: | | | |
| Savings and money market | 32,305 | | | 28,790 | |
| Time | 3,451 | | | 4,719 | |
| | | |
| Total deposits | 67,094 | | | 57,085 | |
| Federal funds purchased and other short-term borrowings | 1,252 | | | 2,053 | |
| Long-term debt | 1,347 | | | 1,723 | |
| Reserve for unfunded lending commitments | 64 | | | 59 | |
| Other liabilities | 932 | | | 899 | |
| Total liabilities | 70,689 | | | 61,819 | |
| Shareholders’ equity: | | | |
Preferred stock, without par value; authorized 4,400 shares | 566 | | | 566 | |
Common stock ($0.001 par value; authorized 350,000 shares; issued and outstanding 164,009 and 165,057 shares) and additional paid-in capital | 2,680 | | | 2,735 | |
| Retained earnings | 4,090 | | | 4,009 | |
| Accumulated other comprehensive income (loss) | 332 | | | 43 | |
| | | |
| | | |
| Total shareholders’ equity | 7,668 | | | 7,353 | |
| Total liabilities and shareholders’ equity | $ | 78,357 | | | $ | 69,172 | |
See accompanying notes to consolidated financial statements.
ZIONS BANCORPORATION, NATIONAL ASSOCIATION AND SUBSIDIARIES
CONSOLIDATED STATEMENTS OF INCOME
(Unaudited)
| | | | | | | | | | | | | | | | | | | | | | | |
| (In millions, except shares and per share amounts) | Three Months Ended
September 30, | | Nine Months Ended
September 30, |
| 2020 | | 2019 | | 2020 | | 2019 |
| Interest income: | | | | | | | |
| Interest and fees on loans | $ | 505 | | | $ | 581 | | | $ | 1,551 | | | $ | 1,731 | |
| Interest on money market investments | 2 | | | 8 | | | 11 | | | 26 | |
| Interest on securities | 74 | | | 88 | | | 235 | | | 279 | |
| Total interest income | 581 | | | 677 | | | 1,797 | | | 2,036 | |
| Interest expense: | | | | | | | |
| Interest on deposits | 18 | | | 69 | | | 92 | | | 192 | |
| Interest on short- and long-term borrowings | 8 | | | 41 | | | 40 | | | 131 | |
| Total interest expense | 26 | | | 110 | | | 132 | | | 323 | |
| Net interest income | 555 | | | 567 | | | 1,665 | | | 1,713 | |
| Provision for credit losses: | | | | | | | |
| Provision for loan losses | 45 | | | 8 | | | 446 | | | 30 | |
| Provision for unfunded lending commitments | 10 | | | 2 | | | 35 | | | 5 | |
| | | | | | | |
| Total provision for credit losses | 55 | | | 10 | | | 481 | | | 35 | |
| Net interest income after provision for credit losses | 500 | | | 557 | | | 1,184 | | | 1,678 | |
| Noninterest income: | | | | | | | |
| Commercial account fees | 32 | | | 31 | | | 93 | | | 90 | |
| Card fees | 21 | | | 24 | | | 61 | | | 70 | |
| Retail and business banking fees | 17 | | | 20 | | | 50 | | | 58 |
| Loan-related fees and income | 32 | | | 21 | | | 84 | | | 55 | |
| Capital markets and foreign exchange fees | 16 | | | 23 | | | 58 | | | 59 | |
| Wealth management and trust fees | 14 | | | 16 | | | 46 | | | 45 | |
| Other customer-related fees | 7 | | | 5 | | | 19 | | | 15 | |
| Customer-related fees | 139 | | | 140 | | | 411 | | | 392 | |
| Fair value and nonhedge derivative gain (loss) | 8 | | | (6) | | | (15) | | | (15) | |
| Dividends and other investment income | 6 | | | 10 | | | 17 | | | 33 | |
| Securities gains (losses), net | 4 | | | 2 | | | (5) | | | — | |
| Total noninterest income | 157 | | | 146 | | | 408 | | | 410 | |
| Noninterest expense: | | | | | | | |
| Salaries and employee benefits | 269 | | | 273 | | | 810 | | | 835 | |
| Occupancy, net | 33 | | | 34 | | | 97 | | | 99 | |
| Furniture, equipment and software, net | 32 | | | 34 | | | 97 | | | 101 | |
| Other real estate expense, net | — | | | (2) | | | — | | | (3) | |
| Credit-related expense | 6 | | | 2 | | | 16 | | | 16 | |
| Professional and legal services | 12 | | | 10 | | | 34 | | | 33 | |
| Advertising | 7 | | | 6 | | | 13 | | | 17 | |
| FDIC premiums | 7 | | | 7 | | | 18 | | | 19 | |
| Other | 76 | | | 51 | | | 194 | | | 153 | |
| Total noninterest expense | 442 | | | 415 | | | 1,279 | | | 1,270 | |
| Income before income taxes | 215 | | | 288 | | | 313 | | | 818 | |
| Income taxes | 40 | | | 66 | | | 58 | | | 185 | |
| Net income | 175 | | | 222 | | | 255 | | | 633 | |
| | | | | | | |
| | | | | | | |
| Preferred stock dividends | (8) | | | (8) | | | (25) | | | (25) | |
| | | | | | | |
| Net earnings applicable to common shareholders | $ | 167 | | | $ | 214 | | | $ | 230 | | | $ | 608 | |
| Weighted average common shares outstanding during the period: | | | | | | | |
| Basic shares (in thousands) | 163,608 | | | 173,160 | | | 163,764 | | | 178,985 | |
| Diluted shares (in thousands) | 163,779 | | | 181,870 | | | 166,029 | | | 188,895 | |
| Net earnings per common share: | | | | | | | |
| Basic | $ | 1.01 | | | $ | 1.23 | | | $ | 1.40 | | | $ | 3.38 | |
| Diluted | 1.01 | | | 1.17 | | | 1.38 | | | 3.20 | |
See accompanying notes to consolidated financial statements.
ZIONS BANCORPORATION, NATIONAL ASSOCIATION AND SUBSIDIARIES
CONSOLIDATED STATEMENTS OF COMPREHENSIVE INCOME
(Unaudited)
| | | | | | | | | | | | | | | | | | | | | | | |
| Three Months Ended
September 30, | | Nine Months Ended
September 30, |
| (In millions) | 2020 | | 2019 | | 2020 | | 2019 |
| | | | | | | |
| Net income for the period | $ | 175 | | | $ | 222 | | | $ | 255 | | | $ | 633 | |
| Other comprehensive income (loss), net of tax: | | | | | | | |
| Net unrealized holding gains (losses) on investment securities | (13) | | | 19 | | | 229 | | | 257 | |
| | | | | | | |
| | | | | | | |
| | | | | | | |
| | | | | | | |
| | | | | | | |
Net unrealized gains (losses) on other noninterest-bearing investments | 2 | | | (3) | | | (4) | | | (6) | |
| Net unrealized holding gains (losses) on derivative instruments | (1) | | | 6 | | | 75 | | | 45 | |
Reclassification adjustment for (increase) decrease in interest income recognized in earnings on derivative instruments | (11) | | | 1 | | | (24) | | | 3 | |
Reclassification to earnings for termination of pension plan | — | | | — | | | 13 | | | — | |
| Other comprehensive income (loss) | (23) | | | 23 | | | 289 | | | 299 | |
| Comprehensive income | $ | 152 | | | $ | 245 | | | $ | 544 | | | $ | 932 | |
See accompanying notes to consolidated financial statements.
ZIONS BANCORPORATION, NATIONAL ASSOCIATION AND SUBSIDIARIES
CONSOLIDATED STATEMENTS OF CHANGES IN SHAREHOLDERS’ EQUITY
(Unaudited)
| | | | | | | | | | | | | | | | | | | | | | | | | | | | | | | | | | | | | | | | | | | | | | | |
(In millions, except shares
and per share amounts) | Preferred
stock | | Common stock | | Accumulated paid-in capital | | Retained earnings | | Accumulated other
comprehensive income (loss) | | Total
shareholders’ equity |
Shares (in thousands) | | Amount | | | | |
| | | | | | | | | | | | | | | |
| Balance at June 30, 2020 | $ | 566 | | | 163,978 | | | $ | — | | | $ | 2,675 | | | $ | 3,979 | | | | $ | 355 | | | | $ | 7,575 | |
| Net income for the period | | | | | | | | | 175 | | | | | | | 175 | |
Other comprehensive loss, net of tax | | | | | | | | | | | | (23) | | | | (23) | |
| | | | | | | | | | | | | | | |
| | | | | | | | | | | | | | | |
| | | | | | | | | | | | | | | |
Net activity under employee plans and related tax benefits | | | 31 | | | | | 5 | | | | | | | | | 5 | |
| Dividends on preferred stock | | | | | | | | | (9) | | | | | | | (9) | |
Dividends on common stock, $0.34 per share | | | | | | | | | (56) | | | | | | | (56) | |
| Change in deferred compensation | | | | | | | | | 1 | | | | | | | 1 | |
| Balance at September 30, 2020 | $ | 566 | | | 164,009 | | | $ | — | | | $ | 2,680 | | | $ | 4,090 | | | | $ | 332 | | | | $ | 7,668 | |
| | | | | | | | | | | | | | | |
| Balance at June 30, 2019 | $ | 566 | | | 176,935 | | | $ | — | | | $ | 3,271 | | | $ | 3,737 | | | | $ | 25 | | | | $ | 7,599 | |
| Net income for the period | | | | | | | | | 222 | | | | | | | 222 | |
Other comprehensive income, net of tax | | | | | | | | | | | | 24 | | | | 24 | |
| | | | | | | | | | | | | | | |
Bank common stock repurchased | | | (6,638) | | | | | (275) | | | | | | | | | (275) | |
| | | | | | | | | | | | | | | |
Net activity under employee plans and related tax benefits | | | 76 | | | | | 6 | | | | | | | | | 6 | |
| Dividends on preferred stock | | | | | | | | | (8) | | | | | | | (8) | |
Dividends on common stock, $0.34 per share | | | | | | | | | (60) | | | | | | | (60) | |
| Change in deferred compensation | | | | | | | | | 1 | | | | | | | 1 | |
| Balance at September 30, 2019 | $ | 566 | | | 170,373 | | | $ | — | | | $ | 3,002 | | | $ | 3,892 | | | | $ | 49 | | | | $ | 7,509 | |
| | | | | | | | | | | | | | | | | | | | | | | | | | | | | | | | | | | | | | | | | | | | | | | |
(In millions, except shares
and per share amounts) | Preferred
stock | | Common stock | | Accumulated paid-in capital | | Retained earnings | | Accumulated other
comprehensive income (loss) | | Total
shareholders’ equity |
Shares (in thousands) | | Amount | | | | |
| | | | | | | | | | | | | | | |
| Balance at December 31, 2019 | $ | 566 | | | 165,057 | | | $ | — | | | $ | 2,735 | | | $ | 4,009 | | | | $ | 43 | | | | $ | 7,353 | |
| Net income for the period | | | | | | | | | 255 | | | | | | | 255 | |
Other comprehensive income, net of tax | | | | | | | | | | | | 289 | | | | 289 | |
Cumulative effect adjustment, adoption of ASU 2016-13, Credit Losses: Measurement of Credit Losses on Financial Instruments | | | | | | | | | 20 | | | | | | | 20 | |
Bank common stock repurchased | | | (1,680) | | | | | (75) | | | | | | | | | (75) | |
Net shares issued from stock warrant exercises | | | 1 | | | | | | | | | | | | | |
Net activity under employee plans and related tax benefits | | | 631 | | | | | 20 | | | | | | | | | 20 | |
| Dividends on preferred stock | | | | | | | | | (25) | | | | | | | (25) | |
Dividends on common stock, $1.02 per share | | | | | | | | | (169) | | | | | | | (169) | |
| | | | | | | | | | | | | | | |
| Balance at September 30, 2020 | $ | 566 | | | 164,009 | | | $ | — | | | $ | 2,680 | | | $ | 4,090 | | | | $ | 332 | | | | $ | 7,668 | |
| | | | | | | | | | | | | | | |
| Balance at December 31, 2018 | $ | 566 | | | 187,554 | | | $ | — | | | $ | 3,806 | | | $ | 3,456 | | | | $ | (250) | | | | $ | 7,578 | |
| Net income for the period | | | | | | | | | 633 | | | | | | | 633 | |
Other comprehensive income, net of tax | | | | | | | | | | | | 299 | | | | 299 | |
Cumulative effect adjustment, adoption of ASU 2017-08, Premium Amortization on Purchased Callable Debt Securities | | | | | | | | | (3) | | | | | | | (3) | |
Bank common stock repurchased | | | (18,001) | | | | | (826) | | | | | | | | | (826) | |
Net shares issued from stock warrant exercises | | | 8 | | | | | | | | | | | | | |
Net activity under employee plans and related tax benefits | | | 812 | | | | | 22 | | | | | | | | | 22 | |
| Dividends on preferred stock | | | | | | | | | (25) | | | | | | | (25) | |
Dividends on common stock, $0.94 per share | | | | | | | | | (169) | | | | | | | (169) | |
| | | | | | | | | | | | | | | |
| Balance at September 30, 2019 | $ | 566 | | | 170,373 | | | $ | — | | | $ | 3,002 | | | $ | 3,892 | | | | $ | 49 | | | | $ | 7,509 | |
ZIONS BANCORPORATION, NATIONAL ASSOCIATION AND SUBSIDIARIES
CONSOLIDATED STATEMENTS OF CASH FLOWS
(Unaudited)
| | | | | | | | | | | | | | |
| (In millions) | | Nine Months Ended
September 30, |
| | | 2020 | | 2019 |
| CASH FLOWS FROM OPERATING ACTIVITIES | | | | | | |
| Net income for the period | | | | $ | 255 | | | $ | 633 | |
Adjustments to reconcile net income to net cash provided by operating activities: | | | | | | |
| | | | | | |
Provision for credit losses | | | | 481 | | | 35 | |
Depreciation and amortization | | | | 75 | | | 143 | |
Share-based compensation | | | | 22 | | | 23 | |
Deferred income tax benefit | | | | (97) | | | (2) | |
Net increase in trading securities | | | | (16) | | | (174) | |
Net increase in loans held for sale | | | | (2) | | | (77) | |
Change in other liabilities | | | | 31 | | | (66) | |
Change in other assets | | | | (185) | | | (146) | |
Other, net | | | | (16) | | | (23) | |
| Net cash provided by operating activities | | | | 548 | | | 346 | |
| CASH FLOWS FROM INVESTING ACTIVITIES | | | | | | |
| Net decrease (increase) in money market investments | | | | (2,433) | | | 426 | |
| Proceeds from maturities and paydowns of investment securities held-to-maturity | | | | 250 | | | 311 | |
| Purchases of investment securities held-to-maturity | | | | (250) | | | (195) | |
| Proceeds from sales, maturities and paydowns of investment securities available-for-sale | | | | 3,198 | | | 2,222 | |
| Purchases of investment securities available-for-sale | | | | (3,907) | | | (1,271) | |
| Net change in loans and leases | | | | (6,004) | | | (2,085) | |
| Purchases and sales of other noninterest-bearing investments | | | | 56 | | | 83 | |
| Purchases of premises and equipment | | | | (123) | | | (94) | |
| | | | | | |
Other, net | | | | 32 | | | — | |
| Net cash used in investing activities | | | | (9,181) | | | (603) | |
| CASH FLOWS FROM FINANCING ACTIVITIES | | | | | | |
| Net increase in deposits | | | | 10,008 | | | 2,039 | |
| Net change in short-term funds borrowed | | | | (801) | | | (1,074) | |
| | | | | | |
| | | | | | |
| | | | | | |
| Proceeds from the issuance of long-term debt | | | | — | | | 497 | |
| Redemption of long-term debt | | | | (429) | | | — | |
| | | | | | |
| Proceeds from the issuance of common stock | | | | 5 | | | 8 | |
| Dividends paid on common and preferred stock | | | | (195) | | | (196) | |
| Bank common stock repurchased | | | | (76) | | | (826) | |
| Other, net | | | | (8) | | | (9) | |
| Net cash provided by financing activities | | | | 8,504 | | | 439 | |
| Net increase (decrease) in cash and due from banks | | | | (129) | | | 182 | |
| Cash and due from banks at beginning of period | | | | 705 | | | 614 | |
| Cash and due from banks at end of period | | | | $ | 576 | | | $ | 796 | |
| Cash paid for interest | | | | $ | 164 | | | $ | 315 | |
| Net cash paid for income taxes | | | | 148 | | | 179 | |
Noncash activities are summarized as follows: | | | | | | |
| Loans held for investment transferred to other real estate owned | | | | 2 | | | 7 | |
| Loans held for investment reclassified to loans held for sale, net | | | | (21) | | | 63 | |
See accompanying notes to consolidated financial statements.
ZIONS BANCORPORATION, NATIONAL ASSOCIATION AND SUBSIDIARIES
NOTES TO CONSOLIDATED FINANCIAL STATEMENTS
(Unaudited)
September 30, 2020
1. BASIS OF PRESENTATION
The accompanying unaudited consolidated financial statements of Zions Bancorporation, National Association and its majority-owned subsidiaries (collectively “Zions Bancorporation, N.A.,” “the Bank,” “we,” “our,” “us”) have been prepared in accordance with United States (“U.S.”) generally accepted accounting principles (“GAAP”) for interim financial information and with the instructions to Form 10-Q and Article 10 of Regulation S-X. Accordingly, they do not include all of the information and footnotes required by GAAP for complete financial statements. In the opinion of management, all adjustments (consisting of normal recurring accruals) considered necessary for a fair presentation have been included. References to GAAP, including standards promulgated by the Financial Accounting Standards Board (“FASB”), are made according to sections of the Accounting Standards Codification (“ASC”). Changes to the ASC are made with Accounting Standards Updates (“ASU”) that include consensus issues of the Emerging Issues Task Force.
Operating results for the nine months ended September 30, 2020 and 2019 are not necessarily indicative of the results that may be expected in future periods. In preparing the consolidated financial statements, we are required to make estimates and assumptions that affect the amounts reported in the financial statements and accompanying notes. Actual results could differ from those estimates. The consolidated balance sheet at December 31, 2019 is from the audited financial statements at that date, but does not include all of the information and footnotes required by GAAP for complete financial statements. For further information, refer to the consolidated financial statements and footnotes thereto included in the Bank’s 2019 Annual Report on Form 10-K. Certain prior period amounts have been reclassified to conform with the current period presentation. These reclassifications did not affect net income or shareholders’ equity. Additionally, effective October 1, 2019, we made certain financial reporting changes and reclassifications to noninterest income in our Consolidated Statements of Income. These changes and reclassifications were adopted on a retrospective basis. The changes and reclassifications reflect changes only to noninterest income in the Consolidated Statements of Income and do not impact net income, net interest income or noninterest expense.
Zions Bancorporation, N.A. is a commercial bank headquartered in Salt Lake City, Utah. The Bank provides a full range of banking and related services in 11 Western and Southwestern states through 7 separately managed and branded units as follows: Zions Bank, in Utah, Idaho and Wyoming; Amegy Bank (“Amegy”), in Texas; California Bank & Trust (“CB&T”); National Bank of Arizona (“NBAZ”); Nevada State Bank (“NSB”); Vectra Bank Colorado (“Vectra”), in Colorado and New Mexico; and The Commerce Bank of Washington (“TCBW”) which operates under that name in Washington and under the name The Commerce Bank of Oregon in Oregon.
ZIONS BANCORPORATION, NATIONAL ASSOCIATION AND SUBSIDIARIES
2. RECENT ACCOUNTING PRONOUNCEMENTS AND DEVELOPMENTS
| | | | | | | | | | | | | | | | | | | | |
| Accounting Standard Updates | | Description | | Date of adoption | | Effect on the financial statements or other significant matters |
| | | | | | |
| Updates adopted by the Bank during 2020 |
| | | | | | |
ASU 2020-04, Reference Rate Reform (Topic 848): Facilitation of the Effects of Reference Rate Reform on Financial Reporting | | As part of reference rate reform, the London Interbank Offered Rate ("LIBOR") is expected to be discontinued by December 31, 2021 and is being replaced by observable or transaction-based alternative reference rates. This ASU addresses certain operational accounting concerns of modifying contracts such as debt, lease, and derivative agreements that reference LIBOR, or another rate, that is expected to be discontinued due to reference rate reform.
The ASU provides temporary optional expedients and exceptions to the accounting requirements for contract modifications for contracts that reference LIBOR. This ASU also provides for a one-time election to sell or transfer to available-for-sale or trading certain qualifying held-to-maturity ("HTM") debt securities. Additionally, this guidance provides various optional expedients for hedging relationships affected by reference rate reform. | | April 1, 2020 | | We adopted ASU 2020-04 on April 1, 2020; the impact upon adoption was not significant as no practical expedients were applied in the current period, but will be applied in future periods.
To date, the Bank has identified a significant number of contracts referencing LIBOR across various business units and contract types. Additionally, the Bank’s designated hedging relationships utilize LIBOR-indexed derivatives and hedge the LIBOR exposure of floating-rate commercial loans and the Bank’s fixed-rate debt. Remediation of these LIBOR exposures will constitute a significant operational effort. While the full impact of reference rate reform is still being determined, the application of the ASU and its practical expedients will significantly reduce the operational and financial statement impact of the Bank’s remediation efforts. |
| | | | | | |
ASU 2016-13, Credit Losses (Topic 326): Measurement of Credit Losses on Financial Instruments and subsequent related ASUs
| | This ASU, and subsequent updates, significantly changes how entities will measure credit losses for virtually all financial assets and certain other instruments that are not measured at fair value through net income that have the contractual right to receive cash. The update replaces the “incurred loss” approach with a current expected credit loss ("CECL") model for instruments such as loans and HTM securities that are measured at amortized cost. The ASU requires credit losses relating to available-for sale (“AFS”) debt securities to be recorded through an allowance for credit loss (“ACL”) rather than a reduction of the carrying amount and replaces the historically required other-than-temporary impairment (“OTTI”) analysis. It also changes the accounting for purchased credit-impaired debt securities and loans.
The ASU retains many of the current disclosure requirements in U.S. GAAP and expands other disclosure requirements. The new guidance is effective for calendar year-end public companies beginning January 1, 2020. | | January 1, 2020 | | We adopted ASU 2016-13 and its subsequent updates on January 1, 2020; the impact upon adoption was an after-tax increase to retained earnings of approximately $20 million. |
ZIONS BANCORPORATION, NATIONAL ASSOCIATION AND SUBSIDIARIES
| | | | | | | | | | | | | | | | | | | | |
| Accounting Standard Updates | | Description | | Date of adoption | | Effect on the financial statements or other significant matters |
| Updates adopted by the Bank during 2020 |
ASU 2017-04, Intangibles – Goodwill and Other (Topic 350): Simplifying the Test for Goodwill Impairment
| | This ASU removes the requirements in step two of the current goodwill impairment model, eliminating the requirement to calculate and compare the implied fair value of the reporting entity with the carrying amount of that entity, including goodwill, to measure any impairment charge. Instead, entities will record an impairment charge based on the excess of a reporting unit’s carrying amount of goodwill over its implied fair value of goodwill (i.e., measure the charge based on step one of the current guidance).
The ASU also continues to allow entities to perform an optional qualitative goodwill impairment assessment before determining whether to proceed to the quantitative step one. The Update is effective for the Bank as of January 1, 2020. Early adoption is allowed for any goodwill impairment test performed after January 1, 2017. | | January 1, 2020 | | We adopted ASU 2017-04 on January 1, 2020; the impact upon adoption was not significant. The transition and adoption provisions were applied prospectively. |
ZIONS BANCORPORATION, NATIONAL ASSOCIATION AND SUBSIDIARIES
3. FAIR VALUE
Fair Value Measurement
Fair value is defined as the exchange price that would be received for an asset or paid to transfer a liability (an exit price) in the principal or most advantageous market for the asset or liability in an orderly transaction between market participants on the measurement date. For a discussion of the Bank’s valuation methodologies for assets and liabilities measured at fair value and the fair value hierarchy, see Note 3 of our 2019 Annual Report on Form 10-K.
Quantitative Disclosure by Fair Value Hierarchy
Assets and liabilities measured at fair value by class on a recurring basis are summarized as follows:
| | | | | | | | | | | | | | | | | | | | | | | |
| (In millions) | September 30, 2020 |
| Level 1 | | Level 2 | | Level 3 | | Total |
| ASSETS | | | | | | | |
Available-for-sale securities: | | | | | | | |
| U.S. Treasury, agencies and corporations | $ | 199 | | | $ | 13,068 | | | $ | — | | | $ | 13,267 | |
| Municipal securities | | | 1,320 | | | | | 1,320 | |
| | | | | | | |
| | | | | | | |
| | | | | | | |
| | | | | | | |
| Other debt securities | | | 75 | | | | | 75 | |
| Total Available-for-sale | 199 | | | 14,463 | | | — | | | 14,662 | |
| Trading account | 26 | | | 172 | | | | | 198 | |
| Other noninterest-bearing investments: | | | | | | | |
| Bank-owned life insurance | | | 534 | | | | | 534 | |
Private equity investments1 | 6 | | | | | 81 | | | 87 | |
| Other assets: | | | | | | | |
| Agriculture loan servicing and interest-only strips | | | | | 17 | | | 17 | |
| Deferred compensation plan assets | 109 | | | | | | | 109 | |
| Derivatives: | | | | | | | |
| | | | | | | |
| Derivatives not designated as hedges: | | | | | | | |
| Interest rate | | | 464 | | | | | 464 | |
| | | | | | | |
| | | | | | | |
| Foreign exchange | 3 | | | | | | | 3 | |
| Total Assets | $ | 343 | | | $ | 15,633 | | | $ | 98 | | | $ | 16,074 | |
| LIABILITIES | | | | | | | |
| Securities sold, not yet purchased | $ | 71 | | | $ | — | | | $ | — | | | $ | 71 | |
| Other liabilities: | | | | | | | |
| Derivatives: | | | | | | | |
| | | | | | | |
| Derivatives not designated as hedges: | | | | | | | |
| Interest rate | | | 34 | | | | | 34 | |
| | | | | | | |
| | | | | | | |
| Foreign exchange | 2 | | | | | | | 2 | |
| | | | | | | |
| | | | | | | |
| Total Liabilities | $ | 73 | | | $ | 34 | | | $ | — | | | $ | 107 | |
1 The level 1 PEI amount relates to the portion of our SBIC investments that is now publicly traded.
ZIONS BANCORPORATION, NATIONAL ASSOCIATION AND SUBSIDIARIES
| | | | | | | | | | | | | | | | | | | | | | | |
| (In millions) | December 31, 2019 |
| Level 1 | | Level 2 | | Level 3 | | Total |
| ASSETS | | | | | | | |
Available-for-sale securities: | | | | | | | |
| U.S. Treasury, agencies and corporations | $ | 25 | | | $ | 12,356 | | | $ | — | | | $ | 12,381 | |
| Municipal securities | | | 1,319 | | | | | 1,319 | |
| | | | | | | |
| | | | | | | |
| | | | | | | |
| | | | | | | |
| Other debt securities | | | 25 | | | | | 25 | |
| | | | | | | |
| Total Available-for-sale | 25 | | | 13,700 | | | — | | | 13,725 | |
| Trading account | 65 | | | 117 | | | | | 182 | |
| Other noninterest-bearing investments: | | | | | | | |
| Bank-owned life insurance | | | 525 | | | | | 525 | |
Private equity investments1 | 9 | | | | | 107 | | | 116 | |
| Other assets: | | | | | | | |
| Agriculture loan servicing and interest-only strips | | | | | 18 | | | 18 | |
| Deferred compensation plan assets | 113 | | | | | | | 113 | |
| Derivatives: | | | | | | | |
| | | | | | | |
| Derivatives not designated as hedges: | | | | | | | |
| Interest rate | | | 149 | | | | | 149 | |
| | | | | | | |
| | | | | | | |
| Foreign exchange | 4 | | | | | | | 4 | |
| Total Assets | $ | 216 | | | $ | 14,491 | | | $ | 125 | | | $ | 14,832 | |
| LIABILITIES | | | | | | | |
| Securities sold, not yet purchased | $ | 66 | | | $ | — | | | $ | — | | | $ | 66 | |
| Other liabilities: | | | | | | | |
| Derivatives: | | | | | | | |
| | | | | | | |
| Derivatives not designated as hedges: | | | | | | | |
| Interest rate | | | 15 | | | | | 15 | |
| | | | | | | |
| | | | | | | |
| Foreign exchange | 4 | | | | | | | 4 | |
| | | | | | | |
| | | | | | | |
| Total Liabilities | $ | 70 | | | $ | 15 | | | $ | — | | | $ | 85 | |
1 The level 1 PEI amount relates to the portion of our SBIC investments that is now publicly traded.
Level 3 Valuations
The Bank’s Level 3 holdings include private equity investments (“PEIs”), agriculture loan servicing, and interest-only strips. For additional information regarding the financial instruments measured under Level 3, and the methods and significant assumptions used to estimate their fair value, see Note 3 of our 2019 Annual Report on Form 10-K.
ZIONS BANCORPORATION, NATIONAL ASSOCIATION AND SUBSIDIARIES
Reconciliation of Level 3 Fair Value Measurements
The following reconciles the beginning and ending balances of assets and liabilities that are measured at fair value by class on a recurring basis using Level 3 inputs:
| | | | | | | | | | | | | | | | | | | | | | | | | | | | | | | | | | | | | | | | | | | | | | | | | | | | | | | | | | | | | | | |
| Level 3 Instruments |
| Three Months Ended | | Nine Months Ended | | | | |
| September 30, 2020 | | September 30, 2019 | | September 30, 2020 | | September 30, 2019 | | | | | | | | |
| (In millions) | Private
equity
investments | | Ag loan svcg and int-only strips | | Private
equity
investments | | Ag loan svcg and int-only strips | | Private
equity
investments | | Ag loan svcg and int-only strips | | Private
equity
investments | | Ag loan svcg and int-only strips | | | | | | | | | | | | | | | | |
| | | | | | | | | | | | | | | | | | | | | | | | | | | | | | | |
Balance at beginning of period | $ | 77 | | | $ | 17 | | | $ | 105 | | | $ | 19 | | | $ | 107 | | | $ | 18 | | | $ | 102 | | | $ | 18 | | | | | | | | | | | | | | | | | |
| | | | | | | | | | | | | | | | | | | | | | | | | | | | | | | |
| Securities gains (losses), net | 1 | | | — | | | 1 | | | — | | | (8) | | | — | | | — | | | — | | | | | | | | | | | | | | | | | |
| Other noninterest income (expense) | — | | | — | | | — | | | — | | | — | | | (1) | | | — | | | 1 | | | | | | | | | | | | | | | | | |
| Purchases | 3 | | | — | | | 1 | | | — | | | 7 | | | — | | | 5 | | | — | | | | | | | | | | | | | | | | | |
| | | | | | | | | | | | | | | | | | | | | | | | | | | | | | | |
| | | | | | | | | | | | | | | | | | | | | | | | | | | | | | | |
| Other | — | | | — | | | — | | | — | | | (25) | | | — | | | — | | | — | | | | | | | | | | | | | | | | | |
Balance at end of period | $ | 81 | | | $ | 17 | | | $ | 107 | | | $ | 19 | | | $ | 81 | | | $ | 17 | | | $ | 107 | | | $ | 19 | | | | | | | | | | | | | | | | | |
The reconciliation of Level 3 instruments includes no realized gains or losses in the statement of income during the three months ended September 30, 2020, and $9 million in realized losses during the same period in 2019. During the nine months ended September 30, realized gains in the statement of income was $15 million in 2020 and $9 million in realized losses during the same period in 2019.
Nonrecurring Fair Value Measurements
Included in the balance sheet amounts are the following amounts of assets that had fair value changes measured on a nonrecurring basis.
| | | | | | | | | | | | | | | | | | | | | | | | | | | | | | | | | | | | | | | | | | | | | | | |
| (In millions) | Fair value at September 30, 2020 | | Fair value at December 31, 2019 |
| Level 1 | | Level 2 | | Level 3 | | Total | | Level 1 | | Level 2 | | Level 3 | | Total |
| ASSETS | | | | | | | | | | | | | | | |
| Private equity investments | $ | — | | | $ | — | | | $ | 1 | | | $ | 1 | | | $ | — | | | $ | — | | | $ | 1 | | | $ | 1 | |
| Collateral-dependent loans | — | | | 1 | | | — | | | 1 | | | — | | | — | | | — | | | — | |
| Other real estate owned | — | | | 4 | | | — | | | 4 | | | — | | | — | | | — | | | — | |
| Total | $ | — | | | $ | 5 | | | $ | 1 | | | $ | 6 | | | $ | — | | | $ | — | | | $ | 1 | | | $ | 1 | |
The previous fair values may not be current as of the dates indicated, but rather as of the date the fair value change occurred, such as a charge for impairment. Accordingly, carrying values may not equal current fair value.
| | | | | | | | | | | | | | | | | | | | | | | |
| Gains (losses) from fair value changes |
| (In millions) | Three Months Ended
September 30, | | Nine Months Ended
September 30, |
| 2020 | | 2019 | | 2020 | | 2019 |
| ASSETS | | | | | | | |
| Private equity investments | $ | — | | | $ | (1) | | | $ | — | | | $ | (1) | |
| Collateral-dependent loans | 1 | | | — | | | 1 | | | (9) | |
| Other real estate owned | — | | | — | | | — | | | (1) | |
| Total | $ | 1 | | | $ | (1) | | | $ | 1 | | | $ | (11) | |
During the three months ended September 30, we recognized $1 million and $2 million of net gains in 2020 and 2019 from the sale of other real estate owned (“OREO”) properties. During the nine months ended September 30, we recognized approximately $1 million and $3 million of net gains in 2020 and 2019 from the sale of OREO properties that had a carrying value, at the time of sale, of $3 million and $4 million during these same periods.
ZIONS BANCORPORATION, NATIONAL ASSOCIATION AND SUBSIDIARIES
Prior to their sale, we recognized an insignificant amount of impairment on these properties during the nine months ended September 30, 2020 and 2019.
Private equity investments carried at cost were measured at fair value for impairment purposes according to the methodology previously discussed for these investments. Amounts of PEIs carried at cost were $8 million at both September 30, 2020 and December 31, 2019. Amounts of other noninterest-bearing investments carried at cost were $108 million at September 30, 2020 and $157 million at December 31, 2019, which were comprised of Federal Reserve and Federal Home Loan Bank (“FHLB”) stock. Private equity investments accounted for using the equity method were $50 million at September 30, 2020 and $45 million at December 31, 2019.
Loans that are collateral-dependent were measured at the lower of amortized cost or the fair value of the collateral. OREO was measured initially at fair value based on collateral appraisals at the time of transfer and subsequently at the lower of cost or fair value. For additional information regarding the measurement of fair value for impaired loans, collateral-dependent loans, and OREO, see Note 3 of our 2019 Annual Report on Form 10-K.
Fair Value of Certain Financial Instruments
Following is a summary of the carrying values and estimated fair values of certain financial instruments:
| | | | | | | | | | | | | | | | | | | | | | | | | | | | | | | | | | | |
| | September 30, 2020 | | December 31, 2019 |
| (In millions) | Carrying
value | | Estimated
fair value | | Level | | Carrying
value | | Estimated
fair value | | Level |
| Financial assets: | | | | | | | | | | | |
| HTM investment securities | $ | 592 | | | $ | 596 | | | 2 | | $ | 592 | | | $ | 597 | | | 2 |
Loans and leases (including loans held for sale), net of allowance | 53,981 | | | 54,154 | | | 3 | | 48,343 | | | 47,958 | | | 3 |
| Financial liabilities: | | | | | | | | | | | |
| Time deposits | 3,451 | | | 3,471 | | | 2 | | 4,719 | | | 4,725 | | | 2 |
| | | | | | | | | | | |
| | | | | | | | | | | |
| Long-term debt | 1,347 | | | 1,332 | | | 2 | | 1,723 | | | 1,751 | | | 2 |
This summary excludes financial assets and liabilities for which carrying value approximates fair value and financial instruments that are recorded at fair value on a recurring basis. For additional information regarding the financial instruments within the scope of this disclosure, and the methods and significant assumptions used to estimate their fair value, see Note 3 of our 2019 Annual Report on Form 10-K.
4. OFFSETTING ASSETS AND LIABILITIES
Gross and net information for selected financial instruments in the balance sheet is as follows:
| | | | | | | | | | | | | | | | | | | | | | | | | | | | | | | | | | | | | | |
| | September 30, 2020 |
| (In millions) | | | | | | | | Gross amounts not offset in the balance sheet | | |
| Description | | Gross amounts recognized | | Gross amounts offset in the balance sheet | | Net amounts presented in the balance sheet | | Financial instruments | | Cash collateral received/pledged | | Net amount |
| Assets: | | | | | | | | | | | | |
Federal funds sold and security resell agreements | | $ | 2,809 | | | $ | (5) | | | $ | 2,804 | | | $ | — | | | $ | — | | | $ | 2,804 | |
| Derivatives (included in other assets) | | 467 | | | — | | | 467 | | | (1) | | | (1) | | | 465 | |
| Total assets | | $ | 3,276 | | | $ | (5) | | | $ | 3,271 | | | $ | (1) | | | $ | (1) | | | $ | 3,269 | |
| Liabilities: | | | | | | | | | | | | |
Federal funds purchased and other short-term borrowings | | $ | 1,257 | | | $ | (5) | | | $ | 1,252 | | | $ | — | | | $ | — | | | $ | 1,252 | |
Derivatives (included in other liabilities) | | 36 | | | — | | | 36 | | | (1) | | | (30) | | | 5 | |
| Total Liabilities | | $ | 1,293 | | | $ | (5) | | | $ | 1,288 | | | $ | (1) | | | $ | (30) | | | $ | 1,257 | |
ZIONS BANCORPORATION, NATIONAL ASSOCIATION AND SUBSIDIARIES
| | | | | | | | | | | | | | | | | | | | | | | | | | | | | | | | | | | | | | |
| | December 31, 2019 |
| (In millions) | | | | | | | | Gross amounts not offset in the balance sheet | | |
| Description | | Gross amounts recognized | | Gross amounts offset in the balance sheet | | Net amounts presented in the balance sheet | | Financial instruments | | Cash collateral received/pledged | | Net amount |
| Assets: | | | | | | | | | | | | |
Federal funds sold and security resell agreements | | $ | 694 | | | $ | (210) | | | $ | 484 | | | $ | — | | | $ | — | | | $ | 484 | |
| Derivatives (included in other assets) | | 153 | | | — | | | 153 | | | (6) | | | — | | | 147 | |
| Total assets | | $ | 847 | | | $ | (210) | | | $ | 637 | | | $ | (6) | | | $ | — | | | $ | 631 | |
| Liabilities: | | | | | | | | | | | | |
Federal funds purchased and other short-term borrowings | | $ | 2,263 | | | $ | (210) | | | $ | 2,053 | | | $ | — | | | $ | — | | | $ | 2,053 | |
Derivatives (included in other liabilities) | | 19 | | | — | | | 19 | | | (6) | | | (10) | | | 3 | |
| Total Liabilities | | $ | 2,282 | | | $ | (210) | | | $ | 2,072 | | | $ | (6) | | | $ | (10) | | | $ | 2,056 | |
Security repurchase and reverse repurchase (“resell”) agreements are offset, when applicable, in the balance sheet according to master netting agreements. Security repurchase agreements are included with “Federal funds purchased and other short-term borrowings.” Derivative instruments may be offset under their master netting agreements; however, for accounting purposes, we present these items on a gross basis in the Bank’s balance sheet. See Note 7 for further information regarding derivative instruments.
5. INVESTMENTS
Investment Securities
Securities are classified as HTM, AFS or trading. HTM securities, which management has the intent and ability to hold until maturity, are carried at amortized cost. AFS securities are carried at fair value and unrealized gains and losses are reported as net increases or decreases to accumulated other comprehensive income (“AOCI”). Trading securities are carried at fair value with gains and losses recognized in current period earnings. The carrying values of our securities do not include accrued interest receivables of $51 million and $58 million at September 30, 2020 and December 31, 2019, respectively. These receivables are presented in the Consolidated Balance Sheet within the Other Assets line item.
The purchase premiums for callable debt securities classified as HTM or AFS are amortized at an effective yield to the earliest call date. The purchase premiums and discounts for all other HTM and AFS securities are recognized in interest income over the contractual life of the security using the effective yield method. As principal repayments are received on securities, a proportionate amount of the related premium or discount is recognized in income so that the effective yield on the remaining portion of the security continues unchanged. Note 3 of our 2019 Annual Report on Form 10-K discusses the process to estimate fair value for investment securities.
ZIONS BANCORPORATION, NATIONAL ASSOCIATION AND SUBSIDIARIES
| | | | | | | | | | | | | | | | | | | | | | | |
| September 30, 2020 |
| (In millions) | Amortized
cost | | Gross unrealized gains | | Gross unrealized losses | | Estimated
fair value |
| Held-to-maturity | | | | | | | |
| Municipal securities | $ | 592 | | | $ | 4 | | | $ | — | | | $ | 596 | |
| Available-for-sale | | | | | | | |
| U.S. Treasury securities | 195 | | | 4 | | | — | | | 199 | |
| U.S. Government agencies and corporations: | | | | | | | |
| Agency securities | 1,058 | | | 37 | | | 2 | | | 1,093 | |
| Agency guaranteed mortgage-backed securities | 10,461 | | | 280 | | | 5 | | | 10,736 | |
| Small Business Administration loan-backed securities | 1,277 | | | 1 | | | 39 | | | 1,239 | |
| Municipal securities | 1,254 | | | 66 | | | — | | | 1,320 | |
| Other debt securities | 75 | | | — | | | — | | | 75 | |
| Total available-for-sale debt securities | 14,320 | | | 388 | | | 46 | | | 14,662 | |
| Total investment securities | $ | 14,912 | | | $ | 392 | | | $ | 46 | | | $ | 15,258 | |
| | | | | | | | | | | | | | | | | | | | | | | |
| December 31, 2019 |
| (In millions) | Amortized
cost | | Gross unrealized gains | | Gross unrealized losses | | Estimated
fair value |
| Held-to-maturity | | | | | | | |
| Municipal securities | $ | 592 | | | $ | 5 | | | $ | — | | | $ | 597 | |
| Available-for-sale | | | | | | | |
| U.S. Treasury securities | 25 | | | — | | | — | | | 25 | |
| U.S. Government agencies and corporations: | | | | | | | |
| Agency securities | 1,301 | | | 5 | | | 4 | | | 1,302 | |
| Agency guaranteed mortgage-backed securities | 9,518 | | | 83 | | | 42 | | | 9,559 | |
| Small Business Administration loan-backed securities | 1,535 | | | 1 | | | 41 | | | 1,495 | |
| Municipal securities | 1,282 | | | 37 | | | — | | | 1,319 | |
| Other debt securities | 25 | | | — | | | — | | | 25 | |
| Total available-for-sale debt securities | 13,686 | | | 126 | | | 87 | | | 13,725 | |
| | | | | | | |
| | | | | | | |
| Total investment securities | $ | 14,278 | | | $ | 131 | | | $ | 87 | | | $ | 14,322 | |
Maturities
The following schedule shows the amortized cost and weighted average yields of investment debt securities by contractual maturity of principal payments as of September 30, 2020. Actual principal payments may differ from contractual or expected principal payments because borrowers may have the right to call or prepay obligations with or without call or prepayment penalties.
ZIONS BANCORPORATION, NATIONAL ASSOCIATION AND SUBSIDIARIES
| | | | | | | | | | | | | | | | | | | | | | | | | | | | | | | | | | | | | | | | | | | | | | | | | | | | | | | | | | | |
| September 30, 2020 |
| Total debt investment securities | | Due in one year or less | | Due after one year through five years | | Due after five years through ten years | | Due after ten years |
| (Dollar amounts in millions) | Amortized cost | | Avg yield | | Amortized cost | | Avg yield | | Amortized cost | | Avg yield | | Amortized cost | | Avg yield | | Amortized cost | | Avg yield |
| | | | | | | | | | | | | | | | | | | |
| Held-to-maturity | | | | | | | | | | | | | | | | | | | |
Municipal securities 1 | $ | 592 | | | 3.55 | % | | $ | 158 | | | 2.80 | % | | $ | 198 | | | 3.69 | % | | $ | 129 | | | 3.70 | % | | $ | 107 | | | 4.20 | % |
| Available-for-sale | | | | | | | | | | | | | | | | | | | |
| U.S. Treasury securities | 195 | | | 0.99 | | | 50 | | | 0.14 | | | — | | | — | | | — | | | — | | | 145 | | | 1.28 | |
| U.S. Government agencies and corporations: | | | | | | | | | | | | | | | | | | | |
| Agency securities | 1,058 | | | 2.37 | | | — | | | — | | | 151 | | | 1.01 | | | 392 | | | 2.57 | | | 515 | | | 2.62 | |
| Agency guaranteed mortgage-backed securities | 10,461 | | | 2.05 | | | 1 | | | 4.40 | | | 284 | | | 1.49 | | | 774 | | | 1.79 | | | 9,402 | | | 2.09 | |
| Small Business Administration loan-backed securities | 1,277 | | | 1.46 | | | — | | | — | | | 33 | | | 1.27 | | | 146 | | | 1.50 | | | 1,098 | | | 1.46 | |
Municipal securities 1 | 1,254 | | | 2.51 | | | 89 | | | 1.78 | | | 595 | | | 2.34 | | | 448 | | | 2.77 | | | 122 | | | 2.97 | |
| Other debt securities | 75 | | | 2.22 | | | — | | | — | | | — | | | — | | | 60 | | | 2.03 | | | 15 | | | 3.00 | |
| Total available-for-sale debt securities | 14,320 | | | 2.05 | | | 140 | | | 1.21 | | | 1,063 | | | 1.89 | | | 1,820 | | | 2.18 | | | 11,297 | | | 2.05 | |
| Total investment securities | $ | 14,912 | | | 2.11 | % | | $ | 298 | | | 2.05 | % | | $ | 1,261 | | | 2.17 | % | | $ | 1,949 | | | 2.28 | % | | $ | 11,404 | | | 2.07 | % |
1 The yields on tax-exempt securities are calculated on a tax-equivalent basis.
The following is a summary of the amount of gross unrealized losses for debt securities and the estimated fair value by length of time the securities have been in an unrealized loss position:
| | | | | | | | | | | | | | | | | | | | | | | | | | | | | | | | | | | |
| September 30, 2020 |
| Less than 12 months | | 12 months or more | | Total |
| (In millions) | Gross
unrealized
losses | | Estimated
fair
value | | Gross
unrealized
losses | | Estimated
fair
value | | Gross
unrealized
losses | | Estimated
fair
value |
| Held-to-maturity | | | | | | | | | | | |
| Municipal securities | $ | — | | | $ | 55 | | | $ | — | | | $ | 16 | | | $ | — | | | $ | 71 | |
| | | | | | | | | | | |
| | | | | | | | | | | |
| | | | | | | | | | | |
| | | | | | | | | | | |
| Available-for-sale | | | | | | | | | | | |
| | | | | | | | | | | |
| U.S. Government agencies and corporations: | | | | | | | | | | | |
| Agency securities | 1 | | | 68 | | | 1 | | | 63 | | | 2 | | | 131 | |
| Agency guaranteed mortgage-backed securities | 3 | | | 704 | | | 2 | | | 201 | | | 5 | | | 905 | |
| Small Business Administration loan-backed securities | — | | | 19 | | | 39 | | | 1,141 | | | 39 | | | 1,160 | |
| Municipal securities | — | | | 54 | | | — | | | — | | | — | | | 54 | |
| Other | — | | | 50 | | | — | | | — | | | — | | | 50 | |
| | | | | | | | | | | |
| | | | | | | | | | | |
| | | | | | | | | | | |
| | | | | | | | | | | |
| | | | | | | | | | | |
| Total available-for-sale | 4 | | | 895 | | | 42 | | | 1,405 | | | 46 | | | 2,300 | |
| | | | | | | | | | | |
| | | | | | | | | | | |
| Total investment securities | $ | 4 | | | $ | 950 | | | $ | 42 | | | $ | 1,421 | | | $ | 46 | | | $ | 2,371 | |
ZIONS BANCORPORATION, NATIONAL ASSOCIATION AND SUBSIDIARIES
| | | | | | | | | | | | | | | | | | | | | | | | | | | | | | | | | | | |
| December 31, 2019 |
| Less than 12 months | | 12 months or more | | Total |
| (In millions) | Gross
unrealized
losses | | Estimated
fair
value | | Gross
unrealized
losses | | Estimated
fair
value | | Gross
unrealized
losses | | Estimated
fair
value |
| Held-to-maturity | | | | | | | | | | | |
| Municipal securities | $ | — | | | $ | 73 | | | $ | — | | | $ | 45 | | | $ | — | | | $ | 118 | |
| | | | | | | | | | | |
| | | | | | | | | | | |
| | | | | | | | | | | |
| | | | | | | | | | | |
| Available-for-sale | | | | | | | | | | | |
| U.S. Government agencies and corporations: | | | | | | | | | | | |
| Agency securities | 2 | | | 222 | | | 2 | | | 359 | | | 4 | | | 581 | |
| Agency guaranteed mortgage-backed securities | 4 | | | 1,173 | | | 38 | | | 3,215 | | | 42 | | | 4,388 | |
| Small Business Administration loan-backed securities | 1 | | | 172 | | | 40 | | | 1,215 | | | 41 | | | 1,387 | |
| Municipal securities | — | | | 50 | | | — | | | 5 | | | — | | | 55 | |
| Other | — | | | — | | | — | | | — | | | — | | | — | |
| | | | | | | | | | | |
| | | | | | | | | | | |
| | | | | | | | | | | |
| | | | | | | | | | | |
| | | | | | | | | | | |
| Total available-for-sale | 7 | | | 1,617 | | | 80 | | | 4,794 | | | 87 | | | 6,411 | |
| | | | | | | | | | | |
| | | | | | | | | | | |
| Total investment securities | $ | 7 | | | $ | 1,690 | | | $ | 80 | | | $ | 4,839 | | | $ | 87 | | | $ | 6,529 | |
At September 30, 2020 and December 31, 2019, respectively, 68 and 146 HTM and 587 and 849 AFS investment securities were in an unrealized loss position.
Impairment
Ongoing Policy
We review investment securities on a quarterly basis for the presence of impairment. For AFS securities, we assess whether impairment is present on an individual security basis when the fair value of a debt security is less than its amortized cost basis at the balance sheet date. When determining if the fair value of an investment is less than the amortized cost basis we have elected to exclude accrued interest from the amortized cost basis of the investment. If we have an intent to sell an identified security, or it is more likely than not we will be required to sell the security before recovery of its amortized cost basis, then we recognize an impairment equal to any existing allowance written off against the security.
If we do not have the intent to sell a security, and it is more likely than not that we will not be required to sell a security prior to recovery of its amortized cost basis, then we determine whether there is any impairment attributable to credit-related factors. We analyze certain factors, primarily internal and external credit ratings, to determine if the decline in fair value below the amortized cost basis has resulted from a credit loss or other factors. If a credit impairment is determined to exist, then we measure the amount of credit loss and recognize an allowance for the credit loss. In measuring the credit loss, we generally compare the present value of cash flows expected to be collected from the security to the amortized cost basis of the security. These cash flows are credit adjusted using, among other things, assumptions for default probability and loss severity. Certain other unobservable inputs such as prepayment rate assumptions are also utilized. In addition, certain internal models may be utilized. To determine the credit-related portion of impairment we use the security-specific effective interest rate when estimating the present value of cash flows. If the present value of cash flows is less than the amortized cost basis of the security, then this amount is recorded as an allowance for credit loss, limited to the amount that the fair value is less than the amortized cost basis (i.e., the credit impairment cannot result in the security being carried at an amount lower than its fair value). The assumptions used to estimate the expected cash flows depends on the particular asset class, structure and credit rating of the security. Declines in fair value that are not recorded in the allowance are recorded in other comprehensive income, net of applicable taxes.
AFS Impairment Conclusions
The Bank did not recognize any impairment on its AFS investment securities portfolio during the first nine months of 2020. Unrealized losses relate to changes in interest rates subsequent to purchase and are not attributable to credit. At September 30, 2020, we had not initiated any sales of AFS securities nor did we have an intent to sell any identified securities with unrealized losses, and we do not believe it is more likely than not we would be required to sell such securities before recovery of their amortized cost basis.
ZIONS BANCORPORATION, NATIONAL ASSOCIATION AND SUBSIDIARIES
HTM Credit Quality
For HTM securities, the allowance for credit losses ("ACL") is assessed consistent with the approach discussed in Note 6 for loans carried at amortized cost. The ACL on HTM securities was less than $1 million at September 30, 2020. All HTM securities were risk-graded as "pass" in terms of credit quality and none were past due as of September 30, 2020. The amortized cost basis of HTM securities categorized by year of issuance is summarized as follows:
| | | | | | | | | | | | | | | | | | | | | | | | | | | | | | | | | | | | | | | | | |
| September 30, 2020 |
| Amortized cost basis by year of issuance | | |
| (In millions) | 2020 | | 2019 | | 2018 | | 2017 | | 2016 | | Prior | | Total Securities |
| Held-to-maturity | $ | 116 | | | $ | 18 | | | $ | 1 | | | $ | 34 | | | $ | 183 | | | $ | 240 | | | $ | 592 | |
Securities Gains and Losses Recognized in Income
The following summarizes gains and losses that were recognized in the statement of income:
| | | | | | | | | | | | | | | | | | | | | | | | | | | | | | | | | | | | | | | | | | | | | | | | | | | | | | | | |
| Three Months Ended September 30, | | Nine Months Ended September 30, | | | |
| 2020 | | 2019 | | 2020 | | 2019 | | | | | |
| (In millions) | Gross gains | | Gross losses | | Gross gains | | Gross losses | | Gross gains | | Gross losses | | Gross gains | | Gross losses | | | | | | | | | |
|
| | | | | | | | | | | | | | | | | | | | | | | | |
| | | | | | | | | | | | | | | | | | | | | | | | |
| | | | | | | | | | | | | | | | | | | | | | | | |
| Other noninterest-bearing investments | $ | 5 | | | $ | 1 | | | $ | 2 | | | $ | — | | | $ | 13 | | | $ | 18 | | | $ | 7 | | | $ | 7 | | | | | | | | | | |
| | | | | | | | | | | | | | | | | | | | | | | | |
Net gains (losses) 1 | | | $ | 4 | | | | | $ | 2 | | | | | $ | (5) | | | | | $ | — | | | | | | | | | | |
| | | | | | | | | | | | | | | | | | | | | | | | |
| | | | | | | | | | | | | | | | | | | | | | | | |
| | | | | | | | | | | | | | | | | | | | | | | | |
| | | | | | | | | | | | | | | | | | | | | | | | |
1 Net gains (losses) were recognized in securities gains (losses), net in the statement of income.
Interest income by security type is as follows:
| | | | | | | | | | | | | | | | | | | | | | | | | | | | | | | | | | | |
| Three Months Ended September 30, |
| 2020 | | 2019 |
| (In millions) | Taxable | | Nontaxable | | Total | | Taxable | | Nontaxable | | Total |
| Investment securities: | | | | | | | | | | | |
| Held-to-maturity | $ | 2 | | | $ | 3 | | | $ | 5 | | | $ | 3 | | | $ | 3 | | | $ | 6 | |
| Available-for-sale | 61 | | | 6 | | | 67 | | | 74 | | | 7 | | | 81 | |
| Trading | — | | | 2 | | | 2 | | | — | | | 1 | | | 1 | |
| Total securities | $ | 63 | | | $ | 11 | | | $ | 74 | | | $ | 77 | | | $ | 11 | | | $ | 88 | |
| | | | | | | | | | | | | | | | | | | | | | | | | | | | | | | | | | | |
| Nine Months Ended September 30, |
| 2020 | | 2019 |
| (In millions) | Taxable | | Nontaxable | | Total | | Taxable | | Nontaxable | | Total |
| Investment securities: | | | | | | | | | | | |
| Held-to-maturity | $ | 7 | | | $ | 8 | | | $ | 15 | | | $ | 7 | | | $ | 11 | | | $ | 18 | |
| Available-for-sale | 196 | | | 19 | | | 215 | | | 238 | | | 19 | | | 257 | |
| Trading | — | | | 5 | | | 5 | | | — | | | 4 | | | 4 | |
| Total | $ | 203 | | | $ | 32 | | | $ | 235 | | | $ | 245 | | | $ | 34 | | | $ | 279 | |
Investment securities with a carrying value of $2.2 billion and $2.0 billion at September 30, 2020 and December 31, 2019, respectively, were pledged to secure public and trust deposits, advances, and for other purposes as required by law. Securities are also pledged as collateral for security repurchase agreements.
ZIONS BANCORPORATION, NATIONAL ASSOCIATION AND SUBSIDIARIES
6. LOANS, LEASES, AND ALLOWANCE FOR CREDIT LOSSES
Loans, Leases, and Loans Held for Sale
Loans and leases are summarized as follows according to major portfolio segment and specific loan class:
| | | | | | | | | | | |
| (In millions) | September 30,
2020 | | December 31,
2019 |
| | | |
| Loans held for sale | $ | 89 | | | $ | 129 | |
| Commercial: | | | |
| Commercial and industrial | $ | 13,543 | | | $ | 14,760 | |
| PPP | 6,810 | | | — | |
| Leasing | 319 | | | 334 | |
| Owner-occupied | 8,136 | | | 7,901 | |
| Municipal | 2,706 | | | 2,393 | |
| Total commercial | 31,514 | | | 25,388 | |
| Commercial real estate: | | | |
| Construction and land development | 2,298 | | | 2,211 | |
| Term | 9,729 | | | 9,344 | |
| Total commercial real estate | 12,027 | | | 11,555 | |
| Consumer: | | | |
| Home equity credit line | 2,797 | | | 2,917 | |
| 1-4 family residential | 7,209 | | | 7,568 | |
| Construction and other consumer real estate | 633 | | | 624 | |
| Bankcard and other revolving plans | 431 | | | 502 | |
| Other | 134 | | | 155 | |
| Total consumer | 11,204 | | | 11,766 | |
| | | |
Total loans and leases | $ | 54,745 | | | $ | 48,709 | |
Loans and leases are presented at their amortized cost basis, which includes net unamortized purchase premiums, discounts, and deferred loan fees and costs totaling $191 million and $60 million at September 30, 2020 and December 31, 2019, respectively. Amortized cost basis does not include accrued interest receivables of $197 million and $164 million at September 30, 2020 and December 31, 2019, respectively. These receivables are presented in the Consolidated Balance Sheet within the Other Assets line item.
Municipal loans generally include loans to state and local governments (“municipalities”) with the debt service being repaid from general funds or pledged revenues of the municipal entity, or to private commercial entities or 501(c)(3) not-for-profit entities utilizing a pass-through municipal entity to achieve favorable tax treatment.
Land acquisition and development loans included in the construction and land development loan portfolio were $119 million at September 30, 2020 and $158 million at December 31, 2019.
Loans with a carrying value of $26.3 billion at September 30, 2020 and $21.5 billion at December 31, 2019 have been pledged at the Federal Reserve or the FHLB of Des Moines as collateral for current and potential borrowings.
We sold loans totaling $463 million and $1.4 billion for the three and nine months ended September 30, 2020 and $278 million and $527 million for the three and nine months ended September 30, 2019, respectively, that were classified as loans held for sale. The sold loans were derecognized from the balance sheet. Loans classified as loans held for sale primarily consist of conforming residential mortgages and the guaranteed portion of Small Business Administration (“SBA”) loans, and does not consist of loans from the SBA's Payroll Protection Program. The loans are mainly sold to U.S. government agencies or participated to third parties. At times, we have continuing involvement in the transferred loans in the form of servicing rights or a guarantee from the respective issuer. Amounts added to loans held for sale during these same periods were $480 million and $1.4 billion for the three and nine months ended September 30, 2020 and $316 million and $579 million for the three and nine months ended September 30, 2019, respectively. See Note 5 for further information regarding guaranteed securities.
ZIONS BANCORPORATION, NATIONAL ASSOCIATION AND SUBSIDIARIES
The principal balance of sold loans for which we retain servicing was approximately $2.5 billion at September 30, 2020 and $1.7 billion at December 31, 2019. Income from loans sold, excluding servicing, was $18 million and $44 million for the three and nine months ended September 30, 2020, and $8 million and $13 million for the three and nine months ended September 30, 2019, respectively.
Allowance for Credit Losses
The allowance for credit losses (“ACL”), which consists of the allowance for loan and lease losses ("ALLL") and the reserve for unfunded lending commitments, represents our estimate of current expected credit losses over the contractual term of the loan and lease portfolio and unfunded lending commitments as of the balance sheet date. The ACL for AFS and HTM debt securities is estimated separately from loans. For HTM securities, the ACL is assessed consistent with the approach for loans carried at amortized cost. See Note 5 for further discussion on our assessment of expected credit losses on AFS securities and disclosures related to AFS and HTM securities.
We determine our ACL as the best estimate within a range of estimated current expected losses by using the loan’s amortized cost basis (principal balance, net of unamortized premiums, discounts, and deferred fees and costs). We do not estimate the ACL for accrued interest receivables because we reverse or write-off uncollectible accrued interest receivable balances in a timely manner, generally within one month.
The methodologies we use to estimate the ACL depend upon the type of loan, the age and contractual term of the loan, expected payments (both contractual and assumed prepayments), credit quality indicators, economic forecasts, and the evaluation method (whether individually or collectively evaluated). Expected loan extensions, renewals, or modifications are not considered in the ACL, unless they are included in the original or modified contract at the reporting date and are not unconditionally cancellable, or we reasonably expect them to result in a TDR.
Losses are charged to the ACL when recognized. Generally, commercial and commercial real estate (“CRE”) loans are charged off or charged down when they are determined to be uncollectible in whole or in part, or when 180 days past due, unless the loan is well-secured and in process of collection. Consumer loans are either charged off or charged down to net realizable value no later than the month in which they become 180 days past due. Closed-end consumer loans that are not secured by residential real estate are either charged off or charged down to net realizable value no later than the month in which they become 120 days past due.
We establish the amount of the ACL by analyzing the portfolio at least quarterly, and we adjust the provision for loan losses and unfunded lending commitments to ensure the ACL is at an appropriate level at the balance sheet date.
For commercial and CRE loans with commitments greater than $1 million, we assign internal risk grades using a comprehensive loan grading system based on financial and statistical models, individual credit analysis, and loan officer experience and judgment. The credit quality indicators discussed subsequently are based on this grading system. Estimated credit losses on all loan segments, including consumer and small commercial and CRE loans with commitments less than or equal to $1 million that are evaluated on a collective basis, are derived from statistical analyses of our historical default and loss experience since January 2008.
We estimate current expected credit losses over the contractual remaining life of each loan, which considers historical credit loss experience, current conditions, and reasonable and supportable forecasts about the future. We use the following two types of credit loss estimation models:
•Econometric loss models, which rely on statistical analyses of our historical loss experience dependent upon economic factors and other loan-level characteristics. Statistically relevant economic factors vary depending upon the type of loan, but include variables such as unemployment, real estate price indices, energy prices, GDP, etc. The results associated with several economic scenarios are weighted to produce the credit loss estimate from these models.
•Loss models that are based on our long-term average historical credit loss experience since 2008, which rely on statistical analyses of our historical loss experience dependent upon loan-level characteristics.
ZIONS BANCORPORATION, NATIONAL ASSOCIATION AND SUBSIDIARIES
Estimated credit losses during the first 12 months of a loan’s contractual remaining life, or reasonable and supportable period, are derived from the econometric loss models. Over a subsequent 12-month reversion period, we blend the estimated credit losses from the two models on a straight-line basis. For the remaining life of the loan, the estimated credit losses are derived from the long-term average historical credit loss models.
For loans that do not share risk characteristics with other loans, we estimate lifetime expected credit losses on an individual basis. We consider individually-evaluated loans to be nonaccrual loans with a balance greater than $1 million; TDR loans, including TDRs that subsequently default; a loan no longer reported as a TDR; or a loan where we reasonably expect it to become a TDR. When a loan is individually-evaluated for expected credit losses, we estimate a specific reserve for the loan based on the projected present value of the loan’s future cash flows discounted at the loan’s effective interest rate, or the observable market price of the loan, or the fair value of the loan’s underlying collateral.
The process of estimating future cash flows also incorporates the same determining factors discussed subsequently under nonaccrual loans. When we base the specific reserve on the fair value of the loan’s underlying collateral, we generally charge off the portion of the balance that is greater than fair value. For these loans, subsequent to the charge-off, if the fair value of the loan's underlying collateral increases according to an updated appraisal, we hold a negative reserve up to the lesser of the amount of the charge-off or the updated fair value.
The methodologies described above generally rely on historical loss information to help determine our quantitative portion of the ACL. However, we also consider other qualitative and environmental factors related to current conditions and reasonable and supportable forecasts that may indicate current expected credit losses may differ from the historical information reflected in our quantitative models. Thus, after applying historical loss experience, as described above, we review the quantitative portion of ACL for each segment using qualitative criteria, and we use those criteria to determine our qualitative estimate. We monitor various risk factors that influence our judgment regarding the level of the ACL across the portfolio segments. These factors primarily include:
•Actual and expected changes in international, national, regional, and local economic and business conditions and developments;
•The volume and severity of past due loans, the volume of nonaccrual loans, and the volume and severity of adversely classified or graded loans;
•Lending policies and procedures, including changes in underwriting standards and practices for collection, charge-off, and recovery;
•The experience, ability, and depth of lending management and other relevant staff;
•The nature and volume of the portfolio;
•The quality of the credit review function;
•The existence, growth, and effect of any concentration of credit;
•The effect of other external factors such as regulatory, legal, and technological environments; fiscal and monetary actions; competition; and events such as natural disasters and pandemics.
The magnitude of the impact of these factors on our qualitative assessment of the ACL changes from quarter to quarter according to changes made by management in its assessment of these factors, the extent these factors are already reflected in quantitative loss estimates, and the extent changes in these factors diverge from one to another. We also consider the uncertainty and imprecision inherent in the estimation process when evaluating the ACL.
Off-Balance-Sheet Credit Exposures
As previously discussed, we estimate current expected credit losses for off-balance-sheet loan commitments, including standby letters of credit, that are not unconditionally cancellable. This estimate uses the same procedures and methodologies described previously for loans and is calculated by taking the difference between the estimated current expected credit loss and the funded balance, if greater than zero.
ZIONS BANCORPORATION, NATIONAL ASSOCIATION AND SUBSIDIARIES
Changes in the Allowance for Credit Losses
On January 1, 2020, we adopted Accounting Standards Update (“ASU”) 2016-13, Credit Losses (Topic 326): Measurement of Credit Losses on Financial Instruments, and its subsequent updates, often referred to as the Current Expected Credit Loss ("CECL") standard. Due to the adoption of the standard, the ACL methodology explained above has significantly changed from the prior period. For more information on our previous ACL methodology, see Note 6 in our 2019 Annual Report on Form 10-K.
The ACL was $917 million at September 30, 2020, compared with $914 million at June 30, 2020. During the third quarter of 2020, our estimate of current expected credit losses increased primarily due to the ongoing economic impact related to the effects of the COVID-19 pandemic.
Changes in the ACL are summarized as follows:
| | | | | | | | | | | | | | | | | | | | | | | |
| Three Months Ended September 30, 2020 |
| (In millions) | Commercial | | Commercial
real estate | | Consumer | | Total |
| Allowance for loan losses | | | | | | | |
| | | | | | | |
| | | | | | | |
| Balance at beginning of period | $ | 571 | | | $ | 144 | | | $ | 145 | | | $ | 860 | |
| Provision for loan losses | 41 | | | 6 | | | (2) | | | 45 | |
| Gross loan and lease charge-offs | 54 | | | 1 | | | 3 | | | 58 | |
| Recoveries | 4 | | | — | | | 2 | | | 6 | |
| Net loan and lease charge-offs (recoveries) | 50 | | | 1 | | | 1 | | | 52 | |
| Balance at end of period | $ | 562 | | | $ | 149 | | | $ | 142 | | | $ | 853 | |
| | | | | | | |
| Reserve for unfunded lending commitments | | | | | | | |
| | | | | | | |
| | | | | | | |
| Balance at beginning of period | $ | 27 | | | $ | 20 | | | $ | 7 | | | $ | 54 | |
| Provision for unfunded lending commitments | 14 | | | (4) | | | — | | | 10 | |
| Balance at end of period | $ | 41 | | | $ | 16 | | | $ | 7 | | | $ | 64 | |
| Total allowance for credit losses at end of period | | | | | | | |
| Allowance for loan losses | $ | 562 | | | $ | 149 | | | $ | 142 | | | $ | 853 | |
| Reserve for unfunded lending commitments | 41 | | | 16 | | | 7 | | | 64 | |
| Total allowance for credit losses | $ | 603 | | | $ | 165 | | | $ | 149 | | | $ | 917 | |
ZIONS BANCORPORATION, NATIONAL ASSOCIATION AND SUBSIDIARIES
| | | | | | | | | | | | | | | | | | | | | | | |
| Nine Months Ended September 30, 2020 |
| (In millions) | Commercial | | Commercial
real estate | | Consumer | | Total |
| Allowance for loan losses | | | | | | | |
| Balance at December 31, 2019 | $ | 341 | | | $ | 101 | | | $ | 53 | | | $ | 495 | |
| Adjustment for change in accounting standard | (59) | | | (32) | | | 93 | | | 2 | |
| Balance at beginning of period (January 1, 2020) | 282 | | | 69 | | | 146 | | | 497 | |
| Provision for loan losses | 364 | | | 81 | | | 1 | | | 446 | |
| Gross loan and lease charge-offs | 95 | | | 1 | | | 11 | | | 107 | |
| Recoveries | 11 | | | — | | | 6 | | | 17 | |
| Net loan and lease charge-offs (recoveries) | 84 | | | 1 | | | 5 | | | 90 | |
| Balance at end of period | $ | 562 | | | $ | 149 | | | $ | 142 | | | $ | 853 | |
| | | | | | | |
| Reserve for unfunded lending commitments | | | | | | | |
| Balance at December 31, 2019 | $ | 39 | | | $ | 20 | | | $ | — | | | $ | 59 | |
| Adjustment for change in accounting standard | (28) | | | (8) | | | 6 | | | (30) | |
| Balance at beginning of period (January 1, 2020) | 11 | | | 12 | | | 6 | | | 29 | |
| Provision for unfunded lending commitments | 30 | | | 4 | | | 1 | | | 35 | |
| Balance at end of period | $ | 41 | | | $ | 16 | | | $ | 7 | | | $ | 64 | |
| Total allowance for credit losses at end of period | | | | | | | |
| Allowance for loan losses | $ | 562 | | | $ | 149 | | | $ | 142 | | | $ | 853 | |
| Reserve for unfunded lending commitments | 41 | | | 16 | | | 7 | | | 64 | |
| Total allowance for credit losses | $ | 603 | | | $ | 165 | | | $ | 149 | | | $ | 917 | |
| | | | | | | | | | | | | | | | | | | | | | | |
| Three Months Ended September 30, 2019 |
| (In millions) | Commercial | | Commercial
real estate | | Consumer | | Total |
| Allowance for loan losses | | | | | | | |
| | | | | | | |
| | | | | | | |
| Balance at beginning of period | $ | 338 | | | $ | 114 | | | $ | 51 | | | $ | 503 | |
| Provision for loan losses | 9 | | | (6) | | | 5 | | | 8 | |
| Gross loan and lease charge-offs | 6 | | | — | | | 5 | | | 11 | |
| Recoveries | 7 | | | 1 | | | 2 | | | 10 | |
| Net loan and lease charge-offs (recoveries) | (1) | | | (1) | | | 3 | | | 1 | |
| Balance at end of period | $ | 348 | | | $ | 109 | | | $ | 53 | | | $ | 510 | |
| | | | | | | |
| Reserve for unfunded lending commitments | | | | | | | |
| | | | | | | |
| | | | | | | |
| Balance at beginning of period | $ | 41 | | | $ | 19 | | | $ | — | | | $ | 60 | |
| Provision for unfunded lending commitments | — | | | 2 | | | — | | | 2 | |
| Balance at end of period | $ | 41 | | | $ | 21 | | | $ | — | | | $ | 62 | |
| Total allowance for credit losses at end of period | | | | | | | |
| Allowance for loan losses | $ | 348 | | | $ | 109 | | | $ | 53 | | | $ | 510 | |
| Reserve for unfunded lending commitments | 41 | | | 21 | | | — | | | 62 | |
| Total allowance for credit losses | $ | 389 | | | $ | 130 | | | $ | 53 | | | $ | 572 | |
ZIONS BANCORPORATION, NATIONAL ASSOCIATION AND SUBSIDIARIES
| | | | | | | | | | | | | | | | | | | | | | | |
| Nine Months Ended September 30, 2019 |
| (In millions) | Commercial | | Commercial
real estate | | Consumer | | Total |
| Allowance for loan losses | | | | | | | |
| | | | | | | |
| | | | | | | |
| Balance at beginning of period | $ | 331 | | | $ | 110 | | | $ | 54 | | | $ | 495 | |
| Provision for loan losses | 31 | | | (4) | | | 3 | | | 30 | |
| Gross loan and lease charge-offs | 33 | | | 1 | | | 12 | | | 46 | |
| Recoveries | 19 | | | 4 | | | 8 | | | 31 | |
| Net loan and lease charge-offs (recoveries) | 14 | | | (3) | | | 4 | | | 15 | |
| Balance at end of period | $ | 348 | | | $ | 109 | | | $ | 53 | | | $ | 510 | |
| | | | | | | |
| Reserve for unfunded lending commitments | | | | | | | |
| | | | | | | |
| | | | | | | |
| Balance at beginning of period | $ | 40 | | | $ | 17 | | | $ | — | | | $ | 57 | |
| Provision for unfunded lending commitments | 1 | | | 4 | | | — | | | 5 | |
| Balance at end of period | $ | 41 | | | $ | 21 | | | $ | — | | | $ | 62 | |
| Total allowance for credit losses at end of period | | | | | | | |
| Allowance for loan losses | $ | 348 | | | $ | 109 | | | $ | 53 | | | $ | 510 | |
| Reserve for unfunded lending commitments | 41 | | | 21 | | | — | | | 62 | |
| Total allowance for credit losses | $ | 389 | | | $ | 130 | | | $ | 53 | | | $ | 572 | |
Nonaccrual Loans
Loans are generally placed on nonaccrual status when payment in full of principal and interest is not expected, or the loan is 90 days or more past due as to principal or interest, unless the loan is both well-secured and in the process of collection. Factors we consider in determining whether a loan is placed on nonaccrual include delinquency status, collateral value, borrower or guarantor financial statement information, bankruptcy status, and other information which would indicate that the full and timely collection of interest and principal is uncertain.
A nonaccrual loan may be returned to accrual status when all delinquent interest and principal become current in accordance with the terms of the loan agreement; the loan, if secured, is well-secured; the borrower has paid according to the contractual terms for a minimum of six months; and an analysis of the borrower indicates a reasonable assurance of the ability and willingness to maintain payments.
ZIONS BANCORPORATION, NATIONAL ASSOCIATION AND SUBSIDIARIES
The amortized cost basis of loans on nonaccrual status are summarized as follows:
| | | | | | | | | | | | | | | | | | | | | | | |
| September 30, 2020 |
| Amortized cost basis | | Total amortized cost basis | | |
| (In millions) | with no allowance | | with allowance | | | Related allowance |
| | | | | | | |
| Loans held for sale | $ | 14 | | | $ | — | | | $ | 14 | | | $ | — | |
| | | | | | | |
| Commercial: | | | | | | | |
| Commercial and industrial | $ | 48 | | | $ | 110 | | | $ | 158 | | | $ | 21 | |
| PPP | — | | | — | | | — | | | — | |
| Leasing | — | | | 1 | | | 1 | | | — | |
| Owner-occupied | 41 | | | 40 | | | 81 | | | 3 | |
| Municipal | — | | | — | | | — | | | — | |
| Total commercial | 89 | | | 151 | | | 240 | | | 24 | |
| Commercial real estate: | | | | | | | |
| Construction and land development | — | | | — | | | — | | | — | |
| Term | 13 | | | 24 | | | 37 | | | 1 | |
| Total commercial real estate | 13 | | | 24 | | | 37 | | | 1 | |
| Consumer: | | | | | | | |
| Home equity credit line | 2 | | | 14 | | | 16 | | | 3 | |
| 1-4 family residential | 7 | | | 52 | | | 59 | | | 4 | |
| Construction and other consumer real estate | — | | | — | | | — | | | — | |
| Bankcard and other revolving plans | — | | | — | | | — | | | 1 | |
| Other | — | | | — | | | — | | | — | |
| Total consumer loans | 9 | | | 66 | | | 75 | | | 8 | |
| Total | $ | 111 | | | $ | 241 | | | $ | 352 | | | $ | 33 | |
The amount of accrued interest receivables written off by reversing interest income during the period is summarized by loan portfolio segment as follows:
| | | | | | | | | | | | | | | | | | | | | | | |
| (In millions) | Three Months Ended
September 30, 2020 | | Nine Months Ended
September 30, 2020 | | | | |
| | | | | | | |
| Commercial | $ | 5 | | | $ | 13 | | | | | |
| Commercial real estate | 1 | | | 2 | | | | | |
| Consumer | — | | | — | | | | | |
| Total | $ | 6 | | | $ | 15 | | | | | |
Past Due Loans
Closed-end loans with payments scheduled monthly are reported as past due when the borrower is in arrears for two or more monthly payments. Similarly, open-end credits, such as charge-card plans and other revolving credit plans, are reported as past due when the minimum payment has not been made for two or more billing cycles. Other multi-payment obligations (i.e., quarterly, semi-annual, etc.), single payment, and demand notes, are reported as past due when either principal or interest is due and unpaid for a period of 30 days or more.
ZIONS BANCORPORATION, NATIONAL ASSOCIATION AND SUBSIDIARIES
Past due loans (accruing and nonaccruing) are summarized as follows:
| | | | | | | | | | | | | | | | | | | | | | | | | | | | | | | | | | | | | | | | | |
| September 30, 2020 |
| (In millions) | Current | | 30-89 days
past due | | 90+ days
past due | | Total
past due | | Total
loans | | Accruing
loans
90+ days
past due | | Nonaccrual loans that are current 1 |
| | | | | | | | | | | | | |
| | | | | | | | | | | | | |
| Commercial: | | | | | | | | | | | | | |
| Commercial and industrial | $ | 13,467 | | | $ | 27 | | | $ | 49 | | | $ | 76 | | | $ | 13,543 | | | $ | 3 | | | $ | 106 | |
| PPP | 6,810 | | | — | | | — | | | — | | | 6,810 | | | — | | | — | |
| Leasing | 319 | | | — | | | — | | | — | | | 319 | | | — | | | 1 | |
| Owner-occupied | 8,084 | | | 20 | | | 32 | | | 52 | | | 8,136 | | | 3 | | | 45 | |
| Municipal | 2,706 | | | — | | | — | | | — | | | 2,706 | | | — | | | — | |
| Total commercial | 31,386 | | | 47 | | | 81 | | | 128 | | | 31,514 | | | 6 | | | 152 | |
| Commercial real estate: | | | | | | | | | | | | | |
Construction and land development | 2,291 | | | 7 | | | — | | | 7 | | | 2,298 | | | — | | | — | |
| Term | 9,703 | | | 12 | | | 14 | | | 26 | | | 9,729 | | | 2 | | | 18 | |
| Total commercial real estate | 11,994 | | | 19 | | | 14 | | | 33 | | | 12,027 | | | 2 | | | 18 | |
| Consumer: | | | | | | | | | | | | | |
| Home equity credit line | 2,788 | | | 6 | | | 3 | | | 9 | | | 2,797 | | | — | | | 9 | |
| 1-4 family residential | 7,164 | | | 9 | | | 36 | | | 45 | | | 7,209 | | | — | | | 19 | |
Construction and other consumer real estate | 633 | | | — | | | — | | | — | | | 633 | | | — | | | — | |
Bankcard and other revolving plans | 427 | | | 3 | | | 1 | | | 4 | | | 431 | | | 1 | | | 1 | |
| Other | 133 | | | 1 | | | — | | | 1 | | | 134 | | | — | | | — | |
| Total consumer loans | 11,145 | | | 19 | | | 40 | | | 59 | | | 11,204 | | | 1 | | | 29 | |
| Total | $ | 54,525 | | | $ | 85 | | | $ | 135 | | | $ | 220 | | | $ | 54,745 | | | $ | 9 | | | $ | 199 | |
| | | | | | | | | | | | | | | | | | | | | | | | | | | | | | | | | | | | | | | | | |
| December 31, 2019 |
| (In millions) | Current | | 30-89 days
past due | | 90+ days
past due | | Total
past due | | Total
loans | | Accruing
loans
90+ days
past due | | Nonaccrual loans that are current 1 |
| | | | | | | | | | | | | |
| | | | | | | | | | | | | |
| Commercial: | | | | | | | | | | | | | |
| Commercial and industrial | $ | 14,665 | | | $ | 57 | | | $ | 38 | | | $ | 95 | | | $ | 14,760 | | | $ | 8 | | | $ | 54 | |
| PPP | — | | | — | | | — | | | — | | | — | | | — | | | — | |
| Leasing | 334 | | | — | | | — | | | — | | | 334 | | | 1 | | | — | |
| Owner-occupied | 7,862 | | | 20 | | | 19 | | | 39 | | | 7,901 | | | — | | | 44 | |
| Municipal | 2,393 | | | — | | | — | | | — | | | 2,393 | | | — | | | — | |
| Total commercial | 25,254 | | | 77 | | | 57 | | | 134 | | | 25,388 | | | 9 | | | 98 | |
| Commercial real estate: | | | | | | | | | | | | | |
Construction and land development | 2,206 | | | 5 | | | — | | | 5 | | | 2,211 | | | — | | | 1 | |
| Term | 9,333 | | | 8 | | | 3 | | | 11 | | | 9,344 | | | — | | | 10 | |
| Total commercial real estate | 11,539 | | | 13 | | | 3 | | | 16 | | | 11,555 | | | — | | | 11 | |
| Consumer: | | | | | | | | | | | | | |
| Home equity credit line | 2,908 | | | 6 | | | 3 | | | 9 | | | 2,917 | | | — | | | 7 | |
| 1-4 family residential | 7,532 | | | 12 | | | 24 | | | 36 | | | 7,568 | | | — | | | 13 | |
Construction and other consumer real estate | 624 | | | — | | | — | | | — | | | 624 | | | — | | | — | |
Bankcard and other revolving plans | 499 | | | 2 | | | 1 | | | 3 | | | 502 | | | 1 | | | — | |
| Other | 154 | | | 1 | | | — | | | 1 | | | 155 | | | — | | | — | |
| Total consumer loans | 11,717 | | | 21 | | | 28 | | | 49 | | | 11,766 | | | 1 | | | 20 | |
| Total | $ | 48,510 | | | $ | 111 | | | $ | 88 | | | $ | 199 | | | $ | 48,709 | | | $ | 10 | | | $ | 129 | |
1 Represents nonaccrual loans that are not past due more than 30 days; however, full payment of principal and interest is still not expected.
ZIONS BANCORPORATION, NATIONAL ASSOCIATION AND SUBSIDIARIES
Credit Quality Indicators
In addition to the nonaccrual and past due criteria, we also analyze loans using loan risk-grading systems, which vary based on the size and type of credit risk exposure. The internal risk grades assigned to loans follow our definitions of Pass, Special Mention, Substandard, and Doubtful, which are consistent with published definitions of regulatory risk classifications.
Definitions of Pass, Special Mention, Substandard, and Doubtful are summarized as follows:
•Pass – A Pass asset is higher-quality and does not fit any of the other categories described below. The likelihood of loss is considered low.
•Special Mention – A Special Mention asset has potential weaknesses that deserve management’s close attention. If left uncorrected, these potential weaknesses may result in deterioration of the repayment prospects for the asset or in the Bank’s credit position at some future date.
•Substandard – A Substandard asset is inadequately protected by the current sound worth and paying capacity of the obligor or of the collateral pledged, if any. Assets so classified have well-defined weaknesses and are characterized by the distinct possibility that the Bank may sustain some loss if deficiencies are not corrected.
•Doubtful – A Doubtful asset has all the weaknesses inherent in a Substandard asset with the added characteristics that the weaknesses make collection or liquidation in full highly questionable and improbable.
The balance of loans classified as Doubtful as of September 30, 2020 and December 31, 2019 was insignificant.
We generally assign internal risk grades to commercial and CRE loans with commitments greater than $1 million based on financial and statistical models, individual credit analysis, and loan officer experience and judgment. For these larger loans, we assign one of multiple grades within the Pass classification or one of the following four grades: Special Mention, Substandard, Doubtful, and Loss. Loss indicates that the outstanding balance has been charged off. We confirm our internal risk grades quarterly, or as soon as we identify information that affects the credit risk of the loan.
For consumer loans and certain small commercial and CRE loans with commitments less than or equal to $1 million, we generally assign internal risk grades similar to those described previously based on automated rules that depend on refreshed credit scores, payment performance, and other risk indicators. These are generally assigned either a Pass or Substandard grade and are reviewed as we identify information that might warrant a grade change.
ZIONS BANCORPORATION, NATIONAL ASSOCIATION AND SUBSIDIARIES
The amortized cost basis of loans and leases categorized by year of origination and by credit quality classifications as monitored by management are summarized as follows:
| | | | | | | | | | | | | | | | | | | | | | | | | | | | | | | | |
| September 30, 2020 | |
| Term Loans | Revolving loans amortized cost basis | Revolving loans converted to term loans amortized cost basis | | |
| Amortized cost basis by year of origination | | |
| (In millions) | 2020 | 2019 | 2018 | 2017 | 2016 | Prior | Total
loans | |
| Commercial: | | | | | | | | | | |
| Commercial and industrial | | | | | | | | | | |
| Pass | $ | 1,613 | | $ | 3,192 | | $ | 2,082 | | $ | 994 | | $ | 372 | | $ | 284 | | $ | 3,405 | | $ | 85 | | $ | 12,027 | | |
| Special Mention | 50 | | 212 | | 181 | | 99 | | 7 | | 44 | | 98 | | 1 | | 692 | | |
| Accruing Substandard | 98 | | 110 | | 222 | | 76 | | 18 | | 17 | | 120 | | 5 | | 666 | | |
| Nonaccrual | 42 | | 7 | | 8 | | 37 | | 2 | | 17 | | 35 | | 10 | | 158 | | |
Total commercial and industrial | 1,803 | | 3,521 | | 2,493 | | 1,206 | | 399 | | 362 | | 3,658 | | 101 | | 13,543 | | |
| PPP | | | | | | | | | | |
| Pass | 6,810 | | — | | — | | — | | — | | — | | — | | — | | 6,810 | | |
| Special Mention | — | | — | | — | | — | | — | | — | | — | | — | | — | | |
| Accruing Substandard | — | | — | | — | | — | | — | | — | | — | | — | | — | | |
| Nonaccrual | — | | — | | — | | — | | — | | — | | — | | — | | — | | |
| Total leasing | 6,810 | | — | | — | | — | | — | | — | | — | | — | | 6,810 | | |
| Leasing | | | | | | | | | | |
| Pass | 64 | | 117 | | 47 | | 36 | | 17 | | 8 | | — | | — | | 289 | | |
| Special Mention | — | | 11 | | 3 | | 2 | | 1 | | 6 | | — | | — | | 23 | | |
| Accruing Substandard | 2 | | 2 | | 1 | | 1 | | — | | — | | — | | — | | 6 | | |
| Nonaccrual | — | | — | | — | | — | | 1 | | — | | — | | — | | 1 | | |
| Total leasing | 66 | | 130 | | 51 | | 39 | | 19 | | 14 | | — | | — | | 319 | | |
| Owner-occupied | | | | | | | | | | |
| Pass | 1,083 | | 1,312 | | 1,234 | | 956 | | 664 | | 1,956 | | 154 | | 17 | | 7,376 | | |
| Special Mention | 55 | | 50 | | 50 | | 75 | | 56 | | 40 | | 12 | | 2 | | 340 | | |
| Accruing Substandard | 25 | | 50 | | 62 | | 38 | | 35 | | 111 | | 17 | | 1 | | 339 | | |
| Nonaccrual | 5 | | 14 | | 16 | | 12 | | 7 | | 25 | | 1 | | 1 | | 81 | | |
| Total owner-occupied | 1,168 | | 1,426 | | 1,362 | | 1,081 | | 762 | | 2,132 | | 184 | | 21 | | 8,136 | | |
| Municipal | | | | | | | | | | |
| Pass | 663 | | 868 | | 374 | | 442 | | 76 | | 242 | | 3 | | — | | 2,668 | | |
| Special Mention | — | | — | | — | | — | | — | | 10 | | — | | — | | 10 | | |
| Accruing Substandard | — | | — | | 21 | | — | | — | | 7 | | — | | — | | 28 | | |
| Nonaccrual | — | | — | | — | | — | | — | | — | | — | | — | | — | | |
| Total municipal | 663 | | 868 | | 395 | | 442 | | 76 | | 259 | | 3 | | — | | 2,706 | | |
| Total commercial | 10,510 | | 5,945 | | 4,301 | | 2,768 | | 1,256 | | 2,767 | | 3,845 | | 122 | | 31,514 | | |
| | | | | | | | | | |
| | | | | | | | | | |
| | | | | | | | | | |
| | | | | | | | | | |
| | | | | | | | | | |
| | | | | | | | | | |
| | | | | | | | | | |
| | | | | | | | | | |
| | | | | | | | | | |
| | | | | | | | | | |
| | | | | | | | | | |
| | | | | | | | | | |
| | | | | | | | | | |
| | | | | | | | | | |
ZIONS BANCORPORATION, NATIONAL ASSOCIATION AND SUBSIDIARIES
| | | | | | | | | | | | | | | | | | | | | | | | | | | | | | | | |
| September 30, 2020 | |
| Term Loans | Revolving loans amortized cost basis | Revolving loans converted to term loans amortized cost basis | | |
| Amortized cost basis by year of origination | | |
| (In millions) | 2020 | 2019 | 2018 | 2017 | 2016 | Prior | Total
loans | |
| Commercial real estate: | | | | | | | | | | |
Construction and land development | | | | | | | | |
| Pass | 467 | | 871 | | 388 | | 52 | | 1 | | 7 | | 407 | | 3 | | 2,196 | | |
| Special Mention | 28 | | 32 | | 10 | | — | | — | | — | | 7 | | — | | 77 | | |
| Accruing Substandard | — | | 4 | | — | | 21 | | — | | — | | — | | — | | 25 | | |
| Nonaccrual | — | | — | | — | | — | | — | | — | | — | | — | | — | | |
Total construction and land development | 495 | | 907 | | 398 | | 73 | | 1 | | 7 | | 414 | | 3 | | 2,298 | | |
| Term | | | | | | | | | | |
| Pass | 1,862 | | 1,886 | | 1,840 | | 917 | | 866 | | 1,438 | | 75 | | 22 | | 8,906 | | |
| Special Mention | 93 | | 139 | | 163 | | 54 | | 17 | | 100 | | — | | — | | 566 | | |
| Accruing Substandard | 55 | | 25 | | 63 | | 31 | | 16 | | 30 | | — | | — | | 220 | | |
| Nonaccrual | — | | 5 | | — | | 3 | | 1 | | 27 | | 1 | | — | | 37 | | |
| Total term | 2,010 | | 2,055 | | 2,066 | | 1,005 | | 900 | | 1,595 | | 76 | | 22 | | 9,729 | | |
| Total commercial real estate | 2,505 | | 2,962 | | 2,464 | | 1,078 | | 901 | | 1,602 | | 490 | | 25 | | 12,027 | | |
| Consumer: | | | | | | | | | | |
| Home equity credit line | | | | | | | | | | |
| Pass | — | | — | | — | | — | | — | | — | | 2,640 | | 130 | | 2,770 | | |
| Accruing Substandard | — | | — | | — | | — | | — | | — | | 10 | | 1 | | 11 | | |
| Nonaccrual | — | | — | | — | | — | | — | | — | | 11 | | 5 | | 16 | | |
| Total home equity credit line | — | | — | | — | | — | | — | | — | | 2,661 | | 136 | | 2,797 | | |
| 1-4 family residential | | | | | | | | | | |
| Pass | 889 | | 1,085 | | 915 | | 1,209 | | 1,288 | | 1,758 | | — | | — | | 7,144 | | |
| Accruing Substandard | — | | — | | 1 | | — | | 1 | | 4 | | — | | — | | 6 | | |
| Nonaccrual | — | | 2 | | 4 | | 10 | | 6 | | 37 | | — | | — | | 59 | | |
| Total 1-4 family residential | 889 | | 1,087 | | 920 | | 1,219 | | 1,295 | | 1,799 | | — | | — | | 7,209 | | |
Construction and other consumer real estate | | | | | | | | |
| Pass | 119 | | 339 | | 141 | | 20 | | 1 | | 13 | | — | | — | | 633 | | |
| Accruing Substandard | — | | — | | — | | — | | — | | — | | — | | — | | — | | |
| Nonaccrual | — | | — | | — | | — | | — | | — | | — | | — | | — | | |
Total construction and other consumer real estate | 119 | | 339 | | 141 | | 20 | | 1 | | 13 | | — | | — | | 633 | | |
Bankcard and other revolving plans | | | | | | | | | |
| Pass | — | | — | | — | | — | | — | | — | | 425 | | 2 | | 427 | | |
| Accruing Substandard | — | | — | | — | | — | | — | | — | | 4 | | — | | 4 | | |
| Nonaccrual | — | | — | | — | | — | | — | | — | | — | | — | | — | | |
Total bankcard and other revolving plans | — | | — | | — | | — | | — | | — | | 429 | | 2 | | 431 | | |
| Other consumer | | | | | | | | | | |
| Pass | 46 | | 42 | | 27 | | 12 | | 5 | | 2 | | — | | — | | 134 | | |
| Accruing Substandard | — | | — | | — | | — | | — | | — | | — | | — | | — | | |
| Nonaccrual | — | | — | | — | | — | | — | | — | | — | | — | | — | | |
| Total other consumer | 46 | | 42 | | 27 | | 12 | | 5 | | 2 | | — | | — | | 134 | | |
| Total consumer | 1,054 | | 1,468 | | 1,088 | | 1,251 | | 1,301 | | 1,814 | | 3,090 | | 138 | | 11,204 | | |
| Total loans | $ | 14,069 | | $ | 10,375 | | $ | 7,853 | | $ | 5,097 | | $ | 3,458 | | $ | 6,183 | | $ | 7,425 | | $ | 285 | | $ | 54,745 | | |
ZIONS BANCORPORATION, NATIONAL ASSOCIATION AND SUBSIDIARIES
Modified and Restructured Loans
Loans may be modified in the normal course of business for competitive reasons or to strengthen the Bank’s position. Loan modifications and restructurings may also occur when the borrower experiences financial difficulty and needs temporary or permanent relief from the original contractual terms of the loan. Loans that have been modified to accommodate a borrower who is experiencing financial difficulties, and for which the Bank has granted a concession that it would not otherwise consider, are considered troubled debt restructurings (“TDRs”).
Consistent with recent accounting and regulatory guidance, loan modifications provided to borrowers experiencing financial difficulties exclusively related to the COVID-19 pandemic, in which we provide certain short-term modifications or payment deferrals, are not classified as TDRs. The TDRs disclosed subsequently do not include these loan modifications. Other loan modifications above and beyond these short-term modifications or payment deferrals were assessed for TDR classification.
For further discussion of our policies and processes regarding TDRs, see Note 6 of our 2019 Annual Report on Form 10-K.
ZIONS BANCORPORATION, NATIONAL ASSOCIATION AND SUBSIDIARIES
Selected information on TDRs that includes the recorded investment on an accruing and nonaccruing basis by loan class and modification type is summarized in the following schedules:
| | | | | | | | | | | | | | | | | | | | | | | | | | | | | | | | | | | | | | | | | |
| September 30, 2020 |
| Recorded investment resulting from the following modification types: | | |
| (In millions) | Interest
rate below
market | | Maturity
or term
extension | | Principal
forgiveness | | Payment
deferral | | Other1 | | Multiple modification types2 | | Total |
| Accruing | | | | | | | | | | | | | |
| Commercial: | | | | | | | | | | | | | |
| Commercial and industrial | $ | — | | | $ | 1 | | | $ | — | | | $ | 1 | | | $ | 8 | | | $ | 4 | | | $ | 14 | |
| Owner-occupied | 5 | | | 1 | | | — | | | 3 | | | 4 | | | 9 | | | 22 | |
| | | | | | | | | | | | | |
| Total commercial | 5 | | | 2 | | | — | | | 4 | | | 12 | | | 13 | | | 36 | |
| Commercial real estate: | | | | | | | | | | | | | |
| | | | | | | | | | | | | |
| Term | 2 | | | — | | | — | | | 7 | | | 94 | | | 24 | | | 127 | |
| Total commercial real estate | 2 | | | — | | | — | | | 7 | | | 94 | | | 24 | | | 127 | |
| Consumer: | | | | | | | | | | | | | |
| Home equity credit line | — | | | 1 | | | 7 | | | — | | | 1 | | | 2 | | | 11 | |
| 1-4 family residential | 1 | | | 1 | | | 4 | | | — | | | 1 | | | 16 | | | 23 | |
Construction and other consumer real estate | — | | | — | | | — | | | — | | | — | | | — | | | — | |
| | | | | | | | | | | | | |
| Total consumer loans | 1 | | | 2 | | | 11 | | | — | | | 2 | | | 18 | | | 34 | |
| Total accruing | 8 | | | 4 | | | 11 | | | 11 | | | 108 | | | 55 | | | 197 | |
| Nonaccruing | | | | | | | | | | | | | |
| Commercial: | | | | | | | | | | | | | |
| Commercial and industrial | — | | | — | | | — | | | 2 | | | 31 | | | 20 | | | 53 | |
| Owner-occupied | 5 | | | — | | | — | | | 1 | | | 3 | | | 7 | | | 16 | |
| | | | | | | | | | | | | |
| Total commercial | 5 | | | — | | | — | | | 3 | | | 34 | | | 27 | | | 69 | |
| Commercial real estate: | | | | | | | | | | | | | |
| | | | | | | | | | | | | |
| Term | — | | | — | | | — | | | 1 | | | 3 | | | 2 | | | 6 | |
| Total commercial real estate | — | | | — | | | — | | | 1 | | | 3 | | | 2 | | | 6 | |
| Consumer: | | | | | | | | | | | | | |
| Home equity credit line | — | | | — | | | 1 | | | — | | | — | | | 1 | | | 2 | |
| 1-4 family residential | — | | | — | | | 1 | | | — | | | 1 | | | 5 | | | 7 | |
| | | | | | | | | | | | | |
| | | | | | | | | | | | | |
| Total consumer loans | — | | | — | | | 2 | | | — | | | 1 | | | 6 | | | 9 | |
| Total nonaccruing | 5 | | | — | | | 2 | | | 4 | | | 38 | | | 35 | | | 84 | |
| Total | $ | 13 | | | $ | 4 | | | $ | 13 | | | $ | 15 | | | $ | 146 | | | $ | 90 | | | $ | 281 | |
1 Includes TDRs that resulted from other modification types including, but not limited to, a legal judgment awarded on different terms, a bankruptcy plan confirmed on different terms, a settlement that includes the delivery of collateral in exchange for debt reduction, etc.
2 Includes TDRs that resulted from a combination of any of the previous modification types.
ZIONS BANCORPORATION, NATIONAL ASSOCIATION AND SUBSIDIARIES
| | | | | | | | | | | | | | | | | | | | | | | | | | | | | | | | | | | | | | | | | |
| December 31, 2019 |
| Recorded investment resulting from the following modification types: | | |
| (In millions) | Interest
rate below
market | | Maturity
or term
extension | | Principal
forgiveness | | Payment
deferral | | Other1 | | Multiple modification types2 | | Total |
| Accruing | | | | | | | | | | | | | |
| Commercial: | | | | | | | | | | | | | |
| Commercial and industrial | $ | 1 | | | $ | 2 | | | $ | — | | | $ | — | | | $ | 8 | | | $ | 5 | | | $ | 16 | |
| Owner-occupied | 3 | | | 1 | | | — | | | — | | | 4 | | | 7 | | | 15 | |
| Total commercial | 4 | | | 3 | | | — | | | — | | | 12 | | | 12 | | | 31 | |
| Commercial real estate: | | | | | | | | | | | | | |
| | | | | | | | | | | | | |
| Term | 2 | | | — | | | — | | | 1 | | | — | | | 3 | | | 6 | |
| Total commercial real estate | 2 | | | — | | | — | | | 1 | | | — | | | 3 | | | 6 | |
| Consumer: | | | | | | | | | | | | | |
| Home equity credit line | — | | | 2 | | | 7 | | | — | | | — | | | 2 | | | 11 | |
| 1-4 family residential | 1 | | | 1 | | | 4 | | | — | | | 1 | | | 22 | | | 29 | |
Construction and other consumer real estate | — | | | 1 | | | — | | | — | | | — | | | — | | | 1 | |
| | | | | | | | | | | | | |
| Total consumer loans | 1 | | | 4 | | | 11 | | | — | | | 1 | | | 24 | | | 41 | |
| Total accruing | 7 | | | 7 | | | 11 | | | 1 | | | 13 | | | 39 | | | 78 | |
| Nonaccruing | | | | | | | | | | | | | |
| Commercial: | | | | | | | | | | | | | |
| Commercial and industrial | — | | | 4 | | | — | | | 20 | | | 4 | | | 22 | | | 50 | |
| Owner-occupied | 5 | | | — | | | — | | | — | | | 1 | | | 4 | | | 10 | |
| | | | | | | | | | | | | |
| Total commercial | 5 | | | 4 | | | — | | | 20 | | | 5 | | | 26 | | | 60 | |
| Commercial real estate: | | | | | | | | | | | | | |
| | | | | | | | | | | | | |
| Term | 1 | | | — | | | — | | | — | | | 3 | | | 3 | | | 7 | |
| Total commercial real estate | 1 | | | — | | | — | | | — | | | 3 | | | 3 | | | 7 | |
| Consumer: | | | | | | | | | | | | | |
| Home equity credit line | — | | | — | | | 2 | | | — | | | — | | | — | | | 2 | |
| 1-4 family residential | — | | | — | | | 1 | | | — | | | 1 | | | 4 | | | 6 | |
| | | | | | | | | | | | | |
| | | | | | | | | | | | | |
| Total consumer loans | — | | | — | | | 3 | | | — | | | 1 | | | 4 | | | 8 | |
| Total nonaccruing | 6 | | | 4 | | | 3 | | | 20 | | | 9 | | | 33 | | | 75 | |
| Total | $ | 13 | | | $ | 11 | | | $ | 14 | | | $ | 21 | | | $ | 22 | | | $ | 72 | | | $ | 153 | |
1 Includes TDRs that resulted from other modification types including, but not limited to, a legal judgment awarded on different terms, a bankruptcy plan confirmed on different terms, a settlement that includes the delivery of collateral in exchange for debt reduction, etc.
2 Includes TDRs that resulted from a combination of any of the previous modification types.
Unfunded lending commitments on TDRs amounted to $4 million and $5 million at September 30, 2020 and December 31, 2019, respectively.
The total recorded investment of all TDRs in which interest rates were modified below market was $62 million at September 30, 2020 and $73 million at December 31, 2019. These loans are included in the previous schedule in the columns for interest rate below market and multiple modification types.
The net financial impact on interest income due to interest rate modifications below market for accruing TDRs for the three and nine months ended September 30, 2020 and 2019 was not significant.
On an ongoing basis, we monitor the performance of all TDRs according to their restructured terms. Subsequent payment default is defined in terms of delinquency, when principal or interest payments are past due 90 days or more for commercial loans, or 60 days or more for consumer loans.
ZIONS BANCORPORATION, NATIONAL ASSOCIATION AND SUBSIDIARIES
The recorded investment of accruing and nonaccruing TDRs that had a payment default during the period listed below (and are still in default at period end) and are within 12 months or less of being modified as TDRs is as follows:
| | | | | | | | | | | | | | | | | | | | | | | | | | | | | | | | | | | |
| Three Months Ended
September 30, 2020 | | Three Months Ended
September 30, 2019 |
| (In millions) | Accruing | | Nonaccruing | | Total | | Accruing | | Nonaccruing | | Total |
| | | | | | | | | | | |
| Commercial and industrial | $ | — | | | $ | 3 | | | $ | 3 | | | $ | — | | | $ | 1 | | | $ | 1 | |
| | | | | | | | | | | |
| | | | | | | | | | | |
| | | | | | | | | | | |
| | | | | | | | | | | |
| | | | | | | | | | | |
| | | | | | | | | | | |
| | | | | | | | | | | |
| | | | | | | | | | | |
| | | | | | | | | | | |
| | | | | | | | | | | |
| | | | | | | | | | | |
| Total | $ | — | | | $ | 3 | | | $ | 3 | | | $ | — | | | $ | 1 | | | $ | 1 | |
| | | | | | | | | | | |
| Nine Months Ended
September 30, 2020 | | Nine Months Ended
September 30, 2019 |
| (In millions) | Accruing | | Nonaccruing | | Total | | Accruing | | Nonaccruing | | Total |
| | | | | | | | | | | |
| Commercial and industrial | $ | — | | | $ | 6 | | | $ | 6 | | | $ | — | | | $ | 2 | | | $ | 2 | |
| Owner-occupied | — | | | — | | | — | | | — | | | 1 | | | 1 | |
| Total commercial | — | | | 6 | | | 6 | | | — | | | 3 | | | 3 | |
| | | | | | | | | | | |
| | | | | | | | | | | |
| | | | | | | | | | | |
| | | | | | | | | | | |
| | | | | | | | | | | |
| | | | | | | | | | | |
| | | | | | | | | | | |
| | | | | | | | | | | |
| | | | | | | | | | | |
| Total | $ | — | | | $ | 6 | | | $ | 6 | | | $ | — | | | $ | 3 | | | $ | 3 | |
Note: Total loans modified as TDRs during the 12 months previous to September 30, 2020 and 2019 were $190 million and $73 million, respectively.
Collateral-Dependent Loans
As discussed previously, when a loan is individually-evaluated for expected credit losses, we estimate a specific reserve for the loan based on the projected present value of the loan’s future cash flows discounted at the loan’s effective interest rate, or the observable market price of the loan, or the fair value of the loan’s underlying collateral.
Selected information on loans for which the repayment is expected to be provided substantially through the operation or sale of the underlying collateral and the borrower is experiencing financial difficulties, including the type of collateral and the extent to which the collateral secures the loans, is summarized as follows:
| | | | | | | | | | | | | | | | | |
| September 30, 2020 |
| (In millions) | Amortized Cost | | Major Types of Collateral | | Weighted Average LTV1 |
| Commercial: | | | | | |
| Commercial and industrial | $ | 19 | | | Single family residential, Agriculture | | 53% |
| | | | | |
| Owner-occupied | 9 | | | Office Building | | 46% |
| | | | | |
| | | | | |
| Commercial real estate: | | | | | |
| | | | | |
| Term | 13 | | | Multi-family, Hotel/Motel, Retail | | 60% |
| | | | | |
| Consumer: | | | | | |
| Home equity credit line | 2 | | | Single family residential | | 33% |
| 1-4 family residential | 3 | | | Single family residential | | 52% |
| | | | | |
| | | | | |
| | | | | |
| | | | | |
| Total | $ | 46 | | | | | |
1 The fair value is based on the most recent appraisal or other collateral evaluation.
Foreclosed Residential Real Estate
At September 30, 2020 and December 31, 2019, the amount of foreclosed residential real estate property held by the Bank was less than $1 million for both periods. The amortized cost basis of consumer mortgage loans collateralized by residential real estate property that are in the process of foreclosure was $7 million and $8 million for the same periods, respectively.
Concentrations of Credit Risk
Credit risk is the possibility of loss from the failure of a borrower, guarantor, or another obligor to fully perform under the terms of a credit-related contract. We perform an ongoing analysis of our loan portfolio to evaluate whether there is any significant exposure to any concentrations of credit risk. See Note 6 of our 2019 Annual Report
ZIONS BANCORPORATION, NATIONAL ASSOCIATION AND SUBSIDIARIES
on Form 10-K for further discussion of our evaluation of credit risk concentrations. See also Note 7 of our 2019 Annual Report on Form 10-K for a discussion of counterparty risk associated with the Bank’s derivative transactions.
7. DERIVATIVE INSTRUMENTS AND HEDGING ACTIVITIES
Objectives and Accounting
The Bank is exposed to certain risks arising from both its business operations and economic conditions. Our objectives in using derivatives are to add stability to interest income or expense, to modify the duration of specific assets or liabilities as we consider advisable, to manage exposure to interest rate movements or other identified risks, and/or to directly offset derivatives sold to our customers. For a detailed discussion of the use of and accounting policies regarding derivative instruments, see Note 7 of our 2019 Annual Report on Form 10-K.
Fair Value Hedges – The Bank generally uses interest rate swaps designated as fair value hedges to hedge changes in the fair value of fixed-rate assets and liabilities for specific risks (e.g., interest rate risk resulting from changes in a benchmark interest rate). The Bank used both received-fixed, pay-floating and pay-fixed, receive floating interest rate swaps to effectively convert the fixed-rate assets and liabilities to floating rates. In qualifying fair value hedges, changes in value of the derivative hedging instrument are recognized in current period earnings in the same line item affected by the hedged item. Similarly, the periodic changes in value of the hedged item, for the risk being hedged, are recognized in current period earnings, thereby offsetting all, or a significant majority, of the change in the value of the derivative hedging instrument. Interest accruals on both the derivative hedging instrument and the hedged item are recorded in the same line item, effectively converting the designated fixed-rate assets or liabilities to a floating rate. Generally, the designated risk being hedged in all of the Bank's fair value hedges is the change in fair value of the London Interbank Offered Rate (“LIBOR”) benchmark swap rate component of the contractual coupon cash flows of the fixed-rate assets or liabilities. The swaps are structured to match the critical terms of the hedged items, maximizing the economic (and accounting) effectiveness of the hedging relationships and resulting in the expectation that the swaps will be highly effective as a hedging instrument. All interest rate swaps designated as fair value hedges were highly effective and met all other requirements to remain designated and part of qualifying hedge accounting relationships as of the balance sheet date.
Fair value hedges of liabilities – As of September 30, 2020, the Bank had one receive-fixed interest rate swap with an aggregate notional amount of $500 million designated in a qualifying fair value hedge relationship of fixed-rate debt. The receive-fixed interest rate swap effectively converts the interest on our fixed-rate debt to floating.
At December 31, 2019 we had $1.5 billion of fixed-to-floating interest rate swaps designated as fair value hedges of long-term debt (effectively converting the fixed-rate debt into floating-rate debt). In late March 2020, we terminated $1 billion of swaps (i.e., two $500 million swaps with maturities in August 2021 and February 2022). As a result, the cumulative basis adjustment on the debt at the time of the terminations (which was equal to the fair value of the swaps at the termination date) will be amortized as an adjustment to interest expense through the maturity of the debt, thereby reducing the effective interest rate. During the third quarter of 2020, the Bank amortized $3 million of the outstanding unamortized debt basis adjustment. The Bank has $15 million of unamortized debt basis adjustments from previously designed fair value hedges remaining.
Fair value hedges of assets – During the third quarter of 2020, the Bank began hedging certain newly acquired fixed-rate AFS securities using pay-fixed, receive-floating interest rate swaps, effectively converting the fixed interest income to a floating rate on the hedged portion of the securities. Additionally, during the quarter, two of these hedges were restructured slightly to better match the terms of the hedged securities requiring these hedges to be redesignated. Changes in the fair value of the hedged securities prior to the redesignations were recognized in the amortized cost basis of the securities and, similar to the terminated debt hedges noted above, the unamortized basis adjustments will be amortized to interest income through the originally designated maturity of the hedging relationships. Both hedges were designated as hedges of 30-year US Treasury securities and hedged for the full life of the securities. The cumulative unamortized basis adjustments at the time of the redesignations was $7 million,
ZIONS BANCORPORATION, NATIONAL ASSOCIATION AND SUBSIDIARIES
which will be amortized as an adjustment to interest income through the end of 2050, thereby increasing the effective interest rate recognized on these securities.
As of September 30, 2020, the Bank had qualifying fair value hedging relationships of fixed-rate AFS securities being hedged by pay-fixed, receive floating interest rate swaps with an aggregate notional amount of $315 million. During the third quarter of 2020, derivatives designated as fair value hedges of fixed-rate AFS securities increased in value by $11 million, which was offset by changes in value of the hedged securities, as shown in the schedules below.
Cash Flow Hedges – For derivatives designated as qualifying cash flow hedges, periodic changes in fair value are deferred in AOCI. Amounts deferred in AOCI are reclassified into earnings in the periods in which the hedged forecast transactions (i.e., the hedged floating-rate commercial loan interest receipts) are recognized in earnings or become probable not to occur.
As of September 30, 2020, the Bank had $3.2 billion notional amount of receive-fixed interest rate swaps designated as cash flow hedges of pools of floating-rate commercial loans. During the third quarter of 2020, the Bank's cash flow hedge portfolio decreased in value by $17 million, which was recorded in AOCI. The amounts deferred in AOCI are reclassified into earnings in the periods in which the interest payments occur (i.e. when the hedged forecast transactions affect earnings).
Collateral and Credit Risk
Exposure to credit risk arises from the possibility of nonperformance by counterparties. No significant losses on derivative instruments have occurred as a result of counterparty nonperformance. For a more detailed discussion of collateral and credit risk related to our derivative contracts, see Note 7 of our 2019 Annual Report on Form 10-K.
Our derivative contracts require us to pledge collateral for derivatives that are in a net liability position at a given balance sheet date. Certain of these derivative contracts contain credit-risk-related contingent features that include the requirement to maintain a minimum debt credit rating. We may be required to pledge additional collateral if a credit-risk-related feature were triggered, such as a downgrade of our credit rating. However, in past situations, not all counterparties have demanded that additional collateral be pledged when provided for by the contractual terms. At September 30, 2020, the fair value of our derivative liabilities was $471 million, for which we were required to pledge cash collateral of $114 million in the normal course of business. If our credit rating were downgraded one notch by either Standard & Poor’s (“S&P”) or Moody’s at September 30, 2020, there would likely be $2 million of additional collateral required to be pledged. As a result of the Dodd-Frank Wall Street Reform and Consumer Protection Act (“Dodd-Frank Act”), all newly eligible derivatives entered into are cleared through a central clearinghouse. Derivatives that are centrally cleared do not have credit-risk-related features that require additional collateral if our credit rating were downgraded.
ZIONS BANCORPORATION, NATIONAL ASSOCIATION AND SUBSIDIARIES
Derivative Amounts
Selected information with respect to notional amounts and recorded gross fair values at September 30, 2020 and December 31, 2019, is summarized as follows:
| | | | | | | | | | | | | | | | | | | | | | | | | | | | | | | | | | | |
| September 30, 2020 | | December 31, 2019 |
| Notional
amount | | Fair value | | Notional
amount | | Fair value |
| (In millions) | Other
assets | | Other
liabilities | | Other
assets | | Other
liabilities |
| Derivatives designated as hedging instruments: | | | | | | | | | | | |
| Cash flow hedges of floating rate assets: | | | | | | | | | | | |
| Purchased interest rate floors | $ | — | | | $ | — | | | $ | — | | | $ | — | | | $ | — | | | $ | — | |
Receive-fixed interest rate swaps | 3,200 | | | — | | | — | | | 3,588 | | | — | | | — | |
| Fair value hedges: | | | | | | | | | | | |
| Debt hedges: Receive-fixed interest rate swaps | 500 | | | — | | | — | | | 1,500 | | | — | | | — | |
| Asset hedges: Pay-fixed interest rate swaps | 315 | | | — | | | — | | | | | | | |
| Total derivatives designated as hedging instruments | 4,015 | | | — | | | — | | | 5,088 | | | — | | | — | |
| Derivatives not designated as hedging instruments: | | | | | | | | | | | |
Customer-facing interest rate derivatives 1, 2 | 5,529 | | | 439 | | | — | | | 4,409 | | | 146 | | | 5 | |
Offsetting interest rate derivatives 2 | 5,530 | | | — | | | 465 | | | 4,422 | | | 5 | | | 157 | |
| Other interest rate derivatives | 1,766 | | | 25 | | | 4 | | | 726 | | | 3 | | | 1 | |
| Foreign exchange derivatives | 204 | | | 3 | | | 2 | | | 385 | | | 4 | | | 4 | |
Total derivatives not designated as hedging instruments | 13,029 | | | 467 | | | 471 | | | 9,942 | | | 158 | | | 167 | |
| Total derivatives | $ | 17,044 | | | $ | 467 | | | $ | 471 | | | $ | 15,030 | | | $ | 158 | | | $ | 167 | |
1 Customer-facing interest rate derivatives in an asset position include a $26 million and an $11 million net credit valuation adjustment reducing the fair value amounts as of September 30, 2020 and December 31, 2019, respectively. There was no significant debit valuation adjustment for derivative liabilities. These adjustments are required to reflect both our nonperformance risk and that of the respective counterparty.
2 The fair value amounts for these derivatives do not include the settlement amounts for those trades that are centrally cleared. Once the settlement amounts with the clearing houses are included the derivative fair values would be the following:
| | | | | | | | | | | | | | | | | | | | | | | |
| September 30, 2020 | | December 31, 2019 |
| (In millions) | Other assets | | Other liabilities | | Other assets | | Other liabilities |
| Customer-facing interest rate derivatives | $ | 439 | | | $ | — | | | $ | 141 | | | $ | 5 | |
| Offsetting interest rate derivatives | — | | | 30 | | | 5 | | | 9 | |
The amount of derivative gains (losses) from cash flow and fair value hedges that was deferred in OCI or recognized in earnings for the three and nine months ended September 30, 2020 and 2019 is shown in the schedules below. As of September 30, 2020, the gain (losses) from fair value hedges of assets were not significant.
| | | | | | | | | | | | | | | | | | | | | | | | | | | | | | | |
| Amount of derivative gain (loss) recognized/reclassified | | |
| Three Months Ended September 30, 2020 | | |
| (In millions) | Effective Portion of Derivatives Gain/(Loss) Deferred in OCI | | Excluded Components Deferred in OCI (Amortization Approach) | | Amount of Gain/(Loss) Reclassified From OCI into Income | | Interest on Fair Value Hedges | | Hedge Ineffectiveness / OCI Reclass due to Missed Forecast | | |
Cash flow hedges of floating-rate assets:1 | | | | | | | | | | | |
| Purchased interest rate floors | $ | — | | | $ | — | | | $ | 3 | | | $ | — | | | $ | — | | | |
| Interest rate swaps | (1) | | | — | | | 13 | | | — | | | — | | | |
| Fair value hedges of liabilities: | | | | | | | | | | | |
| Receive-fixed interest rate swaps | — | | | — | | | — | | | 1 | | | — | | | |
Basis amortization on terminated hedges 2, 3 | — | | | — | | | — | | | 3 | | | — | | | |
| | | | | | | | | | | |
| | | | | | | | | | | |
| | | | | | | | | | | |
Total derivatives designated as hedging instruments | $ | (1) | | | $ | — | | | $ | 16 | | | $ | 4 | | | $ | — | | | |
ZIONS BANCORPORATION, NATIONAL ASSOCIATION AND SUBSIDIARIES
| | | | | | | | | | | | | | | | | | | | | | | | | | | | | |
| Amount of derivative gain (loss) recognized/reclassified |
| Three Months Ended September 30, 2019 |
| (In millions) | Effective Portion of Derivatives Gain/(Loss) Deferred in OCI | | Excluded Components Deferred in OCI (Amortization Approach) | | Amount of Gain/(Loss) Reclassified From OCI into Income | | Interest on Fair Value Hedges | | Hedge Ineffectiveness / OCI Reclass due to Missed Forecast |
Cash flow hedges of floating-rate assets:1 | | | | | | | | | |
| Purchased interest rate floors | $ | (2) | | | $ | 10 | | | $ | 1 | | | $ | — | | | $ | — | |
| Interest rate swaps | 1 | | | — | | | (2) | | | — | | | — | |
| Fair value hedges of liabilities: | | | | | | | | | |
| Receive-fixed interest rate swaps | — | | | — | | | — | | | 1 | | | — | |
Basis amortization on terminated hedges 2,3 | — | | | — | | | — | | | — | | | — | |
Total derivatives designated as hedging instruments | $ | (1) | | | $ | 10 | | | $ | (1) | | | $ | 1 | | | $ | — | |
| | | | | | | | | | | | | | | | | | | | | | | | | | | | | |
| Amount of derivative gain (loss) recognized/reclassified |
| Nine Months Ended September 30, 2020 |
| (In millions) | Effective Portion of Derivatives Gain/(Loss) Deferred in OCI | | Excluded Components Deferred in OCI (Amortization Approach) | | Amount of Gain/(Loss) Reclassified From OCI into Income | | Interest on Fair Value Hedges | | Hedge Ineffectiveness / OCI Reclass due to Missed Forecast |
Cash flow hedges of floating-rate assets:1 | | | | | | | | | |
| Purchased interest rate floors | $ | — | | | $ | — | | | $ | 8 | | | $ | — | | | $ | — | |
| Interest rate swaps | 101 | | | — | | | 24 | | | — | | | — | |
| Fair value hedges of liabilities: | | | | | | | | | |
| Receive-fixed interest rate swaps | — | | | — | | | — | | | 4 | | | — | |
Basis amortization on terminated hedges 2, 3 | — | | | — | | | — | | | 10 | | | — | |
| | | | | | | | | |
| | | | | | | | | |
| | | | | | | | | |
Total derivatives designated as hedging instruments | $ | 101 | | | $ | — | | | $ | 32 | | | $ | 14 | | | $ | — | |
| | | | | | | | | | | | | | | | | | | | | | | | | | | | | |
| Amount of derivative gain (loss) recognized/reclassified |
| Nine Months Ended September 30, 2019 |
| (In millions) | Effective Portion of Derivatives Gain/(Loss) Deferred in OCI | | Excluded Components Deferred in OCI (Amortization Approach) | | Amount of Gain/(Loss) Reclassified From OCI into Income | | Interest on Fair Value Hedges | | Hedge Ineffectiveness / OCI Reclass due to Missed Forecast |
Cash flow hedges of floating-rate assets1: | | | | | | | | | |
| Purchased interest rate floors | $ | — | | | $ | 27 | | | $ | — | | | $ | — | | | $ | — | |
| Interest rate swaps | 33 | | | — | | | (6) | | | — | | | — | |
| Fair value hedges of liabilities: | | | | | | | | | |
| Receive-fixed interest rate swaps | — | | | — | | | — | | | 2 | | | — | |
Basis amortization on terminated swaps2,3 | — | | | — | | | — | | | — | | | — | |
Total derivatives designated as hedging instruments | $ | 33 | | | $ | 27 | | | $ | (6) | | | $ | 2 | | | $ | — | |
Note: These schedules are not intended to present at any given time the Bank’s long/short position with respect to its derivative contracts.
1 Amounts recognized in OCI and reclassified from AOCI represent the effective portion of the derivative gain (loss). For the 12 months following September 30, 2020, we estimate that $60 million will be reclassified from AOCI into interest income.
2 Adjustment to interest expense resulting from the amortization of the debt basis adjustment on fixed-rate debt previously hedged by terminated receive-fixed interest rate.
3The cumulative unamortized basis adjustment from previously terminated or redesignated fair value hedges as of September 30, 2020 is $14 million and $7 million of terminated fair value debt and asset hedges, respectively. The amortization of the cumulative unamortized basis adjustment from asset hedges is not shown in the schedules because it is not significant.
ZIONS BANCORPORATION, NATIONAL ASSOCIATION AND SUBSIDIARIES
The amount of gains (losses) recognized from derivatives not designated as accounting hedges is as follows:
| | | | | | | | | | | | | | | | | | | | | | | |
| Noninterest (Other) Income/(Expense) |
| (In millions) | Three Months Ended September 30, 2020 | | Nine Months Ended September 30, 2020 | | Three Months Ended September 30, 2019 | | Nine Months Ended September 30, 2019 |
Derivatives not designated as hedging instruments: | | | | | | | |
Customer-facing interest rate derivatives | $ | 4 | | | $ | 350 | | | $ | 68 | | | $ | 200 | |
| Offsetting interest rate derivatives | 9 | | | (343) | | | (65) | | | (195) | |
| Other interest rate derivatives | 3 | | | 14 | | | 2 | | | 1 | |
| Foreign exchange derivatives | 4 | | | 16 | | | 6 | | | 16 | |
Total derivatives not designated as hedging instruments | $ | 20 | | | $ | 37 | | | $ | 11 | | | $ | 22 | |
The following schedule presents derivatives used in fair value hedge accounting relationships, as well as pre-tax gains/(losses) recorded on such derivatives and the related hedged items for the periods presented.
| | | | | | | | | | | | | | | | | | | | | | | | | | | | | | | | | | | |
| Gain/(loss) recorded in income |
| Three Months Ended September 30, 2020 | | Three Months Ended September 30, 2019 |
| (In millions) | Derivatives2 | | Hedged items | | Total income statement impact | | Derivatives2 | | Hedged items | | Total income statement impact |
Debt: Receive-fixed interest rate swaps1, 2 | $ | (3) | | | $ | 3 | | | $ | — | | | $ | 1 | | | $ | (1) | | | $ | — | |
Assets: Pay-fixed interest rate swaps 1, 2 | 11 | | | (11) | | | — | | | — | | | — | | | — | |
| | | | | | | | | | | | | | | | | | | | | | | | | | | | | | | | | | | |
| Gain/(loss) recorded in income |
| Nine Months Ended September 30, 2020 | | Nine Months Ended September 30, 2019 |
| (In millions) | Derivatives2 | | Hedged items | | Total income statement impact | | Derivatives2 | | Hedged items | | Total income statement impact |
Debt: Receive-fixed interest rate swaps1, 2 | $ | 72 | | | $ | (72) | | | $ | — | | | $ | 19 | | | $ | (19) | | | $ | — | |
Assets: Pay-fixed interest rate swaps 1, 2 | 11 | | | (11) | | | — | | | — | | | — | | | — | |
1 Consists of hedges of benchmark interest rate risk of fixed-rate long-term debt and fixed-rate AFS securities. Gains and losses were recorded in net interest expense or income consistent with the hedged items.
2 The income/expense for derivatives does not reflect interest income/expense from periodic accruals and payments (which are reported above) to be consistent with the presentation of the gains/ (losses) on the hedged items.
The following schedule provides selected information regarding the long-term debt in the statement of financial position in which the hedged item is included.
| | | | | | | | | | | | | | | | | | | | | | | | | | | | | | | | | | | |
| Par value of hedged assets/(liabilities) | | Carrying amount of the hedged assets/(liabilities)1 | | Cumulative amount of fair value hedging adjustment included in the carrying amount of the hedged assets/(liabilities) |
| (In millions) | September 30, 2020 | | December 31, 2019 | | September 30, 2020 | | December 31, 2019 | | September 30, 2020 | | December 31, 2019 |
Long-term fixed-rate debt 1, 2 | $ | (500) | | | $ | (1,500) | | | $ | (545) | | | $ | (1,510) | | | $ | (45) | | | $ | (10) | |
Fixed-rate AFS securities 1, 2 | 315 | | | — | | | 311 | | | — | | | (4) | | | — | |
| | | | | | | | | | | |
| | | | | | | | | | | |
1 Carrying amounts displayed above exclude issuance and purchase discounts or premiums and unamortized issuance/acquisition costs.
2 The carrying amount of the hedged items shown above (long-term fixed-rate debt and fixed-rate AFS securities) excludes amounts related to terminated fair value hedges.
Table of Contents
ZIONS BANCORPORATION, NATIONAL ASSOCIATION AND SUBSIDIARIES
8. LEASES
We determine if a contract is a lease or contains a lease at inception. For a more detailed discussion of our lease policies, see Note 8 of our 2019 Annual Report on Form 10-K.
We have operating and finance leases for branches, corporate offices, and data centers. Our equipment leases are not material. At September 30, 2020, we had 422 branches, of which 274 are owned and 148 are leased. We lease our headquarters in Salt Lake City, Utah, and other office or data centers are either owned or leased.
The Bank may enter into certain lease arrangements with a term of 12 months or less, and we have elected to exclude these from capitalization. The length of our commitments for leases ranges from 2020 to 2062, some of which include options to extend or terminate the leases.
Assets recorded under operating leases were $217 million at September 30, 2020, and $218 million at December 31, 2019, while assets recorded under finance leases were $4 million at both of those dates. We utilized a secured incremental borrowing rate based on the remaining term of the lease as of the effective date for the discount rate to determine our lease right-of-use (“ROU”) assets and liabilities. The following schedule presents lease-related assets and liabilities, their weighted average remaining life, and the weighted average discount rate.
| | | | | | | | | | | |
| (Dollar amounts in millions) | September 30,
2020 | | December 31, 2019 |
| | | |
| Operating assets and liabilities | | | |
| Operating right-of-use assets, net of amortization | $ | 217 | | | $ | 218 | |
| Operating lease liabilities | 246 | | | 246 | |
| Weighted average remaining lease term (years) | | | |
| Operating leases | 9.0 | | 9.1 |
| Finance leases | 19.5 | | 20.2 |
| Weighted average discount rate | | | |
| Operating leases | 3.0 | % | | 3.2 | % |
| Finance leases | 3.1 | % | | 3.1 | % |
The components of lease expense are as follows:
| | | | | | | | | | | | | | | | | | | | | | | |
| Three Months Ended September 30, | | Nine Months Ended September 30, |
| (In millions) | 2020 | | 2019 | | 2020 | | 2019 |
| | | | | | | |
| Operating lease costs | $ | 12 | | | $ | 12 | | | $ | 37 | | | $ | 36 | |
| | | | | | | |
| | | | | | | |
| | | | | | | |
| | | | | | | |
| | | | | | | |
| Variable lease costs | 12 | | | 14 | | | 36 | | | 40 | |
| | | | | | | |
| Total lease cost | $ | 24 | | | $ | 26 | | | $ | 73 | | | $ | 76 | |
Supplemental cash flow information related to leases is as follows:
| | | | | | | | | | | | | | | | | | | | | | | |
| Three Months Ended September 30, | | Nine Months Ended September 30, |
| (In millions) | 2020 | | 2019 | | 2020 | | 2019 |
| | | | | | | |
| Cash paid for amounts in the measurement of lease liabilities: | | | | | | | |
| Operating cash disbursements from operating leases | $ | 13 | | | $ | 13 | | | $ | 38 | | | $ | 37 | |
| | | | | | | |
| | | | | | | |
| | | | | | | |
| | | | | | | |
| | | | | | | |
ROU assets obtained in exchange for lease liabilities:
| | | | | | | | | | | | | | | | | | | | | | | |
| Three Months Ended September 30, | | Nine Months Ended September 30, |
| (In millions) | 2020 | | 2019 | | 2020 | | 2019 |
| | | | | | | |
| New operating lease liabilities | $ | — | | | $ | 6 | | | $ | 6 | | | $ | 10 | |
| | | | | | | |
| | | | | | | |
Table of Contents
ZIONS BANCORPORATION, NATIONAL ASSOCIATION AND SUBSIDIARIES
Maturities analysis for operating lease liabilities as of September 30, 2020 is as follows (contractual undiscounted lease payments):
| | | | | |
| (In millions) | |
| |
2020 1 | $ | 12 | |
| 2021 | 48 | |
| 2022 | 44 | |
| 2023 | 38 | |
| 2024 | 29 | |
| Thereafter | 116 | |
| Total | $ | 287 | |
1 Contractual maturities for the three months remaining in 2020.
The Bank enters into certain lease agreements where it is the lessor of real estate. Real estate leases are made from bank-owned and subleased property to generate cash flow from the property, including from leasing vacant suites in which the Bank occupies portions of the building. Operating lease income was $3 million for both the third quarters of 2020 and 2019, and $9 million for both the first nine months of 2020 and 2019.
The Bank also has a lending division that makes equipment leases, considered to be sales-type leases or direct financing leases, totaling $319 million and $334 million as of September 30, 2020 and December 31, 2019, respectively. The Bank uses leasing of equipment as a venue for customers to access equipment without purchasing upfront. The Bank recorded income of $3 million on these leases for both the third quarters of 2020 and 2019, and $10 million and $11 million for the first nine months of 2020 and 2019, respectively.
9. LONG-TERM DEBT AND SHAREHOLDERS’ EQUITY
Long-Term Debt
Long-term debt is summarized as follows:
| | | | | | | | | | | |
| (In millions) | September 30,
2020 | | December 31, 2019 |
| | | |
| | | |
| | | |
| Subordinated notes | $ | 627 | | | $ | 572 | |
| Senior notes | 716 | | | 1,147 | |
| | | |
| Finance lease obligations | 4 | | | 4 | |
| Total | $ | 1,347 | | | $ | 1,723 | |
The preceding carrying values represent the par value of the debt adjusted for any unamortized premium or discount, unamortized debt issuance costs, and basis adjustments for interest rate swaps designated as fair value hedges. The change in outstanding senior and subordinated debt balances from December 31, 2019 to September 30, 2020 was primarily a result of the repurchase and retirement of senior notes that had adjustments to their carrying values from being in designated hedge relationships with interest rate swaps. During the second quarter of 2020, the Bank repurchased and retired $219 million of senior notes with an interest rate of 3.50% and $210 million of senior notes with an interest rate of 3.35%.
During the first quarter of 2020, the Bank terminated two receive-fixed interest rate swaps designated as hedges on senior notes, resulting in one outstanding receive-fixed interest rate swap designated as a hedge on a $500 million subordinated note with an interest rate of 3.25% at September 30, 2020. The outstanding swap constitutes a qualifying fair value hedging relationship. The terminated interest rate swaps adjusted the carrying value of the debt and this adjustment will be amortized into earnings until the original maturity date. For more information on derivatives designated as qualifying fair value hedges, see Note 7 – Derivative Instruments and Hedging Activities.
Common Stock
The Bank’s common stock is traded on the National Association of Securities Dealers Automated Quotations (“NASDAQ”) Global Select Market. As of September 30, 2020, there were 164.0 million shares of 0.001 par value
ZIONS BANCORPORATION, NATIONAL ASSOCIATION AND SUBSIDIARIES
common stock outstanding. The balance of common stock and additional paid-in capital was $2.7 billion at September 30, 2020, and decreased $55 million, or 2%, from December 31, 2019, primarily due to Bank common stock repurchases. During the first quarter of 2020, the Bank repurchased 1.7 million shares of common stock outstanding with a fair value of $75 million at an average price of $45.02 per share.
On May 22, 2020, 29.2 million common stock warrants (NASDAQ: ZIONW), with an exercise price of $33.31, expired unexercised. Each common stock warrant was convertible into 1.10 shares and the exercise of the common stock warrants was cashless as the warrants were settled on a net share basis.
Accumulated Other Comprehensive Income
Accumulated other comprehensive income improved to $332 million at September 30, 2020 from $43 million at December 31, 2019 primarily as a result of increases in the fair value of AFS securities due to changes in interest rates. Changes in AOCI by component are as follows:
| | | | | | | | | | | | | | | | | | | | | | | |
| (In millions) | Net unrealized gains (losses) on investment securities | | Net unrealized gains (losses) on derivatives and other | | Pension and post-retirement | | Total |
| Nine Months Ended September 30, 2020 | | | | | | | |
| Balance at December 31, 2019 | $ | 29 | | | $ | 28 | | | $ | (14) | | | $ | 43 | |
| | | | | | | |
OCI before reclassifications, net of tax | 228 | | | 72 | | | 13 | | | 313 | |
| Amounts reclassified from AOCI, net of tax | — | | | (24) | | | — | | | (24) | |
| OCI | 228 | | | 48 | | | 13 | | | 289 | |
| Balance at September 30, 2020 | $ | 257 | | | $ | 76 | | | $ | (1) | | | $ | 332 | |
Income tax expense included in OCI | $ | 75 | | | $ | 16 | | | $ | 4 | | | $ | 95 | |
| Nine Months Ended September 30, 2019 | | | | | | | |
| Balance at December 31, 2018 | $ | (228) | | | $ | (1) | | | $ | (21) | | | $ | (250) | |
| | | | | | | |
OCI before reclassifications, net of tax | 257 | | | 39 | | | — | | | 296 | |
| Amounts reclassified from AOCI, net of tax | — | | | 3 | | | — | | | 3 | |
| OCI | 257 | | | 42 | | | — | | | 299 | |
| Balance at September 30, 2019 | $ | 29 | | | $ | 41 | | | $ | (21) | | | $ | 49 | |
Income tax expense included in OCI | $ | 84 | | | $ | 14 | | | $ | — | | | $ | 98 | |
| | | | | | | | | | | | | | | | | | | | | | | | | | | | | | | | | | | | | | |
| | Amounts reclassified from AOCI 1 | | Amounts reclassified from AOCI 1 | | Statement of income (SI) | | |
| (In millions) | | Three Months Ended
September 30, | | Nine Months Ended
September 30, | | | |
| Details about AOCI components | | 2020 | | 2019 | | 2020 | | 2019 | | | Affected line item |
| | | | | | | | | | | | |
| | | | | | | | | | | | |
| | | | | | | | | | | | |
| | | | | | | | | | | | |
| | | | | | | | | | | | |
| | | | | | | | | | | | |
| | | | | | | | | | | | |
| | | | | | | | | | | | |
| | | | | | | | | | | | |
| | | | | | | | | | | | |
| | | | | | | | | | | | |
Net unrealized gains (losses) on derivative instruments | | $ | 16 | | | $ | (1) | | | $ | 32 | | | $ | (4) | | | SI | | Interest and fees on loans |
| Income tax expense (benefit) | | 4 | | | — | | | 8 | | | (1) | | | | | |
Amounts Reclassified from AOCI | | 12 | | | (1) | | | 24 | | | (3) | | | | | |
1 Positive reclassification amounts indicate increases to earnings in the statement of income.
ZIONS BANCORPORATION, NATIONAL ASSOCIATION AND SUBSIDIARIES
10. COMMITMENTS, GUARANTEES AND CONTINGENT LIABILITIES
Commitments and Guarantees
Contractual amounts of off-balance sheet financial instruments used to meet the financing needs of our customers are as follows:
| | | | | | | | | | | |
| (In millions) | September 30,
2020 | | December 31,
2019 |
| | | |
Net unfunded commitments to extend credit 1 | $ | 24,123 | | | $ | 23,099 | |
| Standby letters of credit: | | | |
| Financial | 526 | | | 631 | |
| Performance | 182 | | | 192 | |
| Commercial letters of credit | 14 | | | 5 | |
| Total unfunded lending commitments | $ | 24,845 | | | $ | 23,927 | |
1 Net of participations
The Bank’s 2019 Annual Report on Form 10-K contains further information about these commitments and guarantees including their terms and collateral requirements. At September 30, 2020, the Bank had recorded $8 million as a liability for the guarantees associated with the standby letters of credit, which consisted of $6 million attributable to the RULC and $2 million of deferred commitment fees.
Legal Matters
We are subject to litigation in court and arbitral proceedings, as well as proceedings, investigations, examinations and other actions brought or considered by governmental and self-regulatory agencies. Litigation may relate to lending, deposit and other customer relationships, vendor and contractual issues, employee matters, intellectual property matters, personal injuries and torts, regulatory and legal compliance, and other matters. While most matters relate to individual claims, we are also subject to putative class action claims and similar broader claims. Proceedings, investigations, examinations and other actions brought or considered by governmental and self-regulatory agencies may relate to our banking, investment advisory, trust, securities, and other products and services; our customers’ involvement in money laundering, fraud, securities violations and other illicit activities or our policies and practices relating to such customer activities; and our compliance with the broad range of banking, securities and other laws and regulations applicable to us. At any given time, we may be in the process of responding to subpoenas, requests for documents, data and testimony relating to such matters and engaging in discussions to resolve the matters.
As of September 30, 2020, we were subject to the following material litigation or governmental inquiries:
•a civil suit, JTS Communities, Inc. et. al v. CB&T, Jun Enkoji and Dawn Satow, brought against us in the Superior Court for Sacramento County, California in June 2017. In this case four investors in our former customer, International Manufacturing Group (“IMG”) seek to hold us liable for losses arising from their investments in that company, alleging that we conspired with and knowingly assisted IMG and its principal in furtherance of an alleged Ponzi scheme. This case is in the discovery phase with dispositive motion practice having been completed. The previously scheduled May 2020 trial setting has been vacated to be reset in the future due to the COVID-19 pandemic.
•a civil class action lawsuit, Evans v. CB&T, brought against us in the United States District Court for the Eastern District of California in May 2017. This case was filed on behalf of a class of up to 50 investors in IMG and seeks to hold us liable for losses of class members arising from their investments in IMG, alleging that we conspired with and knowingly assisted IMG and its principal in furtherance of an alleged Ponzi scheme. In December 2017, the District Court dismissed all claims against the Bank. In January 2018, the plaintiff filed an appeal with the Court of Appeals for the Ninth Circuit. The appeal was heard in early April 2019 with the Court of Appeals reversing the trial court’s dismissal. This case is in the post-pleading phase and trial will not occur for a substantial period of time.
ZIONS BANCORPORATION, NATIONAL ASSOCIATION AND SUBSIDIARIES
•two civil cases, Lifescan Inc. and Johnson & Johnson Health Care Services v. Jeffrey Smith, et. al., brought against us in the United States District Court for the District of New Jersey in December 2017, and Roche Diagnostics and Roche Diabetes Care Inc. v. Jeffrey C. Smith, et. al., brought against us in the United States District Court for the District of New Jersey in March 2019. In these cases, certain manufacturers and distributors of medical products seek to hold us liable for allegedly fraudulent practices of a borrower of the Bank who filed for bankruptcy protection in 2017. The cases are in early phases, with initial motion practice and discovery underway in the Lifescan case. Trial has not been scheduled in either case.
•a civil class action lawsuit, Gregory, et. al. v. Zions Bancorporation, brought against us in the United States District Court for Utah in January 2019. This case was filed on behalf of investors in Rust Rare Coin, Inc., alleging that we aided and abetted a Ponzi scheme fraud perpetrated by Rust Rare Coin, a Zions Bank customer. The case follows civil actions and the establishment of a receivership for Rust Rare Coin by The Commodities Futures Trading Commission and the Utah Division of Securities in November 2018, as well as a separate suit brought by the SEC against Rust Rare Coin and its principal, Gaylen Rust. During the third quarter of 2020, the Court granted our motion to dismiss the plaintiffs' claims in part, dismissing claims relating to fraud and fiduciary duty, but allowing a claim for aiding and abetting conversion to proceed. The case is in the early discovery phase. Trial has not been scheduled.
During the third quarter of 2020, the plaintiffs in three civil class action lawsuits, Fahmia Inc.v. Zions Bancorporation, et. al., ImpAcct LLC v. JPMorgan Chase, et. al., and Manoloff v. Bank of America, et. al., voluntarily agreed to dismiss their actions against us. These cases alleged that we wrongly failed to pay agents of borrowers receiving loans from us under the Government's Paycheck Protection Program fees that were allegedly owed to them under the program.
At least quarterly, we review outstanding and new legal matters, utilizing then available information. In accordance with applicable accounting guidance, if we determine that a loss from a matter is probable and the amount of the loss can be reasonably estimated, we establish an accrual for the loss. In the absence of such a determination, no accrual is made. Once established, accruals are adjusted to reflect developments relating to the matters.
In our review, we also assess whether we can determine the range of reasonably possible losses for significant matters in which we are unable to determine that the likelihood of a loss is remote. Because of the difficulty of predicting the outcome of legal matters, discussed subsequently, we are able to meaningfully estimate such a range only for a limited number of matters. Based on information available as of September 30, 2020, we estimated that the aggregate range of reasonably possible losses for those matters to be from $0 million to roughly $35 million in excess of amounts accrued. The matters underlying the estimated range will change from time to time, and actual results may vary significantly from this estimate. Those matters for which a meaningful estimate is not possible are not included within this estimated range and, therefore, this estimated range does not represent our maximum loss exposure.
Based on our current knowledge, we believe that our current estimated liability for litigation and other legal actions and claims, reflected in our accruals and determined in accordance with applicable accounting guidance, is adequate and that liabilities in excess of the amounts currently accrued, if any, arising from litigation and other legal actions and claims for which an estimate as previously described is possible, will not have a material impact on our financial condition, results of operations, or cash flows. However, in light of the significant uncertainties involved in these matters, and the very large or indeterminate damages sought in some of these matters, an adverse outcome in one or more of these matters could be material to our financial condition, results of operations, or cash flows for any given reporting period.
Any estimate or determination relating to the future resolution of litigation, arbitration, governmental or self-regulatory examinations, investigations or actions or similar matters is inherently uncertain and involves significant judgment. This is particularly true in the early stages of a legal matter, when legal issues and facts have not been well articulated, reviewed, analyzed, and vetted through discovery, preparation for trial or hearings, substantive and productive mediation or settlement discussions, or other actions. It is also particularly true with respect to class action and similar claims involving multiple defendants, matters with complex procedural requirements or
ZIONS BANCORPORATION, NATIONAL ASSOCIATION AND SUBSIDIARIES
substantive issues or novel legal theories, and examinations, investigations and other actions conducted or brought by governmental and self-regulatory agencies, in which the normal adjudicative process is not applicable. Accordingly, we usually are unable to determine whether a favorable or unfavorable outcome is remote, reasonably likely, or probable, or to estimate the amount or range of a probable or reasonably likely loss, until relatively late in the course of a legal matter, sometimes not until a number of years have elapsed. Accordingly, our judgments and estimates relating to claims will change from time to time in light of developments and actual outcomes will differ from our estimates. These differences may be material.
11. REVENUE RECOGNITION
We derive our revenue primarily from interest income on loans and securities, which was more than three-quarters of our revenue in the third quarter of 2020. Only noninterest income is considered to be revenue from contracts with customers in scope of ASC 606. For a discussion of the Bank’s revenue recognition from contracts, and the implementation of ASC 606, see Note 17 of our 2019 Annual Report on Form 10-K.
Disaggregation of Revenue
We provide services across different geographical areas, primarily in 11 Western U.S. States, under banking operations that have their own individual brand names, including Zions Bank, Amegy Bank, California Bank & Trust, National Bank of Arizona, Nevada State Bank, Vectra Bank Colorado, and The Commerce Bank of Washington. The operating segment listed as “Other” includes certain non-bank financial services subsidiaries, centralized back-office functions, and eliminations of transactions between segments. Certain prior period amounts have been reclassified to conform with the current period presentation. These reclassifications did not affect net income or shareholders’ equity.
The following schedule presents the noninterest income and net revenue by operating segments for the three months ended September 30, 2020 and 2019:
| | | | | | | | | | | | | | | | | | | | | | | | | | | | | | | | | | | |
| Zions Bank | | Amegy | | CB&T |
| (In millions) | 2020 | | 2019 | | 2020 | | 2019 | | 2020 | | 2019 |
| | | | | | | | | | | |
Commercial account fees | $ | 11 | | | $ | 10 | | | $ | 9 | | | $ | 8 | | | $ | 6 | | | $ | 6 | |
Card fees | 12 | | | 13 | | | 6 | | | 7 | | | 3 | | | 4 | |
Retail and business banking fees | 5 | | | 6 | | | 4 | | | 5 | | | 3 | | | 3 | |
| | | | | | | | | | | |
Capital markets and foreign exchange fees | — | | | — | | | 1 | | | 2 | | | — | | | — | |
| Wealth management and trust fees | 6 | | | 4 | | | 4 | | | 3 | | | 1 | | | 1 | |
| Other customer-related fees | 1 | | | 1 | | | — | | | — | | | — | | | 1 | |
Total noninterest income from contracts with customers (ASC 606) | 35 | | | 34 | | | 24 | | | 25 | | | 13 | | | 15 | |
Other noninterest income (Non-ASC 606 customer related) | 5 | | | 5 | | | 8 | | | 12 | | | 8 | | | 7 | |
Total customer-related fees | 40 | | | 39 | | | 32 | | | 37 | | | 21 | | | 22 | |
Other noninterest income (non-customer related) | — | | | — | | | — | | | — | | | 1 | | | 1 | |
Total noninterest income | 40 | | | 39 | | | 32 | | | 37 | | | 22 | | | 23 | |
| Other real estate owned gain from sale | — | | | 1 | | | — | | | — | | | 1 | | | — | |
Net interest income | 162 | | | 172 | | | 121 | | | 123 | | | 129 | | | 127 | |
Total income less interest expense | $ | 202 | | | $ | 212 | | | $ | 153 | | | $ | 160 | | | $ | 152 | | | $ | 150 | |
| | | | | | | | | | | |
ZIONS BANCORPORATION, NATIONAL ASSOCIATION AND SUBSIDIARIES
| | | | | | | | | | | | | | | | | | | | | | | | | | | | | | | | | | | |
| NBAZ | | NSB | | Vectra |
| (In millions) | 2020 | | 2019 | | 2020 | | 2019 | | 2020 | | 2019 |
| | | | | | | | | | | |
Commercial account fees | $ | 2 | | | $ | 2 | | | $ | 2 | | | $ | 2 | | | $ | 2 | | | $ | 2 | |
Card fees | 2 | | | 3 | | | 3 | | | 3 | | | 1 | | | 2 | |
Retail and business banking fees | 2 | | | 2 | | | 2 | | | 3 | | | 1 | | | 1 | |
| | | | | | | | | | | |
Capital markets and foreign exchange fees | — | | | — | | | — | | | — | | | — | | | — | |
| Wealth management and trust fees | 1 | | | 1 | | | 1 | | | 1 | | | 1 | | | — | |
| Other customer-related fees | — | | | — | | | — | | | — | | | — | | | — | |
Total noninterest income from contracts with customers (ASC 606) | 7 | | | 8 | | | 8 | | | 9 | | | 5 | | | 5 | |
Other noninterest income (Non-ASC 606 customer related) | 2 | | | 2 | | | 2 | | | 2 | | | 3 | | | 2 | |
Total customer-related fees | 9 | | | 10 | | | 10 | | | 11 | | | 8 | | | 7 | |
Other noninterest income (non-customer related) | — | | | — | | | — | | | — | | | — | | | — | |
Total noninterest income | 9 | | | 10 | | | 10 | | | 11 | | | 8 | | | 7 | |
| Other real estate owned gain from sale | — | | | — | | | — | | | 1 | | | — | | | — | |
Net interest income | 54 | | | 56 | | | 37 | | | 37 | | | 34 | | | 34 | |
Total income less interest expense | $ | 63 | | | $ | 66 | | | $ | 47 | | | $ | 49 | | | $ | 42 | | | $ | 41 | |
| | | | | | | | | | | |
| TCBW | | Other | | Consolidated Bank |
| (In millions) | 2020 | | 2019 | | 2020 | | 2019 | | 2020 | | 2019 |
| | | | | | | | | | | |
Commercial account fees | $ | — | | | $ | 1 | | | $ | — | | | $ | — | | | $ | 32 | | | $ | 31 | |
Card fees | — | | | — | | | 1 | | | — | | | 28 | | | 32 | |
Retail and business banking fees | — | | | — | | | — | | | — | | | 17 | | | 20 | |
| | | | | | | | | | | |
Capital markets and foreign exchange fees | — | | | — | | | 2 | | | 1 | | | 3 | | | 3 | |
| Wealth management and trust fees | — | | | — | | | — | | | 5 | | | 14 | | | 15 | |
| Other customer-related fees | — | | | — | | | 6 | | | 3 | | | 7 | | | 5 | |
Total noninterest income from contracts with customers (ASC 606) | — | | | 1 | | | 9 | | | 9 | | | 101 | | | 106 | |
Other noninterest income (Non-ASC 606 customer related) | 1 | | | — | | | 9 | | | 4 | | | 38 | | | 34 | |
Total customer-related fees | 1 | | | 1 | | | 18 | | | 13 | | | 139 | | | 140 | |
Other noninterest income (non-customer related) | — | | | — | | | 17 | | | 5 | | | 18 | | | 6 | |
Total noninterest income | 1 | | | 1 | | | 35 | | | 18 | | | 157 | | | 146 | |
| Other real estate owned gain from sale | — | | | — | | | — | | | — | | | 1 | | | 2 | |
Net interest income | 13 | | | 13 | | | 5 | | | 5 | | | 555 | | | 567 | |
Total income less interest expense | $ | 14 | | | $ | 14 | | | $ | 40 | | | $ | 23 | | | $ | 713 | | | $ | 715 | |
The following schedule presents the noninterest income and net revenue by operating segments for the nine months ended September 30, 2020 and 2019:
| | | | | | | | | | | | | | | | | | | | | | | | | | | | | | | | | | | |
| Zions Bank | | Amegy | | CB&T |
| (In millions) | 2020 | | 2019 | | 2020 | | 2019 | | 2020 | | 2019 |
| | | | | | | | | | | |
Commercial account fees | $ | 32 | | | $ | 30 | | | $ | 28 | | | $ | 25 | | | $ | 17 | | | $ | 17 | |
Card fees | 36 | | | 38 | | | 18 | | | 21 | | | 10 | | | 12 | |
Retail and business banking fees | 15 | | | 18 | | | 11 | | | 13 | | | 8 | | | 10 | |
| | | | | | | | | | | |
Capital markets and foreign exchange fees | (1) | | | — | | | 4 | | | 4 | | | — | | | — | |
| Wealth management and trust fees | 16 | | | 12 | | | 12 | | | 9 | | | 6 | | | 3 | |
| Other customer-related fees | 2 | | | 2 | | | 1 | | | 1 | | | 1 | | | 1 | |
Total noninterest income from contracts with customers (ASC 606) | 100 | | | 100 | | | 74 | | | 73 | | | 42 | | | 43 | |
Other noninterest income (Non-ASC 606 customer related) | 17 | | | 9 | | | 25 | | | 32 | | | 23 | | | 19 | |
Total customer-related fees | 117 | | | 109 | | | 99 | | | 105 | | | 65 | | | 62 | |
Other noninterest income (non-customer related) | (1) | | | 1 | | | — | | | — | | | 1 | | | 1 | |
Total noninterest income | 116 | | | 110 | | | 99 | | | 105 | | | 66 | | | 63 | |
| Other real estate owned gain from sale | — | | | 3 | | | — | | | — | | | 1 | | | — | |
Net interest income | 492 | | | 517 | | | 368 | | | 368 | | | 381 | | | 387 | |
Total income less interest expense | $ | 608 | | | $ | 630 | | | $ | 467 | | | $ | 473 | | | $ | 448 | | | $ | 450 | |
| | | | | | | | | | | |
ZIONS BANCORPORATION, NATIONAL ASSOCIATION AND SUBSIDIARIES
| | | | | | | | | | | | | | | | | | | | | | | | | | | | | | | | | | | |
| NBAZ | | NSB | | Vectra |
| (In millions) | 2020 | | 2019 | | 2020 | | 2019 | | 2020 | | 2019 |
| | | | | | | | | | | |
Commercial account fees | $ | 5 | | | $ | 5 | | | $ | 6 | | | $ | 6 | | | $ | 5 | | | $ | 5 | |
Card fees | 7 | | | 8 | | | 7 | | | 9 | | | 4 | | | 5 | |
Retail and business banking fees | 6 | | | 6 | | | 7 | | | 8 | | | 3 | | | 3 | |
| | | | | | | | | | | |
Capital markets and foreign exchange fees | — | | | — | | | — | | | — | | | — | | | — | |
| Wealth management and trust fees | 2 | | | 1 | | | 3 | | | 3 | | | 3 | | | 1 | |
| Other customer-related fees | 1 | | | 1 | | | — | | | 1 | | | — | | | — | |
Total noninterest income from contracts with customers (ASC 606) | 21 | | | 21 | | | 23 | | | 27 | | | 15 | | | 14 | |
Other noninterest income (Non-ASC 606 customer related) | 9 | | | 9 | | | 8 | | | 5 | | | 9 | | | 5 | |
Total customer-related fees | 30 | | | 30 | | | 31 | | | 32 | | | 24 | | | 19 | |
Other noninterest income (non-customer related) | — | | | 1 | | | — | | | — | | | — | | | — | |
Total noninterest income | 30 | | | 31 | | | 31 | | | 32 | | | 24 | | | 19 | |
| Other real estate owned gain from sale | — | | | — | | | — | | | 1 | | | — | | | — | |
Net interest income | 162 | | | 169 | | | 110 | | | 111 | | | 101 | | | 102 | |
Total income less interest expense | $ | 192 | | | $ | 200 | | | $ | 141 | | | $ | 144 | | | $ | 125 | | | $ | 121 | |
| | | | | | | | | | | |
| TCBW | | Other | | Consolidated Bank |
| (In millions) | 2020 | | 2019 | | 2020 | | 2019 | | 2020 | | 2019 |
| | | | | | | | | | | |
Commercial account fees | $ | 1 | | | $ | 1 | | | $ | (1) | | | $ | 1 | | | $ | 93 | | | $ | 90 | |
Card fees | 1 | | | 1 | | | — | | | 1 | | | 83 | | | 95 | |
Retail and business banking fees | — | | | — | | | — | | | — | | | 50 | | | 58 | |
| | | | | | | | | | | |
Capital markets and foreign exchange fees | — | | | — | | | 6 | | | 5 | | | 9 | | | 9 | |
| Wealth management and trust fees | 1 | | | 1 | | | 1 | | | 12 | | | 44 | | | 42 | |
| Other customer-related fees | — | | | — | | | 14 | | | 7 | | | 19 | | | 13 | |
Total noninterest income from contracts with customers (ASC 606) | 3 | | | 3 | | | 20 | | | 26 | | | 298 | | | 307 | |
Other noninterest income (Non-ASC 606 customer related) | 1 | | | 1 | | | 21 | | | 5 | | | 113 | | | 85 | |
Total customer-related fees | 4 | | | 4 | | | 41 | | | 31 | | | 411 | | | 392 | |
Other noninterest income (non-customer related) | — | | | — | | | (3) | | | 15 | | | (3) | | | 18 | |
Total noninterest income | 4 | | | 4 | | | 38 | | | 46 | | | 408 | | | 410 | |
| Other real estate owned gain from sale | — | | | — | | | — | | | — | | | 1 | | | 4 | |
Net interest income | 39 | | | 40 | | | 12 | | | 19 | | | 1,665 | | | 1,713 | |
Total income less interest expense | $ | 43 | | | $ | 44 | | | $ | 50 | | | $ | 65 | | | $ | 2,074 | | | $ | 2,127 | |
Revenue from contracts with customers did not generate significant contract assets and liabilities. Contract receivables are included in Other Assets. Payment terms vary by services offered, and the timing between completion of performance obligations and payment is typically not significant.
12. RETIREMENT PLANS
The following discloses the net periodic cost (benefit) and its components for the Bank’s pension and other retirement plans:
| | | | | | | | | | | | | | | | | | | | | | | |
| (In millions) | Three Months Ended September 30, | | Nine Months Ended September 30, |
| 2020 | | 2019 | | 2020 | | 2019 |
| | | | | | | |
| | | | | | | |
| Interest cost | $ | — | | | $ | 1 | | | $ | 2 | | | $ | 4 | |
| Expected return on plan assets | — | | | (2) | | | (3) | | | (6) | |
Pension termination-related expense | — | | | — | | | 28 | | | 1 | |
| | | | | | | |
Amortization of net actuarial loss | — | | | 1 | | | — | | | 1 | |
Net periodic cost | $ | — | | | $ | — | | | $ | 27 | | | $ | — | |
In October 2018, the Bank announced its intention to terminate the defined benefit pension plan subject to obtaining necessary regulatory approval. The Bank received an IRS letter of determination on March 31, 2020. Plan participants made elections for lump-sum distributions or annuity benefits. Lump-sum distributions were completed in May 2020, and the annuity purchase was completed in June 2020. As a result of the pension termination, the Bank incurred $28 million of expense, which was recognized in Other noninterest expense. The pension plan
ZIONS BANCORPORATION, NATIONAL ASSOCIATION AND SUBSIDIARIES
termination expense included a loss of $17 million that was reclassified out of accumulated other comprehensive income, resulting in a pre-tax decrease in shareholders’ equity of $11 million.
13. INCOME TAXES
The effective income tax rate of 18.6% for the third quarter of 2020 was lower than the 2019 third quarter rate of 22.9%. The effective tax rates for the first nine months of 2020 and 2019 were 18.5% and 22.6%, respectively. The income tax rates for 2020 and 2019 were reduced by nontaxable municipal interest income and nontaxable income from certain bank-owned life insurance, and were increased by the non-deductibility of Federal Deposit Insurance Corporation (“FDIC”) premiums, certain executive compensation, and other fringe benefits. Further, the 2020 tax rates were reduced as a result of the proportional increases in nontaxable items and tax credits relative to pretax book income as compared with the prior year periods.
We had a net deferred tax asset (“DTA”) balance of $32 million at September 30, 2020, compared with $37 million at December 31, 2019. The decrease in the net DTA resulted primarily from the decrease of accrued compensation and an increase in unrealized gains in other comprehensive income ("OCI") related to securities. An increase in the provision for loan losses in excess of net charge-offs, offset some of the overall decrease in DTA.
There is no valuation allowance at September 30, 2020 or December 31, 2019, respectively. We evaluate the DTAs on a regular basis to determine whether a valuation allowance is required. In conducting this evaluation, we have considered all available evidence, both positive and negative, based on the more likely than not criteria that such assets will be realized. This evaluation includes, but is not limited to: (1) available carryback potential to prior tax years; (2) potential future reversals of existing deferred tax liabilities, which historically have a reversal pattern generally consistent with DTAs; (3) potential tax planning strategies; and (4) future projected taxable income. Based on this evaluation and considering the weight of the positive evidence compared with the negative evidence, we have concluded that a valuation allowance is not required as of September 30, 2020.
14. NET EARNINGS PER COMMON SHARE
Basic and diluted net earnings per common share based on the weighted average outstanding shares are summarized as follows:
| | | | | | | | | | | | | | | | | | | | | | | |
| Three Months Ended
September 30, | | Nine Months Ended
September 30, |
| (In millions, except shares and per share amounts) | 2020 | | 2019 | | 2020 | | 2019 |
| | | | | | | |
| Basic: | | | | | | | |
| Net income | $ | 175 | | | $ | 222 | | | $ | 255 | | | $ | 633 | |
| Less common and preferred dividends | 64 | | | 67 | | | 193 | | | 194 | |
| Undistributed earnings | 111 | | | 155 | | | 62 | | | 439 | |
| Less undistributed earnings applicable to nonvested shares | 1 | | | 1 | | | 1 | | | 2 | |
| Undistributed earnings applicable to common shares | 110 | | | 154 | | | 61 | | | 437 | |
| Distributed earnings applicable to common shares | 56 | | | 59 | | | 168 | | | 168 | |
| Total earnings applicable to common shares | $ | 166 | | | $ | 213 | | | $ | 229 | | | $ | 605 | |
| Weighted average common shares outstanding (in thousands) | 163,608 | | | 173,160 | | | 163,764 | | | 178,985 | |
| Net earnings per common share | $ | 1.01 | | | $ | 1.23 | | | $ | 1.40 | | | $ | 3.38 | |
| | | | | | | |
| Diluted: | | | | | | | |
| Total earnings applicable to common shares | $ | 166 | | | $ | 213 | | | $ | 229 | | | $ | 605 | |
| Weighted average common shares outstanding (in thousands) | 163,608 | | | 173,160 | | | 163,764 | | | 178,985 | |
| Dilutive effect of common stock warrants (in thousands) | — | | | 8,187 | | | 2,027 | | | 9,293 | |
| | | | | | | |
| Dilutive effect of stock options (in thousands) | 171 | | | 523 | | | 238 | | | 617 | |
Weighted average diluted common shares outstanding (in thousands) | 163,779 | | | 181,870 | | | 166,029 | | | 188,895 | |
| Net earnings per common share | $ | 1.01 | | | $ | 1.17 | | | $ | 1.38 | | | $ | 3.20 | |
ZIONS BANCORPORATION, NATIONAL ASSOCIATION AND SUBSIDIARIES
The following schedule presents the weighted average stock awards that were anti-dilutive and not included in the calculation of diluted earnings per share.
| | | | | | | | | | | | | | | | | | | | | | | |
| Three Months Ended
September 30, | | Nine Months Ended
September 30, |
| (In thousands) | 2020 | | 2019 | | 2020 | | 2019 |
| | | | | | | |
| Restricted stock and restricted stock units | 1,316 | | | 1,348 | | | 1,347 | | | 1,406 | |
| Stock options | 923 | | | 596 | | | 878 | | | 451 | |
15. OPERATING SEGMENT INFORMATION
We manage our operations and prepare management reports and other information with a primary focus on geographical area. Our banking operations are managed under their own individual brand names, including Zions Bank, Amegy Bank, California Bank & Trust, National Bank of Arizona, Nevada State Bank, Vectra Bank Colorado, and The Commerce Bank of Washington. Performance assessment and resource allocation are based upon this geographical structure. The operating segment identified as “Other” includes certain non-bank financial service subsidiaries, centralized back-office functions, and eliminations of transactions between segments.
We use an internal funds transfer pricing (“FTP”) allocation system to report results of operations for business segments. This process is continually refined. In the third quarter of 2019, we made changes to the FTP process to more accurately reflect the cost of funds for loans. Additionally, in the third quarter of 2020, we allocated the net interest income associated with our Treasury department to the affiliates. Historically, this amount was presented in the "Other" segment. Prior period amounts have been revised to reflect the impact of these changes had they been instituted for the periods presented. Total average loans and deposits presented for the banking segments include insignificant intercompany amounts between banking segments and may also include deposits with the Other segment.
As of September 30, 2020, our banking business is conducted through 7 locally managed and branded segments in distinct geographical areas. Zions Bank operates 95 branches in Utah, 25 branches in Idaho, and one branch in Wyoming. Amegy operates 76 branches in Texas. CB&T operates 85 branches in California. NBAZ operates 56 branches in Arizona. NSB operates 46 branches in Nevada. Vectra operates 34 branches in Colorado and one branch in New Mexico. TCBW operates two branches in Washington and one branch in Oregon.
The accounting policies of the individual operating segments are the same as those of the Bank. Transactions between operating segments are primarily conducted at fair value, resulting in profits that are eliminated for reporting consolidated results of operations.
The following schedules do not present total assets or income tax expense for each operating segment, but instead present average loans, average deposits and income before income taxes because these are the metrics that management uses when evaluating performance and making decisions pertaining to the operating segments. The condensed statement of income identifies the components of income and expense which affect the operating amounts presented in the Other segment.
ZIONS BANCORPORATION, NATIONAL ASSOCIATION AND SUBSIDIARIES
The following schedule presents selected operating segment information for the three months ended September 30, 2020 and 2019:
| | | | | | | | | | | | | | | | | | | | | | | | | | | | | | | | | | | |
| Zions Bank | | Amegy | | CB&T |
| (In millions) | 2020 | | 2019 | | 2020 | | 2019 | | 2020 | | 2019 |
| SELECTED INCOME STATEMENT DATA | | | | | | | | | | | |
| Net interest income | $ | 162 | | | $ | 172 | | | $ | 121 | | | $ | 123 | | | $ | 129 | | | $ | 127 | |
| Provision for credit losses | (10) | | | 1 | | | 6 | | | 18 | | | 36 | | | (6) | |
Net interest income after provision for credit losses | 172 | | | 171 | | | 115 | | | 105 | | | 93 | | | 133 | |
| Noninterest income | 40 | | | 39 | | | 32 | | | 37 | | | 22 | | | 23 | |
| Noninterest expense | 111 | | | 114 | | | 82 | | | 84 | | | 74 | | | 75 | |
Income (loss) before income taxes | $ | 101 | | | $ | 96 | | | $ | 65 | | | $ | 58 | | | $ | 41 | | | $ | 81 | |
| SELECTED AVERAGE BALANCE SHEET DATA | | | | | | | | | | | |
| Total average loans | $ | 14,237 | | | $ | 13,229 | | | $ | 13,476 | | | $ | 12,438 | | | $ | 12,954 | | | $ | 10,819 | |
| Total average deposits | 19,283 | | | 15,736 | | | 13,628 | | | 11,842 | | | 14,462 | | | 11,565 | |
| | | | | | | | | | | |
| NBAZ | | NSB | | Vectra |
| (In millions) | 2020 | | 2019 | | 2020 | | 2019 | | 2020 | | 2019 |
| SELECTED INCOME STATEMENT DATA | | | | | | | | | | | |
| Net interest income | $ | 54 | | | $ | 56 | | | $ | 37 | | | $ | 37 | | | $ | 34 | | | $ | 34 | |
| Provision for credit losses | 6 | | | — | | | (2) | | | 1 | | | 18 | | | (3) | |
Net interest income after provision for credit losses | 48 | | | 56 | | | 39 | | | 36 | | | 16 | | | 37 | |
| Noninterest income | 9 | | | 10 | | | 10 | | | 11 | | | 8 | | | 7 | |
| Noninterest expense | 37 | | | 39 | | | 35 | | | 35 | | | 27 | | | 27 | |
Income (loss) before income taxes | $ | 20 | | | $ | 27 | | | $ | 14 | | | $ | 12 | | | $ | (3) | | | $ | 17 | |
| SELECTED AVERAGE BALANCE SHEET DATA | | | | | | | | | | | |
| Total average loans | $ | 5,305 | | | $ | 4,769 | | | $ | 3,310 | | | $ | 2,708 | | | $ | 3,542 | | | $ | 3,161 | |
| Total average deposits | 5,996 | | | 5,028 | | | 5,704 | | | 4,547 | | | 3,838 | | | 2,866 | |
| | | | | | | | | | | |
| TCBW | | Other | | Consolidated Bank |
| (In millions) | 2020 | | 2019 | | 2020 | | 2019 | | 2020 | | 2019 |
| SELECTED INCOME STATEMENT DATA | | | | | | | | | | | |
| Net interest income | $ | 13 | | | $ | 13 | | | $ | 5 | | | $ | 5 | | | $ | 555 | | | $ | 567 | |
| Provision for credit losses | 1 | | | (2) | | | — | | | 1 | | | 55 | | | 10 | |
Net interest income after provision for credit losses | 12 | | | 15 | | | 5 | | | 4 | | | 500 | | | 557 | |
| Noninterest income | 1 | | | 1 | | | 35 | | | 18 | | | 157 | | | 146 | |
| Noninterest expense | 5 | | | 5 | | | 71 | | | 36 | | | 442 | | | 415 | |
Income (loss) before income taxes | $ | 8 | | | $ | 11 | | | $ | (31) | | | $ | (14) | | | $ | 215 | | | $ | 288 | |
| SELECTED AVERAGE BALANCE SHEET DATA | | | | | | | | | | | |
| Total average loans | $ | 1,550 | | | $ | 1,235 | | | $ | 619 | | | $ | 469 | | | $ | 54,993 | | | $ | 48,828 | |
| Total average deposits | 1,316 | | | 1,097 | | | 2,275 | | | 2,603 | | | 66,502 | | | 55,284 | |
ZIONS BANCORPORATION, NATIONAL ASSOCIATION AND SUBSIDIARIES
The following schedule presents selected operating segment information for the nine months ended September 30, 2020 and 2019:
| | | | | | | | | | | | | | | | | | | | | | | | | | | | | | | | | | | |
| Zions Bank | | Amegy | | CB&T |
| (In millions) | 2020 | | 2019 | | 2020 | | 2019 | | 2020 | | 2019 |
| SELECTED INCOME STATEMENT DATA | | | | | | | | | | | |
| Net interest income | $ | 492 | | | $ | 517 | | | $ | 368 | | | $ | 368 | | | $ | 381 | | | $ | 387 | |
| Provision for credit losses | 84 | | | 27 | | | 133 | | | (5) | | | 120 | | | 6 | |
Net interest income after provision for credit losses | 408 | | | 490 | | | 235 | | | 373 | | | 261 | | | 381 | |
| Noninterest income | 116 | | | 110 | | | 99 | | | 105 | | | 66 | | | 63 | |
| Noninterest expense | 332 | | | 351 | | | 243 | | | 258 | | | 225 | | | 239 | |
Income (loss) before income taxes | $ | 192 | | | $ | 249 | | | $ | 91 | | | $ | 220 | | | $ | 102 | | | $ | 205 | |
| SELECTED AVERAGE BALANCE SHEET DATA | | | | | | | | | | | |
| Total average loans | $ | 13,821 | | | $ | 13,079 | | | $ | 13,149 | | | $ | 12,186 | | | $ | 12,170 | | | $ | 10,745 | |
| Total average deposits | 17,735 | | | 15,406 | | | 12,775 | | | 11,549 | | | 13,375 | | | 11,408 | |
| | | | | | | | | | | |
| NBAZ | | NSB | | Vectra |
| (In millions) | 2020 | | 2019 | | 2020 | | 2019 | | 2020 | | 2019 |
| SELECTED INCOME STATEMENT DATA | | | | | | | | | | | |
| Net interest income | $ | 162 | | | $ | 169 | | | $ | 110 | | | $ | 111 | | | $ | 101 | | | $ | 102 | |
| Provision for credit losses | 41 | | | 5 | | | 49 | | | — | | | 41 | | | 3 | |
Net interest income after provision for credit losses | 121 | | | 164 | | | 61 | | | 111 | | | 60 | | | 99 | |
| Noninterest income | 30 | | | 31 | | | 31 | | | 32 | | | 24 | | | 19 | |
| Noninterest expense | 109 | | | 116 | | | 105 | | | 109 | | | 80 | | | 82 | |
Income (loss) before income taxes | $ | 42 | | | $ | 79 | | | $ | (13) | | | $ | 34 | | | $ | 4 | | | $ | 36 | |
| SELECTED AVERAGE BALANCE SHEET DATA | | | | | | | | | | | |
| Total average loans | $ | 5,097 | | | $ | 4,788 | | | $ | 3,066 | | | $ | 2,594 | | | $ | 3,379 | | | $ | 3,107 | |
| Total average deposits | 5,608 | | | 4,990 | | | 5,313 | | | 4,428 | | | 3,497 | | | 2,833 | |
| | | | | | | | | | | |
| TCBW | | Other | | Consolidated Bank |
| (In millions) | 2020 | | 2019 | | 2020 | | 2019 | | 2020 | | 2019 |
| SELECTED INCOME STATEMENT DATA | | | | | | | | | | | |
| Net interest income | $ | 39 | | | $ | 40 | | | $ | 12 | | | $ | 19 | | | $ | 1,665 | | | $ | 1,713 | |
| Provision for credit losses | 10 | | | — | | | 3 | | | (1) | | | 481 | | | 35 | |
Net interest income after provision for credit losses | 29 | | | 40 | | | 9 | | | 20 | | | 1,184 | | | 1,678 | |
| Noninterest income | 4 | | | 4 | | | 38 | | | 46 | | | 408 | | | 410 | |
| Noninterest expense | 16 | | | 17 | | | 169 | | | 98 | | | 1,279 | | | 1,270 | |
Income (loss) before income taxes | $ | 17 | | | $ | 27 | | | $ | (122) | | | $ | (32) | | | $ | 313 | | | $ | 818 | |
| SELECTED AVERAGE BALANCE SHEET DATA | | | | | | | | | | | |
| Total average loans | $ | 1,431 | | | $ | 1,183 | | | $ | 581 | | | $ | 432 | | | $ | 52,694 | | | $ | 48,114 | |
| Total average deposits | 1,216 | | | 1,075 | | | 2,634 | | | 2,832 | | | 62,153 | | | 54,521 | |
ITEM 3. QUANTITATIVE AND QUALITATIVE DISCLOSURES ABOUT MARKET RISK
Interest rate and market risks are among the most significant risks regularly undertaken by us, and they are closely monitored as previously discussed. A discussion regarding our management of interest rate and market risk is included in the section entitled “Interest Rate and Market Risk Management” in this Form 10-Q.
ITEM 4. CONTROLS AND PROCEDURES
The Bank’s management, with the participation of the Bank’s Chief Executive Officer and Chief Financial Officer, has evaluated the effectiveness of the Bank’s disclosure controls and procedures as of September 30, 2020. Based on that evaluation, the Bank’s Chief Executive Officer and Chief Financial Officer concluded that the Bank’s disclosure controls and procedures were effective as of September 30, 2020. There were no changes in the Bank’s
ZIONS BANCORPORATION, NATIONAL ASSOCIATION AND SUBSIDIARIES
internal control over financial reporting during the third quarter of 2020 that have materially affected, or are reasonably likely to materially affect, the Bank’s internal control over financial reporting.
PART II. OTHER INFORMATION
ITEM 1. LEGAL PROCEEDINGS
The information contained in Note 10 of the Notes to Consolidated Financial Statements is incorporated by reference herein.
ITEM 1.A RISK FACTORS
In addition to the risk factors included in Zions Bancorporation, National Association’s 2019 Annual Report on Form 10-K, we have added the following risk factor:
Our business, financial condition, liquidity and results of operations have been, and will likely continue to be, adversely affected by the COVID-19 pandemic.
The COVID-19 pandemic has created economic and financial disruptions that have adversely affected, and are likely to continue to adversely affect, our business, financial condition, liquidity, capital and results of operations. The extent to which the COVID-19 pandemic will continue to negatively affect our business, financial condition, liquidity and results of operations will depend on future developments, which are highly uncertain and cannot be predicted, including the scope and duration of the pandemic, the continued effectiveness of our business continuity plan, the direct and indirect impact of the pandemic on our employees, customers, communities, counterparties and service providers, as well as other market participants, and actions taken by governmental authorities and other third parties in response to the pandemic.
The COVID-19 pandemic has contributed to the following, any of which could have an adverse effect on our business, financial condition, liquidity and results of operations:
•Increased unemployment and decreased consumer confidence and business generally, leading to an increased risk of delinquencies, defaults and foreclosures.
•Ratings downgrades, credit deterioration and defaults in many sectors and industries, including, but not limited to, states and municipalities, retail, oil and gas, hotels and casinos, restaurants, telecommunications/media, real estate/construction, airlines and transportation, leisure and recreation.
•A sudden and significant reduction in the valuation of the equity, fixed-income and commodity markets and the significant increase in the volatility of those markets.
•A decrease in the rates and yields on U.S. Treasury and other securities, which may lead to decreased net interest income.
•Increased demands on capital and liquidity.
•A reduction in the value of the assets that the Bank manages or otherwise administers or services for others, affecting related fee income and demand for the Bank’s services.
•Heightened cybersecurity, information security and operational risks as a result of work-from-home arrangements.
We are prioritizing the safety of our customers, communities and employees, and have limited branch activity to be occupied by a specified number of individuals at any given time, drive-through services or in-office appointments. Additionally, the majority of employees are working remotely. If these measures are not effective in serving our customers or affect the productivity of our associates, they may lead to significant disruptions in our business operations.
Many of our counterparties and third-party service providers have also been, and may further be, affected by “stay-at-home” orders, market volatility and other factors that increase their risks of business disruption or that may otherwise affect their ability to perform under the terms of any agreements with us or provide essential services. As a result, our operational and other risks are generally expected to increase until the pandemic subsides.
ZIONS BANCORPORATION, NATIONAL ASSOCIATION AND SUBSIDIARIES
We are offering special financial assistance to support customers who are experiencing financial hardships related to the COVID-19 pandemic, including waivers of certain withdrawal fees from CDs and savings and money market accounts, loan payment deferrals and extensions, credit card payment extensions, temporary consumer mortgage payment forbearance and payment deferment, suspending initiation of new repossessions of automobiles and other vehicles and suspending new residential property foreclosures on consumer real estate loans. If such measures are not effective in mitigating the effects of the COVID-19 pandemic on borrowers, we may experience higher rates of default and increased credit losses in future periods.
Certain segments and industries where the Bank has credit exposure, including, but not limited to, states and municipalities, retail, oil and gas, hotels and casinos, restaurants, telecommunications/media, real estate/construction, airlines and transportation, leisure and recreation, have experienced significant operational challenges as a result of the COVID-19 pandemic. In some cases, the COVID-19 pandemic accelerated deterioration in industries, such as oil and gas, that were already experiencing increased volatility and stress. These negative effects may result in a number of clients making higher than usual draws on outstanding lines of credit, which may negatively affect our liquidity if current economic conditions persist. These assistance efforts may adversely affect our revenue and results of operations. In addition, the effects of the COVID-19 pandemic may also cause our municipal and commercial customers to be unable to pay their loans as they come due or decrease the value of collateral, which we expect would cause significant increases in our credit losses.
Net interest income is the largest component of the Bank’s revenue. Net interest income is significantly affected by market rates of interest. The significant reductions to the federal funds rate has led to a decrease in the rates and yields on U.S. Treasury securities, in some cases declining below zero. If interest rates are reduced further in response to the COVID-19 pandemic, we expect that our net interest income will decline, perhaps significantly. The overall effect of lower interest rates on the economic environment cannot be predicted at this time and depends on future actions the Federal Reserve may take to increase or reduce the targeted federal funds rate in response to the COVID-19 pandemic, and resulting economic conditions.
Governmental authorities have taken unprecedented measures to provide economic assistance to individual households and businesses, stabilize the markets and support economic growth. The success of these measures is unknown and they may not be sufficient to fully mitigate the negative impact of the COVID-19 pandemic. Additionally, some measures, such as a suspension of mortgage and other loan payments and foreclosures, may have a negative impact on the Bank’s business, financial condition, liquidity and results of operations. We also face an increased risk of litigation and governmental and regulatory scrutiny as a result of the effects of the COVID-19 pandemic on market and economic conditions and actions governmental authorities take in response to those conditions.
The length of the pandemic and the efficacy of the extraordinary measures being put in place to address it are unknown. Until the pandemic subsides, the Bank expects continued draws on lines of credit, reduced revenues and increased customer and client defaults. Even after the pandemic subsides, the U.S. economy may experience a recession which may be prolonged, which could materially and adversely affect the Bank’s business, financial condition, liquidity and capital. To the extent the COVID-19 pandemic adversely affects our business, financial condition, liquidity, capital or results of operations, it may also have the effect of heightening many of the other risks described in the section entitled “Risk Factors” in the Bank’s 2019 Annual Report on Form 10-K and any subsequent Quarterly Reports on Form 10-Q.
ZIONS BANCORPORATION, NATIONAL ASSOCIATION AND SUBSIDIARIES
ITEM 2. UNREGISTERED SALES OF EQUITY SECURITIES AND USE OF PROCEEDS
The following schedule summarizes the Bank’s share repurchases for the third quarter of 2020:
SHARE REPURCHASES
| | | | | | | | | | | | | | | | | | | | | | | | | | | | | | | | | | | | | | | | | | | | |
| Period | | Total number of shares repurchased 1 | | Average
price paid
per share | | Total number of shares purchased as part of publicly announced plans or programs | | Approximate dollar value of shares that may yet be
purchased under the plan (in millions) |
| | | | | | | | | | | | | | |
| July | | | — | | | | $ | — | | | | — | | | | | $ | — | | |
| August | | | 364 | | | | 32.08 | | | | — | | | | | — | | |
| September | | | — | | | | — | | | | — | | | | | — | | |
| Third quarter | | | 364 | | | | 32.08 | | | | — | | | | | | |
1 Represents common shares acquired in connection with our stock compensation plan. Shares were acquired from employees to pay for their payroll taxes and stock option exercise cost upon the exercise of stock options under provisions of an employee share-based compensation plan.
ZIONS BANCORPORATION, NATIONAL ASSOCIATION AND SUBSIDIARIES
ITEM 6. EXHIBITS
a.Exhibits
| | | | | | | | | | | |
Exhibit
Number | | Description | |
| | | |
| | Second Amended and Restated Articles of Association of Zions Bancorporation, National Association, incorporated by reference to Exhibit 3.1 of Form 8-K filed on October 2, 2018. | * |
| | | |
| | Second Amended and Restated Bylaws of Zions Bancorporation, National Association, incorporated by reference to Exhibit 3.2 of Form 8-K filed on April 4, 2019. | * |
| | | |
| | Fourth Amendment to the Zions Bancorporation Payshelter 401(k) and Employee Stock Ownership Plan, dated September 11, 2020, effective January 1, 2020 (filed herewith). | |
| | | |
| | Fifth Amendment to the Zions Bancorporation Payshelter 401(k) and Employee Stock Ownership Plan, dated September 11, 2020, effective January 1, 2020 (filed herewith). | |
| | | |
| | Sixth Amendment to the Zions Bancorporation Payshelter 401(k) and Employee Stock Ownership Plan, dated September 11, 2020, effective October 1, 2020 (filed herewith). | |
| | | |
| | Certification by Chief Executive Officer required by Rules 13a-15(f) and 15d-15(f) under the Securities Exchange Act of 1934 (filed herewith). | |
| | | |
| | Certification by Chief Financial Officer required by Rules 13a-15(f) and 15d-15(f) under the Securities Exchange Act of 1934 (filed herewith). | |
| | | |
| | Certification by Chief Executive Officer and Chief Financial Officer required by Sections 13(a) or 15(d), as applicable, of the Securities Exchange Act of 1934 (15 U.S.C. 78m) and 18 U.S.C. Section 1350 (furnished herewith). | |
| | | |
| 101 | | Pursuant to Rules 405 and 406 of Regulation S-T, the following information is formatted in Inline XBRL (i) the Consolidated Balance Sheets as of September 30, 2020 and December 31, 2019, (ii) the Consolidated Statements of Income for the three months ended September 30, 2020 and September 30, 2019 and the nine months ended September 30, 2020 and September 30, 2019, (iii) the Consolidated Statements of Comprehensive Income for the three months ended September 30, 2020 and September 30, 2019 and the nine months ended September 30, 2020 and September 30, 2019, (iv) the Consolidated Statements of Changes in Shareholders’ Equity for the three months ended September 30, 2020 and September 30, 2019 and the nine months ended September 30, 2020 and September 30, 2019, (v) the Consolidated Statements of Cash Flows for the nine months ended September 30, 2020 and September 30, 2019 and (vi) the Notes to Consolidated Financial Statement (filed herewith). | |
| | | |
| 104 | | The cover page from this Quarterly Report on Form 10-Q, formatted as Inline XBRL. | |
* Incorporated by reference
Pursuant to Item 601(b)(4)(iii)(A) of Regulation S-K, copies of certain instruments defining the rights of holders of long-term debt are not filed. The Bank agrees to furnish a copy thereof to the Securities and Exchange Commission and the Office of the Comptroller of the Currency upon request.
ZIONS BANCORPORATION, NATIONAL ASSOCIATION AND SUBSIDIARIES
SIGNATURES
Pursuant to the requirements of the Securities Exchange Act of 1934, the registrant has duly caused this report to be signed on its behalf by the undersigned thereunto duly authorized.
| | |
|
| ZIONS BANCORPORATION, NATIONAL ASSOCIATION |
|
| /s/ Harris H. Simmons |
Harris H. Simmons, Chairman and
Chief Executive Officer |
|
| /s/ Paul E. Burdiss |
| Paul E. Burdiss, Executive Vice President and Chief Financial Officer |
Date: November 4, 2020


