|
UNITED STATES
|
|||
|
SECURITIES AND EXCHANGE COMMISSION
|
|||
|
Washington, D.C. 20549
|
|||
|
FORM 10-K
|
|||
|
ANNUAL REPORT PURSUANT TO SECTION 13 OR 15(D)
|
|||
|
OF THE SECURITIES EXCHANGE ACT OF 1934
|
|||
|
For the fiscal year ended: December 31, 2013
|
|||
|
Peoples Bancorp of North Carolina, Inc.
|
|||
|
(Exact Name of Registrant as Specified in Its Charter)
|
|||
|
North Carolina
|
|||
|
(State or Other Jurisdiction of Incorporation)
|
|||
|
000-27205
|
56-2132396
|
||
|
(Commission File No.)
|
(IRS Employer Identification No.)
|
||
|
518 West C Street, Newton, North Carolina
|
28658
|
||
|
(Address of Principal Executive Offices)
|
(Zip Code)
|
||
|
(828) 464-5620
|
|||
|
(Registrant’s Telephone Number, Including Area Code)
|
|||
|
Securities Registered Pursuant to Section 12(b) of the Act: None
|
|||
|
Securities Registered Pursuant to Section 12(g) of the Act:
|
|||
|
Common Stock, no par value
|
|||
|
(title of class)
|
|||
|
Indicate by check mark if the registrant is a well-known seasoned issuer, as defined in Rule 405 of the Securities Act.
|
|||
|
Yes
|
o |
No
|
x |
Indicate by check mark if the registrant is not required to file reports pursuant to Section 13 or Section 15(d) of the Act.
|
Yes
|
o |
No
|
x |
|
Indicate by check mark whether the registrant (1) has filed all reports required to be filed by Section 13 or 15(d) of the Securities Exchange Act of 1934 during the preceding 12 months (or for such shorter period that the registrant was required to file such reports), and (2) has been subject to such filing requirements for the past 90 days.
|
|
Yes
|
x |
No
|
o |
Indicate by check mark whether the registrant has submitted electronically and posted on its corporate Web site, if any, every Interactive Data File required to be submitted and posted pursuant to Rule 405 of Regulation S-T (§ 232.405 of this chapter) during the preceding 12 months (or for such shorter period that the registrant was required to submit and post such files).
|
Yes
|
x |
No
|
o |
Indicate by check mark if disclosure of delinquent filers in response to Item 405 of Regulation S-K is not contained herein, and will not be contained, to the best of registrant's knowledge, in definitive proxy or information statements incorporated by reference in Part III of this Form 10-K or any amendment to the Form 10-K. x
Indicate by check mark whether the registrant is a large accelerated filer, an accelerated filer, a non-accelerated filer or a smaller reporting company.
|
Large Accelerate Filer
|
o |
Accelerated Filer
|
o |
Non-Accelerated Filer
|
o |
Smaller Reporting Company
|
x
|
Indicate by check mark whether the registrant is a shell company (as defined in Rule 12b-2 of the Exchange Act).
|
Yes
|
o |
No
|
x |
|
State the aggregate market value of the voting and non-voting common equity held by non-affiliates computed by reference to the price at which the common equity was last sold, or the average bid and asked prices of such common equity, as of the last business day of the registrant’s most recently completed second fiscal quarter. $55,780,675 based on the closing price of such common stock on June 30, 2013, which was $12.90 per share.
|
|
Indicate the number of shares outstanding of each of the registrant's classes of common stock, as of the latest practicable date.
5,613,495 shares of common stock, outstanding at February 28, 2014.
|
DOCUMENTS INCORPORATED BY REFERENCE
Portions of the Annual Report of Peoples Bancorp of North Carolina, Inc. for the year ended December 31, 2013 (the “Annual Report”), which will be included as Appendix A to the Proxy Statement for the 2014 Annual Meeting of Shareholders, are incorporated by reference into Part I and Part II and included as Exhibit 13 to the Form 10-K.
Portions of the Proxy Statement for the 2014 Annual Meeting of Shareholders of Peoples Bancorp of North Carolina, Inc. to be held on May 1, 2014 (the “Proxy Statement”), are incorporated by reference into Part III.
This report contains certain forward-looking statements with respect to the financial condition, results of operations and business of Peoples Bancorp of North Carolina, Inc. (the “Company”). These forward-looking statements involve risks and uncertainties and are based on the beliefs and assumptions of management of the Company and on the information available to management at the time that these disclosures were prepared. These statements can be identified by the use of words like “expect,” “anticipate,” “estimate” and “believe,” variations of these words and other similar expressions. Readers should not place undue reliance on forward-looking statements as a number of important factors could cause actual results to differ materially from those in the forward-looking statements. Factors that could cause actual results to differ materially include, but are not limited to, (1) competition in the markets served by Peoples Bank, (2) changes in the interest rate environment, (3) general national, regional or local economic conditions may be less favorable than expected, resulting in, among other things, a deterioration in credit quality and the possible impairment of collectibility of loans, (4) legislative or regulatory changes, including changes in accounting standards, (5) significant changes in the federal and state legal and regulatory environment and tax laws, (6) the impact of changes in monetary and fiscal policies, laws, rules and regulations and (7) other risks and factors identified in the Company’s other filings with the Securities and Exchange Commission. The Company undertakes no obligation to update any forward-looking statements.
2
|
PEOPLES BANCORP OF NORTH CAROLINA, INC.
|
||
|
FORM 10-K CROSS REFERENCE INDEX
|
||
|
Notice of 2014
|
||
|
Annual Meeting,
|
||
|
2013 Form
|
Proxy Statement
|
|
|
10-K
|
and Annual Report
|
|
|
Page
|
Page
|
|
|
PART I
|
||
|
Item 1 - Business
|
4 - 11
|
N/A
|
|
Item 1A - Risk Factors
|
11 - 18
|
N/A
|
|
Item 1B - Unresolved Staff Comments
|
18
|
N/A
|
|
Item 2 - Properties
|
19
|
N/A
|
|
Item 3 - Legal Proceedings
|
19
|
N/A
|
|
Item 4 - Mine Safety Disclosures
|
20
|
N/A
|
|
PART II
|
||
|
Item 5 - Market for Registrant's Common Equity, Related Stockholder
|
||
|
Matters and Issuer Purchases of Equity Securities
|
20 - 22
|
N/A
|
|
Item 6 - Selected Financial Data
|
22
|
A-3
|
|
Item 7 - Management's Discussion and Analysis of Financial Condition and
|
||
|
Results of Operations
|
22
|
A-4 - A-26
|
|
Item 7A - Quantitative and Qualitative Disclosures About Market Risk
|
23
|
A-25 - A-26
|
|
Item 8 - Financial Statements and Supplementary Data
|
23
|
A-27 - A-64
|
|
Item 9 - Changes in and Disagreements with Accountants on Accounting
|
||
|
and Financial Disclosure
|
23
|
N/A
|
|
Item 9A - Controls and Procedures
|
23
|
N/A
|
|
Item 9B - Other Information
|
24
|
N/A
|
|
PART III
|
||
|
Item 10 - Directors and Executive Officers and Corporate Governance
|
24
|
A-65
|
|
Item 11 - Executive Compensation
|
24
|
20 - 27
|
|
Item 12 - Security Ownership of Certain Beneficial Owners and Management
|
||
|
and Related Stockholder Matters
|
24 - 25
|
7 - 9
|
|
Item 13 - Certain Relationships and Related Transactions
|
||
|
and Director Independence
|
25
|
27 - 28
|
|
Item 14 - Principal Accountant Fees and Services
|
25
|
28 - 29
|
|
PART IV
|
||
|
Item 15 - Exhibits and Financial Statement Schedules
|
26 - 29
|
N/A
|
|
Signatures
|
30
|
N/A
|
3
PART I
ITEM 1. BUSINESS
General
Peoples Bancorp of North Carolina, Inc. (the “Company”), was formed in 1999 to serve as the holding company for Peoples Bank (the “Bank”). The Company is a bank holding company registered with the Board of Governors of the Federal Reserve System (the “Federal Reserve”) under the Bank Holding Company Act of 1956, as amended (the “BHCA”). The Company’s principal source of income is dividends declared and paid by the Bank on its capital stock, if any. The Company has no operations and conducts no business of its own other than owning the Bank and Community Bank Real Estate Solutions, LLC (“CBRES”). Accordingly, the discussion of the business which follows concerns the business conducted by the Bank, unless otherwise indicated.
The Bank, founded in 1912, is a state-chartered commercial bank serving the citizens and business interests of the Catawba Valley and surrounding communities through 22 banking offices, as of December 31, 2013, located in Lincolnton, Newton, Denver, Catawba, Conover, Maiden, Claremont, Hiddenite, Hickory, Charlotte, Monroe, Cornelius, Mooresville and Raleigh, North Carolina. The Bank closed its Gateway office, which served as a satellite location of the Mooresville office, on February 14, 2014. The Bank also operates a loan production office in Denver, North Carolina. At December 31, 2013, the Company had total assets of $1.0 billion, net loans of $607.5 million, deposits of $799.4 million, total securities of $302.9 million, and shareholders’ equity of $83.7 million.
The Bank operates four offices focused on the Latino population under the name Banco de la Gente (“Banco”). These offices are operated as a division of the Bank. Banco offers normal and customary banking services as are offered in the Bank’s other branches such as the taking of deposits and the making of loans and therefore is not considered a reportable segment of the Company.
The Bank has a diversified loan portfolio, with no foreign loans and few agricultural loans. Real estate loans are predominately variable rate commercial property loans, which include residential development loans to commercial customers. Commercial loans are spread throughout a variety of industries with no one particular industry or group of related industries accounting for a significant portion of the commercial loan portfolio. The majority of the Bank’s deposit and loan customers are individuals and small to medium-sized businesses located in the Bank’s market area. The Bank’s loan portfolio also includes Individual Taxpayer Identification Number (ITIN) mortgage loans generated thorough the Bank’s Banco offices. Additional discussion of the Bank’s loan portfolio and sources of funds for loans can be found in “Management’s Discussion and Analysis of Financial Condition and Results of Operations” on pages A-4 through A-26 of the Annual Report, which is included in this Form 10-K as Exhibit (13).
The operations of the Bank and depository institutions in general are significantly influenced by general economic conditions and by related monetary and fiscal policies of depository institution regulatory agencies, including the Federal Reserve, the Federal Deposit Insurance Corporation (the “FDIC”) and the North Carolina Commissioner of Banks (the “Commissioner”).
The Company’s fiscal year ends December 31. This Form 10-K is also being used as the Bank’s Annual Disclosure Statement under FDIC Regulations. This Form 10-K has not been reviewed, or confirmed for accuracy or relevance by the FDIC.
At December 31, 2013, the Company employed 257 full-time employees and 34 part-time employees, which equated to 279 full-time equivalent employees.
Subsidiaries
The Bank is a subsidiary of the Company. The Bank has two subsidiaries, Peoples Investment Services, Inc. and Real Estate Advisory Services, Inc. Through a relationship with Raymond James Financial Services, Inc., Peoples Investment Services, Inc. provides the Bank’s customers access to investment counseling and non-deposit investment products such as stocks, bonds, mutual funds, tax deferred annuities, and related brokerage services. Real Estate Advisory Services, Inc. provides real estate appraisal and real estate brokerage services.
4
In June 2006, the Company formed a wholly owned Delaware statutory trust, PEBK Capital Trust II (“PEBK Trust II”), which issued $20.0 million of guaranteed preferred beneficial interests in the Company’s junior subordinated deferrable interest debentures. All of the common securities of PEBK Trust II are owned by the Company. The proceeds from the issuance of the common securities and the trust preferred securities were used by PEBK Trust II to purchase $20.6 million of junior subordinated debentures of the Company, which pay a floating rate equal to three-month LIBOR plus 163 basis points. The proceeds received by the Company from the sale of the junior subordinated debentures were used in December 2006 to repay the trust preferred securities issued in December 2001 by PEBK Capital Trust, a wholly owned Delaware statutory trust of the Company, and for general purposes. The debentures represent the sole asset of PEBK Trust II. PEBK Trust II is not included in the consolidated financial statements.
The trust preferred securities issued by PEBK Trust II accrue and pay quarterly at a floating rate of three-month LIBOR plus 163 basis points. The Company has guaranteed distributions and other payments due on the trust preferred securities to the extent PEBK Trust II does not have funds with which to make the distributions and other payments. The net combined effect of the trust preferred securities transaction is that the Company is obligated to make the distributions and other payments required on the trust preferred securities.
These trust preferred securities are mandatorily redeemable upon maturity of the debentures on June 28, 2036, or upon earlier redemption as provided in the indenture. The Company has the right to redeem the debentures purchased by PEBK Trust II, in whole or in part, which became effective on June 28, 2011. As specified in the indenture, if the debentures are redeemed prior to maturity, the redemption price will be the principal amount plus any accrued but unpaid interest.
The Company established a new subsidiary, CBRES, in 2009. CBRES serves as a “clearing-house” for appraisal services for community banks. Other banks are able to contract with CBRES to find and engage appropriate appraisal companies in the area where the property is located. This type of service ensures that the appraisal process remains independent from the financing process within the bank.
Market Area
The Bank’s primary market consists of the communities in an approximate 50-mile radius around its headquarters office in Newton, North Carolina. This area includes Catawba County, Alexander County, Lincoln County, Iredell County and portions of northeast Gaston County. The Bank is located only 40 miles north of Charlotte, North Carolina and the Bank’s primary market area is and will continue to be significantly affected by its close proximity to this major metropolitan area. The Bank has two Banco offices in Mecklenburg County, one Banco office in Union County and one Banco office in Wake County specifically designed to serve the growing Latino market.
Employment in the Bank’s primary market area is diversified among manufacturing, retail and wholesale trade, technology, services and utilities. Catawba County’s largest employers include Catawba County Schools, Frye Regional Medical Center, Catawba Valley Medical Center, Merchant Distributors, Inc (wholesale food distributor), Catawba County, CommScope, Inc. (manufacturer of fiber optic cable and accessories), Corning Cable Systems (manufacturer of fiber optic cable and accessories), Ethan Allen (furniture manufacturer), HSM (manufacturing) and Advance Pierre Foods (restaurants and bakeries).
Competition
The Bank has operated in the Catawba Valley region for over 100 years and is the only financial institution headquartered in Newton. Nevertheless, the Bank faces strong competition both in attracting deposits and making loans. Its most direct competition for deposits has historically come from other commercial banks, credit unions and brokerage firms located in its primary market area, including large financial institutions. One national money center commercial bank is headquartered in Charlotte, North Carolina. Based upon June 30, 2013 comparative data, the Bank had 23.38% of the deposits in Catawba County, placing it second in deposit size among a total of 12 banks with branch offices in Catawba County; 9.45% of the deposits in Lincoln County, placing it sixth in deposit size among a total of 10 banks with branch offices in Lincoln County; and 13.14% of the deposits in Alexander County, placing it fifth in deposit size among a total of seven banks with branch offices in Alexander County.
The Bank also faces additional significant competition for investors’ funds from short-term money market securities and other corporate and government securities. The Bank’s core deposit base has grown principally due to economic growth in the Bank’s market area coupled with the implementation of new and competitive deposit products. The ability of the Bank to attract and retain deposits depends on its ability to generally provide a rate of return, liquidity and risk comparable to that offered by competing investment opportunities.
5
The Bank experiences strong competition for loans from commercial banks and mortgage banking companies. The Bank competes for loans primarily through the interest rates and loan fees it charges and the efficiency and quality of services it provides to borrowers. Competition is increasing as a result of the continuing reduction of restrictions on the interstate operations of financial institutions.
Supervision and Regulation
Bank holding companies and commercial banks are extensively regulated under both federal and state law. The following is a brief summary of all material statutes and rules and regulations that affect or will affect the Company, the Bank and any subsidiaries. Supervision, regulation and examination of the Company and the Bank by the regulatory agencies are intended primarily for the protection of depositors rather than shareholders of the Company. Statutes and regulations which contain wide-ranging proposals for altering the structures, regulations and competitive relationship of financial institutions are introduced regularly. The Company cannot predict whether or in what form any proposed statute or regulation will be adopted or the extent to which the business of the Company and the Bank may be affected by such statute or regulation.
General. There are a number of obligations and restrictions imposed on bank holding companies and their depository institution subsidiaries by law and regulatory policy that are designed to minimize potential loss to the depositors of such depository institutions and the FDIC insurance funds in the event the depository institution becomes in danger of default or in default. For example, to avoid receivership of an insured depository institution subsidiary, a bank holding company is required to guarantee the compliance of any insured depository institution subsidiary that may become “undercapitalized” with the terms of the capital restoration plan filed by such subsidiary with its appropriate federal banking agency up to the lesser of (i) an amount equal to 5% of the bank’s total assets at the time the bank became undercapitalized or (ii) the amount which is necessary (or would have been necessary) to bring the bank into compliance with all acceptable capital standards as of the time the bank fails to comply with such capital restoration plan. The Company, as a registered bank holding company, is subject to the regulation of the Federal Reserve. Under a policy of the Federal Reserve with respect to bank holding company operations, a bank holding company is required to serve as a source of financial strength to its subsidiary depository institutions and to commit resources to support such institutions in circumstances where it might not do so absent such policy. The Federal Reserve under the BHCA also has the authority to require a bank holding company to terminate any activity or to relinquish control of a nonbank subsidiary (other than a nonbank subsidiary of a bank) upon the Federal Reserve’s determination that such activity or control constitutes a serious risk to the financial soundness and stability of any bank subsidiary of the bank holding company.
In addition, insured depository institutions under common control are required to reimburse the FDIC for any loss suffered by its deposit insurance funds as a result of the default of a commonly controlled insured depository institution or for any assistance provided by the FDIC to a commonly controlled insured depository institution in danger of default. The FDIC may decline to enforce the cross-guarantee provisions if it determines that a waiver is in the best interest of the deposit insurance funds. The FDIC’s claim for damages is superior to claims of stockholders of the insured depository institution or its holding company but is subordinate to claims of depositors, secured creditors and holders of subordinated debt (other than affiliates) of the commonly controlled insured depository institutions.
As a result of the Company’s ownership of the Bank, the Company is also registered under the bank holding company laws of North Carolina. Accordingly, the Company is also subject to regulation and supervision by the Commissioner.
Dodd-Frank Wall Street Reform and Consumer Protection Act (the “Dodd-Frank Act”). The Dodd-Frank Act significantly changed bank regulation and has affected the lending, investment, trading and operating activities of depository institutions and their holding companies.
The Dodd-Frank Act also created a new Consumer Financial Protection Bureau with extensive powers to supervise and enforce consumer protection laws. The Consumer Financial Protection Bureau has broad rule-making authority for a wide range of consumer protection laws that apply to all banks and savings institutions, including the authority to prohibit “unfair, deceptive or abusive” acts and practices. The Consumer Financial Protection Bureau also has examination and enforcement authority over all banks and savings institutions with more than $10 billion in assets. Banks and savings institutions with $10 billion or less in assets, such as the Bank, will continue to be examined by their applicable federal bank regulators. The Dodd-Frank Act also gave state attorneys general the ability to enforce applicable federal consumer protection laws.
6
The Dodd-Frank Act broadened the base for FDIC assessments for deposit insurance, permanently increased the maximum amount of deposit insurance to $250,000 per depositor. The legislation also, among other things, requires originators of certain securitized loans to retain a portion of the credit risk, stipulates regulatory rate-setting for certain debit card interchange fees, repealed restrictions on the payment of interest on commercial demand deposits and contains a number of reforms related to mortgage originations. The Dodd-Frank Act increased the ability of shareholders to influence boards of directors by requiring companies to give shareholders a non-binding vote on executive compensation and so-called “golden parachute” payments. The legislation also directed the Federal Reserve to promulgate rules prohibiting excessive compensation paid to company executives, regardless of whether the company is publicly traded or not. Many of the provisions of the Dodd-Frank Act are subject to delayed effective dates or require the implementing regulations and, therefore, their impact on our operations cannot be fully determined at this time. However, it is likely that the Dodd-Frank Act will increase the regulatory burden, compliance costs and interest expense for the Bank and Company.
Capital Adequacy Guidelines for Holding Companies. The Federal Reserve has adopted capital adequacy guidelines for bank holding companies and banks that are members of the Federal Reserve System and have consolidated assets of $150 million or more. Bank holding companies subject to the Federal Reserve’s capital adequacy guidelines are required to comply with the Federal Reserve’s risk-based capital guidelines. Under these regulations, the minimum ratio of total capital to risk-weighted assets is 8%. At least half of the total capital is required to be “Tier I capital,” principally consisting of common stockholders’ equity, noncumulative perpetual preferred stock, and a limited amount of cumulative perpetual preferred stock, less certain goodwill items. The remainder (“Tier II capital”) may consist of a limited amount of subordinated debt, certain hybrid capital instruments and other debt securities, perpetual preferred stock, and a limited amount of the general loan loss allowance. In addition to the risk-based capital guidelines, the Federal Reserve has adopted a minimum Tier I capital (leverage) ratio, under which a bank holding company must maintain a minimum level of Tier I capital to average total consolidated assets of at least 3% in the case of a bank holding company which has the highest regulatory examination rating and is not contemplating significant growth or expansion. All other bank holding companies are expected to maintain a Tier I capital (leverage) ratio of at least 1% to 2% above the stated minimum. The Company exceeded all applicable capital adequacy guidelines as of December 31, 2013. At December 31, 2013, the Company’s Tier I risk-based capital and total risk-based capital were 14.83% and 16.14%, respectively.
In July 2013, the Federal Reserve approved a new rule that implements the “Basel III” regulatory capital reforms and changes required by the Dodd-Frank Act. The final rule includes new risk-based capital and leverage ratios, which are effective January 1, 2015, and revise the definition of what constitutes “capital” for purposes of calculating those ratios. See “Capital Requirements for the Bank”, below.
Capital Requirements for the Bank. As a North Carolina chartered, FDIC-insured commercial bank which is not a member of the Federal Reserve System, the Bank is subject to capital requirements imposed by the FDIC. Under the FDIC's regulations, state nonmember banks that (a) receive the highest rating during the examination process and (b) are not anticipating or experiencing any significant growth, are required to maintain a minimum leverage ratio of 3% of total consolidated assets; all other banks are required to maintain a minimum ratio of 1% or 2% above the stated minimum, with a minimum leverage ratio of not less than 4%. The Bank exceeded all applicable capital adequacy guidelines as of December 31, 2013. At December 31, 2013, the Bank’s Tier I risk-based capital and total risk-based capital were 14.43% and 15.73%, respectively.
In July 2013, the Federal Reserve and the FDIC approved revisions to their capital adequacy guidelines and prompt corrective action rules that implement the revised standards of the Basel Committee on Banking Supervision, commonly called Basel III, and address relevant provisions of the Dodd-Frank Act. “Basel III” refers to two consultative documents released by the Basel Committee on Banking Supervision in December 2009, the rules text released in December 2010, and loss absorbency rules issued in January 2011, which include significant changes to bank capital, leverage and liquidity requirements.
7
The rules include new risk-based capital and leverage ratios, which are effective January 1, 2015, and revise the definition of what constitutes “capital” for purposes of calculating those ratios. The new minimum capital level requirements applicable to the Company and the Bank will be: (i) a new common equity Tier 1 capital ratio of 4.5%; (ii) a Tier 1 capital ratio of 6% (increased from 4%); (iii) a total capital ratio of 8% (unchanged from current rules); and (iv) a Tier 1 leverage ratio of 4% for all institutions. The rules eliminate the inclusion of certain instruments, such as trust preferred securities, from Tier 1 capital. Instruments issued prior to May 19, 2010 will be grandfathered for companies with consolidated assets of $15 billion or less. The rules also establish a “capital conservation buffer” of 2.5% above the new regulatory minimum capital requirements, which must consist entirely of common equity Tier 1 capital and would result in the following minimum ratios: (i) a common equity Tier 1 capital ratio of 7.0%, (ii) a Tier 1 capital ratio of 8.5%, and (iii) a total capital ratio of 10.5%. The new capital conservation buffer requirement will be phased in beginning in January 2016 at 0.625% of risk-weighted assets and would increase by that amount each year until fully implemented in January 2019. An institution would be subject to limitations on paying dividends, engaging in share repurchases, and paying discretionary bonuses if its capital level falls below the buffer amount. These limitations would establish a maximum percentage of eligible retained income that could be utilized for such actions.
Dividend and Repurchase Limitations. The Company must obtain Federal Reserve approval prior to repurchasing its common stock in excess of 10% of its net worth during any twelve-month period unless the Company (i) both before and after the redemption satisfies capital requirements for “well capitalized” state member banks; (ii) received a one or two rating in its last examination; and (iii) is not the subject of any unresolved supervisory issues.
Neither the Commissioner nor the FDIC have promulgated any regulations specifically limiting the right of the Company to pay dividends and repurchase shares. However, the ability of the Company to pay dividends or repurchase shares may be dependent upon the Company’s receipt of dividends from the Bank.
Dividends may be paid by the Bank from undivided profits, which are determined by deducting and charging certain items against actual profits. An insured depository institution, such as the Bank, is prohibited from making capital distributions, including the payment of dividends, if, after making such distribution, the institution would become “undercapitalized” (as such term is defined in the applicable law and regulations).
Deposit Insurance. The Bank’s deposits are insured up to applicable limits by the Deposit Insurance Fund (“DIF”) of the FDIC. The Bank’s deposits, therefore, are subject to FDIC deposit insurance assessment.
On November 12, 2009, the FDIC amended its regulations requiring certain insured institutions to prepay their estimated quarterly risk-based assessments for the fourth quarter of 2009, and for all of 2010, 2011, and 2012. The Bank’s prepaid assessment for these periods was $5.0 million and was paid on December 30, 2009, along with its regular quarterly risk-based deposit insurance assessment for the third quarter of 2009. The prepayment has been treated as a prepaid expense on the books of the Bank, and recognized as an expense in the period for which the assessment is effective. The FDIC issued refunds of any unused prepaid assessment credits in June 2013. The Bank received a prepaid assessment refund of $1.2 million.
The Dodd-Frank Act permanently increases the maximum deposit insurance amount for banks, savings institutions and credit unions to $250,000 per depositor, and extended unlimited deposit insurance to non-interest bearing transaction accounts through December 31, 2012. The Dodd-Frank Act also broadens the base for FDIC insurance assessments. Assessments will now be based on the average consolidated total assets less tangible equity capital of a financial institution. The Dodd-Frank Act requires the FDIC to increase the reserve ratio of the DIF from 1.15% to 1.35% of insured deposits by 2020 and eliminates the requirement that the FDIC pay dividends to insured depository institutions when the reserve ratio exceeds certain thresholds.
Federal Home Loan Bank System. The Federal Home Loan Bank (“FHLB”) system provides a central credit facility for member institutions. As a member of the FHLB of Atlanta, the Bank is required to own capital stock in the FHLB of Atlanta in an amount at least equal to 0.20% (or 20 basis points) of the Bank’s total assets at the end of each calendar year, plus 4.5% of its outstanding advances (borrowings) from the FHLB of Atlanta under the new activity-based stock ownership requirement. On December 31, 2013, the Bank was in compliance with this requirement.
Community Reinvestment. Under the Community Reinvestment Act (“CRA”), as implemented by regulations of the FDIC, an insured institution has a continuing and affirmative obligation consistent with its safe and sound operation to help meet the credit needs of its entire community, including low and moderate income neighborhoods. The CRA does not establish specific lending requirements or programs for financial institutions, nor does it limit an institution’s discretion to develop, consistent with the CRA, the types of products and services that it believes are best suited to its particular community. The CRA requires the federal banking regulators, in connection with their examinations of insured institutions, to assess the institutions’ records of meeting the credit needs of their communities, using the ratings of “outstanding,” “satisfactory,” “needs to improve,” or “substantial noncompliance,” and to take that record into account in its evaluation of certain applications by those institutions. All institutions are required to make public disclosure of their CRA performance ratings. The Bank received a “satisfactory” rating in its last CRA examination, which was conducted during July 2010.
8
Prompt Corrective Action. The FDIC has broad powers to take corrective action to resolve the problems of insured depository institutions. The extent of these powers will depend upon whether the institution in question is “well capitalized,” “adequately capitalized,” “undercapitalized,” “significantly undercapitalized,” or “critically undercapitalized.” Under the regulations, an institution is considered: (A) “well capitalized” if it has (i) a total risk-based capital ratio of 10% or greater, (ii) a Tier I risk-based capital ratio of 6% or greater, (iii) a leverage ratio of 5% or greater and (iv) is not subject to any order or written directive to meet and maintain a specific capital level for any capital measure; (B) “adequately capitalized” if it has (i) a total risk-based capital ratio of 8% or greater, (ii) a Tier I risk-based capital ratio of 4% or greater and (iii) a leverage ratio of 4% or greater (or 3% or greater in the case of an institution with the highest examination rating); (C) “undercapitalized” if it has (i) a total risk-based capital ratio of less than 8%, (ii) a Tier I risk-based capital ratio of less than 4% or (iii) a leverage ratio of less than 4% (or 3% in the case of an institution with the highest examination rating); (D) “significantly undercapitalized” if it has (i) a total risk-based capital ratio of less than 6%, or (ii) a Tier I risk-based capital ratio of less than 3% or (iii) a leverage ratio of less than 3%; and (E) “critically undercapitalized” if the institution has a ratio of tangible equity to total assets equal to or less than 2%. At December 31, 2013, the Bank has requisite capital levels to qualify as “well capitalized”.
Changes in Control. The BHCA prohibits the Company from acquiring direct or indirect control of more than 5% of the outstanding voting stock or substantially all of the assets of any bank or savings bank or merging or consolidating with another bank holding company or savings bank holding company without prior approval of the Federal Reserve. Similarly, Federal Reserve approval (or, in certain cases, non-disapproval) must be obtained prior to any person acquiring control of the Company. Control is conclusively presumed to exist if, among other things, a person acquires more than 25% of any class of voting stock of the Company or controls in any manner the election of a majority of the directors of the Company. Control is presumed to exist if a person acquires more than 10% of any class of voting stock and the stock is registered under Section 12 of the Securities Exchange Act of 1934, as amended from time to time (the “Exchange Act”), or the acquiror will be the largest shareholder after the acquisition.
Federal Securities Law. The Company has registered its common stock with the Securities and Exchange Commission (“SEC”) pursuant to Section 12(g) of the Exchange Act. As a result of such registration, the proxy and tender offer rules, insider trading reporting requirements, annual and periodic reporting and other requirements of the Exchange Act are applicable to the Company.
Transactions with Affiliates. Under current federal law, depository institutions are subject to the restrictions contained in Section 22(h) of the Federal Reserve Act with respect to loans to directors, executive officers and principal shareholders. Under Section 22(h), loans to directors, executive officers and shareholders who own more than 10% of a depository institution (18% in the case of institutions located in an area with less than 30,000 in population), and certain affiliated entities of any of the foregoing, may not exceed, together with all other outstanding loans to such person and affiliated entities, the institution’s loans-to-one-borrower limit (as discussed below). Section 22(h) also prohibits loans above amounts prescribed by the appropriate federal banking agency to directors, executive officers and shareholders who own more than 10% of an institution, and their respective affiliates, unless such loans are approved in advance by a majority of the board of directors of the institution. Any “interested” director may not participate in the voting. The FDIC has prescribed the loan amount (which includes all other outstanding loans to such person), as to which such prior board of director approval is required, as being the greater of $25,000 or 5% of capital and surplus (up to $500,000). Further, pursuant to Section 22(h), the Federal Reserve requires that loans to directors, executive officers, and principal shareholders be made on terms substantially the same as offered in comparable transactions with non-executive employees of the Bank. The FDIC has imposed additional limits on the amount a bank can loan to an executive officer.
Loans to One Borrower. The Bank is subject to the Commissioner’s loans-to-one-borrower limits which are substantially the same as those applicable to national banks. Under these limits, no loans and extensions of credit to any borrower outstanding at one time and not fully secured by readily marketable collateral shall exceed 15% of the Bank’s total equity capital. At December 31, 2013, this limit was $15.1 million. This limit is increased by an additional 10% of the Bank’s total equity capital, or $25.1 million as of December 31, 2013, for loans and extensions of credit that are fully secured by readily marketable collateral.
Gramm-Leach-Bliley Act. The federal Gramm-Leach-Bliley Act (the “GLB Act”) dramatically changed various federal laws governing the banking, securities and insurance industries. The GLB Act expanded opportunities for banks and bank holding companies to provide services and engage in other revenue-generating activities that previously were prohibited. In doing so, it increased competition in the financial services industry, presenting greater opportunities for our larger competitors, which were more able to expand their service and products than smaller, community-oriented financial institutions, such as the Bank.
9
USA Patriot Act of 2001. The Uniting and Strengthening America by Providing Appropriate Tools Required to Intercept and Obstruct Terrorism Act (the “Patriot Act”) was enacted in response to the terrorist attacks that occurred in New York, Pennsylvania and Washington, D.C. on September 11, 2001. The Patriot Act was intended to strengthen the ability of U.S. law enforcement and the intelligence community to work cohesively to combat terrorism on a variety of fronts. The impact of the Patriot Act on financial institutions of all kinds has been significant and wide ranging. The Patriot Act contains sweeping anti-money laundering and financial transparency laws and requires various regulations, including standards for verifying customer identification at account opening, and rules to promote cooperation among financial institutions, regulators, and law enforcement entities in identifying parties that may be involved in terrorism or money laundering.
Interstate Banking and Branching. The BHCA was amended by the Interstate Banking Act. The Interstate Banking Act provides that adequately capitalized and managed financial and bank holding companies are permitted to acquire banks in any state.
State law prohibiting interstate banking or discriminating against out-of-state banks are preempted. States are not permitted to enact laws opting out of this provision; however, states are allowed to adopt a minimum age restriction requiring that target banks located within the state be in existence for a period of years, up to a maximum of five years, before a bank may be subject to the Interstate Banking Act. The Interstate Banking Act, as amended by the Dodd-Frank Act, establishes deposit caps which prohibit acquisitions that result in the acquiring company controlling 30% or more of the deposits of insured banks and thrift institutions held in the state in which the target maintains a breach or 10% or more of the deposits nationwide. States have the authority to waive the 30% deposit cap. State-level deposit caps are not preempted as long as they do not discriminate against out-of-state companies, and the federal deposit caps apply only to initial entry acquisitions.
Under the Dodd-Frank Act, national banks and state banks are able to establish branches in any state if that state would permit the establishment of the branch by a state bank chartered in that state. North Carolina law permits a state bank to establish a branch of the bank anywhere in the state. Accordingly, under the Dodd-Frank Act, a bank with its headquarters outside the State of North Carolina may establish branches anywhere within North Carolina.
Sarbanes-Oxley Act of 2002. The Sarbanes-Oxley Act of 2002 is federal legislation issued to address accounting, corporate governance and disclosure issues. The impact of the Sarbanes-Oxley Act has been wide-ranging as it applied to all public companies and imposed significant new requirements for public company governance and disclosure requirements.
In general, the Sarbanes-Oxley Act mandated important corporate governance and financial reporting requirements intended to enhance the accuracy and transparency of public companies’ reported financial results. It established new responsibilities for corporate chief executive officers, chief financial officers and audit committees in the financial reporting process and created a new regulatory body to oversee auditors of public companies. It backed these requirements with SEC enforcement tools, increased criminal penalties for federal mail, wire and securities fraud, and created new criminal penalties for document and record destruction in connection with federal investigations. It also increased the opportunity for more private litigation by lengthening the statute of limitations for securities fraud claims and provided federal corporate whistleblower protection.
The economic and operational effects of this legislation on public companies, including us, have been significant in terms of the time, resources and costs associated with complying with the law.
Government Monetary Policies and Economic Controls. Our earnings and growth, as well as the earnings and growth of the banking industry, are affected by the credit policies of monetary authorities, including the Federal Reserve. An important function of the Federal Reserve is to regulate the national supply of bank credit in order to combat recession and curb inflationary pressures. Among the instruments of monetary policy used by the Federal Reserve to implement these objectives are open market operations in U.S. government securities, changes in reserve requirements against member bank deposits, and changes in the Federal Reserve discount rate. These means are used in varying combinations to influence overall growth of bank loans, investments, and deposits, and may also affect interest rates charged on loans or paid for deposits. The monetary policies of the Federal Reserve authorities have had a significant effect on the operating results of commercial banks in the past and are expected to continue to have such an effect in the future.
10
In view of changing conditions in the national economy and in money markets, as well as the effect of credit policies by monetary and fiscal authorities, including the Federal Reserve, no prediction can be made as to possible future changes in interest rates, deposit levels, and loan demand, or their effect on our business and earnings or on the financial condition of our various customers.
Limits on Rates Paid on Deposits and Brokered Deposits. FDIC regulations limit the ability of insured depository institutions to accept, renew or roll-over deposits by offering rates of interest which are significantly higher than the prevailing rates of interest on deposits offered by other insured depository institutions having the same type of charter in such depository institution’s normal market area. Under these regulations, “well capitalized” depository institutions may accept, renew or roll-over such deposits without restriction, “adequately capitalized” depository institutions may accept, renew or roll-over such deposits with a waiver from the FDIC (subject to certain restrictions on payments of rates) and “undercapitalized” depository institutions may not accept, renew, or roll-over such deposits. Definitions of “well capitalized,” “adequately capitalized” and “undercapitalized” are the same as the definitions adopted by the FDIC to implement the prompt corrective action provisions discussed above.
Other. Additional regulations require annual examinations of all insured depository institutions by the appropriate federal banking agency, with some exceptions for small, well-capitalized institutions and state chartered institutions examined by state regulators. Additional regulations also establish operational and managerial, asset quality, earnings and stock valuation standards for insured depository institutions, as well as compensation standards.
The Bank is subject to examination by the FDIC and the Commissioner. In addition, the Bank is subject to various other state and federal laws and regulations, including state usury laws, laws relating to fiduciaries, consumer credit and equal credit, fair credit reporting laws and laws relating to branch banking. The Bank, as an insured North Carolina commercial bank, is prohibited from engaging as a principal in activities that are not permitted for national banks, unless (i) the FDIC determines that the activity would pose no significant risk to the appropriate deposit insurance fund and (ii) the Bank is, and continues to be, in compliance with all applicable capital standards.
Future Requirements. Statutes and regulations, which contain wide-ranging proposals for altering the structures, regulations and competitive relationships of financial institutions, are introduced regularly. Neither the Company nor the Bank can predict whether or what form any proposed statute or regulation will be adopted or the extent to which the business of the Company or the Bank may be affected by such statute or regulation.
ITEM 1A. RISK FACTORS
The following are potential risks that management considers material and that could affect the future operating results and financial condition of the Bank and the Company. The risks are not listed in any particular order of importance, and there is the potential that there are other risks that have either not been identified or that management believed to be immaterial but which could in fact adversely affect the Bank’s operating results and financial condition.
Our business has been and may continue to be adversely affected by current conditions in the financial markets and economic conditions generally.
The global, U.S. and North Carolina economies, have not fully recovered from disruptions in the capital and credit markets that first occurred during 2008. Since 2008, dramatic declines in the housing market, with falling home prices and increasing foreclosures and unemployment, have resulted in significant write-downs of asset values by financial institutions, including government-sponsored entities and major commercial and investment banks. A sustained weakness or weakening in business and economic conditions generally or specifically in the principal markets in which we do business could have one or more of the following adverse effects on our business:
|
|
•
|
a decrease in the demand for loans or other products and services offered by us;
|
|
|
•
|
a decrease in the value of our loans or other assets secured by consumer or commercial real estate;
|
|
|
•
|
a decrease in deposit balances due to overall reductions in the accounts of customers;
|
|
|
•
|
an impairment of certain intangible assets or investment securities;
|
|
|
•
|
a decreased ability to raise additional capital on terms acceptable to us or at all; or
|
|
|
•
|
an increase in the number of borrowers who become delinquent, file for protection under bankruptcy laws or default on their loans or other obligations to us. An increase in the number of delinquencies, bankruptcies or defaults could result in a higher level of nonperforming assets, net charge-offs and provision for credit losses, which would reduce our earnings.
|
Until the local economy fully recovers, we expect our business, financial condition and results of operations to continue to be negatively impacted.
11
Financial reform legislation enacted by Congress and resulting regulations have increased, and are expected to continue to increase our costs of operations.
Congress enacted the Dodd-Frank Act in 2010. This law has significantly changed the structure of the bank regulatory system and affects the lending, deposit, investment, trading and operating activities of financial institutions and their holding companies. The Dodd-Frank Act requires various federal agencies to adopt a broad range of new implementing rules and regulations, and to prepare numerous studies and reports for Congress. The federal agencies are given significant discretion in drafting the implementing rules and regulations. Although some of these regulations have been promulgated, many additional regulations are expected to be issued in 2014 and thereafter. Consequently, many of the details and much of the impact of the Dodd-Frank Act may not be known for many years.
Certain provisions of the Dodd-Frank Act are having an effect on us. For example, a provision eliminates the federal prohibitions on paying interest on demand deposits, thus allowing businesses to have interest-bearing checking accounts. Although not currently quantifiable, this significant change to existing law could have an adverse effect on our interest expense.
The Dodd-Frank Act requires publicly traded companies to give stockholders a non-binding vote on executive compensation and so-called “golden parachute” payments, and authorizes the SEC to promulgate rules that would allow stockholders to nominate their own candidates using a company’s proxy materials. The legislation also directs the Federal Reserve to promulgate rules prohibiting excessive compensation paid to bank holding company executives, regardless of whether the company is publicly traded or not.
The Dodd-Frank Act created the Consumer Financial Protection Bureau with broad powers to supervise and enforce consumer protection laws. The Bureau has broad rule-making authority for a wide range of consumer protection laws that apply to all banks and savings institutions, including the authority to prohibit “unfair, deceptive or abusive” acts and practices. It also has examination and enforcement authority over all banks and savings institutions with more than $10 billion in assets. Banks and savings institutions with $10 billion or less in assets will be examined by their applicable bank regulators. The Dodd-Frank Act also weakens the federal preemption rules that have been applicable for national banks and federal savings associations, and gives state attorneys general the ability to enforce federal consumer protection laws.
It is difficult to quantify what specific impact the Dodd-Frank Act and related regulations have had on the Company to date and what impact yet to be written regulations will have on us in the future. However, it is expected that at a minimum they will increase our operating and compliance costs and could increase our interest expense.
Increases in FDIC insurance premiums may adversely affect our net income and profitability.
Since 2008, higher levels of bank failures have dramatically increased resolution costs of the FDIC and depleted the DIF. In order to maintain a strong funding position and restore reserve ratios of the DIF, the FDIC has increased assessment rates of insured institutions. In addition, on November 12, 2009, the FDIC adopted a rule requiring banks to prepay three years’ worth of estimated deposit insurance premiums by December 31, 2009. The Company is generally unable to control the amount of premiums that the Bank is required to pay for FDIC insurance. If there are additional bank or financial institution failures, or the cost of resolving prior failures exceeds expectations, the Bank may be required to pay higher FDIC premiums than those currently in force. Any future increases or required prepayments of FDIC insurance premiums may adversely impact the Company’s earnings and financial condition.
Market developments may adversely affect our industry, business and results of operations.
Significant declines in the housing market, with falling home prices and increasing foreclosures and unemployment, have resulted in significant write-downs of asset values by many financial institutions, including government-sponsored entities and major commercial and investment banks. These write-downs, initially of mortgage-backed securities but spreading to credit default swaps and other derivative securities, caused many financial institutions to seek additional capital, to merge with larger and stronger institutions and, in some cases, to fail. As a consequence, the Company has experienced significant challenges, its credit quality deteriorated and its net income and results of operations were adversely impacted. Reflecting concern about the stability of the financial markets generally and the strength of counterparties, many lenders and institutional investors have reduced, and in some cases, ceased to provide funding to borrowers including other financial institutions. Although to date the Company and the Bank remain “well capitalized,” we are part of the financial system and a systemic lack of available credit, a lack of confidence in the financial sector, increased volatility in the financial markets and/or reduced business activity could materially adversely affect our business, financial condition and results of operations.
12
Loss of key personnel could adversely impact results.
The success of the Bank has been and will continue to be greatly influenced by the ability to retain the services of existing senior management. The Bank has benefited from consistency within its senior management team, with its top five executives averaging over 20 years of service with the Bank. The Company has entered into employment contracts with each of these top management officials. Nevertheless, the unexpected loss of the services of any of the key management personnel, or the inability to recruit and retain qualified personnel in the future, could have an adverse impact on the business and financial results of the Bank.
A significant amount of the Bank’s business is concentrated in lending which is secured by property located in the Catawba Valley and surrounding areas.
In addition to the financial strength and cash flow characteristics of the borrower in each case, the Bank often secures its loans with real estate collateral. The real estate collateral in each case provides an alternate source of repayment in the event of default by the borrower and may deteriorate in value during the time the credit is extended. If the Bank is required to liquidate the collateral securing a loan during a period of reduced real estate values, as is currently the case, to satisfy the debt, the Bank’s earnings and capital could be adversely affected.
Additionally, with most of the Bank’s loans concentrated in the Catawba Valley and surrounding areas, a decline in local economic conditions could adversely affect the values of the Bank’s real estate collateral. Consequently, a decline in local economic conditions may have a greater effect on the Bank’s earnings and capital than on the earnings and capital of larger financial institutions whose real estate loan portfolios are geographically diverse.
Our allowance for loan losses may be insufficient and could therefore reduce earnings.
The risk of credit losses on loans varies with, among other things, general economic conditions, the creditworthiness of the borrower over the term of the loan and, in the case of a collateralized loan, the value and marketability of the collateral for the loan. Management maintains an allowance for loan losses based upon, among other things, historical experience, an evaluation of economic conditions and regular reviews of delinquencies and loan portfolio quality. Management believes it has established the allowance in accordance with U.S. Generally Accepted Accounting Principles (“GAAP”) and in consideration of the current economic environment. Although management uses the best information available to make evaluations, significant future additions to the allowance may be necessary based on changes in economic and other conditions, thus adversely affecting the operating results of the Company. If management’s assumptions and judgments prove to be incorrect and the allowance for loan losses is inadequate to absorb future losses, or if the bank regulatory authorities require the Bank to increase the allowance for loan losses as a part of their examination process, the Bank’s earnings and capital could be significantly and adversely affected. For further discussion related to our process for determining the appropriate level of the allowance for loan losses, see “Allowance for Loan Losses” within “Item 7. Management’s Discussion and Analysis of Financial Condition and Results and Operation” of this Annual Report, which is included in this Form 10-K as Exhibit (13).
Changes in interest rates affect profitability and assets.
Changes in prevailing interest rates may hurt the Bank’s business. The Bank derives its income primarily from the difference or “spread” between the interest earned on loans, securities and other interest-earning assets, and interest paid on deposits, borrowings and other interest-bearing liabilities. In general, the larger the spread, the more the Bank earns. When market rates of interest change, the interest the Bank receives on its assets and the interest the Bank pays on its liabilities will fluctuate. This can cause decreases in the “spread” and can adversely affect the Bank’s income. Changes in market interest rates could reduce the value of the Bank’s financial assets. Fixed-rate investments, mortgage-backed and related securities and mortgage loans generally decrease in value as interest rates rise. In addition, interest rates affect how much money the Bank lends. For example, when interest rates rise, the cost of borrowing increases and the loan originations tend to decrease. If the Bank is unsuccessful in managing the effects of changes in interest rates, the financial condition and results of operations could suffer.
We measure interest rate risk under various rate scenarios using specific criteria and assumptions. A summary of this process, along with the results of our net interest income simulations, is presented within “Item 7A. Quantitative and Qualitative Disclosures About Market Risk” of this Annual Report which is included in this Form 10-K as Exhibit (13).
13
The Bank faces strong competition from other banks and financial institutions which can hurt its business.
The financial services industry is highly competitive. The Bank competes against commercial banks, savings banks, savings and loan associations, credit unions, mortgage banks, brokerage firms, investment advisory firms, insurance companies and other financial institutions. Many of these entities are larger organizations with significantly greater financial, management and other resources than the Bank has. Moreover, one national money center commercial bank is headquartered in Charlotte, North Carolina, only 40 miles from the Bank’s primary market area.
While management believes it can and does successfully compete with other financial institutions in our market, we may face a competitive disadvantage as a result of our smaller size and lack of geographic diversification.
Changes in technology may impact the Bank’s business.
The Bank uses various technologies in its business and the banking industry is undergoing rapid technological changes. The effective use of technology increases efficiency and enables financial institutions to reduce costs. The Bank’s future success will depend in part on its ability to address the needs of its customers by using technology to provide products and services that will satisfy customer demands for convenience as well as create additional efficiencies in the Bank’s operations. The Bank’s competitors may have substantially greater resources to invest in technological improvements.
We may be subject to examinations by taxing authorities which could adversely affect our results of operations.
In the normal course of business, we may be subject to examinations from federal and state taxing authorities regarding the amount of taxes due in connection with investments we have made and the businesses in which we are engaged. Recently, federal and state taxing authorities have become increasingly aggressive in challenging tax positions taken by financial institutions. The challenges made by taxing authorities may result in adjustments to the timing or amount of taxable income or deductions or the allocation of income among tax jurisdictions. If any such challenges are made and are not resolved in our favor, they could have an adverse effect on our financial condition and results of operations.
Changes in our accounting policies or in accounting standards could materially affect how we report our financial results and condition.
Our accounting policies are fundamental to understanding our financial results and condition. Some of these policies require use of estimates and assumptions that may affect the value of our assets or liabilities and financial results. Some of our accounting policies are critical because they require management to make difficult, subjective and complex judgments about matters that are inherently uncertain and because it is likely that materially different amounts would be reported under different conditions or using different assumptions.
From time to time the Financial Accounting Standards Board (“FASB”) and the SEC change the financial accounting and reporting standards or the interpretation of those standards that govern the preparation of our external financial statements. These changes are beyond our control, can be hard to predict and could materially impact how we report our results of operations and financial condition. We could be required to apply a new or revised standard retroactively, resulting in our restating prior period financial statements in material amounts.
Our internal controls may be ineffective.
Management regularly reviews and updates our internal controls, disclosure controls and procedures, and corporate governance policies and procedures. Any system of controls, however well designed and operated, is based in part on certain assumptions and can provide only reasonable, not absolute, assurances that the objectives of the system are met. Any failure or circumvention of our controls and procedures or failure to comply with regulations related to controls and procedures could have a material adverse effect on our business, results of operations, and financial condition.
Impairment of investment securities or deferred tax assets could require charges to earnings, which could result in a negative impact on our results of operations.
In assessing the impairment of investment securities, management considers the length of time and extent to which the fair value has been less than cost, the financial condition and near-term prospects of the issues, and the intent and ability of the Company to retain its investment in the issuer for a period of time sufficient to allow for any anticipated recovery of fair value in the near term. In assessing the future ability of the Company to realize the deferred tax assets, management considers whether it is more likely than not that some portion or all of the deferred tax assets will not be realized. The ultimate realization of deferred tax assets is dependent upon the generation of future taxable income during the periods in which those temporary differences become deductible. The impact of each of these impairment matters could have a material adverse effect on our business, results of operations, and financial condition.
14
We rely on other companies to provide key components of our business infrastructure.
Third party vendors provide key components of our business infrastructure such as internet connections, network access and core application processing. While we have selected these third party vendors carefully, we do not control their actions. Any problems caused by these third parties, including as a result of their not providing us their services for any reason or their performing their services poorly, could adversely affect our ability to deliver products and services to our customers and otherwise to conduct our business. Replacing these third party vendors could also entail significant delay and expense.
Our information systems may experience an interruption or breach in security.
We rely heavily on communications and information systems to conduct our business. Any failure, interruption, or breach in security or operational integrity of these systems could result in failures or disruptions in our customer relationship management, general ledger, deposit, loan, and other systems. We have policies and procedures designed with the intention to prevent or limit the effect of the failure, interruption, or security breach of our information systems. The occurrence of any failures, interruptions, or security breaches of our information systems could damage our reputation, result in a loss of customer business, subject us to additional regulatory scrutiny, or expose us to civil litigation and possible financial liability, any of which could have a material adverse effect on our financial condition, results of operations and business.
Liquidity is essential to our businesses.
Our liquidity could be impaired by an inability to access the capital markets or unforeseen outflows of cash. This situation may arise due to circumstances that we may be unable to control, such as a general market disruption or an operational problem that affects third parties or us. Our credit ratings are important to our liquidity. A reduction in our credit ratings could adversely affect our liquidity and competitive position, increase our borrowing costs, limit our access to the capital markets or trigger unfavorable contractual obligations.
Negative publicity could damage our reputation
Reputation risk, or the risk to our earnings and capital from negative public opinion, is inherent in our business. Negative public opinion could adversely affect our ability to keep and attract customers and expose us to adverse legal and regulatory consequences. Negative public opinion could result from our actual or alleged conduct in any number of activities, including lending practices, corporate governance, regulatory compliance, mergers and acquisitions, and disclosure, sharing or inadequate protection of customer information, and from actions taken by government regulators and community organizations in response to that conduct.
Financial services companies depend on the accuracy and completeness of information about customers and counterparties.
In deciding whether to extend credit or enter into other transactions, we may rely on information furnished by or on behalf of customers and counterparties, including financial statements, credit reports, and other financial information. We may also rely on representations of those customers, counterparties, or other third parties, such as independent auditors, as to the accuracy and completeness of that information. Reliance on inaccurate or misleading financial statements, financial advisors and consultants, credit reports, or other financial information could cause us to enter into unfavorable transactions, which could have a material adverse effect on our financial condition and results of operations.
If our non-performing assets increase, our earnings will suffer.
Our non-performing assets adversely affect our net income in various ways. We do not record interest income on non-accrual loans or real estate owned. We must reserve for probable losses, which is established through a current period charge to the provision for loan losses as well as from time to time, as appropriate, the write down of the value of properties in our other real estate owned portfolio to reflect changing market values. Additionally, there are legal fees associated with the resolution of problem assets as well as carrying costs such as taxes, insurance and maintenance related to our other real estate owned. Further, the resolution of non-performing assets requires the active involvement of management, which can distract them from more profitable activity. Finally, if our estimate for the recorded allowance for loan losses proves to be incorrect and our allowance is inadequate, we will have to increase the allowance accordingly.
15
Our loan portfolio includes loans with a higher risk of loss.
We originate commercial real estate loans, commercial loans, construction and land development loans, and residential mortgage loans primarily within our market area. Commercial real estate, commercial, and construction and land development loans tend to involve larger loan balances to a single borrower or groups of related borrowers and are most susceptible to a risk of loss during a downturn in the business cycle. These loans also have historically had greater credit risk than other loans for the following reasons:
|
·
|
Commercial Real Estate Loans. Repayment is dependent on income being generated in amounts sufficient to cover operating expenses and debt service. These loans also involve greater risk because they are generally not fully amortizing over a loan period, but rather have a balloon payment due at maturity. A borrower’s ability to make a balloon payment typically will depend on being able to either refinance the loan or timely sell the underlying property. As of December 31, 2013, commercial real estate loans comprised approximately 34% of the Bank’s total loan portfolio.
|
|
·
|
Commercial Loans. Repayment is generally dependent upon the successful operation of the borrower’s business. In addition, the collateral securing the loans may depreciate over time, be difficult to appraise, be illiquid, or fluctuate in value based on the success of the business. As of December 31, 2013, commercial loans comprised approximately 11% of the Bank’s total loan portfolio.
|
|
·
|
Construction and land development loans. The risk of loss is largely dependent on our initial estimate of whether the property’s value at completion equals or exceeds the cost of property construction and the availability of take-out financing. During the construction phase, a number of factors can result in delays or cost overruns. If our estimate is inaccurate or if actual construction costs exceed estimates, the value of the property securing our loan may be insufficient to ensure full repayment when completed through a permanent loan, sale of the property, or by seizure of collateral. As of December 31, 2013, construction and land development loans comprised approximately 10% of the Bank’s total loan portfolio.
|
|
·
|
Single-family residential loans. Declining home sales volumes, decreased real estate values and higher than normal levels of unemployment could contribute to losses on these loans. As of December 31, 2013, single-family residential loans comprised approximately 40% of the Bank’s total loan portfolio, including Banco de la Gente single-family residential stated income loans which were approximately 8% of the Bank’s total loan portfolio.
|
Because we engage in lending secured by real estate and may be forced to foreclose on the collateral property and own the underlying real estate, we may be subject to the increased costs associated with the ownership of real property, which could result in reduced net income.
Since we originate loans secured by real estate, we may have to foreclose on the collateral property to protect our investment and may thereafter own and operate such property, in which case we are exposed to the risks inherent in the ownership of real estate.
The amount that we, as a mortgagee, may realize after a default is dependent upon factors outside of our control, including, but not limited to:
|
·
|
general or local economic conditions;
|
|
·
|
environmental cleanup liability;
|
|
·
|
neighborhood values;
|
|
·
|
interest rates;
|
|
·
|
real estate tax rates;
|
|
·
|
operating expenses of the mortgaged properties;
|
|
·
|
supply of and demand for rental units or properties;
|
|
·
|
ability to obtain and maintain adequate occupancy of the properties;
|
|
·
|
zoning laws;
|
|
·
|
governmental rules, regulations and fiscal policies; and
|
|
·
|
acts of God.
|
Certain expenditures associated with the ownership of real estate, principally real estate taxes and maintenance costs, may adversely affect the income from the real estate. Therefore, the cost of operating real property may exceed the rental income earned from such property, and we may have to advance funds in order to protect our investment or we may be required to dispose of the real property at a loss.
16
We are subject to extensive regulation and oversight, and, depending upon the findings and determinations of our regulatory authorities, we may be required to make adjustments to our business, operations or financial position and could become subject to formal or informal regulatory action.
We are subject to extensive regulation and supervision, including examination by federal and state banking regulators. Federal and state regulators have the ability to impose substantial sanctions, restrictions and requirements on us if they determine, upon conclusion of their examination or otherwise, violations of laws with which we must comply or weaknesses or failures with respect to general standards of safety and soundness, including, for example, in respect of any financial concerns that the regulators may identify and desire for us to address. Such enforcement may be formal or informal and can include directors’ resolutions, memoranda of understanding, consent orders, civil money penalties and termination of deposit insurance and bank closure. Enforcement actions may be taken regardless of the capital levels of the institutions, and regardless of prior examination findings. In particular, institutions that are not sufficiently capitalized in accordance with regulatory standards may also face capital directives or prompt corrective actions. Enforcement actions may require certain corrective steps (including staff additions or changes), impose limits on activities (such as lending, deposit taking, acquisitions, paying dividends or branching), prescribe lending parameters (such as loan types, volumes and terms) and require additional capital to be raised, any of which could adversely affect our financial condition and results of operations. The imposition of regulatory sanctions, including monetary penalties, may have a material impact on our financial condition and results of operations and/or damage our reputation. In addition, compliance with any such action could distract management’s attention from our operations, cause us to incur significant expenses, restrict us from engaging in potentially profitable activities and limit our ability to raise capital.
We will become subject to more stringent capital requirements, which may adversely impact our return on equity, require us to raise additional capital, or constrain us from paying dividends or repurchasing shares.
In July 2013, the Federal Reserve and the FDIC approved new rules that will substantially amend the regulatory risk-based capital rules applicable to the Bank. The final rule implements the “Basel III” regulatory capital reforms and changes required by the Dodd-Frank Act.
The final rule includes new minimum risk-based capital and leverage ratios, which will be effective for the Bank and the Company on January 1, 2015, and revises the definition of what constitutes “capital” for purposes of calculating those ratios. The new minimum capital requirements will be: (i) a new common equity tier 1 capital ratio of 4.5%; (ii) a tier 1 to risk-based assets capital ratio of 6% (increased from 4%); (iii) a total capital ratio of 8% (unchanged from current rules); and (iv) a tier 1 leverage ratio of 4%. These rules also establish a “capital conservation buffer” of 2.5%, and will result in the following minimum ratios: (i) a common equity tier 1 capital ratio of 7.0%, (ii) a tier 1 to risk-based assets capital ratio of 8.5%, and (iii) a total capital ratio of 10.5%. The new capital conservation buffer requirement would be phased in beginning in January 2016 at 0.625% of risk-weighted assets and would increase each year until fully implemented in January 2019. An institution will be subject to limitations on paying dividends, engaging in share repurchases, and paying discretionary bonuses if its capital level falls below the buffer amount. These limitations will establish a maximum percentage of eligible retained income that can be utilized for such actions.
The application of more stringent capital requirements for the Bank could, among other things, result in lower returns on equity, require the raising of additional capital, and result in regulatory actions constraining us from paying dividends or repurchasing shares if we were to be unable to comply with such requirements.
The trading volume in our common stock is less than that of larger public companies which can cause price volatility.
The trading history of our common stock has been characterized by relatively low trading volume. The value of a shareholder’s investment may be subject to sudden decreases due to the volatility of the price of our common stock, which trades on the NASDAQ Global Market.
The market price of our common stock may be volatile and subject to fluctuations in response to numerous factors, including, but not limited to, the factors discussed in other risk factors and the following:
|
·
|
actual or anticipated fluctuation in our operating results;
|
|
·
|
changes in interest rates;
|
|
·
|
changes in the legal or regulatory environment in which we operate;
|
|
·
|
press releases, announcements or publicity relating to us or our competitors or relating to trends in our industry;
|
|
·
|
changes in expectations as to our future financial performance, including financial estimates or recommendations by securities analysts and investors;
|
|
·
|
future sales of our common stock;
|
|
·
|
changes in economic conditions in our market, general conditions in the U.S. economy, financial markets or the banking industry; and
|
|
·
|
other developments affecting our competitors or us.
|
17
These factors may adversely affect the trading price of our common stock, regardless of our actual operating performance, and could prevent a shareholder from selling common stock at or above the current market price. In addition, the Company cannot say with any certainty that a more active and liquid trading market for its common stock will develop.
Our stock price can be volatile.
Stock price volatility may make it more difficult for you to resell your common stock when you want and at prices you find attractive. Our stock price can fluctuate significantly in response to a variety of factors including, among other things:
|
·
|
actual or anticipated variations in quarterly results of operations;
|
|
·
|
recommendations by securities analysts;
|
|
·
|
operating results and stock price performance of other companies that investors deem comparable to us;
|
|
·
|
news reports relating to trends, concerns, and other issues in the financial services industry;
|
|
·
|
perceptions in the marketplace regarding us and/or our competitors;
|
|
·
|
new technology used or services offered by competitors;
|
|
·
|
significant acquisitions or business combinations, strategic partnerships, joint ventures, or capital commitments by or involving us or our competitors; and
|
|
·
|
changes in government regulations.
|
Our common stock is not FDIC insured.
The Company’s common stock is not a savings or deposit account or other obligation of any bank and is not insured by the FDIC or any other governmental agency and is subject to investment risk, including the possible loss of principal. Investment in our common stock is inherently risky for the reasons described in this “Risk Factors” section and elsewhere in this report and is subject to the same market forces that affect the price of common stock in any company. As a result, holders of our common stock may lose some or all of their investment.
We may reduce or eliminate dividends on our common stock.
Although we have historically paid a quarterly cash dividend to the holders of our common stock, holders of our common stock are not entitled to receive dividends. Downturns in the domestic and global economies could cause our Board of Directors to consider, among other things, reducing or eliminating dividends paid on our common stock. This could adversely affect the market price of our common stock. Furthermore, as a bank holding company, our ability to pay dividends is subject to the guidelines of the Federal Reserve regarding capital adequacy and dividends before declaring or paying any dividends. Dividends also may be limited as a result of safety and soundness considerations.
Our articles of incorporation, as amended, amended and restated bylaws, and certain banking laws may have an anti-takeover effect.
Provisions of our articles of incorporation, as amended, amended and restated bylaws, and federal banking laws, including regulatory approval requirements, could make it more difficult for a third party to acquire us, even if doing so would be perceived to be beneficial to our shareholders. The combination of these provisions may prohibit a non-negotiated merger or other business combination, which, in turn, could adversely affect the market price of our common stock.
ITEM 1B. UNRESOLVED STAFF COMMENTS
Not applicable.
18
ITEM 2. PROPERTIES
At December 31, 2013, the Company and the Bank conducted their business from the headquarters office in Newton, North Carolina, its Banco administrative office and its 22 other branch offices in Lincolnton, Hickory, Newton, Catawba, Conover, Claremont, Maiden, Denver, Triangle, Hiddenite, Charlotte, Monroe, Cornelius, Mooresville and Raleigh, North Carolina. The Bank also operates a loan production office in Denver, North Carolina. The following table sets forth certain information regarding the Bank’s properties at December 31, 2013.
|
Owned
Corporate Office
518 West C Street
Newton, North Carolina 28658
420 West A Street
Newton, North Carolina 28658
2619 North Main Avenue
Newton, North Carolina 28658
213 1st Street, West
Conover, North Carolina 28613
3261 East Main Street
Claremont, North Carolina 28610
6125 Highway 16 South
Denver, North Carolina 28037
5153 N.C. Highway 90E
Hiddenite, North Carolina 28636
200 Island Ford Road
Maiden, North Carolina 28650
3310 Springs Road NE
Hickory, North Carolina 28601
142 South Highway 16
Denver, North Carolina 28037
106 North Main Street
Catawba, North Carolina 28609
2050 Catawba Valley Boulevard
Hickory, North Carolina 28601
800 E. Arrowood Road
Charlotte, NC 28217
1074 River Highway
Mooresville, NC, 28117
|
Leased
1333 2nd Street NE
Hickory, North Carolina 28601
1910 East Main Street
Lincolnton, North Carolina 28092
760 Highway 27 West
Lincolnton, North Carolina 28092
102 Leonard Avenue
Newton, North Carolina 28658
6300 South Boulevard
Suite 100
Charlotte, North Carolina 28217
4451 Central Avenue
Suite A
Charlotte, North Carolina 28205
3752/3754 Highway 16 North
Denver, North Carolina 28037
501 West Roosevelt Boulevard
Monroe, NC 28110
9624-I Bailey Road
Cornelius, North Carolina 28031
4011 Capital Boulevard
Raleigh, NC 27604
125-E Trade Court (closed 2/14/14)
Mooresville, NC 28117
|
|
ITEM 3.
|
LEGAL PROCEEDINGS
|
On April 2, 2013, the Bank received notice that a lawsuit was filed against it in the General Court of Justice, Superior Court Division, Lincoln County, North Carolina. The complaint alleges (i) breach of contract and the covenants of good faith and fair dealing by the Bank, (ii) conversion, (iii) unjust enrichment and (iv) violations of the North Carolina Unfair and Deceptive Trade Practices Act in its assessment and collection of overdraft fees. It seeks the refund of overdraft fees, treble damages, attorneys’ fees and injunctive relief. The Plaintiff seeks to have the lawsuit certified as a class action. The Bank believes that the allegations in the complaint are without merit and intends to vigorously defend the lawsuit, including the request that the lawsuit be certified as a class action. On June 6, 2013, the Bank filed a motion for judgment on the pleadings, which was heard in the North Carolina Business Court on October 1, 2013. The Court has not ruled on that motion as of March 20, 2014.
19
|
ITEM 4.
|
MINE SAFETY DISCLOSURES
|
Not applicable.
PART II
|
ITEM 5.
|
MARKET FOR REGISTRANT'S COMMON EQUITY, RELATED STOCKHOLDER MATTERS AND ISSUER PURCHASES OF EQUITY SECURITIES
|
The Company’s common stock is listed on the NASDAQ Global Market, under the symbol “PEBK.” Market makers for the Company’s shares include Scott and Stringfellow, Inc. and Sterne Agee & Leach.
Although the payment of dividends by the Company is subject to certain requirements and limitations of North Carolina corporate law, neither the Commissioner nor the FDIC have promulgated any regulations specifically limiting the right of the Company to pay dividends and repurchase shares. However, the ability of the Company to pay dividends and repurchase shares may be dependent upon, among other things, the Company’s receipt of dividends from the Bank. The Bank’s ability to pay dividends is limited. North Carolina commercial banks, such as the Bank, are subject to legal limitations on the amount of dividends they are permitted to pay. Dividends may be paid by the Bank from undivided profits, which are determined by deducting and charging certain items against actual profits, including any contributions to surplus required by North Carolina law. Also, an insured depository institution, such as the Bank, is prohibited from making capital distributions, including the payment of dividends, if, after making such distribution, the institution would become “undercapitalized” (as such term is defined in the applicable law and regulations). Based on its current financial condition, the Bank does not expect that this provision will have any impact on the Bank’s ability to pay dividends. See Supervision and Regulation under Item 1 Business.
As of March 18, 2014, the Company had 714 shareholders of record, not including the number of persons or entities whose stock is held in nominee or street name through various brokerage firms or banks. The market price for the Company’s common stock was $15.50 on March 18, 2014.
The following table presents certain market and dividend information for the last two fiscal years. Over-the-counter quotations reflect inter-dealer prices, without retail mark-up, mark down or commission and may not necessarily represent actual transactions.
|
Cash Dividend
|
|||||||
|
2013
|
Low Bid
|
High Bid
|
Per Share
|
||||
|
First Quarter
|
$ | 9.20 | 9.45 | 0.03 | |||
|
Second Quarter
|
$ | 11.21 | 11.23 | 0.03 | |||
|
Third Quarter
|
$ | 12.01 | 14.05 | 0.03 | |||
|
Fourth Quarter
|
$ | 12.39 | 15.00 | 0.03 | |||
|
Cash Dividend
|
|||||||
|
2012
|
Low Bid
|
High Bid
|
Per Share
|
||||
|
First Quarter
|
$ | 5.16 | 8.76 | 0.07 | |||
|
Second Quarter
|
$ | 7.01 | 9.00 | 0.02 | |||
|
Third Quarter
|
$ | 7.88 | 10.44 | 0.02 | |||
|
Fourth Quarter
|
$ | 8.59 | 10.50 | 0.07 | |||
20
STOCK PERFORMANCE GRAPH
The following graph compares the Company’s cumulative shareholder return on its common stock with a NASDAQ index and with a southeastern bank index. The graph was prepared by SNL Securities, L.C., Charlottesville, Virginia, using data as of December 31, 2013.
COMPARISON OF SIX-YEAR CUMULATIVE TOTAL RETURNS
Performance Report for
Peoples Bancorp of North Carolina, Inc.
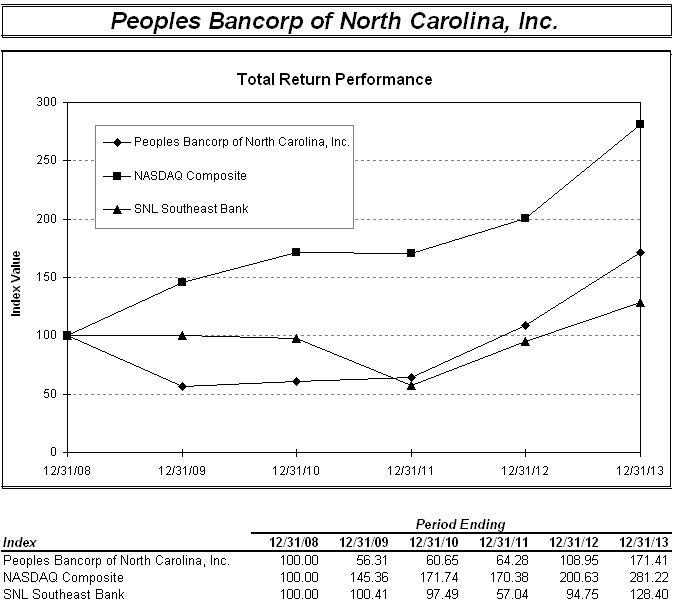
| Source : SNL Financial LC, Charlottesville, VA | ||
| © | 2014 | |
| www.snl.com | ||
21
The information required by Item 201(d) concerning securities authorized for issuance under equity compensation plans is set forth in Item 12 hereof.
|
ISSUER PURCHASES OF EQUITY SECURITIES
|
||||||||||
| Total | ||||||||||
| Number of | ||||||||||
| Shares | ||||||||||
| Purchased as | ||||||||||
| Part of | Maximum Number | |||||||||
| Total | Publicly | of Shares that May | ||||||||
| Number of | Average | Announced | Yet Be Purchased | |||||||
| Shares | Price Paid | Plans or | Under the Plans or | |||||||
| Period | Purchased | per Share | Programs | Programs | ||||||
|
January 1 - 31, 2013
|
- | $ | - | - | - | |||||
|
February 1 - 28, 2013
|
1,255 | (1) | 10.59 | - | - | |||||
|
March 1 - 31, 2013
|
890 | (1) | 11.65 | - | - | |||||
|
April 1 - 30, 2013
|
- | - | - | - | ||||||
|
May 1 - 31, 2013
|
1,000 | (1) | 11.84 | - | - | |||||
|
June 1 - 30, 2013
|
- | - | - | - | ||||||
|
July 1 - 31, 2013
|
631 | (1) | 13.71 | - | - | |||||
|
August 1 - 31, 2013
|
583 | (1) | 13.51 | - | - | |||||
|
September 1 - 30, 2013
|
- | - | - | - | ||||||
|
October 1 - 31, 2013
|
346 | (1) | 12.99 | - | - | |||||
|
November 1 - 30, 2013
|
575 | (1) | 13.10 | - | - | |||||
|
December 1 - 31, 2013
|
13,850 | (1), (2) | 905.63 | - | - | |||||
|
Total
|
19,130 | $ | 659.02 | - | - | |||||
|
(1) The Company purchased 6,606 shares on the open market in the year ended December 31, 2013 for its deferred compensation plan. All purchases were funded by participant contributions to the plan.
|
||||||||||
|
(2) The Company received regulatory approval in December 2013 to repurchase and redeem the remaining 12,524 outstanding shares of its Series A preferred stock. The repurchase and redemption, which was completed on January 17, 2014, is reflected on the Company’s Consolidated Balance Sheets as of December 31, 2013. “Accrued interest payable and other liabilities” at December 31, 2013 includes $12.6 million for the payment to preferred shareholders of principal and accrued dividends on January 17, 2014.
|
||||||||||
|
ITEM 6.
|
SELECTED FINANCIAL DATA
|
The information required by this Item is set forth in the table captioned "Selected Financial Data" on page A-3 of the Annual Report, which Annual Report is included in this Form 10-K as Exhibit (13).
|
ITEM 7.
|
MANAGEMENT'S DISCUSSION AND ANALYSIS OF FINANCIAL CONDITION AND RESULTS OF OPERATIONS
|
The information required by this Item is set forth in the section captioned “Management’s Discussion and Analysis of Financial Condition and Results of Operations” on pages A-4 through A-26 of the Annual Report, which section is included in this Form 10-K as Exhibit (13).
22
|
ITEM 7A.
|
QUANTITATIVE AND QUALITATIVE DISCLOSURES ABOUT MARKET RISK
|
The information required by this Item is set forth in the section captioned “Quantitative and Qualitative Disclosures About Market Risk” on page A-25 of the Annual Report, which Annual Report is included in this Form 10-K as Exhibit (13).
|
ITEM 8.
|
FINANCIAL STATEMENTS AND SUPPLEMENTARY DATA
|
The consolidated financial statements of the Company and supplementary data are set forth on pages A-27 through A-64 of the Annual Report, which Annual Report is included in this Form 10-K as Exhibit (13).
|
ITEM 9.
|
CHANGES IN AND DISAGREEMENTS WITH ACCOUNTANTS ON ACCOUNTING AND FINANCIAL DISCLOSURE
|
Not applicable.
|
ITEM 9A.
|
CONTROLS AND PROCEDURES
|
Evaluation of Disclosure Controls and Procedures
The Company’s management, under the supervision and with the participation of the Chief Executive Officer and the Chief Financial Officer of the Company, has concluded, based on their evaluation as of the end of the period covered by this Report, that the Company’s disclosure controls and procedures (as defined in Rule 13A-15(e) promulgated under the Exchange Act) are effective to ensure that information required to be disclosed by the Company in the reports filed or submitted by it under the Exchange Act is recorded, processed, summarized and reported within the time periods specified in the applicable rules and forms and include controls and procedures designed to ensure that information required to be disclosed by the Company in such reports is accumulated and communicated to the Company’s management including the Chief Executive Officer and the Chief Financial Officer of the Company as appropriate to allow timely decisions regarding required disclosure.
Changes in Internal Controls over Financial Reporting
There have been no changes in internal control over financial reporting during the quarter ended December 31, 2013 that have materially affected, or are reasonably likely to materially affect, the Company’s internal control over financial reporting.
Management’s Annual Report on Internal Controls over Financial Reporting
The Company’s management is responsible for establishing and maintaining adequate internal control over financial reporting. Internal control over financial reporting is defined in Rule 13a-15(f) promulgated under the Securities Exchange Act of 1934. The Company’s internal control over financial reporting is a process designed to provide reasonable assurance regarding the reliability of financial reporting and the preparation of financial statements for external purposes in accordance with accounting principles generally accepted in the United States of America. Internal control over financial reporting includes those policies and procedures that (1) pertain to the maintenance of records that in reasonable detail accurately and fairly reflect the transactions and dispositions of the assets of the company, (2) provide reasonable assurance that transactions are recorded as necessary to permit preparation of financial statements in accordance with accounting principles generally accepted in the United States of America, and that receipts and expenditures of the company are being made only in accordance with authorizations of management and directors of the Company and (3) provide reasonable assurance regarding prevention or timely detection of unauthorized acquisition, use or disposition of the company’s assets that could have a material effect on the financial statements.
Because of its inherent limitations, internal control over financial reporting may not prevent or detect misstatements. Projections of any evaluation of effectiveness to future periods are subject to the risk that controls may become inadequate because of changes in conditions, or that the degree of compliance with the policies or procedures may deteriorate.
Management assessed the effectiveness of the Company’s internal control over financial reporting as of December 31, 2013. In making this assessment, management used the criteria established in “Internal Control – Integrated Framework” issued by the Committee of Sponsoring Organizations of the Treadway Commission. Based on our assessment and those criteria, management believes that the Company maintained effective internal control over financial reporting as of December 31, 2013.
This annual report does not include an attestation report of the Company’s registered independent public accounting firm regarding internal control over financial reporting. Management’s report was not subject to attestation by the Company’s registered independent public accounting firm pursuant to rules that permit the Company to provide only management’s report in this annual report.
23
|
ITEM 9B.
|
OTHER INFORMATION
|
None
PART III
|
ITEM 10.
|
DIRECTORS AND EXECUTIVE OFFICERS AND CORPORATE GOVERNANCE
|
The information required by this Item regarding directors and executive officers of the Company is set forth under the sections captioned “Director Nominees”, “Our Board of Directors and Its Committees”; “Executive Committee”, “Governance Committee”, “Audit and Risk Management Committee”, “Compensation Committee”, “Board Leadership Structure and Risk Oversight” contained in the Proxy Statement, which sections are incorporated herein by reference.
The information required by this Item regarding compliance with Section 16(a) of the Exchange Act is set forth under the section captioned “Section 16(a) Beneficial Ownership Reporting Compliance” contained in the Proxy Statement, which section is incorporated herein by reference.
The information required by this Item regarding identification of members of the Company’s Audit Committee is set forth under the section captioned “Audit and Risk Management Committee” contained in the Proxy Statement, which section is incorporated herein by reference.
The Company has adopted a Code of Ethics that applies to the Company’s employees, including the principal executive officer and principal financial officer. The Company has also adopted a written charter for the Audit Committee, which is reviewed annually, and amended as needed, by the Committee. These documents are available on the Bank’s website (www.peoplesbanknc.com) under “Investor Relations.”
|
ITEM 11.
|
EXECUTIVE COMPENSATION
|
The information required by this Item is set forth under the section captioned “Management Compensation” contained in the Proxy Statement, which section is incorporated herein by reference.
|
ITEM 12.
|
SECURITY OWNERSHIP OF CERTAIN BENEFICIAL OWNERS AND MANAGEMENT AND RELATED STOCKHOLDER MATTERS
|
For the information required by the Item see the section captioned “Security Ownership of Certain Beneficial Owners and Management” contained in the Proxy Statement, which section is incorporated herein by reference.
The following table presents the number of shares of Company common stock to be issued upon the exercise of outstanding options, warrants and rights; the weighted-average price of the outstanding options, warrants and rights and the number of options, warrants and rights remaining that may be issued under the Company’s Omnibus Plan described under the section captioned “Omnibus Stock Option and Long Term Incentive Plan” contained in the Proxy Statement .
24
|
Plan Category
|
Number of securities to
be issued upon exercise
of outstanding option, warrants and rights (1),
(2), (3)
|
Weighted-average
exercise price of
outstanding options,
warrants and rights
(4)
|
Number of securities remaining available for future issuance under equity compensation plans
(excluding securities reflected in
column (a)) (5)
|
||||
|
(a)
|
(b)
|
(c)
|
|||||
|
Equity compensation plans approved by security holders
|
59,939 | $ | 13.95 | 303,691 | |||
|
Equity compensation plans not approved by security holders
|
- | - | - | ||||
|
Total
|
59,939 | $ | 13.95 | 303,691 | |||
|
(1) Includes 3,630 stock options issued on May 6, 2004 under the 1999 Omnibus Stock Option and Long Term Incentive Plan (the "1999 Omnibus Plan"), which are fully vested as of December 31, 2013.
|
|||||||
|
(2) Includes 24,159 restricted stock units granted on March 22, 2012 and 5,355 restricted stock units granted on July 26, 2012 under the February 19, 2009 Omnibus Stock Ownership and Long Term Incentive Plan (the "2009 Omnibus Plan"). These restricted stock grants cliff vest five years after issuance.
|
|||||||
|
(3) Includes 26,795 restricted stock units granted on May 23, 2013 under the 2009 Omnibus Plan (the "2009 Omnibus Plan"). These restricted stock grants cliff vest on March 22, 2017.
|
|||||||
|
(4) The exercise price for the grant of stock options under the 1999 Omnibus Plan on May 6, 2004 is $10.31. Exercise price and shares have been adjusted for the 10% stock dividends paid March 16, 2005 and June 16, 2006 and the three-for-two stock split paid June 15, 2007. The exercise price used for the grants of restricted stock units under the 2009 Omnibus Plan is $14.18, the closing price for the Company’s stock on December 31, 2013.
|
|||||||
|
(5) Reflects shares currently reserved for possible issuance under the 2009 Omnibus Plan.
|
|||||||
|
ITEM 13.
|
CERTAIN RELATIONSHIPS AND RELATED TRANSACTIONS AND DIRECTOR INDEPENDENCE
|
See the section captioned “Indebtedness of and Transactions with Management and Directors” contained in the Proxy Statement, which section is incorporated herein by reference.
|
ITEM 14.
|
PRINCIPAL ACCOUNTANT FEES AND SERVICES
|
See the section captioned “Proposal 2 - Ratification of Selection of Independent Auditor” contained in the Proxy Statement, which section is incorporated herein by reference.
25
|
PART IV
|
|||
|
ITEM 15.
|
EXHIBITS AND FINANCIAL STATEMENT SCHEDULES
|
||
|
15(a)1.
|
Consolidated Financial Statements (contained in the Annual Report attached hereto as Exhibit (13)
|
||
|
and incorporated herein by reference)
|
|||
|
(a)
|
Report of Independent Registered Public Accounting Firm
|
||
|
(b)
|
Consolidated Balance Sheets as of December 31, 2013 and 2012
|
||
|
( c)
|
Consolidated Statements of Earnings for the Years Ended December 31, 2013, 2012 and
|
||
|
2011
|
|||
|
(d)
|
Consolidated Statements of Comprehensive Income (Loss) for the Years Ended
|
||
|
December 31, 2013, 2012 and 2011
|
|||
|
(e)
|
Consolidated Statements of Changes in Shareholders' Equity for the Years Ended
|
||
|
December 31, 2013, 2012 and 2011
|
|||
|
(f)
|
Consolidated Statements of Cash Flows for the Years Ended December 31, 2013, 2012
|
||
|
and 2011
|
|||
|
(g)
|
Notes to Consolidated Financial Statements
|
||
|
15(a)2.
|
Consolidated Financial Statement Schedules
|
||
|
All schedules have been omitted, as the required information is either inapplicable or included in
|
|||
|
the Notes to Consolidated Financial Statements.
|
|||
|
15(a)3.
|
Exhibits
|
||
|
Exhibit (3)(1)
|
Articles of Amendment dated December 19, 2008, regarding the Series A
|
|
|
Preferred Stock, incorporated by reference to Exhibit (3)(1) to the Form 8-K filed
|
||
|
with the Securities and Exchange Commission on December 29, 2008
|
||
|
Exhibit (3)(2)
|
Articles of Amendment dated February 26, 2010, incorporated by reference to
|
|
|
Exhibit (3)(2) to the Form 10-K filed with the Securities and Exchange
|
||
|
Commission on March 25, 2010
|
||
|
Exhibit (3)(i)
|
Articles of Incorporation of the Registrant, incorporated by reference to
|
|
|
Exhibit (3)(i) to the Form 8-A filed with the Securities and Exchange
|
||
|
Commission on September 2, 1999
|
||
|
Exhibit (3)(ii)
|
Amended and Restated Bylaws of the Registrant, incorporated by reference to
|
|
|
Exhibit (3)(ii) to the Form 10-K filed with the Securities and Exchange
|
||
|
Commission on March 25, 2010
|
||
|
Exhibit (4)
|
Specimen Stock Certificate, incorporated by reference to Exhibit (4) to the Form
|
|
|
8-A filed with the Securities and Exchange Commission on September 2, 1999
|
||
|
Exhibit (4)(1)
|
Form of Certificate for the Series A Preferred Stock, incorporated by reference to
|
|
|
Exhibit (4)(1) to the Form 8-K filed with the Securities and Exchange
|
||
|
Commission on December 29, 2008
|
26
|
Exhibit (4)(2)
|
Warrant dated December 23, 2008, for the purchase of shares of Common Stock,
|
|
|
incorporated by reference to Exhibit (4)(2) to the Form 8-K filed with the
|
||
|
Securities and Exchange Commission on December 29, 2008
|
||
|
Exhibit (10)(1)
|
Letter Agreement dated December 23, 2008 between the Registrant and the
|
|
|
United States Department of the Treasury, incorporated by reference to Exhibit
|
||
|
(10)(1) to the Form 8-K filed with the Securities and Exchange Commission on
|
||
|
December 29, 2008
|
||
|
Exhibit (10)(a)(iii)
|
Amended and Restated Executive Salary Continuation Agreement between
|
|
|
Peoples Bank and Tony W. Wolfe dated December 18, 2008, incorporated by
|
||
|
reference to Exhibit (10)(a)(iii) to the Form 8-K filed with the Securities and
|
||
|
Exchange Commission on December 29, 2008
|
||
|
Exhibit (10)(b)(i)
|
Employment Letter Agreement dated December 23, 2008 between the Registrant
|
|
|
and Joseph F. Beaman, Jr., incorporated by reference to Exhibit (10(b)(i) to the
|
||
|
Form 8-K filed with the Securities and Exchange Commission on December 29,
|
||
|
2008
|
||
|
Exhibit (10)(b)(ii)
|
Amendment to Employment Agreement between Peoples Bank and Joseph F.
|
|
|
Beaman, Jr. dated December 18, 2008, incorporated by reference to Exhibit
|
||
|
(10)(b)(ii) to the Form 8-K filed with the Securities and Exchange Commission
|
||
|
on December 29, 2008
|
||
|
Exhibit (10)(b)(iii)
|
Amended and Restated Executive Salary Continuation Agreement between
|
|
|
Peoples Bank and Joseph F. Beaman, Jr. dated December 18, 2008, incorporated
|
||
|
by reference to Exhibit (10)(b)(iii) to the Form 8-K filed with the Securities and
|
||
|
Exchange Commission on December 29, 2008
|
||
|
Exhibit (10)(c)(i)
|
Employment Letter Agreement dated December 23, 2008 between the Registrant
|
|
|
and William D. Cable, Sr., incorporated by reference to Exhibit (10(c)(i) to the
|
||
|
Form 8-K filed with the Securities and Exchange Commission on December 29,
|
||
|
2008
|
||
|
Exhibit (10)(c)(ii)
|
Amendment to Employment Agreement between Peoples Bank and William D.
|
|
|
Cable, Sr. dated December 18, 2008, incorporated by reference to Exhibit
|
||
|
(10)(c)(ii) to the Form 8-K filed with the Securities and Exchange Commission
|
||
|
on December 29, 2008
|
||
|
Exhibit (10)(c)(iii)
|
Amended and Restated Executive Salary Continuation Agreement between
|
|
|
Peoples Bank and William D. Cable, Sr. dated December 18, 2008, incorporated
|
||
|
by reference to Exhibit (10)(c)(iii) to the Form 8-K filed with the Securities and
|
||
|
Exchange Commission on December 29, 2008
|
||
|
Exhibit (10)(d)(i)
|
Employment Letter Agreement dated December 23, 2008 between the Registrant
|
|
|
and Lance A. Sellers, incorporated by reference to Exhibit (10(d)(i) to the Form
|
||
|
8-K filed with the Securities and Exchange Commission on December 29, 2008
|
||
|
Exhibit (10)(d)(ii)
|
Amendment to Employment Agreement between Peoples Bank and Lance A.
|
|
|
Sellers dated December 18, 2008, incorporated by reference to Exhibit (10)(d)(ii)
|
||
|
to the Form 8-K filed with the Securities and Exchange Commission on
|
||
|
December 29, 2008
|
||
|
Exhibit (10)(d)(iii)
|
Amended and Restated Executive Salary Continuation Agreement between
|
|
|
Peoples Bank and Lance A. Sellers dated December 18, 2008, incorporated by
|
||
|
reference to Exhibit (10)(d)(iii) to the Form 8-K filed with the Securities and
|
||
|
Exchange Commission on December 29, 2008
|
27
|
Exhibit (10)(e)
|
Peoples Bancorp of North Carolina, Inc. Omnibus Stock Ownership and Long
|
|
|
Term Incentive Plan incorporated by reference to Exhibit (10)(f) to the Form 10-K
|
||
|
filed with the Securities and Exchange Commission on March 30, 2000
|
||
|
Exhibit (10)(e)(i)
|
Amendment No. 1 to the Peoples Bancorp of North Carolina, Inc. Omnibus Stock
|
|
|
Ownership and Long Term Incentive Plan incorporated by reference to Exhibit
|
||
|
(10)(e)(i) to the Form 10-K filed with the Securities and Exchange Commission
|
||
|
on March 15, 2007
|
||
|
Exhibit (10)(f)(i)
|
Employment Letter Agreement dated December 23, 2008 between the Registrant
|
|
|
and A. Joseph Lampron, Jr., incorporated by reference to Exhibit (10(f)(i) to the
|
||
|
Form 8-K filed with the Securities and Exchange Commission on December 29,
|
||
|
2008
|
||
|
Exhibit (10)(f)(ii)
|
Amendment to Employment Agreement between Peoples Bank and A. Joseph
|
|
|
Lampron, Jr. dated March 18, 2010 incorporated by reference to Exhibit
|
||
|
(10)(f)(ii) to the Form 10-K filed with the Securities and Exchange Commission
|
||
|
on March 25, 2010
|
||
|
Exhibit (10)(f)(iii)
|
Amended and Restated Executive Salary Continuation Agreement between
|
|
|
Peoples Bank and A. Joseph Lampron, Jr. dated December 18, 2008, incorporated
|
||
|
by reference to Exhibit (10)(f)(iii) to the Form 8-K filed with the Securities and
|
||
|
Exchange Commission on December 29, 2008
|
||
|
Exhibit (10)(g)
|
Peoples Bank Directors' and Officers' Deferral Plan, incorporated by reference
|
|
|
to Exhibit (10)(h) to the Form 10-K filed with the Securities and Exchange
|
||
|
Commission on March 28, 2002
|
||
|
Exhibit (10)(h)
|
Rabbi Trust for the Peoples Bank Directors' and Officers' Deferral Plan,
|
|
|
incorporated by reference to Exhibit (10)(i) to the Form 10-K filed with the
|
||
|
Securities and Exchange Commission on March 28, 2002
|
||
|
Exhibit (10)(i)
|
Description of Service Recognition Program maintained by Peoples Bank,
|
|
|
incorporated by reference to Exhibit (10)(i) to the Form 10-K filed with the
|
||
|
Securities and Exchange Commission on March 27, 2003
|
||
|
Exhibit (10)(j)
|
Capital Securities Purchase Agreement dated as of June 26, 2006, by and among
|
|
|
the Registrant, PEBK Capital Trust II and Bear, Sterns Securities Corp.,
|
||
|
incorporated by reference to Exhibit (10)(j) to the Form 10-Q filed with the
|
||
|
Securities and Exchange Commission on November 13, 2006
|
||
|
Exhibit (10)(k)
|
Amended and Restated Trust Agreement of PEBK Capital Trust II, dated as of
|
|
|
June 28, 2006, incorporated by reference to Exhibit (10)(k) to the Form 10-Q filed
|
||
|
with the Securities and Exchange Commission on November 13, 2006
|
||
|
Exhibit (10)(l)
|
Guarantee Agreement of the Registrant dated as of June 28, 2006, incorporated
|
|
|
by reference to Exhibit (10)(l) to the Form 10-Q filed with the Securities and
|
||
|
Exchange Commission on November 13, 2006
|
||
|
Exhibit (10)(m)
|
Indenture, dated as of June 28, 2006, by and between the Registrant and LaSalle
|
|
|
Bank National Association, as Trustee, relating to Junior Subordinated Debt
|
||
|
Securities Due September 15, 2036, incorporated by reference to Exhibit (10)(m)
|
||
|
to the Form 10-Q filed with the Securities and Exchange Commission on
|
||
|
November 13, 2006
|
28
|
Exhibit (10)(n)
|
Form of Amended and Restated Director Supplemental Retirement Agreement
|
|
|
between Peoples Bank and Directors Robert C. Abernethy, James S. Abernethy,
|
||
|
Douglas S. Howard, John W. Lineberger, Jr., Gary E. Matthews, Dr. Billy L.
|
||
|
Price, Jr., Larry E. Robinson, W. Gregory Terry, Dan Ray Timmerman, Sr. and
|
||
|
Benjamin I. Zachary, incorporated by reference to Exhibit (10)(n) to the Form
|
||
|
8-K filed with the Securities and Exchange Commission on December 29, 2008
|
||
|
Exhibit (10)(o)
|
2009 Omnibus Stock Ownership and Long Term Incentive Plan incorporated
|
|
|
by reference to Exhibit (10)(o) to the Form 10-K filed with the Securities and
|
||
|
Exchange Commission on March 20, 2009
|
||
|
Exhibit (10)(p)
|
Underwriting Agreement with Merrill Lynch, Pierce, Fenner & Smith
|
|
|
Incorporated and Sandler O'Neill & Partners, L.P., as representatives of the
|
||
|
several underwriters listed on Schedule A thereto and the UST incorporated by
|
||
|
reference to Exhibit 1.1 to the Form 8-K filed with the Securities and Exchange
|
||
|
Commission on June 29, 2012
|
||
| Exhibit (11) | Statement regarding computation of per share earnings | |
|
Exhibit (12)
|
Statement regarding computation of ratios
|
|
|
Exhibit (13)
|
2013 Annual Report of Peoples Bancorp of North Carolina, Inc.
|
|
|
Exhibit (14)
|
Code of Business Conduct and Ethics of Peoples Bancorp of North Carolina,
|
|
|
Inc., incorporated by reference to Exhibit (14) to the Form 10-K filed with the
|
||
|
Securities and Exchange Commission on March 25, 2005
|
||
|
Exhibit (21)
|
Subsidiaries of the Registrant
|
|
|
Exhibit (23)
|
Consent of Porter Keadle Moore, LLP
|
|
|
Exhibit (31)(a)
|
Certification of principal executive officer pursuant to section 302 of the
|
|
|
Sarbanes-Oxley Act of 2002
|
||
|
Exhibit (31)(b)
|
Certification of principal financial officer pursuant to section 302 of the
|
|
|
Sarbanes-Oxley Act of 2002
|
||
|
Exhibit (32)
|
Certification Pursuant to 18 U.S.C. Section 1350, as adopted pursuant to Section
|
|
|
906 of the Sarbanes-Oxley Act of 2002
|
||
|
Exhibit (101)
|
The following materials from the Company's 10-K Report for the annual
|
|
|
period ended December 31, 2013, formatted in XBRL: (i) the Condensed Consolidated
|
||
|
Balance Sheets, (ii) the Condensed Consolidated Statements of Income, (iii) the
|
||
|
Condensed Consolidated Statements of Changes in Shareholders' Equity, (iv) the
|
||
|
Condensed Consolidated Statements of Cash Flows, and (v) the Notes to the
|
||
|
Condensed Consolidated Financial Statements, tagged as blocks of text.*
|
||
|
*Furnished, not filed.
|
29
|
SIGNATURES
|
|
Pursuant to the requirements of Section 13 or 15(d) of the Securities Exchange Act of 1934, the registrant has duly caused this report to be signed on its behalf by the undersigned, thereunto duly authorized.
|
|
PEOPLES BANCORP OF NORTH CAROLINA, INC.
|
|||
|
(Registrant)
|
|||
|
By:
|
/s/ Lance A. Sellers
|
||
|
Lance A. Sellers
|
|||
|
President and Chief Executive Officer
|
|||
|
Date: March 21, 2014
|
|||
|
Pursuant to the requirements of the Securities Exchange Act of 1934, this report has been signed below by the following persons on behalf of the registrant and in the capacities and on the dates indicated:
|
||||
|
Signature
|
Title
|
Date
|
||
|
/s/ Lance A. Sellers
|
President and Chief Executive Officer
|
March 21, 2014
|
||
|
Lance A. Sellers
|
(Principal Executive Officer)
|
|||
|
/s/ James S. Abernethy
|
Director
|
March 21, 2014
|
||
|
James S. Abernethy
|
||||
|
/s/ Robert C. Abernethy
|
Chairman of the Board and Director
|
March 21, 2014
|
||
|
Robert C. Abernethy
|
||||
|
/s/ Douglas S. Howard
|
Director
|
March 21, 2014
|
||
|
Douglas S. Howard
|
||||
|
/s/ A. Joseph Lampron, Jr.
|
Executive Vice President and Chief
|
March 21, 2014
|
||
|
A. Joseph Lampron, Jr.
|
Financial Officer (Principal Financial
|
|||
|
and Principal Accounting Officer)
|
||||
|
/s/ John W. Lineberger, Jr.
|
Director
|
March 21, 2014
|
||
|
John W. Lineberger, Jr.
|
|
|||
|
/s/ Gary E. Matthews
|
Director
|
March 21, 2014
|
||
|
Gary E. Matthews
|
||||
|
/s/ Billy L. Price, Jr., M.D.
|
Director
|
March 21, 2014
|
||
|
Billy L. Price, Jr., M.D.
|
||||
|
/s/ Larry E. Robinson
|
Director
|
March 21, 2014
|
||
|
Larry E. Robinson
|
||||
|
/s/ William Gregory Terry
|
Director
|
March 21, 2014
|
||
|
William Gregory Terry
|
||||
|
/s/ Dan Ray Timmerman, Sr.
|
Director
|
March 21, 2014
|
||
|
Dan Ray Timmerman, Sr.
|
||||
|
/s/ Benjamin I. Zachary
|
Director
|
March 21, 2014
|
||
|
Benjamin I. Zachary
|
||||
30