EXHIBIT 99.1
CIRCOR Reports Second-Quarter 2017 Financial Results
Burlington, MA - July 28, 2017 - CIRCOR International, Inc. (NYSE: CIR), a leading provider of flow control solutions and other highly engineered products for markets including oil & gas, aerospace, power, process and industrial solutions, today announced financial results for the second quarter ended July 2, 2017.
Second Quarter 2017 Highlights
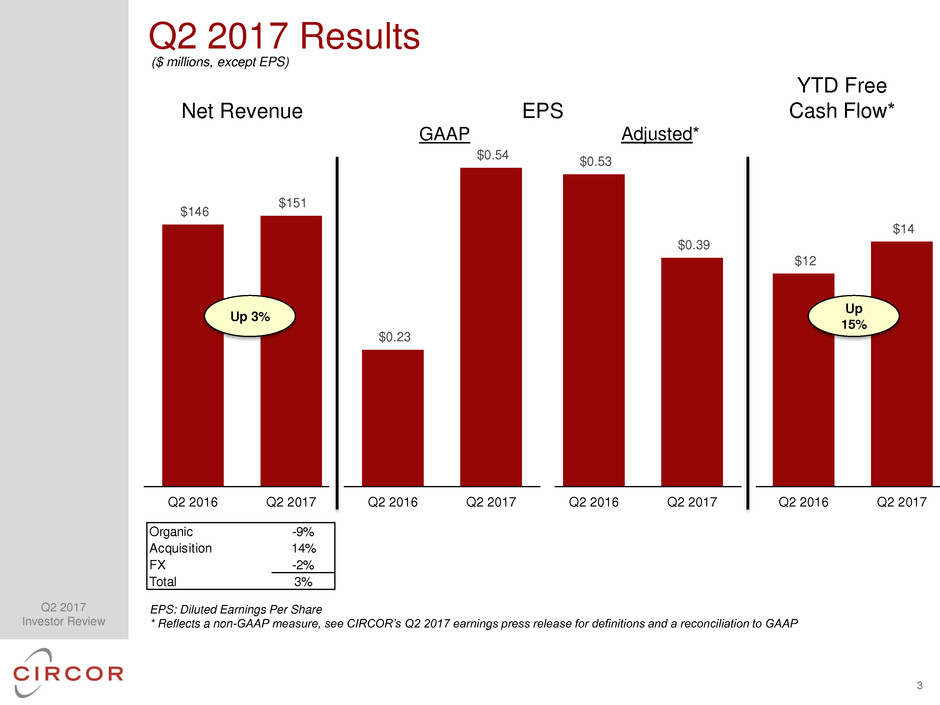
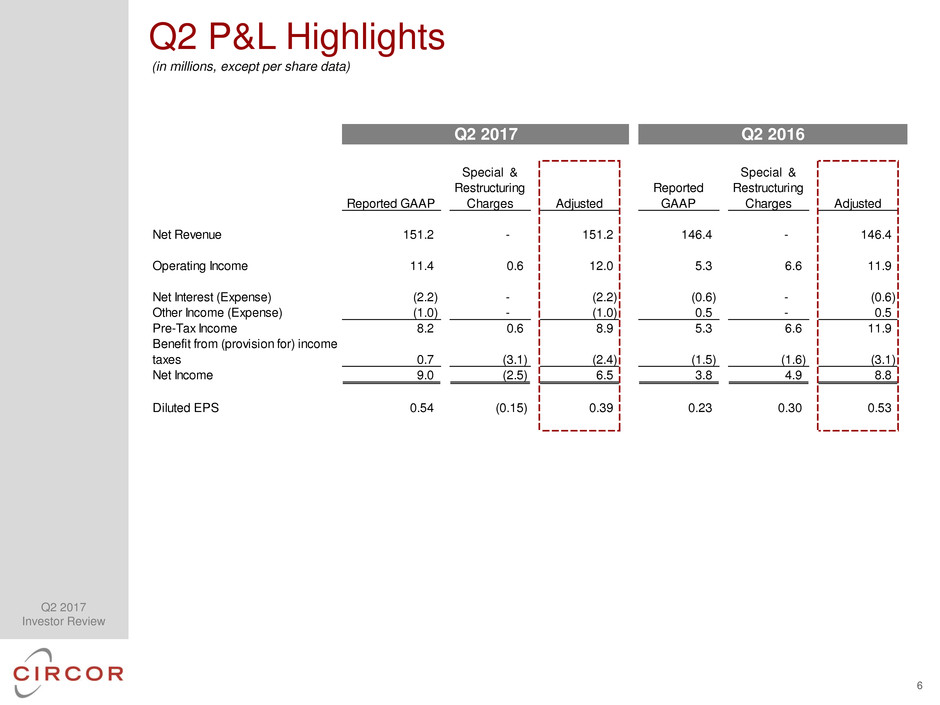
• | Revenue of $151 million, GAAP EPS of $0.54 and Adjusted EPS of $0.39 |
• | Orders of $143 million, up 6% year-over-year |
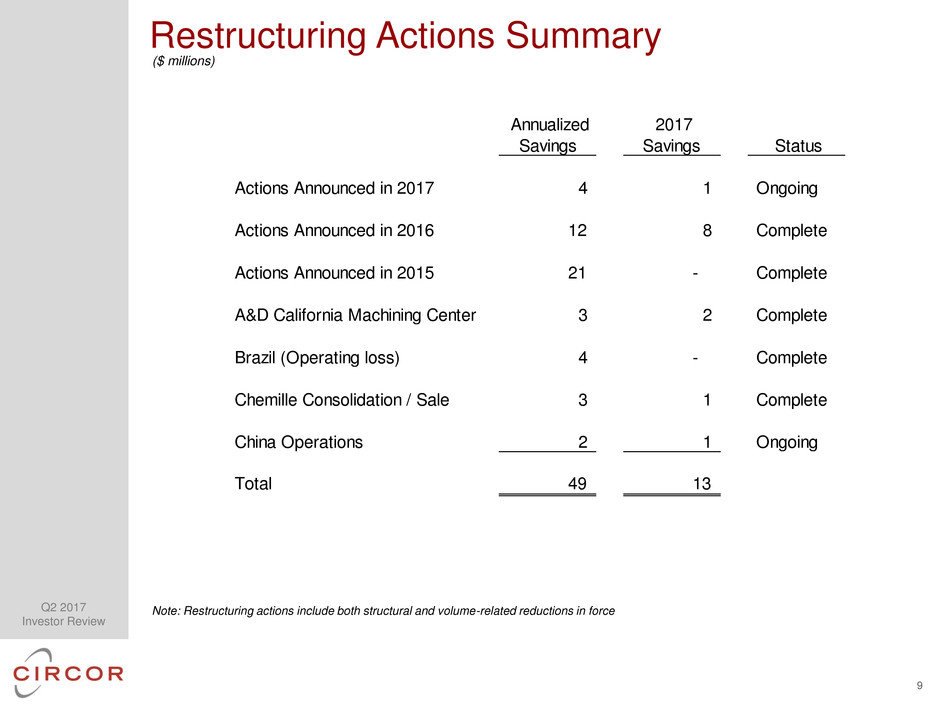
• | Completed factory consolidation and sale of non-core business in France |
“We closed the first half of the year with solid second quarter results, including revenue of $151 million and adjusted earnings per share of $0.39,” said Scott Buckhout, President and Chief Executive Officer. “Orders in our Energy segment were up 8% organically due to strong demand in our Distributed Valves business. In our Advanced Flow Solutions segment, our year-to-date order intake increased 5% organically over the prior year and our strong backlog positions us to deliver revenue growth and margin expansion in the second half of the year.”
“After the close of the second quarter, we exited one of our two French factories, consolidated operations into our low cost facility in Morocco, and completed the sale of our low margin ‘build-to-print’ business,” added Buckhout. “Exiting this sub-scale factory reduces CIRCOR’s structural cost and will contribute to our margin expansion efforts going forward.”
“We remain optimistic about the market outlook across the majority of our end markets. Going forward, we will continue to focus on creating long-term value for shareholders by investing in growth, expanding margins, generating strong free cash flow, and being disciplined with capital deployment,” concluded Buckhout.
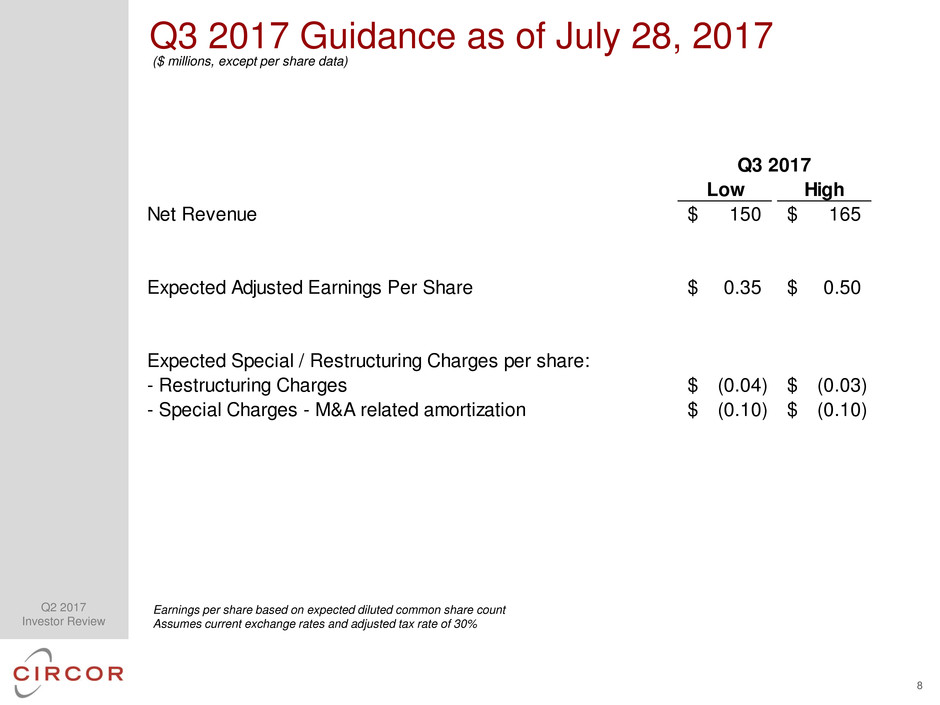
Third-Quarter 2017 Guidance
The Company will provide its guidance for the third quarter of 2017 during the conference call later today.
1
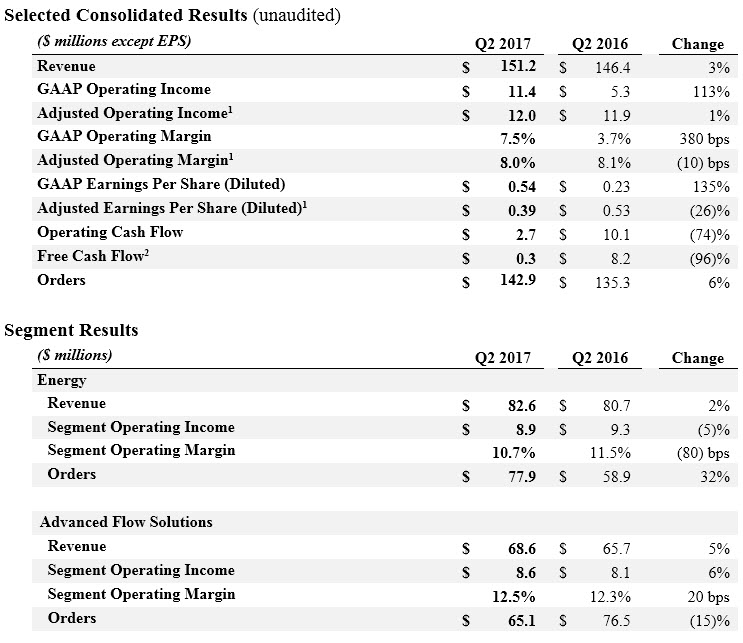
1. | Consolidated and Segment Results for Q2 2017 exclude special and restructuring charges and non-cash acquisition-related intangible amortization, totaling $0.6 million (pre-tax). This net charge includes (i) $2.6 million charge for non-cash acquisition-related intangible amortization expense, (ii) $5.3 million charge related to the sale of our France build-to-print business, (iii) $1.3 million of charges related to exit of manufacturing operations in China, including $0.8 million related to environmental clean-up costs, (iv) $1.1 of other restructuring activities, primarily reductions-in-force, across Europe and North America, and (v) a $9.7 million gain related to the revaluation of the contingent consideration for purchase of Critical Flow Solutions. Consolidated and Segment Results for Q2 2016 exclude special and restructuring charges totaling $6.6 million (pre-tax). The Q2 2016 charges include (i) $1.5 million charge related to the closure of the Brazil manufacturing operations; (ii) $1.9 million charge for non-cash acquisition-related intangible amortization expense; (iii) $2.1 million for the closure of the California machining facility; and (iv) $1.1 million of other restructuring activities. |
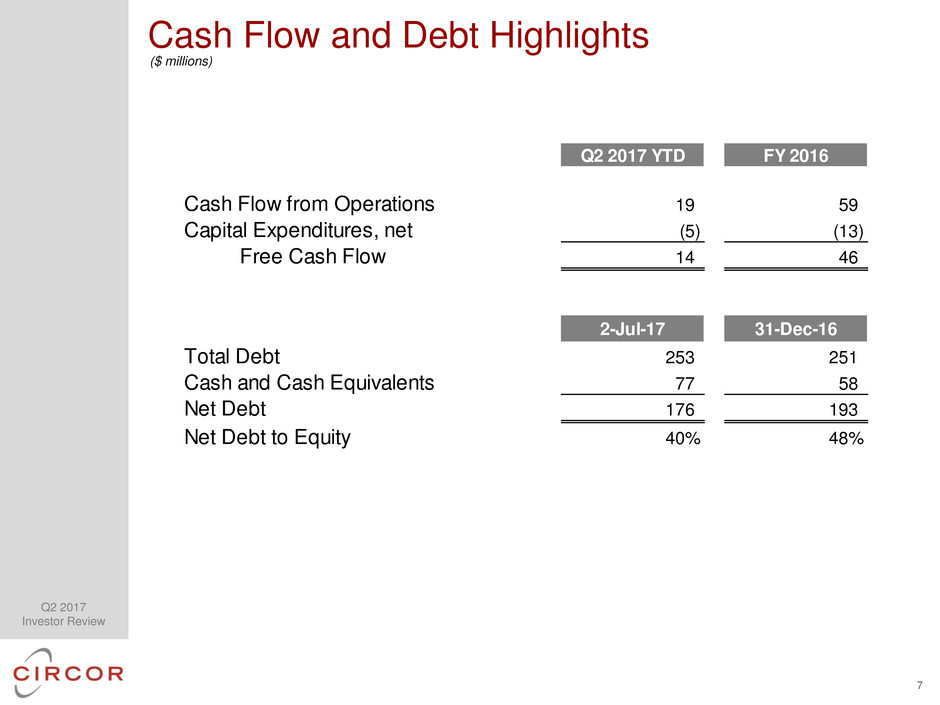
2. | Free Cash Flow is a non-GAAP financial measure and is calculated by subtracting GAAP capital expenditures, net of proceeds from asset sales, from GAAP Operating Cash Flow. |
2
Conference Call Information
CIRCOR International will hold a conference call to review its financial results today, July 28, 2017, at 9:00 a.m. ET. To listen to the conference call and view the accompanying presentation slides, visit “Webcasts & Presentations” in the “Investors” portion of the CIRCOR website. The call also can be accessed by dialing (877) 407-5790 or (201) 689-8328. The webcast will be archived for one year on the Company’s website.
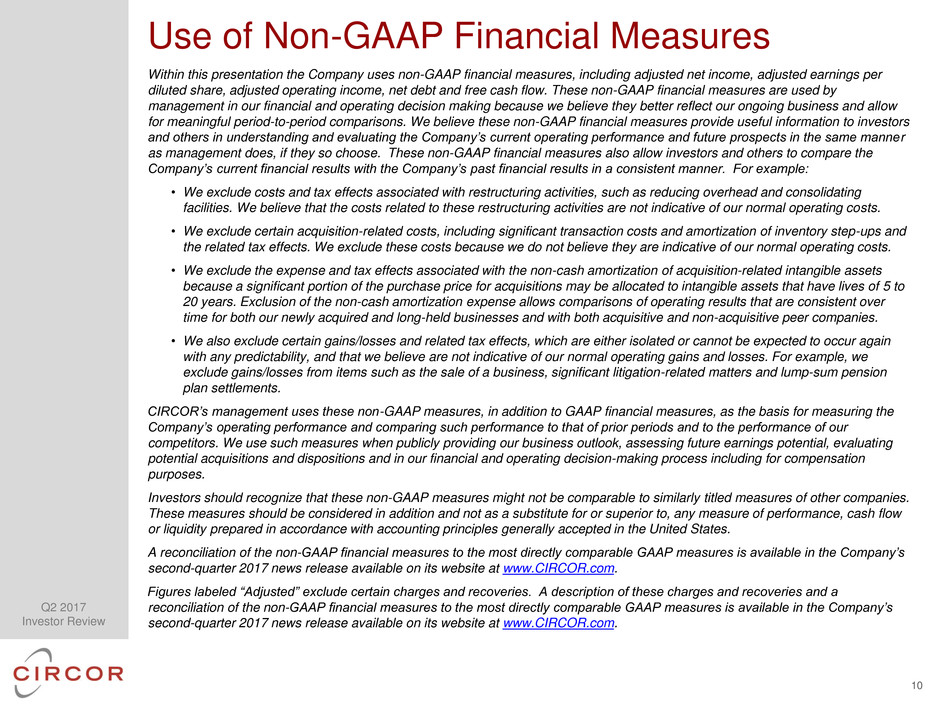
Use of Non-GAAP Financial Measures
Adjusted operating income, Adjusted operating margin, Adjusted net income, Adjusted earnings per share (diluted), EBITDA, Adjusted EBITDA, net debt and free cash flow are non-GAAP financial measures. These non-GAAP financial measures are used by management in our financial and operating decision making because we believe they better reflect our ongoing business and allow for meaningful period-to-period comparisons. We believe these non-GAAP financial measures provide useful information to investors and others in understanding and evaluating the Company’s current operating performance and future prospects in the same manner as management does, if they so choose. These non-GAAP financial measures also allow investors and others to compare the Company’s current financial results with the Company’s past financial results in a consistent manner. For example:
• | We exclude costs and tax effects associated with restructuring activities, such as reducing overhead and consolidating facilities. We believe that the costs related to these restructuring activities are not indicative of our normal operating costs. |
• | We exclude certain acquisition-related costs, including significant transaction costs and amortization of inventory step-ups and the related tax effects. We exclude these costs because we do not believe they are indicative of our normal operating costs. |
• | We exclude the expense and tax effects associated with the non-cash amortization of acquisition-related intangible assets because a significant portion of the purchase price for acquisitions may be allocated to intangible assets that have lives of 5 to 20 years. Exclusion of the non-cash amortization expense allows comparisons of operating results that are consistent over time for both our newly acquired and long-held businesses and with both acquisitive and non-acquisitive peer companies. |
• | We also exclude certain gains/losses and related tax effects, which are either isolated or cannot be expected to occur again with any predictability, and that we believe are not indicative of our normal operating gains and losses. For example, we exclude gains/losses from items such as the sale of a business, significant litigation-related matters and lump-sum pension plan settlements. |
CIRCOR’s management uses these non-GAAP measures, in addition to GAAP financial measures, as the basis for measuring the Company’s operating performance and comparing such performance to that of prior periods and to the performance of our competitors. We use such measures when publicly providing our business outlook, assessing future earnings potential, evaluating potential acquisitions and dispositions and in our financial and operating decision-making process, including for compensation purposes.
Investors should recognize that these non-GAAP measures might not be comparable to similarly titled measures of other companies. These measures should be considered in addition and not as a substitute for or superior to, any measure of performance, cash flow or liquidity prepared in accordance with accounting principles generally accepted in the United States. A reconciliation of the non-GAAP financial measures to the most directly comparable GAAP measures is available in this news release.
3
Safe Harbor Statement
This press release contains forward-looking statements within the meaning of Section 27A of the Securities Act of 1933, as amended, and Section 21E of the Securities Exchange Act of 1934, as amended. Reliance should not be placed on forward-looking statements because they involve unknown risks, uncertainties and other factors, which are, in some cases, beyond the control of CIRCOR. Any statements in this press release that are not statements of historical fact are forward-looking statements, including, but not limited to, those relating to CIRCOR’s future performance, including the realization of cost reductions from restructuring activities. Actual events, performance or results could differ materially from the anticipated events, performance or results expressed or implied by such forward-looking statements. BEFORE MAKING ANY INVESTMENT DECISIONS REGARDING OUR COMPANY, WE STRONGLY ADVISE YOU TO READ THE SECTION ENTITLED "RISK FACTORS" IN OUR MOST RECENT ANNUAL REPORT ON FORM 10-K AND SUBSEQUENT REPORTS ON FORMS 10-Q, WHICH CAN BE ACCESSED UNDER THE "INVESTORS" LINK OF OUR WEBSITE AT WWW.CIRCOR.COM. We undertake no obligation to publicly update or revise any forward-looking statement, whether as a result of new information, future events or otherwise.
About CIRCOR International, Inc.
CIRCOR International, Inc. designs, manufactures and markets flow control solutions and other highly engineered products and sub-systems for markets including oil & gas, aerospace, power, process and industrial solutions. CIRCOR has a diversified product portfolio with recognized, market-leading brands that fulfill its customers’ unique application needs. The Company’s strategy is to grow organically and through complementary acquisitions; simplify CIRCOR’s operations; achieve world class operational excellence; and attract and retain top industry talent. For more information, visit the Company’s investor relations website at http://investors.circor.com.
Contact:
Rajeev Bhalla
Executive Vice President & Chief Financial Officer
CIRCOR International
(781) 270-1200
4
CIRCOR INTERNATIONAL, INC. CONSOLIDATED STATEMENTS OF INCOME (in thousands, except per share data) UNAUDITED | |||||||||||||||
Three Months Ended | Six Months Ended | ||||||||||||||
July 2, 2017 | July 3, 2016 | July 2, 2017 | July 3, 2016 | ||||||||||||
Net revenues | $ | 151,231 | $ | 146,392 | $ | 296,439 | $ | 297,190 | |||||||
Cost of revenues | 103,563 | 99,961 | 202,139 | 205,526 | |||||||||||
GROSS PROFIT | 47,668 | 46,431 | 94,300 | 91,664 | |||||||||||
Selling, general and administrative expenses | 38,218 | 36,490 | 78,305 | 74,289 | |||||||||||
Special and restructuring (recoveries) charges, net | (1,954 | ) | 4,594 | (2,763 | ) | 6,533 | |||||||||
OPERATING INCOME | 11,404 | 5,347 | 18,758 | 10,842 | |||||||||||
Other expense (income): | |||||||||||||||
Interest expense, net | 2,184 | 605 | 3,853 | 1,236 | |||||||||||
Other expense (income), net | 974 | (549 | ) | 1,200 | (1,077 | ) | |||||||||
TOTAL OTHER EXPENSE, NET | 3,158 | 56 | 5,053 | 159 | |||||||||||
INCOME BEFORE INCOME TAXES | 8,246 | 5,291 | 13,705 | 10,683 | |||||||||||
(Benefit from) Provision for income taxes | (724 | ) | 1,478 | (37 | ) | 2,998 | |||||||||
NET INCOME | $ | 8,970 | $ | 3,813 | $ | 13,742 | $ | 7,685 | |||||||
Earnings per common share: | |||||||||||||||
Basic | $ | 0.54 | $ | 0.23 | $ | 0.83 | $ | 0.47 | |||||||
Diluted | $ | 0.54 | $ | 0.23 | $ | 0.82 | $ | 0.46 | |||||||
Weighted average number of common shares outstanding: | |||||||||||||||
Basic | 16,497 | 16,424 | 16,478 | 16,403 | |||||||||||
Diluted | 16,762 | 16,595 | 16,726 | 16,538 | |||||||||||
Dividends declared per common share | $ | 0.0375 | $ | 0.0375 | $ | 0.0750 | $ | 0.0750 | |||||||
5
CIRCOR INTERNATIONAL, INC. CONSOLIDATED STATEMENTS OF CASH FLOWS (in thousands) UNAUDITED | |||||||
Six Months Ended | |||||||
July 2, 2017 | July 3, 2016 | ||||||
OPERATING ACTIVITIES | |||||||
Net income | $ | 13,742 | $ | 7,685 | |||
Adjustments to reconcile net income to net cash provided by operating activities: | |||||||
Depreciation | 7,345 | 6,476 | |||||
Amortization | 6,216 | 5,098 | |||||
Bad debt recovery | (319 | ) | (853 | ) | |||
Loss on write down of inventory | 1,068 | 4,011 | |||||
Compensation expense of share-based plans | 1,386 | 2,909 | |||||
Tax effect of share-based plan compensation | — | 116 | |||||
Change in fair value of contingent consideration | (12,200 | ) | — | ||||
(Gain) Loss on sale or write down of property, plant and equipment | (66 | ) | 3,116 | ||||
Loss on sale of business | 5,300 | — | |||||
Changes in operating assets and liabilities, net of effects of acquisition: | |||||||
Trade accounts receivable | 16,478 | 11,555 | |||||
Inventories | (12,382 | ) | 13,281 | ||||
Prepaid expenses and other assets | (8,011 | ) | (3,480 | ) | |||
Accounts payable, accrued expenses and other liabilities | 305 | (32,161 | ) | ||||
Net cash provided by operating activities | 18,862 | 17,753 | |||||
INVESTING ACTIVITIES | |||||||
Purchases of property, plant and equipment | (5,504 | ) | (6,998 | ) | |||
Proceeds from the sale of property, plant and equipment | 318 | 1,138 | |||||
Business acquisition working capital adjustment | 1,467 | — | |||||
Net cash used in investing activities | (3,719 | ) | (5,860 | ) | |||
FINANCING ACTIVITIES | |||||||
Proceeds from long-term debt | 333,021 | 65,939 | |||||
Payments of long-term debt | (332,233 | ) | (58,890 | ) | |||
Debt issuance costs | (450 | ) | — | ||||
Dividends paid | (1,251 | ) | (1,249 | ) | |||
Proceeds from the exercise of stock options | 707 | 180 | |||||
Tax effect of share-based plan compensation | — | (116 | ) | ||||
Net cash (used in) provided by financing activities | (206 | ) | 5,864 | ||||
Effect of exchange rate changes on cash and cash equivalents | 4,056 | 672 | |||||
INCREASE IN CASH AND CASH EQUIVALENTS | 18,993 | 18,429 | |||||
Cash and cash equivalents at beginning of period | 58,279 | 54,541 | |||||
CASH AND CASH EQUIVALENTS AT END OF PERIOD | $ | 77,272 | $ | 72,970 | |||
6
CIRCOR INTERNATIONAL, INC. CONSOLIDATED BALANCE SHEETS (in thousands) UNAUDITED | |||||||
July 2, 2017 | December 31, 2016 | ||||||
ASSETS | |||||||
CURRENT ASSETS: | |||||||
Cash and cash equivalents | $ | 77,272 | $ | 58,279 | |||
Trade accounts receivable, less allowance for doubtful accounts of $4,761 and $5,056, respectively | 121,161 | 133,046 | |||||
Inventories | 161,750 | 149,584 | |||||
Prepaid expenses and other current assets | 38,285 | 29,557 | |||||
Total Current Assets | 398,468 | 370,466 | |||||
PROPERTY, PLANT AND EQUIPMENT, NET | 98,428 | 99,713 | |||||
OTHER ASSETS: | |||||||
Goodwill | 210,009 | 206,659 | |||||
Intangibles, net | 132,057 | 135,778 | |||||
Other assets | 10,283 | 8,140 | |||||
TOTAL ASSETS | $ | 849,245 | $ | 820,756 | |||
LIABILITIES AND SHAREHOLDERS’ EQUITY | |||||||
CURRENT LIABILITIES: | |||||||
Accounts payable | $ | 63,879 | $ | 46,767 | |||
Accrued expenses and other current liabilities | 45,388 | 50,707 | |||||
Accrued compensation and benefits | 16,593 | 20,249 | |||||
Notes payable and current portion of long-term debt | 5,000 | — | |||||
Total Current Liabilities | 130,860 | 117,723 | |||||
LONG-TERM DEBT | 247,856 | 251,200 | |||||
DEFERRED INCOME TAXES | 10,731 | 13,657 | |||||
OTHER NON-CURRENT LIABILITIES | 21,701 | 33,766 | |||||
SHAREHOLDERS’ EQUITY: | |||||||
Common stock | 179 | 178 | |||||
Additional paid-in capital | 292,619 | 289,423 | |||||
Retained earnings | 277,451 | 265,543 | |||||
Common treasury stock, at cost | (74,472 | ) | (74,472 | ) | |||
Accumulated other comprehensive loss, net of tax | (57,680 | ) | (76,262 | ) | |||
Total Shareholders’ Equity | 438,097 | 404,410 | |||||
TOTAL LIABILITIES AND SHAREHOLDERS’ EQUITY | $ | 849,245 | $ | 820,756 | |||
7
CIRCOR INTERNATIONAL, INC. SUMMARY OF ORDERS AND BACKLOG (in millions) UNAUDITED | ||||||||||||||
Three Months Ended | Six Months Ended | |||||||||||||
July 2, 2017 | July 3, 2016 | July 2, 2017 | July 3, 2016 | |||||||||||
ORDERS (1) | ||||||||||||||
Energy | $ | 77.9 | $ | 58.9 | $ | 181.7 | $ | 130.2 | ||||||
Advanced Flow Solutions | 65.1 | 76.5 | 145.3 | 141.8 | ||||||||||
Total orders | $ | 142.9 | $ | 135.3 | $ | 327.0 | $ | 272.0 | ||||||
BACKLOG (2) | July 2, 2017 | July 3, 2016 | ||||||||||||
Energy | $ | 143.9 | $ | 98.1 | ||||||||||
Advanced Flow Solutions | 135.7 | 146.0 | ||||||||||||
Total backlog | $ | 279.6 | $ | 244.1 | ||||||||||
Note 1: Orders do not include the foreign exchange impact due to the re-measurement of customer order backlog amounts denominated in foreign currencies. | ||||||||||||||
Note 2: Backlog includes unshipped customer orders, including backlog associated with acquisitions. | ||||||||||||||
8
CIRCOR INTERNATIONAL, INC. SEGMENT INFORMATION (in thousands, except percentages) UNAUDITED | ||||||||||||||||||||||||
2016 | 2017 | |||||||||||||||||||||||
1ST QTR | 2ND QTR | 3RD QTR | 4TH QTR | TOTAL | 1ST QTR | 2ND QTR | TOTAL | |||||||||||||||||
NET REVENUES | ||||||||||||||||||||||||
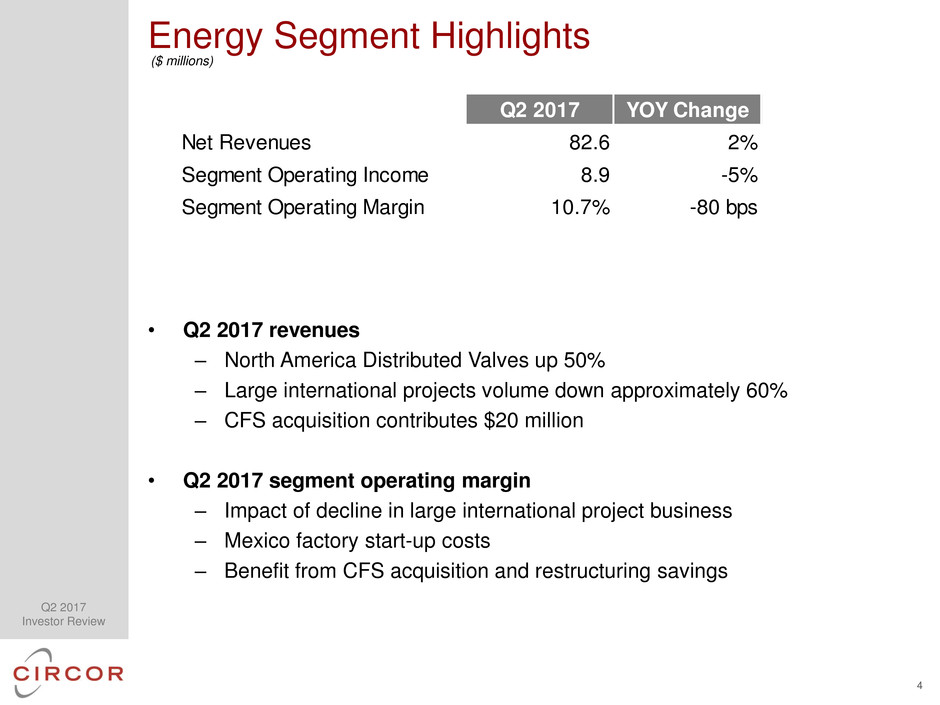
Energy | $ | 83,409 | $ | 80,736 | $ | 68,901 | $ | 89,000 | $ | 322,046 | $ | 80,135 | $ | 82,586 | $ | 162,721 | ||||||||
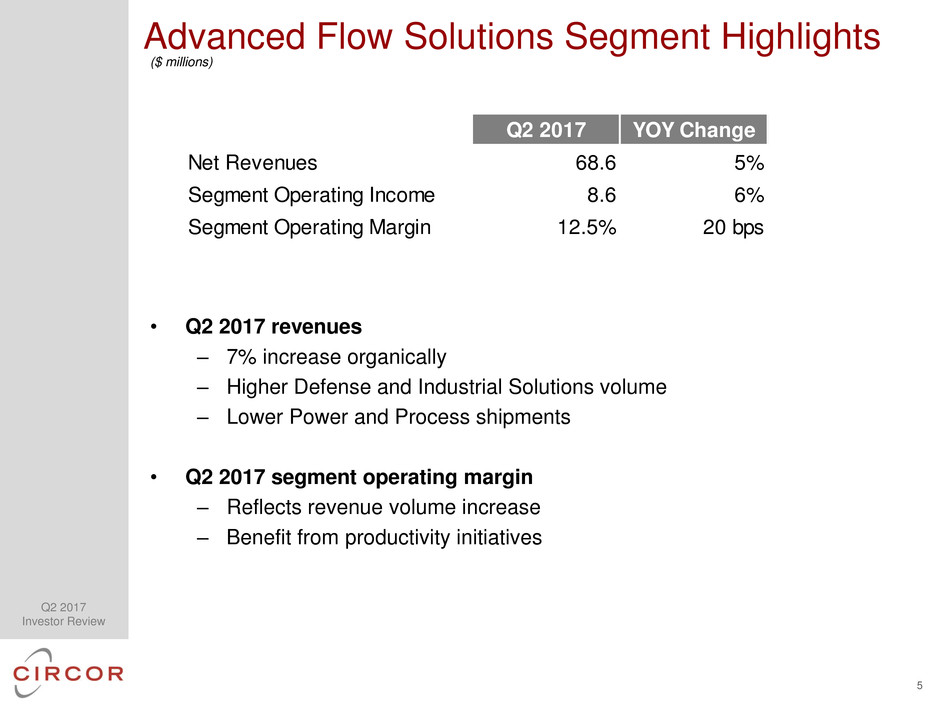
Advanced Flow Solutions | 67,389 | 65,656 | 65,932 | 69,236 | 268,213 | 65,073 | 68,645 | $ | 133,718 | |||||||||||||||
Total | $ | 150,798 | $ | 146,392 | $ | 134,833 | $ | 158,236 | $ | 590,259 | $ | 145,208 | $ | 151,231 | $ | 296,439 | ||||||||
SEGMENT OPERATING INCOME | ||||||||||||||||||||||||
Energy | $ | 9,296 | $ | 9,293 | $ | 6,755 | $ | 9,276 | $ | 34,619 | $ | 6,864 | $ | 8,858 | $ | 15,722 | ||||||||
Advanced Flow Solutions | 8,452 | 8,064 | 8,008 | 8,939 | 33,463 | 7,711 | 8,587 | 16,298 | ||||||||||||||||
Corporate expenses | (6,488 | ) | (5,431 | ) | (6,522 | ) | (7,231 | ) | (25,672 | ) | (5,479 | ) | (5,396 | ) | (10,875 | ) | ||||||||
Adjusted Operating Income | $ | 11,260 | $ | 11,926 | $ | 8,240 | $ | 10,984 | $ | 42,410 | $ | 9,096 | $ | 12,049 | $ | 21,145 | ||||||||
SEGMENT OPERATING MARGIN % | ||||||||||||||||||||||||
Energy | 11.1 | % | 11.5 | % | 9.8 | % | 10.4 | % | 10.7 | % | 8.6 | % | 10.7 | % | 9.7 | % | ||||||||
Advanced Flow Solutions | 12.5 | % | 12.3 | % | 12.1 | % | 12.9 | % | 12.5 | % | 11.8 | % | 12.5 | % | 12.2 | % | ||||||||
Adjusted Operating Margin | 7.5 | % | 8.1 | % | 6.1 | % | 6.9 | % | 7.2 | % | 6.3 | % | 8.0 | % | 7.1 | % | ||||||||
9
CIRCOR INTERNATIONAL, INC. RECONCILIATION OF KEY PERFORMANCE MEASURES TO COMMONLY USED GENERALLY ACCEPTED ACCOUNTING PRINCIPLE TERMS (in thousands, except percentages) UNAUDITED | ||||||||||||||||||||||||
2016 | 2017 | |||||||||||||||||||||||
1ST QTR | 2ND QTR | 3RD QTR | 4TH QTR | TOTAL | 1ST QTR | 2ND QTR | TOTAL | |||||||||||||||||
NET CASH PROVIDED BY OPERATING ACTIVITIES | $ | 7,654 | $ | 10,100 | $ | 21,196 | $ | 20,449 | $ | 59,399 | $ | 16,195 | $ | 2,667 | $ | 18,862 | ||||||||
LESS: | ||||||||||||||||||||||||
Capital expenditures, net of sale proceeds | 3,934 | 1,926 | 3,730 | 3,402 | 12,992 | 2,811 | 2,375 | 5,186 | ||||||||||||||||
FREE CASH FLOW | $ | 3,720 | $ | 8,174 | $ | 17,466 | $ | 17,047 | $ | 46,407 | $ | 13,384 | $ | 292 | $ | 13,676 | ||||||||
TOTAL DEBT | $ | 97,800 | $ | 97,600 | $ | 92,400 | $ | 251,200 | $ | 251,200 | $ | 243,000 | $ | 252,856 | $ | 252,856 | ||||||||
LESS: | ||||||||||||||||||||||||
Cash & cash equivalents | 66,580 | 72,970 | 84,929 | 58,279 | 58,279 | 65,656 | 77,272 | 77,272 | ||||||||||||||||
NET DEBT | $ | 31,220 | $ | 24,630 | $ | 7,471 | $ | 192,921 | $ | 192,921 | $ | 177,344 | $ | 175,584 | $ | 175,584 | ||||||||
TOTAL SHAREHOLDERS' EQUITY | $ | 414,107 | $ | 411,367 | $ | 416,598 | $ | 404,410 | $ | 404,410 | $ | 415,537 | $ | 438,097 | $ | 438,097 | ||||||||
TOTAL DEBT AS % OF EQUITY | 24 | % | 24 | % | 22 | % | 62 | % | 62 | % | 58 | % | 58 | % | 58 | % | ||||||||
NET DEBT AS % OF EQUITY | 8 | % | 6 | % | 2 | % | 48 | % | 48 | % | 43 | % | 40 | % | 40 | % | ||||||||
10
CIRCOR INTERNATIONAL, INC. RECONCILIATION OF KEY PERFORMANCE MEASURES TO COMMONLY USED GENERALLY ACCEPTED ACCOUNTING PRINCIPLE TERMS (in thousands, except per share data) UNAUDITED | ||||||||||||||||||||||||
2016 | 2017 | |||||||||||||||||||||||
1ST QTR | 2ND QTR | 3RD QTR | 4TH QTR | TOTAL | 1ST QTR | 2ND QTR | TOTAL | |||||||||||||||||
NET INCOME (LOSS) | $ | 3,872 | $ | 3,813 | $ | 4,418 | $ | (2,002 | ) | $ | 10,101 | $ | 4,773 | $ | 8,970 | $ | 13,742 | |||||||
LESS: | ||||||||||||||||||||||||
Restructuring related inventory charges | 1,958 | 75 | — | 813 | 2,846 | — | — | — | ||||||||||||||||
Amortization of inventory step-up | — | — | — | 1,366 | 1,366 | — | — | — | ||||||||||||||||
Impairment charges | — | — | 208 | — | 208 | — | — | — | ||||||||||||||||
Restructuring charges, net | 1,163 | 3,259 | 2,252 | 2,301 | 8,975 | 1,458 | 3,566 | 5,025 | ||||||||||||||||
Acquisition amortization | 1,868 | 1,911 | 1,888 | 4,234 | 9,901 | 2,552 | 2,599 | 5,151 | ||||||||||||||||
Special charges (recoveries), net | 776 | 1,334 | 379 | 5,707 | 8,196 | (2,268 | ) | (5,520 | ) | (7,788 | ) | |||||||||||||
Income tax impact | (954 | ) | (1,611 | ) | (1,519 | ) | (4,487 | ) | (8,571 | ) | (1,137 | ) | (3,124 | ) | (4,261 | ) | ||||||||
ADJUSTED NET INCOME | $ | 8,683 | $ | 8,781 | $ | 7,626 | $ | 7,932 | $ | 33,022 | $ | 5,378 | $ | 6,491 | $ | 11,869 | ||||||||
EARNINGS (LOSS) PER COMMON SHARE (Diluted) | $ | 0.23 | $ | 0.23 | $ | 0.27 | $ | (0.12 | ) | $ | 0.61 | $ | 0.29 | $ | 0.54 | $ | 0.82 | |||||||
LESS: | ||||||||||||||||||||||||
Restructuring related inventory charges | 0.12 | — | — | 0.05 | 0.17 | — | — | — | ||||||||||||||||
Amortization of inventory step-up | — | — | — | 0.08 | 0.08 | — | — | — | ||||||||||||||||
Impairment charges | — | — | 0.01 | — | 0.01 | — | — | — | ||||||||||||||||
Restructuring charges, net | 0.07 | 0.20 | 0.14 | 0.14 | 0.54 | 0.09 | 0.21 | 0.30 | ||||||||||||||||
Acquisition amortization | 0.11 | 0.12 | 0.11 | 0.26 | 0.60 | 0.15 | 0.16 | 0.31 | ||||||||||||||||
Special charges (recoveries), net | 0.05 | 0.08 | 0.02 | 0.35 | 0.50 | (0.14 | ) | (0.33 | ) | (0.47 | ) | |||||||||||||
Income tax impact | (0.06 | ) | (0.10 | ) | (0.09 | ) | (0.27 | ) | (0.52 | ) | (0.07 | ) | (0.19 | ) | (0.25 | ) | ||||||||
ADJUSTED EARNINGS PER SHARE (Diluted) | $ | 0.52 | $ | 0.53 | $ | 0.46 | $ | 0.48 | $ | 1.99 | $ | 0.32 | $ | 0.39 | $ | 0.71 | ||||||||
11
CIRCOR INTERNATIONAL, INC. RECONCILIATION OF KEY PERFORMANCE MEASURES TO COMMONLY USED GENERALLY ACCEPTED ACCOUNTING PRINCIPLE TERMS (in thousands) UNAUDITED | ||||||||||||||||||||||||
2016 | 2017 | |||||||||||||||||||||||
1ST QTR | 2ND QTR | 3RD QTR | 4TH QTR | TOTAL | 1ST QTR | 2ND QTR | TOTAL | |||||||||||||||||
NET INCOME (LOSS) | $ | 3,872 | $ | 3,813 | $ | 4,418 | $ | (2,002 | ) | $ | 10,101 | $ | 4,773 | $ | 8,970 | $ | 13,742 | |||||||
LESS: | ||||||||||||||||||||||||
Interest expense, net | (631 | ) | (605 | ) | (605 | ) | (1,468 | ) | (3,310 | ) | (1,669 | ) | (2,184 | ) | (3,853 | ) | ||||||||
Depreciation | (3,263 | ) | (3,213 | ) | (3,138 | ) | (3,690 | ) | (13,304 | ) | (3,798 | ) | (3,547 | ) | (7,345 | ) | ||||||||
Amortization | (2,529 | ) | (2,569 | ) | (2,488 | ) | (4,730 | ) | (12,316 | ) | (3,092 | ) | (3,124 | ) | (6,216 | ) | ||||||||
(Provision for) benefit from income taxes | (1,520 | ) | (1,478 | ) | 1,673 | 1,746 | 421 | (687 | ) | 724 | 37 | |||||||||||||
EBITDA | $ | 11,815 | $ | 11,678 | $ | 8,976 | $ | 6,140 | $ | 38,610 | $ | 14,019 | $ | 17,101 | $ | 31,119 | ||||||||
LESS: | ||||||||||||||||||||||||
Restructuring related inventory charges | (1,958 | ) | (75 | ) | — | (813 | ) | (2,846 | ) | — | — | — | ||||||||||||
Amortization of inventory step-up | — | — | — | (1,366 | ) | (1,366 | ) | — | — | — | ||||||||||||||
Impairment charges | — | — | (208 | ) | — | (208 | ) | — | — | — | ||||||||||||||
Restructuring charges, net | (1,163 | ) | (3,259 | ) | (2,252 | ) | (2,301 | ) | (8,975 | ) | (1,458 | ) | (3,566 | ) | (5,025 | ) | ||||||||
Special (charges) recoveries, net | (776 | ) | (1,334 | ) | (379 | ) | (5,707 | ) | (8,196 | ) | 2,268 | 5,520 | 7,788 | |||||||||||
ADJUSTED EBITDA | $ | 15,712 | $ | 16,346 | $ | 11,815 | $ | 16,327 | $ | 60,201 | $ | 13,209 | $ | 15,147 | $ | 28,356 | ||||||||
12
CIRCOR INTERNATIONAL, INC. RECONCILIATION OF KEY PERFORMANCE MEASURES TO COMMONLY USED GENERALLY ACCEPTED ACCOUNTING PRINCIPLE TERMS (in thousands, except percentages) UNAUDITED | ||||||||||||||||||||||||
2016 | 2017 | |||||||||||||||||||||||
1ST QTR | 2ND QTR | 3RD QTR | 4TH QTR | TOTAL | 1ST QTR | 2ND QTR | TOTAL | |||||||||||||||||
GAAP OPERATING INCOME (LOSS) | $ | 5,495 | $ | 5,347 | $ | 3,513 | $ | (3,437 | ) | $ | 10,918 | $ | 7,354 | $ | 11,404 | $ | 18,758 | |||||||
LESS: | ||||||||||||||||||||||||
Restructuring related inventory charges | 1,958 | 75 | — | 813 | 2,846 | — | — | — | ||||||||||||||||
Amortization of inventory step-up | — | — | — | 1,366 | 1,366 | — | — | — | ||||||||||||||||
Impairment charges | — | — | 208 | — | 208 | — | — | — | ||||||||||||||||
Restructuring charges, net | 1,163 | 3,259 | 2,252 | 2,301 | 8,975 | 1,458 | 3,566 | 5,025 | ||||||||||||||||
Acquisition amortization | 1,868 | 1,911 | 1,888 | 4,234 | 9,901 | 2,552 | 2,599 | 5,151 | ||||||||||||||||
Special charges (recoveries), net | 776 | 1,334 | 379 | 5,707 | 8,196 | (2,268 | ) | (5,520 | ) | (7,788 | ) | |||||||||||||
ADJUSTED OPERATING INCOME | $ | 11,260 | $ | 11,926 | $ | 8,240 | $ | 10,984 | $ | 42,410 | $ | 9,096 | $ | 12,049 | $ | 21,145 | ||||||||
GAAP OPERATING MARGIN | 3.6 | % | 3.7 | % | 2.6 | % | (2.2 | )% | 1.8 | % | 5.1 | % | 7.5 | % | 6.3 | % | ||||||||
LESS: | ||||||||||||||||||||||||
Restructuring related inventory charges | 1.3 | % | 0.1 | % | —% | 0.5 | % | 0.5 | % | — | % | — | % | — | % | |||||||||
Amortization of inventory step-up | —% | —% | —% | 0.9 | % | 0.2 | % | — | % | — | % | — | % | |||||||||||
Impairment charges | —% | —% | 0.2 | % | — | % | — | % | — | % | — | % | — | % | ||||||||||
Restructuring charges, net | 0.8 | % | 2.2 | % | 1.7 | % | 1.5 | % | 1.5 | % | 1.0 | % | 2.4 | % | 1.7 | % | ||||||||
Acquisition amortization | 1.2 | % | 1.3 | % | 1.4 | % | 2.7 | % | 1.7 | % | 1.8 | % | 1.7 | % | 1.7 | % | ||||||||
Special charges (recoveries), net | 0.5 | % | 0.9 | % | 0.3 | % | 3.6 | % | 1.4 | % | (1.6 | )% | (3.7 | )% | (2.6 | )% | ||||||||
ADJUSTED OPERATING MARGIN | 7.5 | % | 8.1 | % | 6.1 | % | 6.9 | % | 7.2 | % | 6.3 | % | 8.0 | % | 7.1 | % | ||||||||
13