
UNITED STATES SECURITIES AND EXCHANGE COMMISSION
Washington, D.C. 20549
Form
(Mark One)
For the fiscal year ended
or
For the transition period from _______ to _______
Commission File Number
(Exact name of registrant as specified in its charter)
|
|
|
||
|
(State or other jurisdiction of incorporation or organization) |
|
(I.R.S. Employer Identification No.) |
|
|
|
|
||
|
(Address of principal executive offices) |
|
(Zip Code) |
|
Registrant’s telephone number, including area code: (
Securities registered pursuant to Section 12(b) of the Act:
Title of each class |
Trading Symbol(s) |
Name of each exchange on which registered |
Securities registered pursuant to Section 12(g) of the Act: None
Indicate by check mark if the registrant is a well-known seasoned issuer, as defined in Rule 405 of the Securities Act.
Indicate by check mark if the registrant is not required to file reports pursuant to Section 13 or Section 15(d) of the Act. Yes ☐
Indicate by check mark whether the registrant (1) has filed all reports required to be filed by Section 13 or 15(d) of the Securities Exchange Act of 1934 during the preceding 12 months (or for such shorter period that the registrant was required to file such reports), and (2) has been subject to such filing requirements for the past 90 days.
Indicate by check mark whether the registrant has submitted electronically every Interactive Data File required to be submitted pursuant to Rule 405 of Regulation S-T (§232.405 of this chapter) during the preceding 12 months (or for such shorter period that the registrant was required to submit such files).
Indicate by check mark whether the registrant is a large accelerated filer, an accelerated filer, a non-accelerated filer, a smaller reporting company, or an emerging growth company. See the definitions of “large accelerated filer,” “accelerated filer,” “smaller reporting company,” and “emerging growth company” in Rule 12b-2 of the Exchange Act.
☑ |
|
|
Accelerated filer |
☐ |
|
Non-accelerated filer |
☐ |
|
|
Smaller reporting company |
|
|
|
|
|
Emerging growth company |
If an emerging growth company, indicate by check mark if the registrant has elected not to use the extended transition period for complying with any new or revised financial accounting standards provided pursuant to Section 13(a) of the Exchange Act. ☐
Indicate by check mark whether the registrant has filed a report on and attestation to its management’s assessment of the effectiveness of its internal control over financial reporting under Section 404(b) of the Sarbanes-Oxley Act (15 U.S.C. 7262(b)) by the registered public accounting firm that prepared or issued its audit report.
If securities are registered pursuant to Section 12(b) of the Act, indicate by check mark whether the financial statements of the registrant included in the filing reflect the correction of an error to previously issued financial statements.
Indicate by check mark whether any of those error corrections are restatements that required a recovery analysis of incentive-based compensation received by any of the registrant’s executive officers during the relevant recovery period pursuant to §240.10D-1(b). ☐
Indicate by check mark whether the registrant is a shell company (as defined in Rule 12b-2 of the Act). Yes
The aggregate market value of the common shares (the only common equity of the registrant) held by non-affiliates of the registrant, based on the closing price of the common shares on the New York Stock Exchange on November 30, 2023, the last business day of the registrant’s most recently completed second fiscal quarter, was $
The number of common shares (the only common equity of the registrant) outstanding, as of July 24, 2024, was
DOCUMENTS INCORPORATED BY REFERENCE:
Selected portions of the registrant’s definitive Proxy Statement for its Annual Meeting of Shareholders to be held on September 24, 2024, are incorporated by reference into Part III of this Form 10-K to the extent provided herein.
TABLE OF CONTENTS
|
|
||
ii |
|||
iv |
|||
vi |
|||
|
|
|
|
Item 1. |
|
1 |
|
Item 1A. |
|
7 |
|
Item 1B. |
|
18 |
|
Item 1C. |
|
19 |
|
Item 2. |
|
20 |
|
Item 3. |
|
20 |
|
Item 4. |
|
20 |
|
Supplemental Item. |
|
21 |
|
|
|
|
|
Item 5. |
|
22 |
|
Item 6. |
|
24 |
|
Item 7. |
|
Management’s Discussion and Analysis of Financial Condition and Results of Operations |
25 |
Item 7A. |
|
39 |
|
Item 8. |
|
41 |
|
Item 9. |
|
Changes in and Disagreements With Accountants on Accounting and Financial Disclosure |
88 |
Item 9A. |
|
88 |
|
Item 9B. |
|
92 |
|
Item 9C. |
|
Disclosure Regarding Foreign Jurisdictions that Prevent Inspections |
92 |
|
|
|
|
Item 10. |
|
93 |
|
Item 11. |
|
93 |
|
Item 12. |
|
Security Ownership of Certain Beneficial Owners and Management and Related Stockholder Matters |
93 |
Item 13. |
|
Certain Relationships and Related Transactions, and Director Independence |
93 |
Item 14. |
|
93 |
|
|
|
|
|
Item 15. |
|
94 |
|
Item 16. |
|
94 |
|
105 |
|||
i
DEFINED TERMS
References in this Form 10-K to “we,” “our,” “us” or the “Company” are collectively to Worthington Enterprises and its consolidated subsidiaries. In addition, the following terms, when used in this Form 10-K, have the meanings set forth below:
Term |
|
Definition |
ABI |
|
Architecture Billings Index |
AICPA |
|
American Institute of Certified Public Accountants |
AOCI |
|
Accumulated other comprehensive (income) loss |
ArtiFlex |
|
ArtiFlex Manufacturing, LLC |
ASU |
|
Accounting Standards Update |
Board |
|
Board of Directors of Worthington Enterprises |
CARES Act |
|
Coronavirus Aid, Relief and Economic Security Act |
ClarkDietrich |
|
Clarkwestern Dietrich Building Systems LLC |
CIO |
|
Chief Information Officer |
CISO |
|
Chief Information Security Officer |
Code |
|
Internal Revenue Code of 1986, as amended |
CODM |
|
Chief Operating Decision Maker |
common shares |
|
The common shares, no par value, of Worthington Enterprises |
Council |
|
Our Diversity, Equity and Inclusion Council |
COVID-19 |
|
The novel coronavirus disease first known to originate in December 2019 |
Credit Facility |
|
Our $500,000,000 unsecured revolving credit facility with a group of lenders maturing on September 27, 2028 |
Distribution |
|
The pro-rata distribution of all outstanding shares of Worthington Steel whereby each holder of record of Worthington Enterprises common shares received one common share of Worthington Steel for every one common share of Worthington Enterprises held as of the Record Date. |
EPS |
|
Earnings per common share |
Equity income |
|
Equity in net income of unconsolidated affiliates |
ERGs |
|
Employee Resource Groups |
Exchange Act |
|
Securities Exchange Act of 1934, as amended |
FASB |
|
Financial Accounting Standards Board |
Form 10-K |
|
Our Annual Report on Form 10-K for fiscal 2024 |
fiscal 2022 |
|
Our fiscal year ended May 31, 2022 |
fiscal 2023 |
|
Our fiscal year ended May 31, 2023 |
fiscal 2024 |
|
Our fiscal year ended May 31, 2024 |
fiscal 2025 |
|
Our fiscal year ending May 31, 2025 |
GAAP |
|
U.S. generally accepted accounting principles |
GDP |
|
Gross domestic product |
GDPR |
|
General Data Protection Regulation of the European Union |
Gerstenslager Plan |
|
The Gerstenslager Company Bargaining Unit Employees’ Pension Plan |
Halo |
|
WH Products, LLC |
Hexagon |
|
Hexagon Composites ASA |
HPG |
|
Halo Products Group, LLC |
HMI |
|
The National Association of Home Builders/Wells Fargo Housing Market Index |
IRS |
|
U.S. Internal Revenue Service |
LPG |
|
Liquified Petroleum Gas |
MD&A |
|
Management’s Discussion and Analysis of Financial Condition and Results of Operations |
New Senior Notes |
|
Collectively, the New Series A Senior Note and the New Series B Senior Notes |
New Series A Senior Note |
|
The senior unsecured note issued by Worthington Enterprises on August 23, 2019, in the principal amount of €36,700,000 that bears interest at a rate of 2.06% and are scheduled to be repaid on August 23, 2031. |
New Series B Senior Note |
|
The senior unsecured notes issued by Worthington Enterprises on August 23, 2019, in the principal amount of €55,000,000 that bears interest at a rate of 2.40% and are scheduled to be repaid on August 23, 2034. |
NYSE |
|
New York Stock Exchange |
OCI |
|
Other comprehensive income (loss) |
Original Senior Notes |
|
Collectively, the Original Series A Senior Note and the Original Series B Senior Notes |
Original Series A Senior Note |
|
The senior unsecured note issued by one of our European subsidiaries on August 23, 2019, in the principal amount of €36,700,000, which had an interest rate of 1.56% and was set to mature on August 23, 2031. |
Original Series B Senior Notes |
|
The senior unsecured notes issued by one of our European subsidiaries on August 23, 2019, in the principal amount of €55,000,000, which had an interest rate of 1.90% and was set to mature on August 23, 2034. |
OSHA |
|
U.S. Occupational Safety and Health Administration |
PSLRA |
|
Private Securities Litigation Reform Act of 1995, as amended |
ii
Term |
|
Definition |
Record Date |
|
Close of business on November 21, 2023 |
Ragasco |
|
Hexagon Ragasco AS |
ROU |
|
Right of use |
Samuel |
|
Worthington Samuel Coil Processing LLC |
SEC |
|
U.S. Securities and Exchange Commission |
Securities Act |
|
Securities Act of 1933, as amended |
Separation |
|
The separation of our steel processing business, effective December 1, 2023 |
Serviacero |
|
Serviacero Planos, S. de R. L. de C.V. |
SG&A |
|
Selling, general and administrative expenses |
Simple SOFR |
|
Simple Secured Overnight Financing Rate |
Spartan |
|
Spartan Steel Coating, L.L.C. |
Topic 606 |
|
ASU 2014-09, Revenue from Contracts with Customers |
TWB |
|
TWB Company, L.L.C. |
U.S. |
|
United States of America |
Voestalpine |
|
Voestalpine Automotive Components Nagold GmbH & Co. KG |
WAVE |
|
Worthington Armstrong Venture |
Workhorse |
|
Taxi Workhorse Holdings, LLC |
Worthington Steel |
|
Worthington Steel, Inc. |
Worthington Enterprises |
|
Worthington Enterprises, Inc. (formerly known as Worthington Industries, Inc.) |
Worthington Steel Credit Facility |
|
Worthington Steel’s $550,000,000 senior secured revolving credit facility with a group of lenders |
WSP |
|
Worthington Specialty Processing |
2024 Annual Meeting |
|
The Annual Meeting of Shareholders of Worthington Enterprises to be held on September 24, 2024 |
2024 Proxy Statement |
|
The definitive Proxy Statement of Worthington Enterprises relating to the 2024 Annual Meeting |
2024 Notes |
|
The senior unsecured notes that we issued on August 10, 2012, in the principal amount of $150,000,000, which bore interest at a rate of 4.60%, were set to mature on August 10, 2024, and were paid in full on December 6, 2023. |
2026 Notes |
|
The senior unsecured notes that we issued on April 15, 2014, in the principal amount of $250,000,000, which bore interest at a rate of 4.55%, were scheduled to mature on April 15, 2026, and were paid in full on July 28, 2023. |
2032 Notes |
|
The senior unsecured notes that were issued on July 28, 2017, in the principal amount of $200,000,000, which bear an interest rate of 4.30% and are scheduled to mature on July 28, 2032. |
iii
CAUTIONARY NOTE REGARDING FORWARD-LOOKING STATEMENTS
Selected statements contained in this Form 10-K, including, without limitation, in MD&A, constitute “forward-looking statements,” as that term is used in the PSLRA. We wish to take advantage of the safe harbor provisions included in the PSLRA. Forward-looking statements reflect our current expectations, estimates or projections concerning future results or events. These statements are often identified by the use of forward-looking words or phrases such as “believe,” “expect,” “anticipate,” “may,” “could,” “should,” “would,” “intend,” “plan,” “will,” “likely,” “estimate,” “project,” “position,” “strategy,” “target,” “aim,” “seek,” “foresee” and similar words or phrases. These forward-looking statements include, without limitation, statements relating to:
Because they are based on beliefs, estimates and assumptions, forward-looking statements are inherently subject to risks and uncertainties that could cause actual results to differ materially from those projected. Any number of factors could affect actual results, including, without limitation, those that follow:
iv
We note these risk factors for investors as contemplated by the PSLRA. Forward-looking statements should be construed in the light of such risks. It is impossible to predict or identify all potential risk factors. Consequently, readers should not consider the foregoing list to be a complete set of all potential risks and uncertainties. Readers are cautioned not to place undue reliance on any forward-looking statements, which speak only as of the date made. We do not undertake, and hereby disclaim, any obligation to update any forward-looking statements, whether as a result of new information, future developments or otherwise, except as required by applicable law.
v
USE OF NON-GAAP FINANCIAL MEASURES
(in thousands)
Non-GAAP Financial Measures
This Form 10-K includes references to certain financial measures that are not calculated or presented in accordance with GAAP. Non-GAAP financial measures typically exclude items that management believes are not reflective of, and thus should not be included when evaluating the performance of our ongoing operations. Management uses these non-GAAP financial measures to evaluate our performance, engage in financial and operational planning, and determine incentive compensation. Management believes these non-GAAP measures provide useful supplemental information and additional perspective on the performance of our ongoing operations and should not be considered an alternative to the comparable GAAP financial measure. Additionally, management believes these non-GAAP financial measures allow for meaningful comparisons and analysis of trends in our business and enable investors to evaluate our operations and future prospects in the same manner as management.
The following provides an explanation of each non-GAAP financial measure presented in this Form 10-K:
Adjusted operating income (loss) is defined as operating income (loss) excluding the items listed below, and in the accompanying reconciliations to comparable GAAP measures, to the extent naturally included in operating income.
Adjusted net earnings from continuing operations is defined as net earnings from continuing operations attributable to controlling interest (“net earnings from continuing operations”) excluding the after-tax effect of the excluded items listed below and in the accompanying reconciliations to comparable GAAP measures.
Adjusted earnings per diluted share from continuing operations (“Adjusted EPS from continuing operations - diluted”) is defined as adjusted net earnings from continuing operations attributable to controlling interest divided by diluted weighted-average shares outstanding.
Adjusted EBITDA from continuing operations is defined as adjusted earnings before interest, taxes, depreciation, and amortization. Adjusted EBITDA is calculated by adding or subtracting, as appropriate, interest expense, net, income tax expense, depreciation, and amortization to/from net earnings from continuing operations attributable to controlling interest, which is further adjusted to exclude impairment and restructuring charges (gains) as well as other items that management believes are not reflective of, and thus should not be included when evaluating the performance of its ongoing operations, as outlined below. Adjusted EBITDA from continuing operations also excludes stock-based compensation due to its non-cash nature, which is consistent with how management assesses operating performance. At the segment level, adjusted EBITDA from continuing operations includes expense allocations for centralized corporate back-office functions that exist to support the day-to-day business operations. Public company and other governance costs are held at the corporate level.
Exclusions from Non-GAAP Financial Measures
Management believes it is useful to exclude the following items from adjusted EBITDA from continuing operations for its own and investors’ assessment of the business for the reasons identified below:
vi
The following provides a reconciliation of these non-GAAP financial measures from their most comparable GAAP measure for fiscal 2024, fiscal 2023, and fiscal 2022.
|
Fiscal 2024 |
|
|||||||||||||||||||||
|
Operating |
|
|
Earnings |
|
|
Income Tax Expense |
|
|
Net Earnings from Continuing Operations (1) |
|
|
Diluted EPS - Continuing Operations |
|
|
Effective |
|
||||||
GAAP |
$ |
(73,459 |
) |
|
$ |
74,007 |
|
|
$ |
39,027 |
|
|
$ |
35,243 |
|
|
$ |
0.70 |
|
|
|
52.6 |
% |
Corporate costs eliminated at Separation |
|
19,343 |
|
|
|
19,343 |
|
|
|
(4,643 |
) |
|
|
14,700 |
|
|
|
0.29 |
|
|
|
|
|
Impairment of goodwill and long-lived assets |
|
32,975 |
|
|
|
32,975 |
|
|
|
- |
|
|
|
32,975 |
|
|
|
0.65 |
|
|
|
|
|
Restructuring and other expense, net |
|
29,327 |
|
|
|
29,327 |
|
|
|
(4,737 |
) |
|
|
24,590 |
|
|
|
0.49 |
|
|
|
|
|
Separation costs |
|
12,705 |
|
|
|
12,705 |
|
|
|
(3,049 |
) |
|
|
9,656 |
|
|
|
0.19 |
|
|
|
|
|
Non-cash charges in miscellaneous expense |
|
- |
|
|
|
19,180 |
|
|
|
(1,922 |
) |
|
|
17,258 |
|
|
|
0.34 |
|
|
|
|
|
Loss on extinguishment of debt |
|
- |
|
|
|
1,534 |
|
|
|
(368 |
) |
|
|
1,166 |
|
|
|
0.02 |
|
|
|
|
|
Gain on sale of assets in equity income |
|
- |
|
|
|
(2,780 |
) |
|
|
662 |
|
|
|
(2,118 |
) |
|
|
(0.04 |
) |
|
|
|
|
Pension settlement charge in equity income |
|
- |
|
|
|
1,040 |
|
|
|
(244 |
) |
|
|
796 |
|
|
|
0.02 |
|
|
|
|
|
One-time tax effects of Separation |
|
- |
|
|
|
- |
|
|
|
9,197 |
|
|
|
9,197 |
|
|
|
0.18 |
|
|
|
|
|
Non-GAAP |
$ |
20,891 |
|
|
$ |
187,331 |
|
|
$ |
44,131 |
|
|
$ |
143,463 |
|
|
$ |
2.84 |
|
|
|
23.5 |
% |
|
Fiscal 2023 |
|
|||||||||||||||||||||
|
Operating |
|
|
Earnings |
|
|
Income Tax Expense |
|
|
Net Earnings from Continuing Operations (1) |
|
|
Diluted EPS - Continuing Operations |
|
|
Effective |
|
||||||
GAAP |
$ |
29,819 |
|
|
$ |
160,286 |
|
|
$ |
34,535 |
|
|
$ |
125,751 |
|
|
$ |
2.55 |
|
|
|
21.5 |
% |
Corporate costs eliminated at Separation |
|
41,479 |
|
|
|
41,479 |
|
|
|
(9,499 |
) |
|
|
31,980 |
|
|
|
0.65 |
|
|
|
|
|
Impairment of long-lived assets |
|
484 |
|
|
|
484 |
|
|
|
(111 |
) |
|
|
373 |
|
|
|
0.01 |
|
|
|
|
|
Restructuring and other income, net |
|
(367 |
) |
|
|
(367 |
) |
|
|
84 |
|
|
|
(283 |
) |
|
|
(0.01 |
) |
|
|
|
|
Separation costs |
|
6,534 |
|
|
|
6,534 |
|
|
|
(1,496 |
) |
|
|
5,038 |
|
|
|
0.11 |
|
|
|
|
|
Pension settlement charge |
|
- |
|
|
|
4,774 |
|
|
|
(1,093 |
) |
|
|
3,681 |
|
|
|
0.07 |
|
|
|
|
|
Loss on sale of investment in Artiflex |
|
- |
|
|
|
16,059 |
|
|
|
(3,678 |
) |
|
|
12,381 |
|
|
|
0.25 |
|
|
|
|
|
Sale lease-back gain in equity income |
|
- |
|
|
|
(2,063 |
) |
|
|
472 |
|
|
|
(1,591 |
) |
|
|
(0.03 |
) |
|
|
|
|
Non-GAAP |
$ |
77,949 |
|
|
$ |
227,186 |
|
|
$ |
49,856 |
|
|
$ |
177,330 |
|
|
$ |
3.60 |
|
|
|
21.9 |
% |
|
Fiscal 2022 |
|
|||||||||||||||||||||
|
Operating |
|
|
Earnings |
|
|
Income Tax Expense |
|
|
Net Earnings from Continuing Operations (1) |
|
|
Diluted EPS - Continuing Operations |
|
|
Effective |
|
||||||
GAAP |
$ |
48,794 |
|
|
$ |
210,649 |
|
|
$ |
52,701 |
|
|
$ |
157,948 |
|
|
$ |
3.10 |
|
|
|
25.0 |
% |
Corporate costs eliminated at Separation |
|
48,020 |
|
|
|
48,020 |
|
|
|
(11,169 |
) |
|
|
36,851 |
|
|
|
0.72 |
|
|
|
|
|
Restructuring and other income, net |
|
(2,616 |
) |
|
|
(2,616 |
) |
|
|
608 |
|
|
|
(2,008 |
) |
|
|
(0.04 |
) |
|
|
|
|
Non-GAAP |
$ |
94,198 |
|
|
$ |
256,053 |
|
|
$ |
63,262 |
|
|
$ |
192,791 |
|
|
$ |
3.78 |
|
|
|
24.7 |
% |
|
vii
The following table presents a reconciliation from earnings before income taxes to adjusted EBITDA from continuing operations for the past three fiscal years:
|
|
2024 |
|
|
2023 |
|
|
2022 |
|
|||
Earnings before income taxes (EBIT) |
|
$ |
74,007 |
|
|
$ |
160,286 |
|
|
$ |
210,649 |
|
Less: net loss attributable to noncontrolling interest |
|
|
(263 |
) |
|
|
- |
|
|
|
- |
|
Net earnings before income taxes attributable to controlling interest |
|
|
74,270 |
|
|
|
160,286 |
|
|
|
210,649 |
|
Interest expense, net |
|
|
1,587 |
|
|
|
18,298 |
|
|
|
23,852 |
|
EBIT (subtotal) |
|
|
75,857 |
|
|
|
178,584 |
|
|
|
234,501 |
|
Corporate costs eliminated at Separation (1) |
|
|
19,343 |
|
|
|
41,479 |
|
|
|
48,020 |
|
Impairment of goodwill and long-lived assets |
|
|
32,975 |
|
|
|
484 |
|
|
|
- |
|
Restructuring and other expense (income), net |
|
|
29,327 |
|
|
|
(367 |
) |
|
|
(2,616 |
) |
Separation costs |
|
|
12,705 |
|
|
|
6,534 |
|
|
|
- |
|
Non-cash charges in miscellaneous expense (2) |
|
|
19,180 |
|
|
|
4,774 |
|
|
|
- |
|
Loss on investment in ArtiFlex (3) |
|
|
- |
|
|
|
16,059 |
|
|
|
- |
|
Loss on extinguishment of debt (4) |
|
|
1,534 |
|
|
|
- |
|
|
|
- |
|
Net gain on sale of assets in equity income (5) |
|
|
(2,780 |
) |
|
|
(2,063 |
) |
|
|
- |
|
Pension settlement charge in equity income (6) |
|
|
1,040 |
|
|
|
- |
|
|
|
- |
|
Adjusted EBIT (subtotal) |
|
|
189,181 |
|
|
|
245,484 |
|
|
|
279,905 |
|
Depreciation and amortization |
|
|
48,663 |
|
|
|
45,975 |
|
|
|
42,645 |
|
Stock-based compensation |
|
|
13,155 |
|
|
|
14,566 |
|
|
|
12,474 |
|
Adjusted EBITDA from continuing operations |
|
$ |
250,999 |
|
|
$ |
306,025 |
|
|
$ |
335,024 |
|
Non-GAAP Footnotes
viii
PART I
Unless otherwise indicated, all Note references in this Form 10-K refer to the notes to the Consolidated Financial Statements included in “Part II – Item 8. – Financial Statements and Supplementary Data” of this Form 10-K. All dollar amounts within Part I are presented in thousands of dollars except per share amounts.
Item 1. — Business
General Overview
Founded in 1955 as Worthington Industries, we are one of the leading designers and manufacturers of products sold to consumers, primarily through retail channels, in the tools, outdoor living and celebrations market categories as well as a wide array of highly specialized building products that primarily serve customers in the residential and non-residential construction markets, including ceiling suspension systems and light gauge metal framing products, respectively, through our unconsolidated joint ventures, WAVE and ClarkDietrich, as well as wholly-owned and consolidated operations that produce pressurized containment solutions for heating, cooking and cooling applications, among others. Our business strategy is rooted in our people first culture that values our relationships across the spectrum and revolves around products and services that empower people to live safer, healthier and more expressive lives. Originally founded as a value-added steel processor domiciled under the laws of the State of Ohio, we expanded our offerings to include manufactured metal products organized around attractive end market under two separate and distinct reportable operating segments: Consumer Products and Building Products.
We believe the foundation of our success is rooted in our people first philosophy and our belief that people are our most important asset, which serves as a basis for our unwavering commitment to our employees, customers, suppliers, and investors. Our primary goal is to create value for our shareholders. Built on the successful foundation of the Worthington Business System, we apply a disciplined approach to capital deployment and seek to grow earnings by optimizing our operations and supply chain, developing and commercializing new products and applications, and pursuing strategic investments and acquisitions.
Our fiscal year ends each May 31 and our fiscal quarters end on the final day of each of August, November, February and May.
We are headquartered at 200 West Old Wilson Bridge Road, Columbus, Ohio 43085, telephone (614) 438-3210. The common shares are traded on the NYSE under the symbol WOR. We maintain a website at www.worthingtonenterprises.com. This uniform resource locator, or URL, is an inactive textual reference only and is not intended to incorporate our website into this Form 10-K. Worthington Enterprises’ Annual Reports on Form 10-K, Quarterly Reports on Form 10-Q, Current Reports on Form 8-K and amendments to those reports, filed or furnished pursuant to Section 13(a) or Section 15(d) of the Exchange Act, as well as Worthington Enterprises’ definitive proxy materials for annual meetings of shareholders filed pursuant to Section 14 of the Exchange Act, are available free of charge, on or through our website, as soon as reasonably practicable after such material is electronically filed with, or furnished to, the SEC.
Separation of the Steel Processing Business
On December 1, 2023, we completed the Separation of our former steel processing business into a separate public company in a transaction intended to qualify as tax free to our shareholders, which was accomplished via the Distribution. Worthington Steel is an independent public company. The operating results of our former steel processing business are reported as discontinued operations for all periods presented. All discussions within this Form 10-K, including amounts, percentages and disclosures for all periods presented, reflect only our continuing operations unless otherwise noted.
Following the completion of the Separation, Worthington Industries, Inc. changed its name to Worthington Enterprises, Inc. and its common shares continue trading on the NYSE under the ticker symbol WOR. On December 1, 2023, the common shares of Worthington Steel began trading on the NYSE under the ticker symbol WS.
1
Other Business Developments
On May 29, 2024, we became a noncontrolling equity partner in a new unconsolidated joint venture with Hexagon, a leading global manufacturer of Type 4 composite cylinders used for storing gas under high-pressure, by selling 51% of the nominal share capital of our former sustainable energy solutions operating segment in Europe. Pursuant to the transaction, Hexagon acquired a 49% stake in the joint venture for approximately $11,518, after adjusting for closing cash and preliminary net working capital, with an additional 2% sold to members of the existing management team for an additional $468. Post-closing, we hold a 49%, noncontrolling interest in the joint venture, which is accounted for under the equity method due to our significant influence. The newly formed joint venture will focus on capitalizing on the global clean energy transition specific to the storage, transport and distribution of hydrogen and compressed natural gas.
Our 49% noncontrolling interest, which is accounted for under the equity method, does not qualify as a standalone operating segment and therefore will be reported within Other along with unallocated corporate expenses, as discussed further in “Note P – Segment Data.” Additionally, upon closing, our sustainable energy solutions business, as historically operated, is no longer part of our management structure and therefore the financial position and results of operations of this business are presented within Other, on an historical basis, through May 29, 2024.
On February 1, 2024, we acquired an 80% ownership stake in Halo, an affiliate of HPG, an asset-light business with technology-enabled solutions in the outdoor cooking space. The total purchase price was $9,588. Refer to “Note Q – Acquisitions” for additional information.
Our Key Strengths
We believe our established portfolio of market-leading brands positions us well to execute on our growth initiatives and overall business strategy. Our ability to manufacture at scale and leverage key customer relationships in diverse end markets distinguishes us from our competitors and creates barriers to entry. We also believe we are well-positioned to capitalize on certain secular trends impacting the markets that we serve, including government stimulus and other initiatives to support long-term construction and supply chain investment as well as the increasing investments in environmental projects at the corporate and government level.
We believe the Worthington Business System is the engine that drives value for our shareholders. The Worthington Business System is rooted in the Worthington Philosophy and designed to drive continuous improvement through use of tools and technologies that help drive results and inform our business decisions by applying lean techniques to streamline costs and reduce waste within manufacturing, commercial, sourcing and supply chain. Through continuous improvement initiatives, we believe we can achieve improved metrics for product quality, service, delivery, workforce safety and waste reduction to further optimize cost, productivity and efficiencies, while creating a resilient and efficient operating platform that can remain agile regardless of external market conditions.
2
Segments
Our operations are managed and reported principally on a products and services basis underneath two reportable operating segments: “Consumer Products,” and “Building Products.” International operations accounted for approximately 21% of our consolidated net sales during fiscal 2024 and were comprised primarily of sales to customers in Europe. Sales to one retail customer accounted for 12% of our consolidated net sales in fiscal 2024.
Refer to the following segment descriptions and “Note P – Segment Data” for a full description of our segments.
Consumer Products
Our Consumer Products business serves retail customers and end consumers in the tools, outdoor living and celebrations categories under market-leading brands that include the following: Balloon Time®, Bernzomatic®, Coleman® (licensed), Garden-Weasel®, General®, Halo®, Hawkeye™, Level5®, Mag-Torch®, Pactool International®, and Worthington Pro Grade™. These include propane-filled cylinders for torches, camping stoves and other applications, handheld torches, helium-filled balloon kits, specialized hand tools and instruments, drywall tools and accessories and gas grills and pizza ovens sold primarily to mass merchandisers, retailers and distributors.
Consumer Products generated approximately 40%, 39% and 39% of our consolidated net sales in fiscal 2024, fiscal 2023 and fiscal 2022, respectively. Consumer Products serviced approximately 1,550 customers during fiscal 2024. Sales to the top customer represented approximately 30% of net sales for Consumer Products during fiscal 2024.
Consumer Products operates five facilities located in Kansas (2), Kentucky, New Jersey, and Wisconsin.
Consumer Products competes on the basis of its reputation for product quality, its well-known brands, its commitment to customer service, its strong customer relationships, the breadth of its product lines, and its innovative products and customer value propositions. Consumer Products encounters active competition in the variety of end-markets in which it competes from both larger and smaller companies that offer the same or similar products. Certain large customers offer private label brands that compete across a wide spectrum of the segment’s product offerings, especially in tools and outdoor living.
The major end markets / product categories in which our consumer products business competes include the following:
Tools: We sell a variety of tools for both professional and DIY consumers. Our products include hand-held torches, micro torches, lighters, accessories and fuel for constructing, fixing making and creating; precision and specialty hand, digital and safety tools; and drywall tools and accessories used for finishing and taping, cutting, siding and roofing. Most of our products are sold online and to home centers and other retailers. We closely monitor key market activity, including, but not limited to inflationary pressures, consumer debt/income ratios, consumer spending levels, and activity within the adjacent repair and remodel end market, discussed further below in the discussion of Building Products end markets.
Outdoor Living: We compete in the large, growing, and fragmented outdoor living market. We believe growth in the outdoor living market is driven by key trends, centered around enhancing enjoyment while participating in outdoor activities. This includes participation levels and the resilience of consumer demand for product purchases in these categories versus other discretionary categories. The nature of the outdoor activities to which we cater often requires recurring purchases throughout the year, resulting in high rates of conversion among customers.
Celebrations: Our business in this end market is generated primarily from celebration and party-related activities. Our products are available at many convenient locations, including mass retailers, party stores and craft stores. We closely monitor key market activity, including but not limited to, inflationary pressures, consumer debt/income ratios, and consumer spending levels. Our principal method of meeting competitive challenges in this market is by creating and maintaining leading brands and products that deliver superior value and performance at a competitive cost.
3
Building Products
Our Building Products business is a market-leading provider of pressurized containment solutions, providing critical components in essential end markets, such as heating, cooking, cooling and water, and, through our unconsolidated joint ventures, WAVE and ClarkDietrich, ceiling suspension systems and light gauge metal framing products. Our pressurized containment solutions include refrigerant and LPG cylinders, well water and expansion tanks, and other specialty products which are generally sold to gas producers and distributors. Refrigerant gas cylinders are used to hold refrigerant gases for commercial, residential, and automotive air conditioning and refrigeration systems. LPG cylinders hold fuel for residential and light commercial heating systems, barbeque grills and recreational vehicle equipment, industrial forklifts and commercial/residential cooking (the latter, generally outside North America). Well water tanks and expansion tanks are used primarily in the residential market with certain products also sold to commercial markets. Specialty products include a variety of fire suppression tanks, chemical tanks, and foam and adhesive tanks.
WAVE, a 50%-owned joint venture with Armstrong World Industries, Inc. is the largest of the four North American manufacturers of ceiling suspension systems for concealed and lay-in panel ceilings used in commercial and residential ceiling markets. It competes with the other North American manufacturers and numerous regional manufacturers. WAVE operates seven manufacturing facilities, one each in Georgia, Michigan, and Nevada and two each in California and Maryland.
ClarkDietrich, a 25%-owned joint venture with CWBS-MISA is an industry leader in the manufacture and supply of light gauge steel framing products in the U.S. ClarkDietrich manufactures a full line of drywall studs and accessories, structural studs and joists, metal lath and accessories, shaft wall studs and track, vinyl and finishing products used primarily in residential and commercial construction. ClarkDietrich operates 14 manufacturing facilities, one each in Connecticut, Georgia, Illinois, Maryland, Missouri and Canada and two each in California, Florida, Ohio, and Texas.
Building Products generated approximately 50%, 51% and 51% of our consolidated net sales in fiscal 2024, fiscal 2023 and fiscal 2022, respectively. Building Products serviced approximately 1,650 customers during fiscal 2024.
Excluding WAVE and ClarkDietrich, our Building Products segment operates eight facilities located in Kentucky, Maryland, Ohio (3), Rhode Island, Norway and Portugal.
In the U.S. and Canada, our manufactured building products are designed to comply with U.S. Department of Transportation and Transport Canada specifications. Outside the U.S. and Canada, cylinders are manufactured according to European specifications, as well as various other international standards. Other products are produced to applicable industry standards including, as applicable, those standards issued by the American Petroleum Institute, the American Society of Mechanical Engineers and UL Solutions.
Building Products has one principal domestic competitor in the low-pressure LPG cylinder market, and a number of foreign competitors in the LPG cylinder, non-refillable refrigerant, and well water and expansion tank markets. We believe that this business has the largest market share in the domestic low-pressure cylinder market. In the other cylinder markets, there are several competitors. Building Products generally has a strong competitive position for its industrial, energy, retail and specialty products, but competition varies on a product-by-product basis. Competition for our Building Products operating segment is based upon price, service and quality.
The major end markets in which our building products business competes include the following:
Residential Construction: We sell products for use in single and multi-family housing. Key statistics that indicate market opportunity include existing home sales (a key indicator for renovation opportunity), housing starts, housing completions, home prices, interest rates and consumer confidence.
Non-residential Construction: Opportunities in this end market come from new construction as well as the renovation of existing buildings. We closely monitor publicly available macroeconomic data and trends that provide insight into non-residential construction market activity, including but not limited to, GDP, office vacancy rates, the ABI, new commercial construction starts, state and local government spending, corporate profits and retail sales. Our revenue from new construction can lag behind construction starts by as much as 24 months. We believe that these statistics, considering the time-lag effect, provide a reasonable indication of our future revenue opportunity from non-residential renovation and new construction.
4
Repair and Remodel: Our business in this end market is generated primarily from repair and remodel projects on residential homes. We monitor key trends such as interest rates, consumer confidence, employment rates, housing affordability, land development costs, the availability of skilled construction labor, the aging housing stock, inflationary pressures, mortgage rates and the overall the health of the economy. We have a broad range of product offerings that serve the need of customers, primarily through a variety of retailers. We compete with numerous foreign and domestic manufacturers and distributors of consumer goods, many of which are well-established. Our principal method of meeting competitive challenges in this market is by creating and maintaining leading brands and differentiated products that deliver superior value and performance at a competitive cost. We closely monitor key market activity, including, but not limited to inflationary pressures, consumer debt/income ratios, and consumer spending levels.
Other Unconsolidated Joint Ventures
In addition to ClarkDietrich and WAVE, we have two additional unconsolidated joint ventures, Workhorse and the Sustainable Energy Solutions joint venture.
Workhorse, a 20%-owned joint venture with an affiliate of Angeles Equity Partners, LLC, is a non-captive designer and manufacturer of high-quality, custom-engineered open and enclosed cabs and operator stations and custom fabrications and packaging for heavy mobile equipment used primarily in the agricultural, construction, forestry, military and mining industries. Workhorse operates three manufacturing facilities, one each in South Dakota, Tennessee and Minnesota.
The Sustainable Energy Solutions joint venture, a newly formed 49%-owned joint venture formed with Hexagon, is primarily based in Europe. The newly formed joint venture, which combines two of Europe’s market leaders in composite high-pressure storage technology, will focus on capitalizing on the global clean energy transition specific to the storage, transport and distribution of hydrogen and compressed natural gas. This joint venture operates three facilities in Austria, Germany, and Poland.
See “Note D – Investments in Unconsolidated Affiliates” for additional information about our unconsolidated joint ventures.
Sources and Availability of Raw Materials
The most important raw materials we purchase are steel, aluminum, copper, and propane. We have developed strong relationships with our suppliers, who provide the materials we need, meet our quality and service requirements, and are able to offer competitive terms with regard to pricing, delivery, and volumes purchased. We are not dependent upon any one source for raw materials of our manufactured products.
We purchase steel in large quantities at regular intervals from Worthington Steel through the Steel Supply Agreement. Refer to “Note U – Related Party Transactions” for additional information. In nearly all market conditions, steel is available from a few suppliers and generally any supplier relationship or contract can and has been replaced with little or no significant interruption to our business.
Seasonality
Historically, sales tend to be stronger in the third and fourth quarters of our fiscal year for our Consumer Products operating segment when our facilities perform at seasonal peaks, matching consumer demand. Sales in our Building Products operating segment are generally stronger in the first and fourth quarters of our fiscal year due to weather conditions, customer business cycles, and the timing of renovation and new construction projects.
Environmental Matters
Our manufacturing facilities, like those of similar industries making similar products, are subject to many federal, state, local and foreign laws and regulations, including those relating to the protection of our employees and the environment. In addition to the requirements of the state and local governments of the communities in which we operate, we must comply with federal health and safety regulations, the most significant of which are enforced by OSHA. We examine ways to improve safety, reduce emissions and waste, and decrease costs related to compliance with environmental and other government regulations. The cost of such activities, compliance or capital expenditures for environmental control facilities necessary to meet regulatory requirements are not estimable, but have not and are not anticipated to be material when compared with our overall costs and capital expenditures and, accordingly, are not anticipated to have a material effect on our capital expenditures, earnings and competitive position.
5
Our commitment to corporate responsibility and sustainability includes putting people first by providing a supportive and inclusive environment built on a culture of engagement, and by working together to ensure the health and safety of our employees. At the corporate level, we maintain a fully dedicated department responsible for best-in-class environmental, health and safety initiatives and best practices across the Company. Two of our facilities hold ISO 14001 certifications, a highly recognized global standard for an effective Environmental Management System and our remaining facilities are managed to similar standards.
We comply with and work to exceed all applicable worker safety regulations in the U.S. as governed by OSHA. Our U.S. facilities also hold certifications with various industry groups that require regular inspections including the International Organization for Standardization. Our global sites meet or exceed all local regulations for worker safety and hold various accreditations, certifications and registrations that require regular inspections.
Intellectual Property
We own several patents, trademarks, copyrights, and trade secrets, as well as licenses to intellectual property owned by others. Although our patents, copyrights, trademarks, trade secrets, and other intellectual property rights are important to our success, we do not consider any single patent, trademark, copyright, trade secret or license to be of material importance to our business. Each registered trademark has an original duration of 10 to 20 years, depending on the date it was registered and the country in which it is registered, and is subject to an indefinite number of renewals for a like period upon continued use and appropriate application. We intend to continue using the trade names and trademarks described above and to timely renew each of our registered trademarks that remains in use.
Corporate Responsibility
Human Capital Management
As of May 31, 2024, we had approximately 3,800 employees and our unconsolidated joint ventures employed approximately 2,000 additional individuals. Approximately 14% of those individuals in those two groups are represented by collective bargaining units. We believe that our open-door policy has created an environment which fosters open communication and serves to cultivate the good relationships we have with our employees, including those covered by collective bargaining units.
In line with our people-first philosophy, our employees have always been, and will always be, our most important asset. We operate under a set of core values that are rooted in our long-standing philosophy, which emphasizes the Golden Rule. These core values guide us as a company, including in our approach to human capital management. As such, we are continually focused on creating and maintaining a strong culture. Our culture provides employees with opportunities for personal and professional development, as well as community engagement, all of which we believe contribute to our overall success. We have repeatedly been recognized as a top place to work and we maintain a focus on safety, wellness, and promoting a diverse and inclusive culture.
Our ability to successfully operate, grow our business and implement our business strategies is largely dependent on our ability to attract, train and retain talented personnel at all levels of our organization. As a result, we offer our employees competitive compensation and benefits, as compared to others in our industry, which include opportunities to participate in profit sharing plans. We also strive to provide our employees with continuous opportunities to learn the skills necessary to maximize their performance and develop new skills that allow them to maximize their potential.
Safety, Health and Wellness
We have always made the safety and well-being of our people a top priority, and we have regularly maintained an industry-leading safety record. For us, safety is about engagement, and our employees have adopted a culture where safety is everyone’s responsibility, and not just the safety of our employees, but the safety of everyone who enters our facilities. We also provide our employees and their families with access to above-market benefits, as compared to others in our industry, including a parental leave benefit that offers all new parents the opportunity for paid time off. We have a broad array of other employee centered-benefits and programs, including a medical center, a pharmacy, chiropractic care, on-site fitness centers, free health screenings, health fairs, and other Company-wide and location-specific wellness events and challenges. We believe our investments in safety, health and wellness are key to supporting and protecting our most important asset, our people.
6
Diversity, Inclusion and Equity
We believe that diversity of all types contributes to our success. We are committed to increasing the diversity of our employee base at all levels of our organization because we believe our differences make us better and that diverse thoughts and experiences drive innovation and produce better results. With our philosophy as our foundation, we are building an environment where diversity is valued, and where all employees feel they belong and are empowered to do their best work.
To further such efforts, we employ a Director of Diversity, Equity and Inclusion and also established the Council, which is chaired by our Chief Executive Officer and focuses on strengthening our four primary pillars around diversity: inclusion and equity, workforce, workplace, and community and partnership. These pillars serve as a foundation for continually building and fostering an inclusive culture. We have also established certain ERGs, employee-led groups that each have executive sponsors that are tasked with raising awareness and offering mentoring and development opportunities to their members. We are also working to establish additional ERGs.
Item 1A. — Risk Factors
Our future results and the market price for the common shares are subject to numerous risks, many of which are driven by factors that we cannot control or predict. The following discussion, as well as other sections of this Form 10-K, including “Part II – Item 7. – Management’s Discussion and Analysis of Financial Condition and Results of Operations,” describe certain risks to our business, our results, our strategies and the common shares. Consideration should be given to the risk factors described below as well as those in the “Cautionary Note Regarding Forward-Looking Statements” section at the beginning of this Form 10-K, in conjunction with reviewing the forward-looking statements and other information contained in this Form 10-K. The risks described below are those that we have identified as material but are not the only risks and uncertainties facing us. Our business is also subject to general risks and uncertainties that affect many other companies, such as market conditions, economic conditions, geopolitical events, changes in laws, rules, regulations or accounting rules, fluctuations in interest rates, terrorism, war or conflicts, major health concerns, natural disasters or other disruptions of expected business conditions. Additional risks and uncertainties not currently known to us or that we currently believe are immaterial also may impair our business, including our results of operations, liquidity and financial condition.
Risks Related to Our Business and Operations
Economic or Industry Downturns and Weakness
Our net sales are heavily concentrated in the consumer products and construction end markets, and a decline in those end markets may have an adverse impact on our results of operations and cash flows. The consumer products and construction industries account for a significant portion of our net sales, and reduced demand from these industries could adversely affect our business. An overall downturn in the general economy, a disruption in capital and credit markets, high inflation, high unemployment, reduced consumer confidence or other factors, could cause reductions in demand from our end markets in general and, in particular, the consumer products and construction end markets. If demand for the products we sell to the end markets which we supply were to be reduced, our sales, financial results and cash flows could be negatively affected.
Financial difficulties and bankruptcy filings by our customers could have an adverse impact on our businesses. In past years, some customers have experienced, and some continue to experience challenging financial conditions, whether due to the COVID-19 pandemic, the war in Ukraine, inflationary pressures, or otherwise. The financial difficulties of certain customers and/or their failure to obtain credit or otherwise improve their overall financial condition could result in changes within the markets we serve, including plant closings, decreased production, reduced demand, changes in product mix, unfavorable changes in the prices, terms or conditions we are able to obtain and other changes that may result in decreased purchases from us and otherwise negatively impact our businesses. These conditions also increase the risk that our customers may delay or default on their payment obligations to us. If the general economy or any of our markets decline, the risk of bankruptcy filings by and financial difficulties of our customers may increase. While we have taken and will continue to take steps intended to mitigate the impact of financial difficulties and potential bankruptcy filings by our customers, these matters could have a negative impact on our businesses.
7
Raw Material Pricing and Availability
Our operating results may be adversely affected by continued volatility in steel prices. Over the past three years, steel prices have increased significantly due to supplier consolidation, tight mill orders due to the COVID-19 pandemic, the war in Ukraine and tariffs on foreign steel. More recently, the volatility in the steel market resulted in steel prices rapidly decreasing before increasing again. If steel prices or other raw material prices were to decrease, competitive conditions or contractual obligations may impact how quickly we must reduce our prices to our customers, and we could be forced to use higher-priced raw materials then on hand to complete orders for which the selling prices have decreased. This could result in losses or a write-down of the value of our inventory, and our financial results could be adversely affected.
Our operating results may be affected by fluctuations in raw material prices and our ability to pass on increases in raw material costs to our customers. Our principal raw material is flat-rolled steel, which we purchase from multiple primary steel producers. The steel industry as a whole has been cyclical, and at times availability and pricing can be volatile due to a number of factors beyond our control. These factors include general economic conditions, domestic and worldwide supply and demand, high inflation, the influence of hedge funds and other investment funds participating in commodity markets, curtailed production from major suppliers due to factors such as the closing or idling of facilities, pandemics, international conflicts, accidents or equipment breakdowns, repairs or catastrophic events, labor costs, shortages, strikes or other problems, competition, new laws and regulations, import duties, tariffs, energy costs, availability and cost of steel inputs (e.g., ore, scrap, coal and energy), foreign currency exchange rates and other factors described in the immediately following paragraph. This volatility, as well as any increases in raw material costs, could significantly affect our steel costs and adversely impact our financial results. To manage our exposure to market risk, where possible, we match our customer pricing terms to the pricing terms offered to us by our suppliers in order to minimize the impact of market fluctuations on our margins. However, should our suppliers increase the prices of our critical raw materials, we may not have alternative sources of supply. In addition, in an environment of increasing prices for steel and other raw materials, competitive conditions or contractual obligations may impact how much of the price increases we can pass on to our customers. To the extent we are unable to pass on future price increases in our raw materials to our customers, our financial results could be adversely affected.
The costs of manufacturing our products and our ability to meet our customers’ demands could be negatively impacted if we experience interruptions in deliveries of needed raw materials or supplies. If, for any reason, our supply of flat-rolled steel or other key raw materials, such as aluminum, zinc, copper or helium, or other supplies is curtailed or we are otherwise unable to obtain the quantities we need at competitive prices, our business could suffer and our financial results could be adversely affected. Such interruptions could result from a number of factors, including a shortage of capacity in the supplier base of raw materials, energy or the inputs needed to make steel or other supplies, a failure of suppliers to fulfill their supply or delivery obligations, financial difficulties of suppliers resulting in the closing or idling of supplier facilities, other significant events affecting supplier facilities, significant weather events, those factors listed in the immediately preceding paragraph or other factors beyond our control like pandemics. Further, the number of suppliers has decreased in recent years due to industry consolidation and the financial difficulties of certain suppliers, and this consolidation may continue.
Inventories
Our businesses could be harmed if we fail to maintain proper inventory levels. We are required to maintain sufficient inventories to accommodate the needs of our customers including, in many cases, short lead times and just-in-time delivery requirements. We anticipate and forecast customer demand for each of our operating segments. We purchase raw materials on a regular basis in an effort to maintain our inventory at levels that we believe are sufficient to satisfy the anticipated needs of our customers based upon orders, customer volume expectations, historic buying practices and market conditions. Inventory levels in excess of customer demand may result in the use of higher-priced inventory to fill orders reflecting lower selling prices if raw material prices have significantly decreased. For example, if steel prices decrease, we could be forced to use higher-priced steel then on hand to complete orders for which the selling price has decreased. These events could adversely affect our financial results. Conversely, if we underestimate demand for our products or if our suppliers fail to supply quality products in a timely manner, we may experience inventory shortages. Inventory shortages could result in unfilled orders, negatively impacting our customer relationships and resulting in lost revenues, which could harm our businesses and adversely affect our financial results.
8
Customers and Suppliers
The loss of significant volume from our key customers could adversely affect us. A significant loss of, or decrease in, business from any of our key customers could have an adverse effect on our sales and financial results if we cannot obtain replacement business. Also, due to consolidation in the industries we serve, including the construction and retail industries, our sales may be increasingly sensitive to deterioration in the financial condition of, or other adverse developments with respect to, one or more of our top customers. In addition, some of our top customers may be able to exert pricing and other influences on us, requiring us to market, deliver and promote our products in a manner that may be more costly to us and negatively impact our profitability. We generally do not have long-term contracts with our customers. As a result, although our customers periodically provide notice of their future product needs and purchases, they generally purchase our products on an order-by-order basis, and the relationship, as well as particular orders, can be terminated at any time.
Many of our key end markets, such as residential and non-residential construction, repair and remodel, general consumer, and outdoor living are cyclical in nature. Many of our key end markets are cyclical and can be impacted by both market demand and raw material supply, particularly with respect to steel. The demand for our products is directly related to, and quickly impacted by, customer demand in our end markets, which can change as the result of changes in the general U.S. or global economies and other factors beyond our control. Adverse changes in demand or pricing can have a negative effect on our businesses and results of operations.
Sales conflicts with our customers and/or suppliers may adversely impact us. In some instances, we may compete with one or more of our customers and/or suppliers in pursuing the same business. Such conflicts may strain our relationships with the parties involved, which could adversely affect our future business with them.
The closing or idling of steel manufacturing facilities could have a negative impact on us. As steel makers have reduced their production capacities by closing or idling production lines, whether due to the war in Ukraine or otherwise, the number of facilities from which we can purchase steel, in particular certain specialty steels, has decreased. Accordingly, if delivery from a supplier is disrupted, particularly with respect to certain types of specialty steel, it may be more difficult to obtain an alternate supply than in the past. These closures and disruptions could also have an adverse effect on our suppliers’ on-time delivery performance, which could have an adverse effect on our ability to meet our own delivery commitments and may have other adverse effects on our businesses.
The loss of key supplier relationships could adversely affect us. Over the years, we have developed relationships with certain steel and other suppliers which have been beneficial to us by providing more assured delivery and a more favorable all-in cost, which includes price and shipping costs. If any of those relationships were disrupted, it could have an adverse effect on delivery times and the overall cost, quality and availability of our products or raw materials, which could have a negative impact on our businesses. If, in the future, we are unable to obtain sufficient amounts raw materials at competitive prices and on a timely basis from our traditional suppliers, we may be unable to obtain these materials from alternative sources at competitive prices to meet our delivery schedules, which could have a material adverse impact on our results of operations.
Competition
We face intense competition which may cause decreased demand, decreased market share and/or reduced prices for our products and services. Our businesses operate in industries that are highly competitive and have been subject to increasing consolidation of customers. Because of the range of the products and services we sell and the variety of markets we serve, we encounter a wide variety of competitors. Our failure to compete effectively and/or pricing pressures resulting from competition may adversely impact our businesses and financial results.
Our businesses are highly competitive, and increased competition may cause decreased demand, decreased market share and/or reduced prices for our products and services and could negatively impact our financial results. Generally, the markets in which we conduct business are highly competitive. Our competitors include a variety of domestic and foreign companies in all major markets. Competition for most of our products is primarily on the basis of price, product quality and our ability to meet delivery requirements. Our businesses have been subject to increasing consolidation of customers. Depending on a variety of factors, including raw material, energy, labor and capital costs, freight availability, government control of foreign currency exchange rates and government subsidies of foreign steel producers or competitors, our businesses may be materially adversely affected by competitive forces. Competition may also increase if suppliers to or customers of our industries begin to more directly compete with our businesses through new facilities, acquisitions or otherwise. As noted above, we can have conflicts with our customers or suppliers who, in some cases, supply the same products and services as we do. Increased competition could cause us to lose market share, increase expenditures, lower our margins or offer additional services at a higher cost to us, which could adversely impact our businesses and financial results.
9
Freight and Energy
Increasing freight and energy costs could increase our operating costs or the costs of our suppliers, which could have an adverse effect on our financial results. The availability and cost of freight and energy, such as electricity, natural gas and diesel fuel, are important in the manufacture and transport of our products. Our operations consume substantial amounts of energy, and our operating costs generally increase when energy costs rise. Factors that may affect our energy costs include significant increases in fuel, oil or natural gas prices, unavailability of electrical power or other energy sources due to droughts, hurricanes or other natural causes or due to shortages resulting from insufficient supplies to serve customers, or interruptions in energy supplies due to equipment failure, international conflict or other causes. During periods of increasing energy and freight costs, we may be unable to fully recover our operating cost increases through price increases without reducing demand for our products. Our financial results could be adversely affected if we are unable to pass all of the cost increases on to our customers or if we are unable to obtain the necessary freight and/or energy. Also, increasing energy costs could put a strain on the transportation of our materials and products if the increased costs force certain transporters to discontinue their operations.
We depend on third parties for freight services, and increases in the costs or the lack of availability of freight services can adversely affect our operations. We rely primarily on third parties for transportation of our products as well as delivery of our raw materials, primarily by truck and container ship. If, due to a lack of freight services, raw materials or products are not delivered to us in a timely manner, we may be unable to manufacture and deliver our products to meet customer demand. Likewise, if due to a lack of freight services, we cannot deliver our products in a timely manner, it could harm our reputation, negatively affect our customer relationships and have a material adverse effect on our results of operations. In addition, any increase in the cost of the transportation of raw materials or our products, as a result of increases in fuel or labor costs, higher demand for logistics services, international conflict or otherwise, may adversely affect our results of operations as we may not be able to pass such cost increases on to our customers.
The COVID-19 Pandemic and Other Public Health Emergencies
The COVID-19 pandemic, as well as similar pandemics and other public health emergencies in the future, could have a material adverse effect on our business financial position, results of operations and cash flows. Our operations expose us to risks associated with pandemics, epidemics and other public health emergencies, such as the COVID-19 pandemic. The impacts of public health emergencies may include, without limitation, potential significant volatility or continued decreases in the demand for our products, changes in customer and consumer behavior and preferences, disruptions in or additional closures of our manufacturing operations or those of our customers and suppliers, disruptions within our supply chain, limitations on our employees’ ability to work and travel, potential financial difficulties of customers and suppliers, significant changes in economic or political conditions, and related volatility in the financial and commodity markets, including volatility in raw material and other input costs. Future disruption to the global economy, as well as to the end markets our business serves, could result in material adverse effects on our business, financial position, results of operations and cash flows.
The ongoing conflict between Russia and Ukraine may adversely affect our business and results of operations.
Since early 2022, Russia and Ukraine have been engaged in active armed conflict. The length, impact and outcome of the ongoing conflict and its potential impact on our business is highly volatile and difficult to predict. It has caused, and could continue to cause, significant market and other disruptions (particularly for our operations in Europe), including significant volatility in commodity prices and supply of energy resources, instability in financial markets, supply chain interruptions, political and social instability, trade disputes or trade barriers, changes in consumer or purchaser preferences, and increases in cyberattacks and espionage.
Further, the broader consequences of the current conflict between Russia and Ukraine may also have the effect of heightening many other risks disclosed in our public filings, any of which could materially and adversely affect our business and results of operations. Such risks include, but are not limited to, adverse effects on global macroeconomic conditions; increased volatility in the price and demand of iron, steel, oil, natural gas, and other commodities, increased exposure to cyberattacks; disruptions in global supply chains; and exposure to foreign currency fluctuations and potential constraints or disruption in the capital markets and our sources of liquidity.
We do not conduct business, either directly or indirectly, in areas impacted by the conflict and, as such, we believe our exposure is principally limited to the impact of the war on macroeconomic conditions, including volatility in commodity and energy prices and supply. Our business was temporarily impacted in the spring of 2022, primarily in the form of higher market prices for steel due to a temporary supply disruption in a key input for our suppliers (pig iron), which has subsequently been resourced by our suppliers.
10
Information Systems
We are subject to information system security risks and systems integration issues that could disrupt our operations. We are dependent upon information technology and networks in connection with a variety of business activities including the distribution of information internally and to our customers and suppliers. This information technology is subject to potential damage or interruption from a variety of sources, including, without limitation, computer viruses, security breaches, and natural disasters. We could also be adversely affected by system or network disruptions if new or upgraded business management systems are defective, not installed properly or not properly integrated into operations. In addition, security breaches of our information systems could result in unauthorized disclosure or destruction of confidential or proprietary information, misappropriation of or damage to our assets, production downtime, and/or loss of the functionality of our systems. These risks may be exacerbated by a partially remote workforce. Various measures have been implemented to manage our risks related to information system and network disruptions and to prevent attempts to gain unauthorized access to our information systems. While we undertake mitigating activities to counter these risks, there can be no assurance that such activities will be sufficient to prevent cyberattacks or security breaches or mitigate all potential risks to our systems, networks and data, and a system or human failure could negatively impact our operations and financial results and cyberattacks could threaten the integrity of our trade secrets and sensitive intellectual property. The potential consequences of a material cybersecurity attack include reputational damage, investigations and/or adverse proceedings with regulators and enforcement agencies, litigation with third parties, disruption to our systems (including production capabilities), unauthorized release of confidential, personally identifiable or otherwise protected information, corruption of data, and increased cybersecurity protection and remediation costs, which in turn could adversely affect our competitiveness, results of operations and financial condition. Insurance coverage for cyberattacks may become unavailable, may not cover the types of losses we may incur, and may be inadequate in amount to cover liabilities resulting from a cyberattack.
Business Disruptions
Disruptions to our business or the business of our customers or suppliers could adversely impact our operations and financial results. Business disruptions, including materials resulting from shortages of supply or transportation, severe weather events (such as hurricanes, tsunamis, earthquakes, tornados, floods and blizzards), casualty events (such as explosions, fires or material equipment breakdown), acts of terrorism, international conflicts (such as the war in Ukraine), labor disruptions, the idling of facilities due to reduced demand (resulting from a downturn in economic activity or otherwise), pandemics and other health crises, or other events (such as required maintenance shutdowns), could cause interruptions to our businesses as well as the operations of our customers and suppliers. While we maintain insurance coverage that may offset some losses relating to certain types of these events, losses from business disruptions could have an adverse effect on our operations and financial results and we could be adversely impacted to the extent any such losses are not covered by insurance or cause some other adverse impact to us.
11
Foreign Operations
Economic, political and other risks associated with foreign operations could adversely affect our financial results. Although the substantial majority of our business activity takes place in the U.S., we derive a portion of our revenues and earnings from operations in foreign countries, and we are subject to risks associated with doing business internationally. We have wholly-owned facilities in Portugal and Norway, and joint venture facilities in Austria, Germany and Poland and are active in exploring other foreign opportunities. The risks of doing business in foreign countries include, among other factors: the potential for adverse changes in the local political climate, in diplomatic relations between foreign countries and the U.S. or in government policies, laws or regulations; international conflicts; terrorist activity that may cause social disruption; logistical and communications challenges; costs of complying with a variety of laws and regulations; difficulty in staffing and managing geographically diverse operations; deterioration of foreign economic conditions; inflation and fluctuations in interest rates; foreign currency exchange rate fluctuations; foreign exchange restrictions; differing local business practices and cultural considerations; restrictions on imports and exports or sources of supply, including energy and raw materials; changes in duties, quotas, tariffs, taxes or other protectionist measures; and potential issues related to matters covered by the Foreign Corrupt Practices Act, regulations related to import/export controls, the Office of Foreign Assets Control sanctions program, anti-boycott provisions or similar laws. We believe that our business activities outside of the U.S. involve a higher degree of risk than our domestic activities, and any one or more of these factors could adversely affect our operating results and financial condition. In addition, global and regional economic conditions and the volatility of worldwide capital and credit markets have significantly impacted and may continue to significantly impact our foreign customers and markets. These factors may result in decreased demand in our foreign operations and have had significant negative impacts on our business. Refer to the “General Economic or Industry Downturns and Weakness” risk factors herein for additional information concerning the impact of the global economic conditions and the volatility of capital and credit markets on our business.
Joint Ventures and Investments
A change in the relationship between the members of any of our joint ventures may have an adverse effect on that joint venture and our financial results. We have been successful in the development and operation of various joint ventures. We believe an important element in the success of any joint venture is a solid relationship between the members of that joint venture. If there is a change in ownership, a change of control, a change in management or management philosophy, a change in business strategy or another event with respect to a member of a joint venture that adversely impacts the relationship between the joint venture members, it could adversely impact that joint venture and, therefore, adversely impact us. The other members in our joint ventures may also, as a result of financial or other reasons, be unable or unwilling to support actions that we believe are in the best interests of the respective joint venture. In addition, joint ventures necessarily involve special risks. Whether or not we hold a majority interest or maintain operational control in a joint venture, the other members in our joint ventures may have economic or business interests or goals that are inconsistent with our interests or goals. For example, because they are joint ventures, we do not have full control of every aspect of the joint venture’s business and/or certain significant decisions concerning the joint venture, which may require certain approvals from the other members in our joint ventures, and the other members in our joint ventures may take action contrary to our policies or objectives with respect to our investments, or may otherwise be unable or unwilling to support actions that we believe are in the best interests of the respective joint venture, each of which could have an adverse effect on that joint venture and our financial results. Where we do not hold a majority interest in a joint venture (i.e., each of the unconsolidated joint ventures in which we are a member), our ability to control the direction and operations of a joint venture is generally very limited and our investment in that joint venture is significantly dependent on the other member(s) of the joint venture. The failure of the other member(s) of the unconsolidated joint ventures to properly manage and operate the joint venture could have an adverse effect on that joint venture and our financial results.
12
Acquisitions and Equity Investments
We may be unable to successfully consummate, manage or integrate our acquisitions or other equity investments or our acquisitions and investments may not meet our expectations. A portion of our growth has occurred through acquisitions. We may from time to time continue to seek attractive opportunities to acquire businesses, enter into joint ventures and make other investments that are complementary to our existing strengths. There are no assurances, however, that any acquisition or investment opportunities will arise or, if they do, that they will be consummated, or that any needed additional financing for such opportunities will be available on satisfactory terms when required. In addition, acquisitions and investments involve risks that the businesses acquired or in which we invest will not perform in accordance with expectations, that business judgments concerning the value, strengths and weaknesses of businesses will prove incorrect, that we may assume unknown liabilities from the seller, that the businesses may not be integrated successfully and that the acquisitions and investments may strain our management resources or divert management’s attention from other business concerns. International acquisitions and investments may present unique challenges and increase our exposure to the risks associated with foreign operations and countries. Also, failure to successfully integrate any of our acquisitions or investments may cause significant operating inefficiencies and could adversely affect our operations and financial condition. Even if the operations of an acquisition or investment are integrated successfully, we may fail to realize the anticipated benefits of the acquisition or investment, including the synergies, cost savings or growth opportunities that we expect. These benefits may not be achieved within the anticipated timeframe, or at all. Failing to realize the benefits could have a material adverse effect on our financial condition and results of operations.
Capital Expenditures and Capital Resources
Our business requires capital investment and maintenance expenditures, and our capital resources may not be adequate to provide for all of our cash requirements. Many of our operations are capital intensive. For the five-year period ended May 31, 2024, our total capital expenditures, including acquisitions and investment activity, were approximately $510,940. Additionally, as of May 31, 2024, we were obligated to make aggregate operating and financing lease payments of $20,081 and $5,820, respectively, under lease agreements. Our businesses also require expenditures for maintenance of our facilities. We currently believe that we have adequate resources (including cash and cash equivalents, cash provided by operating activities, and availability under the Credit Facility) to meet our cash needs for normal operating costs, capital expenditures, debt repayments, dividend payments, future acquisitions and working capital for our existing businesses. However, given the potential for challenges, uncertainty and volatility in the domestic and global economies and financial markets, there can be no assurance that our capital resources will be adequate to provide for all of our cash requirements.
13
Litigation
We may be subject to legal proceedings or investigations, the resolution of which could negatively affect our results of operations and liquidity. Our results of operations or liquidity could be affected by an adverse ruling in any legal proceedings or investigations which may be pending against us or filed against us in the future. We are also subject to a variety of legal and compliance risks, including, without limitation, potential claims relating to product liability, product recall, privacy and information security, health and safety, labor and employment, environmental matters, intellectual property rights, taxes and compliance with U.S. and foreign export laws, anti-bribery laws, competition laws and sales and trading practices. While we believe that we have adopted appropriate risk management and compliance programs to address and reduce these risks, the global and diverse nature of our operations means that these risks will continue to exist and additional legal proceedings and contingencies may arise from time to time. The insurance we maintain may not be adequate, available to protect us in the event of a claim, or its coverage may be limited, canceled or otherwise terminated, or the amount of our insurance may be less than the related impact on our enterprise value after a loss. As appropriate, we establish reserves based on our assessment of contingencies, including contingencies for claims asserted against us in connection with certain legal proceedings. Adverse developments in legal proceedings may affect our assessment and estimates of the loss contingency recorded as a reserve and require us to make payments in excess of our reserves, which could negatively affect our operations, financial results and cash flows. An adverse ruling or settlement or an unfavorable change in laws, rules or regulations could have a material adverse effect on our financial condition, results of operations or liquidity.
Claims and Insurance
Adverse claims experience, to the extent not covered by insurance, may have an adverse effect on our financial results. We self-insure most of our risks for product recall, cyber liability and pollution liability. We also self-insure a significant portion of our potential liability for workers’ compensation, product liability, general liability, property liability, automobile liability and employee medical claims, and in order to reduce risk for these liabilities, we purchase insurance from highly-rated, licensed insurance carriers that cover most claims in excess of the applicable deductible or retained amounts. We also maintain reserves for the estimated cost to resolve certain open claims that have been made against us (which may include active product recall or replacement programs), as well as an estimate of the cost of claims that have been incurred but not reported. The occurrence of significant claims (including claims not covered by insurance or well in excess of insurance limits), our failure to adequately reserve for such claims, a significant cost increase to maintain our insurance or the failure of our insurance providers to perform could have an adverse impact on our financial condition and results of operations.
Accounting and Tax-Related Estimates
We are required to make accounting and tax-related estimates, assumptions and judgments in preparing our consolidated financial statements, and actual results may differ materially from the estimates, assumptions and judgments that we use. In preparing our consolidated financial statements in accordance with GAAP, we are required to make certain estimates and assumptions that affect the accounting for and recognition of assets, liabilities, revenues and expenses. These estimates and assumptions must be made because certain information that is used in the preparation of our consolidated financial statements is dependent on future events or cannot be calculated with a high degree of precision from data available to us. In some cases, these estimates and assumptions are particularly difficult to determine and we must exercise significant judgment. Some of the estimates, assumptions and judgments having the greatest amount of uncertainty, subjectivity and complexity are related to our accounting for bad debts, returns and allowances, inventory, self-insurance reserves, derivatives, stock-based compensation, deferred tax assets and liabilities and asset impairments. Our actual results may differ materially from the estimates, assumptions and judgments that we use, which could have a material adverse effect on our financial condition and results of operations.
Our internal controls could be negatively impacted if a portion of our workforce continues to work remotely, as new processes, procedures, and controls could be required due to the changes in our business environment, which could negatively impact our internal control over financial reporting.
14
Principal Shareholder
The principal shareholder of Worthington Enterprises may have the ability to exert significant influence in matters requiring a shareholder vote and could delay, deter or prevent a change in control of Worthington Enterprises. Pursuant to the charter documents of Worthington Enterprises, certain matters such as those in which a person would attempt to acquire or take control of Worthington Enterprises, must be approved by the vote of the holders of common shares representing at least 75% of Worthington Enterprises’ outstanding voting power. Approximately 35% of the outstanding common shares are beneficially owned, directly or indirectly, by John P. McConnell, our former Executive Chairman. As a result of his beneficial ownership of these common shares, Mr. McConnell may have the ability to exert significant influence in these matters and other proposals upon which shareholders may vote.
Employees
The loss of, or inability to attract and retain, qualified personnel could adversely affect our business. Our ability to successfully operate, grow our business and implement our business strategies is largely dependent on the efforts, abilities and services of our employees. The loss of employees or our inability to attract, train and retain additional personnel could reduce the competitiveness of our business or otherwise impair our operations or prospects. Our future success will also depend, in part, on our ability to attract and retain qualified personnel, including engineers and other skilled technicians, who have experience in the application of our products and are knowledgeable about our business, markets and products.
The loss of senior management or other key employees, or effective succession planning strategies may have a material adverse impact on our business. We cannot assure that we will be able to retain our existing senior management personnel or other key employees or attract additional qualified personnel when needed. The loss of any member of our management team and the failure to find qualified replacements and effectively transition any successors could adversely impact our business and operations. We have not entered into any formal employment contracts with or other stand-alone change in control agreements relative to our executive officers. However, we do have certain change in control provisions in our various compensation plans. We may modify our management structure from time to time or reduce our overall workforce, which may create marketing, operational and other business risks.
Credit Ratings
Ratings agencies may downgrade our credit ratings, which may make it more difficult for us to raise capital and could increase our financing costs. Any downgrade in our credit ratings may make raising capital more difficult, may increase the cost and affect the terms of future borrowings, may affect the terms under which we purchase goods and services and may limit our ability to take advantage of potential business opportunities. In addition, the interest rate on the Credit Facility is tied to our credit ratings, and any downgrade of our credit ratings would likely result in an increase in the cost of borrowings under the Credit Facility.
Difficult Financial Markets
If we are required to raise capital in the future, we could face higher borrowing costs, less available capital, more stringent terms and tighter covenants or, in extreme conditions, an inability to raise capital. Although we currently have cash reserves, as well as adequate borrowing availability under the Credit Facility and should be able to access other capital if needed, should the Credit Facility become unavailable due to covenant or other defaults, or should financial markets tighten so that we otherwise cannot raise capital outside the Credit Facility, or the terms under which we do so change, we may be negatively impacted. Any adverse change in our access to capital or the terms of our borrowings, including increased costs, could have a negative impact on our financial condition.
Information Regarding Future Performance
We may release information or guidance regarding our anticipated future performance and such information or guidance may prove to be inaccurate. Such information or guidance, which consists of forward-looking statements, is qualified by and subject to various assumptions and estimates, including the information included in our annual reports on Form 10-K and our quarterly reports on Form 10-Q. Such assumptions and estimates are inherently subject to a variety of uncertainties and contingencies, many of which are beyond our control and are based upon expectations with respect to future decisions, some of which will change. Guidance is necessarily speculative in nature, and it can be expected that some or all of the assumptions of the guidance furnished by us will not materialize or will vary significantly from actual results. Accordingly, our guidance is only an estimate of what management believes is realizable as of the date of release. Actual results will vary from the guidance. Any failure to successfully implement our operating strategy or the occurrence of any of the risks described in our annual reports on Form 10-K or our quarterly reports on Form 10-Q could cause actual operating results to differ from the guidance, and such differences may be adverse and material. Accordingly, investors are urged not to place undue reliance on guidance.
15
Environmental, Health and Safety
We may incur additional costs related to environmental and health and safety matters. Our operations and facilities are subject to a variety of federal, state, local and foreign laws and regulations relating to the protection of the environment and human health and safety. Compliance with these laws and regulations and any changes therein may sometimes involve substantial operating costs and capital expenditures, and any failure to maintain or achieve compliance with these laws and regulations or with the permits required for our operations could result in increased costs and capital expenditures and potentially fines and civil or criminal sanctions, third-party claims for property damage or personal injury, cleanup costs or temporary or permanent discontinuance of operations. Over time, we and predecessor operators of our facilities have generated, used, handled and disposed of hazardous and other regulated wastes. Environmental liabilities, including cleanup obligations, could exist at our facilities or at off-site locations where materials from our operations were disposed of or at facilities we have divested, which could result in future expenditures that cannot be currently quantified and which could reduce our profits and cash flow. We may be held strictly liable for any contamination of these sites, and the amount of any such liability could be material. Under the joint and several liability principle of certain environmental laws, we may be held liable for all remediation costs at a particular site, even with respect to contamination for which we are not responsible. In addition, changes in environmental and human health and safety laws, rules, regulations or enforcement policies could have a material adverse effect on our business, financial condition or results of operations.
Seasonality
Our operations have historically been subject to seasonal fluctuations that may impact our cash flows for a particular period. Our sales are generally strongest in the third and fourth quarter of the fiscal year for our Consumer Products operating segment when our facilities perform at seasonal peaks, matching consumer demand. Sales in our Building Products operating segment are generally stronger in the first and fourth quarters of our fiscal year due to weather conditions, customer business cycles, and the timing of renovation and construction projects. Our quarterly results may also be affected by the timing of large customer orders. Consequently, our cash flow from operations may fluctuate significantly from quarter to quarter. If, as a result of any such fluctuation, our quarterly cash flows were significantly reduced, we may be unable to service our indebtedness or maintain compliance with certain covenants under the documents governing our indebtedness. A default under any of the documents governing our indebtedness could prevent us from borrowing additional funds, limit our ability to pay interest or principal and allow our lenders to declare the amounts outstanding to be immediately due and payable and to exercise certain other remedies.
Risks Related to the Separation and Our Relationship with Worthington Steel
The Separation may not achieve the anticipated benefits and may expose us to additional risk.
We may not realize the anticipated strategic, financial, operational or other benefits of the Separation. We cannot predict with certainty when the benefits expected from the Separation will occur or the extent to which they will be achieved. There is no assurance that following the Separation each separate company will be successful. We may face material challenges in connection with the Separation, including but not limited to, the impact of having to operate under the terms of transition service agreements; the impact on our ability to retain talent; and potential impacts on our relationships with customers, suppliers, employees and other counterparties. In addition, we have incurred one-time costs and may incur ongoing costs in connection with, or as a result of, the Separation, including costs of operating as independent, publicly-traded companies that the separate businesses are no longer be able to share. Those costs may exceed our estimates or could negate some of the benefits we expect to realize.
If the Distribution, together with certain related transactions, fails to qualify as a reorganization under Sections 355 and 368(a)(1)(D) of the Code, Worthington Enterprises and its shareholders could incur significant tax liabilities.
The Distribution was conditioned upon, among other things, our receipt of an opinion of Latham & Watkins LLP, tax counsel to Worthington, regarding the qualification of the Distribution, together with certain related transactions, as a reorganization under Sections 355 and 368(a)(1)(D) of the Code. The opinion of tax counsel was based on, among other things, certain factual assumptions, representations and undertakings from Worthington Enterprises and Worthington Steel, including those regarding the past and future conduct of the companies’ respective businesses and other matters. If any of these factual assumptions, representations, or undertakings are incorrect or not satisfied, we may not be able to rely on the opinion, and Worthington Enterprises and its shareholders could be subject to significant U.S. federal income tax liabilities. In addition, the opinion of tax counsel will not be binding on the IRS or the courts, and, notwithstanding the opinion of tax counsel, the IRS could determine on audit that the Distribution does not so qualify or that the Distribution should be taxable for other reasons, including as a result of a significant change in stock or asset ownership after the Distribution.
16
If the Distribution is ultimately determined not to qualify as a reorganization under Sections 355 and 368(a)(1)(D) of the Code, the Distribution could be treated as a taxable disposition of common shares of Worthington Steel by Worthington Enterprises and as a taxable dividend or capital gain to the shareholders of Worthington Enterprises for U.S. federal income tax purposes. In such case, Worthington Enterprises and its shareholders that are subject to U.S. federal income tax could incur significant U.S. federal income tax liabilities.
In addition, governments could change their existing tax laws, impose new taxes on us or increase the rates at which we are taxed in the future. The payment of substantial additional taxes, penalties or interest resulting from tax assessments, or the imposition of any new taxes, could materially and adversely impact our results of operations and financial condition. For example, the current administration has previously proposed to increase the federal corporate income tax rate and, if any such proposal were to be adopted, then the increase in the federal corporate income tax rate would adversely affect our results of operations in future periods.
General Risks
General Economic or Industry Downturns and Weakness
Our industries are cyclical and weakness or downturns in the general economy or certain industries could have an adverse effect on our business. If the domestic or global economies, or certain industry sectors of those economies that are key to our sales, contract or deteriorate, it could result in a corresponding decrease in demand for our products and negatively impact our results of operations and financial conditions.
Volatility in the U.S. and worldwide capital and credit markets could impact our end markets and result in negative impacts on demand, increased credit and collection risks and other adverse effects on our businesses. The domestic and worldwide capital and credit markets have experienced significant volatility, disruptions and dislocations with respect to price and credit availability. These factors caused diminished availability of credit and other capital in our end markets, and for participants in, and the customers of, those markets. The effects of the financial crisis, recent bank failures, concerns over the economic impact of COVID-19, the war in Ukraine and inflationary pressures, continue to present risks to us, our customers or our suppliers. In particular, there is no guarantee that the credit markets or liquidity will not once again be restricted. Stricter lending standards may make it more difficult and costly for some firms to access the credit markets. Further, uncertainties in Europe, especially in light of the war in Ukraine, regarding the financial sector and sovereign debt and the potential impact on banks in other regions of the world will continue to weigh on global and domestic growth. Although we believe we have adequate access to several sources of contractually committed borrowings and other available credit facilities, these risks could restrict our ability to borrow money on acceptable terms in the credit markets and potentially affect our ability to draw on the Credit Facility. In addition, restricted access to the credit markets could make it difficult, or in some cases, impossible for our suppliers and customers to borrow money to fund their operations. Lack of, or limited access to, capital would adversely affect our suppliers’ ability to produce the materials we need for our operations and our customers’ ability to purchase our products or, in some cases, to pay for our products on a timely basis.
Tax Laws and Regulations
Tax increases or changes in tax laws or regulations could adversely affect our financial results. We are subject to tax and related obligations in the jurisdictions in which we operate or do business, including state, local, federal and non-U.S. taxes. The taxing rules of the various jurisdictions in which we operate or do business often are complex and subject to varying interpretations. Tax authorities may challenge tax positions that we take or historically have taken and may assess taxes where we have not made tax filings or may audit the tax filings we have made and assess additional taxes. Some of these assessments may be substantial, and also may involve the imposition of penalties and interest.
In addition, governments could change their existing tax laws, impose new taxes on us or increase the rates at which we are taxed in the future. The payment of substantial additional taxes, penalties or interest resulting from tax assessments, or the imposition of any new taxes, could materially and adversely impact our results of operations and financial condition. For example, the current administration has previously proposed to increase the federal corporate income tax rate and, if any such proposal were to be adopted, then the increase in the federal corporate income tax rate would adversely affect our results of operations in future periods.
17
Legislation and Regulations
Certain proposed legislation and regulations may have an adverse impact on the economy in general and in our markets specifically, which may adversely affect our businesses. Our businesses may be negatively impacted by a variety of new or proposed legislation or regulations. For example, legislation and regulations proposing increases in taxation on, or heightened regulation of, greenhouse gas emissions may result in higher prices for steel, higher prices for utilities required to run our facilities, higher fuel costs for us and our suppliers and distributors, limitations on our ability to produce, use or sell certain products and other adverse impacts. To the extent that new legislation or regulations increase our costs, we may not be able to fully pass these costs on to our customers without a resulting decline in sales and adverse impact to our profits. Likewise, to the extent new legislation or regulations would have an adverse effect on the economy, our markets or the ability of domestic businesses to compete against foreign operations, we could also be adversely impacted.
Changes to global data privacy laws and cross-border transfer requirements could adversely affect our businesses and operations. Our businesses depend on the transfer of data between our affiliated entities, to and from our business partners, and with third-party service providers, which may be subject to global data privacy laws and cross-border transfer restrictions. For example, the European Union has implemented the GDPR, which contains numerous requirements that must be complied with in connection with how we handle personal data related to our European-based operations and individuals. A number of U.S. states have also introduced and passed legislation to expand data breach notification rules and to mirror some of the protections provided by GDPR. While we take steps to comply with these legal requirements, the volatility and changes to the applicability of those laws may impact our ability to effectively transfer data across borders in support of our business operations. Compliance with GDPR, or other regulatory standards, could also increase our cost of doing business and/or force us to change our business practices in a manner adverse to our businesses. In addition, violations of GDPR, or other data security and privacy regulations, may result in significant fines, penalties and damage to our brands and businesses which could, individually or in the aggregate, materially harm our businesses and reputation.
Significant changes to the U.S. federal government’s trade policies, including new tariffs or the renegotiation or termination of existing trade agreements and/or treaties, may adversely affect our financial performance. In recent years, the U.S. federal government has altered U.S. international trade policy and has indicated its intention to renegotiate or terminate certain existing trade agreements and treaties with foreign governments. The U.S. federal government’s decision to implement new trade agreements, and/or withdraw or materially modify other existing trade agreements or treaties may adversely impact our business, customers and/or suppliers by disrupting trade and commercial transactions and/or adversely affect the U.S. economy or specific portions thereof.
Additionally, the U.S. federal government has imposed tariffs on certain foreign goods, including on certain steel products imported into the U.S. Although such steel tariffs may benefit portions of our business, these tariffs, as well as country-specific or product-specific exemptions, may also lead to steel price fluctuations and retaliatory actions from foreign governments and/or modifications to the purchasing patterns of our customers that could adversely affect our business. Restrictions on trade with foreign countries, imposition of customs duties or further modifications to U.S. international trade policy have the potential to disrupt our supply chain or the supply chains of our customers and to adversely impact demand for our products, our costs, customers, suppliers and/or the U.S. economy or certain sectors thereof, potentially leading to negative effects on our business and financial condition.
Impairment Charges
Weakness or instability in the general economy, our markets or our results of operations could result in future asset impairments, which would reduce our reported earnings and net worth. Economic conditions remain fragile in some markets and the possibility remains that the domestic or global economies, or certain industry sectors that are key to our sales, may deteriorate. If certain of our operating segments are adversely affected by challenging economic and financial conditions, we may be required to record future impairments, which would negatively impact our results of operations.
Item 1B. — Unresolved Staff Comments
None.
18
Item 1C. — Cybersecurity
We have developed a cybersecurity program for identifying and mitigating risks to our information and information systems, including guarding against increased cybersecurity threats. We have a comprehensive cybersecurity program which includes risk management to identify cybersecurity threats that could adversely affect our information systems and compliance.
The Audit Committee has primary responsibility for oversight of cybersecurity matters. The Audit Committee receives quarterly updates on compliance and cybersecurity from the CIO and CISO. These updates, cover a range of topics, including the performance of our cybersecurity program against established goals and external standards, insights into the evolving cybersecurity landscape, current events and recent cybersecurity threats, and enhancements to our cybersecurity program.
The CIO has extensive leadership experience with 25 years of experience in information technology, project management, business applications including manufacturing. The CISO is responsible for overseeing our cybersecurity risk management program, in coordination with the CIO and our other business leaders, including in the legal, internal audit, finance and risk management departments. The CISO has extensive cybersecurity knowledge and skills gained from over 25 years of technical and business experience in the cybersecurity and information security fields. The CISO reports directly to the CIO who in turn reports directly to the Chief Financial Officer. The CISO receives reports on cybersecurity threats on an ongoing basis and, regularly reviews risks to identify and mitigate data protection and cybersecurity risks. The CISO and CIO also work closely with our legal department to oversee compliance with applicable legal, regulatory and contractual security requirements.
We actively maintain an enterprise risk management program that includes information technology and cybersecurity risk management. Management’s role is to identify, mitigate, guide and review the efforts of our business units, consider whether the residual risks are acceptable, and approve plans to address potentially material risks. Cybersecurity is a key risk management category within our enterprise risk management program.
Our cybersecurity program is designed to safeguard against an evolving threat landscape through effective identification, prevention, detection, response and recovery processes. Our cybersecurity risk management processes include frequent assessment of our top cybersecurity risks and mitigations.
Our cybersecurity and risk management program encompasses several key areas consisting of threat and vulnerability management that help to identify, prioritize and reduce cybersecurity gaps or weaknesses. We regularly educate and share best practices with our employees to raise awareness of cybersecurity threats creating a culture where everyone shares responsibility to help protect our sensitive data and information. All employees are regularly provided cybersecurity training and involved in phishing prevention campaigns to raise awareness. Our identity and access management program involves access controls for least privileged access and additional authentication methods. We have many cybersecurity systems including firewalls, intrusion detection systems, continuous monitoring by a full time Security Operation Center to defend against unauthorized access. Incident response exercises are performed using our response and ransomware playbooks ensuring our readiness to response to cybersecurity events. We have a risk management program for our critical third-party vendors focusing on mitigating risks from external sources. Those third-party applications are monitored and access is reviewed including evaluating System and Organization Controls (SOC) reports.
Our cybersecurity program’s effectiveness is based on recognized best practices, standards, and frameworks for cybersecurity and information technology, including periodic evaluation against established quantifiable goals and other external benchmarks, including the Center for Internet Security (CIS), the National Institute of Standards and Technology (NIST) and several other security frameworks. The evaluation is conducted through periodic internal and external risk assessments and compliance audits. We regularly engage third parties in order to help conduct evaluations and assessments and to advise us on the effectiveness of our cybersecurity program.
To date, the risks from cybersecurity threats, including as a result of any previous cybersecurity incidents, have not materially affected, and are not reasonably likely to materially affect us or our strategy, financial condition, liquidity or results of operations. It is possible that we may not implement appropriate controls if we do not detect a particular risk. In addition, security controls, no matter how well designed or implemented, may only mitigate and not fully eliminate the risks. Even when a risk is detected, disruptive events may not always be immediately and thoroughly interpreted and acted upon.
19
Item 2. — Properties
Our principal corporate offices are located in an owned building in Columbus, Ohio, which also houses the principal corporate offices of our reportable segments. We also own three facilities in Columbus, Ohio used for administrative and medical purposes. At May 31, 2024, including our consolidated and unconsolidated joint ventures, we owned or leased more than 4,000,000 square feet of space for operations, most of which is dedicated to manufacturing facilities. More details on these facilities are contained in the table below. We believe these facilities are well maintained and in good operating condition and are sufficient to meet our current needs. All of the locations we operate facilitate manufacturing and/or distribution activities.
Operating Segments
Operating Segment |
|
Location |
|
Number of facilities |
|
Leased |
|
|
Owned |
|
||
Consumer Products |
|
Kansas (2), New Jersey, Wisconsin |
|
4 |
|
2 |
|
|
2 |
|
||
Building Products |
|
Kentucky, Maryland, Ohio (3), Rhode Island, Norway, Portugal |
|
8 |
|
|
1 |
|
|
7 |
|
|
|
|
Total |
|
12 |
|
|
3 |
|
|
|
9 |
|
Consolidated Joint Venture
Joint Venture |
|
Location |
|
Number of facilities |
|
|
Leased |
|
Owned |
|
||
Halo |
|
Kentucky |
|
|
1 |
|
|
1 |
|
|
- |
|
|
|
Total |
|
1 |
|
|
1 |
|
|
- |
|
|
Unconsolidated Joint Ventures
Joint Venture |
|
Location |
|
Number of facilities |
|
|
Leased |
|
|
Owned |
|
|||
ClarkDietrich |
|
California (2), Connecticut, Georgia, Illinois, Maryland, Missouri, Florida (2), Ohio (2), Texas (2), Canada |
|
14 |
|
|
12 |
|
|
2 |
|
|||
Sustainable Energy Solutions |
|
Austria, Germany, Poland |
|
3 |
|
|
|
- |
|
|
|
3 |
|
|
WAVE |
|
California (2), Georgia, Maryland (2), Michigan, Nevada |
|
7 |
|
|
5 |
|
|
2 |
|
|||
Workhorse |
|
Minnesota, South Dakota, Tennessee |
|
3 |
|
|
3 |
|
|
|
- |
|
||
|
|
Total |
|
|
27 |
|
|
|
20 |
|
|
|
7 |
|
Item 3. — Legal Proceedings
We are involved in various judicial and administrative proceedings, as both plaintiff and defendant, arising in the ordinary course of business. We do not believe that any such proceedings, individually and in the aggregate, will have a material adverse effect on our business, financial position, results of operation or cash flows.
Item 4. — Mine Safety Disclosures
Not applicable.
20
Supplemental Item — Executive Officers of Worthington Enterprises
The following table lists the names, ages, positions and term of present office of the individuals serving as executive officers of Worthington Enterprises as of July 30, 2024.
Name |
Age |
Position(s) with the Registrant |
Present Office Held Since |
B. Andrew Rose |
54 |
President and Chief Executive Officer |
2020 |
Joseph B. Hayek |
52 |
Executive Vice President and Chief Financial and Operations Officer |
2023 |
James R. Bowes |
41 |
President – Building Products |
2023 |
Steven M. Caravati |
42 |
President – Consumer Products |
2021 |
Sonya L. Higginbotham |
48 |
Senior Vice President & Chief of Corporate Affairs, Communications & Sustainability |
2023 |
Kevin J. Chan |
42 |
Vice President – Corporate Controller |
2023 |
Patrick J. Kennedy |
43 |
Vice President – General Counsel and Secretary |
2021 |
B. Andrew (“Andy”) Rose has served as Chief Executive Officer of Worthington Enterprises since September 2020 and President since August 2018. Mr. Rose served as Chief Financial Officer of Worthington Enterprises on an interim basis from August 2018 to November 2018. Mr. Rose served as Executive Vice President and Chief Financial Officer of Worthington Enterprises from July 2014 to August 2018 and as Vice President and Chief Financial Officer of Worthington Enterprises from December 2008 to July 2014. From 2007 to 2008, Mr. Rose served as a senior investment professional with MCG Capital Corporation, a publicly-traded company specializing in debt and equity investments in middle market companies. From 2002 to 2007, Mr. Rose was a founding partner at Peachtree Equity Partners, L.P., a private equity firm backed by Goldman Sachs.
Joseph B. Hayek has served as Executive Vice President and Chief Financial and Operations Officer of Worthington Enterprises since December 2023. Mr. Hayek served as Worthington Enterprises’ Vice President and Chief Financial Officer from November 2018 to November 2023. Mr. Hayek served as Vice President and General Manager of our oil and gas equipment business unit from March 2017 to November 2018. From April 2014 to March 2017, Mr. Hayek served as Worthington Enterprises’ Vice President – Mergers & Acquisitions and Corporate Development. Prior to joining us, Mr. Hayek served as President of Sarcom, Inc. (n/k/a PCM Sales, Inc.), a value-added IT solutions provider and the largest division of PCM, Inc.
James R. Bowes has served as President of Worthington Enterprises’ Building Products operating segment since December 2023. Mr. Bowes served as Vice President and General Manager of Worthington Enterprises’ Building Products operating segment from November 2022 to December 2023. Mr. Bowes served as General Manager of Worthington Cylinder Corporation’s low pressure business unit from October 2019 to November 2022. Mr. Bowes joined us in 2009 and served in numerous finance and other capacities from 2009 to 2019. Prior to joining us, Mr. Bowes spent three years in public accounting with Ernst & Young.
Steven M. Caravati has served as President of Worthington Enterprises’ Consumer Products operating segment since June 2021. Mr. Caravati served as General Manager of Worthington Cylinder Corporation’s consumer products business unit from June 2019 to May 2021 and Director of Sales for the consumer products business unit from July 2014 to May 2019. Mr. Caravati joined us in 2005 and served in numerous sales capacities from 2005 to 2014.
Sonya L. Higginbotham has served as Senior Vice President and Chief of Corporate Affairs, Communications and Sustainability of Worthington Enterprises since December 2023. Ms. Higginbotham served as Vice President of Corporate Communications & Brand Management of Worthington Enterprises from September 2018 to December 2023. Ms. Higginbotham served as Director of Corporate Communications of Worthington Enterprises from November 2006 to September 2018. Ms. Higginbotham joined us in 1997 and served in numerous communications capacities from 1997 to 2006.
Kevin J. Chan has served as Vice President – Corporate Controller and the principal accounting officer of Worthington Enterprises since December 2023. Mr. Chan served as Director of Financial Reporting of Worthington Enterprises from November 2017 to November 2023 and Manager of Financial Reporting from November 2010 to November 2017. Prior to joining us in 2010, Mr. Chan served as Manager, External Reporting & Technical Accounting of Cardinal Health for two years and spent the three years prior in public accounting with KPMG LLP.
Patrick J. Kennedy has served as Worthington Enterprises’ Vice President – General Counsel and Secretary since January 2021. Mr. Kennedy served as Corporate Counsel of Worthington Enterprises from June 2018 to December 2020, and was a participant in the Worthington Industries Rotational Experience and Development (WIRED) program from June 2016 to May 2018. Prior to joining us, Mr. Kennedy was a partner with the law firm Ice Miller LLP, where he was a member of the firm’s business law group.
21
Executive officers serve at the pleasure of the Board. There are no family relationships among any of Worthington Enterprises’ executive officers or directors. No arrangements or understandings exist pursuant to which any individual has been, or is to be, selected as an executive officer of Worthington Enterprises.
PART II
Item 5. — Market for Registrant's Common Equity, Related Stockholder Matters and Issuer Purchases of Equity Securities
Common Shares Information
The common shares trade on the NYSE under the symbol WOR. As of July 24, 2024, Worthington Enterprises had 5,907 registered shareholders.
The Board reviews the declaration and payment of a dividend on a quarterly basis and establishes the dividend rate based upon Worthington Enterprises’ financial condition, results of operations, capital requirements, current and projected cash flows, business prospects and other factors which the directors may deem relevant. While Worthington Enterprises has paid a dividend every quarter since becoming a public company in 1968, there is no guarantee this will continue in the future. We currently have no material contractual or regulatory restrictions on the payment of dividends.
For additional information on the Worthington Enterprises dividend policy, see “Part II – Item 7. – Management’s Discussion and Analysis of Financial Condition and Results of Operations – Dividend Policy.”
Shareholder Return Performance
The following information in this Item 5 of this Form 10-K is not deemed to be “soliciting material” or to be “filed” with the SEC or subject to Regulation 14A or Regulation 14C under the Exchange Act, or to the liabilities of Section 18 of the Exchange Act, and will not be deemed to be incorporated by reference into any filing under the Securities Act or the Exchange Act, except to the extent we specifically incorporate such information into such a filing.
The following stock performance graph and table compare the cumulative total stockholder return on the common shares with the cumulative total return of the S&P SmallCap 600 Index and the S&P SmallCap 600 Industrials Index for each of the last five fiscal years ended May 31, 2024, assuming an investment of $100 at the beginning of such period and the reinvestment of any dividends. Our Annual Report on Form 10-K for the fiscal year ended May 31, 2023, included a comparison to the cumulative total return of the S&P Midcap 400 Index and the S&P 1500 Steel Composite Index. Consequently, pursuant to SEC rules, we have also included those indices in the following graph and table. Following the Separation, we transitioned to the S&P SmallCap 600 Index and the S&P SmallCap 600 Industrials Index, as we believe the S&P SmallCap 600 Index and the S&P SmallCap 600 Industrials Index better represent our relative peer group based on the composition of our current business and our market capitalization. The historical prices presented in the graph and table have been adjusted to reflect the impact of the Separation. The comparisons in the graph and table below are based upon historical data and are not indicative of, nor intended to forecast, the future performance of the common shares.
22
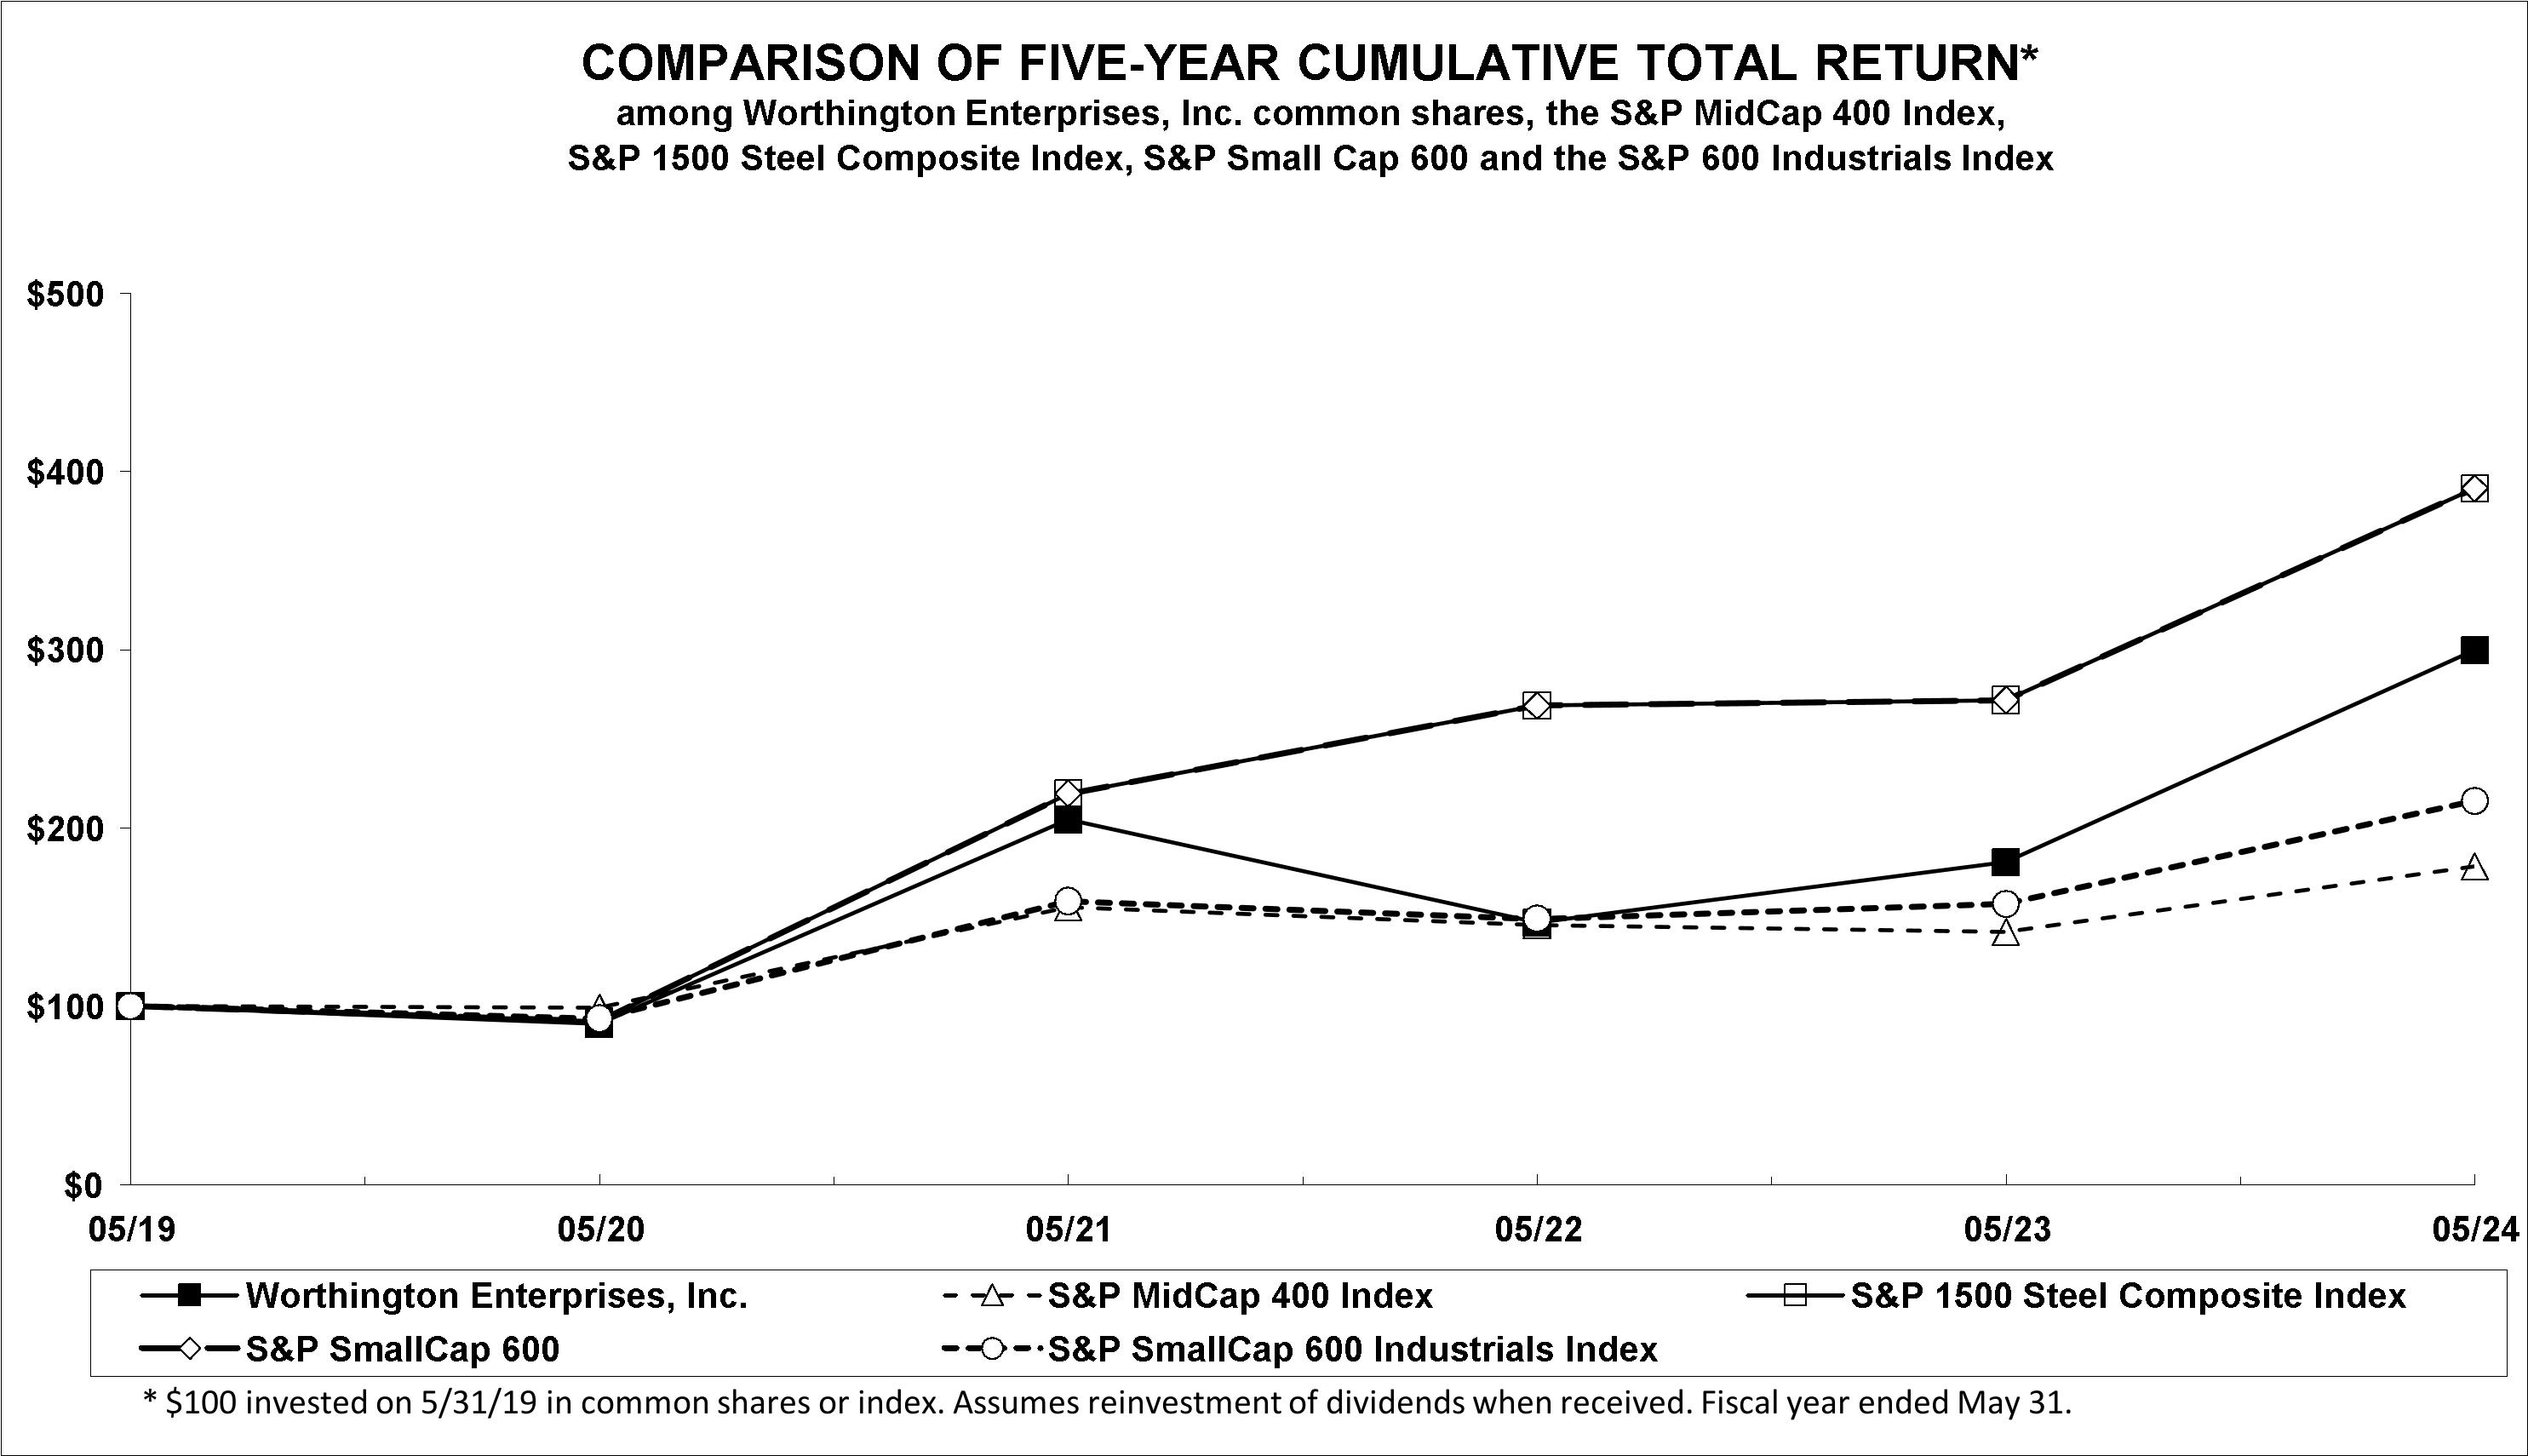
|
|
5/19 |
|
|
5/20 |
|
|
5/21 |
|
|
5/22 |
|
|
5/23 |
|
|
5/24 |
|
|
||||||||||||
Worthington Enterprises, Inc. |
|
$ |
|
100.00 |
|
|
$ |
|
90.21 |
|
|
$ |
|
204.56 |
|
|
$ |
|
146.65 |
|
|
$ |
|
180.80 |
|
|
$ |
|
299.63 |
|
|
S&P SmallCap 600 |
|
$ |
|
100.00 |
|
|
$ |
91.89 |
|
|
$ |
|
159.03 |
|
|
$ |
145.15 |
|
|
$ |
134.62 |
|
|
$ |
161.99 |
|
|
||||
S&P SmallCap 600 Industrials Index |
|
$ |
|
100.00 |
|
|
$ |
|
93.01 |
|
|
$ |
|
158.92 |
|
|
$ |
|
149.00 |
|
|
$ |
|
157.43 |
|
|
$ |
|
215.14 |
|
|
S&P Midcap 400 Index |
|
$ |
|
100.00 |
|
|
$ |
|
99.19 |
|
|
$ |
|
155.50 |
|
|
$ |
|
145.36 |
|
|
$ |
|
141.54 |
|
|
$ |
|
178.30 |
|
|
S&P 1500 Steel Composite Index |
|
$ |
|
100.00 |
|
|
$ |
|
91.36 |
|
|
$ |
|
219.17 |
|
|
$ |
|
268.45 |
|
|
$ |
|
271.60 |
|
|
$ |
|
390.36 |
|
|
Data and graph provided by Zacks Investment Research, Inc. Copyright© 2024, Standard & Poor’s, a division of The McGraw-Hill Companies, Inc. All rights reserved. Used with permission.
Unregistered Sales of Equity Securities
There were no equity securities of Worthington Enterprises sold by Worthington Enterprises during fiscal 2024 that were not registered under the Securities Act.
23
Issuer Purchases of Equity Securities
Common shares withheld to cover tax withholding obligations in connection with the vesting of restricted common shares are treated as common share repurchases. Those withheld common shares are not considered common share repurchases under an authorized common share repurchase plan or program. The table below provides information regarding common shares withheld from our employees to satisfy minimum statutory tax withholding obligations arising from the vesting of restricted common shares.
|
|
|
|
|
|
|
|
Total Number of |
|
|
|
|
||||
|
|
|
|
|
|
|
|
Common Shares |
|
|
|
|
||||
|
|
|
|
|
|
|
|
Purchased as |
|
|
Maximum Number of |
|
||||
|
|
Total Number |
|
|
Average Price |
|
|
Part of Publicly |
|
|
Common Shares that |
|
||||
|
|
of Common |
|
|
Paid per |
|
|
Announced |
|
|
May Yet Be |
|
||||
|
Shares |
|
|
Common |
|
|
Plans or |
|
|
Purchased Under the |
|
|||||
Period |
|
Purchased |
|
|
Share |
|
|
Programs (1) |
|
|
Plans or Programs (2) |
|
||||
March 1-31, 2024 |
|
6,085 |
|
|
$ |
62.12 |
|
|
|
- |
|
|
|
6,065,000 |
|
|
April 1-30, 2024 |
|
2,433 |
|
|
|
58.55 |
|
|
|
- |
|
|
|
6,065,000 |
|
|
May 1-31, 2024 |
|
- |
|
|
|
- |
|
|
|
- |
|
|
|
6,065,000 |
|
|
Total |
|
|
8,518 |
|
|
$ |
60.34 |
|
|
|
- |
|
|
|
|
|
|
Item 6. — Reserved
24
Item 7. — Management’s Discussion and Analysis of Financial Condition and Results of Operations
Selected statements contained in this MD&A constitute forward-looking statements, as that term is used in the PSLRA. Such forward-looking statements are based, in whole or in part, on management’s beliefs, estimates, assumptions and currently available information. For a more detailed discussion of what constitutes a forward-looking statement and of some of the factors that could cause actual results to differ materially from such forward-looking statements, please refer to the “Cautionary Note Regarding Forward-Looking Statements” at the beginning of this Form 10-K and “Part I - Item 1A. - Risk Factors” of this Form 10-K.
This MD&A should be read in conjunction with our consolidated financial statements and the related Notes in this Form 10-K. This MD&A is designed to provide a reader with material information relevant to an assessment of our financial condition and results of operations and to allow investors to view the Company from the perspective of management. This MD&A is divided into seven main sections:
Business Overview
Founded in 1955 as Worthington Industries, we are one of the leading designers and manufacturers of products sold to consumers, primarily through retail channels, in the tools, outdoor living and celebrations market categories as well as a wide array of highly specialized building products that primarily serve customers in the residential and non-residential construction markets, including ceiling suspension systems and light gauge metal framing products, respectively, through our unconsolidated joint ventures, WAVE and ClarkDietrich, as well as wholly-owned and consolidated operations that produce pressurized containment solutions for heating, cooking and cooling applications, among others. Our business strategy is rooted in our people first culture that values our relationships across the spectrum and revolves around products and services that empower people to live safer, healthier and more expressive lives. We were founded as a value-added steel processor domiciled under the laws of the State of Ohio and have since expanded our offerings to include manufactured metal products organized around attractive end market under two separate and distinct reportable operating segments: Consumer Products and Building Products.
Consumer Products: Our Consumer Products business serves retail customers and end consumers in the tools, outdoor living and celebrations categories under market-leading brands that include the following: Balloon Time®, Bernzomatic®, Coleman® (licensed), Garden-Weasel®, General®, Halo®, Hawkeye™, Level5®, Mag-Torch®, Pactool International®, and Worthington Pro Grade™. These include propane-filled cylinders for torches, camping stoves and other applications, handheld torches, helium-filled balloon kits, specialized hand tools and instruments, drywall tools and accessories and gas grills and pizza ovens sold primarily to mass merchandisers, retailers and distributors. This segment also includes our consolidated joint venture, Halo.
Building Products: Our Building Products business is a market-leading provider of pressurized containment solutions, providing critical components in essential categories, such as heating, cooking, cooling and water, and, through our unconsolidated joint ventures, WAVE and ClarkDietrich, ceiling suspension systems and light gauge metal framing products. Our pressurized containment solutions include refrigerant and LPG cylinders, well water and expansion tanks, and other specialty products which are generally sold to gas producers and distributors. Refrigerant gas cylinders are used to hold refrigerant gases for commercial, residential, and automotive air conditioning and refrigeration systems. LPG cylinders hold fuel for residential and light commercial heating systems, barbeque grills and recreational vehicle equipment, industrial forklifts and commercial/residential cooking (the latter, generally outside North America). Well water tanks and expansion tanks are used primarily in the residential market with certain products also sold to commercial markets. Specialty products include a variety of fire suppression tanks, chemical tanks, and foam and adhesive tanks.
25
Separation of the Steel Processing Business
On December 1, 2023, we completed the Separation of our former steel processing business into a separate public company in a transaction intended to qualify as tax free to our shareholders, which was accomplished via the Distribution. Worthington Steel is an independent public company trading under the symbol “WS” on the NYSE. Following the Separation, Worthington Industries, Inc. changed its name to Worthington Enterprises, Inc. and its common shares continue trading on the NYSE under the ticker symbol “WOR.” In connection with the Separation, we received a one-time cash dividend of $150.0 million from Worthington Steel, the proceeds of which were used to pay off in full the 2024 Notes. The dividend was funded by cash drawn on the Worthington Steel Credit Facility of $175.0 million immediately prior to the Distribution.
Other Business Developments
On May 29, 2024, we became a noncontrolling equity partner in a new unconsolidated joint venture with Hexagon, a leading global manufacturer of Type 4 composite cylinders used for storing gas under high-pressure, by selling 51% of the nominal share capital of our former sustainable energy solutions operating segment in Europe. Pursuant to the transaction, Hexagon acquired a 49% stake in the joint venture for approximately $11.5 million, after adjusting for closing cash and preliminary net working capital, with an additional 2% sold to members of the existing management team for an additional $0.5 million. Post-closing, we hold a 49%, noncontrolling interest in the joint venture, which is accounted for under the equity method due to our significant influence. The newly formed joint venture, which combines two of Europe’s market leaders in composite high-pressure storage technology, will focus on capitalizing on the global clean energy transition specific to the storage, transport and distribution of hydrogen and compressed natural gas.
Our 49% noncontrolling interest does not qualify as a standalone operating segment and therefore will be reported within Other along with unallocated corporate expenses, as discussed further in “Note P – Segment Data.” Additionally, upon closing, our sustainable energy solutions business, as historically operated, is no longer part of our management structure and therefore the financial position and results of operations of this business are presented within Other, on an historical basis, through May 29, 2024.
On February 1, 2024, we acquired an 80% ownership stake in Halo, an affiliate of HPG, an asset-light business with technology-enabled solutions in the outdoor cooking space. The total purchase price was approximately $9.6 million. Refer to “Note Q – Acquisitions” for additional information.
Trends and Factors Impacting our Performance
The following trends and factors have contributed to the results of our consolidated operations, and we anticipate that they will continue to affect our future results.
End Markets and Competition
We sell our products and services to a diverse customer base and a broad range of end markets. These end markets include residential construction, non-residential construction, and repair and remodel, which drives demand in our Building Products operating segment, including WAVE and ClarkDietrich, our unconsolidated joint ventures; and tools, outdoor living, and celebrations which drives demand in our Consumer Products operating segment, including Halo, our consolidated joint venture. Given the broad base of products and services offered, specific competitors vary based on the target industry, product type, service type, size of program and geography. Competition is primarily based on price, product quality, brand recognition, product innovation, and customer service. Sales to one customer within Consumer Products represented 12% of consolidated net sales during fiscal 2024.
General Economic and Market Conditions
U.S. GDP growth rate trends typically reflect the strength of demand and, in many cases, the pricing of our products. An increase in year-over-year U.S. GDP growth rates usually signifies a stronger economy, which often leads to higher demand and pricing for our products. Conversely, a decline in U.S. GDP growth rates generally indicates a weaker economy, resulting in lower demand and pricing for our products. Fluctuations in U.S. GDP growth rates can signal changes in conversion costs related to production and in SG&A.
There remains a high level of uncertainty in the current macroeconomic environment and geopolitical environments, and prolonged inflationary pressures continue to negatively impact the discretionary spending of many of our customers. In addition to inflation, consumer spending habits, including spending for products that we sell, are affected by, among other things, prevailing global economic conditions, the costs of basic necessities and other goods, levels of employment, salaries and wage rates, and prevailing interest rates. In addition, consumer purchasing patterns are generally influenced by consumers’ disposable income, credit availability and debt levels.
26
We also actively monitor other publicly available macroeconomic trends that provide insight into the activity in our end markets, including, but not limited to the ABI, the Dodge Momentum Index, the HMI, steel prices, retail sales, state and local government spending, interest rate environment and inflation metrics. Current macro-economic trends within our end markets are described in additional detail below, as well as selected key indicators for the periods presented.
|
|
|
|
|
|
|
|
|
|
|
2024 vs. |
|
|
2023 vs. |
|
|||||
($ and units in millions) |
|
2024 |
|
|
2023 |
|
|
2022 |
|
|
2023 |
|
|
2022 |
|
|||||
U.S. Residential Construction spend (1) |
|
$ |
930,464 |
|
|
$ |
872,594 |
|
|
$ |
990,265 |
|
|
$ |
57,870 |
|
|
$ |
(117,671 |
) |
U.S. Non-residential Construction Spend (1) |
|
$ |
1,209,329 |
|
|
$ |
1,139,236 |
|
|
$ |
940,399 |
|
|
$ |
70,093 |
|
|
$ |
198,837 |
|
Hot-Rolled Steel ($ per ton) (2) |
|
$ |
866 |
|
|
$ |
889 |
|
|
$ |
1,588 |
|
|
$ |
(23 |
) |
|
$ |
(699 |
) |
Existing Home Sales (units) (1) |
|
|
4.1 |
|
|
|
4.2 |
|
|
|
5.4 |
|
|
|
(0.1 |
) |
|
|
(1.2 |
) |
Authorized Housing Permits (units) (1) |
|
|
1.3 |
|
|
|
1.6 |
|
|
|
1.5 |
|
|
|
(0.3 |
) |
|
|
0.1 |
|
U.S Private Housing Starts (units) (1) |
|
|
1.4 |
|
|
|
1.5 |
|
|
|
2.0 |
|
|
|
(0.1 |
) |
|
|
(0.5 |
) |
HMI |
|
|
45.0 |
|
|
|
50.0 |
|
|
|
69.0 |
|
|
|
(5.0 |
) |
|
|
(19.0 |
) |
ABI |
|
|
42.4 |
|
|
|
51.0 |
|
|
|
53.5 |
|
|
|
(8.6 |
) |
|
|
(2.5 |
) |
Dodge Momentum Index |
|
|
179.0 |
|
|
|
180.5 |
|
|
|
173.6 |
|
|
|
(1.5 |
) |
|
|
6.9 |
|
30 Year Fixed mortgage rates (1) |
|
|
7.03 |
% |
|
|
6.57 |
% |
|
|
5.10 |
% |
|
|
0.46 |
% |
|
|
1.47 |
% |
|
Residential Construction: The residential construction sector has demonstrated positive year-over-year growth, with an overall increase in spending during fiscal 2024. This growth is a significant recovery from the relative low in the spring of 2023. However, new housing starts have shown a downward trend, decreasing from 1.5 million units in fiscal 2023 to 1.4 million units in fiscal 2024. Additionally, the HMI of 45 for May 2024 represented its lowest level since December 2023. Persistently high mortgage rates are keeping many prospective buyers from entering the market. Home builders are also dealing with high interest rates for construction and development loans and chronic labor shortages.
Non-residential Construction: Non-residential construction spending has shown consistent year-over-year growth. However, the near-term outlook is mixed due to a rise in on-hold projects and delayed bids. Commercial real estate remains generally weak, with notable softness for office buildings, partially offset by strong demand for data centers and manufacturing facilities. The ABI continued to decline through May 2024, signaling slowing growth in the months ahead. The higher cost of capital has made it difficult for buyers and sellers to agree on terms and the shift to hybrid work has created additional headwinds for offices, especially central business district properties in major markets. Despite these challenges, the fundamentals in this sector remain strong and are expected to improve if the Federal Reserve reduces interest rates in the second half of 2024.
Repair and Remodel: Spending on home improvement is expected to decline in the near term, as existing home sales are at multi-decade lows and interest rates remain high; however, the long-term outlook remains strong, in part, due to the aging housing stock. The median age of owner-occupied homes in the U.S. is 40 years old. The majority of owner-occupied homes were built before 1980, with around 35% built before 1970. Additionally, homeowners have record levels of equity, which is expected to drive spending in the long-term.
Tools: Spending in the tools end market is largely driven by overall macroeconomic conditions. During fiscal 2024, our sales into this end market were negatively impacted by the persistently high inflationary environment which resulted in a general moderation of consumer spending on non-essential items, leading to lower overall demand from our DIY and professional customers. Customer destocking also continued into fiscal 2024, resulting in lower volumes. Despite short-term headwinds in this end market, we believe that the outlook remains positive as we continue to grow market share with our well-known brands and innovation of new products.
Outdoor Living: Participation in outdoor recreation is beginning to normalize to pre-pandemic levels. This trend is evident in the number of new U.S. camping households, a key metric that measures the influx of first-time campers. After reaching a peak in 2020, driven by the desire for safe, socially-distanced activities during the height of the pandemic, the number has steadily declined. However, the long-term fundamentals in the outdoor living category remain strong, driven by diverse participation across different age groups, socio-economic classes, and geographic regions.
Celebrations: During fiscal 2024, the celebrations end market was affected by several macroeconomic trends. Consumer income and the ratio of debt-to-income showed a gradual recovery, approaching levels observed prior to COVID-19, as well as moderating inflation. Despite these positive signals, there remained uncertainty in the current macroeconomic environment and geopolitical environments. It is anticipated that consumer spending on non-essential items will remain constrained, primarily due to a larger share of income being allocated towards essential purchases and mortgage payments.
27
Results of Operations
Fiscal 2024 Compared to Fiscal 2023
The tables throughout this section present, on a comparative basis, our consolidated results of operations for the past two fiscal years.
|
|
|
|
|
|
|
|
|
|
|
|
Increase/ |
|
|||
(In millions, except per common share amounts) |
2024 |
|
|
2023 |
|
|
(Decrease) |
|
||||||||
Net sales |
$ |
1,245.7 |
|
|
$ |
1,418.5 |
|
|
$ |
(172.8 |
) |
|||||
Operating income (loss) |
|
(73.5 |
) |
|
|
29.8 |
|
|
|
(103.3 |
) |
|||||
Adjusted operating income |
|
20.9 |
|
|
|
77.9 |
|
|
|
(57.0 |
) |
|||||
Net earnings from continuing operations attributable to controlling interest |
|
35.2 |
|
|
|
125.8 |
|
|
|
(90.6 |
) |
|||||
Adjusted EBITDA from continuing operations |
|
251.0 |
|
|
|
306.0 |
|
|
|
(55.0 |
) |
|||||
Equity income |
|
167.7 |
|
|
|
153.3 |
|
|
|
14.4 |
|
|||||
EPS from continuing operations - diluted |
|
0.70 |
|
|
|
2.55 |
|
|
|
(1.85 |
) |
|||||
Adjusted EPS from continuing operations - diluted |
$ |
2.84 |
|
|
$ |
3.60 |
|
|
$ |
(0.76 |
) |
|||||
Net Sales and Volume
The following table provides a breakdown of consolidated net sales by operating segment for the past two fiscal years.
|
|
|
|
|
|
|
|
|
|
|
|
|
% |
|
||||
|
|
|
|
|
|
|
|
|
|
Increase/ |
|
|
Increase |
|
||||
(In millions) |
|
2024 |
|
|
2023 |
|
|
(Decrease) |
|
|
(Decrease) |
|
||||||
Consumer Products |
$ |
495.3 |
|
|
$ |
555.3 |
|
|
$ |
(60.0 |
) |
|
|
(10.8 |
%) |
|||
Building Products |
|
619.0 |
|
|
|
717.1 |
|
|
|
(98.1 |
) |
|
|
(13.7 |
%) |
|||
Total reportable segments |
|
1,114.3 |
|
|
|
1,272.4 |
|
|
|
(158.1 |
) |
|
|
(12.4 |
%) |
|||
Other |
|
|
|
|
131.4 |
|
|
|
146.1 |
|
|
|
(14.7 |
) |
|
|
(10.1 |
%) |
Consolidated |
|
|
|
$ |
1,245.7 |
|
|
$ |
1,418.5 |
|
|
$ |
(172.8 |
) |
|
|
(12.2 |
%) |
The following table provides volume (in units) by reportable segment for the past two fiscal years.
|
|
|
|
|
|
|
|
|
|
|
|
|
% |
|
||||
|
|
|
|
|
|
|
|
|
|
Increase/ |
|
|
Increase |
|
||||
|
|
2024 |
|
|
2023 |
|
|
(Decrease) |
|
|
(Decrease) |
|
||||||
Consumer Products |
|
66,632,148 |
|
|
|
74,137,431 |
|
|
|
(7,505,283 |
) |
|
|
(10.1 |
%) |
|||
Building Products |
|
14,157,050 |
|
|
|
14,629,590 |
|
|
|
(472,540 |
) |
|
|
(3.2 |
%) |
|||
Total reportable segments |
|
80,789,198 |
|
|
|
88,767,021 |
|
|
|
(7,977,823 |
) |
|
|
(9.0 |
%) |
|||
Other |
|
523,169 |
|
|
|
573,853 |
|
|
|
(50,684 |
) |
|
|
(8.8 |
%) |
|||
Consolidated |
|
81,312,367 |
|
|
|
89,340,874 |
|
|
|
(8,028,507 |
) |
|
|
(9.0 |
%) |
|||
28
Gross profit
|
|
|
|
|
% of |
|
|
|
|
|
% of |
|
|
Increase/ |
|
|||||
(In millions) |
|
2024 |
|
|
Net sales |
|
|
2023 |
|
|
Net sales |
|
|
(Decrease) |
|
|||||
Gross profit |
|
$ |
285.0 |
|
|
|
22.9 |
% |
|
$ |
323.6 |
|
|
|
22.8 |
% |
|
$ |
(38.6 |
) |
|
|
|
|
|
% of |
|
|
|
|
|
% of |
|
|
Increase/ |
|
|||||
(In millions) |
|
2024 |
|
|
Net sales |
|
|
2023 |
|
|
Net sales |
|
|
(Decrease) |
|
|||||
Selling, general and administrative expense |
|
$ |
283.5 |
|
|
|
22.8 |
% |
|
$ |
287.1 |
|
|
|
20.2 |
% |
|
$ |
(3.6 |
) |
Other operating items
|
|
|
|
|
|
|
|
|
|
|
|
Increase/ |
|
|||
(In millions) |
2024 |
|
|
2023 |
|
|
(Decrease) |
|
||||||||
Impairment of goodwill and long-lived assets |
$ |
33.0 |
|
|
$ |
0.5 |
|
|
$ |
32.5 |
|
|||||
Restructuring and other expense (income), net |
|
29.3 |
|
|
|
(0.4 |
) |
|
|
29.7 |
|
|||||
Separation costs |
|
12.7 |
|
|
|
6.5 |
|
|
|
6.2 |
|
|||||
Miscellaneous expense, net
|
|
|
|
|
|
|
|
|
|
|
|
Increase/ |
|
|||
(In millions) |
2024 |
|
|
2023 |
|
|
(Decrease) |
|
||||||||
Miscellaneous expense, net |
$ |
17.1 |
|
|
$ |
4.5 |
|
|
$ |
12.6 |
|
|||||
29
Loss on extinguishment of debt
|
|
|
|
|
|
|
|
|
|
|
|
Increase/ |
|
|||
(In millions) |
2024 |
|
|
2023 |
|
|
(Decrease) |
|
||||||||
Loss on extinguishment of debt |
$ |
1.5 |
|
|
$ |
- |
|
|
$ |
1.5 |
|
|||||
Interest expense, net
|
|
|
|
|
|
|
|
|
|
|
|
Increase/ |
|
|||
(In millions) |
2024 |
|
|
2023 |
|
|
(Decrease) |
|
||||||||
Interest expense, net |
$ |
1.6 |
|
|
$ |
18.3 |
|
|
$ |
(16.7 |
) |
|||||
Equity income
|
|
|
|
|
|
|
|
|
|
|
|
Increase/ |
|
|||
(In millions) |
2024 |
|
|
2023 |
|
|
(Decrease) |
|
||||||||
WAVE |
$ |
103.3 |
|
|
$ |
85.9 |
|
|
$ |
17.4 |
|
|||||
ClarkDietrich |
|
59.8 |
|
|
|
80.5 |
|
|
|
(20.7 |
) |
|||||
Workhorse |
|
4.6 |
|
|
|
0.5 |
|
|
|
4.1 |
|
|||||
ArtiFlex |
|
- |
|
|
|
(13.7 |
) |
|
|
13.7 |
|
|||||
Total equity income |
$ |
167.7 |
|
|
$ |
153.2 |
|
|
$ |
14.5 |
|
|||||
Income taxes
|
|
|
|
|
Effective |
|
|
|
|
|
Effective |
|
|
Increase/ |
|
|||||
(In millions) |
|
2024 |
|
|
Tax Rate |
|
|
2023 |
|
|
Tax Rate |
|
|
(Decrease) |
|
|||||
Income tax expense |
|
$ |
39.0 |
|
|
|
52.6 |
% |
|
$ |
34.5 |
|
|
|
21.5 |
% |
|
$ |
4.5 |
|
30
The following table provides a summary of adjusted EBITDA from continuing operations by reportable segment, a non-GAAP financial measure, along with the respective percentage of the total of each reportable segment. See the “Use of Non-GAAP Financial Measures” section preceding Part I, Item 1 of this Form 10-K for additional information regarding our use of non-GAAP financial measures. A reconciliation from earnings before income taxes to adjusted EBITDA from continuing operations is provided in “Note P – Segment Data.”
|
|
|
|
|
Adjusted EBITDA |
|
|
|
|
|
Adjusted EBITDA |
|
|
Increase/ |
|
|||||
(In millions) |
|
2024 |
|
|
Margin |
|
|
2023 |
|
|
Margin |
|
|
(Decrease) |
|
|||||
Consumer Products |
|
$ |
69.6 |
|
|
|
14.1 |
% |
|
$ |
97.4 |
|
|
|
17.5 |
% |
|
$ |
(27.8 |
) |
Building Products |
|
|
210.1 |
|
|
|
33.9 |
% |
|
|
222.2 |
|
|
|
31.0 |
% |
|
|
(12.1 |
) |
Total reportable segments |
|
|
279.7 |
|
|
|
25.1 |
% |
|
|
319.6 |
|
|
|
25.1 |
% |
|
|
(39.9 |
) |
Unallocated Corporate and Other |
|
|
(28.7 |
) |
|
n/a |
|
|
|
(13.6 |
) |
|
n/a |
|
|
|
(15.1 |
) |
||
Consolidated |
|
$ |
251.0 |
|
|
|
20.1 |
% |
|
$ |
306.0 |
|
|
|
21.6 |
% |
|
$ |
(55.0 |
) |
Fiscal 2023 Compared to Fiscal 2022
The tables throughout this section present, on a comparative basis, our consolidated results of operations for fiscal 2022 and fiscal 2023.
|
|
|
|
|
|
|
|
|
|
|
|
Increase/ |
|
|||
(In millions, except per common share amounts) |
2023 |
|
|
2022 |
|
|
(Decrease) |
|
||||||||
Net sales |
$ |
1,418.5 |
|
|
$ |
1,309.2 |
|
|
$ |
109.3 |
|
|||||
Operating income |
|
29.8 |
|
|
|
48.8 |
|
|
|
(19.0 |
) |
|||||
Adjusted operating income |
|
|
|
|
|
|
77.9 |
|
|
|
94.2 |
|
|
|
(16.3 |
) |
Net earnings from continuing operations attributable to controlling interest |
|
125.8 |
|
|
|
157.9 |
|
|
|
(32.1 |
) |
|||||
Adjusted EBITDA from continuing operations |
|
306.0 |
|
|
|
335.0 |
|
|
|
(29.0 |
) |
|||||
Equity income |
|
153.3 |
|
|
|
183.9 |
|
|
|
(30.6 |
) |
|||||
EPS from continuing operations - diluted |
|
2.55 |
|
|
|
3.10 |
|
|
|
(0.55 |
) |
|||||
Adjusted EPS from continuing operations - diluted |
$ |
3.60 |
|
|
$ |
3.78 |
|
|
$ |
(0.18 |
) |
|||||
Net Sales and Volume
The following table provides a breakdown of consolidated net sales by operating segment for fiscal 2023 and fiscal 2022.
|
|
|
|
|
|
|
|
|
|
|
|
|
% |
|
||||
|
|
|
|
|
|
|
|
|
|
Increase/ |
|
|
Increase |
|
||||
(In millions) |
|
2023 |
|
|
2022 |
|
|
(Decrease) |
|
|
(Decrease) |
|
||||||
Consumer Products |
|
|
|
$ |
555.3 |
|
|
$ |
504.9 |
|
|
$ |
50.4 |
|
|
|
10.0 |
% |
Building Products |
|
|
|
|
717.1 |
|
|
|
673.3 |
|
|
|
43.8 |
|
|
|
6.5 |
% |
Total reportable segments |
|
|
|
|
1,272.4 |
|
|
|
1,178.2 |
|
|
|
94.2 |
|
|
|
8.0 |
% |
Other |
|
|
|
|
146.1 |
|
|
|
131.0 |
|
|
|
15.1 |
|
|
|
11.5 |
% |
Consolidated |
|
|
|
$ |
1,418.5 |
|
|
$ |
1,309.2 |
|
|
$ |
109.3 |
|
|
|
8.3 |
% |
31
The following table provides volume (in units) by reportable segment for fiscal 2023 and fiscal 2022.
|
|
|
|
|
|
|
|
|
|
|
|
|
% |
|
||||
|
|
|
|
|
|
|
|
|
|
Increase/ |
|
|
Increase |
|
||||
|
|
2023 |
|
|
2022 |
|
|
(Decrease) |
|
|
(Decrease) |
|
||||||
Consumer Products |
|
74,137,431 |
|
|
|
77,976,662 |
|
|
|
(3,839,231 |
) |
|
|
(4.9 |
%) |
|||
Building Products |
|
14,629,590 |
|
|
|
16,123,609 |
|
|
|
(1,494,019 |
) |
|
|
(9.3 |
%) |
|||
Total reportable segments |
|
88,767,021 |
|
|
|
94,100,271 |
|
|
|
(5,333,250 |
) |
|
|
(5.7 |
%) |
|||
Other |
|
573,853 |
|
|
|
610,811 |
|
|
|
(36,958 |
) |
|
|
(6.1 |
%) |
|||
Consolidated |
|
89,340,874 |
|
|
|
94,711,082 |
|
|
|
(5,370,208 |
) |
|
|
(5.7 |
%) |
|||
Gross profit
|
|
|
|
|
% of |
|
|
|
|
|
% of |
|
|
Increase/ |
|
|||||
(In millions) |
|
2023 |
|
|
Net sales |
|
|
2022 |
|
|
Net sales |
|
|
(Decrease) |
|
|||||
Gross profit |
|
$ |
323.6 |
|
|
|
22.8 |
% |
|
$ |
327.6 |
|
|
|
25.0 |
% |
|
$ |
(4.0 |
) |
Selling, general and administrative expense
|
|
|
|
|
% of |
|
|
|
|
|
% of |
|
|
Increase/ |
|
|||||
(In millions) |
|
2023 |
|
|
Net sales |
|
|
2022 |
|
|
Net sales |
|
|
(Decrease) |
|
|||||
Selling, general and administrative expense |
|
$ |
287.1 |
|
|
|
20.2 |
% |
|
$ |
281.4 |
|
|
|
21.5 |
% |
|
$ |
5.7 |
|
Other operating items
|
|
|
|
|
|
|
|
|
|
|
|
Increase/ |
|
|||
(In millions) |
2023 |
|
|
2022 |
|
|
(Decrease) |
|
||||||||
Impairment of long-lived assets |
$ |
0.5 |
|
|
$ |
- |
|
|
$ |
0.5 |
|
|||||
Restructuring and other income, net |
|
(0.4 |
) |
|
|
(2.6 |
) |
|
|
2.2 |
|
|||||
Separation costs |
|
6.5 |
|
|
|
- |
|
|
|
6.5 |
|
|||||
32
Miscellaneous income (expense), net
|
|
|
|
|
|
|
|
|
|
|
|
Increase/ |
|
|||
(In millions) |
2023 |
|
|
2022 |
|
|
(Decrease) |
|
||||||||
Miscellaneous expense (income), net |
$ |
4.5 |
|
|
$ |
(1.9 |
) |
|
$ |
6.4 |
|
|||||
Interest expense, net
|
|
|
|
|
|
|
|
|
|
|
|
Increase/ |
|
|||
(In millions) |
2023 |
|
|
2022 |
|
|
(Decrease) |
|
||||||||
Interest expense, net |
$ |
18.3 |
|
|
$ |
23.9 |
|
|
$ |
(5.6 |
) |
|||||
Equity income
|
|
|
|
|
|
|
|
|
|
|
|
Increase/ |
|
|||
(In millions) |
2023 |
|
|
2022 |
|
|
(Decrease) |
|
||||||||
WAVE |
$ |
85.9 |
|
|
$ |
87.4 |
|
|
$ |
(1.5 |
) |
|||||
ClarkDietrich |
|
80.5 |
|
|
|
89.1 |
|
|
|
(8.6 |
) |
|||||
Workhorse |
|
0.5 |
|
|
|
(0.2 |
) |
|
|
0.7 |
|
|||||
ArtiFlex |
|
(13.7 |
) |
|
|
7.6 |
|
|
|
(21.3 |
) |
|||||
Total equity income |
$ |
153.2 |
|
|
$ |
183.9 |
|
|
$ |
(30.7 |
) |
|||||
Income Taxes
|
|
|
|
|
Effective |
|
|
|
|
|
Effective |
|
|
Increase/ |
|
|||||
(In millions) |
|
2023 |
|
|
Tax Rate |
|
|
2022 |
|
|
Tax Rate |
|
|
(Decrease) |
|
|||||
Income tax expense |
|
$ |
34.5 |
|
|
|
21.5 |
% |
|
$ |
52.7 |
|
|
|
25.0 |
% |
|
$ |
(18.2 |
) |
33
The following table provides a summary of adjusted EBITDA from continuing operations by reportable segment, a non-GAAP financial measure, along with the respective percentage of the total of each reportable segment. See the “Use of Non-GAAP Financial Measures” section preceding Part I, Item 1 of this Form 10-K for additional information regarding our use of non-GAAP financial measures. A reconciliation from earnings before income taxes to adjusted EBITDA from continuing operations is provided in “Note P – Segment Data.”
|
|
|
|
|
Adjusted EBITDA |
|
|
|
|
|
Adjusted EBITDA |
|
|
Increase/ |
|
|||||
(In millions) |
|
2023 |
|
|
Margin |
|
|
2022 |
|
|
Margin |
|
|
(Decrease) |
|
|||||
Consumer Products |
|
$ |
97.4 |
|
|
|
17.5 |
% |
|
$ |
109.4 |
|
|
|
21.7 |
% |
|
$ |
(12.0 |
) |
Building Products |
|
|
222.2 |
|
|
|
31.0 |
% |
|
|
238.8 |
|
|
|
35.5 |
% |
|
|
(16.6 |
) |
Total reportable segments |
|
|
319.6 |
|
|
|
25.1 |
% |
|
|
348.2 |
|
|
|
29.6 |
% |
|
|
(28.6 |
) |
Unallocated Corporate and Other |
|
|
(13.6 |
) |
|
n/a |
|
|
|
(13.2 |
) |
|
n/a |
|
|
|
(0.4 |
) |
||
Consolidated |
|
$ |
306.0 |
|
|
|
21.6 |
% |
|
$ |
335.0 |
|
|
|
25.6 |
% |
|
$ |
(29.0 |
) |
Liquidity and Capital Resources
During fiscal 2024, we generated $290.0 million of cash from operating activities, invested $83.5 million in property, plant and equipment, and spent $42.0 million on acquisitions, which included Worthington Steel’s purchase of Voestalpine for $21.0 million prior to the Separation. In connection with the Separation, we distributed $68.0 million to Worthington Steel, net of the $150.0 million one-time special dividend received from Worthington Steel at Separation that was funded by the Worthington Steel Credit Facility. Additionally, we redeemed, in full, the 2024 Notes and the 2026 Notes for an aggregate of $393.9 million and paid dividends of $56.8 million on the common shares.
(In millions) |
|
2024 |
|
|
2023 |
|
|
2022 |
|
|||
Net cash provided by operating activities |
|
$ |
290.0 |
|
|
$ |
625.4 |
|
|
$ |
70.1 |
|
Net cash used by investing activities |
|
|
(140.8 |
) |
|
|
(71.8 |
) |
|
|
(438.2 |
) |
Net cash used by financing activities |
|
|
(359.9 |
) |
|
|
(133.1 |
) |
|
|
(237.8 |
) |
Increase (decrease) in cash and cash equivalents |
|
|
(210.7 |
) |
|
|
420.5 |
|
|
|
(605.9 |
) |
Cash and cash equivalents at beginning of period |
|
|
454.9 |
|
|
|
34.5 |
|
|
|
640.3 |
|
Cash and cash equivalents at end of period |
|
$ |
244.2 |
|
|
$ |
455.0 |
|
|
$ |
34.4 |
|
|
The cash flows related to discontinued operations have not been segregated. Accordingly, the consolidated statements of cash flows include the results of discontinued operations. See “Note B – Discontinued Operations” for a summarization of significant non-cash items related to discontinued operations
We believe we have access to adequate resources to meet the needs of our existing businesses for normal operating costs, mandatory capital expenditures, debt redemptions, dividend payments, and working capital, to the extent not funded by cash provided by operating activities, for at least 12 months and for the foreseeable future thereafter. These resources include cash and cash equivalents and unused committed lines of credit under our Credit Facility. The Credit Facility had a total of $500.0 million of borrowing capacity available to be drawn as of May 31, 2024.
34
Although we do not currently anticipate a need, we believe that we could access the financial markets to sell long-term debt or equity securities. However, the continuation of uncertain economic conditions and a high interest rate environment could create volatility in the financial markets, which may impact our ability to access capital and the terms under which we can do so.
We routinely monitor current operational requirements, financial market conditions, and credit relationships and we may choose to seek additional capital by issuing new debt and/or equity securities to strengthen our liquidity or capital structure. Should we seek additional capital, there can be no assurance that we would be able to obtain such additional capital on terms acceptable to us, if at all, and such additional equity or debt financing could dilute the interests of our existing shareholders and/or increase our interest costs. We may also from time to time seek to retire or repurchase our outstanding debt through cash purchases, in open-market purchases, privately-negotiated transactions or otherwise. Such repurchases, if any, will be upon such terms and at such prices as we may determine, and will depend on prevailing market conditions, our liquidity requirements, contractual restrictions and other factors. The amounts involved in any such transaction may or may not be material. To facilitate our post-Separation capital structure, during the first quarter of fiscal 2024, we redeemed in full our 2026 Notes for $243.6 million followed by the early redemption of the 2024 Notes for $150.0 million on December 6, 2023, as further discussed in “Note I – Debt.”
Operating Activities
Our business is cyclical and cash flows from operating activities may fluctuate during the year and from year to year due to economic and industry conditions. We rely on cash and short-term borrowings to meet cyclical increases in working capital needs. These needs generally arise during periods of increased economic activity or increasing raw material prices, requiring higher levels of inventory and accounts receivable. During economic slowdowns or periods of decreasing raw material costs, working capital needs generally decrease as a result of the reduction of inventories and accounts receivable.
Fiscal 2024 vs. Fiscal 2023
Net cash provided by operating activities was $290.0 million during fiscal 2024, compared to $625.4 million during fiscal 2023. This change was primarily due to lower net earnings from core operations, a $104.5 million increase in net operating working capital (accounts receivable, inventories, and accounts payable) requirements over the prior year period, of which $88.3 million is related to the former steel processing business, and a decrease in dividends received from our unconsolidated affiliates, down $53.6 million on lower contributions of $44.4 million from WAVE and ClarkDietrich.
Fiscal 2023 vs. Fiscal 2022
Net cash provided by operating activities was $625.4 million during fiscal 2023 compared to $70.1 million in fiscal 2022, an increase of $555.3 million. The increase was primarily due to a $410.4 million change in operating working capital requirements in fiscal 2023, as compared to fiscal 2022, of which $318.5 million is related to our former steel processing business. The remaining increase over fiscal 2022 was driven by higher cash dividends from WAVE and ClarkDietrich, up $138.9 million over the prior fiscal year.
Investing Activities
Fiscal 2024 vs. Fiscal 2023
Net cash used by investing activities was $140.8 million during fiscal 2024, compared to $71.8 million during fiscal 2023. Net cash used by investing activities in fiscal 2024 resulted primarily from capital expenditures of $83.5 million, investment in notes receivable of $14.9 million, a deposit of $11.4 million for the June 3, 2024 acquisition of Ragasco, and the acquisitions of Halo and Voestalpine for net cash consideration of $9.6 million and $21.0 million, respectively. Net cash used by investing activities in the prior year resulted from the purchase of the Level5 business on June 2, 2022, for $56.1 million, and capital expenditures of $86.4 million, partially offset by combined cash proceeds of $71.3 million from the sale of our 50% noncontrolling equity investment in ArtiFlex, and the sale of the remaining net assets of our former WSP Jackson, Michigan facility and other long-lived assets.
35
Fiscal 2023 vs. Fiscal 2022
Net cash used by investing activities was $71.8 million during fiscal 2023 compared to net cash used by investing activities of $438.2 million in fiscal 2022. Net cash used by investing activities in fiscal 2023 resulted from the purchase of the Level5 business on June 2, 2022, for $56.1 million, net of cash acquired, and capital expenditures of $86.4 million, partially offset by combined cash proceeds of $71.3 million from the sale of our 50% noncontrolling equity investment in ArtiFlex, and the sale of our former WSP Jackson, Michigan facility and other long-lived assets. Net cash used by investing activities in fiscal 2022 resulted primarily from cash used to acquire certain assets of the Shiloh Industries’ U.S. BlankLight ® business on June 8, 2021, for $104.5 million and Tempel Steel Company on December 1, 2021 for $272.2 million, and capital expenditures of $94.6 million.
Investment activities are largely discretionary and future investment activities could be reduced significantly, or eliminated, as economic conditions warrant. We assess acquisition opportunities as they arise, and any such opportunities may require additional financing. However, there can be no assurance that any such opportunities will arise, that any such acquisition opportunities will be consummated, or that any needed additional financing will be available on satisfactory terms if required.
Financing Activities
Fiscal 2024 vs. Fiscal 2023
Net cash used by financing activities was $359.9 million in fiscal 2024 compared to $133.1 million in fiscal 2023. The change was primarily due to activity related to the Separation transaction including the net distribution of $68.0 million to Worthington Steel and net proceeds of $172.2 million under Worthington Steel’s short-term credit facilities, which were assumed by Worthington Steel. To facilitate our post-Separation capital structure, we redeemed in full our 2026 Notes for $243.6 million and our 2024 Notes for $150.0 million, as further discussed in “Note I - Debt.”
Fiscal 2023 vs. Fiscal 2022
Net cash used by financing activities was $133.1 million in fiscal 2023 compared to $237.7 million in fiscal 2022. The change was primarily due to $45.2 million of net repayments of short-term borrowings in fiscal 2023 and the repurchase of 3.2 million of common shares at a cost of $180.2 million in fiscal 2022.
Long-term debt – We typically use the net proceeds from long-term debt for acquisitions, refinancing of outstanding debt, capital expenditures and general corporate purposes. As of May 31, 2024, we were in compliance with the covenants in our long-term debt agreements. Our long-term debt agreements do not include ratings triggers or material adverse change provisions.
Short-term borrowings – Our short-term debt agreements do not include ratings triggers or material adverse change provisions. As of May 31, 2024, we were in compliance with the covenants in our short-term debt agreements.
We maintain the $500.0 million Credit Facility that matures on September 27, 2028. Borrowings under the Credit Facility have maturities of up to one year. We have the option to borrow at rates equal to an applicable margin over the Simple SOFR, the Prime Rate of PNC Bank, National Association, or the Overnight Bank Funding Rate. The applicable margin is determined by our credit rating. There were no borrowings outstanding under the Credit Facility at May 31, 2024.
As discussed in “Note H – Guarantees,” we had in place $12.1 million in outstanding letters of credit for third-party beneficiaries as of May 31, 2024. No amounts were drawn against these outstanding letters of credit at May 31, 2024, and the fair value of these guaranteed instruments, based on premiums paid, was not material.
Common shares – During fiscal 2024, we declared dividends totaling $0.96 per common share, which consisted of three quarters of declared dividends under our pre-Separation capital structure and one quarter as a standalone company. During fiscal 2023, we declared dividends totaling $1.24 per common share. Dividends paid on our common shares totaled $56.8 million in fiscal 2024 compared to $59.2 million during fiscal 2023. On June 25, 2024, the Board declared a quarterly dividend of $0.17 per common share for the first quarter of fiscal 2025, a $0.01 per share increase from the previous quarterly rate. The dividend is payable on September 27, 2024 to shareholders of record at the close of business on September 13, 2024.
On March 20, 2019, the Board authorized the repurchase of up to 6.6 million of the common shares. On March 24, 2021, the Board authorized the repurchase of up to an additional 5.6 million of the common shares, increasing the total number of common shares then authorized for repurchase to 10.0 million. The total number of common shares available for repurchase under these authorizations at May 31, 2024 was 6.1 million.
36
These common shares may be repurchased from time to time, with consideration given to the market price of the common shares, the nature of other investment opportunities, cash flows from operations, general economic conditions and other relevant considerations. Repurchases may be made on the open market or through privately-negotiated transactions.
Dividend Policy
We currently have no material contractual or regulatory restrictions on the payment of dividends. Dividends are declared at the discretion of the Board. The Board reviews the dividend quarterly and establishes the dividend rate based upon our consolidated financial condition, results of operations, capital requirements, current and projected cash flows, business prospects, and other relevant factors. While we have paid a dividend every quarter since becoming a public company in 1968, there is no guarantee that payments of dividends will continue in the future.
Recently Adopted Accounting Standards
Refer to “Note A – Summary of Significant Accounting Policies” for further information.
Environmental
We do not believe that compliance with environmental laws has or will have a material effect on our capital expenditures, future results of operations or financial position or competitive position.
Critical Accounting Estimates
The discussion and analysis of our financial condition and results of operations are based upon our consolidated financial statements, which have been prepared in accordance with GAAP. The preparation of these consolidated financial statements requires us to make estimates and assumptions that affect the reported amounts of assets and liabilities and the disclosure of contingent assets and liabilities at the date of our consolidated financial statements and the reported amounts of revenues and expenses during the reporting periods. We base our estimates on historical experience and various other assumptions that we believe to be reasonable under the circumstances. These results form the basis for making judgments about the carrying values of assets and liabilities that are not readily apparent from other sources. Critical accounting estimates are defined as those that reflect our significant judgments and uncertainties that could potentially result in materially different results under different assumptions and conditions. Although actual results historically have not deviated significantly from those determined using our estimates, as discussed below, our consolidated financial position or results of operations could be materially different if we were to report under different conditions or to use different assumptions in the application of such policies. The following accounting estimates are considered to be the most critical to us, as these are the primary areas where financial information is subject to our estimates, assumptions and judgment in the preparation of our consolidated financial statements.
Impairment of Indefinite-Lived Long-Lived Assets
Critical estimate: Goodwill and intangible assets with indefinite lives are not amortized, but instead are tested for impairment annually, during the fourth fiscal quarter, or more frequently if events or changes in circumstances indicate that impairment may be present. Application of goodwill impairment testing involves judgment, including but not limited to, the identification of reporting units and estimation of the fair value of each reporting unit. A reporting unit is defined as an operating segment or one level below an operating segment. We test goodwill at the operating segment level as we have determined that the characteristics of the reporting units within each operating segment are similar and allow for their aggregation in accordance with the applicable accounting guidance.
For goodwill and indefinite lived intangible assets, we test for impairment by first evaluating qualitative factors including macroeconomic conditions, industry and market considerations, cost factors, and overall financial performance. If there are no concerns raised from this evaluation, no further testing is performed. If, however, our qualitative analysis indicates it is more likely than not that the fair value is less than the carrying amount, a quantitative analysis is performed. The quantitative analysis compares the fair value of each reporting unit or indefinite-lived intangible asset to the respective carrying amount, and an impairment loss is recognized in our consolidated statements of earnings equivalent to the excess of the carrying amount over the fair value.
37
Assumptions and judgments: When performing a qualitative assessment, judgment is required when considering relevant events and circumstances that could affect the fair value of the indefinite lived intangible asset or reporting unit to which goodwill is assigned. Management considers whether events and circumstances such as a change in strategic direction and changes in business climate would impact the fair value of the indefinite lived intangible asset or reporting unit to which goodwill is assigned. If a quantitative analysis is required, assumptions are required to estimate fair value, both at the individual asset and enterprise level, to compare against the carrying value. Significant assumptions that form the basis of fair value can include discount rates, underlying forecast assumptions, and royalty rates. These assumptions are forward looking and can be affected by future economic and market conditions. We were able to qualitatively conclude that all of our indefinite-lived intangibles and the goodwill of our Consumer Products and Building Products reporting units were not impaired during fiscal 2024. However, the deconsolidation of our former Sustainable Energy Solutions reporting unit triggered an impairment review of this asset group as an asset held for sale in the fourth quarter of fiscal 2024. This analysis determined that the fair value of the Sustainable Energy Solutions reporting unit exceeded its book value resulting in the full impairment of goodwill, which totaled $14.2 million.
Impairment of Definite-Lived Long-Lived Assets
Critical estimate: We review the carrying value of our long-lived assets, including intangible assets with finite useful lives, for impairment whenever events or changes in circumstances indicate that the carrying value of an asset or asset group may not be recoverable. Impairment testing involves a comparison of the sum of the undiscounted future cash flows of the asset or asset group to its respective carrying amount. If the sum of the undiscounted future cash flows exceeds the carrying amount, then no impairment exists. If the carrying amount exceeds the sum of the undiscounted future cash flows, then a second step is performed to determine the amount of impairment, if any, to be recognized. An impairment loss is recognized to the extent that the carrying amount of the asset or asset group exceeds its fair value.
Assumptions and judgments: When performing the comparison of the sum of the undiscounted cash flows of the asset or asset group to its respective carrying amount, judgment is required when forming the basis for underlying cash flow forecast assumptions. If the second step of the impairment test is required, assumptions are required to estimate the fair value to compare against the carrying value. Significant assumptions that form the basis of fair value can include discount rates, underlying forecast assumptions, and royalty rates. These assumptions are forward looking and can be affected by future economic and market conditions.
As the long-lived assets of our former Sustainable Energy Solutions operating segment/reporting unit both met the criteria for held for sale accounting and were sold during the fourth quarter of fiscal 2024, they were assessed for impairment immediately prior to the sale transaction resulting in the impairment of definite-lived long-lived assets, primarily tangible personal property and unamortized know-how, totaling $18.0 million.
Income Taxes
Critical estimate: In accordance with the authoritative accounting guidance, we account for income taxes using the asset and liability method. The asset and liability method requires the recognition of deferred tax assets and deferred tax liabilities for expected future tax consequences of temporary differences that currently exist between the tax basis and financial reporting basis of our assets and liabilities. We evaluate the deferred tax assets to determine whether it is more likely than not that some, or a portion, of the deferred tax assets will not be realized, and provide a valuation allowance as appropriate. Changes in existing tax laws or rates could significantly impact the estimate of our tax liabilities.
Assumptions and judgments: Significant judgment is required in determining our tax expense and in evaluating our tax positions. In accordance with accounting literature related to uncertainty in income taxes, tax benefits from uncertain tax positions that are recognized in our consolidated financial statements are measured based on the largest benefit that has a greater than fifty percent likelihood of being realized upon ultimate settlement. We have reserves for income taxes and associated interest and penalties that may become payable in future years as a result of audits by taxing authorities. It is our policy to record these in income tax expense. While we believe the positions taken on previously filed tax returns are appropriate, we have established the tax and interest reserves in recognition that various taxing authorities may challenge our positions. These reserves are analyzed periodically, and adjustments are made as events occur to warrant adjustment to the reserves, such as lapsing of applicable statutes of limitations, conclusion of tax audits, additional exposure based on current calculations, identification of new issues, and release of administrative guidance or court decisions affecting a particular tax issue. We have provided for the amounts we believe will ultimately result from these changes; however, due to the complexity of some of these uncertainties, the ultimate resolution may result in a payment that is materially different from our current estimate of the tax liabilities. Such differences will be reflected as increases or decreases to income tax expense in the period in which they are determined. See “Note N – Income Taxes” for further information.
38
Business Combinations
Critical estimate: We account for business combinations using the acquisition method of accounting, which requires that once control is obtained, all the assets acquired and liabilities assumed are recorded at their respective fair values at the date of acquisition. The determination of fair values of identifiable assets and liabilities requires significant judgments and estimates and the use of valuation techniques when market value is not readily available. For the valuation of intangible assets acquired in a business combination, we typically use an income approach. The purchase price allocated to the intangible assets is based on unobservable assumptions, inputs and estimates, including but not limited to, forecasted revenue growth rates, projected expenses, discount rates, customer attrition rates, royalty rates, and useful lives, among others.
Assumptions and judgments: Significant assumptions, which vary by the class of asset or liability, are forward looking and could be affected by future economic and market conditions. We engage third-party valuation specialists who review our critical assumptions and prepare the calculation of the fair value of acquired intangible assets in connection with significant business combinations. The excess of the purchase price over the fair values of identifiable assets acquired and liabilities assumed is recorded as goodwill. During the measurement period, which is up to one year from the acquisition date, we may record adjustments to the assets acquired and liabilities assumed with the corresponding offset to goodwill. Upon the conclusion of the measurement period, any subsequent adjustments are recorded to earnings.
Item 7A. – Quantitative and Qualitative Disclosures About Market Risk
In the normal course of business, we are exposed to various market risks. We continually monitor these risks and regularly develop appropriate strategies to manage them. Accordingly, from time to time, we may enter into certain financial and commodity-based derivative financial instruments. These instruments are used primarily to mitigate market exposure. Refer to “Note R – Derivative Financial Instruments and Hedging Activities” for additional information.
Interest Rate Risk
We are exposed to changes in interest rates primarily as a result of our borrowing and investing activities to maintain liquidity and fund operations. The nature and amount of our long-term and short-term debt can be expected to fluctuate as a result of business requirements, market conditions and other factors. We manage exposures to interest rates using a mix of fixed and variable rate debt. We use interest rate swap instruments to manage our exposure to interest rate movements.
We entered into an interest rate swap in June 2017, in anticipation of the issuance of the 2032 Notes. Refer to “Note I – Debt” for additional information regarding the 2032 Notes. The interest rate swap had a notional amount of $150.0 million to hedge the risk of changes in the semi-annual interest rate payments attributable to changes in the benchmark interest rate during the several days leading up to the issuance of the 15-year fixed-rate debt. Upon pricing of the 2032 Notes, the derivative financial instrument was settled resulting in a gain of approximately $3.1 million, which was reflected in AOCI in our consolidated statements of equity and will be recognized in earnings, as a decrease to interest expense, over the life of the 2032 Notes.
We entered into an interest rate swap in March 2014, in anticipation of the issuance of the 2026 Notes. Refer to “Note I – Debt” for additional information regarding the 2026 Notes. The interest rate swap had a notional amount of $150.0 million to hedge the risk of changes in the semi-annual interest payments attributable to changes in the benchmark interest rate during the several days leading up to the issuance of the 12-year fixed-rate debt. Upon pricing of the 2026 Notes, the derivative financial instrument was settled and resulted in a loss of approximately $3.1 million, a significant portion of which was reflected within AOCI in our consolidated statements of equity and will be recognized in earnings, as an increase to interest expense, over the life of the related 2026 Notes. On July 28, 2023, we redeemed the 2026 Notes in full and released the then remaining amount deferred in AOCI associated with this interest rate swap.
39
Foreign Currency Exchange Risk
The translation of foreign currencies into U.S. dollars subjects us to exposure related to fluctuating foreign currency exchange rates. While derivative financial instruments are not used to manage this risk, we have designated our Euro denominated debt, which was assumed by our U.S. parent company in connection with the deconsolidation of our former Sustainable Energy Solutions business, as a non-derivative hedge of the net investment in our European-based foreign operations in Portugal. We also make use of forward contracts to manage exposure to certain intercompany loans with our foreign affiliates as well as exposure to transactions denominated in a currency other than the related foreign affiliate’s local currency. At May 31, 2024, the difference between the contract and book value of these forward contracts was not material to our consolidated financial position, results of operations or cash flows. A 10% change in the foreign currency exchange rate to the U.S. dollar forward rate is not expected to materially impact our consolidated financial position, results of operations or cash flows. A sensitivity analysis of changes in the U.S. dollar exchange rate on these foreign currency-denominated contracts indicates that if the U.S. dollar uniformly weakened by 10% against all of these foreign currency exposures, the fair value of these forward contracts would not be materially impacted. Any resulting changes in fair value would be offset by changes in the underlying hedged balance sheet position. A sensitivity analysis of changes in the foreign currency exchange rates of our foreign locations indicates that a 10% increase in those rates would not have materially impacted our net results. The sensitivity analysis assumes a uniform shift in all foreign currency exchange rates. The assumption that foreign currency exchange rates change in uniformity may overstate the impact of changing foreign currency exchange rates on assets and liabilities denominated in a foreign currency.
Commodity Price Risk
We are exposed to market risk for price fluctuations on purchases of steel, natural gas, copper, zinc and other raw materials as well as our utility requirements. We attempt to negotiate the best prices for commodities and to competitively price products and services to reflect the fluctuations in market prices. Derivative financial instruments have been used to manage a portion of our exposure to fluctuations in the cost of certain commodities, including steel, natural gas, zinc, copper and other raw materials. These contracts covered periods commensurate with known or expected exposures throughout fiscal 2024. The derivative financial instruments were executed with highly rated financial institutions. No credit loss is anticipated.
A sensitivity analysis of changes in the price of hedged commodities indicates that a 10% decline in the market prices of steel, zinc, copper, natural gas or any combination of these would not have a material impact to the value of our hedges or our reported results.
The fair values of our outstanding derivative positions at May 31, 2024 and 2023 are summarized below. Fair values of these derivative financial instruments do not consider the offsetting impact of the underlying hedged item.
(In millions) |
|
2024 |
|
|
2023 |
|
||
Commodity contracts |
|
$ |
0.7 |
|
|
$ |
(5.6 |
) |
Foreign currency exchange contracts |
|
|
(1.2 |
) |
|
|
- |
|
Total |
|
$ |
(0.5 |
) |
|
$ |
(5.6 |
) |
Safe Harbor
Quantitative and qualitative disclosures about market risk include forward-looking statements with respect to management’s opinion about risks associated with the use of derivative financial instruments. These statements are based on certain assumptions with respect to market prices and industry supply of, and demand for, steel products and certain raw materials. To the extent these assumptions prove to be inaccurate, future outcomes with respect to hedging programs may differ materially from those discussed in the forward-looking statements. Refer to the “Cautionary Note Regarding Forward-Looking Statements” section at the beginning of this Form 10-K for additional information.
40
Item 8. — Financial Statements and Supplementary Data
INDEX TO CONSOLIDATED FINANCIAL STATEMENTS
ITEM |
PAGE |
42 |
|
44 |
|
46 |
|
47 |
|
48 |
|
49 |
|
50 |
|
50 |
|
57 |
|
59 |
|
59 |
|
61 |
|
63 |
|
63 |
|
64 |
|
64 |
|
66 |
|
66 |
|
67 |
|
72 |
|
74 |
|
77 |
|
77 |
|
80 |
|
Note R - Derivative Financial Instruments and Hedging Activities |
82 |
84 |
|
86 |
|
87 |
|
87 |
41
Report of Independent Registered Public Accounting Firm
To the Shareholders and Board of Directors
Worthington Enterprises, Inc.:
Opinion on the Consolidated Financial Statements
We have audited the accompanying consolidated balance sheets of Worthington Enterprises, Inc. and subsidiaries (the Company) as of May 31, 2024 and 2023, the related consolidated statements of earnings, comprehensive income, equity, and cash flows for each of the years in the three-year period ended May 31, 2024, and the related notes and financial statement schedule II (collectively, the consolidated financial statements). In our opinion, the consolidated financial statements present fairly, in all material respects, the financial position of the Company as of May 31, 2024 and 2023, and the results of its operations and its cash flows for each of the years in the three-year period ended May 31, 2024, in conformity with U.S. generally accepted accounting principles.
We also have audited, in accordance with the standards of the Public Company Accounting Oversight Board (United States) (PCAOB), the Company’s internal control over financial reporting as of May 31, 2024, based on criteria established in Internal Control – Integrated Framework (2013) issued by the Committee of Sponsoring Organizations of the Treadway Commission, and our report dated July 30, 2024 expressed an unqualified opinion on the effectiveness of the Company’s internal control over financial reporting.
Basis for Opinion
These consolidated financial statements are the responsibility of the Company’s management. Our responsibility is to express an opinion on these consolidated financial statements based on our audits. We are a public accounting firm registered with the PCAOB and are required to be independent with respect to the Company in accordance with the U.S. federal securities laws and the applicable rules and regulations of the Securities and Exchange Commission and the PCAOB.
We conducted our audits in accordance with the standards of the PCAOB. Those standards require that we plan and perform the audit to obtain reasonable assurance about whether the consolidated financial statements are free of material misstatement, whether due to error or fraud. Our audits included performing procedures to assess the risks of material misstatement of the consolidated financial statements, whether due to error or fraud, and performing procedures that respond to those risks. Such procedures included examining, on a test basis, evidence regarding the amounts and disclosures in the consolidated financial statements. Our audits also included evaluating the accounting principles used and significant estimates made by management, as well as evaluating the overall presentation of the consolidated financial statements. We believe that our audits provide a reasonable basis for our opinion.
Critical Audit Matter
The critical audit matter communicated below is a matter arising from the current period audit of the consolidated financial statements that was communicated or required to be communicated to the audit committee and that: (1) relates to accounts or disclosures that are material to the consolidated financial statements and (2) involved our especially challenging, subjective, or complex judgments. The communication of a critical audit matter does not alter in any way our opinion on the consolidated financial statements, taken as a whole, and we are not, by communicating the critical audit matter below, providing a separate opinion on the critical audit matter or on the accounts or disclosures to which it relates.
42
Sufficiency of audit evidence over equity in net income of unconsolidated affiliates
As discussed in Notes A and D to the consolidated financial statements, the Company has four unconsolidated affiliates as of May 31, 2024, which are recognized using the equity method of accounting. The Company recorded $167,716 thousand of equity in net income of unconsolidated affiliates for the year ended May 31, 2024.
We identified the evaluation of the sufficiency of audit evidence over equity in net income of unconsolidated affiliates as a critical audit matter. Evaluating the sufficiency of audit evidence obtained required subjective auditor judgment because of the nature of the unconsolidated affiliates, including the ownership structures, fiscal year ends, and financial results. This included determination of the unconsolidated affiliates for which procedures were performed.
The following are the primary procedures we performed to address this critical audit matter. We applied auditor judgment to determine the nature and extent of procedures to be performed over equity in net income of unconsolidated affiliates, including the determination of the unconsolidated affiliates for which those procedures were to be performed. For certain unconsolidated affiliates, we evaluated the design and tested the operating effectiveness of certain internal controls over the Company’s unconsolidated affiliates process, including controls over the accurate recording of equity in net income of unconsolidated affiliates. For certain unconsolidated affiliates, we compared the equity in net income recorded in the consolidated financial statements with the audited financial statements of the unconsolidated affiliates. For one unconsolidated affiliate, we 1) performed a software-assisted data analysis to test the relationship among certain revenue transactions and 2) selected a sample of transactions and assessed the recorded net sales by comparing the amounts recognized for consistency with underlying documentation, including contracts with customers and shipping documentation.
Additionally, we developed an expectation of costs of goods sold based on certain publicly available market information and compared the expectation to the amount recorded. We also developed an expectation of certain selling, general and administrative expenses based on the change in net sales and compared the expectation to the amount recorded. We evaluated the sufficiency of audit evidence obtained over equity in net income of unconsolidated affiliates by assessing the results of procedures performed, including the appropriateness of the nature and extent of audit effort.
/s/
|
We have served as the Company's auditor since 2001.
July 30, 2024
43
WORTHINGTON ENTERPRISES, INC.
CONSOLIDATED BALANCE SHEETS
(In thousands)
|
May 31, |
|
|||||
|
2024 |
|
|
2023 |
|
||
ASSETS |
|
|
|
|
|
||
Current assets: |
|
|
|
|
|
||
Cash and cash equivalents |
$ |
|
|
$ |
|
||
Receivables, less allowances of $ |
|
|
|
|
|
||
Inventories: |
|
|
|
|
|
||
Raw materials |
|
|
|
|
|
||
Work in process |
|
|
|
|
|
||
Finished products |
|
|
|
|
|
||
Total inventories |
|
|
|
|
|
||
Income taxes receivable |
|
|
|
|
|
||
Prepaid expenses and other current assets |
|
|
|
|
|
||
Current assets of discontinued operations |
|
- |
|
|
|
|
|
Total current assets |
|
|
|
|
|
||
Investments in unconsolidated affiliates |
|
|
|
|
|
||
Operating lease assets |
|
|
|
|
|
||
Goodwill |
|
|
|
|
|
||
Other intangible assets, net of accumulated amortization of $ |
|
|
|
|
|
||
Other assets |
|
|
|
|
|
||
Property, plant and equipment: |
|
|
|
|
|
||
Land |
|
|
|
|
|
||
Buildings and improvements |
|
|
|
|
|
||
Machinery and equipment |
|
|
|
|
|
||
Construction in progress |
|
|
|
|
|
||
Total property, plant and equipment |
|
|
|
|
|
||
Less: accumulated depreciation |
|
|
|
|
|
||
Total property, plant and equipment, net |
|
|
|
|
|
||
Non-current assets of discontinued operations |
|
- |
|
|
|
|
|
Total assets |
$ |
|
|
$ |
|
||
See notes to consolidated financial statements.
44
WORTHINGTON ENTERPRISES, INC.
CONSOLIDATED BALANCE SHEETS
(In thousands)
|
May 31, |
|
|||||
|
2024 |
|
|
2023 |
|
||
LIABILITIES AND EQUITY |
|
|
|
|
|
||
Current liabilities: |
|
|
|
|
|
||
Accounts payable |
$ |
|
|
$ |
|
||
Accrued compensation, contributions to employee benefit plans and related taxes |
|
|
|
|
|
||
Dividends payable |
|
|
|
|
|
||
Other accrued items |
|
|
|
|
|
||
Current operating lease liabilities |
|
|
|
|
|
||
Income taxes payable |
|
|
|
|
|
||
Current maturities of long-term debt |
|
- |
|
|
|
|
|
Current liabilities of discontinued operations |
|
- |
|
|
|
|
|
Total current liabilities |
|
|
|
|
|
||
Other liabilities |
|
|
|
|
|
||
Distributions in excess of investment in unconsolidated affiliate |
|
|
|
|
|
||
Long-term debt |
|
|
|
|
|
||
Noncurrent operating lease liabilities |
|
|
|
|
|
||
Deferred income taxes, net |
|
|
|
|
|
||
Non-current liabilities of discontinued operations |
|
- |
|
|
|
|
|
Total liabilities |
|
|
|
|
|
||
Shareholders' equity - controlling interest: |
|
|
|
|
|
||
Preferred shares, ; authorized - |
|
|
|
|
|
||
Common shares, par value; authorized - |
|
|
|
|
|
||
Additional paid-in capital |
|
|
|
|
|
||
Accumulated other comprehensive income (loss), net of taxes of $( |
|
|
|
|
( |
) |
|
Retained earnings |
|
|
|
|
|
||
Total shareholders' equity - controlling interest |
|
|
|
|
|
||
Noncontrolling interests |
|
|
|
|
|
||
Total equity |
|
|
|
|
|
||
Total liabilities and equity |
$ |
|
|
$ |
|
||
See notes to consolidated financial statements.
45
WORTHINGTON ENTERPRISES, INC.
CONSOLIDATED STATEMENTS OF EARNINGS
(In thousands, except per common share amounts)
|
Fiscal Years Ended May 31, |
|
|||||||||
|
2024 |
|
|
2023 |
|
|
2022 |
|
|||
Net sales |
$ |
|
|
$ |
|
|
$ |
|
|||
Cost of goods sold |
|
|
|
|
|
|
|
|
|||
Gross profit |
|
|
|
|
|
|
|
|
|||
Selling, general and administrative expense |
|
|
|
|
|
|
|
|
|||
Impairment of goodwill and long-lived assets |
|
|
|
|
|
|
|
- |
|
||
Restructuring and other (income) expense, net |
|
|
|
|
( |
) |
|
|
( |
) |
|
Separation costs |
|
|
|
|
|
|
|
- |
|
||
Operating income (loss) |
|
( |
) |
|
|
|
|
|
|
||
Other income (expense): |
|
|
|
|
|
|
|
|
|||
Miscellaneous income (expense), net |
|
( |
) |
|
|
( |
) |
|
|
|
|
Loss on extinguishment of debt |
|
( |
) |
|
|
- |
|
|
|
- |
|
Interest expense, net |
|
( |
) |
|
|
( |
) |
|
|
( |
) |
Equity in net income of unconsolidated affiliates |
|
|
|
|
|
|
|
|
|||
Earnings before income taxes |
|
|
|
|
|
|
|
|
|||
Income tax expense |
|
|
|
|
|
|
|
|
|||
Net earnings from continuing operations |
|
|
|
|
|
|
|
|
|||
Net earnings from discontinued operations |
|
|
|
|
|
|
|
|
|||
Net earnings |
|
|
|
|
|
|
|
|
|||
Net earnings attributable to noncontrolling interests |
|
|
|
|
|
|
|
|
|||
Net earnings attributable to controlling interest |
$ |
|
|
$ |
|
|
$ |
|
|||
|
|
|
|
|
|
|
|
|
|||
Amounts attributable to controlling interest: |
|
|
|
|
|
|
|
|
|||
Net earnings from continuing operations |
$ |
|
|
$ |
|
|
$ |
|
|||
Net earnings from discontinued operations |
|
|
|
|
|
|
|
|
|||
Net earnings attributable to controlling interest |
$ |
|
|
$ |
|
|
$ |
|
|||
|
|
|
|
|
|
|
|
|
|||
Earnings per share from continuing operations - basic |
$ |
|
|
$ |
|
|
$ |
|
|||
Earnings per share from discontinued operations - basic |
|
|
|
|
|
|
|
|
|||
Net earnings per share attributable to controlling interest - basic |
$ |
|
|
$ |
|
|
$ |
|
|||
|
|
|
|
|
|
|
|
|
|||
Earnings per share from continuing operations - diluted |
$ |
|
|
$ |
|
|
$ |
|
|||
Earnings per share from discontinued operations - diluted |
|
|
|
|
|
|
|
|
|||
Net earnings per share attributable to controlling interest - diluted |
$ |
|
|
$ |
|
|
$ |
|
|||
|
|
|
|
|
|
|
|
|
|||
Weighted average common shares outstanding - basic |
|
|
|
|
|
|
|
|
|||
Weighted average common shares outstanding - diluted |
|
|
|
|
|
|
|
|
|||
See notes to consolidated financial statements.
46
WORTHINGTON ENTERPRISES, INC.
CONSOLIDATED STATEMENTS OF COMPREHENSIVE INCOME
(In thousands)
|
Fiscal Years Ended May 31, |
|
|||||||||
|
2024 |
|
|
2023 |
|
|
2022 |
|
|||
Net earnings |
$ |
|
|
$ |
|
|
$ |
|
|||
Other comprehensive income (loss): |
|
|
|
|
|
|
|
|
|||
Foreign currency translation, net of tax |
|
|
|
|
( |
) |
|
|
( |
) |
|
Pension liability adjustment, net of tax |
|
|
|
|
|
|
|
|
|||
Cash flow hedges, net of tax |
|
|
|
|
|
|
|
( |
) |
||
Other comprehensive income (loss) |
|
|
|
|
( |
) |
|
|
( |
) |
|
Comprehensive income |
|
|
|
|
|
|
|
|
|||
Comprehensive income attributable to noncontrolling interests |
|
|
|
|
|
|
|
|
|||
Comprehensive income attributable to controlling interest |
$ |
|
|
$ |
|
|
$ |
|
|||
See notes to consolidated financial statements.
47
WORTHINGTON ENTERPRISES, INC.
CONSOLIDATED STATEMENTS OF EQUITY
(Dollars in thousands, except per common share amounts)
|
|
Controlling Interest |
|
|
|
|
|
|
|
|||||||||||||||||||||||
|
|
|
|
|
|
|
|
|
|
|
|
|
|
|
|
|
|
|
|
|
|
|
|
|
||||||||
|
|
|
|
|
|
|
|
|
|
|
|
|
|
|
|
|
|
|
|
|
|
|
|
|
||||||||
|
|
|
|
|
|
|
|
Additional |
|
|
|
|
|
|
|
|
|
|
|
|
|
|
|
|
||||||||
|
|
Common Shares |
|
|
Paid-in |
|
|
AOCI |
|
|
Retained |
|
|
|
|
|
Noncontrolling |
|
|
|
|
|||||||||||
|
|
Shares |
|
|
Amount |
|
|
Capital |
|
|
Net of Tax |
|
|
Earnings |
|
|
Total |
|
|
Interests |
|
|
Total |
|
||||||||
Balance at May 31, 2021 |
|
|
|
|
$ |
- |
|
|
$ |
|
|
$ |
|
|
$ |
|
|
$ |
|
|
$ |
|
|
$ |
|
|||||||
Net earnings |
|
|
- |
|
|
|
- |
|
|
|
- |
|
|
|
- |
|
|
|
|
|
|
|
|
|
|
|
|
|
||||
Other comprehensive loss |
|
|
- |
|
|
|
- |
|
|
|
- |
|
|
|
( |
) |
|
|
- |
|
|
|
( |
) |
|
|
- |
|
|
|
( |
) |
Common shares issued, net of withholding tax |
|
|
|
|
|
- |
|
|
|
( |
) |
|
|
- |
|
|
|
- |
|
|
|
( |
) |
|
|
- |
|
|
|
( |
) |
|
Common shares in non-qualified plans |
|
|
- |
|
|
|
- |
|
|
|
|
|
|
- |
|
|
|
- |
|
|
|
|
|
|
- |
|
|
|
|
|||
Stock-based compensation |
|
|
- |
|
|
|
- |
|
|
|
|
|
|
- |
|
|
|
- |
|
|
|
|
|
|
- |
|
|
|
|
|||
Repurchases and retirement of common shares |
|
|
( |
) |
|
|
- |
|
|
|
( |
) |
|
|
- |
|
|
|
( |
) |
|
|
( |
) |
|
|
- |
|
|
|
( |
) |
Purchase of noncontrolling interest in Worthington Taylor, LLC |
|
|
- |
|
|
|
- |
|
|
|
( |
) |
|
|
- |
|
|
|
- |
|
|
|
( |
) |
|
|
( |
) |
|
|
( |
) |
Dividends to noncontrolling interests |
|
|
- |
|
|
|
- |
|
|
|
- |
|
|
|
- |
|
|
|
- |
|
|
|
- |
|
|
|
( |
) |
|
|
( |
) |
Cash dividends declared ($ |
|
|
- |
|
|
|
- |
|
|
|
- |
|
|
|
- |
|
|
|
( |
) |
|
|
( |
) |
|
|
- |
|
|
|
( |
) |
Balance at May 31, 2022 |
|
|
|
|
$ |
- |
|
|
$ |
|
|
$ |
( |
) |
|
$ |
|
|
$ |
|
|
$ |
|
|
$ |
|
||||||
Net earnings |
|
|
- |
|
|
|
- |
|
|
|
- |
|
|
|
- |
|
|
|
|
|
|
|
|
|
|
|
|
|
||||
Other comprehensive loss |
|
|
- |
|
|
|
- |
|
|
|
- |
|
|
|
( |
) |
|
|
- |
|
|
|
( |
) |
|
|
- |
|
|
|
( |
) |
Common shares issued, net of withholding tax |
|
|
|
|
|
- |
|
|
|
( |
) |
|
|
- |
|
|
|
- |
|
|
|
( |
) |
|
|
- |
|
|
|
( |
) |
|
Common shares in non-qualified plans |
|
|
- |
|
|
|
- |
|
|
|
|
|
|
- |
|
|
|
- |
|
|
|
|
|
|
- |
|
|
|
|
|||
Stock-based compensation |
|
|
- |
|
|
|
- |
|
|
|
|
|
|
- |
|
|
|
- |
|
|
|
|
|
|
- |
|
|
|
|
|||
Workhorse adoption of ASC 842 |
|
|
- |
|
|
|
- |
|
|
|
- |
|
|
|
- |
|
|
|
|
|
|
|
|
|
- |
|
|
|
|
|||
Dividends to noncontrolling interests |
|
|
- |
|
|
|
- |
|
|
|
- |
|
|
|
- |
|
|
|
- |
|
|
|
- |
|
|
|
( |
) |
|
|
( |
) |
Cash dividends declared ($ |
|
|
- |
|
|
|
- |
|
|
|
- |
|
|
|
- |
|
|
|
( |
) |
|
|
( |
) |
|
|
- |
|
|
|
( |
) |
Balance at May 31, 2023 |
|
|
|
|
$ |
- |
|
|
$ |
|
|
$ |
( |
) |
|
$ |
|
|
$ |
|
|
$ |
|
|
$ |
|
||||||
Net earnings |
|
|
- |
|
|
|
- |
|
|
|
- |
|
|
|
- |
|
|
|
|
|
|
|
|
|
|
|
|
|
||||
Other comprehensive income |
|
|
- |
|
|
|
- |
|
|
|
- |
|
|
|
|
|
|
- |
|
|
|
|
|
|
- |
|
|
|
|
|||
Common shares issued, net of withholding tax |
|
|
|
|
|
- |
|
|
|
( |
) |
|
|
- |
|
|
|
- |
|
|
|
( |
) |
|
|
- |
|
|
|
( |
) |
|
Common shares in non-qualified plans |
|
|
- |
|
|
|
- |
|
|
|
|
|
|
- |
|
|
|
- |
|
|
|
|
|
|
- |
|
|
|
|
|||
Stock-based compensation |
|
|
- |
|
|
|
- |
|
|
|
|
|
|
- |
|
|
|
- |
|
|
|
|
|
|
- |
|
|
|
|
|||
Acquisition of Halo |
|
|
- |
|
|
|
- |
|
|
|
- |
|
|
|
- |
|
|
|
- |
|
|
|
- |
|
|
|
|
|
|
|
||
Separation of Worthington Steel |
|
|
- |
|
|
|
- |
|
|
|
- |
|
|
|
( |
) |
|
|
( |
) |
|
|
( |
) |
|
|
( |
) |
|
|
( |
) |
Dividends to noncontrolling interests |
|
|
- |
|
|
|
- |
|
|
|
- |
|
|
|
- |
|
|
|
- |
|
|
|
- |
|
|
|
( |
) |
|
|
( |
) |
Cash dividends declared ($ |
|
|
- |
|
|
|
- |
|
|
|
- |
|
|
|
- |
|
|
|
( |
) |
|
|
( |
) |
|
|
- |
|
|
|
( |
) |
Balance at May 31, 2024 |
|
|
|
|
$ |
- |
|
|
$ |
|
|
$ |
|
|
$ |
|
|
$ |
|
|
$ |
|
|
$ |
|
|||||||
See notes to consolidated financial statements
48
WORTHINGTON ENTERPRISES, INC.
CONSOLIDATED STATEMENTS OF CASH FLOWS
(In thousands)
|
Fiscal Years Ended May 31, |
|
|||||||||
|
2024 |
|
|
2023 |
|
|
2022 |
|
|||
Operating activities: |
|
|
|
|
|
|
|
|
|||
Net earnings |
$ |
|
|
$ |
|
|
$ |
|
|||
Adjustments to reconcile net earnings to net cash provided by operating activities: |
|
|
|
|
|
|
|
|
|||
Depreciation and amortization |
|
|
|
|
|
|
|
|
|||
Impairment of goodwill and long-lived assets |
|
|
|
|
|
|
|
|
|||
Provision for (benefit from) deferred income taxes |
|
|
|
|
( |
) |
|
|
|
||
Impairment of investment in note receivable |
|
|
|
|
- |
|
|
|
- |
|
|
Loss on extinguishment of debt |
|
|
|
|
- |
|
|
|
- |
|
|
Bad debt expense (income) |
|
( |
) |
|
|
|
|
|
|
||
Equity in net income of unconsolidated affiliates, net of distributions |
|
|
|
|
|
|
|
( |
) |
||
Net (gain) loss on sale of assets |
|
|
|
|
( |
) |
|
|
( |
) |
|
Stock-based compensation |
|
|
|
|
|
|
|
|
|||
Changes in assets and liabilities, net of impact of acquisitions: |
|
|
|
|
|
|
|
|
|||
Receivables |
|
|
|
|
|
|
|
( |
) |
||
Inventories |
|
|
|
|
|
|
|
( |
) |
||
Accounts payable |
|
( |
) |
|
|
( |
) |
|
|
|
|
Accrued compensation and employee benefits |
|
|
|
|
( |
) |
|
|
( |
) |
|
Other operating items, net |
|
( |
) |
|
|
|
|
|
( |
) |
|
Net cash provided by operating activities |
|
|
|
|
|
|
|
|
|||
|
|
|
|
|
|
|
|
|
|||
Investing activities: |
|
|
|
|
|
|
|
|
|||
Investment in property, plant and equipment |
|
( |
) |
|
|
( |
) |
|
|
( |
) |
Acquisitions, net of cash acquired |
|
( |
) |
|
|
( |
) |
|
|
( |
) |
Proceeds from sale of assets, net of selling costs |
|
|
|
|
|
|
|
|
|||
Investment in note receivable |
|
( |
) |
|
|
- |
|
|
|
- |
|
Investment in non-marketable equity securities |
|
( |
) |
|
|
( |
) |
|
|
- |
|
Purchase of noncontrolling interest in Worthington Taylor, LLC |
|
- |
|
|
|
- |
|
|
|
( |
) |
Net proceeds from sale of investment in ArtiFlex |
|
- |
|
|
|
|
|
|
- |
|
|
Excess distributions from unconsolidated affiliate |
|
|
|
|
- |
|
|
|
- |
|
|
Net cash used by investing activities |
|
( |
) |
|
|
( |
) |
|
|
( |
) |
|
|
|
|
|
|
|
|
|
|||
Financing activities: |
|
|
|
|
|
|
|
|
|||
Dividend from Worthington Steel at Separation |
|
|
|
|
- |
|
|
|
- |
|
|
Distribution to Worthington Steel at Separation |
|
( |
) |
|
|
- |
|
|
|
- |
|
Net proceeds from (repayments of) short-term borrowings, net of issuance costs (1) |
|
|
|
|
( |
) |
|
|
|
||
Principal payments on long-term obligations |
|
( |
) |
|
|
( |
) |
|
|
( |
) |
Proceeds from issuance of common shares, net of tax withholdings |
|
( |
) |
|
|
( |
) |
|
|
( |
) |
Payments to noncontrolling interests |
|
( |
) |
|
|
( |
) |
|
|
( |
) |
Repurchase of common shares |
|
- |
|
|
|
- |
|
|
|
( |
) |
Dividends paid |
|
( |
) |
|
|
( |
) |
|
|
( |
) |
Net cash used by financing activities |
|
( |
) |
|
|
( |
) |
|
|
( |
) |
|
|
|
|
|
|
|
|
|
|||
Increase (decrease) in cash and cash equivalents |
|
( |
) |
|
|
|
|
|
( |
) |
|
Cash and cash equivalents at beginning of year |
|
|
|
|
|
|
|
|
|||
Cash and cash equivalents at end of year |
$ |
|
|
$ |
|
|
$ |
|
|||
|
The cash flows related to discontinued operations have not been segregated. Accordingly, the consolidated statements of cash flows include the results from continuing and discontinued operations. See “Note B – Discontinued Operations” for a summarization of significant non-cash items related to discontinued operations.
See notes to consolidated financial statements.
49
WORTHINGTON ENTERPRISES, INC.
NOTES TO CONSOLIDATED FINANCIAL STATEMENTS
Fiscal Years Ended May 31, 2024, 2023 and 2022
(In thousands, except per common share amounts)
Note A – Summary of Significant Accounting Policies
Basis of Consolidation - Our consolidated financial statements include the accounts of Worthington Enterprises and its consolidated subsidiaries. Significant intercompany accounts and transactions have been eliminated.
Prior to the Separation, we owned controlling interests in the following
Separation of the Steel Processing Business: On December 1, 2023, we completed the spin-off of our former steel processing business into an independent publicly traded company, Worthington Steel, on a tax-free basis. Accordingly, the operating results of the former steel processing business are reported as discontinued operations for all periods presented. All discussion within this Form 10-K, including amounts, percentages and disclosures for all periods presented, reflect only our continuing operations unless otherwise noted. In connection with the Separation, we entered into several agreements with Worthington Steel, that, among other things, provide a framework for our relationship with Worthington Steel, including a long-term Steel Supply Agreement, a Trademark License Agreement, and Transition Services Agreement. See “Note U – Related Party Transactions” for additional information.
Deconsolidation of Sustainable Energy Solutions - On May 29, 2024, we became a noncontrolling equity partner in a new unconsolidated joint venture with Hexagon, a leading global manufacturer of Type 4 composite cylinders used for storing gas under high-pressure, by selling
Our
50
Our contribution to the newly formed joint venture consisted of the net assets of the former Sustainable Energy Solutions operating segment. As a result of the contribution, an impairment charge of $
Cash consideration |
|
$ |
|
|
Retained investment (at fair value) |
|
|
|
|
Total consideration |
|
|
|
|
Less: contributed net assets (at carrying value) |
|
|
|
|
Loss on deconsolidation |
|
|
( |
) |
Deal costs |
|
|
( |
) |
Total loss on deconsolidation |
|
$ |
( |
) |
In accordance with the applicable accounting guidance, our minority ownership interest in the Sustainable Energy Solutions joint venture, which will be accounted for under the equity method, was recorded at fair value as of the closing date. Our estimate of fair value was based on a preliminary valuation of the net assets of the Sustainable Energy Solutions joint venture. For additional information regarding the fair value of our minority ownership interest in the Sustainable Energy Solutions joint venture, refer to “Note S – Fair Value Measurements.”
Use of Estimates - The preparation of consolidated financial statements in conformity with GAAP requires management to make estimates and assumptions that affect the amounts reported in our consolidated financial statements and accompanying notes. Actual results could differ materially from those estimates. On an ongoing basis, we evaluate our estimates and base them on both historical and forward-looking assumptions.
Cash and Cash Equivalents - We consider all highly liquid investments purchased with an original maturity of three months or less to be cash equivalents. At May 31, 2024, cash and cash equivalents included cash held in banks, and short-term, highly liquid investments. Our short-term investments are measured at fair value using the net asset value per share practical expedient, and therefore, are not classified in the fair value hierarchy. Our cash held in banks is measured in the fair value hierarchy using Level 1 inputs.
Receivables - We review our receivables on an ongoing basis to ensure that they are properly valued and collectible. Expected lifetime credit losses on receivables are recognized at the time of origination. We estimate the allowance for credit losses based on the expected future credit losses using the internal historical loss information and observable and forecasted macroeconomic data.
The allowance for doubtful accounts is used to record the estimated risk of loss related to our customers’ inability to pay. This allowance is maintained at a level that we consider appropriate based on factors that affect collectability, such as the financial health of our customers, historical trends of charge-offs and recoveries and current economic and market conditions. As we monitor our receivables, we identify customers that may have payment problems, and we adjust the allowance accordingly, with the offset to SG&A. Account balances are charged off against the allowance when recovery is considered remote. The allowance for doubtful accounts decreased $
While we believe our allowance for doubtful accounts is adequate, changes in economic conditions, the financial health of customers and bankruptcy settlements could impact our future earnings. If the economic environment and market conditions deteriorate, particularly in the automotive and construction end markets where our exposure is greatest, additional reserves may be required.
Inventories - Inventories are valued at the lower of cost or net realizable value. Cost is determined using the first-in, first-out method for all inventories. The assessment of net realizable value requires the use of estimates to determine cost to complete, normal profit margin and the ultimate selling price of inventory. We believe our inventories were valued appropriately as of May 31, 2024 and May 31, 2023.
Property and Depreciation - Property, plant and equipment are carried at cost and depreciated using the straight-line method. Buildings and improvements are depreciated over
51
Goodwill and Other Long-Lived Assets - We use the purchase method of accounting for all business combinations and recognize amortizable and indefinite-lived intangible assets separately from goodwill. The acquired assets and assumed liabilities in an acquisition are measured and recognized based on their estimated fair values at the date of acquisition, with goodwill representing the excess of the purchase price over the fair value of the identifiable net assets. A bargain purchase may occur, wherein the fair value of identifiable net assets exceeds the purchase price, and a gain is then recognized in the amount of that excess. Goodwill and intangible assets with indefinite lives are not amortized, but instead are tested for impairment annually, during the fourth quarter of each fiscal year, or more frequently if events or changes in circumstances indicate that impairment may be present. Application of goodwill impairment testing involves judgment, including but not limited to, the identification of reporting units and estimation of the fair value of each reporting unit. A reporting unit is defined as an operating segment or one level below an operating segment. We test goodwill at the operating segment level as we have determined that the characteristics of the reporting units within each operating segment are similar and allow for their aggregation in accordance with the applicable accounting guidance.
For goodwill and indefinite-lived intangible assets, we test for impairment by first evaluating qualitative factors including macroeconomic conditions, industry and market considerations, cost factors, and overall financial performance. If there are no potential impairments raised from this evaluation, no further testing is performed. If, however, our qualitative analysis indicates it is more likely than not that the fair value is less than the carrying amount, a quantitative analysis is performed. The quantitative analysis compares the fair value of each reporting unit or indefinite-lived intangible asset to the related carrying amount, and an impairment loss is recognized in our consolidated statements of earnings equivalent to the excess of the carrying amount over the fair value. Fair value is determined based on discounted cash flows or appraised values, as appropriate. Our policy is to perform a quantitative analysis of each reporting unit at least every three to five years.
We performed our annual impairment evaluation of goodwill and other indefinite-lived intangible assets during the fourth quarter of fiscal 2024. We were able to qualitatively conclude that all of our indefinite-lived intangibles and the goodwill of our Consumer Products and Building Products reporting units were not impaired during fiscal 2024. However, the deconsolidation of our former Sustainable Energy Solutions reporting unit triggered an impairment review of this asset group as an asset held for sale in the fourth quarter of fiscal 2024. This analysis determined that the fair value of the Sustainable Energy Solutions reporting unit exceeded its book value resulting in the full impairment of goodwill. The Sustainable Energy Solutions business was subsequently sold within the same quarter. See “Note E - Goodwill and Other Long-Lived Assets” for additional information.
We review the carrying value of our long-lived assets, including intangible assets with finite useful lives, for impairment whenever events or changes in circumstances indicate that the carrying value of an asset or asset group may not be recoverable. Impairment testing involves a comparison of the sum of the undiscounted future cash flows of the asset or asset group to its respective carrying amount. If the sum of the undiscounted future cash flows exceeds the carrying amount, then no impairment exists. If the carrying amount exceeds the sum of the undiscounted future cash flows, then a second step is performed to determine the amount of impairment, if any, to be recognized. The impairment loss recognized is equal to the amount that the carrying value of the asset or asset group exceeds its fair value. Long-lived assets held for sale are reported at the lower of cost or fair value less costs to sell and are recorded in a single line in our consolidated balance sheets. We classify assets as held for sale if we commit to a plan to sell the assets within one year and actively market the assets in their current condition for a price that is reasonable in comparison to their estimated fair value.
Our impairment testing for both goodwill and other long-lived assets, including intangible assets with finite useful lives, is largely based on cash flow models that require significant judgment and require assumptions about future volume trends, revenue and expense growth rates; and, in addition, external factors such as changes in economic trends and cost of capital. Significant changes in any of these assumptions could impact the outcomes of the tests performed. See “Note E – Goodwill and Other Long-Lived Assets” for additional details regarding these assets and related impairment testing.
Equity Method Investments - Investments in affiliated companies that we do not control, either through majority ownership or otherwise, are accounted for using the equity method. We review our equity method investments for impairment whenever events or changes in circumstances indicate that the carrying value of the investment might not be recoverable. Events and circumstances can include, but are not limited to: evidence we do not have the ability to recover the carrying value; the inability of the investee to sustain earnings; the current fair value of the investment is less than the carrying value; and other investors cease to provide support or reduce their financial commitment to the investee. If the fair value of the investment is less than the carrying value, and the fair value of the investment will not recover in the near term, then other-than-temporary impairment may exist. When the loss in value of an investment is determined to be other-than-temporary, we recognize an impairment in the period the conclusion is made. See “Note D – Investments in Unconsolidated Affiliates” for additional information.
52
Leases - Under ASU 2016-02, Leases (Topic 842) (“Topic 842”), leases are categorized as operating or financing lease at inception. Lease assets represent our right to use an underlying asset for the lease term, and lease liabilities represent our obligation to make lease payments arising from the lease. Operating lease ROU assets include any initial direct costs and prepayments less lease incentives. Lease terms include options to renew or terminate the lease when it is reasonably certain that we will exercise such options. As most of our leases do not include an implicit rate, we use our collateralized incremental borrowing rate, based on the information available at the lease commencement date, to determine the present value of lease payments. Operating lease expense is recognized on a straight-line basis over the lease term and is included in cost of goods sold or SG&A depending on the underlying nature of the leased assets. For operating leases with variable payments dependent upon an index or rate that commenced subsequent to adoption of Topic 842, we apply the active index or rate as of the lease commencement date. Variable lease payments not based on an index or rate are not included in the operating lease liability as they cannot be reasonably estimated and are recognized in the period in which the obligation for those payments is incurred. Leases with a term of twelve months or less upon the commencement date are considered short-term leases, are not included on our consolidated balance sheets and are expensed on a straight-line basis over the lease term. Refer to “Note T – Leases” for additional information.
Stock-Based Compensation - At May 31, 2024, we had stock-based compensation plans for our employees as well as our non-employee directors as described more fully in “Note L – Stock-Based Compensation.” All share-based awards, including grants of stock options and restricted common shares, are recorded as expense in our consolidated statements of earnings over the vesting period based on their grant date fair values. Stock-based payment transactions are classified as equity-settled. Forfeitures are recognized as they occur.
Derivative Financial Instruments - We utilize derivative financial instruments to primarily manage exposure to certain risks related to our ongoing operations. The primary risks managed through the use of derivative financial instruments include interest rate risk, foreign currency exchange risk and commodity price risk. All derivative financial instruments are accounted for using mark-to-market accounting. The accounting for changes in the fair value of a derivative financial instrument depends on whether it has been designated and qualifies as part of a hedging relationship and, if so, the reason for holding it. Gains and losses on fair value hedges are recognized in current period earnings in the same line as the underlying hedged item. Gains and losses on cash flow hedges are deferred as a component of AOCI and recognized in earnings at the time the hedged item affects earnings, in the same financial statement caption as the underlying hedged item. For net investment hedges, the gains and losses due to remeasurement are recorded as a cumulative translation adjustment, which is a component of AOCI within stockholders’ equity and are not recognized in earnings (loss) until the sale or liquidation of the hedged net investment. Classification in our consolidated statements of earnings of gains and losses related to derivative financial instruments that do not qualify for hedge accounting is determined based on the underlying intent of the instruments. Cash flows related to derivative financial instruments are generally classified as operating activities in our consolidated statements of cash flows. Net investment hedges are classified within investing activities in our consolidated statements of cash flows.
In order for hedging relationships to qualify for hedge accounting under current accounting guidance, we formally document each hedging relationship and its risk management objective. Derivative financial instruments are executed only with highly-rated counterparties.
We discontinue hedge accounting when it is determined that a derivative financial instrument is no longer highly effective in offsetting the hedged risk, expires or is sold, is terminated or is no longer designated as a hedging instrument because it is unlikely that a forecasted transaction will occur or we determine that designation as a hedging instrument is no longer appropriate. In all situations in which hedge accounting is discontinued and the derivative financial instrument is retained, we continue to carry the derivative financial instrument at its fair value on our consolidated balance sheet and recognize any subsequent changes in its fair value in net earnings immediately. When it is probable that a forecasted transaction will not occur, we discontinue hedge accounting and immediately recognize the gains and losses that were accumulated in AOCI.
We have designated our Euro denominated debt, which was assumed by our U.S. parent company in connection with the deconsolidation of our former Sustainable Energy Solutions business, as a non-derivative hedge of the net investment in our European-based foreign operations in Portugal. The effective portion of the unrealized gains or losses on this hedge is recorded in foreign currency translation adjustments as a component of AOCI in stockholders’ equity and will remain there until either the sale or liquidation of the subsidiary. Refer to “Note R - Derivative Financial Instruments and Hedging Activities” for additional information regarding our consolidated balance sheet location and the risk classification of our derivative financial instruments.
Foreign Currency Transactions and Translations - Foreign currency balance sheet accounts are translated into U.S. dollars at the current exchange rates at the balance sheet date. Income and expenses are translated at the average exchange rates in effect during the period for the foreign subsidiaries where the local currency is the functional currency. We use our foreign currency-denominated debt to hedge our net investment in foreign operations against movements in exchange rates. The effective portion of the unrealized gains or losses on this hedge is recorded in foreign currency translation adjustments as a component of AOCI in stockholders’ equity and will remain there until either the sale or liquidation of the subsidiary.
53
Strategic Investments - From time to time, we may make investments in both privately and publicly held equity securities in which we do not have a controlling interest or significant influence. These investments are recorded at fair market value with changes in fair market value recognized in net earnings below operating income. We elected to record equity securities without readily determinable fair values at cost, less impairment, plus or minus subsequent adjustments for observable price changes in orderly transactions for the identical or a similar investment of the same issuer.
Revenue Recognition - Revenue is recognized in accordance with Topic 606. Under this accounting guidance, we recognize revenue upon transfer of control of promised goods or services to customers in an amount that reflects the consideration we expect to receive for those goods or services, including any variable consideration.
Returns and allowances are used to record estimates of returns or other allowances resulting from quality, delivery, discounts or other issues and are estimated based on historical trends and current market conditions, with the offset to net sales.
Shipping and handling costs charged to customers are treated as fulfillment activities and are recorded in both net sales and cost of goods sold at the time control is transferred to the customer. Due to the short-term nature of our contracts with customers, we have elected to apply the practical expedients under Topic 606 to: (1) expense as incurred, incremental costs of obtaining a contract; and (2) not adjust the consideration for the effects of a significant financing component for contracts with an original expected duration of one year or less. When we satisfy (or partially satisfy) a performance obligation, prior to being able to invoice the customer, we recognize an unbilled receivable when the right to consideration is unconditional and a contract asset when the right to consideration is conditional. Unbilled receivables and contract assets at May 31, 2023 were included in receivables and prepaid expenses and other current assets, respectively, on our consolidated balance sheet. There were
Additionally, we do not maintain contract liability balances, as performance obligations are satisfied prior to customer payment for the product. Payments from customers are generally due within
Taxes assessed by a governmental authority that are both imposed on and concurrent with a specific revenue-producing transaction, that we collect from a customer, are excluded from revenue.
Certain contracts with customers include warranties associated with the delivered goods or services. These warranties are not considered to be separate performance obligations, and accordingly, we record an estimated liability for potential warranty costs as the goods or services are transferred.
We recognize revenue at the point in time the performance obligation is satisfied and control of the product is transferred to the customer upon shipment or delivery. Generally, we receive and acknowledge purchase orders from our customers, which define the quantity, pricing, payment and other applicable terms and conditions. In some cases, we receive a blanket purchase order from our customers, which includes pricing, payment and other terms and conditions, with quantities defined at the time each customer subsequently issues periodic releases against the blanket purchase order.
Certain contracts contain variable consideration, which is not constrained, and primarily include estimated sales returns, customer rebates, and sales discounts which are recorded on an expected value basis. These estimates are based on historical returns, analysis of credit memo data and other known factors. We account for rebates by recording reductions to revenue for rebates in the same period the related revenue is recorded. The amount of these reductions is based upon the terms agreed to with the customer. We do not exercise significant judgments in determining the timing of satisfaction of performance obligations or the transaction price.
Cost of Goods Sold - Cost of goods sold includes all costs to make products saleable, such as labor costs, inbound freight, purchasing and receiving costs, inspection costs, internal transfers, and distribution and warehousing of inventory. In addition, shop supplies, facility maintenance costs, manufacturing engineering, project management, and depreciation expense for assets used in the manufacturing process are included in cost of goods sold on the consolidated statements of earnings.
SG&A - SG&A includes selling, marketing, customer service, product management and other administrative expenses not directly supporting the manufacturing process, as well as depreciation expense associated with non-manufacturing assets. In addition, SG&A includes corporate operating expenses for executive management, accounting, tax, treasury, corporate development, human resources, information technology, investor relations, legal, internal audit and risk management.
Advertising Expense - Advertising costs are expensed to SG&A as incurred. Advertising expense was $
54
Statements of Cash Flows -
|
2024 |
|
|
2023 |
|
|
2022 |
|
|||
Interest paid, net of amount capitalized |
$ |
|
|
$ |
|
|
$ |
|
|||
Income taxes paid, net of refunds |
$ |
|
|
$ |
|
|
$ |
|
|||
We use the “cumulative earnings” approach for determining cash flow presentation of distributions from our unconsolidated joint ventures. Distributions received are included in our consolidated statements of cash flows as operating activities, unless the cumulative distributions exceed our portion of the cumulative equity in the net earnings of the joint venture, in which case the excess distributions are deemed to be returns of the investment and are classified as investing activities in our consolidated statements of cash flows.
Income Taxes - We account for income taxes using the asset and liability method. The asset and liability method requires the recognition of deferred tax assets and liabilities for expected future tax consequences of temporary differences that currently exist between the tax basis and the financial reporting basis of our assets and liabilities. We evaluate the deferred tax assets to determine whether it is more likely than not that all, or a portion, of the deferred tax assets will not be realized and provide a valuation allowance as appropriate.
Tax benefits from uncertain tax positions that are recognized in our consolidated financial statements are measured based on the largest benefit that has a greater than fifty percent likelihood of being realized upon ultimate settlement.
We have reserves for income taxes and associated interest and penalties that may become payable in future years as a result of audits by taxing authorities. It is our policy to record these in income tax expense. While we believe the positions taken on previously filed tax returns are appropriate, we have established the tax and interest/penalties reserves in recognition that various taxing authorities may challenge our positions. These reserves are analyzed periodically, and adjustments are made as events occur to warrant adjustment to the reserves, such as lapsing of applicable statutes of limitations, conclusion of tax audits, additional exposure based on current calculations, identification of new issues and release of administrative guidance or court decisions affecting a particular tax issue.
Business Combinations - We account for business combinations using the acquisition method of accounting, which requires that once control is obtained, all the assets acquired and liabilities assumed are recorded at their respective fair values at the date of acquisition. The determination of fair values of identifiable assets and liabilities requires significant judgments and estimates and the use of valuation techniques when market value is not readily available. For the valuation of intangible assets acquired in a business combination, we typically use an income approach. The purchase price allocated to the intangible assets is based on unobservable assumptions, inputs and estimates, including but not limited to, forecasted revenue growth rates, projected expenses, discount rates, customer attrition rates, royalty rates, and useful lives, among others. The excess of the purchase price over the fair values of identifiable assets acquired and liabilities assumed is recorded as goodwill. During the measurement period, which is up to one year from the acquisition date, we may record adjustments to the fair value of assets acquired and liabilities assumed with the corresponding offset to goodwill. Upon the conclusion of the measurement period, any subsequent adjustments are recorded to earnings.
Self-Insurance Reserves - We self-insure most of our risks for product liability, product recall, cyber liability and pollution liability. We also self-insure a significant portion of our potential liability for workers’ compensation, general liability, property liability, automobile liability and employee medical claims. However, in order to reduce risk and better manage our overall loss exposure for these liabilities, we purchase stop-loss insurance that covers individual claims in excess of the deductible amounts. We also maintain reserves for the estimated cost to resolve certain open claims that have been made against us (which may include active product recall or replacement programs), as well as an estimate of the cost of claims that have been incurred but not reported. These estimates are based on actuarial valuations that take into consideration the historical average claim volume, the average cost for settled claims, current trends in claim costs, changes in our business and workforce, general economic factors and other assumptions believed to be reasonable under the circumstances. The estimated reserves for these liabilities could be affected if future occurrences and claims differ from the assumptions used and historical trends.
55
Recently Accounting Pronouncements Not Yet Adopted
In November 2023, the FASB issued ASU No. 2023-07, Segment Reporting (Topic 280): Improvements to Reportable Segment Disclosures, which requires a public entity to disclose significant segment expenses and other segment items on an annual and interim basis and provide in interim periods all disclosures about a reportable segment’s profit or loss and assets that are currently required annually. Additionally, it requires a public entity to disclose the title and position of the CODM. The ASU does not change how a public entity identifies its operating segments, aggregates them, or applies the quantitative thresholds to determine its reportable segments. The new standard is effective for fiscal years beginning after December 15, 2023, and interim periods within fiscal years beginning after December 15, 2024, with early adoption permitted. A public entity should apply the amendments in this ASU retrospectively to all prior periods presented in the financial statements. The adoption of this standard is not expected to have an impact on our financial statements, but may result in expanded segment disclosures.
In December 2023, the FASB issued ASU 2023-09, “Income Taxes - Improvements to Income Tax Disclosures” requiring enhancements and further transparency to certain income tax disclosures, most notably the tax rate reconciliation and income taxes paid. This ASU is effective for fiscal years beginning after December 15, 2024 on a prospective basis and retrospective application is permitted. We expect this ASU to only impact our disclosures with no impact to our results of operations, cash flows and financial condition.
56
Note B – Discontinued Operations
The following table summarizes the assets and liabilities from discontinued operations at May 31, 2023.
Assets |
|
|
|
|
Current assets: |
|
|
|
|
Cash and cash equivalents |
|
$ |
|
|
Receivables, less allowances of $ |
|
|
|
|
Inventories: |
|
|
|
|
Raw materials |
|
|
|
|
Work in process |
|
|
|
|
Finished products |
|
|
|
|
Total inventories |
|
|
|
|
Income taxes receivable |
|
|
|
|
Prepaid expenses and other current assets |
|
|
|
|
Assets held for sale |
|
|
|
|
Total current assets |
|
|
|
|
Investments in unconsolidated affiliates |
|
|
|
|
Operating lease assets |
|
|
|
|
Goodwill |
|
|
|
|
Other intangible assets, net of accumulated amortization of $ |
|
|
|
|
Other assets |
|
|
|
|
Property, plant and equipment: |
|
|
|
|
Land |
|
|
|
|
Buildings and improvements |
|
|
|
|
Machinery and equipment |
|
|
|
|
Construction in progress |
|
|
|
|
Total property, plant and equipment |
|
|
|
|
Less: accumulated depreciation |
|
|
|
|
Total property, plant and equipment, net |
|
|
|
|
Total assets |
|
$ |
|
|
|
|
|
|
|
Liabilities |
|
|
|
|
Current liabilities: |
|
|
|
|
Accounts payable |
|
$ |
|
|
Short-term borrowings |
|
|
|
|
Accrued compensation, contributions to employee benefit plans and related taxes |
|
|
|
|
Other accrued items |
|
|
|
|
Current operating lease liabilities |
|
|
|
|
Total current liabilities |
|
|
|
|
Other liabilities |
|
|
|
|
Noncurrent operating lease liabilities |
|
|
|
|
Deferred income taxes, net |
|
|
|
|
Total liabilities |
|
$ |
|
|
57
The following table summarizes the financial results from the discontinued operations of Worthington Steel for the periods presented.
|
|
Fiscal Years Ended May 31, |
|
|||||||||
|
|
2024 |
|
|
2023 |
|
|
2022 |
|
|||
Net sales |
|
$ |
|
|
$ |
|
|
$ |
|
|||
Cost of goods sold |
|
|
|
|
|
|
|
|
|
|||
Gross profit |
|
|
|
|
|
|
|
|
|
|||
Selling, general and administrative expense |
|
|
|
|
|
|
|
|
|
|||
Impairment of long-lived assets |
|
|
|
|
|
|
|
|
|
|||
Restructuring and other income, net |
|
|
- |
|
|
|
( |
) |
|
|
( |
) |
Separation costs |
|
|
|
|
|
|
|
|
- |
|
||
Operating income |
|
|
|
|
|
|
|
|
|
|||
Other income (expense) |
|
|
|
|
|
|
|
|
|
|||
Miscellaneous income, net |
|
|
|
|
|
|
|
|
|
|||
Interest expense, net |
|
|
( |
) |
|
|
( |
) |
|
|
( |
) |
Equity in net income of unconsolidated affiliate |
|
|
|
|
|
|
|
|
|
|||
Earnings before income taxes |
|
|
|
|
|
|
|
|
|
|||
Income tax expense |
|
|
|
|
|
|
|
|
|
|||
Net earnings |
|
|
|
|
|
|
|
|
|
|||
Net earnings attributable to noncontrolling interest |
|
|
|
|
|
|
|
|
|
|||
Net earnings attributable to controlling interest |
|
$ |
|
|
$ |
|
|
$ |
|
|||
As permitted under U.S. GAAP, the cash flows related to discontinued operations have not been segregated in our consolidated statements of cash flows. Accordingly, the consolidated statements of cash flows include the results from both continuing and discontinued operations and amounts for certain captions will not agree with respective data in the consolidated balance sheet.
The following table summarizes significant non-cash operating items and capital expenditures of discontinued operations included in the consolidated statements of cash flows for the periods presented.
|
|
Fiscal Years Ended May 31, |
|
|||||||||
|
|
2024 |
|
|
2023 |
|
|
2022 |
|
|||
Significant non-cash operating items: |
|
|
|
|
|
|
|
|
|
|||
Depreciation and amortization |
|
$ |
|
|
$ |
|
|
$ |
|
|||
Impairment of long-lived assets |
|
|
|
|
|
|
|
|
|
|||
Equity in income of unconsolidated affiliate, net of distributions |
|
|
( |
) |
|
|
|
|
|
( |
) |
|
Net gain on sale of asset |
|
|
( |
) |
|
|
( |
) |
|
|
( |
) |
Stock-based compensation |
|
|
|
|
|
|
|
|
|
|||
Significant investing activities: |
|
|
|
|
|
|
|
|
|
|||
Investment in property, plant and equipment |
|
|
( |
) |
|
|
( |
) |
|
|
( |
) |
Acquisitions, net of cash acquired |
|
|
( |
) |
|
|
- |
|
|
|
( |
) |
Significant financing activities: |
|
|
|
|
|
|
|
|
|
|||
Net proceeds from short-term borrowings |
|
|
|
|
|
- |
|
|
|
- |
|
|
58
Note C – Inventory
During fiscal 2024, we recognized lower of cost or net realizable charges totaling approximately $
During fiscal 2024, we initiated a recall with the U.S. Consumer Protection Safety Commission for our recently introduced Balloon Time® mini helium tank. We have reserved for the estimated direct and incremental costs expected to be incurred to administer the recall program, which we expect to be immaterial due to the small population of tanks purchased by end consumers. However, we booked a reserve to reflect the impacted inventory at its estimated net realizable value. The adjustment was attributed to our Consumer Products operating segment and was recorded in cost of goods sold in the consolidated statement of earnings during fiscal 2024. The inventory reserve amount as of May 31, 2024 was $
Note D – Investments in Unconsolidated Affiliates
Investments in joint ventures that we do not control, either through majority ownership or otherwise, are unconsolidated and accounted for using the equity method. At May 31, 2024, we held investments in the following joint ventures: ClarkDietrich (
We also held a
During the second quarter of fiscal 2024, we recognized a pre-tax gain of $
On May 29, 2024, we entered into a joint venture agreement with Hexagon and contributed the net assets of our former Sustainable Energy Solutions business to a newly-formed joint venture in which we retained a
We received distributions from unconsolidated affiliates totaling $
We use the cumulative earnings approach for determining cash flow presentation of distributions from our unconsolidated joint ventures. Distributions received are included in our consolidated statements of cash flows as operating activities, unless the cumulative distributions exceed our portion of the cumulative equity in the net earnings of the joint venture, in which case the excess distributions are deemed to be returns of the investment and are classified as investing activities in our consolidated statements of cash flows. In fiscal 2024, we classified $
59
The following table presents combined information regarding the financial position of our unconsolidated affiliates accounted for using the equity method as of May 31:
|
|
|
2024 |
|
|
2023 |
|
||
Cash and cash equivalents |
|
$ |
|
|
$ |
|
|||
Other current assets |
|
|
|
|
|
|
|||
Noncurrent assets |
|
|
|
|
|
|
|||
Total assets |
|
$ |
|
|
$ |
|
|||
|
|
|
|
|
|
|
|||
Current liabilities |
|
$ |
|
|
$ |
|
|||
Current maturities of long-term debt |
|
|
|
|
|
|
|||
Long-term debt |
|
|
|
|
|
|
|||
Other noncurrent liabilities |
|
|
|
|
|
|
|||
Equity |
|
|
|
|
|
|
|||
Total liabilities and equity |
|
$ |
|
|
$ |
|
|||
The following tables presents summarized financial information for our unconsolidated affiliates as of, and for the fiscal years ended May 31.
|
2024 |
|
|
2023 |
|
|
2022 |
|
|||
Net sales |
|
|
|
|
|
|
|
|
|||
WAVE |
$ |
|
|
$ |
|
|
$ |
|
|||
ClarkDietrich |
|
|
|
|
|
|
|
|
|||
Workhorse |
|
|
|
|
|
|
|
|
|||
ArtiFlex |
|
- |
|
|
|
|
|
|
|
||
Total net sales |
$ |
|
|
$ |
|
|
$ |
|
|||
|
2024 |
|
|
2023 |
|
|
2022 |
|
|||
Gross profit |
|
|
|
|
|
|
|
|
|||
WAVE |
$ |
|
|
$ |
|
|
$ |
|
|||
ClarkDietrich |
|
|
|
|
|
|
|
|
|||
Workhorse |
|
|
|
|
|
|
|
|
|||
ArtiFlex |
|
- |
|
|
|
|
|
|
|
||
Total gross profit |
$ |
|
|
$ |
|
|
$ |
|
|||
|
2024 |
|
|
2023 |
|
|
2022 |
|
|||
Operating income (loss) |
|
|
|
|
|
|
|
|
|||
WAVE |
$ |
|
|
$ |
|
|
$ |
|
|||
ClarkDietrich |
|
|
|
|
|
|
|
|
|||
Workhorse |
|
|
|
|
|
|
|
( |
) |
||
ArtiFlex |
|
- |
|
|
|
|
|
|
|
||
Total operating income |
$ |
|
|
$ |
|
|
$ |
|
|||
|
2024 |
|
|
2023 |
|
|
2022 |
|
|||
Depreciation and amortization |
|
|
|
|
|
|
|
|
|||
WAVE |
$ |
|
|
$ |
|
|
$ |
|
|||
ClarkDietrich |
|
|
|
|
|
|
|
|
|||
Workhorse |
|
|
|
|
|
|
|
|
|||
ArtiFlex |
|
- |
|
|
|
|
|
|
|
||
Total depreciation and amortization |
$ |
|
|
$ |
|
|
$ |
|
|||
60
|
2024 |
|
|
2023 |
|
|
2022 |
|
|||
Interest expense |
|
|
|
|
|
|
|
|
|||
WAVE |
$ |
|
|
$ |
|
|
$ |
|
|||
ClarkDietrich |
|
|
|
|
|
|
|
|
|||
Workhorse |
|
|
|
|
|
|
|
|
|||
ArtiFlex |
|
- |
|
|
|
|
|
|
|
||
Total interest expense |
$ |
|
|
$ |
|
|
$ |
|
|||
|
2024 |
|
|
2023 |
|
|
2022 |
|
|||
Income tax expense |
|
|
|
|
|
|
|
|
|||
WAVE |
$ |
|
|
$ |
|
|
$ |
|
|||
ClarkDietrich |
|
|
|
|
|
|
|
- |
|
||
Workhorse |
|
|
|
|
|
|
|
|
|||
ArtiFlex |
|
- |
|
|
|
|
|
|
|
||
Total income tax expense |
$ |
|
|
$ |
|
|
$ |
|
|||
|
2024 |
|
|
2023 |
|
|
2022 |
|
|||
Net earnings (loss) |
|
|
|
|
|
|
|
|
|||
WAVE |
$ |
|
|
$ |
|
|
$ |
|
|||
ClarkDietrich |
|
|
|
|
|
|
|
|
|||
Workhorse |
|
|
|
|
|
|
|
( |
) |
||
ArtiFlex |
|
- |
|
|
|
|
|
|
|
||
Total net earnings |
$ |
|
|
$ |
|
|
$ |
|
|||
At May 31, 2024 and 2023, $
Note E – Goodwill and Other Long-Lived Assets
Goodwill
The following table summarizes the changes in the carrying amount of goodwill during fiscal 2024 and fiscal 2023 by reportable operating segment:
|
|
|
Consumer Products |
|
|
Building Products |
|
|
Total |
|
|
Other |
|
|
Total |
|
|||||
Balance at May 31, 2022 |
$ |
|
|
$ |
|
|
$ |
|
|
$ |
|
|
$ |
|
|||||||
Acquisitions and purchase accounting adjustments |
|
|
|
|
- |
|
|
|
|
|
|
- |
|
|
|
|
|||||
Translation adjustments |
|
- |
|
|
|
( |
) |
|
|
( |
) |
|
|
( |
) |
|
|
( |
) |
||
Balance at May 31, 2023 |
|
|
|
|
|
|
|
|
|
|
|
|
|
|
|||||||
Acquisitions (1) |
|
|
|
|
- |
|
|
|
|
|
|
- |
|
|
|
|
|||||
Impairment losses (2) |
|
- |
|
|
|
- |
|
|
|
- |
|
|
|
( |
) |
|
|
( |
) |
||
Translation adjustments |
|
- |
|
|
|
|
|
|
|
|
|
|
|
|
|
||||||
Balance at May 31, 2024 |
$ |
|
|
$ |
|
|
$ |
|
|
$ |
- |
|
|
$ |
|
||||||
|
Accumulated goodwill impairment charges within Other totaled $
61
Other Intangible Assets
Intangible assets with definite lives are amortized on a straight-line basis over their estimated useful lives, which range from
|
|
|
|
|
2024 |
|
|
2023 |
|
||||||||||
|
|
|
|
|
Accumulated |
|
|
|
|
|
Accumulated |
|
|||||||
|
|
Cost |
|
|
Amortization |
|
|
Cost |
|
|
Amortization |
|
|||||||
Indefinite-lived intangible assets: |
|
|
|
|
|
|
|
|
|
|
|
|
|||||||
Trademarks |
|
$ |
|
|
$ |
- |
|
|
$ |
|
|
$ |
- |
|
|||||
Total indefinite-lived intangible assets |
|
|
|
|
|
- |
|
|
|
|
|
|
- |
|
|||||
Definite-lived intangible assets: |
|
|
|
|
|
|
|
|
|
|
|
|
|||||||
Customer relationships |
|
$ |
|
|
$ |
|
|
$ |
|
|
$ |
|
|||||||
Non-compete agreements |
|
|
|
|
|
|
|
|
|
|
|
|
|||||||
Technology/know-how |
|
|
|
|
|
|
|
|
|
|
|
|
|||||||
Other |
|
|
- |
|
|
|
|
|
|
|
|
|
|
||||||
Total definite-lived intangible assets |
|
|
|
|
|
|
|
|
|
|
|
|
|||||||
Total intangible assets |
|
|
|
$ |
|
|
$ |
|
|
$ |
|
|
$ |
|
|||||
Amortization expense totaled $
Amortization expense for each of the next five fiscal years is estimated to be:
2025 |
$ |
|
|
2026 |
$ |
|
|
2027 |
$ |
|
|
2028 |
$ |
|
|
2029 |
$ |
|
Impairment of Goodwill and Long-Lived Assets
Fiscal 2024: On May 29, 2024, we became a noncontrolling equity partner in a new unconsolidated joint venture with Hexagon by selling
Impairment of long-lived assets in fiscal 2024 also included a non-cash charge of $
Fiscal 2023: Impairment of long-lived assets in fiscal 2023 included a non-cash charge of $
Fiscal 2022: None
62
Note F – Restructuring and Other (Income) Expense, Net
We consider restructuring activities to be programs whereby we fundamentally change our operations, such as closing and consolidating manufacturing facilities or moving manufacturing of a product to another location. Restructuring activities may also involve substantial realignment of the management structure of a business unit in response to changing market conditions.
A progression of the liabilities associated with our restructuring activities, combined with a reconciliation to the restructuring and other expense, net financial statement caption in our consolidated statement of earnings for fiscal 2024, is summarized below:
|
|
Beginning |
|
|
Expense |
|
|
|
|
|
|
|
|
Ending |
|
|||||
|
|
Balance |
|
|
(Income) |
|
|
Payments |
|
|
Adjustments |
|
|
Balance |
|
|||||
Early retirement and severance |
|
$ |
|
|
$ |
|
|
$ |
( |
) |
|
$ |
- |
|
|
$ |
|
|||
Facility exit and other costs |
|
|
- |
|
|
|
|
|
|
( |
) |
|
|
- |
|
|
|
- |
|
|
|
|
$ |
|
|
$ |
|
|
$ |
( |
) |
|
$ |
- |
|
|
$ |
|
|||
Loss on deconsolidation of Sustainable Energy Solutions |
|
|
|
|
|
|
|
|
|
|
|
|
|
|
|
|||||
Release of contingent liability for Level5 earnout |
|
|
|
|
|
( |
) |
|
|
|
|
|
|
|
|
|
||||
Restructuring and other expense, net |
|
|
|
|
$ |
|
|
|
|
|
|
|
|
|
|
|||||
During fiscal 2024, the following selected actions were taken related to our restructuring activities:
The total liability as of May 31, 2024 is expected to be paid in the immediately following twelve months.
A progression of the liabilities associated with our restructuring activities, combined with a reconciliation to the restructuring and other income, net financial statement caption in our consolidated statement of earnings for fiscal 2023, is summarized below:
|
|
Beginning |
|
|
Expense |
|
|
|
|
|
|
|
|
Ending |
|
|||||
|
|
Balance |
|
|
(Income) |
|
|
Payments |
|
|
Adjustments |
|
|
Balance |
|
|||||
Early retirement and severance |
|
$ |
- |
|
|
$ |
|
|
$ |
( |
) |
|
$ |
- |
|
|
$ |
|
||
Net gain on sale of assets |
|
|
|
|
|
( |
) |
|
|
|
|
|
|
|
|
|
||||
Restructuring and other income, net |
|
|
|
|
$ |
( |
) |
|
|
|
|
|
|
|
|
|
||||
During fiscal 2023, the following actions were taken related to our restructuring activities:
Note G – Contingent Liabilities and Commitments
Legal Proceedings
We are defendants in certain legal actions. In the opinion of management, the outcome of these actions, which is not clearly determinable at the present time, would not significantly affect our consolidated financial position or future results of operations. We also believe that environmental issues will not have a material effect on our capital expenditures, consolidated financial position or future results of operations.
63
Note H – Guarantees
We do not have guarantees that we believe are reasonably likely to have a material current or future effect on our consolidated financial condition, changes in financial condition, revenues or expenses, results of operations, liquidity, capital expenditures or capital resources. However, at May 31, 2024, we were party to an operating lease for an aircraft in which we have guaranteed a residual value at the termination of the lease on March 30, 2028. The maximum obligation under the terms of this guarantee was approximately $
At May 31, 2024, we also had in place $
Note I – Debt
The following table summarizes our long-term debt and short-term borrowings outstanding at May 31, 2024 and 2023:
|
|
2024 |
|
|
2023 |
|
||
2024 Notes |
|
$ |
- |
|
|
$ |
|
|
2026 Notes |
|
|
- |
|
|
|
|
|
2032 Notes |
|
|
|
|
|
|
||
Original / New Series A Senior Note |
|
|
|
|
|
|
||
Original / New Series B Senior Notes |
|
|
|
|
|
|
||
Other |
|
|
- |
|
|
|
|
|
Total debt |
|
|
|
|
|
|
||
Unamortized discount and debt issuance costs |
|
|
( |
) |
|
|
( |
) |
Total debt, net |
|
|
|
|
|
|
||
Less: current maturities and short-term borrowings |
|
|
- |
|
|
|
|
|
Total long-term debt |
|
$ |
|
|
$ |
|
||
Maturities of long-term debt and short-term borrowings in the next five fiscal years, and the remaining years thereafter, are as follows:
|
|
|
|
|
2025 |
|
$ |
- |
|
2026 |
|
|
- |
|
2027 |
|
|
- |
|
2028 |
|
|
- |
|
2029 |
|
|
- |
|
Thereafter |
|
|
|
|
Total |
|
$ |
|
|
64
Long-Term Debt
On August 23, 2019,
On July 28, 2017, we issued the 2032 Notes. The 2032 Notes bear interest at a rate of
On April 15, 2014, we issued the 2026 Notes. During fiscal 2023, we purchased approximately $
On August 10, 2012, we issued the 2024 Notes. The 2024 Notes bore interest at a rate of
Other Financing Arrangements
65
Note J – Comprehensive Income (Loss)
OCI:
|
2024 |
|
|
2023 |
|
|
2022 |
|
|||||||||||||||||||||||||||
|
Before- |
|
|
Tax |
|
|
Net-of- |
|
|
Before- |
|
|
Tax |
|
|
Net-of- |
|
|
Before- |
|
|
Tax |
|
|
Net-of- |
|
|||||||||
Foreign currency translation |
$ |
|
|
$ |
|
|
$ |
|
|
$ |
( |
) |
|
$ |
( |
) |
|
$ |
( |
) |
|
$ |
( |
) |
|
$ |
( |
) |
|
$ |
( |
) |
|||
Pension liability adjustment |
|
|
|
|
( |
) |
|
|
|
|
|
|
|
|
( |
) |
|
|
|
|
|
|
|
|
( |
) |
|
|
|
||||||
Cash flow hedges |
|
|
|
|
( |
) |
|
|
|
|
|
|
|
|
( |
) |
|
|
|
|
|
( |
) |
|
|
|
|
|
( |
) |
|||||
OCI |
$ |
|
|
$ |
( |
) |
|
$ |
|
|
$ |
|
|
$ |
( |
) |
|
$ |
( |
) |
|
$ |
( |
) |
|
$ |
|
|
$ |
( |
) |
||||
AOCI:
|
|
|
|
|
|
|
|
|
|
|
|
||||
|
Foreign |
|
|
Pension |
|
|
Cash |
|
|
|
|
||||
|
Currency |
|
|
Liability |
|
|
Flow |
|
|
|
|
||||
|
Translation |
|
|
Adjustment |
|
|
Hedges |
|
|
AOCI |
|
||||
Balance at May 31, 2022 |
$ |
( |
) |
|
$ |
( |
) |
|
$ |
( |
) |
|
$ |
( |
) |
OCI before reclassifications |
|
( |
) |
|
|
|
|
|
( |
) |
|
|
( |
) |
|
Reclassification adjustments to income (a)(b) |
|
- |
|
|
|
|
|
|
|
|
|
|
|||
Income tax effect |
|
( |
) |
|
|
( |
) |
|
|
( |
) |
|
|
( |
) |
Balance at May 31, 2023 |
$ |
( |
) |
|
$ |
( |
) |
|
$ |
|
|
$ |
( |
) |
|
OCI before reclassifications |
|
|
|
|
|
|
|
|
|
|
|
||||
Reclassification adjustments to income (a)(b) |
|
|
|
|
|
|
|
( |
) |
|
|
|
|||
Income tax effect |
|
|
|
|
( |
) |
|
|
( |
) |
|
|
( |
) |
|
Separation of Worthington Steel |
|
|
|
|
( |
) |
|
|
( |
) |
|
|
( |
) |
|
Balance at May 31, 2024 |
$ |
( |
) |
|
$ |
( |
) |
|
$ |
|
|
$ |
|
||
|
The estimated net amount of the gains recognized in AOCI at May 31, 2024, expected to be reclassified into net earnings within the succeeding
Note K – Equity
Preferred Shares: The Worthington Enterprises Amended Articles of Incorporation authorize two classes of preferred shares and their relative voting rights. The Board is empowered to determine the issue prices, dividend rates, amounts payable upon liquidation and other terms of the preferred shares when issued. No preferred shares are issued or outstanding.
Common Shares: On March 20, 2019, the Board authorized the repurchase of up to
During fiscal 2024 and fiscal 2023 we did
66
Common shares in non-qualified plans: Our non-qualified deferred compensation plans for employees require that any portion of a participant’s current account credited to the theoretical common share option, which reflects the fair value of the common shares with dividends reinvested, and any new contributions credited to the theoretical common share option remain credited to the theoretical common share option until distributed. For amounts credited to the theoretical common share option, payouts are required to be made in the form of whole common shares and cash in lieu of fractional common shares. As a result, we account for the deferred compensation obligation credited to the theoretical common share option within equity. The amounts recorded in equity totaled $
Note L – Stock-Based Compensation
Under our employee and non-employee director stock-based compensation plans, we may grant incentive or non-qualified stock options, restricted common shares, market-based restricted common shares, and performance shares to employees and non-qualified stock options and restricted common shares to non-employee directors. We classify share-based compensation expense within SG&A to correspond with the same financial statement caption as the majority of the cash compensation paid to employees who have been awarded common shares. A total of
We recognized pre-tax stock-based compensation expense of $
The Separation of the Steel Processing Business
In connection with the Separation, we adjusted our outstanding share-based awards in accordance with the terms of the Employee Matters Agreement. Adjustments to the underlying shares and terms of outstanding non-qualified stock options, services-based restricted common shares, market-based restricted common shares, and performance share awards were made to preserve the intrinsic value of the awards immediately before the Separation. The adjustment of the underlying shares and exercise prices, as applicable, was determined using a ratio based on the relative values of our pre-Distribution common share price and our post-Distribution common share price.
Non-Qualified Stock Options
Stock options may be granted to purchase common shares at not less than
GAAP requires that all share-based awards be recorded as expense in the statement of earnings based on their grant date fair value. We calculate the fair value of our non-qualified stock options using the Black-Scholes option pricing model and certain assumptions. The computation of fair values for all stock options incorporates the following assumptions: expected volatility (based on the historical volatility of the common shares); risk-free interest rate (based on the U.S. Treasury strip rate for the expected term of the stock options); expected term (based on historical exercise experience); and dividend yield (based on annualized current dividends and an average quoted price of the common shares over the preceding annual period).
The table below sets forth the non-qualified stock options granted during each of the last three fiscal years. For each grant, the exercise price was equal to the closing market price of the underlying common shares at the respective grant date. The fair values of these stock options were based on the Black-Scholes option pricing model, calculated at the respective grant dates. The calculated pre-tax stock-based compensation expense for these stock options will be recognized on a straight-line basis over the three-year vesting period of the stock options.
|
|
2024 |
|
|
2023 |
|
|
2022 |
|
|||
Granted |
|
|
|
|
|
|
|
|
|
|||
Weighted average exercise price, per common share |
|
$ |
|
|
$ |
|
|
$ |
|
|||
Weighted average grant date fair value, per common share |
|
$ |
|
|
$ |
|
|
$ |
|
|||
Pre-tax stock-based compensation expense |
|
$ |
|
|
$ |
|
|
$ |
|
|||
67
The weighted average fair value of stock options granted in fiscal 2024, fiscal 2023 and fiscal 2022 was based on the following weighted average assumptions:
|
|
2024 |
|
|
2023 |
|
|
2022 |
|
|||
Dividend yield |
|
|
% |
|
|
% |
|
|
% |
|||
Expected volatility |
|
|
% |
|
|
% |
|
|
% |
|||
Risk-free interest rate |
|
|
% |
|
|
% |
|
|
% |
|||
Expected life (years) |
|
|
|
|
|
|
|
|
|
|||
The following tables summarize our stock option activity for the prior three fiscal years:
|
|
2024 |
|
|
2023 |
|
|
2022 |
|
|||||||||||||||
|
|
Stock |
|
|
Weighted |
|
|
Stock |
|
|
Weighted |
|
|
Stock |
|
|
Weighted |
|
||||||
Outstanding, beginning of year |
|
|
|
|
$ |
|
|
|
|
|
$ |
|
|
|
|
|
$ |
|
||||||
Converted to Worthington Steel common shares (1) |
|
|
( |
) |
|
|
|
|
|
- |
|
|
|
- |
|
|
|
- |
|
|
|
- |
|
|
Separation related adjustment |
|
|
|
|
|
- |
|
|
|
- |
|
|
|
- |
|
|
|
- |
|
|
|
- |
|
|
Granted |
|
|
|
|
|
|
|
|
|
|
|
|
|
|
|
|
|
|
||||||
Exercised |
|
|
( |
) |
|
|
|
|
|
( |
) |
|
|
|
|
|
( |
) |
|
|
|
|||
Forfeited |
|
|
( |
) |
|
|
|
|
|
- |
|
|
|
- |
|
|
|
( |
) |
|
|
|
||
Outstanding, end of year |
|
|
|
|
$ |
|
|
|
|
|
$ |
|
|
|
|
|
$ |
|
||||||
Exercisable at end of year |
|
|
|
|
$ |
|
|
|
|
|
$ |
|
|
|
|
|
$ |
|
||||||
|
|
|
|
|
|
Weighted |
|
|
|
|
|||
|
|
|
|
|
Average |
|
|
|
|
|||
|
|
Number of |
|
|
Remaining |
|
|
Aggregate |
|
|||
|
|
Stock |
|
|
Contractual |
|
|
Intrinsic |
|
|||
|
|
Options |
|
|
Life |
|
|
Value |
|
|||
|
|
(In thousands) |
|
|
(In years) |
|
|
(In thousands) |
|
|||
May 31, 2024 |
|
|
|
|
|
|
|
|
|
|||
Outstanding |
|
|
|
|
|
|
|
$ |
|
|||
Exercisable |
|
|
|
|
|
|
|
$ |
|
|||
|
|
|
|
|
|
|
|
|
|
|||
May 31, 2023 |
|
|
|
|
|
|
|
|
|
|||
Outstanding |
|
|
|
|
|
|
|
$ |
|
|||
Exercisable |
|
|
|
|
|
|
|
$ |
|
|||
|
|
|
|
|
|
|
|
|
|
|||
May 31, 2022 |
|
|
|
|
|
|
|
|
|
|||
Outstanding |
|
|
|
|
|
|
|
$ |
|
|||
Exercisable |
|
|
|
|
|
|
|
$ |
|
|||
The total intrinsic value of stock options exercised during fiscal 2024 was $
68
The following table summarizes information about non-vested stock option awards for fiscal 2024:
|
|
|
|
|
Weighted |
|
||
|
|
|
|
|
Average |
|
||
|
|
|
|
|
Grant Date |
|
||
|
|
Number of |
|
|
Fair Value |
|
||
|
|
Stock Options |
|
|
Per |
|
||
|
|
(In thousands) |
|
|
Common Share |
|
||
Non-vested, beginning of year |
|
|
|
|
$ |
|
||
Converted to Worthington Steel common shares (1) |
|
|
( |
) |
|
|
|
|
Separation related adjustment |
|
|
|
|
|
- |
|
|
Granted |
|
|
|
|
|
|
||
Vested |
|
|
( |
) |
|
|
|
|
Forfeited |
|
|
( |
) |
|
|
|
|
Non-vested, end of year |
|
|
|
|
$ |
|
||
|
Service-Based Restricted Common Shares
Restricted common shares that contain service-based vesting conditions may be awarded to certain employees and non-employee directors. Service-based restricted common shares granted to employees cliff vest
The table below sets forth the service-based restricted common shares granted under the Plans during each of the past three fiscal years. The calculated pre-tax stock-based compensation expense for these restricted common shares will be recognized on a straight-line basis over their respective three-year service periods.
|
|
2024 |
|
|
2023 |
|
|
2022 |
|
|||
Granted |
|
|
|
|
|
|
|
|
|
|||
Weighted average grant date fair value, per common share |
|
$ |
|
|
$ |
|
|
$ |
|
|||
Pre-tax stock-based compensation |
|
$ |
|
|
$ |
|
|
$ |
|
|||
The following table summarizes the activity for service-based restricted common shares for the past three fiscal years:
|
|
2024 |
|
|
2023 |
|
|
2022 |
|
|||||||||||||||
|
|
Restricted |
|
|
Weighted |
|
|
Restricted |
|
|
Weighted |
|
|
Restricted |
|
|
Weighted |
|
||||||
Outstanding, beginning of year |
|
|
|
|
$ |
|
|
|
|
|
$ |
|
|
|
|
|
$ |
|
||||||
Converted to Worthington Steel common shares (1) |
|
|
( |
) |
|
|
|
|
|
- |
|
|
|
- |
|
|
|
- |
|
|
|
- |
|
|
Separation related adjustment |
|
|
|
|
|
- |
|
|
|
- |
|
|
|
- |
|
|
|
- |
|
|
|
- |
|
|
Granted |
|
|
|
|
|
|
|
|
|
|
|
|
|
|
|
|
|
|
||||||
Vested |
|
|
( |
) |
|
|
|
|
|
( |
) |
|
|
|
|
|
( |
) |
|
|
|
|||
Forfeited |
|
|
( |
) |
|
|
|
|
|
( |
) |
|
|
|
|
|
( |
) |
|
|
|
|||
Outstanding, end of year |
|
|
|
|
$ |
|
|
|
|
|
$ |
|
|
|
|
|
$ |
|
||||||
|
|
|
|
|
|
|
|
|
|
|
|
|
|
|
|
|
|
|
||||||
Weighted average remaining contractual life of |
|
|
|
|
|
|
|
|
|
|
|
|
|
|
|
|
|
|
||||||
outstanding restricted common shares (in years) |
|
|
|
|
|
|
|
|
|
|
|
|
|
|
|
|
|
|
||||||
|
|
|
|
|
|
|
|
|
|
|
|
|
|
|
|
|
|
|
||||||
Aggregate intrinsic value of outstanding restricted |
|
|
|
|
|
|
|
|
|
|
|
|
|
|
|
|
|
|
||||||
common shares |
|
$ |
|
|
|
|
|
$ |
|
|
|
|
|
$ |
|
|
|
|
||||||
|
|
|
|
|
|
|
|
|
|
|
|
|
|
|
|
|
|
|
||||||
Aggregate intrinsic value of restricted common |
|
|
|
|
|
|
|
|
|
|
|
|
|
|
|
|
|
|
||||||
shares vested during the year |
|
$ |
|
|
|
|
|
$ |
|
|
|
|
|
$ |
|
|
|
|
||||||
69
|
Market-Based Restricted Stock Units
Market-based restricted stock units consist of grants of performance-based restricted stock units to certain members of executive management that vest contingent upon the achievement of pre-determined market and service conditions. The fair value of our market-based restricted stock units is estimated using a Monte-Carlo simulation model that incorporates key assumptions such as the risk-free interest rate, expected volatility and expected dividends. Compensation expense is recognized on a straight-line basis over the vesting period, regardless of whether the market condition is satisfied. Vesting is subject to continued service requirements through the vesting date.
The following weighted average assumptions were used to determine the grant date fair value for our market-based restricted common shares for fiscal 2024, fiscal 2023, and fiscal 2022.
|
|
|
|
|
|
|
2024 |
|
|
2023 |
|
|
2022 |
||
Dividend yield |
|
% |
|
|
% |
|
n/a |
||||||||
Expected volatility |
|
% |
|
|
% |
|
n/a |
||||||||
Risk-free interest rate |
|
% |
|
|
% |
|
n/a |
||||||||
70
The following table summarizes our market-based restricted common shares for the past three fiscal years.
|
2024 |
|
|
2023 |
|
|
2022 |
|
|||||||||||||||
|
Market- |
|
|
Weighted |
|
|
Market- |
|
|
Weighted |
|
|
Market- |
|
|
Weighted |
|
||||||
|
based |
|
|
Average |
|
|
based |
|
|
Average |
|
|
based |
|
|
Average |
|
||||||
|
Restricted |
|
|
Grant |
|
|
Restricted |
|
|
Grant |
|
|
Restricted |
|
|
Grant |
|
||||||
|
Common |
|
|
Date Fair |
|
|
Common |
|
|
Date Fair |
|
|
Common |
|
|
Date Fair |
|
||||||
|
Shares |
|
|
Value |
|
|
Shares |
|
|
Value |
|
|
Shares |
|
|
Value |
|
||||||
Outstanding, beginning of year |
|
|
|
$ |
|
|
|
|
|
$ |
|
|
|
|
|
$ |
|
||||||
Separation related adjustment |
|
|
|
|
|
|
|
- |
|
|
|
- |
|
|
|
- |
|
|
|
- |
|
||
Granted |
|
|
|
|
|
|
|
|
|
|
|
|
|
- |
|
|
|
- |
|
||||
Vested |
|
( |
) |
|
|
|
|
|
- |
|
|
|
- |
|
|
|
- |
|
|
|
- |
|
|
Outstanding, end of year |
|
|
|
$ |
|
|
|
|
|
$ |
|
|
|
|
|
$ |
|
||||||
|
|
|
|
|
|
|
|
|
|
|
|
|
|
|
|
|
|
||||||
Weighted average remaining contractual life of |
|
|
|
|
|
|
|
|
|
|
|
|
|
|
|
|
|
||||||
outstanding performance shares (in years) |
|
|
|
|
|
|
|
|
|
|
|
|
|
|
|
|
|
||||||
|
|
|
|
|
|
|
|
|
|
|
|
|
|
|
|
|
|
||||||
Aggregate intrinsic value of outstanding |
|
|
|
|
|
|
|
|
|
|
|
|
|
|
|
|
|
||||||
performance shares |
$ |
|
|
|
|
|
$ |
|
|
|
|
|
$ |
|
|
|
|
||||||
|
|
|
|
|
|
|
|
|
|
|
|
|
|
|
|
|
|
||||||
Aggregate intrinsic value of performance |
|
|
|
|
|
|
|
|
|
|
|
|
|
|
|
|
|
||||||
shares vested during the year |
$ |
|
|
|
|
|
n/a |
|
|
|
|
|
n/a |
|
|
|
|
||||||
Performance Shares
We have awarded performance shares to certain key employees under our stock-based compensation plans. These performance shares are earned based on the level of achievement with respect to corporate targets for cumulative corporate economic value added, EPS growth and, in the case of business unit executives, a business unit adjusted EBITDA from continuing operations target, in each case for the three-year periods ending May 31, 2024, 2025 and 2026. These performance share awards will be paid, to the extent earned, in common shares in the fiscal quarter following the end of the applicable three-year performance period. The fair values of our performance shares are determined by the closing market prices of the underlying common shares at the respective grant dates of the performance shares and the pre-tax stock-based compensation expense is based on our periodic assessment of the probability of the targets being achieved and our estimate of the number of common shares that will ultimately be issued. The ultimate pre-tax stock-based compensation expense to be recognized over the
The table below sets forth the performance shares we granted (at target levels) during fiscal 2024, fiscal 2023 and fiscal 2022:
|
|
2024 |
|
|
2023 |
|
|
2022 |
|
|||
Granted |
|
|
|
|
|
|
|
|
|
|||
Weighted average grant date fair value, per common share |
|
$ |
|
|
$ |
|
|
$ |
|
|||
Pre-tax stock-based compensation expense |
|
$ |
|
|
$ |
|
|
$ |
|
|||
71
The following table summarizes our performance share award activity for the past three fiscal years:
|
2024 |
|
|
2023 |
|
|
2022 |
|
|||||||||||||||
|
|
|
|
Weighted |
|
|
|
|
|
Weighted |
|
|
|
|
|
Weighted |
|
||||||
|
|
|
|
Average |
|
|
|
|
|
Average |
|
|
|
|
|
Average |
|
||||||
|
|
|
|
Grant |
|
|
|
|
|
Grant |
|
|
|
|
|
Grant |
|
||||||
|
Performance |
|
|
Date Fair |
|
|
Performance |
|
|
Date Fair |
|
|
Performance |
|
|
Date Fair |
|
||||||
|
Shares |
|
|
Value |
|
|
Shares |
|
|
Value |
|
|
Shares |
|
|
Value |
|
||||||
Outstanding, beginning of year |
|
|
|
$ |
|
|
|
|
|
$ |
|
|
|
|
|
$ |
|
||||||
Converted to Worthington Steel common shares (1) |
|
( |
) |
|
|
|
|
|
- |
|
|
|
- |
|
|
|
- |
|
|
|
- |
|
|
Separation related adjustment |
|
|
|
|
- |
|
|
|
- |
|
|
|
- |
|
|
|
- |
|
|
|
- |
|
|
Granted |
|
|
|
|
|
|
|
|
|
|
|
|
|
|
|
|
|
||||||
Vested |
|
( |
) |
|
|
|
|
|
( |
) |
|
|
|
|
|
( |
) |
|
|
|
|||
Forfeited |
|
( |
) |
|
|
|
|
|
( |
) |
|
|
|
|
|
( |
) |
|
|
|
|||
Outstanding, end of year |
|
|
|
$ |
|
|
|
|
|
$ |
|
|
|
|
|
$ |
|
||||||
|
|
|
|
|
|
|
|
|
|
|
|
|
|
|
|
|
|
||||||
Weighted average remaining contractual life of |
|
|
|
|
|
|
|
|
|
|
|
|
|
|
|
|
|
||||||
outstanding performance shares (in years) |
|
|
|
|
|
|
|
|
|
|
|
|
|
|
|
|
|
||||||
|
|
|
|
|
|
|
|
|
|
|
|
|
|
|
|
|
|
||||||
Aggregate intrinsic value of outstanding |
|
|
|
|
|
|
|
|
|
|
|
|
|
|
|
|
|
||||||
performance shares |
$ |
|
|
|
|
|
$ |
|
|
|
|
|
$ |
|
|
|
|
||||||
|
|
|
|
|
|
|
|
|
|
|
|
|
|
|
|
|
|
||||||
Aggregate intrinsic value of performance |
|
|
|
|
|
|
|
|
|
|
|
|
|
|
|
|
|
||||||
shares vested during the year |
$ |
|
|
|
|
|
$ |
|
|
|
|
|
$ |
|
|
|
|
||||||
|
Note M – Employee Benefit Plans
Defined Contribution Retirement Plans
We provide retirement benefits to employees mainly through defined contribution retirement plans. Eligible participants make pre-tax contributions based on elected percentages of eligible compensation, subject to annual addition and other limitations imposed by the Code and the various plans’ provisions. Company contributions consist of employer matching contributions, annual or monthly employer contributions and discretionary contributions, based on individual plan provisions.
Defined Benefit Pension Plan
Historically, we sponsored the Gerstenslager Plan, a frozen non-contributory pension plan which covered certain employees based on age and length of service. During August 2022, we purchased an annuity contract from a third-party insurance company to transfer approximately
Discontinued Operations
In conjunction with the Separation, the defined benefit and other postretirement benefit assets and liabilities attributed to our former steel processing business are reported as discontinued operations in our consolidated balance sheet at May 31, 2023 and the net periodic pension costs are reported in the results of discontinued operations in our consolidated statements of earnings for periods prior to the Separation. The tables below exclude information related to our former steel processing business. Refer to “Note B – Discontinued Operations” for additional information.
72
Net Periodic Pension Costs
The following table summarizes the components of net periodic pension costs for our defined benefit pension plans for the prior three fiscal years:
|
2024 |
|
|
2023 |
|
|
2022 |
|
|||
Defined benefit plans: |
|
|
|
|
|
|
|
|
|||
$ |
|
|
$ |
|
|
$ |
|
||||
Return on plan assets |
|
( |
) |
|
|
( |
) |
|
|
( |
) |
|
|
|
|
|
|
|
|
||||
Settlement cost |
|
|
|
|
|
|
|
|
|||
Defined contribution plans |
|
|
|
|
|
|
|
|
|||
Net periodic benefit cost |
$ |
|
|
$ |
|
|
$ |
|
|||
Actuarial Assumptions
The following actuarial assumptions were used to determine the unfunded benefit obligation and net periodic benefit cost:
|
|
|
|
2024 |
|
|
2023 |
|
|
2022 |
|
|||
Benefit obligation: |
|
|
|
|
|
|
|
|
||||||
Discount rate |
n/a |
|
|
|
% |
|
|
% |
||||||
Net periodic pension cost: |
|
|
|
|
|
|
|
|
||||||
Discount rate |
|
% |
|
|
% |
|
|
% |
||||||
Expected long-term rate of return |
|
% |
|
|
% |
|
|
% |
||||||
Actuarial developed yield curves are used to determine discount rates. The expected return on plan assets assumption is determined by reviewing the investment returns, as well as longer-term historical returns of an asset mix approximating our asset allocation targets, and periodically comparing these returns to the expectations of investment advisors and actuaries to determine whether long-term future returns are expected to differ significantly from the past.
Funded Status
The following tables provide a reconciliation of the changes in the projected benefit obligation and the fair value of plan assets and the funded status for our defined benefit plans:
|
2024 |
|
|
2023 |
|
|||||||
Change in benefit obligation |
|
|
|
|
|
|
|
|
|
|
||
Benefit obligation, beginning of year |
$ |
|
|
$ |
|
|||||||
Interest cost |
|
|
|
|
|
|||||||
Actuarial gain |
|
( |
) |
|
|
( |
) |
|||||
Benefits paid |
|
( |
) |
|
|
( |
) |
|||||
Settlements |
|
( |
) |
|
|
( |
) |
|||||
Benefits obligation, end of year |
$ |
|
|
$ |
|
|||||||
|
|
|
|
|
|
|||||||
Change in plan assets |
|
|
|
|
|
|||||||
Fair value, beginning of year |
$ |
|
|
$ |
|
|||||||
Return on plan assets |
|
( |
) |
|
|
( |
) |
|||||
Company contributions |
|
|
|
|
|
|||||||
Benefits paid |
|
( |
) |
|
|
( |
) |
|||||
Settlements |
|
( |
) |
|
|
( |
) |
|||||
Fair value, end of year |
|
|
|
|
|
|||||||
Funded status |
$ |
|
|
$ |
( |
) |
||||||
|
|
|
|
|
|
|||||||
Amounts recognized in our consolidated balance sheets consist of: |
|
|
|
|
|
|||||||
Other liabilities |
$ |
|
|
$ |
( |
) |
||||||
AOCI |
|
|
|
|
|
|||||||
73
The following table shows other changes in plan assets and benefit obligations recognized in OCI during the prior two fiscal years:
|
2024 |
|
|
2023 |
|
||
Net (gain) loss |
$ |
( |
) |
|
$ |
( |
) |
Amortization of net loss |
|
( |
) |
|
|
( |
) |
Settlement cost |
|
( |
) |
|
|
( |
) |
Total recognized in OCI |
$ |
( |
) |
|
$ |
( |
) |
Total recognized in net periodic benefit cost and OCI |
$ |
( |
) |
|
$ |
( |
) |
Fair Value of Plan Assets
There were
The following table sets forth, by level within the fair value hierarchy, a summary of the Gerstenslager Plan assets measured on a recurring basis at May 31, 2023.
|
|
|
|
|
Quoted |
|
|
Significant |
|
|
|
|
||||
|
|
|
|
|
Prices |
|
|
Other |
|
|
Significant |
|
||||
|
|
|
|
|
in Active |
|
|
Observable |
|
|
Unobservable |
|
||||
|
|
Fair |
|
|
Markets |
|
|
Inputs |
|
|
Inputs |
|
||||
|
Value |
|
|
(Level 1) |
|
|
(Level 2) |
|
|
(Level 3) |
|
|||||
Investment: |
|
|
|
|
|
|
|
|
|
|
|
|||||
Cash and cash equivalents |
$ |
|
|
$ |
|
|
$ |
- |
|
|
$ |
- |
|
|||
Fixed-income funds |
|
|
|
|
|
|
|
- |
|
|
|
- |
|
|||
Total |
$ |
|
|
$ |
|
|
$ |
- |
|
|
$ |
- |
|
|||
Plan assets for the Gerstenslager Plan consisted of the following at May 31, 2023.
Asset category: |
|
|
|
|
Cash and cash equivalents |
|
% |
||
Debt securities and related instruments |
|
% |
||
Total |
|
% |
||
Note N – Income Taxes
Earnings before income taxes for the prior three fiscal years included the following components:
|
|
2024 |
|
|
2023 |
|
|
2022 |
|
|||
U.S. based operations |
|
$ |
|
|
$ |
|
|
$ |
|
|||
Non – U.S. based operations |
|
|
( |
) |
|
|
|
|
|
( |
) |
|
Earnings before income taxes |
|
|
|
|
|
|
|
|
|
|||
Plus: net loss attributable to noncontrolling interests (1) |
|
|
|
|
|
|
|
|
|
|||
Earnings before income taxes attributable to controlling interest |
|
$ |
|
|
$ |
|
|
$ |
|
|||
|
74
Significant components of income tax expense (benefit) for the prior three fiscal years were as follows:
|
|
2024 |
|
|
2023 |
|
|
2022 |
|
|||
Current |
|
|
|
|
|
|
|
|
|
|||
Federal |
|
$ |
|
|
$ |
|
|
$ |
|
|||
State and local |
|
|
|
|
|
|
|
|
|
|||
Foreign |
|
|
|
|
|
|
|
|
|
|||
Subtotal |
|
|
|
|
|
|
|
|
|
|||
Deferred |
|
|
|
|
|
|
|
|
|
|||
Federal |
|
|
( |
) |
|
|
( |
) |
|
|
|
|
State and local |
|
|
|
|
|
( |
) |
|
|
|
||
Foreign |
|
|
|
|
|
( |
) |
|
|
( |
) |
|
Subtotal |
|
|
|
|
|
( |
) |
|
|
|
||
Total |
|
$ |
|
|
$ |
|
|
$ |
|
|||
A reconciliation of the federal statutory corporate income tax rate to total tax provision for the prior three fiscal years follows:
|
|
2024 |
|
|
2023 |
|
|
2022 |
|
|||
Federal statutory corporate income tax rate |
|
|
% |
|
|
% |
|
|
% |
|||
State and local income taxes, net of federal tax benefit |
|
|
|
|
|
|
|
|
|
|||
Non-U.S. income taxes at other than federal statutory rate |
|
|
|
|
|
|
|
|
( |
) |
||
Excess benefit related to share-based payment awards |
|
|
( |
) |
|
|
( |
) |
|
|
( |
) |
Non-deductible executive compensation |
|
|
|
|
|
|
|
|
|
|||
Research and development tax credit |
|
|
( |
) |
|
|
( |
) |
|
|
- |
|
Non-deductible spin-off transaction costs |
|
|
|
|
|
- |
|
|
|
- |
|
|
Non-deductible note receivable impairment |
|
|
|
|
|
- |
|
|
|
- |
|
|
Tax impact of Sustainable Energy Solutions impairment and deconsolidation |
|
|
|
|
|
- |
|
|
|
- |
|
|
Deferred state tax adjustment due to spin-off |
|
|
|
|
|
- |
|
|
|
- |
|
|
Other |
|
|
( |
) |
|
|
( |
) |
|
|
( |
) |
Effective tax rate attributable to controlling interest |
|
|
% |
|
|
% |
|
|
% |
|||
The above effective tax rate attributable to controlling interest excludes any impact from the inclusion of net earnings attributable to noncontrolling interests in our consolidated statements of earnings. The effective tax rate upon inclusion of net earnings attributable to noncontrolling interests was
Under applicable accounting guidance, a tax benefit may be recognized from an uncertain tax position only if it is more likely than not that the tax position will be sustained on examination by the taxing authorities, including resolution of any related appeals or litigation processes, based on the technical merits of the position. Any tax benefits recognized in our financial statements from such a position were measured based on the largest benefit that has a greater than fifty percent likelihood of being realized upon ultimate settlement.
The total amount of unrecognized tax benefits was $
75
A tabular reconciliation of unrecognized tax benefits follows:
|
|
|
|
|
Balance at May 31, 2023 |
|
$ |
|
|
Increases - tax positions taken in prior years |
|
|
- |
|
Decreases - tax positions taken in prior years |
|
|
- |
|
Increases - current tax positions |
|
|
- |
|
Settlements |
|
|
- |
|
Lapse of statutes of limitations |
|
|
|
|
Balance at May 31, 2024 |
|
$ |
|
|
Approximately $
The following is a summary of the tax years open to examination by major tax jurisdiction:
The components of our deferred tax assets and liabilities as of May 31 were as follows:
|
|
2024 |
|
|
2023 |
|
||
Deferred tax assets |
|
|
|
|
|
|
||
Accounts receivable |
|
$ |
|
|
$ |
|
||
Note receivable |
|
|
|
|
|
- |
|
|
Inventories |
|
|
|
|
|
|
||
Accrued expenses |
|
|
|
|
|
|
||
Net operating loss carry forwards |
|
|
|
|
|
|
||
Stock-based compensation |
|
|
|
|
|
|
||
Derivative contracts |
|
|
|
|
|
|
||
Operating lease - ROU liability |
|
|
|
|
|
|
||
Capital loss |
|
|
|
|
|
- |
|
|
Other |
|
|
|
|
|
|
||
Total deferred tax assets |
|
|
|
|
|
|
||
Valuation allowance for deferred tax assets |
|
|
( |
) |
|
|
( |
) |
Net deferred tax assets |
|
|
|
|
|
|
||
Deferred tax liabilities |
|
|
|
|
|
|
||
Property, plant and equipment |
|
|
( |
) |
|
|
( |
) |
Intangibles |
|
|
( |
) |
|
|
( |
) |
Investment in affiliated companies, principally due |
|
|
( |
) |
|
|
( |
) |
Operating lease - ROU asset |
|
|
( |
) |
|
|
( |
) |
Other |
|
|
( |
) |
|
|
( |
) |
Total deferred tax liability |
|
|
( |
) |
|
|
( |
) |
Net deferred tax liability |
|
$ |
( |
) |
|
$ |
( |
) |
At May 31, 2024, we had tax benefits for federal net operating loss carry forwards of $
The valuation allowance for deferred tax assets of $
76
Based on our history of profitability, the scheduled reversal of deferred tax liabilities, and taxable income projections, we have determined that it is more likely than not that the remaining deferred tax assets are otherwise realizable.
Note O – Earnings Per Common Share
The following table sets forth the computation of basic and diluted earnings per common share for the prior three fiscal years:
|
2024 |
|
|
2023 |
|
|
2022 |
|
|||
Numerator (basic & diluted): |
|
|
|
|
|
|
|
|
|||
Net earnings from continuing operations attributable to controlling interest |
$ |
|
|
$ |
|
|
$ |
|
|||
Denominator: |
|
|
|
|
|
|
|
|
|||
Denominator for basic EPS from continuing operations - |
|
|
|
|
|
|
|
|
|||
Weighted average common shares |
|
|
|
|
|
|
|
|
|||
Effect of dilutive securities |
|
|
|
|
|
|
|
|
|||
Denominator for diluted EPS from continuing operations - |
|
|
|
|
|
|
|
|
|||
Weighted average common shares |
|
|
|
|
|
|
|
|
|||
Basic EPS from continuing operations |
$ |
|
|
$ |
|
|
$ |
|
|||
Diluted EPS from continuing operations |
$ |
|
|
$ |
|
|
$ |
|
|||
Stock options covering
Note P – Segment Data
Our operating segments reflect the way in which internally-reported financial information is regularly reviewed by the CODM to analyze performance, make decisions and allocate resources. Factors used to identify operating segments include the nature of the products provided by each business, the management reporting structure, similarity of economic characteristics and certain quantitative measures, as prescribed by authoritative accounting guidance. Our operations are organized under the following operating segments: Consumer Products and Building Products. Our operating segments correspond with our reportable segments as described further below.
In connection with the Separation, our CODM began evaluating segment operating performance on the basis of adjusted EBITDA from continuing operations, as described in the “Use of Non-GAAP Financial Measures” section preceding Part I, Item 1 of this Form 10-K. At the reportable segment level, adjusted EBITDA from continuing operations excludes public company and other governance-related costs. Effective December 1, 2023, we also realigned management responsibilities and the internal reporting of our liquified petroleum gas propane tank manufacturing facility in Westerville, Ohio, to fall under our Building Products segment (from Consumer Products). Previously reported results have been recast to reflect these changes.
Consumer Products: Our Consumer Products business serves retail customers and end consumers in the tools, outdoor living and celebrations categories under market-leading brands that include the following: Balloon Time®, Bernzomatic®, Coleman® (licensed), Garden-Weasel®, General®, Halo®, Hawkeye™, Level5®, Mag-Torch®, Pactool International®, and Worthington Pro Grade™. These include propane-filled cylinders for torches, camping stoves and other applications, handheld torches, helium-filled balloon kits, specialized hand tools and instruments, drywall tools and accessories and gas grills and pizza ovens sold primarily to mass merchandisers, retailers and distributors.
Building Products: Our Building Products business is a market-leading provider of pressurized containment solutions, providing critical components in essential end markets, such as heating, cooking, cooling and water, and, through our unconsolidated joint ventures, WAVE and ClarkDietrich, ceiling suspension systems and light gauge metal framing products. Our pressurized containment solutions include refrigerant and LPG cylinders, well water and expansion tanks, and other specialty products which are generally sold to gas producers and distributors. Refrigerant gas cylinders are used to hold refrigerant gases for commercial, residential, and automotive air conditioning and refrigeration systems. LPG cylinders hold fuel for residential and light commercial heating systems, barbeque grills and recreational vehicle equipment, industrial forklifts and commercial/residential cooking (the latter, generally outside North America). Well water tanks and expansion tanks are used primarily in the residential market with certain products also sold to commercial markets. Specialty products include a variety of fire suppression tanks, chemical tanks, and foam and adhesive tanks.
77
Unallocated Corporate and Other: Includes certain assets and liabilities (e.g. public debt) held at the corporate level as well as general corporate expenses that are not directly attributable to our business operations and are administrative in nature, such as public company and other governance-related costs that benefit the organization as a whole, have not been allocated to our operating segments and are held at the corporate level, including direct and incremental costs incurred in connection with the Separation but not attributed to discontinued operations.
Unallocated Corporate and Other also includes the activity of our former Sustainable Energy Solutions operating segment, on an historical basis, through May 29, 2024, when
The accounting policies of the reportable segments are described in “Note A – Summary of Significant Accounting Policies.” Inter-segment sales are not material.
The following tables present summarized financial information for our reportable segments for the past three fiscal years. A reconciliation from net earnings before income taxes from continuing operations to the non-GAAP financial measure of adjusted EBITDA from continuing operations is provided directly following the summarized information below.
|
|
2024 |
|
|||||||||||||||||
|
|
|
|
|
|
|
|
Total |
|
|
Unallocated |
|
|
|
|
|||||
|
|
Consumer |
|
|
Building |
|
|
Reportable |
|
|
Corporate and |
|
|
|
|
|||||
|
|
Products |
|
|
Products |
|
|
Segments |
|
|
Other |
|
|
Total |
|
|||||
Net sales |
|
$ |
|
|
$ |
|
|
$ |
|
|
$ |
|
|
$ |
|
|||||
Capital expenditures |
|
|
|
|
|
|
|
|
|
|
|
|
|
|
|
|||||
Depreciation and amortization |
|
|
|
|
|
|
|
|
|
|
|
|
|
|
|
|||||
Impairment of long-lived assets |
|
|
- |
|
|
|
|
|
|
|
|
|
|
|
|
|
||||
Restructuring and other expense, net |
|
|
- |
|
|
|
|
|
|
|
|
|
|
|
|
|
||||
Separation costs |
|
|
- |
|
|
|
- |
|
|
|
- |
|
|
|
|
|
|
|
||
Equity income |
|
|
- |
|
|
|
|
|
|
|
|
|
|
|
|
|
||||
Adjusted EBITDA from continuing operations |
|
|
|
|
|
|
|
|
|
|
|
( |
) |
|
|
|
||||
|
|
2023 |
|
|||||||||||||||||
|
|
|
|
|
|
|
|
Total |
|
|
Unallocated |
|
|
|
|
|||||
|
|
Consumer |
|
|
Building |
|
|
Reportable |
|
|
Corporate and |
|
|
|
|
|||||
|
|
Products |
|
|
Products |
|
|
Segments |
|
|
Other |
|
|
Total |
|
|||||
Net sales |
|
$ |
|
|
$ |
|
|
$ |
|
|
$ |
|
|
$ |
|
|||||
Capital expenditures |
|
|
|
|
|
|
|
|
|
|
|
|
|
|
|
|||||
Depreciation and amortization |
|
|
|
|
|
|
|
|
|
|
|
|
|
|
|
|||||
Impairment of long-lived assets |
|
|
- |
|
|
|
|
|
|
|
|
|
- |
|
|
|
|
|||
Restructuring and other expense (income), net |
|
|
|
|
|
|
|
|
|
|
|
( |
) |
|
|
( |
) |
|||
Separation costs |
|
|
- |
|
|
|
- |
|
|
|
- |
|
|
|
|
|
|
|
||
Equity income |
|
|
- |
|
|
|
|
|
|
|
|
|
( |
) |
|
|
|
|||
Adjusted EBITDA from continuing operations |
|
|
|
|
|
|
|
|
|
|
|
( |
) |
|
|
|
||||
|
|
2022 |
|
|||||||||||||||||
|
|
|
|
|
|
|
|
Total |
|
|
Unallocated |
|
|
|
|
|||||
|
|
Consumer |
|
|
Building |
|
|
Reportable |
|
|
Corporate and |
|
|
|
|
|||||
|
|
Products |
|
|
Products |
|
|
Segments |
|
|
Other |
|
|
Total |
|
|||||
Net sales |
|
$ |
|
|
$ |
|
|
$ |
|
|
$ |
|
|
$ |
|
|||||
Capital expenditures |
|
|
|
|
|
|
|
|
|
|
|
|
|
|
|
|||||
Depreciation and amortization |
|
|
|
|
|
|
|
|
|
|
|
|
|
|
|
|||||
Restructuring and other income, net |
|
|
- |
|
|
|
( |
) |
|
|
( |
) |
|
|
( |
) |
|
|
( |
) |
Equity income |
|
|
- |
|
|
|
|
|
|
|
|
|
|
|
|
|
||||
Adjusted EBITDA from continuing operations |
|
|
|
|
|
|
|
|
|
|
|
( |
) |
|
|
|
||||
78
The following table presents a reconciliation from earnings before income taxes to adjusted EBITDA from continuing operations for the past three fiscal years:
|
|
2024 |
|
|
2023 |
|
|
2022 |
|
|||
Earnings before income taxes (EBIT) |
|
$ |
|
|
$ |
|
|
$ |
|
|||
Less: net loss attributable to noncontrolling interest |
|
|
( |
) |
|
|
- |
|
|
|
- |
|
Net earnings before income taxes attributable to controlling interest |
|
|
|
|
|
|
|
|
|
|||
Interest expense, net |
|
|
|
|
|
|
|
|
|
|||
EBIT (subtotal) |
|
|
|
|
|
|
|
|
|
|||
Corporate costs eliminated at Separation |
|
|
|
|
|
|
|
|
|
|||
Impairment of goodwill and long-lived assets |
|
|
|
|
|
|
|
|
- |
|
||
Restructuring and other expense (income), net |
|
|
|
|
|
( |
) |
|
|
( |
) |
|
Separation costs |
|
|
|
|
|
|
|
|
- |
|
||
Non-cash charges in miscellaneous expense |
|
|
|
|
|
|
|
|
- |
|
||
Loss on investment in ArtiFlex |
|
|
- |
|
|
|
|
|
|
- |
|
|
Loss on extinguishment of debt |
|
|
|
|
|
- |
|
|
|
- |
|
|
Net gain on sale of assets in equity income |
|
|
( |
) |
|
|
( |
) |
|
|
- |
|
Pension settlement charge in equity income |
|
|
|
|
|
- |
|
|
|
- |
|
|
Adjusted EBIT (subtotal) |
|
|
|
|
|
|
|
|
|
|||
Depreciation and amortization |
|
|
|
|
|
|
|
|
|
|||
Stock-based compensation |
|
|
|
|
|
|
|
|
|
|||
Adjusted EBITDA from continuing operations |
|
$ |
|
|
$ |
|
|
$ |
|
|||
Total assets for each of our reportable segments as of the end of the past two fiscal years were as follows:
|
|
|
|
|
|
|
|
May 31, |
|
|
May 31, |
|
||
|
|
|
|
|
|
|
|
2024 |
|
|
2023 |
|
||
Consumer Products |
$ |
|
|
$ |
|
|||||||||
Building Products |
|
|
|
|
|
|||||||||
Total reportable segments |
|
|
|
|
|
|||||||||
Unallocated Corporate and Other |
|
|
|
|
|
|||||||||
Total assets of continuing operations |
$ |
|
|
$ |
|
|||||||||
The following table presents net sales by geographic region for the past three fiscal years:
|
|
|
|
|
|
2024 |
|
|
2023 |
|
|
2022 |
|
|||
North America |
$ |
|
|
$ |
|
|
$ |
|
||||||||
International |
|
|
|
|
|
|
|
|
||||||||
Total |
$ |
|
|
$ |
|
|
$ |
|
||||||||
The following table presents property, plant and equipment, net, by geographic region as of the end of the past two fiscal years:
|
|
|
|
|
|
|
|
2024 |
|
|
2023 |
|
||
North America |
$ |
|
|
$ |
|
|||||||||
International |
|
|
|
|
|
|||||||||
Total |
$ |
|
|
$ |
|
|||||||||
79
Note Q – Acquisitions
Halo (fiscal 2024)
On February 1, 2024, we acquired an
The information included herein is based on the preliminary allocation of the purchase price using estimates of the fair value and useful lives of the assets acquired. The purchase price allocation is subject to further adjustment until all pertinent information regarding the assets acquired is fully evaluated by us, including but not limited to, the fair value accounting.
The assets acquired and liabilities assumed were recognized at their estimated acquisition-date fair values, with goodwill representing the excess of the purchase price over the fair value of the net identifiable assets acquired. The purchase price includes the fair values of other assets that were not identifiable, not separately recognizable under accounting rules (e.g., assembled workforce) or of immaterial value. The purchase price also includes strategic and synergistic benefits (i.e., investment value) specific to us, which resulted in a purchase price in excess of the fair value of the identifiable net assets. This additional investment value resulted in goodwill which will be deductible by us for income tax purposes.
The assets acquired and liabilities assumed were recognized at their estimated acquisition-date fair values, with goodwill representing the excess of the purchase price over the fair value of the net identifiable assets acquired.
|
|
|
|
|
Useful Life |
|
Category |
|
Amount |
|
|
(Years) |
|
Trade name |
|
$ |
|
|
||
Product design/know-how |
|
|
|
|
||
Customer relationships |
|
|
|
|
||
Total acquired identifiable intangible assets |
|
$ |
|
|
|
|
The following table summarizes the consideration transferred and the estimated fair value assigned to the assets acquired and liabilities assumed at the acquisition date. These amounts reflect various preliminary fair value estimates and assumptions, including preliminary work performed by a third-party valuation specialist, and are subject to change within the measurement period as the valuation is finalized. The primary areas of preliminary purchase price allocation subject to change relate to the valuation of acquired tangible assets and liabilities, identification and valuation of residual goodwill and tax effects of acquired assets and assumed liabilities.
|
|
|
|
|
Measurement |
|
|
|
|
|||
|
|
Preliminary |
|
|
Period |
|
|
Revised |
|
|||
|
|
Valuation |
|
|
Adjustments |
|
|
Valuation |
|
|||
Cash |
|
$ |
|
|
$ |
- |
|
|
$ |
|
||
Accounts receivable |
|
|
|
|
|
- |
|
|
|
|
||
Inventories |
|
|
|
|
|
|
|
|
|
|||
Property, plant and equipment |
|
|
|
|
|
- |
|
|
|
|
||
Intangible assets |
|
|
|
|
|
- |
|
|
|
|
||
Total identifiable assets |
|
|
|
|
|
|
|
|
|
|||
Accounts payable |
|
|
( |
) |
|
|
- |
|
|
|
( |
) |
Other accrued items |
|
|
( |
) |
|
|
- |
|
|
|
( |
) |
Net identifiable assets |
|
|
|
|
|
|
|
|
|
|||
Goodwill |
|
|
|
|
|
|
|
|
|
|||
Net assets |
|
|
|
|
|
|
|
|
|
|||
Noncontrolling interest |
|
|
( |
) |
|
|
( |
) |
|
|
( |
) |
Total cash consideration |
|
$ |
|
|
$ |
|
|
$ |
|
|||
80
Level5 (fiscal 2023)
On June 2, 2022, we acquired Level5, a leading provider of drywall tools and related accessories. The total purchase price was $
Level5 is part of the Consumer Products operating segment and its results have been included in our consolidated statements of earnings since the date of acquisition. Proforma results, including the acquired business since the beginning of fiscal 2022, would not be materially different from the reported results.
The assets acquired and liabilities assumed were recognized at their estimated acquisition-date fair values, with goodwill representing the excess of the purchase price over the fair value of the net identifiable assets acquired.
Category |
|
Amount |
|
|
Useful Life (Years) |
|
Trade name |
|
$ |
|
|
Indefinite |
|
Customer relationships |
|
|
|
|
||
Technological know-how |
|
|
|
|
||
Non-compete agreement |
|
|
|
|
||
Total acquired identifiable intangible assets |
|
$ |
|
|
|
|
The purchase price includes the fair values of other assets that were not identifiable, not separately recognizable under applicable accounting rules (e.g., assembled workforce) or of immaterial value. The purchase price also includes strategic and synergistic benefits (investment value) specific to us, which resulted in a purchase price in excess of the fair value of the identifiable net assets. This additional investment value resulted in goodwill which will be deductible by us for income tax purposes.
The following table summarizes the consideration paid the final fair value assigned to the assets and liabilities assumed at the acquisition date:
|
|
|
|
|
Measurement |
|
|
|
|
|||
|
|
Preliminary |
|
|
Period |
|
|
Final |
|
|||
|
|
Valuation |
|
|
Adjustments |
|
|
Valuation |
|
|||
Cash and cash equivalents |
|
$ |
|
|
$ |
- |
|
|
$ |
|
||
Accounts receivable |
|
|
|
|
|
- |
|
|
|
|
||
Inventories |
|
|
|
|
|
- |
|
|
|
|
||
Prepaid expenses |
|
|
|
|
|
- |
|
|
|
|
||
Property, plant and equipment |
|
|
|
|
|
- |
|
|
|
|
||
Intangible assets |
|
|
|
|
|
- |
|
|
|
|
||
Operating lease assets |
|
|
|
|
|
- |
|
|
|
|
||
Total identifiable assets |
|
|
|
|
|
- |
|
|
|
|
||
Accounts payable |
|
|
( |
) |
|
|
- |
|
|
|
( |
) |
Accrued expenses |
|
|
( |
) |
|
|
|
|
|
( |
) |
|
Current operating lease liabilities |
|
|
( |
) |
|
|
- |
|
|
|
( |
) |
Noncurrent operating lease liabilities |
|
|
( |
) |
|
|
- |
|
|
|
( |
) |
Net identifiable assets |
|
|
|
|
|
|
|
|
|
|||
Goodwill |
|
|
|
|
|
- |
|
|
|
|
||
Total purchase price |
|
|
|
|
|
|
|
|
|
|||
Less: Fair value of earnout |
|
|
( |
) |
|
|
- |
|
|
|
( |
) |
Plus: Net working capital deficit |
|
|
|
|
|
( |
) |
|
|
|
||
Cash purchase price |
|
$ |
|
|
$ |
- |
|
|
$ |
|
||
81
Note R – Derivative Financial Instruments and Hedging Activities
We utilize derivative financial instruments to primarily manage exposure to certain risks related to our ongoing operations. The primary risks managed through the use of derivative financial instruments include interest rate risk, foreign currency exchange risk and commodity price risk. While certain of our derivative financial instruments are designated as hedging instruments, we also enter into derivative financial instruments that are designed to hedge a risk, but are not designated as hedging instruments and therefore do not qualify for hedge accounting. These derivative financial instruments are adjusted to current fair value through earnings at the end of each period.
Interest Rate Risk Management – We are exposed to the impact of interest rate changes. Our objective is to manage the impact of interest rate changes on cash flows and the market value of our borrowings. We utilize a mix of debt maturities along with both fixed-rate and variable-rate debt to manage changes in interest rates. In addition, we enter into interest rate swaps to further manage our exposure to interest rate variations related to our borrowings and to lower our overall borrowing costs.
Foreign Currency Exchange Risk Management – We conduct business in several major international currencies and are, therefore, subject to risks associated with changing foreign currency exchange rates. We enter into various contracts that change in value as foreign currency exchange rates change to manage this exposure. Such contracts limit exposure to both favorable and unfavorable foreign currency exchange rate fluctuations. The translation of foreign currencies into U.S. dollars also subjects us to exposure related to fluctuating foreign currency exchange rates; however, derivative financial instruments are not used to manage this risk.
Commodity Price Risk Management – We are exposed to changes in the price of certain commodities, including steel, natural gas, copper, zinc, aluminum and other raw materials, and our utility requirements. Our objective is to reduce earnings and cash flow volatility associated with forecasted purchases and sales of these commodities to allow management to focus its attention on business operations. Accordingly, we enter into derivative financial instruments to manage the associated price risk.
We are exposed to counterparty credit risk on all of our derivative financial instruments. Accordingly, we have established and maintain strict counterparty credit guidelines. We have credit support agreements in place with certain counterparties to limit our credit exposure. These agreements require either party to post cash collateral if its cumulative market position exceeds a predefined liability threshold. Amounts posted to the margin accounts accrue interest at market rates and are required to be refunded in the period in which the cumulative market position falls below the required threshold. Our net position with these counterparties fell below the predefined threshold in fiscal 2024, fiscal 2023 and fiscal 2022. We do not have significant exposure to any one counterparty and management believes the risk of loss is remote and, in any event, would not be material.
Refer to “Note S – Fair Value Measurements” for additional information regarding the accounting treatment for our derivative financial instruments, as well as how fair value is determined.
The following table summarizes the fair value of our derivative financial instruments and the respective lines in which they were recorded in our consolidated balance sheet at May 31, 2024 and 2023:
|
|
Fair Value of Assets |
|
|
Fair Value of Liabilities |
|
||||||||||||||
|
|
Balance |
|
|
|
|
|
|
|
Balance |
|
|
|
|
|
|
||||
|
|
Sheet |
|
|
|
|
|
|
|
Sheet |
|
|
|
|
|
|
||||
|
|
Location |
|
2024 |
|
|
2023 |
|
|
Location |
|
2024 |
|
|
2023 |
|
||||
Derivatives designated as hedging instruments: |
|
|
|
|
|
|
|
|
|
|
|
|
|
|
|
|
||||
Commodity contracts |
|
Receivables |
|
$ |
|
|
$ |
|
|
Accounts payable |
|
$ |
|
|
$ |
|
||||
Commodity contracts |
|
Other assets |
|
|
- |
|
|
|
- |
|
|
Other liabilities |
|
|
|
|
|
|
||
Foreign currency exchange contracts |
|
Receivables |
|
|
- |
|
|
|
- |
|
|
Accounts payable |
|
|
- |
|
|
|
|
|
Subtotal |
|
|
|
|
|
|
|
|
|
|
|
|
|
|
|
|
||||
|
|
|
|
|
|
|
|
|
|
|
|
|
|
|
|
|
||||
Derivatives not designated as hedging instruments: |
|
|
|
|
|
|
|
|
|
|
|
|
|
|
|
|
||||
Commodity contracts |
|
Receivables |
|
$ |
|
|
$ |
|
|
Accounts payable |
|
$ |
|
|
$ |
|
||||
Foreign currency exchange contracts |
|
Receivables |
|
|
- |
|
|
|
- |
|
|
Accounts payable |
|
|
|
|
|
- |
|
|
Subtotal |
|
|
|
|
|
|
|
|
|
|
|
|
|
|
|
|
||||
|
|
|
|
|
|
|
|
|
|
|
|
|
|
|
|
|
||||
Total |
|
|
|
$ |
|
|
$ |
|
|
|
|
$ |
|
|
$ |
|
||||
82
The amounts in the table above reflect the fair value of our derivative financial instruments on a net basis where allowable under master netting arrangements. Had these amounts been recognized on a gross basis, the impact would have been an increase in receivables with a corresponding increase in accounts payable of $
Cash Flow Hedges
We enter into derivative financial instruments to hedge our exposure to changes in cash flows attributable to interest rate and commodity price fluctuations associated with certain forecasted transactions. These derivative financial instruments are designated and qualify as cash flow hedges. Accordingly, the effective portion of the gain or loss on each of these derivative financial instruments is reported as a component of OCI and reclassified into earnings in the same line associated with the forecasted transaction and in the same period during which the hedged transaction affects earnings. The ineffective portion of the gain or loss on the derivative financial instrument is recognized in earnings immediately.
The following table summarizes our cash flow hedges outstanding at May 31, 2024:
|
Notional |
|
|
|
|
|
Amount |
|
|
Maturity Date |
|
Commodity contracts |
$ |
|
|
- |
|
|
|
|
|
|
|
The following table summarizes the gain (loss) recognized in OCI and the gain (loss) reclassified from AOCI into earnings for derivative financial instruments designated as cash flow hedges during fiscal 2024 and fiscal 2023:
|
|
|
|
Location of |
Gain (Loss) |
|
||
|
Gain (Loss) |
|
|
Gain (Loss) |
Reclassified |
|
||
|
Recognized |
|
|
Reclassified from AOCI |
from AOCI |
|
||
|
in OCI |
|
|
into Net Earnings |
into Net Earnings |
|
||
For the fiscal year ended May 31, 2024: |
|
|
|
|
|
|
||
Commodity contracts |
$ |
|
|
Cost of goods sold |
$ |
( |
) |
|
Interest rate contracts |
|
- |
|
|
Loss on extinguishment of debt |
|
( |
) |
Interest rate contracts |
|
- |
|
|
Interest expense |
|
|
|
Foreign currency exchange contracts |
|
( |
) |
|
Miscellaneous income, net |
|
( |
) |
$ |
|
|
|
$ |
( |
) |
||
|
|
|
|
|
|
|
||
For the fiscal year ended May 31, 2023: |
|
|
|
|
|
|
||
Commodity contracts |
$ |
( |
) |
|
Cost of goods sold |
$ |
( |
) |
Interest rate contracts |
|
- |
|
|
Interest expense |
|
( |
) |
Foreign currency exchange contracts |
|
|
|
Miscellaneous income, net |
|
|
||
$ |
( |
) |
|
|
$ |
( |
) |
|
The estimated net amount of the gains recognized in AOCI at May 31, 2024, expected to be reclassified into net earnings within the succeeding twelve months is $
Net Investment Hedges
We have designated our foreign-denominated debt as a non-derivative net investment hedge. This hedge is used to protect the value of our net investments in certain foreign operations. The foreign currency transaction gains or losses on the carrying value of our foreign-denominated debt are remeasured based on spot exchange rates at the balance sheet date. Any gains and losses attributable to the translation of the foreign-denominated debt designated as a net investment hedge are recognized as a component of the cumulative translation adjustment within AOCI. To the extent the foreign currency-denominated notes designated as net investment hedges become ineffective, changes in the carrying value attributable to the change in spot exchange rates will be recognized in earnings immediately.
83
At May 31, 2024, we designated the New Senior Notes as a non-derivative net investment hedge with a total outstanding principal amount of €
Economic (Non-designated) Hedges
We enter into foreign currency exchange contracts to manage our foreign currency exchange rate exposure related to inter-company and financing transactions that do not meet the requirements for hedge accounting treatment. We also enter into certain commodity contracts that do not qualify for hedge accounting treatment. Accordingly, these derivative financial instruments are adjusted to current market value at the end of each period through earnings.
The following table summarizes our economic (non-designated) derivative financial instruments outstanding at May 31, 2024:
|
Notional |
|
|
|
|
|
Amount |
|
|
Maturity Date |
|
Commodity contracts |
$ |
|
|
- |
|
The following table summarizes the gain (loss) recognized in earnings for economic (non-designated) derivative financial instruments during fiscal 2024 and fiscal 2023:
|
|
|
|
|
Loss |
|
|||||
|
|
|
|
|
Recognized in Earnings |
|
|||||
|
|
|
|
|
Fiscal Year Ended |
|
|||||
|
|
|
Location of Loss |
|
May 31, |
|
|||||
|
|
|
Recognized in Earnings |
|
2024 |
|
|
2023 |
|
||
Commodity contracts |
|
|
Cost of goods sold |
|
$ |
( |
) |
|
$ |
( |
) |
Foreign currency exchange contracts |
|
|
Miscellaneous income, net |
|
|
( |
) |
|
|
- |
|
Total |
|
|
|
|
$ |
( |
) |
|
$ |
( |
) |
Note S – Fair Value Measurements
Fair value is defined as the price that would be received to sell an asset or paid to transfer a liability in an orderly transaction between market participants at the measurement date. Fair value is an exit price concept that assumes an orderly transaction between willing market participants and is required to be based on assumptions that market participants would use in pricing an asset or a liability. Current accounting guidance establishes a three-tier fair value hierarchy as a basis for considering such assumptions and for classifying the inputs used in the valuation methodologies. This hierarchy requires entities to maximize the use of observable inputs and minimize the use of unobservable inputs. The three levels of inputs used to measure fair values are as follows:
Level 1 |
|
– |
|
Quoted prices (unadjusted) in active markets for identical assets or liabilities that the reporting entity can access at the measurement date. |
|
|
|
||
Level 2 |
|
– |
|
Inputs other than quoted prices included within Level 1 that are observable for the asset or liability, either directly or indirectly. |
|
|
|
||
Level 3 |
|
– |
|
Unobservable inputs for the asset or liability and that are significant to the fair value of the assets and liabilities (i.e., allowing for situations in which there is little or no market activity for the asset or liability at the measurement date). |
84
Recurring Fair Value Measurements
At May 31, 2024, our financial assets and liabilities measured at fair value on a recurring basis were as follows:
|
|
Level 1 |
|
|
Level 2 |
|
|
Level 3 |
|
|
Totals |
|
||||
Assets |
|
|
|
|
|
|
|
|
|
|
|
|
||||
Derivative financial instruments (1) |
|
$ |
- |
|
|
$ |
|
|
$ |
- |
|
|
$ |
|
||
Total assets |
|
$ |
- |
|
|
$ |
|
|
$ |
- |
|
|
$ |
|
||
|
|
|
|
|
|
|
|
|
|
|
|
|
||||
Liabilities |
|
|
|
|
|
|
|
|
|
|
|
|
||||
Derivative financial instruments (1) |
|
$ |
- |
|
|
$ |
|
|
$ |
- |
|
|
$ |
|
||
Total liabilities |
|
$ |
- |
|
|
$ |
|
|
$ |
- |
|
|
$ |
|
||
|
At May 31, 2023, our financial assets and liabilities measured at fair value on a recurring basis were as follows:
|
|
Level 1 |
|
|
Level 2 |
|
|
Level 3 |
|
|
Totals |
|
||||
Assets |
|
|
|
|
|
|
|
|
|
|
|
|
||||
Derivative financial instruments (1) |
|
$ |
- |
|
|
$ |
|
|
$ |
- |
|
|
$ |
|
||
Total assets |
|
$ |
- |
|
|
$ |
|
|
$ |
- |
|
|
$ |
|
||
|
|
|
|
|
|
|
|
|
|
|
|
|
||||
Liabilities |
|
|
|
|
|
|
|
|
|
|
|
|
||||
Derivative financial instruments (1) |
|
$ |
- |
|
|
$ |
|
|
$ |
- |
|
|
$ |
|
||
Total liabilities |
|
$ |
- |
|
|
$ |
|
|
$ |
- |
|
|
$ |
|
||
|
Non-Recurring Fair Value Measurements
At May 31, 2024, our assets measured at fair value on a non-recurring basis were categorized as follows:
|
|
Level 1 |
|
|
Level 2 |
|
|
Level 3 |
|
|
Totals |
|
||||
Assets |
|
|
|
|
|
|
|
|
|
|
|
|
||||
Investment in unconsolidated affiliate (1) |
|
$ |
- |
|
|
$ |
- |
|
|
$ |
|
|
$ |
|
||
Investment in notes receivable (2) |
|
|
- |
|
|
|
|
|
|
- |
|
|
|
|
||
Total assets |
|
$ |
- |
|
|
$ |
|
|
$ |
|
|
$ |
|
|||
|
85
At May 31, 2023, our assets measured at fair value on a non-recurring basis were categorized as follows:
|
|
Level 1 |
|
|
Level 2 |
|
|
Level 3 |
|
|
Totals |
|
||||
Assets |
|
|
|
|
|
|
|
|
|
|
|
|
||||
Long-lived assets held and used (1) |
|
$ |
- |
|
|
$ |
|
|
$ |
- |
|
|
$ |
|
||
Total assets |
|
$ |
- |
|
|
$ |
|
|
$ |
- |
|
|
$ |
|
||
|
The non-derivative financial instruments included in the carrying amounts of cash and cash equivalents, receivables, income taxes receivable, other assets, deferred income taxes, net, accounts payable, short-term borrowings, accrued compensation, contributions to employee benefit plans and related taxes, other accrued items, income taxes payable and other liabilities approximate fair value due to their short-term nature. The fair value of long-term debt, including current maturities, based upon models utilizing primarily market observable (Level 2) inputs and credit risk, was $
Note T – Leases
We lease office space, warehouses, vehicles, and equipment. Leases have remaining lease terms of
We determine if an arrangement meets the definition of a lease at inception. Operating lease ROU assets include any initial direct costs and prepayments less lease incentives. Lease terms include options to renew or terminate the lease when it is reasonably certain we will exercise such options. As most of our leases do not include an implicit rate, we use our collateralized incremental borrowing rate based on the information available at the lease commencement date, in determining the present value of lease payments. Operating lease expense is recognized on a straight-line basis over the lease term and is included in cost of goods sold or SG&A depending on the underlying nature of the leased assets.
We lease certain property and equipment from third parties under non-cancellable operating lease agreements. Certain lease agreements provide for payment of property taxes, maintenance and insurance by us. Under Topic 842, we elected the practical expedient to account for lease and non-lease components as a single component for all asset classes. Certain leases include variable lease payments based on usage or an index or rate.
The components of lease expense for fiscal 2024 and fiscal 2023 were as follows:
|
|
2024 |
|
|
2023 |
|
||
Operating lease expense |
|
$ |
|
|
$ |
|
||
Financing lease expense |
|
|
|
|
|
|
||
Amortization of leased assets |
|
|
|
|
|
|
||
Interest on lease liabilities |
|
|
|
|
|
|
||
Total financing lease expense |
|
|
|
|
|
|
||
Short-term lease expense |
|
|
|
|
|
|
||
Variable lease expense |
|
|
|
|
|
|
||
Total lease expense |
|
$ |
|
|
$ |
|
||
Other information related to our leases, as of and for the fiscal years ended May 31, 2024 and May 31, 2023, is provided below:
86
|
|
2024 |
|
|
2023 |
|
||||||||||
|
|
Operating Leases |
|
|
Financing Leases |
|
|
Operating Leases |
|
|
Financing Leases |
|
||||
Cash paid for amounts included in the measurement of lease liabilities: |
|
|
|
|
|
|
|
|
|
|
|
|
||||
Operating cash flows |
|
$ |
|
|
$ |
|
|
$ |
|
|
$ |
|
||||
Financing cash flows |
|
$ |
- |
|
|
$ |
|
|
$ |
- |
|
|
$ |
|
||
ROU assets obtained in exchange for lease liabilities |
|
$ |
|
|
$ |
- |
|
|
$ |
|
|
$ |
- |
|
||
Weighted-average remaining lease term (in years) |
|
|
|
|
|
|
|
|
|
|
|
|
||||
Weighted-average discount rate |
|
|
% |
|
|
% |
|
|
% |
|
|
% |
||||
Future minimum lease payments for non-cancelable leases having an initial or remaining term in excess of one year at May 31, 2024, were as follows:
|
|
|
|
|
|
Operating Leases |
|
|
Financing Leases |
|
||
2025 |
|
$ |
|
|
$ |
|
||||||
2026 |
|
|
|
|
|
|
||||||
2027 |
|
|
|
|
|
|
||||||
2028 |
|
|
|
|
|
|
||||||
2029 |
|
|
|
|
|
|
||||||
Thereafter |
|
|
- |
|
|
|
|
|||||
Total |
|
|
|
|
|
|
||||||
Less: imputed interest |
|
|
( |
) |
|
|
( |
) |
||||
|
$ |
|
|
$ |
|
|||||||
In connection with the Separation, we entered into several agreements with Worthington Steel, effective November 30, 2023, that, among other things, provide a framework for our relationship with Worthington Steel after the Separation, including a long-term Steel Supply Agreement, a Trademark License Agreement, and Transition Services Agreement. Amounts under the Trademark License Agreement and Transition Services Agreement were not significant during fiscal 2024.
Pursuant to the long-term Steel Supply Agreement, Worthington Steel manufactures and supplies to us, at reasonable market rates, certain flat rolled steel products, and will provide us with certain related support services such as design, engineering/technical services, price risk management, scrap management, steel purchasing, supply chain optimization and product rework services, and other services at our request that are ancillary to the supply of the flat rolled steel products. Purchases from Worthington Steel under this agreement for fiscal 2024, totaled $
We have incurred direct and incremental costs associated with the Separation, including approximately $
Note V - Subsequent Events
On June 3, 2024, we acquired Ragasco, a leading manufacturer of composite propane cylinders. The purchase price for the acquisition of Ragasco, was approximately $
87
WORTHINGTON ENTERPRISES, INC. AND SUBSIDIARIES
SCHEDULE II – VALUATION AND QUALIFYING ACCOUNTS
Description |
|
Balance at |
|
|
Charged |
|
|
Uncollectable |
|
|
Balance at |
|
||||
Fiscal 2024: |
|
|
|
|
|
|
|
|
|
|
|
|
||||
Deducted from asset accounts: Allowance for |
|
$ |
|
|
$ |
|
|
$ |
( |
) |
|
$ |
|
|||
Fiscal 2023: |
|
|
|
|
|
|
|
|
|
|
|
|
||||
Deducted from asset accounts: Allowance for |
|
$ |
|
|
$ |
|
|
$ |
( |
) |
|
$ |
|
|||
Fiscal 2022: |
|
|
|
|
|
|
|
|
|
|
|
|
||||
Deducted from asset accounts: Allowance for |
|
$ |
|
|
$ |
|
|
$ |
( |
) |
|
$ |
|
|||
See accompanying Report of Independent Registered Public Accounting Firm.
Item 9. – Changes in and Disagreements With Accountants on Accounting and Financial Disclosure
Not applicable.
Item 9A. – Controls and Procedures
Evaluation of Disclosure Controls and Procedures
We maintain disclosure controls and procedures (as defined in Rules 13a-15(e) and 15d-15(e) under the Exchange Act) that are designed to provide reasonable assurance that information required to be disclosed in the reports that Worthington Enterprises files or submits under the Exchange Act is recorded, processed, summarized and reported within the time periods specified in the SEC’s rules and forms, and that such information is accumulated and communicated to our management, including Worthington Enterprises’ principal executive officer and principal financial officer, as appropriate to allow timely decisions regarding required disclosure.
Management, under the supervision of and with the participation of Worthington Enterprises’ principal executive officer and principal financial officer, performed an evaluation of the effectiveness of our disclosure controls and procedures as of the end of the fiscal year covered by this Form 10-K (the fiscal year ended May 31, 2024). Based on that evaluation, Worthington Enterprises’ principal executive officer and principal financial officer have concluded that such disclosure controls and procedures were designed at the reasonable assurance level and were effective at a reasonable assurance level as of the end of the fiscal year covered by this Form 10-K.
Changes in Internal Control Over Financial Reporting
There were no changes in our internal control over financial reporting that occurred in the last fiscal quarter (the fiscal quarter ended May 31, 2024) that have materially affected, or are reasonably likely to materially affect, our internal control over financial reporting.
Annual Report of Management on Internal Control Over Financial Reporting
Management is responsible for establishing and maintaining adequate internal control over financial reporting to provide reasonable assurance regarding the reliability of our financial reporting and the preparation of financial statements for external purposes in accordance with GAAP. Internal control over financial reporting includes those policies and procedures that (i) pertain to the maintenance of records that, in reasonable detail, accurately and fairly reflect the transactions and dispositions of the assets of Worthington Enterprises and its consolidated subsidiaries; (ii) provide reasonable assurance that transactions are recorded as necessary to permit preparation of financial statements in accordance with GAAP, and that receipts and expenditures of Worthington Enterprises and its consolidated subsidiaries are being made only in accordance with authorizations of management and directors of Worthington Enterprises and our consolidated subsidiaries, as appropriate; and (iii) provide reasonable assurance regarding prevention or timely detection of unauthorized acquisition, use or disposition of the assets of Worthington Enterprises and its consolidated subsidiaries that could have a material effect on the financial statements.
88
Management, with the participation of Worthington Enterprises’ principal executive officer and principal financial officer, evaluated the effectiveness of our internal control over financial reporting as of May 31, 2024, the end of our fiscal year. Management based its assessment on criteria established in Internal Control - Integrated Framework (2013) issued by the Committee of Sponsoring Organizations of the Treadway Commission. The scope of the assessment included all of our consolidated operations, except for those of Halo, which was acquired in fiscal 2024. The total assets and net sales of the acquired Halo business represented $20.5 million and $1.9 million of the consolidated total assets and the consolidated net sales of the Company, respectively, as of and for our fiscal year ended May 31, 2024.
Management’s assessment included an evaluation of elements such as the design and operating effectiveness of key controls over financial reporting, process documentation, accounting policies and our overall control environment. This assessment is supported by testing and monitoring performed under the direction of management.
Because of its inherent limitations, internal control over financial reporting may not prevent or detect misstatements. Also, projections of any evaluation of effectiveness to future periods are subject to the risk that controls may become inadequate because of changes in conditions, or that the degree of compliance with the policies or procedures may deteriorate. Accordingly, even an effective system of internal control over financial reporting will provide only reasonable assurance with respect to financial statement preparation.
Based on the assessment of our internal control over financial reporting, management has concluded that our internal control over financial reporting was effective at a reasonable assurance level as of May 31, 2024. The results of management’s assessment were reviewed with the Audit Committee of the Board.
Additionally, Worthington Enterprises’ independent registered public accounting firm, KPMG LLP, independently assessed the effectiveness of our internal control over financial reporting and issued the accompanying Report of Independent Registered Public Accounting Firm.
89
Report of Independent Registered Public Accounting Firm
To the Shareholders and Board of Directors
Worthington Enterprises, Inc.:
Opinion on Internal Control Over Financial Reporting
We have audited Worthington Enterprises, Inc. and subsidiaries' (the Company) internal control over financial reporting as of May 31, 2024, based on criteria established in Internal Control – Integrated Framework (2013) issued by the Committee of Sponsoring Organizations of the Treadway Commission. In our opinion, the Company maintained, in all material respects, effective internal control over financial reporting as of May 31, 2024, based on criteria established in Internal Control – Integrated Framework (2013) issued by the Committee of Sponsoring Organizations of the Treadway Commission.
We also have audited, in accordance with the standards of the Public Company Accounting Oversight Board (United States) (PCAOB), the consolidated balance sheets of the Company as of May 31, 2024 and 2023, the related consolidated statements of earnings, comprehensive income, equity, and cash flows for each of the years in the three-year period ended May 31, 2024, and the related notes and financial statement schedules II (collectively, the consolidated financial statements), and our report dated July 30, 2024 expressed an unqualified opinion on those consolidated financial statements.
The Company acquired Halo Products Group, LLC during 2024, and management excluded from its assessment of the effectiveness of the Company’s internal control over financial reporting as of May 31, 2024, Halo Products Group, LLC’s internal control over financial reporting associated with total assets of $20.5 million and total revenues of $1.9 million included in the consolidated financial statements of the Company as of and for the year ended May 31, 2024. Our audit of internal control over financial reporting of the Company also excluded an evaluation of the internal control over financial reporting of Halo Products Group, LLC.
Basis for Opinion
The Company’s management is responsible for maintaining effective internal control over financial reporting and for its assessment of the effectiveness of internal control over financial reporting, included in the accompanying Annual Report of Management on Internal Control Over Financial Reporting. Our responsibility is to express an opinion on the Company’s internal control over financial reporting based on our audit. We are a public accounting firm registered with the PCAOB and are required to be independent with respect to the Company in accordance with the U.S. federal securities laws and the applicable rules and regulations of the Securities and Exchange Commission and the PCAOB.
We conducted our audit in accordance with the standards of the PCAOB. Those standards require that we plan and perform the audit to obtain reasonable assurance about whether effective internal control over financial reporting was maintained in all material respects. Our audit of internal control over financial reporting included obtaining an understanding of internal control over financial reporting, assessing the risk that a material weakness exists, and testing and evaluating the design and operating effectiveness of internal control based on the assessed risk. Our audit also included performing such other procedures as we considered necessary in the circumstances. We believe that our audit provides a reasonable basis for our opinion.
Definition and Limitations of Internal Control Over Financial Reporting
A company’s internal control over financial reporting is a process designed to provide reasonable assurance regarding the reliability of financial reporting and the preparation of financial statements for external purposes in accordance with generally accepted accounting principles. A company’s internal control over financial reporting includes those policies and procedures that (1) pertain to the maintenance of records that, in reasonable detail, accurately and fairly reflect the transactions and dispositions of the assets of the company; (2) provide reasonable assurance that transactions are recorded as necessary to permit preparation of financial statements in accordance with generally accepted accounting principles, and that receipts and expenditures of the company are being made only in accordance with authorizations of management and directors of the company; and (3) provide reasonable assurance regarding prevention or timely detection of unauthorized acquisition, use, or disposition of the company’s assets that could have a material effect on the financial statements.
90
Because of its inherent limitations, internal control over financial reporting may not prevent or detect misstatements. Also, projections of any evaluation of effectiveness to future periods are subject to the risk that controls may become inadequate because of changes in conditions, or that the degree of compliance with the policies or procedures may deteriorate.
/s/KPMG LLP
|
Columbus, Ohio
July 30, 2024
91
Item 9B. – Other Information
During the quarter ended May 31, 2024, no director or officer (as defined under Rule 16a-1 of the Exchange Act)
Item 9C. – Disclosure Regarding Foreign Jurisdictions that Prevent Inspections.
Not applicable.
92
PART III
Item 10. – Directors, Executive Officers and Corporate Governance
The information required by this Item will be included in the 2024 Proxy Statement, which will be filed not later than 120 days after the end of fiscal 2024 in connection with the solicitation of proxies for the 2024 Annual Meeting, and is incorporated herein by reference.
The information required by Item 401 of SEC Regulation S-K concerning the executive officers of Worthington Enterprises is incorporated herein by reference from the disclosure included under the caption “Supplemental Item – Executive Officers of Worthington Enterprises” in Part I of this Form 10-K.
The Board has adopted Charters for each of the Audit Committee, the Compensation Committee, the Executive Committee and the Nominating and Governance Committee as well as Corporate Governance Guidelines as contemplated by the applicable sections of the NYSE Listed Company Manual. The Board has also adopted a Charter of the Lead Independent Director of the Board.
In accordance with the requirements of Section 303A.10 of the NYSE Listed Company Manual, the Board has adopted a Code of Conduct covering our directors, officers and employees, including Worthington Enterprises’ President and Chief Executive Officer (the principal executive officer), Executive Vice President and Chief Financial and Operations Officer (the principal financial officer) and Vice President – Corporate Controller (the principal accounting officer). Worthington Enterprises will disclose the following events, if they occur, in a Current Report on Form 8-K to be filed with the SEC within the required four business days following their occurrence: (A) the date and nature of any amendment to a provision of the Code of Conduct that (i) applies to Worthington Enterprises’ principal executive officer, principal financial officer, principal accounting officer or controller, or persons performing similar functions, (ii) relates to any element of the “code of ethics” definition enumerated in Item 406(b) of SEC Regulation S‑K, and (iii) is not a technical, administrative or other non-substantive amendment; and (B) a description of any waiver (including the nature of the waiver, the name of the person to whom the waiver was granted and the date of the waiver), including an implicit waiver, from a provision of the Code of Conduct granted to Worthington Enterprises’ principal executive officer, principal financial officer, principal accounting officer or controller, or persons performing similar functions, that relates to one or more of the elements of the “code of ethics” definition set forth in Item 406(b) of SEC Regulation S-K. In addition, Worthington Enterprises will disclose any waivers from the provisions of the Code of Conduct granted to a director or an executive officer of Worthington Enterprises in a Current Report on Form 8-K to be filed with the SEC within the required four business days following their occurrence.
Each Charter, the Corporate Governance Guidelines and the Code of Conduct are posted on the “Governance” page of the “Investors” section (also referred to as the “Investor Relations” section) of our web site located at https://www.worthingtonenterprises.com. The website addresses in the Form 10-K are intended to provide inactive, textual references only. The information on the websites referenced herein is not part of this Form 10-K.
Item 11. – Executive Compensation
The information required by this Item will be included in the 2024 Proxy Statement and is incorporated herein by reference.
Item 12. – Security Ownership of Certain Beneficial Owners and Management and Related Stockholder Matters
The information required by this Item will be included in the 2024 Proxy Statement and is incorporated herein by reference.
The information required by this Item will be included in the 2024 Proxy Statement and is incorporated herein by reference.
Item 14. – Principal Accountant Fees and Services
The information required by this Item will be included in the 2024 Proxy Statement and is incorporated herein by reference. Our independent registered public accounting firm is KPMG LLP, Columbus, Ohio, Auditor Firm ID:
93
PART IV
Item 15. – Exhibits and Financial Statement Schedules
The consolidated financial statements (and report thereon) listed below are filed as a part of this Form 10-K:
Report of Independent Registered Public Accounting Firm (KPMG LLP)
Consolidated Balance Sheets at May 31, 2024 and 2023
Consolidated Statements of Earnings for the fiscal years ended May 31, 2024, 2023 and 2022
Consolidated Statements of Comprehensive Income for the fiscal years ended May 31, 2024, 2023 and 2022
Consolidated Statements of Equity for the fiscal years ended May 31, 2024, 2023 and 2022
Consolidated Statements of Cash Flows for the fiscal years ended May 31, 2024, 2023 and 2022
Notes to Consolidated Financial Statements – fiscal years ended May 31, 2024, 2023 and 2022
Schedule II – Valuation and Qualifying Accounts
All other financial statement schedules for which provision is made in the applicable accounting regulations of the SEC are omitted because they are not required or the required information has been presented in the aforementioned consolidated financial statements or notes thereto.
The documents listed in the Index to Exhibits that immediately precedes the Signatures page of this Form 10-K are filed or furnished with this Form 10-K as exhibits or incorporated into this Form 10-K by reference as noted. Each management contract or compensatory plan or arrangement is identified as such in the Index to Exhibits.
Item 16. – Form 10-K Summary
None.
94
INDEX TO EXHIBITS
Exhibit |
|
Description of Exhibit |
|
Location |
2.1 |
|
Equity Interest Purchase Agreement, dated as of October 29, 2021, by and among Worthington Steel of Michigan, Inc., Tempel Holdings Inc., and Tempel Steel Company. ^ |
|
|
|
|
|
|
|
2.2 |
|
Separation and Distribution Agreement, dated November 30, 2023, between Worthington Enterprises, Inc. and Worthington Steel, Inc. |
|
|
|
|
|
|
|
3.1 |
|
Amended Articles of Incorporation of Worthington Enterprises, Inc. [This document represents the articles of incorporation of Worthington Enterprises, Inc. in compiled form incorporating all amendments.] |
|
|
|
|
|
|
|
3.2 |
|
Code of Regulations of Worthington Enterprises, Inc. [This document represents the code of regulations of Worthington Enterprises, Inc. in compiled form incorporating all amendments.] |
|
|
|
|
|
|
|
4.1 |
|
Indenture, dated as of April 13, 2010, between Worthington Enterprises, Inc. and U.S. Bank National Association, as Trustee |
|
|
|
|
|
|
|
4.2 |
|
Second Supplemental Indenture, dated as of April 15, 2014, between Worthington Enterprises, Inc. and U.S. Bank National Association, as Trustee [NOTE: The Second Supplemental Indenture relates to the 4.55% Notes Due April 15, 2026 that were redeemed in full on July 28, 2023.] |
|
|
|
|
|
|
|
4.3 |
|
Form of 4.55% Global Note Due April 15, 2026 (included as Exhibit A in Exhibit 4.2 incorporated by reference in this Form 10-K) [NOTE: The 4.55% Notes Due April 15, 2026 were redeemed in full on July 28, 2023.] |
|
|
|
|
|
|
|
4.4 |
|
Third Supplemental Indenture, dated as of July 28, 2017, between Worthington Enterprises, Inc. and U.S. Bank National Association, as Trustee |
|
|
|
|
|
|
|
4.5 |
|
Form of 4.300% Global Note due August 1, 2032 (included as Exhibit A in Exhibit 4.4 incorporated by reference in this Form 10-K) |
|
95
Exhibit |
|
Description of Exhibit |
|
Location |
4.6 |
|
Note Agreement, dated as of August 10, 2012, between Worthington Enterprises, Inc., on the one hand, and The Prudential Insurance Company of America, Pruco Life Insurance Company of New Jersey, Pruco Life Insurance Company, Prudential Arizona Reinsurance Universal Company, Prudential Annuities Life Assurance Corporation, The Prudential Life Insurance Company, Ltd. and The Gibraltar Life Insurance Co., Ltd., on the other hand |
|
|
|
|
|
|
|
4.7 |
|
Form of 4.60% Senior Note due August 10, 2024 (included as Exhibit A in Exhibit 4.6 incorporated by reference in this Form 10-K) |
|
|
|
|
|
|
|
4.8 |
|
Amendment No. 1 to Note Agreement, dated June 10, 2015, among Worthington Enterprises, Inc., on the one hand, and The Prudential Insurance Company of America, Pruco Life Insurance Company of New Jersey, Pruco Life Insurance Company, Prudential Arizona Reinsurance Universal Company, Prudential Annuities Life Assurance Corporation, The Prudential Life Insurance Company, Ltd. and The Gibraltar Life Insurance Co., Ltd., on the other hand |
|
|
|
|
|
|
|
4.9 |
|
Amendment No. 2 to Note Agreement, dated August 23, 2019, with reference to the Note Agreement, dated as of August 10, 2012 (as amended by Amendment No. 1 to Note Agreement dated June 10, 2015), among Worthington Enterprises, Inc., on the one hand, and The Prudential Insurance Company of America, Pruco Life Insurance Company of New Jersey, Pruco Life Insurance Company, Prudential Arizona Reinsurance Universal Company, Prudential Annuities Life Assurance Corporation, The Prudential Life Insurance Company, Ltd. and The Gibraltar Life Insurance Co., Ltd., on the other hand |
|
|
|
|
|
|
|
4.10 |
|
Amendment No. 3 to Note Agreement, dated May 4, 2022, with reference to the Note Agreement, dated as of August 10, 2012 (as amended by Amendment No. 1 to Note Agreement dated June 10, 2015 and Amendment No. 2 to Note Agreement dated August 23, 2019), among Worthington Enterprises, Inc., on the one hand, and The Prudential Insurance Company of America, Pruco Life Insurance Company of New Jersey, Pruco Life Insurance Company, Prudential Arizona Reinsurance Universal Company, Prudential Annuities Life Assurance Corporation, The Prudential Life Insurance Company, Ltd. and The Gibraltar Life Insurance Co., Ltd., on the other hand |
|
96
Exhibit |
|
Description of Exhibit |
|
Location |
4.11 |
|
Note Purchase and Exchange Agreement, dated as of May 17, 2024, among Worthington Enterprises, Inc., on one hand, and PGIM, Inc., The Prudential Insurance Company of America, Pruco Life Insurance Company, and Prudential Legacy Insurance Company of New Jersey, on the other hand. |
|
|
|
|
|
|
|
4.12 |
|
Form of 2.06% Series A Senior Note Due August 23, 2031, issued on May 17, 2024, by Worthington Enterprises, Inc. (included as Exhibit A-1 within Exhibit 4.11 hereto) |
|
|
|
|
|
|
|
4.13 |
|
Form of 2.40% Series B Senior Notes Due August 23, 2034, issued on May 17, 2024, by Worthington Enterprises, Inc. (included as Exhibit A-2 within Exhibit 4.11 hereto) |
|
|
|
|
|
|
|
4.14
|
|
|
Filed herewith |
|
|
|
|
|
|
4.15 |
|
Description of Capital Stock of Worthington Enterprises, Inc. |
|
|
|
|
|
|
|
4.16 |
|
Fourth Amended and Restated Credit Agreement, dated as of September 27, 2023, among Worthington Enterprises, Inc., as a Borrower; PNC Bank, National Association, as a Lender, the Swingline Lender, an Issuing Bank and Administrative Agent; JPMorgan Chase Bank, N.A. and Bank of America, N.A., as Lenders and Syndication Agents; U.S. Bank National Association, The Huntington National Bank, Fifth Third Bank, National Association, The Northern Trust Company, First National Bank of Pennsylvania and Goldmans Sachs Bank USA, as Lenders; and Wells Fargo Bank, National Association and BMO Harris Bank, N.A., as the Departing Lenders; with Citibank, N.A. and The Huntington National Bank serving as Co-Documentation Agents; and JPMorgan Chase Bank, N.A., PNC Capital Markets LLC and BofA Securities, Inc. serving as Joint Bookrunners and Joint Lead Arrangers |
|
|
|
|
|
|
|
97
Exhibit |
|
Description of Exhibit |
|
Location |
|
|
|
|
|
10.1 |
|
Worthington Enterprises, Inc. Non-Qualified Deferred Compensation Plan effective March 1, 2000* |
|
|
|
|
|
|
|
10.2 |
|
Amendment to the Worthington Enterprises, Inc. Non-Qualified Deferred Compensation Plan (Amendment effective as of September 1, 2011)* |
|
|
|
|
|
|
|
10.3 |
|
Second Amendment to the Worthington Enterprises, Inc. Non-Qualified Deferred Compensation Plan (Second Amendment effective as of October 1, 2014)* |
|
|
|
|
|
|
|
10.4 |
|
Worthington Enterprises, Inc. Amended and Restated 2005 Non-Qualified Deferred Compensation Plan (Restatement effective December 2008)* |
|
|
|
|
|
|
|
10.5 |
|
First Amendment to the Worthington Enterprises, Inc. Amended and Restated 2005 Non-Qualified Deferred Compensation Plan (First Amendment effective as of September 1, 2011)* |
|
|
|
|
|
|
|
10.6 |
|
Second Amendment to the Worthington Enterprises, Inc. Amended and Restated 2005 Non-Qualified Deferred Compensation Plan (Second Amendment effective as of October 1, 2014)* |
|
|
|
|
|
|
|
10.7 |
|
Worthington Enterprises, Inc. Deferred Compensation Plan for Directors, as Amended and Restated, effective June 1, 2000* |
|
|
|
|
|
|
|
10.8 |
|
Amendment to the Worthington Enterprises, Inc. Deferred Compensation Plan for Directors, as Amended and Restated, effective June 1, 2000 (Amendment effective as of September 1, 2011)* |
|
|
|
|
|
|
|
10.9 |
|
Second Amendment to the Worthington Enterprises, Inc. Deferred Compensation Plan for Directors, as Amended and Restated (Second Amendment effective as of October 1, 2014)* |
|
98
Exhibit |
|
Description of Exhibit |
|
Location |
10.10 |
|
Worthington Enterprises, Inc. Amended and Restated 2005 Deferred Compensation Plan for Directors (Restatement effective as of December 2008)* |
|
|
|
|
|
|
|
10.11 |
|
First Amendment to the Worthington Enterprises, Inc. Amended and Restated 2005 Deferred Compensation Plan for Directors (First Amendment effective as of September 1, 2011)* |
|
|
|
|
|
|
|
10.12 |
|
Second Amendment to the Worthington Enterprises, Inc. Amended and Restated 2005 Deferred Compensation Plan for Directors (Second Amendment effective as of October 1, 2014)* |
|
|
|
|
|
|
|
10.13 |
|
Worthington Enterprises, Inc. Amended and Restated 1997 Long-Term Incentive Plan (amendment and restatement effective as of November 1, 2008)* |
|
|
|
|
|
|
|
10.14 |
|
First Amendment to the Worthington Enterprises, Inc. Amended and Restated 1997 Long-Term Incentive Plan (First Amendment effective as of June 26, 2013; performance goals approved by shareholders on September 26, 2013)* |
|
|
|
|
|
|
|
10.15 |
|
Second Amendment to the Worthington Enterprises, Inc. Amended and Restated 1997 Long-Term Incentive Plan (Second Amendment adopted on June 26, 2013; effective as of September 26, 2013 when approved by shareholders)* |
|
|
|
|
|
|
|
10.16 |
|
Third Amendment to the Worthington Enterprises, Inc. Amended and Restated 1997 Long-Term Incentive Plan (Third Amendment effective as of June 28, 2017)* |
|
|
|
|
|
|
|
10.17 |
|
Fourth Amendment to the Worthington Enterprises, Inc. Amended and Restated 1997 Long-Term Incentive Plan (Fourth Amendment adopted as of June 26, 2019;effective September 25, 2019 when approved by shareholders) * |
|
|
|
|
|
|
|
10.18 |
|
Worthington Enterprises, Inc. Amended and Restated 1997 Long-Term Incentive Plan (reflects First Amendment, Second Amendment, Third Amendment and Fourth Amendment thereto)* |
|
|
|
|
|
|
|
10.19 |
|
Form of Restricted Stock Award Agreement for awards granted after October 10, 2019 entered into by Worthington Enterprises, Inc. in order to evidence the grant of restricted common shares, in each case which will vest on the third anniversary of the grant date, subject to the terms thereof and of the Worthington Enterprises, Inc. Amended and Restated 1997 Long-Term Incentive Plan* |
|
99
Exhibit |
|
Description of Exhibit |
|
Location |
10.20 |
|
Worthington Enterprises, Inc. Amended and Restated 2006 Equity Incentive Plan for Non-Employee Directors (amended and restated effective as of September 2016)* |
|
|
|
|
|
|
|
10.21 |
|
Worthington Enterprises, Inc. 2010 Stock Option Plan* |
|
|
|
|
|
|
|
10.22 |
|
First Amendment to the Worthington Enterprises, Inc. 2010 Stock Option Plan (First Amendment adopted June 26, 2013; effective September 26, 2013 when approved by shareholders) * |
|
|
|
|
|
|
|
10.23 |
|
Second Amendment to the Worthington Enterprises, Inc. 2010 Stock Option Plan (Second Amendment effective as of June 28, 2017)* |
|
|
|
|
|
|
|
10.24 |
|
Third Amendment to the Worthington Enterprises, Inc. 2010 Stock Option Plan (adopted June 24, 2020; effective September 23, 2020 when approved by shareholders)* |
|
|
|
|
|
|
|
10.25 |
|
Worthington Enterprises, Inc. 2010 Stock Option Plan (as amended by First Amendment, Second Amendment and Third Amendment thereto)* |
|
|
|
|
|
|
|
10.26 |
|
Worthington Enterprises, Inc. Annual Incentive Plan for Executives* |
|
100
Exhibit |
|
Description of Exhibit |
|
Location |
10.27 |
|
First Amendment to the Worthington Enterprises, Inc. Annual Incentive Plan for Executives (adopted on June 26, 2013; effective September 26, 2013 when approved by shareholders)* |
|
|
|
|
|
|
|
10.28 |
|
Form of Letter Evidencing Cash Performance Bonus Awards Granted and to be Granted under the Worthington Enterprises, Inc. Annual Incentive Plan for Executives (sometimes also referred to as the Worthington Enterprises, Inc. Annual Short Term Incentive Plan)* |
|
|
|
|
|
|
|
10.29 |
|
|
Filed herewith |
|
|
|
|
|
|
10.30 |
|
Summary of Annual Cash Incentive Bonus Awards, Long-Term Performance Awards, Stock Options and Restricted Common Shares granted in Fiscal 2022 for then Named Executive Officers * |
|
|
|
|
|
|
|
10.31 |
|
Summary of Annual Cash Incentive Bonus Awards, Long-Term Performance Awards, Stock Options and Restricted Common Shares granted in Fiscal 2023 for then Named Executive Officers * |
|
|
|
|
|
|
|
10.32 |
|
Summary of Annual Cash Incentive Bonus Awards, Long-Term Performance Awards, Stock Options and Restricted Common Shares granted in Fiscal 2024 for Named Executive Officers* |
|
|
|
|
|
|
|
10.33 |
|
|
Filed herewith |
|
|
|
|
|
|
10.34 |
|
|
Filed herewith |
|
|
|
|
|
|
10.35 |
|
|
Filed herewith |
|
|
|
|
|
|
10.36 |
|
Restricted Stock Award Agreement entered into by and between Worthington Enterprises, Inc. and Joseph B. Hayek in order to evidence the grant, effective as of September 25, 2019, of 50,000 performance-based restricted common shares pursuant to the Worthington Enterprises, Inc. Amended and Restated 1997 Long-Term Incentive Plan* |
|
|
|
|
|
|
|
10.37 |
|
Restricted Stock Award Agreement entered into by and between Worthington Enterprises, Inc. and Steven M. Caravati in order to evidence the grant, effective as of June 24, 2022, of 10,000 performance-based restricted common shares pursuant to the Worthington Enterprises, Inc. Amended and Restated 1997 Long-Term Incentive Plan* |
|
|
|
|
|
|
|
10.38 |
|
Transition Services Agreement, dated November 30, 2023, between Worthington Enterprises, Inc. and Worthington Steel, Inc. |
|
101
Exhibit |
|
Description of Exhibit |
|
Location |
10.39 |
|
Tax Matters Agreement, dated November 30, 2023, between Worthington Enterprises, Inc. and Worthington Steel, Inc. |
|
|
|
|
|
|
|
10.40 |
|
Employee Matters Agreement, dated November 30, 2023, between Worthington Enterprises, Inc. and Worthington Steel, Inc. |
|
|
|
|
|
|
|
10.41
|
|
Trademark License Agreement, dated November 30, 2023, between Worthington Enterprises, Inc. and Worthington Steel, Inc. |
|
|
|
|
|
|
|
10.42 |
|
WBS License Agreement, dated November 30, 2023, between Worthington Enterprises, Inc. and Worthington Steel, Inc. |
|
|
|
|
|
|
|
10.43 |
|
Steel Supply Agreement, dated November 30, 2023, between Worthington Enterprises, Inc. and Worthington Steel, Inc. |
|
|
|
|
|
|
|
10.44 |
|
Form of Worthington Enterprises, Inc. Amended and Restated 1997 Long-Term Incentive Plan Performance Share Award Agreement (Absolute Total Shareholder Return) to evidence the grant of performance-based restricted common shares pursuant to the Worthington Enterprises, Inc. Amended and Restated 1997 Long-Term Incentive Plan* |
|
|
|
|
|
|
|
10.45 |
|
Form of Worthington Enterprises, Inc. Amended and Restated 1997 Long-Term Incentive Plan Performance Share Award Agreement (Share Price Appreciation) to evidence the grant of performance-based restricted common shares pursuant to the Worthington Enterprises, Inc. Amended and Restated 1997 Long-Term Incentive Plan* |
|
|
|
|
|
|
|
19 |
|
|
Filed herewith |
|
|
|
|
|
|
21 |
|
|
Filed herewith |
|
|
|
|
|
|
23.1 |
|
Consent of Independent Registered Public Accounting Firm (KPMG LLP) |
|
Filed herewith |
102
Exhibit |
|
Description of Exhibit |
|
Location |
23.2 |
|
|
Filed herewith |
|
|
|
|
|
|
23.3 |
|
|
Filed herewith |
|
|
|
|
|
|
24 |
|
Powers of Attorney of Directors and Certain Executive Officers of Worthington Enterprises, Inc. |
|
Filed herewith |
|
|
|
|
|
31.1 |
|
Rule 13a - 14(a) / 15d - 14(a) Certifications (Principal Executive Officer) |
|
Filed herewith |
|
|
|
|
|
31.2 |
|
Rule 13a - 14(a) / 15d - 14(a) Certifications (Principal Financial Officer) |
|
Filed herewith |
|
|
|
|
|
32.1 |
|
|
Filed herewith |
|
|
|
|
|
|
32.2 |
|
|
Filed herewith |
|
|
|
|
|
|
97.1 |
|
Worthington Enterprises, Inc. Executive Officer Clawback Policy |
|
Filed herewith |
|
|
|
|
|
99.1 |
|
|
Filed herewith |
|
|
|
|
|
|
99.2 |
|
|
Filed herewith |
|
|
|
|
|
|
101.INS |
|
Inline XBRL Instance Document |
|
The instance document does not appear in the Interactive Date File because its XBRL tabs are imbedded within the Inline XBRL document. |
|
|
|
|
|
101.SCH |
|
Inline XBRL Taxonomy Extension Schema With Embedded Linkbase Documents |
|
Submitted electronically herewith # |
|
|
|
|
|
104 |
|
Cover Page Interactive Date File |
|
The cover page from this Form 10-K, formatted in Inline XBRL is included within the Exhibit 101 attachments |
^ The Disclosure Schedules and Exhibits referenced in the Equity Purchase Agreement have been omitted pursuant to Item 601(a)(5) of SEC Regulation S-K. The Registrant will supplementally furnish a copy of any of the omitted Disclosure Schedules and Exhibits to the SEC on a confidential basis upon request.
* Indicates management contract or compensatory plan or arrangement.
+ Certain portions of this document that constitute confidential information have been redacted in accordance with Regulation S-K, Item 601(b)(10).
# Attached as Exhibit 101 to this Form 10-K are the following documents formatted in Inline XBRL (eXtensible Business Reporting Language):
103
104
SIGNATURES
Pursuant to the requirements of Section 13 or 15(d) of the Securities Exchange Act of 1934, the Registrant has duly caused this report to be signed on its behalf by the undersigned, thereunto duly authorized.
|
WORTHINGTON ENTERPRISES, INC. |
||
|
|
|
|
Date: July 30, 2024 |
By: |
|
/s/ B. Andrew Rose |
|
|
|
B. Andrew Rose |
|
|
|
President and Chief Executive Officer |
Pursuant to the requirements of the Securities Exchange Act of 1934, this report has been signed below by the following persons on behalf of the Registrant and in the capacities and on the date indicated.
SIGNATURE |
|
DATE |
|
TITLE |
|
|
|
|
|
/s/ B. Andrew Rose |
|
July 30, 2024 |
|
President and Chief Executive Officer |
B. Andrew Rose |
|
|
|
(Principal Executive Officer) |
|
|
|
|
|
/s/ Joseph B. Hayek |
|
July 30, 2024 |
|
Executive Vice President and Chief Financial and Operations Officer |
Joseph B. Hayek |
|
|
|
(Principal Financial Officer) |
|
|
|
|
|
/s/ Kevin J. Chan |
|
July 30, 2024 |
|
Vice President – Corporate Controller |
Kevin J. Chan |
|
|
|
(Principal Accounting Officer) |
|
|
|
|
|
* |
|
* |
|
Chairman of the Board and a Director |
John B. Blystone
* |
|
* |
|
Director |
Kerrii B. Anderson |
|
|
|
|
|
|
|
|
|
* |
|
* |
|
Director |
David P. Blom |
|
|
|
|
|
|
|
|
|
* |
|
* |
|
Director |
Mark C. Davis |
|
|
|
|
|
|
|
|
|
* |
|
* |
|
Director |
Michael J. Endres |
|
|
|
|
|
|
|
|
|
* |
|
* |
|
Director |
Paul G. Heller |
|
|
|
|
|
|
|
|
|
* |
|
* |
|
Director |
Ozey K. Horton, Jr. |
|
|
|
|
|
|
|
|
|
* |
|
* |
|
Director |
John H. McConnell II |
|
|
|
|
|
|
|
|
|
* |
|
* |
|
Director |
Billy R. Vickers |
|
|
|
|
|
|
|
|
|
* |
|
* |
|
Director |
Virgil L. Winland |
|
|
|
|
* The undersigned, by signing his name hereto, does hereby sign this report on behalf of each of the above-identified directors of the Registrant pursuant to powers of attorney executed by such directors, which powers of attorney are filed with this report within Exhibit 24.
*By: |
|
/s/ B. Andrew Rose |
Date: July 30, 2024 |
|
|
B. Andrew Rose |
|
|
|
Attorney-In-Fact |
|
105