EXHIBIT 99.2


|
Delaware
(State or other jurisdiction of
incorporation or organization)
|
0-25965
(Commission
File Number)
|
51-0371142
(IRS Employer
Identification No.)
|
|
o
|
Written communications pursuant to Rule 425 under the Securities Act (17 CFR 230.425)
|
|
o
|
Soliciting material pursuant to Rule 14a-12 under the Exchange Act (17 CFR 240.14a-12)
|
|
o
|
Pre-commencement communications pursuant to Rule 14d-2(b) under the Exchange Act (17 CFR 240.14d-2(b))
|
|
o
|
Pre-commencement communications pursuant to Rule 13e-4(c) under the Exchange Act (17 CFR 240.13e-4(c))
|
|
Exhibit
Number
|
|
Description
|
|
99.1
|
Press Release dated February 13, 2014.
|
|
| 99.2 |
February 2014 Investor Presentation.
|
|
|
j2 Global, Inc.
(Registrant)
|
|
|
|
||
|
Date: February 13, 2014
|
By:
|
/s/ Jeffrey D. Adelman
|
|
Jeffrey D. Adelman
Vice President, General Counsel and Secretary
|
||
|
Exhibit
Number
|
|
Description
|
|
99.1
|
Press Release dated February 13, 2014.
|
|
| 99.2 |
February 2014 Investor Presentation.
|
|
Q4 2013
|
Q4 2012
|
% Change
|
|
|
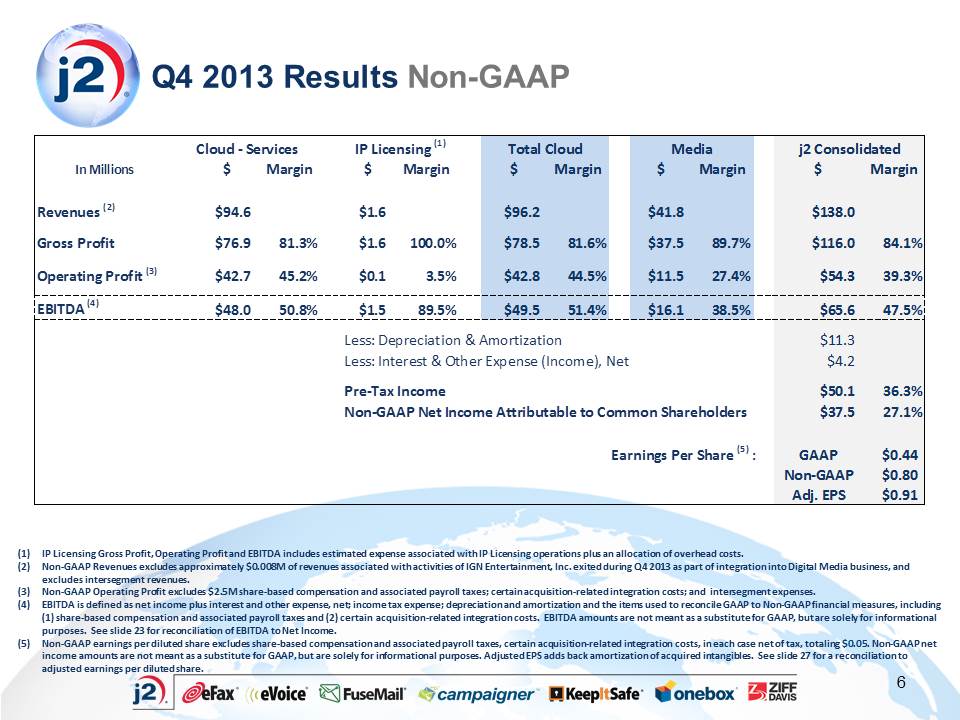
Revenues
|
$138.0 million
|
$102.0 million
|
35.3%
|
|
Earnings per Diluted Share(1)
|
$0.44
|
$0.65
|
(32.3)%
|
|
Non-GAAP Earnings per Diluted Share(1) (2)
|
$0.80
|
$0.70
|
14.3%
|
|
Adjusted Earnings per Diluted Share(1) (3)
|
$0.91
|
$0.77
|
18.1%
|
|
EBITDA(4)
|
$65.6 million
|
$51.7 million
|
26.9%
|
|
Free Cash Flow(5)
|
$50.5 million
|
$45.2 million
|
11.7%
|
|
2013
|
2012
|
% Change
|
|
|
Revenues
|
$520.8 million
|
$371.4 million
|
40.2%
|
|
Earnings per Diluted Share(6)
|
$2.28
|
$2.61
|
(12.6)%
|
|
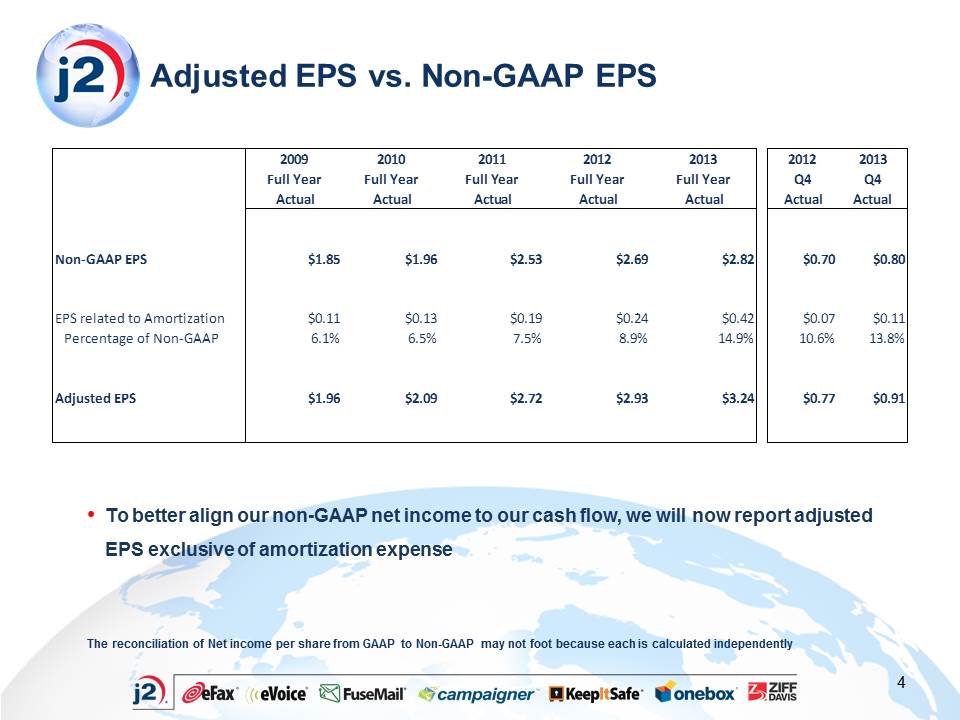
Non-GAAP Earnings per Diluted Share(7) (8)
|
$2.82
|
$2.69
|
4.8%
|
|
Adjusted Earnings per Diluted Share(7) (9)
|
$3.24
|
$2.93
|
10.5%
|
|
EBITDA(4)
|
$233.0 million
|
$194.2 million
|
20%
|
|
Free Cash Flow(5)
|
$177.4 million
|
$166.0 million
|
6.9%
|
|
(1)
|
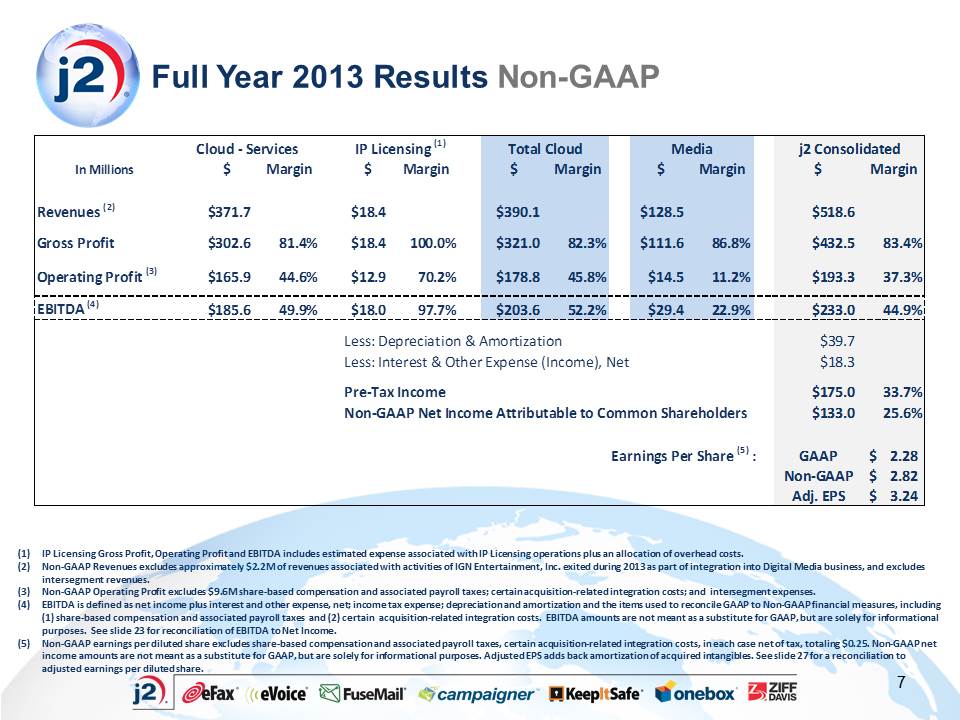
The estimated GAAP effective tax rate was approximately 33.7% for Q4 2013 and 19.6% for Q4 2012. The estimated Non-GAAP effective tax rate was approximately 24.3% for Q4 2013 and 19.8% for Q4 2012. The estimated Adjusted effective tax rate was approximately 26.2% for Q4 2013 and 21.2% for Q4 2012.
|
|
(2)
|
For Q4 2013, Non-GAAP earnings per diluted share excludes share-based compensation and related payroll taxes, certain acquisition-related integration costs and loss on extinguishment of debt and related interest expense, in each case net of tax, totaling $0.36. For Q4 2012, Non-GAAP earnings per diluted share excludes share-based compensation and related payroll taxes and certain acquisition-related integration costs, in each case net of tax, totaling $0.05. Non-GAAP earnings per diluted share amounts are not meant as a substitute for GAAP, but are solely for informational purposes.
|
|
(3)
|
For Q4 2013, Adjusted earnings per diluted share excludes share-based compensation and related payroll taxes, amortization of acquired intangibles, certain acquisition-related integration costs and loss on extinguishment of debt and related interest expense, in each case net of tax, totaling $0.47. For Q4 2012, Adjusted earnings per diluted share excludes share-based compensation and related payroll taxes, amortization of acquired intangibles and certain acquisition-related integration costs, in each case net of tax, totaling $0.12. Adjusted earnings per diluted share amounts are not meant as a substitute for GAAP, but are solely for informational purposes.
|
|
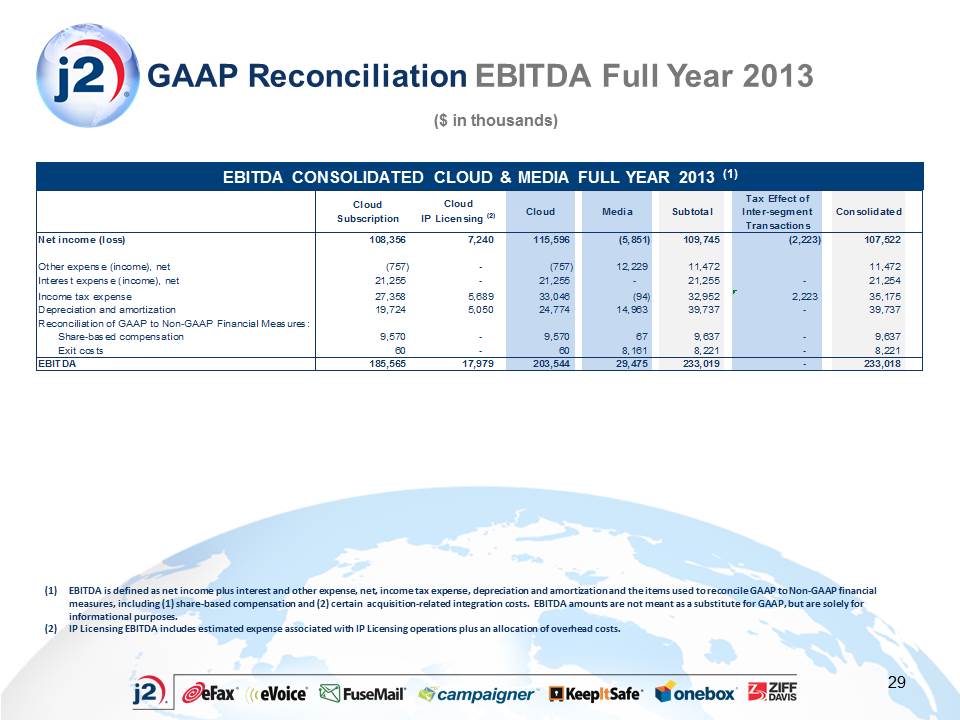
(4)
|
EBITDA is defined as earnings before interest and other expense, net; income tax expense; depreciation and amortization; and the items used to reconcile GAAP to Non-GAAP financial measures referred to in Note (2) above. EBITDA amounts are not meant as a substitute for GAAP, but are solely for informational purposes.
|
|
(5)
|
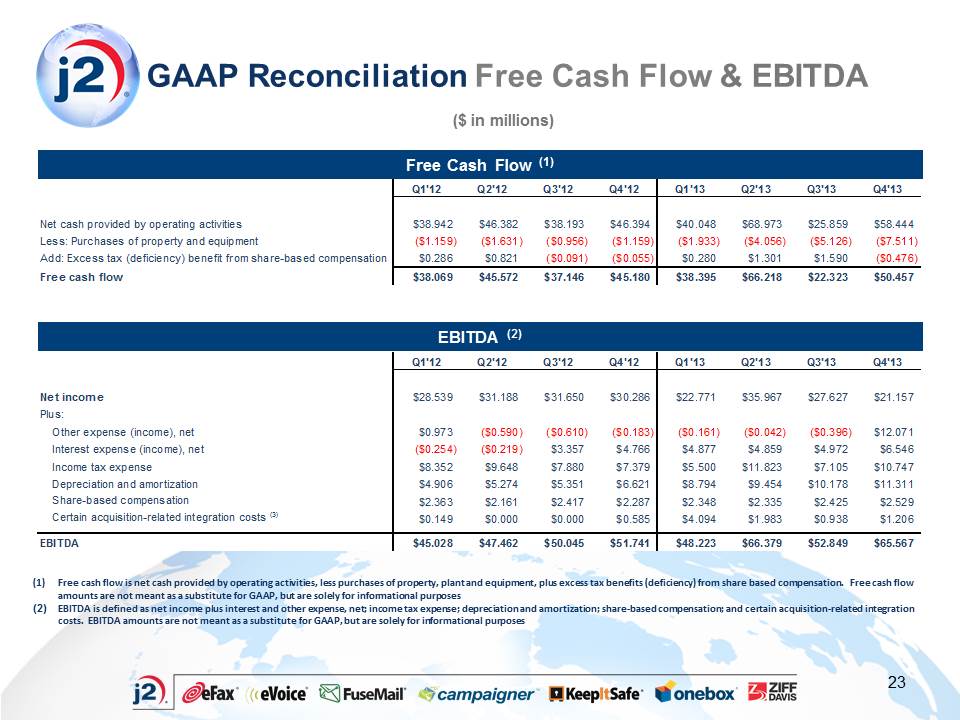
Free cash flow is defined as net cash provided by operating activities, less purchases of property, plant and equipment, plus excess tax benefit from share-based compensation. Free cash flow amounts are not meant as a substitute for GAAP, but are solely for informational purposes.
|
|
(6)
|
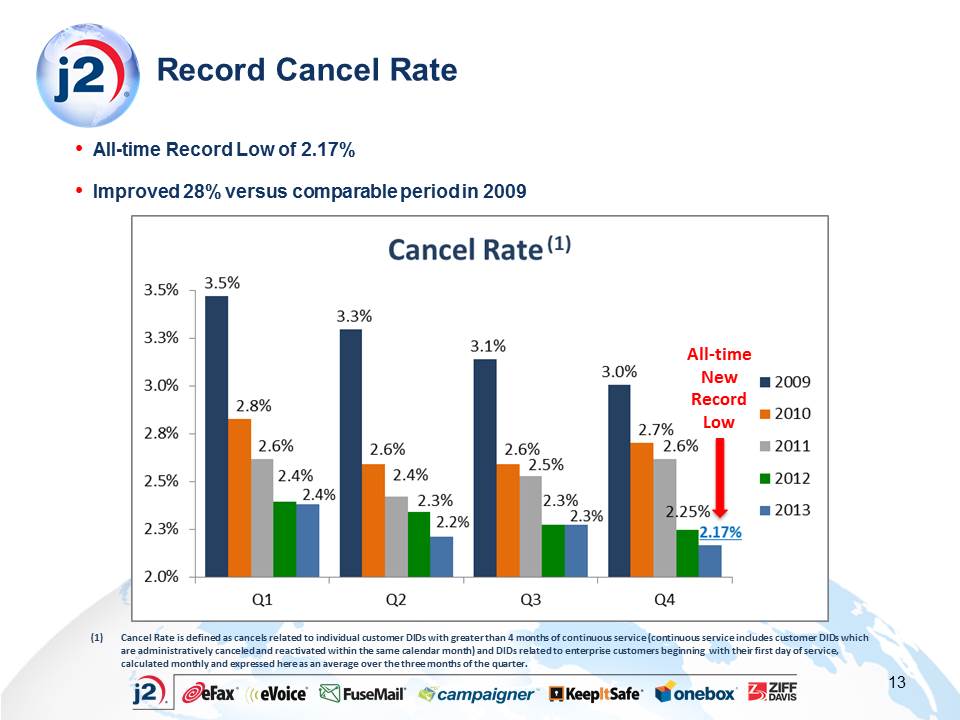
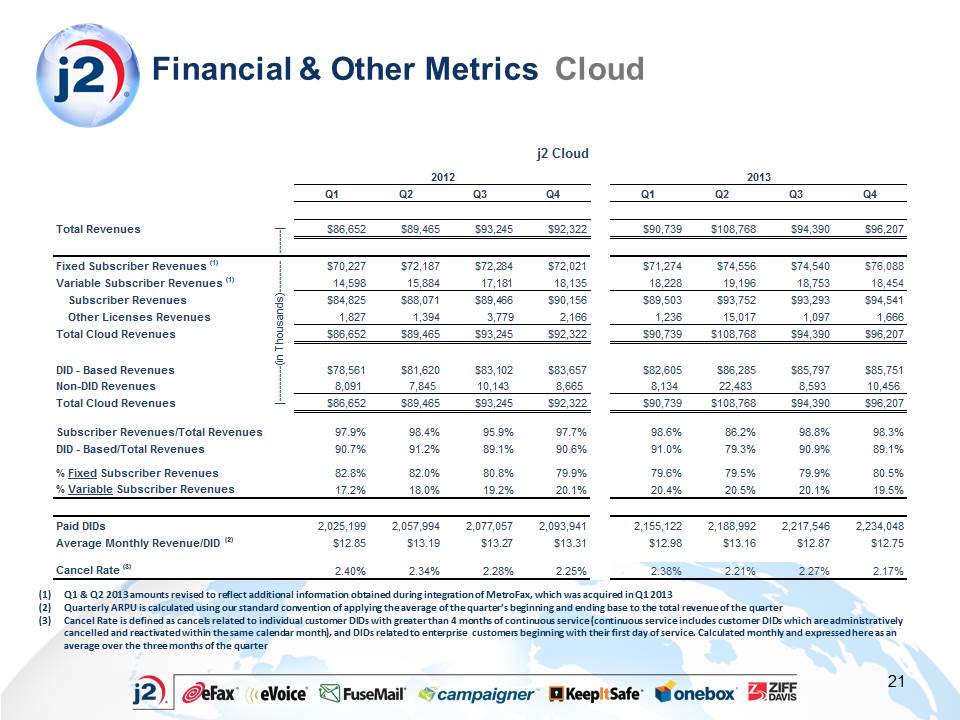
Cancel rate is defined as cancels related to individual customer DIDs with greater than 4 months of continuous service (continuous service includes customer DIDs administratively cancelled and reactivated within the same calendar month), and DIDs related to enterprise customers beginning with their first day of service. For the quarter, calculated monthly and expressed here as an average over the three months of the quarter. For the year, expressed as an average over the four quarters of the year.
|
|
(7)
|
The GAAP effective tax rate was approximately 24.7% for 2013 and 21.5% for 2012. The non-GAAP effective tax rate was approximately 24.0% for 2013 and 23.8% for 2012. The Adjusted effective tax rate was approximately 25.6% for 2013 and 24.4% for 2012.
|
|
For 2013, Non-GAAP earnings per diluted share excludes share-based compensation and related payroll taxes, amortization expense, certain acquisition-related integration costs and loss on extinguishment of debt and related interest expense, in each case net of tax, totaling $0.57. For 2012, Non-GAAP earnings per diluted share excludes share-based compensation and related payroll taxes, amortization expense, domestic production activities tax deduction from prior years, certain acquisition-related integration costs, and gain on sale of investments, in each case net of tax, totaling $0.08. Non-GAAP earnings per diluted share amounts are not meant as a substitute for GAAP, but are solely for informational purposes.
|
|
|
(9)
|
For 2013, Adjusted earnings per diluted share excludes share-based compensation and related payroll taxes, amortization of acquired intangibles, certain acquisition-related integration costs and loss on extinguishment of debt and related interest expense, in each case net of tax, totaling $0.96. For 2012, Adjusted earnings per diluted share excludes share-based compensation and related payroll taxes, amortization of acquired intangibles, domestic production activities tax deduction from prior years, certain acquisition-related integration costs, and gain on sale of investments, in each case net of tax, totaling $0.32. Adjusted earnings per diluted share amounts are not meant as a substitute for GAAP, but are solely for informational purposes.
|
|
DECEMBER 31,
|
DECEMBER 31,
|
|||||||
|
2013
|
2012
|
|||||||
|
ASSETS
|
||||||||
|
Cash and cash equivalents
|
$ | 207,801 | $ | 218,680 | ||||
|
Short-term investments
|
90,789 | 105,054 | ||||||
|
Accounts receivable,
|
||||||||
|
net of allowances of $4,105 and $3,213, respectively
|
67,245 | 37,285 | ||||||
|
Prepaid expenses and other current assets
|
20,064 | 15,388 | ||||||
|
Deferred income taxes
|
3,126 | 1,092 | ||||||
|
Total current assets
|
389,025 | 377,499 | ||||||
|
Long-term investments
|
47,351 | 19,841 | ||||||
|
Property and equipment, net
|
31,200 | 19,599 | ||||||
|
Goodwill
|
457,422 | 407,825 | ||||||
|
Other purchased intangibles, net
|
223,533 | 165,316 | ||||||
|
Deferred income taxes
|
1,845 | 1,852 | ||||||
|
Other assets
|
3,413 | 3,238 | ||||||
|
TOTAL ASSETS
|
$ | 1,153,789 | $ | 995,170 | ||||
|
LIABILITIES AND STOCKHOLDERS' EQUITY
|
||||||||
|
Accounts payable and accrued expenses
|
$ | 69,570 | $ | 39,874 | ||||
|
Income taxes payable
|
1,569 | 3,004 | ||||||
|
Deferred revenue
|
36,326 | 30,493 | ||||||
|
Liability for uncertain tax positions
|
5,535 | 5,523 | ||||||
|
Deferred income taxes
|
1,892 | 33 | ||||||
|
Total current liabilities
|
114,892 | 78,927 | ||||||
|
Long-term debt
|
245,670 | 245,194 | ||||||
|
Liability for uncertain tax positions
|
38,329 | 32,155 | ||||||
|
Deferred income taxes
|
35,833 | 32,393 | ||||||
|
Deferred revenue
|
11,189 | 1,609 | ||||||
|
Other long-term liabilities
|
1,458 | 1,557 | ||||||
|
Mandatorily redeemable financial instrument
|
— | 8,740 | ||||||
|
Total liabilities
|
447,371 | 400,575 | ||||||
|
Commitments and contingencies
|
— | — | ||||||
|
Stockholders' Equity:
|
||||||||
|
Preferred stock
|
— | — | ||||||
|
Common stock
|
461 | 451 | ||||||
|
Additional paid-in capital
|
216,872 | 169,542 | ||||||
|
Retained earnings
|
484,850 | 424,790 | ||||||
|
Accumulated other comprehensive income (loss)
|
4,235 | (88 | ) | |||||
|
Total j2 Global, Inc. stockholder's equity
|
706,418 | 594,695 | ||||||
|
Noncontrolling interest
|
— | (100 | ) | |||||
|
Total stockholders' equity
|
706,418 | 594,595 | ||||||
|
TOTAL LIABILITIES AND STOCKHOLDERS' EQUITY
|
$ | 1,153,789 | $ | 995,170 | ||||
|
THREE MONTHS ENDED DECEMBER 31,
|
TWELVE MONTHS ENDED DECEMBER 31,
|
|||||||||||||||
|
2013
|
2012
|
2013
|
2012
|
|||||||||||||
|
Revenues
|
$ | 138,035 | $ | 102,033 | $ | 520,801 | $ | 371,396 | ||||||||
|
Cost of revenues (including share-based compensation of $175 and $756 for the three and twelve months of 2013, respectively, and $211 and $844 for the three and twelve months of 2012, respectively)
|
22,178 | 18,659 | 86,893 | 67,013 | ||||||||||||
|
Gross profit
|
115,857 | 83,374 | 433,908 | 304,383 | ||||||||||||
|
Operating expenses:
|
||||||||||||||||
|
Sales and marketing (including share-based compensation of $540 and $1,855 for the three and twelve months of 2013, respectively, and $426 and $1,543 for the three and twelve months of 2012, respectively)
|
31,679 | 18,915 | 131,317 | 62,825 | ||||||||||||
|
Research, development and engineering (including share-based compensation of $123 and $434 for the three and twelve months of 2013, respectively, and $115 and $459 for the three and twelve months of 2012, respectively)
|
6,351 | 4,826 | 25,485 | 18,624 | ||||||||||||
|
General and administrative (including share-based compensation of $1,774 and $6,675 for the three and twelve months of 2013, respectively, and $1,529 and $6,286 for the three and twelve months of 2012, respectively)
|
27,306 | 17,385 | 101,683 | 60,772 | ||||||||||||
|
Total operating expenses
|
65,336 | 41,126 | 258,485 | 142,221 | ||||||||||||
|
Income from operations
|
50,521 | 42,248 | 175,423 | 162,162 | ||||||||||||
|
Other expense (income), net
|
12,071 | (183 | ) | 11,472 | (410 | ) | ||||||||||
|
Interest expense (income), net
|
6,546 | 4,766 | 21,254 | 7,650 | ||||||||||||
|
Income before income taxes
|
31,904 | 37,665 | 142,697 | 154,922 | ||||||||||||
|
Income tax expense
|
10,747 | 7,379 | 35,175 | 33,259 | ||||||||||||
|
Net income
|
21,157 | 30,286 | 107,522 | 121,663 | ||||||||||||
|
Less net income attributable to noncontrolling interest
|
403 | 83 | - | 83 | ||||||||||||
|
Net income attributable to j2 Global, Inc. common stockholders
|
$ | 20,754 | $ | 30,203 | $ | 107,522 | $ | 121,580 | ||||||||
|
Basic net income per common share:
|
||||||||||||||||
|
Net income attributable to j2 Global, Inc. common stockholders
|
$ | 0.45 | $ | 0.66 | $ | 2.31 | $ | 2.63 | ||||||||
|
Diluted net income per common share:
|
||||||||||||||||
|
Net income attributable to j2 Global, Inc. common stockholders
|
$ | 0.44 | $ | 0.65 | $ | 2.28 | $ | 2.61 | ||||||||
|
Basic weighted average shares outstanding
|
45,867,769 | 45,071,204 | 45,548,767 | 45,459,712 | ||||||||||||
|
Diluted weighted average shares outstanding
|
46,382,363 | 45,423,502 | 46,140,019 | 45,781,658 | ||||||||||||
|
TWELVE MONTHS ENDED DECEMBER 31,
|
||||||||
|
2013
|
2012
|
|||||||
|
Cash flows from operating activities:
|
||||||||
|
Net income
|
$ | 107,522 | $ | 121,663 | ||||
|
Adjustments to reconcile net income to net cash
|
||||||||
|
provided by operating activities:
|
||||||||
|
Depreciation and amortization
|
39,788 | 22,164 | ||||||
|
Accretion and amortization of discount and premium of investments
|
1,796 | 1,603 | ||||||
|
Amortization of financing costs and discounts
|
613 | 249 | ||||||
|
Share-based compensation
|
9,720 | 9,083 | ||||||
|
Excess tax benefit from share-based compensation
|
(2,695 | ) | (961 | ) | ||||
|
Provision for doubtful accounts
|
3,135 | 4,289 | ||||||
|
Deferred income taxes
|
1,202 | 1,150 | ||||||
|
Loss on extinguishment of debt and related interest expense
|
14,437 | — | ||||||
|
Decrease (increase) in:
|
||||||||
|
Accounts receivable
|
(9,588 | ) | (5,417 | ) | ||||
|
Prepaid expenses and other current assets
|
149 | (2,028 | ) | |||||
|
Other assets
|
242 | (455 | ) | |||||
|
(Decrease) increase in:
|
||||||||
|
Accounts payable and accrued expenses
|
9,126 | 5,138 | ||||||
|
Income taxes payable
|
(285 | ) | 4,188 | |||||
|
Deferred revenue
|
12,368 | 1,612 | ||||||
|
Liability for uncertain tax positions
|
6,186 | 7,601 | ||||||
|
Other liabilities
|
(392 | ) | 32 | |||||
|
Net cash provided by operating activities
|
193,324 | 169,911 | ||||||
|
Cash flows from investing activities:
|
||||||||
|
Maturity of certificate of deposit
|
42,615 | 8,000 | ||||||
|
Purchase of certificates of deposit
|
(22,071 | ) | (34,673 | ) | ||||
|
Sales of available-for-sale investments
|
140,126 | 138,709 | ||||||
|
Purchases of available-for-sale investments
|
(168,901 | ) | (151,989 | ) | ||||
|
Purchases of property and equipment
|
(18,626 | ) | (4,905 | ) | ||||
|
Purchases of intangible assets
|
(14,200 | ) | (6,295 | ) | ||||
|
Acquisition of businesses, net of cash received
|
(126,341 | ) | (198,341 | ) | ||||
|
Net cash used in investing activities
|
(167,398 | ) | (249,494 | ) | ||||
|
Cash flows from financing activities:
|
||||||||
|
Issuance of long-term debt
|
— | 245,000 | ||||||
|
Debt issuance costs
|
(47 | ) | (1,384 | ) | ||||
|
Repurchases of stock
|
(4,587 | ) | (60,282 | ) | ||||
|
Issuance of stock, net of costs
|
13,865 | 5,803 | ||||||
|
Excess tax benefit from share-based compensation
|
2,695 | 961 | ||||||
|
Mandatorily redeemable financial instrument
|
— | 8,557 | ||||||
|
Dividends paid
|
(45,134 | ) | (40,263 | ) | ||||
|
Other
|
(2,485 | ) | — | |||||
|
Net cash (used in) provided by financing activities
|
(35,693 | ) | 158,392 | |||||
|
Effect of exchange rate changes on cash and cash equivalents
|
(1,112 | ) | 512 | |||||
|
Net (decrease) increase in cash and cash equivalents
|
(10,879 | ) | 79,321 | |||||
|
Cash and cash equivalents at beginning of period
|
218,680 | 139,359 | ||||||
|
Cash and cash equivalents at end of period
|
$ | 207,801 | $ | 218,680 | ||||
|
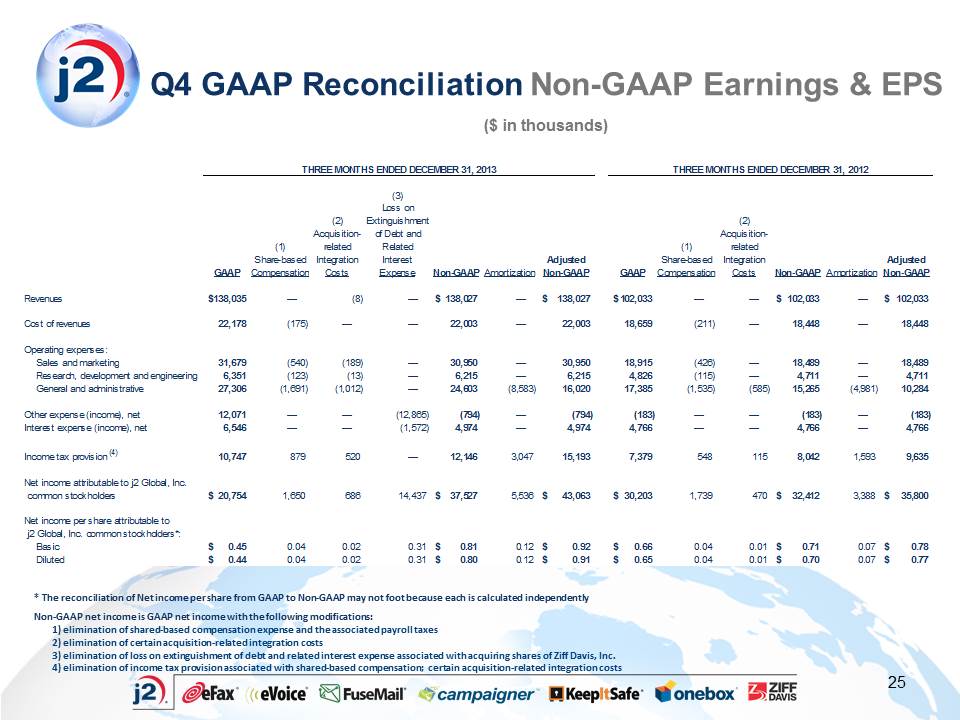
THREE MONTHS ENDED DECEMBER 31, 2013
|
THREE MONTHS ENDED DECEMBER 31, 2012
|
|||||||||||||||||||||||||||||||||||||||||||||||||||
| (3) | ||||||||||||||||||||||||||||||||||||||||||||||||||||
|
Loss on
|
||||||||||||||||||||||||||||||||||||||||||||||||||||
| (2) |
Extinguishment
|
|
(2) | |||||||||||||||||||||||||||||||||||||||||||||||||
|
Acquisition-
|
of Debt and
|
Acquisition-
|
||||||||||||||||||||||||||||||||||||||||||||||||||
| (1) |
related
|
Related
|
(1) |
related
|
||||||||||||||||||||||||||||||||||||||||||||||||
|
Share-based
|
Integration
|
Interest
|
Adjusted
|
Share-based
|
Integration
|
|
Adjusted
|
|||||||||||||||||||||||||||||||||||||||||||||
|
GAAP
|
Compensation
|
Costs
|
Expense
|
Non-GAAP
|
Amortization
|
Non-GAAP
|
GAAP
|
Compensation
|
Costs
|
Non-GAAP
|
Amortization
|
Non-GAAP
|
||||||||||||||||||||||||||||||||||||||||
|
Revenues
|
$ | 138,035 | — | (8 | ) | — | $ | 138,027 | — | $ | 138,027 | $ | 102,033 | — | — | $ | 102,033 | — | $ | 102,033 | ||||||||||||||||||||||||||||||||
|
Cost of revenues
|
22,178 | (175 | ) | — | — | 22,003 | — | 22,003 | 18,659 | (211 | ) | — | 18,448 | — | 18,448 | |||||||||||||||||||||||||||||||||||||
|
Operating expenses:
|
||||||||||||||||||||||||||||||||||||||||||||||||||||
|
Sales and marketing
|
31,679 | (540 | ) | (189 | ) | — | 30,950 | — | 30,950 | 18,915 | (426 | ) | — | 18,489 | — | 18,489 | ||||||||||||||||||||||||||||||||||||
|
Research, development and engineering
|
6,351 | (123 | ) | (13 | ) | — | 6,215 | — | 6,215 | 4,826 | (115 | ) | — | 4,711 | — | 4,711 | ||||||||||||||||||||||||||||||||||||
|
General and administrative
|
27,306 | (1,691 | ) | (1,012 | ) | — | 24,603 | (8,583 | ) | 16,020 | 17,385 | (1,535 | ) | (585 | ) | 15,265 | (4,981 | ) | 10,284 | |||||||||||||||||||||||||||||||||
|
Other expense (income), net
|
12,071 | — | — | (12,865 | ) | (794 | ) | — | (794 | ) | (183 | ) | — | — | (183 | ) | — | (183 | ) | |||||||||||||||||||||||||||||||||
|
Interest expense (income), net
|
6,546 | — | — | (1,572 | ) | 4,974 | — | 4,974 | 4,766 | — | — | 4,766 | — | 4,766 | ||||||||||||||||||||||||||||||||||||||
|
Income tax provision (4)
|
10,747 | 879 | 520 | — | 12,146 | 3,047 | 15,193 | 7,379 | 548 | 115 | 8,042 | 1,593 | 9,635 | |||||||||||||||||||||||||||||||||||||||
|
Net income attributable to j2 Global, Inc.
|
||||||||||||||||||||||||||||||||||||||||||||||||||||
|
common stockholders
|
$ | 20,754 | 1,650 | 686 | 14,437 | $ | 37,527 | 5,536 | $ | 43,063 | $ | 30,203 | 1,739 | 470 | $ | 32,412 | 3,388 | $ | 35,800 | |||||||||||||||||||||||||||||||||
|
Net income per share attributable to
|
||||||||||||||||||||||||||||||||||||||||||||||||||||
|
j2 Global, Inc. common stockholders*:
|
||||||||||||||||||||||||||||||||||||||||||||||||||||
|
Basic
|
$ | 0.45 | 0.04 | 0.02 | 0.31 | $ | 0.81 | 0.12 | $ | 0.92 | $ | 0.66 | 0.04 | 0.01 | $ | 0.71 | 0.07 | $ | 0.78 | |||||||||||||||||||||||||||||||||
|
Diluted
|
$ | 0.44 | 0.04 | 0.02 | 0.31 | $ | 0.80 | 0.12 | $ | 0.91 | $ | 0.65 | 0.04 | 0.01 | $ | 0.70 | 0.07 | $ | 0.77 | |||||||||||||||||||||||||||||||||
|
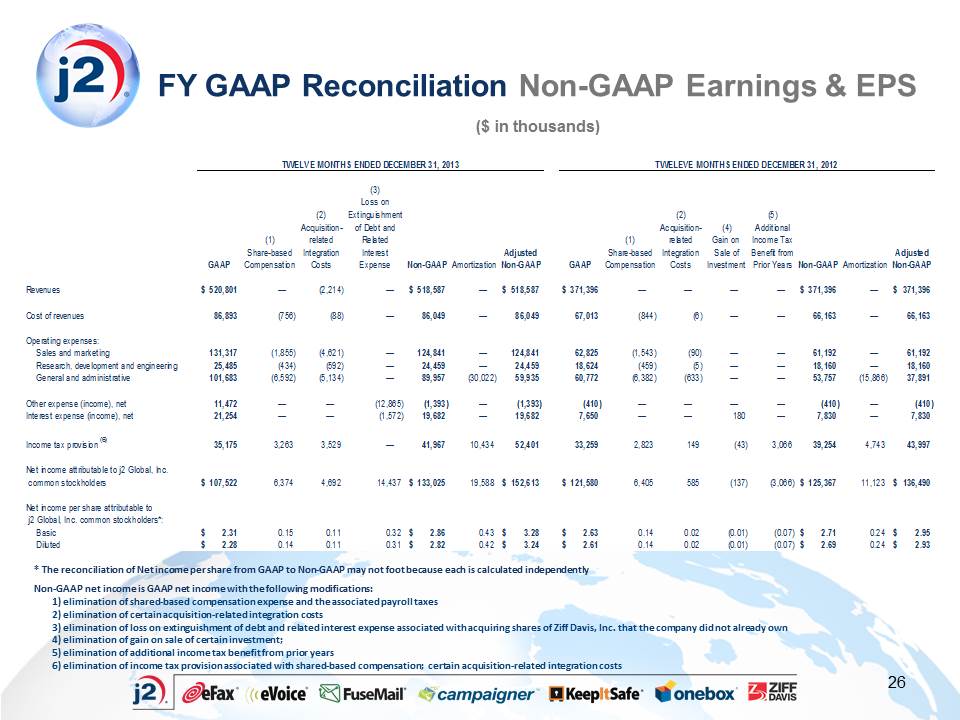
TWELVE MONTHS ENDED DECEMBER 31, 2013
|
TWELEVE MONTHS ENDED DECEMBER 31, 2012
|
|||||||||||||||||||||||||||||||||||||||||||||||||||||||||||
| (3) | ||||||||||||||||||||||||||||||||||||||||||||||||||||||||||||
|
Loss on
|
||||||||||||||||||||||||||||||||||||||||||||||||||||||||||||
| (2) |
Extinguishment
|
|
(2) |
|
(5) | |||||||||||||||||||||||||||||||||||||||||||||||||||||||
|
Acquisition-
|
of Debt and
|
Acquisition-
|
(4) |
Additional
|
|
|||||||||||||||||||||||||||||||||||||||||||||||||||||||
| (1) |
related
|
Related
|
(1) |
related
|
Gain on
|
Income Tax
|
||||||||||||||||||||||||||||||||||||||||||||||||||||||
|
Share-based
|
Integration
|
Interest
|
Non- |
Adjusted
Non-
|
Share-based
|
Integration
|
Sale of
|
Benefit from
|
Non- |
Adjusted
Non-
|
||||||||||||||||||||||||||||||||||||||||||||||||||
|
GAAP
|
Compensation
|
Costs
|
Expense
|
GAAP
|
Amortization
|
GAAP
|
GAAP
|
Compensation
|
Costs
|
Investment
|
Prior Years
|
GAAP
|
Amortization
|
GAAP
|
||||||||||||||||||||||||||||||||||||||||||||||
|
Revenues
|
$ | 520,801 | — | (2,214 | ) | — | $ | 518,587 | — | $ | 518,587 | $ | 371,396 | — | — | — | — | $ | 371,396 | — | $ | 371,396 | ||||||||||||||||||||||||||||||||||||||
|
Cost of revenues
|
86,893 | (756 | ) | (88 | ) | — | 86,049 | — | 86,049 | 67,013 | (844 | ) | (6 | ) | — | — | 66,163 | — | 66,163 | |||||||||||||||||||||||||||||||||||||||||
|
Operating expenses:
|
||||||||||||||||||||||||||||||||||||||||||||||||||||||||||||
|
Sales and marketing
|
131,317 | (1,855 | ) | (4,621 | ) | — | 124,841 | — | 124,841 | 62,825 | (1,543 | ) | (90 | ) | — | — | 61,192 | — | 61,192 | |||||||||||||||||||||||||||||||||||||||||
|
Research, development and engineering
|
25,485 | (434 | ) | (592 | ) | — | 24,459 | — | 24,459 | 18,624 | (459 | ) | (5 | ) | — | — | 18,160 | — | 18,160 | |||||||||||||||||||||||||||||||||||||||||
|
General and administrative
|
101,683 | (6,592 | ) | (5,134 | ) | — | 89,957 | (30,022 | ) | 59,935 | 60,772 | (6,382 | ) | (633 | ) | — | — | 53,757 | (15,866 | ) | 37,891 | |||||||||||||||||||||||||||||||||||||||
|
Other expense (income), net
|
11,472 | — | — | (12,865 | ) | (1,393 | ) | — | (1,393 | ) | (410 | ) | — | — | — | — | (410 | ) | — | (410 | ) | |||||||||||||||||||||||||||||||||||||||
|
Interest expense (income), net
|
21,254 | — | — | (1,572 | ) | 19,682 | — | 19,682 | 7,650 | — | — | 180 | — | 7,830 | — | 7,830 | ||||||||||||||||||||||||||||||||||||||||||||
|
Income tax provision (6)
|
35,175 | 3,263 | 3,529 | — | 41,967 | 10,434 | 52,401 | 33,259 | 2,823 | 149 | (43 | ) | 3,066 | 39,254 | 4,743 | 43,997 | ||||||||||||||||||||||||||||||||||||||||||||
|
Net income attributable to j2 Global, Inc.
|
||||||||||||||||||||||||||||||||||||||||||||||||||||||||||||
|
common stockholders
|
$ | 107,522 | 6,374 | 4,692 | 14,437 | $ | 133,025 | 19,588 | $ | 152,613 | $ | 121,580 | 6,405 | 585 | (137 | ) | (3,066 | ) | $ | 125,367 | 11,123 | $ | 136,490 | |||||||||||||||||||||||||||||||||||||
|
Net income per share attributable to
|
||||||||||||||||||||||||||||||||||||||||||||||||||||||||||||
|
j2 Global, Inc. common stockholders*:
|
||||||||||||||||||||||||||||||||||||||||||||||||||||||||||||
|
Basic
|
$ | 2.31 | 0.15 | 0.11 | 0.32 | $ | 2.86 | 0.43 | $ | 3.28 | $ | 2.63 | 0.14 | 0.02 | (0.01 | ) | (0.07 | ) | $ | 2.71 | 0.24 | $ | 2.95 | |||||||||||||||||||||||||||||||||||||
|
Diluted
|
$ | 2.28 | 0.14 | 0.11 | 0.31 | $ | 2.82 | 0.42 | $ | 3.24 | $ | 2.61 | 0.14 | 0.02 | (0.01 | ) | (0.07 | ) | $ | 2.69 | 0.24 | $ | 2.93 | |||||||||||||||||||||||||||||||||||||
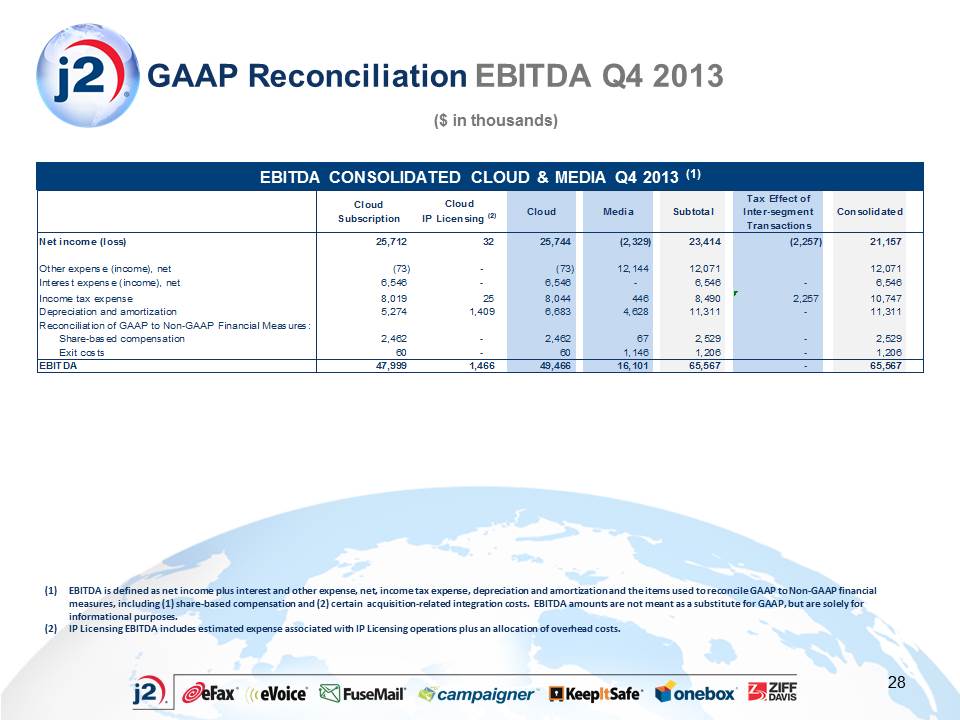
|
THREE MONTHS ENDED DECEMBER 31,
|
TWELVE MONTHS ENDED DECEMBER 31,
|
|||||||||||||||
|
2013
|
2012
|
2013
|
2012
|
|||||||||||||
|
Net income
|
$ | 21,157 | $ | 30,286 | $ | 107,522 | $ | 121,663 | ||||||||
|
Plus:
|
||||||||||||||||
|
Other expense (income), net
|
12,071 | (183 | ) | 11,472 | (410 | ) | ||||||||||
|
Interest expense (income), net
|
6,546 | 4,766 | 21,254 | 7,650 | ||||||||||||
|
Income tax expense
|
10,747 | 7,379 | 35,175 | 33,259 | ||||||||||||
|
Depreciation and amortization
|
11,311 | 6,620 | 39,737 | 22,152 | ||||||||||||
|
Reconciliation of GAAP to Non-GAAP financial measures:
|
||||||||||||||||
|
Share-based compensation and the associated payroll tax expense
|
2,529 | 2,287 | 9,637 | 9,228 | ||||||||||||
|
Acquisition-related integration costs
|
1,206 | 585 | 8,221 | 734 | ||||||||||||
|
EBITDA
|
$ | 65,567 | $ | 51,740 | $ | 233,018 | $ | 194,276 | ||||||||
| Q1 | Q2 | Q3 | Q4 |
YTD
|
||||||||||||||||
|
2013
|
||||||||||||||||||||
|
Net cash provided by operating activities
|
$ | 40,048 | $ | 68,973 | $ | 25,859 | $ | 58,444 | $ | 193,324 | ||||||||||
|
Less: Purchases of property and equipment
|
(1,933 | ) | (4,056 | ) | (5,126 | ) | (7,511 | ) | (18,626 | ) | ||||||||||
|
Add: Excess tax benefit (deficit) from share-based compensation
|
280 | 1,301 | 1,590 | (476 | ) | 2,695 | ||||||||||||||
|
Free cash flows
|
$ | 38,395 | $ | 66,218 | $ | 22,323 | $ | 50,457 | $ | 177,393 | ||||||||||
|
2012
|
||||||||||||||||||||
|
Net cash provided by operating activities
|
$ | 38,942 | $ | 46,382 | $ | 38,193 | $ | 46,394 | $ | 169,911 | ||||||||||
|
Less: Purchases of property and equipment
|
(1,159 | ) | (1,631 | ) | (956 | ) | (1,159 | ) | (4,905 | ) | ||||||||||
|
Add: Excess tax benefit (deficit) from share-based compensation
|
286 | 821 | (91 | ) | (55 | ) | 961 | |||||||||||||
|
Free cash flows
|
$ | 38,069 | $ | 45,572 | $ | 37,146 | $ | 45,180 | $ | 165,967 | ||||||||||