EXHIBIT 99.2


|
Delaware
(State or other jurisdiction of
incorporation or organization)
|
0-25965
(Commission
File Number)
|
51-0371142
(IRS Employer
Identification No.)
|
|
o
|
Written communications pursuant to Rule 425 under the Securities Act (17 CFR 230.425)
|
|
o
|
Soliciting material pursuant to Rule 14a-12 under the Exchange Act (17 CFR 240.14a-12)
|
|
o
|
Pre-commencement communications pursuant to Rule 14d-2(b) under the Exchange Act (17 CFR 240.14d-2(b))
|
|
o
|
Pre-commencement communications pursuant to Rule 13e-4(c) under the Exchange Act (17 CFR 240.13e-4(c))
|
|
(1)
|
The election of the following six director nominees to serve for the ensuing year and until their successors are elected and qualified. All nominees were elected as directors with the following vote:
|
|
Nominee
|
For
|
Against
|
Abstain
|
Broker Non-Votes
|
|
Douglas Y. Bech
|
37,862,888
|
1,048,867
|
154,871
|
4,067,187
|
|
Robert J. Cresci
|
38,015,386
|
898,272
|
152,968
|
4,067,187
|
|
W. Brian Kretzmer
|
38,126,267
|
787,439
|
152,920
|
4,067,187
|
|
Richard S. Ressler
|
38,160,186
|
753,977
|
152,463
|
4,067,187
|
|
Stephen Ross
|
38,279,179
|
634,385
|
153,062
|
4,067,187
|
|
Michael P. Schulhof
|
37,861,796
|
1,051,638
|
153,192
|
4,067,187
|
|
(2)
|
A proposal to ratify the appointment of SingerLewak, LLP to serve as the Company’s independent auditors for fiscal 2013. This proposal was approved with the following vote:
|
|
|
For
|
42,946,351
|
|
|
Against
|
26,449
|
|
|
Abstain
|
161,013
|
|
Broker Non-Votes
|
0
|
|
(3)
|
A proposal to approve, in an advisory vote, the compensation of the named executive officers. This proposal was approved with the following vote:
|
|
|
For
|
38,551,625
|
|
|
Against
|
330,228
|
|
|
Abstain
|
184,773
|
|
Broker Non-Votes
|
4,067,187
|
|
Exhibit
Number
|
|
Description
|
|
99.1
|
Press Release dated May 8, 2013.
|
|
| 99.2 | May 2013 Investor Presentation. |
|
|
j2 Global, Inc.
(Registrant)
|
|
|
|
||
|
Date: May 8, 2013
|
By:
|
/s/ Jeffrey D. Adelman
|
|
Jeffrey D. Adelman
Vice President, General Counsel and Secretary
|
||
|
Exhibit
Number
|
|
Description
|
|
99.1
|
Press Release dated May 8, 2013.
|
|
| 99.2 | May 2013 Investor Presentation. |
|
Q1 2013
|
Q1 2012
|
% Change
|
||||||||||
|
Revenues
|
$113.6 million
|
$86.7 million
|
|
31.0%
|
||||||||
|
Earnings per Diluted Share(1)
|
$0.49
|
$0.60
|
|
(18.3)%
|
||||||||
|
Non-GAAP Earnings per Diluted Share(1) (2)
|
|
$0.58
|
$0.64
|
|
(9.4)%
|
|||||||
|
EBITDA(3)
|
$48.2 million
|
$45.0 million
|
|
7.1%
|
||||||||
|
Free Cash Flow(4)
|
$38.4 million
|
$38.1 million
|
|
1.0%
|
||||||||
|
(1)
|
The estimated GAAP effective tax rates were approximately 19.5% for Q1 2013 and 22.6% for Q1 2012. The estimated Non-GAAP effective tax rates were approximately 23.2% for Q1 2013 and 23.1% for Q1 2012.
|
|
|
(2)
|
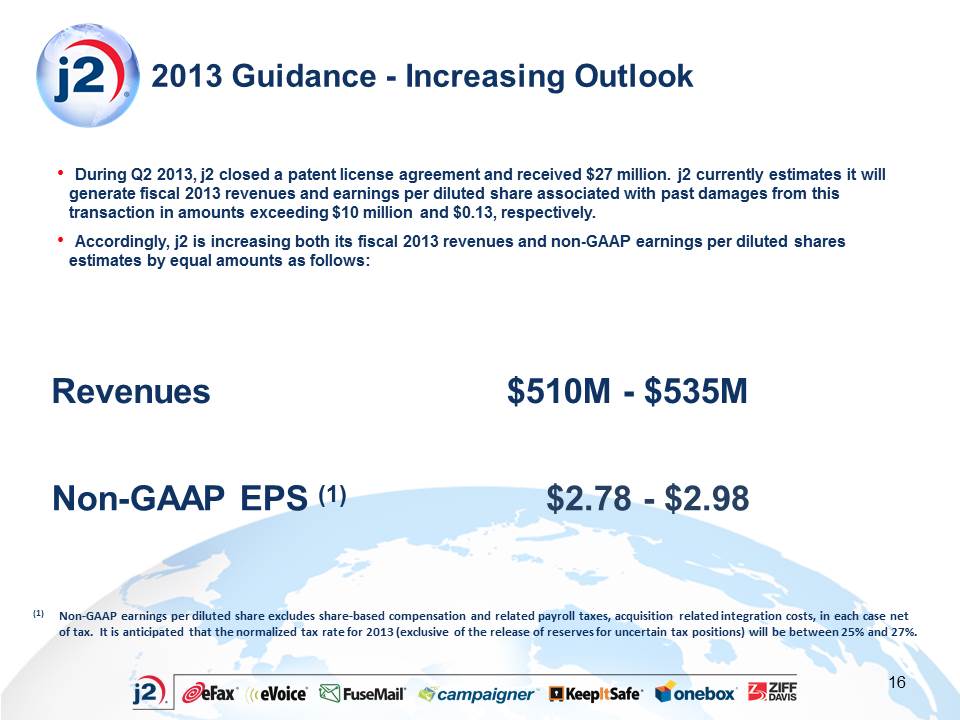
For Q1 2013, Non-GAAP earnings per diluted share excludes share-based compensation and certain acquisition-related integration costs, in each case net of tax, totaling $0.09. For Q1 2012, Non-GAAP earnings per diluted share excludes share-based compensation and related payroll taxes, and certain acquisition-related integration costs, in each case net of tax, totaling $0.04. Non-GAAP earnings per diluted share amounts are not meant as a substitute for GAAP, but are solely for informational purposes.
|
|
|
(3)
|
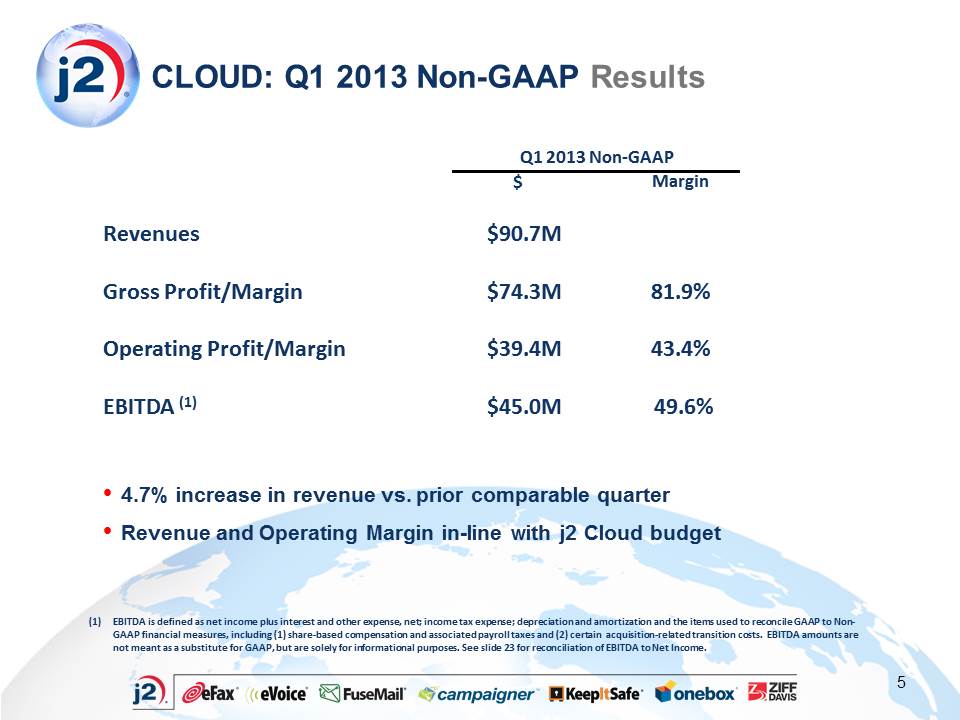
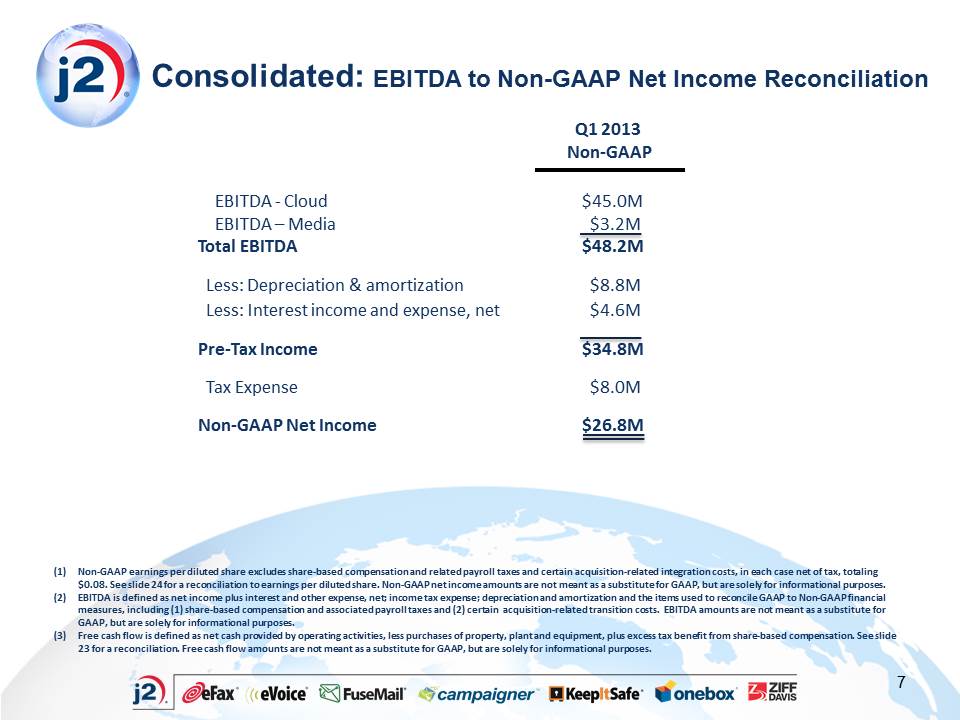
EBITDA is defined as earnings before interest and other expense, net; income tax expense; depreciation and amortization; and the items used to reconcile GAAP to Non-GAAP financial measures, including (1) share-based compensation expense and related payroll taxes and (2) certain acquisition-related integration costs. EBITDA amounts are not meant as a substitute for GAAP, but are solely for informational purposes.
|
|
|
(4)
|
Free cash flow is defined as net cash provided by operating activities, less purchases of property, plant and equipment, plus excess tax benefit from share-based compensation. Free cash flow amounts are not meant as a substitute for GAAP, but are solely for informational purposes.
|
|
|
(5)
|
Cancel rate is defined as cancels related to individual customer DIDs with greater than four months of continuous service (continuous service includes customer DIDs administratively cancelled and reactivated within the same calendar month), and DIDs related to enterprise customers beginning with their first day of service. For the quarter, calculated monthly and expressed here as an average over the three months of the quarter. For the year, expressed as an average over the four quarters of the year.
|
|
|
MARCH 31,
|
DECEMBER 31,
|
|||||||
|
2013
|
2012
|
|||||||
|
ASSETS
|
||||||||
|
Cash and cash equivalents
|
$ | 193,126 | $ | 218,680 | ||||
|
Short-term investments
|
100,846 | 105,054 | ||||||
|
Accounts receivable,
|
||||||||
|
net of allowances of $3,216 and $3,213, respectively
|
56,164 | 37,285 | ||||||
|
Prepaid expenses and other current assets
|
15,891 | 15,388 | ||||||
|
Deferred income taxes
|
2,438 | 1,092 | ||||||
|
Total current assets
|
368,465 | 377,499 | ||||||
|
Long-term investments
|
16,118 | 19,841 | ||||||
|
Property and equipment, net
|
24,874 | 19,599 | ||||||
|
Goodwill
|
429,293 | 407,825 | ||||||
|
Other purchased intangibles, net
|
195,645 | 165,316 | ||||||
|
Deferred income taxes
|
2,165 | 1,852 | ||||||
|
Other assets
|
3,266 | 3,238 | ||||||
|
TOTAL ASSETS
|
$ | 1,039,826 | $ | 995,170 | ||||
|
LIABILITIES AND STOCKHOLDERS' EQUITY
|
||||||||
|
Accounts payable and accrued expenses
|
$ | 57,122 | $ | 39,874 | ||||
|
Income taxes payable
|
3,277 | 3,004 | ||||||
|
Deferred revenue
|
32,753 | 30,493 | ||||||
|
Liability for uncertain tax positions
|
5,532 | 5,523 | ||||||
|
Deferred income taxes
|
1,107 | 33 | ||||||
|
Total current liabilities
|
99,791 | 78,927 | ||||||
|
Long-term debt
|
245,310 | 245,194 | ||||||
|
Liability for uncertain tax positions
|
33,439 | 32,155 | ||||||
|
Deferred income taxes
|
39,163 | 32,393 | ||||||
|
Other long-term liabilities
|
3,001 | 3,166 | ||||||
|
Mandatorily redeemable financial instrument
|
9,068 | 8,740 | ||||||
|
Total liabilities
|
429,772 | 400,575 | ||||||
|
Commitments and contingencies
|
— | — | ||||||
|
Stockholders' Equity:
|
||||||||
|
Preferred stock
|
— | — | ||||||
|
Common stock
|
453 | 451 | ||||||
|
Additional paid-in capital
|
173,231 | 169,542 | ||||||
|
Retained earnings
|
435,976 | 424,790 | ||||||
|
Accumulated other comprehensive income (loss)
|
980 | (88 | ) | |||||
|
Total j2 Global, Inc. stockholder's equity
|
610,640 | 594,695 | ||||||
|
Noncontrolling interest
|
(586 | ) | (100 | ) | ||||
|
Total stockholders' equity
|
610,054 | 594,595 | ||||||
|
TOTAL LIABILITIES AND STOCKHOLDERS' EQUITY
|
$ | 1,039,826 | $ | 995,170 | ||||
|
THREE MONTHS ENDED MARCH 31,
|
||||||||
|
2013
|
2012
|
|||||||
|
Revenues
|
113,617 | 86,652 | ||||||
|
Cost of revenues (including share-based compensation of $214 and $242 for the three months of 2013 and 2012, respectively)
|
20,235 | 15,864 | ||||||
|
Gross profit
|
93,382 | 70,788 | ||||||
|
Operating expenses:
|
||||||||
|
Sales and marketing (including share-based compensation of $418 and $375 for the three months of 2013 and 2012, respectively)
|
29,638 | 14,860 | ||||||
|
Research, development and engineering (including share-based compensation of $106 and $116 for the three months of 2013 and 2012, respectively)
|
6,746 | 4,489 | ||||||
|
General and administrative (including share-based compensation of $1,610 and $1,560 for the three months of 2013 and 2012, respectively)
|
24,011 | 13,829 | ||||||
|
Total operating expenses
|
60,395 | 33,178 | ||||||
|
Income from operations
|
32,987 | 37,610 | ||||||
|
Interest and other expense, net
|
(4,716 | ) | (719 | ) | ||||
|
Income before income taxes
|
28,271 | 36,891 | ||||||
|
Income tax expense
|
5,500 | 8,352 | ||||||
|
Net income
|
22,771 | 28,539 | ||||||
|
Less net loss attributable to noncontrolling interest
|
(151 | ) | — | |||||
|
Net income attributable to j2 Global, Inc. common stockholders
|
$ | 22,922 | $ | 28,539 | ||||
|
Basic net income per common share:
|
||||||||
|
Net income attributable to j2 Global, Inc. common stockholders
|
$ | 0.50 | $ | 0.61 | ||||
|
Diluted net income per common share:
|
||||||||
|
Net income attributable to j2 Global, Inc. common stockholders
|
$ | 0.49 | $ | 0.60 | ||||
|
Basic weighted average shares outstanding
|
45,160,140 | 46,400,441 | ||||||
|
Diluted weighted average shares outstanding
|
45,668,167 | 46,794,603 | ||||||
|
THREE MONTHS ENDED MARCH 31,
|
||||||||
|
2013
|
2012
|
|||||||
|
Cash flows from operating activities:
|
||||||||
|
Net income
|
$ | 22,771 | $ | 28,539 | ||||
|
Adjustments to reconcile net income to net cash
|
||||||||
|
provided by operating activities:
|
||||||||
|
Depreciation and amortization
|
8,762 | 4,926 | ||||||
|
Accretion and amortization of discount and premium of investments
|
453 | 319 | ||||||
|
Amortization of financing costs and discounts
|
150 | — | ||||||
|
Share-based compensation
|
2,348 | 2,280 | ||||||
|
Excess tax benefit from share-based compensation
|
(280 | ) | (286 | ) | ||||
|
Provision for doubtful accounts
|
833 | 1,289 | ||||||
|
Deferred income taxes
|
(1,446 | ) | (3,498 | ) | ||||
|
Decrease (increase) in:
|
||||||||
|
Accounts receivable
|
2,495 | 936 | ||||||
|
Prepaid expenses and other current assets
|
(139 | ) | (1,055 | ) | ||||
|
Other assets
|
357 | 150 | ||||||
|
(Decrease) increase in:
|
||||||||
|
Accounts payable and accrued expenses
|
160 | (4,488 | ) | |||||
|
Income taxes payable
|
2,138 | 7,532 | ||||||
|
Deferred revenue
|
92 | 700 | ||||||
|
Liability for uncertain tax positions
|
1,294 | 1,536 | ||||||
|
Other liabilities
|
60 | 62 | ||||||
|
Net cash provided by operating activities
|
40,048 | 38,942 | ||||||
|
Cash flows from investing activities:
|
||||||||
|
Maturity of certificate of deposit
|
22,106 | — | ||||||
|
Purchase of certificates of deposit
|
(8,165 | ) | (5,822 | ) | ||||
|
Sales of available-for-sale investments
|
31,932 | 45,164 | ||||||
|
Purchases of available-for-sale investments
|
(35,244 | ) | (15,537 | ) | ||||
|
Purchases of property and equipment
|
(1,933 | ) | (1,159 | ) | ||||
|
Purchases of intangible assets
|
(333 | ) | (900 | ) | ||||
|
Acquisition of businesses, net of cash received
|
(62,771 | ) | (18,843 | ) | ||||
|
Net cash (used in) provided by investing activities
|
(54,408 | ) | 2,903 | |||||
|
Cash flows from financing activities:
|
||||||||
|
Debt issuance costs
|
(47 | ) | — | |||||
|
Repurchases of common stock and restricted stock
|
(2,069 | ) | (40,273 | ) | ||||
|
Issuance of common stock under employee stock purchase plan
|
56 | 29 | ||||||
|
Exercise of stock options
|
2,025 | 2,591 | ||||||
|
Excess tax benefit from share-based compensation
|
280 | 286 | ||||||
|
Dividends paid
|
(10,684 | ) | (9,975 | ) | ||||
|
Net cash used in financing activities
|
(10,439 | ) | (47,342 | ) | ||||
|
Effect of exchange rate changes on cash and cash equivalents
|
(755 | ) | 1,820 | |||||
|
Net decrease in cash and cash equivalents
|
(25,554 | ) | (3,677 | ) | ||||
|
Cash and cash equivalents at beginning of period
|
218,680 | 139,359 | ||||||
|
Cash and cash equivalents at end of period
|
$ | 193,126 | $ | 135,682 | ||||
|
THREE MONTHS ENDED MARCH 31, 2013
|
THREE MONTHS ENDED MARCH 31, 2012
|
|||||||||||||||||||||||||||||||
|
GAAP
|
(1)
Share-based
Compensation |
(2)
Acquisition
and ExitCosts
|
Non-GAAP
|
GAAP
|
(1)
Share-based
Compensation |
(2)
Acquisition
and Exit
Costs
|
Non-GAAP
|
|||||||||||||||||||||||||
|
Revenues
|
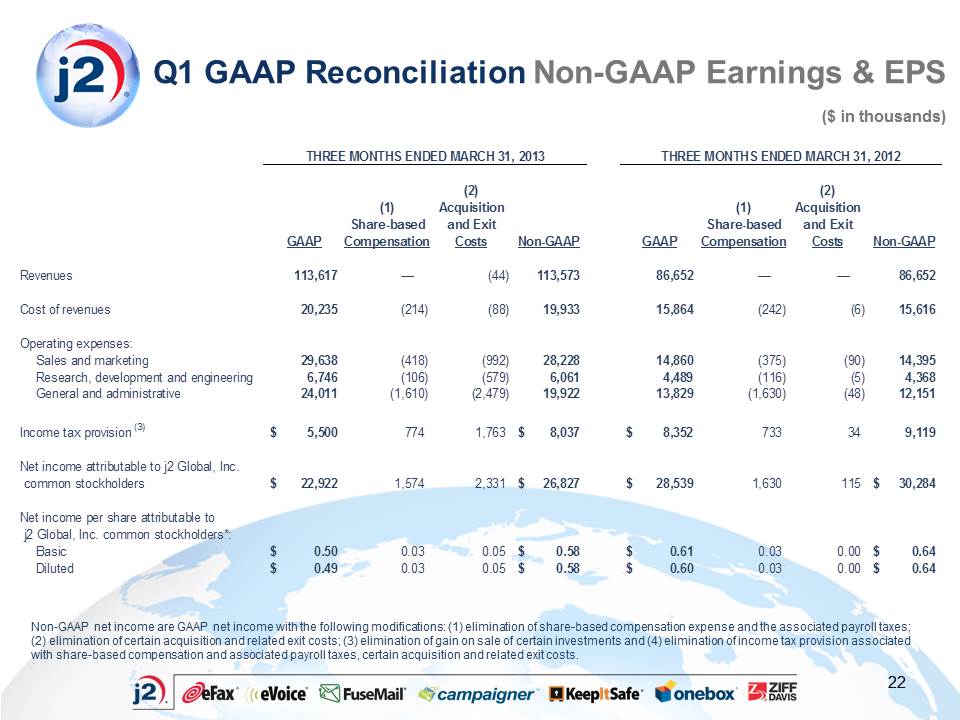
113,617 | — | (44 | ) | 113,573 | 86,652 | — | — | 86,652 | |||||||||||||||||||||||
|
Cost of revenues
|
20,235 | (214 | ) | (88 | ) | 19,933 | 15,864 | (242 | ) | (6 | ) | 15,616 | ||||||||||||||||||||
|
Operating expenses:
|
||||||||||||||||||||||||||||||||
|
Sales and marketing
|
29,638 | (418 | ) | (992 | ) | 28,228 | 14,860 | (375 | ) | (90 | ) | 14,395 | ||||||||||||||||||||
|
Research, development and engineering
|
6,746 | (106 | ) | (579 | ) | 6,061 | 4,489 | (116 | ) | (5 | ) | 4,368 | ||||||||||||||||||||
|
General and administrative
|
24,011 | (1,610 | ) | (2,479 | ) | 19,922 | 13,829 | (1,630 | ) | (48 | ) | 12,151 | ||||||||||||||||||||
|
Income tax provision (3)
|
$ | 5,500 | 774 | 1,763 | $ | 8,037 | $ | 8,352 | 733 | 34 | 9,119 | |||||||||||||||||||||
|
Net income attributable to j2 Global, Inc. common stockholders
|
$ | 22,922 | 1,574 | 2,331 | $ | 26,827 | $ | 28,539 | 1,630 | 115 | $ | 30,284 | ||||||||||||||||||||
|
Net income per share attributable to
|
||||||||||||||||||||||||||||||||
|
j2 Global, Inc. common stockholders*:
|
||||||||||||||||||||||||||||||||
|
Basic
|
$ | 0.50 | 0.03 | 0.05 | $ | 0.58 | $ | 0.61 | 0.03 | 0.00 | $ | 0.64 | ||||||||||||||||||||
|
Diluted
|
$ | 0.49 | 0.03 | 0.05 | $ | 0.58 | $ | 0.60 | 0.03 | 0.00 | $ | 0.64 | ||||||||||||||||||||
|
THREE MONTHS ENDED MARCH 31,
|
||||||||
|
2013
|
2012
|
|||||||
|
Net income
|
$ | 22,771 | $ | 28,539 | ||||
|
Plus:
|
||||||||
|
Interest and other expense, net
|
4,716 | 719 | ||||||
|
Income tax expense
|
5,500 | 8,352 | ||||||
|
Depreciation and amortization
|
8,794 | 4,906 | ||||||
|
Reconciliation of GAAP to Non-GAAP financial measures:
|
||||||||
|
Share-based compensation
|
2,348 | 2,363 | ||||||
|
Exit costs
|
4,094 | 149 | ||||||
|
EBITDA
|
$ | 48,223 | $ | 45,028 | ||||
|
EBITDA as calculated above represents earnings before interest and other expense, net, income tax expense, depreciation and amortization and the items used to reconcile GAAP to Non-GAAP financial measures, including (1) share-based compensation expense and the associated payroll taxes and (2) certain acquisition and related exit costs. We disclose EBITDA as a supplemental non-GAAP financial performance measure as we believe it is a useful metric by which to compare the performance of our business from period to period. We understand that measures similar to EBITDA are broadly used by analysts, rating agencies and investors in assessing our performance. Accordingly, we believe that the presentation of EBITDA provides useful information to investors.
|
||||||||
|
EBITDA is not in accordance with, or an alternative to, Net income, and may be different from non-GAAP measures used by other companies. In addition, EBITDA is not based on any comprehensive set of accounting rules or principles. This non-GAAP measure has limitations in that it does not reflect all of the amounts associated with the company’s results of operations determined in accordance with GAAP.
|
||||||||
| Q1 | Q2 | Q3 | Q4 |
YTD
|
||||||||||||||||
|
2013
|
||||||||||||||||||||
|
Net cash provided by operating activities
|
$ | 40,048 | $ | 40,048 | ||||||||||||||||
|
Less: Purchases of property and equipment
|
(1,933 | ) | (1,933 | ) | ||||||||||||||||
|
Add: Excess tax benefit (deficit) from share-based compensation
|
280 | 280 | ||||||||||||||||||
|
Free cash flows
|
$ | 38,395 | $ | — | $ | — | $ | — | $ | 38,395 | ||||||||||
|
2012
|
||||||||||||||||||||
|
Net cash provided by operating activities
|
$ | 38,942 | $ | 46,382 | $ | 38,193 | $ | 46,394 | $ | 169,911 | ||||||||||
|
Less: Purchases of property and equipment
|
(1,159 | ) | (1,631 | ) | (956 | ) | (1,159 | ) | (4,905 | ) | ||||||||||
|
Add: Excess tax benefit (deficit) from share-based compensation
|
286 | 821 | (91 | ) | (55 | ) | 961 | |||||||||||||
|
Free cash flows
|
$ | 38,069 | $ | 45,572 | $ | 37,146 | $ | 45,180 | $ | 165,967 | ||||||||||