
UNITED STATES
SECURITIES AND EXCHANGE COMMISSION
Washington, D.C. 20549
FORM N-CSRS
CERTIFIED SHAREHOLDER REPORT OF REGISTERED
MANAGEMENT INVESTMENT COMPANIES
Investment Company Act file number: 811-09253
Allspring Funds Trust
(Exact name of registrant as specified in charter)
525 Market St., San Francisco, CA 94105
(Address of principal executive offices) (Zip code)
Matthew Prasse
Allspring Funds Management, LLC
525 Market St., San Francisco, CA 94105
(Name and address of agent for service)
Registrant’s telephone number, including area code: 800-222-8222
Date of fiscal year end: March 31
Registrant is making a filing for 7 of its series:
Allspring Disciplined Small Cap Fund, Allspring Discovery Innovation Fund, Allspring Discovery Small Cap Growth Fund, Allspring Precious Metals Fund, Allspring Small Cap Fund, Allspring Special Small Cap Value Fund, Allspring Utility and Telecommunications Fund.
Date of reporting period: September 30, 2022
ITEM 1. REPORT TO STOCKHOLDERS

Disciplined Small Cap Fund

| 1 | The S&P 500 Index consists of 500 stocks chosen for market size, liquidity, and industry group representation. It is a market-value-weighted index with each stock's weight in the index proportionate to its market value. You cannot invest directly in an index. |
| 2 | The Morgan Stanley Capital International (MSCI) All Country World Index (ACWI) ex USA Index (Net) is a free-float-adjusted market-capitalization-weighted index that is designed to measure the equity market performance of developed and emerging markets, excluding the U.S. Source: MSCI. MSCI makes no express or implied warranties or representations and shall have no liability whatsoever with respect to any MSCI data contained herein. The MSCI data may not be further redistributed or used as a basis for other indexes or any securities or financial products. This report is not approved, reviewed, or produced by MSCI. You cannot invest directly in an index. |
| 3 | The MSCI Emerging Markets (EM) Index (Net) (USD) is a free-float-adjusted market-capitalization-weighted index that is designed to measure equity market performance of emerging markets. You cannot invest directly in an index. |
| 4 | The Bloomberg U.S. Aggregate Bond Index is a broad-based benchmark that measures the investment-grade, U.S.-dollar-denominated, fixed-rate taxable bond market, including Treasuries, government-related and corporate securities, mortgage-backed securities (agency fixed-rate and hybrid adjustable-rate mortgage pass-throughs), asset-backed securities, and commercial mortgage-backed securities. You cannot invest directly in an index. |
| 5 | The Bloomberg Global Aggregate ex-USD Index (unhedged) is an unmanaged index that provides a broad-based measure of the global investment-grade fixed-income markets excluding the U.S.-dollar-denominated debt market. You cannot invest directly in an index. |
| 6 | The Bloomberg Municipal Bond Index is an unmanaged index composed of long-term tax-exempt bonds with a minimum credit rating of Baa. You cannot invest directly in an index. |
| 7 | The ICE BofA U.S. High Yield Index is a market-capitalization-weighted index of domestic and Yankee high-yield bonds. The index tracks the performance of high-yield securities traded in the U.S. bond market. You cannot invest directly in an index. Copyright 2022. ICE Data Indices, LLC. All rights reserved. |
| 1 | The MSCI ACWI (Net) is a free-float-adjusted market-capitalization-weighted index that is designed to measure the equity market performance of developed and emerging markets. You cannot invest directly in an index. |

President
Allspring Funds
| Investment objective | The Fund seeks long-term capital appreciation. |
| Manager | Allspring Funds Management, LLC |
| Subadviser | Allspring Global Investments, LLC |
| Portfolio managers | Justin P. Carr, CFA®‡, Robert M. Wicentowski, CFA®‡ |
| Average annual total returns (%) as of September 30, 2022 | |||||||||||
| Including sales charge | Excluding sales charge | Expense ratios1 (%) | |||||||||
| Inception date | 1 year | 5 year | 10 year | 1 year | 5 year | 10 year | Gross | Net 2 | |||
| Class A (WDSAX)3 | 7-31-2018 | -23.21 | 0.85 | 7.31 | -18.52 | 2.06 | 7.94 | 1.75 | 0.93 | ||
| Class R6 (WSCJX)4 | 10-31-2016 | – | – | – | -18.23 | 2.17 | 8.09 | 1.32 | 0.50 | ||
| Administrator Class (NVSOX) | 8-1-1993 | – | – | – | -18.50 | 1.90 | 7.86 | 1.67 | 0.85 | ||
| Institutional Class (WSCOX)5 | 10-31-2014 | – | – | – | -18.34 | 2.14 | 8.07 | 1.42 | 0.60 | ||
| Russell 2000® Index6 | – | – | – | – | -23.50 | 3.55 | 8.55 | – | – | ||
| 1 | Reflects the expense ratios as stated in the most recent prospectuses. The expense ratios shown are subject to change and may differ from the annualized expense ratios shown in the financial highlights of this report. |
| 2 | The manager has contractually committed through July 31, 2023, to waive fees and/or reimburse expenses to the extent necessary to cap total annual fund operating expenses after fee waivers at 0.93% for Class A, 0.50% for Class R6, 0.85% for Administrator Class, and 0.60% for Institutional Class. Brokerage commissions, stamp duty fees, interest, taxes, acquired fund fees and expenses (if any), and extraordinary expenses are excluded from the expense caps. Prior to or after the commitment expiration date, the caps may be increased or the commitment to maintain the caps may be terminated only with the approval of the Board of Trustees. Without these caps, the Fund’s returns would have been lower. The expense ratio paid by an investor is the net expense ratio (the total annual fund operating expenses after fee waivers) as stated in the prospectuses. |
| 3 | Historical performance shown for the Class A shares prior to their inception reflects the performance of the Administrator Class shares, and is adjusted to reflect the higher expenses and sales charges of the Class A shares. |
| 4 | Historical performance shown for the Class R6 shares prior to their inception reflects the performance of the Institutional Class shares, and includes the higher expenses applicable to the Institutional Class shares. If these expenses had not been included, returns for the Class R6 shares would be higher. |
| 5 | Historical performance shown for the Institutional Class shares prior to their inception reflects the performance of the Administrator Class shares, and includes the higher expenses applicable to the Administrator Class shares. If these expenses had not been included, returns for the Institutional Class shares would be higher. |
| 6 | The Russell 2000® Index measures the performance of the 2,000 smallest companies in the Russell 3000® Index, which represents approximately 8% of the total market capitalization of the Russell 3000® Index. You cannot invest directly in an index. |
| ‡ | CFA® and Chartered Financial Analyst® are trademarks owned by CFA Institute. |
| Beginning
account value 4-1-2022 |
Ending
account value 9-30-2022 |
Expenses
paid during the period1 |
Annualized
net expense ratio | |
| Class A | ||||
| Actual | $1,000.00 | $ 822.34 | $4.11 | 0.90% |
| Hypothetical (5% return before expenses) | $1,000.00 | $1,020.56 | $4.56 | 0.90% |
| Class R6 | ||||
| Actual | $1,000.00 | $ 823.88 | $2.29 | 0.50% |
| Hypothetical (5% return before expenses) | $1,000.00 | $1,022.56 | $2.54 | 0.50% |
| Administrator Class | ||||
| Actual | $1,000.00 | $ 822.68 | $3.88 | 0.85% |
| Hypothetical (5% return before expenses) | $1,000.00 | $1,020.81 | $4.31 | 0.85% |
| Institutional Class | ||||
| Actual | $1,000.00 | $ 823.23 | $2.74 | 0.60% |
| Hypothetical (5% return before expenses) | $1,000.00 | $1,022.06 | $3.04 | 0.60% |
| Shares | Value | ||||
| Common stocks: 96.69% | |||||
| Communication services: 2.62% | |||||
| Diversified telecommunication services: 0.58% | |||||
| Charge Enterprises Incorporated † | 13,555 | $ 23,857 | |||
| Echostar Corporation Class A † | 4,173 | 68,729 | |||
| 92,586 | |||||
| Interactive media & services: 0.42% | |||||
| QuinStreet Incorporated † | 1,558 | 16,359 | |||
| Ziff Davis Incorporated | 724 | 49,580 | |||
| 65,939 | |||||
| Media: 1.49% | |||||
| Entravision Communications Corporation Class A | 10,420 | 41,367 | |||
| Gray Television Incorporated | 3,695 | 52,912 | |||
| Magnite Incorporated † | 1,161 | 7,628 | |||
| Nexstar Media Group Incorporated Class A | 545 | 90,933 | |||
| Sinclair Broadcast Group Incorporated Class A | 900 | 16,281 | |||
| TechTarget Incorporated † | 466 | 27,587 | |||
| 236,708 | |||||
| Wireless telecommunication services: 0.13% | |||||
| Gogo Incorporated † | 1,711 | 20,737 | |||
| Consumer discretionary: 9.81% | |||||
| Auto components: 0.70% | |||||
| Dana Incorporated | 3,903 | 44,611 | |||
| Gentherm Incorporated † | 356 | 17,704 | |||
| Standard Motor Products Incorporated | 864 | 28,080 | |||
| The Goodyear Tire & Rubber Company † | 2,035 | 20,533 | |||
| 110,928 | |||||
| Diversified consumer services: 1.97% | |||||
| Chegg Incorporated † | 2,666 | 56,173 | |||
| Perdoceo Education Corporation † | 4,173 | 42,982 | |||
| Stride Incorporated † | 2,692 | 113,145 | |||
| Vivint Smart Home Incorporated † | 15,119 | 99,483 | |||
| 311,783 | |||||
| Hotels, restaurants & leisure: 1.73% | |||||
| Bloomin' Brands Incorporated | 5,149 | 94,381 | |||
| Brinker International Incorporated † | 3,852 | 96,223 | |||
| International Game Technology plc | 3,853 | 60,877 | |||
| Wingstop Incorporated | 188 | 23,579 | |||
| 275,060 | |||||
| Household durables: 1.75% | |||||
| Helen of Troy Limited † | 292 | 28,160 | |||
| Installed Building Products Incorporated | 311 | 25,188 | |||
| KB Home Incorporated | 1,184 | 30,689 | |||
| M/I Homes Incorporated † | 1,022 | 37,027 | |||
| Meritage Corporation † | 653 | 45,886 | |||
| Skyline Champion Corporation † | 383 | 20,249 | |||
| Sonos Incorporated † | 706 | 9,813 |
| Shares | Value | ||||
| Household durables (continued) | |||||
| Taylor Morrison Home Corporation † | 2,943 | $ 68,631 | |||
| Universal Electronics Incorporated † | 616 | 12,117 | |||
| 277,760 | |||||
| Internet & direct marketing retail: 0.32% | |||||
| Overstock.com Incorporated † | 972 | 23,668 | |||
| Revolve Group Incorporated † | 1,221 | 26,483 | |||
| 50,151 | |||||
| Specialty retail: 2.49% | |||||
| American Eagle Outfitters Incorporated | 1,499 | 14,585 | |||
| Asbury Automotive Group Incorporated † | 585 | 88,394 | |||
| Big 5 Sporting Goods Corporation « | 8,270 | 88,820 | |||
| Genesco Incorporated † | 531 | 20,879 | |||
| Hibbett Incorporated | 1,901 | 94,689 | |||
| ODP Corporation † | 1,067 | 37,505 | |||
| Zumiez Incorporated † | 2,358 | 50,768 | |||
| 395,640 | |||||
| Textiles, apparel & luxury goods: 0.85% | |||||
| Crocs Incorporated † | 665 | 45,659 | |||
| G-III Apparel Group Limited † | 2,489 | 37,211 | |||
| Steven Madden Limited | 1,931 | 51,500 | |||
| 134,370 | |||||
| Consumer staples: 3.65% | |||||
| Beverages: 0.66% | |||||
| Coca Cola Bottling Corporation | 99 | 40,761 | |||
| Duckhorn Portfolio Incorporated † | 4,369 | 63,045 | |||
| 103,806 | |||||
| Food & staples retailing: 1.33% | |||||
| Sprouts Farmers Market Incorporated † | 765 | 21,229 | |||
| The Andersons Incorporated | 1,616 | 50,144 | |||
| The Chef's Warehouse Incorporated † | 1,761 | 51,016 | |||
| United Natural Foods Incorporated † | 2,593 | 89,121 | |||
| 211,510 | |||||
| Food products: 0.60% | |||||
| John B. Sanfilippo & Son Incorporated | 373 | 28,247 | |||
| SunOpta Incorporated † | 1,335 | 12,149 | |||
| The Simply Good Foods Company † | 1,725 | 55,183 | |||
| 95,579 | |||||
| Personal products: 1.06% | |||||
| Bellring Brands Incorporated † | 2,421 | 49,897 | |||
| Medifast Incorporated | 522 | 56,564 | |||
| USANA Health Sciences Incorporated † | 1,102 | 61,767 | |||
| 168,228 | |||||
| Energy: 6.14% | |||||
| Energy equipment & services: 1.21% | |||||
| Nabors Industries Limited † | 356 | 36,116 |
| Shares | Value | ||||
| Energy equipment & services (continued) | |||||
| Nextier Oilfield Solutions Incorporated † | 9,168 | $ 67,843 | |||
| Noble Corporation plc † | 868 | 25,675 | |||
| Oceaneering International Incorporated † | 4,275 | 34,029 | |||
| US Silica Holdings Incorporated † | 2,575 | 28,196 | |||
| 191,859 | |||||
| Oil, gas & consumable fuels: 4.93% | |||||
| Arch Resources Incorporated | 289 | 34,275 | |||
| Callon Petroleum Company † | 360 | 12,604 | |||
| Chord Energy Corporation | 338 | 46,228 | |||
| Civitas Resources Incorporated | 620 | 35,582 | |||
| CVR Energy Incorporated | 1,860 | 53,903 | |||
| Laredo Petroleum Incorporated † | 1,288 | 80,951 | |||
| Matador Resources Company | 1,003 | 49,067 | |||
| PBF Energy Incorporated Class A † | 1,679 | 59,034 | |||
| PDC Energy Incorporated | 508 | 29,357 | |||
| Peabody Energy Corporation † | 4,014 | 99,627 | |||
| Ranger Oil Corporation Class A | 2,503 | 78,719 | |||
| SM Energy Company | 2,881 | 108,354 | |||
| Southwestern Energy Company † | 5,999 | 36,714 | |||
| W&T Offshore Incorporated † | 4,488 | 26,300 | |||
| World Fuel Services Corporation | 1,373 | 32,183 | |||
| 782,898 | |||||
| Financials: 16.26% | |||||
| Banks: 10.03% | |||||
| Bank of N.T. Butterfield & Son Limited | 2,496 | 81,020 | |||
| BankUnited Incorporated | 2,341 | 79,992 | |||
| Brookline Bancorp Incorporated | 4,190 | 48,814 | |||
| CNB Financial Corporation | 2,404 | 56,662 | |||
| Customers Bancorp Incorporated † | 1,588 | 46,814 | |||
| Enterprise Financial Service Corporation | 954 | 42,014 | |||
| Financial Institutions Incorporated | 1,922 | 46,263 | |||
| First Bancorp of North Carolina | 1,657 | 60,613 | |||
| First Bancorp of Puerto Rico | 6,230 | 85,226 | |||
| First Bank | 2,376 | 32,480 | |||
| First Foundation Incorporated | 2,192 | 39,763 | |||
| First Interstate BancSystem Class A | 1,427 | 57,579 | |||
| First Merchants Corporation | 1,418 | 54,848 | |||
| Great Southern Bancorp Incorporated | 1,097 | 62,606 | |||
| Hancock Whitney Corporation | 1,621 | 74,258 | |||
| Hanmi Financial Corporation | 3,344 | 79,186 | |||
| Hilltop Holdings Incorporated | 2,457 | 61,056 | |||
| NBT Bancorp Incorporated | 1,998 | 75,824 | |||
| OFG Bancorp | 2,763 | 69,434 | |||
| Preferred Bank | 1,097 | 71,557 | |||
| RBB Bancorp | 3,183 | 66,143 | |||
| Silvergate Capital Corporation Class A † | 616 | 46,416 | |||
| The Bancorp Incorporated † | 2,943 | 64,687 | |||
| TriCo Bancshares | 1,850 | 82,603 | |||
| Univest Financial Corporation | 1,647 | 38,672 | |||
| Westamerica Bancorporation | 1,288 | 67,350 | |||
| 1,591,880 |
| Shares | Value | ||||
| Capital markets: 1.46% | |||||
| Artisan Partners Asset Management Incorporated Class A | 1,288 | $ 34,686 | |||
| Evercore Partners Incorporated Class A | 837 | 68,843 | |||
| Open Lending Corporation Class A † | 2,587 | 20,799 | |||
| PJT Partners Incorporated Class A | 526 | 35,147 | |||
| Stifel Financial Corporation | 1,378 | 71,532 | |||
| 231,007 | |||||
| Consumer finance: 1.13% | |||||
| Atlanticus Holdings Corporation † | 1,405 | 36,853 | |||
| Enova International Incorporated † | 1,926 | 56,374 | |||
| Green Dot Corporation Class A † | 1,751 | 33,234 | |||
| LendingClub Corporation † | 3,858 | 42,631 | |||
| PROG Holdings Incorporated † | 743 | 11,130 | |||
| 180,222 | |||||
| Insurance: 2.37% | |||||
| American Equity Investment Life Holding Company | 2,566 | 95,686 | |||
| CNO Financial Group Incorporated | 5,031 | 90,407 | |||
| Genworth Financial Incorporated Class A † | 15,065 | 52,728 | |||
| Palomar Holdings Incorporated † | 255 | 21,349 | |||
| Selective Insurance Group Incorporated | 653 | 53,154 | |||
| Stewart Information Services Corporation | 1,440 | 62,842 | |||
| 376,166 | |||||
| Thrifts & mortgage finance: 1.27% | |||||
| Essent Group Limited | 2,557 | 89,163 | |||
| MGIC Investment Corporation | 4,195 | 53,780 | |||
| Radian Group Incorporated | 2,268 | 43,750 | |||
| Walker & Dunlop Incorporated | 171 | 14,318 | |||
| 201,011 | |||||
| Health care: 19.25% | |||||
| Biotechnology: 8.40% | |||||
| Aduro Biotech Incorporated ♦† | 4,415 | 0 | |||
| Agenus Incorporated † | 8,770 | 17,979 | |||
| Alector Incorporated † | 4,893 | 46,288 | |||
| ALX Oncology Holdings Incorporated † | 3,605 | 34,500 | |||
| Amicus Therapeutics Incorporated † | 3,749 | 39,140 | |||
| Arcus Biosciences Incorporated † | 2,341 | 61,241 | |||
| Arrowhead Pharmaceuticals Incorporated † | 716 | 23,664 | |||
| Bridgebio Pharma Incorporated † | 2,439 | 24,244 | |||
| Cullinan Oncology Incorporated † | 2,354 | 30,178 | |||
| Cytokinetics Incorporated † | 1,548 | 75,001 | |||
| Dynavax Technologies Corporation † | 5,752 | 60,051 | |||
| Erasca Incorporated †« | 5,305 | 41,379 | |||
| Forma Therapeutics Holdings † | 8,107 | 161,735 | |||
| Gossamer Bio Incorporated † | 3,376 | 40,444 | |||
| Halozyme Therapeutics Incorporated † | 2,113 | 83,548 | |||
| Icosavax Incorporated †« | 6,117 | 19,330 | |||
| Immunovant Incorporated † | 10,609 | 59,198 | |||
| Intellia Therapeutics Incorporated † | 698 | 39,060 | |||
| Intercept Pharmaceuticals Incorporated † | 3,227 | 45,017 | |||
| Iteos Therapeutics Incorporated † | 2,346 | 44,691 | |||
| Kezar Life Sciences Incorporated † | 4,276 | 36,816 |
| Shares | Value | ||||
| Biotechnology (continued) | |||||
| Kiniksa Pharmaceuticals Limited Class A † | 4,664 | $ 59,886 | |||
| Kodiak Sciences Incorporated † | 4,203 | 32,531 | |||
| Kymera Therapeutics Incorporated † | 802 | 17,460 | |||
| Ligand Pharmaceuticals Incorporated † | 274 | 23,594 | |||
| Organogenesis Holdings Incorporated Class A † | 3,492 | 11,314 | |||
| Protagonist Therapeutics Incorporated † | 1,485 | 12,519 | |||
| Prothena Corporation plc † | 1,822 | 110,468 | |||
| Regenxbio Incorporated † | 754 | 19,928 | |||
| Sana Biotechnology Incorporated † | 7,088 | 42,528 | |||
| Ultragenyx Pharmaceutical Incorporated † | 472 | 19,546 | |||
| 1,333,278 | |||||
| Health care equipment & supplies: 3.04% | |||||
| Axonics Incorporated † | 774 | 54,521 | |||
| Globus Medical Incorporated Class A † | 518 | 30,857 | |||
| Lantheus Holdings Incorporated † | 1,894 | 133,205 | |||
| LivaNova plc † | 1,068 | 54,222 | |||
| Omnicell Incorporated † | 531 | 46,213 | |||
| Outset Medical Incorporated † | 887 | 14,130 | |||
| Shockwave Medical Incorporated † | 203 | 56,448 | |||
| STAAR Surgical Company † | 724 | 51,078 | |||
| Surmodics Incorporated † | 1,395 | 42,408 | |||
| 483,082 | |||||
| Health care providers & services: 4.41% | |||||
| AMN Healthcare Services Incorporated † | 1,165 | 123,443 | |||
| Apollo Medical Holdings Incorporated † | 531 | 20,709 | |||
| Cross Country Healthcare Incorporated † | 1,306 | 37,051 | |||
| Fulgent Genetics Incorporated † | 472 | 17,993 | |||
| Modivcare Incorporated † | 500 | 49,840 | |||
| Option Care Health Incorporated † | 4,356 | 137,083 | |||
| Owens & Minor Incorporated | 1,692 | 40,777 | |||
| Progyny Incorporated † | 1,362 | 50,476 | |||
| Select Medical Holdings Corporation | 1,432 | 31,647 | |||
| Tenet Healthcare Corporation † | 1,827 | 94,237 | |||
| The Ensign Group Incorporated | 1,206 | 95,877 | |||
| 699,133 | |||||
| Health care technology: 0.53% | |||||
| Computer Programs & Systems Incorporated † | 1,718 | 47,898 | |||
| NextGen Healthcare Incorporated † | 2,048 | 36,250 | |||
| 84,148 | |||||
| Life sciences tools & services: 0.21% | |||||
| Abcellera Biologics Incorporated † | 3,418 | 33,804 | |||
| Pharmaceuticals: 2.66% | |||||
| Amneal Pharmaceuticals Incorporated † | 16,388 | 33,104 | |||
| Amphastar Pharmaceuticals Incorporated † | 1,720 | 48,332 | |||
| Corcept Therapeutics Incorporated † | 2,575 | 66,023 | |||
| Fulcrum Therapeutics Incorporated † | 2,498 | 20,209 | |||
| Harmony Biosciences Holdings † | 678 | 30,029 | |||
| Intra-Cellular Therapies Incorporated † | 1,265 | 58,860 | |||
| Pacira Biosciences Incorporated † | 639 | 33,988 |
| Shares | Value | ||||
| Pharmaceuticals (continued) | |||||
| Prestige Consumer Healthcare Incorporated † | 1,661 | $ 82,768 | |||
| Tarsus Pharmaceuticals Incorporated † | 2,803 | 47,987 | |||
| 421,300 | |||||
| Industrials: 14.27% | |||||
| Aerospace & defense: 0.78% | |||||
| Moog Incorporated Class A | 774 | 54,451 | |||
| Vectrus Incorporated † | 1,964 | 69,526 | |||
| 123,977 | |||||
| Building products: 0.28% | |||||
| Simpson Manufacturing Company Incorporated | 571 | 44,766 | |||
| Commercial services & supplies: 0.49% | |||||
| Ennis Incorporated | 1,931 | 38,871 | |||
| SP Plus Corporation † | 1,255 | 39,307 | |||
| 78,178 | |||||
| Construction & engineering: 2.40% | |||||
| Comfort Systems Incorporated | 874 | 85,066 | |||
| EMCOR Group Incorporated | 1,251 | 144,465 | |||
| MasTec Incorporated † | 792 | 50,292 | |||
| MYR Group Incorporated † | 936 | 79,307 | |||
| Primoris Services Corporation | 1,323 | 21,499 | |||
| 380,629 | |||||
| Electrical equipment: 1.76% | |||||
| Atkore Incorporated † | 1,553 | 120,839 | |||
| Bloom Energy Corporation Class A † | 1,191 | 23,808 | |||
| Encore Wire Corporation | 1,013 | 117,042 | |||
| Enovix Corporation † | 973 | 17,840 | |||
| 279,529 | |||||
| Machinery: 2.77% | |||||
| Alamo Group Incorporated | 571 | 69,816 | |||
| Hillenbrand Incorporated | 2,867 | 105,276 | |||
| Mueller Industries Incorporated | 2,063 | 122,625 | |||
| Nikola Corporation † | 2,454 | 8,638 | |||
| Titan International Incorporated † | 4,345 | 52,748 | |||
| Watts Water Technologies Incorporated | 633 | 79,587 | |||
| 438,690 | |||||
| Marine: 0.41% | |||||
| Matson Incorporated | 1,062 | 65,334 | |||
| Professional services: 1.72% | |||||
| CBIZ Incorporated † | 775 | 33,155 | |||
| Insperity Incorporated | 536 | 54,720 | |||
| Kelly Services Incorporated Class A | 4,217 | 57,309 | |||
| Science Applications International Corporation | 500 | 44,215 | |||
| TriNet Group Incorporated † | 1,170 | 83,327 | |||
| 272,726 |
| Shares | Value | ||||
| Road & rail: 0.62% | |||||
| Arcbest Corporation | 1,350 | $ 98,186 | |||
| Trading companies & distributors: 3.04% | |||||
| Applied Industrial Technologies Incorporated | 1,008 | 103,602 | |||
| Boise Cascade Company | 1,440 | 85,622 | |||
| GMS Incorporated † | 423 | 16,924 | |||
| Rush Enterprises Incorporated Class A | 1,765 | 77,413 | |||
| Titan Machinery Incorporated † | 2,760 | 77,998 | |||
| WESCO International Incorporated † | 1,008 | 120,335 | |||
| 481,894 | |||||
| Information technology: 12.78% | |||||
| Electronic equipment, instruments & components: 2.08% | |||||
| Advanced Energy Industries Incorporated | 576 | 44,588 | |||
| Fabrinet † | 517 | 49,348 | |||
| Insight Enterprises Incorporated † | 995 | 81,998 | |||
| Plexus Corporation † | 512 | 44,831 | |||
| Sanmina Corporation † | 2,363 | 108,887 | |||
| 329,652 | |||||
| IT services: 2.48% | |||||
| Evertec Incorporated | 1,418 | 44,454 | |||
| ExlService Holdings Incorporated † | 188 | 27,704 | |||
| Hackett Group Incorporated | 3,938 | 69,781 | |||
| International Money Express Incorporated † | 5,153 | 117,437 | |||
| Marqeta Incorporated Class A † | 5,630 | 40,086 | |||
| Maximus Incorporated | 649 | 37,558 | |||
| Perficient Incorporated † | 693 | 45,059 | |||
| TTEC Holdings Incorporated | 274 | 12,141 | |||
| 394,220 | |||||
| Semiconductors & semiconductor equipment: 3.57% | |||||
| Axcelis Technologies Incorporated † | 443 | 26,828 | |||
| Diodes Incorporated † | 1,121 | 72,764 | |||
| FormFactor Incorporated † | 1,027 | 25,726 | |||
| Ichor Holdings Limited † | 1,081 | 26,171 | |||
| Maxlinear Incorporated † | 982 | 32,033 | |||
| MKS Instruments Incorporated | 261 | 21,569 | |||
| Onto Innovation Incorporated † | 982 | 62,897 | |||
| Photronics Incorporated † | 2,629 | 38,436 | |||
| Rambus Incorporated † | 1,913 | 48,628 | |||
| Sitime Corporation † | 279 | 21,966 | |||
| Smart Global Holdings Incorporated † | 4,010 | 63,639 | |||
| SunPower Corporation † | 662 | 15,252 | |||
| Synaptics Incorporated † | 486 | 48,119 | |||
| Ultra Clean Holdings Incorporated † | 2,395 | 61,671 | |||
| 565,699 | |||||
| Software: 4.65% | |||||
| A10 Networks Incorporated | 6,107 | 81,038 | |||
| Adeia Incorporated | 4,285 | 60,590 | |||
| Amplitude Incorporated Class A † | 2,843 | 43,981 | |||
| Arlo Technologies Incorporated † | 7,017 | 32,559 | |||
| Clear Secure Incorporated Class A † | 1,396 | 31,913 | |||
| eGain Corporation † | 5,351 | 39,330 |
| Shares | Value | ||||
| Software (continued) | |||||
| InterDigital Incorporated | 1,130 | $ 45,675 | |||
| JFrog Limited † | 1,715 | 37,919 | |||
| Rimini Street Incorporated † | 11,457 | 53,390 | |||
| SPS Commerce Incorporated † | 1,048 | 130,193 | |||
| Tenable Holdings Incorporated † | 810 | 28,188 | |||
| Upland Software Incorporated † | 2,035 | 16,545 | |||
| Verint Systems Incorporated | 963 | 32,338 | |||
| Workiva Incorporated † | 343 | 26,685 | |||
| Zeta Global Holdings Corporation Class A † | 11,709 | 77,396 | |||
| 737,740 | |||||
| Materials: 3.64% | |||||
| Chemicals: 1.33% | |||||
| Advansix Incorporated | 1,998 | 64,136 | |||
| Futurefuel Corporation | 2,804 | 16,936 | |||
| Kooper Holdings Incorporated | 1,242 | 25,809 | |||
| Minerals Technologies Incorporated | 1,102 | 54,450 | |||
| Tronox Holdings plc Class A | 4,105 | 50,286 | |||
| 211,617 | |||||
| Containers & packaging: 0.78% | |||||
| Greif Incorporated Class A | 1,044 | 62,191 | |||
| Myers Industries Incorporated | 3,745 | 61,680 | |||
| 123,871 | |||||
| Metals & mining: 1.53% | |||||
| Arconic Corporation † | 1,485 | 25,304 | |||
| Commercial Metals Company | 3,015 | 106,972 | |||
| Ryerson Holding Corporation | 1,091 | 28,082 | |||
| Schnitzer Steel Industries Incorporated Class A | 1,872 | 53,277 | |||
| Suncoke Energy Incorporated | 4,996 | 29,027 | |||
| 242,662 | |||||
| Real estate: 5.28% | |||||
| Equity REITs: 4.87% | |||||
| Acadia Realty Trust | 3,313 | 41,810 | |||
| Armada Hoffler Properties Incorporated | 2,331 | 24,196 | |||
| Braemar Hotels & Resorts Incorporated | 12,934 | 55,616 | |||
| BRT Apartments Corporation REIT | 2,565 | 52,095 | |||
| CareTrust REIT Incorporated | 2,322 | 42,051 | |||
| DiamondRock Hospitality | 2,005 | 15,058 | |||
| Easterly Government Properties Incorporated | 2,543 | 40,103 | |||
| Getty Realty Corporation | 1,036 | 27,858 | |||
| Global Medical REIT Incorporated | 1,990 | 16,955 | |||
| Global Net Lease Incorporated | 7,179 | 76,456 | |||
| iStar Financial Incorporated | 3,795 | 35,142 | |||
| National Health Investors Incorporated | 526 | 29,735 | |||
| NexPoint Residential Trust Incorporated | 1,359 | 62,799 | |||
| Piedmont Office Realty Trust Incorporated Class A | 4,222 | 44,584 | |||
| STAG Industrial Incorporated | 3,520 | 100,074 | |||
| The Macerich Company | 1,305 | 10,362 |
| Shares | Value | ||||
| Equity REITs (continued) | |||||
| Uniti Group Incorporated | 3,497 | $ 24,304 | |||
| Urban Edge Properties | 5,531 | 73,784 | |||
| 772,982 | |||||
| Real estate management & development: 0.41% | |||||
| Newmark Group Incorporated Class A | 7,945 | 64,037 | |||
| Utilities: 2.99% | |||||
| Electric utilities: 1.15% | |||||
| Otter Tail Corporation | 1,754 | 107,906 | |||
| Portland General Electric Company | 1,692 | 73,534 | |||
| 181,440 | |||||
| Gas utilities: 0.65% | |||||
| Brookfield Infrastructure Corporation Class A | 1,477 | 60,114 | |||
| New Jersey Resources Corporation | 1,111 | 42,996 | |||
| 103,110 | |||||
| Independent power & renewable electricity producers: 0.48% | |||||
| Brookfield Renewable Corporation Class A | 719 | 23,497 | |||
| Clearway Energy Incorporated Class A | 1,819 | 52,933 | |||
| 76,430 | |||||
| Multi-utilities: 0.59% | |||||
| Black Hills Corporation | 558 | 37,793 | |||
| Northwestern Corporation | 1,143 | 56,327 | |||
| 94,120 | |||||
| Water utilities: 0.12% | |||||
| York Water Company | 482 | 18,523 | |||
| Total Common stocks (Cost $15,116,511) | 15,340,585 |
| Yield | |||||
| Short-term investments: 3.78% | |||||
| Investment companies: 3.78% | |||||
| Allspring Government Money Market Fund Select Class ♠∞ | 2.75% | 453,061 | 453,061 | ||
| Securities Lending Cash Investments LLC ♠∩∞ | 3.08 | 147,359 | 147,359 | ||
| Total Short-term investments (Cost $600,420) | 600,420 | ||||
| Total investments in securities (Cost $15,716,931) | 100.47% | 15,941,005 | |||
| Other assets and liabilities, net | (0.47) | (75,039) | |||
| Total net assets | 100.00% | $15,865,966 |
| † | Non-income-earning security |
| ♦ | The security is fair valued in accordance with procedures approved by the Board of Trustees. |
| « | All or a portion of this security is on loan. |
| ♠ | The issuer of the security is an affiliated person of the Fund as defined in the Investment Company Act of 1940. |
| ∩ | The investment is a non-registered investment company purchased with cash collateral received from securities on loan. |
| ∞ | The rate represents the 7-day annualized yield at period end. |
| Abbreviations: | |
| REIT | Real estate investment trust |
| Value,
beginning of period |
Purchases | Sales
proceeds |
Net
realized gains (losses) |
Net
change in unrealized gains (losses) |
Value,
end of period |
Shares,
end of period |
Income
from affiliated securities | |||
| Short-term investments | ||||||||||
| Allspring Government Money Market Fund Select Class | $561,734 | $1,857,694 | $(1,966,367) | $0 | $0 | $ 453,061 | 453,061 | $ 2,786 | ||
| Securities Lending Cash Investments LLC | 360,950 | 1,157,063 | (1,370,654) | 0 | 0 | 147,359 | 147,359 | 1,388 # | ||
| $0 | $0 | $600,420 | $4,174 | |||||||
| # | Amount shown represents income before fees and rebates. |
| Description | Number
of contracts |
Expiration
date |
Notional
cost |
Notional
value |
Unrealized
gains |
Unrealized
losses |
| Long | ||||||
| Micro E-Mini Russell 2000 Index | 56 | 12-16-2022 | $531,980 | $467,544 | $0 | $(64,436) |
| Assets | |
|
Investments in unaffiliated securities (including $143,613 of securities loaned), at value (cost
$15,116,511) |
$ 15,340,585 |
|
Investments in affiliated securities, at value (cost
$600,420) |
600,420 |
|
Cash |
516 |
|
Cash at broker segregated for futures
contracts |
49,500 |
|
Receivable for
dividends |
11,314 |
|
Receivable from
manager |
10,122 |
|
Receivable for Fund shares
sold |
8,925 |
|
Receivable for securities lending income,
net |
555 |
|
Prepaid expenses and other
assets |
34,662 |
|
Total
assets |
16,056,599 |
| Liabilities | |
|
Payable upon receipt of securities
loaned |
147,359 |
|
Professional fees
payable |
17,145 |
|
Custody and accounting fees
payable |
13,292 |
|
Payable for daily variation margin on open futures
contracts |
3,447 |
|
Trustees’ fees and expenses
payable |
3,331 |
|
Administration fees
payable |
1,942 |
|
Payable for Fund shares
redeemed |
92 |
|
Accrued expenses and other
liabilities |
4,025 |
|
Total
liabilities |
190,633 |
|
Total net
assets |
$15,865,966 |
| Net assets consist of | |
|
Paid-in
capital |
$ 14,951,114 |
|
Total distributable
earnings |
914,852 |
|
Total net
assets |
$15,865,966 |
| Computation of net asset value and offering price per share | |
|
Net assets – Class
A |
$ 533,656 |
|
Shares outstanding – Class
A1 |
54,929 |
|
Net asset value per share – Class
A |
$9.72 |
|
Maximum offering price per share – Class
A2 |
$10.31 |
|
Net assets – Class
R6 |
$ 206,099 |
|
Shares outstanding – Class
R61 |
21,499 |
|
Net asset value per share – Class
R6 |
$9.59 |
|
Net assets – Administrator
Class |
$ 14,310,516 |
|
Shares outstanding – Administrator
Class1 |
1,483,509 |
|
Net asset value per share – Administrator
Class |
$9.65 |
|
Net assets – Institutional
Class |
$ 815,695 |
|
Shares outstanding – Institutional
Class1 |
84,622 |
Net
asset value per share – Institutional
Class |
$9.64 |
| 1 | The Fund has an unlimited number of authorized shares. |
| 2 | Maximum offering price is computed as 100/94.25 of net asset value. On investments of $50,000 or more, the offering price is reduced. |
| Investment income | |
|
Dividends (net of foreign withholdings taxes of
$413) |
$ 123,206 |
|
Income from affiliated
securities |
4,828 |
|
Total investment
income |
128,034 |
| Expenses | |
|
Management
fee |
47,011 |
| Administration fees | |
|
Class
A |
634 |
|
Class
R6 |
33 |
|
Administrator
Class |
11,037 |
|
Institutional
Class |
649 |
| Shareholder servicing fees | |
|
Class
A |
754 |
|
Administrator
Class |
21,224 |
|
Custody and accounting
fees |
14,017 |
|
Professional
fees |
25,548 |
|
Registration
fees |
30,835 |
|
Shareholder report
expenses |
10,307 |
|
Trustees’ fees and
expenses |
11,176 |
|
Other fees and
expenses |
6,772 |
|
Total
expenses |
179,997 |
| Less: Fee waivers and/or expense reimbursements | |
|
Fund-level |
(101,451) |
|
Class
A |
(119) |
|
Class
R6 |
(11) |
|
Administrator
Class |
(83) |
|
Net
expenses |
78,333 |
|
Net investment
income |
49,701 |
| Realized and unrealized gains (losses) on investments | |
| Net realized gains (losses) on | |
|
Unaffiliated
securities |
982,808 |
|
Futures
contracts |
(22,669) |
|
Net realized gains on
investments |
960,139 |
| Net change in unrealized gains (losses) on | |
|
Unaffiliated
securities |
(4,766,334) |
|
Futures
contracts |
(94,541) |
|
Net change in unrealized gains (losses) on
investments |
(4,860,875) |
|
Net realized and unrealized gains (losses) on
investments |
(3,900,736) |
|
Net decrease in net assets resulting from
operations |
$(3,851,035) |
| Six
months ended September 30, 2022 (unaudited) |
Year
ended March 31, 2022 | |||
| Operations | ||||
|
Net investment
income |
$ 49,701 | $ 35,192 | ||
|
Net realized gains on
investments |
960,139 | 2,783,921 | ||
|
Net change in unrealized gains (losses) on
investments |
(4,860,875) | (2,322,678) | ||
|
Net increase (decrease) in net assets resulting from
operations |
(3,851,035) | 496,435 | ||
| Distributions to shareholders from | ||||
| Net investment income and net realized gains | ||||
|
Class
R6 |
0 | (248) | ||
|
Administrator
Class |
0 | (35,284) | ||
|
Institutional
Class |
0 | (9,783) | ||
|
Total distributions to
shareholders |
0 | (45,315) | ||
| Capital share transactions | Shares | Shares | ||
| Proceeds from shares sold | ||||
|
Class
A |
1,801 | 19,523 | 36,903 | 451,068 |
|
Class
R6 |
1,807 | 18,248 | 8,565 | 101,266 |
|
Administrator
Class |
48,035 | 527,117 | 88,246 | 1,054,709 |
|
Institutional
Class |
688 | 7,147 | 11,224 | 134,580 |
| 572,035 | 1,741,623 | |||
| Reinvestment of distributions | ||||
|
Class
R6 |
0 | 0 | 21 | 248 |
|
Administrator
Class |
0 | 0 | 2,936 | 35,233 |
|
Institutional
Class |
0 | 0 | 817 | 9,783 |
| 0 | 45,264 | |||
| Payment for shares redeemed | ||||
|
Class
A |
(2,911) | (29,571) | (65,850) | (791,179) |
|
Class
R6 |
(570) | (6,187) | (1,858) | (22,060) |
|
Administrator
Class |
(351,150) | (3,687,088) | (402,466) | (4,858,565) |
|
Institutional
Class |
(17,878) | (185,150) | (57,438) | (686,236) |
| (3,907,996) | (6,358,040) | |||
|
Net decrease in net assets resulting from capital share
transactions |
(3,335,961) | (4,571,153) | ||
|
Total decrease in net
assets |
(7,186,996) | (4,120,033) | ||
| Net assets | ||||
|
Beginning of
period |
23,052,962 | 27,172,995 | ||
|
End of
period |
$15,865,966 | $23,052,962 | ||
| Year ended March 31 | |||||
| Class A | Six
months ended September 30, 2022 (unaudited) |
2022 | 2021 | 2020 | 2019 1 |
|
Net asset value, beginning of
period |
$11.82 | $11.67 | $6.12 | $8.39 | $23.70 |
|
Net investment income
(loss) |
0.03 | 0.01 2 | (0.05) 2 | (0.00) 2,3 | 0.02 |
|
Net realized and unrealized gains (losses) on
investments |
(2.13) | 0.14 | 5.60 | (2.22) | (3.37) |
|
Total from investment
operations |
(2.10) | 0.15 | 5.55 | (2.22) | (3.35) |
| Distributions to shareholders from | |||||
|
Net investment
income |
0.00 | 0.00 | 0.00 | (0.05) | (0.04) |
|
Net realized
gains |
0.00 | 0.00 | 0.00 | 0.00 | (11.92) |
|
Total distributions to
shareholders |
0.00 | 0.00 | 0.00 | (0.05) | (11.96) |
|
Net asset value, end of
period |
$9.72 | $11.82 | $11.67 | $6.12 | $8.39 |
|
Total
return4 |
(17.77)% | 1.29% | 90.69% | (26.67)% | (11.52)% |
| Ratios to average net assets (annualized) | |||||
|
Gross
expenses |
2.02% | 1.74% | 1.81% | 1.40% | 1.14% |
|
Net
expenses |
0.90% | 0.91% | 0.93% | 0.93% | 0.92% |
|
Net investment income
(loss) |
0.50% | 0.05% | (0.53)% | (0.05)% | 0.16% |
| Supplemental data | |||||
|
Portfolio turnover
rate |
28% | 39% | 48% | 67% | 176% |
|
Net assets, end of period (000s
omitted) |
$534 | $662 | $991 | $102 | $34 |
| 1 | For the period from July 31, 2018 (commencement of class operations) to March 31, 2019 |
| 2 | Calculated based upon average shares outstanding |
| 3 | Amount is more than $(0.005) |
| 4 | Total return calculations do not include any sales charges. Returns for periods of less than one year are not annualized. |
| Year ended March 31 | ||||||
| Class R6 | Six
months ended September 30, 2022 (unaudited) |
2022 | 2021 | 2020 | 2019 | 2018 |
|
Net asset value, beginning of
period |
$11.64 | $11.45 | $6.15 | $8.50 | $22.63 | $23.82 |
|
Net investment
income |
0.05 1 | 0.06 1 | 0.04 1 | 0.08 1 | 0.06 | 0.07 |
|
Net realized and unrealized gains (losses) on
investments |
(2.10) | 0.14 | 5.51 | (2.35) | (2.19) | 2.08 |
|
Total from investment
operations |
(2.05) | 0.20 | 5.55 | (2.27) | (2.13) | 2.15 |
| Distributions to shareholders from | ||||||
|
Net investment
income |
0.00 | (0.01) | (0.25) | (0.08) | (0.08) | (0.06) |
|
Net realized
gains |
0.00 | 0.00 | 0.00 | 0.00 | (11.92) | (3.28) |
|
Total distributions to
shareholders |
0.00 | (0.01) | (0.25) | (0.08) | (12.00) | (3.34) |
|
Net asset value, end of
period |
$9.59 | $11.64 | $11.45 | $6.15 | $8.50 | $22.63 |
|
Total
return2 |
(17.61)% | 1.76% | 90.71% | (27.03)% | (6.75)% | 8.95% |
| Ratios to average net assets (annualized) | ||||||
|
Gross
expenses |
1.59% | 1.32% | 1.42% | 0.89% | 0.82% | 1.06% |
|
Net
expenses |
0.50% | 0.50% | 0.50% | 0.50% | 0.64% | 0.85% |
|
Net investment
income |
0.90% | 0.49% | 0.51% | 0.95% | 0.48% | 0.14% |
| Supplemental data | ||||||
|
Portfolio turnover
rate |
28% | 39% | 48% | 67% | 176% | 48% |
|
Net assets, end of period (000s
omitted) |
$206 | $236 | $155 | $141 | $4,014 | $23,871 |
| 1 | Calculated based upon average shares outstanding |
| 2 | Returns for periods of less than one year are not annualized. |
| Year ended March 31 | ||||||
| Administrator Class | Six
months ended September 30, 2022 (unaudited) |
2022 | 2021 | 2020 | 2019 | 2018 |
|
Net asset value, beginning of
period |
$11.73 | $11.59 | $6.10 | $8.40 | $22.53 | $23.79 |
|
Net investment
income |
0.03 1 | 0.02 | 0.02 | 0.02 1 | 0.03 1 | 0.06 |
|
Net realized and unrealized gains (losses) on
investments |
(2.11) | 0.14 | 5.47 | (2.27) | (2.21) | 2.00 |
|
Total from investment
operations |
(2.08) | 0.16 | 5.49 | (2.25) | (2.18) | 2.06 |
| Distributions to shareholders from | ||||||
|
Net investment
income |
0.00 | (0.02) | (0.00) 2 | (0.05) | (0.03) | (0.04) |
|
Net realized
gains |
0.00 | 0.00 | 0.00 | 0.00 | (11.92) | (3.28) |
|
Total distributions to
shareholders |
0.00 | (0.02) | (0.00) 2 | (0.05) | (11.95) | (3.32) |
|
Net asset value, end of
period |
$9.65 | $11.73 | $11.59 | $6.10 | $8.40 | $22.53 |
|
Total
return3 |
(17.73)% 4 | 1.37% | 90.04% | (26.99)% | (7.01)% | 8.52% |
| Ratios to average net assets (annualized) | ||||||
|
Gross
expenses |
1.93% | 1.67% | 1.75% | 1.25% | 1.13% | 1.30% |
|
Net
expenses |
0.85% | 0.85% | 0.85% | 0.85% | 0.95% | 1.20% |
|
Net investment
income |
0.51% | 0.12% | 0.17% | 0.27% | 0.16% | 0.12% |
| Supplemental data | ||||||
|
Portfolio turnover
rate |
28% | 39% | 48% | 67% | 176% | 48% |
|
Net assets, end of period (000s
omitted) |
$14,311 | $20,963 | $24,318 | $17,049 | $49,911 | $91,506 |
| 1 | Calculated based upon average shares outstanding |
| 2 | Amount is less than $0.005. |
| 3 | Returns for periods of less than one year are not annualized. |
| 4 | During the six months ended September 30, 2022, the Fund received payments from a service provider which had a 0.17% impact on the total return. |
| Year ended March 31 | ||||||
| Institutional Class | Six
months ended September 30, 2022 (unaudited) |
2022 | 2021 | 2020 | 2019 | 2018 |
|
Net asset value, beginning of
period |
$11.71 | $11.60 | $6.10 | $8.48 | $22.61 | $23.82 |
|
Net investment
income |
0.04 1 | 0.04 1 | 0.04 1 | 0.06 1 | 0.07 1 | 0.09 |
|
Net realized and unrealized gains (losses) on
investments |
(2.11) | 0.16 | 5.47 | (2.28) | (2.22) | 2.03 |
|
Total from investment
operations |
(2.07) | 0.20 | 5.51 | (2.22) | (2.15) | 2.12 |
| Distributions to shareholders from | ||||||
|
Net investment
income |
0.00 | (0.09) | (0.01) | (0.16) | (0.06) | (0.05) |
|
Net realized
gains |
0.00 | 0.00 | 0.00 | 0.00 | (11.92) | (3.28) |
|
Total distributions to
shareholders |
0.00 | (0.09) | (0.01) | (0.16) | (11.98) | (3.33) |
|
Net asset value, end of
period |
$9.64 | $11.71 | $11.60 | $6.10 | $8.48 | $22.61 |
|
Total
return2 |
(17.68)% | 1.68% | 90.34% | (26.80)% | (6.79)% | 8.81% |
| Ratios to average net assets (annualized) | ||||||
|
Gross
expenses |
1.68% | 1.42% | 1.51% | 0.94% | 0.89% | 1.07% |
|
Net
expenses |
0.60% | 0.60% | 0.60% | 0.60% | 0.71% | 0.95% |
|
Net investment
income |
0.77% | 0.36% | 0.47% | 0.69% | 0.41% | 0.37% |
| Supplemental data | ||||||
|
Portfolio turnover
rate |
28% | 39% | 48% | 67% | 176% | 48% |
|
Net assets, end of period (000s
omitted) |
$816 | $1,192 | $1,708 | $1,586 | $25,658 | $67,798 |
| 1 | Calculated based upon average shares outstanding |
| 2 | Returns for periods of less than one year are not annualized. |
| Gross unrealized gains | $ 2,419,488 |
| Gross unrealized losses | (2,303,506) |
| Net unrealized gains | $ 115,982 |
| ■ | Level 1 – quoted prices in active markets for identical securities |
| ■ | Level 2 – other significant observable inputs (including quoted prices for similar securities, interest rates, prepayment speeds, credit risk, etc.) |
| ■ | Level 3 – significant unobservable inputs (including the Fund’s own assumptions in determining the fair value of investments) |
| Quoted
prices (Level 1) |
Other
significant observable inputs (Level 2) |
Significant
unobservable inputs (Level 3) |
Total | |
| Assets | ||||
| Investments in: | ||||
| Common stocks | ||||
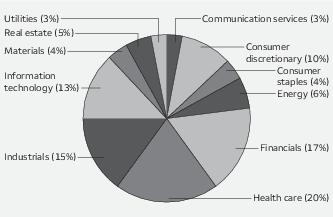
| Communication services | $ 415,970 | $0 | $0 | $ 415,970 |
| Consumer discretionary | 1,555,692 | 0 | 0 | 1,555,692 |
| Consumer staples | 579,123 | 0 | 0 | 579,123 |
| Energy | 974,757 | 0 | 0 | 974,757 |
| Financials | 2,580,286 | 0 | 0 | 2,580,286 |
| Health care | 3,054,745 | 0 | 0 | 3,054,745 |
| Industrials | 2,263,909 | 0 | 0 | 2,263,909 |
| Information technology | 2,027,311 | 0 | 0 | 2,027,311 |
| Materials | 578,150 | 0 | 0 | 578,150 |
| Real estate | 837,019 | 0 | 0 | 837,019 |
| Utilities | 473,623 | 0 | 0 | 473,623 |
| Short-term investments | ||||
| Investment companies | 600,420 | 0 | 0 | 600,420 |
| Total assets | $15,941,005 | $0 | $0 | $15,941,005 |
| Liabilities | ||||
| Futures contracts | $ 64,436 | $0 | $0 | $ 64,436 |
| Total liabilities | $ 64,436 | $0 | $0 | $ 64,436 |
| Average daily net assets | Management fee |
| First $1 billion | 0.500% |
| Next $4 billion | 0.475 |
| Next $5 billion | 0.440 |
| Over $10 billion | 0.430 |
| Class-level
administration fee | |
| Class A | 0.21% |
| Class R6 | 0.03 |
| Administrator Class | 0.13 |
| Institutional Class | 0.13 |
| Expense ratio caps | |
| Class A | 0.93% |
| Class R6 | 0.50 |
| Administrator Class | 0.85 |
| Institutional Class | 0.60 |
| Counterparty | Value
of securities on loan |
Collateral
received1 |
Net amount |
| National Financial Services LLC | $ 18,231 | $ (18,231) | $0 |
| Morgan Stanley & Co. LLC | 125,382 | (125,382) | 0 |
| Name
and year of birth |
Position
held and length of service* |
Principal occupations during past five years or longer | Current
other public company or investment company directorships |
| William
R. Ebsworth (Born 1957) |
Trustee,
since 2015 |
Retired. From 1984 to 2013, equities analyst, portfolio manager, research director and chief investment officer at Fidelity Management and Research Company in Boston, Tokyo, and Hong Kong, and retired in 2013 as Chief Investment Officer of Fidelity Strategic Advisers, Inc. where he led a team of investment professionals managing client assets. Prior thereto, Board member of Hong Kong Securities Clearing Co., Hong Kong Options Clearing Corp., the Thailand International Fund, Ltd., Fidelity Investments Life Insurance Company, and Empire Fidelity Investments Life Insurance Company. Audit Committee Chair and Investment Committee Chair of the Vincent Memorial Hospital Endowment (non-profit organization). Mr. Ebsworth is a CFA® charterholder. | N/A |
| Jane
A. Freeman (Born 1953) |
Trustee,
since 2015; Chair Liaison, since 2018 |
Retired. From 2012 to 2014 and 1999 to 2008, Chief Financial Officer of Scientific Learning Corporation. From 2008 to 2012, Ms. Freeman provided consulting services related to strategic business projects. Prior to 1999, Portfolio Manager at Rockefeller & Co. and Scudder, Stevens & Clark. Board member of the Harding Loevner Funds from 1996 to 2014, serving as both Lead Independent Director and chair of the Audit Committee. Board member of the Russell Exchange Traded Funds Trust from 2011 to 2012 and the chair of the Audit Committee. Ms. Freeman is also an inactive Chartered Financial Analyst. | N/A |
| Isaiah
Harris, Jr. (Born 1952) |
Trustee,
since 2009; Audit Committee Chair, since 2019 |
Retired. Chairman of the Board of CIGNA Corporation from 2009 to 2021, and Director from 2005 to 2008. From 2003 to 2011, Director of Deluxe Corporation. Prior thereto, President and CEO of BellSouth Advertising and Publishing Corp. from 2005 to 2007, President and CEO of BellSouth Enterprises from 2004 to 2005 and President of BellSouth Consumer Services from 2000 to 2003. Emeritus member of the Iowa State University Foundation Board of Governors. Emeritus Member of the Advisory Board of Iowa State University School of Business. Advisory Board Member, Palm Harbor Academy (private school). Advisory Board Member, Fellowship of Christian Athletes. Mr. Harris is a certified public accountant (inactive status). | N/A |
| David
F. Larcker (Born 1950) |
Trustee,
since 2009 |
James Irvin Miller Professor of Accounting at the Graduate School of Business (Emeritus), Stanford University, Director of the Corporate Governance Research Initiative and Senior Faculty of The Rock Center for Corporate Governance since 2006. From 2005 to 2008, Professor of Accounting at the Graduate School of Business, Stanford University. Prior thereto, Ernst & Young Professor of Accounting at The Wharton School, University of Pennsylvania from 1985 to 2005. | N/A |
| Name
and year of birth |
Position
held and length of service* |
Principal occupations during past five years or longer | Current
other public company or investment company directorships |
| Olivia
S. Mitchell (Born 1953) |
Trustee,
since 2006; Nominating and Governance Committee Chair, since 2018 |
International Foundation of Employee Benefit Plans Professor since 1993, Wharton School of the University of Pennsylvania. Director of Wharton’s Pension Research Council and Boettner Center on Pensions & Retirement Research, and Research Associate at the National Bureau of Economic Research. Previously taught at Cornell University from 1978 to 1993. | N/A |
| Timothy
J. Penny (Born 1951) |
Trustee,
since 1996; Chair, since 2018 |
President and Chief Executive Officer of Southern Minnesota Initiative Foundation, a non-profit organization, since 2007. Vice Chair of the Economic Club of Minnesota, since 2007. Co-Chair of the Committee for a Responsible Federal Budget, since 1995. Member of the Board of Trustees of NorthStar Education Finance, Inc., a non-profit organization, since 2007. Senior Fellow of the University of Minnesota Humphrey Institute from 1995 to 2017. | N/A |
| James
G. Polisson (Born 1959) |
Trustee,
since 2018 |
Retired. Chief Marketing Officer, Source (ETF) UK Services, Ltd, from 2015 to 2017. From 2012 to 2015, Principal of The Polisson Group, LLC, a management consulting, corporate advisory and principal investing company. Chief Executive Officer and Managing Director at Russell Investments, Global Exchange Traded Funds from 2010 to 2012. Managing Director of Barclays Global Investors from 1998 to 2010 and Global Chief Marketing Officer for iShares and Barclays Global Investors from 2000 to 2010. Trustee of the San Francisco Mechanics’ Institute, a non-profit organization, from 2013 to 2015. Board member of the Russell Exchange Traded Fund Trust from 2011 to 2012. Director of Barclays Global Investors Holdings Deutschland GmbH from 2006 to 2009. Mr. Polisson is an attorney and has a retired status with the Massachusetts and District of Columbia Bar Associations. | N/A |
| Pamela
Wheelock (Born 1959) |
Trustee,
since January 2020; previously Trustee from January 2018 to July 2019 |
Retired. Executive and Senior Financial leadership positions in the public, private and nonprofit sectors. Interim President and CEO, McKnight Foundation, 2020. Interim Commissioner, Minnesota Department of Human Services, 2019. Chief Operating Officer, Twin Cities Habitat for Humanity, 2017-2019. Vice President for University Services, University of Minnesota, 2012-2016. Interim President and CEO, Blue Cross and Blue Shield of Minnesota, 2011-2012. Executive Vice-President and Chief Financial Officer, Minnesota Wild, 2002-2008. Commissioner, Minnesota Department of Finance, 1999-2002. Chair of the Board of Directors of Destination Medical Center Corporation. Board member of the Minnesota Wild Foundation. | N/A |
| Name
and year of birth |
Position
held and length of service |
Principal occupations during past five years or longer |
| Andrew
Owen (Born 1960) |
President,
since 2017 |
President and Chief Executive Officer of Allspring Funds Management, LLC since 2017 and Head of Global Fund Governance of Allspring Global Investments since 2022. Prior thereto, co-president of Galliard Capital Management, LLC, an affiliate of Allspring Funds Management, LLC, from 2019 to 2022 and Head of Affiliated Managers, Allspring Global Investments, from 2014 to 2019 and Executive Vice President responsible for marketing, investments and product development for Allspring Funds Management, LLC, from 2009 to 2014. |
| Jeremy
DePalma (Born 1974) |
Treasurer,
since 2012 (for certain funds in the Fund Complex); since 2021 (for the remaining funds in the Fund Complex) |
Senior Vice President of Allspring Funds Management, LLC since 2009. Senior Vice President of Evergreen Investment Management Company, LLC from 2008 to 2010 and head of the Fund Reporting and Control Team within Fund Administration from 2005 to 2010. |
| Christopher
Baker (Born 1976) |
Chief Compliance Officer, since 2022 | Global Chief Compliance Officer for Allspring Global Investments since 2022. Prior thereto, Chief Compliance Officer for State Street Global Advisors from 2018 to 2021. Senior Compliance Officer for the State Street divisions of Alternative Investment Solutions, Sector Solutions, and Global Marketing from 2015 to 2018. From 2010 to 2015 Vice President, Global Head of Investment and Marketing Compliance for State Street Global Advisors. |
| Matthew
Prasse (Born 1983) |
Chief Legal Officer, since 2022; Secretary, since 2021 | Senior Counsel of the Allspring Legal Department since 2021. Senior Counsel of the Wells Fargo Legal Department from 2018 to 2021. Previously, Counsel for Barings LLC from 2015 to 2018. Prior to joining Barings, Associate at Morgan, Lewis & Bockius LLP from 2008 to 2015. |
P.O. Box 219967
Kansas City, MO 64121-9967

1-800-222-8222 or visit the Fund's website at allspringglobal.com. Read the prospectus carefully before you invest or send money.
SA243/SAR243 09-22

Discovery Small Cap Growth Fund

| 1 | The S&P 500 Index consists of 500 stocks chosen for market size, liquidity, and industry group representation. It is a market-value-weighted index with each stock's weight in the index proportionate to its market value. You cannot invest directly in an index. |
| 2 | The Morgan Stanley Capital International (MSCI) All Country World Index (ACWI) ex USA Index (Net) is a free-float-adjusted market-capitalization-weighted index that is designed to measure the equity market performance of developed and emerging markets, excluding the U.S. Source: MSCI. MSCI makes no express or implied warranties or representations and shall have no liability whatsoever with respect to any MSCI data contained herein. The MSCI data may not be further redistributed or used as a basis for other indexes or any securities or financial products. This report is not approved, reviewed, or produced by MSCI. You cannot invest directly in an index. |
| 3 | The MSCI Emerging Markets (EM) Index (Net) (USD) is a free-float-adjusted market-capitalization-weighted index that is designed to measure equity market performance of emerging markets. You cannot invest directly in an index. |
| 4 | The Bloomberg U.S. Aggregate Bond Index is a broad-based benchmark that measures the investment-grade, U.S.-dollar-denominated, fixed-rate taxable bond market, including Treasuries, government-related and corporate securities, mortgage-backed securities (agency fixed-rate and hybrid adjustable-rate mortgage pass-throughs), asset-backed securities, and commercial mortgage-backed securities. You cannot invest directly in an index. |
| 5 | The Bloomberg Global Aggregate ex-USD Index (unhedged) is an unmanaged index that provides a broad-based measure of the global investment-grade fixed-income markets excluding the U.S.-dollar-denominated debt market. You cannot invest directly in an index. |
| 6 | The Bloomberg Municipal Bond Index is an unmanaged index composed of long-term tax-exempt bonds with a minimum credit rating of Baa. You cannot invest directly in an index. |
| 7 | The ICE BofA U.S. High Yield Index is a market-capitalization-weighted index of domestic and Yankee high-yield bonds. The index tracks the performance of high-yield securities traded in the U.S. bond market. You cannot invest directly in an index. Copyright 2022. ICE Data Indices, LLC. All rights reserved. |
| 1 | The MSCI ACWI (Net) is a free-float-adjusted market-capitalization-weighted index that is designed to measure the equity market performance of developed and emerging markets. You cannot invest directly in an index. |

President
Allspring Funds
| Investment objective | The Fund seeks long-term capital appreciation. |
| Manager | Allspring Funds Management, LLC |
| Subadviser | Allspring Global Investments, LLC |
| Portfolio managers | Michael T. Smith, CFA®‡, Christopher J. Warner, CFA®‡ |
| Average annual total returns (%) as of September 30, 2022 | |||||||||||
| Including sales charge | Excluding sales charge | Expense ratios1 (%) | |||||||||
| Inception date | 1 year | 5 year | 10 year | 1 year | 5 year | 10 year | Gross | Net 2 | |||
| Class A (EGWAX) | 6-5-1995 | -43.82 | 5.03 | 8.06 | -40.38 | 6.28 | 8.70 | 1.44 | 1.23 | ||
| Class C (EGWCX) | 7-30-2010 | -41.86 | 5.51 | 8.06 | -40.86 | 5.51 | 8.06 | 2.19 | 1.98 | ||
| Class R6 (EGWRX)3 | 5-29-2020 | – | – | – | -40.17 | 6.68 | 9.09 | 1.01 | 0.80 | ||
| Administrator Class (EGWDX) | 7-30-2010 | – | – | – | -40.24 | 6.67 | 9.00 | 1.36 | 1.15 | ||
| Institutional Class (EGRYX) | 11-19-1997 | – | – | – | -40.24 | 6.63 | 9.06 | 1.11 | 0.90 | ||
| Russell 2000® Growth Index4 | – | – | – | – | -29.27 | 3.60 | 8.81 | – | – | ||
| 1 | Reflects the expense ratios as stated in the most recent prospectuses. The expense ratios shown are subject to change and may differ from the annualized expense ratios shown in the financial highlights of this report. |
| 2 | The manager has contractually committed through July 31, 2023, to waive fees and/or reimburse expenses to the extent necessary to cap total annual fund operating expenses after fee waivers at 1.23% for Class A, 1.98% for Class C, 0.80% for Class R6, 1.15% for Administrator Class, and 0.90% for Institutional Class. Brokerage commissions, stamp duty fees, interest, taxes, acquired fund fees and expenses (if any), and extraordinary expenses are excluded from the expense caps. Prior to or after the commitment expiration date, the caps may be increased or the commitment to maintain the caps may be terminated only with the approval of the Board of Trustees. Without these caps, the Fund’s returns would have been lower. The expense ratio paid by an investor is the net expense ratio (the total annual fund operating expenses after fee waivers) as stated in the prospectuses. |
| 3 | Historical performance shown for the Class R6 shares prior to their inception reflects the performance of the Institutional Class shares, and includes the higher expenses applicable to the Institutional Class shares. If these expenses had not been included, returns for the Class R6 shares would be higher. |
| 4 | The Russell 2000® Growth Index measures the performance of those Russell 2000 companies with higher price/book ratios and higher forecasted growth values. You cannot invest directly in an index. |
| ‡ | CFA® and Chartered Financial Analyst® are trademarks owned by CFA Institute. |
| Beginning
account value 4-1-2022 |
Ending
account value 9-30-2022 |
Expenses
paid during the period1 |
Annualized
net expense ratio | |
| Class A | ||||
| Actual | $1,000.00 | $ 762.48 | $5.43 | 1.23% |
| Hypothetical (5% return before expenses) | $1,000.00 | $1,018.90 | $6.23 | 1.23% |
| Class C | ||||
| Actual | $1,000.00 | $ 758.97 | $8.64 | 1.96% |
| Hypothetical (5% return before expenses) | $1,000.00 | $1,015.24 | $9.90 | 1.96% |
| Class R6 | ||||
| Actual | $1,000.00 | $ 763.59 | $3.54 | 0.80% |
| Hypothetical (5% return before expenses) | $1,000.00 | $1,021.06 | $4.05 | 0.80% |
| Administrator Class | ||||
| Actual | $1,000.00 | $ 763.96 | $5.09 | 1.15% |
| Hypothetical (5% return before expenses) | $1,000.00 | $1,019.30 | $5.82 | 1.15% |
| Institutional Class | ||||
| Actual | $1,000.00 | $ 763.09 | $3.98 | 0.90% |
| Hypothetical (5% return before expenses) | $1,000.00 | $1,020.56 | $4.56 | 0.90% |
| Shares | Value | ||||
| Common stocks: 96.51% | |||||
| Communication services: 1.98% | |||||
| Interactive media & services: 1.98% | |||||
| Bumble Incorporated Class A † | 62,150 | $ 1,335,604 | |||
| IAC/InterActiveCorp † | 13,688 | 758,041 | |||
| 2,093,645 | |||||
| Consumer discretionary: 11.09% | |||||
| Diversified consumer services: 1.06% | |||||
| Mister Car Wash Incorporated † | 130,014 | 1,115,520 | |||
| Hotels, restaurants & leisure: 4.68% | |||||
| Papa John's International Incorporated | 27,184 | 1,903,152 | |||
| Wingstop Incorporated | 24,293 | 3,046,828 | |||
| 4,949,980 | |||||
| Internet & direct marketing retail: 2.89% | |||||
| Global-E Online Limited † | 51,473 | 1,377,417 | |||
| Xometry Incorporated Class A †« | 29,566 | 1,679,053 | |||
| 3,056,470 | |||||
| Leisure products: 2.46% | |||||
| Callaway Golf Company † | 84,264 | 1,622,925 | |||
| Games Workshop Group plc | 15,358 | 982,046 | |||
| 2,604,971 | |||||
| Consumer staples: 2.35% | |||||
| Beverages: 2.35% | |||||
| MGP Ingredients Incorporated | 23,436 | 2,487,966 | |||
| Financials: 2.41% | |||||
| Banks: 1.09% | |||||
| Silvergate Capital Corporation Class A † | 15,365 | 1,157,753 | |||
| Capital markets: 0.59% | |||||
| Open Lending Corporation Class A † | 77,973 | 626,903 | |||
| Insurance: 0.73% | |||||
| Goosehead Insurance Incorporated Class A † | 21,512 | 766,688 | |||
| Health care: 29.79% | |||||
| Biotechnology: 5.02% | |||||
| Apellis Pharmaceuticals Incorporated † | 10,851 | 741,123 | |||
| Ascendis Pharma AS ADR †« | 8,193 | 846,009 | |||
| Chimerix Incorporated † | 156,443 | 301,935 | |||
| CRISPR Therapeutics AG † | 7,563 | 494,242 | |||
| CTI BioPharma Corporation † | 83,094 | 483,607 | |||
| Fate Therapeutics Incorporated † | 17,460 | 391,279 | |||
| Halozyme Therapeutics Incorporated † | 33,133 | 1,310,079 | |||
| Mirati Therapeutics Incorporated † | 5,892 | 411,497 | |||
| Zentalis Pharmaceuticals Incorporated † | 15,363 | 332,763 | |||
| 5,312,534 |
| Shares | Value | ||||
| Health care equipment & supplies: 14.08% | |||||
| Axonics Incorporated † | 12,845 | $ 904,802 | |||
| Cryoport Incorporated † | 34,934 | 850,992 | |||
| Establishment Labs Holdings Incorporated † | 14,934 | 815,546 | |||
| ICU Medical Incorporated † | 4,884 | 735,530 | |||
| Inari Medical Incorporated † | 23,637 | 1,716,992 | |||
| Inspire Medical Systems Incorporated † | 10,988 | 1,948,942 | |||
| iRhythm Technologies Incorporated † | 15,571 | 1,950,735 | |||
| Lantheus Holdings Incorporated † | 20,081 | 1,412,297 | |||
| Shockwave Medical Incorporated † | 8,669 | 2,410,589 | |||
| Treace Medical Concepts Incorporated † | 57,594 | 1,271,100 | |||
| UFP Technologies Incorporated † | 10,174 | 873,336 | |||
| 14,890,861 | |||||
| Health care providers & services: 5.95% | |||||
| Amedisys Incorporated † | 7,353 | 711,697 | |||
| HealthEquity Incorporated † | 52,189 | 3,505,530 | |||
| Option Care Health Incorporated † | 65,953 | 2,075,541 | |||
| 6,292,768 | |||||
| Life sciences tools & services: 4.09% | |||||
| Azenta Incorporated | 16,844 | 721,934 | |||
| Inotiv Incorporated † | 57,365 | 966,600 | |||
| MaxCyte Incorporated †« | 152,247 | 989,606 | |||
| Stevanato Group SpA | 96,867 | 1,640,927 | |||
| 4,319,067 | |||||
| Pharmaceuticals: 0.65% | |||||
| Arvinas Incorporated † | 15,363 | 683,500 | |||
| Industrials: 16.05% | |||||
| Aerospace & defense: 1.50% | |||||
| Axon Enterprise Incorporated † | 13,730 | 1,589,248 | |||
| Building products: 2.20% | |||||
| Advanced Drainage Systems Incorporated | 12,518 | 1,556,864 | |||
| Trex Company Incorporated † | 17,435 | 766,094 | |||
| 2,322,958 | |||||
| Commercial services & supplies: 5.28% | |||||
| Casella Waste Systems Incorporated Class A † | 34,631 | 2,645,462 | |||
| Ritchie Bros. Auctioneers Incorporated | 8,627 | 539,015 | |||
| Tetra Tech Incorporated | 18,643 | 2,396,185 | |||
| 5,580,662 | |||||
| Electrical equipment: 1.68% | |||||
| Allied Motion Technologies | 62,073 | 1,776,529 | |||
| Professional services: 1.28% | |||||
| ICF International Incorporated | 12,430 | 1,355,119 | |||
| Road & rail: 2.35% | |||||
| Saia Incorporated † | 13,082 | 2,485,580 | |||
| Trading companies & distributors: 1.76% | |||||
| SiteOne Landscape Supply Incorporated † | 17,883 | 1,862,336 |
| Shares | Value | ||||
| Information technology: 28.96% | |||||
| Electronic equipment, instruments & components: 5.00% | |||||
| Littelfuse Incorporated | 7,994 | $ 1,588,328 | |||
| Nayax Limited † | 41,723 | 990,007 | |||
| Nlight Incorporated † | 80,845 | 763,985 | |||
| Novanta Incorporated † | 16,813 | 1,944,423 | |||
| 5,286,743 | |||||
| IT services: 9.23% | |||||
| Globant SA † | 10,238 | 1,915,325 | |||
| Keywords Studios plc | 67,233 | 1,715,096 | |||
| Marqeta Incorporated Class A † | 122,583 | 872,791 | |||
| Shift4 Payments Incorporated Class A † | 34,193 | 1,525,350 | |||
| StoneCo Limited Class A † | 96,075 | 915,595 | |||
| WNS Holdings Limited ADR † | 34,451 | 2,819,470 | |||
| 9,763,627 | |||||
| Semiconductors & semiconductor equipment: 2.20% | |||||
| Impinj Incorporated † | 22,588 | 1,807,718 | |||
| Sitime Corporation † | 6,569 | 517,177 | |||
| 2,324,895 | |||||
| Software: 12.53% | |||||
| Bill.com Holdings Incorporated † | 10,600 | 1,403,122 | |||
| CCC Intelligent Solutions † | 88,579 | 806,069 | |||
| Clearwater Analytics Holdings Incorporated Class A † | 63,110 | 1,059,617 | |||
| CS Disco Incorporated † | 45,033 | 450,330 | |||
| Five9 Incorporated † | 20,454 | 1,533,641 | |||
| Gitlab Incorporated Class A † | 17,819 | 912,689 | |||
| Jamf Holding Corporation † | 63,626 | 1,409,952 | |||
| Lightspeed Commerce Incorporated † | 31,326 | 550,711 | |||
| Olo Incorporated Class A † | 134,351 | 1,061,373 | |||
| SentinelOne, Incorporated Class A † | 31,549 | 806,392 | |||
| Sprout Social Incorporated Class A † | 32,297 | 1,959,782 | |||
| Workiva Incorporated † | 16,681 | 1,297,782 | |||
| 13,251,460 | |||||
| Materials: 0.59% | |||||
| Chemicals: 0.27% | |||||
| Aspen Aerogels Incorporated † | 30,257 | 278,970 | |||
| Containers & packaging: 0.32% | |||||
| Ranpak Holdings Corporation † | 99,060 | 338,785 | |||
| Real estate: 3.29% | |||||
| Equity REITs: 2.26% | |||||
| Rexford Industrial Realty Incorporated | 46,009 | 2,392,468 | |||
| Real estate management & development: 1.03% | |||||
| DigitalBridge Group Incorporated | 86,816 | 1,086,068 | |||
| Total Common stocks (Cost $113,647,116) | 102,054,074 |
| Yield | Shares | Value | |||
| Short-term investments: 6.58% | |||||
| Investment companies: 6.58% | |||||
| Allspring Government Money Market Fund Select Class ♠∞ | 2.75% | 3,764,268 | $ 3,764,268 | ||
| Securities Lending Cash Investments LLC ♠∩∞ | 3.08 | 3,194,700 | 3,194,700 | ||
| Total Short-term investments (Cost $6,958,968) | 6,958,968 | ||||
| Total investments in securities (Cost $120,606,084) | 103.09% | 109,013,042 | |||
| Other assets and liabilities, net | (3.09) | (3,268,624) | |||
| Total net assets | 100.00% | $105,744,418 |
| † | Non-income-earning security |
| « | All or a portion of this security is on loan. |
| ♠ | The issuer of the security is an affiliated person of the Fund as defined in the Investment Company Act of 1940. |
| ∩ | The investment is a non-registered investment company purchased with cash collateral received from securities on loan. |
| ∞ | The rate represents the 7-day annualized yield at period end. |
| Abbreviations: | |
| ADR | American depositary receipt |
| REIT | Real estate investment trust |
| Value,
beginning of period |
Purchases | Sales
proceeds |
Net
realized gains (losses) |
Net
change in unrealized gains (losses) |
Value,
end of period |
Shares,
end of period |
Income
from affiliated securities | |||
| Short-term investments | ||||||||||
| Allspring Government Money Market Fund Select Class | $1,852,545 | $16,378,435 | $(14,466,712) | $0 | $0 | $ 3,764,268 | 3,764,268 | $ 27,450 | ||
| Securities Lending Cash Investments LLC | 5,055,425 | 24,651,377 | (26,512,102) | 0 | 0 | 3,194,700 | 3,194,700 | 29,684 # | ||
| $0 | $0 | $6,958,968 | $57,134 | |||||||
| # | Amount shown represents income before fees and rebates. |
| Assets | |
|
Investments in unaffiliated securities (including $3,114,664 of securities loaned), at value (cost
$113,647,116) |
$ 102,054,074 |
|
Investments in affiliated securities, at value (cost
$6,958,968) |
6,958,968 |
|
Foreign currency, at value (cost
$348) |
291 |
|
Receivable for investments
sold |
1,405,291 |
|
Receivable for Fund shares
sold |
137,046 |
|
Receivable for
dividends |
26,986 |
|
Receivable for securities lending income,
net |
1,487 |
|
Prepaid expenses and other
assets |
90,459 |
|
Total
assets |
110,674,602 |
| Liabilities | |
|
Payable upon receipt of securities
loaned |
3,194,700 |
|
Payable for investments
purchased |
1,558,359 |
|
Management fee
payable |
55,053 |
|
Payable for Fund shares
redeemed |
49,045 |
|
Administration fees
payable |
18,112 |
|
Trustees’ fees and expenses
payable |
3,758 |
|
Overdraft due to custodian
bank |
600 |
|
Distribution fee
payable |
325 |
|
Accrued expenses and other
liabilities |
50,232 |
|
Total
liabilities |
4,930,184 |
|
Total net
assets |
$105,744,418 |
| Net assets consist of | |
|
Paid-in
capital |
$ 122,791,214 |
|
Total distributable
loss |
(17,046,796) |
|
Total net
assets |
$105,744,418 |
| Computation of net asset value and offering price per share | |
|
Net assets – Class
A |
$ 72,874,247 |
|
Shares outstanding – Class
A1 |
6,451,842 |
|
Net asset value per share – Class
A |
$11.30 |
|
Maximum offering price per share – Class
A2 |
$11.99 |
|
Net assets – Class
C |
$ 474,664 |
|
Shares outstanding – Class
C1 |
52,161 |
|
Net asset value per share – Class
C |
$9.10 |
|
Net assets – Class
R6 |
$ 2,320,637 |
|
Shares outstanding – Class
R61 |
160,370 |
|
Net asset value per share – Class
R6 |
$14.47 |
|
Net assets – Administrator
Class |
$ 315,857 |
|
Shares outstanding – Administrator
Class1 |
22,642 |
|
Net asset value per share – Administrator
Class |
$13.95 |
|
Net assets – Institutional
Class |
$ 29,759,013 |
|
Shares outstanding – Institutional
Class1 |
2,061,900 |
Net
asset value per share – Institutional
Class |
$14.43 |
| 1 | The Fund has an unlimited number of authorized shares. |
| 2 | Maximum offering price is computed as 100/94.25 of net asset value. On investments of $50,000 or more, the offering price is reduced. |
| Investment income | |
|
Dividends (net of foreign withholdings taxes of
$793) |
$ 115,085 |
|
Income from affiliated
securities |
27,450 |
|
Securities lending income (including from affiliate),
net |
10,954 |
|
Total investment
income |
153,489 |
| Expenses | |
|
Management
fee |
498,907 |
| Administration fees | |
|
Class
A |
86,723 |
|
Class
C |
576 |
|
Class
R6 |
342 |
|
Administrator
Class |
247 |
|
Institutional
Class |
20,533 |
| Shareholder servicing fees | |
|
Class
A |
103,241 |
|
Class
C |
619 |
|
Administrator
Class |
475 |
| Distribution fee | |
|
Class
C |
1,762 |
|
Custody and accounting
fees |
12,733 |
|
Professional
fees |
29,370 |
|
Registration
fees |
35,283 |
|
Shareholder report
expenses |
25,697 |
|
Trustees’ fees and
expenses |
11,176 |
|
Other fees and
expenses |
5,497 |
|
Total
expenses |
833,181 |
| Less: Fee waivers and/or expense reimbursements | |
|
Fund-level |
(97,784) |
|
Class
A |
(50,297) |
|
Class
R6 |
(342) |
|
Administrator
Class |
(226) |
|
Institutional
Class |
(18,641) |
|
Net
expenses |
665,891 |
|
Net investment
loss |
(512,402) |
| Realized and unrealized gains (losses) on investments | |
|
Net realized losses on
investments |
(11,628,034) |
|
Net change in unrealized gains (losses) on
investments |
(21,054,108) |
|
Net realized and unrealized gains (losses) on
investments |
(32,682,142) |
|
Net decrease in net assets resulting from
operations |
$(33,194,544) |
| Six
months ended September 30, 2022 (unaudited) |
Year
ended March 31, 2022 | |||
| Operations | ||||
|
Net investment
loss |
$ (512,402) | $ (1,646,546) | ||
|
Net realized gains (losses) on
investments |
(11,628,034) | 19,377,472 | ||
|
Net change in unrealized gains (losses) on
investments |
(21,054,108) | (48,630,162) | ||
|
Net decrease in net assets resulting from
operations |
(33,194,544) | (30,899,236) | ||
| Distributions to shareholders from | ||||
| Net investment income and net realized gains | ||||
|
Class
A |
0 | (20,423,584) | ||
|
Class
C |
0 | (219,886) | ||
|
Class
R6 |
0 | (261,203) | ||
|
Administrator
Class |
0 | (73,953) | ||
|
Institutional
Class |
0 | (5,596,005) | ||
|
Total distributions to
shareholders |
0 | (26,574,631) | ||
| Capital share transactions | Shares | Shares | ||
| Proceeds from shares sold | ||||
|
Class
A |
66,892 | 815,010 | 332,425 | 6,683,479 |
|
Class
C |
1,674 | 17,272 | 9,338 | 159,600 |
|
Class
R6 |
69,223 | 1,049,984 | 101,634 | 2,520,991 |
|
Administrator
Class |
3,257 | 48,141 | 19,749 | 478,478 |
|
Institutional
Class |
415,978 | 6,297,370 | 1,426,944 | 36,296,515 |
| 8,227,777 | 46,139,063 | |||
| Reinvestment of distributions | ||||
|
Class
A |
0 | 0 | 1,111,624 | 20,009,223 |
|
Class
C |
0 | 0 | 15,071 | 219,886 |
|
Class
R6 |
0 | 0 | 11,367 | 261,203 |
|
Administrator
Class |
0 | 0 | 3,223 | 71,474 |
|
Institutional
Class |
0 | 0 | 243,402 | 5,583,641 |
| 0 | 26,145,427 | |||
| Payment for shares redeemed | ||||
|
Class
A |
(440,138) | (5,423,824) | (833,733) | (16,092,697) |
|
Class
C |
(15,682) | (159,212) | (45,052) | (778,561) |
|
Class
R6 |
(23,303) | (365,728) | (15,802) | (375,226) |
|
Administrator
Class |
(8,211) | (130,620) | (10,679) | (239,024) |
|
Institutional
Class |
(307,504) | (4,774,166) | (452,264) | (10,422,365) |
| (10,853,550) | (27,907,873) | |||
|
Net increase (decrease) in net assets resulting from capital share
transactions |
(2,625,773) | 44,376,617 | ||
|
Total decrease in net
assets |
(35,820,317) | (13,097,250) | ||
| Net assets | ||||
|
Beginning of
period |
141,564,735 | 154,661,985 | ||
|
End of
period |
$105,744,418 | $141,564,735 | ||
| Year ended March 31 | ||||||
| Class A | Six
months ended September 30, 2022 (unaudited) |
2022 | 2021 | 2020 | 2019 | 2018 |
|
Net asset value, beginning of
period |
$14.82 | $21.39 | $11.00 | $13.28 | $15.32 | $14.08 |
|
Net investment
loss |
(0.06) 1 | (0.21) 1 | (0.18) 1 | (0.10) 1 | (0.11) 1 | (0.12) 1 |
|
Net realized and unrealized gains (losses) on
investments |
(3.46) | (2.94) | 11.09 | (1.27) | 2.17 | 2.35 |
|
Total from investment
operations |
(3.52) | (3.15) | 10.91 | (1.37) | 2.06 | 2.23 |
| Distributions to shareholders from | ||||||
|
Net realized
gains |
0.00 | (3.42) | (0.52) | (0.91) | (4.10) | (0.99) |
|
Net asset value, end of
period |
$11.30 | $14.82 | $21.39 | $11.00 | $13.28 | $15.32 |
|
Total
return2 |
(23.75)% | (17.57)% | 99.31% | (11.52)% | 17.46% | 16.08% |
| Ratios to average net assets (annualized) | ||||||
|
Gross
expenses |
1.51% | 1.44% | 1.47% | 1.52% | 1.51% | 1.52% |
|
Net
expenses |
1.23% | 1.23% | 1.23% | 1.23% | 1.23% | 1.33% |
|
Net investment
loss |
(0.97)% | (1.03)% | (0.99)% | (0.74)% | (0.74)% | (0.79)% |
| Supplemental data | ||||||
|
Portfolio turnover
rate |
19% | 55% | 55% | 63% | 155% | 44% |
|
Net assets, end of period (000s
omitted) |
$72,874 | $101,163 | $132,937 | $66,472 | $86,006 | $84,738 |
| 1 | Calculated based upon average shares outstanding |
| 2 | Total return calculations do not include any sales charges. Returns for periods of less than one year are not annualized. |
| Year ended March 31 | ||||||
| Class C | Six
months ended September 30, 2022 (unaudited) |
2022 | 2021 | 2020 | 2019 | 2018 |
|
Net asset value, beginning of
period |
$11.99 | $18.08 | $9.39 | $11.55 | $13.94 | $12.99 |
|
Net investment
loss |
(0.09) 1 | (0.31) 1 | (0.28) 1 | (0.18) 1 | (0.20) 1 | (0.21) 1 |
|
Payment from
affiliate |
0.00 | 0.00 | 0.01 | 0.00 | 0.00 | 0.00 |
|
Net realized and unrealized gains (losses) on
investments |
(2.80) | (2.36) | 9.48 | (1.07) | 1.91 | 2.15 |
|
Total from investment
operations |
(2.89) | (2.67) | 9.21 | (1.25) | 1.71 | 1.94 |
| Distributions to shareholders from | ||||||
|
Net realized
gains |
0.00 | (3.42) | (0.52) | (0.91) | (4.10) | (0.99) |
|
Net asset value, end of
period |
$9.10 | $11.99 | $18.08 | $9.39 | $11.55 | $13.94 |
|
Total
return2 |
(24.10)% | (18.16)% | 98.22% 3 | (12.30)% | 16.69% | 15.17% |
| Ratios to average net assets (annualized) | ||||||
|
Gross
expenses |
2.13% | 2.18% | 2.20% | 2.26% | 2.26% | 2.27% |
|
Net
expenses |
1.96% | 1.98% | 1.98% | 1.98% | 1.98% | 2.08% |
|
Net investment
loss |
(1.71)% | (1.79)% | (1.74)% | (1.49)% | (1.48)% | (1.54)% |
| Supplemental data | ||||||
|
Portfolio turnover
rate |
19% | 55% | 55% | 63% | 155% | 44% |
|
Net assets, end of period (000s
omitted) |
$475 | $793 | $1,569 | $395 | $349 | $274 |
| 1 | Calculated based upon average shares outstanding |
| 2 | Total return calculations do not include any sales charges. Returns for periods of less than one year are not annualized. |
| 3 | During the year ended March 31, 2021, the Fund received a payment from an affiliate which had a 0.09% impact on the total return. |
| Year ended March 31 | |||
| Class R6 | Six
months ended September 30, 2022 (unaudited) |
2022 | 2021 1 |
|
Net asset value, beginning of
period |
$18.95 | $26.29 | $17.87 |
|
Net investment
loss |
(0.04) 2 | (0.14) 2 | (0.11) 2 |
|
Net realized and unrealized gains (losses) on
investments |
(4.44) | (3.78) | 9.05 |
|
Total from investment
operations |
(4.48) | (3.92) | 8.94 |
| Distributions to shareholders from | |||
|
Net realized
gains |
0.00 | (3.42) | (0.52) |
|
Net asset value, end of
period |
$14.47 | $18.95 | $26.29 |
|
Total
return3 |
(23.64)% | (17.21)% | 50.11% |
| Ratios to average net assets (annualized) | |||
|
Gross
expenses |
1.09% | 1.02% | 1.03% |
|
Net
expenses |
0.80% | 0.80% | 0.80% |
|
Net investment
loss |
(0.53)% | (0.58)% | (0.54)% |
| Supplemental data | |||
|
Portfolio turnover
rate |
19% | 55% | 55% |
|
Net assets, end of period (000s
omitted) |
$2,321 | $2,169 | $454 |
| 1 | For the period from May 29, 2020 (commencement of class operations) to March 31, 2021 |
| 2 | Calculated based upon average shares outstanding |
| 3 | Returns for periods of less than one year are not annualized. |
| Year ended March 31 | ||||||
| Administrator Class | Six
months ended September 30, 2022 (unaudited) |
2022 | 2021 | 2020 | 2019 | 2018 |
|
Net asset value, beginning of
period |
$18.26 | $25.54 | $12.91 | $15.43 | $17.14 | $15.63 |
|
Net investment
loss |
(0.07) 1 | (0.22) 1 | (0.20) 1 | (0.11) 1 | (0.11) 1 | (0.11) 1 |
|
Payment from
affiliate |
0.00 | 0.00 | 0.11 | 0.00 | 0.00 | 0.00 |
|
Net realized and unrealized gains (losses) on
investments |
(4.24) | (3.64) | 13.24 | (1.50) | 2.50 | 2.61 |
|
Total from investment
operations |
(4.31) | (3.86) | 13.15 | (1.61) | 2.39 | 2.50 |
| Distributions to shareholders from | ||||||
|
Net realized
gains |
0.00 | (3.42) | (0.52) | (0.91) | (4.10) | (0.99) |
|
Net asset value, end of
period |
$13.95 | $18.26 | $25.54 | $12.91 | $15.43 | $17.14 |
|
Total
return2 |
(23.60)% | (17.49)% | 101.97% 3 | (11.52)% | 17.59% | 16.21% |
| Ratios to average net assets (annualized) | ||||||
|
Gross
expenses |
1.43% | 1.37% | 1.39% | 1.44% | 1.43% | 1.44% |
|
Net
expenses |
1.15% | 1.15% | 1.15% | 1.15% | 1.15% | 1.20% |
|
Net investment
loss |
(0.89)% | (0.95)% | (0.90)% | (0.66)% | (0.62)% | (0.66)% |
| Supplemental data | ||||||
|
Portfolio turnover
rate |
19% | 55% | 55% | 63% | 155% | 44% |
|
Net assets, end of period (000s
omitted) |
$316 | $504 | $391 | $93 | $104 | $133 |
| 1 | Calculated based upon average shares outstanding |
| 2 | Returns for periods of less than one year are not annualized. |
| 3 | During the year ended March 31, 2021, the Fund received a payment from an affiliate which had a 0.89% impact on the total return. |
| Year ended March 31 | ||||||
| Institutional Class | Six
months ended September 30, 2022 (unaudited) |
2022 | 2021 | 2020 | 2019 | 2018 |
|
Net asset value, beginning of
period |
$18.91 | $26.26 | $13.39 | $15.94 | $17.53 | $15.94 |
|
Net investment
loss |
(0.05) 1 | (0.17) 1 | (0.15) 1 | (0.07) 1 | (0.07) 1 | (0.08) 1 |
|
Net realized and unrealized gains (losses) on
investments |
(4.43) | (3.76) | 13.54 | (1.57) | 2.58 | 2.66 |
|
Total from investment
operations |
(4.48) | (3.93) | 13.39 | (1.64) | 2.51 | 2.58 |
| Distributions to shareholders from | ||||||
|
Net realized
gains |
0.00 | (3.42) | (0.52) | (0.91) | (4.10) | (0.99) |
|
Net asset value, end of
period |
$14.43 | $18.91 | $26.26 | $13.39 | $15.94 | $17.53 |
|
Total
return2 |
(23.69)% | (17.27)% | 100.11% | (11.29)% | 17.85% | 16.40% |
| Ratios to average net assets (annualized) | ||||||
|
Gross
expenses |
1.18% | 1.12% | 1.14% | 1.19% | 1.18% | 1.19% |
|
Net
expenses |
0.90% | 0.90% | 0.90% | 0.90% | 0.90% | 0.98% |
|
Net investment
loss |
(0.64)% | (0.69)% | (0.66)% | (0.41)% | (0.41)% | (0.44)% |
| Supplemental data | ||||||
|
Portfolio turnover
rate |
19% | 55% | 55% | 63% | 155% | 44% |
|
Net assets, end of period (000s
omitted) |
$29,759 | $36,936 | $19,311 | $7,980 | $9,695 | $8,878 |
| 1 | Calculated based upon average shares outstanding |
| 2 | Returns for periods of less than one year are not annualized. |
| Gross unrealized gains | $ 21,275,948 |
| Gross unrealized losses | (32,870,344) |
| Net unrealized losses | $(11,594,396) |
| ■ | Level 1 – quoted prices in active markets for identical securities |
| ■ | Level 2 – other significant observable inputs (including quoted prices for similar securities, interest rates, prepayment speeds, credit risk, etc.) |
| ■ | Level 3 – significant unobservable inputs (including the Fund’s own assumptions in determining the fair value of investments) |
| Quoted
prices (Level 1) |
Other
significant observable inputs (Level 2) |
Significant
unobservable inputs (Level 3) |
Total | |
| Assets | ||||
| Investments in: | ||||
| Common stocks | ||||
| Communication services | $ 2,093,645 | $ 0 | $0 | $ 2,093,645 |
| Consumer discretionary | 10,744,895 | 982,046 | 0 | 11,726,941 |
| Consumer staples | 2,487,966 | 0 | 0 | 2,487,966 |
| Financials | 2,551,344 | 0 | 0 | 2,551,344 |
| Health care | 31,498,730 | 0 | 0 | 31,498,730 |
| Industrials | 16,972,432 | 0 | 0 | 16,972,432 |
| Information technology | 27,921,622 | 2,705,103 | 0 | 30,626,725 |
| Materials | 617,755 | 0 | 0 | 617,755 |
| Real estate | 3,478,536 | 0 | 0 | 3,478,536 |
| Short-term investments | ||||
| Investment companies | 6,958,968 | 0 | 0 | 6,958,968 |
| Total assets | $105,325,893 | $3,687,149 | $0 | $109,013,042 |
| Average daily net assets | Management fee |
| First $500 million | 0.850% |
| Next $500 million | 0.825 |
| Next $1 billion | 0.800 |
| Next $1 billion | 0.775 |
| Next $1 billion | 0.750 |
| Next $1 billion | 0.730 |
| Next $5 billion | 0.720 |
| Over $10 billion | 0.710 |
| Class-level
administration fee | |
| Class A | 0.21% |
| Class C | 0.21 |
| Class R6 | 0.03 |
| Administrator Class | 0.13 |
| Institutional Class | 0.13 |
| Expense ratio caps | |
| Class A | 1.23% |
| Class C | 1.98 |
| Class R6 | 0.80 |
| Administrator Class | 1.15 |
| Institutional Class | 0.90 |
| Counterparty | Value
of securities on loan |
Collateral
received1 |
Net amount |
| BNP Paribas Securities Corporation | $1,334,322 | $(1,334,322) | $0 |
| Morgan Stanley & Co. LLC | 615,720 | (615,720) | 0 |
| National Financial Services LLC | 369,264 | (369,264) | 0 |
| Scotia Capital (USA) Incorporated | 795,358 | (795,358) | 0 |
| Name
and year of birth |
Position
held and length of service* |
Principal occupations during past five years or longer | Current
other public company or investment company directorships |
| William
R. Ebsworth (Born 1957) |
Trustee,
since 2015 |
Retired. From 1984 to 2013, equities analyst, portfolio manager, research director and chief investment officer at Fidelity Management and Research Company in Boston, Tokyo, and Hong Kong, and retired in 2013 as Chief Investment Officer of Fidelity Strategic Advisers, Inc. where he led a team of investment professionals managing client assets. Prior thereto, Board member of Hong Kong Securities Clearing Co., Hong Kong Options Clearing Corp., the Thailand International Fund, Ltd., Fidelity Investments Life Insurance Company, and Empire Fidelity Investments Life Insurance Company. Audit Committee Chair and Investment Committee Chair of the Vincent Memorial Hospital Endowment (non-profit organization). Mr. Ebsworth is a CFA® charterholder. | N/A |
| Jane
A. Freeman (Born 1953) |
Trustee,
since 2015; Chair Liaison, since 2018 |
Retired. From 2012 to 2014 and 1999 to 2008, Chief Financial Officer of Scientific Learning Corporation. From 2008 to 2012, Ms. Freeman provided consulting services related to strategic business projects. Prior to 1999, Portfolio Manager at Rockefeller & Co. and Scudder, Stevens & Clark. Board member of the Harding Loevner Funds from 1996 to 2014, serving as both Lead Independent Director and chair of the Audit Committee. Board member of the Russell Exchange Traded Funds Trust from 2011 to 2012 and the chair of the Audit Committee. Ms. Freeman is also an inactive Chartered Financial Analyst. | N/A |
| Isaiah
Harris, Jr. (Born 1952) |
Trustee,
since 2009; Audit Committee Chair, since 2019 |
Retired. Chairman of the Board of CIGNA Corporation from 2009 to 2021, and Director from 2005 to 2008. From 2003 to 2011, Director of Deluxe Corporation. Prior thereto, President and CEO of BellSouth Advertising and Publishing Corp. from 2005 to 2007, President and CEO of BellSouth Enterprises from 2004 to 2005 and President of BellSouth Consumer Services from 2000 to 2003. Emeritus member of the Iowa State University Foundation Board of Governors. Emeritus Member of the Advisory Board of Iowa State University School of Business. Advisory Board Member, Palm Harbor Academy (private school). Advisory Board Member, Fellowship of Christian Athletes. Mr. Harris is a certified public accountant (inactive status). | N/A |
| David
F. Larcker (Born 1950) |
Trustee,
since 2009 |
James Irvin Miller Professor of Accounting at the Graduate School of Business (Emeritus), Stanford University, Director of the Corporate Governance Research Initiative and Senior Faculty of The Rock Center for Corporate Governance since 2006. From 2005 to 2008, Professor of Accounting at the Graduate School of Business, Stanford University. Prior thereto, Ernst & Young Professor of Accounting at The Wharton School, University of Pennsylvania from 1985 to 2005. | N/A |
| Name
and year of birth |
Position
held and length of service* |
Principal occupations during past five years or longer | Current
other public company or investment company directorships |
| Olivia
S. Mitchell (Born 1953) |
Trustee,
since 2006; Nominating and Governance Committee Chair, since 2018 |
International Foundation of Employee Benefit Plans Professor since 1993, Wharton School of the University of Pennsylvania. Director of Wharton’s Pension Research Council and Boettner Center on Pensions & Retirement Research, and Research Associate at the National Bureau of Economic Research. Previously taught at Cornell University from 1978 to 1993. | N/A |
| Timothy
J. Penny (Born 1951) |
Trustee,
since 1996; Chair, since 2018 |
President and Chief Executive Officer of Southern Minnesota Initiative Foundation, a non-profit organization, since 2007. Vice Chair of the Economic Club of Minnesota, since 2007. Co-Chair of the Committee for a Responsible Federal Budget, since 1995. Member of the Board of Trustees of NorthStar Education Finance, Inc., a non-profit organization, since 2007. Senior Fellow of the University of Minnesota Humphrey Institute from 1995 to 2017. | N/A |
| James
G. Polisson (Born 1959) |
Trustee,
since 2018 |
Retired. Chief Marketing Officer, Source (ETF) UK Services, Ltd, from 2015 to 2017. From 2012 to 2015, Principal of The Polisson Group, LLC, a management consulting, corporate advisory and principal investing company. Chief Executive Officer and Managing Director at Russell Investments, Global Exchange Traded Funds from 2010 to 2012. Managing Director of Barclays Global Investors from 1998 to 2010 and Global Chief Marketing Officer for iShares and Barclays Global Investors from 2000 to 2010. Trustee of the San Francisco Mechanics’ Institute, a non-profit organization, from 2013 to 2015. Board member of the Russell Exchange Traded Fund Trust from 2011 to 2012. Director of Barclays Global Investors Holdings Deutschland GmbH from 2006 to 2009. Mr. Polisson is an attorney and has a retired status with the Massachusetts and District of Columbia Bar Associations. | N/A |
| Pamela
Wheelock (Born 1959) |
Trustee,
since January 2020; previously Trustee from January 2018 to July 2019 |
Retired. Executive and Senior Financial leadership positions in the public, private and nonprofit sectors. Interim President and CEO, McKnight Foundation, 2020. Interim Commissioner, Minnesota Department of Human Services, 2019. Chief Operating Officer, Twin Cities Habitat for Humanity, 2017-2019. Vice President for University Services, University of Minnesota, 2012-2016. Interim President and CEO, Blue Cross and Blue Shield of Minnesota, 2011-2012. Executive Vice-President and Chief Financial Officer, Minnesota Wild, 2002-2008. Commissioner, Minnesota Department of Finance, 1999-2002. Chair of the Board of Directors of Destination Medical Center Corporation. Board member of the Minnesota Wild Foundation. | N/A |
| Name
and year of birth |
Position
held and length of service |
Principal occupations during past five years or longer |
| Andrew
Owen (Born 1960) |
President,
since 2017 |
President and Chief Executive Officer of Allspring Funds Management, LLC since 2017 and Head of Global Fund Governance of Allspring Global Investments since 2022. Prior thereto, co-president of Galliard Capital Management, LLC, an affiliate of Allspring Funds Management, LLC, from 2019 to 2022 and Head of Affiliated Managers, Allspring Global Investments, from 2014 to 2019 and Executive Vice President responsible for marketing, investments and product development for Allspring Funds Management, LLC, from 2009 to 2014. |
| Jeremy
DePalma (Born 1974) |
Treasurer,
since 2012 (for certain funds in the Fund Complex); since 2021 (for the remaining funds in the Fund Complex) |
Senior Vice President of Allspring Funds Management, LLC since 2009. Senior Vice President of Evergreen Investment Management Company, LLC from 2008 to 2010 and head of the Fund Reporting and Control Team within Fund Administration from 2005 to 2010. |
| Christopher
Baker (Born 1976) |
Chief Compliance Officer, since 2022 | Global Chief Compliance Officer for Allspring Global Investments since 2022. Prior thereto, Chief Compliance Officer for State Street Global Advisors from 2018 to 2021. Senior Compliance Officer for the State Street divisions of Alternative Investment Solutions, Sector Solutions, and Global Marketing from 2015 to 2018. From 2010 to 2015 Vice President, Global Head of Investment and Marketing Compliance for State Street Global Advisors. |
| Matthew
Prasse (Born 1983) |
Chief Legal Officer, since 2022; Secretary, since 2021 | Senior Counsel of the Allspring Legal Department since 2021. Senior Counsel of the Wells Fargo Legal Department from 2018 to 2021. Previously, Counsel for Barings LLC from 2015 to 2018. Prior to joining Barings, Associate at Morgan, Lewis & Bockius LLP from 2008 to 2015. |
P.O. Box 219967
Kansas City, MO 64121-9967

1-800-222-8222 or visit the Fund's website at allspringglobal.com. Read the prospectus carefully before you invest or send money.
SA247/SAR247 09-22


| 1 | The S&P 500 Index consists of 500 stocks chosen for market size, liquidity, and industry group representation. It is a market-value-weighted index with each stock's weight in the index proportionate to its market value. You cannot invest directly in an index. |
| 2 | The Morgan Stanley Capital International (MSCI) All Country World Index (ACWI) ex USA Index (Net) is a free-float-adjusted market-capitalization-weighted index that is designed to measure the equity market performance of developed and emerging markets, excluding the U.S. Source: MSCI. MSCI makes no express or implied warranties or representations and shall have no liability whatsoever with respect to any MSCI data contained herein. The MSCI data may not be further redistributed or used as a basis for other indexes or any securities or financial products. This report is not approved, reviewed, or produced by MSCI. You cannot invest directly in an index. |
| 3 | The MSCI Emerging Markets (EM) Index (Net) (USD) is a free-float-adjusted market-capitalization-weighted index that is designed to measure equity market performance of emerging markets. You cannot invest directly in an index. |
| 4 | The Bloomberg U.S. Aggregate Bond Index is a broad-based benchmark that measures the investment-grade, U.S.-dollar-denominated, fixed-rate taxable bond market, including Treasuries, government-related and corporate securities, mortgage-backed securities (agency fixed-rate and hybrid adjustable-rate mortgage pass-throughs), asset-backed securities, and commercial mortgage-backed securities. You cannot invest directly in an index. |
| 5 | The Bloomberg Global Aggregate ex-USD Index (unhedged) is an unmanaged index that provides a broad-based measure of the global investment-grade fixed-income markets excluding the U.S.-dollar-denominated debt market. You cannot invest directly in an index. |
| 6 | The Bloomberg Municipal Bond Index is an unmanaged index composed of long-term tax-exempt bonds with a minimum credit rating of Baa. You cannot invest directly in an index. |
| 7 | The ICE BofA U.S. High Yield Index is a market-capitalization-weighted index of domestic and Yankee high-yield bonds. The index tracks the performance of high-yield securities traded in the U.S. bond market. You cannot invest directly in an index. Copyright 2022. ICE Data Indices, LLC. All rights reserved. |
| 1 | The MSCI ACWI (Net) is a free-float-adjusted market-capitalization-weighted index that is designed to measure the equity market performance of developed and emerging markets. You cannot invest directly in an index. |

President
Allspring Funds
| Investment objective | The Fund seeks long-term capital appreciation. |
| Manager | Allspring Funds Management, LLC |
| Subadviser | Allspring Global Investments, LLC |
| Portfolio managers | Christopher G. Miller, CFA®‡, Theran Motl, CFA®‡ |
| Average annual total returns (%) as of September 30, 2022 | |||||||||||
| Including sales charge | Excluding sales charge | Expense ratios1 (%) | |||||||||
| Inception date | 1 year | 5 year | 10 year | 1 year | 5 year | 10 year | Gross | Net 2 | |||
| Class A (WFSMX) | 3-31-2008 | -27.94 | 0.13 | 6.68 | -23.53 | 1.32 | 7.31 | 1.67 | 1.23 | ||
| Class C (WSCDX) | 3-31-2008 | -25.11 | 0.55 | 6.68 | -24.11 | 0.55 | 6.68 | 2.42 | 1.98 | ||
| Class R6 (WFSJX)3 | 5-29-2020 | – | – | – | -23.21 | 1.74 | 7.75 | 1.24 | 0.80 | ||
| Administrator Class (WFSDX) | 4-8-2005 | – | – | – | -23.47 | 1.44 | 7.49 | 1.59 | 1.15 | ||
| Institutional Class (WFSSX) | 4-8-2005 | – | – | – | -23.28 | 1.67 | 7.71 | 1.34 | 0.90 | ||
| Russell 2000® Index4 | – | – | – | – | -23.50 | 3.55 | 8.55 | – | – | ||
| 1 | Reflects the expense ratios as stated in the most recent prospectuses. The expense ratios shown are subject to change and may differ from the annualized expense ratios shown in the financial highlights of this report. |
| 2 | The manager has contractually committed through July 31, 2023, to waive fees and/or reimburse expenses to the extent necessary to cap total annual fund operating expenses after fee waivers at 1.23% for Class A, 1.98% for Class C, 0.80% for Class R6, 1.15% for Administrator Class, and 0.90% for Institutional Class. Brokerage commissions, stamp duty fees, interest, taxes, acquired fund fees and expenses (if any), and extraordinary expenses are excluded from the expense caps. Prior to or after the commitment expiration date, the caps may be increased or the commitment to maintain the caps may be terminated only with the approval of the Board of Trustees. Without these caps, the Fund’s returns would have been lower. The expense ratio paid by an investor is the net expense ratio (the total annual fund operating expenses after fee waivers) as stated in the prospectuses. |
| 3 | Historical performance shown for the Class R6 shares prior to their inception reflects the performance of the Institutional Class shares, and includes the higher expenses applicable to the Institutional Class shares. If these expenses had not been included, returns for the Class R6 shares would be higher. |
| 4 | The Russell 2000® Index measures the performance of the 2,000 smallest companies in the Russell 3000® Index, which represents approximately 8% of the total market capitalization of the Russell 3000® Index. You cannot invest directly in an index. |
| ‡ | CFA® and Chartered Financial Analyst® are trademarks owned by CFA Institute. |
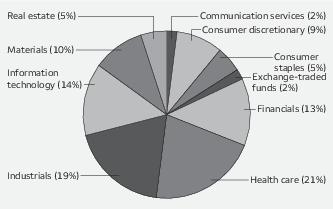
| Beginning
account value 4-1-2022 |
Ending
account value 9-30-2022 |
Expenses
paid during the period1 |
Annualized
net expense ratio | |
| Class A | ||||
| Actual | $1,000.00 | $ 800.19 | $ 5.46 | 1.21% |
| Hypothetical (5% return before expenses) | $1,000.00 | $1,019.00 | $ 6.12 | 1.21% |
| Class C | ||||
| Actual | $1,000.00 | $ 796.92 | $ 8.92 | 1.98% |
| Hypothetical (5% return before expenses) | $1,000.00 | $1,015.14 | $10.00 | 1.98% |
| Class R6 | ||||
| Actual | $1,000.00 | $ 801.70 | $ 3.61 | 0.80% |
| Hypothetical (5% return before expenses) | $1,000.00 | $1,021.06 | $ 4.05 | 0.80% |
| Administrator Class | ||||
| Actual | $1,000.00 | $ 800.63 | $ 5.19 | 1.15% |
| Hypothetical (5% return before expenses) | $1,000.00 | $1,019.30 | $ 5.82 | 1.15% |
| Institutional Class | ||||
| Actual | $1,000.00 | $ 801.59 | $ 4.06 | 0.90% |
| Hypothetical (5% return before expenses) | $1,000.00 | $1,020.56 | $ 4.56 | 0.90% |
| Shares | Value | ||||
| Common stocks: 95.71% | |||||
| Communication services: 1.68% | |||||
| Interactive media & services: 1.68% | |||||
| Bumble Incorporated Class A † | 15,537 | $ 333,890 | |||
| Eventbrite Incorporated Class A † | 49,064 | 298,309 | |||
| 632,199 | |||||
| Consumer discretionary: 8.51% | |||||
| Auto components: 1.71% | |||||
| Dana Incorporated | 29,034 | 331,859 | |||
| Gentherm Incorporated † | 6,187 | 307,680 | |||
| 639,539 | |||||
| Diversified consumer services: 1.03% | |||||
| Service Corporation International | 6,708 | 387,320 | |||
| Hotels, restaurants & leisure: 1.61% | |||||
| Jack In The Box Incorporated | 2,931 | 217,099 | |||
| Planet Fitness Incorporated Class A † | 6,730 | 388,052 | |||
| 605,151 | |||||
| Internet & direct marketing retail: 1.28% | |||||
| Revolve Group Incorporated † | 19,075 | 413,737 | |||
| The RealReal Incorporated † | 45,361 | 68,042 | |||
| 481,779 | |||||
| Specialty retail: 2.88% | |||||
| Leslie's Incorporated † | 31,221 | 459,261 | |||
| National Vision Holdings Incorporated † | 19,049 | 621,950 | |||
| 1,081,211 | |||||
| Consumer staples: 5.19% | |||||
| Food products: 3.38% | |||||
| Nomad Foods Limited † | 36,023 | 511,527 | |||
| The Simply Good Foods Company † | 15,701 | 502,275 | |||
| TreeHouse Foods Incorporated † | 6,028 | 255,708 | |||
| 1,269,510 | |||||
| Personal products: 1.81% | |||||
| e.l.f. Beauty Incorporated † | 10,833 | 407,537 | |||
| The Honest Company Incorporated † | 77,510 | 271,285 | |||
| 678,822 | |||||
| Financials: 12.93% | |||||
| Banks: 6.93% | |||||
| Ameris Bancorp | 10,222 | 457,026 | |||
| Pinnacle Financial Partners Incorporated | 6,376 | 517,094 | |||
| United Community Bank | 10,977 | 363,339 | |||
| Veritex Holdings Incorporated | 14,991 | 398,611 |
| Shares | Value | ||||
| Banks (continued) | |||||
| Webster Financial Corporation | 13,678 | $ 618,246 | |||
| Wintrust Financial Corporation | 3,057 | 249,298 | |||
| 2,603,614 | |||||
| Capital markets: 0.90% | |||||
| Raymond James Financial Incorporated | 3,425 | 338,459 | |||
| Insurance: 3.46% | |||||
| Axis Capital Holdings Limited | 11,480 | 564,242 | |||
| Reinsurance Group of America Incorporated | 5,846 | 735,485 | |||
| 1,299,727 | |||||
| Thrifts & mortgage finance: 1.64% | |||||
| Essent Group Limited | 17,668 | 616,083 | |||
| Health care: 20.04% | |||||
| Biotechnology: 2.83% | |||||
| Agios Pharmaceuticals Incorporated † | 8,219 | 232,433 | |||
| Atara Biotherapeutics Incorporated † | 9,820 | 37,120 | |||
| Coherus Biosciences Incorporated † | 8,994 | 86,432 | |||
| Insmed Incorporated † | 11,453 | 246,698 | |||
| Mirati Therapeutics Incorporated † | 790 | 55,174 | |||
| Neurocrine Biosciences Incorporated † | 1,686 | 179,070 | |||
| Sage Therapeutics Incorporated † | 3,717 | 145,558 | |||
| Zymeworks Incorporated † | 12,980 | 79,827 | |||
| 1,062,312 | |||||
| Health care equipment & supplies: 11.49% | |||||
| AngioDynamics Incorporated † | 26,958 | 551,561 | |||
| Cardiovascular Systems Incorporated † | 26,357 | 365,308 | |||
| Haemonetics Corporation † | 7,633 | 565,071 | |||
| Integer Holdings Corporation † | 11,036 | 686,770 | |||
| LivaNova plc † | 17,123 | 869,333 | |||
| Neuronetics Incorporated † | 76,793 | 244,202 | |||
| Teleflex Incorporated | 2,391 | 481,691 | |||
| ViewRay Incorporated † | 151,414 | 551,147 | |||
| 4,315,083 | |||||
| Health care providers & services: 1.66% | |||||
| HealthEquity Incorporated † | 9,306 | 625,084 | |||
| Health care technology: 0.60% | |||||
| Schrodinger Incorporated † | 8,957 | 223,746 | |||
| Life sciences tools & services: 3.46% | |||||
| Azenta Incorporated | 11,133 | 477,160 | |||
| Bruker Corporation | 10,687 | 567,052 | |||
| Codexis Incorporated † | 24,647 | 149,361 | |||
| Sotera Health Company † | 15,400 | 105,028 | |||
| 1,298,601 | |||||
| Industrials: 18.65% | |||||
| Building products: 5.84% | |||||
| Armstrong World Industries Incorporated | 8,805 | 697,620 | |||
| Masonite International Corporation † | 11,708 | 834,663 |
| Shares | Value | ||||
| Building products (continued) | |||||
| Tecnoglass Incorporated « | 13,611 | $ 285,695 | |||
| The AZEK Company Incorporated † | 22,558 | 374,914 | |||
| 2,192,892 | |||||
| Commercial services & supplies: 2.81% | |||||
| Steelcase Incorporated Class A | 48,614 | 316,963 | |||
| Stericycle Incorporated † | 17,513 | 737,472 | |||
| 1,054,435 | |||||
| Construction & engineering: 1.36% | |||||
| APi Group Corporation † | 38,584 | 512,009 | |||
| Electrical equipment: 3.33% | |||||
| Atkore Incorporated † | 10,801 | 840,426 | |||
| Regal Rexnord Corporation | 2,933 | 411,676 | |||
| 1,252,102 | |||||
| Machinery: 1.77% | |||||
| SPX Technologies Incorporated † | 12,042 | 664,959 | |||
| Road & rail: 1.05% | |||||
| Ryder System Incorporated | 5,224 | 394,360 | |||
| Trading companies & distributors: 2.49% | |||||
| Air Lease Corporation | 18,537 | 574,832 | |||
| Herc Holdings Incorporated | 3,454 | 358,802 | |||
| 933,634 | |||||
| Information technology: 13.71% | |||||
| Communications equipment: 0.41% | |||||
| Infinera Corporation † | 31,630 | 153,089 | |||
| Electronic equipment, instruments & components: 1.49% | |||||
| Littelfuse Incorporated | 2,821 | 560,504 | |||
| IT services: 1.57% | |||||
| WNS Holdings Limited ADR † | 7,206 | 589,739 | |||
| Semiconductors & semiconductor equipment: 1.17% | |||||
| Macom Technology Solutions Holdings Incorporated † | 8,473 | 438,817 | |||
| Software: 9.07% | |||||
| 8x8 Incorporated † | 24,642 | 85,015 | |||
| Benefitfocus Incorporated † | 24,120 | 153,162 | |||
| CommVault Systems Incorporated † | 8,565 | 454,288 | |||
| Instructure Holdings Incorporated †« | 26,498 | 590,375 | |||
| New Relic Incorporated † | 5,268 | 302,278 | |||
| Pagerduty Incorporated † | 23,250 | 536,378 | |||
| Q2 Holdings Incorporated † | 11,793 | 379,735 | |||
| Riskified Limited Class A †« | 14,558 | 57,359 | |||
| SPS Commerce Incorporated † | 3,709 | 460,769 | |||
| WalkMe Limited †« | 45,824 | 389,504 | |||
| 3,408,863 |
| Shares | Value | ||||
| Materials: 9.84% | |||||
| Chemicals: 6.65% | |||||
| Ashland Global Holdings Incorporated | 8,917 | $ 846,847 | |||
| Olin Corporation | 13,621 | 584,068 | |||
| Quaker Chemical Corporation | 3,990 | 576,076 | |||
| Westlake Chemical Corporation | 5,621 | 488,352 | |||
| 2,495,343 | |||||
| Containers & packaging: 1.55% | |||||
| Silgan Holdings Incorporated | 13,879 | 583,473 | |||
| Metals & mining: 1.64% | |||||
| Reliance Steel & Aluminum Company | 3,535 | 616,539 | |||
| Real estate: 5.16% | |||||
| Equity REITs: 5.16% | |||||
| American Homes 4 Rent Class A | 18,583 | 609,708 | |||
| Apartment Income REIT Corporation | 11,954 | 461,663 | |||
| Four Corners Property Trust Incorporated | 17,609 | 425,962 | |||
| Terreno Realty Corporation | 8,287 | 439,128 | |||
| 1,936,461 | |||||
| Total Common stocks (Cost $39,117,401) | 35,945,459 |
| Investment companies: 1.34% | |||||
| Exchange-traded funds: 1.34% | |||||
| SPDR S&P Biotech ETF « | 6,334 | 502,413 | |||
| Total Investment companies (Cost $834,809) | 502,413 |
| Yield | |||||
| Short-term investments: 7.78% | |||||
| Investment companies: 7.78% | |||||
| Allspring Government Money Market Fund Select Class ♠∞ | 2.75% | 1,389,201 | 1,389,201 | ||
| Securities Lending Cash Investments LLC ♠∩∞ | 3.08 | 1,533,775 | 1,533,775 | ||
| Total Short-term investments (Cost $2,922,976) | 2,922,976 | ||||
| Total investments in securities (Cost $42,875,186) | 104.83% | 39,370,848 | |||
| Other assets and liabilities, net | (4.83) | (1,812,392) | |||
| Total net assets | 100.00% | $37,558,456 |
| † | Non-income-earning security |
| « | All or a portion of this security is on loan. |
| ♠ | The issuer of the security is an affiliated person of the Fund as defined in the Investment Company Act of 1940. |
| ∩ | The investment is a non-registered investment company purchased with cash collateral received from securities on loan. |
| ∞ | The rate represents the 7-day annualized yield at period end. |
| Abbreviations: | |
| ADR | American depositary receipt |
| REIT | Real estate investment trust |
| Value,
beginning of period |
Purchases | Sales
proceeds |
Net
realized gains (losses) |
Net
change in unrealized gains (losses) |
Value,
end of period |
Shares,
end of period |
Income
from affiliated securities | |||
| Short-term investments | ||||||||||
| Allspring Government Money Market Fund Select Class | $ 594,684 | $4,846,113 | $(4,051,596) | $0 | $0 | $ 1,389,201 | 1,389,201 | $ 5,954 | ||
| Securities Lending Cash Investments LLC | 1,552,990 | 6,160,465 | (6,179,680) | 0 | 0 | 1,533,775 | 1,533,775 | 14,123 # | ||
| $0 | $0 | $2,922,976 | $20,077 | |||||||
| # | Amount shown represents income before fees and rebates. |
| Assets | |
|
Investments in unaffiliated securities (including $1,494,049 of securities loaned), at value (cost
$39,952,210) |
$ 36,447,872 |
|
Investments in affiliated securities, at value (cost
$2,922,976) |
2,922,976 |
|
Receivable for investments
sold |
453,310 |
|
Receivable for
dividends |
27,702 |
|
Receivable for Fund shares
sold |
22,357 |
|
Receivable for securities lending income,
net |
746 |
|
Prepaid expenses and other
assets |
80,099 |
|
Total
assets |
39,955,062 |
| Liabilities | |
|
Payable upon receipt of securities
loaned |
1,533,775 |
|
Payable for investments
purchased |
771,482 |
|
Payable for Fund shares
redeemed |
27,393 |
|
Management fee
payable |
11,152 |
|
Administration fees
payable |
6,855 |
|
Trustees’ fees and expenses
payable |
3,342 |
|
Distribution fee
payable |
22 |
|
Accrued expenses and other
liabilities |
42,585 |
|
Total
liabilities |
2,396,606 |
|
Total net
assets |
$37,558,456 |
| Net assets consist of | |
|
Paid-in
capital |
$ 34,937,446 |
|
Total distributable
earnings |
2,621,010 |
|
Total net
assets |
$37,558,456 |
| Computation of net asset value and offering price per share | |
|
Net assets – Class
A |
$ 31,984,026 |
|
Shares outstanding – Class
A1 |
1,288,149 |
|
Net asset value per share – Class
A |
$24.83 |
|
Maximum offering price per share – Class
A2 |
$26.34 |
|
Net assets – Class
C |
$ 29,983 |
|
Shares outstanding – Class
C1 |
1,382 |
|
Net asset value per share – Class
C |
$21.70 |
|
Net assets – Class
R6 |
$ 813,293 |
|
Shares outstanding – Class
R61 |
30,855 |
|
Net asset value per share – Class
R6 |
$26.36 |
|
Net assets – Administrator
Class |
$ 325,293 |
|
Shares outstanding – Administrator
Class1 |
12,721 |
|
Net asset value per share – Administrator
Class |
$25.57 |
|
Net assets – Institutional
Class |
$ 4,405,861 |
|
Shares outstanding – Institutional
Class1 |
168,334 |
Net
asset value per share – Institutional
Class |
$26.17 |
| 1 | The Fund has an unlimited number of authorized shares. |
| 2 | Maximum offering price is computed as 100/94.25 of net asset value. On investments of $50,000 or more, the offering price is reduced. |
| Investment income | |
|
Dividends |
$ 183,045 |
|
Income from affiliated
securities |
10,752 |
|
Total investment
income |
193,797 |
| Expenses | |
|
Management
fee |
183,814 |
| Administration fees | |
|
Class
A |
38,867 |
|
Class
C |
45 |
|
Class
R6 |
142 |
|
Administrator
Class |
195 |
|
Institutional
Class |
3,215 |
| Shareholder servicing fees | |
|
Class
A |
46,270 |
|
Class
C |
53 |
|
Administrator
Class |
373 |
| Distribution fee | |
|
Class
C |
159 |
|
Custody and accounting
fees |
7,976 |
|
Professional
fees |
24,210 |
|
Registration
fees |
27,814 |
|
Shareholder report
expenses |
19,507 |
|
Trustees’ fees and
expenses |
11,176 |
|
Other fees and
expenses |
2,030 |
|
Total
expenses |
365,846 |
| Less: Fee waivers and/or expense reimbursements | |
|
Fund-level |
(104,067) |
|
Class
A |
(10,180) |
|
Class
C |
(1) |
|
Class
R6 |
(32) |
|
Administrator
Class |
(11) |
|
Institutional
Class |
(196) |
|
Net
expenses |
251,359 |
|
Net investment
loss |
(57,562) |
| Realized and unrealized gains (losses) on investments | |
|
Net realized gains on
investments |
9,807 |
|
Net change in unrealized gains (losses) on
investments |
(9,536,160) |
|
Net realized and unrealized gains (losses) on
investments |
(9,526,353) |
|
Net decrease in net assets resulting from
operations |
$(9,583,915) |
| Six
months ended September 30, 2022 (unaudited) |
Year
ended March 31, 2022 | |||
| Operations | ||||
|
Net investment
loss |
$ (57,562) | $ (273,654) | ||
|
Net realized gains on
investments |
9,807 | 8,162,825 | ||
|
Net change in unrealized gains (losses) on
investments |
(9,536,160) | (7,318,854) | ||
|
Net increase (decrease) in net assets resulting from
operations |
(9,583,915) | 570,317 | ||
| Distributions to shareholders from | ||||
| Net investment income and net realized gains | ||||
|
Class
A |
0 | (8,202,400) | ||
|
Class
C |
0 | (13,229) | ||
|
Class
R6 |
0 | (166,835) | ||
|
Administrator
Class |
0 | (76,156) | ||
|
Institutional
Class |
0 | (1,065,163) | ||
|
Total distributions to
shareholders |
0 | (9,523,783) | ||
| Capital share transactions | Shares | Shares | ||
| Proceeds from shares sold | ||||
|
Class
A |
15,669 | 425,047 | 63,622 | 2,219,863 |
|
Class
C |
0 | 0 | 2,679 | 92,317 |
|
Class
R6 |
5,650 | 159,678 | 7,280 | 281,475 |
|
Administrator
Class |
2,720 | 71,140 | 2,330 | 86,569 |
|
Institutional
Class |
6,744 | 204,414 | 8,764 | 343,421 |
| 860,279 | 3,023,645 | |||
| Reinvestment of distributions | ||||
|
Class
A |
0 | 0 | 241,326 | 7,944,449 |
|
Class
C |
0 | 0 | 457 | 13,229 |
|
Class
R6 |
0 | 0 | 4,790 | 166,835 |
|
Administrator
Class |
0 | 0 | 1,824 | 61,820 |
|
Institutional
Class |
0 | 0 | 28,785 | 996,275 |
| 0 | 9,182,608 | |||
| Payment for shares redeemed | ||||
|
Class
A |
(104,416) | (2,963,321) | (161,278) | (5,903,305) |
|
Class
C |
(826) | (20,264) | (4,193) | (145,645) |
|
Class
R6 |
(4,271) | (124,500) | (6,311) | (255,377) |
|
Administrator
Class |
(280) | (7,807) | (5,921) | (211,605) |
|
Institutional
Class |
(6,666) | (187,425) | (210,359) | (8,645,948) |
| (3,303,317) | (15,161,880) | |||
|
Net decrease in net assets resulting from capital share
transactions |
(2,443,038) | (2,955,627) | ||
|
Total decrease in net
assets |
(12,026,953) | (11,909,093) | ||
| Net assets | ||||
|
Beginning of
period |
49,585,409 | 61,494,502 | ||
|
End of
period |
$ 37,558,456 | $ 49,585,409 | ||
| Year ended March 31 | ||||||
| Class A | Six
months ended September 30, 2022 (unaudited) |
2022 | 2021 | 2020 | 2019 | 2018 |
|
Net asset value, beginning of
period |
$31.03 | $37.77 | $19.77 | $30.27 | $31.46 | $28.92 |
|
Net investment income
(loss) |
(0.04) 1 | (0.20) 1 | (0.07) 1 | 0.02 1 | (0.04) 1 | (0.08) 1 |
|
Net realized and unrealized gains (losses) on
investments |
(6.16) | 0.52 | 18.10 | (8.43) | (1.15) | 2.62 |
|
Total from investment
operations |
(6.20) | 0.32 | 18.03 | (8.41) | (1.19) | 2.54 |
| Distributions to shareholders from | ||||||
|
Net investment
income |
0.00 | 0.00 | (0.03) | 0.00 | 0.00 | 0.00 |
|
Net realized
gains |
0.00 | (7.06) | 0.00 | (2.09) | 0.00 | 0.00 |
|
Total distributions to
shareholders |
0.00 | (7.06) | (0.03) | (2.09) | 0.00 | 0.00 |
|
Net asset value, end of
period |
$24.83 | $31.03 | $37.77 | $19.77 | $30.27 | $31.46 |
|
Total
return2 |
(19.98)% | (0.22)% | 91.20% | (30.24)% | (3.78)% | 8.78% |
| Ratios to average net assets (annualized) | ||||||
|
Gross
expenses |
1.74% | 1.67% | 1.68% | 1.60% | 1.54% | 1.54% |
|
Net
expenses |
1.21% | 1.21% | 1.32% | 1.33% | 1.35% | 1.35% |
|
Net investment income
(loss) |
(0.31)% | (0.54)% | (0.24)% | 0.05% | (0.11)% | (0.26)% |
| Supplemental data | ||||||
|
Portfolio turnover
rate |
12% | 37% | 55% | 41% | 34% | 27% |
|
Net assets, end of period (000s
omitted) |
$31,984 | $42,732 | $46,580 | $27,115 | $44,028 | $50,993 |
| 1 | Calculated based upon average shares outstanding |
| 2 | Total return calculations do not include any sales charges. Returns for periods of less than one year are not annualized. |
| Year ended March 31 | ||||||
| Class C | Six
months ended September 30, 2022 (unaudited) |
2022 | 2021 | 2020 | 2019 | 2018 |
|
Net asset value, beginning of
period |
$27.22 | $34.21 | $18.03 | $27.98 | $29.30 | $27.14 |
|
Net investment
loss |
(0.13) 1 | (0.43) 1 | (0.23) 1 | (0.20) 1 | (0.25) 1 | (0.28) 1 |
|
Net realized and unrealized gains (losses) on
investments |
(5.39) | 0.50 | 16.41 | (7.66) | (1.07) | 2.44 |
|
Total from investment
operations |
(5.52) | 0.07 | 16.18 | (7.86) | (1.32) | 2.16 |
| Distributions to shareholders from | ||||||
|
Net realized
gains |
0.00 | (7.06) | 0.00 | (2.09) | 0.00 | 0.00 |
|
Net asset value, end of
period |
$21.70 | $27.22 | $34.21 | $18.03 | $27.98 | $29.30 |
|
Total
return2 |
(20.31)% | (1.02)% | 89.74% | (30.76)% | (4.51)% | 7.96% |
| Ratios to average net assets (annualized) | ||||||
|
Gross
expenses |
2.49% | 2.40% | 2.44% | 2.34% | 2.29% | 2.29% |
|
Net
expenses |
1.98% | 1.98% | 2.09% | 2.10% | 2.10% | 2.10% |
|
Net investment
loss |
(1.09)% | (1.27)% | (0.94)% | (0.73)% | (0.85)% | (1.02)% |
| Supplemental data | ||||||
|
Portfolio turnover
rate |
12% | 37% | 55% | 41% | 34% | 27% |
|
Net assets, end of period (000s
omitted) |
$30 | $60 | $112 | $190 | $526 | $840 |
| 1 | Calculated based upon average shares outstanding |
| 2 | Total return calculations do not include any sales charges. Returns for periods of less than one year are not annualized. |
| Year ended March 31 | |||
| Class R6 | Six
months ended September 30, 2022 (unaudited) |
2022 | 2021 1 |
|
Net asset value, beginning of
period |
$32.88 | $39.46 | $25.43 |
|
Net investment income
(loss) |
0.02 2 | (0.05) 2 | 0.03 2 |
|
Net realized and unrealized gains (losses) on
investments |
(6.54) | 0.53 | 14.09 |
|
Total from investment
operations |
(6.52) | 0.48 | 14.12 |
| Distributions to shareholders from | |||
|
Net investment
income |
0.00 | 0.00 | (0.09) |
|
Net realized
gains |
0.00 | (7.06) | 0.00 |
|
Total distributions to
shareholders |
0.00 | (7.06) | (0.09) |
|
Net asset value, end of
period |
$26.36 | $32.88 | $39.46 |
|
Total
return3 |
(19.83)% | 0.23% | 55.58% |
| Ratios to average net assets (annualized) | |||
|
Gross
expenses |
1.31% | 1.24% | 1.23% |
|
Net
expenses |
0.80% | 0.80% | 0.88% |
|
Net investment income
(loss) |
0.10% | (0.13)% | 0.09% |
| Supplemental data | |||
|
Portfolio turnover
rate |
12% | 37% | 55% |
|
Net assets, end of period (000s
omitted) |
$813 | $969 | $936 |
| 1 | For the period from May 29, 2020 (commencement of class operations) to March 31, 2021 |
| 2 | Calculated based upon average shares outstanding |
| 3 | Returns for periods of less than one year are not annualized. |
| Year ended March 31 | ||||||
| Administrator Class | Six
months ended September 30, 2022 (unaudited) |
2022 | 2021 | 2020 | 2019 | 2018 |
|
Net asset value, beginning of
period |
$31.95 | $38.67 | $20.23 | $30.89 | $32.06 | $29.43 |
|
Net investment income
(loss) |
(0.03) 1 | (0.17) 1 | (0.01) 1 | 0.05 1 | 0.01 1 | (0.03) 1 |
|
Net realized and unrealized gains (losses) on
investments |
(6.35) | 0.51 | 18.51 | (8.62) | (1.18) | 2.66 |
|
Total from investment
operations |
(6.38) | 0.34 | 18.50 | (8.57) | (1.17) | 2.63 |
| Distributions to shareholders from | ||||||
|
Net investment
income |
0.00 | 0.00 | (0.06) | 0.00 | 0.00 | 0.00 |
|
Net realized
gains |
0.00 | (7.06) | 0.00 | (2.09) | 0.00 | 0.00 |
|
Total distributions to
shareholders |
0.00 | (7.06) | (0.06) | (2.09) | 0.00 | 0.00 |
|
Net asset value, end of
period |
$25.57 | $31.95 | $38.67 | $20.23 | $30.89 | $32.06 |
|
Total
return2 |
(19.94)% | (0.16)% | 91.48% | (30.15)% | (3.65)% | 8.94% |
| Ratios to average net assets (annualized) | ||||||
|
Gross
expenses |
1.66% | 1.59% | 1.61% | 1.51% | 1.46% | 1.46% |
|
Net
expenses |
1.15% | 1.15% | 1.20% | 1.20% | 1.20% | 1.20% |
|
Net investment income
(loss) |
(0.23)% | (0.46)% | (0.02)% | 0.17% | 0.05% | (0.10)% |
| Supplemental data | ||||||
|
Portfolio turnover
rate |
12% | 37% | 55% | 41% | 34% | 27% |
|
Net assets, end of period (000s
omitted) |
$325 | $329 | $466 | $450 | $1,165 | $1,347 |
| 1 | Calculated based upon average shares outstanding |
| 2 | Returns for periods of less than one year are not annualized. |
| Year ended March 31 | ||||||
| Institutional Class | Six
months ended September 30, 2022 (unaudited) |
2022 | 2021 | 2020 | 2019 | 2018 |
|
Net asset value, beginning of
period |
$32.66 | $39.29 | $20.58 | $31.33 | $32.45 | $29.73 |
|
Net investment income
(loss) |
(0.00) 1,2 | (0.11) 1 | 0.02 1 | 0.12 1 | 0.08 1 | 0.03 1 |
|
Net realized and unrealized gains (losses) on
investments |
(6.49) | 0.54 | 18.87 | (8.78) | (1.20) | 2.69 |
|
Total from investment
operations |
(6.49) | 0.43 | 18.89 | (8.66) | (1.12) | 2.72 |
| Distributions to shareholders from | ||||||
|
Net investment
income |
0.00 | 0.00 | (0.18) | (0.00) 3 | 0.00 | 0.00 |
|
Net realized
gains |
0.00 | (7.06) | 0.00 | (2.09) | 0.00 | 0.00 |
|
Total distributions to
shareholders |
0.00 | (7.06) | (0.18) | (2.09) | 0.00 | 0.00 |
|
Net asset value, end of
period |
$26.17 | $32.66 | $39.29 | $20.58 | $31.33 | $32.45 |
|
Total
return4 |
(19.84)% | 0.09% | 91.87% | (30.00)% | (3.45)% | 9.15% |
| Ratios to average net assets (annualized) | ||||||
|
Gross
expenses |
1.41% | 1.33% | 1.35% | 1.27% | 1.21% | 1.21% |
|
Net
expenses |
0.90% | 0.90% | 0.98% | 1.00% | 1.00% | 1.00% |
|
Net investment income
(loss) |
(0.00) % | (0.28)% | 0.08% | 0.38% | 0.24% | 0.08% |
| Supplemental data | ||||||
|
Portfolio turnover
rate |
12% | 37% | 55% | 41% | 34% | 27% |
|
Net assets, end of period (000s
omitted) |
$4,406 | $5,496 | $13,401 | $11,305 | $21,398 | $28,032 |
| 1 | Calculated based upon average shares outstanding |
| 2 | Amount is more than $(0.005) |
| 3 | Amount is less than $0.005. |
| 4 | Returns for periods of less than one year are not annualized. |
| Gross unrealized gains | $ 5,438,820 |
| Gross unrealized losses | (8,929,528) |
| Net unrealized losses | $(3,490,708) |
| ■ | Level 1 – quoted prices in active markets for identical securities |
| ■ | Level 2 – other significant observable inputs (including quoted prices for similar securities, interest rates, prepayment speeds, credit risk, etc.) |
| ■ | Level 3 – significant unobservable inputs (including the Fund’s own assumptions in determining the fair value of investments) |
| Quoted
prices (Level 1) |
Other
significant observable inputs (Level 2) |
Significant
unobservable inputs (Level 3) |
Total | |
| Assets | ||||
| Investments in: | ||||
| Common stocks | ||||
| Communication services | $ 632,199 | $0 | $0 | $ 632,199 |
| Consumer discretionary | 3,195,000 | 0 | 0 | 3,195,000 |
| Consumer staples | 1,948,332 | 0 | 0 | 1,948,332 |
| Financials | 4,857,883 | 0 | 0 | 4,857,883 |
| Health care | 7,524,826 | 0 | 0 | 7,524,826 |
| Industrials | 7,004,391 | 0 | 0 | 7,004,391 |
| Information technology | 5,151,012 | 0 | 0 | 5,151,012 |
| Materials | 3,695,355 | 0 | 0 | 3,695,355 |
| Real estate | 1,936,461 | 0 | 0 | 1,936,461 |
| Investment companies | 502,413 | 0 | 0 | 502,413 |
| Short-term investments | ||||
| Investment companies | 2,922,976 | 0 | 0 | 2,922,976 |
| Total assets | $39,370,848 | $0 | $0 | $39,370,848 |
| Average daily net assets | Management fee |
| First $500 million | 0.850% |
| Next $500 million | 0.825 |
| Next $1 billion | 0.800 |
| Next $1 billion | 0.775 |
| Next $1 billion | 0.750 |
| Next $1 billion | 0.730 |
| Next $5 billion | 0.720 |
| Over $10 billion | 0.710 |
| Class-level
administration fee | |
| Class A | 0.21% |
| Class C | 0.21 |
| Class R6 | 0.03 |
| Administrator Class | 0.13 |
| Institutional Class | 0.13 |
| Expense ratio caps | |
| Class A | 1.23% |
| Class C | 1.98 |
| Class R6 | 0.80 |
| Administrator Class | 1.15 |
| Institutional Class | 0.90 |
| Counterparty | Value
of securities on loan |
Collateral
received1 |
Net amount |
| Bank of America Securities Incorporated | $551,346 | $(551,346) | $0 |
| JPMorgan Securities LLC | 167,505 | (167,505) | 0 |
| National Financial Services LLC | 270,255 | (270,255) | 0 |
| SG Americas Securities LLC | 473,160 | (473,160) | 0 |
| UBS Securities LLC | 31,783 | (31,783) | 0 |
| Name
and year of birth |
Position
held and length of service* |
Principal occupations during past five years or longer | Current
other public company or investment company directorships |
| William
R. Ebsworth (Born 1957) |
Trustee,
since 2015 |
Retired. From 1984 to 2013, equities analyst, portfolio manager, research director and chief investment officer at Fidelity Management and Research Company in Boston, Tokyo, and Hong Kong, and retired in 2013 as Chief Investment Officer of Fidelity Strategic Advisers, Inc. where he led a team of investment professionals managing client assets. Prior thereto, Board member of Hong Kong Securities Clearing Co., Hong Kong Options Clearing Corp., the Thailand International Fund, Ltd., Fidelity Investments Life Insurance Company, and Empire Fidelity Investments Life Insurance Company. Audit Committee Chair and Investment Committee Chair of the Vincent Memorial Hospital Endowment (non-profit organization). Mr. Ebsworth is a CFA® charterholder. | N/A |
| Jane
A. Freeman (Born 1953) |
Trustee,
since 2015; Chair Liaison, since 2018 |
Retired. From 2012 to 2014 and 1999 to 2008, Chief Financial Officer of Scientific Learning Corporation. From 2008 to 2012, Ms. Freeman provided consulting services related to strategic business projects. Prior to 1999, Portfolio Manager at Rockefeller & Co. and Scudder, Stevens & Clark. Board member of the Harding Loevner Funds from 1996 to 2014, serving as both Lead Independent Director and chair of the Audit Committee. Board member of the Russell Exchange Traded Funds Trust from 2011 to 2012 and the chair of the Audit Committee. Ms. Freeman is also an inactive Chartered Financial Analyst. | N/A |
| Isaiah
Harris, Jr. (Born 1952) |
Trustee,
since 2009; Audit Committee Chair, since 2019 |
Retired. Chairman of the Board of CIGNA Corporation from 2009 to 2021, and Director from 2005 to 2008. From 2003 to 2011, Director of Deluxe Corporation. Prior thereto, President and CEO of BellSouth Advertising and Publishing Corp. from 2005 to 2007, President and CEO of BellSouth Enterprises from 2004 to 2005 and President of BellSouth Consumer Services from 2000 to 2003. Emeritus member of the Iowa State University Foundation Board of Governors. Emeritus Member of the Advisory Board of Iowa State University School of Business. Advisory Board Member, Palm Harbor Academy (private school). Advisory Board Member, Fellowship of Christian Athletes. Mr. Harris is a certified public accountant (inactive status). | N/A |
| David
F. Larcker (Born 1950) |
Trustee,
since 2009 |
James Irvin Miller Professor of Accounting at the Graduate School of Business (Emeritus), Stanford University, Director of the Corporate Governance Research Initiative and Senior Faculty of The Rock Center for Corporate Governance since 2006. From 2005 to 2008, Professor of Accounting at the Graduate School of Business, Stanford University. Prior thereto, Ernst & Young Professor of Accounting at The Wharton School, University of Pennsylvania from 1985 to 2005. | N/A |
| Name
and year of birth |
Position
held and length of service* |
Principal occupations during past five years or longer | Current
other public company or investment company directorships |
| Olivia
S. Mitchell (Born 1953) |
Trustee,
since 2006; Nominating and Governance Committee Chair, since 2018 |
International Foundation of Employee Benefit Plans Professor since 1993, Wharton School of the University of Pennsylvania. Director of Wharton’s Pension Research Council and Boettner Center on Pensions & Retirement Research, and Research Associate at the National Bureau of Economic Research. Previously taught at Cornell University from 1978 to 1993. | N/A |
| Timothy
J. Penny (Born 1951) |
Trustee,
since 1996; Chair, since 2018 |
President and Chief Executive Officer of Southern Minnesota Initiative Foundation, a non-profit organization, since 2007. Vice Chair of the Economic Club of Minnesota, since 2007. Co-Chair of the Committee for a Responsible Federal Budget, since 1995. Member of the Board of Trustees of NorthStar Education Finance, Inc., a non-profit organization, since 2007. Senior Fellow of the University of Minnesota Humphrey Institute from 1995 to 2017. | N/A |
| James
G. Polisson (Born 1959) |
Trustee,
since 2018 |
Retired. Chief Marketing Officer, Source (ETF) UK Services, Ltd, from 2015 to 2017. From 2012 to 2015, Principal of The Polisson Group, LLC, a management consulting, corporate advisory and principal investing company. Chief Executive Officer and Managing Director at Russell Investments, Global Exchange Traded Funds from 2010 to 2012. Managing Director of Barclays Global Investors from 1998 to 2010 and Global Chief Marketing Officer for iShares and Barclays Global Investors from 2000 to 2010. Trustee of the San Francisco Mechanics’ Institute, a non-profit organization, from 2013 to 2015. Board member of the Russell Exchange Traded Fund Trust from 2011 to 2012. Director of Barclays Global Investors Holdings Deutschland GmbH from 2006 to 2009. Mr. Polisson is an attorney and has a retired status with the Massachusetts and District of Columbia Bar Associations. | N/A |
| Pamela
Wheelock (Born 1959) |
Trustee,
since January 2020; previously Trustee from January 2018 to July 2019 |
Retired. Executive and Senior Financial leadership positions in the public, private and nonprofit sectors. Interim President and CEO, McKnight Foundation, 2020. Interim Commissioner, Minnesota Department of Human Services, 2019. Chief Operating Officer, Twin Cities Habitat for Humanity, 2017-2019. Vice President for University Services, University of Minnesota, 2012-2016. Interim President and CEO, Blue Cross and Blue Shield of Minnesota, 2011-2012. Executive Vice-President and Chief Financial Officer, Minnesota Wild, 2002-2008. Commissioner, Minnesota Department of Finance, 1999-2002. Chair of the Board of Directors of Destination Medical Center Corporation. Board member of the Minnesota Wild Foundation. | N/A |
| Name
and year of birth |
Position
held and length of service |
Principal occupations during past five years or longer |
| Andrew
Owen (Born 1960) |
President,
since 2017 |
President and Chief Executive Officer of Allspring Funds Management, LLC since 2017 and Head of Global Fund Governance of Allspring Global Investments since 2022. Prior thereto, co-president of Galliard Capital Management, LLC, an affiliate of Allspring Funds Management, LLC, from 2019 to 2022 and Head of Affiliated Managers, Allspring Global Investments, from 2014 to 2019 and Executive Vice President responsible for marketing, investments and product development for Allspring Funds Management, LLC, from 2009 to 2014. |
| Jeremy
DePalma (Born 1974) |
Treasurer,
since 2012 (for certain funds in the Fund Complex); since 2021 (for the remaining funds in the Fund Complex) |
Senior Vice President of Allspring Funds Management, LLC since 2009. Senior Vice President of Evergreen Investment Management Company, LLC from 2008 to 2010 and head of the Fund Reporting and Control Team within Fund Administration from 2005 to 2010. |
| Christopher
Baker (Born 1976) |
Chief Compliance Officer, since 2022 | Global Chief Compliance Officer for Allspring Global Investments since 2022. Prior thereto, Chief Compliance Officer for State Street Global Advisors from 2018 to 2021. Senior Compliance Officer for the State Street divisions of Alternative Investment Solutions, Sector Solutions, and Global Marketing from 2015 to 2018. From 2010 to 2015 Vice President, Global Head of Investment and Marketing Compliance for State Street Global Advisors. |
| Matthew
Prasse (Born 1983) |
Chief Legal Officer, since 2022; Secretary, since 2021 | Senior Counsel of the Allspring Legal Department since 2021. Senior Counsel of the Wells Fargo Legal Department from 2018 to 2021. Previously, Counsel for Barings LLC from 2015 to 2018. Prior to joining Barings, Associate at Morgan, Lewis & Bockius LLP from 2008 to 2015. |
P.O. Box 219967
Kansas City, MO 64121-9967

1-800-222-8222 or visit the Fund's website at allspringglobal.com. Read the prospectus carefully before you invest or send money.
SA242/SAR242 09-22

Special Small Cap Value Fund

| 1 | The S&P 500 Index consists of 500 stocks chosen for market size, liquidity, and industry group representation. It is a market-value-weighted index with each stock's weight in the index proportionate to its market value. You cannot invest directly in an index. |
| 2 | The Morgan Stanley Capital International (MSCI) All Country World Index (ACWI) ex USA Index (Net) is a free-float-adjusted market-capitalization-weighted index that is designed to measure the equity market performance of developed and emerging markets, excluding the U.S. Source: MSCI. MSCI makes no express or implied warranties or representations and shall have no liability whatsoever with respect to any MSCI data contained herein. The MSCI data may not be further redistributed or used as a basis for other indexes or any securities or financial products. This report is not approved, reviewed, or produced by MSCI. You cannot invest directly in an index. |
| 3 | The MSCI Emerging Markets (EM) Index (Net) (USD) is a free-float-adjusted market-capitalization-weighted index that is designed to measure equity market performance of emerging markets. You cannot invest directly in an index. |
| 4 | The Bloomberg U.S. Aggregate Bond Index is a broad-based benchmark that measures the investment-grade, U.S.-dollar-denominated, fixed-rate taxable bond market, including Treasuries, government-related and corporate securities, mortgage-backed securities (agency fixed-rate and hybrid adjustable-rate mortgage pass-throughs), asset-backed securities, and commercial mortgage-backed securities. You cannot invest directly in an index. |
| 5 | The Bloomberg Global Aggregate ex-USD Index (unhedged) is an unmanaged index that provides a broad-based measure of the global investment-grade fixed-income markets excluding the U.S.-dollar-denominated debt market. You cannot invest directly in an index. |
| 6 | The Bloomberg Municipal Bond Index is an unmanaged index composed of long-term tax-exempt bonds with a minimum credit rating of Baa. You cannot invest directly in an index. |
| 7 | The ICE BofA U.S. High Yield Index is a market-capitalization-weighted index of domestic and Yankee high-yield bonds. The index tracks the performance of high-yield securities traded in the U.S. bond market. You cannot invest directly in an index. Copyright 2022. ICE Data Indices, LLC. All rights reserved. |
| 1 | The MSCI ACWI (Net) is a free-float-adjusted market-capitalization-weighted index that is designed to measure the equity market performance of developed and emerging markets. You cannot invest directly in an index. |

President
Allspring Funds
| Investment objective | The Fund seeks long-term capital appreciation. |
| Manager | Allspring Funds Management, LLC |
| Subadviser | Allspring Global Investments, LLC |
| Portfolio managers | Brian Martin, CFA®‡, James M. Tringas, CFA®‡, Bryant VanCronkhite, CFA®‡ |
| Average annual total returns (%) as of September 30, 2022 | |||||||||||
| Including sales charge | Excluding sales charge | Expense ratios1 (%) | |||||||||
| Inception date | 1 year | 5 year | 10 year | 1 year | 5 year | 10 year | Gross | Net 2 | |||
| Class A (ESPAX) | 5-7-1993 | -22.38 | 1.76 | 8.18 | -17.64 | 2.97 | 8.82 | 1.24 | 1.24 | ||
| Class C (ESPCX) | 12-12-2000 | -19.27 | 2.22 | 8.18 | -18.27 | 2.22 | 8.18 | 1.99 | 1.99 | ||
| Class R (ESPHX)3 | 9-30-2015 | – | – | – | -17.86 | 2.71 | 8.56 | 1.49 | 1.49 | ||
| Class R6 (ESPRX)4 | 10-31-2014 | – | – | – | -17.29 | 3.42 | 9.28 | 0.81 | 0.81 | ||
| Administrator Class (ESPIX) | 7-23-1996 | – | – | – | -17.58 | 3.06 | 8.98 | 1.16 | 1.16 | ||
| Institutional Class (ESPNX) | 7-30-2010 | – | – | – | -17.37 | 3.33 | 9.22 | 0.91 | 0.91 | ||
| Russell 2000® Value Index5 | – | – | – | – | -17.69 | 2.87 | 7.94 | – | – | ||
| 1 | Reflects the expense ratios as stated in the most recent prospectuses. The expense ratios shown are subject to change and may differ from the annualized expense ratios shown in the financial highlights of this report. |
| 2 | The manager has contractually committed through July 31, 2023, to waive fees and/or reimburse expenses to the extent necessary to cap total annual fund operating expenses after fee waivers at 1.31% for Class A, 2.06% for Class C, 1.56% for Class R, 0.89% for Class R6, 1.20% for Administrator Class, and 0.94% for Institutional Class. Brokerage commissions, stamp duty fees, interest, taxes, acquired fund fees and expenses (if any), and extraordinary expenses are excluded from the expense caps. Prior to or after the commitment expiration date, the caps may be increased or the commitment to maintain the caps may be terminated only with the approval of the Board of Trustees. Without these caps, the Fund’s returns would have been lower. The expense ratio paid by an investor is the net expense ratio (the total annual fund operating expenses after fee waivers) as stated in the prospectuses. |
| 3 | Historical performance shown for the Class R shares prior to their inception reflects the performance of the Institutional Class shares, adjusted to reflect the higher expenses applicable to the Class R shares. |
| 4 | Historical performance shown for the Class R6 shares prior to their inception reflects the performance of the Institutional Class shares, and includes the higher expenses applicable to the Institutional Class shares. If these expenses had not been included, returns for the Class R6 shares would be higher. |
| 5 | The Russell 2000® Value Index measures the performance of those Russell 2000 companies with lower price/book ratios and lower forecasted growth values. You cannot invest directly in an index. |
| ‡ | CFA® and Chartered Financial Analyst® are trademarks owned by CFA Institute. |

| Beginning
account value 4-1-2022 |
Ending
account value 9-30-2022 |
Expenses
paid during the period1 |
Annualized
net expense ratio | |
| Class A | ||||
| Actual | $1,000.00 | $ 804.21 | $ 5.70 | 1.26% |
| Hypothetical (5% return before expenses) | $1,000.00 | $1,018.75 | $ 6.38 | 1.26% |
| Class C | ||||
| Actual | $1,000.00 | $ 801.05 | $ 9.03 | 2.00% |
| Hypothetical (5% return before expenses) | $1,000.00 | $1,015.04 | $10.10 | 2.00% |
| Class R | ||||
| Actual | $1,000.00 | $ 803.09 | $ 6.83 | 1.51% |
| Hypothetical (5% return before expenses) | $1,000.00 | $1,017.50 | $ 7.64 | 1.51% |
| Class R6 | ||||
| Actual | $1,000.00 | $ 805.86 | $ 3.76 | 0.83% |
| Hypothetical (5% return before expenses) | $1,000.00 | $1,020.91 | $ 4.20 | 0.83% |
| Administrator Class | ||||
| Actual | $1,000.00 | $ 804.58 | $ 5.25 | 1.16% |
| Hypothetical (5% return before expenses) | $1,000.00 | $1,019.25 | $ 5.87 | 1.16% |
| Institutional Class | ||||
| Actual | $1,000.00 | $ 805.62 | $ 4.21 | 0.93% |
| Hypothetical (5% return before expenses) | $1,000.00 | $1,020.41 | $ 4.71 | 0.93% |
| Shares | Value | ||||
| Common stocks: 95.08% | |||||
| Communication services: 0.47% | |||||
| Media: 0.47% | |||||
| DallasNews Corporation Class A ♠ | 436,597 | $ 2,025,810 | |||
| Thryv Holdings Incorporated † | 860,400 | 19,642,932 | |||
| 21,668,742 | |||||
| Consumer discretionary: 6.64% | |||||
| Auto components: 0.54% | |||||
| Holley Incorporated †« | 6,099,043 | 24,701,124 | |||
| Hotels, restaurants & leisure: 3.63% | |||||
| Denny’s Corporation ♠† | 4,560,412 | 42,913,477 | |||
| Dine Brands Global Incorporated ♠ | 993,743 | 63,162,305 | |||
| Jack In The Box Incorporated | 815,800 | 60,426,306 | |||
| 166,502,088 | |||||
| Household durables: 1.43% | |||||
| Helen of Troy Limited † | 563,533 | 54,347,123 | |||
| Tupperware Brands Corporation ♠† | 1,751,837 | 11,474,532 | |||
| 65,821,655 | |||||
| Multiline retail: 0.39% | |||||
| Franchise Group Incorporated | 733,421 | 17,822,130 | |||
| Textiles, apparel & luxury goods: 0.65% | |||||
| Delta Apparel Incorporated ♠† | 602,202 | 8,424,806 | |||
| Steven Madden Limited | 798,100 | 21,285,327 | |||
| 29,710,133 | |||||
| Consumer staples: 8.34% | |||||
| Beverages: 0.84% | |||||
| Primo Water Corporation | 3,078,389 | 38,633,782 | |||
| Food products: 4.38% | |||||
| J & J Snack Foods Corporation ♠ | 1,015,608 | 131,490,768 | |||
| Nomad Foods Limited † | 3,325,728 | 47,225,338 | |||
| Tootsie Roll Industries Incorporated | 672,640 | 22,385,459 | |||
| 201,101,565 | |||||
| Household products: 3.12% | |||||
| Central Garden & Pet Company ♠† | 813,322 | 29,312,125 | |||
| Central Garden & Pet Company Class A † | 1,267,151 | 43,285,878 | |||
| Spectrum Brands Holdings Incorporated ##« | 1,803,094 | 70,374,759 | |||
| 142,972,762 | |||||
| Energy: 7.30% | |||||
| Energy equipment & services: 1.74% | |||||
| Forum Energy Technologies Incorporated † | 172,344 | 3,660,587 | |||
| Liberty Oilfield Services Class A † | 1,584,371 | 20,089,824 | |||
| Patterson-UTI Energy Incorporated | 4,803,848 | 56,108,945 | |||
| 79,859,356 |
| Shares | Value | ||||
| Oil, gas & consumable fuels: 5.56% | |||||
| Alto Ingredients Incorporated † | 2,132,188 | $ 7,761,164 | |||
| Berry Corporation | 2,139,686 | 16,047,645 | |||
| Callon Petroleum Company †## | 534,930 | 18,727,899 | |||
| Chord Energy Corporation | 449,912 | 61,534,464 | |||
| Magnolia Oil & Gas Corporation Class A | 2,941,984 | 58,280,703 | |||
| Nordic American Tankers Limited « | 3,711,011 | 9,908,399 | |||
| Northern Oil and Gas Incorporated | 908,210 | 24,894,036 | |||
| Southwestern Energy Company †## | 9,482,980 | 58,035,838 | |||
| 255,190,148 | |||||
| Financials: 16.75% | |||||
| Banks: 7.27% | |||||
| Associated Banc Corporation | 1,955,756 | 39,271,580 | |||
| CVB Financial Corporation | 832,774 | 21,085,838 | |||
| First Hawaiian Incorporated | 1,022,658 | 25,188,067 | |||
| Hancock Whitney Corporation | 1,038,240 | 47,561,774 | |||
| Renasant Corporation | 1,132,774 | 35,433,171 | |||
| South State Corporation | 637,618 | 50,448,336 | |||
| UMB Financial Corporation | 1,360,980 | 114,717,004 | |||
| 333,705,770 | |||||
| Capital markets: 1.16% | |||||
| Apollo Investment Corporation | 1,873,186 | 19,143,961 | |||
| Capitol Investment Corporation V | 1,250,000 | 549,250 | |||
| Glassbridge Enterprises Incorporated ♠†« | 1,527 | 38,175 | |||
| New Mountain Finance Corporation | 2,515,550 | 29,004,292 | |||
| Pershing Square Escrow Shares ♦† | 1,415,995 | 0 | |||
| Westwood Holdings Group Incorporated ♠ | 446,683 | 4,301,557 | |||
| 53,037,235 | |||||
| Diversified financial services: 0.75% | |||||
| Jackson Financial Incorporation Class A | 1,247,661 | 34,622,593 | |||
| Insurance: 4.95% | |||||
| CNO Financial Group Incorporated | 747,092 | 13,425,243 | |||
| Enstar Group Limited † | 308,502 | 52,318,854 | |||
| National Western Life Group Class A | 68,833 | 11,756,676 | |||
| ProAssurance Corporation | 1,230,100 | 23,999,251 | |||
| Stewart Information Services Corporation | 1,316,802 | 57,465,239 | |||
| The Hanover Insurance Group Incorporated | 530,177 | 67,936,881 | |||
| 226,902,144 | |||||
| Mortgage REITs: 2.62% | |||||
| AGNC Investment Corporation | 3,643,200 | 30,675,744 | |||
| Apollo Commercial Real Estate Finance Incorporated | 2,404,190 | 19,954,777 | |||
| New York Mortgage Trust Incorporated | 11,637,106 | 27,230,828 | |||
| Two Harbors Investment Corporation | 12,763,196 | 42,373,811 | |||
| 120,235,160 |
| Shares | Value | ||||
| Health care: 4.87% | |||||
| Health care equipment & supplies: 0.88% | |||||
| Enovis Corporation | 113,800 | $ 5,242,766 | |||
| Varex Imaging Corporation † | 1,675,689 | 35,424,065 | |||
| 40,666,831 | |||||
| Health care providers & services: 1.88% | |||||
| Owens & Minor Incorporated | 1,732,034 | 41,742,019 | |||
| Patterson Companies Incorporated | 1,127,665 | 27,086,513 | |||
| Premier Incorporated Class A | 515,737 | 17,504,114 | |||
| 86,332,646 | |||||
| Life sciences tools & services: 0.74% | |||||
| Azenta Incorporated | 790,241 | 33,869,729 | |||
| Pharmaceuticals: 1.37% | |||||
| Perrigo Company plc | 752,251 | 26,825,271 | |||
| Prestige Consumer Healthcare Incorporated † | 720,526 | 35,903,811 | |||
| 62,729,082 | |||||
| Industrials: 29.16% | |||||
| Aerospace & defense: 0.69% | |||||
| Parsons Corporation † | 808,516 | 31,693,827 | |||
| Air freight & logistics: 0.19% | |||||
| GXO Logistics Incorporated † | 249,757 | 8,756,480 | |||
| Building products: 6.75% | |||||
| CSW Industrials Incorporated ♠ | 862,581 | 103,337,204 | |||
| Griffon Corporation | 1,609,799 | 47,521,266 | |||
| Janus International Group Incorporated † | 2,443,102 | 21,792,470 | |||
| JELD-WEN Holding Incorporated † | 681,621 | 5,964,184 | |||
| Quanex Building Products Corporation ♠ | 2,782,780 | 50,535,285 | |||
| Simpson Manufacturing Company Incorporated | 546,267 | 42,827,333 | |||
| UFP Industries Incorporated | 522,259 | 37,686,209 | |||
| 309,663,951 | |||||
| Commercial services & supplies: 2.34% | |||||
| ACCO Brands Corporation | 3,845,700 | 18,843,932 | |||
| Custom Truck One Source Incorporated | 3,475,000 | 20,259,250 | |||
| Ennis Incorporated ♠ | 1,256,422 | 25,291,775 | |||
| Harsco Corporation † | 1,319,631 | 4,935,420 | |||
| Matthews International Corporation Class A | 221,500 | 4,963,815 | |||
| Viad Corporation ♠† | 1,050,007 | 33,159,221 | |||
| 107,453,413 | |||||
| Construction & engineering: 0.99% | |||||
| APi Group Corporation † | 3,407,467 | 45,217,087 | |||
| Electrical equipment: 1.55% | |||||
| Atkore Incorporated †## | 742,609 | 57,782,406 | |||
| Babcock & Wilcox Enterprises Incorporated † | 2,119,231 | 13,520,694 | |||
| 71,303,100 |
| Shares | Value | ||||
| Machinery: 12.36% | |||||
| Alamo Group Incorporated | 291,849 | $ 35,684,377 | |||
| Columbus McKinnon Corporation | 961,117 | 25,142,821 | |||
| Douglas Dynamics Incorporated ♠ | 1,848,821 | 51,803,964 | |||
| Franklin Electric Company Incorporated | 1,710,869 | 139,795,106 | |||
| Hillenbrand Incorporated | 578,157 | 21,229,925 | |||
| Hillman Group Incorporated | 3,622,900 | 27,316,666 | |||
| Hillman Solutions Corporation † | 2,182,381 | 16,455,153 | |||
| Kadant Incorporated | 305,289 | 50,925,258 | |||
| Mayville Engineering Company Incorporated † | 1,628,924 | 10,604,295 | |||
| Mueller Industries Incorporated ♠## | 3,139,496 | 186,611,642 | |||
| NN Incorporated †« | 946,098 | 1,617,828 | |||
| 567,187,035 | |||||
| Professional services: 2.63% | |||||
| CBIZ Incorporated † | 1,637,002 | 70,030,946 | |||
| Korn Ferry International | 1,073,437 | 50,397,867 | |||
| 120,428,813 | |||||
| Road & rail: 0.84% | |||||
| Werner Enterprises Incorporated | 1,028,689 | 38,678,706 | |||
| Trading companies & distributors: 0.82% | |||||
| Air Lease Corporation | 956,100 | 29,648,661 | |||
| Custom Truck One Source Incorporated †« | 1,350,793 | 7,875,123 | |||
| 37,523,784 | |||||
| Information technology: 4.23% | |||||
| Electronic equipment, instruments & components: 1.53% | |||||
| Belden Incorporated | 1,169,293 | 70,180,966 | |||
| IT services: 2.19% | |||||
| Concentrix Corporation | 114,200 | 12,748,146 | |||
| Euronet Worldwide Incorporated † | 75,000 | 5,682,000 | |||
| Global Blue Group Holding AG | 4,536,904 | 21,005,866 | |||
| Kyndryl Holdings Incorporated † | 3,264,489 | 26,997,324 | |||
| Maximus Incorporated | 588,400 | 34,050,708 | |||
| 100,484,044 | |||||
| Software: 0.51% | |||||
| E2open Parent Holding Incorporated † | 3,077,572 | 18,680,862 | |||
| Synchronoss Technologies Incorporated † | 4,327,500 | 4,933,350 | |||
| 23,614,212 | |||||
| Materials: 16.09% | |||||
| Chemicals: 8.35% | |||||
| Avient Corporation | 3,176,901 | 96,260,100 | |||
| Diversey Holdings Limited † | 2,050,560 | 9,965,722 | |||
| Ecovyst Incorporated † | 3,945,238 | 33,297,809 | |||
| Element Solutions Incorporated | 668,592 | 10,877,992 | |||
| Innospec Incorporated ♠ | 1,740,494 | 149,108,121 | |||
| Minerals Technologies Incorporated | 229,756 | 11,352,244 | |||
| NewMarket Corporation | 240,293 | 72,287,343 | |||
| 383,149,331 |
| Shares | Value | ||||
| Construction materials: 2.64% | |||||
| Eagle Materials Incorporated | 1,131,401 | $ 121,263,559 | |||
| Containers & packaging: 3.33% | |||||
| Myers Industries Incorporated | 1,671,660 | 27,532,240 | |||
| Silgan Holdings Incorporated | 1,730,665 | 72,757,157 | |||
| Trimas Corporation | 2,094,063 | 52,498,159 | |||
| 152,787,556 | |||||
| Paper & forest products: 1.77% | |||||
| Mativ Holdings Inc ♠ | 3,679,722 | 81,248,262 | |||
| Real estate: 0.56% | |||||
| Equity REITs: 0.56% | |||||
| Washington REIT | 1,450,410 | 25,469,200 | |||
| Utilities: 0.67% | |||||
| Electric utilities: 0.67% | |||||
| Hawaiian Electric Industries Incorporated | 889,664 | 30,835,754 | |||
| Total Common stocks (Cost $4,481,047,607) | 4,363,023,755 |
| Investment companies: 1.13% | |||||
| Mutual funds: 1.13% | |||||
| iShares Russell 2000 Index ETF | 314,275 | 51,830,233 | |||
| Total Investment companies (Cost $56,092,263) | 51,830,233 |
| Yield | |||||
| Short-term investments: 2.76% | |||||
| Investment companies: 2.76% | |||||
| Allspring Government Money Market Fund Select Class ♠∞ | 2.75% | 124,897,784 | 124,897,784 | ||
| Securities Lending Cash Investments LLC ♠∩∞ | 3.08 | 1,780,491 | 1,780,491 | ||
| Total Short-term investments (Cost $126,678,275) | 126,678,275 | ||||
| Total investments in securities (Cost $4,663,818,145) | 98.97% | 4,541,532,263 | |||
| Other assets and liabilities, net | 1.03 | 47,327,948 | |||
| Total net assets | 100.00% | $4,588,860,211 |
| † | Non-income-earning security |
| ♦ | The security is fair valued in accordance with procedures approved by the Board of Trustees. |
| « | All or a portion of this security is on loan. |
| ♠ | The issuer of the security is an affiliated person of the Fund as defined in the Investment Company Act of 1940. |
| ∩ | The investment is a non-registered investment company purchased with cash collateral received from securities on loan. |
| ∞ | The rate represents the 7-day annualized yield at period end. |
| ## | All or a portion of this security is segregated as collateral for investments in derivative instruments. |
| Abbreviations: | |
| REIT | Real estate investment trust |
| Value,
beginning of period |
Purchases | Sales
proceeds |
Net
realized gains (losses) |
Net
change in unrealized gains (losses) |
Value,
end of period |
Shares,
end of period |
Income
from affiliated securities | |||
| Common Stocks | ||||||||||
| Central Garden & Pet Company† | $ 35,722,863 | $ 29,713 | $ 0 | $ 0 | $ (6,440,451) | $ 29,312,125 | 813,322 | $ 0 | ||
| CSW Industrials Incorporated | 100,337,313 | 1,056,901 | 0 | 0 | 1,942,990 | 103,337,204 | 862,581 | 293,159 | ||
| DallasNews Corporation Class A | 3,757,683 | 0 | (850,593) | (2,637,121) | 1,755,841 | 2,025,810 | 436,597 | 827,663 | ||
| Delta Apparel Incorporated† | 17,924,703 | 13,759 | 0 | 0 | (9,513,656) | 8,424,806 | 602,202 | 0 | ||
| Denny’s Corporation† | 64,584,064 | 639,745 | 0 | 0 | (22,310,332) | 42,913,477 | 4,560,412 | 0 | ||
| Dine Brands Global Incorporated | 81,172,687 | 375,259 | (3,634,052) | (546,554) | (14,205,035) | 63,162,305 | 993,743 | 1,525,939 | ||
| Douglas Dynamics Incorporated | 63,549,474 | 367,932 | 0 | 0 | (12,113,442) | 51,803,964 | 1,848,821 | 1,071,852 | ||
| Ennis Incorporated | 24,606,270 | 0 | (1,490,593) | (72,749) | 2,248,847 | 25,291,775 | 1,256,422 | 649,163 | ||
| Glassbridge Enterprises Incorporated† | 9,926 | 0 | 0 | 0 | 28,249 | 38,175 | 1,527 | 0 | ||
| Innospec Incorporated | 165,737,985 | 597,281 | (5,706,497) | (172,528) | (11,348,120) | 149,108,121 | 1,740,494 | 1,923,345 | ||
| J & J Snack Foods Corporation | 158,418,985 | 2,481,150 | (3,201,873) | (713,077) | (25,494,417) | 131,490,768 | 1,015,608 | 1,288,927 | ||
| Mativ Holdings Inc | 0 | 154,683,625 | 0 | (291,456) | (73,143,907) | 81,248,262 | 3,679,722 | 2,819,690 | ||
| Mueller Industries Incorporated | 171,377,466 | 5,668,024 | (8,289,414) | 1,887,638 | 15,967,928 | 186,611,642 | 3,139,496 | 2,066,467 | ||
| Quanex Building Products Corporation | 56,833,951 | 1,570,736 | 0 | 0 | (7,869,402) | 50,535,285 | 2,782,780 | 442,860 | ||
| Tupperware Brands Corporation† | 51,130,899 | 1,062,750 | (7,268,001) | (12,246,733) | (21,204,383) | 11,474,532 | 1,751,837 | 0 | ||
| Viad Corporation† | 42,137,421 | 178,001 | (5,425,336) | (2,436,258) | (1,294,606) | 33,159,221 | 1,050,007 | 0 | ||
| Westwood Holdings Group Incorporated | 6,843,184 | 0 | 0 | 0 | (2,541,627) | 4,301,557 | 446,683 | 134,005 | ||
| Short-term investments | ||||||||||
| Allspring Government Money Market Fund Select Class | 110,061,302 | 581,217,415 | (566,380,933) | 0 | 0 | 124,897,784 | 124,897,784 | 787,652 | ||
| Securities Lending Cash Investments LLC | 3,452,615 | 47,086,421 | (48,758,545) | 0 | 0 | 1,780,491 | 1,780,491 | 74,466 # | ||
| Investments
in affiliates no longer held at end of period |
||||||||||
| Neenah Incorporated | 61,082,785 | 76,658 | (98,150,707) | 0 | 36,991,264 | 0 | 0 | 0 | ||
| $(17,228,838) | $(148,544,259) | $1,100,917,304 | $13,905,188 | |||||||
| † | Non-income-earning security |
| # | Amount shown represents income before fees and rebates. |
| Description | Counterparty | Number
of contracts |
Notional
amount |
Exercise
price |
Expiration
date |
Value |
| Call | ||||||
| Atkore International Incorporated | Bank of America Securities Incorporated | (250) | $(2,000,000) | $ 80.00 | 10-21-2022 | $ (70,000) |
| Atkore International Incorporated | Bank of America Securities Incorporated | (250) | (2,125,000) | 85.00 | 11-18-2022 | (95,625) |
| J&J Snack Foods Corporation | Bank of America Securities Incorporated | (250) | (3,250,000) | 130.00 | 11-18-2022 | (157,500) |
| Mueller Industries Incorporated | Bank of America Securities Incorporated | (250) | (1,750,000) | 70.00 | 10-21-2022 | (8,125) |
| Mueller Industries Incorporated | Bank of America Securities Incorporated | (250) | (1,875,000) | 75.00 | 12-16-2022 | (12,392) |
| Description | Counterparty | Number
of contracts |
Notional
amount |
Exercise
price |
Expiration
date |
Value |
| Call (continued) | ||||||
| Petroleum Company | Bank of America Securities Incorporated | (500) | $(2,000,000) | $ 40.00 | 10-21-2022 | $ (48,750) |
| Southwestern Energy Company | Bank of America Securities Incorporated | (1,000) | (800,000) | 8.00 | 10-21-2022 | (3,000) |
| Spectrum Brands Holdings Incorporated | Bank of America Securities Incorporated | (250) | (1,250,000) | 50.00 | 10-21-2022 | (4,375) |
| Put | ||||||
| Atkore International Incorporated | Bank of America Securities Incorporated | (250) | (2,000,000) | 80.00 | 10-21-2022 | (118,750) |
| Atkore International Incorporated | Bank of America Securities Incorporated | (250) | (2,125,000) | 85.00 | 10-21-2022 | (206,250) |
| Atkore International Incorporated | Bank of America Securities Incorporated | (250) | (1,875,000) | 75.00 | 11-18-2022 | (123,750) |
| Atkore International Incorporated | Bank of America Securities Incorporated | (250) | (1,750,000) | 70.00 | 11-18-2022 | (74,375) |
| Avient Corporation | Bank of America Securities Incorporated | (500) | (1,750,000) | 35.00 | 11-18-2022 | (277,500) |
| Azenta Incorporated | Bank of America Securities Incorporated | (500) | (2,750,000) | 55.00 | 10-21-2022 | (597,500) |
| Chord Energy Corporation | Bank of America Securities Incorporated | (250) | (3,125,000) | 125.00 | 10-21-2022 | (80,000) |
| Concenrix Corporation | Bank of America Securities Incorporated | (500) | (6,000,000) | 120.00 | 10-21-2022 | (472,500) |
| Concentrix Corporation | Bank of America Securities Incorporated | (250) | (2,750,000) | 110.00 | 11-18-2022 | (151,250) |
| Enovis Corporation | Bank of America Securities Incorporated | (1,250) | (6,250,000) | 50.00 | 10-21-2022 | (490,625) |
| Euronet Worldwide Incorporated | Bank of America Securities Incorporated | (250) | (2,125,000) | 85.00 | 10-21-2022 | (248,750) |
| Petroleum Company | Bank of America Securities Incorporated | (250) | (875,000) | 35.00 | 11-18-2022 | (107,500) |
| Simpson Manufacturing Company Incorporated | Bank of America Securities Incorporated | (500) | (4,750,000) | 95.00 | 10-21-2022 | (835,000) |
| SM Energy Company | Bank of America Securities Incorporated | (1,000) | (4,000,000) | 40.00 | 11-18-2022 | (560,000) |
| Southwestern Energy Company | Bank of America Securities Incorporated | (1,000) | (700,000) | 7.00 | 10-21-2022 | (100,500) |
| $(4,844,017) |
| Assets | |
|
Investments in unaffiliated securities (including $1,672,448 of securities loaned), at value (cost
$3,575,390,707) |
$ 3,440,614,959 |
|
Investments in affiliated securities, at value (cost
$1,088,427,438) |
1,100,917,304 |
|
Cash |
37,999 |
|
Cash at broker segregated for written
options |
42,824,952 |
|
Receivable for investments
sold |
12,143,170 |
|
Receivable for
dividends |
10,121,254 |
|
Receivable for Fund shares
sold |
10,005,400 |
|
Receivable for securities lending income,
net |
3,013 |
|
Prepaid expenses and other
assets |
318,985 |
|
Total
assets |
4,616,987,036 |
| Liabilities | |
|
Payable for Fund shares
redeemed |
11,414,680 |
|
Payable for investments
purchased |
5,424,249 |
|
Written options at value (premiums received
$2,821,480) |
4,844,017 |
|
Management fee
payable |
3,404,992 |
|
Payable upon receipt of securities
loaned |
1,780,491 |
|
Administration fees
payable |
485,048 |
|
Distribution fees
payable |
8,158 |
|
Trustees’ fees and expenses
payable |
3,331 |
|
Accrued expenses and other
liabilities |
761,859 |
|
Total
liabilities |
28,126,825 |
|
Total net
assets |
$4,588,860,211 |
| Net assets consist of | |
|
Paid-in
capital |
$ 4,449,432,869 |
|
Total distributable
earnings |
139,427,342 |
|
Total net
assets |
$4,588,860,211 |
| Computation of net asset value and offering price per share | |
|
Net assets – Class
A |
$ 646,036,343 |
|
Shares outstanding – Class
A1 |
19,685,731 |
|
Net asset value per share – Class
A |
$32.82 |
|
Maximum offering price per share – Class
A2 |
$34.82 |
|
Net assets – Class
C |
$ 7,402,259 |
|
Shares outstanding – Class
C1 |
256,377 |
|
Net asset value per share – Class
C |
$28.87 |
|
Net assets – Class
R |
$ 11,799,184 |
|
Shares outstanding – Class
R1 |
354,501 |
|
Net asset value per share – Class
R |
$33.28 |
|
Net assets – Class
R6 |
$ 1,419,796,846 |
|
Shares outstanding – Class
R61 |
41,967,766 |
|
Net asset value per share – Class
R6 |
$33.83 |
|
Net assets – Administrator
Class |
$ 102,049,147 |
|
Shares outstanding – Administrator
Class1 |
3,022,905 |
|
Net asset value per share – Administrator
Class |
$33.76 |
|
Net assets – Institutional
Class |
$ 2,401,776,432 |
|
Shares outstanding – Institutional
Class1 |
71,023,252 |
Net
asset value per share – Institutional
Class |
$33.82 |
| 1 | The Fund has an unlimited number of authorized shares. |
| 2 | Maximum offering price is computed as 100/94.25 of net asset value. On investments of $50,000 or more, the offering price is reduced. |
| Investment income | |
|
Dividends (net of foreign withholdings taxes of
$64,619) |
$ 45,615,086 |
|
Income from affiliated
securities |
13,861,089 |
|
Total investment
income |
59,476,175 |
| Expenses | |
|
Management
fee |
20,929,501 |
| Administration fees | |
|
Class
A |
782,402 |
|
Class
C |
9,952 |
|
Class
R |
14,532 |
|
Class
R6 |
245,430 |
|
Administrator
Class |
80,086 |
|
Institutional
Class |
1,868,353 |
| Shareholder servicing fees | |
|
Class
A |
931,431 |
|
Class
C |
11,831 |
|
Class
R |
17,300 |
|
Administrator
Class |
147,622 |
| Distribution fees | |
|
Class
C |
35,446 |
|
Class
R |
17,221 |
|
Custody and accounting
fees |
197,838 |
|
Professional
fees |
26,995 |
|
Registration
fees |
77,424 |
|
Shareholder report
expenses |
215,209 |
|
Trustees’ fees and
expenses |
11,191 |
|
Other fees and
expenses |
71,758 |
|
Total
expenses |
25,691,522 |
| Less: Fee waivers and/or expense reimbursements | |
|
Class
A |
(1,214) |
|
Class
C |
(1) |
|
Administrator
Class |
(811) |
|
Institutional
Class |
(16) |
|
Net
expenses |
25,689,480 |
|
Net investment
income |
33,786,695 |
| Realized and unrealized gains (losses) on investments | |
| Net realized gains (losses) on | |
|
Unaffiliated
securities |
26,530,528 |
|
Affiliated
securities |
(17,228,838) |
|
Written
options |
11,920,070 |
|
Net realized gains on
investments |
21,221,760 |
| Net change in unrealized gains (losses) on | |
|
Unaffiliated
securities |
(1,028,759,435) |
|
Affiliated
securities |
(148,544,259) |
|
Written
options |
(1,736,658) |
|
Net change in unrealized gains (losses) on
investments |
(1,179,040,352) |
|
Net realized and unrealized gains (losses) on
investments |
(1,157,818,592) |
|
Net decrease in net assets resulting from
operations |
$(1,124,031,897) |
| Six
months ended September 30, 2022 (unaudited) |
Year
ended March 31, 2022 | |||
| Operations | ||||
|
Net investment
income |
$ 33,786,695 | $ 27,875,748 | ||
|
Net realized gains on
investments |
21,221,760 | 476,640,248 | ||
|
Net change in unrealized gains (losses) on
investments |
(1,179,040,352) | (343,672,729) | ||
|
Net increase (decrease) in net assets resulting from
operations |
(1,124,031,897) | 160,843,267 | ||
| Distributions to shareholders from | ||||
| Net investment income and net realized gains | ||||
|
Class
A |
0 | (50,783,331) | ||
|
Class
C |
0 | (807,798) | ||
|
Class
R |
0 | (917,911) | ||
|
Class
R6 |
0 | (114,036,990) | ||
|
Administrator
Class |
0 | (11,844,857) | ||
|
Institutional
Class |
0 | (204,793,322) | ||
|
Total distributions to
shareholders |
0 | (383,184,209) | ||
| Capital share transactions | Shares | Shares | ||
| Proceeds from shares sold | ||||
|
Class
A |
1,724,048 | 64,593,958 | 4,280,098 | 184,277,105 |
|
Class
C |
2,403 | 80,977 | 8,749 | 336,570 |
|
Class
R |
36,441 | 1,392,178 | 103,689 | 4,505,291 |
|
Class
R6 |
4,392,528 | 168,917,725 | 15,549,670 | 685,689,346 |
|
Administrator
Class |
183,666 | 7,098,960 | 885,087 | 39,305,726 |
|
Institutional
Class |
9,383,869 | 362,214,803 | 24,127,132 | 1,060,759,280 |
| 604,298,601 | 1,974,873,318 | |||
| Reinvestment of distributions | ||||
|
Class
A |
0 | 0 | 1,121,289 | 46,807,127 |
|
Class
C |
0 | 0 | 21,112 | 778,823 |
|
Class
R |
0 | 0 | 21,670 | 917,911 |
|
Class
R6 |
0 | 0 | 2,465,581 | 106,043,414 |
|
Administrator
Class |
0 | 0 | 273,495 | 11,744,267 |
|
Institutional
Class |
0 | 0 | 3,574,870 | 153,704,110 |
| 0 | 319,995,652 | |||
| Payment for shares redeemed | ||||
|
Class
A |
(1,570,413) | (59,134,399) | (4,682,744) | (200,722,890) |
|
Class
C |
(45,485) | (1,498,067) | (101,436) | (3,882,504) |
|
Class
R |
(42,181) | (1,590,002) | (107,696) | (4,664,636) |
|
Class
R6 |
(4,461,099) | (174,370,197) | (12,714,796) | (559,504,556) |
|
Administrator
Class |
(398,930) | (15,414,367) | (2,444,640) | (105,093,900) |
|
Institutional
Class |
(14,437,157) | (556,307,981) | (22,927,729) | (1,005,623,154) |
| (808,315,013) | (1,879,491,640) | |||
|
Net increase (decrease) in net assets resulting from capital share
transactions |
(204,016,412) | 415,377,330 | ||
|
Total increase (decrease) in net
assets |
(1,328,048,309) | 193,036,388 | ||
| Net assets | ||||
|
Beginning of
period |
5,916,908,520 | 5,723,872,132 | ||
|
End of
period |
$ 4,588,860,211 | $ 5,916,908,520 | ||
| Year ended March 31 | ||||||
| Class A | Six
months ended September 30, 2022 (unaudited) |
2022 | 2021 | 2020 | 2019 | 2018 |
|
Net asset value, beginning of
period |
$40.81 | $42.37 | $23.39 | $31.74 | $34.42 | $33.15 |
|
Net investment
income |
0.18 1 | 0.07 | 0.14 1 | 0.24 | 0.22 | 0.24 |
|
Net realized and unrealized gains (losses) on
investments |
(8.17) | 1.07 | 18.98 | (8.00) | (0.69) | 2.89 |
|
Total from investment
operations |
(7.99) | 1.14 | 19.12 | (7.76) | (0.47) | 3.13 |
| Distributions to shareholders from | ||||||
|
Net investment
income |
0.00 | (0.10) | (0.13) | (0.28) | (0.15) | (0.32) |
|
Net realized
gains |
0.00 | (2.60) | (0.01) | (0.31) | (2.06) | (1.54) |
|
Total distributions to
shareholders |
0.00 | (2.70) | (0.14) | (0.59) | (2.21) | (1.86) |
|
Net asset value, end of
period |
$32.82 | $40.81 | $42.37 | $23.39 | $31.74 | $34.42 |
|
Total
return2 |
(19.58)% | 2.56% | 81.92% | (25.08)% | (0.87)% | 9.42% |
| Ratios to average net assets (annualized) | ||||||
|
Gross
expenses |
1.26% | 1.24% | 1.27% | 1.27% | 1.29% | 1.31% |
|
Net
expenses |
1.26% | 1.24% | 1.27% | 1.27% | 1.29% | 1.31% |
|
Net investment
income |
0.96% | 0.17% | 0.43% | 0.75% | 0.67% | 0.66% |
| Supplemental data | ||||||
|
Portfolio turnover
rate |
13% | 28% | 40% | 39% | 32% | 41% |
|
Net assets, end of period (000s
omitted) |
$646,036 | $797,067 | $797,193 | $381,058 | $526,656 | $539,499 |
| 1 | Calculated based upon average shares outstanding |
| 2 | Total return calculations do not include any sales charges. Returns for periods of less than one year are not annualized. |
| Year ended March 31 | ||||||
| Class C | Six
months ended September 30, 2022 (unaudited) |
2022 | 2021 | 2020 | 2019 | 2018 |
|
Net asset value, beginning of
period |
$36.04 | $37.90 | $20.99 | $28.49 | $31.21 | $30.19 |
|
Net investment income
(loss) |
0.03 1 | (0.22) 1 | (0.08) 1 | (0.01) 1 | (0.05) 1 | (0.03) 1 |
|
Net realized and unrealized gains (losses) on
investments |
(7.20) | 0.96 | 17.00 | (7.18) | (0.61) | 2.64 |
|
Total from investment
operations |
(7.17) | 0.74 | 16.92 | (7.19) | (0.66) | 2.61 |
| Distributions to shareholders from | ||||||
|
Net investment
income |
0.00 | 0.00 | 0.00 | 0.00 | 0.00 | (0.05) |
|
Net realized
gains |
0.00 | (2.60) | (0.01) | (0.31) | (2.06) | (1.54) |
|
Total distributions to
shareholders |
0.00 | (2.60) | (0.01) | (0.31) | (2.06) | (1.59) |
|
Net asset value, end of
period |
$28.87 | $36.04 | $37.90 | $20.99 | $28.49 | $31.21 |
|
Total
return2 |
(19.89)% | 1.79% | 80.71% | (25.65)% | (1.63)% | 8.60% |
| Ratios to average net assets (annualized) | ||||||
|
Gross
expenses |
2.00% | 1.99% | 2.01% | 2.02% | 2.04% | 2.06% |
|
Net
expenses |
2.00% | 1.99% | 2.01% | 2.02% | 2.04% | 2.06% |
|
Net investment income
(loss) |
0.17% | (0.58)% | (0.29)% | (0.04)% | (0.13)% | (0.10)% |
| Supplemental data | ||||||
|
Portfolio turnover
rate |
13% | 28% | 40% | 39% | 32% | 41% |
|
Net assets, end of period (000s
omitted) |
$7,402 | $10,792 | $14,063 | $11,419 | $24,334 | $53,145 |
| 1 | Calculated based upon average shares outstanding |
| 2 | Total return calculations do not include any sales charges. Returns for periods of less than one year are not annualized. |
| Year ended March 31 | ||||||
| Class R | Six
months ended September 30, 2022 (unaudited) |
2022 | 2021 | 2020 | 2019 | 2018 |
|
Net asset value, beginning of
period |
$41.44 | $43.01 | $23.73 | $32.20 | $34.94 | $33.73 |
|
Net investment income
(loss) |
0.14 1 | (0.03) | 0.07 | 0.16 | 0.18 | 0.17 |
|
Net realized and unrealized gains (losses) on
investments |
(8.30) | 1.07 | 19.25 | (8.12) | (0.74) | 2.92 |
|
Total from investment
operations |
(8.16) | 1.04 | 19.32 | (7.96) | (0.56) | 3.09 |
| Distributions to shareholders from | ||||||
|
Net investment
income |
0.00 | (0.01) | (0.03) | (0.20) | (0.12) | (0.34) |
|
Net realized
gains |
0.00 | (2.60) | (0.01) | (0.31) | (2.06) | (1.54) |
|
Total distributions to
shareholders |
0.00 | (2.61) | (0.04) | (0.51) | (2.18) | (1.88) |
|
Net asset value, end of
period |
$33.28 | $41.44 | $43.01 | $23.73 | $32.20 | $34.94 |
|
Total
return2 |
(19.69)% | 2.27% | 81.50% | (25.29)% | (1.11)% | 9.13% |
| Ratios to average net assets (annualized) | ||||||
|
Gross
expenses |
1.51% | 1.49% | 1.51% | 1.52% | 1.55% | 1.57% |
|
Net
expenses |
1.51% | 1.49% | 1.51% | 1.52% | 1.55% | 1.56% |
|
Net investment income
(loss) |
0.70% | (0.08)% | 0.13% | 0.46% | 0.47% | 0.43% |
| Supplemental data | ||||||
|
Portfolio turnover
rate |
13% | 28% | 40% | 39% | 32% | 41% |
|
Net assets, end of period (000s
omitted) |
$11,799 | $14,929 | $14,733 | $5,209 | $6,656 | $4,631 |
| 1 | Calculated based upon average shares outstanding |
| 2 | Returns for periods of less than one year are not annualized. |
| Year ended March 31 | ||||||
| Class R6 | Six
months ended September 30, 2022 (unaudited) |
2022 | 2021 | 2020 | 2019 | 2018 |
|
Net asset value, beginning of
period |
$41.98 | $43.51 | $24.00 | $32.55 | $35.25 | $33.93 |
|
Net investment
income |
0.27 1 | 0.26 1 | 0.28 | 0.37 | 0.38 | 0.38 1 |
|
Net realized and unrealized gains (losses) on
investments |
(8.42) | 1.10 | 19.49 | (8.17) | (0.72) | 2.97 |
|
Total from investment
operations |
(8.15) | 1.36 | 19.77 | (7.80) | (0.34) | 3.35 |
| Distributions to shareholders from | ||||||
|
Net investment
income |
0.00 | (0.29) | (0.25) | (0.44) | (0.30) | (0.49) |
|
Net realized
gains |
0.00 | (2.60) | (0.01) | (0.31) | (2.06) | (1.54) |
|
Total distributions to
shareholders |
0.00 | (2.89) | (0.26) | (0.75) | (2.36) | (2.03) |
|
Net asset value, end of
period |
$33.83 | $41.98 | $43.51 | $24.00 | $32.55 | $35.25 |
|
Total
return2 |
(19.41)% | 2.99% | 82.77% | (24.78)% | (0.42)% | 9.85% |
| Ratios to average net assets (annualized) | ||||||
|
Gross
expenses |
0.83% | 0.81% | 0.84% | 0.84% | 0.86% | 0.88% |
|
Net
expenses |
0.83% | 0.81% | 0.84% | 0.84% | 0.86% | 0.88% |
|
Net investment
income |
1.38% | 0.59% | 0.84% | 1.12% | 1.16% | 0.10% |
| Supplemental data | ||||||
|
Portfolio turnover
rate |
13% | 28% | 40% | 39% | 32% | 41% |
|
Net assets, end of period (000s
omitted) |
$1,419,797 | $1,764,529 | $1,598,341 | $580,535 | $518,377 | $254,801 |
| 1 | Calculated based upon average shares outstanding |
| 2 | Returns for periods of less than one year are not annualized. |
| Year ended March 31 | ||||||
| Administrator Class | Six
months ended September 30, 2022 (unaudited) |
2022 | 2021 | 2020 | 2019 | 2018 |
|
Net asset value, beginning of
period |
$41.96 | $43.50 | $24.00 | $32.55 | $35.22 | $33.90 |
|
Net investment
income |
0.20 1 | 0.11 1 | 0.16 1 | 0.26 1 | 0.27 1 | 0.27 1 |
|
Net realized and unrealized gains (losses) on
investments |
(8.40) | 1.09 | 19.48 | (8.18) | (0.71) | 2.97 |
|
Total from investment
operations |
(8.20) | 1.20 | 19.64 | (7.92) | (0.44) | 3.24 |
| Distributions to shareholders from | ||||||
|
Net investment
income |
0.00 | (0.14) | (0.13) | (0.32) | (0.17) | (0.38) |
|
Net realized
gains |
0.00 | (2.60) | (0.01) | (0.31) | (2.06) | (1.54) |
|
Total distributions to
shareholders |
0.00 | (2.74) | (0.14) | (0.63) | (2.23) | (1.92) |
|
Net asset value, end of
period |
$33.76 | $41.96 | $43.50 | $24.00 | $32.55 | $35.22 |
|
Total
return2 |
(19.54)% | 2.62% | 82.13% | (25.03)% | (0.77)% | 9.52% |
| Ratios to average net assets (annualized) | ||||||
|
Gross
expenses |
1.17% | 1.16% | 1.19% | 1.19% | 1.21% | 1.23% |
|
Net
expenses |
1.16% | 1.16% | 1.18% | 1.19% | 1.20% | 1.20% |
|
Net investment
income |
1.03% | 0.26% | 0.51% | 0.79% | 0.74% | 0.76% |
| Supplemental data | ||||||
|
Portfolio turnover
rate |
13% | 28% | 40% | 39% | 32% | 41% |
|
Net assets, end of period (000s
omitted) |
$102,049 | $135,870 | $196,801 | $105,286 | $160,369 | $229,992 |
| 1 | Calculated based upon average shares outstanding |
| 2 | Returns for periods of less than one year are not annualized. |
| Year ended March 31 | ||||||
| Institutional Class | Six
months ended September 30, 2022 (unaudited) |
2022 | 2021 | 2020 | 2019 | 2018 |
|
Net asset value, beginning of
period |
$41.98 | $43.52 | $24.01 | $32.56 | $35.27 | $33.94 |
|
Net investment
income |
0.25 1 | 0.22 1 | 0.25 1 | 0.31 | 0.33 | 0.33 |
|
Net realized and unrealized gains (losses) on
investments |
(8.41) | 1.08 | 19.50 | (8.14) | (0.70) | 3.01 |
|
Total from investment
operations |
(8.16) | 1.30 | 19.75 | (7.83) | (0.37) | 3.34 |
| Distributions to shareholders from | ||||||
|
Net investment
income |
0.00 | (0.24) | (0.23) | (0.41) | (0.28) | (0.47) |
|
Net realized
gains |
0.00 | (2.60) | (0.01) | (0.31) | (2.06) | (1.54) |
|
Total distributions to
shareholders |
0.00 | (2.84) | (0.24) | (0.72) | (2.34) | (2.01) |
|
Net asset value, end of
period |
$33.82 | $41.98 | $43.52 | $24.01 | $32.56 | $35.27 |
|
Total
return2 |
(19.44)% | 2.87% | 82.59% | (24.85)% | (0.53)% | 9.82% |
| Ratios to average net assets (annualized) | ||||||
|
Gross
expenses |
0.93% | 0.91% | 0.94% | 0.94% | 0.96% | 0.98% |
|
Net
expenses |
0.93% | 0.91% | 0.93% | 0.94% | 0.94% | 0.94% |
|
Net investment
income |
1.27% | 0.49% | 0.77% | 1.07% | 1.04% | 1.02% |
| Supplemental data | ||||||
|
Portfolio turnover
rate |
13% | 28% | 40% | 39% | 32% | 41% |
|
Net assets, end of period (000s
omitted) |
$2,401,776 | $3,193,721 | $3,102,741 | $1,465,398 | $1,359,038 | $1,196,501 |
| 1 | Calculated based upon average shares outstanding |
| 2 | Returns for periods of less than one year are not annualized. |
| Gross unrealized gains | $ 664,900,986 |
| Gross unrealized losses | (794,053,617) |
| Net unrealized losses | $(129,152,631) |
| ■ | Level 1 – quoted prices in active markets for identical securities |
| ■ | Level 2 – other significant observable inputs (including quoted prices for similar securities, interest rates, prepayment speeds, credit risk, etc.) |
| ■ | Level 3 – significant unobservable inputs (including the Fund’s own assumptions in determining the fair value of investments) |
| Quoted
prices (Level 1) |
Other
significant observable inputs (Level 2) |
Significant
unobservable inputs (Level 3) |
Total | |
| Assets | ||||
| Investments in: | ||||
| Common stocks | ||||
| Communication services | $ 21,668,742 | $ 0 | $0 | $ 21,668,742 |
| Consumer discretionary | 304,557,130 | 0 | 0 | 304,557,130 |
| Consumer staples | 382,708,109 | 0 | 0 | 382,708,109 |
| Energy | 335,049,504 | 0 | 0 | 335,049,504 |
| Financials | 768,464,727 | 38,175 | 0 | 768,502,902 |
| Health care | 223,598,288 | 0 | 0 | 223,598,288 |
| Industrials | 1,337,906,196 | 0 | 0 | 1,337,906,196 |
| Information technology | 194,279,222 | 0 | 0 | 194,279,222 |
| Materials | 738,448,708 | 0 | 0 | 738,448,708 |
| Real estate | 25,469,200 | 0 | 0 | 25,469,200 |
| Utilities | 30,835,754 | 0 | 0 | 30,835,754 |
| Investment companies | 51,830,233 | 0 | 0 | 51,830,233 |
| Short-term investments | ||||
| Investment companies | 126,678,275 | 0 | 0 | 126,678,275 |
| Total assets | $4,541,494,088 | $38,175 | $0 | $4,541,532,263 |
| Liabilities | ||||
| Written options | $ 4,831,625 | $ 12,392 | $0 | $ 4,844,017 |
| Total liabilities | $ 4,831,625 | $12,392 | $0 | $ 4,844,017 |
| Average daily net assets | Management fee |
| First $500 million | 0.850% |
| Next $500 million | 0.825 |
| Next $1 billion | 0.800 |
| Next $1 billion | 0.775 |
| Next $1 billion | 0.750 |
| Next $1 billion | 0.730 |
| Next $5 billion | 0.720 |
| Over $10 billion | 0.710 |
| Class-level
administration fee | |
| Class A | 0.21% |
| Class C | 0.21 |
| Class R | 0.21 |
| Class R6 | 0.03 |
| Administrator Class | 0.13 |
| Institutional Class | 0.13 |
| Expense ratio caps | |
| Class A | 1.31% |
| Class C | 2.06 |
| Class R | 1.56 |
| Class R6 | 0.89 |
| Administrator Class | 1.20 |
| Institutional Class | 0.94 |
| Counterparty | Value
of securities on loan |
Collateral
received1 |
Net amount |
| Bank of America Securities Incorporated | $ 12,810 | $ (12,810) | $0 |
| JPMorgan Securities LLC | 105,000 | (105,000) | 0 |
| National Financial Services LLC | 766,238 | (766,238) | 0 |
| UBS Securities LLC | 788,400 | (788,400) | 0 |
| Counterparty | Value
of written options |
Collateral
received1 |
Net amount |
| Bank of America Securities Incorporated | $4,844,017 | $(4,844,017) | $0 |
| Date | Value
of securities issued |
Cash | Realized
gains (losses) |
%
of the Fund |
| 11-8-2021 | $ 31,199,229 | $645,412 | $ 17,188,502 | 0.50 % |
| Name
and year of birth |
Position
held and length of service* |
Principal occupations during past five years or longer | Current
other public company or investment company directorships |
| William
R. Ebsworth (Born 1957) |
Trustee,
since 2015 |
Retired. From 1984 to 2013, equities analyst, portfolio manager, research director and chief investment officer at Fidelity Management and Research Company in Boston, Tokyo, and Hong Kong, and retired in 2013 as Chief Investment Officer of Fidelity Strategic Advisers, Inc. where he led a team of investment professionals managing client assets. Prior thereto, Board member of Hong Kong Securities Clearing Co., Hong Kong Options Clearing Corp., the Thailand International Fund, Ltd., Fidelity Investments Life Insurance Company, and Empire Fidelity Investments Life Insurance Company. Audit Committee Chair and Investment Committee Chair of the Vincent Memorial Hospital Endowment (non-profit organization). Mr. Ebsworth is a CFA® charterholder. | N/A |
| Jane
A. Freeman (Born 1953) |
Trustee,
since 2015; Chair Liaison, since 2018 |
Retired. From 2012 to 2014 and 1999 to 2008, Chief Financial Officer of Scientific Learning Corporation. From 2008 to 2012, Ms. Freeman provided consulting services related to strategic business projects. Prior to 1999, Portfolio Manager at Rockefeller & Co. and Scudder, Stevens & Clark. Board member of the Harding Loevner Funds from 1996 to 2014, serving as both Lead Independent Director and chair of the Audit Committee. Board member of the Russell Exchange Traded Funds Trust from 2011 to 2012 and the chair of the Audit Committee. Ms. Freeman is also an inactive Chartered Financial Analyst. | N/A |
| Isaiah
Harris, Jr. (Born 1952) |
Trustee,
since 2009; Audit Committee Chair, since 2019 |
Retired. Chairman of the Board of CIGNA Corporation from 2009 to 2021, and Director from 2005 to 2008. From 2003 to 2011, Director of Deluxe Corporation. Prior thereto, President and CEO of BellSouth Advertising and Publishing Corp. from 2005 to 2007, President and CEO of BellSouth Enterprises from 2004 to 2005 and President of BellSouth Consumer Services from 2000 to 2003. Emeritus member of the Iowa State University Foundation Board of Governors. Emeritus Member of the Advisory Board of Iowa State University School of Business. Advisory Board Member, Palm Harbor Academy (private school). Advisory Board Member, Fellowship of Christian Athletes. Mr. Harris is a certified public accountant (inactive status). | N/A |
| David
F. Larcker (Born 1950) |
Trustee,
since 2009 |
James Irvin Miller Professor of Accounting at the Graduate School of Business (Emeritus), Stanford University, Director of the Corporate Governance Research Initiative and Senior Faculty of The Rock Center for Corporate Governance since 2006. From 2005 to 2008, Professor of Accounting at the Graduate School of Business, Stanford University. Prior thereto, Ernst & Young Professor of Accounting at The Wharton School, University of Pennsylvania from 1985 to 2005. | N/A |
| Name
and year of birth |
Position
held and length of service* |
Principal occupations during past five years or longer | Current
other public company or investment company directorships |
| Olivia
S. Mitchell (Born 1953) |
Trustee,
since 2006; Nominating and Governance Committee Chair, since 2018 |
International Foundation of Employee Benefit Plans Professor since 1993, Wharton School of the University of Pennsylvania. Director of Wharton’s Pension Research Council and Boettner Center on Pensions & Retirement Research, and Research Associate at the National Bureau of Economic Research. Previously taught at Cornell University from 1978 to 1993. | N/A |
| Timothy
J. Penny (Born 1951) |
Trustee,
since 1996; Chair, since 2018 |
President and Chief Executive Officer of Southern Minnesota Initiative Foundation, a non-profit organization, since 2007. Vice Chair of the Economic Club of Minnesota, since 2007. Co-Chair of the Committee for a Responsible Federal Budget, since 1995. Member of the Board of Trustees of NorthStar Education Finance, Inc., a non-profit organization, since 2007. Senior Fellow of the University of Minnesota Humphrey Institute from 1995 to 2017. | N/A |
| James
G. Polisson (Born 1959) |
Trustee,
since 2018 |
Retired. Chief Marketing Officer, Source (ETF) UK Services, Ltd, from 2015 to 2017. From 2012 to 2015, Principal of The Polisson Group, LLC, a management consulting, corporate advisory and principal investing company. Chief Executive Officer and Managing Director at Russell Investments, Global Exchange Traded Funds from 2010 to 2012. Managing Director of Barclays Global Investors from 1998 to 2010 and Global Chief Marketing Officer for iShares and Barclays Global Investors from 2000 to 2010. Trustee of the San Francisco Mechanics’ Institute, a non-profit organization, from 2013 to 2015. Board member of the Russell Exchange Traded Fund Trust from 2011 to 2012. Director of Barclays Global Investors Holdings Deutschland GmbH from 2006 to 2009. Mr. Polisson is an attorney and has a retired status with the Massachusetts and District of Columbia Bar Associations. | N/A |
| Pamela
Wheelock (Born 1959) |
Trustee,
since January 2020; previously Trustee from January 2018 to July 2019 |
Retired. Executive and Senior Financial leadership positions in the public, private and nonprofit sectors. Interim President and CEO, McKnight Foundation, 2020. Interim Commissioner, Minnesota Department of Human Services, 2019. Chief Operating Officer, Twin Cities Habitat for Humanity, 2017-2019. Vice President for University Services, University of Minnesota, 2012-2016. Interim President and CEO, Blue Cross and Blue Shield of Minnesota, 2011-2012. Executive Vice-President and Chief Financial Officer, Minnesota Wild, 2002-2008. Commissioner, Minnesota Department of Finance, 1999-2002. Chair of the Board of Directors of Destination Medical Center Corporation. Board member of the Minnesota Wild Foundation. | N/A |
| Name
and year of birth |
Position
held and length of service |
Principal occupations during past five years or longer |
| Andrew
Owen (Born 1960) |
President,
since 2017 |
President and Chief Executive Officer of Allspring Funds Management, LLC since 2017 and Head of Global Fund Governance of Allspring Global Investments since 2022. Prior thereto, co-president of Galliard Capital Management, LLC, an affiliate of Allspring Funds Management, LLC, from 2019 to 2022 and Head of Affiliated Managers, Allspring Global Investments, from 2014 to 2019 and Executive Vice President responsible for marketing, investments and product development for Allspring Funds Management, LLC, from 2009 to 2014. |
| Jeremy
DePalma (Born 1974) |
Treasurer,
since 2012 (for certain funds in the Fund Complex); since 2021 (for the remaining funds in the Fund Complex) |
Senior Vice President of Allspring Funds Management, LLC since 2009. Senior Vice President of Evergreen Investment Management Company, LLC from 2008 to 2010 and head of the Fund Reporting and Control Team within Fund Administration from 2005 to 2010. |
| Christopher
Baker (Born 1976) |
Chief Compliance Officer, since 2022 | Global Chief Compliance Officer for Allspring Global Investments since 2022. Prior thereto, Chief Compliance Officer for State Street Global Advisors from 2018 to 2021. Senior Compliance Officer for the State Street divisions of Alternative Investment Solutions, Sector Solutions, and Global Marketing from 2015 to 2018. From 2010 to 2015 Vice President, Global Head of Investment and Marketing Compliance for State Street Global Advisors. |
| Matthew
Prasse (Born 1983) |
Chief Legal Officer, since 2022; Secretary, since 2021 | Senior Counsel of the Allspring Legal Department since 2021. Senior Counsel of the Wells Fargo Legal Department from 2018 to 2021. Previously, Counsel for Barings LLC from 2015 to 2018. Prior to joining Barings, Associate at Morgan, Lewis & Bockius LLP from 2008 to 2015. |
P.O. Box 219967
Kansas City, MO 64121-9967

1-800-222-8222 or visit the Fund's website at allspringglobal.com. Read the prospectus carefully before you invest or send money.
SA246/SAR246 09-22

|
|
2 |
|
|
6 |
|
|
8 |
|
|
9 |
| Consolidated financial statements | |
|
|
12 |
|
|
13 |
|
|
14 |
|
|
15 |
|
|
19 |
|
|
25 |

| 1 | The S&P 500 Index consists of 500 stocks chosen for market size, liquidity, and industry group representation. It is a market-value-weighted index with each stock's weight in the index proportionate to its market value. You cannot invest directly in an index. |
| 2 | The Morgan Stanley Capital International (MSCI) All Country World Index (ACWI) ex USA Index (Net) is a free-float-adjusted market-capitalization-weighted index that is designed to measure the equity market performance of developed and emerging markets, excluding the U.S. Source: MSCI. MSCI makes no express or implied warranties or representations and shall have no liability whatsoever with respect to any MSCI data contained herein. The MSCI data may not be further redistributed or used as a basis for other indexes or any securities or financial products. This report is not approved, reviewed, or produced by MSCI. You cannot invest directly in an index. |
| 3 | The MSCI Emerging Markets (EM) Index (Net) (USD) is a free-float-adjusted market-capitalization-weighted index that is designed to measure equity market performance of emerging markets. You cannot invest directly in an index. |
| 4 | The Bloomberg U.S. Aggregate Bond Index is a broad-based benchmark that measures the investment-grade, U.S.-dollar-denominated, fixed-rate taxable bond market, including Treasuries, government-related and corporate securities, mortgage-backed securities (agency fixed-rate and hybrid adjustable-rate mortgage pass-throughs), asset-backed securities, and commercial mortgage-backed securities. You cannot invest directly in an index. |
| 5 | The Bloomberg Global Aggregate ex-USD Index (unhedged) is an unmanaged index that provides a broad-based measure of the global investment-grade fixed-income markets excluding the U.S.-dollar-denominated debt market. You cannot invest directly in an index. |
| 6 | The Bloomberg Municipal Bond Index is an unmanaged index composed of long-term tax-exempt bonds with a minimum credit rating of Baa. You cannot invest directly in an index. |
| 7 | The ICE BofA U.S. High Yield Index is a market-capitalization-weighted index of domestic and Yankee high-yield bonds. The index tracks the performance of high-yield securities traded in the U.S. bond market. You cannot invest directly in an index. Copyright 2022. ICE Data Indices, LLC. All rights reserved. |
| 1 | The MSCI ACWI (Net) is a free-float-adjusted market-capitalization-weighted index that is designed to measure the equity market performance of developed and emerging markets. You cannot invest directly in an index. |

President
Allspring Funds
| Investment objective | The Fund seeks long-term capital appreciation. |
| Manager | Allspring Funds Management, LLC |
| Subadviser | Allspring Global Investments, LLC |
| Portfolio managers | Michael Bradshaw, CFA®‡, Oleg Makhorine |
| Average annual total returns (%) as of September 30, 2022 | |||||||||||
| Including sales charge | Excluding sales charge | Expense ratios1 (%) | |||||||||
| Inception date | 1 year | 5 year | 10 year | 1 year | 5 year | 10 year | Gross | Net 2 | |||
| Class A (EKWAX) | 1-20-1998 | -20.01 | -0.19 | -6.88 | -15.12 | 1.00 | -6.32 | 1.18 | 1.09 | ||
| Class C (EKWCX) | 1-29-1998 | -16.74 | 0.24 | -6.88 | -15.74 | 0.24 | -6.88 | 1.93 | 1.84 | ||
| Administrator Class (EKWDX) | 7-30-2010 | – | – | – | -14.99 | 1.14 | -6.19 | 1.10 | 0.95 | ||
| Institutional Class (EKWYX) | 2-29-2000 | – | – | – | -14.86 | 1.30 | -6.04 | 0.85 | 0.79 | ||
| FTSE Gold Mines Index3 | – | – | – | – | -19.59 | 1.01 | -6.49 | – | – | ||
| S&P 500 Index4 | – | – | – | – | -15.47 | 9.24 | 11.70 | – | – | ||
| 1 | Reflects the expense ratios as stated in the most recent prospectuses. The expense ratios shown are subject to change and may differ from the annualized expense ratios shown in the financial highlights of this report. |
| 2 | The manager has contractually committed through July 31, 2023, to waive fees and/or reimburse expenses to the extent necessary to cap total annual fund operating expenses after fee waivers at 1.09% for Class A, 1.84% for Class C, 0.95% for Administrator Class, and 0.79% for Institutional Class. Brokerage commissions, stamp duty fees, interest, taxes, acquired fund fees and expenses (if any), and extraordinary expenses are excluded from the expense caps. Prior to or after the commitment expiration date, the caps may be increased or the commitment to maintain the caps may be terminated only with the approval of the Board of Trustees. Without these caps, the Fund’s returns would have been lower. The expense ratio paid by an investor is the net expense ratio (the total annual fund operating expenses after fee waivers) as stated in the prospectuses. |
| 3 | FTSE Gold Mines Index is an unmanaged, open-ended index designed to reflect the performance of the worldwide market in the shares of companies whose principal activity is the mining of gold. You cannot invest directly in an index. |
| 4 | The S&P 500 Index consists of 500 stocks chosen for market size, liquidity, and industry group representation. It is a market-value weighted index with each stock’s weight in the index proportionate to its market value. You cannot invest directly in an index. |
| ‡ | CFA® and Chartered Financial Analyst® are trademarks owned by CFA Institute. |

| Beginning
account value 4-1-2022 |
Ending
account value 9-30-2022 |
Consolidated
expenses paid during the period1 |
Annualized
net expense ratio | |
| Class A | ||||
| Actual | $1,000.00 | $ 664.71 | $4.51 | 1.08% |
| Hypothetical (5% return before expenses) | $1,000.00 | $1,019.65 | $5.47 | 1.08% |
| Class C | ||||
| Actual | $1,000.00 | $ 662.32 | $7.67 | 1.84% |
| Hypothetical (5% return before expenses) | $1,000.00 | $1,015.84 | $9.30 | 1.84% |
| Administrator Class | ||||
| Actual | $1,000.00 | $ 665.27 | $3.97 | 0.95% |
| Hypothetical (5% return before expenses) | $1,000.00 | $1,020.31 | $4.81 | 0.95% |
| Institutional Class | ||||
| Actual | $1,000.00 | $ 665.77 | $3.30 | 0.79% |
| Hypothetical (5% return before expenses) | $1,000.00 | $1,021.11 | $4.00 | 0.79% |
| Shares | Value | |||||
| Common stocks: 93.94% | ||||||
| Australia: 7.42% | ||||||
| Capricorn Metals Limited (Materials, Metals & mining) † | 300,000 | $ 574,353 | ||||
| Evolution Mining Limited (Materials, Metals & mining) | 1,400,000 | 1,826,407 | ||||
| Newcrest Mining Limited (Materials, Metals & mining) | 702,294 | 7,710,613 | ||||
| Northern Star Resources Limited (Materials, Metals & mining) | 1,536,412 | 7,693,264 | ||||
| 17,804,637 | ||||||
| Canada: 64.79% | ||||||
| Agnico-Eagle Mines Limited (Materials, Metals & mining) | 334,527 | 14,133,272 | ||||
| Agnico-Eagle Mines Limited-Legend Shares (Materials, Metals & mining) | 35,000 | 1,478,050 | ||||
| Agnico-Eagle Mines Limited-U.S. Exchange Traded Shares (Materials, Metals & mining) | 124,164 | 5,243,446 | ||||
| Alamos Gold Incorporated Class A (Materials, Metals & mining) | 1,153,980 | 8,554,498 | ||||
| Artemis Gold Incorporated (Materials, Metals & mining) † | 900,000 | 2,782,061 | ||||
| Ascot Resources Limited (Materials, Metals & mining) † | 2,650,000 | 748,181 | ||||
| B2Gold Corporation (Materials, Metals & mining) | 3,100,000 | 9,964,165 | ||||
| Barrick Gold Corporation (Materials, Metals & mining) | 945,723 | 14,658,707 | ||||
| Centerra Gold Incorporated (Materials, Metals & mining) | 200,000 | 880,298 | ||||
| Centerra Gold Incorporated-Legend Shares (Materials, Metals & mining) 144A | 250,000 | 1,100,373 | ||||
| Dundee Precious Metals Incorporated (Materials, Metals & mining) | 1,075,000 | 4,778,297 | ||||
| Franco-Nevada Corporation-Legend Shares (Materials, Metals & mining) 144A | 130,948 | 15,641,525 | ||||
| Kinross Gold Corporation (Materials, Metals & mining) | 3,032,483 | 11,415,580 | ||||
| Lundin Gold Incorporated (Materials, Metals & mining) | 1,150,000 | 7,992,182 | ||||
| MAG Silver Corporation (Materials, Metals & mining) † | 510,000 | 6,383,538 | ||||
| MAG Silver Corporation-Legend Shares (Materials, Metals & mining) | 100,000 | 1,251,674 | ||||
| Marathon Gold Corporation (Materials, Metals & mining) † | 1,300,000 | 997,575 | ||||
| Orla Mining Limited (Materials, Metals & mining) † | 300,000 | 979,477 | ||||
| Osisko Mining Incorporated (Materials, Metals & mining) † | 450,000 | 1,006,620 | ||||
| Pan American Silver Corporation (Materials, Metals & mining) | 265,000 | 4,208,200 | ||||
| SilverCrest Metals Incorporated (Materials, Metals & mining) † | 1,135,000 | 6,302,132 | ||||
| Skeena Resources Limited (Materials, Metals & mining) † | 300,000 | 1,402,975 | ||||
| SSR Mining Incorporated (Materials, Metals & mining) | 275,000 | 4,045,250 | ||||
| SSR Mining Incorporated-U.S. Exchange Traded Shares (Materials, Metals & mining) | 383,552 | 5,639,368 | ||||
| Torex Gold Resources Incorporated (Materials, Metals & mining) † | 310,000 | 2,237,449 | ||||
| Torex Gold Resources Incorporated-Legend Shares (Materials, Metals & mining) 144A | 185,000 | 1,335,252 | ||||
| Torex Gold Resources Incorporated-Legend Shares (Materials, Metals & mining) | 266,250 | 1,921,680 | ||||
| Triple Flag Precious Metals Corporation (Materials, Metals & mining) | 210,000 | 2,660,441 | ||||
| Wheaton Precious Metals Corporation (Materials, Metals & mining) | 12,950 | 419,339 |
| Shares | Value | |||||
| Canada: (continued) | ||||||
| Wheaton Precious Metals Corporation-U.S. Exchange Traded Shares (Materials, Metals & mining) | 380,000 | $ 12,296,800 | ||||
| Yamana Gold Incorporated (Materials, Metals & mining) | 650,000 | 2,940,964 | ||||
| 155,399,369 | ||||||
| South Africa: 6.46% | ||||||
| AngloGold Ashanti Limited ADR (Materials, Metals & mining) | 330,591 | 4,568,768 | ||||
| Gold Fields Limited ADR (Materials, Metals & mining) | 1,350,000 | 10,921,500 | ||||
| 15,490,268 | ||||||
| United Kingdom: 5.31% | ||||||
| Endeavour Mining plc (Materials, Metals & mining) | 690,000 | 12,727,549 | ||||
| United States: 9.96% | ||||||
| Newmont Corporation (Materials, Metals & mining) | 150,802 | 6,338,208 | ||||
| Newmont Corporation-Toronto Exchange Traded Shares (Materials, Metals & mining) | 131,348 | 5,514,077 | ||||
| Royal Gold Incorporated (Materials, Metals & mining) | 128,436 | 12,049,866 | ||||
| 23,902,151 | ||||||
| Total Common stocks (Cost $180,077,819) | 225,323,974 |
| Expiration
date |
||||||
| Rights: 0.00% | ||||||
| Canada: 0.00% | ||||||
| Kinross Gold Corporation Contingent Value Rights (Materials, Metals & mining) ♦† | 3-1-2032 | 75,000 | 0 | |||
| Total Rights (Cost $0) | 0 |
| Warrants: 0.00% | ||||||
| Canada: 0.00% | ||||||
| Marathon Gold Corporation (Materials, Metals & mining) ♦† | 9-20-2024 | 250,000 | 0 | |||
| Total Warrants (Cost $0) | 0 |
| Troy ounces | ||||||
| Commodities: 5.33% | ||||||
| Gold Bullion * | 7,690 | 12,779,600 | ||||
| Total Commodities (Cost $4,532,552) | 12,779,600 |
| Yield | Shares | Value | ||||
| Short-term investments: 0.73% | ||||||
| Investment companies: 0.73% | ||||||
| Allspring Government Money Market Fund Select Class ♠∞ | 2.75% | 1,747,897 | $ 1,747,897 | |||
| Total Short-term investments (Cost $1,747,897) | 1,747,897 | |||||
| Total investments in securities (Cost $186,358,268) | 100.00% | 239,851,471 | ||||
| Other assets and liabilities, net | 0.00 | 10,810 | ||||
| Total net assets | 100.00% | $239,862,281 |
| † | Non-income-earning security |
| 144A | The security may be resold in transactions exempt from registration, normally to qualified institutional buyers, pursuant to Rule 144A under the Securities Act of 1933. |
| ♦ | The security is fair valued in accordance with procedures approved by the Board of Trustees. |
| * | Represents an investment held in Special Investments (Cayman) SPC, the consolidated subsidiary. |
| ♠ | The issuer of the security is an affiliated person of the Fund as defined in the Investment Company Act of 1940. |
| ∞ | The rate represents the 7-day annualized yield at period end. |
| Abbreviations: | |
| ADR | American depositary receipt |
| Value,
beginning of period |
Purchases | Sales
proceeds |
Net
realized gains (losses) |
Net
change in unrealized gains (losses) |
Value,
end of period |
Shares,
end of period |
Income
from affiliated securities | |
| Short-term investments | ||||||||
| Allspring Government Money Market Fund Select Class | $8,444,788 | $37,252,536 | $(43,949,427) | $0 | $0 | $1,747,897 | 1,747,897 | $25,712 |
| Assets | |
|
Investments in unaffiliated securities, at value (cost
$180,077,819) |
$ 225,323,974 |
|
Investments in affiliated securities, at value (cost
$1,747,897) |
1,747,897 |
|
Investments in commodities, at value (cost
$4,532,552) |
12,779,600 |
|
Cash |
227,279 |
|
Foreign currency, at value (cost
$2,195,755) |
2,107,012 |
|
Receivable for Fund shares
sold |
498,907 |
|
Receivable for
dividends |
136,050 |
|
Prepaid expenses and other
assets |
63,689 |
|
Total
assets |
242,884,408 |
| Liabilities | |
|
Payable for Fund shares
redeemed |
2,727,120 |
|
Management fee
payable |
117,633 |
|
Administration fees
payable |
37,343 |
|
Distribution fee
payable |
4,842 |
|
Trustees’ fees and expenses
payable |
3,726 |
|
Accrued expenses and other
liabilities |
131,463 |
|
Total
liabilities |
3,022,127 |
|
Total net
assets |
$239,862,281 |
| Net assets consist of | |
|
Paid-in
capital |
$ 331,258,061 |
|
Total distributable
loss |
(91,395,780) |
|
Total net
assets |
$239,862,281 |
| Computation of net asset value and offering price per share | |
|
Net assets – Class
A |
$ 130,696,800 |
|
Shares outstanding – Class
A1 |
3,600,210 |
|
Net asset value per share – Class
A |
$36.30 |
|
Maximum offering price per share – Class
A2 |
$38.51 |
|
Net assets – Class
C |
$ 7,411,165 |
|
Shares outstanding – Class
C1 |
231,693 |
|
Net asset value per share – Class
C |
$31.99 |
|
Net assets – Administrator
Class |
$ 16,181,922 |
|
Shares outstanding – Administrator
Class1 |
441,772 |
|
Net asset value per share – Administrator
Class |
$36.63 |
|
Net assets – Institutional
Class |
$ 85,572,394 |
|
Shares outstanding – Institutional
Class1 |
2,315,686 |
Net
asset value per share – Institutional
Class |
$36.95 |
| 1 | The Fund has an unlimited number of authorized shares. |
| 2 | Maximum offering price is computed as 100/94.25 of net asset value. On investments of $50,000 or more, the offering price is reduced. |
| Investment income | |
|
Dividends (net of foreign withholdings taxes of
$357,068) |
$ 2,970,042 |
|
Income from affiliated
securities |
25,712 |
|
Total investment
income |
2,995,754 |
| Expenses | |
|
Management
fee |
1,002,138 |
| Administration fees | |
|
Class
A |
175,935 |
|
Class
C |
9,836 |
|
Administrator
Class |
13,317 |
|
Institutional
Class |
72,110 |
| Shareholder servicing fees | |
|
Class
A |
209,446 |
|
Class
C |
11,709 |
|
Administrator
Class |
25,609 |
| Distribution fee | |
|
Class
C |
35,127 |
|
Custody and accounting
fees |
20,668 |
|
Professional
fees |
31,182 |
|
Registration
fees |
27,458 |
|
Shareholder report
expenses |
7,028 |
|
Trustees’ fees and
expenses |
11,191 |
|
Transfer agent
fees |
2,211 |
|
Other fees and
expenses |
3,387 |
|
Total
expenses |
1,658,352 |
| Less: Fee waivers and/or expense reimbursements | |
|
Fund-level |
(84,504) |
|
Class
A |
(34,182) |
|
Class
C |
(1,427) |
|
Administrator
Class |
(7,550) |
|
Net
expenses |
1,530,689 |
|
Net investment
income |
1,465,065 |
| Realized and unrealized gains (losses) on investments | |
|
Net realized losses on
investments |
(1,878,377) |
| Net change in unrealized gains (losses) on | |
|
Unaffiliated
securities |
(127,920,556) |
|
Commodities |
(2,114,339) |
|
Net change in unrealized gains (losses) on
investments |
(130,034,895) |
|
Net realized and unrealized gains (losses) on
investments |
(131,913,272) |
|
Net decrease in net assets resulting from
operations |
$(130,448,207) |
| Six
months ended September 30, 2022 (unaudited) |
Year
ended March 31, 2022 | |||
| Operations | ||||
|
Net investment
income |
$ 1,465,065 | $ 2,289,676 | ||
|
Net realized gains (losses) on
investments |
(1,878,377) | 11,771,865 | ||
|
Net change in unrealized gains (losses) on
investments |
(130,034,895) | 43,339,500 | ||
|
Net increase (decrease) in net assets resulting from
operations |
(130,448,207) | 57,401,041 | ||
| Distributions to shareholders from | ||||
| Net investment income and net realized gains | ||||
|
Class
A |
0 | (2,465,823) | ||
|
Class
C |
0 | (23,828) | ||
|
Administrator
Class |
0 | (285,008) | ||
|
Institutional
Class |
0 | (1,978,706) | ||
|
Total distributions to
shareholders |
0 | (4,753,365) | ||
| Capital share transactions | Shares | Shares | ||
| Proceeds from shares sold | ||||
|
Class
A |
361,822 | 16,887,094 | 635,264 | 31,820,827 |
|
Class
C |
13,060 | 528,950 | 34,189 | 1,491,358 |
|
Administrator
Class |
157,744 | 7,216,001 | 546,383 | 27,219,384 |
|
Institutional
Class |
536,312 | 24,338,599 | 908,294 | 46,314,183 |
| 48,970,644 | 106,845,752 | |||
| Reinvestment of distributions | ||||
|
Class
A |
0 | 0 | 50,693 | 2,290,305 |
|
Class
C |
0 | 0 | 590 | 23,631 |
|
Administrator
Class |
0 | 0 | 6,179 | 281,352 |
|
Institutional
Class |
0 | 0 | 32,848 | 1,507,057 |
| 0 | 4,102,345 | |||
| Payment for shares redeemed | ||||
|
Class
A |
(579,619) | (23,951,857) | (999,369) | (48,762,130) |
|
Class
C |
(34,788) | (1,382,223) | (72,521) | (3,120,098) |
|
Administrator
Class |
(170,288) | (7,387,766) | (393,345) | (19,388,309) |
|
Institutional
Class |
(749,463) | (32,054,557) | (1,081,288) | (53,579,450) |
| (64,776,403) | (124,849,987) | |||
|
Net decrease in net assets resulting from capital share
transactions |
(15,805,759) | (13,901,890) | ||
|
Total increase (decrease) in net
assets |
(146,253,966) | 38,745,786 | ||
| Net assets | ||||
|
Beginning of
period |
386,116,247 | 347,370,461 | ||
|
End of
period |
$ 239,862,281 | $ 386,116,247 | ||
| Year ended March 31 | ||||||
| Class A | Six
months ended September 30, 2022 (unaudited) |
2022 | 2021 | 2020 | 2019 | 2018 |
|
Net asset value, beginning of
period |
$54.61 | $46.95 | $35.30 | $33.94 | $32.80 | $35.99 |
|
Net investment income
(loss) |
0.19 1 | 0.27 1 | 0.08 | (0.03) 1 | (0.03) 1 | (0.11) 1 |
|
Net realized and unrealized gains (losses) on
investments |
(18.50) | 8.03 | 12.35 | 1.44 | 1.17 | (2.60) |
|
Total from investment
operations |
(18.31) | 8.30 | 12.43 | 1.41 | 1.14 | (2.71) |
| Distributions to shareholders from | ||||||
|
Net investment
income |
0.00 | (0.64) | (0.78) | (0.05) | 0.00 | (0.48) |
|
Net asset value, end of
period |
$36.30 | $54.61 | $46.95 | $35.30 | $33.94 | $32.80 |
|
Total
return2 |
(33.53)% | 17.96% | 34.95% | 4.13% | 3.48% | (7.56)% |
| Ratios to average net assets (annualized) | ||||||
|
Gross
expenses |
1.18% | 1.18% | 1.17% | 1.20% | 1.22% | 1.21% |
|
Net
expenses |
1.08% | 1.09% | 1.09% | 1.09% | 1.09% | 1.04% |
|
Net investment income
(loss) |
0.86% | 0.55% | 0.12% | (0.08)% | (0.11)% | (0.32)% |
| Supplemental data | ||||||
|
Portfolio turnover
rate3 |
7% | 15% | 22% | 25% | 19% | 27% |
|
Net assets, end of period (000s
omitted) |
$130,697 | $208,497 | $193,949 | $147,020 | $162,860 | $177,859 |
| 1 | Calculated based upon average shares outstanding |
| 2 | Total return calculations do not include any sales charges. Returns for periods of less than one year are not annualized. |
| 3 | Portfolio turnover rate includes the purchases and sales transactions of its wholly-owned subsidiary. |
| Year ended March 31 | ||||||
| Class C | Six
months ended September 30, 2022 (unaudited) |
2022 | 2021 | 2020 | 2019 | 2018 |
|
Net asset value, beginning of
period |
$48.30 | $41.35 | $30.87 | $29.88 | $29.09 | $32.07 |
|
Net investment income
(loss) |
0.02 1 | (0.09) 1 | (0.32) 1 | (0.29) 1 | (0.24) 1 | (0.33) 1 |
|
Net realized and unrealized gains (losses) on
investments |
(16.33) | 7.13 | 10.80 | 1.28 | 1.03 | (2.30) |
|
Total from investment
operations |
(16.31) | 7.04 | 10.48 | 0.99 | 0.79 | (2.63) |
| Distributions to shareholders from | ||||||
|
Net investment
income |
0.00 | (0.09) | 0.00 | 0.00 | 0.00 | (0.35) |
|
Net asset value, end of
period |
$31.99 | $48.30 | $41.35 | $30.87 | $29.88 | $29.09 |
|
Total
return2 |
(33.77)% | 17.07% | 33.95% | 3.31% | 2.72% | (8.24)% |
| Ratios to average net assets (annualized) | ||||||
|
Gross
expenses |
1.93% | 1.93% | 1.92% | 1.95% | 1.97% | 1.96% |
|
Net
expenses |
1.84% | 1.84% | 1.84% | 1.84% | 1.84% | 1.79% |
|
Net investment income
(loss) |
0.10% | (0.21)% | (0.68)% | (0.83)% | (0.88)% | (1.07)% |
| Supplemental data | ||||||
|
Portfolio turnover
rate3 |
7% | 15% | 22% | 25% | 19% | 27% |
|
Net assets, end of period (000s
omitted) |
$7,411 | $12,241 | $12,039 | $11,834 | $14,908 | $33,022 |
| 1 | Calculated based upon average shares outstanding |
| 2 | Total return calculations do not include any sales charges. Returns for periods of less than one year are not annualized. |
| 3 | Portfolio turnover rate includes the purchases and sales transactions of its wholly-owned subsidiary. |
| Year ended March 31 | ||||||
| Administrator Class | Six
months ended September 30, 2022 (unaudited) |
2022 | 2021 | 2020 | 2019 | 2018 |
|
Net asset value, beginning of
period |
$55.06 | $47.36 | $35.66 | $34.29 | $33.09 | $36.27 |
|
Net investment income
(loss) |
0.22 1 | 0.38 1 | 0.17 1 | 0.02 1 | 0.01 1 | (0.09) 1 |
|
Net realized and unrealized gains (losses) on
investments |
(18.65) | 8.05 | 12.47 | 1.45 | 1.19 | (2.59) |
|
Total from investment
operations |
(18.43) | 8.43 | 12.64 | 1.47 | 1.20 | (2.68) |
| Distributions to shareholders from | ||||||
|
Net investment
income |
0.00 | (0.73) | (0.94) | (0.10) | 0.00 | (0.50) |
|
Net asset value, end of
period |
$36.63 | $55.06 | $47.36 | $35.66 | $34.29 | $33.09 |
|
Total
return2 |
(33.47)% | 18.13% | 35.13% | 4.24% | 3.63% | (7.40)% |
| Ratios to average net assets (annualized) | ||||||
|
Gross
expenses |
1.10% | 1.10% | 1.09% | 1.12% | 1.14% | 1.15% |
|
Net
expenses |
0.95% | 0.95% | 0.95% | 0.95% | 0.95% | 0.91% |
|
Net investment income
(loss) |
1.00% | 0.78% | 0.31% | 0.06% | 0.04% | (0.25)% |
| Supplemental data | ||||||
|
Portfolio turnover
rate3 |
7% | 15% | 22% | 25% | 19% | 27% |
|
Net assets, end of period (000s
omitted) |
$16,182 | $25,016 | $13,976 | $7,994 | $8,086 | $9,148 |
| 1 | Calculated based upon average shares outstanding |
| 2 | Returns for periods of less than one year are not annualized. |
| 3 | Portfolio turnover rate includes the purchases and sales transactions of its wholly-owned subsidiary. |
| Year ended March 31 | ||||||
| Institutional Class | Six
months ended September 30, 2022 (unaudited) |
2022 | 2021 | 2020 | 2019 | 2018 |
|
Net asset value, beginning of
period |
$55.50 | $47.74 | $35.96 | $34.57 | $33.30 | $36.47 |
|
Net investment
income |
0.38 | 0.50 | 0.24 | 0.09 1 | 0.04 | 0.02 |
|
Net realized and unrealized gains (losses) on
investments |
(18.93) | 8.07 | 12.59 | 1.46 | 1.23 | (2.67) |
|
Total from investment
operations |
(18.55) | 8.57 | 12.83 | 1.55 | 1.27 | (2.65) |
| Distributions to shareholders from | ||||||
|
Net investment
income |
0.00 | (0.81) | (1.05) | (0.16) | 0.00 | (0.52) |
|
Net asset value, end of
period |
$36.95 | $55.50 | $47.74 | $35.96 | $34.57 | $33.30 |
|
Total
return2 |
(33.42)% | 18.30% | 35.34% | 4.43% | 3.81% | (7.27)% |
| Ratios to average net assets (annualized) | ||||||
|
Gross
expenses |
0.85% | 0.85% | 0.84% | 0.87% | 0.89% | 0.88% |
|
Net
expenses |
0.79% | 0.79% | 0.79% | 0.79% | 0.79% | 0.73% |
|
Net investment
income |
1.14% | 0.85% | 0.37% | 0.22% | 0.21% | 0.01% |
| Supplemental data | ||||||
|
Portfolio turnover
rate3 |
7% | 15% | 22% | 25% | 19% | 27% |
|
Net assets, end of period (000s
omitted) |
$85,572 | $140,363 | $127,406 | $107,907 | $95,431 | $82,650 |
| 1 | Calculated based upon average shares outstanding |
| 2 | Returns for periods of less than one year are not annualized. |
| 3 | Portfolio turnover rate includes the purchases and sales transactions of its wholly-owned subsidiary. |
| Gross unrealized gains | $248,250,108 |
| Gross unrealized losses | (25,891,187) |
| Net unrealized gains | $222,358,921 |
| ■ | Level 1 – quoted prices in active markets for identical securities |
| ■ | Level 2 – other significant observable inputs (including quoted prices for similar securities, interest rates, prepayment speeds, credit risk, etc.) |
| ■ | Level 3 – significant unobservable inputs (including the Fund’s own assumptions in determining the fair value of investments) |
| Quoted
prices (Level 1) |
Other
significant observable inputs (Level 2) |
Significant
unobservable inputs (Level 3) |
Total | |
| Assets | ||||
| Investments in: | ||||
| Common stocks | ||||
| Australia | $ 0 | $ 17,804,637 | $0 | $ 17,804,637 |
| Canada | 132,670,815 | 22,728,554 | 0 | 155,399,369 |
| South Africa | 15,490,268 | 0 | 0 | 15,490,268 |
| United Kingdom | 12,727,549 | 0 | 0 | 12,727,549 |
| United States | 23,902,151 | 0 | 0 | 23,902,151 |
| Rights | ||||
| Canada | 0 | 0 | 0 | 0 |
| Warrants | ||||
| Canada | 0 | 0 | 0 | 0 |
| Commodities | 12,779,600 | 0 | 0 | 12,779,600 |
| Short-term investments | ||||
| Investment companies | 1,747,897 | 0 | 0 | 1,747,897 |
| Total assets | $199,318,280 | $40,533,191 | $0 | $239,851,471 |
| Average daily net assets | Management fee |
| First $500 million | 0.650% |
| Next $500 million | 0.600 |
| Next $1 billion | 0.550 |
| Next $2 billion | 0.525 |
| Next $1 billion | 0.500 |
| Next $5 billion | 0.490 |
| Over $10 billion | 0.480 |
| Class-level
administration fee | |
| Class A | 0.21% |
| Class C | 0.21 |
| Administrator Class | 0.13 |
| Institutional Class | 0.13 |
| Expense ratio caps | |
| Class A | 1.09% |
| Class C | 1.84 |
| Administrator Class | 0.95 |
| Institutional Class | 0.79 |
| Creditable
foreign taxes paid |
Per
share amount |
Foreign
income as % of ordinary income distributions |
| $553,621 | $0.0785 | 49.85% |
| Name
and year of birth |
Position
held and length of service* |
Principal occupations during past five years or longer | Current
other public company or investment company directorships |
| William
R. Ebsworth (Born 1957) |
Trustee,
since 2015 |
Retired. From 1984 to 2013, equities analyst, portfolio manager, research director and chief investment officer at Fidelity Management and Research Company in Boston, Tokyo, and Hong Kong, and retired in 2013 as Chief Investment Officer of Fidelity Strategic Advisers, Inc. where he led a team of investment professionals managing client assets. Prior thereto, Board member of Hong Kong Securities Clearing Co., Hong Kong Options Clearing Corp., the Thailand International Fund, Ltd., Fidelity Investments Life Insurance Company, and Empire Fidelity Investments Life Insurance Company. Audit Committee Chair and Investment Committee Chair of the Vincent Memorial Hospital Endowment (non-profit organization). Mr. Ebsworth is a CFA® charterholder. | N/A |
| Jane
A. Freeman (Born 1953) |
Trustee,
since 2015; Chair Liaison, since 2018 |
Retired. From 2012 to 2014 and 1999 to 2008, Chief Financial Officer of Scientific Learning Corporation. From 2008 to 2012, Ms. Freeman provided consulting services related to strategic business projects. Prior to 1999, Portfolio Manager at Rockefeller & Co. and Scudder, Stevens & Clark. Board member of the Harding Loevner Funds from 1996 to 2014, serving as both Lead Independent Director and chair of the Audit Committee. Board member of the Russell Exchange Traded Funds Trust from 2011 to 2012 and the chair of the Audit Committee. Ms. Freeman is also an inactive Chartered Financial Analyst. | N/A |
| Isaiah
Harris, Jr. (Born 1952) |
Trustee,
since 2009; Audit Committee Chair, since 2019 |
Retired. Chairman of the Board of CIGNA Corporation from 2009 to 2021, and Director from 2005 to 2008. From 2003 to 2011, Director of Deluxe Corporation. Prior thereto, President and CEO of BellSouth Advertising and Publishing Corp. from 2005 to 2007, President and CEO of BellSouth Enterprises from 2004 to 2005 and President of BellSouth Consumer Services from 2000 to 2003. Emeritus member of the Iowa State University Foundation Board of Governors. Emeritus Member of the Advisory Board of Iowa State University School of Business. Advisory Board Member, Palm Harbor Academy (private school). Advisory Board Member, Fellowship of Christian Athletes. Mr. Harris is a certified public accountant (inactive status). | N/A |
| David
F. Larcker (Born 1950) |
Trustee,
since 2009 |
James Irvin Miller Professor of Accounting at the Graduate School of Business (Emeritus), Stanford University, Director of the Corporate Governance Research Initiative and Senior Faculty of The Rock Center for Corporate Governance since 2006. From 2005 to 2008, Professor of Accounting at the Graduate School of Business, Stanford University. Prior thereto, Ernst & Young Professor of Accounting at The Wharton School, University of Pennsylvania from 1985 to 2005. | N/A |
| Name
and year of birth |
Position
held and length of service* |
Principal occupations during past five years or longer | Current
other public company or investment company directorships |
| Olivia
S. Mitchell (Born 1953) |
Trustee,
since 2006; Nominating and Governance Committee Chair, since 2018 |
International Foundation of Employee Benefit Plans Professor since 1993, Wharton School of the University of Pennsylvania. Director of Wharton’s Pension Research Council and Boettner Center on Pensions & Retirement Research, and Research Associate at the National Bureau of Economic Research. Previously taught at Cornell University from 1978 to 1993. | N/A |
| Timothy
J. Penny (Born 1951) |
Trustee,
since 1996; Chair, since 2018 |
President and Chief Executive Officer of Southern Minnesota Initiative Foundation, a non-profit organization, since 2007. Vice Chair of the Economic Club of Minnesota, since 2007. Co-Chair of the Committee for a Responsible Federal Budget, since 1995. Member of the Board of Trustees of NorthStar Education Finance, Inc., a non-profit organization, since 2007. Senior Fellow of the University of Minnesota Humphrey Institute from 1995 to 2017. | N/A |
| James
G. Polisson (Born 1959) |
Trustee,
since 2018 |
Retired. Chief Marketing Officer, Source (ETF) UK Services, Ltd, from 2015 to 2017. From 2012 to 2015, Principal of The Polisson Group, LLC, a management consulting, corporate advisory and principal investing company. Chief Executive Officer and Managing Director at Russell Investments, Global Exchange Traded Funds from 2010 to 2012. Managing Director of Barclays Global Investors from 1998 to 2010 and Global Chief Marketing Officer for iShares and Barclays Global Investors from 2000 to 2010. Trustee of the San Francisco Mechanics’ Institute, a non-profit organization, from 2013 to 2015. Board member of the Russell Exchange Traded Fund Trust from 2011 to 2012. Director of Barclays Global Investors Holdings Deutschland GmbH from 2006 to 2009. Mr. Polisson is an attorney and has a retired status with the Massachusetts and District of Columbia Bar Associations. | N/A |
| Pamela
Wheelock (Born 1959) |
Trustee,
since January 2020; previously Trustee from January 2018 to July 2019 |
Retired. Executive and Senior Financial leadership positions in the public, private and nonprofit sectors. Interim President and CEO, McKnight Foundation, 2020. Interim Commissioner, Minnesota Department of Human Services, 2019. Chief Operating Officer, Twin Cities Habitat for Humanity, 2017-2019. Vice President for University Services, University of Minnesota, 2012-2016. Interim President and CEO, Blue Cross and Blue Shield of Minnesota, 2011-2012. Executive Vice-President and Chief Financial Officer, Minnesota Wild, 2002-2008. Commissioner, Minnesota Department of Finance, 1999-2002. Chair of the Board of Directors of Destination Medical Center Corporation. Board member of the Minnesota Wild Foundation. | N/A |
| Name
and year of birth |
Position
held and length of service |
Principal occupations during past five years or longer |
| Andrew
Owen (Born 1960) |
President,
since 2017 |
President and Chief Executive Officer of Allspring Funds Management, LLC since 2017 and Head of Global Fund Governance of Allspring Global Investments since 2022. Prior thereto, co-president of Galliard Capital Management, LLC, an affiliate of Allspring Funds Management, LLC, from 2019 to 2022 and Head of Affiliated Managers, Allspring Global Investments, from 2014 to 2019 and Executive Vice President responsible for marketing, investments and product development for Allspring Funds Management, LLC, from 2009 to 2014. |
| Jeremy
DePalma (Born 1974) |
Treasurer,
since 2012 (for certain funds in the Fund Complex); since 2021 (for the remaining funds in the Fund Complex) |
Senior Vice President of Allspring Funds Management, LLC since 2009. Senior Vice President of Evergreen Investment Management Company, LLC from 2008 to 2010 and head of the Fund Reporting and Control Team within Fund Administration from 2005 to 2010. |
| Christopher
Baker (Born 1976) |
Chief Compliance Officer, since 2022 | Global Chief Compliance Officer for Allspring Global Investments since 2022. Prior thereto, Chief Compliance Officer for State Street Global Advisors from 2018 to 2021. Senior Compliance Officer for the State Street divisions of Alternative Investment Solutions, Sector Solutions, and Global Marketing from 2015 to 2018. From 2010 to 2015 Vice President, Global Head of Investment and Marketing Compliance for State Street Global Advisors. |
| Matthew
Prasse (Born 1983) |
Chief Legal Officer, since 2022; Secretary, since 2021 | Senior Counsel of the Allspring Legal Department since 2021. Senior Counsel of the Wells Fargo Legal Department from 2018 to 2021. Previously, Counsel for Barings LLC from 2015 to 2018. Prior to joining Barings, Associate at Morgan, Lewis & Bockius LLP from 2008 to 2015. |
P.O. Box 219967
Kansas City, MO 64121-9967

1-800-222-8222 or visit the Fund's website at allspringglobal.com. Read the prospectus carefully before you invest or send money.
SA316/SAR316 09-22

Discovery Innovation Fund

| 1 | The S&P 500 Index consists of 500 stocks chosen for market size, liquidity, and industry group representation. It is a market-value-weighted index with each stock's weight in the index proportionate to its market value. You cannot invest directly in an index. |
| 2 | The Morgan Stanley Capital International (MSCI) All Country World Index (ACWI) ex USA Index (Net) is a free-float-adjusted market-capitalization-weighted index that is designed to measure the equity market performance of developed and emerging markets, excluding the U.S. Source: MSCI. MSCI makes no express or implied warranties or representations and shall have no liability whatsoever with respect to any MSCI data contained herein. The MSCI data may not be further redistributed or used as a basis for other indexes or any securities or financial products. This report is not approved, reviewed, or produced by MSCI. You cannot invest directly in an index. |
| 3 | The MSCI Emerging Markets (EM) Index (Net) (USD) is a free-float-adjusted market-capitalization-weighted index that is designed to measure equity market performance of emerging markets. You cannot invest directly in an index. |
| 4 | The Bloomberg U.S. Aggregate Bond Index is a broad-based benchmark that measures the investment-grade, U.S.-dollar-denominated, fixed-rate taxable bond market, including Treasuries, government-related and corporate securities, mortgage-backed securities (agency fixed-rate and hybrid adjustable-rate mortgage pass-throughs), asset-backed securities, and commercial mortgage-backed securities. You cannot invest directly in an index. |
| 5 | The Bloomberg Global Aggregate ex-USD Index (unhedged) is an unmanaged index that provides a broad-based measure of the global investment-grade fixed-income markets excluding the U.S.-dollar-denominated debt market. You cannot invest directly in an index. |
| 6 | The Bloomberg Municipal Bond Index is an unmanaged index composed of long-term tax-exempt bonds with a minimum credit rating of Baa. You cannot invest directly in an index. |
| 7 | The ICE BofA U.S. High Yield Index is a market-capitalization-weighted index of domestic and Yankee high-yield bonds. The index tracks the performance of high-yield securities traded in the U.S. bond market. You cannot invest directly in an index. Copyright 2022. ICE Data Indices, LLC. All rights reserved. |
| 1 | The MSCI ACWI (Net) is a free-float-adjusted market-capitalization-weighted index that is designed to measure the equity market performance of developed and emerging markets. You cannot invest directly in an index. |

President
Allspring Funds
| Investment objective | The Fund seeks long-term capital appreciation. |
| Manager | Allspring Funds Management, LLC |
| Subadviser | Allspring Global Investments, LLC |
| Portfolio managers | Michael T. Smith#, Christopher J. Warner, CFA‡# |
| Average annual total returns (%) as of September 30, 2022* | |||||||||||
| Including sales charge | Excluding sales charge | Expense ratios1 (%) | |||||||||
| Inception date | 1 year | 5 year | 10 year | 1 year | 5 year | 10 year | Gross | Net 2 | |||
| Class A (WFSTX) | 9-18-2000 | -37.74 | 10.50 | 14.19 | -33.94 | 11.81 | 14.86 | 1.28 | 1.23 | ||
| Class C (WFTCX) | 9-18-2000 | -35.46 | 11.00 | 14.20 | -34.46 | 11.00 | 14.20 | 2.03 | 1.98 | ||
| Administrator Class (WFTDX) | 7-30-2010 | – | – | – | -33.88 | 11.90 | 15.00 | 1.20 | 1.15 | ||
| Institutional Class (WFTIX)3 | 10-31-2016 | – | – | – | -33.69 | 12.18 | 15.16 | 0.95 | 0.90 | ||
| Russell 3000® Growth Index4 | – | – | – | – | -23.01 | 11.57 | 13.36 | – | – | ||
| S&P North American Technology Sector Index5 | – | – | – | – | -30.58 | 13.29 | 16.17 | – | – | ||
| * | The Fund changed its principal investment strategy on September 6, 2022. Performance shown prior to this date reflects the Fund’s previous investment strategy |
| 1 | Reflects the expense ratios as stated in the most recent prospectuses. The expense ratios shown are subject to change and may differ from the annualized expense ratios shown in the financial highlights of this report. |
| 2 | The manager has contractually committed through July 31, 2024, to waive fees and/or reimburse expenses to the extent necessary to cap total annual fund operating expenses after fee waivers at 1.23% for Class A, 1.98% for Class C, 1.15% for Administrator Class, and 0.90% for Institutional Class. Brokerage commissions, stamp duty fees, interest, taxes, acquired fund fees and expenses (if any), and extraordinary expenses are excluded from the expense caps. Prior to or after the commitment expiration date, the caps may be increased or the commitment to maintain the caps may be terminated only with the approval of the Board of Trustees. Without these caps, the Fund’s returns would have been lower. The expense ratio paid by an investor is the net expense ratio (the total annual fund operating expenses after fee waivers) as stated in the prospectuses. |
| 3 | Historical performance shown for the Institutional Class shares prior to their inception reflects the performance of the Administrator Class shares, and includes the higher expenses applicable to the Administrator Class shares. If these expenses had not been included, returns for the Institutional Class shares would be higher. |
| 4 | The Russell 3000® Growth Index measures the performance of those Russell 3000® Index companies with higher price/book ratios and higher forecasted growth values. You cannot invest directly in an index. The Fund has changed its primary benchmark from the S&P North American Technology Sector Index to the Russell 3000® Growth Index to more accurately reflect the revised strategy of the Fund. The S&P North American Technology Sector Index will remain as a secondary benchmark for the Fund. |
| 5 | The S&P North American Technology Sector Index is a modified market-capitalization-weighted index of select technology stocks. You cannot invest directly in an index |
| ‡ | CFA® and Chartered Financial Analyst® are trademarks owned by CFA Institute. |
| # | Mr. Smith and Mr. Warner became portfolio managers of the Fund on July 15, 2022. |
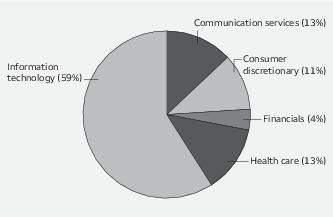
| Beginning
account value 4-1-2022 |
Ending
account value 9-30-2022 |
Expenses
paid during the period1 |
Annualized
net expense ratio | |
| Class A | ||||
| Actual | $1,000.00 | $ 713.99 | $ 5.50 | 1.28% |
| Hypothetical (5% return before expenses) | $1,000.00 | $1,018.65 | $ 6.48 | 1.28% |
| Class C | ||||
| Actual | $1,000.00 | $ 710.93 | $ 8.79 | 2.05% |
| Hypothetical (5% return before expenses) | $1,000.00 | $1,014.79 | $10.35 | 2.05% |
| Administrator Class | ||||
| Actual | $1,000.00 | $ 714.57 | $ 5.24 | 1.22% |
| Hypothetical (5% return before expenses) | $1,000.00 | $1,018.95 | $ 6.17 | 1.22% |
| Institutional Class | ||||
| Actual | $1,000.00 | $ 715.76 | $ 4.22 | 0.98% |
| Hypothetical (5% return before expenses) | $1,000.00 | $1,020.16 | $ 4.96 | 0.98% |
| Shares | Value | ||||
| Common stocks: 97.69% | |||||
| Communication services: 12.62% | |||||
| Entertainment: 1.17% | |||||
| Spotify Technology SA † | 55,884 | $ 4,822,789 | |||
| Interactive media & services: 10.89% | |||||
| Alphabet Incorporated Class C † | 328,440 | 31,579,510 | |||
| Bumble Incorporated Class A † | 116,283 | 2,498,922 | |||
| IAC/InterActiveCorp † | 75,343 | 4,172,495 | |||
| ZoomInfo Technologies Incorporated † | 159,591 | 6,648,561 | |||
| 44,899,488 | |||||
| Media: 0.56% | |||||
| Comcast Corporation Class A | 79,201 | 2,322,965 | |||
| Consumer discretionary: 11.09% | |||||
| Hotels, restaurants & leisure: 3.99% | |||||
| Chipotle Mexican Grill Incorporated † | 10,946 | 16,449,211 | |||
| Internet & direct marketing retail: 7.10% | |||||
| Amazon.com Incorporated † | 185,689 | 20,982,857 | |||
| Global-E Online Limited † | 97,853 | 2,618,546 | |||
| MercadoLibre Incorporated † | 6,823 | 5,647,943 | |||
| 29,249,346 | |||||
| Financials: 3.89% | |||||
| Capital markets: 1.90% | |||||
| MSCI Incorporated | 4,218 | 1,779,110 | |||
| S&P Global Incorporated | 19,854 | 6,062,419 | |||
| 7,841,529 | |||||
| Insurance: 1.99% | |||||
| Progressive Corporation | 70,645 | 8,209,655 | |||
| Health care: 12.47% | |||||
| Health care equipment & supplies: 0.99% | |||||
| Intuitive Surgical Incorporated † | 21,714 | 4,070,072 | |||
| Health care providers & services: 6.87% | |||||
| UnitedHealth Group Incorporated | 56,083 | 28,324,158 | |||
| Life sciences tools & services: 4.61% | |||||
| Bio-Rad Laboratories Incorporated Class A † | 22,555 | 9,408,593 | |||
| Bio-Techne Corporation | 33,835 | 9,609,140 | |||
| 19,017,733 | |||||
| Information technology: 57.62% | |||||
| Communications equipment: 2.11% | |||||
| F5 Networks Incorporated † | 20,177 | 2,920,217 | |||
| Motorola Solutions Incorporated | 25,822 | 5,783,353 | |||
| 8,703,570 |
| Shares | Value | ||||
| Electronic equipment, instruments & components: 8.44% | |||||
| Cognex Corporation | 76,261 | $ 3,161,018 | |||
| Novanta Incorporated † | 101,791 | 11,772,129 | |||
| Teledyne Technologies Incorporated † | 58,876 | 19,868,884 | |||
| 34,802,031 | |||||
| IT services: 16.87% | |||||
| Automatic Data Processing Incorporated | 9,107 | 2,059,912 | |||
| Fiserv Incorporated † | 104,439 | 9,772,357 | |||
| Globant SA † | 64,102 | 11,992,202 | |||
| MasterCard Incorporated Class A | 6,751 | 1,919,579 | |||
| Maximus Incorporated | 35,954 | 2,080,658 | |||
| MongoDB Incorporated † | 37,158 | 7,378,092 | |||
| Visa Incorporated Class A | 131,998 | 23,449,445 | |||
| WNS Holdings Limited ADR † | 132,941 | 10,879,891 | |||
| 69,532,136 | |||||
| Semiconductors & semiconductor equipment: 6.61% | |||||
| Enphase Energy Incorporated † | 55,687 | 15,451,472 | |||
| Impinj Incorporated † | 33,280 | 2,663,398 | |||
| Micron Technology Incorporated | 80,663 | 4,041,216 | |||
| Wolfspeed Incorporated † | 49,330 | 5,098,749 | |||
| 27,254,835 | |||||
| Software: 20.75% | |||||
| Atlassian Corporation plc Class A † | 25,651 | 5,401,844 | |||
| Bill.com Holdings Incorporated † | 48,165 | 6,375,601 | |||
| Crowdstrike Holdings Incorporated Class A † | 112,796 | 18,589,909 | |||
| Five9 Incorporated † | 118,351 | 8,873,958 | |||
| HubSpot Incorporated † | 29,167 | 7,878,590 | |||
| Microsoft Corporation | 141,789 | 33,022,658 | |||
| NortonLifeLock Incorporated | 80,993 | 1,631,199 | |||
| Olo Incorporated Class A † | 221,593 | 1,750,585 | |||
| Oracle Corporation | 32,905 | 2,009,508 | |||
| 85,533,852 | |||||
| Technology hardware, storage & peripherals: 2.84% | |||||
| Apple Incorporated | 84,869 | 11,728,896 | |||
| Total Common stocks (Cost $376,319,001) | 402,762,266 |
| Yield | |||||
| Short-term investments: 2.40% | |||||
| Investment companies: 2.40% | |||||
| Allspring Government Money Market Fund Select Class ♠∞ | 2.75% | 9,890,294 | 9,890,294 | ||
| Total Short-term investments (Cost $9,890,294) | 9,890,294 | ||||
| Total investments in securities (Cost $386,209,295) | 100.09% | 412,652,560 | |||
| Other assets and liabilities, net | (0.09) | (373,661) | |||
| Total net assets | 100.00% | $412,278,899 |
| † | Non-income-earning security |
| ♠ | The issuer of the security is an affiliated person of the Fund as defined in the Investment Company Act of 1940. |
| ∞ | The rate represents the 7-day annualized yield at period end. |
| Abbreviations: | |
| ADR | American depositary receipt |
| Value,
beginning of period |
Purchases | Sales
proceeds |
Net
realized gains (losses) |
Net
change in unrealized gains (losses) |
Value,
end of period |
Shares,
end of period |
Income
from affiliated securities | |||
| Short-term investments | ||||||||||
| Allspring Government Money Market Fund Select Class | $31,826,516 | $76,007,534 | $(97,943,756) | $0 | $0 | $ 9,890,294 | 9,890,294 | $ 159,714 | ||
| Investments
in affiliates no longer held at end of period |
||||||||||
| Securities Lending Cash Investments LLC | 786,600 | 78,600 | (865,200) | 0 | 0 | 0 | 0 | 43 # | ||
| $0 | $0 | $9,890,294 | $159,757 | |||||||
| # | Amount shown represents income before fees and rebates. |
| Assets | |
|
Investments in unaffiliated securities, at value (cost
$376,319,001) |
$ 402,762,266 |
|
Investments in affiliated securities, at value (cost
$9,890,294) |
9,890,294 |
|
Foreign currency, at value (cost
$7,257) |
6,606 |
|
Receivable for Fund shares
sold |
156,696 |
|
Receivable for
dividends |
74,359 |
|
Prepaid expenses and other
assets |
118,563 |
|
Total
assets |
413,008,784 |
| Liabilities | |
|
Management fee
payable |
282,302 |
|
Payable for Fund shares
redeemed |
192,954 |
|
Administration fees
payable |
79,291 |
|
Distribution fee
payable |
4,269 |
|
Trustees’ fees and expenses
payable |
3,405 |
|
Accrued expenses and other
liabilities |
167,664 |
|
Total
liabilities |
729,885 |
|
Total net
assets |
$412,278,899 |
| Net assets consist of | |
|
Paid-in
capital |
$ 338,110,108 |
|
Total distributable
earnings |
74,168,791 |
|
Total net
assets |
$412,278,899 |
| Computation of net asset value and offering price per share | |
|
Net assets – Class
A |
$ 361,289,893 |
|
Shares outstanding – Class
A1 |
34,699,787 |
|
Net asset value per share – Class
A |
$10.41 |
|
Maximum offering price per share – Class
A2 |
$11.05 |
|
Net assets – Class
C |
$ 5,948,443 |
|
Shares outstanding – Class
C1 |
982,956 |
|
Net asset value per share – Class
C |
$6.05 |
|
Net assets – Administrator
Class |
$ 6,729,126 |
|
Shares outstanding – Administrator
Class1 |
620,887 |
|
Net asset value per share – Administrator
Class |
$10.84 |
|
Net assets – Institutional
Class |
$ 38,311,437 |
|
Shares outstanding – Institutional
Class1 |
3,458,992 |
Net
asset value per share – Institutional
Class |
$11.08 |
| 1 | The Fund has an unlimited number of authorized shares. |
| 2 | Maximum offering price is computed as 100/94.25 of net asset value. On investments of $50,000 or more, the offering price is reduced. |
| Investment income | |
|
Dividends (net of foreign withholdings taxes of
$21,937) |
$ 963,074 |
|
Income from affiliated
securities |
159,760 |
|
Total investment
income |
1,122,834 |
| Expenses | |
|
Management
fee |
2,050,583 |
| Administration fees | |
|
Class
A |
450,314 |
|
Class
C |
7,876 |
|
Administrator
Class |
5,295 |
|
Institutional
Class |
32,776 |
| Shareholder servicing fees | |
|
Class
A |
534,133 |
|
Class
C |
9,283 |
|
Administrator
Class |
10,182 |
| Distribution fee | |
|
Class
C |
27,849 |
|
Custody and accounting
fees |
32,854 |
|
Professional
fees |
23,996 |
|
Registration
fees |
35,574 |
|
Shareholder report
expenses |
17,343 |
|
Trustees’ fees and
expenses |
11,191 |
|
Other fees and
expenses |
6,029 |
|
Total
expenses |
3,255,278 |
| Less: Fee waivers and/or expense reimbursements | |
|
Fund-level |
(17,780) |
|
Class
A |
(119,067) |
|
Class
C |
(1,178) |
|
Administrator
Class |
(763) |
|
Institutional
Class |
(8,458) |
|
Net
expenses |
3,108,032 |
|
Net investment
loss |
(1,985,198) |
| Realized and unrealized gains (losses) on investments | |
|
Net realized losses on
investments |
(27,182,492) |
|
Net change in unrealized gains (losses) on
investments |
(142,522,320) |
|
Net realized and unrealized gains (losses) on
investments |
(169,704,812) |
|
Net decrease in net assets resulting from
operations |
$(171,690,010) |
| Six
months ended September 30, 2022 (unaudited) |
Year
ended March 31, 2022 | |||
| Operations | ||||
|
Net investment
loss |
$ (1,985,198) | $ (7,037,826) | ||
|
Net realized gains (losses) on
investments |
(27,182,492) | 87,045,702 | ||
|
Net change in unrealized gains (losses) on
investments |
(142,522,320) | (66,380,714) | ||
|
Net increase (decrease) in net assets resulting from
operations |
(171,690,010) | 13,627,162 | ||
| Distributions to shareholders from | ||||
| Net investment income and net realized gains | ||||
|
Class
A |
0 | (143,063,634) | ||
|
Class
C |
0 | (4,200,146) | ||
|
Administrator
Class |
0 | (2,584,254) | ||
|
Institutional
Class |
0 | (19,099,092) | ||
|
Total distributions to
shareholders |
0 | (168,947,126) | ||
| Capital share transactions | Shares | Shares | ||
| Proceeds from shares sold | ||||
|
Class
A |
342,453 | 4,139,941 | 1,025,768 | 18,709,362 |
|
Class
C |
16,112 | 109,639 | 69,766 | 881,654 |
|
Administrator
Class |
44,434 | 548,162 | 109,867 | 2,157,542 |
|
Institutional
Class |
162,985 | 2,062,501 | 807,805 | 15,521,449 |
| 6,860,243 | 37,270,007 | |||
| Reinvestment of distributions | ||||
|
Class
A |
0 | 0 | 8,259,821 | 138,104,208 |
|
Class
C |
0 | 0 | 429,463 | 4,200,146 |
|
Administrator
Class |
0 | 0 | 146,691 | 2,550,952 |
|
Institutional
Class |
0 | 0 | 1,064,445 | 18,883,248 |
| 0 | 163,738,554 | |||
| Payment for shares redeemed | ||||
|
Class
A |
(1,766,597) | (21,055,935) | (4,175,414) | (73,339,383) |
|
Class
C |
(187,930) | (1,306,315) | (295,041) | (3,224,878) |
|
Administrator
Class |
(95,425) | (1,167,895) | (88,403) | (1,634,898) |
|
Institutional
Class |
(992,746) | (12,329,418) | (2,000,907) | (37,260,346) |
| (35,859,563) | (115,459,505) | |||
|
Net increase (decrease) in net assets resulting from capital share
transactions |
(28,999,320) | 85,549,056 | ||
|
Total decrease in net
assets |
(200,689,330) | (69,770,908) | ||
| Net assets | ||||
|
Beginning of
period |
612,968,229 | 682,739,137 | ||
|
End of
period |
$ 412,278,899 | $ 612,968,229 | ||
| Year ended March 31 | ||||||
| Class A | Six
months ended September 30, 2022 (unaudited) |
2022 | 2021 | 2020 | 2019 | 2018 |
|
Net asset value, beginning of
period |
$14.58 | $18.55 | $12.08 | $13.33 | $14.08 | $10.95 |
|
Net investment
loss |
(0.05) | (0.19) 1 | (0.16) | (0.11) | (0.11) | (0.10) 1 |
|
Net realized and unrealized gains (losses) on
investments |
(4.12) | 1.04 | 9.44 | (0.01) | 2.06 | 4.20 |
|
Total from investment
operations |
(4.17) | 0.85 | 9.28 | (0.12) | 1.95 | 4.10 |
| Distributions to shareholders from | ||||||
|
Net realized
gains |
0.00 | (4.82) | (2.81) | (1.13) | (2.70) | (0.97) |
|
Net asset value, end of
period |
$10.41 | $14.58 | $18.55 | $12.08 | $13.33 | $14.08 |
|
Total
return2 |
(28.60)% | 1.26% | 77.67% | (1.31)% | 16.80% | 38.41% |
| Ratios to average net assets (annualized) | ||||||
|
Gross
expenses |
1.34% | 1.34% | 1.35% | 1.39% | 1.40% | 1.41% |
|
Net
expenses |
1.28% | 1.33% | 1.34% | 1.37% | 1.39% | 1.41% |
|
Net investment
loss |
(0.82)% | (1.02)% | (0.98)% | (0.80)% | (0.77)% | (0.75)% |
| Supplemental data | ||||||
|
Portfolio turnover
rate |
101% | 93% | 146% | 149% | 107% | 109% |
|
Net assets, end of period (000s
omitted) |
$361,290 | $526,555 | $575,422 | $344,949 | $401,990 | $353,552 |
| 1 | Calculated based upon average shares outstanding |
| 2 | Total return calculations do not include any sales charges. Returns for periods of less than one year are not annualized. |
| Year ended March 31 | ||||||
| Class C | Six
months ended September 30, 2022 (unaudited) |
2022 | 2021 | 2020 | 2019 | 2018 |
|
Net asset value, beginning of
period |
$8.51 | $12.64 | $8.80 | $10.09 | $11.38 | $9.06 |
|
Net investment
loss |
(0.25) | (0.21) 1 | (0.17) | (0.16) 1 | (0.17) 1 | (0.16) |
|
Net realized and unrealized gains (losses) on
investments |
(2.21) | 0.90 | 6.82 | (0.00) 2 | 1.58 | 3.45 |
|
Total from investment
operations |
(2.46) | 0.69 | 6.65 | (0.16) | 1.41 | 3.29 |
| Distributions to shareholders from | ||||||
|
Net realized
gains |
0.00 | (4.82) | (2.81) | (1.13) | (2.70) | (0.97) |
|
Net asset value, end of
period |
$6.05 | $8.51 | $12.64 | $8.80 | $10.09 | $11.38 |
|
Total
return3 |
(28.91)% | 0.51% | 76.67% | (2.15)% | 16.01% | 37.45% |
| Ratios to average net assets (annualized) | ||||||
|
Gross
expenses |
2.08% | 2.09% | 2.10% | 2.14% | 2.15% | 2.16% |
|
Net
expenses |
2.05% | 2.09% | 2.10% | 2.13% | 2.14% | 2.16% |
|
Net investment
loss |
(1.60)% | (1.79)% | (1.75)% | (1.57)% | (1.52)% | (1.49)% |
| Supplemental data | ||||||
|
Portfolio turnover
rate |
101% | 93% | 146% | 149% | 107% | 109% |
|
Net assets, end of period (000s
omitted) |
$5,948 | $9,822 | $12,017 | $8,035 | $11,615 | $15,932 |
| 1 | Calculated based upon average shares outstanding |
| 2 | Amount is more than $(0.005) |
| 3 | Total return calculations do not include any sales charges. Returns for periods of less than one year are not annualized. |
| Year ended March 31 | ||||||
| Administrator Class | Six
months ended September 30, 2022 (unaudited) |
2022 | 2021 | 2020 | 2019 | 2018 |
|
Net asset value, beginning of
period |
$15.17 | $19.13 | $12.40 | $13.65 | $14.34 | $11.12 |
|
Net investment
loss |
(0.05) 1 | (0.18) 1 | (0.16) | (0.10) 1 | (0.09) 1 | (0.09) 1 |
|
Net realized and unrealized gains (losses) on
investments |
(4.28) | 1.04 | 9.70 | (0.02) | 2.10 | 4.28 |
|
Total from investment
operations |
(4.33) | 0.86 | 9.54 | (0.12) | 2.01 | 4.19 |
| Distributions to shareholders from | ||||||
|
Net realized
gains |
0.00 | (4.82) | (2.81) | (1.13) | (2.70) | (0.97) |
|
Net asset value, end of
period |
$10.84 | $15.17 | $19.13 | $12.40 | $13.65 | $14.34 |
|
Total
return2 |
(28.54)% | 1.28% | 77.92% | (1.28)% | 17.02% | 38.55% |
| Ratios to average net assets (annualized) | ||||||
|
Gross
expenses |
1.26% | 1.27% | 1.27% | 1.31% | 1.32% | 1.33% |
|
Net
expenses |
1.22% | 1.26% | 1.27% | 1.28% | 1.29% | 1.32% |
|
Net investment
loss |
(0.77)% | (0.95)% | (0.91)% | (0.71)% | (0.65)% | (0.66)% |
| Supplemental data | ||||||
|
Portfolio turnover
rate |
101% | 93% | 146% | 149% | 107% | 109% |
|
Net assets, end of period (000s
omitted) |
$6,729 | $10,192 | $9,636 | $11,873 | $22,480 | $19,140 |
| 1 | Calculated based upon average shares outstanding |
| 2 | Returns for periods of less than one year are not annualized. |
| Year ended March 31 | ||||||
| Institutional Class | Six
months ended September 30, 2022 (unaudited) |
2022 | 2021 | 2020 | 2019 | 2018 |
|
Net asset value, beginning of
period |
$15.48 | $19.39 | $12.51 | $13.73 | $14.37 | $11.12 |
|
Net investment
loss |
(0.04) 1 | (0.13) | (0.12) | (0.07) | (0.07) | (0.05) |
|
Net realized and unrealized gains (losses) on
investments |
(4.36) | 1.04 | 9.81 | (0.02) | 2.13 | 4.27 |
|
Total from investment
operations |
(4.40) | 0.91 | 9.69 | (0.09) | 2.06 | 4.22 |
| Distributions to shareholders from | ||||||
|
Net realized
gains |
0.00 | (4.82) | (2.81) | (1.13) | (2.70) | (0.97) |
|
Net asset value, end of
period |
$11.08 | $15.48 | $19.39 | $12.51 | $13.73 | $14.37 |
|
Total
return2 |
(28.42)% | 1.53% | 78.30% | (1.05)% | 17.25% | 38.91% |
| Ratios to average net assets (annualized) | ||||||
|
Gross
expenses |
1.01% | 1.01% | 1.02% | 1.06% | 1.07% | 1.08% |
|
Net
expenses |
0.98% | 1.01% | 1.02% | 1.03% | 1.04% | 1.07% |
|
Net investment
loss |
(0.52)% | (0.71)% | (0.66)% | (0.47)% | (0.42)% | (0.40)% |
| Supplemental data | ||||||
|
Portfolio turnover
rate |
101% | 93% | 146% | 149% | 107% | 109% |
|
Net assets, end of period (000s
omitted) |
$38,311 | $66,399 | $85,664 | $48,504 | $51,223 | $27,509 |
| 1 | Calculated based upon average shares outstanding |
| 2 | Returns for periods of less than one year are not annualized. |
| Gross unrealized gains | $ 42,846,832 |
| Gross unrealized losses | (18,735,595) |
| Net unrealized gains | $ 24,111,237 |
| ■ | Level 1 – quoted prices in active markets for identical securities |
| ■ | Level 2 – other significant observable inputs (including quoted prices for similar securities, interest rates, prepayment speeds, credit risk, etc.) |
| ■ | Level 3 – significant unobservable inputs (including the Fund’s own assumptions in determining the fair value of investments) |
| Quoted
prices (Level 1) |
Other
significant observable inputs (Level 2) |
Significant
unobservable inputs (Level 3) |
Total | |
| Assets | ||||
| Investments in: | ||||
| Common stocks | ||||
| Communication services | $ 52,045,242 | $0 | $0 | $ 52,045,242 |
| Consumer discretionary | 45,698,557 | 0 | 0 | 45,698,557 |
| Financials | 16,051,184 | 0 | 0 | 16,051,184 |
| Health care | 51,411,963 | 0 | 0 | 51,411,963 |
| Information technology | 237,555,320 | 0 | 0 | 237,555,320 |
| Short-term investments | ||||
| Investment companies | 9,890,294 | 0 | 0 | 9,890,294 |
| Total assets | $412,652,560 | $0 | $0 | $412,652,560 |
| Average daily net assets | Management fee |
| First $500 million | 0.800% |
| Next $500 million | 0.750 |
| Next $1 billion | 0.700 |
| Next $2 billion | 0.675 |
| Next $1 billion | 0.650 |
| Next $3 billion | 0.640 |
| Next $2 billion | 0.615 |
| Next $2 billion | 0.605 |
| Next $4 billion | 0.580 |
| Over $16 billion | 0.555 |
| Average daily net assets | Management fee |
| First $500 million | 0.850% |
| Next $500 million | 0.840 |
| Next $1 billion | 0.815 |
| Next $2 billion | 0.790 |
| Next $1 billion | 0.765 |
| Next $5 billion | 0.755 |
| Over $10 billion | 0.745 |
| Class-level
administration fee | |
| Class A | 0.21% |
| Class C | 0.21 |
| Administrator Class | 0.13 |
| Institutional Class | 0.13 |
| Expense ratio caps | |
| Class A | 1.23% |
| Class C | 1.98 |
| Administrator Class | 1.15 |
| Institutional Class | 0.90 |
| Name
and year of birth |
Position
held and length of service* |
Principal occupations during past five years or longer | Current
other public company or investment company directorships |
| William
R. Ebsworth (Born 1957) |
Trustee,
since 2015 |
Retired. From 1984 to 2013, equities analyst, portfolio manager, research director and chief investment officer at Fidelity Management and Research Company in Boston, Tokyo, and Hong Kong, and retired in 2013 as Chief Investment Officer of Fidelity Strategic Advisers, Inc. where he led a team of investment professionals managing client assets. Prior thereto, Board member of Hong Kong Securities Clearing Co., Hong Kong Options Clearing Corp., the Thailand International Fund, Ltd., Fidelity Investments Life Insurance Company, and Empire Fidelity Investments Life Insurance Company. Audit Committee Chair and Investment Committee Chair of the Vincent Memorial Hospital Endowment (non-profit organization). Mr. Ebsworth is a CFA® charterholder. | N/A |
| Jane
A. Freeman (Born 1953) |
Trustee,
since 2015; Chair Liaison, since 2018 |
Retired. From 2012 to 2014 and 1999 to 2008, Chief Financial Officer of Scientific Learning Corporation. From 2008 to 2012, Ms. Freeman provided consulting services related to strategic business projects. Prior to 1999, Portfolio Manager at Rockefeller & Co. and Scudder, Stevens & Clark. Board member of the Harding Loevner Funds from 1996 to 2014, serving as both Lead Independent Director and chair of the Audit Committee. Board member of the Russell Exchange Traded Funds Trust from 2011 to 2012 and the chair of the Audit Committee. Ms. Freeman is also an inactive Chartered Financial Analyst. | N/A |
| Isaiah
Harris, Jr. (Born 1952) |
Trustee,
since 2009; Audit Committee Chair, since 2019 |
Retired. Chairman of the Board of CIGNA Corporation from 2009 to 2021, and Director from 2005 to 2008. From 2003 to 2011, Director of Deluxe Corporation. Prior thereto, President and CEO of BellSouth Advertising and Publishing Corp. from 2005 to 2007, President and CEO of BellSouth Enterprises from 2004 to 2005 and President of BellSouth Consumer Services from 2000 to 2003. Emeritus member of the Iowa State University Foundation Board of Governors. Emeritus Member of the Advisory Board of Iowa State University School of Business. Advisory Board Member, Palm Harbor Academy (private school). Advisory Board Member, Fellowship of Christian Athletes. Mr. Harris is a certified public accountant (inactive status). | N/A |
| David
F. Larcker (Born 1950) |
Trustee,
since 2009 |
James Irvin Miller Professor of Accounting at the Graduate School of Business (Emeritus), Stanford University, Director of the Corporate Governance Research Initiative and Senior Faculty of The Rock Center for Corporate Governance since 2006. From 2005 to 2008, Professor of Accounting at the Graduate School of Business, Stanford University. Prior thereto, Ernst & Young Professor of Accounting at The Wharton School, University of Pennsylvania from 1985 to 2005. | N/A |
| Name
and year of birth |
Position
held and length of service* |
Principal occupations during past five years or longer | Current
other public company or investment company directorships |
| Olivia
S. Mitchell (Born 1953) |
Trustee,
since 2006; Nominating and Governance Committee Chair, since 2018 |
International Foundation of Employee Benefit Plans Professor since 1993, Wharton School of the University of Pennsylvania. Director of Wharton’s Pension Research Council and Boettner Center on Pensions & Retirement Research, and Research Associate at the National Bureau of Economic Research. Previously taught at Cornell University from 1978 to 1993. | N/A |
| Timothy
J. Penny (Born 1951) |
Trustee,
since 1996; Chair, since 2018 |
President and Chief Executive Officer of Southern Minnesota Initiative Foundation, a non-profit organization, since 2007. Vice Chair of the Economic Club of Minnesota, since 2007. Co-Chair of the Committee for a Responsible Federal Budget, since 1995. Member of the Board of Trustees of NorthStar Education Finance, Inc., a non-profit organization, since 2007. Senior Fellow of the University of Minnesota Humphrey Institute from 1995 to 2017. | N/A |
| James
G. Polisson (Born 1959) |
Trustee,
since 2018 |
Retired. Chief Marketing Officer, Source (ETF) UK Services, Ltd, from 2015 to 2017. From 2012 to 2015, Principal of The Polisson Group, LLC, a management consulting, corporate advisory and principal investing company. Chief Executive Officer and Managing Director at Russell Investments, Global Exchange Traded Funds from 2010 to 2012. Managing Director of Barclays Global Investors from 1998 to 2010 and Global Chief Marketing Officer for iShares and Barclays Global Investors from 2000 to 2010. Trustee of the San Francisco Mechanics’ Institute, a non-profit organization, from 2013 to 2015. Board member of the Russell Exchange Traded Fund Trust from 2011 to 2012. Director of Barclays Global Investors Holdings Deutschland GmbH from 2006 to 2009. Mr. Polisson is an attorney and has a retired status with the Massachusetts and District of Columbia Bar Associations. | N/A |
| Pamela
Wheelock (Born 1959) |
Trustee,
since January 2020; previously Trustee from January 2018 to July 2019 |
Retired. Executive and Senior Financial leadership positions in the public, private and nonprofit sectors. Interim President and CEO, McKnight Foundation, 2020. Interim Commissioner, Minnesota Department of Human Services, 2019. Chief Operating Officer, Twin Cities Habitat for Humanity, 2017-2019. Vice President for University Services, University of Minnesota, 2012-2016. Interim President and CEO, Blue Cross and Blue Shield of Minnesota, 2011-2012. Executive Vice-President and Chief Financial Officer, Minnesota Wild, 2002-2008. Commissioner, Minnesota Department of Finance, 1999-2002. Chair of the Board of Directors of Destination Medical Center Corporation. Board member of the Minnesota Wild Foundation. | N/A |
| Name
and year of birth |
Position
held and length of service |
Principal occupations during past five years or longer |
| Andrew
Owen (Born 1960) |
President,
since 2017 |
President and Chief Executive Officer of Allspring Funds Management, LLC since 2017 and Head of Global Fund Governance of Allspring Global Investments since 2022. Prior thereto, co-president of Galliard Capital Management, LLC, an affiliate of Allspring Funds Management, LLC, from 2019 to 2022 and Head of Affiliated Managers, Allspring Global Investments, from 2014 to 2019 and Executive Vice President responsible for marketing, investments and product development for Allspring Funds Management, LLC, from 2009 to 2014. |
| Jeremy
DePalma (Born 1974) |
Treasurer,
since 2012 (for certain funds in the Fund Complex); since 2021 (for the remaining funds in the Fund Complex) |
Senior Vice President of Allspring Funds Management, LLC since 2009. Senior Vice President of Evergreen Investment Management Company, LLC from 2008 to 2010 and head of the Fund Reporting and Control Team within Fund Administration from 2005 to 2010. |
| Christopher
Baker (Born 1976) |
Chief Compliance Officer, since 2022 | Global Chief Compliance Officer for Allspring Global Investments since 2022. Prior thereto, Chief Compliance Officer for State Street Global Advisors from 2018 to 2021. Senior Compliance Officer for the State Street divisions of Alternative Investment Solutions, Sector Solutions, and Global Marketing from 2015 to 2018. From 2010 to 2015 Vice President, Global Head of Investment and Marketing Compliance for State Street Global Advisors. |
| Matthew
Prasse (Born 1983) |
Chief Legal Officer, since 2022; Secretary, since 2021 | Senior Counsel of the Allspring Legal Department since 2021. Senior Counsel of the Wells Fargo Legal Department from 2018 to 2021. Previously, Counsel for Barings LLC from 2015 to 2018. Prior to joining Barings, Associate at Morgan, Lewis & Bockius LLP from 2008 to 2015. |
P.O. Box 219967
Kansas City, MO 64121-9967

1-800-222-8222 or visit the Fund's website at allspringglobal.com. Read the prospectus carefully before you invest or send money.
SA317/SAR317 09-22

Telecommunications Fund

| 1 | The S&P 500 Index consists of 500 stocks chosen for market size, liquidity, and industry group representation. It is a market-value-weighted index with each stock's weight in the index proportionate to its market value. You cannot invest directly in an index. |
| 2 | The Morgan Stanley Capital International (MSCI) All Country World Index (ACWI) ex USA Index (Net) is a free-float-adjusted market-capitalization-weighted index that is designed to measure the equity market performance of developed and emerging markets, excluding the U.S. Source: MSCI. MSCI makes no express or implied warranties or representations and shall have no liability whatsoever with respect to any MSCI data contained herein. The MSCI data may not be further redistributed or used as a basis for other indexes or any securities or financial products. This report is not approved, reviewed, or produced by MSCI. You cannot invest directly in an index. |
| 3 | The MSCI Emerging Markets (EM) Index (Net) (USD) is a free-float-adjusted market-capitalization-weighted index that is designed to measure equity market performance of emerging markets. You cannot invest directly in an index. |
| 4 | The Bloomberg U.S. Aggregate Bond Index is a broad-based benchmark that measures the investment-grade, U.S.-dollar-denominated, fixed-rate taxable bond market, including Treasuries, government-related and corporate securities, mortgage-backed securities (agency fixed-rate and hybrid adjustable-rate mortgage pass-throughs), asset-backed securities, and commercial mortgage-backed securities. You cannot invest directly in an index. |
| 5 | The Bloomberg Global Aggregate ex-USD Index (unhedged) is an unmanaged index that provides a broad-based measure of the global investment-grade fixed-income markets excluding the U.S.-dollar-denominated debt market. You cannot invest directly in an index. |
| 6 | The Bloomberg Municipal Bond Index is an unmanaged index composed of long-term tax-exempt bonds with a minimum credit rating of Baa. You cannot invest directly in an index. |
| 7 | The ICE BofA U.S. High Yield Index is a market-capitalization-weighted index of domestic and Yankee high-yield bonds. The index tracks the performance of high-yield securities traded in the U.S. bond market. You cannot invest directly in an index. Copyright 2022. ICE Data Indices, LLC. All rights reserved. |
| 1 | The MSCI ACWI (Net) is a free-float-adjusted market-capitalization-weighted index that is designed to measure the equity market performance of developed and emerging markets. You cannot invest directly in an index. |

President
Allspring Funds
| Investment objective | The Fund seeks total return, consisting of current income and capital appreciation. |
| Manager | Allspring Funds Management, LLC |
| Subadviser | Allspring Global Investments, LLC |
| Portfolio managers | Kent Newcomb, CFA®‡, Jack Spudich, CFA®‡ |
| Average annual total returns (%) as of September 30, 2022 | |||||||||||
| Including sales charge | Excluding sales charge | Expense ratios1 (%) | |||||||||
| Inception date | 1 year | 5 year | 10 year | 1 year | 5 year | 10 year | Gross | Net 2 | |||
| Class A (EVUAX) | 1-4-1994 | -7.95 | 5.72 | 7.73 | -2.34 | 6.98 | 8.37 | 1.16 | 1.05 | ||
| Class C (EVUCX) | 9-2-1994 | -4.03 | 6.18 | 7.72 | -3.03 | 6.18 | 7.72 | 1.91 | 1.80 | ||
| Administrator Class (EVUDX) | 7-30-2010 | – | – | – | -2.20 | 7.14 | 8.56 | 1.08 | 0.92 | ||
| Institutional Class (EVUYX) | 2-28-1994 | – | – | – | -2.03 | 7.34 | 8.73 | 0.83 | 0.72 | ||
| S&P 500 Utilities Index3 | – | – | – | – | 5.58 | 7.82 | 9.85 | – | – | ||
| S&P 500 Index4 | – | – | – | – | -15.47 | 9.24 | 11.70 | – | – | ||
| 1 | Reflects the expense ratios as stated in the most recent prospectuses. The expense ratios shown are subject to change and may differ from the annualized expense ratios shown in the financial highlights of this report. |
| 2 | The manager has contractually committed through July 31, 2023, to waive fees and/or reimburse expenses to the extent necessary to cap total annual fund operating expenses after fee waivers at 1.05% for Class A, 1.80% for Class C, 0.92% for Administrator Class, and 0.72% for Institutional Class. Brokerage commissions, stamp duty fees, interest, taxes, acquired fund fees and expenses (if any), and extraordinary expenses are excluded from the expense caps. Prior to or after the commitment expiration date, the caps may be increased or the commitment to maintain the caps may be terminated only with the approval of the Board of Trustees. Without these caps, the Fund’s returns would have been lower. The expense ratio paid by an investor is the net expense ratio (the total annual fund operating expenses after fee waivers) as stated in the prospectuses. |
| 3 | The S&P 500 Utilities Index is a market-value-weighted index that measures the performance of all stocks within the utilities sector of the S&P 500 Index. You cannot invest directly in an index. |
| 4 | The S&P 500 Index consists of 500 stocks chosen for market size, liquidity, and industry group representation. It is a market-value weighted index with each stock’s weight in the index proportionate to its market value. You cannot invest directly in an index. |
| ‡ | CFA® and Chartered Financial Analyst® are trademarks owned by CFA Institute. |
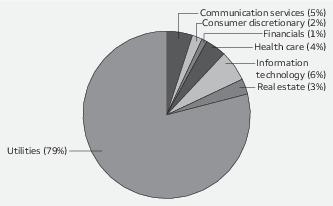
| Beginning
account value 4-1-2022 |
Ending
account value 9-30-2022 |
Expenses
paid during the period1 |
Annualized
net expense ratio | |
| Class A | ||||
| Actual | $1,000.00 | $ 869.43 | $4.83 | 1.03% |
| Hypothetical (5% return before expenses) | $1,000.00 | $1,019.90 | $5.22 | 1.03% |
| Class C | ||||
| Actual | $1,000.00 | $ 866.65 | $8.42 | 1.80% |
| Hypothetical (5% return before expenses) | $1,000.00 | $1,016.04 | $9.10 | 1.80% |
| Administrator Class | ||||
| Actual | $1,000.00 | $ 870.30 | $4.31 | 0.92% |
| Hypothetical (5% return before expenses) | $1,000.00 | $1,020.46 | $4.66 | 0.92% |
| Institutional Class | ||||
| Actual | $1,000.00 | $ 871.24 | $3.38 | 0.72% |
| Hypothetical (5% return before expenses) | $1,000.00 | $1,021.46 | $3.65 | 0.72% |
| Shares | Value | ||||
| Common stocks: 97.55% | |||||
| Communication services: 5.09% | |||||
| Diversified telecommunication services: 2.54% | |||||
| Verizon Communications Incorporated | 274,564 | $ 10,425,195 | |||
| Media: 2.55% | |||||
| Comcast Corporation Class A | 357,700 | 10,491,341 | |||
| Consumer discretionary: 2.03% | |||||
| Multiline retail: 0.80% | |||||
| Target Corporation | 22,069 | 3,274,819 | |||
| Specialty retail: 1.23% | |||||
| The Home Depot Incorporated | 18,381 | 5,072,053 | |||
| Financials: 1.01% | |||||
| Banks: 1.01% | |||||
| JPMorgan Chase & Company | 39,772 | 4,156,174 | |||
| Health care: 3.53% | |||||
| Biotechnology: 1.71% | |||||
| Amgen Incorporated | 31,093 | 7,008,362 | |||
| Health care providers & services: 1.82% | |||||
| UnitedHealth Group Incorporated | 14,830 | 7,489,743 | |||
| Information technology: 5.75% | |||||
| Communications equipment: 2.90% | |||||
| Cisco Systems Incorporated | 297,717 | 11,908,680 | |||
| IT services: 2.85% | |||||
| MasterCard Incorporated Class A | 20,588 | 5,853,992 | |||
| Visa Incorporated Class A | 32,898 | 5,844,330 | |||
| 11,698,322 | |||||
| Real estate: 3.43% | |||||
| Equity REITs: 3.43% | |||||
| American Tower Corporation | 65,522 | 14,067,573 | |||
| Utilities: 76.71% | |||||
| Electric utilities: 45.30% | |||||
| Alliant Energy Corporation | 100,158 | 5,307,374 | |||
| American Electric Power Company Incorporated | 210,292 | 18,179,743 | |||
| Constellation Energy Corporation | 111,094 | 9,241,910 | |||
| Duke Energy Corporation | 207,113 | 19,265,651 | |||
| Entergy Corporation | 77,022 | 7,750,724 | |||
| Evergy Incorporated | 113,357 | 6,733,406 | |||
| Eversource Energy | 101,960 | 7,948,802 | |||
| Exelon Corporation | 380,990 | 14,271,885 | |||
| FirstEnergy Corporation | 205,868 | 7,617,116 | |||
| NextEra Energy Incorporated | 735,750 | 57,690,158 |
| Shares | Value | ||||
| Electric utilities (continued) | |||||
| The Southern Company | 246,693 | $ 16,775,124 | |||
| Xcel Energy Incorporated | 238,866 | 15,287,424 | |||
| 186,069,317 | |||||
| Gas utilities: 3.41% | |||||
| Atmos Energy Corporation | 97,312 | 9,911,227 | |||
| ONE Gas Incorporated | 58,135 | 4,092,123 | |||
| 14,003,350 | |||||
| Multi-utilities: 25.87% | |||||
| Ameren Corporation | 133,679 | 10,767,843 | |||
| CenterPoint Energy Incorporated | 361,174 | 10,177,883 | |||
| CMS Energy Corporation | 208,002 | 12,114,036 | |||
| Dominion Energy Incorporated | 278,504 | 19,247,411 | |||
| DTE Energy Company | 103,797 | 11,941,845 | |||
| Public Service Enterprise Group Incorporated | 158,388 | 8,906,157 | |||
| Sempra Energy | 131,761 | 19,756,244 | |||
| WEC Energy Group Incorporated | 149,041 | 13,328,737 | |||
| 106,240,156 | |||||
| Water utilities: 2.13% | |||||
| American Water Works Company Incorporated | 67,273 | 8,756,254 | |||
| Total Common stocks (Cost $291,422,656) | 400,661,339 |
| Yield | |||||
| Short-term investments: 2.52% | |||||
| Investment companies: 2.52% | |||||
| Allspring Government Money Market Fund Select Class ♠∞ | 2.75% | 10,368,624 | 10,368,624 | ||
| Total Short-term investments (Cost $10,368,624) | 10,368,624 | ||||
| Total investments in securities (Cost $301,791,280) | 100.07% | 411,029,963 | |||
| Other assets and liabilities, net | (0.07) | (294,373) | |||
| Total net assets | 100.00% | $410,735,590 |
| ♠ | The issuer of the security is an affiliated person of the Fund as defined in the Investment Company Act of 1940. |
| ∞ | The rate represents the 7-day annualized yield at period end. |
| Abbreviations: | |
| REIT | Real estate investment trust |
| Value,
beginning of period |
Purchases | Sales
proceeds |
Net
realized gains (losses) |
Net
change in unrealized gains (losses) |
Value,
end of period |
Shares,
end of period |
Income
from affiliated securities | |
| Short-term investments | ||||||||
| Allspring Government Money Market Fund Select Class | $2,507,848 | $20,977,679 | $(13,116,903) | $0 | $0 | $10,368,624 | 10,368,624 | $43,363 |
| Assets | |
|
Investments in unaffiliated securities, at value (cost
$291,422,656) |
$ 400,661,339 |
|
Investments in affiliated securities, at value (cost
$10,368,624) |
10,368,624 |
|
Receivable for
dividends |
379,992 |
|
Receivable for Fund shares
sold |
96,267 |
|
Prepaid expenses and other
assets |
50,134 |
|
Total
assets |
411,556,356 |
| Liabilities | |
|
Payable for Fund shares
redeemed |
351,942 |
|
Management fee
payable |
221,765 |
|
Shareholder servicing fees
payable |
81,898 |
|
Administration fees
payable |
77,757 |
|
Trustees’ fees and expenses
payable |
3,970 |
|
Distribution fee
payable |
3,634 |
|
Accrued expenses and other
liabilities |
79,800 |
|
Total
liabilities |
820,766 |
|
Total net
assets |
$410,735,590 |
| Net assets consist of | |
|
Paid-in
capital |
$ 265,160,575 |
|
Total distributable
earnings |
145,575,015 |
|
Total net
assets |
$410,735,590 |
| Computation of net asset value and offering price per share | |
|
Net assets – Class
A |
$ 322,687,226 |
|
Shares outstanding – Class
A1 |
17,428,477 |
|
Net asset value per share – Class
A |
$18.51 |
|
Maximum offering price per share – Class
A2 |
$19.64 |
|
Net assets – Class
C |
$ 4,977,525 |
|
Shares outstanding – Class
C1 |
267,392 |
|
Net asset value per share – Class
C |
$18.62 |
|
Net assets – Administrator
Class |
$ 7,673,394 |
|
Shares outstanding – Administrator
Class1 |
413,715 |
|
Net asset value per share – Administrator
Class |
$18.55 |
|
Net assets – Institutional
Class |
$ 75,397,445 |
|
Shares outstanding – Institutional
Class1 |
4,074,790 |
Net
asset value per share – Institutional
Class |
$18.50 |
| 1 | The Fund has an unlimited number of authorized shares. |
| 2 | Maximum offering price is computed as 100/94.25 of net asset value. On investments of $50,000 or more, the offering price is reduced. |
| Investment income | |
|
Dividends |
$ 6,242,890 |
|
Income from affiliated
securities |
43,363 |
|
Total investment
income |
6,286,253 |
| Expenses | |
|
Management
fee |
1,508,263 |
| Administration fees | |
|
Class
A |
388,522 |
|
Class
C |
5,448 |
|
Administrator
Class |
5,160 |
|
Institutional
Class |
52,606 |
| Shareholder servicing fees | |
|
Class
A |
462,526 |
|
Class
C |
6,477 |
|
Administrator
Class |
9,922 |
| Distribution fee | |
|
Class
C |
19,195 |
|
Custody and accounting
fees |
10,009 |
|
Professional
fees |
18,243 |
|
Registration
fees |
33,948 |
|
Shareholder report
expenses |
8,042 |
|
Trustees’ fees and
expenses |
11,191 |
|
Other fees and
expenses |
5,705 |
|
Total
expenses |
2,545,257 |
| Less: Fee waivers and/or expense reimbursements | |
|
Fund-level |
(174,194) |
|
Class
A |
(75,679) |
|
Class
C |
(9) |
|
Administrator
Class |
(2,426) |
|
Institutional
Class |
(4,265) |
|
Net
expenses |
2,288,684 |
|
Net investment
income |
3,997,569 |
| Realized and unrealized gains (losses) on investments | |
|
Net realized gains on
investments |
1,491,942 |
|
Net change in unrealized gains (losses) on
investments |
(67,115,868) |
|
Net realized and unrealized gains (losses) on
investments |
(65,623,926) |
|
Net decrease in net assets resulting from
operations |
$(61,626,357) |
| Six
months ended September 30, 2022 (unaudited) |
Year
ended March 31, 2022 | |||
| Operations | ||||
|
Net investment
income |
$ 3,997,569 | $ 7,075,173 | ||
|
Net realized gains on
investments |
1,491,942 | 34,747,201 | ||
|
Net change in unrealized gains (losses) on
investments |
(67,115,868) | 16,262,033 | ||
|
Net increase (decrease) in net assets resulting from
operations |
(61,626,357) | 58,084,407 | ||
| Distributions to shareholders from | ||||
| Net investment income and net realized gains | ||||
|
Class
A |
(3,074,828) | (44,877,027) | ||
|
Class
C |
(27,743) | (572,530) | ||
|
Administrator
Class |
(75,324) | (791,404) | ||
|
Institutional
Class |
(819,739) | (9,166,657) | ||
|
Total distributions to
shareholders |
(3,997,634) | (55,407,618) | ||
| Capital share transactions | Shares | Shares | ||
| Proceeds from shares sold | ||||
|
Class
A |
368,217 | 7,738,402 | 1,015,898 | 22,075,851 |
|
Class
C |
87,548 | 1,810,253 | 37,936 | 829,370 |
|
Administrator
Class |
93,103 | 1,960,026 | 247,879 | 5,407,252 |
|
Institutional
Class |
766,571 | 16,116,842 | 1,249,622 | 26,754,319 |
| 27,625,523 | 55,066,792 | |||
| Reinvestment of distributions | ||||
|
Class
A |
146,892 | 2,903,376 | 2,096,156 | 42,565,818 |
|
Class
C |
1,387 | 27,575 | 27,825 | 565,194 |
|
Administrator
Class |
3,798 | 75,177 | 38,712 | 787,414 |
|
Institutional
Class |
41,378 | 817,149 | 448,365 | 9,114,183 |
| 3,823,277 | 53,032,609 | |||
| Payment for shares redeemed | ||||
|
Class
A |
(742,072) | (15,377,581) | (2,391,654) | (51,265,683) |
|
Class
C |
(32,098) | (675,166) | (150,982) | (3,277,302) |
|
Administrator
Class |
(29,310) | (608,676) | (82,475) | (1,755,120) |
|
Institutional
Class |
(422,835) | (8,782,805) | (1,067,904) | (22,740,013) |
| (25,444,228) | (79,038,118) | |||
|
Net increase in net assets resulting from capital share
transactions |
6,004,572 | 29,061,283 | ||
|
Total increase (decrease) in net
assets |
(59,619,419) | 31,738,072 | ||
| Net assets | ||||
|
Beginning of
period |
470,355,009 | 438,616,937 | ||
|
End of
period |
$410,735,590 | $470,355,009 | ||
| Year ended March 31 | ||||||
| Class A | Six
months ended September 30, 2022 (unaudited) |
2022 | 2021 | 2020 | 2019 | 2018 |
|
Net asset value, beginning of
period |
$21.48 | $21.47 | $20.19 | $24.03 | $20.46 | $20.01 |
|
Net investment
income |
0.18 | 0.33 | 0.34 | 0.34 | 0.32 | 0.34 |
|
Net realized and unrealized gains (losses) on
investments |
(2.97) | 2.40 | 3.82 | 0.02 | 3.65 | 0.47 |
|
Total from investment
operations |
(2.79) | 2.73 | 4.16 | 0.36 | 3.97 | 0.81 |
| Distributions to shareholders from | ||||||
|
Net investment
income |
(0.18) | (0.32) | (0.35) | (0.34) | (0.34) | (0.36) |
|
Net realized
gains |
0.00 | (2.40) | (2.53) | (3.86) | (0.06) | 0.00 |
|
Total distributions to
shareholders |
(0.18) | (2.72) | (2.88) | (4.20) | (0.40) | (0.36) |
|
Net asset value, end of
period |
$18.51 | $21.48 | $21.47 | $20.19 | $24.03 | $20.46 |
|
Total
return1 |
(13.06)% | 13.62% | 21.23% | 0.04% | 19.59% | 4.00% |
| Ratios to average net assets (annualized) | ||||||
|
Gross
expenses |
1.15% | 1.16% | 1.17% | 1.17% | 1.19% | 1.17% |
|
Net
expenses |
1.03% | 1.04% | 1.04% | 1.09% | 1.14% | 1.14% |
|
Net investment
income |
1.67% | 1.52% | 1.58% | 1.42% | 1.47% | 1.60% |
| Supplemental data | ||||||
|
Portfolio turnover
rate |
2% | 11% | 20% | 49% | 10% | 7% |
|
Net assets, end of period (000s
omitted) |
$322,687 | $379,164 | $363,540 | $319,200 | $337,848 | $287,047 |
| 1 | Total return calculations do not include any sales charges. Returns for periods of less than one year are not annualized. |
| Year ended March 31 | ||||||
| Class C | Six
months ended September 30, 2022 (unaudited) |
2022 | 2021 | 2020 | 2019 | 2018 |
|
Net asset value, beginning of
period |
$21.60 | $21.57 | $20.25 | $24.06 | $20.47 | $20.01 |
|
Net investment
income |
0.10 1 | 0.17 1 | 0.17 1 | 0.16 1 | 0.16 1 | 0.13 |
|
Net realized and unrealized gains (losses) on
investments |
(2.97) | 2.40 | 3.85 | 0.01 | 3.63 | 0.52 |
|
Total from investment
operations |
(2.87) | 2.57 | 4.02 | 0.17 | 3.79 | 0.65 |
| Distributions to shareholders from | ||||||
|
Net investment
income |
(0.11) | (0.14) | (0.17) | (0.12) | (0.14) | (0.19) |
|
Net realized
gains |
0.00 | (2.40) | (2.53) | (3.86) | (0.06) | 0.00 |
|
Total distributions to
shareholders |
(0.11) | (2.54) | (2.70) | (3.98) | (0.20) | (0.19) |
|
Net asset value, end of
period |
$18.62 | $21.60 | $21.57 | $20.25 | $24.06 | $20.47 |
|
Total
return2 |
(13.34)% | 12.75% | 20.34% | (0.73)% | 18.65% | 3.24% |
| Ratios to average net assets (annualized) | ||||||
|
Gross
expenses |
1.89% | 1.90% | 1.91% | 1.92% | 1.94% | 1.92% |
|
Net
expenses |
1.80% | 1.80% | 1.80% | 1.86% | 1.89% | 1.89% |
|
Net investment
income |
0.91% | 0.77% | 0.80% | 0.63% | 0.74% | 0.85% |
| Supplemental data | ||||||
|
Portfolio turnover
rate |
2% | 11% | 20% | 49% | 10% | 7% |
|
Net assets, end of period (000s
omitted) |
$4,978 | $4,548 | $6,379 | $10,274 | $19,618 | $41,729 |
| 1 | Calculated based upon average shares outstanding |
| 2 | Total return calculations do not include any sales charges. Returns for periods of less than one year are not annualized. |
| Year ended March 31 | ||||||
| Administrator Class | Six
months ended September 30, 2022 (unaudited) |
2022 | 2021 | 2020 | 2019 | 2018 |
|
Net asset value, beginning of
period |
$21.52 | $21.51 | $20.22 | $24.05 | $20.48 | $20.03 |
|
Net investment
income |
0.19 | 0.37 | 0.37 | 0.36 | 0.36 | 0.37 |
|
Net realized and unrealized gains (losses) on
investments |
(2.97) | 2.39 | 3.83 | 0.04 | 3.65 | 0.48 |
|
Total from investment
operations |
(2.78) | 2.76 | 4.20 | 0.40 | 4.01 | 0.85 |
| Distributions to shareholders from | ||||||
|
Net investment
income |
(0.19) | (0.35) | (0.38) | (0.37) | (0.38) | (0.40) |
|
Net realized
gains |
0.00 | (2.40) | (2.53) | (3.86) | (0.06) | 0.00 |
|
Total distributions to
shareholders |
(0.19) | (2.75) | (2.91) | (4.23) | (0.44) | (0.40) |
|
Net asset value, end of
period |
$18.55 | $21.52 | $21.51 | $20.22 | $24.05 | $20.48 |
|
Total
return1 |
(12.97)% | 13.76% | 21.39% | 0.20% | 19.80% | 4.21% |
| Ratios to average net assets (annualized) | ||||||
|
Gross
expenses |
1.07% | 1.08% | 1.09% | 1.09% | 1.11% | 1.09% |
|
Net
expenses |
0.92% | 0.92% | 0.92% | 0.94% | 0.95% | 0.95% |
|
Net investment
income |
1.79% | 1.63% | 1.70% | 1.49% | 1.66% | 1.80% |
| Supplemental data | ||||||
|
Portfolio turnover
rate |
2% | 11% | 20% | 49% | 10% | 7% |
|
Net assets, end of period (000s
omitted) |
$7,673 | $7,447 | $3,054 | $2,449 | $5,296 | $4,702 |
| 1 | Returns for periods of less than one year are not annualized. |
| Year ended March 31 | ||||||
| Institutional Class | Six
months ended September 30, 2022 (unaudited) |
2022 | 2021 | 2020 | 2019 | 2018 |
|
Net asset value, beginning of
period |
$21.46 | $21.46 | $20.18 | $24.01 | $20.45 | $20.00 |
|
Net investment
income |
0.21 | 0.40 | 0.43 | 0.44 | 0.41 | 0.41 |
|
Net realized and unrealized gains (losses) on
investments |
(2.96) | 2.39 | 3.80 | 0.01 | 3.62 | 0.47 |
|
Total from investment
operations |
(2.75) | 2.79 | 4.23 | 0.45 | 4.03 | 0.88 |
| Distributions to shareholders from | ||||||
|
Net investment
income |
(0.21) | (0.39) | (0.42) | (0.42) | (0.41) | (0.43) |
|
Net realized
gains |
0.00 | (2.40) | (2.53) | (3.86) | (0.06) | 0.00 |
|
Total distributions to
shareholders |
(0.21) | (2.79) | (2.95) | (4.28) | (0.47) | (0.43) |
|
Net asset value, end of
period |
$18.50 | $21.46 | $21.46 | $20.18 | $24.01 | $20.45 |
|
Total
return1 |
(12.88)% | 13.94% | 21.62% | 0.42% | 20.03% | 4.38% |
| Ratios to average net assets (annualized) | ||||||
|
Gross
expenses |
0.82% | 0.83% | 0.84% | 0.84% | 0.86% | 0.84% |
|
Net
expenses |
0.72% | 0.72% | 0.72% | 0.75% | 0.78% | 0.78% |
|
Net investment
income |
2.00% | 1.84% | 1.92% | 1.76% | 1.83% | 1.95% |
| Supplemental data | ||||||
|
Portfolio turnover
rate |
2% | 11% | 20% | 49% | 10% | 7% |
|
Net assets, end of period (000s
omitted) |
$75,397 | $79,196 | $65,644 | $45,888 | $42,427 | $31,548 |
| 1 | Returns for periods of less than one year are not annualized. |
| Gross unrealized gains | $121,166,197 |
| Gross unrealized losses | (11,927,514) |
| Net unrealized gains | $109,238,683 |
| ■ | Level 1 – quoted prices in active markets for identical securities |
| ■ | Level 2 – other significant observable inputs (including quoted prices for similar securities, interest rates, prepayment speeds, credit risk, etc.) |
| ■ | Level 3 – significant unobservable inputs (including the Fund’s own assumptions in determining the fair value of investments) |
| Quoted
prices (Level 1) |
Other
significant observable inputs (Level 2) |
Significant
unobservable inputs (Level 3) |
Total | |
| Assets | ||||
| Investments in: | ||||
| Common stocks | ||||
| Communication services | $ 20,916,536 | $0 | $0 | $ 20,916,536 |
| Consumer discretionary | 8,346,872 | 0 | 0 | 8,346,872 |
| Financials | 4,156,174 | 0 | 0 | 4,156,174 |
| Health care | 14,498,105 | 0 | 0 | 14,498,105 |
| Information technology | 23,607,002 | 0 | 0 | 23,607,002 |
| Real estate | 14,067,573 | 0 | 0 | 14,067,573 |
| Utilities | 315,069,077 | 0 | 0 | 315,069,077 |
| Short-term investments | ||||
| Investment companies | 10,368,624 | 0 | 0 | 10,368,624 |
| Total assets | $411,029,963 | $0 | $0 | $411,029,963 |
| Average daily net assets | Management fee |
| First $500 million | 0.650% |
| Next $500 million | 0.600 |
| Next $1 billion | 0.550 |
| Next $2 billion | 0.525 |
| Next $1 billion | 0.500 |
| Next $5 billion | 0.490 |
| Over $10 billion | 0.480 |
| Class-level
administration fee | |
| Class A | 0.21% |
| Class C | 0.21 |
| Administrator Class | 0.13 |
| Institutional Class | 0.13 |
| Expense ratio caps | |
| Class A | 1.05% |
| Class C | 1.80 |
| Administrator Class | 0.92 |
| Institutional Class | 0.72 |
| Name
and year of birth |
Position
held and length of service* |
Principal occupations during past five years or longer | Current
other public company or investment company directorships |
| William
R. Ebsworth (Born 1957) |
Trustee,
since 2015 |
Retired. From 1984 to 2013, equities analyst, portfolio manager, research director and chief investment officer at Fidelity Management and Research Company in Boston, Tokyo, and Hong Kong, and retired in 2013 as Chief Investment Officer of Fidelity Strategic Advisers, Inc. where he led a team of investment professionals managing client assets. Prior thereto, Board member of Hong Kong Securities Clearing Co., Hong Kong Options Clearing Corp., the Thailand International Fund, Ltd., Fidelity Investments Life Insurance Company, and Empire Fidelity Investments Life Insurance Company. Audit Committee Chair and Investment Committee Chair of the Vincent Memorial Hospital Endowment (non-profit organization). Mr. Ebsworth is a CFA® charterholder. | N/A |
| Jane
A. Freeman (Born 1953) |
Trustee,
since 2015; Chair Liaison, since 2018 |
Retired. From 2012 to 2014 and 1999 to 2008, Chief Financial Officer of Scientific Learning Corporation. From 2008 to 2012, Ms. Freeman provided consulting services related to strategic business projects. Prior to 1999, Portfolio Manager at Rockefeller & Co. and Scudder, Stevens & Clark. Board member of the Harding Loevner Funds from 1996 to 2014, serving as both Lead Independent Director and chair of the Audit Committee. Board member of the Russell Exchange Traded Funds Trust from 2011 to 2012 and the chair of the Audit Committee. Ms. Freeman is also an inactive Chartered Financial Analyst. | N/A |
| Isaiah
Harris, Jr. (Born 1952) |
Trustee,
since 2009; Audit Committee Chair, since 2019 |
Retired. Chairman of the Board of CIGNA Corporation from 2009 to 2021, and Director from 2005 to 2008. From 2003 to 2011, Director of Deluxe Corporation. Prior thereto, President and CEO of BellSouth Advertising and Publishing Corp. from 2005 to 2007, President and CEO of BellSouth Enterprises from 2004 to 2005 and President of BellSouth Consumer Services from 2000 to 2003. Emeritus member of the Iowa State University Foundation Board of Governors. Emeritus Member of the Advisory Board of Iowa State University School of Business. Advisory Board Member, Palm Harbor Academy (private school). Advisory Board Member, Fellowship of Christian Athletes. Mr. Harris is a certified public accountant (inactive status). | N/A |
| David
F. Larcker (Born 1950) |
Trustee,
since 2009 |
James Irvin Miller Professor of Accounting at the Graduate School of Business (Emeritus), Stanford University, Director of the Corporate Governance Research Initiative and Senior Faculty of The Rock Center for Corporate Governance since 2006. From 2005 to 2008, Professor of Accounting at the Graduate School of Business, Stanford University. Prior thereto, Ernst & Young Professor of Accounting at The Wharton School, University of Pennsylvania from 1985 to 2005. | N/A |
| Name
and year of birth |
Position
held and length of service* |
Principal occupations during past five years or longer | Current
other public company or investment company directorships |
| Olivia
S. Mitchell (Born 1953) |
Trustee,
since 2006; Nominating and Governance Committee Chair, since 2018 |
International Foundation of Employee Benefit Plans Professor since 1993, Wharton School of the University of Pennsylvania. Director of Wharton’s Pension Research Council and Boettner Center on Pensions & Retirement Research, and Research Associate at the National Bureau of Economic Research. Previously taught at Cornell University from 1978 to 1993. | N/A |
| Timothy
J. Penny (Born 1951) |
Trustee,
since 1996; Chair, since 2018 |
President and Chief Executive Officer of Southern Minnesota Initiative Foundation, a non-profit organization, since 2007. Vice Chair of the Economic Club of Minnesota, since 2007. Co-Chair of the Committee for a Responsible Federal Budget, since 1995. Member of the Board of Trustees of NorthStar Education Finance, Inc., a non-profit organization, since 2007. Senior Fellow of the University of Minnesota Humphrey Institute from 1995 to 2017. | N/A |
| James
G. Polisson (Born 1959) |
Trustee,
since 2018 |
Retired. Chief Marketing Officer, Source (ETF) UK Services, Ltd, from 2015 to 2017. From 2012 to 2015, Principal of The Polisson Group, LLC, a management consulting, corporate advisory and principal investing company. Chief Executive Officer and Managing Director at Russell Investments, Global Exchange Traded Funds from 2010 to 2012. Managing Director of Barclays Global Investors from 1998 to 2010 and Global Chief Marketing Officer for iShares and Barclays Global Investors from 2000 to 2010. Trustee of the San Francisco Mechanics’ Institute, a non-profit organization, from 2013 to 2015. Board member of the Russell Exchange Traded Fund Trust from 2011 to 2012. Director of Barclays Global Investors Holdings Deutschland GmbH from 2006 to 2009. Mr. Polisson is an attorney and has a retired status with the Massachusetts and District of Columbia Bar Associations. | N/A |
| Pamela
Wheelock (Born 1959) |
Trustee,
since January 2020; previously Trustee from January 2018 to July 2019 |
Retired. Executive and Senior Financial leadership positions in the public, private and nonprofit sectors. Interim President and CEO, McKnight Foundation, 2020. Interim Commissioner, Minnesota Department of Human Services, 2019. Chief Operating Officer, Twin Cities Habitat for Humanity, 2017-2019. Vice President for University Services, University of Minnesota, 2012-2016. Interim President and CEO, Blue Cross and Blue Shield of Minnesota, 2011-2012. Executive Vice-President and Chief Financial Officer, Minnesota Wild, 2002-2008. Commissioner, Minnesota Department of Finance, 1999-2002. Chair of the Board of Directors of Destination Medical Center Corporation. Board member of the Minnesota Wild Foundation. | N/A |
| Name
and year of birth |
Position
held and length of service |
Principal occupations during past five years or longer |
| Andrew
Owen (Born 1960) |
President,
since 2017 |
President and Chief Executive Officer of Allspring Funds Management, LLC since 2017 and Head of Global Fund Governance of Allspring Global Investments since 2022. Prior thereto, co-president of Galliard Capital Management, LLC, an affiliate of Allspring Funds Management, LLC, from 2019 to 2022 and Head of Affiliated Managers, Allspring Global Investments, from 2014 to 2019 and Executive Vice President responsible for marketing, investments and product development for Allspring Funds Management, LLC, from 2009 to 2014. |
| Jeremy
DePalma (Born 1974) |
Treasurer,
since 2012 (for certain funds in the Fund Complex); since 2021 (for the remaining funds in the Fund Complex) |
Senior Vice President of Allspring Funds Management, LLC since 2009. Senior Vice President of Evergreen Investment Management Company, LLC from 2008 to 2010 and head of the Fund Reporting and Control Team within Fund Administration from 2005 to 2010. |
| Christopher
Baker (Born 1976) |
Chief Compliance Officer, since 2022 | Global Chief Compliance Officer for Allspring Global Investments since 2022. Prior thereto, Chief Compliance Officer for State Street Global Advisors from 2018 to 2021. Senior Compliance Officer for the State Street divisions of Alternative Investment Solutions, Sector Solutions, and Global Marketing from 2015 to 2018. From 2010 to 2015 Vice President, Global Head of Investment and Marketing Compliance for State Street Global Advisors. |
| Matthew
Prasse (Born 1983) |
Chief Legal Officer, since 2022; Secretary, since 2021 | Senior Counsel of the Allspring Legal Department since 2021. Senior Counsel of the Wells Fargo Legal Department from 2018 to 2021. Previously, Counsel for Barings LLC from 2015 to 2018. Prior to joining Barings, Associate at Morgan, Lewis & Bockius LLP from 2008 to 2015. |
P.O. Box 219967
Kansas City, MO 64121-9967

1-800-222-8222 or visit the Fund's website at allspringglobal.com. Read the prospectus carefully before you invest or send money.
SA318/SAR318 09-22
ITEM 2. CODE OF ETHICS
Not applicable.
ITEM 3. AUDIT COMMITTEE FINANCIAL EXPERT
Not applicable.
ITEM 4. PRINCIPAL ACCOUNTANT FEES AND SERVICES
Not applicable.
ITEM 5. AUDIT COMMITTEE OF LISTED REGISTRANTS
Not applicable.
ITEM 6. INVESTMENTS
A Portfolio of Investments for each series of Allspring Funds Trust is included as part of the report to shareholders filed under Item 1 of this Form.
ITEM 7. DISCLOSURE OF PROXY VOTING POLICIES AND PROCEDURES FOR CLOSED-END MANAGEMENT INVESTMENT COMPANIES
Not applicable.
ITEM 8. PORTFOLIO MANAGERS OF CLOSED-END MANAGEMENT INVESTMENT COMPANIES
Not applicable.
ITEM 9. PURCHASES OF EQUITY SECURITIES BY CLOSED-END MANAGEMEENT INVESTMENT COMPANY AND AFFILIATED PURCHASERS
Not applicable.
ITEM 10. SUBMISSION OF MATTERS TO A VOTE OF SECURITY HOLDERS
There have been no material changes to the procedures by which shareholders may recommend nominees to the registrant’s Board of Trustees that have been implemented since the registrant’s last provided disclosure in response to the requirements of this Item.
ITEM 11. CONTROLS AND PROCEDURES
(a) The President and Treasurer have concluded that the Allspring Funds Trust disclosure controls and procedures (as defined in Rule 30a-3(c) under the Investment Company Act of 1940) provide reasonable assurances that material information relating to the registrant is made known to them by the appropriate persons, based on their evaluation of these controls and procedures as of a date within 90 days of the filing of this report.
(b) There were no significant changes in the registrant’s internal controls over financial reporting (as defined in Rule 30a-3(d) under the Investment Company Act of 1940) that occurred during the most recent fiscal half-year of the period covered by this report that materially affected, or is reasonably likely to materially affect, the registrant’s internal control over financial reporting.
ITEM 12. DISCLOSURES OF SECURITIES LENDING ACTIVITES FOR CLOSED-END MANAGEMENT INVESTMENT COMPANIES
Not applicable.
ITEM 13. EXHIBITS
(a)(1) Not applicable.
(a)(2) Certifications pursuant to Section 302 of the Sarbanes-Oxley Act of 2002.
(b) Certifications pursuant to Section 906 of the Sarbanes-Oxley Act of 2002.
SIGNATURES
Pursuant to the requirements of the Securities Exchange Act of 1934 and the Investment Company Act of 1940, the registrant has duly caused this report to be signed on its behalf by the undersigned, thereunto duly authorized.
| Allspring Funds Trust | ||
| By: | /s/Andrew Owen | |
| Andrew Owen | ||
| President | ||
| Date: November 22, 2022 | ||
Pursuant to the requirements of the Securities Exchange Act of 1934 and the Investment Company Act of 1940, this report has been signed below by the following persons on behalf of the registrant and in the capacities and on the date indicated.
| Allspring Funds Trust | ||
| By: | /s/Andrew Owen | |
| Andrew Owen | ||
| President | ||
| Date: November 22, 2022 | ||
| By: | /s/Jeremy DePalma | |
| Jeremy DePalma | ||
| Treasurer | ||
| Date: November 22, 2022 | ||