
UNITED STATES
SECURITIES AND EXCHANGE COMMISSION
Washington, D.C. 20549
FORM N-CSR
CERTIFIED SHAREHOLDER REPORT OF REGISTERED
MANAGEMENT INVESTMENT COMPANIES
Investment Company Act file number: 811-09253
Allspring Funds Trust
(Exact name of registrant as specified in charter)
525 Market St., San Francisco, CA 94105
(Address of principal executive offices) (Zip code)
Matthew Prasse
Allspring Funds Management, LLC
525 Market St., San Francisco, CA 94105
(Name and address of agent for service)
Registrant’s telephone number, including area code: 800-222-8222
Date of fiscal year end: January 31
Registrant is making a filing for 7 of its series:
Allspring 100% Treasury Money Market Fund, Allspring Government Money Market Fund, Allspring Heritage Money Market Fund, Allspring Money Market Fund, Allspring Municipal Cash Management Money Market Fund, Allspring National Tax-Free Money Market Fund and Allspring Treasury Plus Money Market Fund.
Date of reporting period: January 31, 2022
| ITEM 1. | REPORT TO STOCKHOLDERS |

| ■ | Allspring 100% Treasury Money Market Fund |
|
|
2 |
|
|
6 |
|
|
10 |
|
|
11 |
| Financial statements | |
|
|
13 |
|
|
14 |
|
|
15 |
|
|
16 |
|
|
20 |
|
|
24 |
|
|
25 |

| 1 | The S&P 500 Index consists of 500 stocks chosen for market size, liquidity, and industry group representation. It is a market-value-weighted index with each stock's weight in the index proportionate to its market value. You cannot invest directly in an index. |
| 2 | The Morgan Stanley Capital International (MSCI) All Country World Index (ACWI) ex USA Index (Net) is a free-float-adjusted market-capitalization-weighted index that is designed to measure the equity market performance of developed and emerging markets, excluding the U.S. Source: MSCI. MSCI makes no express or implied warranties or representations and shall have no liability whatsoever with respect to any MSCI data contained herein. The MSCI data may not be further redistributed or used as a basis for other indexes or any securities or financial products. This report is not approved, reviewed, or produced by MSCI. You cannot invest directly in an index. |
| 3 | The MSCI Emerging Markets (EM) Index (Net) (USD) is a free-float-adjusted market-capitalization-weighted index that is designed to measure equity market performance of emerging markets. You cannot invest directly in an index. |
| 4 | The Bloomberg U.S. Aggregate Bond Index is a broad-based benchmark that measures the investment-grade, U.S.-dollar-denominated, fixed-rate taxable bond market, including Treasuries, government-related and corporate securities, mortgage-backed securities (agency fixed-rate and hybrid adjustable-rate mortgage pass-throughs), asset-backed securities, and commercial mortgage-backed securities. You cannot invest directly in an index. |
| 5 | The Bloomberg Global Aggregate ex-USD Index (unhedged) is an unmanaged index that provides a broad-based measure of the global investment-grade fixed-income markets excluding the U.S.-dollar-denominated debt market. You cannot invest directly in an index. |
| 6 | The Bloomberg Municipal Bond Index is an unmanaged index composed of long-term tax-exempt bonds with a minimum credit rating of Baa. You cannot invest directly in an index. |
| 7 | The ICE BofA U.S. High Yield Index is a market-capitalization-weighted index of domestic and Yankee high-yield bonds. The index tracks the performance of high-yield securities traded in the U.S. bond market. You cannot invest directly in an index. Copyright 2022. ICE Data Indices, LLC. All rights reserved. |
| 1 | The Consumer Price Index (CPI) is a measure of the average change over time in the prices paid by urban consumers for a market basket of consumer goods and services. You cannot invest directly in an index. |

President
Allspring Funds
| 1 | As of December 31, 2021, assets under management (AUM) includes $91.6 billion from Galliard Capital Management, LLC, an investment advisor that is not part of the Allspring trade name/GIPS firm. |
| Investment objective | The Fund seeks current income exempt from most state and local individual income taxes, while preserving capital and liquidity. |
| Manager | Allspring Funds Management, LLC |
| Subadviser | Allspring Global Investments, LLC |
| Portfolio managers | Michael C. Bird, CFA®‡, Jeffrey L. Weaver, CFA®‡, Laurie White |
| Average annual total returns (%) as of January 31, 2022 | ||||||
| Expense ratios1 (%) | ||||||
| Inception date | 1 year | 5 year | 10 year | Gross | Net 2 | |
| Class A (WFTXX) | 11-8-1999 | 0.02 | 0.67 | 0.34 | 0.61 | 0.60 |
| Administrator Class (WTRXX) | 6-30-2010 | 0.01 | 0.87 | 0.44 | 0.34 | 0.30 |
| Institutional Class (WOTXX)3 | 10-31-2014 | 0.01 | 0.94 | 0.49 | 0.22 | 0.20 |
| Service Class (NWTXX) | 12-3-1990 | 0.01 | 0.74 | 0.37 | 0.51 | 0.50 |
| 1 | Reflects the expense ratios as stated in the most recent prospectuses. The expense ratios shown are subject to change and may differ from the annualized expense ratios shown in the financial highlights of this report. |
| 2 | The manager has contractually committed through May 31, 2022, to waive fees and/or reimburse expenses to the extent necessary to cap total annual fund operating expenses after fee waivers at 0.60% for Class A, 0.30% for Administrator Class, 0.20% for Institutional Class, and 0.50% for Service Class. Brokerage commissions, stamp duty fees, interest, taxes, acquired fund fees and expenses (if any), and extraordinary expenses are excluded from the expense caps. Prior to or after the commitment expiration date, the caps may be increased or the commitment to maintain the caps may be terminated only with the approval of the Board of Trustees. The manager and/or its affiliates may also voluntarily waive all or a portion of any fees to which they are entitled and/or reimburse certain expenses as they may determine from time to time. Without these caps, the Fund’s returns would have been lower. The expense ratio paid by an investor is the net expense ratio (the total annual fund operating expenses after fee waivers) as stated in the prospectuses. |
| 3 | Historical performance shown for the Institutional Class shares prior to their inception reflects the performance of the Administrator Class shares, and includes the higher expenses applicable to the Administrator Class shares. If these expenses had not been included, returns for the Institutional Class shares would be higher. |
| Yield summary (%) as of January 31, 2022 | ||||
| Class A | Administrator
Class |
Institutional
Class |
Service
Class | |
| 7-day current yield1 | 0.01 | 0.01 | 0.01 | 0.01 |
| 7-day compound yield | 0.01 | 0.01 | 0.01 | 0.01 |
| 30-day simple yield | 0.02 | 0.01 | 0.01 | 0.01 |
| 30-day compound yield | 0.02 | 0.01 | 0.01 | 0.01 |
| 1 | The manager has contractually committed through May 31, 2022, to waive fees and/or reimburse expenses to the extent necessary to cap total annual fund operating expenses and may also voluntarily waive or reimburse additional fees and expenses which may be discontinued or modified at any time without notice. Without these reductions, the Fund’s 7-day current yield would have been -0.36%, -0.22%, -0.13% and -0.34% for Class A, Administrator Class, Institutional Class and Service Class, respectively. |
| ‡ | CFA® and Chartered Financial Analyst® are trademarks owned by CFA Institute. |
| * | The Core Personal Consumption Expenditures (PCE) Price Index measures the prices paid by U.S. consumers for domestic goods and services, excluding the prices of food and energy. You cannot invest directly into an index. |
| Beginning
account value 8-1-2021 |
Ending
account value 1-31-2022 |
Expenses
paid during the period1 |
Annualized
net expense ratio | |
| Class A | ||||
| Actual | $1,000.00 | $1,000.13 | $0.25 | 0.05% |
| Hypothetical (5% return before expenses) | $1,000.00 | $1,024.95 | $0.26 | 0.05% |
| Administrator Class | ||||
| Actual | $1,000.00 | $1,000.06 | $0.30 | 0.06% |
| Hypothetical (5% return before expenses) | $1,000.00 | $1,024.90 | $0.31 | 0.06% |
| Institutional Class | ||||
| Actual | $1,000.00 | $1,000.06 | $0.30 | 0.06% |
| Hypothetical (5% return before expenses) | $1,000.00 | $1,024.90 | $0.31 | 0.06% |
| Service Class | ||||
| Actual | $1,000.00 | $1,000.06 | $0.30 | 0.06% |
| Hypothetical (5% return before expenses) | $1,000.00 | $1,024.90 | $0.31 | 0.06% |
| Interest
rate |
Maturity
date |
Principal | Value | ||
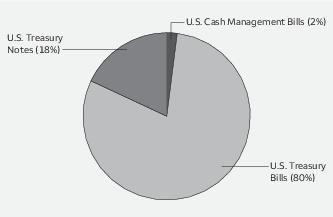
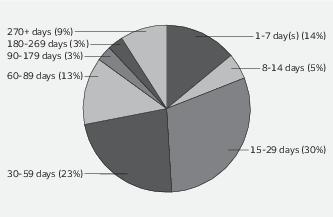
| U.S. Treasury securities: 111.73% | |||||
| U.S. Cash Management Bill ☼ | 0.07% | 4-5-2022 | $ 50,000,000 | $ 49,993,613 | |
| U.S. Cash Management Bill ☼ | 0.09 | 4-19-2022 | 100,000,000 | 99,981,285 | |
| U.S. Cash Management Bill ☼ | 0.11 | 4-26-2022 | 100,000,000 | 99,973,750 | |
| U.S. Cash Management Bill ☼ | 0.13 | 5-3-2022 | 50,000,000 | 49,983,253 | |
| U.S. Cash Management Bill ☼ | 0.15 | 5-10-2022 | 50,000,000 | 49,980,264 | |
| U.S. Cash Management Bill ☼ | 0.19 | 5-17-2022 | 20,000,000 | 19,988,742 | |
| U.S. Cash Management Bill ☼ | 0.28 | 5-24-2022 | 20,000,000 | 19,982,889 | |
| U.S. Treasury Bill ☼ | 0.04 | 2-1-2022 | 1,364,480,000 | 1,364,480,000 | |
| U.S. Treasury Bill ☼ | 0.04 | 2-3-2022 | 1,220,000,000 | 1,219,997,593 | |
| U.S. Treasury Bill ☼ | 0.04 | 2-22-2022 | 894,140,000 | 894,116,827 | |
| U.S. Treasury Bill ☼ | 0.05 | 2-8-2022 | 549,600,000 | 549,594,657 | |
| U.S. Treasury Bill ☼ | 0.05 | 2-10-2022 | 333,320,000 | 333,315,944 | |
| U.S. Treasury Bill ☼ | 0.05 | 2-17-2022 | 800,000,000 | 799,982,222 | |
| U.S. Treasury Bill ☼ | 0.05 | 2-24-2022 | 780,000,000 | 779,977,065 | |
| U.S. Treasury Bill ☼ | 0.05 | 3-3-2022 | 660,000,000 | 659,972,875 | |
| U.S. Treasury Bill ☼ | 0.05 | 3-8-2022 | 350,000,000 | 349,982,257 | |
| U.S. Treasury Bill ☼ | 0.05 | 3-15-2022 | 350,000,000 | 349,979,408 | |
| U.S. Treasury Bill ☼ | 0.05 | 3-17-2022 | 400,000,000 | 399,974,639 | |
| U.S. Treasury Bill ☼ | 0.06 | 2-15-2022 | 1,370,000,000 | 1,369,977,872 | |
| U.S. Treasury Bill ☼ | 0.06 | 3-1-2022 | 1,500,000,000 | 1,499,952,011 | |
| U.S. Treasury Bill ☼ | 0.06 | 3-10-2022 | 1,210,590,000 | 1,210,526,150 | |
| U.S. Treasury Bill ☼ | 0.08 | 3-22-2022 | 100,000,000 | 99,988,975 | |
| U.S. Treasury Bill ☼ | 0.08 | 3-24-2022 | 400,000,000 | 399,962,813 | |
| U.S. Treasury Bill ☼ | 0.08 | 3-31-2022 | 500,000,000 | 499,933,542 | |
| U.S. Treasury Bill ☼ | 0.08 | 4-14-2022 | 350,000,000 | 349,921,600 | |
| U.S. Treasury Bill ☼ | 0.08 | 4-21-2022 | 330,000,000 | 329,893,537 | |
| U.S. Treasury Bill ☼ | 0.09 | 4-7-2022 | 350,000,000 | 349,945,337 | |
| U.S. Treasury Bill ☼ | 0.10 | 6-2-2022 | 50,000,000 | 49,985,379 | |
| U.S. Treasury Bill ☼ | 0.13 | 3-29-2022 | 300,000,000 | 299,938,400 | |
| U.S. Treasury Bill ☼ | 0.15 | 6-23-2022 | 20,000,000 | 19,988,324 | |
| U.S. Treasury Bill ☼ | 0.16 | 11-3-2022 | 70,000,000 | 69,914,444 | |
| U.S. Treasury Bill ☼ | 0.19 | 4-28-2022 | 300,000,000 | 299,865,267 | |
| U.S. Treasury Bill ☼ | 0.21 | 6-30-2022 | 20,000,000 | 19,982,989 | |
| U.S. Treasury Bill ☼ | 0.22 | 7-7-2022 | 20,000,000 | 19,980,717 | |
| U.S. Treasury Bill ☼ | 0.23 | 5-5-2022 | 250,000,000 | 249,855,917 | |
| U.S. Treasury Bill ☼ | 0.27 | 7-14-2022 | 10,000,000 | 9,987,866 | |
| U.S. Treasury Bill ☼ | 0.36 | 7-21-2022 | 10,000,000 | 9,982,858 | |
| U.S. Treasury Bill ☼ | 0.38 | 7-28-2022 | 10,000,000 | 9,981,415 | |
| U.S. Treasury Bill ☼ | 0.39 | 12-29-2022 | 10,000,000 | 9,964,142 | |
| U.S. Treasury Bill ☼ | 0.62 | 1-26-2023 | 10,000,000 | 9,938,372 | |
| U.S. Treasury Note | 0.13 | 5-31-2022 | 17,000,000 | 17,002,151 | |
| U.S. Treasury Note | 0.13 | 6-30-2022 | 18,000,000 | 18,002,480 | |
| U.S. Treasury Note | 0.13 | 7-31-2022 | 120,000,000 | 120,016,877 | |
| U.S. Treasury Note | 0.13 | 8-31-2022 | 20,000,000 | 20,003,885 | |
| U.S. Treasury Note | 0.13 | 10-31-2022 | 20,000,000 | 20,002,004 | |
| U.S. Treasury Note | 0.13 | 11-30-2022 | 65,000,000 | 64,958,401 | |
| U.S. Treasury Note | 0.13 | 12-31-2022 | 15,000,000 | 14,964,130 | |
| U.S. Treasury Note (U.S. Treasury 3 Month Bill Money Market Yield +0.03%) ± | 0.22 | 4-30-2023 | 360,000,000 | 360,013,078 | |
| U.S. Treasury Note (U.S. Treasury 3 Month Bill Money Market Yield +0.03%) ± | 0.22 | 7-31-2023 | 80,000,000 | 80,003,630 | |
| U.S. Treasury Note (U.S. Treasury 3 Month Bill Money Market Yield +0.04%) ± | 0.23 | 10-31-2023 | 390,000,000 | 390,017,491 | |
| U.S. Treasury Note (U.S. Treasury 3 Month Bill Money Market Yield +0.05%) ± | 0.24 | 1-31-2023 | 170,000,000 | 170,011,316 |
| Interest
rate |
Maturity
date |
Principal | Value | ||
| U.S. Treasury securities (continued) | |||||
| U.S. Treasury Note (U.S. Treasury 3 Month Bill Money Market Yield +0.06%) ± | 0.25% | 7-31-2022 | $ 210,000,000 | $ 209,997,602 | |
| U.S. Treasury Note (U.S. Treasury 3 Month Bill Money Market Yield +0.06%) ± | 0.25 | 10-31-2022 | 400,000,000 | 399,994,191 | |
| U.S. Treasury Note (U.S. Treasury 3 Month Bill Money Market Yield +0.11%) ± | 0.30 | 4-30-2022 | 738,000,000 | 738,019,579 | |
| U.S. Treasury Note | 1.13 | 2-28-2022 | 50,000,000 | 50,038,222 | |
| U.S. Treasury Note | 1.38 | 10-15-2022 | 80,000,000 | 80,690,965 | |
| U.S. Treasury Note | 1.50 | 8-15-2022 | 20,000,000 | 20,151,527 | |
| U.S. Treasury Note | 1.63 | 8-15-2022 | 20,000,000 | 20,164,872 | |
| U.S. Treasury Note | 1.63 | 8-31-2022 | 40,000,000 | 40,353,999 | |
| U.S. Treasury Note | 1.75 | 3-31-2022 | 70,000,000 | 70,186,946 | |
| U.S. Treasury Note | 1.75 | 7-15-2022 | 30,000,000 | 30,223,555 | |
| U.S. Treasury Note | 1.88 | 4-30-2022 | 30,000,000 | 30,129,651 | |
| U.S. Treasury Note | 1.88 | 7-31-2022 | 50,000,000 | 50,438,430 | |
| U.S. Treasury Note | 1.88 | 10-31-2022 | 10,000,000 | 10,131,634 | |
| U.S. Treasury Note | 2.00 | 11-30-2022 | 20,000,000 | 20,266,413 | |
| U.S. Treasury Note | 2.13 | 5-15-2022 | 20,000,000 | 20,115,948 | |
| U.S. Treasury Note | 2.50 | 2-15-2022 | 220,000,000 | 220,204,233 | |
| Total U.S. Treasury securities (Cost $18,566,828,420) | 18,566,828,420 | ||||
| Total investments in securities (Cost $18,566,828,420) | 111.73% | 18,566,828,420 | |||
| Other assets and liabilities, net | (11.73) | (1,949,651,197) | |||
| Total net assets | 100.00% | $16,617,177,223 |
| ± | Variable rate investment. The rate shown is the rate in effect at period end. |
| ☼ | Zero coupon security. The rate represents the current yield to maturity. |
| Assets | |
|
Investments in unaffiliated securities, at amortized
cost |
$ 18,566,828,420 |
|
Cash |
9,438 |
|
Receivable for
interest |
4,528,273 |
|
Receivable for Fund shares
sold |
479,996 |
|
Receivable from
manager |
464,070 |
|
Prepaid expenses and other
assets |
716,897 |
|
Total
assets |
18,573,027,094 |
| Liabilities | |
|
Payable for investments
purchased |
1,949,750,761 |
|
Payable for Fund shares
redeemed |
4,636,603 |
|
Administration fees
payable |
1,287,569 |
|
Dividends
payable |
70,365 |
|
Accrued expenses and other
liabilities |
104,573 |
|
Total
liabilities |
1,955,849,871 |
|
Total net
assets |
$16,617,177,223 |
| Net assets consist of | |
|
Paid-in
capital |
$ 16,617,119,772 |
|
Total distributable
earnings |
57,451 |
|
Total net
assets |
$16,617,177,223 |
| Computation of net asset value per share | |
|
Net assets – Class
A |
$ 47,408,900 |
|
Shares outstanding – Class
A1 |
47,407,182 |
|
Net asset value per share – Class
A |
$1.00 |
|
Net assets – Administrator
Class |
$ 435,817,539 |
|
Shares outstanding – Administrator
Class1 |
435,802,894 |
|
Net asset value per share – Administrator
Class |
$1.00 |
|
Net assets – Institutional
Class |
$ 10,797,672,914 |
|
Shares outstanding – Institutional
Class1 |
10,797,317,817 |
|
Net asset value per share – Institutional
Class |
$1.00 |
|
Net assets – Service
Class |
$ 5,336,277,870 |
|
Shares outstanding – Service
Class1 |
5,336,081,427 |
Net
asset value per share – Service
Class |
$1.00 |
| 1 | The Fund has an unlimited number of authorized shares. |
| Investment income | |
|
Interest |
$ 12,035,526 |
| Expenses | |
|
Management
fee |
23,650,020 |
| Administration fees | |
|
Class
A |
180,247 |
|
Administrator
Class |
469,486 |
|
Institutional
Class |
8,857,166 |
|
Service
Class |
6,319,586 |
|
Sweep
Class |
56,680 1 |
| Shareholder servicing fees | |
|
Class
A |
204,826 |
|
Administrator
Class |
469,485 |
|
Service
Class |
13,165,808 |
|
Sweep
Class |
472,333 1 |
| Distribution fee | |
|
Sweep
Class |
188,933 1 |
|
Custody and accounting
fees |
590,175 |
|
Professional
fees |
65,954 |
|
Registration
fees |
216,491 |
|
Shareholder report
expenses |
48,177 |
|
Trustees’ fees and
expenses |
19,272 |
|
Other fees and
expenses |
173,704 |
|
Total
expenses |
55,148,343 |
| Less: Fee waivers and/or expense reimbursements | |
|
Fund-level |
(28,314,116) |
|
Class
A |
(311,336) |
|
Administrator
Class |
(563,383) |
|
Service
Class |
(15,272,337) |
|
Sweep
Class |
(547,906) 1 |
|
Net
expenses |
10,139,265 |
|
Net investment
income |
1,896,261 |
|
Net realized losses on
investments |
(58,032) |
|
Net increase in net assets resulting from
operations |
$ 1,838,229 |
| 1 | For the period from February 1, 2021 to April 26, 2021. Effective at the close of business on April 26, 2021, Sweep Class shares were liquidated and the class was subsequently closed. |
| Year
ended January 31, 2022 |
Year
ended January 31, 2021 | |||
| Operations | ||||
|
Net investment
income |
$ 1,896,261 | $ 29,093,012 | ||
|
Net realized gains (losses) on
investments |
(58,032) | 159,636 | ||
|
Net increase in net assets resulting from
operations |
1,838,229 | 29,252,648 | ||
| Distributions to shareholders from | ||||
| Net investment income and net realized gains | ||||
|
Class
A |
(12,378) | (473,676) | ||
|
Administrator
Class |
(50,308) | (1,039,690) | ||
|
Institutional
Class |
(1,190,941) | (21,057,299) | ||
|
Service
Class |
(567,854) | (6,608,812) | ||
|
Sweep
Class |
(30,845) 1 | (614,373) | ||
|
Total distributions to
shareholders |
(1,852,326) | (29,793,850) | ||
| Capital share transactions | Shares | Shares | ||
| Proceeds from shares sold | ||||
|
Class
A |
118,470,894 | 118,470,894 | 879,783,683 | 879,783,683 |
|
Administrator
Class |
1,836,092,008 | 1,836,092,008 | 1,892,103,152 | 1,892,103,152 |
|
Institutional
Class |
35,621,095,104 | 35,621,095,104 | 42,133,377,022 | 42,133,377,022 |
|
Service
Class |
25,165,686,665 | 25,165,686,665 | 22,226,504,129 | 22,226,504,129 |
|
Sweep
Class |
1,687,760,994 1 | 1,687,760,994 1 | 7,128,257,353 | 7,128,257,353 |
| 64,429,105,665 | 74,260,025,339 | |||
| Reinvestment of distributions | ||||
|
Class
A |
12,172 | 12,172 | 497,162 | 497,162 |
|
Administrator
Class |
34,027 | 34,027 | 828,749 | 828,749 |
|
Institutional
Class |
648,015 | 648,015 | 12,824,015 | 12,824,015 |
|
Service
Class |
190,790 | 190,790 | 2,348,163 | 2,348,163 |
|
Sweep
Class |
24,216 1 | 24,216 1 | 638,970 | 638,970 |
| 909,220 | 17,137,059 | |||
| Payment for shares redeemed | ||||
|
Class
A |
(274,067,705) | (274,067,705) | (1,145,613,117) | (1,145,613,117) |
|
Administrator
Class |
(1,893,982,528) | (1,893,982,528) | (1,953,668,446) | (1,953,668,446) |
|
Institutional
Class |
(37,145,224,574) | (37,145,224,574) | (37,389,255,328) | (37,389,255,328) |
|
Service
Class |
(25,055,393,988) | (25,055,393,988) | (21,233,428,405) | (21,233,428,405) |
|
Sweep
Class |
(2,509,539,856) 1 | (2,509,539,856) 1 | (6,849,965,760) | (6,849,965,760) |
| (66,878,208,651) | (68,571,931,056) | |||
|
Net increase (decrease) in net assets resulting from capital share
transactions |
(2,448,193,766) | 5,705,231,342 | ||
|
Total increase (decrease) in net
assets |
(2,448,207,863) | 5,704,690,140 | ||
| Net assets | ||||
|
Beginning of
period |
19,065,385,086 | 13,360,694,946 | ||
|
End of
period |
$ 16,617,177,223 | $ 19,065,385,086 | ||
| 1 | For the period from February 1, 2021 to April 26, 2021. Effective at the close of business on April 26, 2021, Sweep Class shares were liquidated and the class was subsequently closed. |
| Year ended January 31 | |||||
| Class A | 2022 | 2021 | 2020 | 2019 | 2018 |
|
Net asset value, beginning of
period |
$1.00 | $1.00 | $1.00 | $1.00 | $1.00 |
|
Net investment
income |
0.00 1,2 | 0.00 1 | 0.02 | 0.01 | 0.00 1 |
|
Net realized gains (losses) on
investments |
(0.00) 3 | 0.00 1 | 0.00 1 | (0.00) 3 | (0.00) 3 |
|
Total from investment
operations |
0.00 1 | 0.00 1 | 0.02 | 0.01 | 0.00 1 |
| Distributions to shareholders from | |||||
|
Net investment
income |
(0.00) 1 | (0.00) 1 | (0.02) | (0.01) | (0.00) 1 |
|
Net realized
gains |
(0.00) 1 | (0.00) 1 | (0.00) 1 | (0.00) 1 | (0.00) 1 |
|
Total distributions to
shareholders |
(0.00) 1 | (0.00) 1 | (0.02) | (0.01) | (0.00) 1 |
|
Net asset value, end of
period |
$1.00 | $1.00 | $1.00 | $1.00 | $1.00 |
|
Total
return |
0.02% | 0.14% | 1.54% | 1.35% | 0.32% |
| Ratios to average net assets (annualized) | |||||
|
Gross
expenses |
0.61% | 0.61% | 0.63% | 0.71% | 0.79% |
|
Net
expenses |
0.06% * | 0.31% * | 0.60% | 0.62% | 0.64% |
|
Net investment
income |
0.02% | 0.15% | 1.49% | 1.35% | 0.31% |
| Supplemental data | |||||
|
Net assets, end of period (000s
omitted) |
$47,409 | $202,999 | $468,360 | $384,013 | $291,246 |
| * | Ratio includes class-level expenses which were voluntarily waived by the investment manager. Without this voluntary waiver, the net expense ratio would be increased by the following amounts: |
| Year ended January 31, 2022 | 0.54% |
| Year ended January 31, 2021 | 0.29% |
| 1 | Amount is less than $0.005. |
| 2 | Calculated based upon average shares outstanding |
| 3 | Amount is more than $(0.005) |
| Year ended January 31 | |||||
| Administrator Class | 2022 | 2021 | 2020 | 2019 | 2018 |
|
Net asset value, beginning of
period |
$1.00 | $1.00 | $1.00 | $1.00 | $1.00 |
|
Net investment
income |
0.00 1 | 0.00 1 | 0.02 | 0.02 | 0.01 |
|
Net realized gains (losses) on
investments |
(0.00) 2 | 0.00 1 | 0.00 1 | (0.00) 2 | (0.00) 2 |
|
Total from investment
operations |
0.00 1 | 0.00 1 | 0.02 | 0.02 | 0.01 |
| Distributions to shareholders from | |||||
|
Net investment
income |
(0.00) 1 | (0.00) 1 | (0.02) | (0.02) | (0.01) |
|
Net realized
gains |
(0.00) 1 | (0.00) 1 | (0.00) 1 | (0.00) 1 | (0.00) 1 |
|
Total distributions to
shareholders |
(0.00) 1 | (0.00) 1 | (0.02) | (0.02) | (0.01) |
|
Net asset value, end of
period |
$1.00 | $1.00 | $1.00 | $1.00 | $1.00 |
|
Total
return |
0.01% | 0.20% | 1.84% | 1.67% | 0.67% |
| Ratios to average net assets (annualized) | |||||
|
Gross
expenses |
0.34% | 0.34% | 0.36% | 0.44% | 0.52% |
|
Net
expenses |
0.06% * | 0.22% * | 0.30% | 0.30% | 0.30% |
|
Net investment
income |
0.01% | 0.19% | 1.85% | 1.63% | 0.65% |
| Supplemental data | |||||
|
Net assets, end of period (000s
omitted) |
$435,818 | $493,677 | $554,447 | $692,247 | $914,471 |
| * | Ratio includes class-level expenses which were voluntarily waived by the investment manager. Without this voluntary waiver, the net expense ratio would be increased by the following amounts: |
| Year ended January 31, 2022 | 0.24% |
| Year ended January 31, 2021 | 0.08% |
| 1 | Amount is less than $0.005. |
| 2 | Amount is more than $(0.005) |
| Year ended January 31 | |||||
| Institutional Class | 2022 | 2021 | 2020 | 2019 | 2018 |
|
Net asset value, beginning of
period |
$1.00 | $1.00 | $1.00 | $1.00 | $1.00 |
|
Net investment
income |
0.00 1 | 0.00 1 | 0.02 | 0.02 | 0.01 |
|
Net realized gains (losses) on
investments |
(0.00) 2 | 0.00 1 | 0.00 1 | (0.00) 2 | (0.00) 2 |
|
Total from investment
operations |
0.00 1 | 0.00 1 | 0.02 | 0.02 | 0.01 |
| Distributions to shareholders from | |||||
|
Net investment
income |
(0.00) 1 | (0.00) 1 | (0.02) | (0.02) | (0.01) |
|
Net realized
gains |
(0.00) 1 | (0.00) 1 | (0.00) 1 | (0.00) 1 | (0.00) 1 |
|
Total distributions to
shareholders |
(0.00) 1 | (0.00) 1 | (0.02) | (0.02) | (0.01) |
|
Net asset value, end of
period |
$1.00 | $1.00 | $1.00 | $1.00 | $1.00 |
|
Total
return |
0.01% | 0.24% | 1.95% | 1.77% | 0.77% |
| Ratios to average net assets (annualized) | |||||
|
Gross
expenses |
0.23% | 0.22% | 0.24% | 0.31% | 0.40% |
|
Net
expenses |
0.06% * | 0.18% * | 0.20% | 0.20% | 0.20% |
|
Net investment
income |
0.01% | 0.17% | 1.92% | 1.79% | 0.78% |
| Supplemental data | |||||
|
Net assets, end of period (000s
omitted) |
$10,797,673 | $12,321,170 | $7,564,485 | $7,296,690 | $4,700,731 |
| * | Ratio includes class-level expenses which were voluntarily waived by the investment manager. Without this voluntary waiver, the net expense ratio would be increased by the following amounts: |
| Year ended January 31, 2022 | 0.14% |
| Year ended January 31, 2021 | 0.02% |
| 1 | Amount is less than $0.005. |
| 2 | Amount is more than $(0.005) |
| Year ended January 31 | |||||
| Service Class | 2022 | 2021 | 2020 | 2019 | 2018 |
|
Net asset value, beginning of
period |
$1.00 | $1.00 | $1.00 | $1.00 | $1.00 |
|
Net investment
income |
0.00 1 | 0.00 1 | 0.02 | 0.01 | 0.00 1 |
|
Net realized gains (losses) on
investments |
(0.00) 2 | 0.00 1 | 0.00 1 | (0.00) 2 | (0.00) 2 |
|
Total from investment
operations |
0.00 1 | 0.00 1 | 0.02 | 0.01 | 0.00 1 |
| Distributions to shareholders from | |||||
|
Net investment
income |
(0.00) 1 | (0.00) 1 | (0.02) | (0.01) | (0.00) 1 |
|
Net realized
gains |
(0.00) 1 | (0.00) 1 | (0.00) 1 | (0.00) 1 | (0.00) 1 |
|
Total distributions to
shareholders |
(0.00) 1 | (0.00) 1 | (0.02) | (0.01) | (0.00) 1 |
|
Net asset value, end of
period |
$1.00 | $1.00 | $1.00 | $1.00 | $1.00 |
|
Total
return |
0.01% | 0.15% | 1.64% | 1.46% | 0.46% |
| Ratios to average net assets (annualized) | |||||
|
Gross
expenses |
0.52% | 0.51% | 0.53% | 0.61% | 0.69% |
|
Net
expenses |
0.06% * | 0.25% * | 0.50% | 0.50% | 0.50% |
|
Net investment
income |
0.01% | 0.12% | 1.58% | 1.45% | 0.45% |
| Supplemental data | |||||
|
Net assets, end of period (000s
omitted) |
$5,336,278 | $5,225,755 | $4,230,537 | $2,796,397 | $2,945,498 |
| * | Ratio includes class-level expenses which were voluntarily waived by the investment manager. Without this voluntary waiver, the net expense ratio would be increased by the following amounts: |
| Year ended January 31, 2022 | 0.44% |
| Year ended January 31, 2021 | 0.25% |
| 1 | Amount is less than $0.005. |
| 2 | Amount is more than $(0.005) |
| ■ | Level 1 – quoted prices in active markets for identical securities |
| ■ | Level 2 – other significant observable inputs (including quoted prices for similar securities, interest rates, prepayment speeds, credit risk, etc.) |
| ■ | Level 3 – significant unobservable inputs (including the Fund’s own assumptions in determining the fair value of investments) |
| Quoted
prices (Level 1) |
Other
significant observable inputs (Level 2) |
Significant
unobservable inputs (Level 3) |
Total | |
| Assets | ||||
| Investments in: | ||||
| U.S. Treasury securities | $0 | $18,566,828,420 | $0 | $18,566,828,420 |
| Average daily net assets | Management fee |
| First $5 billion | 0.150% |
| Next $5 billion | 0.140 |
| Next $5 billion | 0.130 |
| Next $85 billion | 0.125 |
| Over $100 billion | 0.120 |
| Average daily net assets | Management fee | |
| First $5 billion | 0.150% | |
| Next $5 billion | 0.140 | |
| Over $10 billion | 0.130 |
| Class-level
administration fee | |
| Class A | 0.22% |
| Administrator Class | 0.10 |
| Institutional Class | 0.08 |
| Service Class | 0.12 |
| Sweep Class | 0.03 |
| Expense ratio caps | |
| Class A | 0.60% |
| Administrator Class | 0.30 |
| Institutional Class | 0.20 |
| Service Class | 0.50 |
Allspring Funds Trust:

| Shares voted “For” | 7,562,408,823 | |
| Shares voted “Against” | 169,831,839 | |
| Shares voted “Abstain” | 1,107,574,959 |
| Shares voted “For” | 7,572,277,736 | |
| Shares voted “Against” | 180,187,310 | |
| Shares voted “Abstain” | 1,087,350,575 |
| Name
and year of birth |
Position
held and length of service* |
Principal occupations during past five years or longer | Current
other public company or investment company directorships |
| William
R. Ebsworth (Born 1957) |
Trustee,
since 2015 |
Retired. From 1984 to 2013, equities analyst, portfolio manager, research director and chief investment officer at Fidelity Management and Research Company in Boston, Tokyo, and Hong Kong, and retired in 2013 as Chief Investment Officer of Fidelity Strategic Advisers, Inc. where he led a team of investment professionals managing client assets. Prior thereto, Board member of Hong Kong Securities Clearing Co., Hong Kong Options Clearing Corp., the Thailand International Fund, Ltd., Fidelity Investments Life Insurance Company, and Empire Fidelity Investments Life Insurance Company. Audit Committee Chair and Investment Committee Chair of the Vincent Memorial Hospital Endowment (non-profit organization). Mr. Ebsworth is a CFA® charterholder. | N/A |
| Jane
A. Freeman (Born 1953) |
Trustee,
since 2015; Chair Liaison, since 2018 |
Retired. From 2012 to 2014 and 1999 to 2008, Chief Financial Officer of Scientific Learning Corporation. From 2008 to 2012, Ms. Freeman provided consulting services related to strategic business projects. Prior to 1999, Portfolio Manager at Rockefeller & Co. and Scudder, Stevens & Clark. Board member of the Harding Loevner Funds from 1996 to 2014, serving as both Lead Independent Director and chair of the Audit Committee. Board member of the Russell Exchange Traded Funds Trust from 2011 to 2012 and the chair of the Audit Committee. Ms. Freeman is also an inactive Chartered Financial Analyst. | N/A |
| Isaiah
Harris, Jr. (Born 1952) |
Trustee,
since 2009; Audit Committee Chair, since 2019 |
Retired. Chairman of the Board of CIGNA Corporation from 2009 to 2021, and Director from 2005 to 2008. From 2003 to 2011, Director of Deluxe Corporation. Prior thereto, President and CEO of BellSouth Advertising and Publishing Corp. from 2005 to 2007, President and CEO of BellSouth Enterprises from 2004 to 2005 and President of BellSouth Consumer Services from 2000 to 2003. Emeritus member of the Iowa State University Foundation Board of Governors. Emeritus Member of the Advisory Board of Iowa State University School of Business. Advisory Board Member, Palm Harbor Academy (private school). Advisory Board Member, Fellowship of Christian Athletes. Mr. Harris is a certified public accountant (inactive status). | N/A |
| David
F. Larcker (Born 1950) |
Trustee,
since 2009 |
James Irvin Miller Professor of Accounting at the Graduate School of Business (Emeritus), Stanford University, Director of the Corporate Governance Research Initiative and Senior Faculty of The Rock Center for Corporate Governance since 2006. From 2005 to 2008, Professor of Accounting at the Graduate School of Business, Stanford University. Prior thereto, Ernst & Young Professor of Accounting at The Wharton School, University of Pennsylvania from 1985 to 2005. | N/A |
| Name
and year of birth |
Position
held and length of service* |
Principal occupations during past five years or longer | Current
other public company or investment company directorships |
| Olivia
S. Mitchell (Born 1953) |
Trustee,
since 2006; Nominating and Governance Committee Chair, since 2018 |
International Foundation of Employee Benefit Plans Professor since 1993, Wharton School of the University of Pennsylvania. Director of Wharton’s Pension Research Council and Boettner Center on Pensions & Retirement Research, and Research Associate at the National Bureau of Economic Research. Previously taught at Cornell University from 1978 to 1993. | N/A |
| Timothy
J. Penny (Born 1951) |
Trustee,
since 1996; Chair, since 2018 |
President and Chief Executive Officer of Southern Minnesota Initiative Foundation, a non-profit organization, since 2007. Member of the Board of Trustees of NorthStar Education Finance, Inc., a non-profit organization, since 2007. | N/A |
| James
G. Polisson (Born 1959) |
Trustee,
since 2018 |
Retired. Chief Marketing Officer, Source (ETF) UK Services, Ltd, from 2015 to 2017. From 2012 to 2015, Principal of The Polisson Group, LLC, a management consulting, corporate advisory and principal investing company. Chief Executive Officer and Managing Director at Russell Investments, Global Exchange Traded Funds from 2010 to 2012. Managing Director of Barclays Global Investors from 1998 to 2010 and Global Chief Marketing Officer for iShares and Barclays Global Investors from 2000 to 2010. Trustee of the San Francisco Mechanics’ Institute, a non-profit organization, from 2013 to 2015. Board member of the Russell Exchange Traded Fund Trust from 2011 to 2012. Director of Barclays Global Investors Holdings Deutschland GmbH from 2006 to 2009. Mr. Polisson is an attorney and has a retired status with the Massachusetts and District of Columbia Bar Associations. | N/A |
| Pamela
Wheelock (Born 1959) |
Trustee,
since January 2020; previously Trustee from January 2018 to July 2019 |
Board member of the Destination Medical Center Economic Development Agency, Rochester, Minnesota since 2019. Interim President of the McKnight Foundation from January to September 2020. McKnight Foundation Consultant, November 2020 to February 2021. Acting Commissioner, Minnesota Department of Human Services, July 2019 through September 2019. Consultant (part-time), Minnesota Department of Human Services, October 2019 through December 2019. Chief Operating Officer, Twin Cities Habitat for Humanity from 2017 to 2019. Vice President of University Services, University of Minnesota from 2012 to 2016. Prior thereto, on the Board of Directors, Governance Committee and Finance Committee for the Minnesota Philanthropy Partners (Saint Paul Foundation) from 2012 to 2018, Interim Chief Executive Officer of Blue Cross Blue Shield of Minnesota from 2011 to 2012, Chairman of the Board from 2009 to 2012 and Board Director from 2003 to 2015. Vice President, Leadership and Community Engagement, Bush Foundation, Saint Paul, Minnesota (a private foundation) from 2009 to 2011. Executive Vice President and Chief Financial Officer, Minnesota Sports and Entertainment from 2004 to 2009 and Senior Vice President from 2002 to 2004. Executive Vice President of the Minnesota Wild Foundation from 2004 to 2008. Commissioner of Finance, State of Minnesota, from 1999 to 2002. Currently Board Chair of the Minnesota Wild Foundation since 2010. | N/A |
| Name
and year of birth |
Position
held and length of service |
Principal occupations during past five years or longer |
| Andrew
Owen (Born 1960) |
President,
since 2017 |
President, Chief Executive Officer and Director of Allspring Funds Management, LLC since 2017 and co-president of Galliard Capital Management, LLC, an affiliate of Allspring Funds Management, LLC, since 2019. Prior thereto, Head of Affiliated Managers, Allspring Global Investments, from 2014 to 2019 and Executive Vice President responsible for marketing, investments and product development for Allspring Funds Management, LLC, from 2009 to 2014. In addition, Mr. Owen was an Executive Vice President of Wells Fargo & Company from 2014 to 2021. |
| Jeremy
DePalma (Born 1974) |
Treasurer,
since 2012 (for certain funds in the Fund Complex); since 2021 (for the remaining funds in the Fund Complex) |
Senior Vice President of Allspring Funds Management, LLC since 2009. Senior Vice President of Evergreen Investment Management Company, LLC from 2008 to 2010 and head of the Fund Reporting and Control Team within Fund Administration. |
| Kate
McKinley (Born 1977) |
Chief
Legal Officer, since 2021 |
Chief Legal Officer of Allspring Global Investments since 2021. Prior thereto, held various roles at State Street Global Advisors beginning in 2010, including serving as Senior Vice President and General Counsel from 2019 to 2021, and Chief Operating Officer of the Institutional Client Group from 2016 - 2019. Prior to working at State Street Global Advisors served as Assistant General Counsel for Bank of America Corporation from 2005 to 2010 and as an Associate at WilmerHale from 2002 to 2005. |
| Christopher
Baker (Born 1976) |
Chief Compliance Officer, since 2022 | Global Chief Compliance Officer for Allspring Global Investments since 2022. Prior thereto, Chief Compliance Officer for State Street Global Advisors from 2018 to 2021. Senior Compliance Officer for the State Street divisions of Alternative Investment Solutions, Sector Solutions, and Global Marketing from 2015 to 2018. From 2010 to 2015 Vice President, Global Head of Investment and Marketing Compliance for State Street Global Advisors. |
| Matthew
Prasse (Born 1983) |
Secretary,
since 2021 |
Senior Counsel of the Allspring Legal Department since 2021. Senior Counsel of the Wells Fargo Legal Department from 2018 to 2021. Previously, Counsel for Barings LLC from 2015 to 2018. Prior to joining Barings, Associate at Morgan, Lewis & Bockius LLP from 2008 to 2015. |
P.O. Box 219967
Kansas City, MO 64121-9967
1-800-222-8222 or visit the Fund's website at allspringglobal.com. Read the prospectus carefully before you invest or send money.
A300/AR300 01-22

| ■ | Allspring Government Money Market Fund |
|
|
2 |
|
|
6 |
|
|
10 |
|
|
11 |
| Financial statements | |
|
|
21 |
|
|
22 |
|
|
23 |
|
|
24 |
|
|
30 |
|
|
35 |
|
|
36 |

| 1 | The S&P 500 Index consists of 500 stocks chosen for market size, liquidity, and industry group representation. It is a market-value-weighted index with each stock's weight in the index proportionate to its market value. You cannot invest directly in an index. |
| 2 | The Morgan Stanley Capital International (MSCI) All Country World Index (ACWI) ex USA Index (Net) is a free-float-adjusted market-capitalization-weighted index that is designed to measure the equity market performance of developed and emerging markets, excluding the U.S. Source: MSCI. MSCI makes no express or implied warranties or representations and shall have no liability whatsoever with respect to any MSCI data contained herein. The MSCI data may not be further redistributed or used as a basis for other indexes or any securities or financial products. This report is not approved, reviewed, or produced by MSCI. You cannot invest directly in an index. |
| 3 | The MSCI Emerging Markets (EM) Index (Net) (USD) is a free-float-adjusted market-capitalization-weighted index that is designed to measure equity market performance of emerging markets. You cannot invest directly in an index. |
| 4 | The Bloomberg U.S. Aggregate Bond Index is a broad-based benchmark that measures the investment-grade, U.S.-dollar-denominated, fixed-rate taxable bond market, including Treasuries, government-related and corporate securities, mortgage-backed securities (agency fixed-rate and hybrid adjustable-rate mortgage pass-throughs), asset-backed securities, and commercial mortgage-backed securities. You cannot invest directly in an index. |
| 5 | The Bloomberg Global Aggregate ex-USD Index (unhedged) is an unmanaged index that provides a broad-based measure of the global investment-grade fixed-income markets excluding the U.S.-dollar-denominated debt market. You cannot invest directly in an index. |
| 6 | The Bloomberg Municipal Bond Index is an unmanaged index composed of long-term tax-exempt bonds with a minimum credit rating of Baa. You cannot invest directly in an index. |
| 7 | The ICE BofA U.S. High Yield Index is a market-capitalization-weighted index of domestic and Yankee high-yield bonds. The index tracks the performance of high-yield securities traded in the U.S. bond market. You cannot invest directly in an index. Copyright 2022. ICE Data Indices, LLC. All rights reserved. |
| 1 | The Consumer Price Index (CPI) is a measure of the average change over time in the prices paid by urban consumers for a market basket of consumer goods and services. You cannot invest directly in an index. |

President
Allspring Funds
| 1 | As of December 31, 2021, assets under management (AUM) includes $91.6 billion from Galliard Capital Management, LLC, an investment advisor that is not part of the Allspring trade name/GIPS firm. |
| Investment objective | The Fund seeks current income, while preserving capital and liquidity. |
| Manager | Allspring Funds Management, LLC |
| Subadviser | Allspring Global Investments, LLC |
| Portfolio managers | Michael C. Bird, CFA®‡, Jeffrey L. Weaver, CFA®‡, Laurie White |
| Average annual total returns (%) as of January 31, 2022 | ||||||
| Expense ratios1 (%) | ||||||
| Inception date | 1 year | 5 year | 10 year | Gross | Net 2 | |
| Class A (WFGXX) | 11-8-1999 | 0.01 | 0.70 | 0.35 | 0.59 | 0.59 |
| Administrator Class (WGAXX) | 7-31-2003 | 0.01 | 0.86 | 0.45 | 0.32 | 0.32 |
| Institutional Class (GVIXX) | 7-28-2003 | 0.01 | 0.96 | 0.51 | 0.20 | 0.20 |
| Select Class (WFFXX)3 | 6-30-2015 | 0.03 | 1.01 | 0.54 | 0.16 | 0.14 |
| Service Class (NWGXX) | 11-16-1987 | 0.01 | 0.76 | 0.39 | 0.49 | 0.49 |
| Sweep Class 4 | 7-31-2020 | 0.01 | 0.55 | (0.04) | 0.50 | 0.50 |
| 1 | Reflects the expense ratios as stated in the most recent prospectuses. The expense ratios shown are subject to change and may differ from the annualized expense ratios shown in the financial highlights of this report. |
| 2 | The manager has contractually committed through May 31, 2022, to waive fees and/or reimburse expenses to the extent necessary to cap total annual fund operating expenses after fee waivers at 0.60% for Class A, 0.34% for Administrator Class, 0.20% for Institutional Class, 0.14% for Select Class, 0.50% for Service Class and 0.50% for Sweep Class. Brokerage commissions, stamp duty fees, interest, taxes, acquired fund fees and expenses (if any), and extraordinary expenses are excluded from the expense caps. Prior to or after the commitment expiration date, the caps may be increased or the commitment to maintain the caps may be terminated only with the approval of the Board of Trustees. The manager and/or its affiliates may also voluntarily waive all or a portion of any fees to which they are entitled and/or reimburse certain expenses as they may determine from time to time. Without these caps, the Fund’s returns would have been lower. The expense ratio paid by an investor is the net expense ratio (the total annual fund operating expenses after fee waivers) as stated in the prospectuses. |
| 3 | Historical performance shown for the Select Class shares prior to their inception reflects the performance of the Institutional Class shares, and includes the higher expenses applicable to the Institutional Class shares. If these expenses had not been included, returns for the Select Class shares would be higher. |
| 4 | Historical performance shown for the Sweep Class shares prior to their inception reflects the performance of the Service Class shares, and includes the higher expenses applicable to the Sweep Class shares. |
| Yield summary (%) as of January 31, 2022 | ||||||
| Class A | Administrator
Class |
Institutional
Class |
Select
Class |
Service
Class |
Sweep
Class | |
| 7-day current yield1 | 0.01 | 0.01 | 0.01 | 0.03 | 0.01 | 0.01 |
| 7-day compound yield | 0.01 | 0.01 | 0.01 | 0.03 | 0.01 | 0.01 |
| 30-day simple yield | 0.01 | 0.01 | 0.01 | 0.03 | 0.01 | 0.01 |
| 30-day compound yield | 0.01 | 0.01 | 0.01 | 0.03 | 0.01 | 0.01 |
| 1 | The manager has contractually committed through May 31, 2022, to waive fees and/or reimburse expenses to the extent necessary to cap total annual fund operating expenses and may also voluntarily waive or reimburse additional fees and expenses which may be discontinued or modified at any time without notice. Without these reductions, the Fund’s 7-day current yield would have been -0.50%, -0.21%, -0.12%, -0.08%, -0.34% and -0.34% for Class A, Administrator Class, Institutional Class, Select Class, Service Class and Sweep Class, respectively. |
| ‡ | CFA® and Chartered Financial Analyst® are trademarks owned by CFA Institute. |
| * | The Core Personal Consumption Expenditures (PCE) Price Index measures the prices paid by U.S. consumers for domestic goods and services, excluding the prices of food and energy. You cannot invest directly into an index. |
| Beginning
account value 8-1-2021 |
Ending
account value 1-31-2022 |
Expenses
paid during the period1 |
Annualized
net expense ratio | |
| Class A | ||||
| Actual | $1,000.00 | $1,000.06 | $0.35 | 0.07% |
| Hypothetical (5% return before expenses) | $1,000.00 | $1,024.85 | $0.36 | 0.07% |
| Administrator Class | ||||
| Actual | $1,000.00 | $1,000.06 | $0.35 | 0.07% |
| Hypothetical (5% return before expenses) | $1,000.00 | $1,024.85 | $0.36 | 0.07% |
| Institutional Class | ||||
| Actual | $1,000.00 | $1,000.06 | $0.35 | 0.07% |
| Hypothetical (5% return before expenses) | $1,000.00 | $1,024.85 | $0.36 | 0.07% |
| Select Class | ||||
| Actual | $1,000.00 | $1,000.13 | $0.25 | 0.05% |
| Hypothetical (5% return before expenses) | $1,000.00 | $1,024.95 | $0.26 | 0.05% |
| Service Class | ||||
| Actual | $1,000.00 | $1,000.06 | $0.35 | 0.07% |
| Hypothetical (5% return before expenses) | $1,000.00 | $1,024.85 | $0.36 | 0.07% |
| Sweep Class | ||||
| Actual | $1,000.00 | $1,000.06 | $0.35 | 0.07% |
| Hypothetical (5% return before expenses) | $1,000.00 | $1,024.85 | $0.36 | 0.07% |
| Interest
rate |
Maturity
date |
Principal | Value | ||
| Corporate bonds and notes: 0.01% | |||||
| Mitchell 2019 Irrevocable Life Insurance Trust § | 0.11% | 9-1-2059 | $ 18,495,000 | $ 18,495,000 | |
| Total Corporate bonds and notes (Cost $18,495,000) | 18,495,000 | ||||
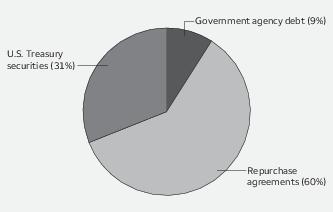
| Government agency debt: 8.27% | |||||
| FFCB (U.S. SOFR +0.04%) ±%% | 0.00 | 2-2-2024 | 130,000,000 | 130,000,000 | |
| FFCB ☼ | 0.05 | 2-11-2022 | 20,000,000 | 19,999,722 | |
| FFCB ☼ | 0.08 | 6-13-2022 | 30,000,000 | 29,991,200 | |
| FFCB (U.S. SOFR +0.04%) ± | 0.09 | 9-20-2023 | 75,000,000 | 75,000,000 | |
| FFCB (U.S. SOFR +0.05%) ±## | 0.10 | 8-25-2022 | 250,000,000 | 249,985,737 | |
| FFCB ☼ | 0.10 | 9-19-2022 | 20,000,000 | 19,987,222 | |
| FFCB (U.S. SOFR +0.05%) ± | 0.10 | 10-16-2023 | 90,000,000 | 90,000,000 | |
| FFCB (U.S. SOFR +0.05%) ± | 0.10 | 11-9-2023 | 50,000,000 | 50,000,000 | |
| FFCB (U.S. SOFR +0.05%) ± | 0.10 | 1-18-2024 | 115,000,000 | 115,000,000 | |
| FFCB (U.S. SOFR +0.06%) ± | 0.11 | 1-13-2023 | 165,000,000 | 165,000,000 | |
| FFCB (U.S. SOFR +0.06%) ± | 0.11 | 1-20-2023 | 98,000,000 | 98,000,000 | |
| FFCB (U.S. SOFR +0.06%) ± | 0.11 | 2-9-2023 | 120,000,000 | 120,000,000 | |
| FFCB (U.S. SOFR +0.08%) ± | 0.13 | 3-10-2022 | 140,000,000 | 140,000,000 | |
| FFCB | 0.13 | 9-12-2022 | 425,000,000 | 424,971,942 | |
| FFCB (U.S. SOFR +0.08%) ± | 0.13 | 10-14-2022 | 165,000,000 | 165,000,000 | |
| FFCB (U.S. SOFR +0.08%) ± | 0.13 | 11-3-2022 | 110,000,000 | 110,000,000 | |
| FFCB (U.S. SOFR +0.09%) ± | 0.14 | 10-7-2022 | 140,000,000 | 140,000,000 | |
| FFCB (U.S. Federal Funds Effective Rate +0.06%) ± | 0.14 | 1-19-2023 | 200,000,000 | 199,990,250 | |
| FFCB ☼ | 0.15 | 10-6-2022 | 5,000,000 | 4,994,854 | |
| FFCB (U.S. SOFR +0.12%) ± | 0.17 | 12-8-2023 | 50,000,000 | 50,074,838 | |
| FFCB (U.S. SOFR +0.13%) ± | 0.18 | 2-11-2022 | 173,400,000 | 173,395,107 | |
| FFCB (U.S. Treasury 3 Month Bill Money Market Yield +0.02%) ± | 0.21 | 7-17-2023 | 185,000,000 | 184,965,853 | |
| FFCB (U.S. SOFR +0.17%) ± | 0.22 | 3-15-2022 | 200,000,000 | 199,999,999 | |
| FFCB (U.S. Treasury 3 Month Bill Money Market Yield +0.03%) ± | 0.22 | 7-27-2023 | 150,000,000 | 149,988,720 | |
| FFCB (U.S. Treasury 3 Month Bill Money Market Yield +0.04%) ± | 0.23 | 5-17-2023 | 185,000,000 | 185,000,000 | |
| FFCB (U.S. SOFR +0.19%) ± | 0.24 | 7-14-2022 | 100,000,000 | 100,000,000 | |
| FFCB (U.S. SOFR +0.20%) ± | 0.25 | 4-22-2022 | 181,500,000 | 181,443,716 | |
| FFCB ☼ | 0.25 | 10-26-2022 | 15,000,000 | 14,972,188 | |
| FFCB (U.S. Treasury 3 Month Bill Money Market Yield +0.07%) ± | 0.26 | 10-19-2022 | 195,000,000 | 195,000,000 | |
| FFCB (U.S. Treasury 3 Month Bill Money Market Yield +0.06%) ± | 0.30 | 8-1-2022 | 260,000,000 | 259,980,394 | |
| FFCB (U.S. Treasury 3 Month Bill Money Market Yield +0.07%) ± | 0.31 | 10-31-2022 | 100,000,000 | 99,999,999 | |
| FFCB (U.S. SOFR +0.38%) ± | 0.43 | 4-22-2022 | 365,000,000 | 365,000,000 | |
| FFCB | 1.60 | 10-13-2022 | 15,000,000 | 15,154,673 | |
| FHLB ☼ | 0.05 | 2-4-2022 | 587,000,000 | 586,997,557 | |
| FHLB ☼ | 0.05 | 2-15-2022 | 350,000,000 | 349,993,196 | |
| FHLB ☼ | 0.05 | 2-16-2022 | 250,000,000 | 249,994,792 | |
| FHLB | 0.05 | 3-25-2022 | 12,000,000 | 11,999,717 | |
| FHLB ☼ | 0.06 | 4-22-2022 | 12,000,000 | 11,998,507 | |
| FHLB ☼ | 0.10 | 4-7-2022 | 289,000,000 | 288,946,059 | |
| FHLB | 0.13 | 8-12-2022 | 25,950,000 | 25,950,509 | |
| FHLB (U.S. SOFR +0.12%) ± | 0.17 | 2-10-2022 | 48,000,000 | 48,000,000 | |
| FHLB | 0.21 | 12-2-2022 | 385,000,000 | 385,000,000 | |
| FHLB | 0.21 | 12-12-2022 | 250,000,000 | 250,000,000 | |
| FHLB (U.S. SOFR +0.35%) ± | 0.40 | 3-28-2022 | 50,000,000 | 50,000,000 |
| Interest
rate |
Maturity
date |
Principal | Value | ||
| Government agency debt (continued) | |||||
| FHLMC ☼ | 0.13% | 4-7-2022 | $ 75,000,000 | $ 74,983,073 | |
| FHLMC (U.S. SOFR +0.10%) ± | 0.15 | 9-9-2022 | 200,000,000 | 200,000,000 | |
| FHLMC (U.S. SOFR +0.14%) ± | 0.19 | 4-22-2022 | 648,000,000 | 648,000,000 | |
| FHLMC (U.S. SOFR +0.19%) ± | 0.24 | 6-3-2022 | 200,000,000 | 200,000,000 | |
| FNMA (U.S. SOFR +0.17%) ± | 0.22 | 3-9-2022 | 100,000,000 | 100,000,000 | |
| FNMA (U.S. SOFR +0.18%) ± | 0.23 | 6-3-2022 | 200,000,000 | 200,000,000 | |
| FNMA (U.S. SOFR +0.20%) ± | 0.25 | 6-15-2022 | 200,000,000 | 200,000,000 | |
| FNMA (U.S. SOFR +0.22%) ± | 0.27 | 3-16-2022 | 200,000,000 | 200,000,000 | |
| FNMA (U.S. SOFR +0.23%) ± | 0.28 | 5-6-2022 | 200,000,000 | 200,015,641 | |
| FNMA (U.S. SOFR +0.30%) ± | 0.35 | 4-28-2022 | 300,000,000 | 300,000,000 | |
| FNMA (U.S. SOFR +0.32%) ± | 0.37 | 4-28-2022 | 200,000,000 | 200,000,000 | |
| FNMA (U.S. SOFR +0.35%) ± | 0.40 | 4-7-2022 | 400,000,000 | 400,000,000 | |
| FNMA (U.S. SOFR +0.37%) ± | 0.42 | 3-30-2022 | 250,000,000 | 250,000,000 | |
| FNMA (U.S. SOFR +0.39%) ± | 0.44 | 4-15-2022 | 450,000,000 | 450,000,000 | |
| U.S. International Development Finance Corporation (U.S. Treasury 3 Month Bill +0.00%) §± | 0.08 | 11-15-2025 | 5,557,895 | 5,557,895 | |
| U.S. International Development Finance Corporation (U.S. Treasury 3 Month Bill +0.00%) §± | 0.08 | 10-15-2032 | 17,751,282 | 17,751,282 | |
| U.S. International Development Finance Corporation (U.S. Treasury 3 Month Bill +0.00%) §± | 0.08 | 6-15-2034 | 14,836,325 | 14,836,325 | |
| U.S. International Development Finance Corporation (U.S. Treasury 3 Month Bill +0.00%) §± | 0.11 | 11-15-2022 | 5,425,000 | 5,425,000 | |
| U.S. International Development Finance Corporation (U.S. Treasury 3 Month Bill +0.00%) §± | 0.11 | 11-15-2023 | 10,000,000 | 10,000,000 | |
| U.S. International Development Finance Corporation (U.S. Treasury 3 Month Bill +0.00%) §± | 0.11 | 7-19-2027 | 7,333,334 | 7,333,334 | |
| U.S. International Development Finance Corporation (U.S. Treasury 3 Month Bill +0.00%) §± | 0.11 | 9-20-2027 | 20,535,714 | 20,535,714 | |
| U.S. International Development Finance Corporation (U.S. Treasury 3 Month Bill +0.00%) §± | 0.11 | 3-15-2030 | 18,000,000 | 18,000,000 | |
| U.S. International Development Finance Corporation (U.S. Treasury 3 Month Bill +0.00%) §± | 0.11 | 7-7-2040 | 10,057,212 | 10,057,212 | |
| U.S. International Development Finance Corporation (U.S. Treasury 3 Month Bill +0.00%) §± | 0.11 | 7-7-2040 | 18,285,840 | 18,285,840 | |
| U.S. International Development Finance Corporation (U.S. Treasury 3 Month Bill +0.00%) §± | 0.11 | 7-7-2040 | 7,862,911 | 7,862,911 | |
| U.S. International Development Finance Corporation (U.S. Treasury 3 Month Bill +0.00%) §± | 0.11 | 7-7-2040 | 13,257,235 | 13,257,235 | |
| U.S. International Development Finance Corporation (U.S. Treasury 3 Month Bill +0.00%) §± | 0.12 | 7-9-2026 | 42,270,750 | 42,270,750 | |
| U.S. International Development Finance Corporation (U.S. Treasury 3 Month Bill +0.00%) §± | 0.12 | 1-15-2030 | 12,075,471 | 12,075,471 | |
| U.S. International Development Finance Corporation (U.S. Treasury 3 Month Bill +0.00%) §± | 0.15 | 7-5-2038 | 8,400,000 | 8,400,000 | |
| U.S. International Development Finance Corporation (U.S. Treasury 3 Month Bill +0.00%) §± | 0.16 | 1-20-2027 | 56,666,666 | 56,666,666 | |
| U.S. International Development Finance Corporation (U.S. Treasury 3 Month Bill +0.00%) §± | 0.16 | 9-2-2031 | 10,133,200 | 10,133,200 | |
| U.S. International Development Finance Corporation (U.S. Treasury 3 Month Bill +0.00%) §± | 0.16 | 9-2-2031 | 17,248,000 | 17,248,000 | |
| U.S. International Development Finance Corporation (U.S. Treasury 3 Month Bill +0.00%) §± | 0.16 | 9-2-2031 | 10,137,512 | 10,137,512 | |
| U.S. International Development Finance Corporation (U.S. Treasury 3 Month Bill +0.00%) §± | 0.16 | 9-2-2031 | 15,376,592 | 15,376,592 | |
| U.S. International Development Finance Corporation (U.S. Treasury 3 Month Bill +0.00%) §± | 0.16 | 9-2-2031 | 11,582,032 | 11,582,032 |
| Interest
rate |
Maturity
date |
Principal | Value | ||
| Government agency debt (continued) | |||||
| U.S. International Development Finance Corporation (U.S. Treasury 3 Month Bill +0.00%) §± | 0.16% | 9-30-2031 | $ 10,055,860 | $ 10,055,860 | |
| U.S. International Development Finance Corporation (U.S. Treasury 3 Month Bill +0.00%) §± | 0.16 | 12-20-2031 | 37,209,303 | 37,209,303 | |
| U.S. International Development Finance Corporation (U.S. Treasury 3 Month Bill +0.00%) §± | 0.16 | 5-15-2033 | 3,147,654 | 3,147,654 | |
| U.S. International Development Finance Corporation (U.S. Treasury 3 Month Bill +0.00%) §± | 0.16 | 1-20-2035 | 9,326,790 | 9,326,790 | |
| U.S. International Development Finance Corporation (U.S. Treasury 3 Month Bill +0.00%) §± | 0.16 | 1-20-2035 | 3,768,400 | 3,768,400 | |
| U.S. International Development Finance Corporation (U.S. Treasury 3 Month Bill +0.00%) §± | 0.16 | 1-20-2035 | 11,305,200 | 11,305,200 | |
| U.S. International Development Finance Corporation (U.S. Treasury 3 Month Bill +0.00%) §± | 0.16 | 1-20-2035 | 9,797,840 | 9,797,840 | |
| U.S. International Development Finance Corporation (U.S. Treasury 3 Month Bill +0.00%) §± | 0.16 | 4-20-2035 | 4,753,000 | 4,753,000 | |
| U.S. International Development Finance Corporation (U.S. Treasury 3 Month Bill +0.00%) §± | 0.16 | 4-20-2035 | 4,753,000 | 4,753,000 | |
| U.S. International Development Finance Corporation (U.S. Treasury 3 Month Bill +0.00%) §± | 0.16 | 4-20-2035 | 16,635,500 | 16,635,500 | |
| U.S. International Development Finance Corporation (U.S. Treasury 3 Month Bill +0.00%) §± | 0.16 | 1-15-2040 | 7,656,000 | 7,656,000 | |
| U.S. International Development Finance Corporation (U.S. Treasury 3 Month Bill +0.00%) §± | 0.16 | 1-15-2040 | 11,484,000 | 11,484,000 | |
| U.S. International Development Finance Corporation (U.S. Treasury 3 Month Bill +0.00%) §± | 0.16 | 7-15-2040 | 18,725,900 | 18,725,900 | |
| U.S. International Development Finance Corporation Series 1 (U.S. Treasury 3 Month Bill +0.00%) §± | 0.16 | 9-30-2031 | 3,959,000 | 3,959,000 | |
| U.S. International Development Finance Corporation Series 1 (U.S. Treasury 3 Month Bill +0.00%) §± | 0.16 | 1-15-2040 | 19,140,000 | 19,140,000 | |
| U.S. International Development Finance Corporation Series 2 (U.S. Treasury 3 Month Bill +0.00%) §± | 0.11 | 9-20-2038 | 3,534,212 | 3,534,212 | |
| U.S. International Development Finance Corporation Series 2 (U.S. Treasury 3 Month Bill +0.00%) §± | 0.16 | 9-30-2031 | 9,264,060 | 9,264,060 | |
| U.S. International Development Finance Corporation Series 2-2 (U.S. Treasury 3 Month Bill +0.00%) §± | 0.16 | 7-15-2040 | 6,587,000 | 6,587,000 | |
| U.S. International Development Finance Corporation Series 4 (U.S. Treasury 3 Month Bill +0.00%) §± | 0.08 | 11-15-2033 | 19,418,804 | 19,418,804 | |
| U.S. International Development Finance Corporation Series 4 (U.S. Treasury 3 Month Bill +0.00%) §± | 0.16 | 9-2-2031 | 3,018,400 | 3,018,400 | |
| U.S. International Development Finance Corporation Series 4 (U.S. Treasury 3 Month Bill +0.00%) §± | 0.16 | 9-30-2031 | 5,384,240 | 5,384,240 | |
| U.S. International Development Finance Corporation Series 4 (U.S. Treasury 3 Month Bill +0.00%) §± | 0.16 | 1-20-2035 | 8,478,900 | 8,478,900 | |
| U.S. International Development Finance Corporation Series 5 (U.S. Treasury 3 Month Bill +0.00%) §± | 0.16 | 9-30-2031 | 5,542,600 | 5,542,600 | |
| U.S. International Development Finance Corporation Series 6 (U.S. Treasury 3 Month Bill +0.00%) §± | 0.11 | 7-7-2040 | 4,480,031 | 4,480,031 | |
| U.S. International Development Finance Corporation Series 6 (U.S. Treasury 3 Month Bill +0.00%) §± | 0.16 | 9-30-2031 | 16,073,540 | 16,073,540 | |
| U.S. International Development Finance Corporation Series 6 (U.S. Treasury 3 Month Bill +0.00%) §± | 0.16 | 4-20-2035 | 8,460,340 | 8,460,340 | |
| U.S. International Development Finance Corporation Series 7 (U.S. Treasury 3 Month Bill +0.00%) §± | 0.16 | 9-30-2031 | 6,334,400 | 6,334,400 | |
| U.S. International Development Finance Corporation Series 7 (U.S. Treasury 3 Month Bill +0.00%) §± | 0.16 | 1-20-2035 | 2,732,090 | 2,732,090 |
| Interest
rate |
Maturity
date |
Principal | Value | ||
| Government agency debt (continued) | |||||
| U.S. International Development Finance Corporation Series 8 (U.S. Treasury 3 Month Bill +0.00%) §± | 0.16% | 9-30-2031 | $ 11,877,000 | $ 11,877,000 | |
| U.S. International Development Finance Corporation Series 9 (U.S. Treasury 3 Month Bill +0.00%) §± | 0.08 | 5-15-2030 | 19,584,000 | 19,584,000 | |
| U.S. International Development Finance Corporation Series 9 (U.S. Treasury 3 Month Bill +0.00%) §± | 0.16 | 9-30-2031 | 3,721,460 | 3,721,460 | |
| Total Government agency debt (Cost $11,043,776,960) | 11,043,776,960 | ||||
| Municipal obligations: 0.09% | |||||
| New York: 0.06% | |||||
| Variable rate demand notes ø: 0.06% | |||||
| New York HFA West 23rd Street Series 2002-A (Housing revenue, FNMA LOC, FNMA LIQ) | 0.06 | 5-15-2033 | 47,600,000 | 47,600,000 | |
| New York Housing Development Corporation Related Sierra Series A (Housing revenue, FNMA LOC) | 0.06 | 3-15-2033 | 32,000,000 | 32,000,000 | |
| 79,600,000 | |||||
| Other: 0.03% | |||||
| Variable rate demand notes ø: 0.03% | |||||
| FHLMC MFHR Series M006 Class A (Housing revenue, FHLMC LOC) | 0.20 | 10-15-2045 | 3,495,827 | 3,495,827 | |
| FHLMC MFHR Series M028 Class A (Housing revenue, FHLMC LIQ) 144A | 0.09 | 9-15-2024 | 30,735,000 | 30,735,000 | |
| 34,230,827 | |||||
| Total Municipal obligations (Cost $113,830,827) | 113,830,827 | ||||
| Other instruments: 0.14% | |||||
| ASC Admiral Way LLC §øø | 0.12 | 8-1-2056 | 22,270,000 | 22,270,000 | |
| ASC Mercer Island LLC §øø | 0.30 | 6-1-2057 | 33,900,000 | 33,900,000 | |
| Brandon Place Partners Series 2018 §øø | 0.12 | 12-1-2058 | 15,335,000 | 15,335,000 | |
| Hacienda Senior Villas Series C §øø | 0.12 | 12-1-2058 | 20,575,000 | 20,575,000 | |
| La Mesa Senior Living LP Secured §øø | 0.12 | 8-1-2057 | 48,125,000 | 48,125,000 | |
| Plaza Patria Court Limited §øø | 0.12 | 12-1-2058 | 17,325,000 | 17,325,000 | |
| Rohnert Park 668 LP Series A §øø | 0.12 | 6-1-2058 | 20,920,000 | 20,920,000 | |
| Southside Brookshore §øø | 0.12 | 9-1-2059 | 5,000,000 | 5,000,000 | |
| Total Other instruments (Cost $183,450,000) | 183,450,000 | ||||
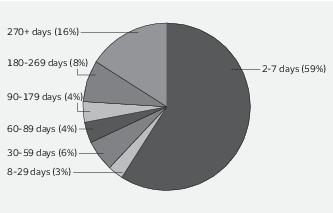
| Repurchase agreements^^: 59.83% | |||||
| Bank of America Corporation, dated 1/31/2022, maturity value $1,000,001,389 (01) | 0.05 | 2-1-2022 | 1,000,000,000 | 1,000,000,000 | |
| Bank of Montreal, dated 1/31/2022, maturity value $700,000,972 (02) | 0.05 | 2-1-2022 | 700,000,000 | 700,000,000 | |
| Bank of Montreal, dated 11/10/2021, maturity value $50,050,333 (03) | 0.12 | 9-8-2022 | 50,000,000 | 50,000,000 | |
| Bank of New York Mellon Corporation, dated 1/31/2022, maturity value $1,750,002,674 (04) | 0.06 | 2-1-2022 | 1,750,000,000 | 1,750,000,000 | |
| Bank of New York Mellon Corporation, dated 1/3/2022, maturity value $64,003,307 (05) | 0.06 | 2-3-2022 | 64,000,000 | 64,000,000 | |
| Bank of Nova Scotia New York Agency, dated 1/31/2022, maturity value $1,500,002,292 (06) | 0.06 | 2-1-2022 | 1,500,000,000 | 1,500,000,000 |
| Interest
rate |
Maturity
date |
Principal | Value | ||
| Repurchase agreements (continued) | |||||
| Bank of Nova Scotia New York Agency, dated 1/31/2022, maturity value $250,000,382 (07) | 0.06% | 2-1-2022 | $ 250,000,000 | $ 250,000,000 | |
| Barclays Bank plc, dated 1/31/2022, maturity value $2,420,003,361 (08) | 0.05 | 2-1-2022 | 2,420,000,000 | 2,420,000,000 | |
| BNP Paribas, dated 1/31/2022, maturity value $1,090,001,514 (09) | 0.05 | 2-1-2022 | 1,090,000,000 | 1,090,000,000 | |
| BNP Paribas, dated 1/27/2022, maturity value $1,000,009,722 (10) | 0.05 | 2-3-2022 | 1,000,000,000 | 1,000,000,000 | |
| BNP Paribas Securities Corporation, dated 1/31/2022, maturity value $100,000,139 (11) | 0.05 | 2-1-2022 | 100,000,000 | 100,000,000 | |
| Canadian Imperial Bank of Commerce, dated 1/31/2022, maturity value $100,000,139 (12) | 0.05 | 2-1-2022 | 100,000,000 | 100,000,000 | |
| Citibank NA, dated 1/31/2022, maturity value $250,000,417 (13) | 0.06 | 2-1-2022 | 250,000,000 | 250,000,000 | |
| Citibank NA, dated 1/27/2022, maturity value $250,002,917 (14) | 0.06 | 2-3-2022 | 250,000,000 | 250,000,000 | |
| Citigroup Global Markets Incorporated, dated 1/31/2022, maturity value $800,001,111 (15) | 0.05 | 2-1-2022 | 800,000,000 | 800,000,000 | |
| Citigroup Global Markets Incorporated, dated 1/25/2022, maturity value $1,000,011,667 (16) | 0.06 | 2-1-2022 | 1,000,000,000 | 1,000,000,000 | |
| Credit Agricole FICC, dated 1/31/2022, maturity value $1,000,001,389 (17) | 0.05 | 2-1-2022 | 1,000,000,000 | 1,000,000,000 | |
| Credit Agricole SA, dated 1/31/2022, maturity value $410,000,569 (18) | 0.05 | 2-1-2022 | 410,000,000 | 410,000,000 | |
| Daiwa Capital Markets America Incorporated, dated 1/31/2022, maturity value $1,000,001,389 (19) | 0.05 | 2-1-2022 | 1,000,000,000 | 1,000,000,000 | |
| Deutsche Bank Securities, dated 1/31/2022, maturity value $1,000,001,389 (20) | 0.05 | 2-1-2022 | 1,000,000,000 | 1,000,000,000 | |
| Federal Reserve Bank of New York, dated 1/31/2022, maturity value $43,750,060,764 (21) | 0.05 | 2-1-2022 | 43,750,000,000 | 43,749,999,992 | |
| Goldman Sachs & Company, dated 1/31/2022, maturity value $526,000,146 (22) | 0.01 | 2-1-2022 | 526,000,000 | 526,000,000 | |
| Goldman Sachs & Company, dated 1/31/2022, maturity value $100,000,139 (23) | 0.05 | 2-1-2022 | 100,000,000 | 100,000,000 | |
| ING Financial Markets LLC, dated 1/31/2022, maturity value $300,008,993 (24) | 0.05 | 2-1-2022 | 300,008,576 | 300,008,576 | |
| ING Financial Markets LLC, dated 1/19/2022, maturity value $500,047,500 (25) | 0.06 | 3-17-2022 | 500,000,000 | 500,000,000 | |
| ING Financial Markets LLC, dated 11/10/2021, maturity value $50,016,431 (26) | 0.07 | 4-28-2022 | 50,000,000 | 50,000,000 | |
| ING Financial Markets LLC, dated 11/10/2021, maturity value $25,008,750 (27) | 0.07 | 5-9-2022 | 25,000,000 | 25,000,000 | |
| ING Financial Markets LLC, dated 1/19/2022, maturity value $300,110,667 (28) | 0.16 | 4-12-2022 | 300,000,000 | 300,000,000 | |
| JP Morgan Securities, dated 1/31/2022, maturity value $250,000,347 (29) | 0.05 | 2-1-2022 | 250,000,000 | 250,000,000 | |
| JP Morgan Securities, dated 1/31/2022, maturity value $500,000,764 (30) | 0.06 | 2-1-2022 | 500,000,000 | 500,000,000 | |
| JP Morgan Securities , dated 5/24/2019, maturity value $500,956,667 (31) §∂øø | 0.07 | 2-1-2022 | 500,000,000 | 500,000,000 | |
| Mitsubishi Bank, dated 1/25/2022, maturity value $500,004,861 (32) | 0.05 | 2-1-2022 | 500,000,000 | 500,000,000 | |
| Mitsubishi UFJ Financial Group Bank, dated 7/16/2021, maturity value $850,047,222 (33) §∂øø | 0.01 | 2-1-2022 | 850,000,000 | 850,000,000 |
| Interest
rate |
Maturity
date |
Principal | Value | ||
| Repurchase agreements (continued) | |||||
| Mitsubishi UFJ Financial Group Securities Canada Limited, dated 1/31/2022, maturity value $4,400,006,111 (34) | 0.05% | 2-1-2022 | $ 4,400,000,000 | $ 4,400,000,000 | |
| Mizuho Bank, dated 1/31/2022, maturity value$250,000,347 (35) | 0.05 | 2-1-2022 | 250,000,000 | 250,000,000 | |
| Nomura Securities Company Limited, dated 1/31/2022, maturity value $2,500,003,472 (36) | 0.05 | 2-1-2022 | 2,500,000,000 | 2,500,000,000 | |
| Royal Bank of Canada, dated 1/7/2022, maturity value $500,021,528 (37) | 0.05 | 2-7-2022 | 500,000,000 | 500,000,000 | |
| Royal Bank of Canada Dominion Securities, dated 1/11/2022, maturity value $1,500,077,500 (38) | 0.06 | 2-11-2022 | 1,500,000,000 | 1,500,000,000 | |
| Societe Generale, dated 1/27/2022, maturity value $500,004,861 (39) | 0.05 | 2-3-2022 | 500,000,000 | 500,000,000 | |
| Societe Generale New York, dated 1/25/2022, maturity value $500,004,861 (40) | 0.05 | 2-1-2022 | 500,000,000 | 500,000,000 | |
| Societe Generale New York, dated 1/4/2022, maturity value $425,021,958 (41) | 0.06 | 2-4-2022 | 425,000,000 | 425,000,000 | |
| Standard Chartered Bank, dated 1/31/2022, maturity value $1,021,425,411 (42) | 0.05 | 2-1-2022 | 1,021,423,992 | 1,021,423,992 | |
| Standard Chartered Bank, dated 1/31/2022, maturity value $2,750,003,819 (43) | 0.05 | 2-1-2022 | 2,750,000,000 | 2,750,000,000 | |
| Sumitomo Mitsui Banking Corporation, dated 11/15/2021, maturity value $462,863,934 (44) | 0.09 | 2-15-2022 | 462,757,500 | 462,757,500 | |
| Sumitomo Mitsui Banking Corporation, dated 12/1/2021, maturity value $278,175,075 (45) | 0.09 | 3-1-2022 | 278,112,500 | 278,112,500 | |
| Sumitomo Mitsui Banking Corporation, dated 12/15/2021, maturity value $188,943,474 (46) | 0.10 | 3-15-2022 | 188,896,250 | 188,896,250 | |
| Sumitomo Mitsui Banking Corporation, dated 12/23/2021, maturity value $142,947,831 (47) | 0.10 | 3-22-2022 | 142,912,500 | 142,912,500 | |
| TD Securities USA Incorporated, dated 1/31/2022, maturity value $628,525,873 (48) | 0.05 | 2-1-2022 | 628,525,000 | 628,525,000 | |
| Total Repurchase agreements (Cost $79,932,636,310) | 79,932,636,310 | ||||
| U.S. Treasury securities: 31.73% | |||||
| U.S. Cash Management Bill ☼ | 0.07 | 4-5-2022 | 250,000,000 | 249,968,063 | |
| U.S. Cash Management Bill ☼ | 0.09 | 4-19-2022 | 400,000,000 | 399,925,139 | |
| U.S. Cash Management Bill ☼ | 0.11 | 4-26-2022 | 300,000,000 | 299,921,250 | |
| U.S. Cash Management Bill ☼ | 0.13 | 5-3-2022 | 300,000,000 | 299,899,521 | |
| U.S. Cash Management Bill ☼ | 0.15 | 5-10-2022 | 400,000,000 | 399,842,111 | |
| U.S. Cash Management Bill ☼ | 0.19 | 5-17-2022 | 50,000,000 | 49,971,854 | |
| U.S. Cash Management Bill ☼ | 0.28 | 5-24-2022 | 50,000,000 | 49,957,222 | |
| U.S. Treasury Bill ☼ | 0.04 | 2-22-2022 | 400,000,000 | 399,987,633 | |
| U.S. Treasury Bill ☼ | 0.05 | 2-10-2022 | 400,000,000 | 399,994,750 | |
| U.S. Treasury Bill ☼ | 0.05 | 2-17-2022 | 350,000,000 | 349,992,222 | |
| U.S. Treasury Bill ☼ | 0.05 | 3-3-2022 | 400,000,000 | 399,983,167 | |
| U.S. Treasury Bill ☼ | 0.05 | 3-8-2022 | 350,000,000 | 349,982,646 | |
| U.S. Treasury Bill ☼ | 0.06 | 2-15-2022 | 300,000,000 | 299,993,467 | |
| U.S. Treasury Bill ☼ | 0.06 | 3-1-2022 | 500,000,000 | 499,978,066 | |
| U.S. Treasury Bill ☼ | 0.06 | 3-10-2022 | 1,650,000,000 | 1,649,890,028 | |
| U.S. Treasury Bill ☼ | 0.08 | 3-22-2022 | 400,000,000 | 399,955,900 | |
| U.S. Treasury Bill ☼ | 0.08 | 3-24-2022 | 800,000,000 | 799,915,886 | |
| U.S. Treasury Bill ☼ | 0.08 | 3-31-2022 | 345,000,000 | 344,953,866 | |
| U.S. Treasury Bill ☼ | 0.08 | 4-14-2022 | 456,000,000 | 455,940,048 | |
| U.S. Treasury Bill ☼ | 0.08 | 4-21-2022 | 500,000,000 | 499,913,759 | |
| U.S. Treasury Bill ☼ | 0.09 | 4-7-2022 | 50,000,000 | 49,992,191 |
| Interest
rate |
Maturity
date |
Principal | Value | ||
| U.S. Treasury securities (continued) | |||||
| U.S. Treasury Bill ☼ | 0.10% | 6-2-2022 | $ 570,000,000 | $ 569,819,340 | |
| U.S. Treasury Bill ☼ | 0.10 | 9-8-2022 | 240,000,000 | 239,850,350 | |
| U.S. Treasury Bill ☼ | 0.11 | 10-6-2022 | 1,280,000,000 | 1,279,059,822 | |
| U.S. Treasury Bill ☼ | 0.13 | 3-29-2022 | 250,000,000 | 249,949,444 | |
| U.S. Treasury Bill ☼ | 0.15 | 6-23-2022 | 150,000,000 | 149,912,433 | |
| U.S. Treasury Bill ☼ | 0.16 | 11-3-2022 | 930,000,000 | 928,884,531 | |
| U.S. Treasury Bill ☼ | 0.19 | 4-28-2022 | 40,000,000 | 39,982,036 | |
| U.S. Treasury Bill ☼ | 0.21 | 6-30-2022 | 150,000,000 | 149,872,419 | |
| U.S. Treasury Bill ☼ | 0.22 | 7-7-2022 | 160,000,000 | 159,845,733 | |
| U.S. Treasury Bill ☼ | 0.27 | 7-14-2022 | 70,000,000 | 69,915,059 | |
| U.S. Treasury Bill ☼ | 0.36 | 7-21-2022 | 50,000,000 | 49,914,292 | |
| U.S. Treasury Bill ☼ | 0.38 | 7-28-2022 | 40,000,000 | 39,925,660 | |
| U.S. Treasury Bill ☼ | 0.39 | 12-29-2022 | 70,000,000 | 69,748,992 | |
| U.S. Treasury Bill ☼ | 0.62 | 1-26-2023 | 40,000,000 | 39,753,487 | |
| U.S. Treasury Note | 0.13 | 5-31-2022 | 220,000,000 | 220,027,831 | |
| U.S. Treasury Note | 0.13 | 6-30-2022 | 180,000,000 | 180,024,805 | |
| U.S. Treasury Note | 0.13 | 7-31-2022 | 810,000,000 | 810,118,971 | |
| U.S. Treasury Note | 0.13 | 8-31-2022 | 230,000,000 | 230,044,673 | |
| U.S. Treasury Note | 0.13 | 9-30-2022 | 885,000,000 | 885,190,875 | |
| U.S. Treasury Note | 0.13 | 10-31-2022 | 1,940,000,000 | 1,940,266,142 | |
| U.S. Treasury Note | 0.13 | 11-30-2022 | 1,220,000,000 | 1,219,496,957 | |
| U.S. Treasury Note | 0.13 | 12-31-2022 | 395,000,000 | 394,243,169 | |
| U.S. Treasury Note (U.S. Treasury 3 Month Bill Money Market Yield +0.03%) ± | 0.22 | 4-30-2023 | 3,600,000,000 | 3,600,125,747 | |
| U.S. Treasury Note (U.S. Treasury 3 Month Bill Money Market Yield +0.03%) ± | 0.22 | 7-31-2023 | 3,150,000,000 | 3,150,095,284 | |
| U.S. Treasury Note (U.S. Treasury 3 Month Bill Money Market Yield +0.04%) ± | 0.23 | 10-31-2023 | 2,190,000,000 | 2,190,100,890 | |
| U.S. Treasury Note (U.S. Treasury 3 Month Bill Money Market Yield +0.05%) ± | 0.24 | 1-31-2023 | 2,100,000,000 | 2,100,128,428 | |
| U.S. Treasury Note (U.S. Treasury 3 Month Bill Money Market Yield +0.06%) ± | 0.25 | 7-31-2022 | 365,000,000 | 364,994,943 | |
| U.S. Treasury Note (U.S. Treasury 3 Month Bill Money Market Yield +0.06%) ± | 0.25 | 10-31-2022 | 2,430,000,000 | 2,429,969,095 | |
| U.S. Treasury Note (U.S. Treasury 3 Month Bill Money Market Yield +0.11%) ± | 0.30 | 4-30-2022 | 250,000,000 | 250,043,651 | |
| U.S. Treasury Note | 0.38 | 3-31-2022 | 749,794,000 | 750,120,853 | |
| U.S. Treasury Note | 1.13 | 2-28-2022 | 390,000,000 | 390,298,129 | |
| U.S. Treasury Note | 1.38 | 10-15-2022 | 620,000,000 | 625,338,988 | |
| U.S. Treasury Note | 1.50 | 8-15-2022 | 100,000,000 | 100,757,633 | |
| U.S. Treasury Note | 1.50 | 9-15-2022 | 225,000,000 | 226,952,812 | |
| U.S. Treasury Note | 1.63 | 8-15-2022 | 240,000,000 | 241,978,483 | |
| U.S. Treasury Note | 1.63 | 8-31-2022 | 470,000,000 | 474,140,947 | |
| U.S. Treasury Note | 1.63 | 11-15-2022 | 85,000,000 | 86,007,937 | |
| U.S. Treasury Note | 1.75 | 2-28-2022 | 570,000,000 | 570,719,646 | |
| U.S. Treasury Note | 1.75 | 3-31-2022 | 612,000,000 | 613,629,375 | |
| U.S. Treasury Note | 1.75 | 4-30-2022 | 225,000,000 | 225,905,389 | |
| U.S. Treasury Note | 1.75 | 5-15-2022 | 200,000,000 | 200,947,724 | |
| U.S. Treasury Note | 1.75 | 6-30-2022 | 110,000,000 | 110,746,776 | |
| U.S. Treasury Note | 1.75 | 7-15-2022 | 470,000,000 | 473,502,180 | |
| U.S. Treasury Note | 1.75 | 9-30-2022 | 592,000,000 | 598,456,355 | |
| U.S. Treasury Note | 1.88 | 3-31-2022 | 665,000,000 | 666,874,059 | |
| U.S. Treasury Note | 1.88 | 4-30-2022 | 75,000,000 | 75,324,126 | |
| U.S. Treasury Note | 1.88 | 7-31-2022 | 1,570,000,000 | 1,583,767,652 | |
| U.S. Treasury Note | 1.88 | 8-31-2022 | 170,000,000 | 171,719,833 |
| Interest
rate |
Maturity
date |
Principal | Value | ||
| U.S. Treasury securities (continued) | |||||
| U.S. Treasury Note | 1.88% | 9-30-2022 | $ 130,000,000 | $ 131,523,195 | |
| U.S. Treasury Note | 1.88 | 10-31-2022 | 40,000,000 | 40,526,537 | |
| U.S. Treasury Note | 2.00 | 7-31-2022 | 420,000,000 | 423,942,020 | |
| U.S. Treasury Note | 2.00 | 10-31-2022 | 180,000,000 | 182,463,857 | |
| U.S. Treasury Note | 2.00 | 11-30-2022 | 340,000,000 | 344,876,077 | |
| U.S. Treasury Note | 2.13 | 5-15-2022 | 120,000,000 | 120,692,404 | |
| U.S. Treasury Note | 2.13 | 12-31-2022 | 170,000,000 | 172,776,255 | |
| U.S. Treasury Note | 2.38 | 3-15-2022 | 50,000,000 | 50,131,031 | |
| U.S. Treasury Note | 2.50 | 2-15-2022 | 85,000,000 | 85,078,350 | |
| Total U.S. Treasury securities (Cost $42,390,462,471) | 42,390,462,471 | ||||
| Total investments in securities (Cost $133,682,651,568) | 100.07% | 133,682,651,568 | |||
| Other assets and liabilities, net | (0.07) | (87,996,362) | |||
| Total net assets | 100.00% | $133,594,655,206 |
| § | The security is subject to a demand feature which reduces the effective maturity. |
| ± | Variable rate investment. The rate shown is the rate in effect at period end. |
| ## | All or a portion of this security is segregated for when-issued securities. |
| ø | Variable rate demand notes are subject to a demand feature which reduces the effective maturity. The maturity date shown represents the final maturity date of the security. The interest rate is determined and reset by the issuer daily, weekly, or monthly depending upon the terms of the security. The rate shown is the rate in effect at period end. |
| 144A | The security may be resold in transactions exempt from registration, normally to qualified institutional buyers, pursuant to Rule 144A under the Securities Act of 1933. |
| øø | The interest rate is determined and reset by the issuer periodically depending upon the terms of the security. The rate shown is the rate in effect at period end. |
| ^^ | Collateralized by: |
| (01) U.S. government securities, 3.00% to 4.00%, 1-20-2047 to 7-20-2049, fair value including accrued interest is $1,030,000,000. | |
| (02) U.S. government securities, 1.34% to 8.00%, 9-1-2023 to 2-1-2052, fair value including accrued interest is $721,000,000. | |
| (03) U.S. government securities, 0.00% to 3.00%, 2-24-2022 to 2-15-2050, fair value including accrued interest is $51,000,010. | |
| (04) U.S. government securities, 0.13% to 3.00%, 2-15-2022 to 8-15-2051, fair value including accrued interest is $1,785,000,046. | |
| (05) U.S. government securities, 0.13% to 3.63%, 10-15-2026 to 4-15-2028, fair value including accrued interest is $66,030,848. | |
| (06) U.S. government securities, 1.75%, 1-31-2029, fair value including accrued interest is $1,530,612,245. | |
| (07) U.S. government securities, 1.63% to 5.00%, 4-1-2034 to 11-20-2051, fair value including accrued interest is $257,500,001. | |
| (08) U.S. government securities, 0.00% to 7.63%, 2-1-2022 to 2-15-2051, fair value including accrued interest is $2,468,400,008. | |
| (09) U.S. government securities, 0.00% to 7.63%, 2-3-2022 to 5-15-2051, fair value including accrued interest is $1,111,800,000. | |
| (10) U.S. government securities, 0.00% to 2.75%, 2-15-2022 to 5-15-2051, fair value including accrued interest is $1,020,000,000. | |
| (11) U.S. government securities, 2.00% to 5.00%, 11-1-2028 to 12-20-2067, fair value including accrued interest is $102,999,974. | |
| (12) U.S. government securities, 0.13% to 7.63%, 8-15-2023 to 12-1-2051, fair value including accrued interest is $102,017,590. | |
| (13) U.S. government securities, 0.00% to 9.00%, 2-4-2022 to 9-15-2065, fair value including accrued interest is $255,352,281. | |
| (14) U.S. government securities, 0.00% to 9.00%, 2-4-2022 to 1-20-2052, fair value including accrued interest is $255,746,704. | |
| (15) U.S. government securities, 0.13% to 6.63%, 3-15-2023 to 6-30-2027, fair value including accrued interest is $816,114,783. | |
| (16) U.S. government securities, 2.00% to 6.00%, 9-20-2050 to 2-20-2051, fair value including accrued interest is $1,030,000,824. | |
| (17) U.S. government securities, 2.75%, 2-15-2024, fair value including accrued interest is $1,019,999,996. | |
| (18) U.S. government securities, 2.00%, 1-20-2051, fair value including accrued interest is $422,300,001. | |
| (19) U.S. government securities, 0.00% to 7.63%, 2-3-2022 to 3-1-2052, fair value including accrued interest is $1,027,349,394. | |
| (20) U.S. government securities, 0.00% to 4.00%, 4-6-2022 to 1-20-2052, fair value including accrued interest is $1,027,906,480. | |
| (21) U.S. government securities, 0.13% to 3.63%, 12-31-2022 to 5-15-2044, fair value including accrued interest is $43,750,060,801. | |
| (22) U.S. government securities, 0.00% to 0.88%, 4-7-2022 to 1-15-2032, fair value including accrued interest is $536,520,043. | |
| (23) U.S. government securities, 2.50% to 5.00%, 7-15-2023 to 1-20-2052, fair value including accrued interest is $103,000,000. | |
| (24) U.S. government securities, 0.00%, 1-26-2023, fair value is $306,008,748. | |
| (25) U.S. government securities, 0.00% to 7.00%, 4-5-2022 to 1-1-2057, fair value including accrued interest is $514,588,330. | |
| (26) U.S. government securities, 1.50% to 3.66%, 11-1-2050 to 8-1-2028, fair value including accrued interest is $51,500,000. | |
| (27) U.S. government securities, 1.50% to 5.00%, 8-1-2028 to 12-1-2051, fair value including accrued interest is $25,750,000. | |
| (28) U.S. government securities, 1.50% to 5.50%, 8-1-2028 to 9-1-2057, fair value including accrued interest is $309,000,000. | |
| (29) U.S. government securities, 1.04% to 8.50%, 1-25-2024 to 1-20-2052, fair value including accrued interest is $255,284,485. | |
| (30) U.S. government securities, 0.00% to 1.88%, 7-31-2022 to 10-15-2026, fair value including accrued interest is $510,000,128. | |
| (31) U.S. government securities, 0.00% to 8.00%, 5-22-2023 to 9-20-2056, fair value including accrued interest is $512,735,781. | |
| (32) U.S. government securities, 0.00% to 3.38%, 8-15-2022 to 2-15-2043, fair value including accrued interest is $510,000,004. | |
| (33) U.S. government securities, 0.00% to 5.38%, 9-15-2022 to 9-15-2060, fair value including accrued interest is $870,671,756. | |
| (34) U.S. government securities, 0.00% to 6.38%, 2-15-2022 to 3-15-2063, fair value including accrued interest is $4,521,344,286. | |
| (35) U.S. government securities, 2.50%, 3-31-2023, fair value including accrued interest is $255,000,059. | |
| (36) U.S. government securities, 0.00% to 2.88%, 3-15-2022 to 8-15-2049, fair value including accrued interest is $2,550,000,073. | |
| (37) U.S. government securities, 1.50% to 4.50%, 10-1-2035 to 12-1-2051, fair value including accrued interest is $515,000,000. | |
| (38) U.S. government securities, 0.00% to 7.13%, 4-5-2022 to 12-20-2051, fair value including accrued interest is $1,537,798,887. | |
| (39) U.S. government securities, 0.00% to 3.88%, 6-2-2022 to 8-15-2049, fair value including accrued interest is $510,000,071. | |
| (40) U.S. government securities, 0.00% to 7.63%, 3-10-2022 to 2-1-2057, fair value including accrued interest is $510,793,381. | |
| (41) U.S. government securities, 0.00% to 7.63%, 2-3-2022 to 5-15-2050, fair value including accrued interest is $433,500,001. | |
| (42) U.S. government securities, 1.13% to 2.88%, 5-15-2028 to 9-30-2028, fair value including accrued interest is $1,042,269,380. | |
| (43) U.S. government securities, 0.00% to 4.38%, 2-22-2022 to 11-15-2051, fair value including accrued interest is $2,805,000,013. | |
| (44) U.S. government securities, 0.38% to 3.50%, 3-31-2022 to 2-1-2051, fair value including accrued interest is $476,554,723. | |
| (45) U.S. government securities, 0.38% to 3.50%, 3-31-2022 to 3-1-2048, fair value including accrued interest is $286,371,453. | |
| (46) U.S. government securities, 0.38% to 3.50%, 3-31-2022 to 5-1-2048, fair value including accrued interest is $194,540,022. | |
| (47) U.S. government securities, 0.38% to 3.50%, 3-31-2022 to 1-20-2050, fair value including accrued interest is $147,223,827. | |
| (48) U.S. government securities, 1.50% to 8.00%, 8-1-2022 to 2-1-2052, fair value including accrued interest is $647,380,750. | |
| ∂ | The security represents a long-dated and extendible repurchase agreement which automatically renews on previously set terms. The maturity date represents the next put date. |
| ☼ | Zero coupon security. The rate represents the current yield to maturity. |
| %% | The security is purchased on a when-issued basis. |
| Abbreviations: | |
| FFCB | Federal Farm Credit Banks |
| FHLB | Federal Home Loan Bank |
| FHLMC | Federal Home Loan Mortgage Corporation |
| FNMA | Federal National Mortgage Association |
| HFA | Housing Finance Authority |
| LIQ | Liquidity agreement |
| LOC | Letter of credit |
| MFHR | Multifamily housing revenue |
| SOFR | Secured Overnight Financing Rate |
| Assets | |
|
Investments in unaffiliated securities, at amortized
cost |
$ 53,750,015,258 |
|
Investments in repurchase agreements, at amortized
cost |
79,932,636,310 |
|
Cash |
4,250,001 |
|
Receivable for investments
sold |
249,973,438 |
|
Receivable for
interest |
38,590,043 |
|
Receivable for Fund shares
sold |
3,348,622 |
|
Prepaid expenses and other
assets |
5,900,764 |
|
Total
assets |
133,984,714,436 |
| Liabilities | |
|
Payable for investments
purchased |
249,949,444 |
|
Payable for when-issued
transactions |
130,000,000 |
|
Administration fees
payable |
6,324,443 |
|
Payable for Fund shares
redeemed |
2,543,265 |
|
Dividends
payable |
805,806 |
|
Management fee
payable |
401,079 |
|
Distribution fee
payable |
35,193 |
|
Total
liabilities |
390,059,230 |
|
Total net
assets |
$133,594,655,206 |
| Net assets consist of | |
|
Paid-in
capital |
$ 133,594,445,804 |
|
Total distributable
earnings |
209,402 |
|
Total net
assets |
$133,594,655,206 |
| Computation of net asset value per share | |
|
Net assets – Class
A |
$ 316,458,565 |
|
Shares outstanding – Class
A1 |
316,458,281 |
|
Net asset value per share – Class
A |
$1.00 |
|
Net assets – Administrator
Class |
$ 5,027,251,871 |
|
Shares outstanding – Administrator
Class1 |
5,027,248,421 |
|
Net asset value per share – Administrator
Class |
$1.00 |
|
Net assets – Institutional
Class |
$ 40,078,395,223 |
|
Shares outstanding – Institutional
Class1 |
40,078,402,910 |
|
Net asset value per share – Institutional
Class |
$1.00 |
|
Net assets – Select
Class |
$ 85,197,343,948 |
|
Shares outstanding – Select
Class1 |
85,197,188,309 |
|
Net asset value per share – Select
Class |
$1.00 |
|
Net assets – Service
Class |
$ 1,873,382,051 |
|
Shares outstanding – Service
Class1 |
1,873,385,577 |
|
Net asset value per share – Service
Class |
$1.00 |
|
Net assets – Sweep
Class |
$ 1,101,823,548 |
|
Shares outstanding – Sweep
Class1 |
1,101,824,210 |
Net
asset value per share – Sweep
Class |
$1.00 |
| 1 | The Fund has an unlimited number of authorized shares. |
| Investment income | |
|
Interest |
$ 108,604,386 |
| Expenses | |
|
Management
fee |
182,563,604 |
| Administration fees | |
|
Class
A |
674,606 |
|
Administrator
Class |
3,882,564 |
|
Institutional
Class |
32,877,023 |
|
Select
Class |
38,290,351 |
|
Service
Class |
2,314,165 |
|
Sweep
Class |
249,781 |
| Shareholder servicing fees | |
|
Class
A |
766,598 |
|
Administrator
Class |
3,882,565 |
|
Service
Class |
4,821,159 |
|
Sweep
Class |
2,081,506 |
| Distribution fee | |
|
Sweep
Class |
832,603 |
|
Custody and accounting
fees |
4,722,134 |
|
Professional
fees |
90,479 |
|
Registration
fees |
1,425,087 |
|
Shareholder report
expenses |
98,072 |
|
Trustees’ fees and
expenses |
19,272 |
|
Other fees and
expenses |
1,252,518 |
|
Total
expenses |
280,844,087 |
| Less: Fee waivers and/or expense reimbursements | |
|
Fund-level |
(177,456,895) |
|
Class
A |
(1,266,216) |
|
Administrator
Class |
(5,536,115) |
|
Institutional
Class |
(9,526,660) |
|
Service
Class |
(6,039,634) |
|
Sweep
Class |
(2,717,549) |
|
Net
expenses |
78,301,018 |
|
Net investment
income |
30,303,368 |
|
Net realized gains on
investments |
425,866 |
|
Net increase in net assets resulting from
operations |
$ 30,729,234 |
| Year
ended January 31, 2022 |
Year
ended January 31, 2021 | |||
| Operations | ||||
|
Net investment
income |
$ 30,303,368 | $ 234,013,463 | ||
|
Net realized gains on
investments |
425,866 | 848,637 | ||
|
Net increase in net assets resulting from
operations |
30,729,234 | 234,862,100 | ||
| Distributions to shareholders from | ||||
| Net investment income and net realized gains | ||||
|
Class
A |
(32,156) | (444,535) | ||
|
Administrator
Class |
(407,833) | (5,053,047) | ||
|
Institutional
Class |
(4,315,675) | (65,216,497) | ||
|
Select
Class |
(25,942,933) | (161,056,607) | ||
|
Service
Class |
(201,661) | (2,796,854) | ||
|
Sweep
Class |
(89,466) | (5) 1 | ||
|
Total distributions to
shareholders |
(30,989,724) | (234,567,545) | ||
| Capital share transactions | Shares | Shares | ||
| Proceeds from shares sold | ||||
|
Class
A |
101,363,824 | 101,363,824 | 245,392,922 | 245,392,922 |
|
Administrator
Class |
21,325,222,248 | 21,325,222,248 | 18,923,119,258 | 18,923,119,258 |
|
Institutional
Class |
197,535,730,467 | 197,535,730,467 | 220,379,617,551 | 220,379,617,551 |
|
Select
Class |
1,160,483,999,071 | 1,160,483,999,071 | 819,624,460,567 | 819,624,460,567 |
|
Service
Class |
77,872,528,777 | 77,872,528,777 | 88,311,417,547 | 88,311,417,547 |
|
Sweep
Class |
7,001,689,901 | 7,001,689,901 | 1,465,010 1 | 1,465,010 1 |
| 1,464,320,534,288 | 1,147,485,472,855 | |||
| Reinvestment of distributions | ||||
|
Class
A |
31,866 | 31,866 | 461,983 | 461,983 |
|
Administrator
Class |
188,849 | 188,849 | 1,925,746 | 1,925,746 |
|
Institutional
Class |
1,487,445 | 1,487,445 | 22,578,181 | 22,578,181 |
|
Select
Class |
16,408,984 | 16,408,984 | 103,202,391 | 103,202,391 |
|
Service
Class |
19,548 | 19,548 | 262,945 | 262,945 |
|
Sweep
Class |
89,474 | 89,474 | 3 1 | 3 1 |
| 18,226,166 | 128,431,249 | |||
| Payment for shares redeemed | ||||
|
Class
A |
(91,800,580) | (91,800,580) | (305,591,017) | (305,591,017) |
|
Administrator
Class |
(20,838,430,663) | (20,838,430,663) | (18,278,691,699) | (18,278,691,699) |
|
Institutional
Class |
(200,342,145,260) | (200,342,145,260) | (206,547,476,608) | (206,547,476,608) |
|
Select
Class |
(1,170,469,084,534) | (1,170,469,084,534) | (776,516,340,075) | (776,516,340,075) |
|
Service
Class |
(77,862,043,660) | (77,862,043,660) | (88,443,707,111) | (88,443,707,111) |
|
Sweep
Class |
(5,901,420,153) | (5,901,420,153) | (25) 1 | (25) 1 |
| (1,475,504,924,850) | (1,090,091,806,535) | |||
|
Net increase (decrease) in net assets resulting from capital share
transactions |
(11,166,164,396) | 57,522,097,569 | ||
|
Total increase (decrease) in net
assets |
(11,166,424,886) | 57,522,392,124 | ||
| Net assets | ||||
|
Beginning of
period |
144,761,080,092 | 87,238,687,968 | ||
|
End of
period |
$ 133,594,655,206 | $ 144,761,080,092 | ||
| 1 | For the period from July 31, 2020 (commencement of class operations) to January 31, 2021 |
| Year ended January 31 | |||||
| Class A | 2022 | 2021 | 2020 | 2019 | 2018 |
|
Net asset value, beginning of
period |
$1.00 | $1.00 | $1.00 | $1.00 | $1.00 |
|
Net investment
income |
0.00 1 | 0.00 1 | 0.02 | 0.01 | 0.00 1 |
|
Net realized gains (losses) on
investments |
0.00 1 | 0.00 1 | 0.00 1 | 0.00 1 | 0.00 1 |
|
Total from investment
operations |
0.00 1 | 0.00 1 | 0.02 | 0.01 | 0.00 1 |
| Distributions to shareholders from | |||||
|
Net investment
income |
(0.00) 1 | (0.00) 1 | (0.02) | (0.01) | (0.00) 1 |
|
Net realized
gains |
(0.00) 1 | (0.00) 1 | (0.00) 1 | (0.00) 1 | (0.00) 1 |
|
Total distributions to
shareholders |
(0.00) 1 | (0.00) 1 | (0.02) | (0.01) | (0.00) 1 |
|
Net asset value, end of
period |
$1.00 | $1.00 | $1.00 | $1.00 | $1.00 |
|
Total
return |
0.01% | 0.13% | 1.59% | 1.38% | 0.38% |
| Ratios to average net assets (annualized) | |||||
|
Gross
expenses |
0.60% | 0.60% | 0.61% | 0.61% | 0.61% |
|
Net
expenses |
0.07% * | 0.28% * | 0.60% | 0.60% | 0.61% |
|
Net investment
income |
0.01% | 0.13% | 1.56% | 1.39% | 0.38% |
| Supplemental data | |||||
|
Net assets, end of period (000s
omitted) |
$316,459 | $306,864 | $366,601 | $311,616 | $264,735 |
| * | Ratio includes class-level expenses which were voluntarily waived by the investment manager. Without this voluntary waiver, the net expense ratio would be increased by the following amounts: |
| Year ended January 31, 2022 | 0.53% |
| Year ended January 31, 2021 | 0.32% |
| 1 | Amount is less than $0.005. |
| Year ended January 31 | |||||
| Administrator Class | 2022 | 2021 | 2020 | 2019 | 2018 |
|
Net asset value, beginning of
period |
$1.00 | $1.00 | $1.00 | $1.00 | $1.00 |
|
Net investment
income |
0.00 1 | 0.00 1 | 0.02 | 0.02 | 0.01 |
|
Net realized gains (losses) on
investments |
0.00 1 | 0.00 1 | 0.00 1 | 0.00 1 | 0.00 1 |
|
Total from investment
operations |
0.00 1 | 0.00 1 | 0.02 | 0.02 | 0.01 |
| Distributions to shareholders from | |||||
|
Net investment
income |
(0.00) 1 | (0.00) 1 | (0.02) | (0.02) | (0.01) |
|
Net realized
gains |
(0.00) 1 | (0.00) 1 | (0.00) 1 | (0.00) 1 | (0.00) 1 |
|
Total distributions to
shareholders |
(0.00) 1 | (0.00) 1 | (0.02) | (0.02) | (0.01) |
|
Net asset value, end of
period |
$1.00 | $1.00 | $1.00 | $1.00 | $1.00 |
|
Total
return |
0.01% | 0.17% | 1.85% | 1.65% | 0.65% |
| Ratios to average net assets (annualized) | |||||
|
Gross
expenses |
0.33% | 0.33% | 0.34% | 0.34% | 0.34% |
|
Net
expenses |
0.07% * | 0.22% * | 0.34% | 0.34% | 0.34% |
|
Net investment
income |
0.01% | 0.14% | 1.81% | 1.67% | 0.72% |
| Supplemental data | |||||
|
Net assets, end of period (000s
omitted) |
$5,027,252 | $4,540,262 | $3,893,928 | $2,411,490 | $1,554,764 |
| * | Ratio includes class-level expenses which were voluntarily waived by the investment manager. Without this voluntary waiver, the net expense ratio would be increased by the following amounts: |
| Year ended January 31, 2022 | 0.27% |
| Year ended January 31, 2021 | 0.11% |
| 1 | Amount is less than $0.005. |
| Year ended January 31 | |||||
| Institutional Class | 2022 | 2021 | 2020 | 2019 | 2018 |
|
Net asset value, beginning of
period |
$1.00 | $1.00 | $1.00 | $1.00 | $1.00 |
|
Net investment
income |
0.00 1 | 0.00 1 | 0.02 | 0.02 | 0.01 |
|
Net realized gains (losses) on
investments |
0.00 1 | 0.00 1 | 0.00 1 | 0.00 1 | 0.00 1 |
|
Total from investment
operations |
0.00 1 | 0.00 1 | 0.02 | 0.02 | 0.01 |
| Distributions to shareholders from | |||||
|
Net investment
income |
(0.00) 1 | (0.00) 1 | (0.02) | (0.02) | (0.01) |
|
Net realized
gains |
(0.00) 1 | (0.00) 1 | (0.00) 1 | (0.00) 1 | (0.00) 1 |
|
Total distributions to
shareholders |
(0.00) 1 | (0.00) 1 | (0.02) | (0.02) | (0.01) |
|
Net asset value, end of
period |
$1.00 | $1.00 | $1.00 | $1.00 | $1.00 |
|
Total
return |
0.01% | 0.22% | 1.99% | 1.79% | 0.79% |
| Ratios to average net assets (annualized) | |||||
|
Gross
expenses |
0.21% | 0.21% | 0.22% | 0.22% | 0.22% |
|
Net
expenses |
0.07% * | 0.18% * | 0.20% | 0.20% | 0.20% |
|
Net investment
income |
0.01% | 0.16% | 1.97% | 1.79% | 0.79% |
| Supplemental data | |||||
|
Net assets, end of period (000s
omitted) |
$40,078,395 | $42,883,663 | $29,289,517 | $26,000,569 | $21,931,321 |
| * | Ratio includes class-level expenses which were voluntarily waived by the investment manager. Without this voluntary waiver, the net expense ratio would be increased by the following amounts: |
| Year ended January 31, 2022 | 0.13% |
| Year ended January 31, 2021 | 0.02% |
| 1 | Amount is less than $0.005. |
| Year ended January 31 | |||||
| Select Class | 2022 | 2021 | 2020 | 2019 | 2018 |
|
Net asset value, beginning of
period |
$1.00 | $1.00 | $1.00 | $1.00 | $1.00 |
|
Net investment
income |
0.00 1 | 0.00 1 | 0.02 | 0.02 | 0.01 |
|
Net realized gains (losses) on
investments |
0.00 1 | 0.00 1 | 0.00 1 | 0.00 1 | 0.00 1 |
|
Total from investment
operations |
0.00 1 | 0.00 1 | 0.02 | 0.02 | 0.01 |
| Distributions to shareholders from | |||||
|
Net investment
income |
(0.00) 1 | (0.00) 1 | (0.02) | (0.02) | (0.01) |
|
Net realized
gains |
(0.00) 1 | (0.00) 1 | (0.00) 1 | (0.00) 1 | (0.00) 1 |
|
Total distributions to
shareholders |
(0.00) 1 | (0.00) 1 | (0.02) | (0.02) | (0.01) |
|
Net asset value, end of
period |
$1.00 | $1.00 | $1.00 | $1.00 | $1.00 |
|
Total
return |
0.03% | 0.26% | 2.05% | 1.85% | 0.85% |
| Ratios to average net assets (annualized) | |||||
|
Gross
expenses |
0.17% | 0.17% | 0.18% | 0.18% | 0.18% |
|
Net
expenses |
0.05% 2 | 0.14% | 0.14% | 0.14% | 0.14% |
|
Net investment
income |
0.03% | 0.19% | 2.02% | 1.82% | 0.86% |
| Supplemental data | |||||
|
Net assets, end of period (000s
omitted) |
$85,197,344 | $95,165,936 | $51,954,718 | $45,335,385 | $46,288,730 |
| 1 | Amount is less than $0.005. |
| 2 | Ratio includes class-level expenses which were voluntarily waived by the investment manager. Without this voluntary waiver, the net expense ratio would have been 0.09% higher. |
| Year ended January 31 | |||||
| Service Class | 2022 | 2021 | 2020 | 2019 | 2018 |
|
Net asset value, beginning of
period |
$1.00 | $1.00 | $1.00 | $1.00 | $1.00 |
|
Net investment
income |
0.00 1 | 0.00 1 | 0.02 | 0.01 | 0.00 1 |
|
Net realized gains (losses) on
investments |
0.00 1 | 0.00 1 | 0.00 1 | 0.00 1 | 0.00 1 |
|
Total from investment
operations |
0.00 1 | 0.00 1 | 0.02 | 0.01 | 0.00 1 |
| Distributions to shareholders from | |||||
|
Net investment
income |
(0.00) 1 | (0.00) 1 | (0.02) | (0.01) | (0.00) 1 |
|
Net realized
gains |
(0.00) 1 | (0.00) 1 | (0.00) 1 | (0.00) 1 | (0.00) 1 |
|
Total distributions to
shareholders |
(0.00) 1 | (0.00) 1 | (0.02) | (0.01) | (0.00) 1 |
|
Net asset value, end of
period |
$1.00 | $1.00 | $1.00 | $1.00 | $1.00 |
|
Total
return |
0.01% | 0.14% | 1.69% | 1.48% | 0.49% |
| Ratios to average net assets (annualized) | |||||
|
Gross
expenses |
0.50% | 0.50% | 0.51% | 0.51% | 0.51% |
|
Net
expenses |
0.07% * | 0.25% * | 0.50% | 0.50% | 0.50% |
|
Net investment
income |
0.01% | 0.13% | 1.67% | 1.45% | 0.48% |
| Supplemental data | |||||
|
Net assets, end of period (000s
omitted) |
$1,873,382 | $1,862,889 | $1,994,923 | $1,856,426 | $2,506,898 |
| * | Ratio includes class-level expenses which were voluntarily waived by the investment manager. Without this voluntary waiver, the net expense ratio would be increased by the following amounts: |
| Year ended January 31, 2022 | 0.43% |
| Year ended January 31, 2021 | 0.25% |
| 1 | Amount is less than $0.005. |
| Year ended January 31 | ||
| Sweep Class | 2022 | 2021 1 |
|
Net asset value, beginning of
period |
$1.00 | $1.00 |
|
Net investment
income |
0.00 2 | 0.00 2 |
|
Net realized gains (losses) on
investments |
0.00 2 | 0.00 2 |
|
Total from investment
operations |
0.00 2 | 0.00 2 |
| Distributions to shareholders from | ||
|
Net investment
income |
(0.00) 2 | (0.00) 2 |
|
Net realized
gains |
(0.00) 2 | (0.00) 2 |
|
Total distributions to
shareholders |
(0.00) 2 | (0.00) 2 |
|
Net asset value, end of
period |
$1.00 | $1.00 |
|
Total
return3 |
0.01% | 0.01% |
| Ratios to average net assets (annualized) | ||
|
Gross
expenses |
0.51% | 0.56% |
|
Net
expenses |
0.06% * | 0.13% * |
|
Net investment
income |
0.01% | 0.01% |
| Supplemental data | ||
|
Net assets, end of period (000s
omitted) |
$1,101,824 | $1,465 |
| * | Ratio includes class-level expenses which were voluntarily waived by the investment manager. Without this voluntary waiver, the net expense ratio would be increased by the following amounts: |
| Year ended January 31, 2022 | 0.44% |
| Year ended January 31, 2021 | 0.37% |
| 1 | For the period from July 31, 2020 (commencement of class operations) to January 31, 2021 |
| 2 | Amount is less than $0.005. |
| 3 | Returns for periods of less than one year are not annualized. |
| ■ | Level 1 – quoted prices in active markets for identical securities |
| ■ | Level 2 – other significant observable inputs (including quoted prices for similar securities, interest rates, prepayment speeds, credit risk, etc.) |
| ■ | Level 3 – significant unobservable inputs (including the Fund’s own assumptions in determining the fair value of investments) |
| Quoted
prices (Level 1) |
Other
significant observable inputs (Level 2) |
Significant
unobservable inputs (Level 3) |
Total | |
| Assets | ||||
| Investments in: | ||||
| Corporate bonds and notes | $0 | $ 18,495,000 | $0 | $ 18,495,000 |
| Government agency debt | 0 | 11,043,776,960 | 0 | 11,043,776,960 |
| Municipal obligations | 0 | 113,830,827 | 0 | 113,830,827 |
| Other instruments | 0 | 183,450,000 | 0 | 183,450,000 |
| Repurchase agreements | 0 | 79,932,636,310 | 0 | 79,932,636,310 |
| U.S. Treasury securities | 0 | 42,390,462,471 | 0 | 42,390,462,471 |
| Total assets | $0 | $133,682,651,568 | $0 | $133,682,651,568 |
| Average daily net assets | Management fee |
| First $5 billion | 0.150% |
| Next $5 billion | 0.140 |
| Next $5 billion | 0.130 |
| Next $85 billion | 0.125 |
| Over $100 billion | 0.120 |
| Average daily net assets | Management fee | |
| First $5 billion | 0.150% | |
| Next $5 billion | 0.140 | |
| Over $10 billion | 0.130 |
| Class-level
administration fee | |
| Class A | 0.22% |
| Administrator Class | 0.10 |
| Institutional Class | 0.08 |
| Select Class | 0.04 |
| Service Class | 0.12 |
| Sweep Class | 0.03 |
| Expense ratio caps | |
| Class A | 0.60% |
| Administrator Class | 0.34 |
| Institutional Class | 0.20 |
| Select Class | 0.14 |
| Service Class | 0.50 |
| Sweep Class | 0.50 |
| Year ended January 31 | ||
| 2022 | 2021 | |
| Ordinary income | $30,988,366 | $234,567,545 |
| Long-term capital gain | 1,358 | 0 |
Allspring Funds Trust:

| Shares voted “For” | 69,963,209,979 | |
| Shares voted “Against” | 762,832,182 | |
| Shares voted “Abstain” | 10,838,033,984 |
| Shares voted “For” | 69,616,187,947 | |
| Shares voted “Against” | 768,007,824 | |
| Shares voted “Abstain” | 11,179,880,374 |
| Name
and year of birth |
Position
held and length of service* |
Principal occupations during past five years or longer | Current
other public company or investment company directorships |
| William
R. Ebsworth (Born 1957) |
Trustee,
since 2015 |
Retired. From 1984 to 2013, equities analyst, portfolio manager, research director and chief investment officer at Fidelity Management and Research Company in Boston, Tokyo, and Hong Kong, and retired in 2013 as Chief Investment Officer of Fidelity Strategic Advisers, Inc. where he led a team of investment professionals managing client assets. Prior thereto, Board member of Hong Kong Securities Clearing Co., Hong Kong Options Clearing Corp., the Thailand International Fund, Ltd., Fidelity Investments Life Insurance Company, and Empire Fidelity Investments Life Insurance Company. Audit Committee Chair and Investment Committee Chair of the Vincent Memorial Hospital Endowment (non-profit organization). Mr. Ebsworth is a CFA® charterholder. | N/A |
| Jane
A. Freeman (Born 1953) |
Trustee,
since 2015; Chair Liaison, since 2018 |
Retired. From 2012 to 2014 and 1999 to 2008, Chief Financial Officer of Scientific Learning Corporation. From 2008 to 2012, Ms. Freeman provided consulting services related to strategic business projects. Prior to 1999, Portfolio Manager at Rockefeller & Co. and Scudder, Stevens & Clark. Board member of the Harding Loevner Funds from 1996 to 2014, serving as both Lead Independent Director and chair of the Audit Committee. Board member of the Russell Exchange Traded Funds Trust from 2011 to 2012 and the chair of the Audit Committee. Ms. Freeman is also an inactive Chartered Financial Analyst. | N/A |
| Isaiah
Harris, Jr. (Born 1952) |
Trustee,
since 2009; Audit Committee Chair, since 2019 |
Retired. Chairman of the Board of CIGNA Corporation from 2009 to 2021, and Director from 2005 to 2008. From 2003 to 2011, Director of Deluxe Corporation. Prior thereto, President and CEO of BellSouth Advertising and Publishing Corp. from 2005 to 2007, President and CEO of BellSouth Enterprises from 2004 to 2005 and President of BellSouth Consumer Services from 2000 to 2003. Emeritus member of the Iowa State University Foundation Board of Governors. Emeritus Member of the Advisory Board of Iowa State University School of Business. Advisory Board Member, Palm Harbor Academy (private school). Advisory Board Member, Fellowship of Christian Athletes. Mr. Harris is a certified public accountant (inactive status). | N/A |
| David
F. Larcker (Born 1950) |
Trustee,
since 2009 |
James Irvin Miller Professor of Accounting at the Graduate School of Business (Emeritus), Stanford University, Director of the Corporate Governance Research Initiative and Senior Faculty of The Rock Center for Corporate Governance since 2006. From 2005 to 2008, Professor of Accounting at the Graduate School of Business, Stanford University. Prior thereto, Ernst & Young Professor of Accounting at The Wharton School, University of Pennsylvania from 1985 to 2005. | N/A |
| Name
and year of birth |
Position
held and length of service* |
Principal occupations during past five years or longer | Current
other public company or investment company directorships |
| Olivia
S. Mitchell (Born 1953) |
Trustee,
since 2006; Nominating and Governance Committee Chair, since 2018 |
International Foundation of Employee Benefit Plans Professor since 1993, Wharton School of the University of Pennsylvania. Director of Wharton’s Pension Research Council and Boettner Center on Pensions & Retirement Research, and Research Associate at the National Bureau of Economic Research. Previously taught at Cornell University from 1978 to 1993. | N/A |
| Timothy
J. Penny (Born 1951) |
Trustee,
since 1996; Chair, since 2018 |
President and Chief Executive Officer of Southern Minnesota Initiative Foundation, a non-profit organization, since 2007. Member of the Board of Trustees of NorthStar Education Finance, Inc., a non-profit organization, since 2007. | N/A |
| James
G. Polisson (Born 1959) |
Trustee,
since 2018 |
Retired. Chief Marketing Officer, Source (ETF) UK Services, Ltd, from 2015 to 2017. From 2012 to 2015, Principal of The Polisson Group, LLC, a management consulting, corporate advisory and principal investing company. Chief Executive Officer and Managing Director at Russell Investments, Global Exchange Traded Funds from 2010 to 2012. Managing Director of Barclays Global Investors from 1998 to 2010 and Global Chief Marketing Officer for iShares and Barclays Global Investors from 2000 to 2010. Trustee of the San Francisco Mechanics’ Institute, a non-profit organization, from 2013 to 2015. Board member of the Russell Exchange Traded Fund Trust from 2011 to 2012. Director of Barclays Global Investors Holdings Deutschland GmbH from 2006 to 2009. Mr. Polisson is an attorney and has a retired status with the Massachusetts and District of Columbia Bar Associations. | N/A |
| Pamela
Wheelock (Born 1959) |
Trustee,
since January 2020; previously Trustee from January 2018 to July 2019 |
Board member of the Destination Medical Center Economic Development Agency, Rochester, Minnesota since 2019. Interim President of the McKnight Foundation from January to September 2020. McKnight Foundation Consultant, November 2020 to February 2021. Acting Commissioner, Minnesota Department of Human Services, July 2019 through September 2019. Consultant (part-time), Minnesota Department of Human Services, October 2019 through December 2019. Chief Operating Officer, Twin Cities Habitat for Humanity from 2017 to 2019. Vice President of University Services, University of Minnesota from 2012 to 2016. Prior thereto, on the Board of Directors, Governance Committee and Finance Committee for the Minnesota Philanthropy Partners (Saint Paul Foundation) from 2012 to 2018, Interim Chief Executive Officer of Blue Cross Blue Shield of Minnesota from 2011 to 2012, Chairman of the Board from 2009 to 2012 and Board Director from 2003 to 2015. Vice President, Leadership and Community Engagement, Bush Foundation, Saint Paul, Minnesota (a private foundation) from 2009 to 2011. Executive Vice President and Chief Financial Officer, Minnesota Sports and Entertainment from 2004 to 2009 and Senior Vice President from 2002 to 2004. Executive Vice President of the Minnesota Wild Foundation from 2004 to 2008. Commissioner of Finance, State of Minnesota, from 1999 to 2002. Currently Board Chair of the Minnesota Wild Foundation since 2010. | N/A |
| Name
and year of birth |
Position
held and length of service |
Principal occupations during past five years or longer |
| Andrew
Owen (Born 1960) |
President,
since 2017 |
President, Chief Executive Officer and Director of Allspring Funds Management, LLC since 2017 and co-president of Galliard Capital Management, LLC, an affiliate of Allspring Funds Management, LLC, since 2019. Prior thereto, Head of Affiliated Managers, Allspring Global Investments, from 2014 to 2019 and Executive Vice President responsible for marketing, investments and product development for Allspring Funds Management, LLC, from 2009 to 2014. In addition, Mr. Owen was an Executive Vice President of Wells Fargo & Company from 2014 to 2021. |
| Jeremy
DePalma (Born 1974) |
Treasurer,
since 2012 (for certain funds in the Fund Complex); since 2021 (for the remaining funds in the Fund Complex) |
Senior Vice President of Allspring Funds Management, LLC since 2009. Senior Vice President of Evergreen Investment Management Company, LLC from 2008 to 2010 and head of the Fund Reporting and Control Team within Fund Administration. |
| Kate
McKinley (Born 1977) |
Chief
Legal Officer, since 2021 |
Chief Legal Officer of Allspring Global Investments since 2021. Prior thereto, held various roles at State Street Global Advisors beginning in 2010, including serving as Senior Vice President and General Counsel from 2019 to 2021, and Chief Operating Officer of the Institutional Client Group from 2016 - 2019. Prior to working at State Street Global Advisors served as Assistant General Counsel for Bank of America Corporation from 2005 to 2010 and as an Associate at WilmerHale from 2002 to 2005. |
| Christopher
Baker (Born 1976) |
Chief Compliance Officer, since 2022 | Global Chief Compliance Officer for Allspring Global Investments since 2022. Prior thereto, Chief Compliance Officer for State Street Global Advisors from 2018 to 2021. Senior Compliance Officer for the State Street divisions of Alternative Investment Solutions, Sector Solutions, and Global Marketing from 2015 to 2018. From 2010 to 2015 Vice President, Global Head of Investment and Marketing Compliance for State Street Global Advisors. |
| Matthew
Prasse (Born 1983) |
Secretary,
since 2021 |
Senior Counsel of the Allspring Legal Department since 2021. Senior Counsel of the Wells Fargo Legal Department from 2018 to 2021. Previously, Counsel for Barings LLC from 2015 to 2018. Prior to joining Barings, Associate at Morgan, Lewis & Bockius LLP from 2008 to 2015. |
P.O. Box 219967
Kansas City, MO 64121-9967
1-800-222-8222 or visit the Fund's website at allspringglobal.com. Read the prospectus carefully before you invest or send money.
A303/AR303 01-22

| ■ | Allspring Heritage Money Market Fund |
|
|
2 |
|
|
6 |
|
|
9 |
|
|
10 |
| Financial statements | |
|
|
17 |
|
|
18 |
|
|
19 |
|
|
20 |
|
|
24 |
|
|
30 |
|
|
31 |

| 1 | The S&P 500 Index consists of 500 stocks chosen for market size, liquidity, and industry group representation. It is a market-value-weighted index with each stock's weight in the index proportionate to its market value. You cannot invest directly in an index. |
| 2 | The Morgan Stanley Capital International (MSCI) All Country World Index (ACWI) ex USA Index (Net) is a free-float-adjusted market-capitalization-weighted index that is designed to measure the equity market performance of developed and emerging markets, excluding the U.S. Source: MSCI. MSCI makes no express or implied warranties or representations and shall have no liability whatsoever with respect to any MSCI data contained herein. The MSCI data may not be further redistributed or used as a basis for other indexes or any securities or financial products. This report is not approved, reviewed, or produced by MSCI. You cannot invest directly in an index. |
| 3 | The MSCI Emerging Markets (EM) Index (Net) (USD) is a free-float-adjusted market-capitalization-weighted index that is designed to measure equity market performance of emerging markets. You cannot invest directly in an index. |
| 4 | The Bloomberg U.S. Aggregate Bond Index is a broad-based benchmark that measures the investment-grade, U.S.-dollar-denominated, fixed-rate taxable bond market, including Treasuries, government-related and corporate securities, mortgage-backed securities (agency fixed-rate and hybrid adjustable-rate mortgage pass-throughs), asset-backed securities, and commercial mortgage-backed securities. You cannot invest directly in an index. |
| 5 | The Bloomberg Global Aggregate ex-USD Index (unhedged) is an unmanaged index that provides a broad-based measure of the global investment-grade fixed-income markets excluding the U.S.-dollar-denominated debt market. You cannot invest directly in an index. |
| 6 | The Bloomberg Municipal Bond Index is an unmanaged index composed of long-term tax-exempt bonds with a minimum credit rating of Baa. You cannot invest directly in an index. |
| 7 | The ICE BofA U.S. High Yield Index is a market-capitalization-weighted index of domestic and Yankee high-yield bonds. The index tracks the performance of high-yield securities traded in the U.S. bond market. You cannot invest directly in an index. Copyright 2022. ICE Data Indices, LLC. All rights reserved. |
| 1 | The Consumer Price Index (CPI) is a measure of the average change over time in the prices paid by urban consumers for a market basket of consumer goods and services. You cannot invest directly in an index. |

President
Allspring Funds
| 1 | As of December 31, 2021, assets under management (AUM) includes $91.6 billion from Galliard Capital Management, LLC, an investment advisor that is not part of the Allspring trade name/GIPS firm. |
| Investment objective | The Fund seeks current income, while preserving capital and liquidity. |
| Manager | Allspring Funds Management, LLC |
| Subadviser | Allspring Global Investments, LLC |
| Portfolio managers | Michael C. Bird, CFA®‡, Jeffrey L. Weaver, CFA®‡, Laurie White |
| Average annual total returns (%) as of January 31, 2022 | ||||||
| Expense ratios1 (%) | ||||||
| Inception date | 1 year | 5 year | 10 year | Gross | Net 2 | |
| Administrator Class (SHMXX) | 6-29-1995 | 0.02 | 1.05 | 0.56 | 0.35 | 0.33 |
| Institutional Class (SHIXX) | 3-31-2000 | 0.02 | 1.14 | 0.63 | 0.23 | 0.20 |
| Select Class (WFJXX) | 6-29-2007 | 0.05 | 1.21 | 0.70 | 0.19 | 0.13 |
| Service Class (WHTXX) | 6-30-2010 | 0.02 | 0.98 | 0.51 | 0.52 | 0.43 |
| 1 | Reflects the expense ratios as stated in the most recent prospectuses. The expense ratios shown are subject to change and may differ from the annualized expense ratios shown in the financial highlights of this report. |
| 2 | The manager has contractually committed through May 31, 2022, to waive fees and/or reimburse expenses to the extent necessary to cap total annual fund operating expenses after fee waivers at 0.33% for Administrator Class, 0.20% for Institutional Class, 0.13% for Select Class and 0.43% for Service Class. Brokerage commissions, stamp duty fees, interest, taxes, acquired fund fees and expenses (if any), and extraordinary expenses are excluded from the expense caps. Prior to or after the commitment expiration date, the caps may be increased or the commitment to maintain the caps may be terminated only with the approval of the Board of Trustees. The manager and/or its affiliates may also voluntarily waive all or a portion of any fees to which they are entitled and/or reimburse certain expenses as they may determine from time to time. Without these caps, the Fund’s returns would have been lower. The expense ratio paid by an investor is the net expense ratio (the total annual fund operating expenses after fee waivers) as stated in the prospectuses. |
| Yield summary (%) as of January 31, 2022 | ||||
| Administrator
Class |
Institutional
Class |
Select
Class |
Service
Class | |
| 7-day current yield1 | 0.01 | 0.01 | 0.04 | 0.01 |
| 7-day compound yield | 0.01 | 0.01 | 0.04 | 0.01 |
| 30-day simple yield | 0.01 | 0.01 | 0.04 | 0.01 |
| 30-day compound yield | 0.01 | 0.01 | 0.04 | 0.01 |
| 1 | The manager has contractually committed through May 31, 2022, to waive fees and/or reimburse expenses to the extent necessary to cap total annual fund operating expenses and may also voluntarily waive or reimburse additional fees and expenses which may be discontinued or modified at any time without notice. Without these reductions, the Fund’s 7-day current yield would have been -0.18%, -0.07%, -0.03% and -0.34% for Administrator Class, Institutional Class, Select Class and Service Class, respectively. |
| ‡ | CFA® and Chartered Financial Analyst® are trademarks owned by CFA Institute. |
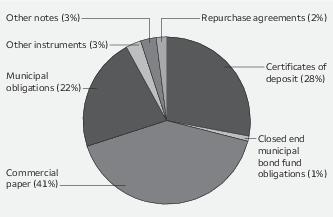
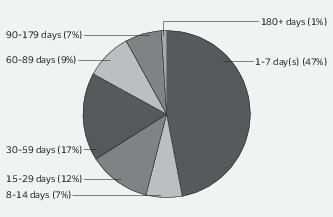
| Beginning
account value 8-1-2021 |
Ending
account value 1-31-2022 |
Expenses
paid during the period1 |
Annualized
net expense ratio | |
| Administrator Class | ||||
| Actual | $1,000.00 | $1,000.05 | $0.66 | 0.13% |
| Hypothetical (5% return before expenses) | $1,000.00 | $1,024.55 | $0.66 | 0.13% |
| Institutional Class | ||||
| Actual | $1,000.00 | $1,000.05 | $0.66 | 0.13% |
| Hypothetical (5% return before expenses) | $1,000.00 | $1,024.55 | $0.66 | 0.13% |
| Select Class | ||||
| Actual | $1,000.00 | $1,000.16 | $0.55 | 0.11% |
| Hypothetical (5% return before expenses) | $1,000.00 | $1,024.65 | $0.56 | 0.11% |
| Service Class | ||||
| Actual | $1,000.00 | $1,000.05 | $0.66 | 0.13% |
| Hypothetical (5% return before expenses) | $1,000.00 | $1,024.55 | $0.66 | 0.13% |
| Interest
rate |
Maturity
date |
Principal | Value | ||
| Certificates of deposit: 28.11% | |||||
| ABN Amro Bank NV | 0.08% | 2-4-2022 | $ 55,000,000 | $ 55,000,000 | |
| Australia & New Zealand Banking Group Limited | 0.07 | 2-1-2022 | 115,000,000 | 115,000,000 | |
| Canadian Imperial Bank of Commerce | 0.07 | 2-1-2022 | 108,000,000 | 108,000,000 | |
| Credit Agricole Corporate and Investment Bank of New York | 0.07 | 2-1-2022 | 155,000,000 | 155,000,000 | |
| HSBC Bank USA NA | 0.08 | 2-1-2022 | 150,000,000 | 150,000,000 | |
| Legacy Capital Company 144A | 0.27 | 4-12-2022 | 37,000,000 | 37,000,508 | |
| Mizuho Bank Limited | 0.07 | 2-1-2022 | 155,000,000 | 155,000,000 | |
| MUFG Bank Limited | 0.23 | 4-7-2022 | 33,000,000 | 33,003,264 | |
| National Australia Bank Limited 144A☼ | 0.21 | 3-1-2022 | 33,000,000 | 32,997,634 | |
| Natixis Bank | 0.22 | 2-2-2022 | 3,000,000 | 3,000,023 | |
| Nordea Bank AB | 0.20 | 2-18-2022 | 65,000,000 | 65,003,439 | |
| Nordea Bank AB (U.S. SOFR +0.17%) ± | 0.22 | 11-28-2022 | 50,000,000 | 49,982,883 | |
| Norinchukin Bank | 0.23 | 4-19-2022 | 33,000,000 | 33,001,713 | |
| Norinchukin Bank | 0.25 | 5-9-2022 | 35,000,000 | 34,998,176 | |
| Norinchukin Bank | 0.25 | 5-16-2022 | 37,000,000 | 36,996,210 | |
| Oversea-Chinese Banking Corporation | 0.19 | 4-20-2022 | 40,000,000 | 39,998,148 | |
| Oversea-Chinese Banking Corporation | 0.22 | 4-8-2022 | 35,000,000 | 35,004,749 | |
| Oversea-Chinese Banking Corporation | 0.33 | 6-7-2022 | 35,000,000 | 34,995,539 | |
| Royal Bank of Canada (U.S. SOFR +0.15%) 144A± | 0.20 | 6-24-2022 | 35,000,000 | 35,003,638 | |
| Sumitomo Mitsui Banking Corporation 144A☼ | 0.20 | 3-9-2022 | 35,700,000 | 35,696,074 | |
| Sumitomo Mitsui Banking Corporation | 0.20 | 4-27-2022 | 32,000,000 | 31,996,628 | |
| Sumitomo Mitsui Banking Corporation | 0.25 | 5-12-2022 | 40,000,000 | 39,995,944 | |
| Sumitomo Mitsui Trust Bank | 0.17 | 4-18-2022 | 35,000,000 | 34,997,148 | |
| Sumitomo Mitsui Trust Bank | 0.18 | 2-9-2022 | 41,500,000 | 41,501,099 | |
| Sumitomo Mitsui Trust Bank | 0.22 | 3-14-2022 | 35,000,000 | 35,003,999 | |
| Svenska Handelsbanken AB 144A☼ | 0.22 | 6-2-2022 | 28,000,000 | 27,971,628 | |
| Toronto-Dominion Bank | 0.25 | 5-13-2022 | 37,000,000 | 36,992,651 | |
| Total Certificates of deposit (Cost $1,493,149,384) | 1,493,141,095 |
| Closed end municipal bond fund obligations: 0.43% | |||||
| Nuveen Floating Rate Income Fund Variable Rate Demand Preferred Shares Class A (230 shares) 0.21% 144A | 23,000,000 | 23,000,000 | |||
| Total Closed end municipal bond fund obligations (Cost $23,000,000) | 23,000,000 |
| Commercial paper: 40.70% | |||||
| Asset-backed commercial paper: 25.96% | |||||
| Albion Capital Corporation LLC ☼ | 0.22 | 2-22-2022 | 20,000,000 | 19,998,423 | |
| Angelsea Funding LLC (U.S. OBFR +0.08%) 144A± | 0.15 | 5-9-2022 | 32,000,000 | 32,000,000 | |
| Angelsea Funding LLC 144A☼ | 0.20 | 2-1-2022 | 5,000,000 | 4,999,989 | |
| Atlantic Asset Securitization LLC 144A☼ | 0.17 | 2-17-2022 | 33,000,000 | 32,998,598 | |
| Bennington Sark Capital Company LLC 144A☼ | 0.08 | 2-1-2022 | 49,000,000 | 48,999,878 | |
| Bennington Sark Capital Company LLC 144A☼ | 0.08 | 2-2-2022 | 28,000,000 | 27,999,860 | |
| Bennington Sark Capital Company LLC 144A☼ | 0.15 | 2-11-2022 | 15,000,000 | 14,999,565 | |
| Chesham Finance Limited 144A☼ | 0.07 | 2-1-2022 | 18,000,000 | 17,999,960 | |
| Chesham Finance Limited 144A☼ | 0.13 | 2-1-2022 | 100,000,000 | 99,999,778 | |
| Concord Minutemen Capital Company 144A☼ | 0.15 | 2-23-2022 | 60,000,000 | 59,996,282 | |
| Glencove Funding DAC 144A☼ | 0.15 | 2-9-2022 | 30,800,000 | 30,799,369 | |
| Institutional Secured Funding LLC 144A☼ | 0.14 | 2-1-2022 | 20,000,000 | 19,999,929 |
| Interest
rate |
Maturitydate | Principal | Value | ||
| Asset-backed commercial paper (continued) | |||||
| Institutional Secured Funding LLC 144A☼ | 0.14% | 2-2-2022 | $ 45,000,000 | $ 44,999,665 | |
| Institutional Secured Funding LLC 144A☼ | 0.17 | 2-9-2022 | 60,000,000 | 59,997,405 | |
| Ionic Capital II Trust ☼ | 0.18 | 2-16-2022 | 35,000,000 | 34,998,600 | |
| Ionic Capital II Trust ☼ | 0.22 | 3-8-2022 | 60,000,000 | 59,991,600 | |
| Ionic Capital III Trust ☼ | 0.17 | 2-9-2022 | 36,745,000 | 36,744,247 | |
| Ionic Capital III Trust ☼ | 0.18 | 2-15-2022 | 67,000,000 | 66,997,488 | |
| Ionic Capital III Trust ☼ | 0.24 | 2-4-2022 | 20,000,000 | 19,999,822 | |
| Ionic Capital III Trust ☼ | 0.27 | 2-24-2022 | 32,000,000 | 31,997,867 | |
| Legacy Capital Company 144A☼ | 0.22 | 2-16-2022 | 25,000,000 | 24,999,000 | |
| Legacy Capital Company 144A☼ | 0.22 | 2-18-2022 | 25,000,000 | 24,998,875 | |
| Lexington Parker Capital Company LLC 144A☼ | 0.17 | 2-17-2022 | 30,000,000 | 29,998,725 | |
| Lexington Parker Capital Company LLC 144A☼ | 0.20 | 2-3-2022 | 13,325,000 | 13,324,911 | |
| LMA Americas LLC 144A☼ | 0.22 | 3-21-2022 | 26,000,000 | 25,993,524 | |
| Manhattan Asset Funding Company LLC 144A☼ | 0.13 | 2-7-2022 | 25,000,000 | 24,999,611 | |
| Mountcliff Funding LLC 144A☼ | 0.11 | 2-1-2022 | 35,000,000 | 34,999,922 | |
| Mountcliff Funding LLC 144A☼ | 0.16 | 2-2-2022 | 38,150,000 | 38,149,831 | |
| Mountcliff Funding LLC 144A☼ | 0.20 | 2-14-2022 | 70,000,000 | 69,997,577 | |
| Mountcliff Funding LLC 144A☼ | 0.25 | 3-7-2022 | 25,000,000 | 24,996,670 | |
| Nieuw Amsterdam Receivables Corporation BV 144A☼ | 0.17 | 2-10-2022 | 66,000,000 | 65,998,460 | |
| Ridgefield Funding Company, LLC 144A☼ | 0.25 | 5-4-2022 | 15,153,000 | 15,141,217 | |
| Versailles CDS LLC (U.S. SOFR +0.11%) 144A± | 0.16 | 4-4-2022 | 50,000,000 | 50,003,325 | |
| Versailles CDS LLC (U.S. SOFR +0.16%) 144A± | 0.21 | 8-2-2022 | 75,000,000 | 74,999,999 | |
| Victory Receivables Corporation 144A☼ | 0.17 | 2-1-2022 | 32,000,000 | 31,999,929 | |
| Victory Receivables Corporation 144A☼ | 0.20 | 2-16-2022 | 42,000,000 | 41,998,320 | |
| Victory Receivables Corporation 144A☼ | 0.23 | 3-16-2022 | 20,000,000 | 19,995,918 | |
| 1,379,114,139 | |||||
| Financial company commercial paper: 12.92% | |||||
| Banco Santander SA 144A☼ | 0.17 | 3-8-2022 | 35,000,000 | 34,996,220 | |
| Banco Santander SA 144A☼ | 0.19 | 2-4-2022 | 50,000,000 | 49,999,556 | |
| Bank of Montreal ☼ | 0.20 | 4-14-2022 | 25,000,000 | 24,990,571 | |
| Bank of Nova Scotia 144A☼ | 0.20 | 3-24-2022 | 42,500,000 | 42,492,081 | |
| DBS Bank Limited 144A☼ | 0.23 | 3-8-2022 | 33,000,000 | 32,996,106 | |
| DBS Bank Limited 144A☼ | 0.28 | 6-2-2022 | 33,000,000 | 32,960,411 | |
| DBS Group Holdings Limited 144A☼ | 0.22 | 4-1-2022 | 40,000,000 | 39,986,000 | |
| Dexia Credit Local SA 144A☼ | 0.29 | 5-16-2022 | 13,000,000 | 12,988,625 | |
| Erste Finance LLC 144A☼ | 0.07 | 2-1-2022 | 71,000,000 | 70,999,843 | |
| Mitsubishi UFJ Trust & Banking 144A☼ | 0.15 | 2-15-2022 | 32,000,000 | 31,998,973 | |
| Mitsubishi UFJ Trust & Banking 144A☼ | 0.24 | 3-1-2022 | 33,000,000 | 32,997,634 | |
| Mitsubishi UFJ Trust & Banking 144A☼ | 0.30 | 4-25-2022 | 30,000,000 | 29,982,780 | |
| Santander plc ☼ | 0.16 | 3-16-2022 | 40,000,000 | 39,992,276 | |
| Suncorp Group Limited 144A☼ | 0.19 | 3-23-2022 | 10,000,000 | 9,996,048 | |
| Svenska Handelsbanken AB 144A☼ | 0.22 | 6-1-2022 | 40,000,000 | 39,960,339 | |
| Toronto-Dominion Bank 144A☼ | 0.16 | 4-22-2022 | 35,000,000 | 34,985,353 | |
| United Overseas Bank Limited 144A☼ | 0.19 | 3-9-2022 | 34,000,000 | 33,996,191 | |
| United Overseas Bank Limited 144A☼ | 0.19 | 3-11-2022 | 35,000,000 | 34,995,753 | |
| United Overseas Bank Limited 144A☼ | 0.22 | 4-11-2022 | 55,000,000 | 54,979,681 | |
| 686,294,441 | |||||
| Other commercial paper: 1.82% | |||||
| Alberta Province 144A☼ | 0.14 | 2-3-2022 | 18,000,000 | 17,999,919 | |
| Alberta Province 144A☼ | 0.14 | 2-17-2022 | 35,000,000 | 34,999,108 |
| Interest
rate |
Maturitydate | Principal | Value | ||
| Other commercial paper (continued) | |||||
| COFCO Capital Corporation ☼ | 0.30% | 2-1-2022 | $ 18,490,000 | $ 18,489,958 | |
| Erste Abwicklungsanstalt 144A☼ | 0.10 | 2-11-2022 | 25,000,000 | 24,999,465 | |
| 96,488,450 | |||||
| Total Commercial paper (Cost $2,161,860,902) | 2,161,897,030 | ||||
| Municipal obligations: 21.51% | |||||
| Arizona: 1.86% | |||||
| Variable rate demand notes ø: 1.86% | |||||
| Maricopa County AZ IDA Series 2021B-2 (Health revenue) | 0.07 | 1-1-2061 | 16,500,000 | 16,500,000 | |
| Taxable Municipal Funding Trust Various States Floaters Series 2021-004 (Health revenue, Barclays Bank plc LOC) 144A | 0.29 | 11-15-2054 | 9,425,000 | 9,425,000 | |
| Tender Option Bond Trust Receipts/Floater Certificates Series 2021-MIZ9060TX (Tax revenue, Mizuho Capital Markets LLC LOC) 144A | 0.34 | 2-15-2041 | 73,030,009 | 73,030,009 | |
| 98,955,009 | |||||
| California: 2.40% | |||||
| Other municipal debt : 0.39% | |||||
| California Series B2 (GO revenue) | 0.15 | 3-3-2022 | 21,000,000 | 20,999,252 | |
| Variable rate demand notes ø: 2.01% | |||||
| Metropolitan Water District of Southern California Series A (Water & sewer revenue, Bank of America NA SPA) | 0.10 | 7-1-2042 | 30,000,000 | 30,000,000 | |
| Mizuho Floater Residual Certificates Series 2021 (Housing revenue, Mizuho Capital Markets LLC LOC, Mizuho Capital Markets LLC LIQ) 144A | 0.18 | 4-15-2042 | 15,000,000 | 15,000,000 | |
| Tender Option Bond Trust Receipts/Floater Certificates Series 2019-MIZ9003 (Tax revenue, Mizuho Capital Markets LLC LOC, Mizuho Capital Markets LLC LIQ) 144A | 0.31 | 3-1-2036 | 23,200,000 | 23,200,000 | |
| University of California Revenue Various Taxable Series Z-1 (Education revenue) | 0.08 | 7-1-2041 | 38,340,000 | 38,340,000 | |
| 106,540,000 | |||||
| Colorado: 2.46% | |||||
| Variable rate demand notes ø: 2.46% | |||||
| Colorado HFA MFHR Class II Series B (Housing revenue, FHLB SPA) | 0.12 | 5-1-2052 | 82,865,000 | 82,865,000 | |
| Colorado HFA Single Family Mortgage Bonds Class II Series 2021-I (Housing revenue, GNMA Insured, Royal Bank of Canada SPA) | 0.08 | 11-1-2051 | 16,000,000 | 16,000,000 | |
| Colorado Southern Ute Indian Tribe Reservation Company Series 2007 (Miscellaneous revenue) 144A | 0.10 | 1-1-2027 | 32,000,000 | 32,000,000 | |
| 130,865,000 |
| Interest
rate |
Maturitydate | Principal | Value | ||
| Georgia: 2.02% | |||||
| Variable rate demand notes ø: 2.02% | |||||
| Macon-Bibb County GA Industrial Authority Kumho Tire Georgia Incorporated Series 2015A (Industrial development revenue, Korea Development Bank LOC) | 0.17% | 12-1-2022 | $ 73,000,000 | $ 73,000,000 | |
| Macon-Bibb County GA Industrial Authority Kumho Tire Georgia Incorporated Series 2015B (Industrial development revenue, Korea Development Bank LOC) | 0.17 | 12-1-2022 | 34,000,000 | 34,000,000 | |
| 107,000,000 | |||||
| Illinois: 0.76% | |||||
| Variable rate demand notes ø: 0.76% | |||||
| Tender Option Bond Trust Receipts/Certificates Series 2020-XFT993 (Health revenue, JPMorgan Chase & Company LIQ) 144A | 0.12 | 5-15-2050 | 16,000,000 | 16,000,000 | |
| Tender Option Bond Trust Receipts/Floater Certificates Series 2020-XF2854 (Tax revenue, Barclays Bank plc LOC, Barclays Bank plc LIQ) 144A | 0.10 | 6-15-2050 | 24,160,000 | 24,160,000 | |
| 40,160,000 | |||||
| Indiana: 0.38% | |||||
| Variable rate demand notes ø: 0.38% | |||||
| Indiana Finance Authority Stadium Project Series A-5 (Miscellaneous revenue, U.S. Bank NA SPA) | 0.11 | 2-1-2035 | 20,000,000 | 20,000,000 | |
| Kansas: 0.17% | |||||
| Variable rate demand notes ø: 0.17% | |||||
| Olathe KS Multi-Modal-Diamant Boart Series B (Industrial development revenue, Svenska HandelsBanken LOC) | 0.52 | 3-1-2027 | 8,900,000 | 8,900,000 | |
| Kentucky: 0.80% | |||||
| Variable rate demand notes ø: 0.80% | |||||
| Kentucky Housing Corporation Series B (Housing revenue, Kentucky Housing Corporation SPA) | 0.11 | 7-1-2041 | 26,150,000 | 26,150,000 | |
| Kentucky Housing Corporation Series O (Housing revenue, Kentucky Housing Corporation SPA) | 0.11 | 1-1-2036 | 9,255,000 | 9,255,000 | |
| Kentucky Housing Corporation Series T (Housing revenue, Kentucky Housing Corporation SPA) | 0.11 | 7-1-2037 | 6,930,000 | 6,930,000 | |
| 42,335,000 | |||||
| Michigan: 0.58% | |||||
| Variable rate demand notes ø: 0.58% | |||||
| Michigan State Housing Development AMT Refunding Bond Series B (Housing revenue, Industrial & Commercial Bank of China Limited SPA) | 0.15 | 6-1-2038 | 30,895,000 | 30,895,000 | |
| Nevada: 0.43% | |||||
| Variable rate demand notes ø: 0.43% | |||||
| Mizuho Floater Residual Certificates Series 2021 (Housing revenue, Mizuho Capital Markets LLC LOC, Mizuho Capital Markets LLC LIQ) 144A | 0.34 | 2-1-2058 | 23,000,000 | 23,000,000 |
| Interest
rate |
Maturitydate | Principal | Value | ||
| New Hampshire: 1.05% | |||||
| Variable rate demand notes ø: 1.05% | |||||
| New Hampshire Business Finance Authority CJ Foods Manufacturing Beaumont Corporation Series A (Industrial development revenue, Kookmin Bank LOC) 144A | 0.17% | 10-1-2028 | $ 56,000,000 | $ 56,000,000 | |
| New York: 4.30% | |||||
| Other municipal debt : 2.17% | |||||
| Long Island Power Authority Series 2015 GR-5A (Utilities revenue) | 0.12 | 2-10-2022 | 15,000,000 | 15,000,075 | |
| Long Island Power Authority Series 2015 GR-5A (Utilities revenue) | 0.22 | 3-2-2022 | 25,000,000 | 24,999,785 | |
| Metropolitan Transportation Authority Grant Anticipation Notes Series 2021A (Miscellaneous revenue) | 0.78 | 11-15-2022 | 28,000,000 | 28,002,022 | |
| New York Power Authority Series 3B (Utilities revenue, JPMorgan Chase & Company LIQ) ☼ | 0.18 | 3-16-2022 | 25,000,000 | 24,994,158 | |
| Port Authority New York & New Jersey Series C (Airport revenue) | 0.23 | 3-1-2022 | 8,000,000 | 7,999,999 | |
| Port Authority New York & New Jersey Series C (Airport revenue) | 0.25 | 4-21-2022 | 14,055,000 | 14,052,255 | |
| 115,048,294 | |||||
| Variable rate demand notes ø: 2.13% | |||||
| Mizuho Floater Residual Certificates Series 2021 (Housing revenue, Mizuho Capital Markets LLC LOC, Mizuho Capital Markets LLC LIQ) 144A | 0.49 | 9-1-2026 | 22,250,000 | 22,250,000 | |
| New York Dormitory Authority Personal Income Tax Revenue Series XFT910 (Tax revenue, Citibank NA LIQ) 144A | 0.14 | 3-15-2040 | 4,000,000 | 4,000,000 | |
| New York Dormitory Authority Secondary Issues Floater Series B-4 (Tax revenue, Morgan Stanley Bank LIQ) 144A | 0.14 | 3-15-2040 | 16,000,000 | 16,000,000 | |
| New York Municipal Water Finance Authority Series T-30001-I (Water & sewer revenue, Citibank NA LIQ) 144A | 0.14 | 6-15-2044 | 16,000,000 | 16,000,000 | |
| Taxable Municipal Funding Trust Various States Floaters Series 2021-003 (GO revenue, Barclays Bank plc LOC) 144A | 0.29 | 5-15-2056 | 40,100,000 | 40,100,000 | |
| Tender Option Bond Trust Receipts/Certificates Series 2021-TPG020 (Tax revenue, Bank of America NA LIQ) 144A | 0.39 | 1-1-2023 | 15,000,000 | 15,000,000 | |
| 113,350,000 | |||||
| Other: 3.49% | |||||
| Variable rate demand notes ø: 3.49% | |||||
| JPMorgan Chase Puttable Tax-Exempt Receipts/Derivative Inverse Tax-Exempt Receipts & Custodial Receipts Trust Series 5039 (Miscellaneous revenue) | 0.21 | 11-16-2022 | 85,000,000 | 85,000,000 | |
| Taxable Municipal Funding Trust Various States Floaters Series 2019-019 (Health revenue, Barclays Bank plc LOC) 144A | 0.29 | 12-1-2030 | 2,565,000 | 2,565,000 | |
| Taxable Municipal Funding Trust Various States Floaters Series 2020-012 (Health revenue, Barclays Bank plc LOC) 144A | 0.15 | 9-1-2030 | 13,705,000 | 13,705,000 | |
| Taxable Municipal Funding Trust Various States Floaters Series 2020-11 (Health revenue, Barclays Bank plc LOC) 144A | 0.29 | 9-1-2030 | 84,215,000 | 84,215,000 | |
| 185,485,000 |
| Interest
rate |
Maturitydate | Principal | Value | ||
| Texas: 0.62% | |||||
| Other municipal debt : 0.62% | |||||
| San Antonio TX Electric & Gas Series A (Utilities revenue) | 0.15% | 2-17-2022 | $ 33,000,000 | $ 32,999,855 | |
| Wisconsin: 0.19% | |||||
| Variable rate demand notes ø: 0.19% | |||||
| University of Wisconsin Hospitals and Clinics Authority Revenue Various Refunding Bond Series C (Health revenue, BMO Harris Bank NA SPA) | 0.12 | 4-1-2048 | 10,000,000 | 10,000,000 | |
| Total Municipal obligations (Cost $1,142,534,634) | 1,142,532,410 | ||||
| Other instruments: 4.18% | |||||
| AARP §øø | 0.10 | 5-1-2031 | 33,900,000 | 33,900,000 | |
| Altoona Blair County Development Corporation 144A§øø | 0.15 | 4-1-2035 | 12,000,000 | 12,000,000 | |
| Altoona Blair County Development Corporation 144A§øø | 0.15 | 9-1-2038 | 14,850,000 | 14,850,000 | |
| Altoona Blair County Development Corporation 144A§øø | 0.15 | 9-1-2038 | 39,350,000 | 39,350,000 | |
| Fortenbery Children 2017 Irrevocable Trust UTA §øø | 0.12 | 4-1-2026 | 15,000,000 | 15,000,000 | |
| Keep Memory Alive §øø | 0.15 | 5-1-2037 | 31,740,000 | 31,740,000 | |
| Ken-Vin Life Company LLC §øø | 0.11 | 12-1-2059 | 19,645,000 | 19,645,000 | |
| L Ward Huntley Irrevocable Life Insurance Trust §øø | 0.11 | 4-1-2071 | 14,000,000 | 14,000,000 | |
| Morris Family Insurance Trust §øø | 0.11 | 10-1-2059 | 3,350,000 | 3,350,000 | |
| New Grammercy LLC §øø | 0.12 | 2-1-2061 | 15,000,000 | 15,000,000 | |
| Rock Hill SI LLC §øø | 0.12 | 6-1-2061 | 23,000,000 | 23,000,000 | |
| Total Other instruments (Cost $221,835,000) | 221,835,000 | ||||
| Other notes: 3.06% | |||||
| Corporate bonds and notes: 3.06% | |||||
| Cellmark Incorporated Taxable Notes Series 2018A §øø | 0.12 | 6-1-2038 | 44,000,000 | 44,000,000 | |
| Jets Stadium Development LLC Series A-4B 144A§øø | 0.17 | 4-1-2047 | 56,560,000 | 56,560,000 | |
| Jets Stadium Finance 144A§øø | 0.17 | 4-1-2047 | 22,220,000 | 22,220,000 | |
| Lavonne V. Johnson Life Insurance Trust §øø | 0.12 | 6-1-2041 | 24,790,000 | 24,790,000 | |
| VPM Linden Manor LP §øø | 0.12 | 9-1-2060 | 15,200,000 | 15,200,000 | |
| Total Other notes (Cost $162,770,000) | 162,770,000 | ||||
| Repurchase agreements^^: 1.60% | |||||
| TD Securities USA Incorporated, dated 1-31-2022, maturity value $85,125,118 | 0.05 | 2-1-2022 | 85,125,000 | 85,125,000 | |
| Total Repurchase agreements (Cost $85,125,000) | 85,125,000 | ||||
| Total investments in securities (Cost $5,290,274,920) | 99.59% | 5,290,300,535 | |||
| Other assets and liabilities, net | 0.41 | 21,883,977 | |||
| Total net assets | 100.00% | $5,312,184,512 |
| 144A | The security may be resold in transactions exempt from registration, normally to qualified institutional buyers, pursuant to Rule 144A under the Securities Act of 1933. |
| ± | Variable rate investment. The rate shown is the rate in effect at period end. |
| ø | Variable rate demand notes are subject to a demand feature which reduces the effective maturity. The maturity date shown represents the final maturity date of the security. The interest rate is determined and reset by the issuer daily, weekly, or monthly depending upon the terms of the security. The rate shown is the rate in effect at period end. |
| § | The security is subject to a demand feature which reduces the effective maturity. |
| øø | The interest rate is determined and reset by the issuer periodically depending upon the terms of the security. The rate shown is the rate in effect at period end. |
| ^^ | Collateralized by U.S. government securities, 1.50% to 8.00%, 8-1-2022 to 2-1-2052, fair value including accrued interest is $87,678,750. |
| ☼ | Zero coupon security. The rate represents the current yield to maturity. |
| Abbreviations: | |
| AMT | Alternative minimum tax |
| FHLB | Federal Home Loan Bank |
| GNMA | Government National Mortgage Association |
| GO | General obligation |
| HFA | Housing Finance Authority |
| IDA | Industrial Development Authority |
| LIQ | Liquidity agreement |
| LOC | Letter of credit |
| MFHR | Multifamily housing revenue |
| OBFR | Overnight Bank Funding Rate |
| SOFR | Secured Overnight Financing Rate |
| SPA | Standby purchase agreement |
| Assets | |
|
Investments in unaffiliated securities, at value (cost
$5,290,274,920) |
$ 5,290,300,535 |
|
Cash |
20,168 |
|
Receivable for investments
sold |
20,290,039 |
|
Receivable from
manager |
1,489,045 |
|
Receivable for
interest |
731,801 |
|
Receivable for Fund shares
sold |
40,450 |
|
Prepaid expenses and other
assets |
179,889 |
|
Total
assets |
5,313,051,927 |
| Liabilities | |
|
Payable for Fund shares
redeemed |
243,277 |
|
Administration fees
payable |
231,078 |
|
Custody and accounting fees
payable |
202,889 |
|
Professional fees
payable |
46,109 |
|
Dividends
payable |
13,556 |
|
Trustees’ fees and expenses
payable |
3,411 |
|
Accrued expenses and other
liabilities |
127,095 |
|
Total
liabilities |
867,415 |
|
Total net
assets |
$5,312,184,512 |
| Net assets consist of | |
|
Paid-in
capital |
$ 5,316,133,586 |
|
Total distributable
loss |
(3,949,074) |
|
Total net
assets |
$5,312,184,512 |
| Computation of net asset value per share | |
|
Net assets – Administrator
Class |
$ 131,539,019 |
|
Shares outstanding – Administrator
Class1 |
131,485,144 |
|
Net asset value per share – Administrator
Class |
$1.0004 |
|
Net assets – Institutional
Class |
$ 678,991,282 |
|
Shares outstanding – Institutional
Class1 |
678,712,622 |
|
Net asset value per share – Institutional
Class |
$1.0004 |
|
Net assets – Select
Class |
$ 4,373,390,796 |
|
Shares outstanding – Select
Class1 |
4,371,172,534 |
|
Net asset value per share – Select
Class |
$1.0005 |
|
Net assets – Service
Class |
$ 128,263,415 |
|
Shares outstanding – Service
Class1 |
128,223,768 |
Net
asset value per share – Service
Class |
$1.0003 |
| 1 | The Fund has an unlimited number of authorized shares. |
| Investment income | |
|
Interest |
$ 10,565,931 |
| Expenses | |
|
Management
fee |
9,714,220 |
| Administration fees | |
|
Administrator
Class |
125,075 |
|
Institutional
Class |
628,164 |
|
Select
Class |
2,221,315 |
|
Service
Class |
142,411 |
| Shareholder servicing fees | |
|
Administrator
Class |
125,074 |
|
Service
Class |
296,696 |
|
Custody and accounting
fees |
415,471 |
|
Professional
fees |
83,790 |
|
Registration
fees |
73,357 |
|
Shareholder report
expenses |
31,516 |
|
Trustees’ fees and
expenses |
19,271 |
|
Other fees and
expenses |
171,215 |
|
Total
expenses |
14,047,575 |
| Less: Fee waivers and/or expense reimbursements | |
|
Fund-level |
(5,131,991) |
|
Administrator
Class |
(169,150) |
|
Institutional
Class |
(102,926) |
|
Service
Class |
(366,086) |
|
Net
expenses |
8,277,422 |
|
Net investment
income |
2,288,509 |
| Realized and unrealized gains (losses) on investments | |
|
Net realized gains on
investments |
82,528 |
|
Net change in unrealized gains (losses) on
investments |
(496,573) |
|
Net realized and unrealized gains (losses) on
investments |
(414,045) |
|
Net increase in net assets resulting from
operations |
$ 1,874,464 |
| Year
ended January 31, 2022 |
Year
ended January 31, 2021 | |||
| Operations | ||||
|
Net investment
income |
$ 2,288,509 | $ 42,570,022 | ||
|
Net realized gains (losses) on
investments |
82,528 | (3,462,935) | ||
|
Net change in unrealized gains (losses) on
investments |
(496,573) | (935,328) | ||
|
Net increase in net assets resulting from
operations |
1,874,464 | 38,171,759 | ||
|
Payment from
affiliate |
1,808,392 | 0 | ||
| Distributions to shareholders from | ||||
| Net investment income and net realized gains | ||||
|
Administrator
Class |
(12,502) | (436,596) | ||
|
Institutional
Class |
(86,623) | (6,503,976) | ||
|
Select
Class |
(2,177,520) | (35,587,951) | ||
|
Service
Class |
(11,864) | (156,658) | ||
|
Total distributions to
shareholders |
(2,288,509) | (42,685,181) | ||
| Capital share transactions | Shares | Shares | ||
| Proceeds from shares sold | ||||
|
Administrator
Class |
93,914,370 | 93,954,103 | 151,680,145 | 151,753,090 |
|
Institutional
Class |
2,738,058,572 | 2,739,217,888 | 8,350,606,674 | 8,354,296,880 |
|
Select
Class |
15,622,488,773 | 15,630,572,259 | 52,923,446,524 | 52,952,592,405 |
|
Service
Class |
657,349,101 | 657,531,937 | 191,669,359 | 191,728,887 |
| 19,121,276,187 | 61,650,371,262 | |||
| Reinvestment of distributions | ||||
|
Administrator
Class |
12,035 | 12,040 | 434,551 | 434,670 |
|
Institutional
Class |
81,153 | 81,187 | 5,364,861 | 5,366,701 |
|
Select
Class |
1,904,174 | 1,905,169 | 28,485,791 | 28,498,799 |
|
Service
Class |
9,488 | 9,490 | 125,346 | 125,362 |
| 2,007,886 | 34,425,532 | |||
| Payment for shares redeemed | ||||
|
Administrator
Class |
(113,886,118) | (113,934,702) | (188,896,671) | (188,974,481) |
|
Institutional
Class |
(2,963,747,935) | (2,964,979,464) | (9,265,802,669) | (9,269,605,465) |
|
Select
Class |
(19,930,356,193) | (19,940,662,649) | (51,598,922,110) | (51,624,804,401) |
|
Service
Class |
(670,596,763) | (670,804,688) | (205,517,672) | (205,573,717) |
| (23,690,381,503) | (61,288,958,064) | |||
| Net asset value of shares issued in acquisition | ||||
|
Administrator
Class |
74,725,415 | 74,759,591 | 0 | 0 |
|
Institutional
Class |
109,981,768 | 110,028,740 | 0 | 0 |
|
Select
Class |
208,219,903 | 208,338,708 | 0 | 0 |
|
Service
Class |
99,315,488 | 99,370,192 | 0 | 0 |
| 492,497,231 | 0 | |||
|
Net increase (decrease) in net assets resulting from capital share
transactions |
(4,074,600,199) | 395,838,730 | ||
|
Total increase (decrease) in net
assets |
(4,073,205,852) | 391,325,308 | ||
| Net assets | ||||
|
Beginning of
period |
9,385,390,364 | 8,994,065,056 | ||
|
End of
period |
$ 5,312,184,512 | $ 9,385,390,364 | ||
| Year ended January 31 | |||||
| Administrator Class | 2022 | 2021 | 2020 | 2019 | 2018 |
|
Net asset value, beginning of
period |
$1.0003 | $1.0005 | $1.0004 | $1.0003 | $1.0003 |
|
Net investment
income |
0.0001 | 0.0033 | 0.0203 | 0.0188 | 0.0096 |
|
Net realized and unrealized gains (losses) on
investments |
0.0000 1 | (0.0002) | 0.0001 | 0.0001 | 0.0000 1 |
|
Total from investment
operations |
0.0001 | 0.0031 | 0.0204 | 0.0189 | 0.0096 |
|
Payment from
affiliate |
0.0001 | 0.0000 | 0.0000 | 0.0000 | 0.0000 |
| Distributions to shareholders from | |||||
|
Net investment
income |
(0.0001) | (0.0033) | (0.0203) | (0.0188) | (0.0096) |
|
Net realized
gains |
0.0000 | 0.0000 | (0.0000) 1 | 0.0000 | (0.0000) 1 |
|
Total distributions to
shareholders |
(0.0001) | (0.0033) | (0.0203) | (0.0188) | (0.0096) |
|
Net asset value, end of
period |
$1.0004 | $1.0003 | $1.0005 | $1.0004 | $1.0003 |
|
Total
return |
0.02% 2 | 0.32% | 2.05% | 1.91% | 0.96% |
| Ratios to average net assets (annualized) | |||||
|
Gross
expenses |
0.36% | 0.35% | 0.35% | 0.36% | 0.40% |
|
Net
expenses |
0.15% * | 0.29% * | 0.33% | 0.33% | 0.32% |
|
Net investment
income |
0.01% | 0.39% | 2.01% | 1.87% | 0.96% |
| Supplemental data | |||||
|
Net assets, end of period (000s
omitted) |
$131,539 | $76,740 | $113,555 | $92,671 | $92,542 |
| * | Ratio includes class-level expenses which were voluntarily waived by the investment manager. Without this voluntary waiver, the net expense ratio would be increased by the following amounts: |
| Year ended January 31, 2022 | 0.18% |
| Year ended January 31, 2021 | 0.03% |
| 1 | Amount is less than $0.00005. |
| 2 | During the year ended January 31, 2022, the Fund received a payment from an affiliate which had a 0.01% impact on total return. See Note 4 in the Notes to Financial Statement for additional information. |
| Year ended January 31 | |||||
| Institutional Class | 2022 | 2021 | 2020 | 2019 | 2018 |
|
Net asset value, beginning of
period |
$1.0003 | $1.0004 | $1.0004 | $1.0003 | $1.0003 |
|
Net investment
income |
0.0001 | 0.0041 | 0.0216 | 0.0202 | 0.0108 |
|
Net realized and unrealized gains (losses) on
investments |
(0.0001) | 0.0000 | 0.0000 1 | 0.0000 1 | 0.0000 1 |
|
Total from investment
operations |
0.0000 | 0.0041 | 0.0216 | 0.0202 | 0.0108 |
|
Payment from
affiliate |
0.0002 | 0.0000 | 0.0000 | 0.0000 | 0.0000 |
| Distributions to shareholders from | |||||
|
Net investment
income |
(0.0001) | (0.0042) | (0.0216) | (0.0201) | (0.0108) |
|
Net realized
gains |
0.0000 | 0.0000 | (0.0000) 1 | 0.0000 | (0.0000) 1 |
|
Total distributions to
shareholders |
(0.0001) | (0.0042) | (0.0216) | (0.0201) | (0.0108) |
|
Net asset value, end of
period |
$1.0004 | $1.0003 | $1.0004 | $1.0004 | $1.0003 |
|
Total
return |
0.02% 2 | 0.42% | 2.18% | 2.04% | 1.09% |
| Ratios to average net assets (annualized) | |||||
|
Gross
expenses |
0.24% | 0.23% | 0.23% | 0.24% | 0.28% |
|
Net
expenses |
0.15% 3 | 0.20% | 0.20% | 0.20% | 0.20% |
|
Net investment
income |
0.01% | 0.46% | 2.14% | 2.03% | 1.11% |
| Supplemental data | |||||
|
Net assets, end of period (000s
omitted) |
$678,991 | $794,541 | $1,704,936 | $1,573,458 | $1,104,814 |
| 1 | Amount is less than $0.00005. |
| 2 | During the year ended January 31, 2022, the Fund received a payment from an affiliate which had a 0.02% impact on total return. See Note 4 in the Notes to Financial Statement for additional information. |
| 3 | Ratio includes class-level expenses which were voluntarily waived by the investment manager. Without this voluntary waiver, the net expense ratio would have been 0.05% higher. |
| Year ended January 31 | |||||
| Select Class | 2022 | 2021 | 2020 | 2019 | 2018 |
|
Net asset value, beginning of
period |
$1.0004 | $1.0005 | $1.0005 | $1.0004 | $1.0004 |
|
Net investment
income |
0.0004 1 | 0.0049 | 0.0223 | 0.0208 | 0.0116 |
|
Net realized and unrealized gains (losses) on
investments |
(0.0002) | (0.0001) | 0.0000 2 | 0.0001 | 0.0000 2 |
|
Total from investment
operations |
0.0002 | 0.0048 | 0.0223 | 0.0209 | 0.0116 |
|
Payment from
affiliate |
0.0003 | 0.0000 | 0.0000 | 0.0000 | 0.0000 |
| Distributions to shareholders from | |||||
|
Net investment
income |
(0.0004) | (0.0049) | (0.0223) | (0.0208) | (0.0116) |
|
Net realized
gains |
0.0000 | 0.0000 | (0.0000) 2 | 0.0000 | (0.0000) 2 |
|
Total distributions to
shareholders |
(0.0004) | (0.0049) | (0.0223) | (0.0208) | (0.0116) |
|
Net asset value, end of
period |
$1.0005 | $1.0004 | $1.0005 | $1.0005 | $1.0004 |
|
Total
return |
0.05% 3 | 0.49% | 2.25% | 2.11% | 1.16% |
| Ratios to average net assets (annualized) | |||||
|
Gross
expenses |
0.20% | 0.19% | 0.19% | 0.20% | 0.24% |
|
Net
expenses |
0.12% 4 | 0.13% | 0.13% | 0.13% | 0.12% |
|
Net investment
income |
0.04% | 0.40% | 2.21% | 2.10% | 1.19% |
| Supplemental data | |||||
|
Net assets, end of period (000s
omitted) |
$4,373,391 | $8,471,954 | $7,119,681 | $6,459,320 | $5,717,659 |
| 1 | Calculated based upon average shares outstanding |
| 2 | Amount is less than $0.00005. |
| 3 | During the year ended January 31, 2022, the Fund received a payment from an affiliate which had a 0.03% impact on total return. See Note 4 in the Notes to Financial Statement for additional information. |
| 4 | Ratio includes class-level expenses which were voluntarily waived by the investment manager. Without this voluntary waiver, the net expense ratio would have been 0.01% higher. |
| Year ended January 31 | |||||
| Service Class | 2022 | 2021 | 2020 | 2019 | 2018 |
|
Net asset value, beginning of
period |
$1.0002 | $1.0004 | $1.0004 | $1.0003 | $1.0003 |
|
Net investment income
(loss) |
0.0001 1 | 0.0031 | 0.0194 | 0.0177 | 0.0085 |
|
Net realized and unrealized gains (losses) on
investments |
0.0000 2 | (0.0004) | (0.0001) | 0.0002 | 0.0000 2 |
|
Total from investment
operations |
0.0001 | 0.0027 | 0.0193 | 0.0179 | 0.0085 |
|
Payment from
affiliate |
0.0001 | 0.0000 | 0.0000 | 0.0000 | 0.0000 |
| Distributions to shareholders from | |||||
|
Net investment
income |
(0.0001) | (0.0029) | (0.0193) | (0.0178) | (0.0085) |
|
Net realized
gains |
0.0000 | 0.0000 | (0.0000) 2 | 0.0000 | (0.0000) 2 |
|
Total distributions to
shareholders |
(0.0001) | (0.0029) | (0.0193) | (0.0178) | (0.0085) |
|
Net asset value, end of
period |
$1.0003 | $1.0002 | $1.0004 | $1.0004 | $1.0003 |
|
Total
return |
0.02% 3 | 0.28% | 1.95% | 1.81% | 0.85% |
| Ratios to average net assets (annualized) | |||||
|
Gross
expenses |
0.53% | 0.50% | 0.51% | 0.51% | 0.55% |
|
Net
expenses |
0.14% * | 0.34% * | 0.43% | 0.43% | 0.43% |
|
Net investment
income |
0.01% | 0.33% | 1.92% | 1.79% | 0.84% |
| Supplemental data | |||||
|
Net assets, end of period (000s
omitted) |
$128,263 | $42,155 | $55,893 | $70,327 | $61,415 |
| * | Ratio includes class-level expenses which were voluntarily waived by the investment manager. Without this voluntary waiver, the net expense ratio would be increased by the following amounts: |
| Year ended January 31, 2022 | 0.29% |
| Year ended January 31, 2021 | 0.09% |
| 1 | Calculated based upon average shares outstanding |
| 2 | Amount is less than $0.00005. |
| 3 | During the year ended January 31, 2022, the Fund received a payment from an affiliate which had a 0.01% impact on total return. See Note 4 in the Notes to Financial Statement for additional information. |
| Gross unrealized gains | $ 93,582 |
| Gross unrealized losses | (67,970) |
| Net unrealized gains | $ 25,612 |
| ■ | Level 1 – quoted prices in active markets for identical securities |
| ■ | Level 2 – other significant observable inputs (including quoted prices for similar securities, interest rates, prepayment speeds, credit risk, etc.) |
| ■ | Level 3 – significant unobservable inputs (including the Fund’s own assumptions in determining the fair value of investments) |
| Quoted
prices (Level 1) |
Other
significant observable inputs (Level 2) |
Significant
unobservable inputs (Level 3) |
Total | |
| Assets | ||||
| Investments in: | ||||
| Certificates of deposit | $0 | $ 1,493,141,095 | $0 | $ 1,493,141,095 |
| Closed end municipal bond fund obligations | 0 | 23,000,000 | 0 | 23,000,000 |
| Commercial paper | 0 | 2,161,897,030 | 0 | 2,161,897,030 |
| Municipal obligations | 0 | 1,142,532,410 | 0 | 1,142,532,410 |
| Other instruments | 0 | 221,835,000 | 0 | 221,835,000 |
| Other notes | 0 | 162,770,000 | 0 | 162,770,000 |
| Repurchase agreements | 0 | 85,125,000 | 0 | 85,125,000 |
| Total assets | $0 | $5,290,300,535 | $0 | $5,290,300,535 |
| Average daily net assets | Management fee |
| First $5 billion | 0.150% |
| Next $5 billion | 0.140 |
| Next $5 billion | 0.130 |
| Next $85 billion | 0.125 |
| Over $100 billion | 0.120 |
| Average daily net assets | Rate prior to June 1, 2021 |
| First $5 billion | 0.15% |
| Next $5 billion | 0.14 |
| Over $10 billion | 0.13 |
| Class-level
administration fee | |
| Administrator Class | 0.10% |
| Institutional Class | 0.08 |
| Select Class | 0.04 |
| Service Class | 0.12 |
| Expense ratio caps | |
| Administrator Class | 0.33% |
| Institutional Class | 0.20 |
| Select Class | 0.13 |
| Service Class | 0.43 |
| Net investment income | $ | 6,579,046 |
| Net realized and unrealized losses on investment | (412,563) | |
| Net increase in net assets resulting from operations | $ | 6,166,483 |
| Unrealized
gains |
Capital
loss carryforward |
| $25,612 | $(3,735,218) |
Allspring Funds Trust:

| Shares voted “For” | 2,778,263,390 | |
| Shares voted “Against” | 179,412,334 | |
| Shares voted “Abstain” | 573,090,373 |
| Shares voted “For” | 2,778,064,696 | |
| Shares voted “Against” | 179,611,028 | |
| Shares voted “Abstain” | 573,090,373 |
| Name
and year of birth |
Position
held and length of service* |
Principal occupations during past five years or longer | Current
other public company or investment company directorships |
| William
R. Ebsworth (Born 1957) |
Trustee,
since 2015 |
Retired. From 1984 to 2013, equities analyst, portfolio manager, research director and chief investment officer at Fidelity Management and Research Company in Boston, Tokyo, and Hong Kong, and retired in 2013 as Chief Investment Officer of Fidelity Strategic Advisers, Inc. where he led a team of investment professionals managing client assets. Prior thereto, Board member of Hong Kong Securities Clearing Co., Hong Kong Options Clearing Corp., the Thailand International Fund, Ltd., Fidelity Investments Life Insurance Company, and Empire Fidelity Investments Life Insurance Company. Audit Committee Chair and Investment Committee Chair of the Vincent Memorial Hospital Endowment (non-profit organization). Mr. Ebsworth is a CFA® charterholder. | N/A |
| Jane
A. Freeman (Born 1953) |
Trustee,
since 2015; Chair Liaison, since 2018 |
Retired. From 2012 to 2014 and 1999 to 2008, Chief Financial Officer of Scientific Learning Corporation. From 2008 to 2012, Ms. Freeman provided consulting services related to strategic business projects. Prior to 1999, Portfolio Manager at Rockefeller & Co. and Scudder, Stevens & Clark. Board member of the Harding Loevner Funds from 1996 to 2014, serving as both Lead Independent Director and chair of the Audit Committee. Board member of the Russell Exchange Traded Funds Trust from 2011 to 2012 and the chair of the Audit Committee. Ms. Freeman is also an inactive Chartered Financial Analyst. | N/A |
| Isaiah
Harris, Jr. (Born 1952) |
Trustee,
since 2009; Audit Committee Chair, since 2019 |
Retired. Chairman of the Board of CIGNA Corporation from 2009 to 2021, and Director from 2005 to 2008. From 2003 to 2011, Director of Deluxe Corporation. Prior thereto, President and CEO of BellSouth Advertising and Publishing Corp. from 2005 to 2007, President and CEO of BellSouth Enterprises from 2004 to 2005 and President of BellSouth Consumer Services from 2000 to 2003. Emeritus member of the Iowa State University Foundation Board of Governors. Emeritus Member of the Advisory Board of Iowa State University School of Business. Advisory Board Member, Palm Harbor Academy (private school). Advisory Board Member, Fellowship of Christian Athletes. Mr. Harris is a certified public accountant (inactive status). | N/A |
| David
F. Larcker (Born 1950) |
Trustee,
since 2009 |
James Irvin Miller Professor of Accounting at the Graduate School of Business (Emeritus), Stanford University, Director of the Corporate Governance Research Initiative and Senior Faculty of The Rock Center for Corporate Governance since 2006. From 2005 to 2008, Professor of Accounting at the Graduate School of Business, Stanford University. Prior thereto, Ernst & Young Professor of Accounting at The Wharton School, University of Pennsylvania from 1985 to 2005. | N/A |
| Name
and year of birth |
Position
held and length of service* |
Principal occupations during past five years or longer | Current
other public company or investment company directorships |
| Olivia
S. Mitchell (Born 1953) |
Trustee,
since 2006; Nominating and Governance Committee Chair, since 2018 |
International Foundation of Employee Benefit Plans Professor since 1993, Wharton School of the University of Pennsylvania. Director of Wharton’s Pension Research Council and Boettner Center on Pensions & Retirement Research, and Research Associate at the National Bureau of Economic Research. Previously taught at Cornell University from 1978 to 1993. | N/A |
| Timothy
J. Penny (Born 1951) |
Trustee,
since 1996; Chair, since 2018 |
President and Chief Executive Officer of Southern Minnesota Initiative Foundation, a non-profit organization, since 2007. Member of the Board of Trustees of NorthStar Education Finance, Inc., a non-profit organization, since 2007. | N/A |
| James
G. Polisson (Born 1959) |
Trustee,
since 2018 |
Retired. Chief Marketing Officer, Source (ETF) UK Services, Ltd, from 2015 to 2017. From 2012 to 2015, Principal of The Polisson Group, LLC, a management consulting, corporate advisory and principal investing company. Chief Executive Officer and Managing Director at Russell Investments, Global Exchange Traded Funds from 2010 to 2012. Managing Director of Barclays Global Investors from 1998 to 2010 and Global Chief Marketing Officer for iShares and Barclays Global Investors from 2000 to 2010. Trustee of the San Francisco Mechanics’ Institute, a non-profit organization, from 2013 to 2015. Board member of the Russell Exchange Traded Fund Trust from 2011 to 2012. Director of Barclays Global Investors Holdings Deutschland GmbH from 2006 to 2009. Mr. Polisson is an attorney and has a retired status with the Massachusetts and District of Columbia Bar Associations. | N/A |
| Pamela
Wheelock (Born 1959) |
Trustee,
since January 2020; previously Trustee from January 2018 to July 2019 |
Board member of the Destination Medical Center Economic Development Agency, Rochester, Minnesota since 2019. Interim President of the McKnight Foundation from January to September 2020. McKnight Foundation Consultant, November 2020 to February 2021. Acting Commissioner, Minnesota Department of Human Services, July 2019 through September 2019. Consultant (part-time), Minnesota Department of Human Services, October 2019 through December 2019. Chief Operating Officer, Twin Cities Habitat for Humanity from 2017 to 2019. Vice President of University Services, University of Minnesota from 2012 to 2016. Prior thereto, on the Board of Directors, Governance Committee and Finance Committee for the Minnesota Philanthropy Partners (Saint Paul Foundation) from 2012 to 2018, Interim Chief Executive Officer of Blue Cross Blue Shield of Minnesota from 2011 to 2012, Chairman of the Board from 2009 to 2012 and Board Director from 2003 to 2015. Vice President, Leadership and Community Engagement, Bush Foundation, Saint Paul, Minnesota (a private foundation) from 2009 to 2011. Executive Vice President and Chief Financial Officer, Minnesota Sports and Entertainment from 2004 to 2009 and Senior Vice President from 2002 to 2004. Executive Vice President of the Minnesota Wild Foundation from 2004 to 2008. Commissioner of Finance, State of Minnesota, from 1999 to 2002. Currently Board Chair of the Minnesota Wild Foundation since 2010. | N/A |
| Name
and year of birth |
Position
held and length of service |
Principal occupations during past five years or longer |
| Andrew
Owen (Born 1960) |
President,
since 2017 |
President, Chief Executive Officer and Director of Allspring Funds Management, LLC since 2017 and co-president of Galliard Capital Management, LLC, an affiliate of Allspring Funds Management, LLC, since 2019. Prior thereto, Head of Affiliated Managers, Allspring Global Investments, from 2014 to 2019 and Executive Vice President responsible for marketing, investments and product development for Allspring Funds Management, LLC, from 2009 to 2014. In addition, Mr. Owen was an Executive Vice President of Wells Fargo & Company from 2014 to 2021. |
| Jeremy
DePalma (Born 1974) |
Treasurer,
since 2012 (for certain funds in the Fund Complex); since 2021 (for the remaining funds in the Fund Complex) |
Senior Vice President of Allspring Funds Management, LLC since 2009. Senior Vice President of Evergreen Investment Management Company, LLC from 2008 to 2010 and head of the Fund Reporting and Control Team within Fund Administration. |
| Kate
McKinley (Born 1977) |
Chief
Legal Officer, since 2021 |
Chief Legal Officer of Allspring Global Investments since 2021. Prior thereto, held various roles at State Street Global Advisors beginning in 2010, including serving as Senior Vice President and General Counsel from 2019 to 2021, and Chief Operating Officer of the Institutional Client Group from 2016 - 2019. Prior to working at State Street Global Advisors served as Assistant General Counsel for Bank of America Corporation from 2005 to 2010 and as an Associate at WilmerHale from 2002 to 2005. |
| Christopher
Baker (Born 1976) |
Chief Compliance Officer, since 2022 | Global Chief Compliance Officer for Allspring Global Investments since 2022. Prior thereto, Chief Compliance Officer for State Street Global Advisors from 2018 to 2021. Senior Compliance Officer for the State Street divisions of Alternative Investment Solutions, Sector Solutions, and Global Marketing from 2015 to 2018. From 2010 to 2015 Vice President, Global Head of Investment and Marketing Compliance for State Street Global Advisors. |
| Matthew
Prasse (Born 1983) |
Secretary,
since 2021 |
Senior Counsel of the Allspring Legal Department since 2021. Senior Counsel of the Wells Fargo Legal Department from 2018 to 2021. Previously, Counsel for Barings LLC from 2015 to 2018. Prior to joining Barings, Associate at Morgan, Lewis & Bockius LLP from 2008 to 2015. |
P.O. Box 219967
Kansas City, MO 64121-9967
1-800-222-8222 or visit the Fund's website at allspringglobal.com. Read the prospectus carefully before you invest or send money.
A304/AR304 01-22

| ■ | Allspring Money Market Fund |
|
|
2 |
|
|
6 |
|
|
10 |
|
|
11 |
| Financial statements | |
|
|
18 |
|
|
19 |
|
|
20 |
|
|
21 |
|
|
25 |
|
|
30 |
|
|
31 |

| 1 | The S&P 500 Index consists of 500 stocks chosen for market size, liquidity, and industry group representation. It is a market-value-weighted index with each stock's weight in the index proportionate to its market value. You cannot invest directly in an index. |
| 2 | The Morgan Stanley Capital International (MSCI) All Country World Index (ACWI) ex USA Index (Net) is a free-float-adjusted market-capitalization-weighted index that is designed to measure the equity market performance of developed and emerging markets, excluding the U.S. Source: MSCI. MSCI makes no express or implied warranties or representations and shall have no liability whatsoever with respect to any MSCI data contained herein. The MSCI data may not be further redistributed or used as a basis for other indexes or any securities or financial products. This report is not approved, reviewed, or produced by MSCI. You cannot invest directly in an index. |
| 3 | The MSCI Emerging Markets (EM) Index (Net) (USD) is a free-float-adjusted market-capitalization-weighted index that is designed to measure equity market performance of emerging markets. You cannot invest directly in an index. |
| 4 | The Bloomberg U.S. Aggregate Bond Index is a broad-based benchmark that measures the investment-grade, U.S.-dollar-denominated, fixed-rate taxable bond market, including Treasuries, government-related and corporate securities, mortgage-backed securities (agency fixed-rate and hybrid adjustable-rate mortgage pass-throughs), asset-backed securities, and commercial mortgage-backed securities. You cannot invest directly in an index. |
| 5 | The Bloomberg Global Aggregate ex-USD Index (unhedged) is an unmanaged index that provides a broad-based measure of the global investment-grade fixed-income markets excluding the U.S.-dollar-denominated debt market. You cannot invest directly in an index. |
| 6 | The Bloomberg Municipal Bond Index is an unmanaged index composed of long-term tax-exempt bonds with a minimum credit rating of Baa. You cannot invest directly in an index. |
| 7 | The ICE BofA U.S. High Yield Index is a market-capitalization-weighted index of domestic and Yankee high-yield bonds. The index tracks the performance of high-yield securities traded in the U.S. bond market. You cannot invest directly in an index. Copyright 2022. ICE Data Indices, LLC. All rights reserved. |
| 1 | The Consumer Price Index (CPI) is a measure of the average change over time in the prices paid by urban consumers for a market basket of consumer goods and services. You cannot invest directly in an index. |

President
Allspring Funds
| 1 | As of December 31, 2021, assets under management (AUM) includes $91.6 billion from Galliard Capital Management, LLC, an investment advisor that is not part of the Allspring trade name/GIPS firm. |
| Investment objective | The Fund seeks current income, while preserving capital and liquidity. |
| Manager | Allspring Funds Management, LLC |
| Subadviser | Allspring Global Investments, LLC |
| Portfolio managers | Michael C. Bird, CFA®‡, Jeffrey L. Weaver, CFA®‡, Laurie White |
| Average annual total returns (%) as of January 31, 2022 | |||||||||||
| Including sales charge | Excluding sales charge | Expense ratios1 (%) | |||||||||
| Inception date | 1 year | 5 year | 10 year | 1 year | 5 year | 10 year | Gross | Net 2 | |||
| Class A (STGXX) | 7-1-1992 | – | – | – | 0.01 | 0.86 | 0.44 | 0.68 | 0.60 | ||
| Class C * | 6-30-2010 | -0.99 | 0.39 | 0.20 | 0.01 | 0.39 | 0.20 | 1.43 | 1.35 | ||
| Premier Class (WMPXX)3 | 3-31-2016 | – | – | – | 0.03 | 1.17 | 0.62 | 0.29 | 0.20 | ||
| Service Class (WMOXX) | 6-30-2010 | – | – | – | 0.01 | 0.93 | 0.48 | 0.58 | 0.50 | ||
| * | Class C shares are available only to shareholders making an exchange out of Class C shares of another mutual fund within the Allspring family of funds. |
| 1 | Reflects the expense ratios as stated in the most recent prospectuses. The expense ratios shown are subject to change and may differ from the annualized expense ratios shown in the financial highlights of this report. |
| 2 | The manager has contractually committed through May 31, 2022, to waive fees and/or reimburse expenses to the extent necessary to cap total annual fund operating expenses after fee waivers at 0.60% for Class A, 1.35% for Class C, 0.20% for Premier Class and 0.50% for Service Class. Brokerage commissions, stamp duty fees, interest, taxes, acquired fund fees and expenses (if any), and extraordinary expenses are excluded from the expense caps. Prior to or after the commitment expiration date, the caps may be increased or the commitment to maintain the caps may be terminated only with the approval of the Board of Trustees. The manager and/or its affiliates may also voluntarily waive all or a portion of any fees to which they are entitled and/or reimburse certain expenses as they may determine from time to time. Without these caps, the Fund’s returns would have been lower. The expense ratio paid by an investor is the net expense ratio (the total annual fund operating expenses after fee waivers) as stated in the prospectuses. |
| 3 | Historical performance shown for the Premier Class shares prior to their inception reflects the performance of the Class A shares, and includes the higher expenses applicable to the Class A shares. If these expenses had not been included, returns for the Premier Class shares would be higher. |
| Yield summary (%) as of January 31, 2022 | ||||
| Class A | Class C* | Premier
Class |
Service
Class | |
| 7-day current yield1 | 0.01 | 0.01 | 0.04 | 0.01 |
| 7-day compound yield | 0.01 | 0.01 | 0.04 | 0.01 |
| 30-day simple yield | 0.01 | 0.01 | 0.04 | 0.01 |
| 30-day compound yield | 0.01 | 0.01 | 0.04 | 0.01 |
| * | Class C shares are available only to shareholders making an exchange out of Class C shares of another mutual fund within the Allspring family of funds. |
| 1 | The manager has contractually committed through May 31, 2022, to waive fees and/or reimburse expenses to the extent necessary to cap total annual fund operating expenses and may also voluntarily waive or reimburse additional fees and expenses which may be discontinued or modified at any time without notice. Without these reductions, the Fund’s 7-day current yield would have been -0.52%, -1.17%, -0.14% and -0.43% for Class A, Class C, Premier Class and Service Class, respectively. |
| ‡ | CFA® and Chartered Financial Analyst® are trademarks owned by CFA Institute. |
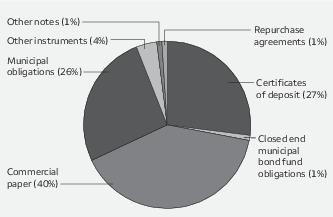
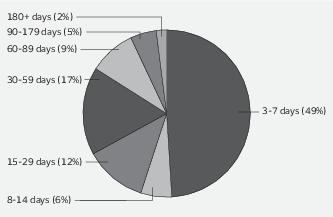
| Beginning
account value 8-1-2021 |
Ending
account value 1-31-2022 |
Expenses
paid during the period1 |
Annualized
net expense ratio | |
| Class A | ||||
| Actual | $1,000.00 | $1,000.05 | $0.66 | 0.13% |
| Hypothetical (5% return before expenses) | $1,000.00 | $1,024.55 | $0.66 | 0.13% |
| Class C | ||||
| Actual | $1,000.00 | $1,000.05 | $0.66 | 0.13% |
| Hypothetical (5% return before expenses) | $1,000.00 | $1,024.55 | $0.66 | 0.13% |
| Premier Class | ||||
| Actual | $1,000.00 | $1,000.09 | $0.66 | 0.13% |
| Hypothetical (5% return before expenses) | $1,000.00 | $1,024.55 | $0.66 | 0.13% |
| Service Class | ||||
| Actual | $1,000.00 | $1,000.05 | $0.66 | 0.13% |
| Hypothetical (5% return before expenses) | $1,000.00 | $1,024.55 | $0.66 | 0.13% |
| Interest
rate |
Maturity
date |
Principal | Value | ||
| Certificates of deposit: 26.85% | |||||
| ABN Amro Bank NV | 0.08% | 2-4-2022 | $70,000,000 | $ 70,000,000 | |
| Australia & New Zealand Banking Group Limited | 0.07 | 2-1-2022 | 60,000,000 | 60,000,000 | |
| Canadian Imperial Bank of Commerce | 0.07 | 2-1-2022 | 80,000,000 | 80,000,000 | |
| Credit Agricole Corporate and Investment Bank of New York | 0.07 | 2-1-2022 | 85,000,000 | 85,000,000 | |
| HSBC Bank USA NA | 0.08 | 2-1-2022 | 50,000,000 | 50,000,000 | |
| Legacy Capital Company 144A | 0.27 | 4-12-2022 | 33,000,000 | 32,998,717 | |
| Mizuho Bank Limited | 0.07 | 2-1-2022 | 85,000,000 | 85,000,000 | |
| MUFG Bank Limited | 0.23 | 4-7-2022 | 17,000,000 | 17,000,000 | |
| National Australia Bank Limited 144A☼ | 0.21 | 3-1-2022 | 17,000,000 | 16,997,223 | |
| Nordea Bank AB | 0.20 | 2-18-2022 | 35,000,000 | 35,001,153 | |
| Nordea Bank AB (U.S. SOFR +0.17%) ± | 0.22 | 11-28-2022 | 20,000,000 | 19,991,651 | |
| Norinchukin Bank | 0.23 | 4-19-2022 | 17,000,000 | 17,000,000 | |
| Norinchukin Bank | 0.25 | 5-9-2022 | 15,000,000 | 15,000,000 | |
| Norinchukin Bank | 0.25 | 5-16-2022 | 13,000,000 | 13,000,000 | |
| Oversea-Chinese Banking Corporation | 0.19 | 4-20-2022 | 25,000,000 | 25,000,000 | |
| Oversea-Chinese Banking Corporation | 0.22 | 4-8-2022 | 15,000,000 | 15,000,000 | |
| Oversea-Chinese Banking Corporation | 0.33 | 6-7-2022 | 15,000,000 | 15,000,000 | |
| Royal Bank of Canada (U.S. SOFR +0.15%) 144A± | 0.20 | 6-24-2022 | 15,000,000 | 15,001,193 | |
| Sumitomo Mitsui Banking Corporation 144A☼ | 0.20 | 3-9-2022 | 20,000,000 | 19,996,000 | |
| Sumitomo Mitsui Banking Corporation | 0.20 | 4-27-2022 | 18,000,000 | 18,000,000 | |
| Sumitomo Mitsui Banking Corporation | 0.25 | 5-12-2022 | 10,000,000 | 10,000,000 | |
| Sumitomo Mitsui Trust Bank | 0.17 | 4-18-2022 | 15,000,000 | 15,000,000 | |
| Sumitomo Mitsui Trust Bank | 0.18 | 2-9-2022 | 15,000,000 | 15,000,000 | |
| Sumitomo Mitsui Trust Bank | 0.22 | 3-14-2022 | 15,000,000 | 15,000,000 | |
| Toronto-Dominion Bank | 0.25 | 5-13-2022 | 13,000,000 | 13,000,000 | |
| Total Certificates of deposit (Cost $772,985,937) | 772,985,937 |
| Closed end municipal bond fund obligations: 1.18% | |||||
| Nuveen Floating Rate Income Fund Variable Rate Demand Preferred Shares Class A (110 shares) 0.21% 144Aø | 11,000,000 | 11,000,000 | |||
| Nuveen Short Duration Credit Opportunities Fund Taxable Fund Preferred Shares Series A (23,000 shares) 0.21% 144Aø | 23,000,000 | 23,000,000 | |||
| Total Closed end municipal bond fund obligations (Cost $34,000,000) | 34,000,000 |
| Commercial paper: 40.62% | |||||
| Asset-backed commercial paper: 26.90% | |||||
| Albion Capital Corporation LLC ☼ | 0.22 | 2-22-2022 | 30,086,000 | 30,082,139 | |
| Angelsea Funding LLC (U.S. OBFR +0.08%) 144A± | 0.15 | 5-9-2022 | 18,000,000 | 18,000,000 | |
| Angelsea Funding LLC 144A☼ | 0.20 | 2-1-2022 | 2,000,000 | 2,000,000 | |
| Atlantic Asset Securitization LLC 144A☼ | 0.17 | 2-17-2022 | 17,000,000 | 16,998,716 | |
| Bennington Sark Capital Company LLC 144A☼ | 0.08 | 2-1-2022 | 20,000,000 | 20,000,000 | |
| Bennington Sark Capital Company LLC 144A☼ | 0.15 | 2-11-2022 | 10,000,000 | 9,999,583 | |
| Chesham Finance Limited 144A☼ | 0.07 | 2-1-2022 | 45,000,000 | 45,000,000 | |
| Chesham Finance Limited 144A☼ | 0.13 | 2-1-2022 | 56,000,000 | 56,000,000 | |
| Concord Minutemen Capital Company 144A☼ | 0.15 | 2-23-2022 | 20,700,000 | 20,697,371 | |
| Glencove Funding DAC 144A☼ | 0.15 | 2-9-2022 | 18,000,000 | 17,999,400 | |
| Institutional Secured Funding LLC 144A☼ | 0.17 | 2-9-2022 | 20,000,000 | 19,999,244 | |
| Institutional Secured Funding LLC 144A☼ | 0.21 | 2-15-2022 | 14,000,000 | 13,998,857 |
| Interest
rate |
Maturitydate | Principal | Value | ||
| Asset-backed commercial paper (continued) | |||||
| Ionic Capital II Trust ☼ | 0.18% | 2-16-2022 | $15,000,000 | $ 14,998,875 | |
| Ionic Capital II Trust ☼ | 0.22 | 3-8-2022 | 40,000,000 | 39,991,444 | |
| Ionic Capital III Trust ☼ | 0.17 | 2-9-2022 | 10,000,000 | 9,999,622 | |
| Ionic Capital III Trust ☼ | 0.18 | 2-15-2022 | 33,000,000 | 32,997,690 | |
| Ionic Capital III Trust ☼ | 0.24 | 2-4-2022 | 8,000,000 | 7,999,840 | |
| Ionic Capital III Trust ☼ | 0.27 | 2-24-2022 | 18,000,000 | 17,996,895 | |
| Legacy Capital Company 144A☼ | 0.22 | 2-16-2022 | 25,000,000 | 24,997,708 | |
| Lexington Parker Capital Company LLC 144A☼ | 0.17 | 2-17-2022 | 20,000,000 | 19,998,489 | |
| Lexington Parker Capital Company LLC 144A☼ | 0.20 | 2-3-2022 | 7,000,000 | 6,999,922 | |
| Liberty Funding LLC 144A☼ | 0.22 | 3-18-2022 | 35,000,000 | 34,990,375 | |
| LMA Americas LLC 144A☼ | 0.22 | 3-21-2022 | 14,000,000 | 13,995,893 | |
| LMA Americas LLC 144A☼ | 0.27 | 4-8-2022 | 25,000,000 | 24,987,625 | |
| Manhattan Asset Funding Company LLC 144A☼ | 0.13 | 2-7-2022 | 13,358,000 | 13,357,711 | |
| Mountcliff Funding LLC 144A☼ | 0.11 | 2-1-2022 | 40,000,000 | 40,000,000 | |
| Mountcliff Funding LLC 144A☼ | 0.20 | 2-14-2022 | 30,000,000 | 29,997,833 | |
| Mountcliff Funding LLC 144A☼ | 0.25 | 3-7-2022 | 9,575,000 | 9,572,739 | |
| Nieuw Amsterdam Receivables Corporation BV 144A☼ | 0.17 | 2-10-2022 | 34,000,000 | 33,998,556 | |
| Starbird Funding Corporation 144A☼ | 0.19 | 3-2-2022 | 5,000,000 | 4,999,235 | |
| Versailles CDS LLC (U.S. SOFR +0.11%) 144A± | 0.16 | 4-4-2022 | 25,000,000 | 25,000,000 | |
| Versailles CDS LLC (U.S. SOFR +0.16%) 144A± | 0.21 | 8-2-2022 | 25,000,000 | 25,000,000 | |
| Victory Receivables Corporation 144A☼ | 0.17 | 2-1-2022 | 28,000,000 | 28,000,000 | |
| Victory Receivables Corporation 144A☼ | 0.20 | 2-16-2022 | 22,602,000 | 22,600,117 | |
| Victory Receivables Corporation 144A☼ | 0.23 | 3-16-2022 | 8,650,000 | 8,647,624 | |
| Victory Receivables Corporation 144A☼ | 0.27 | 4-13-2022 | 12,416,000 | 12,409,388 | |
| 774,312,891 | |||||
| Financial company commercial paper: 12.40% | |||||
| Banco Santander SA 144A☼ | 0.17 | 3-8-2022 | 15,000,000 | 14,997,521 | |
| Banco Santander SA 144A☼ | 0.19 | 2-4-2022 | 25,000,000 | 24,999,604 | |
| Bank of Montreal ☼ | 0.20 | 4-14-2022 | 15,000,000 | 14,994,000 | |
| Bank of Nova Scotia 144A☼ | 0.20 | 3-24-2022 | 15,000,000 | 14,995,750 | |
| DBS Bank Limited 144A☼ | 0.23 | 3-8-2022 | 17,000,000 | 16,996,281 | |
| DBS Bank Limited 144A☼ | 0.28 | 6-2-2022 | 17,000,000 | 16,984,001 | |
| DBS Group Holdings Limited 144A☼ | 0.22 | 4-1-2022 | 10,000,000 | 9,996,394 | |
| Dexia Credit Local SA 144A☼ | 0.29 | 5-16-2022 | 7,000,000 | 6,994,136 | |
| Erste Finance LLC 144A☼ | 0.07 | 2-1-2022 | 80,000,000 | 80,000,000 | |
| Macquarie Group Limited 144A☼ | 0.26 | 3-4-2022 | 12,982,000 | 12,979,093 | |
| Mitsubishi UFJ Trust & Banking 144A☼ | 0.15 | 2-15-2022 | 18,000,000 | 17,998,950 | |
| Mitsubishi UFJ Trust & Banking 144A☼ | 0.24 | 3-1-2022 | 17,000,000 | 16,996,827 | |
| Santander plc ☼ | 0.16 | 3-16-2022 | 10,000,000 | 9,998,089 | |
| Suncorp Group Limited 144A☼ | 0.19 | 3-23-2022 | 5,000,000 | 4,998,681 | |
| Svenska Handelsbanken AB 144A☼ | 0.22 | 6-1-2022 | 20,000,000 | 19,985,333 | |
| Svenska Handelsbanken AB 144A☼ | 0.22 | 6-2-2022 | 7,000,000 | 6,994,824 | |
| Toronto-Dominion Bank 144A☼ | 0.16 | 4-22-2022 | 15,000,000 | 14,994,667 | |
| United Overseas Bank Limited 144A☼ | 0.19 | 3-9-2022 | 16,000,000 | 15,997,040 | |
| United Overseas Bank Limited 144A☼ | 0.19 | 3-11-2022 | 15,000,000 | 14,997,071 | |
| United Overseas Bank Limited 144A☼ | 0.22 | 4-11-2022 | 20,000,000 | 19,991,758 | |
| 356,890,020 | |||||
| Other commercial paper: 1.32% | |||||
| Alberta Province 144A☼ | 0.14 | 2-3-2022 | 8,000,000 | 7,999,938 |
| Interest
rate |
Maturitydate | Principal | Value | ||
| Other commercial paper (continued) | |||||
| Alberta Province 144A☼ | 0.14% | 2-17-2022 | $15,000,000 | $ 14,999,067 | |
| Erste Abwicklungsanstalt 144A☼ | 0.10 | 2-11-2022 | 15,000,000 | 14,999,583 | |
| 37,998,588 | |||||
| Total Commercial paper (Cost $1,169,201,499) | 1,169,201,499 | ||||
| Municipal obligations: 26.48% | |||||
| Arizona: 1.66% | |||||
| Variable rate demand notes ø: 1.66% | |||||
| Taxable Municipal Funding Trust Various States Floaters Series 2021-004 (Health revenue, Barclays Bank plc LOC) 144A | 0.29 | 11-15-2054 | 5,150,000 | 5,150,000 | |
| Tender Option Bond Trust Receipts/Floater Certificates Series 2021-MIZ9060TX (Tax revenue, Mizuho Capital Markets LLC LOC) 144A | 0.34 | 2-15-2041 | 42,548,337 | 42,548,337 | |
| 47,698,337 | |||||
| California: 5.11% | |||||
| Other municipal debt : 1.29% | |||||
| California Series B2 (GO revenue) | 0.15 | 3-3-2022 | 10,440,000 | 10,440,000 | |
| San Francisco CA City & County Public Utilities Commission (Water & sewer revenue) | 0.28 | 4-19-2022 | 26,637,000 | 26,637,000 | |
| 37,077,000 | |||||
| Variable rate demand notes ø: 3.82% | |||||
| Metropolitan Water District of Southern California Series A (Water & sewer revenue, Bank of America NA SPA) | 0.10 | 7-1-2042 | 27,000,000 | 27,000,000 | |
| Mizuho Floater Residual Certificates Series 2021 (Housing revenue, Mizuho Capital Markets LLC LOC, Mizuho Capital Markets LLC LIQ) 144A | 0.18 | 4-15-2042 | 8,000,000 | 8,000,000 | |
| San Francisco CA City & County Certificate of Participation Series 2016-XFT901 (Miscellaneous revenue, Morgan Stanley Bank LIQ) 144A | 0.14 | 11-1-2041 | 18,000,000 | 18,000,000 | |
| Tender Option Bond Trust Receipts/Certificates Los Angeles Community College District Series 2016-TXG002 (GO revenue, Bank of America NA LIQ) 144A | 0.20 | 8-1-2049 | 15,700,000 | 15,700,000 | |
| Tender Option Bond Trust Receipts/Floater Certificates Series 2019-MIZ9003 (Tax revenue, Mizuho Capital Markets LLC LOC, Mizuho Capital Markets LLC LIQ) 144A | 0.31 | 3-1-2036 | 6,465,000 | 6,465,000 | |
| University of California Revenue Various Taxable Series Z-1 (Education revenue) | 0.08 | 7-1-2041 | 35,000,000 | 35,000,000 | |
| 110,165,000 | |||||
| Colorado: 2.10% | |||||
| Variable rate demand notes ø: 2.10% | |||||
| Colorado HFA MFHR Class II Series B (Housing revenue, FHLB SPA) | 0.12 | 5-1-2052 | 35,905,000 | 35,905,000 |
| Interest
rate |
Maturitydate | Principal | Value | ||
| Variable rate demand notes ø(continued) | |||||
| Colorado HFA Single Family Mortgage Bonds Class II Series 2021-I (Housing revenue, GNMA Insured, Royal Bank of Canada SPA) | 0.08% | 11-1-2051 | $10,000,000 | $ 10,000,000 | |
| Colorado Southern Ute Indian Tribe Reservation Company Series 2007 (Miscellaneous revenue) 144A | 0.10 | 1-1-2027 | 14,490,000 | 14,490,000 | |
| 60,395,000 | |||||
| Georgia: 1.84% | |||||
| Variable rate demand notes ø: 1.84% | |||||
| Macon-Bibb County GA Industrial Authority Kumho Tire Georgia Incorporated Series 2015A (Industrial development revenue, Korea Development Bank LOC) | 0.17 | 12-1-2022 | 27,000,000 | 27,000,000 | |
| Macon-Bibb County GA Industrial Authority Kumho Tire Georgia Incorporated Series 2015B (Industrial development revenue, Korea Development Bank LOC) | 0.17 | 12-1-2022 | 26,000,000 | 26,000,000 | |
| 53,000,000 | |||||
| Illinois: 0.73% | |||||
| Variable rate demand notes ø: 0.73% | |||||
| Tender Option Bond Trust Receipts/Floater Certificates Series 2019-XF0779 (Tax revenue, BAM Insured, TD Bank NA LIQ) 144A | 0.11 | 1-1-2048 | 11,000,000 | 11,000,000 | |
| Tender Option Bond Trust Receipts/Floater Certificates Series 2020-XF2854 (Tax revenue, Barclays Bank plc LOC, Barclays Bank plc LIQ) 144A | 0.10 | 6-15-2050 | 10,000,000 | 10,000,000 | |
| 21,000,000 | |||||
| Indiana: 0.66% | |||||
| Variable rate demand notes ø: 0.66% | |||||
| Indiana Finance Authority Stadium Project Series A-5 (Miscellaneous revenue, U.S. Bank NA SPA) | 0.11 | 2-1-2035 | 18,920,000 | 18,920,000 | |
| Kentucky: 0.47% | |||||
| Variable rate demand notes ø: 0.47% | |||||
| Kentucky Housing Corporation Series B (Housing revenue, Kentucky Housing Corporation SPA) | 0.11 | 7-1-2041 | 10,000,000 | 10,000,000 | |
| Kentucky Housing Corporation Series O (Housing revenue, Kentucky Housing Corporation SPA) | 0.11 | 1-1-2036 | 3,560,000 | 3,560,000 | |
| 13,560,000 | |||||
| Michigan: 0.32% | |||||
| Variable rate demand notes ø: 0.32% | |||||
| Michigan State Housing Development AMT Refunding Bond Series B (Housing revenue, Industrial & Commercial Bank of China Limited SPA) | 0.15 | 6-1-2038 | 9,185,000 | 9,185,000 |
| Interest
rate |
Maturitydate | Principal | Value | ||
| Missouri: 0.50% | |||||
| Variable rate demand notes ø: 0.50% | |||||
| Bridgeton MO IDA Stolze Printing (Industrial development revenue, Carrollton Bank LOC) | 0.12% | 12-1-2047 | $ 2,050,000 | $ 2,050,000 | |
| Missouri HEFA Royal Bank of Canada Municipal Products Incorporated Trust Series C-16 (Health revenue, Royal Bank of Canada LOC, Royal Bank of Canada LIQ) 144A | 0.11 | 9-1-2039 | 12,200,000 | 12,200,000 | |
| 14,250,000 | |||||
| Nevada: 0.52% | |||||
| Variable rate demand notes ø: 0.52% | |||||
| Mizuho Floater Residual Certificates Series 2021 (Housing revenue, Mizuho Capital Markets LLC LOC, Mizuho Capital Markets LLC LIQ) 144A | 0.34 | 2-1-2058 | 15,000,000 | 15,000,000 | |
| New Hampshire: 1.68% | |||||
| Variable rate demand notes ø: 1.68% | |||||
| New Hampshire Business Finance Authority CJ Foods Manufacturing Beaumont Corporation Series A (Industrial development revenue, Kookmin Bank LOC) 144A | 0.17 | 10-1-2028 | 24,000,000 | 24,000,000 | |
| New Hampshire National Finance Authority Industrial Development Revenue Series A (Industrial development revenue, Kookmin Bank LOC) 144A | 0.17 | 7-1-2029 | 24,500,000 | 24,500,000 | |
| 48,500,000 | |||||
| New York: 5.18% | |||||
| Other municipal debt : 2.11% | |||||
| Long Island Power Authority Series 2015 GR-5A (Utilities revenue) | 0.12 | 2-10-2022 | 10,000,000 | 10,000,000 | |
| Long Island Power Authority Series 2015 GR-5A (Utilities revenue) | 0.22 | 3-2-2022 | 10,000,000 | 10,000,000 | |
| Metropolitan Transportation Authority Grant Anticipation Notes Series 2021A (Miscellaneous revenue) | 0.78 | 11-15-2022 | 12,000,000 | 12,000,000 | |
| New York Power Authority Series 3B (Utilities revenue) ☼ | 0.18 | 3-16-2022 | 16,000,000 | 15,996,560 | |
| Port Authority New York & New Jersey Series C (Airport revenue) | 0.23 | 3-1-2022 | 3,835,000 | 3,835,000 | |
| Port Authority New York & New Jersey Series C (Airport revenue) | 0.25 | 4-21-2022 | 9,000,000 | 9,000,000 | |
| 60,831,560 | |||||
| Variable rate demand notes ø: 3.07% | |||||
| Mizuho Floater Residual Certificates Series 2021 (Housing revenue, Mizuho Capital Markets LLC LOC, Mizuho Capital Markets LLC LIQ) 144A | 0.49 | 9-1-2026 | 15,000,000 | 15,000,000 | |
| New York HFA Affordable Housing (Housing revenue, TD Bank NA SPA) | 0.09 | 11-1-2055 | 19,290,000 | 19,290,000 | |
| Taxable Municipal Funding Trust Various States Floaters Series 2021-003 (GO revenue, Barclays Bank plc LOC) 144A | 0.15 | 5-1-2041 | 14,135,000 | 14,135,000 | |
| Taxable Municipal Funding Trust Various States Floaters Series 2021-003 (GO revenue, Barclays Bank plc LOC) 144A | 0.29 | 5-15-2056 | 23,110,000 | 23,110,000 |
| Interest
rate |
Maturitydate | Principal | Value | ||
| Variable rate demand notes ø(continued) | |||||
| Tender Option Bond Trust Receipts/Certificates Series 2021-TPG020 (Tax revenue, Bank of America NA LIQ) 144A | 0.39% | 1-1-2023 | $ 5,000,000 | $ 5,000,000 | |
| Triborough Bridge & Tunnel Authority New York Refunding Bond Series 2018E (Transportation revenue, Bank of America NA LOC) | 0.10 | 11-15-2032 | 11,890,000 | 11,890,000 | |
| 88,425,000 | |||||
| Other: 3.12% | |||||
| Variable rate demand notes ø: 3.12% | |||||
| JPMorgan Chase Puttable Tax-Exempt Receipts/Derivative Inverse Tax-Exempt Receipts & Custodial Receipts Trust Series 5039 (Miscellaneous revenue) | 0.21 | 11-16-2022 | 37,000,000 | 37,000,000 | |
| Taxable Municipal Funding Trust Various States Floaters Series 2019-019 (Health revenue, Barclays Bank plc LOC) 144A | 0.29 | 12-1-2030 | 555,000 | 555,000 | |
| Taxable Municipal Funding Trust Various States Floaters Series 2020-012 (Health revenue, Barclays Bank plc LOC) 144A | 0.15 | 9-1-2030 | 8,455,000 | 8,455,000 | |
| Taxable Municipal Funding Trust Various States Floaters Series 2020-11 (Health revenue, Barclays Bank plc LOC) 144A | 0.29 | 9-1-2030 | 43,770,000 | 43,770,000 | |
| 89,780,000 | |||||
| South Carolina: 0.24% | |||||
| Variable rate demand notes ø: 0.24% | |||||
| South Carolina Public Service Authority (Utilities revenue, Citibank NA LIQ) 144A | 0.16 | 1-1-2050 | 6,900,000 | 6,900,000 | |
| Texas: 2.07% | |||||
| Other municipal debt : 1.46% | |||||
| San Antonio TX Electric & Gas Series A (Utilities revenue) | 0.10 | 2-16-2022 | 25,000,000 | 24,999,013 | |
| San Antonio TX Electric & Gas Series A (Utilities revenue) | 0.15 | 2-17-2022 | 17,000,000 | 17,000,000 | |
| 41,999,013 | |||||
| Variable rate demand notes ø: 0.61% | |||||
| Harris County TX Cultural Education Facilities Finance Corporation Texas Children's Hospital Series 2021C (Health revenue, Bank of America NA SPA) | 0.12 | 10-1-2041 | 17,500,000 | 17,500,000 | |
| Wisconsin: 0.28% | |||||
| Variable rate demand notes ø: 0.28% | |||||
| University of Wisconsin Hospitals and Clinics Authority Revenue Various Refunding Bond Series C (Health revenue, BMO Harris Bank NA SPA) | 0.12 | 4-1-2048 | 8,200,000 | 8,200,000 | |
| Total Municipal obligations (Cost $762,385,910) | 762,385,910 | ||||
| Other instruments: 4.38% | |||||
| 17th Street Rentals LLC §øø | 0.12 | 6-1-2025 | 18,200,000 | 18,200,000 | |
| 2020 Sheu Family Exempt Trust §øø | 0.12 | 7-1-2041 | 9,175,000 | 9,175,000 | |
| AARP §øø | 0.10 | 5-1-2031 | 14,000,000 | 14,000,000 | |
| Altoona Blair County Development Corporation 144A§øø | 0.15 | 4-1-2035 | 5,850,000 | 5,850,000 | |
| Altoona Blair County Development Corporation 144A§øø | 0.15 | 9-1-2038 | 3,000,000 | 3,000,000 |
| Interest
rate |
Maturitydate | Principal | Value | ||
| Other instruments (continued) | |||||
| Fortenbery Children 2017 Irrevocable Trust UTA §øø | 0.12% | 4-1-2026 | $ 9,675,000 | $ 9,675,000 | |
| Keep Memory Alive §øø | 0.15 | 5-1-2037 | 2,760,000 | 2,760,000 | |
| L Ward Huntley Irrevocable Life Insurance Trust §øø | 0.11 | 4-1-2071 | 7,350,000 | 7,350,000 | |
| New Grammercy LLC §øø | 0.12 | 2-1-2061 | 9,800,000 | 9,800,000 | |
| Rock Hill SI LLC §øø | 0.12 | 6-1-2061 | 12,700,000 | 12,700,000 | |
| Royal Bank of Canada §øø | 0.86 | 2-1-2022 | 15,000,000 | 15,000,000 | |
| Solis Seattle LLC §øø | 0.12 | 2-1-2061 | 16,000,000 | 16,000,000 | |
| Southside Brookshore §øø | 0.12 | 9-1-2059 | 2,640,000 | 2,640,000 | |
| Total Other instruments (Cost $126,150,000) | 126,150,000 | ||||
| Other notes: 0.90% | |||||
| Corporate bonds and notes: 0.90% | |||||
| Cellmark Incorporated Taxable Notes Series 2018A §øø | 0.12 | 6-1-2038 | 16,000,000 | 16,000,000 | |
| Jets Stadium Development LLC Series A-4B 144A§øø | 0.17 | 4-1-2047 | 9,940,000 | 9,940,000 | |
| Total Other notes (Cost $25,940,000) | 25,940,000 | ||||
| Repurchase agreements^^: 0.67% | |||||
| TD Securities USA Incorporated, dated 1-31-2022, maturity value $19,250,027 | 0.05 | 2-1-2022 | 19,250,000 | 19,250,000 | |
| Total Repurchase agreements (Cost $19,250,000) | 19,250,000 | ||||
| Total investments in securities (Cost $2,909,913,346) | 101.08% | 2,909,913,346 | |||
| Other assets and liabilities, net | (1.08) | (30,966,300) | |||
| Total net assets | 100.00% | $2,878,947,046 |
| 144A | The security may be resold in transactions exempt from registration, normally to qualified institutional buyers, pursuant to Rule 144A under the Securities Act of 1933. |
| ± | Variable rate investment. The rate shown is the rate in effect at period end. |
| ø | Variable rate demand notes are subject to a demand feature which reduces the effective maturity. The maturity date shown represents the final maturity date of the security. The interest rate is determined and reset by the issuer daily, weekly, or monthly depending upon the terms of the security. The rate shown is the rate in effect at period end. |
| § | The security is subject to a demand feature which reduces the effective maturity. |
| øø | The interest rate is determined and reset by the issuer periodically depending upon the terms of the security. The rate shown is the rate in effect at period end. |
| ^^ | Collateralized by U.S. government securities, 1.50% to 8.00%, 8-1-2022 to 2-1-2052, fair value including accrued interest is $19,827,500. |
| ☼ | Zero coupon security. The rate represents the current yield to maturity. |
| Abbreviations: | |
| AMT | Alternative minimum tax |
| BAM | Build America Mutual Assurance Company |
| FHLB | Federal Home Loan Bank |
| GNMA | Government National Mortgage Association |
| GO | General obligation |
| HEFA | Health & Educational Facilities Authority |
| HFA | Housing Finance Authority |
| IDA | Industrial Development Authority |
| LIQ | Liquidity agreement |
| LOC | Letter of credit |
| MFHR | Multifamily housing revenue |
| OBFR | Overnight Bank Funding Rate |
| SOFR | Secured Overnight Financing Rate |
| SPA | Standby purchase agreement |
| Assets | |
|
Investments in unaffiliated securities, at amortized
cost |
$ 2,909,913,346 |
|
Cash |
16,403 |
|
Receivable for Fund shares
sold |
1,662,368 |
|
Receivable for investments
sold |
960,000 |
|
Receivable for
interest |
404,527 |
|
Receivable from
manager |
83,652 |
|
Prepaid expenses and other
assets |
370,917 |
|
Total
assets |
2,913,411,213 |
| Liabilities | |
|
Payable for investments
purchased |
24,987,625 |
|
Payable for Fund shares
redeemed |
9,118,202 |
|
Administration fees
payable |
248,781 |
|
Dividends
payable |
15,206 |
|
Distribution fee
payable |
808 |
|
Accrued expenses and other
liabilities |
93,545 |
|
Total
liabilities |
34,464,167 |
|
Total net
assets |
$2,878,947,046 |
| Net assets consist of | |
|
Paid-in
capital |
$ 2,879,748,077 |
|
Total distributable
loss |
(801,031) |
|
Total net
assets |
$2,878,947,046 |
| Computation of net asset value per share | |
|
Net assets – Class
A |
$ 434,891,787 |
|
Shares outstanding – Class
A1 |
434,920,884 |
|
Net asset value per share – Class
A |
$1.00 |
|
Net assets – Class
C |
$ 1,960,111 |
|
Shares outstanding – Class
C1 |
1,960,241 |
|
Net asset value per share – Class
C |
$1.00 |
|
Net assets – Premier
Class |
$ 2,431,266,951 |
|
Shares outstanding – Premier
Class1 |
2,431,446,461 |
|
Net asset value per share – Premier
Class |
$1.00 |
|
Net assets – Service
Class |
$ 10,828,197 |
|
Shares outstanding – Service
Class1 |
10,828,910 |
Net
asset value per share – Service
Class |
$1.00 |
| 1 | The Fund has an unlimited number of authorized shares. |
| Investment income | |
|
Interest |
$ 5,973,418 |
| Expenses | |
|
Management
fee |
7,430,884 |
| Administration fees | |
|
Class
A |
1,001,137 |
|
Class
C |
4,788 |
|
Premier
Class |
2,597,523 |
|
Service
Class |
13,560 |
| Shareholder servicing fees | |
|
Class
A |
1,137,656 |
|
Class
C |
5,441 |
|
Service
Class |
27,717 |
| Distribution fee | |
|
Class
C |
16,322 |
|
Custody and accounting
fees |
184,118 |
|
Professional
fees |
62,383 |
|
Registration
fees |
628,206 |
|
Shareholder report
expenses |
102,213 |
|
Trustees’ fees and
expenses |
19,272 |
|
Other fees and
expenses |
63,231 |
|
Total
expenses |
13,294,451 |
| Less: Fee waivers and/or expense reimbursements | |
|
Fund-level |
(6,677,538) |
|
Class
A |
(1,686,119) |
|
Class
C |
(24,332) |
|
Service
Class |
(29,979) |
|
Net
expenses |
4,876,483 |
|
Net investment
income |
1,096,935 |
|
Net realized gains on
investments |
13,887 |
|
Net increase in net assets resulting from
operations |
$ 1,110,822 |
| Year
ended January 31, 2022 |
Year
ended January 31, 2021 | |||
| Operations | ||||
|
Net investment
income |
$ 1,096,935 | $ 17,417,772 | ||
|
Payment from
affiliate |
0 | 1,222 | ||
|
Net realized gains (losses) on
investments |
13,887 | (563,831) | ||
|
Net increase in net assets resulting from
operations |
1,110,822 | 16,855,163 | ||
| Distributions to shareholders from | ||||
| Net investment income and net realized gains | ||||
|
Class
A |
(45,509) | (1,268,127) | ||
|
Class
C |
(218) | (2,802) | ||
|
Premier
Class |
(1,050,078) | (16,125,602) | ||
|
Service
Class |
(1,130) | (37,293) | ||
|
Total distributions to
shareholders |
(1,096,935) | (17,433,824) | ||
| Capital share transactions | Shares | Shares | ||
| Proceeds from shares sold | ||||
|
Class
A |
116,628,006 | 116,628,006 | 221,976,995 | 221,976,995 |
|
Class
C |
1,408,108 | 1,408,108 | 5,242,042 | 5,242,042 |
|
Premier
Class |
1,050,830,115 | 1,050,830,115 | 7,562,687,659 | 7,562,687,659 |
|
Service
Class |
946,410 | 946,410 | 1,788,741 | 1,788,741 |
| 1,169,812,639 | 7,791,695,437 | |||
| Reinvestment of distributions | ||||
|
Class
A |
37,827 | 37,827 | 1,277,953 | 1,277,953 |
|
Class
C |
203 | 203 | 2,835 | 2,835 |
|
Premier
Class |
1,028,386 | 1,028,386 | 16,201,117 | 16,201,117 |
|
Service
Class |
994 | 994 | 37,293 | 37,293 |
| 1,067,410 | 17,519,198 | |||
| Payment for shares redeemed | ||||
|
Class
A |
(148,324,202) | (148,324,202) | (231,789,213) | (231,789,213) |
|
Class
C |
(2,303,589) | (2,303,589) | (5,542,212) | (5,542,212) |
|
Premier
Class |
(3,073,049,703) | (3,073,049,703) | (5,309,546,817) | (5,309,546,817) |
|
Service
Class |
(2,081,671) | (2,081,671) | (1,898,691) | (1,898,691) |
| (3,225,759,165) | (5,548,776,933) | |||
|
Net increase (decrease) in net assets resulting from capital share
transactions |
(2,054,879,116) | 2,260,437,702 | ||
|
Total increase (decrease) in net
assets |
(2,054,865,229) | 2,259,859,041 | ||
| Net assets | ||||
|
Beginning of
period |
4,933,812,275 | 2,673,953,234 | ||
|
End of
period |
$ 2,878,947,046 | $ 4,933,812,275 | ||
| Year ended January 31 | |||||
| Class A | 2022 | 2021 | 2020 | 2019 | 2018 |
|
Net asset value, beginning of
period |
$1.00 | $1.00 | $1.00 | $1.00 | $1.00 |
|
Net investment
income |
0.00 1 | 0.00 1 | 0.02 | 0.02 | 0.01 |
|
Net realized gains (losses) on
investments |
0.00 1 | (0.00) 2 | 0.00 1 | 0.00 1 | 0.00 1 |
|
Total from investment
operations |
0.00 1 | 0.00 1 | 0.02 | 0.02 | 0.01 |
| Distributions to shareholders from | |||||
|
Net investment
income |
(0.00) 1 | (0.00) 1 | (0.02) | (0.02) | (0.01) |
|
Net realized
gains |
0.00 | (0.00) 1 | 0.00 | 0.00 | 0.00 |
|
Total distributions to
shareholders |
(0.00) 1 | (0.00) 1 | (0.02) | (0.02) | (0.01) |
|
Net asset value, end of
period |
$1.00 | $1.00 | $1.00 | $1.00 | $1.00 |
|
Total
return |
0.01% | 0.27% | 1.76% | 1.61% | 0.64% |
| Ratios to average net assets (annualized) | |||||
|
Gross
expenses |
0.70% | 0.68% | 0.70% | 0.76% | 0.85% |
|
Net
expenses |
0.15% * | 0.40% * | 0.60% | 0.62% | 0.65% |
|
Net investment
income |
0.01% | 0.27% | 1.74% | 1.60% | 0.63% |
| Supplemental data | |||||
|
Net assets, end of period (000s
omitted) |
$434,892 | $466,559 | $475,180 | $474,040 | $462,416 |
| * | Ratio includes class-level expenses which were voluntarily waived by the investment manager. Without this voluntary waiver, the net expense ratio would be increased by the following amounts: |
| Year ended January 31, 2022 | 0.45% |
| Year ended January 31, 2021 | 0.18% |
| 1 | Amount is less than $0.005. |
| 2 | Amount is more than $(0.005) |
| Year ended January 31 | |||||
| Class C | 2022 | 2021 | 2020 | 2019 | 2018 |
|
Net asset value, beginning of
period |
$1.00 | $1.00 | $1.00 | $1.00 | $1.00 |
|
Net investment
income |
0.00 1 | 0.00 1 | 0.01 | 0.01 | 0.00 1 |
|
Payment from
affiliate |
0.00 | 0.00 1 | 0.00 | 0.00 | 0.00 |
|
Net realized gains (losses) on
investments |
0.00 1 | 0.00 1 | 0.00 1 | 0.00 1 | 0.00 1 |
|
Total from investment
operations |
0.00 1 | 0.00 1 | 0.01 | 0.01 | 0.00 1 |
| Distributions to shareholders from | |||||
|
Net investment
income |
(0.00) 1 | (0.00) 1 | (0.01) | (0.01) | (0.00) 1 |
|
Net realized
gains |
0.00 | (0.00) 1 | 0.00 | 0.00 | 0.00 |
|
Total distributions to
shareholders |
(0.00) 1 | (0.00) 1 | (0.01) | (0.01) | (0.00) 1 |
|
Net asset value, end of
period |
$1.00 | $1.00 | $1.00 | $1.00 | $1.00 |
|
Total
return |
0.01% | 0.08% 2 | 1.00% | 0.84% | 0.04% |
| Ratios to average net assets (annualized) | |||||
|
Gross
expenses |
1.45% | 1.43% | 1.45% | 1.51% | 1.60% |
|
Net
expenses |
0.15% * | 0.59% * | 1.35% | 1.37% | 1.23% |
|
Net investment
income |
0.01% | 0.07% | 1.03% | 0.87% | 0.03% |
| Supplemental data | |||||
|
Net assets, end of period (000s
omitted) |
$1,960 | $2,855 | $3,153 | $8,229 | $7,763 |
| * | Ratio includes class-level expenses which were voluntarily waived by the investment manager. Without this voluntary waiver, the net expense ratio would be increased by the following amounts: |
| Year ended January 31, 2022 | 1.20% |
| Year ended January 31, 2021 | 0.76% |
| 1 | Amount is less than $0.005. |
| 2 | During the year ended January 31, 2021, the Fund received a payment from an affiliate which had a 0.04% impact on the total return. See Note 4 in the Notes to Financial Statements for additional information. |
| Year ended January 31 | |||||
| Premier Class | 2022 | 2021 | 2020 | 2019 | 2018 |
|
Net asset value, beginning of
period |
$1.00 | $1.00 | $1.00 | $1.00 | $1.00 |
|
Net investment
income |
0.00 1 | 0.01 | 0.02 | 0.02 | 0.01 |
|
Net realized gains (losses) on
investments |
0.00 1 | (0.00) 2 | 0.00 1 | 0.00 1 | 0.00 1 |
|
Total from investment
operations |
0.00 1 | 0.01 | 0.02 | 0.02 | 0.01 |
| Distributions to shareholders from | |||||
|
Net investment
income |
(0.00) 1 | (0.01) | (0.02) | (0.02) | (0.01) |
|
Net realized
gains |
0.00 | (0.00) 1 | 0.00 | 0.00 | 0.00 |
|
Total distributions to
shareholders |
(0.00) 1 | (0.01) 1 | (0.02) | (0.02) | (0.01) |
|
Net asset value, end of
period |
$1.00 | $1.00 | $1.00 | $1.00 | $1.00 |
|
Total
return |
0.03% | 0.54% | 2.20% | 2.03% | 1.09% |
| Ratios to average net assets (annualized) | |||||
|
Gross
expenses |
0.31% | 0.29% | 0.30% | 0.33% | 0.45% |
|
Net
expenses |
0.13% | 0.13% 3 | 0.15% | 0.20% | 0.20% |
|
Net investment
income |
0.03% | 0.41% | 1.99% | 2.26% | 1.08% |
| Supplemental data | |||||
|
Net assets, end of period (000s
omitted) |
$2,431,267 | $4,452,436 | $2,183,582 | $295,962 | $101 |
| 1 | Amount is less than $0.005. |
| 2 | Amount is more than $(0.005) |
| 3 | During the year ended January 31, 2021, class-level expenses were voluntarily waived by the investment manager. Without this voluntary waiver, the net expense ratio would have been 0.07% higher. |
| Year ended January 31 | |||||
| Service Class | 2022 | 2021 | 2020 | 2019 | 2018 |
|
Net asset value, beginning of
period |
$1.00 | $1.00 | $1.00 | $1.00 | $1.00 |
|
Net investment
income |
0.00 1 | 0.00 1 | 0.02 | 0.02 | 0.01 |
|
Net realized gains (losses) on
investments |
0.00 1 | (0.00) 2 | 0.00 1 | 0.00 1 | 0.00 1 |
|
Total from investment
operations |
0.00 1 | 0.00 1 | 0.02 | 0.02 | 0.01 |
| Distributions to shareholders from | |||||
|
Net investment
income |
(0.00) 1 | (0.00) 1 | (0.02) | (0.02) | (0.01) |
|
Net realized
gains |
0.00 | (0.00) 1 | 0.00 | 0.00 | 0.00 |
|
Total distributions to
shareholders |
(0.00) 1 | (0.00) 1 | (0.02) | (0.02) | (0.01) |
|
Net asset value, end of
period |
$1.00 | $1.00 | $1.00 | $1.00 | $1.00 |
|
Total
return |
0.01% | 0.31% | 1.86% | 1.72% | 0.79% |
| Ratios to average net assets (annualized) | |||||
|
Gross
expenses |
0.59% | 0.58% | 0.60% | 0.66% | 0.74% |
|
Net
expenses |
0.15% * | 0.36% * | 0.50% | 0.50% | 0.50% |
|
Net investment
income |
0.01% | 0.31% | 1.84% | 1.71% | 0.74% |
| Supplemental data | |||||
|
Net assets, end of period (000s
omitted) |
$10,828 | $11,963 | $12,038 | $11,884 | $11,910 |
| * | Ratio includes class-level expenses which were voluntarily waived by the investment manager. Without this voluntary waiver, the net expense ratio would be increased by the following amounts: |
| Year ended January 31, 2022 | 0.35% |
| Year ended January 31, 2021 | 0.12% |
| 1 | Amount is less than $0.005. |
| 2 | Amount is more than $(0.005) |
| Paid-in capital | Total
distributable loss |
| $(4,602) | $4,602 |
| ■ | Level 1 – quoted prices in active markets for identical securities |
| ■ | Level 2 – other significant observable inputs (including quoted prices for similar securities, interest rates, prepayment speeds, credit risk, etc.) |
| ■ | Level 3 – significant unobservable inputs (including the Fund’s own assumptions in determining the fair value of investments) |
| Quoted
prices (Level 1) |
Other
significant observable inputs (Level 2) |
Significant
unobservable inputs (Level 3) |
Total | |
| Assets | ||||
| Investments in: | ||||
| Certificates of deposit | $0 | $ 772,985,937 | $0 | $ 772,985,937 |
| Closed end municipal bond fund obligations | 0 | 34,000,000 | 0 | 34,000,000 |
| Commercial paper | 0 | 1,169,201,499 | 0 | 1,169,201,499 |
| Municipal obligations | 0 | 762,385,910 | 0 | 762,385,910 |
| Other instruments | 0 | 126,150,000 | 0 | 126,150,000 |
| Other notes | 0 | 25,940,000 | 0 | 25,940,000 |
| Repurchase agreements | 0 | 19,250,000 | 0 | 19,250,000 |
| Total assets | $0 | $2,909,913,346 | $0 | $2,909,913,346 |
| Average daily net assets | Management fee |
| First $5 billion | 0.200% |
| Next $5 billion | 0.190 |
| Over $10 billion | 0.180 |
| Class-level
administration fee | |
| Class A | 0.22% |
| Class C | 0.22 |
| Premier Class | 0.08 |
| Service Class | 0.12 |
| Expense ratio caps | |
| Class A | 0.60% |
| Class C | 1.35 |
| Premier Class | 0.20 |
| Service Class | 0.50 |
Allspring Funds Trust:

| Shares voted “For” | 1,698,918,179 |
| Shares voted “Against” | 140,003,926 |
| Shares voted “Abstain” | 169,666,931 |
| Shares voted “For” | 1,681,732,977 |
| Shares voted “Against” | 156,025,933 |
| Shares voted “Abstain” | 170,830,126 |
| Shares voted “For” | 1,632,774,001 |
| Shares voted “Against” | 200,359,533 |
| Shares voted “Abstain” | 175,455,502 |
| Name
and year of birth |
Position
held and length of service* |
Principal occupations during past five years or longer | Current
other public company or investment company directorships |
| William
R. Ebsworth (Born 1957) |
Trustee,
since 2015 |
Retired. From 1984 to 2013, equities analyst, portfolio manager, research director and chief investment officer at Fidelity Management and Research Company in Boston, Tokyo, and Hong Kong, and retired in 2013 as Chief Investment Officer of Fidelity Strategic Advisers, Inc. where he led a team of investment professionals managing client assets. Prior thereto, Board member of Hong Kong Securities Clearing Co., Hong Kong Options Clearing Corp., the Thailand International Fund, Ltd., Fidelity Investments Life Insurance Company, and Empire Fidelity Investments Life Insurance Company. Audit Committee Chair and Investment Committee Chair of the Vincent Memorial Hospital Endowment (non-profit organization). Mr. Ebsworth is a CFA® charterholder. | N/A |
| Jane
A. Freeman (Born 1953) |
Trustee,
since 2015; Chair Liaison, since 2018 |
Retired. From 2012 to 2014 and 1999 to 2008, Chief Financial Officer of Scientific Learning Corporation. From 2008 to 2012, Ms. Freeman provided consulting services related to strategic business projects. Prior to 1999, Portfolio Manager at Rockefeller & Co. and Scudder, Stevens & Clark. Board member of the Harding Loevner Funds from 1996 to 2014, serving as both Lead Independent Director and chair of the Audit Committee. Board member of the Russell Exchange Traded Funds Trust from 2011 to 2012 and the chair of the Audit Committee. Ms. Freeman is also an inactive Chartered Financial Analyst. | N/A |
| Isaiah
Harris, Jr. (Born 1952) |
Trustee,
since 2009; Audit Committee Chair, since 2019 |
Retired. Chairman of the Board of CIGNA Corporation from 2009 to 2021, and Director from 2005 to 2008. From 2003 to 2011, Director of Deluxe Corporation. Prior thereto, President and CEO of BellSouth Advertising and Publishing Corp. from 2005 to 2007, President and CEO of BellSouth Enterprises from 2004 to 2005 and President of BellSouth Consumer Services from 2000 to 2003. Emeritus member of the Iowa State University Foundation Board of Governors. Emeritus Member of the Advisory Board of Iowa State University School of Business. Advisory Board Member, Palm Harbor Academy (private school). Advisory Board Member, Fellowship of Christian Athletes. Mr. Harris is a certified public accountant (inactive status). | N/A |
| David
F. Larcker (Born 1950) |
Trustee,
since 2009 |
James Irvin Miller Professor of Accounting at the Graduate School of Business (Emeritus), Stanford University, Director of the Corporate Governance Research Initiative and Senior Faculty of The Rock Center for Corporate Governance since 2006. From 2005 to 2008, Professor of Accounting at the Graduate School of Business, Stanford University. Prior thereto, Ernst & Young Professor of Accounting at The Wharton School, University of Pennsylvania from 1985 to 2005. | N/A |
| Name
and year of birth |
Position
held and length of service* |
Principal occupations during past five years or longer | Current
other public company or investment company directorships |
| Olivia
S. Mitchell (Born 1953) |
Trustee,
since 2006; Nominating and Governance Committee Chair, since 2018 |
International Foundation of Employee Benefit Plans Professor since 1993, Wharton School of the University of Pennsylvania. Director of Wharton’s Pension Research Council and Boettner Center on Pensions & Retirement Research, and Research Associate at the National Bureau of Economic Research. Previously taught at Cornell University from 1978 to 1993. | N/A |
| Timothy
J. Penny (Born 1951) |
Trustee,
since 1996; Chair, since 2018 |
President and Chief Executive Officer of Southern Minnesota Initiative Foundation, a non-profit organization, since 2007. Member of the Board of Trustees of NorthStar Education Finance, Inc., a non-profit organization, since 2007. | N/A |
| James
G. Polisson (Born 1959) |
Trustee,
since 2018 |
Retired. Chief Marketing Officer, Source (ETF) UK Services, Ltd, from 2015 to 2017. From 2012 to 2015, Principal of The Polisson Group, LLC, a management consulting, corporate advisory and principal investing company. Chief Executive Officer and Managing Director at Russell Investments, Global Exchange Traded Funds from 2010 to 2012. Managing Director of Barclays Global Investors from 1998 to 2010 and Global Chief Marketing Officer for iShares and Barclays Global Investors from 2000 to 2010. Trustee of the San Francisco Mechanics’ Institute, a non-profit organization, from 2013 to 2015. Board member of the Russell Exchange Traded Fund Trust from 2011 to 2012. Director of Barclays Global Investors Holdings Deutschland GmbH from 2006 to 2009. Mr. Polisson is an attorney and has a retired status with the Massachusetts and District of Columbia Bar Associations. | N/A |
| Pamela
Wheelock (Born 1959) |
Trustee,
since January 2020; previously Trustee from January 2018 to July 2019 |
Board member of the Destination Medical Center Economic Development Agency, Rochester, Minnesota since 2019. Interim President of the McKnight Foundation from January to September 2020. McKnight Foundation Consultant, November 2020 to February 2021. Acting Commissioner, Minnesota Department of Human Services, July 2019 through September 2019. Consultant (part-time), Minnesota Department of Human Services, October 2019 through December 2019. Chief Operating Officer, Twin Cities Habitat for Humanity from 2017 to 2019. Vice President of University Services, University of Minnesota from 2012 to 2016. Prior thereto, on the Board of Directors, Governance Committee and Finance Committee for the Minnesota Philanthropy Partners (Saint Paul Foundation) from 2012 to 2018, Interim Chief Executive Officer of Blue Cross Blue Shield of Minnesota from 2011 to 2012, Chairman of the Board from 2009 to 2012 and Board Director from 2003 to 2015. Vice President, Leadership and Community Engagement, Bush Foundation, Saint Paul, Minnesota (a private foundation) from 2009 to 2011. Executive Vice President and Chief Financial Officer, Minnesota Sports and Entertainment from 2004 to 2009 and Senior Vice President from 2002 to 2004. Executive Vice President of the Minnesota Wild Foundation from 2004 to 2008. Commissioner of Finance, State of Minnesota, from 1999 to 2002. Currently Board Chair of the Minnesota Wild Foundation since 2010. | N/A |
| Name
and year of birth |
Position
held and length of service |
Principal occupations during past five years or longer |
| Andrew
Owen (Born 1960) |
President,
since 2017 |
President, Chief Executive Officer and Director of Allspring Funds Management, LLC since 2017 and co-president of Galliard Capital Management, LLC, an affiliate of Allspring Funds Management, LLC, since 2019. Prior thereto, Head of Affiliated Managers, Allspring Global Investments, from 2014 to 2019 and Executive Vice President responsible for marketing, investments and product development for Allspring Funds Management, LLC, from 2009 to 2014. In addition, Mr. Owen was an Executive Vice President of Wells Fargo & Company from 2014 to 2021. |
| Jeremy
DePalma (Born 1974) |
Treasurer,
since 2012 (for certain funds in the Fund Complex); since 2021 (for the remaining funds in the Fund Complex) |
Senior Vice President of Allspring Funds Management, LLC since 2009. Senior Vice President of Evergreen Investment Management Company, LLC from 2008 to 2010 and head of the Fund Reporting and Control Team within Fund Administration. |
| Kate
McKinley (Born 1977) |
Chief
Legal Officer, since 2021 |
Chief Legal Officer of Allspring Global Investments since 2021. Prior thereto, held various roles at State Street Global Advisors beginning in 2010, including serving as Senior Vice President and General Counsel from 2019 to 2021, and Chief Operating Officer of the Institutional Client Group from 2016 - 2019. Prior to working at State Street Global Advisors served as Assistant General Counsel for Bank of America Corporation from 2005 to 2010 and as an Associate at WilmerHale from 2002 to 2005. |
| Christopher
Baker (Born 1976) |
Chief Compliance Officer, since 2022 | Global Chief Compliance Officer for Allspring Global Investments since 2022. Prior thereto, Chief Compliance Officer for State Street Global Advisors from 2018 to 2021. Senior Compliance Officer for the State Street divisions of Alternative Investment Solutions, Sector Solutions, and Global Marketing from 2015 to 2018. From 2010 to 2015 Vice President, Global Head of Investment and Marketing Compliance for State Street Global Advisors. |
| Matthew
Prasse (Born 1983) |
Secretary,
since 2021 |
Senior Counsel of the Allspring Legal Department since 2021. Senior Counsel of the Wells Fargo Legal Department from 2018 to 2021. Previously, Counsel for Barings LLC from 2015 to 2018. Prior to joining Barings, Associate at Morgan, Lewis & Bockius LLP from 2008 to 2015. |
P.O. Box 219967
Kansas City, MO 64121-9967
1-800-222-8222 or visit the Fund's website at allspringglobal.com. Read the prospectus carefully before you invest or send money.
A306/AR306 01-22

| ■ | Allspring Municipal Cash Management Money Market Fund |
|
|
2 |
|
|
6 |
|
|
11 |
|
|
12 |
| Financial statements | |
|
|
21 |
|
|
22 |
|
|
23 |
|
|
24 |
|
|
27 |
|
|
32 |
|
|
33 |

| 1 | The S&P 500 Index consists of 500 stocks chosen for market size, liquidity, and industry group representation. It is a market-value-weighted index with each stock's weight in the index proportionate to its market value. You cannot invest directly in an index. |
| 2 | The Morgan Stanley Capital International (MSCI) All Country World Index (ACWI) ex USA Index (Net) is a free-float-adjusted market-capitalization-weighted index that is designed to measure the equity market performance of developed and emerging markets, excluding the U.S. Source: MSCI. MSCI makes no express or implied warranties or representations and shall have no liability whatsoever with respect to any MSCI data contained herein. The MSCI data may not be further redistributed or used as a basis for other indexes or any securities or financial products. This report is not approved, reviewed, or produced by MSCI. You cannot invest directly in an index. |
| 3 | The MSCI Emerging Markets (EM) Index (Net) (USD) is a free-float-adjusted market-capitalization-weighted index that is designed to measure equity market performance of emerging markets. You cannot invest directly in an index. |
| 4 | The Bloomberg U.S. Aggregate Bond Index is a broad-based benchmark that measures the investment-grade, U.S.-dollar-denominated, fixed-rate taxable bond market, including Treasuries, government-related and corporate securities, mortgage-backed securities (agency fixed-rate and hybrid adjustable-rate mortgage pass-throughs), asset-backed securities, and commercial mortgage-backed securities. You cannot invest directly in an index. |
| 5 | The Bloomberg Global Aggregate ex-USD Index (unhedged) is an unmanaged index that provides a broad-based measure of the global investment-grade fixed-income markets excluding the U.S.-dollar-denominated debt market. You cannot invest directly in an index. |
| 6 | The Bloomberg Municipal Bond Index is an unmanaged index composed of long-term tax-exempt bonds with a minimum credit rating of Baa. You cannot invest directly in an index. |
| 7 | The ICE BofA U.S. High Yield Index is a market-capitalization-weighted index of domestic and Yankee high-yield bonds. The index tracks the performance of high-yield securities traded in the U.S. bond market. You cannot invest directly in an index. Copyright 2022. ICE Data Indices, LLC. All rights reserved. |
| 1 | The Consumer Price Index (CPI) is a measure of the average change over time in the prices paid by urban consumers for a market basket of consumer goods and services. You cannot invest directly in an index. |

President
Allspring Funds
| 1 | As of December 31, 2021, assets under management (AUM) includes $91.6 billion from Galliard Capital Management, LLC, an investment advisor that is not part of the Allspring trade name/GIPS firm. |
| Investment objective | The Fund seeks current income exempt from regular federal income tax, while preserving capital and liquidity. |
| Manager | Allspring Funds Management, LLC |
| Subadviser | Allspring Global Investments, LLC |
| Portfolio managers | James Randazzo, Jeffrey L. Weaver, CFA®‡ |
| Average annual total returns (%) as of January 31, 2022 | ||||||
| Expense ratios1 (%) | ||||||
| Inception date | 1 year | 5 year | 10 year | Gross | Net 2 | |
| Administrator Class (WUCXX) | 7-9-2010 | 0.05 * | 0.73 | 0.41 | 0.44 | 0.30 |
| Institutional Class (EMMXX) | 11-20-1996 | 0.04 | 0.80 | 0.46 | 0.32 | 0.20 |
| Service Class (EISXX) | 11-25-1996 | 0.05 | 0.66 | 0.36 | 0.61 | 0.45 |
| * | Total return differs from the return in the Financial Highlights in this report. The total return presented is calculated based on the NAV at which the shareholder transactions were processed. The NAV and total return presented in the Financial Highlights reflects certain adjustments made to the net assets of the Fund that are necessary under U.S. generally accepted accounting principles. |
| 1 | Reflects the expense ratios as stated in the most recent prospectuses. The expense ratios shown are subject to change and may differ from the annualized expense ratios shown in the financial highlights of this report. |
| 2 | The manager has contractually committed through May 31, 2022, to waive fees and/or reimburse expenses to the extent necessary to cap total annual fund operating expenses after fee waivers at 0.30% for Administrator Class, 0.20% for Institutional Class and 0.45% for Service Class. Brokerage commissions, stamp duty fees, interest, taxes, acquired fund fees and expenses (if any), and extraordinary expenses are excluded from the expense caps. Prior to or after the commitment expiration date, the caps may be increased or the commitment to maintain the caps may be terminated only with the approval of the Board of Trustees. The manager and/or its affiliates may also voluntarily waive all or a portion of any fees to which they are entitled and/or reimburse certain expenses as they may determine from time to time. Without these caps, the Fund’s returns would have been lower. The expense ratio paid by an investor is the net expense ratio (the total annual fund operating expenses after fee waivers) as stated in the prospectuses. |
| Yield summary (%) as of January 31, 2022 | |||
| Administrator
Class |
Institutional
Class |
Service
Class | |
| 7-day current yield1 | 0.01 | 0.01 | 0.01 |
| 7-day compound yield | 0.01 | 0.01 | 0.01 |
| 30-day simple yield | 0.01 | 0.01 | 0.01 |
| 30-day compound yield | 0.01 | 0.01 | 0.01 |
| 1 | The manager has contractually committed through May 31, 2022, to waive fees and/or reimburse expenses to the extent necessary to cap total annual fund operating expenses and may also voluntarily waive or reimburse additional fees and expenses which may be discontinued or modified at any time without notice. Without these reductions, the Fund’s 7-day current yield would have been -0.31%, -0.19% and -0.39% for Administrator Class, Institutional Class and Service Class, respectively. |
| ‡ | CFA® and Chartered Financial Analyst® are trademarks owned by CFA Institute. |
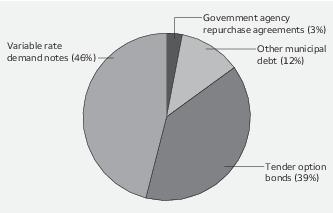
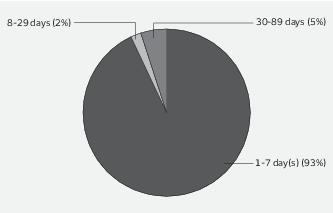
| * | The Securities Industry and Financial Markets Association (SIFMA) Municipal Swap Index (SIFMA Index) is a seven-day high-grade market index composed of tax-exempt variable-rate demand obligations with certain characteristics. The index is calculated and published by Bloomberg. The index is overseen by SIFMA’s Municipal Swap Index Committee. You cannot invest directly in an index. |
| ** | Variable Rate Demand Notes (VRDNs) are debt securities commonly held within certain mutual funds. Like all bonds, VRDN values fluctuate in response to the financial condition of individual issuers, general market and economic conditions, and changes in interest rates. Changes in market conditions and government policies may lead to periods of heightened volatility in the bond market and reduced liquidity for certain bonds. In general, when interest rates rise, bond values fall and investors may lose principal value. Interest rate changes can be sudden and unpredictable. In addition to credit and interest rate risk, VRDNs are subject to municipal securities risk. |
| Beginning
account value 8-1-2021 |
Ending
account value 1-31-2022 |
Expenses
paid during the period1 |
Annualized
net expense ratio | |
| Administrator Class | ||||
| Actual | $1,000.00 | $1,000.10 | $0.40 | 0.08% |
| Hypothetical (5% return before expenses) | $1,000.00 | $1,024.80 | $0.41 | 0.08% |
| Institutional Class | ||||
| Actual | $1,000.00 | $1,000.10 | $0.40 | 0.08% |
| Hypothetical (5% return before expenses) | $1,000.00 | $1,024.80 | $0.41 | 0.08% |
| Service Class | ||||
| Actual | $1,000.00 | $1,000.10 | $0.40 | 0.08% |
| Hypothetical (5% return before expenses) | $1,000.00 | $1,024.80 | $0.41 | 0.08% |
| Principal | Value | ||||
| Closed end municipal bond fund obligations: 2.59% | |||||
| Nuveen AMT-Free Municipal Credit Income Fund MuniFund Preferred Shares Series D (20 shares) 0.26% 144Aø | $ 2,000,000 | $ 2,000,000 | |||
| Nuveen California AMT-Free Quality Municipal Income Fund MuniFund Preferred Shares Series A (30 shares) 0.15% 144Aø | 3,000,000 | 3,000,000 | |||
| Nuveen Quality Municipal Income Fund Series 1-2118 (40 shares) 0.15% 144Aø | 4,000,000 | 4,000,000 | |||
| Total Closed end municipal bond fund obligations (Cost $9,000,000) | 9,000,000 |
| Interest
rate |
Maturity
date |
||||
| Municipal obligations: 94.10% | |||||
| Arizona: 2.72% | |||||
| Variable rate demand notes ø: 2.72% | |||||
| Arizona Health Facility Authority Floater Series 2015 XF 2050 (Health revenue, Morgan Stanley Bank LIQ) 144A | 0.09% | 1-1-2037 | 2,000,000 | 2,000,000 | |
| Maricopa County AZ IDA Solid Waste Disposal Series 2006 (Resource recovery revenue, Farm Credit Services America LOC) | 0.11 | 8-1-2026 | 2,500,000 | 2,500,000 | |
| Pinal County AZ IDA Shamrock Farms Project (Resource recovery revenue, Farm Credit Services America LOC) | 0.14 | 8-1-2022 | 3,700,000 | 3,700,000 | |
| Pinal County AZ IDA Solid Waste Disposal Feenstra Investments LLC Project Series 2002 (Resource recovery revenue, Farm Credit Services America LOC) | 0.14 | 8-1-2027 | 1,250,000 | 1,250,000 | |
| 9,450,000 | |||||
| California: 6.88% | |||||
| Other municipal debt : 4.33% | |||||
| Los Angeles CA Department Airports Revenue Subordinated Bond Series A2 (Airport revenue) | 0.07 | 2-3-2022 | 7,000,000 | 7,000,015 | |
| San Jose CA International Airport Series B (Airport revenue) | 0.12 | 2-3-2022 | 8,000,000 | 8,000,022 | |
| 15,000,037 | |||||
| Variable rate demand notes ø: 2.55% | |||||
| Modesto CA MFHR Live Oak Apartments Project (Tax revenue, FNMA Insured, FNMA LIQ) | 0.12 | 9-15-2024 | 230,000 | 230,000 | |
| Tender Option Bond Trust Receipts/Floater Certificates Series 2016-XX1040 (Miscellaneous revenue, Barclays Bank plc LIQ) 144A | 0.08 | 2-1-2046 | 4,160,000 | 4,160,000 | |
| Tender Option Bond Trust Receipts/Floater Certificates Series 2020-MIZ9012 (Housing revenue, Mizuho Capital Markets LLC LIQ) 144A | 0.31 | 10-1-2036 | 4,455,000 | 4,455,000 | |
| 8,845,000 |
| Interest
rate |
Maturity
date |
Principal | Value | ||
| Colorado: 1.02% | |||||
| Variable rate demand notes ø: 1.02% | |||||
| Colorado ECFA Series F-2 (Miscellaneous revenue, Northern Trust Company LOC) | 0.13% | 7-1-2041 | $ 3,395,000 | $ 3,395,000 | |
| Colorado Springs CO Utilities System Improvement Bonds Series 2008A (Utilities revenue, U.S. Bank NA SPA) | 0.06 | 11-1-2038 | 135,000 | 135,000 | |
| 3,530,000 | |||||
| Connecticut: 0.12% | |||||
| Other municipal debt : 0.12% | |||||
| North Branford CT BAN (GO revenue) | 2.00 | 8-4-2022 | 400,000 | 402,927 | |
| District of Columbia: 1.15% | |||||
| Variable rate demand notes ø: 1.15% | |||||
| Tender Option Bond Trust Receipts/Floater Certificates Series 2018-XF0621 (Water & sewer revenue, Royal Bank of Canada LIQ) 144A | 0.09 | 4-1-2026 | 4,000,000 | 4,000,000 | |
| Florida: 3.56% | |||||
| Variable rate demand notes ø: 3.56% | |||||
| St. Lucie County FL Power & Light Company (Industrial development revenue) | 0.10 | 9-1-2028 | 5,000,000 | 5,000,000 | |
| Tender Option Bond Trust Receipts/Floater Certificates Series 2017-TX1073 (Housing revenue, GNMA / FNMA / FHLMC Insured, Barclays Bank plc LIQ) 144A | 0.09 | 7-1-2037 | 4,335,000 | 4,335,000 | |
| Tender Option Bond Trust Receipts/Floater Certificates Series 2018-XG0173 (Health revenue, Credit Suisse LIQ) 144A | 0.11 | 10-1-2025 | 3,000,000 | 3,000,000 | |
| 12,335,000 | |||||
| Georgia: 0.84% | |||||
| Variable rate demand notes ø: 0.84% | |||||
| Roswell GA Housing Authority Refunding Bonds Belcourt Limited Project A (Housing revenue, Northern Trust Company LOC) | 0.07 | 9-1-2027 | 2,900,000 | 2,900,000 | |
| Idaho: 1.15% | |||||
| Variable rate demand notes ø: 1.15% | |||||
| Idaho Health Facilities Authority Hospital Trinity Health Credit Group Series D (Health revenue) | 0.10 | 12-1-2048 | 4,000,000 | 4,000,000 | |
| Illinois: 10.52% | |||||
| Variable rate demand notes ø: 10.52% | |||||
| Illinois Educational Facilities Authority Aurora University (Education revenue, BMO Harris Bank NA LOC) | 0.07 | 3-1-2032 | 5,800,000 | 5,800,000 | |
| Illinois Finance Authority American College of Surgeons (Education revenue, Northern Trust Company LOC) | 0.06 | 8-1-2026 | 2,676,000 | 2,676,000 | |
| Illinois Finance Authority Revenue Various Refunding Bond Northwestern Memorial (Health revenue, Barclays Bank plc SPA) | 0.12 | 7-15-2055 | 2,150,000 | 2,150,000 | |
| Peoria County IL Caterpillar Incorporated Project (Industrial development revenue) | 0.24 | 2-1-2030 | 4,300,000 | 4,300,000 |
| Interest
rate |
Maturity
date |
Principal | Value | ||
| Variable rate demand notes ø(continued) | |||||
| Royal Bank of Canada Municipal Products Incorporated Trust Series E-151 (Miscellaneous revenue, Royal Bank of Canada LOC, Royal Bank of Canada LIQ) 144A | 0.10% | 11-30-2023 | $10,000,000 | $ 10,000,000 | |
| Tender Option Bond Trust Receipts/Floater Certificates (Miscellaneous revenue, Bank of America NA LIQ) 144A | 0.11 | 3-1-2046 | 1,550,000 | 1,550,000 | |
| Tender Option Bond Trust Receipts/Floater Certificates Series 2018-XM0683 (Tax revenue, Bank of America NA LIQ) 144A | 0.20 | 1-1-2048 | 5,000,000 | 5,000,000 | |
| Tender Option Bond Trust Receipts/Floater Certificates Series 2019-XF0779 (Tax revenue, BAM Insured, TD Bank NA LIQ) 144A | 0.11 | 1-1-2048 | 5,000,000 | 5,000,000 | |
| 36,476,000 | |||||
| Indiana: 1.80% | |||||
| Variable rate demand notes ø: 1.80% | |||||
| Indiana Finance Authority Duke Energy Indiana Incorporated Series 2009A-4 (Industrial development revenue, Sumitomo Mitsui Banking Corporation LOC) | 0.12 | 12-1-2039 | 2,500,000 | 2,500,000 | |
| Jeffersonville IN Economic Development Eagle Steel Products Incorporated Project (Industrial development revenue, Bank of America NA LOC) | 0.13 | 12-1-2027 | 2,000,000 | 2,000,000 | |
| Noblesville IN Greystone Apartments Project Series B (Housing revenue, FHLB LOC) | 0.12 | 3-1-2041 | 1,295,000 | 1,295,000 | |
| St. Joseph County IN Midcorr Land Development LLC Project (Industrial development revenue, PNC Bank NA LOC) | 0.09 | 10-1-2023 | 460,000 | 460,000 | |
| 6,255,000 | |||||
| Iowa: 3.77% | |||||
| Variable rate demand notes ø: 3.77% | |||||
| Iowa Finance Authority John Maassen & Sons Project (Industrial development revenue, Farm Credit Services America LOC) | 0.11 | 11-1-2035 | 2,075,000 | 2,075,000 | |
| Iowa Finance Authority Midwestern Disaster Area Bio-America Incorporated Project (Industrial development revenue, Korea Development Bank LOC) 144A | 0.10 | 12-1-2041 | 11,000,000 | 11,000,000 | |
| 13,075,000 | |||||
| Kansas: 1.99% | |||||
| Variable rate demand notes ø: 1.99% | |||||
| University of Kansas Hospital Authority Health System (Health revenue, U.S. Bank NA LOC) | 0.11 | 9-1-2034 | 6,900,000 | 6,900,000 | |
| Kentucky: 2.95% | |||||
| Variable rate demand notes ø: 2.95% | |||||
| Boone Country KY PCR Various Refunding Bonds Duke Energy (Industrial development revenue, Sumitomo Mitsui Banking Corporation LOC) | 0.08 | 8-1-2027 | 10,000,000 | 10,000,000 | |
| Jefferson County KY Industrial Building Dant Growth LLC Project Series 2002 (Industrial development revenue, Stock Yards Bank & Trust LOC) | 0.09 | 9-1-2022 | 250,000 | 250,000 | |
| 10,250,000 |
| Interest
rate |
Maturity
date |
Principal | Value | ||
| Louisiana: 1.15% | |||||
| Variable rate demand notes ø: 1.15% | |||||
| Louisiana Local Government Environmental Facilities CDA Honeywell International Incorporated Project (Industrial development revenue) | 0.24% | 12-1-2036 | $ 4,000,000 | $ 4,000,000 | |
| Maryland: 1.00% | |||||
| Variable rate demand notes ø: 1.00% | |||||
| Tender Option Bond Trust Receipts/Floater Certificates Series 2021-XG0332 (Housing revenue, Bank of America NA LIQ) 144A | 0.09 | 9-1-2043 | 3,465,000 | 3,465,000 | |
| Michigan: 2.55% | |||||
| Other municipal debt : 1.44% | |||||
| University of Michigan Series L-1 (Education revenue) | 0.11 | 3-3-2022 | 5,000,000 | 4,999,877 | |
| Variable rate demand notes ø: 1.11% | |||||
| Tender Option Bond Trust Receipts/Certificates Series 2018-ZM0614 (Education revenue, Morgan Stanley Bank LIQ) 144A | 0.21 | 11-1-2028 | 3,835,000 | 3,835,000 | |
| Minnesota: 4.81% | |||||
| Variable rate demand notes ø: 4.81% | |||||
| Forest Lake MN Kilkenny Court Apartments Project Series 2008 (Housing revenue, FNMA LOC, FNMA LIQ) | 0.15 | 8-15-2038 | 690,000 | 690,000 | |
| JPMorgan Chase Puttable Tax-Exempt Receipts Trust Series 5027 (GO revenue, JPMorgan Chase & Company LIQ) 144A | 0.21 | 3-20-2024 | 10,000,000 | 10,000,000 | |
| Minnesota HEFAR Concordia University Series 6Q (Education revenue, U.S. Bank NA LOC) | 0.12 | 4-1-2037 | 3,640,000 | 3,640,000 | |
| Tender Option Bond Trust Receipts/Certificates Series 2018-XF2760 (Education revenue, Morgan Stanley Bank LIQ) 144A | 0.26 | 11-1-2037 | 2,365,000 | 2,365,000 | |
| 16,695,000 | |||||
| Montana: 0.61% | |||||
| Variable rate demand notes ø: 0.61% | |||||
| Floater/Residual Trust Tender Option Bond (Housing revenue, Mizuho Capital Markets LLC LOC, Mizuho Capital Markets LLC LIQ) 144A | 0.31 | 6-1-2034 | 1,000,000 | 1,000,000 | |
| Floater/Residual Trust Tender Option Bond (Housing revenue, Mizuho Capital Markets LLC LOC, Mizuho Capital Markets LLC LIQ) 144A | 0.31 | 6-1-2034 | 1,110,000 | 1,110,000 | |
| 2,110,000 | |||||
| Nebraska: 1.80% | |||||
| Variable rate demand notes ø: 1.80% | |||||
| Nebraska Investment Finance Authority Single Family Housing Series F (Housing revenue, GNMA / FNMA / FHLMC Insured, FHLB SPA) | 0.07 | 3-1-2038 | 6,230,000 | 6,230,000 |
| Interest
rate |
Maturity
date |
Principal | Value | ||
| Nevada: 1.18% | |||||
| Variable rate demand notes ø: 1.18% | |||||
| Tender Option Bond Trust Receipts/Floater Certificates Series 2020-XM0866 (Tax revenue, Royal Bank of Canada LOC, Royal Bank of Canada LIQ) 144A | 0.10% | 7-1-2026 | $ 4,100,000 | $ 4,100,000 | |
| New Jersey: 4.93% | |||||
| Other municipal debt : 0.29% | |||||
| Burlington County NJ Bridge Commission Series 2021C (Miscellaneous revenue) | 2.00 | 11-10-2022 | 1,000,000 | 1,010,288 | |
| Variable rate demand notes ø: 4.64% | |||||
| New Jersey HFA Series 2013-5 (Housing revenue, Citibank NA LOC) | 0.08 | 11-1-2046 | 5,600,000 | 5,600,000 | |
| Tender Option Bond Trust Receipts/Floater Certificates Series 2018-XG0205 (Miscellaneous revenue, Barclays Bank plc LOC, Barclays Bank plc LIQ) 144A | 0.09 | 6-15-2050 | 7,500,000 | 7,500,000 | |
| Tender Option Bond Trust Receipts/Floater Certificates Series 2020-ZF1206 (Transportation revenue, BAM Insured, JPMorgan Chase & Company LIQ) 144A | 0.09 | 11-1-2028 | 3,000,000 | 3,000,000 | |
| 16,100,000 | |||||
| New York: 8.39% | |||||
| Variable rate demand notes ø: 8.39% | |||||
| New York HFA Revenue Various 8 East 102nd Street Housing Series A (Housing revenue, TD Bank NA LOC) | 0.05 | 5-1-2044 | 7,000,000 | 7,000,000 | |
| New York Metropolitan Transportation Authority Subordinate Bond Series 2012A-2 (Transportation revenue, Bank of Montreal LOC) | 0.09 | 11-15-2041 | 4,000,000 | 4,000,000 | |
| New York NY Housing Development Corporation Refunding Bonds Series 2005-A (Housing revenue, Citibank NA LOC) | 0.09 | 6-1-2037 | 200,000 | 200,000 | |
| New York NY Subordinated Bond Series E-5 (GO revenue, TD Bank NA LOC) | 0.11 | 3-1-2048 | 2,500,000 | 2,500,000 | |
| New York Transitional Finance Authority Future Tax Secured Tax-Exempt Bond Fiscal 2015 Subordinate Bonds Series A-3 (Tax revenue, Mizuho Bank Limited SPA) | 0.12 | 8-1-2043 | 2,790,000 | 2,790,000 | |
| New York Various Fiscal 2018 Subordinated Bond Series B-5 (GO revenue, Barclays Bank plc SPA) | 0.12 | 10-1-2046 | 5,000,000 | 5,000,000 | |
| Tender Option Bond Trust Receipts/Floater Certificates (Airport revenue, Royal Bank of Canada LOC, Royal Bank of Canada LIQ) 144A | 0.10 | 7-15-2028 | 3,000,000 | 3,000,000 | |
| Triborough Bridge & Tunnel Authority Subordinated Bonds series B-2 (Transportation revenue, State Street Bank & Trust Company LOC) | 0.10 | 1-1-2032 | 2,500,000 | 2,500,000 | |
| Triborough Bridge & Tunnel Authority Subordinated Bonds Series B-2 (Transportation revenue, State Street Bank & Trust Company LOC) | 0.08 | 1-1-2032 | 2,100,000 | 2,100,000 | |
| 29,090,000 |
| Interest
rate |
Maturity
date |
Principal | Value | ||
| North Carolina: 1.66% | |||||
| Variable rate demand notes ø: 1.66% | |||||
| Rockingham County NC Industrial Facilities & PCFA Innofa USA Project Series 2007 (Industrial development revenue, Truist Bank LOC) | 0.18% | 1-1-2027 | $ 1,050,000 | $ 1,050,000 | |
| Tender Option Bond Trust Receipts/Floater Certificates Series 2022-XF1270 (Miscellaneous revenue, JPMorgan Chase & Company LIQ) 144A | 0.09 | 1-1-2028 | 4,716,000 | 4,716,000 | |
| 5,766,000 | |||||
| Ohio: 6.71% | |||||
| Other municipal debt : 0.58% | |||||
| Milford OH Exempted Village School District BAN School Improvement (GO revenue) | 1.63 | 4-5-2022 | 2,000,000 | 2,003,285 | |
| Variable rate demand notes ø: 6.13% | |||||
| Franklin County OH Trinity Health Group (Health revenue) | 0.10 | 12-1-2046 | 3,000,000 | 3,000,000 | |
| Ohio Health System Cleveland Clinic Series F (Health revenue, U.S. Bank NA SPA) | 0.10 | 1-1-2052 | 2,500,000 | 2,500,000 | |
| Ohio Special Obligation Various Capital Facilities Lease (Miscellaneous revenue) | 0.05 | 12-1-2041 | 5,000,000 | 5,000,000 | |
| Tender Option Bond Trust Receipts/Floater Certificates Series 2015-XF0225 (Water & sewer revenue, TD Bank NA LIQ) 144A | 0.11 | 11-15-2043 | 1,375,000 | 1,375,000 | |
| Tender Option Bond Trust Receipts/Floater Certificates Series 2018-XL0074 (Health revenue, JPMorgan Chase & Company LIQ) 144A | 0.13 | 2-1-2029 | 8,630,000 | 8,630,000 | |
| Tender Option Bond Trust Receipts/Various States (Miscellaneous revenue, Mizuho Capital Markets LLC LOC, Mizuho Capital Markets LLC LIQ) 144A | 0.19 | 12-15-2040 | 750,000 | 750,000 | |
| 21,255,000 | |||||
| Oregon: 0.85% | |||||
| Variable rate demand notes ø: 0.85% | |||||
| Portland OR Portland International Airport Series 18-A (Airport revenue, Bank of China LOC) | 0.10 | 7-1-2026 | 235,000 | 235,000 | |
| Tender Option Bond Trust Receipts/Floater Certificates Series 2020-XM0814 (Education revenue, Royal Bank of Canada LIQ) 144A | 0.09 | 1-1-2028 | 2,700,000 | 2,700,000 | |
| 2,935,000 | |||||
| Pennsylvania: 2.20% | |||||
| Variable rate demand notes ø: 2.20% | |||||
| Floater/Residual Trust Tender Option Bond (Housing revenue, Mizuho Capital Markets LLC LOC, Mizuho Capital Markets LLC LIQ) 144A | 0.31 | 11-1-2034 | 530,000 | 530,000 | |
| Pennsylvania EDFA Series D-7 (Industrial development revenue, PNC Bank NA LOC) | 0.09 | 8-1-2022 | 200,000 | 200,000 |
| Interest
rate |
Maturity
date |
Principal | Value | ||
| Variable rate demand notes ø(continued) | |||||
| Tender Option Bond Trust Receipts/Floater Certificates Series 2020-SM0860 (GO revenue, JPMorgan Chase & Company LOC, JPMorgan Chase & Company LIQ) 144A | 0.09% | 9-1-2027 | $ 4,275,000 | $ 4,275,000 | |
| Westmoreland County PA Municipal Authority Service Series 2016 Tender Option Bond Trust Receipts/Floater Certificates Series 2017-ZF0539 (Water & sewer revenue, BAM Insured, TD Bank NA LIQ) 144A | 0.20 | 8-15-2038 | 2,615,000 | 2,615,000 | |
| 7,620,000 | |||||
| South Dakota: 1.44% | |||||
| Variable rate demand notes ø: 1.44% | |||||
| South Dakota EDA Riverview Project (Resource recovery revenue, AgCountry Farm Credit Services LOC) | 0.11 | 11-1-2051 | 5,000,000 | 5,000,000 | |
| Texas: 8.16% | |||||
| Other municipal debt : 4.90% | |||||
| Harris County TX Cultural Education Facilities Finance Corporation Revenue Series C-2 (Education revenue) | 0.10 | 2-17-2022 | 2,000,000 | 1,999,990 | |
| San Antonio TX Electric & Gas Revenue Series A (Utilities revenue) | 0.10 | 2-10-2022 | 5,000,000 | 4,999,959 | |
| University of Texas Permanent University Fund Series A (Education revenue) | 0.10 | 3-8-2022 | 8,000,000 | 7,999,693 | |
| University of Texas University Revenue Series A (Education revenue) | 0.10 | 2-1-2022 | 2,000,000 | 2,000,000 | |
| 16,999,642 | |||||
| Variable rate demand notes ø: 3.26% | |||||
| Dallam County TX Industrial Development Corporation Dalhart Jersey Ranch Incorporated Series 2008 (Resource recovery revenue) | 0.11 | 8-1-2039 | 695,000 | 695,000 | |
| Port Arthur TX Navigation District Jefferson County Total Petrochemicals USA Incorporated Project Series 2003-C (Industrial development revenue) | 0.07 | 4-1-2027 | 3,000,000 | 3,000,000 | |
| Tender Option Bond Trust Receipts/Certificates Series 2021 MS0002 (Education revenue, Morgan Stanley Bank LIQ) 144A | 0.26 | 6-15-2056 | 3,000,000 | 3,000,000 | |
| Tender Option Bond Trust Receipts/Floater Certificates (Transportation revenue, JPMorgan Chase & Company LIQ) 144A | 0.10 | 3-1-2051 | 3,055,000 | 3,055,000 | |
| Tender Option Bond Trust Receipts/Various States (GO revenue, Royal Bank of Canada LIQ) 144A | 0.09 | 2-15-2029 | 1,545,000 | 1,545,000 | |
| 11,295,000 | |||||
| Utah: 1.90% | |||||
| Variable rate demand notes ø: 1.90% | |||||
| Royal Bank of Canada Municipal Products Incorporated Trust Series E-142 (Utilities revenue, Royal Bank of Canada LOC, Royal Bank of Canada LIQ) 144A | 0.09 | 5-1-2022 | 5,000,000 | 5,000,000 | |
| Utah County UT IHC Health Services Series B (Health revenue, U.S. Bank NA SPA) | 0.06 | 5-15-2035 | 1,575,000 | 1,575,000 | |
| 6,575,000 |
| Interest
rate |
Maturity
date |
Principal | Value | ||
| Virginia: 2.54% | |||||
| Variable rate demand notes ø: 2.54% | |||||
| Albemarle County VA EDA Series 2018A & 2018B (Health revenue, TD Bank NA SPA) | 0.12% | 10-1-2048 | $ 3,920,000 | $ 3,920,000 | |
| Floater/Residual Trust Tender Option Bond Series 2020-MIZ9025 (Health revenue, Mizuho Capital Markets LLC LOC, Mizuho Capital Markets LLC LIQ) 144A | 0.13 | 11-1-2035 | 2,890,000 | 2,890,000 | |
| Virginia MFHR Series M-031 Class A (Housing revenue, FHLMC LIQ) 144A | 0.09 | 12-15-2045 | 1,995,000 | 1,995,000 | |
| 8,805,000 | |||||
| Washington: 1.28% | |||||
| Variable rate demand notes ø: 1.28% | |||||
| Eclipse Funding Trust (Water & sewer revenue, U.S. Bank NA LIQ) 144A | 0.11 | 7-1-2042 | 4,430,000 | 4,430,000 | |
| Wisconsin: 2.47% | |||||
| Variable rate demand notes ø: 2.47% | |||||
| Tender Option Bond Trust Receipts/Floater Certificates Series 2020-YX1129 (GO revenue, Barclays Bank plc LIQ) 144A | 0.14 | 4-1-2035 | 7,835,000 | 7,835,000 | |
| Tender Option Bond Trust Receipts/Various States (Education revenue, Mizuho Capital Markets LLC LOC, Mizuho Capital Markets LLC LIQ) 144A | 0.19 | 12-15-2040 | 735,000 | 735,000 | |
| 8,570,000 | |||||
| Total Municipal obligations (Cost $326,314,605) | 326,308,056 | ||||
| Repurchase agreements^^: 2.65% | |||||
| MUFG Securities Canada Limited, dated 1-31-2022, maturity value $9,200,013 | 0.05 | 2-1-2022 | 9,200,000 | 9,200,000 | |
| Total Repurchase agreements (Cost $9,200,000) | 9,200,000 | ||||
| Total investments in securities (Cost $344,514,605) | 99.34% | 344,508,056 | |||
| Other assets and liabilities, net | 0.66 | 2,276,481 | |||
| Total net assets | 100.00% | $346,784,537 |
| 144A | The security may be resold in transactions exempt from registration, normally to qualified institutional buyers, pursuant to Rule 144A under the Securities Act of 1933. |
| ø | Variable rate demand notes are subject to a demand feature which reduces the effective maturity. The maturity date shown represents the final maturity date of the security. The interest rate is determined and reset by the issuer daily, weekly, or monthly depending upon the terms of the security. The rate shown is the rate in effect at period end. |
| ^^ | Collateralized by U.S. government securities, 0.00% to 6.38%, 6-16-2022 to 2-15-2051, fair value including accrued interest is $9,384,000. |
| Abbreviations: | |
| BAM | Build America Mutual Assurance Company |
| BAN | Bond anticipation notes |
| CDA | Community Development Authority |
| ECFA | Educational & Cultural Facilities Authority |
| EDA | Economic Development Authority |
| EDFA | Economic Development Finance Authority |
| FHLB | Federal Home Loan Bank |
| FHLMC | Federal Home Loan Mortgage Corporation |
| FNMA | Federal National Mortgage Association |
| GNMA | Government National Mortgage Association |
| GO | General obligation |
| HEFAR | Higher Education Facilities Authority Revenue |
| HFA | Housing Finance Authority |
| IDA | Industrial Development Authority |
| LIQ | Liquidity agreement |
| LOC | Letter of credit |
| MFHR | Multifamily housing revenue |
| PCFA | Pollution Control Financing Authority |
| PCR | Pollution control revenue |
| SPA | Standby purchase agreement |
| Assets | |
|
Investments in unaffiliated securities, at value (cost
$344,514,605) |
$ 344,508,056 |
|
Cash |
355,212 |
|
Receivable for investments
sold |
1,885,000 |
|
Receivable for
interest |
71,010 |
|
Receivable from
manager |
18,954 |
|
Prepaid expenses and other
assets |
26,386 |
|
Total
assets |
346,864,618 |
| Liabilities | |
|
Professional fees
payable |
39,085 |
|
Administration fees
payable |
28,690 |
|
Payable for Fund shares
redeemed |
41 |
|
Accrued expenses and other
liabilities |
12,265 |
|
Total
liabilities |
80,081 |
|
Total net
assets |
$346,784,537 |
| Net assets consist of | |
|
Paid-in
capital |
$ 346,762,374 |
|
Total distributable
earnings |
22,163 |
|
Total net
assets |
$346,784,537 |
| Computation of net asset value per share | |
|
Net assets – Administrator
Class |
$ 5,277,804 |
|
Shares outstanding – Administrator
Class1 |
5,274,634 |
|
Net asset value per share – Administrator
Class |
$1.0006 |
|
Net assets – Institutional
Class |
$ 324,812,824 |
|
Shares outstanding – Institutional
Class1 |
324,634,801 |
|
Net asset value per share – Institutional
Class |
$1.0005 |
|
Net assets – Service
Class |
$ 16,693,909 |
|
Shares outstanding – Service
Class1 |
16,662,997 |
Net
asset value per share – Service
Class |
$1.0019 |
| 1 | The Fund has an unlimited number of authorized shares. |
| Investment income | |
|
Interest |
$ 344,434 |
| Expenses | |
|
Management
fee |
547,151 |
| Administration fees | |
|
Administrator
Class |
3,338 |
|
Institutional
Class |
275,152 |
|
Service
Class |
20,987 |
| Shareholder servicing fees | |
|
Administrator
Class |
3,337 |
|
Service
Class |
43,723 |
|
Custody and accounting
fees |
57,313 |
|
Professional
fees |
55,043 |
|
Registration
fees |
49,281 |
|
Shareholder report
expenses |
26,368 |
|
Trustees’ fees and
expenses |
19,272 |
|
Other fees and
expenses |
26,587 |
|
Total
expenses |
1,127,552 |
| Less: Fee waivers and/or expense reimbursements | |
|
Fund-level |
(764,944) |
|
Administrator
Class |
(4,062) |
|
Service
Class |
(50,571) |
|
Net
expenses |
307,975 |
|
Net investment
income |
36,459 |
| Realized and unrealized gains (losses) on investments | |
|
Net realized gains on
investments |
106,951 |
|
Net change in unrealized gains (losses) on
investments |
(15,014) |
|
Net realized and unrealized gains (losses) on
investments |
91,937 |
|
Net increase in net assets resulting from
operations |
$ 128,396 |
| Year
ended January 31, 2022 |
Year
ended January 31, 2021 | |||
| Operations | ||||
|
Net investment
income |
$ 36,459 | $ 930,787 | ||
|
Payment from
affiliate |
0 | 23,941 | ||
|
Net realized gains on
investments |
106,951 | 13,933 | ||
|
Net change in unrealized gains (losses) on
investments |
(15,014) | 7,474 | ||
|
Net increase in net assets resulting from
operations |
128,396 | 976,135 | ||
| Distributions to shareholders from | ||||
| Net investment income and net realized gains | ||||
|
Administrator
Class |
(612) | (6,478) | ||
|
Institutional
Class |
(47,079) | (876,650) | ||
|
Service
Class |
(2,629) | (48,046) | ||
|
Total distributions to
shareholders |
(50,320) | (931,174) | ||
| Capital share transactions | Shares | Shares | ||
| Proceeds from shares sold | ||||
|
Administrator
Class |
3,997,602 | 4,000,000 | 72,277 | 72,278 |
|
Institutional
Class |
4,854,975,318 | 4,857,045,209 | 5,084,691,969 | 5,085,947,624 |
|
Service
Class |
595,530 | 596,580 | 5,008,803 | 5,011,070 |
| 4,861,641,789 | 5,091,030,972 | |||
| Reinvestment of distributions | ||||
|
Administrator
Class |
605 | 605 | 6,231 | 6,233 |
|
Institutional
Class |
47,013 | 47,035 | 877,979 | 878,148 |
|
Service
Class |
1,644 | 1,647 | 36,323 | 36,333 |
| 49,287 | 920,714 | |||
| Payment for shares redeemed | ||||
|
Administrator
Class |
0 | 0 | (1,039,021) | (1,039,036) |
|
Institutional
Class |
(4,893,287,361) | (4,895,358,721) | (4,946,833,721) | (4,948,088,247) |
|
Service
Class |
(2,376,949) | (2,381,199) | (1,851,875) | (1,853,409) |
| (4,897,739,920) | (4,950,980,692) | |||
|
Net increase (decrease) in net assets resulting from capital share
transactions |
(36,048,844) | 140,970,994 | ||
|
Total increase (decrease) in net
assets |
(35,970,768) | 141,015,955 | ||
| Net assets | ||||
|
Beginning of
period |
382,755,305 | 241,739,350 | ||
|
End of
period |
$ 346,784,537 | $ 382,755,305 | ||
| Year ended January 31 | |||||
| Administrator Class | 2022 | 2021 | 2020 | 2019 | 2018 |
|
Net asset value, beginning of
period |
$1.0004 | $1.0004 | $1.0003 | $1.0010 | $1.0005 |
|
Net investment
income |
0.0003 | 0.0033 | 0.0124 | 0.0125 | 0.0069 |
|
Net realized and unrealized gains (losses) on
investments |
0.0001 | 0.0001 | 0.0005 | (0.0001) | 0.0005 |
|
Total from investment
operations |
0.0004 | 0.0034 | 0.0129 | 0.0124 | 0.0074 |
| Distributions to shareholders from | |||||
|
Net investment
income |
(0.0001) | (0.0034) | (0.0125) | (0.0124) | (0.0069) |
|
Net realized
gains |
(0.0001) | (0.0000) 1 | (0.0003) | (0.0007) | (0.0000) 1 |
|
Total distributions to
shareholders |
(0.0002) | (0.0034) | (0.0128) | (0.0131) | (0.0069) |
|
Net asset value, end of
period |
$1.0006 | $1.0004 | $1.0004 | $1.0003 | $1.0010 |
|
Total
return |
0.04% | 0.34% | 1.29% | 1.25% | 0.74% |
| Ratios to average net assets (annualized) | |||||
|
Gross
expenses |
0.42% | 0.45% | 0.43% | 0.44% | 0.41% |
|
Net
expenses |
0.08% * | 0.23% * | 0.30% | 0.30% | 0.30% |
|
Net investment
income |
0.01% | 0.46% | 1.28% | 1.25% | 0.68% |
| Supplemental data | |||||
|
Net assets, end of period (000s
omitted) |
$5,278 | $1,277 | $2,238 | $6,313 | $3,247 |
| * | Ratio includes class-level expenses which were voluntarily waived by the investment manager. Without this voluntary waiver, the net expense ratio would be increased by the following amounts: |
| Year ended January 31, 2022 | 0.22% |
| Year ended January 31, 2021 | 0.06% |
| 1 | Amount is less than $0.00005. |
| Year ended January 31 | |||||
| Institutional Class | 2022 | 2021 | 2020 | 2019 | 2018 |
|
Net asset value, beginning of
period |
$1.0003 | $1.0004 | $1.0004 | $1.0011 | $1.0005 |
|
Net investment
income |
0.0001 | 0.0040 | 0.0137 | 0.0133 1 | 0.0080 |
|
Net realized and unrealized gains (losses) on
investments |
0.0003 | (0.0003) | 0.0001 | 0.0001 | 0.0005 |
|
Total from investment
operations |
0.0004 | 0.0037 | 0.0138 | 0.0134 | 0.0085 |
| Distributions to shareholders from | |||||
|
Net investment
income |
(0.0001) | (0.0038) | (0.0135) | (0.0134) | (0.0079) |
|
Net realized
gains |
(0.0001) | (0.0000) 2 | (0.0003) | (0.0007) | (0.0000) 2 |
|
Total distributions to
shareholders |
(0.0002) | (0.0038) | (0.0138) | (0.0141) | (0.0079) |
|
Net asset value, end of
period |
$1.0005 | $1.0003 | $1.0004 | $1.0004 | $1.0011 |
|
Total
return |
0.04% | 0.38% | 1.38% | 1.35% | 0.85% |
| Ratios to average net assets (annualized) | |||||
|
Gross
expenses |
0.29% | 0.32% | 0.31% | 0.31% | 0.29% |
|
Net
expenses |
0.08% * | 0.18% * | 0.20% | 0.20% | 0.20% |
|
Net investment
income |
0.01% | 0.41% | 1.34% | 1.32% | 0.79% |
| Supplemental data | |||||
|
Net assets, end of period (000s
omitted) |
$324,813 | $363,006 | $224,247 | $166,024 | $336,215 |
| * | Ratio includes class-level expenses which were voluntarily waived by the investment manager. Without this voluntary waiver, the net expense ratio would be increased by the following amounts: |
| Year ended January 31, 2022 | 0.12% |
| Year ended January 31, 2021 | 0.02% |
| 1 | Calculated based upon average shares outstanding |
| 2 | Amount is less than $0.00005. |
| Year ended January 31 | |||||
| Service Class | 2022 | 2021 | 2020 | 2019 | 2018 |
|
Net asset value, beginning of
period |
$1.0016 | $1.0003 | $1.0004 | $1.0010 | $1.0005 |
|
Net investment
income |
0.0004 | 0.0024 | 0.0110 1 | 0.0109 1 | 0.0059 |
|
Payment from
affiliate |
0.0000 | 0.0013 | 0.0000 | 0.0000 | 0.0000 |
|
Net realized and unrealized gains (losses) on
investments |
0.0001 | 0.0006 | 0.0002 | 0.0001 | 0.0000 |
|
Total from investment
operations |
0.0005 | 0.0043 | 0.0112 | 0.0110 | 0.0059 |
| Distributions to shareholders from | |||||
|
Net investment
income |
(0.0001) | (0.0030) | (0.0110) | (0.0109) | (0.0054) |
|
Net realized
gains |
(0.0001) | (0.0000) 2 | (0.0003) | (0.0007) | (0.0000) 2 |
|
Total distributions to
shareholders |
(0.0002) | (0.0030) | (0.0113) | (0.0116) | (0.0054) |
|
Net asset value, end of
period |
$1.0019 | $1.0016 | $1.0003 | $1.0004 | $1.0010 |
|
Total
return |
0.05% | 0.44% 3 | 1.12% | 1.11% | 0.59% |
| Ratios to average net assets (annualized) | |||||
|
Gross
expenses |
0.59% | 0.62% | 0.60% | 0.61% | 0.58% |
|
Net
expenses |
0.09% * | 0.26% * | 0.45% | 0.45% | 0.45% |
|
Net investment
income |
0.01% | 0.27% | 1.09% | 1.09% | 0.53% |
| Supplemental data | |||||
|
Net assets, end of period (000s
omitted) |
$16,694 | $18,472 | $15,255 | $19,001 | $19,355 |
| * | Ratio includes class-level expenses which were voluntarily waived by the investment manager. Without this voluntary waiver, the net expense ratio would be increased by the following amounts: |
| Year ended January 31, 2022 | 0.36% |
| Year ended January 31, 2021 | 0.19% |
| 1 | Calculated based upon average shares outstanding |
| 2 | Amount is less than $0.00005. |
| 3 | During the year ended January 31, 2021, the Fund received a payment from an affiliate which had a 0.13% impact on the total return. See Note 4 in the Notes to Financial Statements for additional information. |
| Gross unrealized gains | $ 57 |
| Gross unrealized losses | (6,606) |
| Net unrealized losses | $(6,549) |
| Paid-in capital | Total
distributable earnings |
| $27,010 | $(27,010) |
| ■ | Level 1 – quoted prices in active markets for identical securities |
| ■ | Level 2 – other significant observable inputs (including quoted prices for similar securities, interest rates, prepayment speeds, credit risk, etc.) |
| ■ | Level 3 – significant unobservable inputs (including the Fund’s own assumptions in determining the fair value of investments) |
| Quoted
prices (Level 1) |
Other
significant observable inputs (Level 2) |
Significant
unobservable inputs (Level 3) |
Total | |
| Assets | ||||
| Investments in: | ||||
| Closed end municipal bond fund obligations | $0 | $ 9,000,000 | $0 | $ 9,000,000 |
| Municipal obligations | 0 | 326,308,056 | 0 | 326,308,056 |
| Repurchase agreements | 0 | 9,200,000 | 0 | 9,200,000 |
| Total assets | $0 | $344,508,056 | $0 | $344,508,056 |
| Average daily net assets | Management fee |
| First $5 billion | 0.150% |
| Next $5 billion | 0.140 |
| Next $5 billion | 0.130 |
| Next $85 billion | 0.125 |
| Over $100 billion | 0.120 |
| Average daily net assets | Management fee |
| First $5 billion | 0.150% |
| Next $5 billion | 0.140 |
| Over $10 billion | 0.130 |
| Class-level
administration fee | |
| Administrator Class | 0.10% |
| Institutional Class | 0.08 |
| Service Class | 0.12 |
| Expense ratio caps | |
| Administrator Class | 0.30% |
| Institutional Class | 0.20 |
| Service Class | 0.45 |
| Year ended January 31 | ||
| 2022 | 2021 | |
| Ordinary income | $20,183 | $ 32,248 |
| Tax-exempt income | 30,137 | 898,926 |
| Undistributed
ordinary income |
Undistributed
tax-exempt income |
Undistributed
long-term gain |
Unrealized
losses |
| $90,772 | $23,975 | $16,179 | $(6,549) |
Allspring Funds Trust:

| Name
and year of birth |
Position
held and length of service* |
Principal occupations during past five years or longer | Current
other public company or investment company directorships |
| William
R. Ebsworth (Born 1957) |
Trustee,
since 2015 |
Retired. From 1984 to 2013, equities analyst, portfolio manager, research director and chief investment officer at Fidelity Management and Research Company in Boston, Tokyo, and Hong Kong, and retired in 2013 as Chief Investment Officer of Fidelity Strategic Advisers, Inc. where he led a team of investment professionals managing client assets. Prior thereto, Board member of Hong Kong Securities Clearing Co., Hong Kong Options Clearing Corp., the Thailand International Fund, Ltd., Fidelity Investments Life Insurance Company, and Empire Fidelity Investments Life Insurance Company. Audit Committee Chair and Investment Committee Chair of the Vincent Memorial Hospital Endowment (non-profit organization). Mr. Ebsworth is a CFA® charterholder. | N/A |
| Jane
A. Freeman (Born 1953) |
Trustee,
since 2015; Chair Liaison, since 2018 |
Retired. From 2012 to 2014 and 1999 to 2008, Chief Financial Officer of Scientific Learning Corporation. From 2008 to 2012, Ms. Freeman provided consulting services related to strategic business projects. Prior to 1999, Portfolio Manager at Rockefeller & Co. and Scudder, Stevens & Clark. Board member of the Harding Loevner Funds from 1996 to 2014, serving as both Lead Independent Director and chair of the Audit Committee. Board member of the Russell Exchange Traded Funds Trust from 2011 to 2012 and the chair of the Audit Committee. Ms. Freeman is also an inactive Chartered Financial Analyst. | N/A |
| Isaiah
Harris, Jr. (Born 1952) |
Trustee,
since 2009; Audit Committee Chair, since 2019 |
Retired. Chairman of the Board of CIGNA Corporation from 2009 to 2021, and Director from 2005 to 2008. From 2003 to 2011, Director of Deluxe Corporation. Prior thereto, President and CEO of BellSouth Advertising and Publishing Corp. from 2005 to 2007, President and CEO of BellSouth Enterprises from 2004 to 2005 and President of BellSouth Consumer Services from 2000 to 2003. Emeritus member of the Iowa State University Foundation Board of Governors. Emeritus Member of the Advisory Board of Iowa State University School of Business. Advisory Board Member, Palm Harbor Academy (private school). Advisory Board Member, Fellowship of Christian Athletes. Mr. Harris is a certified public accountant (inactive status). | N/A |
| David
F. Larcker (Born 1950) |
Trustee,
since 2009 |
James Irvin Miller Professor of Accounting at the Graduate School of Business (Emeritus), Stanford University, Director of the Corporate Governance Research Initiative and Senior Faculty of The Rock Center for Corporate Governance since 2006. From 2005 to 2008, Professor of Accounting at the Graduate School of Business, Stanford University. Prior thereto, Ernst & Young Professor of Accounting at The Wharton School, University of Pennsylvania from 1985 to 2005. | N/A |
| Name
and year of birth |
Position
held and length of service* |
Principal occupations during past five years or longer | Current
other public company or investment company directorships |
| Olivia
S. Mitchell (Born 1953) |
Trustee,
since 2006; Nominating and Governance Committee Chair, since 2018 |
International Foundation of Employee Benefit Plans Professor since 1993, Wharton School of the University of Pennsylvania. Director of Wharton’s Pension Research Council and Boettner Center on Pensions & Retirement Research, and Research Associate at the National Bureau of Economic Research. Previously taught at Cornell University from 1978 to 1993. | N/A |
| Timothy
J. Penny (Born 1951) |
Trustee,
since 1996; Chair, since 2018 |
President and Chief Executive Officer of Southern Minnesota Initiative Foundation, a non-profit organization, since 2007. Member of the Board of Trustees of NorthStar Education Finance, Inc., a non-profit organization, since 2007. | N/A |
| James
G. Polisson (Born 1959) |
Trustee,
since 2018 |
Retired. Chief Marketing Officer, Source (ETF) UK Services, Ltd, from 2015 to 2017. From 2012 to 2015, Principal of The Polisson Group, LLC, a management consulting, corporate advisory and principal investing company. Chief Executive Officer and Managing Director at Russell Investments, Global Exchange Traded Funds from 2010 to 2012. Managing Director of Barclays Global Investors from 1998 to 2010 and Global Chief Marketing Officer for iShares and Barclays Global Investors from 2000 to 2010. Trustee of the San Francisco Mechanics’ Institute, a non-profit organization, from 2013 to 2015. Board member of the Russell Exchange Traded Fund Trust from 2011 to 2012. Director of Barclays Global Investors Holdings Deutschland GmbH from 2006 to 2009. Mr. Polisson is an attorney and has a retired status with the Massachusetts and District of Columbia Bar Associations. | N/A |
| Pamela
Wheelock (Born 1959) |
Trustee,
since January 2020; previously Trustee from January 2018 to July 2019 |
Board member of the Destination Medical Center Economic Development Agency, Rochester, Minnesota since 2019. Interim President of the McKnight Foundation from January to September 2020. McKnight Foundation Consultant, November 2020 to February 2021. Acting Commissioner, Minnesota Department of Human Services, July 2019 through September 2019. Consultant (part-time), Minnesota Department of Human Services, October 2019 through December 2019. Chief Operating Officer, Twin Cities Habitat for Humanity from 2017 to 2019. Vice President of University Services, University of Minnesota from 2012 to 2016. Prior thereto, on the Board of Directors, Governance Committee and Finance Committee for the Minnesota Philanthropy Partners (Saint Paul Foundation) from 2012 to 2018, Interim Chief Executive Officer of Blue Cross Blue Shield of Minnesota from 2011 to 2012, Chairman of the Board from 2009 to 2012 and Board Director from 2003 to 2015. Vice President, Leadership and Community Engagement, Bush Foundation, Saint Paul, Minnesota (a private foundation) from 2009 to 2011. Executive Vice President and Chief Financial Officer, Minnesota Sports and Entertainment from 2004 to 2009 and Senior Vice President from 2002 to 2004. Executive Vice President of the Minnesota Wild Foundation from 2004 to 2008. Commissioner of Finance, State of Minnesota, from 1999 to 2002. Currently Board Chair of the Minnesota Wild Foundation since 2010. | N/A |
| Name
and year of birth |
Position
held and length of service |
Principal occupations during past five years or longer |
| Andrew
Owen (Born 1960) |
President,
since 2017 |
President, Chief Executive Officer and Director of Allspring Funds Management, LLC since 2017 and co-president of Galliard Capital Management, LLC, an affiliate of Allspring Funds Management, LLC, since 2019. Prior thereto, Head of Affiliated Managers, Allspring Global Investments, from 2014 to 2019 and Executive Vice President responsible for marketing, investments and product development for Allspring Funds Management, LLC, from 2009 to 2014. In addition, Mr. Owen was an Executive Vice President of Wells Fargo & Company from 2014 to 2021. |
| Jeremy
DePalma (Born 1974) |
Treasurer,
since 2012 (for certain funds in the Fund Complex); since 2021 (for the remaining funds in the Fund Complex) |
Senior Vice President of Allspring Funds Management, LLC since 2009. Senior Vice President of Evergreen Investment Management Company, LLC from 2008 to 2010 and head of the Fund Reporting and Control Team within Fund Administration. |
| Kate
McKinley (Born 1977) |
Chief
Legal Officer, since 2021 |
Chief Legal Officer of Allspring Global Investments since 2021. Prior thereto, held various roles at State Street Global Advisors beginning in 2010, including serving as Senior Vice President and General Counsel from 2019 to 2021, and Chief Operating Officer of the Institutional Client Group from 2016 - 2019. Prior to working at State Street Global Advisors served as Assistant General Counsel for Bank of America Corporation from 2005 to 2010 and as an Associate at WilmerHale from 2002 to 2005. |
| Christopher
Baker (Born 1976) |
Chief Compliance Officer, since 2022 | Global Chief Compliance Officer for Allspring Global Investments since 2022. Prior thereto, Chief Compliance Officer for State Street Global Advisors from 2018 to 2021. Senior Compliance Officer for the State Street divisions of Alternative Investment Solutions, Sector Solutions, and Global Marketing from 2015 to 2018. From 2010 to 2015 Vice President, Global Head of Investment and Marketing Compliance for State Street Global Advisors. |
| Matthew
Prasse (Born 1983) |
Secretary,
since 2021 |
Senior Counsel of the Allspring Legal Department since 2021. Senior Counsel of the Wells Fargo Legal Department from 2018 to 2021. Previously, Counsel for Barings LLC from 2015 to 2018. Prior to joining Barings, Associate at Morgan, Lewis & Bockius LLP from 2008 to 2015. |
P.O. Box 219967
Kansas City, MO 64121-9967
1-800-222-8222 or visit the Fund's website at allspringglobal.com. Read the prospectus carefully before you invest or send money.
A307/AR307 01-22

| ■ | Allspring National Tax-Free Money Market Fund |
|
|
2 |
|
|
6 |
|
|
10 |
|
|
11 |
| Financial statements | |
|
|
23 |
|
|
24 |
|
|
25 |
|
|
26 |
|
|
30 |
|
|
35 |
|
|
36 |

| 1 | The S&P 500 Index consists of 500 stocks chosen for market size, liquidity, and industry group representation. It is a market-value-weighted index with each stock's weight in the index proportionate to its market value. You cannot invest directly in an index. |
| 2 | The Morgan Stanley Capital International (MSCI) All Country World Index (ACWI) ex USA Index (Net) is a free-float-adjusted market-capitalization-weighted index that is designed to measure the equity market performance of developed and emerging markets, excluding the U.S. Source: MSCI. MSCI makes no express or implied warranties or representations and shall have no liability whatsoever with respect to any MSCI data contained herein. The MSCI data may not be further redistributed or used as a basis for other indexes or any securities or financial products. This report is not approved, reviewed, or produced by MSCI. You cannot invest directly in an index. |
| 3 | The MSCI Emerging Markets (EM) Index (Net) (USD) is a free-float-adjusted market-capitalization-weighted index that is designed to measure equity market performance of emerging markets. You cannot invest directly in an index. |
| 4 | The Bloomberg U.S. Aggregate Bond Index is a broad-based benchmark that measures the investment-grade, U.S.-dollar-denominated, fixed-rate taxable bond market, including Treasuries, government-related and corporate securities, mortgage-backed securities (agency fixed-rate and hybrid adjustable-rate mortgage pass-throughs), asset-backed securities, and commercial mortgage-backed securities. You cannot invest directly in an index. |
| 5 | The Bloomberg Global Aggregate ex-USD Index (unhedged) is an unmanaged index that provides a broad-based measure of the global investment-grade fixed-income markets excluding the U.S.-dollar-denominated debt market. You cannot invest directly in an index. |
| 6 | The Bloomberg Municipal Bond Index is an unmanaged index composed of long-term tax-exempt bonds with a minimum credit rating of Baa. You cannot invest directly in an index. |
| 7 | The ICE BofA U.S. High Yield Index is a market-capitalization-weighted index of domestic and Yankee high-yield bonds. The index tracks the performance of high-yield securities traded in the U.S. bond market. You cannot invest directly in an index. Copyright 2022. ICE Data Indices, LLC. All rights reserved. |
| 1 | The Consumer Price Index (CPI) is a measure of the average change over time in the prices paid by urban consumers for a market basket of consumer goods and services. You cannot invest directly in an index. |

President
Allspring Funds
| 1 | As of December 31, 2021, assets under management (AUM) includes $91.6 billion from Galliard Capital Management, LLC, an investment advisor that is not part of the Allspring trade name/GIPS firm. |
| Investment objective | The Fund seeks current income exempt from federal income tax, while preserving capital and liquidity. |
| Manager | Allspring Funds Management, LLC |
| Subadviser | Allspring Global Investments, LLC |
| Portfolio managers | James Randazzo, Jeffrey L. Weaver, CFA®‡ |
| Average annual total returns (%) as of January 31, 2022 | ||||||
| Expense ratios1 (%) | ||||||
| Inception date | 1 year | 5 year | 10 year | Gross | Net 2 | |
| Class A (NWMXX) | 7-28-2003 | 0.02 | 0.49 | 0.27 | 0.64 | 0.60 |
| Administrator Class (WNTXX) | 4-8-2005 | 0.02 | 0.70 | 0.39 | 0.37 | 0.30 |
| Premier Class (WFNXX) | 11-8-1999 | 0.02 | 0.77 | 0.43 | 0.25 | 0.20 |
| Service Class (MMIXX) | 8-3-1993 | 0.02 | 0.60 | 0.33 | 0.54 | 0.45 |
| 1 | Reflects the expense ratios as stated in the most recent prospectuses. The expense ratios shown are subject to change and may differ from the annualized expense ratios shown in the financial highlights of this report. |
| 2 | The manager has contractually committed through May 31, 2022, to waive fees and/or reimburse expenses to the extent necessary to cap total annual fund operating expenses after fee waivers at 0.60% for Class A, 0.30% for Administrator Class, 0.20% for Premier Class and 0.45% for Service Class. Brokerage commissions, stamp duty fees, interest, taxes, acquired fund fees and expenses (if any), and extraordinary expenses are excluded from the expense caps. Prior to or after the commitment expiration date, the caps may be increased or the commitment to maintain the caps may be terminated only with the approval of the Board of Trustees. The manager and/or its affiliates may also voluntarily waive all or a portion of any fees to which they are entitled and/or reimburse certain expenses as they may determine from time to time. Without these caps, the Fund’s returns would have been lower. The expense ratio paid by an investor is the net expense ratio (the total annual fund operating expenses after fee waivers) as stated in the prospectuses. |
| Yield summary (%) as of January 31, 2022 | ||||
| Class A | Administrator Class | Premier Class | Service Class | |
| 7-day current yield1 | 0.01 | 0.01 | 0.01 | 0.01 |
| 7-day compound yield | 0.01 | 0.01 | 0.01 | 0.01 |
| 30-day simple yield | 0.01 | 0.01 | 0.01 | 0.01 |
| 30-day compound yield | 0.01 | 0.01 | 0.01 | 0.01 |
| 1 | The manager has contractually committed through May 31, 2022, to waive fees and/or reimburse expenses to the extent necessary to cap total annual fund operating expenses and may also voluntarily waive or reimburse additional fees and expenses which may be discontinued or modified at any time without notice. Without these reductions, the Fund’s 7-day current yield would have been -0.54%, -0.28%, -0.17% and -0.40% for Class A, Administrator Class, Premier Class and Service Class, respectively. |
| ‡ | CFA® and Chartered Financial Analyst® are trademarks owned by CFA Institute. |
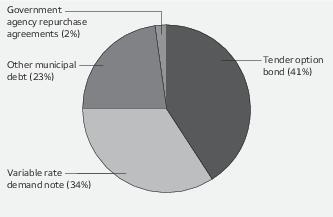
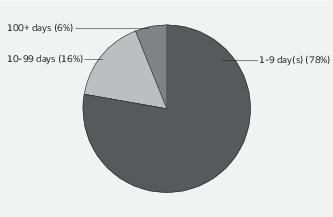
| * | The Securities Industry and Financial Markets Association (SIFMA) Municipal Swap Index (SIFMA Index) is a seven-day high-grade market index composed of tax-exempt variable-rate demand obligations with certain characteristics. The index is calculated and published by Bloomberg. The index is overseen by SIFMA’s Municipal Swap Index Committee. You cannot invest directly in an index. |
| ** | Variable Rate Demand Notes (VRDNs) are debt securities commonly held within certain mutual funds. Like all bonds, VRDN values fluctuate in response to the financial condition of individual issuers, general market and economic conditions, and changes in interest rates. Changes in market conditions and government policies may lead to periods of heightened volatility in the bond market and reduced liquidity for certain bonds. In general, when interest rates rise, bond values fall and investors may lose principal value. Interest rate changes can be sudden and unpredictable. In addition to credit and interest rate risk, VRDNs are subject to municipal securities risk. |
| Beginning
account value 8-1-2021 |
Ending
account value 1-31-2022 |
Expenses
paid during the period1 |
Annualized
net expense ratio | |
| Class A | ||||
| Actual | $1,000.00 | $1,000.19 | $0.50 | 0.10% |
| Hypothetical (5% return before expenses) | $1,000.00 | $1,024.70 | $0.51 | 0.10% |
| Administrator Class | ||||
| Actual | $1,000.00 | $1,000.19 | $0.50 | 0.10% |
| Hypothetical (5% return before expenses) | $1,000.00 | $1,024.70 | $0.51 | 0.10% |
| Premier Class | ||||
| Actual | $1,000.00 | $1,000.19 | $0.50 | 0.10% |
| Hypothetical (5% return before expenses) | $1,000.00 | $1,024.70 | $0.51 | 0.10% |
| Service Class | ||||
| Actual | $1,000.00 | $1,000.19 | $0.50 | 0.10% |
| Hypothetical (5% return before expenses) | $1,000.00 | $1,024.70 | $0.51 | 0.10% |
| Principal | Value | ||||
| Closed end municipal bond fund obligations: 1.83% | |||||
| Nuveen AMT-Free Municipal Credit Income Fund MuniFund Preferred Shares Series D (50 shares) 0.26% 144Aø | $ 5,000,000 | $ 5,000,000 | |||
| Nuveen AMT-Free Quality Municipal Income Fund Preferred Shares Series C (100 shares) 0.12% 144Aø | 10,000,000 | 10,000,000 | |||
| Total Closed end municipal bond fund obligations (Cost $15,000,000) | 15,000,000 |
| Interest
rate |
Maturity
date |
||||
| Municipal obligations: 96.25% | |||||
| Alabama: 0.55% | |||||
| Variable rate demand notes ø: 0.55% | |||||
| Tender Option Bond Trust Receipts/Floater Certificates Series 2018-XL0098 (Utilities revenue, Royal Bank of Canada LIQ) 144A | 0.12% | 12-1-2022 | 4,500,000 | 4,500,000 | |
| Arizona: 6.15% | |||||
| Variable rate demand notes ø: 6.15% | |||||
| Arizona Health Facility Authority Floater Series 2015 XF 2050 (Health revenue, Morgan Stanley Bank LIQ) 144A | 0.09 | 1-1-2037 | 19,000,000 | 19,000,000 | |
| Phoenix AZ IDA Various Mayo Clinic Series A (Health revenue, Bank of America NA SPA) | 0.11 | 11-15-2052 | 4,700,000 | 4,700,000 | |
| Royal Bank of Canada Municipal Products Incorporated (Health revenue, Royal Bank of Canada LOC, Royal Bank of Canada LIQ) 144A | 0.09 | 2-1-2025 | 5,000,000 | 5,000,000 | |
| Tender Option Bond Trust Receipts/Floater Certificates Series 2018-XF2537 (Utilities revenue, Barclays Bank plc LOC, Barclays Bank plc LIQ) 144A | 0.10 | 12-1-2037 | 3,215,000 | 3,215,000 | |
| Tender Option Bond Trust Receipts/Floater Certificates Series 2020-XF2862 (Education revenue, Mizuho Capital Markets LLC LOC, Mizuho Capital Markets LLC LIQ) 144A | 0.19 | 12-15-2047 | 18,398,763 | 18,398,763 | |
| 50,313,763 | |||||
| California: 9.62% | |||||
| Other municipal debt : 3.90% | |||||
| Los Angeles CA Department Airports Revenue Subordinated Bond Series A2 (Airport revenue) | 0.07 | 2-3-2022 | 17,475,000 | 17,475,000 | |
| Los Angeles CA Municipal Improvement Corporation Lease Revenue Series A-3 (GO revenue) | 0.09 | 2-15-2022 | 3,500,000 | 3,500,000 | |
| San Jose CA International Airport Series B (Airport revenue) | 0.12 | 2-3-2022 | 10,912,000 | 10,912,000 | |
| 31,887,000 | |||||
| Variable rate demand notes ø: 5.72% | |||||
| Bay Area Toll Authority Series E-1 (Transportation revenue, Bank of Tokyo-Mitsubishi LOC) | 0.05 | 4-1-2045 | 4,250,000 | 4,250,000 | |
| California CDA Uptown Newport Apartments Series 2017 AA & BB (Housing revenue, East West Bank LOC) | 0.10 | 3-1-2057 | 3,000,000 | 3,000,000 | |
| California Series A (GO revenue, State Street Bank & Trust Company LOC) | 0.03 | 5-1-2048 | 600,000 | 600,000 | |
| Los Angeles CA Department Water & Power Revenue Various Power System Subordinated Bond Series A5 (Utilities revenue, Bank of America NA SPA) | 0.09 | 7-1-2035 | 100,000 | 100,000 |
| Interest
rate |
Maturity
date |
Principal | Value | ||
| Variable rate demand notes ø(continued) | |||||
| Riverside County CA Certificates Various Refunding Bond Public Safety (Miscellaneous revenue, Bank of America NA LOC) | 0.05% | 11-1-2039 | $ 585,000 | $ 584,942 | |
| San Joaquin CA Delta Community College Tender Option Bond Trust Receipts/Floater Certificates Series 2015-ZF0180 (GO revenue, JPMorgan Chase & Company LIQ) 144A | 0.08 | 8-1-2022 | 2,415,000 | 2,415,000 | |
| Tender Option Bond Trust Receipts/Floater Certificates Series 2015-ZF0179 (GO revenue, JPMorgan Chase & Company LIQ) 144A | 0.08 | 8-1-2022 | 2,050,000 | 2,050,000 | |
| Tender Option Bond Trust Receipts/Floater Certificates Series 2017-XF2466 (GO revenue, BAM Insured, Citibank NA LIQ) 144A | 0.10 | 8-1-2024 | 2,200,000 | 2,200,000 | |
| Tender Option Bond Trust Receipts/Floater Certificates Series 2018-XG0188 (GO revenue, Royal Bank of Canada LIQ) 144A | 0.09 | 2-1-2026 | 1,600,000 | 1,600,000 | |
| Tender Option Bond Trust Receipts/Floater Certificates Series 2019-MIZ9002 (Tax revenue, Mizuho Capital Markets LLC LOC, Mizuho Capital Markets LLC LIQ) 144A | 0.31 | 7-7-2036 | 17,000,000 | 17,000,000 | |
| Tender Option Bond Trust Receipts/Floater Certificates Series 2019-XF2830 (GO revenue, Mizuho Capital Markets LLC LIQ) 144A | 0.19 | 10-1-2034 | 3,460,000 | 3,460,000 | |
| Tender Option Bond Trust Receipts/Floater Certificates Series 2020-MIZ9012 (Housing revenue, Mizuho Capital Markets LLC LIQ) 144A | 0.31 | 10-1-2036 | 6,037,000 | 6,037,000 | |
| Tender Option Bond Trust Receipts/Floater Certificates Series 2020-YX1142 (Tax revenue, Barclays Bank plc LOC, Barclays Bank plc LIQ) 144A | 0.11 | 10-1-2049 | 2,555,000 | 2,555,000 | |
| Tender Option Bond Trust Receipts/Various States (Housing revenue, Mizuho Capital Markets LLC LIQ) 144A | 0.19 | 2-1-2036 | 938,000 | 938,000 | |
| 46,789,942 | |||||
| Colorado: 0.04% | |||||
| Variable rate demand notes ø: 0.04% | |||||
| Colorado Springs CO Utilities System Improvement Bonds Series 2008A (Utilities revenue, U.S. Bank NA SPA) | 0.06 | 11-1-2038 | 300,000 | 300,000 | |
| Connecticut: 0.97% | |||||
| Other municipal debt : 0.62% | |||||
| North Branford CT BAN (GO revenue) | 2.00 | 8-4-2022 | 5,000,000 | 5,047,062 | |
| Variable rate demand notes ø: 0.35% | |||||
| Connecticut Residual Interest Bond Floater Trust Series 2017-016 (Miscellaneous revenue, Barclays Bank plc LOC, Barclays Bank plc LIQ) 144A | 0.18 | 6-1-2037 | 2,600,000 | 2,600,000 | |
| Connecticut State Housing Authority Various Subordinated Bond Series A-3 (Housing revenue, Bank of America NA SPA) | 0.06 | 5-15-2048 | 250,000 | 249,975 | |
| 2,849,975 | |||||
| Delaware: 0.01% | |||||
| Variable rate demand notes ø: 0.01% | |||||
| University of Delaware (Education revenue, TD Bank NA SPA) | 0.12 | 11-1-2035 | 100,000 | 100,000 |
| Interest
rate |
Maturity
date |
Principal | Value | ||
| District of Columbia: 0.60% | |||||
| Variable rate demand notes ø: 0.60% | |||||
| Tender Option Bond Trust Receipts/Floater Certificates Series 2019-ZF2784 (Housing revenue, FHA Insured, Morgan Stanley Bank LIQ) 144A | 0.09% | 9-1-2039 | $ 2,800,000 | $ 2,800,000 | |
| Tender Option Bond Trust Receipts/Floater Certificates Series 2019-ZF2785 (Housing revenue, FHA Insured, Morgan Stanley Bank LIQ) 144A | 0.09 | 9-1-2039 | 2,070,000 | 2,070,000 | |
| 4,870,000 | |||||
| Florida: 8.03% | |||||
| Variable rate demand notes ø: 8.03% | |||||
| Florida Local Government Finance Commission Pooled Loan Program Series A-1 (GO revenue) | 0.11 | 2-2-2022 | 4,450,000 | 4,450,000 | |
| Highlands County FL Health Facilities Authority Adventist Health System Series A-2 (Health revenue) | 0.06 | 11-15-2037 | 5,000,000 | 5,000,000 | |
| Highlands County FL Health Facilities Authority Adventist Health System Series I5 (Health revenue) | 0.06 | 11-15-2035 | 300,000 | 300,000 | |
| Highlands County FL Health Facilities Authority Adventist Health System Sunbelt Obligated Group Series 2012 I-2 (Health revenue) | 0.06 | 11-15-2032 | 600,000 | 600,000 | |
| Miami Dade County FL IDA Revenue Various Refunding Florida Power & Light Company Project (Utilities revenue) | 0.13 | 5-1-2046 | 1,500,000 | 1,500,000 | |
| Orlando Florida Commission Utility System Refunding Bond Series B (Utilities revenue, TD Bank NA SPA) | 0.05 | 10-1-2039 | 18,000,000 | 18,000,000 | |
| Seminole County FL Tender Option Bond Trust Receipts/Floater Certificates Series 2016-ZF0444 (Tax revenue, NPFGC Insured, JPMorgan Chase & Company LIQ) 144A | 0.12 | 4-1-2027 | 5,250,000 | 5,250,000 | |
| St. Lucie County FL Power & Light Company (Industrial development revenue) | 0.10 | 9-1-2028 | 1,685,000 | 1,685,000 | |
| Tender Option Bond Trust Receipts/Floater Certificates Series 2017-XF2517 (Health revenue, Morgan Stanley Bank LIQ) 144A | 0.11 | 8-15-2047 | 10,130,000 | 10,130,000 | |
| Tender Option Bond Trust Receipts/Floater Certificates Series 2018-XF2523 (Health revenue, Barclays Bank plc LIQ) 144A | 0.12 | 8-15-2047 | 5,090,000 | 5,090,000 | |
| Tender Option Bond Trust Receipts/Floater Certificates Series 2018-XG0173 (Health revenue, Credit Suisse LIQ) 144A | 0.11 | 10-1-2025 | 8,000,000 | 8,000,000 | |
| Tender Option Bond Trust Receipts/Floater Certificates Series 2020-XX1136 (Transportation revenue, Barclays Bank plc LOC, Barclays Bank plc LIQ) 144A | 0.10 | 7-1-2049 | 2,375,000 | 2,375,000 | |
| Tender Option Bond Trust Receipts/Various States (Water & sewer revenue, Royal Bank of Canada LOC, Royal Bank of Canada LIQ) 144A | 0.09 | 4-1-2029 | 3,255,000 | 3,255,000 | |
| 65,635,000 |
| Interest
rate |
Maturity
date |
Principal | Value | ||
| Georgia: 0.97% | |||||
| Variable rate demand notes ø: 0.97% | |||||
| Dekalb County GA Series 2006-B ROC RR-II-R-11900 (Water & sewer revenue, AGM Insured, JPMorgan Chase & Company LIQ) 144A | 0.09% | 4-1-2023 | $ 2,500,000 | $ 2,500,000 | |
| Roswell GA Housing Authority Refunding Bonds Belcourt Limited Project A (Housing revenue, Northern Trust Company LOC) | 0.07 | 9-1-2027 | 5,400,000 | 5,400,000 | |
| 7,900,000 | |||||
| Idaho: 0.61% | |||||
| Variable rate demand notes ø: 0.61% | |||||
| Idaho Health Facilities Authority Hospital Trinity Health Credit Group Series D (Health revenue) | 0.10 | 12-1-2048 | 5,000,000 | 5,000,000 | |
| Illinois: 7.53% | |||||
| Variable rate demand notes ø: 7.53% | |||||
| Illinois Finance Authority Elmhurst Memorial Healthcare Series D (Health revenue, Bank of America NA LOC) | 0.05 | 1-1-2048 | 1,250,000 | 1,250,000 | |
| Illinois Finance Authority Revenue Various Refunding Bond Northwestern Memorial (Health revenue, Barclays Bank plc SPA) | 0.12 | 7-15-2055 | 10,000,000 | 10,000,000 | |
| Lake County IL MFHR Various Whispering Oaks Apartments Project (Housing revenue, FHLMC LIQ) | 0.06 | 11-1-2045 | 250,000 | 249,975 | |
| Quad Cities Illinois Regional EDA Augustana College Series 2005 (Education revenue, BMO Harris Bank NA LOC) | 0.07 | 10-1-2035 | 3,600,000 | 3,600,000 | |
| Tender Option Bond Trust Receipts/Floater Certificates (Miscellaneous revenue, Bank of America NA LIQ) 144A | 0.11 | 3-1-2046 | 1,000,000 | 1,000,000 | |
| Tender Option Bond Trust Receipts/Floater Certificates Series 2015-XF2202 (Transportation revenue, TD Bank NA LIQ) 144A | 0.11 | 1-1-2037 | 1,140,000 | 1,140,000 | |
| Tender Option Bond Trust Receipts/Floater Certificates Series 2015-ZM0120 (Transportation revenue, Royal Bank of Canada LIQ) 144A | 0.12 | 7-1-2023 | 3,100,000 | 3,100,000 | |
| Tender Option Bond Trust Receipts/Floater Certificates Series 2017-XG0108 (Tax revenue, Barclays Bank plc LOC, Barclays Bank plc LIQ) 144A | 0.14 | 4-1-2046 | 8,735,000 | 8,735,000 | |
| Tender Option Bond Trust Receipts/Floater Certificates Series 2018-XF0722 (Tax revenue, Royal Bank of Canada LIQ) 144A | 0.20 | 7-1-2026 | 7,900,000 | 7,900,000 | |
| Tender Option Bond Trust Receipts/Floater Certificates Series 2018-XF2547 (Tax revenue, Barclays Bank plc LOC, Barclays Bank plc LIQ) 144A | 0.10 | 6-15-2031 | 4,355,000 | 4,355,000 | |
| Tender Option Bond Trust Receipts/Floater Certificates Series 2018-XM0683 (Tax revenue, Bank of America NA LIQ) 144A | 0.20 | 1-1-2048 | 3,340,000 | 3,340,000 | |
| Tender Option Bond Trust Receipts/Floater Certificates Series 2018-XM0713 (Tax revenue, Morgan Stanley Bank LIQ) 144A | 0.18 | 1-1-2043 | 8,000,000 | 8,000,000 |
| Interest
rate |
Maturity
date |
Principal | Value | ||
| Variable rate demand notes ø(continued) | |||||
| Tender Option Bond Trust Receipts/Floater Certificates Series 2019-XM0863 (GO revenue, BAM Insured, JPMorgan Chase & Company LIQ) 144A | 0.09% | 12-1-2026 | $ 6,375,000 | $ 6,375,000 | |
| Tender Option Bond Trust Receipts/Floater Certificates Series 2020-XG0299 (Health revenue, Barclays Bank plc LOC, Barclays Bank plc LIQ) 144A | 0.10 | 5-15-2050 | 2,500,000 | 2,500,000 | |
| 61,544,975 | |||||
| Indiana: 0.76% | |||||
| Variable rate demand notes ø: 0.76% | |||||
| Indiana Finance Authority Duke Energy Indiana Incorporated Series 2009A-4 (Industrial development revenue, Sumitomo Mitsui Banking Corporation LOC) | 0.12 | 12-1-2039 | 5,200,000 | 5,200,000 | |
| Indiana Finance Authority Various Refunding Bond Duke Energy Industry project A-3 (Industrial development revenue, Mizuho Bank Limited LOC) | 0.08 | 12-1-2039 | 250,000 | 249,975 | |
| Purdue University Indiana University Revenue Adjusted Student Facilities System Series A (Education revenue) | 0.05 | 7-1-2029 | 785,000 | 784,923 | |
| 6,234,898 | |||||
| Iowa: 1.47% | |||||
| Variable rate demand notes ø: 1.47% | |||||
| Iowa Finance Authority Midwestern Disaster Area Bio-America Incorporated Project (Industrial development revenue, Korea Development Bank LOC) 144A | 0.10 | 12-1-2041 | 12,000,000 | 12,000,000 | |
| Louisiana: 0.39% | |||||
| Variable rate demand notes ø: 0.39% | |||||
| East Baton Rouge Parish Louisiana Incorporate Various ExxonMobil Project Gulf (Industrial development revenue) | 0.11 | 12-1-2051 | 228,000 | 227,977 | |
| Tender Option Bond Trust Receipts/Floater Certificates Series 2019-XM0735 (Water & sewer revenue, Bank of America NA LOC, Bank of America NA LIQ) 144A | 0.11 | 12-1-2045 | 3,000,000 | 3,000,000 | |
| 3,227,977 | |||||
| Maryland: 0.61% | |||||
| Variable rate demand notes ø: 0.61% | |||||
| Montgomery County MD Housing Opportunities Commission Single Family Mortgage Revenue Various Series C (Housing revenue, PNC Bank NA LOC) | 0.06 | 1-1-2041 | 5,000,000 | 5,000,000 | |
| Massachusetts: 1.72% | |||||
| Variable rate demand notes ø: 1.72% | |||||
| Massachusetts Housing Finance Agency Housing Revenue Various Single Family Housing Series 200 (Housing revenue) | 0.06 | 12-1-2048 | 6,000,000 | 6,000,000 | |
| Tender Option Bond Trust Receipts/Floater Certificates Series 2018-XF2692 (Education revenue, Citibank NA LIQ) 144A | 0.07 | 7-1-2025 | 4,190,000 | 4,190,000 | |
| Tender Option Bond Trust Receipts/Floater Certificates Series 2020-XF2891 (Health revenue, Barclays Bank plc LOC, AGM Insured, Barclays Bank plc LIQ) 144A | 0.10 | 10-1-2045 | 3,845,000 | 3,845,000 | |
| 14,035,000 |
| Interest
rate |
Maturity
date |
Principal | Value | ||
| Michigan: 0.92% | |||||
| Other municipal debt : 0.92% | |||||
| University of Michigan Series L-1 (Education revenue) | 0.11% | 3-3-2022 | $ 7,525,000 | $ 7,525,000 | |
| Minnesota: 1.32% | |||||
| Variable rate demand notes ø: 1.32% | |||||
| Burnsville MN Bridgeway Apartments Project Series 2003 (Housing revenue, FNMA LOC, FNMA LIQ) | 0.14 | 10-15-2033 | 2,375,000 | 2,375,000 | |
| Forest Lake MN Kilkenny Court Apartments Project Series 2008 (Housing revenue, FNMA LOC, FNMA LIQ) | 0.15 | 8-15-2038 | 4,160,000 | 4,160,000 | |
| Minnesota HEFAR Concordia University Series 6Q (Education revenue, U.S. Bank NA LOC) | 0.12 | 4-1-2037 | 1,400,000 | 1,400,000 | |
| Plymouth MN Lancaster Village Apartments Project Series 2001 (Housing revenue, FNMA LOC, FNMA LIQ) | 0.14 | 9-15-2031 | 2,865,000 | 2,865,000 | |
| 10,800,000 | |||||
| Mississippi: 0.98% | |||||
| Variable rate demand notes ø: 0.98% | |||||
| Perry County MS PCR Various Refunding Bond Leaf River Cellulose (GO revenue) 144A | 0.09 | 10-1-2041 | 8,000,000 | 8,000,000 | |
| Missouri: 1.31% | |||||
| Variable rate demand notes ø: 1.31% | |||||
| Tender Option Bond Trust Receipts/Floater Certificates Series 2015-XF2198 (Water & sewer revenue, Citibank NA LIQ) 144A | 0.14 | 5-1-2023 | 10,680,000 | 10,680,000 | |
| Montana: 0.43% | |||||
| Variable rate demand notes ø: 0.43% | |||||
| Floater/Residual Trust Tender Option Bond (Housing revenue, Mizuho Capital Markets LLC LOC, Mizuho Capital Markets LLC LIQ) 144A | 0.31 | 6-1-2034 | 3,515,000 | 3,515,000 | |
| Nebraska: 1.28% | |||||
| Variable rate demand notes ø: 1.28% | |||||
| Nebraska Investment Finance Authority MFHR Apple Creek Associates Project Series 1985-A (Housing revenue, Northern Trust Company LOC) | 0.45 | 9-1-2031 | 10,500,000 | 10,500,000 | |
| Nevada: 2.10% | |||||
| Other municipal debt : 1.10% | |||||
| Nevada Housing Division Single Family Mortgage Revenue Senior Series D (Housing revenue, GNMA / FNMA / FHLMC Insured) | 0.25 | 12-1-2022 | 9,000,000 | 9,000,000 | |
| Variable rate demand notes ø: 1.00% | |||||
| Tender Option Bond Trust Receipts/Floater Certificates Series 2018-ZM0634 (GO revenue, Royal Bank of Canada LIQ) 144A | 0.09 | 12-1-2025 | 3,330,000 | 3,330,000 |
| Interest
rate |
Maturity
date |
Principal | Value | ||
| Variable rate demand notes ø(continued) | |||||
| Tender Option Bond Trust Receipts/Floater Certificates Series 2020-XM0845 (GO revenue, BAM Insured, JPMorgan Chase & Company LIQ) 144A | 0.10% | 6-15-2026 | $ 3,870,000 | $ 3,870,000 | |
| Tender Option Bond Trust Receipts/Floater Certificates Series 2020-XM0866 (Tax revenue, Royal Bank of Canada LOC, Royal Bank of Canada LIQ) 144A | 0.10 | 7-1-2026 | 1,000,000 | 1,000,000 | |
| 8,200,000 | |||||
| New Jersey: 3.12% | |||||
| Other municipal debt : 1.24% | |||||
| Burlington County NJ Bridge Commission Series 2021C (Miscellaneous revenue) | 2.00 | 11-10-2022 | 10,000,000 | 10,138,759 | |
| Variable rate demand notes ø: 1.88% | |||||
| Tender Option Bond Trust Receipts/Floater Certificates Series 2017-XF2495 (Miscellaneous revenue, BAM Insured, Morgan Stanley Bank LIQ) 144A | 0.11 | 7-1-2031 | 8,450,000 | 8,450,000 | |
| Tender Option Bond Trust Receipts/Floater Certificates Series 2018-XG0205 (Miscellaneous revenue, Barclays Bank plc LOC, Barclays Bank plc LIQ) 144A | 0.09 | 6-15-2050 | 3,135,000 | 3,135,000 | |
| Tender Option Bond Trust Receipts/Floater Certificates Series 2020-ZF1206 (Transportation revenue, BAM Insured, JPMorgan Chase & Company LIQ) 144A | 0.09 | 11-1-2028 | 3,795,000 | 3,795,000 | |
| 15,380,000 | |||||
| New York: 9.85% | |||||
| Other municipal debt : 2.71% | |||||
| Corinth NY Central School District BAN (GO revenue) | 1.25 | 7-22-2022 | 8,000,000 | 8,040,403 | |
| Delhi NY Central School District BAN (GO revenue) | 1.13 | 7-28-2022 | 8,968,747 | 9,010,630 | |
| Franklinville NY Central School District BAN (GO revenue) | 1.25 | 6-28-2022 | 5,100,000 | 5,121,897 | |
| 22,172,930 | |||||
| Variable rate demand notes ø: 7.14% | |||||
| New York Fiscal Subordinate Bond Series 2017A-6 (GO revenue, JPMorgan Chase & Company SPA) | 0.12 | 8-1-2044 | 3,190,000 | 3,190,000 | |
| New York HFA Revenue Various 8 East 102nd Street Housing Series A (Housing revenue, TD Bank NA LOC) | 0.05 | 5-1-2044 | 16,545,000 | 16,545,000 | |
| New York Metropolitan Transportation Authority Subordinate Bond Series 2012A-2 (Transportation revenue, Bank of Montreal LOC) | 0.09 | 11-15-2041 | 8,300,000 | 8,300,000 | |
| New York Transitional Finance Authority Future Tax Secured Tax-Exempt Bond Fiscal 2015 Subordinate Bonds Series A-3 (Tax revenue, Mizuho Bank Limited SPA) | 0.12 | 8-1-2043 | 2,100,000 | 2,100,000 | |
| New York Various Fiscal 2018 Subordinated Bond Series B-5 (GO revenue, Barclays Bank plc SPA) | 0.12 | 10-1-2046 | 6,000,000 | 6,000,000 | |
| Tender Option Bond Trust Receipts/Floater Certificates Series 2018-XF2556 (Tax revenue, TD Bank NA LIQ) 144A | 0.08 | 9-15-2025 | 6,720,000 | 6,720,000 |
| Interest
rate |
Maturity
date |
Principal | Value | ||
| Variable rate demand notes ø(continued) | |||||
| Triborough Bridge & Tunnel Authority Subordinated Bonds series B-2 (Transportation revenue, State Street Bank & Trust Company LOC) | 0.10% | 1-1-2032 | $ 600,000 | $ 600,000 | |
| Triborough Bridge & Tunnel Authority Subordinated Bonds Series B-2 (Transportation revenue, State Street Bank & Trust Company LOC) | 0.08 | 1-1-2032 | 14,950,000 | 14,950,000 | |
| 58,405,000 | |||||
| North Carolina: 0.90% | |||||
| Variable rate demand notes ø: 0.90% | |||||
| Charlotte NC Water & Sewer Tender Option Bond Trust Receipts/Certificates Series 2018-XG0170 (Water & sewer revenue, Royal Bank of Canada LIQ) 144A | 0.09 | 1-1-2026 | 2,430,000 | 2,430,000 | |
| Charlotte-Mecklenburg Hospital Authority Atrium Health Series G (Health revenue, JPMorgan Chase & Company SPA) | 0.12 | 1-15-2048 | 2,665,000 | 2,665,000 | |
| Tender Option Bond Trust Receipts/Floater Certificates Series 2015-ZM0105 (Education revenue, Morgan Stanley Bank LIQ) 144A | 0.09 | 10-1-2055 | 2,250,500 | 2,250,500 | |
| 7,345,500 | |||||
| Ohio: 9.37% | |||||
| Other municipal debt : 1.79% | |||||
| Mahoning County OH BAN Various Purpose (GO revenue) | 1.00 | 9-8-2022 | 1,590,000 | 1,597,615 | |
| Milford OH Exempted Village School District BAN School Improvement (GO revenue) | 1.63 | 4-5-2022 | 13,000,000 | 13,032,396 | |
| 14,630,011 | |||||
| Variable rate demand notes ø: 7.58% | |||||
| Allen County OH Catholic Healthcare Series C (Health revenue, Bank of Montreal LOC) | 0.09 | 6-1-2034 | 1,200,000 | 1,200,000 | |
| Franklin County OH Trinity Health Group (Health revenue) | 0.10 | 12-1-2046 | 11,445,000 | 11,445,000 | |
| Ohio Adult Correctional Capital Facilities Various Lease Appropriation Building (Miscellaneous revenue) | 0.05 | 10-1-2040 | 10,000,000 | 10,000,000 | |
| Ohio Capital Facilities Lease Adult Correctional Building Fund Series C (Miscellaneous revenue) | 0.01 | 10-1-2036 | 10,000,000 | 10,000,000 | |
| Ohio Special Obligation Various Capital Facilities Lease (Miscellaneous revenue) | 0.05 | 12-1-2041 | 5,000,000 | 5,000,000 | |
| Royal Bank of Canada Municipal Products Incorporated Trust Series 1 (Health revenue, Royal Bank of Canada LOC, Royal Bank of Canada LIQ) 144A | 0.10 | 1-15-2037 | 8,000,000 | 8,000,000 | |
| Tender Option Bond Trust Receipts/Floater Certificates Series 2015-XF0225 (Water & sewer revenue, TD Bank NA LIQ) 144A | 0.11 | 11-15-2043 | 8,000,000 | 8,000,000 | |
| Tender Option Bond Trust Receipts/Floater Certificates Series 2017-XF2438 (Education revenue, JPMorgan Chase & Company LIQ) 144A | 0.09 | 12-1-2024 | 2,000,000 | 2,000,000 | |
| Tender Option Bond Trust Receipts/Floater Certificates Series 2020-MIZ9020 (Health revenue, Mizuho Capital Markets LLC LOC, Mizuho Capital Markets LLC LIQ) 144A | 0.14 | 5-1-2022 | 3,985,000 | 3,985,000 | |
| Tender Option Bond Trust Receipts/Various States (Miscellaneous revenue, Mizuho Capital Markets LLC LOC, Mizuho Capital Markets LLC LIQ) 144A | 0.19 | 12-15-2040 | 2,370,000 | 2,370,000 | |
| 62,000,000 |
| Interest
rate |
Maturity
date |
Principal | Value | ||
| Oregon: 1.41% | |||||
| Variable rate demand notes ø: 1.41% | |||||
| Oregon Housing & Community Services Department Mortgage Revenue Various Single Family Mortgage Program (Housing revenue, Sumitomo Mitsui Banking Corporation LOC) | 0.07% | 7-1-2037 | $ 2,000,000 | $ 2,000,000 | |
| Tender Option Bond Trust Receipts/Floater Certificates Series 2020-XM0813 (Health revenue, Royal Bank of Canada LIQ) 144A | 0.11 | 5-15-2027 | 4,895,000 | 4,895,000 | |
| Tender Option Bond Trust Receipts/Floater Certificates Series 2020-XM0814 (Education revenue, Royal Bank of Canada LIQ) 144A | 0.09 | 1-1-2028 | 4,605,000 | 4,605,000 | |
| 11,500,000 | |||||
| Pennsylvania: 1.98% | |||||
| Variable rate demand notes ø: 1.98% | |||||
| Floater/Residual Trust Tender Option Bond (Housing revenue, Mizuho Capital Markets LLC LOC, Mizuho Capital Markets LLC LIQ) 144A | 0.31 | 11-1-2034 | 3,000,000 | 3,000,000 | |
| Lehigh County General Purpose Authority Hospital Revenue Various Lehigh Valley Health Network (Health revenue, Bank of America NA LOC) | 0.06 | 7-1-2049 | 600,000 | 599,940 | |
| Pennsylvania EDFA Exempt Facilities Refunding Bond Energy Supply LLC (Utilities revenue, MUFG Bank Limited LOC) | 0.16 | 12-1-2038 | 1,000,000 | 1,000,000 | |
| Pennsylvania Public School Building Authority Series A (Miscellaneous revenue, AGM Insured, Citibank NA LIQ) 144A | 0.12 | 12-1-2023 | 5,000,000 | 5,000,000 | |
| Tender Option Bond Trust Receipts/Floater Certificates Series 2015-ZM0081 (Health revenue, Morgan Stanley Bank LIQ) 144A | 0.09 | 6-1-2044 | 1,700,000 | 1,700,000 | |
| Tender Option Bond Trust Receipts/Floater Certificates Series 2016-ZF0504 (Water & sewer revenue, TD Bank NA LIQ) 144A | 0.18 | 8-15-2042 | 4,875,000 | 4,875,000 | |
| 16,174,940 | |||||
| South Carolina: 1.37% | |||||
| Other municipal debt : 0.61% | |||||
| South Carolina Association Governmental Organizations Certificate of Participation Series A (Miscellaneous revenue) | 3.00 | 3-1-2022 | 5,000,000 | 5,011,114 | |
| Variable rate demand notes ø: 0.76% | |||||
| South Carolina Educational Facilities Authority for Private Non-Profit Institutions Higher Learning Educational Facilities Spartanburg Methodist Series 2005 (Education revenue, Truist Bank LOC) | 0.14 | 8-1-2025 | 1,475,000 | 1,475,000 | |
| South Carolina Jobs EDA Institutional Business & Home Safety Project Series 2009 (Industrial development revenue, Truist Bank LOC) | 0.14 | 11-1-2034 | 735,000 | 735,000 | |
| Tender Option Bond Trust Receipts/Certificates Series 2021-XF0185 (Utilities revenue, Barclays Bank plc LIQ) 144A | 0.14 | 12-1-2051 | 3,960,000 | 3,960,000 | |
| 6,170,000 |
| Interest
rate |
Maturity
date |
Principal | Value | ||
| Texas: 12.38% | |||||
| Other municipal debt : 7.74% | |||||
| Harris County TX Cultural Education Facilities Finance Corporation Revenue Series C-2 (Education revenue) | 0.10% | 2-17-2022 | $18,580,000 | $ 18,580,000 | |
| San Antonio TX Electric & Gas Revenue Series A (Utilities revenue) | 0.10 | 2-10-2022 | 20,000,000 | 20,000,000 | |
| University of Texas Permanent University Fund Series A (Education revenue) | 0.10 | 3-8-2022 | 12,000,000 | 12,000,000 | |
| University of Texas University Revenue Series A (Education revenue) | 0.10 | 2-2-2022 | 5,000,000 | 5,000,000 | |
| University of Texas University Revenue Series A (Education revenue) | 0.10 | 2-1-2022 | 7,700,000 | 7,700,000 | |
| 63,280,000 | |||||
| Variable rate demand notes ø: 4.64% | |||||
| Bexar County TX Housing Finance Corporation Palisades Park Apartments Project Series 2009 (Housing revenue, FHLMC LIQ) | 0.14 | 9-1-2039 | 3,400,000 | 3,400,000 | |
| North East Texas Independent School District Series A (Education revenue) | 0.16 | 3-16-2022 | 9,000,000 | 9,000,000 | |
| Port Arthur TX Navigation District Industrial Development Corporation Total Petrochemicals USA Incorporated Project (Industrial development revenue) | 0.09 | 6-1-2041 | 5,000,000 | 5,000,000 | |
| Port Corpus Christi TX Solid Waste Disposal Flint Hills Resources Project Series 2002-B (Resource recovery revenue) | 0.10 | 7-1-2029 | 4,200,000 | 4,200,000 | |
| Tender Option Bond Trust Receipts/Certificates Series 2021 MS0002 (Education revenue, Morgan Stanley Bank LIQ) 144A | 0.26 | 6-15-2056 | 5,000,000 | 5,000,000 | |
| Tender Option Bond Trust Receipts/Certificates Series 2021-XF1235 (Education revenue, Royal Bank of Canada LIQ) 144A | 0.09 | 2-15-2029 | 1,600,000 | 1,600,000 | |
| Tender Option Bond Trust Receipts/Various States (GO revenue, Royal Bank of Canada LIQ) 144A | 0.09 | 2-15-2029 | 1,455,000 | 1,455,000 | |
| Upper Trinity Regional Water District Texas Water Revenue Commercial Paper Notes 3-A2 Series A (Water & sewer revenue) | 0.10 | 3-4-2022 | 8,300,000 | 8,300,000 | |
| 37,955,000 | |||||
| Utah: 2.03% | |||||
| Variable rate demand notes ø: 2.03% | |||||
| Royal Bank of Canada Municipal Products Incorporated Trust Series E-142 (Utilities revenue, Royal Bank of Canada LOC, Royal Bank of Canada LIQ) 144A | 0.09 | 5-1-2022 | 16,600,000 | 16,600,000 | |
| Vermont: 0.27% | |||||
| Variable rate demand notes ø: 0.27% | |||||
| Vermont Educational & Health Buildings Financing Agency Landmark College Project Series 2008-A (Education revenue, TD Bank NA LOC) | 0.12 | 7-1-2033 | 2,200,000 | 2,200,000 | |
| Virginia: 1.26% | |||||
| Variable rate demand notes ø: 1.26% | |||||
| Floater/Residual Trust Tender Option Bond Series 2020-MIZ9025 (Health revenue, Mizuho Capital Markets LLC LOC, Mizuho Capital Markets LLC LIQ) 144A | 0.13 | 11-1-2035 | 2,030,000 | 2,030,000 |
| Interest
rate |
Maturity
date |
Principal | Value | ||
| Variable rate demand notes ø(continued) | |||||
| Tender Option Bond Trust Receipts/Various States (Education revenue, Bank of America NA LIQ) 144A | 0.08% | 9-1-2051 | $ 7,310,000 | $ 7,310,000 | |
| Virginia MFHR Series M-031 Class A (Housing revenue, FHLMC LIQ) 144A | 0.09 | 12-15-2045 | 980,000 | 980,000 | |
| 10,320,000 | |||||
| Wisconsin: 3.94% | |||||
| Variable rate demand notes ø: 3.94% | |||||
| Tender Option Bond Trust Receipts/Floater Certificates Series 2015-XF0127 (Health revenue, JPMorgan Chase & Company LIQ) 144A | 0.09 | 9-29-2022 | 3,815,000 | 3,815,000 | |
| Tender Option Bond Trust Receipts/Floater Certificates Series 2018-XF2634 (Health revenue, Credit Suisse LIQ) 144A | 0.08 | 8-15-2025 | 2,000,000 | 2,000,000 | |
| Tender Option Bond Trust Receipts/Floater Certificates Series 2019-XF2831 (Housing revenue, Mizuho Capital Markets LLC LIQ) 144A | 0.19 | 7-1-2029 | 1,800,000 | 1,800,000 | |
| Tender Option Bond Trust Receipts/Floater Certificates Series 2020-XL0148 (Health revenue, Barclays Bank plc LOC, AGM Insured, Barclays Bank plc LIQ) 144A | 0.10 | 6-1-2045 | 2,250,000 | 2,250,000 | |
| Tender Option Bond Trust Receipts/Various States (Education revenue, Mizuho Capital Markets LLC LOC, Mizuho Capital Markets LLC LIQ) 144A | 0.19 | 12-15-2040 | 1,915,000 | 1,915,000 | |
| University of Wisconsin Hospitals and Clinics Authority Revenue Various Refunding Bond Series C (Health revenue, BMO Harris Bank NA SPA) | 0.12 | 4-1-2048 | 9,000,000 | 9,000,000 | |
| Wisconsin Housing & EDA Housing Revenue Series A (Housing revenue) | 0.20 | 11-1-2038 | 135,000 | 135,000 | |
| Wisconsin Series 2019A (GO revenue) | 0.06 | 5-1-2029 | 11,300,000 | 11,300,000 | |
| 32,215,000 | |||||
| Total Municipal obligations (Cost $786,953,846) | 786,953,846 | ||||
| Repurchase agreements^^: 1.47% | |||||
| MUFG Securities Canada Limited, dated 1-31-2022, maturity value $12,000,017 | 0.05 | 2-1-2022 | 12,000,000 | 12,000,000 | |
| Total Repurchase agreements (Cost $12,000,000) | 12,000,000 | ||||
| Total investments in securities (Cost $813,953,846) | 99.55% | 813,953,846 | |||
| Other assets and liabilities, net | 0.45 | 3,672,434 | |||
| Total net assets | 100.00% | $817,626,280 |
| 144A | The security may be resold in transactions exempt from registration, normally to qualified institutional buyers, pursuant to Rule 144A under the Securities Act of 1933. |
| ø | Variable rate demand notes are subject to a demand feature which reduces the effective maturity. The maturity date shown represents the final maturity date of the security. The interest rate is determined and reset by the issuer daily, weekly, or monthly depending upon the terms of the security. The rate shown is the rate in effect at period end. |
| ^^ | Collateralized by U.S. government securities, 0.00% to 6.38%, 6-16-2022 to 2-15-2051, fair value including accrued interest is $12,240,000. |
| Abbreviations: | |
| AGM | Assured Guaranty Municipal |
| BAM | Build America Mutual Assurance Company |
| BAN | Bond anticipation notes |
| CDA | Community Development Authority |
| EDA | Economic Development Authority |
| EDFA | Economic Development Finance Authority |
| FHA | Federal Housing Administration |
| FHLMC | Federal Home Loan Mortgage Corporation |
| FNMA | Federal National Mortgage Association |
| GNMA | Government National Mortgage Association |
| GO | General obligation |
| HEFAR | Higher Education Facilities Authority Revenue |
| HFA | Housing Finance Authority |
| IDA | Industrial Development Authority |
| LIQ | Liquidity agreement |
| LOC | Letter of credit |
| MFHR | Multifamily housing revenue |
| NPFGC | National Public Finance Guarantee Corporation |
| PCR | Pollution control revenue |
| SPA | Standby purchase agreement |
| Assets | |
|
Investments in unaffiliated securities, at amortized
cost |
$ 813,953,846 |
|
Cash |
298,115 |
|
Receivable for investments
sold |
4,187,443 |
|
Receivable for
interest |
512,563 |
|
Receivable for Fund shares
sold |
230,158 |
|
Receivable from
manager |
50,191 |
|
Prepaid expenses and other
assets |
9,778 |
|
Total
assets |
819,242,094 |
| Liabilities | |
|
Payable for Fund shares
redeemed |
1,421,785 |
|
Administration fees
payable |
69,696 |
|
Dividends
payable |
3,496 |
|
Accrued expenses and other
liabilities |
120,837 |
|
Total
liabilities |
1,615,814 |
|
Total net
assets |
$817,626,280 |
| Net assets consist of | |
|
Paid-in
capital |
$ 817,682,258 |
|
Total distributable
loss |
(55,978) |
|
Total net
assets |
$817,626,280 |
| Computation of net asset value per share | |
|
Net assets – Class
A |
$ 84,531,970 |
|
Shares outstanding – Class
A1 |
84,522,647 |
|
Net asset value per share – Class
A |
$1.00 |
|
Net assets – Administrator
Class |
$ 108,156,922 |
|
Shares outstanding – Administrator
Class1 |
108,144,789 |
|
Net asset value per share – Administrator
Class |
$1.00 |
|
Net assets – Premier
Class |
$ 559,264,222 |
|
Shares outstanding – Premier
Class1 |
559,202,461 |
|
Net asset value per share – Premier
Class |
$1.00 |
|
Net assets – Service
Class |
$ 65,673,166 |
|
Shares outstanding – Service
Class1 |
65,665,925 |
Net
asset value per share – Service
Class |
$1.00 |
| 1 | The Fund has an unlimited number of authorized shares. |
| Investment income | |
|
Interest |
$ 1,071,835 |
| Expenses | |
|
Management
fee |
1,273,584 |
| Administration fees | |
|
Class
A |
204,779 |
|
Administrator
Class |
102,320 |
|
Premier
Class |
470,405 |
|
Service
Class |
78,778 |
| Shareholder servicing fees | |
|
Class
A |
232,704 |
|
Administrator
Class |
97,856 |
|
Service
Class |
164,121 |
|
Custody and accounting
fees |
48,528 |
|
Professional
fees |
55,690 |
|
Registration
fees |
136,734 |
|
Shareholder report
expenses |
19,450 |
|
Trustees’ fees and
expenses |
19,272 |
|
Other fees and
expenses |
24,686 |
|
Total
expenses |
2,928,907 |
| Less: Fee waivers and/or expense reimbursements | |
|
Fund-level |
(1,269,461) |
|
Class
A |
(362,333) |
|
Administrator
Class |
(119,748) |
|
Service
Class |
(190,420) |
|
Net
expenses |
986,945 |
|
Net investment
income |
84,890 |
|
Net realized gains on
investments |
118,683 |
|
Net increase in net assets resulting from
operations |
$ 203,573 |
| Year
ended January 31, 2022 |
Year
ended January 31, 2021 | |||
| Operations | ||||
|
Net investment
income |
$ 84,890 | $ 3,873,355 | ||
|
Net realized gains on
investments |
118,683 | 212,135 | ||
|
Net increase in net assets resulting from
operations |
203,573 | 4,085,490 | ||
| Distributions to shareholders from | ||||
| Net investment income and net realized gains | ||||
|
Class
A |
(21,610) | (290,972) | ||
|
Administrator
Class |
(25,998) | (353,108) | ||
|
Premier
Class |
(138,801) | (3,237,560) | ||
|
Service
Class |
(16,045) | (195,932) | ||
|
Total distributions to
shareholders |
(202,454) | (4,077,572) | ||
| Capital share transactions | Shares | Shares | ||
| Proceeds from shares sold | ||||
|
Class
A |
19,081,495 | 19,081,495 | 48,992,755 | 48,992,755 |
|
Administrator
Class |
82,252,702 | 82,252,702 | 28,381,498 | 28,381,498 |
|
Premier
Class |
239,015,930 | 239,015,930 | 742,724,878 | 742,724,878 |
|
Service
Class |
4,336,224 | 4,336,224 | 3,786,718 | 3,786,718 |
| 344,686,351 | 823,885,849 | |||
| Reinvestment of distributions | ||||
|
Class
A |
20,678 | 20,678 | 286,044 | 286,044 |
|
Administrator
Class |
25,556 | 25,556 | 347,010 | 347,010 |
|
Premier
Class |
83,214 | 83,214 | 2,209,973 | 2,209,973 |
|
Service
Class |
3,828 | 3,828 | 56,873 | 56,873 |
| 133,276 | 2,899,900 | |||
| Payment for shares redeemed | ||||
|
Class
A |
(35,489,215) | (35,489,215) | (43,994,444) | (43,994,444) |
|
Administrator
Class |
(59,613,625) | (59,613,625) | (50,697,012) | (50,697,012) |
|
Premier
Class |
(311,871,568) | (311,871,568) | (960,769,724) | (960,769,724) |
|
Service
Class |
(2,850,800) | (2,850,800) | (4,464,228) | (4,464,228) |
| (409,825,208) | (1,059,925,408) | |||
|
Net decrease in net assets resulting from capital share
transactions |
(65,005,581) | (233,139,659) | ||
|
Total decrease in net
assets |
(65,004,462) | (233,131,741) | ||
| Net assets | ||||
|
Beginning of
period |
882,630,742 | 1,115,762,483 | ||
|
End of
period |
$ 817,626,280 | $ 882,630,742 | ||
| Year ended January 31 | |||||
| Class A | 2022 | 2021 | 2020 | 2019 | 2018 |
|
Net asset value, beginning of
period |
$1.00 | $1.00 | $1.00 | $1.00 | $1.00 |
|
Net investment
income |
0.00 1 | 0.00 1 | 0.01 | 0.01 | 0.00 1 |
|
Net realized gains (losses) on
investments |
0.00 1 | 0.00 1 | 0.00 1 | 0.00 1 | 0.00 1 |
|
Total from investment
operations |
0.00 1 | 0.00 1 | 0.01 | 0.01 | 0.00 1 |
| Distributions to shareholders from | |||||
|
Net investment
income |
(0.00) 1 | (0.00) 1 | (0.01) | (0.01) | (0.00) 1 |
|
Net realized
gains |
(0.00) 1 | (0.00) 1 | (0.00) 1 | (0.00) 1 | (0.00) 1 |
|
Total distributions to
shareholders |
(0.00) 1 | (0.00) 1 | (0.01) | (0.01) | (0.00) 1 |
|
Net asset value, end of
period |
$1.00 | $1.00 | $1.00 | $1.00 | $1.00 |
|
Total
return |
0.02% | 0.27% | 0.93% | 0.89% | 0.35% |
| Ratios to average net assets (annualized) | |||||
|
Gross
expenses |
0.66% | 0.64% | 0.66% | 0.66% | 0.68% |
|
Net
expenses |
0.12% * | 0.33% * | 0.60% | 0.61% | 0.64% |
|
Net investment
income |
0.01% | 0.25% | 0.92% | 0.88% | 0.30% |
| Supplemental data | |||||
|
Net assets, end of period (000s
omitted) |
$84,532 | $100,920 | $95,632 | $101,680 | $119,524 |
| * | Ratio includes class-level expenses which were voluntarily waived by the investment manager. Without this voluntary waiver, the net expense ratio would be increased by the following amounts: |
| Year ended January 31, 2022 | 0.48% |
| Year ended January 31, 2021 | 0.25% |
| 1 | Amount is less than $0.005. |
| Year ended January 31 | |||||
| Administrator Class | 2022 | 2021 | 2020 | 2019 | 2018 |
|
Net asset value, beginning of
period |
$1.00 | $1.00 | $1.00 | $1.00 | $1.00 |
|
Net investment
income |
0.00 1 | 0.00 1 | 0.01 | 0.01 | 0.01 |
|
Net realized gains (losses) on
investments |
0.00 1 | 0.00 1 | 0.00 1 | 0.00 1 | 0.00 1 |
|
Total from investment
operations |
0.00 1 | 0.00 1 | 0.01 | 0.01 | 0.01 |
| Distributions to shareholders from | |||||
|
Net investment
income |
(0.00) 1 | (0.00) 1 | (0.01) | (0.01) | (0.01) |
|
Net realized
gains |
(0.00) 1 | (0.00) 1 | (0.00) 1 | (0.00) 1 | (0.00) 1 |
|
Total distributions to
shareholders |
(0.00) 1 | (0.00) 1 | (0.01) | (0.01) | (0.01) |
|
Net asset value, end of
period |
$1.00 | $1.00 | $1.00 | $1.00 | $1.00 |
|
Total
return |
0.02% | 0.35% | 1.23% | 1.21% | 0.69% |
| Ratios to average net assets (annualized) | |||||
|
Gross
expenses |
0.38% | 0.37% | 0.39% | 0.39% | 0.41% |
|
Net
expenses |
0.11% * | 0.25% * | 0.30% | 0.30% | 0.30% |
|
Net investment
income |
0.01% | 0.34% | 1.22% | 1.21% | 0.64% |
| Supplemental data | |||||
|
Net assets, end of period (000s
omitted) |
$108,157 | $85,489 | $107,457 | $131,395 | $132,964 |
| * | Ratio includes class-level expenses which were voluntarily waived by the investment manager. Without this voluntary waiver, the net expense ratio would be increased by the following amounts: |
| Year ended January 31, 2022 | 0.19% |
| Year ended January 31, 2021 | 0.04% |
| 1 | Amount is less than $0.005. |
| Year ended January 31 | |||||
| Premier Class | 2022 | 2021 | 2020 | 2019 | 2018 |
|
Net asset value, beginning of
period |
$1.00 | $1.00 | $1.00 | $1.00 | $1.00 |
|
Net investment
income |
0.00 1 | 0.00 1 | 0.01 | 0.01 | 0.01 |
|
Net realized gains (losses) on
investments |
0.00 1 | 0.00 1 | 0.00 1 | 0.00 1 | 0.00 1 |
|
Total from investment
operations |
0.00 1 | 0.00 1 | 0.01 | 0.01 | 0.01 |
| Distributions to shareholders from | |||||
|
Net investment
income |
(0.00) 1 | (0.00) 1 | (0.01) | (0.01) | (0.01) |
|
Net realized
gains |
(0.00) 1 | (0.00) 1 | (0.00) 1 | (0.00) 1 | (0.00) 1 |
|
Total distributions to
shareholders |
(0.00) 1 | (0.00) 1 | (0.01) | (0.01) | (0.01) |
|
Net asset value, end of
period |
$1.00 | $1.00 | $1.00 | $1.00 | $1.00 |
|
Total
return |
0.02% | 0.40% | 1.33% | 1.31% | 0.79% |
| Ratios to average net assets (annualized) | |||||
|
Gross
expenses |
0.27% | 0.25% | 0.27% | 0.27% | 0.28% |
|
Net
expenses |
0.12% 2 | 0.20% | 0.20% | 0.20% | 0.20% |
|
Net investment
income |
0.01% | 0.38% | 1.28% | 1.31% | 0.79% |
| Supplemental data | |||||
|
Net assets, end of period (000s
omitted) |
$559,264 | $632,040 | $847,871 | $593,961 | $339,331 |
| 1 | Amount is less than $0.005. |
| 2 | Ratio includes class-level expenses which were voluntarily waived by the investment manager. Without this voluntary waiver, the net expense ratio would have been 0.08% higher. |
| Year ended January 31 | |||||
| Service Class | 2022 | 2021 | 2020 | 2019 | 2018 |
|
Net asset value, beginning of
period |
$1.00 | $1.00 | $1.00 | $1.00 | $1.00 |
|
Net investment
income |
0.00 1 | 0.00 1 | 0.01 | 0.01 | 0.01 |
|
Net realized gains (losses) on
investments |
0.00 1 | 0.00 1 | 0.00 1 | 0.00 1 | 0.00 1 |
|
Total from investment
operations |
0.00 1 | 0.00 1 | 0.01 | 0.01 | 0.01 |
| Distributions to shareholders from | |||||
|
Net investment
income |
(0.00) 1 | (0.00) 1 | (0.01) | (0.01) | (0.01) |
|
Net realized
gains |
(0.00) 1 | (0.00) 1 | (0.00) 1 | (0.00) 1 | (0.00) 1 |
|
Total distributions to
shareholders |
(0.00) 1 | (0.00) 1 | (0.01) | (0.01) | (0.01) |
|
Net asset value, end of
period |
$1.00 | $1.00 | $1.00 | $1.00 | $1.00 |
|
Total
return |
0.02% | 0.30% | 1.08% | 1.06% | 0.54% |
| Ratios to average net assets (annualized) | |||||
|
Gross
expenses |
0.56% | 0.54% | 0.56% | 0.56% | 0.58% |
|
Net
expenses |
0.12% * | 0.29% * | 0.45% | 0.45% | 0.45% |
|
Net investment
income |
0.01% | 0.28% | 1.06% | 1.05% | 0.49% |
| Supplemental data | |||||
|
Net assets, end of period (000s
omitted) |
$65,673 | $64,183 | $64,802 | $65,682 | $66,460 |
| * | Ratio includes class-level expenses which were voluntarily waived by the investment manager. Without this voluntary waiver, the net expense ratio would be increased by the following amounts: |
| Year ended January 31, 2022 | 0.33% |
| Year ended January 31, 2021 | 0.15% |
| 1 | Amount is less than $0.005. |
| ■ | Level 1 – quoted prices in active markets for identical securities |
| ■ | Level 2 – other significant observable inputs (including quoted prices for similar securities, interest rates, prepayment speeds, credit risk, etc.) |
| ■ | Level 3 – significant unobservable inputs (including the Fund’s own assumptions in determining the fair value of investments) |
| Quoted
prices (Level 1) |
Other
significant observable inputs (Level 2) |
Significant
unobservable inputs (Level 3) |
Total | |
| Assets | ||||
| Investments in: | ||||
| Closed end municipal bond fund obligations | $0 | $ 15,000,000 | $0 | $ 15,000,000 |
| Municipal obligations | 0 | 786,953,846 | 0 | 786,953,846 |
| Repurchase agreements | 0 | 12,000,000 | 0 | 12,000,000 |
| Total assets | $0 | $813,953,846 | $0 | $813,953,846 |
| Average daily net assets | Management fee |
| First $5 billion | 0.150% |
| Next $5 billion | 0.140 |
| Next $5 billion | 0.130 |
| Next $85 billion | 0.125 |
| Over $100 billion | 0.120 |
| Average daily net assets | Management fee |
| First $5 billion | 0.150% |
| Next $5 billion | 0.140 |
| Over $10 billion | 0.130 |
| Class-level
administration fee | |
| Class A | 0.22% |
| Administrator Class | 0.10 |
| Premier Class | 0.08 |
| Service Class | 0.12 |
| Expense ratio caps | |
| Class A | 0.60% |
| Administrator Class | 0.30 |
| Premier Class | 0.20 |
| Service Class | 0.45 |
| Year ended January 31 | ||
| 2022 | 2021 | |
| Ordinary income | $127,978 | $ 210,574 |
| Tax-exempt income | 74,476 | 3,794,946 |
| Long-term capital gain | 0 | 72,052 |
| Undistributed
ordinary income |
Undistributed
long-term gain |
| $613 | $5,513 |
Allspring Funds Trust:

| Name
and year of birth |
Position
held and length of service* |
Principal occupations during past five years or longer | Current
other public company or investment company directorships |
| William
R. Ebsworth (Born 1957) |
Trustee,
since 2015 |
Retired. From 1984 to 2013, equities analyst, portfolio manager, research director and chief investment officer at Fidelity Management and Research Company in Boston, Tokyo, and Hong Kong, and retired in 2013 as Chief Investment Officer of Fidelity Strategic Advisers, Inc. where he led a team of investment professionals managing client assets. Prior thereto, Board member of Hong Kong Securities Clearing Co., Hong Kong Options Clearing Corp., the Thailand International Fund, Ltd., Fidelity Investments Life Insurance Company, and Empire Fidelity Investments Life Insurance Company. Audit Committee Chair and Investment Committee Chair of the Vincent Memorial Hospital Endowment (non-profit organization). Mr. Ebsworth is a CFA® charterholder. | N/A |
| Jane
A. Freeman (Born 1953) |
Trustee,
since 2015; Chair Liaison, since 2018 |
Retired. From 2012 to 2014 and 1999 to 2008, Chief Financial Officer of Scientific Learning Corporation. From 2008 to 2012, Ms. Freeman provided consulting services related to strategic business projects. Prior to 1999, Portfolio Manager at Rockefeller & Co. and Scudder, Stevens & Clark. Board member of the Harding Loevner Funds from 1996 to 2014, serving as both Lead Independent Director and chair of the Audit Committee. Board member of the Russell Exchange Traded Funds Trust from 2011 to 2012 and the chair of the Audit Committee. Ms. Freeman is also an inactive Chartered Financial Analyst. | N/A |
| Isaiah
Harris, Jr. (Born 1952) |
Trustee,
since 2009; Audit Committee Chair, since 2019 |
Retired. Chairman of the Board of CIGNA Corporation from 2009 to 2021, and Director from 2005 to 2008. From 2003 to 2011, Director of Deluxe Corporation. Prior thereto, President and CEO of BellSouth Advertising and Publishing Corp. from 2005 to 2007, President and CEO of BellSouth Enterprises from 2004 to 2005 and President of BellSouth Consumer Services from 2000 to 2003. Emeritus member of the Iowa State University Foundation Board of Governors. Emeritus Member of the Advisory Board of Iowa State University School of Business. Advisory Board Member, Palm Harbor Academy (private school). Advisory Board Member, Fellowship of Christian Athletes. Mr. Harris is a certified public accountant (inactive status). | N/A |
| David
F. Larcker (Born 1950) |
Trustee,
since 2009 |
James Irvin Miller Professor of Accounting at the Graduate School of Business (Emeritus), Stanford University, Director of the Corporate Governance Research Initiative and Senior Faculty of The Rock Center for Corporate Governance since 2006. From 2005 to 2008, Professor of Accounting at the Graduate School of Business, Stanford University. Prior thereto, Ernst & Young Professor of Accounting at The Wharton School, University of Pennsylvania from 1985 to 2005. | N/A |
| Name
and year of birth |
Position
held and length of service* |
Principal occupations during past five years or longer | Current
other public company or investment company directorships |
| Olivia
S. Mitchell (Born 1953) |
Trustee,
since 2006; Nominating and Governance Committee Chair, since 2018 |
International Foundation of Employee Benefit Plans Professor since 1993, Wharton School of the University of Pennsylvania. Director of Wharton’s Pension Research Council and Boettner Center on Pensions & Retirement Research, and Research Associate at the National Bureau of Economic Research. Previously taught at Cornell University from 1978 to 1993. | N/A |
| Timothy
J. Penny (Born 1951) |
Trustee,
since 1996; Chair, since 2018 |
President and Chief Executive Officer of Southern Minnesota Initiative Foundation, a non-profit organization, since 2007. Member of the Board of Trustees of NorthStar Education Finance, Inc., a non-profit organization, since 2007. | N/A |
| James
G. Polisson (Born 1959) |
Trustee,
since 2018 |
Retired. Chief Marketing Officer, Source (ETF) UK Services, Ltd, from 2015 to 2017. From 2012 to 2015, Principal of The Polisson Group, LLC, a management consulting, corporate advisory and principal investing company. Chief Executive Officer and Managing Director at Russell Investments, Global Exchange Traded Funds from 2010 to 2012. Managing Director of Barclays Global Investors from 1998 to 2010 and Global Chief Marketing Officer for iShares and Barclays Global Investors from 2000 to 2010. Trustee of the San Francisco Mechanics’ Institute, a non-profit organization, from 2013 to 2015. Board member of the Russell Exchange Traded Fund Trust from 2011 to 2012. Director of Barclays Global Investors Holdings Deutschland GmbH from 2006 to 2009. Mr. Polisson is an attorney and has a retired status with the Massachusetts and District of Columbia Bar Associations. | N/A |
| Pamela
Wheelock (Born 1959) |
Trustee,
since January 2020; previously Trustee from January 2018 to July 2019 |
Board member of the Destination Medical Center Economic Development Agency, Rochester, Minnesota since 2019. Interim President of the McKnight Foundation from January to September 2020. McKnight Foundation Consultant, November 2020 to February 2021. Acting Commissioner, Minnesota Department of Human Services, July 2019 through September 2019. Consultant (part-time), Minnesota Department of Human Services, October 2019 through December 2019. Chief Operating Officer, Twin Cities Habitat for Humanity from 2017 to 2019. Vice President of University Services, University of Minnesota from 2012 to 2016. Prior thereto, on the Board of Directors, Governance Committee and Finance Committee for the Minnesota Philanthropy Partners (Saint Paul Foundation) from 2012 to 2018, Interim Chief Executive Officer of Blue Cross Blue Shield of Minnesota from 2011 to 2012, Chairman of the Board from 2009 to 2012 and Board Director from 2003 to 2015. Vice President, Leadership and Community Engagement, Bush Foundation, Saint Paul, Minnesota (a private foundation) from 2009 to 2011. Executive Vice President and Chief Financial Officer, Minnesota Sports and Entertainment from 2004 to 2009 and Senior Vice President from 2002 to 2004. Executive Vice President of the Minnesota Wild Foundation from 2004 to 2008. Commissioner of Finance, State of Minnesota, from 1999 to 2002. Currently Board Chair of the Minnesota Wild Foundation since 2010. | N/A |
| Name
and year of birth |
Position
held and length of service |
Principal occupations during past five years or longer |
| Andrew
Owen (Born 1960) |
President,
since 2017 |
President, Chief Executive Officer and Director of Allspring Funds Management, LLC since 2017 and co-president of Galliard Capital Management, LLC, an affiliate of Allspring Funds Management, LLC, since 2019. Prior thereto, Head of Affiliated Managers, Allspring Global Investments, from 2014 to 2019 and Executive Vice President responsible for marketing, investments and product development for Allspring Funds Management, LLC, from 2009 to 2014. In addition, Mr. Owen was an Executive Vice President of Wells Fargo & Company from 2014 to 2021. |
| Jeremy
DePalma (Born 1974) |
Treasurer,
since 2012 (for certain funds in the Fund Complex); since 2021 (for the remaining funds in the Fund Complex) |
Senior Vice President of Allspring Funds Management, LLC since 2009. Senior Vice President of Evergreen Investment Management Company, LLC from 2008 to 2010 and head of the Fund Reporting and Control Team within Fund Administration. |
| Kate
McKinley (Born 1977) |
Chief
Legal Officer, since 2021 |
Chief Legal Officer of Allspring Global Investments since 2021. Prior thereto, held various roles at State Street Global Advisors beginning in 2010, including serving as Senior Vice President and General Counsel from 2019 to 2021, and Chief Operating Officer of the Institutional Client Group from 2016 - 2019. Prior to working at State Street Global Advisors served as Assistant General Counsel for Bank of America Corporation from 2005 to 2010 and as an Associate at WilmerHale from 2002 to 2005. |
| Christopher
Baker (Born 1976) |
Chief Compliance Officer, since 2022 | Global Chief Compliance Officer for Allspring Global Investments since 2022. Prior thereto, Chief Compliance Officer for State Street Global Advisors from 2018 to 2021. Senior Compliance Officer for the State Street divisions of Alternative Investment Solutions, Sector Solutions, and Global Marketing from 2015 to 2018. From 2010 to 2015 Vice President, Global Head of Investment and Marketing Compliance for State Street Global Advisors. |
| Matthew
Prasse (Born 1983) |
Secretary,
since 2021 |
Senior Counsel of the Allspring Legal Department since 2021. Senior Counsel of the Wells Fargo Legal Department from 2018 to 2021. Previously, Counsel for Barings LLC from 2015 to 2018. Prior to joining Barings, Associate at Morgan, Lewis & Bockius LLP from 2008 to 2015. |
P.O. Box 219967
Kansas City, MO 64121-9967
1-800-222-8222 or visit the Fund's website at allspringglobal.com. Read the prospectus carefully before you invest or send money.
A309/AR309 01-22

| ■ | Allspring Treasury Plus Money Market Fund |
|
|
2 |
|
|
6 |
|
|
10 |
|
|
11 |
| Financial statements | |
|
|
14 |
|
|
15 |
|
|
16 |
|
|
17 |
|
|
22 |
|
|
27 |
|
|
28 |

| 1 | The S&P 500 Index consists of 500 stocks chosen for market size, liquidity, and industry group representation. It is a market-value-weighted index with each stock's weight in the index proportionate to its market value. You cannot invest directly in an index. |
| 2 | The Morgan Stanley Capital International (MSCI) All Country World Index (ACWI) ex USA Index (Net) is a free-float-adjusted market-capitalization-weighted index that is designed to measure the equity market performance of developed and emerging markets, excluding the U.S. Source: MSCI. MSCI makes no express or implied warranties or representations and shall have no liability whatsoever with respect to any MSCI data contained herein. The MSCI data may not be further redistributed or used as a basis for other indexes or any securities or financial products. This report is not approved, reviewed, or produced by MSCI. You cannot invest directly in an index. |
| 3 | The MSCI Emerging Markets (EM) Index (Net) (USD) is a free-float-adjusted market-capitalization-weighted index that is designed to measure equity market performance of emerging markets. You cannot invest directly in an index. |
| 4 | The Bloomberg U.S. Aggregate Bond Index is a broad-based benchmark that measures the investment-grade, U.S.-dollar-denominated, fixed-rate taxable bond market, including Treasuries, government-related and corporate securities, mortgage-backed securities (agency fixed-rate and hybrid adjustable-rate mortgage pass-throughs), asset-backed securities, and commercial mortgage-backed securities. You cannot invest directly in an index. |
| 5 | The Bloomberg Global Aggregate ex-USD Index (unhedged) is an unmanaged index that provides a broad-based measure of the global investment-grade fixed-income markets excluding the U.S.-dollar-denominated debt market. You cannot invest directly in an index. |
| 6 | The Bloomberg Municipal Bond Index is an unmanaged index composed of long-term tax-exempt bonds with a minimum credit rating of Baa. You cannot invest directly in an index. |
| 7 | The ICE BofA U.S. High Yield Index is a market-capitalization-weighted index of domestic and Yankee high-yield bonds. The index tracks the performance of high-yield securities traded in the U.S. bond market. You cannot invest directly in an index. Copyright 2022. ICE Data Indices, LLC. All rights reserved. |
| 1 | The Consumer Price Index (CPI) is a measure of the average change over time in the prices paid by urban consumers for a market basket of consumer goods and services. You cannot invest directly in an index. |

President
Allspring Funds
| 1 | As of December 31, 2021, assets under management (AUM) includes $91.6 billion from Galliard Capital Management, LLC, an investment advisor that is not part of the Allspring trade name/GIPS firm. |
| Investment objective | The Fund seeks current income, while preserving capital and liquidity. |
| Manager | Allspring Funds Management, LLC |
| Subadviser | Allspring Global Investments, LLC |
| Portfolio managers | Michael C. Bird, CFA®‡, Jeffrey L. Weaver, CFA®‡, Laurie White |
| Average annual total returns (%) as of January 31, 2022 | ||||||
| Expense ratios1 (%) | ||||||
| Inception date | 1 year | 5 year | 10 year | Gross | Net 2 | |
| Class A (PIVXX) | 7-28-2003 | 0.01 | 0.69 | 0.35 | 0.60 | 0.60 |
| Administrator Class (WTPXX) | 3-31-2008 | 0.01 | 0.85 | 0.44 | 0.33 | 0.33 |
| Institutional Class (PISXX) | 8-11-1995 | 0.01 | 0.95 | 0.50 | 0.21 | 0.20 |
| Select Class (WTLXX)3 | 3-15-2019 | 0.01 | 0.96 | 0.51 | 0.17 | 0.14 |
| Service Class (PRVXX) | 10-1-1985 | 0.01 | 0.78 | 0.40 | 0.50 | 0.45 |
| 1 | Reflects the expense ratios as stated in the most recent prospectuses. The expense ratios shown are subject to change and may differ from the annualized expense ratios shown in the financial highlights of this report. |
| 2 | The manager has contractually committed through May 31, 2022, to waive fees and/or reimburse expenses to the extent necessary to cap total annual fund operating expenses after fee waivers at 0.60% for Class A, 0.34% for Administrator Class, 0.20% for Institutional Class, 0.14% for Select Class and 0.45% for Service Class. Brokerage commissions, stamp duty fees, interest, taxes, acquired fund fees and expenses (if any), and extraordinary expenses are excluded from the expense caps. Prior to or after the commitment expiration date, the caps may be increased or the commitment to maintain the caps may be terminated only with the approval of the Board of Trustees. The manager and/or its affiliates may also voluntarily waive all or a portion of any fees to which they are entitled and/or reimburse certain expenses as they may determine from time to time. Without these caps, the Fund’s returns would have been lower. The expense ratio paid by an investor is the net expense ratio (the total annual fund operating expenses after fee waivers) as stated in the prospectuses. |
| 3 | Historical performance shown for the Select Class shares prior to their inception reflects the performance of the Institutional Class shares, and includes the higher expenses applicable to the Institutional Class shares. If these expenses had not been included, returns for the Select Class shares would be higher. |
| Yield summary (%) as of January 31, 2022 | |||||
| Class A | Administrator
Class |
Institutional
Class |
Select
Class |
Service
Class | |
| 7-day current yield1 | 0.01 | 0.01 | 0.01 | 0.01 | 0.01 |
| 7-day compound yield | 0.01 | 0.01 | 0.01 | 0.01 | 0.01 |
| 30-day simple yield | 0.01 | 0.03 | 0.01 | 0.01 | 0.01 |
| 30-day compound yield | 0.01 | 0.03 | 0.01 | 0.01 | 0.01 |
| 1 | The
manager has contractually committed through May 31, 2022, to waive fees and/or reimburse expenses to the extent necessary to cap total annual fund operating expenses and may also voluntarily waive or reimburse additional fees and expenses which may
be discontinued or modified at any time without notice. Without these reductions, the Fund’s 7-day current yield would have been -0.47%, -0.21%, -0.12%, -0.08% and -0.33% for Class A, Administrator Class, Institutional Class, Select Class and Service Class, respectively. |
| ‡ | CFA® and Chartered Financial Analyst® are trademarks owned by CFA Institute. |
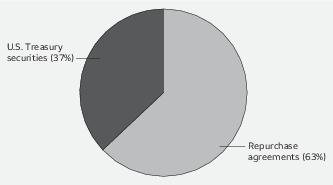
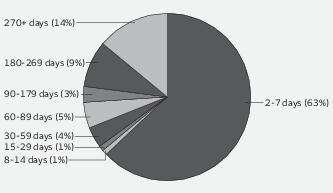
| * | The Core Personal Consumption Expenditures (PCE) Price Index measures the prices paid by U.S. consumers for domestic goods and services, excluding the prices of food and energy. You cannot invest directly into an index. |
| Beginning
account value 8-1-2021 |
Ending
account value 1-31-2022 |
Expenses
paid during the period1 |
Annualized
net expense ratio | |
| Class A | ||||
| Actual | $1,000.00 | $1,000.06 | $0.30 | 0.06% |
| Hypothetical (5% return before expenses) | $1,000.00 | $1,024.90 | $0.31 | 0.06% |
| Administrator Class | ||||
| Actual | $1,000.00 | $1,000.07 | $0.30 | 0.06% |
| Hypothetical (5% return before expenses) | $1,000.00 | $1,024.90 | $0.31 | 0.06% |
| Institutional Class | ||||
| Actual | $1,000.00 | $1,000.06 | $0.30 | 0.06% |
| Hypothetical (5% return before expenses) | $1,000.00 | $1,024.90 | $0.31 | 0.06% |
| Select Class | ||||
| Actual | $1,000.00 | $1,000.06 | $0.30 | 0.06% |
| Hypothetical (5% return before expenses) | $1,000.00 | $1,024.90 | $0.31 | 0.06% |
| Service Class | ||||
| Actual | $1,000.00 | $1,000.06 | $0.30 | 0.06% |
| Hypothetical (5% return before expenses) | $1,000.00 | $1,024.90 | $0.31 | 0.06% |
| Interest
rate |
Maturity
date |
Principal | Value | ||
| Repurchase agreements^^: 63.14% | |||||
| ANZ Bank New Zealand Limited, dated 1-31-2022, maturity value $49,999,183 (01) | 0.05% | 2-1-2022 | $ 49,999,114 | $ 49,999,114 | |
| Bank of America, dated 1-31-2022, maturity value $100,000,139 (02) | 0.05 | 2-1-2022 | 100,000,000 | 100,000,000 | |
| Bank
of New York Mellon Corporation, dated 1-31-2022, maturity value $250,000,382 (03) |
0.06 | 2-1-2022 | 250,000,000 | 250,000,000 | |
| Barclays Bank plc, dated 1-31-2022, maturity value $780,001,083 (04) | 0.05 | 2-1-2022 | 780,000,000 | 780,000,000 | |
| BNP Paribas, dated 1-31-2022, maturity value $1,660,002,306 (05) | 0.05 | 2-1-2022 | 1,660,000,000 | 1,660,000,000 | |
| BNP Paribas, dated 1-31-2022, maturity value $1,000,001,528 (06) | 0.06 | 2-1-2022 | 1,000,000,000 | 1,000,000,000 | |
| Citigroup
Global Markets Incorporated, dated 1-31-2022, maturity value $565,000,785 (07) |
0.05 | 2-1-2022 | 565,000,000 | 565,000,000 | |
| Citigroup
Global Markets Incorporated, dated 1-27-2022, maturity value $250,002,431 (08) |
0.05 | 2-3-2022 | 250,000,000 | 250,000,000 | |
| Credit Agricole SA, dated 1-31-2022, maturity value $150,000,208 (09) | 0.05 | 2-1-2022 | 150,000,000 | 150,000,000 | |
| Federal Reserve Bank of New York, dated 1-31-2022, maturity value $7,250,010,069 (10) | 0.05 | 2-1-2022 | 7,250,000,000 | 7,250,000,000 | |
| ING Financial Markets LLC, dated 1-31-2022, maturity value $100,009,472 (11) | 0.05 | 2-1-2022 | 100,009,333 | 100,009,333 | |
| JPMorgan Securities, dated 1-2-2022, maturity value $100,005,000 (12) §∂øø | 0.06 | 2-1-2022 | 100,000,000 | 100,000,000 | |
| JPMorgan Securities, dated 1-31-2022, maturity value $100,000,153 (13) | 0.06 | 2-1-2022 | 100,000,000 | 100,000,000 | |
| MUFG Securities Canada Limited, dated 1-25-2022, maturity value $250,002,431 (14) | 0.05 | 2-1-2022 | 250,000,000 | 250,000,000 | |
| MUFG Securities Canada Limited, dated 1-31-2022, maturity value $228,800,318 (15) | 0.05 | 2-1-2022 | 228,800,000 | 228,800,000 | |
| MUFG Securities Canada Limited, dated 1-31-2022, maturity value $250,000,347 (16) | 0.05 | 2-1-2022 | 250,000,000 | 250,000,000 | |
| RBS Securities Incorporated, dated 1-31-2022, maturity value $1,000,001,528 (17) | 0.06 | 2-1-2022 | 1,000,000,000 | 1,000,000,000 | |
| Societe Generale NY, dated 1-4-2022, maturity value $75,003,875 (18) | 0.06 | 2-4-2022 | 75,000,000 | 75,000,000 | |
| Standard Chartered Bank, dated 1-31-2022, maturity value $142,125,197 (19) | 0.05 | 2-1-2022 | 142,125,000 | 142,125,000 | |
| Sumitomo Mitsui Banking Corporation, dated 1-26-2022, maturity value $405,528,539 (20) §∂øø | 0.07 | 2-9-2022 | 405,517,500 | 405,517,500 | |
| Total Repurchase agreements (Cost $14,706,450,947) | 14,706,450,947 | ||||
| U.S. Treasury securities: 36.83% | |||||
| U.S. Cash Management Bill ☼ | 0.07 | 4-5-2022 | 50,000,000 | 49,993,613 | |
| U.S. Cash Management Bill ☼ | 0.09 | 4-19-2022 | 100,000,000 | 99,981,285 | |
| U.S. Cash Management Bill ☼ | 0.11 | 4-26-2022 | 50,000,000 | 49,986,875 | |
| U.S. Cash Management Bill ☼ | 0.13 | 5-3-2022 | 50,000,000 | 49,983,253 | |
| U.S. Cash Management Bill ☼ | 0.15 | 5-10-2022 | 50,000,000 | 49,980,264 | |
| U.S. Cash Management Bill ☼ | 0.19 | 5-17-2022 | 30,000,000 | 29,983,113 | |
| U.S. Cash Management Bill ☼ | 0.28 | 5-24-2022 | 30,000,000 | 29,974,333 | |
| U.S. Treasury Bill ☼ | 0.04 | 2-22-2022 | 50,000,000 | 49,998,454 | |
| U.S. Treasury Bill ☼ | 0.05 | 2-10-2022 | 50,000,000 | 49,999,344 | |
| U.S. Treasury Bill ☼ | 0.05 | 2-17-2022 | 50,000,000 | 49,998,889 | |
| U.S. Treasury Bill ☼ | 0.05 | 3-8-2022 | 50,000,000 | 49,997,521 | |
| U.S. Treasury Bill ☼ | 0.06 | 3-10-2022 | 300,000,000 | 299,980,164 |
| Interest
rate |
Maturity
date |
Principal | Value | ||
| U.S. Treasury securities (continued) | |||||
| U.S. Treasury Bill ☼ | 0.08% | 3-22-2022 | $ 100,000,000 | $ 99,988,975 | |
| U.S. Treasury Bill ☼ | 0.08 | 3-24-2022 | 150,000,000 | 149,984,063 | |
| U.S. Treasury Bill ☼ | 0.08 | 3-31-2022 | 100,000,000 | 99,986,628 | |
| U.S. Treasury Bill ☼ | 0.08 | 4-14-2022 | 80,000,000 | 79,986,940 | |
| U.S. Treasury Bill ☼ | 0.08 | 4-21-2022 | 70,000,000 | 69,986,537 | |
| U.S. Treasury Bill ☼ | 0.09 | 4-7-2022 | 50,000,000 | 49,992,191 | |
| U.S. Treasury Bill ☼ | 0.10 | 6-2-2022 | 130,000,000 | 129,958,490 | |
| U.S. Treasury Bill ☼ | 0.10 | 9-8-2022 | 36,000,000 | 35,977,553 | |
| U.S. Treasury Bill ☼ | 0.11 | 10-6-2022 | 220,000,000 | 219,838,969 | |
| U.S. Treasury Bill ☼ | 0.13 | 3-29-2022 | 50,000,000 | 49,989,889 | |
| U.S. Treasury Bill ☼ | 0.15 | 6-23-2022 | 30,000,000 | 29,982,487 | |
| U.S. Treasury Bill ☼ | 0.16 | 11-3-2022 | 100,000,000 | 99,877,778 | |
| U.S. Treasury Bill ☼ | 0.19 | 4-28-2022 | 10,000,000 | 9,995,509 | |
| U.S. Treasury Bill ☼ | 0.21 | 6-30-2022 | 30,000,000 | 29,974,484 | |
| U.S. Treasury Bill ☼ | 0.22 | 7-7-2022 | 20,000,000 | 19,980,717 | |
| U.S. Treasury Bill ☼ | 0.27 | 7-14-2022 | 20,000,000 | 19,975,731 | |
| U.S. Treasury Bill ☼ | 0.36 | 7-21-2022 | 20,000,000 | 19,965,717 | |
| U.S. Treasury Bill ☼ | 0.38 | 7-28-2022 | 10,000,000 | 9,981,415 | |
| U.S. Treasury Bill ☼ | 0.39 | 12-29-2022 | 20,000,000 | 19,928,283 | |
| U.S. Treasury Bill ☼ | 0.62 | 1-26-2023 | 10,000,000 | 9,938,372 | |
| U.S. Treasury Note | 0.13 | 5-31-2022 | 30,000,000 | 30,003,795 | |
| U.S. Treasury Note | 0.13 | 6-30-2022 | 20,000,000 | 20,002,756 | |
| U.S. Treasury Note | 0.13 | 7-31-2022 | 220,000,000 | 220,032,204 | |
| U.S. Treasury Note | 0.13 | 8-31-2022 | 100,000,000 | 100,019,424 | |
| U.S. Treasury Note | 0.13 | 9-30-2022 | 158,000,000 | 158,034,446 | |
| U.S. Treasury Note | 0.13 | 10-31-2022 | 317,850,000 | 317,892,824 | |
| U.S. Treasury Note | 0.13 | 11-30-2022 | 152,000,000 | 151,927,870 | |
| U.S. Treasury Note | 0.13 | 12-31-2022 | 90,000,000 | 89,830,848 | |
| U.S. Treasury Note (U.S. Treasury 3 Month Bill Money Market Yield +0.03%) ± | 0.22 | 4-30-2023 | 640,000,000 | 640,022,131 | |
| U.S. Treasury Note (U.S. Treasury 3 Month Bill Money Market Yield +0.03%) ± | 0.22 | 7-31-2023 | 520,000,000 | 520,016,789 | |
| U.S. Treasury Note (U.S. Treasury 3 Month Bill Money Market Yield +0.04%) ± | 0.23 | 10-31-2023 | 520,000,000 | 520,014,130 | |
| U.S. Treasury Note (U.S. Treasury 3 Month Bill Money Market Yield +0.05%) ± | 0.24 | 1-31-2023 | 230,000,000 | 230,015,863 | |
| U.S. Treasury Note (U.S. Treasury 3 Month Bill Money Market Yield +0.06%) ± | 0.25 | 7-31-2022 | 610,000,000 | 609,996,850 | |
| U.S. Treasury Note (U.S. Treasury 3 Month Bill Money Market Yield +0.06%) ± | 0.25 | 10-31-2022 | 570,000,000 | 569,992,002 | |
| U.S. Treasury Note (U.S. Treasury 3 Month Bill Money Market Yield +0.11%) ± | 0.30 | 4-30-2022 | 730,000,000 | 730,019,750 | |
| U.S. Treasury Note | 0.38 | 3-31-2022 | 50,000,000 | 50,021,729 | |
| U.S. Treasury Note | 1.13 | 2-28-2022 | 60,000,000 | 60,045,866 | |
| U.S. Treasury Note | 1.38 | 10-15-2022 | 167,000,000 | 168,443,454 | |
| U.S. Treasury Note | 1.50 | 8-15-2022 | 30,000,000 | 30,227,290 | |
| U.S. Treasury Note | 1.50 | 9-15-2022 | 50,000,000 | 50,433,958 | |
| U.S. Treasury Note | 1.63 | 8-15-2022 | 40,000,000 | 40,329,749 | |
| U.S. Treasury Note | 1.63 | 8-31-2022 | 95,000,000 | 95,829,162 | |
| U.S. Treasury Note | 1.63 | 11-15-2022 | 30,600,000 | 30,962,728 | |
| U.S. Treasury Note | 1.75 | 2-28-2022 | 30,000,000 | 30,037,866 | |
| U.S. Treasury Note | 1.75 | 3-31-2022 | 130,000,000 | 130,346,508 | |
| U.S. Treasury Note | 1.75 | 6-30-2022 | 40,000,000 | 40,271,555 | |
| U.S. Treasury Note | 1.75 | 7-15-2022 | 100,000,000 | 100,745,106 | |
| U.S. Treasury Note | 1.75 | 9-30-2022 | 80,000,000 | 80,871,473 |
| Interest
rate |
Maturity
date |
Principal | Value | ||
| U.S. Treasury securities (continued) | |||||
| U.S. Treasury Note | 1.88% | 3-31-2022 | $ 60,000,000 | $ 60,169,197 | |
| U.S. Treasury Note | 1.88 | 4-30-2022 | 70,000,000 | 70,302,518 | |
| U.S. Treasury Note | 1.88 | 7-31-2022 | 140,000,000 | 141,227,665 | |
| U.S. Treasury Note | 1.88 | 8-31-2022 | 47,000,000 | 47,478,442 | |
| U.S. Treasury Note | 1.88 | 9-30-2022 | 83,000,000 | 83,973,575 | |
| U.S. Treasury Note | 2.00 | 7-31-2022 | 30,000,000 | 30,281,574 | |
| U.S. Treasury Note | 2.00 | 10-31-2022 | 45,000,000 | 45,614,130 | |
| U.S. Treasury Note | 2.00 | 11-30-2022 | 45,000,000 | 45,642,812 | |
| U.S. Treasury Note | 2.13 | 5-15-2022 | 60,000,000 | 60,347,023 | |
| U.S. Treasury Note | 2.13 | 12-31-2022 | 40,000,000 | 40,653,649 | |
| U.S. Treasury Note | 2.50 | 2-15-2022 | 20,000,000 | 20,018,435 | |
| Total U.S. Treasury securities (Cost $8,577,244,982) | 8,577,244,982 | ||||
| Total investments in securities (Cost $23,283,695,929) | 99.97% | 23,283,695,929 | |||
| Other assets and liabilities, net | 0.03 | 7,238,315 | |||
| Total net assets | 100.00% | $23,290,934,244 |
| ^^ | Collateralized by: |
| (01) U.S. government securities, 0.75% to 3.75%, 1-31-2024 to 8-15-2050, fair value including accrued interest is $50,738,014. | |
| (02) U.S. government securities, 1.13% to 2.75%, 2-15-2024 to 1-15-2025, fair value including accrued interest is $102,000,071. | |
| (03) U.S. government securities, 2.88% to 4.25%, 5-15,2028 to 5-15-2039, fair value including accrued interest is $255,000,093. | |
| (04) U.S. government securities, 0.00% to 7.63%, 2-1-2022 to 2-15-2051, fair value including accrued interest is $795,600,002. | |
| (05) U.S. government securities, 0.00% to 7.63%, 2-3-2022 to 5-15-2051, fair value including accrued interest is $1,693,200,000. | |
| (06) U.S. government securities, 1.00% to 1.25%, 7-31-2028 to 9-30-2028, fair value including accrued interest is $1,020,408,163. | |
| (07) U.S. government securities, 0.13% to 3.00%, 8-31-2025 to 1-15-2030, fair value including accrued interest is $576,300,112. | |
| (08) U.S. government securities, 0.13% to 2.88%, 2-28-2025 to 5-15-2025, fair value including accrued interest is $255,005,913. | |
| (09) U.S. government securities, 1.13%, 8-15-2040, fair value including accrued interest is $153,000,077. | |
| (10) U.S. government securities, 0.13% to 3.63%, 8-15-2022 to 5-15-2044, fair value including accrued interest is $7,250,010,118. | |
| (11) U.S. government securities, 0.63% to 2.75%, 3-31-2023 to 11-30-2027, fair value including accrued interest is $102,009,520. | |
| (12) U.S. government securities, 0.00%, 7-7-2022, fair value is $102,000,314. | |
| (13) U.S. government securities, 0.00% to 1.88%, 7-31-2022 to 10-15-2026, fair value including accrued interest is $102,000,026. | |
| (14) U.S. government securities, 0.00% to 6.38%, 1-31-2023 to 2-15-2051, fair value including accrued interest is $255,000,055. | |
| (15) U.S. government securities, 0.00% to 6.38%, 6-16-2022 to 2-15-2051, fair value including accrued interest is $233,376,000. | |
| (16) U.S. government securities, 0.13% to 4.38%, 7-15-2022 to 5-15-2041, fair value including accrued interest is $255,000,000. | |
| (17) U.S. government securities, 0.00% to 3.13%, 2-15-2022 to 8-15-2051, fair value including accrued interest is $1,020,000,037. | |
| (18) U.S. government securities, 0.00% to 7.63%, 2-3-2022 to 5-15-2050, fair value including accrued interest is $76,500,000. | |
| (19) U.S. government securities, 1.25%, 8-31-2028, fair value including accrued interest is $145,025,510. | |
| (20) U.S. government securities, 0.38% to 3.38%, 3-31-2022 to 5-15-2044, fair value including accrued interest is $413,766,417. | |
| § | The security is subject to a demand feature which reduces the effective maturity. |
| ∂ | The security represents a long-dated and extendible repurchase agreement which automatically renews on previously set terms. The maturity date represents the next put date. |
| øø | The interest rate is determined and reset by the issuer periodically depending upon the terms of the security. The rate shown is the rate in effect at period end. |
| ± | Variable rate investment. The rate shown is the rate in effect at period end. |
| ☼ | Zero coupon security. The rate represents the current yield to maturity. |
| Assets | |
|
Investments in unaffiliated securities, at amortized
cost |
$ 8,577,244,982 |
|
Investments in repurchase agreements, at amortized
cost |
14,706,450,947 |
|
Cash |
184,136 |
|
Receivable for investments
sold |
49,994,688 |
|
Receivable for
interest |
7,157,397 |
|
Receivable from
manager |
546,937 |
|
Receivable for Fund shares
sold |
35,103 |
|
Prepaid expenses and other
assets |
1,472,029 |
|
Total
assets |
23,343,086,219 |
| Liabilities | |
|
Payable for investments
purchased |
49,989,889 |
|
Administration fees
payable |
1,762,327 |
|
Payable for Fund shares
redeemed |
244,235 |
|
Dividends
payable |
120,654 |
|
Accrued expenses and other
liabilities |
34,870 |
|
Total
liabilities |
52,151,975 |
|
Total net
assets |
$23,290,934,244 |
| Net assets consist of | |
|
Paid-in
capital |
$ 23,291,186,459 |
|
Total distributable
loss |
(252,215) |
|
Total net
assets |
$23,290,934,244 |
| Computation of net asset value per share | |
|
Net assets – Class
A |
$ 2,421,542,325 |
|
Shares outstanding – Class
A1 |
2,421,326,490 |
|
Net asset value per share – Class
A |
$1.00 |
|
Net assets – Administrator
Class |
$ 117,555,835 |
|
Shares outstanding – Administrator
Class1 |
117,547,725 |
|
Net asset value per share – Administrator
Class |
$1.00 |
|
Net assets – Institutional
Class |
$ 14,984,670,384 |
|
Shares outstanding – Institutional
Class1 |
14,983,539,747 |
|
Net asset value per share – Institutional
Class |
$1.00 |
|
Net assets – Select
Class |
$ 4,360,651,693 |
|
Shares outstanding – Select
Class1 |
4,360,246,689 |
|
Net asset value per share – Select
Class |
$1.00 |
|
Net assets – Service
Class |
$ 1,406,514,007 |
|
Shares outstanding – Service
Class1 |
1,406,407,210 |
Net
asset value per share – Service
Class |
$1.00 |
| 1 | The Fund has an unlimited number of authorized shares. |
| Investment income | |
|
Interest |
$ 16,772,807 |
| Expenses | |
|
Management
fee |
31,503,929 |
| Administration fees | |
|
Class
A |
4,405,629 |
|
Administrator
Class |
87,097 |
|
Institutional
Class |
12,314,042 |
|
Select
Class |
1,747,665 |
|
Service
Class |
1,744,808 |
| Shareholder servicing fees | |
|
Class
A |
5,006,405 |
|
Administrator
Class |
87,097 |
|
Service
Class |
3,635,018 |
|
Custody and accounting
fees |
884,727 |
|
Professional
fees |
71,032 |
|
Registration
fees |
304,347 |
|
Shareholder report
expenses |
43,890 |
|
Trustees’ fees and
expenses |
19,272 |
|
Other fees and
expenses |
352,105 |
|
Total
expenses |
62,207,063 |
| Less: Fee waivers and/or expense reimbursements | |
|
Fund-level |
(27,974,397) |
|
Class
A |
(8,616,730) |
|
Administrator
Class |
(139,817) |
|
Institutional
Class |
(6,229,156) |
|
Service
Class |
(4,805,354) |
|
Net
expenses |
14,441,609 |
|
Net investment
income |
2,331,198 |
|
Net realized gains on
investments |
78,655 |
|
Net increase in net assets resulting from
operations |
$ 2,409,853 |
| Year
ended January 31, 2022 |
Year
ended January 31, 2021 | |||
| Operations | ||||
|
Net investment
income |
$ 2,331,198 | $ 31,525,314 | ||
|
Net realized gains on
investments |
78,655 | 100,625 | ||
|
Net increase in net assets resulting from
operations |
2,409,853 | 31,625,939 | ||
| Distributions to shareholders from | ||||
| Net investment income and net realized gains | ||||
|
Class
A |
(214,632) | (1,570,166) | ||
|
Administrator
Class |
(9,840) | (274,712) | ||
|
Institutional
Class |
(1,626,052) | (24,959,137) | ||
|
Select
Class |
(469,032) | (3,152,338) | ||
|
Service
Class |
(153,404) | (1,646,130) | ||
|
Total distributions to
shareholders |
(2,472,960) | (31,602,483) | ||
| Capital share transactions | Shares | Shares | ||
| Proceeds from shares sold | ||||
|
Class
A |
17,292,778,758 | 17,292,778,758 | 9,941,597,730 | 9,941,597,730 |
|
Administrator
Class |
301,493,085 | 301,493,085 | 575,602,412 | 575,602,412 |
|
Institutional
Class |
78,183,860,257 | 78,183,860,257 | 89,663,135,695 | 89,663,135,695 |
|
Select
Class |
158,221,246,956 | 158,221,246,956 | 84,526,317,126 | 84,526,317,126 |
|
Service
Class |
8,837,003,941 | 8,837,003,941 | 6,391,237,824 | 6,391,237,824 |
| 262,836,382,997 | 191,097,890,787 | |||
| Reinvestment of distributions | ||||
|
Class
A |
102,289 | 102,289 | 827,512 | 827,512 |
|
Administrator
Class |
9,834 | 9,834 | 284,450 | 284,450 |
|
Institutional
Class |
513,020 | 513,020 | 9,197,042 | 9,197,042 |
|
Select
Class |
321,522 | 321,522 | 2,646,092 | 2,646,092 |
|
Service
Class |
31,358 | 31,358 | 396,877 | 396,877 |
| 978,023 | 13,351,973 | |||
| Payment for shares redeemed | ||||
|
Class
A |
(16,408,606,695) | (16,408,606,695) | (9,784,258,186) | (9,784,258,186) |
|
Administrator
Class |
(327,688,424) | (327,688,424) | (569,238,199) | (569,238,199) |
|
Institutional
Class |
(79,078,616,429) | (79,078,616,429) | (85,088,285,515) | (85,088,285,515) |
|
Select
Class |
(156,979,444,837) | (156,979,444,837) | (82,102,590,260) | (82,102,590,260) |
|
Service
Class |
(8,846,695,273) | (8,846,695,273) | (6,144,319,269) | (6,144,319,269) |
| (261,641,051,658) | (183,688,691,429) | |||
|
Net increase in net assets resulting from capital share
transactions |
1,196,309,362 | 7,422,551,331 | ||
|
Total increase in net
assets |
1,196,246,255 | 7,422,574,787 | ||
| Net assets | ||||
|
Beginning of
period |
22,094,687,989 | 14,672,113,202 | ||
|
End of
period |
$ 23,290,934,244 | $ 22,094,687,989 | ||
| Year ended January 31 | |||||
| Class A | 2022 | 2021 | 2020 | 2019 | 2018 |
|
Net asset value, beginning of
period |
$1.00 | $1.00 | $1.00 | $1.00 | $1.00 |
|
Net investment
income |
0.00 1 | 0.00 1 | 0.02 | 0.01 | 0.00 1 |
|
Net realized gains (losses) on
investments |
0.00 1 | 0.00 1 | 0.00 1 | 0.00 1 | 0.00 1 |
|
Total from investment
operations |
0.00 1 | 0.00 1 | 0.02 | 0.01 | 0.00 1 |
| Distributions to shareholders from | |||||
|
Net investment
income |
(0.00) 1 | (0.00) 1 | (0.02) | (0.01) | (0.00) 1 |
|
Net realized
gains |
(0.00) 1 | 0.00 | (0.00) 1 | (0.00) 1 | (0.00) 1 |
|
Total distributions to
shareholders |
(0.00) 1 | (0.00) 1 | (0.02) | (0.01) | (0.00) 1 |
|
Net asset value, end of
period |
$1.00 | $1.00 | $1.00 | $1.00 | $1.00 |
|
Total
return |
0.01% | 0.12% | 1.56% | 1.37% | 0.38% |
| Ratios to average net assets (annualized) | |||||
|
Gross
expenses |
0.61% | 0.61% | 0.61% | 0.61% | 0.62% |
|
Net
expenses |
0.06% * | 0.25% * | 0.60% | 0.60% | 0.61% |
|
Net investment
income |
0.01% | 0.11% | 1.53% | 1.36% | 0.38% |
| Supplemental data | |||||
|
Net assets, end of period (000s
omitted) |
$2,421,542 | $1,537,192 | $1,379,059 | $1,202,749 | $1,291,723 |
| * | Ratio includes class-level expenses which were voluntarily waived by the investment manager. Without this voluntary waiver, the net expense ratio would be increased by the following amounts: |
| Year ended January 31, 2022 | 0.54% |
| Year ended January 31, 2021 | 0.35% |
| 1 | Amount is less than $0.005. |
| Year ended January 31 | |||||
| Administrator Class | 2022 | 2021 | 2020 | 2019 | 2018 |
|
Net asset value, beginning of
period |
$1.00 | $1.00 | $1.00 | $1.00 | $1.00 |
|
Net investment
income |
0.00 1 | 0.00 1 | 0.02 | 0.02 | 0.01 |
|
Net realized gains (losses) on
investments |
0.00 1 | 0.00 1 | 0.00 1 | 0.00 1 | 0.00 1 |
|
Total from investment
operations |
0.00 1 | 0.00 1 | 0.02 | 0.02 | 0.01 |
| Distributions to shareholders from | |||||
|
Net investment
income |
(0.00) 1 | (0.00) 1 | (0.02) | (0.02) | (0.01) |
|
Net realized
gains |
(0.00) 1 | 0.00 | (0.00) 1 | (0.00) 1 | (0.00) 1 |
|
Total distributions to
shareholders |
(0.00) 1 | (0.00) 1 | (0.02) | (0.02) | (0.01) |
|
Net asset value, end of
period |
$1.00 | $1.00 | $1.00 | $1.00 | $1.00 |
|
Total
return |
0.01% | 0.16% | 1.83% | 1.63% | 0.65% |
| Ratios to average net assets (annualized) | |||||
|
Gross
expenses |
0.34% | 0.34% | 0.34% | 0.35% | 0.35% |
|
Net
expenses |
0.06% * | 0.24% * | 0.34% | 0.35% | 0.35% |
|
Net investment
income |
0.01% | 0.16% | 1.84% | 1.48% | 0.61% |
| Supplemental data | |||||
|
Net assets, end of period (000s
omitted) |
$117,556 | $143,745 | $137,102 | $101,340 | $142,198 |
| * | Ratio includes class-level expenses which were voluntarily waived by the investment manager. Without this voluntary waiver, the net expense ratio would be increased by the following amounts: |
| Year ended January 31, 2022 | 0.28% |
| Year ended January 31, 2021 | 0.10% |
| 1 | Amount is less than $0.005. |
| Year ended January 31 | |||||
| Institutional Class | 2022 | 2021 | 2020 | 2019 | 2018 |
|
Net asset value, beginning of
period |
$1.00 | $1.00 | $1.00 | $1.00 | $1.00 |
|
Net investment
income |
0.00 1 | 0.00 1 | 0.02 | 0.02 | 0.01 |
|
Net realized gains (losses) on
investments |
0.00 1 | 0.00 1 | 0.00 1 | 0.00 1 | 0.00 1 |
|
Total from investment
operations |
0.00 1 | 0.00 1 | 0.02 | 0.02 | 0.01 |
| Distributions to shareholders from | |||||
|
Net investment
income |
(0.00) 1 | (0.00) 1 | (0.02) | (0.02) | (0.01) |
|
Net realized
gains |
(0.00) 1 | 0.00 | (0.00) 1 | (0.00) 1 | (0.00) 1 |
|
Total distributions to
shareholders |
(0.00) 1 | (0.00) 1 | (0.02) | (0.02) | (0.01) |
|
Net asset value, end of
period |
$1.00 | $1.00 | $1.00 | $1.00 | $1.00 |
|
Total
return |
0.01% | 0.21% | 1.97% | 1.78% | 0.79% |
| Ratios to average net assets (annualized) | |||||
|
Gross
expenses |
0.22% | 0.22% | 0.22% | 0.22% | 0.23% |
|
Net
expenses |
0.06% * | 0.18% * | 0.20% | 0.20% | 0.20% |
|
Net investment
income |
0.01% | 0.16% | 1.95% | 1.77% | 0.81% |
| Supplemental data | |||||
|
Net assets, end of period (000s
omitted) |
$14,984,670 | $15,879,274 | $11,295,226 | $12,466,864 | $13,085,244 |
| * | Ratio includes class-level expenses which were voluntarily waived by the investment manager. Without this voluntary waiver, the net expense ratio would be increased by the following amounts: |
| Year ended January 31, 2022 | 0.14% |
| Year ended January 31, 2021 | 0.02% |
| 1 | Amount is less than $0.005. |
| Year ended January 31 | |||
| Select Class | 2022 | 2021 | 2020 1 |
|
Net asset value, beginning of
period |
$1.00 | $1.00 | $1.00 |
|
Net investment
income |
0.00 2 | 0.00 2 | 0.02 |
|
Net realized gains (losses) on
investments |
0.00 2 | 0.00 2 | 0.00 2 |
|
Total from investment
operations |
0.00 2 | 0.00 2 | 0.02 |
| Distributions to shareholders from | |||
|
Net investment
income |
(0.00) 2 | (0.00) 2 | (0.02) |
|
Net realized
gains |
(0.00) 2 | 0.00 | (0.00) 2 |
|
Total distributions to
shareholders |
(0.00) 2 | (0.00) 2 | (0.02) |
|
Net asset value, end of
period |
$1.00 | $1.00 | $1.00 |
|
Total
return |
0.01% | 0.24% | 1.74% |
| Ratios to average net assets (annualized) | |||
|
Gross
expenses |
0.18% | 0.18% | 0.18% |
|
Net
expenses |
0.06% 3 | 0.14% | 0.14% |
|
Net investment
income |
0.01% | 0.09% | 1.81% |
| Supplemental data | |||
|
Net assets, end of period (000s
omitted) |
$4,360,652 | $3,118,274 | $691,825 |
| 1 | For the period from March 15, 2019 (commencement of class operations) to January 31, 2020 |
| 2 | Amount is less than $0.005. |
| 3 | Ratio includes class-level expenses which were voluntarily waived by the investment manager. Without this voluntary waiver, the net expense ratio would have been 0.08% higher. |
| Year ended January 31 | |||||
| Service Class | 2022 | 2021 | 2020 | 2019 | 2018 |
|
Net asset value, beginning of
period |
$1.00 | $1.00 | $1.00 | $1.00 | $1.00 |
|
Net investment
income |
0.00 1 | 0.00 1 | 0.02 | 0.02 | 0.01 |
|
Net realized gains (losses) on
investments |
0.00 1 | 0.00 1 | 0.00 1 | 0.00 1 | 0.00 1 |
|
Total from investment
operations |
0.00 1 | 0.00 1 | 0.02 | 0.02 | 0.01 |
| Distributions to shareholders from | |||||
|
Net investment
income |
(0.00) 1 | (0.00) 1 | (0.02) | (0.02) | (0.01) |
|
Net realized
gains |
(0.00) 1 | 0.00 | (0.00) 1 | (0.00) 1 | (0.00) 1 |
|
Total distributions to
shareholders |
(0.00) 1 | (0.00) 1 | (0.02) | (0.02) | (0.01) |
|
Net asset value, end of
period |
$1.00 | $1.00 | $1.00 | $1.00 | $1.00 |
|
Total
return |
0.01% | 0.14% | 1.72% | 1.53% | 0.54% |
| Ratios to average net assets (annualized) | |||||
|
Gross
expenses |
0.51% | 0.51% | 0.51% | 0.51% | 0.52% |
|
Net
expenses |
0.06% * | 0.23% * | 0.45% | 0.45% | 0.45% |
|
Net investment
income |
0.01% | 0.12% | 1.71% | 1.51% | 0.54% |
| Supplemental data | |||||
|
Net assets, end of period (000s
omitted) |
$1,406,514 | $1,416,203 | $1,168,901 | $1,431,420 | $1,459,295 |
| * | Ratio includes class-level expenses which were voluntarily waived by the investment manager. Without this voluntary waiver, the net expense ratio would be increased by the following amounts: |
| Year ended January 31, 2022 | 0.39% |
| Year ended January 31, 2021 | 0.22% |
| 1 | Amount is less than $0.005. |
| ■ | Level 1 – quoted prices in active markets for identical securities |
| ■ | Level 2 – other significant observable inputs (including quoted prices for similar securities, interest rates, prepayment speeds, credit risk, etc.) |
| ■ | Level 3 – significant unobservable inputs (including the Fund’s own assumptions in determining the fair value of investments) |
| Quoted
prices (Level 1) |
Other
significant observable inputs (Level 2) |
Significant
unobservable inputs (Level 3) |
Total | |
| Assets | ||||
| Investments in: | ||||
| Repurchase agreements | $0 | $ 14,706,450,947 | $0 | $ 14,706,450,947 |
| U.S. Treasury securities | 0 | 8,577,244,982 | 0 | 8,577,244,982 |
| Total assets | $0 | $23,283,695,929 | $0 | $23,283,695,929 |
| Average daily net assets | Management fee |
| First $5 billion | 0.150% |
| Next $5 billion | 0.140 |
| Next $5 billion | 0.130 |
| Next $85 billion | 0.125 |
| Over $100 billion | 0.120 |
| Average daily net assets | Rate
prior to June 1, 2021 |
| First $5 billion | 0.150% |
| Next $5 billion | 0.140 |
| Over $10 billion | 0.130 |
| Class-level
administration fee | |
| Class A | 0.22% |
| Administrator Class | 0.10 |
| Institutional Class | 0.08 |
| Select Class | 0.04 |
| Service Class | 0.12 |
| Expense ratio caps | |
| Class A | 0.60% |
| Administrator Class | 0.34 |
| Institutional Class | 0.20 |
| Select Class | 0.14 |
| Service Class | 0.45 |
Allspring Funds Trust:

| Shares voted “For” | 9,814,671,096 |
| Shares voted “Against” | 16,783,546 |
| Shares voted “Abstain” | 2,427,634,903 |
| Shares voted “For” | 9,818,924,095 |
| Shares voted “Against” | 18,704,483 |
| Shares voted “Abstain” | 2,421,460,967 |
| Name
and year of birth |
Position
held and length of service* |
Principal occupations during past five years or longer | Current
other public company or investment company directorships |
| William
R. Ebsworth (Born 1957) |
Trustee,
since 2015 |
Retired. From 1984 to 2013, equities analyst, portfolio manager, research director and chief investment officer at Fidelity Management and Research Company in Boston, Tokyo, and Hong Kong, and retired in 2013 as Chief Investment Officer of Fidelity Strategic Advisers, Inc. where he led a team of investment professionals managing client assets. Prior thereto, Board member of Hong Kong Securities Clearing Co., Hong Kong Options Clearing Corp., the Thailand International Fund, Ltd., Fidelity Investments Life Insurance Company, and Empire Fidelity Investments Life Insurance Company. Audit Committee Chair and Investment Committee Chair of the Vincent Memorial Hospital Endowment (non-profit organization). Mr. Ebsworth is a CFA® charterholder. | N/A |
| Jane
A. Freeman (Born 1953) |
Trustee,
since 2015; Chair Liaison, since 2018 |
Retired. From 2012 to 2014 and 1999 to 2008, Chief Financial Officer of Scientific Learning Corporation. From 2008 to 2012, Ms. Freeman provided consulting services related to strategic business projects. Prior to 1999, Portfolio Manager at Rockefeller & Co. and Scudder, Stevens & Clark. Board member of the Harding Loevner Funds from 1996 to 2014, serving as both Lead Independent Director and chair of the Audit Committee. Board member of the Russell Exchange Traded Funds Trust from 2011 to 2012 and the chair of the Audit Committee. Ms. Freeman is also an inactive Chartered Financial Analyst. | N/A |
| Isaiah
Harris, Jr. (Born 1952) |
Trustee,
since 2009; Audit Committee Chair, since 2019 |
Retired. Chairman of the Board of CIGNA Corporation from 2009 to 2021, and Director from 2005 to 2008. From 2003 to 2011, Director of Deluxe Corporation. Prior thereto, President and CEO of BellSouth Advertising and Publishing Corp. from 2005 to 2007, President and CEO of BellSouth Enterprises from 2004 to 2005 and President of BellSouth Consumer Services from 2000 to 2003. Emeritus member of the Iowa State University Foundation Board of Governors. Emeritus Member of the Advisory Board of Iowa State University School of Business. Advisory Board Member, Palm Harbor Academy (private school). Advisory Board Member, Fellowship of Christian Athletes. Mr. Harris is a certified public accountant (inactive status). | N/A |
| David
F. Larcker (Born 1950) |
Trustee,
since 2009 |
James Irvin Miller Professor of Accounting at the Graduate School of Business (Emeritus), Stanford University, Director of the Corporate Governance Research Initiative and Senior Faculty of The Rock Center for Corporate Governance since 2006. From 2005 to 2008, Professor of Accounting at the Graduate School of Business, Stanford University. Prior thereto, Ernst & Young Professor of Accounting at The Wharton School, University of Pennsylvania from 1985 to 2005. | N/A |
| Name
and year of birth |
Position
held and length of service* |
Principal occupations during past five years or longer | Current
other public company or investment company directorships |
| Olivia
S. Mitchell (Born 1953) |
Trustee,
since 2006; Nominating and Governance Committee Chair, since 2018 |
International Foundation of Employee Benefit Plans Professor since 1993, Wharton School of the University of Pennsylvania. Director of Wharton’s Pension Research Council and Boettner Center on Pensions & Retirement Research, and Research Associate at the National Bureau of Economic Research. Previously taught at Cornell University from 1978 to 1993. | N/A |
| Timothy
J. Penny (Born 1951) |
Trustee,
since 1996; Chair, since 2018 |
President and Chief Executive Officer of Southern Minnesota Initiative Foundation, a non-profit organization, since 2007. Member of the Board of Trustees of NorthStar Education Finance, Inc., a non-profit organization, since 2007. | N/A |
| James
G. Polisson (Born 1959) |
Trustee,
since 2018 |
Retired. Chief Marketing Officer, Source (ETF) UK Services, Ltd, from 2015 to 2017. From 2012 to 2015, Principal of The Polisson Group, LLC, a management consulting, corporate advisory and principal investing company. Chief Executive Officer and Managing Director at Russell Investments, Global Exchange Traded Funds from 2010 to 2012. Managing Director of Barclays Global Investors from 1998 to 2010 and Global Chief Marketing Officer for iShares and Barclays Global Investors from 2000 to 2010. Trustee of the San Francisco Mechanics’ Institute, a non-profit organization, from 2013 to 2015. Board member of the Russell Exchange Traded Fund Trust from 2011 to 2012. Director of Barclays Global Investors Holdings Deutschland GmbH from 2006 to 2009. Mr. Polisson is an attorney and has a retired status with the Massachusetts and District of Columbia Bar Associations. | N/A |
| Pamela
Wheelock (Born 1959) |
Trustee,
since January 2020; previously Trustee from January 2018 to July 2019 |
Board member of the Destination Medical Center Economic Development Agency, Rochester, Minnesota since 2019. Interim President of the McKnight Foundation from January to September 2020. McKnight Foundation Consultant, November 2020 to February 2021. Acting Commissioner, Minnesota Department of Human Services, July 2019 through September 2019. Consultant (part-time), Minnesota Department of Human Services, October 2019 through December 2019. Chief Operating Officer, Twin Cities Habitat for Humanity from 2017 to 2019. Vice President of University Services, University of Minnesota from 2012 to 2016. Prior thereto, on the Board of Directors, Governance Committee and Finance Committee for the Minnesota Philanthropy Partners (Saint Paul Foundation) from 2012 to 2018, Interim Chief Executive Officer of Blue Cross Blue Shield of Minnesota from 2011 to 2012, Chairman of the Board from 2009 to 2012 and Board Director from 2003 to 2015. Vice President, Leadership and Community Engagement, Bush Foundation, Saint Paul, Minnesota (a private foundation) from 2009 to 2011. Executive Vice President and Chief Financial Officer, Minnesota Sports and Entertainment from 2004 to 2009 and Senior Vice President from 2002 to 2004. Executive Vice President of the Minnesota Wild Foundation from 2004 to 2008. Commissioner of Finance, State of Minnesota, from 1999 to 2002. Currently Board Chair of the Minnesota Wild Foundation since 2010. | N/A |
| Name
and year of birth |
Position
held and length of service |
Principal occupations during past five years or longer |
| Andrew
Owen (Born 1960) |
President,
since 2017 |
President, Chief Executive Officer and Director of Allspring Funds Management, LLC since 2017 and co-president of Galliard Capital Management, LLC, an affiliate of Allspring Funds Management, LLC, since 2019. Prior thereto, Head of Affiliated Managers, Allspring Global Investments, from 2014 to 2019 and Executive Vice President responsible for marketing, investments and product development for Allspring Funds Management, LLC, from 2009 to 2014. In addition, Mr. Owen was an Executive Vice President of Wells Fargo & Company from 2014 to 2021. |
| Jeremy
DePalma (Born 1974) |
Treasurer,
since 2012 (for certain funds in the Fund Complex); since 2021 (for the remaining funds in the Fund Complex) |
Senior Vice President of Allspring Funds Management, LLC since 2009. Senior Vice President of Evergreen Investment Management Company, LLC from 2008 to 2010 and head of the Fund Reporting and Control Team within Fund Administration. |
| Kate
McKinley (Born 1977) |
Chief
Legal Officer, since 2021 |
Chief Legal Officer of Allspring Global Investments since 2021. Prior thereto, held various roles at State Street Global Advisors beginning in 2010, including serving as Senior Vice President and General Counsel from 2019 to 2021, and Chief Operating Officer of the Institutional Client Group from 2016 - 2019. Prior to working at State Street Global Advisors served as Assistant General Counsel for Bank of America Corporation from 2005 to 2010 and as an Associate at WilmerHale from 2002 to 2005. |
| Christopher
Baker (Born 1976) |
Chief Compliance Officer, since 2022 | Global Chief Compliance Officer for Allspring Global Investments since 2022. Prior thereto, Chief Compliance Officer for State Street Global Advisors from 2018 to 2021. Senior Compliance Officer for the State Street divisions of Alternative Investment Solutions, Sector Solutions, and Global Marketing from 2015 to 2018. From 2010 to 2015 Vice President, Global Head of Investment and Marketing Compliance for State Street Global Advisors. |
| Matthew
Prasse (Born 1983) |
Secretary,
since 2021 |
Senior Counsel of the Allspring Legal Department since 2021. Senior Counsel of the Wells Fargo Legal Department from 2018 to 2021. Previously, Counsel for Barings LLC from 2015 to 2018. Prior to joining Barings, Associate at Morgan, Lewis & Bockius LLP from 2008 to 2015. |
P.O. Box 219967
Kansas City, MO 64121-9967
1-800-222-8222 or visit the Fund's website at allspringglobal.com. Read the prospectus carefully before you invest or send money.
A314/AR314 01-22
| ITEM 2. | CODE OF ETHICS |
(a) As of the end of the period covered by the report, Allspring Funds Trust has adopted a code of ethics that applies to its President and Treasurer. A copy of the code of ethics is filed as an exhibit to this Form N-CSR.
(c) During the period covered by this report, there were no amendments to the provisions of the code of ethics adopted in Item 2(a) above.
(d) During the period covered by this report, there were no implicit or explicit waivers to the provisions of the code of ethics adopted in Item 2(a) above.
| ITEM 3. | AUDIT COMMITTEE FINANCIAL EXPERT |
The Board of Trustees of Allspring Funds Trust has determined that Isaiah Harris is an audit committee financial expert, as defined in Item 3 of Form N-CSR. Mr. Harris is independent for purposes of Item 3 of Form N-CSR.
| ITEM 4. | PRINCIPAL ACCOUNTANT FEES AND SERVICES |
(a), (b), (c), (d) The following table presents aggregate fees billed in each of the last two fiscal years for services rendered to the Registrant by the Registrant’s principal accountant. These fees were billed to the registrant and were approved by the Registrant’s audit committee.
| Fiscal year ended January 31, 2022 |
Fiscal year ended January 31, 2021 |
|||||||
| Audit fees |
$ | 328,850 | $ | 269,220 | ||||
| Audit-related fees(1) |
16,400 | — | ||||||
| Tax fees(2) |
14,665 | 12,120 | ||||||
| All other fees |
— | — | ||||||
|
|
|
|
|
|||||
| $ | 359,915 | $ | 281,340 | |||||
|
|
|
|
|
|||||
| (1) | Amount represents fees related to the merger of Allspring Cash Investment Money Market Fund into Allspring Heritage Money Market Fund on March 26, 2021. |
| (2) | Tax fees consist of fees for tax compliance, tax advice, tax planning and excise tax. |
(e) The Chair of the Audit Committees is authorized to pre-approve: (1) audit services for the mutual funds of Allspring Funds Trust; (2) non-audit tax or compliance consulting or training services provided to
the Funds by the independent auditors (“Auditors”) if the fees for any particular engagement are not anticipated to exceed $50,000; and (3) non-audit tax or compliance consulting or training services provided by the Auditors to a Fund’s investment adviser and its controlling entities (where pre-approval is required because the engagement relates directly to the operations and financial reporting of the Fund) if the fee to the Auditors for any particular engagement is not anticipated to exceed $50,000. For any such pre-approval sought from the Chair, Management shall prepare a brief description of the proposed services.
If the Chair approves of such service, he or she shall sign the statement prepared by Management. Such written statement shall be presented to the full Committees at their next regularly scheduled meetings.
(f) Not applicable
(g) Not applicable
(h) Not applicable
| ITEM 5. | AUDIT COMMITTEE OF LISTED REGISTRANTS |
Not applicable.
| ITEM 6. | INVESTMENTS |
A Portfolio of Investments for each series of Allspring Funds Trust is included as part of the report to shareholders filed under Item 1 of this Form.
| ITEM 7. | DISCLOSURE OF PROXY VOTING POLICIES AND PROCEDURES FOR CLOSED-END MANAGEMENT INVESTMENT COMPANIES |
Not applicable.
| ITEM 8. | PORTFOLIO MANAGERS OF CLOSED-END MANAGEMENT INVESTMENT COMPANIES |
Not applicable.
| ITEM 9. | PURCHASES OF EQUITY SECURITIES BY CLOSED-END MANAGEMENT INVESTMENT COMPANY AND AFFILIATED PURCHASERS |
Not applicable.
| ITEM 10. | SUBMISSION OF MATTERS TO A VOTE OF SECURITY HOLDERS |
There have been no material changes to the procedures by which shareholders may recommend nominees to the registrant’s Board of Trustees that have been implemented since the registrant’s last provided disclosure in response to the requirements of this Item.
| ITEM 11. | CONTROLS AND PROCEDURES |
(a) The President and Treasurer have concluded that the Allspring Funds Trust disclosure controls and procedures (as defined in Rule 30a-3(c) under the Investment Company Act of 1940) provide reasonable assurances that material information relating to the registrant is made known to them by the appropriate persons based on their evaluation of these controls and procedures as of a date within 90 days of the filing of this report.
(b) There were no significant changes in the registrant’s internal controls over financial reporting (as defined in Rule 30a-3(d) under the Investment Company Act of 1940) that occurred during the most recent fiscal half-year of the period covered by this report that materially affected, or is reasonably likely to materially affect, the registrant’s internal control over financial reporting.
| ITEM 12. | DISCLOSURES OF SECURITIES LENDING ACTIVITES FOR CLOSED-END MANAGEMENT INVESTMENT COMPANIES |
Not applicable.
| ITEM 13. | EXHIBITS |
(a)(1) Code of Ethics.
(a)(2) Certifications pursuant to Section 302 of the Sarbanes-Oxley Act of 2002.
(b) Certifications pursuant to Section 906 of the Sarbanes-Oxley Act of 2002.
SIGNATURES
Pursuant to the requirements of the Securities Exchange Act of 1934 and the Investment Company Act of 1940, the registrant has duly caused this report to be signed on its behalf by the undersigned, thereunto duly authorized.
| Allspring Funds Trust | ||
| By: |
||
| /s/ Andrew Owen | ||
| Andrew Owen | ||
| President | ||
| Date: |
March 30, 2022 | |
Pursuant to the requirements of the Securities Exchange Act of 1934 and the Investment Company Act of 1940, this report has been signed below by the following persons on behalf of the registrant and in the capacities and on the date indicated.
| Allspring Funds Trust | ||
| By: | ||
| /s/ Andrew Owen | ||
| Andrew Owen | ||
| President | ||
| Date: | March 30, 2022 | |
| By: | ||
| /s/ Jeremy DePalma | ||
| Jeremy DePalma | ||
| Treasurer | ||
| Date: | March 30, 2022 | |