
2019 EEI Financial Conference November 2019 Patrick J. Goodman Executive Vice President and Chief Financial Officer

Forward-Looking Statements This presentation contains statements that do not directly or exclusively relate to historical facts. These statements are "forward-looking statements" within the meaning of Section 27A of the Securities Act of 1933, as amended, and Section 21E of the Securities Exchange Act of 1934, as amended. Forward-looking statements can typically be identified by the use of forward-looking words, such as "will," "may," "could," "project," "believe," "anticipate," "expect," "estimate," "continue," "intend," "potential," "plan," "forecast" and similar terms. These statements are based upon Berkshire Hathaway Energy Company (BHE) and its subsidiaries, PacifiCorp and its subsidiaries, MidAmerican Funding, LLC and its subsidiaries, MidAmerican Energy Company, Nevada Power Company and its subsidiaries or Sierra Pacific Power Company and its subsidiaries (collectively, the Registrants), as applicable, current intentions, assumptions, expectations and beliefs and are subject to risks, uncertainties and other important factors. Many of these factors are outside the control of each Registrant and could cause actual results to differ materially from those expressed or implied by such forward-looking statements. These factors include, among others: – general economic, political and business conditions, as well as changes in, and compliance with, laws and regulations, including income tax reform, initiatives regarding deregulation and restructuring of the utility industry, and reliability and safety standards, affecting the respective Registrant's operations or related industries; – changes in, and compliance with, environmental laws, regulations, decisions and policies that could, among other items, increase operating and capital costs, reduce facility output, accelerate facility retirements or delay facility construction or acquisition; – the outcome of regulatory rate reviews and other proceedings conducted by regulatory agencies or other governmental and legal bodies and the respective Registrant's ability to recover costs through rates in a timely manner; – changes in economic, industry, competition or weather conditions, as well as demographic trends, new technologies and various conservation, energy efficiency and private generation measures and programs, that could affect customer growth and usage, electricity and natural gas supply or the respective Registrant's ability to obtain long-term contracts with customers and suppliers; – performance, availability and ongoing operation of the respective Registrant's facilities, including facilities not operated by the Registrants, due to the impacts of market conditions, outages and repairs, transmission constraints, weather, including wind, solar and hydroelectric conditions, and operating conditions; – the effects of catastrophic and other unforeseen events, which may be caused by factors beyond the control of each respective Registrant or by a breakdown or failure of the Registrants' operating assets, including severe storms, floods, fires, earthquakes, explosions, landslides, an electromagnetic pulse, mining incidents, litigation, wars, terrorism, embargoes, and cyber security attacks, data security breaches, disruptions, or other malicious acts; – a high degree of variance between actual and forecasted load or generation that could impact a Registrant's hedging strategy and the cost of balancing its generation resources with its retail load obligations; – changes in prices, availability and demand for wholesale electricity, coal, natural gas, other fuel sources and fuel transportation that could have a significant impact on generating capacity and energy costs; – the financial condition and creditworthiness of the respective Registrant's significant customers and suppliers; – changes in business strategy or development plans; – availability, terms and deployment of capital, including reductions in demand for investment-grade commercial paper, debt securities and other sources of debt financing and volatility in interest rates; – changes in the respective Registrant's credit ratings; – risks relating to nuclear generation, including unique operational, closure and decommissioning risks; 2
Forward-Looking Statements – hydroelectric conditions and the cost, feasibility and eventual outcome of hydroelectric relicensing proceedings; – the impact of certain contracts used to mitigate or manage volume, price and interest rate risk, including increased collateral requirements, and changes in commodity prices, interest rates and other conditions that affect the fair value of certain contracts; – the impact of inflation on costs and the ability of the respective Registrants to recover such costs in regulated rates; – fluctuations in foreign currency exchange rates, primarily the British pound and the Canadian dollar; – increases in employee healthcare costs; – the impact of investment performance and changes in interest rates, legislation, healthcare cost trends, mortality and morbidity on pension and other postretirement benefits expense and funding requirements; – changes in the residential real estate brokerage, mortgage and franchising industries and regulations that could affect brokerage, mortgage and franchising transactions; – the ability to successfully integrate future acquired operations into a Registrant's business; – unanticipated construction delays, changes in costs, receipt of required permits and authorizations, ability to fund capital projects and other factors that could affect future facilities and infrastructure additions; – the availability and price of natural gas in applicable geographic regions and demand for natural gas supply; – the impact of new accounting guidance or changes in current accounting estimates and assumptions on the consolidated financial results of the respective Registrants; and – other business or investment considerations that may be disclosed from time to time in the Registrants' filings with the United States Securities and Exchange Commission (SEC) or in other publicly disseminated written documents. Further details of the potential risks and uncertainties affecting the Registrants are described in the Registrants’ filings with the SEC. Each Registrant undertakes no obligation to publicly update or revise any forward-looking statements, whether as a result of new information, future events or otherwise. The foregoing factors should not be construed as exclusive. This presentation includes certain non-Generally Accepted Accounting Principles (GAAP) financial measures as defined by the SEC’s Regulation G. Refer to the BHE Appendix in this presentation for a reconciliation of those non-GAAP financial measures to the most directly comparable GAAP measures. 3

Berkshire Hathaway Energy Vision To be the best energy company in serving our customers, while delivering sustainable energy solutions Culture Personal responsibility to our customers Strategy Reinvest in our businesses Invest in internal growth • Continue to invest in our employees and • Pursue the development of a value-enhancing operations, maintenance and capital energy grid and gas pipeline infrastructure programs for property, plant and equipment • Create customer solutions through innovative • Position our regulated businesses to meet rate design and redesign changing customer expectations and retain • Grow our portfolio of renewable energy customers (reduce bypass risk) by providing • Develop strong grid systems, including excellent service and competitive rates cybersecurity and physical resilience programs • Reduce the carbon footprint of our operations by participating in energy policy development, resulting in the transformation of our businesses and assets Acquire companies • Advance grid resilience, cybersecurity and • Additive to business model physical security programs Competitive Advantage Berkshire Hathaway ownership 4
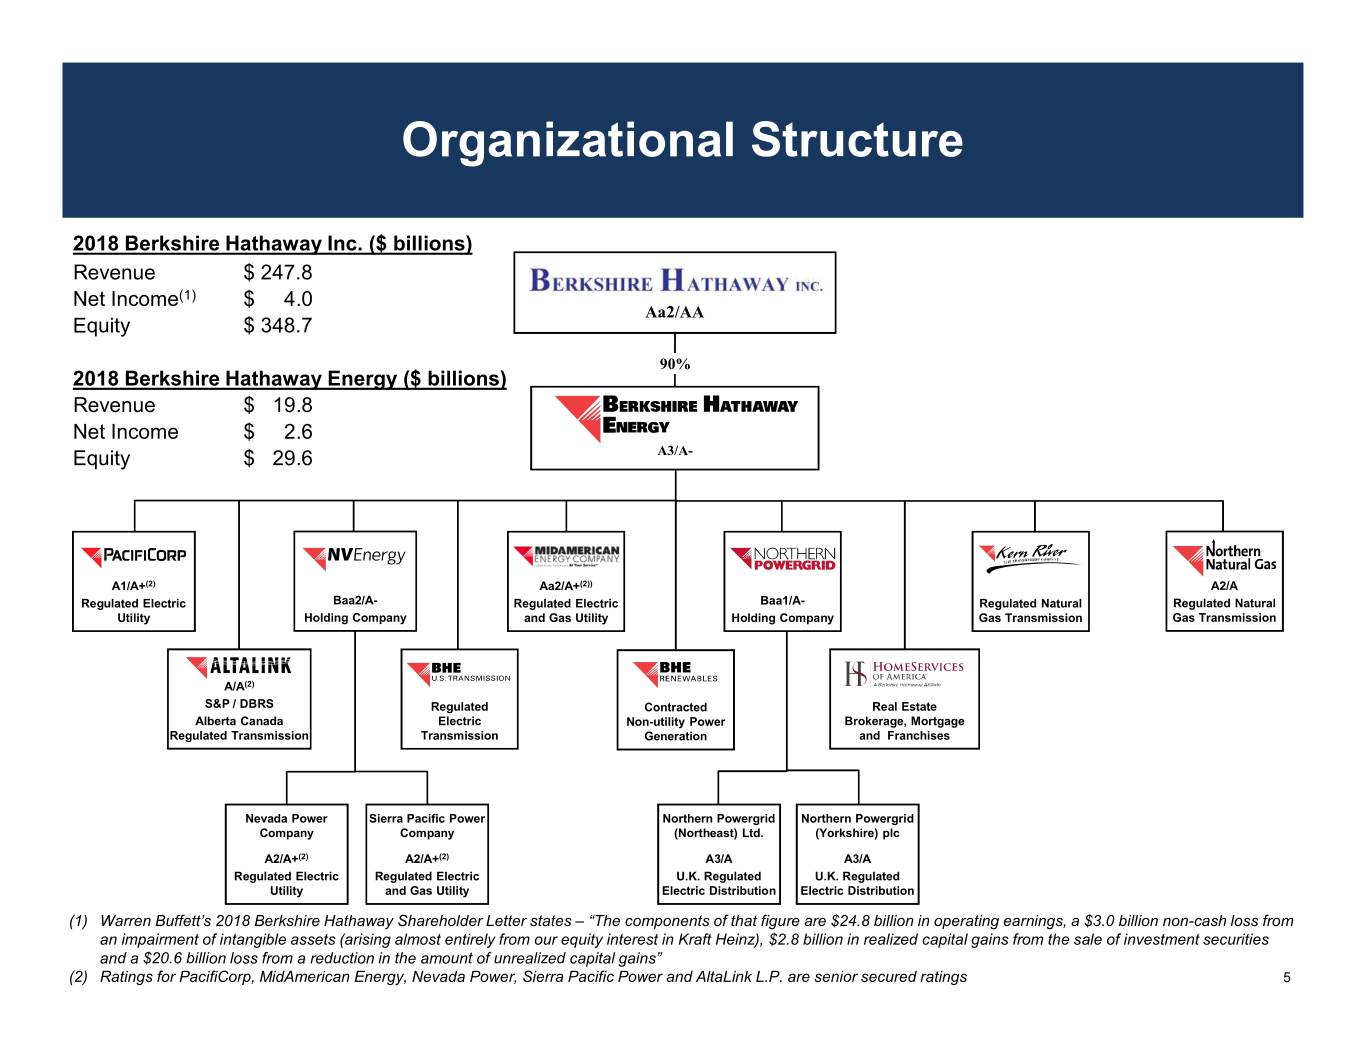
Organizational Structure 2018 Berkshire Hathaway Inc. ($ billions) Revenue $ 247.8 Net Income(1) $ 4.0 Aa2/AA Equity $ 348.7 90% 2018 Berkshire Hathaway Energy ($ billions) Revenue $ 19.8 Net Income $ 2.6 Equity $ 29.6 A3/A- A1/A+(2) Aa2/A+(2)) A2/A Regulated Electric Baa2/A- Regulated Electric Baa1/A- Regulated Natural Regulated Natural Utility Holding Company and Gas Utility Holding Company Gas Transmission Gas Transmission A/A(2) S&P / DBRS Regulated Contracted Real Estate Alberta Canada Electric Non-utility Power Brokerage, Mortgage Regulated Transmission Transmission Generation and Franchises Nevada Power Sierra Pacific Power Northern Powergrid Northern Powergrid Company Company (Northeast) Ltd. (Yorkshire) plc A2/A+(2) A2/A+(2) A3/A A3/A Regulated Electric Regulated Electric U.K. Regulated U.K. Regulated Utility and Gas Utility Electric Distribution Electric Distribution (1) Warren Buffett’s 2018 Berkshire Hathaway Shareholder Letter states – “The components of that figure are $24.8 billion in operating earnings, a $3.0 billion non-cash loss from an impairment of intangible assets (arising almost entirely from our equity interest in Kraft Heinz), $2.8 billion in realized capital gains from the sale of investment securities and a $20.6 billion loss from a reduction in the amount of unrealized capital gains” (2) Ratings for PacifiCorp, MidAmerican Energy, Nevada Power, Sierra Pacific Power and AltaLink L.P. are senior secured ratings 5
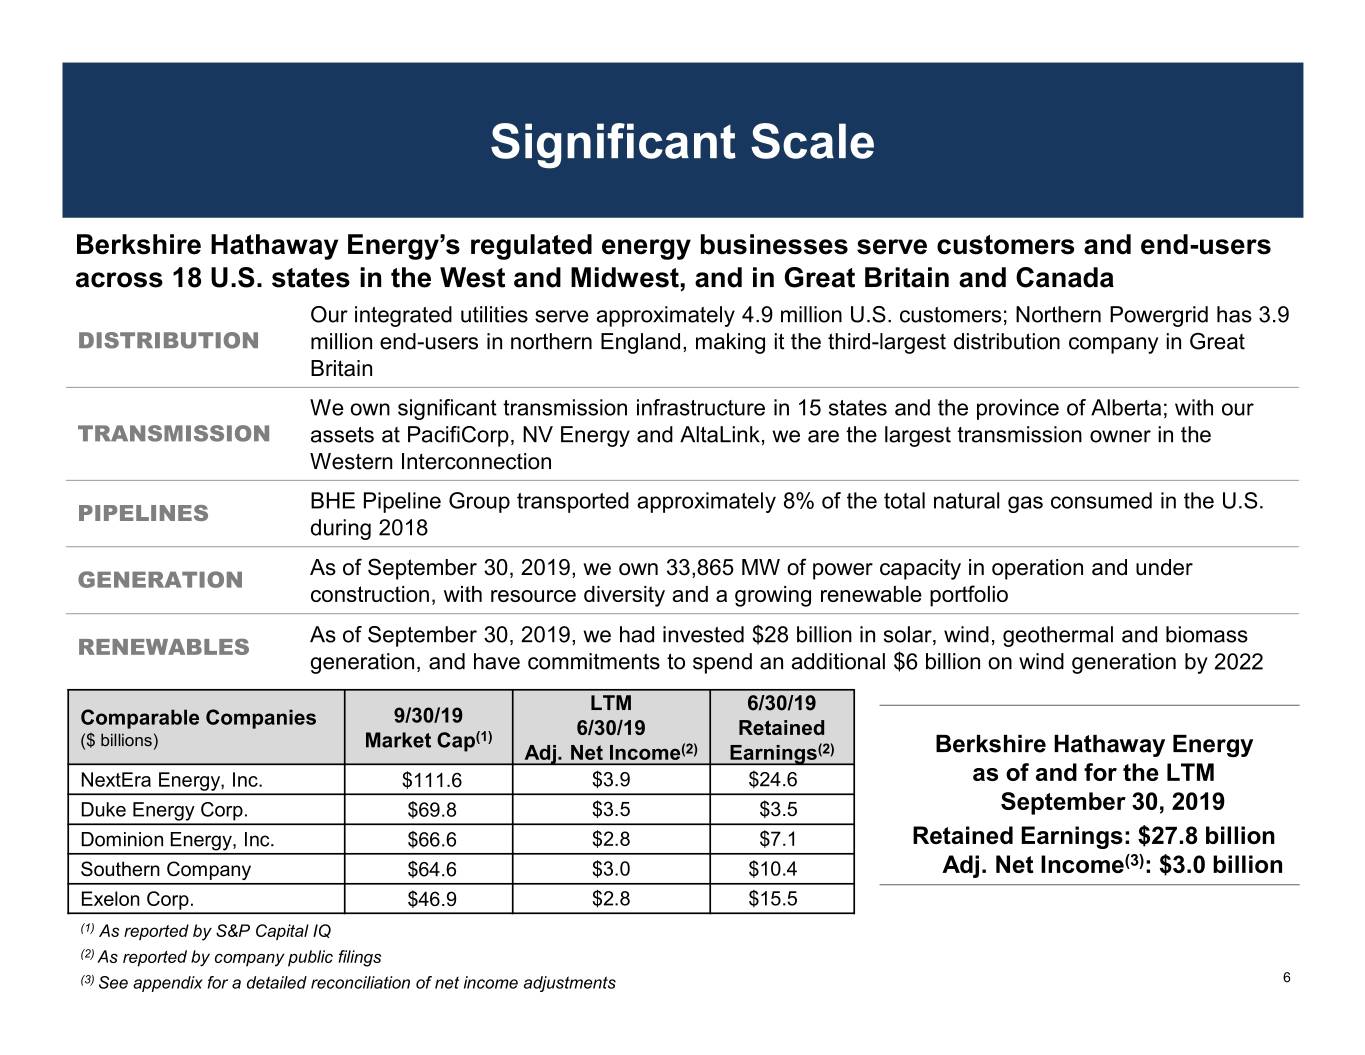
Significant Scale Berkshire Hathaway Energy’s regulated energy businesses serve customers and end-users across 18 U.S. states in the West and Midwest, and in Great Britain and Canada Our integrated utilities serve approximately 4.9 million U.S. customers; Northern Powergrid has 3.9 DISTRIBUTION million end-users in northern England, making it the third-largest distribution company in Great Britain We own significant transmission infrastructure in 15 states and the province of Alberta; with our TRANSMISSION assets at PacifiCorp, NV Energy and AltaLink, we are the largest transmission owner in the Western Interconnection BHE Pipeline Group transported approximately 8% of the total natural gas consumed in the U.S. PIPELINES during 2018 As of September 30, 2019, we own 33,865 MW of power capacity in operation and under GENERATION construction, with resource diversity and a growing renewable portfolio As of September 30, 2019, we had invested $28 billion in solar, wind, geothermal and biomass RENEWABLES generation, and have commitments to spend an additional $6 billion on wind generation by 2022 LTM 6/30/19 9/30/19 Comparable Companies 6/30/19 Retained ($ billions) Market Cap(1) Adj. Net Income(2) Earnings(2) Berkshire Hathaway Energy NextEra Energy, Inc. $111.6 $3.9 $24.6 as of and for the LTM Duke Energy Corp. $69.8 $3.5 $3.5 September 30, 2019 Dominion Energy, Inc. $66.6 $2.8 $7.1 Retained Earnings: $27.8 billion Southern Company $64.6 $3.0 $10.4 Adj. Net Income(3): $3.0 billion Exelon Corp. $46.9 $2.8 $15.5 (1) As reported by S&P Capital IQ (2) As reported by company public filings (3) See appendix for a detailed reconciliation of net income adjustments 6

Energy Assets As of and for the LTM ended 9/30/19 Assets $98 billion Revenues $19.9 billion Customers(1) 8.8 million Employees 22,700 Transmission Line 33,600 Miles Natural Gas Pipeline 16,400 Miles Power Capacity 33,865 MW(2) Renewables 42% Natural Gas 31% Coal 26% Nuclear and Other 1% (1) Includes both electric and natural gas customers and end-users worldwide. Additionally, AltaLink serves approximately 85% of the population in Alberta, Canada (2) Net MW owned in operation and under construction as of September 30, 2019 7

Competitive Advantage • Diversified portfolio of regulated assets – Weather, customer, regulatory, generation, economic and catastrophic risk diversification • Berkshire Hathaway ownership – Access to capital from Berkshire Hathaway allows us to take advantage of market opportunities – Berkshire Hathaway is a long-term holder of assets which promotes stability and helps make Berkshire Hathaway Energy the buyer of choice in many circumstances – Tax appetite of Berkshire Hathaway has allowed us to receive significant cash tax benefits from our parent, including $534 million in the nine months ended September 30, 2019, and $884 million in 2018 • No dividend requirement – Cash flow is retained within the business and used to help fund growth and strengthen our balance sheet 8

Capital Expenditures and Cash Flows • Berkshire Hathaway Energy and its subsidiaries will spend approximately $19.3 billion from 2019 – 2021 for growth and operating capital expenditures, which primarily consist of new wind generation project expansions, repowering of existing wind facilities, and transmission and distribution capital expenditures $9,000 $8,000 $7,000 $6,000 $5,000 $4,000 Free Cash Flow ($ ($ millions) $3,000 $2,000 $1,000 $- 2014A 2015A 2016A 2017A 2018A 2019F 2020F 2021F BHE Cash Flow from Operations BHE Total Capital Expenditures BHE Operating Capital Expenditures 2019 – 2021: $2 Billion Free + 2019 – 2021: $12 Billion Free Cash Cash Flow above Total Capex Flow above Operating Capex 9

Regulatory Overview Adjustment Mechanisms Capital Renewable Energy Fuel Recovery Transmission Forward Recovery Rider Efficiency Decoupling Mechanism Rider Test Year Mechanism (REC/PTC/ZEC) Rider PacifiCorp Utah (1) Wyoming (1) Idaho Oregon Washington California MidAmerican Energy Iowa – Electric Illinois – Electric South Dakota – Electric Iowa – Gas Illinois – Gas South Dakota - Gas NV Energy Nevada Power Sierra Pacific Power – Electric Sierra Pacific Power – Gas (1) PacifiCorp has relied on both historical test periods with known and measurable adjustments, as well as forecast test periods 10

Revenue and Net Income Diversification • Diversified revenue sources reduce regulatory concentrations • For the last 12 months ended September 30, 2019, 83% of adjusted net income was from investment- grade regulated subsidiaries. A significant portion of the remaining non-regulated adjusted net income is from contracted generation assets at BHE Renewables BHE LTM 9/30/19 BHE LTM 9/30/19 Energy Revenue(1): $16 Billion Adjusted Net Income(2): $3 Billion Other HomeServices Alberta 4% BHE 5% 5% Nevada Transmission PacifiCorp United 19% 7% 25% Kingdom Northern 6% Powergrid 8% FERC 7% Idaho 2% BHE Washington Renewables 2% Iowa 12% Illinois 18% 4% California 4% MidAmerican Funding Wyoming 20% 6% BHE Pipeline Group Oregon Utah 13% 8% NV Energy 15% 10% (1) Excludes HomeServices and equity income, which add further diversification (2) Percentages exclude BHE and Other. See appendix for a detailed reconciliation of net income adjustments 11

Net Income ($ millions) LTM Years Ended Net Income Attributable to BHE 9/30/2019 12/31/2018 12/31/2017 PacifiCorp 762 $ 739 $ 763 MidAmerican Funding 606 669 601 NV Energy 322 317 365 Northern Powergrid 251 239 251 BHE Pipeline Group 396 387 270 BHE Transmission 218 210 224 BHE Renewables 360 329 236 HomeServices 168 145 118 BHE and Other (88) (218) (211) Adjusted Net Income attributable to BHE(1) 2,995 2,817 2,617 Unrealized Loss on BYD, net of Income Taxes (359) (383) - Debt Tender Offer Premium - - (263) 2017 Tax Reform Benefits 89 134 516 Net Income attributable to BHE$ 2,725 $ 2,568 $ 2,870 (1) See appendix for a detailed reconciliation of net income adjustments 12

Berkshire Hathaway Energy Financial Summary • Since being acquired by Berkshire Hathaway in March 2000, Berkshire Hathaway Energy has realized significant growth in its assets, equity, net income and cash flows Property, Plant and Equipment (Net) BHE Shareholders’ Equity $ billions $ billions $75 $65.9 $68.6 $71.3 $35 $31.6 $62.5 $28.2 $29.6 $60 $28 $24.3 $45 $21 $30 $14 $15 $6.5 $7 $1.7 $0 $0 2001 2016 2017 2018 9/30/19 2001 2016 2017 2018 9/30/19 Net Income Attributable to BHE(1) Cash Flows From Operations $ billions $ billions $3.5 $3.0 $8.0 $2.8 $6.8 $2.8 $2.5 $2.6 $6.1 $6.1 $6.4 $6.0 $2.1 $4.0 $1.4 $2.0 $0.8 $0.7 $0.1 $0.0 $0.0 2001 2016 2017 2018 LTM 2001 2016 2017 2018 LTM 9/30/19 9/30/19 (1) Starting in 2017, net income reflects adjusted net income. See appendix for detailed reconciliation 13

Long-Term Perspective Growing the Business • We have significantly grown our assets while de-risking the business since being acquired by Berkshire Hathaway in 2000, reducing total debt(1) / total assets from 58% to 42% and improving our credit ratings $120 $8,000 12/31/01 – 9/30/19 CAGR Total Assets 12% $7,000 $100 Net Income 19% Cash Flows From Operations 12% $6,000 $80 $5,000 $60 $4,000 ($ ($ billions) $3,000 ($ millions) $40 Total &AssetsTotal Debt $2,000 $20 $1,000 Net Income and Cash Flows Net Income andCash Flows From Operations $- $- 2001 2002 2003 2004 2005 2006 2007 2008 2009 2010 2011 2012 2013 2014 2015 2016 2017 2018 LTM Sept. Total Assets Total Debt Net Income(2) Cash Flows From Operations 2019 (1) Total Debt excludes junior subordinated debentures and Berkshire Hathaway Energy trust preferred securities. As of September 30, 2019, $100 million of junior subordinated debentures remained outstanding (2) Starting in 2017, net income reflects adjusted net income. See appendix for detailed reconciliation 14

Supporting a Cleaner Energy Future $34.1 Billion Renewable Investments $34.1 ($ billions) $5.4 $28.2 $3.0 $0.9 $0.9 $6.6 $6.6 Remaining capital to be deployed • $3.5 billion – Wind development and repowering • $2.4 billion – Wind tax equity funding $17.7 $21.2 Wind Solar Geothermal and Other Wind Tax Equity Q3 2019A 2022E Net Owned Operating Capacity (MW) September 2019 December 2022 Wind Solar Other Wind Solar Other PacifiCorp 1,039 - 32 2,229 - 32 MidAmerican Energy 5,352 - - 6,803 - - NV Energy - 15 5 - 15 5 BHE Renewables 1,665 1,536 346 1,665 1,536 346 8,056 1,551 383 10,697 1,551 383 • In addition to owned renewable capacity, Berkshire Hathaway Energy’s regulated utilities have renewable energy power purchase agreements for more than 4,100 MW. By the end of 2020, NV Energy plans to enter contracts to purchase approximately 2,500 MW of additional solar energy and PacifiCorp expects to have entered into contracts to purchase approximately 1,000 MW of additional wind and solar energy 15

Advancing a Sustainable Energy Future • Berkshire Hathaway Energy is a leader in renewable energy. As of September 30, 2019, approximately 43% of our businesses’ owned generation capacity (operating and under construction) comes from non-carbon resources – Through September 30, 2019, Berkshire Hathaway Energy has spent $28.2 billion on renewable energy, and has made commitments to spend an additional $6 billion on wind generation by 2022 – The America Wind Energy Association’s 2019 Annual Market Report listed Berkshire Hathaway Energy as the largest investor-owned utility of regulated operating wind-power capacity – As we advance sustainable energy solutions, we are helping our customers achieve their sustainability goals and reduce environmental impact through increasing the amount of renewable energy we generate, empowering customers to conserve and manage their energy use, and partnering with them on unique projects • One example of these efforts is an innovative partnership at a newly constructed all-electric, net-zero residential multi-family community that will be partially powered by 5 megawatts of on-site solar panels with battery storage located in each of the 600 apartments, totaling 12.6 megawatt-hours of energy storage that is controlled by Rocky Mountain Power for the benefit of the community and the broader grid as a real-time dispatchable distributed energy solution – MidAmerican Energy is the largest owner in the U.S. of rate-regulated wind capacity, with 6,803 MW in operation or under construction. In 2018, MidAmerican Energy generated wind energy equivalent to approximately 51% of its Iowa customers’ annual retail electric usage. Once Wind XI, Wind XII, and the Wind XII expansion are completed (expected late 2020) adding up to 2,796 MW of wind generation, MidAmerican Energy is expected to meet 100% of its Iowa and South Dakota customers’ energy use on an annual basis with renewable, zero-carbon energy, becoming the first major utility in the U.S. to do so for its customers 16
Advancing a Sustainable Energy Future • PacifiCorp’s Energy Vision 2020 program will repower 1,039 MW of existing company-owned wind facilities, acquire 950 MW of new wind projects, add 200 MW of wind procured through a power purchase agreement and build a new 140-mile, 500 kV transmission line. The projects are on schedule to be placed in service by year-end 2020 to deliver benefits to customers and improve transmission transfer capacity and reliability. In October 2019, PacifiCorp filed its Integrated Resource Plan, which includes the addition of more than 4,600 MW of new wind generation, 6,300 MW of new solar generation, 2,800 MW of battery storage, and nearly 4,500 MW of coal plant retirements through 2038 • As part of its Integrated Resource Plan filed in 2019 and as amended, NV Energy announced plans to enter into power purchase agreements to procure generation from nearly 2,200 MW of solar generation and almost 700 MW of battery storage by 2024. Beyond 2024, the resource plan includes nearly 2,000 MW of additional solar generation and 100 MW of geothermal generation through 2038 which is consistent with Nevada’s energy policy to increase the amount of renewable energy. Nevada Power is retiring its last coal unit by year end 2019 • Owned coal-fueled capacity has declined as a percentage of Berkshire Hathaway Energy’s power capacity portfolio from 58% in 2006 to 26% as of September 30, 2019. Since 2013, Berkshire Hathaway Energy has retired or has plans to retire approximately 6,400 MW (61% reduction) of coal generation capacity by 2038 • Berkshire Hathaway Energy’s natural gas transmission pipelines’ operational practices and methane leak detection programs are designed to minimize the release of methane emissions. These leading practices resulted in the gas transmission pipelines’ combined leak rates, measured as a percentage of throughput, of 0.05% in 2018, which is significantly less than the industry average and goal of the ONE Future Initiative of 1% • Additional information regarding our sustainability and environmental outlook can be found at www.brkenergyco.com/environment 17
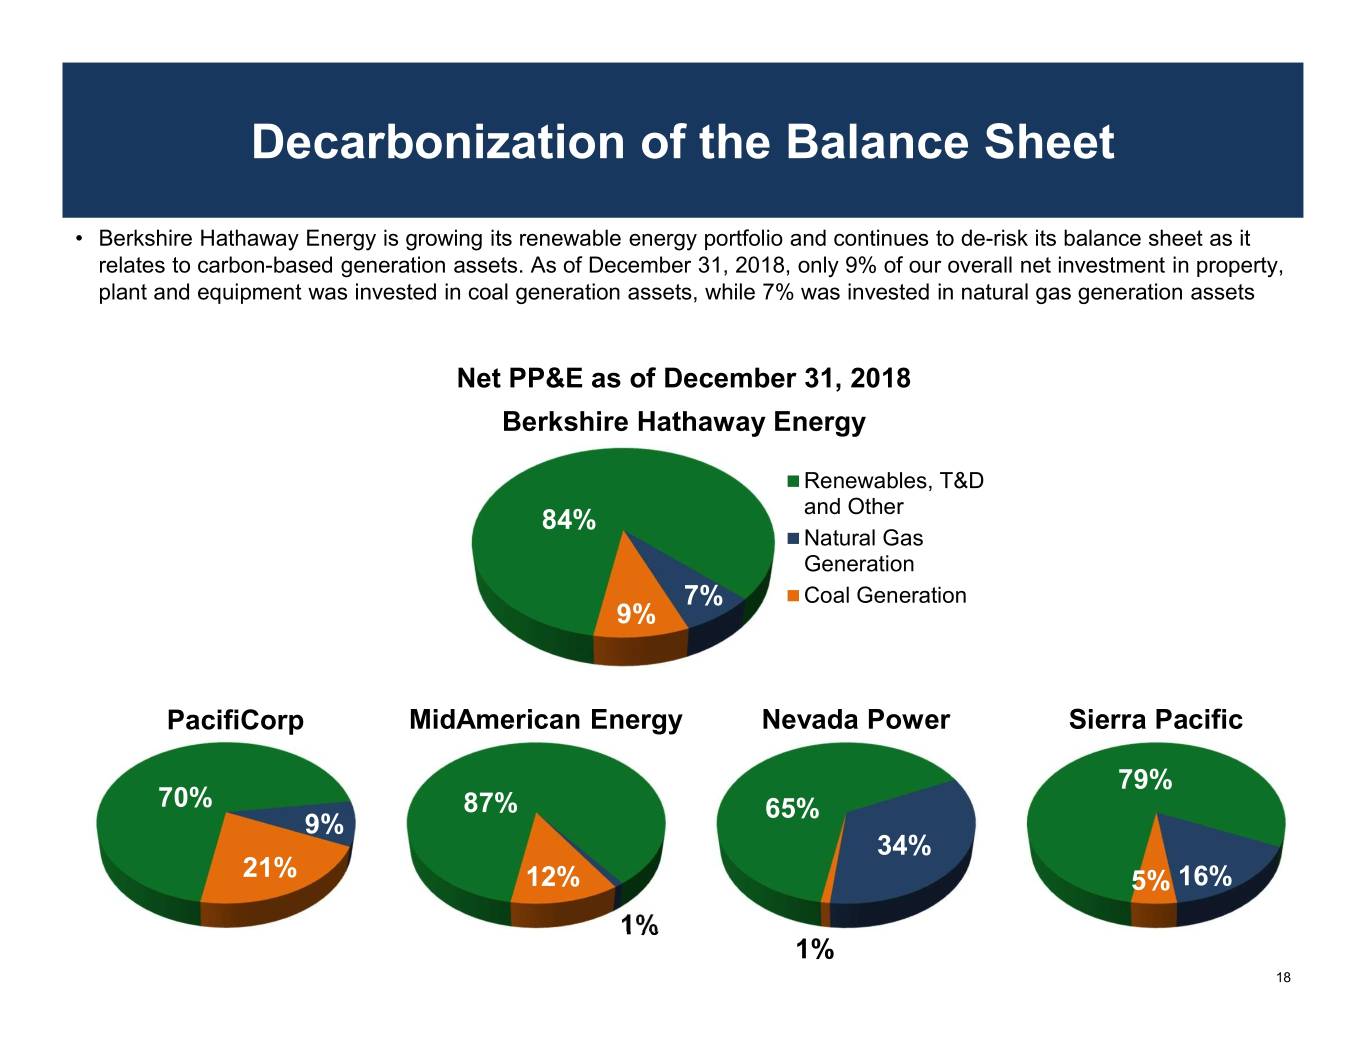
Decarbonization of the Balance Sheet • Berkshire Hathaway Energy is growing its renewable energy portfolio and continues to de-risk its balance sheet as it relates to carbon-based generation assets. As of December 31, 2018, only 9% of our overall net investment in property, plant and equipment was invested in coal generation assets, while 7% was invested in natural gas generation assets Net PP&E as of December 31, 2018 Berkshire Hathaway Energy Renewables, T&D 84% and Other Natural Gas Generation 7% Coal Generation 9% PacifiCorp MidAmerican Energy Nevada Power Sierra Pacific 79% 70% 87% 65% 9% 34% 21% 12% 5% 16% 1% 1% 18

Power Diversification 2006 BHE Power Capacity – 16,386 MW 9/30/2019 BHE Power Capacity – 33,865 MW Geothermal Coal Geothermal Hydro 1% 26% 3% Coal 4% Total Hydro 58% Renewables 8% Solar 16% Total 5% Wind Renewables 5% 42% Nuclear and Other Natural Gas 3% 31% Wind 32% Natural Gas Nuclear and 23% Other 1% 2006 BHE Power Generation – 83 TWh LTM 9/30/2019 BHE Power Generation – 123 TWh Geothermal Coal Geothermal Hydro 2% 43% Total Coal 5% 3% Renewables(1) Hydro 74% Solar 12% 5% Total 3% Wind Renewables(1) 2% 27% Nuclear and Wind Other 19% 5% Natural Gas 9% Nuclear and Other Natural Gas 3% 27% • In 2006, Berkshire Hathaway Energy acquired PacifiCorp, and since this acquisition we have significantly changed our generation mix by growing our renewable portfolio of assets (1) All or some of the renewable energy attributes associated with generation from these generating facilities may be: (a) used in future years to comply with renewable portfolio standards or other regulatory requirements, or (b) sold to third parties in the form of renewable energy credits or other environmental commodities 19

Low Cost Competitive Rates Company Weighted Average Retail Rate ($/kWh) U.S. National Average(1) $0.1081 Pacific Power $0.0941 13% lower than the U.S. National Average Rocky Mountain Power $0.0774 28% lower than the U.S. National Average MidAmerican Energy $0.0733 32% lower than the U.S. National Average Nevada Power $0.1019 6% lower than the U.S. National Average Sierra Pacific $0.0818 24% lower than the U.S. National Average BHE Pipeline Group Mastio No. 1 for the 14th consecutive year Highest Average Rates ($/kWh) by State(1): Hawaii – $0.2974; Massachusetts – $0.2098; Connecticut – $0.2029; Rhode Island – $0.1940; New Hampshire – $0.1761 (1) Source: Edison Electric Institute (Summer 2019) 20

Strong Credit Profile Credit ratios continue to support our credit ratings Credit Metrics FFO Interest Coverage FFO / Debt Debt / Total Capitalization LTM LTM LTM Credit Ratings(1) Average 9/30/19 2018 2017 Average 9/30/19 2018 2017 9/30/19 2018 2017 Berkshire Hathaway Energy(2) A3 / A- 4.4x 4.4x 4.5x 4.4x 16.0% 15.8% 16.3% 15.8% 56% 57% 58% Regulated U.S. Utilities PacifiCorp(2) (3) A1 / A+ 5.0x 4.7x 5.1x 5.3x 21.5% 19.2% 22.3% 23.1% 48% 47% 48% MidAmerican Energy(2) (3) Aa2 / A+ 6.8x 6.1x 6.8x 7.6x 24.2% 21.2% 23.4% 28.1% 47% 47% 47% Nevada Power(2) (3) A2 / A+ 4.9x 4.9x 4.8x 4.9x 24.7% 28.3% 23.0% 22.8% 44% 49% 53% Sierra Pacific Power(2) (3) A2 / A+ 6.3x 5.9x 6.8x 6.1x 20.4% 20.1% 22.0% 19.2% 47% 48% 50% Regulated Pipelines and Electric Distribution Northern Natural Gas A2 / A 8.7x 8.2x 8.6x 9.2x 33.8% 28.8% 31.5% 41.1% 39% 37% 34% AltaLink, L.P.(3)(4) – / A / A 4.1x 4.1x 4.1x 4.1x 12.0% 11.8% 11.9% 12.2% 60% 60% 60% Northern Powergrid Holdings Baa1 / A- 4.5x 4.7x 4.4x 4.5x 17.7% 18.4% 17.2% 17.7% 41% 42% 43% Northern Powergrid (Northeast) A3 / A Northern Powergrid (Yorkshire) A3 / A (1) Moody’s / S&P / DBRS. Ratings are issuer or senior unsecured ratings unless otherwise noted (2) Refer to the Appendix for the calculations of key ratios (3) Ratings are senior secured ratings (4) ALP’s reported FFO is adjusted for disallowed capital costs and future income tax re-measurement 21

Capital Investment Plan $8,000 7,582 7,096 7,235 $7,000 Capex Current Plan Prior Plan $6,000 5,529 by Type 2019-2021 2019-2021 Variance $5,000 4,433 Operating $ 9,439 $ 8,746 $ 693 3,920 $4,000 Wind Generation 5,813 4,990 823 $3,000 (Growth) ($ millions) ($ $2,000 Other Growth 2,333 1,727 606 $1,000 Electric Transmission 1,665 1,082 583 $- (Growth) 2019 2019 2020 2020 2021 2021 Total $ 19,250 $ 16,545 $ 2,705 Current Prior Current Prior Current Prior Operating Wind Generation (Growth) Other Growth Electric Transmission (Growth) Capex Current Plan Prior Plan $8,000 7,582 7,096 7,235 by Business 2019-2021 2019-2021 Variance $7,000 PacifiCorp $ 6,455 $ 5,431 $ 1,024 $6,000 5,529 MidAmerican Funding 5,767 5,039 728 $5,000 4,433 NV Energy 1,819 1,935 (116) 3,920 $4,000 Northern Powergrid 1,929 1,564 365 $3,000 ($ millions) ($ BHE Pipeline Group 1,729 1,481 248 $2,000 BHE Renewables 290 245 45 $1,000 BHE Transmission 1,082 701 381 $- HomeServices and 179 149 30 2019 2019 2020 2020 2021 2021 Other Current Prior Current Prior Current Prior Total $ 19,250 $ 16,545 $ 2,705 PacifiCorp MidAmerican Funding NV Energy Northern Powergrid BHE Pipeline Group BHE Renewables BHE Transmission HomeServices and Other 22
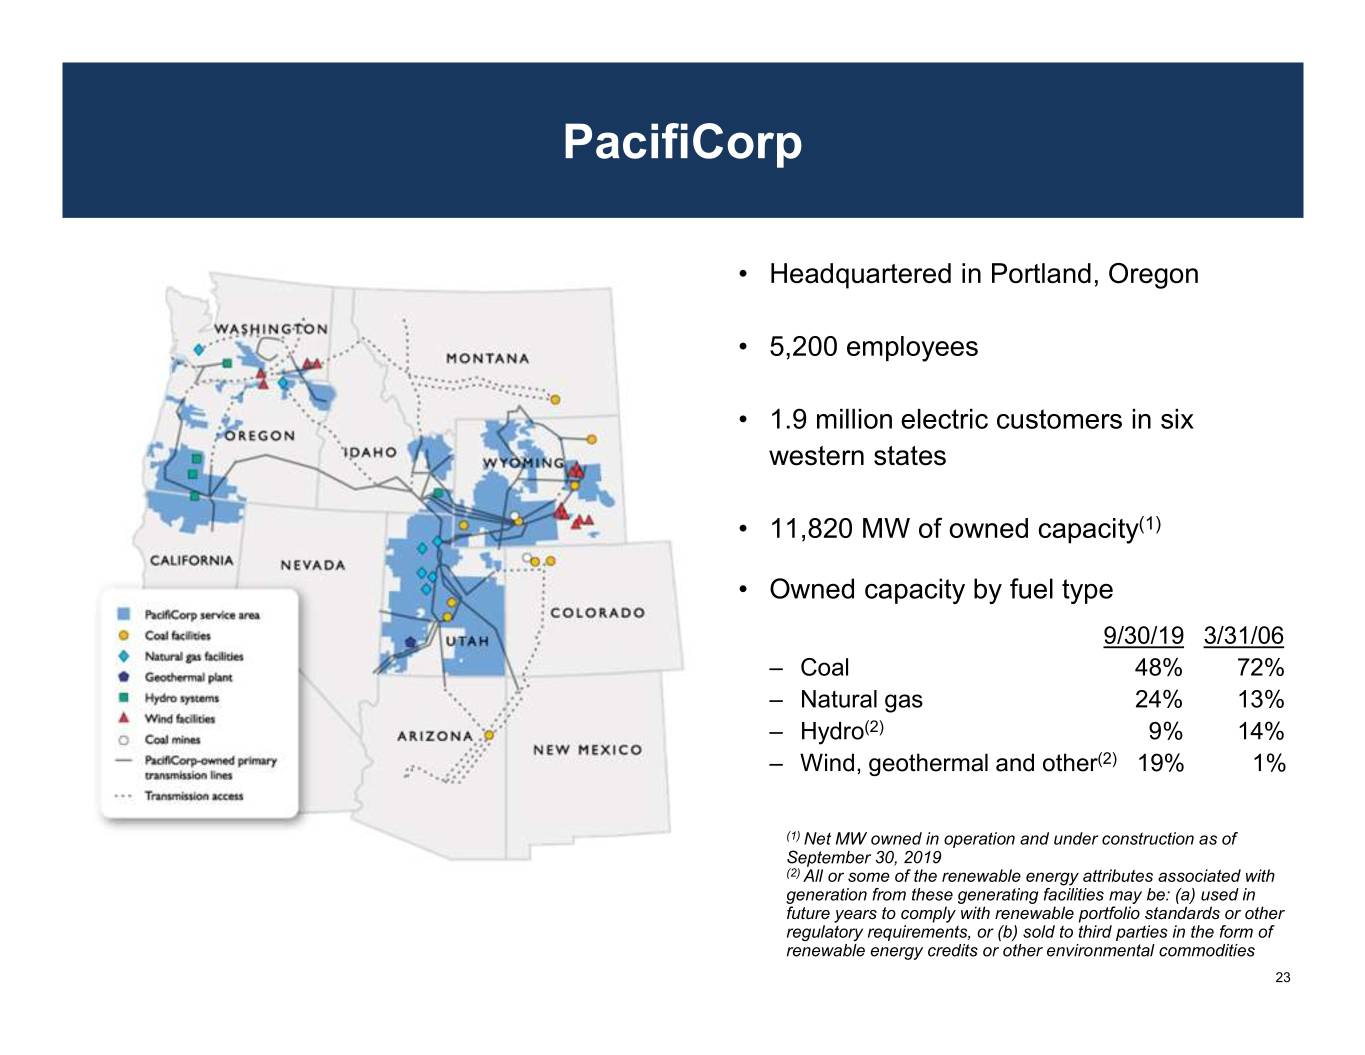
PacifiCorp • Headquartered in Portland, Oregon • 5,200 employees • 1.9 million electric customers in six western states • 11,820 MW of owned capacity(1) • Owned capacity by fuel type 9/30/19 3/31/06 – Coal 48% 72% – Natural gas 24% 13% – Hydro(2) 9% 14% – Wind, geothermal and other(2) 19% 1% (1) Net MW owned in operation and under construction as of September 30, 2019 (2) All or some of the renewable energy attributes associated with generation from these generating facilities may be: (a) used in future years to comply with renewable portfolio standards or other regulatory requirements, or (b) sold to third parties in the form of renewable energy credits or other environmental commodities 23
PacifiCorp – Business Update • Actual retail load for the nine months ended September 30, 2019, was 41,528 GWh; an approximate 113 GWh increase compared with the same time period last year with drivers being favorable, residential and commercial growth due to increases in number of customers, and favorable weather impacts • Energy Vision 2020 – PacifiCorp’s Energy Vision 2020 program will repower 1,039 MW of existing company-owned wind facilities, acquire 950 MW of new wind projects, add 200 MW of wind procured through a power purchase agreement and build a new 140-mile, 500 kV transmission line – The Energy Vision 2020 projects are on schedule to be placed in service by year-end 2020 to deliver benefits to customers and improve transmission transfer capacity and reliability • Incremental Renewable Resources – 240 MW Pryor Mountain in Carbon County, Montana will be placed in-service in December 2020 – Acquired remaining 21.2% ownership in the Foote Creek wind facility. PacifiCorp now owns 100% of the capacity of Foot Creek, increasing the capacity by 9 MW • PacifiCorp’s 2019 Integrated Resource Plan (IRP) — Pursuing Renewables and Clean Energy Policies – PacifiCorp’s 2019 plan was filed with its state commissions in October 2019 – Updated every two years, the plan identifies the best mix of resources to serve customers in the future – The plan filing supports PacifiCorp's goals of purchasing renewables and developing clean energy policies – The 2019 plan includes: o More than 3,500 MW of new wind generation by 2025, and a total of more than 4,600 MW of new wind generation by 2038 o Nearly 3,000 MW of new solar by 2025, and more than 6,300 MW of new solar generation by 2038 o Nearly 600 MW of battery storage by 2025, and more than 2,800 MW of battery storage by 2038 o Construction of a new 400-mile transmission line known as Gateway South connecting southeastern Wyoming and northern Utah o Coal plant retirements that reduce coal-fueled generation capacity by nearly 2,800 MW by 2030, and by nearly 4,500 MW by 2038 24

PacifiCorp – Business Update • Strong cost containment has minimized rate increases while continuing to improve safety, reliability and customer service – PacifiCorp has stay-out pledges in Utah, Oregon and Wyoming, and made a customer pledge to not increase base rates prior to 2021 – Rate reductions implemented in Utah, Idaho and Wyoming in 2018 to begin passing back a portion of 2017 Tax Reform benefits – Rate reductions implemented in Oregon and Washington in 2019 to begin passing back a portion of 2017 Tax Reform benefits. A decision authorizing the return of Tax Reform benefits to customers is pending in California – Energy cost adjustment mechanisms exist in all six states where PacifiCorp has operations – A new customer generation program was implemented in Utah to transition from net metering beginning December 1, 2017 o Applications for interconnection of new customer generation in 2019 have dropped more than 80% compared to applications in 2017 • Wildfire Mitigation – California Senate Bill 901 requires electric utilities to develop annual wildfire mitigation plans to prevent, combat and respond to wildfires within their service territories o PacifiCorp used the California fire threat modeling process to evaluate the fire risk throughout its service territory; areas highlighted were in southern Oregon; Park City, Utah; and a small number of other isolated locations that it titled Fire High Consequence Areas o In May 2019, the California Public Utilities Commission approved PacifiCorp’s plan o The company has continued to implement aspects of its plan and reported on the progress as required by the commission – Subsequently, California Assembly Bill 1054 established a wildfire fund to support the creditworthiness of electrical corporations, among other things o PacifiCorp filed official notice with the commission that it will not participate in the fund 25

PacifiCorp – Business Update • Oregon Clean Electricity and Coal Transition Plan signed into law by Gov. Brown in March 2016 – Doubled renewable energy portfolio standard to 50% o 20% by 2020, 27% by 2025, 35% by 2030, 40% by 2035, 50% by 2040 o Incorporates renewable energy credit banking provisions – Removes coal costs from Oregon rates by January 1, 2030 – Allows production tax credits to be annually adjusted as part of a Net Power Cost Adjustment • Washington Senate Bill 5116 and House Bill 1211 – Clean Energy Transformation Act – Key provisions: o Coal out of rates by 2025 o 80% renewable by 2030 with compliance options for remaining 20% o 2% cost cap measured over a four-year compliance period; if the cost cap is triggered, the utility is deemed to be in compliance o Compliance penalty = $100/MWh with multiplier depending on type of fossil generation o Sets mandate of 100% carbon free electricity sector by 2045 – PacifiCorp is participating in extensive rule-making activities and serves on a working group to align requirements of the new law with regional electricity markets – PacifiCorp is currently negotiating a new multistate cost allocation agreement among its states that may address some of Washington’s policy direction 26
PacifiCorp – Business Update • Utah Sustainable Transportation and Energy Plan – PacifiCorp’s application to implement the legislatively mandated plan was approved by Utah regulators in three phases – The orders approved a five-year pilot program (2017 to 2021) with a budget of $10 million each year, including: o Deferment of Demand Side Management costs in a regulatory asset and amortized over 10 years o A risk mitigation fund to minimize the rate impact to customers for coal-fueled generation plants due to compliance requirements or other purposes o Mandated full recovery of Utah’s share of fuel, purchased power and other supply costs through an Energy Balancing Account that is not fully in the base rates through 2019 • Rocky Mountain Power supported legislation that was signed into law in 2019 permanently removing the 2019 sunset date • Wyoming Senate Enrolled Act 74 – Effective July 2019, and requires electric utilities to make a good faith effort to sell a coal-fueled generation facility in Wyoming before it can receive recovery in rates for capital costs associated with new generation facilities built, in whole or in part, to replace the retiring coal facility – If the plant is successfully sold, the electric utility is obligated to purchase the electricity from the facility through a power purchase agreement at a price that is no greater than the utility’s avoided cost, as determined by the Wyoming Public Service Commission. Costs associated with an approved power purchase agreement are expected to be recoverable in rates from Wyoming customers – PacifiCorp is working with the commission and other stakeholders to determine the implementation process. The overall impacts of this legislation cannot be determined at this time 27

MidAmerican Energy • Headquartered in Des Moines, Iowa • 3,400 employees • 1.6 million electric and natural gas customers in four Midwestern states IOWA • 11,379 MW(1) of owned capacity • Owned capacity by fuel type 9/30/19(1) 12/31/00 – Wind(2) 60% 0% – Coal 24% 70% – Natural gas 12% 19% MidAmerican Energy service area – Nuclear and other 4% 11% Major generating facilities Operational wind farms (1) Wind farms to begin generating in 2019 Net MW owned in operation and under construction as of September 30, 2019 (2) All or some of the renewable energy attributes associated with generation from these generating facilities may be: (a) used in future years to comply with renewable portfolio standards or other regulatory requirements, or (b) sold to third parties in the form of renewable energy credits or other environmental commodities 28

MidAmerican Energy – Business Update • Customer growth, warmer-than-normal summer weather, colder-than-normal winter weather and improved industrial sales increased retail electric sales 175 GWh for the nine months ended September 30, 2019, a 0.9% increase over the same period in 2018 • MVP transmission build-out completed • No electric base rate increases anticipated until late 2020s • Wind XI – Approved in 2016 – up to 2,000 MW – $3.6 billion approved cost cap deemed prudent – Qualifies for 100% of eligible production tax credit rate – 1,345 MW in-service through September 30, 2019; remainder expected to be complete by year-end 2019 • Wind XII – Approved in 2018 – up to 591 MW – $922 million approved cost cap deemed prudent – Qualifies for 100% of eligible production tax credit rate – Completion expected between fourth quarter 2019 and fourth quarter 2020 • Wind XII Expansion – Proceeding without pre-authorization sought from the Iowa Utilities Board – Comprised of 205 MW of additional wind-powered facilities with an estimated cost of $300 million – Qualifies for 100% of eligible production tax credit rate – Completion expected in 2020 29
MidAmerican Energy – Business Update • Wind repowering – Production tax credits will be reinstated for another 10-year period – Improved capacity factors from longer blades and more efficient equipment, resulting in greater generation – GE fleet o $1,129 million incurred through September 30, 2019, including AFUDC o 615 turbines comprising 924 original MW repowered through September 30, 2019 o 91 turbines comprising 136 original MW repowered in remainder of 2019 and 2020 o 100% of production tax credits rate expected for all projects – Siemens fleet o $233 million incurred through September 30, 2019, including AFUDC o 334 turbines comprising 768 original MW repowered in 2019 through 2021 (of which 4 MW has been repowered as of September 30, 2019) at 80% of full production tax credit rate o 176 turbines comprising 407 original MW repowered in 2022 at 60% of full production tax credit rate • Other generation projects – Additional cost-effective wind and solar generation projects continue to be evaluated in an effort to maintain and further expand the company’s renewable commitment to retail customers 30

NV Energy Overview • Headquartered in Las Vegas, Nevada, with territory throughout Nevada • 2,500 employees • 1.3 million electric and 170,000 gas customers • Service to 90% of Nevada population, along with tourist population in excess of 45 million • 6,011MW(1) of owned power generation (91% natural gas, 9% coal/renewable/other) Nevada Power Sierra Pacific Power Service Las Vegas and Reno and northern Territory surrounding areas Nevada 350,000 electric Customers 950,000 electric 170,000 gas Power 4,639 MW 1,372 MW Capacity (1) Net MW owned in operation as of September 30, 2019 31
NV Energy – Business Update • Retail load growth – Nevada Power – Actual retail load for the nine months ended September 30, 2019 was 17,679 GWh, a decrease of 755 GWh relative to the same period in 2018. Normal weather for the nine months ended September 30, 2019 compared to unusually warm weather in 2018 caused the majority of the decrease – Sierra Pacific Power – Actual retail load for the nine months ended September 30, 2019 was 8,201 GWh, an increase of 409 GWh relative to the same period in 2018, primarily due to customer growth • NV Energy’s 2019 Integrated Resource Plan (IRP) - Advancing environmental respect – In February 2019, the Public Utilities Commission of Nevada issued a final order approving six power purchase agreements for 1,001 MW of solar photovoltaic generation, the projects include 100 MW of co-located battery storage; and early conditional retirement of NV Energy's 50% interest in the coal-fueled North Valmy Generating Station Unit 1 – In June 2019, NV Energy filed an amendment to the integrated resource plan seeking approval of three power purchase agreements for 1,190 MW of solar photovoltaic generation and 590 MW of integrated battery storage – NV Energy filed an uncontested stipulation recommending approval of the three power purchase agreements on October 18, 2019 – The commission is expected to issue an order in the amendment application in December 2019 • Renewable portfolio standard – Senate Bill 358 increased the renewable portfolio standard to 50% by 2030 – NV Energy is positioned to comply with the renewable portfolio standard ahead of 2030 32
NV Energy – Business Update • 704B applications – Since 2016 only five customers have formally transitioned to distribution-only service having a total estimated peak of 400 MW. Two existing and four new customers (not currently on the system) received 704B approval but have not yet become distribution-only service customers – There are no pending applications before the Public Utilities Commission of Nevada for customers pursuing the statutory right to utilize an alternative energy provider o The reduction and withdrawal of 704B applications is a result of 2019 legislation, the company’s customer retention efforts, and the planned rate reductions for Nevada Power ($120 million) and Sierra Pacific ($5 million) customers o The Nevada Legislature amended the 704B statute to establish annual limits on the total amount of energy and capacity that eligible customers may be authorized to purchase from wholesale energy providers and established licensing provisions for alternative energy providers • Natural disaster mitigation – The Nevada Legislature enacted Senate Bill 329 for the prevention of natural disasters, including wildfires. The legislation requires submission of a natural disaster protection plan to the commission and authorizes the company to recover costs associated with implementation of the plan through a separate rate rider – On October 30, 2019, NV Energy filed a stipulation with the commission recommending the establishment of regulatory asset accounts to track and recover costs associated with natural disaster mitigation • General rate review – Sierra Pacific Power filed its triennial general rate review for electric operations in June 2019, and on September 24, 2019, filed a stipulation supported by all participating parties which, if approved by the commission, would resolve the cost of capital and revenue requirement phases of the proceeding o Key aspects of the stipulation include a $5 million revenue requirement reduction, an authorized return on equity of 9.5%, and a mechanism to share earnings in excess of 9.7% equally between Sierra Pacific Power and customers – Nevada Power will file its triennial general rate review in June 2020 and anticipates requesting a $120 million reduction in revenue requirement for rates effective January 2021 through December 2023 o The lower revenue requirement is largely driven by reductions in long-term interest expense, tax reform savings and overearnings accrued for customer benefit during the 2018 and 2019 periods 33

Northern Powergrid • 3.9 million end-users in northern England • Approximately 60,000 miles of distribution lines • Approximately 58% of 2019 distribution revenue from Northeast residential and commercial customers through Yorkshire September 30, 2019 Edinburgh • Distribution revenue (£ millions): Nine Months Ended 9/30/19 9/30/18 Residential 223 221 Commercial 65 68 Newcastle Upon Tyne Industrial 202 192 Other 5 5 Middlesbrough Total 495 486 • Strong performance in ED1 period (eight-year price York control started April 2015); expect to outperform Leeds output targets and exceed many of the commitments made to stakeholders, all within the cost allowances Sheffield set by Ofgem 34
Northern Powergrid – Business Update • Ofgem is signalling lower returns in the next price control period, ED2, running for five years beginning in April 2023 – Ofgem’s current view of the cost of equity for Transmission and Gas Distribution 2 (T1/GD2, which is 2 years ahead of ED2), is 4.3% plus CPIH indexation alongside tougher targets, weaker incentives and introducing a backstop return adjustment mechanism – Ofgem has made moves in the right direction from initial T1/GD2 proposals, and we believe there is scope to get to a fair price control with sufficiently strong incentives. ED2 starts later, faces more change from decarbonization and impacts more companies; all of these factors give scope for improvements in the price control at ED2 compared to T2/GD2 – Smart meter rental business has been a success from its initial launch in April 2014, with the company securing contracts to deploy 3.5 million meters before the end of 2021, resulting in total capital deployed of over £572 million. Through September 30, 2019, £397 million of capital has been deployed • In October 2019, CalEnergy Resources Limited, a Northern Powergrid subsidiary, closed on a transaction with Independent Oil and Gas plc to become a joint owner of a portfolio of Southern North Sea assets – The company made an initial upfront payment and committed to the first phase of what has the potential to become a four-phase development if early projects are successful – The first phase involves deployment of £331 million of development capital split over three separate projects that will bring the first three gas fields on stream. The first phase includes acquiring and re- commissioning an existing gas transportation pipeline already constructed and previously in service – Phase 1 includes three fields that have proven and probable reserves and production has been successfully tested – Upon completion, the company will acquire 50% of the existing pipeline that brings gas to shore and the associated onshore processing facilities required to take the gas to market 35

Northern Natural Gas • Headquartered in Omaha, Nebraska • Approximately 900 employees • 14,700-mile interstate natural gas transmission pipeline system • 6.0 Bcf per day of market area design capacity; 1.73 Bcf per day field area capacity to demarcation and 1.4 Bcf per day of Permian area capacity • More than 79 Bcf of firm service and operational storage cycle capacity • 90% of transportation and storage revenue in 2019 is contracted based on fixed amounts (demand charges) that are not dependent on the volumes transported − Market area transportation contracts have a weighted average contract term of eight years − Storage contracts have a weighted average contract term of seven years • Increased the integrity and reliability of the pipeline • Ranked No. 1 among 16 mega-pipelines and No. 1 among 34 interstate pipelines in 2019 Mastio & Company customer satisfaction survey 36
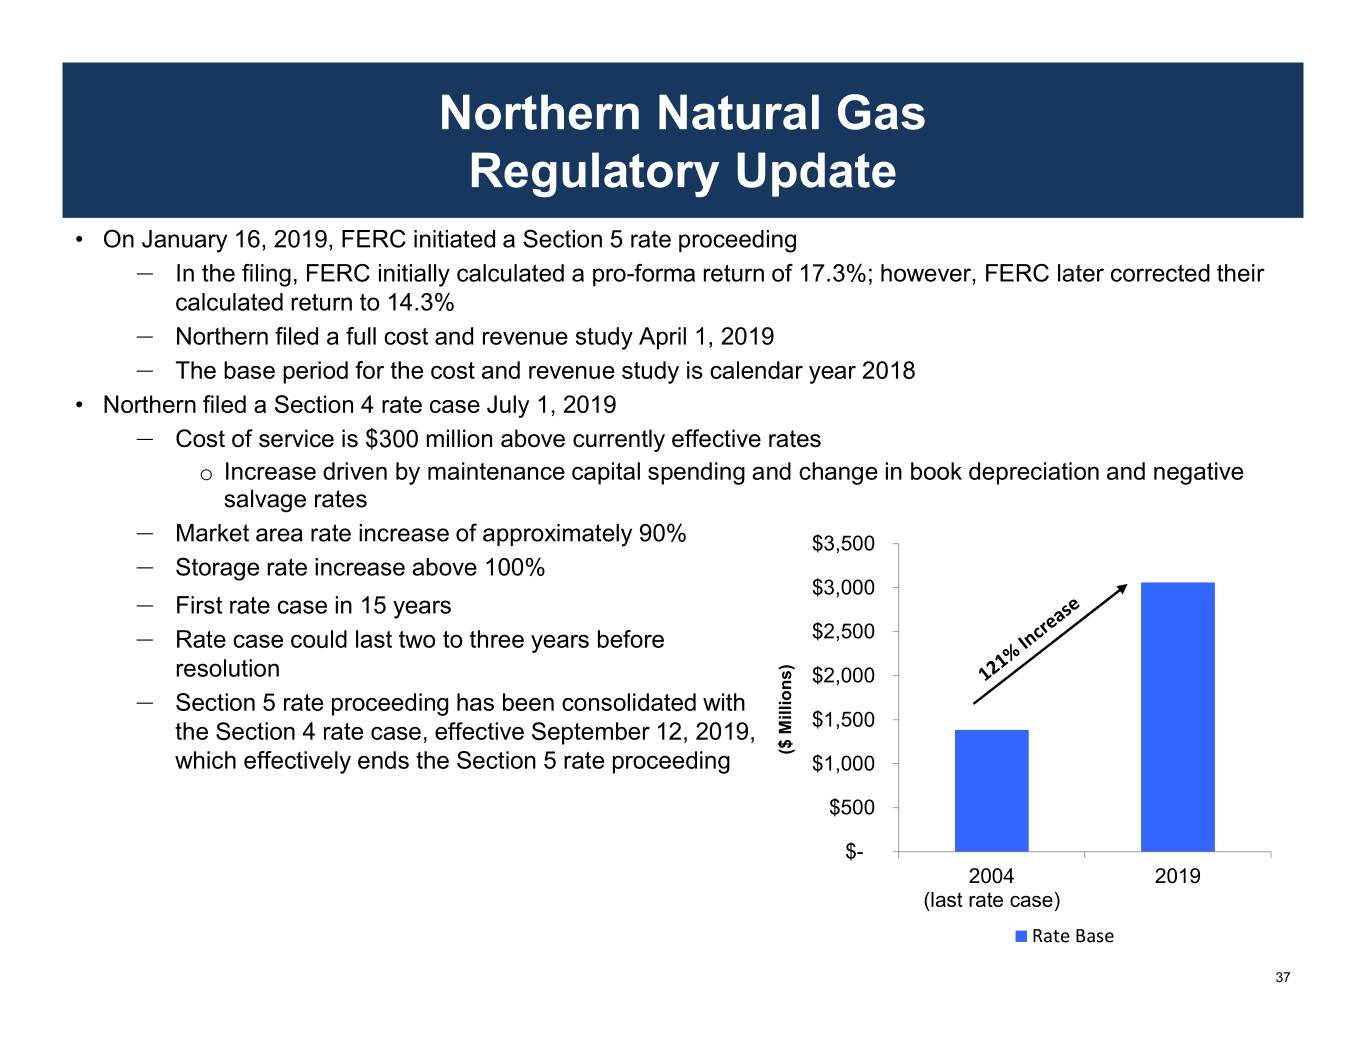
Northern Natural Gas Regulatory Update • On January 16, 2019, FERC initiated a Section 5 rate proceeding – In the filing, FERC initially calculated a pro-forma return of 17.3%; however, FERC later corrected their calculated return to 14.3% – Northern filed a full cost and revenue study April 1, 2019 – The base period for the cost and revenue study is calendar year 2018 • Northern filed a Section 4 rate case July 1, 2019 – Cost of service is $300 million above currently effective rates o Increase driven by maintenance capital spending and change in book depreciation and negative salvage rates – Market area rate increase of approximately 90% $3,500 – Storage rate increase above 100% $3,000 – First rate case in 15 years – Rate case could last two to three years before $2,500 resolution $2,000 – Section 5 rate proceeding has been consolidated with $1,500 the Section 4 rate case, effective September 12, 2019, which effectively ends the Section 5 rate proceeding Millions) ($ $1,000 $500 $- 2004 2019 (last rate case) Rate Base 37
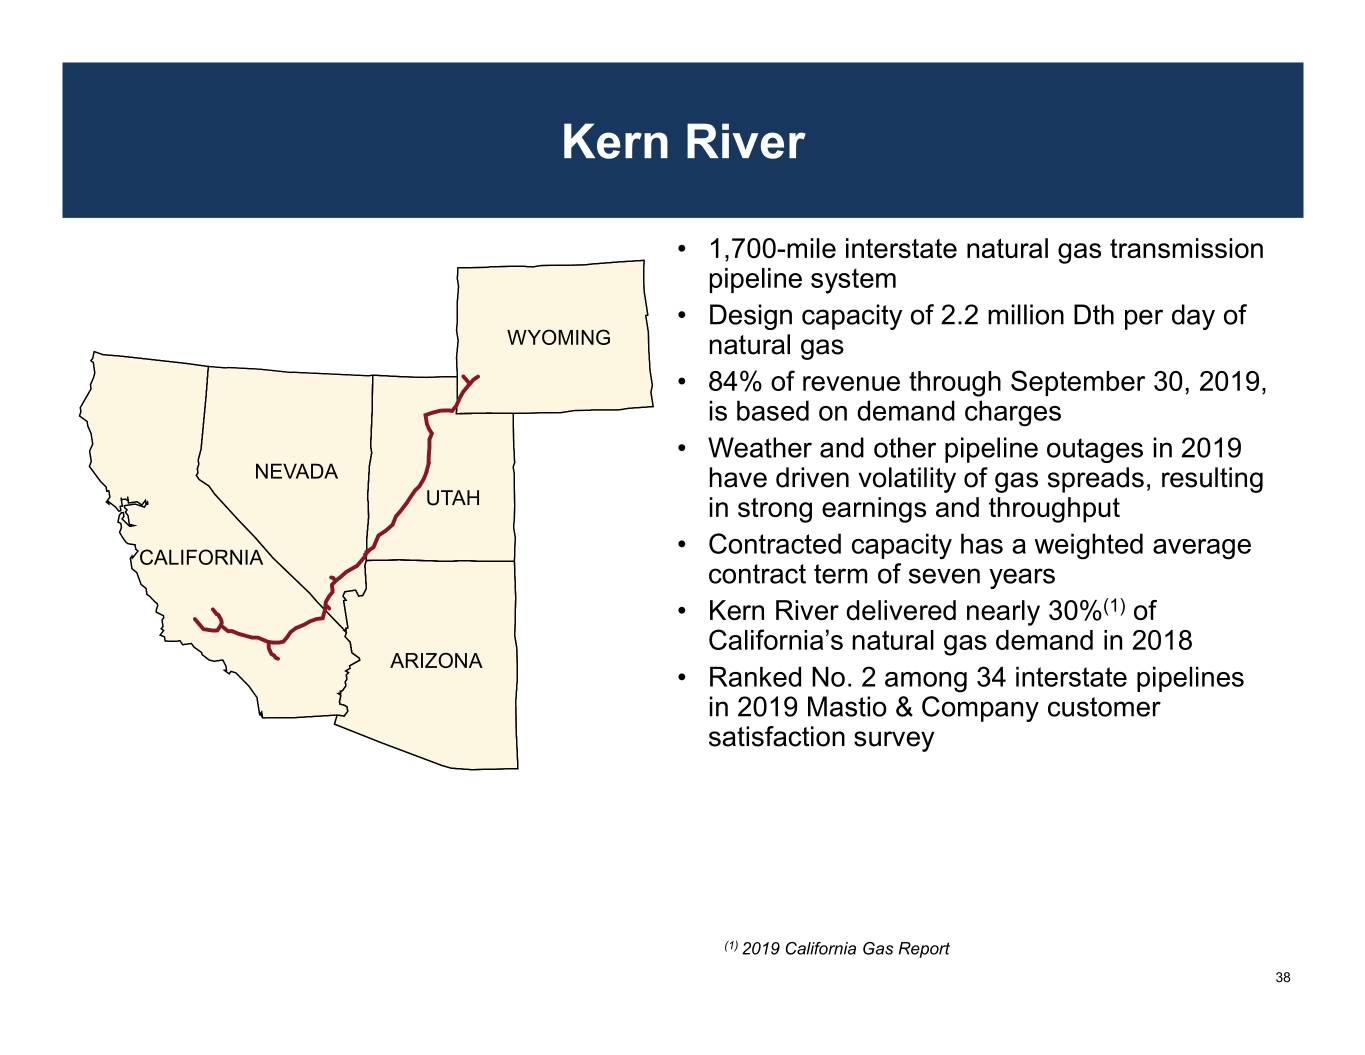
Kern River • 1,700-mile interstate natural gas transmission pipeline system • Design capacity of 2.2 million Dth per day of WYOMING natural gas • 84% of revenue through September 30, 2019, is based on demand charges • Weather and other pipeline outages in 2019 NEVADA have driven volatility of gas spreads, resulting UTAH in strong earnings and throughput CALIFORNIA • Contracted capacity has a weighted average contract term of seven years • Kern River delivered nearly 30%(1) of California’s natural gas demand in 2018 ARIZONA • Ranked No. 2 among 34 interstate pipelines in 2019 Mastio & Company customer satisfaction survey (1) 2019 California Gas Report 38
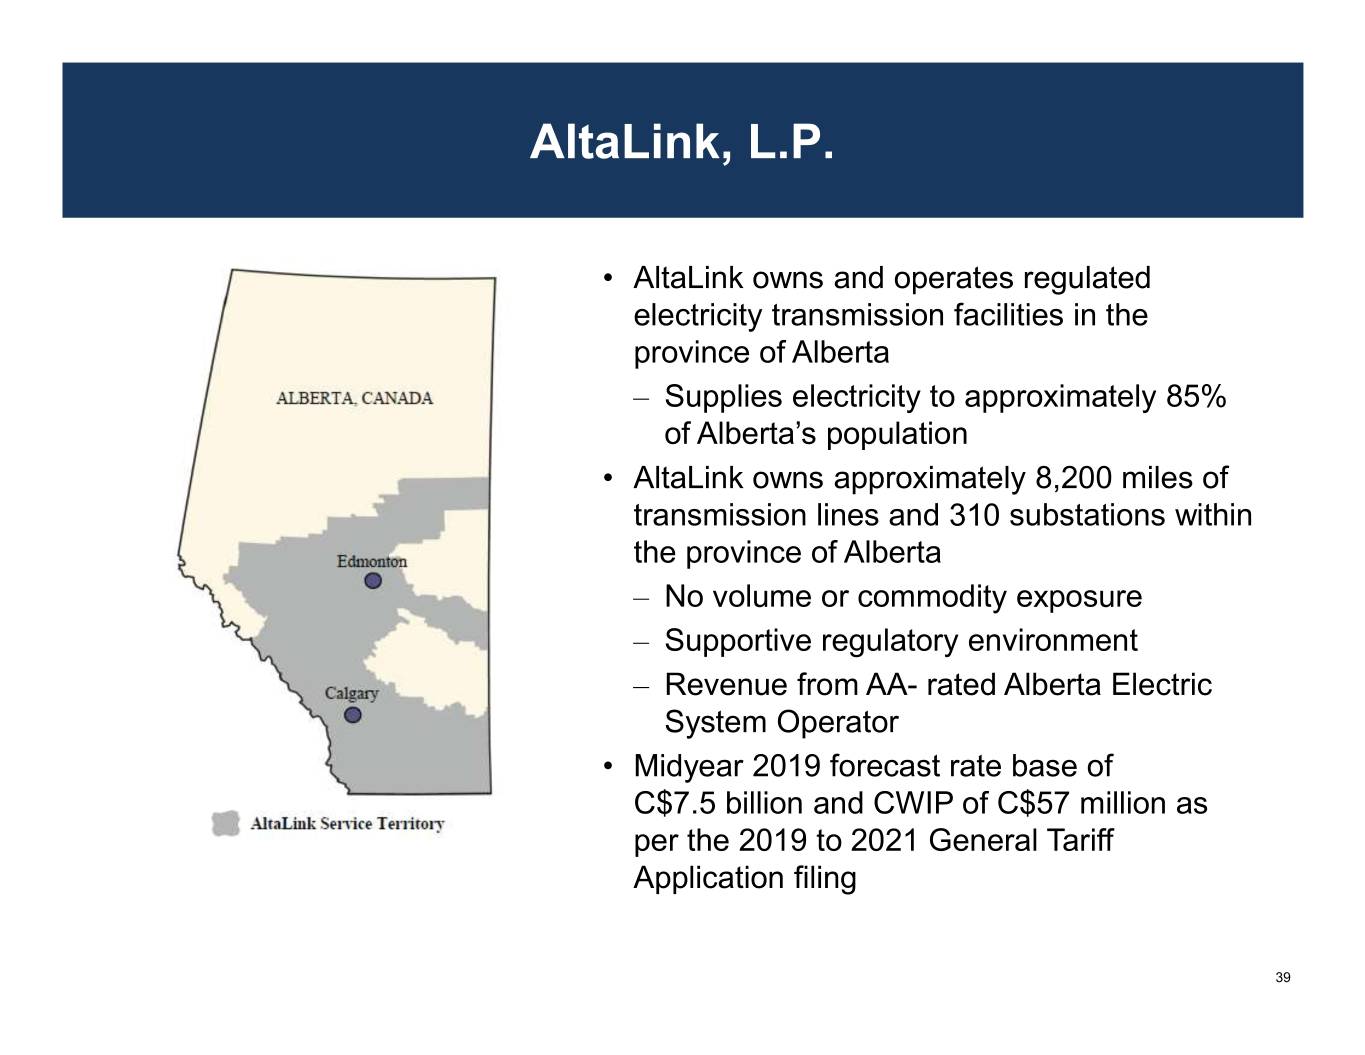
AltaLink, L.P. • AltaLink owns and operates regulated electricity transmission facilities in the province of Alberta – Supplies electricity to approximately 85% of Alberta’s population • AltaLink owns approximately 8,200 miles of transmission lines and 310 substations within the province of Alberta – No volume or commodity exposure – Supportive regulatory environment – Revenue from AA- rated Alberta Electric System Operator • Midyear 2019 forecast rate base of C$7.5 billion and CWIP of C$57 million as per the 2019 to 2021 General Tariff Application filing 39
AltaLink, L.P. – Business Update • 2014 to 2015 Direct Assign Capital Deferral Account – On December 30, 2018, the Alberta Utilities Commission approved the majority of the C$3.8 billion in capital costs – The commission disallowed approximately C$30 million of costs, representing 0.7% of total capital additions applied for – Berkshire Hathaway Energy recovered C$14.8 million of the disallowance under the terms of the AltaLink Purchase and Sale Agreement with SNC-Lavalin – The Commission has approved C$10 million of carrying costs associated with the unsettled DACDA receivable • 2016 to 2018 Direct Assign Capital Deferral Account – Proceeding was initiated June 27, 2019 – Application includes C$976 million in gross capital additions including AFUDC • 2021 Generic Cost of Capital Proceeding – Process timeline includes filling of expert evidence by January 2020, with a hearing expected in second quarter 2020. A decision is expected before year-end 2020 – The commission indicated that it intends to explore the possibility of returning to a formula-based approach to setting cost of capital parameters in subsequent Generic Cost of Capital proceedings – Current approved parameters include an 8.5% ROE and 37% equity thickness for the years 2018 through 2020 40

AltaLink, L.P. – Business Update • 2019 to 2021 General Tariff Application – Filed August 23, 2018 – The application includes the first three years of a five-year commitment (2019 to 2023) to keep customer rates at no higher than the 2018 approved tariff of C$903.5 million – On June 13, 2019, a letter was filed with the commission advising that AltaLink had reached a negotiated settlement with customers – Under the agreement, AltaLink will reduce operating expenses by C$22.5 million and sustaining capital by C$58.0 million for 2019 to 2021, in addition to a refund of C$31.0 million of previously collected depreciation – The agreement does not include a proposed change to the method of funding salvage and excludes certain capital programs that will be part of an application hearing – An oral hearing is scheduled for fourth quarter 2019 • Alberta Electric System Operator Tariff Decision – On September 22, 2019, the Alberta Utilities Commission approved AltaLink’s proposal to refund FortisAlberta (Fortis) customer contributions which would increase AltaLink's capital investment by approximately C$375 million – The proposal would benefit customers by flowing through AltaLink’s lower cost of capital rather than Fortis’ higher cost of capital – The timing and amount of any refund remains uncertain as the Commission has granted Fortis’ request for Review and Variance application 41

BHE Renewables Net or Net Contract Owned PPA Power Capacity Capacity Location Installed Expiration Purchaser (MW) (MW) SOLAR Solar Star I & II CA 2013-2015 2035 SCE 586 586 Topaz CA 2013-2014 2039 PG&E 550 550 Agua Caliente AZ 2012-2013 2039 PG&E 290 142 Alamo 6 TX 2017 2042 CPS 110 110 Community Solar Gardens MN 2016-2018 (2) (2) 98 98 Pearl TX 2017 2042 CPS 50 50 1,684 1,536 WIND Grande Prairie NE 2016 2036 OPPD 400 400 BHE Solar Pinyon Pines I & II CA 2012 2035 SCE 300 300 Geothermal Jumbo Road TX 2015 2033 AE 300 300 Santa Rita TX 2018 2038 Various 300 300 Natural Gas Walnut Ridge IL 2018 2028 USGSA 212 212 BHE Wind Bishop Hill II IL 2012 2032 Ameren 81 81 Marshall Wind KS 2016 2036 (3) 72 72 BHE Hydro 1,665 1,665 CalEnergy Philippines GEOTHERMAL Imperial Valley CA 1982-2019 (4) (4) 346 346 Portfolio Composition (1) HYDROELECTRIC Solar Casecnan Phil. 2001 2021 NIA 150 128 25% Wind Wailuku HI 1993 2023 HELCO 10 10 39% 160 138 NATURAL GAS Cordova IL 2001 2019 EGC 512 512 Power Resources TX 1988 2021 EDF 212 212 Natural Gas 17% Saranac NY 1994 2019 TEMUS 245 196 Yuma AZ 1994 2024 SDG&E 50 50 1,019 970 Hydro Geothermal 2% 17% Total Owned 4,874 4,655 (1) Based on actual generation from September 30, 2018, through September 30, 2019 (2) Approximately 100 off-takers for the purchase of all the energy produced by the solar portfolio for a period up to 25 years (3) Separate PPAs exist with Missouri Joint Municipal Electric Commission (20 MW), Kansas Power Pool (25 MW), City of Independence, Missouri (20 MW) and Kansas Municipal Energy Agency (7 MW) (4) 29% of the company's interests in the Imperial Valley Projects' Contract Capacity are currently sold to Southern California Edison Company under long-term power purchase agreements expiring in 2020 through 2026. Certain long-term power purchase agreement renewals for 252 MW have been entered into with other parties at fixed prices that expire from 2028 to 2039, of which 202 MW mature in 2039 42

BHE Renewables – Business Update • Topaz Project – PG&E bankruptcy update – Both PG&E and the ad-hoc unsecured noteholder group’s plan of reorganization have pledged to honor legacy renewable PPAs o Through October 2019, all post-petition monthly sales invoices have been paid in full by PG&E on their due date • Wind tax equity update Invested by Year YTD Future 2015 2016 2017 2018 9/30/2019 Commitments Total Capacity (MW) 204 829 602 808 1,490 2,863 6,796 Investment ($ in millions) $170 $584 $403 $698 $ 1,145 $ 2,416 $5,416 – Tax equity investments enable investment in new renewable energy projects – Accounted for as equity method investments • Battery storage – Currently have a solar plus energy storage pilot project that became operational in September 2018. The 60 kW/548 kWh project was completed at Solar Star in California – Developing solar plus energy storage projects with a combined output of 48 MW, with a targeted commercial operation date of 2020 to 2021 and will be adjacent to Solar Star in California 43

BHE Renewables Operational Performance Owned Generation by Type 6,000 5,000 4,000 3,000 2,000 1,000 0 Thousands ofMWhs Thousands 2014 2015 2016 2017 2018 LTM 2019 Solar Wind Geothermal Hydro Natural Gas 2017 2018 2019 Capacity Capacity Capacity Factor Factor Factor Wind 36.2% 39.3% 39.6% Solar 29.8% 29.0% 29.9% Geothermal 82.4% 84.5% 79.5% Hydro 38.4% 35.7% 26.6% Natural Gas 2.4% 9.3% 35.1% Total 29.7% 32.4% 38.0% 44
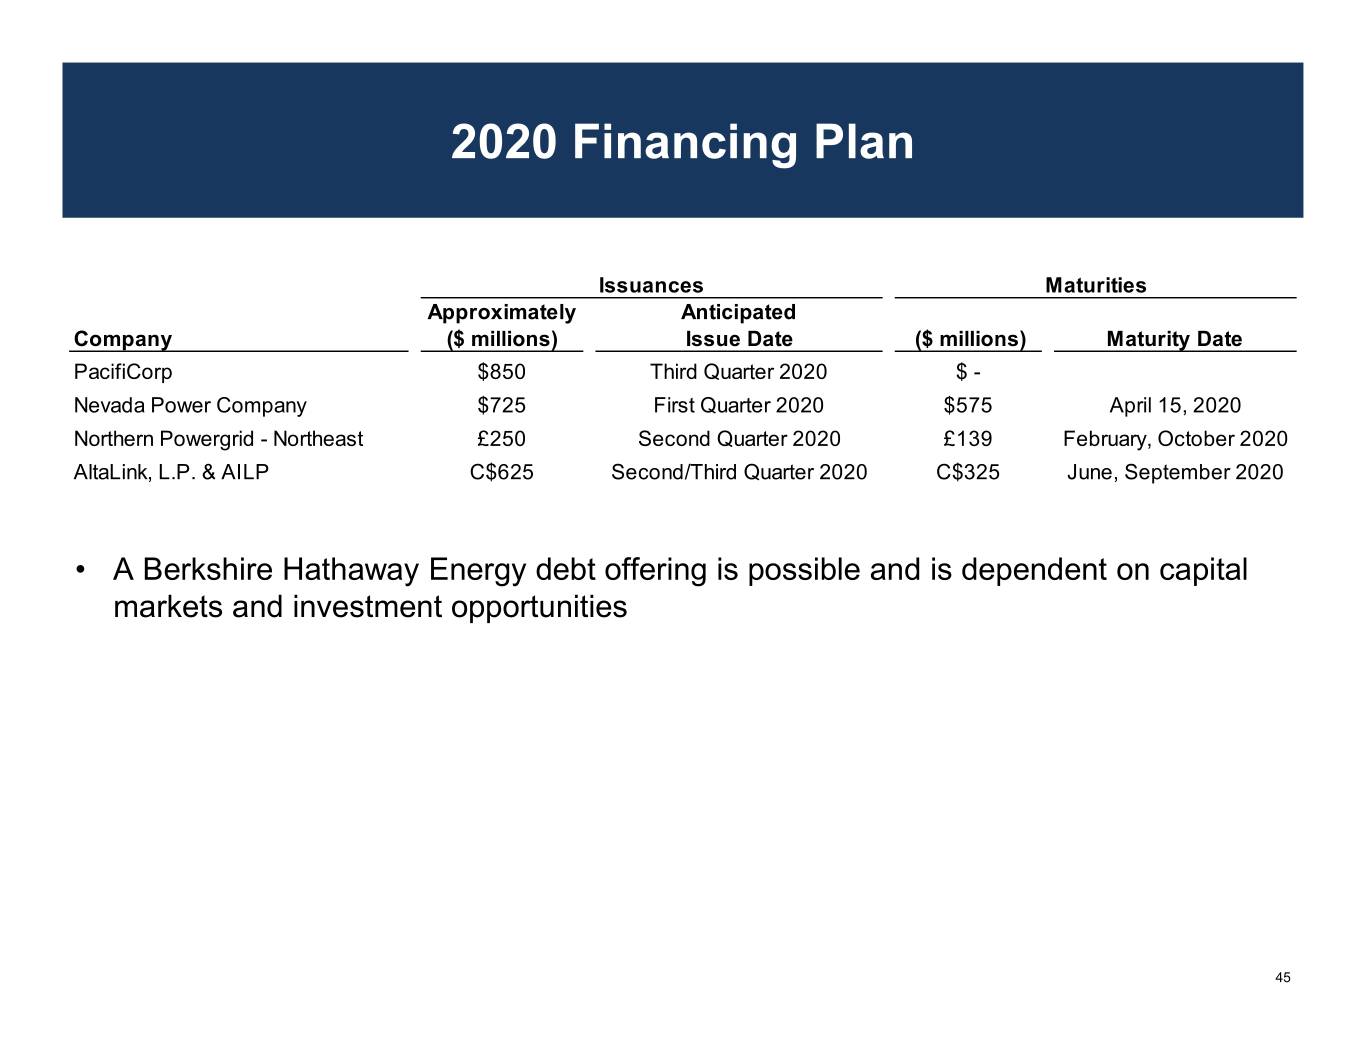
2020 Financing Plan Issuances Maturities Approximately Anticipated Company ($ millions) Issue Date ($ millions) Maturity Date PacifiCorp $850 Third Quarter 2020 $ - Nevada Power Company $725 First Quarter 2020 $575 April 15, 2020 Northern Powergrid - Northeast £250 Second Quarter 2020 £139 February, October 2020 AltaLink, L.P. & AILP C$625 Second/Third Quarter 2020 C$325 June, September 2020 • A Berkshire Hathaway Energy debt offering is possible and is dependent on capital markets and investment opportunities 45

Environmental, Social and Governance (ESG) Positioning ourselves for a sustainable future

Our Balanced Long-Term Approach Leads to a Culture of Sustainability Berkshire Hathaway Energy recognizes the importance of reducing our environmental footprint by minimizing the impact of our operations on the environment. From reducing our air emissions and conserving water to protecting sensitive plant and animal species and their habitats, our Environmental RESPECT policy details our commitment in the areas of Responsibility, Efficiency, Stewardship, Performance, Evaluation, Communication and Training. Our core principles – customer service, employee commitment, environmental respect, regulatory integrity, operational excellence and financial strength – guide our decisions as we work to provide balanced outcomes for all stakeholders • Sustainability is naturally a part of this balanced approach • The approach addresses long-term issues, risks and opportunities aligned with our vision and core principles • Aligns the objectives of providing safe, reliable and affordable clean energy • Committed and supportive leadership and owners • Committed and engaged employees • Renewables investments • Carbon reduction efforts Environmental • Environmental Respect Index • Methane emissions reduction • Species protection • Green bonds • BHE CARES – global giving • Veterans Engagement and Social and volunteering Retention Network • Customer first • Diversity and Inclusion Policy • Our board of directors own or • Berkshire Hathaway Energy represent entities that own 100% Code of Business Conduct Governance of Berkshire Hathaway Energy’s • Berkshire Hathaway Inc. common stock Code of Business Conduct and Ethics 47

Advancing a Sustainable Energy Future • Berkshire Hathaway Energy is a leader in renewable energy. As of September 30, 2019, approximately 43% of our businesses’ owned generation capacity (operating and under construction) comes from non-carbon resources – Through September 30, 2019, Berkshire Hathaway Energy has spent $28.2 billion on renewable energy, and has made commitments to spend an additional $6 billion on wind generation by 2022 – The America Wind Energy Association’s 2019 Annual Market Report listed Berkshire Hathaway Energy as the largest investor-owned utility of regulated operating wind-power capacity – As we advance sustainable energy solutions, we are helping our customers achieve their sustainability goals and reduce environmental impact through increasing the amount of renewable energy we generate, empowering customers to conserve and manage their energy use, and partnering with them on unique projects • One example of these efforts is an innovative partnership at a newly constructed all-electric, net-zero residential multi-family community that will be partially powered by 5 megawatts of on-site solar panels with battery storage located in each of the 600 apartments, totaling 12.6 megawatt-hours of energy storage that is controlled by Rocky Mountain Power for the benefit of the community and the broader grid as a real-time dispatchable distributed energy solution – MidAmerican Energy is the largest owner in the U.S. of rate-regulated wind capacity, with 6,803 MW in operation or under construction. In 2018, MidAmerican Energy generated wind energy equivalent to approximately 51% of its Iowa customers’ annual retail electric usage. Once Wind XI, Wind XII, and the Wind XII expansion are completed (expected late 2020) adding up to 2,796 MW of wind generation, MidAmerican Energy is expected to meet 100% of its Iowa and South Dakota customers’ energy use on an annual basis with renewable, zero-carbon energy, becoming the first major utility in the U.S. to do so for its customers 48

Advancing a Sustainable Energy Future • PacifiCorp’s Energy Vision 2020 program will repower 1,039 MW of existing company-owned wind facilities, acquire 950 MW of new wind projects, add 200 MW of wind procured through a power purchase agreement and build a new 140-mile, 500 kV transmission line. The projects are on schedule to be placed in service by year-end 2020 to deliver benefits to customers and improve transmission transfer capacity and reliability. In October 2019, PacifiCorp filed its Integrated Resource Plan, which includes the addition of more than 4,600 MW of new wind generation, 6,300 MW of new solar generation, 2,800 MW of battery storage, and nearly 4,500 MW of coal plant retirements through 2038 • As part of its Integrated Resource Plan filed in 2019 and as amended, NV Energy announced plans to enter into power purchase agreements to procure generation from nearly 2,200 MW of solar generation and almost 700 MW of battery storage by 2024. Beyond 2024, the resource plan includes nearly 2,000 MW of additional solar generation and 100 MW of geothermal generation through 2038 which is consistent with Nevada’s energy policy to increase the amount of renewable energy. Nevada Power is retiring its last coal unit by year end 2019 • Owned coal-fueled capacity has declined as a percentage of Berkshire Hathaway Energy’s power capacity portfolio from 58% in 2006 to 26% as of September 30, 2019. Since 2013, Berkshire Hathaway Energy has retired or has plans to retire approximately 6,400 MW (61% reduction) of coal generation capacity by 2038 • Berkshire Hathaway Energy’s natural gas transmission pipelines’ operational practices and methane leak detection programs are designed to minimize the release of methane emissions. These leading practices resulted in the gas transmission pipelines’ combined leak rates, measured as a percentage of throughput, of 0.05% in 2018, which is significantly less than the industry average and goal of the ONE Future Initiative of 1% • Additional information regarding our sustainability and environmental outlook can be found at www.brkenergyco.com/environment 49

Supporting a Cleaner Energy Future $34.1 Billion Renewable Investments $34.1 ($ billions) $5.4 $28.2 $3.0 $0.9 $0.9 $6.6 $6.6 Remaining capital to be deployed • $3.5 billion – Wind development and repowering • $2.4 billion – Wind tax equity funding $17.7 $21.2 Wind Solar Geothermal and Other Wind Tax Equity Q3 2019A 2022E Net Owned Operating Capacity (MW) September 2019 December 2022 Wind Solar Other Wind Solar Other PacifiCorp 1,039 - 32 2,229 - 32 MidAmerican Energy 5,352 - - 6,803 - - NV Energy - 15 5 - 15 5 BHE Renewables 1,665 1,536 346 1,665 1,536 346 8,056 1,551 383 10,697 1,551 383 • In addition to owned renewable capacity, Berkshire Hathaway Energy’s regulated utilities have renewable energy power purchase agreements for more than 4,100 MW. By the end of 2020, NV Energy plans to enter contracts to purchase approximately 2,500 MW of additional solar energy and PacifiCorp expects to have entered into contracts to purchase approximately 1,000 MW of additional wind and solar energy 50
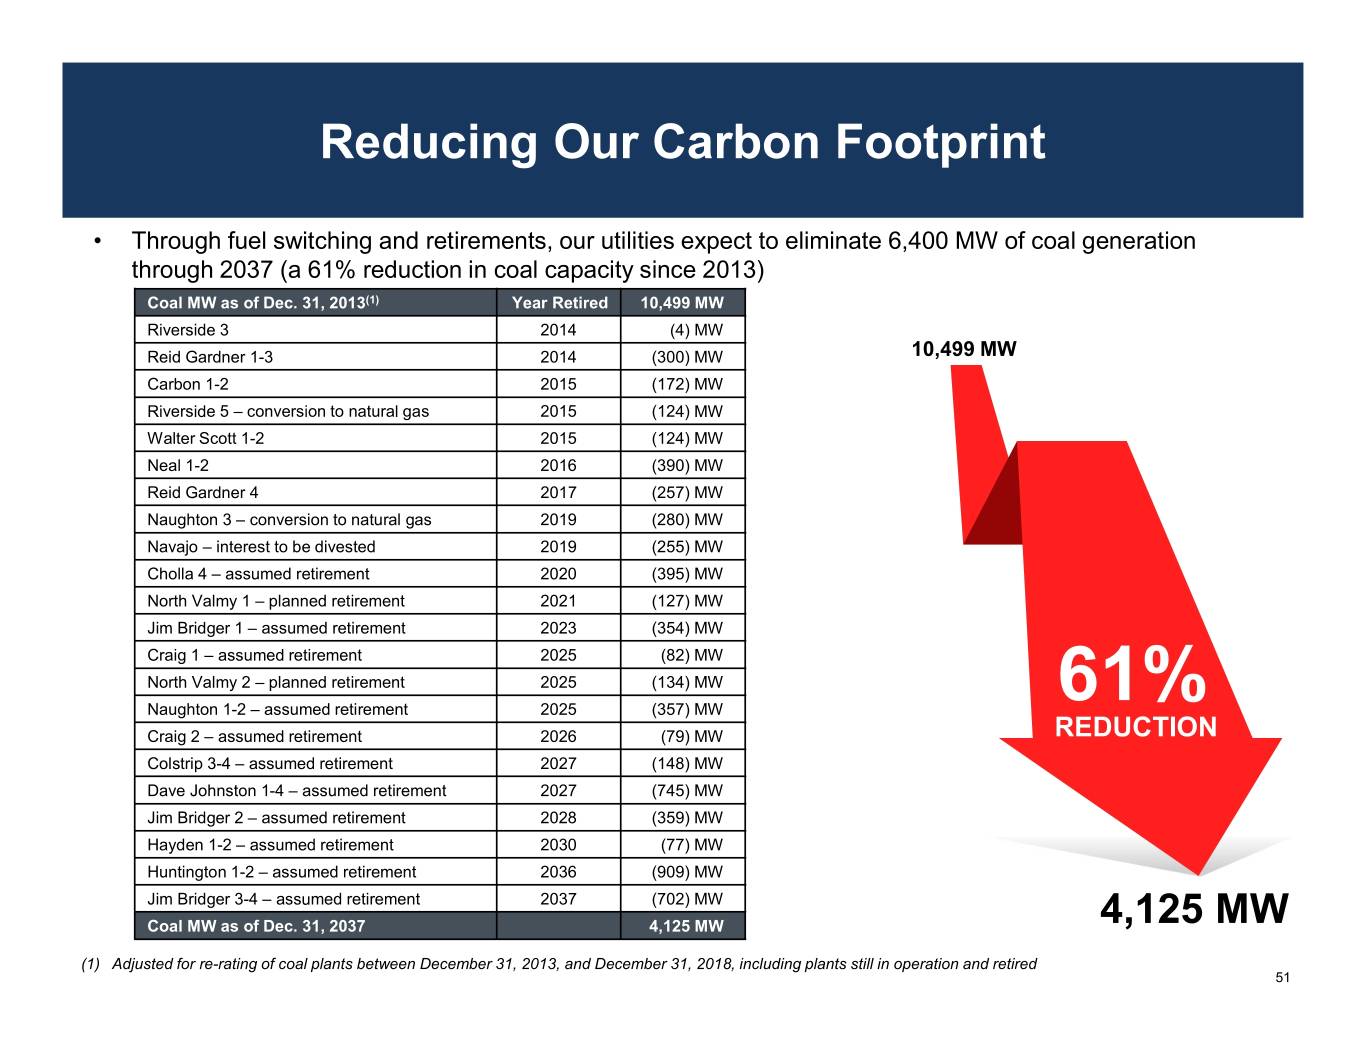
Reducing Our Carbon Footprint • Through fuel switching and retirements, our utilities expect to eliminate 6,400 MW of coal generation through 2037 (a 61% reduction in coal capacity since 2013) Coal MW as of Dec. 31, 2013(1) Year Retired 10,499MW Riverside 3 2014 (4) MW Reid Gardner 1-3 2014 (300) MW 10,499 MW Carbon 1-2 2015 (172) MW Riverside 5 – conversion to natural gas 2015 (124) MW Walter Scott 1-2 2015 (124) MW Neal 1-2 2016 (390) MW Reid Gardner 4 2017 (257) MW Naughton 3 – conversion to natural gas 2019 (280) MW Navajo – interest to be divested 2019 (255) MW Cholla 4 – assumed retirement 2020 (395) MW North Valmy 1 – planned retirement 2021 (127) MW Jim Bridger 1 – assumed retirement 2023 (354) MW Craig 1 – assumed retirement 2025 (82) MW North Valmy 2 – planned retirement 2025 (134) MW 61% Naughton 1-2 – assumed retirement 2025 (357) MW Craig 2 – assumed retirement 2026 (79) MW REDUCTION Colstrip 3-4 – assumed retirement 2027 (148) MW Dave Johnston 1-4 – assumed retirement 2027 (745) MW Jim Bridger 2 – assumed retirement 2028 (359) MW Hayden 1-2 – assumed retirement 2030 (77) MW Huntington 1-2 – assumed retirement 2036 (909) MW Jim Bridger 3-4 – assumed retirement 2037 (702) MW Coal MW as of Dec. 31, 2037 4,125 MW 4,125 MW (1) Adjusted for re-rating of coal plants between December 31, 2013, and December 31, 2018, including plants still in operation and retired 51

Energy Imbalance Market Provide Customer Savings and Carbon Reduction • The energy imbalance market is an innovative market that allows utilities across the West to access the lowest cost energy available in near real-time, making it easy for zero-fuel-cost renewable energy to go where it’s needed and reduce carbon emissions. Through September 2019, cumulative benefits have totaled $801 million • PacifiCorp and California ISO launched the Energy Imbalance Market in November 2014. NV Energy joined in December 2015. Berkshire Hathaway Energy customer benefits total $306 million November 2014 – September 2019 Combined Benefits Balancing Area Authority Total ($ millions) CAISO $189.5 PacifiCorp $224.0 NV Energy $82.4 Arizona Public Service $123.0 Puget Sound Energy $38.3 Portland General Electric $62.5 Idaho Power $49.0 Powerex $19.2 Balancing Authority of Northern California $13.2 Total $801.1 52

CO2 Emissions Intensity 2005 (1) (2) 2018 (2) CO Metric MT (000’s) / CO Metric MT (000’s) / 2 Net GWh 2 Net GWh Tons (000’s) GWh Tons (000’s) GWh PacifiCorp 49,001 58,221 .842 43,248 61,509 .703 MidAmerican Energy 18,380 22,856 .804 16,216 34,249 .473 NV Energy 10,792 14,358 .752 10,872 26,843 .405 BHE Renewables 1,702 6,631 .257 505 11,852 .043 Berkshire Hathaway Energy 79,875 102,066 .783 70,841 134,453 .527 Berkshire Hathaway Energy 0.900 140,000 0.783 0.750 120,000 100,000 0.600 0.527 80,000 0.450 60,000 0.300 40,000 Emissions Intensity Emissions 0.150 20,000 Net Generation (in GWh) (in Generation Net (in Co2 000’s of MT/GWh) of 000’sCo2 (in - - 2005 2018 Emissions Intensity Net Generation (1) 2005 data is pro forma as if all energy businesses owned today were owned in 2005 (2) The data provided includes generation associated with renewable energy credits which were not retained, and excludes generation and emissions related to market purchases from non-specified sources 53

CO2 Emissions Intensity PacifiCorp MidAmerican Energy 1.000 70,000 0.900 0.804 70,000 0.842 60,000 0.750 60,000 0.800 0.703 50,000 50,000 0.600 0.600 40,000 0.473 40,000 0.450 0.400 30,000 30,000 0.300 20,000 20,000 Emissions Intensity Emissions 0.200 Intensity Emissions 10,000 0.150 10,000 Net Generation (in GWh) (in Generation Net GWh) (in Generation Net (in Co2 000’s of MT/GWh) of 000’sCo2 (in - - MT/GWh) of 000’sCo2 (in - - 2005 2018 2005 2018 Emissions Intensity Net Generation Emissions Intensity Net Generation NV Energy BHE Renewables 1.000 70,000 0.300 20,000 0.257 60,000 0.800 0.752 0.250 50,000 15,000 0.200 0.600 40,000 0.405 0.150 10,000 0.400 30,000 0.100 20,000 0.043 5,000 Emissions Intensity Emissions 0.200 Intensity Emissions 10,000 0.050 Net Generation (in GWh) (in Generation Net GWh) (in Generation Net (in Co2 000’s of MT/GWh) of 000’sCo2 (in - - MT/GWh) of 000’sCo2 (in - - 2005 2018 2005 2018 Emissions Intensity Net Generation Emissions Intensity Net Generation 54

Electric Vehicle Charging Stations MidAmerican Energy • In July 2019, MidAmerican Energy announced an electric vehicle charging station network launch in 15 urban and rural communities across Iowa, which includes two charging plugs per station – To further promote electric vehicle adoption in Iowa, in 2019, MidAmerican Energy started offering electric vehicle and charging station rebates to its customers. The company provides rebates to residential customers who buy or lease a new electric vehicle and rebates to businesses that purchase Level 2 charging stations, which generally charge electric vehicles in four to eight hours PacifiCorp • Rocky Mountain Power is investing to develop electric transportation primarily in Utah and has developed one of the largest comprehensive utility electric vehicle programs in the country to install EV fast chargers and workplace chargers. In addition, the company has deployed the most traveled electric bus route in the U.S. and developed electric ride hailing programs with LYFT • Pacific Power is investing to develop electric transportation programs in Oregon, Washington and California, including EV fast charging in underserved key areas and interest and engagement in non-residential charging across all service areas; and creating partnership opportunities with community grants and larger-scale transit funding NV Energy • The company is investing in and supporting electric vehicle incentive programs that support the expansion of electric vehicle infrastructure in Nevada – The Public Utilities Commission of Nevada has authorized incentives for multifamily, workplace, fleet and public charging infrastructure programs – Incentives include rebates for Level 2 and direct current fast chargers – The company, in partnership with the Nevada Governor’s Office of Energy, is providing incentives for construction of fast-charging infrastructure along highway corridors throughout Nevada – The company is authorized to incentivize the electrification of public school bus fleets and charging infrastructure 55

Social Workforce and Diversity • We are committed to attracting and retaining the best employees and supporting an environment that reflects the diversity of our communities • We are focused on providing a positive employee experience through our engagement, training and development programs Safety Management • Keeping our customers, employees and communities safe and secure will always be our top priority • Based on July 2019 Edison Electric Institute data for electric and gas combination companies without nuclear employees: – The 2018 median recordable incident rate was 1.20 (50th percentile) – Berkshire Hathaway Energy’s 2018 recordable incident rate was 0.56 (15th percentile) Customer Engagement • Our U.S. regulated utilities have low-cost competitive rates below the U.S. national average, benefiting customers and supporting growth and job opportunities in the communities served • BHE Pipeline Group was No. 1 for the 14th consecutive year in Mastio and Company’s 2019 survey of natural gas pipeline customers 56

Social In Our Communities • Berkshire Hathaway Energy and its businesses sponsor organizations that provide resources to underserved populations; participate in community service projects; volunteer in local schools to educate parents and children on safety and energy efficiency; and raise funds for numerous charitable organizations to increase the impact we have on the communities we serve and support 57

Governance Organization • Berkshire Hathaway Energy’s vision is to be the best energy company in serving our customers, while delivering sustainable energy solutions. Our businesses operate with that a shared vision, culture and set of core principles • Our board of directors own or represent entities that own 100% of Berkshire Hathaway Energy’s common stock and we believe this ownership structure supports our strong corporate governance Board Member Role Years on Board Gregory Abel Executive Chairman of the Board 2000-Present William Fehrman President, CEO and Director 2018-Present Walter Scott Jr. Director 1991-Present Warren Buffett Director 2000-Present Marc Hamburg Director 2000-Present • Our privately held ownership structure is a major source of financial strength and a competitive advantage. We have historically not paid dividends allowing us to reinvest 100% of net income back into our businesses to better serve customers and focus on system hardening 58

Governance Codes and Values • We uphold the highest ethical standards and values through the Berkshire Hathaway Code of Business Conduct and Ethics. We believe a diverse workforce brings significant benefits to our organization. Additionally, we hold our organization accountable to provisions we include in the Berkshire Hathaway Energy Code of Business Conduct. These provisions demonstrate how to approach work, business relationships, decisions, and actions and include: – Treating customers with honesty, respect and dignity – Dealing fairly with customers, suppliers and competitors – Maintaining confidentiality of information – Full, fair, accurate, timely and understandable financial disclosures – Zero-tolerance policy on any type of harassment or behavior that is hostile, disrespectful, abusive or humiliating – Commitment to a safe and healthy environment for all employees Data Protection • Berkshire Hathaway Energy is vigilant in managing employee and customer data to protect against the release of any sensitive information, creating strong layers of defense against cyber and physical security incidents. We use internationally recognized cybersecurity frameworks to strengthen these efforts Transparency and Reporting • We are transparent in our operational results and voluntarily report key indicators related to our emissions data, resource mix, investments in technology, water resources, waste products, employee count, and safety performance Chief Sustainability Officer • Appointed a chief sustainability officer in 2018 to focus on ESG 59
Appendix

Rate Base PacifiCorp MidAmerican Energy ($ billions) ($ billions) $11.7 $16.0 $14.0 $13.9 $13.7 $14.0 $12.0 $10.0 $8.9 $12.0 $9.0 $8.3 $8.0 $6.0 $4.0 $3.0 $0.0 $0.0 2016A 2017A 2018A 2019F 2016A 2017A 2018A 2019F NV Energy BHE Pipeline Group ($ billions) ($ billions) $3.9 $8.0 $4.0 $6.8 $6.7 $6.8 $6.5 $3.0 $3.0 $3.1 $6.0 $3.0 $4.0 $2.0 $2.0 $1.0 $0.0 $0.0 2016A 2017A 2018A 2019F 2016A 2017A 2018A 2019F 61
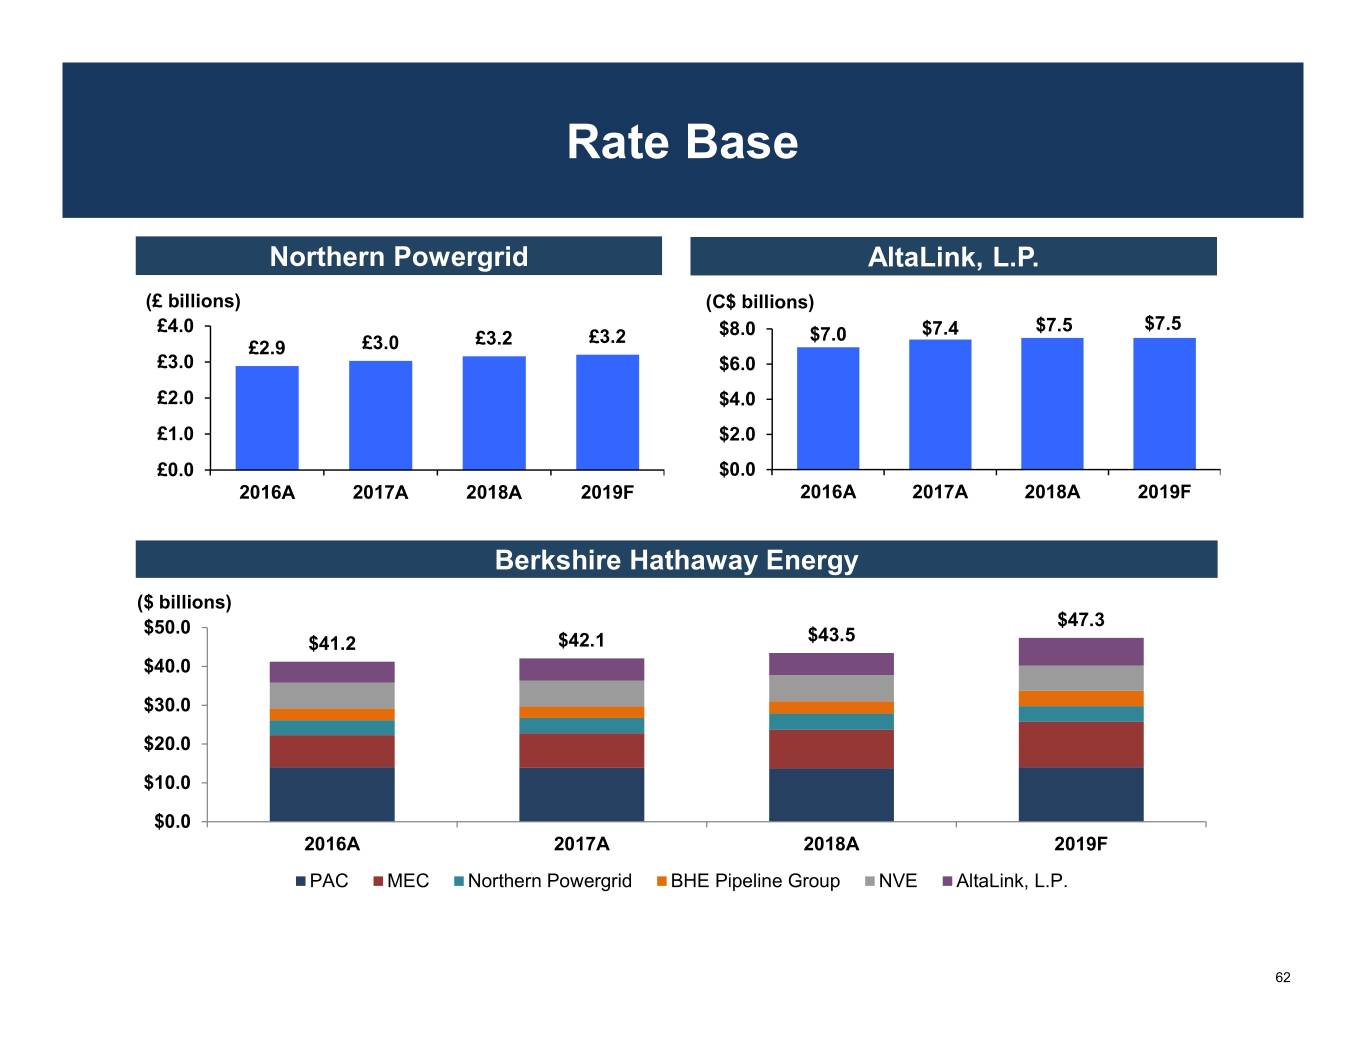
Rate Base Northern Powergrid AltaLink, L.P. (£ billions) (C$ billions) £4.0 $8.0 $7.4 $7.5 $7.5 £3.2 £3.2 $7.0 £2.9 £3.0 £3.0 $6.0 £2.0 $4.0 £1.0 $2.0 £0.0 $0.0 2016A 2017A 2018A 2019F 2016A 2017A 2018A 2019F Berkshire Hathaway Energy ($ billions) $50.0 $47.3 $41.2 $42.1 $43.5 $40.0 $30.0 $20.0 $10.0 $0.0 2016A 2017A 2018A 2019F PAC MEC Northern Powergrid BHE Pipeline Group NVE AltaLink, L.P. 62

Private Generation Penetration Rate Berkshire Hathaway Energy – Impact of Private Generation Private Generation Total Electric Private Generation Customers as of Customers as of Portion of September 2019 September 2019 Total Customers MidAmerican Energy Iowa 942 696,593 0.14% Illinois 102 85,414 0.12% South Dakota 0 5,134 0.00% PacifiCorp Utah 36,919 939,041 3.93% Oregon 7,289 597,889 1.22% Wyoming 332 141,464 0.23% Washington 1,305 132,406 0.99% Idaho 1,025 81,947 1.25% California 512 45,531 1.12% NV Energy Nevada 46,593 1,309,247 3.56% Total BHE Customers 95,019 4,034,666 2.36% 63

Retail Electric Sales – Weather Normalized Year-to-Date September 30 Variance (GWh) 2019 2018 Actual Percent PacifiCorp Residential 12,057 12,012 45 0.4% Commercial 13,586 13,455 131 1.0% Industrial and Other 15,706 15,853 (147) -0.9% Total 41,349 41,320 29 0.1% MidAmerican Energy Residential 4,894 4,915 (21) -0.4% Commercial 2,863 2,847 16 0.6% Industrial and Other 11,767 11,376 391 3.4% Total 19,524 19,138 386 2.0% Nevada Power Residential 7,691 7,609 82 1.1% Commercial 3,711 3,652 59 1.6% Industrial and Other 4,287 4,335 (48) -1.1% Distribution-Only Service 2,008 1,893 115 6.1% Total 17,697 17,489 208 1.2% Sierra Pacific Power Residential 1,864 1,816 48 2.6% Commercial 2,278 2,275 3 0.1% Industrial and Other 2,826 2,502 324 12.9% Distribution-Only Service 1,212 1,123 89 7.9% Total 8,180 7,716 464 6.0% Northern Powergrid Residential 8,976 9,020 (44) -0.5% Commercial 3,026 3,098 (72) -2.3% Industrial and Other 13,565 13,804 (239) -1.7% Total 25,567 25,922 (355) -1.4% 64

Retail Electric Sales – Actual Year-to-Date September 30 Variance (GWh) 2019 2018 Actual Percent PacifiCorp Residential 12,213 11,996 217 1.8% Commercial 13,622 13,530 92 0.7% Industrial and Other 15,693 15,889 (196) -1.2% Total 41,528 41,415 113 0.3% MidAmerican Energy Residential 5,105 5,307 (202) -3.8% Commercial 2,930 2,944 (14) -0.5% Industrial and Other 11,767 11,376 391 3.4% Total 19,802 19,627 175 0.9% Nevada Power Residential 7,692 8,299 (607) -7.3% Commercial 3,698 3,759 (61) -1.6% Industrial and Other 4,283 4,438 (155) -3.5% Distribution-Only Service 2,006 1,938 68 3.5% Total 17,679 18,434 (755) -4.1% Sierra Pacific Power Residential 1,881 1,877 4 0.2% Commercial 2,281 2,282 (1) 0.0% Industrial and Other 2,827 2,509 318 12.7% Distribution-Only Service 1,212 1,124 88 7.8% Total 8,201 7,792 409 5.2% Northern Powergrid Residential 8,868 9,081 (213) -2.3% Commercial 2,985 3,137 (152) -4.8% Industrial and Other 13,564 13,805 (241) -1.7% Total 25,417 26,023 (606) -2.3% 65

Berkshire Hathaway Energy Non-GAAP Financial Measures 9/30/2019 LTM Adjusted Net Income Reconciliation Net Income Tax Reform Unrealized Loss Net Income Adjusted Benefits on BYD As Reported PacifiCorp$ 762 $ - $ - $ 762 MidAmerican Funding 606 - - 606 NV Energy 322 - - 322 Northern Powergrid 251 - - 251 BHE Pipeline Group 396 - - 396 BHE Transmission 218 - - 218 BHE Renewables 360 - - 360 HomeServices 168 - - 168 BHE and Other (88) 89 (359) (358) Net Income attributable to BHE 2,995 89 (359) 2,725 Operating Revenue 19,865 - - 19,865 Total Operating Costs and Expenses 15,831 - - 15,831 Operating Income 4,034 - 4,034 Interest Expense - Senior and Subsidiary (1,881) - - (1,881) Interest Expense - Junior Subordinated Debentures (5) - - (5) Capitalized Interest and Other, Net 360 - (503) (143) Income Tax (Benefit) Expense (510) (89) (144) (743) Equity (Loss) Income (4) - - (4) Net Income Attributable to Noncontrolling Interests 19 - - 19 Net Income attributable to BHE $ 2,995 $ 89 $ (359) $ 2,725 66

Berkshire Hathaway Energy Non-GAAP Financial Measures 2018 Adjusted Net Income Reconciliation Net Income Tax Reform Unrealized Loss Net Income Adjusted Benefits on BYD As Reported PacifiCorp$ 739 $ - $ - $ 739 MidAmerican Funding 669 - - 669 NV Energy 317 - - 317 Northern Powergrid 239 - - 239 BHE Pipeline Group 387 - - 387 BHE Transmission 210 - - 210 BHE Renewables 329 - - 329 HomeServices 145 - - 145 BHE and Other (218) 134 (383) (467) Net Income attributable to BHE 2,817 134 (383) 2,568 Operating Revenue 19,787 - - 19,787 Total Operating Costs and Expenses 15,715 - - 15,715 Operating Income 4,072 - - 4,072 Interest Expense - Senior and Subsidiary (1,833) - - (1,833) Interest Expense - Junior Subordinated Debentures (5) - - (5) Capitalized Interest and Other, Net 269 - (538) (269) Income Tax (Benefit) Expense (294) (134) (155) (583) Equity (Loss) Income 43 - - 43 Net Income Attributable to Noncontrolling Interests 23 - - 23 Net Income attributable to BHE $ 2,817 $ 134 $ (383) $ 2,568 67

Berkshire Hathaway Energy Non-GAAP Financial Measures 2017 Adjusted Net Income Reconciliation Net Income Tax Reform Debt Tender Offer Net Income Adjusted Benefits Premium As Reported PacifiCorp$ 763 $ 6 $ - $ 769 MidAmerican Funding 601 (10) (17) 574 NV Energy 365 (19) - 346 Northern Powergrid 251 - - 251 BHE Pipeline Group 270 7 - 277 BHE Transmission 224 - - 224 BHE Renewables 236 628 - 864 HomeServices 118 31 - 149 BHE and Other (211) (127) (246) (584) Net Income attributable to BHE 2,617 516 (263) 2,870 Operating Revenue 18,614 - - 18,614 Total Operating Costs and Expenses 14,105 (13) - 14,092 Operating Income 4,509 13 - 4,522 Interest Expense - Senior and Subsidiary (1,822) - - (1,822) Interest Expense - Junior Subordinated Debentures (19) - - (19) Capitalized Interest and Other, Net 265 - (439) (174) Income Tax (Benefit) Expense 353 (731) (176) (554) Equity (Loss) Income 77 (228) - (151) Net Income Attributable to Noncontrolling Interests 40 - - 40 Net Income attributable to BHE $ 2,617 $ 516 $ (263) $ 2,870 68

Non-GAAP Financial Measures Berkshire Hathaway Energy ($ millions) LTM FFO 9/30/2019 2018 2017 Net cash flows from operating activities$ 6,399 $ 6,770 $ 6,078 +/- changes in other operating assets and liabilities 74 (389) 165 FFO$ 6,473 $ 6,381 $ 6,243 Adjusted Interest Interest expense$ 1,886 $ 1,838 $ 1,841 Interest expense on subordinated debt (5) (5) (19) Adjusted Interest$ 1,881 $ 1,833 $ 1,822 FFO Interest Coverage(1) 4.4x 4.5x 4.4x Adjusted Debt Debt(2) $ 41,028 $ 39,290 $ 39,681 Subordinated debt (100) (100) (100) Adjusted Debt$ 40,928 $ 39,190 $ 39,581 FFO to Adjusted Debt 15.8% 16.3% 15.8% Capitalization Total BHE shareholders’ equity$ 31,608 $ 29,593 $ 28,176 Adjusted debt 40,928 39,190 39,581 Subordinated debt 100 100 100 Noncontrolling interests 132 130 132 Capitalization$ 72,768 $ 69,013 $ 67,989 (3) Adjusted Debt to Total Capitalization 56.2% 56.8% 58.2% (1) FFO Interest Coverage equals the sum of FFO and Adjusted Interest divided by Adjusted Interest (2) Debt includes short-term debt, Berkshire Hathaway Energy senior debt, Berkshire Hathaway Energy subordinated debt and subsidiary debt (including current maturities). Excludes capital leases starting in 2019 (3) Adjusted Debt to Total Capitalization equals Adjusted Debt divided by Capitalization 69

Non-GAAP Financial Measures PacifiCorp ($ millions) LTM FFO 9/30/2019 2018 2017 Net cash flows from operating activities$ 1,598 $ 1,811 $ 1,602 +/- changes in other operating assets and liabilities (128) (236) 39 FFO$ 1,470 $ 1,575 $ 1,641 Interest expense$ 395 $ 384 $ 381 FFO Interest Coverage(1) 4.7x 5.1x 5.3x Debt (2) $ 7,657 $ 7,066 $ 7,105 FFO to Debt(3) 19.2% 22.3% 23.1% Capitalization PacifiCorp shareholders’ equity$ 8,295 $ 7,845 $ 7,555 Debt 7,657 7,066 7,105 Capitalization$ 15,952 $ 14,911 $ 14,660 Debt to Total Capitalization(4) 48.0% 47.4% 48.5% (1) FFO Interest Coverage equals the sum of FFO and Interest divided by Interest (2) Debt includes short-term debt and current maturities. Excludes capital leases starting in 2019 (3) FFO to Debt equals FFO divided by Debt (4) Debt to Total Capitalization equals Debt divided by Capitalization 70
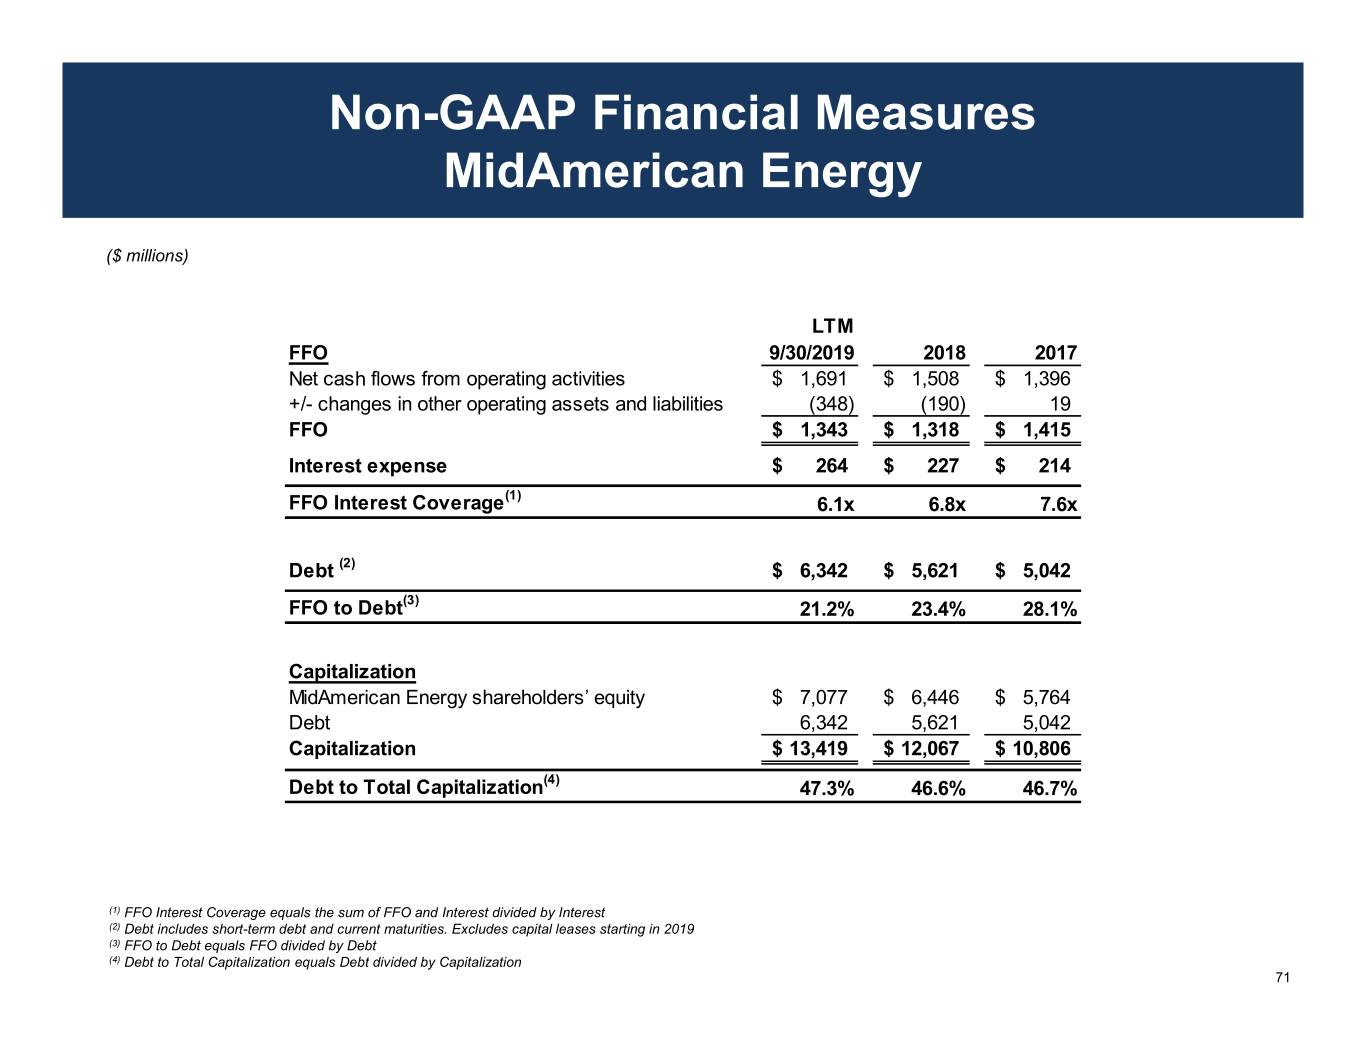
Non-GAAP Financial Measures MidAmerican Energy ($ millions) LTM FFO 9/30/2019 2018 2017 Net cash flows from operating activities$ 1,691 $ 1,508 $ 1,396 +/- changes in other operating assets and liabilities (348) (190) 19 FFO$ 1,343 $ 1,318 $ 1,415 Interest expense$ 264 $ 227 $ 214 FFO Interest Coverage(1) 6.1x 6.8x 7.6x Debt (2) $ 6,342 $ 5,621 $ 5,042 FFO to Debt(3) 21.2% 23.4% 28.1% Capitalization MidAmerican Energy shareholders’ equity$ 7,077 $ 6,446 $ 5,764 Debt 6,342 5,621 5,042 Capitalization$ 13,419 $ 12,067 $ 10,806 Debt to Total Capitalization(4) 47.3% 46.6% 46.7% (1) FFO Interest Coverage equals the sum of FFO and Interest divided by Interest (2) Debt includes short-term debt and current maturities. Excludes capital leases starting in 2019 (3) FFO to Debt equals FFO divided by Debt (4) Debt to Total Capitalization equals Debt divided by Capitalization 71

Non-GAAP Financial Measures Nevada Power Company ($ millions) LTM FFO 9/30/2019 2018 2017 Net cash flows from operating activities$ 688 $ 619 $ 665 +/- changes in other operating assets and liabilities (24) 30 37 FFO$ 664 $ 649 $ 702 Interest expense$ 171 $ 170 $ 179 FFO Interest Coverage(1) 4.9x 4.8x 4.9x Debt (2) $ 2,350 $ 2,816 $ 3,075 FFO to Debt(3) 28.3% 23.0% 22.8% Capitalization Nevada Power shareholder's equity$ 3,049 $ 2,904 $ 2,678 Debt 2,350 2,816 3,075 Capitalization$ 5,399 $ 5,720 $ 5,753 Debt to Total Capitalization(4) 43.5% 49.2% 53.5% (1) FFO Interest Coverage equals the sum of FFO and Interest divided by Interest (2) Debt includes short-term debt and current maturities. Excludes capital leases starting in 2019 (3) FFO to Debt equals FFO divided by Debt (4) Debt to Total Capitalization equals Debt divided by Capitalization 72

Non-GAAP Financial Measures Sierra Pacific Power Company ($ millions) LTM FFO 9/30/2019 2018 2017 Net cash flows from operating activities$ 256 $ 275 $ 182 +/- changes in other operating assets and liabilities (28) (20) 39 FFO$ 228 $ 255 $ 221 Interest expense$ 47 $ 44 $ 43 FFO Interest Coverage(1) 5.9x 6.8x 6.1x Debt (2) $ 1,135 $ 1,158 $ 1,154 FFO to Debt(3) 20.1% 22.0% 19.2% Capitalization Sierra Pacific Power shareholder's equity$ 1,298 $ 1,264 $ 1,172 Debt 1,135 1,158 1,154 Capitalization$ 2,433 $ 2,422 $ 2,326 Debt to Total Capitalization(4) 46.7% 47.8% 49.6% (1) FFO Interest Coverage equals the sum of FFO and Interest divided by Interest (2) Debt includes short-term debt and current maturities. Excludes capital leases starting in 2019 (3) FFO to Debt equals FFO divided by Debt (4) Debt to Total Capitalization equals Debt divided by Capitalization 73


