UNITED STATES
SECURITIES AND EXCHANGE COMMISSION
Washington, D.C. 20549
FORM 8-K
Current Report
Pursuant to Section 13 or 15(d)
of the Securities and Exchange Act of 1934
Date of Report (Date of earliest event reported): January 23, 2014 (January 22, 2014)
TEXAS CAPITAL BANCSHARES, INC.
(Name of Registrant)
Delaware | 001-34657 | 75-2679109 | ||
(State or other jurisdiction of incorporation or organization) |
(Commission File Number) |
(I.R.S. Employer Identification Number) |
2000 McKinney Avenue, Suite 700, Dallas, Texas, U.S.A.
(Address of principal executive officers)
75201
(Zip Code)
214-932-6600
(Registrants telephone number, including area code)
N/A
(Former address of principal executive offices)
Check the appropriate box below if the Form 8-K filing is intended to simultaneously satisfy the filing obligation of the registrant under any of the following provisions:
¨ | Written communications pursuant to Rule 425 under the Securities Act (17 CFR 230.425) |
¨ | Soliciting material pursuant to Rule 14a-12 under the Exchange Act (17 CFR 240.14a-12) |
¨ | Pre-commencement communications pursuant to Rule 14d-2(b) under the Exchange Act (17 CFR 240.14d-2(b)) |
¨ | Pre-commencement communications pursuant to Rule 13e-4(c) under the Exchange Act (17 CFR 240.13e-4(c)) |
Item 2.02. | Results of Operations and Financial Condition. |
On January 22, 2014, Texas Capital Bancshares, Inc. (TCBI) issued a press release and made a concurrent public presentation regarding its operating and financial results for its year and fiscal quarter ended December 31, 2013 (the Release). A copy of the Release is attached hereto as Exhibit 99.1. A copy of the presentation is attached hereto as Exhibit 99.2
The information in Exhibit 99.1 shall be deemed filed for purposes of Section 18 of the Securities Exchange Act of 1934, as amended (the 1934 Act), with the exception of the statements by Mr. Cargill contained in the second full paragraph of the Release, which shall be deemed furnished for purposes of Section 18 of the 1934 Act. This Item 2.02 and Exhibit 99.2 shall be deemed furnished for purposes of Section 18 of the 1934 Act.
Item 8.01. | Other Events. |
Mortgage finance loans. Our mortgage finance loans consist of ownership interests purchased in single-family residential mortgages funded through our warehouse lending group. These loans are typically on our balance sheet for 10 to 20 days or less. We have agreements with mortgage lenders and purchase legal ownership interests in individual loans they originate. All loans are underwritten consistent with established programs for permanent financing with financially sound investors. Substantially all loans are conforming loans or loans eligible for sale to federal agencies or government sponsored entities. However, for accounting purposes, these loans are deemed to be loans to the originator and are as such are classified as loans held for investment. At December 31, 2013, mortgage finance loans totaled approximately $2.8 billion, approximately 25% of our total funded loans. Mortgage finance loans as of December 31, 2013 are net of $33.1 million of participations sold.
Correction of an Error in the Financial Statements. We determined during the fourth quarter of 2013 that purchases and sales of mortgage finance loan interests that had been reported on our consolidated statements of cash flows as cash flows from operating activities in prior periods should have been reported as investing activities because the related asset balances should have been reported as held for investment rather than held for sale on our consolidated balance sheets. We have evaluated the effect of the incorrect presentation, both qualitatively and quantitatively, and concluded that it did not materially misstate our previously issued financial statements. The errors will be corrected in our regularly filed financial reports commencing with our Annual Report on Form 10-K for the year ended December 31, 2013 (the 2013 10-K) for all periods presented. The financial data included in the Release for prior periods reflect correction of the errors.
We have corrected the classification of these assets on our consolidated balance sheets to reflect them as held for investment. We will correct the presentation in the consolidated statements of cash flows when presented in the 2013 10-K. The correction is presented in the unaudited consolidated statements of cash flows for the years ended December 31, 2013, 2012 and 2011 and certain financial data tables included in our Annual Report on Form 10-K for the year ended December 31, 2012 (the 2012 Form 10-K) is attached as Exhibit 99.3. Correction of the error in the statements of cash flows resulted in increased cash flows from operating activities for 2012 and 2011 of $1.1 billion and $885.9 million, respectively, with corresponding decreases in net cash flows from investing activities, as presented below. The changes do not impact our reported earnings, risk profile of the assets or the Companys financial position. These reclassifications do not change total loans or total assets on our consolidated balance sheets and do not impact our reported changes in cash and cash equivalents in our consolidated statements of cash flows.
2
To correct the error the Originations of loans held for sale and Proceeds from sales of loans held for sale lines from the 2012 Form 10-K have been removed from operating activities and the net of these amounts has been subtracted from net cash used in operating activities as indicated below (in thousands):
Year ended December 31 | ||||||||||||
2012 | 2011 | 2010 | ||||||||||
Originations of loans held for sale (as reported) |
$ | (51,110,692 | ) | $ | (27,234,509 | ) | $ | (22,859,900 | ) | |||
Proceeds from sales of loans held for sale (as reported) |
50,015,503 | 26,348,634 | 22,359,195 | |||||||||
Net cash used in operating activities (as reported) |
(1,020,345 | ) | (810,022 | ) | (403,922 | ) | ||||||
Net cash provided by operating activities (corrected) |
74,844 | 75,853 | 96,783 |
The changes in loans held for sale data indicated above are presented within investing activities, with the net change flowing through to net cash used in investing activities:
Year ended December 31 | ||||||||||||
2012 | 2011 | 2010 | ||||||||||
Net increase in loans held for investment (as reported) |
(1,220,626 | ) | (890,753 | ) | (303,618 | ) | ||||||
Originations of mortgage finance loans (corrected) |
(51,110,692 | ) | (27,234,509 | ) | (22,859,900 | ) | ||||||
Proceeds from payoffs of mortgage finance loans (corrected) |
50,015,503 | 26,348,634 | 22,359,195 | |||||||||
Net increase in loans held for investment, excluding mortgage finance loans |
(1,220,626 | ) | (890,753 | ) | (303,618 | ) | ||||||
Net cash used in investing activities (as reported) |
(1,167,996 | ) | (841,531 | ) | (232,302 | ) | ||||||
Net cash used in investing activities (corrected) |
(2,263,185 | ) | (1,727,406 | ) | (733,007 | ) |
Corresponding data for the year-to-date periods ended March 31, June 30, and September 30, 2013 appears below:
March 31, 2013 |
June 30, 2013 |
September 30, 2013 |
||||||||||
Originations of loans held for sale (as reported) |
$ | (13,173,476 | ) | $ | (27,736,248 | ) | $ | (39,620,728 | ) | |||
Proceeds from sales of loans held for sale (as reported) |
13,770,918 | 28,073,286 | 40,533,915 | |||||||||
Net cash provided by operating activities (as reported) |
671,666 | 452,968 | 1,073,648 | |||||||||
Net cash provided by operating activities (corrected) | 74,224 | 115,930 | 160,461 |
March 31, 2013 |
June 30, 2013 |
September 30, 2013 |
||||||||||
Net increase in loans held for investment (as reported) |
(135,812 | ) | (729,034 | ) | (1,270,123 | ) | ||||||
Originations of mortgage finance loans (corrected) |
(13,173,476 | ) | (27,736,248 | ) | (39,620,728) | |||||||
Proceeds from payoffs of mortgage finance loans (corrected) |
13,770,918 | 28,073,286 | 40,533,915 | |||||||||
Net increase in loans held for investment, excluding mortgage finance loans |
(135,812 | ) | (729,034 | ) | (1,270,123 | ) | ||||||
Net cash used in investing activities (as reported) |
(123,500 | ) | (707,543 | ) | (1,242,292 | ) | ||||||
Net cash provided by (used in) investing activities (corrected) |
473,942 | (370,505 | ) | (329,105 | ) |
3
We do not believe any reserve for loan losses relating to the mortgage finance portfolio is necessary based upon the risk profile of the assets and the less than one basis point loss experience of the program over the last ten years. The mortgage finance loan portfolio is graded as pass, with no past due balances, and with no activity within the allowance for loan losses for all periods presented.
We have included in our Selected Financial Ratios additional asset quality ratios presented with and excluding the mortgage finance loans because the risk profile of our mortgage finance loans is different than our other loans held for investment. These ratios can be found in Exhibit 99.1 and Exhibit 99.3.
The classification of mortgage finance loans as held for investment is consistent with Federal Financial Institutions Examination Council (FFIEC) Financial Institution Letter FIL-44-2013 issued October 7, 2013, which included Supplemental Instructions for September 30, 2013 Call Reports requiring that reporting institutions present loans originated by third parties and acquired by the institution as a secured loan to the originator that is held for investment based upon factors identified in the Supplemental Instructions. The Bank reported mortgage finance loans as held for investment in the September 30, 2013 Call Report. They are reflected as held for sale in prior Call Reports.
Changes in Regulatory Capital Risk Weights. In response to supplemental FFIEC Call Report instructions issued in early April 2013, we began using a 100% risk weight for the mortgage finance loans with our March 31, 2013 Call Report and our Report on Form 10-Q for the period ended March 31, 2013. In filings for prior periods, we applied a 50% risk weight (or 20% risk weight for government-guaranteed loans) to these assets for purposes of calculating the Banks risk-based capital ratios. Having determined that the 100% risk weight must be applied under our current program we were required to amend our year-end Call Reports for 2012 and 2011. This change required application of the 100% risk weight to our mortgage finance loans in these earlier periods, which is consistent with all of our 2013 Call Reports. The amendment of these Call Reports had no impact on our consolidated balance sheets or statements of operations, stockholders equity and cash flows.
This retroactive change in risk weighting of our mortgage finance loans required that we amend the previously reported values for our risk-weighted capital ratios for December 31, 2012 and 2011. The amended December 31, 2011 and 2012 risk-weighted capital ratios, as well as the risk-weighted capital ratio as of December 31, 2013, are provided below. The amended ratios exceeded levels required to be adequately capitalized on a consolidated basis and at the Bank. As amended, the Bank was well capitalized in the Tier 1 measure of capital adequacy, but the total risk-based capital ratio was below that required to be considered well capitalized. The adjustment had no impact on the ratio of tangible common equity to total assets. We believe that we had the financial and operational capacity to maintain well-capitalized status had we determined that the higher risk weighting was required to be applied to our ownership interests in mortgage finance loans at year-end 2012 and 2011, and the Bank is considered well capitalized as of December 31, 2013. Incidental to the amended Call Reports described above, we were assessed an additional $3.0 million for deposit insurance by the FDIC that was paid during the third quarter of 2013, which is reflected in our consolidated financial statements for the quarter ended September 30, 2013.
Risk-based Capital Ratios |
12/31/13 | 12/31/12 As Reported |
12/31/12 Amended |
12/31/11 As Reported |
12/31/11 Amended |
To Be Well- Capitalized |
To Be Adequately Capitalized |
|||||||||||||||||||||
Consolidated |
||||||||||||||||||||||||||||
Tier 1 capital |
9.15 | % | 10.06 | % | 8.27 | % | 9.57 | % | 8.38 | % | N/A | 4.00 | % | |||||||||||||||
Total capital |
10.73 | % | 12.12 | % | 9.97 | % | 10.56 | % | 9.25 | % | N/A | 8.00 | % | |||||||||||||||
Bank |
||||||||||||||||||||||||||||
Tier 1 capital |
7.55 | % | 8.72 | % | 7.17 | % | 9.12 | % | 7.99 | % | 6.00 | % | 4.00 | % | ||||||||||||||
Total capital |
10.27 | % | 10.34 | % | 8.50 | % | 10.12 | % | 8.86 | % | 10.00 | % | 8.00 | % |
Risk factors. An investment in our common stock, preferred stock or debt securities involves risks that should be carefully considered. The most significant risks and uncertainties that we believe could adversely affect our business, financial condition or results of operations are set forth in the Risk Factors set forth in Exhibit 99.4 attached hereto. The risk factors set forth in Exhibit 99.4 are intended to supersede in their entirety the risk factors set forth in Item 1A of TCBIs Annual Report on Form 10-K for the year ended December 31, 2012.
This Item 8.01 and the information in Exhibits 99.3 and 99.4 shall be deemed filed for purposes of Section 18 of the 1934 Act.
4
FORWARD-LOOKING STATEMENTS
The information in this report contains forward-looking statements within the meaning of Section 27A of the United States Securities Act of 1933 and Section 21E of the United States Securities Exchange Act of 1934. Such statements are based upon current expectations that involve risks and uncertainties that may be outside of our control. Any statements contained herein that are not statements of historical fact may be deemed to be forward-looking statements. For example, words such as may, will, should, estimates, predicts, potential, continue, strategy, believes, anticipates, plans, expects, intends, and similar expressions are intended to identify forward-looking statements. Our actual results and the timing of certain events may differ significantly from the results discussed in the forward-looking statements. Factors that could cause our results to differ materially from those described in the forward-looking statements can be found in the risk factors set forth in Exhibit 99.4 to this Current Report on Form 8-K and our other filings with the Securities and Exchange Commission. All forward-looking statements in this Current Report on Form 8-K and Exhibits 99.1 and 99.2 speak only as of January 22, 2014 and we undertake no obligation to update any forward-looking statement to reflect events or circumstances after that date.
Item 9.01 | Financial Statements and Exhibits. |
(d) Exhibits. See Exhibit Index attached to this Current Report on Form 8-K, which is incorporated by reference herein.
SIGNATURE
Pursuant to the requirements of the Securities and Exchange Act of 1934, the Registrant has duly caused this report to be signed on its behalf by the undersigned hereunto duly authorized.
Date: January 22, 2014 | TEXAS CAPITAL BANCSHARES, INC. | |||||
By: | /s/ Peter B. Bartholow | |||||
Peter B. Bartholow | ||||||
Chief Financial Officer |
5
EXHIBIT INDEX
Exhibit No. |
Document Description | |
99.1 | Press Release, dated January 22, 2014, of Texas Capital Bancshares, Inc., announcing its operating and financial results for its fiscal year and quarter ended December 31, 2013 | |
99.2 | Presentation given January 22, 2014 discussing Texas Capital Bancshares, Inc.s operating and financial results for its fiscal year and quarter ended December 31, 2013 | |
99.3 | Consolidated Statements of Cash Flows for the years ended December 31, 2011, 2012 and 2013 (Corrected) and Supplemental Data (unaudited) | |
99.4 | Risk Factors as of January 22, 2014 |
6
Exhibit 99.1
MEDIA CONTACT
Heather Worley, 214.932.6827
heather.worley@texascapitalbank.com
INVESTOR CONTACT
Myrna Vance, 214.932.6646
myrna.vance@texascapitalbank.com
TEXAS CAPITAL BANCSHARES ANNOUNCES OPERATING RESULTS FOR 2013
DALLAS January 22, 2014 Texas Capital Bancshares, Inc. (NASDAQ: TCBI), the parent company of Texas Capital Bank, announced earnings and operating results for the fourth quarter and full year of 2013.
| Net income decreased 9% on a linked quarter basis and decreased 3% from the fourth quarter of 2012 |
| EPS decreased 9% on a linked quarter basis and decreased 12% from the fourth quarter of 2012 |
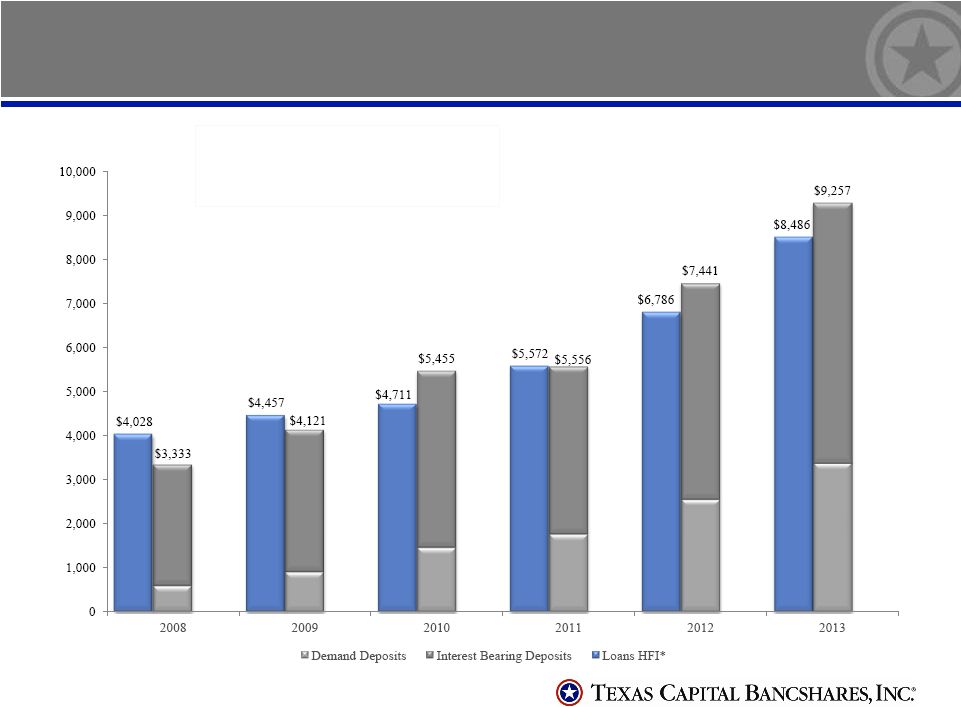
| Demand deposits increased 3% and total deposits increased 3% on a linked quarter basis, growing 32% and 24%, respectively, from the fourth quarter of 2012 |
| Loans held for investment, excluding mortgage finance, increased 5% and total loans increased 9% on a linked quarter basis, growing 25% and 13%, respectively, from the fourth quarter of 2012 |
2013 has been an extraordinary year for Texas Capital as we continue to build our business consistent with our successful, long-standing model, said Keith Cargill, CEO. As we win top client-facing talent and the critically important people who deliver outstanding service, products and support, we build growing earnings power for the future. This is consistent with our upcoming capital raise to support our anticipated strong growth.
FINANCIAL SUMMARY
(dollars and shares in thousands)
2013 | 2012 | % Change | ||||||||||
ANNUAL OPERATING RESULTS(1) |
||||||||||||
Net Income |
$ | 121,046 | $ | 120,709 | 0 | % | ||||||
Net Income Available to Common Shareholders |
$ | 113,652 | $ | 120,709 | (6 | )% | ||||||
Diluted EPS |
$ | 2.72 | $ | 3.01 | (10 | )% | ||||||
ROA |
1.17 | % | 1.35 | % | ||||||||
ROE |
12.82 | % | 16.93 | % | ||||||||
Diluted Shares |
41,780 | 40,166 | ||||||||||
QUARTERLY OPERATING RESULTS(1) |
||||||||||||
Net Income |
$ | 30,356 | $ | 31,435 | (3 | )% | ||||||
Net Income Available to Common Shareholders |
$ | 27,918 | $ | 31,435 | (11 | )% | ||||||
Diluted EPS |
$ | .67 | $ | .76 | (12 | )% | ||||||
ROA |
1.10 | % | 1.27 | % | ||||||||
ROE |
11.94 | % | 15.35 | % | ||||||||
Diluted Shares |
41,889 | 41,505 | ||||||||||
BALANCE SHEET(1) |
||||||||||||
Total Assets |
$ | 11,714,397 | $ | 10,540,542 | 11 | % | ||||||
Demand Deposits |
3,347,567 | 2,535,375 | 32 | % | ||||||||
Total Deposits |
9,257,379 | 7,440,804 | 24 | % | ||||||||
Loans Held for Investment |
8,486,309 | 6,785,535 | 25 | % | ||||||||
Loans Held for Investment, Mortgage Finance |
2,784,265 | 3,175,272 | (12 | )% | ||||||||
Total Loans |
11,270,574 | 9,960,807 | 13 | % | ||||||||
Stockholders Equity |
1,096,350 | 836,242 | 31 | % |
(1) | Operating results, assets and loans are reporting from continuing operations |
DETAILED FINANCIALS
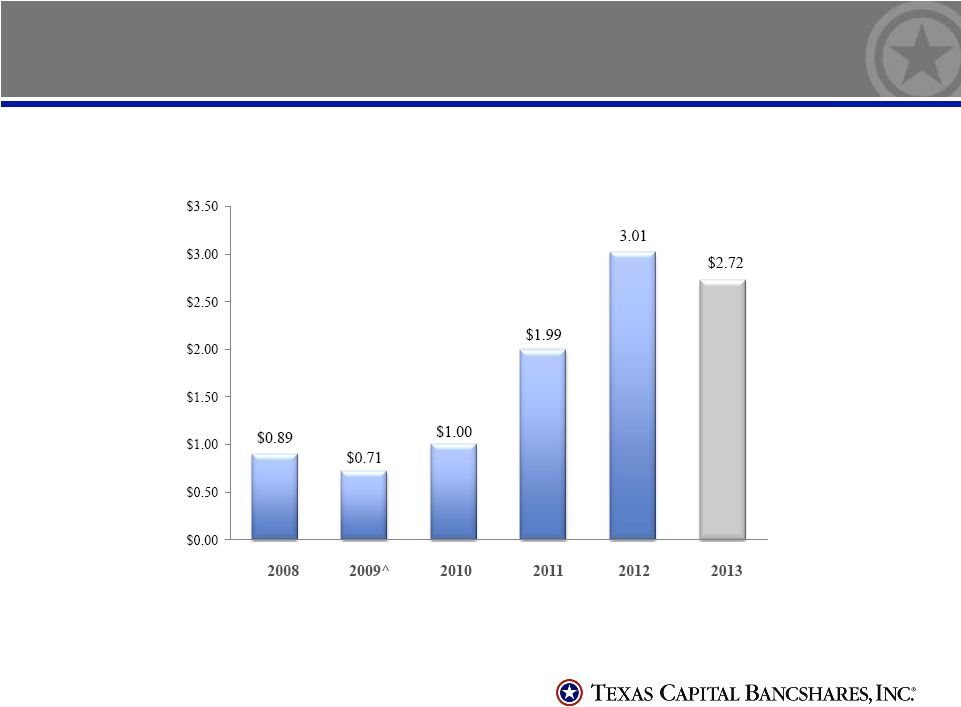
Texas Capital Bancshares, Inc. reported net income from continuing operations of $121.0 million and net income available to common shareholders of $113.7 million for the year ended December 31, 2013 compared to $120.7 million for both net income from continuing operations and net income available to common shareholders for the year ended December 31, 2012. For the fourth quarter of 2013, net income from continuing operations was $30.4 million and net income available to common shareholders was $27.9 million, compared to $31.4 million for both net income from continuing operations and net income available to common shareholders for the same period in 2012. On a fully diluted basis, earnings per common share from continuing operations were $2.72 for the year ended December 31, 2013, compared to $3.01 for the same period in 2012. For the fourth quarter of 2013, diluted earnings per share was $.67 compared to $.76 for the same period in 2012. The discussion below relates only to continuing operations.
Return on average common equity was 12.82 percent and return on average assets was 1.17 percent for the year ended December 31, 2013, compared to 16.93 percent and 1.35 percent, respectively, for 2012. Return on average common equity was 11.94 percent and return on average assets was 1.10 percent for the fourth quarter of 2013, compared to 15.35 percent and 1.27 percent, respectively, for the fourth quarter of 2012.
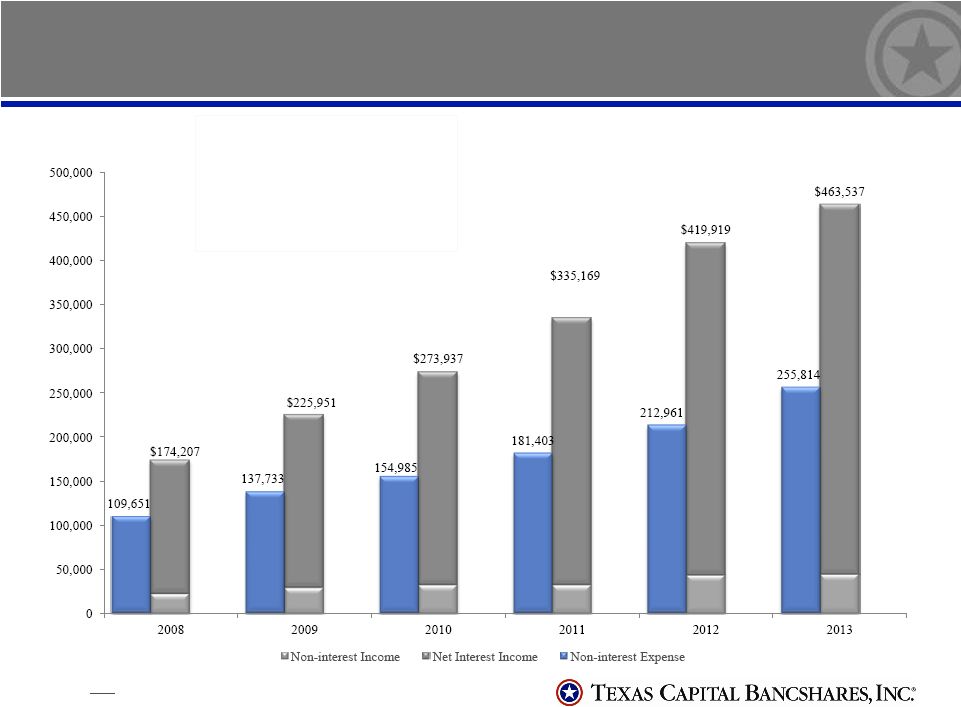
Net interest income was $111.5 million for the fourth quarter of 2013, compared to $108.8 million in the third quarter of 2013 and $101.2 million for the fourth quarter of 2012. For 2013, net interest income reached $419.5 million compared to $376.9 million in 2012. The net interest margin in the fourth quarter of 2013 was 4.21 percent, a 6 basis point decrease from the fourth quarter of 2012 and consistent with the third quarter of 2013. The year-to-date decrease in net interest margin is due to the growth in loans with lower yields offset with a reduction in the total cost of deposits and borrowed funds.
Average loans, excluding mortgage finance, for the year ended December 31, 2013 were $7.5 billion, an increase of $1.4 billion, or 23 percent, from 2012. Average mortgage finance loans for the year ended December 31, 2013 were $2.3 billion, consistent with 2012. Average loans, excluding mortgage finance, for the fourth quarter of 2013 were $8.1 billion, an increase of $1.4 billion, or 21 percent, from the fourth quarter of 2012 and an increase of $410.7 million, or 5 percent, from the third quarter of 2013. Average mortgage finance loans for the fourth quarter of 2013 decreased $419.4 million to $2.2 billion compared to the fourth quarter of 2012 and decreased $123.4 million from the third quarter of 2013.
Average total deposits for the fourth quarter of 2013 increased $2.2 billion from the fourth quarter of 2012 and increased $439.1 million from the third quarter of 2013. For the same periods, the average balance of demand deposits increased $932.5 million, or 40 percent, to $3.3 billion from $2.4 billion during the fourth quarter of 2012 and increased $164.7 million, or 5 percent, from the third quarter of 2013.
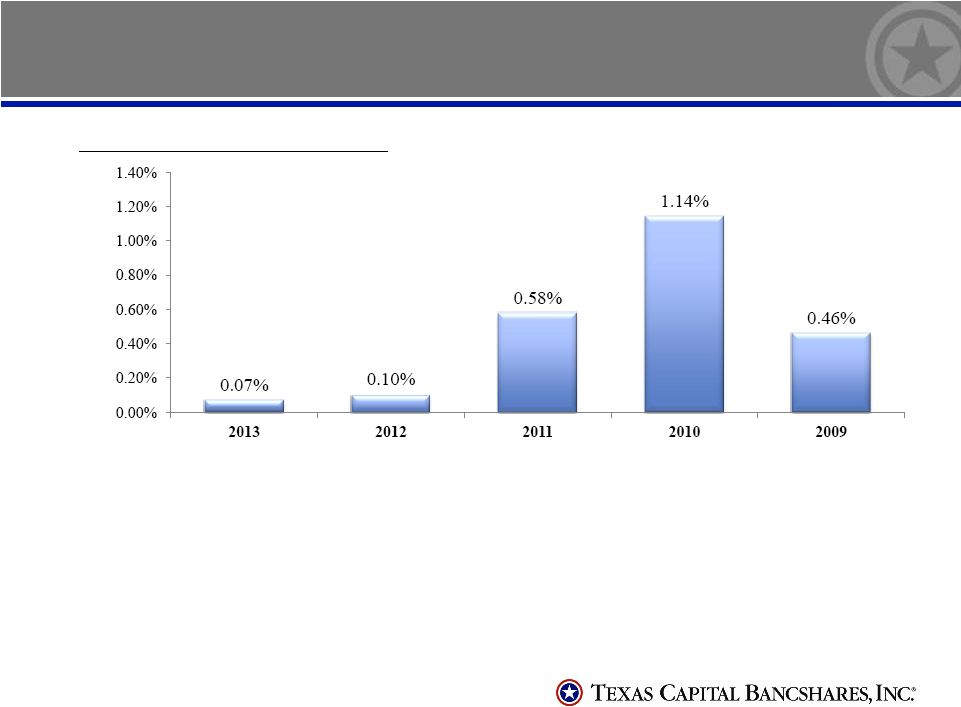
In the fourth quarter of 2013, we experienced decreases in the levels of non-performing assets. Credit costs, including the provision for credit losses and valuation charges related to other real estate owned (OREO) totaled $5.5 million in the fourth quarter of 2013 compared to $5.5 million in the fourth quarter of 2012 and $5.0 million in the third quarter of 2013. We recorded a $5.0 million provision for credit losses in the fourth quarter of 2013 compared to $4.5 million in the fourth quarter of 2012 and $5.0 million in the third quarter of 2013. For 2013, the total provision for credit losses was $19.0 million, an increase of 65 percent from $11.5 million in 2012. The substantial majority of the provision for the year ended December 31, 2013 was directly related to the significant growth in loans excluding mortgage finance loans during the year. Due to growth and improving credit quality, at December 31, 2013, the combined reserve decreased to 1.09 percent of loans excluding mortgage finance loans as compared to 1.15 percent at December 31, 2012 and 1.10 percent at September 30, 2013. In managements opinion, the reserve is appropriate and is derived from consistent application of the methodology for establishing the adequacy of reserves for Texas Capital Banks loan portfolio. In the fourth quarter of 2013, net charge-offs were $1.3 million compared to net charge-offs of $3.5 million in the fourth quarter of 2012 and net charge-offs of $46,000 in the third quarter of 2013. For 2013, net charge-offs were $4.9 million, .07 percent of average loans, excluding mortgage finance loans, compared to $6.1 million and a ratio of .10 percent in 2012. Non-accrual loans were $32.4 million, or .38 percent of loans excluding mortgage finance loans as of December 31, 2013, $55.8 million, or .82 percent, as of December 31, 2012 and $35.7 million, or .44 percent, as of September 30, 2013. At December 31, 2013, total
2
OREO was $5.1 million compared to $16.0 million as of December 31, 2012, and $12.8 million as of September 30, 2013. The OREO balance of $5.1 million at December 31, 2013 does not have a valuation allowance. The valuation charge for OREO reflected in non-interest expense was $466,000 in the fourth quarter of 2013 compared to $955,000 in the fourth quarter of 2012 and none in the third quarter of 2013.
Non-interest income decreased $1.7 million during the fourth quarter of 2013, or 13 percent, compared to the same period of 2012 primarily related to a $1.6 million decrease in brokered loan fees as a result of declining mortgage finance volumes during the fourth quarter of 2013 as compared to the fourth of 2012.
Non-interest expense for the fourth quarter of 2013 increased $10.2 million, or 17 percent, to $70.3 million from $60.1 million in the fourth quarter of 2012. The increase is primarily related to an $11.8 million increase in salaries and employee benefits to $43.0 million for the fourth quarter of 2013 from $31.2 million for the same period in 2012, which was primarily due to general business growth and an increase in cost of incentives tied to stock price.
Stockholders equity increased by 31 percent from $836.2 million at December 31, 2012 to $1.1 billion at December 31, 2013, primarily due to the offering of 6.0 million preferred shares for net proceeds of $145.1 million in the first quarter of 2013 and retained income during 2013. The Bank is well capitalized under regulatory guidelines and at December 31, 2013, our ratio of tangible common equity to total tangible assets was 7.9 percent.
ABOUT TEXAS CAPITAL BANCSHARES, INC.
Texas Capital Bancshares, Inc. (NASDAQ®: TCBI), a member of the Russell 2000® Index and the S&P SmallCap 600®, is the parent company of Texas Capital Bank, a commercial bank that delivers highly personalized financial services to businesses and individual clients. Headquartered in Dallas, the bank has full-service locations in Austin, Dallas, Fort Worth, Houston and San Antonio.
This news release may be deemed to include forward-looking statements which are based on Texas Capitals current estimates or expectations of future events or future results. Texas Capital is under no obligation, and expressly disclaims such obligation, to update, alter or revise its forward-looking statements, whether as a result of new information, future events, or otherwise. A number of factors, many of which are beyond Texas Capitals control, could cause actual results to differ materially from future results expressed or implied by such forward-looking statements. These risks and uncertainties include, but are not limited to, the risk of adverse impacts from general economic conditions, competition, interest rate sensitivity and exposure to regulatory and legislative changes. These and other factors that could cause results to differ materially from those described in the forward-looking statements can be found in the prospectus supplements, the Annual Report on Form 10-K and other filings made by Texas Capital with the Securities and Exchange Commission (SEC).
3
TEXAS CAPITAL BANCSHARES, INC.
SELECTED FINANCIAL HIGHLIGHTS (UNAUDITED)
(Dollars in thousands except per share data)
4th Quarter 2013 |
3rd Quarter 2013 |
2nd Quarter 2013 |
1st Quarter 2013 |
4th Quarter 2012 |
||||||||||||||||
CONSOLIDATED STATEMENT OF INCOME |
||||||||||||||||||||
Interest income |
$ | 117,965 | $ | 115,217 | $ | 107,264 | $ | 104,179 | $ | 107,769 | ||||||||||
Interest expense |
6,490 | 6,441 | 6,044 | 6,137 | 6,614 | |||||||||||||||
|
|
|
|
|
|
|
|
|
|
|||||||||||
Net interest income |
111,475 | 108,776 | 101,220 | 98,042 | 101,155 | |||||||||||||||
Provision for credit losses |
5,000 | 5,000 | 7,000 | 2,000 | 4,500 | |||||||||||||||
|
|
|
|
|
|
|
|
|
|
|||||||||||
Net interest income after provision for credit losses |
106,475 | 103,776 | 94,220 | 96,042 | 96,655 | |||||||||||||||
Non-interest income |
11,184 | 10,431 | 11,128 | 11,281 | 12,836 | |||||||||||||||
Non-interest expense |
70,291 | 62,009 | 68,734 | 55,700 | 60,074 | |||||||||||||||
|
|
|
|
|
|
|
|
|
|
|||||||||||
Income from continuing operations before income taxes |
47,368 | 52,198 | 36,614 | 51,623 | 49,417 | |||||||||||||||
Income tax expense |
17,012 | 18,724 | 12,542 | 18,479 | 17,982 | |||||||||||||||
|
|
|
|
|
|
|
|
|
|
|||||||||||
Income from continuing operations |
30,356 | 33,474 | 24,072 | 33,144 | 31,435 | |||||||||||||||
Income (loss) from discontinued operations (after-tax) |
3 | 2 | 1 | (1 | ) | (6 | ) | |||||||||||||
|
|
|
|
|
|
|
|
|
|
|||||||||||
Net income |
30,359 | 33,476 | 24,073 | 33,143 | 31,429 | |||||||||||||||
Preferred stock dividends |
2,438 | 2,437 | 2,438 | 81 | | |||||||||||||||
|
|
|
|
|
|
|
|
|
|
|||||||||||
Net income available to common shareholders |
$ | 27,921 | $ | 31,039 | $ | 21,635 | $ | 33,062 | $ | 31,429 | ||||||||||
|
|
|
|
|
|
|
|
|
|
|||||||||||
Diluted EPS from continuing operations |
$ | .67 | $ | .74 | $ | .52 | $ | .80 | $ | .76 | ||||||||||
Diluted EPS |
$ | .67 | $ | .74 | $ | .52 | $ | .80 | $ | .76 | ||||||||||
Diluted shares |
41,888,768 | 41,791,674 | 41,723,525 | 41,429,244 | 41,505,026 | |||||||||||||||
CONSOLIDATED BALANCE SHEET DATA |
||||||||||||||||||||
Total assets |
$ | 11,714,397 | $ | 10,797,448 | $ | 10,977,990 | $ | 10,020,565 | $ | 10,540,542 | ||||||||||
Loans held for investment |
8,486,309 | 8,051,328 | 7,510,662 | 6,920,011 | 6,785,535 | |||||||||||||||
Loans held for investment, mortgage finance |
2,784,265 | 2,262,085 | 2,838,234 | 2,577,830 | 3,175,272 | |||||||||||||||
Securities |
63,214 | 67,815 | 75,861 | 87,527 | 100,195 | |||||||||||||||
Demand deposits |
3,347,567 | 3,242,060 | 2,928,735 | 2,628,446 | 2,535,375 | |||||||||||||||
Total deposits |
9,257,379 | 8,957,081 | 7,980,598 | 7,745,831 | 7,440,804 | |||||||||||||||
Other borrowings |
1,025,630 | 449,724 | 1,634,630 | 938,134 | 1,947,161 | |||||||||||||||
Subordinated notes |
111,000 | 111,000 | 111,000 | 111,000 | 111,000 | |||||||||||||||
Long-term debt |
113,406 | 113,406 | 113,406 | 113,406 | 113,406 | |||||||||||||||
Stockholders equity |
1,096,350 | 1,066,629 | 1,034,955 | 1,013,195 | 836,242 | |||||||||||||||
End of period shares outstanding |
41,036,370 | 40,934,623 | 40,862,481 | 40,771,414 | 40,727,579 | |||||||||||||||
Book value (excluding securities gains/losses) |
$ | 23.02 | $ | 22.35 | $ | 21.60 | $ | 21.10 | $ | 20.45 | ||||||||||
Tangible book value (excluding securities gains/losses) |
$ | 22.50 | $ | 21.82 | $ | 21.08 | $ | 20.62 | $ | 19.96 | ||||||||||
SELECTED FINANCIAL RATIOS |
||||||||||||||||||||
Net interest margin |
4.21 | % | 4.21 | % | 4.19 | % | 4.27 | % | 4.27 | % | ||||||||||
Return on average assets |
1.10 | % | 1.25 | % | 0.95 | % | 1.38 | % | 1.27 | % | ||||||||||
Return on average common equity |
11.94 | % | 13.74 | % | 9.94 | % | 15.82 | % | 15.35 | % | ||||||||||
Non-interest income to earning assets |
.42 | % | .40 | % | .46 | % | .49 | % | .54 | % | ||||||||||
Efficiency ratio |
57.3 | % | 52.0 | % | 61.2 | % | 50.9 | % | 52.7 | % | ||||||||||
Efficiency ratio (excluding OREO valuation/write-down) |
56.9 | % | 52.0 | % | 60.8 | % | 50.9 | % | 51.9 | % | ||||||||||
Non-interest expense to earning assets |
2.65 | % | 2.40 | % | 2.84 | % | 2.42 | % | 2.53 | % | ||||||||||
Non-interest expense to earning assets (excluding OREO valuation charge) |
2.63 | % | 2.40 | % | 2.83 | % | 2.42 | % | 2.49 | % | ||||||||||
Tangible common equity to total tangible assets |
7.9 | % | 8.3 | % | 7.9 | % | 8.4 | % | 7.7 | % |
4
TEXAS CAPITAL BANCSHARES, INC.
CONSOLIDATED BALANCE SHEETS (UNAUDITED)
(Dollars in thousands)
December 31, 2013 |
December 31, 2012 |
% Change |
||||||||||
Assets |
||||||||||||
Cash and due from banks |
$ | 92,484 | $ | 111,938 | (17 | )% | ||||||
Interest-bearing deposits |
61,337 | 94,410 | (35 | )% | ||||||||
Federal funds sold |
90 | | 100 | % | ||||||||
Securities, available-for-sale |
63,214 | 100,195 | (37 | )% | ||||||||
Loans held for sale from discontinued operations |
294 | 302 | (3 | )% | ||||||||
Loans held for investment, mortgage finance |
2,784,265 | 3,175,272 | (12 | )% | ||||||||
Loans held for investment (net of unearned income) |
8,486,309 | 6,785,535 | 25 | % | ||||||||
Less: Allowance for loan losses |
87,604 | 74,337 | 18 | % | ||||||||
|
|
|
|
|
|
|||||||
Loans held for investment, net |
11,182,970 | 9,886,470 | 13 | % | ||||||||
Premises and equipment, net |
11,482 | 11,445 | (0 | )% | ||||||||
Accrued interest receivable and other assets |
281,534 | 316,201 | (11 | )% | ||||||||
Goodwill and intangibles, net |
21,286 | 19,883 | 7 | % | ||||||||
|
|
|
|
|
|
|||||||
Total assets |
$ | 11,714,691 | $ | 10,540,844 | 11 | % | ||||||
|
|
|
|
|
|
|||||||
Liabilities and Stockholders Equity |
||||||||||||
Liabilities: |
||||||||||||
Deposits: |
||||||||||||
Non-interest bearing |
$ | 3,347,567 | $ | 2,535,375 | 32 | % | ||||||
Interest bearing |
5,579,505 | 4,576,120 | 22 | % | ||||||||
Interest bearing in foreign branches |
330,307 | 329,309 | 0 | % | ||||||||
|
|
|
|
|
|
|||||||
Total deposits |
9,257,379 | 7,440,804 | 24 | % | ||||||||
Accrued interest payable |
749 | 650 | 15 | % | ||||||||
Other liabilities |
110,177 | 91,581 | 20 | % | ||||||||
Federal funds purchased |
148,650 | 273,179 | (46 | )% | ||||||||
Repurchase agreements |
21,954 | 23,936 | (8 | )% | ||||||||
Other borrowings |
855,026 | 1,650,046 | (48 | )% | ||||||||
Subordinated notes |
111,000 | 111,000 | | |||||||||
Trust preferred subordinated debentures |
113,406 | 113,406 | | |||||||||
|
|
|
|
|
|
|||||||
Total liabilities |
10,618,341 | 9,704,602 | 9 | % | ||||||||
Stockholders equity: |
||||||||||||
Preferred stock, $.01 par value, $1,000 liquidation value: |
||||||||||||
Authorized shares 10,000,000 |
||||||||||||
Issued shares |
150,000 | | 100 | % | ||||||||
Common stock, $.01 par value: |
||||||||||||
Authorized shares 100,000,000 |
||||||||||||
Issued shares 41,036,787 and 40,727,996 at December 31, 2013 and 2012, respectively |
410 | 407 | 1 | % | ||||||||
Additional paid-in capital |
448,208 | 450,116 | (0 | )% | ||||||||
Retained earnings |
496,112 | 382,455 | 30 | % | ||||||||
Treasury stock (shares at cost: 417 at December 31, 2013 and 2012) |
(8 | ) | (8 | ) | | |||||||
Accumulated other comprehensive income, net of taxes |
1,628 | 3,272 | (50 | )% | ||||||||
|
|
|
|
|
|
|||||||
Total stockholders equity |
1,096,350 | 836,242 | 31 | % | ||||||||
|
|
|
|
|
|
|||||||
Total liabilities and stockholders equity |
$ | 11,714,691 | $ | 10,540,844 | 11 | % | ||||||
|
|
|
|
|
|
5
TEXAS CAPITAL BANCSHARES, INC.
CONSOLIDATED STATEMENTS OF INCOME (UNAUDITED)
(Dollars in thousands except per share data)
Three Months Ended December 31 |
Year Ended December 31 |
|||||||||||||||
2013 | 2012 | 2013 | 2012 | |||||||||||||
Interest income |
||||||||||||||||
Interest and fees on loans |
$ | 117,261 | $ | 106,653 | $ | 441,314 | $ | 393,548 | ||||||||
Securities |
621 | 1,053 | 3,015 | 4,688 | ||||||||||||
Federal funds sold |
24 | 6 | 65 | 13 | ||||||||||||
Deposits in other banks |
59 | 57 | 231 | 208 | ||||||||||||
|
|
|
|
|
|
|
|
|||||||||
Total interest income |
117,965 | 107,769 | 444,625 | 398,457 | ||||||||||||
Interest expense |
||||||||||||||||
Deposits |
3,858 | 3,312 | 14,030 | 13,644 | ||||||||||||
Federal funds purchased |
116 | 190 | 686 | 979 | ||||||||||||
Repurchase agreements |
5 | 3 | 18 | 13 | ||||||||||||
Other borrowings |
40 | 615 | 515 | 2,149 | ||||||||||||
Subordinated notes |
1,840 | 1,829 | 7,327 | 2,037 | ||||||||||||
Trust preferred subordinated debentures |
631 | 665 | 2,536 | 2,756 | ||||||||||||
|
|
|
|
|
|
|
|
|||||||||
Total interest expense |
6,490 | 6,614 | 25,112 | 21,578 | ||||||||||||
|
|
|
|
|
|
|
|
|||||||||
Net interest income |
111,475 | 101,155 | 419,513 | 376,879 | ||||||||||||
Provision for credit losses |
5,000 | 4,500 | 19,000 | 11,500 | ||||||||||||
|
|
|
|
|
|
|
|
|||||||||
Net interest income after provision for credit losses |
106,475 | 96,655 | 400,513 | 365,379 | ||||||||||||
Non-interest income |
||||||||||||||||
Service charges on deposit accounts |
1,674 | 1,693 | 6,783 | 6,605 | ||||||||||||
Trust fee income |
1,250 | 1,260 | 5,023 | 4,822 | ||||||||||||
Bank owned life insurance (BOLI) income |
533 | 510 | 1,917 | 2,168 | ||||||||||||
Brokered loan fees |
3,380 | 4,978 | 16,980 | 17,596 | ||||||||||||
Swap fees |
1,904 | 2,093 | 5,520 | 4,909 | ||||||||||||
Other |
2,443 | 2,302 | 7,801 | 6,940 | ||||||||||||
|
|
|
|
|
|
|
|
|||||||||
Total non-interest income |
11,184 | 12,836 | 44,024 | 43,040 | ||||||||||||
Non-interest expense |
||||||||||||||||
Salaries and employee benefits |
43,008 | 31,198 | 157,752 | 121,456 | ||||||||||||
Net occupancy expense |
4,487 | 3,916 | 16,821 | 14,852 | ||||||||||||
Marketing |
4,183 | 3,980 | 16,203 | 13,449 | ||||||||||||
Legal and professional |
5,520 | 5,320 | 18,104 | 17,557 | ||||||||||||
Communications and technology |
3,597 | 3,070 | 13,762 | 11,158 | ||||||||||||
FDIC insurance assessment |
1,923 | 1,071 | 8,057 | 5,568 | ||||||||||||
Allowance and other carrying costs for OREO |
609 | 1,369 | 1,788 | 9,075 | ||||||||||||
Litigation settlement expense |
| 4,000 | | 4,000 | ||||||||||||
Other |
6,964 | 6,150 | 24,247 | 22,729 | ||||||||||||
|
|
|
|
|
|
|
|
|||||||||
Total non-interest expense |
70,291 | 60,074 | 256,734 | 219,844 | ||||||||||||
|
|
|
|
|
|
|
|
|||||||||
Income from continuing operations before income taxes |
47,368 | 49,417 | 187,803 | 188,575 | ||||||||||||
Income tax expense |
17,012 | 17,982 | 66,757 | 67,866 | ||||||||||||
|
|
|
|
|
|
|
|
|||||||||
Income from continuing operations |
30,356 | 31,435 | 121,046 | 120,709 | ||||||||||||
Loss from discontinued operations (after-tax) |
3 | (6 | ) | 5 | (37 | ) | ||||||||||
|
|
|
|
|
|
|
|
|||||||||
Net income |
30,359 | 31,429 | 121,051 | 120,672 | ||||||||||||
Preferred stock dividends |
2,438 | | 7,394 | | ||||||||||||
|
|
|
|
|
|
|
|
|||||||||
Net income available to common shareholders |
$ | 27,921 | $ | 31,429 | $ | 113,657 | $ | 120,672 | ||||||||
|
|
|
|
|
|
|
|
|||||||||
Basic earnings per common share: |
||||||||||||||||
Income from continuing operations |
$ | .68 | $ | .78 | $ | 2.78 | $ | 3.09 | ||||||||
Net income |
$ | .68 | $ | .78 | $ | 2.78 | $ | 3.09 | ||||||||
Diluted earnings per common share: |
||||||||||||||||
Income from continuing operations |
$ | .67 | $ | .76 | $ | 2.72 | $ | 3.01 | ||||||||
Net income |
$ | .67 | $ | .76 | $ | 2.72 | $ | 3.00 |
6
TEXAS CAPITAL BANCSHARES, INC.
SUMMARY OF LOAN LOSS EXPERIENCE
(Dollars in thousands)
4th Quarter 2013 |
3rd Quarter 2013 |
2nd Quarter 2013 |
1st Quarter 2013 |
4th Quarter 2012 |
||||||||||||||||
Reserve for loan losses: |
||||||||||||||||||||
Beginning balance |
$ | 84,006 | $ | 79,428 | $ | 75,000 | $ | 74,337 | $ | 73,722 | ||||||||||
Loans charged-off: |
||||||||||||||||||||
Commercial |
1,605 | 496 | 2,826 | 1,648 | 4,044 | |||||||||||||||
Real estate term |
| 13 | 26 | 105 | | |||||||||||||||
Consumer |
| | 26 | 19 | | |||||||||||||||
Leases |
| 2 | | | 34 | |||||||||||||||
|
|
|
|
|
|
|
|
|
|
|||||||||||
Total loans charged-off |
1,605 | 511 | 2,878 | 1,772 | 4,078 | |||||||||||||||
Recoveries: |
||||||||||||||||||||
Commercial |
225 | 233 | 348 | 397 | 350 | |||||||||||||||
Real estate term |
60 | 195 | 7 | 8 | 226 | |||||||||||||||
Consumer |
9 | 19 | 15 | 30 | 7 | |||||||||||||||
Leases |
43 | 18 | 140 | 121 | 21 | |||||||||||||||
|
|
|
|
|
|
|
|
|
|
|||||||||||
Total recoveries |
337 | 465 | 510 | 556 | 604 | |||||||||||||||
|
|
|
|
|
|
|
|
|
|
|||||||||||
Net charge-offs |
1,268 | 46 | 2,368 | 1,216 | 3,474 | |||||||||||||||
Provision for loan losses |
4,866 | 4,624 | 6,796 | 1,879 | 4,089 | |||||||||||||||
|
|
|
|
|
|
|
|
|
|
|||||||||||
Ending balance |
$ | 87,604 | $ | 84,006 | $ | 79,428 | $ | 75,000 | $ | 74,337 | ||||||||||
|
|
|
|
|
|
|
|
|
|
|||||||||||
Reserve for off-balance sheet credit losses: |
||||||||||||||||||||
Beginning balance |
$ | 4,556 | $ | 4,180 | $ | 3,976 | $ | 3,855 | $ | 3,444 | ||||||||||
Provision for off-balance sheet credit losses |
134 | 376 | 204 | 121 | 411 | |||||||||||||||
|
|
|
|
|
|
|
|
|
|
|||||||||||
Ending balance |
$ | 4,690 | $ | 4,556 | $ | 4,180 | $ | 3,976 | $ | 3,855 | ||||||||||
|
|
|
|
|
|
|
|
|
|
|||||||||||
Total reserves for credit losses |
$ | 92,294 | $ | 88,562 | $ | 83,608 | $ | 78,976 | $ | 78,192 | ||||||||||
Total provision for credit losses |
$ | 5,000 | $ | 5,000 | $ | 7,000 | $ | 2,000 | $ | 4,500 | ||||||||||
Reserve to loans |
.78 | % | .81 | % | .77 | % | .79 | % | .75 | % | ||||||||||
Reserve to loans excluding mortgage finance loans(2) |
1.03 | % | 1.04 | % | 1.06 | % | 1.08 | % | 1.10 | % | ||||||||||
Reserve to average loans |
.84 | % | .83 | % | .83 | % | .81 | % | .88 | % | ||||||||||
Reserve to average loans excluding mortgage finance loans(2) |
1.08 | % | 1.09 | % | 1.11 | % | 1.10 | % | 1.12 | % | ||||||||||
Net charge-offs to average loans(1) |
.05 | % | .00 | % | .10 | % | .05 | % | .15 | % | ||||||||||
Net charge-offs to average loans excluding mortgage
finance |
.06 | % | .00 | % | .13 | % | .07 | % | .21 | % | ||||||||||
Net charge-offs to average loans for last twelve months(1) |
.05 | % | .07 | % | .09 | % | .07 | % | .07 | % | ||||||||||
Net charge-offs to average loans, excluding mortgage finance loans, for last twelve months(1)(2) |
.07 | % | .10 | % | .12 | % | .10 | % | .10 | % | ||||||||||
Total provision for credit losses to average loans(1) |
.19 | % | .20 | % | .29 | % | .09 | % | .19 | % | ||||||||||
Total provision for credit losses to average loans excluding mortgage finance loans(1)(2) |
.24 | % | .26 | % | .39 | % | .12 | % | .27 | % | ||||||||||
Combined reserves for credit losses to loans |
.82 | % | .86 | % | .81 | % | .83 | % | .78 | % | ||||||||||
Combined reserves for credit losses to loans, excluding mortgage finance loans(2) |
1.09 | % | 1.10 | % | 1.11 | % | 1.14 | % | 1.15 | % | ||||||||||
Non-performing assets (NPAs): |
||||||||||||||||||||
Non-accrual loans |
$ | 32,375 | $ | 35,737 | $ | 38,450 | $ | 43,424 | $ | 55,833 | ||||||||||
Other real estate owned (OREO) (4) |
5,110 | 12,805 | 13,053 | 14,426 | 15,991 | |||||||||||||||
Other repossessed assets |
| | 19 | | 42 | |||||||||||||||
|
|
|
|
|
|
|
|
|
|
|||||||||||
Total |
$ | 37,485 | $ | 48,542 | $ | 51,522 | $ | 57,850 | $ | 71,866 | ||||||||||
|
|
|
|
|
|
|
|
|
|
7
Non-accrual loans to loans |
.29 | % | .35 | % | .37 | % | .46 | % | .56 | % | ||||||||||
Non-accrual loans to loans excluding mortgage finance loans(2) |
.38 | % | .44 | % | .51 | % | .63 | % | .82 | % | ||||||||||
Total NPAs to loans plus OREO |
.33 | % | .47 | % | .50 | % | .61 | % | .72 | % | ||||||||||
Total NPAs to loans excluding mortgage finance loans plus OREO(2) |
.44 | % | .60 | % | .68 | % | .83 | % | 1.06 | % | ||||||||||
Total NPAs to earning assets |
.33 | % | .47 | % | .49 | % | .60 | % | .71 | % | ||||||||||
Reserve for loan losses to non-accrual loans |
2.7x | 2.4x | 2.1x | 1.7x | 1.3x | |||||||||||||||
Restructured loans |
$ | 1,935 | $ | 4,691 | $ | 4,765 | $ | 11,755 | $ | 10,407 | ||||||||||
Loans past due 90 days and still accruing(3) |
$ | 9,325 | $ | 7,510 | $ | 7,633 | $ | 12,614 | $ | 3,674 | ||||||||||
Loans past due 90 days to loans |
.08 | % | .07 | % | .07 | % | .13 | % | .04 | % | ||||||||||
Loans past due 90 days to loans excluding mortgage finance loans(2) |
.11 | % | .09 | % | .10 | % | .18 | % | .05 | % |
(1) | Interim period ratios are annualized. |
(2) | Mortgage finance loans were previously classified as loans held for sale but have been reclassified as loans held for investment. The indicated ratios are presented with and excluding the mortgage finance loans because the risk profile of our mortgage finance loans is different than our other loans held for investment. No provision for credit losses is allocated to these loans based on the internal risk grade assigned. |
(3) | At December 31, 2013, loans past due 90 days and still accruing includes premium finance loans of $3.8 million. These loans are primarily secured by obligations of insurance carriers to refund premiums on cancelled insurance policies. The refund of premiums from the insurance carriers can take 180 days or longer from the cancellation date. |
(4) | At December 31, 2013, there is no valuation allowance recorded against the OREO balance. |
8
TEXAS CAPITAL BANCSHARES, INC.
CONSOLIDATED STATEMENT OF INCOME (UNAUDITED)
(Dollars in thousands)
4th Quarter 2013 |
3rd Quarter 2013 |
2nd Quarter 2013 |
1st Quarter 2013 |
4th Quarter 2012 |
||||||||||||||||
Interest income |
||||||||||||||||||||
Interest and fees on loans |
$ | 117,261 | $ | 114,453 | $ | 106,418 | $ | 103,182 | $ | 106,653 | ||||||||||
Securities |
621 | 682 | 773 | 939 | 1,053 | |||||||||||||||
Federal funds sold |
24 | 22 | 13 | 6 | 6 | |||||||||||||||
Deposits in other banks |
59 | 60 | 60 | 52 | 57 | |||||||||||||||
|
|
|
|
|
|
|
|
|
|
|||||||||||
Total interest income |
117,965 | 115,217 | 107,264 | 104,179 | 107,769 | |||||||||||||||
Interest expense |
||||||||||||||||||||
Deposits |
3,858 | 3,699 | 3,228 | 3,245 | 3,312 | |||||||||||||||
Federal funds purchased |
116 | 152 | 206 | 212 | 190 | |||||||||||||||
Repurchase agreements |
5 | 4 | 5 | 4 | 3 | |||||||||||||||
Other borrowings |
40 | 119 | 143 | 213 | 615 | |||||||||||||||
Subordinated notes |
1,840 | 1,829 | 1,829 | 1,829 | 1,829 | |||||||||||||||
Trust preferred subordinated debentures |
631 | 638 | 633 | 634 | 665 | |||||||||||||||
|
|
|
|
|
|
|
|
|
|
|||||||||||
Total interest expense |
6,490 | 6,441 | 6,044 | 6,137 | 6,614 | |||||||||||||||
|
|
|
|
|
|
|
|
|
|
|||||||||||
Net interest income |
111,475 | 108,776 | 101,220 | 98,042 | 101,155 | |||||||||||||||
Provision for credit losses |
5,000 | 5,000 | 7,000 | 2,000 | 4,500 | |||||||||||||||
|
|
|
|
|
|
|
|
|
|
|||||||||||
Net interest income after provision for credit losses |
106,475 | 103,776 | 94,220 | 96,042 | 96,655 | |||||||||||||||
Non-interest income |
||||||||||||||||||||
Service charges on deposit accounts |
1,674 | 1,659 | 1,749 | 1,701 | 1,693 | |||||||||||||||
Trust fee income |
1,250 | 1,263 | 1,269 | 1,241 | 1,260 | |||||||||||||||
Bank owned life insurance (BOLI) income |
533 | 423 | 463 | 498 | 510 | |||||||||||||||
Brokered loan fees |
3,380 | 4,078 | 4,778 | 4,744 | 4,978 | |||||||||||||||
Swap fees |
1,904 | 983 | 981 | 1,652 | 2,093 | |||||||||||||||
Other |
2,443 | 2,025 | 1,888 | 1,445 | 2,302 | |||||||||||||||
|
|
|
|
|
|
|
|
|
|
|||||||||||
Total non-interest income |
11,184 | 10,431 | 11,128 | 11,281 | 12,836 | |||||||||||||||
Non-interest expense |
||||||||||||||||||||
Salaries and employee benefits |
43,008 | 36,012 | 45,191 | 33,541 | 31,198 | |||||||||||||||
Net occupancy expense |
4,487 | 4,342 | 4,135 | 3,857 | 3,916 | |||||||||||||||
Marketing |
4,183 | 3,974 | 4,074 | 3,972 | 3,980 | |||||||||||||||
Legal and professional |
5,520 | 3,937 | 4,707 | 3,940 | 5,320 | |||||||||||||||
Communications and technology |
3,597 | 3,696 | 3,347 | 3,122 | 3,070 | |||||||||||||||
FDIC insurance assessment |
1,923 | 4,357 | 699 | 1,078 | 1,071 | |||||||||||||||
Allowance and other carrying costs for OREO |
609 | 267 | 482 | 430 | 1,369 | |||||||||||||||
Litigation settlement expense |
| (908 | ) | | | 4,000 | ||||||||||||||
Other |
6,964 | 6,332 | 6,099 | 5,760 | 6,150 | |||||||||||||||
|
|
|
|
|
|
|
|
|
|
|||||||||||
Total non-interest expense |
70,291 | 62,009 | 68,734 | 55,700 | 60,074 | |||||||||||||||
|
|
|
|
|
|
|
|
|
|
|||||||||||
Income from continuing operations before income taxes |
47,368 | 52,198 | 36,614 | 51,623 | 49,417 | |||||||||||||||
Income tax expense |
17,012 | 18,724 | 12,542 | 18,479 | 17,982 | |||||||||||||||
|
|
|
|
|
|
|
|
|
|
|||||||||||
Income from continuing operations |
30,356 | 33,474 | 24,072 | 33,144 | 31,435 | |||||||||||||||
Income (loss) from discontinued operations (after-tax) |
3 | 2 | 1 | (1 | ) | (6 | ) | |||||||||||||
|
|
|
|
|
|
|
|
|
|
|||||||||||
Net income |
30,359 | 33,476 | 24,073 | 33,143 | 31,429 | |||||||||||||||
Preferred stock dividends |
2,438 | 2,437 | 2,438 | 81 | | |||||||||||||||
|
|
|
|
|
|
|
|
|
|
|||||||||||
Net income available to common shareholders |
$ | 27,921 | $ | 31,039 | $ | 21,635 | $ | 33,062 | $ | 31,429 | ||||||||||
|
|
|
|
|
|
|
|
|
|
9
TEXAS CAPITAL BANCSHARES, INC.
QUARTERLY FINANCIAL SUMMARY UNAUDITED
Consolidated Daily Average Balances, Average Yields and Rates
Continuing Operations
(Dollars in thousands)
4th Quarter 2013 | 3rd Quarter 2013 | 2nd Quarter 2013 | 1st Quarter 2013 | 4th Quarter 2012 | ||||||||||||||||||||||||||||||||||||||||||||||||||||||||
Average Balance |
Revenue/ Expense (1) |
Yield/ Rate |
Average Balance |
Revenue/ Expense (1) |
Yield/ Rate |
Average Balance |
Revenue/ Expense (1) |
Yield/ Rate |
Average Balance |
Revenue/ Expense (1) |
Yield/ Rate |
Average Balance |
Revenue/ Expense (1) |
Yield/ Rate |
||||||||||||||||||||||||||||||||||||||||||||||
Assets |
||||||||||||||||||||||||||||||||||||||||||||||||||||||||||||
Securities Taxable |
$ | 50,281 | $ | 480 | 3.79 | % | $ | 54,838 | $ | 522 | 3.78 | % | $ | 60,063 | $ | 594 | 3.97 | % | $ | 71,220 | $ | 729 | 4.15 | % | $ | 78,182 | $ | 811 | 4.13 | % | ||||||||||||||||||||||||||||||
Securities Non-taxable(2) |
14,786 | 217 | 5.82 | % | 16,879 | 246 | 5.78 | % | 18,843 | 275 | 5.85 | % | 22,174 | 323 | 5.91 | % | 25,301 | 372 | 5.85 | % | ||||||||||||||||||||||||||||||||||||||||
Federal funds sold and securities purchased under resale agreements |
59,409 | 24 | 0.16 | % | 78,896 | 22 | 0.11 | % | 54,448 | 13 | 0.10 | % | 24,785 | 6 | 0.10 | % | 21,617 | 6 | 0.11 | % | ||||||||||||||||||||||||||||||||||||||||
Deposits in other banks |
99,185 | 59 | 0.24 | % | 88,717 | 60 | 0.27 | % | 91,177 | 60 | 0.26 | % | 78,718 | 52 | 0.27 | % | 69,886 | 57 | 0.32 | % | ||||||||||||||||||||||||||||||||||||||||
Loans held for investment, mortgage finance loans |
2,238,730 | 20,236 | 3.59 | % | 2,362,118 | 22,547 | 3.79 | % | 2,406,246 | 22,440 | 3.74 | % | 2,362,646 | 22,641 | 3.89 | % | 2,658,092 | 26,440 | 3.96 | % | ||||||||||||||||||||||||||||||||||||||||
Loans held for investment |
8,142,569 | 97,025 | 4.73 | % | 7,731,901 | 91,906 | 4.72 | % | 7,152,323 | 83,978 | 4.71 | % | 6,842,766 | 80,541 | 4.77 | % | 6,662,817 | 80,213 | 4.79 | % | ||||||||||||||||||||||||||||||||||||||||
Less reserve for loan losses |
84,009 | | | 79,551 | | | 75,006 | | | 74,442 | | | 73,912 | | | |||||||||||||||||||||||||||||||||||||||||||||
|
|
|
|
|
|
|
|
|
|
|
|
|
|
|
|
|
|
|
|
|
|
|
|
|
|
|
|
|
|
|||||||||||||||||||||||||||||||
Loans, net of reserve |
10,297,290 | 117,261 | 4.52 | % | 10,014,468 | 114,453 | 4.53 | % | 9,483,563 | 106,418 | 4.50 | % | 9,130,970 | 103,182 | 4.58 | % | 9,246,997 | 106,653 | 4.59 | % | ||||||||||||||||||||||||||||||||||||||||
|
|
|
|
|
|
|
|
|
|
|
|
|
|
|
|
|
|
|
|
|
|
|
|
|
|
|
|
|
|
|||||||||||||||||||||||||||||||
Total earning assets |
10,520,951 | 118,041 | 4.45 | % | 10,253,798 | 115,303 | 4.46 | % | 9,708,094 | 107,360 | 4.44 | % | 9,327,867 | 104,292 | 4.53 | % | 9,441,983 | 107,899 | 4.55 | % | ||||||||||||||||||||||||||||||||||||||||
Cash and other assets |
378,315 | 383,968 | 402,898 | 401,692 | 427,299 | |||||||||||||||||||||||||||||||||||||||||||||||||||||||
|
|
|
|
|
|
|
|
|
|
|||||||||||||||||||||||||||||||||||||||||||||||||||
Total assets |
$ | 10,899,266 | $ | 10,637,766 | $ | 10,110,992 | $ | 9,729,559 | $ | 9,869,282 | ||||||||||||||||||||||||||||||||||||||||||||||||||
|
|
|
|
|
|
|
|
|
|
|||||||||||||||||||||||||||||||||||||||||||||||||||
Liabilities and Stockholders Equity |
||||||||||||||||||||||||||||||||||||||||||||||||||||||||||||
Transaction deposits |
$ | 787,720 | $ | 76 | 0.04 | % | $ | 794,630 | $ | 102 | 0.05 | % | $ | 1,051,199 | $ | 233 | 0.09 | % | $ | 1,003,735 | $ | 253 | 0.10 | % | $ | 941,947 | $ | 244 | 0.10 | % | ||||||||||||||||||||||||||||||
Savings deposits |
4,365,746 | 3,079 | 0.28 | % | 4,057,792 | 2,863 | 0.28 | % | 3,340,420 | 2,292 | 0.28 | % | 3,246,675 | 2,297 | 0.29 | % | 2,933,904 | 2,299 | 0.31 | % | ||||||||||||||||||||||||||||||||||||||||
Time deposits |
385,546 | 394 | 0.41 | % | 402,920 | 414 | 0.41 | % | 397,868 | 407 | 0.41 | % | 403,113 | 414 | 0.42 | % | 423,685 | 448 | 0.42 | % | ||||||||||||||||||||||||||||||||||||||||
Deposits in foreign branches |
348,240 | 309 | 0.35 | % | 357,532 | 320 | 0.36 | % | 340,713 | 296 | 0.35 | % | 335,265 | 281 | 0.34 | % | 362,580 | 321 | 0.35 | % | ||||||||||||||||||||||||||||||||||||||||
|
|
|
|
|
|
|
|
|
|
|
|
|
|
|
|
|
|
|
|
|
|
|
|
|
|
|
|
|
|
|||||||||||||||||||||||||||||||
Total interest bearing deposits |
5,887,252 | 3,858 | 0.26 | % | 5,612,874 | 3,699 | 0.26 | % | 5,130,200 | 3,228 | 0.25 | % | 4,988,788 | 3,245 | 0.26 | % | 4,662,116 | 3,312 | 0.28 | % | ||||||||||||||||||||||||||||||||||||||||
Other borrowings |
314,018 | 161 | 0.20 | % | 539,767 | 275 | 0.20 | % | 727,158 | 354 | 0.20 | % | 1,041,573 | 429 | 0.17 | % | 1,725,129 | 808 | 0.19 | % | ||||||||||||||||||||||||||||||||||||||||
Subordinated notes |
111,000 | 1,840 | 6.58 | % | 111,000 | 1,829 | 6.54 | % | 111,000 | 1,829 | 6.61 | % | 111,000 | 1,829 | 6.68 | % | 111,000 | 1,829 | 6.56 | % | ||||||||||||||||||||||||||||||||||||||||
Trust preferred subordinated debentures |
113,406 | 631 | 2.21 | % | 113,406 | 638 | 2.23 | % | 113,406 | 633 | 2.24 | % | 113,406 | 634 | 2.27 | % | 113,406 | 665 | 2.33 | % | ||||||||||||||||||||||||||||||||||||||||
|
|
|
|
|
|
|
|
|
|
|
|
|
|
|
|
|
|
|
|
|
|
|
|
|
|
|
|
|
|
|||||||||||||||||||||||||||||||
Total interest bearing liabilities |
6,425,676 | 6,490 | 0.40 | % | 6,377,047 | 6,441 | 0.40 | % | 6,081,764 | 6,044 | 0.40 | % | 6,254,767 | 6,137 | 0.40 | % | 6,611,651 | 6,614 | 0.40 | % | ||||||||||||||||||||||||||||||||||||||||
Demand deposits |
3,289,307 | 3,124,602 | 2,914,341 | 2,529,927 | 2,356,758 | |||||||||||||||||||||||||||||||||||||||||||||||||||||||
Other liabilities |
106,461 | 89,640 | 91,608 | 90,538 | 86,308 | |||||||||||||||||||||||||||||||||||||||||||||||||||||||
Stockholders equity |
1,077,822 | 1,046,477 | 1,023,279 | 854,327 | 814,565 | |||||||||||||||||||||||||||||||||||||||||||||||||||||||
|
|
|
|
|
|
|
|
|
|
|||||||||||||||||||||||||||||||||||||||||||||||||||
Total liabilities and stockholders equity |
$ | 10,899,266 | $ | 10,637,766 | $ | 10,110,992 | $ | 9,729,559 | $ | 9,869,282 | ||||||||||||||||||||||||||||||||||||||||||||||||||
|
|
|
|
|
|
|
|
|
|
|||||||||||||||||||||||||||||||||||||||||||||||||||
Net interest income |
$ | 111,551 | $ | 108,862 | $ | 101,316 | $ | 98,155 | $ | 101,285 | ||||||||||||||||||||||||||||||||||||||||||||||||||
Net interest margin |
4.21 | % | 4.21 | % | 4.19 | % | 4.27 | % | 4.27 | % |
(1) | The loan averages include loans on which the accrual of interest has been discontinued and are stated net of unearned income. |
(2) | Taxable equivalent rates used where applicable. |
10
![]() January 22, 2014
TCBI Q4 2013
Earnings
Exhibit 99.2 |
![]() Certain
matters
discussed
on
this
call
may
contain
forward-looking
statements,
which
are
subject
to
risks
and
uncertainties
and
are
based
on
Texas
Capitals
current
estimates
or
expectations
of
future
events
or
future
results.
Texas
Capital
is
under
no
obligation,
and
expressly
disclaims
such
obligation,
to
update,
alter
or
revise
its
forward-looking
statements,
whether
as
a
result
of
new
information,
future
events
or
otherwise.
A
number
of
factors,
many
of
which
are
beyond
Texas
Capitals
control,
could
cause
actual
results
to
differ
materially
from
future
results
expressed
or
implied
by
such
forward-looking
statements.
These
risks
and
uncertainties
include
the
risk
of
adverse
impacts
from
general
economic
conditions,
competition,
interest
rate
sensitivity
and
exposure
to
regulatory
and
legislative
changes.
These
and
other
factors
that
could
cause
results
to
differ
materially
from
those
described
in
the
forward-looking
statements
can
be
found
in
the
prospectus
supplements,
the
Annual
Report
on
Form
10-K
and
other
filings
made
by
Texas
Capital
with
the
Securities
and
Exchange
Commission
(SEC).
2 |
![]() Opening Remarks
Exceptional growth in loans and deposits for 2013
Capital raising consistent with market opportunity for growth
Continued improvement in NPAs with low level of charge-offs for the
year
2013 non-interest expense includes hiring foundation of market
leading talent supporting 2014 growth and beyond
Mortgage Finance levels up, with 2013 average slightly up as compared
to 2012 average, and continued to outperform the industry
3 |
![]() Financial Review
Net Income
Decrease in net income of 9% compared to Q3-2013; full year net
income consistent with 2012
Profitability
ROA and ROE remained strong, despite decrease in net income
Net Revenue
3% increase from Q3-2013
8% growth from Q4-2012
Exceptional growth in LHI average balances (excluding mortgage
finance) and Total Loans
Growth of 5% from Q3-2013 and 22% from Q4-2012
Clear increase in market share for Mortgage Finance with growth of 2%
from 2012 and modest decrease from Q3-2013
Margin remained consistent with Q3-2013 at 4.21%
Strong LHI levels, improved composition with reduced proportion of MF
Loan balances and yields
Improved funding profile from continued growth in DDA and total
deposits
Correction of error
for
accounting
of
Mortgage
Finance
formerly
LHS
Previously classified as Held for Sale; will now be consistent with
regulatory accounting and treated as Held for Investment
No
change
in
business
direction
anticipate
continued
improvement
in
market
position
No
change
in
character
of
the
assets
quality,
liquidity
and
duration
unaffected
No
change
in
any
aspect
of
the
business
still
producing
excellent
returns
with
highly
liquid ownership
interests in individual mortgage loans of superior quality
4
Operating Leverage, Core Earnings Power & NIM
LHI/LHS Accounting |
![]() Financial Review
Loan Growth
Broad-based growth in traditional LHI (excluding Mortgage
Finance)
Growth of $435.1 million from Q3-2013 and $1.7 billion from
Q4-2012
Period end balance $343.7 million over average balance for the
quarter
Averages increased 5% from Q3-2013 and 22% from Q4-2012
Average MF balances consistent with objectives
Results well above industry trends demonstrate increase in market
position and managements focus on providing ongoing
income
Growth of 2% from 2012 and only modest decrease from Q3-2013
Q4-2013 expenses were largest factor in linked quarter earnings
change, including those associated with exceptional performance
and growth
Cost of long-term incentives increased $3.6 million ($0.06 per
share) resulting from unprecedented increase in stock price
from Q3-2013
Incentive true-up of $1.6 million (almost $0.03 per share) for
lines of business producing average of 20% increase in earnings
contribution from 2012
Build-out
expense
of
$0.02
per
share
related
to
exceptional
recruiting
in
Q3,
expansion
of
business
lines
and impact of lag in growth of support and infrastructure costs
associated with growth
For all of 2013, the unusual
items represented almost $20 million
5
Expense Management |
![]() Financial Review
Funding
Funding profile optimal with exceptional DDA and total deposit
growth
Average DDA increased 5% from Q3-2013 and 40% from
Q4-2012
Total average deposits increased 5% from Q3-2013 and 31% from
Q4-2012
Total deposit cost stable at 17 bps
Credit Costs
Total credit costs of $5.4 million for Q4-2013
Provision of $5.0 million consistent with Q3-2013
OREO valuation cost of $466,000 in Q4-2013 associated with 60%
reduction in total ORE balances
NCOs of 6 bps in Q4-2013 and 7 bps for all of 2013
Favorable trend in NPA ratio with $11.1 million (23%) decrease from
Q3-2013 6 |
![]() Income Statement -
Quarterly
7
Q4-13
Q3-13
Q2-13
Q1-13
Q4-12
Net interest income
$ 111,475
$ 108,776
$ 101,220
$ 98,042
$ 101,155
Non-interest income
11,184
10,431
11,128
11,281
12,836
Net revenue
122,659
119,207
112,348
109,323
113,991
Provision for credit losses
5,000
5,000
7,000
2,000
4,500
OREO valuation and write-down expense
466
-
382
71
955
Total provision and OREO valuation
5,466
5,000
7,382
2,071
5,455
Non-interest expense
69,825
62,009
68,352
55,629
59,119
Income before income taxes
47,368
52,198
36,614
51,623
49,417
Income tax expense
17,012
18,724
12,542
18,479
17,982
Net income
30,356
33,474
24,072
33,144
31,435
Preferred stock dividends
2,438
2,437
2,438
81
Net income available to common shareholders
$ 27,918
$ 31,037
$ 21,634
$ 33,063
$ 31,435
Diluted EPS
$ .67
$ .74
$ .52
$ .80
$ .76
Net interest margin
4.21%
4.21%
4.19%
4.27%
4.27%
ROA
1.10%
1.25%
0.95%
1.38%
1.27%
ROE
11.94%
13.74%
9.94%
15.82%
15.35%
Efficiency
(1)
56.9%
52.0%
60.8%
50.9%
51.9%
(1) Excludes OREO valuation charge
|
![]() Income Statement -
Annual
8
2013
2012
2011
2010
2009
Net interest income
$ 419,513
$ 376,879
$ 302,937
$ 241,674
$ 196,691
Non-interest income
44,024
43,040
32,232
32,263
29,260
Net revenue
463,537
419,919
335,169
273,937
225,951
Provision for credit losses
19,000
11,500
28,500
53,500
43,500
OREO valuation and write-down expense
920
6,883
6,798
8,504
7,809
Total provision and OREO valuation
19,920
18,383
35,298
62,004
51,309
Non-interest expense
255,814
212,961
181,403
154,984
137,733
Income before income taxes
187,803
188,575
118,468
56,949
36,909
Income tax expense
66,757
67,866
42,366
19,626
12,522
Net income
121,046
120,709
76,102
37,323
24,387
Preferred stock dividends
7,394
Net income available to common shareholders
$ 113,652
$ 120,709
$ 76,102
$ 37,323
$ 24,387
Diluted EPS
$ 2.72
$ 3.01
$ 1.99
$ 1.00
$ .56
Net interest margin
4.22%
4.41%
4.68%
4.28%
3.89%
ROA
1.17%
1.35%
1.12%
.63%
.46%
ROE
12.82%
16.93%
13.39%
7.23%
5.15%
Efficiency
(1)
55.2%
49.8%
54.1%
56.6%
61.0%
(1) Excludes OREO valuation charge
|
![]() QTD Average Balances, Yields and Rates
9
(in thousands)
Q4 2013
Q3 2013
Q4 2012
Avg. Bal.
Yield Rate
Avg. Bal.
Yield Rate
Avg. Bal.
Yield Rate
Assets
Securities
$ 65,067
4.25%
$ 71,717
4.25%
$103,483
4.55%
Fed funds sold & liquidity investments
158,594
.21%
167,613
.19%
91,503
.27%
Loans held for investment, mortgage finance
2,238,730
3.59%
2,362,118
3.79%
2,658,092
3.96%
Loans held for investment
8,142,569
4.73%
7,731,901
4.72%
6,662,817
4.79%
Total loans, net of reserve
10,297,290
4.52%
10,014,468
4.53%
9,246,997
4.59%
Total earning assets
10,520,951
4.45%
10,253,798
4.46%
9,441,983
4.55%
Total assets
$10,899,266
$10,637,766
$9,869,282
Liabilities and Stockholders
Equity
Total interest bearing deposits
$ 5,887,252
.26%
$ 5,612,874
.26%
$4,662,116
.28%
Other borrowings
314,018
.20%
539,767
.20%
1,725,129
.19%
Subordinated notes
111,000
6.58%
111,000
6.54%
12,065
6.56%
Long-term debt
113,406
2.21%
113,406
2.23%
113,406
2.33%
Total interest bearing liabilities
6,425,676
.40%
6,377,047
.40%
6,611,651
.40%
Demand deposits
3,289,307
3,124,602
2,356,758
Stockholders
equity
1,077,822
1,046,477
814,565
Total liabilities and stockholders
equity
$10,899,266
.24%
$10,637,766
.24%
$9,869,282
.27%
Net interest margin
4.21%
4.21%
4.27% |
![]() 10
YTD Average Balances, Yields and Rates
10
(in thousands)
2013
2012
Avg. Bal.
Yield Rate
Avg. Bal.
Yield Rate
Assets
Securities
$ 77,178
4.39%
$117,375
4.46%
Fed funds sold & liquidity investments
144,050
.21%
72,689
.30%
Loans held for investment, mortgage finance
2,342,149
3.75%
2,298,651
4.06%
Loans held for investment
7,471,676
4.73%
6,148,860
4.88%
Total loans, net of reserve
9,735,543
4.53%
8,375,424
4.70%
Total earning assets
9,956,771
4.47%
8,565,488
4.66%
Total assets
$10,348,404
$8,965,960
Liabilities and Stockholders
Equity
Total interest bearing deposits
$ 5,407,810
.26%
$4,459,836
.31%
Other borrowings
653,318
.19%
1,585,723
.20%
Subordinated notes
111,000
6.60%
30,934
6.58%
Long-term debt
113,406
2.24%
113,406
2.43%
Total interest bearing liabilities
6,285,534
.40%
6,189,899
.35%
Demand deposits
2,967,063
1,984,171
Stockholders
equity
1,001,215
713,190
Total liabilities and stockholders
equity
$10,348,404
.24%
$8,965,960
.24%
Net interest margin
4.22%
4.41% |
![]() Financial Summary
11
(in thousands)
QTD Averages
Q4 2013
Q3 2013
Q4 2012
Q4/Q3 %
Change
YOY %
Change
Total assets
$10,899,266
$10,637,766
$9,869,282
2%
10%
Loans held for investment
8,142,569
7,731,901
6,662,817
5%
22%
Loans held for investment, mortgage finance
2,238,730
2,362,118
2,658,092
(5)%
(16)%
Total loans
10,381,299
10,094,019
9,320,909
3%
11%
Securities
65,067
71,717
103,483
(9)%
(37)%
Demand deposits
3,289,307
3,124,602
2,356,758
5%
40%
Total deposits
9,176,559
8,737,476
7,018,874
5%
31%
Stockholders
equity
1,077,822
1,046,477
814,565
3%
32% |
![]() 12
Financial Summary
12
(in thousands)
YTD Averages
2013
2012
YOY % Change
Total assets
$10,348,404
$8,965,961
15%
Loans held for investment
7,471,676
6,148,860
22%
Loans held for investment, mortgage finance
2,342,149
2,298,651
2%
Total loans
9,813,825
8,447,511
16%
Securities
77,178
117,375
(34)%
Demand deposits
2,967,063
1,984,171
50%
Total deposits
8,374,873
6,444,007
30%
Stockholders
equity
1,001,215
713,190
40% |
![]() Financial Summary
13
(in thousands)
Period End
Q4 2013
Q3 2013
Q4 2012
Q4/Q3 %
Change
YOY %
Change
Total assets
$11,714,397
$10,797,448
$10,540,542
8%
11%
Loans held for investment
8,486,309
8,051,328
6,785,535
5%
25%
Loans held for investment, mortgage finance
2,784,265
2,262,085
3,175,272
23%
(12)%
Total loans
11,270,574
10,313,413
9,960,807
9%
13%
Securities
63,214
67,815
100,195
(7)%
(37)%
Demand deposits
3,347,567
3,242,060
2,535,375
3%
32%
Total deposits
9,257,379
8,957,081
7,440,804
3%
24%
Stockholders
equity
1,096,350
1,066,629
836,242
3%
31% |
![]() 14
Revenue and Income Growth
Operating Revenue CAGR: 22%
Net Interest
Income CAGR:
23%
Non-interest Income CAGR: 14%
Non-interest Expense CAGR: 18%
Net Income CAGR: 37%
($ in thousands)
Note:
Excludes OREO valuation charge for YTD 2013, 2012, 2011 and
2010. |
![]() 15
EPS Growth
5 Year EPS CAGR: 27%
^Excludes $.15 effect of preferred TARP dividend during 2009. Reported
EPS was $0.56. |
![]() 16
Demand Deposit CAGR: 42%
Total Deposit CAGR: 23%
Loans Held for Investment* CAGR: 16%
Deposit and Loan Growth
($ in millions)
* Excludes MF loans. |
![]() Loan Portfolio Statistics
17
Non-accrual loans
Commercial
$ 12,896
Construction
705
Real estate
18,670
Consumer
54
Equipment leases
50
Total non-accrual loans
32,375
Non-accrual loans as % of
loans excluding MF
.38%
Non-accrual loans as % of
total loans
.29%
OREO
5,110
Total Non-accruals +
OREO
37,485
Non-accrual loans + OREO
as % of loans excluding MF
+ OREO
.44%
Total Loans $11,270,574
All numbers in thousands.
Loan Collateral by Type 12/31/13 |
![]() Credit Quality
Improved Credit Trends
Total credit cost of $5.4 million for Q4-2013, compared to $ 5.0
million in Q3-2013 and $5.5 million in Q4-2012
Provision of $5.0 million for Q4-2013 compared to $5.0 million for
Q3-2013 and $4.5 million in Q4-2012
NCOs $1.3 million (6 bps) in Q4-2013 compared to 0 bps in
Q3-2013 and 21 bps in Q4- 2012; NCO ratio of 7 bps for
YTD
OREO valuation charge of $466,000 in Q4-2013 compared to none in
Q3-2013 and $955,000 in Q4-2012
NPA ratio continues to decline
Reduction of $11.1 million (23%) from Q3-2013 and $34.4 million
(48%) from Q4-2012
NPA ratio of .44% compared to .60% in Q3-2013 and 1.06% in
Q4-2012
NPLs at $32.4 million, down $3.4 million from Q3-2013 and down
$23.5 million from Q4-2012
NPL ratio at .29% of total loans and .38% of LHI excluding MF
loans
OREO reduction of $7.7 (60%) from Q3-2013 and $10.9 million (68%)
from Q4-2012 18 |
![]() 19
Credit Quality
Net Charge-offs / Average Loans*
* Excludes MF loans.
Combined reserve /
Loans
*
1.09%
1.15%
1.31%
1.56%
1.59%
Non-accrual loans +
OREO to loans
*
+
OREO
.44%
1.06%
1.58%
3.25%
2.74%
Combined reserve to
non-accruals
2.7x
1.3x
1.3x
.6x
.7x |
![]() Closing Comments
Strong core
earnings
power,
profitability
and
growth
to
continue
in
2014
Credit continues positive trend
Strong LHI pipeline and new commitments present opportunity for growth
potential
Producers in place for 2014 growth
Building more liquidity in 2014 which will impact NIM
Mortgage finance average balances to be down in 2014 but outperform
the industry
Improving capital position with capital raise to support growth
20 |
![]() Q&A
21 |
Exhibit 99.3
TEXAS CAPITAL BANCSHARES, INC.
CONSOLIDATED STATEMENTS OF CASH FLOWS (UNAUDITED)
(In thousands) (2010, 2011, 2012 corrected)
Year ended December 31 | ||||||||||||||||
2013 | 2012 | 2011 | 2010 | |||||||||||||
Operating activities |
||||||||||||||||
Net income from continuing operations |
$ | 121,046 | $ | 120,709 | $ | 76,102 | $ | 37,323 | ||||||||
Adjustments to reconcile net income from continuing operations to net cash used in operating activities: |
||||||||||||||||
Provision for credit losses |
19,000 | 11,500 | 28,500 | 53,500 | ||||||||||||
Deferred tax benefit/(expense) |
(11,599 | ) | (3,131 | ) | (6,682 | ) | (5,613 | ) | ||||||||
Depreciation and amortization |
5,382 | 4,782 | 5,364 | 6,821 | ||||||||||||
Amortization and accretion on securities |
22 | 38 | 78 | 139 | ||||||||||||
Bank owned life insurance (BOLI) income |
(1,917 | ) | (2,168 | ) | (2,095 | ) | (1,889 | ) | ||||||||
Stock-based compensation expense |
20,953 | 12,018 | 7,340 | 6,770 | ||||||||||||
Tax benefit from stock option exercises |
1,200 | 7,769 | 3,139 | 621 | ||||||||||||
Excess tax benefits from stock-based compensation arrangements |
(3,427 | ) | (22,197 | ) | (8,970 | ) | (1,774 | ) | ||||||||
(Gain) loss on sale of assets |
(931 | ) | (917 | ) | (80 | ) | 93 | |||||||||
Changes in operating assets and liabilities: |
||||||||||||||||
Accrued interest receivable and other assets |
37,100 | (56,679 | ) | (59,508 | ) | (24,287 | ) | |||||||||
Accrued interest payable and other liabilities |
2,308 | 3,066 | 32,694 | 25,207 | ||||||||||||
|
|
|
|
|
|
|
|
|||||||||
Net cash used in operating activities of continuing operations |
189,137 | 74,790 | 75,882 | 96,911 | ||||||||||||
Net cash provided by/(used in) operating activities of discontinued operations |
13 | 54 | (29 | ) | (128 | ) | ||||||||||
|
|
|
|
|
|
|
|
|||||||||
Net cash used in operating activities |
189,150 | 74,844 | 75,853 | 96,783 | ||||||||||||
Investing activities |
||||||||||||||||
Purchases of available-for-sale securities |
(2 | ) | (13 | ) | (10,000 | ) | | |||||||||
Maturities and calls of available-for-sale securities |
15,890 | 14,260 | 8,240 | 4,425 | ||||||||||||
Principal payments received on available-for-sale securities |
18,542 | 27,000 | 42,421 | 74,895 | ||||||||||||
Originations of mortgage finance loans |
(51,087,328 | ) | (51,110,692 | ) | (27,234,509 | ) | (22,859,900 | ) | ||||||||
Proceeds from pay-offs of mortgage finance loans |
51,478,335 | 50,015,503 | 26,348,634 | 22,359,195 | ||||||||||||
Net increase in loans held for investment, excluding mortgage finance loans |
(1,706,505 | ) | (1,220,626 | ) | (890,753 | ) | (303,618 | ) | ||||||||
Purchase of premises and equipment, net |
(4,029 | ) | (3,538 | ) | (3,286 | ) | (3,832 | ) | ||||||||
Proceeds from sale of foreclosed assets |
11,667 | 14,921 | 23,329 | 5,980 | ||||||||||||
Cash paid for acquisition |
(2,445 | ) | | (11,482 | ) | (10,152 | ) | |||||||||
|
|
|
|
|
|
|
|
|||||||||
Net cash used in investing activities of continuing operations |
(1,275,875 | ) | (2,263,185 | ) | (1,727,406 | ) | (733,007 | ) | ||||||||
Financing activities |
||||||||||||||||
Net increase in deposits |
1,816,575 | 1,884,547 | 100,856 | 1,334,676 | ||||||||||||
Proceeds from issuance of stock related to stock-based awards and warrants |
(2,210 | ) | 355 | 2,190 | 866 | |||||||||||
Proceeds from issuance of common stock |
| 86,987 | | 12,477 | ||||||||||||
Proceeds from issuance of preferred stock |
144,987 | | | | ||||||||||||
Preferred dividends paid |
(6,960 | ) | | | | |||||||||||
Net increase (decrease) in other borrowings |
(797,002 | ) | 318,115 | 1,341,761 | (362,404 | ) | ||||||||||
Excess tax benefits from stock-based compensation arrangements |
3,427 | 22,197 | 8,970 | 1,774 | ||||||||||||
Net increase (decrease) in federal funds purchased |
(124,529 | ) | (139,070 | ) | 128,468 | (296,738 | ) | |||||||||
Issuance of subordinated notes |
| 111,000 | | | ||||||||||||
|
|
|
|
|
|
|
|
|||||||||
Net cash provided by financing activities of continuing operations |
1,034,288 | 2,284,131 | 1,582,245 | 690,651 | ||||||||||||
|
|
|
|
|
|
|
|
|||||||||
Net increase (decrease) in cash and cash equivalents |
(52,437 | ) | 95,790 | (69,308 | ) | 54,427 | ||||||||||
Cash and cash equivalents at beginning of period |
206,348 | 110,558 | 179,866 | 125,439 | ||||||||||||
|
|
|
|
|
|
|
|
|||||||||
Cash and cash equivalents at end of period |
$ | 153,911 | $ | 206,348 | $ | 110,558 | $ | 179,866 | ||||||||
|
|
|
|
|
|
|
|
|||||||||
Supplemental disclosures of cash flow information: |
||||||||||||||||
Cash paid during the period for interest |
$ | 24,962 | $ | 21,527 | $ | 20,643 | $ | 38,025 | ||||||||
Cash paid during the period for income taxes |
77,635 | 69,095 | 32,127 | 27,134 | ||||||||||||
Transfers from loans/leases to OREO and other repossessed assets |
1,331 | 3,489 | 24,327 | 29,559 |
See accompanying notes to consolidated financial statements.
EXHIBIT 99.3 SUPPLEMENTAL DATA (unaudited)
SELECTED CONSOLIDATED FINANCIAL DATA (corrected)(unaudited)
2012 | 2011 | 2010 | 2009 | 2008 | ||||||||||||||||
(In thousands, except per share, average share and percentage data) | ||||||||||||||||||||
Consolidated Balance Sheet Data (1) |
||||||||||||||||||||
Total assets (2) |
$ | 10,540,542 | $ | 8,137,225 | $ | 6,445,679 | $ | 5,698,318 | $ | 5,141,034 | ||||||||||
Loans held for investment, mortgage finance loans |
3,175,272 | 2,080,081 | 1,194,209 | 693,504 | 496,351 | |||||||||||||||
Loans held for investment |
6,785,535 | 5,572,371 | 4,711,130 | 4,457,293 | 4,027,871 | |||||||||||||||
Loans held for sale from discontinued operations |
302 | 393 | 490 | 586 | 648 | |||||||||||||||
Securities available-for-sale |
100,195 | 143,710 | 185,424 | 266,128 | 378,752 | |||||||||||||||
Demand deposits |
2,535,375 | 1,751,944 | 1,451,307 | 899,492 | 587,161 | |||||||||||||||
Total deposits |
7,440,804 | 5,556,257 | 5,455,401 | 4,120,725 | 3,333,187 | |||||||||||||||
Federal funds purchased |
273,179 | 412,249 | 283,781 | 580,519 | 350,155 | |||||||||||||||
Other borrowings |
1,673,982 | 1,355,867 | 14,106 | 376,510 | 930,452 | |||||||||||||||
Subordinated notes |
111,000 | | | | | |||||||||||||||
Trust preferred subordinated debentures |
113,406 | 113,406 | 113,406 | 113,406 | 113,406 | |||||||||||||||
Stockholders equity |
836,242 | 616,331 | 528,319 | 481,360 | 387,073 | |||||||||||||||
Selected Financial Ratios (3) |
||||||||||||||||||||
Asset Quality Ratios |
||||||||||||||||||||
Net charge-offs (recoveries) to average loans |
0.07 | % | 0.47 | % | 0.95 | % | 0.41 | % | 0.35 | % | ||||||||||
Net charge-offs (recoveries) to average loans excluding mortgage finance loans |
0.10 | % | 0.58 | % | 1.14 | % | 0.46 | % | 0.35 | % | ||||||||||
Reserve for loan losses to loans held for investment |
0.75 | % | 0.92 | % | 1.21 | % | 1.32 | % | 1.00 | % | ||||||||||
Reserve for loan losses to loans held for investment excluding mortgage finance loans |
1.10 | % | 1.26 | % | 1.52 | % | 1.52 | % | 1.13 | % | ||||||||||
Reserve for loan losses to non-accrual loans |
1.3x | 1.3x | .6x | .7x | 1.0x | |||||||||||||||
Non-accrual loans to loans |
0.56 | % | 0.71 | % | 1.90 | % | 1.86 | % | 1.05 | % | ||||||||||
Non-accrual loans to loans excluding mortgage finance loans |
0.82 | % | 0.98 | % | 2.38 | % | 2.15 | % | 1.18 | % | ||||||||||
Total NPAs to loans plus OREO |
0.72 | % | 1.17 | % | 2.60 | % | 2.38 | % | 1.61 | % | ||||||||||
Total NPAs to loans excluding mortgage finance loans plus OREO |
1.06 | % | 1.61 | % | 3.26 | % | 2.74 | % | 1.81 | % |
(1) | The consolidated statement of operating data and consolidated balance sheet data presented above for the five most recent fiscal years ended December 31, have been derived from our audited consolidated financial statements. The historical results are not necessarily indicative of the results to be expected in any future period. |
(2) | From continuing operations. |
(3) | Mortgage finance loans were previously classified as loans held for sale but have been reclassified as loans held for investment. The indicated ratios are presented with and excluding the mortgage finance loans because the risk profile of our mortgage finance loans is different than our other loans held for investment. No provision for credit losses is allocated to these loans based on the internal risk grade assigned. |
Consolidated Daily Average Balances, Average Yields and Rates (corrected)
2012 | 2011 | 2010 | ||||||||||||||||||||||||||||||||||
Average Balance |
Revenue / Expense(1) |
Yield / Rate |
Average Balance |
Revenue / Expense(1) |
Yield / Rate |
Average Balance |
Revenue / Expense(1) |
Yield / Rate |
||||||||||||||||||||||||||||
Assets |
||||||||||||||||||||||||||||||||||||
SecuritiesTaxable |
$ | 90,796 | $ | 3,681 | 4.05 | % | $ | 123,124 | $ | 5,186 | 4.21 | % | $ | 183,363 | $ | 8,023 | 4.38 | % | ||||||||||||||||||
SecuritiesNon-taxable(2) |
26,579 | 1,550 | 5.83 | % | 33,996 | 1,957 | 5.76 | % | 39,360 | 2,243 | 5.70 | % | ||||||||||||||||||||||||
Federal funds sold |
11,497 | 13 | 0.11 | % | 21,897 | 37 | 0.17 | % | 112,716 | 210 | 0.19 | % | ||||||||||||||||||||||||
Deposits in other banks |
61,192 | 208 | 0.34 | % | 107,734 | 352 | 0.33 | % | 47,365 | 116 | 0.24 | % | ||||||||||||||||||||||||
Loans held for investment, mortgage finance loans |
2,298,651 | 93,275 | 4.06 | % | 1,210,954 | 53,940 | 4.45 | % | 883,033 | 41,808 | 4.73 | % | ||||||||||||||||||||||||
Loans held for investment |
6,148,860 | 300,273 | 4.88 | % | 5,059,134 | 260,813 | 5.16 | % | 4,475,668 | 228,195 | 5.10 | % | ||||||||||||||||||||||||
Less reserve for loan losses |
72,087 | | | 67,888 | | | 71,942 | | | |||||||||||||||||||||||||||
|
|
|
|
|
|
|
|
|
|
|
|
|
|
|
|
|
|
|||||||||||||||||||
Loans, net |
8,375,424 | 393,548 | 4.70 | % | 6,202,200 | 314,753 | 5.07 | % | 5,286,759 | 270,003 | 5.11 | % | ||||||||||||||||||||||||
|
|
|
|
|
|
|
|
|
|
|
|
|
|
|
|
|
|
|||||||||||||||||||
Total earning assets |
8,565,488 | 399,000 | 4.66 | % | 6,488,951 | 322,285 | 4.97 | % | 5,669,563 | 280,595 | 4.95 | % | ||||||||||||||||||||||||
Cash and other assets |
400,472 | 330,137 | 281,448 | |||||||||||||||||||||||||||||||||
|
|
|
|
|
|
|||||||||||||||||||||||||||||||
Total assets |
$ | 8,965,960 | $ | 6,819,088 | $ | 5,951,011 | ||||||||||||||||||||||||||||||
|
|
|
|
|
|
|||||||||||||||||||||||||||||||
Liabilities and stockholders equity |
||||||||||||||||||||||||||||||||||||
Transaction deposits |
$ | 752,040 | $ | 829 | 0.11 | % | $ | 391,100 | $ | 195 | 0.05 | % | $ | 437,674 | $ | 974 | 0.22 | % | ||||||||||||||||||
Savings deposits |
2,765,089 | 8,674 | 0.31 | % | 2,401,997 | 7,797 | 0.32 | % | 2,142,541 | 15,777 | 0.74 | % | ||||||||||||||||||||||||
Time deposits |
530,816 | 2,775 | 0.52 | % | 562,654 | 5,231 | 0.93 | % | 913,616 | 11,707 | 1.28 | % | ||||||||||||||||||||||||
Deposits in foreign branches |
411,891 | 1,366 | 0.33 | % | 490,703 | 1,727 | 0.35 | % | 401,155 | 4,851 | 1.21 | % | ||||||||||||||||||||||||
|
|
|
|
|
|
|
|
|
|
|
|
|
|
|
|
|
|
|||||||||||||||||||
Total interest bearing deposits |
4,459,836 | 13,644 | 0.31 | % | 3,846,454 | 14,950 | 0.39 | % | 3,894,986 | 33,309 | 0.86 | % | ||||||||||||||||||||||||
Other borrowings |
1,585,723 | 3,141 | 0.20 | % | 723,172 | 1,140 | 0.16 | % | 280,899 | 1,155 | 0.41 | % | ||||||||||||||||||||||||
Subordinated notes |
30,934 | 2,037 | 6.58 | % | | | | | | | ||||||||||||||||||||||||||
Trust preferred subordinated debentures |
113,406 | 2,756 | 2.43 | % | 113,406 | 2,573 | 2.27 | % | 113,406 | 3,672 | 3.24 | % | ||||||||||||||||||||||||
|
|
|
|
|
|
|
|
|
|
|
|
|
|
|
|
|
|
|||||||||||||||||||
Total interest bearing liabilities |
6,189,899 | 21,578 | 0.35 | % | 4,683,032 | 18,663 | 0.40 | % | 4,289,291 | 38,136 | 0.89 | % | ||||||||||||||||||||||||
Demand deposits |
1,984,171 | 1,515,021 | 1,116,260 | |||||||||||||||||||||||||||||||||
Other liabilities |
78,700 | 52,888 | 29,492 | |||||||||||||||||||||||||||||||||
Stockholders equity |
713,190 | 568,147 | 515,968 | |||||||||||||||||||||||||||||||||
|
|
|
|
|
|
|||||||||||||||||||||||||||||||
Total liabilities and stockholders equity |
$ | 8,965,960 | $ | 6,819,088 | $ | 5,951,011 | ||||||||||||||||||||||||||||||
|
|
|
|
|
|
Exhibit 99.4
EXHIBIT 99.4 | RISK FACTORS |
An investment in our common stock, preferred stock or debt securities involves risks that you should carefully consider. The following discussion, along with managements discussion and analysis and our financial statements and footnotes, sets forth the most significant risks and uncertainties that we believe could adversely affect our business, financial condition or results of operations. Additional risks and uncertainties that management is not aware of or that management currently deems immaterial may also have a material adverse effect on our business, financial condition or results of operations. There is no assurance that this discussion covers all potential risks that we face. The occurrence of the described risks could cause our results to differ materially from those described in our forward-looking statements included elsewhere in this report, and could result in the loss of some or all of your investment.
Risk Factors Associated With Our Business
We must effectively manage our credit risk. The risk of non-payment of loans is inherent in commercial banking. Increased credit risk may result from several factors, including adverse changes in economic and industry conditions, declines in the value of collateral and risks related to individual borrowers. We rely heavily on information provided by third parties when originating and monitoring loans. If this information is intentionally or negligently misrepresented and we do not detect such misrepresentations, the credit risk associated with the transaction may be increased. Although we attempt to manage our credit risk by carefully monitoring the concentration of our loans within specific loan categories and industries and through prudent loan approval and monitoring practices in all categories of our lending, we cannot assure you that our approval and monitoring procedures will reduce these lending risks. If our credit administration personnel, policies and procedures are not able to adequately adapt to changes in economic or other conditions that affect customers and the quality of the loan portfolio, we may incur increased losses that could adversely affect our financial results.
A significant portion of our assets consists of commercial loans. We generally invest a greater proportion of our assets in commercial loans to business customers than other banking institutions of our size, and our business plan calls for continued efforts to increase our assets invested in these loans. At December 31, 2013, approximately 44% of our loan portfolio was comprised of commercial loans. Commercial loans may involve a higher degree of credit risk than other types of loans due, in part, to their larger average size, the effects of changing economic conditions on the businesses of our commercial loan customers, the dependence of borrowers on operating cash flow to service debt and our reliance upon collateral which may not be readily marketable. Due to the proportionate amount of these commercial loans in our portfolio, losses incurred on a relatively small number of commercial loans could have a materially adverse impact on our results of operations and financial condition.
A significant portion of our loans are secured by commercial and residential real estate. At December 31, 2013, approximately 30% of our loan portfolio was comprised of loans with real estate as the primary component of collateral. Our real estate lending activities, and our exposure to fluctuations in real estate collateral values, are significant and expected to increase as our assets increase. The market value of real estate can fluctuate significantly in a relatively short period of time as a result of market conditions in the geographic area in which the real estate is located. If the value of real estate serving as collateral for our loans declines materially, a significant part of our loan portfolio could become under-collateralized and losses incurred upon borrower defaults would increase. Conditions in certain segments of the real estate industry, including homebuilding, lot development and mortgage lending, may have an effect on values of real estate pledged as collateral for our loans. The inability of purchasers of real estate, including residential real estate, to obtain financing may weaken the financial condition of our borrowers who are dependent on the sale or refinancing of property to repay their loans.
We must maintain an adequate allowance for loan losses. Our experience in the banking industry indicates that some portion of our loans will become delinquent, and some may only be partially repaid or may never be repaid at all. We maintain an allowance for loan losses, which is a reserve established through a provision for loan losses charged to expense each quarter, that is consistent with managements assessment of the collectability of the loan portfolio in light of the amount of loans committed and outstanding and current economic conditions and market trends. When specific loan losses are identified, the amount of the expected loss is removed, or charged-off, from the allowance. Our methodology for establishing the adequacy of the allowance for loan losses depends on our subjective application of risk grades as indicators of each borrowers ability to repay the loan.
If our assessment of future losses is inaccurate, or economic and market conditions or the borrowers financial performance experience material unanticipated changes, the allowance may become inadequate, requiring larger provisions for loan losses that can materially decrease our earnings. Certain of our loans individually represent a significant percentage of our total allowance for loan losses. Adverse collection experience in a relatively small number of these loans could require an increase in the provision for loan losses. Federal regulators periodically review our allowance for loan losses and, based on their judgments, which may be different than ours, may require us to change classifications or grades of loans, increase the allowance for loan losses and recognize further loan charge-offs. Any increase in the allowance for loan losses or in the amount of loan charge-offs required by these regulatory agencies could have a negative effect on our results of operations and financial condition.
We must effectively manage our interest rate risk. Our profitability is dependent to a large extent on our net interest income, which is the difference between the interest income paid to us on our loans and investments and the interest we pay to third parties such as our depositors, lenders and debtholders. Changes in interest rates can impact our profits and the fair values of certain of our assets and liabilities. Prolonged periods of unusually low interest rates may have an adverse effect on our earnings by reducing yields on loans and other earning assets. Increases in market interest rates may reduce our customers desire to borrow money from us or adversely affect their ability to repay their outstanding loans by increasing their debt service obligations through the periodic reset of adjustable interest rate loans. If our borrowers ability to pay their loans is impaired by increasing interest payment obligations, our level of non-performing assets would increase, producing an adverse effect on operating results. Increases in interest rates can have a material impact on the volume of mortgage originations and refinancings, adversely affecting the profitability of our mortgage finance business. Interest rate risk can also result from mismatches between the dollar amounts of repricing or maturing assets and liabilities and from mismatches in the timing and rates at which our assets and liabilities reprice. We actively monitor and manage the balances of our maturing and repricing assets and liabilities to reduce the adverse impact of changes in interest rates, but there can be no assurance that we will be able to avoid material adverse effects on our net interest margin in all market conditions.
Federal prohibitions on the ability of financial institutions to pay interest on demand deposit accounts were repealed in 2011 by the Dodd-Frank Act. This change has had limited impact to date due to the excess of commercial liquidity and the very low rate environment in recent years. There can be no assurance that we will not be materially adversely affected in the future if economic activity increases and interest rates rise, which may result in our interest expense increasing, and our net interest margin decreasing, if we must offer interest on demand deposits to attract or retain customer deposits.
We must effectively execute our business strategy in order to continue our asset and earnings growth. Our core strategy is to develop our business principally through organic growth. Our prospects for continued growth must be considered in light of the risks, expenses and difficulties frequently encountered by companies seeking to realize significant growth. In order to execute our growth strategy successfully, we must, among other things:
| continue to identify and expand into suitable markets and lines of business, in Texas, regionally and nationally; |
-2-
| develop new products and services and execute our full range of products and services more efficiently and effectively; |
| attract and retain qualified bankers in each of our targeted markets to build our customer base; |
| expand our loan portfolio while maintaining credit quality; |
| attract sufficient deposits and capital to fund our anticipated loan growth; |
| control expenses; and |
| maintain sufficient qualified staffing and infrastructure to support growth and compliance with increasing regulatory requirements. |
Failure to effectively execute our business strategy could have a material adverse effect on our business, future prospects, financial condition or results of operations.
Our future profitability depends, to a significant extent, upon our middle market business customers. Our future profitability depends, to a significant extent, upon revenue we receive from middle market business customers, and their ability to continue to meet their loan obligations. Adverse economic conditions or other factors affecting this market segment may have a greater adverse effect on us than on other financial institutions that have a more diversified customer base.
Our business is concentrated in Texas. A substantial majority of our customers are located in Texas. As a result, our financial condition and results of operations may be strongly affected any prolonged period of economic recession or other adverse business, economic or regulatory conditions affecting Texas businesses and financial institutions.
Our growth plans are dependent on the availability of capital and funding. Our historical ability to raise capital through the sale of capital stock and debt securities may be affected by economic and market conditions or regulatory changes that are beyond our control. Adverse changes in our operating performance or financial condition could make raising additional capital difficult or more expensive or limit our access to customary sources of funding, including inter-bank borrowings, repurchase agreements and borrowings from the Federal Reserve Bank of Dallas or the Federal Home Loan Bank. We cannot offer assurance that capital will be available to us in the future, upon acceptable terms or at all. Our efforts to raise capital could require the issuance of securities at times and with maturities, conditions and rates that are disadvantageous, and which could have a dilutive impact on our current stockholders. Factors that could adversely affect our ability to raise additional capital include conditions in the capital markets, our financial performance, regulatory actions and general economic conditions. Increases in our cost of capital, including increased interest or dividend requirements, could have a direct adverse impact on our operating performance and our ability to achieve our growth objectives. Trust preferred securities are no longer a viable as a source of new long-term debt capital as a result of regulatory changes. The treatment of our existing trust preferred securities as capital may be subject to further regulatory change prior to their maturity, which could require the Company to seek additional capital.
We must effectively manage our liquidity risk. Our bank requires available funds (liquidity) to meet its deposit, debt and other obligations as they come due as well as unexpected demands for cash payments. Our banks principal source of funding consists of customer deposits. A substantial majority of our banks liabilities consist of demand, savings, interest checking and money market deposits, which are payable on demand or upon several days notice. By comparison, a substantial portion of our assets are loans, most of which, excluding our mortgage finance loans, cannot be collected or sold in so short a time frame, creating the potential for an imbalance in the availability of liquid assets to satisfy depositors and loan
-3-
funding requirements. We hold smaller balances of marketable securities than many of our competitors, limiting our ability to increase our liquidity by completing market sales of these assets. An inability to raise funds through deposits, borrowings, the sale of securities and loans and other sources, including our access to capital market transactions, could have a substantial negative effect on our banks liquidity. We actively manage our available sources of funds to meet our expected needs under normal and financially stressed conditions, but there is no assurance that our bank will be able to meet funding commitments to borrowers and replace maturing deposits and advances as necessary under all possible circumstances. Our banks ability to obtain funding could be impaired by factors beyond its control, such as disruptions in financial markets, negative expectations regarding the financial services industry generally or in our markets or negative perceptions of our bank.
Our bank sources a significant volume of its demand deposits from financial services companies and other commercial sources, resulting in a smaller number of larger deposits than would be typical of other banks in our markets. In recent periods over half of our total deposits have been attributable to customers whose balances exceed the $250,000 FDIC insurance limit. Many of these customers actively monitor our financial condition and results of operations and could withdraw their deposits quickly upon the occurrence of a material adverse development affecting our bank. One potential source of liquidity for our bank consists of brokered deposits arranged by brokers acting as intermediaries, typically larger money-center financial institutions. We have significant balances of other deposits defined for regulatory purposes to be brokered deposits, including deposits provided by certain of our customers in connection with our delivery of other financial services to them or their customers. If we do not maintain our regulatory capital above the level required to be well capitalized FDIC consent would be required for us to continue to obtain deposits classified as brokered deposits. Our non-traditional deposits are subject to greater operational and reputational risk of unexpected withdrawal than traditional demand and time deposits, particularly those provided by consumers. See Managements Discussion and Analysis of Financial Condition and Results of Operations below for further discussion of our liquidity.
We must be effective in developing and executing new lines of business and new products and services while managing associated risks. Our business strategy requires that we develop and grow new lines of business and offer new products and services within existing lines of business in order to compete successfully and realize our growth objections. Substantial costs, risks and uncertainties are associated with these efforts, particularly in instances where the markets are not fully developed. Developing and marketing new activities requires that we invest significant time and resources before revenues and profits can be realized. Timetables for the development and launch of new activities may not be achieved and price and profitability targets may not prove feasible. External factors, such as compliance with regulations, competitive alternatives and shifting market preferences, may also adversely impact the successful execution of new activities. New activities necessarily entail additional risks and may present additional risks to the effectiveness of our system of internal controls. All service offerings, including current offerings and new activities, may become more risky due to changes in economic, competitive and market conditions beyond our control. Failure to successfully manage these risks in the development and implementation of new lines of business or new products or services could have a material adverse effect on our business, results of operations and financial condition.
We must continue to attract and retain key personnel. Our success depends to a significant extent upon our ability to attract and retain experienced bankers in each of our markets. Competition for the best people in our industry can be intense, and there is no assurance that we will continue to have the same level of success in this effort that has supported our historical results. Factors that affect our ability to attract and retain key employees include our compensation and benefits programs, our profitability and our reputation for rewarding and promoting qualified employees. The cost of employee compensation is a significant portion of our operating expenses and can materially impact our results of operations. The unanticipated loss of the services of key personnel could have an adverse effect on our business. Although we have entered into employment agreements with certain key employees, we cannot assure you that we will be successful in retaining them.
-4-
Our business faces unpredictable economic and business conditions. Our business is directly impacted by general economic and business conditions in the United States and abroad. The credit quality of our loan portfolio necessarily reflects, among other things, the general economic conditions in the areas in which we conduct our business. Our continued financial success can be affected by other factors that are beyond our control, including:
| national, regional and local economic conditions; |
| general economic consequences of international conditions, such as weakness in European sovereign debt and the impact of that weakness on the US and global economies; |
| legislative and regulatory changes impacting our industry; |
| the financial health of our customers and economic conditions affecting them and the value of our collateral, including changes in the price of energy and other commodities; |
| the incidence of fraud, illegal payments, security breaches and other illegal acts among or impacting our bank and our customers; |
| structural changes in the markets for origination, sale and servicing of residential mortgages; |
| changes in governmental economic and regulatory policies generally, including the extent and timing of intervention in credit markets by the Federal Reserve Board or withdrawal from that intervention; |
| changes in the availability of liquidity at a systemic level; and |
| material inflation or deflation. |
Substantial deterioration in any of the foregoing conditions, including continuation of weak economic recovery and employment growth in recent years, can have a material adverse effect on our prospects and our results of operations and financial condition. There is no assurance that we will be able to sustain our historical rate of growth or our profitability. Our banks customer base is primarily commercial in nature, and our bank does not have a significant retail branch network or retail consumer deposit base. In periods of economic downturn, business and commercial deposits may be more volatile than traditional retail consumer deposits. As a result, our financial condition and results of operations could be adversely affected to a greater degree by these uncertainties than our competitors who have a larger retail customer base.
We compete with many larger banks and other financial service providers. Competition among providers of financial services in our markets, in Texas, regionally and nationally, is intense. We compete with other financial and bank holding companies, state and national commercial banks, savings and loan associations, consumer finance companies, credit unions, securities brokerages, insurance companies, mortgage banking companies, money market mutual funds, asset-based non-bank lenders, government sponsored or subsidized lenders and other financial services providers. Many of these competitors have substantially greater financial resources, lending limits and larger branch networks than we do, and are able to offer a broader range of products and services than we can, including systems and services that could protect customers from cyber threats. We are increasingly faced with competition in many of our products and services by non-bank providers who may have competitive advantages of size, access to potential customers and fewer regulatory requirements. Failure to compete effectively for deposit, loan and other banking customers in our markets could cause us to lose market share, slow our growth rate or suffer adverse effects on our financial condition and results of operations.
-5-
Our accounting estimates and risk management processes rely on management judgment, which may be supported by analytical and forecasting models. The processes we use to estimate probable credit losses for purposes of establishing the allowance for loan losses and to measure the fair value of financial instruments, as well as the processes we use to estimate the effects of changing interest rates and other market measures on our financial condition and results of operations, depend upon managements judgment. Managements judgment and the data relied upon by management may be based on assumptions that prove to be inaccurate, particularly in times of market stress or other unforeseen circumstances. Even if the relevant factual assumptions are accurate, our decisions may prove to be inadequate or inaccurate because of other flaws in the design or use of analytical tools used by management. Any such failures in our processes for producing accounting estimates and managing risks could have a material adverse effect on our business, financial condition and results of operations.
We are dependent on funds obtained from capital transactions or from our bank to fund our obligations. We are a financial holding company engaged in the business of managing, controlling and operating our bank. We conduct no material business or other activity at the parent company level other than activities incidental to holding equity and debt investments in our bank. As a result, we rely on the proceeds of capital transactions and payments of interest and principal on loans made to our bank to pay our operating expenses, to satisfy our obligations to debtholders and to pay dividends on our preferred stock. We may in the future rely on dividends from our bank to satisfy all or part of our parent company financial obligations. Our banks ability to pay dividends may be limited. The profitability of our bank is subject to fluctuation based upon, among other things, the cost and availability of funds, changes in interest rates and economic conditions in general. Our banks ability to pay dividends to us is subject to regulatory limitations that can, under certain adverse circumstances, prohibit the payment of dividends to us by our bank. Our right to participate in any distribution from the sale or liquidation of our bank is subject to the prior claims of our banks creditors. If we are unable to access funds from capital transactions or our bank we may be unable to satisfy our obligations to creditors or debtholders or pay dividends on our preferred stock.
We must effectively manage our counterparty risk. Financial services institutions are interrelated as a result of trading, clearing, counterparty and other relationships. Our bank has exposure to many different industries and counterparties, and routinely executes transactions with counterparties in the financial services industry, including commercial banks, brokers and dealers, investment banks, and other institutional clients. Many of these transactions expose our bank to credit risk in the event of a default by a counterparty or client. In addition, our banks credit risk may be increased when the collateral it is entitled to cannot be realized upon or is liquidated at prices not sufficient to recover the full amount of its credit or derivative exposure. Any such losses could have a material adverse effect on our business, financial condition and results of operations.
We must effectively manage our information systems risk. We rely heavily on our communications and information systems to conduct our business. The financial services industry is undergoing rapid technological changes with frequent introductions of new technology-driven products and services. Our ability to compete successfully depends in part upon our ability to use technology to provide products and services that will satisfy customer demands. Many of the Companys competitors invest substantially greater resources in technological improvements than we do. We may not be able to effectively implement new technology-driven products and services or be successful in marketing these products and services to our customers, which may negatively affect our business, results of operations or financial condition.
Our communications and information systems remain vulnerable to unexpected disruptions and failures. Any failure or interruption of these systems could impair our ability to serve our customers and to operate our business and could damage our reputation, result in a loss of business, subject us to additional regulatory scrutiny or enforcement or expose us to civil litigation and possible financial liability. While we have developed extensive recovery plans, we cannot assure that those plans will be effective to prevent adverse effects upon us and our customers resulting from system failures.
-6-
We collect and store sensitive data, including personally identifiable information of our customers and employees. Computer break-ins of our systems or our customers systems, thefts of data and other breaches and criminal activity may result in significant costs to respond, liability for customer losses if we are at fault, damage to our customer relationships, regulatory scrutiny and enforcement and loss of future business opportunities due to reputational damage. Although we, with the help of third-party service providers, will continue to implement security technology and establish operational procedures to protect sensitive data, there can be no assurance that these measures will be effective. We advise and provide training to our customers regarding protection of their systems, but there is no assurance that our advice and training will be appropriately acted upon by our customers or effective to prevent losses. In some cases we may elect to contribute to the cost of responding to cybercrime against our customers, even when we are not at fault, in order to maintain valuable customer relationships.
Our operations rely on external vendors. We rely on certain external vendors to provide products and services necessary to maintain our day-to-day operations, particularly in the areas of operations, treasury management systems, information technology and security, exposing us to the risk that these vendors will not perform as required by our agreements. An external vendors failure to perform in accordance with our agreement could be disruptive to our operations, which could have a material adverse impact on our business, financial condition and results of operations.
Our business is susceptible to fraud. Our business exposes us to fraud risk from our loan and deposit customers and the parties they do business with. We rely on financial and other data which could turn out to be fraudulent in accepting new customers, executing their financial transactions and making and purchasing loans and other financial assets. In times of increased economic stress we are at increased risk of fraud losses. We believe we have underwriting and operational controls in place to prevent or detect such fraud, but we cannot provide assurance that these controls will be effective in detecting fraud or that we will not suffer fraud costs or losses at levels that adversely affect our financial results or reputation. Our lending customers may also experience fraud in their businesses which could adversely affect their ability to repay their loans.
We are subject to extensive government regulation and supervision. We, as a bank holding company and financial holding company, and our bank as a national bank, are subject to extensive federal and state regulation and supervision that impacts our business on a daily basis. See the discussion above at Business Regulation and Supervision. These regulations affect our lending practices, permissible products and services and their terms and conditions, customer relationships, capital structure, investment practices, accounting, financial reporting, operations and our ability to grow, among other things. These regulations also impose obligations to maintain appropriate policies, procedures and controls to detect, prevent and report money laundering and terrorist financing and to verify the identities of our customers.
Congress and federal regulatory agencies continually review banking laws, regulations and policies for possible changes. Changes to statutes, regulations or regulatory policies, including changes in interpretation or implementation of statutes, regulations or policies, could affect us in substantial and unpredictable ways. Recent material changes in regulation and requirements imposed on financial institutions, such as the Dodd-Frank Act and the Basel III Accord, result in additional costs, impose more stringent capital, liquidity and leverage requirements, limit the types of financial services and products we may offer and increase the ability of non-bank financial services providers to offer competing financial services and products, among other things. The Dodd-Frank Act has not yet been fully implemented and there are many additional regulations that have not been proposed, or if proposed, have not been adopted. The full impact of the Dodd-Frank Act on our business strategies is unknown at this time and cannot be predicted.
-7-
We receive inquiries from our regulators from time to time regarding, among other things, lending practices, reserve methodology, interest rate and operational risk management, regulatory and financial accounting practices and policies and related matters, which can divert managements time and attention from focusing on our business. Because our assets now exceed $10 billion we are subject to additional regulatory requirements and have increased the amount of management time and expense devoted to developing the infrastructure to support our compliance. Commencing in 2014 we are required to conduct enhanced stress testing to evaluate the adequacy of our capital and liquidity planning. Uncertainties regarding the conditions and risk factors that will be required to be included in stress tests and how the financial models of our business will respond subject us to risk as this new activity is implemented. Any change to our practices or policies requested or required by our regulators, or any changes in interpretation of regulatory policy applicable to our businesses, may have a material adverse effect on our business, results of operations or financial condition.
We expend substantial effort and incur costs to continually improve our systems, controls, accounting, operations, information security, compliance, audit effectiveness, analytical capabilities, staffing and training in order to satisfy regulatory requirements. We cannot offer assurance that these efforts will satisfy applicable legal and regulatory requirements. Failure to comply with relevant laws, regulations or policies could result in sanctions by regulatory agencies, civil money penalties and/or reputation damage, which could have a material adverse effect on our business, financial condition and results of operations. While we have policies and procedures designed to prevent any such violations, there can be no assurance that such violations will not occur.
The FDIC has imposed higher general and special assessments on deposits or assets based on general industry conditions and as a result of changes in specific programs, and there is no restriction on the amount by which the FDIC may increase deposit and asset assessments in the future. Increases in FDIC assessments, fees or taxes could affect our earnings. Reports from the Public Company Accounting Oversight Boards (PCAOB) inspections of public accounting firms continue to outline findings and recommendations which could require these firms to perform additional work as part of their financial statement audits, increasing our audit and internal audit costs to respond to these added requirements and exposure to adverse findings by the PCAOB of the work performed. As a result, we have experienced, and may continue to experience, greater internal and external compliance and audit costs to comply with these changes that could adversely affect our results of operations.
We must maintain adequate regulatory capital to support our business objectives. Under regulatory capital adequacy guidelines and other regulatory requirements, we must satisfy capital requirements based upon quantitative measures of assets, liabilities and certain off-balance sheet items. Our satisfaction of these requirements is subject to qualitative judgments by regulators that may differ materially from managements and that are subject to being determined retroactively for prior periods. Our ability to maintain our status as a financial holding company to continue to operate our bank as we have in recent periods is dependent upon a number of factors, including our bank qualifying as well capitalized and well managed under applicable prompt corrective action regulations and upon our company qualifying on an ongoing basis as well capitalized and well managed under applicable Federal Reserve regulations.
Failure to meet regulatory capital standards could have a material adverse effect on our business, including damaging the confidence of customers in us, adversely impacting our competitive position, limiting our ability to use brokered deposits, limiting our access to capital markets transactions, limiting our ability to pursue new activities and resulting in higher FDIC assessments on deposits or assets. Were we to fall below guidelines for being deemed adequately capitalized the OCC or Federal Reserve could impose further restrictions and requirements in order to effect prompt corrective action. The capital requirements applicable to us are in a process of continuous evaluation and revision in connection with
-8-
Basel III and the requirements of the Dodd-Frank Act. We cannot predict the final form, or the effects, of these regulations on our business, but among the possible effects are requirements that we slow our rate of growth or obtain additional capital which could reduce our earnings or dilute our existing stockholders.
We are subject to environmental liability risk associated with lending activities. A significant portion of our loan portfolio is secured by real property. During the ordinary course of business, we may foreclose on and take title to properties securing certain loans. There is a risk that hazardous or toxic substances could be found on these properties, and that we may be liable for remediation costs, as well as for personal injury and property damage. Environmental laws may require us to incur substantial expenses and may materially reduce the affected propertys value by limiting our ability to use or sell it. Although we have policies and procedures requiring environmental review before initiating any foreclosure action on real property, these reviews may not be sufficient to detect all potential environmental hazards. The remediation costs and any other financial liabilities associated with an environmental hazard could have a material adverse effect on our financial condition and results of operations. Future laws or regulations or more stringent interpretations or enforcement policies with respect to existing laws and regulations may increase our exposure to environmental liability.
Severe weather, natural disasters, acts of war or terrorism and other external events could significantly impact our business. Severe weather, natural disasters, acts of war or terrorism and other adverse external events could have a significant impact on our ability to conduct business. Such events could affect the stability of our deposit base, impair the ability of borrowers to repay outstanding loans, impair the value of collateral securing loans, cause significant property damage, result in loss of revenue and/or cause us to incur additional expenses. Hurricanes have caused extensive flooding and destruction along the coastal areas of Texas, including communities where we conduct business. Although management has established disaster recovery policies and procedures, the occurrence of any such events could have a material adverse effect on our business, financial condition and results of operations.
We are subject to claims and litigation in the ordinary course of our business, including claims that may not be covered by our insurers. Customers and other parties we engage with assert claims and take legal action against us on a regular basis and we regularly take legal action to collect unpaid borrower obligations, realize on collateral and assert our rights in commercial and other contexts. These actions frequently result in counter-claims against us. Litigation arises in a variety of contexts, including lending activities, employment practices, commercial agreements, fiduciary responsibility related to our wealth management services, intellectual property rights and other general business matters.
Claims and legal actions may result in significant legal costs to defend us or assert our rights and reputational damage that adversely affects existing and future customer relationships. If claims and legal actions are not resolved in a manner favorable to us we may suffer significant financial liability adverse effects upon our reputation, which could have a material adverse effect on our business, financial condition and results of operations. See Legal Proceedings below for additional disclosures regarding legal proceedings.
We purchase insurance coverage to mitigate a wide range of operating risks, including general liability, errors and omissions, professional liability, business interruption, cyber-crime and property loss, for events that may be materially detrimental to our bank or customers. There is no assurance that our insurance will be adequate to protect us against material losses in excess of our coverage limits or that insurers will perform their obligations under our policies without attempting to limit or exclude coverage. We could be required to pursue legal actions against insurers to obtain payment of amounts we are owed, and there is no assurance that such actions, if pursued, would be successful.
-9-
Our controls and procedures may fail or be circumvented. Management regularly reviews and updates our internal controls over financial reporting, disclosure controls and procedures, and corporate governance policies and procedures. Any system of controls, however well designed and operated, is based in part on certain assumptions and can provide only reasonable, not absolute, assurances that the objectives of the system are met. Any failure or circumvention of our controls and procedures or failure to comply with regulations related to controls and procedures could have a material adverse effect on our business, results of operations and financial condition.
-10-
5=`C[N,5+J,PEG0(
5=`C[N,5+J,PEG0(
5=`C[N,5+J,PEG0(
5=`C[N,5+J,PEG0(
5=`C[N,5+J,PEG0(%X22&3(VF3;E0"=PQ7H]%`'GWQHO=%N_A1XUBNKG3Y_
MLMC+&Z2.C>3<&/,2D'[LFYD*CKDKCM6/X^N+:^G\-W,^OIIVB_8)+FSO$$,L
M$UW^[\H'>K*Q*E]H')R=IR`1ZI%;Q12RRH#YDI!=F8L3CH!GH.O`XY/J:EH`
M\6U`:QJDRV$_V#XA_Z`UU70?#W2-9T;6KJ]N]'NFCEB*!4:,$'*G^)E]#7JU%`
M&7_:=W_T`]1_[[M__CM']IW?_0#U'_ONW_\`CM:E%`&7_:=W_P!`/4?^^[?_
M`..T?VG=_P#0#U'_`+[M_P#X[6I10!E_VG=_]`/4?^^[?_X[5C3+\7PN`;>:
MVD@E\IXYMN0=JM_"Q&,,.]7*BAMXH9)WC7:\[B20Y)W-M"Y_)0/PH`EHHHH`
M****`"BBB@`HHHH`****`"BBB@`HHHH`****`"BBB@`HHHH`****`"BBB@`H
MHHH`*KZA;"\LY('FG@1QAG@D,;XSR`PY7(XR,$9X(/-6*IZQIMMJ^FSV%\)C
M;3KMD$,[PL1Z;T(8?@:`/.`=1@31='?4+Y]&UG7)8;>X:ZE^T"R6UDE5//W>
M9EI(B0^[=L(Y[U4T;4=1\0D:=>ZG>V]O81ZIY<\$SQ2SM;7GDPR,X.6"JOS*
M
5=`C[N,5+J,PEG0(
G?;+:*WFA::W/DYV3>7*Z>'[S7F6TU/48CH;HHN;*"VV-
M/X?_:+T74?B"L=U/J,!L="O;',<$)R4,;Q'+;R9
M3SO8#S1_P!/CMXG_`+,\5:7KMCJ=KYOA*^A673A<(D\ZSIF?0`D^(^E:1XU\
M*:99W9%SI>HW,)26%L':ZMMD0^N"".WUKS.PU[4/#OA7QA\,O&,BR7]EHMVV
MD7S?*+^U$+X_$H!X!/"D?P$GL?#GA#QAHW@WP[H3W6D7;:/=I-]IDFE!EA
M1B5BV[#MP#M#9.`HX-:WQ>^'L'Q$\)_8Y?*MM9MP9;*YR2(I<
5=`C[N,5+J,PEG0( :UEM8WN-Y.^.&0+M."VY@H#97DX
MXVO#,,NR_O;J)XI[VZ>38^E?]?@_]%O6Q>?$&WTOPV-0UNVBL[PW
(K1F)+$/DGOTK:/0UAS?\`(P6?T;^E<>/_`($C?#?Q$=
-FV\?F=^"ZFQ1117CG<%9^M?\>$_^X?Y5H5GZU_QX3_[A_E0!]/Z'
M_P`@FV_W!5ZJ.A_\@FV_W!5Z@`HHHH`****`.+^,/_(@:G]$_P#0UKP&+[@K
MW[XP_P#(@:G]$_\`0UKP&+[@KW,J^"7J>=C/B0ZBBBO5.,#T-8LG^Z:Z7P7_P`@D?[Q_G7C9MO'
MYG?@NIT%%%%>.=P5F:__`,@ZX_ZYM_*M.LS7_P#D'7'_`%S;^5`'O>A_\@JV
M_P!P5>JCH?\`R"K;_<%7J`"BBB@`HHHH`XOXP_\`(@:G]$_]#6O`8ON"O?OC
M#_R(&I_1/_0UKP&+[@KW,J^"7J>=C/B0ZBBBO5.,#T-9]E_R-5G_`+K_`-*T
M#T-9]E_R-5G_`+K_`-*X\?\`P)&^'_B(])7[HI:1?NBEKYH]8*1ONFEI&^Z:
M`-3X7_\`([7'_7H?_0UKV.O'/A?_`,CM\`7H?_`$-:]CH`****`"BBB@`H
MHHH`****`"BBB@`HHHH`****`"BBB@`HHHH`****`"BBB@#`U75=0M/%VB:?
M'!:G3;Y9O,E9V\T.B;@`N,8]\D]L=Z9XJU+4H+S2]+T)K*/4+]I&\Z\C:6.*
M.-LG^Z:Z7P7_R"A_O'^=
5=`C[N,5+J,PEG0( T Q+,2Q))Y)/>DHKZ?#
MX:GAX\M-&$I.6X4445N(****`"BBB@`I02I!!((Y!%)10!]]_"+Q/_PEWP^T
MC5)'#W1B\FY]?-3Y6)],XW?1A78U\P?L@>(O*U#6O#DS_+,@O8%/]Y<*_P")
M!3_OFOI^O)JPY)M'1%W04445F,****`"BBB@`HHHH`****`"BBB@`HHHH`**
M**`"BBB@`HHHH`****`"BBB@`HHHH`****`"BBB@`HHHH`****`"BBB@`HHH
MH`****`"BBB@`HHHH`****`"BBB@`HHHH`****`"BBB@`HHHH`****`"BBB@
M`HHHH`****`"BBB@`HHHH`****`"BBB@`HHHH`***SO$>I)H^@:EJ4IPEI;R
M3G_@*D_TH'%.3LCX^^.&N?V[\2]7E1MT%J_V.+Z1\'_Q[XN(X8AEY&"KGU)KT^")8((X8_N1J
M$7Z`8KC?!=IYNH/
5=`C[N,5+J,PEG0(
5=`C[N,5+J,PEG0(<:4W^A1?[HKTL!%2
M4DSFQ'0WO[3N?[]']IW/]^LW=1NKO]C#L
5=`C[N,5+J,PEG0(
5=`C[N,5+J,PEG0(
5=`C[N,5+J,PEG0(
5=`C[N,5+J,PEG0(
5=`C[N,5+J,PEG0(
5=`C[N,5+J,PEG0(
5=`C[N,5+J,PEG0(
5=`C[N,5+J,PEG0(
5=`C[N,5+J,PEG0(M/X?_:+T74?B"L=U
M/J,!L="O;',<$)R4,;Q'+;R93SO8#S1_P!/CMXG_`+,\5:7KMCJ=KYOA*^A6
M73A<(D\ZSIF?0`D^(^E:1XU\*:99W9%SI>HW,)26%L':ZMMD0^N"".WUKS.P
MU[4/#OA7QA\,O&,BR7]EHMVVD7S?*+^U$+X_$H!X!/"D?P$GL?#GA#QAHW
M@WP[H3W6D7;:/=I-]IDFE!EA1B5BV[#MP#M#9.`HX-:WQ>^'L'Q$\)_8Y?*M
MM9MP9;*YR2(I<
5=`C[N,5+J,PEG0(