Table of Contents
Table of Contents
Exhibit 13 – 2020 Annual Report to Shareholders

Table of Contents
CITIZENS HOLDING COMPANY
Philadelphia, Mississippi
Consolidated Financial Statements
As of December 31, 2020 and 2019 and for the
Years Ended December 31, 2020, 2019 and 2018

Table of Contents
CONTENTS
 
    
1-3
 
     4 – 5  
Consolidated Financial Statements
  
     6  
     7  
     8  
     9  
     10 –11  
     12 – 76  

Table of Contents
REPORT OF INDEPENDENT REGISTERED PUBLIC ACCOUNTING FIRM
To Shareholders and the Board of Directors of Citizens Holding Company
Opinion on Financial Statement
We have audited the accompanying consolidated statements of financial condition of Citizens Holding Company and subsidiary (the “Company”) as of December 31, 2020 and 2019, the related consolidated statements of income, comprehensive income (loss), changes in shareholders’ equity, and cash flows for each of the three years in the period ended December 31, 2020, and the related notes to the consolidated financial statements (collectively, referred to as the “financial statements”). In our opinion, the financial statements present fairly, in all material respects, the financial position of the Company as of December 31, 2020 and 2019, and the results of its operations and its cash flows for each of the three years in the period ended December 31, 2020, are in conformity with accounting principles generally accepted in the United States of America.
Basis for Opinion
These financial statements are the responsibility of the Company’s management. Our responsibility is to express an opinion on the Company’s financial statements based on our audits. We are a public accounting firm registered with the PCAOB and are required to be independent with respect to the Company in accordance with U.S. federal securities laws and the applicable rules and regulations of the Securities and Exchange Commission and the PCAOB.
We conducted our audits in accordance with the standards of the PCAOB. Those standards require that we plan and perform the audit to obtain reasonable assurance about whether the financial statements are free of material misstatement, whether due to error or fraud. Our audits included performing procedures to assess the risks of material misstatement of the financial statements, whether due to error or fraud, and performing procedures that respond to those risks. Such procedures included examining, on a test basis, evidence regarding the amounts and disclosures in the financial statements. Our audits also included evaluating the accounting principles used and significant estimates made by management, as well as evaluating the overall presentation of the financial statements. We believe that our audits provide a reasonable basis for our opinion.
Critical Audit Matter
The critical audit matter communicated below is a matter arising from the current period audit of the financial statements that was communicated or required to be communicated to the audit committee and that: (1) relate to accounts or disclosures that are material to the financial statements and (2) involved especially challenging, subjective, or complex judgments. The communication of critical audit matters does not alter in any way our opinion on the financial statements, taken as a whole, and we are not, by communicating the critical audit matter below, providing separate opinions on the critical audit matter or on the accounts or disclosures to which it relates.
 
1

Table of Contents
Allowance for Loan Losses
As described in Notes 1 and 7 to the financial statements, the Company’s allowance for loan losses is a valuation allowance that reflects the Company’s estimation of incurred losses in its loan portfolio to the extent they are both probable and reasonable to estimate. The allowance for loan losses was $4,735,000 at December 31, 2020, which consists of two components; the allowance for loans individually evaluated for impairment (“specific reserves”) and the allowance for loans collectively evaluated for impairment (“general reserves”).
The Company’s general reserves include reserves based on historical
charge-off
factors and qualitative general reserve factors. The component for qualitative general reserve factors involves an evaluation of items which are not yet reflected in the factors for historical charge-offs including changes in: lending policies and procedures, economic and business conditions, nature and volume of the portfolio, lending staff, volume and severity of delinquent loans, loan review systems, collateral values, and concentrations of credit. The evaluation of these items results in qualitative general reserve factors, which contribute significantly to the general reserve component of the estimate of the allowance for loan losses.
We identified management’s estimate of the aggregate effect of the qualitative reserve factors on the allowance for loan losses as a critical audit matter as it involved subjective auditor judgment. Management’s determination of qualitative general reserve factors involved especially subjective judgment because management’s estimate relies on qualitative analysis to determine the quantitative impact the items have on the allowance.
The primary procedures we performed to address this critical audit matter included:
Evaluated the design and tested the operating effectiveness of controls over the determination of items used to estimate the qualitative general reserve factors, including controls addressing:
 
   
The data used as the basis for the adjustments relating to qualitative general reserve factors.
 
   
Management’s determination of loans excluded from qualitative general reserve factors calculation.
 
   
Management’s review of the qualitative and quantitative conclusions related to the qualitative general reserve factors and the resulting allocation to the allowance.
Substantively tested the general reserves related to qualitative general reserve factors which primarily included:
 
   
Evaluation of the completeness and accuracy of data inputs used as a basis for the adjustments relating to the qualitative general reserve factors.
 
   
Evaluation of loans excluded from the qualitative general reserve calculation for propriety of classification.
 
   
Evaluation of the reasonableness of management’s judgments related to the qualitative and quantitative assessment of the data used in the determination of qualitative general reserve factors and the resulting allocation to the allowance. Our evaluation considered the weight of confirming and disconfirming evidence from internal and external sources, loan portfolio performance and third-party data, and whether management’s assumptions were applied consistently period to period.
 
2

Table of Contents
/s/ HORNE LLP
We have served as the Company’s auditor since 1998.
Memphis, Tennessee
March 12, 2021
 
3

Table of Contents
[CITIZENS HOLDING COMPANY LETTERHEAD]
Report on Management’s Assessment of Internal Control over Financial Reporting
Citizens Holding Company (the “Company”) is responsible for the preparation, integrity and fair presentation of the consolidated financial statements included in this annual report. The consolidated financial statements and notes included in this annual report have been prepared in conformity with accounting principles generally accepted in the United States and necessarily include some amounts that are based on management’s best estimates and judgments.
Management of the Company is responsible for establishing and maintaining effective internal control over financial reporting designed to provide reasonable assurance regarding the reliability of financial reporting and the preparation of financial statements for external purposes in accordance with accounting principles generally accepted in the United States. The Company’s internal control over financial reporting includes those policies and procedures that: (1) pertain to the maintenance of records that, in reasonable detail, accurately and fairly reflect the transactions and dispositions of the assets of the Company; (2) provide reasonable assurance that transactions are recorded as necessary to permit preparation of financial statements in accordance with accounting principles generally accepted in the United States of America and that receipts and expenditures of the Company are being made only in accordance with authorizations of management and directors of the Company; and (3) provide reasonable assurance regarding prevention or timely detection of unauthorized acquisition, use or disposition of the Company’s assets that could have a material effect on the financial statements.
The system of internal control over financial reporting as it relates to the financial statements is evaluated for effectiveness by management and tested for reliability through a program of internal audits. Actions are taken to correct potential deficiencies as they are identified. Any system of internal control, no matter how well designed, has inherent limitations, including the possibility that a control can be circumvented or overridden, and misstatements due to error or fraud may occur and not be detected. Also, because of changes in conditions, internal control effectiveness may vary over time. Accordingly, even an effective system of internal control will provide only reasonable assurance with respect to financial statement preparation.
 
4

Table of Contents
Citizens Holding Company
Page Two
 
Management, with the participation of the Company’s principal executive officer and principal financial officer, conducted an assessment of the effectiveness of the Company’s system of internal control over financial reporting as of December 31, 2020, based on criteria for effective internal control over financial reporting described in the “Internal Control – Integrated Framework,” (2013) issued by the Committee of Sponsoring Organizations of the Treadway Commission. Based on this assessment, management has concluded that, as of December 31, 2020, the Company’s system of internal control over financial reporting was effective.
 
/s/ Greg L. McKee     /s/ Phillip R. Branch
Greg L. McKee     Phillip R. Branch
President and Chief Executive Officer     Treasurer and Chief Financial Officer
March 12, 2021
 
5

Table of Contents
CITIZENS HOLDING COMPANY
Consolidated Statements of Financial Condition
December 31, 2020 and 2019
(in thousands, except share data)
 
    
2020
    
2019
 
ASSETS
                 
Cash and due from banks
   $ 16,840      $ 15,937  
Interest bearing deposits with other banks
     25,468        58,557  
Federal funds sold
     —          1,600  
Securities available for sale, at fair value
     678,749        464,383  
Loans, net of allowance for loan losses of $4,735 in 2020 and $3,755 in 2019
     647,521        573,312  
Bank premises, furniture, fixtures and equipment, net
     25,630        24,672  
Other real estate owned, net
     3,073        3,552  
Accrued interest receivable
     5,983        4,181  
Cash surrender value of life insurance
     25,814        25,088  
Deferred tax assets
     1,548        3,684  
Identifiable intangible assets, net
     13,660        13,856  
Other assets
     6,406        6,612  


Total assets
   $ 1,450,692      $ 1,195,434  


LIABILITIES AND SHAREHOLDERS’ EQUITY
                 
Deposits
                 
Non-interest bearing deposits
   $ 276,033      $ 190,406  
Interest bearing deposits
     819,156        708,590  


Total deposits
     1,095,189        898,996  
     
Securities sold under agreement to repurchase
     196,272        170,410  
Federal Home Loan Bank (FHLB) advances
     25,000        —    
Accrued interest payable
     522        1,128  
Deferred compensation payable
     9,665        9,453  
Other liabilities
     4,496        2,647  


Total liabilities
     1,331,144        1,082,634  


Shareholders’ equity
                 
Common stock, $.20 par value, authorized 22,500,000 shares; 5,587,070 shares issued and outstanding at December 31, 2020 and 5,578,131 shares issued and outstanding at December 31, 2019
  
 
1,118


1,116
 
Additional paid-in capital
     18,134        17,883  
Accumulated other comprehensive income (loss), net of tax (expense) benefit of ($1,376) in 2020 and $262 in 2019
     4,138        (789
Retained earnings
     96,158        94,590  


Total shareholders’ equity
     119,548        112,800  


Total liabilities and shareholders’ equity
   $ 1,450,692      $ 1,195,434  


The accompanying notes are an integral part of these statements.
 
6

Table of Contents
CITIZENS HOLDING COMPANY
Consolidated Statements of Income
Years Ended December 31, 2020, 2019, and 2018
(in thousands, except share and per share data)


2020
   
2019
   
2018
 
Interest income
                        
Interest and fees on loans
   $ 30,941     $ 24,652     $ 20,241  
Interest on securities
                        
Taxable
     7,837       7,993       8,345  
Non-taxable
     1,501       1,808       2,579  
Other interest
     282       908       193  


Total interest income
     40,561       35,361       31,358  
       
Interest expense
                        
Deposits
     6,556       7,719       2,811  
Other borrowed funds
     871       2,003       1,648  


Total interest expense
     7,427       9,722       4,459  


Net interest income
     33,134       25,639       26,899  
       
Provision for loan losses
     (1,485     (573     (334


Net interest income after provision for loan losses
     31,649       25,066       26,565  
       
Non-interest income
                        
Service charges on deposit accounts
     3,352       4,413       4,562  
Other service charges and fees
     3,606       3,129       2,879  
Net gains on sales of securities
     829       191       11  
Other income
     2,673       2,015       1,148  


Total non-interest income
     10,460       9,748       8,600  
       
Non-interest expense
                        
Salaries and employee benefits
     17,476       14,883       14,530  
Occupancy expense
     4,156       2,099       2,017  
Equipment expense
     3,204       3,146       3,713  
Other expense
     8,590       7,430       7,404  


Total non-interest expense
     33,426       27,558       27,664  


Income before income taxes
     8,683       7,256       7,501  
Income tax expense
     1,752       1,354       828  


Net income
   $ 6,931     $ 5,902     $ 6,673  


Net income per share – basic
   $ 1.24     $ 1.17     $ 1.36  


Net income per share – diluted
   $ 1.24     $ 1.17     $ 1.36  


Weighted average shares outstanding
                        
Basic
     5,577,352       5,063,736       4,889,420  


Diluted
     5,579,916       5,066,103       4,899,218  


The accompanying notes are an integral part of these statements.
 
7

Table of Contents
CITIZENS HOLDING COMPANY
Consolidated Statements of Comprehensive Income (Loss)
Years Ended December 31, 2020, 2019, and 2018
(in thousands)
 
    
2020
   
2019
   
2018
 
Net income
   $ 6,931     $ 5,902     $ 6,673  
       
Other comprehensive income (loss)
                        
       
Unrealized holding gains (losses) on available-for-sale securities
     7,394       19,093       (8,982
Income tax effect
     (1,845     (4,764     2,240  


Net unrealized gains (losses)
     5,549       14,329       (6,742


Reclassification adjustment for gains included in net income
     (829     (191     (11
Income tax effect
     207       48       3  


Net gains included in net income
     (622     (143     (8


Total other comprehensive income (loss)
     4,927       14,186       (6,750


Comprehensive income (loss)
   $ 11,858     $ 20,088     $ (77


The accompanying notes are an integral part of these statements.
 
8

Table of Contents
CITIZENS HOLDING COMPANY
Consolidated Statements of Changes in Shareholders’ Equity
Years Ended December 31, 2020, 2019, and 2018
(in thousands, except share data)
 
    
Number
of Shares
Issued
   
Common
Stock
   
Additional
Paid-In
Capital
   
Accumulated
Other
Comprehensive
Income (Loss)
   
Retained
Earnings
   
Total
 
Balance, January 1, 2018
     4,894,705     $ 979     $ 4,103     $ (8,225   $ 91,595     $ 88,452  
Net income
     —         —         —         —         6,673       6,673  
Dividends paid ($0.96 per share)
     —         —         —         —         (4,706     (4,706
Options exercised
     2,325       —         27       —         —         27  
Restricted stock granted
     7,500       2       (2     —         —         —    
Stock compensation expense
     —         —         170       —         —         170  
Other comprehensive loss, net
     —         —         —         (6,750     —         (6,750


Balance, December 31, 2018
     4,904,530       981       4,298       (14,975     93,562       83,866  
Net income
     —         —         —         —         5,902       5,902  
Dividends paid ($0.96 per share)
     —         —         —         —         (4,874     (4,874
Common stock issued in connection with acquisition
     666,101       133       13,424       —         —         13,557  
Restricted stock granted
     7,500       2       (2     —         —         —    
Stock compensation expense
     —         —         163       —         —         163  
Other comprehensive income, net
     —         —         —         14,186       —         14,186  


Balance, December 31, 2019
     5,578,131       1,116       17,883       (789     94,590       112,800  
Net income
     —         —         —         —         6,931       6,931  
Dividends paid ($0.96 per share)
     —         —         —         —         (5,363     (5,363
Options exercised
     5,189       1       85                       86  
Restricted stock granted
     8,250       2       (2     —         —         —    
Restricted stock forfeited
     (4,500     (1     1                       —    
Stock compensation expense
     —         —         167       —         —         167  
Other comprehensive income, net
     —         —         —         4,927       —         4,927  


Balance, December 31, 2020
     5,587,070     $ 1,118     $ 18,134     $ 4,138     $ 96,158     $ 119,548  


The accompanying notes are an integral part of these statements.
 
9

Table of Contents
CITIZENS HOLDING COMPANY
Consolidated Statements of Cash Flows
Years Ended December 31, 2020, 2019, and 2018
1 of 2
(in thousands)
 
    
2020
   
2019
   
2018
 
Cash flows from operating activities
                        
Net income
   $ 6,931     $ 5,902     $ 6,673  
Adjustments to reconcile net income to net cash provided by operating activities
                        
Depreciation and amortization
     1,121       912       937  
Amortization of premiums and accretion of discounts on investment securities, net
     7,286       5,294       3,283  
Stock compensation expense
     167       163       170  
Provision for loan losses
     1,485       573       334  
Gain on sale of securities
     (829     (191     (11
Gain from death benefit proceeds on BOLI
     —         (371     —    
Gain on sale of fixed assets
     (74     —         —    
Net gain on sale of other real estate owned
     (105     (311     —    
Deferred income tax expense
     498       459       973  
Writedown on other real estate owned
     230       —         —    
(Increase) decrease in accrued interest receivable
     (1,802     382       285  
Increase in cash surrender value life insurance
     (726     (709     (771
(Decrease) increase in accrued interest payable
     (606     166       273  
Increase in deferred compensation liability
     212       400       432  
Net change in other operating assets and liabilities
     255       (722     (407


Net cash provided by operating activities
     14,043       11,947       12,171  


Cash flows from investing activities
                        
Proceeds from calls, paydowns and maturities of securities available-for-sale
     237,705       59,189       40,964  
Proceeds from sales of securities available-for-sale
     188,324       122,171       17,620  
Proceeds from sale of FHLB stock
     2,913       —         —    
Purchases of investment securities available-for-sale
     (640,289     (160,591     (10,550
Decrease (increase) in federal funds sold
     1,600       (1,600     —    
Death benefit proceeds from bank-owned life insurance
     —         1,549       —    
Purchases of bank premises, furniture, fixtures and equipment
     (2,019     (1,042     (346
Proceeds from sales of bank premises, furniture, fixtures and equipment
     124       —         264  
Proceeds from sale of other real estate owned
     1,899       584       812  
 
10

Table of Contents
CITIZENS HOLDING COMPANY
Consolidated Statements of Cash Flows
Years Ended December 31, 2020, 2019, and 2018
2 of 2
(in thousands)
 
    
2020
   
2019
   
2018
 
Net decrease (increase) in interest bearing deposits with other banks
     33,089       (48,927     (6,547
Net cash paid in acquisition of business
     —         (317     —    
Purchases of FHLB stock
     (1,025     —         (476
Net increase in loans
     (77,239     (44,678     (24,108


Net cash (used by) provided by investing activities
     (254,918     (73,662     17,633  


Cash flows from financing activities
                        
Net increase in deposits
   $ 196,193     $ 16,459     $ 35,536  
Net decrease in federal funds purchased
     —         —         (1,500
Net increase (decrease) in securities sold under agreement to repurchase
     25,862       62,444       (34,532
Proceeds from exercise of stock options
     86       —         27  
Dividends paid to shareholders
     (5,363     (4,874     (4,706
Net increase (decrease) increase in FHLB advances
     25,000       (8,969     (30,000


Net cash provided by (used in) financing activities
     241,778       65,060       (35,175


Net increase (decrease) in cash and due from banks
     903       3,345       (5,371
       
Cash and due from banks, beginning of year
     15,937       12,592       17,963  


Cash and due from banks, end of year
   $ 16,840     $ 15,937     $ 12,592  


Supplemental disclosures of cash flow information
                        
Cash paid for
                        
Interest
   $ 8,033     $ 9,065     $ 4,186  


Income taxes
   $ 1,539     $ 685     $ 410  


Noncash disclosures
                        
Issuance of common stock for acquisition of business
   $ —       $ 13,557     $ —    


Real estate acquired by foreclosure
   $ 1,546     $ 385     $ 260  


The accompanying notes are an integral part of these financial statements.
 
11

Table of Contents
CITIZENS HOLDING COMPANY
Years Ended December 31, 2020, 2019 and 2018
NOTES TO CONSOLIDATED FINANCIAL STATEMENTS
 
 
Note 1.
Nature of Business and Summary of Significant Accounting Policies
 
(in thousands, except share and per share data)
Nature of Business
Citizens Holding Company (referred to herein as the “Company”) owns and operates The Citizens Bank of Philadelphia (the “Bank”). In addition to full service commercial banking, the Bank offers title insurance services through its subsidiary, Title Services LLC. As a state bank, the Bank is subject to regulations of the Mississippi Department of Banking and Consumer Finance and the Federal Deposit Insurance Company. The Company is also subject to the regulations of the Federal Reserve. The area served by the Bank is east central Mississippi, along with southern and northern counties of Mississippi and their surrounding areas. Services are provided at multiple branch offices.
Risks and Uncertainties
The outbreak of
COVID-19
has adversely impacted a broad range of industries in which the Company’s customers operate and could impair their ability to fulfill their financial obligations to the Company. The World Health Organization has declared
COVID-19
to be a global pandemic indicating that almost all public commerce and related business activities must be, to varying degrees, curtailed with the goal of decreasing the rate of new infections. The spread of the outbreak has caused significant disruptions in the U.S. economy and has disrupted banking and other financial activity in the areas in which the Company operates. While there has been no material impact to the Company’s employees to date,
COVID-19
could also potentially create widespread business continuity issues for the Company.
Congress, the President, and the Federal Reserve have taken several actions designed to cushion the economic fallout. Most notably, the Coronavirus Aid, Relief and Economic Security (“CARES”) Act was signed into law at the end of March 2020 as an over $2 trillion legislative package. The goal of the CARES Act is to prevent a severe economic downturn through various measures, including direct financial aid to American families and economic stimulus to significantly impacted industry sectors. The package also includes extensive emergency funding for hospitals and providers. In addition to the general impact of
COVID-19,
certain provisions of the CARES Act as well as other recent legislative and regulatory relief efforts are expected to have a material impact on the Company’s operations.
The Company’s business is dependent upon the willingness and ability of its employees and customers to conduct banking and other financial transactions. If the global response to contain
COVID-19
escalates further or is unsuccessful, the Company could experience a material adverse effect on its business, financial condition, results of operations and cash flows. While it is not possible to know the full extent that the impact of
COVID-19,
and resulting measures to curtail its spread, will have on the Company’s operations, the Company is disclosing potentially material items of which it is aware.
 
12

Table of Contents
CITIZENS HOLDING COMPANY
Years Ended December 31, 2020, 2019 and 2018
NOTES TO CONSOLIDATED FINANCIAL STATEMENTS
 
 
Note 1.
Continued
 
Financial position and results of operations
The Company’s fee income has been, and could continue to be, reduced due to
COVID-19. In
keeping with guidance from regulators, the Company is actively working with
COVID-19
affected customers to waive fees from a variety of sources, such as, but not limited to, insufficient funds and overdraft fees, ATM fees, account maintenance fees, etc. These reductions in fees are thought, at this time, to be temporary in conjunction with the length of the expected
COVID-19
related economic crisis. At this time, the Company is unable to project the materiality of such an impact, but recognizes the breadth of the economic impact is likely to impact its fee income in future periods.
The Company’s interest income could be reduced due to
COVID-19. In
keeping with guidance from regulators, the Company is actively working with
COVID-19
affected borrowers to defer their payments and fees. While interest and fees will still accrue to income, through normal GAAP accounting, should eventual credit losses on these deferred payments emerge, interest income and fees accrued would need to be reversed. In such a scenario, interest income in future periods could be negatively impacted. At this time, the Company is unable to project the materiality of such an impact, but recognizes the breadth of the economic impact may affect its borrowers’ ability to repay in future periods.
Capital and liquidity
While the Company believes that it has sufficient capital to withstand an extended economic recession brought about by
COVID-19,
its reported and regulatory capital ratios could be adversely impacted by further credit losses and loss of fee income.
The Company maintains access to multiple sources of liquidity. If an extended recession caused large numbers of the Company’s deposit customers to withdraw their funds, the Company might become more reliant on volatile or more expensive sources of funding. Wholesale funding markets have remained open to us, but rates for short term funding have recently been volatile. If funding costs are elevated for an extended period of time, it could have an adverse effect on the Company’s net interest margin.
Asset valuation
Currently, the Company does not expect
COVID-19
to affect its ability to account timely for the assets on its consolidated statements of financial condition; however, this could change in future periods. While certain valuation assumptions and judgments will change to account for pandemic-related circumstances such as widening credit spreads, the Company does not anticipate significant changes in methodology used to determine the fair value of assets measured in accordance with GAAP.
 
13

Table of Contents
CITIZENS HOLDING COMPANY
Years Ended December 31, 2020, 2019 and 2018
NOTES TO CONSOLIDATED FINANCIAL STATEMENTS
 
 
Note 1.
Continued
 
COVID-19
could cause a decline in the Company’s stock price or the occurrence of what management would deem to be a triggering event that could, under certain circumstances, cause us to perform a goodwill impairment test and result in an impairment charge being recorded for that period. In the event that the Company concludes that all or a portion of its goodwill is impaired, a
non-cash
charge for the amount of such impairment would be recorded to earnings. Such a charge would have no impact on tangible capital or regulatory capital.
Lending operations and accommodations to borrowers
In keeping with regulatory guidance to work with borrowers during this unprecedented situation and as outlined in the CARES Act, the Company has been executing a payment deferral program for its commercial lending clients that are adversely affected by the pandemic. Depending on the demonstrated need of the client, the Company is deferring either the full loan payment or the principal component of the loan payment for 60 or 90 days. As of December 31, 2020, the Company had 9 loans with aggregate principal balances totaling $12,258 which were modified under this guidance. In accordance with interagency guidance issued in March 2020, these short-term deferrals are not considered troubled debt restructurings.
With the passage of the Paycheck Protection Program (“PPP”), administered by the Small Business Administration (“SBA”), the Company is actively participating in assisting its customers with applications for resources through the program. PPP loans have a
two-year
term and earn interest at 1%. The Company believes that the majority of these loans will ultimately be forgiven by the SBA in accordance with the terms of the program. The Company closed 590 SBA PPP loans representing $48,830 in funding and starting in the fourth quarter of 2020, the SBA began forgiving these loans. The Company currently has 446 loans with a total balance of $29,523 still outstanding at December 31, 2020. It is the Company’s understanding that loans funded through the PPP program are fully guaranteed by the U.S. government. Should those circumstances change, the Company could be required to establish additional allowance for credit loss through additional credit loss expense charged to earnings.
Further, in sensitivity and service to its communities during this unprecedented time, the Company is waiving certain late payments and service charges.
Credit
The Company is working with customers directly affected by
COVID-19. The
Company is prepared to offer short-term assistance in accordance with regulator guidelines. As a result of the current economic environment caused by the
COVID-19
virus, the Company is engaging in more frequent communication with borrowers to better understand their situation and the challenges faced, allowing it to respond proactively as needs and issues arise. Should economic conditions worsen, the Company could experience further increases in its allowance for loan losses and record additional credit loss expense. It is possible that the Company’s asset quality measures could worsen at future measurement periods if the effects of
COVID-19
are prolonged.
 
14

Table of Contents
CITIZENS HOLDING COMPANY
Years Ended December 31, 2020, 2019 and 2018
NOTES TO CONSOLIDATED FINANCIAL STATEMENTS
 
 
Note 1.
Continued
 
Basis of Financial Statement Presentation
The accounting policies of the Company and its subsidiary conform to generally accepted accounting principles (“GAAP”) in the United States of America and to general practices within the banking industry. The consolidated financial statements of the Company include the accounts of the Bank and its subsidiary (collectively, the “Company”). All significant intercompany transactions have been eliminated in consolidation.
Segment Reporting
We have determined that all of our lending divisions meet the aggregation criteria of ASC 280, Segment Reporting, since all offer similar products and services, operate with similar processes, have similar customers and are collectively reviewed by the chief operating decision maker. No other services are material for presentation as a separate segment.
Estimates
The preparation of financial statements in conformity with GAAP requires management to make estimates and assumptions that affect the reported amounts of assets and liabilities and disclosure of contingent assets and liabilities at the date of the financial statements and the reported amounts of revenues and expenses during the reporting period. Actual results could differ from those estimates.
Estimates that are particularly susceptible to significant change relate to the determination of the allowance for loan losses and the valuation of real estate acquired in connection with foreclosures or in satisfaction of loans. In connection with the determination of the allowance for loan losses and valuation of foreclosed real estate, management obtains independent appraisals for significant properties.
While management uses available information to recognize losses on loans and to value foreclosed real estate, future additions to the allowance or adjustments to the valuation may be necessary based on changes in local economic conditions. In addition, regulatory agencies, as an integral part of their examination process, periodically review the Company’s allowance for loan losses and valuations of foreclosed real estate. Such agencies may require the Company to recognize additions to the allowance or to make adjustments to the valuation based on their judgments about information available to them at the time of their examination. Due to these factors, it is reasonably possible that the allowance for loan losses and valuation of foreclosed real estate may change materially in the near term.
 
15

Table of Contents
CITIZENS HOLDING COMPANY
Years Ended December 31, 2020, 2019 and 2018
NOTES TO CONSOLIDATED FINANCIAL STATEMENTS
 
 
Note 1.
Continued
 
Cash, Due from Banks and Interest Bearing Deposits with Other Banks
For the purpose of reporting cash flows, cash and due from banks includes cash on hand and demand deposits. Cash flows from loans originated by the Company, deposits, and federal funds purchased and sold are reported net in the statement of cash flows. The Company is required to maintain average reserve balances with the Federal Reserve Bank based on a percentage of deposits.
Interest-bearing deposits with other banks mature within one year and are carried at cost.
Investment Securities
In accordance with the investments topic of the Accounting Standards Codification (“ASC”), securities are classified as
“available-for-sale,”
“held-to-maturity”
or “trading”. Fair values for securities are based on quoted market prices where available. If quoted market prices are not available, fair values are based on quoted market prices of comparable instruments. Gains or losses on the sale of securities are determined using the specific identification method. Currently, the Company has no held to maturity or trading securities.
Securities
Available-for-Sale
Securities that are held for indefinite periods of time or used as part of the Company’s asset/liability management strategy and that may be sold in response to interest rate changes, changes in prepayment risk, the need to increase regulatory capital and other similar factors are classified as
available-for-sale
(“AFS”). Securities
available-for-sale
are reported at fair value, with unrealized gains and losses reported, net of related income tax effect, as a separate component of shareholders’ equity.
The Company periodically reviews its securities for impairment based upon a number of factors, including but not limited to, length of time and extent to which the fair value has been less than cost, the likelihood of the security’s ability to recover any decline in its fair value, financial condition of the underlying issuer, ability of the issuer to meet contractual obligations and ability to retain the security for a period of time sufficient to allow for recovery in fair value. Impairments on securities are recognized when management, based on its analysis, deems the impairment to be other-than-temporary.
 
16

Table of Contents
CITIZENS HOLDING COMPANY
Years Ended December 31, 2020, 2019 and 2018
NOTES TO CONSOLIDATED FINANCIAL STATEMENTS
 
 
Note 1.
Continued
 
Loans and Allowance for Loan Losses
Loans receivable that management has the intent and ability to hold for the foreseeable future or until maturity or payoff are reported at the principal amount outstanding, net of unearned income and an allowance for loan losses. The Company has no loans
held-for-sale.
Unearned income includes deferred fees net of deferred direct incremental loan origination cost. Unearned income attributable to loans held with a maturity of more than one year is recognized as income or expense over the life of the loan.
Unearned discounts on installment loans are recognized as income over the terms of the loans by a method that approximates the interest method. Unearned income and interest on commercial loans are recognized based on the principal amount outstanding. For all other loans, interest is accrued daily on the outstanding balances. For impaired loans, interest is discontinued on a loan when management believes, after considering collection efforts and other factors, that the borrower’s financial condition is such that collection of interest is doubtful. Cash collections on impaired loans are credited to the loan receivable balance, and no interest income is recognized on those loans until the principal balance has been collected. The Company generally discontinues the accrual of interest income when a loan becomes 90 days past due as to principal or interest; however, management may elect to continue the accrual when the estimated net realizable value of collateral is sufficient to cover the principal balance and the accrued interest. Interest income on other nonaccrual loans is recognized only to the extent of interest payments.
Upon discontinuance of the accrual of interest on a loan, any previously accrued but unpaid interest is reversed against interest income.
A loan is impaired when management determines that it is probable the Company will be unable to collect all contractual principal and interest payments due in accordance with the terms of the loan agreement. Impaired loans are measured based on the present value of expected future cash flows discounted at the loan’s effective interest rate or, as a practical expedient, at the loan’s observable market price or the fair value of the collateral if the loan is collateral dependent. The amount of impairment, if any, and any subsequent changes are included in the allowance for loan losses.
Troubled debt restructurings (“TDR”) are those for which concessions have been granted to the borrower due to a deterioration of the borrower’s financial condition. Such concessions may include reduction in interest rates or deferral of interest or principal payments. In evaluating whether to restructure a loan, management analyzes the long-term financial condition of the borrower, including guarantor and collateral support, to determine whether the proposed concessions will increase the likelihood of repayment of principal and interest. TDR are classified as performing, unless they are on nonaccrual status of 90 days or more delinquent, in which case they are considered nonperforming.
 
17

Table of Contents
CITIZENS HOLDING COMPANY
Years Ended December 31, 2020, 2019 and 2018
NOTES TO CONSOLIDATED FINANCIAL STATEMENTS
 
 
Note 1.
Continued
 
The allowance for loan losses is established through a provision for loan losses charged against net income. Loans determined to be uncollectible are charged against the allowance for loan losses, and subsequent recoveries, if any, are credited to the allowance. The allowance represents an amount, which, in management’s judgment, will be adequate to absorb estimated probable losses on existing loans that may become uncollectible. In order to determine an adequate level of allowance, management utilizes a model that calculates the allowance for loan loss by applying an average historical
charge-off
percentage by loan segment and over a 20 quarter period of time with the most current quarters weighted to show the effect of the most recent chargeoff activity to the current loan balances in the corresponding loan segment. Additionally, for loan balances over $100, specific reserves on an individual loan basis may be applied in addition to the allowance calculated using the model. This specific reserve is determined by an extensive review of the borrower’s credit history, capacity to pay, adequacy of collateral and general economic conditions related to the respective loan. This specific reserve will stay in place until such time that the borrower’s obligation is satisfied or the loan is greatly improved.
Large groups of small-balance homogenous loans are collectively evaluated for impairment. Accordingly, the Company does not separately identify individual consumer and residential loans for impairment disclosures.
Business Combinations, Accounting for Credit-Deteriorated Purchased Loans and Related Assets
Business combinations are accounted for by applying the acquisition method in accordance with ASC 805, “Business Combinations.” Under the acquisition method, identifiable assets acquired and liabilities assumed and any
non-controlling
interest in the acquiree at the acquisition date are measured at their fair values as of that date and are recognized separately from goodwill. Results of operations of the acquired entities are included in the Consolidated Statements of Income from the date of acquisition. Acquisition costs incurred by the Company are expensed as incurred.
Loans purchased in business combinations with evidence of credit deterioration since origination and for which it is probable that all contractually required payments will not be collected are considered to be credit-impaired. Purchased credit deteriorated loans are accounted for in accordance with ASC
310-30,
“Loans and Debt Securities Acquired with Deteriorated Credit Quality” (“ASC
310-30”),
and initially measured at fair value, which includes estimated future credit losses expected to be incurred over the life of the loans. Increases in expected cash flows to be collected on these loans are recognized as an adjustment of the loan’s yield over its remaining life, while decreases in expected cash flows are recognized as an impairment.
 
18

Table of Contents
CITIZENS HOLDING COMPANY
Years Ended December 31, 2020, 2019 and 2018
NOTES TO CONSOLIDATED FINANCIAL STATEMENTS
 
 
Note 1.
Continued
 
Bank Premises, Furniture, Fixtures and Equipment
The Company’s premises, furniture, fixtures and equipment are stated at cost less accumulated depreciation computed by straight-line methods over the estimated useful lives of the assets, which range from three to forty years. Costs of major additions and improvements are capitalized. Expenditures for maintenance and repairs are charged to expense as incurred.
Leases
ASU
2016-02,
“Leases (Topic 842),” became effective for the Company on January 1, 2019. The Company adopted FASB ASC Topic 842 utilizing the modified retrospective transition approach prescribed by ASU
2018-11,
“Leases (Topic 842): Targeted Improvements”. The Company did not elect to adopt the package of practical expedients, which includes reassessing whether any expired or existing contracts are or contain leases, reassessing the lease classification and reassessing initial direct costs. Also, the Company did not elect to adopt the hindsight practical expedient therefore maintaining the lease terms previously determined under FASB ASC Topic 840, “Leases”. The Company made an accounting policy election to not recognize short-term leases (12 months or less) on the balance sheet. The Company accounts for the lease and nonlease components separately as such amounts are readily determinable.
Once the Company identifies and determines certain contracts are leases according to FASB ASC Topic 842, the Company classifies it as an operating or a finance lease and recognizes a
right-of-use
asset and a lease liability at the lease commencement date. The lease liability represents the present value of the lease payments that remain unpaid as of the commencement date and the
right-of-use
asset is the initial lease liability recognized for the lease plus any lease payments made to the lessor at or before the commencement date as well as any initial direct costs less any lease incentives received.
The Company’s operating leases primarily consist of building and land leases. The Company recognizes lease rent expense on a straight-line basis over the term of the lease contract and records it as noninterest expense in net occupancy – premises for building and land leases. The Company’s amortization of the
right-of-use
asset is the difference between the straight-line lease expense and the interest expense recognized on the lease liability during the period. The Company’s lease liabilities are measured as the present value of the remaining lease payments throughout the lease term.
In order to calculate its
right-of-use
assets and lease liabilities, FASB ASC Topic 842 requires the Company to use the rate of interest implicit in the lease when readily determinable. If the rate implicit in the lease is not readily determinable, the Company is required to use its incremental borrowing rate, which is the rate of interest the Company would have to pay to borrow on a collateralized basis over a similar term in a similar economic environment. Since the implicit interest rate for most of its building and land leases were not readily determinable, the Company used its incremental borrowing rate.
 
19

Table of Contents
CITIZENS HOLDING COMPANY
Years Ended December 31, 2020, 2019 and 2018
NOTES TO CONSOLIDATED FINANCIAL STATEMENTS
 
 
Note 1.
Continued
 
The Company’s short-term leases primarily include automated teller machines. For short-term leases, the Company recognizes lease expense on a straight-line basis over the lease term. As previously stated, the Company has elected not to include short-term leases on its balance sheet.
Other Real Estate Owned
Other real estate owned (“OREO”) consists of properties repossessed by the Company on foreclosed loans. These assets are stated at fair value at the date acquired less estimated costs to sell. Losses arising from the acquisition of such property are charged against the allowance for loan losses. Declines in value resulting from subsequent revaluation of the property or losses resulting from disposition of such property are expensed as incurred. Revenue and expenses from operations of other real estate owned are reflected as other income (expense).
Cash Surrender Value of Life Insurance
The Company has purchased life insurance contracts on certain employees and directors. Certain of such policies were acquired to fund deferred compensation arrangements with employees and directors. The cash surrender value of the Company owned policies is carried at the actual cash surrender value of the policy at the balance sheet date. Changes in the value of the policies are classified in
non-interest
income.
Intangible Assets
Intangible assets include core deposits purchased and goodwill. Core deposit intangibles are amortized on a straight-line basis over their estimated economic lives ranging from 5
 
to 10
 
years. Goodwill and other intangible assets with indefinite lives are not amortized but are tested at least annually for impairment. Fair values are determined based on market valuation multiples for the Company and comparable businesses based on the assets and cash flow of the Bank, the Company’s only reportable segment. If impairment has occurred, the goodwill or other intangible asset is reduced to its estimated fair value through a charge to expense.
Trust Assets
Assets held by the trust department of the Company in its fiduciary or agency capacities are not assets of the Company and are not included in the consolidated financial statements.
 
20

Table of Contents
CITIZENS HOLDING COMPANY
Years Ended December 31, 2020, 2019 and 2018
NOTES TO CONSOLIDATED FINANCIAL STATEMENTS
 
 
Note 1.
Continued
 
Income Taxes
Provisions for income taxes are based on taxes payable or refundable for the current year and the changes in deferred tax assets and liabilities, excluding components of other comprehensive income. Deferred tax assets and liabilities are included in the financial statements at currently enacted income tax rates applicable to the period in which the deferred tax assets and liabilities are expected to be realized or settled. As changes in tax laws or rates are enacted, deferred tax assets and liabilities are adjusted through the provision for income taxes. Deferred tax assets are reduced by a valuation allowance when, in the opinion of management, it is more likely than not that some portion or all of the deferred tax assets will not be realized.
Comprehensive Income (Loss)
Comprehensive income (loss) includes net earnings reported in the consolidated statements of income and changes in unrealized gain (loss) on securities
available-for-sale
reported as a component of shareholders’ equity. Unrealized gain (loss) on securities
available-for-sale,
net of related income taxes, was the only component of accumulated other comprehensive income for the Company.
 
21

Table of Contents
CITIZENS HOLDING COMPANY
Years Ended December 31, 2020, 2019 and 2018
NOTES TO CONSOLIDATED FINANCIAL STATEMENTS
 
 
Note 1.
Continued
 
Net Income Per Share
Net income per share-basic is computed by dividing net income by the weighted average number of common shares outstanding during the year. Net income per share-diluted is based on the weighted average number of shares of common stock outstanding for the periods, including the dilutive effect of the Company’s outstanding stock options and restricted stock grants. The effect of the dilutive shares for the years 2020, 2019 and 2018 is illustrated in the following table.
 
     2020      2019      2018  
       
Basic weighted average shares outstanding
     5,577,352        5,063,736        4,889,420  
Dilutive effect of stock options
     2,564        2,367        9,798  


Dilutive weighted average shares outstanding
     5,579,916        5,066,103        4,899,218  


Net income
   $ 6,931      $ 5,902      $ 6,673  


Net income per share-basic
   $ 1.24      $ 1.17      $ 1.36  
Net income per share-diluted
   $ 1.24      $ 1.17      $ 1.36  
Advertising Costs
Advertising costs are charged to expense when incurred. Advertising expense was $642, $551 and $640 for the years ended December 31, 2020, 2019 and 2018, respectively.
Securities Sold Under Agreements to Repurchase
Securities sold under agreements to repurchase are accounted for as collateralized financing transactions and are recorded at the amounts at which the securities were sold. Securities, generally United States Government, federal agency and state county municipal securities, pledged as collateral under these financing arrangements cannot be sold or
re-pledged
by the secured party.
Reclassifications
Certain information for 2019 has been reclassified to conform to the financial presentation for 2020. Such reclassifications had no effect on net income or shareholders’ equity.
 
22

Table of Contents
CITIZENS HOLDING COMPANY
Years Ended December 31, 2020, 2019 and 2018
NOTES TO CONSOLIDATED FINANCIAL STATEMENTS
 
 
Note 1.
Continued
Stock-Based Compensation
At December 31, 2020, the Company had outstanding grants under two stock-based compensation plans, which are the 1999 Directors’ Stock Compensation Plan and the 2013 Incentive Compensation Plan. Compensation expense for option grants and restricted stock awards is determined based on the estimated fair value of the stock options and restricted stock on the applicable grant or award date. The Company has elected to account for forfeitures in compensation cost when they occur as permitted under the guidance in ASC 718, “Compensation - Stock Compensation” (“ASC 718”). Expense associated with the Company’s stock-based compensation is included under the line item “Salaries and benefits” on the Consolidated Statements of Income. The Company recognizes compensation expense for all share-based payments to employees in accordance with ASC 718, “Compensation – Stock Compensation.”
Subsequent Events
The Company has evaluated, for consideration of recognition or disclosure, subsequent events that have occurred through the date of issuance of its financial statements, and has determined that no significant events occurred after December 31, 2020 but prior to the issuance of these financial statements that would have a material impact on its Consolidated Financial Statements.
Adoption of New Accounting Standards
In January 2017, the FASB issued ASU
2017-04, “Intangibles
- Goodwill and Other (Topic 350) - Simplifying the Test for Goodwill Impairment” (“ASU
2017-04”). ASU
2017-04
simplifies the accounting for goodwill impairment for all entities by requiring impairment charges to be based on the first step in the previous
two-step
impairment test. Under the new guidance, if a reporting unit’s carrying amount exceeds its fair value, an entity will record an impairment charge based on that difference. The impairment charge will be limited to the amount of goodwill allocated to that reporting unit. The standard eliminates the prior requirement to calculate a goodwill impairment charge using Step 2, which requires an entity to calculate any impairment charge by comparing the implied fair value of goodwill with its carrying amount. ASU
2017-04
was effective for the Corporation on January 1, 2020 and did not have a material impact on the Corporation’s financial statements.
 
23

Table of Contents
CITIZENS HOLDING COMPANY
Years Ended December 31, 2020, 2019 and 2018
NOTES TO CONSOLIDATED FINANCIAL STATEMENTS
 
 
Note 1.
Continued
ASU
2019-13
“Fair Value Measurement (Topic 820) – Changes in the Disclosure Requirements for Fair Value Measurement” (“ASU
2019-13”)
removes the requirement to disclose the amount of and reasons for transfers between Level 1 and Level 2 fair value measurement methodologies, the policy for timing of transfers between levels and the valuation processes for Level 3 fair value measurements. It also adds a requirement to disclose changes in unrealized gains and losses for the period included in other comprehensive income for recurring Level 3 fair value measurements held at the end of the reporting period and the range and weighted average of significant unobservable inputs used to develop Level 3 measurements. For certain unobservable inputs, entities may disclose other quantitative information in lieu of the weighted average if the other quantitative information would be a more reasonable and rational method to reflect the distribution of unobservable inputs used to develop Level 3 fair value measurements. ASU
2019-13
is effective for annual and interim periods beginning after December 15, 2019. ASU
2019-13
was effective for the Corporation on January 1, 2020 and did not have a material impact on the Corporation’s financial statements.
In March 2020, various regulatory agencies, including the Board of Governors of the Federal Reserve System and the Federal Deposit Insurance Corporation, (“the agencies”) issued an interagency statement on loan modifications and reporting for financial institutions working with customers affected by
COVID-19.
The interagency statement was effective immediately and impacted accounting for loan modifications. Under Accounting Standards Codification
310-40,
“Receivables – Troubled Debt Restructurings by Creditors,” (“ASC
310-40”),
a restructuring of debt constitutes a troubled debt restructuring (“TDR”) if the creditor, for economic or legal reasons related to the debtor’s financial difficulties, grants a concession to the debtor that it would not otherwise consider. The agencies confirmed with the staff of the FASB that short-term modifications made on a good faith basis in response to
COVID-19
to borrowers who were current prior to any relief, are not to be considered TDRs. This includes short-term (e.g., six months) modifications such as payment deferrals, fee waivers, extensions of repayment terms, or other delays in payment that are insignificant. Borrowers considered current are those that are less than 30 days past due on their contractual payments at the time a modification program is implemented. This interagency guidance is expected to have a material impact on the Corporation’s financial statements; however, this impact cannot be quantified at this time.
 
24

Table of Contents
CITIZENS HOLDING COMPANY
Years Ended December 31, 2020, 2019 and 2018
NOTES TO CONSOLIDATED FINANCIAL STATEMENTS
 
 
Note 1.
Continued
 
Newly Issued, But Not Yet Effective Accounting Standards
In June 2016, the FASB issued ASU
2016-13,
Financial Instruments – Credit Losses (Topic 326): Measurement of Credit Losses on Financial Instruments
” (“ASU
2016-13”).
ASU
2016-13
makes significant changes to the accounting for credit losses on financial instruments and disclosures about them. The new current expected credit loss (CECL) impairment model will require an estimate of expected credit losses, measured over the contractual life of an instrument, which considers reasonable and supportable forecasts of future economic conditions in addition to information about past events and current conditions. The standard provides significant flexibility and requires a high degree of judgment with regards to pooling financial assets with similar risk characteristics, determining the contractual terms of said financial assets and adjusting the relevant historical loss information in order to develop an estimate of expected lifetime losses. In addition, ASU
2016-13
amends the accounting for credit losses on debt securities and purchased financial assets with credit deterioration. The amendments in ASU
2016-13
were originally effective for fiscal years beginning after December 31, 2019, and interim periods within those years for public business entities that are SEC filers. However, in October 2019, the FASB approved deferral of the effective date for ASU
2016-13
for certain companies.
The new effective date for the Company is January 1, 2023. ASU
2016-13
permits the use of estimation techniques that are practical and relevant to the Company’s circumstances, as long as they are applied consistently over time and faithfully estimate expected credit losses in accordance with the standard. The ASU lists several common credit loss methods that are acceptable such as a discounted cash flow method, loss-rate method and probability of default/loss given default (PD/LGD) method. Depending on the nature of each identified pool of financial assets with similar risk characteristics, the Company currently plans on implementing a PD/LGD method or a loss-rate method to estimate expected credit losses. The Company expects ASU
2016-13
to have a significant impact on the Company’s accounting policies, internal controls over financial reporting and footnote disclosures. The Company has assessed its data and system needs and has begun designing its financial models to estimate expected credit losses in accordance with the standard. Further development, testing and evaluation of said models is required to determine the impact that adoption of this standard will have on the financial condition and results of operations of the Company.
In December 2019, the FASB issued Accounting Standards Update
No. 2019-12,
Income Taxes (Topic 740)
: Simplifying the Accounting for Income Taxes to simplify various aspects of the current guidance to promote consistent application of the standard among reporting entities by moving certain exceptions to the general principles. The amendments are effective for fiscal years beginning after December 15, 2020, with early adoption permitted. Management does not expect a material impact to the Company’s consolidated financial statements upon adoption.
 
25

Table of Contents
CITIZENS HOLDING COMPANY
Years Ended December 31, 2020, 2019 and 2018
NOTES TO CONSOLIDATED FINANCIAL STATEMENTS
 
 
Note 2.
Business Combinations
(dollar amounts in thousands, except share and per share data)
Acquisition of Charter Bank
Effective October 1, 2019, the Company completed its acquisition of Charter Bank (“Charter”) in a transaction valued at approximately $19,668. The Company issued 666,101 shares of common stock and paid approximately $6,110 to Charter stockholders for 100% voting equity interest in Charter. On October 1, 2019, Charter operated 4 banking locations on the Mississippi Gulf Coast.
The Company recorded approximately $10,719 in intangible assets which consist of goodwill of $9,953 and a core deposit intangible of $766. Goodwill resulted from a combination of revenue enhancements from expansion in existing markets and efficiencies resulting from operational synergies. The fair value of the core deposit intangible is being amortized on a straight-line basis over the estimated useful life, currently expected to be 7 years.
The Company recorded approximately $558 in expenses related to the merger in 2019. Merger expenses were expensed as incurred and are included in other expense in the consolidated statements of income.
 
The following table summarizes the allocation of purchase price to assets and liabilities acquired in connection with the Company’s acquisition of Charter based on their fair values on October 1, 2019.
 
Purchase Price:
                 
Shares issued to common shareholders
     666,101           
Purchase price per share
   $ 20.35           


Value of stock paid
            $ 13,555  
Cash consideration paid
              6,110  
Cash paid for fractional shares
              3  


Total Purchase Price
            $ 19,668  
Net Assets Acquired:
                 
Stockholders’ equity at transaction date
   $ 11,383           
Increase (decrease) to net assets as a result of fair value adjustments to assets acquired and liabilities assumed:
                 
Securities
     (237         
Loans, including loans held for sale
     (347         
Premises and equipment
     (1,252         
Intangible assets
     575           
Other assets
     (272         
Deposits
     (135         


Total Net Assets Acquired
              9,715  


Goodwill resulting from merger
            $ 9,953  


26

Table of Contents
CITIZENS HOLDING COMPANY
Years Ended December 31, 2020, 2019 and 2018
NOTES TO CONSOLIDATED FINANCIAL STATEMENTS
 
 
Note 2.
Continued
 
The following table summarizes the fair value on October 1, 2019 of assets acquired and liabilities assumed at acquisition date in connection with the merger with Charter.
 
Cash and cash equivalents
   $ 7,343  
Investment securities available for sale
     26,607  
Loans
     103,665  
Premises and equipment
     4,813  
Intangible assets
     10,719  
Other assets
     3,957  


Total assets
     157,104  
   
Deposits
     126,316  
Borrowings
     8,969  
Other liabilities
     2,151  


Total liabilities
   $ 137,436  


Note 3.
Investment Securities
(in thousands)
The amortized cost and estimated fair value of securities
available-for-sale
and the corresponding amounts of gross unrealized gains and losses recognized in accumulated other comprehensive income at December 31, 2020 and 2019 were as follows:
 
2020
  
Amortized

Cost
    
Gross

Unrealized

Gains
    
Gross

Unrealized

Losses
    
Fair Value
 
Securities available-for-sale
                                   
Obligations of U.S.
                                   
Government agencies
   $ 11,870      $ 191      $ —        $ 12,061  
Mortgage-backed securities
     560,033        4,550        2,600        561,983  
State, County, Municipals
     100,823        3,410        36        104,197  
Other securities
     500        8        —          508  


Total
   $ 673,226      $ 8,159      $ 2,636      $ 678,749  


27

Table of Contents
CITIZENS HOLDING COMPANY
Years Ended December 31, 2020, 2019 and 2018
NOTES TO CONSOLIDATED FINANCIAL STATEMENTS
 
 
Note 3.
Continued
 
2019
  
Amortized

Cost
    
Gross

Unrealized

Gains
    
Gross

Unrealized

Losses
    
Fair Value
 
Securities available-for-sale
                                   
Obligations of U.S.
                                   
Government agencies
   $ 97,400      $ —        $ 289      $ 97,111  
Mortgage-backed securities
     308,310        640        2,050        306,900  
State, County, Municipals
     59,724        708        60        60,372  


Total
   $ 465,434      $ 1,348      $ 2,399      $ 464,383  


The following tables show the gross unrealized losses and fair value of the Company’s investments classified as AFS investments with unrealized losses that are not deemed to be other-than-temporarily impaired, aggregated by investment category and length of time that individual securities have been in a continuous unrealized loss position, at December 31, 2020 and 2019.
A summary of unrealized loss information for AFS securities, categorized by security type follows:
 
December 31, 2020
  
Less than 12 months
 
  
2 months or more
 
  
Total
 
Description of Securities
  
Fair Value
 
  
Unrealized

Losses
 
  
Fair Value
 
  
Unrealized

Losses
 
  
Fair Value
 
  
Unrealized

Losses
 
             
Mortgage backed securities
  
$
278,162
 
  
$
2,600
 
  
$
—  
 
  
$
—  
 
  
$
278,162
 
  
$
2,600
 
State, County, Municipal
  
 
6,541


36


—  


—  


6,541


36


Total
  
$
284,703
 
  
$
2,636
 
  
$
—  
 
  
$
—  
 
  
$
284,703
 
  
$
2,636


28

Table of Contents
CITIZENS HOLDING COMPANY
Years Ended December 31, 2020, 2019 and 2018
NOTES TO CONSOLIDATED FINANCIAL STATEMENTS
 
 
Note 3.
Continued
 
December 31, 2019
  
Less than 12 months
    
12 months or more
    
Total
 
Description of Securities
  
Fair Value
    
Unrealized
Losses
    
Fair Value
    
Unrealized
Losses
    
Fair Value
    
Unrealized
Losses
 
             
Obligations of U.S.
                                                     
Government agencies
   $ 76,682      $ 217      $ 20,429      $ 72      $ 97,111      $ 289  
Mortgage backed securities
     101,730        871        76,630        1,179        178,360        2,050  
State, County, Municipal
     8,280        37        3,731        23        12,011        60  


Total
   $ 186,692      $ 1,125      $ 100,790      $ 1,274      $ 287,482      $ 2,399  


The unrealized losses shown above are due to increases in market rates over the yields available at the time of purchase of the underlying securities and not credit quality. The Company does not intend to sell any of the securities in an unrealized loss position, and it is more likely than not that the Company will not be required to sell any such security prior to the recovery of its amortized cost basis, which may be at maturity. None of the unrealized losses disclosed in the previous table are related to credit deterioration. As such, the Company did not record any other-than-temporary impairment for the years ended December 31, 2020 or 2019.
The amortized cost and estimated fair value of securities at December 31, 2020, by contractual maturity, are shown below. Expected maturities will differ from contractual maturities because borrowers may have the right to call or prepay obligations with or without call or prepayment penalties.
 
    
Amortized Cost
    
Fair Value
 
Securities AFS
                 
Due in one year or less
   $ —        $ —    
Due after one year through five years
     3,594        3,701  
Due after five years through ten years
     20,538        21,446  
Due after ten years
     89,061        91,619  
Residential mortgage backed securities
     536,215        537,027  
Commercial mortgage backed securities
     23,818        24,956  


Total
   $ 673,226      $ 678,749  


Investment securities with fair values of $558,955 and $413,275 at December 31, 2020 and December 31, 2019, respectively, were pledged as collateral for public deposits and securities sold under agreement to repurchase.
 
29

Table of Contents
CITIZENS HOLDING COMPANY
Years Ended December 31, 2020, 2019 and 2018
NOTES TO CONSOLIDATED FINANCIAL STATEMENTS
 
 
Note 3.
Continued
 
Gross realized gains and losses are included in net gains on sales of securities in the Consolidated Statements of Income. Total gross realized gains and gross realized losses from the sale of investment securities for each of the years ended December 31 were:
 
    
2020
    
2019
    
2018
 
Gross realized gains
   $ 1,656      $ 414      $ 171  
Gross realized losses
     827        223        160  


Net realized gains
   $ 829      $ 191      $ 11  


Note 4.
Federal Home Loan Bank Stock
(in thousands)
The Company, as a member of the Federal Home Loan Bank of Dallas (“FHLB”) system, owns stock in the organization. No ready market exists for the stock, and it has no quoted market value. The Company’s investment in the FHLB is carried at cost of $1,223 and $3,083 at December 31, 2020 and December 31, 2019, respectively, and is included in other assets in the Consolidated Statements of Financial Condition. The Company purchased stock in 2020 and 2019 at the par value of $100 per share.
 
30

Table of Contents
CITIZENS HOLDING COMPANY
Years Ended December 31, 2020, 2019 and 2018
NOTES TO CONSOLIDATED FINANCIAL STATEMENTS
 
 
Note 5.
Non Purchased Loans
(In Thousands, Except Number of Loans)
“Purchased” loans are those acquired in any of the Company’s previous acquisitions. “Non purchased” loans include all of the Company’s other loans. For purposes of this Note 5, all references to “loans” mean non purchased loans.
The composition of loans, net at December 31, 2020 and 2019 is as follows:
 
    
2020
    
2019
 
Real Estate:
                 
Land Development and Construction
(1)
   $ 42,677      $ 66,428  
Farmland
     15,616        15,595  
1-4 Family Mortgages
     94,280        87,631  
Commercial Real Estate
     306,875        207,604  


Total Real Estate Loans
     459,448        377,258  
     
Business Loans:
                 
Commercial and Industrial Loans
(2)
     115,679        84,611  
Farm Production and Other Farm Loans
     541        683  


Total Business Loans
     116,220        85,294  
     
Consumer Loans:
                 
Credit Cards
     1,878        1,833  
Other Consumer Loans
     10,929        12,060  


Total Consumer Loans
     12,807        13,893  


Total Gross Loans
     588,475        476,445  
     
Unearned Income
     (1      (8
Allowance for Loan Losses
     (4,735      (3,755


Loans, net
   $ 583,739      $ 472,682  


(1)
Reclassifications to other loan segments due to changes in loan risk characteristics that occurred in 2020.
(2)
Includes PPP loans of $29,523 and $-0- as of December 31, 2020 and December 31, 2019, respectively.
 
31

Table of Contents
CITIZENS HOLDING COMPANY
Years Ended December 31, 2020, 2019 and 2018
NOTES TO CONSOLIDATED FINANCIAL STATEMENTS
 
 
Note 5.
Continued
 
The Company has certain lending policies and procedures in place that are designed to maximize loan income within an acceptable level of risk. Management reviews these policies and procedures and submits them to the Company’s Board of Directors for its approval when needed, but no less frequently than annually. A reporting system supplements the review process by providing management with frequent reports related to loan production, loan quality, concentrations of credit, loan delinquencies and
non-performing
and potential problem loans. Diversification in the loan portfolio is a means of managing risk associated with fluctuations in economic conditions.
The Company maintains an independent loan review department that reviews and validates the credit risk program on a periodic basis. Results of this review are presented to management with quarterly reports made to the board of directors. The loan review process complements and reinforces the risk identification and assessment decisions made by the lenders and credit personnel, as well as the Company’s policies and procedures.
Loans are made principally to customers in the Company’s market. The Company’s lending policy provides that loans collateralized by real estate are normally made with
loan-to-value
(“LTV”) ratios of 80 percent or less. Commercial loans are typically collateralized by property, equipment, inventories or receivables with LTV ratios from 50 percent to 80 percent. Real estate mortgage loans are collateralized by personal residences with LTV ratios of 80 percent or less. Consumer loans are typically collateralized by real estate, vehicles and other consumer durable goods. Approximately $88,986 and $77,700 of the loans outstanding at December 31, 2020 and 2019, respectively, were variable rate loans.
In the ordinary course of business, the Company has granted loans to certain directors, significant shareholders and their affiliates (collectively referred to as “related parties”). These loans were made on substantially the same terms, including interest rates and collateral, as those prevailing at the time for comparable transactions with other unaffiliated persons and do not involve more than normal risk of collectability. Activity in related party loans during 2020 is presented in the following table.​​​​​​​
 
Balance outstanding at December 31, 2019
   $ 387  
   
Principal additions
     690  
   
Principal reductions
     (231


Balance outstanding at December 31, 2020
   $ 846  


32

Table of Contents
CITIZENS HOLDING COMPANY
Years Ended December 31, 2020, 2019 and 2018
NOTES TO CONSOLIDATED FINANCIAL STATEMENTS
 
 
Note 5.
Continued
 
Loans are considered to be past due if the required principal and interest payments have not been received as of the date such payments were due. Loans are placed on
non-accrual
status, when, in management’s opinion, the borrower may be unable to meet payment obligations as they become due, as well as when required by regulatory provisions. Loans may be placed on non-accrual status regardless of whether such loans are considered past due. When interest accruals are discontinued, all unpaid accrued interest is reversed. Interest income is subsequently recognized only to the extent cash payments are received in excess of principal due. Loans are returned to accrual status when all the principal and interest amounts contractually due are brought current and future payments are reasonably assured.
Year-end
non-accrual
loans, segregated by class of loans, were as follows:
 
     2020      2019  
Real Estate:
                 
Land Development and Construction
   $ 308      $ 111  
Farmland
     287        232  
1-4 Family Mortgages
     1,809        2,160  
Commercial Real Estate
     5,600        9,082  


Total Real Estate Loans
     8,004        11,585  
     
Business Loans:
                 
Commercial and Industrial Loans
     413        338  
Farm Production and Other Farm Loans
     9        10  


Total Business Loans
     422        348  
     
Consumer Loans:
                 
Other Consumer Loans
     33        60  


Total Consumer Loans
     33        60  


Total non-accrual Loans
   $ 8,459      $ 11,993  


In the event that
non-accrual
loans had performed in accordance with their original terms, the Company would have recognized additional interest income of approximately $383, $555 and $429 in 2020, 2019 and 2018, respectively.
 
33

Table of Contents
CITIZENS HOLDING COMPANY
Years Ended December 31, 2020, 2019 and 2018
NOTES TO CONSOLIDATED FINANCIAL STATEMENTS
 
 
Note 5.
Continued
 
An age analysis of past due loans, segregated by class of loans, as of December 31, 2020 is as follows:
     Loans
30-89 Days

Past Due
     Loans
90 or more
Days
Past Due
     Total Past
Due Loans
     Current
Loans
     Total
Loans
     Accruing
Loans
90 or more
Days
Past Due
 
Real Estate:
                                                     
Land Development and Construction
   $ 112      $ —        $ 112      $ 42,565      $ 42,677      $ —    
Farmland
     183        75        258        15,358        15,616        —    
1-4
Family Mortgages
     1,301        246        1,547        92,733        94,280        —    
Commercial Real Estate
     1,407        700        2,107        304,768        306,875        —    


Total Real Estate Loans
     3,003        1,021        4,024        455,424        459,448        —    
             
Business Loans:
                                                     
Commercial and Industrial Loans
     97        405        502        115,177        115,679        5  
Farm Production and Other Farm Loans
     2        —          2        539        541        —    


Total Business Loans
     99        405        504        115,716        116,220        5  
             
Consumer Loans:
                                                     
Credit Cards
     25        9        34        1,844        1,878        9  
Other Consumer Loans
     66        —          66        10,863        10,929        —    


Total Consumer Loans
     91        9        100        12,707        12,807        9  


Total Loans
   $ 3,193      $ 1,435      $ 4,628      $ 583,847      $ 588,475      $ 14  


34

Table of Contents
CITIZENS HOLDING COMPANY
Years Ended December 31, 2020, 2019 and 2018
NOTES TO CONSOLIDATED FINANCIAL STATEMENTS
 
 
Note 5.
Continued
 
An age analysis of past due loans, segregated by class of loans, as of December 31, 2019 is as follows:
 
     Loans
30-89 Days

Past Due
     Loans
90 or more
Days
Past Due
     Total Past
Due Loans
     Current
Loans
     Total
Loans
     Accruing
Loans
90 or more
Days
Past Due
 
Real Estate:
                                                     
Land Development and Construction
   $ 736      $ —        $ 736      $ 65,692      $ 66,428      $ —    
Farmland
     171        39        210        15,385        15,595        39  
1-4
Family Mortgages
     3,116        777        3,893        83,738        87,631        147  
Commercial Real Estate
     8,511        2,080        10,591        197,013        207,604        18  


Total Real Estate Loans
     12,534        2,896        15,430        361,828        377,258        204  
             
Business Loans:
                                                     
Commercial and Industrial Loans
     586        312        898        83,713        84,611        52  
Farm Production and Other Farm Loans
     17                  17        666        683        —    


Total Business Loans
     603        312        915        84,379        85,294        52  
             
Consumer Loans:
                                                     
Credit Cards
     45        18        63        1,770        1,833        18  
Other Consumer Loans
     172        42        214        11,846        12,060        —    


Total Consumer Loans
     217        60        277        13,616        13,893        18  


Total Loans
   $ 13,354      $ 3,268      $ 16,622      $ 459,823      $ 476,445      $ 274  


35

Table of Contents
CITIZENS HOLDING COMPANY
Years Ended December 31, 2020, 2019 and 2018
NOTES TO CONSOLIDATED FINANCIAL STATEMENTS
 
 
Note 5.
Continued
 
Loans are considered impaired when, based on current information and events, it is probable the Company will be unable to collect all the amounts due in accordance with the original contractual terms of the loan agreement, including scheduled principal and interest payments. In determining which loans to evaluate for impairment, management looks at past due loans, bankruptcy filings and any situation that might lend itself to cause a borrower to be unable to repay the loan according to the original contract terms on those loans in excess of $100. If a loan is determined to be impaired and the collateral is deemed to be insufficient to fully repay the loan, a specific reserve will be established. Interest payments on impaired loans are typically applied to principal unless collectability of the principal amount is reasonably assured, in which case interest is recognized on a cash basis. Impaired loans or portions thereof, are
charged-off
when deemed uncollectible.
Impaired loans as of December 31, by class of loans, are as follows:
 
2020    Unpaid
Principal
Balance
     Recorded
Investment
With No
Allowance
     Recorded
Investment
With
Allowance
     Total
Recorded
Investment
     Related
Allowance
     Average
Recorded
Investment
 
Real Estate:
                                                     
             
Land Development and Construction
   $ 308      $ 256      $ 52      $ 308      $ 13      $ 210  
Farmland
     111        111        —          111        —          182  
1-4
Family Mortgages
     1,016        1,012        4        1,016        1        928  
Commercial Real Estate
     6,021        3,323        2,504        5,827        768        7,808  


Total Real Estate Loans
     7,456        4,702        2,560        7,262        782        9,127  
             
Business:
                                                     
Commercial and Industrial
     413        54        359        413        125        279  


Total Business Loans
     413        54        359        413        125        279  
             
Total Loans
   $ 7,869      $ 4,756      $ 2,919      $ 7,675      $ 907      $ 9,405  


36

Table of Contents
CITIZENS HOLDING COMPANY
Years Ended December 31, 2020, 2019 and 2018
NOTES TO CONSOLIDATED FINANCIAL STATEMENTS
 
 
Note 5.
Continued
 
2019    Unpaid
Principal
Balance
     Recorded
Investment
With No
Allowance
     Recorded
Investment
With
Allowance
     Total
Recorded
Investment
     Related
Allowance
     Average
Recorded
Investment
 
Real Estate:
                                                     
Land Development and Construction
   $ 111      $ 58      $ 53      $ 111      $ 16      $ 56  
Farmland
     252        252        —          252        —          261  
1-4
Family Mortgages
     839        740        99        839        28        996  
Commercial Real Estate
     11,506        5,949        3,840        9,789        566        9,337  


Total Real Estate Loans
     12,708        6,999        3,992        10,991        610        10,649  
             
Business:
                                                     
Commercial and Industrial
     144                  144        144        72        72  


Total Business Loans
     144                  144        144        72        72  
             
Total Loans
   $ 12,852      $ 6,999      $ 4,136      $ 11,135      $ 682      $ 10,721  


37

Table of Contents
CITIZENS HOLDING COMPANY
Years Ended December 31, 2020, 2019 and 2018
NOTES TO CONSOLIDATED FINANCIAL STATEMENTS
 
 
Note 5.
Continued
 
The Company did not have any new troubled debt restructurings as of December 31, 2020, 2019, and 2018, respectively.
Changes in the Company’s troubled debt restructurings are set forth in the table below:
 
     Number
of Loans
     Recorded
Investment
 
Total at January 1, 2018
     3      $ 3,047  
Reductions due to:
                 
Principal paydowns
              (265


Total at December 31, 2018
     3        2,782  
Reductions due to:
                 
Principal paydowns
              (287


Total at December 31, 2019
     3        2,495  
Reductions due to:
                 
Principal paydowns
              (382


Total at December 31, 2020
     3      $ 2,113  


The allocated allowance for loan losses attributable to restructured loans was
$-0-
at December 31, 2020 and 2019, respectively.
The Company had no commitments to lend additional funds on these troubled debt restructurings at December 31, 2020.
 
38

Table of Contents
CITIZENS HOLDING COMPANY
Years Ended December 31, 2020, 2019 and 2018
NOTES TO CONSOLIDATED FINANCIAL STATEMENTS
 
 
Note 5.
Continued
 
The Company utilizes a risk grading matrix to assign a risk grade to each of its loans when originated and is updated as factors related to the strength of the loan changes. Loans are graded on a scale of 1 to 9. A description of the general characteristics of the 9 risk grades is as follows.
Grade 1. MINIMAL RISK - These loans are without loss exposure to the Company. This classification is reserved for only the best, well secured loans to borrowers with significant capital strength, low leverage, stable earnings and growth and other readily available financing alternatives. This type of loan would also include loans secured by a program of the government.
Grade 2. MODEST RISK - These loans include borrowers with solid credit quality and moderate risk of loss. These loans may be fully secured by certificates of deposit with another reputable financial institution, or secured by readily marketable securities with acceptable margins.
Grade 3. AVERAGE RISK - This is the rating assigned to most of the loans held by the Company. This includes loans with average loss exposure and average overall quality. These loans should liquidate through possessing adequate collateral and adequate earnings of the borrower. In addition, these loans are properly documented and are in accordance with all aspects of the current loan policy.
Grade 4. ACCEPTABLE RISK - Borrower generates sufficient cash flow to fund debt service but most working asset and capital expansion needs are provided from external sources. Profitability and key balance sheet ratios are usually close to peers but one or more may be higher than peers.
Grade 5. MANAGEMENT ATTENTION - Borrower has significant weaknesses resulting from performance trends or management concerns. The financial condition of the borrower has taken a negative turn and may be temporarily strained. Cash flow is weak but cash reserves remain adequate to meet debt service. Management weakness is evident.
Grade 6. OTHER LOANS ESPECIALLY MENTIONED (“OLEM”) - Loans in this category are fundamentally sound but possess some weaknesses. OLEM loans have potential weaknesses, which may, if not checked or corrected, weaken the asset or inadequately protect the Bank’s credit position at some future date. These loans have an identifiable weakness in credit, collateral, or repayment ability but there is no expectation of loss.
 
39

Table of Contents
CITIZENS HOLDING COMPANY
Years Ended December 31, 2020, 2019 and 2018
NOTES TO CONSOLIDATED FINANCIAL STATEMENTS
 
 
Note 5.
Continued
 
Grade 7. SUBSTANDARD ASSETS - Assets classified as substandard are inadequately protected by the current net worth and paying capacity of the obligor or of the collateral pledged, if any. Assets classified as substandard must have a well-defined weakness based upon objective evidence. Assets classified as substandard are characterized by the distinct possibility that the insured institution will sustain some loss if the deficiencies are not corrected. The possibility that liquidation would not be timely requires a substandard classification even if there is little likelihood of total loss.
Grade 8. DOUBTFUL - A loan classified as doubtful has all the weaknesses of a substandard classification and the added characteristic that the weakness makes collection or liquidation in full, on the basis of currently existing facts, conditions, and values, highly questionable or improbable. The possibility of loss is extremely high, but because of certain important and reasonable specific pending factors that may work to the advantage and strengthening of the asset, its classification as an estimated loss is deferred until its more exact status may be determined. A doubtful classification could reflect the fact that the primary source of repayment is gone and serious doubt exists as to the quality of a secondary source of repayment.
Grade 9. LOSS - Loans classified loss are considered uncollectible and of such little value that their continuance as bankable assets is not warranted. This classification does not mean that the asset has absolutely no recovery or salvage value, but rather it is not practical or desirable to defer writing off this basically worthless asset even though partial recovery may occur in the future. Also included in this classification is the defined loss portion of loans rated substandard assets and doubtful assets.
These internally assigned grades are updated on a continual basis throughout the course of the year and represent management’s most updated judgment regarding grades at December 31, 2020.
 
40

Table of Contents
CITIZENS HOLDING COMPANY
Years Ended December 31, 2020, 2019 and 2018
NOTES TO CONSOLIDATED FINANCIAL STATEMENTS
 
 
Note 5.
Continued
 
The following table details the amount of gross loans by loan grade and class for the year ended December 31, 2020:
 
     Satisfactory
1,2,3,4
     Special
Mention
5,6
     Substandard
7
     Doubtful
8
     Loss
9
     Total
Loans
 
Real Estate:
                                                     
Land Development and Construction
   $ 41,775      $ 120      $ 782      $ —        $ —        $ 42,677  
Farmland
     14,801        95        720        —          —          15,616  
1-4
Family Mortgages
     85,203        3,210        5,867        —          —          94,280  
Commercial Real Estate
     258,339        35,769        12,767        —          —          306,875  


Total Real Estate Loans
     400,118        39,194        20,136        —          —          459,448  
             
Business Loans:
                                                     
Commercial and Industrial Loans
     109,525        4,409        1,738        —          7        115,679  
Farm Production and Other Farm Loans
     512        —          20        —          9        541  


Total Business Loans
     110,037        4,409        1,758        —          16        116,220  
             
Consumer Loans:
                                                     
Credit Cards
     1,845        —          33        —          —          1,878  
Other Consumer Loans
     10,820        43        41        25        —          10,929  


Total Consumer Loans
     12,665        43        74        25        —          12,807  


Total Loans
   $ 522,820      $ 43,646      $ 21,968      $ 25      $ 16      $ 588,475  


41

Table of Contents
CITIZENS HOLDING COMPANY
Years Ended December 31, 2020, 2019 and 2018
NOTES TO CONSOLIDATED FINANCIAL STATEMENTS
 
 
Note 5.
Continued
 
The following table details the amount of gross loans by loan grade and class for the year ended December 31, 2019:


Satisfactory

1,2,3,4
    
Special

Mention

5,6
    
Substandard

7
    
Doubtful

8
    
Loss

9
    
Total

Loans
 
Real Estate:
                                                     
Land Development and Construction
  
$
64,112
 
  
$
1,682
 
  
$
634
 
  
$
—  
 
  
$
—  
 
  
$
66,428
 
Farmland
  
 
14,533


331


731


—  


—  


15,595
 
1-4 Family Mortgages
  
 
79,068


1,917


6,646


—  


—  


87,631
 
Commercial Real Estate
  
 
169,270


21,266


17,068


—  


—  


207,604


Total Real Estate Loans
  
 
326,983


25,196


25,079


—  


—  


377,258
 
             
Business Loans:
                                                     
Commercial and Industrial Loans
  
 
80,289


128


4,194


—  


—  


84,611
 
Farm Production and Other Farm Loans
  
 
669


—  


4


—  


10


683


Total Business Loans
  
 
80,958


128


4,198


—  


10


85,294
 
             
Consumer Loans:
                                                     
Credit Cards
  
 
1,770


—  


63


—  


—  


1,833
 
Other Consumer Loans
  
 
11,907


59


53


41


—  


12,060


Total Consumer Loans
  
 
13,677


59


116


41


—  


13,893


Total Loans
  
$
421,618
 
  
$
25,383
 
  
$
29,393
 
  
$
41
 
  
$
10
 
  
$
476,445


42

Table of Contents
CITIZENS HOLDING COMPANY
Years Ended December 31, 2020, 2019 and 2018
NOTES TO CONSOLIDATED FINANCIAL STATEMENTS
 
 
Note 6.
Purchased Loans
(In Thousands)
For purposes of this Note 6, all references to “loans” means purchased loans.
The following is a summary of purchased loans at December 31:


2020
    
2019
 
Real Estate:
                 
Land Development and Construction
  
$
6,153
 
  
$
14,722
 
Farmland
  
 
520


510
 
1-4
Family Mortgages
  
 
23,306


35,952
 
Commercial Real Estate
  
 
24,237


32,436


Total Real Estate Loans
  
 
54,216


83,620
 
     
Business Loans:
                 
Commercial and Industrial Loans
  
 
7,871


14,153
 
Farm Production and Other Farm Loans
  
 
755


884


Total Business Loans
  
 
8,626


15,037
 
     
Consumer Loans:
                 
Other Consumer Loans
  
 
940


1,973


Total Consumer Loans
  
 
940


1,973


Total Gross Loans
  
 
63,782


100,630
 
     
Total Purchased Loans
  
$
63,782
 
  
$
100,630


43

Table of Contents
CITIZENS HOLDING COMPANY
Years Ended December 31, 2020, 2019 and 2018
NOTES TO CONSOLIDATED FINANCIAL STATEMENTS
 
 
Note 6.
Continued
 
An age analysis of past due loans, segregated by class of loans, as of December 31, 2020 is as follows:
 
     Loans
30-89 Days

Past Due
     Loans
90 or more
Days
Past Due
     Total Past
Due Loans
     Current
Loans
     Total
Loans
     Accruing
Loans
90 or more
Days
Past Due
 
Real Estate:
                                                     
Land Development and Construction
   $ 332      $ —        $ 332      $ 5,821      $ 6,153      $ —    
Farmland
     —          —          —          520        520        —    
1-4 Family Mortgages
     401        —          401        22,905        23,306        —    
Commercial Real Estate
               —                    24,237        24,237        —    


Total Real Estate Loans
     733        —          733        53,483        54,216        —    
             
Business Loans:
                                                     
Commercial and Industrial Loans
     849                  849        7,022        7,871        —    
Farm Production and Other Farm Loans
     —          —          —          755        755        —    


Total Business Loans
     849                  849        7,777        8,626        —    
             
Consumer Loans:
                                                     
Credit Cards
     —          —          —          —          —          —    
Other Consumer Loans
     35                  35        905        940        —    


Total Consumer Loans
     35                  35        905        940        —    


Total Loans
   $ 1,617      $         $ 1,617      $ 62,165      $ 63,782      $ —    


44

Table of Contents
CITIZENS HOLDING COMPANY
Years Ended December 31, 2020, 2019 and 2018
NOTES TO CONSOLIDATED FINANCIAL STATEMENTS
 
 
Note 6.
Continued
 
An age analysis of past due loans, segregated by class of loans, as of December 31, 2019 is as follows:
 
     Loans
30-89 Days

Past Due
     Loans
90 or more
Days
Past Due
     Total Past
Due Loans
     Current
Loans
     Total
Loans
     Accruing
Loans
90 or more
Days
Past Due
 
Real Estate:
                                                     
Land Development and Construction
   $ 528      $ —        $ 528      $ 14,194      $ 14,722      $ —    
Farmland
     —          —          —          510        510        —    
1-4 Family Mortgages
     444        —          444        35,508        35,952        —    
Commercial Real Estate
     603        —          603        31,833        32,436        —    


Total Real Estate Loans
     1,575        —          1,575        82,045        83,620        —    
             
Business Loans:
                                                     
Commercial and Industrial Loans
     379        3        382        13,771        14,153        —    
Farm Production and Other Farm Loans
     —          —          —          884        884        —    


Total Business Loans
     379        3        382        14,655        15,037        —    
             
Consumer Loans:
                                                     
Credit Cards
     —          —          —          —          —          —    
Other Consumer Loans
     49        8        57        1,916        1,973        —    


Total Consumer Loans
     49        8        57        1,916        1,973        —    


Total Loans
   $ 2,003      $ 11      $ 2,014      $ 98,616      $ 100,630      $ —    


There were no non credit deteriorated loans that were subsequently impaired and recognized in conformity with ASC 310 as of December 31, 2020 or 2019.
 
45

Table of Contents
CITIZENS HOLDING COMPANY
Years Ended December 31, 2020, 2019 and 2018
NOTES TO CONSOLIDATED FINANCIAL STATEMENTS
 
 
Note 6.
Continued
 
The following table details the amount of gross loans by loan grade, which are consistent with the Company’s loan grades, and class for the year ended December 31, 2020:


1,2,3,4
    
5,6
    
7
    
8
    
9
    
Loans
 
Real Estate:
                                                     
Land Development and Construction
  
$
5,364
 
  
$
766
 
  
$
23
 
  
$
—  
 
  
$
—  
 
  
$
6,153
 
Farmland
  
 
357


163


—  


—  


—  


520
 
1-4 Family Mortgages
  
 
21,116


1,655


535


—  


—  


23,306
 
Commercial Real Estate
  
 
22,469


1,484


284


—  


—  


24,237


Total Real Estate Loans
  
 
49,306


4,068


842


—  


—  


54,216
 
             
Business Loans:
                                                     
Commercial and Industrial Loans
  
 
7,121


397


353


—  


—  


7,871
 
Farm Production and Other Farm Loans
  
 
755


—  


—  


—  


—  


755


Total Business Loans
  
 
7,876


397


353


—  


—  


8,626
 
             
Consumer Loans:
                                                     
Other Consumer Loans
  
 
862


29


35


—  


14


940


Total Consumer Loans
  
 
862


29


35


—  


14


940


Total Loans
  
$
58,044
 
  
$
4,494
 
  
$
1,230
 
  
$
—  
 
  
$
14
 
  
$
63,782


46

Table of Contents
CITIZENS HOLDING COMPANY
Years Ended December 31, 2020, 2019 and 2018
NOTES TO CONSOLIDATED FINANCIAL STATEMENTS
 
 
Note 6.
Continued
 
The following table details the amount of gross loans by loan grade and class for the year ended December 31, 2019:


Satisfactory
1,2,3,4
    
Special
Mention
5,6
    
Substandard
7
    
Doubtful
8
    
Loss
9
    
Total

Loans
 
Real Estate:
                                                     
Land Development and Construction
  
$
13,890
 
  
$
789
 
  
$
43
 
  
$
—  
 
  
$
—  
 
  
$
14,722
 
Farmland
  
 
510


—  


—  


—  


—  


510
 
1-4 Family Mortgages
  
 
33,737


1,535


680


—  


—  


35,952
 
Commercial Real Estate
  
 
30,780


1,656


—  


—  


—  


32,436


Total Real Estate Loans
  
 
78,917


3,980


723


—  


—  


83,620
 
             
Business Loans:
                                                     
Commercial and Industrial Loans
  
 
13,545


608


—  


—  


—  


14,153
 
Farm Production and Other Farm Loans
  
 
884


—  


—  


—  


—  


884


Total Business Loans
  
 
14,429


608


—  


—  


—  


15,037
 
             
Consumer Loans:
                                                     
Credit Cards
  
 
—  


—  


—  


—  


—  


—  
 
Other Consumer Loans
  
 
1,937


36


—  


—  


—  


1,973


Total Consumer Loans
  
 
1,937


36


—  


—  


—  


1,973


Total Loans
  
$
95,283
 
  
$
4,624
 
  
$
723
 
  
$
—  
 
  
$
—  
 
  
$
100,630


47

Table of Contents
CITIZENS HOLDING COMPANY
Years Ended December 31, 2020, 2019 and 2018
NOTES TO CONSOLIDATED FINANCIAL STATEMENTS
 
 
Note 6.
Continued
 
Loans purchased in business combinations that exhibited, at the date of acquisition, evidence of deterioration of the credit quality since origination, such that it was probable that all contractually required payments would not be collected, were as follows as of December 31:


2020
    
2019
 
Real Estate:
                 
Land Development and Construction
  
$
8
 
  
$
43
 
1-4 Family Mortgages
  
 
25


706


Total Real Estate Loans
  
 
33


749
 
     
Business Loans:
                 
Commercial and Industrial Loans
  
 
305


—  


Total Business Loans
  
 
305


—  
 
     
Total PCD Loans
  
$
338
 
  
$
749


Non-accrual
loans of $25 and 33 are included in the
1-4
Family Mortgages at December 31, 2020 and 2019, respectively.
The following table presents the fair value of loans determined to be impaired at the time of acquisition:
 
     Total Purchased Credit Deteriorated Loans  
   
Contractually-required principal
   $ 993  
Nonaccretable difference
     (68


Cash flows expected to be collected
     925  
Accretable yield
     (36


Fair Value
   $ 889  


48

Table of Contents
CITIZENS HOLDING COMPANY
Years Ended December 31, 2020, 2019 and 2018
NOTES TO CONSOLIDATED FINANCIAL STATEMENTS
 
 
Note 6.
Continued
 
The following table presents the fair value of loans purchased from Charter as of the October 1, 2019 acquisition date:
 
     October 1, 2019  
   
At acquisition date:
        
Contractually-required principal
   $ 104,127  


Nonaccretable difference
     (68
Cash flows expected to be collected
     104,059  


Accretable yield
     (394


Fair Value
   $ 103,665  
 
Note 7.
Allowance for Loan Losses
(in thousands)
The allowance for loan losses is a reserve established through a provision for possible loan losses charged to expense, which represents management’s best estimate of probable losses that will occur within the existing portfolio of loans. The allowance, in the judgment of management, is necessary to reserve for estimated loan losses and risks inherent in the loan portfolio.
The allowance on the majority of the loan portfolio is calculated using a historical chargeoff percentage applied to the current loan balances by loan segment. This historical period is the average of the previous five years with the most current years weighted to show the effect of the most recent chargeoff activity. This percentage is also adjusted for economic factors such as unemployment and general business conditions, both local and nationwide.
The group of loans that are considered to be impaired are individually evaluated for possible loss and a specific reserve is established to cover any loss contingency. Loans that are determined to be a loss with no benefit of remaining in the portfolio are charged off to the allowance. These specific reserves are reviewed periodically for continued impairment and adequacy of the specific reserve and adjusted when necessary.
 
49

Table of Contents
CITIZENS HOLDING COMPANY
Years Ended December 31, 2020, 2019 and 2018
NOTES TO CONSOLIDATED FINANCIAL STATEMENTS
 
 
Note 7.
Continued
 
The following table details activity in the allowance for loan losses by portfolio segment for the years ended December 31:
2020
   Real
Estate
     Business
Loans
     Consumer      Total  
Beginning Balance
   $ 3,075      $ 371      $ 309      $ 3,755  
Provision for loan losses
     1,072        422        (9      1,485  
Chargeoffs
     384        229        104        717  
Recoveries
     122        47        43        212  


Net chargeoffs
     262        182        61        505  


Ending Balance
   $ 3,885      $ 611      $ 239      $ 4,735  


Period end allowance allocated to:
                                   
Loans individually evaluated for impairment
   $ 782      $ 125      $ —        $ 907  
Loans collectively evaluated for impairment
     3,103        486        239        3,828  


Ending Balance
   $ 3,885      $ 611      $ 239      $ 4,735  


2019
   Real
Estate
     Business
Loans
     Consumer      Total  
Beginning Balance
   $ 2,845      $ 222      $ 305      $ 3,372  
Provision for loan losses
     231        247        95        573  
Chargeoffs
     115        107        138        360  
Recoveries
     114        9        47        170  


Net chargeoffs
     1        98        91        190  


Ending Balance
   $ 3,075      $ 371      $ 309      $ 3,755  


Period end allowance allocated to:
                                   
Loans individually evaluated for impairment
   $ 610      $ 72      $ —        $ 682  
Loans collectively evaluated for impairment
     2,465        299        309        3,073  


Ending Balance
   $ 3,075      $ 371      $ 309      $ 3,755  


50

Table of Contents
CITIZENS HOLDING COMPANY
Years Ended December 31, 2020, 2019 and 2018
NOTES TO CONSOLIDATED FINANCIAL STATEMENTS
 
 
Note 7.
Continued


2018
  
Real
Estate
    
Business
Loans
    
Consumer
    
Total
 
Beginning Balance
  
$
2,151
 
  
$
347
 
  
$
521
 
  
$
3,019
 
Provision for (reversal of) loan losses
  
 
606


(113
  
 
(159
  
 
334
 
Chargeoffs
  
 
223


19


145


387
 
Recoveries
  
 
311


7


88


406


Net chargeoffs
  
 
(88
  
 
12


57


(19


Ending Balance
  
$
2,845
 
  
$
222
 
  
$
305
 
  
$
3,372


Period end allowance allocated to:
                                   
Loans individually evaluated for impairment
  
$
401
 
  
$
—  
 
  
$
—  
 
  
$
401
 
Loans collectively evaluated for impairment
  
 
2,444


222


305


2,971


Ending Balance
  
$
2,845
 
  
$
222
 
  
$
305
 
  
$
3,372


The Company’s recorded investment in loans as of December 31, 2020 and 2019 related to each balance in the allowance for possible loan losses by portfolio segment and disaggregated on the basis of the Company’s impairment methodology was as follows:
 
                                                                                 
2020
  
Real Estate
    
Business
Loans
    
Consumer
    
Total
 
Loans individually evaluated for impairment
  
$
7,262
 
  
$
413
 
  
$
—  
 
  
$
7,675
 
Loans collectively evaluated for impairment
  
 
506,368


124,128


13,748


644,244
 
Acquired with deteriorated credit quality
  
 
33


305


—  


338


$
513,663
 
  
$
124,846
 
  
$
13,748
 
  
$
652,257


2019
  
Real Estate
    
Business
Loans
    
Consumer
    
Total
 
Loans individually evaluated for impairment
  
$
10,991
 
  
$
144
 
  
$
—  
 
  
$
11,135
 
Loans collectively evaluated for impairment
  
 
449,138


100,187


15,866


565,191
 
Acquired with deteriorated credit quality
  
 
749


—  


—  


749


$
460,878
 
  
$
100,331
 
  
$
15,866
 
  
$
577,075


51

Table of Contents
CITIZENS HOLDING COMPANY
Years Ended December 31, 2020, 2019 and 2018
NOTES TO CONSOLIDATED FINANCIAL STATEMENTS
 
 
Note 7.
Continued
 
Net chargeoffs (recoveries), segregated by class of loans, were as follows:
 
     2020      2019      2018  
Real Estate:
                          
Land Development and Construction
   $ (6    $ (18    $ 56  
Farmland
     —                    3  
1-4 Family Mortgages
     243        32        51  
Commercial Real Estate
     25        (13      (198


Total Real Estate Loans
     262        1        (88


Business Loans:
                          
Commercial and Industrial Loans
     182        98        12  


Total Business Loans
     182        98        12  


Consumer Loans:
                          
Credit Cards
     39        34        36  
Other Consumer Loans
     22        57        21  


Total Consumer Loans
     61        91        57  


Total Net Chargeoffs (Recoveries)
   $ 505      $ 190      $ (19


52

Table of Contents
CITIZENS HOLDING COMPANY
Years Ended December 31, 2020, 2019 and 2018
NOTES TO CONSOLIDATED FINANCIAL STATEMENTS
 
 
Note 8.
Bank Premises, Furniture, Fixtures and Equipment
(in thousands)
Bank premises, furniture, fixtures and equipment consist of the following at December 31, 2020 and December 31, 2019:
 
    
2020
    
2019
 
Land and buildings
   $ 33,651      $ 33,791  
Furniture, fixtures and equipment
     7,105        8,447  


       40,756        42,238  
Less accumulated depreciation
     15,126        17,566  


Total
   $ 25,630      $ 24,672  


Depreciation expense for the years ended December 31, 2020, 2019 and 2018, respectively, was $1,012, $899, and $937.
The Company leases certain premises and equipment under operating leases. At December 31, 2020, the Company had lease liabilities and ROU assets totaling $2,339 related to these leases. Lease liabilities and ROU assets are reflected in other liabilities and other assets, respectively. For the year ended December 31, 2020, the weighted average remaining lease term for operating leases was .6 years and the weighted average discount rate used in the measurement of operating lease liabilities was 5.58%.
Lease costs were as follows:
 
    
December 31, 2020
    
December 31, 2019
 
(in thousands)
             
Operating lease cost
   $ 473      $ 370  
Short-term lease cost
     23        23  
Variable lease cost
               —    


     $ 496      $ 393  


There were no sale and leaseback transactions, leverage leases or lease transactions with related parties during the year ended December 31, 2020 and 2019.
 
53

Table of Contents
CITIZENS HOLDING COMPANY
Years Ended December 31, 2020, 2019 and 2018
NOTES TO CONSOLIDATED FINANCIAL STATEMENTS
 
 
Note 8.
Continued
 
A maturity analysis of operating lease liabilities and reconciliation of the undiscounted cash flows to the total operating lease liability is as follows:
 
    
December 31, 2020
 
   
Lease payments due:
        
Within one year
   $ 2,177  
After one year but within two years
     139  
After two years but within three years
     2  
After three year but within four years
         
After four years but within five years
         
After five years


Total undiscounted cash flows
     2,318  
Discount on cash flows
     21  


Total lease liability
   $ 2,339  


Note 9.
Goodwill and Other Intangible Assets
(in thousands)
Changes in the carrying amount of goodwill during the years ended December 31, 2020 and 2019 were as follows:
 
    
Total
 
Balance at December 31, 2018
   $ 3,150  
Addition to goodwill from Charter acquisition
     9,953  


Balance at December 31, 2019
     13,103  
Measurement period adjustment to goodwill from charter acquisition
     (73


Balance at December 31, 2020
   $ 13,030  


The additions to goodwill in 2019 from the Charter acquisition represents the excess of the purchase price over the fair value of assets acquired and liabilities assumed in the relevant transaction. The Company performed a goodwill impairment test for 2020 and concluded that the fair value of Charter acquisition substantially exceeded the book value and no impairment charge was required.
 
54

Table of Contents
CITIZENS HOLDING COMPANY
Years Ended December 31, 2020, 2019 and 2018
NOTES TO CONSOLIDATED FINANCIAL STATEMENTS
 
 
Note 9.
Continued
 
The following table provides a summary of finite-lived intangible assets as of the dates presented:
 
    
2020
    
2019
 
Core deposit intangible
   $ 739      $ 766  
Accumulated amortization
     (109      (27


Total finite-lived intangible assets
   $ 630      $ 739  


Core deposit intangible amortization expense for the years ended December 31, 2020, 2019 and 2018 was $109, $27 and
$-0-,
respectively. The estimated amortization expense of finite-lived intangible assets for the five succeeding fiscal years is summarized as follows:​​​​​​​
 
Year Ending December 31,
  
Amount
 
2021
   $ 109  
2022
     109  
2023
     109  
2024
     109  
2025
     109  
Thereafter
     85  


     $ 630  


Note 10.
Deposits
(in thousands)
The composition of deposits as of December 31, 2020 and December 31, 2019 is as follows:
 
    
2020
    
2019
 
Non-interest
bearing
   $ 276,033      $ 190,406  
NOW and money market accounts
     480,650        369,354  
Savings deposits
     104,869        83,065  
Time deposits, $250,000 or more
     71,344        74,098  
Other time deposits
     162,293        182,073  


Total
   $ 1,095,189      $ 898,996  


55

Table of Contents
CITIZENS HOLDING COMPANY
Years Ended December 31, 2020, 2019 and 2018
NOTES TO CONSOLIDATED FINANCIAL STATEMENTS
 
 
Note 10.
Continued
 
The scheduled maturities of time deposits at December 31, 2020 are as follows:
 
Year Ending December 31,
  
Amount
 
2021
   $ 151,033  
2022
     48,684  
2023
     17,603  
2024
     13,069  
2025
     3,248  


     $ 233,637  


Note 11.
Federal Home Loan Bank Advances
(in thousands)
Advances from the FHLB have a maturity date of January 25, 2021. Interest is payable monthly at an interest rate of 0.16%. Pursuant to collateral agreements with the FHLB, advances are collateralized by all of the Bank’s FHLB stock and qualifying first mortgages and other loans. As of December 31, 2020, the balance in qualifying first mortgages and other loans was $167,285.
There were $25,000 and
$-0-
in outstanding FHLB advances at December 31, 2020 and 2019, respectively.
 
56

Table of Contents
CITIZENS HOLDING COMPANY
Years Ended December 31, 2020, 2019 and 2018
NOTES TO CONSOLIDATED FINANCIAL STATEMENTS
 
 
Note 12.
Other Income and Other Expense
(in thousands)
The following is a detail of the major income classifications that are included in other income under
non-interest
income on the income statement for the year ended December 31:
 
Other Income
   2020      2019      2018  
       
BOLI Insurance
   $ 506      $ 471      $ 495  
Mortgage Loan Origination Income
     1,310        320        363  
Other Income
     857        1,224        290  


Total Other Income
   $ 2,673      $ 2,015      $ 1,148  


The following is a detail of the major expense classifications that comprise the other expense line item in the income statement for the years ended December 31:
 
Other Operating Expense
   2020      2019      2018  
       
Advertising
   $ 642      $ 551      $ 640  
Office Supplies
     1,171        973        975  
Professional fees
     1,027        1,668        561  
FDIC and State Assessment
     669        274        350  
Telephone Expense
     578        501        520  
Postage and Freight
     548        (49      567  
Loan Collection Expense
     236        286        288  
Other Losses
     291        73        243  
Debit Card/ATM expense
     612        551        471  
Travel and Convention
     129        200        207  
Other expenses
     2,687        2,402        2,582  


Total Other Expense
   $ 8,590      $ 7,430      $ 7,404  


57

Table of Contents
CITIZENS HOLDING COMPANY
Years Ended December 31, 2020, 2019 and 2018
NOTES TO CONSOLIDATED FINANCIAL STATEMENTS
 
 
Note 13.
Income Taxes
(in thousands)
Income tax expense consists of the following:
 
    
2020
    
2019
    
2018
 
Current payable (benefit)
                          
Federal
   $ 872      $ 806      $ (181
State
     382        89        36  


       1,254        895        (145
       
Deferred tax expense
     498        459        973  


Income tax expense
   $ 1,752      $ 1,354      $ 828  


The differences between income taxes calculated at the federal statutory rate and income tax expense were as follows:
 
    
2020
    
2019
    
2018
 
Federal taxes based on statutory rate
   $ 1,823      $ 1,524      $ 1,575  
State income taxes, net of federal benefit
     326        145        133  
Tax-exempt
investment interest
     (280      (309      (487
Income related to bank-owned life insurance
     (126      —          —    
Other, net
     9        (6      (394


Income tax expense
   $ 1,752      $ 1,354      $ 8,28  


58

Table of Contents
CITIZENS HOLDING COMPANY
Years Ended December 31, 2020, 2019 and 2018
NOTES TO CONSOLIDATED FINANCIAL STATEMENTS
 
 
Note 13.
Continued
 
At December 31, 2020 and December 31, 2019, net deferred tax assets
consist
of the following:
 
    
2020
    
2019
 
Deferred tax assets
                 
Allowance for loan losses
   $ 1,181      $ 937  
Deferred compensation liability
     2,485        2,488  
Net operating loss carryforward
     267        1,000  
Other real estate owned
     488        819  
Acquisition fair value adjustments
     76        130  
Unrealized loss on securities
available-for-sale
     —          262  
Other
     206        6  


Total
     4,703        5,642  
Deferred tax liabilities
                 
Premises and equipment
     1,622        1,603  
Unrealized gain on securities
available-for-sale
     1,376        —    
Core deposit intangible
     157        184  
Other
     —          171  


Total
     3,155        1,958  


Net deferred tax asset
   $ 1,548      $ 3,684  


The Company has evaluated the need for a valuation allowance related to the above deferred tax assets and, based on the weight of the available evidence, has determined that it is more likely than not that all deferred tax assets will be realized.
As of December 31, 2020, the Company has no unrecognized tax benefits related to federal and state income tax matters. As of December 31, 2020, the Company has not accrued for interest and penalties related to uncertain tax positions. It is the Company’s policy to recognize interest or penalties related to income tax matters in income tax expense.
The Company and the Bank file a consolidated United States federal income tax return. The Company is currently open to audit under the statute of limitations by the Internal Revenue Service for the years ended December 31, 2017 through 2019. The Company and Bank’s state income tax returns are open to audit under the statute of limitations for the years ended December 31, 2017 through 2019.
The Company acquired federal net operating losses as part of its Charter acquisition, with varying expiration periods. The federal net operating losses (“NOLs”) acquired were $2,302, including $241 created during 2019. The Company used $824 of the NOL during 2020. As part of the Tax Act, the federal NOLs created by Charter during 2019 have an indefinite carryforward period.
 
59

Table of Contents
CITIZENS HOLDING COMPANY
Years Ended December 31, 2020, 2019 and 2018
NOTES TO CONSOLIDATED FINANCIAL STATEMENTS
 
 
Note 14.
Summarized Financial Information of Citizens Holding Company
(in thousands)
Summarized financial information of Citizens Holding Company, excluding the Bank, at December 31, 2020 and December 31, 2019, and for the years ended December 31, 2020, 2019 and 2018, is as follows:
Balance Sheets
December 31, 2020 and 2019
 
    
2020
    
2019
 
Assets
                 
Cash
(1)
   $ 2,197      $ 1,736  
Investment in bank subsidiary
(1)
     117,078        110,892  
Other assets
(1)
     273        172  


Total assets
   $ 119,548      $ 112,800  


Liabilities
                 
Other liabilities
   $ —        $ —    
     
Shareholders’ equity
     119,548        112,800  


Total liabilities and shareholders’ equity
   $ 119,548      $ 112,800  


(1)
 
Fully or partially eliminates in consolidation.
 
60

Table of Contents
CITIZENS HOLDING COMPANY
Years Ended December 31, 2020, 2019 and 2018
NOTES TO CONSOLIDATED FINANCIAL STATEMENTS
 
 
Note 14.
Continued
 
Income Statements
Years Ended December 31, 2020, 2019 and 2018
 
    
2020
   
2019
   
2018
 
Interest income
(1)
   $ 2     $ 2     $ 2  


Other income
                        
Dividends from bank subsidiary
(1)
     6,099       11,242       3,990  
Equity in undistributed earnings gain (loss) of bank subsidiary
(1)
     1,260       (4,965     3,022  
Other income
     —         —         —    


Total other income
     7,359       6,277       7,012  


Other expense
     524       462       446  


Income before income taxes
     6,835       5,817       6,568  
Income tax benefit
     (96     (85     (105


Net income
   $ 6,931     $ 5,902     $ 6,673  


(1)
Eliminates in consolidation.
 
61

Table of Contents
CITIZENS HOLDING COMPANY
Years Ended December 31, 2020, 2019 and 2018
NOTES TO CONSOLIDATED FINANCIAL STATEMENTS
 
 
Note 14.
Continued
 
Statements of Cash Flows
Years Ended December 31, 2020, 2019 and 2018
 
    
2020
   
2019
   
2018
 
Cash flows from operating activities
                        
Net income
   $ 6,931     $ 5,902     $ 6,673  
Adjustments to reconcile net income to net cash provided by operating activities
                        
Equity in undistributed (earnings) loss of the Bank
     (1,260     4,965       (3,022
Stock compensation expense
     167       163       170  
Increase in other assets
     (100     97       84  


Net cash provided by operating activities
     5,738       11,127       3,905  


Cash flows from investing activities
                        
Net cash paid in acquisition activities
   $        $ (6,113   $ —    


Net cash used in investing activities
              (6,113     —    


Cash flows from financing activities
                        
Dividends paid to shareholders
   $ (5,363   $ (4,874   $ (4,706
Proceeds from stock options
     86                27  


Net cash used in financing activities
     (5,277     (4,874     (4,679


Net increase (decrease) in cash
     461       140       (774


Cash, beginning of year
     1,736       1,596       2,370  


Cash, end of year
   $ 2,197     $ 1,736     $ 1,596  


The Bank is required to obtain approval from state regulators before paying dividends.
 
62

Table of Contents
CITIZENS HOLDING COMPANY
Years Ended December 31, 2020, 2019 and 2018
NOTES TO CONSOLIDATED FINANCIAL STATEMENTS
 
 
Note 15.
Related Party Transactions
(in thousands)
The Company had, and may have in the future, banking transactions in the ordinary course of business with directors, significant shareholders, principal officers, their immediate families, and affiliated companies in which they are principal shareholders (commonly referred to as related parties). In management’s opinion, such loans are made on substantially the same terms, including interest rates and collateral, as those prevailing at the time for comparable transactions with unrelated parties, and do not involve more than the normal risk of collectability at the time of the transaction.
Activity in related party loans is detailed in tabular form in Note 5 of the notes to the Financial Statements.
Deposits from related parties at December 31, 2020 and December 31, 2019 approximated $7,190 and $5,406, respectively.
 
Note 16.
Off-Balance
Sheet Financial Instruments, Commitments and Contingencies and Concentrations of Risks
(in thousands)
Commitments to Extend Credit
In the ordinary course of business, the Company makes various commitments and incurs certain contingent liabilities to fulfill the financing needs of its customers. These commitments and contingent liabilities include commitments to extend credit and issue standby letters of credit. They involve, to varying degrees, elements of credit risk in excess of the amount recognized in the balance sheets. The Company’s exposure to credit loss in the event of nonperformance by the other party to the financial instrument for commitments to extend credit and standby letters of credit is represented by the contractual amount of those instruments. At December 31, 2020 and December 31, 2019, commitments related to unused lines of credit were $138,185 and $94,009, respectively, and standby letters of credit were $4,565 and $2,436, respectively. The fair value of such commitments is not materially different than stated values. As some of these commitments are expected to expire without being drawn upon, the total commitment amount does not necessarily represent future cash requirements. The Company applies the same credit policies and standards as it does in the lending process when making these commitments. The collateral obtained is based upon the assessed credit worthiness of the borrower. Collateral held varies, but may include accounts receivable, crops, livestock, inventory, property and equipment, residential real estate and income-producing commercial properties.
 
63

Table of Contents
CITIZENS HOLDING COMPANY
Years Ended December 31, 2020, 2019 and 2018
NOTES TO CONSOLIDATED FINANCIAL STATEMENTS
 
 
Note 16.
Continued
 
Interest Rate Risk
The Company is principally engaged in providing short-term and medium-term installment, commercial and agricultural loans with interest rates that are fixed or fluctuate with the prime lending rate. These assets are primarily funded through short-term demand deposits and long-term certificates of deposit with variable and fixed rates. Accordingly, the Company is exposed to interest rate risk because in changing interest rate environments interest rate adjustments on assets and liabilities may not occur at the same time or in the same amount. The Company manages the overall rate sensitivity and mix of its asset and liability portfolio and attempts to minimize the effects that interest rate fluctuations will have on its net interest margin.
Legal Proceedings
We are a party to various legal proceedings such as claims and lawsuits arising in the course of our normal business activities. Although the ultimate outcome of all claims and lawsuits outstanding as of December 31, 2020 cannot be ascertained at this time, it is the opinion of management that these matters, when resolved, will not have a material adverse effect on our business, results of operations or financial condition.
Concentration of Risk
The Company makes commercial, residential and consumer loans throughout the state of Mississippi. A substantial portion of the customers’ abilities to honor their contracts is dependent on their business and the agricultural economy in the state.
Although the Company’s loan portfolio is diversified, there is a relationship in this state and our operating regions between the agricultural economy and the economic performance of loans made to nonagricultural customers. The Company’s lending policies for agricultural and nonagricultural customers require loans to be well-collateralized and supported by cash flows. Credit losses from loans related to the agricultural economy are consistent with credit losses experienced in the portfolio as a whole. The concentration of credit in the regional agricultural economy is taken into consideration by management in determining the allowance for loan losses. See Note 5 for a summary of loans by type.
 
64

Table of Contents
CITIZENS HOLDING COMPANY
Years Ended December 31, 2020, 2019 and 2018
NOTES TO CONSOLIDATED FINANCIAL STATEMENTS
 
 
Note 17.
Benefit Plans
(in thousands)
The Company provides its employees with a profit sharing and savings plan, which allows employees to direct a percentage of their compensation into a tax deferred retirement account, subject to statutory limitations. To encourage participation, the Company provides a 50 percent matching contribution for up to a maximum of 3 percent of each participant’s compensation, plus discretionary
non-matching
contributions. Employees are eligible after one year of service. For 2020, 2019 and 2018, the Company’s contributions were $712, $605 and $590, respectively.
In connection with the acquisition of Charter, the Company assumed the Charter Bank 401(k) Plan. The plan was terminated by Charter immediately prior to the acquisition where the Charter employees had the choice to rollover their account balance into the Company’s plan, rollover their account balance into another account or take a distribution. The final distribution of account balances has occurred. There was no impact on the Company’s consolidated financial statements as of and for the years ended December 31, 2019 associated with the plan.
Deferred Compensation Plans
The Company provides a deferred compensation plan covering its directors. Participants in the deferred compensation plan can defer a portion of their compensation for payment after attaining age 70. Life insurance contracts have been purchased which may be used to fund payments under the plan. Expenses related to this plan were $142, $173 and $194 for the plan years ended December 31, 2020, 2019 and 2018, respectively.
The Company has also entered into deferred compensation arrangements with certain officers that provide for payments to such officers or their survivors after retirement. Life insurance policies have been purchased that may be used to fund all or a portion of the payments under these arrangements. The obligations of the Company under both the directors and officers deferred compensation arrangements are expensed on a systematic basis over the remaining expected service period of the individual directors and officers. Expenses related to this plan were $607, $586 and $535 for the plan years ended December 31, 2020, 2019 and 2018, respectively.
 
65

Table of Contents
CITIZENS HOLDING COMPANY
Years Ended December 31, 2020, 2019 and 2018
NOTES TO CONSOLIDATED FINANCIAL STATEMENTS
 
 
Note 18.
Regulatory Matters
(in thousands)
The Company (on a consolidated basis) and the Bank are subject to various regulatory capital requirements administered by federal banking agencies. Failure to meet the minimum regulatory capital requirements can initiate certain mandatory and possible additional discretionary actions by regulators that, if undertaken, could have a direct material adverse effect on the Company.
Under the regulatory capital adequacy guidelines and the regulatory framework for prompt corrective action, the Company must meet specific capital guidelines involving quantitative measures of the Company’s assets, liabilities and certain
off-balance
sheet items as calculated under regulatory accounting practices. The Company’s capital amounts and classification under the prompt corrective action guidelines are also subject to qualitative judgments by the regulators about components, risk weightings, and other factors. Quantitative measures established by regulation to ensure capital adequacy require the Company to maintain minimum amounts and ratios of total capital and Tier I capital to risk-weighted assets (as defined in the regulations) and Tier I capital to average assets (as defined in the regulations). Management believes, as of December 31, 2020, that the Company and the Bank meet all capital adequacy requirements to which they are subject.
The FRB, FDIC and other federal banking agencies have established risk-based capital adequacy guidelines. These guidelines are intended to provide a measure of a bank’s capital adequacy that reflects the degree of risk associated with a bank’s operations.
A banking organization’s risk-based capital ratios are obtained by dividing its qualifying capital by its total risk-adjusted assets and
off-balance
sheet items. Since December 31, 1992, the federal banking agencies have required a minimum ratio of qualifying total capital to risk-adjusted assets and
off-balance
sheet items of 8%, and a minimum ratio of Tier 1 capital to risk-adjusted assets and
off-balance
sheet items of 4%.
The Dodd-Frank Act requires the FRB, the Office of the Comptroller of the Currency (“OCC”) and the FDIC to adopt regulations imposing a continuing “floor” on the risk based capital requirements. In December 2010, the Basel Committee released a final framework for a strengthened set of capital requirements, known as “Basel III”. In July 2013, each of the U.S. federal banking agencies adopted final rules relevant to us: (1) the Basel III regulatory capital reforms; and (2) the “standardized approach of Basel II for
non-core
banks and bank holding companies, such as the Bank and the Company. The capital framework under Basel III will replace the existing regulatory capital rules for all banks, savings associations and U.S. bank holding companies with greater than $500 million in total assets, and all savings and loan holding companies.
 
66

Table of Contents
CITIZENS HOLDING COMPANY
Years Ended December 31, 2020, 2019 and 2018
NOTES TO CONSOLIDATED FINANCIAL STATEMENTS
 
 
Note 18.
Continued
 
Beginning January 1, 2015, the Bank began to comply with the Basel III rules, which became effective on January 1, 2019. Among other things, the Basel III rules impact regulatory capital ratios of banking organizations in the following manner:
 
   
Create a new requirement to maintain a ratio of common equity Tier 1 capital to total risk-weighted assets of not less than 4.5%;
 
   
Increase the minimum leverage ratio to 4% for all banking organizations (currently 3% for certain banking organizations);
 
   
Increase the minimum Tier 1 risk-based capital ratio from 4% to 6%; and
 
   
Maintain the minimum total risk-based capital ratio at 8%.
In addition, the Basel III rules will subject a banking organization to certain limitations on capital distributions and discretionary bonus payments to executive officers if the organization did not maintain a capital conservation buffer of common equity Tier 1 capital in an amount greater than 2.5% of its total risk-weighted assets. The capital conservation buffer increases the minimum common equity Tier 1 capital ratio to 7%, the minimum Tier 1 risk-based capital ratio to 8.5% and the minimum total risk-based capital ratio to 10.5% for banking organizations seeking to avoid the limitations on capital distributions and discretionary bonus payments to executive officers.
The Basel III rules also changed the capital categories for insured depository institutions for purposes of prompt corrective action. Under the rules, to be well capitalized, an insured depository institution must maintain a minimum common equity Tier 1 capital ratio of at least 6.5%, a Tier 1 risk-based capital ratio of at least 8%, a total risk-based capital ratio of at least 10.0%, and a leverage capital ratio of at least 5%. In addition, the Basel III rules established more conservative standards for including an instrument in regulatory capital and imposed certain deductions from and adjustments to the measure of common equity Tier 1 capital.
 
67

Table of Contents
CITIZENS HOLDING COMPANY
Years Ended December 31, 2020, 2019 and 2018
NOTES TO CONSOLIDATED FINANCIAL STATEMENTS
 
 
Note 18.
Continued
 
As of December 31, 2020 and 2019, the most recent regulatory notification categorized the Bank as well capitalized. There have been no conditions or events that would cause changes to the capital structure of the Company since this notification. To continue to be categorized as well capitalized under the regulatory framework for prompt corrective action, the Company would have to maintain minimum total risk-based, Tier I risk-based, and Tier I leverage ratios as disclosed below, in comparison with actual capital amounts and ratios:​​​​​​​​​​​​​​
 
     Actual     Minimum Capital
Requirement to be
Well Capitalized
    Minimum Capital
Requirement to be
Adequately
Capitalized
 
     Amount      Ratio     Amount      Ratio     Amount      Ratio  
December 31, 2020
                                                   
Citizens Holding Company
                                                   
Tier 1 leverage ratio
   $ 101,640        7.22   $ 70,344        5.00   $ 56,275        4.00
Common Equity tier 1 capital ratio
     101,640        7.22     91,448        6.50     63,310        4.50
Tier 1 risk-based capital ratio
     101,640        12.55     64,780        8.00     48,585        6.00
Total risk-based capital ratio
     106,375        13.14     80,975        10.00     64,780        8.00
The Citizens Bank of Philadelphia
                                                   
Tier 1 leverage ratio
   $ 99,170        7.05   $ 70,326        5.00   $ 56,261        4.00
Common Equity tier 1 capital ratio
     99,170        7.05     91,423        6.50     63,293        4.50
Tier 1 risk-based capital ratio
     99,170        12.25     64,759        8.00     48,569        6.00
Total risk-based capital ratio
     103,905        12.84     80,948        10.00     64,759        8.00
             
December 31, 2019
                                                   
Citizens Holding Company
                                                   
Tier 1 leverage ratio
   $ 98,733        8.33   $ 59,270        5.00   $ 47,416        4.00
Common Equity tier 1 capital ratio
     98,733        8.33     77,051        6.50     53,343        4.50
Tier 1 risk-based capital ratio
     98,733        13.86     56,972        8.00     42,729        6.00
Total risk-based capital ratio
     102,488        14.39     71,215        10.00     56,972        8.00
The Citizens Bank of Philadelphia
                                                   
Tier 1 leverage ratio
   $ 96,824        8.18   $ 59,206        5.00   $ 47,365        4.00
Common Equity tier 1 capital ratio
     96,824        8.18     76,968        6.50     53,285        4.50
Tier 1 risk-based capital ratio
     96,824        13.60     56,958        8.00     42,719        6.00
Total risk-based capital ratio
     100,579        14.13     71,198        10.00     56,958        8.00
 
68

Table of Contents
CITIZENS HOLDING COMPANY
Years Ended December 31, 2020, 2019 and 2018
NOTES TO CONSOLIDATED FINANCIAL STATEMENTS
 
 
Note 19.
Fair Values of Financial Instruments
(in thousands)
Under the authoritative guidance on fair value measurements, fair value is the price that would be received to sell an asset or paid to transfer a liability in an orderly transaction between market participants at the measurement date. In determining fair value, the Company uses various methods including market, income and cost approaches. Based on these approaches, the Company often utilizes certain assumptions about risk and or the risks inherent in the inputs to the valuation technique. These inputs can be readily observable, market corroborated, or generally unobservable inputs. The Company utilizes valuation techniques that maximize the use of observable inputs and minimize the use of unobservable inputs. Based on the observability of the inputs used in the valuation techniques, the Company is required to provide the following information according to the fair value hierarchy. The fair value hierarchy ranks the quality and reliability of the information used to determine fair values. Financial assets and liabilities carried at fair value will be classified and disclosed in one of the three following categories:
 
    Level 1    Quoted prices in active markets for identical assets or liabilities;
     
    Level 2    Quoted prices in active markets for similar assets and liabilities and inputs that are observable for the asset or liability; or
     
    Level 3    Unobservable inputs, such as discounted cash flow models or valuations.
The determination of where assets and liabilities fall within this hierarchy is based upon the lowest level of input that is significant to the fair value measurement. The Company used the following methods and assumptions to estimate the fair value of financial instruments that are measured at fair value on a recurring basis:
Investment Securities
The fair values of debt securities available for sale are determined by third party matrix pricing, which is a mathematical technique widely used in the industry to value debt securities without relying exclusively on quoted prices for the specific securities but rather by relying on the securities’ relationship to other benchmark quoted securities (Level 2 inputs).
 
69

Table of Contents
CITIZENS HOLDING COMPANY
Years Ended December 31, 2020, 2019 and 2018
NOTES TO CONSOLIDATED FINANCIAL STATEMENTS
 
 
Note 19.
Continued
The following table presents investment securities that are measured at fair value on a recurring basis as of December 31, 2020:
 
     Quoted Prices
in Active
Markets for
Identical
Assets
     Significant
Other
Observable
Inputs
     Significant
Unobservable
Inputs
        
     (Level 1)      (Level 2)      (Level 3)      Totals  
Securities available for sale
                                   
Obligations of U.S. Government agencies
   $ —        $ 12,061      $ —        $ 12,061  
Mortgage-backed securities
     —          561,983        —          561,983  
State, County, Municipals
     —          104,197        —          104,197  
Other securities
     —          508        —          508  


     $ —        $ 678,749      $ —        $ 678,749  


The following table presents investment securities that are measured at fair value on a recurring basis as of December 31, 2019:
 
     Quoted Prices
in Active
Markets for
Identical
Assets
     Significant
Other
Observable
Inputs
     Significant
Unobservable
Inputs
        
     (Level 1)      (Level 2)      (Level 3)      Totals  
Securities available for sale
                                   
Obligations of U.S. Government agencies
   $ —        $ 97,111      $ —        $ 97,111  
Mortgage-backed securities
     —          306,900        —          306,900  
State, County, Municipals
     —          60,372.00        —          60,372  


     $ —        $ 464,383      $ —        $ 464,383  


70

Table of Contents
CITIZENS HOLDING COMPANY
Years Ended December 31, 2020, 2019 and 2018
NOTES TO CONSOLIDATED FINANCIAL STATEMENTS
 
 
Note 19.
Continued
 
Impaired Loans
Loans considered impaired are reserved for at the time the loan is identified as impaired taking into account the fair value of the collateral less estimated selling costs. Collateral may be real estate and/or business assets including but not limited to, equipment, inventory and accounts receivable. The fair value of real estate is determined based on appraisals by qualified licensed appraisers. The fair value of the business assets is generally based on amounts reported on the business’s financial statements. Appraised and reported values may be adjusted based on management’s historical knowledge, changes in market conditions from the time of valuation and management knowledge of the client and the client’s business. Since not all valuation inputs are observable, these nonrecurring fair value determinations are classified Level 3. The unobservable inputs may vary depending on the individual assets with the fair value of real estate based on appraised value being the predominant approach. The Company reviews the certified appraisals for appropriateness and adjusts the value downward to consider selling, closing and liquidation costs, which typically approximates 25% of the appraised value. Impaired loans are reviewed and evaluated on at least a quarterly basis for additional impairment and adjusted accordingly, based on the same factors previously identified.
Other real estate owned
OREO is primarily comprised of real estate acquired in partial or full satisfaction of loans. OREO is recorded at its estimated fair value less estimated selling and closing costs at the date of transfer, with any excess of the related loan balance over the fair value less expected selling costs charged to the ALLL. Subsequent changes in fair value are reported as adjustments to the carrying amount and are recorded against earnings. The Company outsources the valuation of OREO with material balances to third party appraisers. The Company reviews the third-party appraisal for appropriateness and adjusts the value downward to consider selling and closing costs, which typically approximate 25% of the appraised value.
 
71

Table of Contents
CITIZENS HOLDING COMPANY
Years Ended December 31, 2020, 2019 and 2018
NOTES TO CONSOLIDATED FINANCIAL STATEMENTS
 
 
Note 19.
Continued
 
The following table presents assets measured at fair value on a nonrecurring basis during December 31, 2020 and 2019 and were still held at those respective dates:
 
     in Active
Markets for
Identical
Assets
     Significant
Other
Observable
Inputs
     Significant
Unobservable
Inputs
        
     (Level 1)      (Level 2)      (Level 3)      Totals  
December 31, 2020
                                   
Impaired loans
   $ —        $ —        $ 2,013      $ 2,013  


     $ —        $ —        $ 2,013      $ 2,013  


December 31, 2019
                                   
Impaired loans
   $ —        $ —        $ 4,576      $ 4,576  


     $ —        $ —        $ 4,576      $ 4,576  


Impaired loans with a carrying value of $2,920 and $5,003 had an allocated allowance for loan losses of $907 and $427 at December 31, 2020 and December 31, 2019, respectively. The allocated allowance is based on the carrying value of the impaired loan and the fair value of the underlying collateral less estimated costs to sell.
After monitoring the carrying amounts for subsequent declines or impairment after foreclosure, management determined that no fair value adjustments to OREO was necessary or recorded during the year ended December 31, 2020 and December 31, 2019, respectively.
 
72

Table of Contents
CITIZENS HOLDING COMPANY
Years Ended December 31, 2020, 2019 and 2018
NOTES TO CONSOLIDATED FINANCIAL STATEMENTS
 
 
Note 19.
Continued
 
The following represents the carrying value and estimated fair value of the Company’s financial instruments at December 31, 2020 and December 31, 2019:


Carrying
Value
    
Quoted Prices
in Active
Markets for
Identical
Assets
    
Significant
Other
Observable
Inputs
    
Significant
Unobservable
Inputs
    
Total
Fair
Value
 
2020
         
(Level 1)
    
(Level 2)
    
(Level 3)
        
Financial assets
                                            
Cash and due from banks
  
$
16,840
 
  
$
16,840
 
  
$
—  
 
  
$
—  
 
  
$
16,840
 
Interest bearing deposits with banks
  
 
25,468


25,468


—  


—  


25,468
 
Federal funds sold
  
 
—  


—  


—  


—  


Securities
available-for-sale
  
 
678,749


—  


678,749


—  


678,749
 
Net loans
  
 
647,521


—  


—  


638,362


638,362
 
Financial liabilities
                                            
Deposits
  
 
1,095,189


861,552


234,909


—  


1,096,461
 
Securities Sold under Agreement to Repurchase
  
 
196,272


196,272


—  


—  


196,272
 
Federal Home Loan
                                      
 
—  
 
Bank advances
  
 
25,000


25,000


—  


—  


25,000


Carrying
Value
    
Quoted Prices
in Active
Markets for
Identical
Assets
    
Significant
Other
Observable
Inputs
    
Significant
Unobservable
Inputs
    
Total
Fair
Value
 
2019
         
(Level 1)
    
(Level 2)
    
(Level 3)
        
Financial assets
                                            
Cash and due from banks
  
$
15,937
 
  
$
15,937
 
  
$
—  
 
  
$
—  
 
  
$
15,937
 
Interest bearing deposits with banks
  
 
58,557


58,557


—  


—  


58,557
 
Federal funds sold
  
 
1,600


1,600


—  


—  


1,600
 
Securities
available-for-sale
  
 
464,383


—  


464,383


—  


464,383
 
Net loans
  
 
573,312


—  


—  


569,640


569,640
 
Financial liabilities
                                            
Deposits
  
 
898,996


642,825


258,100


—  


900,925
 
Securities Sold under Agreement to Repurchase
  
 
170,410


170,410


—  


—  


170,410
 
 
73

Table of Contents
CITIZENS HOLDING COMPANY
Years Ended December 31, 2020, 2019 and 2018
NOTES TO CONSOLIDATED FINANCIAL STATEMENTS
 
 
Note 20.
Stock Based Compensation
(in thousands, except share data)
The Company has a directors’ stock compensation plan and had an employees’ long-term incentive plan. Under the directors’ plan, the Company may grant options for up to 210,000 shares of common stock. The price of each option is equal to the market price determined as of the option grant date. Options granted are exercisable after six months and expire after 10 years. The employee plan expired on April 13, 2009, no options have been granted since this date and all previously granted options either expired or were exercised as of December 31, 2020. The options previously granted under the employee plan expire 10 years from the grant date. The exercise price is equal to the market price of the Company’s stock on the date of grant.
The fair value of each option granted is estimated on the date of the grant using the Black-Sholes option-pricing model. No options were granted in 2020 or 2019, therefore no calculations were required in 2020 or 2019 to determine fair values.
The Company has adopted the 2013 Incentive Compensation Plan (the “2013 Plan”), which the Company has used for all equity grants after the adoption and approval of the 2013 Plan.
During 2020, the Company’s directors received restricted stock grants totaling 8,250 shares of common stock at a then market value of $20.49 per share and in 2019 received 7,500 shares of common stock at a then market value of $21.53 per share. These grants vest over a
one-year
period during which time the recipients have rights to vote the shares and to receive dividends. The grant date fair value of these shares granted in 2020 was $169 and will be recognized ratably over the
one-year
vesting period. The grant date fair value of the shares granted in 2019 was $161 and was recognized ratably over the
one-year
vesting period.
During 2015, 7,500 shares of restricted stock was granted to the Chief Executive Officer (CEO) that would vest according to a stock performance schedule over the next five years. The stock performance for the Company met the goal for 2016 and the CEO became vested in 20%, or 1,500 shares of the restricted stock at an expense of $32. Again in 2017, the Company met 20% of its goal and the CEO became vested in an additional 1,500 shares of the restricted stock at an expense of $37. The stock performance for the Company did not meet the goal in 2020, 2019 or 2018 and no corresponding expense was recorded. Additionally, the remaining 4,500 shares of restricted stock were forfeited as of June 22, 2020, the expiration of the five-year vesting period.
During 2020 and 2019, the Company recorded expense of $167 and $163 related to all of the restricted shares.
At December 31, 2020, there were 8,250 shares
non-vested
with $56 in unrecognized stock-based compensation expense related to the 2013 Plan.
 
74

Table of Contents
CITIZENS HOLDING COMPANY
Years Ended December 31, 2020, 2019 and 2018
NOTES TO CONSOLIDATED FINANCIAL STATEMENTS
 
 
Note 20.
Continued
 
Following is a summary of the status of the stock options remaining under the plans for the years ending December 31, 2020, 2019 and 2018:
 
    
Directors’ Plan
 
    
Number
of
Shares
    
Weighted
Average
Exercise
Price
 
Outstanding at January 1, 2018
     63,000      $ 20.96  
Granted
                   
Exercised
     (6,000      18.00  
Expired
     (4,500      18.00  


Outstanding at December 31, 2018
     52,500      $ 21.55  
Granted
                   
Exercised
                   
Expired
     (12,000      21.75  


Outstanding at December 31, 2019
     40,500      $ 21.49  
Granted
                   
Exercised
     (7,500      19.26  
Expired
     (13,500      25.72  


Outstanding at December 31, 2020
     19,500      $ 19.42  


Options exercisable at:
                 
December 31, 2020
     19,500      $ 19.42  


75

Table of Contents
CITIZENS HOLDING COMPANY
Years Ended December 31, 2020, 2019 and 2018
NOTES TO CONSOLIDATED FINANCIAL STATEMENTS
 
 
Note 20.
Continued
 
The following table presents the outstanding stock options granted in relation to the option price and the weighted average maturity.
 
Range of Exercise Prices
   Options
Outstanding
     Weighted
Average Price
     Weighted Average
Life Remaining
       
$15.01 to $20.00
     9,000        18.76      1 years, 4 months
$20.01 to $22.50
     10,500        20.02      4 months


Total
     19,500      $ 19.42      9 months


The intrinsic value of options outstanding under the Directors’ Plan at December 31, 2020 was $29. Additionally, the total intrinsic value of options exercised during 2020 and 2019 was $9 and
$-0-,
respectively.
There were no options granted during 2020 or 2019 under the 2013 Plan.
 
76

Table of Contents
Management’s Discussion and Analysis of Financial Condition and Results of Operations as of December 31, 2020, 2019 and 2018
(in thousands)
OVERVIEW
The following information discusses the financial condition and results of operations of Citizens Holding Company (the “Company”) as of December 31, 2020, 2019 and 2018. In this discussion, all references to the activities, operations or financial performance of the Company reflect the Company’s activities, operations and financial performance through its wholly-owned subsidiary, The Citizens Bank of Philadelphia, Mississippi (the “Bank”), unless otherwise specifically noted. The Company’s financial statements and accompanying notes should be read in conjunction with this Management’s Discussion and Analysis.
The Company has been committed to meeting the banking financial needs of its customers and communities for over 110 years. During the
COVID-19
pandemic, the Company remained focused on providing support, advice and solutions to meet its customers’ unique needs. As a result, the Company experienced strong revenue growth with total revenue increasing $5,912 or 13.11% to $51,021 at December 31, 2020 compared to $45,109 at December 31, 2019.
Net income for the year was $6,931, an increase of $1,029, or 17.43% compared to $5,902 at December 31, 2019. The majority of the increase in net income is related to an increase in net interest income partially offset by additional provision for loan losses and
non-interest
expense.
The Company continued to maintain and expand customer relationships as reflected by the loan growth of $75,182 or 13.03%, and growth in deposits of $196,193 or 21.82% to $1,095,189 at December 31, 2020. Excluding PPP loans with a total balance of $29,523 at December 31, 2020, total loans increased $45,666, or 7.91%, compared to December 31, 2019.
As a result of the
COVID-19
pandemic, continued low interest rates decreased the yield on the loans as well as the securities portfolio but were partially offset by lower costs on interest-bearing deposits along with an increased volume of loans, excluding PPP loans which earn 1% interest, thus further compressing our margin.
Due to the loan growth over the period, management has increased the provision for loan losses to help manage the risks of loan growth along with the additional increased credit risks related to the pandemic. All of these factors are driving the net income results and continue to be a focus of management moving forward.
During the second quarter of 2020, the Company participated as a lender in the Small Business Administration’s (“SBA”) and U.S. Department of Treasury’s Paycheck Protection Program (“PPP”) as established by the Coronavirus Aid, Relief, and Economic Security Act (“CARES Act”). The PPP loans are generally 100% guaranteed by the SBA. At December 31, 2020, the balance of PPP loans was $29,523 and the Company had recognized $1,172 in PPP fee income for the year ended December 31, 2020.
 
77

Table of Contents
The Company and Bank remain well capitalized with all capital ratios above the regulatory requirements. The Tier 1 capital ratio for the Company and Bank was 12.55% and 12.25%, respectively, at December 31, 2020. The Company’s capital position reflects the consistent profitability of its diversified financial services businesses.
The Company’s return on average assets (“ROA”) was 0.52% in 2020, compared to 0.51% in 2019 and 0.69% in 2018. The Company’s return on average equity (“ROE”) was 5.88% in 2020, 6.13% in 2019 and 7.95% in 2018. During these periods, leverage capital ratios (the ratio of equity to average total assets) decreased from 9.93% in 2018 to 8.33% in 2019 to 7.22% in 2020. The ROE in 2020, 2019 and 2018 is a function of the level of net income and equity balances during those years. The changes in ROA were also a result of the Company’s net income in those years and also affected by the increase in total assets during these time periods. The Company set the annual dividend payout rate to approximately 77.42% of 2020 earnings per share, as compared to 82.05% in 2019 and 70.59% in 2018. The leverage capital ratio of 7.05% in 2020 remains above the regulatory requirement of 5% to be considered “well capitalized” under applicable Federal Deposit Insurance Corporation (the “FDIC”) guidelines for the Bank.
Management has continued its practice of maintaining excess funding capacity to provide the Company with adequate liquidity for its ongoing operations. In this regard, the Company benefits from its strong deposit base, its highly liquid investment portfolio, and its access to funding from a variety of external funding sources such as federal funds lines and FHLB advances. Liquidity is discussed in more detail beginning on page 98 of this report under the heading,
Liquidity and Rate Sensitivity
. The Company did not have any commitments at December 31, 2020 that would require a material expenditure of capital resources.
The Company is not aware of any developments that would have material impact on its revenues or net income outside of the pandemic. Interest rates are currently projected to remain at historical lows for 2021 to help stimulate the economy due to the
COIVD-19
pandemic. The Company continues to be proactive in dealing with the effects of the pandemic to its employees, customers and communities. Although the ultimate impact of the crisis cannot be accurately predicted at this point, the Company believes that it is well-capitalized and has the financial stability to continue to serve its customers and communities during this unprecedented time.
 
78

Table of Contents
CRITICAL ACCOUNTING POLICIES
The preparation of financial statements in conformity with accounting principles generally accepted in the United States of America requires management to make estimates and assumptions that affect the reported amounts of assets and liabilities and disclosure of contingent assets and liabilities at the date of the financial statements and the reported amounts of revenues and expenses during the reporting period. Actual results could differ from those estimates.
Allowance for Loan Losses
The accounting policy most important to the presentation of the Company’s financial statements relates to the allowance for loan loss and the related provision for loan losses. The allowance for loan losses is available to absorb probable credit losses inherent in the entire loan portfolio. The appropriate level of the allowance is based on a monthly analysis of the loan portfolio and represents an amount that management deems adequate to provide for inherent losses, including collective impairment as recognized under ASC Subtopic
450-20,
Loss Contingencies
. The collective impairment is calculated based on loans grouped by similar risk characteristics. Another component of the allowance is losses on loans assessed as impaired under ASC Subtopic
310-10,
Loan Impairments
. The balance of these loans determined to be impaired under ASC Subtopic
310-10
and their related allowance is included in management’s estimation and analysis of the allowance for loan losses. For a discussion of other considerations in establishing the allowance for loan losses and the Company’s and the Bank’s loan policies and procedures for addressing credit risk, please refer to the disclosures in this Item under the heading “Provision for Loan Losses and Asset Quality.”
Loans purchased in acquisitions or mergers with evidence of credit deterioration since origination are accounted for under ASC
310-30,
“Loans and Debt Securities Acquired with Deteriorated Credit Quality” (“ASC
310-30”).
ASC
310-30
prohibits the carryover of an allowance for loan losses for loans purchased in which the acquirer concludes that it will not collect the contractual amount. As a result, these loans are carried at values which represent management’s estimate of the future cash flows of these loans. Increases in expected cash flow to be collected from the contractual cash flows are required to be recognized as an adjustment of the loan’s yield over its remaining life, while decreases in expected cash flows are required to be recognized as an impairment. A more detailed discussion of loans accounted for under ASC
310-30,
which were acquired in connection with our mergers, including our acquisitions of Charter, is set forth below under the heading “Provision for Loan Losses and Asset Quality” and in Note 6, “Purchased Loans” in the Notes to Consolidated Financial Statements in Item 8, Financial Statements and Supplementary Data.
Business Combinations, Accounting for Purchased Loans
The Company accounts for its acquisitions under ASC 805, “Business Combinations,” which requires the use of the acquisition method of accounting. All identifiable assets acquired, including loans, and liabilities assumed are recorded at fair value and recognized separately from goodwill. For a purchased loan, no allowance for loan losses is recorded on the acquisition date because the fair value measurements incorporate assumptions regarding credit risk. This applies even to a purchased loan with evidence of credit deterioration since origination pursuant to ASC
 
79

Table of Contents
310-30,
“Loans and Debt Securities Acquired with Deteriorated Credit Quality” (“ASC
310-30”).
Generally speaking, rather than carry over an allowance for loan losses, as part of the acquisition we establish a “Day 1 Fair Value” of a purchased loan or pools of purchased loans sharing common risk characteristics, which equals the outstanding balance of a purchased loan or pool on the acquisition date less any credit and/or yield discount applied against the purchased loan or pool of loans. In other words, these loans or pools of loans are carried at values which represent our estimate of their future cash flows. After the acquisition date, a purchased loan or pool of loans will either meet or exceed the performance expectations established in determining the Day 1 Fair Values or deteriorate from such expected performance. If the cash flows expected to be collected on a purchased loan or pool of loans decreases from expectations established in determining the Day 1 Fair Values or since our most recent review of such portfolio’s performance, then the decrease is recognized as an impairment, and the Company provides for such loan or pool in the provision for loan losses in its consolidated statement of income; ultimately, the Company may partially or fully
charge-off
the carrying value thereof. If performance expectations are exceeded such that we increase our expectations of cash flows to be collected on the loan or pool, then the Company reverses any previous provision for such loan or pool and, if it continues to exceed expectations subsequent to the reversal of any previously-established provision, then we adjust the amount of accretable yield recognized on a prospective basis over the loan’s or pool’s remaining life, which has a positive impact on interest income.
Additional detail about our loans acquired in connection with our mergers, including our acquisition of Brand, is set forth below under the heading “Risk Management - Allowance for Loan Losses” and in Note 6, “Purchased Loans” in the Notes to Consolidated Financial Statements in Item 8, Financial Statements and Supplementary Data, in this report.
Please refer to Note 1, “Nature of Business and Summary of Significant Accounting Policies,” to the Consolidated Financial Statements of the Company included in this Annual Report for a detailed discussion of other significant accounting policies affecting the Company.
 
80

Table of Contents
DISCLOSURE REGARDING FORWARD-LOOKING STATEMENTS
In addition to historical information, this report contains statements that constitute forward-looking statements within the meaning of Section 27A of the Securities Act of 1933, as amended, and Section 21E of the Securities Exchange Act of 1934, as amended, that are based on management’s beliefs, plans, expectations, assumptions and on information currently available to management. The words “may,” “should,” “expect,” “anticipate,” “intend,” “plan,” “continue,” “believe,” “seek,” “estimate” and similar expressions used in this report that do not relate to historical facts are intended to identify forward-looking statements. These statements appear in a number of places in this report, including, but not limited to, statements found in Item 1, “Business,” and in Item 7, “Management’s Discussion and Analysis of Financial Condition and Results of Operations.” Citizens Holding Company (the “Company”) notes that a variety of factors could cause its actual results or experience to differ materially from the anticipated results or other expectations described or implied by such forward-looking statements. The risks and uncertainties that may affect the operation, performance, development and results of the business of the Company and the Company’s wholly-owned subsidiary, The Citizens Bank of Philadelphia, Mississippi (the “Bank”), include, but are not limited to, the following:
 
 
expectations about the movement of interest rates, including actions that may be taken by the Federal Reserve Board in response to changing economic conditions;
 
 
adverse changes in asset quality and loan demand, and the potential insufficiency of the allowance for loan losses and our ability to foreclose on delinquent mortgages;
 
 
the risk of adverse changes in business conditions in the banking industry generally and in the specific markets in which the Company operates including, but not limited to, the negative impacts and disruptions resulting from the
COVID-19
pandemic;
 
 
extensive regulation, changes in the legislative and regulatory environment that negatively impact the Company and the Bank through increased operating expenses and the potential for regulatory enforcement actions, claims, or litigation;
 
 
increased competition from other financial institutions and the risk of failure to achieve our business strategies;
 
 
events affecting our business operations, including the effectiveness of our risk management framework, the accuracy of our estimates, our reliance on third party vendors, the risk of security breaches and potential fraud, and the impact of technological advances;
 
 
our ability to maintain sufficient capital and to raise additional capital when needed;
 
 
our ability to maintain adequate liquidity to conduct business and meet our obligations;
 
 
events affecting our ability to compete effectively and achieve our strategies, such as the risk of failure to achieve the revenue increases expected to result from our acquisitions, branch additions and in new product and service offerings, our ability to control expenses and our ability to attract and retain skilled people;
 
 
events that adversely affect our reputation, and the resulting potential adverse impact on our business operations;
 
 
risks arising from owning our common stock, such as the volatility and trading volume, our ability to pay dividends, the regulatory limitations on stock ownership, and provisions in our governing documents that may make it more difficult for another party to obtain control of us; and
 
 
other risks detailed from
time-to-time
in the Company’s filings with the Securities and Exchange Commission.
 
81

Table of Contents
The Company undertakes no obligation to update or revise any forward-looking statements subsequent to the date on which they are made.
NET INCOME
Net income for 2020 increased by 17.43% to $6,931 or $1.24 per share-basic and -diluted, from $5,902 or $1.17 per share-basic and -diluted for 2019. The provision for loan losses for 2020 was $1,485 as compared to $573 in 2019. The increases in the provision for loan losses in each quarter of 2020 compared to the same quarters in 2019 are primarily a result of the stable loan growth during the year along with qualitative adjustments for uncertainty of market conditions brought about by the
COVID-19
pandemic.
Non-interest
income increased by $712, or 7.30%, and
non-interest
expense increased by $5,868 or 21.29%, in 2020.
Non-interest
income for 2020 increased primarily due to the result of increase in mortgage loan origination income due to a decrease in long-term mortgages rates, increase in gains from security sales to lower the Company’s prepayment risk within the Company’s mortgage-backed securities portfolio, partially offset by a decrease in overdraft income due to the savings trend related to the
COVID-19
pandemic.
Non-interest
expense increased mainly due to an increase in
non-recurring
COVID-19
safety measures such as: PPE, laptops, and branch safety measures. In addition, the Company also incurred with an increase in regulatory related expenses and core service contracts after the merger conversion in the second quarter of 2020. Also, a full year of recurring expenses from the Charter acquisition contributed to the increase of
non-interest
expense.
Net income for 2019 decreased by 11.6% to $5,902 or $1.17 per share-basic and -diluted, from $6,673 or $1.36 per share-basic and -diluted for 2018. The provision for loan losses for 2019 was $573 as compared to $334 in 2018. The increase in the loan loss provision for 2019 was mainly due to the increase in the balance of loans outstanding coupled with management’s assessment of inherent losses in the loan portfolio, including the impact caused by current local and national economic conditions.
Non-interest
income increased by $1,148, or 13.4%, and
non-interest
expense decreased by $106 or 0.4%, in 2019.
Non-interest
income for 2019 increased primarily due to the result of gains from security sales and other real estate coupled with death benefit proceeds from a bank-owned life insurance policy offset by a decrease in mortgage loan origination income.
Non-interest
expense decreased mainly due to a refund of excess prepaid postage and continued cost containment focus throughout the Company, partially offset by an increase in salaries and benefits related to the Charter acquisition.
NET INTEREST INCOME
Net interest income is the most significant component of the Company’s earnings. Net interest income is the difference between interest and fees realized on earning assets, primarily loans and securities, and interest paid on deposits and other borrowed funds. The net interest margin is this difference expressed as a percentage of average earning assets. Net interest income is affected by several factors, including the volume of earning assets and liabilities, the mix of earning assets and liabilities, and interest rates. The discussion below is presented on a tax equivalent basis which management believes to be the best way to analyze net interest income.
 
82

Table of Contents
Net interest income on a tax equivalent basis was $33,699, $29,897 and $27,806 for the years 2020, 2019 and 2018, respectively. Net interest margin was 2.72%, 2.77% and 3.05% for the same periods. During 2020, the yields on interest earning assets and the rates paid on interest bearing deposits decreased. In 2020 as compared to 2019, interest-bearing assets increased by $156,334, or 14.50% and interest-bearing liabilities increased by $109,494, or 12.76%. For the year ended December 31, 2020, the average yield on earnings assets was 3.33%, a decrease of 44 basis points compared to the average yield at December 31, 2019. The average rate paid on interest-bearing liabilities was 0.76%, a decrease of 50 basis points compared to the average rate at December 31, 2019.
During 2019, the yields on interest earning assets and the rates paid on interest bearing deposits increased. In 2019 as compared to 2018, interest-bearing assets increased by $167,713, or 18.4% and interest-bearing liabilities increased by $145,753, or 20.5%. For the year ended December 31, 2019, the average yield on earnings assets was 3.77%, an increase of 23 basis points compared to the average yield at December 31, 2018. The average rate paid on interest-bearing liabilities was 1.26%, an increase of 64 basis points compared to the average rate at December 31, 2018.
During this three-year period, loans outstanding increased in 2018, 2019 and 2020. Loans generally provide the Company with yields that are greater than the yields on typical investment securities.
Table 1 – Average Balance Sheets and Interest Rates sets forth average balance sheet data, including all major categories of interest-earning assets and interest-bearing liabilities, together with the interest earned or interest paid and the average yield or average rate paid on each such category for the fiscal years ended December 31, 2020, 2019 and 2018.
 
83

Table of Contents
TABLE 1 – AVERAGE BALANCE SHEETS AND INTEREST RATES
(in thousands)
 
     Average Balance      Income/Expense      Average Yield/Rate  
     2020      2019      2018      2020      2019      2018      2020     2019     2018  
Loans:
                        
Loans, net of unearned
(1)
   $ 622,309      $ 560,888      $ 417,624      $ 30,980      $ 29,427      $ 20,287        4.98     5.25     4.86
Investment Securities
                        
Taxable
     498,016        388,490        376,392        7,837        7,993        8,345        1.57     2.06     2.22
Tax-exempt
     69,591        78,843        107,906        2,027        2,423        3,445        2.91     3.07     3.19


Total Investment Securities
     567,607        467,333        484,298        9,864        10,416        11,790        1.74     2.23     2.43
Federal Funds Sold and Other
     45,305        50,666        9,253        250        854        157        0.55     1.69     1.70


Total Interest Earning Assets
(1)(2)
     1,235,221        1,078,887        911,175        41,094        40,697        32,234        3.33     3.77     3.54


Non-Earning Assets
     101,292        85,683        69,971                  


Total Assets
   $ 1,336,513      $ 1,164,570      $ 981,146                  


Deposits:
                        
Interest-bearing Demand Deposits 
(3)
   $ 449,828      $ 381,635      $ 325,192      $ 3,062      $ 3,468      $ 1,131        0.68     0.91     0.35
Savings
     93,886        79,886        79,281        111        130        113        0.12     0.16     0.14
Time
     231,832        274,597        191,836        3,351        5,226        1,536        1.45     1.90     0.80


Total Deposits
     775,546        736,118        596,309        6,524        8,824        2,780        0.84     1.20     0.47
Borrowed Funds
                        
Short-term Borrowings
     192,017        121,951        116,787        871        1,976        1,648        0.45     1.62     1.41
Long-term Borrowings
     —          —          —          —          —          —          0.00     0.00     0.00


Total Borrowed Funds
     192,017        121,951        116,787        871        1,976        1,648        0.45     1.62     1.41


Total Interest-Bearing Liabilities 
(3)
     967,563        858,069        713,096        7,395        10,800        4,428        0.76     1.26     0.62
Non-Interest Bearing Liabilities
                        
Demand Deposits
     236,881        192,672        164,682                  
Other Liabilities
     14,294        17,534        10,208                  
Shareholders’ Equity
     117,775        96,295        93,160                  


Total Liabilities and Shareholders’ Equity
   $ 1,336,513      $ 1,164,570      $ 981,146                  


Interest Rate Spread
                       2.56     2.51     2.92


Net Interest Margin
            $ 33,699      $ 29,897      $ 27,806        2.72     2.77     3.05


Less
                        
Tax Equivalent Adjustment
              565        654        906         


Net Interest Income
            $ 33,134      $ 29,243      $ 26,900         


(1)
Overdrafts on demand deposit accounts are not included in the average volume calculation as they are not considered interest earning assets by the Company. They are included in the
“Non-Earning
Assets” balance above.
(2)
Earning Assets in Table 1 does not include the dividend paying stock of the Federal Home Loan Bank.
(3)
Demand deposits are not included in the average volume calculation as they are not interest bearing liabilities. They are included within the
non-interest
bearing liabilities section above.
 
84

Table of Contents
Table 2 – Net Average Interest Earning Assets illustrates net interest earning assets and liabilities for 2020, 2019, and 2018.
TABLE 2 – NET AVERAGE INTEREST EARNING ASSETS
 
     (in thousands)  
     2020      2019      2018  
Average interest earning assets
   $ 1,235,221      $ 1,078,887      $ 911,175  
Average interest bearing liabilities
     967,563        858,069        713,096  


Net average interest earning assets
   $ 267,658      $ 220,818      $ 198,079  


85

Table of Contents
Table 3 – Volume/Rate Analysis depicts the effect on interest income and interest expense of changes in volume and changes in rate from 2018 through 2020. Variances, which were attributable to both volume and rate, are allocated proportionately between rate and volume using the absolute values of each for a basis for the allocation.
Non-accruing
loans are included in the average loan balances used in determining the yields. Interest income on
tax-exempt
securities and loans has been adjusted to a tax equivalent basis using a federal income tax rate of 21% and a state tax rate of 5% in 2020 and 2019, respectively.
TABLE 3 – VOLUME/RATE ANALYSIS
 
     (in thousands)                    
     2020 Change from 2019     2019 Change from 2018  
     Volume     Rate     Total     Volume     Rate     Total  
INTEREST INCOME
            
Loans
   $ 3,222       (1,669   $ 1,553     $ 6,959     $ 2,181     $ 9,140  
Taxable securities
     2,253       (2,454     (201     268       (620     (352
Non-Taxable securities
     (284     (67     (351     (928     (94     (1,022
Federal funds sold and other
     (90     (514     (604     703       (6     697  


TOTAL INTEREST INCOME
   $ 5,101     $ (4,704   $ 397     $ 7,002     $ 1,461     $ 8,463  


INTEREST EXPENSE
            
Interest-bearing demand deposits
   $ 620       (1,026     (406   $ 196     $ 2,141       2,337  
Savings deposits
     23       (42     (19     1       16       17  
Time deposits
     (814     (1,061     (1,875     663       3,027       3,690  
Short-term borrowings
     1,135       (2,241     (1,106     73       255       328  


TOTAL INTEREST EXPENSE
   $ 964     $ (4,370     (3,406   $ 933     $ 5,439       6,372  


NET INTEREST INCOME
   $ 4,137     $ (334   $ 3,803     $ 6,070     $ (3,979   $ 2,091  


86

Table of Contents
LOANS
The loan portfolio constitutes the major earning asset of the Company and, in the opinion of management, offers the best alternative for maximizing net interest margin. The Company’s loan personnel have the authority to extend credit under guidelines established and approved by the Board of Directors. Any aggregate credit that exceeds the authority of the loan officer is forwarded to the Board’s loan committee for approval. The loan committee is composed of certain directors, including the Chairman of the Board of Directors. All aggregate loans that exceed the loan committee’s lending authority are presented to the full Board of Directors for ultimate approval or denial. The loan committee not only acts as an approval body to ensure consistent application of the Company’s loan policy but also provides valuable insight through communication and pooling of knowledge, judgment, and experience of its members.
The Company has stated in its loan policy the following objectives for its loan portfolio:
 
   
to make loans after sound and thorough credit analysis;
 
   
to properly document all loans;
 
   
to eliminate loans from the portfolio that are underpriced, high risk or difficult and costly to administer;
 
   
to seek good relationships with the customer;
 
   
to avoid undue concentrations of loans; and
 
   
to keep
non-accrual
loans to a minimum by aggressive collection policies.
Loan demand in the Company’s market remained stable for the year even with the negative economic impact of the
COVID-19
pandemic. Although the Company continues to face intense competition for available loans from other financial institutions, the Company was able, in 2020 and 2019, to increase the amount of loans outstanding. Additionally, the PPP loans added a significant amount of loans to the Company’s portfolio in 2020. The overall loan demand in the Company’s operating markets has been stable in certain sectors. Commercial, financial and agricultural has seen the most growth with an increase of 31.95%, or $114,305, in 2020, by 25.3%, or $77,353, in 2019 and by 6.6%, or $17,653, in 2018. Included in this portfolio segment is the Company’s PPP loans of $29,523. Commercial, financial and agricultural loans are the largest segment of the loan portfolio and, by nature, bear a higher degree of risk. Management believes the lending practices, policies and procedures applicable to this loan category are adequate to manage any risk represented by the growth of this loan segment.
Real estate mortgage loans originated by the Company decreased by 3.63%, or $4,430 in 2020 and increased by 37.4%, or $33,267, in 2019, and decreased by 7.5%, or $7,177, in 2018 when compared to the prior years. The increase in mortgage loans in 2019 was mainly driven by the acquisition of Charter coupled with expansion to more metropolitan markets and the decrease in 2020 and 2018 years reflects the weakness in some of the Company’s local housing markets coupled with increased competition in the mortgage market.
 
87

Table of Contents
Real estate construction loans decreased by $32,366, or (39.86%) in 2020 to $48,831 when compared to the $81,197 at December 31, 2019 and increased by $7,697 or 18.71% when compared to 2018. Of the overall decrease for the year, the Company had a reclassification of $54,023 from real estate construction to other loan segments. Real estate construction loans are usually short term in nature and are dependent on construction activity in the Company’s service area. Demand was stable for construction loans during the 2020 fiscal year despite the impact due to the
COVID-19
pandemic.
Consumer loans decreased by $2,327 or 14.48% in 2020 and increased by $2,054 or 14.6% in 2019, and decreased by $1,969, or 12.3% in 2018, compared to the prior years. The Company believes the
COVID-19
pandemic has caused a pause of consumer spending due to the economic impact of the pandemic.
Table 4 – Loans Outstanding reflects outstanding balances by loan type for the past five years. Additional loan information is presented in Note 5, “Loans,” to the Company’s Consolidated Financial Statements included in this Annual Report.
TABLE 4 – LOANS OUTSTANDING
(in thousands)
 
     AT DECEMBER 31,  
     2020      2019      2018      2017      2016  
Commercial, financial and agricultural
   $ 472,094      $ 357,789      $ 285,420      $ 267,767      $ 253,581  
Real estate - construction
     48,831        81,197        41,134        25,923        23,793  
Real estate - mortgage
     117,584        122,014        88,747        95,925        97,812  
Consumer
     13,748        16,075        14,021        15,990        19,466  


TOTAL LOANS
   $ 652,257      $ 577,075      $ 429,322      $ 405,605      $ 394,652  


Table 5 – Loan Liquidity and Sensitivity to Changes in Interest Rates reflects the maturity schedule or repricing frequency of all loans. Also presented are fixed and variable rate loans maturing after one year.
TABLE 5 – LOAN LIQUIDITY
LOAN MATURITIES AT DECEMBER 31, 2020
 
     1 YEAR
OR LESS
    
1 - 5

YEARS
     OVER 5
YEARS
     Total  
Commercial, financial and agricultural
   $ 69,949      $ 305,828      $ 96,317      $ 472,094  
Real estate - construction
     10,457        33,946        4,428      $ 48,831  
Real estate - mortgage
     20,330        76,059        21,195      $ 117,584  
Consumer
     5,202        8,065        481      $ 13,748  


Total loans
   $ 105,938      $ 423,898      $ 122,421      $ 652,257  


88

Table of Contents
SENSITIVITY TO CHANGES IN INTEREST RATES
 
     1 - 5
YEARS
     OVER 5
YEARS
 
Fixed rates
   $ 487,792      $ 75,479  
Variable rates
     39,569        49,417  


Total loans
   $ 527,361      $ 124,896  


Each loan the Company makes either has a stated maturity as to when the loan is to be repaid or is subject to an agreement between the Company and the customer governing its progressive reduction. The Company’s policy is that every loan is to be repaid by its stated maturity and not carried as a continuing debt. Generally, the Company requires that principal reductions on a loan must have begun prior to the second renewal date of the loan.
PROVISION FOR LOAN LOSSES AND ASSET QUALITY
The allowance for loan losses represents an amount that in management’s judgment will be adequate to absorb estimated probable losses within the existing loan portfolio. Loans that management determines to be uncollectible are charged against the allowance for loan losses, and subsequent recoveries, if any, are credited to the allowance. Management’s judgment in determining the adequacy of the allowance is based on evaluations of the collectability of specific loans and prior loss experience. Other factors considered by management include specific economic events, general economic conditions and trends, and loan portfolio mix and growth. The allowance for loan losses is subject to close regulatory review from the FDIC and the Mississippi Department of Banking and Consumer Finance and is also a factor in each agency’s determination of the Company’s capital adequacy. The estimation of losses in the Company’s loan portfolio is susceptible to changes resulting from changes in the financial condition of individual borrowers and economic conditions in the Company’s market area.
The allowance for loan losses is established through a provision for loan losses charged against net income. This expense is determined by a number of factors, including historical loan losses, assessment of specific credit weaknesses within the portfolio, assessment of the prevailing economic climate, and other factors that may affect the overall condition of the loan portfolio. Management utilized these factors to determine the provision for loan losses for each of 2020, 2019 and 2018. The ratio of net loans charged off to average loans was 0.08% in 2020, 0.03% in 2019 and 0.00% in 2018. Management evaluates the adequacy of the allowance for loan loss on a monthly basis and makes adjustments to the allowance based on this analysis.
The provision for loan losses in 2020 was an expense of $1,485 compared to an expense of $573 in 2019 and an expense of $334 in 2018. The change in the provision for all three years was mainly due to management’s assessment of inherent losses in the loan portfolio, including the impact caused by current local and national economic conditions. Additionally, during the second quarter of 2020 management made qualitative adjustments for the uncertainty of market conditions brought about by the
COVID-19
pandemic that contributed to a majority of the provision increase coupled with stable loan growth. The Company uses a model that takes into
 
89

Table of Contents
account historical charge-offs and recoveries and applies that to certain loan segments of the Company’s portfolio. At the end of 2020, the total allowance for loan losses was $4,735, an amount that management believes to be sufficient to cover estimated probable losses in the loan portfolio.
Activity in the allowance for loan losses is reflected in Table 6 – Analysis of Allowance for Loan Losses. The Company’s policy is to
charge-off
loans when in management’s opinion the loan is deemed uncollectible. Even after it is charged off, however, the Company makes concerted efforts to maximize recovery of such loan.
TABLE 6 – ANALYSIS OF ALLOWANCE FOR LOAN LOSSES
(in thousands except for percentage amounts)
 
     2020     2019     2018     2017     2016  
BALANCE AT BEGINNING OF YEAR
   $ 3,755     $ 3,372     $ 3,019     $ 3,903     $ 6,474  
LOANS CHARGED-OFF
          
Commercial, financial and agricultural
     272       176       35       166       2,397  
Real estate - construction
     37       —         74       112       —    
Real estate - mortgage
     304       46       133       57       179  
Consumer
     104       138       146       102       65  


TOTAL CHARGE-OFFS
     717       360       388       437       2,641  


CHARGE-OFFS RECOVERED
          
Commercial, financial and agricultural
     65       91       219       2       18  
Real estate - construction
     43       18       19       14       18  
Real estate - mortgage
     61       14       81       16       24  
Consumer
     43       47       88       64       75  


TOTAL RECOVERIES
     212       170       407       96       135  


Net loans charged-off
     505       190       (19     341       2,506  
Additions charged to operating expense
     1,485       573       334       (543     (65


BALANCE AT END OF YEAR
   $ 4,735     $ 3,755     $ 3,372     $ 3,019     $ 3,903  


Loans, net of unearned, at year end
   $ 652,256     $ 577,067     $ 429,277     $ 406,605     $ 394,051  
Ratio of allowance to loans at year end
     0.73     0.65     0.79     0.74     0.99
Average loans - net of unearned
   $ 622,805     $ 561,483     $ 418,136     $ 395,217     $ 409,367  
Ratio of net loans charged-off to average loans
     0.08     0.03     0.00     0.09     0.61
 
90

Table of Contents
ALLOCATION OF ALLOWANCE FOR LOAN LOSSES
(in thousands)
 
     AT DECEMBER 31,  
     2020      2019      2018      2017      2016  
Commercial, financial and agricultural
   $ 3,576      $ 2,692      $ 2,295      $ 1,550      $ 2,139  
Real estate - construction
     267        192        139        120        402  
Real estate - mortgage
     653        566        417        821        770  
Consumer
     239        305        521        528        592  


Total
   $ 4,735      $ 3,755      $ 3,372      $ 3,019      $ 3,903  


COMPOSITION OF LOAN PORTFOLIO BY TYPE
 
     AT DECEMBER 31,  
     2020     2019     2018     2017     2016  
Commercial, financial and agricultural
     72.38     62.00     66.48     66.02     64.25
Real estate - construction
     7.49     14.07     9.58     6.39     6.03
Real estate - mortgage
     18.03     21.14     20.67     23.65     24.78
Consumer
     2.11     2.79     3.27     3.94     4.93


     100.00     100.00     100.00     100.00     100.00


Loan balances outstanding, as illustrated in Table 4, increased in 2020 even though the Company maintained tight credit standards and the negative economic impact of the
COVID-19.
All loan segments decreased from 2019 except for the commercial, financial and agricultural loan segment. In 2019 as compared to 2018, all loan segments increased primarily due to the acquisition of Charter coupled with solid organic growth. The allowance for loan losses is allocated to the various categories based on the historical loss percentage for each segment of loan and any specific reserves that might be assigned to those loans.
Non-performing
assets and the relative percentages of such assets to loan balances are presented in Table 7 –
Non-performing
Assets.
Non-performing
loans include
non-accrual
loans, loans delinquent 90 days or more based on contractual terms and troubled debt restructurings. Management classifies loans as
non-accrual
when it believes that collection of interest is doubtful. This typically occurs when payments are past due over 90 days, unless the loans are well secured and in the process of collection. Another measurement of asset quality is OREO, which represents properties acquired by the Company through foreclosure following loan defaults by customers. The percentage of OREO to total loans at December 31, 2020 was 0.47% compared to 0.62% in 2019. OREO decreased in 2020 after increasing in 2019 due to sales of several parcels in 2020 partially offset by foreclosures in 2020.
Loans on
non-accrual
status amounted to $8,484 in 2020 as compared to $12,026 in 2019 and $9,839 in 2018. Interest income forgone on loans classified as
non-accrual
in 2020 was $383 as compared to $555 in 2019 and $429 in 2018. Upon the classification of a loan as
non-accrual,
all interest accrued on the loan prior to the time it is classified as
non-accrual
is reversed and interest accruals are suspended until such time that the loan is in compliance with its terms and deemed collectable.
 
91

Table of Contents
TABLE 7 – NON-PERFORMING ASSETS
(in thousands, except percentages)
 
     As of December 31,  
     2020     2019     2018     2017     2016  
PRINCIPAL BALANCE
          
Non-accrual
   $ 8,484     $ 12,026     $ 9,839     $ 7,582     $ 8,879  
Accruing loans 90 days or more past due
     14       274       73       807       206  
Troubled debt restructurings
     2,113       2,495       2,782       3,047       3,288  


TOTAL NON-PERFORMING LOANS
   $ 10,611     $ 14,795     $ 12,694     $ 11,436     $ 12,373  


Income on non-accrual loans not recorded
   $ 395     $ 555     $ 429     $ 413     $ 652  
Non-performing as a percent of loans
     1.63     2.56     2.96     2.82     3.14
Other real estate owned
   $ 3,073     $ 3,552     $ 3,440     $ 3,980     $ 4,443  
OREO as a percent of loans
     0.47     0.62     0.80     0.98     1.13
Allowance as a percent of non-performing loans
     44.62     25.38     26.56     26.40     31.54
ASC Subtopic
310-10,
Loan Impairments
outlines the guidance for evaluating impaired loans. These statements changed the methods of estimating the loan loss allowance for problem loans. In general, when management determines that principal and interest due under the contractual terms of a loan are not fully collectible, management must value the loan using discounted future expected cash flows. Management evaluates the Company’s loans for impairment under ASC Subtopic
310-10.
The balances of impaired (including
non-accruals)
loans for the years 2020, 2019 and 2018 were $7,675, $11,135 and $10,305, respectively.
 
92

Table of Contents
This table details the impaired loans by category for years ending 2020, 2019 and 2018.
 
     AT DECEMBER 31,  
     2020      2019      2018  
Commercial, financial and agricultural
   $ 6,659      $ 10,296      $ 9,153  
Real estate - mortgage
     1,016        839        1,152  


Total loans
   $ 7,675      $ 11,135      $ 10,305  


Management monitors any loans that are classified under FDIC regulations as loss, doubtful or substandard, even if management has not classified the loans as
non-performing
or impaired. In addition to loans classified for regulatory purposes, management also designates certain loans for internal monitoring purposes in a “watch” category. Loans may be placed on management’s watch list as a result of delinquent status, management’s concern about the borrower’s financial condition or the value of the collateral securing the loan, a substandard classification during regulatory examinations, or simply as a result of management’s desire to monitor more closely a borrower’s financial condition and performance. Watch category loans may include loans that are still performing and accruing interest and may be current under the terms of the loan agreement but which management has a significant degree of concern about the borrowers’ ability to continue to perform according to the terms of the loan agreement. Watch category loans may also include loans, which, although adequately secured and performing, reflect a past delinquency problem or unfavorable financial trends exhibited by the borrower. Loss exposure on these loans is typically evaluated based primarily upon the estimated liquidation value of the collateral securing the loan.
At December 31, 2020, loans totaling $25,146 were included on the Company’s watch list compared to $30,756 at December 31, 2019. The majority of these loans are real estate loans that, although adequately collateralized, have experienced frequent delinquencies in scheduled payments. The inclusion of loans on this list does not indicate a greater risk of loss; rather it indicates that the loan possesses one of the several characteristics described above warranting increased oversight by management.
SECURITIES
At December 31, 2020, the Company classified all of its securities as AFS. AFS securities are reported at fair value, with unrealized gains and losses included as a separate component of equity, net of tax. The Company does not hold any securities classified as held to maturity or held for trading purposes.
Table 8 – Securities and Securities Maturity Schedule summarizes the amortized cost of securities from 2018 through 2020 and the maturity distribution at December 31, 2020, by classification.
 
93

Table of Contents
TABLE 8 – SECURITIES
(in thousands)
 
     2020      2019      2018  
SECURITIES AVAILABLE-FOR-SALE
        
U. S. Government Agencies
   $ 11,870      $ 97,400      $ 99,366  
Mortgage Backed Securities
     560,033        308,310        259,742  
State, County and Municipal Obligations
     100,823        59,724        105,591  
Other Securities
     500        —          —    


TOTAL SECURITIES AVAILABLE-FOR-SALE
   $ 673,226      $ 465,434      $ 464,699  


SECURITIES MATURITY SCHEDULE
 
     1 year or less      1 to 5 years     5 to 10 years     over 10 years  
     Actual
Balance
     Average
Yield
     Actual
Balance
     Average
Yield
    Actual
Balance
     Average
Yield
    Actual
Balance
     Average
Yield
 
AVAILABLE-FOR-SALE
                     
U. S. Government Agencies
   $ —          —        $ —          —       $ 6,903        2.31   $ 4,967        1.74
Mortgage Backed Securities
(1)
     —          —          4,749        2.50     19,857        1.34     535,427        0.14
State, County and Municipal
(2)
     —          —          3,594        3.26     13,635        2.68     83,594        2.50
Other Securities
     —          —          —          —         —          —         500        —    


TOTAL AVAILABLE-FOR-SALE
   $ —          —        $ 8,343        2.83   $ 40,395        1.96   $ 624,488        0.47


(1)
 
The maturities for the mortgage backed securities included in this line item are based on final maturity.
(2)
 
Average yields were calculated on tax equivalent basis using a marginal federal income tax rate of 21% and a state tax rate of 5%.
The change in the carrying value of the AFS portfolio is due to market value fluctuations resulting from the changing interest rate environment during 2020. This change is not used in the Tier 1 capital calculation.
As detailed in Table 8, the security portfolio increased $207,792 or 44.64% in 2020, increased $735 or 0.02% in 2019 and decreased $51,307 or (9.9%) in 2018. The Company strives to maximize the yields on its portfolio while balancing pledging needs and managing risk. The Company seeks to invest most of its funds not needed for loan demand or the reduction of other borrowings in higher yielding securities and not in the lower yielding federal funds sold.
DEPOSITS
The Company offers a wide variety of deposit services to individual and commercial customers, such as
non-interest-bearing
and interest-bearing checking accounts, savings accounts, money market deposit accounts and time deposits. The deposit base is the Company’s major funding source for earning assets. Time deposits decreased in 2020 as a result of low
 
94

Table of Contents
interest rates and increases in other deposit products as a result of the
COVID-19
pandemic. Time deposits increased in 2019 and 2018 due to an increase in rates paid by the Company caused by competition in our operating markets.
A three-year schedule of average deposits by type and maturities of time deposits greater than $250 is presented in Table 9 – Deposit Information.
TABLE 9 – DEPOSIT INFORMATION
(in thousands, except percentages)
 
     2020     2019     2018  
     Average
Balance
     Average
Rate
    Average
Balance
     Average
Rate
    Average
Balance
     Average
Rate
 
Noninterest-bearing
   $ 236,881        $ 192,672        $ 164,682     
Interest-bearing demand
     449,828        0.68     381,635        0.91     325,192        0.35
Savings
     93,886        0.12     79,886        0.16     79,281        0.14
Time deposits
     231,832        1.44     274,597        1.90     191,836        0.80


   $ 1,012,427        0.84   $ 928,790        1.20   $ 760,991        0.47


MATURITY RANGES OF TIME DEPOSITS
OF $250 OR MORE
 
     AS OF DECEMBER 31, 2020  
3 months or less
   $ 16,789  
3 through 12 months
     35,167  
1 year to 3 years
     11,166  
over 3 years
     8,222  


   $ 71,344  


The Company, in its normal course of business, will acquire large time deposits, generally from public entities, with a variety of maturities. These funds are acquired on a bid basis and are considered to be part of the deposit base of the Company.
BORROWINGS
Aside from the core deposit base and large denomination time deposits mentioned above, the remaining funding sources utilized by the Company include short-term and long-term borrowings. Short-term borrowings consist of Federal Funds Purchased from other financial institutions on an overnight basis, short-term advances from the FHLB and securities sold under agreement to repurchase. Long-term borrowings are advances from the FHLB with an initial maturity of greater than one year.
 
95

Table of Contents
TABLE 10
-
SHORT-TERM
BORROWINGS
(in thousands)
 
     As of December 31,  
     2020     2019     2018  
Short-term borrowings
      
Year-end balance
   $ 221,272     $ 170,410     $ 107,966  
Weighted average rate
     0.39     1.05     1.20
Maximum month-end balance
   $ 265,177     $ 181,347     $ 140,115  
Year to date average balance
   $ 192,017     $ 121,951     $ 116,787  
Weighted average rate
     0.45     1.62     1.41
The Company borrows funds for short periods from the FHLB as an alternative to Federal Funds Purchased. The Company foresees short-term borrowings to be a continued source of liquidity and likely will continue to use these borrowings as a method to fund short-term needs. At December 31, 2020, the Company had the capacity to borrow up to $167,285 from the FHLB and other financial institutions in the form of Federal Funds Purchased. The Company generally will use these types of borrowings if loan demand is greater than the growth in deposits. At December 31, 2020 the Company had borrowed $25,000 from the FHLB and
$-0-
in Federal Funds Purchased. At December 31, 2019, the Company had borrowed
$-0-
from the FHLB and
$-0-
in Federal Funds Purchased. In 2020, the balances in Securities Sold Under Agreement to Repurchase increased $25,862, or 15.18% to $196,272. In 2019, these balances increased to $170,410, an increase of $62,444, or 57.8%.
At the end of 2020, the Company had
$-0-
in long-term debt to the FHLB for advances or any other institution.
NON-INTEREST
INCOME AND EXPENSE
Table 11 -
Non-Interest
Income and Expense illustrates the Company’s
non-interest
income and expense from 2018 through 2020 and percentage changes between such years.
TABLE 11
-
NON-INTEREST
INCOME & EXPENSE
(in thousands)
 
     2020      % CHANGE
FROM ‘19
    2019      % CHANGE
FROM ‘18
    2018  
NON-INTEREST INCOME
            
Service charges on deposit accounts
   $ 3,352        -24.04   $ 4,413        -3.27   $ 4,562  
Other operating income
     7,108        33.23     5,335        32.12     4,038  


TOTAL NON-INTEREST INCOME
   $ 10,460        7.30   $ 9,748        13.35   $ 8,600  


NON-INTEREST EXPENSE
            
Salaries and employee benefits
   $ 17,476        17.42   $ 14,883        2.43   $ 14,530  
Occupancy expense, including equipment
     7,360        40.32     5,245        -8.46     5,730  
Other operating expense
     8,590        15.61     7,430        0.35     7,404  


TOTAL NON-INTEREST EXPENSE
   $ 33,426        21.29   $ 27,558        -0.38   $ 27,664  


96

Table of Contents
Non-interest
income typically consists of service charges on checking accounts, including debit card fees, and other financial services. With continued pressure on interest rates, the Company has sought to increase its
non-interest
income through the expansion of fee income and the development of new services. Currently, the Company’s main sources of
non-interest
income are service charges on checking accounts, safe deposit box rentals, credit life insurance premiums and title insurance service fees.
During 2020 as compared to 2019,
non-interest
income increased by $712, or 7.30%. An increase in other operating income mainly attributed to increases in mortgage loan origination income and net gains on sales of securities, partially offset by a decrease in overdraft income.
During 2019 as compared to 2018,
non-interest
income increased by $1,148, or 13.4%. An increase in other operating income and net gains on sales of securities was partially offset by a decrease in service charges on deposits.
Non-interest
expenses consist of salaries and benefits, occupancy expense and other overhead expenses incurred by the Company in the transaction of its business. In 2020 as compared to 2019,
non-interest
expense increased by $5,868, or 21.29%, to $33,426. Included in this increase was an increase in occupancy expense of $2,115 or 40.32%. Additionally, an increase in salaries and benefits in the amount of $2,593, or 17.42%, and other expense in the amount of $1,160, or 15.61%. The increase in occupancy expense was primarily due to
non-recurring
COVID-19
safety measures such as: PPE, laptops, and branch safety measures. In addition, the Company also incurred an increase in regulatory related expenses and core service contracts after the merger conversion in the second quarter of 2020. The increase in salaries and benefits was due to the Charter acquisition October 1, 2019.
In 2019 as compared to 2018,
non-interest
expense decreased by $106, or 0.4%, to $27,558. Included in this decrease was a decrease in occupancy expense of $485 or 8.5% partially offset by an increase in salaries and benefits in the amount of $353, or 2.4%, and other expense in the amount of $26, or 0.4%. The decrease in occupancy expense was primarily due to a to a refund of excess prepaid postage and continued cost containment focus throughout the Company. The increase in salaries and benefits was due to the Charter acquisition on October 1, 2019.
In 2020, the Company’s efficiency ratio was 78.29%, compared to 77.88% in 2019 and 75.99% in 2018. The efficiency ratio is calculated to measure the cost of generating one dollar of revenue. The efficiency ratio is calculated by dividing
non-interest
expense by the sum of net interest income, on a fully tax equivalent basis, and
non-interest
income.
INCOME TAXES
The Company records a provision for income taxes currently payable, along with a provision for deferred taxes to be realized in the future. Such deferred taxes arise from differences in timing of certain items for financial statement reporting rather than income tax reporting. The deferred tax amount of $1,548 is considered realizable and no valuation allowance is considered necessary.
 
97

Table of Contents
The Company’s effective tax rate was 20.18%, 18.66% and 11.04% % in 2020, 2019 and 2018, respectively. The major difference between the effective tax rate applied to the Company’s financial statement income and the federal statutory rate of 21% in 2020, 2019 and 2018, respectively, is interest on
tax-exempt
securities and loans. Further tax information is disclosed in Note 13, “Income Taxes” to the Company’s Consolidated Financial Statements included in this Annual Report.
LIQUIDITY AND RATE SENSITIVITY
Liquidity management is the process by which the Company ensures that adequate liquid funds are available to meet its financial commitments on a timely basis. These commitments include honoring withdrawals by depositors, funding credit obligations to borrowers, servicing long-term obligations, making shareholder dividend payments, paying operating expenses, funding capital expenditures and maintaining reserve requirements.
The Company’s predominant sources of funding include: core deposits (consisting of both commercial and individual deposits); proceeds from maturities of securities; repayments of loan principal and interest; commercial repurchase agreements; Federal Funds Purchased; and short-term and long-term borrowing from the FHLB. In 2020 as compared to 2019, the Company experienced an increase in deposits and repurchase agreements in excess of the increase in loans outstanding. The increase in investment securities is mainly the result of the desire to invest excess funds outside of new loans. The Company relies upon
non-core
sources of funding, such as commercial repurchase agreements, Federal Funds Purchased and short and long- term borrowings from the FHLB, when deposit growth is not adequate to meet its short-term needs. While the strategy of using these wholesale funding sources is adequate to cover liquidity deficiencies in the short term, the Company’s goal is to increase core deposits as a source of long term funding. Management does not intend to rely on borrowings from the FHLB as the first choice as a source of funds but prefers to increase core deposits through increased competition for available deposits. Management believes that core deposits will increase by offering competitive rates and superior service to the Bank’s customers.
The Company had $25,000 of FHLB advances outstanding at year end. The Company will continue to use advances if they are needed to maintain the Company’s liquidity position.
The deposit base is diversified between individual and commercial accounts, which the Company believes helps it avoid dependence on large concentrations of funds. The Company does not currently solicit certificates of deposit from brokers. The primary sources of liquidity on the asset side of the balance sheet are securities classified as AFS. All of the $678,749 in the investment securities portfolio is classified in the AFS category, and any securities not pledged are available to be sold, should liquidity needs arise. Management, through its Asset Liability Committee (“ALCO”), and the Board review the Company’s liquidity position on a monthly basis. At December 31, 2020, both the ALCO and the Board of Directors determined that the Company’s liquidity position was adequate.
 
98

Table of Contents
Table 12 - Funding Uses and Sources details the main components of cash flows for 2020 and 2019.
TABLE 12 - FUNDING USES AND SOURCES
(in thousands)
 
     2020     2019  
     Average
Balance
     Increase/
(decrease)
Amount
    Percent     Average
Balance
     Increase/
(decrease)
Amount
    Percent  
FUNDING USES
              
Loans, net of unearned income
   $ 622,309      $ 61,421       10.95   $ 560,888      $ 142,752       34.14
Taxable securities
     498,016        109,526       28.19     388,490        12,098       3.21
Tax-exempt securities
     69,591        (9,252     -11.73     78,843        (29,063     -26.93
Federal funds sold and other
     45,305        (5,361     -10.58     50,666        41,413       447.56


TOTAL USES
   $ 1,235,221      $ 156,334       14.49   $ 1,078,887      $ 167,200       17.95


FUNDING SOURCES
              
Noninterest-bearing deposits
   $ 236,881      $ 44,209       22.95   $ 192,672      $ 27,990       17.00
Interest-bearing demand and
              
savings deposits
     543,714        82,193       17.81     461,521        57,048       14.10
Time deposits
     231,832        (42,765     -15.57     274,597        82,761       43.14
Short-term borrowings
     10,318        8,835       595.75     1,483        (19,996     -93.10
Commercial repo
     181,699        57,355       46.13     124,344        29,036       30.47
Long-term debt
     —          —         —         —          —         —    


TOTAL SOURCES
   $ 1,204,444      $ 149,827       14.21   $ 1,054,617      $ 176,839       19.36


The Company’s liquidity depends substantially on the ability of the Bank to transfer funds to the Company in the form of dividends. The information under the heading “Market Price and Dividend Information” in this Annual Report discusses federal and state statutory and regulatory restrictions on the ability of the Bank to transfer funds to the Company in the form of dividends.
CAPITAL RESOURCES
The Company and Bank are subject to various regulatory capital guidelines as required by federal and state banking agencies. These guidelines define the various components of core capital and assign risk weights to various categories of assets.
The Federal Deposit Insurance Corporation Improvement Act of 1991, as amended (“FDICIA”), required federal regulatory agencies to define capital tiers. These tiers are: well capitalized, adequately capitalized, undercapitalized, significantly undercapitalized, and critically undercapitalized. Under FDICIA, a “well-capitalized” institution must achieve a Tier 1 risk-based capital ratio of at least 6.00%, a total capital ratio of at least 10.00%, a leverage ratio of at least 5.00% and not be under a capital directive order. These ratios generally measure the percentage of a bank’s capital to all or certain categories of assets. Failure to meet capital requirements can initiate regulatory action that could have a direct material effect on the Company’s financial statements. If a bank is only adequately capitalized, regulatory approval is required before the bank may accept brokered deposits. If undercapitalized, capital distributions, asset growth, and expansion are limited, and the institution is required to submit a capital restoration plan.

99

Table of Contents
During 2020 as compared to 2019, total risk-based capital decreased due to assets outpacing earnings.
Management believes the Company and the Bank meet all the capital requirements to be well-capitalized under the guidelines established by FDICIA as of December 31, 2020, as noted below in Table 13 - Capital Ratios. To be classified as well-capitalized, the Company and Bank must maintain the ratios described above.
TABLE 13 – CAPITAL RATIOS
(in thousands, except percentage amounts)
 
     At December 31,  
     2020     2019     2018  
Tier 1 capital
      
Shareholders’ equity
   $ 119,548     $ 112,800     $ 83,866  
Less: Intangibles
     (13,502     (13,856     (3,150
Less: DTA related to NOLs
     (267     (1,000     —    
Add/less: Unrealized loss/(gain) on securities
     (4,139     789       14,975  


TOTAL TIER 1 CAPITAL
   $ 101,640     $ 98,733     $ 95,691  


Total capital
      
Tier 1 capital
   $ 101,640     $ 98,733     $ 95,691  
Allowable allowance for loan losses
     4,735       3,755       3,372  


TOTAL CAPITAL
   $ 106,375     $ 102,488     $ 99,063  


RISK WEIGHTED ASSETS
   $ 809,754     $ 712,154     $ 549,828  


AVERAGE ASSETS (FOURTH QUARTER)
   $ 1,406,885     $ 1,185,397     $ 963,820  


TIER 1 LEVERAGE RATIO
     7.22     8.33     9.93


COMMON EQUITY TIER 1 CAPITAL RATIO
     7.22     8.33     9.93


TIER 1 RISK-BASED CAPITAL RATIO
     12.55     13.86     17.40


TOTAL RISK-BASED CAPITAL RATIO
     13.14     14.39     18.02


Management’s strategy with respect to capital levels is to maintain a sufficient amount of capital to allow the Company to respond to growth and acquisition opportunities in the Bank’s service area. Over the past three years, the Company has been able to increase the amount of its capital, through retention of earnings, while still maintaining the dividend payout ratio to approximately 70% of earnings per share. The Company does not currently have any commitments for capital expenditures that would require the Company to raise additional capital by means other than retained earnings. The Company does not plan to change this strategy unless needed to support future acquisition activity.
 
100

Table of Contents
OFF-BALANCE
SHEET ARRANGEMENTS
In the ordinary course of business, the Company makes various commitments and incurs certain contingent liabilities to fulfill the financing needs of its customers. These commitments and contingent liabilities include commitments to extend credit and issue standby letters of credit. These
off-balance
sheet arrangements are further detailed in Note 16,
“Off-Balance
Sheet Financial Instruments, Commitments and Contingencies and Concentrations of Risks,” in the notes to the Company’s Consolidated Financial Statements included in this Annual Report.
CONTRACTUAL OBLIGATIONS
Long-term debt obligations represent borrowings from the FHLB that have an original maturity in excess of one year. The only other significant obligations, other than obligations under deposit contracts and short-term borrowing, were for operating leases for banking facilities. Operating leases are primarily for the lease of branches, ATM machines and other necessary equipment. The equipment leases are for various terms.
 
101

Table of Contents
QUANTITATIVE AND QUALITATIVE DISCLOSURES ABOUT MARKET RISK
OVERVIEW
The definition of market risk is the possibility of loss that could result from adverse changes in market prices or interest rates. The Company has taken steps to assess the amount of risk that is associated with its asset and liability structure. The Company measures the potential risk on a regular basis and makes changes to its strategies to manage these risks. The Board of Directors reviews important policy limits each month, with a more detailed risk analysis completed on a quarterly basis. These measurement tools are important in allowing the Company to manage market risk and to plan effective strategies to respond to any adverse changes in risk. The Company does not participate in some of the financial instruments that are inherently subject to substantial market risk. All of the financial instruments entered into by the Company are for purposes other than trading. All information presented in this report are denominated in U.S. dollars.
MARKET/INTEREST RATE RISK MANAGEMENT
Interest rate risk is the primary market risk that management must address. Interest rate risk is the exposure of Company earnings and capital to changes in interest rates. All financial institutions assume interest rate risk as an integral part of normal operations.
The primary purpose in managing interest rate risk is to effectively invest capital and preserve the value created by the core banking business of the Company. The Company utilizes an investment portfolio to manage the interest rate risk naturally created through its business activities. The process of managing interest rate risk generally involves both reducing the exposure of the Company’s net interest margin to swings in interest rates and concurrently ensuring that there is sufficient capital and liquidity to support balance sheet growth. The Company uses a quarterly interest rate risk report to evaluate its exposure to interest rate risk, project earnings and manage the composition of the balance sheet and its growth.
In addition to the quarterly interest rate risk report, the Company employs a number of tools to measure interest rate risk. One tool is static gap analysis, which matches assets with specified maturities to liabilities with corresponding maturities.
Although management believes that this does not provide a complete picture of the Company’s exposure to interest rate risk, it does highlight significant short-term repricing volume mismatches. The following table presents the Company’s rate sensitivity static gap analysis at December 31, 2020 ($ in thousands):
 
     Interest Sensitive Within  
     90 days      One year  
Total rate sensitive assets
   $ 206,190      $ 305,309  
Total rate sensitive liabilities
     258,994        140,107  


Net gap
   $ (52,804    $ 165,202  


102

Table of Contents
The analysis shows a negative gap position over the next three-month period, which indicates that the Company would benefit somewhat from a decrease in market interest rates in the very short term. Although rate increases would be detrimental to the interest rate risk of the Company, management believes there is adequate flexibility to alter the overall rate sensitivity structure as necessary to minimize exposure to these changes.
Management believes that static gap analysis does not fully capture the impact of interest rate movements on interest sensitive assets and liabilities. Thus, the Company also measures interest rate risk by analyzing interest rate sensitivity and the rate sensitivity gap. Table 14 - Interest Rate Sensitivity provides additional information about the financial instruments that are sensitive to changes in interest rates. This tabular disclosure is limited by its failure to depict accurately the effect on assumptions of significant changes in the economy or interest rates or changes in management’s expectations or intentions relating to the Company’s financial statements. The information in the interest rate sensitivity table below reflects contractual interest rate pricing dates and contractual maturity dates. For indeterminate maturity deposit products (money market, NOW and savings accounts), the tables present principal cash flows in the shortest term. Although these deposits may not reprice within this time frame, the depositors of such funds have the ability to reprice. Weighted average floating rates are based on the rate for that product as of December 31, 2020 and December 31, 2019.
 
103

Table of Contents
TABLE 14 - INTEREST RATE SENSITIVITY
AS OF DECEMBER 31, 2020
(in thousands)
 
     2021     2022     2023     2024     2025     Thereafter     Carrying
Value
    Fair Value  
Loans
                
Fixed Rate
   $ 91,241     $ 85,106     $ 88,745     $ 100,155     $ 122,545     $ 75,479     $ 563,271     $ 557,032  
Average Int Rate
     4.74     3.48     4.63     5.14     4.01     4.00     4.35  
Floating Rate
   $ 12,223     $ 7,700     $ 4,469     $ 13,150     $ 2,027     $ 49,417     $ 88,986     $ 88,986  
Average Int Rate
     3.52     4.63     3.88     4.57     4.49     4.62     4.42  
Investment securities
                
Fixed Rate
   $ 0     $ 5,375     $ 228     $ 240     $ 2,501     $ 664,882     $ 673,226     $ 678,749  
Average Int Rate
     0.00     2.41     1.80     1.99     3.89     0.56     2.30  
Floating Rate
                
Average Int Rate
                
Other earning assets
                
Fixed Rate
                
Average Int Rate
                
Floating Rate
   $ 25,468               $ 25,468     $ 25,468  
Average Int Rate
     0.98               0.98  
Interest-bearing deposits
 
             
Fixed Rate
   $ 736,611     $ 48,684     $ 17,603     $ 13,069     $ 3,189       $ 819,156     $ 820,487  
Average Int Rate
     0.67     1.67     1.42     2.04     0.68       1.16  
Floating Rate
                
Average Int Rate
                
Other int-bearing liabilities
                
Fixed Rate
                
Average Int Rate
                
Floating Rate
   $ 221,272               $ 221,272     $ 221,272  
Average Int Rate
     0.39               0.39  
 
104

Table of Contents
AS OF DECEMBER 31, 2019
(in thousands)
 
     2020     2021     2022     2023     2024     Thereafter     Carrying
Value
    Fair Value  
Loans
                
Fixed Rate
   $ 90,909     $ 85,660     $ 48,416     $ 110,943     $ 83,211     $ 60,129     $ 479,268     $ 475,595  
Average Int Rate
     4.95     4.77     4.87     5.00     5.25     4.33     4.67  
Floating Rate
   $ 25,758     $ 14,582     $ 3,049     $ 3,274     $ 10,345     $ 37,036     $ 94,044     $ 94,044  
Average Int Rate
     5.30     3.99     4.97     4.90     4.91     5.47     5.68  
Investment securities
                
Fixed Rate
   $ 345     $ 10,000     $ 53,481     $ 25,566     $ 5,722     $ 370,320     $ 465,434     $ 464,383  
Average Int Rate
     3.13     1.75     1.92     1.80     2.08     2.41     2.42  
Floating Rate
                
Average Int Rate
                
Other earning assets
                
Fixed Rate
                
Average Int Rate
                
Floating Rate
   $ 60,157               $ 60,157     $ 60,157  
Average Int Rate
     1.58               1.58  
Interest-bearing deposits
 
             
Fixed Rate
   $ 591,785     $ 59,641     $ 27,709     $ 15,912     $ 15,279       $ 710,326     $ 710,195  
Average Int Rate
     0.93     1.99     2.61     2.37     2.74       0.78  
Floating Rate
                
Average Int Rate
                
Other int-bearing liabilities
                
Fixed Rate
                
Average Int Rate
                
Floating Rate
   $ 170,410               $ 170,410     $ 170,410  
Average Int Rate
     1.10               1.10  
Rate sensitivity gap analysis is another tool management uses to measure interest rate risk. The rate sensitivity gap is the difference between the repricing of interest-earning assets and the repricing of interest-bearing liabilities within certain defined time frames. The Company’s interest rate sensitivity position is influenced by the distribution of interest-earning assets and interest-bearing liabilities among the maturity categories. Table 15 - Rate Sensitivity Gap reflects interest-earning assets and interest-bearing liabilities by maturity distribution as of December 31, 2020. Product lines repricing in time periods predetermined by contractual agreements are included in the respective maturity categories.
 
105

Table of Contents
TABLE 15
-
RATE SENSITIVITY GAP AT DECEMBER 31, 2020
(in thousands, except percentage amounts)
 
     1 - 90 Days     91 - 365
Days
    1 - 5 Years     Over 5 years     Total  
INTEREST EARNING ASSETS
          
Loans
   $ 84,899     $ 117,177     $ 423,500     $ 16,372     $ 641,948  
Investment securities
     95,823       188,132       233,317       157,552       674,824  
Interest Bearing Due From Bank Accounts
     25,468       —         —         —         25,468  
Federal funds sold
     —         —         —         —         —    


TOTAL INTEREST BEARING ASSETS
   $ 206,190     $ 305,309     $ 656,817     $ 173,924     $ 1,342,240  


INTEREST BEARING LIABILITIES
          
Interest bearing demand deposits
   $ 11,387     $ 34,161     $ 182,189     $ 45,547     $ 273,284  
Savings and Money Market deposits
     158,263       —         224,953       204,498       587,714  
Time deposits
     44,717       105,946       82,917       —         233,580  
Short term borrowings
     44,627       —         117,764       58,882       221,273  
Long term borrowings
     —         —         —         —         —    


TOTAL INTEREST BEARING LIABILITIES
   $ 258,994     $ 140,107     $ 607,823     $ 308,927     $ 1,315,851  


Rate sensitive gap
   $ (52,804   $ 165,202     $ 48,994     $ (135,003   $ 26,389  
Rate sensitive cumulative gap
     (52,804     112,398       161,392       26,389       —    
Cumulative gap as a percentage of total earning assets
     -3.93     8.37     12.02     1.97  
The purpose of the above table is to measure interest rate risk utilizing the repricing intervals of interest sensitive assets and liabilities. Rate sensitive gaps constantly change as funds are acquired and invested and as rates change. Rising interest rates are likely to increase net interest income in a positive gap position while falling interest rates are beneficial in a negative gap position.
The above rate sensitivity analysis places interest-bearing demand and savings deposits in the shortest maturity category because these liabilities do not have defined maturities. If these deposits were placed in a maturity distribution representative of the Company’s deposit base history, the shortfall of the negative rate sensitive gap position would be reduced in the
1-to-90
day time frame. It is the goal of the Company to achieve a cumulative gap ratio of plus or minus 15% for all periods under one year, with maximum acceptable limits of plus or minus 20%. Quarterly, management discusses with the ALCO and the board of directors the gap position in relation to the established goals, highlights any reasons for variances from the goals and suggests changes to better align the Company’s position with the established goals. When reviewing the Company’s position, impacting factors and suggested changes, the board of directors also considers other corporate objectives, including increasing core deposits and increasing profitability, before implementing changes intended to align the Company’s position with the established goals. While the board of directors continues to closely monitor the Company’s negative gap position, at this time, management does not anticipate making any significant changes to the Company’s operating practices in order to mitigate the negative gap position.
 
106

Table of Contents
The rate sensitivity gap table illustrates that the Company had a large negative cumulative gap position for the 1 to
90-day
period as of December 31, 2020. This negative gap position was mainly due to: (1) a large amount of investment securities that have call dates within that period; (2) a significant amount of
non-maturity
deposits classified within that period; and (3) approximately 19.14% of certificates of deposit maturing during that period.
The interest rate sensitivity and rate sensitivity gap tables, taken together, indicate that the Company to be in an asset sensitive position when evaluating the maturities of interest-bearing items. Thus, an increase in the interest rate environment would enhance earnings, while a decrease in interest rates would have the opposite effect on the Company’s earnings. Due to the pandemic the Company does not believe interest rates will go any lower than the rates currently are, therefore; the Company has attempted to mitigate the impact of its interest rate position by structuring deposit rates to entice customers to lengthen the maturities of their time deposits.
The
COVID-19
pandemic has significantly affected the financial markets and has resulted in a number of actions by the Federal Reserve Bank (“FRB”). Market interest rates have declined significantly. On March 3, 2020, the
ten-year
Treasury yield fell below 1.00% for the first time, and the FRB reduced the target federal funds rate by 50 basis points to a range of 1.00% to 1.25%. On March 15, 2020, the FRB further reduced the target federal funds rate by 100 basis points to a range of 0.00% to 0.25% and announced a $700 billion quantitative easing program in response to the expected economic downturn caused by the
COVID-19
pandemic. The FRB reduced the interest that it pays on excess reserves from 1.60% to 1.10% on March 3, 2020, and then to 0.10% on March 15, 2020. The movement in the short term interest rates impact the Company’s decisions in regards to pricing the Company’s products and services. The short term interest rates have had an impact on the Company’s earnings as we positioned our balance sheet for rising rates. Therefore, this caused an increase in our deposit costs without the corresponding increase in earning asset yields. The Company is focused on positioning the balance sheet to remain more neutral to interest rates during these uncertain times. In 2020 and 2019, the Company was asset sensitive with a focus on getting closer to neutral through investing the Company’s excess funds into longer-term loans and investment securities. The Company’s net interest margin in 2020 was 2.72% and in 2019 was 2.77% due to the aforementioned facts.
 
107

Table of Contents
Market Price and Dividend Information
MARKET PRICE INFORMATION
The Company’s common stock trades on the NASDAQ Global Market (“NASDAQ”) under the symbol “CIZN”. On March 1, 2021, the common stock’s closing price on NASDAQ was $20.00.
On March 1, 2021, shares of the Company’s common stock were held of record by approximately 486 shareholders.
DIVIDENDS
Dividends totaled $0.96 per share for 2020 and 2019.
If funds are available, the Board of Directors of the Company typically declares dividends on a quarterly basis in March, June, September and December with payment following at the end of the month in which the dividend was declared. Funds for the payment by the Company of cash dividends are obtained from dividends, loans or advances received by the Company from the Bank. Accordingly, the declaration and payment of dividends by the Company depend upon the Bank’s earnings and financial condition, general economic conditions, compliance with regulatory requirements, and other factors. The Bank must also receive the approval of the Mississippi Department of Banking and Consumer Finance prior to the payment of a dividend.
 
108

Table of Contents
STOCK PERFORMANCE GRAPH
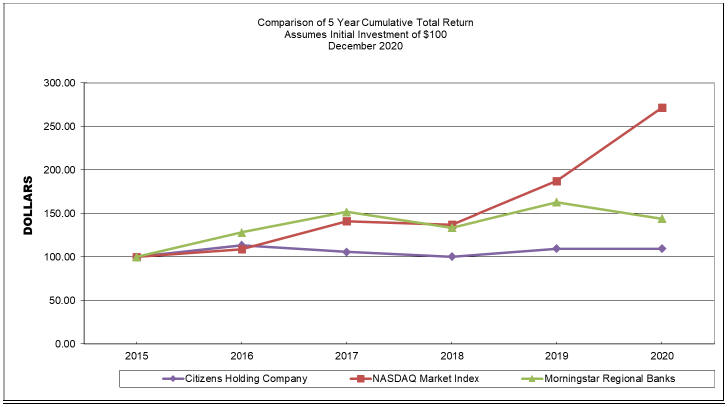
The following performance graph compares the performance of the Company’s common stock to the NASDAQ Composite Index and the Morningstar Regional Bank index (a peer group of other regional bank holding companies) for the Company’s reporting period. The graph assumes that the value of the investment in the Company’s common stock and each index was $100 at December 31, 2015 and that all dividends were reinvested.
Performance Graph
December 31, 2015 - December 31, 2020
 
 
     2015      2016      2017      2018      2019      2020  
Citizens Holding Company
     100.00        113.57        105.68        100.38        109.57        109.57  
NASDAQ Market Index
     100.00        108.87        141.13        137.12        187.44        271.64  
Morningstar Regional Banks
     100.00        128.37        151.66        133.74        162.97        144.00  
There can be no assurance that the Company’s common stock performance will continue in the future with the same or similar trends depicted in the performance graph above. The Company does not and will not make or endorse any predictions as to future stock performance.
 
109

Table of Contents
THE CITIZENS BANK OFFICERS
 
Greg McKee
President and CEO
 
Phillip R. Branch
Senior Vice President, CFO
 
Mark Taylor
Senior Vice President, COO, Trust Officer
 
Ray Stone
Senior Vice President, Chief Credit Officer
 
Ledale Reynolds
Senior Vice President and CIO
 
Liz Owen
Senior Vice President, Director of
Human Resources, Chief Risk Officer
 
Erdis Chaney
Vice President, Senior Deposit Officer
 
Jackie Hester
Vice President, Marketing Officer
 
Darrel Bates
Vice President, Collections Manager
 
Jean T. Fulton
Vice President, Internal Auditor
 
Brad Copeland
Vice President, Branch Manager
 
Mark Majure
Vice President, Loan Review Officer
 
Bob Posey
Vice President
 
Mike Chandler
Vice President
 
Stacy Arnold
Vice President, Compliance Officer
 
Tabbetha Calvert
Vice President, BSA Officer
 
Joshua Sullivan
Vice President, Senior Credit Analyst
 
Ashley Peebles
Vice President, Director of Deposit Services
 
Sommer Vick
Assistant Vice President, Assistant Trust Officer
 
Mitch Peden
Assistant Vice President, Information Services Manager
  
Pam Garrett
Network Services Manager
 
Pat Stokes
Assistant Vice President, Operations Officer
 
Scott Lewis
Assistant Vice President, Information Security Officer
 
Sam Mars
Assistant Vice President, Loan Officer
 
Shon Kirkland
Assistant Vice President, Security Officer/
Facilities Manager
 
Charles Wilkerson
Assistant Vice President, Loan Operations Officer
 
Greg Jackson
Accounting Officer
 
Reaghan Jenkins
Accounting Officer
 
Deborah Ladd
Item Processing Officer
 
Sandra Curtis
Assistant Cashier, Teller Administrator
 
Temika Triplett
Assistant Cashier, Electronic Services Officer
 
Grant Comans
Assistance Vice President, Branch Manager
 
Jamie Shotts
Vice President, Appraisal Review Officer
 
Carthage Branch
 
Billy Cook
Vice President
 
Tonya Dorman
Deposit Operations Officer
 
Sebastopol Branch
 
Connie Comans
Branch President
 
Union and Decatur Branches
 
Susan Brown
Deposit Operations Officer
 
Kosciusko Branch
 
Teresa Patterson
Vice President, Branch Manager
 
110

Table of Contents
 
Scooba and DeKalb Branches
 
Reggie Moore
Assistant Vice President, Branch Manager
 
Jan White
Branch Operations Officer
 
Forest Branch
 
Lawanda McCaughn
Deposit Operation Officer
 
Louisville Branch
 
Bruce Lee
Market President – Winston County
 
Lynn Graham
Assistant Vice President, Branch Operations Officer
 
Starkville Branch
 
Rhonda Edmonson
Assistant Vice President, Branch Manager
 
Collinsville Branch
 
Mike Shelby
Vice President, Branch Manager
 
Meridian Eastgate and Broadmoor Branches
 
Jay Hines
Vice President, Regional Commercial Lender
 
Tammara Hopson,
Deposit Operations Officer
 
Hattiesburg Branch
 
Chad Hill
Vice President, Branch Manager
 
Tammy McAlpin
Commercial Loan Portfolio Manager
 
Flowood Branch
 
George Gammon III
Metro Jackson President
 
Cory Bass
Assistant Vice President, Accounting Officer
 
Ridgeland Branch
 
Daniel Webb
Assistance Vice President
  
 
Biloxi Cedar Lake and Lemoyne Branches
 
Travis Moore
Vice President, Regional Commercial Lender
 
Brandon Sherwood
Regional Commercial Lender
 
Tammy Warren
Assistant Vice President, Mortgage Loan Officer
 
Katie Hancock
Vice President, Branch Manager
 
Patrick Ricci
Vice President, Commercial Lender
 
Mandy Dawson
Treasury Management Officer
 
Mortgage Loan Department
 
Charlene Deweese
Assistant Vice President, Mortgage Loan Officer
 
Oxford Branch
 
Grant Boone
Oxford City President
 
Marion Boyd
Vice President, Regional Commercial Lender
 
Meg Smith
Branch Operations Officer
 
Pascagoula Branch
 
Gregory E. Cronin
Gulf Coast President
 
Ford Kinsey
Vice President, Senior Credit Officer
 
Pam Lindsey
Vice President, Senior Bank Officer
 
Paulette Roberts
Vice President, Senior Operations Officer
 
Amber Thomas
Vice President, Commercial Lender
 
Julius Bosco III
Loan Compliance Officer
 
Pam Pierce
Human Resources Administrator
 
Theresa Jenkins
Community Retail Officer
 
111

Table of Contents
 
Ocean Springs Branch
 
Melissa Ceasar
Community Retail Officer
 
Sharon Wetzel
Vice President, Information Technology Officer
 
Reagan Bridley
Vice President, Commercial Lender
 
Thomas Graham
Vice President, Mortgage Loan Officer
  
 
112

Table of Contents
BOARD OF DIRECTORS
 
Don Fulton
Retired
W. G. Yates and Sons Construction Co.
 
Donald L. Kilgore
Special Assistant Attorney General
State of Mississippi
 
David A. King
Proprietor
Philadelphia Motor Company
 
Herbert A. King
Civil Engineer
King Engineering Associates, Inc.
 
Adam Mars
Business Manager
Mars, Mars & Mars
 
Gregory E. Cronin
Gulf Coast President
Citizens Holding Company and The Citizens Bank
 
  
Craig Dungan, MD
Physician
Meridian Gastroenterology PLLC
 
Greg L. McKee
President & Chief Executive Officer
Citizens Holding Company and The Citizens Bank
 
David P. Webb
Attorney
Baker, Donelson, Bearman, Caldwell & Berkowitz, PC
 
Jane Crosswhite
Executive Vice President
Williams Brothers Inc.
 
Terrell E. Winstead
Executive Vice President
Molpus Woodlands Group
CITIZENS HOLDING COMPANY OFFICERS
 
Herbert A. King
Chairman
 
Greg L. McKee
President and Chief Executive Officer
 
Mark Taylor
Secretary
 
Phillip R. Branch
Treasurer and Chief Financial Officer
 
Gregory E. Cronin
Gulf Coast President
  
 
113

Table of Contents
BANKING LOCATIONS
 
Philadelphia Main Office
521 Main Street
Philadelphia, MS 39350
601.656.4692
 
Westside Branch
912 West Beacon Street
Philadelphia, MS 39350
601.656.4692
 
Northside Branch
802 Pecan Avenue
Philadelphia, MS 39350
601.656.4692
 
Eastside Branch
599 East Main Street
Philadelphia, MS 39350
601.656.4692
 
Union Branch
502 Bank Street
Union, MS 39365
601.774.9231
 
Starkville Branch
201 Highway 12 West
Starkville, MS 39759
662.323.1420
 
Carthage Main Office
301 West Main Street
Carthage, MS 39051
601.257.4525
 
Biloxi Cedar Lakes
1830 Popps Ferry Road
Biloxi, MS 39532
228.594.6913
 
Oxford Branch
902 Sisk Avenue, Ste E
Oxford, MS 38655
  
Collinsville Branch
9065 Collinsville Road
Collinsville, MS 39325
601.626.7608
 
Flowood Branch
2845 Lakeland Drive 247
Flowood, MS 39232
601.992.7688
 
Sebastopol Branch
24 Pine Street
Sebastopol, MS 39359
601.625.7447
 
DeKalb Branch
176 Main Avenue
DeKalb, MS 39328
601.743.2115
 
Kosciusko Branch
775 North Jackson Street
Kosciusko, MS 39090
662.289.4356
 
Scooba Branch
27597 Highway 16 East
Scooba, MS 39358
662.476.8431
 
Meridian Eastgate
1825 Hwy 39 North
Meridian, MS 39301
601.693.8367
 
Hattiesburg Branch
6222 Highway 98
Hattiesburg, MS 39402
601.264.4425
 
Gulfport Branch
12008 Hwy 49
Gulfport, MS 39503
  
Decatur Branch
15330 Hwy 15 South
Decatur, MS 39327
601.635.2321
 
Forest Branch
Woodland Drive North
Forest, MS 39074
601.469.3424
 
Louisville-Main Branch
100 East Main Street
Louisville, MS 39339
662.773.6261
 
Noxapater Branch
45 East Main Street
Noxapater, MS 39346
662.724.4261
 
Louisville-Industrial Branch
803 South Church Street
Louisville, MS 39339
662.773.6261
 
Biloxi Lemoyne Boulevard
15309 Lemoyne Boulevard
Biloxi, MS 39532
228.207.2343
 
Meridian Broadmoor
5015 Highway 493
Meridian. MS 39305
601.581.1541
 
Ridgeland Branch
320 Highway 51 North
Ridgeland, MS 39157
601.519.4020
 
Pascagoula Branch
1519 Jackson Ave
Pascagoula, MS 39567
 
114

Table of Contents
BANKING LOCATIONS
- Continued
 
 
Ocean Springs Branch
2702 Bienville Blvd
Ocean Springs, MS 39564
 
Internet and Mobile Banking
http.//www.thecitizensbankphila.com
  
 
Phone Teller
1.800.397.0344
  
 
115

Table of Contents
FINANCIAL INFORMATION
CORPORATE HEADQUARTERS
521 Main Street
P.O. Box 209
Philadelphia, MS 39350
601.656.4692
ANNUAL SHAREHOLDER MEETING
The Annual Shareholder meeting of the Citizens Holding Company, Inc. will be held Tuesday, April 27, 2021, at 4:30 P.M. in the lobby of the main office of The Citizens Bank, 521 Main Street, Philadelphia, Mississippi.
STOCK REGISTRAR AND TRANSFER AGENT
American Stock Transfer & Trust Company
59 Maiden Lane
New York, NY 10038
FORM
10-K
The Company’s most recent Annual Report on Form
10-K,
filed with the Securities and Exchange Commission, is available without charge to shareholders upon request to the Treasurer of the Citizens Holding Company.
FINANCIAL CONTACT
Phillip R. Branch
Treasurer and Chief Financial Officer
P.O. 209
Philadelphia, Mississippi 39350
Additional information can be obtained from the Company’s website at www.citizensholdingcompany.com.
 
116