EXHIBIT 99.1
THOMSON REUTERS CORPORATION
MANAGEMENT’S DISCUSSION AND ANALYSIS
This management’s discussion and analysis is designed to provide you with a narrative explanation through the eyes of our management of our financial condition and results of operations. We recommend that you read this in conjunction with our consolidated interim financial statements for the three months ended March 31, 2014, our 2013 annual consolidated financial statements and our 2013 annual management’s discussion and analysis. This management’s discussion and analysis is dated as of April 29, 2014. This management's discussion and analysis contains forward-looking statements, which are subject to risks and uncertainties that could cause our actual results to differ materially from the forward-looking statements. Forward-looking statements include, but are not limited to, our 2014 outlook and our expectations related to general economic conditions and market trends and their anticipated effects on our business segments. For additional information related to forward-looking statements and material risks associated with them, please see the “Cautionary Note Concerning Factors That May Affect Future Results” section of this management’s discussion and analysis.
Contents - We have organized our management’s discussion and analysis in the following key sections:
|
|
Page
|
|
| · |
Overview – a brief discussion of our business
|
1
|
| · |
Results of Operations – a comparison of our current and prior period results
|
3
|
| · |
Liquidity and Capital Resources – a discussion of our cash flow and debt
|
12
|
| · |
Outlook – our current financial outlook for 2014
|
17
|
| · |
Related Party Transactions – a discussion of transactions with our principal and controlling shareholder, The Woodbridge Company Limited (Woodbridge), and others
|
18
|
| · |
Subsequent Events – a discussion of material events occurring after March 31, 2014 and through the date of this management’s discussion and analysis
|
19
|
| · |
Changes in Accounting Policies - a discussion of changes in our accounting policies and recent accounting pronouncements
|
19
|
| · |
Critical Accounting Estimates and Judgments – a discussion of critical estimates and judgments made by our management in applying accounting policies
|
19
|
| · |
Additional Information – other required disclosures
|
19
|
| · |
Appendices – supplemental information and discussion
|
21
|
We prepare our consolidated financial statements in accordance with International Financial Reporting Standards (IFRS), as issued by the International Accounting Standards Board (IASB). This management’s discussion and analysis also includes certain non-IFRS financial measures which we use as supplemental indicators of our operating performance and financial position and for internal planning purposes.
References in this discussion to “$” and “US$” are to U.S. dollars and references to “C$” are to Canadian dollars. In addition, “bp” means “basis points” and “na” and “n/m” refer to “not applicable” and “not meaningful”, respectively. Unless otherwise indicated or the context otherwise requires, references in this discussion to “we,” “our,” “us” and “Thomson Reuters” are to Thomson Reuters Corporation and our subsidiaries.
OVERVIEW
Our company - We are the leading source of intelligent information for businesses and professionals. We combine industry expertise with innovative technology to deliver critical information to leading decision-makers. We deliver this must-have insight to the financial and risk, legal, tax and accounting, intellectual property and science and media markets, powered by the world’s most trusted news organization.
We derive the majority of our revenues from selling electronic content and services to professionals, primarily on a subscription basis. Over the years, this has proven to be capital efficient and cash flow generative, and it has enabled us to maintain leading and scalable positions in our chosen markets. Within each of the market segments that we serve, we bring in-depth understanding of our customers’ needs, flexible technology platforms, proprietary content and scale. We believe our ability to embed our solutions into customers’ workflows is a significant competitive advantage as it leads to strong customer retention.
Our company is organized as a group of strategic business units: Financial & Risk, Legal, Tax & Accounting and Intellectual Property & Science, supported by a corporate center. We believe this structure allows us to best meet the complex demands of our customers, capture growth opportunities and achieve efficiencies. We also operate a Global Growth & Operations (GGO) organization which works across our business units to identify opportunities in faster growing geographic areas. We do not report GGO as a separate business unit, but rather include its results within our strategic business units. Our Reuters News business is managed and reported within our corporate center.
1
|
KEY HIGHLIGHTS
|
||
|
|
|
|
|
First quarter performance:
Our first quarter performance was consistent with our full-year expectations. Revenues from ongoing businesses increased 1% before currency(1), reflecting 5% combined growth from our Legal, Tax & Accounting and Intellectual Property & Science businesses, which was partially offset by a 1% decline in our Financial & Risk business. The increase in revenues from ongoing businesses before currency included a 1% contribution from acquisitions. Revenues from existing businesses were essentially unchanged.
|
||
|
|
|
|
|
|
·
|
Financial & Risk’s revenues decreased 1% reflecting the lag effect of negative net sales over the past 12 months on our revenue. A 2% contribution from acquisitions was more than offset by a 3% decline in existing businesses. Although net sales were negative for the first quarter of 2014, net sales improved compared to the prior-year period and the fourth quarter of 2013. The business continued to make progress in its operational priorities, which included the launch of Eikon 4.0 and the implementation of a unified technology platform.
|
|
|
|
|
|
|
·
|
Legal’s revenues rose 2% driven by the contribution from acquisitions. Revenues from existing businesses were essentially unchanged as a 4% increase in our growth businesses was offset by a decline in U.S. print and U.S. online legal information.
|
|
|
|
|
|
|
·
|
Tax & Accounting revenues increased 13%, of which 10% was from existing businesses driven by the continued strength of our offerings and healthy conditions prevailing in the global tax and accounting markets.
|
|
|
|
|
|
|
·
|
Intellectual Property & Science revenues increased 4% driven by 3% growth from existing businesses, which reflected growth in both recurring and transaction revenues.
|
|
|
|
|
|
|
·
|
Our Global Growth & Operations (GGO) unit, which works across our businesses to combine our global capabilities, increased revenues 7%, of which 3% was from existing businesses. On an annualized basis, GGO comprises about $1.2 billion of our company’s total revenues.
|
|
|
|
|
|
Adjusted EBITDA(1) increased 8% and the related margin increased 180bp to 26.2% reflecting lower severance charges associated with our simplification initiatives. Excluding charges from both periods, our consolidated adjusted EBITDA margin declined 50bp to 26.5% in the first quarter of 2014 compared to the prior-year period. The impact of lower revenues on our adjusted EBITDA margin was somewhat mitigated by benefits from our earlier simplification initiatives, but as expected, these benefits were not enough to fully mitigate the impact of the 3% decline in revenues from existing businesses within our Financial & Risk segment in the quarter. Underlying operating profit(1) increased 14%, and the related margin increased 200bp reflecting the same factors that impacted adjusted EBITDA as well as lower depreciation and amortization expense. Adjusted EPS(1) was $0.46 per share, which represented an $0.08 increase compared to the prior-year period, driven by higher underlying operating profit.
|
||
|
|
|
|
|
During 2014, we are focused on:
|
||
|
|
|
|
|
|
·
|
Transforming from a portfolio company to an enterprise model to realize more benefits from simplification and greater scale;
|
|
|
|
|
|
|
·
|
Shifting our growth focus towards organic initiatives (rather than acquisitions), with greater emphasis on innovation and investing organically in high growth opportunities; and
|
|
|
|
|
|
|
·
|
Delivering strong and consistent cash flow growth to reinvest in our growth businesses while returning capital to our shareholders both through dividends and increased share repurchases.
|
|
|
|
|
| 2014 Outlook:
We recently reaffirmed our 2014 full-year business outlook that we originally communicated in February. For 2014, we continue to expect revenues to be comparable to 2013(1), adjusted EBITDA margin(1) between 26.0% and 27.0%, underlying operating profit margin(1) between 17.0% and 18.0%, and free cash flow(1) between $1.3 billion and $1.5 billion.
Our 2014 outlook includes the impact of an estimated $120 million of previously announced charges expected to be incurred this year. The free cash flow outlook for 2014 reflects the estimated cash impact of the charges incurred in 2013 and expected to be incurred in 2014, as well as the impact of the loss of free cash flow from Other Businesses (approximately $375 million in the aggregate). Additional information is provided in the “Outlook” section of this management’s discussion and analysis.
|
||
|
(1)
|
Refer to Appendix A for additional information on non-IFRS financial measures.
|
|
2
SEASONALITY
Our revenues and operating profit on a consolidated basis do not tend to be significantly impacted by seasonality as we record a large portion of our revenues ratably over a contract term and our costs are generally incurred evenly throughout the year. However, our non-recurring revenues can cause changes in our performance from quarter to consecutive quarter. Additionally, the release of certain print-based offerings can be seasonal as can certain product releases for the regulatory markets, which tend to be concentrated at the end of the year. As a consequence, the results of certain of our segments can be impacted by seasonality to a greater extent than our consolidated revenues and operating profit.
USE OF NON-IFRS FINANCIAL MEASURES
In addition to our results reported in accordance with IFRS, we use certain non-IFRS financial measures as supplemental indicators of our operating performance and financial position and for internal planning purposes. These non-IFRS financial measures include:
| · | Revenues from ongoing businesses; |
| · | Revenues at constant currency (before currency or revenues excluding the effects of foreign currency); |
| · | Underlying operating profit and the related margin; |
| · | Adjusted EBITDA and the related margin; |
| · | Adjusted EBITDA less capital expenditures and the related margin; |
| · | Adjusted earnings and adjusted earnings per share; |
| · | Net debt; |
| · | Free cash flow; and |
| · | Free cash flow from ongoing businesses. |
We report non-IFRS financial measures as we believe their use provides more insight into and understanding of our performance. Refer to Appendix A of this management’s discussion and analysis for a description of our non-IFRS financial measures, including an explanation of why we believe they are useful measures of our performance, including our ability to generate cash flow. Refer to the sections of this management’s discussion and analysis entitled “Results of Operations”, “Liquidity and Capital Resources” and Appendix B for reconciliations of these non-IFRS financial measures to the most directly comparable IFRS financial measures.
RESULTS OF OPERATIONS
BASIS OF PRESENTATION
Within this management’s discussion and analysis, we discuss our results of operations on both an IFRS and non-IFRS basis. Both bases exclude discontinued operations and include the performance of acquired businesses from the date of purchase.
Consolidated results
We discuss our consolidated results from continuing operations on an IFRS basis, as reported in our consolidated income statement. Additionally, we discuss our consolidated results on a non-IFRS basis using the measures described within the “Use of Non-IFRS Financial Measures” section. Among other adjustments, our non-IFRS revenue and profitability measures as well as free cash flow from ongoing businesses exclude Other Businesses, which is an aggregation of businesses that have been or are expected to be exited through sale or closure that did not qualify for discontinued operations classification.
Segment results
We discuss the results of our four reportable segments as presented in our consolidated interim financial statements for the three months ended March 31, 2014: Financial & Risk, Legal, Tax & Accounting and Intellectual Property & Science.
We also provide information on “Corporate & Other” and “Other Businesses”. These categories neither qualify as a component of another reportable segment nor as a separate reportable segment.
| · | Corporate & Other includes expenses for corporate functions, certain share-based compensation costs and the Reuters News business, which is comprised of the Reuters News Agency and consumer publishing. |
| · | Other Businesses is an aggregation of businesses that have been or are expected to be exited through sale or closure that did not qualify for discontinued operations classification. The results of Other Businesses are not comparable from period to period as the composition of businesses changes due to the timing of completed divestitures. |
See note 3 of our consolidated interim financial statements for the three months ended March 31, 2014 which includes a reconciliation of results from our reportable segments to consolidated results as reported in our consolidated income statement.
3
In analyzing our revenues from ongoing businesses, at both the consolidated and segment levels, we separately measure the effect of foreign currency changes. We separately measure both the revenue growth of existing businesses and the impact of acquired businesses on our revenue growth, on a constant currency basis.
CONSOLIDATED RESULTS
|
|
Three months ended
March 31,
|
|
||||||||||
|
(millions of U.S. dollars, except per share amounts)
|
2014
|
2013
|
Change
|
|||||||||
|
IFRS Financial Measures
|
||||||||||||
|
Revenues
|
3,130
|
3,175
|
(1
|
%)
|
||||||||
|
Operating profit
|
359
|
390
|
(8
|
%)
|
||||||||
|
Diluted earnings (loss) per share
|
$
|
0.34
|
$
|
(0.04
|
)
|
n/
|
m
|
|||||
|
|
||||||||||||
|
Non-IFRS Financial Measures
|
||||||||||||
|
Revenues from ongoing businesses
|
3,129
|
3,097
|
1
|
%
|
||||||||
|
Adjusted EBITDA
|
820
|
757
|
8
|
%
|
||||||||
|
Adjusted EBITDA margin
|
26.2
|
%
|
24.4
|
%
|
180
|
bp
|
||||||
|
Adjusted EBITDA less capital expenditures
|
572
|
407
|
41
|
%
|
||||||||
|
Adjusted EBITDA less capital expenditures margin
|
18.3
|
%
|
13.1
|
%
|
520
|
bp
|
||||||
|
Underlying operating profit
|
528
|
462
|
14
|
%
|
||||||||
|
Underlying operating profit margin
|
16.9
|
%
|
14.9
|
%
|
200
|
bp
|
||||||
|
Adjusted earnings per share
|
$
|
0.46
|
$
|
0.38
|
21
|
%
|
||||||
Foreign currency effects. With respect to the average foreign exchange rates that we use to report our results, the U.S. dollar strengthened against the Japanese yen, but weakened against the Euro and the British pound sterling in the first quarter of 2014 compared to the same period in 2013. Given our currency mix of revenues and expenses around the world, these fluctuations had no impact on our revenue growth, but positively impacted our adjusted EBITDA and underlying operating profit margins.
Revenues.
|
|
Three months ended
March 31,
|
Percentage change: | ||||||||||||||||||||||||||
|
(millions of U.S. dollars)
|
2014
|
2013
|
Existing
businesses
|
Acquired
businesses
|
Constant currency
|
Foreign
currency
|
Total
|
|||||||||||||||||||||
|
Revenues from ongoing businesses
|
3,129
|
3,097
|
-
|
1%
|
|
1%
|
|
-
|
1%
|
|
||||||||||||||||||
|
Other Businesses
|
1
|
78
|
n/m
|
|
n/m
|
|
n/m
|
|
n/m
|
|
n/m
|
|
||||||||||||||||
|
Revenues
|
3,130
|
3,175
|
n/m
|
|
n/m
|
|
n/m
|
|
n/m
|
|
(1%)
|
|
||||||||||||||||
Revenues from ongoing businesses increased on a constant currency basis as our Legal, Tax & Accounting and Intellectual Property & Science segments, which increased 5% on a combined basis, were partially offset by a 1% decline in our Financial & Risk segment. Acquisitions contributed to revenue growth across all segments. Revenues from existing businesses were essentially unchanged as 10% growth in our Tax & Accounting segment offset a 3% decline in Financial & Risk. The decline in Financial & Risk was primarily due to the lag effect of negative net sales over the prior 12 months on our current period revenue, reflecting our largely subscription-based model.
Our GGO organization is focused on supporting our businesses in the following geographic areas: Latin America, China, India, the Middle East, Africa, the Association of Southeast Asian Nations/North Asia, Russia and countries comprising the Commonwealth of Independent States and Turkey. Revenues from these geographic areas represented approximately 9% of our revenues in the first quarter of 2014 and grew 7% on a constant currency basis (3% from existing businesses).
4
Operating profit, underlying operating profit, adjusted EBITDA and adjusted EBITDA less capital expenditures.
|
|
Three months ended
March 31,
|
|
||||||||||
|
(millions of U.S. dollars)
|
2014
|
2013
|
Change
|
|||||||||
|
Operating profit
|
359
|
390
|
(8
|
%)
|
||||||||
|
Adjustments to remove:
|
||||||||||||
|
Amortization of other identifiable intangible assets
|
163
|
160
|
||||||||||
|
Fair value adjustments
|
2
|
(62
|
)
|
|||||||||
|
Other operating losses, net
|
3
|
6
|
||||||||||
|
Operating loss (profit) from Other Businesses
|
1
|
(32
|
)
|
|||||||||
|
Underlying operating profit
|
528
|
462
|
14
|
%
|
||||||||
|
Remove: depreciation and amortization of computer software (excluding Other Businesses)
|
292
|
295
|
||||||||||
|
Adjusted EBITDA(1)
|
820
|
757
|
8
|
%
|
||||||||
|
Remove: capital expenditures, less proceeds from disposals (excluding Other Businesses)
|
248
|
350
|
||||||||||
|
Adjusted EBITDA less capital expenditures(1)
|
572
|
407
|
41
|
%
|
||||||||
|
|
||||||||||||
|
Underlying operating profit margin
|
16.9
|
%
|
14.9
|
%
|
200
|
bp
|
||||||
|
Adjusted EBITDA margin
|
26.2
|
%
|
24.4
|
%
|
180
|
bp
|
||||||
|
Adjusted EBITDA less capital expenditures margin
|
18.3
|
%
|
13.1
|
%
|
520
|
bp
|
||||||
|
(1)
|
See Appendix B for a reconciliation of earnings (loss) to adjusted EBITDA and adjusted EBITDA less capital expenditures.
|
Operating profit decreased in the first quarter of 2014 as 2013 included a benefit from fair value adjustments as well as operating profit from Other Businesses which were sold later in the year. The impact of these items was partly offset bylower severance charges associated with our simplification initiatives. We incurred $10 million of severance charges during the three months ended March 31, 2014 compared to $78 million in the prior-year period. As previously announced, we expect to incur approximately $120 million of charges in 2014.
Adjusted EBITDA and the related margin increased due to lower severance charges associated with our simplification initiatives primarily within our Financial & Risk segment. The increase in underlying operating profit and the related margin reflected these lower severance charges as well as slightly lower depreciation and amortization. Foreign currency increased adjusted EBITDA and underlying operating margins each by 60bp.
Adjusted EBITDA less capital expenditures and the related margin increased due to higher adjusted EBITDA and lower capital expenditures.
As discussed above, in the first quarter of 2014, we incurred $10 million of severance charges for additional simplification initiatives, and we continued to reduce our costs as a result of earlier simplification initiatives. We believe that our adjusted EBITDA margins excluding these charges from each period provide a better measurement of our performance. Excluding charges from both periods, our consolidated adjusted EBITDA margin declined 50bp to 26.5% in the first quarter of 2014 compared to the prior-year period. The impact of lower revenues on our adjusted EBITDA margin was somewhat mitigated by benefits from our earlier simplification initiatives, but as expected, these benefits were not enough to fully mitigate the impact of the 3% decline in revenues from existing businesses within our Financial & Risk segment in the quarter. Our initiatives are expected to generate additional benefits in 2014, and by 2015, we expect to generate approximately $300 million of annual cost savings from our aggregate simplification initiatives related to severance.
Operating expenses.
|
|
Three months ended
March 31,
|
|
||||||||||
|
(millions of U.S. dollars)
|
2014
|
2013
|
Change
|
|||||||||
|
Operating expenses
|
2,313
|
2,324
|
-
|
|||||||||
|
Adjustments to remove:
|
||||||||||||
|
Fair value adjustments(1)
|
(2
|
)
|
62
|
|||||||||
|
Other Businesses
|
(2
|
)
|
(46
|
)
|
||||||||
|
Operating expenses, excluding fair value adjustments and Other Businesses
|
2,309
|
2,340
|
(1
|
%)
|
||||||||
|
(1)
|
Fair value adjustments primarily represent non-cash accounting adjustments from the revaluation of embedded foreign exchange derivatives within certain customer contracts due to fluctuations in foreign exchange rates and mark-to-market adjustments from certain share-based awards.
|
5
Operating expenses, excluding fair value adjustments and Other Businesses, decreased due to lower severance charges associated with our simplification initiatives as well as currency translation. These decreases were partly offset by higher expenses associated with newly acquired businesses.
Depreciation and amortization.
|
|
Three months ended
March 31,
|
|
||||||||||
|
(millions of U.S. dollars)
|
2014
|
2013
|
Change
|
|||||||||
|
Depreciation
|
98
|
107
|
(8
|
%)
|
||||||||
|
Amortization of computer software
|
194
|
188
|
3
|
%
|
||||||||
|
Subtotal
|
292
|
295
|
(1
|
%)
|
||||||||
|
Amortization of other identifiable intangible assets
|
163
|
160
|
2
|
%
|
||||||||
| · | Depreciation and amortization of computer software on a combined basis decreased as the completion of depreciation of fixed assets acquired in previous years was partly offset by higher amortization reflecting our investments in products, such as Thomson Reuters Eikon, and the amortization of assets from recently acquired businesses. |
| · | Amortization of other identifiable intangible assets increased due to amortization from newly-acquired assets, which more than offset decreases from the completion of amortization for certain identifiable intangible assets acquired in previous years. |
Net interest expense.
|
|
Three months ended
March 31,
|
|
||||||||||
|
(millions of U.S. dollars)
|
2014
|
2013
|
Change
|
|||||||||
|
Net interest expense
|
108
|
115
|
(6
|
%)
|
||||||||
The decrease in net interest expense was primarily attributable to lower interest costs on our net pension obligations. In 2013, we contributed $500 million to our pension plans which reduced our net obligations, as well as our ongoing interest cost associated with the net obligations. As of March 31, 2014, over 95% of our long-term debt obligations paid interest at fixed rates (after swaps), so the balance of net interest expense was relatively unchanged.
Other finance income (costs).
|
|
Three months ended
March 31,
|
|||||||
|
(millions of U.S. dollars)
|
2014
|
2013
|
||||||
|
Other finance income (costs)
|
28
|
(55
|
)
|
|||||
In both periods, other finance income (costs) primarily included gains or losses realized from changes in foreign currency exchange rates on certain intercompany funding arrangements. Additionally, the 2013 period included gains from freestanding derivative instruments.
Share of post-tax earnings in equity method investments.
|
|
Three months ended
March 31,
|
|||||||
|
(millions of U.S. dollars)
|
2014
|
2013
|
||||||
|
Share of post-tax earnings in equity method investments
|
-
|
10
|
||||||
The three months ended March 31, 2013 included our share of post-tax earnings from our former joint venture in Omgeo, a provider of trade management services, which was sold in the fourth quarter of 2013.
Tax benefit (expense).
|
|
Three months ended
March 31,
|
|||||||
|
(millions of U.S. dollars)
|
2014
|
2013
|
||||||
|
Tax benefit (expense)
|
13
|
(247
|
)
|
|||||
6
The comparability of our tax benefit (expense) was impacted by various transactions and accounting adjustments during each period. Additionally, the tax benefit (expense) in each period reflected the mix of taxing jurisdictions in which pre-tax profits and losses were recognized. Because the geographical mix of pre-tax profits and losses in interim periods distorts the reported effective tax rate, tax expense or benefit in interim periods is not necessarily indicative of tax expense for the full year.
In the three months ended March 31, 2013, we recorded a tax charge of $235 million in connection with intercompany sales of certain technology and content assets between our wholly owned subsidiaries. These transactions were part of the consolidation of the ownership and management of our technology and content assets and are part of our simplification program. The intercompany gains that arose from these transactions were eliminated in consolidation.
The following table sets forth significant components within income tax benefit (expense) that impact comparability from period to period, including tax benefit (expense) associated with items that are removed from adjusted earnings:
|
Benefit (expense)
|
Three months ended
March 31,
|
|||||||
|
(millions of U.S. dollars)
|
2014
|
2013
|
||||||
|
Discrete tax items:
|
|
|
||||||
|
Consolidation of technology and content assets(1)
|
-
|
(235
|
)
|
|||||
|
Uncertain tax positions(2)
|
3
|
2
|
||||||
|
Corporate tax rates(3)
|
2
|
1
|
||||||
|
Other(4)
|
9
|
11
|
||||||
|
Subtotal
|
14
|
(221
|
)
|
|||||
|
Tax related to:
|
||||||||
|
Sale of businesses
|
-
|
(8
|
)
|
|||||
|
Operating profit of Other Businesses
|
-
|
(8
|
)
|
|||||
|
Fair value adjustments
|
(1
|
)
|
(9
|
)
|
||||
|
Other items
|
1
|
3
|
||||||
|
Subtotal
|
-
|
(22
|
)
|
|||||
|
Total
|
14
|
(243
|
)
|
|||||
|
(1)
|
Relates to the consolidation of the ownership and management of our technology and content assets.
|
|
(2)
|
Relates to the reversal of tax reserves in connection with favorable developments regarding tax disputes.
|
|
(3)
|
Relates to the net reduction of deferred tax liabilities due to changes in corporate tax rates that were substantively enacted in certain jurisdictions.
|
|
(4)
|
Primarily relates to the recognition of deferred tax benefits in connection with acquisitions.
|
Because the items described above impact the comparability of our tax benefit (expense) for each period, we remove them from our calculation of adjusted earnings, along with the pre-tax items to which they relate. Accordingly, in our calculation of adjusted earnings for the three months ended March 31, 2013, we removed the impact of the tax charge associated with the consolidation of technology and content assets. Within our tax provision on adjusted earnings, we amortize a portion of the taxes associated with the intercompany sales on a straight line basis over seven years (see note 2 below).
The computation of our adjusted tax expense is set forth below:
|
|
Three months ended
March 31,
|
|||||||
|
(millions of U.S. dollars)
|
2014
|
2013
|
||||||
|
Tax benefit (expense)
|
13
|
(247
|
)
|
|||||
|
Remove: Items from above impacting comparability
|
(14
|
)
|
243
|
|||||
|
Other adjustments:
|
||||||||
|
Interim period effective tax rate normalization(1)
|
(12
|
)
|
(7
|
)
|
||||
|
Tax charge amortization(2)
|
(22
|
)
|
(8
|
)
|
||||
|
Total tax expense on adjusted earnings
|
(35
|
)
|
(19
|
)
|
||||
|
(1)
|
Adjustment to reflect income taxes based on estimated full-year effective tax rate. Reported earnings or loss for interim periods reflect income taxes based on the estimated effective tax rates of each of the jurisdictions in which we operate. The adjustment reallocates estimated full-year income taxes between interim periods, but has no effect on full-year income taxes.
|
|
(2)
|
For the year ended December 31, 2013, we recorded $604 million of deferred tax charges associated with the consolidation of the ownership and management of our technology and content assets. Within our tax expense on adjusted earnings, we amortize these charges on a straight line basis over seven years. We believe this treatment more appropriately reflects our tax position because these charges are expected to be paid over seven years, in varying annual amounts, in conjunction with the repayments of interest-bearing notes that were issued as consideration in the original transactions.
|
7
Net earnings (loss) and earnings (loss) per share.
|
|
Three months ended
March 31,
|
|||||||
|
(millions of U.S. dollars, except per share amounts)
|
2014
|
2013
|
||||||
|
Net earnings (loss)
|
292
|
(17
|
)
|
|||||
|
Diluted earnings (loss) per share
|
$
|
0.34
|
$
|
(0.04
|
)
|
|||
Net earnings (loss) and the related per share amounts increased primarily due to lower income tax expense.
Adjusted earnings and adjusted earnings per share.
|
|
Three months ended
March 31,
|
|
||||||||||
|
(millions of U.S. dollars, except per share amounts and share data)
|
2014
|
2013
|
Change
|
|||||||||
|
Earnings (loss) attributable to common shareholders
|
282
|
(31
|
)
|
n/m
|
|
|||||||
|
Adjustments to remove:
|
||||||||||||
|
Operating loss (profit) from Other Businesses
|
1
|
(32
|
)
|
|||||||||
|
Fair value adjustments
|
2
|
(62
|
)
|
|||||||||
|
Other operating losses, net
|
3
|
6
|
||||||||||
|
Other finance (income) costs
|
(28
|
)
|
55
|
|||||||||
|
Share of post-tax earnings in equity method investments
|
-
|
(10
|
)
|
|||||||||
|
Tax on above items(1)
|
-
|
22
|
||||||||||
|
Discrete tax items(1)
|
(14
|
)
|
221
|
|||||||||
|
Amortization of other identifiable intangible assets
|
163
|
160
|
||||||||||
|
Interim period effective tax rate normalization(1)
|
(12
|
)
|
(7
|
)
|
||||||||
|
Tax charge amortization(1)
|
(22
|
)
|
(8
|
)
|
||||||||
|
Dividends declared on preference shares
|
(1
|
)
|
(1
|
)
|
||||||||
|
Adjusted earnings
|
374
|
313
|
19
|
%
|
||||||||
|
Adjusted earnings per share (adjusted EPS)
|
$
|
0.46
|
$
|
0.38
|
21
|
%
|
||||||
|
Diluted weighted average common shares (millions)(2)
|
820.9
|
830.4
|
||||||||||
| (1) | Refer to “Tax expense” section above. |
| (2) | Refer to Appendix B for reconciliation of diluted weighted average common shares at March 31, 2013. |
Adjusted earnings and the related per share amount increased primarily due to higher underlying operating profit. Foreign currency positively impacted adjusted earnings per share by $0.02 compared to the prior-year period.
SEGMENT RESULTS
A discussion of the operating results of each of our reportable segments follows.
| · | Results from the Reuters News business and Other Businesses are excluded from our reportable segments as they do not qualify as a component of our four reportable segments, nor as a separate reportable segment. |
| · | We use segment operating profit to measure the operating performance of our reportable segments. |
| o | The costs of centralized support services such as technology, news, real estate, accounting, procurement, legal and human resources are allocated to each segment based on usage or other applicable measures. |
| o | We define segment operating profit as operating profit before (i) amortization of other identifiable intangible assets; (ii) other operating gains and losses; (iii) certain asset impairment charges; (iv) corporate-related items; and (v) fair value adjustments. We use this measure because we do not consider these excluded items to be controllable operating activities for purposes of assessing the current performance of our reportable segments. |
| o | We also use segment operating profit margin, which we define as segment operating profit as a percentage of revenues. |
| o | Our definition of segment operating profit may not be comparable to that of other companies. |
| · | As a supplemental measure of segment operating performance, we add back depreciation and amortization of computer software to segment operating profit to arrive at each segment’s EBITDA and the related margin as a percentage of revenues. Refer to Appendix B for additional information. |
8
Financial & Risk
|
|
Three months ended
March 31,
|
Percentage change: | ||||||||||||||||||||||||||
|
(millions of U.S. dollars)
|
2014
|
2013
|
Existing
businesses
|
Acquired
businesses
|
Constant currency
|
Foreign
currency
|
Total
|
|||||||||||||||||||||
|
Revenues
|
1,658
|
1,675
|
(3%)
|
|
2%
|
|
(1%)
|
|
-
|
(1%)
|
|
|||||||||||||||||
|
EBITDA
|
399
|
360
|
11%
|
|
||||||||||||||||||||||||
|
EBITDA margin
|
24.1
|
%
|
21.5
|
%
|
260bp
|
|
||||||||||||||||||||||
|
Segment operating profit
|
240
|
200
|
20%
|
|
||||||||||||||||||||||||
|
Segment operating profit margin
|
14.5
|
%
|
11.9
|
%
|
260bp
|
|
||||||||||||||||||||||
Revenues decreased on a constant currency basis as growth from acquired businesses was more than offset by a decline in revenues from existing businesses. The 3% decline in revenues from existing businesses was due to the lag effect of negative net sales over the past 12 months on our current period revenues, reflecting our largely subscription-based model. Although net sales were negative for the first quarter of 2014, net sales improved over the prior-year period as well as the fourth quarter of 2013, and were positive in the Americas and Asia Pacific. In 2014, we expect this gradually improving trend to continue over the remaining nine months of the year. The improving trend in net sales in 2014 is expected to lead to improving revenue performance in 2015.
By geographic area, revenues were essentially unchanged in the Americas (decreased 2% from existing businesses), decreased 3% in Europe, Middle East and Africa (4% from existing businesses), and increased 1% in Asia Pacific (essentially unchanged from existing businesses).
We continued to make progress in our operational execution which included the launch of Eikon 4.0 as well as a new “Know Your Customer” proposition in our Risk business. We also discontinued our legacy Reuters 3000Xtra product with over 120,000 customers upgraded to Eikon.
In 2014, we are no longer reporting revenue information for four lines of businesses in our Financial & Risk segment, as the business is no longer managed under that structure. We are pursuing a unified technology platform, which not only allows us to leverage the scale of a single Financial & Risk business, but also provides a vehicle for innovation and the creation of industry solutions. The unified technology platform strategy has enabled us to simplify our structure, remove costs and focus investment spending on areas that we believe provide the greatest growth and scale opportunities.
|
Results by revenue type were:
· Subscription revenues decreased 2% (3% from existing businesses) reflecting the impact of negative, but improved, net sales over the past 12 months;
· Transactions revenues increased 3% as revenues from acquired businesses more than offset a 4% revenue decline from existing businesses due to lower foreign exchange volumes. The decline in volumes was market related and reflective of the performance across the industry; and
· Recoveries revenues (low-margin revenues that we collect and largely pass-through to a third party provider, such as stock exchange fees) decreased 1% primarily due to declines in desktops.
|
|
First Quarter 2014 Revenues
|
|
|
 |
EBITDA, segment operating profit and the related margins increased due to lower severance charges associated with our simplification initiatives. However, we believe that our adjusted EBITDA margins excluding these charges from each period provide a better measurement of our performance. Excluding these charges from both periods, EBITDA margin declined 60bp to 24.8% as expected in the first quarter of 2014, compared to the first quarter of 2013 primarily due to the impact of lower revenues from existing businesses. We expect year-over-year margins, excluding charges, to improve during the remaining nine months of 2014 as our simplification initiatives should have a greater impact. Foreign currency increased EBITDA margin by approximately 50bp.
9
Legal
|
|
Three months ended
March 31,
|
Percentage change: | ||||||||||||||||||||||||||
|
(millions of U.S. dollars)
|
2014
|
2013
|
Existing
businesses
|
Acquired
businesses
|
Constant currency
|
Foreign
currency
|
Total
|
|||||||||||||||||||||
|
Revenues
|
803
|
794
|
-
|
2%
|
|
2%
|
|
(1%)
|
|
1%
|
|
|||||||||||||||||
|
EBITDA
|
284
|
276
|
3%
|
|
||||||||||||||||||||||||
|
EBITDA margin
|
35.4
|
%
|
34.8
|
%
|
60bp
|
|
||||||||||||||||||||||
|
Segment operating profit
|
215
|
201
|
7%
|
|
||||||||||||||||||||||||
|
Segment operating profit margin
|
26.8
|
%
|
25.3
|
%
|
150bp
|
|
||||||||||||||||||||||
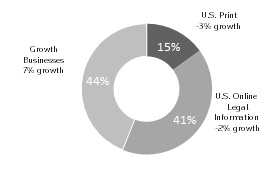
Revenues increased on a constant currency basis due to contributions from acquired businesses. Revenues from existing businesses were unchanged, as 1% growth in subscription revenues, which comprise approximately 75% of our Legal business, was offset by an expected 3% decline in both transaction revenues and U.S. print. Excluding U.S. print, revenues from existing businesses increased 1%.
The following chart illustrates the growth dynamics and business mix in the Legal segment:
|
Results by line of business were:
· Growth Business revenues include non U.S. legal information and global software and services businesses. Our growth business revenues increased 7% (4% from existing businesses) driven by our U.K. Practical Law, Elite and FindLaw businesses;
· U.S. Online Legal Information revenues are primarily comprised of Westlaw and decreased 2%, all from existing businesses; and
· U.S. Print revenues decreased 3%, all from existing businesses. We expect print revenues to decline by mid-to-high single digits in 2014.
|
First Quarter 2014 Revenues
2% constant currency revenue growth
|
|
 |
EBITDA increased primarily due to the impact of higher revenues and timing of expenses. The increase in EBITDA margin was due to foreign currency, as the impact of business mix kept margins in line with 2013. Segment operating profit growth and margin improvement also benefited from lower depreciation and amortization.
Tax & Accounting
|
|
Three months ended
March 31,
|
Percentage change: | ||||||||||||||||||||||||||
|
(millions of U.S. dollars)
|
2014
|
2013
|
Existing
businesses
|
Acquired
businesses
|
Constant currency
|
Foreign
currency
|
Total
|
|||||||||||||||||||||
|
Revenues
|
348
|
317
|
10%
|
|
3%
|
|
13%
|
|
(3%)
|
|
10%
|
|
||||||||||||||||
|
EBITDA
|
115
|
98
|
17%
|
|
||||||||||||||||||||||||
|
EBITDA margin
|
33.0
|
%
|
30.9
|
%
|
210bp
|
|
||||||||||||||||||||||
|
Segment operating profit
|
84
|
69
|
22%
|
|
||||||||||||||||||||||||
|
Segment operating profit margin
|
24.1
|
%
|
21.8
|
%
|
230bp
|
|
||||||||||||||||||||||
Revenues increased on a constant currency basis reflecting contributions from both existing and acquired businesses. Recurring revenues, which comprise approximately 80% of our Tax & Accounting business, increased 10% (9% from existing businesses) and transaction revenues increased 24% (11% from existing businesses).
10
|
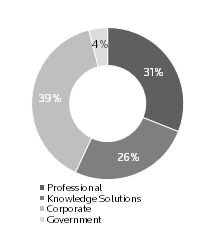
Results by line of business were:
· Professional revenues from small, medium and large accounting firms increased 10%, all from existing businesses, primarily from our CS Professional Suite and Enterprise Suite solutions for accounting firms;
· Knowledge Solutions revenues increased 4% (2% from existing businesses) primarily from growth in our U.S. Checkpoint business;
· Corporate revenues increased 22% (14% from existing businesses) primarily from ONESOURCE software and services and strong growth in solutions revenues in Latin America; and
· Government revenues increased 13%, all from existing businesses.
|
First Quarter 2014 Revenues
|
|
 |
EBITDA, segment operating profit and the related margins increased due to higher revenues.
Tax & Accounting is a seasonal business with a significant percentage of its operating profit historically generated in the fourth quarter. Small movements in the timing of revenues and expenses can impact quarterly margins. Full-year margins are more reflective of the segment’s performance.
Intellectual Property & Science
|
|
Three months ended
March 31,
|
Percentage change: | ||||||||||||||||||||||||||
|
(millions of U.S. dollars)
|
2014
|
2013
|
Existing
businesses
|
Acquired
businesses
|
Constant currency
|
Foreign
currency
|
Total
|
|||||||||||||||||||||
|
Revenues
|
243
|
233
|
3%
|
|
1%
|
|
4%
|
|
-
|
4%
|
|
|||||||||||||||||
|
EBITDA
|
72
|
70
|
3%
|
|
||||||||||||||||||||||||
|
EBITDA margin
|
29.6
|
%
|
30.0
|
%
|
(40)bp
|
|
||||||||||||||||||||||
|
Segment operating profit
|
51
|
51
|
-
|
|||||||||||||||||||||||||
|
Segment operating profit margin
|
21.0
|
%
|
21.9
|
%
|
(90)bp
|
|
||||||||||||||||||||||
Revenues increased on a constant currency basis reflecting contributions from both existing and acquired businesses. Recurring revenues, which represent approximately 75% of Intellectual Property & Science’s business, increased 5% (4% from existing businesses) and transaction revenues increased 3% (2% from existing businesses).
|
Results by line of business were:
· IP Solutions revenues increased 2%, all from existing businesses, due to growth from MarkMonitor partly offset by softness in our Innovation product revenues;
· Scientific & Scholarly Research revenues increased 9% (8% from existing businesses) led by higher subscriptions and discrete sales for Web of Science products; and
· Life Sciences revenues increased 5% (3% from existing businesses) led by our Business of Science solutions.
|
|
First Quarter 2014 Revenues
|
|
|
 |
Segment operating profit was unchanged as the impact of higher revenues was offset by higher depreciation and amortization. EBITDA and segment operating profit margins decreased due to the dilutive impact of businesses acquired in 2013.
Quarterly revenue growth for Intellectual Property & Science can be uneven due to the impact of large sales in the Scientific & Scholarly Research business. Small movements in the timing of revenues and expenses can impact quarterly margins. Full-year revenues and margins are more reflective of the segment’s performance.
11
Corporate & Other
|
|
Three months ended
March 31,
|
|||||||
|
(millions of U.S. dollars)
|
2014
|
2013
|
||||||
|
Revenues - Reuters News
|
79
|
81
|
||||||
|
|
||||||||
|
Reuters News
|
-
|
(4
|
)
|
|||||
|
Core corporate expenses
|
(62
|
)
|
(55
|
)
|
||||
|
Total
|
(62
|
)
|
(59
|
)
|
||||
Revenues from our Reuters News business declined 2%. Before currency, revenues from our Reuters News business decreased 1%.
Higher core corporate expenses were primarily driven by higher costs associated with our simplification initiatives. Full-year 2014 core corporate expenses are expected to be unchanged to slightly lower than the prior-year period.
Other Businesses
“Other Businesses” is an aggregation of businesses that have been or are expected to be exited through sale or closure that did not qualify for discontinued operations classification. The results of Other Businesses are not comparable from period to period, as the composition of businesses changes as businesses are identified for sale or closure. Further fluctuations are caused by the timing of the sales or closures. In 2013, the most significant business in Other Businesses was the Investor Relations, Public Relations and Multimedia Solutions businesses (Corporate Services), a provider of tools and solutions that help companies communicate with investors and media formerly in the Financial & Risk segment. Corporate Services was sold in the second quarter of 2013.
The results of Other Businesses were as follows:
|
|
Three months ended
March 31,
|
|||||||
|
(millions of U.S. dollars)
|
2014
|
2013
|
||||||
|
Revenues
|
1
|
78
|
||||||
|
Operating (loss) profit
|
(1
|
)
|
32
|
|||||
LIQUIDITY AND CAPITAL RESOURCES
Our disciplined capital management strategy remains focused on:
| · | Growing free cash flow and balancing the cash generated between reinvestment in the business and returns to shareholders; and |
| · | Maintaining a strong balance sheet, solid credit ratings and ample financial flexibility to support the execution of our business strategy. |
Our principal sources of liquidity are cash on hand, cash provided by our operations, our $2.0 billion commercial paper programs and our $2.5 billion credit facility. From time to time, we also issue debt securities. Our principal uses of cash are for debt repayments, debt servicing costs, dividend payments, capital expenditures, acquisitions and share repurchases. We believe that our existing sources of liquidity will be sufficient to fund our expected 2014 cash requirements in the normal course of business.
12
CASH FLOW
Summary of Consolidated Statement of Cash Flow
|
|
Three months ended March 31,
|
|
||||||||||
|
(millions of U.S. dollars)
|
2014
|
2013
|
$ Change
|
|||||||||
|
Net cash provided by operating activities
|
113
|
116
|
(3
|
)
|
||||||||
|
Net cash used in investing activities
|
(247
|
)
|
(1,046
|
)
|
799
|
|||||||
|
Net cash (used in) provided by financing activities
|
(523
|
)
|
76
|
(599
|
)
|
|||||||
|
Decrease in cash and bank overdrafts
|
(657
|
)
|
(854
|
)
|
197
|
|||||||
|
Translation adjustments
|
-
|
(11
|
)
|
11
|
||||||||
|
Cash and bank overdrafts at beginning of period
|
1,312
|
1,276
|
36
|
|||||||||
|
Cash and bank overdrafts at end of period
|
655
|
411
|
244
|
|||||||||
|
Cash and bank overdrafts at end of period comprised of:
|
||||||||||||
|
Cash and cash equivalents
|
667
|
423
|
244
|
|||||||||
|
Bank overdrafts
|
(12
|
)
|
(12
|
)
|
-
|
|||||||
Operating activities. The decrease in net cash provided by operating activities was primarily due to higher tax payments and higher severance payments associated with our simplification initiatives. These decreases were partly offset by favorable movements in working capital.
Investing activities. The decrease in net cash used in investing activities for the first quarter of 2014 reflected lower acquisition spending and capital expenditures. We did not acquire any businesses in the first quarter of 2014. In the first quarter of 2013, we acquired Practical Law, a provider of practical legal know-how, current awareness and workflow solutions within the Legal segment. Our capital expenditures were lower in 2014 due to timing of spending.
Financing activities. The increase in net cash used in financing activities was primarily attributable to 2014 share repurchases and 2013 commercial paper borrowings. We returned approximately $0.5 billion and $0.3 billion to our shareholders through dividends and share repurchases in the three months ended March 31, 2014 and 2013, respectively. Additional information about our debt, dividends and share repurchases is as follows:
| · | Commercial paper programs. Our $2.0 billion commercial paper programs provide cost-effective and flexible short-term funding to balance the timing of completed acquisitions, dividend payments and debt repayments. We had no short-term notes outstanding at March 31, 2014. Issuances of commercial paper reached a peak of $0.1 billion during the three-month period of 2014. |
| · | Credit facility. We have a $2.5 billion syndicated credit facility agreement which matures in May 2018. The facility may be utilized to provide liquidity for general corporate purposes (including support for our commercial paper programs). There were no borrowings during the first quarter of 2014. In the first quarter of 2013, we borrowed and repaid $440 million under the credit facility. |
We may request an extension of the maturity date under certain circumstances for up to two additional one-year periods, which the applicable lenders may accept or decline in their sole discretion. We may also request an increase, subject to approval by applicable lenders, in the lenders’ commitments up to a maximum amount of $3.0 billion.
Based on our current credit ratings, the cost of borrowing under the agreement is priced at LIBOR/EURIBOR plus 100 basis points. If our long-term debt rating were downgraded by Moody’s or Standard & Poor’s, our facility fee and borrowing costs may increase, although availability would be unaffected. Conversely, an upgrade in our ratings may reduce our facility fees and borrowing costs. We monitor the lenders that are party to our facility and believe they continue to be able to lend to us.
We guarantee borrowings by our subsidiaries under the credit facility. We must also maintain a ratio of net debt as of the last day of each fiscal quarter to EBITDA as defined in the credit agreement (earnings before interest, income taxes, depreciation and amortization and other modifications described in the credit agreement) for the last four quarters ended of not more than 4.5:1. We were in compliance with this covenant at March 31, 2014.
| · | Debt shelf prospectus. In March 2014, we filed a new debt shelf prospectus under which we may issue up to $3.0 billion principal amount of debt securities from time to time through April 2016. No debt securities have been issued under this prospectus as of the date of this management’s discussion and analysis. |
| · | Credit ratings. Our access to financing depends on, among other things, suitable market conditions and the maintenance of suitable long-term credit ratings. Our credit ratings may be adversely affected by various factors, including increased debt levels, decreased earnings, declines in customer demand, increased competition, a further deterioration in general economic and business conditions and adverse publicity. Any downgrades in our credit ratings may impede our access to the debt markets or result in significantly higher borrowing rates. |
13
The following table sets forth the credit ratings that we have received from rating agencies in respect of our outstanding securities as of the date of this management's discussion and analysis:
|
|
Moody’s
|
Standard &
Poor’s
|
DBRS
Limited
|
Fitch
|
||||
|
Long-term debt
|
Baa2
|
BBB+
|
BBB (high)
|
BBB+
|
||||
|
Commercial paper
|
P-2
|
A-2 (1)
|
R-2 (high)
|
F2
|
||||
|
Trend/Outlook
|
Stable
|
Stable
|
Stable
|
Stable
|
|
(1)
|
The A-2 rating represents the global short-term/commercial paper rating from Standard & Poor’s. This A-2 global short-term/ commercial paper rating, taken together with our global long-term debt rating of BBB+, corresponds to a Canadian market commercial paper rating of A-1 (low) per Standard & Poor’s ratings criteria.
|
We are not aware of any changes to our credit ratings being contemplated by rating agencies.
These credit ratings are not recommendations to purchase, hold, or sell securities and do not address the market price or suitability of a specific security for a particular investor. Credit ratings may not reflect the potential impact of all risks on the value of securities. We cannot assure you that our credit ratings will not be lowered in the future or that rating agencies will not issue adverse commentaries regarding our securities.
| · | Dividends. In February 2014, our board of directors approved a $0.02 per share increase in the annualized dividend rate to $1.32 per common share. Dividends paid on our common shares were as follows for the periods presented: |
|
|
Three months ended
March 31,
|
|||||||
|
(millions of U.S. dollars)
|
2014
|
2013
|
||||||
|
Dividends declared
|
270
|
269
|
||||||
|
Dividends reinvested
|
(8
|
)
|
(10
|
)
|
||||
|
Dividends paid
|
262
|
259
|
||||||
| · | Share repurchases. We may buy back shares (and subsequently cancel them) from time to time as part of our capital strategy. In October 2013, we announced that we plan to repurchase up to $1.0 billion of our shares by the end of 2014. Under our current normal course issuer bid (NCIB), we may repurchase up to 30 million common shares between May 22, 2013 and May 21, 2014 in open market transactions on the TSX, the New York Stock Exchange (NYSE) and/or other exchanges and alternative trading systems, if eligible, or by such other means as may be permitted by the TSX. During the three months ended March 31, 2014, we repurchased approximately 8.0 million common shares for approximately $279 million, of which $15 million was payable to the broker at March 31, 2014. The average price per share that we repurchased in the first quarter of 2014 was $35.07. As of March 31, 2014, we have cumulatively repurchased $579 million of common shares as part of the up to $1.0 billion targeted to be repurchased by the end of 2014. We did not repurchase any shares during the three months ended March 31, 2013. |
Decisions regarding any future repurchases will be based on market conditions, share price and other factors including opportunities to invest capital for growth. We may elect to suspend or discontinue our share repurchases at any time, in accordance with applicable laws. From time to time when we do not possess material nonpublic information about ourselves or our securities, we may enter into a pre-defined plan with our broker to allow for the repurchase of shares at times when we ordinarily would not be active in the market due to our own internal trading blackout periods, insider trading rules or otherwise. Any such plans entered into with our broker will be adopted in accordance with applicable Canadian securities laws and the requirements of Rule 10b5-1 under the U.S. Securities Exchange Act of 1934, as amended. We entered into such plans with our broker on March 31, 2014 and on December 31, 2013. As a result, we recorded a $100 million liability in “Other financial liabilities” within current liabilities with a corresponding amount recorded in equity in the consolidated statement of financial position in both periods. The liability recorded on December 31, 2013 was settled in the first quarter of 2014.
14
Free cash flow and free cash flow from ongoing businesses.
|
|
Three months ended
March 31,
|
|||||||
|
(millions of U.S. dollars)
|
2014
|
2013
|
||||||
|
Net cash provided by operating activities
|
113
|
116
|
||||||
|
Capital expenditures, less proceeds from disposals
|
(248
|
)
|
(350
|
)
|
||||
|
Other investing activities
|
1
|
4
|
||||||
|
Dividends paid on preference shares
|
(1
|
)
|
(1
|
)
|
||||
|
Free cash flow
|
(135
|
)
|
(231
|
)
|
||||
|
Remove: Other Businesses
|
-
|
7
|
||||||
|
Free cash flow from ongoing businesses
|
(135
|
)
|
(224
|
)
|
||||
Free cash flow and free cash flow from ongoing operations are historically the lowest in the first quarter of the year and are not indicative of our full year expectations of $1.3 billion to $1.5 billion. The improvement in free cash flow and free cash flow from ongoing businesses in the first quarter of 2014 was primarily due to lower capital expenditures, which reflected timing of spending.
FINANCIAL POSITION
Our total assets were $31.6 billion at March 31, 2014, reflecting a decrease of approximately $0.8 billion compared to December 31, 2013. The decrease in total assets was due to share repurchases, depreciation and amortization, partly offset by capital expenditures and changes in foreign currency. See “Cash Flow” for additional information.
As at March 31, 2014, the carrying amounts of our total current liabilities exceeded the carrying amounts of our total current assets principally because current liabilities include deferred revenue from the sale of information and services delivered electronically on a subscription basis, for which many customers pay in advance. The cash received from these advance payments is used to currently fund the operating, investing and financing activities of our business. However, for accounting purposes, these advance payments must be deferred and recognized over the term of the subscription. As such, we typically reflect a negative working capital position in our balance sheet. In the ordinary course of business, deferred revenue does not represent a cash obligation, but rather an obligation to perform services or deliver products. Therefore, we believe that our negative working capital position as at March 31, 2014, was not indicative of a liquidity issue, but rather an outcome of the required accounting for our business model.
Net Debt (1)
|
|
As at
|
|||||||
|
(millions of U.S. dollars)
|
March 31, 2014
|
December 31, 2013
|
||||||
|
Current indebtedness
|
580
|
596
|
||||||
|
Long-term indebtedness
|
7,379
|
7,470
|
||||||
|
Total debt
|
7,959
|
8,066
|
||||||
|
Swaps
|
13
|
(86
|
)
|
|||||
|
Total debt after swaps
|
7,972
|
7,980
|
||||||
|
Remove fair value adjustments for hedges
|
(13
|
)
|
(27
|
)
|
||||
|
Total debt after hedging arrangements
|
7,959
|
7,953
|
||||||
|
Remove transaction costs and discounts included in the carrying value of debt
|
77
|
78
|
||||||
|
Less: cash and cash equivalents (2)
|
(667
|
)
|
(1,316
|
)
|
||||
|
Net debt
|
7,369
|
6,715
|
||||||
|
(1)
|
Net debt is a non-IFRS financial measure, which we define in Appendix A.
|
|
(2)
|
Includes cash and cash equivalents of $87 million and $105 million at March 31, 2014 and December 31, 2013, respectively, which was held in subsidiaries which have regulatory restrictions, contractual restrictions or operate in countries where exchange controls and other legal restrictions apply and are therefore not available for general use by our company.
|
The increase in our net debt was primarily due to a decrease in cash and cash equivalents of $649 million, which reflected capital expenditures, and payments for dividends and repurchases of shares exceeding net cash provided by operating activities. Refer to “Cash Flow” for additional information.
The maturity dates for our debt are well balanced with no significant concentration in any one year. Our next scheduled debt maturity occurs in the fourth quarter of 2014 and is recorded as “Current indebtedness” in our consolidated statement of financial position. At March 31, 2014, the average maturity of our long-term debt was approximately nine years at an average interest rate (after swaps) of approximately 5%.
15
Additional information.
| · | We monitor the financial strength of financial institutions with which we have banking and other commercial relationships, including those that hold our cash and cash equivalents as well as those which are counterparties to derivative financial instruments and other arrangements; and |
| · | We expect to continue to have access to funds held by our subsidiaries outside the U.S. in a tax efficient manner to meet our liquidity requirements. |
OFF-BALANCE SHEET ARRANGEMENTS, COMMITMENTS AND CONTRACTUAL OBLIGATIONS
For a summary of our other off-balance sheet arrangements, commitments and contractual obligations please see our 2013 annual management’s discussion and analysis. There were no material changes to these arrangements, commitments and contractual obligations during the three months ended March 31, 2014.
CONTINGENCIES
Lawsuits and Legal Claims
We are engaged in various legal proceedings, claims, audits and investigations that have arisen in the ordinary course of business. These matters include, but are not limited to, intellectual property infringement claims, employment matters and commercial matters. The outcome of all of the matters against us is subject to future resolution, including the uncertainties of litigation. Based on information currently known to us and after consultation with outside legal counsel, management believes that the probable ultimate resolution of any such matters, individually or in the aggregate, will not have a material adverse impact on our financial condition taken as a whole.
Uncertain Tax Positions
We are subject to taxation in numerous jurisdictions. There are many transactions and calculations during the course of business for which the ultimate tax determination is uncertain. We maintain provisions for uncertain tax positions that we believe appropriately reflect our risk. These provisions are made using the best estimate of the amount expected to be paid based on a qualitative assessment of all relevant factors. We review the adequacy of these provisions at the end of the reporting period. It is possible that at some future date, liabilities in excess of our provisions could result from audits by, or litigation with, relevant taxing authorities. Management believes that such additional liabilities would not have a material adverse impact on our financial condition taken as a whole.
16
OUTLOOK
The information in this section is forward-looking and should be read in conjunction with the section below entitled “Cautionary Note Concerning Factors That May Affect Future Results”.
We recently reaffirmed our business outlook for 2014 that was first communicated in February.
Our 2014 outlook for adjusted EBITDA margin and underlying operating profit margin includes an estimated $120 million of previously announced charges associated with our simplification initiatives. Our free cash flow outlook includes the estimated cash impact of charges incurred in 2013 and expected to be incurred in 2014, as well as the impact of the loss of free cash flow from Other Businesses (approximately $375 million in the aggregate).
The following table sets forth our current 2014 financial outlook, the material assumptions related to our financial outlook and the material risks that may cause actual performance to differ materially from our current expectations.
Our 2014 outlook for revenues, adjusted EBITDA margin and underlying operating profit margin excludes the impact of foreign currency.
|
Revenues to be comparable to 2013
|
||
|
Material assumptions
|
|
Material risks
|
|
— Gradual improvement in Financial & Risk’s net sales performance during the year
— Gross domestic product (GDP) growth in the countries where we operate
— Continued increase in the number of professionals around the world and their demand for high quality information and services
— Continued operational improvement in the Financial & Risk business and the successful execution of new sales initiatives, ongoing product release programs, our globalization strategy and other growth and efficiency initiatives
· A mid-to-high single digit decline in our U.S. print revenues within the Legal segment
|
|
— Uneven economic growth or recession across the markets we serve may result in reduced spending levels by our customers
— Demand for our products and services could be reduced by changes in customer buying patterns, competitive pressures or our inability to execute on key product or customer support initiatives
— Implementation of regulatory reform, including further Dodd-Frank legislation and similar financial services laws around the world, may limit business opportunities for our customers, lowering their demand for our products and services
— Pressure on our customers, in developed markets in particular, to constrain the number of professionals employed due to regulatory and economic uncertainty
· Competitive pricing actions could impact our revenues
|
|
Adjusted EBITDA margin expected to be between 26.0% and 27.0%
|
||
|
Material assumptions
|
|
Material risks
|
|
— Revenues expected to be comparable to 2013
— Business mix continues to shift to higher-growth, lower margin offerings
— Realization of expected benefits from simplification initiatives, primarily in our Financial & Risk segment, relative to reductions in workforce, platform consolidation and operational simplification
|
|
— Refer to the risks above related to the revenue outlook
— Revenues from higher margin businesses may be lower than expected
— The costs of required investments exceed expectations or actual returns are below expectations
· Acquisition and disposal activity may dilute margins
· Simplification initiatives may cost more than expected, be delayed or may not produce the expected level of savings
|
17
|
Underlying operating profit margin expected to be between 17.0% and 18.0%
|
||
|
Material assumptions
|
|
Material risks
|
|
· Adjusted EBITDA margin expected to be between 26.0% and 27.0%
— Depreciation and software amortization expense expected to be approximately 9.5% of revenues
— Capital expenditures expected to be approximately 8% of revenues
|
|
— Refer to the risks above related to adjusted EBITDA margin outlook
— Capital expenditures may be higher than currently expected, resulting in higher in-period depreciation and amortization
|
|
Free cash flow is expected to be between $1.3 billion and $1.5 billion
|
||
|
Material assumptions
|
|
Material risks
|
|
— Revenues expected to be comparable to 2013
— Adjusted EBITDA margin expected to be between 26.0% and 27.0%
— Capital expenditures expected to be approximately 8% of revenues
|
|
— Refer to the risks above related to the revenue outlook and adjusted EBITDA margin outlook
— A weaker macroeconomic environment and unanticipated disruptions from new order-to-cash applications could negatively impact working capital performance
— Capital expenditures may be higher than currently expected resulting in higher cash outflows
· The timing and amount of tax payments to governments may differ from our expectations
|
Additionally, in 2014, we expect interest expense to be between $450 million and $475 million, assuming no significant change in our level of indebtedness. We expect our 2014 effective tax rate (as a percentage of post-amortization adjusted earnings) to be between 13% and 15%, assuming no material changes in current tax laws or treaties to which we are subject.
RELATED PARTY TRANSACTIONS
As of April 29, 2014, Woodbridge beneficially owned approximately 56% of our shares.
TRANSACTIONS WITH WOODBRIDGE
From time to time, in the normal course of business, we enter into transactions with Woodbridge and certain of its affiliates. These transactions involve providing and receiving product and service offerings, are negotiated at arm’s length on standard terms, including price, and are not significant to our results of operations or financial condition either individually or in the aggregate.
In May 2012, as part of our efforts to expand our mutual fund data and strategic research capabilities, we acquired a Canadian mutual fund database, fund fact sheet business and mutual fund and equity data feed business for approximately C$9 million from The Globe and Mail (The Globe), which is majority owned by Woodbridge. We paid approximately C$8 million in cash and issued a C$1 million promissory note to The Globe that will be due in May 2016. In connection with the acquisition, we licensed the acquired database to The Globe over a four year term, valued at approximately C$250,000 per year. The Globe issued four promissory notes to us, each for the value of the annual license. Amounts due each year under the notes issued by The Globe are offset against the note issued by us. Our board of directors’ Corporate Governance Committee approved the transaction.
In the normal course of business, certain of our subsidiaries charge a Woodbridge owned company fees for various administrative services. In 2013, the total amount charged to Woodbridge for these services was approximately $105,000.
We purchase property and casualty insurance from third party insurers and retain the first $500,000 of each and every claim under the programs via our captive insurance subsidiaries. Woodbridge is included in these programs and pays us a premium commensurate with its exposures. Premiums relating to 2013 were $44,000, which would approximate the premium charged by a third party insurer for such coverage.
We maintained an agreement with Woodbridge until April 17, 2008 (the closing date of the Reuters acquisition) under which Woodbridge agreed to indemnify up to $100 million of liabilities incurred either by our current and former directors and officers or by our company in providing indemnification to these individuals on substantially the same terms and conditions as would apply under an arm’s length, commercial arrangement. We were required to pay Woodbridge an annual fee of $750,000, which was less than the premium that would have been paid for commercial insurance. In 2008, we replaced this agreement with a conventional insurance agreement. We were entitled to seek indemnification from Woodbridge for any claims arising from events prior to April 17, 2008, so long as the claims were made before April 17, 2014. We did not seek indemnification from Woodbridge under this arrangement.
18
TRANSACTIONS WITH ASSOCIATES AND JOINT VENTURES
From time to time, we enter into transactions with our investments in associates and joint ventures. These transactions typically involve providing or receiving services and are entered into in the normal course of business and on an arm’s length basis.
We and Shin Nippon Hoki Shuppan K.K. each own 50% of Westlaw Japan K.K., a provider of legal information and solutions to the Japanese legal market. We provide the joint venture with technology and other services, which were valued at approximately $140,000 for the three months ended March 31, 2014.
In connection with the 2008 acquisition of Reuters, we assumed a lease agreement with 3XSQ Associates, an entity owned by Thomson Reuters and Rudin Times Square Associates LLC that was formed to build and operate the 3 Times Square property and building in New York, New York that serves as our corporate headquarters. We follow the equity method of accounting for our investment in 3XSQ Associates. The lease provides us with over 690,000 square feet of office space until 2021 and includes provisions to terminate portions early and various renewal options. Our costs under this lease arrangement for rent, taxes and other expenses were approximately $10 million for the three months ended March 31, 2014.
SUBSEQUENT EVENTS
There were no material events occurring after March 31, 2014 through the date of this management’s discussion and analysis.
CHANGES IN ACCOUNTING POLICIES
Please refer to the “Changes in Accounting Policies” section of our 2013 annual management’s discussion and analysis, which is contained in our 2013 annual report, as well as note 2 of our consolidated interim financial statements for the three months ended March 31, 2014, for information regarding changes in accounting policies.
CRITICAL ACCOUNTING ESTIMATES AND JUDGMENTS
The preparation of financial statements requires management to make estimates and judgments about the future. Estimates and judgments are continually evaluated and are based on historical experience and other factors, including expectations of future events that are believed to be reasonable under the circumstances. Please refer to the “Critical Accounting Estimates and Judgments” section of our 2013 annual management’s discussion and analysis, which is contained in our 2013 annual report, for additional information. Since the date of our 2013 annual management’s discussion and analysis, there have not been any significant changes to our critical accounting estimates and judgments.
ADDITIONAL INFORMATION
DISCLOSURE CONTROLS AND PROCEDURES
Our Chief Executive Officer and Chief Financial Officer, after evaluating the effectiveness of our disclosure controls and procedures (as defined in applicable U.S. and Canadian securities law) as of the end of the period covered by this management’s discussion and analysis, have concluded that our disclosure controls and procedures were effective to ensure that all information that we are required to disclose in reports that we file or furnish under the U.S. Securities Exchange Act and applicable Canadian securities law is (i) recorded, processed, summarized and reported within the time periods specified in the rules and forms of the SEC and Canadian securities regulatory authorities and (ii) accumulated and communicated to our management, including our Chief Executive Officer and Chief Financial Officer, to allow timely decisions regarding required disclosure.
INTERNAL CONTROL OVER FINANCIAL REPORTING
Our management is responsible for establishing and maintaining adequate internal control over financial reporting to provide reasonable assurance regarding the reliability of financial reporting and the preparation of financial statements for external purposes in accordance with IFRS. A multi-year phased implementation of order-to-cash (OTC) applications and related workflow processes is in progress. Key elements of the OTC solutions are order management, billing, cash management and collections functionality. We expect to reduce the number of applications and to streamline processes across our organization through this initiative. We are also in the process of automating manual processes and updating workflows associated with intercompany revenue and cost allocation. In 2014, we outsourced the support for selected key financial applications to a third-party provider as part of our simplification program. We continue to modify the design and documentation of the related internal control processes and procedures as the implementations of these initiatives progress.
Except as described above, there was no change in our internal control over financial reporting during the three months ended March 31, 2014 that materially affected, or is reasonably likely to materially affect, our internal control over financial reporting.
19
SHARE CAPITAL
As of April 29, 2014, we had outstanding 811,076,786 common shares, 6,000,000 Series II preference shares, 11,131,190 stock options and a total of 7,788,759 time-based restricted share units and performance restricted share units. We have also issued a Thomson Reuters Founders Share which enables Thomson Reuters Founders Share Company to exercise extraordinary voting power to safeguard the Thomson Reuters Trust Principles.
PUBLIC SECURITIES FILINGS AND REGULATORY ANNOUNCEMENTS
You may access other information about our company, including our 2013 annual report (which contains information required in an annual information form) and our other disclosure documents, reports, statements or other information that we file with the Canadian securities regulatory authorities through SEDAR at www.sedar.com and in the United States with the SEC at www.sec.gov.
CAUTIONARY NOTE CONCERNING FACTORS THAT MAY AFFECT FUTURE RESULTS
Certain statements in this management’s discussion and analysis are forward-looking, including, but not limited to, statements about 2014 expectations in the “Overview” and ”Outlook” sections, our expectations about additional charges associated with our simplification initiatives and expected cost savings, net sales, revenue growth and EBITDA margin in the Financial & Risk segment, U.S. print revenues in our Legal segment, and future share repurchases. The words “expect”, “target” and “will” and similar expressions identify forward-looking statements. These forward-looking statements are based on certain assumptions and reflect our company’s current expectations. As a result, forward-looking statements are subject to a number of risks and uncertainties that could cause actual results or events to differ materially from current expectations. Certain factors that could cause actual results or events to differ materially from current expectations are discussed in the “Outlook“ section above. Additional factors are discussed in the “Risk Factors” section of our 2013 annual report and in materials that we from time to time file with, or furnish to, the Canadian securities regulatory authorities and the U.S. Securities and Exchange Commission. There is no assurance that any forward-looking statement will materialize. Our outlook is provided for the purpose of providing information about current expectations for 2014. This information may not be appropriate for other purposes. You are cautioned not to place undue reliance on forward-looking statements, which reflect our expectations only as of the date of this management’s discussion and analysis. Except as may be required by applicable law, we disclaim any obligation to update or revise any forward-looking statements.
20
APPENDIX A
NON-IFRS FINANCIAL MEASURES
We use non-IFRS financial measures as supplemental indicators of our operating performance and financial position. Additionally, we use non-IFRS measures as performance metrics as the basis for management incentive programs. These measures do not have any standardized meanings prescribed by IFRS and therefore are unlikely to be comparable to the calculation of similar measures used by other companies. The following table sets forth our non-IFRS financial measures, including an explanation of why we believe they are useful measures of our performance. Reconciliations for the most directly comparable IFRS measure are reflected in our management’s discussion and analysis.
|
How We Define It
|
|
Why We Use It and Why It Is Useful to Investors
|
|
Most Directly Comparable IFRS Measure/Reconciliation
|
|
Revenues from ongoing businesses
|
||||
|
Revenues from reportable segments and Corporate & Other (which includes the Reuters News business), less eliminations.
|
|
Provides a measure of our ability to grow our ongoing businesses over the long term.
|
|
Revenues
|
|
Revenues at constant currency (before currency or revenues excluding the effects of foreign currency)
|
||||
|
Revenues applying the same foreign currency exchange rates for the current and equivalent prior period. To calculate the foreign currency impact between periods, we convert the current and equivalent prior period’s local currency revenues using the same foreign currency exchange rate.
|
|
Provides a measure of underlying business trends, without distortion from the effect of foreign currency movements during the period.
Our reporting currency is the U.S. dollar. However, we conduct a significant amount of our activities in currencies other than the U.S. dollar. We manage our operating segments on a constant currency basis, and we manage currency exchange risk at the corporate level.
|
|
Revenues
|
|
Underlying operating profit and underlying operating profit margin
|
||||
|
Operating profit from reportable segments and Corporate & Other. The related margin is expressed as a percentage of revenues from ongoing businesses.
|
|
Provides a basis to evaluate operating profitability and performance trends, excluding the impact of items which distort the performance of our operations.
|
|
Operating profit
|
|
Adjusted EBITDA and adjusted EBITDA margin
|
||||
|
Underlying operating profit excluding the related depreciation and amortization of computer software. The related margin is expressed as a percentage of revenues from ongoing businesses.
|
|
Provides a measure commonly reported and widely used by investors as an indicator of a company’s operating performance and ability to incur and service debt, and as a valuation metric.
|
|
Earnings (loss) from continuing operations
|
|
Adjusted EBITDA less capital expenditures and adjusted EBITDA less capital expenditures margin
|
||||
|
Adjusted EBITDA less capital expenditures, less proceeds from disposals (excluding Other Businesses). The related margin is expressed as a percentage of revenues from ongoing businesses.
|
|
Provides a basis for evaluating the operating profitability and capital intensity of a business in a single measure. This measure captures investments regardless of whether they are expensed or capitalized.
|
|
Earnings (loss) from continuing operations
|
21
|
How We Define It
|
|
Why We Use It and Why It Is Useful to
Investors
|
|
Most Directly Comparable IFRS Measure/Reconciliation
|
|
Adjusted earnings and adjusted earnings per share
|
||||
|
Earnings (loss) attributable to common shareholders and per share excluding:
· the pre-tax impacts of amortization of other identifiable intangible assets;
|
|
Provides a more comparable basis to analyze earnings and is also a measure commonly used by shareholders to measure our performance.
|
|
Earnings (loss) attributable to common shareholders and earnings (loss) per share attributable to common shareholders
|
|
· the post-tax impacts of fair value adjustments, other operating gains and losses, certain impairment charges, the results of Other Businesses, other net finance costs or income, our share of post-tax earnings or losses in equity method investments, discontinued operations and other items affecting comparability. We also deduct dividends declared on preference shares; and
|
||||
|
amortization of the tax charges associated with the consolidation of ownership and management of technology and content assets. For the non-IFRS measure, the majority of the charges are amortized over seven years, the period over which the tax is expected to be paid.
This measure is calculated using diluted weighted-average shares.
|
|
We believe this treatment more accurately reflects our tax position because the tax liability is associated with ongoing tax implications from the consolidation of these assets.
|
|
|
|
In interim periods, we also adjust our reported earnings and earnings per share to reflect a normalized effective tax rate. Specifically, the normalized effective rate is computed as the estimated full-year effective tax rate applied to adjusted pre-tax earnings of the interim period. The reported effective tax rate is based on separate annual effective income tax rates for each taxing jurisdiction that are applied to each interim period’s pre-tax income.
|
|
Because the geographical mix of pre-tax profits and losses in interim periods distorts the reported effective tax rate within an interim period, we believe that using the expected full-year effective tax rate provides more comparability among interim periods. The adjustment to normalize the effective tax rate reallocates estimated full-year income taxes between interim periods, but has no effect on full year tax expense or on cash taxes paid.
|
|
|
22
|
How We Define It
|
|
Why We Use It and Why It Is Useful to Investors
|
|
Most Directly Comparable IFRS Measure/Reconciliation
|
|
Net debt
|
||||
|
Total indebtedness, including the associated fair value of hedging instruments on our debt, but excluding unamortized transaction costs and premiums or discounts associated with our debt, less cash and cash equivalents.
|
|
Provides a commonly used measure of a company’s leverage.
Given that we hedge some of our debt to reduce risk, we include hedging instruments as we believe it provides a better measure of the total obligation associated with our outstanding debt. However, because we intend to hold our debt and related hedges to maturity, we do not consider certain components of the associated fair value of hedges in our measurements. We reduce gross indebtedness by cash and cash equivalents.
|
|
Total debt (current indebtedness plus long-term indebtedness)
|
|
Free cash flow
|
||||
|
Net cash provided by operating activities and other investing activities, less capital expenditures and dividends paid on our preference shares.
|
|
Helps assess our ability, over the long term, to create value for our shareholders as it represents cash available to repay debt, pay common dividends and fund share repurchases and new acquisitions.
|
|
Net cash provided by operating activities
|
|
Free cash flow from ongoing businesses
|
||||
|
Free cash flow excluding businesses that have been or are expected to be exited through sale or closure, which we refer to as “Other Businesses”.
|
|
Provides a supplemental measure of our ability, over the long term, to create value for our shareholders because it represents free cash flow generated by our operations excluding businesses that have been or are expected to be exited through sale or closure.
|
|
Net cash provided by operating activities
|
23
APPENDIX B
This appendix provides reconciliations that are not presented elsewhere in this management’s discussion and analysis for certain non-IFRS measures to the most directly comparable IFRS measure for the three months ended March 31, 2014 and 2013.
RECONCILIATION OF NET EARNINGS (LOSS) TO ADJUSTED EBITDA AND ADJUSTED EBITDA LESS CAPITAL EXPENDITURES
|
|
Three months ended
March 31,
|
|||||||||||
|
(millions of U.S. dollars)
|
2014
|
2013
|
Change
|
|||||||||
|
Net earnings (loss)
|
292
|
(17
|
)
|
n/
|
m
|
|||||||
|
Adjustments to remove:
|
||||||||||||
|
Tax (benefit) expense
|
(13
|
)
|
247
|
|||||||||
|
Other finance (income) costs
|
(28
|
)
|
55
|
|||||||||
|
Net interest expense
|
108
|
115
|
||||||||||
|
Amortization of other identifiable intangible assets
|
163
|
160
|
||||||||||
|
Amortization of computer software
|
194
|
188
|
||||||||||
|
Depreciation
|
98
|
107
|
||||||||||
|
EBITDA
|
814
|
855
|
||||||||||
|
Adjustments to remove:
|
||||||||||||
|
Share of post-tax earnings in equity method investments
|
-
|
(10
|
)
|
|||||||||
|
Other operating losses, net
|
3
|
6
|
||||||||||
|
Fair value adjustments
|
2
|
(62
|
)
|
|||||||||
|
EBITDA from Other Businesses(1)
|
1
|
(32
|
)
|
|||||||||
|
Adjusted EBITDA
|
820
|
757
|
8
|
%
|
||||||||
|
Remove: Capital expenditures, less proceeds from disposals (excluding Other Businesses(1))
|
248
|
350
|
||||||||||
|
Adjusted EBITDA less capital expenditures
|
572
|
407
|
41
|
%
|
||||||||
|
Adjusted EBITDA margin
|
26.2
|
%
|
24.4
|
%
|
180
|
bp
|
||||||
|
Adjusted EBITDA less capital expenditures margin
|
18.3
|
%
|
13.1
|
%
|
520
|
bp
|
||||||
24
RECONCILIATION OF UNDERLYING OPERATING PROFIT TO ADJUSTED EBITDA BY SEGMENT
|
|
Three months ended March 31, 2014
|
Three months ended March 31, 2013
|
||||||||||||||||||||||
|
(millions of U.S. dollars)
|
Underlying
Operating
profit
|
Add:
Depreciation and
amortization of
computer
software **
|
Adjusted
EBITDA
|
Underlying
Operating
profit
|
Add:
Depreciation and
amortization of
computer
software **
|
Adjusted
EBITDA
|
||||||||||||||||||
|
Financial & Risk
|
240
|
159
|
399
|
200
|
160
|
360
|
||||||||||||||||||
|
Legal
|
215
|
69
|
284
|
201
|
75
|
276
|
||||||||||||||||||
|
Tax & Accounting
|
84
|
31
|
115
|
69
|
29
|
98
|
||||||||||||||||||
|
Intellectual Property & Science
|
51
|
21
|
72
|
51
|
19
|
70
|
||||||||||||||||||
|
Corporate & Other (includes Reuters News)(2)
|
(62
|
)
|
12
|
(50
|
)
|
(59
|
)
|
12
|
(47
|
)
|
||||||||||||||
|
Total
|
528
|
292
|
820
|
462
|
295
|
757
|
||||||||||||||||||
** Excludes Other Businesses (1)
|
(1)
|
Other Businesses are businesses that have been or are expected to be exited through sale or closure that did not qualify for discontinued operations classification. Includes Corporate Services, which was sold in the second quarter of 2013.
|
|
|
Three months ended
March 31,
|
|||||||
|
(millions of U.S. dollars)
|
2014
|
2013
|
||||||
|
Revenues
|
1
|
78
|
||||||
|
|
||||||||
|
Operating (loss) profit
|
(1
|
)
|
32
|
|||||
|
Depreciation and amortization of computer software
|
-
|
-
|
||||||
|
EBITDA
|
(1
|
)
|
32
|
|||||
|
Capital expenditures, less proceeds from disposals
|
- | - | ||||||
|
(2)
|
Corporate & Other includes the Reuters News business and expenses for corporate functions and certain share-based compensation costs.
|
RECONCILIATION OF WEIGHTED AVERAGE DILUTED SHARES USED IN ADJUSTED EPS
Because we reported a net loss under IFRS for the three months ended March 31, 2013, the weighted-average number of common shares used for basic and diluted loss per share is the same, as the effect of stock options and other equity incentive awards would reduce the loss per share, and therefore be anti-dilutive. Since our non-IFRS measure “adjusted earnings” is a profit, potential common shares are included, as they lower adjusted EPS and are therefore dilutive.
The following table reconciles IFRS and non-IFRS common share information:
|
(weighted-average common shares)
|
Three months ended
March 31, 2013
|
|||
|
IFRS: Basic and Diluted
|
828,342,978
|
|||
|
Effect of stock options and other equity incentive awards
|
2,104,177
|
|||
|
Non-IFRS Diluted
|
830,447, 155
|
|||
25
APPENDIX C
QUARTERLY INFORMATION (UNAUDITED)
The following table presents a summary of our consolidated operating results for the eight most recent quarters.
|
|
Quarter ended
March 31,
|
Quarter ended
June 30,
|
Quarter ended
September 30,
|
Quarter ended
December 31,
|
||||||||||||||||||||||||||||
|
(millions of U.S. dollars, except per share amounts)
|
2014
|
2013
|
2013
|
2012
|
2013
|
2012
|
2013
|
2012
|
||||||||||||||||||||||||
|
Revenues
|
3,130
|
3,175
|
3,163
|
3,272
|
3,086
|
3,181
|
3,278
|
3,364
|
||||||||||||||||||||||||
|
Operating profit
|
359
|
390
|
597
|
1,297
|
316
|
372
|
213
|
537
|
||||||||||||||||||||||||
|
Earnings (loss) from continuing operations
|
292
|
(17
|
)
|
256
|
916
|
283
|
451
|
(347
|
)
|
365
|
||||||||||||||||||||||
|
Earnings (loss) from discontinued operations, net of tax
|
-
|
-
|
6
|
(1
|
)
|
-
|
2
|
4
|
3
|
|||||||||||||||||||||||
|
Net earnings (loss)
|
292
|
(17
|
)
|
262
|
915
|
283
|
453
|
(343
|
)
|
368
|
||||||||||||||||||||||
|
Earnings (loss) attributable to common shareholders
|
282
|
(31
|
)
|
248
|
902
|
271
|
441
|
(351
|
)
|
352
|
||||||||||||||||||||||
|
|
||||||||||||||||||||||||||||||||
|
Dividends declared on preference shares
|
(1
|
)
|
(1
|
)
|
(1
|
)
|
(1
|
)
|
-
|
-
|
(1
|
)
|
(1
|
)
|
||||||||||||||||||
|
|
||||||||||||||||||||||||||||||||
|
Basic earnings (loss) per share
|
||||||||||||||||||||||||||||||||
|
From continuing operations
|
$
|
0.34
|
$
|
(0.04
|
)
|
$
|
0.29
|
$
|
1.09
|
$
|
0.33
|
$
|
0.53
|
$
|
(0.43
|
)
|
$
|
0.41
|
||||||||||||||
|
From discontinued operations
|
-
|
-
|
0.01
|
-
|
-
|
-
|
-
|
0.01
|
||||||||||||||||||||||||
|
|
$
|
0.34
|
$
|
(0.04
|
)
|
$
|
0.30
|
$
|
1.09
|
$
|
0.33
|
$
|
0.53
|
$
|
(0.43
|
)
|
$
|
0.42
|
||||||||||||||
|
Diluted earnings (loss) per share
|
||||||||||||||||||||||||||||||||
|
From continuing operations
|
$
|
0.34
|
$
|
(0.04
|
)
|
$
|
0.29
|
$
|
1.08
|
$
|
0.33
|
$
|
0.53
|
$
|
(0.43
|
)
|
$
|
0.41
|
||||||||||||||
|
From discontinued operations
|
-
|
-
|
0.01
|
-
|
-
|
-
|
-
|
0.01
|
||||||||||||||||||||||||
|
|
$
|
0.34
|
$
|
(0.04
|
)
|
$
|
0.30
|
$
|
1.08
|
$
|
0.33
|
$
|
0.53
|
$
|
(0.43
|
)
|
$
|
0.42
|
||||||||||||||
Our revenues and operating profit on a consolidated basis do not tend to be significantly impacted by seasonality as we record a large portion of our revenues ratably over a contract term and our costs are generally incurred evenly throughout the year. However, our non-recurring revenues can cause changes in our performance from quarter to consecutive quarter. Additionally, the release of certain print-based offerings can be seasonal as can certain product releases for the regulatory markets, which tend to be concentrated at the end of the year. As a consequence, the results of certain of our segments can be impacted by seasonality to a greater extent than our consolidated revenues and operating profit.
Revenues - Revenues declined in each of the trailing four quarters compared to the respective prior-year periods, primarily reflecting the impact of divestitures. Revenue performance over these periods also reflected challenges in our Financial & Risk segment, including an overall difficult economic environment. This dynamic was partially offset by growth in our Legal, Tax & Accounting and Intellectual Property & Science segments. Acquisitions contributed to revenue changes. Foreign currency had no impact on revenues in the first quarter of 2014 and fourth quarter of 2013, but had a negative impact on revenues in the second and third quarters of 2013.
Operating profit - Operating profit in the first quarter of 2014 decreased from the first quarter of 2013 primarily because 2013 included benefits from fair value adjustments as well as operating profit from Other Businesses which were sold later in the year. In the fourth quarter of 2013, operating profit included $275 million of charges associated with our simplification initiatives. Operating profit in the second quarter of 2012 included gains on sales of businesses of $789 million, primarily from the sale of our Healthcare business.
Net earnings (loss) - Net earnings in the first quarter of 2014 compares to a net loss in the first quarter of 2013. The net losses in the first quarter and fourth quarter of 2013 were primarily due to $235 million and $425 million, respectively, of tax charges associated with the consolidation of the ownership and management of our technology and content assets, which are part of our simplification program. The net loss in the fourth quarter of 2013 also included $275 million of charges, primarily severance, associated with our simplification initiatives. The decrease in net earnings in the third quarter of 2013 reflected lower income tax benefits, as the 2012 period included higher tax benefits from the reversal of uncertain tax provisions and changes in estimates identified during the preparation of prior year income tax returns. The decrease in the second quarter of 2013 was due to prior year gains from the sales of businesses, primarily our Healthcare business.
26