0001070732falsePlus accumulated and unpaid dividends. Calculated by subtracting the Trust’s total liabilities (not including the notes payable and preferred shares) from the Trust’s total assets, dividing the result by the sum of the value of the notes payable and liquidation value of the preferred shares, and multiplying the result by the liquidation value of one preferred share. Calculated by subtracting the Trust’s total liabilities (not including the notes payable and preferred shares) from the Trust’s total assets, and dividing the result by the notes payable balance in thousands. Stated as a percentage of average net assets attributable to common shares for the year ended June 30, 2024. As of June 30, 2024, the outstanding borrowings represented approximately 7.66% leverage and the preferred shares represented approximately 23.99% leverage, totaling 31.65% leverage. Interest and fee expense relates to the notes payable. The investment adviser fee paid by the Trust to EVM is based on the average weekly gross assets of the Trust, including all assets attributable to any form of investment leverage that the Trust may utilize. Accordingly, if the Trust were to increase investment leverage in the future, the investment adviser fee will increase as a percentage of net assets. Pursuant to the investment advisory agreement, the investment adviser fee was computed at an annual rate of 0.71% of the Trust’s average weekly gross assets through April 30, 2024 and beginning May 1, 2024, at 0.70% of the Trust’s average weekly gross assets, and is payable monthly. The annual investment adviser fee rate shall be reduced to the following as of the stated date: May 1, 2025: 0.69% and May 1, 2026: 0.55%. You will be charged a $5.00 service charge and pay brokerage charges if you direct the plan agent to sell your common shares held in a dividend reinvestment account. If common shares are sold to or through underwriters, the Prospectus Supplement will set forth any applicable sales load.Eaton Vance Management (“EVM”) will pay the expenses of the offering (other than the applicable commissions); therefore, offering expenses are not included in the Summary of Fund Expenses. Offering expenses generally include, but are not limited to, the preparation, review and filing with the SEC of the Trust’s registration statement (including its current Prospectus Supplement, the accompanying Prospectus and Statement of Additional Information (“SAI”)), the preparation, review and filing of any associated marketing or similar materials, costs associated with the printing, mailing or other distribution of its current Prospectus Supplement, the accompanying Prospectus, SAI and/or marketing materials, associated filing fees, stock exchange listing fees, and legal and auditing fees associated with the offering. 0001070732 2023-07-01 2024-06-30 0001070732 cik0001070732:CommonSharesMember 2023-07-01 2024-06-30 0001070732 cik0001070732:SeriesAOneMember 2023-07-01 2024-06-30 0001070732 cik0001070732:SeriesBOneMember 2023-07-01 2024-06-30 0001070732 cik0001070732:MarketRiskMember 2023-07-01 2024-06-30 0001070732 cik0001070732:IncomeRiskMember 2023-07-01 2024-06-30 0001070732 cik0001070732:RegulatoryRiskMember 2023-07-01 2024-06-30 0001070732 cik0001070732:GeopoliticalRiskMember 2023-07-01 2024-06-30 0001070732 cik0001070732:CybersecurityRiskMember 2023-07-01 2024-06-30 0001070732 cik0001070732:RecentMarketConditionsMember 2023-07-01 2024-06-30 0001070732 cik0001070732:RisksAssociatedWithActiveManagementMember 2023-07-01 2024-06-30 0001070732 cik0001070732:InflationRiskMember 2023-07-01 2024-06-30 0001070732 cik0001070732:DerivativesRiskMember 2023-07-01 2024-06-30 0001070732 cik0001070732:CurrencyRiskMember 2023-07-01 2024-06-30 0001070732 cik0001070732:EmergingMarketsInvestmentRiskMember 2023-07-01 2024-06-30 0001070732 cik0001070732:ForeignInvestmentRiskMember 2023-07-01 2024-06-30 0001070732 cik0001070732:LeverageRiskMember 2023-07-01 2024-06-30 0001070732 cik0001070732:CreditRisksMember 2023-07-01 2024-06-30 0001070732 cik0001070732:MarketDisruptionMember 2023-07-01 2024-06-30 0001070732 cik0001070732:GeneralFundInvestingRisksMember 2023-07-01 2024-06-30 0001070732 cik0001070732:AntiTakeoverProvisionsMember 2023-07-01 2024-06-30 0001070732 cik0001070732:PooledInvestmentVehiclesRiskMember 2023-07-01 2024-06-30 0001070732 cik0001070732:USGovernmentSecuritiesRiskMember 2023-07-01 2024-06-30 0001070732 cik0001070732:IssuerRiskMember 2023-07-01 2024-06-30 0001070732 cik0001070732:PrepaymentRisksMember 2023-07-01 2024-06-30 0001070732 cik0001070732:NonInvestmentGradeBondsRiskMember 2023-07-01 2024-06-30 0001070732 us-gaap:InterestRateRiskMember 2023-07-01 2024-06-30 0001070732 cik0001070732:LowerRatedInvestmentsRiskMember 2023-07-01 2024-06-30 0001070732 cik0001070732:AdditionalRisksOfLoansMember 2023-07-01 2024-06-30 0001070732 cik0001070732:ReinvestmentRiskMember 2023-07-01 2024-06-30 0001070732 cik0001070732:MoneyMarketInstrumentRiskMember 2023-07-01 2024-06-30 0001070732 cik0001070732:MarketDiscountRiskMember 2023-07-01 2024-06-30 0001070732 cik0001070732:LiquidityRiskMember 2023-07-01 2024-06-30 0001070732 cik0001070732:EquitySecuritiesRiskMember 2023-07-01 2024-06-30 0001070732 cik0001070732:SeniorLoansRiskMember 2023-07-01 2024-06-30 0001070732 cik0001070732:PreferredSharesMember 2023-07-01 2024-06-30 0001070732 cik0001070732:OfferingExpensesMember 2023-07-01 2024-06-30 0001070732 cik0001070732:PreferredSharesMember 2022-07-01 2023-06-30 0001070732 cik0001070732:PreferredSharesMember 2021-07-01 2022-06-30 0001070732 cik0001070732:PreferredSharesMember 2014-07-01 2015-06-30 0001070732 cik0001070732:PreferredSharesMember 2015-07-01 2016-06-30 0001070732 cik0001070732:PreferredSharesMember 2016-07-01 2017-06-30 0001070732 cik0001070732:PreferredSharesMember 2017-07-01 2018-06-30 0001070732 cik0001070732:PreferredSharesMember 2018-07-01 2019-06-30 0001070732 cik0001070732:PreferredSharesMember 2019-07-01 2020-06-30 0001070732 cik0001070732:PreferredSharesMember 2020-07-01 2021-06-30 0001070732 cik0001070732:CommonSharesMember 2024-04-01 2024-06-30 0001070732 cik0001070732:CommonSharesMember 2024-01-01 2024-03-31 0001070732 cik0001070732:CommonSharesMember 2023-10-01 2023-12-31 0001070732 cik0001070732:CommonSharesMember 2023-07-01 2023-09-30 0001070732 cik0001070732:CommonSharesMember 2023-04-01 2023-06-30 0001070732 cik0001070732:CommonSharesMember 2022-10-01 2022-12-31 0001070732 cik0001070732:CommonSharesMember 2022-07-01 2022-09-30 0001070732 cik0001070732:CommonSharesMember 2023-01-01 2023-03-31 0001070732 cik0001070732:NotesPayableMember 2024-06-30 0001070732 cik0001070732:PreferredSharesMember 2024-06-30 0001070732 cik0001070732:NotesPayableMember 2023-06-30 0001070732 cik0001070732:PreferredSharesMember 2023-06-30 0001070732 cik0001070732:NotesPayableMember 2022-06-30 0001070732 cik0001070732:PreferredSharesMember 2022-06-30 0001070732 cik0001070732:NotesPayableMember 2021-06-30 0001070732 cik0001070732:PreferredSharesMember 2021-06-30 0001070732 cik0001070732:NotesPayableMember 2020-06-30 0001070732 cik0001070732:PreferredSharesMember 2020-06-30 0001070732 cik0001070732:NotesPayableMember 2019-06-30 0001070732 cik0001070732:PreferredSharesMember 2019-06-30 0001070732 cik0001070732:NotesPayableMember 2018-06-30 0001070732 cik0001070732:PreferredSharesMember 2018-06-30 0001070732 cik0001070732:NotesPayableMember 2017-06-30 0001070732 cik0001070732:PreferredSharesMember 2017-06-30 0001070732 cik0001070732:NotesPayableMember 2016-06-30 0001070732 cik0001070732:PreferredSharesMember 2016-06-30 0001070732 cik0001070732:NotesPayableMember 2015-06-30 0001070732 cik0001070732:PreferredSharesMember 2015-06-30 xbrli:pure iso4217:USD xbrli:shares iso4217:USD xbrli:shares
SECURITIES AND EXCHANGE COMMISSION
CERTIFIED SHAREHOLDER REPORT OF REGISTERED
MANAGEMENT INVESTMENT COMPANIES
Investment Company Act File Number:
811-09013
Eaton Vance Senior Income Trust
(Exact Name of Registrant as Specified in Charter)
One Post Office Square, Boston, Massachusetts 02109
(Address of Principal Executive Offices)
One Post Office Square, Boston, Massachusetts 02109
(Name and Address of Agent for Services)
(Registrant’s Telephone Number)
Item 1. Reports to Stockholders
Eaton Vance
Senior Income Trust (EVF)
Annual Report
June 30, 2024
Commodity Futures Trading Commission Registration.
The Commodity Futures Trading Commission (“CFTC”) has adopted regulations that subject registered investment companies and advisers to regulation by the CFTC if a fund invests more than a prescribed level of its assets in certain CFTC-regulated instruments (including futures, certain options and swap agreements) or markets itself as providing investment exposure to such instruments. The investment adviser has claimed an exclusion from the definition of “commodity pool operator” under the Commodity Exchange Act with respect to its management of the Fund. Accordingly, neither the Fund nor the adviser with respect to the operation of the Fund is subject to CFTC regulation. Because of its management of other strategies, the Fund's adviser is registered with the CFTC as a commodity pool operator. The adviser is also registered as a commodity trading advisor.
Fund shares are not insured by the FDIC and are not deposits or other obligations of, or guaranteed by, any depository institution. Shares are subject to investment risks, including possible loss of principal invested.
Annual Report
June 30, 2024
Eaton Vance
Senior Income Trust
|
|
| |
2 |
| |
3 |
| |
4 |
| |
5 |
| |
10 |
| |
11 |
| |
12 |
| |
13 |
| |
14 |
| |
43 |
| |
44 |
| |
45 |
| |
47 |
| |
51 |
| |
53 |
| |
56 |
| |
62 |
Eaton Vance
Senior Income Trust
June 30, 2024
Management’s Discussion of Fund Performance
†
Economic and Market Conditions
Amid global concerns over inflation, high interest rates, and wars in Ukraine and the Middle East, senior loans displayed their value as a portfolio diversifier, outperforming most U.S. fixed-income asset classes during the 12-month period ended June 30, 2024.
With senior loans among the few asset classes to benefit from rising interest rates, the Morningstar® LSTA® US Leveraged Loan Index
SM
(the Index), a broad measure of the asset class, returned 11.11% during the period. Senior loans generally outperformed investment-grade corporate bonds, corporate high yield bonds, municipal bonds, and U.S. government bonds during the period.
From the beginning of the period -- July 2023 through September 2023 -- senior loans rallied as fears of a U.S. recession receded. In October, the Index return was virtually flat amid volatility that briefly rattled capital markets worldwide. But the senior loan market showed resilience, capping its second-best calendar year on record with strong performances in November and December 2023, driven by expectations that the U.S. Federal Reserve (the Fed) had ended its interest rate hiking cycle and the American economy was heading for a soft landing.
The senior loan rally continued into 2024. By June 30, the asset class had delivered eight straight months of positive returns, and a 2024 year-to-date performance of 4.40%. Reflecting investors’ increased appetite for risk in a thriving U.S. economy, lower-rated loans generally outperformed higher-rated loans during the period.
Asset class technical factors contributed to senior loan performance. Investor demand outstripped net supply, which helped support floating-rate prices in secondary markets. Meanwhile, new capital formation in structured products reflected strong institutional demand for senior loans. Retail loan funds also experienced increasingly strong demand as the period progressed, particularly in the final three months of the period. Most notably, in May 2024 retail funds posted their largest inflows since the Fed began hiking interest rates in March 2022.
Issuer fundamentals also strengthened during the period. The trailing 12-month default rate fell from 1.71% at the start of the period to 0.90% at period-end -- well below the senior loan market’s 2.70% long-term default average. Loan prices improved from $94.24 at the start of the period to $96.59 at period-end.
For the period as a whole, BBB, BB, B, CCC, and D-rated (defaulted) loans within the Index returned 8.23%, 9.01%, 12.01%, 15.38%, and -20.71%, respectively.
Fund Performance
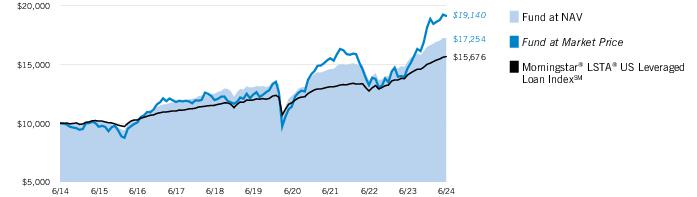
For the 12-month period ended June 30, 2024, Eaton Vance Senior Income Trust (the Fund) returned 13.22% at net asset value of its common shares (NAV), outperforming its benchmark, the Morningstar® LSTA® US Leveraged Loan Index
SM
(the Index), which returned 11.11%.
The Fund’s use of investment leverage during the period contributed to performance versus the Index, which does not employ leverage. The use of leverage has the effect of achieving additional exposure to the loan market, magnifying exposure to the Fund’s underlying investments in both up-and-down market environments. During this period of strong performance by the senior loan market, leverage amplified the price appreciation and interest income of loans in the Fund’s underlying portfolio, helping Fund performance versus the Index.
Additional contributors to Fund performance relative to the Index included an out-of-Index allocation to debt securities of collateralized loan obligations, which generally outperformed the Index during the period, as well as loan selections within the pharmaceuticals and the health care equipment & supplies industries.
In contrast, detractors from performance versus the Index during the period included loan selections in the health care providers & services industry, and the household durables industry. On an individual loan basis, the largest detractors from Index-relative performance were overweight positions in a struggling mattress maker and a primary care health care company that filed for bankruptcy in early 2024.
See Endnotes and Additional Disclosures in this report.
Past performance is no guarantee of future results. Returns are historical and are calculated net of management fees and other expenses by determining the percentage change in net asset value (NAV) or market price (as applicable) with all distributions reinvested in accordance with the Fund’s Dividend Reinvestment Plan. Furthermore, returns do not reflect the deduction of taxes that shareholders may have to pay on Fund distributions or upon the sale of Fund shares. Performance at market price will differ from performance at NAV due to variations in the Fund’s market price versus NAV, which may reflect factors such as fluctuations in supply and demand for Fund shares, changes in Fund distributions, shifting market expectations for the Fund’s future returns and distribution rates, and other considerations affecting the trading prices of closed-end funds. Investment return and principal value will fluctuate so that shares, when sold, may be worth more or less than their original cost. Performance for periods less than or equal to one year is cumulative. Performance is for the stated time period only; due to market volatility, current Fund performance may be lower or higher than the quoted return. For performance as of the most recent month-end, please refer to eatonvance.com.
Eaton Vance
Senior Income Trust
June 30, 2024
Performance
Portfolio Manager(s)
Andrew N. Sveen, CFA, Catherine C. McDermott, Daniel P. McElaney, CFA and Sarah A. Choi
% Average Annual Total Returns 1,2 |
Inception Date |
One Year |
Five Years |
Ten Years |
| Fund at NAV |
10/30/1998 |
13.22% |
5.73% |
5.60% |
| Fund at Market Price |
— |
30.40 |
9.00 |
6.70 |
|
| Morningstar® LSTA® US Leveraged Loan Index SM |
— |
11.11% |
5.52% |
4.59% |
% Premium/Discount to NAV 3 |
|
| As of period end |
2.92% |
|
|
| Total Distributions per share for the period |
$0.70 |
| Distribution Rate at NAV |
11.88% |
| Distribution Rate at Market Price |
11.55 |
|
|
| Auction Preferred Shares (APS) |
23.99% |
| Borrowings |
7.66 |
Growth of $10,000
This graph shows the change in value of a hypothetical investment of $10,000 in the Fund for the period indicated. For comparison, the same investment is shown in the indicated index.
See Endnotes and Additional Disclosures in this report.
Past performance is no guarantee of future results. Returns are historical and are calculated net of management fees and other expenses by determining the percentage change in net asset value (NAV) or market price (as applicable) with all distributions reinvested in accordance with the Fund’s Dividend Reinvestment Plan. Furthermore, returns do not reflect the deduction of taxes that shareholders may have to pay on Fund distributions or upon the sale of Fund shares. Performance at market price will differ from performance at NAV due to variations in the Fund’s market price versus NAV, which may reflect factors such as fluctuations in supply and demand for Fund shares, changes in Fund distributions, shifting market expectations for the Fund’s future returns and distribution rates, and other considerations affecting the trading prices of closed-end funds. Investment return and principal value will fluctuate so that shares, when sold, may be worth more or less than their original cost. Performance for periods less than or equal to one year is cumulative. Performance is for the stated time period only; due to market volatility, current Fund performance may be lower or higher than the quoted return. For performance as of the most recent month-end, please refer to eatonvance.com.
Eaton Vance
Senior Income Trust
June 30, 2024
| Top 10 Issuers (% of total investments) 1 |
|
| Cloud Software Group, Inc. |
0.9% |
| UKG, Inc. |
0.8 |
| Mallinckrodt International Finance SA |
0.8 |
| Sophia LP |
0.8 |
| Great Outdoors Group LLC |
0.8 |
| INEOS U.S. Finance LLC |
0.8 |
| INEOS Quattro Holdings U.K. Ltd. |
0.8 |
| Clarios Global LP |
0.7 |
| Drake Software LLC |
0.7 |
| Banff Merger Sub, Inc. |
0.7 |
Total |
7.8% |
| Top 10 Industries (% of total investments) 1 |
| Software |
12.6% |
| Health Care Providers & Services |
6.8 |
| Chemicals |
6.1 |
| Machinery |
5.0 |
| Hotels, Restaurants & Leisure |
4.6 |
| Capital Markets |
3.7 |
| Commercial Services & Supplies |
3.6 |
| Specialty Retail |
3.4 |
| Professional Services |
3.0 |
| IT Services |
2.9 |
Total |
51.7% |
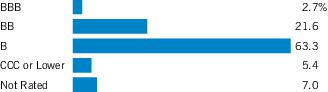
| Credit Quality (% of bonds, loans and asset-backed securities) 2 |
Footnotes:
1 |
Excludes cash and cash equivalents. |
2 |
Credit ratings are categorized using S&P Global Ratings (“S&P”). Ratings, which are subject to change, apply to the creditworthiness of the issuers of the underlying securities and not to the Fund or its shares. Credit ratings measure the quality of a bond based on the issuer’s creditworthiness, with ratings ranging from AAA, being the highest, to D, being the lowest based on S&P’s measures. Ratings of BBB or higher by S&P are considered to be investment-grade quality. Credit ratings are based largely on the ratings agency’s analysis at the time of rating. The rating assigned to any particular security is not necessarily a reflection of the issuer’s current financial condition and does not necessarily reflect its assessment of the volatility of a security’s market value or of the liquidity of an investment in the security. Holdings designated as “Not Rated” (if any) are not rated by S&P. |
Eaton Vance
Senior Income Trust
June 30, 2024
The Fund's Investment Objectives, Principal Strategies and Principal Risks
‡
Investment Objectives.
The Fund’s investment objective is to provide a high level of current income, consistent with the preservation of capital.
Principal Strategies.
The Fund pursues its objective by investing primarily in senior, secured floating-rate loans (“Senior Loans”). Senior Loans typically are secured with specific collateral and have a claim on the assets and/or stock that is senior to subordinated debtholders and stockholders of the borrower. Senior Loans are made to corporations, partnerships and other business entities (“Borrowers”) that operate in various industries and geographical regions. The Senior Loans are loans in which the interest rate paid fluctuates based on a reference rate. The interest rates for the Senior Loans are reset periodically on the basis of a floating base lending rate plus a premium. Senior Loans typically are of below investment grade quality and have below investment grade credit ratings, which ratings are associated with securities having high risk, speculative characteristics.
Under normal market conditions, at least 80% of the Fund’s total assets will be invested in interests in Senior Loans of domestic and foreign borrowers that are denominated in U.S. dollars or in euros, British pounds, Swiss francs, Canadian dollars and Australian dollars (each an “Authorized Foreign Currency”) making payments in such Authorized Foreign Currency. The remaining investment assets of the Fund may include, among other types of investments, equity securities that are acquired in connection with an investment in a Senior Loan. For the purpose of the 80% test, total assets is defined as net assets plus any borrowings for investment purposes, including any outstanding preferred shares. The Fund may invest up to 15% of its net assets in foreign Senior Loans denominated in an Authorized Foreign Currency.
The Fund may invest up to 20% of its total assets in (i) loan interests which have (a) a second lien on collateral (“Second Lien”), (b) no security interest in the collateral, or (c) lower than a senior claim on collateral; (ii) other income-producing securities, such as investment and non-investment grade corporate debt securities and U.S. government and U.S. dollar-denominated foreign government or supranational debt securities; and (iii) warrants and equity securities issued by a Borrower or its affiliates as part of a package of investments in the Borrower or its affiliates. In respect of (ii) above, the Fund may invest in corporate bonds of below investment grade quality (“Non-Investment Grade Bonds”), commonly referred to as “junk bonds,” which are bonds that are rated below investment grade by each of the nationally recognized statistical rating agencies who cover the security, or, if unrated, are determined to be of comparable quality by the Adviser. S&P Global Ratings and Fitch Ratings consider securities rated below BBB- to be below investment grade and Moody’s Investors Service, Inc. considers securities rated below Baa3 to be below investment grade. The Fund’s credit quality policies apply only at the time a security is purchased, and the Fund is not required to dispose of a security in the event of a downgrade of an assessment of credit quality or the withdrawal of a rating. Securities rated in the lowest investment grade rating (BBB- or Baa3) may have certain speculative characteristics. Below investment grade quality securities are considered to be predominantly speculative because of the credit risk of the issuers.
The Fund may invest in individual Senior Loans and other securities of any credit quality.
The Fund may invest up to 15% of net assets in foreign Senior Loans denominated in Authorized Foreign Currencies and may invest in other securities of non-United States issuers. The Fund’s investments may have significant exposure to certain sectors of the economy and thus may react differently to political or economic developments than the market as a whole. The Fund will not invest more than 10% of its assets in securities (including interests in Senior Loans) of any single Borrower.
The Fund may purchase or sell derivative instruments (which derive their value from another instrument, security or index) for risk management purposes, such as hedging against fluctuations in Senior Loans and other securities prices or interest rates. Transactions in derivative instruments may include the purchase or sale of futures contracts on securities, indices and other financial instruments, credit-linked notes, tranches of collateralized loan obligations and/or collateralized debt obligations, options on futures contracts, exchange-traded and over-the-counter options on securities or indices, forward foreign currency exchange contracts, and interest rate, total return and credit default swaps.
The Fund employs leverage to seek opportunities for additional income. Leverage may amplify the effect on the Fund’s net asset value (“NAV”) of any increase or decrease in the value of investments held. There can be no assurance that the use of borrowings will be successful. The Fund has issued preferred shares and borrowed to establish leverage. Investments in derivative instruments may result in economic leverage for the Fund.
Principal Risks
Income Risk.
The income investors receive from the Fund is based primarily on the interest it earns from its investments, which can vary widely over the short and long-term. If prevailing market interest rates drop, investors’ income from the Fund could drop as well. The Fund’s income could also be affected adversely when prevailing short-term interest rates increase and the Fund is utilizing leverage, although this risk is mitigated by the Fund’s investment in Senior Loans, which pay floating-rates of interest.
Market Risk.
The value of investments held by the Fund may increase or decrease in response to social, economic, political, financial, public health crises or other disruptive events (whether real, expected or perceived) in the U.S. and global markets and include events such as war, natural disasters, epidemics and pandemics, terrorism, conflicts and social unrest. These events may negatively impact broad segments of businesses and populations and may exacerbate pre-existing risks to the Fund. The frequency and magnitude of resulting changes in the value of the Fund’s investments cannot be predicted. Certain securities and other investments held by the Fund may experience increased volatility, illiquidity, or other potentially adverse effects in reaction to changing market conditions. Monetary and/or fiscal actions taken by U.S. or foreign governments to stimulate or stabilize the global economy may not be effective and could lead to higher market volatility. No active trading market may exist for certain investments held by the Fund, which may impair the ability of the Fund to sell or to realize the current valuation of such investments in the event of the need to liquidate such assets.
See Endnotes and Additional Disclosures in this report.
5
Eaton Vance
Senior Income Trust
June 30, 2024
The Fund's Investment Objectives, Principal Strategies and Principal Risks
‡
— continued
Senior Loans Risk.
The risks associated with Senior Loans are similar to the risks of Non-Investment Grade Bonds (discussed below), although Senior Loans are typically senior and secured in contrast to Non-Investment Grade Bonds, which are often subordinated and unsecured. Senior Loans’ higher standing has historically resulted in generally higher recoveries in the event of a corporate reorganization or other restructuring. In addition, because their interest rates are adjusted for changes in short-term interest rates, Senior Loans generally have less interest rate risk than Non-Investment Grade Bonds, which are typically fixed rate. The Fund’s investments in Senior Loans are typically below investment grade and are considered speculative because of the credit risk of their issuers. Such companies are more likely to default on their payments of interest and principal owed to the Fund, and such defaults could reduce the Fund’s NAV and income distributions. An economic downturn generally leads to a higher non-payment rate, and a debt obligation may lose significant value before a default occurs. Moreover, any specific collateral used to secure a loan may decline in value or lose all its value or become illiquid, which would adversely affect the loan’s value. “Junior Loans” are secured and unsecured subordinated loans, second lien loans and subordinate bridge loans. Senior Loans and Junior Loans are referred to together herein as “loans.”
Loans and other debt securities are also subject to the risk of price declines and to increases in prevailing interest rates, although floating-rate debt instruments are less exposed to this risk than fixed-rate debt instruments. Interest rate changes may also increase prepayments of debt obligations and require the Fund to invest assets at lower yields.
Loans are traded in a private, unregulated inter-dealer or inter-bank resale market and are generally subject to contractual restrictions that must be satisfied before a loan can be bought or sold. These restrictions may impede the Fund’s ability to buy or sell loans (thus affecting their liquidity) and may negatively impact the transaction price. See also “Market Risk” above. It also may take longer than seven days for transactions in loans to settle. The types of covenants included in loan agreements generally vary depending on market conditions, the creditworthiness of the issuer, the nature of the collateral securing the loan and possibly other factors. Loans with fewer covenants that restrict activities of the borrower may provide the borrower with more flexibility to take actions that may be detrimental to the loan holders and provide fewer investor protections in the event of such actions or if covenants are breached. The Fund may experience relatively greater realized or unrealized losses or delays and expense in enforcing its rights with respect to loans with fewer restrictive covenants. Loans to entities located outside of the U.S. may have substantially different lender protections and covenants as compared to loans to U.S. entities and may involve greater risks. The Fund may have difficulties and incur expense enforcing its rights with respect to non-U.S. loans and such loans could be subject to bankruptcy laws that are materially different than in the U.S. Loans may be structured such that they are not securities under securities law, and in the event of fraud or misrepresentation by a borrower, lenders may not have the protection of the anti-fraud provisions of the federal securities laws. Loans are also subject to risks associated with other types of income investments, including credit risk and risks of lower rated investments.
Credit Risk.
Investments in fixed-income and other debt obligations, including loans, (referred to below as “debt instruments”) are subject to the risk of non-payment of scheduled principal and interest. Changes in economic conditions or other circumstances may reduce the capacity of the party obligated to make principal and interest payments on such instruments and may lead to defaults. Such non-payments and defaults may reduce the value of Fund shares and income distributions. The value of debt instruments also may decline because of concerns about the issuer’s ability to make principal and interest payments. In addition, the credit ratings of debt instruments may be lowered if the financial condition of the party obligated to make payments with respect to such instruments deteriorates. In the event of bankruptcy of the issuer of a debt instrument, the Fund could experience delays or limitations with respect to its ability to realize the benefits of any collateral securing the instrument. In order to enforce its rights in the event of a default, bankruptcy or similar situation, the Fund may be required to retain legal or similar counsel, which may increase the Fund’s operating expenses and adversely affect NAV. Due to their lower place in the borrower’s capital structure, Junior Loans involve a higher degree of overall risk than Senior Loans to the same borrower.
Additional Risks of Loans.
Loans are traded in a private, unregulated inter-dealer or inter-bank resale market and are generally subject to contractual restrictions that must be satisfied before a loan can be bought or sold. These restrictions may impede the Fund’s ability to buy or sell loans (thus affecting their liquidity) and may negatively impact the transaction price. See also “Market Risk” above. It also may take longer than seven days for transactions in loans to settle. The types of covenants included in loan agreements generally vary depending on market conditions, the creditworthiness of the issuer, the nature of the collateral securing the loan and possibly other factors. Loans with fewer covenants that restrict activities of the borrower may provide the borrower with more flexibility to take actions that may be detrimental to the loan holders and provide fewer investor protections in the event of such actions or if covenants are breached. The Fund may experience relatively greater realized or unrealized losses or delays and expense in enforcing its rights with respect to loans with fewer restrictive covenants. Loans to entities located outside of the U.S. may have substantially different lender protections and covenants as compared to loans to U.S. entities and may involve greater risks. The Fund may have difficulties and incur expense enforcing its rights with respect to non-U.S. loans and such loans could be subject to bankruptcy laws that are materially different than in the U.S. Loans may be structured such that they are not securities under securities law, and in the event of fraud or misrepresentation by a borrower, lenders may not have the protection of the anti-fraud provisions of the federal securities laws. Loans are also subject to risks associated with other types of income investments, including credit risk and risks of lower rated investments.
Lower Rated Investments Risk.
Investments rated below investment grade and comparable unrated investments (sometimes referred to as “junk”) are speculative because of increased credit risk relative to other fixed income investments. Changes in economic conditions or other circumstances typically have a greater effect on the ability of issuers of lower rated investments to make principal and interest payments than they do on issuers of higher rated investments. An economic downturn generally leads to a higher non-payment rate, and a lower rated investment may lose significant value before a default occurs. Lower rated investments typically are subject to greater price volatility and illiquidity than higher rated investments.
See Endnotes and Additional Disclosures in this report.
Eaton Vance
Senior Income Trust
June 30, 2024
The Fund's Investment Objectives, Principal Strategies and Principal Risks
‡
— continued
Interest Rate Risk.
In general, the value of income securities will fluctuate based on changes in interest rates. The
value
of these securities is likely to increase when interest rates fall and decline when interest rates rise. Duration measures the time-weighted expected cash flows of a fixed-income security, while maturity refers to the amount of time until a fixed-income
security
matures. Generally, securities with longer durations or maturities are more sensitive to changes in interest rates than securities with shorter durations or maturities, causing them to be more volatile. Conversely, fixed-income securities with shorter durations or maturities will be less volatile but may provide lower returns than fixed-income securities with longer durations or maturities. The impact of interest rate changes is significantly less for floating-rate instruments that have relatively short periodic rate resets (e.g., ninety days or less). In a rising interest rate environment, the duration of income securities that have the ability to be prepaid or called by the issuer may be extended. In a declining interest rate environment, the proceeds from prepaid or maturing instruments may have to be reinvested at a lower interest rate.
Non-Investment Grade Bonds Risk.
The Fund’s investments in Non-Investment Grade Bonds, commonly referred to as “junk bonds,” are predominantly speculative because of the credit risk of their issuers. While offering a greater potential opportunity for capital appreciation and higher yields, Non-Investment Grade Bonds typically entail greater potential price volatility and may be less liquid than higher-rated securities. Issuers of Non-Investment Grade Bonds are more likely to default on their payments of interest and principal owed to the Fund, and such defaults will reduce the Fund’s NAV and income distributions. The prices of these lower rated obligations are more sensitive to negative developments than higher rated securities. Adverse business conditions, such as a decline in the issuer’s revenues or an economic downturn, generally lead to a higher non-payment rate. In addition, a security may lose significant value before a default occurs as the market adjusts to expected higher non-payment rates.
Prepayment Risk.
During periods of declining interest rates or for other purposes, Borrowers may exercise their option to prepay principal earlier than scheduled. For fixed-income securities, such payments often occur during periods of declining interest rates, forcing the Fund to reinvest in lower yielding securities. This is known as call or prepayment risk. Non-Investment Grade Bonds frequently have call features that allow the issuer to redeem the security at dates prior to its stated maturity at a specified price (typically greater than par) only if certain prescribed conditions are met (“call protection”). An issuer may redeem a Non-Investment Grade Bond if, for example, the issuer can refinance the debt at a lower cost due to declining interest rates or an improvement in the credit standing of the issuer. Senior Loans typically have no such call protection. For premium bonds (bonds acquired at prices that exceed their par or principal value) purchased by the Fund, prepayment risk may be enhanced.
Issuer Risk.
The value of corporate income-producing securities held by the Fund may decline for a number of reasons, which directly relate to the issuer, such as management performance, financial leverage and reduced demand for the issuer’s goods and services.
Leverage Risk.
Leverage, including leverage from the issuance of preferred shares and borrowings, creates risks, including the likelihood of greater volatility of NAV and market price of, and distributions from, the common shares and the risk that fluctuations in dividend rates on preferred shares and in the costs of borrowings may affect the return to common shareholders. To the extent the income derived from investments purchased with funds received from leverage exceeds the cost of leverage, the Fund’s distributions will be greater than if leverage had not been used. Conversely, if the income from the investments purchased with such funds is not sufficient to cover the cost of leverage, the amount of income available for distribution to common shareholders will be less than if leverage had not been used. In the latter case, the investment adviser may nevertheless determine to maintain the Fund’s leveraged position if it deems such action to be appropriate. While the Fund has preferred shares or borrowings outstanding, an increase in short-term rates would also result in an increased cost of leverage, which would adversely affect the Fund’s income available for distribution. In connection with its borrowings and preferred shares, the Fund will be required to maintain specified asset coverage by applicable federal securities laws and (as applicable) the terms of the preferred shares and its credit facility. The Fund may be required to dispose of portfolio investments on unfavorable terms if market fluctuations or other factors cause the required asset coverage to be less than the prescribed amount. There can be no assurance that a leveraging strategy will be successful.
Foreign Investment Risk.
Foreign investments can be adversely affected by political, economic and market developments abroad, including the imposition of economic and other sanctions by the United States or another country against a particular country or countries, organizations, entities and/or individuals. There may be less publicly available information about foreign issuers because they may not be subject to reporting practices, requirements or regulations comparable to those to which U.S. companies are subject. Adverse changes in investment regulations, capital requirements or exchange controls could adversely affect the value of the Fund’s investments. Foreign markets may be smaller, less liquid and more volatile than the major markets in the United States, and as a result, Fund share values may be more volatile. Trading in foreign markets typically involves higher expense than trading in the United States. The Fund may have difficulties enforcing its legal or contractual rights in a foreign country.
Emerging Markets Investment Risk
. Investment markets within emerging market countries are typically smaller, less liquid, less developed and more volatile than those in more developed markets like the United States, and may be focused in certain sectors. Emerging market securities often involve greater risks than developed market securities. The information available about an emerging market issuer may be less reliable than for comparable issuers in more developed capital markets.
Currency Risk.
Exchange rates for currencies fluctuate daily. The value of foreign
investments
may be affected favorably or unfavorably by changes in currency exchange rates in relation to the U.S. dollar. Currency markets generally are not as regulated as securities markets and currency transactions are subject to settlement, custodial and other operational risks.
See Endnotes and Additional Disclosures in this report.
Eaton Vance
Senior Income Trust
June 30, 2024
The Fund's Investment Objectives, Principal Strategies and Principal Risks
‡
— continued
Derivatives Risk.
The Fund’s exposure to derivatives involves risks different from, or possibly greater than, the risks associated with investing directly in securities and other investments. The use of derivatives can lead to losses because of adverse movements in the price or value of the security, instrument, index, currency, commodity, economic indicator or event underlying a derivative (“reference instrument”), due to failure of a counterparty or due to tax or regulatory constraints. Derivatives may create leverage in the Fund, which represents a non-cash exposure to the underlying reference instrument. Leverage can increase both the risk and return potential of the Fund. Derivatives risk may be more significant when derivatives are used to enhance return or as a substitute for a cash investment position, rather than solely to hedge the risk of a position held by the Fund. Use of derivatives involves the exercise of specialized skill and judgment, and a transaction may be unsuccessful in whole or in part because of market behavior or unexpected events. Changes in the value of a derivative (including one used for hedging) may not correlate perfectly with the underlying reference instrument. Derivative instruments traded in over-the-counter markets may be difficult to value, may be illiquid, and may be subject to wide swings in valuation caused by changes in the value of the underlying reference instrument. If a derivative’s counterparty is unable to honor its commitments, the value of Fund shares may decline and the Fund could experience delays in (or be unable to achieve) the return of collateral or other assets held by the counterparty. The loss on derivative transactions may substantially exceed the initial investment. A derivative investment also involves the risks relating to the reference instrument underlying the investment.
U.S. Government Securities Risk.
Different types of U.S. government securities are subject to different levels of credit risk, including the risk of default, depending on the nature of the particular government support for that security. Although certain U.S. Government sponsored agencies (such as the Federal Home Loan Mortgage Corporation and the Federal National Mortgage Association) may be chartered or sponsored by acts of Congress, their securities are neither issued nor guaranteed by the U.S. Treasury. With respect to U.S. government securities that are not backed by the full faith and credit of the United States, there is a risk that the U.S. Government will not provide financial support to such U.S. government agencies, instrumentalities or sponsored enterprises if not obligated to do so by law. U.S. Treasury and U.S. Government agency securities generally have a lower return than other obligations because of their higher credit quality and market liquidity.
Pooled Investment Vehicles Risk.
Pooled investment vehicles are open- and closed-end investment companies and exchange-traded funds (“ETFs”). Pooled investment vehicles are subject to the risks of investing in the underlying securities or other investments. Shares of closed-end investment companies and ETFs may trade at a premium or discount to NAV and are subject to secondary market trading risks. In addition, the Fund will bear a pro rata portion of the operating expenses of a pooled investment vehicle in which it invests.
Equity Securities Risk.
The value of equity securities and related instruments may decline in response to adverse changes in the economy or the economic outlook; deterioration in investor sentiment; interest rate, currency, and commodity price fluctuations; adverse geopolitical, social or environmental developments; issuer and sector-specific considerations; unexpected trading activity among retail investors; or other factors. Market conditions may affect certain types of stocks to a greater extent than other types of stocks. If the stock market declines in value, the value of the Fund’s equity securities will also likely decline. Although prices can rebound, there is no assurance that values will return to previous levels.
Liquidity Risk.
The Fund is exposed to liquidity risk when trading volume, lack of a market maker or trading partner, large position size, market conditions, or legal restrictions impair its ability to sell particular investments or to sell them at advantageous market prices. Consequently, the Fund may have to accept a lower price to sell an investment or continue to hold it or keep the position open, sell other investments to raise cash or abandon an investment opportunity, any of which could have a negative effect on the Fund’s performance. These effects may be exacerbated during times of financial or political stress.
Market Discount Risk.
As with any security, the market value of the common shares may increase or decrease from the amount initially paid for the common shares. The Fund’s common shares have traded both at a premium and at a discount relative to NAV. The shares of closed-end management investment companies frequently trade at a discount from their NAV. This is a risk separate and distinct from the risk that the Fund’s NAV may decrease.
Money Market Instrument Risk.
Money market instruments may be adversely affected by market and economic events, such as a sharp rise in prevailing short-term interest rates; adverse developments in the banking industry, which issues or guarantees many money market instruments; adverse economic, political or other developments affecting issuers of money market instruments; changes in the credit quality of issuers; and default by a counterparty.
Reinvestment Risk.
Income from the Fund’s portfolio will decline if and when the Fund invests the proceeds from matured, traded or called debt obligations into lower yielding instruments.
Inflation Risk.
Inflation risk is the risk that the value of assets or income from investments will be worth less in the future as inflation decreases the value of money. As inflation increases, the real value of the common shares and distributions thereon can decline. In addition, during any periods of rising inflation, dividend rates of preferred shares would likely increase, which would tend to further reduce returns to common shareholders. This risk is mitigated to some degree by the Fund’s investments in Senior Loans.
Risks Associated with Active Management.
The success of the Fund’s investment strategy depends on portfolio management’s successful application of analytical skills and investment judgment. Active management involves subjective decisions and there is no guarantee that such decisions will produce the desired results or expected returns.
See Endnotes and Additional Disclosures in this report.
Eaton Vance
Senior Income Trust
June 30, 2024
The Fund's Investment Objectives, Principal Strategies and Principal Risks
‡
— continued
Recent Market Conditions.
The outbreak of COVID-19 and efforts to contain its spread resulted in closing borders, enhanced health screenings, changes to healthcare service preparation and delivery, quarantines, cancellations, disruptions to supply chains and customer activity, as well as general concern and uncertainty. The impact of this coronavirus, and the effects of other infections illness outbreaks, epidemics and pandemics, may be short term or may continue for an extended period of time. Health crises caused by outbreaks of disease may exacerbate other pre-existing political, social and economic risks and disrupt normal market conditions and operations. For example, a global pandemic or other widespread health crisis could cause substantial market volatility and exchange trading suspensions and closures. In addition, the increasing interconnectedness of markets around the world may result in many markets being affected by events or conditions in a single country or region or events affecting a single or small number of issuers. The coronavirus outbreak and public and private sector responses thereto led to large portions of the populations of many countries working from home for indefinite periods of time, temporary or permanent layoffs, disruptions in supply chains, and lack of availability of certain goods. The impact of such responses could adversely affect the information technology and operational systems upon which the Fund and the Fund’s service providers rely, and could otherwise disrupt the ability of the employees of the Fund’s service providers to perform critical tasks relating to the Fund. Any such impact could adversely affect the Fund’s performance, or the performance of the securities in which the Fund invests and may lead to losses on your investment in the Fund.
Cybersecurity Risk.
With the increased use of technologies by Fund service providers to conduct business, such as the Internet, the Fund is susceptible to operational, information security and related risks. The Fund relies on communications technology, systems, and networks to engage with clients, employees, accounts, shareholders, and service providers, and a cyber incident may inhibit the Fund’s ability to use these technologies. In general, cyber incidents can result from deliberate attacks or unintentional events. Cybersecurity failures by or breaches of the Fund’s investment adviser or administrator and other service providers (including, but not limited to, the custodian or transfer agent), and the issuers of securities in which the Fund invests, may disrupt and otherwise adversely affect their business operations. This may result in financial losses of the Fund, impede Fund trading, interfere with the Fund’s ability to calculate its NAV, limit a Fund shareholders’ ability to transact business or cause violations of applicable privacy and other laws, regulatory fines, penalties, reputational damage, reimbursement or other compensation costs, litigation costs, or additional compliance costs.
Geopolitical Risk.
The increasing interconnectivity between global economies and markets increases the likelihood that events or conditions in one country, region, sector, industry or market or, with respect to one company, may adversely impact issuers in a different country, region, industry or market. For example, adverse developments in the banking or financial services could impact companies operating in various sectors or industries and adversely impact the Fund’s investments. Securities in the Fund’s portfolio may underperform due to inflation (or expectations for inflation), interest rates, global demand for particular products or resources, natural disasters, health emergencies (such as epidemics and pandemics), terrorism, regulatory events and governmental or quasi-governmental actions. The occurrence of global events similar to those in recent years, such as terrorist attacks around the world, natural disasters, health emergencies, social and political discord, war or debt crises and downgrades, among others, may result in market volatility and may have long term effects on both the U.S. and global financial markets. Other financial, economic and other global market and social developments or disruptions may result in similar adverse circumstances, and it is difficult to predict when similar events affecting the U.S. or global financial markets may occur, the effects that such events may have and the duration of those effects (which may last for extended periods). Such global events may negatively impact broad segments of businesses and populations, cause a significant negative impact on the performance of the Fund’s investments, adversely affect and increase the volatility of the Fund’s share price and/or exacerbate preexisting political, social and economic risks to the Fund. The Fund’s operations may be interrupted and any such event(s) could have a significant adverse impact on the value and risk profile of the Fund’s portfolio. There is a risk that you may lose money by investing in the Fund.
Regulatory Risk.
To the extent that legislation or state or federal regulators that regulate certain financial institutions impose additional requirements or restrictions with respect to the ability of such institutions to make loans, particularly in connection with highly leveraged transactions, the availability of Senior Loans for investment may be adversely affected. Further, such legislation or regulation could depress the market value of Senior Loans.
Market Disruption.
Global instability, war, geopolitical tensions and terrorist attacks in the United States and around the world have previously resulted, and may in the future result in market volatility and may have long-term effects on the United States and worldwide financial markets and may cause further economic uncertainties in the United States and worldwide. The Fund cannot predict the effects of significant future events on the global economy and securities markets. A similar disruption of the financial markets could impact interest rates, auctions, secondary trading, ratings, credit risk, inflation and other factors relating to the common shares. In particular, Non-Investment Grade Bonds and Senior Loans tend to be more volatile than higher rated fixed-income securities so that these events and any actions resulting from them may have a greater impact on the prices and volatility of Non-Investment Grade Bonds and Senior Loans than on higher rated fixed-income securities.
Anti-Takeover Provisions.
The Fund’s Agreement and Declaration of Trust (the “Declaration of Trust”) and Amended and Restated By-Laws include provisions that could have the effect of limiting the ability of other persons or entities to acquire control of the Fund or to change the composition of its Board. For example, pursuant to the Fund’s Declaration of Trust, the Board is divided into three classes of Trustees with each class serving for a three-year term and certain types of transactions require the favorable vote of holders of at least 75% of the outstanding shares of the Fund.
General Fund Investing Risks.
The Fund is not a complete investment program and there is no guarantee that the Fund will achieve its investment objective. It is possible to lose money by investing in the Fund. An investment in the Fund is not a deposit in a bank and is not insured or guaranteed by the Federal Deposit Insurance Corporation or any other government agency.
There have been no material changes to the Fund’s investment objectives or principal investment strategies since June 30, 2023.
See Endnotes and Additional Disclosures in this report.
Eaton Vance
Senior Income Trust
June 30, 2024
The purpose of the table below is to help you understand all fees and expenses that you, as a common shareholder, would bear directly or indirectly. The table reflects the Trust’s issuance of preferred shares and borrowings, and shows Trust expenses as a percentage of net assets attributable to common shares for the year ended June 30, 2024.
Common shareholder transaction expenses |
|
| Sales load paid by you (as a percentage of offering price) |
— 1 |
| Offering expenses (as a percentage of offering price) |
None 2 |
| Dividend reinvestment plan fees |
$5.00 3 |
Annual expenses |
Percentage of net assets
attributable to common shares4 |
| Investment adviser fee |
1.09% 5 |
| Interest and fee expense 6 |
1.21 7 |
| Other expenses |
0.91 |
| Acquired fund fees and expenses |
0.12 |
| Total annual Trust operating expenses |
3.33% |
| Dividends on preferred shares |
2.46 7 |
| Total annual Trust operating expenses and dividends on preferred shares |
5.79% |
Example
The following example illustrates the expenses that common shareholders would pay on a $1,000 investment in common shares, assuming (i) total annual expenses and dividends on preferred shares of 5.79% of net assets attributable to common shares in years 1 through 10; (ii) a 5% annual return; and (iii) all distributions are reinvested at NAV:
1 Year |
3 Years |
5 Years |
10 Years |
| $58 |
$172 |
$284 |
$557 |
The above table and example and the assumption in the example of a 5% annual return are required by regulations of the U.S. Securities and Exchange Commission (“SEC”) that are applicable to all investment companies; the assumed 5% annual return is not a prediction of, and does not represent, the projected or actual performance of the Trust’s common shares. In addition, while the example assumes reinvestment of all dividends and distributions at NAV, participants in the Trust’s dividend reinvestment plan may receive common shares purchased or issued at a price or value different from NAV. The example does not include sales load or estimated offering costs, which would cause the expenses shown in the example to increase. The example should not be considered a representation of past or future expenses, and the Trust’s actual expenses may be greater or less than those shown. Moreover,
the
Trust’s actual rate of return may be greater or less than the hypothetical 5% return shown in the example.
1
If common shares are sold to or through underwriters, the Prospectus Supplement will set forth any applicable sales load.
2
Eaton Vance Management (“EVM”) will pay the expenses of the offering (other than the applicable commissions); therefore, offering expenses are not included in the Summary of Fund Expenses. Offering expenses generally include, but are not limited to, the preparation, review and filing with the SEC of the Trust’s registration statement (including its current Prospectus Supplement, the accompanying Prospectus and Statement of Additional Information (“SAI”)), the preparation, review and filing of any associated marketing or similar materials, costs associated with the printing, mailing or other distribution of its current Prospectus Supplement, the accompanying Prospectus, SAI and/or marketing materials, associated filing fees, stock exchange listing fees, and legal and auditing fees associated with the offering.
3
You will be charged a $5.00 service charge and pay brokerage charges if you direct the plan agent to sell your common shares held in a dividend reinvestment account.
4
Stated as a percentage of average net assets attributable to common shares for the year ended June 30, 2024.
5
The investment adviser fee paid by the Trust to EVM is based on the average weekly gross assets of the Trust, including all assets attributable to any form of investment leverage that the Trust may utilize. Accordingly, if the Trust were to increase investment leverage in the future, the investment adviser fee will increase as a percentage of net assets. Pursuant to the investment advisory agreement, the investment adviser fee was computed at an annual rate of 0.71% of the Trust’s average weekly gross assets through April 30, 2024 and beginning May 1, 2024, at 0.70% of the Trust’s average weekly gross assets, and is payable monthly. The annual investment adviser fee rate shall be reduced to the following as of the stated date: May 1, 2025: 0.69% and May 1, 2026: 0.55%.
6
Interest and fee expense relates to the notes payable.
7
As of June 30, 2024, the outstanding borrowings represented approximately 7.66% leverage and the preferred shares represented approximately 23.99% leverage, totaling 31.65% leverage.
Eaton Vance
Senior Income Trust
June 30, 2024
Trading and NAV Information
The Trust’s common shares have traded both at a premium and a discount to NAV. The Trust cannot predict whether its shares will trade in the future at a premium or discount to NAV. The provisions of the Investment Company Act of 1940, as amended (the “1940 Act”), generally require that the public offering price of common shares (less any underwriting commissions and discounts) must equal or exceed the NAV per share of a company’s common stock. The issuance of common shares may have an adverse effect on prices in the secondary market for the Trust’s common shares by increasing the number of common shares available, which may put downward pressure on the market price for the Trust’s common shares. Shares of common stock of closed-end investment companies frequently trade at a discount from NAV.
In addition, the Trust’s Board of Trustees has authorized the Trust to
repurchase
up to 10% of its outstanding common shares
as
of the last day of the prior calendar year at market prices when shares are trading at a discount to net asset value. The share repurchase program does not obligate the Trust to purchase a specific amount of shares. The results of the share repurchase program are disclosed in the Trust’s annual and semi-annual reports to shareholders.
The following table sets forth for each of the periods indicated the high and low closing market prices for the common shares on the New York Stock Exchange, and the corresponding NAV per share and the premium or discount to NAV per share at which the Trust’s common shares were trading as of such date.
| |
Market Price ($) |
|
NAV per Share on
Date of Market Price ($) |
|
NAV Premium/(Discount) on
Date of Market Price (%) |
Fiscal Quarter Ended |
High |
Low |
|
High |
Low |
|
High |
Low |
| June 30, 2024 |
6.50 |
6.29 |
|
6.23 |
6.18 |
|
4.33 |
1.78 |
| March 31, 2024 |
6.74 |
6.23 |
|
6.25 |
6.23 |
|
7.84 |
0.00 |
| December 31, 2023 |
6.31 |
5.60 |
|
6.19 |
6.09 |
|
1.94 |
(8.05) |
| September 30, 2023 |
5.96 |
5.40 |
|
6.22 |
6.13 |
|
(4.18) |
(11.91) |
| June 30, 2023 |
5.46 |
5.21 |
|
6.11 |
6.00 |
|
(10.64) |
(13.17) |
| March 31, 2023 |
5.76 |
5.25 |
|
6.15 |
5.98 |
|
(6.34) |
(12.21) |
| December 31, 2022 |
5.51 |
5.12 |
|
6.00 |
5.92 |
|
(8.17) |
(13.51) |
| September 30, 2022 |
5.86 |
5.24 |
|
6.36 |
6.01 |
|
(7.86) |
(12.81) |
Eaton Vance
Senior Income Trust
June 30, 2024
The following table sets forth information regarding the Trust’s outstanding bank loans and preferred shares as of the end of each of the Trust’s last ten fiscal years. The information in the table below was taken from the Trust’s financial statements for each fiscal year in the ten-year period ended June 30, 2024, and such financial statements have been audited by Deloitte & Touche LLP, the Trust’s independent registered public accounting firm.
Fiscal Year Ended |
Notes
Payable
Outstanding
(in 000's) |
Asset
Coverage
per $1,000
of Notes
Payable ¹ |
Preferred
Shares
Outstanding |
Asset
Coverage
per
Preferred
Share ² |
Involuntary
Liquidation
Preference
per
Preferred
Share ³ |
Approximate
Market
Value per
Preferred
Share ³ |
| June 30, 2024 |
$12,000 |
13,064 |
1,504 |
$79,014 |
$25,000 |
$25,000 |
| June 30, 2023 |
20,000 |
8,235 |
1,504 |
71,481 |
25,000 |
25,000 |
| June 30, 2022 |
26,000 |
6,531 |
1,504 |
66,752 |
25,000 |
25,000 |
| June 30, 2021 |
103,000 |
3,903 |
1,504 |
71,484 |
25,000 |
25,000 |
| June 30, 2020 |
95,000 |
3,866 |
1,504 |
69,242 |
25,000 |
25,000 |
| June 30, 2019 |
103,000 |
3,957 |
1,504 |
72,464 |
25,000 |
25,000 |
| June 30, 2018 |
93,000 |
4,587 |
2,464 |
68,989 |
25,000 |
25,000 |
| June 30, 2017 |
92,000 |
4,613 |
2,464 |
69,078 |
25,000 |
25,000 |
| June 30, 2016 |
25,000 |
15,472 |
4,400 |
71,629 |
25,000 |
25,000 |
| June 30, 2015 |
60,000 |
7,267 |
4,400 |
64,119 |
25,000 |
25,000 |
1
Calculated by subtracting the Trust’s total liabilities (not including the notes payable and preferred shares) from the Trust’s total assets, and dividing the result by the notes payable balance in thousands.
2
Calculated by subtracting the Trust’s total liabilities (not including the notes payable and preferred shares) from the Trust’s total assets, dividing the result by the sum of the value of the notes payable and liquidation value of the preferred shares, and multiplying the result by the liquidation value of one preferred share.
3
Plus accumulated and unpaid dividends.
Eaton Vance
Senior Income Trust
June 30, 2024
Endnotes and Additional Disclosures
| † |
The views expressed in this report are those of the portfolio manager(s) and are current only through the date stated at the top of this page. These views are subject to change at any time based upon market or other conditions, and Eaton Vance and the Fund(s) disclaim any responsibility to update such views. These views may not be relied upon as investment advice and, because investment decisions are based on many factors, may not be relied upon as an indication of trading intent on behalf of any Eaton Vance fund. This commentary may contain statements that are not historical facts, referred to as “forward-looking statements.” The Fund’s actual future results may differ significantly from those stated in any forward-looking statement, depending on factors such as changes in securities or financial markets or general economic conditions, the volume of sales and purchases of Fund shares, the continuation of investment advisory, administrative and service contracts, and other risks discussed from time to time in the Fund’s filings with the Securities and Exchange Commission. |
‡ |
The information contained herein is provided for informational purposes only and does not constitute a solicitation of an offer to buy or sell Fund shares. Common shares of the Fund are available for purchase and sale only at current market prices in secondary market trading. |
| |
|
1 |
Morningstar® LSTA® US Leveraged Loan Index SM is an unmanaged index of the institutional leveraged loan market. Morningstar® LSTA® Leveraged Loan indices are a product of Morningstar, Inc. (“Morningstar”) and have been licensed for use. Morningstar® is a registered trademark of Morningstar licensed for certain use. Loan Syndications and Trading Association® and LSTA® are trademarks of the LSTA licensed for certain use by Morningstar, and further sublicensed by Morningstar for certain use. Neither Morningstar nor LSTA guarantees the accuracy and/or completeness of the Morningstar® LSTA® US Leveraged Loan IndexSM or any data included therein, and shall have no liability for any errors, omissions, or interruptions therein. Unless otherwise stated, index returns do not reflect the effect of any applicable sales charges, commissions, expenses, taxes or leverage, as applicable. It is not possible to invest directly in an index. |
2 |
Performance results reflect the effects of leverage. Included in the average annual total return at NAV for the five- and ten-year periods, as applicable, is the impact of the 2017 and 2019 tender and repurchase of a portion of the Fund’s APS at 95% and 92% of the Fund’s APS per share liquidation preference, respectively. Had these transactions not occurred, the total return at NAV would be lower for the Fund. Included in the average annual total return at NAV for the five- and ten-year periods is the impact of the 2021 tender offer by the Fund for a portion of its common shares at 99% of the Fund’s NAV. Had this tender offer not occurred, the total return at NAV would be lower for the Fund. |
3 |
The shares of the Fund often trade at a discount or premium to their net asset value. The discount or premium may vary over time and may be higher or lower than what is quoted in this report. For up-to-date premium/discount information, please refer to https://funds.eatonvance.com/closed-end-fund-prices.php. |
4 |
The Distribution Rate is based on the Fund’s last regular distribution per share in the period (annualized) divided by the Fund’s NAV or market price at the end of the period. The Fund’s distributions may be comprised of amounts characterized for federal income tax purposes as qualified and non-qualified ordinary dividends, capital gains and nondividend distributions, also known as return of capital. For additional information about nondividend distributions, please refer to Eaton Vance Closed-End Fund Distribution Notices (19a) posted on our website, eatonvance.com. The Fund will determine the federal income tax character of distributions paid to a shareholder after the end of the calendar year. This is reported on the IRS form 1099-DIV and provided to the shareholder shortly after each year-end. For information about the tax character of distributions made in prior calendar years, please refer to Performance-Tax Character of Distributions on the Fund’s webpage available at eatonvance.com. The Fund’s distributions are determined by the investment adviser based on its current assessment of the Fund’s long-term return potential. Fund distributions may be affected by numerous factors including changes in Fund performance, the cost of financing for leverage, portfolio holdings, realized and projected returns, and other factors. As portfolio and market conditions change, the rate of distributions paid by the Fund could change. |
5 |
Leverage represents the liquidation value of the Fund’s APS and borrowings outstanding as a percentage of Fund net assets applicable to common shares plus APS and borrowings outstanding. Use of leverage creates an opportunity for income, but creates risks including greater price volatility. The cost of leverage rises and falls with changes in short-term interest rates. The Fund may be required to maintain prescribed asset coverage for its leverage and may be required to reduce its leverage at an inopportune time. |
| |
Fund profile subject to change due to active management. |
Eaton Vance
Senior Income Trust
June 30, 2024
| Asset-Backed Securities — 10.1% |
Security |
Principal
Amount
(000's omitted) |
Value |
| ARES XXXIIR CLO Ltd., Series 2014-32RA, Class D, 11.434%, (3 mo. SOFR + 6.112%), 5/15/30 (1)(2) |
$ |
1,000 |
$ 1,002,712 |
| ARES XXXIV CLO Ltd., Series 2015-2A, Class ER, 12.429%, (3 mo. SOFR + 7.112%), 4/17/33 (1)(2) |
|
550 |
550,427 |
| Benefit Street Partners CLO XVIII Ltd., Series 2019-18A, Class ER, 12.34%, (3 mo. SOFR + 7.012%), 10/15/34 (1)(2) |
|
500 |
503,633 |
| BlueMountain CLO XXVI Ltd., Series 2019-26A, Class ER, 12.716%, (3 mo. SOFR + 7.392%), 10/20/34 (1)(2) |
|
1,000 |
1,004,764 |
| Canyon Capital CLO Ltd., Series 2019-2A, Class ER, 12.34%, (3 mo. SOFR + 7.012%), 10/15/34 (1)(2) |
|
400 |
397,519 |
| Carlyle Global Market Strategies CLO Ltd.: |
|
|
|
| Series 2012-3A, Class DR2, 12.09%, (3 mo. SOFR + 6.762%), 1/14/32 (1)(2) |
|
600 |
601,719 |
| Series 2015-5A, Class DR, 12.286%, (3 mo. SOFR + 6.962%), 1/20/32 (1)(2) |
|
500 |
493,494 |
| Cedar Funding X CLO Ltd., Series 2019-10A, Class ER, 12.086%, (3 mo. SOFR + 6.762%), 10/20/32 (1)(2) |
|
500 |
502,412 |
| Galaxy XV CLO Ltd., Series 2013-15A, Class ER, 12.235%, (3 mo. SOFR + 6.907%), 10/15/30 (1)(2) |
|
500 |
501,269 |
| Galaxy XXI CLO Ltd., Series 2015-21A, Class ER, 10.836%, (3 mo. SOFR + 5.512%), 4/20/31 (1)(2) |
|
500 |
501,399 |
| Golub Capital Partners CLO 23M Ltd., Series 2015-23A, Class ER, 11.336%, (3 mo. SOFR + 6.012%), 1/20/31 (1)(2) |
|
600 |
602,194 |
| Neuberger Berman Loan Advisers CLO 31 Ltd., Series 2019-31A, Class ER, 12.086%, (3 mo. SOFR + 6.762%), 4/20/31 (1)(2) |
|
500 |
503,710 |
| Palmer Square CLO Ltd.: |
|
|
|
| Series 2013-2A, Class DRR, 11.429%, (3 mo. SOFR + 6.112%), 10/17/31 (1)(2) |
|
450 |
451,938 |
| Series 2019-1A, Class DR, 12.084%, (3 mo. SOFR + 6.762%), 11/14/34 (1)(2) |
|
500 |
502,052 |
| Regatta XIV Funding Ltd., Series 2018-3A, Class E, 11.535%, (3 mo. SOFR + 6.212%), 10/25/31 (1)(2) |
|
300 |
300,328 |
| Regatta XVI Funding Ltd., Series 2019-2A, Class E, 12.59%, (3 mo. SOFR + 7.262%), 1/15/33 (1)(2) |
|
500 |
503,376 |
| Vibrant CLO XI Ltd., Series 2019-11A, Class D, 12.356%, (3 mo. SOFR + 7.032%), 7/20/32 (1)(2) |
|
500 |
498,800 |
| Voya CLO Ltd., Series 2013-1A, Class DR, 12.07%, (3 mo. SOFR + 6.742%), 10/15/30 (1)(2) |
|
1,000 |
903,212 |
| Wellfleet CLO Ltd., Series 2020-1A, Class D, 12.83%, (3 mo. SOFR + 7.502%), 4/15/33 (1)(2) |
|
550 |
542,436 |
Total Asset-Backed Securities
(identified cost $10,855,962) |
|
|
$ 10,867,394 |
Security |
Shares |
Value |
| BlackRock Floating Rate Income Strategies Fund, Inc. |
|
6,311 |
$ 81,664 |
Total Closed-End Funds
(identified cost $87,555) |
|
|
$ 81,664 |
Security |
Shares |
Value |
| Aerospace and Defense — 0.0% |
| IAP Worldwide Services LLC (3)(4)(5) |
|
28 |
$ 0 |
| |
|
|
$ 0 |
| Commercial Services & Supplies — 0.1% |
| Monitronics International, Inc. (4)(5) |
|
4,716 |
$ 99,035 |
| Phoenix Services International LLC (4)(5) |
|
7,568 |
37,367 |
| Phoenix Services International LLC (4)(5) |
|
690 |
3,407 |
| |
|
|
$ 139,809 |
| Electronics/Electrical — 0.0% (6) |
| Skillsoft Corp. (4)(5) |
|
1,256 |
$ 17,370 |
| |
|
|
$ 17,370 |
| Entertainment — 0.1% |
| New Cineworld Ltd. (4)(5) |
|
7,709 |
$ 134,667 |
| |
|
|
$ 134,667 |
| Health Care — 0.2% |
| Envision Parent, Inc. (4)(5) |
|
19,128 |
$ 192,476 |
| |
|
|
$ 192,476 |
| Household Durables — 0.3% |
| Serta Simmons Bedding, Inc. (4)(5) |
|
35,996 |
$ 260,971 |
| Serta SSB Equipment Co. (3)(4)(5) |
|
35,996 |
0 |
| |
|
|
$ 260,971 |
| Investment Companies — 0.0% (6) |
| Aegletes BV (4)(5) |
|
6,311 |
$ 13,695 |
| |
|
|
$ 13,695 |
| Pharmaceuticals — 0.4% |
| Covis Midco 1 SARL, Class A (4)(5) |
|
147 |
$ 75 |
| Covis Midco 1 SARL, Class B (4)(5) |
|
147 |
75 |
| Covis Midco 1 SARL, Class C (4)(5) |
|
147 |
75 |
14
See Notes to Financial Statements.
Eaton Vance
Senior Income Trust
June 30, 2024
Portfolio of Investments — continued
Security |
Shares |
Value |
| Pharmaceuticals (continued) |
| Covis Midco 1 SARL, Class D (4)(5) |
|
147 |
$ 75 |
| Covis Midco 1 SARL, Class E (4)(5) |
|
147 |
75 |
| Mallinckrodt International Finance SA (4)(5) |
|
8,609 |
464,886 |
| |
|
|
$ 465,261 |
| Retail — 0.0% |
| Jubilee Enterprise PCL, Class A1 (3)(4)(5) |
|
995 |
$ 0 |
| Jubilee Enterprise PCL, Class A2 (3)(4)(5) |
|
795,141 |
0 |
| |
|
|
$ 0 |
| Retailers (Except Food and Drug) — 0.0% |
| Phillips Feed Service, Inc. (3)(4)(5) |
|
269 |
$ 0 |
| |
|
|
$ 0 |
| Telecommunications — 0.0% |
| GEE Acquisition Holdings Corp. (3)(4)(5) |
|
21,114 |
$ 0 |
| |
|
|
$ 0 |
Total Common Stocks
(identified cost $2,347,497) |
|
|
$ 1,224,249 |
Security |
Principal
Amount
(000's omitted) |
Value |
| Aerospace and Defense — 0.2% |
| Bombardier, Inc., 6.00%, 2/15/28 (1) |
$ |
100 |
$ 98,963 |
| TransDigm, Inc., 4.875%, 5/1/29 |
|
135 |
126,593 |
| |
|
|
$ 225,556 |
| Automotive — 0.5% |
| Clarios Global LP/Clarios U.S. Finance Co., 8.50%, 5/15/27 (1) |
$ |
500 |
$ 503,758 |
| |
|
|
$ 503,758 |
| Building and Development — 0.3% |
| CP Atlas Buyer, Inc., 7.00%, 12/1/28 (1) |
$ |
16 |
$ 13,695 |
| Smyrna Ready Mix Concrete LLC, 6.00%, 11/1/28 (1) |
|
135 |
132,036 |
| Standard Industries, Inc., 4.75%, 1/15/28 (1) |
|
135 |
128,581 |
| |
|
|
$ 274,312 |
| Business Equipment and Services — 0.8% |
| GEMS MENASA Cayman Ltd./GEMS Education Delaware LLC, 7.125%, 7/31/26 (1) |
$ |
500 |
$ 497,480 |
Security |
Principal
Amount
(000's omitted) |
Value |
| Business Equipment and Services (continued) |
| Prime Security Services Borrower LLC/Prime Finance, Inc., 5.75%, 4/15/26 (1) |
$ |
325 |
$ 322,802 |
| |
|
|
$ 820,282 |
| Cable and Satellite Television — 0.1% |
| CCO Holdings LLC/CCO Holdings Capital Corp., 4.50%, 8/15/30 (1) |
$ |
135 |
$ 114,390 |
| |
|
|
$ 114,390 |
| Commercial Services — 0.1% |
| Mavis Tire Express Services Topco Corp., 6.50%, 5/15/29 (1) |
$ |
130 |
$ 121,305 |
| |
|
|
$ 121,305 |
| Cosmetics/Toiletries — 0.1% |
| Edgewell Personal Care Co., 5.50%, 6/1/28 (1) |
$ |
135 |
$ 131,828 |
| |
|
|
$ 131,828 |
| Distribution & Wholesale — 0.4% |
| BCPE Empire Holdings, Inc., 7.625%, 5/1/27 (1) |
$ |
129 |
$ 125,124 |
| Performance Food Group, Inc., 5.50%, 10/15/27 (1) |
|
300 |
293,686 |
| |
|
|
$ 418,810 |
| Diversified Financial Services — 0.1% |
| VistaJet Malta Finance PLC/Vista Management Holding, Inc., 6.375%, 2/1/30 (1) |
$ |
135 |
$ 106,227 |
| |
|
|
$ 106,227 |
| Ecological Services and Equipment — 0.1% |
| GFL Environmental, Inc., 4.375%, 8/15/29 (1) |
$ |
98 |
$ 90,403 |
| |
|
|
$ 90,403 |
| Engineering & Construction — 0.1% |
| TopBuild Corp., 3.625%, 3/15/29 (1) |
$ |
135 |
$ 121,344 |
| |
|
|
$ 121,344 |
| Entertainment — 0.5% |
| Caesars Entertainment, Inc., 8.125%, 7/1/27 (1) |
$ |
500 |
$ 510,506 |
| |
|
|
$ 510,506 |
| Food Service — 0.1% |
| Albertsons Cos., Inc./Safeway, Inc./New Albertsons LP/Albertsons LLC, 3.50%, 3/15/29 (1) |
$ |
135 |
$ 121,546 |
| |
|
|
$ 121,546 |
See Notes to Financial Statements.
Eaton Vance
Senior Income Trust
June 30, 2024
Portfolio of Investments — continued
Security |
Principal
Amount
(000's omitted) |
Value |
| Health Care — 0.7% |
| LifePoint Health, Inc., 5.375%, 1/15/29 (1) |
$ |
135 |
$ 118,770 |
| Medline Borrower LP, 5.25%, 10/1/29 (1) |
|
64 |
61,127 |
| Tenet Healthcare Corp., 6.875%, 11/15/31 |
|
500 |
528,110 |
| |
|
|
$ 708,007 |
| Home Furnishings — 0.1% |
| Tempur Sealy International, Inc., 4.00%, 4/15/29 (1) |
$ |
135 |
$ 121,910 |
| |
|
|
$ 121,910 |
| Insurance — 0.1% |
| Alliant Holdings Intermediate LLC/Alliant Holdings Co.-Issuer, 6.75%, 10/15/27 (1) |
$ |
100 |
$ 98,726 |
| |
|
|
$ 98,726 |
| Leisure Goods/Activities/Movies — 0.2% |
| NCL Finance Ltd., 6.125%, 3/15/28 (1) |
$ |
124 |
$ 122,551 |
| Viking Cruises Ltd., 5.875%, 9/15/27 (1) |
|
135 |
133,688 |
| |
|
|
$ 256,239 |
| Media — 0.1% |
| Diamond Sports Group LLC/Diamond Sports Finance Co., 5.375%, 8/15/26 (1)(7) |
$ |
0 (8) |
$ 4 |
| iHeartCommunications, Inc., 6.375%, 5/1/26 |
|
102 |
79,592 |
| |
|
|
$ 79,596 |
| Oil and Gas — 0.3% |
| Civitas Resources, Inc., 8.375%, 7/1/28 (1) |
$ |
100 |
$ 104,908 |
| Permian Resources Operating LLC, 5.375%, 1/15/26 (1) |
|
135 |
133,716 |
| Vital Energy, Inc., 9.75%, 10/15/30 |
|
100 |
109,279 |
| |
|
|
$ 347,903 |
| Pipelines — 0.1% |
| Venture Global LNG, Inc., 8.375%, 6/1/31 (1) |
$ |
119 |
$ 123,519 |
| |
|
|
$ 123,519 |
| Real Estate Investment Trusts (REITs) — 0.1% |
| HAT Holdings I LLC/HAT Holdings II LLC, 3.375%, 6/15/26 (1) |
$ |
135 |
$ 127,427 |
| |
|
|
$ 127,427 |
| Surface Transport — 0.0% (6) |
| Hertz Corp., 4.625%, 12/1/26 (1) |
$ |
46 |
$ 33,420 |
| |
|
|
$ 33,420 |
Security |
Principal
Amount
(000's omitted) |
Value |
| Technology — 0.1% |
| athenahealth Group, Inc., 6.50%, 2/15/30 (1) |
$ |
135 |
$ 124,413 |
| |
|
|
$ 124,413 |
| Utilities — 0.5% |
| Calpine Corp., 5.00%, 2/1/31 (1) |
$ |
134 |
$ 125,146 |
| NRG Energy, Inc., 3.625%, 2/15/31 (1) |
|
500 |
429,174 |
| |
|
|
$ 554,320 |
| Wireless Telecommunication Services — 0.3% |
| Digicel Intermediate Holdings Ltd./Digicel International Finance Ltd./DIFL U.S., 10.50%, (9.00% cash and 1.50% PIK), 5/25/27 |
$ |
276 |
$ 273,781 |
| |
|
|
$ 273,781 |
Total Corporate Bonds
(identified cost $6,378,425) |
|
|
$ 6,409,528 |
| Senior Floating-Rate Loans — 131.0% (9) |
Borrower/Description |
Principal
Amount * (000's omitted) |
Value |
| Aerospace and Defense — 1.1% |
| Dynasty Acquisition Co., Inc.: |
|
|
|
| Term Loan, 8.844%, (SOFR + 3.50%), 8/24/28 |
|
143 |
$ 144,016 |
| Term Loan, 8.844%, (SOFR + 3.50%), 8/24/28 |
|
55 |
55,529 |
| IAP Worldwide Services, Inc., Term Loan - Second Lien, 0.00%, 7/18/23 (3)(7) |
|
202 |
160,817 |
| Novaria Holdings LLC, Term Loan, 6/6/31 (10) |
|
350 |
352,625 |
| TransDigm, Inc., Term Loan, 7.843%, (SOFR + 2.50%), 8/24/28 |
|
499 |
500,250 |
| |
|
|
$ 1,213,237 |
| Airlines — 0.9% |
| American Airlines, Inc., Term Loan, 10.336%, (SOFR + 4.75%), 4/20/28 |
|
740 |
$ 765,206 |
| Mileage Plus Holdings LLC, Term Loan, 10.744%, (SOFR + 5.25%), 6/21/27 |
|
210 |
214,554 |
| |
|
|
$ 979,760 |
| Apparel & Luxury Goods — 0.9% |
| ABG Intermediate Holdings 2 LLC, Term Loan, 12/21/28 (10) |
|
125 |
$ 125,117 |
See Notes to Financial Statements.
Eaton Vance
Senior Income Trust
June 30, 2024
Portfolio of Investments — continued
Borrower/Description |
Principal
Amount * (000's omitted) |
Value |
| Apparel & Luxury Goods (continued) |
| Gloves Buyer, Inc., Term Loan, 9.345%, (SOFR + 4.00%), 12/29/27 |
|
856 |
$ 852,858 |
| |
|
|
$ 977,975 |
| Auto Components — 3.2% |
| Adient U.S. LLC, Term Loan, 8.094%, (SOFR + 2.75%), 1/31/31 |
|
322 |
$ 323,966 |
| Autokiniton U.S. Holdings, Inc., Term Loan, 9.458%, (SOFR + 4.00%), 4/6/28 |
|
728 |
733,051 |
| Clarios Global LP, Term Loan, 8.344%, (SOFR + 3.00%), 5/6/30 |
|
623 |
626,068 |
| DexKo Global, Inc.: |
|
|
|
| Term Loan, 7.722%, (3 mo. EURIBOR + 4.00%), 10/4/28 |
EUR |
91 |
94,782 |
| Term Loan, 7.722%, (3 mo. EURIBOR + 4.00%), 10/4/28 |
EUR |
134 |
139,194 |
| Term Loan, 9.346%, (SOFR + 3.75%), 10/4/28 |
|
196 |
194,734 |
| Garrett LX I SARL, Term Loan, 8.076%, (SOFR + 2.75%), 4/30/28 |
|
340 |
340,375 |
| LTI Holdings, Inc., Term Loan, 10.208%, (SOFR + 4.75%), 7/24/26 |
|
268 |
265,720 |
| RealTruck Group, Inc.: |
|
|
|
| Term Loan, 8.958%, (SOFR + 3.50%), 1/31/28 |
|
491 |
490,371 |
| Term Loan, 10.458%, (SOFR + 5.00%), 1/31/28 |
|
200 |
198,876 |
| |
|
|
$ 3,407,137 |
| Automobiles — 0.7% |
| MajorDrive Holdings IV LLC: |
|
|
|
| Term Loan, 9.596%, (SOFR + 4.00%), 6/1/28 |
|
315 |
$ 316,179 |
| Term Loan, 10.985%, (SOFR + 5.50%), 6/1/29 |
|
415 |
418,467 |
| |
|
|
$ 734,646 |
| Beverages — 1.5% |
| Arterra Wines Canada, Inc., Term Loan, 9.096%, (SOFR + 3.50%), 11/24/27 |
|
483 |
$ 447,820 |
| City Brewing Co. LLC: |
|
|
|
| Term Loan, 9.09%, (SOFR + 3.50%), 4/5/28 |
|
154 |
140,842 |
| Term Loan, 11.574%, (SOFR + 6.25%), 4/5/28 |
|
50 |
50,478 |
| Term Loan - Second Lien, 10.59%, (SOFR + 5.26%), 9.09% cash, 1.50% PIK, 4/5/28 |
|
304 |
242,805 |
| Triton Water Holdings, Inc., Term Loan, 8.846%, (SOFR + 3.25%), 3/31/28 |
|
728 |
728,487 |
| |
|
|
$ 1,610,432 |
| Biotechnology — 0.4% |
| Alkermes, Inc., Term Loan, 7.832%, (SOFR + 2.50%), 3/12/26 |
|
179 |
$ 179,305 |
Borrower/Description |
Principal
Amount * (000's omitted) |
Value |
| Biotechnology (continued) |
| Alltech, Inc., Term Loan, 9.458%, (SOFR + 4.00%), 10/13/28 |
|
296 |
$ 295,686 |
| |
|
|
$ 474,991 |
| Building Products — 2.3% |
| Cornerstone Building Brands, Inc., Term Loan, 8.679%, (SOFR + 3.25%), 4/12/28 |
|
449 |
$ 438,749 |
| LHS Borrower LLC, Term Loan, 10.194%, (SOFR + 4.75%), 2/16/29 |
|
287 |
271,889 |
| MI Windows and Doors LLC, Term Loan, 8.844%, (SOFR + 3.50%), 3/28/31 |
|
700 |
705,250 |
| Oscar AcquisitionCo LLC, Term Loan, 9.585%, (SOFR + 4.25%), 4/29/29 |
|
720 |
720,918 |
| Standard Industries, Inc., Term Loan, 7.344%, (SOFR + 2.00%), 9/22/28 |
|
277 |
277,987 |
| |
|
|
$ 2,414,793 |
| Capital Markets — 5.4% |
| Advisor Group, Inc., Term Loan, 9.344%, (SOFR + 4.00%), 8/17/28 |
|
495 |
$ 497,025 |
| AllSpring Buyer LLC, Term Loan, 8.887%, (SOFR + 3.25%), 11/1/28 |
|
390 |
389,561 |
| Aretec Group, Inc., Term Loan, 9.344%, (SOFR + 4.00%), 8/9/30 |
|
935 |
939,708 |
| Citco Funding LLC, Term Loan, 8.097%, (SOFR + 2.75%), 4/27/28 |
|
223 |
224,290 |
| Edelman Financial Center LLC, Term Loan, 8.595%, (SOFR + 3.25%), 4/7/28 |
|
813 |
814,593 |
| EIG Management Co. LLC, Term Loan, 10.329%, (SOFR + 5.00%), 5/17/29 |
|
125 |
124,063 |
| FinCo I LLC, Term Loan, 8.33%, (SOFR + 3.00%), 6/27/29 |
|
347 |
347,896 |
| Focus Financial Partners LLC, Term Loan, 8.094%, (SOFR + 2.75%), 6/30/28 |
|
298 |
298,134 |
| Franklin Square Holdings LP, Term Loan, 7.594%, (SOFR + 2.25%), 4/25/31 |
|
275 |
275,344 |
| HighTower Holdings LLC, Term Loan, 9.586%, (SOFR + 4.00%), 4/21/28 |
|
813 |
815,913 |
| Kestra Advisor Services Holdings A, Inc., Term Loan, 9.344%, (SOFR + 4.00%), 3/22/31 |
|
475 |
477,375 |
| Mariner Wealth Advisors LLC, Term Loan, 8.335%, (SOFR + 3.00%), 8/18/28 |
|
122 |
121,745 |
| Press Ganey Holdings, Inc., Term Loan, 8.844%, (SOFR + 3.50%), 4/30/31 |
|
425 |
425,266 |
| |
|
|
$ 5,750,913 |
See Notes to Financial Statements.
Eaton Vance
Senior Income Trust
June 30, 2024
Portfolio of Investments — continued
Borrower/Description |
Principal
Amount * (000's omitted) |
Value |
| Chemicals — 9.0% |
| Aruba Investments Holdings LLC: |
|
|
|
| Term Loan, 7.646%, (1 mo. EURIBOR + 4.00%), 11/24/27 |
EUR |
242 |
$ 253,640 |
| Term Loan, 9.444%, (SOFR + 4.00%), 11/24/27 |
|
339 |
336,239 |
| Axalta Coating Systems U.S. Holdings, Inc., Term Loan, 7.335%, (SOFR + 2.00%), 12/20/29 |
|
523 |
524,632 |
| Charter NEX U.S., Inc., Term Loan, 8.844%, (SOFR + 3.50%), 12/1/27 |
|
466 |
466,929 |
| CPC Acquisition Corp., Term Loan, 9.346%, (SOFR + 3.75%), 12/29/27 |
|
401 |
336,096 |
| Gemini HDPE LLC, Term Loan, 8.591%, (SOFR + 3.00%), 12/31/27 |
|
323 |
323,851 |
| Groupe Solmax, Inc., Term Loan, 10.283%, (SOFR + 4.75%), 5/29/28 (11) |
|
355 |
345,318 |
| INEOS Enterprises Holdings U.S. Finco LLC, Term Loan, 9.197%, (SOFR + 3.75%), 7/8/30 |
|
324 |
321,959 |
| INEOS Finance PLC, Term Loan, 6.396%, (1 mo. EURIBOR + 2.75%), 11/8/28 |
EUR |
175 |
186,089 |
| INEOS Quattro Holdings U.K. Ltd.: |
|
|
|
| Term Loan, 7.646%, (1 mo. EURIBOR + 4.00%), 3/14/30 |
EUR |
75 |
80,271 |
| Term Loan, 9.194%, (SOFR + 3.75%), 3/14/30 |
|
124 |
123,286 |
| Term Loan, 9.694%, (SOFR + 4.25%), 4/2/29 |
|
975 |
975,056 |
| INEOS U.S. Finance LLC: |
|
|
|
| Term Loan, 7.944%, (SOFR + 2.50%), 11/8/28 |
|
147 |
146,570 |
| Term Loan, 8.597%, (SOFR + 3.25%), 2/18/30 |
|
718 |
716,442 |
| Term Loan, 9.094%, (SOFR + 3.75%), 2/7/31 |
|
150 |
150,258 |
| Kraton Corp., Term Loan, 8.693%, (SOFR + 3.25%), 3/15/29 |
|
418 |
416,087 |
| Lonza Group AG, Term Loan, 9.36%, (SOFR + 3.93%), 7/3/28 |
|
704 |
683,561 |
| Momentive Performance Materials, Inc., Term Loan, 9.844%, (SOFR + 4.50%), 3/29/28 |
|
395 |
393,724 |
| Nouryon Finance BV, Term Loan, 8.829%, (SOFR + 3.50%), 4/3/28 |
|
174 |
174,426 |
| Olympus Water U.S. Holding Corp., Term Loan, 9.097%, (SOFR + 3.50%), 6/20/31 |
|
633 |
634,810 |
| Rohm Holding GmbH, Term Loan, 10.837%, (SOFR + 5.50%), 1/31/29 |
|
436 |
417,768 |
| SCUR-Alpha 1503 GmbH, Term Loan, 10.83%, (SOFR + 5.50%), 3/29/30 |
|
148 |
139,246 |
| Tronox Finance LLC, Term Loan, 8.094%, (SOFR + 2.75%), 4/4/29 |
|
650 |
652,010 |
| W.R. Grace & Co.-Conn., Term Loan, 8.594%, (SOFR + 3.25%), 9/22/28 |
|
789 |
793,612 |
| |
|
|
$ 9,591,880 |
Borrower/Description |
Principal
Amount * (000's omitted) |
Value |
| Commercial Services & Supplies — 4.9% |
| Albion Financing 3 SARL, Term Loan, 10.836%, (SOFR + 5.25%), 8/17/26 |
|
390 |
$ 391,950 |
| Allied Universal Holdco LLC, Term Loan, 9.194%, (SOFR + 3.75%), 5/12/28 |
|
790 |
788,367 |
| Belfor Holdings, Inc., Term Loan, 9.094%, (SOFR + 3.75%), 11/1/30 |
|
164 |
165,052 |
| EnergySolutions LLC, Term Loan, 9.094%, (SOFR + 3.75%), 9/20/30 |
|
777 |
783,640 |
| Foundever Worldwide Corp., Term Loan, 9.208%, (SOFR + 3.75%), 8/28/28 |
|
878 |
679,429 |
| Garda World Security Corp., Term Loan, 9.594%, (SOFR + 4.25%), 2/1/29 |
|
494 |
497,582 |
| GFL Environmental, Inc.: |
|
|
|
| Term Loan, 7.826%, (SOFR + 2.50%), 5/31/27 |
|
14 |
13,813 |
| Term Loan, 6/27/31 (10) |
|
250 |
249,375 |
| Heritage-Crystal Clean, Inc., Term Loan, 9.829%, (SOFR + 4.50%), 10/17/30 |
|
199 |
199,715 |
| LABL, Inc., Term Loan, 10.444%, (SOFR + 5.00%), 10/29/28 |
|
171 |
168,705 |
| Monitronics International, Inc., Term Loan, 13.091%, (SOFR + 7.50%), 6/30/28 |
|
258 |
258,152 |
| Phoenix Services International LLC, Term Loan, 11.444%, (SOFR + 6.10%), 6/30/28 |
|
93 |
89,064 |
| Prime Security Services Borrower LLC, Term Loan, 10/13/30 (10) |
|
250 |
250,274 |
| Tempo Acquisition LLC, Term Loan, 7.594%, (SOFR + 2.25%), 8/31/28 |
|
491 |
492,681 |
| TruGreen LP, Term Loan, 9.444%, (SOFR + 4.00%), 11/2/27 |
|
290 |
277,618 |
| |
|
|
$ 5,305,417 |
| Construction Materials — 0.9% |
| Quikrete Holdings, Inc., Term Loan, 7.594%, (SOFR + 2.25%), 3/19/29 |
|
978 |
$ 979,307 |
| |
|
|
$ 979,307 |
| Consumer Staples Distribution & Retail — 0.9% |
| Cardenas Markets, Inc., Term Loan, 12.185%, (SOFR + 6.75%), 8/1/29 |
|
123 |
$ 123,532 |
| Peer Holding III BV: |
|
|
|
| Term Loan, 7.396%, (1 mo. EURIBOR + 3.75%), 9/29/28 |
EUR |
150 |
160,990 |
| Term Loan, 8.585%, (SOFR + 3.25%), 10/28/30 |
|
324 |
325,201 |
| Term Loan, 6/20/31 (10) |
|
375 |
375,860 |
| |
|
|
$ 985,583 |
See Notes to Financial Statements.
Eaton Vance
Senior Income Trust
June 30, 2024
Portfolio of Investments — continued
Borrower/Description |
Principal
Amount * (000's omitted) |
Value |
| Containers & Packaging — 1.6% |
| Altium Packaging LLC, Term Loan, 7.844%, (SOFR + 2.50%), 6/5/31 |
|
125 |
$ 125,000 |
| Berlin Packaging LLC, Term Loan, 9.144%, (SOFR + 3.75%), 6/9/31 (11) |
|
515 |
516,512 |
| Clydesdale Acquisition Holdings, Inc., Term Loan, 9.119%, (SOFR + 3.68%), 4/13/29 |
|
638 |
640,409 |
| Pretium Packaging LLC, Term Loan - Second Lien, 11.33%, (SOFR + 6.00%), 9.927% cash, 1.403% PIK, 10/2/28 |
|
14 |
11,862 |
| Pretium PKG Holdings, Inc., Term Loan - Second Lien, 12.333%, (SOFR + 6.75%), 10/1/29 |
|
100 |
61,250 |
| Proampac PG Borrower LLC, Term Loan, 9.326%, (SOFR + 4.00%), 9/15/28 |
|
323 |
324,438 |
| |
|
|
$ 1,679,471 |
| Distributors — 0.4% |
| CD&R Hydra Buyer, Inc., Term Loan, 9.444%, (SOFR + 4.00%), 3/25/31 |
|
374 |
$ 375,608 |
| Phillips Feed Service, Inc., Term Loan, 12.444%, (SOFR + 7.00%), 11/13/24 (3) |
|
49 |
29,595 |
| |
|
|
$ 405,203 |
| Diversified Consumer Services — 2.9% |
| Ascend Learning LLC, Term Loan, 8.944%, (SOFR + 3.50%), 12/11/28 |
|
571 |
$ 571,135 |
| Fugue Finance BV, Term Loan, 1/31/28 (10) |
|
600 |
605,475 |
| KUEHG Corp., Term Loan, 9.835%, (SOFR + 4.50%), 6/12/30 |
|
620 |
623,470 |
| Sotheby's, Term Loan, 10.09%, (SOFR + 4.50%), 1/15/27 |
|
501 |
462,328 |
| Spring Education Group, Inc., Term Loan, 10/4/30 (10) |
|
500 |
504,375 |
| Wand NewCo 3, Inc., Term Loan, 9.094%, (SOFR + 3.75%), 1/30/31 |
|
350 |
352,662 |
| |
|
|
$ 3,119,445 |
| Diversified Financial Services — 0.5% |
| Concorde Midco Ltd., Term Loan, 7.851%, (6 mo. EURIBOR + 4.00%), 3/1/28 |
EUR |
250 |
$ 267,236 |
| Sandy BidCo BV, Term Loan, 7.41%, (3 mo. EURIBOR + 3.60%), 8/17/29 |
EUR |
275 |
293,979 |
| |
|
|
$ 561,215 |
| Diversified Telecommunication Services — 2.2% |
| Altice France SA, Term Loan, 10.829%, (SOFR + 5.50%), 8/15/28 |
|
439 |
$ 324,030 |
| GEE Holdings 2 LLC: |
|
|
|
| Term Loan, 13.444%, (SOFR + 8.00%), 3/24/25 (3) |
|
186 |
149,071 |
Borrower/Description |
Principal
Amount * (000's omitted) |
Value |
| Diversified Telecommunication Services (continued) |
| GEE Holdings 2 LLC: (continued) |
|
|
|
| Term Loan - Second Lien, 13.597%, (SOFR + 8.25%), 5.347% cash, 8.25% PIK, 3/23/26 (3) |
|
446 |
$ 195,436 |
| Level 3 Financing, Inc.: |
|
|
|
| Term Loan, 4/15/29 (10) |
|
500 |
490,833 |
| Term Loan, 4/15/30 (10) |
|
150 |
146,111 |
| Virgin Media Bristol LLC, Term Loan, 8.693%, (SOFR + 3.25%), 1/31/29 |
|
1,075 |
1,029,564 |
| |
|
|
$ 2,335,045 |
| Electrical Equipment — 1.0% |
| AZZ, Inc., Term Loan, 8.594%, (SOFR + 3.25%), 5/13/29 |
|
258 |
$ 260,356 |
| WEC U.S. Holdings Ltd., Term Loan, 8.094%, (SOFR + 2.75%), 1/27/31 |
|
850 |
851,965 |
| |
|
|
$ 1,112,321 |
| Electronic Equipment, Instruments & Components — 2.3% |
| Chamberlain Group, Inc.: |
|
|
|
| Term Loan, 8.694%, (SOFR + 3.25%), 11/3/28 |
|
390 |
$ 390,348 |
| Term Loan, 8.844%, (SOFR + 3.50%), 11/3/28 |
|
324 |
325,504 |
| Creation Technologies, Inc., Term Loan, 11.068%, (SOFR + 5.50%), 10/5/28 |
|
393 |
366,229 |
| Ingram Micro, Inc., Term Loan, 8.596%, (SOFR + 3.00%), 6/30/28 |
|
398 |
400,451 |
| Mirion Technologies, Inc., Term Loan, 7.585%, (SOFR + 2.25%), 10/20/28 |
|
146 |
146,732 |
| Verifone Systems, Inc., Term Loan, 9.598%, (SOFR + 4.00%), 8/20/25 |
|
492 |
404,852 |
| Verisure Holding AB, Term Loan, 6.722%, (3 mo. EURIBOR + 3.00%), 3/27/28 |
EUR |
375 |
400,648 |
| |
|
|
$ 2,434,764 |
| Energy Equipment & Services — 0.3% |
| Ameriforge Group, Inc., Term Loan, 11.458%, (SOFR + 6.00%), 5.458% cash, 6.00% PIK, 12/31/25 (3) |
|
25 |
$ 11,411 |
| PG Investment Co. 59 SARL, Term Loan, 8.835%, (SOFR + 3.50%), 3/26/31 |
|
300 |
302,297 |
| |
|
|
$ 313,708 |
| Engineering & Construction — 1.4% |
| American Residential Services LLC, Term Loan, 9.096%, (SOFR + 3.50%), 10/15/27 |
|
265 |
$ 265,707 |
| Artera Services LLC, Term Loan, 9.835%, (SOFR + 4.50%), 2/15/31 |
|
125 |
125,545 |
| Azuria Water Solutions, Inc., Term Loan, 9.60%, (SOFR + 4.25%), 5/17/28 |
|
296 |
297,286 |
See Notes to Financial Statements.
Eaton Vance
Senior Income Trust
June 30, 2024
Portfolio of Investments — continued
Borrower/Description |
Principal
Amount * (000's omitted) |
Value |
| Engineering & Construction (continued) |
| Northstar Group Services, Inc., Term Loan, 10.014%, (SOFR + 4.75%), 5/8/30 |
|
575 |
$ 576,258 |
| Platea BC Bidco AB: |
|
|
|
| Term Loan, 4/2/31 (10) |
EUR |
188 |
200,887 |
| Term Loan, 4/2/31 (10) |
EUR |
38 |
40,177 |
| |
|
|
$ 1,505,860 |
| Entertainment — 0.9% |
| Crown Finance U.S., Inc., Term Loan, 13.958%, (SOFR + 8.50%), 6.958% cash, 7.00% PIK, 7/31/28 |
|
176 |
$ 178,635 |
| Renaissance Holding Corp., Term Loan, 9.597%, (SOFR + 4.25%), 4/5/30 |
|
273 |
273,069 |
| Vue Entertainment International Ltd., Term Loan, 12.428%, (6 mo. EURIBOR + 8.50%), 4.028% cash, 8.40% PIK, 12/31/27 |
EUR |
547 |
344,603 |
| Vue International Bidco PLC, Term Loan, 11.844%, (6 mo. EURIBOR + 8.00%), 6/30/27 |
EUR |
149 |
159,763 |
| |
|
|
$ 956,070 |
| Equity Real Estate Investment Trusts (REITs) — 0.3% |
| Iron Mountain, Inc., Term Loan, 7.594%, (SOFR + 2.25%), 1/31/31 |
|
274 |
$ 273,397 |
| |
|
|
$ 273,397 |
| Financial Services — 2.2% |
| CPI Holdco B LLC, Term Loan, 7.344%, (SOFR + 2.00%), 5/17/31 |
|
325 |
$ 324,797 |
| Grant Thornton Advisors LLC, Term Loan, 8.597%, (SOFR + 3.25%), 6/2/31 |
|
625 |
627,734 |
| GTCR W Merger Sub LLC, Term Loan, 8.335%, (SOFR + 3.00%), 1/31/31 |
|
850 |
851,594 |
| NCR Atleos LLC, Term Loan, 10.18%, (SOFR + 4.75%), 3/27/29 |
|
372 |
376,855 |
| Nuvei Technologies Corp., Term Loan, 8.444%, (SOFR + 3.00%), 12/19/30 |
|
224 |
224,435 |
| |
|
|
$ 2,405,415 |
| Food Products — 1.4% |
| 8th Avenue Food & Provisions, Inc., Term Loan, 10.208%, (SOFR + 4.75%), 10/1/25 |
|
146 |
$ 138,946 |
| CHG PPC Parent LLC, Term Loan, 8.458%, (SOFR + 3.00%), 12/8/28 |
|
122 |
122,549 |
| Del Monte Foods, Inc., Term Loan, 9.736%, (SOFR + 4.25%), 5/16/29 |
|
297 |
229,513 |
Borrower/Description |
Principal
Amount * (000's omitted) |
Value |
| Food Products (continued) |
| Nomad Foods U.S. LLC, Term Loan, 11/12/29 (10) |
|
600 |
$ 600,750 |
| United Petfood Group BV, Term Loan, 6.583%, (6 mo. EURIBOR + 2.75%), 4/24/28 |
EUR |
350 |
373,349 |
| |
|
|
$ 1,465,107 |
| Gas Utilities — 0.8% |
| CQP Holdco LP, Term Loan, 7.593%, (SOFR + 2.25%), 12/31/30 |
|
908 |
$ 909,897 |
| |
|
|
$ 909,897 |
| Health Care Equipment & Supplies — 1.5% |
| Bayou Intermediate II LLC, Term Loan, 10.091%, (SOFR + 4.50%), 8/2/28 |
|
390 |
$ 386,100 |
| Journey Personal Care Corp., Term Loan, 9.708%, (SOFR + 4.25%), 3/1/28 |
|
730 |
728,007 |
| Medline Borrower LP, Term Loan, 8.094%, (SOFR + 2.75%), 10/23/28 |
|
445 |
446,779 |
| |
|
|
$ 1,560,886 |
| Health Care Providers & Services — 9.1% |
| AEA International Holdings (Lux) SARL, Term Loan, 8.835%, (SOFR + 3.50%), 9/7/28 |
|
564 |
$ 565,046 |
| Biogroup-LCD, Term Loan, 7.314%, (3 mo. EURIBOR + 3.50%), 2/9/28 |
EUR |
125 |
129,685 |
| BW NHHC Holdco, Inc., Term Loan - Second Lien, 13.335%, (SOFR + 8.00%), 1/15/26 |
|
1,057 |
914,559 |
| Cano Health LLC: |
|
|
|
| DIP Loan, 16.326%, (SOFR + 11.00%), 10/7/24 |
|
73 |
73,406 |
| DIP Loan, 16.326%, (SOFR + 11.00%), 10/7/24 |
|
111 |
112,521 |
| Term Loan, 0.00%, 11/23/27 (7) |
|
978 |
272,409 |
| CCRR Parent, Inc., Term Loan, 9.708%, (SOFR + 4.25%), 3/6/28 |
|
686 |
584,714 |
| Cerba Healthcare SAS: |
|
|
|
| Term Loan, 7.346%, (1 mo. EURIBOR + 3.70%), 6/30/28 |
EUR |
125 |
120,800 |
| Term Loan, 7.596%, (1 mo. EURIBOR + 3.95%), 2/16/29 |
EUR |
150 |
145,984 |
| CHG Healthcare Services, Inc.: |
|
|
|
| Term Loan, 8.694%, (SOFR + 3.25%), 9/29/28 |
|
563 |
564,439 |
| Term Loan, 9.094%, (SOFR + 3.75%), 9/29/28 |
|
124 |
124,906 |
| CNT Holdings I Corp., Term Loan, 8.83%, (SOFR + 3.50%), 11/8/27 |
|
679 |
681,689 |
| Covis Finco SARL, Term Loan, 0.00%, 2/18/27 (7) |
|
181 |
73,339 |
| Electron BidCo, Inc., Term Loan, 8.458%, (SOFR + 3.00%), 11/1/28 |
|
196 |
195,683 |
| Ensemble RCM LLC, Term Loan, 8/1/29 (10) |
|
325 |
324,458 |
See Notes to Financial Statements.
Eaton Vance
Senior Income Trust
June 30, 2024
Portfolio of Investments — continued
Borrower/Description |
Principal
Amount * (000's omitted) |
Value |
| Health Care Providers & Services (continued) |
| IVC Acquisition Ltd.: |
|
|
|
| Term Loan, 8.795%, (6 mo. EURIBOR + 5.00%), 12/12/28 |
EUR |
400 |
$ 428,462 |
| Term Loan, 10.085%, (SOFR + 4.75%), 12/12/28 |
|
274 |
274,396 |
| LSCS Holdings, Inc., Term Loan, 9.958%, (SOFR + 4.61%), 12/16/28 |
|
171 |
168,990 |
| Medical Solutions Holdings, Inc., Term Loan, 8.694%, (SOFR + 3.25%), 11/1/28 |
|
638 |
483,371 |
| National Mentor Holdings, Inc.: |
|
|
|
| Term Loan, 3/2/28 (10) |
|
583 |
551,763 |
| Term Loan, 3/2/28 (10) |
|
17 |
15,863 |
| Option Care Health, Inc., Term Loan, 7.594%, (SOFR + 2.25%), 10/27/28 |
|
98 |
98,272 |
| Pacific Dental Services LLC, Term Loan, 8.579%, (SOFR + 3.25%), 3/15/31 |
|
224 |
225,244 |
| Phoenix Guarantor, Inc., Term Loan, 8.594%, (SOFR + 3.25%), 2/21/31 |
|
449 |
448,251 |
| Radnet Management, Inc., Term Loan, 7.827%, (SOFR + 2.50%), 4/18/31 |
|
200 |
200,375 |
| Select Medical Corp., Term Loan, 8.344%, (SOFR + 3.00%), 3/6/27 |
|
250 |
250,625 |
| Sound Inpatient Physicians, Term Loan - Second Lien, 10.596%, (SOFR + 5.00%), 9.096% cash, 1.50% PIK, 6/28/28 |
|
185 |
142,226 |
| Surgery Center Holdings, Inc., Term Loan, 8.089%, (SOFR + 2.75%), 12/19/30 |
|
645 |
647,784 |
| Synlab Bondco PLC: |
|
|
|
| Term Loan, 6.361%, (6 mo. EURIBOR + 2.50%), 7/1/27 |
EUR |
150 |
159,873 |
| Term Loan, 8.673%, (3 mo. EURIBOR + 4.75%), 12/23/30 |
EUR |
150 |
161,295 |
| TTF Holdings LLC, Term Loan, 3/31/28 (10) |
|
600 |
600,000 |
| |
|
|
$ 9,740,428 |
| Health Care Technology — 3.2% |
| athenahealth Group, Inc., Term Loan, 8.594%, (SOFR + 3.25%), 2/15/29 |
|
529 |
$ 527,655 |
| Certara LP, Term Loan, 8.341%, (SOFR + 3.00%), 6/26/31 |
|
468 |
470,153 |
| Imprivata, Inc., Term Loan, 8.83%, (SOFR + 3.50%), 12/1/27 |
|
972 |
978,895 |
| PointClickCare Technologies, Inc., Term Loan, 8.335%, (SOFR + 3.00%), 12/29/27 |
|
291 |
292,819 |
| Project Ruby Ultimate Parent Corp., Term Loan, 8.708%, (SOFR + 3.25%), 3/10/28 |
|
532 |
533,843 |
| Symplr Software, Inc., Term Loan, 9.93%, (SOFR + 4.50%), 12/22/27 |
|
658 |
619,262 |
| |
|
|
$ 3,422,627 |
Borrower/Description |
Principal
Amount * (000's omitted) |
Value |
| Hotels, Restaurants & Leisure — 6.1% |
| Caesars Entertainment, Inc., Term Loan, 8.097%, (SOFR + 2.75%), 2/6/31 |
|
648 |
$ 649,417 |
| Carnival Corp., Term Loan, 8.094%, (SOFR + 2.75%), 10/18/28 |
|
876 |
880,962 |
| ClubCorp Holdings, Inc., Term Loan, 10.596%, (SOFR + 5.26%), 9/18/26 |
|
333 |
335,155 |
| Fertitta Entertainment LLC, Term Loan, 9.081%, (SOFR + 3.75%), 1/27/29 |
|
592 |
593,467 |
| Flutter Financing BV, Term Loan, 7.585%, (SOFR + 2.25%), 11/25/30 |
|
846 |
847,230 |
| Great Canadian Gaming Corp., Term Loan, 9.609%, (SOFR + 4.00%), 11/1/26 |
|
441 |
443,343 |
| IRB Holding Corp., Term Loan, 8.194%, (SOFR + 2.75%), 12/15/27 |
|
349 |
349,398 |
| Ontario Gaming GTA LP, Term Loan, 9.585%, (SOFR + 4.25%), 8/1/30 |
|
274 |
275,221 |
| Oravel Stays Singapore Pte. Ltd., Term Loan, 13.859%, (SOFR + 8.25%), 6/23/26 |
|
173 |
174,356 |
| Playa Resorts Holding BV, Term Loan, 8.094%, (SOFR + 2.75%), 1/5/29 |
|
640 |
641,651 |
| Scientific Games Holdings LP, Term Loan, 8.306%, (SOFR + 3.00%), 4/4/29 |
|
600 |
599,700 |
| SeaWorld Parks & Entertainment, Inc., Term Loan, 7.844%, (SOFR + 2.50%), 8/25/28 |
|
718 |
718,930 |
| |
|
|
$ 6,508,830 |
| Household Durables — 2.2% |
| ACProducts, Inc., Term Loan, 9.846%, (SOFR + 4.25%), 5/17/28 |
|
723 |
$ 614,666 |
| Libbey Glass, Inc., Term Loan, 11.975%, (SOFR + 6.50%), 11/22/27 |
|
284 |
283,136 |
| Serta Simmons Bedding LLC: |
|
|
|
| Term Loan, 12.941%, (SOFR + 7.50%), 6/29/28 |
|
76 |
75,643 |
| Term Loan, 12.949%, (SOFR + 7.50%), 6/29/28 |
|
700 |
564,412 |
| Solis IV BV, Term Loan, 7.808%, (3 mo. EURIBOR + 4.00%), 2/26/29 |
EUR |
750 |
800,201 |
| |
|
|
$ 2,338,058 |
| Household Products — 1.0% |
| Kronos Acquisition Holdings, Inc.: |
|
|
|
| Term Loan, 9.314%, (SOFR + 4.00%), 6/27/31 |
|
500 |
$ 497,500 |
| Term Loan, 9.356%, (SOFR + 3.75%), 12/22/26 |
|
396 |
396,124 |
| Term Loan, 11.493%, (SOFR + 6.00%), 12/22/26 |
|
163 |
163,898 |
| |
|
|
$ 1,057,522 |
See Notes to Financial Statements.
Eaton Vance
Senior Income Trust
June 30, 2024
Portfolio of Investments — continued
Borrower/Description |
Principal
Amount * (000's omitted) |
Value |
| Industrials Conglomerates — 0.6% |
| Kohler Energy Co. LLC, Term Loan, 10.085%, (SOFR + 4.75%), 5/1/31 |
|
625 |
$ 628,386 |
| |
|
|
$ 628,386 |
| Insurance — 2.2% |
| Alliant Holdings Intermediate LLC, Term Loan, 8.831%, (SOFR + 3.50%), 11/6/30 |
|
622 |
$ 624,195 |
| AmWINS Group, Inc., Term Loan, 7.594%, (SOFR + 2.25%), 2/19/28 |
|
158 |
157,650 |
| Broadstreet Partners, Inc., Term Loan, 6/14/31 (10) |
|
600 |
599,015 |
| Ryan Specialty Group LLC, Term Loan, 8.094%, (SOFR + 2.75%), 9/1/27 |
|
748 |
752,826 |
| Truist Insurance Holdings LLC, Term Loan, 8.585%, (SOFR + 3.25%), 5/6/31 |
|
250 |
250,937 |
| |
|
|
$ 2,384,623 |
| Interactive Media & Services — 1.6% |
| Arches Buyer, Inc., Term Loan, 8.694%, (SOFR + 3.25%), 12/6/27 |
|
788 |
$ 755,309 |
| Buzz Finco LLC: |
|
|
|
| Term Loan, 8.194%, (SOFR + 2.75%), 1/29/27 |
|
263 |
263,752 |
| Term Loan, 8.679%, (SOFR + 3.25%), 1/29/27 |
|
262 |
262,157 |
| Getty Images, Inc., Term Loan, 9.935%, (SOFR + 4.50%), 2/19/26 |
|
463 |
463,212 |
| |
|
|
$ 1,744,430 |
| IT Services — 4.3% |
| Asurion LLC: |
|
|
|
| Term Loan - Second Lien, 10.708%, (SOFR + 5.25%), 1/31/28 |
|
750 |
$ 700,000 |
| Term Loan - Second Lien, 10.708%, (SOFR + 5.25%), 1/20/29 |
|
325 |
300,480 |
| Endure Digital, Inc., Term Loan, 8.944%, (SOFR + 3.50%), 2/10/28 |
|
982 |
913,519 |
| Gainwell Acquisition Corp., Term Loan, 9.435%, (SOFR + 4.00%), 10/1/27 |
|
737 |
711,080 |
| Go Daddy Operating Co. LLC, Term Loan, 7.344%, (SOFR + 2.00%), 11/9/29 |
|
498 |
499,530 |
| NAB Holdings LLC, Term Loan, 8.097%, (SOFR + 2.75%), 11/23/28 |
|
786 |
787,606 |
| Rackspace Technology Global, Inc.: |
|
|
|
| Term Loan, 11.692%, (SOFR + 6.25%), 5/15/28 |
|
192 |
194,305 |
| Term Loan - Second Lien, 8.192%, (SOFR + 2.75%), 5/15/28 |
|
961 |
449,483 |
| |
|
|
$ 4,556,003 |
Borrower/Description |
Principal
Amount * (000's omitted) |
Value |
| Leisure Products — 0.5% |
| Recess Holdings, Inc., Term Loan, 9.844%, (SOFR + 4.50%), 2/20/30 |
|
575 |
$ 579,492 |
| |
|
|
$ 579,492 |
| Life Sciences Tools & Services — 1.8% |
| Cambrex Corp., Term Loan, 8.944%, (SOFR + 3.50%), 12/4/26 |
|
144 |
$ 142,184 |
| Curia Global, Inc., Term Loan, 9.177%, (SOFR + 3.75%), 8/30/26 |
|
667 |
629,494 |
| IQVIA, Inc., Term Loan, 7.335%, (SOFR + 2.00%), 1/2/31 |
|
373 |
375,078 |
| LGC Group Holdings Ltd., Term Loan, 6.896%, (1 mo. EURIBOR + 3.25%), 4/21/27 |
EUR |
225 |
240,211 |
| Loire Finco Luxembourg SARL, Term Loan, 8.944%, (SOFR + 3.50%), 4/21/27 |
|
144 |
143,523 |
| Sotera Health Holdings LLC, Term Loan, 8.594%, (SOFR + 3.25%), 5/30/31 |
|
350 |
349,562 |
| |
|
|
$ 1,880,052 |
| Machinery — 7.3% |
| AI Aqua Merger Sub, Inc., Term Loan, 9.329%, (SOFR + 4.00%), 7/31/28 |
|
588 |
$ 589,746 |
| Alliance Laundry Systems LLC, Term Loan, 10/8/27 (10) |
|
700 |
703,412 |
| American Trailer World Corp., Term Loan, 9.194%, (SOFR + 3.75%), 3/3/28 |
|
255 |
249,803 |
| Apex Tool Group LLC: |
|
|
|
| Term Loan, 15.444%, (SOFR + 10.00%), 7.50% cash, 7.944% PIK, 2/8/30 |
|
196 |
190,348 |
| Term Loan - Second Lien, 12.694%, (SOFR + 7.35%), 5.344% cash, 7.35% PIK, 2/8/29 |
|
84 |
82,899 |
| Barnes Group, Inc., Term Loan, 7.844%, (SOFR + 2.50%), 9/3/30 |
|
149 |
149,415 |
| Conair Holdings LLC, Term Loan, 9.208%, (SOFR + 3.75%), 5/17/28 |
|
584 |
581,433 |
| CPM Holdings, Inc., Term Loan, 9/28/28 (10) |
|
499 |
495,318 |
| EMRLD Borrower LP, Term Loan, 7.844%, (SOFR + 2.50%), 5/31/30 |
|
216 |
216,162 |
| Engineered Machinery Holdings, Inc., Term Loan, 9.346%, (SOFR + 3.75%), 5/19/28 |
|
948 |
953,944 |
| Filtration Group Corp., Term Loan, 8.958%, (SOFR + 3.50%), 10/21/28 |
|
170 |
171,198 |
| Gates Global LLC, Term Loan, 7.594%, (SOFR + 2.25%), 6/4/31 |
|
700 |
701,604 |
| Icebox Holdco III, Inc., Term Loan, 9.346%, (SOFR + 3.75%), 12/22/28 |
|
196 |
196,456 |
| Madison IAQ LLC, Term Loan, 8.094%, (SOFR + 2.75%), 6/21/28 |
|
247 |
248,346 |
See Notes to Financial Statements.
Eaton Vance
Senior Income Trust
June 30, 2024
Portfolio of Investments — continued
Borrower/Description |
Principal
Amount * (000's omitted) |
Value |
| Machinery (continued) |
| Pro Mach Group, Inc., Term Loan, 8.844%, (SOFR + 3.50%), 8/31/28 |
|
297 |
$ 298,818 |
| Roper Industrial Products Investment Co. LLC, Term Loan, 8.585%, (SOFR + 3.25%), 11/22/29 |
|
420 |
421,873 |
| SPX Flow, Inc., Term Loan, 8.844%, (SOFR + 3.50%), 4/5/29 |
|
419 |
421,417 |
| TK Elevator Midco GmbH, Term Loan, 7.926%, (3 mo. EURIBOR + 4.00%), 4/30/30 |
EUR |
250 |
268,072 |
| TK Elevator Topco GmbH, Term Loan, 7.491%, (6 mo. EURIBOR + 3.63%), 7/30/27 |
EUR |
150 |
160,944 |
| TK Elevator U.S. Newco, Inc., Term Loan, 8.791%, (SOFR + 3.50%), 4/30/30 |
|
416 |
418,949 |
| Zephyr German BidCo GmbH, Term Loan, 7.446%, (6 mo. EURIBOR + 3.60%), 3/10/28 |
EUR |
300 |
318,675 |
| |
|
|
$ 7,838,832 |
| Media — 0.8% |
| Gray Television, Inc., Term Loan, 8.444%, (SOFR + 3.00%), 12/1/28 |
|
243 |
$ 219,193 |
| Hubbard Radio LLC, Term Loan, 9.844%, (SOFR + 4.50%), 9/30/27 |
|
178 |
143,057 |
| Sinclair Television Group, Inc., Term Loan, 8.091%, (SOFR + 2.50%), 9/30/26 |
|
286 |
268,682 |
| Univision Communications, Inc., Term Loan, 8.708%, (SOFR + 3.25%), 3/15/26 |
|
278 |
278,489 |
| |
|
|
$ 909,421 |
| Metals/Mining — 1.4% |
| Arsenal AIC Parent LLC, Term Loan, 9.094%, (SOFR + 3.75%), 8/18/30 |
|
720 |
$ 724,744 |
| Dynacast International LLC, Term Loan, 14.697%, (SOFR + 9.00%), 10/22/25 |
|
160 |
118,023 |
| PMHC II, Inc., Term Loan, 9.706%, (SOFR + 4.25%), 4/23/29 |
|
518 |
506,962 |
| WireCo WorldGroup, Inc., Term Loan, 9.075%, (SOFR + 3.75%), 11/13/28 |
|
109 |
109,097 |
| |
|
|
$ 1,458,826 |
| Oil, Gas & Consumable Fuels — 1.5% |
| Freeport LNG Investments LLLP, Term Loan, 12/21/28 (10) |
|
350 |
$ 350,049 |
| ITT Holdings LLC, Term Loan, 8.444%, (SOFR + 3.00%), 10/11/30 |
|
248 |
248,671 |
| Matador Bidco SARL, Term Loan, 10.194%, (SOFR + 4.75%), 10/15/26 |
|
670 |
672,082 |
Borrower/Description |
Principal
Amount * (000's omitted) |
Value |
| Oil, Gas & Consumable Fuels (continued) |
| Oryx Midstream Services Permian Basin LLC, Term Loan, 8.441%, (SOFR + 3.00%), 10/5/28 |
|
242 |
$ 242,835 |
| Oxbow Carbon LLC, Term Loan, 8.844%, (SOFR + 3.50%), 5/10/30 |
|
149 |
149,242 |
| |
|
|
$ 1,662,879 |
| Passenger Airlines — 0.2% |
| WestJet Loyalty LP, Term Loan, 9.048%, (SOFR + 3.75%), 2/14/31 |
|
250 |
$ 251,469 |
| |
|
|
$ 251,469 |
| Personal Products — 0.3% |
| Olaplex, Inc., Term Loan, 8.944%, (SOFR + 3.50%), 2/23/29 |
|
345 |
$ 332,759 |
| |
|
|
$ 332,759 |
| Pharmaceuticals — 1.4% |
| Jazz Financing Lux SARL, Term Loan, 8.458%, (SOFR + 3.00%), 5/5/28 |
|
655 |
$ 656,045 |
| Mallinckrodt International Finance SA: |
|
|
|
| Term Loan, 12.842%, (SOFR + 7.50%), 11/14/28 |
|
118 |
131,334 |
| Term Loan - Second Lien, 14.842%, (SOFR + 9.50%), 11/14/28 |
|
668 |
725,722 |
| |
|
|
$ 1,513,101 |
| Professional Services — 4.4% |
| AlixPartners LLP, Term Loan, 6.722%, (3 mo. EURIBOR + 3.00%), 2/4/28 |
EUR |
242 |
$ 259,475 |
| Camelot U.S. Acquisition LLC, Term Loan, 8.094%, (SOFR + 2.75%), 1/31/31 |
|
423 |
424,566 |
| CoreLogic, Inc., Term Loan, 8.958%, (SOFR + 3.50%), 6/2/28 |
|
491 |
483,487 |
| EAB Global, Inc., Term Loan, 8.594%, (SOFR + 3.50%), 8/16/28 |
|
495 |
494,927 |
| Employbridge Holding Co., Term Loan, 10.314%, (SOFR + 4.75%), 7/19/28 |
|
585 |
407,836 |
| Fleet Midco I Ltd., Term Loan, 8.594%, (SOFR + 3.25%), 2/21/31 |
|
200 |
201,250 |
| Genuine Financial Holdings LLC, Term Loan, 9.345%, (SOFR + 4.00%), 9/27/30 |
|
124 |
123,791 |
| Neptune Bidco U.S., Inc., Term Loan, 10.406%, (SOFR + 5.00%), 4/11/29 |
|
594 |
560,142 |
| Rockwood Service Corp., Term Loan, 9.458%, (SOFR + 4.00%), 1/23/27 |
|
219 |
220,746 |
| Techem Verwaltungsgesellschaft 675 GmbH, Term Loan, 7.426%, (1 mo. EURIBOR + 3.75%), 7/15/29 |
EUR |
425 |
455,211 |
See Notes to Financial Statements.
Eaton Vance
Senior Income Trust
June 30, 2024
Portfolio of Investments — continued
Borrower/Description |
Principal
Amount * (000's omitted) |
Value |
| Professional Services (continued) |
| Teneo Holdings LLC, Term Loan, 10.094%, (SOFR + 4.75%), 3/13/31 |
|
299 |
$ 300,326 |
| Vaco Holdings LLC, Term Loan, 10.485%, (SOFR + 5.00%), 1/21/29 |
|
495 |
492,243 |
| Wood Mackenzie Ltd., Term Loan, 8.823%, (SOFR + 3.50%), 2/7/31 |
|
325 |
327,641 |
| |
|
|
$ 4,751,641 |
| Real Estate Management & Development — 0.9% |
| Greystar Real Estate Partners LLC, Term Loan, 8.577%, (SOFR + 3.25%), 8/21/30 |
|
672 |
$ 676,639 |
| Homeserve USA Holding Corp., Term Loan, 7.839%, (SOFR + 2.50%), 10/21/30 |
|
274 |
275,227 |
| |
|
|
$ 951,866 |
| Road & Rail — 0.8% |
| First Student Bidco, Inc.: |
|
|
|
| Term Loan, 8.596%, (SOFR + 3.00%), 7/21/28 |
|
66 |
$ 65,671 |
| Term Loan, 8.596%, (SOFR + 3.00%), 7/21/28 |
|
216 |
215,931 |
| Hertz Corp., Term Loan, 9.098%, (SOFR + 3.75%), 6/30/28 |
|
199 |
180,841 |
| Uber Technologies, Inc., Term Loan, 8.089%, (SOFR + 2.75%), 3/3/30 |
|
396 |
398,135 |
| |
|
|
$ 860,578 |
| Semiconductors & Semiconductor Equipment — 0.8% |
| Altar Bidco, Inc.: |
|
|
|
| Term Loan, 7.947%, (SOFR + 3.10%), 2/1/29 |
|
614 |
$ 613,747 |
| Term Loan - Second Lien, 10.399%, (SOFR + 5.60%), 2/1/30 |
|
125 |
122,891 |
| Bright Bidco BV, Term Loan, 14.344%, (SOFR + 9.00%), 6.344% cash, 8.00% PIK, 10/31/27 |
|
206 |
98,737 |
| |
|
|
$ 835,375 |
| Software — 17.9% |
| Applied Systems, Inc., Term Loan, 8.835%, (SOFR + 3.50%), 2/24/31 |
|
199 |
$ 200,237 |
| AppLovin Corp., Term Loan, 7.844%, (SOFR + 2.50%), 8/16/30 |
|
558 |
559,069 |
| Astra Acquisition Corp.: |
|
|
|
| Term Loan, 10.585%, (SOFR + 5.25%), 10/25/28 |
|
213 |
86,400 |
| Term Loan, 12.026%, (SOFR + 6.75%), 2/25/28 |
|
153 |
139,978 |
| Term Loan, 18.665%, (SOFR + 13.33%), 10/25/29 |
|
319 |
97,195 |
| Banff Merger Sub, Inc.: |
|
|
|
| Term Loan, 7.896%, (1 mo. EURIBOR + 4.25%), 12/29/28 |
EUR |
119 |
128,127 |
| Term Loan, 9.344%, (SOFR + 4.25%), 12/29/28 |
|
958 |
960,727 |
Borrower/Description |
Principal
Amount * (000's omitted) |
Value |
| Software (continued) |
| Central Parent, Inc., Term Loan, 8.585%, (SOFR + 3.25%), 7/6/29 |
|
571 |
$ 563,777 |
| Cloud Software Group, Inc., Term Loan, 9.335%, (SOFR + 4.00%), 3/30/29 |
|
1,342 |
1,342,782 |
| Cloudera, Inc.: |
|
|
|
| Term Loan, 9.194%, (SOFR + 3.75%), 10/8/28 |
|
858 |
859,790 |
| Term Loan - Second Lien, 11.444%, (SOFR + 6.00%), 10/8/29 |
|
200 |
198,875 |
| Constant Contact, Inc., Term Loan, 2/10/28 (10) |
|
400 |
394,100 |
| Cornerstone OnDemand, Inc., Term Loan, 9.208%, (SOFR + 3.75%), 10/16/28 |
|
342 |
323,950 |
| Drake Software LLC, Term Loan, 9.595%, (SOFR + 4.25%), 6/17/31 |
|
550 |
545,875 |
| E2open LLC, Term Loan, 8.958%, (SOFR + 3.50%), 2/4/28 |
|
412 |
414,517 |
| ECI Macola Max Holding LLC, Term Loan, 9.085%, (SOFR + 3.75%), 5/31/30 |
|
629 |
633,820 |
| Epicor Software Corp.: |
|
|
|
| Term Loan, 0.00%, 5/30/31 (12) |
|
103 |
103,337 |
| Term Loan, 8.578%, (SOFR + 3.25%), 5/23/31 |
|
876 |
880,749 |
| Fiserv Investment Solutions, Inc., Term Loan, 9.326%, (SOFR + 4.00%), 2/18/27 |
|
445 |
428,981 |
| iSolved, Inc., Term Loan, 8.844%, (SOFR + 3.50%), 10/15/30 |
|
150 |
150,311 |
| Ivanti Software, Inc., Term Loan, 9.814%, (SOFR + 4.25%), 12/1/27 |
|
208 |
165,146 |
| Magenta Buyer LLC, Term Loan, 10.591%, (SOFR + 5.00%), 7/27/28 |
|
1 |
836 |
| Marcel LUX IV SARL, Term Loan, 9.32%, (SOFR + 4.00%), 11/11/30 |
|
374 |
377,569 |
| Maverick Bidco, Inc., Term Loan, 9.23%, (SOFR + 3.75%), 5/18/28 |
|
55 |
55,275 |
| McAfee LLC, Term Loan, 8.579%, (SOFR + 3.25%), 3/1/29 |
|
688 |
687,750 |
| OceanKey (U.S.) II Corp., Term Loan, 8.944%, (SOFR + 3.50%), 12/15/28 |
|
147 |
146,594 |
| Open Text Corp., Term Loan, 7.594%, (SOFR + 2.25%), 1/31/30 |
|
418 |
420,627 |
| Proofpoint, Inc., Term Loan, 8.344%, (SOFR + 3.00%), 8/31/28 |
|
975 |
977,156 |
| Quartz Acquireco LLC, Term Loan, 8.085%, (SOFR + 2.75%), 6/28/30 |
|
722 |
725,441 |
| Quest Software U.S. Holdings, Inc., Term Loan, 9.73%, (SOFR + 4.25%), 2/1/29 |
|
396 |
295,163 |
| Redstone Holdco 2 LP, Term Loan, 10.208%, (SOFR + 4.75%), 4/27/28 |
|
428 |
385,399 |
| Sabre GLBL, Inc., Term Loan, 9.694%, (SOFR + 4.25%), 6/30/28 |
|
1,000 |
906,667 |
See Notes to Financial Statements.
Eaton Vance
Senior Income Trust
June 30, 2024
Portfolio of Investments — continued
Borrower/Description |
Principal
Amount * (000's omitted) |
Value |
| Software (continued) |
| Skillsoft Corp., Term Loan, 10.708%, (SOFR + 5.25%), 7/14/28 |
|
297 |
$ 234,051 |
| SolarWinds Holdings, Inc., Term Loan, 8.594%, (SOFR + 3.25%), 2/5/27 |
|
447 |
447,742 |
| Sophia LP, Term Loan, 8.944%, (SOFR + 3.50%), 10/9/29 |
|
1,309 |
1,316,077 |
| UKG, Inc., Term Loan, 8.576%, (SOFR + 3.25%), 2/10/31 |
|
1,319 |
1,325,120 |
| Veritas U.S., Inc.: |
|
|
|
| Term Loan, 8.472%, (3 mo. EURIBOR + 4.75%), 9/1/25 |
EUR |
144 |
133,274 |
| Term Loan, 10.458%, (SOFR + 5.00%), 9/1/25 |
|
540 |
471,971 |
| Vision Solutions, Inc., Term Loan, 9.591%, (SOFR + 4.25%), 4/24/28 |
|
1,076 |
1,060,572 |
| |
|
|
$ 19,145,027 |
| Specialty Retail — 4.8% |
| Apro LLC, Term Loan, 6/26/31 (10) |
|
175 |
$ 175,437 |
| Boels Topholding BV, Term Loan, 7.052%, (3 mo. EURIBOR + 3.25%), 5/23/31 |
EUR |
237 |
253,850 |
| Great Outdoors Group LLC, Term Loan, 9.208%, (SOFR + 3.75%), 3/6/28 |
|
1,255 |
1,255,204 |
| Harbor Freight Tools USA, Inc., Term Loan, 7.844%, (SOFR + 2.50%), 6/5/31 |
|
600 |
599,042 |
| Hoya Midco LLC, Term Loan, 2/3/29 (10) |
|
500 |
502,812 |
| Les Schwab Tire Centers, Term Loan, 8.344%, (SOFR + 3.00%), 4/23/31 |
|
864 |
864,629 |
| LIDS Holdings, Inc., Term Loan, 10.994%, (SOFR + 5.50%), 12/14/26 |
|
76 |
75,937 |
| Mattress Firm, Inc., Term Loan, 9.846%, (SOFR + 4.25%), 9/25/28 |
|
777 |
777,291 |
| PetSmart, Inc., Term Loan, 9.194%, (SOFR + 3.75%), 2/11/28 |
|
623 |
621,444 |
| |
|
|
$ 5,125,646 |
| Trading Companies & Distributors — 3.0% |
| Beacon Roofing Supply, Inc., Term Loan, 7.345%, (SOFR + 2.00%), 5/19/28 |
|
149 |
$ 149,920 |
| DXP Enterprises, Inc., Term Loan, 10.164%, (SOFR + 4.75%), 10/11/30 |
|
199 |
200,013 |
| Foundation Building Materials Holding Co. LLC, Term Loan, 9.33%, (SOFR + 4.00%), 1/29/31 |
|
349 |
348,198 |
| Patagonia Bidco Ltd., Term Loan, 10.472%, (SONIA + 5.25%), 11/1/28 |
GBP |
375 |
409,302 |
| Spin Holdco, Inc., Term Loan, 9.60%, (SOFR + 4.00%), 3/4/28 |
|
1,245 |
1,063,392 |
Borrower/Description |
Principal
Amount * (000's omitted) |
Value |
| Trading Companies & Distributors (continued) |
| White Cap Buyer LLC, Term Loan, 8.594%, (SOFR + 3.25%), 10/19/29 |
|
667 |
$ 669,050 |
| Windsor Holdings III LLC, Term Loan, 9.339%, (SOFR + 4.00%), 8/1/30 |
|
323 |
325,210 |
| |
|
|
$ 3,165,085 |
| Transportation Infrastructure — 0.5% |
| KKR Apple Bidco LLC, Term Loan, 9/22/28 (10) |
|
499 |
$ 500,731 |
| |
|
|
$ 500,731 |
| Wireless Telecommunication Services — 0.6% |
| CCI Buyer, Inc., Term Loan, 9.335%, (SOFR + 4.00%), 12/17/27 |
|
493 |
$ 493,619 |
| SBA Senior Finance II LLC, Term Loan, 7.35%, (SOFR + 2.00%), 1/25/31 |
|
200 |
199,925 |
| |
|
|
$ 693,544 |
Total Senior Floating-Rate Loans
(identified cost $142,888,678) |
|
|
$140,301,106 |
Security |
Shares |
Value |
| Cable and Satellite Television — 0.0% |
| ACC Claims Holdings LLC (3) |
|
200,340 |
$ 0 |
Total Miscellaneous
(identified cost $0) |
|
|
$ 0 |
See Notes to Financial Statements.
Eaton Vance
Senior Income Trust
June 30, 2024
Portfolio of Investments — continued
| Short-Term Investments — 4.2% |
Security |
Shares |
Value |
| Morgan Stanley Institutional Liquidity Funds - Government Portfolio, Institutional Class, 5.22% (13) |
|
4,538,748 |
$ 4,538,748 |
Total Short-Term Investments
(identified cost $4,538,748) |
|
|
$ 4,538,748 |
Total Investments — 152.5%
(identified cost $167,096,865) |
|
|
$163,422,689 |
| Less Unfunded Loan Commitments — (0.1)% |
|
|
|
Net Investments — 152.4%
(identified cost $166,994,089) |
|
|
$163,319,913 |
| Other Assets, Less Liabilities — (52.4)% |
|
|
|
| Net Assets Applicable to Common Shares — 100.0% |
|
|
$107,135,786 |
| The percentage shown for each investment category in the Portfolio of Investments is based on net assets applicable to common shares. |
| * |
In U.S. dollars unless otherwise indicated. |
(1) |
Security exempt from registration under Rule 144A of the Securities Act of 1933, as amended. These securities may be sold in certain transactions in reliance on an exemption from registration (normally to qualified institutional buyers). At June 30, 2024, the aggregate value of these securities is $16,159,567 or 15.1% of the Trust's net assets applicable to common shares. |
(2) |
Variable rate security. The stated interest rate represents the rate in effect at June 30, 2024. |
(3) |
For fair value measurement disclosure purposes, security is categorized as Level 3 (see Note 10). |
(4) |
Non-income producing security. |
(5) |
Security was acquired in connection with a restructuring of a Senior Loan and may be subject to restrictions on resale. |
(6) |
Amount is less than 0.05%. |
(7) |
Issuer is in default with respect to interest and/or principal payments or has declared bankruptcy and is non-income producing. For a variable rate security, interest rate has been adjusted to reflect non-accrual status. |
(8) |
Principal amount is less than $500. |
(9) |
Senior floating-rate loans (Senior Loans) often require prepayments from excess cash flows or permit the borrowers to repay at their election. The degree to which borrowers repay, whether as a contractual requirement or at their election, cannot be predicted with accuracy. As a result, the actual remaining maturity may be substantially less than the stated maturities shown. However, Senior Loans will typically have an expected average life of approximately two to four years. Senior Loans typically have rates of interest which are redetermined periodically by reference to a base lending rate, plus a spread. These base lending rates are primarily the Secured Overnight Financing Rate (“SOFR”) and secondarily, the prime rate offered by one or more major United States banks (the “Prime Rate”). Base lending rates may be subject to a floor, or minimum rate. Rates for SOFR are generally 1 or 3-month tenors and may also be subject to a credit spread adjustment. Senior Loans are generally subject to contractual restrictions that must be satisfied before they can be bought or sold. |
(10) |
This Senior Loan will settle after June 30, 2024, at which time the interest rate will be determined. |
(11) |
The stated interest rate represents the weighted average interest rate at June 30, 2024 of contracts within the senior loan facility. Interest rates on contracts are primarily redetermined either monthly or quarterly by reference to the indicated base lending rate and spread and the reset period. |
(12) |
Unfunded or partially unfunded loan commitments. The stated interest rate reflects the weighted average of the reference rate and spread for the funded portion, if any, and the commitment fees on the portion of the loan that is unfunded. At June 30, 2024, the total value of unfunded loan commitments is $103,337. See Note 1F for description. |
(13) |
May be deemed to be an affiliated investment company. The rate shown is the annualized seven-day yield as of June 30, 2024. |
Forward Foreign Currency Exchange Contracts (OTC) |
Currency Purchased |
Currency Sold |
Counterparty |
Settlement
Date |
Unrealized
Appreciation |
Unrealized
(Depreciation) |
| USD |
3,393,959 |
EUR |
3,122,552 |
Standard Chartered Bank |
7/2/24 |
$ 49,861 |
$ — |
| USD |
3,351,422 |
EUR |
3,122,551 |
Standard Chartered Bank |
8/2/24 |
2,443 |
— |
| EUR |
1,500,000 |
USD |
1,610,700 |
State Street Bank and Trust Company |
8/30/24 |
233 |
— |
| USD |
674,432 |
EUR |
621,000 |
Bank of America, N.A. |
8/30/24 |
7,506 |
— |
| USD |
683,823 |
EUR |
630,000 |
Bank of America, N.A. |
8/30/24 |
7,231 |
— |
| USD |
648,280 |
EUR |
597,114 |
Bank of America, N.A. |
8/30/24 |
7,007 |
— |
| USD |
693,017 |
EUR |
638,000 |
Standard Chartered Bank |
8/30/24 |
7,833 |
— |
| USD |
711,255 |
EUR |
655,000 |
Standard Chartered Bank |
8/30/24 |
7,815 |
— |
| USD |
689,280 |
EUR |
635,000 |
State Street Bank and Trust Company |
8/30/24 |
7,318 |
— |
| USD |
246,737 |
EUR |
228,754 |
State Street Bank and Trust Company |
8/30/24 |
1,065 |
— |
See Notes to Financial Statements.
Eaton Vance
Senior Income Trust
June 30, 2024
Portfolio of Investments — continued
Forward Foreign Currency Exchange Contracts (OTC) (continued) |
Currency Purchased |
Currency Sold |
Counterparty |
Settlement
Date |
Unrealized
Appreciation |
Unrealized
(Depreciation) |
| USD |
656,494 |
GBP |
516,000 |
Bank of America, N.A. |
8/30/24 |
$ 3,942 |
$ — |
| USD |
643,087 |
GBP |
505,657 |
State Street Bank and Trust Company |
8/30/24 |
3,616 |
— |
| USD |
710,661 |
EUR |
662,000 |
State Street Bank and Trust Company |
9/30/24 |
— |
(1,367) |
| USD |
717,180 |
EUR |
668,279 |
State Street Bank and Trust Company |
9/30/24 |
— |
(1,602) |
| USD |
716,710 |
EUR |
668,000 |
State Street Bank and Trust Company |
9/30/24 |
— |
(1,772) |
| |
|
|
|
|
|
$105,870 |
$(4,741) |
Abbreviations: |
| DIP |
– Debtor In Possession |
| EURIBOR |
– Euro Interbank Offered Rate |
| OTC |
– Over-the-counter |
| PCL |
– Public Company Limited |
| PIK |
– Payment In Kind |
| SOFR |
– Secured Overnight Financing Rate |
| SONIA |
– Sterling Overnight Interbank Average |
Currency Abbreviations: |
| EUR |
– Euro |
| GBP |
– British Pound Sterling |
| USD |
– United States Dollar |
See Notes to Financial Statements.
Eaton Vance
Senior Income Trust
June 30, 2024
Statement of Assets and Liabilities
| |
June 30, 2024 |
| Assets |
|
| Unaffiliated investments, at value (identified cost $162,455,341) |
$158,781,165 |
| Affiliated investments, at value (identified cost $4,538,748) |
4,538,748 |
| Cash |
2,188,402 |
| Foreign currency, at value (identified cost $2,075,368) |
2,068,192 |
| Interest and dividends receivable |
1,183,499 |
| Dividends receivable from affiliated investments |
22,941 |
| Receivable for investments sold |
1,007,786 |
| Receivable for shares sold through shelf offering |
94,427 |
| Receivable for open forward foreign currency exchange contracts |
105,870 |
| Trustees' deferred compensation plan |
90,742 |
| Prepaid upfront fees on notes payable |
14,624 |
| Prepaid expenses |
14,344 |
Total assets |
$170,110,740 |
| Liabilities |
|
| Notes payable |
$12,000,000 |
| Payable for investments purchased |
12,828,217 |
| Payable for open forward foreign currency exchange contracts |
4,741 |
| Payable to affiliates: |
|
| Investment adviser fee |
89,223 |
| Administration fee |
32,091 |
| Trustees' fees |
2,614 |
| Trustees' deferred compensation plan |
90,742 |
| Accrued expenses |
299,503 |
Total liabilities |
|
Auction preferred shares (1,504 shares outstanding) at liquidation value plus cumulative unpaid dividends |
|
Net assets applicable to common shares |
$107,135,786 |
| Sources of Net Assets |
|
| Common shares, $0.01 par value, unlimited number of shares authorized |
$173,955 |
| Additional paid-in capital |
138,769,923 |
| Accumulated loss |
(31,808,092) |
Net assets applicable to common shares |
$107,135,786 |
| Common Shares Issued and Outstanding |
17,395,473 |
| Net Asset Value Per Common Share |
|
Net assets ÷ common shares issued and outstanding |
|
28
See Notes to Financial Statements.
Eaton Vance
Senior Income Trust
June 30, 2024
| |
Year Ended |
| |
June 30, 2024 |
| Investment Income |
|
| Dividend income |
$387,420 |
| Dividend income from affiliated investments |
203,249 |
| Interest income |
15,485,562 |
| Other income |
364,709 |
Total investment income |
$16,440,940 |
| Expenses |
|
| Investment adviser fee |
$1,129,207 |
| Administration fee |
398,525 |
| Trustees’ fees and expenses |
10,582 |
| Custodian fee |
92,371 |
| Transfer and dividend disbursing agent fees |
29,866 |
| Legal and accounting services |
203,610 |
| Printing and postage |
64,560 |
| Interest expense and fees |
1,251,657 |
| Preferred shares service fee |
32,431 |
| Miscellaneous |
104,047 |
Total expenses |
|
| Deduct: |
|
| Waiver and/or reimbursement of expenses by affiliates |
$5,705 |
Total expense reductions |
|
Net expenses |
|
Net investment income |
$13,129,789 |
| Realized and Unrealized Gain (Loss) |
|
| Net realized gain (loss): |
|
| Investment transactions |
$(4,623,881) |
| Foreign currency transactions |
(40,345) |
| Forward foreign currency exchange contracts |
115,387 |
Net realized loss |
|
| Change in unrealized appreciation (depreciation): |
|
| Investments |
$5,729,192 |
| Foreign currency |
(16,572) |
| Forward foreign currency exchange contracts |
265,381 |
Net change in unrealized appreciation (depreciation) |
|
Net realized and unrealized gain |
|
Distributions to preferred shareholders |
|
Net increase in net assets from operations |
$12,024,898 |
See Notes to Financial Statements.
Eaton Vance
Senior Income Trust
June 30, 2024
Statements of Changes in Net Assets
| |
Year Ended June 30, |
| |
2024 |
2023 |
| Increase (Decrease) in Net Assets |
|
|
| From operations: |
|
|
| Net investment income |
$13,129,789 |
$11,862,098 |
| Net realized loss |
(4,548,839) |
(6,967,701) |
| Net change in unrealized appreciation (depreciation) |
5,978,001 |
7,600,828 |
| Distributions to preferred shareholders |
(2,534,053) |
(1,801,915) |
Net increase in net assets from operations |
|
|
Distributions to common shareholders |
|
|
Tax return of capital to common shareholders |
|
|
| Capital share transactions: |
|
|
| Proceeds from shelf offering, net of offering costs (see Note 6) |
$10,090,739 |
$— |
| Reinvestment of distributions to common shareholders |
151,135 |
— |
| Cost of shares repurchased in tender offer (see Note 6) |
(10,480,521) |
— |
Net decrease in net assets from capital share transactions |
|
|
Net increase in net assets |
|
|
| Net Assets Applicable to Common Shares |
|
|
| At beginning of year |
$107,079,168 |
$106,207,619 |
At end of year |
$107,135,786 |
$107,079,168 |
See Notes to Financial Statements.
Eaton Vance
Senior Income Trust
June 30, 2024
| |
Year Ended |
| |
June 30, 2024 |
| Cash Flows From Operating Activities |
|
| Net increase in net assets from operations |
$12,024,898 |
| Distributions to preferred shareholders |
2,534,053 |
| Net increase in net assets from operations excluding distributions to preferred shareholders |
$14,558,951 |
| Adjustments to reconcile net increase in net assets from operations to net cash provided by operating activities: |
|
| Investments purchased |
(48,340,282) |
| Investments sold and principal repayments |
60,407,010 |
| Increase in short-term investments, net |
(1,375,103) |
| Net amortization/accretion of premium (discount) |
(878,402) |
| Amortization of prepaid upfront fees on notes payable |
21,842 |
| Decrease in interest and dividends receivable |
122,673 |
| Increase in dividends receivable from affiliated investments |
(9,684) |
| Increase in Trustees’ deferred compensation plan |
(90,742) |
| Decrease in prepaid expenses |
9,226 |
| Decrease in payable to affiliate for investment adviser fee |
(5,722) |
| Decrease in payable to affiliate for administration fee |
(1,474) |
| Decrease in payable to affiliate for Trustees' fees |
(136) |
| Increase in payable to affiliate for Trustees' deferred compensation plan |
90,742 |
| Decrease in accrued expenses |
(210,305) |
| Increase in unfunded loan commitments |
65,520 |
| Net change in unrealized (appreciation) depreciation from investments |
(5,729,192) |
| Net change in unrealized (appreciation) depreciation from forward foreign currency exchange contracts (OTC) |
(265,381) |
| Net realized loss from investments |
4,623,881 |
Net cash provided by operating activities |
|
| Cash Flows From Financing Activities |
|
| Cash distributions paid to common shareholders |
$(11,578,498) |
| Cash distributions paid to preferred shareholders |
(2,519,455) |
| Proceeds from shelf offering |
9,996,312 |
| Repurchases of common shares in tender offer |
(10,480,521) |
| Proceeds from notes payable |
16,000,000 |
| Repayments of notes payable |
(24,000,000) |
| Payment of upfront fees on notes payable |
(17,500) |
Net cash used in financing activities |
$(22,599,662) |
Net increase in cash* |
|
Cash at beginning of year (including foreign currency) |
|
Cash at end of year (including foreign currency) |
|
| Supplemental disclosure of cash flow information: |
|
| Noncash financing activities not included herein consist of: |
|
| Reinvestment of dividends and distributions |
$151,135 |
| Cash paid for interest and fees on borrowings |
1,364,590 |
| * |
Includes net change in unrealized (appreciation) depreciation on foreign currency of $15,416. |
See Notes to Financial Statements.
Eaton Vance
Senior Income Trust
June 30, 2024
Selected data for a common share outstanding during the periods stated
| |
Year Ended June 30, |
| |
2024 |
2023 |
2022 |
2021 |
2020 |
| Net asset value — Beginning of year (Common shares) |
$6.11 |
$6.06 |
$6.90 |
$6.20 |
$7.05 |
| Income (Loss) From Operations |
|
|
|
|
|
| Net investment income (1) |
$0.79 |
$0.67 |
$0.36 |
$0.41 |
$0.40 |
| Net realized and unrealized gain (loss) |
0.09 |
0.04 |
(0.87) |
0.70 |
(0.82) |
Distributions to preferred shareholders:
From net investment income(1) |
(0.15) |
(0.10) |
(0.01) |
(0.00) (2) |
(0.02) |
Total income (loss) from operations |
|
|
|
|
$(0.44) |
| Less Distributions to Common Shareholders |
|
|
|
|
|
| From net investment income |
$(0.68) |
$(0.56) |
$(0.37) |
$(0.41) |
$(0.41) |
| Tax return of capital |
(0.02) |
— |
(0.02) |
— |
— |
Total distributions to common shareholders |
|
|
|
|
$(0.41) |
Premium from common shares sold through shelf offering (see Note 6) (1) |
|
|
|
|
|
Discount on tender offer (see Note 6) (1) |
|
|
|
|
|
Net asset value — End of year (Common shares) |
|
|
|
|
|
Market value — End of year (Common shares) |
|
|
|
|
|
Total Investment Return on Net Asset Value (3) |
13.22% |
11.71% |
|
18.65% |
(5.64)% |
Total Investment Return on Market Value (3) |
30.40% |
10.80% |
(14.68)% |
36.01% |
(8.20)% |
See Notes to Financial Statements.
Eaton Vance
Senior Income Trust
June 30, 2024
Financial Highlights — continued
Selected data for a common share outstanding during the periods stated
| |
Year Ended June 30, |
| |
2024 |
2023 |
2022 |
2021 |
2020 |
| Ratios/Supplemental Data |
|
|
|
|
|
| Net assets applicable to common shares, end of year (000’s omitted) |
$107,136 |
$107,079 |
$106,208 |
$261,425 |
$234,657 |
| Ratios (as a percentage of average daily net assets applicable to common shares): (5)† |
|
|
|
|
|
| Expenses excluding interest and fees |
2.00% (6) |
1.99% (6) |
1.91% |
1.96% |
1.73% |
| Interest and fee expense (7) |
1.21% |
1.05% |
0.47% |
0.57% |
1.19% |
| Total expenses |
3.21% (6) |
3.04% (6) |
2.38% |
2.53% |
2.92% |
| Net investment income |
12.72% |
11.15% |
5.31% |
6.08% |
5.93% |
| Portfolio Turnover |
34% |
27% |
43% |
40% |
57% |
| Senior Securities: |
|
|
|
|
|
| Total notes payable outstanding (in 000’s) |
$12,000 |
$20,000 |
$26,000 |
$103,000 |
$95,000 |
| Asset coverage per $1,000 of notes payable (8) |
$13,064 |
$8,235 |
$6,531 |
$3,903 |
$3,866 |
| Total preferred shares outstanding |
1,504 |
1,504 |
1,504 |
1,504 |
1,504 |
| Asset coverage per preferred share (9) |
$79,014 |
$71,481 |
$66,752 |
$71,484 |
$69,242 |
| Involuntary liquidation preference per preferred share (10) |
$25,000 |
$25,000 |
$25,000 |
$25,000 |
$25,000 |
| Approximate market value per preferred share (10) |
$25,000 |
$25,000 |
$25,000 |
$25,000 |
$25,000 |
(1) |
Computed using average common shares outstanding. |
(2) |
Amount is less than $(0.005). |
(3) |
Returns are historical and are calculated by determining the percentage change in net asset value or market value with all distributions reinvested. Distributions are assumed to be reinvested at prices obtained under the Trust’s dividend reinvestment plan. |
(4) |
The total return based on net asset value reflects the impact of the tender and repurchase by the Trust of a portion of its common shares at 99% of the Trust’s net asset value per common share. Absent this transaction, the total return based on net asset value would have been (7.90)%. |
(5) |
Ratios do not reflect the effect of dividend payments to preferred shareholders. |
(6) |
Includes a reduction by the investment adviser of a portion of its adviser fee due to the Trust’s investment in the Liquidity Fund (equal to less than 0.01% and less than 0.005% of average daily net assets for the years ended June 30, 2024 and 2023, respectively). |
(7) |
Interest and fee expense relates to the notes payable to partially redeem the Trust’s Auction Preferred Shares and/or to fund investments (see Note 8). |
(8) |
Calculated by subtracting the Trust’s total liabilities (not including the notes payable and preferred shares) from the Trust’s total assets, and dividing the result by the notes payable balance in thousands. |
(9) |
Calculated by subtracting the Trust’s total liabilities (not including the notes payable and preferred shares) from the Trust’s total assets, dividing the result by the sum of the value of the notes payable and liquidation value of the preferred shares, and multiplying the result by the liquidation value of one preferred share. |
(10) |
Plus accumulated and unpaid dividends. |
† |
Ratios based on net assets applicable to common shares plus preferred shares and borrowings are presented below. Ratios do not reflect the effect of dividend payments to preferred shareholders. |
| |
Year Ended June 30, |
| |
2024 |
2023 |
2022 |
2021 |
2020 |
| Expenses excluding interest and fees |
1.30% |
1.29% |
1.28% |
1.25% |
1.11% |
| Interest and fee expense |
0.78% |
0.68% |
0.32% |
0.36% |
0.76% |
| Total expenses |
2.08% |
1.97% |
1.60% |
1.61% |
1.87% |
| Net investment income |
8.23% |
7.23% |
3.57% |
3.87% |
3.81% |
See Notes to Financial Statements.
Eaton Vance
Senior Income Trust
June 30, 2024
Notes to Financial Statements
1 Significant Accounting Policies
Eaton Vance Senior Income Trust (the Trust) is a Massachusetts business trust registered under the Investment Company Act of 1940, as amended (the 1940 Act), as a diversified, closed-end management investment company. The Trust’s investment objective is to provide a high level of current income, consistent with the preservation of capital, by investing primarily in senior, secured floating-rate loans.
The following is a summary of significant accounting policies of the Trust. The policies are in conformity with accounting principles generally accepted in the United States of America (U.S. GAAP). The Trust is an investment company and follows accounting and reporting guidance in the Financial Accounting Standards Board (FASB) Accounting Standards Codification Topic 946.
A Investment Valuation
—
The following methodologies are used to determine the market value or fair value of investments.
Senior Floating-Rate Loans.
Interests in senior floating-rate loans (Senior Loans) are valued generally at the average mean of bid and ask quotations obtained from a third party pricing service. Senior Loans, for which a valuation is not available or deemed unreliable, are fair valued by the investment adviser utilizing one or more of the valuation techniques described below to assess the likelihood that the borrower will make a full repayment of the loan underlying such Senior Loan. If the investment adviser believes that there is a reasonable likelihood of full repayment, the investment adviser will determine fair value using a matrix pricing approach that considers the yield on the Senior Loan relative to yields on other Senior Loans issued by companies of comparable credit quality. If the investment adviser believes there is not a reasonable likelihood of full repayment, the investment adviser will determine fair value using analyses that include, but are not limited to: (i) a comparison of the value of the borrower’s outstanding equity and debt to that of comparable public companies; (ii) a discounted cash flow analysis; or (iii) when the investment adviser believes it is likely that a borrower will be liquidated or sold, an analysis of the terms of such liquidation or sale. In certain cases, the investment adviser will use a combination of analytical methods to determine fair value, such as when only a portion of a borrower’s assets are likely to be sold. In conducting its assessment and analyses for purposes of determining fair value of a Senior Loan, the investment adviser will use its discretion and judgment in considering and appraising relevant factors. Junior Loans (i.e., subordinated loans and second lien loans) are valued in the same manner as Senior Loans.
Debt Obligations.
Debt obligations are generally valued on the basis of valuations provided by third party pricing services, as derived from such services’ pricing models. Inputs to the models may include, but are not limited to, reported trades, executable bid and ask prices, broker/dealer quotations, prices or yields of securities with similar characteristics, interest rates, anticipated prepayments, benchmark curves or information pertaining to the issuer, as well as industry and economic events. The pricing services may use a matrix approach, which considers information regarding securities with similar characteristics to determine the valuation for a security. Short-term debt obligations purchased with a remaining maturity of sixty days or less for which a valuation from a third party pricing service is not readily available may be valued at amortized cost, which approximates fair value.
Equity Securities.
Equity securities listed on a U.S. securities exchange generally are valued at the last sale or closing price on the day of valuation or, if no sales took place on such date, at the mean between the closing bid and ask prices on the exchange where such securities are principally traded. Equity securities listed on the NASDAQ National Market System are valued at the NASDAQ official closing price. Unlisted or listed securities for which closing sales prices or closing quotations are not available are valued at the mean between the latest available bid and ask prices or, in the case of preferred equity securities that are not listed or traded in the over-the-counter market, by a third party pricing service that uses various techniques that consider factors including, but not limited to, prices or yields of securities with similar characteristics, benchmark yields, broker/dealer quotes, quotes of underlying common stock, issuer spreads, as well as industry and economic events.
Derivatives.
Forward foreign currency exchange contracts are generally valued at the mean of the average bid and average ask prices that are reported by currency dealers to a third party pricing service at the valuation time. Such third party pricing service valuations are supplied for specific settlement periods and the Trust’s forward foreign currency exchange contracts are valued at an interpolated rate between the closest preceding and subsequent settlement period reported by the third party pricing service.
Foreign Securities and Currencies.
Foreign securities and currencies are valued in U.S. dollars, based on foreign currency exchange rate quotations supplied by a third party pricing service. The pricing service uses a proprietary model to determine the exchange rate. Inputs to the model include reported trades and implied bid/ask spreads.
Other.
Investments in management investment companies (including money market funds) that do not trade on an exchange are valued at the net asset value as of the close of each business day.
Fair Valuation.
In connection with Rule 2a-5 of the 1940 Act, the Trustees have designated the Trust’s investment adviser as its valuation designee. Investments for which valuations or market quotations are not readily available or are deemed unreliable are valued by the investment adviser, as valuation designee, at fair value using methods that most fairly reflect the security’s “fair value”, which is the amount that the Trust might reasonably expect to receive for the security upon its current sale in the ordinary course. Each such determination is based on a consideration of relevant factors, which are likely to vary from one pricing context to another. These factors may include, but are not limited to, the type of security, the existence of any contractual restrictions on the security’s disposition, the price and extent of public trading in similar securities of the issuer or of comparable companies or entities, quotations or relevant information obtained from broker/dealers or other market participants, information obtained from the issuer, analysts, and/or the appropriate stock exchange (for exchange-traded securities), an analysis of the company’s or entity’s financial statements, and an evaluation of the forces that influence the issuer and the market(s) in which the security is purchased and sold.
Eaton Vance
Senior Income Trust
June 30, 2024
Notes to Financial Statements — continued
B Investment Transactions
—
Investment transactions for financial statement purposes are accounted for on a trade date basis. Realized gains and losses on investments sold are determined on the basis of identified cost.
C Income
—
Interest income is recorded on the basis of interest accrued, adjusted for amortization of premium or accretion of discount. Fees in connection with investments in senior floating-rate loans may include amendment fees, consent fees and prepayment fees, which are recorded to income as earned and included in Other income on the Statement of Operations. Dividend income is recorded on the ex-dividend date for dividends received in cash and/or securities. Distributions from investment companies are recorded as dividend income, capital gains or return of capital based on the nature of the distribution.
D Federal Taxes
—
The Trust's policy is to comply with the provisions of the Internal Revenue Code applicable to regulated investment companies and to distribute to shareholders each year substantially all of its net investment income, and all or substantially all of its net realized capital gains. Accordingly, no provision for federal income or excise tax is necessary.
As of June 30, 2024, the Trust had no uncertain tax positions that would require financial statement recognition, de-recognition, or disclosure. The Trust files a U.S. federal income tax return annually after its fiscal year-end, which is subject to examination by the Internal Revenue Service for a period of three years from the date of filing.
E Foreign Currency Translation
—
Investment valuations, other assets, and liabilities initially expressed in foreign currencies are translated each business day into U.S. dollars based upon current exchange rates. Purchases and sales of foreign investment securities and income and expenses denominated in foreign currencies are translated into U.S. dollars based upon currency exchange rates in effect on the respective dates of such transactions. Recognized gains or losses on investment transactions attributable to changes in foreign currency exchange rates are recorded for financial statement purposes as net realized gains and losses on investments. That portion of unrealized gains and losses on investments that results from fluctuations in foreign currency exchange rates is not separately disclosed.
F Unfunded Loan Commitments
—
The Trust may enter into certain loan agreements all or a portion of which may be unfunded. The Trust is obligated to fund these commitments at the borrower's discretion. These commitments are disclosed in the accompanying Portfolio of Investments. At June 30, 2024, the Trust had sufficient cash and/or securities to cover these commitments.
G Use of Estimates
—
The preparation of the financial statements in conformity with U.S. GAAP requires management to make estimates and assumptions that affect the reported amounts of assets and liabilities at the date of the financial statements and the reported amounts of income and expense during the reporting period. Actual results could differ from those estimates.
H Indemnifications
—
Under the Trust’s organizational documents, its officers and Trustees may be indemnified against certain liabilities and expenses arising out of the performance of their duties to the Trust. Under Massachusetts law, if certain conditions prevail, shareholders of a Massachusetts business trust (such as the Trust) could be deemed to have personal liability for the obligations of the Trust. However, the Trust’s Declaration of Trust contains an express disclaimer of liability on the part of Trust shareholders and the By-laws provide that the Trust shall assume, upon request by the shareholder, the defense on behalf of any Trust shareholders. Moreover, the By-laws also provide for indemnification out of Trust property of any shareholder held personally liable solely by reason of being or having been a shareholder for all loss or expense arising from such liability. Additionally, in the normal course of business, the Trust enters into agreements with service providers that may contain indemnification clauses. The Trust's maximum exposure under these arrangements is unknown as this would involve future claims that may be made against the Trust that have not yet occurred.
I Forward Foreign Currency Exchange Contracts
—
The Trust may enter into forward foreign currency exchange contracts for the purchase or sale of a specific foreign currency at a fixed price on a future date. The forward foreign currency exchange contracts are adjusted by the daily exchange rate of the underlying currency and any gains or losses are recorded as unrealized until such time as the contracts have been closed. Risks may arise upon entering these contracts from the potential inability of counterparties to meet the terms of their contracts and from movements in the value of a foreign currency relative to the U.S. dollar.
2 Auction Preferred Shares
The Trust issued Auction Preferred Shares (APS) on July 27, 2001 in a public offering. Dividends on the APS, which accrue daily, are cumulative at rates which are reset every seven days by an auction, unless a special dividend period has been set. Series of APS are identical in all respects except for the reset dates of the dividend rates. If the APS auctions do not successfully clear, the dividend payment rate over the next period for the APS holders is set at a specified maximum applicable rate until such time as the APS auctions are successful. Auctions have not cleared since February 13, 2008 and the rate since that date has been the maximum applicable rate (see Note 3). The maximum applicable rate on the APS is 125% of the “AA” Financial Composite Commercial Paper Rate at the date of the auction. The stated spread over the reference benchmark rate is determined based on the credit rating of the APS.
Eaton Vance
Senior Income Trust
June 30, 2024
Notes to Financial Statements — continued
The number of APS issued and outstanding as of June 30, 2024 are as
follows
:
| |
APS Issued and
Outstanding |
| Series A |
752 |
| Series B |
752 |
The APS are redeemable at the option of the Trust at a redemption price equal to $25,000 per share, plus accumulated and unpaid dividends, on any dividend payment date. The APS are also subject to mandatory redemption at a redemption price equal to $25,000 per share, plus accumulated and unpaid dividends, if the Trust is in default for an extended period on its asset maintenance requirements with respect to the APS. If the dividends on the APS remain unpaid in an amount equal to two full years’ dividends, the holders of the APS as a class have the right to elect a majority of the Board of Trustees. In general, the holders of the APS and the common shares have equal voting rights of one vote per share, except that the holders of the APS, as a separate class, have the right to elect at least two members of the Board of Trustees. The APS have a liquidation preference of $25,000 per share, plus accumulated and unpaid dividends. The Trust is required to maintain certain asset coverage with respect to the APS as defined in the Trust's By-Laws and the 1940 Act. The Trust pays an annual fee up to 0.15% of the liquidation value of the APS to broker/dealers as a service fee if the auctions are unsuccessful; otherwise, the annual fee is 0.25%.
3 Distributions to Shareholders and Income Tax Information
The Trust intends to make monthly distributions of net investment income to common shareholders, after payment of any dividends on any outstanding APS. In addition, at least annually, the Trust intends to distribute all or substantially all of its net realized capital gains. Distributions to common shareholders are recorded on the ex-dividend date. Distributions to preferred shareholders are recorded daily and are payable at the end of each dividend period. The dividend rates for the APS at June 30, 2024, and the amount of dividends accrued (including capital gains, if any) to APS shareholders, average APS dividend rates, and dividend rate ranges for the year then ended were as follows:
| |
APS Dividend
Rates at
June 30, 2024 |
Dividends
Accrued to
APS
Shareholders |
Average
APS
Dividend
Rates |
Dividend
Rate
Ranges
(%) |
| Series A |
6.67% |
$1,266,410 |
6.63% |
6.32-6.67 |
| Series B |
6.65 |
1,267,643 |
6.63 |
6.33-6.67 |
Beginning February 13, 2008 and consistent with the patterns in the broader market for auction-rate securities, the Trust's APS auctions were unsuccessful in clearing due to an imbalance of sell orders over bids to buy the APS. As a result, the dividend rates of the APS were reset to the maximum applicable rates. The table above reflects such maximum dividend rate for each series as of June 30, 2024.
Distributions to shareholders are determined in accordance with income tax regulations, which may differ from U.S. GAAP. As required by U.S. GAAP, only distributions in excess of tax basis earnings and profits are reported in the financial statements as a return of capital. Permanent differences between book and tax accounting relating to distributions are reclassified to paid-in capital. For tax purposes, distributions from short-term capital gains are considered to be from ordinary income.
The tax character of distributions declared for the years ended June 30, 2024 and June 30, 2023 was as follows:
| |
Year Ended June 30, |
| |
2024 |
2023 |
| Ordinary income |
$13,897,335 |
$11,623,676 |
| Tax return of capital |
$366,351 |
$ — |
Eaton Vance
Senior Income Trust
June 30, 2024
Notes to Financial Statements — continued
As of June 30, 2024, the components of distributable earnings (accumulated loss) on a tax basis were as follows:
| Deferred capital losses |
$(28,461,167) |
| Net unrealized depreciation |
(3,346,925) |
Accumulated loss |
$(31,808,092) |
At June 30, 2024, the Trust, for federal income tax purposes, had deferred capital losses of $28,461,167 which would reduce its taxable income arising from future net realized gains on investment transactions, if any, to the extent permitted by the Internal Revenue Code, and thus would reduce the amount of distributions to shareholders, which would otherwise be necessary to relieve the Trust of any liability for federal income or excise tax. The deferred capital losses are treated as arising on the first day of the Trust’s next taxable year and retain the same short-term or long-term character as when originally deferred. Of the deferred capital losses at June 30, 2024, $1,220,538 are short-term and $27,240,629 are long-term.
The cost and unrealized appreciation (depreciation) of investments, including open derivative contracts, of the Trust at June 30, 2024, as determined on a federal income tax basis, were as follows:
Aggregate cost |
$166,659,671 |
| Gross unrealized appreciation |
$1,812,067 |
| Gross unrealized depreciation |
(5,151,825) |
Net unrealized depreciation |
|
4 Investment Adviser Fee and Other Transactions with Affiliates
The investment adviser fee is earned by Eaton Vance Management (EVM), an indirect, wholly-owned subsidiary of Morgan Stanley, as compensation for investment advisory services rendered to the Trust. The investment adviser fee is computed at an annual rate of 0.70% (0.71% prior to May 1, 2024) of the Trust’s average weekly gross assets and is payable monthly. The annual investment adviser fee rate shall be reduced to the following as of the stated date: May 1, 2025: 0.69% and May 1, 2026: 0.55%. Gross assets as referred to herein are calculated by deducting accrued liabilities of the Trust except the principal amount of any indebtedness for money borrowed, including debt securities issued by the Trust. For the year ended June 30, 2024, the Trust’s investment adviser fee amounted to $1,129,207.
The Trust may invest in a money market fund, the Institutional Class of the Morgan Stanley Institutional Liquidity Funds - Government Portfolio (the "Liquidity Fund"), an open-end management investment company managed by Morgan Stanley Investment Management Inc., a wholly-owned subsidiary of Morgan Stanley. The investment adviser fee paid by the Trust is reduced by an amount equal to its pro rata share of the advisory and administration fees paid by the Trust due to its investment in the Liquidity Fund. For the year ended June 30, 2024, the investment adviser fee paid was reduced by $5,705 relating to the Trust’s investment in the Liquidity Fund. The administration fee is earned by EVM for administering the business affairs of the Trust and is computed at an annual rate of 0.25% of the Trust’s average weekly gross assets. For the year ended June 30, 2024, the administration fee amounted to $398,525.
Trustees and officers of the Trust who are members of EVM’s organization receive remuneration for their services to the Trust out of the investment adviser fee. Trustees of the Trust who are not affiliated with EVM may elect to defer receipt of all or a percentage of their annual fees in accordance with the terms of the Trustees Deferred Compensation Plan. Certain officers and Trustees of the Trust are officers of EVM.
5 Purchases and Sales of Investments
Purchases and sales of investments, other than short-term obligations and including maturities, paydowns and principal repayments on Senior Loans, aggregated $53,024,327 and $57,803,933, respectively, for the year ended June 30, 2024.
6 Common Shares of Beneficial Interest and Shelf Offering
The Trust may issue common shares pursuant to its dividend reinvestment plan. Common shares issued by the Trust pursuant to its dividend reinvestment plan for the year ended June 30, 2024 were 24,424. There were no common shares issued by the Trust for the year ended June 30, 2023.
Eaton Vance
Senior Income Trust
June 30, 2024
Notes to Financial Statements — continued
On May 12, 2021, the Trust announced that it will conduct cash tender offers in the fourth quarter of each of 2022, 2023 and 2024 (each, a “Conditional Tender Offer”) for up to 10% of the Trust’s then-outstanding common shares if, from January to August of the relevant year, the Trust’s shares trade at an average daily discount to NAV of more than 10%, based upon the Trust’s volume-weighted average market price and NAV on each business day during the period. If triggered, common shares tendered and accepted in a Conditional Tender Offer would be repurchased at a price per share equal to 98% of the Trust’s NAV as of the close of regular trading on the New York Stock Exchange on the date such Conditional Tender Offer expires.
On September 26, 2023, the Trust commenced a cash tender offer for up to 1,753,886 of its outstanding common shares. The tender offer expired at 5:00 P.M. Eastern Time on October 25, 2023. The number of shares properly tendered was 1,753,886. The purchase price of the properly tendered shares was equal to $5.9756 per share for an aggregate purchase price of $10,480,521. The condition to trigger a tender offer by the Trust in the fourth quarter of 2022 was not met.
In November 2013, the Board of Trustees initially approved a share repurchase program for the Trust. Pursuant to the reauthorization of the share repurchase program by the Board of Trustees in March 2019, the Trust is authorized to repurchase up to 10% of its common shares outstanding as of the last day of the prior calendar year at market prices when shares are trading at a discount to net asset value. The share repurchase program does not obligate the Trust to purchase a specific amount of shares. There were no repurchases of common shares by the Trust pursuant to the share repurchase program for the years ended June 30, 2024 and June 30, 2023.
Pursuant to a registration statement filed with the SEC, the Trust is authorized to issue up to an additional 4,551,438 common shares through an equity shelf offering program (the “shelf offering”). Under the shelf offering, the Trust, subject to market conditions, may raise additional capital from time to time and in varying amounts and offering methods at a net price at or above the Trust’s net asset value per common share.
During the year ended June 30, 2024, the Trust sold 1,586,077 common shares and received proceeds (net of offering costs) of $10,090,739 through its shelf offering. The net proceeds in excess of the net asset value of the shares sold was $245,093 for the year ended June 30, 2024. Offering costs (other than the applicable sales commissions) incurred in connection with the shelf offering were borne directly by EVM. Eaton Vance Distributors, Inc. (EVD), an affiliate of EVM, is the distributor of the Trust’s shares and is entitled to receive a sales commission from the Trust of 1.00% of the gross sales price per share, a portion of which is re-allowed to sales agents. The Trust was informed that the sales commissions retained by EVD during the year ended June 30, 2024 was $20,386. There were no shares sold by the Trust pursuant to its shelf offering for the year ended June 30, 2023.
7 Financial Instruments
The Trust may trade in financial instruments with off-balance sheet risk in the normal course of its investing activities. These financial instruments may include forward foreign currency exchange contracts and may involve, to a varying degree, elements of risk in excess of the amounts recognized for financial statement purposes. The notional or contractual amounts of these instruments represent the investment the Trust has in particular classes of financial instruments and do not necessarily represent the amounts potentially subject to risk. The measurement of the risks associated with these instruments is meaningful only when all related and offsetting transactions are considered. A summary of obligations under these financial instruments at June 30, 2024 is included in the Portfolio of Investments. At June 30, 2024, the Trust had sufficient cash and/or securities to cover commitments under these contracts.
The Trust is subject to foreign exchange risk in the normal course of pursuing its investment objective. Because the Trust holds foreign currency denominated investments, the value of these investments and related receivables and payables may change due to future changes in foreign currency exchange rates. To hedge against this risk, the Trust enters into forward foreign currency exchange contracts.
The Trust enters into forward foreign currency exchange contracts that may contain provisions whereby the counterparty may terminate the contract under certain conditions, including but not limited to a decline in the Trust’s net assets below a certain level over a certain period of time, which would trigger a payment by the Trust for those derivatives in a liability position. At June 30, 2024, the fair value of derivatives with credit-related contingent features in a net liability position was $4,741. At June 30, 2024, there were no assets pledged as collateral by the Trust for such liability.
The over-the-counter (OTC) derivatives in which the Trust invests are subject to the risk that the counterparty to the contract fails to perform its obligations under the contract. To mitigate this risk, the Trust has entered into an International Swaps and Derivatives Association, Inc. Master Agreement (“ISDA Master Agreement”) or similar agreement with substantially all its derivative counterparties. An ISDA Master Agreement is a bilateral agreement between the Trust and a counterparty that governs certain OTC derivatives and typically contains, among other things, set-off provisions in the event of a default and/or termination event as defined under the relevant ISDA Master Agreement. Under an ISDA Master Agreement, the Trust may, under certain circumstances, offset with the counterparty certain derivative financial instruments’ payables and/or receivables with collateral held and/or posted and create one single net payment. The provisions of the ISDA Master Agreement typically permit a single net payment in the event of default including the bankruptcy or insolvency of the counterparty. However, bankruptcy or insolvency laws of a particular jurisdiction may impose restrictions on or prohibitions against the right of offset in bankruptcy or insolvency. Certain ISDA Master Agreements allow counterparties to OTC derivatives to terminate derivative contracts prior to maturity in the event the Trust’s net assets decline by a stated percentage or the Trust fails to meet the terms of its ISDA Master Agreements, which would cause the counterparty to accelerate payment by the Trust of any net liability owed to it.
The collateral requirements for derivatives traded under an ISDA Master Agreement are governed by a Credit Support Annex to the ISDA Master Agreement. Collateral requirements are determined at the close of business each day and are typically based on changes in market values for each transaction under an
Eaton Vance
Senior Income Trust
June 30, 2024
Notes to Financial Statements — continued
ISDA Master Agreement and netted into one amount for such agreement. Generally, the amount of collateral due from or to a counterparty is subject to a minimum transfer threshold amount before a transfer is required, which may vary by counterparty. Collateral pledged for the benefit of the Trust and/or counterparty is held in segregated accounts by the Trust’s custodian and cannot be sold, re-pledged, assigned or otherwise used while pledged. The portion of such collateral representing cash, if any, is reflected as deposits for derivatives collateral and, in the case of cash pledged by a counterparty for the benefit of the Trust, a corresponding liability on the Statement of Assets and Liabilities. Securities pledged by the Trust as collateral, if any, are identified as such in the Portfolio of Investments.
The fair value of open derivative instruments (not considered to be hedging instruments for accounting disclosure purposes) and whose primary underlying risk exposure is foreign exchange risk at June 30, 2024 was as follows:
| |
Fair Value |
Derivative |
|
|
| Forward foreign currency exchange contracts |
$105,870 |
$(4,741) |
(1) |
Statement of Assets and Liabilities location: Receivable for open forward foreign currency exchange contracts. |
(2) |
Statement of Assets and Liabilities location: Payable for open forward foreign currency exchange contracts. |
The Trust's derivative assets and liabilities at fair value by type, which are reported gross in the Statement of Assets and Liabilities, are presented in the table above. The following tables present the Trust's derivative assets and liabilities by counterparty, net of amounts available for offset under a master netting agreement and net of the related collateral received by the Trust for such assets and pledged by the Trust for such liabilities as of June 30, 2024.
Counterparty |
Derivative
Assets Subject to
Master Netting
Agreement |
Derivatives
Available
for Offset |
Non-cash Collateral Received (a) |
Cash Collateral Received (a) |
Net Amount of Derivative Assets (b) |
| Bank of America, N.A. |
$25,686 |
$ — |
$ — |
$ — |
$25,686 |
| Standard Chartered Bank |
67,952 |
— |
— |
— |
67,952 |
| State Street Bank and Trust Company |
12,232 |
(4,741) |
— |
— |
7,491 |
| |
$105,870 |
$(4,741) |
|
|
$101,129 |
Counterparty |
Derivative
Liabilities Subject to
Master Netting
Agreement |
Derivatives
Available
for Offset |
Non-cash Collateral Pledged (a) |
Cash Collateral Pledged (a) |
Net Amount of Derivative Liabilities (c) |
| State Street Bank and Trust Company |
$(4,741) |
$4,741 |
$ — |
$ — |
$ — |
(a) |
In some instances, the total collateral received and/or pledged may be more than the amount shown due to overcollateralization. |
(b) |
Net amount represents the net amount due from the counterparty in the event of default. |
(c) |
Net amount represents the net amount payable to the counterparty in the event of default. |
Eaton Vance
Senior Income Trust
June 30, 2024
Notes to Financial Statements — continued
The effect of derivative instruments (not considered to be hedging instruments for accounting disclosure purposes) on the Statement of Operations and whose primary underlying risk exposure is foreign exchange risk for the year ended June 30, 2024 was as follows:
Derivative |
Realized Gain (Loss) on Derivatives Recognized in Income (1) |
Change in Unrealized Appreciation (Depreciation) on Derivatives Recognized in Income (2) |
| Forward foreign currency exchange contracts |
$115,387 |
$265,381 |
(1) |
Statement of Operations location: Net realized gain (loss): Forward foreign currency exchange contracts. |
(2) |
Statement of Operations location: Change in unrealized appreciation (depreciation): Forward foreign currency exchange contracts. |
The average notional amount of forward foreign currency exchange contracts (based on the absolute value of notional amounts of currency purchased and currency sold) outstanding during the year ended June 30, 2024, which is indicative of the volume of this derivative type, was approximately $15,272,000.
8 Revolving Credit and Security Agreement
The Trust has entered into a Credit Agreement, as amended, (the Agreement) with a bank to borrow up to a limit of $35 million ($45 million prior to May 2, 2024) pursuant to a revolving line of credit. Borrowings under the Agreement are secured by the assets of the Trust. Interest is generally charged at a rate above the Secured Overnight Financing Rate (SOFR) and is payable monthly. Under the terms of the Agreement, in effect through May 1, 2025, the Trust pays a facility fee of 0.15% on the borrowing limit. In connection with the renewal of the Agreement on May 2, 2024, the Trust also paid upfront fees of $17,500, which are being amortized to interest expense through May 1, 2025. The unamortized balance at June 30, 2024 is approximately $15,000 and is included in prepaid upfront fees on notes payable on the Statement of Assets and Liabilities. The Trust is required to maintain certain net asset levels during the term of the Agreement. At June 30, 2024, the Trust had borrowings outstanding under the Agreement of $12,000,000 at an annual interest rate of 6.34%. Based on the short-term nature of the borrowings under the Agreement and the variable interest rate, the carrying amount of the borrowings at June 30, 2024 approximated its fair value. If measured at fair value, borrowings under the Agreement would have been considered as Level 2 in the fair value hierarchy (see Note 10) at June 30, 2024. For the year ended June 30, 2024, the average borrowings under the Agreement and the average annual interest rate (excluding fees) were $18,669,399 and 6.37%, respectively.
9 Affiliated Investments
At June 30, 2024, the value of the Trust's investment in funds that may be deemed to be affiliated was $4,538,748, which represents 4.2% of the Trust's net assets applicable to common shares. Transactions in such investments by the Trust for the year ended June 30, 2024 were as follows:
Name |
Value,
beginning
of period |
Purchases |
Sales
proceeds |
Net realized
gain (loss) |
Change in
unrealized
appreciation
(depreciation) |
Value, end
of period |
Dividend
income |
Shares,
end of period |
Short-Term Investments |
| Liquidity Fund |
$3,163,645 |
$78,818,166 |
$(77,443,063) |
$ — |
$ — |
$4,538,748 |
$203,249 |
4,538,748 |
10 Fair Value Measurements
Under generally accepted accounting principles for fair value measurements, a three-tier hierarchy to prioritize the assumptions, referred to as inputs, is used in valuation techniques to measure fair value. The three-tier hierarchy of inputs is summarized in the three broad levels listed below.
| • |
Level 1 – quoted prices in active markets for identical investments |
| • |
Level 2 – other significant observable inputs (including quoted prices for similar investments, interest rates, prepayment speeds, credit risk, etc.) |
| • |
Level 3 – significant unobservable inputs (including a fund's own assumptions in determining the fair value of investments) |
In cases where the inputs used to measure fair value fall in different levels of the fair value hierarchy, the level disclosed is determined based on the lowest level input that is significant to the fair value measurement in its entirety. The inputs or methodology used for valuing securities are not necessarily an indication of the risk associated with investing in those securities.
Eaton Vance
Senior Income Trust
June 30, 2024
Notes to Financial Statements — continued
At June 30, 2024, the hierarchy of inputs used in valuing the Trust’s investments and open derivative instruments, which are carried at fair value, were as follows:
Asset Description |
Level 1 |
Level 2 |
Level 3* |
Total |
| Asset-Backed Securities |
$ — |
$ 10,867,394 |
$ — |
$ 10,867,394 |
| Closed-End Funds |
81,664 |
— |
— |
81,664 |
| Common Stocks |
17,370 |
1,206,879 |
0 |
1,224,249 |
| Corporate Bonds |
— |
6,409,528 |
— |
6,409,528 |
| Senior Floating-Rate Loans (Less Unfunded Loan Commitments) |
— |
139,652,000 |
546,330 |
140,198,330 |
| Miscellaneous |
— |
— |
0 |
0 |
| Short-Term Investments |
4,538,748 |
— |
— |
4,538,748 |
Total Investments |
|
|
|
|
| Forward Foreign Currency Exchange Contracts |
$ — |
$ 105,870 |
$ — |
$ 105,870 |
Total |
|
|
|
|
Liability Description |
|
|
|
|
| Forward Foreign Currency Exchange Contracts |
$ — |
$ (4,741) |
$ — |
$ (4,741) |
Total |
$ — |
|
$ — |
|
| * |
None of the unobservable inputs for Level 3 assets, individually or collectively, had a material impact on the Trust. |
Level 3 investments at the beginning and/or end of the period in relation to net assets were not significant and accordingly, a reconciliation of Level 3 assets for the year ended June 30, 2024 is not presented.
11 Risks and Uncertainties
Risks Associated with Foreign Investments
Foreign investments can be adversely affected by political, economic and market developments abroad, including the imposition of economic and other sanctions by the United States or another country, and by acts of terrorism and war. There may be less publicly available information about foreign issuers because they may not be subject to reporting practices, requirements or regulations comparable to those to which United States companies are subject. Foreign markets may be smaller, less liquid and more volatile than the major markets in the United States. Trading in foreign markets typically involves higher expense than trading in the United States. The Trust may have difficulties enforcing its legal or contractual rights in a foreign country. Securities that trade or are denominated in currencies other than the U.S. dollar may be adversely affected by fluctuations in currency exchange rates.
The Trust invests primarily in below investment grade floating-rate loans, which are considered speculative because of the credit risk of their issuers. Changes in economic conditions or other circumstances are more likely to reduce the capacity of issuers of these securities to make principal and interest payments. Such companies are more likely to default on their payments of interest and principal owed than issuers of investment grade bonds. An economic downturn generally leads to a higher non-payment rate, and a loan or other debt obligation may lose significant value before a default occurs. Lower rated investments also may be subject to greater price volatility than higher rated investments. Moreover, the specific collateral used to secure a loan may decline in value or become illiquid, which would adversely affect the loan’s value.
Eaton Vance
Senior Income Trust
June 30, 2024
Notes to Financial Statements — continued
12 Additional Information
On August 27, 2020, Saba Capital Master Fund, Ltd., a hedge fund (“Saba”), filed claims against the Trust in a lawsuit in Suffolk County Superior Court in Massachusetts asserting breach of contract and fiduciary duty by the Trust and certain of its affiliates, the Trust's adviser, and the Board, following the implementation by the Trust of by-law amendments that (i) require trustee nominees in contested elections to obtain affirmative votes of a majority of eligible shares in order to be elected and (ii) establish certain requirements related to shares obtained in "Control Share Acquisitions". With respect to the Trust, Saba seeks rescission of these by-law provisions and certain related relief. On March 31, 2021, the court allowed in part and denied in part a motion to dismiss Saba's claims. Discovery is complete. On January 23, 2023, in ruling on the parties’ cross-motions for partial summary judgment, the court dismissed Saba’s claims for breach of fiduciary duty against the Board, while holding that the control share by-law amendment violated Section 18(i) of the 1940 Act. Additional claims and defenses will be addressed at trial, which is scheduled to begin on September 9, 2024. While management of the Trust is unable to predict the outcome of this matter, it does not believe the outcome would result in the payment of any monetary damages by the Trust.
Eaton Vance
Senior Income Trust
June 30, 2024
Report of Independent Registered Public Accounting Firm
To the Trustees and Shareholders of Eaton Vance Senior Income Trust:
Opinion on the Financial Statements and Financial Highlights
We have audited the accompanying statement of assets and liabilities of Eaton Vance Senior Income Trust (the “Trust”), including the portfolio of investments, as of June 30, 2024, the related statements of operations and cash flows for the year then ended, the statements of changes in net assets for each of the two years in the period then ended, the financial highlights for each of the five years in the period then ended, and the related notes. In our opinion, the financial statements and financial highlights present fairly, in all material respects, the financial position of the Trust as of June 30, 2024, and the results of its operations and its cash flows for the year then ended, the changes in its net assets for each of the two years in the period then ended, and the financial highlights for each of the five years in the period then ended, in conformity with accounting principles generally accepted in the United States of America.
Basis for Opinion
These financial statements and financial highlights are the responsibility of the Trust's management. Our responsibility is to express an opinion on the Trust's financial statements and financial highlights based on our audits. We are a public accounting firm registered with the Public Company Accounting Oversight Board (United States) (PCAOB) and are required to be independent with respect to the Trust in accordance with the U.S. federal securities laws and the applicable rules and regulations of the Securities and Exchange Commission and the PCAOB.
We conducted our audits in accordance with the standards of the PCAOB. Those standards require that we plan and perform the audit to obtain reasonable assurance about whether the financial statements and financial highlights are free of material misstatement, whether due to error or fraud. The Trust is not required to have, nor were we engaged to perform, an audit of its internal control over financial reporting. As part of our audits, we are required to obtain an understanding of internal control over financial reporting but not for the purpose of expressing an opinion on the effectiveness of the Trust’s internal control over financial reporting. Accordingly, we express no such opinion.
Our audits included performing procedures to assess the risks of material misstatement of the financial statements and financial highlights, whether due to error or fraud, and performing procedures that respond to those risks. Such procedures included examining, on a test basis, evidence regarding the amounts and disclosures in the financial statements and financial highlights. Our audits also included evaluating the accounting principles used and significant estimates made by management, as well as evaluating the overall presentation of the financial statements and financial highlights. Our procedures included confirmation of securities and senior loans owned as of June 30, 2024, by correspondence with the custodian, brokers and agent banks; when replies were not received from brokers and agent banks, we performed other auditing procedures. We believe that our audits provide a reasonable basis for our opinion.
/s/ Deloitte & Touche LLP
Boston, Massachusetts
August 20, 2024
We have served as the auditor of one or more Eaton Vance investment companies since 1959.
Eaton Vance
Senior Income Trust
June 30, 2024
Federal Tax Information (Unaudited)
The Form 1099-DIV you receive in February 2025 will show the tax status of all distributions paid to your account in calendar year 2024. Shareholders are advised to consult their own tax adviser with respect to the tax consequences of their investment in the Trust. As required by the Internal Revenue Code and/or regulations, shareholders must be notified regarding the status of qualified dividend income for individuals and 163(j) interest dividends.
Qualified Dividend Income.
For the fiscal year ended June 30, 2024, the Trust designates approximately $5,329, or up to the maximum amount of such dividends allowable pursuant to the Internal Revenue Code, as qualified dividend income eligible for the reduced tax rate of 15%.
163(j) Interest Dividends.
For the fiscal year ended June 30, 2024, the Trust designates 9.43% of distributions from net investment income as a 163(j) interest dividend.
Eaton Vance
Senior Income Trust
June 30, 2024
Dividend Reinvestment Plan
The Trust offers a dividend reinvestment plan (Plan) pursuant to which shareholders automatically have distributions reinvested in common shares (Shares) of the Trust unless they elect otherwise through their investment dealer. On the distribution payment date, if the NAV per Share is equal to or less than the market price per Share plus estimated brokerage commissions, then new Shares will be issued. The number of Shares shall be determined by the greater of the NAV per Share or 95% of the market price. Otherwise, Shares generally will be purchased on the open market by Equiniti Trust Company, LLC, the Plan agent (Agent). Distributions subject to income tax (if any) are taxable whether or not Shares are reinvested.
If your Shares are in the name of a brokerage firm, bank, or other nominee, you can ask the firm or nominee to participate in the Plan on your behalf. If the nominee does not offer the Plan, you will need to request that the Trust's transfer agent re-register your Shares in your name or you will not be able to participate.
The Agent’s service fee for handling distributions will be paid by the Trust. Plan participants will be charged their pro rata share of brokerage commissions on all open-market purchases.
Plan participants may withdraw from the Plan at any time by writing to the Agent at the address noted on the following page. If you withdraw, you will receive Shares in your name for all Shares credited to your account under the Plan. If a participant elects by written notice to the Agent to sell part or all of his or her Shares and remit the proceeds, the Agent is authorized to deduct a $5.00 fee plus brokerage commissions from the proceeds.
If you wish to participate in the Plan and your Shares are held in your own name, you may complete the form on the following page and deliver it to the Agent. Any inquiries regarding the Plan can be directed to the Agent at 1-866-439-6787.
Eaton Vance
Senior Income Trust
June 30, 2024
Application for Participation in Dividend Reinvestment Plan
This form is for shareholders who hold their common shares in their own names. If your common shares are held in the name of a brokerage firm, bank, or other nominee, you should contact your nominee to see if it will participate in the Plan on your behalf. If you wish to participate in the Plan, but your brokerage firm, bank, or nominee is unable to participate on your behalf, you should request that your common shares be re-registered in your own name which will enable your participation in the Plan.
The following authorization and appointment is given with the understanding that I may terminate it at any time by terminating my participation in the Plan as provided in the terms and conditions of the Plan.
|
| Please print exact name on account |
|
| |
| Shareholder signature |
Date |
| |
| Shareholder signature |
Date |
| Please sign exactly as your common shares are registered. All persons whose names appear on the share certificate must sign. |
YOU SHOULD NOT RETURN THIS FORM IF YOU WISH TO RECEIVE YOUR DISTRIBUTIONS IN CASH. THIS IS NOT A PROXY.
This authorization form, when signed, should be mailed to the following address:
Eaton Vance Senior Income Trust
c/o Equiniti Trust Company, LLC ("EQ")
P.O. Box 922
Wall Street Station
New York, NY 10269-0560
Eaton Vance
Senior Income Trust
June 30, 2024
Board of Trustees’ Contract Approval
Overview of the Contract Review Process
The Investment Company Act of 1940, as amended (the “1940 Act”), provides, in substance, that the investment advisory agreement between a fund and its investment adviser will continue in effect from year-to-year only if its continuation is approved on an annual basis by a vote of the fund’s board of trustees, including a majority of the trustees who are not “interested persons” of the fund (“independent trustees”), cast in person at a meeting called for the purpose of considering such approval.
At a meeting held on June 6, 2024, the Boards of Trustees/Directors (collectively, the “Board”) that oversee the registered investment companies advised by Eaton Vance Management or its affiliate, Boston Management and Research (the “Eaton Vance Funds”), including a majority of the independent trustees (the “Independent Trustees”), voted to approve the continuation of existing investment advisory agreements and sub-advisory agreements
1
for each of the Eaton Vance Funds for an additional one-year period. The Board relied upon the affirmative recommendation of its Contract Review Committee, which is a committee comprised of all of the Independent Trustees. Prior to making its recommendation, the Contract Review Committee reviewed information furnished by the adviser and sub-adviser to each of the Eaton Vance Funds (including information specifically requested by the Board) for a series of meetings held between April and June 2024, as well as certain additional information provided in response to specific requests from the Independent Trustees as members of the Contract Review Committee. Members of the Contract Review Committee also considered information received at prior meetings of the Board and its committees, to the extent such information was relevant to the Contract Review Committee’s annual evaluation of the investment advisory agreements and sub-advisory agreements.
In connection with its evaluation of the investment advisory agreements and sub-advisory agreements, the Board considered various information relating to the Eaton Vance Funds. This included information applicable to all or groups of Eaton Vance Funds, which is referenced immediately below, and information applicable to the particular Eaton Vance Fund covered by this report (each “Eaton Vance Fund” is referred to below as a “fund”). (For funds that invest through one or more underlying portfolios, references to “each fund” in this section may include information that was considered at the portfolio-level.)
Information about Fees, Performance and Expenses
• A report from an independent data provider comparing advisory and other fees paid by each fund to such fees paid by comparable funds, as identified by the independent data provider (“comparable funds”);
• A report from an independent data provider comparing each fund’s total expense ratio (and its components) to those of comparable funds;
• A report from an independent data provider comparing the investment performance of each fund (including, as relevant, total return data, income data, Sharpe ratios, and information ratios) to the investment performance of comparable funds and, as applicable, benchmark indices, over various time periods;
• In certain instances, data regarding investment performance relative to customized groups of peer funds and blended indices identified by the adviser in consultation with the Portfolio Management Committee of the Board (a committee exclusively comprised of Independent Trustees);
• Comparative information concerning the fees charged and services provided by the adviser and sub-adviser to each fund in managing other accounts (which may include other funds, collective investment trusts and institutional accounts) with the same or substantially similar investment objective as the fund and with a significant overlap in holdings based on criteria set by the Board, if any;
• Profitability analyses with respect to the adviser and sub-adviser to each of the funds;
Information about Portfolio Management and Trading
• Descriptions of the investment management services provided to each fund, as well as each of the funds’ investment strategies and policies;
• The procedures and processes used by the adviser to determine the value of fund assets, including, when necessary, the determination of “fair value” by the adviser in its role as each funds’ valuation designee and actions taken to monitor and test the effectiveness of such procedures and processes;
• Information about the policies and practices of each fund’s adviser and sub-adviser with respect to trading, including their processes for seeking best execution of portfolio transactions;
• Information about the allocation of brokerage transactions and the benefits, if any, received by the adviser and sub-adviser to each fund as a result of brokerage allocation, including, as applicable, information concerning the acquisition of research through client commission arrangements and policies with respect to “soft dollars”;
• Data relating to the portfolio turnover rate of each fund and related information regarding active management in the context of particular strategies;
Information about each Adviser and Sub-adviser
• Reports detailing the financial results and condition of the adviser and sub-adviser to each fund;
1
Not all Eaton Vance Funds have entered into a sub-advisory agreement with a sub-adviser. Accordingly, references to “sub-adviser” or “sub-advisory agreement” in this “Overview” section may not be applicable to the particular Eaton Vance Fund covered by this report. Eaton Vance Management and Boston Management and Research are referred to collectively as the “adviser.”
Eaton Vance
Senior Income Trust
June 30, 2024
Board of Trustees’ Contract Approval — continued
• Information regarding the individual investment professionals whose responsibilities include portfolio management and investment research for the funds, and, for portfolio managers and certain other investment professionals, information relating to their responsibilities with respect to managing other funds and investment accounts, as applicable;
• Information regarding the adviser’s and its parent company’s (Morgan Stanley’s) efforts to retain and attract talented investment professionals, including in the context of a competitive marketplace for talent;
• Information regarding the adviser’s compensation methodology for its investment professionals and the incentives and accountability it creates, along with investment professionals’ investments in the fund(s) they manage;
• The personal trading codes of ethics of the adviser and its affiliates and the sub-adviser of each fund, together with information relating to compliance with, and the administration of, such codes;
• Policies and procedures relating to proxy voting, including regular reporting with respect to fund proxy voting activities;
• Information regarding the handling of corporate actions and class actions, as well as information regarding litigation and other regulatory matters;
• Information concerning the resources devoted to compliance efforts undertaken by the adviser and its affiliates and the sub-adviser of each fund, including descriptions of their various compliance programs and their record of compliance and remediation;
• Information concerning the business continuity and disaster recovery plans of the adviser and its affiliates and the sub-adviser of each fund;
• A description of the adviser’s oversight of sub-advisers, including with respect to regulatory and compliance issues, investment management and other matters;
Other Relevant Information
• Information regarding ongoing initiatives to further integrate and harmonize, where applicable, the investment management and other departments of the adviser and its affiliates with the overall investment management infrastructure of Morgan Stanley, in light of Morgan Stanley’s acquisition of Eaton Vance Corp. on March 1, 2021;
• Information concerning the nature, cost, and character of the administrative and other non-investment advisory services provided by the adviser and its affiliates;
• Information concerning oversight of the relationship with the custodian, subcustodians, fund accountants, and other third-party service providers by the adviser and/or administrator to each of the funds;
• Information concerning efforts to implement policies and procedures with respect to various regulations applicable to the funds, including Rule 12d1-4 (the Fund-of-Funds Rule), Rule 18f-4 (the Derivatives Rule), and Rule 2a-5 (the Fair Valuation Rule);
• For an Eaton Vance Fund structured as an exchange-listed closed-end fund, information concerning the benefits of the closed-end fund structure, as well as, where relevant, the closed-end fund’s market prices (including as compared to the closed-end fund’s net asset value (NAV)), trading volume data, continued use of auction preferred shares (where applicable), distribution rates, and other relevant matters;
• The risks that the adviser and/or its affiliates incur in connection with the management and operation of the funds, including, among others, litigation, regulatory, entrepreneurial, and other business risks (and the associated costs of such risks); and
• The terms of each investment advisory agreement and sub-advisory agreement.
During the various meetings of the Board and its committees over the course of the year leading up to the June 6, 2024 meeting, the Board and its committees received information from portfolio managers and other investment professionals of the adviser and sub-advisers of the funds regarding investment and performance matters, and considered various investment and trading strategies used in pursuing the funds’ investment objectives. The Board and its committees also received information regarding risk management techniques employed in connection with the management of the funds. The Board and its committees evaluated issues pertaining to industry and regulatory developments, compliance procedures, fund governance, and other issues with respect to the funds, and received and participated in reports and presentations provided by the adviser and sub-advisers, with respect to such matters. In addition to the formal meetings of the Board and its committees, the Independent Trustees held regular video or telephone conferences to discuss, among other topics, matters relating to the continuation of investment advisory agreements and sub-advisory agreements.
The Contract Review Committee was advised throughout the contract review process by Kirkland & Ellis LLP, independent legal counsel for the Independent Trustees. The members of the Contract Review Committee, with the advice of such counsel, exercised their own business judgment in determining the material factors to be considered in evaluating each investment advisory agreement and sub-advisory agreement and the weight to be given to each such factor. The conclusions reached with respect to each investment advisory agreement and sub-advisory agreement were based on a comprehensive evaluation of all the information provided and not any single factor. Moreover, each member of the Contract Review Committee may have placed varying emphasis on particular factors in reaching conclusions with respect to each investment advisory agreement and sub-advisory agreement. In evaluating each investment advisory agreement and sub-advisory agreement, including the fee structures and other terms contained in such agreements, the members of the Contract Review Committee were also informed by multiple years of analysis and discussion with the adviser and sub-adviser to each of the Eaton Vance Funds.
Eaton Vance
Senior Income Trust
June 30, 2024
Board of Trustees’ Contract Approval — continued
Results of the Contract Review Process
Based on its consideration of the foregoing, and such other information it deemed relevant, including the factors and conclusions described below, the Contract Review Committee concluded that the continuation of the investment advisory agreement between Eaton Vance Senior Income Trust (the “Fund”) and Eaton Vance Management (the “Adviser”), including its fee structure, is in the interests of shareholders and, therefore, recommended to the Board approval of the agreement. Based on the recommendation of the Contract Review Committee, the Board, including a majority of the Independent Trustees, voted to approve continuation of the investment advisory agreement for the Fund.
Nature, Extent and Quality of Services
In considering whether to approve the investment advisory agreement for the Fund, the Board evaluated the nature, extent and quality of services provided to the Fund by the Adviser.
The Board considered the Adviser’s management capabilities and investment processes in light of the types of investments held by the Fund, including the education and experience of the investment professionals who provide services to the Fund, including recent changes to such personnel. In particular, the Board considered the abilities and experience of the Adviser’s investment professionals in analyzing special considerations relevant to investing in senior floating rate loans. Specifically, the Board noted the experience of the Adviser’s large group of bank loan investment professionals and other personnel who provide services to the Fund, including portfolio managers and analysts. The Board also took into account the resources dedicated to portfolio management and other services, the compensation methods of the Adviser and other factors, including the reputation and resources of the Adviser to recruit and retain highly qualified research, advisory and supervisory investment professionals. In addition, the Board considered the time and attention devoted to the Eaton Vance Funds, including the Fund, by senior management, as well as the infrastructure, operational capabilities and support staff in place to assist in the portfolio management and operations of the Fund, including the provision of administrative services. The Board also considered the business-related and other risks to which the Adviser or its affiliates may be subject in managing the Fund. The Board considered the deep experience of the Adviser and its affiliates with managing and operating funds organized as exchange-listed closed-end funds, such as the Fund. In this regard, the Board considered, among other things, the Adviser’s and its affiliates’ experience with implementing leverage arrangements, monitoring and assessing trading price discounts and premiums and adhering to the requirements of securities exchanges.
The Board considered the compliance programs of the Adviser and relevant affiliates thereof. The Board considered compliance and reporting matters regarding, among other things, personal trading by investment professionals, disclosure of portfolio holdings, compliance with policies and procedures, portfolio valuation, business continuity and the allocation of investment opportunities. The Board also considered relevant examinations of the Adviser and its affiliates by regulatory authorities, such as the Securities and Exchange Commission and the Financial Industry Regulatory Authority.
The Board considered other administrative services provided or overseen by Eaton Vance Management and its affiliates, including transfer agency and accounting services. The Board evaluated the benefits to shareholders of investing in a fund that is a part of a large fund complex offering exposure to a variety of asset classes and investment disciplines.
After consideration of the foregoing factors, among others, the Board concluded that the nature, extent and quality of services provided by the Adviser, taken as a whole, are appropriate and consistent with the terms of the investment advisory agreement.
The Board compared the Fund’s investment performance to that of comparable funds identified by an independent data provider (the peer group), as well as an appropriate benchmark index and a custom peer group of similarly managed funds. The Board’s review included comparative performance data with respect to the Fund for the one-, three-, five- and ten-year periods ended December 31, 2023. In this regard, the Board noted that the performance of the Fund was consistent with the median performance of the Fund’s peer group and lower than the median performance of the Fund’s custom peer group for the three-year period. The Board also noted that the performance of the Fund was lower than its benchmark index for the three-year period. On the basis of the foregoing, the performance of the Fund over other periods, and other relevant information provided by the Adviser in response to requests from the Contract Review Committee, the Board concluded that the performance of the Fund was satisfactory.
Management Fees and Expenses
The Board considered contractual fee rates payable by the Fund for advisory and administrative services (referred to collectively as “management fees”). As part of its review, the Board considered the Fund’s management fees and total expense ratio for the one-year period ended December 31, 2023, as compared to those of comparable funds, before and after giving effect to any undertaking to waive fees or reimburse expenses. The Board also considered certain Fund specific factors that had an impact on the Fund’s total expense ratio relative to comparable funds, as identified by management in response to requests from the Contract Review Committee. Additionally, the Board took into account the financial resources committed by the Adviser in structuring the Fund at the time of its initial public offering and the waiver of fees provided by the Adviser for the first five years of the Fund’s life. The Board also considered that, following discussions with the Contract Review Committee, the Adviser had implemented a series of permanent reductions in management fees beginning in May 2010, which included a further fee reduction effective May 1, 2024.
After considering the foregoing information, and in light of the nature, extent and quality of the services provided by the Adviser, the Board concluded that the management fees charged for advisory and related services are reasonable.
Eaton Vance
Senior Income Trust
June 30, 2024
Board of Trustees’ Contract Approval — continued
Profitability and “Fall-Out” Benefits
The Board considered the level of profits realized by the Adviser and relevant affiliates thereof in providing investment advisory and administrative services to the Fund and to all Eaton Vance Funds as a group. The Board considered the level of profits realized without regard to marketing support or other payments by the Adviser and its affiliates to third parties in respect of distribution or other services.
The Board concluded that, in light of the foregoing factors and the nature, extent and quality of the services rendered, the profits realized by the Adviser and its affiliates are not excessive.
The Board also considered direct or indirect fall-out benefits received by the Adviser and its affiliates in connection with their respective relationships with the Fund, including the benefits of research services that may be available to the Adviser as a result of securities transactions effected for the Fund and other investment advisory clients.
In reviewing management fees and profitability, the Board also considered the extent to which the Adviser and its affiliates, on the one hand, and the Fund, on the other hand, can expect to realize benefits from economies of scale as the assets of the Fund increase. The Board acknowledged the difficulty in accurately measuring the benefits resulting from economies of scale, if any, with respect to the management of any specific fund or group of funds. To assist in the evaluation of the sharing of any economies of scale, the Board received data showing for recent years, asset levels, Adviser profitability and total expense ratios. Based upon the foregoing, the Board concluded that the Fund currently shares in the benefits from economies of scale, if any, when they are realized by the Adviser. The Board also considered the fact that the Fund is not continuously offered in the same manner as an open-end fund and that, notwithstanding that the Fund is authorized to issue additional common shares through a shelf offering, the Fund’s assets are not expected to increase materially in the foreseeable future. The Board did not find that the implementation of breakpoints in the advisory fee schedule is warranted at this time.
Eaton Vance
Senior Income Trust
June 30, 2024
Management and Organization
Fund Management.
The Board of Trustees of the Fund (the “Board”) is responsible for the overall management and supervision of the affairs of the Fund. The Board members and officers of the Fund are listed below. Except as indicated, each individual has held the office shown or other offices in the same company for the last five years. Each Trustee holds office until the annual meeting for the year in which his or her term expires and until his or her successor is elected and qualified, subject to a prior death, resignation, retirement, disqualification or removal. Under the terms of the Fund’s current Trustee retirement policy, an Independent Trustee must retire and resign as a Trustee on the earlier of: (i) the first day of July following his or her 74th birthday; or (ii), with limited exception, December 31st of the 20th year in which he or she has served as a Trustee. However, if such retirement and resignation would cause the Fund to be out of compliance with Section 16 of the 1940 Act or any other regulations or guidance of the Securities and Exchange Commission, then such retirement and resignation will not become effective until such time as action has been taken for the Fund to be in compliance therewith. The “noninterested Trustees” consist of those Trustees who are not “interested persons” of the Fund, as that term is defined under the 1940 Act. The business address of each Board member and officer is One Post Office Square, Boston, Massachusetts 02109. As used below, “BMR” refers to Boston Management and Research, “EV” refers to EV LLC, “EVM” refers to Eaton Vance Management, "MSIM" refers to Morgan Stanley Investment Management Inc. and “EVD” refers to Eaton Vance Distributors, Inc. EV is the trustee of each of EVM and BMR. Each of EVM, BMR, EVD and EV are indirect, wholly owned subsidiaries of Morgan Stanley. Each officer affiliated with EVM may hold a position with other EVM affiliates that is comparable to his or her position with EVM listed below. Each Trustee oversees 127 funds in the Eaton Vance fund complex (including both funds and portfolios in a hub and spoke structure).
Name and Year of Birth |
Fund
Position(s) |
Length of Service |
Principal Occupation(s) and Other Directorships
During Past Five Years and Other Relevant Experience |
| Noninterested Trustees |
Alan C. Bowser
1962 |
Class III
Trustee |
Until 2025.
3 years.
Since 2023. |
Private investor. Formerly, Chief Diversity Officer, Partner and a member of the Operating Committee, and formerly served as Senior Advisor on Diversity and Inclusion for the firm’s chief executive officer, Co-Head of the Americas Region, and Senior Client Advisor of Bridgewater Associates, an asset management firm (2011- 2023).
. Independent Director of Stout Risius Ross (a middle market professional services advisory firm) (since 2021). |
Mark R. Fetting
1954 |
Class II
Trustee |
Until 2024.
3 years.
Since 2016. |
Private investor. Formerly held various positions at Legg Mason, Inc. (investment management firm) (2000-2012), including President, Chief Executive Officer, Director and Chairman (2008-2012), Senior Executive Vice President (2004-2008) and Executive Vice President (2001-2004). Formerly, President of Legg Mason family of funds (2001-2008). Formerly, Division President and Senior Officer of Prudential Financial Group, Inc. and related companies (investment management firm) (1991-2000).
None. |
Cynthia E. Frost
1961 |
Class I
Trustee |
Until 2026.
3 years.
Since 2014. |
Private investor. Formerly, Chief Investment Officer of Brown University (university endowment) (2000-2012). Formerly, Portfolio Strategist for Duke Management Company (university endowment manager) (1995-2000). Formerly, Managing Director, Cambridge Associates (investment consulting company) (1989-1995). Formerly, Consultant, Bain and Company (management consulting firm) (1987-1989). Formerly, Senior Equity Analyst, BA Investment Management Company (1983-1985).
None. |
George J. Gorman
1952 |
Chairperson
of the Board
and Class III
Trustee |
Until 2025.
3 years. Chairperson of the Board since 2021 and Trustee since 2014. |
Principal at George J. Gorman LLC (consulting firm). Formerly, Senior Partner at Ernst & Young LLP (a registered public accounting firm) (1974-2009).
None. |
| Valerie A. Mosley (1)
1960 |
Class I
Trustee |
Until 2026.
3 years.
Since 2014. |
Chairwoman and Chief Executive Officer of Valmo Ventures (a consulting and investment firm). Founder of Upward Wealth, Inc., dba BrightUp, a fintech platform. Formerly, Partner and Senior Vice President, Portfolio Manager and Investment Strategist at Wellington Management Company, LLP (investment management firm) (1992-2012). Formerly, Chief Investment Officer, PG Corbin Asset Management (1990-1992). Formerly worked in institutional corporate bond sales at Kidder Peabody (1986-1990).
Director of DraftKings, Inc. (digital sports entertainment and gaming company) (since September 2020). Director of Envestnet, Inc. (provider of intelligent systems for wealth management and financial wellness) (since 2018). Formerly, Director of Dynex Capital, Inc. (mortgage REIT) (2013-2020) and Director of Groupon, Inc. (e-commerce provider) (2020-2022). |
Eaton Vance
Senior Income Trust
June 30, 2024
Management and Organization — continued
Name and Year of Birth |
Fund
Position(s) |
Length of Service |
Principal Occupation(s) and Other Directorships
During Past Five Years and Other Relevant Experience |
| Noninterested Trustees (continued) |
Keith Quinton
1958 |
Class II
Trustee |
Until 2024.
3 years.
Since 2018. |
Private investor, researcher and lecturer. Formerly, Independent Investment Committee Member at New Hampshire Retirement System (2017-2021). Formerly, Portfolio Manager and Senior Quantitative Analyst at Fidelity Investments (investment management firm) (2001-2014).
Formerly, Director (2016-2021) and Chairman (2019-2021) of New Hampshire Municipal Bond Bank. |
Marcus L. Smith
1966 |
Class III
Trustee |
Until 2025.
3 years.
Since 2018. |
Private investor and independent corporate director. Formerly, Chief Investment Officer, Canada (2012-2017), Chief Investment Officer, Asia (2010-2012), Director of Asian Research (2004-2010) and portfolio manager (2001-2017) at MFS Investment Management (investment management firm).
Director of First Industrial Realty Trust, Inc. (an industrial REIT) (since 2021). Director of MSCI Inc. (global provider of investment decision support tools) (since 2017). Formerly, Director of DCT Industrial Trust Inc. (logistics real estate company) (2017-2018). |
Susan J. Sutherland
1957 |
Class I
Trustee |
Until 2026.
3 years.
Since 2015. |
Private investor. Director of Ascot Group Limited and certain of its subsidiaries (insurance and reinsurance) (since 2017). Formerly, Director of Hagerty Holding Corp. (insurance) (2015-2018) and Montpelier Re Holdings Ltd. (insurance and reinsurance) (2013-2015). Formerly, Associate, Counsel and Partner at Skadden, Arps, Slate, Meagher & Flom LLP (law firm) (1982-2013).
Formerly, Director of Kairos Acquisition Corp. (insurance/InsurTech acquisition company) (2021-2023). |
Scott E. Wennerholm
1959 |
Class II
Trustee |
Until 2024.
3 years.
Since 2016. |
Private investor. Formerly, Trustee at Wheelock College (postsecondary institution) (2012-2018). Formerly, Consultant at GF Parish Group (executive recruiting firm) (2016-2017). Formerly, Chief Operating Officer and Executive Vice President at BNY Mellon Asset Management (investment management firm) (2005-2011). Formerly, Chief Operating Officer and Chief Financial Officer at Natixis Global Asset Management (investment management firm) (1997-2004). Formerly, Vice President at Fidelity Investments Institutional Services (investment management firm) (1994-1997).
None. |
| Nancy A. Wiser (1)
1967 |
Class III
Trustee |
Until 2025.
3 years.
Since 2022. |
Formerly, Executive Vice President and the Global Head of Operations at Wells Fargo Asset Management (2011-2021).
None. |
Name and Year of Birth |
Fund
Position(s) |
Length of Service |
Principal Occupation(s)
During Past Five Years |
| Principal Officers who are not Trustees |
Kenneth A. Topping
1966 |
President |
Since 2023 |
Vice President and Chief Administrative Officer of EVM and BMR and Chief Operating Officer for Public Markets at MSIM. Also Vice President of Calvert Research and Management (“CRM”) since 2021. Formerly, Chief Operating Officer for Goldman Sachs Asset Management ‘Classic’ (2009-2020). |
Deidre E. Walsh
1971 |
Vice President and
Chief
Legal Officer |
Since 2009 |
Vice President of EVM and BMR. Also Vice President of CRM. |
James F. Kirchner
1967 |
Treasurer |
Since 2007 |
Vice President of EVM and BMR. Also Vice President of CRM. |
Nicholas S. Di Lorenzo
1987 |
Secretary |
Since 2022 |
Formerly, associate (2012-2021) and counsel (2022) at Dechert LLP. |
Laura T. Donovan
1976 |
Chief Compliance
Officer |
Since 2024 |
Vice President of EVM and BMR. |
(1)
Preferred shares Trustee.
| U.S. Customer Privacy Notice |
March 2024 |
FACTS |
WHAT DOES EATON VANCE DO WITH YOUR PERSONAL INFORMATION? |
Why? |
Financial companies choose how they share your personal information. Federal law gives consumers the right to limit some but not all sharing. Federal law also requires us to tell you how we collect, share, and protect your personal information. Please read this notice carefully to understand what we do. |
|
|
What? |
The types of personal information we collect and share depend on the product or service you have with us. This information can include:■ Social Security number and income
■ investment experience and risk tolerance
■ checking account information and wire transfer instructions |
|
|
How? |
All financial companies need to share customers’ personal information to run their everyday business. In the section below, we list the reasons financial companies can share their customers’ personal information; the reasons Eaton Vance chooses to share; and whether you can limit this sharing. |
Reasons we can share your personal information |
Does Eaton Vance
share? |
Can you limit
this sharing? |
For our everyday business purposes — such as to process your transactions, maintain your account(s), respond to court orders and legal investigations, or report to credit bureaus |
Yes |
No |
For our marketing purposes — to offer our products and services to you |
Yes |
No |
For joint marketing with other financial companies |
No |
We don’t share |
For our affiliates’ everyday business purposes — information about your transactions and experiences |
Yes |
No* |
For our affiliates’ everyday business purposes — information about your creditworthiness |
Yes |
Yes* |
For our affiliates to market to you |
Yes |
Yes* |
For nonaffiliates to market to you |
No |
We don’t share |
To limit our
sharing |
Call toll-free 1-800-262-1122 or email: EVPrivacy@eatonvance.com If you are a customer, we can begin sharing your information 30 days from the date we sent this notice. When you are our customer, we continue to share your information as described in this notice. However, you can contact us at any time to limit our sharing. |
Questions? |
Call toll-free 1-800-262-1122 or email: EVPrivacy@eatonvance.com |
| U.S. Customer Privacy Notice — continued |
March 2024 |
Who we are |
Who is providing this notice? |
Eaton Vance Management and our investment management affiliates (“Eaton Vance”) (see Affiliates definition below.) |
What we do |
How does Eaton Vance
protect my personal
information? |
To protect your personal information from unauthorized access and use, we use security measures that comply with federal law. These measures include computer safeguards and secured files and buildings. We have policies governing the proper handling of customer information by personnel and requiring third parties that provide support to adhere to appropriate security standards with respect to such information. |
How does Eaton Vance
collect my personal
information? |
We collect your personal information, for example, when you■ open an account or make deposits or withdrawals from your account
■ buy securities from us or make a wire transfer
■ give us your contact informationWe also collect your personal information from others, such as credit bureaus, affiliates, or other companies. |
Why can’t I limit all sharing? |
Federal law gives you the right to limit only■ sharing for affiliates’ everyday business purposes — information about your creditworthiness
■ affiliates from using your information to market to you
■ sharing for nonaffiliates to market to youState laws and individual companies may give you additional rights to limit sharing. (See below for more on your rights under state law.) |
What happens when I limit
sharing for an account I hold
jointly with someone else? |
Your choices will apply to everyone on your account. |
Definitions |
Affiliates |
Companies related by common ownership or control. They can be financial and nonfinancial companies.■ Our affiliates include registered investment advisers such as Eaton Vance Management, Eaton Vance Advisers International Ltd., Boston Management and Research, Calvert Research and Management, Parametric Portfolio Associates LLC, Atlanta Capital Management Company LLC, Morgan Stanley Investment Management Inc., Morgan Stanley Investment Management Co.; registered broker-dealers such as Morgan Stanley Distributors Inc. and Eaton Vance Distributors, Inc. (together, the “Investment Management Affiliates”); and companies with a Morgan Stanley name and financial companies such as Morgan Stanley Smith Barney LLC and Morgan Stanley & Co. (the “Morgan Stanley Affiliates”). |
Nonaffiliates |
Companies not related by common ownership or control. They can be financial and nonfinancial companies.■ Eaton Vance does not share with nonaffiliates so they can market to you. |
Joint marketing |
A formal agreement between nonaffiliated financial companies that together market financial products or services to you.■ Eaton Vance does not jointly market. |
| U.S. Customer Privacy Notice — continued |
March 2024 |
Other important information |
*PLEASE NOTE: Eaton Vance does not share your creditworthiness information or your transactions and experiences information with the Morgan Stanley Affiliates, nor does Eaton Vance enable the Morgan Stanley Affiliates to market to you. Your opt outs will prevent Eaton Vance from sharing your creditworthiness information with the Investment Management Affiliates and will prevent the Investment Management Affiliates from marketing their products to you. Vermont: Except as permitted by law, we will not share personal information we collect about Vermont residents with Nonaffiliates unless you provide us with your written consent to share such information. California: Except as permitted by law, we will not share personal information we collect about California residents with Nonaffiliates and we will limit sharing such personal information with our Affiliates to comply with California privacy laws that apply to us. |
Eaton Vance
Senior Income Trust
June 30, 2024
Potential Conflicts of Interest
As a diversified global financial services firm, Morgan Stanley, the parent company of the investment adviser, engages in a broad spectrum of activities, including financial advisory services, investment management activities, lending, commercial banking, sponsoring and managing private investment funds, engaging in broker-dealer transactions and principal securities, commodities and foreign exchange transactions, research publication and other activities. In the ordinary course of its business, Morgan Stanley is a full-service investment banking and financial services firm and therefore engages in activities where Morgan Stanley’s interests or the interests of its clients may conflict with the interests of the Fund. Morgan Stanley advises clients and sponsors, manages or advises other investment funds and investment programs, accounts and businesses (collectively, together with the Morgan Stanley funds, any new or successor funds, programs, accounts or businesses (other than funds, programs, accounts or businesses sponsored, managed, or advised by former direct or indirect subsidiaries of Eaton Vance Corp. (“Eaton Vance Investment Accounts”)), the ‘‘MS Investment Accounts, and, together with the Eaton Vance Investment Accounts, the “Affiliated Investment Accounts’’) with a wide variety of investment objectives that in some instances may overlap or conflict with the Fund’s investment objectives and present conflicts of interest. In addition, Morgan Stanley or the investment adviser may also from time to time create new or successor Affiliated Investment Accounts that may compete with the Fund and present similar conflicts of interest. The discussion below enumerates certain actual, apparent and potential conflicts of interest. There is no assurance that conflicts of interest will be resolved in favor of Fund shareholders and, in fact, they may not be. Conflicts of interest not described below may also exist.
The discussions below with respect to actual, apparent and potential conflicts of interest also may be applicable to or arise from the MS Investment Accounts whether or not specifically identified.
Material Non-public and Other Information.
It is expected that confidential or material non-public information regarding an investment or potential investment opportunity may become available to the investment adviser. If such information becomes available, the investment adviser may be precluded (including by applicable law or internal policies or procedures) from pursuing an investment or disposition opportunity with respect to such investment or investment opportunity. The investment adviser may also from time to time be subject to contractual ‘‘stand-still’’ obligations and/or confidentiality obligations that may restrict its ability to trade in certain investments on the Fund’s behalf. In addition, the investment adviser may be precluded from disclosing such information to an investment team, even in circumstances in which the information would be beneficial if disclosed. Therefore, the investment team may not be provided access to material non-public information in the possession of Morgan Stanley that might be relevant to an investment decision to be made on behalf of the Fund, and the investment team may initiate a transaction or sell an investment that, if such information had been known to it, may not have been undertaken. In addition, certain members of the investment team may be recused from certain investment-related discussions so that such members do not receive information that would limit their ability to perform functions of their employment with the investment adviser or its affiliates unrelated to that of the Fund. Furthermore, access to certain parts of Morgan Stanley may be subject to third party confidentiality obligations and to information barriers established by Morgan Stanley in order to manage potential conflicts of interest and regulatory restrictions, including without limitation joint transaction restrictions pursuant to the Investment Company Act of 1940 (the “1940 Act”). Accordingly, the investment adviser’s ability to source investments from other business units within Morgan Stanley may be limited and there can be no assurance that the investment adviser will be able to source any investments from any one or more parts of the Morgan Stanley network.
The investment adviser may restrict its investment decisions and activities on behalf of the Fund in various circumstances, including because of applicable regulatory requirements or information held by the investment adviser or Morgan Stanley. The investment adviser might not engage in transactions or other activities for, or enforce certain rights in favor of, the Fund due to Morgan Stanley’s activities outside the Fund. In instances where trading of an investment is restricted, the investment adviser may not be able to purchase or sell such investment on behalf of the Fund, resulting in the Fund’s inability to participate in certain desirable transactions. This inability to buy or sell an investment could have an adverse effect on the Fund’s portfolio due to, among other things, changes in an investment’s value during the period its trading is restricted. Also, in situations where the investment adviser is required to aggregate its positions with those of other Morgan Stanley business units for position limit calculations, the investment adviser may have to refrain from making investments due to the positions held by other Morgan Stanley business units or their clients. There may be other situations where the investment adviser refrains from making an investment due to additional disclosure obligations, regulatory requirements, policies, and reputational risk, or the investment adviser may limit purchases or sales of securities in respect of which Morgan Stanley is engaged in an underwriting or other distribution capacity.
Morgan Stanley has established certain information barriers and other policies to address the sharing of information between different businesses within Morgan Stanley. As a result of information barriers, the investment adviser generally will not have access, or will have limited access, to certain information and personnel in other areas of Morgan Stanley relating to business transactions for clients (including transactions in investing, banking, prime brokerage and certain other areas), and generally will not manage the Fund with the benefit of the information held by such other areas. Morgan Stanley, due to its access to and knowledge of funds, markets and securities based on its prime brokerage and other businesses, may make decisions based on information or take (or refrain from taking) actions with respect to interests in investments of the kind held (directly or indirectly) by the Fund in a manner that may be adverse to the Fund, and will not have any obligation or other duty to share information with the investment adviser. In limited circumstances, however, including for purposes of managing business and reputational risk, and subject to policies and procedures and any applicable regulations, Morgan Stanley personnel, including personnel of the investment adviser, on one side of an information barrier may have access to information and personnel on the other side of the information barrier through “wall crossings.” The investment adviser faces conflicts of interest in determining whether to engage in such wall crossings. Information obtained in connection with such wall crossings may limit or restrict the ability of the investment adviser to engage in or otherwise effect transactions on behalf of the Fund (including purchasing or selling securities that the investment adviser may otherwise have purchased or sold for the Fund in the absence of a wall crossing). In managing conflicts of interest that arise because of the foregoing, the investment adviser generally will be subject to fiduciary requirements. The investment adviser may also implement internal information barriers or ethical walls, and the conflicts described herein with respect to information barriers and otherwise with respect to Morgan Stanley and the investment adviser will also apply internally within the
Eaton Vance
Senior Income Trust
June 30, 2024
Potential Conflicts of Interest — continued
investment adviser. As a result, the Fund may not be permitted to transact in (e.g., dispose of a security in whole or in part) during periods when it otherwise would have been able to do so, which could adversely affect the Fund. Other investors in the security that are not subject to such restrictions may be able to transact in the security during such periods. There may also be circumstances in which, as a result of information held by certain portfolio management teams in the investment adviser, the investment adviser limits an activity or transaction for the Fund, including if the Fund is managed by a portfolio management team other than the team holding such information.
Investments by Morgan Stanley and its Affiliated Investment Accounts.
In serving in multiple capacities to Affiliated Investment Accounts, Morgan Stanley, including the investment adviser and its investment teams, may have obligations to other clients or investors in Affiliated Investment Accounts, the fulfillment of which may not be in the best interests of the Fund or its shareholders. The Fund’s investment objectives may overlap with the investment objectives of certain Affiliated Investment Accounts. As a result, the members of an investment team may face conflicts in the allocation of investment opportunities among the Fund and other investment funds, programs, accounts and businesses advised by or affiliated with the investment adviser. Certain Affiliated Investment Accounts may provide for higher management or incentive fees or greater expense reimbursements or overhead allocations, all of which may contribute to this conflict of interest and create an incentive for the investment adviser to favor such other accounts.
Morgan Stanley currently invests and plans to continue to invest on its own behalf and on behalf of its Affiliated Investment Accounts in a wide variety of investment opportunities globally. Morgan Stanley and its Affiliated Investment Accounts, to the extent consistent with applicable law and policies and procedures, will be permitted to invest in investment opportunities without making such opportunities available to the Fund beforehand. Subject to the foregoing, Morgan Stanley may offer investments that fall into the investment objectives of an Affiliated Investment Account to such account or make such investment on its own behalf, even though such investment also falls within the Fund’s investment objectives. The Fund may invest in opportunities that Morgan Stanley and/or one or more Affiliated Investment Accounts has declined, and vice versa. All of the foregoing may reduce the number of investment opportunities available to the Fund and may create conflicts of interest in allocating investment opportunities. Investors should note that the conflicts inherent in making such allocation decisions may not always be resolved to the Fund’s advantage. There can be no assurance that the Fund will have an opportunity to participate in certain opportunities that fall within its investment objectives.
To seek to reduce potential conflicts of interest and to attempt to allocate such investment opportunities in a fair and equitable manner, the investment adviser has implemented allocation policies and procedures. These policies and procedures are intended to give all clients of the investment adviser, including the Fund, fair access to investment opportunities consistent with the requirements of organizational documents, investment strategies, applicable laws and regulations, and the fiduciary duties of the investment adviser. Each client of the investment adviser that is subject to the allocation policies and procedures, including each Fund, is assigned an investment team and portfolio manager(s) by the investment adviser. The investment team and portfolio managers review investment opportunities and will decide with respect to the allocation of each opportunity considering various factors and in accordance with the allocation policies and procedures. The allocation policies and procedures are subject to change. Investors should note that the conflicts inherent in making such allocation decisions may not always be resolved to the advantage of the Fund.
It is possible that Morgan Stanley or an Affiliated Investment Account, including another Eaton Vance fund, will invest in or advise a company that is or becomes a competitor of a company of which the Fund holds an investment. Such investment could create a conflict between the Fund, on the one hand, and Morgan Stanley or the Affiliated Investment Account, on the other hand. In such a situation, Morgan Stanley may also have a conflict in the allocation of its own resources to the portfolio investment. Furthermore, certain Affiliated Investment Accounts will be focused primarily on investing in other funds which may have strategies that overlap and/or directly conflict and compete with the Fund.
In addition, certain investment professionals who are involved in the Fund’s activities remain responsible for the investment activities of other Affiliated Investment Accounts managed by the investment adviser and its affiliates, and they will devote time to the management of such investments and other newly created Affiliated Investment Accounts (whether in the form of funds, separate accounts or other vehicles), as well as their own investments. In addition, in connection with the management of investments for other Affiliated Investment Accounts, members of Morgan Stanley and its affiliates may serve on the boards of directors of or advise companies which may compete with the Fund’s portfolio investments. Moreover, these Affiliated Investment Accounts managed by Morgan Stanley and its affiliates may pursue investment opportunities that may also be suitable for the Fund.
It should be noted that Morgan Stanley may, directly or indirectly, make large investments in certain of its Affiliated Investment Accounts, and accordingly Morgan Stanley’s investment in the Fund may not be a determining factor in the outcome of any of the foregoing conflicts. Nothing herein restricts or in any way limits the activities of Morgan Stanley, including its ability to buy or sell interests in, or provide financing to, equity and/or debt instruments, funds or portfolio companies, for its own accounts or for the accounts of Affiliated Investment Accounts or other investment funds or clients in accordance with applicable law.
Different clients of the investment adviser, including the Fund, may invest in different classes of securities of the same issuer, depending on the respective clients’ investment objectives and policies. As a result, the investment adviser and its affiliates, at times, will seek to satisfy fiduciary obligations to certain clients owning one class of securities of a particular issuer by pursuing or enforcing rights on behalf of those clients with respect to such class of securities, and those activities may have an adverse effect on another client which owns a different class of securities of such issuer. For example, if one client holds debt securities of an issuer and another client holds equity securities of the same issuer, if the issuer experiences financial or operational challenges, the investment adviser and its affiliates may seek a liquidation of the issuer on behalf of the client that holds the debt securities, whereas the client holding the
Eaton Vance
Senior Income Trust
June 30, 2024
Potential Conflicts of Interest — continued
equity securities may benefit from a reorganization of the issuer. Thus, in such situations, the actions taken by the investment adviser or its affiliates on behalf of one client can negatively impact securities held by another client. These conflicts also exist as between the investment adviser’s clients, including the Fund, and the Affiliated Investment Accounts managed by Morgan Stanley.
The investment adviser and its affiliates may give advice and recommend securities to other clients which may differ from advice given to, or securities recommended or bought for, the Fund even though such other clients’ investment objectives may be similar to those of the Fund.
The investment adviser and its affiliates manage long and short portfolios. The simultaneous management of long and short portfolios creates conflicts of interest in portfolio management and trading in that opposite directional positions may be taken in client accounts, including client accounts managed by the same investment team, and creates risks such as: (i) the risk that short sale activity could adversely affect the market value of long positions in one or more portfolios (and vice versa) and (ii) the risks associated with the trading desk receiving opposing orders in the same security simultaneously. The investment adviser and its affiliates have adopted policies and procedures that are reasonably designed to mitigate these conflicts. In certain circumstances, the investment adviser invests on behalf of itself in securities and other instruments that would be appropriate for, held by, or may fall within the investment guidelines of its clients, including the Fund. At times, the investment adviser may give advice or take action for its own accounts that differs from, conflicts with, or is adverse to advice given or action taken for any client.
From time to time, conflicts also arise due to the fact that certain securities or instruments may be held in some client accounts, including the Fund, but not in others, or that client accounts may have different levels of holdings in certain securities or instruments. In addition, due to differences in the investment strategies or restrictions among client accounts, the investment adviser may take action with respect to one account that differs from the action taken with respect to another account. In some cases, a client account may compensate the investment adviser based on the performance of the securities held by that account. The existence of such a performance based fee may create additional conflicts of interest for the investment adviser in the allocation of management time, resources and investment opportunities. The investment adviser has adopted several policies and procedures designed to address these potential conflicts including a code of ethics and policies that govern the investment adviser’s trading practices, including, among other things, the aggregation and allocation of trades among clients, brokerage allocations, cross trades and best execution.
In addition, at times an investment adviser investment team will give advice or take action with respect to the investments of one or more clients that is not given or taken with respect to other clients with similar investment programs, objectives, and strategies. Accordingly, clients with similar strategies will not always hold the same securities or instruments or achieve the same performance. The investment adviser’s investment teams also advise clients with conflicting programs, objectives or strategies. These conflicts also exist as between the investment adviser’s clients, including the Fund, and the Affiliated Investment Accounts managed by Morgan Stanley.
The investment adviser maintains separate trading desks by investment team and generally based on asset class, including two trading desks trading equity securities. These trading desks operate independently of one another. The two equity trading desks do not share information. The separate equity trading desks may result in one desk competing against the other desk when implementing buy and sell transactions, possibly causing certain accounts to pay more or receive less for a security than other accounts. In addition, Morgan Stanley and its affiliates maintain separate trading desks that operate independently of each other and do not share trading information with the investment adviser. These trading desks may compete against the investment adviser trading desks when implementing buy and sell transactions, possibly causing certain Affiliated Investment Accounts to pay more or receive less for a security than other Affiliated Investment Accounts.
Investments by Separate Investment Departments.
The entities and individuals that provide investment-related services for the Fund and certain other Eaton Vance Investment Accounts (the “Eaton Vance Investment Department”) may be different from the entities and individuals that provide investment-related services to MS Investment Accounts (the “MS Investment Department and, together with the Eaton Vance Investment Department, the “Investment Departments”). Although Morgan Stanley has implemented information barriers between the Investment Departments in accordance with internal policies and procedures, each Investment Department may engage in discussions and share information and resources with the other Investment Department on certain investment-related matters. The sharing of information and resources between the Investment Departments is designed to further increase the knowledge and effectiveness of each Investment Department. Because each Investment Department generally makes investment decisions and executes trades independently of the other, the quality and price of execution, and the performance of investments and accounts, can be expected to vary. In addition, each Investment Department may use different trading systems and technology and may employ differing investment and trading strategies. As a result, a MS Investment Account could trade in advance of the Fund (and vice versa), might complete trades more quickly and efficiently than the Fund, and/or achieve different execution than the Fund on the same or similar investments made contemporaneously, even when the Investment Departments shared research and viewpoints that led to that investment decision. Any sharing of information or resources between the Investment Department servicing the Fund and the MS Investment Department may result, from time to time, in the Fund simultaneously or contemporaneously seeking to engage in the same or similar transactions as an account serviced by the other Investment Department and for which there are limited buyers or sellers on specific securities, which could result in less favorable execution for the Fund than such account. The Eaton Vance Investment Department will not knowingly or intentionally cause the Fund to engage in a cross trade with an account serviced by the MS Investment Department, however, subject to applicable law and internal policies and procedures, the Fund may conduct cross trades with other accounts serviced by the Eaton Vance Investment Department. Although the Eaton Vance Investment Department may aggregate the Fund’s trades with trades of other accounts serviced by the Eaton Vance Investment Department, subject to applicable law and internal policies and procedures, there will be no aggregation or coordination of trades with accounts serviced by the MS Investment Department, even when both Investment Departments are seeking to acquire or dispose of the same investments contemporaneously.
Eaton Vance
Senior Income Trust
June 30, 2024
Potential Conflicts of Interest — continued
Payments to Broker-Dealers and Other Financial Intermediaries.
The investment adviser and/or Eaton Vance Distributors, Inc. (“EVD”) may pay compensation, out of their own funds and not as an expense of the Fund, to certain financial intermediaries (which may include affiliates of the investment adviser and EVD), including recordkeepers and administrators of various deferred compensation plans, in connection with the sale, distribution, marketing and retention of shares of the Fund and/or shareholder servicing. For example, the investment adviser or EVD may pay additional compensation to a financial intermediary for, among other things, promoting the sale and distribution of Fund shares, providing access to various programs, mutual fund platforms or preferred or recommended mutual fund lists that may be offered by a financial intermediary, granting EVD access to a financial intermediary’s financial advisors and consultants, providing assistance in the ongoing education and training of a financial intermediary’s financial personnel, furnishing marketing support, maintaining share balances and/or for sub-accounting, recordkeeping, administrative, shareholder or transaction processing services. Such payments are in addition to any distribution fees, shareholder servicing fees and/or transfer agency fees that may be payable by the Fund. The additional payments may be based on various factors, including level of sales (based on gross or net sales or some specified minimum sales or some other similar criteria related to sales of the Fund and/or some or all other Eaton Vance funds), amount of assets invested by the financial intermediary’s customers (which could include current or aged assets of the Fund and/or some or all other Eaton Vance funds), a Fund’s advisory fee, some other agreed upon amount or other measures as determined from time to time by the investment adviser and/or EVD. The amount of these payments may be different for different financial intermediaries.
The prospect of receiving, or the receipt of, additional compensation, as described above, by financial intermediaries may provide such financial intermediaries and their financial advisors and other salespersons with an incentive to favor sales of shares of the Fund over other investment options with respect to which these financial intermediaries do not receive additional compensation (or receive lower levels of additional compensation). These payment arrangements, however, will not change the price that an investor pays for shares of the Funds or the amount that the Fund receive to invest on behalf of an investor. Investors may wish to take such payment arrangements into account when considering and evaluating any recommendations relating to Fund shares and should review carefully any disclosures provided by financial intermediaries as to their compensation. In addition, in certain circumstances, the investment adviser may restrict, limit or reduce the amount of the Fund’s investment, or restrict the type of governance or voting rights it acquires or exercises, where the Fund (potentially together with Morgan Stanley) exceeds a certain ownership interest, or possesses certain degrees of voting or control or has other interests.
Morgan Stanley Trading and Principal Investing Activities.
Notwithstanding anything to the contrary herein, Morgan Stanley will generally conduct its sales and trading businesses, publish research and analysis, and render investment advice without regard for the Fund’s holdings, although these activities could have an adverse impact on the value of one or more of the Fund’s investments, or could cause Morgan Stanley to have an interest in one or more portfolio investments that is different from, and potentially adverse to that of the Fund. Furthermore, from time to time, the investment adviser or its affiliates may invest “seed” capital in the Fund, typically to enable the Fund to commence investment operations and/or achieve sufficient scale. The investment adviser and its affiliates may hedge such seed capital exposure by investing in derivatives or other instruments expected to produce offsetting exposure. Such hedging transactions, if any, would occur outside of the Fund.
Morgan Stanley’s sales and trading, financing and principal investing businesses (whether or not specifically identified as such, and including Morgan Stanley’s trading and principal investing businesses) will not be required to offer any investment opportunities to the Fund. These businesses may encompass, among other things, principal trading activities as well as principal investing.
Morgan Stanley’s sales and trading, financing and principal investing businesses have acquired or invested in, and in the future may acquire or invest in, minority and/or majority control positions in equity or debt instruments of diverse public and/or private companies. Such activities may put Morgan Stanley in a position to exercise contractual, voting or creditor rights, or management or other control with respect to securities or loans of portfolio investments or other issuers, and in these instances Morgan Stanley may, in its discretion and subject to applicable law, act to protect its own interests or interests of clients, and not the Fund’s interests.
Subject to the limitations of applicable law, the Fund may purchase from or sell assets to, or make investments in, companies in which Morgan Stanley has or may acquire an interest, including as an owner, creditor or counterparty.
Morgan Stanley’s Investment Banking and Other Commercial Activities.
Morgan Stanley advises clients on a variety of mergers, acquisitions, restructuring, bankruptcy and financing transactions. Morgan Stanley may act as an advisor to clients, including other investment funds that may compete with the Fund and with respect to investments that the Fund may hold. Morgan Stanley may give advice and take action with respect to any of its clients or proprietary accounts that may differ from the advice given, or may involve an action of a different timing or nature than the action taken, by the Fund. Morgan Stanley may give advice and provide recommendations to persons competing with the Fund and/or any of the Fund’s investments that are contrary to the Fund’s best interests and/or the best interests of any of its investments.
Morgan Stanley could be engaged in financial advising, whether on the buy-side or sell-side, or in financing or lending assignments that could result in Morgan Stanley’s determining in its discretion or being required to act exclusively on behalf of one or more third parties, which could limit the Fund’s ability to transact with respect to one or more existing or potential investments. Morgan Stanley may have relationships with third-party funds, companies or investors who may have invested in or may look to invest in portfolio companies, and there could be conflicts between the Fund’s best interests, on the one hand, and the interests of a Morgan Stanley client or counterparty, on the other hand.
Eaton Vance
Senior Income Trust
June 30, 2024
Potential Conflicts of Interest — continued
To the extent that Morgan Stanley advises creditor or debtor companies in the financial restructuring of companies either prior to or after filing for protection under Chapter 11 of the U.S. Bankruptcy Code or similar laws in other jurisdictions, the investment adviser’s flexibility in making investments in such restructurings on the Fund’s behalf may be limited.
Morgan Stanley could provide investment banking services to competitors of portfolio companies, as well as to private equity and/or private credit funds; such activities may present Morgan Stanley with a conflict of interest vis-a-vis the Fund’s investment and may also result in a conflict in respect of the allocation of investment banking resources to portfolio companies.
To the extent permitted by applicable law, Morgan Stanley may provide a broad range of financial services to companies in which the Fund invests, including strategic and financial advisory services, interim acquisition financing and other lending and underwriting or placement of securities, and Morgan Stanley generally will be paid fees (that may include warrants or other securities) for such services. Morgan Stanley will not share any of the foregoing interest, fees and other compensation received by it (including, for the avoidance of doubt, amounts received by the investment adviser) with the Fund, and any advisory fees payable will not be reduced thereby.
Morgan Stanley may be engaged to act as a financial advisor to a company in connection with the sale of such company, or subsidiaries or divisions thereof, may represent potential buyers of businesses through its mergers and acquisition activities and may provide lending and other related financing services in connection with such transactions. Morgan Stanley’s compensation for such activities is usually based upon realized consideration and is usually contingent, in substantial part, upon the closing of the transaction. Under these circumstances, the Fund may be precluded from participating in a transaction with or relating to the company being sold or participating in any financing activity related to merger or acquisition.
The involvement or presence of Morgan Stanley in the investment banking and other commercial activities described above (or the financial markets more broadly) may restrict or otherwise limit investment opportunities that may otherwise be available to the Fund. For example, issuers may hire and compensate Morgan Stanley to provide underwriting, financial advisory, placement agency, brokerage services or other services and, because of limitations imposed by applicable law and regulation, the Fund may be prohibited from buying or selling securities issued by those issuers or participating in related transactions or otherwise limited in its ability to engage in such investments.
Morgan Stanley’s Marketing Activities.
Morgan Stanley is engaged in the business of underwriting, syndicating, brokering, administering, servicing, arranging and advising on the distribution of a wide variety of securities and other investments in which the Fund may invest. Subject to the restrictions of the 1940 Act, including Sections 10(f) and 17(e) thereof, the Fund may invest in transactions in which Morgan Stanley acts as underwriter, placement agent, syndicator, broker, administrative agent, servicer, advisor, arranger or structuring agent and receives fees or other compensation from the sponsors of such products or securities. Any fees earned by Morgan Stanley in such capacity will not be shared with the investment adviser or the Fund. Certain conflicts of interest, in addition to the receipt of fees or other compensation, would be inherent in these transactions. Moreover, the interests of one of Morgan Stanley’s clients with respect to an issuer of securities in which the Fund has an investment may be adverse to the investment adviser’s or a Fund’s best interests. In conducting the foregoing activities, Morgan Stanley will be acting for its other clients and will have no obligation to act in the investment adviser’s or a Fund’s best interests.
Client Relationships.
Morgan Stanley has existing and potential relationships with a significant number of corporations, institutions and individuals. In providing services to its clients, Morgan Stanley may face conflicts of interest with respect to activities recommended to or performed for such clients, on the one hand, and a Fund, its shareholders or the entities in which the Fund invests, on the other hand. In addition, these client relationships may present conflicts of interest in determining whether to offer certain investment opportunities to a Fund.
In acting as principal or in providing advisory and other services to its other clients, Morgan Stanley may engage in or recommend activities with respect to a particular matter that conflict with or are different from activities engaged in or recommended by the investment adviser on a Fund’s behalf.
Principal Investments.
To the extent permitted by applicable law, there may be situations in which a Fund’s interests may conflict with the interests of one or more general accounts of Morgan Stanley and its affiliates or accounts managed by Morgan Stanley or its affiliates. This may occur because these accounts hold public and private debt and equity securities of many issuers which may be or become portfolio companies, or from whom portfolio companies may be acquired.
Transactions with Portfolio Companies of Affiliated Investment Accounts.
The companies in which the Fund may invest may be counterparties to or participants in agreements, transactions or other arrangements with portfolio companies or other entities of portfolio investments of Affiliated Investment Accounts (for example, a company in which the Fund invests may retain a company in which an Affiliated Investment Account invests to provide services or may acquire an asset from such company or vice versa). Certain of these agreements, transactions and arrangements involve fees, servicing payments, rebates and/or other benefits to Morgan Stanley or its affiliates. For example, portfolio entities may, including at the encouragement of Morgan Stanley, enter into agreements regarding group procurement and/or vendor discounts. Morgan Stanley and its affiliates may also participate in these agreements and may realize better pricing or discounts as a result of the participation of portfolio entities. To the extent permitted by applicable law, certain of these agreements may provide for commissions or similar payments and/or discounts or rebates to be paid to a portfolio entity of an Affiliated Investment Account, and such payments or discounts or rebates may also be made directly to Morgan Stanley or its affiliates. Under these arrangements, a particular portfolio company or other entity may benefit to a greater degree than the other participants, and the funds, investment vehicles and accounts (which may
Eaton Vance
Senior Income Trust
June 30, 2024
Potential Conflicts of Interest — continued
or may not include a Fund) that own an interest in such entity will receive a greater relative benefit from the arrangements than the Eaton Vance funds, investment vehicles or accounts that do not own an interest therein. Fees and compensation received by portfolio companies of Affiliated Investment Accounts in relation to the foregoing will not be shared with the Fund or offset advisory fees payable.
Investments in Portfolio Investments of Other Funds.
To the extent permitted by applicable law, when the Fund invests in certain companies or other entities, other funds affiliated with the investment adviser may have made or may be making an investment in such companies or other entities. Other funds that have been or may be managed by the investment adviser may invest in the companies or other entities in which the Fund has made an investment. Under such circumstances, the Fund and such other funds may have conflicts of interest (e.g., over the terms, exit strategies and related matters, including the exercise of remedies of their respective investments). If the interests held by the Fund are different from (or take priority over) those held by such other funds, the investment adviser may be required to make a selection at the time of conflicts between the interests held by such other funds and the interests held by a Fund.
Allocation of Expenses.
Expenses may be incurred that are attributable to the Fund and one or more other Affiliated Investment Accounts (including in connection with issuers in which the Fund and such other Affiliated Investment Accounts have overlapping investments). The allocation of such expenses among such entities raises potential conflicts of interest. The investment adviser and its affiliates intend to allocate such common expenses among the Fund and any such other Affiliated Investment Accounts on a pro rata basis or in such other manner as the investment adviser deems to be fair and equitable or in such other manner as may be required by applicable law.
Temporary Investments.
To more efficiently invest short-term cash balances held by a Fund, the investment adviser may invest such balances on an overnight “sweep” basis in shares of one or more money market funds or other short-term vehicles. It is anticipated that the investment adviser to these money market funds or other short-term vehicles may be the investment adviser (or an affiliate) to the extent permitted by applicable law, including Rule 12d1-1 under the 1940 Act.
Transactions with Affiliates.
The investment adviser and any investment sub-adviser might purchase securities from underwriters or placement agents in which a Morgan Stanley affiliate is a member of a syndicate or selling group, as a result of which an affiliate might benefit from the purchase through receipt of a fee or otherwise. Neither the investment adviser nor any investment sub-adviser will purchase securities on behalf of the Fund from an affiliate that is acting as a manager of a syndicate or selling group. Purchases by the investment adviser on behalf of the Fund from an affiliate acting as a placement agent must meet the requirements of applicable law. Furthermore, Morgan Stanley may face conflicts of interest when the Fund uses service providers affiliated with Morgan Stanley because Morgan Stanley receives greater overall fees when they are used.
General Process for Potential Conflicts.
All of the transactions described above involve the potential for conflicts of interest between the investment adviser, related persons of the investment adviser and/or their clients. The Investment Advisers Act of 1940, as amended (the “Advisers Act”), the 1940 Act and the Employee Retirement Income Security Act, as amended (“ERISA”), impose certain requirements designed to decrease the possibility of conflicts of interest between an investment adviser and its clients. In some cases, transactions may be permitted subject to fulfillment of certain conditions. Certain other transactions may be prohibited. In addition, the investment adviser has instituted policies and procedures designed to prevent conflicts of interest from arising and, when they do arise, to ensure that it effects transactions for clients in a manner that is consistent with its fiduciary duty to its clients and in accordance with applicable law. The investment adviser seeks to ensure that potential or actual conflicts of interest are appropriately resolved taking into consideration the overriding best interests of the client.
Delivery of Shareholder Documents.
The Securities and Exchange Commission (SEC) permits funds to deliver only one copy of shareholder documents, including prospectuses, proxy statements and shareholder reports, to fund investors with multiple accounts at the same residential or post office box address. This practice is often called “householding” and it helps eliminate duplicate mailings to shareholders.
Equiniti Trust Company, LLC
(“
”),
the closed-end funds transfer agent, or your financial intermediary, may household the mailing of your documents indefinitely unless you instruct EQ, or your financial intermediary, otherwise.
If you would prefer that your Eaton Vance documents not be householded, please contact EQ or your financial intermediary. Your instructions that householding not apply to delivery of your Eaton Vance documents will typically be effective within 30 days of receipt by EQ or your financial intermediary.
Portfolio Holdings.
Each Eaton Vance Fund and its underlying Portfolio(s) (if applicable) files a schedule of portfolio holdings on Part F to Form N-PORT with the SEC. Certain information filed on Form N-PORT may be viewed on the Eaton Vance website at www.eatonvance.com, by calling Eaton Vance at 1-800-262-1122 or in the EDGAR database on the SEC’s website at www.sec.gov.
Proxy Voting.
From time to time, funds are required to vote proxies related to the securities held by the funds. The Eaton Vance Funds or their underlying Portfolios (if applicable) vote proxies according to a set of policies and procedures approved by the Funds’ and Portfolios’ Boards. You may obtain a description of these policies and procedures and information on how the Funds or Portfolios voted proxies relating to portfolio securities during the most recent 12-month period ended June 30, without charge, upon request, by calling 1-800-262-1122 and by accessing the SEC’s website at www.sec.gov.
Share Repurchase Program.
The Fund’s Board of Trustees has approved a share repurchase program authorizing the Fund to repurchase up to 10% of its common shares outstanding as of the last day of the prior calendar year in open-market transactions at a discount to net asset value. The repurchase program does not obligate the Fund to purchase a specific amount of shares. The Fund’s repurchase activity, including the number of shares purchased, average price and average discount to net asset value, is disclosed in the Fund’s annual and semi-annual reports to shareholders.
Additional Notice to Shareholders.
If applicable, a Fund may also redeem or purchase its outstanding preferred shares in order to maintain compliance with regulatory requirements, borrowing or rating agency requirements or for other purposes as it deems appropriate or necessary.
Closed-End Fund Information.
Eaton Vance closed-end funds make fund performance data and certain information about portfolio characteristics available on the Eaton Vance website shortly after the end of each month. Other information about the funds is available on the website. The funds’ net asset value per share is readily accessible on the Eaton Vance website. Portfolio holdings for the most recent month-end are also posted to the website approximately 30 days following the end of the month. This information is available at www.eatonvance.com on the fund information pages under “Closed-End Funds & Term Trusts.”
This Page Intentionally Left Blank
This Page Intentionally Left Blank
Investment Adviser and Administrator
Eaton Vance Management
One Post Office Square
Boston, MA 02109
Custodian
State Street Bank and Trust Company
One Congress Street, Suite 1
Boston, MA 02114-2016
Transfer Agent
Equiniti Trust Company, LLC (“EQ”)
P.O. Box 500
Newark, NJ 07101
Independent Registered Public Accounting Firm
Deloitte & Touche LLP
200 Berkeley Street
Boston, MA 02116-5022
Fund Offices
One Post Office Square
Boston, MA 02109
Item 2. Code of Ethics
The registrant (sometimes referred to as the “Fund”) has adopted a code of ethics applicable to its Principal Executive Officer, Principal Financial Officer and Principal Accounting Officer. The registrant undertakes to provide a copy of such code of ethics to any person upon request, without charge, by calling 1-800-262-1122. The registrant has not amended the code of ethics as described in Form N-CSR during the period covered by this report. The registrant has not granted any waiver, including an implicit waiver, from a provision of the code of ethics as described in Form N-CSR during the period covered by this report.
Item 3. Audit Committee Financial Expert
The registrant’s Board of Trustees (the “Board”) has designated George J. Gorman and Scott E. Wennerholm, each an independent trustee, as audit committee financial experts. Mr. Gorman is a certified public accountant who is the Principal at George J. Gorman LLC (a consulting firm). Previously, Mr. Gorman served in various capacities at Ernst & Young LLP (a registered public accounting firm), including as Senior Partner. Mr. Gorman also has experience serving as an independent trustee and audit committee financial expert of other mutual fund complexes. Mr. Wennerholm is a private investor. Previously, Mr. Wennerholm served as a Trustee at Wheelock College (postsecondary institution), as a Consultant at GF Parish Group (executive recruiting firm), Chief Operating Officer and Executive Vice President at BNY Mellon Asset Management (investment management firm), Chief Operating Officer and Chief Financial Officer at Natixis Global Asset Management (investment management firm), and Vice President at Fidelity Investments Institutional Services (investment management firm).
Item 4. Principal Accountant Fees and Services
(a) –(d)
The following table presents the aggregate fees billed to the registrant for the registrant’s fiscal years ended June 30, 2023 and June 30, 2024 by the registrant’s principal accountant, Deloitte & Touche LLP (“D&T”), for professional services rendered for the audit of the registrant’s annual financial statements and fees billed for other services rendered by D&T during such periods.
Eaton Vance Senior Income Trust
|
|
|
|
|
|
|
|
|
| Fiscal Years Ended |
|
6/30/23 |
|
|
6/30/24 |
|
| Audit Fees |
|
$ |
81,500 |
|
|
$ |
79,900 |
|
| Audit-Related Fees(1) |
|
$ |
0 |
|
|
$ |
0 |
|
| Tax Fees(2) |
|
$ |
0 |
|
|
$ |
0 |
|
| All Other Fees(3) |
|
$ |
0 |
|
|
$ |
0 |
|
|
|
|
|
|
|
|
|
|
| Total |
|
$ |
81,500 |
|
|
$ |
79,900 |
|
|
|
|
|
|
|
|
|
|
| (1) |
Audit-related fees consist of the aggregate fees billed for assurance and related services that are reasonably related to the performance of the audit of financial statements and are not reported under the category of audit fees and specifically include fees for the performance of certain agreed-upon procedures relating to the registrant’s Revolving Credit Agreement. |
| (2) |
Tax fees consist of the aggregate fees billed for professional services rendered by the principal accountant relating to tax compliance, tax advice, and tax planning and specifically include fees for tax return preparation and other related tax compliance/planning matters. |
| (3) |
All other fees consist of the aggregate fees billed for products and services provided by the principal accountant other than audit, audit-related, and tax services. |
(e)(1) The registrant’s audit committee has adopted policies and procedures relating to the pre-approval of services provided by the registrant’s principal accountant (the “Pre-Approval Policies”). The Pre-Approval Policies establish a framework intended to assist the audit committee in the proper discharge of its pre-approval responsibilities. As a general matter, the Pre-Approval Policies (i) specify certain types of audit, audit-related, tax, and other services determined to be pre-approved by the audit committee; and (ii) delineate specific procedures governing the mechanics of the pre-approval process, including the approval and monitoring of audit and non-audit service fees. Unless a service is specifically pre-approved under the Pre-Approval Policies, it must be separately pre-approved by the audit committee.
The Pre-Approval Policies and the types of audit and non-audit services pre-approved therein must be reviewed and ratified by the registrant’s audit committee at least annually. The registrant’s audit committee maintains full responsibility for the appointment, compensation, and oversight of the work of the registrant’s principal accountant.
(e)(2) No services described in paragraphs (b)-(d) above were approved by the registrant’s audit committee pursuant to the “de minimis exception” set forth in Rule 2-01(c)(7)(i)(C) of Regulation S-X.
(f) Not applicable.
(g) The following table presents (i) the aggregate non-audit fees (i.e., fees for audit-related, tax, and other services) billed to the registrant by D&T for the registrant’s fiscal years ended June 30, 2023 and June 30, 2024; and (ii) the aggregate non-audit fees (i.e., fees for audit-related, tax, and other services) billed to the Eaton Vance organization by D&T for the same time periods.
|
|
|
|
|
|
|
|
|
| Fiscal Years Ended |
|
6/30/23 |
|
|
6/30/24 |
|
| Registrant |
|
$ |
0 |
|
|
$ |
0 |
|
| Eaton Vance(1) |
|
$ |
0 |
|
|
$ |
18,490 |
|
| (1) |
The investment adviser to the registrant, as well as any of its affiliates that provide ongoing services to the registrant, are subsidiaries of Morgan Stanley. |
(h) The registrant’s audit committee has considered whether the provision by the registrant’s principal accountant of non-audit services to the registrant’s investment adviser and any entity controlling, controlled by, or under common control with the adviser that provides ongoing services to the registrant that were not pre-approved pursuant to Rule 2-01(c)(7)(ii) of Regulation S-X is compatible with maintaining the principal accountant’s independence.
(i) Not applicable.
(j) Not applicable.
Item 5. Audit Committee of Listed Registrants
The registrant has a separately-designated standing audit committee established in accordance with Section 3(a)(58)(A) of the Securities and Exchange Act of 1934, as amended. George J. Gorman, Keith Quinton, Scott E. Wennerholm (Chair), and Nancy A. Wiser are the members of the registrant’s audit committee.
Item 6. Schedule of Investments
| (a) |
Please see schedule of investments contained in the Report to Stockholders included under Item 1 of this Form N-CSR. |
Item 7. Financial Statements and Financial Highlights for Open-End Management Investment Companies
Not applicable.
Item 8. Changes in and Disagreements with Accountants for Open-End Management Investment Companies
Not applicable.
Item 9. Proxy Disclosures for Open-End Management Investment Companies
Not applicable.
Item 10. Remuneration Paid to Directors, Officers, and Others of Open-End Management Investment Companies
Not applicable.
Item 11. Statement Regarding Basis for Approval of Investment Advisory Contract
The information is included in Item 1 of this Form N-CSR.
Item 12. Disclosure of Proxy Voting Policies and Procedures for Closed-End Management Investment Companies
The Board of the Fund has adopted a proxy voting policy and procedure (the “Fund Policy”), pursuant to which the trustees have delegated proxy voting responsibility to the Fund’s investment adviser and adopted the investment adviser’s proxy voting policies and procedures (the “Policies”) which are described below. The trustees will review the Policies annually. In the event that a conflict of interest arises between the Fund’s shareholders and the investment adviser, the administrator, or any of their affiliates or any affiliate of the Fund, the investment adviser will generally refrain from voting the proxies related to the companies giving rise to such conflict until it consults with the Board, or any committee, sub-committee or group of independent trustees identified by the Board, which will instruct the investment adviser on the appropriate course of action. If the Board Members are unable to meet and the failure to vote a proxy would have a material adverse impact on the Fund, the investment adviser may vote such proxy, provided that it discloses the existence of the material conflict to the Chairperson of the Fund’s Board as soon as practicable and to the Board at its next meeting.
The Policies are designed to promote accountability of a company’s management to its shareholders and to align the interests of management with those shareholders. An independent proxy voting service (“Agent”), currently Institutional Shareholder Services, Inc., has been retained to assist in the voting of proxies through the provision of vote analysis, implementation and recordkeeping and disclosure services. The investment adviser will generally vote proxies through the Agent. The Agent is required to vote all proxies in accordance with customized proxy voting guidelines (the “Guidelines”) and/or refer them back to the investment adviser pursuant to the Policies.
The Agent is required to establish and maintain adequate internal controls and policies in connection with the provision of proxy voting services, including methods to reasonably ensure that its analysis and recommendations are not influenced by a conflict of interest. The Guidelines include voting guidelines for matters relating to, among other things, the election of directors, approval of independent auditors, executive compensation, corporate structure and anti-takeover defenses. The investment adviser may cause the Fund to abstain from voting from time to time where it determines that the costs associated with voting a proxy outweigh the benefits derived from exercising the right to vote or it is unable to access or access timely ballots or other proxy information, among other stated reasons. The Agent will refer Fund proxies to the investment adviser for instructions under circumstances where, among others: (1) the application of the Guidelines is unclear; (2) a particular proxy question is not covered by the Guidelines; or (3) the Guidelines require input from the investment adviser. When a proxy voting issue has been referred to the investment adviser, the analyst (or portfolio manager if applicable) covering the company subject to the proxy proposal determines the final
vote (or decision not to vote) and the investment adviser’s Proxy Administrator (described below) instructs the Agent to vote accordingly for securities held by the Fund. Where more than one analyst covers a particular company and the recommendations of such analysts voting a proposal conflict, the investment adviser’s Global Proxy Group (described below) will review such recommendations and any other available information related to the proposal and determine the manner in which it should be voted, which may result in different recommendations for the Fund that may differ from other clients of the investment adviser.
The investment adviser has appointed a Proxy Administrator to assist in the coordination of the voting of client proxies (including the Fund’s) in accordance with the Guidelines and the Policies. The investment adviser and its affiliates have also established a Global Proxy Group. The Global Proxy Group develops the investment adviser’s positions on all major corporate issues, creates the Guidelines and oversees the proxy voting process. The Proxy Administrator maintains a record of all proxy questions that have been referred by the Agent, all applicable recommendations, analysis and research received and any resolution of the matter. Before instructing the Agent to vote contrary to the Guidelines or the recommendation of the Agent, the Proxy Administrator will provide the Global Proxy Group with the Agent’s recommendation for the proposal along with any other relevant materials, including the basis for the analyst’s recommendation. The Proxy Administrator will then instruct the Agent to vote the proxy in the manner determined by the Global Proxy Group. A similar process will be followed if the Agent has a conflict of interest with respect to a proxy. The investment adviser will report to the Fund’s Board any votes cast contrary to the Guidelines or Agent recommendations, as applicable, no less than annually.
The investment adviser’s Global Proxy Group is responsible for monitoring and resolving possible material conflicts with respect to proxy voting. Because the Guidelines are predetermined and designed to be in the best interests of shareholders, application of the Guidelines to vote client proxies should, in most cases, adequately address any possible conflict of interest. The investment adviser will monitor situations that may result in a conflict of interest between any of its clients and the investment adviser or any of its affiliates by maintaining a list of significant existing and prospective corporate clients. The Proxy Administrator will compare such list with the names of companies of which he or she has been referred a proxy statement (the “Proxy Companies”). If a company on the list is also a Proxy Company, the Proxy Administrator will report that fact to the Global Proxy Group. If the Proxy Administrator intends to instruct the Agent to vote in a manner inconsistent with the Guidelines, the Global Proxy Group will first determine, in consultation with legal counsel if necessary, whether a material conflict exists. If it is determined that a material conflict exists, the investment adviser will seek instruction on how the proxy should be voted from the Fund’s Board, or any committee or subcommittee identified by the Board. If a matter is referred to the Global Proxy Group, the decision made and basis for the decision will be documented by the Proxy Administrator and/or Global Proxy Group.
Information on how the Fund voted proxies relating to portfolio securities during the most recent 12 month period ended June 30 is available (1) without charge, upon request, by calling 1-800-262-1122, and (2) on the Securities and Exchange Commission’s website at http://www.sec.gov.
Item 13. Portfolio Managers of Closed-End Management Investment Companies
Eaton Vance Management (“EVM” or “Eaton Vance”) is the investment adviser of the Trust. Sarah A. Choi, Catherine C. McDermott, Daniel P. McElaney and Andrew N. Sveen comprise the investment team responsible for the overall and day-to-day management of the Trust’s investments.
Messrs. McElaney and Sveen and Ms. McDermott are Vice Presidents of EVM and have been portfolio managers of the Trust since March 2019. Ms. Choi is a Vice President of EVM and has been a portfolio manager of the Trust since July 2022. Messrs. McElaney and Sveen and Ms. McDermott have been employed by EVM for more than five years and manage other Eaton Vance funds. Ms. Choi has been employed by EVM since October 2019 and manages other Eaton Vance funds. Prior to joining EVM, Ms. Choi worked as a Senior Credit Analyst at Apex Credit Partners from 2014 to 2019. This information is provided as of the date of filing this report.
The following table shows, as of the Trust’s most recent fiscal year end, the number of accounts each portfolio manager managed in each of the listed categories and the total assets (in millions of dollars) in the accounts managed within each category. The table also shows the number of accounts with respect to which the advisory fee is based on the performance of the account, if any, and the total assets (in millions of dollars) in those accounts.
|
|
|
|
|
|
|
|
|
|
|
|
|
|
|
|
|
| |
|
Number
of All
Accounts |
|
|
Total Assets of
All
Accounts |
|
|
Number of
Accounts
Paying a
Performance Fee |
|
|
Total Assets of
Accounts Paying a
Performance Fee |
|
| Sarah A. Choi |
|
|
|
|
|
|
|
|
|
|
|
|
|
|
|
|
| Registered Investment Companies |
|
|
3 |
|
|
|
$1,349.1 |
|
|
|
0 |
|
|
|
$0 |
|
| Other Pooled Investment Vehicles |
|
|
0 |
|
|
|
$0 |
|
|
|
0 |
|
|
|
$0 |
|
| Other Accounts |
|
|
0 |
|
|
|
$0 |
|
|
|
0 |
|
|
|
$0 |
|
| Catherine C. McDermott, CFA |
|
|
|
|
|
|
|
|
|
|
|
|
|
|
|
|
| Registered Investment Companies |
|
|
6 |
|
|
|
$3,849.2 |
|
|
|
0 |
|
|
|
$0 |
|
| Other Pooled Investment Vehicles |
|
|
0 |
|
|
|
$0 |
|
|
|
0 |
|
|
|
$0 |
|
| Other Accounts |
|
|
0 |
|
|
|
$0 |
|
|
|
0 |
|
|
|
$0 |
|
| Daniel P. McElaney |
|
|
|
|
|
|
|
|
|
|
|
|
|
|
|
|
| Registered Investment Companies |
|
|
4 |
|
|
|
$1,883.4 |
|
|
|
0 |
|
|
|
$0 |
|
| Other Pooled Investment Vehicles |
|
|
0 |
|
|
|
$0 |
|
|
|
0 |
|
|
|
$0 |
|
| Other Accounts |
|
|
0 |
|
|
|
$0 |
|
|
|
0 |
|
|
|
$0 |
|
| Andrew N. Sveen, CFA(1) |
|
|
|
|
|
|
|
|
|
|
|
|
|
|
|
|
| Registered Investment Companies |
|
|
11 |
|
|
|
$28,378.9 |
|
|
|
0 |
|
|
|
$0 |
|
| Other Pooled Investment Vehicles |
|
|
0 |
|
|
|
$0 |
|
|
|
0 |
|
|
|
$0 |
|
| Other Accounts |
|
|
0 |
|
|
|
$0 |
|
|
|
0 |
|
|
|
$0 |
|
| (1) |
This portfolio manager serves as portfolio manager of one or more registered investment companies that invests or may invest in one or more underlying registered investment companies in the Eaton Vance family of funds or other pooled investment vehicles sponsored by Eaton Vance. The underlying investment companies may be managed by this portfolio manager or another portfolio manager. |
The following table shows the dollar range of Fund shares beneficially owned by the portfolio manager as of the Fund’s most recent fiscal year end.
|
|
|
| Portfolio Manager |
|
Dollar Range of Equity
Securities Beneficially Owned
in the Trust |
| Sarah A. Choi |
|
None |
|
|
| Catherine C. McDermott |
|
None |
|
|
| Daniel P. McElaney, CFA |
|
None |
|
|
| Andrew N. Sveen, CFA |
|
None |
Potential for Conflicts of Interest. It is possible that conflicts of interest may arise in connection with a portfolio manager’s management of the Fund’s investments on the one hand and the investments of other accounts for which a portfolio manager is responsible on the other. For example, a portfolio manager may have conflicts of interest in allocating management time, resources and investment opportunities among the Fund and other accounts he or she advises. In addition, due to differences in the investment strategies or restrictions
between the Fund and the other accounts, the portfolio manager may take action with respect to another account that differs from the action taken with respect to the Fund. In some cases, another account managed by a portfolio manager may compensate the investment adviser based on the performance of the securities held by that account. The existence of such a performance based fee may create additional conflicts of interest for the portfolio manager in the allocation of management time, resources and investment opportunities. Whenever conflicts of interest arise, the portfolio manager will endeavor to exercise his or her discretion in a manner that he or she believes is equitable to all interested persons. EVM has adopted several policies and procedures designed to address these potential conflicts including a code of ethics and policies that govern the investment adviser’s trading practices, including among other things the aggregation and allocation of trades among clients, brokerage allocations, cross trades and best execution.
Compensation Structure for EVM
The compensation structure of Eaton Vance and its affiliates that are investment advisers (for purposes of this section “Eaton Vance”) is based on a total reward system of base salary and incentive compensation, which is paid either in the form of cash bonus, or for employees meeting the specified deferred compensation eligibility threshold, partially as a cash bonus and partially as mandatory deferred compensation. Deferred compensation granted to Eaton Vance employees is generally granted as a mix of deferred cash awards under the Investment Management Alignment Plan (IMAP) and equity-based awards in the form of stock units. The portion of incentive compensation granted in the form of a deferred compensation award and the terms of such awards are determined annually by the Compensation, Management Development and Succession Committee of the Board of Directors of Eaton Vance’s parent company, Morgan Stanley.
Base salary compensation. Generally, portfolio managers and research analysts receive base salary compensation based on the level of their position with the Adviser.
Incentive compensation. In addition to base compensation, portfolio managers and research analysts may receive discretionary year-end compensation. Incentive compensation may include:
| |
• |
|
A mandatory program that defers a portion of incentive compensation into restricted stock units or other awards based on Morgan Stanley common stock or other plans that are subject to vesting and other conditions. |
| |
• |
|
IMAP is a cash-based deferred compensation plan designed to increase the alignment of participants’ interests with the interests of clients. For eligible employees, a portion of their deferred compensation is mandatorily deferred into IMAP on an annual basis. Awards granted under IMAP are notionally invested in referenced funds available pursuant to the plan, which are funds advised by MSIM and its affiliates including Eaton Vance. Portfolio managers are required to notionally invest a minimum of 40% of their account balance in the designated funds that they manage and are included in the IMAP notional investment fund menu. |
| |
• |
|
Deferred compensation awards are typically subject to vesting over a multi-year period and are subject to cancellation through the payment date for competition, cause (i.e., any act or omission that constitutes a breach of obligation to the Funds, including failure to comply with internal compliance, ethics or risk management standards, and failure or refusal to perform duties satisfactorily, including supervisory and management duties), disclosure of proprietary information, and solicitation of employees or clients. Awards are also subject to clawback through the payment date if an employee’s act or omission (including with respect to direct supervisory responsibilities) causes a restatement of the firm’s consolidated financial results, constitutes a violation of the firm’s global risk management principles, policies and standards, or causes a loss of revenue associated with a position on which the employee was paid and the employee operated outside of internal control policies. |
Eaton Vance compensates employees based on principles of pay-for-performance, market competitiveness and risk management. Eligibility for, and the amount of any, discretionary compensation is subject to a multi-dimensional process. Specifically, consideration is given to one or more of the following factors, which can vary by portfolio management team and circumstances:
| |
• |
|
Revenue and profitability of the business and/or each fund/account managed by the portfolio manager |
| |
• |
|
Individual contribution and performance |
| |
• |
|
Contribution to client objectives |
| |
• |
|
Revenue and profitability of the firm |
| |
• |
|
Return on equity and risk factors of both the business units and Morgan Stanley |
| |
• |
|
Assets managed by the portfolio manager |
| |
• |
|
External market conditions |
| |
• |
|
New business development and business sustainability |
| |
• |
|
Team, product and/or Eaton Vance performance |
| |
• |
|
The pre-tax investment performance of the funds/accounts managed by the portfolio manager(1) (which may, in certain cases, be measured against the applicable benchmark(s) and/or peer group(s) over one, three and five-year periods),(2) provided that for funds that are tax-managed or otherwise have an objective of after-tax returns, performance net of taxes will be considered |
Further, the firm’s Global Incentive Compensation Discretion Policy requires compensation managers to consider only legitimate, business related factors when exercising discretion in determining variable incentive compensation, including adherence to Morgan Stanley’s core values, conduct, disciplinary actions in the current performance year, risk management and risk outcomes.
| (1) |
Generally, this is total return performance, provided that consideration may also be given to relative risk-adjusted performance. |
| (2) |
When a fund’s peer group as determined by Lipper or Morningstar is deemed by the relevant Eaton Vance Chief Investment Officer, or in the case of the sub-advised Funds, the Director of Product Development and Sub-Advised Funds, not to provide a fair comparison, performance may instead be evaluated primarily against a custom peer group or market index. |
Item 14. Purchases of Equity Securities by Closed-End Management Investment Company and Affiliated Purchasers
|
|
|
|
|
|
|
|
|
|
|
|
|
|
|
|
|
| Period |
|
(a)
Total
Number of
Shares
Purchased |
|
|
(b)
Average Price
Paid per Share |
|
|
(c)
Total Number
of Shares
Purchased as
Part of
Publicly
Announced
Plans or
Programs |
|
|
(d)
Maximum
Number of
Shares that
May Yet Be
Purchased
Under the
Plans or
Programs |
|
| July 1 through July 31 |
|
|
0 |
|
|
|
0 |
|
|
|
0 |
|
|
|
0 |
|
| August 1 through August 31 |
|
|
0 |
|
|
|
0 |
|
|
|
0 |
|
|
|
0 |
|
| September 1 through September 30 |
|
|
0 |
|
|
|
0 |
|
|
|
0 |
|
|
|
0 |
|
| October 1 through October 31 |
|
|
1,753,886 |
|
|
|
5.9756 |
|
|
|
1,753,886 |
|
|
|
0 |
|
| November 1 through November 30 |
|
|
0 |
|
|
|
0 |
|
|
|
0 |
|
|
|
0 |
|
| December 1 through December 31 |
|
|
0 |
|
|
|
0 |
|
|
|
0 |
|
|
|
0 |
|
| January 1 through January 31 |
|
|
0 |
|
|
|
0 |
|
|
|
0 |
|
|
|
0 |
|
| February 1 through February 29 |
|
|
0 |
|
|
|
0 |
|
|
|
0 |
|
|
|
0 |
|
| March 1 through March 31 |
|
|
0 |
|
|
|
0 |
|
|
|
0 |
|
|
|
0 |
|
| April 1 through April 30 |
|
|
0 |
|
|
|
0 |
|
|
|
0 |
|
|
|
0 |
|
| May 1 through May 31 |
|
|
0 |
|
|
|
0 |
|
|
|
0 |
|
|
|
0 |
|
| June 1 through June 30 |
|
|
0 |
|
|
|
0 |
|
|
|
0 |
|
|
|
0 |
|
|
|
|
|
|
|
|
|
|
|
|
|
|
|
|
|
|
| Total |
|
|
1,753,886 |
|
|
|
5.9756 |
|
|
|
1,753,886 |
|
|
|
0 |
|
|
|
|
|
|
|
|
|
|
|
|
|
|
|
|
|
|
On May 12, 2021, the Trust announced that it will conduct cash tender offers in the fourth quarter of each of 2022, 2023 and 2024 (each, a “Conditional Tender Offer”) for up to 10% of the Trust’s then-outstanding common shares if, from January to August of the relevant year, the Trust’s shares trade at an average daily discount to NAV of more than 10%, based upon the Trust’s volume-weighted average market price and NAV on each business day during the period. If triggered, common shares tendered and accepted in a Conditional Tender Offer would be repurchased at a price per share equal to 98% of the Trust’s NAV as of the close of regular trading on the New York Stock Exchange on the date such Conditional Tender Offer expires.
On September 26, 2023, the Trust commenced a cash tender offer for up to 1,753,886 of its outstanding common shares. The tender offer expired at 5:00 P.M. Eastern Time on October 25, 2023. The number of shares properly tendered was 1,753,886. The purchase price of the properly tendered shares was equal to $5.9756 per share for an aggregate purchase price of $10,480,521.
Item 15. Submission of Matters to a Vote of Security Holders
There have been no material changes to the procedures by which shareholders may recommend nominee to the Trust’s Board of Trustees since the Trust last provided disclosure in response to this item.
Item 16. Controls and Procedures
| (a) |
It is the conclusion of the registrant’s principal executive officer and principal financial officer that the effectiveness of the registrant’s current disclosure controls and procedures (such disclosure controls and procedures having been evaluated within 90 days of the date of this filing) provide reasonable assurance that the information required to be disclosed by the registrant has been recorded, processed, summarized and reported within the time period specified in the Commission’s rules and forms and that the information required to be disclosed by the registrant has been accumulated and communicated to the registrant’s principal executive officer and principal financial officer in order to allow timely decisions regarding required disclosure. |
| (b) |
There have been no changes in the registrant’s internal controls over financial reporting during the period covered by this report that has materially affected, or is reasonably likely to materially affect, the registrant’s internal control over financial reporting. |
Item 17. Disclosure of Securities Lending Activities for Closed-End Management Investment Companies
No activity to report for the registrant’s most recent fiscal year end.
Item 18. Recovery of Erroneously Awarded Compensation
Not applicable.
Item 19. Exhibits
Signatures
Pursuant to the requirements of the Securities Exchange Act of 1934 and the Investment Company Act of 1940, the registrant has duly caused this report to be signed on its behalf by the undersigned, thereunto duly authorized.
|
|
|
| Eaton Vance Senior Income Trust |
|
|
| By: |
|
/s/ Kenneth A. Topping |
|
|
Kenneth A. Topping |
|
|
Principal Executive Officer |
|
|
| Date: |
|
August 23, 2024 |
Pursuant to the requirements of the Securities Exchange Act of 1934 and the Investment Company Act of 1940, this report has been signed below by the following persons on behalf of the registrant and in the capacities and on the dates indicated.
|
|
|
| By: |
|
/s/ James F. Kirchner |
|
|
James F. Kirchner |
|
|
Principal Financial Officer |
|
|
| Date: |
|
August 23, 2024 |
|
|
| By: |
|
/s/ Kenneth A. Topping |
|
|
Kenneth A. Topping |
|
|
Principal Executive Officer |
|
|
| Date: |
|
August 23, 2024 |