Form 8-K
UNITED STATES
SECURITIES AND EXCHANGE COMMISSION
WASHINGTON, D.C. 20549
FORM N-CSRS
CERTIFIED SHAREHOLDER REPORT OF REGISTERED
MANAGEMENT INVESTMENT COMPANIES
|
Investment Company Act file number:
|
811-09261
|
|
|
|
Foxby Corp.
(Exact name of registrant as specified in charter)
11 Hanover Square, New York, NY 10005
(Address of principal executive offices) (Zipcode)
John F. Ramírez, Esq.
11 Hanover Square
New York, NY 10005
(Name and address of agent for service)
Registrant's telephone number, including area code: 1-212-785-0900
Date of fiscal year end: 12/31
Date of reporting period: 1/1/15 - 6/30/15
Form N-CSRS is to be used by management investment companies to file reports with the Commission not later than 10 days after the transmission to stockholders of any report that is required to be transmitted to stockholders under Rule 30e-1 under the Investment Company Act of 1940 (17 CFR 270.30e-1). The Commission may use the information provided on Form N-CSRS in its regulatory, disclosure review, inspection, and policy making roles.
A registrant is required to disclose the information specified by Form N-CSRS and the Commission will make this information public. A registrant is not required to respond to the collection of information contained in Form N-CSRS unless the Form displays a current valid Office of Management and Budget ("OMB") control number. Please direct comments concerning the accuracy of the information collection burden estimate and any suggestions for reducing the burden to Secretary, Securities and Exchange Commission, 450 Fifth Street, NW, Washington, DC 20549-0609. The OMB has reviewed this collection of information under clearance requirements of 44 U.S.C. sec. 3507.
Item 1. Report to Stockholders.
SEEKING TOTAL RETURN
|
|
| 2015 |
| JUNE 30 |
|
SEMI-ANNUAL REPORT
|
|
| WWW.FOXBYCORP.COM |
|
|
|
|
|
|
PORTFOLIO ANALYSIS
|
|
|
|
|
|
|
|
|
June 30, 2015
|
|
|
|
|
|
|
|
|
|
|
TOP TEN
|
|
June 30, 2015
|
|
|
|
TOP TEN
|
|
June 30, 2015
|
|
HOLDINGS
|
|
|
|
|
|
INDUSTRIES
|
|
|
| |
|
|
|
1 Berkshire Hathaway, Inc. Class B
|
|
|
|
1 Investment Advice
|
| |
|
|
|
2 Daimler AG
|
|
|
|
2 Exchange Traded Funds
|
| |
|
|
|
3 Franklin Resources, Inc.
|
|
|
|
3 Motor Vehicles & Passenger Car Bodies
|
| |
|
|
|
4 Wells Fargo & Company
|
|
|
|
4 Fire, Marine & Casualty Insurance
|
| |
|
|
|
5 The Procter & Gamble Company
|
|
|
|
5 Computer Communications Equipment
|
| |
|
|
|
6 McDonald’s Corp.
|
|
|
|
6 Retail - Eating Places
|
| |
|
|
|
7 Google Inc. Class A
|
|
|
|
7 National Commercial Banks
|
| |
|
|
|
8 Wal-Mart Stores, Inc.
|
|
|
|
8 Soap, Detergents, Cleaning Preparations,
|
| |
|
|
|
Perfumes, Cosmetics
|
|
9 Cisco Systems, Inc.
|
|
|
|
|
| |
|
|
|
9 Information Retrieval Services
|
|
10 Express Scripts Holding Company
|
|
|
|
|
| |
|
|
|
10 Retail - Variety Stores
|
|
Top ten holdings comprise approximately 46% of total assets.
|
|
|
|
|
|
|
|
|
Holdings are subject to change. The above portfolio information should not be considered as a recommendation to purchase or sell a particular security and there is no assurance that any securities will remain in or out of the Fund.
|
|
|
|
|
|
|
|
|
|
|
FOXBY CORP.
|
|
|
|
Semi-Annual Report 2015
|
|
|
|
|
|
|
TO OUR SHAREHOLDERS
|
|
|
|
|
|
|
|
|
June 30, 2015
|
Dear Fellow Shareholders:
We are delighted to welcome all new shareholders to Foxby Corp. and to submit this 2015 Semi-Annual Report for the Fund. The Fund’s investment objective is total return. In seeking this objective, the Fund may invest in equity and fixed income securities of both new and seasoned U.S. and foreign issuers, including securities convertible into common stock and debt securities, closed end funds, and mutual funds. The Fund is not limited by the issuer’s location, industry, or market capitalization and uses a flexible strategy in the selection of securities. The Fund also may employ speculative and aggressive investment techniques, such as selling securities short and borrowing money for investment purposes, an approach known as “leverage.” A potential benefit of its closed end structure, the Fund may invest without limit in illiquid investments such as private placements and private companies. The Fund may also invest defensively, for example, in money market fund shares.
Economic and Market Report
At the June 2015 meeting of the Federal Open Market Committee (FOMC) of the Federal Reserve Bank (the “Fed”), the staff’s review of the economic situation suggested that real gross domestic product (GDP) was “increasing moderately in the second quarter after edging down in the first quarter.” The staff viewed labor market conditions as having improved in recent months, citing an unemployment rate of 5.5% in May and small gains in labor force participation, the employment-to-population ratio, the share of workers employed part time for economic reasons, and the rate of private-sector job openings. Regarding inflation, the staff noted that “consumer price inflation continued to run below the FOMC’s longer-run objective of 2%,” due in part to lower energy prices and lower import costs. In fact, over the 12 months through May 2015, the Consumer Price Index for All Urban Consumers was unchanged, i.e. no inflation, before seasonal adjustment. Moreover, on an unadjusted basis, the Producer Price Index for final demand declined 0.7% for the 12 months ended in June, the fifth straight 12 month decrease. Interestingly, the continuing rise of real disposable income and increases in households’ net worth as equity prices and home values improve seems to be having a positive impact on consumer sentiment, which under some measures is approaching its highest levels since 2007.
The Fed’s board members and bank presidents generally projected a 2015 change in real U.S. GDP in a range of 1.8-2.0%, increasing to 2.4-2.7% for 2016. Likewise, the World Bank’s outlook for the global economy anticipates expansion by 2.8% this year and 3.3% in 2016, as compared to projections it made
last year of 3.4% and 3.5% global growth in 2015 and 2016, respectively. Real GDP growth has slowed in China to a 7.1% level and economic recovery appears to be gaining momentum in the Euro Area and Japan. Risks to the world economy recently identified by the World Bank include the expected rise in U.S. interest rates, diminishing improvement in credit ratings for emerging markets, especially in oil exporting countries, financial market volatility, and declining capital flows.
In summary, recent broad economic data appears generally positive for the U.S. and developed countries, but the ongoing strength of the U.S. dollar may have a strong negative impact on U.S. trading partners, especially developing countries. Equity markets in the United States appear to be reflecting investor caution over the anticipation of higher interest rates to come later in 2015 and 2016, although to us some equity securities appear to offer value and attractive prospects even in a rising interest rate environment. Of some concern to us is ebullient consumer sentiment, which can be associated with market corrections. Investors should expect market volatility through the second half of the year.
Total Return Strategy
In view of these economic and market developments, the Fund’s general strategy in the first half of 2015 was to sell some holdings whose further prospects appeared limited and reduce concentrated and growth oriented holdings, and to re-invest much of the proceeds into less concentrated positions, with generally more conservative valuations. Over the course of the first six months of the year, the Fund sold sufficient stocks so, at June 30, 2015, leverage was moderated from 8% of net assets to 5%. At June 30, 2015, the Fund’s holdings included some of the largest and best known global companies in financial services, automobile, and retail industries, as well as smaller and mid-sized companies in apparel and distribution businesses, among others. Approximately 9% of the Fund was invested in foreign securities. As the Fund pursues its total return objective through its flexible investment approach, these holdings and allocations may substantially change at any time.
In the first six months of 2015, the Fund’s net asset value return was (2.24)%, including the reinvestment of dividends, and its market return, also including the reinvestment of dividends, was (1.07)%. Generally, the Fund’s total return on a market value basis will be higher than total return on a net asset value basis in periods where there is a decrease in the discount or an increase in the premium of the market value to the net asset value
|
|
|
|
|
|
1 Semi-Annual Report 2015
|
|
|
|
FOXBY CORP.
|
|
|
|
|
|
|
TO OUR SHAREHOLDERS
|
|
|
|
|
|
|
|
|
June 30, 2015
|
from the beginning to the end of such periods. For comparison, in the same period, the S&P 500 Index total return was 1.23%. The index is unmanaged and does not reflect fees and expenses, nor is it available for direct investment.
Fund Website
The Fund’s website, www.FoxbyCorp.com, provides investors with investment information, news, and other material about the Fund. The website also has links to SEC filings, performance data, and daily net asset value reporting. You are invited to use this resource to learn more about the Fund.
Long Term Strategies
Our current view of financial conditions continues to suggest that the Fund may benefit during the current year from its flexible portfolio approach, investing opportunistically in a variety of markets. At some times, the Fund may employ aggressive and speculative investment techniques and, at other times, the Fund may invest defensively, as deemed appropriate. We look forward to serving your investment needs over the years ahead and thank you for investing in the Fund. Importantly, we share your enthusiasm for the Fund, as reflected by the fact that affiliates of the Fund’s Investment Manager own approximately 24% of the Fund’s shares as of June 30, 2015.
Sincerely,

Thomas B. Winmill
Chairman, Investment Policy Committee
|
|
|
|
|
|
FOXBY CORP.
|
|
|
|
Semi-Annual Report 2015 2
|
|
|
|
|
|
|
SCHEDULE OF PORTFOLIO INVESTMENTS
|
|
|
|
June 30, 2015 (Unaudited)
|
|
|
|
|
Financial Statements
|
|
|
|
|
|
|
|
|
|
|
|
|
Shares
|
|
|
|
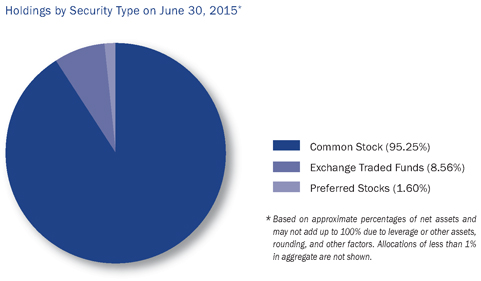
Common Stocks (95.25%)
|
|
Value
|
|
|
|
|
|
|
|
|
|
|
|
|
Cable & Other Pay Television Services (1.89%)
|
|
|
|
|
|
|
| 2,000 |
|
|
|
Viacom Inc.
|
|
$ |
129,280 |
|
|
|
|
|
|
|
|
|
|
|
|
Cigarettes (1.17%)
|
|
|
|
|
|
|
| 1,000 |
|
|
|
Philip Morris International, Inc.
|
|
|
80,170 |
|
|
|
|
|
|
|
|
|
|
|
|
Computer Communications Equipment (6.18%)
|
|
|
|
|
|
|
| 9,000 |
|
|
|
Cisco Systems, Inc. (a)
|
|
|
247,140 |
|
|
|
| 6,750 |
|
|
|
Juniper Networks, Inc.
|
|
|
175,298 |
|
|
|
|
|
|
|
|
|
|
422,438 |
|
|
|
|
|
|
|
|
|
|
|
|
Computer & Office Equipment (0.95%)
|
|
|
|
|
|
|
| 400 |
|
|
|
International Business Machines Corporation
|
|
|
65,064 |
|
|
|
|
|
|
|
|
|
|
|
|
Electronic & Other Electrical Equipment (1.18%)
|
|
|
|
|
|
|
| 1,000 |
|
|
|
Emerson Electric Co.
|
|
|
55,430 |
|
|
|
| 1,000 |
|
|
|
Koninklijke Philips N.V.
|
|
|
25,460 |
|
|
|
|
|
|
|
|
|
|
80,890 |
|
|
|
|
|
|
|
|
|
|
|
|
Finance Services (1.14%)
|
|
|
|
|
|
|
| 1,000 |
|
|
|
American Express Company
|
|
|
77,720 |
|
|
|
|
|
|
|
|
|
|
|
|
Fire, Marine & Casualty Insurance (7.73%)
|
|
|
|
|
|
|
| 3,500 |
|
|
|
Berkshire Hathaway, Inc. Class B (a) (b)
|
|
|
476,385 |
|
|
|
| 1,000 |
|
|
|
W.R. Berkley Corporation
|
|
|
51,930 |
|
|
|
|
|
|
|
|
|
|
528,315 |
|
|
|
|
|
|
|
|
|
|
|
|
Information Retrieval Services (3.95%)
|
|
|
|
|
|
|
| 500 |
|
|
|
Google Inc. Class A (a) (b)
|
|
|
270,020 |
|
|
|
|
|
|
|
|
|
|
|
|
Investment Advice (10.66%)
|
|
|
|
|
|
|
| 3,000 |
|
|
|
Apollo Global Management, LLC
|
|
|
66,450 |
|
|
|
| 20,000 |
|
|
|
Fortress Investment Group LLC
|
|
|
146,000 |
|
|
|
| 9,000 |
|
|
|
Franklin Resources, Inc. (a)
|
|
|
441,270 |
|
|
|
| 2,000 |
|
|
|
Invesco Ltd.
|
|
|
74,980 |
|
|
|
|
|
|
|
|
|
|
728,700 |
|
|
|
|
|
|
|
|
|
|
|
|
In Vitro & In Vivo Diagnostic Substances (2.98%)
|
|
|
|
|
|
|
| 6,000 |
|
|
|
Myriad Genetics, Inc. (b)
|
|
|
203,940 |
|
|
|
|
|
|
|
|
|
|
|
|
Leather & Leather Products (1.52%)
|
|
|
|
|
|
|
| 3,000 |
|
|
|
Coach, Inc. (a)
|
|
|
103,830 |
|
|
|
|
|
|
|
|
|
|
|
|
Men’s & Boys’ Furnishings, Work Clothing, & Allied Garments (1.94%)
|
|
|
|
|
|
|
| 1,000 |
|
|
|
Ralph Lauren Corp.
|
|
|
132,360 |
|
|
|
|
|
|
|
|
|
|
|
|
Motor Vehicles & Passenger Car Bodies (8.53%)
|
|
|
|
|
|
|
| 4,800 |
|
|
|
Daimler AG
|
|
|
441,456 |
|
|
|
| 4,250 |
|
|
|
General Motors Company
|
|
|
141,652 |
|
|
|
|
|
|
|
|
|
|
583,108 |
|
|
|
|
|
|
|
See notes to financial statements.
|
|
|
|
|
|
|
|
|
|
|
|
|
3 Semi-Annual Report 2015
|
|
|
|
FOXBY CORP.
|
|
|
|
|
|
|
SCHEDULE OF PORTFOLIO INVESTMENTS
|
|
|
|
June 30, 2015 (Unaudited)
|
|
|
|
|
Financial Statements
|
|
|
|
|
|
|
|
|
|
|
|
|
Shares
|
|
|
|
Common Stocks (continued)
|
|
Value
|
|
|
|
|
|
|
|
|
|
|
|
|
National Commercial Banks (4.94%)
|
|
|
|
|
|
|
| 6,000 |
|
|
|
Wells Fargo & Company (a)
|
|
$ |
337,440 |
|
|
|
|
|
|
|
|
|
|
|
|
Office Furniture (2.22%)
|
|
|
|
|
|
|
| 12,500 |
|
|
|
Kimball International Inc. Class B
|
|
|
152,000 |
|
|
|
|
|
|
|
|
|
|
|
|
Paperboard Containers & Boxes (0.64%)
|
|
|
|
|
|
|
| 1,000 |
|
|
|
REXAM PLC
|
|
|
43,590 |
|
|
|
|
|
|
|
|
|
|
|
|
Petroleum Refining (1.22%)
|
|
|
|
|
|
|
| 1,000 |
|
|
|
Exxon Mobil Corp.
|
|
|
83,200 |
|
|
|
|
|
|
|
|
|
|
|
|
Pharmaceutical Preparations (0.72%)
|
|
|
|
|
|
|
| 1,000 |
|
|
|
Sanofi ADR
|
|
|
49,530 |
|
|
|
|
|
|
|
|
|
|
|
|
Plastic Mail, Synth Resin/Rubber, Cellulose (1.17%)
|
|
|
|
|
|
|
| 4,900 |
|
|
|
Rayonier Advanced Materials Inc.
|
|
|
79,674 |
|
|
|
|
|
|
|
|
|
|
|
|
Printed Circuit Boards (2.00%)
|
|
|
|
|
|
|
| 9,375 |
|
|
|
Kimball Electronics, Inc. (b)
|
|
|
136,781 |
|
|
|
|
|
|
|
|
|
|
|
|
Real Estate (1.35%)
|
|
|
|
|
|
|
| 5,000 |
|
|
|
NorthStar Asset Management Group Inc.
|
|
|
92,450 |
|
|
|
|
|
|
|
|
|
|
|
|
Real Estate Investment Trusts (0.93%)
|
|
|
|
|
|
|
| 2,000 |
|
|
|
Tanger Factory Outlet Centers, Inc.
|
|
|
63,400 |
|
|
|
|
|
|
|
|
|
|
|
|
Retail Consulting and Investment (0.01%)
|
|
|
|
|
|
|
| 72,728 |
|
|
|
Amerivon Holdings LLC (c)
|
|
|
727 |
|
|
|
|
|
|
|
|
|
|
|
|
Retail - Drug Stores and Proprietary Stores (3.25%)
|
|
|
|
|
|
|
| 2,500 |
|
|
|
Express Scripts Holding Company (a) (b)
|
|
|
222,350 |
|
|
|
|
|
|
|
|
|
|
|
|
Retail - Eating Places (5.20%)
|
|
|
|
|
|
|
| 3,000 |
|
|
|
McDonald’s Corp. (a)
|
|
|
285,210 |
|
|
|
| 400 |
|
|
|
Panera Bread Company (b)
|
|
|
69,908 |
|
|
|
|
|
|
|
|
|
|
355,118 |
|
|
|
|
|
|
|
|
|
|
|
|
Retail - Family Clothing Stores (2.01%)
|
|
|
|
|
|
|
| 3,600 |
|
|
|
The GAP, Inc. (a)
|
|
|
137,412 |
|
|
|
|
|
|
|
|
|
|
|
|
Retail - Variety Stores (3.94%)
|
|
|
|
|
|
|
| 3,800 |
|
|
|
Wal-Mart Stores, Inc. (a)
|
|
|
269,534 |
|
|
|
|
|
|
|
|
|
|
|
|
Semiconductors & Related Devices (1.50%)
|
|
|
|
|
|
|
| 2,000 |
|
|
|
Altera Corp.
|
|
|
102,400 |
|
|
|
|
|
|
|
|
|
|
|
|
Services - Business Services (2.08%)
|
|
|
|
|
|
|
| 7,000 |
|
|
|
The Western Union Company
|
|
|
142,310 |
|
|
|
|
|
|
|
See notes to financial statements.
|
|
|
|
|
|
|
|
|
|
|
|
|
FOXBY CORP.
|
|
|
|
Semi-Annual Report 2015 4
|
|
|
|
|
|
|
SCHEDULE OF PORTFOLIO INVESTMENTS
|
|
|
|
June 30, 2015 (Unaudited)
|
|
|
|
|
Financial Statements
|
|
|
|
|
|
|
|
|
|
|
|
|
Shares
|
|
|
|
Common Stocks (concluded)
|
|
Value
|
|
|
|
|
|
|
|
|
|
|
|
|
Services - Medical Laboratories (2.31%)
|
|
|
|
|
|
|
| 1,300 |
|
|
|
Laboratory Corporation of America Holdings (b)
|
|
|
$ 157,586 |
|
|
|
|
|
|
|
|
|
|
|
|
Services - Prepackaged Software (2.04%)
|
|
|
|
|
|
|
| 4,750 |
|
|
|
CA, Inc. (a)
|
|
|
139,128 |
|
|
|
|
|
|
|
|
|
|
|
|
Soap, Detergents, Cleaning Preparations, Perfumes, Cosmetics (4.58%)
|
|
|
|
|
|
|
| 4,000 |
|
|
|
The Procter & Gamble Company (a)
|
|
|
312,960 |
|
|
|
|
|
|
|
|
|
|
|
|
Wholesale - Computers & Peripheral Equipment & Software (1.10%)
|
|
|
|
|
|
|
| 3,000 |
|
|
|
Ingram Micro Inc. (b)
|
|
|
75,090 |
|
|
|
|
|
|
|
|
|
|
|
|
Wholesale - Electronic Parts & Equipment (1.20%)
|
|
|
|
|
|
|
| 2,000 |
|
|
|
Avnet, Inc.
|
|
|
82,220 |
|
|
|
|
|
|
|
|
|
|
|
|
Wholesale - Industrial Machinery & Equipment (1.02%)
|
|
|
|
|
|
|
| 1,000 |
|
|
|
MSC Industrial Direct Co., Inc.
|
|
|
69,770 |
|
|
|
|
|
|
|
|
|
|
|
|
Total common stocks (Cost $5,404,609)
|
|
|
6,510,505 |
|
|
|
|
|
|
|
|
|
|
|
|
Exchange Traded Funds (8.56%)
|
|
|
|
|
|
|
| 4,500 |
|
|
|
Cambria Shareholder Yield ETF
|
|
|
140,760 |
|
|
|
| 2,900 |
|
|
|
First Trust US IPO Index Fund ETF
|
|
|
158,166 |
|
|
|
| 3,000 |
|
|
|
Guggenheim Spin-Off ETF
|
|
|
137,610 |
|
|
|
| 3,050 |
|
|
|
PowerShares Buyback Achievers ETF Trust
|
|
|
148,261 |
|
|
|
|
|
|
|
|
|
|
|
|
Total exchange traded funds (Cost $547,971)
|
|
|
584,797 |
|
|
|
|
|
|
|
|
|
|
|
|
Preferred Stocks (1.60%)
|
|
|
|
|
|
|
|
|
|
|
Retail Consulting and Investment (1.60%)
|
|
|
|
|
|
|
| 194,990 |
|
|
|
Amerivon Holdings LLC (c) (Cost $539,522)
|
|
|
109,194 |
|
|
|
|
|
|
|
|
|
|
|
|
Money Market Fund (0.07%)
|
|
|
|
|
|
|
| 4,807 |
|
|
|
SSgA Money Market Fund, 7 day annualized yield 0.00% (Cost $4,807)
|
|
|
4,807 |
|
|
|
|
|
|
|
|
|
|
|
|
Total investments (Cost $6,496,909) (105.48%)
|
|
|
7,209,303 |
|
|
|
|
|
|
|
|
|
|
|
|
Liabilities in excess of other assets (-5.48%)
|
|
|
(374,625) |
|
|
|
|
|
|
|
|
|
|
|
|
Net assets (100.00%)
|
|
|
$ 6,834,678 |
|
|
|
|
|
|
|
(a) All or a portion of these securities have been segregated as collateral pursuant to the Committed Facility Agreement.
As of June 30, 2015, the value of securities pledged as collateral was $3,242,679 and there were no securities on loan under the lending agreement.
(b) Non-income producing.
(c) Illiquid and/or restricted security that has been fair valued.
|
|
|
|
|
|
|
|
|
|
|
See notes to financial statements.
|
|
|
|
|
|
|
|
|
|
|
|
|
5 Semi-Annual Report 2015
|
|
|
|
FOXBY CORP.
|
|
|
|
|
|
|
STATEMENT OF ASSETS AND LIABILITIES
|
|
|
|
(Unaudited)
|
|
|
|
|
Financial Statements
|
|
|
|
|
|
|
|
| |
|
June 30, 2015
|
|
|
|
|
|
|
|
Assets
|
|
|
|
|
|
|
|
Investments at value (cost $6,496,909)
|
|
|
$ 7,209,303 |
|
|
|
|
Dividends receivable
|
|
|
5,210 |
|
|
|
|
Other assets
|
|
|
1,772 |
|
|
|
|
|
|
|
Total assets
|
|
|
7,216,285 |
|
|
|
|
|
|
|
Liabilities
|
|
|
|
|
|
|
|
Bank credit facility borrowing
|
|
|
338,224 |
|
|
|
|
Payables
|
|
|
|
|
|
|
|
Accrued expenses
|
|
|
35,879 |
|
|
|
|
Investment management fee
|
|
|
5,731 |
|
|
|
|
Administrative services
|
|
|
1,773 |
|
|
|
|
|
|
|
Total liabilities
|
|
|
381,607 |
|
|
|
|
|
|
|
Net Assets
|
|
|
$ 6,834,678 |
|
|
|
|
|
|
|
Net Asset Value Per Share
|
|
|
|
|
|
|
|
(applicable to 2,610,050 shares outstanding: 500,000,000 shares of $.01 par value authorized)
|
|
|
$2.62 |
|
|
|
|
|
|
|
Net Assets Consist of
|
|
|
|
|
|
|
|
Paid in capital
|
|
|
$ 7,651,433 |
|
|
|
|
Accumulated undistributed net investment income
|
|
|
110,139 |
|
|
|
|
Accumulated net realized loss on investments
|
|
|
(1,643,803) |
|
|
|
|
Net unrealized appreciation on investments
|
|
|
716,909 |
|
|
|
|
|
|
|
|
|
$ 6,834,678 |
|
|
|
|
|
|
|
See notes to financial statements.
|
|
|
|
|
|
|
|
|
|
|
|
|
FOXBY CORP.
|
|
|
|
Semi-Annual Report 2015 6
|
|
|
|
|
|
|
STATEMENT OF OPERATIONS
|
|
|
|
(Unaudited)
|
|
|
|
|
Financial Statements
|
|
|
|
|
|
|
|
| |
|
|
|
Six Months Ended
June 30, 2015
|
|
|
|
Investment Income
|
|
|
|
|
|
|
|
Dividends (net of $437 foreign tax expense)
|
|
|
|
$ 101,227 |
|
|
|
|
|
|
|
|
|
|
|
|
|
|
Total investment income
|
|
|
|
101,227 |
|
|
|
|
|
|
|
|
|
|
|
|
|
|
Expenses
|
|
|
|
|
|
|
|
Investment management
|
|
|
|
35,780 |
|
|
|
Bookkeeping and pricing
|
|
|
|
12,890 |
|
|
|
Directors
|
|
|
|
7,868 |
|
|
|
Audit
|
|
|
|
6,915 |
|
|
|
Shareholder communications
|
|
|
|
6,362 |
|
|
|
Administrative services
|
|
|
|
5,630 |
|
|
|
Custody
|
|
|
|
2,595 |
|
|
|
Transfer agent
|
|
|
|
2,260 |
|
|
|
Interest on bank credit facility
|
|
|
|
1,818 |
|
|
|
Insurance
|
|
|
|
905 |
|
|
|
Other
|
|
|
|
671 |
|
|
|
|
|
|
|
|
|
|
|
|
|
|
Total expenses
|
|
|
|
83,694 |
|
|
|
|
|
|
|
|
|
|
|
|
|
|
Net investment income
|
|
|
|
17,533 |
|
|
|
|
|
|
|
|
|
|
|
|
|
|
Realized and Unrealized Gain (Loss)
|
|
|
|
|
|
|
|
Net realized gain on investments
|
|
|
|
721,308 |
|
|
|
Unrealized depreciation on investments
|
|
|
|
(899,882) |
|
|
|
|
|
|
|
|
|
|
|
|
|
|
Net realized and unrealized loss
|
|
|
|
(178,574) |
|
|
|
|
|
|
|
|
|
|
|
|
|
|
Net decrease in net assets resulting from operations
|
|
|
|
$ (161,041) |
|
|
|
|
|
|
|
|
|
|
|
|
|
|
|
|
|
|
|
|
|
|
|
|
|
|
|
|
|
|
|
|
|
|
|
|
|
|
|
|
|
|
|
|
|
|
|
|
|
|
|
|
|
|
|
|
|
|
|
|
|
|
|
|
|
|
|
|
|
|
|
|
|
|
|
|
|
|
|
|
|
|
|
|
|
|
|
|
|
|
|
|
|
|
|
|
|
|
|
|
|
|
|
|
|
|
|
|
|
|
|
|
|
|
|
|
|
|
|
|
|
|
|
|
|
|
|
|
|
|
|
|
|
|
|
|
|
|
|
|
|
|
|
|
|
|
|
|
|
|
|
|
|
|
|
|
|
|
7 Semi-Annual Report 2015
|
|
|
|
FOXBY CORP.
|
|
|
|
|
|
|
STATEMENTS OF CHANGES IN NET ASSETS
|
|
|
|
(Unaudited)
|
|
|
|
|
Financial Statements
|
|
|
|
|
|
|
|
|
|
|
|
|
|
| |
|
|
|
Six Months Ended
June 30, 2015
|
|
|
|
|
|
Year Ended
December 31, 2014
|
|
|
|
|
|
|
|
|
|
|
Operations
|
|
|
|
|
|
|
|
|
|
|
|
|
|
Net investment income
|
|
|
|
$ 17,533 |
|
|
|
|
|
$ 47,822 |
|
|
|
Net realized gain
|
|
|
|
721,308 |
|
|
|
|
|
570,698 |
|
|
|
Unrealized depreciation
|
|
|
|
(899,882) |
|
|
|
|
|
(567,754) |
|
|
|
|
|
|
|
|
|
|
|
|
|
|
|
|
|
|
|
|
|
|
|
Net increase (decrease) in net assets resulting from operations
|
|
|
|
(161,041) |
|
|
|
|
|
50,766 |
|
|
|
|
|
|
|
|
|
|
|
|
|
|
|
|
|
|
|
|
|
|
|
Total increase (decrease) in net assets
|
|
|
|
(161,041) |
|
|
|
|
|
50,766 |
|
|
|
|
|
|
|
|
|
|
Net Assets
|
|
|
|
|
|
|
|
|
|
|
|
|
|
Beginning of period
|
|
|
|
6,995,719 |
|
|
|
|
|
6,944,953 |
|
|
|
|
|
|
|
|
|
|
|
|
|
|
|
|
|
|
|
|
|
|
|
End of period
|
|
|
|
$ 6,834,678
|
|
|
|
|
|
$ 6,995,719
|
|
|
|
|
|
|
|
|
|
|
|
|
|
|
|
|
|
|
|
|
|
|
|
End of period net assets include undistributed net investment income
|
|
|
|
$ 110,139
|
|
|
|
|
|
$ 92,606
|
|
|
|
|
|
|
|
|
|
|
|
|
|
|
|
|
|
|
|
|
|
|
|
|
|
|
|
|
|
|
|
|
|
|
|
|
|
|
|
|
|
|
|
|
|
|
|
|
|
|
|
|
|
|
|
|
|
|
|
|
|
|
|
|
|
|
|
|
|
|
|
|
|
|
|
|
|
|
|
|
|
|
|
|
|
|
|
|
|
|
|
|
|
|
|
|
|
|
|
|
|
|
|
|
|
|
|
|
|
|
|
|
|
|
|
|
|
|
|
|
|
|
|
|
|
|
|
|
|
|
|
|
|
|
|
|
|
|
|
|
|
|
|
|
|
|
|
|
|
|
|
|
|
|
|
|
|
|
|
|
|
|
|
|
|
|
|
|
|
|
|
|
|
|
|
|
|
|
|
|
|
|
|
|
|
|
|
|
|
|
|
|
|
|
|
|
|
|
|
|
|
|
|
|
|
|
|
|
|
|
|
|
|
|
|
|
|
|
|
|
|
|
|
|
|
|
|
|
|
|
|
|
|
|
|
|
|
|
|
|
|
|
|
|
|
|
|
|
|
|
|
|
|
|
|
|
|
|
|
|
|
|
|
|
|
|
|
|
|
|
|
|
|
|
|
|
|
|
|
|
|
|
|
|
|
|
|
|
|
|
|
|
|
|
|
|
|
|
|
|
|
|
|
|
|
|
|
|
|
|
|
|
|
|
|
|
|
|
|
|
|
|
|
|
|
|
|
|
|
|
|
|
|
|
|
|
|
|
|
|
|
|
|
|
|
|
|
|
|
|
|
|
|
|
|
|
|
|
|
|
|
|
|
|
|
|
|
|
|
|
|
|
|
|
|
|
See notes to financial statements.
|
|
|
|
|
|
|
|
|
|
|
|
|
|
|
|
|
|
|
FOXBY CORP.
|
|
|
|
Semi-Annual Report 2015 8
|
|
|
|
|
|
|
STATEMENT OF CASH FLOWS
|
|
|
|
(Unaudited)
|
|
|
|
|
Financial Statements
|
|
|
|
|
|
|
|
|
|
| |
|
|
|
Six Months Ended
June 30, 2015
|
|
|
|
|
|
|
|
|
Cash Flows From Operating Activities
|
|
|
|
|
|
|
|
|
|
Net decrease in net assets resulting from operations
|
|
|
|
$ (161,041) |
|
|
|
Adjustments to reconcile decrease in net assets resulting from operations
to net cash provided by (used in) operating activities:
|
|
|
|
|
|
|
|
|
|
Unrealized depreciation of investments
|
|
|
|
899,882 |
|
|
|
Net realized gain on sales of investments
|
|
|
|
(721,308) |
|
|
|
Purchase of long term investments
|
|
|
|
(1,296,065) |
|
|
|
Proceeds from sales of long term investments
|
|
|
|
1,494,353 |
|
|
|
Net purchases of short term investments
|
|
|
|
(7,332) |
|
|
|
Decrease in dividends receivable
|
|
|
|
9,468 |
|
|
|
Increase in other assets
|
|
|
|
(570) |
|
|
|
Decrease in accrued expenses
|
|
|
|
(10,060) |
|
|
|
Decrease in investment management fee payable
|
|
|
|
(300) |
|
|
|
Increase in administrative services payable
|
|
|
|
270 |
|
|
|
|
|
|
|
|
|
|
|
|
|
|
|
|
Net cash provided by operating activities
|
|
|
|
207,297 |
|
|
|
|
|
|
|
|
|
|
|
|
|
|
|
Cash Flows from Financing Activities
|
|
|
|
|
|
|
|
|
|
Bank credit facility repayment
|
|
|
|
(207,297) |
|
|
|
|
|
|
|
|
|
|
|
|
|
|
Net cash used in financing activities
|
|
|
|
(207,297) |
|
|
|
|
|
|
|
|
|
|
|
|
|
|
|
Net change in cash
|
|
|
|
|
|
- |
|
|
|
|
|
|
|
|
Cash
|
|
|
|
|
|
|
|
|
|
Beginning of period
|
|
|
|
|
|
- |
|
|
|
|
|
|
|
|
|
|
|
|
|
|
End of period
|
|
|
|
$ - |
|
|
|
|
|
|
|
|
|
|
|
|
|
|
|
Supplemental disclosure of cash flow information:
|
|
|
|
|
|
|
|
|
|
Cash paid for interest on bank credit facility
|
|
|
|
|
|
$ 1,824 |
|
|
|
|
|
|
|
|
|
|
|
|
|
|
|
|
|
|
|
|
|
|
|
|
|
|
|
|
|
|
|
|
|
|
|
|
|
|
|
|
|
|
|
|
|
|
|
|
|
|
|
|
|
|
|
|
|
|
|
|
|
|
|
|
|
|
|
|
|
|
|
|
|
|
|
|
|
|
|
|
|
|
|
|
|
|
|
|
|
|
|
|
|
|
|
|
|
|
|
|
|
|
|
|
|
|
|
|
|
|
|
|
|
|
|
|
|
|
|
|
|
|
|
|
|
|
|
|
|
|
|
|
|
|
|
|
|
|
|
|
|
|
|
|
|
|
|
|
|
|
|
|
|
|
|
|
|
|
|
|
|
|
|
|
|
|
|
|
|
|
|
|
|
|
|
|
|
|
|
|
|
|
|
|
|
|
|
|
|
|
|
|
|
|
|
|
|
|
|
|
|
|
|
|
|
|
|
|
|
|
See notes to financial statements.
|
|
|
|
|
|
|
|
|
|
|
|
|
|
|
9 Semi-Annual Report 2015
|
|
|
|
FOXBY CORP.
|
|
|
|
|
|
|
NOTES TO FINANCIAL STATEMENTS
|
|
|
|
June 30, 2015 (Unaudited)
|
|
|
|
|
Financial Statements
|
1. ORGANIZATION AND SIGNIFICANT ACCOUNTING POLICIES Foxby Corp. (the “Fund”), a Maryland corporation registered under the Investment Company Act of 1940, as amended (the “Act”), is a non-diversified, closed end management investment company whose shares are quoted over the counter under the ticker symbol FXBY. The Fund’s non-fundamental investment objective is total return which it may seek from growth of capital and from income in any security type and in any industry sector. The Fund retains Midas Management Corporation as its Investment Manager.
The financial statements have been prepared in conformity with accounting principles generally accepted in the United States of America (“GAAP”), which require management to make certain estimates and assumptions at the date of the financial statements. Actual results could differ from those estimates. Subsequent events, if any, through the date that the financial statements were issued have been evaluated in the preparation of the financial statements. The following summarizes the significant accounting policies of the Fund:
Valuation of Investments – Portfolio securities are valued by various methods depending on the primary market or exchange on which they trade. Most equity securities for which the primary market is in the United States are valued at the official closing price, last sale price or, if no sale has occurred, at the closing bid price. Most equity securities for which the primary market is outside the United States are valued using the official closing price or the last sale price in the principal market in which they are traded. If the last sale price on the local exchange is unavailable, the last evaluated quote or closing bid price normally is used. Certain debt securities may be priced through pricing services that may utilize a matrix pricing system which takes into consideration factors such as yields, prices, maturities, call features, and ratings on comparable securities or according to prices quoted by a securities dealer that offers pricing services. Open end investment companies are valued at their net asset value. Foreign securities markets may be open on days when the U.S. markets are closed. For this reason, the value of any foreign securities owned by the Fund could change on a day when shareholders cannot buy or sell shares of the Fund. Securities for which market quotations are not readily available or reliable and other assets may be valued as determined in good faith by the Investment Manager under the direction of or pursuant to procedures approved by the Fund’s Board of Directors. Due to the inherent uncertainty of valuation, such fair value pricing values may differ from the values that would have been used had a readily available market for the securities existed. These differences in valuation could be material.
A security’s valuation may differ depending on the method used for determining value. The use of fair value pricing by the Fund may cause the net asset value of its shares to differ from the net asset value that would be calculated using market prices. A fair value price is an estimate and there is no assurance that such price will be at or close to the price at which a security is next quoted or next trades.
Foreign Currency Translation – Securities denominated in foreign currencies are translated into U.S. dollars at prevailing exchange rates. Realized gain or loss on sales of such investments in local currency terms is reported separately from gain or loss attributable to a change in foreign exchange rates for those investments.
Short Sales – The Fund may sell a security short it does not own in anticipation of a decline in the market value of the security. When the Fund sells a security short, it must borrow the security sold short and deliver it to the broker/dealer through which it made the short sale. The Fund is liable for any dividends or interest paid on securities sold short. A gain, limited to the price at which the Fund sold the security short, or a loss, unlimited in size, will be recognized upon the termination of the short sale. Securities sold short result in off balance sheet risk as the Fund’s ultimate obligation to satisfy the terms of a sale of securities sold short may exceed the amount recognized in the Statement of Assets and Liabilities.
Derivatives – The Fund may use derivatives for a variety of reasons, such as to attempt to protect against possible changes in the value of its portfolio holdings or to generate potential gain. Derivatives are financial instruments that derive their values from other securities or commodities, or that are based on indices. Derivative instruments are marked to market with the change in value reflected in unrealized appreciation or depreciation. Upon disposition, a realized gain or loss is recognized accordingly, except when taking delivery of a security underlying a contract. In these instances, the recognition of gain or loss is postponed until the disposal of the security underlying the contract. Risk may arise as a result of the potential inability of the counterparties to meet the terms of their contracts. Derivative instruments include written options, purchased options, futures contracts, forward foreign currency exchange contracts, and swap agreements.
Investments in Other Investment Companies – The Fund may invest in shares of other investment companies such as closed end funds, exchange traded funds, and mutual funds (the “Acquired Funds”) in accordance with the Act and related rules. Shareholders in the Fund bear the pro rata portion of the fees and expenses
|
|
|
|
|
|
FOXBY CORP.
|
|
|
|
Semi-Annual Report 2015 10
|
|
|
|
|
|
|
NOTES TO FINANCIAL STATEMENTS
|
|
|
|
(Unaudited)
|
|
|
|
|
Financial Statements
|
of the Acquired Funds in addition to the Fund’s expenses. Expenses incurred by the Fund that are disclosed in the Statement of Operations do not include fees and expenses incurred by the Acquired Funds. The fees and expenses of an Acquired Fund are reflected in such fund’s total returns.
Investment Transactions – Investment transactions are accounted for on the trade date (the date the order to buy or sell is executed). Realized gains or losses are determined by specifically identifying the cost basis of the investment sold.
Investment Income – Dividend income is recorded on the ex-dividend date or in the case of certain foreign securities, as soon as practicable after the Fund is notified. Interest income is recorded on the accrual basis. Taxes withheld on foreign dividends have been provided for in accordance with the Fund’s understanding of the applicable country’s tax rules and rates.
Expenses – Expenses deemed by the Investment Manager to have been incurred solely by the Fund are charged to the Fund. Expenses deemed by the Investment Manager to have been incurred jointly by the Fund and one or more of the other investment companies for which the Investment Manager or its affiliates serve as investment manager, an internally managed investment company with substantially similar officers and directors, or other related entities are allocated on the basis of relative net assets, except where a more appropriate allocation can be made fairly in the judgment of the Investment Manager.
Expense Reduction Arrangement – Through arrangements with the Fund’s custodian, credits realized as a result of uninvested cash balances are used to reduce custodian expenses. No credits were realized by the Fund during the periods covered by this report.
Distributions to Shareholders – Distributions to shareholders are determined in accordance with income tax regulations and are recorded on the ex-dividend date.
Income Taxes – No provision has been made for U.S. income taxes because the Fund’s current intention is to continue to qualify as a regulated investment company under the Internal Revenue Code (the “IRC”) and to distribute to its shareholders substantially all of its taxable income and net realized gains. Foreign securities held by the Fund may be subject to foreign taxation. Foreign taxes, if
any, are recorded based on the tax regulations and rates that exist in the foreign markets in which the Fund invests. The Fund recognizes the tax benefits of uncertain tax positions only where the position is “more likely than not” to be sustained assuming examination by tax authorities. The Fund has reviewed its tax positions and has concluded that no liability for unrecognized tax benefits should be recorded related to uncertain tax positions taken on federal, state, and local income tax returns for open tax years (2012-2014) or expected to be taken in the Fund’s 2015 tax returns.
2. FEES AND TRANSACTIONS WITH RELATED PARTIES The Fund has retained the Investment Manager pursuant to an investment management agreement. Under the terms of the investment management agreement, the Investment Manager receives a fee payable monthly for investment advisory services at an annual rate of 0.95% of the Fund’s Managed Assets. “Managed Assets” means the average weekly value of the Fund’s total assets minus the sum of the Fund’s liabilities, which liabilities exclude debt relating to leverage, short term debt, and the aggregate liquidation preference of any outstanding preferred stock.
Pursuant to the investment management agreement, the Fund reimburses the Investment Manager for providing at cost certain administrative services comprised of compliance and accounting services. For the six months ended June 30, 2015, the Fund’s payments of such costs were $5,630, of which $3,005 and $2,625 was for compliance and accounting services, respectively.
Certain officers and directors of the Fund are officers and directors of the Investment Manager. As of June 30, 2015, affiliates of the Investment Manager owned approximately 24% of the Fund’s outstanding shares.
3. DISTRIBUTIONS TO SHAREHOLDERS AND DISTRIBUTABLE EARNINGS
As of December 31, 2014, the components of distributable earnings on a tax basis were as follows:
|
|
|
|
|
|
Undistributed net investment income
|
|
$ 4,355 |
|
|
|
Capital loss carryover
|
|
(2,015,152) |
|
|
|
Unrealized appreciation
|
|
1,705,042 |
|
|
|
Post-October losses
|
|
(349,959) |
|
|
|
|
|
$ (655,714)
|
|
|
|
|
|
|
|
|
|
11 Semi-Annual Report 2015
|
|
|
|
FOXBY CORP.
|
|
|
|
|
|
|
NOTES TO FINANCIAL STATEMENTS
|
|
|
|
(Unaudited)
|
|
|
|
|
Financial Statements
|
Federal income tax regulations permit post-October net capital losses, if any, to be deferred and recognized on the tax return of the next succeeding taxable year.
Capital loss carryovers are calculated and reported as of a specific date. Results of transactions and other activity after that date may affect the amount of capital loss carryovers actually available for the Fund to utilize under the IRC and related regulations. Capital losses incurred in taxable years beginning after November 30, 2011, are allowed to be carried forward indefinitely and retain the character of the original loss. As a transition rule, post-enactment net capital losses are required to be utilized before pre-enactment net capital losses. As of December 31, 2014, the Fund has a net capital loss carryover of $2,015,152, of which $249,264, $964,048, and $801,840 expires in 2016, 2017, and 2018, respectively.
4. VALUE MEASUREMENTS GAAP establishes a hierarchy that prioritizes inputs to valuation methods. The three levels of inputs are:
• Level 1 – unadjusted quoted prices in active markets for identical assets or liabilities including securities actively traded on a securities exchange.
• Level 2 – observable inputs other than quoted prices included in level 1 that are observable for the asset or liability which may include quoted prices for similar instruments, interest rates, prepayment speeds, credit risk, yield curves, default rates, and similar data.
• Level 3 – unobservable inputs for the asset or liability including the Fund’s own assumptions about the assumptions a market participant would use in valuing the asset or liability.
The availability of observable inputs can vary from security to security and is affected by a wide variety of factors, including, for example the type of security, whether the security is new and not yet established in the marketplace, the liquidity of markets, and other characteristics particular to the security. To the extent that
valuation is based on models or inputs that are less observable or unobservable in the market, the determination of fair value requires more judgment. Accordingly, the degree of judgment exercised in determining fair value is greatest for investments categorized in level 3. The inputs used to measure fair value may fall into different levels of the fair value hierarchy. In such cases, the level in the fair value hierarchy within which the fair value measurement falls in its entirety is determined based on the lowest level input that is significant to the fair value measurement in its entirety. The inputs or methodology used for valuing investments are not an indication of the risk associated with investing in those securities.
The following is a description of the valuation techniques applied to the Fund’s major categories of assets and liabilities measured at fair value on a recurring basis:
Equity securities (common and preferred stock) – Most publicly traded equity securities are valued normally at the most recent official closing price, last sale price, evaluated quote, or closing bid price. To the extent these securities are actively traded and valuation adjustments are not applied, they may be categorized in level 1 of the fair value hierarchy. Equities on inactive markets or valued by reference to similar instruments may be categorized in level 2.
Restricted and/or illiquid securities – Restricted and/or illiquid securities for which quotations are not readily available or reliable may be valued with fair value pricing as determined in good faith by the Investment Manager under the direction of or pursuant to procedures approved by the Fund’s Board of Directors. Restricted securities issued by publicly traded companies are generally valued at a discount to similar publicly traded securities. Restricted or illiquid securities issued by nonpublic entities may be valued by reference to comparable public entities or fundamental data relating to the issuer or both or similar inputs. Depending on the relative significance of valuation inputs, these instruments may be categorized in either level 2 or level 3 of the fair value hierarchy.
|
|
|
|
|
|
FOXBY CORP.
|
|
|
|
Semi-Annual Report 2015 12
|
|
|
|
|
|
|
NOTES TO FINANCIAL STATEMENTS
|
|
|
|
(Unaudited)
|
|
|
|
|
Financial Statements
|
The following is a summary of the inputs used as of June 30, 2015 in valuing the Fund’s assets. Refer to the Schedule of Portfolio Investments for detailed information on specific investments.
|
|
|
|
|
|
|
|
|
|
|
|
|
|
|
|
|
|
ASSETS
|
|
Level 1
|
|
|
Level 2
|
|
|
Level 3
|
|
|
Total
|
|
|
Investments, at value
|
|
|
|
|
|
|
|
|
|
|
|
|
|
|
|
|
|
Common Stocks
|
|
|
|
|
|
|
|
|
|
|
|
|
|
|
|
|
|
Cable & Other Pay Television Services
|
|
|
$ 129,280 |
|
|
|
$ - |
|
|
|
$ - |
|
|
|
$ 129,280 |
|
|
Cigarettes
|
|
|
80,170 |
|
|
|
- |
|
|
|
- |
|
|
|
80,170 |
|
|
Computer Communications Equipment
|
|
|
422,438 |
|
|
|
- |
|
|
|
- |
|
|
|
422,438 |
|
|
Computer & Office Equipment
|
|
|
65,064 |
|
|
|
- |
|
|
|
- |
|
|
|
65,064 |
|
|
Electronic & Other Electrical Equipment
|
|
|
80,890 |
|
|
|
- |
|
|
|
- |
|
|
|
80,890 |
|
|
Finance Services
|
|
|
77,720 |
|
|
|
- |
|
|
|
- |
|
|
|
77,720 |
|
|
Fire, Marine & Casualty Insurance
|
|
|
528,315 |
|
|
|
- |
|
|
|
- |
|
|
|
528,315 |
|
|
Information Retrieval Services
|
|
|
270,020 |
|
|
|
- |
|
|
|
- |
|
|
|
270,020 |
|
|
Investment Advice
|
|
|
728,700 |
|
|
|
- |
|
|
|
- |
|
|
|
728,700 |
|
|
In Vitro & In Vivo Diagnostic Substances
|
|
|
203,940 |
|
|
|
- |
|
|
|
- |
|
|
|
203,940 |
|
|
Leather & Leather Products
|
|
|
103,830 |
|
|
|
- |
|
|
|
- |
|
|
|
103,830 |
|
|
Men’s & Boy’s Furnishings, Work Clothing &
Allied Garments
|
|
|
132,360 |
|
|
|
- |
|
|
|
- |
|
|
|
132,360 |
|
|
Motor Vehicles & Passenger Car Bodies
|
|
|
583,108 |
|
|
|
- |
|
|
|
- |
|
|
|
583,108 |
|
|
National Commercial Banks
|
|
|
337,440 |
|
|
|
- |
|
|
|
- |
|
|
|
337,440 |
|
|
Office Furniture
|
|
|
152,000 |
|
|
|
- |
|
|
|
- |
|
|
|
152,000 |
|
|
Paperboard Containers & Boxes
|
|
|
43,590 |
|
|
|
- |
|
|
|
- |
|
|
|
43,590 |
|
|
Petroleum Refining
|
|
|
83,200 |
|
|
|
- |
|
|
|
- |
|
|
|
83,200 |
|
|
Pharmaceutical Preparations
|
|
|
49,530 |
|
|
|
- |
|
|
|
- |
|
|
|
49,530 |
|
|
Plastic Mail, Synth Resin/Rubber, Cellulose
|
|
|
79,674 |
|
|
|
- |
|
|
|
- |
|
|
|
79,674 |
|
|
Printed Circuit Boards
|
|
|
136,781 |
|
|
|
- |
|
|
|
- |
|
|
|
136,781 |
|
|
Real Estate
|
|
|
92,450 |
|
|
|
- |
|
|
|
- |
|
|
|
92,450 |
|
|
Real Estate Investment Trusts
|
|
|
63,400 |
|
|
|
- |
|
|
|
- |
|
|
|
63,400 |
|
|
Retail Consulting and Investment
|
|
|
- |
|
|
|
- |
|
|
|
727 |
|
|
|
727 |
|
|
Retail - Drug Stores and Proprietary Stores
|
|
|
222,350 |
|
|
|
- |
|
|
|
- |
|
|
|
222,350 |
|
|
Retail - Eating Places
|
|
|
355,118 |
|
|
|
- |
|
|
|
- |
|
|
|
355,118 |
|
|
Retail - Family Clothing Stores
|
|
|
137,412 |
|
|
|
- |
|
|
|
- |
|
|
|
137,412 |
|
|
Retail - Variety Stores
|
|
|
269,534 |
|
|
|
- |
|
|
|
- |
|
|
|
269,534 |
|
|
Semiconductors & Related Devices
|
|
|
102,400 |
|
|
|
- |
|
|
|
- |
|
|
|
102,400 |
|
|
Services - Business Services
|
|
|
142,310 |
|
|
|
- |
|
|
|
- |
|
|
|
142,310 |
|
|
Services - Medical Laboratories
|
|
|
157,586 |
|
|
|
- |
|
|
|
- |
|
|
|
157,586 |
|
|
Services - Prepackaged Software
|
|
|
139,128 |
|
|
|
- |
|
|
|
- |
|
|
|
139,128 |
|
|
Soap, Detergents, Cleaning Preparations,
Perfumes, Cosmetics
|
|
|
312,960 |
|
|
|
- |
|
|
|
- |
|
|
|
312,960 |
|
|
Wholesale - Computers & Peripheral Equipment
& Software
|
|
|
75,090 |
|
|
|
- |
|
|
|
- |
|
|
|
75,090 |
|
|
Wholesale - Electronic Parts & Equipment
|
|
|
82,220 |
|
|
|
- |
|
|
|
- |
|
|
|
82,220 |
|
|
Wholesale - Industrial Machinery & Equipment
|
|
|
69,770 |
|
|
|
- |
|
|
|
- |
|
|
|
69,770 |
|
|
Exchange Traded Funds
|
|
|
584,797 |
|
|
|
- |
|
|
|
- |
|
|
|
584,797 |
|
|
Preferred Stocks
|
|
|
|
|
|
|
|
|
|
|
|
|
|
|
|
|
|
Retail Consulting and Investment
|
|
|
- |
|
|
|
- |
|
|
|
109,194 |
|
|
|
109,194 |
|
|
Money Market Fund
|
|
|
4,807 |
|
|
|
- |
|
|
|
- |
|
|
|
4,807 |
|
|
Total investments, at value
|
|
|
$ 7,099,382 |
|
|
|
$ - |
|
|
|
$ 109,921 |
|
|
|
$ 7,209,303 |
|
| |
|
|
|
|
|
|
|
|
|
|
|
|
|
|
|
|
|
|
There were no securities transferred from level 1 on December 31, 2014 to level 2 at June 30, 2015.
|
|
|
|
|
|
13 Semi-Annual Report 2015
|
|
|
|
FOXBY CORP.
|
|
|
|
|
|
|
NOTES TO FINANCIAL STATEMENTS
|
|
|
|
(Unaudited)
|
|
|
|
|
Financial Statements
|
The following is a reconciliation of level 3 assets:
|
|
|
|
|
|
|
|
|
|
|
|
|
|
|
|
|
|
|
|
|
|
|
|
|
|
| |
|
Common
Stocks
|
|
|
Preferred
Stocks
|
|
|
Total |
|
|
Balance at December 31, 2014
|
|
|
$ 1,455
|
|
|
$
|
108,478
|
|
|
$
|
109,933
|
|
|
|
|
|
|
Payment of in-kind dividends
|
|
|
- |
|
|
|
12,863 |
|
|
|
12,863 |
|
|
|
|
|
|
Change in unrealized appreciation
|
|
|
(728) |
|
|
|
(12,147) |
|
|
|
(12,875) |
|
|
|
|
|
|
Balance at June 30, 2015
|
|
|
$ 727 |
|
|
$ |
109,194 |
|
|
$ |
109,921 |
|
|
|
|
|
|
|
|
|
|
|
|
|
|
|
|
|
|
|
Net change in unrealized appreciation attributable to
assets still held as level 3 at June 30, 2015
|
|
|
$ (728)
|
|
|
$
|
(12,147)
|
|
|
$
|
(12,875)
|
|
| |
|
|
|
|
|
|
|
|
|
|
|
|
|
|
|
|
There were no transfers into or out of level 3 assets during the period. Unrealized gains (losses) are included in the related amounts on investments in the Statement of Operations.
The Investment Manager, under the direction of the Fund’s Board of Directors, considers various valuation approaches for valuing assets categorized within level 3 of the fair value hierarchy. The factors used in determining the value of such assets may include, but are not limited to: the discount applied due to the private nature of the asset; the type of the security; the size of the asset; the initial cost of the security; the existence of any contractual restrictions on the security’s disposition; the price and extent of public trading in similar securities of the issuer or of comparable companies; quotations or evaluated prices from broker-dealers and/or pricing services; information obtained from the issuer or analysts; an analysis of the company’s or issuer’s financial statements; or an evaluation of the forces that influence the issuer and the market in which the asset is purchased and sold. Significant changes in any of those inputs in isolation may result in a significantly lower or higher fair value measurement. The pricing of all fair value assets is normally reported to the Fund’s Board of Directors.
The following table presents additional information about valuation methodologies and inputs used for assets that are measured at fair value and categorized as level 3 as of June 30, 2015:
|
|
|
|
|
|
|
|
|
|
June 30, 2015
|
|
Fair Value
|
|
Valuation Technique
|
|
Unobservable Input
|
|
Range
|
|
Common Stocks
|
|
|
|
|
|
|
|
|
|
Retail - Consulting and
|
|
$ 727 |
|
Value of liquidation per share |
|
Discount rate due to lack of |
|
80% |
|
Investment
|
|
|
|
|
|
marketability |
|
|
|
Preferred Stocks
|
|
|
|
|
|
|
|
|
|
Retail - Consulting and
|
|
$ 109,194 |
|
Value of liquidation preference |
|
Discount rate due to lack of |
|
80% |
|
Investment
|
|
|
|
per share
|
|
marketability
|
|
|
|
|
|
|
|
5. INVESTMENT TRANSACTIONS Purchases and proceeds from sales of investment securities, excluding short term securities, were $1,296,065 and $1,494,353, respectively, for the six months ended June 30, 2015. As of June 30, 2015, for federal income tax purposes, subject to change, the aggregate cost of securities was $6,496,909 and net unrealized appreciation was $712,394, comprised of gross unrealized appreciation of $1,404,909 and gross unrealized depreciation of $692,515. The aggregate costs of investments for tax purposes will depend upon the Fund’s investment experience during the entirety of its fiscal year and may be subject to changes based on tax regulations.
|
|
|
|
|
|
FOXBY CORP.
|
|
|
|
Semi-Annual Report 2015 14
|
|
|
|
|
|
|
NOTES TO FINANCIAL STATEMENTS
|
|
|
|
(Unaudited)
|
|
|
|
|
Financial Statements
|
6. ILLIQUID AND RESTRICTED SECURITIES The Fund owns securities which have a limited trading market and/or certain restrictions on trading and, therefore, may be considered illiquid and/or restricted. Such securities have been valued using fair value pricing. Due to the inherent uncertainty of valuation, fair value pricing values may differ from the values that would have been used had a readily available market for the securities existed. These differences in valuation could be material. Illiquid and/or restricted securities owned as of June 30, 2015 were as follows:
|
|
|
|
|
|
|
|
|
|
|
|
|
|
|
|
|
| |
|
Acquisition Date
|
|
Cost
|
|
|
|
|
Value
|
|
|
|
|
|
|
Amerivon Holdings LLC preferred shares
|
|
9/20/07
|
|
$
|
539,522
|
|
|
|
|
$
|
109,194
|
|
|
|
|
|
|
|
|
|
|
|
|
|
Amerivon Holdings LLC common equity units
|
|
9/20/07
|
|
|
0
|
|
|
|
|
|
727
|
|
|
|
|
|
|
|
|
|
|
|
|
Total
|
|
|
|
$ |
539,522 |
|
|
|
|
$ |
109,921 |
|
|
|
|
|
|
|
|
|
|
|
|
Percent of net assets
|
|
|
|
|
8
|
%
|
|
|
|
|
2
|
%
|
|
|
|
|
|
|
|
|
|
|
|
|
|
|
|
|
|
|
|
|
|
|
|
|
7. BORROWING AND SECURITIES LENDING The Fund has entered into a Committed Facility Agreement (the “CFA”) with BNP Paribas Prime Brokerage, Inc. (“BNP”) which allows the Fund to adjust its credit facility amount up to $2,500,000, subject to BNP’s approval, and a Lending Agreement, as defined below. Borrowings under the CFA are secured by assets of the Fund that are held with the Fund’s custodian in a separate account (the “pledged collateral”). Interest is charged at the 1 month LIBOR (London Inter-bank Offered Rate) plus 0.95% on the amount borrowed and 0.50% on the undrawn balance. Because the Fund adjusts the facility amount each day to equal borrowing drawn that day, the annualized rate charge on undrawn facility amounts provided for by the CFA has not been incurred. The outstanding loan balance and the value of eligible collateral investments as of June 30, 2015 were $338,224 and $3,242,679, respectively, and the weighted average interest rate and average daily amount outstanding under the CFA for the six months ended June 30, 2015 were 1.13% and $318,822, respectively. The maximum amount outstanding during the six months ended June 30, 2015 was $607,172.
The Lending Agreement provides that BNP may borrow a portion of the pledged collateral (the “Lent Securities”) in an amount not to exceed the outstanding borrowings owed by the Fund to BNP under the CFA. BNP may re-register the Lent Securities in its own name or in another name other than the Fund and may pledge, re-pledge, sell, lend, or otherwise transfer or use the Lent Securities with all attendant rights of ownership. The Fund may designate any security within the pledged collateral as ineligible to be a Lent Security, provided there are eligible securities within the pledged collateral in an amount equal to the outstanding borrowing owed by the Fund. BNP must remit payment to the Fund equal to the amount of all dividends, interest, or other distributions earned or made by the Lent Securities.
Under the Lending Agreement, Lent Securities are marked to market daily and, if the value of the Lent Securities exceeds the value of the then-outstanding borrowings owed by the Fund to BNP under the CFA (the “Current Borrowings”), BNP must, on that day, either (1) return Lent Securities to the Fund’s custodian in an amount sufficient to cause the value of the outstanding Lent Securities to equal the Current Borrowings; or (2) post cash collateral with the Fund’s custodian equal to the difference between the value of the Lent Securities and the value of the Current Borrowings. If BNP fails to perform either of these actions as required, the Fund may recall securities, as discussed below, in an amount sufficient to cause the value of the outstanding Lent Securities to equal the Current Borrowings. The Fund can recall any of the Lent Securities and BNP is obligated, to the extent commercially possible, to return such security or equivalent security to the Fund’s custodian no later than three business days after such request. If the Fund recalls a Lent Security pursuant to the Lending Agreement, and BNP fails to return the Lent Securities or equivalent securities in a timely fashion, BNP normally remains liable to the Fund’s custodian for the ultimate delivery of such Lent Securities, or equivalent securities, and for any buy-in costs that the executing broker for the sales transaction may impose with respect to the failure to deliver. The Fund also has the right to apply and set-off an amount equal to one hundred percent (100%) of the then-current fair value of such Lent Securities against the Current Borrowings. The Fund earns securities lending income consisting of payments received from BNP for lending certain securities, less any rebates paid to borrowers and lending agent fees associated with the loan. There were no Lent Securities during the six months ended June 30, 2015.
|
|
|
|
|
|
15 Semi-Annual Report 2015
|
|
|
|
FOXBY CORP.
|
|
|
|
|
|
|
NOTES TO FINANCIAL STATEMENTS
|
|
|
|
(Unaudited)
|
|
|
|
|
Financial Statements
|
8. FOREIGN SECURITIES RISK Investments in the securities of foreign issuers involve special risks which include changes in foreign exchange rates and the possibility of future adverse political and economic developments which could adversely affect the value of such securities. Moreover, securities of foreign issuers and traded in foreign markets may be less liquid and their prices more volatile than those of U.S. issuers and markets.
9. CAPITAL STOCK As of June 30, 2015, there were 2,610,050 shares of $.01 par value common stock outstanding and 500,000,000 shares authorized. There were no transactions in capital stock during 2014 or the six months ended June 30, 2015.
10. SHARE REPURCHASE PROGRAM In accordance with Section 23(c) of the Act, the Fund may from time to time repurchase its shares in the open market at the discretion of and upon such terms as determined by the Board of Directors. The Fund did not repurchase any of its shares during 2014 or the six months ended June 30, 2015.
11. CONTINGENCIES The Fund indemnifies its officers and directors from certain liabilities that might arise from their performance of their duties for the Fund. Additionally, in the normal course of business, the Fund enters into contracts that contain a variety of representations and warranties and which may provide general indemnifications. The Fund’s maximum exposure under these arrangements is unknown as it involves future claims that may be made against the Fund under circumstances that have not occurred.
12. OTHER INFORMATION The Fund may at times raise cash for investment by issuing shares through one or more offerings, including rights offerings. Proceeds from any such offerings will be invested in accordance with the investment objective and policies of the Fund.
|
|
|
|
|
|
FOXBY CORP.
|
|
|
|
Semi-Annual Report 2015 16
|
|
|
|
|
|
|
FINANCIAL HIGHLIGHTS
|
|
|
|
(Unaudited)
|
|
|
|
|
Financial Statements
|
|
|
|
|
|
|
|
|
|
|
|
|
|
|
|
|
|
|
|
|
|
|
|
|
|
|
|
|
|
|
|
| |
|
Six Months
Ended
June 30, 2015
|
|
Year Ended December 31,
|
| Per Share Operating Performance |
|
|
2014
|
|
2013
|
|
2012
|
|
2011
|
|
2010
|
| (for a share outstanding throughout each period) |
|
|
|
|
|
|
|
|
|
|
|
|
|
Net asset value, beginning of period
|
|
|
|
$2.68 |
|
|
|
|
$2.66 |
|
|
|
|
$2.09 |
|
|
|
|
$1.79 |
|
|
|
|
$1.72 |
|
|
|
|
$1.65 |
|
|
|
|
|
|
|
|
|
Income from investment operations:
|
|
|
|
|
|
|
|
|
|
|
|
|
|
|
|
|
|
|
|
|
|
|
|
|
|
|
|
|
|
|
|
Net investment income (loss) (1)
|
|
|
|
0.01 |
|
|
|
|
0.02 |
|
|
|
|
0.02 |
|
|
|
|
(0.04 |
) |
|
|
|
0.01 |
|
|
|
|
(0.01 |
) |
|
Net realized and unrealized gain on investments
|
|
|
|
(0.07 |
) |
|
|
|
-* |
|
|
|
|
0.57 |
|
|
|
|
0.35 |
|
|
|
|
0.06 |
|
|
|
|
0.08 |
|
|
Total from investment operations
|
|
|
|
(0.06 |
) |
|
|
|
0.02 |
|
|
|
|
0.59 |
|
|
|
|
0.31 |
|
|
|
|
0.07 |
|
|
|
|
0.07 |
|
|
|
|
|
|
|
|
|
Less distributions:
|
|
|
|
|
|
|
|
|
|
|
|
|
|
|
|
|
|
|
|
|
|
|
|
|
|
|
|
|
|
|
|
Net investment income
|
|
|
|
-
|
|
|
|
|
- |
|
|
|
|
(0.02 |
) |
|
|
|
(0.01 |
) |
|
|
|
- |
|
|
|
|
- |
|
|
Return of capital
|
|
|
|
-
|
|
|
|
|
- |
|
|
|
|
- |
|
|
|
|
-* |
|
|
|
|
- |
|
|
|
|
- |
|
|
Total distributions
|
|
|
|
- |
|
|
|
|
- |
|
|
|
|
(0.02 |
) |
|
|
|
(0.01 |
) |
|
|
|
- |
|
|
|
|
- |
|
|
|
|
|
|
|
|
|
Net asset value, end of period
|
|
|
|
$2.62 |
|
|
|
|
$2.68 |
|
|
|
|
$2.66 |
|
|
|
|
$2.09 |
|
|
|
|
$1.79 |
|
|
|
|
$1.72 |
|
|
|
|
|
|
|
|
|
Market value, end of period
|
|
|
|
$1.85 |
|
|
|
|
$1.87 |
|
|
|
|
$1.95 |
|
|
|
|
$1.45 |
|
|
|
|
$1.24 |
|
|
|
|
$1.10 |
|
|
|
|
|
|
|
|
|
Total Return (3)
|
|
|
|
|
|
|
|
|
|
|
|
|
|
|
|
|
|
|
|
|
|
|
|
|
|
|
|
|
|
|
|
Based on net asset value
|
|
|
|
(2.24 |
)% |
|
|
|
0.75 |
% |
|
|
|
28.23 |
% |
|
|
|
17.53 |
% |
|
|
|
4.07 |
% |
|
|
|
4.24 |
% |
|
|
|
|
|
|
|
|
Based on market price
|
|
|
|
(1.07 |
)% |
|
|
|
(4.10 |
)% |
|
|
|
35.50 |
% |
|
|
|
17.70 |
% |
|
|
|
12.73 |
% |
|
|
|
7.84 |
% |
|
|
|
|
|
|
|
|
Ratios/Supplemental Data
|
|
|
|
|
|
|
|
|
|
|
|
|
|
|
|
|
|
|
|
|
|
|
|
|
|
|
|
|
|
|
|
Net assets at end of period (000s omitted)
|
|
|
|
$6,835 |
|
|
|
|
$6,996 |
|
|
|
|
$6,945 |
|
|
|
|
$5,442 |
|
|
|
|
$4,661 |
|
|
|
|
$4,491 |
|
|
|
|
|
|
|
|
|
Ratio of expenses to average net assets
|
|
|
|
2.39 |
%† |
|
|
|
1.92 |
% |
|
|
|
1.60 |
% |
|
|
|
4.57 |
%(4) |
|
|
|
2.03 |
% |
|
|
|
2.28 |
% |
|
Ratio of expenses excluding loan interest and fees to average net assets
|
|
|
|
2.39 |
%† |
|
|
|
1.86 |
% |
|
|
|
1.60 |
% |
|
|
|
4.57 |
%(4) |
|
|
|
2.03 |
% |
|
|
|
2.25 |
% |
|
Ratio of net investment income (loss) to average net assets
|
|
|
|
0.50 |
%† |
|
|
|
0.75 |
% |
|
|
|
0.92 |
% |
|
|
|
(1.94 |
)% |
|
|
|
0.34 |
% |
|
|
|
(0.41 |
)% |
|
|
|
|
|
|
|
|
Portfolio turnover rate
|
|
|
|
18.23 |
% |
|
|
|
52.94 |
% |
|
|
|
12.30 |
% |
|
|
|
14.92 |
% |
|
|
|
11.41 |
% |
|
|
|
4.49 |
% |
|
Average commission rate paid
|
|
|
|
$0.0253 |
|
|
|
|
$0.0114 |
|
|
|
|
$0.0170 |
|
|
|
|
$0.0115 |
|
|
|
|
$0.0077 |
|
|
|
|
$0.0011 |
|
|
|
|
|
|
|
|
|
|
|
|
|
|
|
|
|
|
|
|
|
|
|
|
|
|
|
|
|
|
|
|
|
|
|
|
|
|
|
|
|
|
|
|
|
|
|
|
|
|
|
|
|
|
|
|
|
|
|
|
|
|
|
| (1) |
The per share amounts were calculated using the average number of shares outstanding during the period.
|
| (2) |
The amount of net investment income (loss) was less than $.005 per share.
|
| (3) |
Total return on a market value basis is calculated assuming a purchase of common stock on the opening of the first day and a sale on the closing of the last day of each period reported. Dividend and distributions, if any, are assumed for purposes of this calculation to be reinvested at prices obtained under the Fund’s dividend reinvestment plan if in effect or, if there is no plan in effect, at the lower of the per share net asset value or the closing market price of the Fund’s shares on the dividend/distribution date. Generally, total return on a net asset value basis will be higher than total return on a market value basis in periods where there is an increase in the discount or a decrease in the premium of the market value to the net asset value from the beginning to the end of such periods. Conversely, total return on a net asset value basis will be lower than total return on a market value basis in periods where there is a decrease in the discount or an increase in the premium of the market value to the net asset value from the beginning to the end of such periods. The calculation does not reflect brokerage commissions, if any.
|
| (4) |
Expenses incurred by the Fund in connection with a special meeting of shareholders held on September 12, 2012, increased the ratio of expenses to average net assets by 2.27% for the year ended December 31, 2012.
|
| * |
Less than $0.005 per share.
|
See notes to financial statements.
|
|
|
|
|
|
17 Semi-Annual Report 2015
|
|
|
|
FOXBY CORP.
|
|
|
|
| The additional information below and on the following pages is supplemental and not part of the financial statements of the Fund. |
|
BOARD APPROVAL OF INVESTMENT MANAGEMENT AGREEMENT
|
|
(Unaudited)
|
|
|
Additional Information
|
The renewal of the investment management agreement (“Agreement”) between Foxby Corp. (“Fund”) and the investment manager, Midas Management Corporation (“Investment Manager”), was unanimously approved by the Fund’s Board of Directors (“Board”), including all of the Fund’s directors who are not “interested persons” of the Fund (“Independent Directors”) as defined under the Investment Company Act of 1940, as amended, at an in person meeting held on March 11, 2015 (“Meeting”). In this connection, the Board considered a number of factors, including, among other things, information that had been provided at other meetings, as well as information furnished to the Board for the Meeting. Such information included, among other things: information comparing the management fees of the Fund with a peer group of broadly comparable funds as determined by Lipper, Inc. (“Lipper”), an independent data service; information regarding the Fund’s investment performance on an absolute basis and in comparison to a relevant peer group of funds as determined by Lipper; the economic outlook and the general investment outlook in relevant investment markets; the Investment Manager’s results and financial condition and the overall organization of the Investment Manager; the allocation of brokerage and the benefits received by the Investment Manager as a result of brokerage allocation; the Investment Manager’s trading practices, including soft dollars; the Investment Manager’s management of relationships with custodians, transfer agents, pricing agents, brokers, and other service providers; the resources devoted to the Investment Manager’s compliance efforts undertaken on behalf of the Fund and the record of compliance with the compliance programs of the Fund, the Investment Manager, and its affiliates; the quality, nature, cost, and character of the administrative and other non-investment management services provided by the Investment Manager and its affiliates; the terms of the Agreement; the Investment Manager’s gifts and entertainment log; and the reasonableness and appropriateness of the fee paid by the Fund for the services provided.
The Board also considered the nature, extent, and quality of the management services provided by the Investment Manager. In so doing, the Board considered the Investment Manager’s management capabilities with respect to the types of investments held by the Fund, including information relating to the education, experience, and number of investment professionals and other personnel who provide services under the Agreement. The Board also took into account the time and attention to be devoted by management to the Fund. In this regard, the Board noted that the Investment Manager is responsible for, among other things, overseeing the selection of investments for the Fund, making investment decisions for the Fund, monitoring the investment operations and composition of the Fund, and, in connection therewith, monitoring compliance with the Fund’s investment objectives, policies and restrictions, as well as the Fund’s compliance with applicable law; monitoring brokerage selection, commission and
other trading costs, quality of execution, and other brokerage matters; and implementing the Board’s directives as they relate to the Fund. Further, the Board considered that the Investment Manager’s responsibilities include daily monitoring of investment, operational, enterprise, legal, regulatory and compliance risks as they relate to the Fund. The Board evaluated the level of skill required to manage the Fund and concluded that the resources available at the Investment Manager are appropriate to fulfill effectively its duties on behalf of the Fund. In addition, the Board noted that while shareholders approved the appointment of Midas Management Corporation as the Fund’s Investment Manager in October 2012, the Investment Manager’s management is the same as the management that operated the Fund’s previous investment manager. The Board indicated its belief that a long term relationship with capable, conscientious personnel is in the best interests of the Fund.
The Board received information concerning the investment philosophy and investment process applied by the Investment Manager in managing the Fund. The Board noted that the investment policy committee (“IPC”) had not changed its investment philosophy or investment process applied in managing the Fund.
The Board also considered the Investment Manager’s in-house research capabilities as well as other resources available to the Investment Manager’s personnel, including research services that may be available to the Investment Manager as a result of securities transactions effected for the Fund. The Board concluded that the Investment Manager’s investment process, research capabilities, and philosophy were well suited to the Fund, given the Fund’s investment objective and policies.
In its review of comparative information with respect to the Fund’s investment performance, the Board received information from Lipper comparing the Fund’s investment performance on an absolute basis and to that of a peer group of investment companies pursuing broadly similar strategies selected by Lipper. The Board observed that the total return performance exceeded the average and matched the median total return performance of its Lipper peer group for the four year period, underperformed the average and matched the median for the two and ten year periods, and underperformed the average and median for the one, three, and five year periods ended December 31, 2014. The Chairman of the Board noted that the Fund’s investments in the financial services sector generally performed well in the year ended December 31, 2014, although certain energy and retail stocks hindered overall returns. The Board observed that Foxby slightly underperformed in the two, three, and ten year periods ended December 31, 2014 and was reminded that Foxby’s total return performance exceeded the average and median total return performance of its Lipper peer group for the one, two, and three year periods
|
|
|
|
|
|
FOXBY CORP.
|
|
|
|
Semi-Annual Report 2015 18
|
|
|
|
|
|
BOARD APPROVAL OF INVESTMENT MANAGEMENT AGREEMENT
|
|
(Unaudited)
|
|
|
Additional Information
|
ended December 31, 2013. After discussion, the Board concluded that Foxby’s performance was within a range that it deemed competitive.
The Board noted that performance is only one of the factors that it deems relevant to its consideration of an Agreement and that, after considering all relevant factors, it can reach a decision to renew the Agreement notwithstanding the Fund’s underperformance over certain periods.
With respect to its review of the fee payable under the Agreement, the Board considered information from Lipper comparing the Fund’s management fee and expense ratio to those of its Lipper peer group. The Board observed that the Fund’s management fee was lower than the median in its Lipper peer group and its overall expense ratio (excluding extraordinary expenses) was higher than the median in its Lipper peer group. The Board concluded that although the Fund’s expense ratio, excluding extraordinary expenses, was higher relative to the Fund’s Lipper peer group, it was competitive with comparable funds in light of the quality of services received and the level of assets managed. The Board also evaluated any apparent or anticipated economies of scale in relation to the services the Investment Manager provides to the Fund. The Board considered that, being a closed end fund that does not continuously offer shares and that, without daily inflows and outflows of capital, there are limited opportunities for significant economies of scale to be realized by the Investment Manager in managing the Fund’s assets.
The information provided assisted the Board in concluding that the fee paid by the Fund is within the range of those paid by comparable funds within the fund industry. Further, the Board concluded that the Investment Manager’s fee bears a reasonable relationship to the services rendered and has been the product of arm’s length bargaining.
The Board also considered information regarding the character and amount of other incidental benefits received by the Investment Manager and its affiliates from its association with the Fund. The Board concluded that potential “fall-out” benefits that the Investment Manager and its affiliates may receive, such as increased ability to obtain research services, appear to be fair and reasonable and may, in some cases, benefit the Fund.
The Board also considered the profitability of the Investment Manager from its association with the Fund. In this regard, the Board considered the costs of the services provided by and the profits realized, if any, by the Investment Manager in connection with the operation of the Fund and was satisfied that the profitability was not excessive under the circumstances. In addition, the Board considered the financial stability of the Investment Manager during its deliberations.
The Board did not consider any single factor as controlling in determining whether or not to renew the Agreement. In assessing the information provided by the Investment Manager and its affiliates, the Board also noted that it was taking into consideration the benefits to shareholders of investing in a Fund that is part of a fund complex which provides a variety of shareholder services.
Based on its consideration of the foregoing factors and conclusions, and such other factors and conclusions as it deemed relevant, the Board, including all of the Independent Directors, concluded that the approval of the Agreement, including the fee structure, is in the best interests of the Fund.
|
|
|
|
19 Semi-Annual Report 2015
|
|
FOXBY CORP.
|
|
|
|
|
|
|
GENERAL INFORMATION
|
|
|
|
(Unaudited)
|
|
|
|
|
Additional Information
|
Proxy Voting
The Fund’s Proxy Voting Guidelines, which describe the policies and procedures the Fund uses to determine how to vote proxies relating to portfolio securities as well as its voting record for the most recent 12 months ended June 30, are available without charge by calling the Fund collect at 1-212-785-0900, on the SEC’s website at www.sec.gov, and on the Fund’s website at www.FoxbyCorp.com.
Quarterly Schedule of Portfolio Holdings
The Fund files its complete schedule of portfolio holdings with the SEC for the first and third quarters of each fiscal year on Form N-Q. The Fund’s Forms N-Q are available on the SEC’s website at www.sec.gov. The Fund’s Forms N-Q may be reviewed and copied at the SEC’s Public Reference Room in Washington, DC, and information on the operation of the Public Reference Room may be obtained by calling 1-800-SEC-0330. The Fund makes the Forms N-Q available on its website at www.FoxbyCorp.com.
|
|
|
|
|
| STOCK DATA AT JUNE 30, 2015 |
|
|
|
|
|
| Market Price per Share |
|
|
$1.85 |
|
|
|
| Net Asset Value per Share |
|
|
$2.62 |
|
|
|
| Market Price Discount to Net Asset Value |
|
|
29.4% |
|
|
|
| Ticker Symbol |
|
|
FXBY |
|
|
|
| CUSIP Number |
|
|
351645106 |
|
FUND INFORMATION
Investment Manager
Midas Management Corporation
11 Hanover Square
New York, NY 10005
www.FoxbyCorp.com
1-212-785-0900
Stock Transfer Agent and Registrar
Securities Transfer Corporation
2591 Dallas Parkway, Suite 102
Frisco, TX 75034
www.stctransfer.com
1-469-633-0101
FOXBYCORP.COM
Visit us on the web at www.FoxbyCorp.com. The site provides information about the Fund including market performance, net asset value, dividends, press releases, and shareholder reports. For further information, please email us at info@FoxbyCorp.com.
Cautionary Note Regarding Forward Looking Statements- This report contains “forward looking statements” as defined under the U.S. federal securities laws. Generally, the words “believe,” “expect,” “intend,” “estimate,” “anticipate,” “project,” “will,” and similar expressions identify forward looking statements, which generally are not historical in nature. Forward looking statements are subject to certain risks and uncertainties that could cause actual results to materially differ from the Fund’s historical experience and its current expectations or projections indicated in any forward looking statements. These risks include, but are not limited to, equity securities risk, corporate bonds risk, credit risk, interest rate risk, leverage and borrowing risk, additional risks of certain securities in which the Fund invests, market discount from net asset value, distribution policy risk, management risk, and other risks discussed in the Fund’s filings with the SEC. You should not place undue reliance on forward looking statements, which speak only as of the date they are made. The Fund undertakes no obligation to update or revise any forward looking statements made herein. There is no assurance that the Fund’s investment objectives will be attained.
Fund Information - This report, including the financial statements herein, is provided for informational purposes only. This is not a prospectus, circular, or representation intended for use in the purchase of shares of the Fund or any securities mentioned in this report. This report shall not constitute an offer to sell or the solicitation of an offer to buy, nor shall there be any sale of, these securities in any state in which such offer, solicitation or sale would be unlawful prior to registration or qualification under the securities laws of any such state, or an exemption therefrom.
Section 23 Notice- Pursuant to Section 23 of the Investment Company Act of 1940, as amended, notice is hereby given that the Fund may in the future purchase its own shares in the open market. These purchases may be made from time to time, at such times, and in such amounts, as may be deemed advantageous to the Fund, although nothing herein shall be considered a commitment to purchase such shares.
|
|
|
|
|
|
FOXBY CORP.
|
|
|
|
Semi-Annual Report 2015 20
|
FOXBY CORP.
|
|
FXBY
|
| TICKER |
|
WWW.FOXBYCORP.COM
|
PRINTED ON RECYCLED PAPER
Item 2. Code of Ethics.
Not applicable.
Item 3. Audit Committee Financial Expert.
Not applicable.
Item 4. Principal Accountant Fees and Services.
Not applicable.
Item 5. Audit Committee of Listed Registrants.
Not applicable.
Item 6. Investments.
Included as part of the report to stockholders filed under Item 1 of this Form.
Item 7. Disclosure of Proxy Voting Policies and Procedures for Closed-End Management Investment Companies.
Not applicable.
Item 8. Portfolio Managers of Closed-End Management Investment Companies.
Not applicable.
Item 9. Purchases of Equity Securities by Closed-End Management Investment Company and Affiliated Purchasers.
Not applicable.
Item 10. Submission of Matters to a Vote of Security Holders.
There were no material changes to the procedures by which shareholders may recommend nominees to the registrant's board of directors made or implemented after the registrant last provided disclosure in response to the requirements of Item 407(c)(2)(iv) of Regulation S-K (17 CFR 229.407), or this Item.
Item 11. Controls and Procedures.
|
(a)
|
The registrant's principal executive officer and principal financial officer have concluded that the registrant's disclosure controls and procedures (as defined in Rule 30a- 3(c) under the Investment Company Act of 1940, as amended (the "1940 Act")) are effective as of a date within 90 days of the filing date of this report that includes the disclosure required by this paragraph, based on their evaluation of the disclosure controls and procedures required by Rule 30a-3(b) under the 1940 Act and Rule 15d-15(b) under the Securities Exchange Act of 1934, as amended.
|
|
(b)
|
There were no changes in the registrant's internal control over financial reporting (as defined in Rule 30a-3(d) under the 1940 Act) that occurred during the registrant's second fiscal quarter of the period covered by the report that have materially affected, or are reasonably likely to materially affect, the registrant's internal control over financial reporting.
|
|
(a)(1)
|
Not applicable.
|
| |
|
| (a)(2) |
Certifications pursuant to Rule 30a-2(a) under the Investment Company Act of 1940 (17 CFR 270.30a-2) attached hereto as Exhibit EX-99.
|
| |
|
| (a)(3) |
Not applicable.
|
| |
|
| (b) |
Certifications pursuant to 18 U.S.C. Section 1350, as adopted pursuant to Section 906 of the Sarbanes-Oxley Act of 2002 attached hereto as Exhibit EX-99 906. |
Pursuant to the requirements of the Securities Exchange Act of 1934 and the Investment Company Act of 1940, the registrant has duly caused this report to be signed on its behalf by the undersigned, thereunto duly authorized.
|
|
|
|
|
Foxby Corp.
|
|
|
|
|
August 27, 2015
|
By: /s/ Thomas B. Winmill
|
|
|
Thomas B. Winmill
|
|
|
President
|
|
|
|
|
|
|
|
|
Foxby Corp.
|
|
|
|
|
August 27, 2015
|
By: /s/ Thomas O'Malley
|
|
|
Thomas O'Malley
|
|
|
Chief Financial Officer
|
Pursuant to the requirements of the Securities Exchange Act of 1934 and the Investment Company Act of 1940, this report has been signed below by the following persons on behalf of the registrant and in the capacities and on the dates indicated.
|
|
|
|
|
Foxby Corp.
|
|
|
|
|
August 27, 2015
|
By: /s/ Thomas B. Winmill
|
|
|
Thomas B. Winmill
|
|
|
President
|
|
|
|
|
|
|
|
|
Foxby Corp.
|
|
|
|
|
August 27, 2015
|
By: /s/ Thomas O'Malley
|
|
|
Thomas O'Malley
|
|
|
Chief Financial Officer
|